Version 1.5 UK NO 2 Diffusion Tube Network Instruction Manual Produced for the Department for Environment, Food and Rural Affairs, the Scottish Executive, the Welsh Assembly Government and the Department of Environment in Northern Ireland. February 2003

Welcome message from author
This document is posted to help you gain knowledge. Please leave a comment to let me know what you think about it! Share it to your friends and learn new things together.
Transcript

Version 1.5
UK NO2 Diffusion Tube Network Instruction Manual
Produced for the Department for Environment, Food and Rural Affairs, the Scottish Executive, the Welsh Assembly Government and the Department of Environment in Northern Ireland.
February 2003
Version 1.5
UK NO2 Diffusion Tube Network Instruction Manual
Produced for the Department for Environment, Food and Rural Affairs, the Scottish Executive, the Welsh Assembly Government and the Department of Environment in Northern Ireland.
February 2003

UK NO2 Diffusion Tube Network Instruction Manual Version 1.5
Title UK Nitrogen Dioxide Diffusion Tube Network Instruction Manual Customer Department for Environment, Food and Rural Affairs, the
Scottish Executive, the Welsh Assembly Government and the Department of Environment in Northern Ireland.
Customer reference
EPG 1/3/174
Confidentiality, copyright and reproduction
Copyright AEA Technology 2000. All rights reserved. Enquiries about copyright and reproduction should be addressed to the Commercial Manager, AEA Technology plc.
File reference ED 45005002 Report number AEAT – 3675: version 1.5 Report status Unclassified Netcen
AEA Technology plc Culham ABINGDON Oxfordshire OX14 3ED Telephone 012345 463073 Facsimile 01235 463817
AEA Technology is the trading name of AEA Technology plc AEA Technology is certificated to BS EN ISO9001:(1994)
Name Signature Date
Author Tony Bush Diane Mooney Alison Loader
Reviewed by Ken Stevenson
Approved by Ken Stevenson
r:\foxpro\uk_no2\docs\no2instr_1.5.doc AEA Technology ii

UK NO2 Diffusion Tube Network Instruction Manual Version 1.5
Contents
1 Introduction 1
2 Oxides of Nitrogen in the Atmosphere 2
3 NO2 Diffusion Tube Samplers 3
4 Organisation of the Network 4
4.1 ORGANISATIONAL STRUCTURE 4 4.2 QUALITY ASSURANCE AND QUALITY CONTROL 5
4.2.1 Local/Unitary Authority QA/QC Responsibilities 5 4.2.2 Analytical Laboratory QA/QC Responsibilities 6
4.3 CORRECTION FOR BIAS 7
5 Location of Monitoring Sites 7
5.1 DETAILED SITING OF THE SAMPLER 8 5.2 SITE CATEGORIES 8
5.2.1 Roadside sites 8 5.2.2 Urban background sites 9
6 Instructions for Exposing Diffusion Tubes9
7 Comparing Data with Air Quality Standards 10
7.2 COMPARISON WITH THE EC DIRECTIVE 85/203 11 7.2 COMPARISON WITH DIRECTIVE 1999/30/EC LIMIT VALUES 12 7.3 COMPARISON WITH AQS OBJECTIVES 12
8 References 12
Appendices APPENDIX 1 LOCAL & UNITARY AUTHORITY CODES APPENDIX 2 COUNTY CODES APPENDIX 3 ANALYTICAL LABORATORY CODES
r:\foxpro\uk_no2\docs\no2instr_1.5.doc AEA Technology iii

UK NO2 Diffusion Tube Network Instruction Manual Version 1.5
r:\foxpro\uk_no2\docs\no2instr_1.5.doc AEA Technology iv

UK NO2 Diffusion Tube Network Instruction Manual Version 1.5
1 Introduction
Ambient concentrations of oxides of nitrogen (principally NO and NO2) have become the subject of increasing interest in recent years. Nitrogen dioxide (NO2) is the most significant of this family of pollutant gases, because of its known human health impacts and contribution to acidification of the environment. In order to protect human health, ambient concentrations of nitrogen dioxide (NO2) have been regulated throughout Europe by EC Directive 85/2031, since 1985. This is being superseded by the first EC Daughter Directive (1999/30/EC)2, which came into force in January 2000 and has set Limit Values for NO2, to be achieved by 2010. The UK Department for Environment, Food and Rural Affairs (Defra), the Scottish Executive, the Welsh Assembly Government and the Department of Environment in Northern Ireland have also introduced The Air Quality Strategy (AQS) 3. This document sets out air quality objectives for NO2 and other air pollutants, which are in most cases to be achieved by the end of 2005. The recommendations for NO2 objectives set out by the AQS have been formally made part of UK legislation by the Air Quality Regulations 2000 for England4, Wales5, Scotland6 and Northern Ireland7. In June 1990, the UK Photochemical Oxidants Review Group published a major report reviewing all measurements of nitrogen oxides in the UK8. The conclusions of this report included recommendations for continued monitoring oxides of nitrogen, and pointed out that diffusion tube samplers provided a cost-effective method of determining spatial variation of NO2 throughout the UK. The Government White Paper, “This Common Inheritance” committed Defra’s predecessor, the Department of Environment, Transport and the Regions (DETR) to the expansion of air quality monitoring. This has partly been achieved by the creation of the Automatic Urban Network (AUN) and its affiliated automatic monitoring sites; these use continuous automatic techniques to monitor air quality at a number of urban locations. The detailed air quality information from these sites is used primarily for public information, via the Department’s Air Quality Bulletin service and the National Air Quality Archive on the World Wide Web, at www.airquality.co.uk. However, automatic air quality monitoring is expensive to set up, operate and maintain. Historically, this has limited spatial coverage. Simple passive samplers, such as diffusion tubes, are therefore a useful supplement to automatic monitoring. Passive samplers absorb pollutants direct from the ambient air, and do not need a power supply of any kind. They are exposed at the selected site for an extended period (typically several weeks), and subsequently analysed at a central laboratory. Passive samplers are easy to use and relatively inexpensive, so they can be deployed in large numbers over a wide area, giving good spatial coverage. They may be used to complement detailed measurements made at automatic monitoring sites. In 1993 DETR established the UK Nitrogen Dioxide Network, using diffusion tube samplers. This network is now co-ordinated on behalf of Defra and the Devolved Administrations by netcen, an operating division of AEA Technology plc, in collaboration with a large number of Local and Unitary Authorities. The UK Network follows on from two successful short-term nationwide surveys carried out in 1986 and 19919,10, which utilised the infrastructure of the existing UK Smoke and SO2 Monitoring Network. The NO2 Diffusion Tube Network currently collects data from 324 Local and Unitary Authorities, and has the objective of assessing the spatial and temporal distribution of Nitrogen Dioxide concentrations in urban areas of the UK. The network is the first of its kind to monitor NO2 concentrations over such a large area and long period with a consistent siting criteria optimised for the monitoring of NO2 in the urban environment.
r:\foxpro\uk_no2\docs\no2instr_1.5.doc AEA Technology 1

UK NO2 Diffusion Tube Network Instruction Manual Version 1.5
The network has also enabled the assessment of changes in urban NO2 concentrations in the UK. This is particularly relevant as NOx emissions from road traffic are expected to decrease as the percentage of the UK car fleet fitted with catalytic converters increases. This instruction manual is intended to provide an introduction to the monitoring of NO2 using diffusion tubes, for the purposes of the Network. It gives information on how to set up monitoring sites, expose tubes, and submit data to the network. With such a large number of participants in the study, it is essential that recommendations and instructions provided in this manual are followed closely. This will ensure that data are of the highest quality, and comparability. • The manual is periodically updated. This version (Version 1.5) was produced
in February 2003. A published annual report provides the major route for public dissemination of data from the network. This report, and data from the network are also included in the Air Quality Archive on the World Wide Web, at www.airquality.co.uk A copy of this Instruction Manual is also available via this web site, at http://www.aeat.co.uk/netcen/airqual/reports/no2man/no2man.html . All measurement data supplied to netcen as part of the UK NO2 Network must be regarded as “in the public domain”, and subject to meeting data quality criteria will be made available on the Archive.
2 Oxides of Nitrogen in the Atmosphere
Oxides of nitrogen, collectively termed NOX, are air pollutant gases. The most significant of these (in terms of anthropogenic ground level air pollution) are nitric oxide (NO) and nitrogen dioxide (NO2). Nitrous oxide (N2O) is the most prevalent oxide of nitrogen in the atmosphere, and although an important “greenhouse gas”, it has no known detrimental effect on human health at ambient concentrations and will not be discussed further in this document. Both NO and NO2 are formed in high temperature combustion processes, though NO predominates. (The term NOx, total oxides of nitrogen, is generally used to describe the sum of NO and NO2 concentrations). In 2000, motor vehicles accounted for approximately 46%11 of the UK’s total estimated emission of oxides of nitrogen, with coal combustion (including coal fired power stations) accounting for about a further 18%. However, in urban areas, especially close to major roads, a much higher percentage of the observed oxides of nitrogen will arise from motor vehicles. Almost all oxidised nitrogen pollution is emitted as NO, which at ambient temperatures is oxidised to the more toxic secondary pollutant, NO2. This process is accelerated in the presence of sunlight, reactive hydrocarbons and ozone.
r:\foxpro\uk_no2\docs\no2instr_1.5.doc AEA Technology 2
UK NO2 Diffusion Tube Network Instruction Manual Version 1.5
3 NO2 Diffusion Tube Samplers
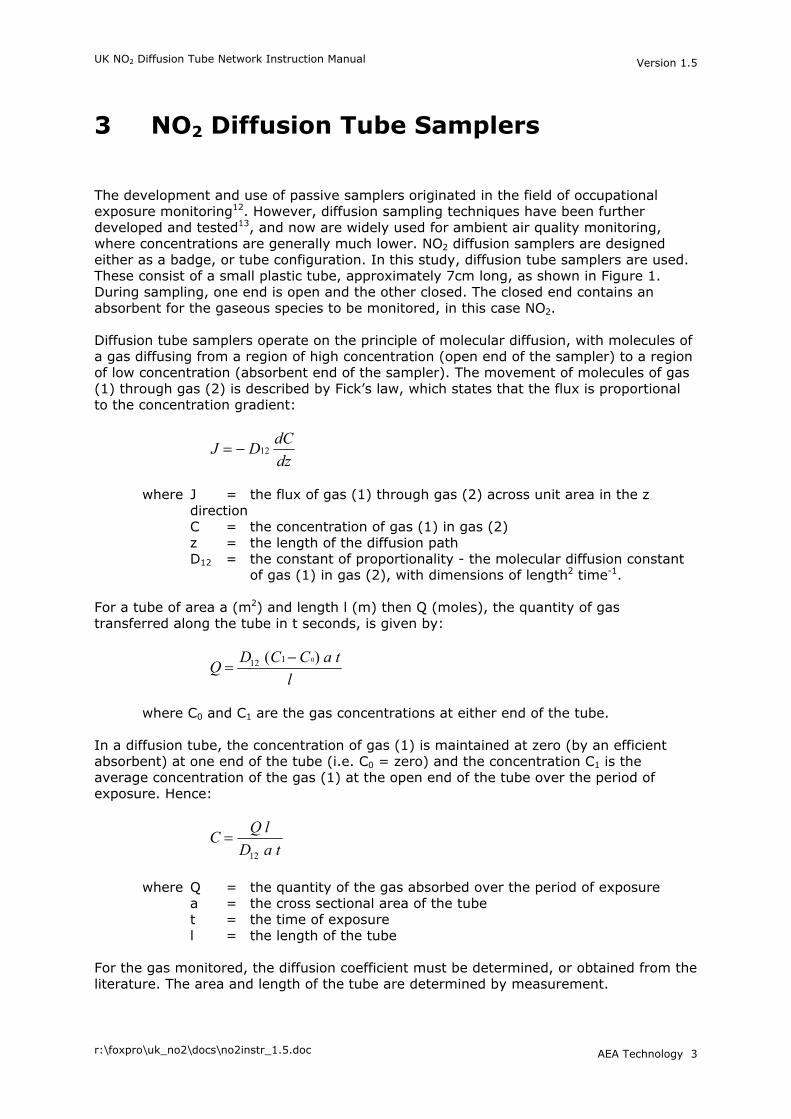
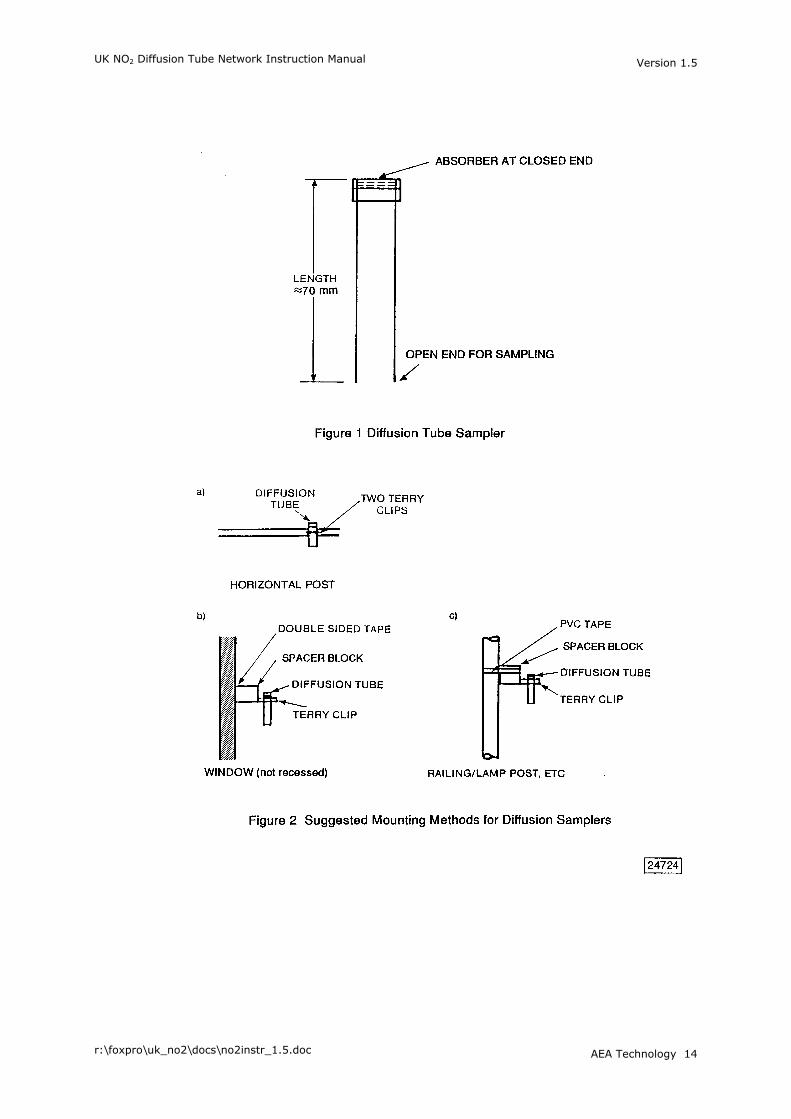
The development and use of passive samplers originated in the field of occupational exposure monitoring12. However, diffusion sampling techniques have been further developed and tested13, and now are widely used for ambient air quality monitoring, where concentrations are generally much lower. NO2 diffusion samplers are designed either as a badge, or tube configuration. In this study, diffusion tube samplers are used. These consist of a small plastic tube, approximately 7cm long, as shown in Figure 1. During sampling, one end is open and the other closed. The closed end contains an absorbent for the gaseous species to be monitored, in this case NO2. Diffusion tube samplers operate on the principle of molecular diffusion, with molecules of a gas diffusing from a region of high concentration (open end of the sampler) to a region of low concentration (absorbent end of the sampler). The movement of molecules of gas (1) through gas (2) is described by Fick’s law, which states that the flux is proportional to the concentration gradient:
J D dCdz
= − 12
where J = the flux of gas (1) through gas (2) across unit area in the z
direction C = the concentration of gas (1) in gas (2) z = the length of the diffusion path D12 = the constant of proportionality - the molecular diffusion constant
of gas (1) in gas (2), with dimensions of length2 time-1. For a tube of area a (m2) and length l (m) then Q (moles), the quantity of gas transferred along the tube in t seconds, is given by:
Q D C C al
=−12 1 0( ) t
where C0 and C1 are the gas concentrations at either end of the tube. In a diffusion tube, the concentration of gas (1) is maintained at zero (by an efficient absorbent) at one end of the tube (i.e. C0 = zero) and the concentration C1 is the average concentration of the gas (1) at the open end of the tube over the period of exposure. Hence:
C Q lD a t
=12
where Q = the quantity of the gas absorbed over the period of exposure a = the cross sectional area of the tube t = the time of exposure l = the length of the tube For the gas monitored, the diffusion coefficient must be determined, or obtained from the literature. The area and length of the tube are determined by measurement.
r:\foxpro\uk_no2\docs\no2instr_1.5.doc AEA Technology 3

UK NO2 Diffusion Tube Network Instruction Manual Version 1.5
Triethanolamine (TEA) is the absorbent used for NO2 in diffusion tubes. The closed end of the tube holds stainless steel mesh discs, coated with this absorbent. Tubes must be prepared in a clean atmosphere, to minimise contamination by atmospheric NO2. The open end of the tube is then sealed and the tube stored in a sealed container prior to exposure. For monitoring, the end cap not containing the mesh discs is removed and the tube mounted vertically with the open end at the bottom. NO2 is absorbed as nitrite and after exposure, the lower end cap is replaced and the tubes sent for chemical analysis. Step-by-step instructions for exposing the tubes are given in Section 6. For the purpose of the network, the tubes must be analysed by standard colorimetric or spectrophotometric techniques. This generally involves the addition of a solution of sulphanilamide in orthophosphoric acid and naphthyl ethylene diamine dihydrochloride (NEDA) solution, to form an azo dye, the intensity of which is determined on a spectrometer at 540nm. The spectrometer is calibrated against standard nitrite solutions, to allow the total NO2 as nitrite, collected by the tube, to be determined. If required, the method can be automated for a large throughput of samples. It should be noted that diffusion tubes are an indicative monitoring technique. Whilst ideal for screening surveys, or for identifying locations where NO2 concentrations are highest, they do not provide the same level of accuracy as automatic monitoring techniques.
4 Organisation of the Network
4.1 ORGANISATIONAL STRUCTURE
The organisation of the UK NO2 Network is similar to that of the long-running UK Smoke & SO2 monitoring network. netcen provides the organisational infrastructure, quality assurance and control, data collation and reporting for the network. Participating Local and Unitary Authorities are responsible for undertaking the measurements of NO2 with diffusion tube samplers, and reporting of results to netcen on a monthly basis following the instructions given in this manual. Each participating Local/Unitary Authority is asked to set up a minimum 4 monitoring sites, in accordance with the siting requirements set out in Section 5 of this manual. Full details of the monitoring locations and Authority contacts must be forwarded to netcen using the ‘Site Details’ form provided. In addition, participants are asked to supply copies of suitable 1:1250 scale maps or GIS town planning maps with the location of monitoring sites clearly identified. This enables the netcen team to check that sites meet the criteria of the network. Supply and analysis of diffusion tubes may be obtained from any of the organisations listed in Appendix 3. All of these laboratories participate in the network’s laboratory performance testing scheme, which tests to ensure their analyses are of sufficient quality to be included in the network. Participants should note that data will be rejected from the network if the contracted laboratory does not meet satisfactory QA/QC standards. Diffusion tube exposure periods and change over dates are defined by the network’s monitoring timetable, which will be supplied annually. Under this timetable the year is
r:\foxpro\uk_no2\docs\no2instr_1.5.doc AEA Technology 4

UK NO2 Diffusion Tube Network Instruction Manual Version 1.5
divided into twelve “pollution months” which contain either 4 or 5 whole weeks, i.e. 28 or 35 days. These start on Tuesdays, to avoid the problem of Bank Holidays. Wherever possible, the diffusion tube change over must occur on the stipulated date, however, if this is not possible tubes may be changed within ±2 days of the due date. If for any reason diffusion tube exposure periods differ from standard dates provided in the relevant timetable, netcen must be informed; generally, a note on the regular monthly concentration report form is sufficient for this purpose. The Local/Unitary Authority and analyst must set up a system to ensure that all tubes are individually numbered and careful records kept of where and when each tube is exposed. This numbering system needs to be maintained throughout the analytical procedure, so that the final result can be unambiguously assigned to a particular site and a particular period. Results for each monitoring site are to be sent to netcen as soon as they are available and in any case no later than 2 months after the end of the sampling period. A ‘concentration report form’ will be sent to each Local/Unitary Authority on around the 10th day of each month for this purpose. netcen will then collate and archive the results and prepare annual reports on the data and the operation of the network. Please note that we must receive all data for the preceding calendar year by the end of February, to ensure its inclusion in the Annual Report.
4.2 QUALITY ASSURANCE AND QUALITY CONTROL
Quality assurance and control of diffusion tube location, handling and also diffusion tube preparation and analysis are important tasks in the network. These activities attempt to minimise uncertainties in the network’s data and to optimise the comparability of data produced by the various authorities and laboratories taking part in the network. Responsibilities to QA/QC may be broadly split into two areas. These are discussed below. 4.2.1 Local/Unitary Authority QA/QC Responsibilities It is vital that the siting criteria detailed in Section 5 of this manual are followed as strictly as possible. This will ensure that data from equivalent siting locations in other authorities in the UK are directly comparable. If you are at any stage unsure about the best option to take or require clarification of the criteria, please contact netcen for further assistance. In addition, it is essential for netcen to be kept fully informed of changes to routine monitoring. For example : • If a monitoring location needs to be moved, please notify netcen in advance
with full details of the replacement site, reasons for moving the sampler location and dates when sampling is to stop at the existing site and recommence the replacement site.
• If there are any changes in your address or contact details, please forward these to netcen immediately.
• If you change your analytical laboratory, please notify netcen of the change and the month when it took place.
Local and Unitary Authorities are also responsible for arranging and record keeping of travel blank diffusion tubes. In order to quantify any contamination of diffusion tubes during transit and storage, an additional diffusion tube must be used as a “travel blank”, once per quarter. The travel blank must accompany the diffusion tubes for exposure to and from the sites, although it must not be exposed. During the exposure period the
r:\foxpro\uk_no2\docs\no2instr_1.5.doc AEA Technology 5

UK NO2 Diffusion Tube Network Instruction Manual Version 1.5
travel blank must be stored in a sealed bag in a refrigerator. The mass of nitrite on the blank will provide an indication of possible contamination during transit. NO2 diffusion tubes are known to degrade over time. Therefore, the interval between preparation and analysis should be kept to a minimum. For the purposes of this network, this interval shall not be more than three months. Diffusion tubes shall be kept refrigerated, in a sealed plastic bag, during storage before and after exposure and care shall also be taken to isolate them from other nitrite and nitrate based chemicals to minimise the possibility of contamination. Any laboratory wishing to undertake supply and analysis of NO2 diffusion tubes for the UK NO2 Diffusion Tube Network must take part in the following: • The Workplace Analysis Scheme for Proficiency (WASP) for NO2 Diffusion Tubes,
which is now run independently by the Health and Safety Laboratory (HSL). See section 4.2.2.
• The NO2 Network Field Intercomparison. • Analysis of Quality Control Solutions supplied by netcen. It is strongly recommended that Local/Unitary Authorities check the overall performance of a laboratory prior to placing a contract for supply and analysis of diffusion tubes. This can be done by requesting information on the laboratory's performance in the WASP programme, from the laboratory concerned. Full details of the WASP programme are given in section 4.2.2 below. Results from the scheme are distributed to the laboratories monthly, and summarised in the NO2 Network annual report. They provide an indication of the quality of the laboratory’s diffusion tube analysis. It should be noted that if the laboratory fails to demonstrate satisfactory performance in the WASP programme and the Field Intercomparison, data produced by this laboratory may be rejected from the network’s dataset. It is, therefore, important to choose a laboratory with a proven track record and also to check on a laboratory’s performance regularly, if data is to be fully utilised. 4.2.2 Analytical Laboratory QA/QC Responsibilities As explained above, any laboratory providing supply and analysis of diffusion tubes for the purposes of the UK NO2 Network must take part in the following QA/QC programmes. (i) The WASP Programme. The Health and Safety Laboratory WASP scheme for NO2 diffusion tubes was initiated in 1999, and replaced the old Performance Testing Scheme. It involves the analysis, by each participating analytical laboratory, of a tube doped with a known mass of nitrite. Each month a doped diffusion tube is distributed to each participant. This is analysed and the result returned to HSL for checking. Performance scores are then assigned to the analyses on the basis of their difference from the actual mass nitrite, and the standard deviation. Hence results are classified as follows:
Good < 2 Standard deviations from true value Warning 2-3 Standard deviations from true value Action ≥ 3 Standard deviations from true value
Performance test results are disseminated to participating laboratories on a monthly basis. (ii) The Field Intercomparison. This comprises an ongoing monthly field trial, designed to complement the monthly performance testing scheme described in (i) above by providing information on the uncertainties arising from both the sampling and analysis phases of diffusive sampling in the field. Formerly an annual exercise, run by netcen, in
r:\foxpro\uk_no2\docs\no2instr_1.5.doc AEA Technology 6

UK NO2 Diffusion Tube Network Instruction Manual Version 1.5
November 2002 this was expanded to an ongoing monthly programme, also operated independently by HSL. Each laboratory supplies three tubes plus a travel blank, to be exposed in the field at an existing automatic NO2 monitoring station. Diffusion tube results for each laboratory are compared with the NO2 concentration as measured by the automatic analyser. Laboratories have the option of participating monthly or quarterly. (iii) Quality Control Solution Testing Scheme operated by netcen. This involves the monthly analysis of a nitrite solution of known concentration by all participating laboratories. Every six months approximately 150ml of a stock nitrite solution is distributed to each laboratory. The laboratories analyse a sample of this stock solution on a monthly basis and return the result to netcen for checking.
4.3 CORRECTION FOR BIAS
Many of the Local Authorities participating in the NO2 Network also use their diffusion tube measurements for Local Air Quality Management purposes, in their ongoing Updating And Screening Assessment of local air quality. Local Authorities using diffusion tubes in this context are advised by Defra’s Technical Guidance14 to establish the average bias (i.e. over-read or under-read) of the tubes they are using, and to make appropriate correction for this bias when calculating the annual mean. However, at the present time, there is insufficient information available to allow diffusion tube data from every participating Local Authority to be corrected for bias in a reliable and consistent manner throughout the Network. Also, bias can vary from month to month, so it is only appropriate to apply bias correction to the annual mean, not the individual monthly measurements. Therefore, at the present time, data sent to netcen for the purposes of the Nitrogen Dioxide Network should continue to be submitted without any bias correction. This will be reviewed as more information on bias correction becomes available, and participants will be informed of any changes.
5 Location of Monitoring Sites
This section gives information about the general location of the monitoring sites, as required from January 2001 onwards. The network will take data from a minimum of 4 sites in each Local/Unitary Authority area. Two sites will be close to busy roads (roadside sites), and two sites will be at a distance of at least 50 m from a busy road (urban background sites). Prior to December 2002, a third "Intermediate" classification was also used. However, this category of sites had been found, over the years, to provide little additional information, so Intermediate sites were discontinued from the end of 2002, to be replaced in most cases with additional roadside sites. Sites should be located in areas where people are normally present in daily life. The network is primarily designed to monitor general urban air pollution, rather than that from specific industrial sources, and hence, locations where industrial sources predominate should not be included. The immediate area around sampler location must be open, allowing free circulation of air around the tube. Ideally, samplers would be placed at breathing height, but in order to reduce theft of tubes, it is recommended that tubes are placed at a height 2-4 m, and in all cases no higher than 5 m.
r:\foxpro\uk_no2\docs\no2instr_1.5.doc AEA Technology 7
UK NO2 Diffusion Tube Network Instruction Manual Version 1.5
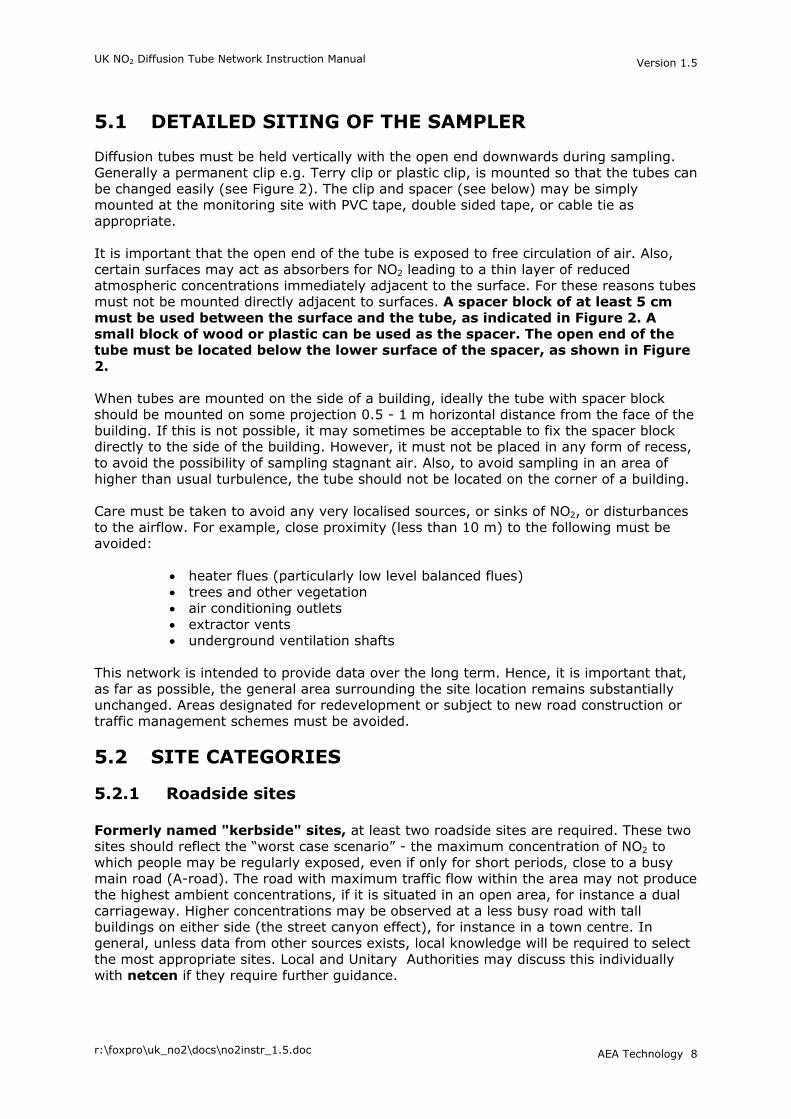
5.1 DETAILED SITING OF THE SAMPLER
Diffusion tubes must be held vertically with the open end downwards during sampling. Generally a permanent clip e.g. Terry clip or plastic clip, is mounted so that the tubes can be changed easily (see Figure 2). The clip and spacer (see below) may be simply mounted at the monitoring site with PVC tape, double sided tape, or cable tie as appropriate. It is important that the open end of the tube is exposed to free circulation of air. Also, certain surfaces may act as absorbers for NO2 leading to a thin layer of reduced atmospheric concentrations immediately adjacent to the surface. For these reasons tubes must not be mounted directly adjacent to surfaces. A spacer block of at least 5 cm must be used between the surface and the tube, as indicated in Figure 2. A small block of wood or plastic can be used as the spacer. The open end of the tube must be located below the lower surface of the spacer, as shown in Figure 2. When tubes are mounted on the side of a building, ideally the tube with spacer block should be mounted on some projection 0.5 - 1 m horizontal distance from the face of the building. If this is not possible, it may sometimes be acceptable to fix the spacer block directly to the side of the building. However, it must not be placed in any form of recess, to avoid the possibility of sampling stagnant air. Also, to avoid sampling in an area of higher than usual turbulence, the tube should not be located on the corner of a building. Care must be taken to avoid any very localised sources, or sinks of NO2, or disturbances to the airflow. For example, close proximity (less than 10 m) to the following must be avoided:
• heater flues (particularly low level balanced flues) • trees and other vegetation • air conditioning outlets • extractor vents • underground ventilation shafts
This network is intended to provide data over the long term. Hence, it is important that, as far as possible, the general area surrounding the site location remains substantially unchanged. Areas designated for redevelopment or subject to new road construction or traffic management schemes must be avoided.
5.2 SITE CATEGORIES
5.2.1 Roadside sites Formerly named "kerbside" sites, at least two roadside sites are required. These two sites should reflect the “worst case scenario” - the maximum concentration of NO2 to which people may be regularly exposed, even if only for short periods, close to a busy main road (A-road). The road with maximum traffic flow within the area may not produce the highest ambient concentrations, if it is situated in an open area, for instance a dual carriageway. Higher concentrations may be observed at a less busy road with tall buildings on either side (the street canyon effect), for instance in a town centre. In general, unless data from other sources exists, local knowledge will be required to select the most appropriate sites. Local and Unitary Authorities may discuss this individually with netcen if they require further guidance.
r:\foxpro\uk_no2\docs\no2instr_1.5.doc AEA Technology 8
UK NO2 Diffusion Tube Network Instruction Manual Version 1.5
The diffusion tube should be sited between 1-5 m from the kerb edge, and mounted ideally either on a lamp post or road sign on the pavement, or on the face of a building adjoining the pavement. Measurements from roadside sites will only be representative over a very small area, as NO2 concentrations close to sources vary considerably, even over short distances. 5.2.2 Urban background sites At distances of more than 50m from a busy road, it is anticipated that NO2 concentrations will have been diluted to the local urban background concentration. Hence, measurements made in this type of location are likely to be representative of a fairly large area, and can be reliably compared with similar locations in other urban areas. Urban background sites must be located >50 m from any busy road. Examples of typical urban background sites are on lampposts or street signs in quiet residential areas, schools or other public buildings, either close to the town centre or in suburbs bordered by a busy arterial road. When street furniture is used, even on quiet roads, the sampler must be more than 1 m from the kerb. At least two urban background sites are required.
6 Instructions for Exposing Diffusion Tubes
On the exposure date detailed in the UK NO2 Network monitoring calendar the following procedures should be followed:
• Remove tubes from the refrigerator and transport to site in a snap seal bag. Travel blanks, where applicable, should be identified and their code numbers noted on the exposure details form provided by your analytical laboratory.
• Transport tubes for exposure to monitoring sites, with travel blanks if appropriate, and exposure details form.
• At each site, select a tube. Record its ID number, and the site at which it is to be exposed on the exposure details form.
• With the absorbent end cap uppermost, remove the bottom end cap and clip the tube into the holder. Ensure the sampler is mounted vertically with its open end downwards
• Record the date and time of the start of the exposure period on the exposure details form, and make a note of any site irregularities (for example building/road works, traffic diversions).
• Keep the end caps in the bag, for use when the exposure period is completed. On the appropriate date, the samplers will need to be changed and a new batch of tubes identified for exposure. The following procedures should be followed:
• Transport the new batch of unexposed tubes to site, together with the end caps from the last batch, any travel blanks as appropriate, and exposure details forms for both batches.
• At each site, remove the exposed tube from sample holder and replace end cap tightly.
r:\foxpro\uk_no2\docs\no2instr_1.5.doc AEA Technology 9
UK NO2 Diffusion Tube Network Instruction Manual Version 1.5
• Record the time and date of the end of the exposure period on the exposure details form, against the appropriate tube number.
• Make a note of any site irregularities (building/road works, traffic diversions), also anything which might affect the tube, (for example the tube found on the ground, insects or moisture inside the tube) on the form.
• Select a new tube for exposure. Remove its end cap and place it open end down in the holder, as above. Record tube ID details, date and time. Tubes that are damaged or have splits in the end-caps should not be used.
Tubes should always be capped securely after exposure; any tubes returned uncapped to the laboratory will be rejected. When visiting sites, it is recommended that the operator takes some spare tube end caps, also some spare mounting clips and spacer blocks to replace any missing or damaged.
7 Comparing Data with Air Quality Standards
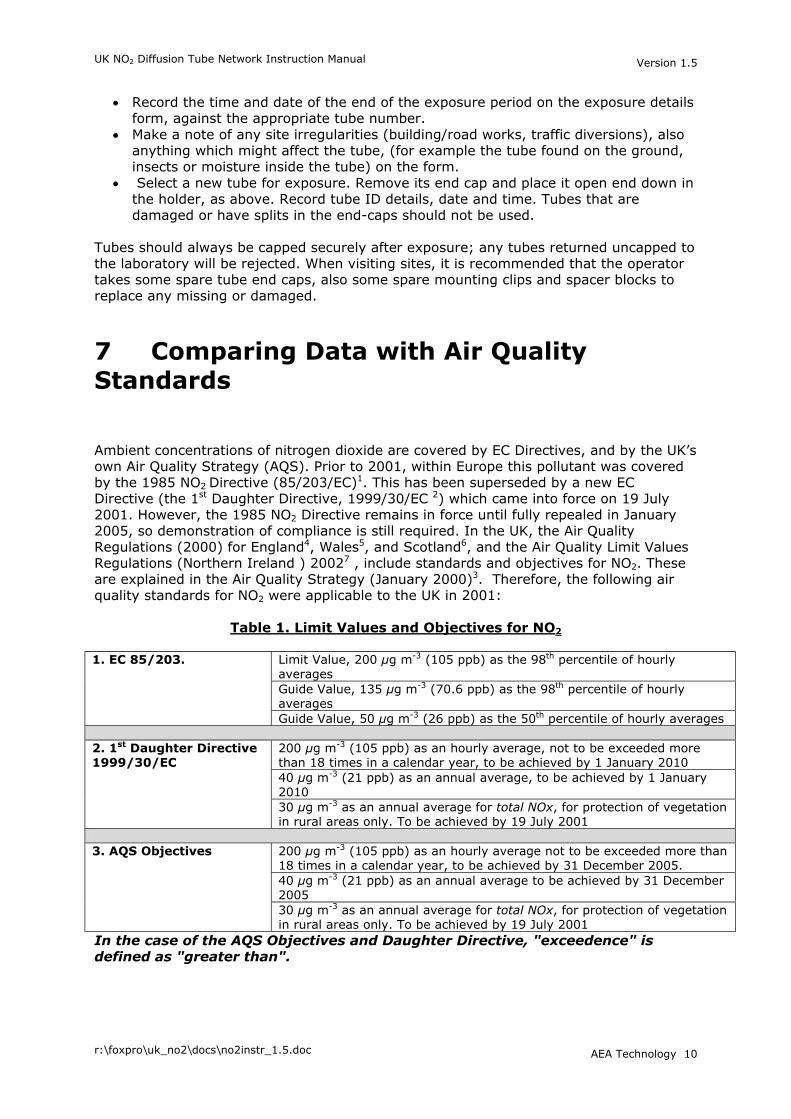
Ambient concentrations of nitrogen dioxide are covered by EC Directives, and by the UK’s own Air Quality Strategy (AQS). Prior to 2001, within Europe this pollutant was covered by the 1985 NO2 Directive (85/203/EC)1. This has been superseded by a new EC Directive (the 1st Daughter Directive, 1999/30/EC 2) which came into force on 19 July 2001. However, the 1985 NO2 Directive remains in force until fully repealed in January 2005, so demonstration of compliance is still required. In the UK, the Air Quality Regulations (2000) for England4, Wales5, and Scotland6, and the Air Quality Limit Values Regulations (Northern Ireland ) 20027 , include standards and objectives for NO2. These are explained in the Air Quality Strategy (January 2000)3. Therefore, the following air quality standards for NO2 were applicable to the UK in 2001:
Table 1. Limit Values and Objectives for NO2
Limit Value, 200 µg m-3 (105 ppb) as the 98th percentile of hourly averages Guide Value, 135 µg m-3 (70.6 ppb) as the 98th percentile of hourly averages
1. EC 85/203.
Guide Value, 50 µg m-3 (26 ppb) as the 50th percentile of hourly averages
200 µg m-3 (105 ppb) as an hourly average, not to be exceeded more than 18 times in a calendar year, to be achieved by 1 January 2010 40 µg m-3 (21 ppb) as an annual average, to be achieved by 1 January 2010
2. 1st Daughter Directive 1999/30/EC
30 µg m-3 as an annual average for total NOx, for protection of vegetation in rural areas only. To be achieved by 19 July 2001
200 µg m-3 (105 ppb) as an hourly average not to be exceeded more than 18 times in a calendar year, to be achieved by 31 December 2005. 40 µg m-3 (21 ppb) as an annual average to be achieved by 31 December 2005
3. AQS Objectives
30 µg m-3 as an annual average for total NOx, for protection of vegetation in rural areas only. To be achieved by 19 July 2001
In the case of the AQS Objectives and Daughter Directive, "exceedence" is defined as "greater than".
r:\foxpro\uk_no2\docs\no2instr_1.5.doc AEA Technology 10
UK NO2 Diffusion Tube Network Instruction Manual Version 1.5
7.2 COMPARISON WITH THE EC DIRECTIVE 85/203
The 1985 EC Directive Limit Value for NO2 is 200 µg m-3 (104.6 ppb) for the 98th
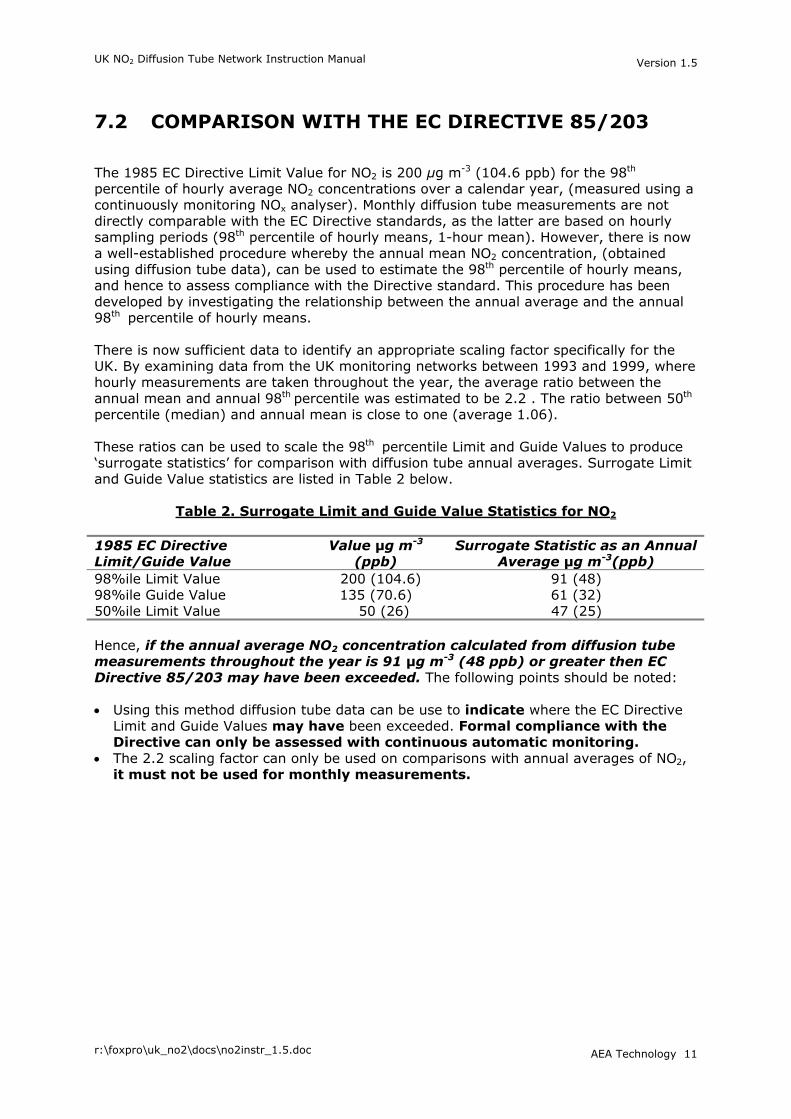
percentile of hourly average NO2 concentrations over a calendar year, (measured using a continuously monitoring NOx analyser). Monthly diffusion tube measurements are not directly comparable with the EC Directive standards, as the latter are based on hourly sampling periods (98th percentile of hourly means, 1-hour mean). However, there is now a well-established procedure whereby the annual mean NO2 concentration, (obtained using diffusion tube data), can be used to estimate the 98th percentile of hourly means, and hence to assess compliance with the Directive standard. This procedure has been developed by investigating the relationship between the annual average and the annual 98th percentile of hourly means. There is now sufficient data to identify an appropriate scaling factor specifically for the UK. By examining data from the UK monitoring networks between 1993 and 1999, where hourly measurements are taken throughout the year, the average ratio between the annual mean and annual 98th percentile was estimated to be 2.2 . The ratio between 50th percentile (median) and annual mean is close to one (average 1.06). These ratios can be used to scale the 98th percentile Limit and Guide Values to produce ‘surrogate statistics’ for comparison with diffusion tube annual averages. Surrogate Limit and Guide Value statistics are listed in Table 2 below.
Table 2. Surrogate Limit and Guide Value Statistics for NO2
1985 EC Directive Limit/Guide Value
Value µg m-3 (ppb)
Surrogate Statistic as an Annual Average µg m-3(ppb)
98%ile Limit Value 200 (104.6) 91 (48) 98%ile Guide Value 135 (70.6) 61 (32) 50%ile Limit Value 50 (26) 47 (25) Hence, if the annual average NO2 concentration calculated from diffusion tube measurements throughout the year is 91 µg m-3 (48 ppb) or greater then EC Directive 85/203 may have been exceeded. The following points should be noted: • Using this method diffusion tube data can be use to indicate where the EC Directive
Limit and Guide Values may have been exceeded. Formal compliance with the Directive can only be assessed with continuous automatic monitoring.
• The 2.2 scaling factor can only be used on comparisons with annual averages of NO2, it must not be used for monthly measurements.
r:\foxpro\uk_no2\docs\no2instr_1.5.doc AEA Technology 11

UK NO2 Diffusion Tube Network Instruction Manual Version 1.5
7.2 COMPARISON WITH DIRECTIVE 1999/30/EC LIMIT VALUES
The Daughter Directive provides two Limit Values for NO2 to be achieved by the end of year 2010. The first applies to the hourly average NO2 concentration, which must not exceed 200 µg m-3 (105 ppb) on more than 18 occasions per calendar year. The second applies to the annual average concentration, which must not exceed 40 µg m-3 (21 ppb). Diffusion tube measurements from the UK NO2 Network cannot be used to assess compliance with the maximum hourly average standard. However, direct comparison of an annual average calculated from diffusion tube monthly measurements may be made with the annual average Limit Value of 40 µg m-3 as set out in the Daughter Directive. Analysis of NO2 data from automatic monitoring sites indicates that the annual average Limit Value is generally the more stringent of the two.
7.3 COMPARISON WITH AQS OBJECTIVES
The Objectives for NO2 are essentially the same as those set in the Daughter Directive above, with the exception of the more stringent dates by which they must be achieved. The regulations set down two air quality standards for NO2 with the objective of achieving compliance by the end of year 2005. The first applies to the hourly average NO2 concentration, which must not exceed 200 µg m-3 (105 ppb) on more than 18 occasions per calendar year. The second applies to the annual average concentration, which must not exceed 40 µg m-3 (21 ppb). Diffusion tube measurements from the UK NO2 Network are based on a monthly sampling period and therefore cannot be used to assess compliance with the maximum hourly average standard. However, direct comparison of an annual average calculated from diffusion tube monthly measurements may be made with the annual average standard of 40 µg m-3 as set out in the AQS.
8 References
1. Commission of the European Communities (1985) Council Directive of 7 March 1985 on Air Quality Standards for Nitrogen Dioxide (85/203/EEC) O.J. L 87 27/03/85
pp 1-7. 2. Council Directive 1999/30/EEC relating to Limit Values for sulphur dioxide, nitrogen
dioxide and oxides of nitrogen, particulate matter and lead in ambient air. 22 April 1999.
3. The Air Quality Strategy for England, Scotland, Wales and Northern Ireland. Working Together for Clean Air. The Stationery Office, January 2000.
4. The Air Quality (England) Regulations 2000 (Statutory Instrument 2000 No. 928), March 2000.
5. The Air Quality (Wales) Regulations 2000 (Statutory Instrument 2000 No. 1940 (W.138)), July 2000.
6. The Air Quality (Scotland) Regulations 2000 (Scottish Statutory Instrument 2000 No. 97), March 2000.
7. The Air Quality Limit Values Regulations (Northern Ireland) 2002 (Statutory Rule 2002 No. 94), March 2002.
8. Photochemical Oxidants Review Group. Oxides of Nitrogen in the UK. Department of the Environment 1990 ISBN 0 7058 1616 8.
r:\foxpro\uk_no2\docs\no2instr_1.5.doc AEA Technology 12

UK NO2 Diffusion Tube Network Instruction Manual Version 1.5
9. Campbell, G.W. et al. A Survey of Nitrogen Dioxide Concentrations in the United Kingdom using Diffusion Tubes. July to December 1991. Stevenage: Warren Spring Laboratory. 1992. LR893(AP).
10.Bower, J.S., Lampert, J.E., Stevenson, K.J., Atkins, D.H.F. and Law, D.W. A Diffusion Tube Survey of NO2 Levels in Urban Areas of the UK Atmospheric Environment. 1991. Vol 25B, No. 2, pp 255-265.
11.Goodwin J W L, Salway A G, Murrells T P, Dore CJ, Passant NR, and Eggleston H S. UK Emissions of Air Pollutants 1970-1998. August 2000. AEA Technology Report No AEAT/R/ENV/0270
12.Palmes, E.D., Gunniston, A.F., DiMattio, J. and Tomczyk, C. Personal Sampler for Nitrogen Dioxide. Am Ind Hyg Assoc. J. 1976, Vol 37.
13.Atkins, D.H.F., Sandalls, J., Law, D.V., Hough, A.M. and Stevenson, K.J. The measurements of Nitrogen Dioxide in the Outdoor Environment using Passive Diffusion Tube Samplers. London: HMSO, 1986, AERE-R12133.
14.Part IV The Environment Act 1995, Local Air Quality Management. Review and Assessment: Draft Technical Guidance. http://www.defra.gov.uk/environment/consult/laqm/pdf/laqmtg02consult.pdf
r:\foxpro\uk_no2\docs\no2instr_1.5.doc AEA Technology 13
UK NO2 Diffusion Tube Network Instruction Manual Version 1.5
r:\foxpro\uk_no2\docs\no2instr_1.5.doc AEA Technology 14

Version 1.5
Appendices
CONTENTS
Appendix 1 Local & Unitary Authority Codes Appendix 2 County Codes Appendix 3 Analytical Laboratory Codes
r:\foxpro\uk_no2\docs\no2instr_1.5.doc AEA Technology

Version 1.5
Appendix 1 Local & Unitary Authority Codes
r:\foxpro\uk_no2\docs\no2instr_1.5.doc AEA Technology

Local/Unitary Authority Codes
Local/Unitary Authority Code Local/Unitary Authority CodeAdur 1 Cambridge 52Allerdale 2 Camden 53Alnwick 3 Cannock Chase 54Amber Valley 4 Canterbury 55Anglesey 5 Caradon 56Arun 6 Cardiff County 57Ashfield 7 Cardiganshire 58Ashford 8 Carlisle 59Aylesbury Vale 9 Carmarthenshire County 60Babergh 10 Carrick 61Barking 11 Castle Morpeth 62Barnet 12 Castle Point 63Barnsley 13 Charnwood 64Barrow in Furness 14 Chelmsford 65Basildon 15 Cheltenham 66Basingstoke 16 Cherwell 67Bassetlaw 17 Chester 68Bath & NE Somerset 18 Chester-le-Street 69Beaconsfield 19 Chesterfield 70Bedford 20 Chichester 71Berwick Upon Tweed 21 Chiltern 72Bexley 22 Chorley 73Birmingham 23 Christchurch 74Blaby 24 Kingston Upon Hull 75Blackburn with Darwen 25 York City Council 76Blackpool 26 City of London 77Blaenau Gwent 27 Colchester 78Blyth Valley 28 Congleton 79Bolsover 29 Conwy 80Bolton 30 Copeland 81Boston 31 Corby 82Bournemouth 32 Cotswold 83Bracknell 33 Coventry 84Bradford 34 Craven 85Braintree 35 Crawley 86Breckland 36 Crewe & Nantwich 87Brent 37 Croydon 88Brentwood 38 Dacorum 89Bridgend 39 Darlington 90Bridgnorth 40 Dartford 91Brighton & Hove 41 Daventry 92Bristol 42 Denbighshire County 93Broadland 43 Derby City 94Bromley 44 Derbyshire Dales 95Bromsgrove 45 Derwentside 96Broxbourne 46 Doncaster 97Broxtowe 47 Dover 98Burnley 48 Dudley 99Bury 49 Durham 100Caerphilly 50 Ealing 101Calderdale 51 Easington 102
With Effect of February 2003

Local/Unitary Authority Codes
Local/Unitary Authority Code Local/Unitary Authority CodeEast Cambridgeshire 103 High Peak 154East Devon 104 Hillingdon 155East Dorset 105 Hinckley & Bosworth 156East Hampshire 106 Horsham 157East Hertfordshire 107 Hounslow 158East Lindsey 108 Huntingdon 159East Northamptonshire 109 Hyndburn 160East Riding of Yorkshire 110 Ipswich 161East Staffordshire 111 Isle of Wight 162Eastbourne 112 Islington 163Eastleigh 113 Kennet 164Eden 114 Kensington & Chelsea 165Ellesmere Port 115 Kerrier 166Elmbridge 116 Kettering 167Enfield 117 Kingston Upon Thames 168Epping Forest 118 Kirklees 169Epsom & Ewell 119 Knowsley 170Erewash 120 Lambeth 171Exeter 121 Lancaster 172Fareham 122 Leeds 173Fenland 123 Leicester City 174Flintshire County 124 Leominster 175Forest Heath 125 Lewes 176Forest of Dean 126 Lewisham 177Fylde 127 Lichfield 178Gateshead 128 Lincoln 179Gedling 129 Liverpool 180Gillingham 130 Luton 181Gloucester 131 Macclesfield 182Gosport 132 Maidstone 183Gravesham 133 Maldon 184Great Yarmouth 134 Malvern Hills 185Greenwich 135 Manchester 186Guildford 136 Mansfield 187Gwynedd 137 Melton 188Hackney 138 Mendip 189Halton 139 Merthyr Tydfil 190Hambleton 140 Merton 191Hammersmith & Fulham 141 Mid Bedfordshire 192Harborough 142 Mid Suffolk 193Haringey 143 Mid Sussex 194Harlow 144 Middlesbrough 195Harrogate 145 Milton Keynes 196Harrow 146 Mole Valley 197Hartlepool 147 Monmouthshire 198Hartley Witney 148 Neath & Port Talbot 199Hastings 149 New Forest 200Havant 150 Newark 201Havering 151 Newbury 202Herefordshire 152 Newcastle Under Lyme 203Hertsmere 153 Newcastle Upon Tyne 204
With Effect of February 2003

Local/Unitary Authority Codes
Local/Unitary Authority Code Local/Unitary Authority CodeNewham 205 Rugby 256Newport 206 Runnymede 257North Cornwall 207 Rushcliffe 258North Devon 208 Rushmoor 259North Dorset 209 Rutland 260North East Derbyshire 210 Ryedale 261NE Lincolnshire 211 Salford 262North Hertfordshire 212 Salisbury 263North Kesteven 213 Sandwell 264North Lincolnshire 214 Scarborough 265North Norfolk 215 Sedgefield 266North Shropshire 216 Sedgemoor 267North Somerset 217 Sefton 268North Tyneside 218 Selby 269North Warwickshire 219 Sevenoaks 270NW Leicestershire 220 Sheffield 271North Wiltshire 221 Shepway 272Northampton 222 Shrewsbury 273Norwich 223 Slough 274Nottingham 224 Solihull 275Nuneaton 225 South Bedfordshire 276Oadby & Wigston 226 South Cambridgeshire 277Oldham 227 South Derbyshire 278Oswestry 228 South Gloucestershire 279Oxford 229 South Hams 280Pembrokeshire 230 South Herefordshire 281Pendle 231 South Holland 282Penwith 232 South Kesteven 283Peterborough 233 South Lakeland 284Plymouth 234 South Norfolk 285Poole 235 South Northamptonshire 286Portsmouth 236 South Oxfordshire 287Powys 237 South Ribble 288Preston 238 South Shropshire 289Purbeck 239 South Somerset 290Reading 240 South Staffordshire 291Redbridge 241 South Tyneside 292Redcar & Cleveland 242 Southampton 293Redditch 243 Southend-on-sea 294Reigate & Banstead 244 Southwark 295Restormel 245 Spelthorne 296Rhondda Cynon Taff 246 St Albans 297Ribble Valley 247 St Edmundsbury 298Richmond Upon Thames 248 St Helens 299Richmondshire 249 Stafford 300Rochdale 250 Staffordshire Moorlands 301Rochester upon Medway 251 Stevenage 302Rochford 252 Stockport 303Rossendale 253 Stockton-On-Tees 304Rother 254 Stoke-On-Trent 305Rotherham 255 Stratford on Avon 306
With Effect of February 2003

Local/Unitary Authority Codes
Local/Unitary Authority Code Local/Unitary Authority CodeStroud 307 West Lindsey 358Suffolk Coastal 308 West Norfolk 359Sunderland 309 West Oxfordshire 360Surrey Heath 310 West Somerset 361Sutton 311 West Wiltshire 362Swale 312 Westminster 363Swansea 313 Weymouth & Portland 364Swindon 314 Wigan 365Tameside 315 Winchester 366Tamworth 316 Windsor & Maidenhead 367Tandridge 317 Wirral 368Taunton Deane 318 Woking 369Teesdale 319 Wokingham 370Teignbridge 320 Wolverhampton 371Tendring 321 Worcester 372Test Valley 322 Worthing 373Tewkesbury 323 Wrexham County Borough 374Thanet 324 Wychavon 375The Wrekin 325 Wycombe 376Three Rivers 326 Wyre 377Thurrock 327 Wyre Forest 378Tiverton 328 Aberdeen City 379Tonbridge & Malling 329 Aberdeenshire 380Torbay 330 Angus 381Torfaen 331 Argyll & Bute 382Torridge 332 City of Dundee 383Tower Hamlets 333 City of Edinburgh 384Trafford 334 City of Glasgow 385Tunbridge Wells 335 Clackmannanshire 386Tynedale 336 Dumfries & Galloway 387Uttlesford 337 East Ayrshire 388Vale of Glamorgan 338 East Dunbartonshire 389Vale of White Horse 339 East Lothian 390Vale Royal 340 East Renfrewshire 391Wakefield 341 Falkirk 392Walsall 342 Fife 393Waltham Forest 343 Highland 394Wandsworth 344 Inverclyde 395Wansbeck 345 Midlothian 396Warrington 346 Moray 397Warwick 347 North Ayrshire 398Watford 348 North Lanarkshire 399Waveney 349 Orkney Islands 400Waverley 350 Perth & Kinross 401Wealden 351 Renfrewshire 402Wear Valley 352 Scottish Borders 403Wellingborough 353 Shetland Islands 404Welwyn & Hatfield 354 South Ayrshire 405West Devon 355 South Lanarkshire 406West Dorset 356 Stirling 407West Lancashire 357 West Dunbartonshire 408
With Effect of February 2003

Local/Unitary Authority Codes
Local/Unitary Authority CodeWest Lothian 409Western Isles 410Antrim 411Ards 412Armagh 413Ballymena 414Ballymoney 415Banbridge 416Belfast 417Carrickfergus 418Castlereagh 419Coleraine 420Cookstown 421Craigavon 422Down 423Dungannon 424Fermanagh 425Larne 426Limavady 427Lisburn 428Derry 429Magherafelt 430Moyle 431Newry & Mourne 432Newtownabbey 433North Down 434Omagh 435Strabane 436Jersey 437Isle of Man 438Isles of Scilly 439
With Effect of February 2003

Version 1.5
Appendix 2 County Codes
r:\foxpro\uk_no2\docs\no2instr_1.5.doc AEA Technology
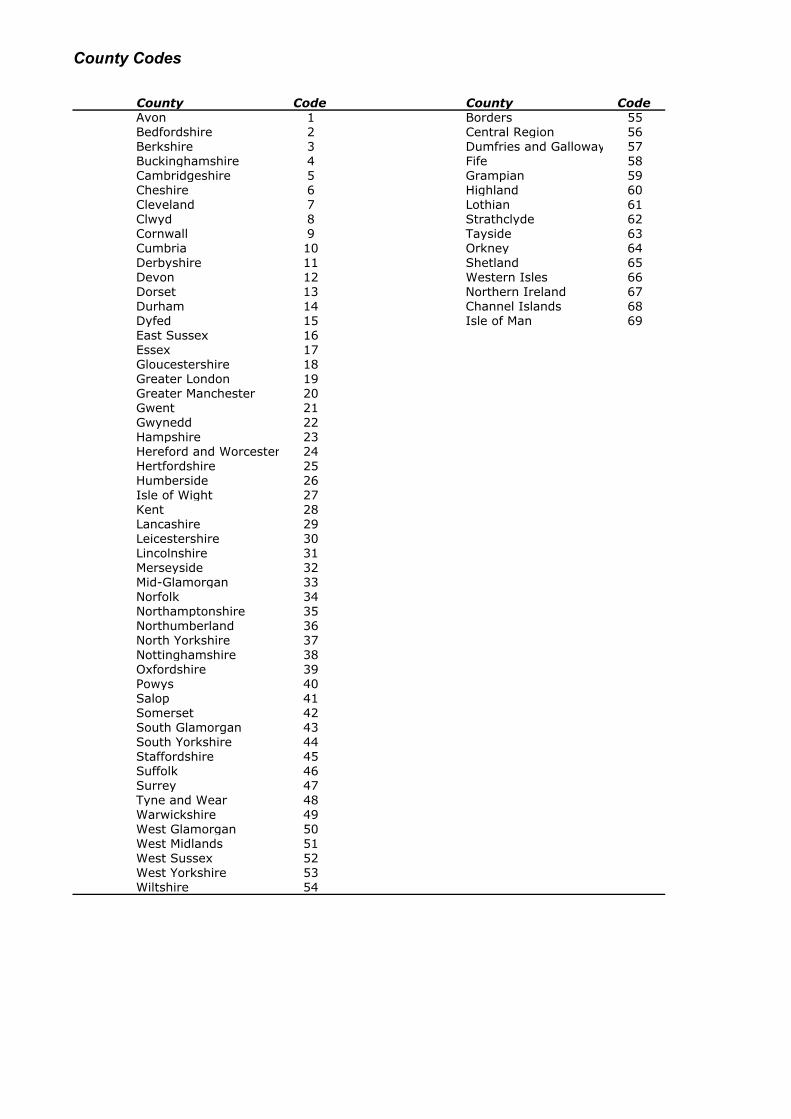
County Codes
County Code County CodeAvon 1 Borders 55Bedfordshire 2 Central Region 56Berkshire 3 Dumfries and Galloway 57Buckinghamshire 4 Fife 58Cambridgeshire 5 Grampian 59Cheshire 6 Highland 60Cleveland 7 Lothian 61Clwyd 8 Strathclyde 62Cornwall 9 Tayside 63Cumbria 10 Orkney 64Derbyshire 11 Shetland 65Devon 12 Western Isles 66Dorset 13 Northern Ireland 67Durham 14 Channel Islands 68Dyfed 15 Isle of Man 69East Sussex 16Essex 17Gloucestershire 18Greater London 19Greater Manchester 20Gwent 21Gwynedd 22Hampshire 23Hereford and Worcester 24Hertfordshire 25Humberside 26Isle of Wight 27Kent 28Lancashire 29Leicestershire 30Lincolnshire 31Merseyside 32Mid-Glamorgan 33Norfolk 34Northamptonshire 35Northumberland 36North Yorkshire 37Nottinghamshire 38Oxfordshire 39Powys 40Salop 41Somerset 42South Glamorgan 43South Yorkshire 44Staffordshire 45Suffolk 46Surrey 47Tyne and Wear 48Warwickshire 49West Glamorgan 50West Midlands 51West Sussex 52West Yorkshire 53Wiltshire 54

Version 1.5
Appendix 3 Analytical Laboratory Codes
r:\foxpro\uk_no2\docs\no2instr_1.5.doc AEA Technology

UK Nitrogen Dioxide Network Participating Laboratories Code Laboratory Name Contact Name 2 Bristol City Council Scientific Services Mr S D Pearce Tel: 0117 903 8666 Bristol City Council Scientific Services Fax: 0117 903 8667 7 Redcross Street Old Market Bristol BS2 0BA 5 Cardiff Scientific Services Mr T F Billimore Tel: 029 2082 2158 Cardiff Scientific Services Fax: 029 2087 1159 Crofts Street Roath Cardiff CF2 3DY 6 Clyde Aalytical Ltd Ms Angela Johnson Tel: 01475 721007 Clyde Analytical Ltd Fax: 01475 722296 Mentor Gardens 1 Ratho Street Greenock Scotland PA15 2BU 9 Dundee City Council Scientific Services Dr K H Mole Tel: 01382 455909 Dundee City Council Scientific Services Fax: 01382 461381 Scientific Services 24 Mains Loan Dundee DD4 7AA 10 City of Edinburgh Council Mr Arthur Moan Tel: 0131 555 7984 Regional Analyst’s Laboratory Fax: 0131 555 7987 City of Edinburgh Council 4 Marine Esplanade Edinburgh EH6 7LU 12 Gradko International Ltd Mr Gerry Stutchbury Tel: 01962 860331 Gradko International Ltd Fax: 01962 841339 St Martin’s House 77 Wales Street Winchester Hampshire SO23 0RH 13 Casella CRE Air Mr John Carrington Tel: 01928 517800 Casella CRE Air Fax: 01928 517830 The Heath Runcorn Cheshire WA7 4QF 15 Harwell Scientifics Ltd Mr Geraint Apps Tel: 01235 434610 Harwell Scientifics Ltd Fax: 01235 434917 551 Harwell Didcot Oxfordshire OX11 0RA

Code Laboratory Name Contact Name 16 Rotherham Metropolitan Borough Council Mr Andy Hawkins Tel: 01709 822348 Rotherham Metropolitan Borough Council Fax: 01709 367554 Scientific Services Laboratory Elm Bank House 73 Alma Road Rotherham S60 2BY 17 Worcestershire Scientific Services Carol A Stevens Tel: 01905 765453 Worcestershire Council Fax: 01905 765454 Scientific Services County Buildings St Mary’s Street Worcester WR1 1TN 19 Kent Scientific Services Ms Samantha Keller or Mr David Tel: 01732 220001 Kent Scientific Services Heath Fax: 01732 220006 8 Abbey Wood Road Kings Hill West Malling Kent ME19 6YT 21 Lambeth Scientific Services Ltd Mr Cecil Samasuwo Tel: 020 7926 8877 Lambeth Scientific Services Ltd Fax: 020 7926 8882 P.O. Box 27800 London SE24 0ZR 22 Lancashire County Analyst Mr M Ainscough Tel: 01772 721660 Lancashire County Analyst Fax: 01772 732417 County Laboratory Pedders Way Preston Riversway Docklands Ashton-on-Ribble, PR2 2TX 26 Glasgow Scientific Services Dr Alan Bruce Tel: 0141 562 2270 Glasgow Scientific Services Fax: 0141 563 5129 Colston Laboratory 64 Everard Drive Glasgow G21 1XG 28 Jesmond Dene Laboratory Mr Colin Bird Tel: 0191 281 2779 Jesmond Dene Laboratory Fax: 0191 281 8589 Jesmond Dene Road Off Matthew Bank Newcastle upon Tyne NE2 2EY 32 Walsall Metropolitan Borough Council Mr Mick Clews / Mrs Alison Tel: 01922 454219 Walsall Metropolitan Borough Council Coleman Fax: 01922 630697 Environmental Health & Consumer Services Department Challenge Building Hatherton Rd Walsall WS1 1YG

Code Laboratory Name Contact Name 34 West Yorkshire Analytical Services Mr Richard Sykes Tel: 0113 383 7567 West Yorkshire Analytical Services Fax: 0113 383 7551 PO Box 11 Nepshaw Lane South Morley Leeds LS27 0UQ 36 University of Essex Dr I Colbeck Tel: 01206 873333 Department of Chemistry & Biological Fax: 01206 873593 Chemistry University of Essex Wivenhoe Park Colchester CO4 3SQ 38 Milton Keynes Council Mr Neil Crook Tel: 01908 691691 Environmental Health Fax: 01908 682456 Environmental Directorate Milton Keynes Council 1 Saxon Gate East Milton Keynes MK9 3HH 40 Staffordshire County Council Mr V M Stanway Tel: 01785 277817 Scientific Services Fax: 01785 277812 Staffordshire County Council Martin Street Stafford ST16 2LG 41 Ruddock and Sherratt Ms Tara O'Neill Tel: 028 9032 1691 Ruddock and Sherratt Fax: 028 9043 9604 Room 74 4th Floor 16 Donegall Square South Belfast BT1 5JJ 42 Northampton Borough Council Mr Joe Alfano Tel: 01604 238788 Northampton Borough Council Fax: 01604 238755 Pollution Team Cliftonville House Bedford Rd Northampton NN4 7NR 47 Aberdeen City Council Public Analyst Mr James Darroch Tel: 01224 491648 Aberdeen City Council Fax: 01224 276873 Old Aberdeen House Dunbar Street Aberdeen AB2 1UE 48 STL Bridgend Ms Michelle Harman Tel: 01656 647557 STL Bridgend Fax: 01656 646525 Mid Glamorgan Science Park 2 Technology Drive Bridgend Mid Glamorgan CF31 3NA

Code Laboratory Name Contact Name 49 Kirklees Environmental Services Margaret Durkin or Brian Tel: 01484 226477 Kirklees Environmental Services Wharam Fax: 01484 226475 Scientific Services West Riding House 9 Manchester Road Huddersfield HD1 3HH 50 City of Liverpool Public Analysts Ms Elizabeth Moran Tel: 0151 709 3932 City Analyst & Scientific Services Fax: 0151 708 8361 Liverpool City Council Third Floor 126 Mount Pleasant Liverpool L69 3GR
Related Documents