COMPANY REGISTRATION NUMBER 07876075 Aon plc Annual Report and Accounts For the year ended December 31, 2018

Welcome message from author
This document is posted to help you gain knowledge. Please leave a comment to let me know what you think about it! Share it to your friends and learn new things together.
Transcript

COMPANY REGISTRATION NUMBER 07876075
Aon plc
Annual Report and Accounts
For the year ended December 31, 2018

2
CONTENTS PAGES
Strategic Report
Report of the Directors
Directors’ Remuneration Report
Statement of Directors’ Responsibilities
Independent Auditor’s Report to the Members
Consolidated Financial Statements:
Consolidated Statements of Income
Consolidated Statements of Comprehensive Income
Consolidated Statements of Financial Position
Consolidated Statements of Shareholders’ Equity
Consolidated Statements of Cash Flows
Notes to Consolidated Financial Statements
Parent Company Financial Statements:
Parent Company Statements of Financial Position
Parent Company Statements of Shareholders’ Equity
Parent Company Statements of Cash Flows
Notes to Parent Company Financial Statements
3
34
40
54
55
63
64
65
66
67
68
137
138
139
140

3
STRATEGIC REPORT
STRATEGY AND BUSINESS MODEL
Aon plc and its controlled subsidiaries (which may be referred to as “Aon,” the “Company,” “Group,” “we,” “us,” or “our”) is a leading global professional services firm that provides advice and solutions to clients focused on risk, retirement, and health, delivering distinctive client value via innovative and effective risk management and workforce productivity solutions that are under-pinned by industry-leading data and analytics. Our strategy is to be the preeminent professional services firm in the world, focused on risk and people.
Our clients are globally diversified and include all market segments (individuals through personal lines, mid-market companies, and large global companies) and almost every industry in over 120 countries and sovereignties. This diversification of our customer base helps provide us stability in different economic scenarios that could affect specific industries, customer segments, or geographies. The Company’s registered office is located at the Aon Centre, 122 Leadenhall Street, London, England.
We have continued to focus our portfolio on higher-margin, capital-light professional services businesses that have high recurring revenue streams and strong cash flow generation. We endeavor to make capital allocation decisions based upon return on invested capital (“ROIC”).
BUSINESS SEGMENT
Beginning in 2017 and following the sale of our benefits administration and business process outsourcing business (the “Divested Business”) on May 1, 2017, the Company led a set of initiatives designed to strengthen Aon and unite the firm with one portfolio of capability enabled by proprietary data and analytics and one operating model to deliver additional insight, connectivity, and efficiency. These initiatives reinforce Aon’s ROIC decision making process and emphasis on operating cash flow. The Company is now operating as one segment that includes all of Aon’s continuing operations, which, as a global professional services firm, provides advice and solutions to clients focused on risk, retirement, and health through five principal products and services: Commercial Risk Solutions, Reinsurance Solutions, Retirement Solutions, Health Solutions, and Data & Analytic Services. Collectively, these products and service revenue lines make up our one segment: Aon United.
In 2018, our consolidated total revenue was $10,770 million. This includes $4,652 million in Commercial Risk Solutions, $1,563 million in Reinsurance Solutions, $1,865 million in Retirement Solutions, $1,596 million in Health Solutions, and $1,105 million in Data & Analytic Services, before intercompany eliminations.
Principal Products and Services
Commercial Risk Solutions includes retail brokerage, cyber solutions, global risk consulting, and captives. In retail brokerage, our team of expert risk advisors applies a client-focused approach to commercial risk products and services that leverage Aon’s global network of resources, industry-leading data and analytics, and specialized expertise. Cyber solutions is one of the industry’s premier resources in cyber risk management. Our strategic focus extends to identify and protect critical digital assets supported by best-in-class transactional capabilities, enhanced coverage expertise, deep carrier relationships, and incident response expertise. Global risk consulting is a world-leading provider of risk consulting services supporting clients to better understand and manage their risk profile through identifying and quantifying the risks they face. We assist clients with the selection and implementation of the appropriate risk transfer, risk retention, and risk mitigation solutions, and ensure the continuity of their operations through claims consulting. Captives is a leading global captive insurance solutions provider that manages over 1,100 insurance entities worldwide including captives, protected segregated and incorporated cell facilities, as well as entities that support insurance-linked securities and specialist insurance and reinsurance companies.
Reinsurance Solutions includes treaty and facultative reinsurance and capital markets. Treaty reinsurance addresses underwriting and capital objectives on a portfolio level, allowing our clients to more effectively manage the combination of premium growth, return on capital, and rating agency interests. This includes the development of more competitive, innovative, and efficient risk transfer options. Facultative reinsurance empowers clients to better understand, manage, and transfer risk through innovative facultative solutions and provides the most efficient access to the global facultative reinsurance markets. Capital markets is a global investment bank with expertise in mergers and acquisitions, capital raising, strategic advice, restructuring, recapitalization services, and insurance-linked securities. We partner with insurers, reinsurers, investment firms, banks, and corporations in the management of complex commercial issues through the provision of corporate finance advisory services, capital markets solutions, and innovative risk management products.
Retirement Solutions includes core retirement, investment consulting, and talent, rewards, and performance. Retirement consulting specializes in providing organizations across the globe with strategic design consulting on their retirement programs, actuarial services, and risk management, including pension de-risking, governance, integrated pension administration, and legal and compliance consulting. Investment consulting provides public and private companies and other institutions with advice on

4
developing and maintaining investment programs across a broad range of plan types, including defined benefit plans, defined contribution plans, endowments, and foundations. Our delegated investment solutions offer ongoing management of investment programs and fiduciary responsibilities either in a partial or full discretionary model for multiple asset owners. It partners with clients to deliver our scale and experience to help them effectively manage their investments, risk, and governance and potentially lower costs. Talent, rewards, and performance delivers advice and solutions that help clients accelerate business outcomes by improving the performance of their people. It supports the full employee lifecycle, including assessment and selection of the right talent, optimized deployment and engagement, and the design, alignment, and benchmarking of compensation to business strategy and performance outcomes.
Health Solutions includes heath and benefits brokerage and health care exchanges. Health and benefits brokerage partners with employers to develop innovative, customized benefits strategies that help manage risk, drive engagement, and promote accountability. Our private health exchange solutions help employers transform how they sponsor, structure, and deliver health benefits by building and operating a cost effective alternative to traditional employee and retiree health care. We seek outcomes of reduced employer costs, risk, and volatility, alongside greater coverage and plan choices for individual participants.
Data & Analytic Services includes Affinity, Aon InPoint, and ReView. Affinity specializes in developing, marketing and administering customized insurance programs and specialty market solutions for Affinity organizations and their members or affiliates. Aon InPoint draws on the Global Risk Insight Platform, one of Aon’s proprietary databases, and is dedicated to making insurers more competitive by providing data, analytics, engagement, and consulting services. ReView draws on another Aon proprietary database and broker market knowledge to provide advisory services, analysis, and benchmarking to help reinsurers more effectively meet the needs of cedents through the development of more competitive, innovative, and efficient risk transfer options.
Revenue and Compensation
Our business generates revenues primarily through commissions, compensation from insurance and reinsurance companies for services we provide to them, and fees from customers. Commissions and fees for brokerage services vary depending upon several factors, which may include the amount of premium, the type of insurance or reinsurance coverage provided, the particular services provided to a client, insurer, or reinsurer, and the capacity in which we act. Compensation from insurance and reinsurance companies includes: (1) fees for consulting and analytics services, and (2) fees and commissions for administrative and other services provided to or on behalf of insurers. Fees from clients for advice and consulting services are dependent on the extent and value of the services we provide. Payment terms are consistent with current industry practices.
Fiduciary Funds
We typically hold funds on behalf of clients, including premiums received from clients and claims due to clients that are in transit to and from insurers. Certain funds held on behalf of clients are invested in interest-bearing premium trust accounts and can fluctuate significantly depending on when we collect and remit cash. The principal is segregated and not available for general operating purposes, though we earn interest on these accounts.
Competition
Our business operates in a highly competitive and fragmented environment. We compete with other global insurance brokers and consulting companies, including Marsh & McLennan Companies, Inc., Willis Towers Watson Public Limited Company, Arthur J Gallagher & Company, and Jardine Lloyd Thompson Group plc, as well as numerous specialist, regional, and local firms in almost every area of our business. We also compete with insurance and reinsurance companies that market and service their insurance products without the assistance of brokers or agents, and with other businesses that do not fall into the categories above, including large financial institutions and independent consulting firms and consulting organizations affiliated with accounting, information systems, technology, and financial services firms.
Seasonality
Due to buying patterns and delivery of certain products in the markets we serve, revenues recognized tend to be higher in the first three months and last three months of each fiscal year.
Licensing and Regulation
Our business activities are subject to licensing requirements and extensive regulation under the laws of countries in which we operate, including United States (“U.S.”) federal and state laws. See the “Principal Risks and Uncertainties” section of this report for information regarding how actions by regulatory authorities or changes in legislation and regulation in the jurisdictions in which we operate may have an adverse effect on our business.

5
Regulatory authorities in the countries and states in the U.S. in which our operating subsidiaries conduct business may require individual or company licenses to act as producers, brokers, agents, third-party administrators, managing general agents, reinsurance intermediaries, or adjusters. Under the laws of most countries and states, regulatory authorities have relatively broad discretion with respect to granting, renewing, and revoking producers’, brokers’, and agents’ licenses to transact business in the country or state. The operating terms may vary according to the licensing requirements of the particular country or state, which may require, among other things, that a firm operates in the country or state through a local corporation. In a few countries and states, licenses may be issued only to individual residents or locally owned business entities. In such cases, our subsidiaries either have such licenses or have arrangements with residents or business entities licensed to act in the country or state.
Our subsidiaries must comply with laws and regulations of the jurisdictions in which they do business. These laws and regulations are enforced by the Financial Conduct Authority (“FCA”) in the United Kingdom (“U.K.”), by federal and state agencies in the U.S., and by various regulatory agencies and other supervisory authorities in other countries through the granting and revoking of licenses to do business, the licensing of agents, the monitoring of trade practices, policy form approval, limits on commission rates, and mandatory remuneration disclosure requirements.
Insurance authorities in the U.K., U.S., and certain other jurisdictions in which our subsidiaries operate have enacted laws and regulations governing the investment of funds, such as premiums and claims proceeds, held in a fiduciary capacity for others. These laws and regulations generally require the segregation of these fiduciary funds and limit the types of investments that may be made with them.
Investment, securities, and futures licensing authorities also govern certain of our business activities. For example, in the U.S., we use Aon Securities, LLC, a U.S.-registered broker-dealer and investment advisor, member of the Financial Industry Regulatory Authority (“FINRA”) and Securities Investor Protection Corporation, and an indirect, wholly owned subsidiary of Aon, for capital management transaction and advisory services and other broker-dealer activities. Similar operations exist in other jurisdictions outside of the U.S.
Further, pension and financial laws and regulations, including oversight and supervision by the FCA in the U.K., the Securities and Exchange Commission (“SEC”) in the U.S., and regulators in other countries govern certain of the retirement-related consulting services provided by Aon and its subsidiaries and affiliates. This includes Aon subsidiaries that provide investment advisory services regulated by various U.S. federal authorities including the SEC and FINRA, as well as authorities on the state level. In addition, other services provided by Aon and its subsidiaries and affiliates, such as trustee services and retirement and employee benefit program administrative services, are subject in various jurisdictions to pension, investment, securities, and insurance laws and regulations, and supervision.
Clientele
Our clients operate in many businesses and industries throughout the world. No one client accounted for more than 1% of our consolidated total revenues in 2018. Additionally, we place insurance with many insurance carriers, none of which individually accounted for more than 10% of the total premiums we placed on behalf of our clients in 2018.
Employees
At December 31, 2018, we employed approximately 50,000 employees and conducted our operations through various subsidiaries in more than 120 countries and sovereignties.
Information Concerning Forward-Looking Statements
This report and in reports we subsequently file or furnish and have previously filed or furnished with Companies House contains certain statements related to future results, or states our intentions, beliefs, and expectations or predictions for the future which are forward-looking statements as that term is defined in the Private Securities Litigation Reform Act of 1995. Forward-looking statements represent management’s expectations or forecasts of future events. Forward-looking statements are typically identified by words such as “anticipate,” “believe,” “estimate,” “expect,” “forecast,” “project,” “intend,” “plan,” “probably,” “potential,” “looking forward,” “continue,” and other similar terms, and future or conditional tense verbs like “could,” “may,” “might,” “should,” “will,” and “would.” You can also identify forward-looking statements by the fact that they do not relate strictly to historical or current facts. For example, we may use forward-looking statements when addressing topics such as: market and industry conditions, including competitive and pricing trends; changes in our business strategies and methods of generating revenue; the development and performance of our services and products; changes in the composition or level of our revenues; our cost structure and the outcome of cost-saving or restructuring initiatives; the outcome of contingencies; dividend policy; the expected impact of acquisitions and dispositions; pension obligations; cash flow and liquidity; expected effective tax rate; future actions by regulators; and the impact of changes in accounting rules. These forward-looking statements are subject to certain risks and uncertainties that could cause actual results to differ materially from either historical or anticipated results depending on a variety

6
of factors. Potential factors, which may be revised or supplemented in subsequent reports filed or furnished with Companies House, that could impact results include:
• general economic and political conditions in the countries in which we do business around the world, including the U.K.’s expected withdrawal from the European Union;
• changes in the competitive environment or damage to our reputation;
• fluctuations in exchange and interest rates that could influence revenues and expenses;
• changes in global equity and fixed income markets that could affect the return on invested assets;
• changes in the funding status of our various defined benefit pension plans and the impact of any increased pension funding resulting from those changes;
• the level of our debt limiting financial flexibility or increasing borrowing costs;
• rating agency actions that could affect our ability to borrow funds;
• volatility in our tax rate due to a variety of different factors including U.S. federal income tax reform;
• changes in estimates or assumptions on our financial statements;
• limits on our subsidiaries to make dividend and other payments to us;
• the impact of lawsuits and other contingent liabilities and loss contingencies arising from errors and omissions (“E&O”) and other claims against us;
• the impact of, and potential challenges in complying with, legislation and regulation in the jurisdictions in which we operate, particularly given the global scope of our businesses and the possibility of conflicting regulatory requirements across jurisdictions in which we do business;
• the impact of any investigations brought by regulatory authorities in the U.S., U.K., and other countries;
• the impact of any inquiries relating to compliance with the U.S. Foreign Corrupt Practices Act and non-U.S. anti-corruption laws and with U.S. and non-U.S. trade sanctions regimes;
• failure to protect intellectual property rights or allegations that we infringe on the intellectual property rights of others;
• the effects of English law on our operating flexibility and the enforcement of judgments against us;
• the failure to retain and attract qualified personnel;
• international risks associated with our global operations;
• the effect of natural or man-made disasters;
• the potential of a system or network breach or disruption resulting in operational interruption or improper disclosure of personal data;
• our ability to develop and implement new technology;
• damage to our reputation among clients, markets or third parties;
• the actions taken by third parties that perform aspects of our business operations and client services;
• the extent to which we manage certain risks created in connection with the various services, including fiduciary and investment consulting and other advisory services, among others, that we currently provide, or will provide in the future, to clients;
• our ability to continue, and the costs and risks associated with, growing, developing and integrating companies that we acquire or new lines of business;
• changes in commercial property and casualty markets, commercial premium rates or methods of compensation;
• changes in the health care system or our relationships with insurance carriers;
• our ability to implement initiatives intended to yield cost savings and the ability to achieve those cost savings;

7
• our risks and uncertainties in connection with the sale of the Divested Business; and
• our ability to realize the expected benefits from our restructuring plan.
Any or all of our forward-looking statements may turn out to be inaccurate, and there are no guarantees about our performance. The factors identified above are not exhaustive. Aon and its subsidiaries operate in a dynamic business environment in which new risks may emerge frequently. Accordingly, readers should not place undue reliance on forward-looking statements, which speak only as of the dates on which they are made. We are under no obligation (and expressly disclaim any obligation) to update or alter any forward-looking statement that we may make from time to time, whether as a result of new information, future events or otherwise. Further information about factors that could materially affect Aon, including our results of operations and financial condition, is contained in the “Principal Risks and Uncertainties” section of this report.
PRINCIPAL RISKS AND UNCERTAINTIES
The principal risks and uncertainties set forth below reflect material risks associated with existing and potential business and contain “forward-looking statements” as discussed in the “Business Segment” section of this report. Readers should consider them in addition to the other information contained in this report as our business, financial condition, or results of operations could be adversely affected if any of these risks were to actually occur.
The following are material risks related to our business specifically and the industries in which we operate generally that could adversely affect our business, financial condition, and results of operations and cause our actual results to differ materially from those stated in the forward-looking statements in this document and elsewhere.
Business Risks
An overall decline in economic activity could have a material adverse effect on the financial condition and results of operations of our business.
The results of our operations are generally affected by the level of business activity of our clients, which in turn is affected by the level of economic activity in the industries and markets these clients serve. Economic downturns, volatility, or uncertainty in some markets may cause reductions in technology and discretionary spending by our clients, which may result in reductions in the growth of new business or reductions in existing business. If our clients become financially less stable, enter bankruptcy, liquidate their operations or consolidate, our revenues and collectability of receivables could be adversely affected.
The demand for property and casualty insurance generally rises as the overall level of economic activity increases and generally falls as such activity decreases, affecting both the commissions and fees generated by our Commercial Risk Solutions, Reinsurance Solutions, and Data and Analytic Services revenue lines. The economic activity that impacts property and casualty insurance is most closely correlated with employment levels, corporate revenue, and asset values. Downward fluctuations in the year-over-year insurance premiums charged by insurers to protect against the same risk, referred to in the industry as softening of the insurance market, could adversely affect these businesses as a significant portion of the earnings are determined as a percentage of premium charged to our clients. Insolvencies and consolidations associated with an economic downturn, especially insolvencies in the insurance industry, could adversely affect our brokerage business through the loss of clients by hampering our ability to place insurance and reinsurance business. Also, error and omission claims against us, which we refer to as E&O claims, may increase in economic downturns, also adversely affecting our business.
We face significant competitive pressures.
As a global professional services firm, we compete with global, national, regional and local insurance companies that market and service their own products, other financial services providers, brokers, and investment managers, independent firms, and consulting organizations affiliated with accounting, information systems, technology, and financial services firms. We compete with respect to service, product features, price, commission structure, financial strength, ability to access certain insurance markets, and name recognition.
Our competitors may have greater financial, technical and marketing resources, larger customer bases, greater name recognition, more comprehensive products, stronger presence in certain geographies, or more established relationships with their customers and suppliers than we have. In addition, new competitors, alliances among competitors, or mergers of competitors could emerge and gain significant market share, and some of our competitors may have or may develop a lower cost structure, adopt more aggressive pricing policies, or provide services that gain greater market acceptance than the services that we offer or develop. Competitors may be able to respond to the need for technological changes and innovate faster, or price their services more aggressively. They may also compete for skilled professionals, finance acquisitions, fund internal growth, and compete for market share more effectively than we do. This competition is intensified by an industry trend where clients engage multiple brokers to

8
service different portions of their accounts. If we fail to respond successfully to the competition we face, our financial condition or results of operations might be adversely affected.
If our clients or third parties are not satisfied with our services, we may face additional cost, loss of profit opportunities, damage to our reputation, or legal liability.
We depend, to a large extent, on our relationships with our clients and our reputation for high-quality advice and solutions focused on risk, retirement, and health. If a client is not satisfied with our services, it could cause us to incur additional costs and impair profitability. Many of our clients are businesses that band together in industry groups or trade associations and actively share information among themselves about the quality of service they receive from their vendors. Accordingly, poor service to one client may negatively impact our relationships with multiple other clients. Moreover, if we fail to meet our contractual obligations, we could be subject to legal liability or loss of client relationships.
The nature of much of our work involves assumptions and estimates concerning future events, the actual outcome of which we cannot know with certainty in advance. In our investment consulting business, we may be measured based on our track record regarding judgments and advice on investments that are susceptible to influences unknown at the time the advice was given. In addition, we could make computational, software programming, or data entry or management errors. A client may claim it suffered losses due to reliance on our consulting advice, which poses risks of liability exposure and costs of defense and increased insurance premiums. In addition, claims arising from our professional services may produce publicity that could hurt our reputation and business and adversely affect our ability to retain business or secure new business.
Damage to our reputation could have a material adverse effect on our business.
Our reputation is a key asset of the Company. We advise our clients on and provide services related to a wide range of subjects and our ability to attract and retain clients is highly dependent upon the external perceptions of our level of service, trustworthiness, business practices, financial condition, and other subjective qualities. Negative perceptions or publicity regarding these matters or others could erode trust and confidence and damage our reputation among existing and potential clients, which could make it difficult for us to attract new clients and retain existing ones. Negative public opinion could also result from actual or alleged conduct by us or those currently or formerly associated with us in any number of activities or circumstances, including third parties, the use and protection of data and systems, satisfaction of client expectations, and regulatory compliance. Damage to our reputation could affect the confidence of our clients, rating agencies, regulators, stockholders, and third parties in transactions that are important to our business adversely effecting our business, financial condition, and operating results.
Revenues from commission arrangements may fluctuate due to many factors, including cyclical or permanent changes in the insurance and reinsurance markets outside of our control.
Revenues from commission arrangements have historically been affected by significant fluctuations arising from uncertainties and changes in the industries in which we operate. A significant portion of our revenue consists of commissions paid to us out of the premiums that insurers and reinsurers charge our clients for coverage. We have no control over premium rates, and our revenues and profitability are subject to change to the extent that premium rates fluctuate or trend in a particular direction. The potential for changes in premium rates is significant, due to pricing cyclicality in the commercial insurance and reinsurance markets.
In addition to movements in premium rates, our ability to generate premium-based commission revenue may be challenged by:
• the growing availability of alternative methods for clients to meet their risk-protection needs, including a greater willingness on the part of corporations to “self-insure,” the use of so-called “captive” insurers, and the development of capital markets-based solutions and other alternative capital sources for traditional insurance and reinsurance needs that increase market capacity, increase competition and put pressure on pricing;
• fluctuation in the need for insurance;• the level of compensation, as a percentage of premium, that insurance carriers are willing to compensate brokers for
placement activity;• the growing desire of clients to move away from variable commission rates and instead compensate brokers based upon
flat fees, which can negatively impact us as fees are not generally indexed for inflation and do not automatically increase with premium as does commission-based compensation; and
• competition from insurers seeking to sell their products directly to consumers, including online sales, without the involvement of an insurance broker.

9
The profitability of our consulting engagements with clients may not meet our expectations due to unexpected costs, cost overruns, early contract terminations, unrealized assumptions used in our contract bidding process or the inability to maintain our prices.
Our profitability with respect to consulting engagements is highly dependent upon our ability to control our costs and improve our efficiency. As we adapt to changes in our business, adapt to the regulatory environment, enter into new engagements, acquire additional businesses, and take on new employees in new locations, we may not be able to manage our large, diverse and changing workforce, control our costs, or improve our efficiency.
Our profit margin, and therefore our profitability, is largely a function of the rates we are able to charge for our services and the staffing costs for our personnel. Accordingly, if we are not able to maintain the rates we charge for our services or appropriately manage the staffing costs of our personnel, we may not be able to sustain our profit margin and our profitability will suffer. The prices we are able to charge for our services are affected by a number of factors, including competitive factors, the extent of ongoing clients’ perception of our ability to add value through our services, and general economic conditions. If we cannot drive suitable cost efficiencies, our profit margins will suffer. Our cost efficiencies may also be impacted by factors such as our ability to transition consultants from completed projects to new assignments, our ability to secure new consulting engagements, our ability to forecast demand for consulting services (and, consequently, appropriately manage the size and location of our workforce), employee attrition, and the need to devote time and resources to training and professional and business development.
In our investment consulting business, we advise or act on behalf of clients regarding their investments. The results of these investments are uncertain and subject to numerous factors, some of which are within our control and some which are not. Clients that experience losses or lower than expected investment returns may leave us for competitors and/or assert claims against us.
Our investment consulting business provides advice to clients on: investment strategy, which can include advice on setting investment objectives, asset allocation, and hedging strategies; selection (or removal) of investment managers; the investment in different investment instruments and products; and the selection of other investment service providers such as custodians and transition managers. For some clients, we are responsible for making decisions on these matters and we may implement such decisions in a fiduciary or agency capacity without assuming title or custody over the underlying funds or assets invested. Asset classes may experience poor absolute performance and third parties we recommend or select, such as investment managers, may underperform their benchmarks due to poor market performance, negligence, or other reasons, resulting in poor investment returns or losses. These losses may be attributable in whole or in part to failures on our part or to events entirely outside of our control, including but not limited to uncertainty in financial markets due to economic, political, and regulatory conditions. Regardless of the cause, clients experiencing losses or clients that allege that we overcharge for such fiduciary services have in the past asserted claims against us, and we anticipate future similar claims, which could be for significant amounts. Defending against these claims can involve potentially significant costs, including legal defense costs, as well as cause substantial distraction and diversion of other resources. Furthermore, our ability to limit our potential liability is restricted in certain jurisdictions and in connection with claims involving breaches of fiduciary or agency duties or other alleged errors or omissions. Additionally, clients experiencing losses or lower than expected investment returns may leave us for our competitors.
Financial Risks
We are exposed to fluctuations in currency exchange rates that could negatively impact our financial results and cash flows.
We face exposure to adverse movements in exchange rates of currencies other than our reporting currency, the U.S. dollar, as a significant portion of our business is located outside of the U.S. These exposures may change over time, and they could have a material adverse impact on our financial results and cash flows. Approximately 57% of our consolidated revenue is non-U.S., attributed on the basis of where the services are performed, and the exposures created can have significant currency volatility. These currency exchange fluctuations create risk in both the translation of the financial results of our global subsidiaries into U.S. dollars for our consolidated financial statements, as well as in those of our operations that receive revenue and incur expenses other than in their respective local currencies, which can reduce the profitability of our operations based on the direction the respective currencies’ exchange rates move. A decrease in the value of certain currencies relative to other currencies could place us at a competitive disadvantage compared to our competitors that benefit to a greater degree from a specific exchange rate move and can, as a result, deliver services at a lower cost or receive greater revenues from such a transaction. Although we use various derivative financial instruments to help protect against adverse foreign exchange rate fluctuations, we cannot eliminate such risks, and, as a result, changes in exchange rates may adversely affect our results. For example, the strengthening of the value of the U.S. dollar versus other currencies might adversely affect the value of our products and services when translated to U.S. dollar, even if the value of such products and services has not changed in their original currency.
Changes in interest rates and deterioration of credit quality could reduce the value of our cash balances and investment portfolios and adversely affect our financial condition or results.

10
Operating funds available for corporate use were $828 million at December 31, 2018 and are reported in Cash and cash equivalents and Short-term investments. Funds held on behalf of clients and insurers were $3.9 billion at December 31, 2018 and are reported in Fiduciary assets. We also carry an investment portfolio of other long-term investments. As of December 31, 2018, these long-term investments had a carrying value of $54 million. Adverse changes in interest rates, performance, and counterparty credit quality, including default, could reduce the value of these funds and investments, thereby adversely affecting our financial condition or results. We may experience reduced investment earnings on our cash and short-term investments of fiduciary and operating funds if the yields on investments deemed to be low risk remain at or near their current low levels, or if negative yields on deposits or investments are experienced, as we have experienced in Japan and certain jurisdictions in the European Union. On the other hand, higher interest rates could result in a higher discount rate used by investors to value our future cash flows thereby resulting in a lower valuation of the Company. In addition, during times of stress in the banking industry, counterparty risk can quickly escalate, potentially resulting in substantial losses for us as a result of our cash or other investments with such counterparties, as well as substantial losses for our clients and the insurance companies with which we work.
Our pension obligations and value of our pension assets could adversely affect our shareholders’ equity, net income, cash flow and liquidity.
To the extent that the pension obligations associated with our pension plans continue to exceed the fair value of the assets supporting those obligations, our financial position and results of operations may be adversely affected. In particular, lower interest rates and investment returns could result in the present value of plan liabilities increasing at a greater rate than the value of plan assets, resulting in higher unfunded positions in our pension plans. In addition, the periodic revision of pension assumptions or variances of actual results from our assumptions can materially change the present value of expected future benefits, and therefore the funded status of the plans and resulting net periodic pension expense. As a result, we may experience future changes in the funded status of our plans that could require us to make additional cash contributions beyond those that have been estimated and which could adversely affect shareholders’ equity, net income, cash flow and liquidity.
Our worldwide pension plans are significant, and therefore our pension contributions and expense are sensitive to various market, demographic, and other factors. These factors include equity and bond market returns, fair value of pension assets, the assumed interest rates we use to discount our pension liabilities, foreign exchange rates, rates of inflation, mortality assumptions, potential regulatory and legal changes or developments and counterparty exposure from various investments and derivative contracts, including annuities. Variations or developments in connection with any of these factors could cause significant changes to our financial position and results of operations from year to year. In addition, contributions are generally based on statutory requirements and local funding practices, which may differ from measurements under International Financial Reporting Standards as endorsed by the European Union (“IFRS”).
We have debt outstanding that could adversely affect our financial flexibility.
As of December 31, 2018, we had total consolidated debt outstanding of approximately $6.2 billion. The level of debt outstanding could adversely affect our financial flexibility by reducing our ability to use cash from operations for other purposes, including working capital, dividends to shareholders, share repurchases, acquisitions, capital expenditures and general corporate purposes. We also are subject to risks that, at the time any of our outstanding debt matures, we will not be able to retire or refinance the debt on terms that are acceptable to us, or at all.
As of December 31, 2018, we had two committed credit facilities outstanding. Each of these facilities is intended to support our commercial paper obligations and our general working capital needs. In addition, each of these facilities included customary representations, warranties, and covenants, including financial covenants that require us to maintain specified ratios of adjusted consolidated earnings before interest, taxes, depreciation, and amortization (“EBITDA”) to consolidated interest expense and consolidated debt to adjusted consolidated EBITDA, tested quarterly.
A substantial portion of our outstanding debt, including certain intercompany debt obligations, contains financial and other covenants. The terms of these covenants may limit our ability to obtain, or increase the costs of obtaining, additional financing to fund working capital, capital expenditures, acquisitions, or general corporate requirements. This in turn may have the impact of reducing our flexibility to respond to changing business and economic conditions, thereby placing us at a relative disadvantage compared to competitors that have less indebtedness, or fewer or less onerous covenants associated with such indebtedness, and making us more vulnerable to general adverse economic and industry conditions.
If we cannot service our indebtedness, we may have to take actions such as selling assets, seeking additional equity, or reducing or delaying capital expenditures, strategic acquisitions, investments, and alliances, any of which could impede the implementation of our business strategy or prevent us from entering into transactions that would otherwise benefit our business. Additionally, we may not be able to effect such actions or refinance any of our debt, if necessary, on commercially reasonable terms, or at all.

11
A decline in the credit ratings of our senior debt and commercial paper may adversely affect our borrowing costs, access to capital, and financial flexibility.
A downgrade in the credit ratings of our senior debt and commercial paper could increase our borrowing costs, reduce or eliminate our access to capital, reduce our financial flexibility, and limit our ability to implement on corporate strategy. Our senior debt ratings at December 31, 2018 were A- with a stable outlook (Standard & Poor’s, or “S&P”), BBB+ with a stable outlook (Fitch, Inc., or “Fitch”), and Baa2 with a stable outlook (Moody’s Investor Services, or “Moody’s”). Our commercial paper ratings were A-2 (S&P), F-2 (Fitch) and P-2 (Moody’s).
Real or anticipated changes in our credit ratings will generally affect any trading market for, or trading value of, our securities. Such changes could result from any number of factors, including the modification by a credit rating agency of the criteria or methodology it applies to particular issuers, a change in the agency’s view of us or our industry, or as a consequence of actions we take to implement our corporate strategies. A change in our credit rating could adversely limit our access to capital and our competitive position.
U.S. federal income tax reform could create uncertainty and adversely affect our business and financial condition.
On December 22, 2017, U.S. federal tax legislation, commonly referred to as the Tax Cuts and Jobs Act (the “Tax Reform Act”), was signed into law, significantly changing the U.S. Internal Revenue Code. These changes include, among other things, lowering the corporate income tax rate, subjecting certain future foreign subsidiary earnings, whether or not distributed, to U.S. tax under a Global Intangible Low-Taxed Income provision, imposing a new alternative “Base Erosion and Anti-Abuse Tax” on U.S. corporations that limits deductions for certain deductible amounts payable to foreign affiliates, imposing significant additional limitations on the deductibility of interest payable to related and unrelated lenders, further limiting deductible executive compensation, and imposing a one-time repatriation tax on deemed repatriated earnings of foreign subsidiaries accumulations through the end of 2017. The new provisions have been the subject of proposed regulations and other guidance that, if and when issued in final form, could materially affect the application of the new statutory provisions. In many cases, the proposed regulations and other guidance proposed to apply retroactively to the date of enactment of the Tax Reform Act. The government could also further modify the rules when they are issued in final form. We continue to analyze how the Tax Reform Act, and any regulations or other governmental action with respect thereto, may impact our business and results of operations. The changes effected pursuant to the Tax Reform Act, and the regulations or other governmental action thereunder, may have an adverse or volatile effect on our tax rate in fiscal years 2019 and beyond, thereby affecting our results of operations. Additionally, the resulting uncertainty with respect to the interpretation and application of the new provisions, and the risk that regulations or other governmental guidance, including revisions to any such regulations or other governmental action that may change the application of the new statutory provisions, may affect our assessment of the effect of the Tax Reform Act on our business and operations as we continue to analyze it.
Our global effective tax rate is subject to a variety of different factors, which could create volatility in that tax rate, expose us to greater than anticipated tax liabilities or cause us to adjust previously recognized tax assets and liabilities.
We are subject to income taxes in the U.K., U.S. and many other jurisdictions. As a result, our global effective tax rate from period to period can be affected by many factors, including changes in tax legislation or regulations, such as the enactment of the U.S. Tax Reform Act detailed above, the continuing development of regulations and other governmental action that affect the application of such legislation, our global mix of earnings, the use of global funding structures, the tax characteristics of our income, the effect of complying with transfer pricing requirements under laws of many different countries on our revenues and costs, the consequences of acquisitions and dispositions of businesses and business segments, and the portion of the income of non-U.S. subsidiaries that may be subject to U.S. tax, or the portion of the income of non-U.K subsidiaries that may be subject to U.K. tax, whether or not distributed to the respective U.S. or U.K. shareholders. In addition, we could be subject to increased taxation as a result of changes in eligibility for the benefits of current income tax treaties between and among the U.K., the U.S., and other countries, including any future amendments to the current income tax treaties between the U.K. and other jurisdictions (including the U.S.), or any new statutory or regulatory provisions that might limit our ability to take advantage of any such treaties. Significant judgment is required in determining our worldwide provision for income taxes, and our determination of the amount of our tax liability is always subject to review by applicable tax authorities. Our actual global tax rate may vary from our expectation and that variance may be material.
We are subject to tax audits conducted by U.S., U.K., and other tax authorities, and the resolution of such audits could impact our tax rate in future periods, as would any reclassification or other changes (such as those in applicable accounting rules) that increases the amounts we have provided for income taxes in our consolidated financial statements. There can be no assurance that we would be successful in attempting to mitigate the adverse impacts resulting from any changes in law, audits and other matters. Our inability to mitigate the negative consequences of any changes in the law, audits and other matters could cause our global tax rate to increase, our use of cash to increase and our financial condition and results of operations to suffer.

12
Changes in our accounting estimates and assumptions could negatively affect our financial position and results of operations.
We prepare our consolidated financial statements in accordance with IFRS. IFRS require us to make estimates and assumptions that affect the reported amounts of assets and liabilities, and the disclosure of contingent assets and liabilities at the date of our financial statements. We are also required to make certain judgments that affect the reported amounts of revenues and expenses during each reporting period. We periodically evaluate our estimates and assumptions including, but not limited to, those relating to revenue recognition, restructuring, pensions, recoverability of assets including customer receivables, valuation of goodwill and intangibles, contingencies, share-based payments, and income taxes. We base our estimates on historical experience and various assumptions that we believe to be reasonable based on specific circumstances. These assumptions and estimates involve the exercise of judgment and discretion, which may evolve over time in light of operational experience, regulatory direction, developments or changes in accounting principles or standards, and other factors. Actual results could differ from these estimates, or changes in assumptions, estimates, policies, or developments in the business may change our initial estimates, which could materially affect the Consolidated Statements of Income, Comprehensive Income, Financial Position, Shareholders’ Equity, and Cash Flows.
We may be required to record goodwill or other long-lived asset impairment charges, which could result in a significant charge to earnings.
Under IFRS, we review our long-lived assets for impairment when events or changes in circumstances indicate the carrying value may not be recoverable. Goodwill is assessed for impairment at least annually. Factors that may be considered in assessing whether goodwill or other long-lived assets may not be recoverable include a decline in our share price or market capitalization, reduced estimates of future cash flows and slower growth rates in our industry. We may experience unforeseen circumstances that adversely affect the value of our goodwill or other long-lived assets and trigger an evaluation of the recoverability of the recorded goodwill and other long-lived intangible assets. Future goodwill or other long-lived asset impairment charges could materially impact our consolidated financial statements.
We are a holding company and, therefore, may not be able to receive dividends or other payments in needed amounts from our subsidiaries.
The Company is organized as a holding company, a legal entity separate and distinct from our operating entities. As a holding company without significant operations of its own, our principal assets are the shares of capital stock of our subsidiaries. We rely on dividends, interest, and other payments from these subsidiaries to meet our obligations for paying principal and interest on outstanding debt, paying dividends to shareholders, repurchasing ordinary shares, and corporate expenses. Certain of our subsidiaries are subject to regulatory requirements of the jurisdictions in which they operate or other restrictions that may limit the amounts that subsidiaries can pay in dividends or other payments to us. No assurance can be given that there will not be further changes in law, regulatory actions, or other circumstances that could restrict the ability of our subsidiaries to pay dividends or otherwise make payments to us. Furthermore, no assurance can be given that our subsidiaries may be able to make timely payments to us in order for us to meet our obligations.
Legal and Regulatory Risks
We are subject to E&O claims against us as well as other contingencies and legal proceedings, some of which, if determined unfavorably to us, could have a material adverse effect on the financial condition or results of operations of a business line or the Company as a whole.
We assist our clients with various matters, including placing insurance and reinsurance coverage and handling related claims, consulting on various human resources matters, and providing actuarial, investment consulting, and asset management services. E&O claims against us may allege our potential liability for damages arising from these services. E&O claims could include, for example, the failure of our employees or sub-agents, whether negligently or intentionally, to place coverage correctly or notify carriers of claims on behalf of clients, to provide insurance carriers with complete and accurate information relating to the risks being insured, or the failure to give error-free consulting or investment advice. It is not always possible to prevent and detect E&O, and the precautions we take may not be effective in all cases. In addition, we are subject to other types of claims, litigation, and proceedings in the ordinary course of business, which along with E&O claims, may seek damages, including punitive damages, in amounts that could, if awarded, have a material adverse impact on the Company’s financial position, earnings, and cash flows. In addition to potential liability for monetary damages, such claims or outcomes could harm our reputation or divert management resources away from operating our business.
We have historically purchased, and intend to continue to purchase, insurance to cover E&O claims and other insurance to provide protection against certain losses that arise in such matters. However, we have exhausted or materially depleted our coverage under some of the policies that protect us for certain years and, consequently, are self-insured or materially self-insured for some historical claims. Additionally, parts or all of an E&O claim could fall within insurance deductibles, self-insured retentions, or policy exclusions. Accruals for these exposures, and related insurance receivables, when applicable, have been provided to the

13
extent that losses are deemed probable and are reasonably estimable. These accruals and receivables are adjusted from time to time as developments warrant and may also be adversely affected by disputes we may have with our insurers over coverage. Amounts related to settlement provisions are recorded in Other general expenses in the Consolidated Statements of Income. Discussion of some of these claims, lawsuits, and proceedings are contained in the Notes to Consolidated Financial Statements.
In addition, we provide a variety of guarantees and indemnifications to our customers and others. In the event of a default, Aon’s potential exposure is equal to the amount of the guarantee or indemnification.
The ultimate outcome of claims, lawsuits, proceedings, guarantees and indemnifications cannot be ascertained, and liabilities in indeterminate amounts may be imposed on us. It is possible that future results of operations or cash flows for any particular annual period could be materially affected by an unfavorable resolution of these matters.
Our businesses are subject to extensive governmental regulation, which could reduce our profitability, limit our growth, or increase competition.
Our businesses are subject to extensive legal and regulatory oversight throughout the world, including the U.K. Companies Act and the rules and regulations promulgated by the FCA, the U.S. securities laws, rules, and regulations, and a variety of other laws, rules, and regulations addressing, among other things, licensing, data privacy and protection, trade restriction and export controls, anti-money laundering, wage-and-hour standards, employment and labor relations, anti-competition, anti-corruption, currency, reserves, government contracting, and the amount of local investment with respect to our operations in certain countries. This legal and regulatory oversight could reduce our profitability or limit our growth by: increasing the costs of legal and regulatory compliance; limiting or restricting the products or services we sell, the markets we serve or enter, the methods by which we sell our products and services, the prices we can charge for our services, or the form of compensation we can accept from our clients, carriers, and third parties; or by subjecting our businesses to the possibility of legal and regulatory actions, proceedings, or fines.
The global nature of our operations increases the complexity and cost of compliance with laws and regulations adding to our cost of doing business. In addition, many of these laws and regulations may have differing or conflicting legal standards across jurisdictions, increasing the complexity and cost of compliance. In emerging markets and other jurisdictions with less developed legal systems, local laws and regulations may not be established with sufficiently clear and reliable guidance to provide us adequate assurance that we are operating our business in a compliant manner with all required licenses or that our rights are otherwise protected. In addition, certain laws and regulations, such as the Foreign Corrupt Practices Act (“FCPA”) and the Foreign Account Tax Compliance provisions of the Hiring Incentives to Restore Employment Act (“FATCA”) in the U.S., and the Bribery Act of 2010 (“U.K. Bribery Act”) in the U.K., impact our operations outside of the legislating country by imposing requirements for the conduct of overseas operations, and in several cases, requiring compliance by foreign subsidiaries.
In addition to the complexity of the laws and regulations themselves, the development of new laws and regulations or changes in application or interpretation of current laws and regulations also increases our legal and regulatory compliance complexity. Additionally, our acquisitions of new businesses and our continued operational changes and entry into new jurisdictions and new service offerings increases our legal and regulatory compliance complexity, as well as the type of governmental oversight to which we may be subject. Changes in laws and regulations could mandate significant and costly changes to the way we implement our services and solutions, could impose additional licensure requirements or costs to our operations and services, or even cause us to cease offering certain services or solutions. Furthermore, as we enter new jurisdictions or businesses and further develop and expand our services, we may become subject to additional types of laws and policies and governmental oversight and supervision, such as those applicable to the financial lending or other service institutions. New regulatory developments that could result in changes that adversely affect us or cause us to change our business or operations include: additional requirements respecting data privacy, data security, and data usage in jurisdictions in which we operate that may increase our costs of compliance and potentially reduce the manner in which we can use data; additional changes in tax regulations in the jurisdictions in which we operate; changes in accounting standards; regulatory actions or changes that require us to change our compensation model; or additional regulations promulgated by the FCA in the U.K., or other regulatory bodies in jurisdictions in which we operate.
In all jurisdictions, the applicable laws and regulations are subject to amendment or interpretation by regulatory authorities. Generally, such authorities are vested with relatively broad discretion to grant, renew, and revoke licenses and approvals and to implement regulations. Accordingly, we may have a license revoked or be unable to obtain new licenses and therefore be precluded or temporarily suspended from carrying on or developing some or all of our activities or otherwise fined or penalized in a given jurisdiction. No assurances can be given that our business can further develop or continue to be conducted in any given jurisdiction in the future as it has been conducted in the past.
Changes in the regulatory scheme, or even changes in how existing regulations are interpreted, could have an adverse impact on our results of operations by limiting revenue streams or increasing costs of compliance. For instance, The General Data Protection Regulation (“GDPR”), which became effective in May 2018, created a range of new compliance obligations, increased financial penalties for non-compliance, and extended the scope of the European Union data protection law to all companies processing data

14
of European Union residents, wherever the company’s location. We have incurred substantial operational costs to bring our practices into compliance with GDPR and where other jurisdictions enact privacy and data protection regulations, we will incur further expenses to bring our practices in compliance with those regulations, which may differ from GDPR.
Our business’ regulatory oversight also includes licensing of insurance brokers and agents, managing general agency or general underwriting operations, and the regulation of the handling and investment of client funds held in a fiduciary capacity. Our continuing ability to provide insurance broking in the jurisdictions in which we operate depends on our compliance with the rules and regulations promulgated by the regulatory authorities in each of these jurisdictions. Also, we can be affected indirectly by the governmental regulation and supervision of insurance companies. For instance, if we are providing or managing general underwriting services for an insurer, we may have to contend with regulations affecting our client.
Services provided in our Health Solutions and Retirement Solutions revenue lines are also the subject of ever-evolving government regulation, either because the services provided to our clients are regulated directly or because third parties upon whom we rely to provide services to clients are regulated, thereby indirectly affecting the manner in which we provide services to those clients. In particular, our health care exchange business depends upon the private sector of the U.S. insurance system and its role in financing health care delivery, and insurance carriers’ use and payment of commissions to agents, brokers, and other organizations to market and sell individual and family health insurance products and plans. Uncertainty regarding, or any changes to, state or federal law, or the interpretation of such law by applicable regulatory agencies, including the effects of health care reform by the U.S. government, could delay client adoption of our health care exchanges, impair our ability to retain clients who have adopted our health care exchanges, or cause insurance carriers to alter or eliminate the products and plans that they offer or attempt to move members into new products or plans for which we receive lower commissions. In addition, changes in laws, government regulations, or the way those regulations are interpreted in the jurisdictions in which we operate could affect the viability, value, use, or delivery of benefits and human resources programs, including changes in regulations relating to health and welfare plans (such as medical), defined contribution plans (such as 401(k)), or defined benefit plans (such as pension), may adversely affect the demand for, or profitability of, our services.
If we violate the laws and regulations to which we are subject, we could be subject to fines, penalties, or criminal sanctions and could be prohibited from conducting business in one or more countries. There can be no assurance that our employees, contractors, or agents will not violate these laws and regulations, causing an adverse effect on our operations and financial condition.
Heightened regulatory oversight and scrutiny may lead to additional regulatory investigations, increased government involvement, or enforcement actions. For instance, increased scrutiny by competition authorities may increase our costs of doing business or force us to change the way we conduct business or refrain from or otherwise alter the way we engage in certain activities. Additionally, we operate in many different business lines, which may occasionally intersect with each other, such as placing both insurance and reinsurance or providing both investment consultancy and fiduciary management services. If we fail to control possible resulting conflicts of interest, we could be subject to civil litigation, fines, penalties, and criminal sanctions and could be prohibited from participating in one or more lines of business. As regulators and other government agencies continue to examine our operations, there is no assurance that consent orders or other enforcement actions will not be issued by them in the future. These and other initiatives from national, state, and local officials may subject us to judgments, settlements, fines, or penalties, or cause us to be required to restructure or divest operations and activities, all of which could lead to reputational issues, higher operational costs, business disruption or loss, thereby adversely affecting our business, financial condition, or operating results.
Failure to protect our intellectual property rights, or allegations that we have infringed on the intellectual property rights of others, could harm our reputation, ability to compete effectively, and financial condition.
To protect our intellectual property rights, we rely on a combination of trademark laws, copyright laws, patent laws, trade secret protection, confidentiality agreements, and other contractual arrangements with our affiliates, employees, clients, strategic partners, and others. However, the protective steps that we take may be inadequate to deter misappropriation of our proprietary information. In addition, we may be unable to detect the unauthorized use of, or take appropriate steps to enforce, our intellectual property rights. Further, effective trademark, copyright, patent, and trade secret protection may not be available in every country in which we offer our services or competitors may develop products similar to our products that do not conflict with our related intellectual property rights. Failure to protect our intellectual property adequately could harm our reputation and affect our ability to compete effectively.
In addition, to protect or enforce our intellectual property rights, we may initiate litigation against third parties, such as infringement suits or interference proceedings. Third parties may assert intellectual property rights claims against us, which may be costly to defend, could require the payment of damages, and could limit our ability to use or offer certain technologies, products or other intellectual property. Any intellectual property claims, with or without merit, could be expensive, take significant time and divert management’s attention from other business concerns. Successful challenges against us could require us to modify or discontinue our use of technology or business processes where such use is found to infringe or violate the rights of others, or

15
require us to purchase licenses from third parties, any of which could adversely affect our business, financial condition, and operating results.
We have less flexibility as a public limited company incorporated under the laws of England and Wales with respect to certain aspects of capital management.
English law imposes additional restrictions on certain corporate actions. For example, English law provides that a board of directors may only allot securities with the prior authorization of shareholders, with such authorization specifying a maximum amount of shares that may be allotted under it, and lasting for a maximum period of five years, each as specified in the articles of association or relevant shareholder resolution. The current authorization is effective until the earlier of our next annual general meeting or August 31, 2019. This authorization will need to be renewed by our shareholders periodically and we intend to renew this authorization at each annual general meeting.
English law also generally provides shareholders with preemptive rights when new shares are issued for cash; however, it is possible for the articles of association, or shareholders in general meeting, to exclude preemptive rights. Such an exclusion of preemptive rights may be for a maximum period of up to five years as specified in the articles of association or relevant shareholder resolution. The current exclusion is effective until the earlier of our next annual general meeting or August 31, 2019. This exclusion would need to be renewed by our shareholders periodically and we intend to renew this exclusion at each annual general meeting.
English law also requires us to have available “distributable reserves” to make share repurchases or pay dividends to shareholders. Distributable reserves may be created through the earnings of the U.K. parent company (the “Parent Company”) or other actions. As of December 31, 2018, we had distributable reserves in excess of $3.7 billion. While it is our intention to maintain a sufficient level of distributable reserves in order to pay dividends on our ordinary shares and make share repurchases, there is no assurance that the Parent Company level will maintain the necessary level of distributable reserves to do so. If at any time we do not have sufficient distributable reserves to declare and pay dividends, we may undertake a reduction in capital of the Company to reduce the amount of our share capital and non-distributable reserves and to create a corresponding increase in our distributable reserves out of which future distributions to shareholders could be made.
English law also generally prohibits a company from repurchasing its own shares by way of “off-market purchases” without the prior approval of our shareholders. Such approval lasts for a maximum period of up to five years. Our shares are traded on the New York Stock Exchange (“NYSE”), which is not a recognized investment exchange in the U.K. Consequently, any repurchase of our shares is currently considered an “off market purchase.” The current authorization expires on June 22, 2023. Renewal of this authorization will be sought periodically.
The enforcement of civil liabilities against us may be more difficult.
Because we are a public limited company incorporated under the laws of England and Wales, investors could experience more difficulty enforcing judgments obtained against us in U.S. courts than would have been the case for a U.S. company. In addition, it may be more difficult (or impossible) to bring some types of claims against us in courts in England than it would be to bring similar claims against a U.S. company in a U.S. court.
We are a public limited company incorporated under the laws of England and Wales. Therefore, it may not be possible to effect service of process upon us within the U.S. in order to enforce judgments of U.S. courts against us based on the civil liability provisions of the U.S. federal securities laws.
There is doubt as to the enforceability in England and Wales, in original actions or in actions for enforcement of judgments of U.S. courts, of civil liabilities solely based on the U.S. federal securities laws. The English courts will, however, treat any amount payable by us under U.S. judgment as a debt and new proceedings can be commenced in the English courts to enforce this debt against us. The following criteria must be satisfied in order for the English court to enforce the debt created by the U.S. judgment:
• the U.S. court having had jurisdiction over the original proceedings according to English conflicts of laws principles and rules of English private international law at the time when proceedings were initiated;
• the U.S. proceedings not having been brought in breach of a jurisdiction or arbitration clause except with the agreement of the defendant or the defendant’s subsequent submission to the jurisdiction of the court;
• the U.S. judgment being final and conclusive on the merits in the sense of being final and unalterable in the court which pronounced it and being for a definite sum of money;
• the recognition or enforcement, as the case may be, of the U.S. judgment not contravening English public policy in a sufficiently significant way or contravening the Human Rights Act 1998 (or any subordinate legislation made thereunder, to the extent applicable);
• the U.S. judgment not being for a sum payable in respect of taxes, or other charges of a like nature, or in respect of a penalty or fine, or otherwise based on a U.S. law that an English court considers to be a penal or revenue law;

16
• the U.S. judgment not having been arrived at by doubling, trebling or otherwise multiplying a sum assessed as compensation for the loss or damages sustained, and not otherwise being a judgment contrary to section 5 of the Protection of Trading Interests Act 1980 or is a judgment based on measures designated by the Secretary of State under Section 1 of that Act;
• the U.S. judgment not having been obtained by fraud or in breach of English principles of natural justice; • the U.S. judgment not being a judgment on a matter previously determined by an English court, or another court whose
judgment is entitled to recognition (or enforcement as the case may be) in England, in proceedings involving the same parties which conflicts with an earlier judgment of such court;
• the party seeking enforcement (being a party who is not ordinarily resident in some part of the U.K. or resident in an EU Member State) providing security for costs, if ordered to do so by the English courts; and
• the English enforcement proceedings being commenced within the relevant limitation period.
If an English court gives judgment for the sum payable under a U.S. judgment, the English judgment will be enforceable by methods generally available for this purpose. These methods generally permit the English court discretion to prescribe the manner of enforcement. Also note that, in any enforcement proceedings, the judgment debtor may raise any counterclaim that could have been brought if the action had been originally brought in England unless the subject of the counterclaim was in issue and denied in the U.S. proceedings.
Operational Risks
The economic and political conditions of the countries and regions in which we operate, including the U.K.’s expected withdrawal from the European Union, could have an adverse impact on our business, financial condition, operating results, liquidity, and prospects for growth.
Our operations in countries undergoing political change or experiencing economic instability are subject to uncertainty and risks that could materially adversely affect our business. These risks include, particularly in emerging markets, the possibility we would be subject to undeveloped or evolving legal systems, unstable governments and economies, and potential governmental actions affecting the flow of goods, services, and currency.
Furthermore, the U.K.’s expected withdrawal from the European Union, (“Brexit”), has created uncertainty about the future relationship between the U.K. and the European Union. As the U.K. and European Union continue to negotiate the terms of the U.K.’s withdrawal, there remains inevitable uncertainty on topics such as financial laws and regulations, tax and free trade agreements, immigration laws, and employment laws. Our publicly traded parent is incorporated in the U.K. and we have significant operations and a substantial workforce therein and therefore enjoy certain benefits based on the U.K.’s membership in the European Union. The lack of clarity about Brexit and, whether, in the future U.K. laws and regulations are recognized in the EU, creates uncertainty for us as the eventual outcome of negotiations may affect our business and operations. We may be required to incur additional expense as we adapt to the political and regulatory environment post-Brexit. This may include legal entity structure changes, adjusting the way we engage with some of our European and U.K. clients, or choosing to re-locate some of our staff. We are currently examining the various impacts to our business and operating models in an effort to develop solutions to address any of the potential outcomes of the negotiations, so our organization can continue to provide our clients with the services and expertise they require. We also cannot be certain that regulators in other European Union countries will grant us the permissions or licenses we seek to operate our business. We have and will continue to invest significant time and resources as we navigate the effects of Brexit, and the uncertainty related thereto, on our business and operations. A less orderly Brexit has the potential to adversely affect global economic conditions and the stability of global financial markets, which in turn could have a material adverse effect on our business, financial condition, and results of operations.
Additionally, any development that has the effect of devaluing the euro or British pound could meaningfully reduce the value of our assets and reducing the usefulness of liquidity alternatives denominated in that currency such as our multicurrency U.S. credit facility. We also deposit some of our cash, including cash held in a fiduciary capacity, with certain European financial institutions. While we continuously monitor and manage exposures associated with those deposits, to the extent the uncertainty surrounding economic stability in Europe and the future viability of the euro suddenly and adversely impacts those financial institutions, some or all of those cash deposits could be at risk.
We may not realize all of the expected benefits from our restructuring plan and other operational improvement initiatives.
In 2017, we initiated a global restructuring plan (the “Restructuring Plan”) in connection with the sale of the Divested Business. The Restructuring Plan is intended to streamline operations across the organization and deliver greater efficiency, insight and connectivity. We expect these restructuring activities and related expenses to affect continuing operations through 2019, including an estimated 4,800 to 5,400 role eliminations. The Restructuring Plan is expected to result in cumulative costs of approximately $1,225 million through the end of the Restructuring Plan, consisting of approximately $450 million in employee termination costs, $130 million in IT rationalization costs, $65 million in real estate realization costs, $50 million in asset impairment

17
costs and $530 million in other costs associated with the restructuring. Included in the estimated $1,225 million is $100 million of estimated non-cash charges.
We estimate that our annualized savings from the Restructuring Plan and other operational improvement initiatives will be approximately $500 million by the end of 2019. Actual total costs, savings, and timing may vary from these estimates due to changes in the scope or assumptions underlying the Restructuring Plan and other operational improvement initiatives. We therefore cannot assure that we will achieve the targeted savings. Unanticipated costs or unrealized savings in connection with the Restructuring Plan and other operational improvement initiatives could adversely affect our consolidated financial statements.
Our success depends on our ability to retain and attract experienced and qualified personnel, including our senior management team and other professional personnel.
We depend, in material part, upon the members of our senior management team who possess extensive knowledge and a deep understanding of our business and our strategy, as well as the colleagues who are critical to developing and retaining client relationships. The unexpected loss of services of any of these senior leaders could have a disruptive effect adversely impacting our ability to manage our business effectively and execute our business strategy. Competition for experienced professional personnel is intense, and we are constantly working to retain and attract these professionals. If we cannot successfully do so, our business, operating results, and financial condition could be adversely affected. While we have plans for key management succession and long-term compensation plans designed to retain our senior management team and critical colleagues, if our succession plans and retention programs do not operate effectively, our business could be adversely affected. We also are committed to diversity and inclusion and strive to maintain an equitable work environment that unlocks the full potential of all of our personnel. If we are unsuccessful in maintaining such a work environment, we could experience difficulty attracting and retaining personnel, which could have a negative impact on our business.
Our global operations expose us to various international risks that could adversely affect our business.
Our operations are conducted globally. Accordingly, we are subject to regulatory, legal, economic, and market risks associated with operating in, and sourcing from, foreign countries, including:
• difficulties in staffing and managing our foreign offices, including due to unexpected wage inflation or job turnover, and the increased travel, infrastructure, and legal and compliance costs and risks associated with multiple international locations;
• hyperinflation in certain foreign countries;• conflicting regulations in the countries in which we do business;• imposition of investment requirements or other restrictions by foreign governments;• longer payment cycles;• greater difficulties in collecting accounts receivable;• insufficient demand for our services in foreign jurisdictions;• our ability to execute effective and efficient cross-border sourcing of services on behalf of our clients;• the reliance on or use of third parties to perform services on behalf of the Company;• disparate tax regimes;• restrictions on the import and export of technologies; and• trade barriers.
The occurrence of natural or man-made disasters could result in declines in business and increases in claims that could adversely affect our financial condition and results of operations.
We are exposed to various risks arising out of natural disasters, including earthquakes, hurricanes, fires, floods, tornadoes, extreme weather, or other climate events; pandemic health events, and man-made disasters, including acts of terrorism, civil unrest, violence, military actions, and cyber-terrorism. The continued threat of terrorism and other events or disasters may cause significant volatility in global financial markets, and a natural or man-made disaster could trigger energy shortages, public health issues, or an economic downturn or instability in the areas directly or indirectly affected by the disaster. These consequences could, among other things, result in a decline in business and increased claims from those areas. They could also result in reduced underwriting capacity, making it more difficult for our professionals to place business. Disasters also could disrupt public and private infrastructure, including communications and financial services, which could disrupt our normal business operations.
A natural or man-made disaster also could disrupt the operations of our counterparties or result in increased prices for the products and services they provide to us. In addition, a disaster could adversely affect the value of the assets in our investment portfolio. Finally, a natural or man-made disaster could increase the incidence or severity of E&O claims against us.

18
Our inability to successfully recover should we experience a disaster or other business continuity problem could cause material financial loss, loss of human capital, regulatory actions, reputational harm, or legal liability.
Our operations are dependent upon our ability to protect our personnel, offices, and technology infrastructure against damage from business continuity events that could have a significant disruptive effect on our operations. Should we experience a local or regional disaster or other business continuity problem, such as a security incident or attack, a natural disaster, climate event, terrorist attack, pandemic, power loss, telecommunications failure, or other natural or man-made disaster, our continued success will depend, in part, on the availability of our personnel and office facilities, and the proper functioning of computer systems, telecommunications, and other related systems and operations. In events like these, while our operational size, the multiple locations from which we operate, and our existing back-up systems provide us with some degree of flexibility, we still can experience near-term operational challenges in particular areas of our operations. We could potentially lose access to key executives, personnel, or client data or experience material adverse interruptions to our operations or delivery of services to our clients in a disaster recovery scenario. A disaster on a significant scale or affecting certain of our key operating areas within or across regions, or our inability to successfully recover should we experience a disaster or other business continuity problem, could materially interrupt our business operations and cause material financial loss, loss of human capital, regulatory actions, reputational harm, damaged client relationships, or legal liability.
We rely on complex information technology systems and networks to operate our business. Any significant system or network disruption due to a breach in the security of our information technology systems could have a negative impact on our reputation, operations, sales and operating results.
We rely on the efficient, uninterrupted, and secure operation of complex information technology systems and networks, some of which are within the Company and some of which are outsourced to third parties. All information technology systems are potentially vulnerable to damage or interruption from a variety of sources, including but not limited to cyber-attacks, computer viruses, security breaches, and unauthorized access or improper actions by insiders or employees. We are at risk of attack by a growing list of adversaries through increasingly sophisticated methods of attack. Because the techniques used to obtain unauthorized access or sabotage systems change frequently, we may be unable to anticipate these techniques, implement adequate preventative measures, or respond quickly enough in the event of an incident or attack. We regularly experience attacks to our systems and networks and have from time to time experienced cybersecurity incidents, such as computer viruses, unauthorized parties gaining access to our information technology systems, data loss via malicious and non-malicious methods, and similar incidents, which to date have not had a material impact on our business. If we are unable to efficiently and effectively maintain and upgrade our system safeguards, we may incur unexpected costs and certain of our systems may become more vulnerable to unauthorized access. Problems with the information technology systems of vendors, including breakdowns or other disruptions in communication services provided by a vendor, failure of a vendor to handle current or higher volumes, cyber-attacks, and security breaches at a vendor could adversely affect our ability to deliver products and services to customers and otherwise conduct business. Additionally, we are a global and acquisitive organization and we therefore might not adequately identify weaknesses in certain of our information systems, including those of targets we acquire, which could expose us to unexpected liabilities or make our own systems more vulnerable to attack. These types of incidents affecting us or our third-party vendors could result in intellectual property or other confidential information being lost or stolen, including client or employee personal information, or company data. In addition, we may not be able to detect breaches in our information technology systems or assess the severity or impact of a breach in a timely manner.
We have implemented various measures to manage our risks related to system and network security and disruptions, but a security breach or a significant or extended disruption in the functioning of our information technology systems could damage our reputation, cause us to lose clients, adversely impact our operations, sales and operating results, and require us to incur significant expense and divert resources to address and remediate or otherwise resolve such issues. Additionally, in order to maintain the level of security, service, and reliability that our clients require, we may be required to make significant additional investments in our information technology system.
Improper disclosure of confidential, personal, or proprietary data could result in regulatory scrutiny, legal liability, or harm to our reputation.
One of our significant responsibilities is to maintain the security and privacy of our employees’ and clients’ confidential and proprietary information, including confidential information about our clients’ and employees’ compensation, medical information, and other personally identifiable information. We maintain policies, procedures, and technological safeguards designed to protect the security and privacy of this information. Nonetheless, we cannot eliminate the risk of human error, employee or vendor malfeasance, or cyber-attacks that could result in improper access to or disclosure of confidential, personal, or proprietary information. Such access or disclosure could harm our reputation and subject us to liability under our contracts and laws and regulations that protect personal data, resulting in increased costs, loss of revenue, and loss of clients. The release of confidential information as a result of a security breach could also lead to litigation or other proceedings against us by affected individuals or

19
business partners, or by regulators, and the outcome of such proceedings, which could include penalties or fines, could have a significant negative impact on our business.
In many jurisdictions, including in the European Union and the U.S., we are subject to laws and regulations relating to the collection, use, retention, security, and transfer of this information. These laws and regulations are frequently changing and are becoming increasingly complex and sometimes conflict among the various jurisdictions and countries in which we provide services both in terms of substance and in terms of enforceability. This makes compliance challenging and expensive. Additionally, certain jurisdictions’ regulations include notice provisions that may require us to inform affected clients or employees in the event of a breach of confidential information before we fully understand or appreciate the extent of the breach. These notice provisions present operational challenges and related risk. In particular, the European Union’s GDPR, which went into effect in May 2018, caused us to incur significant expenses in an effort to implement the applicable GDPR provisions within our business before the effective date causing distraction from other aspects of our business. In addition, non-compliance with GDPR could result in proceedings against us by governmental entities or others and additional costs in connection therewith. We expect other jurisdictions in which we operate to adopt regulations governing personal data and information, and we will have to continue to incur expenses and devote resources to bring our practices into compliance with such future regulations. Our failure to adhere to or successfully implement processes in response to changing regulatory requirements in this area could result in legal liability or impair our reputation in the marketplace. Further, regulatory initiatives in the area of data protection are more frequently including provisions allowing authorities to impose substantial fines and penalties, and therefore, failure to comply could also have a significant financial impact.
Our business performance and growth plans could be negatively affected if we are not able to effectively apply technology in driving value for our clients through technology-based solutions or gain internal efficiencies through the effective application of technology and related tools. Conversely, investments in innovative product offerings may fail to yield sufficient return to cover their investments.
Our success depends, in part, on our ability to develop and implement technology solutions that anticipate and keep pace with rapid and continuing changes in technology, industry standards, and client preferences. We may not be successful in anticipating or responding to these developments on a timely and cost-effective basis, and our ideas may not be accepted in the marketplace. Additionally, the effort to gain technological expertise and develop new technologies in our business requires us to incur significant expenses. If we cannot offer new technologies as quickly as our competitors or if our competitors develop more cost-effective technologies, it could have a material adverse effect on our ability to obtain and complete client engagements. For example, we have invested significantly in the development of our proprietary databases, repositories of global insurance and reinsurance placement information, which we use to drive results for our clients in the insurance and reinsurance placement process. Our competitors are developing competing databases, and their success in this space may impact our ability to differentiate our services to our clients through the use of unique technological solutions. Innovations in software, cloud computing, or other technologies that alter how our services are delivered could significantly undermine our investment in this business if we are slow or unable to take advantage of these developments.
We are continually developing and investing in innovative and novel service offerings that we believe will address needs that we identify in the markets. Nevertheless, for those efforts to produce meaningful value, we are reliant on a number of other factors, some of which our outside of our control. For example, our Health Solutions revenue line has invested substantial time and resources in launching health care exchanges under the belief that these exchanges will serve a useful role in helping corporations and individuals in the U.S. manage their growing health care expenses. In order for these exchanges to be successful, health care insurers and corporate and individual participants have to deem them suitable, and whether those parties will find them suitable will be subject to their own particular circumstances.
We rely on third parties to perform key functions of our business operations enabling our provision of services to our clients. These third parties may act in ways that could harm our business.
We rely on third parties, and in some cases subcontractors, to provide services, data, and information such as technology, information security, funds transfers, data processing, and administration and support functions that are critical to the operations of our business. These third parties include correspondents, agents and other brokerage and intermediaries, insurance markets, data providers, plan trustees, payroll service providers, benefits administrators, software and system vendors, health plan providers, investment managers and providers of human resource, among others. As we do not fully control the actions of these third parties, we are subject to the risk that their decisions, actions, or inactions may adversely impact us and replacing these service providers could create significant delay and expense. A failure by third parties to comply with service level agreements or regulatory or legal requirements in a high quality and timely manner, particularly during periods of our peak demand for their services, could result in economic and reputational harm to us. In addition, we face risks as we transition from in-house functions to third-party support functions and providers that there may be disruptions in service or other unintended results that may adversely affect our business operations. These third parties face their own technology, operating, business, and economic risks, and any significant failures by

20
them, including the improper use or disclosure of our confidential client, employee, or company information, could cause harm to our reputation. An interruption in or the cessation of service by any service provider as a result of systems failures, cybersecurity incidents, capacity constraints, financial difficulties, or for any other reason could disrupt our operations, impact our ability to offer certain products and services, and result in contractual or regulatory penalties, liability claims from clients, or employees, damage to our reputation, and harm to our business.
Our business is exposed to risks associated with the handling of client funds.
Certain of our businesses collect premiums from insureds and remits the premiums to the respective insurers. We also collect claims or refunds from insurers on behalf of insureds, which are then remitted to the insureds. Consequently, at any given time, we may be holding and managing funds of our clients. This function creates a risk of loss arising from, among other things, fraud by employees or third parties, execution of unauthorized transactions, errors relating to transaction processing, or other cybersecurity events or security breaches. We are also potentially at risk in the event the financial institution in which we hold these funds suffers any kind of insolvency or liquidity event. The occurrence of any of these types of events in connection with this function could cause us financial loss and reputational harm.
In connection with the implementation of our corporate strategies, we face risks associated with the acquisition or disposition of businesses, the entry into new lines of business, the integration of acquired businesses, and the growth and development of these businesses.
In pursuing our corporate strategy, we often acquire other businesses or dispose of or exit businesses we currently own. The success of this strategy is dependent upon our ability to identify appropriate acquisition and disposition targets, negotiate transactions on favorable terms, complete transactions and, in the case of acquisitions, successfully integrate them into our existing businesses. If a proposed transaction is not consummated, the time and resources spent pursuing it could adversely result in missed opportunities to locate and acquire other businesses. If acquisitions are made, there can be no assurance that we will realize the anticipated benefits of such acquisitions, including, but not limited to, revenue growth, operational efficiencies, or expected synergies. If we dispose of or otherwise exit certain businesses, there can be no assurance that we will not incur certain disposition related charges, or that we will be able to reduce overhead related to the divested assets.
From time to time, either through acquisitions or internal development, we enter new lines of business or offer new products and services within existing lines of business. These new lines of business or new products and services present the Company with additional risks, particularly in instances where the markets are not fully developed. Such risks include the investment of significant time and resources; the possibility that these efforts will be not be successful; the possibility that the marketplace does not accept our products or services or that we are unable to retain clients that adopt our new products or services; and the risk of additional liabilities associated with these efforts. In addition, many of the businesses that we acquire and develop will likely have significantly smaller scales of operations prior to the implementation of our growth strategy. If we are not able to manage the growing complexity of these businesses, including improving, refining, or revising our systems and operational practices, and enlarging the scale and scope of the businesses, our business may be adversely affected. Other risks include developing knowledge of and experience in the new business, integrating the acquired business into our systems and culture, recruiting professionals, and developing and capitalizing on new relationships with experienced market participants. External factors, such as compliance with new or revised regulations, competitive alternatives, and shifting market preferences may also impact the successful implementation of a new line of business. Failure to manage these risks in the acquisition or development of new businesses could materially and adversely affect our business, results of operations, and financial condition.
We are subject to various risks and uncertainties in connection with the sale of the Divested Business.
On May 1, 2017, we sold the Divested Business to an entity controlled by affiliates of The Blackstone Group L.P. (the “Buyer”). This transaction carries inherent risks, including the risk that we will not earn the $500 million of additional consideration or otherwise realize the intended value of the transaction, as well as risks connected with separating the Divested Business from Aon. We are party to a transition services agreement with the Buyer and there are risks associated with this transition services agreement, particularly as we transition off of the Buyer’s systems and services and initiate our own new systems and processes, which could adversely affect our business and results of operations.
Furthermore, we have entered into ongoing commercial arrangements with the Buyer. If we do not realize the intended benefits of these arrangements, it could affect our results of operations or adversely affect our relationship with clients, partners, colleagues, and other third parties. Additionally, if the Divested Business does not deliver the level of service to which our clients and partners are accustomed, it could adversely affect our relationships with such third parties.

21
Our results may be adversely affected by changes in the mode of compensation in the insurance industry.
In the past, the Attorney General of the State of New York brought charges against members of the insurance brokerage community. These actions have created uncertainty concerning longstanding methods of compensating insurance brokers. Given that the insurance brokerage industry has faced scrutiny from regulators in the past over its compensation practices, and the transparency and disclosure to clients regarding brokers’ compensation, it is possible that regulators may choose to revisit the same or other practices in the future. If they do so, compliance with new regulations along with any sanctions that might be imposed for past practices deemed improper could have an adverse impact on our future results of operations and inflict significant reputational harm on our business.
Risks Related to Our Ordinary Shares
Transfers of the Class A Ordinary Shares may be subject to stamp duty or SDRT in the U.K., which would increase the cost of dealing in the Class A Ordinary Shares.
Stamp duty reserve taxes (“SDRT”) are imposed in the U.K. on certain transfers of chargeable securities (which include shares in companies incorporated in the U.K.) at a rate of 0.5 percent of the consideration paid for the transfer. Certain transfers of shares to depositories or into clearance systems are charged at a higher rate of 1.5 percent.
Our Class A Ordinary Shares are eligible to be held in book entry form through the facilities of Depository Trust Company (“DTC”). Transfers of shares held in book entry form through DTC will not attract a charge to stamp duty or SDRT in the U.K. A transfer of the shares from within the DTC system out of DTC and any subsequent transfers that occur entirely outside the DTC system will attract a charge to stamp duty at a rate of 0.5 percent of any consideration, which is payable by the transferee of the shares. Any such duty must be paid (and the relevant transfer document stamped by Her Majesty’s Revenues and Customs (“HMRC”) before the transfer can be registered in the share registers of Aon. If those shares are redeposited into DTC, the redeposit will attract stamp duty or SDRT at a rate of 1.5 percent of the value of the shares.
We have put in place arrangements to require that shares held in certificated form cannot be transferred into the DTC system until the transferor of the shares has first delivered the shares to a depository specified by us so that SDRT may be collected in connection with the initial delivery to the depository. Any such shares will be evidenced by a receipt issued by the depository. Before the transfer can be registered in our share registers, the transferor will also be required to put in the depository funds to settle the resultant liability to SDRT, which will be charged at a rate of 1.5 percent of the value of the shares.
If the Class A Ordinary Shares are not eligible for continued deposit and clearing within the facilities of DTC, then transactions in our securities may be disrupted.
The facilities of DTC are a widely used mechanism that allow for rapid electronic transfers of securities between the participants in the DTC system, which include many large banks and brokerage firms. We believe that prior to our reincorporation in the U.K. in 2012 (the “Redomestication”), approximately 99% of the outstanding shares of common stock of Aon Corporation were held within the DTC system. The Class A Ordinary Shares of Aon plc are, at present, eligible for deposit and clearing within the DTC system. In connection with the closing of the Redomestication, we entered into arrangements with DTC whereby we agreed to indemnify DTC for any stamp duty and/or SDRT that may be assessed upon it as a result of its service as a depository and clearing agency for our Class A Ordinary Shares. In addition, we have obtained a ruling from HMRC in respect of the stamp duty and SDRT consequences of the reorganization, and SDRT has been paid in accordance with the terms of this ruling in respect of the deposit of Class A Ordinary Shares with the initial depository. DTC will generally have discretion to cease to act as a depository and clearing agency for the Class A Ordinary Shares. If DTC determines at any time that the Class A Ordinary Shares are not eligible for continued deposit and clearance within its facilities, then we believe the Class A Ordinary Shares would not be eligible for continued listing on a U.S. securities exchange or inclusion in the S&P 500 and trading in the Class A Ordinary Shares would be disrupted. While we would pursue alternative arrangements to preserve our listing and maintain trading, any such disruption could have a material adverse effect on the trading price of the Class A Ordinary Shares.
Quantitative and Qualitative Disclosures About Market Risk
We are exposed to potential fluctuations in earnings, cash flows, and the fair values of certain of our assets and liabilities due to changes in interest rates and foreign exchange rates. To manage the risk from these exposures, we enter into a variety of derivative instruments. We do not enter into derivatives or financial instruments for trading or speculative purposes.
The following discussion describes our specific exposures and the strategies we use to manage these risks. Refer to Note 2 “Summary of Significant Accounting Principles and Practices” of the Notes to Consolidated Financial Statements for a discussion of our accounting policies for financial instruments and derivatives.

22
Foreign Exchange Risk
We are subject to foreign exchange rate risk. Our primary exposures include exchange rates between the U.S. dollar and the euro, the British pound, the Canadian dollar, the Australian dollar, the Indian rupee, and the Japanese yen. We use over-the-counter options and forward contracts to reduce the impact of foreign currency risk to our financial statements.
Additionally, some of our non-U.S. brokerage subsidiaries receive revenues in currencies that differ from their functional currencies. Our U.K. subsidiaries earn a portion of their revenue in U.S. dollars, euros, and Japanese yen, but most of their expenses are incurred in British pounds. At December 31, 2018, we have hedged approximately 45% of our U.K. subsidiaries’ expected exposures to the U.S. dollar, euro, and Japanese yen transactions for the years ending December 31, 2019, 2020, and 2021 respectively. We generally do not hedge exposures beyond three years.
We also use forward contracts to economically hedge foreign exchange risk associated with monetary balance sheet exposures, such as inter-company notes and short-term assets and liabilities that are denominated in a non-functional currency and are subject to remeasurement.
The potential loss in future earnings from foreign exchange derivative instruments resulting from a hypothetical 10% adverse change in year-end exchange rates would be insignificant and $2 million at December 31, 2019 and 2020 respectively.
Interest Rate Risk
Our fiduciary investment income is affected by changes in international and domestic short-term interest rates. We monitor our net exposure to short-term interest rates, and as appropriate, hedge our exposure with various derivative financial instruments. This activity primarily relates to brokerage funds held on behalf of clients in the North America, continental Europe, and the Asia Pacific region. A hypothetical, instantaneous parallel decrease in the year-end yield curve of 100 basis points would cause a decrease, net of derivative positions, of $42 million to each of 2019 and 2020 pretax income. A corresponding increase in the year-end yield curve of 100 basis points would cause an increase, net of derivative positions, of $42 million to each of 2019 and 2020pretax income.
We have long-term debt outstanding with a fair market value of $6.2 billion at both December 31, 2018 and 2017. This fair value was greater than the carrying value by $166 million at December 31, 2018, and $600 million greater than the carrying value at December 31, 2017. A hypothetical 1% increase or decrease in interest rates would change the fair value by a decrease of 7%or an increase of 8%, respectively, at December 31, 2018.
We have selected hypothetical changes in foreign currency exchange rates, interest rates, and equity market prices to illustrate the possible impact of these changes; we are not predicting market events.
BUSINESS REVIEW
EXECUTIVE SUMMARY OF 2018 FINANCIAL RESULTS
Aon is a leading global professional services firm providing a broad range of risk, retirement, and health solutions underpinned by proprietary data and analytics. Management is leading a set of initiatives designed to strengthen Aon and unite the firm with one portfolio of capability enabled by proprietary data and analytics and one operating model to deliver additional insight, connectivity, and efficiency.
Financial Results
On January 1, 2018, Aon adopted new accounting guidance related to the treatment of revenue from contracts with customers that was applied prospectively on the IFRS financial statements and therefore comparable periods have not been restated. Refer to Note 2 “Summary of Significant Accounting Principles and Practices” for further information surrounding the quantitative and qualitative impacts of adopting the new accounting guidance.
The following is a summary of our 2018 financial results from continuing operations:
• Revenue increased $772 million, or 8%, to $10,770 million in 2018 compared to 2017, reflecting 5% organic revenue growth, a 2% increase related to acquisitions, net of divestitures, and a 1% favorable impact from translating prior year period results at current period foreign exchange rates (“foreign currency translation”). Organic revenue growth for the year was driven by growth across every major revenue line, with particular strength in Reinsurance Solutions, Commercial Risk Solutions, and Health Solutions.
• Operating expenses increased $245 million, or 3%, to $9,314 million in 2018 compared to 2017 due primarily to a $172 million increase in expenses related to acquisitions, net of divestitures, a $75 million increase in expense related

23
to legacy litigation, $71 million of accelerated amortization related to tradenames, a $54 million unfavorable impact from foreign currency translation, a $14 million increase in expense to support GDPR compliance, and an increase in expense associated with 5% organic revenue growth, partially offset by $195 million of incremental savings related to restructuring, a $185 million net decrease in impairment charges and other operational improvement initiatives, and a $28 million decrease in regulatory and compliance costs.
• Operating margin increased to 13.5% in 2018 from 9.3% in 2017, including an increase of 90 basis points resulting from adoption of the new revenue recognition standard in 2018. The underlying increase in operating margin from the prior year is primarily driven by organic revenue growth of 5% and strong core operational improvement, partially offset by an increase in operating expenses, described above.
• Due to the factors set forth above, net income from continuing operations was $1,030 million in 2018, an increaseof $599 million, or 139%, from 2017.
• Diluted earnings per share from continuing operations increased to $3.99 per share during the twelve months of 2018 from $1.50 per share in 2017, including an increase of $0.31 per share resulting from the adoption of the new revenue recognition standard.
• Cash flow provided by operating activities from continuing operations was $1,633 million in 2018, an increase of $1,028 million, or 170%, from $605 million in 2017. The prior year included $940 million of cash tax payments related to the sale of the Divested Business. Strong operational improvement and working capital improvements in both receivables and payables contributed to year-over-year growth, partially offset by $145 million of incremental cash restructuring charges and $80 million of accelerated pension contributions.
REVIEW OF CONSOLIDATED RESULTS
Summary of Results
On January 1, 2018, Aon adopted new accounting guidance related to the treatment of revenue from contracts with customers that was applied prospectively on the IFRS financial statements and therefore comparable periods have not been restated. Refer to Note 2 “Summary of Significant Accounting Principles and Practices” for further information surrounding the quantitative and qualitative impacts of adopting the new accounting guidance.

24
Our consolidated results are as follow:
Years ended December 31
(millions) 2018 2017
Revenue Total revenue $ 10,770 $ 9,998
Expenses Compensation and benefits 6,193 6,115Information technology 484 423Premises 372 357Depreciation of fixed assets 101 103Amortization and impairment of intangible assets 681 791Other general expenses 1,483 1,280
Total operating expenses 9,314 9,069Operating income 1,456 929
Interest income 5 27Interest expense (276) (281)Other income (expense) (25) (2)
Income from continuing operations before income taxes 1,160 673Income taxes 130 242
Net income from continuing operations 1,030 431Net income from discontinued operations 14 806
Net income $ 1,044 $ 1,237Net income attributable to:
Aon shareholders $ 1,004 $ 1,200Noncontrolling interests 40 37
Net income $ 1,044 $ 1,237
Consolidated Results for 2018 Compared to 2017
Organic Revenue Growth
We use supplemental information related to organic revenue growth to evaluate business growth from existing operations. Organic revenue growth includes the impact of intercompany activity and excludes the impact of changes in foreign exchange rate, acquisitions, divestitures, transfers between subsidiaries, fiduciary investment income, and reimbursable expenses. A reconciliation of organic revenue to the reported Total revenue is as follows (in millions, except percentages):
Years ended
Dec 31,2018
Dec 31,2017
% Change
Revenue Recognition(1)
Less: Currency Impact (2)
Less: Fiduciary
Investment Income (3)
Less: Acquisitions,
Divestitures & Other
Organic Revenue
Growth (4)
Commercial Risk Solutions $ 4,652 $ 4,169 12% —% 1% —% 5% 6%Reinsurance Solutions 1,563 1,429 9 (1) 2 1 — 7Retirement Solutions 1,865 1,755 6 — 1 — 3 2Health Solutions 1,596 1,515 5 (1) — — 1 5Data & Analytic Services 1,105 1,140 (3) — — — (6) 3Elimination (11) (10) NA NA NA NA NA NA
Total revenue $ 10,770 $ 9,998 8% —% 1% —% 2% 5%
(1) Revenue Recognition represents the impact of Aon’s adoption of the new revenue recognition standard, effective for Aon on January 1, 2018(2) Currency impact is determined by translating prior period’s revenue at this period’s foreign exchange rates.(3) Fiduciary investment income for the years ended December 31, 2018 and 2017, respectively, was $53 million and $32 million.

25
(4) Organic revenue growth includes the impact of intercompany activity and excludes the impact of the adoption of the new revenue recognition standard, changes in foreign exchange rates, acquisitions, divestitures, transfers between business units, and fiduciary investment income.
Total Revenue
Total revenue increased $772 million, or 8%, to $10,770 million in 2018, compared to $9,998 million in 2017. The increasewas driven by 5% organic revenue growth, a 2% increase related to acquisitions, net of divestitures, and a 1% favorable impact from foreign currency translation. Organic revenue growth for the year was driven by growth across every major revenue line, with particular strength in Reinsurance Solutions, Commercial Risk Solutions, and Health Solutions.
Commercial Risk Solutions revenue increased $483 million, or 12%, to $4,652 million in 2018, compared to $4,169 millionin 2017. Organic revenue growth was 6% in 2018 driven by growth across every major geography, with particular strength in U.S. Retail driven by record new business generation and strong management of the renewal book portfolio. Results also include double-digit growth in both cyber solutions and transaction liability, two specific areas of investment to support increasing client demand.
Reinsurance Solutions revenue increased $134 million, or 9%, to $1,563 million in 2018, compared to $1,429 million in 2017. Organic revenue growth was 7% in 2018 driven by net new business generation in treaty and strong growth in facultative placements, partially offset by a modest decline in capital markets transactions given the prior year period benefited from record catastrophe bond issuance during the mid-year renewal season.
Retirement Solutions revenue increased $110 million, or 6%, to $1,865 million in 2018, compared to $1,755 million in 2017. Organic revenue growth was 2% in 2018 driven by solid growth in core actuarial retirement and in the talent practice, as well as modest growth in investment consulting.
Health Solutions revenue increased $81 million, or 5%, to $1,596 million in 2018, compared to $1,515 million in 2017. Organic revenue growth was 5% in 2018 driven primarily by strong growth in health & benefits brokerage, in both the Americas and internationally, and in the health care exchange business driven by new client wins in both the active and retiree exchanges.
Data & Analytic Services revenue decreased $35 million, or 3%, to $1,105 million in 2018, compared to $1,140 million in 2017. Organic revenue growth was 3% in 2018 driven by strong growth globally across Affinity.
Compensation and Benefits
Compensation and benefits increased $78 million, or 1%, in 2018 compared to 2017. The increase was primarily driven by a $145 million increase in expenses related to acquisitions, net of divestitures, a $47 million unfavorable impact from foreign currency translation, and an increase in expense associated with 5% organic revenue growth, partially offset by a $184 million decrease in restructuring costs, $182 million of incremental savings related to restructuring and other operational improvement initiatives, and a $51 million decrease related to the adoption of the new revenue recognition standard in 2018.
Information Technology
Information technology, which represents costs associated with supporting and maintaining our infrastructure, increased $61 million, or 14%, in 2018 compared to 2017. The increase was primarily driven by a $16 million increase in expenses related to acquisitions, net of divestitures, a $14 million increase in restructuring costs, an increase in expense associated with 5% organic revenue growth, and investments supporting long-term growth initiatives, partially offset by $1 million of incremental savings related to restructuring and other operational improvement initiatives.
Premises
Premises, which represents the cost of occupying offices in various locations throughout the world, increased $15 million, or 4%, in 2018 compared to 2017. The increase was primarily driven by a $10 million increase in restructuring costs, and a $10 million increase in expenses related to acquisitions, net of divestitures, partially offset by $16 million of incremental savings related to restructuring and other operational improvement initiatives.
Depreciation of Fixed Assets
Depreciation of fixed assets primarily relates to leasehold improvements, furniture, fixtures and equipment, computer equipment, buildings, and automobiles. Depreciation of fixed assets decreased $2 million, or 2%, in 2018 compared to 2017. The decrease was primarily driven by a $14 million decrease in restructuring costs, partially offset by a $4 million increase related to acquisitions, net of divestitures.
Amortization and Impairment of Intangible Assets
Amortization and impairment of intangibles primarily relates to software, finite-lived tradenames and customer-related, contract-based, and technology assets. Amortization and impairment of intangibles decreased $110 million, or 14%, in 2018

26
compared to 2017. The decrease was primarily driven by a net $185 million decrease in impairment charges, partially offset by a $71 million increase in accelerated amortization related to tradenames.
Other General Expenses
Other general expenses increased $203 million, or 16%, in 2018 compared to 2017. The increase was primarily driven by a $151 million increase in restructuring costs, a $75 million increase in legacy litigation, an $11 million increase in expense to support GDPR regulatory compliance, and an increase in expense associated with 5% organic revenue growth, partially offset by a $28 million decrease in costs related to regulatory and compliance matters.
Interest Income
Interest income represents income earned on operating cash balances and other income-producing investments. It does not include interest earned on funds held on behalf of clients. Interest income was $5 million in 2018, a decrease of $22 million, or 81%, from 2017, due primarily to additional income earned on the balance of cash proceeds from the Divested Business in the prior year period.
Interest Expense
Interest expense, which represents the cost of our debt obligations, was $276 million in 2018, a decrease of $5 million, or 2%, from 2017. This decrease was driven primarily by the maturity of higher interest rate term debt in Q1 2018, partially offset by interest on a higher average commercial paper outstanding compared to the prior year.
Other Income (Expense)
Other expense decreased $23 million, or 1,150%, to $25 million in 2018 compared to 2017. Other expense in 2018 includes, among other things, $32 million of losses on derivatives and hedging, $12 million of losses on investments, and $6 million in net losses on the disposition of businesses, partially offset by a $24 million favorable impact of exchange rates on the remeasurement of assets and liabilities in non-functional currencies and $2 million of equity earnings. Other expense in 2017 includes $37 millionunfavorable impact of exchange rates on the remeasurement of assets and liabilities in non-functional currencies, and $16 million in net losses on the disposition of businesses, partially offset by $37 million of gains on investments, $10 million of gains on derivatives and hedging $4 million in equity earnings.
Income From Continuing Operations before Income Taxes
Due to factors discussed above, income from continuing operations before income taxes was $1,160 million in 2018, an 72%increase from $673 million in 2017.
Income Taxes From Continuing Operations
The effective tax rate on net income from continuing operations was 11.2% in 2018 and 36.0% in 2017. The primary drivers of the 2018 tax rate include the following:
• The geographical distribution of income including restructuring charges, legacy litigation, and the impairment of certain assets and liabilities as well as the post-enactment date impacts of the Tax Reform Act.
• Certain discrete items including the tax benefit associated with the sale of certain assets and liabilities offset by the net tax expense from adjustments to the enactment date impact of the Tax Reform Act.
The 2017 tax rate reflects changes in the geographical distribution of income including restructuring charges and the impairment and amortization of tradenames and the estimate of the enactment date impact of the Tax Reform Act.
Income from Discontinued Operations, Net of Tax
Net income from discontinued operations decreased $792 million to $14 million compared to 2017 due to the execution of the sale of the Divested Business on May 1, 2017.
Net Income Attributable to Aon Shareholders
Net income attributable to Aon shareholders decreased to $1,004 million, or $4.05 per diluted share, in 2018, compared to $1,200 million, or $4.58 per diluted share, in 2017.

27
Competition and Markets Authority
The U.K.’s competition regulator, the Competition and Markets Authority (the “CMA”), conducted a market investigation into the supply and acquisition of investment consulting and fiduciary management services, including those offered by Aon and its competitors in the U.K., to assess whether any feature or combination of features in the target market prevents, restricts, or distorts competition. The CMA issued a final report on December 12, 2018. The CMA has drafted an order that sets out the details of the remedies outline in the final report, this order is currently subject to public consultation. We do not anticipate the remedies to have a significant impact on the Company’s consolidated financial position or business.
Financial Conduct Authority
The FCA has been conducting a market study to assess how effectively competition is working in the wholesale insurance broker sector in the U.K. in which Aon, through its subsidiaries, participates. The FCA has now published its final report stating that it has completed the Market Study. After a detailed investigation it has found no evidence of material market conditions or behaviors warranting further regulatory intervention. In particular, it has found no evidence of material market concentration at an aggregate level, nor of coercion of market participants or other abuses of market power. Whilst the FCA reports that it has identified some instances where remediation is required in individual firms, (for example to remove potentially onerous or anti-competitive contract terms, or to enhance conflict of interest controls) at the time of reporting, Aon has not been advised of any such remedial measures or issues relating to its own operations.
LIQUIDITY AND FINANCIAL CONDITION
Liquidity
Executive Summary
We believe that our balance sheet and strong cash flow provide us with adequate liquidity. Our primary sources of liquidity are cash flows from operations, available cash reserves, and debt capacity available under our credit facilities. Our primary uses of liquidity are operating expenses, restructuring activities, capital expenditures, acquisitions, share repurchases, pension obligations, and shareholder dividends. We believe that cash flows from operations, available credit facilities, and the capital markets will be sufficient to meet our liquidity needs, including principal and interest payments on debt obligations, capital expenditures, pension contributions, and anticipated working capital requirements, for the foreseeable future.
Cash on our balance sheet includes funds available for general corporate purposes, as well as amounts restricted as to their use. Funds held on behalf of clients in a fiduciary capacity are segregated and shown together with uncollected insurance premiums and claims in Fiduciary assets in the Consolidated Statements of Financial Position, with a corresponding amount in Fiduciary liabilities.
In our capacity as an insurance broker or agent, we collect premiums from insureds and, after deducting our commission, remit the premiums to the respective insurance underwriters. We also collect claims or refunds from underwriters on behalf of insureds, which are then returned to the insureds. Unremitted insurance premiums and claims are held by us in a fiduciary capacity. In addition, some of our outsourcing agreements require us to hold funds on behalf of clients to pay obligations on their behalf. The levels of fiduciary assets and liabilities can fluctuate significantly depending on when we collect the premiums, claims, and refunds, make payments to underwriters and insureds, and collect funds from clients and make payments on their behalf, and upon the impact of foreign currency movements. Fiduciary assets, because of their nature, are generally invested in very liquid securities with highly rated, credit-worthy financial institutions. In our Consolidated Statements of Financial Position, the amount we report for Fiduciary assets and Fiduciary liabilities are equal. Our Fiduciary assets included cash and short-term investments of $3.9 billion and $3.7 billion at December 31, 2018 and 2017, respectively, and fiduciary receivables of $6.3 billion and $5.9 billion at December 31, 2018 and 2017, respectively. While we earn investment income on the fiduciary assets held in cash and investments, the cash and investments cannot be used for general corporate purposes.
We maintain multicurrency cash pools with third-party banks in which various Aon entities participate. Individual Aon entities are permitted to overdraw on their individual accounts provided the overall global balance does not fall below zero. At December 31, 2018, non-U.S. cash balances of one or more entities were negative; however, the overall balance was positive.

28
The following table summarizes our Fiduciary assets, non-fiduciary Cash and cash equivalents, and Short-term investments as of December 31, 2018 (in millions):
Statement of Financial Position Classification
Asset TypeCash and Cash
EquivalentsShort-termInvestments
FiduciaryAssets Total
Certificates of deposit, bank deposits or time deposits $ 656 $ — $ 2,279 $ 2,935Money market funds — 172 1,587 1,759
Cash and short-term investments 656 172 3,866 4,694Fiduciary receivables — — 6,300 6,300Total $ 656 $ 172 $ 10,166 $ 10,994
Cash and cash equivalents decreased $100 million in 2018 compared to 2017. A summary of our cash flows provided by and used for continuing operations from operating, investing, and financing activities is as follows (in millions):
Years Ended December 312018 2017
Cash provided by operating activities - continuing operations $ 1,633 $ 605Cash provided by investing activities - continuing operations $ 39 $ 2,824Cash used for financing activities - continuing operations $ (1,654) $ (3,219)Effect of exchange rates changes on cash and cash equivalents $ (118) $ 69
Operating Activities
Net cash provided by operating activities for continuing operations during the twelve months ended December 31, 2018increased $1,028 million, or 170%, from the prior year to $1,633 million. This amount represents net income reported, as adjusted for gains or losses on sales of businesses, share-based compensation expense, depreciation expense, amortization and impairments, and other non-cash income and expenses, as well as changes in working capital that relate primarily to the timing of payments of accounts payable and accrued liabilities and the collection of receivables.
Pension Contributions
Pension cash contributions were $252 million for the twelve months ended December 31, 2018, which includes our acceleration of contributions to the qualified U.S. pension plan, as compared to cash contributions of $146 million and a non-cash contribution of $80 million for the twelve months ended December 31, 2017. In 2019, we expect to contribute approximately $145 million to our pension plans, with the majority attributable to non-U.S. pension plans, which are subject to changes in foreign exchange rates.
Restructuring Plan
In 2017, we initiated a global restructuring plan (the “Restructuring Plan”) in connection with the sale of the Divested Business. The Restructuring Plan is intended to streamline operations across the organization and deliver greater efficiency, insight, and connectivity. We expect these restructuring activities and related expenses to affect continuing operations through 2019, including an estimated 4,800 to 5,400 role eliminations. In 2018, we expanded the Restructuring Plan, which resulted in additional expected costs of approximately $200 million, consisting of $150 million of cash investment and $50 million of non-cash charges. Annualized estimated savings increased $50 million as a result of the expanded program. We do not expect any further adjustments to the total estimated program costs or annualized savings through the remainder of the program, which will be completed in 2019.
We expect the Restructuring Plan to result in cumulative costs of approximately $1,225 million through the end of the plan, consisting of approximately $450 million in employee termination costs, $130 million in technology rationalization costs, $65 million in real estate consolidation costs, $50 million in non-cash asset impairments, such as expense taken on software no longer in use, and $530 million in other costs including certain separation costs associated with the sale of the Divested Business. We estimate that our annualized savings from the Restructuring Plan and other operational improvement initiatives will be approximately $500 million by the end of 2019.

29
Estimated remaining costs by type may be revised in future periods as these assumptions are updated. The following table summarizes restructuring and separation costs by type that have been incurred through December 31, 2018 and are estimated to be incurred through the end of the Restructuring Plan (in millions):
Year EndedDecember 31, 2018 Inception to Date
EstimatedRemaining Costs
Estimated Total Cost (1)
Workforce reduction $ 115 $ 414 $ 36 $ 450Technology rationalization (2) 47 80 50 130Lease consolidation (2) 30 50 15 65Asset impairments 14 42 8 50Other costs associated with restructuring and separation (2) (3) 282 413 117 530
Total restructuring and related expenses $ 488 $ 999 $ 226 $ 1,225
(1) Actual costs, when incurred, may vary due to changes in the assumptions built into the Restructuring Plan. Significant assumptions that may change when plans are finalized and implemented include, but are not limited to, changes in severance calculations, changes in the assumptions underlying sublease loss calculations due to changing market conditions, and changes in the overall analysis that might cause the Company to add or cancel component initiatives.
(2) Total contract termination costs incurred under the Restructuring Plan associated with Technology rationalizations, Lease consolidations, and Other costs associated with restructuring and separation, respectively, for the twelve months ended December 31, 2018 were $5 million, $27 million, and $85 million; and since inception of the Restructuring Plan, were $6 million, $47 million, and $88 million, respectively. Total estimated contract termination costs expected to be incurred under the Restructuring Plan associated with Technology rationalizations, Lease consolidations, and Other costs associated with restructuring and separation, respectively, are $15 million, $80 million, and $95 million.
(3) Other costs associated with the Restructuring Plan include those to separate the Divested Business, as well as moving costs and consulting and legal fees. These costs are generally recognized when incurred.
Investing Activities
Cash flow provided by investing activities in continuing operations was $39 million during the twelve months ended December 31, 2018, a decrease of $2,785 million compared to prior year. The primary drivers of cash flow used for investing activities are acquisition of businesses, purchases of short-term investments, capital expenditures, and payments for investments. The primary drivers of cash flow provided by investing activities are sales of businesses, sales of short-term investments, and proceeds from investments. The gains and losses corresponding to cash flows provided by proceeds from investments and used for payments for investments are primarily recognized in Other income (expense) in the Consolidated Statements of Income.
Short-term Investments
Short-term investments decreased $357 million at December 31, 2018 as compared to December 31, 2017. As disclosed in Note 16 “Fair Value Measurements and Financial Instruments” of the Financial Statements, the majority of our investments carried at fair value are money market funds. These money market funds are held throughout the world with various financial institutions. We are not aware of any market liquidity issues that would materially impact the fair value of these investments.
Acquisitions and Dispositions of Businesses
During 2018, the Company completed the acquisition of eight businesses for consideration of $58 million, net of cash acquired, and completed the disposition of four business for a net cash outflow of $10 million.
During 2017, the Company completed the acquisition of seventeen businesses for consideration of $1,029 million, net of cash acquired, and the sale of nine businesses for $4,246 million.
Capital Expenditures
The Company’s additions to fixed assets, including capitalized software, which amounted to $240 million in 2018 and $183 million in 2017, primarily related to computer equipment purchases, the refurbishing and modernizing of office facilities, and software development costs.
Financing Activities
Cash flow used for financing activities in continuing operations during the twelve months ended December 31, 2018 was $1,654 million, a decrease of $1,565 million compared to prior year. The primary drivers of cash flow used for financing activities are share repurchases, issuances of debt, net of repayments, dividends paid to shareholders, issuances of shares for employee benefit plans, transactions with noncontrolling interests, and other financing activities.

30
Share Repurchase Program
Aon has a share repurchase program authorized by the Company’s Board of Directors (the “Repurchase Program”). The Repurchase Program was established in April 2012 with $5.0 billion in authorized repurchases, and was increased by $5.0 billion in authorized repurchases in each of November 2014 and February 2017, for a total of $15.0 billion in repurchase authorizations.
The following table summarizes the Company’s Share Repurchase activity (in millions, except per share data):
Twelve months ended December 312018 2017 (1)
Shares repurchased 10.0 18.0Average price per share $ 143.94 $ 133.67Costs recorded to retained earnings
Total repurchase cost $ 1,447 $ 2,403Additional associated costs 7 12
Total costs recorded to retained earnings $ 1,454 $ 2,415
(1) Included in the 18.0 million shares repurchased during the twelve months ended December 31, 2017 were 0.1 million shares that did not settle until January 2018. These shares were settled at an average price per share of $134.41 and total cost of $15.9 million.
At December 31, 2018, the remaining authorized amount for share repurchase under the Repurchase Program was approximately $4.0 billion. Under the Repurchase Program, the Company has repurchased a total of 118.3 million shares for an aggregate cost of approximately $11.0 billion.
Borrowings
Total debt at December 31, 2018 was $6.2 billion, an increase of $278 million compared to December 31, 2017. Commercial paper activity during the years ended December 31, 2018 and 2017 is as follows (in millions):
Twelve months ended December 31
2018 2017
Total issuances(1) $ 5,400 $ 1,648Total repayments (5,118) (1,997)
Net issuances $ 282 $ (349)
(1) The proceeds of the commercial paper issuances were used primarily for short-term working capital needs.
On December 3, 2018, Aon Corporation issued $350 million 4.50% Senior Notes due December 2028. The Company used the proceeds for general corporate purposes.
On March 8, 2018 the Company’s CAD 375 million ($291 million at March 8, 2018 Exchange Rates) 4.76% Senior Notes due March 2018 issued by a Canadian subsidiary of Aon Corporation matured and was repaid in full.
Other Liquidity Matters
Distributable Reserves
As a company incorporated in England and Wales, we are required under U.K. law to have available “distributable reserves” to make share repurchases or pay dividends to shareholders. Distributable reserves may be created through the earnings of the Parent Company and, among other methods, through a reduction in share capital approved by the courts of England and Wales. Distributable reserves are not linked to a IFRS reported amount (e.g., retained earnings). As of December 31, 2018 and 2017, we had distributable reserves in excess of $3.7 billion and $4.0 billion, respectively. We believe that we will have sufficient distributable reserves to fund shareholder dividends and make share repurchases for the foreseeable future.
Credit Facilities
We expect cash generated by operations for 2018 to be sufficient to service our debt and contractual obligations, finance capital expenditures, continue purchases of shares under the Repurchase Program, and continue to pay dividends to our shareholders. Although cash from operations is expected to be sufficient to service these activities, we have the ability to access the commercial paper markets or borrow under our credit facilities to accommodate any timing differences in cash flows. Additionally, under

31
current market conditions, we believe that we could access capital markets to obtain debt financing for longer-term funding, if needed.
As of December 31, 2018, we had two primary committed credit facilities outstanding: our $900 million multi-currency U.S. credit facility expiring in February 2021 (the “2021 Facility”) and our $400 million multi-currency U.S. credit facility expiring in October 2022 (the “2022 Facility”). On February 2, 2019, we extended the 2021 Facility by one year, and it will now expire in February 2022.
Each of these facilities includes customary representations, warranties, and covenants, including financial covenants that require us to maintain specified ratios of adjusted consolidated EBITDA to consolidated interest expense and consolidated debt to adjusted consolidated EBITDA, in each case, tested quarterly. At December 31, 2018, we did not have borrowings under either the 2021 Facility or the 2022 Facility, and we were in compliance with all other covenants contained therein during the twelve months ended December 31, 2018.
Shelf Registration Statement
On September 25, 2018, we filed a shelf registration statement with the SEC, registering the offer and sale from time to time of an indeterminate amount of, among other securities, debt securities, preference shares, Class A Ordinary Shares, and convertible securities. Our ability to access the market as a source of liquidity is dependent on investor demand, market conditions and other factors.
Rating Agency Ratings
The major rating agencies’ ratings of our debt at March 28, 2019 appear in the table below.
Senior Long-term Debt Commercial Paper Outlook
Standard & Poor’s A- A-2 StableMoody’s Investor Services Baa2 P-2 StableFitch, Inc. BBB+ F-2 Stable
A downgrade in the credit ratings of our senior debt and commercial paper could increase our borrowing costs, reduce or eliminate our access to debt capital, reduce our financial flexibility, or restrict our access to the commercial paper market altogether, and/or impact future pension contribution requirements.
Guarantees in Connection with the Sale of the Divested Business
In connection with the sale of the Divested Business, we guaranteed future operating lease commitments related to certain facilities assumed by the Buyer. We are obligated to perform under the guarantees if the Divested Business defaults on the leases at any time during the remainder of the lease agreements, which expire on various dates through 2024. As of December 31, 2018, the undiscounted maximum potential future payments under the lease guarantee were $85 million, with an estimated fair value of $17 million. No cash payments were made in connection to the lease commitments during the year ended December 31, 2018.
Additionally, we are subject to performance guarantee requirements under certain client arrangements that were assumed by the Buyer. Should the Divested Business fail to perform as required by the terms of the arrangements, we would be required to fulfill the remaining contract terms, which expire on various dates through 2023. As of December 31, 2018, the undiscounted maximum potential future payments under the performance guarantees were $188 million, with an estimated fair value of $1 million. No cash payments were made in connection to the performance guarantees during the year ended December 31, 2018.
Letters of Credit and Other Guarantees
We have entered into a number of arrangements whereby our performance on certain obligations is guaranteed by a third party through the issuance of a letter of credit (“LOCs”). We had total LOCs outstanding of approximately $83 million at December 31, 2018, compared to $96 million at December 31, 2017. These LOCs cover the beneficiaries related to certain of our U.S. and Canadian non-qualified pension plan schemes and secure deductible retentions for our own workers’ compensation program. We also have obtained LOCs to cover contingent payments for taxes and other business obligations to third parties, and other guarantees for miscellaneous purposes at our international subsidiaries.

32
The Company has certain contractual contingent guarantees for premium payments owed by clients to certain insurance companies. The maximum exposure with respect to such contractual contingent guarantees was approximately $103 million at December 31, 2018, compared to $95 million at December 31, 2017.
Off-Balance Sheet Arrangements
Apart from commitments, guarantees, and contingencies, as disclosed herein and Note 17 “Provisions and Other Contingencies” of the Notes to Consolidated Financial Statements of this report, the Company had no off-balance sheet arrangements that have, or are reasonably likely to have, a current or future material effect on the Company’s financial condition, results of operations, or liquidity. Our cash flows from operations, borrowing availability, and overall liquidity are subject to risks and uncertainties. See “Information Concerning Forward-Looking Statements” for further information.
Contractual Obligations
Summarized in the table below are our contractual obligations and commitments as of December 31, 2018. Payments by year due are estimated as follows (in millions):
Payments due by
2019 2020-2021 2022-2023 After 2023 Total
Principal payments on debt $ 251 $ 1,000 $ — $ 5,095 $ 6,346Interest payments on debt 275 514 467 2,220 3,476Operating leases 303 474 330 472 1,579Pension and other postretirement benefit plans 150 270 298 314 1,032Purchase obligations 179 132 24 5 340
Total $ 1,158 $ 2,390 $ 1,119 $ 8,106 $ 12,773
Pension and other postretirement benefit plan obligations include estimates of our minimum funding requirements pursuant to the Employee Retirement Income Security Act and other regulations, as well as minimum funding requirements agreed with the trustees of our U.K. pension plans. Additional amounts may be agreed to with, or required by, the U.K. pension plan trustees. Nonqualified pension and other postretirement benefit obligations are based on estimated future benefit payments. We may make additional discretionary contributions.
In 2017, our principal U.K. subsidiary agreed with the trustees of one of the U.K. plans to contribute £44 million ($59 million at December 31, 2017 exchange rates) through 2019 which is estimated to bring the plan to 100% funded basis. Contributions were based on the 2016 valuation and no further contributions are forecasted after 2019. The trustees of the plan have certain rights to request that our U.K. subsidiary advance an amount equal to an actuarially determined winding-up deficit. As of December 31, 2018, the estimated winding-up deficit was £84 million ($106 million at December 31, 2018 exchange rates). The trustees of the plan have accepted in practice the agreed-upon schedule of contributions detailed above and have not requested the winding-up deficit be paid.
Purchase obligations are defined as agreements to purchase goods and services that are enforceable and legally binding on us, and that specifies all significant terms, including the goods to be purchased or services to be rendered, the price at which the goods or services are to be rendered, and the timing of the transactions. Most of our purchase obligations are related to purchases of information technology services or other service contracts. Purchase obligations exclude $279 million of liabilities for uncertain tax positions due to our inability to reasonably estimate the period(s) when potential cash settlements will be made.
Environment
The Company recognizes the importance of its environmental responsibilities, generally monitors its impact on the environment, and designs and implements policies to reduce any damage that might be caused by its activities. The Company’s commitment to environmental issues is explained on its website at www.aon.com/about-aon/global-citizenship.
Employees
Disabled Employees
The Company endeavors to provide full and fair consideration to applications for employment from disabled persons where the requirements of the job can be adequately fulfilled by a handicapped or disabled person. Where existing employees become disabled, it is the Company’s policy where practicable to provide continuing employment under normal terms and conditions and to provide training and career development, as well as promotion as appropriate.

33
Employee Involvement
The Company’s policies and practices are designed to keep employees informed on matters relevant to them as employees through regular updates to its internal employee website. The Company considers the needs of its employees when implementing policies which affect them. During the year, the Company continued its training and development scheme covering technical, personal and management development programs. Additionally, employees are encouraged to gain professional qualifications with the active support of the Company.
Diversity
In order to foster diversity within the workforce, the Company has continued its Aon Diversity Council. The Council’s mission is to champion initiatives throughout the Company by raising awareness of the value of having a diverse workforce and the value of inclusion. Its aim is to create an environment where every employee feels valued, and where their talents are fully utilized. The Council’s membership consists of representatives of relevant diversity groups across Aon’s businesses as well as representatives of Aon’s senior management and human resources department. For the purpose of this initiative, diversity groups are made up of Aon’s employees who help us identify and understand the diversity issues facing our workforce. Aon’s diversity initiative has several objectives, including encouraging an environment where everyone feels valued and free to be open about their diversity and to widen our talent pool to be seen as an employer of choice by people from all backgrounds.
Employee Gender
2018 2017
As of December 31 Male Female Male Female
Directors 8 3 8 3Senior Managers 14 4 13 4Employees of the Company 22,000 26,000 23,000 25,000
Social and Community Issues
The Company is committed to the health and safety and the human rights of its employees and communities in which it operates. The Aon Foundation is the principal vehicle for Aon’s charitable donations. The Foundation’s charitable giving is focused primarily on promoting access to and excellence in education. The Company believes that education sets the foundation for future success, for individuals as well as the business community. Therefore, the Company invests in programs that make a marked difference in the academic achievement of young people and help to develop our future workforce.
The Foundation also supports the enrichment of our society through arts and cultural programs and community and human service projects that serve diverse communities, with emphasis on organizations that foster the development of at-risk youth.
In 2002, the Company established The Aon Memorial Education Fund to provide post-secondary educational financial assistance to the dependent children of the Aon employees who were killed in the World Trade Center attacks.
Details of the Company’s charitable work and service in local communities can be found at www.aon.com/about-aon/global-citizenship.
For and on behalf of the Board
/S/ Peter Lieb
Company Secretary
Date: March 29, 2019
Registered Number 07876075

34
REPORT OF THE DIRECTORS
The directors present their annual report together with the audited consolidated financial statements for the year ended December 31, 2018, as well as the audited Parent Company financial statements for the year ended December 31, 2018.
Basis of Presentation
The directors have elected to prepare the Consolidated Financial Statements and the Parent Company Financial Statements in accordance with IFRS and International Financial Reporting Interpretations Committee (“IFRIC”) interpretations and the Companies Act 2006 applicable to Companies reporting under IFRS.
The accompanying Consolidated Financial Statements include the accounts of Aon plc.
The Consolidated Financial Statements include the Consolidated Statement of Financial Position and Shareholders’ Equity of Aon plc and its subsidiaries as of December 31, 2018 and December 31, 2017, and the related Consolidated Statements of Income, Comprehensive Income, and Cash Flows for the period ended December 31, 2018 and December 31, 2017. The Parent Company Financial Statements include the Statement of Financial Position and Shareholders’ Equity of Aon plc as of December 31, 2018 and December 31, 2017, and the related Cash Flows for the periods ended December 31, 2018 and December 31, 2017.
Directors
Gregory C. Case (appointed January 9, 2012)Lester B. Knight (appointed April 2, 2012)Jin-Yong Cai (appointed August 10, 2016)Jeffrey C. Campbell (appointed March 23, 2018)Fulvio Conti (appointed April 2, 2012)Cheryl A. Francis (appointed April 2, 2012)J. Michael Losh (appointed April 2, 2012)Robert Morrison (resigned June 22, 2018)Richard B. Myers (appointed April 2, 2012)Richard C. Notebaert (appointed April 2, 2012)Gloria Santona (appointed April 2, 2012)Carolyn Y. Woo (appointed April 2, 2012)
Acquisition of Own Shares
Aon’s Class A Ordinary Shares, $0.01 nominal value per share, are traded on the New York Stock Exchange. We hereby incorporate by reference Note 12, “Shareholders’ Equity” of the Notes to Consolidated Financial Statements.
Aon has a share repurchase program authorized by the Company’s Board of Directors. The Repurchase Program was established in April 2012 with $5.0 billion in authorized repurchases, and was increased by $5.0 billion in authorized repurchases in each of November 2014 and February 2017 for a total of $15.0 billion in repurchase authorizations.
During 2018, we repurchased 10.0 million shares at an average price per share of $143.94 for a total cost of $1.5 billion. The remaining authorized amount for share repurchase under our Repurchase Program is $4.0 billion.
Information relating to the compensation plans under which equity securities of Aon are authorized for issuance is set forth under the Directors’ Remuneration section of this report and is incorporated herein by reference.
Greenhouse Gas Emissions
The Company is committed to reducing its impact on the environment. Since 2007, Aon has had a network of Eco-Champions to drive internal change. Since 2009, Aon has had a sustainability strategy led by Aon’s Head of Sustainability. This strategy is supported by both operational and product strategies, including an energy management strategy and a membership in the ClimateWise initiative for the insurance industry.
Reporting Period - January 1, 2018 to December 31, 2018.

35
Operational Control Methodology - The Company has adopted the operational control method of reporting which includes those entities over which the Company has operational control. The emissions reported below are for the 283 Aon plc offices around the world where the Company exercises direct operational control.
Emissions Scopes - Mandatory greenhouse gas (“GHG”) reporting requires emissions associated with Scope 1 (direct emissions) and Scope 2 (indirect emissions from purchased electricity, heating and cooling) to be reported1. It is not obligatory to report Scope 3 (indirect emissions from the inputs and outputs to the main business activity - i.e. supply chain and consumer/end-user related emissions). While the Company has not collected and presented Scope 3 data in this year’s report, there is potential to do this in future years.
Exclusions - The Company has collected as much data as possible from its 283 office portfolio. In cases where electricity or gas consumption data was not available, it has been estimated using one of the following techniques:
• Extrapolating data where offices were not able to provide usage figures for the full 12 month period (January 1, 2018 to December 31, 2018).
• Where extrapolation was not possible as no data was provided by the office, a “medium-high reliability” benchmark by country was selected as a basis for estimating electricity and gas consumption.
• Where no data was provided for a site and this was located within the same property address as a part of the same building where there is another area where energy data was provided, an estimation was carried out based on it.
Where travel data (in terms of mileage and/or fuel use) was not reasonably available, this data has been excluded from the emissions reported as it was not determined to make accurate estimates.
Refrigerant data has been provided for 2018; however this does not represent the full usage across Aon’s global sites. Where only refrigerant stock data was available, and it was not accompanied by associated recharges that would indicate leakage, these were excluded from the total emissions. Aon will make further efforts to collect this data from its global office portfolio in future reporting periods.
Methodology - All data has been collected and analyzed in a manner consistent with the GHG Protocol Corporate Accounting and Reporting Standard. The Defra U.K. and international 2018 emission factors have been used to calculate GHG emissions for the Company’s 2018 operations. Due to limitations of international emissions factors for natural gas, all natural gas is calculated utilizing the U.K. emissions factor provided by Defra. The data inputs and outputs have been reviewed by Coldwell Banker Richard Ellis (“CBRE”) on behalf of the Company.
The Company’s Emissions - Purchased electricity accounts for the greatest amount of overall emissions (2018: 38,194 CO2e, 77%; 2017: 71,670 CO2e, 75%). Diesel usage (for non-travel related) accounts for the lowest level of emissions.
Comparison to the 2017 reporting period - The Company’s recorded emissions have decreased by approximately 48% from 2017, which can be mainly attributed to restructuring initiatives and portfolio rationalization, the sale of the Divested Business, improved data collection processes carried out in 2018 that the Company believes are more accurate and better reflect the emissions produced by Aon’s offices and through its operations, changes in methodology, and improved efficiencies across the portfolio.
The emissions have also been calculated using an intensity metric, which will enable Aon to monitor how well it is controlling emissions on an annual basis, independent of fluctuations in the levels of its activity. For Aon, the most suitable metric is emissions per dollar of revenue. Aon’s emissions per dollar of revenue for the 2018 and 2017 reporting periods are shown in the table below.
1 Scope 1 emissions relate to gas combustion and refrigerant usage. Scope 2 emissions relate to purchased electricity. Scope 3 emissions relate to water usage, commercial air travel and office waste.

36
Aon plc’s Emissions by Scope for the year ended December 31 (in CO2e):
For the Year Ended December 31
Scope 2018 2017
Scope 1 11,554 23,543Scope 2 38,335 71,670
Total 49,889 95,213
Aon plc’s Emissions
For the Year Ended December 31 2018 2017
Emission Sources Scope Unit Entered Value C02e Entered Value C02e
Travel Related EmissionsCar - Average (All fuel types - miles) 1 km 34,648 7 — —Car - Average (diesel - miles) 1 km — — 6,573,791 1,221Car - Average (petrol - miles) 1 km — — 2,473,651 459Diesel (litres) 1 litres 291,996 785 — —Petrol (litres) 1 litres 119,850 264 — —LPG car usage 1 kWh — — — —
Electricity Related EmissionsPurchased electricity 2 kWh 93,056,779 38,194 163,282,014 71,670Electricity generated on site 1 kWh 304,823 80 — —
Heating Related EmissionsNatural Gas 1 kWh 44,586,997 9,112 52,694,668 18,610Heat and steam (from district provider) 2 GJ 860 141 — —Oil 1 kWh 1,037,556 296 1,836,349 510
Other Fuels (Non-Travel)Diesel 1 litres — — — —
Refrigerants / Other FuelsHCFC-22/R22 = chlorodifluoromethane 1 kg 109 722 — 1HFC-134a 1 kg — — — —R404A 1 kg — — — —R407C 1 kg — — — —R410A 1 kg 138 288 1,263 2,743
Total CO2e (tons) 49,889 95,213

37
Aon plc’s Emissions by Source
Emissions Intensity - Emissions have also been calculated using an “intensity metric,” which will assist the Company in monitoring how well it is controlling emissions on an annual basis, independent of fluctuations in the levels of its activity. For the Company the most suitable metric is “emissions per million dollars of revenue” and “emissions per employee.”
The Company’s emissions per million dollars of revenue are shown in the table below.
Tons CO2e/$M Turnover
Scope 2018 2017
Scope 1 1.07 2.35Scope 2 3.56 7.17
Total 4.63 9.52
The Company’s emissions per employee are shown in the table below.
Tons CO2e/Employee
Scope 2018 2017
Scope 1 0.23 0.34Scope 2 0.77 1.02
Total 1.00 1.36
Political Donations
No political donations were made by the Company during 2018 or 2017.
Employees
Information relating to employees is incorporated herein by reference to the Employees section of the Strategic Report contained in this report.
Dividends
In January 2019, the Board of Directors approved the declaration of a dividend to shareholders of $0.40 per ordinary share. In February 2019, we paid those dividends in the amount of $96 million.
Future dividends on Aon plc ordinary shares, if any, and the timing of declaration of any such dividends, will be at the discretion of the Board of Directors of Aon plc and will depend on, among other things, our results of operations, cash requirements and surplus, financial condition, contractual restrictions and other factors that the Board of Directors of Aon plc may deem relevant, as well as our ability to pay dividends in compliance with the Companies Act 2006.

38
Future Developments
The directors do not anticipate that any other of the Company’s primary activities will change in the foreseeable future.
Directors - Indemnity
The Company has entered into deeds of indemnity with each of its directors effective upon the director’s appointment to the Board of Directors (other than with respect to Mr. Case, who entered into a deed of indemnity with the Company on March 29, 2012). The Company has also entered into deeds of indemnity with certain executive officers. The deeds of indemnity provide that the Company will indemnify such persons to the maximum extent permitted by applicable law against all losses suffered or incurred by them, among other things, that arise out of or in connection with his or her appointment as a director or officer, an act done, concurred in or omitted to be done by such person in connection with such person’s performance of his or her functions as a director or officer, or an official investigation, examination or other proceedings ordered or commissioned in connection with the affairs of the company of which he or she is serving as a director or officer at the request of the indemnifying company.
Use of Financial Instruments
Information on the Company’s risk management process and the policies for mitigating certain types of risk are set out on pages 7 to 22. Details of the financial instruments used for these purposes are set out in Note 15 “Derivatives and Hedging” and Note 16 “Fair Value Measurements and Financial Instruments” of the Notes to Consolidated Financial Statements.
Disclosure of Information to the Auditor
So far as each person who was a director at the date of approving this report is aware, there is no relevant audit information, being information needed by the auditor in connection with preparing its report, of which the auditor is unaware. Having made inquiries of fellow directors and the Group’s auditor, each director has taken all the steps that he/she is obliged to take as a director in order to make himself/herself aware of any relevant audit information and to establish that the auditor is aware of that information.
Statement of Going Concern
The Directors have undertaken a going concern assessment in accordance with “Guidance on the Going Concern Basis of Accounting and Reporting on Solvency and Liquidity Risks,” published by the Financial Reporting Council in 2016. As a result of this assessment, and after making inquiries, the directors have a reasonable expectation that the Company has adequate resources to continue in operational existence for the foreseeable future. Accordingly, they have adopted the going concern basis in preparing the financial statements.
Auditor
Ernst & Young LLP were re-appointed as auditors of the Company on June 23, 2017. In accordance with s.485 of the Companies Act 2006, a resolution is to be proposed at the Annual General Meeting for reappointment of Ernst & Young LLP as auditor of the Company.
Significant Events Since Year End
This report was issued on March 29, 2019. The Company has evaluated events and transactions subsequent to the balance sheet date.
During the period from January 1, 2019 to March 27, 2019, the Company repurchased 0.6 million shares at an average price per share of $161.16 for a total cost of $100 million. At March 27, 2019, the remaining authorized amount for share repurchase under the Share Repurchase Programs is $3.9 billion. The amount of shares repurchased after this date and prior to authorization of the financial statements on March 29, 2019 was insignificant to the Consolidated Financial Statements.
As of March 27, 2019, the Company had €220 million ($247 million at March 27, 2019 exchange rates) of commercial paper borrowings outstanding on the European commercial paper program and $365 million outstanding on the US commercial paper program. The proceeds from the issuance of commercial paper will be used to fund short-term working capital needs. The amount of commercial paper borrowed after this date and prior to authorization of the financial statements on March 29, 2019 was insignificant to the Consolidated Financial Statements.
On March 29, 2017, the U.K. invoked Article 50 of the Treaty on European Union, which began the member state's withdrawal from the European Union. Under Article 50, the U.K. had a maximum of two years in which to complete and execute upon exit negotiations with the European Union, unless the European Council unanimously decided to extend this period. As of late March 2019, negotiations with the European Union were ongoing and the U.K. was granted an extension to the Article 50 period to at least April 12, 2019. Aon continues to monitor negotiation developments and assess its impact to the Company accordingly.

39
The Company is not aware of any events or transactions, other than those disclosed above and in Future Developments, that occurred subsequent to the balance sheet date but prior to March 29, 2019 that would require recognition or disclosure in its Consolidated Financial Statements or Parent Company Financial Statements.
For and on behalf of the Board
/S/ Peter LiebCompany SecretaryDate: March 29, 2019Registered Number 07876075

40
DIRECTORS’ REMUNERATION REPORT
This report sets out the relevant disclosures in relation to directors’ remuneration for the financial year ended December 31, 2018. The report has been prepared in accordance with the requirements of the U.K. Large and Medium-sized Companies & Groups (Accounts & Reports) (Amendment) Regulations 2013 (the “Regulations”) which apply to the Company. The relevant sections of the report have been audited by Ernst & Young LLP.
STATEMENT OF THE CHAIRMAN OF THE ORGANIZATION & COMPENSATION COMMITTEE
We continue our journey to be the leading professional services firm focused on risk, retirement and health. To achieve our objectives, we must be the destination of choice for the best talent. Our remuneration programs support this vision and business strategy and are designed to align the financial interests of our executives with those of our shareholders in both the short- and long-term.
The core principle of our executive compensation program continues to be pay for performance. That core principle dictates that performance-based pay elements (which constitute the bulk of our executive officers’ total direct compensation) will not be earned or paid unless our shareholders benefit first.
As discussed elsewhere in this annual report, in respect of 2018, we again delivered a strong performance. Results reflect solid earnings per share (“EPS”) growth and operating cash flow generation. We continue to execute on our goals of strategically investing in client-serving capabilities and long-term growth opportunities across our portfolio, managing expenses, and effectively allocating capital to the highest return. Further, we returned $1.8 billion of capital to shareholders in 2018 through share repurchases and dividends, with an additional $58 million spent on attractive acquisitions, highlighting our strong cash flow generation and effective allocation of capital. We believe we are strongly positioned for continued long-term value creation through further improvements in operating performance and strong free cash flow generation coupled with significant financial flexibility.
During 2018, we again made no adjustments to target bonus percentages. In the first quarter of 2018, we determined that the Company’s 2018 incentive compensation pool for members of the Company’s management executive committee would equal the budgeted accruals for aggregate target annual incentive payments for those members, multiplied by the percentage increase in operating income from 2017 to 2018 (reduced by 200 basis points). We set the minimum achievement threshold at 70% of a 2017 baseline adjusted operating income number of $2,336 million, or $1,635 million. We selected operating income, as adjusted, as the measure to emphasize performance of the Company as a whole and directly link executives’ awards to our key business initiatives of delivering distinctive client value and achieving operational excellence. For 2018, adjusted operating income in 2018 was $2,464 million (after permitted adjustments by the Organization and Compensation Committee to exclude the impact of restructuring savings), which exceeded the minimum achievement threshold. After application of the operating income funding guidelines approved in March 2018, the total incentive pool for executive committee members, including Mr. Case, was determined to be funded at $15.5 million. The independent members of the Board, on the recommendation of the Organization and Compensation Committee, approved an annual incentive bonus for Mr. Case under the plan of $2 million.
In early 2019, we determined the actual achievement under the eleventh cycle of our Leadership Performance Program, covering the performance period from January 1, 2016 through December 31, 2018, and the performance share units granted under this program vested. The Company’s cumulative adjusted EPS from continuing operations targets for this program ranged from $18.28, below which no payout was due to occur, to $20.72 or higher, which would have yielded shares equal to 200% of the target number. A result of $19.01 in cumulative adjusted EPS from continuing operations would have yielded shares equal to 100% of the target number. This target represented a 4.8% increase over the adjusted target for the prior cycle of our Leadership Performance Program established for the performance period from 2015 through 2017. Our actual cumulative adjusted EPS from continuing operations for the three-year period (after permitted adjustments) was $20.31, resulting in a payout at 183% of target. For each year of the eleventh performance cycle under the Leadership Performance Program, adjustments to EPS from continuing operations were approved by the Organization and Compensation Committee to address the impact of extraordinary legal settlements, the divestiture of our benefits administration and business process outsourcing platform, the divestiture of National Flood Services, and restructuring savings.
In the first quarter of 2018, we granted performance share units under our Leadership Performance Program to our executive officers, including Mr. Case, our Chief Executive Officer and our sole executive director. This program began on January 1, 2018 and ends on December 31, 2020, and is intended to further strengthen the relationship between capital accumulation for our executives and long-term financial performance of the Company and the generation of shareholder value. The target levels for this program have been omitted from this directors’ remuneration report as such targets are considered commercially sensitive. The target levels are expected to be disclosed in the directors’ remuneration report after the completion of the applicable performance period.

41
We believe that the performance metrics established under our annual incentive program and each of our Leadership Performance Programs cycles reflect our core operating performance and balance our executives’ short and long term perspective appropriately.
With regard to the compensation of our non-executive directors, after reviewing market conditions, the Board approved changes to our non-executive director compensation for 2018. The annual retainer for each non-executive Board member was increased from $120,000 to $130,000 annually. In addition, the annual equity award to each of our non-executive directors was increased from $160,000 to $170,000 to each of our non-executive directors and from $385,000 to $395,000 in the aggregate to our non-executive chairman.
The Committee believes that the Company is well positioned for long-term value creation through improvements in operating performance and strong free cash flow generation and that the Company’s remuneration programs achieved their purposes of linking pay to performance in 2018.
/S/ Richard Notebaert
Chairman
Organization and Compensation Committee
Date: March 29, 2019

42
GOVERNANCE
Operation of the Organization & Compensation Committee
The Organization & Compensation Committee (the “Committee”) assists the Company’s Board of Directors (the “Board”) in carrying out its overall responsibilities with regard to executive compensation, including oversight of the determination and administration of the Company’s compensation philosophy, policies, and schemes for the Company’s executive officers and non-executive directors. The Committee annually reviews and determines the compensation of the Company’s executive officers, including Mr. Case, the Company’s Chief Executive Officer and sole executive director, subject to the input of the other independent members of the Board. The Committee consults with Mr. Case on, and directly approves, the compensation of other executive officers, including special hiring, compensation, and severance arrangements. The Committee administers the Aon plc 2011 Incentive Plan (and its predecessor plans), including granting equity (other than awards to Mr. Case, which awards are approved by the independent members of the Company’s Board in accordance with applicable law) and interpreting the plan, and has general settlor responsibility with respect to the Company’s other U.S. employee benefit programs. In addition, the Committee reviews and makes recommendations to the Board concerning the non-executive directors’ compensation and certain amendments to the Company’s incentive plans and equity plans. The Committee also reviews and discusses the compensation disclosures contained in the Company’s Annual Report on Form 10-K, proxy statement and this directors’ remuneration report. The Committee may delegate its authority to sub-committees when appropriate.
During 2018, the members of the Committee were:
• Richard C. Notebaert (chair)• Jin-Yong Cai • Jeffrey C. Campbell• Cheryl A. Francis• Robert S. Morrison• Richard B. Myers• Carolyn Y. Woo
Jeffrey Campbell joined the Board of Directors and the Committee effective March 23, 2018. Robert Morrison retired from the Board on June 22, 2018. None of the members of the Committee is an executive officer of Aon and each member is independent as such term is defined under the rules of the New York Stock Exchange (“NYSE”) and the Company’s own independence standards. The remuneration of the Company’s non-executive directors is considered by the Board as a whole with recommendations made by the Committee. In 2018, the Committee met eight times.
Committee Advisors
The Committee has retained Frederic W. Cook & Co., Inc. (“FW Cook”) as its independent remuneration consultant. The consultant is engaged by, and reports directly to, the Chairman of the Committee. The consultant does not advise Company management or receive other remuneration from the Company. The Committee annually reviews the independence of FW Cook pursuant to U.S. Securities & Exchange Commission (“SEC”) and NYSE rules. The Committee has determined that no conflict of interest exists that would prevent FW Cook from serving as an independent consultant to the Committee. George Paulin, the Chairman of FW Cook, typically participates in all meetings of the Committee during which remuneration matters for Mr. Case, other executive officers, or non-executive directors are discussed and communicates between meetings with the Chairman of the Committee. During 2018, the consultant assisted the Committee by:
• providing insights and advice regarding our compensation philosophy, objectives and strategy;• developing criteria for identification of our peer group for executive and Board compensation and Company
performance review purposes; • reviewing management’s design proposals for short-term cash and long-term equity incentive compensation
programs; • providing insights and advice regarding our analysis of risks arising from our compensation policies and
practices; • providing change in control severance calculations for our senior executive officers in the Company’s 2018
annual proxy disclosure; • providing compensation data from the Company’s peer group proxy and other disclosures; and• advising on and providing comments on management’s recommendations regarding executive officers’ annual
incentives for 2018 and equity based awards granted in 2018.
FW Cook charges the Company on an hourly rate plus expenses basis. During the year ended December 31, 2018, the Company paid FW Cook $231,734 for its services.

43
The Committee has delegated certain governance responsibilities related to the Company’s retirement plans globally to the Retirement Plan Governance and Investment Committee (“RPGIC”), and the Committee delegated certain administrative responsibilities under the Company’s U.S. employee benefit plans to the Administrative Committee. Each of the members of the RPGIC and the Administrative Committee are employees of the Company or its subsidiary undertakings. In addition, the following officers and employees of the Company and its subsidiary undertakings provide assistance to the Committee as required:
• Mr. Anthony Goland, Executive Vice President and Chief Innovative Officer; • Ms. Siobhan Cifelli, Interim Chief Human Resources Officer;• Ms. Christa Davies, Executive Vice President and Chief Financial Officer;• Mr. Peter Lieb, Executive Vice President, General Counsel and Company Secretary;• Mr. Darren Zeidel, Vice President, Global Chief Counsel; and• Ms. Jennifer Kobayashi, Assistant General Counsel.
The Committee is also supported by the Company Secretary and Compensation functions. No individuals provide input to the Committee with regard to their own remuneration.
THE COMPANY’S REMUNERATION REPORT FOR 2018
Directors’ Remuneration (in thousands):
Salary and Fees Benefits(1) Annual Bonus(2) LPP Vesting(3) Pension Total(audited) 2018 2017 2018 2017 2018 2017 2018 2017 2018 2017 2018 2017Executive
Gregory C. Case(4) $ 1,500 $ 1,500 $ 679 $ 712 $ 2,025 $ 2,029 $30,907 $63,067 $ 29 $ 29 $35,140 $67,337Non-Executive
Lester B. Knight 545 525 256 157 — — — — — — 801 682Jin-Yong Cai 300 280 103 84 — — — — — — 403 364Jeffrey C. Campbell (5) 311 — 78 — — — — — — — 389 —Fulvio Conti 320 300 87 54 — — — — — — 407 354Cheryl A. Francis 300 280 37 10 — — — — — — 337 290J. Michael Losh 325 305 45 8 — — — — — — 370 313Robert S. Morrison (6) 65 280 — 50 — — — — — — 65 330Richard B. Myers 300 280 34 50 — — — — — — 334 330Richard C. Notebaert 320 300 68 15 — — — — — — 388 315Gloria Santona 320 300 57 55 — — — — — — 377 355Carolyn Y. Woo 300 280 24 50 — — — — — — 324 330
Total $ 4,906 $ 4,630 $ 1,468 $ 1,245 $ 2,025 $ 2,029 $30,907 $63,067 $ 29 $ 29 $39,335 $71,000
(1) For Mr. Case, “Benefits” consists of accompanied travel, tax preparation services, health and welfare benefits, and certain allowances in connection with his relocation to London. See the description of “Executive and Relocation Benefits” below. For accompanied travel, the amount included is the amount charged to income tax for Mr. Case in accordance with United States Internal Revenue Service regulations. Allowances related to Mr. Case’s relocation totaled $614,513 in 2017 and 2018. For each non-executive director, “Benefits” consists of tax equalization for incremental individual income taxes paid in the U.K. as a result of the Company’s redomestication and certain other travel-related benefits.
(2) Approximately 35% of the bonus award ($700,000 in 2018 and 2017) was paid in restricted share units under the Incentive Stock Program (“ISP”). This amount also includes dividend equivalents granted under the ISP.
(3) Performance share units under the Leadership Performance Plan (“LPP”) vest upon certification of the achievement of performance criteria following the completion of the performance period. The amount shown is determined by multiplying the actual number of shares delivered (182,211 for 2018 and 447,633 for 2017) by the closing share price on the date of vesting ($169.62 for 2018 and $140.89 for 2017).
(4) Mr. Case serves as the Company’s Chief Executive Officer, and receives his remuneration for serving in that role.(5) Mr. Campbell joined the board on March 23, 2018.(6) Mr. Morrison resigned from the Board on June 22, 2018. Due to tax reconciliation payments made to Aon in 2018, Mr. Morrison had a negative reportable
benefits value.
Since 2017, we have implemented individual limits on annual non-employee director compensation. The maximum value of total cash and equity compensation that may be paid annually is $600,000 for non-employee directors other than the non-executive chairman, and $900,000 for the non-executive chairman. The maximum tax equalization payment that may be paid annually is $150,000 for non-employee directors other than the non-executive chairman, and $250,000 for the non-executive chairman. The maximum value of other benefits (excluding charitable contributions under the Aon plc Corporate Sponsored Bequest Plan) that may be provided annually is $25,000 for all non-employee directors, including the non-executive chairman.
Remuneration Decisions in 2018
The Committee sets executive compensation at levels that it believes to be appropriate and competitive for global professional services firms within the Company’s market sector and the general industry marketplace. The Committee also strives to link a

44
significant portion of Mr. Case’s remuneration and the remuneration of the Company’s other senior executives to performance. Overall, the Committee’s intent is to manage the various elements of total remuneration together so that the emphasis of the Company’s remuneration program is on the Company’s variable components of pay, including long-term share-based awards and annual cash incentives that fluctuate based on the Company’s performance.
For 2018, the Committee did not have a specific market target to set total remuneration or particular components of it for Mr. Case or other executive officers. The Committee does not use a specific formula to set total remuneration either in relation to market data, the relative mix of pay components, or otherwise. Rather, the Committee uses its judgement and business experience. A decision regarding one component of remuneration has only an indirect link to decisions regarding other pay components.
In setting remuneration for 2018, the Committee took into account the pay and employment conditions of other employees within the Group, as follows:
• the Committee oversees the general funding of the annual cash incentive scheme for other eligible employees within the Group, and the funding of that scheme is similarly linked to the Company’s performance; and
• the Committee oversees the long-term share-based schemes available to other employees within the Group and, where applicable, the Committee links those awards to the performance of the Company’s business.
The chart below summarizes the actual total remuneration for Mr. Case received for 2018 as reported in the single figure table
above.
Determination of 2018 Annual Bonus
Annual bonus payments were determined with reference to performance for the year ended December 31, 2018. In the first quarter of 2018, the Committee determined that 2018 Aon wide performance would be measured by growth in adjusted operating income (“OI”) for 2018 as compared to adjusted OI in 2017. OI excludes the impact of certain items calculated in accordance with U.S. GAAP, such as amortization and impairment of intangible assets, restructuring charges, and other specific legal or regulatory matters. The 2017 baseline was determined based on 2017 adjusted OI ($2,336 million) less $59 million related to the restatement of OI due to the adoption of the IFRS revenue recognition standard. The Compensation Committee set the minimum achievement threshold at 70% of the 2017 adjusted OI, or $1,635 million. The Committee selected adjusted OI as the measure to emphasize performance of Aon as a whole and directly link executives’ awards to Aon’s key business initiatives of delivering distinctive client value and achieving operational excellence. The Committee believed that the 2018 target was achievable but challenging. The Committee set the minimum threshold at 70% because we believed performance below that level would not create sufficient value for the Company’s shareholders and, therefore, should not result in annual incentive payments.
If the minimum achievement threshold is satisfied, the annual incentive pool is funded. If not achieved, no annual incentive bonuses to the management executive committee members are paid. During the first quarter of 2018, the Committee determined that Aon’s 2018 adjusted OI was $2,464 million (after permitted adjustments to exclude restructuring savings), or 108.2% of the 2017 baseline. This resulted in an annual incentive pool being funded under a framework approved by the Committee in early

45
2018; under that framework, the size of the incentive pool generally equals the budgeted accruals for aggregate target annual incentive payments for management executive committee members, multiplied by the percentage increase in OI from 2017 to 2018 (reduced by 200 basis points), although the Committee retains the discretion to approve increases (up to 10%) and decreases (up to 20%) in the size of the incentive pool. In other words, the incentive pool is only funded at target if there is a 2% increase in adjusted OI over the previous year. Based on 2018 results and the downward adjustment, the incentive pool was funded at $15.5 million.
The Committee has sole discretion to determine each executive officer’s actual bonus amount as long as the corporate performance threshold was achieved. As the threshold was achieved, the Committee had discretion to pay bonuses at the cap level of the lesser of three times the target bonus or $10 million, or a lesser amount. For 2018, in support of the annual incentive award paid to Mr. Case, the Committee determined that under his leadership, the Company achieved strong business and financial results across the four key metrics that we report to shareholders: organic revenue growth, adjusted operating margins, adjusted diluted EPS, and free cash flow. During 2018, the Company also achieved a record share price of $165.58 and deployed $1.9 billion of capital through share repurchases, acquisitions and dividends. During Mr. Case’s leadership, which began in April 2005, our average annual total shareholder return has been 16%, compared to the return of the benchmark S&P 500 of 6% and 9% for our direct peers. Under Mr. Case’s leadership, we also made key progress on strategic initiatives including divestiture of non core businesses to optimize our portfolio, embedding a focus on return on capital in our firm wide decision making processes. The independent members of the Board of Directors also determined that Mr. Case demonstrated leadership behavior that aligned with Aon’s leadership model for colleague, market, and client interactions. In light of the above considerations, Mr. Case’s bonus was approved at $2 million. The Committee elected to use its discretion to pay an annual incentive to Mr. Case below target.
In accordance with the Company’s Remuneration Policy, 65% of the bonus was paid in cash and 35% of the bonus was paid in restricted share units vesting over three years. The restricted share units are not subject to any performance measures.
Determination of Vesting of Leadership Performance Program Award
Performance Target
Performance Criteria Threshold (50%) Target (100%)Maximum
(200%)Actual
Performance PSUs Vested
Adjusted cumulative earnings per share $18.28 $19.01 $20.72 $20.31 183%
In February 2019, we determined the actual achievement under the eleventh cycle of the LPP, covering the performance period January 1, 2016 through December 31, 2018 (“LPP 11”) and settled the performance share units in Aon plc ordinary shares. The target level represented a 5% increase over the adjusted target for the tenth cycle of the LPP established for the performance period from 2015 through 2017 (“LPP 10”). The target number of shares granted to Mr. Case under LPP 11 was 99,569. The actual number of shares ultimately vesting could range from 50% of the target number of shares if the threshold amount was met, to 200% of the target number of shares if the maximum amount was met or exceeded. The adjusted EPS from continuing operations results for LPP 11 include adjustments detailed by the plan governing LPP 11 and approved by the Committee. For each year of the performance period associated with LPP 11, adjustments to EPS from continuing operations were approved by the Committee. Such adjustments addressed the divestiture of National Flood Services, the divestiture of our benefits administration and business process outsourcing platform, and restructuring savings.
Director Pension Scheme
No director who served during the year ended December 31, 2018 has any prospective entitlement to a defined benefit pension or a cash balance benefit arrangement (as defined in s152, Finance Act 2004).
The Company operates the Aon Savings Plan and the Aon Supplemental Savings Plan, which are U.S. defined contribution plans. During the year ended December 31, 2018, for Mr. Case, the Company made matching contributions of $17,500 to the Aon Savings Plan and $11,625 to the Aon Supplemental Savings Plan on behalf of Mr. Case. No other director participates in the Aon Savings Plan or the Aon Supplemental Savings Plan.
Scheme Interests Awarded During the Year
In line with the Company’s Remuneration Policy, Mr. Case was granted awards under the ISP in February 2018 and under the LPP in March 2018. The resulting number of restricted share units and performance share units (“PSUs”) and the associated performance conditions are set forth below.

46
Leadership Performance Plan
Target Number of PSUs(1)Nominal
ValueThreshold
VestingEnd of Performance
Period Performance condition
Gregory C. Case 90,399 $12,400,000 50% December 31, 2020Cumulative adjusted earnings per share(2)
(1) The target number of PSUs is determined by dividing the nominal value of $12,400,000 by the closing share price at the date of grant (March 23, 2018) of $137.17, rounded to the nearest whole share.
(2) Vesting occurs based upon the achievement of EPS targets for the performance periods. The performance targets have been omitted from this directors’ remuneration report as such targets are considered commercially sensitive. The target levels will be disclosed in the directors' remuneration report after the completion of the applicable performance period.
Incentive Stock Program
Number of RSUs(1)Nominal
ValueThreshold
Vesting End of Vesting Period Performance condition
Gregory C. Case 4,969 $ 700,000 100% February 16, 2021Continued
employment
(1) Valued with a nominal value of $700,000 and the closing share price at the date of grant (February 16, 2018) of $140.86, rounded to the nearest whole share.
Vesting occurs per the schedule below:
Date Number of Shares
February 16, 2019 1,656February 16, 2020 1,656February 16, 2021 1,657
Long-Term Share-Based Awards
The Company awarded two forms of long-term share-based awards to Mr. Case and other executive officers - performance share unit awards and restricted share units granted in settlement of a proportion of the annual incentive scheme award. The Committee believes that performance share units should be the exclusive form of award under the LPP because performance share units utilize fewer shares and are, therefore, a more efficient form of award than share options, while allowing the Committee to maintain a strong performance focus.
Performance Share Units
In the first quarter of 2018, we granted performance share units to our executive officers, including Mr. Case, pursuant to the thirteenth cycle of the LPP (“LPP 13”). LPP 13 is the thirteenth layer of consecutive three-year performance cycles for certain of our executive officers. It is intended to further strengthen the relationship between capital accumulation for our executives and long-term Aon financial performance and shareholder value.
The performance share units awarded under LPP 13 are payable in Aon plc ordinary shares. The nominal value of the awards was determined and approved by the Committee. The number of target performance share units granted was calculated on the date of grant based on that day’s closing price of the Company’s ordinary shares on the NYSE.
The performance share units under LPP 13 will be earned and settled in a range of 0% to 200% of the target value based on performance results over a three-year performance period. The performance period began January 1, 2018, and will end on December 31, 2020. As was the case under the twelfth cycle of our LPP established for the performance period from 2017 through 2019 (“LPP 12”), the performance results for LPP 13 will be measured against three-year publicly reported adjusted cumulative EPS growth rate, subject to limited adjustments set forth in the program documentation. The adjustments are intended to exclude the impact of items of a discrete or non-operating nature, such as amortization of intangibles, so as to provide a target that while challenging, does not factor in events outside of the control of the relevant executive officers. The target levels for LPP 13 have been omitted from this directors’ remuneration report as such targets are considered commercially sensitive. The target levels will be disclosed in the directors’ remuneration report after the completion of the applicable performance period.
In determining the individual awards under LPP 13, the Committee considered internal pay fairness factors, the award recipient’s compensation mix, and total direct compensation. In addition, the market data relevant to Mr. Case supported a larger award to him than the awards granted to the other executive officers generally. The Committee does not use a specific formula to set total remuneration either in relation to market data, the relative mix of pay components or otherwise.

47
The Committee’s selection under LPP 13 of the three-year performance period and cumulative adjusted EPS financial performance metric provides the award recipients a reasonable period of time within which to achieve and sustain challenging long-term growth objectives. The Committee believes adjusted EPS more effectively aligns executives to improve Aon performance, rather than EPS calculated in accordance with U.S. GAAP, as the adjusted measure provides a target that is within their control and area of accountability. Further, the Committee believes that as adjusted, the EPS measure provides a perspective on the Company’s core operating performance that is more consistent with that of its shareholders and creates transparency and clarity for participants.
Restricted Share Units
In early 2018, the Company granted 4,969 time-vested restricted share units to Mr. Case and smaller awards to the Company’s other executive officers in connection with the Company’s ISP. These time-vested restricted share units are awarded based upon the achievement of performance goals related solely to the Company’s past financial performance measured under the annual incentive plan for the year 2017 (under the Company’s Remuneration Policy, 65% of the annual performance bonus is paid in cash and 35% is paid in restricted share units); however, the time based vesting of the restricted share units is intended to further focus the attention of Mr. Case and other executive officers on the Company’s longer-term performance as a whole, and to further promote employee retention and equity ownership. The Committee believes this strikes a fair balance between reward for past performance and incentive for future improvements.
Each of the time-vested restricted share units granted in connection with the program will vest ratably over a three-year period subject to continued employment. Awards are subject to forfeiture if an employee voluntarily terminates employment but in the event of termination by the Company without cause vesting continues over the same three-year period. Vesting is not subject to personal or corporate performance conditions. The restricted share units are settled in Aon plc ordinary shares.
Implementation of Policy in 2019
In 2019, the Committee intends to continue to provide remuneration in accordance with the Remuneration Policy approved at the Company’s 2017 annual general meeting. The Remuneration Policy can be found in the Company’s 2017 proxy statement, available at http://s2.q4cdn.com/545627090/files/doc_financials/2017/Aon-Proxy-Statement.pdf.
For 2019, the Committee determined that adjusted EPS should continue to be the sole performance criteria for the fourteenth cycle of the LPP (“LPP 14”). The performance stock units awarded under LPP 14 are payable in Aon plc ordinary shares. Mr. Case was granted an award under LPP 14 with a target value of $13.4 million. The nominal value of the annual award for Mr. Case was based upon internal pay fairness factors, Mr. Case’s compensation mix, and his total direct compensation. The number of target PSUs was calculated on the date of grant based on that day’s closing price of Aon plc ordinary shares on the NYSE.
The performance period applying to LPP 14 began January 1, 2019 and will end on December 31, 2021. The performance results will be measured against the specified cumulative adjusted EPS target for the years 2019 through 2021. The target levels for LPP 14 have been omitted from this directors’ remuneration report as such targets are considered commercially sensitive. The target levels will be disclosed in the directors’ remuneration report after the completion of the applicable performance period.
In addition, the Committee determined that the adjusted operating income should be the sole performance criteria for our annual bonus scheme. The Committee selected adjusted operating income because it is a broad-based metric that aligns the annual bonus scheme with the key metrics the Company measures against externally to deliver value to its shareholders. Year-over-year adjusted operating income growth will be used to determine the 2019 funding level. An increase in funding from the prior year will only occur when adjusted operating income increases by more than 2%. The Committee set the minimum achievement threshold at 70% of 2018 adjusted operating income, or $1,888 million, as adjusted for extraordinary, unusual or infrequently occurring items. Mr. Case’s target bonus in 2019 remained at $3 million in accordance with the terms of his employment agreement.
Base Salary
Base salary is a fixed component of remuneration and is initially set at a level based primarily upon the executive’s job scope or level of responsibility. No base salary adjustment was made for Mr. Case during 2018 or is otherwise proposed.
Incentive Repayment Policy and Forfeiture Provisions
Under the Company’s Incentive Repayment Policy, the Board is permitted to cancel or require reimbursement of any incentive payment or equity-based award received by the Company’s executive officers if the payment or award is based on the achievement of financial results that are subsequently restated.
If the Board determines that an executive officer engaged in fraud that caused or partially caused the need for financial restatement, the incentive payment or equity-based award is required to be forfeited in full.

48
If the restatement is not the result of fraud by the executive officer, the Board may, to the extent allowable under applicable law, require forfeiture or reimbursement of the amount by which the incentive payment or equity-based award exceeded the lower amount that would have been paid based on the restated financial results.
In addition, beginning with equity-based awards granted in 2019, unvested equity-based awards are subject to forfeiture in the event of a material violation of the Company’s policies or procedures or a breach of applicable restrictive covenants.
Executive and Relocation Benefits
During 2018, the Company provided few personal benefits to Mr. Case as a component of his total compensation. Over the years, the Committee has taken significant steps to de-emphasize personal benefits in the Company’s executive remuneration schemes.
Retirement Benefits
Mr. Case is eligible to participate in broad-based employee benefit programs that are available to the Company’s employees generally (such as health coverage and 401(k) salary deferrals for the Company’s U.S.-based employees). Mr. Case does not participate in the defined benefit pension plan or the supplemental pension program of the Company’s predecessor, Aon Corporation. Mr. Case was hired by Aon Corporation after participation in the plans was frozen in 2004.
The Company also maintains a Supplemental Savings Plan, in which Mr. Case participates. It is a non-qualified, deferred compensation plan that provides eligible employees, including Mr. Case, with the opportunity to receive contributions that could not be credited under the base U.S. tax-qualified plan because of tax limitations and the specific provisions of such plan.
If an executive officer contributes on a match eligible basis to the Aon Savings Plan an amount equal to the annual contribution limit imposed by the United States Internal Revenue Code (IRC) ($18,500 in 2018), the Supplemental Savings Plan provides for a company allocation as a percentage of: eligible compensation deferred under the Aon Deferred Compensation Plan, and of eligible compensation in excess of the United States Internal Revenue Service limit ($275,000 in 2018). The combined total annual eligible compensation for the Aon Savings and Aon Supplemental Savings Plans is capped at $500,000. The percentage allocation varies by length of service but in the first four years of employment the allocation percentage is 3% and increases to 6% after 15 years of service.
Relocation Benefits
In connection with the Company’s relocation of its headquarters to London, the Committee approved relocation benefits for the executive officers who relocated to the new corporate headquarters and entered into assignment letters with such executive officers. In consideration of the executive officers’ renewals of their commitments to their international assignments, the Committee approved the subsequent renewals of these letters with modest changes to each executive officer’s relocation benefits. In each case, the Committee approved the relocation benefits after consulting with its independent remuneration consultant, FW Cook, and each relocating executive officer signed an international assignment letter with the Company’s predecessor, Aon Corporation (the “Letter”) dated 12 January 2012, a renewal letters dated 1 July 2014 and 1 July 2016, and a current renewal letter dated 25 June 2018 which describe the relocation benefits available to them.
The terms of the Letter for Mr. Case provide for the following benefits:
• relocation and housing benefits; • cost of living differential benefits; • a monthly foreign service allowance; and • tax preparation benefits.
Relocation benefits are customary for expatriate assignments for the Company and other employers in its industry. The relocation packages approved are intended to keep the executive “whole” on a total rewards basis, to be transparent and equitable, and to reflect best practices and benchmarks of industry counterparts. The Committee will periodically review the relocation packages of all relocated executive officers.
All of the relocation benefits are subject to recoupment if an executive officer resigns employment with the Company within two years of commencing the international assignment, or 12 months after the end thereof, and becomes employed by a direct competitor of the Company.
In addition to the retirement and relocation benefits, the Company provides an executive health screening program to Mr. Case and other executive officers.

49
Non-Executive Director Remuneration
Fees
Non-executive director fees are set by the Board as a whole. In 2018, the Company provided its non-executive directors with the following cash compensation:
• an annual retainer of $130,000, payable periodically in arrears;• an additional annual retainer of $20,000 to the chairperson of each Board committee other than the Audit Committee;
and• an additional annual retainer of $25,000 to the chairperson of the Audit Committee.
In 2018, the Board approved an increase in the annual cash retainer of $6,000 (from $130,000 to $136,000) related to 2019 Board service.
Equity Awards
Each non-executive director is entitled to receive an annual grant of fully-vested Aon plc ordinary shares on the date of the Company’s annual general meeting of shareholders. In 2018, the annual grant of Aon plc ordinary shares had an initial value of $170,000 and the non-executive chairman of the Board received an additional grant with a $225,000 initial value. The number of Aon plc ordinary shares to be granted was determined by dividing $170,000 (or in the case of the non-executive chairman of the Board, $395,000) by the fair market value of an Aon plc ordinary share on the date of grant.
In 2018, the Board approved an increase in the annual stock retainer of $6,000 (from $170,000 to $176,000) related to 2019 Board service.
Payments to Past Directors and Payments for Loss of Office
There have been no payments made to directors for loss of office or to past directors during the year ended December 31, 2018 with respect to service as a director of the Company.
Director Shareholdings and Share Ownership Guidelines
The Board has adopted share ownership guidelines. The guidelines are designed to increase the Company’s executives’ equity stakes and to align the Company’s executives’ interests more closely with those of its shareholders. The guidelines provide that Mr. Case should attain an investment position in the Aon plc ordinary shares equal to six times his annual base salary and each other executive officer should attain an investment position in the Aon plc ordinary shares equal to three times his or her annual base salary. While there is no specific period of time for an executive officer to reach these levels, each executive officer is expected to make consistent progress toward these levels. Mr. Case has agreed in his amended and restated employment agreement that he will attain an investment position in the Aon plc ordinary shares equal to 20 times his annual base salary. Mr. Case’s shareholdings in the Company exceed the amount required under the guidelines and his employment agreement.
The guidelines also set out equity retention rules generally requiring that net profit shares received upon the exercise of options to purchase Aon plc ordinary shares, the vesting of restricted stock units and the vesting of performance share units be retained until the required investment position is achieved. Aon plc ordinary shares counted toward these guidelines include:
• any shares owned outright; • shares owned through an Aon-sponsored savings or retirement plan; • shares purchased through an Aon-sponsored employee stock purchase plan;• shares obtained through the exercise of share options; • shares issued upon the vesting of restricted share units or performance share units; and • “phantom stock” held in the Aon Supplemental Savings Plan.
The Board also has adopted share ownership guidelines for the Company’s non-executive directors. These guidelines require each non-executive director to hold an investment position in Aon plc ordinary shares equal to five times the annual director retainer. The guidelines provide a transition period of seven years for non-executive directors to achieve the ownership guidelines level; provided, however that each new non-executive director is expected to hold 1,000 Aon plc ordinary shares within the first year of joining the Board or transitioning from an executive director to a non-executive director. Each non-executive director is in compliance with the guidelines.
Share Options
As of December 31, 2018, no non-executive director has received any share option granted in respect of their service as a director of the Company or otherwise in respect of any “qualifying services” in respect of the Company.

50
Mr. Case held options, which were granted in respect of his prior service as President, Chief Executive Officer and Director of Aon Corporation, and which were assumed by the Company on April 2, 2012 and relate to Aon plc ordinary shares. Mr. Case exercised all of his outstanding options during 2015. As a result, Mr. Case held no options at December 31, 2018.
Long-Term Incentive Schemes
As of December 31, 2018, Mr. Case had the awards set forth below outstanding under the Company’s LPP and ISP. The awards set forth below vest in future years and the Aon plc ordinary shares will become receivable under the plans in respect of qualifying service. None of the Company’s non-executive directors has any scheme interest in respect of qualifying service.
Award Date
At Jan 1, 2018Maximum number of
shares under
At Dec 31, 2018Maximum
number of sharesunder Award
End ofPerformancePeriod/LatestVesting Date Vesting Date
Number ofShares
Vested in2017/2018
Market Price on
Award Date($)
Market Price on Vesting
Date($)
LPP Awards(1)
Gregory C. Case Mar 20, 2015 511,580 — Dec 31, 2017 Feb 15, 2018 447,633 (2) 99.30 140.89Mar 31, 2016 199,138 199,138 Dec 31, 2018 Feb 14, 2019 182,211 (3) 104.45 169.62Mar 31, 2017 175,246 175,246 Dec 31, 2019 Feb 2020 — 118.69 n/aMar 23, 2018 — 180,798 Dec 31, 2020 Feb 2021 — 137.37 n/a
ISP Awards(4)
Feb 20, 2015 3,488 — Feb 20, 2018 Feb 20, 2018 3,488 100.34 140.72Feb 19, 2016 7,480 3,740 Feb 19, 2019 Feb 19, 2018 3,740 93.58 140.86
Feb 19, 2019 3,740 172.66Feb 17, 2017 8,394 5,956 Feb 17, 2020 Feb 17, 2018 2,978 117.53 140.86
Feb 17, 2019 2,978 171.97Feb 16, 2018 — 4,969 Feb 16, 2021 Feb 16, 2019 1,656 140.86 171.97
(1) For performance share units awarded under the LPP, the actual number of shares issued to Mr. Case is determined based upon the adjusted EPS of the Company during the performance period. For all awards, the maximum potential number of shares that may vest is shown. See “The Company’s Remuneration Policy”.
(2) Represents the actual number of shares awarded to Mr. Case on February 15, 2018.(3) Represents the actual number of shares awarded to Mr. Case on February 14, 2019.(4) For restricted share units awarded under our ISP, the shares awarded are the restricted share portion of awards approved by the independent members of the
Board based upon the achievement of certain performance measures by Mr. Case during the year prior to the award date under the annual incentive plan. The restricted share units vest in equal amounts on the first through the third anniversary date of the award date subject to continued employment. No other performance conditions apply to the vesting of the restricted share units.
Directors’ Interests in Aon plc Ordinary Shares
The table below provides details on the directors’ interests in shares of the Company at December 31, 2018, including interests of connected persons:
Beneficially OwnedShares LPP ISP Options Total
Executive DirectorGregory C. Case 1,012,178 277,591 14,665 — 1,304,434
Non-Executive DirectorsLester B. Knight 215,393 — — — 215,393Jin-Yong Cai 3,386 — — — 3,386Jeffrey C. Campbell 7,084 — — — 7,084Fulvio Conti 26,977 — — — 26,977Cheryl A. Francis 23,757 — — — 23,757J. Michael Losh 38,652 — — — 38,652Richard B. Myers 24,961 — — — 24,961Richard C. Notebaert 52,207 — — — 52,207Gloria Santona 34,661 — — — 34,661Carolyn Y. Woo 25,370 — — — 25,370

51
Performance Graph
The graphs below shows the total shareholder return of the Company for the five and ten years ended December 31, 2018 on an assumed investment of $100 on December 31, 2013 and 2008, respectively, in Aon plc, the Standard & Poor’s S&P 500 Stock Index and an index of peer group companies.
The Standard & Poor’s S&P 500 Stock Index has been chosen because the Company is a part of this index, and as a result the Company is required to use this index in its performance graph under SEC rules.
The peer group index reflects the performance of the following peer group companies which are, taken as a whole, in the same industry or which have similar lines of business as Aon: Arthur J. Gallagher & Co.; Marsh & McLennan Companies, Inc.; Brown & Brown, Inc. and Willis Towers Watson. The peer group returns are weighted by market capitalization at the beginning of each year. The performance graph assumes that the value of the investment of Aon plc ordinary shares and the peer group index was allocated pro rata among the peer group companies according to their respective market capitalizations, and that all dividends were reinvested.

52
Chief Executive Officer Remuneration
(thousands except percentages) 2011 2012 2013 2014 2015 2016 2017 2018
Total Remuneration(1) $11,959 $25,323 $22,322 $40,423 $32,471 $30,594 $67,337 $35,140Annual bonus as a percentage of
maximum(2) 22% 33% 35% 33% 33% 33% 22% 22%Shares vesting as a percentage of
maximum 62% 44% 63% 100% 100% 100% 88% 92%
(1) For all periods prior to April 2, 2012, the remuneration shown includes remuneration paid to Mr. Case for serving as an executive officer of Aon Corporation.(2) In 2011, the maximum bonus under the Shareholder Approved Plan was increased from the lesser of $5 million or three times target bonus to the lesser of $10
million or three times target bonus.
Percentage Change in Chief Executive Officer Remuneration Compared to Average
The table below shows the percentage change in the remuneration of our chief executive officer from 2017 to 2018 compared to the average percentage change for the Company’s employees who participate in similar compensation schemes to our chief executive officer and are based in the U.K. and the U.S. The Company believes that this is an appropriate comparator group because the remuneration arrangements for this group allow for a meaningful comparison.
Salary Benefits Annual Bonus
Chief Executive Officer —% (5)% —%Comparator Employees 1% (11)% 5%

53
Relative Importance of Spend on Pay
During the years ended December 31, 2017 and 2018, the Company’s remuneration paid to its employees and distributions to shareholders were as follows:
Year ended 31 December,Percentage
Change($ millions) 2018 2017
Employee remuneration $ 6,074 $ 5,816 4.4 %Dividends $ 382 $ 364 4.9 %Share buyback $ 1,447 $ 2,403 (39.8)%
Votes on Remuneration in 2017 and 2018
At the Company’s annual general meeting held on June 23, 2017, the Company’s Remuneration Policy received the following votes from shareholders:
Votes %
For 207,415,302 87.9%Against 11,209,261 4.8%Withheld 277,985 0.1%Broker Non-Votes 17,053,562 7.2%
At the Company’s annual general meeting held on June 21, 2018, the director’s remuneration report received the following votes from shareholders:
Votes %
For 170,509,976 76.8%Against 34,496,906 15.5%Withheld 260,121 0.1%Broker Non-Votes 16,813,100 7.6%
For and on behalf of the Board
/S/ Peter Lieb
Company Secretary
Date: March 29, 2019
Registered Number 07876075

54
STATEMENT OF DIRECTORS’ RESPONSIBILITIES
The directors are responsible for preparing the Annual Report and the Group and Parent Company financial statements in accordance with applicable United Kingdom law and regulations.
Company law requires the directors to prepare Group and Parent Company financial statements for each financial year. Under that law, the directors have elected to prepare both financial statements in accordance with IFRS and IFRIC interpretations effective for the 2018 year end.
Under Company law the directors must not approve the Group or Parent Company financial statements unless they are satisfied that they give a true and fair view of the state of affairs of the Group and Parent Company and of the profit or loss of the Group and Parent Company for that period.
In preparing the Group and Parent Company financial statements, the directors are required to:
• for the financial statements, present fairly the financial position, financial performance and cash flows;
• select suitable accounting policies and then apply them consistently;
• present information, including accounting policies, in a manner that provides relevant, reliable, comparable and understandable information;
• make judgments and accounting estimates that are reasonable and prudent;
• state whether the Group and Parent Company financial statements have been prepared in accordance with IFRS subject to any material departures disclosed and explained in the financial statements; and
• prepare the financial statements on the going concern basis unless it is inappropriate to presume that the company will continue in business.
The directors are responsible for keeping adequate accounting records that are sufficient to show and explain the Group’s and Parent Company’s transactions and disclose with reasonable accuracy at any time the financial position of the Group and Parent Company and enable them to ensure that the financial statements comply with the Companies Act 2006. They are also responsible for safeguarding the assets of the Group and Parent Company and hence for taking reasonable steps for the prevention and detection of fraud and other irregularities.
The directors are also responsible for preparing the Report of the Directors and Strategic Report in accordance with the Companies Act 2006.
The directors are responsible for the maintenance and integrity of the corporate and financial information included on the Company’s website. Legislation in the U.K. governing the preparation and dissemination of financial statements may differ from legislation in other jurisdictions.

55
INDEPENDENT AUDITOR’S REPORT TO THE MEMBERS OF AON PLC
Opinion
In our opinion:
• Aon plc’s Group financial statements and Parent Company financial statements (the “financial statements”) give a true and fair view of the state of the Group’s and of the Parent Company’s affairs as at December 31, 2018 and of the Group’s profit for the year then ended;
• The Group financial statements have been properly prepared in accordance with International Financial Reporting Standards as adopted by the European Union (“IFRS”);
• The Parent Company financial statements have been prepared in accordance with IFRS as applied in accordance with the provisions of Companies Act 2006; and
• The financial statements have been prepared in accordance with the requirements of the Companies Act 2006.
We have audited the financial statements of Aon plc which comprise:
Group Parent Company• Consolidated balance sheet as at December 31, 2018• Consolidated income statement for the year then ended• Consolidated statement of comprehensive income for the
year then ended• Consolidated statement of changes in equity for the year
then ended• Consolidated statement of cash flows for the year then
ended• Related notes 1 to 24 to the consolidated financial
statements, including a summary of significant accounting policies
• Balance sheet as at December 31, 2018• Statement of changes in equity for the year then ended• Statement of cash flows for the year then ended• Related notes 1 to 16 to the financial statements including a
summary of significant accounting policies
The financial reporting framework that has been applied in their preparation is applicable law and IFRS and, as regards to the Parent Company financial statements, as applied in accordance with the provisions of the Companies Act 2006.
Basis for opinion
We conducted our audit in accordance with International Standards on Auditing (UK) (“ISAs”) and applicable law. Our responsibilities under those standards are further described in the Auditor’s responsibilities for the audit of the financial statements section of our report below. We are independent of the Group and Parent Company in accordance with the ethical requirements that are relevant to our audit of the financial statements in the UK, including the Financial Reporting Council’s (“FRC”) Ethical Standard as applied to listed entities, and we have fulfilled our other ethical responsibilities in accordance with these requirements.
We believe that the audit evidence we have obtained is sufficient and appropriate to provide a basis for our opinion.
Conclusions relating to going concern
We have nothing to report in respect of the following matters in relation to which the ISAs require us to report to you where:
• the directors’ use of the going concern basis of accounting in the preparation of the financial statements is not appropriate; or
• the directors have not disclosed in the financial statements any identified material uncertainties that may cast significant doubt about the Group or Parent Company’s ability to continue to adopt the going concern basis of accounting for a period of at least twelve months from the date when the financial statements are authorised for issue.

56
Overview of our audit approach
Key audit matters • Revenue recognition - Group• Income taxes: Uncertain tax positions - Group• Investments in subsidiaries - Parent Company
Audit scope • We performed detailed audit procedures on 8 components, which accounted for 76% of Income from continuing operations before income taxes and 77% of Revenue.
Materiality • Overall materiality for the Group and the Parent Company of $100 million (2017: $65 million) which represents 5% (2017: 4%) of Income from continuing operations before income taxes adjusted for nonrecurring items described in the Materiality section below and 0.3% (2017: 1%) of Parent Company net assets.
Key audit matters
Key audit matters are those matters that, in our professional judgement, were of most significance in our audit of the financial statements of the current period and include the most significant assessed risks of material misstatement (whether or not due to fraud) that we identified. These matters included those which had the greatest effect on: the overall audit strategy, the allocation of resources in the audit and directing the efforts of the engagement team. These matters were addressed in the context of our audit of the financial statements as a whole, and in our opinion thereon, and we do not provide a separate opinion on these matters.
Risk Our response to the risk
Key observationscommunicated tothe AuditCommittee
Revenue recognition - GroupRevenue is the most significant income statement account for the Group. The majority of the Group’s revenue is routine, however, the remaining revenue is recorded manually either due to timing or the complexity of the transaction. Furthermore, the Group adopted IFRS 15 - Revenue from Contracts with Customers on January 1, 2018, which has changed when the revenue from certain income streams can be recognised as well as changing the recognition of certain revenue-related costs. The combination of the judgement required to apply the new revenue standard to the Group as well as the complexity and manual nature of certain transactions leads to a risk of misstatement.Refer to the Critical Accounting Estimates and Judgements and Accounting policies in Note 2 and Note 3 of the Consolidated Financial Statements.
To obtain sufficient audit evidence to conclude on the appropriate recognition of revenue, we:
• Performed walkthroughs of key processes, including adoption of IFRS 15, and tested the design and operating effectiveness of revenue recognition controls, including transaction-level controls, cut-off controls and IFRS 15 adoption controls
• Tested adjustments made to opening Retained Earnings as a result of adoption of IFRS 15
• Tested the Group’s costs incurred to obtain and fulfil a contract by reviewing assumptions and clerically testing the Group’s model, recalculating the amortization recognized and performing data input testing
• Performed revenue transaction testing, including inspecting contractual terms and service obligations to customers, including manual adjustments, to confirm that revenue recognized is in line with the contractual terms and IFRS 15
• Tested significant and unusual manual journal entries to revenue to confirm that revenue was recognized accurately
• Tested significant new or modified contracts to confirm the contracts were setup and any revenue was recorded accurately
• Tested cut-off of revenue, including determination of adequate support for any unbilled commissions or fees to confirm that revenue was recognised in the correct period
Based on the results of our controls and substantive testing, we are satisfied that revenue, including manual adjustments, has been appropriately recorded in line with IFRS 15.

57
Risk Our response to the risk
Key observationscommunicated tothe AuditCommittee
Income Taxes: Uncertain tax positions - Group
Uncertainty in a tax position may arise as tax laws are subject to interpretation, and management’s application of its income tax accounting policies involves assumptions and estimates about future operating results and levels of taxable income, as well as judgments regarding the interpretation of accounting principles. The liability for uncertain tax positions (“UTPs”) requires judgment in the identification, recognition and measurement of tax positions taken. UTPs related to U.S. tax reform, intercompany royalty transactions and debt arrangements in the US and UK pose a significant risk due to their complex nature, significant judgment required in preparation and susceptibility to a contrary position being sustained by taxing authorities.
As of December 31, 2018, the Company’s liability for uncertain tax positions was approximately $279 million.
In the prior year, we included U.S. tax reform as a key audit matter as calculating its impact required the assessment of a significant amount of data, and there was a risk that Aon did not have the necessary information available, prepared, or analyzed to estimate the impact on the financial statements. In the current year, we have included the judgments made in respect of U.S. tax reform as part of our UTP key audit matter described above.
Refer to the Critical Accounting Estimates and Judgements and Accounting policies in Note 2 and Note 11 of the Consolidated Financial Statements.
To obtain sufficient audit evidence to conclude on uncertain tax position risk, we:
• Performed walkthroughs of key processes and tested the design and operating effectiveness of controls in the income tax process
• Tested the UTP analyses, including assumptions and probability assessments used by management, supporting the Group’s position for each significant uncertain tax position
• Audited the accounting for UTP’s arising from US tax reform, including tax positions taken with respect to the transition tax calculation
• Inspected reports of income tax examinations, including significant local and foreign examinations completed during the year, assessments or notices received and the status of current examinations in process
• Inspected third-party memoranda or opinions in connection with significant tax matters where the Group has obtained the advice of an outside tax advisors. We used this evidence with the assistance of our tax specialists to identify contrary evidence and evaluate the judgments used in determining and valuing UTPs
• We tested new UTPs, evaluated existing UTPs for new information received that would change the Company’s judgment about tax positions taken and tested any highly certain tax positions to validate the recorded UTPs were complete and accurate. We also tested the UTP analyses, including assumptions and probability assessments used by management to support the Company’s position for each significant UTP
Based on the results of our controls and substantive testing, we are satisfied the Group has appropriately recorded the liability for UTPs.

58
Risk Our response to the risk
Key observationscommunicated tothe AuditCommittee
Investments in subsidiaries - Parent Company
The investment in subsidiaries balance is the most significant on the Parent Company’s balance sheet. In the current year, the Parent Company has made a voluntary policy election to change the measurement basis of its investment in subsidiaries from cost to fair value. Under IFRS 9, the financial instruments standard, the Parent Company has additionally elected to measure its investments in subsidiaries at fair value through other comprehensive income (OCI).
Determining the fair value of its investments in subsidiaries balance requires judgment, including assumptions made regarding the discount rate and long-term growth rates of its subsidiaries.This is a new risk in 2018 due to the change in accounting policy.Refer to the Accounting policies in Note 2 and Note 6 of the Parent Company Financial Statements.
To obtain sufficient audit evidence to conclude on the appropriate valuation of investments in subsidiaries, we:• Performed a walkthrough of the investments in
subsidiaries process• Tested adjustments made as a result of the change
in policy election, including adjustment of prior period balances
• Engaged valuation specialists to assist in reviewing the Parent Company’s investments in subsidiaries valuation
• Tested and challenged the assumptions used by management in the investments in subsidiaries valuation
• Reviewed the Parent Company’s change in policy and investments in subsidiaries disclosure in Note 6 of the Parent Company financial statements for compliance with IFRS
Based on the results of our substantive testing, we are satisfied the Parent Company’s investments in subsidiaries balance has been appropriately recorded.
Overview of the scope of our audit
Tailoring the scope
Our assessment of audit risk, our evaluation of materiality and our allocation of performance materiality determine our audit scope for each entity within the Group. Taken together, this enables us to form an opinion on the consolidated financial statements. We take into account size, risk, organisation of the Group, effectiveness of group-wide controls, changes in the business and other factors such as recent internal audit results when assessing the level of work to be performed at each entity.
In assessing the risk of material misstatement to the Group financial statements, and to ensure we had adequate quantitative coverage of significant accounts in the financial statements, of the 86 components of the Group, we selected 8 components based on their size or risk characteristics, for which we performed detailed audit procedures on, including Australia, Brazil, Canada, Germany, Italy, Netherlands, the United Kingdom and the United States, which represent key locations within the Group.

59
Procedures on these components accounted for 76% (2017: 86%) of Income from continuing operations before income taxes and 77% (2017: 78%) of Revenue. For the remaining 78 components, we performed other procedures, including analytical reviews, inquiries of operating and financial personnel, control procedures to determine whether management has implemented group policies, procedures and appropriate controls over reporting financial information and operating results, and the policies, procedures and controls are being followed by component management and other personnel.
Changes from the prior year
In 2018, we identified components based on geography to better align with the Group’s operations.
In 2017, we had 18 business unit components in scope and in 2018 we identified 8 geographic components. The change in identification of components did not significantly alter our coverage over income before income taxes and revenue.
Group audit team and approach
The Group is required to prepare consolidated financial statements in both the UK and the US as they are a UK domiciled company and are traded on the New York Stock Exchange.
Due to the reporting requirements in the UK and the US, we have determined the most effective audit approach is to have an integrated audit team led by the UK with both UK and US team members (“Group audit team”). The UK and US team members work together throughout the audit including in the determination of risks, scoping of the audit and oversight of component teams.
Involvement with component teams
In establishing our overall approach to the Group audit, we determined the type of work that needed to be undertaken at each of the components by us, as the primary audit engagement team, or by the component auditors operating under our instruction.
The Group audit team provided detailed audit instructions to the component teams that included guidance on areas of focus, including the relevant risks of material misstatement detailed above, and set out the information required to be reported to the Group audit team.
The Group audit team is responsible for the audit of the Group function. The Group audit team visited 7 of the component teams, reviewed key work papers and participated in the planning and execution of the component teams’ audit of the identified risks. For the component the Group audit team did not visit, the Group audit team held regular updates with the component team, reviewed key work papers and participated in the planning and execution of the component team’s audit of the identified risks. The Group audit team attended the closing meetings with management for all in-scope locations.
The work performed on the components, together with the additional procedures performed at Group level, gave us appropriate evidence for our opinion on the consolidated financial statements as a whole.
Our application of materiality
We apply the concept of materiality in planning and performing the audit, in evaluating the effect of identified misstatements on the audit and in forming our audit opinion.
Materiality
The magnitude of an omission or misstatement that, individually or in the aggregate, could reasonably be expected to influence the economic decisions of the users of the financial statements. Materiality provides a basis for determining the nature and extent of our audit procedures.
We determined materiality for the Group to be $100 million (2017: $65 million), which is 5% (2017: 4%) of Income from continuing operations before income taxes adjusted for restructuring charges ($488m) and tradename amortization ($218m) included in Notes 6 and 8, respectively. We believe that Income before income taxes adjusted for these items is a reasonable basis to form our materiality as it reflects the Group’s underlying business performance.
We determined materiality for the Parent Company to be $100 million (2017: $65 million), which is 0.3% (2017: 1%) of Parent Company net assets.
During the course of our audit, we reassessed our initial materiality calculation. Our final calculated materiality did not result in any substantive change in our audit procedures.

60
Performance materiality
The application of materiality at the individual account or balance level. It is set at an amount to reduce to an appropriately low level the probability that the aggregate of uncorrected and undetected misstatements exceeds materiality.
On the basis of our risk assessments, together with our assessment of the Group’s overall control environment, our judgement was that performance materiality was 75% (2017: 75%) of our planning materiality, namely $75 million (2017: $49 million). We have set performance materiality at this percentage due to our past experience as auditors of the Group, which indicates a lower risk of material misstatements, both corrected and uncorrected. Our objective in adopting this approach is to confirm that total detected and undetected audit differences do not exceed our materiality for the financial statements as a whole.
Audit work at component locations for the purpose of obtaining audit coverage over significant financial statement accounts is undertaken based on a percentage of total performance materiality. The performance materiality set for each component is based on the relative scale and risk of the component to the Group as a whole and our assessment of the risk of misstatement at that component. In the current year, the range of performance materiality allocated to components was $15 million to $45 million (2017: $10 million to $36 million).
Reporting threshold
An amount below which identified misstatements are considered as being clearly trivial.
We agreed with the Audit Committee that we would report to them all uncorrected audit differences in excess of $5 million (2017: $3 million), which is set at 5% of planning materiality, as well as differences below that threshold that, in our view, warranted reporting on qualitative grounds.
We evaluate any uncorrected misstatements against both the quantitative measures of materiality discussed above and in light of other relevant qualitative considerations in forming our opinion.
Other information
The other information comprises the information included in the annual report set out on pages 1 to 53, other than the financial statements and our auditor’s report thereon. The directors are responsible for the other information
Our opinion on the financial statements does not cover the other information and, except to the extent otherwise explicitly stated in this report, we do not express any form of assurance conclusion thereon.
In connection with our audit of the financial statements, our responsibility is to read the other information and, in doing so, consider whether the other information is materially inconsistent with the financial statements or our knowledge obtained in the audit or otherwise appears to be materially misstated. If we identify such material inconsistencies or apparent material misstatements, we are required to determine whether there is a material misstatement in the financial statements or a material misstatement of the other information. If, based on the work we have performed, we conclude that there is a material misstatement of the other information, we are required to report that fact.
We have nothing to report in this regard.
Opinions on other matters prescribed by the Companies Act 2006
In our opinion, the part of the directors’ remuneration report to be audited has been properly prepared in accordance with the Companies Act 2006.
In our opinion, based on the work undertaken in the course of the audit:
• the information given in the strategic report and the directors’ report for the financial year for which the financial statements are prepared is consistent with the financial statements; and
• the strategic report and directors’ report have been prepared in accordance with applicable legal requirements.

61
Matters on which we are required to report by exception
In the light of the knowledge and understanding of the Group and Parent Company and their environment obtained in the course of the audit, we have not identified material misstatements in the strategic report or directors’ report.
We have nothing to report for the Group or the Parent Company in respect of the following matters in relation to which the Companies Act 2006 requires us to report to you if, in our opinion:
• adequate accounting records have not been kept, or returns adequate for our audit have not been received from branches not visited by us; or
• the financial statements and the part of the Directors’ Remuneration Report to be audited are not in agreement with the accounting records and returns; or
• certain disclosures of directors’ remuneration specified by law are not made; or• we have not received all the information and explanations we require for our audit.
Responsibilities of directors
As explained more fully in the directors’ responsibilities statement set out on page 53, the directors are responsible for the preparation of the financial statements and for being satisfied that they give a true and fair view, and for such internal control as the directors determine is necessary to enable the preparation of financial statements that are free from material misstatement, whether due to fraud or error.
In preparing the financial statements, the directors are responsible for assessing the Group and Parent Company’s ability to continue as a going concern, disclosing, as applicable, matters related to going concern and using the going concern basis of accounting unless the directors either intend to liquidate the Group or the Parent Company or to cease operations, or have no realistic alternative but to do so.
Auditor’s responsibilities for the audit of the financial statements
Our objectives are to obtain reasonable assurance about whether the financial statements as a whole are free from material misstatement, whether due to fraud or error, and to issue an auditor’s report that includes our opinion. Reasonable assurance is a high level of assurance, but is not a guarantee that an audit conducted in accordance with ISAs (UK) will always detect a material misstatement when it exists. Misstatements can arise from fraud or error and are considered material if, individually or in the aggregate, they could reasonably be expected to influence the economic decisions of users taken on the basis of these financial statements.
Explanation as to what extent the audit was considered capable of detecting irregularities, including fraud
The objectives of our audit:
• in respect to fraud, are; to identify and assess the risks of material misstatement of the financial statements due to fraud; to obtain sufficient appropriate audit evidence regarding the assessed risks of material misstatement due to fraud, through designing and implementing appropriate responses; and to respond appropriately to fraud or suspected fraud identified during the audit. However, the primary responsibility for the prevention and detection of fraud rests with both those charged with governance of the entity and management; and
• in respect to irregularities (which we consider to mean non-compliance with laws and regulations) are to obtain sufficient appropriate audit evidence regarding compliance with the provisions of those laws and regulations generally recognized to have a direct effect on the determination of material amounts and disclosures in the financial statements (‘direct laws and regulations’), and perform other audit procedures to help identify instances of non-compliance with other laws and regulations that may have a material effect on the financial statements. We are not responsible for preventing non-compliance with laws and regulations and our audit procedures cannot be expected to detect non-compliance with all laws and regulations.
Our approach was as follows:
• We obtained a general understanding of the legal and regulatory frameworks that are applicable to the Group and Parent Company and determined the direct laws and regulations related to elements of company law and tax legislation, and the financial reporting framework. As the Group operates in a number of countries throughout the world, they are subject to a number of different legal and regulatory jurisdictions. Our considerations of other laws and regulations that we determined have the most significant impact on the financial statements are: • Companies Act 2006

62
• Financial Reporting Counsel (FRC) rules• Financial Conduct Authority (FCA) rules• US securities laws and the regulations of the Securities and Exchange Commission• Tax legislation, most notably in the UK governed by HM Revenue and Customs and in the US by Internal Revenue
Services • We obtained a general understanding of how the Company complies with these legal and regulatory frameworks by
making inquiries of management, internal audit, and those responsible for legal and compliance matters. We also reviewed correspondence between the Company and regulatory bodies; reviewed minutes of the Board and Compliance Committee; and gained an understanding of the Company’s approach to governance, demonstrated by the Board’s involvement in the Company’s governance framework and the Board’s discussion of risk and compliance and internal control processes.
• For direct laws and regulations, we considered the extent of compliance with those laws and regulations as part of our procedures on the related financial statement items.
• For both direct and other laws and regulations, our procedures involved: making inquiry of those charged with governance and senior management for their awareness of any non-compliance of laws or regulations, inquiring about the policies that have been established to prevent non-compliance with laws and regulations by officers and employees, inquiring about the Company’s methods of enforcing and monitoring compliance with such policies, inspecting significant correspondence with regulators.
• The Company operates in a highly regulated environment. As such the Senior Statutory Auditor considered the experience and expertise of the engagement team to ensure the team had the appropriate competence and capabilities, which included the use of specialists where appropriate.
• We assessed the susceptibility of the Company’s financial statements to material misstatement, including how fraud might occur, by considering the controls the Company has established to address risks identified by the entity, or that otherwise seek to prevent, deter or detect fraud. We also considered areas of significant judgement and the impact these have on the control environment. Where this risk was considered to be higher, we performed audit procedures to address each identified fraud risk, which we have identified in the Key audit matters section above. These procedures included testing manual journals and were designed to provide reasonable assurance the financial statements were free from fraud or error.
A further description of our responsibilities for the audit of the financial statements is located on the Financial Reporting Council’s website at https://www.frc.org.uk/auditorsresponsibilities. This description forms part of our auditor’s report.
Use of our report
This report is made solely to the company’s members, as a body, in accordance with Chapter 3 of Part 16 of the Companies Act 2006. Our audit work has been undertaken so that we might state to the company’s members those matters we are required to state to them in an auditor’s report and for no other purpose. To the fullest extent permitted by law, we do not accept or assume responsibility to anyone other than the company and the company’s members as a body, for our audit work, for this report, or for the opinions we have formed.
/S/ Jonathan Bell (Senior statutory auditor)
for and on behalf of Ernst &Young LLP, Statutory Auditor
London
March 29, 2019
Notes:
1. The maintenance and integrity of the Aon plc web site is the responsibility of the directors; the work carried out by the auditors does not involve consideration of these matters and, accordingly, the auditors accept no responsibility for any changes that may have occurred to the financial statements since they were initially presented on the web site.
2. Legislation in the United Kingdom governing the preparation and dissemination of financial statements may differ from legislation in other jurisdictions.

63
CONSOLIDATED STATEMENTS OF INCOME
Years ended December 31
(millions, except per share data) Notes 2018 2017
Revenue Total revenue 3 $ 10,770 $ 9,998
Expenses Compensation and benefits 21 6,193 6,115Information technology 484 423Premises 372 357Depreciation of fixed assets 101 103Amortization and impairment of intangible assets 681 791Other general expenses 1,483 1,280
Total operating expenses 9,314 9,069Operating income 1,456 929
Interest income 5 27Interest expense (276) (281)Other income (expense) 4 (25) (2)
Income from continuing operations before income taxes 1,160 673Income taxes 11 130 242
Net income from continuing operations 1,030 431Net income from discontinued operations 5 14 806
Net income $ 1,044 $ 1,237
Net income attributable to continuing operations:Aon shareholders $ 990 $ 394Noncontrolling interests 40 37
Net income from continuing operations $ 1,030 $ 431Net income attributable to discontinued operations:
Aon shareholders $ 14 $ 806Noncontrolling interests — —
Net income from discontinued operations $ 14 $ 806
Basic net income per share attributable to Aon shareholdersContinuing operations $ 4.03 $ 1.52Discontinued operations 0.06 3.12Net income $ 4.09 $ 4.64
Diluted net income per share attributable to Aon shareholdersContinuing operations $ 3.99 $ 1.50Discontinued operations 0.06 3.08Net income $ 4.05 $ 4.58
Weighted average ordinary shares outstanding — basic 12 245.4 258.7Weighted average ordinary shares outstanding — diluted 12 247.9 262.1
The notes on pages 68 to 136 are an integral part of these financial statements.

64
CONSOLIDATED STATEMENTS OF COMPREHENSIVE INCOME
Years endedDecember 31
(millions) Notes 2018 2017
Net income $ 1,044 $ 1,237Other comprehensive income (loss), net of tax:
Items that will not be reclassified subsequently to profit or loss:Postretirement benefit obligation 106 (23)
Items that will be reclassified subsequently to profit or loss:Foreign currency translation adjustments (1) 12 (434) 385Change in fair value of financial instruments 12 1 (11)
Total items that will be reclassified subsequently to profit and loss (433) 374Total other comprehensive income (loss), net of tax (327) 351
Total comprehensive income $ 717 $ 1,588Total comprehensive income attributable to:
Aon shareholders $ 681 $ 1,546Noncontrolling interests 36 42
Total comprehensive income $ 717 $ 1,588
(1) Foreign currency translation adjustments includes $(4) million and $5 million, respectively, related to noncontrolling interests during 2018 and 2017.
The notes on pages 68 to 136 are an integral part of these financial statements.

65
CONSOLIDATED STATEMENTS OF FINANCIAL POSITION
As of December 31
(millions, except nominal value) Notes 2018 2017
AssetsCurrent AssetsCash and cash equivalents $ 656 $ 756Short-term investments 16 172 529Receivables, net 16 2,759 2,477Fiduciary assets 16 10,166 9,625Other current assets 4 626 289
Total current assets 14,379 13,676Non-current assetsGoodwill 8 8,171 8,358Intangible assets, net 8 1,352 1,951Fixed assets, net 22 371 344Deferred tax assets 11 623 510Prepaid pension 13 1,128 1,054Other non-current assets 4 438 277
Total non-current assets 12,083 12,494Total assets $ 26,462 $ 26,170
Liabilities and equityLiabilities
Current liabilitiesAccounts payable and accrued liabilities 16 $ 1,767 $ 1,791Short-term debt and current portion of long-term debt 9 251 299Fiduciary liabilities 16 10,166 9,625Current provisions 17 470 357Other current liabilities 4 943 952
Total current liabilities 13,597 13,024Non-current liabilitiesLong-term debt 9 5,993 5,667Deferred tax liabilities 11 152 111Pension, other postretirement, and postemployment liabilities 13 1,711 1,898Non-current provisions 17 72 82Other non-current liabilities 4 677 714
Total non-current liabilities 8,605 8,472Total liabilities 22,202 21,496
EquityOrdinary shares - $0.01 nominal value Authorized: 750 shares (issued: December 31, 2018 - 240.1; 2017 - 247.6) 2 2Share premium account 472 430Retained earnings 5,179 5,208Other reserves 12 (1,461) (1,031)Total Aon shareholders equity 4,192 4,609Noncontrolling interests 68 65Total equity 4,260 4,674
Total liabilities and equity $ 26,462 $ 26,170
The financial statements were approved by the Board of Directors on March 29, 2019.
/S/ Gregory C. Case, Director
The notes on pages 68 to 136 are an integral part of these financial statements.

66
CONSOLIDATED STATEMENTS OF SHAREHOLDERS’ EQUITY
(millions) Notes SharesOrdinary
Shares
SharePremiumAccount
Retained Earnings
OtherReserves
Shareholders’ Equity
Noncontrolling Interest Total
Balance at January 1, 2017 262 $ 3 $ 369 $ 6,646 $ (1,400) $ 5,618 $ 57 $ 5,675Profit for the year — — — 1,200 — 1,200 37 1,237Other comprehensive income (loss) for theyear
12 — — — (23) 369 346 5 351
Total comprehensive income (loss) for theyear
— — — 1,177 369 1,546 42 1,588
Shares issued — employee stock compensation plans
3.6 — 61 (182) — (121) — (121)
Shares purchased 12 (18) (1) — (2,415) — (2,416) — (2,416)Tax benefit — employee benefit plans — — — 47 — 47 — 47Share-based compensation expense 14 — — — 303 — 303 — 303Dividends to shareholders ($1.41 per share) 12 — — — (364) — (364) — (364)Net purchases of shares from noncontrolling
interests— — — (4) — (4) (7) (11)
Dividends paid to noncontrolling interests onsubsidiary common stock
— — — — — — (27) (27)
Balance at December 31, 2017 247.6 2 430 5,208 (1,031) 4,609 65 4,674Adoption of new accounting guidance 2 — — — 508 (1) 507 — 507
Balance at January 1, 2018 247.6 2 430 5,716 (1,032) 5,116 65 5,181Profit for the year — — — 1,004 — 1,004 40 1,044Other comprehensive income (loss) for theyear
12 — — — 106 (429) (323) (4) (327)
Total comprehensive income (loss) for theyear
— — — 1,110 (429) 681 36 717
Shares issued — employee stock compensation plans
2.5 — 42 (190) — (148) — (148)
Shares purchased 12 (10.0) — — (1,454) — (1,454) — (1,454)Tax benefit — employee benefit plans — — — 36 — 36 — 36Share-based compensation expense 14 — — — 343 — 343 — 343Dividends to shareholders ($1.56 per share) 12 — — — (382) — (382) — (382)Net purchases of shares from noncontrolling
interests— — — — — — (1) (1)
Dividends paid to noncontrolling interests onsubsidiary common stock
— — — — — — (32) (32)
Balance at December 31, 2018 240.1 $ 2 $ 472 $ 5,179 $ (1,461) $ 4,192 $ 68 $ 4,260
The notes on pages 68 to 136 are an integral part of these financial statements.

67
CONSOLIDATED STATEMENTS OF CASH FLOWS
Years ended December 31(millions) Notes 2018 2017Cash flows from operating activities
Net income $ 1,044 $ 1,237Less: Income from discontinued operations, net of income taxes 14 806Adjustments to reconcile net income to cash provided by operating activities:
Loss from sales of businesses and investments, net 4 6 16Depreciation of fixed assets 22 101 103Amortization and impairment of intangible assets 8 681 791Share-based compensation expense 14 342 318Deferred income taxes (315) 193
Change in assets and liabilities:Fiduciary receivables (679) 171Short-term investments — funds held on behalf of clients (320) (135)Fiduciary liabilities 999 (36)Receivables, net (127) (254)Accounts payable and accrued liabilities 25 97Restructuring reserves 37 185Current income taxes 63 (1,130)Pension, other postretirement and other postemployment liabilities (174) (38)Other assets and liabilities (36) (107)
Cash provided by operating activities - continuing operations 1,633 605Cash provided by operating activities - discontinued operations — 65Cash provided by operating activities 1,633 670
Cash flows from investing activities Proceeds from investments 65 67Payments for investments (66) (44)Net sales (purchases) of short-term investments — non-fiduciary 348 (232)Acquisition of businesses, net of cash acquired (58) (1,030)Sale of businesses, net of cash sold (10) 4,246Capital expenditures (240) (183)
Cash provided by investing activities - continuing operations 39 2,824Cash used for investing activities - discontinued operations — (19)Cash provided by investing activities 39 2,805
Cash flows from financing activities Share repurchase 12 (1,470) (2,399)Issuance of shares for employee benefit plans (104) (75)Issuance of debt 5,754 1,654Repayment of debt (5,417) (1,999)Cash dividends to shareholders 12 (382) (364)Noncontrolling interests and other financing activities (35) (36)
Cash used for financing activities - continuing operations (1,654) (3,219)Cash used for financing activities - discontinued operations — —Cash used for financing activities (1,654) (3,219)
Effect of exchange rates on cash and cash equivalents (118) 69Net increase (decrease) in cash and cash equivalents (100) 325Cash and cash equivalents at beginning of period 756 431Cash and cash equivalents at end of period $ 656 $ 756Supplemental disclosure: Interest paid $ 266 $ 272Income taxes paid, net of refunds $ 337 $ 1,182
The notes on pages 68 to 136 are an integral part of these financial statements.

68
NOTES TO CONSOLIDATED FINANCIAL STATEMENTS
1. Basis of Presentation
The accompanying Consolidated Financial Statements and Notes thereto have been prepared in accordance with IFRS and the Companies Act 2006 applicable to Companies reporting under IFRS. The Consolidated Financial Statements include the accounts of Aon and its controlled subsidiaries. Intercompany accounts and transactions have been eliminated. The Consolidated Financial Statements include, in the opinion of management, all adjustments (consisting of normal recurring adjustments and reclassifications) necessary to present fairly the Company’s consolidated financial position, results of operations and cash flows for all periods presented.
The Consolidated Financial Statements have been prepared on a historical cost basis unless otherwise noted. A summary of the IFRS accounting policies adopted by the Company in preparing the Consolidated Financial Statements have been included in Note 2 “Summary of Significant Accounting Principles and Practices”.
Aon plc is a public limited company incorporated and domiciled in the United Kingdom under the Companies Act 2006 (registration number 07876075). The Company is registered in England and its registered office is located at the Aon Centre, 122 Leadenhall Street, London, England.
Use of Estimates, Judgments and Assumptions
The preparation of the accompanying Consolidated Financial Statements in conformity with IFRS requires management to make estimates and assumptions that affect the reported amounts of assets, liabilities, the disclosures of contingent assets and liabilities at the date of the financial statements, and the reported amounts of provisions and expenses. These estimates and assumptions are based on management’s best estimates and judgments. Management evaluates its estimates and assumptions on an ongoing basis using historical experience and other factors, including the current economic environment. Management believes its estimates to be reasonable given the current facts available. Aon adjusts such estimates and assumptions when facts and circumstances dictate. Illiquid credit markets, volatile equity markets, and foreign currency exchange rate movements increase the uncertainty inherent in such estimates and assumptions. As future events and their effects cannot be determined with precision, actual results could differ significantly from these estimates. Changes in estimates resulting from continuing changes in the economic environment would, if applicable, be reflected in the financial statements in future periods.
A summary of key estimates, judgments, and assumptions that affect what the Company reports as assets and liabilities and what is disclosed as contingent assets and liabilities at the date of the financial statements, and the reported amounts of revenues and expenses during the periods presented have been included in Note 2 “Summary of Significant Accounting Principles and Practices.”
2. Summary of Significant Accounting Principles and Practices
Consolidation
Aon consolidates any entity in which it is exposed, or has rights, to variable returns from its involvement with the entity and has the ability to affect those returns through its power over the entity. In determining whether Aon holds control over an investee it considers the design and purpose of the investee, it’s substantive rights over the investee in relation to other investors, and Aon’s ability to direct relevant activities to affect our return on the investment.
Revenue Recognition
The Company generates revenues primarily through commissions, compensation from insurance and reinsurance companies for services provided to them, and fees from customers. Commissions and fees for brokerage services vary depending upon several factors, which may include the amount of premium, the type of insurance or reinsurance coverage provided, the particular services provided to a client, insurer, or reinsurer, and the capacity in which the Company acts. Compensation from insurance and reinsurance companies includes: (1) fees for consulting and analytics services and (2) fees and commissions for administrative and other services provided to or on behalf of insurers. In Aon’s capacity as an insurance and reinsurance broker, the service promised to the customer is placement of an effective insurance or reinsurance policy, respectively. At the completion of the insurance or reinsurance policy placement process once coverage is effective, the customer has obtained control over the services promised by the Company. Judgment is not typically required when assessing whether the coverage is effective. Fees from clients for advice and consulting services are dependent on the extent and value of the services provided. Payment terms for the Company’s principal service lines are discussed below; the Company believes these terms are consistent with current industry practices. Significant financing components are typically not present in Aon’s arrangements.
The Company recognizes revenue when control of the promised services is transferred to the customer in the amount that best reflects the consideration to which the Company expects to be entitled in exchange for those services. For arrangements where

69
control is transferred over time, an input or output method is applied that represents a faithful depiction of the progress towards completion of the performance obligation. For arrangements that include variable consideration, the Company assesses whether any amounts should be constrained. For arrangements that include multiple performance obligations, the Company allocates consideration based on their relative fair values.
Costs incurred by the Company in obtaining a contract are capitalized and amortized on a systematic basis that is consistent with the transfer of control of the services to which the asset relates, considering anticipated renewals when applicable. Certain contract related costs, including pre-placement brokerage costs, are capitalized as a cost to fulfill and are amortized on a systematic basis consistent with the transfer of control of the services to which the asset relates, which is generally less than one year.
The Company has elected to apply practical expedients to not disclose the revenue related to unsatisfied performance obligations if the contract has an original duration of 1 year or less or the Company has recognized revenue for the amount in which it has the right to bill.
Disaggregation of Revenue
The following is a description of principal service lines from which the Company generates its revenue:
Commercial Risk Solutions includes retail brokerage, cyber solutions, global risk consulting, and captives. Revenue primarily includes insurance commissions and fees for services rendered. Revenue is predominantly recognized at a point in time upon the effective date of the underlying policy, or for a limited number of arrangements, over the term of the arrangement using output measures to depict the transfer of control of the services to customers in an amount that reflects the consideration to which the Company expects to be entitled in exchange for those services. For arrangements recognized over time, various output measures, including units transferred and time elapsed, are utilized to provide a faithful depiction of the progress towards completion of the performance obligation. Revenue is recorded net of allowances for estimated policy cancellations, which are determined based on an evaluation of historical and current cancellation data. Commissions and fees for brokerage services may be invoiced near the effective date of the underlying policy or over the term of the arrangement in installments during the policy period.
Reinsurance Solutions includes treaty and facultative reinsurance brokerage and capital markets. Revenue primarily includes reinsurance commissions and fees for services rendered. Revenue is predominantly recognized at a point in time upon the effective date of the underlying policy (or policies), or for a limited number of arrangements, over the term of the arrangement using output measures to depict the transfer of control of the services to customers in an amount that reflects the consideration to which the Company expects to be entitled in exchange for those services. For arrangements recognized over time, various output measures, including units delivered and time elapsed, are utilized to provide a faithful depiction of the progress towards completion of the performance obligation. Commissions and fees for brokerage services may be invoiced at the inception of the reinsurance period for certain reinsurance brokerage, or more commonly, over the term of the arrangement in installments based on deposit or minimum premiums for most treaty reinsurance arrangements.
Retirement Solutions includes core retirement, investment consulting, and talent, rewards & performance. Revenue consists primarily of fees paid by customers for consulting services, such as risk management strategies, health and benefits, and human capital consulting services. Revenue recognized for these arrangements is predominantly recognized over the term of the arrangement using input or output measures to depict the transfer of control of the services to customers in an amount that reflects the consideration to which the Company expects to be entitled in exchange for those services, or for certain arrangements, at a point in time upon completion of the services. For consulting arrangements recognized over time, revenue will be recognized based on a measure of progress that depicts the transfer of control of the services to the customer, utilizing an appropriate input or output measure to provide a reasonable assessment of the progress towards completion of the performance obligation including units delivered or time elapsed. Fees paid by customers for consulting services are typically charged on an hourly, project or fixed-fee basis, and revenue for these arrangements is typically recognized based on time incurred, days elapsed, or reports delivered. Revenue from time-and-materials or cost-plus arrangements are recognized as services are performed using input or output measures to provide a reasonable assessment of the progress towards completion of the performance obligation including hours worked, and revenue for these arrangements is typically recognized based on time and materials incurred. Reimbursements received for out-of-pocket expenses are recorded as a component of revenue. Payment terms vary but are typically over the contract term in installments.
Health Solutions includes health and benefits brokerage and health care exchanges. Revenue primarily includes insurance commissions and fees for services rendered. For brokerage commissions, revenue is predominantly recognized at the effective date of the underlying policy (or policies), or for a limited number of arrangements, over the term of the arrangement to depict the transfer of control of the services to customers in an amount that reflects the consideration to which the Company expects to be entitled in exchange for those services using input or output measures, including units delivered or time elapsed, to provide a faithful depiction of the progress towards completion of the performance obligation. Revenue from health care exchange arrangements are typically recognized upon successful enrollment of participants, net of a reserve for estimated cancellations.

70
Commissions and fees for brokerage services may be invoiced at the effective date of the underlying policy or over the term of the arrangement in installments during the policy period. Payment terms for other services vary but are typically over the contract term in installments.
Data & Analytic Services includes Affinity, Aon InPoint, and ReView. Revenue consists primarily of fees for services rendered and is generally recognized over the term of the arrangement to depict the transfer of control of the services to customers in an amount that reflects the consideration to which the Company expects to be entitled in exchange for those services. Payment terms vary but are typically over the contract term in installments. For Data & Analytic Services arrangements recognized over time, revenue will be recognized based on a measure of progress that depicts the transfer of control of the services to the customer, utilizing an appropriate input or output measure to provide a faithful depiction of the progress towards completion of the performance obligation, including units delivered or time elapsed. Input and output measures utilized vary based on the arrangement but typically include reports provided or days elapsed.
Share-Based Compensation Costs
Share-based payments to employees, including grants of restricted share units and performance share awards, are measured based on estimated grant date fair value. The Company recognizes compensation expense over the requisite service period for awards expected to ultimately vest. Forfeitures are estimated on the date of grant and revised if actual or expected forfeiture activity differs materially from original estimates.
Restricted Share Units
Restricted share units (“RSUs’’) are service-based awards for which the Company recognizes the associated compensation cost over the requisite service period. The Company estimates the fair value of the awards based on the market price of the underlying share on the date of grant, reduced by the present value of estimated dividends foregone during the vesting period where applicable.
Performance Share Awards
Performance share awards (“PSAs’’) are performance-based awards for which vesting is dependent on the achievement of certain objectives. Such objectives may be made on a personal, group or company level. The Company estimates the fair value of the awards based on the market price of the underlying share on the date of grant, reduced by the present value of estimated dividends foregone during the vesting period.
Compensation expense is recognized over the performance period. The number of shares issued on the vesting date will vary depending on the actual performance objectives achieved. The Company makes assessments of future performance using subjective estimates, such as long-term plans. As a result, changes in the underlying assumptions could have a material impact on the compensation expense recognized.
The largest plan is the LPP, which has a three-year performance period. As the percent of expected performance increases or decreases, the potential change in expense can go from 0% to 200% of the targeted total expense. The 2016 to 2018 performance period ended on December 31, 2018 and the 2015 to 2017 performance period ended on December 31, 2017. The LPP currently has two open performance periods: 2017 to 2019 and 2018 to 2020. A 10% upward adjustment in the estimated performance achievement percentage for both LPP plans would have increased Aon’s 2018 expense by approximately $2.6 million, while a 10% downward adjustment would have decreased Aon’s expense by approximately $6.8 million.
Pension and Other Postretirement Benefits
The Company sponsors defined benefit pension plans throughout the world. The most significant plans are located in the U.S., the U.K., the Netherlands, and Canada, which are closed to new entrants. The Company has ceased crediting future benefits relating to salary and service for its U.S., U.K., Netherlands, and Canadian plans to the extent statutorily permitted.
The Company records net periodic cost relating to its pension and other postretirement benefit plans based on calculations that include various actuarial assumptions, including discount rates, inflation rates, mortality rates, compensation increases, and turnover rates. The Company reviews its actuarial assumptions on an annual basis and modifies these assumptions based on current rates and trends.
The Company utilizes a full yield curve approach in the estimation of the service and interest cost components of net periodic pension and postretirement benefit cost for our major pension and other postretirement benefit plans by applying the specific spot rates along the yield curve used in the determination of the benefit obligation to the relevant projected cash flows.
Actuarial gains and losses are recognized in Other comprehensive income in the period in which they occur in and are not reclassified to net income in subsequent periods. Service costs, administrative expenses, and net interest on the defined benefit liability (asset)

71
is included within Compensation and benefits and the return on assets (excluding amounts included in net interest) is recognized in Other comprehensive income.
The defined benefit surplus or deficit is calculated as the present value of defined benefit obligations less the fair value of the plan assets and is included within Prepaid pension or Pension, other postretirement, and postemployment liabilities on the Statement of Financial Position. The Company recognizes a pension surplus on the basis that it is entitled to the surplus of each plan in the event of a gradual settlement of the liabilities, due to its ability to order a winding-up of the Trust. Additionally under IFRIC 14 pension funding contributions are considered to be a minimum funding requirement and, to the extent that the contributions payable will not be available to the Company after they are paid into the scheme, a liability is recognized when the obligation arises.
Net Income per Share
Basic net income per share is computed by dividing net income available to ordinary shareholders by the weighted-average number of ordinary shares outstanding, including participating securities, which consist of unvested share awards with non-forfeitable rights to dividends. Diluted net income per share is computed by dividing net income available to ordinary shareholders by the weighted-average number of ordinary shares outstanding, which have been adjusted for the dilutive effect of potentially issuable ordinary shares, including certain contingently issuable shares. The diluted earnings per share calculation reflects the more dilutive effect of either (1) the two-class method that assumes that the participating securities have not been exercised, or (2) the treasury stock method.
Potentially issuable shares are not included in the computation of diluted income per share if their inclusion would be antidilutive.
Cash and Cash Equivalents and Short-term Investments
Cash and cash equivalents include cash balances and all highly liquid investments with initial maturities of three months or less. Short-term investments consist of money market funds. The estimated fair value of Cash and cash equivalents and Short-term investments approximates their carrying values.
At December 31, 2018, Cash and cash equivalents and Short-term investments totaled $828 million compared to $1,285 millionat December 31, 2017. Of the total balance, $91 million and $96 million was restricted as to its use at December 31, 2018 and 2017, respectively. Included within the December 31, 2018 and 2017 balances, respectively, were £42.7 million ($53.9 million at December 31, 2018 exchanges rates) and £42.7 million ($57.1 million at December 31, 2017 exchange rates) of operating funds required to be held by the Company in the U.K. by the FCA, which were included in Short-term investments.
Fiduciary Assets and Liabilities
In its capacity as an insurance agent and broker, Aon collects premiums from insureds and, after deducting its commission, remits the premiums to the respective insurers. Aon also collects claims or refunds from insurers on behalf of insureds. Uncollected premiums from insureds and uncollected claims or refunds from insurers are recorded as Fiduciary assets in the Company’s Consolidated Statements of Financial Position. Unremitted insurance premiums and claims are held in a fiduciary capacity and the obligation to remit these funds is recorded as Fiduciary liabilities in the Company’s Consolidated Statements of Financial Position.
Aon held fiduciary assets for premiums collected form insureds but not yet remitted to insurance companies and claims collected from insurance companies but not yet remitted to insureds of $3.9 billion and $3.7 billion at December 31, 2018 and 2017, respectively. These funds and a corresponding liability are included in Fiduciary assets and Fiduciary liabilities, respectively, in the accompanying Consolidated Statements of Financial Position.
Allowance for Doubtful Accounts
The Company’s allowance for doubtful accounts with respect to receivables is based on a combination of factors, including the aging of balances, current and forward-looking information including macroeconomic factors, financial health of large customers, significant delinquent payments, and other qualitative and quantitative information, which are used to assess default. The Company measures the allowance for doubtful accounts at the amount equal to the lifetime expected credit loss including assessment of whether risk of collectability on receivables has increased significantly since initial recognition. Receivables, net included allowance for doubtful accounts of $62 million and $59 million at December 31, 2018 and 2017, respectively.

72
Fixed Assets
Fixed assets are stated at cost, less accumulated depreciation. Depreciation and amortization are computed using the straight-line method over the estimated useful lives of the assets, which are generally as follows:
Asset Description Expected Life
Leasehold improvements Lesser of estimated useful life or lease term, not to exceed 10 yearsFurniture, fixtures and equipment 4 to 10 yearsComputer equipment 4 to 6 yearsBuildings 35 yearsAutomobiles 6 years
Estimated useful lives are reviewed on an annual basis.
Leases
The determination of whether an arrangement is, or contains, a lease is based on the substance of the arrangement at the inception date. The arrangement is assessed for whether fulfillment of the arrangement is dependent on the use of a specific asset or assets or the arrangement conveys a right to use the asset or assets, even if that right is not explicitly specified in an arrangement.
Leases in which a significant portion of the risks and rewards of ownership are retained by the lessor are classified as operating leases. Expense associated with payments made under operating leases is recognized in Premises in the Consolidated Statements of Income on a straight-line basis over the period of the lease.
Derivatives
Derivative instruments are recognized in the Consolidated Statements of Financial Position at fair value. Where the Company has entered into master netting agreements with counterparties, the derivative positions are netted by counterparty and are reported accordingly in Other assets or Other liabilities. Changes in the fair value of derivative instruments are recognized in earnings each period, unless the derivative is designated and qualifies as a cash flow or net investment hedge.
The Company has historically designated the following hedging relationships for certain transactions: (1) a hedge of the change in fair value of a recognized asset or liability or firm commitment (“fair value hedge”), (2) a hedge of the variability in cash flows from a recognized variable-rate asset or liability or forecasted transaction (“cash flow hedge”), and (3) a hedge of the net investment in a foreign operation (“net investment hedge”).
In order for a derivative to qualify for hedge accounting, the derivative must be formally designated as a fair value, cash flow, or a net investment hedge by documenting the relationship between the derivative and the hedged item. The documentation must include a description of the hedging instrument, the hedged item, the risk being hedged, Aon’s risk management objective and strategy for undertaking the hedge, the method for assessing the effectiveness of the hedge, and the method for measuring hedge ineffectiveness. Additionally, the hedge relationship must be expected to be highly effective at offsetting changes in either the fair value or cash flows of the hedged item at both the inception of the hedge and on an ongoing basis. Aon assesses the ongoing effectiveness of its hedges and measures and records hedge ineffectiveness, if any, at the end of each quarter or more frequently if facts and circumstances require.
For a derivative designated as a fair value hedging instrument, the gain or loss is recognized in earnings in the period of change together with the offsetting loss or gain on the hedged item attributable to the risk being hedged. The effect is to reflect in earnings the extent to which the hedge is not effective in achieving offsetting changes in fair value. For a cash flow hedge that qualifies for hedge accounting, the effective portion of the change in fair value of a hedging instrument is recognized in Other reserves and subsequently reclassified to earnings in the same period the hedged item impacts earnings. The ineffective portion of the change in fair value is recognized immediately in earnings. For a net investment hedge, the effective portion of the change in fair value of the hedging instrument is recognized in Other reserves as part of the cumulative translation adjustment, while the ineffective portion is recognized immediately in earnings.
Changes in the fair value of a derivative that is not designated as part of a hedging relationship (commonly referred to as an “economic hedge”) are recorded in Other income (expense) in the Consolidated Statements of Income.
The Company discontinues hedge accounting prospectively when (1) the derivative expires or is sold, terminated, or exercised, (2) the qualifying criteria are no longer met, or (3) management removes the designation of the hedging relationship.

73
Goodwill and Other Intangible Assets
Goodwill represents the excess of acquisition cost over the fair value of the net assets in the acquisition of a business. Goodwill is not amortized, but instead is tested for impairment at least annually in the fourth quarter. The Company tests more frequently if there are indicators of impairment or whenever business circumstances suggest that the carrying value of goodwill may not be recoverable. These indicators may include a sustained significant decline in the Company’s share price and market capitalization, a decline in expected future cash flows, or a significant adverse change in legal factors or in the business climate, among others. No events occurred during 2018 that indicate the existence of an impairment with respect to the Company’s reported goodwill.
For goodwill impairment testing, assets are grouped together into the smallest group of assets that generates cash inflows from continuing use that are largely independent of the cash inflows of other assets or cash generating units (“CGU”). An impairment loss is recognized in net income if the carrying amount of a CGU exceeds its recoverable amount. The recoverable amount is the higher of a CGU’s fair value less costs to sell and value-in-use. The recoverable amount is determined based on calculations prepared on the basis of management’s assumptions and estimates. In determining the recoverable amount of CGUs, the Company uses a discounted cash flow (“DCF’’) model based on current forecasts. The related cash flow forecasts are discounted using a pre-tax rate at the date of evaluation. Preparation of forecasts and selection of the discount rate for use in the DCF model involve significant judgments, and changes in these estimates could affect the estimated fair value of one or more of the Company’s CGUs and could result in a goodwill impairment charge in a future period. Market multiples are also used which are obtained from quoted prices of comparable companies to corroborate the Company’s DCF model results. The combined estimated fair value of our reporting units from our DCF model often results in a premium over our market capitalization, commonly referred to as a control premium. The Company believes that the implied control premium determined by our impairment analysis is reasonable based upon historic data of premiums paid on actual transactions within our industry.
Intangible assets are comprised primarily of customer-related and contract-based, software, tradenames and technology assets. Amortization is recognized as Amortization and impairment of intangible assets on the Consolidated Statements of Income. Amortization basis and estimated useful lives by intangible asset type are generally as follows:
Intangible Asset Description Amortization Basis Expected Life
Customer-related and contract-based In line with underlying cash flows 7 to 20 yearsSoftware Straight-line 4 to 7 yearsTradenames Straight-line 1 to 3 yearsTechnology Straight-line 5 to 7 years
The Company reviews intangible assets that are being amortized for impairment whenever events or changes in circumstances indicate that their carrying amount may not be recoverable.
Foreign Currency
The Company’s Consolidated Financial Statements are presented in U.S. dollars, which is also the Parent Company’s functional currency. Certain of the Company’s non-U.S. operations use their respective local currency as their functional currency. These operations that do not have the U.S. dollar as their functional currency translate their financial statements at the current rates of exchange in effect at the balance sheet date and revenues and expenses using rates that approximate those in effect during the period. The resulting translation adjustments are included in net foreign currency translation adjustments within the Consolidated Statements of Shareholders’ Equity. Gains and losses from the remeasurement of monetary assets and liabilities that are denominated in a non-functional currency are included in Other income (expense) within the Company’s Consolidated Statements of Income.
Income Taxes
Current income tax
Current income tax is measured at the amount expected to be recovered from or paid to the taxation authorities, using the tax rates and laws enacted or substantively enacted at the reporting date in the countries where the Group operates and generates taxable income or loss. Current income tax relating to items recognized directly in equity is recognized in equity and not the income statement.
Management evaluates positions taken in its tax returns with respect to situations in which applicable tax regulations are subject to interpretation and establishes provisions where appropriate. A tax position is recognized if it is considered probable that the tax position will be sustained. Current tax liabilities or assets for the current and prior periods are measured at the amounts expected to be paid to or recovered from the taxing authorities. A change in the recognition and measurement of a tax position is needed when circumstances change or where new facts clarify the probability of estimates previously made. Significant judgment is required in assessing tax positions, particularly with respect to transfer pricing requirements under the laws of many different

74
countries on our revenues and costs. Estimates are determined by management based on the technical merits of each position taking into account prior audit experience of similar transactions and in some cases reports from independent experts. The Company records penalties and interest related to these positions subject to interpretation within Income Tax in the Company’s Consolidated Statements of Income.
Deferred tax
Deferred tax is provided using the liability method on temporary differences between the tax bases of assets and liabilities and their carrying amounts in the consolidated financial statements.
Deferred tax is not recognized for:
(1) taxable temporary differences arising from the initial recognition of goodwill,
(2) temporary differences on the initial recognition of assets or liabilities in a transaction that is not a business combination and, at the time of the transaction, affects neither the accounting profit nor taxable profit or loss, or
(3) temporary differences related to investments in subsidiaries, associates and joint ventures, to the extent the Group is able to control the timing of the reversal of the temporary differences and it is probable that the temporary differences will not reverse in the foreseeable future. Additional income taxes could be recorded (or incurred) if we change our investment strategy relating to these subsidiaries, which could materially affect our future effective tax rate.
Deferred tax assets are recognized for deductible temporary differences and the carry forward of unused tax credits and unused tax losses to the extent that it is probable that future taxable profit will be available against which they can be utilized. Deferred tax assets are reviewed at each reporting date and reduced to the extent that it is no longer probable that the related tax benefit will be realized. Unrecognized deferred tax assets are reassessed at each reporting date and are recognized to the extent that it has become probable that future taxable profits will allow the deferred tax asset to be recovered.
Deferred tax is measured at the tax rates that are expected to apply in the year when the asset is realized or the liability is settled, using tax rates and laws enacted or substantively enacted at the reporting date.
Deferred tax assets and deferred tax liabilities are offset if a legally enforceable right exists to set off current tax assets against current income tax liabilities and the deferred taxes relate to the same taxable entity and the same taxation authority.
Provisions
Provisions are recognized when the Company has a present obligation (legal or constructive) as a result of a past event, it is probable that an outflow of resources embodying economic benefits will be required to settle the obligation and a reliable estimate can be made of the amount of the obligation.
The Company is required to assess the likelihood of material adverse judgments or outcomes as well as potential ranges or probability of losses. The Company determines the amount of provisions required, if any, after carefully analyzing each individual item. The required provisions may change due to new developments in each issue. The Company does not recognize gain contingencies until the contingency is resolved and amounts due are virtually certain of collection.
Critical Accounting Estimates and Judgments
In accordance with our policies, the Company regularly evaluates its estimates, assumptions, and judgments, including, but not limited to, those concerning revenue recognition, pensions, goodwill and other intangible assets, provisions, share-based payments, and income taxes, and bases estimates, assumptions, and judgments on historical experience and on factors the Company believes reasonable under the circumstances. The results involve judgments about the carrying values of assets and liabilities not readily apparent from other sources. If assumptions or conditions change, the actual results reported may differ from these estimates. The areas where judgment, estimates, and assumptions have the most significant effect on the amounts recognized in the consolidated financial statements are as follows:
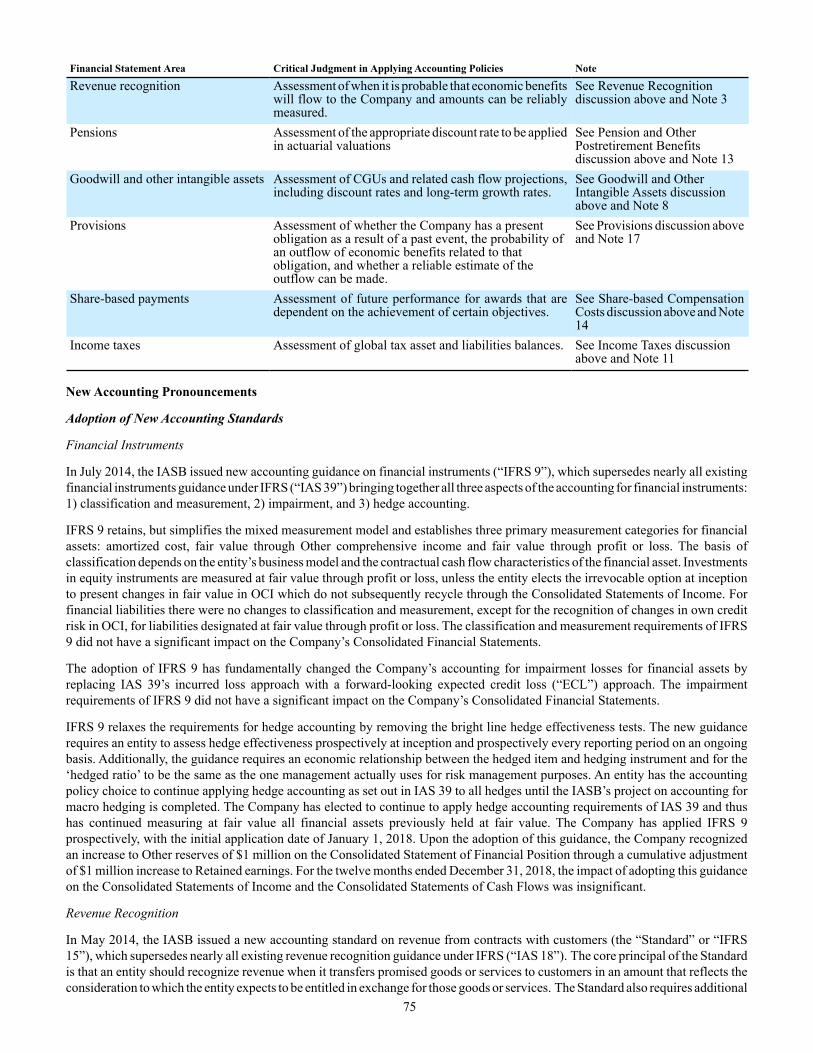
75
Financial Statement Area Critical Judgment in Applying Accounting Policies Note
Revenue recognition Assessment of when it is probable that economic benefits will flow to the Company and amounts can be reliably measured.
See Revenue Recognitiondiscussion above and Note 3
Pensions Assessment of the appropriate discount rate to be applied in actuarial valuations
See Pension and OtherPostretirement Benefitsdiscussion above and Note 13
Goodwill and other intangible assets Assessment of CGUs and related cash flow projections, including discount rates and long-term growth rates.
See Goodwill and OtherIntangible Assets discussionabove and Note 8
Provisions Assessment of whether the Company has a presentobligation as a result of a past event, the probability ofan outflow of economic benefits related to thatobligation, and whether a reliable estimate of theoutflow can be made.
See Provisions discussion above and Note 17
Share-based payments Assessment of future performance for awards that are dependent on the achievement of certain objectives.
See Share-based Compensation Costs discussion above and Note 14
Income taxes Assessment of global tax asset and liabilities balances. See Income Taxes discussionabove and Note 11
New Accounting Pronouncements
Adoption of New Accounting Standards
Financial Instruments
In July 2014, the IASB issued new accounting guidance on financial instruments (“IFRS 9”), which supersedes nearly all existing financial instruments guidance under IFRS (“IAS 39”) bringing together all three aspects of the accounting for financial instruments: 1) classification and measurement, 2) impairment, and 3) hedge accounting.
IFRS 9 retains, but simplifies the mixed measurement model and establishes three primary measurement categories for financial assets: amortized cost, fair value through Other comprehensive income and fair value through profit or loss. The basis of classification depends on the entity’s business model and the contractual cash flow characteristics of the financial asset. Investments in equity instruments are measured at fair value through profit or loss, unless the entity elects the irrevocable option at inception to present changes in fair value in OCI which do not subsequently recycle through the Consolidated Statements of Income. For financial liabilities there were no changes to classification and measurement, except for the recognition of changes in own credit risk in OCI, for liabilities designated at fair value through profit or loss. The classification and measurement requirements of IFRS 9 did not have a significant impact on the Company’s Consolidated Financial Statements.
The adoption of IFRS 9 has fundamentally changed the Company’s accounting for impairment losses for financial assets by replacing IAS 39’s incurred loss approach with a forward-looking expected credit loss (“ECL”) approach. The impairment requirements of IFRS 9 did not have a significant impact on the Company’s Consolidated Financial Statements.
IFRS 9 relaxes the requirements for hedge accounting by removing the bright line hedge effectiveness tests. The new guidance requires an entity to assess hedge effectiveness prospectively at inception and prospectively every reporting period on an ongoing basis. Additionally, the guidance requires an economic relationship between the hedged item and hedging instrument and for the ‘hedged ratio’ to be the same as the one management actually uses for risk management purposes. An entity has the accounting policy choice to continue applying hedge accounting as set out in IAS 39 to all hedges until the IASB’s project on accounting for macro hedging is completed. The Company has elected to continue to apply hedge accounting requirements of IAS 39 and thus has continued measuring at fair value all financial assets previously held at fair value. The Company has applied IFRS 9 prospectively, with the initial application date of January 1, 2018. Upon the adoption of this guidance, the Company recognized an increase to Other reserves of $1 million on the Consolidated Statement of Financial Position through a cumulative adjustment of $1 million increase to Retained earnings. For the twelve months ended December 31, 2018, the impact of adopting this guidance on the Consolidated Statements of Income and the Consolidated Statements of Cash Flows was insignificant.
Revenue Recognition
In May 2014, the IASB issued a new accounting standard on revenue from contracts with customers (the “Standard” or “IFRS 15”), which supersedes nearly all existing revenue recognition guidance under IFRS (“IAS 18”). The core principal of the Standard is that an entity should recognize revenue when it transfers promised goods or services to customers in an amount that reflects the consideration to which the entity expects to be entitled in exchange for those goods or services. The Standard also requires additional

76
disclosure about the nature, amount, timing, and uncertainty of revenue and cash flows arising from customer contracts, including significant judgments, changes in judgments, and assets recognized from costs incurred to obtain or fulfill a contract. Two methods of transition were permitted upon adoption: full retrospective and modified retrospective. The Company elected to apply the modified retrospective adoption approach to all contracts. Under this approach, prior periods were not restated. Rather, revenues and other disclosures for prior periods were provided in the notes to the financial statements as previously reported under IAS 18, and the cumulative effect of initially applying the guidance was recognized as an adjustment to Retained earnings.
The following summarizes the significant changes to the Company as a result of the adoption of IFRS 15 on January 1, 2018.
• The Company previously recognized revenue either at a point in time or over a period of time based on the transfer of value to customers or as the remuneration became determinable. Under IFRS 15, the revenue related to certain brokerage services recognized over a period of time is recognized on the effective date of the associated policies when control of the policy transfers to the customer. As a result, revenue from these arrangements are typically recognized in earlier periods under IFRS 15 in comparison to IAS 18, changing the timing and amount of revenue recognized for annual periods.
• The Standard provides guidance on accounting for certain revenue-related costs including when to capitalize costs associated with obtaining and fulfilling a contract. The majority of these costs were previously expensed as incurred under IAS 18. Assets recognized for the costs to obtain a contract, which includes certain sales commissions, are amortized on a systematic basis that is consistent with the transfer of the services to which the asset relates, considering anticipated renewals when applicable. For situations where the renewal period is one year or less and renewal costs are commensurate with the initial contract, the Company applied a practical expedient and recognizes the costs of obtaining a contract as an expense when incurred. Assets recognized as costs to fulfill a contract, which includes internal costs related to pre-placement broking activities, as well as other costs, are amortized on a systematic basis that is consistent with the transfer of the services to which the asset relates, which is generally less than one year.
As a result of applying the modified retrospective method to adopt IFRS 15, the following adjustments were made to the Consolidated Statement of Financial Position as of January 1, 2018:
December 31,2017
January 1,2018
(millions) As Reported Adjustments As Adjusted
Assets
Receivables, net $ 2,477 $ 252 $ 2,729Other current assets $ 289 $ 298 $ 587Deferred tax assets $ 510 $ (128) $ 382Other non-current assets $ 277 $ 145 $ 422
Liabilities
Accounts payable and accrued liabilities $ 1,791 $ 8 $ 1,799Other current liabilities $ 952 $ 13 $ 965Deferred tax liabilities $ 111 $ 42 $ 153Other non-current liabilities $ 714 $ (3) $ 711
Equity
Total equity $ 4,674 $ 507 $ 5,181

77
The following tables summarize the impacts of adopting IFRS 15 on the Company’s Consolidated Statement of Income, Financial Position, and Cash Flows as of and for the twelve months ended December 31, 2018.
Consolidated Statement of Income
Twelve months ended December 31, 2018
(millions) As Reported Adjustments
BalancesWithout
Adoption ofIFRS 15
RevenueTotal revenue $ 10,770 $ (61) $ 10,709
ExpensesCompensation and benefits $ 6,193 $ 51 $ 6,244Other general expenses $ 1,483 $ (1) $ 1,482Other income (expense) $ (25) $ 1 $ (24)Income taxes $ 130 $ (34) $ 96
Adoption of IFRS 15 had a favorable impact of $78 million on net income from continuing operations, or $0.31 per share, for the twelve months ended December 31, 2018.
Consolidated Statement of Financial Position
As of December 31, 2018
(millions) As Reported Adjustments
BalancesWithout
Adoption ofIFRS 15
Assets
Receivables, net $ 2,759 $ (301) $ 2,458Other current assets $ 626 $ (319) $ 307Deferred tax assets $ 623 $ 137 $ 760Other non-current assets $ 438 $ (155) $ 283
Liabilities
Other current liabilities $ 943 $ (43) $ 900Deferred tax liabilities $ 152 $ (28) $ 124Other non-current liabilities $ 677 $ 2 $ 679
Equity
Total equity $ 4,260 $ (569) $ 3,691
Consolidated Statement of Cash Flows
Twelve months ended December 31, 2018
(millions) As Reported Adjustments
BalancesWithout
Adoption ofIFRS 15
Cash flows from operating activities Net income $ 1,044 $ (78) $ 966Receivables, net $ (127) $ 49 $ (78)Accounts payable and accrued liabilities $ 25 $ 8 $ 33Current income taxes $ 63 $ (34) $ 29Other assets and liabilities $ (36) $ 55 $ 19
The adoption of IFRS 15 had no impact on total Cash provided by operating activities.

78
Refer to Note 3 “Revenue from Contracts with Customers” for further information.
Accounting Standards Issued but Not Yet Adopted
Leases
In January 2016, the IASB issued new accounting guidance on leases, which requires lessees to recognize assets and liabilities for most leases. Under the new standard, a lessee is required to recognize in the Consolidated Statement of Financial Position liabilities to make future lease payments and right-of-use assets representing its right to use the underlying assets for the lease term. The new standard is effective for the Company on January 1, 2019, with early adoption permitted and permits lessees to use either a retrospective or a modified retrospective approach on transition for leases existing at the date of transition with options to use certain transition reliefs. Under the modified retrospective approach, entities may elect to recognize a cumulative-effect adjustment to the opening balance of retained earnings in the year of adoption. Under this transition method, an entity's reporting for the comparative periods prior to adoption presented in the financial statements would continue to be in accordance with current lease guidance and thus not restated. The Company will adopt the new standard as of January 1, 2019 using the modified retrospective approach approved by the IASB. Additionally, the Company will provide expanded lease disclosures required under the new standard in the 2019 report, including both qualitative and quantitative information.
The modified retrospective approach includes several optional practical expedients that entities may independently elect to apply upon transition. The Company has determined it will elect the practical expedient which allows a lessee to carryforward their population of existing leases. The Company will elect the practical expedient related to lease and non-lease components, as an accounting policy election for all asset classes, which allows a lessee to not separate non-lease from lease components and instead account for consideration paid in a contract as a single lease component. Additionally, the Company will elect the practical expedient which allows lessees to apply a single discount rate to a portfolio of leases with reasonably similar characteristics on a lease by lease basis. Lastly, the Company will elect the practical expedient which allows lessees to rely on their assessment of whether leases are onerous immediately before the date of initial application as an alternative to performing an impairment review.
Furthermore, the Company has made two accounting policy elections related to short-term leases and leases of low-value assets which applies to all classes of underlying assets. The short-term election allows entities to not recognize right-of-use assets and lease liabilities that arise from leases with a remaining term of twelve months or less on the Consolidated Statements of Financial Position. The low-value asset election allows entities to exclude right-of-use assets and lease liabilities arising from leases of low-value, which the Company has defined as $5,000 or less, from the Consolidated Statements of Financial Position.
The Company has executed a comprehensive approach to identify arrangements that may contain a lease, has performed completeness assessments over the identified lease population, and has implemented system solutions and processes to appropriately account for the lease right-of-use assets and lease liabilities upon transition and an ongoing basis. Further, control activities related to the adoption of this standard as well as ongoing transactional processes and procedures have been designed and begun to be implemented to ensure compliance with the new standard.
The Company expects to recognize lease liabilities ranging from approximately $1.2 billion to $1.4 billion, corresponding right-of-use assets ranging from $1.0 billion to $1.2 billion, and adjustments to Retained earnings of approximately $20 million to $30 million on the Consolidated Statements of Financial Position upon the adoption of this standard. Additionally, the Company expects net cash outflows related to leasing arrangements to be primarily recognized as financing activities on the Consolidated Statements of Cash Flows upon adoption of the new standard as compared to operating activities under the current guidance. In addition, the Company expects the Consolidated Statements of Income to reflect increased Interest expense and decreased Premise expense under the new standard.

79
3. Revenue from Contracts with Customers
Disaggregation of Revenue
The following table summarizes revenue from contracts with customers by principal service line (in millions):
Years ended December 312018 2017
Commercial Risk Solutions $ 4,652 $ 4,169Reinsurance Solutions 1,563 1,429Retirement Solutions 1,865 1,755Health Solutions 1,596 1,515Data & Analytic Services 1,105 1,140Elimination (11) (10)
Total revenue $ 10,770 $ 9,998
Consolidated revenue from contracts with customers by geographic area, which is attributed on the basis of where the services are performed, is as follows (in millions):
Years ended December 312018 2017
United States $ 4,677 $ 4,425Americas other than United States 940 976United Kingdom 1,555 1,436Europe, Middle East, & Africa other than United Kingdom 2,413 2,025Asia Pacific 1,185 1,136
Total revenue $ 10,770 $ 9,998
Contract Costs
The Company recognizes an asset for costs incurred to fulfill a contract for costs that are specifically identified and relate to a contract or anticipated contract, generate or enhance resources used in satisfying the Company’s performance obligations, and are expected to be recovered. Assets recognized as costs to fulfill a contract, which includes internal costs related to pre-placement broking activities, as well as other costs, are amortized on a systematic basis that is consistent with the transfer of control of the services to which the asset relates. The amortization is primarily included in Compensation and benefits on the Consolidated Statements of Income.
An analysis of the changes in the net carrying amount of costs to fulfill contracts with customers is as follows (in millions):
2018
Balance at beginning of period (1) $ 298Additions 1,504Amortization (1,465)Impairment —Foreign currency translation and other (8)
Balance at end of period $ 329
(1) Upon adoption of the new revenue recognition standard on January 1, 2018, Aon capitalized $298 million of costs to fulfill contracts with customers.
The Company capitalizes incremental costs to obtain a contract with a customer that are expected to be recovered. Assets recognized for the costs to obtain a contract, which includes certain sales commissions, will be amortized on a systematic basis that is consistent with the transfer of control of the services to which the asset relates, considering anticipated renewals when applicable. For situations where the renewal period is one year or less and renewal costs are commensurate with the initial contract, the Company has applied a practical expedient and recognized the costs of obtaining a contract as an expense when incurred. The amortization is primarily included in Compensation and benefits on the Consolidated Statements of Income.

80
An analysis of the changes in the net carrying amount of costs to obtain contracts with customers is as follows (in millions):
2018
Balance at beginning of period (1) $ 145Additions 53Amortization (41)Impairment —Foreign currency translation and other (1)
Balance at end of period $ 156
(1) Upon adoption of the new revenue recognition standard on January 1, 2018, Aon capitalized $145 million of costs to obtain contracts with customers.
Please refer to Note 2 “Summary of Significant Accounting Principles and Practices” for further information regarding the Company’s revenue recognition policy.
4. Other Financial Data
Consolidated Statements of Income Information
Other Income (Expense)
Other income (expense) consists of the following (in millions):
Years ended December 31
2018 2017
Foreign currency remeasurement $ 24 $ (37)Disposal of business (6) (16)Equity earnings 2 4Investments (12) 37Derivatives and hedging (32) 10Other (1) —
Total $ (25) $ (2)
Consolidated Statements of Financial Position Information
Allowance for Doubtful Accounts
An analysis of the allowance for doubtful accounts is as follows (in millions):
2018 2017
Balance at January 1 $ 59 $ 58Impairment loss charged to Other general expenses 24 18Accounts written off, net of recoveries (25) (18)Allowance of Divested Business — (2)Foreign currency translation 4 3
Balance at December 31 $ 62 $ 59
As of December 31, 2018, the Company had exposures to individual trade counterparties within trade receivables. In accordance with Company policy, Aon operating entities continually monitor exposures against credit limits and concentration of risk. No individual trade counterparty credit exposure is considered significant in the ordinary course of trading activity. Management does not expect any significant losses from non-performance by trade counterparties that have not been provided for.

81
Other Current Assets
The components of Other current assets are as follows (in millions):
As of December 31 2018 2017
Prepaid expense $ 97 $ 126Taxes receivable 113 114Costs to fulfill contracts with customers (1) 329 —Other 87 49
Total $ 626 $ 289
(1) Refer to Note 3 “Revenue from Contracts with Customers” for further information.
Other Non-Current Assets
The components of Other non-current assets are as follows (in millions):
As of December 31 2018 2017
Taxes receivable $ 100 $ 84Investments 54 62Costs to obtain contracts with customers (1) 156 —Other 128 131
Total $ 438 $ 277
(1) Refer to Note 3 “Revenue from Contracts with Customers” for further formation.
Other Current Liabilities
The components of Other current liabilities are as follows (in millions):
As of December 31 2018 2017
Deferred revenue (1) $ 251 $ 311Taxes payable (2) 427 446Other 265 195
Total $ 943 $ 952
(1) During the twelve months ended December 31, 2018, $487 was recognized in the Consolidated Statements of Income.(2) Includes $42 million for the current portion of the Transition Tax as of December 31, 2017. Refer to Note 11 “Income Taxes” for further information on
the Transition Tax.
Other Non-Current Liabilities
The components of Other non-current liabilities are as follows (in millions):
As of December 31 2018 2017
Taxes payable (1) $ 240 $ 222Leases 159 143Compensation and benefits 56 67Deferred revenue 65 49Other 157 233
Total $ 677 $ 714
(1) Represents the non-current portion of the Transition Tax as of December 31, 2018 and 2017, respectively. Refer to Note 11 “Income Taxes” for further information on the Transition Tax.

82
5. Discontinued Operations
On February 9, 2017, the Company entered into a Purchase Agreement with Tempo Acquisition, LLC (the “Purchase Agreement”) to sell the Divested Business to an entity formed and controlled by affiliates of The Blackstone Group L.P. (the “Buyer”) and certain designated purchasers that are direct or indirect subsidiaries of the Buyer.
On May 1, 2017, the Buyer purchased all of the outstanding equity interests of the Divested Business, plus certain related assets and liabilities, for a purchase price of $4.3 billion in cash paid at closing, subject to customary adjustments set forth in the Purchase Agreement, and deferred consideration of up to $500 million. Cash proceeds after customary adjustments and before taxes due were $4.2 billion.
Aon and the Buyer entered into certain transaction related agreements at the closing, including two commercial agreements, a transition services agreement, certain intellectual property license agreements, sub-leases, and other customary agreements. Aon expects to continue to be a significant client of the Divested Business and the Divested Business has agreed to use Aon for its broking and other services for a specified period of time.
The financial results of the Divested Business for the years ended December 31, 2018 and 2017 are presented as Income from discontinued operations, net of tax, on the Company’s Consolidated Statements of Income. The following table presents the financial results of the Divested Business (in millions):
Years ended December 312018 2017
RevenueTotal revenue $ — $ 698
ExpensesTotal operating expenses 12 639
Operating income from discontinued operations (12) 59Other income — 10
Income (loss) from discontinued operations before income taxes (12) 69Income tax (benefit) (3) 13
Income (loss) from discontinued operations excluding gain, net of tax (9) 56Gain on sale of discontinued operations, net of tax (1) 23 750
Income from discontinued operations, net of tax $ 14 $ 806
(1) Tax benefit on the sale of the Divested Business was $11 million in 2018. Taxes on the sale of the Divested Business were $1.2 billion in 2017.
Upon triggering held for sale criteria in February 2017, Aon ceased depreciating and amortizing all long-lived assets included in discontinued operations. Total operating expenses for the year ended December 31, 2017 include $8 million of depreciation of fixed assets and $11 million of intangible asset amortization for the time prior to the Company triggering held for sale criteria.
The Company’s Consolidated Statements of Cash Flows present the operating, investing, and financing cash flows of the Divested Business as discontinued operations. Aon uses a centralized approach to cash management and financing of its operations. Prior to the closing of the Transaction, portions of the Divested Business’s cash were transferred to Aon daily, and Aon would fund the Divested Business as needed. There were no Cash and cash equivalents of discontinued operations at December 31, 2017. Total proceeds received for the sale of the Divested Business and taxes paid as a result of the sale are recognized on the Consolidated Statements of Cash Flows in Cash provided by investing activities - continuing operations and Cash provided by operating activities - continuing operations, respectively.

83
6. Restructuring
In 2017, Aon initiated a global restructuring plan (the “Restructuring Plan”) in connection with the sale of the Divested Business. The Restructuring Plan is intended to streamline operations across the organization and deliver greater efficiency, insight, and connectivity. The Company expects these restructuring activities and related expenses to affect continuing operations through 2019, including an estimated 4,800 to 5,400 role eliminations. At the end of 2018, Aon expanded the Restructuring Plan, which resulted in additional expected costs of approximately $200 million, consisting of $150 million of cash investment and $50 millionof non-cash charges.
The Restructuring Plan is expected to result in cumulative costs of approximately $1,225 million through the end of the plan, consisting of approximately $450 million in employee termination costs, $130 million in technology rationalization costs, $65 million in lease consolidation costs, $50 million in non-cash asset impairments, and $530 million in other costs, including certain separation costs associated with the sale of the Divested Business.
From the inception of the Restructuring Plan through December 31, 2018, the Company has eliminated 4,366 positions and incurred total expenses of $999 million for restructuring and related separation costs. These charges are included in Compensation and benefits, Information technology, Premises, Depreciation of fixed assets, and Other general expenses in the accompanying Consolidated Statements of Income.
The following table summarizes restructuring and separation costs by type that have been incurred through December 31, 2018and are estimated to be incurred through the end of the Restructuring Plan (in millions). Estimated costs by type may be revised in future periods as these assumptions are updated:
Year EndedDecember 31, 2018 Inception to Date
EstimatedRemaining Costs
Estimated Total Cost (1)
Workforce reduction $ 115 $ 414 $ 36 $ 450Technology rationalization (2) 47 80 50 130Lease consolidation (2) 30 50 15 65Asset impairments 14 42 8 50Other costs associated with restructuring and separation (2) (3) 282 413 117 530
Total restructuring and related expenses $ 488 $ 999 $ 226 $ 1,225
(1) Actual costs, when incurred, may vary due to changes in the assumptions built into the Restructuring Plan. Significant assumptions that may change when plans are finalized and implemented include, but are not limited to, changes in severance calculations, changes in the assumptions underlying sublease loss calculations due to changing market conditions, and changes in the overall analysis that might cause the Company to add or cancel component initiatives.
(2) Total contract termination costs incurred under the Restructuring Plan associated with Technology rationalizations, Lease consolidations, and Other costs associated with restructuring and separation, respectively, for the twelve months ended December 31, 2018 were $5 million, $27 million, and $85 million; and since inception of the Restructuring Plan, were $6 million, $47 million, and $88 million, respectively. Total estimated contract termination costs expected to be incurred under the Restructuring Plan associated with Technology rationalizations, Lease consolidations, and Other costs associated with restructuring and separation, respectively, are $15 million, $80 million, and $95 million.
(3) Other costs associated with the Restructuring Plan include primarily those to separate the Divested Business, as well as moving costs and consulting and legal fees. These costs are generally recognized when incurred.

84
7. Acquisitions and Dispositions of Businesses
Acquisitions
The Company completed eight acquisitions during the year ended December 31, 2018 and seventeen acquisitions during the year ended December 31, 2017. The following table includes the preliminary fair values of consideration transferred, assets acquired, and liabilities assumed as a result of the Company’s acquisitions (in millions):
For the year endedDecember 31, 2018
Consideration transferredCash $ 55Deferred and contingent consideration 18
Aggregate consideration transferred $ 73
Assets acquiredCash and cash equivalents $ 1Receivables, net 4Goodwill 38Intangible assets, net 34Other assets 4
Total assets acquired 81Liabilities assumed
Current liabilities 6Other non-current liabilities 2
Total liabilities assumed 8Net assets acquired $ 73
Intangible assets are primarily customer-related and contract-based assets. Those intangible assets acquired as part of a business acquisition in 2018 had a weighted average useful economic life of 7 years. Acquisition related costs incurred and recognized within Other general expenses for the year ended December 31, 2018 were $2 million. Total revenue for these acquisitions included in the Company’s Consolidated Statement of Income for the year ended December 31, 2018 was approximately $17 million.
The results of operations of these acquisitions are included in the Consolidated Financial Statements as of the respective acquisition dates. The results of operations of the Company would not have been materially different if these acquisitions had been reported from the beginning of the period in which they were acquired.
2018 Acquisitions
On December 31, 2018, the Company completed the transaction to acquire certain assets of Bill Beatty Insurance Agency, Inc. based in the United States.
On November 15, 2018, the Company completed the transaction to acquire certain business and assets of North Harbour Insurance Services (1985) Limited, a New Zealand-based firm.
On October 25, 2018, the Company completed the transaction to acquire 100% capital of GEFASS S.R.L and GE.F.IT S.R.L., Italy-based firms specialized in Bancassurance schemes.
On May 9, 2018, the Company completed the transaction to acquire certain assets of 601West, a division of Lee & Hayes, P.L.L.C. based in the United States.
On April 24, 2018, the Company completed the transaction to acquire Inspiring Benefits, S.L., a Spain-based firm specialized in employee loyalty, wellbeing, and rewards programs.
On March 1, 2018, the Company completed the transaction to acquire the business and assets of the trade credit business of Niche International Business Proprietary Limited, a trade credit brokerage based in Johannesburg, South Africa.

85
On March 1, 2018, the Company completed the transaction to acquire Affinity Risk Partners (Brokers) Pty. Ltd., an insurance broker in Victoria, Australia.
On January 19, 2018, the Company completed the transaction to acquire substantially all of the assets of The Burchfield Group, a provider in pharmacy benefit consulting, auditing, and health plan compliance services based in the United States.
2017 Acquisitions
On December 29, 2017, the Company completed the transaction to acquire the Townsend Group, a U.S.-based provider of global investment management and advisory services primarily focused on real estate. On December 29, 2017, the Company completed the transaction to acquire Baltolink UADBB, a regional broker based in Lithuania. On December 19, 2017, the Company completed the transaction to acquire a client register of Grant Liddell Financial Advisor Services Pty Ltd in Australia. On December 1, 2017, the Company completed the transaction to acquire Henderson Insurance Brokers Limited, an independent insurance broking firm based in the United Kingdom. On November 30, 2017, the Company completed the transaction to acquire Unidelta AG, an insurance broker located in Switzerland. On October 31, 2017, the Company completed the transaction to acquire Unirobe Meeùs Groep, an insurance broker based in the Netherlands. On October 31, 2017, the Company completed the transaction to acquire Lenzi Paolo Broker di Assicurazioni S.r.l., an insurance broker based in Italy. On October 26, 2017, the Company completed the transaction to acquire Nauman Insurance Brokers Limited, an insurance broker based in New Zealand. On October 2, 2017, the Company completed the transaction to acquire Portus Consulting, an independent employee benefits firm based in the United Kingdom.
On August 31, 2017, the Company completed the transaction to acquire Mark Kelly Insurance and Financial Services PTY LTD, an Australia-based broker servicing the insurance needs of commercial clients in and around the Townsville regional center.
On August 28, 2017, the Company completed the transaction to acquire a certain portfolio in the Charlotte office of The Hays Group, Inc. d/b/a Hays Companies.
On July 27, 2017, the Company completed the transaction to acquire Grupo Innovac Sociedad de Correduría de Seguros, S.A, an insurance broker based in Valencia, Spain.
On July 3, 2017, the Company completed the transaction to acquire PWZ AG, an independent insurance broker based in Zurich, Switzerland.
On May 31, 2017, the Company completed the transaction to acquire SchneiderGolling IFFOXX Assekuranzmakler AG and SchneiderGolling Industrie Assekuranzmaklergesellschaft mbH from SchneiderGolling Gruppe, a property and casualty broker based in Southern Germany.
On May 2, 2017, the Company completed the transaction to acquire cut-e Assessment Global Holdings Limited, a high-volume online psychometric assessments provider based in Ireland.
On March 3, 2017, the Company completed the transaction to acquire Finaccord Limited, a market research, publishing and consulting company based in the United Kingdom.
On January 19, 2017, the Company completed the transaction to acquire VERO Management AG, an insurance broker and risk advisor based in Austria.
Dispositions
The Company completed four dispositions during the year ended December 31, 2018 and nine dispositions during the year ended December 31, 2017, excluding the sale of the Divested Business.

86
Total pretax losses, net of gains, for the year ended December 31, 2018 was $6 million. Total pretax gains, net of losses, for the year ended December 31, 2017, was $16 million. Gains and losses recognized as a result of a disposition are included in Other income (expense) in the Consolidated Statements of Income.
During 2018, Aon disposed of certain assets and liabilities that were previously classified as held for sale due to management’s decision to exit certain operations. A non-cash impairment charge of $176 million was recognized to write down the assets and liabilities to a fair value less cost-to-sell of $47 million and $41 million, respectively. The impairment charge was recognized in Amortization and impairment of intangible assets on the Consolidated Statement of Income. Adjustments made to the non-cash impairment charge throughout the remainder of the year were insignificant.
8. Goodwill and Other Intangible Assets
The changes in the net carrying amount of goodwill for the years ended December 31, 2018 and 2017, respectively, are as follows (in millions):
Total
Balance as of January 1, 2018 $ 8,358Goodwill related to current year acquisitions 38Goodwill related to disposals (2)Goodwill related to prior year acquisitions 4Foreign currency translation (227)
Balance as of December 31, 2018 $ 8,171
Balance as of January 1, 2017 $ 8,747Goodwill related to current year acquisitions 619Goodwill related to disposals (1,342)Goodwill related to prior year acquisitions (13)Foreign currency translation 347
Balance as of December 31, 2017 $ 8,358

87
Other Intangible Assets
The changes in other intangible assets for the years ended December 31, 2018 and 2017 are as follows (in millions):
TradenamesCustomer related
and contract basedTechnology and
other Software Total
As of January 1, 2018 $ 514 $ 1,135 $ 84 $ 218 $ 1,951Additions — — — 74 74Acquisitions — 28 6 — 34Held for sale (7) (152) (6) (8) (173)Impairment — (13) — (6) (19)Amortization (218) (182) (17) (69) (486)Foreign currency translation and other (2) (32) (1) 6 (29)
As of December 31, 2018 $ 287 $ 784 $ 66 $ 215 $ 1,352
As of December 31, 2018Cost $ 1,027 $ 2,240 $ 391 $ 725 $ 4,383Accumulated amortization (740) (1,456) (325) (510) (3,031)
Closing net book amount $ 287 $ 784 $ 66 $ 215 $ 1,352
As of January 1, 2017 $ 1,021 $ 1,137 $ 65 $ 350 $ 2,573Additions — 13 — 83 96Acquisitions 12 518 37 2 569Disposals — (303) (25) (147) (475)Impairment (380) — — (17) (397)Amortization (146) (168) (21) (74) (409)Foreign currency translation and other 7 (62) 28 21 (6)
As of December 31, 2017 $ 514 $ 1,135 $ 84 $ 218 $ 1,951
As of December 31, 2017Cost $ 1,047 $ 2,550 $ 416 $ 715 $ 4,728Accumulated amortization (533) (1,415) (332) (497) (2,777)
Closing net book amount $ 514 $ 1,135 $ 84 $ 218 $ 1,951
In connection with the completion of the sale of the Divested Business in 2017, the Company recognized a non-cash impairment charge to the associated tradenames of $380 million. The fair value of the tradenames was determined using the Relief from Royalty Method. This impairment was included in Amortization and impairment of intangible assets on the Consolidated Statement of Income. Refer to Note 5 “Discontinued Operations” for further information.
Amortization expense and impairment charges from finite lived intangible assets were $681 million and $791 million for the years ended December 31, 2018 and 2017, respectively.
Impairment Testing of Goodwill
Goodwill is allocated to the Commercial Risk Solutions, Reinsurance Solutions, Retirement Solutions, Health Solutions, and Data & Analytic Services CGUs for purposes of impairment testing. Goodwill by CGU is as follows (in millions):
As ofCommercial Risk
SolutionsReinsurance
SolutionsRetirementSolutions
HealthSolutions
Data & AnalyticServices Total
December 31, 2018 $ 2,749 $ 1,431 $ 1,201 $ 1,496 $ 1,294 $ 8,171December 31, 2017 $ 2,816 $ 1,470 $ 1,229 $ 1,533 $ 1,310 $ 8,358
During 2018, the Company conducted an impairment review of all material goodwill assets. No impairments were identified.

88
The recoverable amount of a CGU is determined based on value-in-use calculations, which utilize the Income and Market Approaches. IFRS describes fair value as a market-based measurement, not an entity-specific measurement. As such, when determining fair value, the assumptions used were consistent with those of a market participant. In quantifying the fair value under the Income and Market Approaches, the Company utilized third party specialists that used a variety of market inputs, including historical industry performance, to determine key assumptions, such as the terminal growth and discount rates.
The key assumptions used for value-in-use calculations for each CGU with significant goodwill in comparison to the Company’s total are shown below. The Company does not believe that a reasonably possible change in any of the assumptions could cause an impairment.
As of December 31, 2018Commercial Risk
SolutionsReinsurance
SolutionsRetirementSolutions Health Solutions
Data & AnalyticServices
Long-term Growth Rate % 2.0% 2.5% 2.0% 3.0% 2.0%Discount Rate % 9.4 - 10.1% 9.9 - 10.6% 10.7 - 11.3% 9.5 - 10.1% 9.8 - 10.3%
As of December 31, 2017Commercial Risk
SolutionsReinsurance
SolutionsRetirementSolutions Health Solutions
Data & AnalyticServices
Long-term Growth Rate % 2.0% 2.0% 2.0% 3.0% 2.0%Discount Rate % 10.1 - 10.7% 10.9 - 11.6% 11.4 - 12.1% 10.2 - 10.8% 10.5 - 11.1%
9. Debt
The following is a summary of outstanding debt (in millions):
As of December 31 2018 2017
3.875% Senior Notes due December 2025 $ 746 $ 7455.00% Senior Notes due September 2020 599 5983.50% Senior Notes due June 2024 596 5954.75% Senior Notes due May 2045 592 5922.875% Senior Notes due May 2026 (EUR 500M) 562 5874.60% Senior Notes due June 2044 544 5448.205% Junior Subordinated Notes due January 2027 521 5212.80% Senior Notes due March 2021 398 3984.00% Senior Notes due November 2023 348 3484.50% Senior Notes due December 2028 347 —6.25% Senior Notes due September 2040 296 2964.76% Senior Notes due March 2018 (CAD 375M) — 2964.45% Senior Notes due May 2043 246 2464.25% Senior Notes due December 2042 198 197Commercial paper 250 —Other 1 3
Total debt 6,244 5,966Less: Short-term and current portion of long-term debt 251 299
Total long-term debt $ 5,993 $ 5,667
Notes
On December 3, 2018, Aon Corporation issued $350 million 4.50% Senior Notes due December 2028. The Company used the net proceeds of the offering to pay down a portion of outstanding commercial paper and for general corporate purposes.
On March 8, 2018 the Company’s CAD $375 million ($291 million at March 8, 2018 Exchange Rates) 4.76% Senior Notes due March 2018 issued by a Canadian subsidiary of Aon Corporation matured and was repaid in full.

89
Each of the notes issued by Aon plc is fully and unconditionally guaranteed by Aon Corporation, and each of the notes issued by Aon Corporation is fully and unconditionally guaranteed by Aon plc. Each of the notes described and identified in the table above contains customary representations, warranties, and covenants, and the Company was in compliance with all such covenants as of December 31, 2018.
Repayments of total debt are as follows (in millions):
2019 $ 2512020 6002021 4002022 —2023 —Thereafter 5,095
Total Repayments $ 6,346Unamortized discount, premium, and debt issuance cost (102)
Total Debt $ 6,244
Revolving Credit Facilities
As of December 31, 2018, Aon plc had two primary committed credit facilities outstanding: its $900 million multi-currency U.S. credit facility expiring in February 2021 (the “2021 Facility”) and its $400 million multi-currency U.S. credit facility expiring in October 2022 (the “2022 Facility”). On February 2, 2019, the Company extended the 2021 Facility by one year, and it will now expire in February 2022.
Each of these facilities includes customary representations, warranties, and covenants, including financial covenants that require Aon plc to maintain specified ratios of adjusted consolidated EBITDA to consolidated interest expense and consolidated debt to adjusted consolidated EBITDA, in each case, tested quarterly. At December 31, 2018, Aon plc did not have borrowings under either the 2021 Facility or the 2022 Facility, and was in compliance with all covenants contained therein during the twelve months ended December 31, 2018.
Commercial Paper
Aon Corporation, a wholly owned subsidiary of Aon plc, has established a U.S. commercial paper program, and Aon plc has established a European multi-currency commercial paper program (collectively, the “CP Programs”). Commercial paper may be issued in aggregate principal amounts of up to $600 million under the U.S. program and €525 million under the European program, not to exceed the amount of the Company’s committed credit, which was $1.3 billion at December 31, 2018. The U.S. commercial paper program is fully and unconditionally guaranteed by Aon plc and the European commercial paper program is fully and unconditionally guaranteed by Aon Corporation.
Commercial paper outstanding, which is included in Short-term debt and current portion of long-term debt in the Company’s Consolidated Statements of Financial Position, is as follows (in millions):
As of December 31, 2018 2017
Commercial paper outstanding $ 250 $ —
The weighted average commercial paper outstanding and its related interest rates are as follows (in millions, except percentages):
Years ended December 31, 2018 2017
Weighted average commercial paper outstanding $ 580 $ 170Weighted average interest rate of commercial paper outstanding 0.84% 0.18%
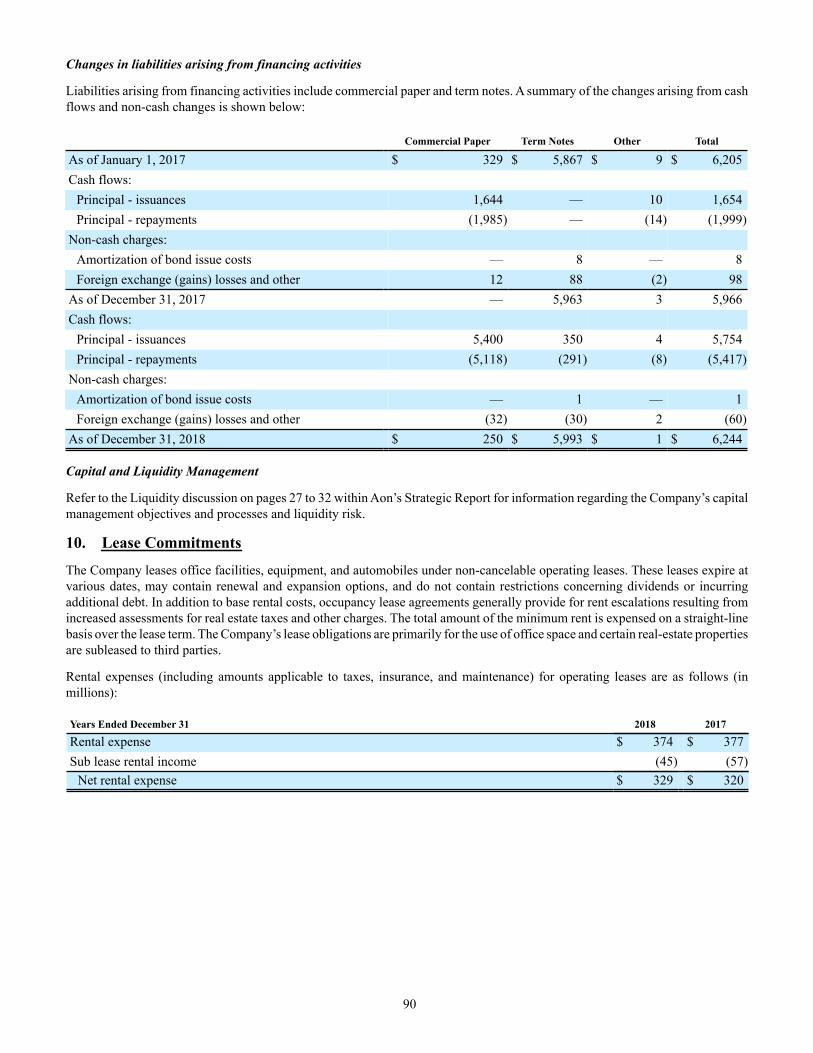
90
Changes in liabilities arising from financing activities
Liabilities arising from financing activities include commercial paper and term notes. A summary of the changes arising from cash flows and non-cash changes is shown below:
Commercial Paper Term Notes Other Total
As of January 1, 2017 $ 329 $ 5,867 $ 9 $ 6,205Cash flows:
Principal - issuances 1,644 — 10 1,654Principal - repayments (1,985) — (14) (1,999)
Non-cash charges:Amortization of bond issue costs — 8 — 8Foreign exchange (gains) losses and other 12 88 (2) 98
As of December 31, 2017 — 5,963 3 5,966Cash flows:
Principal - issuances 5,400 350 4 5,754Principal - repayments (5,118) (291) (8) (5,417)
Non-cash charges:Amortization of bond issue costs — 1 — 1Foreign exchange (gains) losses and other (32) (30) 2 (60)
As of December 31, 2018 $ 250 $ 5,993 $ 1 $ 6,244
Capital and Liquidity Management
Refer to the Liquidity discussion on pages 27 to 32 within Aon’s Strategic Report for information regarding the Company’s capital management objectives and processes and liquidity risk.
10. Lease Commitments
The Company leases office facilities, equipment, and automobiles under non-cancelable operating leases. These leases expire at various dates, may contain renewal and expansion options, and do not contain restrictions concerning dividends or incurring additional debt. In addition to base rental costs, occupancy lease agreements generally provide for rent escalations resulting from increased assessments for real estate taxes and other charges. The total amount of the minimum rent is expensed on a straight-line basis over the lease term. The Company’s lease obligations are primarily for the use of office space and certain real-estate properties are subleased to third parties.
Rental expenses (including amounts applicable to taxes, insurance, and maintenance) for operating leases are as follows (in millions):
Years Ended December 31 2018 2017
Rental expense $ 374 $ 377Sub lease rental income (45) (57)
Net rental expense $ 329 $ 320

91
At December 31, 2018, future minimum rental payments required under operating leases that have initial or remaining non-cancelable lease terms in excess of one year are as follows (in millions):
Year Ended December 31, 2018Gross rental
commitmentsRentals from
subleasesNet rental
commitments
2019 $ 303 $ (34) $ 2692020 253 (30) 2232021 221 (30) 1912022 182 (30) 1522023 148 (12) 136Thereafter 472 (5) 467
Total minimum payments required $ 1,579 $ (141) $ 1,438
11. Income Taxes
On December 22, 2017, the Tax Reform Act was enacted. The Tax Reform Act included a number of changes to existing U.S. tax laws that impact the Company, most notably a reduction of the U.S. corporate income tax rate from 35% to 21% for tax years beginning after December 31, 2017 and the Transition Tax.
On January 26, 2018, the European Securities and Markets Authority (ESMA) issued a Public Statement “Accounting for Income Tax consequences of the United States Tax Cuts and Jobs Act under IFRS”. The ESMA expected issuers to make a reasonable estimate of the impact of the material aspects of the Tax Reform Act on their current and deferred tax assets and/or liabilities in their 2017 annual financial statements. The ESMA acknowledged that these reported amounts were subject to a higher degree of estimation uncertainty than usually is the case and that measurement adjustments could be recorded in subsequent reporting periods as issuers obtained more accurate information on the impact of the Tax Reform Act and the modalities of its application.
The Company recognized its best estimate of the enactment date impacts of the Tax Reform Act in its consolidated financial statements for the year ended December 31, 2017 and adjusted those estimates in 2018 after considering guidance issued during 2018 and completing its calculations. The Company recorded a $36 million tax charge in 2018 related to the Transition Tax.
Other significant provisions of the Tax Reform Act that impact income taxes include: additional limitations on the timing of deductibility of interest payable to related and unrelated lenders, further limitations on the deductibility of executive compensation, an alternative Base Erosion and Anti-Abuse Tax that limits deductions for certain amounts payable to foreign affiliates, and an additional U.S. tax on certain future foreign subsidiary earnings, whether or not distributed, (i.e., global intangible low-taxed income or “GILTI”). The Company has elected to account for GILTI tax in the period in which it is incurred, and therefore has not provided any deferred tax impacts of GILTI in its consolidated financial statements for the year ended December 31, 2018.
The major components of income tax expense from continuing operations for the years ended December 31, 2018 and 2017 are:
Years ended December 31 2018 2017
Current income tax:Current income tax charge $ 412 $ 107Tax adjustments in respect of prior years 33 4
Total current $ 445 $ 111Deferred income tax:
Origination and reversal of temporary differences $ (233) $ 124Tax rate changes (5) 79Tax adjustments in respect of prior years (77) (72)
Total deferred $ (315) $ 131Total income tax expense (benefit) $ 130 $ 242

92
Income tax (charged) or credited directly to other comprehensive income (in millions):
Years ended December 31 2018 2017
Deferred income tax:Unrealized gain (loss) on available-for-sale financial assets $ 1 $ 11Unrealized gain (loss) on derivatives/swaps 3 (1)Unrealized gain (loss) on foreign exchanges (3) (8)Foreign currency translation adjustment 6 (2)Net gain (loss) on actuarial gains and losses (70) (66)
Total deferred (63) (66)Current income tax:
Net gain (loss) on actuarial gains and losses 38 41Total income tax (charged) or credited directly to other comprehensive income $ (25) $ (25)
The aggregate current and deferred tax relating to items that are (charged) or credited directly to equity, excluding other comprehensive income outlined above, is $(135) million and $47 million for years 2018 and 2017, respectively.
A reconciliation of the income tax provisions based on the Company’s domicile and statutory rate at each reporting period is performed. The 2018 and 2017 reconciliations are based on the U.K. statutory corporate tax rate of 19.0% and 19.25%, respectively. The U.K. has reduced its corporate income tax rate in recent years. The tax rate will be further reduced to 17% from April 1, 2020. The reconciliation of total income tax expense and the pretax income multiplied by U.K.’s statutory tax rate is as follows
Years ended December 31 2018 2017
Pretax Income from continuing operations $ 1,160 $ 673At U.K. statutory tax rate of 19.0% (2017: 19.25%) 19.0 % 19.3 %State income taxes, net of federal benefit (0.7)% (1.4)%Taxes on international operations (1) (7.3)% (31.0)%Nondeductible Expenses 2.9 % 3.5 %Adjustments to prior year tax requirements 1.2 % 3.6 %Deferred taxes from changes in tax rates (0.4)% 11.7 %Deferred tax adjustments, international earnings (0.3)% 2.0 %Recognition of previously unrecognized deferred taxes (0.6)% (9.3)%Uncertain tax positions 2.8 % (1.4)%Tax Reform (2) 3.1 % 39.3 %Loss on disposition (8.2)% — %Other-net (0.3)% (0.3)%
Effective tax rate 11.2 % 36.0 %
(1) The Company determines the adjustment for taxes on international operations based on the difference between the statutory tax rate applicable to earnings in each foreign jurisdiction and the enacted rate of 19.0% and 19.25% at December 31, 2018 and 2017 respectively. The benefit to the Company’s effective income tax rate from taxes on international operations relates to benefits from lower-taxed global operations, primarily due to the use of global funding structures and a tax holiday in Singapore. The impact decreased from 2017 to 2018 primarily as a result of the decrease in the U.S. federal tax rate and the impairment and amortization of tradenames in 2017 which was primarily recorded in the U.S.
(2) The impact of the Transition Tax as a result of the Tax Reform Act.

93
The components of the Company’s deferred tax assets and liabilities are as follows (in millions):
Consolidated Statements ofFinancial Position
Consolidated Statements ofIncome
As of December 31 2018 2017 2018 2017
Pension & other employee benefit plans $ 433 $ 523 $ — $ (189)Net operating loss, capital loss, interest and tax creditcarryforwards 393 248 139 (71)Brokerage fee arrangements — 4 (4) (62)Other accrued expenses 67 60 45 53Investment basis differences 28 33 (3) (26)Tradename liability — 12 (12) 12Lease and service guarantees 5 6 (1) 6Accrued interest — (13) 13 (179)Intangibles and property, plant and equipment (306) (411) 108 584Unremitted earnings (30) (39) 10 (11)Deferred revenue (113) (12) 20 (40)Unrealized foreign exchange gains (26) (22) (3) 11Other 20 10 2 10
Deferred tax income (expense) $ 314 $ 98Net deferred tax asset (liability) $ 471 $ 399
Deferred income taxes (assets and liabilities have been netted by jurisdiction) have been reflected in the Consolidated Statements of Financial Position as follows (in millions):
2018 2017
Deferred tax assets - non-current $ 623 $ 510Deferred tax liabilities - non-current (152) (111)
Net deferred tax asset (liability) $ 471 $ 399
Reconciliation of deferred tax assets and liabilities net (in millions):
2018 2017
Opening balance as of January 1 $ 399 $ 400Tax income (expense) recognized in profit or loss 314 98Tax income (expense) recognized in other comprehensive income (63) (66)Retained earnings (179) (12)Other balance sheet accounts — (6)Acquisition and disposal of subsidiaries — (15)
Closing balance as of December 31 $ 471 $ 399
Aon offsets tax assets with liabilities if and only if it has a legally enforceable right to set off current tax assets with current tax liabilities and the deferred tax assets and deferred tax liabilities relate to income taxes levied by the same tax authority.
The Company has deferred tax assets relating to net operating loss, capital loss and interest carryforwards that have not been recognized in the balance sheet because it is not probable that future taxable profits will be available against which Aon can use the benefits. The U.K. has unrecognized operating loss, capital loss and interest carryforwards of $79 million (2017: $76 million) that have an indefinite carryforward. The U.S. has unrecognized federal capital loss carryforwards of $24 million (2017: $0 million) that expire in 2023, state capital loss carryforwards of $9 million (2017: $0 million) that expire in 2023, and state operating loss carryforwards of $17 million (2017: $18 million) that expire at various dates from 2019 to 2038. In other jurisdictions, the Company has operating loss, capital loss and interest carryforwards of $42 million (2017: $41 million). The operating loss and capital losses begin to expire at various dates starting in 2019 and the interest carryforwards have an indefinite carryforward.

94
In 2018 and 2017, Aon recognized previously unrecognized tax losses of $7 million and $36 million, respectively, following changes in state filing positions and estimates of subsidiaries future results from operating activities. Management has determined that the recoverability of the remaining balance of losses is still in doubt because these losses relate to subsidiaries that have a history of losses or can only be utilized if capital gain is generated.
The Company generally intends to limit distributions from foreign subsidiaries to earnings previously taxed in the U.S., primarily as a result of the Transition Tax or GILTI. As of December 31, 2018, the Company has accrued $30 million for local country income taxes, withholding taxes and state income taxes on those undistributed earnings that are not indefinitely reinvested. The Company has not provided for deferred taxes on outside basis differences in investments in its foreign subsidiaries that are unrelated to these accumulated undistributed earnings, as these outside basis differences are indefinitely reinvested. A determination of the unrecognized deferred taxes related to these other components of its outside basis differences is not practicable.
12. Shareholders’ Equity
Distributable Reserves
As a company incorporated in England and Wales, Aon is required under U.K. law to have available “distributable reserves” to make share repurchases or pay dividends to shareholders. Distributable reserves may be created through the earnings of the Parent Company and, among other methods, through a reduction in share capital approved by the courts of England and Wales. Distributable reserves are not directly linked to an IFRS reported amount (e.g., retained earnings). As of December 31, 2018 and 2017, the Company had distributable reserves in excess of $3.7 billion and $4.0 billion, respectively.
Ordinary Shares
Aon has a share repurchase program authorized by the Company’s Board of Directors (the “Repurchase Program”). The Repurchase Program was established in April 2012 with $5.0 billion in authorized repurchases, and was increased by $5.0 billion in authorized repurchases in each of November 2014 and February 2017 for a total of $15.0 billion in repurchase authorizations.
Under the Repurchase Program, Class A Ordinary Shares may be repurchased through the open market or in privately negotiated transactions, from time to time, based on prevailing market conditions, and will be funded from available capital.
The following table summarizes the Company’s Share Repurchase activity (in millions, except per share data):
Twelve months ended December 312018 2017 (1)
Shares repurchased 10.0 18.0Average price per share $ 143.94 $ 133.67Costs recorded to retained earnings
Total repurchase cost $ 1,447 $ 2,403Additional associated costs 7 12
Total costs recorded to retained earnings $ 1,454 $ 2,415
(1) Included in the 18.0 million shares repurchased during the twelve months ended December 31, 2017 were 0.1 million shares that did not settle until January 2018. These shares were settled at an average price per share of $134.41 and total cost of $15.9 million.
At December 31, 2018, the remaining authorized amount for share repurchase under the Repurchase Program was $4.0 billion. Under the Repurchase Program, the Company has repurchased a total of 118.3 million shares for an aggregate cost of approximately $11.0 billion.
Net Income Per Share
Weighted average ordinary shares outstanding are as follows (in millions):
Years ended December 31 2018 2017
Basic weighted-average ordinary shares outstanding 245.4 258.7Dilutive effect of potentially issuable shares 2.5 3.4
Diluted weighted-average ordinary shares outstanding 247.9 262.1

95
Potentially issuable shares are not included in the computation of diluted net income per share if its inclusion would be antidilutive. There were no shares excluded from the calculation in 2018 or 2017.
Dividends
During 2018 and 2017, the Company paid dividends of $382 million and $364 million, respectively, to holders of its Class A Ordinary Shares. Dividends paid per Class A Ordinary Share were $1.56 and $1.41 for the years ended December 31, 2018 and 2017, respectively.
In January 2019, the Company declared a dividend to shareholders of $0.40 per ordinary share. In February 2019, the Company paid those dividends in the amount of $96.0 million.
Future dividends on Aon plc ordinary shares, if any, and the timing of declaration of any such dividends, will be at the discretion of the Board of Directors of Aon plc and will depend on, among other things, our results of operations, cash requirements and surplus, financial condition, contractual restrictions and other factors that the Board of Directors of Aon plc may deem relevant, as well as our ability to pay dividends in compliance with the Companies Act 2006.
Other Reserves
Changes in Other reserves by component, net of related tax, are as follows (in millions):
Change in Fair Value of
Financial Instruments (1)
ForeignCurrency
TranslationAdjustments
TotalOther
Reserves
Balance at January 1, 2017 $ 18 $ (1,418) $ (1,400)Fair value gains (losses) (11) — (11)Currency translation differences — 380 380
Balance at December 31, 2017 7 (1,038) (1,031)Adoption of new accounting guidance (2) (1) — (1)
Balance at January 1, 2018 6 (1,038) (1,032)Fair value gains (losses) 1 — 1Currency translation differences — (430) (430)
Balance at December 31, 2018 $ 7 $ (1,468) $ (1,461)
(1) Reclassifications from this category included in Other reserves are recorded in Other income (expense).(2) Refer to Note 2 “Summary of Significant Accounting Principles and Practices” for further information.
13. Employee Benefits
Defined Contribution Savings Plans
Aon maintains defined contribution savings plans for the benefit of its employees. The expense recognized for these plans is included in Compensation and benefits in the Consolidated Statements of Income. The expense for the significant plans in the U.S, U.K., Netherlands and Canada is as follows (in millions):
Years ended December 31 2018 2017
U.S. $ 98 $ 105U.K. 45 43Netherlands and Canada 25 25
Total $ 168 $ 173

96
Pension and Other Postretirement Benefits
The Company sponsors defined benefit pension and postretirement health and welfare plans that provide retirement, medical, and life insurance benefits. The postretirement health care plans are contributory, with retiree contributions adjusted annually, and the life insurance and pension plans are generally noncontributory. The significant U.S., U.K., Netherlands, and Canadian pension plans are closed to new entrants. Defined benefit plans are generally funded by Company contributions to a trust fund or insurance contract. Contributions are generally based on statutory requirements and local funding practices. In the U.S., the amount that Aon must contribute for a qualified plan is dictated by Employee Retirement Income Security Act (“ERISA”) minimum funding standards and the risk/reward of investment performance lies with the Company, since the benefits the employee receives are unrelated to investment performance. In the U.K., minimum funding requirements are generally agreed with the trustees of the U.K. pension plans. Additional amounts may be agreed to with, or required by, the U.K. pension plan trustees. Most foreign jurisdictions have their own individual laws that dictate treatment/requirements of pension arrangements within their respective jurisdictions. The Company may make additional discretionary contributions. The significance of the Company’s worldwide pension plans means that pension contributions and expense are comparatively sensitive to various market and demographic factors. These factors include equity and bond market returns, the assumed interest rates we use to discount our pension liabilities, foreign exchange rates, rates of inflation, mortality assumptions, potential regulatory and legal changes and counterparty exposure from various investments and derivative contracts, including annuities.
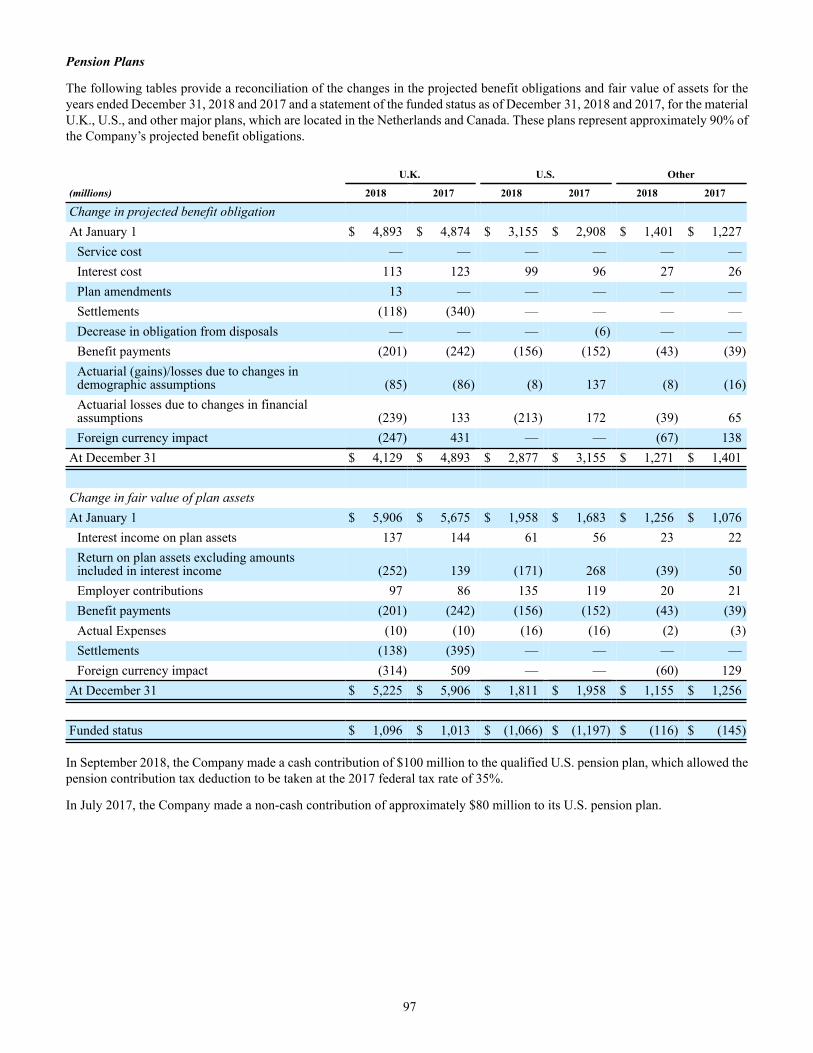
97
Pension Plans
The following tables provide a reconciliation of the changes in the projected benefit obligations and fair value of assets for the years ended December 31, 2018 and 2017 and a statement of the funded status as of December 31, 2018 and 2017, for the material U.K., U.S., and other major plans, which are located in the Netherlands and Canada. These plans represent approximately 90% of the Company’s projected benefit obligations.
U.K. U.S. Other
(millions) 2018 2017 2018 2017 2018 2017
Change in projected benefit obligation At January 1 $ 4,893 $ 4,874 $ 3,155 $ 2,908 $ 1,401 $ 1,227
Service cost — — — — — —Interest cost 113 123 99 96 27 26Plan amendments 13 — — — — —Settlements (118) (340) — — — —Decrease in obligation from disposals — — — (6) — —Benefit payments (201) (242) (156) (152) (43) (39)Actuarial (gains)/losses due to changes indemographic assumptions (85) (86) (8) 137 (8) (16)Actuarial losses due to changes in financialassumptions (239) 133 (213) 172 (39) 65Foreign currency impact (247) 431 — — (67) 138
At December 31 $ 4,129 $ 4,893 $ 2,877 $ 3,155 $ 1,271 $ 1,401
Change in fair value of plan assets At January 1 $ 5,906 $ 5,675 $ 1,958 $ 1,683 $ 1,256 $ 1,076
Interest income on plan assets 137 144 61 56 23 22Return on plan assets excluding amountsincluded in interest income (252) 139 (171) 268 (39) 50Employer contributions 97 86 135 119 20 21Benefit payments (201) (242) (156) (152) (43) (39)Actual Expenses (10) (10) (16) (16) (2) (3)Settlements (138) (395) — — — —Foreign currency impact (314) 509 — — (60) 129
At December 31 $ 5,225 $ 5,906 $ 1,811 $ 1,958 $ 1,155 $ 1,256
Funded status $ 1,096 $ 1,013 $ (1,066) $ (1,197) $ (116) $ (145)
In September 2018, the Company made a cash contribution of $100 million to the qualified U.S. pension plan, which allowed the pension contribution tax deduction to be taken at the 2017 federal tax rate of 35%.
In July 2017, the Company made a non-cash contribution of approximately $80 million to its U.S. pension plan.

98
Amounts recognized in the Consolidated Statements of Financial Position consist of (in millions):
U.K. U.S. Other
2018 2017 2018 2017 2018 2017
Prepaid surpluses (1) $ 1,113 $ 1,034 $ — $ — $ — $ —Pension deficit (2) (17) (21) (1,066) (1,197) (116) (145)
Net amount recognized $ 1,096 $ 1,013 $(1,066) $(1,197) $ (116) $ (145)
(1) Included in Prepaid pension(2) Included in Pension, other postretirement, and postemployment liabilities
The following table provides the components of net periodic benefit (income) cost for the plans (in millions):
U.K. U.S. Other
2018 2017 2018 2017 2018 2017
Service cost $ 34 $ 53 $ — $ — $ — $ —Net interest (24) (21) 37 40 4 4Administration expenses 10 10 16 16 2 3
Net periodic cost (benefit) $ 20 $ 42 $ 53 $ 56 $ 6 $ 7
The Company uses a full-yield curve approach in the estimation of the service and interest cost components of net periodic pension and postretirement benefit cost for its major pension and other postretirement benefit plans; this was obtained by applying the specific spot rates along the yield curve used in the determination of the benefit obligation to the relevant projected cash flows.
In March 2017, the Company approved a plan to offer a voluntary one-time lump sum payment option to certain eligible employees of the Company’s U.K. pension plans that, if accepted, would settle the Company’s pension obligations to them. The lump sum cash payment offer closed during 2018. As of December 31, 2018, lump sum payments from plan assets of £109 million ($138 million using December 31, 2018 exchange rates) were paid. As a result of this settlement, the Company remeasured the assets and liabilities of the U.K. pension plan during the fourth quarter of 2018, which in aggregate resulted in a reduction to the projected benefit obligation of £93 million ($118 million using December 31, 2018 exchange rates) as well as a non-cash settlement charge of £16 million ($20 million using December 31, 2018 exchange rates).
In total for 2017, lump sum payments from plan assets of £295 million ($395 million using December 31, 2017 exchange rates) were paid. As a result of this settlement, the Company remeasured the assets and liabilities of the U.K. pension plan during the fourth quarter of 2017, which in aggregate resulted in a reduction to the projected benefit obligation of £254 million ($340 million using December 31, 2017 exchange rates) as well as a non-cash settlement charge of £41 million ($55 million using average December 31, 2017 exchange rate) in the fourth quarter of 2017.
The weighted-average assumptions used to determine benefit obligations are as follows:
U.K. U.S. (1) Other
2018 2017 2018 2017 2018 2017
Discount rate 2.95% 2.63% 3.92 - 4.26% 3.27 - 3.61% 1.89 - 3.88% 1.78 - 3.39%Rate of compensation increase 3.73 - 4.23% 3.70 - 4.20% N/A N/A 1.00 - 3.00% 1.00 - 3.00%Underlying price inflation 1.88% 1.87% N/A N/A 2.00% 2.00%
(1) U.S. pension plans are frozen and therefore not impacted by compensation increases or price inflation.
The weighted-average assumptions used to determine the net periodic benefit cost are as follows:
U.K. U.S. Other
2018 2017 2018 2017 2018 2017
Discount rate 2.63% 2.77% 3.27 - 3.61% 3.53 - 4.11% 1.78 - 3.39% 1.85 - 3.81%Rate of compensationincrease 3.70 - 4.20% 3.70 - 4.20% N/A N/A 1.00 - 3.00% 1.00 - 3.50%

99
The significant U.K., U.S., Netherlands and Canadian pension plans are closed to new entrants. The Company has ceased crediting future benefits relating to salary and service for significant U.K., U.S., Netherlands and Canadian plans. As a result, changes in these assumptions will not have a significant impact on pension obligations and pension expense.
Holding all other assumptions constant, the following table reflects what a twenty five basis point increase and decrease in the estimated discount rate would have on the projected benefit obligation and pension expense as of, or for the year ended December 31, 2018 (in millions):
U.K. U.S. Other
Hypothetical 25 Basis Point Change in Discount Rate: (1)
Change inobligation
Change inexpense
Change inobligation
Change inexpense
Change inobligation
Change inexpense
Increase (2) $(158) $(7) $(80) $(1) $(52) $(1)Decrease $168 $7 $84 $— $56 $1
(1) These sensitivities are hypothetical and should be used with caution. Favorable hypothetical changes in the assumptions result in decreased amounts, and unfavorable hypothetical changes in the assumptions result in increased amounts, of the obligations and expenses. Changes in amounts based on a 25 basis point variation in assumptions generally cannot be extrapolated because the relationship of the change in assumption to the change in amounts may not be linear. Also, in this table, the effect of a variation in a particular assumption on the change in obligation or change in expense is calculated without changing any other assumption; in reality, changes in one factor may result in changes in another, which might magnify or counteract the sensitivities.
(2) Increases to the projected benefit obligation reflect increases to our pension obligations, while decreases in the projected benefit obligation are recoveries toward fully funded status. A change in the discount rate has an inverse relationship to the projected benefit obligation.
Plan Assets
No plan assets are expected to be returned to the Company during 2019.
Fair value of plan assets
The Company determined the fair value of plan assets through numerous procedures based on the asset class and available information. Refer to Note 16 “Fair Value Measurements and Financial Instruments” for a description of the procedures performed to determine the fair value of the plan assets.

100
The fair values of the Company’s U.S. pension plan assets at December 31, 2018 and December 31, 2017, by asset category, are as follows (in millions):
As of December 31 2018 2017
Cash and cash equivalents (1) $ 145 $ 56Equity investments:
Large cap domestic 294 313Small cap domestic 14 17International 76 90Equity derivatives (14) 111Pooled funds: International 235 270 Large cap domestic 8 12 Small cap domestic 42 114
Fixed income investments: (2) Corporate bonds 111 110Government and agency bonds 126 148Asset-backed securities 2 —Pooled funds:
Government and agency bonds 95 —Corporate bonds 322 290
Other investments: Real estate and REITs (3) 78 82Alternative investments (4) 277 345
Total $ 1,811 $ 1,958
(1) Consists of cash and institutional short-term investment funds.(2) Consists of corporate and government bonds, asset-backed securities, and fixed-income derivatives.(3) Consists of exchange traded real estate investment trusts (“REITs”).(4) Consists of limited partnerships, private equity, and hedge funds.

101
The fair values of the Company’s major U.K. pension plan assets at December 31, 2018 and December 31, 2017, by asset category, are as follows (in millions):
As of December 31 2018 2017
Cash and cash equivalents (1) $ 96 $ 209Equity investments:
Pooled funds: Global 209 401Europe 3 6
Fixed income investments: (2)
Derivatives (3) (949) (771)Fixed income securities (4) 2,446 2,787Annuities 1,688 1,909Pooled funds:
Derivatives 39 57Fixed income securities 850 251
Other investments: Real estate (5) 149 146Alternative investments (6) 694 911
Total $ 5,225 $ 5,906
(1) Consists of cash and institutional short-term investment funds.(2) Consists of various equity, fixed income, commodity, and real estate mutual fund type investment vehicles.(3) Consists of equity securities and equity derivatives, including repurchase agreements.(4) Consists of corporate and government bonds.(5) Consists of property funds and trusts holding direct real estate investments.(6) Consists of limited partnerships, private equity, and hedge funds.

102
The fair values of the Company’s major other pension plan assets at December 31, 2018 and December 31, 2017, by asset category, are as follows (in millions):
As of December 31 2018 2017
Cash and cash equivalents $ 10 $ 11Equity investments:
Pooled funds: Global 281 370North America — 26
Fixed income investments: Fixed income securities (1) — 211Derivatives (1) 9 40Pooled funds:
Fixed income securities 766 566Derivatives (1) 16 —
Other investments: Alternative investments (2) 63 26Pooled funds:
REITs (3) 10 6Total $ 1,155 $ 1,256
(1) Consists of corporate and government bonds and fixed-income derivatives.(2) Consists of limited partnerships, private equity, and hedge funds.(3) Consists of property funds and trusts holding direct real estate investments.
Investment Policy and Strategy
The U.S. investment policy, as established by the Aon Retirement Plan Governance and Investment Committee (“RPGIC”), seeks reasonable asset growth at prudent risk levels within target allocations, which are 50% equity investments, 27% fixed income investments, and 23% other investments. Aon believes that plan assets are well-diversified and are of appropriate quality. The investment portfolio asset allocation is reviewed quarterly and re-balanced to be within policy target allocations. The investment policy is reviewed at least annually and revised, as deemed appropriate by the RPGIC. The investment policies for international plans are generally established by the local pension plan trustees and seek to maintain the plans’ ability to meet liabilities and to comply with local minimum funding requirements. Plan assets are invested in diversified portfolios that provide adequate levels of return at an acceptable level of risk. The investment policies are reviewed at least annually and revised, as deemed appropriate to ensure that the objectives are being met. At December 31, 2018, the weighted average targeted allocation for the U.K. and non-U.S. plans was 12% for equity investments, 79% for fixed income investments, and 9% for other investments.
Cash Flows
Contributions
Based on current assumptions, in 2019, the Company expects to contribute approximately $80 million, $46 million, and $19 million to its U.K., U.S. and other significant international pension plans, respectively.

103
Estimated Future Benefit Payments
Estimated future benefit payments for plans, not including voluntary one-time lump sum payments, are as follows at December 31, 2018 (in millions):
U.K. U.S. Other
2019 $ 137 $ 178 $ 422020 $ 139 $ 182 $ 432021 $ 144 $ 185 $ 442022 $ 149 $ 187 $ 452023 $ 152 $ 177 $ 462024 – 2028 $ 795 $ 879 $ 248
U.S. and Canadian Other Postretirement Benefits
The following table provides an overview of the accumulated projected benefit obligation, fair value of plan assets, funded status and net amount recognized as of December 31, 2018 and 2017 for the Company’s other significant postretirement benefit plans located in the U.S. and Canada (in millions):
2018 2017
Accumulated projected benefit obligation $ 91 $ 99Plan Assets:
Fair value of plan assets 14 17Unrecognized asset due to asset ceiling (5) (6)
Net plan assets 9 11Net liability recognized in the Statement of Financial Position $ 82 $ 88
Other information related to the Company’s other postretirement benefit plans are as follows:
2018 2017
Net periodic benefit cost recognized (millions) $5 $6Weighted-average discount rate used to determine future benefit obligations 3.91 - 4.26% 3.32 - 3.64%Weighted-average discount rate used to determine net periodic benefit costs 3.32 - 3.64% 3.71 - 4.15%
Based on current assumptions, the Company expects:
• To contribute $5 million to fund significant other postretirement benefit plans during 2019.• Estimated future benefit payments will be approximately $5 million each year for 2019 through 2023, and $25 million
in aggregate for 2024-2028.
The accumulated postretirement benefit obligation is increased by $5 million and decreased by $5 million by a respective 1% increase or decrease to the assumed healthcare trend rate. The service cost and interest cost components of net periodic benefits cost is increased by $0.5 million and decreased by $0.4 million by a respective 1% increase or decrease to the assumed health care trend rate.

104
14. Share-Based Compensation Plans
The following table summarizes share-based compensation expense recognized in the Consolidated Statements of Income in Compensation and benefits (in millions):
Years ended December 31 2018 2017
Restricted share units (“RSUs”) $ 188 $ 180Performance share awards (“PSAs”) 145 127Employee share purchase plans 9 11
Total share-based compensation expense 342 318Tax benefit 75 72
Share-based compensation expense, net of tax $ 267 $ 246
Restricted Share Units
RSUs generally vest between three and five years. The fair value of RSUs is based upon the market value of Aon plc ordinary shares at the date of grant. With certain limited exceptions, any break in continuous employment will cause the forfeiture of all non-vested awards. Compensation expense associated with RSUs is recognized on a straight-line basis over the requisite service period. Dividend equivalents are paid on certain RSUs, based on the initial grant amount.
The following table summarizes the status of the Company’s RSUs, including shares related to the Divested Business (shares in thousands, except fair value):
2018 2017
Years ended December 31 SharesFair Value atDate of Grant Shares
Fair Value atDate of Grant
Non-vested at beginning of year 4,849 $ 104 6,195 $ 89Granted 1,500 $ 141 1,700 $ 123Vested (1,943) $ 97 (2,407) $ 82Forfeited (198) $ 114 (639) $ 93
Non-vested at end of year 4,208 $ 120 4,849 $ 104
The fair value of RSUs that vested during 2018 and 2017 was $189 million and $197 million, respectively.
Unamortized deferred compensation expense amounted to $250 million as of December 31, 2018, with a remaining weighted-average amortization period of approximately 1.7 years.
Performance Share Awards
The vesting of PSAs is contingent upon meeting a cumulative level of earnings per share related performance over a three-year period. The actual issue of shares may range from 0-200% of the target number of PSAs granted, based on the terms of the plan and level of achievement of the related performance target. The grant date fair value of PSAs is based upon the market price of Aon plc ordinary shares at the date of grant. The performance conditions are not considered in the determination of the grant date fair value for these awards. Compensation expense is recognized over the performance period based on management’s estimate of the number of units expected to vest. Management evaluates its estimate of the actual number of shares expected to be issued at the end of the programs on a quarterly basis. The cumulative effect of the change in estimate is recognized in the period of change as an adjustment to Compensation and benefits expense in the Consolidated Statements of Income, if necessary. Dividend equivalents are not paid on PSAs.

105
The following table summarizes the Company’s target PSAs granted and shares that would be issued at current performance levels for PSAs granted during the years ended December 31, 2018 and 2017, respectively, is as follows (shares in thousands and dollars in millions, except fair value):
2018 2017
Target PSAs granted during period 564 548Weighted average fair value per share at date of grant $ 134 $ 114Number of shares that would be issued based on current performance levels 840 1,068Unamortized expense, based on current performance levels $ 75 $ 40
During 2018, the Company issued approximately 1.0 million shares in connection with performance achievements related to the 2015-2017 LPP cycle. During 2017, the Company issued approximately 0.9 million shares in connection with performance achievements related to the 2014-2016 LPP cycle.
15. Derivatives and Hedging
The Company is exposed to market risks, including changes in foreign currency exchange rates and interest rates. To manage the risk related to these exposures, the Company enters into various derivative instruments that reduce these risks by creating offsetting exposures. The Company does not enter into derivative transactions for trading or speculative purposes.
Foreign Exchange Risk Management
The Company is exposed to foreign exchange risk when it earns revenues, pays expenses, enters into monetary intercompany transfers or other transactions denominated in a currency that differs from its functional currency. The Company uses foreign exchange derivatives, typically forward contracts, options and cross-currency swaps, to reduce its overall exposure to the effects of currency fluctuations on cash flows. These exposures are hedged, on average, for less than two years. These derivatives are accounted for as hedges, and changes in fair value are recorded each period in Other comprehensive income (loss) in the Consolidated Statements of Comprehensive Income.
The Company also uses foreign exchange derivatives, typically forward contracts and options, to economically hedge the currency exposure of the Company’s global liquidity profile, including monetary assets or liabilities that are denominated in a non-functional currency of an entity, typically on a rolling 30-day basis, but may be for up to one year in the future. These derivatives are not accounted for as hedges, and changes in fair value are recorded each period in Other income (expense) in the Consolidated Statements of Income.
The notional and fair values of derivative instruments are as follows (in millions):
Notional Amount
Net Amount of Derivative Assets Presented in the Statements of Financial
Position (1)
Net Amount of Derivative Liabilities Presented in the
Statements of Financial Position (2)
As of December 31 2018 2017 2018 2017 2018 2017
Foreign exchange contracts Accounted for as hedges $ 576 $ 557 $ 17 $ 28 $ — $ —Not accounted for as hedges 339 398 1 4 8 6
Total $ 915 $ 955 $ 18 $ 32 $ 8 $ 6
(1) Included within Other current assets ($3 million in 2018 and $9 million in 2017) or Other non-current assets ($15 million in 2018 and $23 million in 2017).(2) Included within Other current liabilities ($5 million in 2018 and $3 million in 2017) or Other non-current liabilities ($3 million in 2018 and $3 million in
2017).

106
The amounts of derivative gains (losses) recognized in the Consolidated Financial Statements are as follows (in millions):
Gain (Loss) recognized in Other reserves: 2018 2017
Cash flow hedges
Foreign exchange contracts $ (16) $ 14
Gain (Loss) reclassified from Other reserves into Other income (expense) - effective portion: 2018 2017
Cash flow hedges
Foreign exchange contracts $ 2 $ 1
The Company estimates that there will be insignificant pretax gains currently included within Accumulated other comprehensive loss will be reclassified in to earnings in the next twelve months.
The amount of loss recognized in Other income (expense) on the ineffective portion of derivatives was $6 million and $13 million for 2018 and 2017, respectively.
The Company recorded a loss of $29 million and a gain of $22 million in Other income (expense) for foreign exchange derivatives not designated or qualifying as hedges for 2018 and 2017, respectively.
Net Investments in Foreign Operations Risk Management
The Company uses non-derivative financial instruments to protect the value of its investments in a number of foreign subsidiaries. In 2016, the Company designated a portion of its euro-denominated commercial paper issuances as a non-derivative hedge of the foreign currency exposure of a net investment in its European operations. The change in fair value of the designated portion of the euro-denominated commercial paper due to changes in foreign currency exchange rates is recorded in Foreign currency translation adjustment, a component of Accumulated other comprehensive loss, to the extent it is effective as a hedge. The foreign currency translation adjustment of the hedged net investments is also recorded in Accumulated other comprehensive loss. Ineffective portions of net investment hedges, if any, are reclassified from Accumulated other comprehensive loss into earnings during the period of change.
As of December 31, 2018, the Company has €220 million ($250 million at December 31,2018 exchange rates) of outstanding euro-denominated commercial paper designated as a hedge of the foreign currency exposure of its net investment in its European operations. As of December 31, 2018, the unrealized gain recognized in Accumulated other comprehensive loss related to the net investment non derivative hedging instrument was $21 million.
The Company did not reclassify any deferred gains or losses related to net investment hedges from Accumulated other comprehensive loss to earnings for 2018 or 2017. In addition, the Company did not incur any ineffectiveness related to net investment hedges during 2018 or 2017.
16. Fair Value Measurements and Financial Instruments
Accounting standards establish a three tier fair value hierarchy that prioritizes the inputs used in measuring fair values as follows:
• Level 1 — observable inputs such as quoted prices for identical assets in active markets;
• Level 2 — inputs other than quoted prices for identical assets in active markets, that are observable either directly or indirectly; and
• Level 3 — unobservable inputs in which there is little or no market data which requires the use of valuation techniques and the development of assumptions.
The following methods and assumptions are used to estimate the fair values of the Company’s financial instruments, including pension assets (refer to Note 13 “Employee Benefits”):
Money market funds consist of institutional prime, treasury, and government money market funds. The Company reviews treasury and government money market funds to obtain reasonable assurance that the fund net asset value is $1 per share, and reviews the floating net asset value of institutional prime money market funds for reasonableness.
Cash and cash equivalents consist of cash and institutional short-term investment funds. The Company reviews the short-term investment funds to obtain reasonable assurance that the fund net asset value is $1 per share.

107
Equity investments consist of domestic and international equity securities and equity derivatives valued using the closing stock price on a national securities exchange. Over the counter equity derivatives are valued using observable inputs such as underlying prices of the underlying security and volatility. On a sample basis the Company reviews the listing of Level 1 equity securities in the portfolio and agrees the closing stock prices to a national securities exchange, and independently verifies the observable inputs for Level 2 equity derivatives and securities.
Fixed income investments consist of certain categories of bonds and derivatives. Corporate, government, and agency bonds are valued by pricing vendors who estimate fair value using recently executed transactions and proprietary models based on observable inputs, such as interest rate spreads, yield curves, and credit risk. Asset-backed securities are valued by pricing vendors who estimate fair value using discounted cash flow models utilizing observable inputs based on trade and quote activity of securities with similar features. Fixed income derivatives are valued by pricing vendors using observable inputs such as interest rates and yield curves. The Company obtains an understanding of the models, inputs, and assumptions used in developing prices provided by its vendors through discussions with the fund managers. The Company independently verifies the observable inputs, as well as assesses assumptions used for reasonableness based on relevant market conditions and internal Company guidelines. If an assumption is deemed unreasonable, based on the Company’s guidelines, it is then reviewed by management and the fair value estimate provided by the vendor is adjusted, if deemed appropriate. These adjustments do not occur frequently and historically are not material to the fair value estimates used in the Consolidated Financial Statements.
Pooled funds consist of various equity, fixed income, commodity, and real estate mutual fund type investment vehicles. Pooled investment funds fair value is estimated based on the proportionate share ownership in the underlying net assets of the investment, which is based on the fair value of the underlying securities that trade on a national securities exchange. The Company gains an understanding of the investment guidelines and valuation policies of the fund and discusses fund performance with pooled fund managers. The Company obtains audited fund manager financial statements, when available. If the pooled fund is designed to replicate a publicly traded index, the Company compares the performance of the fund to the index to assess the reasonableness of the fair value measurement.
Alternative investments consist of limited partnerships, private equity, and hedge funds. Alternative investment fair value is generally estimated based on the proportionate share ownership in the underlying net assets of the investment as determined by the general partner or investment manager. The valuations are based on various factors depending on investment strategy, proprietary models, and specific financial data or projections. The Company obtains audited fund manager financial statements, when available. The Company obtains a detailed understanding of the models, inputs, and assumptions used in developing prices provided by the investment managers (or appropriate party) through regular discussions. The Company also obtains the investment manger’s valuation policies and assesses the assumptions used for reasonableness based on relevant market conditions and internal Company guidelines. If an assumption is deemed unreasonable, based on the Company’s guidelines, it is then reviewed by management and the fair value estimate provided by the vendor is adjusted, if deemed appropriate. These adjustments do not occur frequently and historically are not material to the fair value estimates in the Consolidated Financial Statements.
Derivatives are carried at fair value, based upon industry standard valuation techniques that use, where possible, current market-based or independently sourced pricing inputs, such as interest rates, currency exchange rates, or implied volatilities.
Annuity contracts consist of insurance group annuity contracts purchased to match the pension benefit payment stream owed to certain selected plan participant demographics within a few major U.K. defined benefit plans. Annuity contracts are valued using a discounted cash flow model utilizing assumptions such as discount rate, mortality, and inflation.
Real estate and REITs consist of publicly traded real estate investment trusts (“REITs”) and direct real estate investments. Level 1 REITs are valued using the closing stock price on a national securities exchange. Non Level 1 values are based on the proportionate share of ownership in the underlying net asset value as determined by the investment manager. The Company independently reviews the listing of Level 1 REIT securities in the portfolio and agrees the closing stock prices to a national securities exchange. The Company gains an understanding of the investment guidelines and valuation policies of the non Level 1 real estate funds and discusses performance with the fund managers. The Company obtains audited fund manager financial statements, when available. See the description of “Alternative investments” for further detail on valuation procedures surrounding non Level 1 REITs.
Debt is carried at outstanding principal balance, less any unamortized issuance costs, discount or premium. Fair value is based on quoted market prices or estimates using discounted cash flow analyses based on current borrowing rates for similar types of borrowing arrangements.

108
The following tables present the categorization of the Company’s assets and liabilities that are measured at fair value on a recurring basis at December 31, 2018 and December 31, 2017 (in millions):
Fair Value Measurements Using
Balance at
December 31, 2018
Quoted Prices inActive Markets
for IdenticalAssets (Level 1)
Significant OtherObservable Inputs
(Level 2)
Significant Unobservable Inputs
(Level 3)
Assets Money market funds (1) $ 1,759 $ 1,759 $ — $ —Other investments
Government bonds $ 1 $ — $ 1 $ —Equity investments (2) $ 23 $ — $ 2 $ 21
Derivatives (3)
Gross foreign exchange contracts $ 21 $ — $ 21 $ —Liabilities
Derivatives (3)
Gross foreign exchange contracts $ 12 $ — $ 12 $ —
(1) Included within Fiduciary assets or Short-term investments or in the Consolidated Statements of Financial Position, depending on their nature and initial maturity.
(2) Level 3 equity investments consists primarily of limited partnerships which are valued using net asset statements provided by independent third parties, and therefore alternative assumptions would not change the fair value significantly.
(3) Refer to Note 15 “Derivatives and Hedging” for additional information regarding the Company’s derivatives and hedging activity.
Fair Value Measurements Using
Balance at
December 31, 2017
Quoted Prices inActive Markets
for IdenticalAssets (Level 1)
Significant OtherObservable Inputs
(Level 2)
Significant Unobservable Inputs
(Level 3)
Assets Money market funds (1) $ 1,847 $ 1,847 $ — $ —Other investments
Government bonds $ 1 $ — $ 1 $ —Equity investments (2) $ 35 $ — $ 4 $ 31
Derivatives (3)
Gross foreign exchange contracts $ 33 $ — $ 33 $ —Liabilities
Derivatives (3)
Gross foreign exchange contracts $ 6 $ — $ 6 $ —
(1) Included within Fiduciary assets or Short-term investments in the Consolidated Statements of Financial Position, depending on their nature and initial maturity. (2) Level 3 investments consists primarily of limited partnerships which are valued using net asset statements provided by independent third parties, and therefore
alternative assumptions would not change the fair value significantly.(3) Refer to Note 15 “Derivatives and Hedging” for additional information regarding the Company’s derivatives and hedging activity.

109
The following is a reconciliation of the beginning to the closing balances of the Company’s Level 3 inputs (in millions):
Measurement ofLevel 3 Inputs
Balance at January 1, 2017 $ 100Total gains and (losses) in fair value through OCI (1)Sales (11)Purchases 3Disposition (1) (80)Acquisition 20
Balance at December 31, 2017 31Total gains and (losses) in fair value through profit or loss (9)Sales (3)Purchases 2
Balance at December 31, 2018 $ 21
(1) In July 2017, the Company made a non-cash contribution of approximately $80 million of Level 3 investments to its U.S. pension plan.
There were no transfers of assets or liabilities between fair value hierarchy levels during 2018 or 2017. The Company recognized realized losses of $2 million in 2018 and realized gains of $32 million in 2017 in the Consolidated Statements of Income related to assets and liabilities measured at fair value using unobservable inputs.
The fair value of debt is classified as Level 2 of the fair value hierarchy. The following table provides the carrying value and fair value for the Company’s term debt (in millions):
2018 2017
As of December 31Carrying
ValueFair
ValueCarrying
ValueFair
Value
Current portion of long-term debt $ — $ — $ 299 $ 301Long-term debt $ 5,993 $ 6,159 $ 5,667 $ 6,267
Financial assets and liabilities
The Company classifies its financial assets and liabilities in accordance with categories prescribed under IFRS 9, except for derivatives which are in accordance with IAS 39, as follows:
Derivatives at fair value through profit or loss - Aon’s instruments which qualify for fair value through profit and loss include derivatives not accounted for as hedges. The derivative assets not accounted for as hedges were $1 million, and $4 million, respectively, at December 31, 2018 and 2017. Derivative assets are classified as Other current and Other non-current assets on the Consolidated Statements of Financial Position.
Equity instruments at fair value through profit or loss - Aon’s investments held for trading were $22 million and $26 million, respectively, at December 31, 2018 and 2017. Aon’s remaining investments not held for trading were $2 million and $10 million, respectively, at December 31, 2018 and 2017. Investments are classified as Other non-current assets on the Consolidated Statements of Financial Position.
Derivatives used for hedging - Aon’s derivative assets used for hedging were $17 million and $28 million, respectively, as of December 31, 2018 and 2017. Derivative assets are classified as Other current and Other non-current assets on the Consolidated Statements of Financial Position.
Debt instruments at amortized cost - Aon’s financial assets which qualify for debt instruments at amortized cost include balances classified as Cash and cash equivalents, Short-term investments, Receivables, net, Fiduciary assets, and financial assets held in Other current and non-current assets on the Consolidated Statements of Financial Position.
Financial liabilities at fair value through profit or loss - Aon’s derivative liabilities not accounted for as hedges were $8 millionand $6 million, respectively, at December 31, 2018 and 2017. Derivative liabilities are classified as Other current and Other non-current liabilities on the Consolidated Statements of Financial Position.

110
Other financial liabilities at amortized cost - All other financial liabilities held by Aon outside of the derivative liabilities identified above are measured at amortized cost. Aon’s financial liabilities included within this category under IFRS 9 include balances held in Fiduciary liabilities, Short-term debt and current portion of long-term debt, Long-term debt, Accounts payable and accrued liabilities, and financial liabilities classified as Other current and non-current liabilities on the Statements of Financial Position.
Financial assets and financial liabilities are offset in the Statement of financial position when the Company has a legally enforceable right to offset and has the intention to settle the asset and liability on a net basis. The following table present the balances that have been offset within Fiduciary assets and Fiduciary liabilities at December 31, 2018 and 2017.
Gross Amounts ofRecognized Assets and
Liabilities
Gross Amounts Offset inthe Statement of Financial
Position
Net Amounts of Assets and Liabilities Presented in the
Statement of Financial Position (1)
As of December 31, 2018Fiduciary assets and liabilities $ 11,782 $ 1,616 $ 10,166
As of December 31, 2017Fiduciary assets and liabilities $ 11,101 $ 1,476 $ 9,625
(1) Recorded within Fiduciary assets and Fiduciary liabilities on the Consolidated Statement of Financial Position. Refer to the Strategic Report for further information regarding the composition of fiduciary assets.
17. Provisions and Other Contingencies
Provisions
The changes in the Company’s Current provisions and Non-current provisions for 2018 are as follows:
(millions) Legal (1) 2017 Restructuring Plan Other Total
At January 1, 2018 $ 137 $ 184 $ 118 $ 439Arising during the year 164 450 11 625Utilized (57) (422) (1) (480)Amended provisions (14) (4) (11) (29)Foreign currency translation (6) (4) (3) (13)
At December 31, 2018 $ 224 $ 204 $ 114 $ 542
(1) Legal provisions are recorded gross of insurance receivables.
Legal
Aon and its subsidiaries are subject to numerous claims, tax assessments, lawsuits and proceedings that arise in the ordinary course of business, which include E&O claims. The damages claimed in these matters are or may be substantial, including, in many instances, claims for punitive, treble or extraordinary damages. While Aon maintains meaningful E&O insurance and other insurance programs to provide protection against certain losses that arise in such matters, Aon has exhausted or materially depleted its coverage under some of the policies that protect the Company and, consequently, is self-insured or materially self-insured for some claims. Accruals for these exposures, and related insurance receivables, when applicable, are included in the Consolidated Statements of Financial Position and have been recognized in Other general expenses in the Consolidated Statements of Income to the extent that losses are deemed probable and are reasonably estimable. These amounts are adjusted from time to time as developments warrant. Matters that are not probable and reasonably estimable are not accrued for in the financial statements.
The Company has included in the current matters described below certain matters in which (1) loss is probable, (2) loss is reasonably possible; that is, more than remote but not probable, or (3) there exists the reasonable possibility of loss greater than the accrued amount. In addition, the Company may from time to time disclose matters for which the probability of loss could be remote but the claim amounts associated with such matters are potentially significant. The reasonably possible range of loss for the matters described below, in excess of amounts that are deemed probable and estimable and therefore already accrued, is estimated to be between $0 and $0.2 billion, exclusive of any insurance coverage. These estimates are based on currently available information. As available information changes, the matters for which Aon is able to estimate may change, and the estimates themselves may change. In addition, many estimates involve significant judgment and uncertainty. For example, at the time of making an estimate, Aon may only have limited information about the facts underlying the claim, and predictions and assumptions about future court rulings and outcomes may prove to be inaccurate. Although management at present believes that the ultimate outcome of all matters

111
described below, individually or in the aggregate, will not have a material adverse effect on the consolidated financial position of Aon, legal proceedings are subject to inherent uncertainties and unfavorable rulings or other events. Unfavorable resolutions could include substantial monetary or punitive damages imposed on Aon or its subsidiaries. If unfavorable outcomes of these matters were to occur, future results of operations or cash flows for any particular quarterly or annual period could be materially adversely affected.
Current Matters
A pensions consulting and administration subsidiary of Aon provided advisory services to the Trustees of the Gleeds pension fund in the United Kingdom and, on occasion, to the relevant employer of the fund. In April 2014, the High Court, Chancery Division, London found that certain governing documents of the fund that sought to alter the fund’s benefit structure and that had been drafted by Aon were procedurally defective and therefore invalid. No lawsuit naming Aon as a party was filed, although a tolling agreement was entered. The High Court decision says that the additional liabilities in the pension fund resulting from the alleged defect in governing documents amount to approximately £45 million ($57 million at December 31, 2018 exchange rates). In December 2014, the Court of Appeal granted the employer leave to appeal the High Court decision. At a hearing in October 2016, the Court of Appeal approved a settlement of the pending litigation. On October 31, 2016, the fund’s trustees and employer sued Aon in the High Court, Chancery Division, London, alleging negligence and breach of duty in relation to the governing documents. The proceedings were served on Aon on December 20, 2016. The claimants seek damages of approximately £70 million ($88 million at December 31, 2018 exchange rates). In February 2018, the claimants instructed new lawyers and in May 2018 added their previous lawyers as defendants to the Aon lawsuit. The claimants allege that the previous lawyers were responsible for some of the losses sought from Aon because the lawyers gave negligent legal advice during the High Court and Court of Appeal proceedings. The trial of this matter has been set for November 2019. Aon believes that it has meritorious defenses and intends to vigorously defend itself against this claim.
On June 29, 2015, Lyttelton Port Company Limited (“LPC”) sued Aon New Zealand in the Christchurch Registry of the High Court of New Zealand. LPC alleges, among other things, that Aon was negligent and in breach of contract in arranging LPC’s property insurance program for the period covering June 30, 2010, to June 30, 2011. LPC contends that acts and omissions by Aon caused LPC to recover less than it otherwise would have from insurers for losses suffered in the 2010 and 2011 Canterbury earthquakes. LPC claims damages of approximately NZD $184 million ($124 million at December 31, 2018 exchange rates) plus interest and costs. Aon believes that it has meritorious defenses and intends to vigorously defend itself against these claims.
On October 3, 2017, Christchurch City Council (“CCC”) invoked arbitration to pursue a claim that it asserts against Aon New Zealand. Aon provided insurance broking services to CCC in relation to CCC’s 2010-2011 material damage and business interruption program. In December 2015, CCC settled its property and business interruption claim for its losses arising from the 2010-2011 Canterbury earthquakes against the underwriter of its material damage and business interruption program and the reinsurers of that underwriter. CCC contends that acts and omissions by Aon caused CCC to recover less in that settlement than it otherwise would have. CCC claims damages of approximately NZD $528 million ($355 million at December 31, 2018 exchange rates) plus interest and costs. Aon believes that it has meritorious defenses and intends to vigorously defend itself against these claims.
A retail insurance brokerage subsidiary of Aon was sued on September 6, 2018 in the United States District Court for the Southern District of New York by a client, Pilkington North America, Inc., that sustained damage from a tornado to its Ottawa, Illinois property. The lawsuit seeks between $45 million and $85 million in property and business interruption damages from either its insurer or Aon. The insurer contends that insurance proceeds were limited to $15 million in coverage by a windstorm sub-limit purportedly contained in the policy procured by Aon for Pilkington. The insurer therefore has tendered $15 million to Pilkington and denied coverage for the remainder of the loss. Pilkington sued the insurer and Aon seeking full coverage for the loss from the insurer or, in the alternative, seeking the same damages against Aon on various theories of professional liability if the court finds that the $15 million sub-limit applies to the claim. Aon believes it has meritorious defenses and intends to vigorously defend itself against these claims.
In April 2017, the FCA announced an investigation relating to suspected competition law breaches in the aviation and aerospace broking industry, which, for Aon in 2016, represented less than $100 million in global revenue. The European Commission has now assumed jurisdiction over the investigation in place of the FCA. Other antitrust agencies outside the European Union are also conducting formal or informal investigations regarding these matters. Aon intends to work diligently with all antitrust agencies concerned to ensure they can carry out their work as efficiently as possible. At this time, in light of the uncertainties and many variables involved, Aon cannot estimate the ultimate impact on our company from these investigations or any related private litigation, nor any damages, penalties, or fines related to them. There can be no assurance that the ultimate resolution of these matters will not have a material adverse effect on the Company’s consolidated financial position, results of operations, or liquidity.

112
Settled/Closed Matters
A retail insurance brokerage subsidiary of Aon was sued on September 14, 2010 in the Chancery Court for Davidson County, Tennessee Twentieth Judicial District, at Nashville by a client, Opry Mills Mall Limited Partnership (“Opry Mills”), that sustained flood damage to its property in May 2010. The lawsuit sought $200 million in coverage from numerous insurers with whom this Aon subsidiary placed the client’s property insurance coverage. The insurers contended that only $50 million in coverage (which had already been paid) was available for the loss because the flood event occurred on property in a high hazard flood zone. Opry Mills sought full coverage from the insurers for the loss and sued this Aon subsidiary in the alternative for the same $150 milliondifference on various theories of professional liability if the court determined there was not full coverage. In addition, Opry Mills sought prejudgment interest, attorneys’ fees and enhanced damages which could have substantially increased Aon’s exposure. In March 2015, the trial court granted partial summary judgment in favor of plaintiffs and against the insurers, holding generally that the plaintiffs are entitled to $200 million in coverage under the language of the policies. In August 2015, a jury returned a verdict in favor of Opry Mills and against the insurers in the amount of $204 million. On January 26, 2018, the Tennessee Court of Appeals reversed and remanded, reversing summary judgment in favor of plaintiffs and concluding that coverage is limited to $50 million. In December 2018, the parties reach an agreement to settle this case, and the settlement is now concluded. The terms of this settlement did not have a significant impact on Aon’s results of operations or financial condition.
2017 Restructuring Plan
In 2017, Aon initiated the Restructuring Plan in connection with the sale of the Divested Business. The Restructuring Plan is intended to streamline operations across the organization and deliver greater efficiency, insight, and connectivity. The Company expects these restructuring activities and related expenses to affect continuing operations through 2019.
The Restructuring Plan is expected to result in cumulative costs of approximately $1,225 million through the end of the plan, consisting of approximately $450 million in employee termination costs, $130 million in technology rationalization costs, $65 million in lease consolidation costs, $50 million in non-cash asset impairments, and $530 million in other costs, including certain separation costs associated with the sale of the Divested Business.
Refer to Note 6 “Restructuring” for further information surrounding the 2017 Restructuring Plan.
Other Provisions
Other provisions includes claims handling, policy cancellation, dilapidation, certain employment related items, former restructuring programs, and non-restructuring onerous contract reserves.
Guarantees and Indemnifications
The Company provides a variety of guarantees and indemnifications to its customers and others. The maximum potential amount of future payments represents the notional amounts that could become payable under the guarantees and indemnifications if there were a total default by the guaranteed parties, without consideration of possible recoveries under recourse provisions or other methods. These amounts may bear no relationship to the expected future payments, if any, for these guarantees and indemnifications. Any anticipated amounts payable are included in the Company’s Consolidated Financial Statements, and are recorded at fair value.
The Company expects that, as prudent business interests dictate, additional guarantees and indemnifications may be issued from time to time.
Redomestication
In connection with the Redomestication, the Company on April 2, 2012 entered into various agreements pursuant to which it agreed to guarantee the obligations of its subsidiaries arising under issued and outstanding debt securities. Those agreements included the (1) Amended and Restated Indenture, dated as of April 2, 2012, among Aon Corporation, Aon plc, and The Bank of New York Mellon Trust Company, N.A., as trustee (the “Trustee”) (amending and restating the Indenture, dated as of September 10, 2010, between Aon Corporation and the Trustee), (2) Amended and Restated Indenture, dated as of April 2, 2012, among Aon Corporation, Aon plc and the Trustee (amending and restating the Indenture, dated as of December 16, 2002, between Aon Corporation and the Trustee), and (3) Amended and Restated Indenture, dated as of April 2, 2012, among Aon Corporation, Aon plc and the Trustee (amending and restating the Indenture, dated as of January 13, 1997, as supplemented by the First Supplemental Indenture, dated as of January 13, 1997).
Sale of the Divested Business
In connection with the sale of the Divested Business, the Company guaranteed future operating lease commitments related to certain facilities assumed by the Buyer. The Company is obligated to perform under the guarantees if the Divested Business defaults on such leases at any time during the remainder of the lease agreements, which expire on various dates through 2025. As of

113
December 31, 2018, the undiscounted maximum potential future payments under the lease guarantee is $85 million, with an estimated fair value of $17 million. No cash payments were made in connection to the lease commitments during 2018.
Additionally, the Company is subject to performance guarantee requirements under certain client arrangements that were assumed by the Buyer. Should the Divested Business fail to perform as required by the terms of the arrangements, the Company would be required to fulfill the remaining contract terms, which expire on various dates through 2023. As of December 31, 2018, the undiscounted maximum potential future payments under the performance guarantees were $188 million, with an estimated fair value of $1 million. No cash payments were made in connection to the lease commitments during 2018.
Letters of Credit
Aon has entered into a number of arrangements whereby the Company’s performance on certain obligations is guaranteed by a third party through the issuance of a letter of credit (“LOCs”). The Company had total LOCs outstanding of approximately $83 million at December 31, 2018, compared to $96 million at December 31, 2017. These letters of credit cover the beneficiaries related to certain of Aon’s U.S. and Canadian non-qualified pension plan schemes and secure deductible retentions for Aon’s own workers compensation program. The Company has also obtained LOCs to cover contingent payments for taxes and other business obligations to third parties, and other guarantees for miscellaneous purposes at its international subsidiaries.
Premium Payments
The Company has certain contractual contingent guarantees for premium payments owed by clients to certain insurance companies. The maximum exposure with respect to such contractual contingent guarantees was approximately $103 million at December 31, 2018, compared to $95 million at December 31, 2017.
18. Segment Information
The Company operates as one segment that includes all of Aon’s continuing operations, which as a global professional services firm provides advice and solutions to clients focused on risk, retirement, and health through five revenue lines which make up its principal products and services. The Chief Operating Decision Maker (the “CODM”) assesses the performance of the Company and allocates resources based on one segment: Aon United.
The Company’s reportable operating segment has been determined using a management approach, which is consistent with the basis and manner in which Aon’s CODM uses financial information for the purposes of allocating resources and evaluating performance. The CODM assesses performance and allocates resources based on total Aon results against its key four metrics, including organic revenue growth, expense discipline, and collaborative behaviors that maximize value for Aon and its shareholders, regardless of which revenue line it benefits.
As Aon operates as one segment, segment profit or loss is consistent with consolidated reporting as disclosed on the Consolidated Statements of Income. Refer to Note 3 “Revenue from Contracts with Customers” for further information on revenue by principal service line.
Consolidated Non-current assets by geographic area are as follows (in millions):
As of December 31, 2018 TotalUnitedStates
Americasother than U.S.
UnitedKingdom
Europe, MiddleEast, & Africa
AsiaPacific
Fixed assets, net $ 371 $ 156 $ 39 $ 50 $ 88 $ 38Goodwill and other intangible assets 9,523 5,281 539 929 2,326 448
Total $ 9,894 $ 5,437 $ 578 $ 979 $ 2,414 $ 486
As of December 31, 2017 TotalUnitedStates
Americasother than U.S.
UnitedKingdom
Europe, MiddleEast, & Africa
AsiaPacific
Fixed assets, net $ 344 $ 105 $ 39 $ 59 $ 99 $ 42Goodwill and other intangible assets 10,309 5,701 654 1,028 2,460 466
Total $ 10,653 $ 5,806 $ 693 $ 1,087 $ 2,559 $ 508
19. Directors’ Emoluments
Information regarding the Non-Executive Directors’ emoluments and further information on the emoluments for Mr. Case is incorporated herein by reference to the audited section of the Directors’ Remuneration Report contained in this report.

114
Mr. Case serves as the Company’s President and Chief Executive Officer, and receives his remuneration for serving in that role. Mr. Case is the Company’s sole executive director.
His remuneration is as follows (in thousands):
Salary and Fees Benefits Annual BonusLPP SharesDelivered Pension Share Options Total
Executive 2018 2017 2018 2017 2018 2017 2018 2017 2018 2017 2018 2017 2018 2017Gregory C.Case $ 1,500 $ 1,500 $ 679 $ 712 $ 2,025 $ 2,029 $63,067 $25,306 $ 29 $ 29 $ — $ — $67,300 $29,576
20. Auditors’ Remuneration
The Company obtained the following services from the Company’s auditor, Ernst & Young LLP, at costs as detailed in the tables below (in millions):
2018AuditFees
Audit RelatedFees
TaxationFees
All OtherFees Total
Audit of the Group’s financial statements $ 9.1 $ — $ — $ — $ 9.1Other Services:
The auditing of accounts of any associate of the company 7.4 0.3 — — 7.7Audit-related assurance services — 1.2 — — 1.2Taxation compliance services — — 0.2 — 0.2All taxation advisory services — — 2.8 — 2.8All assurance services 0.1 — — — 0.1All non-audit services — — — 0.4 0.4
Total $ 16.6 $ 1.5 $ 3.0 $ 0.4 $ 21.5
2017AuditFees
Audit RelatedFees
TaxationFees
All OtherFees Total
Audit of the Group’s financial statements $ 9.4 $ — $ — $ — $ 9.4Other Services:
The auditing of accounts of any associate of the company 6.4 0.4 — — 6.8Audit-related assurance services — 0.8 — — 0.8Taxation compliance services — — 0.1 — 0.1All taxation advisory services — — 1.7 — 1.7All assurance services 0.1 — — — 0.1All non-audit services — — — 0.2 0.2
Total $ 15.9 $ 1.2 $ 1.8 $ 0.2 $ 19.1

115
21. Employees
The average number of persons employed by the Company was 47,538 and 48,453 for 2018 and 2017, respectively.
Employee compensation and benefits were as follows (in millions):
2018 2017
Wages and salaries $ 3,787 $ 3,611Social security costs 172 140Share based compensation expense 342 318Pension and postretirement expense 247 278Workforce reduction 115 299Other, primarily employee benefits 1,530 1,469
Total employee compensation and benefits $ 6,193 $ 6,115
Refer to Note 3 “Employees” of the Parent Company financial statements for disclosures surrounding compensation for key management personnel.

116
22. Fixed Assets
(millions)Leasehold
improvements
Furniture,fixtures andequipment
Computerequipment Other
Capital inprogress Total
Cost:Balance at January 1, 2018 $ 349 $ 239 $ 295 $ 90 $ 45 $1,018Additions 13 11 22 5 122 173Asset Impairments (15) (8) (5) — 13 (15)Disposals (21) (14) (41) (45) — (121)Foreign currency translation and other 8 — 8 (5) (59) (48)
Balance at December 31, 2018 $ 334 $ 228 $ 279 $ 45 $ 121 $1,007Accumulated depreciation:
Balance at January 1, 2018 $ 242 $ 174 $ 213 $ 45 $ — $ 674Charge for the year 27 18 36 5 — 86Disposals (22) (13) (39) (28) — (102)Foreign currency translation and other (6) (6) (7) (3) — (22)
Balance at December 31, 2018 $ 241 $ 173 $ 203 $ 19 $ — $ 636
Net book value:As of December 31, 2018 $ 93 $ 55 $ 76 $ 26 $ 121 $ 371
As of January 1, 2018 $ 107 $ 65 $ 82 $ 45 $ 45 $ 344
(millions)Leasehold
improvements
Furniture,fixtures andequipment
Computerequipment Other
Capital inprogress Total
Cost:Balance at January 1, 2017 $ 442 $ 295 $ 385 $ 114 $ 40 $1,276Additions 9 7 15 5 82 118Acquisitions 1 2 4 9 — 16Asset Impairments (6) (3) (4) — (4) (17)Disposals (129) (81) (164) (46) (3) (423)Foreign currency translations and other 32 19 59 8 (70) 48
Balance at December 31, 2017 $ 349 $ 239 $ 295 $ 90 $ 45 $1,018Accumulated Depreciation:
Balance at January 1, 2017 $ 305 $ 208 $ 271 $ 77 $ — $ 861Charge for the year 29 19 41 7 — 96Disposals (1) (2) (3) — — (6)Foreign currency translation (96) (62) (118) (45) — (321)Other 5 11 22 6 — 44
Balance at December 31, 2017 $ 242 $ 174 $ 213 $ 45 $ — $ 674
Net book value:As of December 31, 2017 $ 107 $ 65 $ 82 $ 45 $ 45 $ 344
As of January 1, 2017 $ 137 $ 87 $ 114 $ 37 $ 40 $ 415

117
23. Subsequent Events
Dividends
In January, 2019, the Company declared dividends of per share of $0.40 for a total cost of $96.0 million. The dividends were paid in February, 2019.
Brexit
On March 29, 2017, the U.K. invoked Article 50 of the Treaty on European Union, which began the member state's withdrawal from the European Union. Under Article 50, the U.K. had a maximum of two years in which to complete and execute upon exit negotiations with the European Union, unless the European Council unanimously decided to extend this period. As of late March 2019, negotiations with the European Union were ongoing and the U.K. was granted an extension to the Article 50 period to at least April 12, 2019. Aon continues to monitor negotiation developments and assess its impact to the Company accordingly.
Repurchase of Shares
During the period from January 1, 2019 to March 27, 2019, the Company repurchased 0.6 million shares at an average price per share of $161.16 for a total cost of $100 million. At March 27, 2019, the remaining authorized amount for share repurchase under the Share Repurchase Programs is $3.9 billion. The amount of shares repurchased after this date and prior to authorization of the financial statements on March 29, 2019 was insignificant to the Consolidated Financial Statements.
Commercial Paper
As of March 27, 2019, the Company had €220 million ($247 million at March 27, 2019 exchange rates) of commercial paper borrowings outstanding on the European commercial paper program and $365 million outstanding on the US commercial paper program. The proceeds from the issuance of commercial paper will be used to fund short-term working capital needs. The amount of commercial paper borrowed after this date and prior to authorization of the financial statements on March 29, 2019 was insignificant to the Consolidated Financial Statements.
24. Group Undertakings
As of December 31, 2018, the Aon’s worldwide Group undertakings were as follows:
Name of Company Address Country Holding % HoldingAon Angola Corretores de SegurosLimitada
Condominio Belas Business Park, Edificio Cabinda, Porta404, Piso 4, Talatona, Luanda, Angola Angola Ordinary Shares 70%
Admiseg SA Sarmiento 1239, Buenes Aires Argentina Ordinary Shares 100%Aon Affinity Argentina S.A. Emma de la barra 353 6 piso, Buenes Aires Argentina Ordinary Shares 96%Aon Benfield Argentina S.A. Emma de la barra 353 6 piso, Buenes Aires Argentina Ordinary Shares 100%Aon Risk Services Argentina S.A. Emma de la barra 353 6 piso, Buenes Aires Argentina Ordinary Shares 98%Aon Soluciones S.A. Emma de la barra 353 6 piso, Buenes Aires Argentina Ordinary Shares 98%Asevasa Argentina S.A. Emma de la barra 353 6 piso, Buenes Aires Argentina Ordinary Shares 100%Marinaro Dundas S.A. Av presidente Julio Roca 620, Buenes Aires Argentina Ordinary Shares 100%SN Re S.A. Emma de la barra 353 6 piso, Buenes Aires Argentina Ordinary Shares 73%Swire Blanch MSTC II SA Emma de la barra 353 6 piso, Buenes Aires Argentina Ordinary Shares 98%Swire Blanch MSTC SA Emma de la barra 353 6 piso, Buenes Aires Argentina Ordinary Shares 98%Aon Aruba N.V. Italiestraat 30 Oranjestad Aruba Aruba Ordinary Shares 100%Aon Captive Services Aruba N.V. Italiestraat 30 Oranjestad Aruba Aruba Ordinary Shares 100%Affinity Risk Partners (Brokers)Pty Ltd Level 1, 1265 Nepean Highway, Cheltenham, VIC 3192 Australia Ordinary Shares 100%Aon Australia Group Pty Ltd Level 33, 201 Kent Street, Sydney, NSW 2000 Australia Ordinary Shares 100%Aon Australian Holdco 1 Pty Ltd Level 33, 201 Kent Street, Sydney, NSW 2000 Australia Ordinary Shares 100%Aon Australian Holdco 2 Pty Ltd Level 33, 201 Kent Street, Sydney, NSW 2000 Australia Ordinary Shares 100%Aon Australian Holdco 3 Pty Ltd Level 33, 201 Kent Street, Sydney, NSW 2000 Australia Ordinary Shares 100%
Aon Benfield Australia Limited Level 33, 201 Kent Street, Sydney, NSW 2000 Australia
Ordinary Sharesand Preference
Shares 100%Aon Charitable Foundation Pty Ltd Level 33, 201 Kent Street, Sydney, NSW 2000 Australia Ordinary Shares 100%Aon Consolidation Group Pty Ltd Level 33, 201 Kent Street, Sydney, NSW 2000 Australia Ordinary Shares 100%

118
Name of Company Address Country Holding % HoldingAon Corporation Australia Limited Level 33, 201 Kent Street, Sydney, NSW 2000 Australia Ordinary Shares 100%Aon Group Pty Ltd Level 33, 201 Kent Street, Sydney, NSW 2000 Australia Ordinary Shares 100%
Aon Hewitt Financial AdviceLimited Level 33, 201 Kent Street, Sydney, NSW 2000 Australia
Ordinary Sharesand Preference
Shares 100%Aon Hewitt Limited Level 33, 201 Kent Street, Sydney, NSW 2000 Australia Ordinary Shares 100%
Aon Holdings Australia PtyLimited Level 33, 201 Kent Street, Sydney, NSW 2000 Australia
Ordinary Sharesand Preference
Shares 100%Aon Product Design &Development Australia Pty Limited Level 33, 201 Kent Street, Sydney, NSW 2000 Australia Ordinary Shares 100%Aon Risk & Asset ManagementPty Ltd Level 33, 201 Kent Street, Sydney, NSW 2000 Australia Ordinary Shares 100%Aon Risk Services AustraliaLimited Level 33, 201 Kent Street, Sydney, NSW 2000 Australia Ordinary Shares 100%Aon Services Pty Ltd. Level 33, 201 Kent Street, Sydney, NSW 2000 Australia Ordinary Shares 100%Aon Superannuation Pty Limited Level 33, 201 Kent Street, Sydney, NSW 2000 Australia Ordinary Shares 100%Cut-e Australia Pty Limited Level 33, 201 Kent Street, Sydney, NSW 2000 Australia Ordinary Shares 100%
Hewitt Associates Pty Ltd Level 33, 201 Kent Street, Sydney, NSW 2000 Australia
Ordinary Sharesand Preference
Shares 100%HIA Insurance Services Pty Ltd. Level 33, 201 Kent Street, Sydney, NSW 2000 Australia Ordinary Shares 50%One Underwriting Pty Ltd Level 51, 80 Collins Street, Melbourne, VIC 3000 Australia Ordinary Shares 100%Aon Austria GmbH Schwarzenbergplatz 3, 1010 Wien Austria Ordinary Shares 100%Aon Holdings Austria GmbH Schwarzenbergplatz 3, 1010 Wien Austria Ordinary Shares 100%Aon Jauch & Hübener Gesellschaftm.b.H. Schwarzenbergplatz 3, 1010 Wien Austria Ordinary Shares 100%
Aon Bahrain W.L.L.BMMI Tower | 12th Floor | Road 2813 | Seef District 428 POBox 30125 | Manama | Kingdom of Bahrain Bahrain Ordinary Shares 100%
Aon Insurance Managers(Barbados) Ltd. "Sunrise House", Wildey Main Road, St. Michael Barbados Ordinary Shares 100%Agenion N.V./SA Telecomlaan 5-7, B-1831 Diegem Belgium Ordinary Shares 100%Aon Belgium B.V.B.A. Telecomlaan 5-7, B-1831 Diegem Belgium Ordinary Shares 100%Crion N.V. Maaltemeers 84 B-9051 Sint-Denijs-Westrem Belgium Ordinary Shares 95%Probabilitas N.V./SA Tiensesteenweg 28 B-3001 Heverlee Belgium Ordinary Shares 100%Aon (Bermuda) Ltd. Aon House, 30 Woodbourne Avenue, Pembroke, Bermuda Bermuda Ordinary Shares 100%Aon Benfield Group Limited Aon House, 30 Woodbourne Avenue, Pembroke, Bermuda Bermuda Ordinary Shares 100%Aon Bermuda Holding Company Limited (1) Aon House, 30 Woodbourne Avenue, Pembroke, Bermuda Bermuda Ordinary Shares 100%Aon Bermuda QI Holdings Ltd. Aon House, 30 Woodbourne Avenue, Pembroke, Bermuda Bermuda Ordinary Shares 100%Aon Delta Bermuda Ltd. Aon House, 30 Woodbourne Avenue, Pembroke, Bermuda Bermuda Ordinary Shares 100%Aon Finance Bermuda 1 Ltd. Aon House, 30 Woodbourne Avenue, Pembroke, Bermuda Bermuda Ordinary Shares 100%Aon Finance Bermuda 2 Ltd. Aon House, 30 Woodbourne Avenue, Pembroke, Bermuda Bermuda Ordinary Shares 100%Aon Group (Bermuda) Ltd. Aon House, 30 Woodbourne Avenue, Pembroke, Bermuda Bermuda Ordinary Shares 100%Aon Hewitt (Bermuda) Ltd. Aon House, 30 Woodbourne Avenue, Pembroke, Bermuda Bermuda Ordinary Shares 100%Aon Insurance Managers(Bermuda) Ltd Aon House, 30 Woodbourne Avenue, Pembroke, Bermuda Bermuda Ordinary Shares 100%Aon Underwriting Managers(Bermuda) Ltd. Aon House, 30 Woodbourne Avenue, Pembroke, Bermuda Bermuda Ordinary Shares 100%Benfield Investment HoldingsLimited Aon House, 30 Woodbourne Avenue, Pembroke, Bermuda Bermuda Ordinary Shares 100%Benfield Juniperus HoldingsLimited Aon House, 30 Woodbourne Avenue, Pembroke, Bermuda Bermuda Ordinary Shares 100%International Risk ManagementGroup Ltd Aon House, 30 Woodbourne Avenue, Pembroke, Bermuda Bermuda Ordinary Shares 100%White Rock Insurance (Americas)Ltd. Aon House, 30 Woodbourne Avenue, Pembroke, Bermuda Bermuda Ordinary Shares 100%
White Rock Insurance (SAC) Ltd. Aon House, 30 Woodbourne Avenue, Pembroke, Bermuda Bermuda
Ordinary Sharesand Preference
Shares 100%

119
Name of Company Address Country Holding % HoldingWhite Rock Services (Bermuda)Ltd. Aon House, 30 Woodbourne Avenue, Pembroke, Bermuda Bermuda Ordinary Shares 100%Aon Bolivia S.A. Corredores deSeguros
Calle 10 de Calacoto 7812, Edificio Emporium, Piso 4Oficinas 401 y 402, La Paz Bolivia Ordinary Shares 100%
Aon Consulting Bolivia S.R.L.Calle 10 de Calacoto 7812, Edificio Emporium, Piso 4Oficinas 401 y 402, La Paz Bolivia Ordinary Shares 99%
Aon Re Bolivia S.A. Corredores deReaseguros
Calle 10 de Calacoto 7812, Edificio Emporium, Piso 4Oficinas 401 y 402, La Paz Bolivia Ordinary Shares 100%
Aon Botswana (Pty) Ltd.Aon House | Plot 50368 | Gaborone Business Park |Showgrounds P O Box 624 | Gaborone | Botswana Botswana Ordinary Shares 94%
Aon Holdings Botswana (Pty) LtdAon House | Plot 50368 | Gaborone Business Park |Showgrounds P O Box 624 | Gaborone | Botswana Botswana Ordinary Shares 100%
Aon Risk Management (Pty) LtdAon House | Plot 50368 | Gaborone Business Park |Showgrounds P O Box 624 | Gaborone | Botswana Botswana Ordinary Shares 100%
Adm Administradora de BeneficiosLtda.
Alameda Campinas 1070, 7th Floor, Jardim Paulista, SaoPaulo, SP 01404-200 Brazil Ordinary Shares 100%
Admix - Administracao,Consultoria, Participacoes eCorretora de Seguros de Vida Ltda.
Alameda Campinas 1070, 7th Floor, Jardim Paulista, SaoPaulo, SP 01404-200 Brazil Ordinary Shares 100%
Aon Affinity Administradora deBeneficios Ltda.
Alameda Campinas 1070, 2nd Floor, parte, Jardim Paulista,Sao Paulo, SP 01404-200 Brazil Ordinary Shares 100%
Aon Affinity do Brasil Servicos eCorretora de Seguros Ltda.
Alameda Campinas 1070, 2nd Floor, parte, Jardim Paulista,Sao Paulo, SP 01404-200 Brazil Ordinary Shares 100%
Aon Affinity Servicos eParticipacoes Ltda.
Alameda Campinas 1070, 2nd Floor, parte, Jardim Paulista,Sao Paulo, SP 01404-200 Brazil Ordinary Shares 100%
Aon Benfield Brasil Corretora deResseguros Ltda.
Rua Sao Bento, 18, sala 1302, Centro, CEP 20090-010, Rio deJaniero/RJ Brazil Ordinary Shares 100%
Aon Holdings Corretores deSeguros Ltda.
Alameda Campinas 1070, 1st to 13th floor, Jardim Paulista,01404-200, Sao Paulo/SP Brazil Ordinary Shares 100%
Associação Instituto AonRua Dr. Eduardo de Souza Aranha, n° 153, 5° andar, sale 01,Itaim Bibi, São Paulo, SP, CEP: 04543-120 Brazil Ordinary Shares 100%
Benfield do Brasil ParticipacoesLtda. (dormant)
Rua Sao Bento, 18, sala 1302, Centro, CEP 20090-010, Rio deJaniero/RJ Brazil Ordinary Shares 100%
Farmaseg - Solucoes, Assistencia eServicos Empresariais Ltda. Avenida Tambore, 267, Suite 201B, Barueri, SP 06460-0000 Brazil Ordinary Shares 100%Hewitt Associates Administradorae Corretora de Seguros Ltda.
Alameda Campinas 1070, 9th floor, parte, Jardim Paulista,Sao Paulo/SP, 01404-200 Brazil Ordinary Shares 100%
Hewitt Associates Servicos deRecursos Humanos Ltda.
Alameda Campinas 1070, 9th floor, parte, Jardim Paulista,Sao Paulo/SP, 01404-200 Brazil Ordinary Shares 100%
6824625 Canada Ltd.1200 Waterfront Centre, 200 Burrand St., Vancouver, BC V6C3L6 Canada Ordinary Shares 100%
7193599 Canada Inc. 20 Bay Street, Suite 2400, Toronto, ON M5J 2N9 Canada Ordinary Shares 100%Aon Benfield Canada ULC 225 King Street West, Suite 1000, Toronto, Ontario M5V 3M2 Canada Ordinary Shares 100%Aon Canada Holdings N.S. ULC 1959 Upper Water Street, Suite 900, Halifax, NS B3J 3N2 Canada Ordinary Shares 100%Aon Canada Inc. 20 Bay Street, Suite 2400, Toronto, ON M5J 2N9 Canada Ordinary Shares 100%Aon Canada Intermediaries GP 20 Bay Street, Suite 2400, Toronto, ON M5J 2N9 Canada Ordinary Shares 100%Aon CANZ Holdings N.S. ULC 1959 Upper Water Street, Suite 900, Halifax, NS B3J 3N2 Canada Ordinary Shares 100%Aon Direct Group Inc. 2255 Sheppard Ave. East, Suite E400, Toronto, ON M2J 4Y1 Canada Ordinary Shares 100%Aon Finance Canada 1 Corp. 20 Bay Street, Suite 2400, Toronto, ON M5J 2N9 Canada Ordinary Shares 100%Aon Finance Canada 2 Corp. 20 Bay Street, Suite 2400, Toronto, ON M5J 2N9 Canada Ordinary Shares 100%Aon Finance International N.S.ULC 1959 Upper Water Street, Suite 900, Halifax, NS B3J 3N2 Canada Ordinary Shares 100%
Aon Finance N.S. 1, ULC1959 Upper Water Street, Purdy's Wharf, Tower II, Halifax,NSB3J 3R7 Canada Ordinary Shares 100%
Aon Finance N.S. 5, ULC 1959 Upper Water Street, Suite 900, Halifax, NS B3J 3N2 Canada Ordinary Shares 100%Aon Finance N.S. 8, ULC 1959 Upper Water Street, Suite 900, Halifax, NS B3J 3N2 Canada Ordinary Shares 100%
Aon Hewitt Inc. 1001-1969 Upper Water Street, Halifax, NS B3J 2X2 Canada
Ordinary Sharesand Preference
Shares 100%Aon Hewitt InvestmentManagement Inc.
225 King Street West, Suite 1600, Toronto, Ontario M5V3M2 Canada Ordinary Shares 100%
Aon Parizeau Inc.700 de la Gauchetierre West, 16 and 17th Floors, Montreal,QC H3B 0A4 Canada Ordinary Shares 100%

120
Name of Company Address Country Holding % HoldingAon Reed Stenhouse Inc. 20 Bay Street, Suite 2400, Toronto, ON M5J 2N9 Canada Ordinary Shares 100%Aon Risk Services Canada Inc. 20 Bay Street, Suite 2400, Toronto, ON M5J 2N9 Canada Ordinary Shares 100%Aon Securities InvestmentManagement Inc.
225 King Street West, Suite 1000, Toronto, Ontario M5V3M2 Canada Ordinary Shares 100%
Coles Hewitt Partnership1200 Waterfront Centre, 200 Burrand St., Vancouver, BC V6C3L6 Canada Ordinary Shares 100%
Groupe-Conseil Aon Inc.700 de la Gauchetierre West, Suite 1900, Montreal, QC H3B0A4 Canada
Ordinary Sharesand Preference
Shares 100%Hewitt Amalco 3 ULC 1001-1969 Upper Water Street, Halifax, NS B3J 3R7 Canada Ordinary Shares 100%Hewitt Amalco 4 ULC 1001-1969 Upper Water Street, Halifax, NS B3J 3R7 Canada Ordinary Shares 100%Hewitt Amalco 5 ULC 1001-1969 Upper Water Street, Halifax, NS B3J 3R7 Canada Ordinary Shares 99%
Hewitt Associates (a partnership)22-5 King Street West, Suite 1600, Toronto, Ontario M5V3M2 Canada Ordinary Shares 100%
Hewitt Associates Corp. Suite 800, 1959 Upper Water Street, Halifax, NS B3J 3N2 Canada
Ordinary Sharesand Preference
Shares 100%Hewitt Holdings Canada Company 1959 Upper Water Street, Sutie 900, Halifax, NS B3J 2X2 Canada Ordinary Shares 100%
Hewitt Management Ltd.1200 Waterfront Centre, 200 Burrand St., Vancouver, BC V6C3L6 Canada
Ordinary Sharesand Preference
Shares 100%
Hewitt Western ManagementAmalco Inc.
1200 Waterfront Centre, 200 Burrand St., Vancouver, BC V6C3L6 Canada
Ordinary Sharesand Preference
Shares 100%IAO Actuarial Consulting ServicesCanada Inc. 600 Alden Road, Suite 700, Markham, Ontario L3R 0E7 Canada Ordinary Shares 100%
J. Allan Brown Consultants, Inc.1200 Waterfront Centre, 200 Burrand St., Vancouver, BC V6C3L6 Canada
Ordinary Sharesand Preference
Shares 100%
K & K Insurance Brokers, Inc.Canada 5800 Explorer Drive, Suite305, Mississauga, ON L4W 5K9 Canada
Ordinary Sharesand Preference
Shares 100%Linx Underwriting Solutions Inc. 20 Bay Street, Suite 2400, Toronto, ON M5J 2N9 Canada Ordinary Shares 100%
M.A. Shakeel Management Ltd.Amalco
1200 Waterfront Centre, 200 Burrand St., Vancouver, BC V6C3L6 Canada
Ordinary Sharesand Preference
Shares 100%
Minet Inc.700 de la Gauchetierre West, Suite 800, Montreal, QC H3B0A5 Canada
Ordinary Sharesand Preference
Shares 100%USLP Underwriting Solutions LP 1100-1st Street SE, 4th Floor, Calgary, AB T2G 181 Canada Ordinary Shares 99%Aon Insurance Managers(Cayman) Ltd.
94 Solaris Avenue, 2nd Floor, Camana Bay, P.O. Box 69,Grand Cayman, KY1-1102, Cayman Islands
CaymanIslands Ordinary Shares 100%
Aon Risk Solutions (Cayman) Ltd.94 Solaris Avenue, 2nd Floor, Camana Bay, P.O. Box 69,Grand Cayman, KY1-1102, Cayman Islands
CaymanIslands Ordinary Shares 100%
Harbourview West Lake Co-Invest(GP) LP
Conyers Corporate Services (Cayman) Limited, CricketSquare, Hutchins Drive, Grand Cayman, Cayman Islands, P.O.Box 2681
CaymanIslands Ordinary Shares 100%
Townsend HWL GP, Ltd.
Conyers Corporate Services (Cayman) Limited, CricketSquare, Hutchins Drive, Grand Cayman, Cayman Islands, P.O.Box 2681
CaymanIslands Ordinary Shares 100%
Aon Affinity Chile Ltda. Hendaya 60 Oficina 602, Santiago Chile Ordinary Shares 100%Aon Benfield (Chile) Corredoresde Reaseguros Ltda. Hendaya 60 Oficina 602, Santiago Chile Ordinary Shares 100%Aon Consulting (Chile) Limitada Hendaya 60 Oficina 602, Santiago Chile Ordinary Shares 100%Aon Risk Services (Chile)Corredores de Seguros Limitada Hendaya 60 Oficina 602, Santiago Chile Ordinary Shares 100%Aon Risk Services Holdings(Chile ) Ltda. Hendaya 60 Oficina 602, Santiago Chile Ordinary Shares 100%Asevasa Chile Peritaciones eIngenieria de Riesgos, S.A. Hendaya 60 Oficina 602, Santiago Chile Ordinary Shares 100%Benfield Corredores de ReaseguroLtda. Hendaya 60 Oficina 602, Santiago Chile Ordinary Shares 100%Inversiones Benfield Chile Ltda. Hendaya 60 Oficina 602, Santiago Chile Ordinary Shares 100%Aon Hewitt Consulting (Shanghai)Co., Ltd.
36/F Shanghai Central Plaza, 381 Huai Hai Middle Road,Shanghai, China 200020 China Ordinary Shares 100%

121
Name of Company Address Country Holding % HoldingAon-COFCO Insurance BrokersCo., Ltd.
Room 4105-4106, 42F, Jiinmao Tower 88 Century Boulevard,Pudong, Shanghai, China China Ordinary Shares 50%
Shanghai Kayi InformationTechnology Co., Ltd
Unit 2507, 25F Central Plaza, 381 HuaHai Middle Rd,Shanghai China Ordinary Shares 100%
Aon Affinity Colombia Ltda.Agencia de Seguros Carrera 11 # 86-53, Bogotá, Colombia 110221 Colombia Ordinary Shares 100%Aon Benfield Colombia LimitadaCorredores de Reaseguros Avenida Carrera 9 #113-52 Of. 505, Bogotá, Colombia Colombia Ordinary Shares 100%Aon Risk Services Colombia SACorredores de Seguros Carrera 11 # 86-53, Bogotá, Colombia 110221 Colombia Ordinary Shares 99%Salud, Riesgos y RecursosHumanos Consultores Ltda.(former Aon Corporte AdvisorsLtda.) Carrera 11 # 86-53, Bogotá, Colombia 110221 Colombia Ordinary Shares 100%Tecsefin, S.A. en liquidacion Carrera 11 # 86-53, Bogotá, Colombia 110221 Colombia Ordinary Shares 100%Alexander Insurance Managers(Netherlands Antilles) N.V.(dormant) p/a Prof Kernkampweg 1 Willemstad Curacao Curacao Ordinary Shares 100%Aon Antillen N.V. Prof Kernkampweg 1 Willemstad Curacao Curacao Ordinary Shares 100%Aon Captive Services Antilles N.V. Prof Kernkampweg 1 Willemstad Curacao Curacao Ordinary Shares 100%Aon Holdings Antillen N.V. Prof Kernkampweg 1 Willemstad Curacao Curacao Ordinary Shares 100%Aon Insurance Managers (Antilles)N.V. Prof Kernkampweg 1 Willemstad Curacao Curacao Ordinary Shares 100%Aon Cyprus Insurance BrokerCompany Limited
8 Kennedy Ave., Athienitis House, 4th floor, 1087 Nicosia,Cyprus Cyprus Ordinary Shares 100%
Aon Central and Eastern Europea.s. Vaclavske namesti 19, 110 00 Praha 1 Czech Rep. Ordinary Shares 100%ADIS A/S Strandgade 4C, 1401 Copenhagen K Denmark Ordinary Shares 100%Aon Denmark A/S Strandgade 4C, 1401 Copenhagen K Denmark Ordinary Shares 100%Aon Riskminder A/S Voldbjergvej 16, 8240 Risskov Denmark Ordinary Shares 100%Cut-e Danmark A/S Strandgade 4C, 1401 Copenhagen K Denmark Ordinary Shares 100%Optica Agency A/S Voldbjergvej 16, 8240 Risskov Denmark Ordinary Shares 100%Aon Consulting Ecuador S.A. Quito, Av. 12 de Octubre y Lincoln Ecuador Ordinary Shares 100%Aon Risk Services Ecuador S.A.Agencia Asesora Productora deSeguros Quito, Av. 12 de Octubre N24-15 y Lincoln Ecuador Ordinary Shares 100%Riskikonsultatsioonide OÜ Telliskivi 60 N- 63, 10412 Tallinn Estonia Ordinary Shares 100%Aon (Fiji) Ltd. Level 3, RB Jetpoint, Queens Road, Martintar Nadi Fiji Ordinary Shares 100%Aon Finland Oy Valimotie 1 A, FI-00380 Helsinki Finland Finland Ordinary Shares 100%Cut-e Finland Oy Regus Business Center, Jaakonkatu 3 C, 00100 Helsinki Finland Ordinary Shares 100%Aon France 31-35 rue de la Fédération 75015 Paris France Ordinary Shares 100%Aon Holdings France SNC 31-35 rue de la Fédération 75015 Paris France Ordinary Shares 100%Hewitt Associates SAS 31-35 rue de la Fédération 75015 Paris France Ordinary Shares 100%International Space Brokers France 31-35 rue de la Fédération 75015 Paris France Ordinary Shares 100%Kloud S.à.r.l. 31-35 rue de la Fédération 75015 Paris France Ordinary Shares 100%Aon BeteiligungsmanagementDeutschland GmbH & Co. KG Caffamacherreihe 16, 20355 Hamburg, Germany Germany Ordinary Shares 100%Aon Credit International InsuranceBroker GmbH Caffamacherreihe 16, 20355 Hamburg, Germany Germany Ordinary Shares 100%Aon Deutschland BeteiligungsGmbH Caffamacherreihe 16, 20355 Hamburg, Germany Germany Ordinary Shares 100%Aon Hewitt GmbH St.-Martin-Str. 60, 81541 München, Germany Germany Ordinary Shares 100%Aon Hewitt Trust Solutions GmbH Luxemburger Allee 4, 45481 Mülheim, Germany Germany Ordinary Shares 100%Aon Holding Deutschland GmbH Caffamacherreihe 16, 20355 Hamburg, Germany Germany Ordinary Shares 100%Aon Pensions Insurance BrokersGmbH Caffamacherreihe 16, 20355 Hamburg, Germany Germany Ordinary Shares 100%Aon Risiko &Unternehmensberatungs GmbH Caffamacherreihe 16, 20355 Hamburg, Germany Germany Ordinary Shares 100%Aon VersicherungsberatungsGmbH Caffamacherreihe 16, 20355 Hamburg, Germany Germany Ordinary Shares 100%

122
Name of Company Address Country Holding % HoldingAon VersicherungsmaklerDeutschland GmbH Caffamacherreihe 16, 20355 Hamburg, Germany Germany Ordinary Shares 100%Cut-e GmbH Großer Burstah 18-32, 20457 Hamburg Germany Ordinary Shares 100%Hamburger Gesellschaft zurForderung desVersicherungswesens mbH Caffamacherreihe 16, 20355 Hamburg, Germany Germany Ordinary Shares 100%One Underwriting Agency GmbH Caffamacherreihe 16, 20355 Hamburg, Germany Germany Ordinary Shares 100%PRORÜCK RuckversicherungsAktiengesellschaft Caffamacherreihe 16, 20355 Hamburg, Germany Germany Ordinary Shares 100%SG IFFOXXAssekuranzmaklergesellschaftmbH Galgenbergstraße 2c, 93053 Regensburg Germany Ordinary Shares 100%UNIT Versicherungsmakler GmbH Luxemburger Allee 4, 45481 Mülheim, Germany Germany Ordinary Shares 100%UnitedPensions Deutschland AG Caffamacherreihe 16, 20355 Hamburg, Germany Germany Ordinary Shares 100%Wannet Sports Insurance GmbH Springemarkt 1, 45894 Gelsenkirchen Germany Ordinary Shares 80%Aon Insurance Managers GibraltarLtd. Suite 913 Europort, GX 11 1AA Gibraltar Ordinary Shares 100%White Rock Insurance (Gibraltar)PCC Ltd. Suite 913 Europort, GX 11 1AA Gibraltar Ordinary Shares 100%
Aon Greece S.A.1-3, Tzavella & Ethnikis Antistaseos Str., Business Plaza,Building 1, 152 31 Halandri, Athens, Greece Greece Ordinary Shares 100%
Aon Insurance Micronesia (Guam)Inc 718 North Marine Corps Drive Suite 306, Tumon
Guam(Micronesia) Ordinary Shares 100%
Aon Insurance Managers(Guernsey) Ltd.
PO Box 33, Maison Trinity, Trinity Square, St. Peter Port,Guernsey GY1 4AT Guernsey Ordinary Shares 100%
Aon Insurance Managers(Holdings) Ltd.
PO Box 33, Maison Trinity, Trinity Square, St. Peter Port,Guernsey GY1 4AT Guernsey Ordinary Shares 100%
Aon PMI International Limited Lorica House, 16a Cornet Street Guernsey Ordinary Shares 100%
Aon Services (Guernsey) LtdPO Box 33, Maison Trinity, Trinity Square, St. Peter Port,Guernsey GY1 4AT Guernsey Ordinary Shares 100%
Lake Erie Real Estate GeneralPartner Limited
P.O. Box 255 Trafalgar Court, Les Banques, St. Peter Port,Guernsey GY1 3QL Guernsey Ordinary Shares 100%
Lincolnshire Insurance CompanyPCC Limited
PO Box 33, Maison Trinity, Trinity Square, St. Peter Port,Guernsey GY1 4AT Guernsey Ordinary Shares 100%
Lombard Trustee CompanyLimited
PO Box 33, Maison Trinity, Trinity Square, St. Peter Port,Guernsey GY1 4AT Guernsey Ordinary Shares 100%
Townsend Lake Constance GPLimited
P.O. Box 255 Trafalgar Court, Les Banques, St. Peter Port,Guernsey GY1 3QL Guernsey Ordinary Shares 100%
White Rock Insurance (Guernsey)ICC Limited
PO Box 33, Maison Trinity, Trinity Square, St. Peter Port,Guernsey GY1 4AT Guernsey Ordinary Shares 50%
White Rock Insurance CompanyPCC Ltd.
PO Box 33, Maison Trinity, Trinity Square, St. Peter Port,Guernsey GY1 4AT Guernsey Ordinary Shares 100%
Aon (CR) Insurance AgenciesCompany Limited
28/F, Tower 1, Times Square, 1 Matheson Street, CausewayBay, Hong Kong Hong Kong Ordinary Shares 100%
Aon Agencies Hong Kong Limited28/F, Tower 1, Times Square, 1 Matheson Street, CausewayBay, Hong Kong Hong Kong Ordinary Shares 100%
Aon Assurance Agencies HongKong Limited
28/F, Tower 1, Times Square, 1 Matheson Street, CausewayBay, Hong Kong Hong Kong Ordinary Shares 100%
Aon Benfield China Limited28/F, Tower 1, Times Square, 1 Matheson Street, CausewayBay, Hong Kong Hong Kong Ordinary Shares 100%
Aon Commercial InsuranceAgencies Hong Kong Limited
28/F, Tower 1, Times Square, 1 Matheson Street, CausewayBay, Hong Kong Hong Kong Ordinary Shares 100%
Aon Enterprise Insurance AgenciesHong Kong Limited
28/F, Tower 1, Times Square, 1 Matheson Street, CausewayBay, Hong Kong Hong Kong Ordinary Shares 100%
Aon Hewitt Hong Kong Limited28/F, Tower 1, Times Square, 1 Matheson Street, CausewayBay, Hong Kong Hong Kong Ordinary Shares 100%
Aon Holdings Hong Kong Limited28/F, Tower 1, Times Square, 1 Matheson Street, CausewayBay, Hong Kong Hong Kong Ordinary Shares 100%
Aon Hong Kong Limited28/F, Tower 1, Times Square, 1 Matheson Street, CausewayBay, Hong Kong Hong Kong Ordinary Shares 100%
Aon Insurance Agencies (HK)Limited
28/F, Tower 1, Times Square, 1 Matheson Street, CausewayBay, Hong Kong Hong Kong Ordinary Shares 100%
Aon Insurance ManagementAgencies (HK) Limited
28/F, Tower 1, Times Square, 1 Matheson Street, CausewayBay, Hong Kong Hong Kong Ordinary Shares 100%

123
Name of Company Address Country Holding % HoldingAon Insurance UnderwritingAgencies Hong Kong Limited
28/F, Tower 1, Times Square, 1 Matheson Street, CausewayBay, Hong Kong Hong Kong Ordinary Shares 100%
Aon Product Risk Services HongKong Limited
28/F, Tower 1, Times Square, 1 Matheson Street, CausewayBay, Hong Kong Hong Kong Ordinary Shares 100%
Aon Securities (Hong Kong)Limited
28/F, Tower 1, Times Square, 1 Matheson Street, CausewayBay, Hong Kong Hong Kong Ordinary Shares 100%
Aon Services Hong Kong Limited28/F, Tower 1, Times Square, 1 Matheson Street, CausewayBay, Hong Kong Hong Kong Ordinary Shares 100%
Aon Underwriting Agencies (HK)Limited
28/F, Tower 1, Times Square, 1 Matheson Street, CausewayBay, Hong Kong Hong Kong Ordinary Shares 100%
Asian Reinsurance UnderwritersLimited Level 54 Hopewell Centre 183 Queen's Road East Hong Kong Hong Kong Ordinary Shares 100%Contingency Insurance BrokersLimited Level 54 Hopewell Centre 183 Queen's Road East Hong Kong Hong Kong Ordinary Shares 51%Cut-e Assessment (Hong Kong)Limited
28/F, Tower 1, Times Square, 1 Matheson Street, CausewayBay, Hong Kong Hong Kong Ordinary Shares 100%
Essar Insurance Services Limited28/F, Tower 1, Times Square, 1 Matheson Street, CausewayBay, Hong Kong Hong Kong Ordinary Shares 100%
EW Blanch Limited Level 54 Hopewell Centre 183 Queen's Road East Hong Kong Hong Kong Ordinary Shares 100%
Stroz Friedberg (Asia) Limited28/F, Tower 1, Times Square, 1 Matheson Street, CausewayBay, Hong Kong Hong Kong Ordinary Shares 100%
Townsend Group Asia LimitedRoom 2903, 29/F Two Exchange Square, Central District,Hong Kong Hong Kong Ordinary Shares 100%
Aon Hungary Insurance BrokersRisk and Human Consulting LLC Gateway Office Park, Tower 1 Dunavirág u. 2. Budapest 1138 Hungary Ordinary Shares 100%
Aon Consulting Private Limited710, Ansal Chambers II, 6, Bhikaji Cama Place, New Delhi-110066 India Ordinary Shares 100%
Cocubes Technologies PrivateLimited
SCO 13-14-15, Second Floor, Sector 34A, Chandigarh160034 India Ordinary Shares 100%
PT Aon Benfield IndonesiaEnergy Building 25th Floor SCBD Lot 11 A JenderalSudirman Kav 52 - 53 Jakarta Indonesia Ordinary Shares 100%
PT Aon Hewitt IndonesiaEnergy Building 25th Floor SCBD Lot 11 A JenderalSudirman Kav 52 - 53 Jakarta Indonesia Ordinary Shares 100%
PT Aon IndonesiaEnergy Building 25th Floor SCBD Lot 11 A JenderalSudirman Kav 52 - 53 Jakarta Indonesia Ordinary Shares 50%
Aeropeople Limited 1-2 Bride Street, Loughrea, Co. Galway, Ireland Ireland Ordinary Shares 100%Aon Broking Technology Limited Metropolitan Building, James Joyce Street, Dublin 1, Ireland Ireland Ordinary Shares 100%
Aon Centre for Innovation andAnalytics Ltd Metropolitan Building, James Joyce Street, Dublin 1, Ireland Ireland
Ordinary Sharesand Preference
Shares 100%Aon Commercial Services andOperations Ireland Limited Admiraliteitskade 62, 3063 ED Rotterdam, the Netherlands Ireland Ordinary Shares 100%Aon Commercial Services IrelandLimited Metropolitan Building, James Joyce Street, Dublin 1, Ireland Ireland Ordinary Shares 100%Aon Corporate Services Limited Metropolitan Building, James Joyce Street, Dublin 1, Ireland Ireland Ordinary Shares 100%Aon Global Risk Research Limited Aon House, 30 Woodbourne Avenue, Pembroke, Bermuda Ireland Ordinary Shares 100%
Aon Hewitt (Ireland) Limited5th Floor, Block D, Iveagh Court, Harcourt Road, Dublin 2,Ireland Ireland Ordinary Shares 100%
Aon Hewitt ManagementCompany Limited Metropolitan Building, James Joyce Street, Dublin 1, Ireland Ireland Ordinary Shares 100%Aon Insurance Managers (Dublin)Ltd. Metropolitan Building, James Joyce Street, Dublin 1, Ireland Ireland Ordinary Shares 100%Aon Insurance Managers(Shannon) Limited Metropolitan Building, James Joyce Street, Dublin 1, Ireland Ireland Ordinary Shares 100%Aon Investment Holdings IrelandLimited Metropolitan Building, James Joyce Street, Dublin 1, Ireland Ireland Ordinary Shares 100%Aon MacDonagh Boland GroupLtd Metropolitan Building, James Joyce Street, Dublin 1, Ireland Ireland Ordinary Shares 100%Bacon & Woodrow Partnerships(Ireland) Limited Metropolitan Building, James Joyce Street, Dublin 1, Ireland Ireland Ordinary Shares 100%Beaubien Finance Ireland Limited Metropolitan Building, James Joyce Street, Dublin 1, Ireland Ireland Ordinary Shares 100%Becketts (Trustees) Limited Metropolitan Building, James Joyce Street, Dublin 1, Ireland Ireland Ordinary Shares 100%Becketts Limited Metropolitan Building, James Joyce Street, Dublin 1, Ireland Ireland Ordinary Shares 100%

124
Name of Company Address Country Holding % HoldingBeech Hill Pension Trustees Ltd Metropolitan Building, James Joyce Street, Dublin 1, Ireland Ireland Ordinary Shares 100%Benton Finance Ireland Limited Metropolitan Building, James Joyce Street, Dublin 1, Ireland Ireland Ordinary Shares 100%Cut-e Assessment Global Holdings 1-2 Bride Street, Loughrea, Co. Galway, Ireland Ireland Ordinary Shares 100%Cut-e Assessment SolutionsEurope Limited 1-2 Bride Street, Loughrea, Co. Galway, Ireland Ireland Ordinary Shares 100%Cut-e Ireland Limited 1-2 Bride Street, Loughrea, Co. Galway, Ireland Ireland Ordinary Shares 100%Delany Bacon & WoodrowPartnership Metropolitan Building, James Joyce Street, Dublin 1, Ireland Ireland Ordinary Shares 100%MacDonagh Boland CrottyMacRedmond Ltd Metropolitan Building, James Joyce Street, Dublin 1, Ireland Ireland Ordinary Shares 100%Private Client Trustees Ltd. Metropolitan Building, James Joyce Street, Dublin 1, Ireland Ireland Ordinary Shares 100%
Randolph Finance UnlimitedCompany Metropolitan Building, James Joyce Street, Dublin 1, Ireland Ireland
Ordinary Sharesand Preference
Shares 100%The Aon Ireland MastertrusteeLimited
5th Floor, Block D, Iveagh Court, Harcourt Road, Dublin 2,Ireland Ireland Ordinary Shares 100%
Aon Treasury Ireland Limited Metropolitan Building, James Joyce Street, Dublin 1, Ireland Ireland Ordinary Shares 100%Aon (Isle of Man) Limited Third Floor, St George's Court, Upper Church Street, Douglas Isle of Man Ordinary Shares 100%Aon Corporate Services (Isle ofMan) Limited Third Floor, St George's Court, Upper Church Street, Douglas Isle of Man Ordinary Shares 100%Aon Holdings (Isle of Man)Limited Third Floor, St George's Court, Upper Church Street, Douglas Isle of Man Ordinary Shares 100%Aon Insurance Managers (Isle ofMan) Ltd. Third Floor, St George's Court, Upper Church Street, Douglas Isle of Man Ordinary Shares 100%White Rock Insurance PCC (Isle ofMan) Limited Third Floor, St George's Court, Upper Church Street, Douglas Isle of Man Ordinary Shares 100%
Aon Benfield Israel Limited4 Berkovitch Street, Museum Building, 18th floor 64238 TelAviv Israel Ordinary Shares 100%
Aon Holdings Israel Ltd. 12 Aba Hillel Silver St. Ramat Gan 52506. Israel Israel Ordinary Shares 100%Aon Israel Insurance BrokerageLtd. 12 Aba Hillel Silver St. Ramat Gan 52506. Israel Israel Ordinary Shares 85%I. Beck Insurance Agency (1994)Ltd. 12 Aba Hillel Silver St. Ramat Gan 52506. Israel Israel Ordinary Shares 100%National Insurance Office Ltd. 12 Aba Hillel Silver St. Ramat Gan 52506. Israel Israel Ordinary Shares 100%Ronnie Elementary InsuranceAgency Ltd
4 Berkovitch Street, Museum Building, 18th floor 64238 TelAviv Israel Ordinary Shares 100%
Aon Benfield Italia S.p.A. Via Andrea Ponti, n.10, 20143 - MILANO Italy Ordinary Shares 100%Aon Hewitt Risk & ConsultingS.r.l. Via Andrea Ponti, n. 8/10, 20143 - MILANO Italy Ordinary Shares 100%Aon Italia S.r.l. Via Andrea Ponti, n. 8/10, 20143 - MILANO Italy Ordinary Shares 100%Aon S.p.A. Insurance &Reinsurance Brokers Via Andrea Ponti, n. 8/10, 20143 - MILANO Italy Ordinary Shares 100%Asscom Insurance Brokers S.r.l. Via Camperio Manfredo, n. 9, 20123 - MILANO Italy Ordinary Shares 80%Coverall S.r.l. Insurance andReinsurance Underwriting Agency Via Albricci, n. 8, 20122 MILANO Italy Ordinary Shares 100%Ge.f.it. S.r.l. Via Agostino Bertani, n. 6 - 20154 - MILANO Italy Ordinary Shares 100%Gefass S.r.l. Via Agostino Bertani, n. 6 - 20154 - MILANO Italy Ordinary Shares 100%Global Safe Insurance BrokersS.r.l. Via Riva di Reno, n. 29/c 40121 BOLOGNA Italy Ordinary Shares 100%Praesidium S.p.A. - SoluzioniAssicurative per il Management Via Ravenna, n. 14, 00161 - ROMA Italy Ordinary Shares 50%US Underwriting Solutions S.r.l. Via Santa Radegonda, n. 11 20121 - MILANO Italy Ordinary Shares 100%
Aon Benfield Japan LtdTokyu Capitol Tower 11F, 2-10-3, Nagatacho, Chiyoda-ku,Tokyo Japan Ordinary Shares 100%
Aon Hewitt Japan Ltd.Tokyu Capitol Tower 11F, 2-10-3, Nagatacho, Chiyoda-ku,Tokyo Japan Ordinary Shares 100%
Aon Holdings Japan LtdTokyu Capitol Tower 11F, 2-10-3, Nagatacho, Chiyoda-ku,Tokyo Japan Ordinary Shares 100%
Aon Japan LtdTokyu Capitol Tower 11F, 2-10-3, Nagatacho, Chiyoda-ku,Tokyo Japan Ordinary Shares 100%
Townsend Re Global GP Limited 1 Waverly Place, Union Street, St. Helier, Jersey JE1 1SG Jersey Ordinary Shares 100%

125
Name of Company Address Country Holding % HoldingAon Consulting Kazakhstan LLP 25, Samal-3, Almaty, Kazakhstan Kazakhstan Ordinary Shares 100%Insurance Broker Aon KazakhstanLLP 25, Samal-3, Almaty, Kazakhstan Kazakhstan Ordinary Shares 55%
Aon Hewitt Consulting Korea Inc.29th Floor, Center 1 East Tower, 26 Eulji-ro 5-gil, Jung-Gu,Seoul, Korea, 04539 Korea Ordinary Shares 100%
Aon Korea Inc.29th Floor, Center 1 East Tower, 26 Eulji-ro 5-gil, Jung-Gu,Seoul, Korea, 04539 Korea Ordinary Shares 100%
Aon Insurance Managers(Liechtenstein) AG Erlenweg 3, LI-9495 Triesen Liechtenstein Ordinary Shares 100%UAB "One Underwriting" (formername UAB Balto LinkSprendimai) Lithuania Ordinary Shares 100%UADBB Aon Baltic Gostauto str. 40b, LT-03163, Vilnius Lithuania Ordinary Shares 100%Aon Finance Luxembourg S.à.r.l. 534, Rue de Neudorf BP 593 L-2220 Luxembourg Luxembourg Ordinary Shares 100%Aon Global Risk ConsultingLuxembourg S.à.r.l. 534, Rue de Neudorf BP 593 L-2220 Luxembourg Luxembourg Ordinary Shares 100%Aon Holdings Luxembourg S.à.r.l. 534, Rue de Neudorf BP 593 L-2220 Luxembourg Luxembourg Ordinary Shares 100%Aon Insurance Managers(Luxembourg) S.A. 534, Rue de Neudorf BP 593 L-2220 Luxembourg Luxembourg Ordinary Shares 100%Aon Neudorf Finance S.à.r.l. 534, Rue de Neudorf BP 593 L-2220 Luxembourg Luxembourg Ordinary Shares 100%Aon Re Canada Holdings SARL 534, Rue de Neudorf BP 593 L-2220 Luxembourg Luxembourg Ordinary Shares 100%TTG Cayuga Bavaria Intermediate2 S.à.r.l 22 Rue Goethe, Luxembourg, Luxembourg 1637 Luxembourg Ordinary Shares 100%Aon Insurance Agencies (Macau)Limited
Avenida Doutor Mario Soares, n° 323, Edifício Banco daChina, 25° andar F, em Macau Macau Ordinary Shares 100%
Aon Benfield Malaysia LimitedLevel 10, Tower 3, Avenue 7, The Horizon, Bangsar South,No 8 Jalan Kerinchi, Kuala Lumpur 59200 Malaysia Ordinary Shares 100%
Aon Hewitt Malaysia Sdn BhdLevel 10, Tower 3, Avenue 7, The Horizon, Bangsar South,No 8 Jalan Kerinchi, Kuala Lumpur 59200 Malaysia Ordinary Shares 100%
Aon Insurance Brokers (Malaysia)Sdn Bhd
Level 10, Tower 3, Avenue 7, The Horizon, Bangsar South,No 8 Jalan Kerinchi, Kuala Lumpur 59200 Malaysia Ordinary Shares 49%
Aon Insurance Managers (Malta)PCC Limited
Vision Exchange Building Territorials Street Mriehel BKR3000, Malta Malta Ordinary Shares 100%
Aon Services (Malta) LtdVision Exchange Building Territorials Street Mriehel BKR3000, Malta Malta Ordinary Shares 100%
White Rock Insurance (Europe)PCC Limited
Vision Exchange Building Territorials Street Mriehel BKR3000, Malta Malta Ordinary Shares 100%
White Rock Insurance(Netherlands) PCC Limited
Vision Exchange Building Territorials Street Mriehel BKR3000, Malta Malta Ordinary Shares 100%
Aon Hewitt Ltd. 4th floor Dias Pier, Le Caudan Waterfront, Port Louis Mauritius Ordinary Shares 67%
Aon Mauritius Holdingsc/o Abax Corporate Services Ltd, 6th Floor, Tower A, 1CyberCity, Ebene Mauritius Ordinary Shares 100%
Aon Affinity Mexico Agente deSeguros y de Fianzas, S.A. de C.V.
Rio Lerma 232 Piso 28 Suite B, 29 y 30 Suite A, Col.Cuauhtemoc, Del. Cuauhtemoc, C.P. 06500, Mexico City Mexico Ordinary Shares 100%
Aon Affinity Mexico, S.A. de C.V.Rio Lerma 232 Piso 28 Suite B, 29 y 30 Suite A, Col.Cuauhtemoc, Del. Cuauhtemoc, C.P. 06500, Mexico City Mexico Ordinary Shares 100%
Aon Benfield MexicoIntermediario de Reaseguro SA deCV
Rio Lerma 232 Piso 28 Suite B, 29 y 30 Suite A, Col.Cuauhtemoc, Del. Cuauhtemoc, C.P. 06500, Mexico City Mexico Ordinary Shares 100%
Aon Life, Agente de Seguros, S.A.de C.V.
Rio Lerma 232 Piso 28 Suite B, 29 y 30 Suite A, Col.Cuauhtemoc, Del. Cuauhtemoc, C.P. 06500, Mexico City Mexico Ordinary Shares 100%
Aon Mexico Business Support SAde CV
Rio Lerma 232 Piso 28 Suite B, 29 y 30 Suite A, Col.Cuauhtemoc, Del. Cuauhtemoc, C.P. 06500, Mexico City Mexico Ordinary Shares 100%
Aon Mexico Holdings, S. de R.L.de C.V.
Rio Lerma 232 Piso 28 Suite B, 29 y 30 Suite A, Col.Cuauhtemoc, Del. Cuauhtemoc, C.P. 06500, Mexico City Mexico Ordinary Shares 100%
Aon Risk Solutions Agente deSeguros y de Fianzas SA de CV
Rio Lerma 232 Piso 28 Suite B, 29 y 30 Suite A, Col.Cuauhtemoc, Del. Cuauhtemoc, C.P. 06500, Mexico City Mexico Ordinary Shares 100%
Asevasa Mexico, S.A. de C.V.Rio Lerma 232 Piso 28 Suite B, 29 y 30 Suite A, Col.Cuauhtemoc, Del. Cuauhtemoc, C.P. 06500, Mexico City Mexico Ordinary Shares 100%
Hewitt Associates, S.C.Rio Lerma 232 Piso 28 Suite B, 29 y 30 Suite A, Col.Cuauhtemoc, Del. Cuauhtemoc, C.P. 06500, Mexico City Mexico Ordinary Shares 100%
Hewitt Beneficios Agente deSeguros y de Fianzas, S.A. de C.V.
Rio Lerma 232 Piso 28 Suite B, 29 y 30 Suite A, Col.Cuauhtemoc, Del. Cuauhtemoc, C.P. 06500, Mexico City Mexico Ordinary Shares 100%

126
Name of Company Address Country Holding % HoldingAon Acore Sarl 179 boulevard Moulay Hassan 1er Casablanca Morocco Ordinary Shares 70%Casablanca IntermediationCompany Sarl 179 boulevard Moulay Hassan 1er Casablanca Morocco Ordinary Shares 100%Glenrand M I B (Moçambique)Corretores de Seguros Limitada
Av. Marginal, Parcela 2, Talhão no 141 C, Maputo,Mozambique Mozambique Ordinary Shares 100%
Alexander & Alexander HoldingB.V. Admiraliteitskade 62, 3063 ED Rotterdam Netherlands Ordinary Shares 100%Aon Americas Holdings BV Admiraliteitskade 62, 3063 ED Rotterdam Netherlands Ordinary Shares 100%Aon APAC Holdings B.V. Admiraliteitskade 62, 3063 ED Rotterdam Netherlands Ordinary Shares 100%Aon CANZ Holdings B.V. Admiraliteitskade 62, 3063 ED Rotterdam Netherlands Ordinary Shares 100%Aon Cash Management B.V. Admiraliteitskade 62, 3063 ED Rotterdam Netherlands Ordinary Shares 100%Aon Corporation EMEA B.V. Admiraliteitskade 62, 3063 ED Rotterdam Netherlands Ordinary Shares 100%Aon Global Risk Consulting B.V. Admiraliteitskade 62, 3063 ED Rotterdam Netherlands Ordinary Shares 100%Aon Groep Nederland B.V. Admiraliteitskade 62, 3063 ED Rotterdam Netherlands Ordinary Shares 100%Aon Group Holdings International 1 B.V.(1) Admiraliteitskade 62, 3063 ED Rotterdam Netherlands Ordinary Shares 100%Aon Group Holdings International2 B.V. Admiraliteitskade 62, 3063 ED Rotterdam Netherlands Ordinary Shares 100%Aon Group International N.V. Admiraliteitskade 62, 3063 ED Rotterdam Netherlands Ordinary Shares 100%Aon Hewitt Risk & FinancialManagement B.V. Admiraliteitskade 62, 3062 ED Rotterdam Netherlands Ordinary Shares 100%Aon Holdings B.V. Admiraliteitskade 62, 3063 ED Rotterdam Netherlands Ordinary Shares 100%Aon Holdings International B.V. Admiraliteitskade 62, 3063 ED Rotterdam Netherlands Ordinary Shares 100%
Aon Holdings Mid Europe B.V. Admiraliteitskade 62, 3062 ED Rotterdam Netherlands
Ordinary Sharesand Preference
Shares 100%Aon International Coöperatief U.A. Admiraliteitskade 62, 3063 ED Rotterdam Netherlands Ordinary Shares 100%Aon Latam Holdings N.V. Admiraliteitskade 62, 3063 ED Rotterdam Netherlands Ordinary Shares 100%Aon Lead QI B.V. Admiraliteitskade 62, 3063 ED Rotterdam Netherlands Ordinary Shares 100%Aon Meeus Assurantiën B.V. Eendrachtlaan 315, 3526 LB Utrecht Netherlands Ordinary Shares 100%Aon Nederland C.V. Admiraliteitskade 62, 3063 ED Rotterdam Netherlands Ordinary Shares 100%Aon Netherlands Operations B.V. Admiraliteitskade 62, 3063 ED Rotterdam Netherlands Ordinary Shares 100%Aon Real Estate B.V. Kemelstede 4, 4817 ST Breda Netherlands Ordinary Shares 100%Aon Risk Services EMEA B.V. Admiraliteitskade 62, 3063 ED Rotterdam Netherlands Ordinary Shares 100%Aon Trust Services B.V. Admiraliteitskade 62, 3063 ED Rotterdam Netherlands Ordinary Shares 100%B.V. AssurantiekantoorLangeveldt-Schroder Admiraliteitskade 62, 3063 ED Rotterdam Netherlands Ordinary Shares 100%Bekouw Mendes C.V. Admiraliteitskade 62, 3063 ED Rotterdam Netherlands Ordinary Shares 100%Celinvest Amsterdam B.V. Admiraliteitskade 62, 3063 ED Rotterdam Netherlands Ordinary Shares 100%ExploitatiemaatschappijBeukenlaan 68-72 B.V. Beukenlaan 70, 5651 CD Eindhoven Netherlands Ordinary Shares 100%One Underwriting B.V. (fka Jacobs& Brom B.V.) Admiraliteitskade 62, 3062 ED Rotterdam Netherlands Ordinary Shares 100%One Underwriting Health B.V. (fkaIAK Volmacht B.V.) Beukenlaan 70, 5651 CD Eindhoven Netherlands Ordinary Shares 100%Sheppard Netherlands B.V. Admiraliteitskade 62, 3063 ED Rotterdam Netherlands Ordinary Shares 100%Wannet Speciale VerzekeringenB.V. Mr E.N. van Kleffensstraat 4, 6842 CV Arnhem Netherlands Ordinary Shares 100%Aon Benfield New ZealandLimited 16th Floor AMP Centre 29 Customs Street West New Zealand Ordinary Shares 100%Aon Holdings New Zealand 16th Floor AMP Centre 29 Customs Street West New Zealand Ordinary Shares 100%Aon New Zealand 16th Floor AMP Centre 29 Customs Street West New Zealand Ordinary Shares 100%
Aon New Zealand Group ULC 16th Floor AMP Centre 29 Customs Street West New Zealand
Ordinary Sharesand Preference
Shares 100%Aon Product Design andDevelopment New ZealandLimited Level 33, 201 Kent Street, Sydney New Zealand Ordinary Shares 100%Aon Saver Limited 16th Floor AMP Centre 29 Customs Street West New Zealand Ordinary Shares 100%

127
Name of Company Address Country Holding % HoldingSuperannuation ManagementNominees Limited 16th Floor AMP Centre 29 Customs Street West New Zealand Ordinary Shares 100%Aon Norway AS Stortingsgata 6, N-0161 Oslo Norway Ordinary Shares 100%Cut-e Nordic AS St Olavs plass 3, 0165 Oslo Norway Ordinary Shares 100%Cut-e Norge AS St Olavs plass 3, 0165 Oslo Norway Ordinary Shares 100%
Aon Majan LLCAon Majan LLC P.O. Box 67 | Postal Code 134 Jawharat Al-Shati | Muscat | Sultanate of Oman Oman Ordinary Shares 49%
Aon Insurance Brokers (Pvt) Ltd.2nd Floor, Bahria Complex III, M.T. Khan Road, Karachi -74000 Pakistan Ordinary Shares 100%
Aon Benfield Panama, S.A.Ave. Samuel Lewis y Calle, 54 Olbarrio Torre Generali, Piso#27, Bella Vista, Panama Panama Ordinary Shares 100%
Aon Broking Services SASwiss Bank Building, 16th Floor, 53rd Street, urbanizacionObarrio- World Trade Center, Panama Panama Ordinary Shares 100%
Asevasa Caricam, S.A. Calle 77, San Francisco, Edif. Ducruet, ciudad de Panama Panama Ordinary Shares 100%Asevasa Panama, S.A. Calle 77, San Francisco, Edif. Ducruet, ciudad de Panama Panama Ordinary Shares 100%
Aon Hewitt (PNG) Ltd. Level 1, Aon Haus, Mcregror StreetPapua New
Guinea Ordinary Shares 100%
Aon Risk Services (PNG) Ltd. Level 4 Aon Haus MacGregor StreetPapua New
Guinea Ordinary Shares 100%Aon Superannuation (PNG)Limited Level 1, Aon Haus, Mcregror Street
Papua NewGuinea Ordinary Shares 100%
Aon Benfield Peru Corredores deReaseguros SA Calle Dionisio Derteano 144, oficina 1001, San Isidro Peru Ordinary Shares 100%Aon Graña Peru Corredores deSeguros SA Calle Dionisio Derteano 144, oficina 1001, San Isidro Peru Ordinary Shares 100%Aon Soluciones, S.A.C. Calle Dionisio Derteano 144, oficina 1001, San Isidro Peru Ordinary Shares 100%Aon Insurance and ReinsuranceBrokers Philippines Inc.
4/F Tower One and Exchange Plaza Ayala Triangle AyalaAvenue Makati City Philippines Ordinary Shares 100%
Aon Polska Services Sp. z o.o. Al. Jerozolimskie 96, 00-807 Warsaw Poland Ordinary Shares 100%Aon Polska Sp. z o.o. Al. Jerozolimskie 96, 00-807 Warsaw Poland Ordinary Shares 100%Aon Sp. z o.o. Al. Jerozolimskie 96, 00-807 Warsaw Poland Ordinary Shares 100%Aon Portugal - Consultores,Unipessoal, Lda. Av. da Liberdade 249 - 2º Lisbon, 1250-143 Portugal Portugal Ordinary Shares 100%Aon Portugal - Corretores deSeguros, S.A. Av. da Liberdade 249 - 2º Lisbon, 1250-143 Portugal Portugal Ordinary Shares 100%Aon Re Bertoldi - Corretagem deResseguros S.A. Av. da Liberdade 249 - 2º Lisbon, 1250-143 Portugal Portugal Ordinary Shares 100%Inspiring Benefits Portugal,Unipessoal Lda Av. da Liberdade 249 - 2º Lisbon, 1250-143 Portugal Portugal Ordinary Shares 100%
Aon Qatar LLCOffice 203-C, 2nd Flr, Jaidah Square | 63 Airport Road | UmmGhuwailina, Zone 27 P.O. Box 16456 | Doha | Qatar Qatar Ordinary Shares 51%
Aon Consulting Romania SRLVictoria Center - 145 Calea Victoriei St, Level 6, room 3,Bucharest, CP 010072 Romania Ordinary Shares 100%
Aon Romania Broker de Asigurare- Reasigurare SRL
Victoria Center - 145 Calea Victoriei St, Level 6, Bucharest,CP 010072 Romania Ordinary Shares 100%
Aon Rus Insurance Brokers LLC4, 4th Lesnoy Lane, White Stone Business Center, Moscow,125047, Russia Russia Ordinary Shares 100%
Aon Rus LLC4, 4th Lesnoy Lane, White Stone Business Center, Moscow,125047, Russia Russia Ordinary Shares 100%
Aon Sint Maarten N.V. Unoun Road 88 Colebay Philipsburg Sint Maarten Saint Martin Ordinary Shares 100%Aon Insurance Micronesia (Saipan)Inc 1st Floor TSL Plaza, Beach Road, Garapan
Saipan(Micronesia) Ordinary Shares 100%
Aon Hewitt Saudi Arabia LLCThe BusinessGate, Building 16, Zone B P. O. Box 61192 |Riyadh 11565, Kingdom of Saudi Arabia Saudi Arabia Ordinary Shares 100%
Aon Saudi Arabia LLCThe BusinessGate, Building 16, Zone B P. O. Box 61192 |Riyadh 11565, Kingdom of Saudi Arabia Saudi Arabia Ordinary Shares 60%
Alexander & Alexander (Asia)Holdings Pte Ltd 2 Shenton Way #26-01 SGX Centre 1 Singapore
Ordinary Sharesand Preference
Shares 100%Aon Benfield Asia Pte. Ltd. 2 Shenton Way #26-01 SGX Centre 1 Singapore Ordinary Shares 100%Aon Hewitt Singapore Pte. Ltd. 2 Shenton Way #26-01 SGX Centre 1 Singapore Ordinary Shares 100%

128
Name of Company Address Country Holding % HoldingAon Hewitt Wealth ManagementPte. Ltd. 2 Shenton Way #26-01 SGX Centre 1 Singapore Ordinary Shares 100%Aon Insurance Agencies Pte Ltd 2 Shenton Way #26-01 SGX Centre 1 Singapore Ordinary Shares 100%Aon Insurance Managers(Singapore) Pte Ltd 2 Shenton Way #26-01 SGX Centre 1 Singapore Ordinary Shares 100%Aon Randolph Singapore Pte. Ltd. 2 Shenton Way #26-01 SGX Centre 1 Singapore Ordinary Shares 100%Aon Singapore (Broking Centre)Pte. Ltd. 2 Shenton Way #26-01 SGX Centre 1 Singapore Ordinary Shares 100%Aon Singapore Center forInnovation, Strategy andManagement Pte. Ltd. 2 Shenton Way #26-01 SGX Centre 1 Singapore Ordinary Shares 100%Aon Singapore Pte. Ltd. 2 Shenton Way #26-01 SGX Centre 1 Singapore Ordinary Shares 100%Cut-e Consulting Singapore PteLimited 2 Shenton Way #26-01 SGX Centre 1 Singapore Ordinary Shares 100%
Stenhouse (South East Asia)Private Limited 2 Shenton Way #26-01 SGX Centre 1 Singapore
Ordinary Sharesand Preference
Shares 100%
Aon Benfield Bratislava s.r.o.Slovak
Republic Ordinary Shares 100%Aon Consulting South Africa (Pty)Ltd.
The Place, 1 Sandton Drive, Sandhurst, Sandton, 2196,Johannesburg, South Africa South Africa Ordinary Shares 100%
Aon Holdings Sub-Sahara Africa(Pty) Ltd.
The Place, 1 Sandton Drive, Sandhurst, Sandton, 2196,Johannesburg, South Africa South Africa Ordinary Shares 100%
Aon Limpopo (Pty) Ltd.The Place, 1 Sandton Drive, Sandhurst, Sandton, 2196,Johannesburg, South Africa South Africa Ordinary Shares 50%
Aon Re Africa (Pty) LimitedThe Place, 1 Sandton Drive, Sandhurst, Sandton, 2196,Johannesburg, South Africa South Africa Ordinary Shares 70%
Aon South Africa (Pty) Ltd.The Place, 1 Sandton Drive, Sandhurst, Sandton, 2196,Johannesburg, South Africa South Africa Ordinary Shares 75%
Aon Worldaware (Pty) Ltd.The Place, 1 Sandton Drive, Sandhurst, Sandton, 2196,Johannesburg, South Africa South Africa Ordinary Shares 100%
Claims Fulfilment Company (Pty)Ltd.
The Place, 1 Sandton Drive, Sandhurst, Sandton, 2196,Johannesburg, South Africa South Africa Ordinary Shares 100%
Mafube Risk and InsuranceConsultants (Pty) Ltd.
The Place, 1 Sandton Drive, Sandhurst, Sandton, 2196,Johannesburg, South Africa South Africa Ordinary Shares 51%
Aon Benfield Iberia Correduria deReaseguros, S.A.U. Calle Rosario Pino núm. 14-16, 28020 Madrid Spain Ordinary Shares 100%Aon Gil y Carvajal, S.A.U.Correduria de Seguros Calle Rosario Pino núm. 14-16, 28020 Madrid Spain Ordinary Shares 100%Aon Hewitt España S.A.U. Calle Rosario Pino núm. 14-16, 28020 Madrid Spain Ordinary Shares 100%Aon Management Solutions,S.A.U. Calle Rosario Pino núm. 14-16, 28020 Madrid Spain Ordinary Shares 100%Aon Marketing Directo, S.A.U. Calle Rosario Pino núm. 14-16, 28020 Madrid Spain Ordinary Shares 100%Aon Southern Europe y Cia, S.L. Calle Rosario Pino núm. 14-16, 28020 Madrid Spain Preference Shares 100%Asevasa Asesoramiento yValoraciones S.A.U. Av. Manuel Siurot núm. 38, 41013 Sevilla Spain Ordinary Shares 100%Fundación Aon España Calle Rosario Pino núm. 14-16, 28020 Madrid Spain Preference Shares 100%Grupo Innovac SociedadCorreduria de Seguros S.A. Calle Rosario Pino núm. 14-16, 28020 Madrid Spain Ordinary Shares 91%Inspiring Benefits, S.L. Calle Rosario Pino núm. 14-16, 28020 Madrid Spain Ordinary Shares 100%One Underwriting Agencia deSuscripción S.L Calle Rosario Pino núm. 14-16, 28020 Madrid Spain Ordinary Shares 100%
Aon Swaziland (Pty) Ltd1st Floor, Umkhiwa House, Kal Grant Street, Mbabane,Swaziland Swaziland Ordinary Shares 60%
Aon Global Risk Consulting ABValhallavägen 117H, PO Box 27093, S-102 51 Stockholm,Sweden Sweden Ordinary Shares 100%
Aon Hewitt ABValhallavägen 117H, PO Box 27093, S-102 51 Stockholm,Sweden Sweden Ordinary Shares 100%
Aon Sweden ABValhallavägen 117H, PO Box 27093, S-102 51 Stockholm,Sweden Sweden Ordinary Shares 100%
Cut-e Sverige ABValhallavägen 117H, PO Box 27093, S-102 51 Stockholm,Sweden Sweden Ordinary Shares 100%

129
Name of Company Address Country Holding % HoldingAon Insurance Managers(Switzerland) AG Baarerstrasse 14, CH 6300 Zug Switzerland Ordinary Shares 100%Aon Schweiz AG Vulkanstrasse 106, 8048 Zürich Switzerland Ordinary Shares 100%Inpoint Switzerland GmbH Elisabethenstrasse 15, 4051 Basel Switzerland Ordinary Shares 100%PWZ AG Obstgartenstrasse 7, 8006 Zürich Switzerland Ordinary Shares 100%Stroz Friedberg GmbH Schanzeneggstrasse 3, CH-8002 Zurich, Switzerland Switzerland Ordinary Shares 100%Unidelta AG Tiefenaustrasse 2, 8640 Rapperswil Switzerland Ordinary Shares 100%Aon Management ConsultingTaiwan Ltd. 9/F, No.136, Section 3, Jen Ai Road, Taipei Taiwan Ordinary Shares 100%Aon Taiwan Ltd. 9/F, No.136, Section 3, Jen Ai Road, Taipei Taiwan Ordinary Shares 100%
Aon (Thailand) Limited18A Floor, Siam Tower Building, 989 Rama 1 Road, KwangPatumwan, Khet Patumwan, Thailand Ordinary Shares 62%
Aon Consulting (Thailand) Limited18E Floor, Siam Tower Building, 989 Rama 1 Road, KwangPatumwan, Khet Patumwan, Bangkok Thailand Ordinary Shares 80%
Aon Group (Thailand) Limited11 Floor, Siam Tower Building, 989 Rama 1 Road, KwangPatumwan, Khet Patumwan, Bangkok Thailand Ordinary Shares 49%
Aon Hewitt (Thailand) Ltd.12B Floor Unit A1 Floor, Siam Tower Building, 989 Rama 1Road, Kwang Patumwan, Khet Patumwan, Bangkok Thailand Ordinary Shares 100%
Aon Re (Thailand) Limited1 Floor 11 Unit B1, Siam Tower Building, 989 Rama 1 Road,Kwang Patumwan, Khet Patumwan, Bangkok Thailand Ordinary Shares 80%
Aon Risk Services (Thailand)Limited
18C Floor, Siam Tower Building,989 Rama 1 Road, KwangPatumwan, Khet Patumwan, Bangkok Thailand Ordinary Shares 80%
A.B. Insurances Limited 119 Henry StreetTrinidad and
Tobago Ordinary Shares 100%
AIB Services Limited 119 Henry StreetTrinidad and
Tobago Ordinary Shares 100%
Aon Energy Caribbean Limited #1 Murray Street,WoodvrookTrinidad and
Tobago Ordinary Shares 100%
Cardea Health Solutions Limited 119 Henry StreetTrinidad and
Tobago Ordinary Shares 100%
Aon Danismanlik Hizmetleri ASSaray Mahallesi, Dr.Adnan Büyükdeniz Caddesi, Akkom Ofis
Turkey Ordinary Shares 100%
Aon Sigorta ve ReasuransBrokerligi ve A.S.
Saray Mahallesi, Dr.Adnan Büyükdeniz Caddesi, Akkom Ofis
34768 Turkey Ordinary Shares 100%Acumen Credit Insurance BrokersLimited
Trueman House, Capitol Park Tingley, Leeds, West Yorkshire,LS27 0TS U.K. Ordinary Shares 100%
Affinity Group Insurance ServicesLimited
Trueman House, Capitol Park Tingley, Leeds, West Yorkshire,LS27 0TS U.K. Ordinary Shares 100%
Agility Credit Insurance BrokersLimited
Trueman House, Capitol Park Tingley, Leeds, West Yorkshire,LS27 0TS U.K. Ordinary Shares 100%
Alexander Clay 103, Waterloo Street, Glasgow, Scotland, G2 7BW U.K. Ordinary Shares 100%Aon 180412 Limited (inliquidation) Devonshire House, 60 Goswell Road, London, EC1M 7AD U.K. Ordinary Shares 100%
Aon Adjudication Services LimitedBriarcliff House, Kingsmead, Farnborough, Hampshire, GU147TE U.K. Ordinary Shares 100%
Aon ANZ Holdings LimitedThe Aon Centre, The Leadenhall Building, 122 LeadenhallStreet, London, EC3V 4AN U.K. Ordinary Shares 100%
Aon Benfield LimitedThe Aon Centre, The Leadenhall Building, 122 LeadenhallStreet, London, EC3V 4AN U.K. Ordinary Shares 100%
Aon Consulting Financial ServicesLimited
Briarcliff House, Kingsmead, Farnborough, Hampshire, GU147TE U.K. Ordinary Shares 100%
Aon Consulting LimitedBriarcliff House, Kingsmead, Farnborough, Hampshire, GU147TE U.K. Ordinary Shares 100%
Aon DC Trustee LimitedThe Aon Centre, The Leadenhall Building, 122 LeadenhallStreet, London, EC3V 4AN U.K. Ordinary Shares 100%
Aon Delta UK LimitedThe Aon Centre, The Leadenhall Building, 122 LeadenhallStreet, London, EC3V 4AN U.K. Ordinary Shares 100%
Aon Global Holdings 1 LimitedThe Aon Centre, The Leadenhall Building, 122 LeadenhallStreet, London EC3V 4AN U.K. Ordinary Shares 100%
Aon Global Holdings 2 LimitedThe Aon Centre, The Leadenhall Building, 122 LeadenhallStreet, London EC3V 4AN U.K. Ordinary Shares 100%

130
Name of Company Address Country Holding % HoldingAon Global Holdings 3 Limited (instrike-off)
The Aon Centre, The Leadenhall Building, 122 LeadenhallStreet, London EC3V 4AN U.K. Ordinary Shares 100%
Aon Global Holdings LimitedThe Aon Centre, The Leadenhall Building, 122 LeadenhallStreet, London, EC3V 4AN U.K. Ordinary Shares 100%
Aon Global Operations plcThe Aon Centre, The Leadenhall Building, 122 LeadenhallStreet, London, EC3V 4AN U.K. Ordinary Shares 100%
Aon Hewitt LimitedThe Aon Centre, The Leadenhall Building, 122 LeadenhallStreet, London, EC3V 4AN U.K. Ordinary Shares 100%
Aon Hewitt US Holdings LimitedThe Aon Centre, The Leadenhall Building, 122 LeadenhallStreet, London, EC3V 4AN U.K. Ordinary Shares 100%
Aon Holdings LimitedThe Aon Centre, The Leadenhall Building, 122 LeadenhallStreet, London, EC3V 4AN U.K. Ordinary Shares 100%
Aon Overseas Holdings LimitedThe Aon Centre, The Leadenhall Building, 122 LeadenhallStreet, London, EC3V 4AN U.K. Ordinary Shares 100%
Aon Pension Trustees LimitedThe Aon Centre, The Leadenhall Building, 122 LeadenhallStreet, London, EC3V 4AN U.K. Ordinary Shares 100%
Aon Risk Services (NI) Limited 8th Floor Victoria House 15 - 17 Gloucester Street Belfast U.K.
Ordinary Sharesand Preference
Shares 100%
Aon Securities LimitedThe Aon Centre, The Leadenhall Building, 122 LeadenhallStreet, London EC3V 4AN U.K. Ordinary Shares 100%
Aon Southern Europe UK LimitedThe Aon Centre, The Leadenhall Building, 122 LeadenhallStreet, London EC3V 4AN U.K. Ordinary Shares 100%
Aon Trust Corporation LimitedThe Aon Centre, The Leadenhall Building, 122 LeadenhallStreet, London EC3V 4AN U.K. Ordinary Shares 100%
Aon UK Group LimitedThe Aon Centre, The Leadenhall Building, 122 LeadenhallStreet, London EC3V 4AN U.K. Ordinary Shares 100%
Aon UK Holdings IntermediariesLimited
The Aon Centre, The Leadenhall Building, 122 LeadenhallStreet, London EC3V 4AN U.K. Ordinary Shares 100%
Aon UK LimitedThe Aon Centre, The Leadenhall Building, 122 LeadenhallStreet, London EC3V 4AN U.K. Ordinary Shares 100%
Aon UK Trustees LimitedThe Aon Centre, The Leadenhall Building, 122 LeadenhallStreet, London EC3V 4AN U.K. Ordinary Shares 100%
Aon US & International Holdings Limited(1)
The Aon Centre, The Leadenhall Building, 122 LeadenhallStreet, London EC3V 4AN U.K. Ordinary Shares 100%
Bacon & Woodrow PartnershipsLimited
The Aon Centre, The Leadenhall Building, 122 LeadenhallStreet, London EC3V 4AN U.K. Ordinary Shares 100%
Bain Hogg Group Limited (inliquidation) Devonshire House, 60 Goswell Road, London, EC1M 7AD U.K. Ordinary Shares 100%Bankassure Insurance ServicesLimited
The Aon Centre, The Leadenhall Building, 122 LeadenhallStreet, London EC3V 4AN U.K. Ordinary Shares 100%
Beaubien Finance LimitedThe Aon Centre, The Leadenhall Building, 122 LeadenhallStreet, London EC3V 4AN U.K. Ordinary Shares 100%
Beaubien UK Finance LimitedThe Aon Centre, The Leadenhall Building, 122 LeadenhallStreet, London EC3V 4AN U.K. Ordinary Shares 100%
Benton Finance LimitedThe Aon Centre, The Leadenhall Building, 122 LeadenhallStreet, London EC3V 4AN U.K. Ordinary Shares 100%
Contractsure LimitedTrueman House, Capitol Park Tingley, Leeds, West Yorkshire,LS27 0TS U.K. Ordinary Shares 100%
CoSec 2000 LimitedThe Aon Centre, The Leadenhall Building, 122 LeadenhallStreetLondon EC3V 4AN U.K. Ordinary Shares 100%
Credit Insurance Brokers(Reynolds) Limited
Trueman House, Capitol Park Tingley, Leeds, West Yorkshire,LS27 0TS U.K. Ordinary Shares 100%
Cut-e (UK) Limited GO8 Quality Court, Chancery Lane, London WC2A 1HR U.K. Ordinary Shares 100%Denney O'Hara (Life & Pensions)Limited
Trueman House, Capitol Park Tingley, Leeds, West Yorkshire,LS27 0TS U.K. Ordinary Shares 100%
Doveland Services LimitedThe Aon Centre, The Leadenhall Building, 122 LeadenhallStreet London EC3V 4AN U.K. Ordinary Shares 100%
E. W. Blanch Holdings LimitedThe Aon Centre, The Leadenhall Building, 122 LeadenhallStreet, London, EC3V 4AN U.K. Ordinary Shares 100%
E. W. Blanch Investments LimitedThe Aon Centre, The Leadenhall Building, 122 LeadenhallStreet London EC3V 4AN U.K. Ordinary Shares 100%
Farmsure Limited (in strike-off)Trueman House, Capitol Park Tingley, Leeds, West Yorkshire,LS27 0TS U.K. Ordinary Shares 100%

131
Name of Company Address Country Holding % Holding
Gotham Digital Science Ltd.Capital House 85 King William Street, London EC4N 7BLLondon, EC4N 7BL U.K. Ordinary Shares 100%
Hall Rhodes Holdings LimitedTrueman House, Capitol Park Tingley, Leeds, West Yorkshire,LS27 0TS U.K. Ordinary Shares 100%
Hall Rhodes LimitedTrueman House, Capitol Park Tingley, Leeds, West Yorkshire,LS27 0TS U.K. Ordinary Shares 100%
Henderson Corporate InsuranceBrokers Limited
Trueman House, Capitol Park Tingley, Leeds, West Yorkshire,LS27 0TS U.K. Ordinary Shares 100%
Henderson Insurance BrokersLimited
Trueman House, Capitol Park Tingley, Leeds, West Yorkshire,LS27 0TS U.K. Ordinary Shares 100%
Henderson Insurance PartnershipLimited (in strike-off)
Trueman House, Capitol Park Tingley, Leeds, West Yorkshire,LS27 0TS U.K. Ordinary Shares 100%
Henderson Risk ManagementLimited
Trueman House, Capitol Park Tingley, Leeds, West Yorkshire,LS27 0TS U.K. Ordinary Shares 100%
Hewitt Associates OutsourcingLimited
The Aon Centre, The Leadenhall Building, 122 LeadenhallStreet, London, EC3V 4AN U.K. Ordinary Shares 100%
Hewitt Risk Management ServicesLimited
The Aon Centre, The Leadenhall Building, 122 LeadenhallStreet, London, EC3V 4AN U.K. Ordinary Shares 100%
Hogg Group LimitedThe Aon Centre, The Leadenhall Building, 122 LeadenhallStreet, London, EC3V 4AN U.K. Ordinary Shares 100%
Insuractive Limited (in strike-off)Trueman House, Capitol Park Tingley, Leeds, West Yorkshire,LS27 0TS U.K. Ordinary Shares 100%
International Space BrokersEurope Limited
The Aon Centre, The Leadenhall Building, 122 LeadenhallStreet, London, EC3V 4AN U.K. Ordinary Shares 100%
International Space BrokersLimited
The Aon Centre, The Leadenhall Building, 122 LeadenhallStreet, London, EC3V 4AN U.K. Ordinary Shares 100%
Jenner Fenton Slade LimitedThe Aon Centre, The Leadenhall Building, 122 LeadenhallStreet, London, EC3V 4AN U.K. Ordinary Shares 100%
John Reynolds & Company (CreditInsurance) Limited
Trueman House, Capitol Park Tingley, Leeds, West Yorkshire,LS27 0TS U.K. Ordinary Shares 100%
John Reynolds & Company(Insurances) Limited
Trueman House, Capitol Park Tingley, Leeds, West Yorkshire,LS27 0TS U.K. Ordinary Shares 100%
John Reynolds & Company (Life& Pensions) Limited
Trueman House, Capitol Park Tingley, Leeds, West Yorkshire,LS27 0TS U.K. Ordinary Shares 100%
Krumlin Hall LimitedTrueman House, Capitol Park Tingley, Leeds, West Yorkshire,LS27 0TS U.K. Ordinary Shares 100%
McLagan (Aon) LimitedThe Aon Centre, The Leadenhall Building, 122 LeadenhallStreet, London, EC3V 4AN U.K. Ordinary Shares 100%
Minet Consultancy Services LtdThe Aon Centre, The Leadenhall Building, 122 LeadenhallStreet, London, EC3V 4AN U.K. Ordinary Shares 100%
Minet GroupThe Aon Centre, The Leadenhall Building, 122 LeadenhallStreet, London, EC3V 4AN U.K. Ordinary Shares 100%
NBS Nominees LimitedThe Aon Centre, The Leadenhall Building, 122 LeadenhallStreet, London, EC3V 4AN U.K. Ordinary Shares 100%
Optimum Risk Solutions LimitedTrueman House, Capitol Park Tingley, Leeds, West Yorkshire,LS27 0TS U.K. Ordinary Shares 100%
P.G. Bradley & Co LimitedTrueman House, Capitol Park Tingley, Leeds, West Yorkshire,LS27 0TS U.K. Ordinary Shares 100%
Portus Consulting (Leamington)Limited
The Aon Centre, The Leadenhall Building, 122 LeadenhallStreet, London, EC3V 4AN U.K. Ordinary Shares 100%
Portus Consulting LimitedThe Aon Centre, The Leadenhall Building, 122 LeadenhallStreet, London, EC3V 4AN U.K. Ordinary Shares 100%
Portus Online LLPThe Aon Centre, The Leadenhall Building, 122 LeadenhallStreet, London, EC3V 4AN U.K. Ordinary Shares 100%
Rasini Vigano LimitedThe Aon Centre, The Leadenhall Building, 122 LeadenhallStreet, London, EC3V 4AN U.K. Ordinary Shares 100%
Richard Kiddle (InsuranceBrokers) Limited
Trueman House, Capitol Park Tingley, Leeds, West Yorkshire,LS27 0TS U.K. Ordinary Shares 100%
SLE Worldwide LimitedThe Aon Centre, The Leadenhall Building, 122 LeadenhallStreet, London, EC3V 4AN U.K. Ordinary Shares 100%
Sports Insure Limited (in strike-off)
Trueman House, Capitol Park Tingley, Leeds, West Yorkshire,LS27 0TS U.K. Ordinary Shares 100%
Stroz Friedberg Limited Capital House, 85 King William Street London, EC4N 7BL U.K. Ordinary Shares 100%
Suresport Limited (In strike-off)Trueman House, Capitol Park Tingley, Leeds, West Yorkshire,LS27 0TS U.K. Ordinary Shares 100%

132
Name of Company Address Country Holding % Holding
The Aon MasterTrustee LimitedThe Aon Centre, The Leadenhall Building, 122 LeadenhallStreet, London, EC3V 4AN U.K. Ordinary Shares 100%
The John Reynolds CompanyLimited
Trueman House, Capitol Park Tingley, Leeds, West Yorkshire,LS27 0TS U.K. Ordinary Shares 100%
Townsend Group Europe Ltd. 6 St. Andrew Street, 5th Floor, London EC4A 3AE U.K. Ordinary Shares 100%UK Credit Insurance SpecialistsLimited
Trueman House, Capitol Park Tingley, Leeds, West Yorkshire,LS27 0TS U.K. Ordinary Shares 100%
Access Plans USA, Inc. 200 E. Randolph St., Chicago, IL 60601 U.S. Ordinary Shares 100%Affinity Insurance Services, Inc. 200 E. Randolph St., Chicago, IL 60601 U.S. Ordinary Shares 100%AIS Affinity Insurance Agency,Inc. 200 E. Randolph St., Chicago, IL 60601 U.S. Ordinary Shares 100%AIS Insurance Agency, Inc. 200 E. Randolph St., Chicago, IL 60601 U.S. Ordinary Shares 100%Alexander ReinsuranceIntermediaries, Inc. 200 E. Randolph St., Chicago, IL 60601 U.S. Ordinary Shares 100%Allen Insurance Associates, Inc. 200 E. Randolph St., Chicago, IL 60601 U.S. Ordinary Shares 100%Alliance HealthCard of Florida,Inc. 200 E. Randolph St., Chicago, IL 60601 U.S. Ordinary Shares 100%Alliance HealthCard, Inc. 200 E. Randolph St., Chicago, IL 60601 U.S. Ordinary Shares 100%American Insurance Services Corp. 200 E. Randolph St., Chicago, IL 60601 U.S. Ordinary Shares 100%American Special Risk InsuranceCompany 200 E. Randolph St., Chicago, IL 60601 U.S. Ordinary Shares 100%AMXH, LLC 200 E. Randolph St., Chicago, IL 60601 U.S. Ordinary Shares 100%Aon Benefit Solutions Inc. 200 E. Randolph St., Chicago, IL 60601 U.S. Ordinary Shares 100%Aon Benfield Fac Inc. 200 E. Randolph St., Chicago, IL 60601 U.S. Ordinary Shares 100%Aon Benfield Global, Inc. 200 E. Randolph St., Chicago, IL 60601 U.S. Ordinary Shares 100%Aon Benfield Inc. 200 E. Randolph St., Chicago, IL 60601 U.S. Ordinary Shares 100%Aon Benfield Puerto Rico Inc. 304 Ponce De Leon, Suite 1017, San Juan, PR 00918 U.S. Ordinary Shares 100%Aon Brazil Holdings, LLC 200 E. Randolph St., Chicago, IL 60601 U.S. Ordinary Shares 100%Aon Chile Holdings, LLC 200 E. Randolph St., Chicago, IL 60601 U.S. Ordinary Shares 100%Aon Consulting & InsuranceServices 200 E. Randolph St., Chicago, IL 60601 U.S. Ordinary Shares 100%Aon Consulting, Inc. 200 E. Randolph St., Chicago, IL 60601 U.S. Ordinary Shares 100%Aon Consulting, Inc. 200 E. Randolph St., Chicago, IL 60601 U.S. Ordinary Shares 100%Aon Corporation 200 E. Randolph St., Chicago, IL 60601 U.S. Ordinary Shares 100%Aon Edge Insurance Agency, Inc. 200 E. Randolph St., Chicago, IL 60601 U.S. Ordinary Shares 100%Aon Finance US 1, LLC 200 E. Randolph St., Chicago, IL 60601 U.S. Ordinary Shares 100%Aon Finance US 2, LLC 200 E. Randolph St., Chicago, IL 60601 U.S. Ordinary Shares 100%Aon Financial & InsuranceSolutions, Inc. 200 E. Randolph St., Chicago, IL 60601 U.S. Ordinary Shares 100%Aon Group, Inc. 200 E. Randolph St., Chicago, IL 60601 U.S. Ordinary Shares 100%Aon Hewitt Health MarketInsurance Solutions Inc. 200 E. Randolph St., Chicago, IL 60601 U.S. Ordinary Shares 100%Aon Hewitt InvestmentConsulting, Inc. 200 E. Randolph St., Chicago, IL 60601 U.S. Ordinary Shares 100%Aon Insurance Managers (PuertoRico) Inc. 304 Ponce De Leon, Suite 1000, San Juan, PR 00918 U.S. Ordinary Shares 100%Aon Insurance Managers (USA)Inc. 200 E. Randolph St., Chicago, IL 60601 U.S. Ordinary Shares 100%Aon Insurance Managers (USVI),Inc. 5093 Dronningens Gade, St. Thomas, USVI 00802 U.S. Ordinary Shares 100%Aon International Energy, Inc. 200 E. Randolph St., Chicago, IL 60601 U.S. Ordinary Shares 100%Aon International Holdings, Inc. 200 E. Randolph St., Chicago, IL 60601 U.S. Ordinary Shares 100%Aon Life Agency of Texas, Inc. 200 E. Randolph St., Chicago, IL 60601 U.S. Ordinary Shares 100%Aon Life Insurance Company 200 E. Randolph St., Chicago, IL 60601 U.S. Ordinary Shares 100%Aon Mexico Holdings, LLC 200 E. Randolph St., Chicago, IL 60601 U.S. Ordinary Shares 100%Aon PHI Acquisition Corporationof California 200 E. Randolph St., Chicago, IL 60601 U.S. Ordinary Shares 100%Aon Premium Finance, LLC 200 E. Randolph St., Chicago, IL 60601 U.S. Ordinary Shares 100%

133
Name of Company Address Country Holding % HoldingAon Private Risk ManagementInsurance Agency, Inc. 200 E. Randolph St., Chicago, IL 60601 U.S. Ordinary Shares 100%Aon Private Risk Management ofCalifornia Insurance Agency, Inc. 200 E. Randolph St., Chicago, IL 60601 U.S. Ordinary Shares 100%Aon Property Risk Consulting, Inc. 200 E. Randolph St., Chicago, IL 60601 U.S. Ordinary Shares 100%Aon Realty Services, Inc. 200 E. Randolph St., Chicago, IL 60601 U.S. Ordinary Shares 100%Aon Retirement Plan Advisors,LLC 200 E. Randolph St., Chicago, IL 60601 U.S. Ordinary Shares 100%Aon Risk Consultants, Inc. 200 E. Randolph St., Chicago, IL 60601 U.S. Ordinary Shares 100%Aon Risk Insurance Services West,Inc. 200 E. Randolph St., Chicago, IL 60601 U.S. Ordinary Shares 100%Aon Risk Services (Holdings) ofLatin America, Inc. 200 E. Randolph St., Chicago, IL 60601 U.S. Ordinary Shares 100%Aon Risk Services (Holdings) ofthe Americas, Inc. 200 E. Randolph St., Chicago, IL 60601 U.S. Ordinary Shares 100%Aon Risk Services Central, Inc. 200 E. Randolph St., Chicago, IL 60601 U.S. Ordinary Shares 100%
Aon Risk Services Companies, Inc. 200 E. Randolph St., Chicago, IL 60601 U.S.
Ordinary Sharesand Preference
Shares 100%Aon Risk Services Northeast, Inc. 200 E. Randolph St., Chicago, IL 60601 U.S. Ordinary Shares 100%Aon Risk Services South, Inc. 200 E. Randolph St., Chicago, IL 60601 U.S. Ordinary Shares 100%Aon Risk Services Southwest, Inc. 200 E. Randolph St., Chicago, IL 60601 U.S. Ordinary Shares 100%Aon Risk Services, Inc. of Florida 200 E. Randolph St., Chicago, IL 60601 U.S. Ordinary Shares 100%Aon Risk Services, Inc. of Hawaii 200 E. Randolph St., Chicago, IL 60601 U.S. Ordinary Shares 100%Aon Risk Services, Inc. ofMaryland 200 E. Randolph St., Chicago, IL 60601 U.S. Ordinary Shares 100%Aon Risk Services, Inc. ofWashington, D.C. 200 E. Randolph St., Chicago, IL 60601 U.S. Ordinary Shares 100%Aon Risk Solutions of Puerto Rico,Inc. 304 Ponce De Leon, Suite 1000, San Juan, PR 00918 U.S. Ordinary Shares 100%Aon Securities LLC 200 E. Randolph St., Chicago, IL 60601 U.S. Ordinary Shares 100%Aon Service Corporation 200 E. Randolph St., Chicago, IL 60601 U.S. Ordinary Shares 100%Aon Services Group, Inc. 200 E. Randolph St., Chicago, IL 60601 U.S. Ordinary Shares 100%Aon Special Risk Resources, Inc. 200 E. Randolph St., Chicago, IL 60601 U.S. Ordinary Shares 100%Aon TC Holdings, Inc. 200 E. Randolph St., Chicago, IL 60601 U.S. Ordinary Shares 100%Aon Trust Company LLC 4 Overlook Point, Lincolnshire, IL 60069 U.S. Ordinary Shares 100%Aon Underwriting Managers, Inc. 200 E. Randolph St., Chicago, IL 60601 U.S. Ordinary Shares 100%Aon US Holdings 2, Inc. 200 E. Randolph St., Chicago, IL 60601 U.S. Ordinary Shares 100%Aon US Holdings, Inc. 200 E. Randolph St., Chicago, IL 60601 U.S. Ordinary Shares 100%Aon Ward Financial Corporation 200 E. Randolph St., Chicago, IL 60601 U.S. Ordinary Shares 100%Aon/Albert G. Ruben InsuranceServices, Inc. 200 E. Randolph St., Chicago, IL 60601 U.S. Ordinary Shares 100%ARM International Corp. 200 E. Randolph St., Chicago, IL 60601 U.S. Ordinary Shares 100%ARM International InsuranceAgency Corp. 200 E. Randolph St., Chicago, IL 60601 U.S. Ordinary Shares 100%
ARMRISK CORP. 200 E. Randolph St., Chicago, IL 60601 U.S.
Ordinary Sharesand Preference
Shares 100%AS Holdings, Inc. 200 E. Randolph St., Chicago, IL 60601 U.S. Ordinary Shares 100%ASPN Insurance Agency, LLC 200 E. Randolph St., Chicago, IL 60601 U.S. Ordinary Shares 100%Association of Rural and SmallTown Americans 200 E. Randolph St., Chicago, IL 60601 U.S. Ordinary Shares 100%Assurance Licensing Services, Inc. 200 E. Randolph St., Chicago, IL 60601 U.S. Ordinary Shares 100%B E P International Corp. 200 E. Randolph St., Chicago, IL 60601 U.S. Ordinary Shares 100%Benefit Marketing Solutions,L.L.C. 200 E. Randolph St., Chicago, IL 60601 U.S. Ordinary Shares 100%Benfield Advisory Inc. 200 E. Randolph St., Chicago, IL 60601 U.S. Ordinary Shares 100%Benfield Finance (London) LLC 200 E. Randolph St., Chicago, IL 60601 U.S. Ordinary Shares 100%Blanch Americas Inc. 200 E. Randolph St., Chicago, IL 60601 U.S. Ordinary Shares 100%

134
Name of Company Address Country Holding % HoldingBMS Insurance Agency, L.L.C. 200 E. Randolph St., Chicago, IL 60601 U.S. Ordinary Shares 100%Bowes & Company, Inc., of NewYork 200 E. Randolph St., Chicago, IL 60601 U.S. Ordinary Shares 100%Cammack Health LLC 200 E. Randolph St., Chicago, IL 60601 U.S. Ordinary Shares 100%Cananwill Corporation 200 E. Randolph St., Chicago, IL 60601 U.S. Ordinary Shares 100%Cananwill, Inc. 200 E. Randolph St., Chicago, IL 60601 U.S. Ordinary Shares 100%Cananwill, Inc. 200 E. Randolph St., Chicago, IL 60601 U.S. Ordinary Shares 100%CEREP III Secondary Manager,LLC 200 E. Randolph St., Chicago, IL 60601 U.S. Ordinary Shares 100%CFSSG Real Estate Partners I,LLC 200 E. Randolph St., Chicago, IL 60601 U.S. Ordinary Shares 100%CFSSG Real Estate Partners II,LLC 200 E. Randolph St., Chicago, IL 60601 U.S. Ordinary Shares 100%CIF-H GP LLC 200 E. Randolph St., Chicago, IL 60601 U.S. Ordinary Shares 100%Citadel Insurance Managers, Inc. 200 E. Randolph St., Chicago, IL 60601 U.S. Ordinary Shares 100%Coalition for Benefits Equality andChoice 200 E. Randolph St., Chicago, IL 60601 U.S. Ordinary Shares 100%Custom Benefit Programs, Inc. 200 E. Randolph St., Chicago, IL 60601 U.S. Ordinary Shares 100%cut-e USA Inc. 200 E. Randolph St., Chicago, IL 60601 U.S. Ordinary Shares 100%E.W. Blanch Capital RiskSolutions, Inc. 200 E. Randolph St., Chicago, IL 60601 U.S. Ordinary Shares 100%E.W. Blanch International Inc. 200 E. Randolph St., Chicago, IL 60601 U.S. Ordinary Shares 100%Elysium Digital IP Products, LLC 200 E. Randolph St., Chicago, IL 60601 U.S. Ordinary Shares 100%Elysium Digital, L.L.C. 200 E. Randolph St., Chicago, IL 60601 U.S. Ordinary Shares 100%Ennis Knupp Secondary MarketServices, LLC 200 E. Randolph St., Chicago, IL 60601 U.S. Ordinary Shares 100%Financial & Professional RiskSolutions, Inc. 200 E. Randolph St., Chicago, IL 60601 U.S. Ordinary Shares 100%Futurity Group, Inc. 200 E. Randolph St., Chicago, IL 60601 U.S. Ordinary Shares 100%Gotham Digital Science, LLC 200 E. Randolph St., Chicago, IL 60601 U.S. Ordinary Shares 100%Grant Park Capital, LLC 200 E. Randolph St., Chicago, IL 60601 U.S. Ordinary Shares 100%GTCR/AAM Blocker Corp. 200 E. Randolph St., Chicago, IL 60601 U.S. Ordinary Shares 100%Health Index Advisors LLC 200 E. Randolph St., Chicago, IL 60601 U.S. Ordinary Shares 50%Healthy Paws Pet Insurance LLC 200 E. Randolph St., Chicago, IL 60601 U.S. Ordinary Shares 100%Hewitt Insurance Brokerage LLC 200 E. Randolph St., Chicago, IL 60601 U.S. Ordinary Shares 100%Hewitt Insurance, Inc. 304 Ponce De Leon, Suite 1000, San Juan, PR 00918 U.S. Ordinary Shares 100%Hewitt International Holdings LLC 200 E. Randolph St., Chicago, IL 60601 U.S. Ordinary Shares 100%Hogg Robinson North America,Inc. 200 E. Randolph St., Chicago, IL 60601 U.S. Ordinary Shares 100%Huntington T. Block InsuranceAgency, Inc. 200 E. Randolph St., Chicago, IL 60601 U.S. Ordinary Shares 100%Impact Forecasting, L.L.C. 200 E. Randolph St., Chicago, IL 60601 U.S. Ordinary Shares 100%INPOINT, INC. 200 E. Randolph St., Chicago, IL 60601 U.S. Ordinary Shares 100%International Risk Management(Americas), Inc. 200 E. Randolph St., Chicago, IL 60601 U.S. Ordinary Shares 100%International Space Brokers, Inc. 200 E. Randolph St., Chicago, IL 60601 U.S. Ordinary Shares 100%IRM/GRC Holding Inc. 200 E. Randolph St., Chicago, IL 60601 U.S. Ordinary Shares 100%J H Minet Puerto Rico Inc. 304 Ponce De Leon, Suite 1000, San Juan, PR 00918 U.S. Ordinary Shares 100%JDPT Manager, LLC 200 E. Randolph St., Chicago, IL 60601 U.S. Ordinary Shares 100%Johnson Rooney Welch, Inc. 200 E. Randolph St., Chicago, IL 60601 U.S. Ordinary Shares 100%K & K Insurance Group of Florida,Inc. 200 E. Randolph St., Chicago, IL 60601 U.S. Ordinary Shares 100%K & K Insurance Group, Inc. 200 E. Randolph St., Chicago, IL 60601 U.S. Ordinary Shares 100%K2 Technologies Inc. 200 E. Randolph St., Chicago, IL 60601 U.S. Ordinary Shares 100%KVT GP, LLC 200 E. Randolph St., Chicago, IL 60601 U.S. Ordinary Shares 100%Lake Tahoe GP, LLC 200 E. Randolph St., Chicago, IL 60601 U.S. Ordinary Shares 100%Lake Tahoe II GP, LLC 200 E. Randolph St., Chicago, IL 60601 U.S. Ordinary Shares 100%

135
Name of Company Address Country Holding % HoldingLake Tahoe III GP, LLC 200 E. Randolph St., Chicago, IL 60601 U.S. Ordinary Shares 100%Lake Tahoe IV GP, LLC 200 E. Randolph St., Chicago, IL 60601 U.S. Ordinary Shares 100%McLagan Partners Asia, Inc. 200 E. Randolph St., Chicago, IL 60601 U.S. Ordinary Shares 100%McLagan Partners, Inc. 200 E. Randolph St., Chicago, IL 60601 U.S. Ordinary Shares 100%Membership Leasing Trust 200 E. Randolph St., Chicago, IL 60601 U.S. Ordinary Shares 100%Minet Holdings Inc. 200 E. Randolph St., Chicago, IL 60601 U.S. Ordinary Shares 100%Minet Re North America, Inc. 200 E. Randolph St., Chicago, IL 60601 U.S. Ordinary Shares 100%Modern Survey, Inc. 201 E. Randolph St., Chicago, IL 60601 U.S. Ordinary Shares 100%Muirfield Underwriters, Ltd. 200 E. Randolph St., Chicago, IL 60601 U.S. Ordinary Shares 100%Paragon Strategic Solutions Inc. 200 E. Randolph St., Chicago, IL 60601 U.S. Ordinary Shares 100%PathWise Solutions LLC 200 E. Randolph St., Chicago, IL 60601 U.S. Ordinary Shares 100%Penn Square Manager 1, LLC 200 E. Randolph St., Chicago, IL 60601 U.S. Ordinary Shares 100%Penn Square Manager II, LLC 200 E. Randolph St., Chicago, IL 60601 U.S. Ordinary Shares 100%PGOF Manager 1, LLC 200 E. Randolph St., Chicago, IL 60601 U.S. Ordinary Shares 100%Premier Auto Finance, Inc. 200 E. Randolph St., Chicago, IL 60601 U.S. Ordinary Shares 100%Private Equity PartnershipStructures I, LLC 200 E. Randolph St., Chicago, IL 60601 U.S. Ordinary Shares 100%Protective Marketing Enterprises,Inc. 200 E. Randolph St., Chicago, IL 60601 U.S. Ordinary Shares 100%Redwoods Dental Underwriters,Inc. 200 E. Randolph St., Chicago, IL 60601 U.S. Ordinary Shares 100%SA Special Situations GeneralPartner, LLC 200 E. Randolph St., Chicago, IL 60601 U.S. Ordinary Shares 100%Scritch Inc. 200 E. Randolph St., Chicago, IL 60601 U.S. Ordinary Shares 100%Specialty Benefits, Inc. 200 E. Randolph St., Chicago, IL 60601 U.S. Ordinary Shares 100%Strategic Manager-III, LLC 200 E. Randolph St., Chicago, IL 60601 U.S. Ordinary Shares 100%Stroz Friedberg Inc. 200 E. Randolph St., Chicago, IL 60601 U.S. Ordinary Shares 100%Stroz Friedberg, LLC 200 E. Randolph St., Chicago, IL 60601 U.S. Ordinary Shares 100%The Key West Saxon Group, LLC 200 E. Randolph St., Chicago, IL 60601 U.S. Ordinary Shares 100%The Townsend Group, LLC 200 E. Randolph St., Chicago, IL 60601 U.S. Ordinary Shares 100%Townsend Alpha Manager I, LLC 200 E. Randolph St., Chicago, IL 60601 U.S. Ordinary Shares 100%Townsend Alpha Manager II, LLC 200 E. Randolph St., Chicago, IL 60601 U.S. Ordinary Shares 100%Townsend Alpha Manager III, LLC 200 E. Randolph St., Chicago, IL 60601 U.S. Ordinary Shares 100%Townsend Holdings LLC 200 E. Randolph St., Chicago, IL 60601 U.S. Ordinary Shares 100%Townsend REF GP, LLC 200 E. Randolph St., Chicago, IL 60601 U.S. Ordinary Shares 100%Townsend SO Manager I, LLC 200 E. Randolph St., Chicago, IL 60601 U.S. Ordinary Shares 100%TTG BRPTP GP, LLC 200 E. Randolph St., Chicago, IL 60601 U.S. Ordinary Shares 100%TTG Core Plus Investments, LLC 200 E. Randolph St., Chicago, IL 60601 U.S. Ordinary Shares 100%TTG German Investments I, LLC 200 E. Randolph St., Chicago, IL 60601 U.S. Ordinary Shares 100%TTG Investments II, LLC 200 E. Randolph St., Chicago, IL 60601 U.S. Ordinary Shares 100%TTG Irish Investments I, LLC 200 E. Randolph St., Chicago, IL 60601 U.S. Ordinary Shares 100%TTG Manager, LLC 200 E. Randolph St., Chicago, IL 60601 U.S. Ordinary Shares 100%Underwriters Marine Services, Inc. 200 E. Randolph St., Chicago, IL 60601 U.S. Ordinary Shares 100%Ward Financial Group, Inc. 200 E. Randolph St., Chicago, IL 60601 U.S. Ordinary Shares 100%West Lake General Partner, LLC 200 E. Randolph St., Chicago, IL 60601 U.S. Ordinary Shares 100%West Lake II GP, LLC 200 E. Randolph St., Chicago, IL 60601 U.S. Ordinary Shares 100%Wexford Underwriting Managers,Inc. 200 E. Randolph St., Chicago, IL 60601 U.S. Ordinary Shares 100%White Rock USA Ltd. 200 E. Randolph St., Chicago, IL 60601 U.S. Ordinary Shares 100%Worldwide Integrated ServicesCompany 200 E. Randolph St., Chicago, IL 60601 U.S. Ordinary Shares 100%Wrapid Specialty, Inc. 200 E. Randolph St., Chicago, IL 60601 U.S. Ordinary Shares 100%WT Government Services, LLC 200 E. Randolph St., Chicago, IL 60601 U.S. Ordinary Shares 100%WT Technologies, LLC 200 E. Randolph St., Chicago, IL 60601 U.S. Ordinary Shares 100%Aon Ukraine LLC M. Amosova, 12 03038 Kyiv Ukraine Ordinary Shares 100%

136
Name of Company Address Country Holding % Holding
Aon (DIFC) Gulf LimitedDIFC, Currency House Tower 2, Level 5 | Dubai, UnitedArab Emirates | P.O. Box 506746
United ArabEmirates Ordinary Shares 100%
Aon Benfield Middle East LimitedDIFC, Currency House Tower 2, Level 5 | Dubai, UnitedArab Emirates | P.O. Box 10764
United ArabEmirates Ordinary Shares 100%
Aon Hewitt Middle East LimitedDIFC, Currency House Tower 2, Level 5 | Dubai, UnitedArab Emirates | P.O. Box 10764
United ArabEmirates Ordinary Shares 100%
Aon Middle East Co LLC6th Floor I Al Reem Tower I Al Maktoum Street I P.O. Box10764 I Dubai I United Arab Emirates
United ArabEmirates Ordinary Shares 49%
Aon Retirement Solutions LimitedDIFC, Currency House Tower 2, Level 5 | Dubai, UnitedArab Emirates | P.O. Box 10764
United ArabEmirates Ordinary Shares 100%
Cut-e Consult DMCCMayfair executive office #3703-04 37th floor JumeiraBusiness Centre 2, JLT, Dubai, UAE
United ArabEmirates Ordinary Shares 100%
Stroz Friedberg Risk ManagementLimited
Unit 34 Level 3 Gate Village Building 10 Dubai InternationalFinancial Centre PO Box 125115 Dubai, United ArabEmirates
United ArabEmirates Ordinary Shares 100%
Aon Benfield Latin America SA Juncal 1305, piso 21 Uruguay Ordinary Shares 100%Marinaro Dundas SA Juncal 1305, piso 21 Uruguay Ordinary Shares 95%
Administradora Aon, C.A.
Avenida Luis Roches de Altamira con 3ra. Transversal de LosPalos Grandes, Edificio Seguros Nuevo Mundo, pisos 8 y 9,Urbanización Altamira, Caracas, Venezuela Venezuela Ordinary Shares 100%
Aon Group Venezuela, Corretajede Reaseguros, C.A.
Avenida Principal del Bosque, Edificio Pichincha, PentHouse, Chacaito, Caracas 1080, Venezuela Venezuela Ordinary Shares 100%
Aon Risk Services Venezuela,Corretaje de Seguros C.A.
Avenida Luis Roches de Altamira con 3ra. Transversal de LosPalos Grandes, Edificio Seguros Nuevo Mundo, pisos 8 y 9,Urbanización Altamira, Caracas, Venezuela Venezuela Ordinary Shares 100%
Aon Vietnam LimitedUnit 1201, 12th Floor, Hanoi Central Office Building, 44B LyThuong Kiet Street, Hoan Kiem District Vietnam Ordinary Shares 100%
(1) These entities are direct subsidiaries of Aon plc.
Aon consolidates all subsidiaries with ownership exceeding 50%, unless otherwise noted above.

137
PARENT COMPANY STATEMENTS OF FINANCIAL POSITION
As of December 31, As of January 1,(millions, except nominal value) Notes 2018 2017 2017
AssetsCurrent assetsCash and cash equivalents (1) $ 1 $ 1 $ —Intercompany receivables 7 146 121 96Other current assets 47 45 8
Total current assets 194 167 104Non-current assets
Deferred tax assets 14 6 11 9Intercompany notes receivable, net 10 347 359 310Other non-current assets 1 1 2Investments in subsidiaries 6 43,183 42,904 36,982
Total non-current Assets 43,537 43,275 37,303Total assets $ 43,731 $ 43,442 $ 37,407
Liabilities and equityLiabilities
Current liabilitiesAccounts payable and accrued liabilities 8 $ 55 $ 55 $ 53Short-term debt and current portion of long-term debt 9 467 511 811Intercompany payables 8 219 136 149Other current liabilities 8 1 15 —
Total current liabilities 742 717 1,013Non-current liabilitiesLong-term debt 9 4,230 4,252 4,176Other non-current liabilities 1 9 —
Total non-current liabilities 4,231 4,261 4,176Total liabilities 4,973 4,978 5,189
EquityOrdinary shares - $0.01 nominal value Authorized: 750 shares (issued: December 31, 2018 - 240.1; 2017 - 247.6) 2 2 3Share premium reserve 472 430 369Revaluation reserves 32,997 32,660 26,619Retained earnings 12 5,287 5,372 5,227Total equity 38,758 38,464 32,218
Total liabilities and equity $ 43,731 $ 43,442 $ 37,407
(1) Cash and cash equivalents were $567 thousand at December 31, 2018 and $552 thousand at December 31, 2017.
Profits for the Parent Company were $1.6 billion and $2.8 billion at December 31, 2018 and 2017, respectively. The financial statements of Aon plc (registered number 07876075) were approved by the Board of Directors on March 29, 2019.
Signed on behalf of the Board
/S/ Gregory C. Case, Director
The notes on pages 140 to 150 form an integral part of these financial statements.

138
PARENT COMPANY STATEMENTS OF SHAREHOLDERS’ EQUITY
(millions) NotesOrdinary
shares
Share premium account
Revaluation reserves
Retained Earnings Total
Balance at January 1, 2017 1 $ 3 $ 369 $ 1,907 $ 5,227 $ 7,506Fair value adjustment of investment in subsidiaries 1 — — 24,712 — 24,712
Adjusted beginning balance 3 369 26,619 5,227 32,218Net income — — — 2,760 2,760Shares issued - employee stock compensation plans — 61 — (182) (121)Shares purchased (1) — — (2,415) (2,416)Tax benefit - employee benefit plans — — — 47 47Revaluation reserves 6 — — 6,041 — 6,041Share-based compensation expense — — — 303 303Dividends to shareholders 13 — — — (364) (364)Net purchases of shares from noncontrolling interests — — — (4) (4)
Balance at December 31, 2017 $ 2 $ 430 $ 32,660 $ 5,372 $ 38,464Adoption of new accounting guidance — — — (2) (2)
Balance at January 1, 2018 2 430 32,660 5,370 38,462Net income — — — 1,564 1,564Shares issued - employee stock compensation plans — 42 — (190) (148)Shares purchased — — — (1,454) (1,454)Tax benefit - employee benefit plans — — — 36 36Revaluation reserves 6 — — 337 — 337Share-based compensation expense — — — 343 343Dividends to shareholders 13 — — — (382) (382)
Balance at December 31, 2018 $ 2 $ 472 $ 32,997 $ 5,287 $ 38,758
The notes on pages 140 to 150 form an integral part of these financial statements.

139
PARENT COMPANY STATEMENTS OF CASH FLOWS
Years ended December 31
(millions) Notes 2018 2017
Cash flows from operating activitiesNet income $ 1,564 $ 2,760Adjustments to reconcile net income to cash provided by operating activities:
Share-based compensation expense 3 45 52Deferred income taxes 14 4 (1)
Change in assets and liabilities:Accounts payable and accrued liabilities — (5)Current income taxes 14 (45) (45)Other assets and liabilities (37) (19)
Cash provided by operating activities 1,531 2,742Cash flows from investing activities
Proceeds from investments 355 607Payments for investments (13) (261)
Cash provided by investing activities 342 346Cash flows from financing activities
Share repurchase 12 (1,470) (2,399)Advances from affiliates 96 63Issuance of shares for employee benefit plans (104) (75)Issuance of debt 9 1,723 544Repayment of debt 9 (1,736) (856)Cash dividends to shareholders 13 (382) (364)
Cash used for financing activities (1,873) (3,087)Effect of exchange rates on cash and cash equivalents — —Net increase in cash and cash equivalents — 1Cash and cash equivalents at beginning of period (1) 1 —Cash and cash equivalents at end of period (1) $ 1 $ 1
(1) $567 thousand at December 31, 2018 and $552 thousand at December 31, 2017.
The notes on pages 140 to 150 form an integral part of these financial statements.

140
NOTES TO PARENT COMPANY FINANICAL STATEMENTS
1. Basis of Presentation
The financial statements of the Parent Company have been prepared in accordance with International Financial Reporting Standards (“IFRS”) as endorsed by the European Union and the Companies Act of 2006 applicable to companies reporting under IFRS. The Parent Company Financial Statements have been prepared on a historical cost basis unless otherwise noted.
The Parent Company has also adopted the exemption of presenting the statement of income account as permitted by section 408 of the Companies Act 2006. The Parent Company’s net income for the year ended December 31, 2018 and 2017 was $1,564 million and $2,760 million, respectively.
The Parent Company Financial Statements have been prepared on a going concern basis. The directors have considered the appropriateness of the going concern basis in the Report of the Directors on page 38.
The Parent Company Financial Statements and related notes have been prepared and presented in U.S. dollars (“USD”), being the Parent Company’s functional and presentational currency.
Fair Value of Investment in Subsidiaries
For the year ended December 31, 2018, the Parent Company made a voluntary policy election to change the measurement of its investment in subsidiary balance from cost to fair value. Management believes as Aon plc is the top holding entity of a listed group, fair value provides a more accurate reflection of the Parent Company’s underlying holdings as compared to the cost method. Aon has made the irrevocable election to measure its investment in subsidiary instruments as fair value through OCI, in accordance with IFRS 9.
Aon has applied this guidance retrospectively effective January 1, 2017, which resulted in an increase to Investment in subsidiary of $24.7 billion with an offset to Revaluation reserves on the Parent Company’s Statements of Financial Position.
Additionally, the Parent Company has reclassified $1.9 billion of legacy revaluation reserves that were previously held in Retained earnings to Revaluation reserves, effective January 1, 2017. Prior to adopting IFRS, the Parent Company measured its Investments in group undertakings using a valuation that was based on alternative accounting rules as allowed by Schedule 1.32(3) of the Companies Act 2006 on a basis that the Directors deemed to be appropriate in the circumstances of the Parent Company. Under this methodology, the Directors elected to value the investment in group undertakings at its U.S. GAAP net asset value, as it provided a consistent measure of the value of the Group headed by the subsidiary undertakings. The value of this investment was revalued at each balance sheet date and changes in the net asset value were recorded in Revaluation reserves. Upon adoption of IFRS on January 1, 2014, the Parent Company made the election measure its Investment in subsidiaries balance at cost and reclassified the existing $1.9 billion of Revaluation reserves to Retained earnings. Due to the Parent Company’s voluntary policy election to change the measurement of its investment subsidiary from cost to fair value, as described above, it has recommenced utilization of a Revaluation reserve and reclassified legacy balances accordingly.
2. Summary of Significant Accounting Principles and Practices
The Parent Company Financial Statements have been prepared using accounting policies, principals, practices, and critical accounting estimates and judgments consistent with the Consolidated Financials Statements, where relevant. Note 2 “Summary of Significant Accounting Principles and Practices” of the Notes to the Consolidated Financials Statements of the Company, should be read in addition to the intercompany accounting policies addressed below.
Investments in Subsidiaries
Investments in subsidiaries are stated at fair value and classified as Level 3 investments. Subsequent remeasurement of the fair value is adjusted through OCI.
Financial Assets and Liabilities
Intercompany financial assets and liabilities on the Parent Company Financial Statements are accounted for in accordance with IFRS 9 and primarily classified as amortized cost. These intercompany balances are included within Intercompany receivables, Intercompany notes receivables, net, and Intercompany payables on the Parent Company Statements of Financial Position.
The Parent Company will utilize an ECL approach to assess credit loss on its intercompany balances. To determine whether a financial instrument has low credit risk, the Parent Company will apply internal credit risk ratings or other methodologies that consider the risks and the type of financial instruments that are being assessed. Further, the Parent Company determines both

141
external and internal factors to assess whether the financial instrument carries minimal risk of default whereas a market participant would have the same perspective when taking into account all of the terms and conditions of the financial instrument.
Refer to Note 2 “Summary of Significant Accounting Principles and Practices” to the Consolidated Financial Statements of the Company for the ECL approach utilized for third party receivables, which is consistent with the Parent Company’s approach for assessing intercompany receivables.
At inception of a loan agreement, the Parent Company will determine the classification of credit risk for its counterparty utilizing various valuation techniques. At each reporting period subsequent to inception of the instrument, the Parent Company will assess whether there has been a significant change in the counterparty’s credit risk and quantify the ECL using either a 12-month or lifetime loss approach in accordance with IFRS 9. An investment grade entity is considered low risk and Aon plc will apply the 12-month ECL. If the entity is below investment grade at inception of the instrument, but there is no significant change in the credit risk at the reporting date, the Parent Company will continue to apply a 12-month ECL approach. If the credit risk significantly increases subsequent to the inception of the loan, the Parent Company will calculate a lifetime ECL at the reporting date.
New Accounting Pronouncements
Adoption of New Accounting Standards
Financial Instruments
The adoption of IFRS 9 has changed the Parent Company’s accounting for impairment losses for financial assets by replacing the incurred loss approach under IAS 39 with a forward-looking ECL approach as mentioned above. Upon adoption in January 2018, the Parent Company recognized a $2 million decrease to Retained earnings and Intercompany notes receivable on the Parent Company Statement of Financial Position. For the twelve months ended December 31, 2018, the impact of adopting this guidance on the Parent Company Statements of Cash Flows and Net income was insignificant.
Refer to Note 2 “Summary of Significant Accounting Principles and Practices” to the Consolidated Financial Statements of the Company for additional information regarding the adoption and initial application of IFRS 9.
3. Employees
The Parent Company employed certain officers during the years ended December 31, 2018 and 2017. These officers are identified as Aon’s key management personnel. Information regarding directors’ remunerations, interests in stock, stock options, and pension benefits for consolidated Aon plc is included within the Directors’ Remuneration Report contained in this report. Information regarding directors’ remunerations for the Parent Company is included in Note 4 “Directors’ Remuneration.”
The number of persons employed by the Parent Company was 13 for both 2018 and 2017.
Employee costs were as follows (in millions):
Years ended December 31 2018 2017
Wages and salaries $ 6 $ 5Social security costs 9 1Share based compensation expense (1) 45 52Other, primarily employee benefits 12 24
Total employee costs $ 72 $ 82
(1) Refer to Note 14 “Share-Based Compensation Plans” to the Consolidated Financial Statements of the Company for additional information regarding the Company’s share-based compensation plans.
4. Directors’ Remuneration
Gregory C. Case was the only director of the Parent Company during the period who was also a director or employee of other Group companies. Mr. Case, who is the Parent Company’s sole executive director, serves as the Company’s Chief Executive Officer, and receives his remuneration for serving in that role. Information regarding Mr. Case’s remuneration is disclosed in Note 19 “Directors’ Emoluments” to the Consolidated Financial Statements of the Company. Stock compensation expense for non-executive directors was $2 million in both the years ended December 31, 2018 and 2017. Further information regarding the non-executive directors’ remunerations is disclosed in audited section of the Directors’ Remuneration Report contained in this report.

142
5. Auditor’s Remuneration
The actual auditor’s remuneration for the statutory audit is analysed as follows (in thousands):
Years ended December 31 2018 2017
Audit of the individual financial statements $ 253 $ 310
Fees paid to the Company’s auditor, Ernst & Young LLP and its associates, for services other than the statutory audit of the Company and other Group undertakings, are disclosed in Note 20 “Auditors’ Remuneration” to the Consolidated Financial Statements of the Company.
6. Investments in Subsidiaries
Details of the Parent Company’s direct subsidiaries are detailed as follows:
Name of companyCountry of
incorporation (1) Holdings
Proportion ofvoting rights and
shares held
Aon Bermuda Holding Company Limited Bermuda Ordinary shares 100%Aon Group Holdings International 1 B.V. Netherlands Ordinary shares 100%Aon U.S. & International Holdings Limited U.K. Ordinary shares 100%
(1) Refer to Note 24 “Group Undertakings” to the Consolidated Financial Statements of the Company for the registered addresses of these subsidiaries.
In December 2018, Aon plc obtained direct ownership in two subsidiaries, Aon U.S. & International Holdings Limited and Aon Bermuda Holding Company Limited, that were previously indirectly owned subsidiaries. Additionally, Aon plc transferred direct ownership of Aon Global Holdings Limited to Aon U.S. & International Holdings Limited.
Changes in investment in subsidiaries for the years ended are as follows (in millions):
Total
As of January 1, 2017 $ 36,982Capital contributions 272Returns of capital (391)Fair value adjustment 6,041
As of December 31, 2017 42,904Capital contributions 303Returns of capital (361)Fair value adjustment 337
As of December 31, 2018 $ 43,183
The fair value of the Parent Company’s direct subsidiaries as of December 31, 2018, December 31, 2017, and January 1, 2017, respectively, were as follows (in millions):
As of December 31, 2018 December 31, 2017 January 1, 2017
Aon Global Holdings Limited $ — $ 42,896 $ 36,978Aon Group Holdings International 1 B.V. 21 8 4Aon U.S. & International Holdings Limited 35,762 — —Aon Bermuda Holding Company Limited 7,400 — —
Total $ 43,183 $ 42,904 $ 36,982
The Parent Company’s investment in subsidiary balances are classified as Level 3 investments. The fair value estimation of the Parent Company’s direct subsidiaries considered the Income, Market, and Net Underlying Asset Approaches. IFRS describes fair value as a market-based measurement, not an entity-specific measurement. As such, when determining fair value, the assumptions used were consistent with those of a market participant. In quantifying the fair value under the Income and Market Approaches, the Parent Company utilized third party specialists that used a variety of market inputs, including historical industry performance,

143
to determine key assumptions, such as the terminal growth and discount rates. The Net Underlying Asset Approach, used for non-operating companies, adjusts the asset and liability balances on the investment entity’s balance sheet to approximate their fair value.
Key assumptions used in estimating fair value under the Income Approach are shown below:
Aon Group Holdings International 1 B.V. (1)
Aon Global HoldingsLimited
Aon U.S. & InternationalHoldings Limited
As of December 31, 2018Long-term Growth Rate % 1% Not directly owned 2.0 - 2.8%Discount Rate % 13.5 - 14.5% Not directly owned 8.0 - 14.5%
As of December 31, 2017Long-term Growth Rate % 2.5% 2.0 - 2.8% Not directly ownedDiscount Rate % 13.5 - 14.5% 8.0 - 14.0% Not directly owned
As of January 1, 2017Long-term Growth Rate % — 2.5 - 3.3% Not directly ownedDiscount Rate % — 8.3 - 16.0% Not directly owned
(1) At January 1, 2017, Aon Group Holdings International 1 B.V. only included non-operating companies, and therefore was valued under the Net Underlying Asset Approach, as described above. Therefore, no long-term growth rate or discount rate was applied.
A hypothetical 25 to 50 basis point increase or decrease in the discount rate could change the fair value of the total investment by (4)% or 5%, respectively. A hypothetical 25 to 50 basis point increase or decrease in the long-term growth rate could change the fair value of the total investment balance by 3% or (3)%, respectively.
For a complete listing of all directly and indirectly-owned subsidiaries, see Note 24 “Group Undertakings” to the Consolidated Financial Statements.
7. ReceivablesAs of December 31
(millions) 2018 2017
Other intercompany receivables $ 141 $ 120Interest on intercompany notes receivable 5 1
Intercompany receivables $ 146 $ 121
8. PayablesAs of December 31
(millions) 2018 2017
Intercompany payables $ 219 $ 136Accounts payable and accrued liabilities 55 55Other current liabilities 1 15
Total $ 275 $ 206

144
9. Debt
The following is a summary of outstanding debt (in millions):
As of December 31 2018 2017
3.875% Senior Notes due December 2025 $ 746 $ 7453.50% Senior Notes due June 2024 596 5954.75% Senior Notes due May 2045 592 5922.875% Senior Notes due May 2026 (EUR 500M) 562 5874.60% Senior Notes due June 2044 544 5442.80% Senior Notes due March 2021 398 3984.00% Senior Notes due November 2023 348 3484.45% Senior Notes due May 2043 246 2464.25% Senior Notes due December 2042 198 197Commercial paper 250 —Bank overdraft 217 511
Total debt 4,697 4,763Less: Short-term and current portion of long-term debt 467 511
Total long-term debt $ 4,230 $ 4,252
Bank Overdraft
The bank overdraft arises in connection with the Group’s multicurrency cash pools with third party banks, in which various Aon entities participate. Individual Aon entities are permitted to overdraw on their individual accounts, provided the overall balance does not fall below zero.
Revolving Credit Facilities
As of December 31, 2018, Aon plc had two primary committed credit facilities outstanding: its $900 million multi-currency U.S. credit facility expiring in February 2021 (the “2021 Facility”) and its $400 million multi-currency U.S. credit facility expiring in October 2022 (the “2022 Facility”). On February 2, 2019, the Parent Company extended the 2021 Facility by one year, and it will now expire in February 2022.
Each of these facilities includes customary representations, warranties, and covenants, including financial covenants that require Aon plc to maintain specified ratios of adjusted consolidated EBITDA to consolidated interest expense and consolidated debt to adjusted consolidated EBITDA, in each case, tested quarterly. At December 31, 2018, Aon plc did not have borrowings under either the 2021 Facility or the 2022 Facility, and was in compliance with all covenants contained therein during the twelve months ended December 31, 2018.
Commercial Paper
The Parent Company has established a European multi-currency commercial paper program which provides for commercial paper to be issued in an aggregate principal amount of up to €525 million. The European commercial paper program is fully and unconditionally guaranteed by Aon Corporation.
Commercial paper outstanding, which is included in Short-term debt and current portion of long-term debt in the Parent Company’s Statement of Financial Position, is as follows (in millions):
As of December 31 2018 2017
Commercial paper outstanding $ 250 $ —

145
The weighted average commercial paper outstanding and its related interest rates are as follows:
Years ended December 31 2018 2017
Weighted average commercial paper outstanding $ 298 $ 125Weighted average interest rate of commercial paper outstanding (0.25)% (0.19)%
Repayments
Repayments of total debt are as follows (in millions):
As of December 31 2018 2017
Wholly repayable within five years $ 1,213 $ 909Not wholly repayable within five years 3,484 3,854
Total $ 4,697 $ 4,763
Fair Value and Interest Rate Risk
The following table discloses the Parent Company’s debt instruments where the carrying amounts and fair values differ (in millions):
2018 2017
As of December 31Carrying
ValueFair
ValueCarrying
ValueFair
Value
Long-term debt $ 4,230 $ 4,211 $ 4,252 $ 4,554
A hypothetical 1% increase or decrease in interest rates would have the following impact upon the fair value of Aon plc’s debt instruments:
2018 2017As of December 31 +1% -1% +1% -1%
Change in fair value (8)% 9% (9)% 10%
Changes in liabilities arising from financing activities
Liabilities arising from financing activities include commercial paper and term notes. A summary of the changes arising from cash flows and non-cash changes is shown below:
Commercial Paper Term Notes Cash Pools Total
As of January 1, 2017 $ 279 $ 4,176 $ 532 $ 4,987Cash flows:
Principal - issuances 544 — — 544Principal - repayments (835) — (21) (856)
Non-cash charges:Amortization of bond issue costs — 5 — 5Foreign exchange (gains) losses and other 12 71 — 83
As of December 31, 2017 — 4,252 511 4,763Cash flows:
Principal - issuances 1,723 — — 1,723Principal - repayments (1,441) — (295) (1,736)
Non-cash charges:Amortization of bond issue costs — 4 — 4Foreign exchange (gains) losses and other (32) (26) 1 (57)
As of December 31, 2018 $ 250 $ 4,230 $ 217 $ 4,697

146
10. Intercompany NotesAs of December 31,
(millions) 2018 2017
2.95% Notes due May 2026 $ 236 $ 2484.35% Notes due December 2042 111 111
Total $ 347 $ 359
On December 12, 2012, Aon Corporation borrowed $166 million aggregate principal amount of 4.350% Notes due 2042 from Aon plc in connection with an exchange offer of its outstanding 8.205% external junior subordinated deferrable interest debentures due January 2027. In connection with this exchange, the Aon plc received a premium of $59 million which will be amortized into intercompany interest income over the life of the new notes.
On December 14, 2017, a subsidiary of Aon plc early settled the €191 million ($226 million at December 31, 2017 exchange rates) loan issued on June 14, 2014, which had an original maturity date of May 2026. Also on December 14, 2017, a subsidiary of Aon plc borrowed €209 ($248 million at December 31, 2017 exchange rates) aggregate principal amount of 2.95% Notes due May 2026.
The Parent Company adopted new financial statement guidance on January 1, 2018, and performed the required ECL analysis on the loan receivable balances discussed in Note 2 “Summary of Significant Accounting Principles and Practices”. Based on the ECL analysis performed, the Parent Company recorded a $2 million reduction in the loan receivable balances upon initial application of IFRS 9. The Parent Company assessed whether there was a significant change in credit risk of the counterparties as of December 31, 2018, and determined that there was none, therefore, no adjustment was made to the ECL as of the reporting date. Refer to Note 2 “Summary of Significant Accounting Principles and Practices” for additional information regarding the Parent Company’s ECL accounting policy.
11. Guarantees
The Parent Company has entered into a series of agreements to guarantee certain debt instruments of Aon Corporation and its subsidiaries. The following debt instruments are guaranteed by the Parent Company:
• A $900 million U.S. multi-currency revolving loan credit facility used by Aon plc, Aon Corporation, and certain of Aon Corporation’s subsidiaries to fund operations. The facility expires in February 2021 and has a commitment fee of 12.5 basis points on the unused portion of the facility. The rate on borrowing from this facility varies based upon the prevalent market rate of several benchmarks plus a margin ranging from 0 to 100 basis points. There are no borrowings under this facility as of December 31, 2018. On February 2, 2019, the Parent Company extended the 2021 Facility by one year, and it will now expire in February 2022.
• A $400 million U.S. revolving credit facility used by Aon plc, Aon Corporation, and certain designated subsidiaries to fund operations. This facility expires in October 2022 and has commitment fees of 12.5 basis points on the unused portion of the facility. The rate on borrowings from this facility varies based upon the prevalent market rate of several benchmarks plus a margin ranging from 0 to 100 basis points. There are no borrowings under this facility as of December 31, 2018.
• Commercial paper issued by Aon Corporation. There was no commercial paper issued by Aon Corporation at December 31, 2018.
• Four term loans issued by Aon Corporation.
The following table summarizes the remaining term loans that are guaranteed by the Parent Company and their respective balances at December 31, 2018:
Issue Type Debt Outstanding (millions) Coupon Maturity
Sr. Unsecured Debt $350 4.50% December 15, 2028Sr. Unsecured Debt $600 5.00% September 30, 2020Jr. Sub Debt $521 8.21% January 1, 2027Sr. Unsecured Debt $300 6.25% September 30, 2040

147
12. Ordinary SharesDecember 31,
(millions, except thousands of shares) 2018 2017
Allotted and called up and fully paid:Class A Ordinary Shares of $0.01 each (December 31, 2018 - 240,092; 2017 - 247,649) (1) $ 2 $ 2Class B Ordinary Shares of £0.40 each (December 31, 2018 - 125; 2017 - 125) (2) — —
Total $ 2 $ 2
(1) Per the Articles of Association, Class A Ordinary Shares have voting rights and rights to dividends or distributions.
During 2018, the Parent Company repurchased in the open market 10.0 million Class A Ordinary Shares having a nominal value of $0.01 each in the Capital of the Parent Company for a total consideration of $1.4 billion. Additionally, the Parent Company issued 2.5 million Class A Ordinary Shares having a nominal value of $0.01 each in the Capital of the Parent Company for a total consideration of $42 million related to employee benefit plans and employee compensation.
During 2017, the Parent Company repurchased in the open market 18.0 million Class A Ordinary Shares having a nominal value of $0.01 each in the Capital of the Parent Company for a total consideration of $2.4 billion. Additionally, the Parent Company issued 3.6 million Class A Ordinary Shares having a nominal value of $0.01 each in the Capital of the Parent Company for a total consideration of $61 million related to employee benefit plans and employee compensation.
(2) the Parent Company has outstanding 125,000 Class B Ordinary Shares of £0.40 each, held by Aon Corporation. The Class B Ordinary Shares have no voting rights or rights to dividends or distributions as they continue to be held by a subsidiary undertaking.
13. Shareholders’ Equity
The Parent Company had distributable reserves in excess of $3.7 billion and $4.0 billion as at December 31, 2018 and 2017, respectively.
the Parent Company paid dividends on its ordinary shares of $382 million and $364 million for the years ended December 31, 2018 and 2017, respectively. Dividends paid per Class A Ordinary Share were $1.56 and $1.41 for the years ended December 31, 2018 and 2017, respectively.
Future dividends on Aon plc ordinary shares, if any, and the timing of declaration of any such dividends, will be at the discretion of the Board of Directors of Aon plc and will depend on, among other things, our results of operations, cash requirements and surplus, financial condition, contractual restrictions and other factors that the Board of Directors of Aon plc may deem relevant, as well as our ability to pay dividends in compliance with the Companies Act 2006.
Please refer to Note 1 “Basis of Presentation” for further information regarding Aon plc’s voluntary accounting policy election to change the measurement of its investment in subsidiary balance from cost to fair value and the related impact this election had on our Revaluation reserves balance beginning January 1, 2017.

148
14. Income Taxes
The tax expense (benefit) incurred on ordinary activities is comprised of (in millions):
Years ended December 31 2018 2017
Current tax $ (47) $ (46)Deferred tax 3 (1)Adjustment recognized for prior periods 3 —
Total $ (41) $ (47)
The tax charges for the years ended December 31, 2018 and 2017 were lower than those calculated using the U.K. standard rates of corporation tax of 19% and 19.25% for 2018 and 2017, respectively. The differences are reconciled below (in millions):
Years ended December 31 2018 2017
Income before taxes $ 1,523 $ 2,713Tax at the statutory rate of 19% (2017: 19.25%) $ 289 $ 522
Adjustments recognized for prior periods 3 —Current year temporary differences not recognized 7 2Expenses not deductible for tax purposes 1 5Share-based payments 5 1Income not taxable (346) (577)
Income tax (benefit)/expense $ (41) $ (47)
Amounts charged directly to equity with respect to share-based payments (in millions):
Years ended December 31 2018 2017
Deferred tax assets $ 1 $ (1)Current tax (2) 2
Total $ (1) $ 1
Change in Statutory Tax Rates
The headline rate of UK corporation tax is 19%. As of December 31, 2018, the UK government had enacted further reductions to the headline corporation tax rate to 17%. This rate is applicable beginning April 1, 2020.
Any temporary differences expected to reverse have been re-measured using the above rates.
Deferred tax in the income statement (in millions):
Years ended December 31 2018 2017
Share-based payments $ 3 $ —Other provisions — (1)
Total deferred tax movement $ 3 $ (1)
Deferred tax assets are comprised of (in millions):
Years ended December 31 2018 2017
Share-based payments $ 6 $ 10Other provisions — 1
Deferred tax asset $ 6 $ 11

149
Deferred tax movements are as follows (in millions):
Years ended December 31 2018 2017
Opening balance $ 11 $ 9Credited (charged) to income statement (3) 1Credited (charged) to equity (1) 1Adjustment recognized for prior periods (1) —
Closing balance $ 6 $ 11
the Parent Company has $48 million (2017: $0 million) of unused interest expense as of December 31, 2018 for which no deferred tax asset has been recognized.
15. Related-Party Transactions
Aon plc receives dividend and interest income from subsidiaries and pays interest to those subsidiaries in the normal course of business. These activities are reflected in the table below (in millions):
Years ended December 31 2018 2017
Intercompany dividend income $ 1,800 $ 3,000Intercompany interest income 15 15Intercompany other income (expense) (49) 61
Total $ 1,766 $ 3,076
Outstanding related party balances are comprised of the following:
Intercompany Receivables
For further information on Aon plc’s Intercompany receivables, see Note 7 “Receivables” to the Parent Company Financial Statements.
Intercompany Payables
For further information on Aon plc’s Intercompany payables, see Note 8 “Payables” to the Parent Company Financial Statements.
Guarantees
In connection with the Redomestication, Aon plc entered into various agreements pursuant to which it agreed to guarantee the obligations of Aon Corporation and other subsidiaries arising under issued and outstanding debt securities. See Note 11 “Guarantees” to the Parent Company Financial Statements for additional information. In addition, Aon plc entered into certain other financing arrangements as part of the normal course of business.
Incentives Program
As part of its ongoing effort to attract and retain top talent, Aon plc maintains a competitive incentive program, which includes share-based compensation, options, performance awards, and deferred cash. Aon plc issues awards on behalf of colleagues worldwide and is reimbursed by subsidiaries on an annual basis.
Key Management Personnel
See the Directors’ Remuneration Report and Note 3 “Employees” to the Parent Company Financial Statements for additional information on the compensation of key management personnel.
Intercompany Derivatives
The Parent Company is exposed to changes in foreign currency exchange rates. To manage this risk, the Parent Company uses foreign exchange derivatives with Aon Oversees Holdings Limited to economically hedge the currency exposure of the Parent Company’s liquidity profile, including monetary assets or liabilities that are denominated in a non-functional currencies. These derivatives are not accounted for as hedges, and changes in fair value are recorded each period in Intercompany other income (expense) in the Statements of Income. These contracts, typically forward contracts with a 90-day basis, are executed close to the last day of the period, thereby resulting in nominal fair values at the balance sheet date.

150
Investments in Subsidiaries
For further information on Aon plc’s Investments in subsidiaries, see Note 6 “Investments in Subsidiaries” to the Parent Company Financial Statements.
Intercompany Loan Receivables
For further information on Aon plc’s Intercompany loan receivables, see Note 10 “Intercompany Notes” to the Parent Company Financial Statements.
16. Subsequent Events
Dividends
In January, 2019, the Parent Company declared dividends of per share of $0.40 for a total cost of $96.0 million. The dividends were paid in February, 2019.
Intercompany Loans
On March 19, 2019, the Parent Company entered into various agreements pursuant to which it agreed to guarantee certain intercompany debt obligations of an indirectly held subsidiary. The term of the underlying intercompany debt securities is 5 years.
Brexit
On March 29, 2017, the U.K. invoked Article 50 of the Treaty on European Union, which began the member state's withdrawal from the European Union. Under Article 50, the U.K. had a maximum of two years in which to complete and execute upon exit negotiations with the European Union, unless the European Council unanimously decided to extend this period. As of late March 2019, negotiations with the European Union were ongoing and the U.K. was granted an extension to the Article 50 period to at least April 12, 2019. Aon continues to monitor negotiation developments and assess its impact to the Company accordingly.
Repurchase of Shares
During the period from January 1, 2019 to March 27, 2019, the Parent Company repurchased 0.6 million shares at an average price per share of $161.16 for a total cost of $100 million. At March 27, 2019, the remaining authorized amount for share repurchase under the Share Repurchase Programs is $3.9 billion. The amount of shares repurchased after this date and prior to authorization of the financial statements on March 29, 2019 was insignificant to the Parent Company Financial Statements.
Commercial Paper
As of March 27, 2019, the Parent Company had €220 million ($247 million at March 27, 2019 exchange rates) of commercial paper borrowings outstanding on the European commercial paper program. The proceeds from the issuance of commercial paper will be used to fund short-term working capital needs. The amount of commercial paper borrowed after this date and prior to authorization of the financial statements on March 29, 2019 was insignificant to the Parent Company Financial Statements.
Related Documents