UK Energy Balances Iain MacLeay – Head Energy Balances, Prices and Publications Date May 2009

UK Energy Balances Iain MacLeay – Head Energy Balances, Prices and Publications Date May 2009.
Dec 26, 2015
Welcome message from author
This document is posted to help you gain knowledge. Please leave a comment to let me know what you think about it! Share it to your friends and learn new things together.
Transcript
UK Energy Balances
Iain MacLeay – Head Energy Balances, Prices and Publications
Date May 2009
Outline of Presentation
1.UK Balance
2.Simplified balance
3.Other issues
UK Practice - part 1
1.Raw data collection – mainly surveys, but some admin data
2.Aggregates produced – eg production of steam coal, coking coal, anthracite etc. Imports, exports, consumption split by industry etc.
3.Balances produced by fuel in natural units
UK Practice - part 21.Data translated to standard unit (UK
chooses to use tonne of oil equivalent)2.Start with matrix of 50+ columns (see next
slide)3.Conversion made using Gross Calorific
Values (though also done using Net CVs to meet EU needs (20/20 targets etc))
4.CVs obtained from industry and survey responses
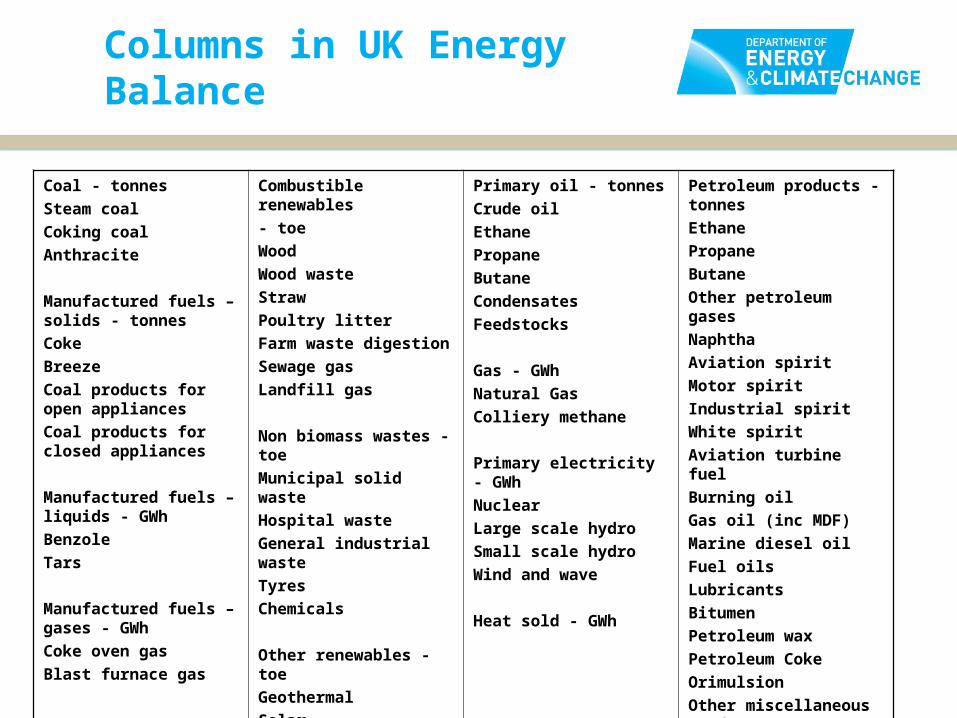
Columns in UK Energy Balance
Coal - tonnes
Steam coal
Coking coal
Anthracite
Manufactured fuels – solids - tonnes
Coke
Breeze
Coal products for open appliances
Coal products for closed appliances
Manufactured fuels – liquids - GWh
Benzole
Tars
Manufactured fuels – gases - GWh
Coke oven gas
Blast furnace gas
Combustible renewables
- toe
Wood
Wood waste
Straw
Poultry litter
Farm waste digestion
Sewage gas
Landfill gas
Non biomass wastes - toe
Municipal solid waste
Hospital waste
General industrial waste
Tyres
Chemicals
Other renewables - toe
Geothermal
Solar
Liquid biofuels for transport
Primary oil - tonnes
Crude oil
Ethane
Propane
Butane
Condensates
Feedstocks
Gas - GWh
Natural Gas
Colliery methane
Primary electricity - GWh
Nuclear
Large scale hydro
Small scale hydro
Wind and wave
Heat sold - GWh
Petroleum products - tonnes
Ethane
Propane
Butane
Other petroleum gases
Naphtha
Aviation spirit
Motor spirit
Industrial spirit
White spirit
Aviation turbine fuel
Burning oil
Gas oil (inc MDF)
Marine diesel oil
Fuel oils
Lubricants
Bitumen
Petroleum wax
Petroleum Coke
Orimulsion
Other miscellaneous products
UK Practice - part 31.Calculations performed
2.Results analysed – statistical differences considered
3.Data aggregated into 9 columns for final publication
4.Flow charts and other summary charts produced
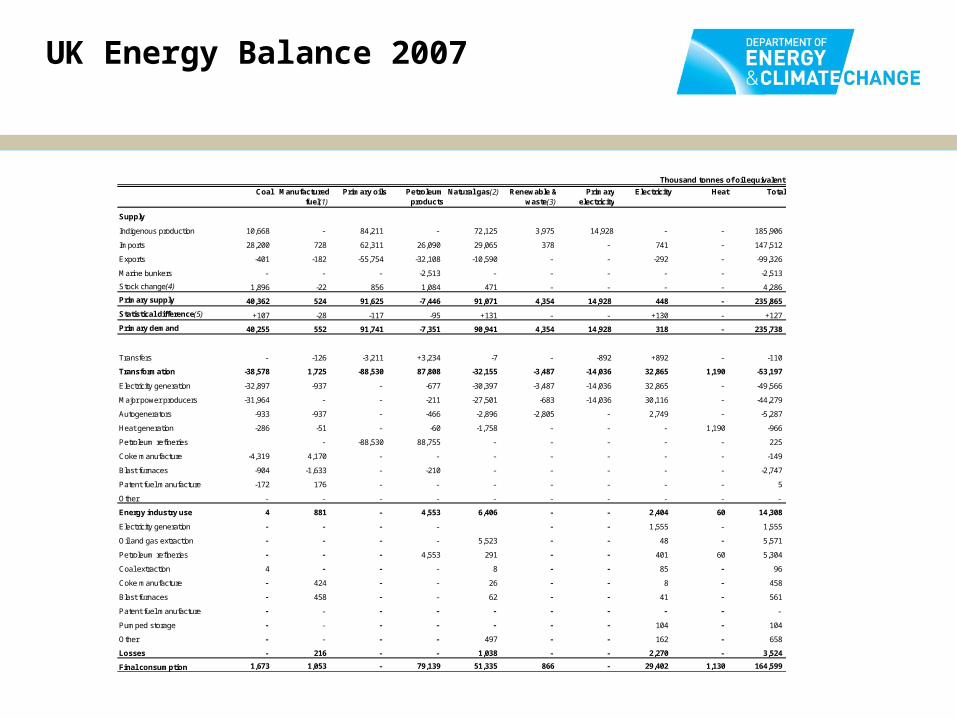
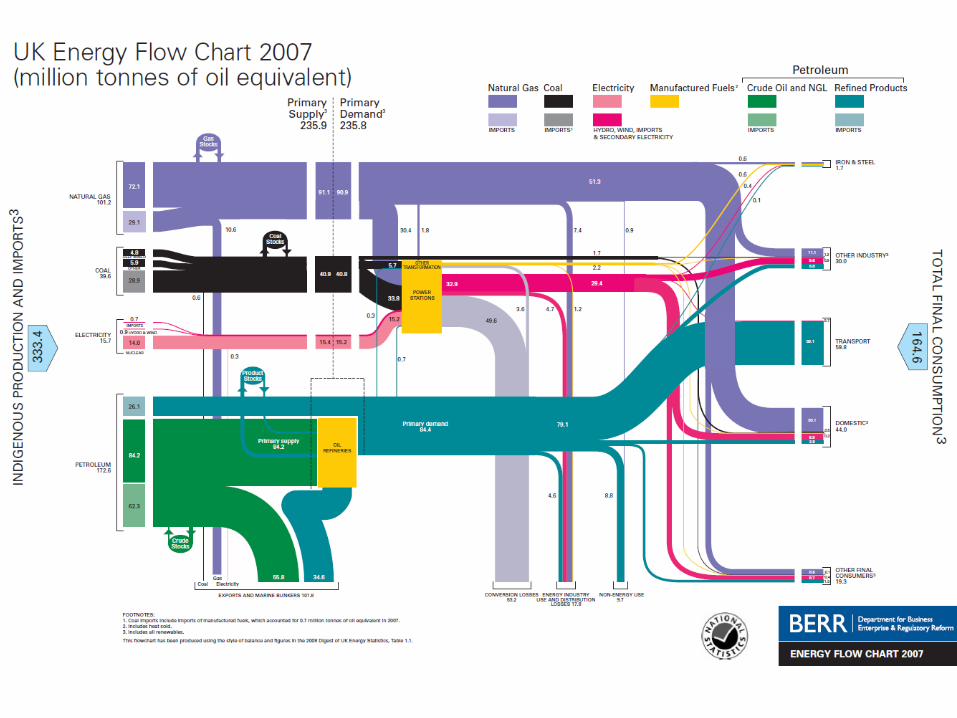
Thousand tonnes of oil equivalent
Coal Manufactured fuel(1)
Primary oils Petroleum products
Natural gas(2) Renewable & waste(3)
Primary electricity
Electricity Heat Total
Supply
Indigenous production 10,668 - 84,211 - 72,125 3,975 14,928 - - 185,906
Imports 28,200 728 62,311 26,090 29,065 378 - 741 - 147,512
Exports -401 -182 -55,754 -32,108 -10,590 - - -292 - -99,326
Marine bunkers - - - -2,513 - - - - - -2,513
Stock change(4) 1,896 -22 856 1,084 471 - - - - 4,286
Primary supply 40,362 524 91,625 -7,446 91,071 4,354 14,928 448 - 235,865
Statistical difference(5) +107 -28 -117 -95 +131 - - +130 - +127
Primary demand 40,255 552 91,741 -7,351 90,941 4,354 14,928 318 - 235,738
Transfers - -126 -3,211 +3,234 -7 - -892 +892 - -110
Transformation -38,578 1,725 -88,530 87,808 -32,155 -3,487 -14,036 32,865 1,190 -53,197
Electricity generation -32,897 -937 - -677 -30,397 -3,487 -14,036 32,865 - -49,566
Major power producers -31,964 - - -211 -27,501 -683 -14,036 30,116 - -44,279
Autogenerators -933 -937 - -466 -2,896 -2,805 - 2,749 - -5,287
Heat generation -286 -51 - -60 -1,758 - - - 1,190 -966
Petroleum refineries - -88,530 88,755 - - - - - 225
Coke manufacture -4,319 4,170 - - - - - - - -149
Blast furnaces -904 -1,633 - -210 - - - - - -2,747
Patent fuel manufacture -172 176 - - - - - - - 5
Other - - - - - - - - - -
Energy industry use 4 881 - 4,553 6,406 - - 2,404 60 14,308
Electricity generation - - - - - - 1,555 - 1,555
Oil and gas extraction - - - - 5,523 - - 48 - 5,571
Petroleum refineries - - - 4,553 291 - - 401 60 5,304
Coal extraction 4 - - - 8 - - 85 - 96
Coke manufacture - 424 - - 26 - - 8 - 458
Blast furnaces - 458 - - 62 - - 41 - 561
Patent fuel manufacture - - - - - - - - - -
Pumped storage - - - - - - - 104 - 104
Other - - - - 497 - - 162 - 658
Losses - 216 - - 1,038 - - 2,270 - 3,524
Final consumption 1,673 1,053 - 79,139 51,335 866 - 29,402 1,130 164,599
UK Energy Balance 2007
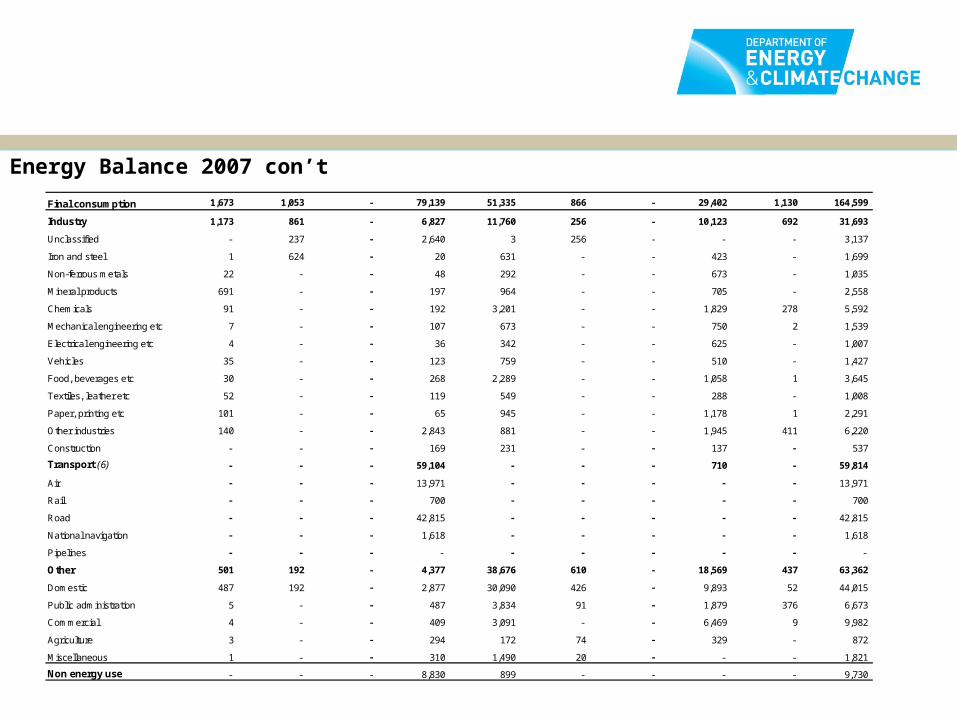
Energy Balance 2007 con’t
Final consumption 1,673 1,053 - 79,139 51,335 866 - 29,402 1,130 164,599
Industry 1,173 861 - 6,827 11,760 256 - 10,123 692 31,693
Unclassified - 237 - 2,640 3 256 - - - 3,137
Iron and steel 1 624 - 20 631 - - 423 - 1,699
Non-ferrous metals 22 - - 48 292 - - 673 - 1,035
Mineral products 691 - - 197 964 - - 705 - 2,558
Chemicals 91 - - 192 3,201 - - 1,829 278 5,592
Mechanical engineering etc 7 - - 107 673 - - 750 2 1,539
Electrical engineering etc 4 - - 36 342 - - 625 - 1,007
Vehicles 35 - - 123 759 - - 510 - 1,427
Food, beverages etc 30 - - 268 2,289 - - 1,058 1 3,645
Textiles, leather etc 52 - - 119 549 - - 288 - 1,008
Paper, printing etc 101 - - 65 945 - - 1,178 1 2,291
Other industries 140 - - 2,843 881 - - 1,945 411 6,220
Construction - - - 169 231 - - 137 - 537
Transport (6) - - - 59,104 - - - 710 - 59,814
Air - - - 13,971 - - - - - 13,971
Rail - - - 700 - - - - - 700
Road - - - 42,815 - - - - - 42,815
National navigation - - - 1,618 - - - - - 1,618
Pipelines - - - - - - - - - -
Other 501 192 - 4,377 38,676 610 - 18,569 437 63,362
Domestic 487 192 - 2,877 30,090 426 - 9,893 52 44,015
Public administration 5 - - 487 3,834 91 - 1,879 376 6,673
Commercial 4 - - 409 3,091 - - 6,469 9 9,982
Agriculture 3 - - 294 172 74 - 329 - 872
Miscellaneous 1 - - 310 1,490 20 - - - 1,821
Non energy use - - - 8,830 899 - - - - 9,730
Simplified Balances – part 1
1.Not reasonable to expect all countries to produce such a comprehensive picture of their energy system
2.The following slide shows the energy balance for the Channel Island of Jersey
3.With the one after showing the UK quarterly balance.
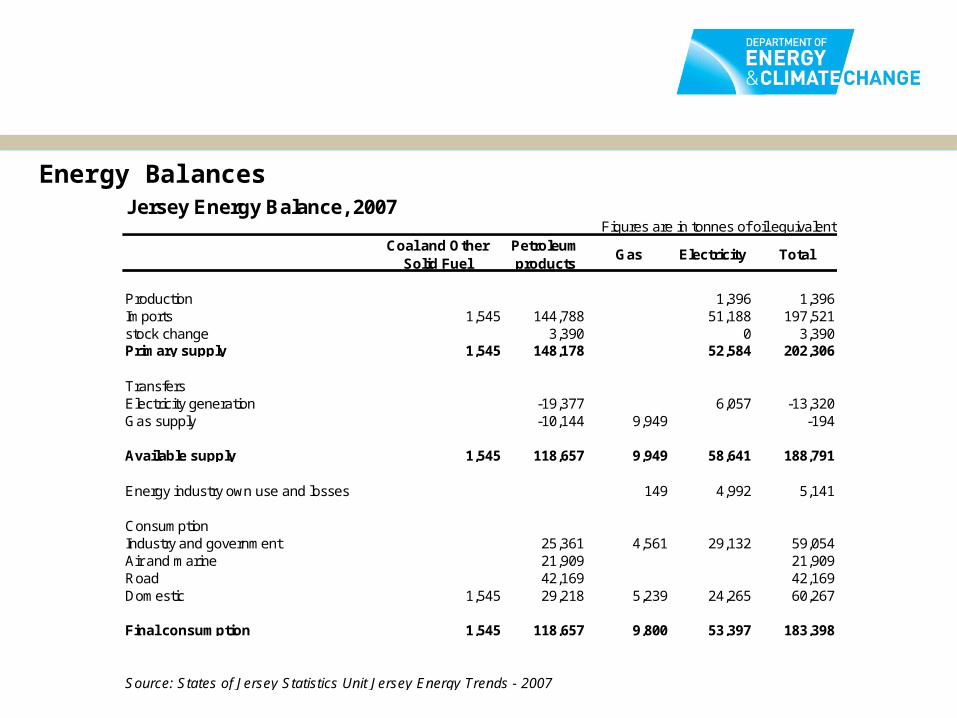
Energy BalancesJersey Energy Balance, 2007
Figures are in tonnes of oil equivalentCoal and Other
Solid FuelPetroleum products
Gas Electricity Total
Production 1,396 1,396Imports 1,545 144,788 51,188 197,521stock change 3,390 0 3,390Primary supply 1,545 148,178 52,584 202,306
TransfersElectricity generation -19,377 6,057 -13,320Gas supply -10,144 9,949 -194
Available supply 1,545 118,657 9,949 58,641 188,791
Energy industry own use and losses 149 4,992 5,141
ConsumptionIndustry and government 25,361 4,561 29,132 59,054Air and marine 21,909 21,909Road 42,169 42,169Domestic 1,545 29,218 5,239 24,265 60,267
Final consumption 1,545 118,657 9,800 53,397 183,398
Source: States of Jersey Statistics Unit Jersey Energy Trends - 2007
Co
al
Ma
nu
fac
ture
d
fue
ls4
Pri
ma
ry o
il
Pe
tro
leu
m
Pro
du
cts
Na
tura
l g
as
5
Re
nn
ew
ab
les
& w
as
te6
Pri
ma
ry
ele
ctr
icit
y
Ele
ctr
icit
y
He
at
so
ld
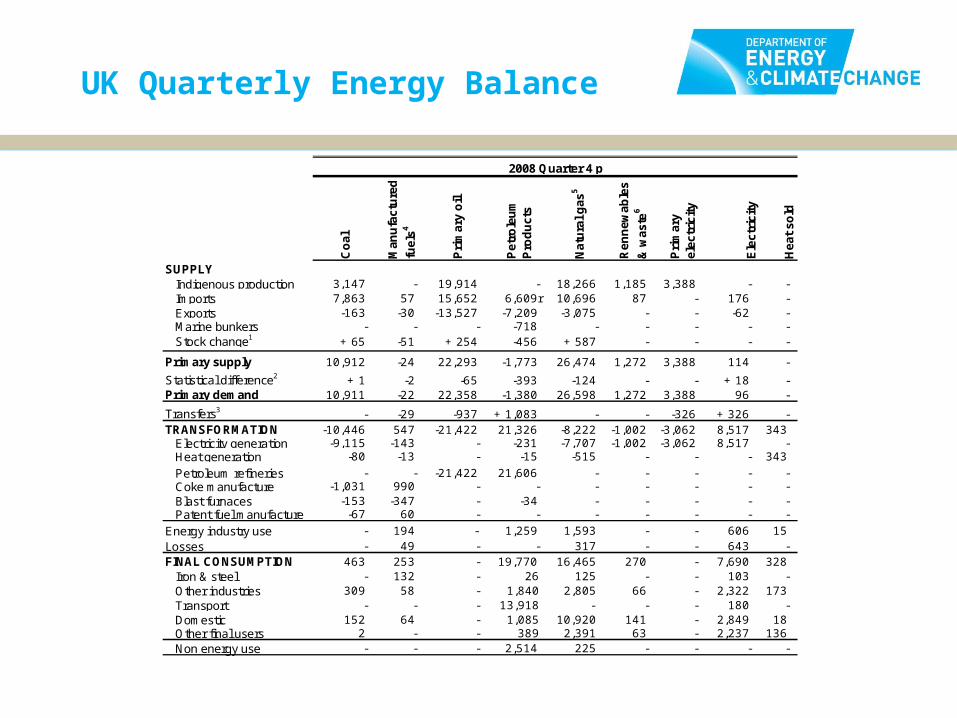
SUPPLY Indigenous production 3,147 - 19,914 - 18,266 1,185 3,388 - - Imports 7,863 57 15,652 6,609r 10,696 87 - 176 - Exports -163 -30 -13,527 -7,209 -3,075 - - -62 - Marine bunkers - - - -718 - - - - - Stock change1 + 65 -51 + 254 -456 + 587 - - - -
Primary supply 10,912 -24 22,293 -1,773 26,474 1,272 3,388 114 -
Statistical difference2 + 1 -2 -65 -393 -124 - - + 18 -Primary demand 10,911 -22 22,358 -1,380 26,598 1,272 3,388 96 -
Transfers3 - -29 -937 + 1,083 - - -326 + 326 -TRANSFORMATION -10,446 547 -21,422 21,326 -8,222 -1,002 -3,062 8,517 343 Electricity generation -9,115 -143 - -231 -7,707 -1,002 -3,062 8,517 - Heat generation -80 -13 - -15 -515 - - - 343
Petroleum refineries - - -21,422 21,606 - - - - - Coke manufacture -1,031 990 - - - - - - - Blast furnaces -153 -347 - -34 - - - - - Patent fuel manufacture -67 60 - - - - - - -
Energy industry use - 194 - 1,259 1,593 - - 606 15 Losses - 49 - - 317 - - 643 -FINAL CONSUMPTION 463 253 - 19,770 16,465 270 - 7,690 328 Iron & steel - 132 - 26 125 - - 103 - Other industries 309 58 - 1,840 2,805 66 - 2,322 173 Transport - - - 13,918 - - - 180 - Domestic 152 64 - 1,085 10,920 141 - 2,849 18 Other final users 2 - - 389 2,391 63 - 2,237 136 Non energy use - - - 2,514 225 - - - -
2008 Quarter 4 p
UK Quarterly Energy Balance
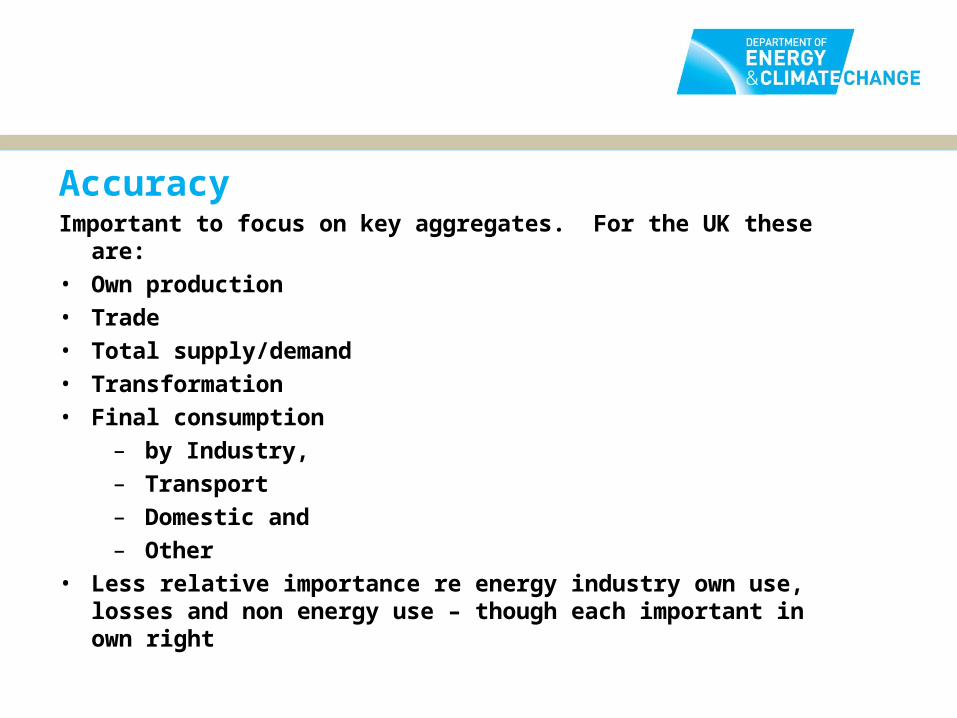
AccuracyImportant to focus on key aggregates. For the UK these are:
• Own production
• Trade
• Total supply/demand
• Transformation
• Final consumption
– by Industry,
– Transport
– Domestic and
– Other
• Less relative importance re energy industry own use, losses and non energy use – though each important in own right
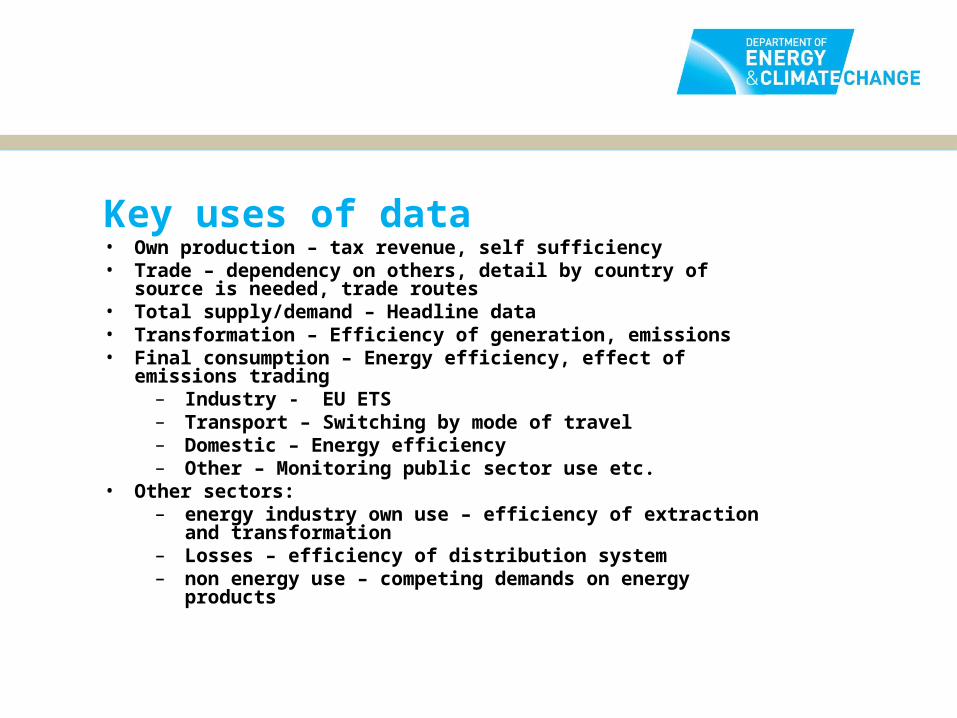
Key uses of data• Own production – tax revenue, self sufficiency• Trade – dependency on others, detail by country of source is
needed, trade routes• Total supply/demand – Headline data• Transformation – Efficiency of generation, emissions• Final consumption – Energy efficiency, effect of emissions
trading– Industry - EU ETS– Transport – Switching by mode of travel– Domestic – Energy efficiency– Other – Monitoring public sector use etc.
• Other sectors:– energy industry own use – efficiency of extraction and
transformation– Losses – efficiency of distribution system– non energy use – competing demands on energy products
History:
UnitsFrom May 1991 the UK commenced using tonnes of oil
equivalent (toe). Previously tonnes of coal equivalent had been used, with therms used for some energy consumption information. UK move to toe follows that of Eurostat and the IEA – though it was recognised that the UN used the SI unit of joules.
Gross v NetConsultation November 1993UK has been using gross calorific values since we started
producing balances in the 1960’s.There were two reasons for adopting this practice:
1. This was the method industries used for pricing their fuels;
2. The small step that NCVs represented in the transition from energy supplied to useful energy was very small compared with the large losses that generally occur in practice in extracting useful energy from all fuels, other than electricity.
It was recognised that IEA, Eurostat and the UN all used NCVs.
Arguments1. Changing the UK to using NCVs would bring the UK into line
with international organisations2. There would need to be revisions made to UK historical data 3. There could be confusion re price information4. NCVs provide a better measure of available energy – but the
efficiency of most energy uses, especially for fossil fuels, will be such that there will still be large gaps between this measure and useful energy – space heating and lighting can use as little as 20% of the energy supplied.
5. Condensing boilers are able to utilise the latent heat of the water vapour so NCVs will understate the available energy
ResultsHave been unable to locate detailed responses – but the UK
continued to use GCVs in producing energy balances.
Consultation July 2005• DTI issued a consultation document that proposed we
commence using NCVs from 2006. • Five written responses were received: 3 from energy related
businesses, 1 from a major business user, and 1 from a mechanical engineer.
• Two were in favour, 3 were against, with particular reservations regarding gaseous fuels.
• Two additional users, who did not respond formally, welcomed the provision of NCVs as well as GCVs and thus felt that there was no need for DTI to change from GCVs as they could do their own calculations.
In conclusion, DTI recognised that there were good arguments for both NCVs and GCVs. At present there was no demonstrable advantage in changing from the present UK practice, and so GCVs remain the headline method.
Related Documents


