Website Review UK CropNet http://ukcrop.net Jo Wixon Managing Editor – School of Biological Sciences, University of Manchester, Oxford Street, Manchester M13 9PT, UK Abstract This review explores the UK CropNet site. The project is aimed at aiding the comparative mapping of cereal and other crop genomes. The site provides software tools for use by those working on genome mapping, and access to an array of databases that will be of interest to all members of the plant genomics research community, using several ACeDB interfaces. All screen views from the website are reproduced with the kind permission of Dr Sean May, Director, Nottingham Arabidopsis Stock Centre (NASC). Copyright # 2000 John Wiley & Sons, Ltd. Background UK CropNet consists of project groups at the John Innes Centre (JIC), the Nottingham Arabidopsis Stock Centre (NASC), the Scottish Crop Research Institute (SCRI) and the Institute of Grassland and Environmental Research (IGER) (for details see http://ukcrop.net/projects.html). UK CropNet aims to produce databases and bioinformatic tools for the study of plant genome evolution. The site author is Keith Bradnam of the Nottingham Arabidopsis Stock Centre. Site structure $ About: Background on the raison d’etre of UK CropNet. $ Projects: A breakdown of the projects, with contact details for each group. $ Software: Tools available from the groups, mainly for comparative mapping. $ Databases: UK CropNet databases and mirrors of several US plant databases. $ What’s New: News of improvements and update reports for the site. $ Help: E-mail address for queries and feedback. $ Links: Links to the home pages of the project teams and other related sites Site guide About This section gives information on the scientific background of the project and explains the aims of UK CropNet with links to pages containing further information on each of the projects. Projects This page has a section for each of the projects, with links to pages giving more information on the project and to the home pages of the host research centre. The names and contact numbers are given for the members of each group. A drop-down menu is provided at the top of the page for quick access to each project profile. Each project page gives background information on the plant genus or species under study and details the relevant resources that are made available in UK CropNet. Software This page starts with links to information on new tools being developed by members of UK CropNet, such as CITA, a simple CORBA Interface to one or more ACEDB databases, and GFace, which is a general Java CITA client. In keeping with the aims of UK CropNet, the other tools available on the site are mainly for comparative mapping. A link to the source code for the Recombination Viewer tool is available, and a demonstration link takes you to a page explaining the concept behind the tool and the way the data is displayed. The tool is designed to help to assign ambiguous markers and to allow rapid detection of mainly heterozygous or mainly homozygous plants. Grid Map is a Java version of the Oxford Grid Yeast Yeast 2000; 17: 244–254. Copyright # 2000 John Wiley & Sons, Ltd.

Welcome message from author
This document is posted to help you gain knowledge. Please leave a comment to let me know what you think about it! Share it to your friends and learn new things together.
Transcript
Website Review
UK CropNethttp://ukcrop.net
Jo WixonManaging Editor ± School of Biological Sciences, University of Manchester, Oxford Street, Manchester M13 9PT, UK
Abstract
This review explores the UK CropNet site. The project is aimed at aiding the comparative mapping of cereal and other
crop genomes. The site provides software tools for use by those working on genome mapping, and access to an array of
databases that will be of interest to all members of the plant genomics research community, using several ACeDB
interfaces. All screen views from the website are reproduced with the kind permission of Dr Sean May, Director,
Nottingham Arabidopsis Stock Centre (NASC). Copyright # 2000 John Wiley & Sons, Ltd.
Background
UK CropNet consists of project groups at the JohnInnes Centre (JIC), the Nottingham ArabidopsisStock Centre (NASC), the Scottish Crop ResearchInstitute (SCRI) and the Institute of Grassland andEnvironmental Research (IGER) (for details seehttp://ukcrop.net/projects.html). UK CropNet aimsto produce databases and bioinformatic tools forthe study of plant genome evolution. The siteauthor is Keith Bradnam of the NottinghamArabidopsis Stock Centre.
Site structure
$ About: Background on the raison d'etre of UKCropNet.
$ Projects: A breakdown of the projects, withcontact details for each group.
$ Software: Tools available from the groups,mainly for comparative mapping.
$ Databases: UK CropNet databases and mirrorsof several US plant databases.
$ What's New: News of improvements and updatereports for the site.
$ Help: E-mail address for queries and feedback.$ Links: Links to the home pages of the project
teams and other related sites
Site guide
About
This section gives information on the scienti®cbackground of the project and explains the aims of
UK CropNet with links to pages containing furtherinformation on each of the projects.
Projects
This page has a section for each of the projects,with links to pages giving more information on theproject and to the home pages of the host researchcentre. The names and contact numbers are givenfor the members of each group. A drop-down menuis provided at the top of the page for quick accessto each project pro®le. Each project page givesbackground information on the plant genus orspecies under study and details the relevantresources that are made available in UK CropNet.
Software
This page starts with links to information on newtools being developed by members of UK CropNet,such as CITA, a simple CORBA Interface to one ormore ACEDB databases, and GFace, which is ageneral Java CITA client.
In keeping with the aims of UK CropNet, theother tools available on the site are mainly forcomparative mapping.
A link to the source code for the RecombinationViewer tool is available, and a demonstration linktakes you to a page explaining the concept behindthe tool and the way the data is displayed. The toolis designed to help to assign ambiguous markersand to allow rapid detection of mainly heterozygousor mainly homozygous plants.
Grid Map is a Java version of the Oxford Grid
YeastYeast 2000; 17: 244±254.
Copyright # 2000 John Wiley & Sons, Ltd.
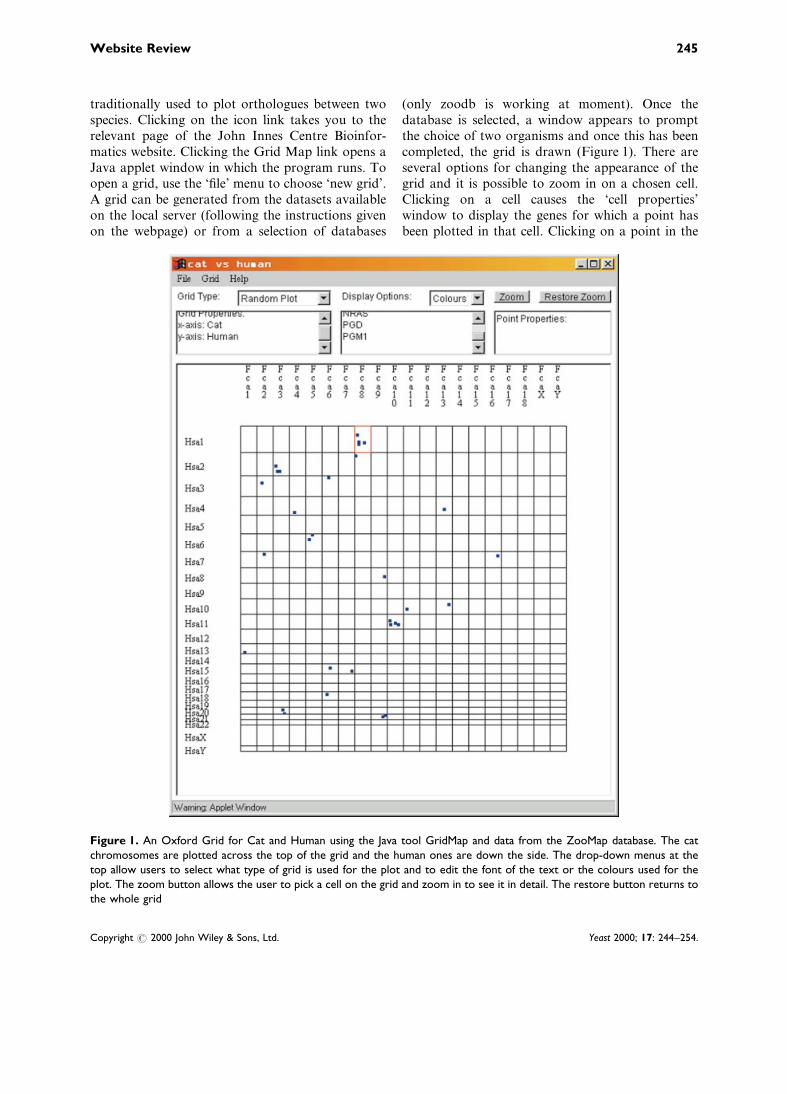
traditionally used to plot orthologues between twospecies. Clicking on the icon link takes you to therelevant page of the John Innes Centre Bioinfor-matics website. Clicking the Grid Map link opens aJava applet window in which the program runs. Toopen a grid, use the `®le' menu to choose `new grid'.A grid can be generated from the datasets availableon the local server (following the instructions givenon the webpage) or from a selection of databases
(only zoodb is working at moment). Once thedatabase is selected, a window appears to promptthe choice of two organisms and once this has beencompleted, the grid is drawn (Figure 1). There areseveral options for changing the appearance of thegrid and it is possible to zoom in on a chosen cell.Clicking on a cell causes the `cell properties'window to display the genes for which a point hasbeen plotted in that cell. Clicking on a point in the
Figure 1. An Oxford Grid for Cat and Human using the Java tool GridMap and data from the ZooMap database. The catchromosomes are plotted across the top of the grid and the human ones are down the side. The drop-down menus at thetop allow users to select what type of grid is used for the plot and to edit the font of the text or the colours used for theplot. The zoom button allows the user to pick a cell on the grid and zoom in to see it in detail. The restore button returns tothe whole grid
Website Review 245
Copyright # 2000 John Wiley & Sons, Ltd. Yeast 2000; 17: 244±254.
cell causes the `point properties' window to displaythe names of the genes that the point signi®es.
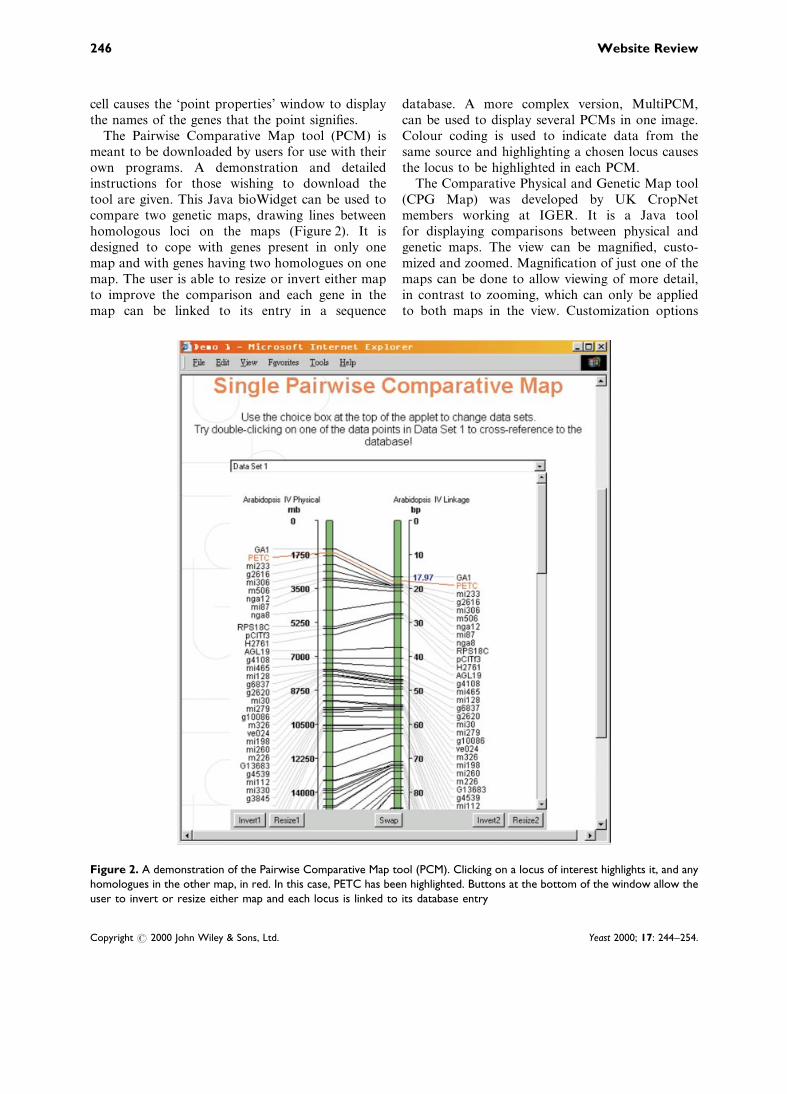
The Pairwise Comparative Map tool (PCM) ismeant to be downloaded by users for use with theirown programs. A demonstration and detailedinstructions for those wishing to download thetool are given. This Java bioWidget can be used tocompare two genetic maps, drawing lines betweenhomologous loci on the maps (Figure 2). It isdesigned to cope with genes present in only onemap and with genes having two homologues on onemap. The user is able to resize or invert either mapto improve the comparison and each gene in themap can be linked to its entry in a sequence
database. A more complex version, MultiPCM,can be used to display several PCMs in one image.Colour coding is used to indicate data from thesame source and highlighting a chosen locus causesthe locus to be highlighted in each PCM.
The Comparative Physical and Genetic Map tool(CPG Map) was developed by UK CropNetmembers working at IGER. It is a Java toolfor displaying comparisons between physical andgenetic maps. The view can be magni®ed, custo-mized and zoomed. Magni®cation of just one of themaps can be done to allow viewing of more detail,in contrast to zooming, which can only be appliedto both maps in the view. Customization options
Figure 2. A demonstration of the Pairwise Comparative Map tool (PCM). Clicking on a locus of interest highlights it, and anyhomologues in the other map, in red. In this case, PETC has been highlighted. Buttons at the bottom of the window allow theuser to invert or resize either map and each locus is linked to its database entry
246 Website Review
Copyright # 2000 John Wiley & Sons, Ltd. Yeast 2000; 17: 244±254.
include colouring or resizing of items of interest inthe map. The site includes a comprehensive demo,which I would encourage interested readers to tryout for themselves.
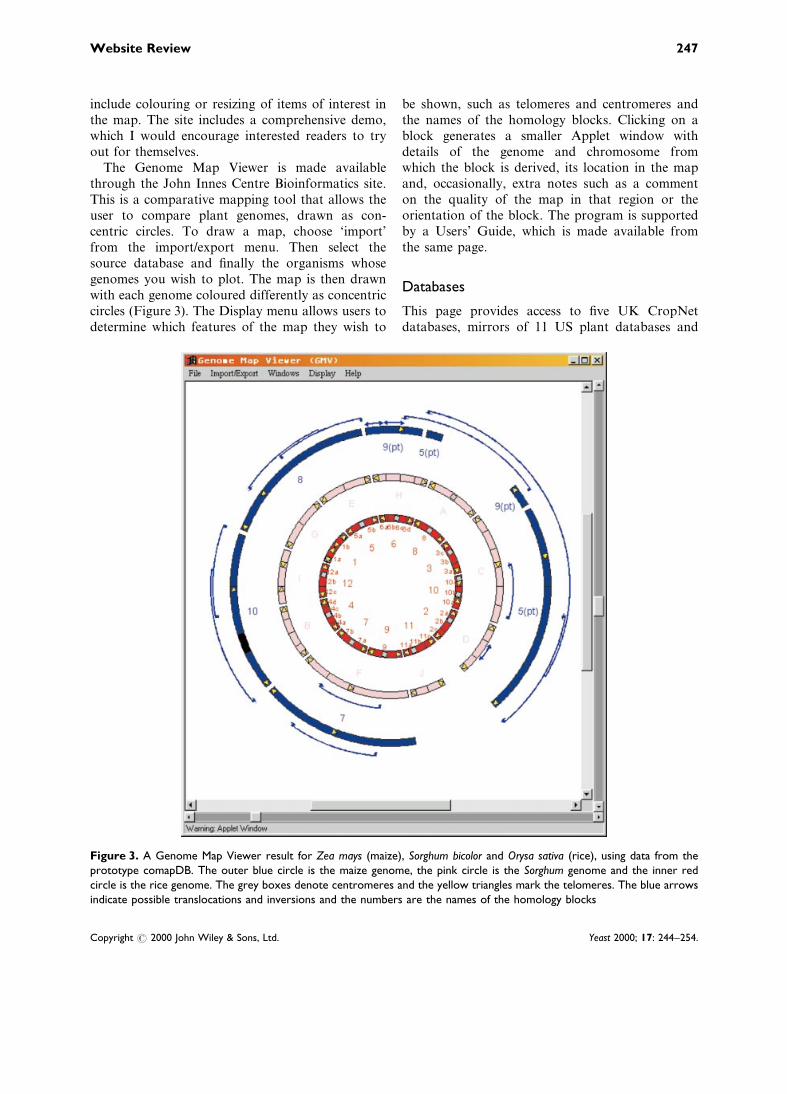
The Genome Map Viewer is made availablethrough the John Innes Centre Bioinformatics site.This is a comparative mapping tool that allows theuser to compare plant genomes, drawn as con-centric circles. To draw a map, choose `import'from the import/export menu. Then select thesource database and ®nally the organisms whosegenomes you wish to plot. The map is then drawnwith each genome coloured differently as concentriccircles (Figure 3). The Display menu allows users todetermine which features of the map they wish to
be shown, such as telomeres and centromeres andthe names of the homology blocks. Clicking on ablock generates a smaller Applet window withdetails of the genome and chromosome fromwhich the block is derived, its location in the mapand, occasionally, extra notes such as a commenton the quality of the map in that region or theorientation of the block. The program is supportedby a Users' Guide, which is made available fromthe same page.
Databases
This page provides access to ®ve UK CropNetdatabases, mirrors of 11 US plant databases and
Figure 3. A Genome Map Viewer result for Zea mays (maize), Sorghum bicolor and Orysa sativa (rice), using data from theprototype comapDB. The outer blue circle is the maize genome, the pink circle is the Sorghum genome and the inner redcircle is the rice genome. The grey boxes denote centromeres and the yellow triangles mark the telomeres. The blue arrowsindicate possible translocations and inversions and the numbers are the names of the homology blocks
Website Review 247
Copyright # 2000 John Wiley & Sons, Ltd. Yeast 2000; 17: 244±254.
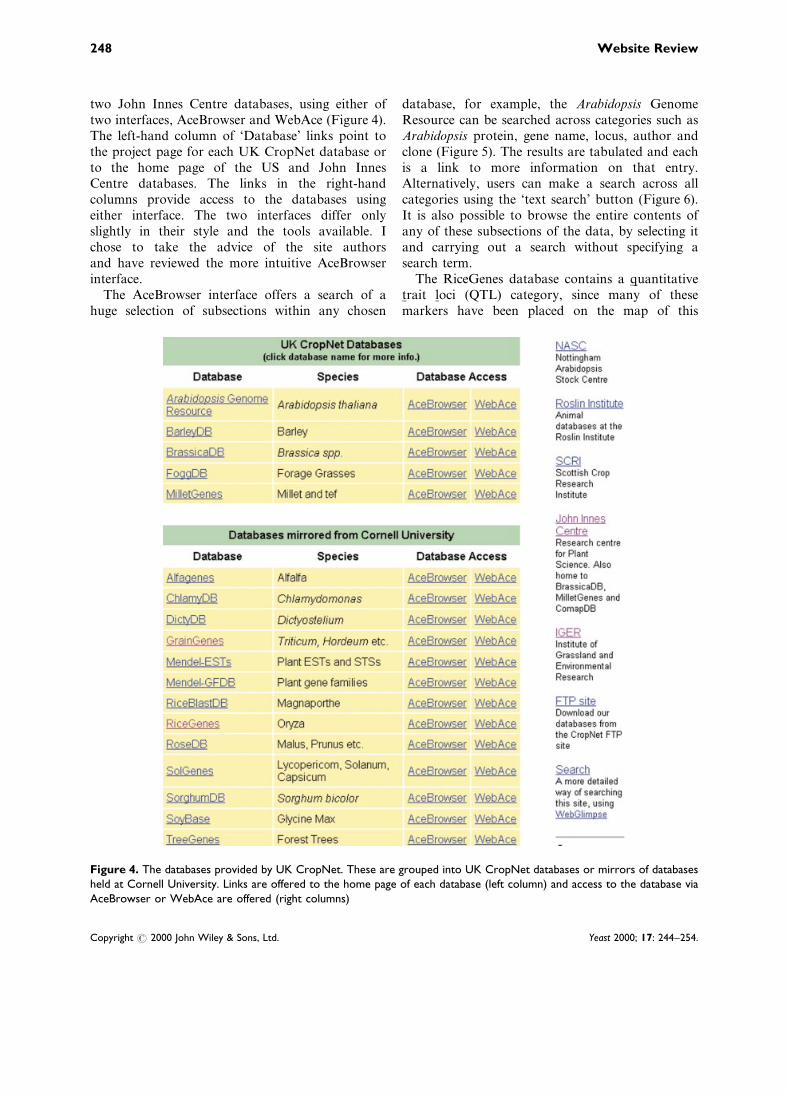
two John Innes Centre databases, using either oftwo interfaces, AceBrowser and WebAce (Figure 4).The left-hand column of `Database' links point tothe project page for each UK CropNet database orto the home page of the US and John InnesCentre databases. The links in the right-handcolumns provide access to the databases usingeither interface. The two interfaces differ onlyslightly in their style and the tools available. Ichose to take the advice of the site authorsand have reviewed the more intuitive AceBrowserinterface.
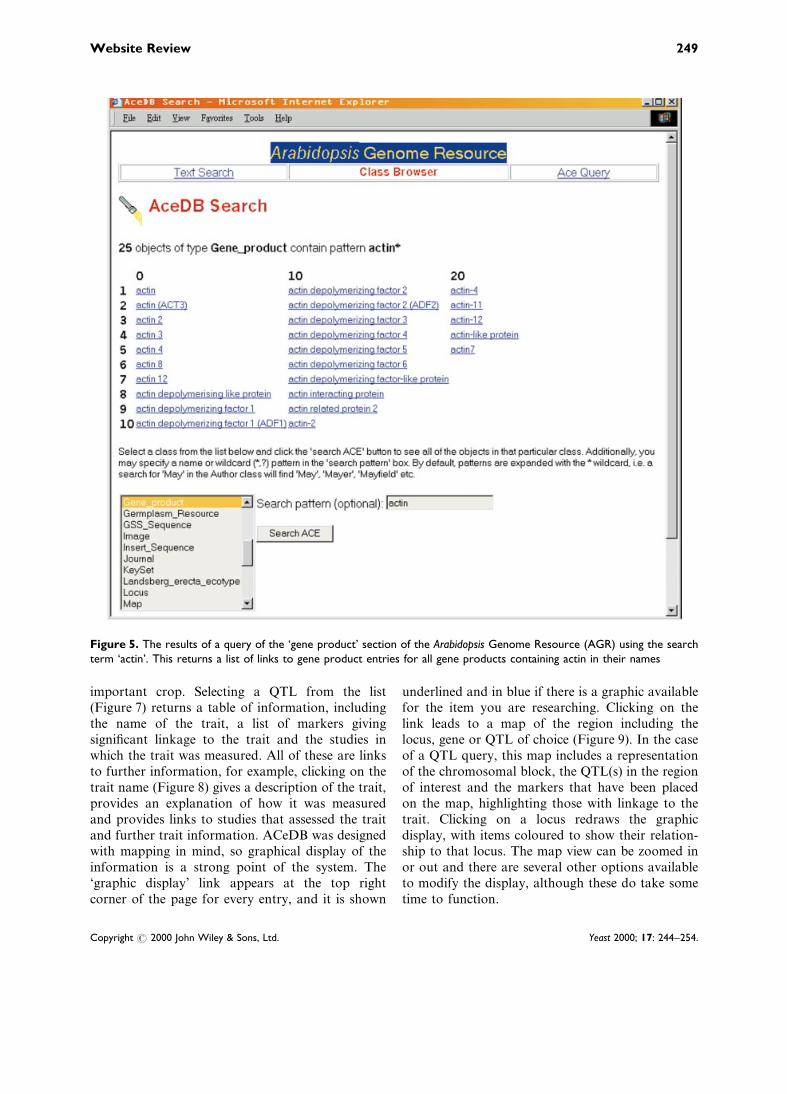
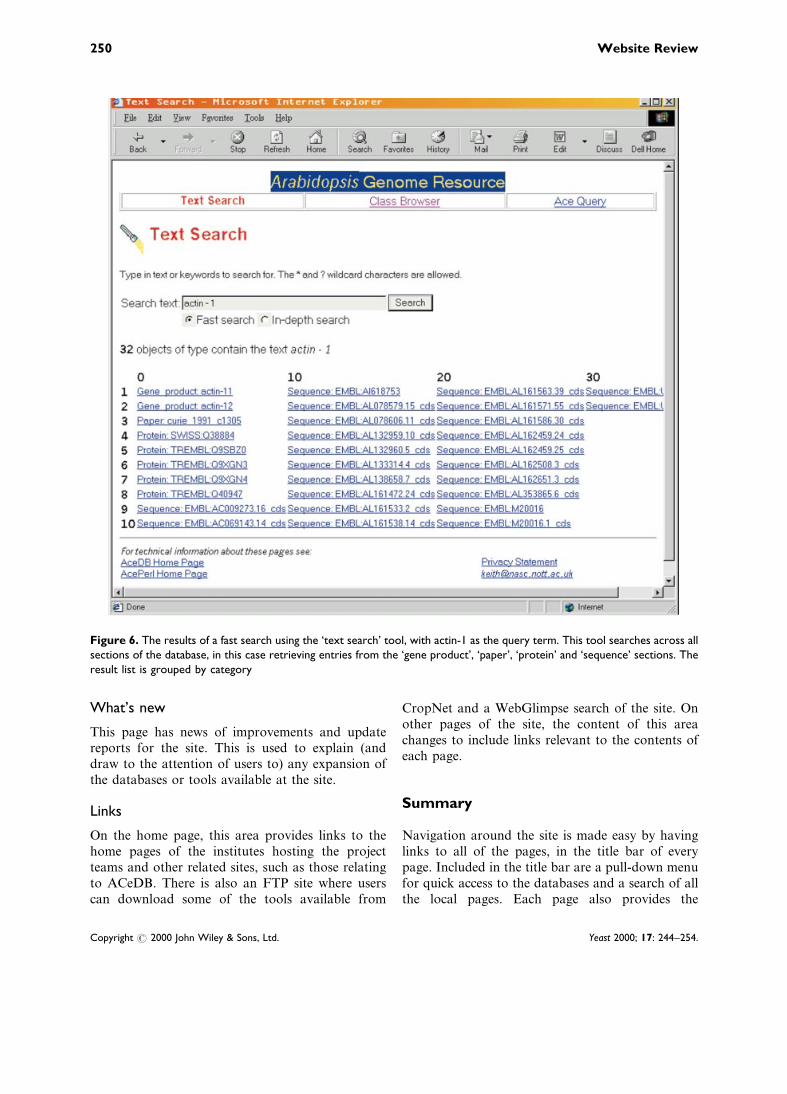
The AceBrowser interface offers a search of ahuge selection of subsections within any chosen
database, for example, the Arabidopsis GenomeResource can be searched across categories such asArabidopsis protein, gene name, locus, author andclone (Figure 5). The results are tabulated and eachis a link to more information on that entry.Alternatively, users can make a search across allcategories using the `text search' button (Figure 6).It is also possible to browse the entire contents ofany of these subsections of the data, by selecting itand carrying out a search without specifying asearch term.
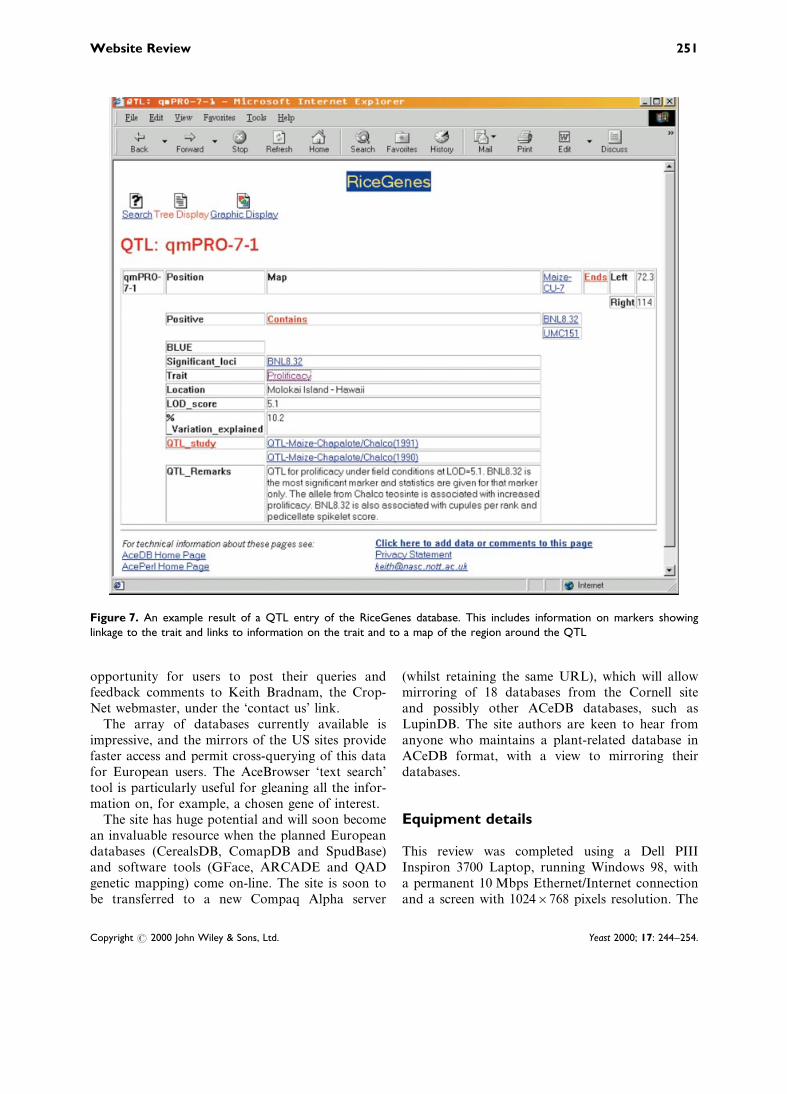
The RiceGenes database contains a quantitativetrait loci (QTL) category, since many of thesemarkers have been placed on the map of this
Figure 4. The databases provided by UK CropNet. These are grouped into UK CropNet databases or mirrors of databasesheld at Cornell University. Links are offered to the home page of each database (left column) and access to the database viaAceBrowser or WebAce are offered (right columns)
248 Website Review
Copyright # 2000 John Wiley & Sons, Ltd. Yeast 2000; 17: 244±254.
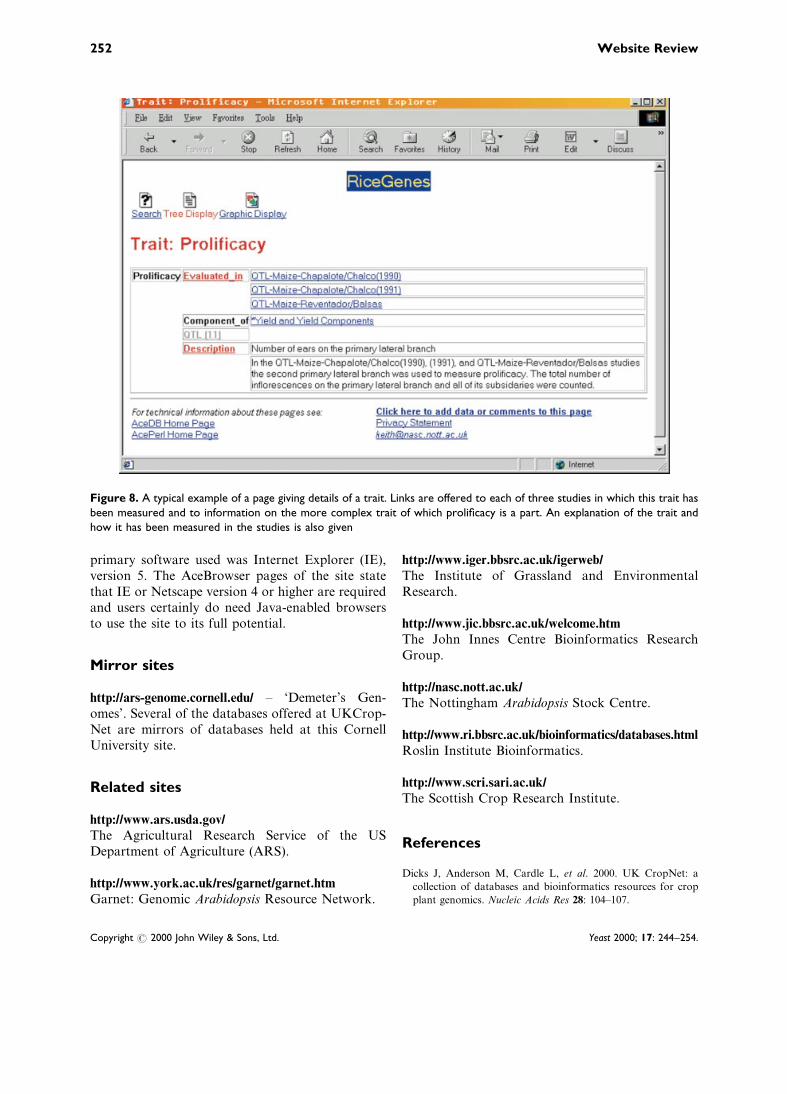
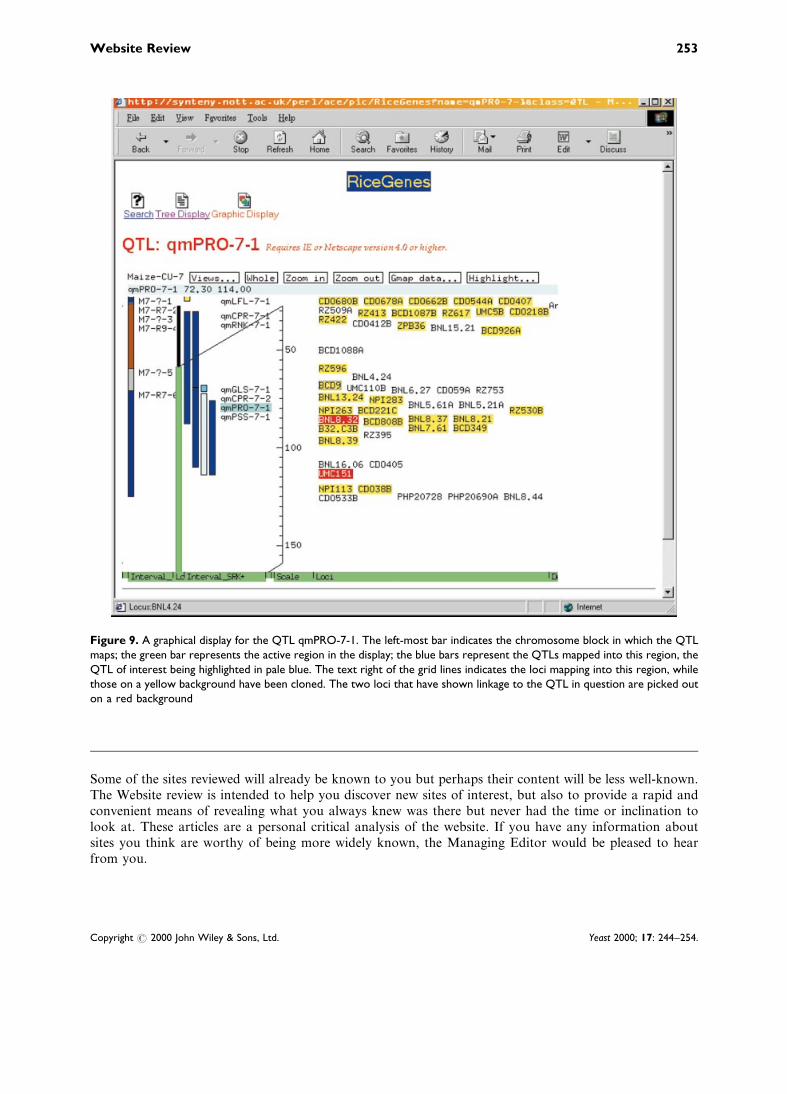
important crop. Selecting a QTL from the list(Figure 7) returns a table of information, includingthe name of the trait, a list of markers givingsigni®cant linkage to the trait and the studies inwhich the trait was measured. All of these are linksto further information, for example, clicking on thetrait name (Figure 8) gives a description of the trait,provides an explanation of how it was measuredand provides links to studies that assessed the traitand further trait information. ACeDB was designedwith mapping in mind, so graphical display of theinformation is a strong point of the system. The`graphic display' link appears at the top rightcorner of the page for every entry, and it is shown
underlined and in blue if there is a graphic availablefor the item you are researching. Clicking on thelink leads to a map of the region including thelocus, gene or QTL of choice (Figure 9). In the caseof a QTL query, this map includes a representationof the chromosomal block, the QTL(s) in the regionof interest and the markers that have been placedon the map, highlighting those with linkage to thetrait. Clicking on a locus redraws the graphicdisplay, with items coloured to show their relation-ship to that locus. The map view can be zoomed inor out and there are several other options availableto modify the display, although these do take sometime to function.
Figure 5. The results of a query of the `gene product' section of the Arabidopsis Genome Resource (AGR) using the searchterm `actin'. This returns a list of links to gene product entries for all gene products containing actin in their names
Website Review 249
Copyright # 2000 John Wiley & Sons, Ltd. Yeast 2000; 17: 244±254.
What's new
This page has news of improvements and updatereports for the site. This is used to explain (anddraw to the attention of users to) any expansion ofthe databases or tools available at the site.
Links
On the home page, this area provides links to thehome pages of the institutes hosting the projectteams and other related sites, such as those relatingto ACeDB. There is also an FTP site where userscan download some of the tools available from
CropNet and a WebGlimpse search of the site. Onother pages of the site, the content of this areachanges to include links relevant to the contents ofeach page.
Summary
Navigation around the site is made easy by havinglinks to all of the pages, in the title bar of everypage. Included in the title bar are a pull-down menufor quick access to the databases and a search of allthe local pages. Each page also provides the
Figure 6. The results of a fast search using the `text search' tool, with actin-1 as the query term. This tool searches across allsections of the database, in this case retrieving entries from the `gene product', `paper', `protein' and `sequence' sections. Theresult list is grouped by category
250 Website Review
Copyright # 2000 John Wiley & Sons, Ltd. Yeast 2000; 17: 244±254.
opportunity for users to post their queries andfeedback comments to Keith Bradnam, the Crop-Net webmaster, under the `contact us' link.
The array of databases currently available isimpressive, and the mirrors of the US sites providefaster access and permit cross-querying of this datafor European users. The AceBrowser `text search'tool is particularly useful for gleaning all the infor-mation on, for example, a chosen gene of interest.
The site has huge potential and will soon becomean invaluable resource when the planned Europeandatabases (CerealsDB, ComapDB and SpudBase)and software tools (GFace, ARCADE and QADgenetic mapping) come on-line. The site is soon tobe transferred to a new Compaq Alpha server
(whilst retaining the same URL), which will allowmirroring of 18 databases from the Cornell siteand possibly other ACeDB databases, such asLupinDB. The site authors are keen to hear fromanyone who maintains a plant-related database inACeDB format, with a view to mirroring theirdatabases.
Equipment details
This review was completed using a Dell PIIIInspiron 3700 Laptop, running Windows 98, witha permanent 10 Mbps Ethernet/Internet connectionand a screen with 1024r768 pixels resolution. The
Figure 7. An example result of a QTL entry of the RiceGenes database. This includes information on markers showinglinkage to the trait and links to information on the trait and to a map of the region around the QTL
Website Review 251
Copyright # 2000 John Wiley & Sons, Ltd. Yeast 2000; 17: 244±254.
primary software used was Internet Explorer (IE),version 5. The AceBrowser pages of the site statethat IE or Netscape version 4 or higher are requiredand users certainly do need Java-enabled browsersto use the site to its full potential.
Mirror sites
http://ars-genome.cornell.edu/ ± `Demeter's Gen-omes'. Several of the databases offered at UKCrop-Net are mirrors of databases held at this CornellUniversity site.
Related sites
http://www.ars.usda.gov/The Agricultural Research Service of the USDepartment of Agriculture (ARS).
http://www.york.ac.uk/res/garnet/garnet.htm
Garnet: Genomic Arabidopsis Resource Network.
http://www.iger.bbsrc.ac.uk/igerweb/
The Institute of Grassland and EnvironmentalResearch.
http://www.jic.bbsrc.ac.uk/welcome.htmThe John Innes Centre Bioinformatics ResearchGroup.
http://nasc.nott.ac.uk/
The Nottingham Arabidopsis Stock Centre.
http://www.ri.bbsrc.ac.uk/bioinformatics/databases.html
Roslin Institute Bioinformatics.
http://www.scri.sari.ac.uk/
The Scottish Crop Research Institute.
References
Dicks J, Anderson M, Cardle L, et al. 2000. UK CropNet: a
collection of databases and bioinformatics resources for crop
plant genomics. Nucleic Acids Res 28: 104±107.
Figure 8. A typical example of a page giving details of a trait. Links are offered to each of three studies in which this trait hasbeen measured and to information on the more complex trait of which proli®cacy is a part. An explanation of the trait andhow it has been measured in the studies is also given
252 Website Review
Copyright # 2000 John Wiley & Sons, Ltd. Yeast 2000; 17: 244±254.
Some of the sites reviewed will already be known to you but perhaps their content will be less well-known.The Website review is intended to help you discover new sites of interest, but also to provide a rapid andconvenient means of revealing what you always knew was there but never had the time or inclination tolook at. These articles are a personal critical analysis of the website. If you have any information aboutsites you think are worthy of being more widely known, the Managing Editor would be pleased to hearfrom you.
Figure 9. A graphical display for the QTL qmPRO-7-1. The left-most bar indicates the chromosome block in which the QTLmaps; the green bar represents the active region in the display; the blue bars represent the QTLs mapped into this region, theQTL of interest being highlighted in pale blue. The text right of the grid lines indicates the loci mapping into this region, whilethose on a yellow background have been cloned. The two loci that have shown linkage to the QTL in question are picked outon a red background
Website Review 253
Copyright # 2000 John Wiley & Sons, Ltd. Yeast 2000; 17: 244±254.
Announcement ± External Training Sessions
UKcrop.net holds and represents nearly 20 public plant databases on a variety of model and crop species,and is developing and implementing a wide range of development tools for researchers in plant genomicsand post-genomics. We would like to invite you to acquire some supervised tuition on the use of these toolsin your own research.
Our current series of training sessions consist of mini-lectures and hands-on personal tuition by thedevelopers and project leaders of UKcrop.net in an informal workshop setting at each of our developmentsites.
Potential and existing users of these international resources at beginner or advanced levels are allwelcome.
Calendar 2000/2001
UKcropnet Training III
Friday 1 December 2000, The John Innes Centre, Norwich.Local Organizer: Jo Dicks.
UKcropnet Training IV
March/April 2001, SCRI, Dundee or NASC, Nottingham.Date and venue to be con®rmed.
For details see http://ukcrop.net/training/
254 Website Review
Copyright # 2000 John Wiley & Sons, Ltd. Yeast 2000; 17: 244±254.
Related Documents