Chapter 7 Math Connects, Course 1 169 Copyright © Glencoe/McGraw-Hill, a division of The McGraw-Hill Companies, Inc. C H A P T E R 7 BUILD YOUR VOCABULARY (continued on the next page) This is an alphabetical list of new vocabulary terms you will learn in Chapter 7. As you complete the study notes for the chapter, you will see Build Your Vocabulary reminders to complete each term’s definition or description on these pages. Remember to add the textbook page number in the second column for reference when you study. Vocabulary Term Found on Page Definition Description or Example complementary events circle graph experimental probability Fundamental Counting Principle outcomes percent population probability

Welcome message from author
This document is posted to help you gain knowledge. Please leave a comment to let me know what you think about it! Share it to your friends and learn new things together.
Transcript

Ch
apte
r 7
Math Connects, Course 1 169
Cop
yrig
ht ©
Gle
ncoe
/McG
raw
-Hill
, a d
ivis
ion
of T
he M
cGra
w-H
ill C
ompa
nies
, Inc
.
C H A P T E R
7BUILD YOUR VOCABULARY
(continued on the next page)
This is an alphabetical list of new vocabulary terms you will learn in Chapter 7. As you complete the study notes for the chapter, you will see Build Your Vocabulary reminders to complete each term’s defi nition or description on these pages. Remember to add the textbook page number in the second column for reference when you study.
Vocabulary Term Found on Page Defi nition Description or
Example
complementary events
circle graph
experimental probability
Fundamental CountingPrinciple
outcomes
percent
population
probability
0168-0195 CH07-881040.indd 1690168-0195 CH07-881040.indd 169 12/3/07 4:40:59 PM12/3/07 4:40:59 PM

170 Math Connects, Course 1
Copyright ©
Glencoe/M
cGraw
-Hill, a division of T
he McG
raw-H
ill Com
panies, Inc.
Chapter 7 BUILD YOUR VOCABULARY
Vocabulary Term Found on Page Defi nition Description or
Example
random
sample
sample space
simple event
survey [sir-vay]
theoretical probability[thee-uh-REHT-uh-kuhl]
tree diagram
0168-0195 CH07-881040.indd 1700168-0195 CH07-881040.indd 170 12/3/07 4:40:59 PM12/3/07 4:40:59 PM

Math Connects, Course 1 171
Cop
yrig
ht ©
Gle
ncoe
/McG
raw
-Hill
, a d
ivis
ion
of T
he M
cGra
w-H
ill C
ompa
nies
, Inc
.Percents and Fractions7–1
A percent is a ratio that compares a number to
.
BUILD YOUR VOCABULARY (pages 169–170)
EXAMPLES Write a Percent as a Fraction
Write 60% as a fraction in simplest form.
60% means out of .
60% = 60 __ Defi nition of percent.
60% =
= 60 _
100 or Simplify. Divide the numerator and
denominator by the GCF, .
Write 140% as a mixed number in simplest form.
140% means
140% = 1 2 _ 5
for every .
140% = 140 __ Defi nition of percent
= 1 40 _
100 Write as a mixed number. Divide the
numerator and denominator by the
GCF, .
=
KEY CONCEPT
Percent to Fraction To write a percent as a fraction, write the percent as a fraction with a denominator of 100. Then simplify.
MAIN IDEA
• Express percents as fractions and fractions as percents.
0168-0195 CH07-881040.indd 1710168-0195 CH07-881040.indd 171 12/3/07 4:40:59 PM12/3/07 4:40:59 PM
7–1
172 Math Connects, Course 1
Copyright ©
Glencoe/M
cGraw
-Hill, a division of T
he McG
raw-H
ill Com
panies, Inc.Check Your Progress Write each percent as a fraction
or mixed number in simplest form.
a. 30% b. 180%
EXAMPLE
ORGANIZE ITInclude some examples of percents written as fractions and fractions written as percents in your Foldable chart.
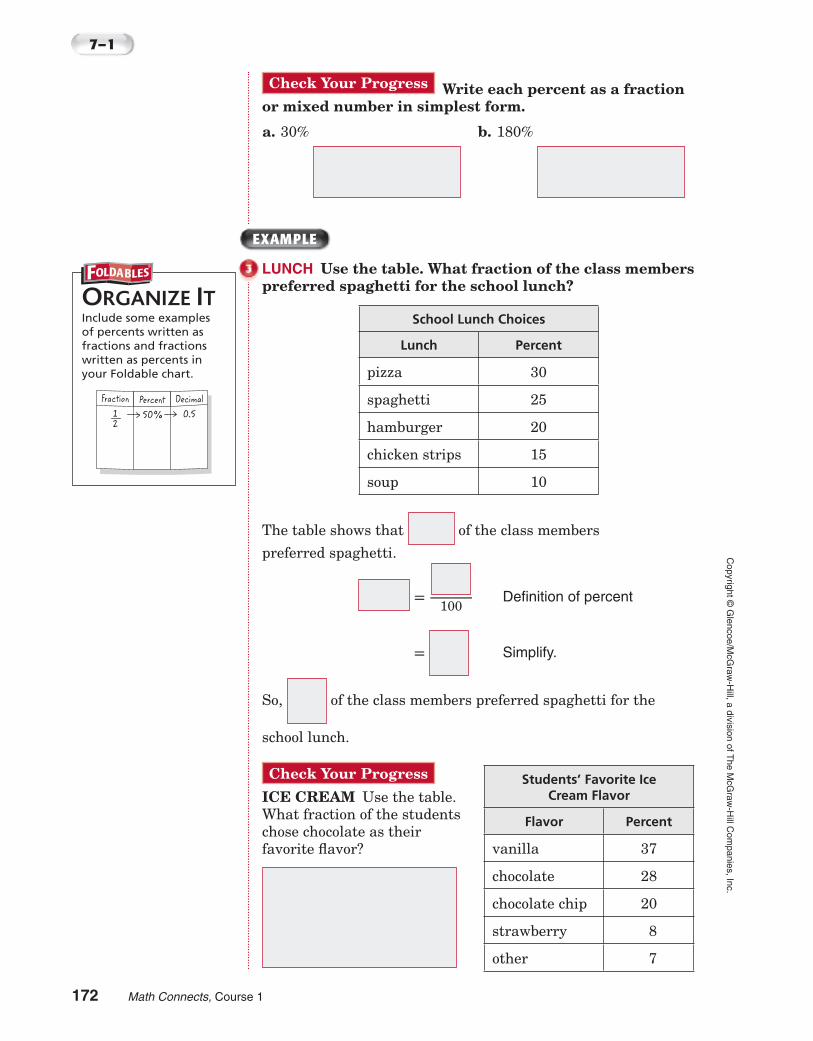
® LUNCH Use the table. What fraction of the class members preferred spaghetti for the school lunch?
School Lunch Choices
Lunch Percent
pizza 30
spaghetti 25
hamburger 20
chicken strips 15
soup 10
The table shows that of the class members
preferred spaghetti.
= __ 100
Defi nition of percent
= Simplify.
So, of the class members preferred spaghetti for the
school lunch.
Check Your Progress Students’ Favorite IceCream Flavor
Flavor Percent
vanilla 37
chocolate 28
chocolate chip 20
strawberry 8
other 7
ICE CREAM Use the table. What fraction of the students chose chocolate as their favorite fl avor?
0168-0195 CH07-881040.indd 1720168-0195 CH07-881040.indd 172 12/3/07 4:41:00 PM12/3/07 4:41:00 PM

7–1
Math Connects, Course 1 173
Cop
yrig
ht ©
Gle
ncoe
/McG
raw
-Hill
, a d
ivis
ion
of T
he M
cGra
w-H
ill C
ompa
nies
, Inc
.EXAMPLES Write a Fraction as a Percent
Write 7 _ 10
as a percent.
7 _ 10
= n __ Write a proportion.
7 _ 10
=
× 10
× 10
Since 10 × 10 = 100,multiply 7 by 10 tofi nd n.
So, 7 _ 10
= or .
Write a percent to represent the shaded portion of the model.
The portion shaded is 1 6 _ 8 or .
1 3 _ 4 = Write 1 3 _
4 as an
improper fraction.
7 _ 4 = n _
100 Write a proportion.
7 _ 4 =
× 25
× 25
Since 4 × 25 = 100, multiply 7 by 25 to fi nd n.
So, 175 _ 100
or of the model is shaded.
Check Your Progress Write each fraction or shaded portion of each model as a percent.
a. 4 _ 10
b.
HOMEWORKASSIGNMENTPage(s):
Exercises:
0168-0195 CH07-881040.indd 1730168-0195 CH07-881040.indd 173 12/3/07 4:41:01 PM12/3/07 4:41:01 PM

174 Math Connects, Course 1
Copyright ©
Glencoe/M
cGraw
-Hill, a division of T
he McG
raw-H
ill Com
panies, Inc.7–2
A circle graph is used to data that are parts of a whole.
BUILD YOUR VOCABULARY (pages 169–170)
EXAMPLE Sketch Circle Graphs Time Spent Playing
Video Games
Time (h) Percent
0–1 35
1–2 10
2–3 25
3 or more 30
ENTERTAINMENT The table shows how many hours a group of teenagers spent playing video games in one week. Sketch a circle graph to display the data. Remember to label each section of the graph and give the graph a title.
• Write a fraction to represent each percent.
35% = 35 _ 100
or 10% = 10 _ 100
or
25% = 25 _ 100
or 30% = 30 _ 100
or
• Since 10% = , mark
of the circle for
“1–2 hours.” Since
30% = , mark a section
3 times as big as the section
for “1–2 hours” for “3 or more hours.” Since 25% = ,
mark of the circle for “2–3 hours.” The remaining
portion of the circle should be about 35% or of the circle for “0–1 hour.”
MAIN IDEA
• Sketch and analyze circle graphs.
Circle Graphs
0168-0195 CH07-881040.indd 1740168-0195 CH07-881040.indd 174 12/3/07 4:41:01 PM12/3/07 4:41:01 PM

7–2
Math Connects, Course 1 175
Cop
yrig
ht ©
Gle
ncoe
/McG
raw
-Hill
, a d
ivis
ion
of T
he M
cGra
w-H
ill C
ompa
nies
, Inc
.Check Your Progress SPORTS Favorite Sport
Sport Percent
Baseball 30
Tennis 19
Soccer 9
Hockey 10
Basketball 12
Football 20
The table shows students’ choices for favorite sport. Sketch a circle graph to display the data.
EXAMPLES Analyze Circle Graphs
REMEMBER IT When you read and interpret a circle graph, it is helpful to remember that the percents of all the sections add up to 100%.
TRANSPORTATION The circle graph shows which method of transportation students use to get to Martin Luther King, Jr., Middle School.
Which method of transportation do most students use?
The largest section of the graph is the section that
represents . So, the method of
transportation most students use is the .
0168-0195 CH07-881040.indd 1750168-0195 CH07-881040.indd 175 12/3/07 4:41:02 PM12/3/07 4:41:02 PM

7–2
176 Math Connects, Course 1
Copyright ©
Glencoe/M
cGraw
-Hill, a division of T
he McG
raw-H
ill Com
panies, Inc. Which two methods of transportation are used by the least amount of students?
The smallest sections of the graph are the sections that
represent . So,
are the two methods of transportation
used by the least amount of students.
How does the number of students who ride mopeds to school compare to the number of students who take the bus?
The percent of students who ride a moped is and the
percent of students who ride the bus is .
The number of students who take the bus is about times the number of students who ride a moped.
ORGANIZE ITIn your Foldable, write the similarities and differences among circle graphs, bar graphs, and line graphs. Think about how each kind of graph is constructed.
®
Check Your Progress ICE CREAM The circle graph shows which fl avor of ice cream students consider their favorite.
a. Which fl avor of ice cream do most students prefer?
b. Which two fl avors are the least favorite among these students?
c. How does the number of students who prefer peanut butter ice cream compare to the number of students who prefer cookie dough ice cream?
HOMEWORKASSIGNMENTPage(s):
Exercises:
0168-0195 CH07-881040.indd 1760168-0195 CH07-881040.indd 176 12/3/07 4:41:02 PM12/3/07 4:41:02 PM

Math Connects, Course 1 177
Cop
yrig
ht ©
Gle
ncoe
/McG
raw
-Hill
, a d
ivis
ion
of T
he M
cGra
w-H
ill C
ompa
nies
, Inc
.7–3 Percents and Decimals
EXAMPLES Write a Percent as a Decimal
Write each percent as a decimal.
86%
86% = 86 __ Rewrite the percent as a fraction
with a denominator of .
=
Write 86 hundredths as a decimal.
1%
1% = 1 __ Rewrite the percent as a fraction
with a denominator of .
=
Write 1 hundredth as a decimal.
110%
110% = 110 __ Rewrite the percent as a fraction
with a denominator of .
= Write as a mixed number.
= or
Write 1 and 10 hundredths.
Check Your Progress Write each percent as a decimal.
a. 34%
b. 4%
c. 154%
MAIN IDEA
• Express percents as decimals and decimals as percents.
KEY CONCEPT
Percent as Decimal To write a percent as a decimal, rewrite the percent as a fraction with a denominator of 100. Then write the fraction as a decimal.
0168-0195 CH07-881040.indd 1770168-0195 CH07-881040.indd 177 12/3/07 4:41:03 PM12/3/07 4:41:03 PM

7–3
178 Math Connects, Course 1
Copyright ©
Glencoe/M
cGraw
-Hill, a division of T
he McG
raw-H
ill Com
panies, Inc.EXAMPLES Write a Decimal as a Percent
Write each decimal as a percent.
0.44
0.44 = 44 __ Write 44 hundredths as a fraction.
=
Write the fraction as a percent.
1.81
1.81 = 1 81 __ Write 1 and 81 hundredths as a mixed number.
=
Write the mixed number as an improper fraction.
=
Write the fraction as a percent.
Check Your Progress Write each decimal as a percent.
a. 0.82 b. 1.68
EXAMPLE
CULTURE In 2000, about 0.32 of Texas’ population was Hispanic. Write 0.32 as a percent.
0.32 = Write 32 hundredths as a fraction.
=
Write the fraction as a percent.
Check Your Progress GASES The atmosphere is composed of gases. About 0.78 of the atmosphere is nitrogen. Write 0.78 as a percent.
KEY CONCEPTS
Decimal as Percent To write a decimal as a percent, write the decimal as a fraction whose denominator is 100. Then write the fraction as a percent.
HOMEWORKASSIGNMENTPage(s):
Exercises:
0168-0195 CH07-881040.indd 1780168-0195 CH07-881040.indd 178 12/3/07 4:41:03 PM12/3/07 4:41:03 PM

Math Connects, Course 1 179
Cop
yrig
ht ©
Gle
ncoe
/McG
raw
-Hill
, a d
ivis
ion
of T
he M
cGra
w-H
ill C
ompa
nies
, Inc
.
An outcome is a possible of an experiment.
A simple event is one or a collection of
outcomes.
Probability is the that some event will occur.
Outcomes occur at random if each outcome is
likely to occur.
BUILD YOUR VOCABULARY (pages 169–170)
EXAMPLES Find Probability
There are six equally likely outcomes on the spinner shown.
Find the probability of landing on 1.
P(1) = number of outcomes
_______
number of outcomes
=
The probability of landing on 1 is .
Find the probability of landing on 2 or 4.
P(2 or 4) = number of favorable outcomes ______ number of possible outcomes
= or Simplify.
The probability of landing on 2 or 4 is .
MAIN IDEA
• Find and interpret the probability of a simple event.
Probability7–4
®
Write the defi nition of probability in your Foldable.
0168-0195 CH07-881040.indd 1790168-0195 CH07-881040.indd 179 12/3/07 4:41:04 PM12/3/07 4:41:04 PM

7–4
180 Math Connects, Course 1
Copyright ©
Glencoe/M
cGraw
-Hill, a division of T
he McG
raw-H
ill Com
panies, Inc.
Complementary events are two events in which either one or the other must happen, but they cannot happen at the same time. The sum of the probability of an event and its
complement is or .
BUILD YOUR VOCABULARY (pages 169–170)
EXAMPLE Find Probability of the Complement
Use the spinner from Example 1. Find the probability of not landing on 6.
The probability of not landing on 6 and the probability of
landing on 6 are . So, the sum of the
probabilities is .
P(6) + P(not 6) = 1
+ P(not 6) = 1 Replace P(6) with .
1 _ 6 + = 1 THINK 1 _
6 plus what number equals 1?
So, the probability of not landing on 6 is .
Check Your Progress A number cube is rolled.
a. Find the probability of rolling a 4.
b. Find the probability of rolling a number greater than 3.
c. Find the probability of not rolling an even number.
HOMEWORKASSIGNMENTPage(s):
Exercises:
0168-0195 CH07-881040.indd 1800168-0195 CH07-881040.indd 180 12/3/07 4:41:04 PM12/3/07 4:41:04 PM

7–4
Math Connects, Course 1 181
Cop
yrig
ht ©
Gle
ncoe
/McG
raw
-Hill
, a d
ivis
ion
of T
he M
cGra
w-H
ill C
ompa
nies
, Inc
.EXAMPLE
SPORTS A sportscaster predicted that the Tigers had a 75% chance of winning tonight. Describe the complement of this event and fi nd its probability.
The complement of winning is not winning. The sum of the
probabilities is .
P(win) + P(not win) =
+ P(not win) = Replace P(win) with .
75% + = 100% THINK 75% plus what number equals 100%?
So, the probability that the Tigers will not win tonight
is .
Check Your Progress SLEEPOVER Celia guesses the probability that her parents will allow her to sleep over her best friend’s house tonight is 55%. What is the probability that Celia will not be allowed to sleep over?
0168-0195 CH07-881040.indd 1810168-0195 CH07-881040.indd 181 12/3/07 4:41:05 PM12/3/07 4:41:05 PM

Sample Spaces7–5
182 Math Connects, Course 1
Copyright ©
Glencoe/M
cGraw
-Hill, a division of T
he McG
raw-H
ill Com
panies, Inc.
The set of all possible outcomes is called the sample space.
A tree diagram is a diagram that shows all possible outcomes of an event.
BUILD YOUR VOCABULARY (pages 169–170)
EXAMPLE Use a List to Find Sample Space
VACATION While on vacation, Carlos can go snorkeling, boating, and paragliding. In how many ways can Carlos do the three activities? Make an organized list to show the sample space.
Make an organized list. Use S for snorkeling, B for boating, and P for paragliding.
There are Carlos can do the three activities.
Check Your Progress STUDENT COUNCIL Ken, Betsy, Sally, and David are seated in a row at the head table at a student council meeting. In how many ways can the four students be seated? Make an organized list to show the sample space.
EXAMPLE Use a Tree Diagram to Find a Sample Space
A car can be purchased with either two doors or four doors. You may also choose leather, fabric, or vinyl seats. Use a tree diagram to fi nd all the buying options.
List each choice for the number of doors. Then pair each choice for the number of doors with each choice for the types of seats.
MAIN IDEA
• Construct sample spaces using tree diagrams or lists.
ORGANIZE ITIn your Foldable, tell how a tree diagram is used to show a sample space.
®
0168-0195 CH07-881040.indd 1820168-0195 CH07-881040.indd 182 12/3/07 4:41:05 PM12/3/07 4:41:05 PM

7–5
Math Connects, Course 1 183
Cop
yrig
ht ©
Gle
ncoe
/McG
raw
-Hill
, a d
ivis
ion
of T
he M
cGra
w-H
ill C
ompa
nies
, Inc
. Car Seats Outcome
There are possible buying options.
REMEMBER IT Outcomes are all the possible results of a probability event.
Check Your Progress A pair of sneakers can be purchased with either laces or Velcro. You may also choose white, gray, or black sneakers. Use a tree diagram to fi nd how many different sneakers are possible.
0168-0195 CH07-881040.indd 1830168-0195 CH07-881040.indd 183 12/3/07 4:41:06 PM12/3/07 4:41:06 PM

7–5
184 Math Connects, Course 1
Copyright ©
Glencoe/M
cGraw
-Hill, a division of T
he McG
raw-H
ill Com
panies, Inc.
The Fundamental Counting Priniciple states that if there
are outcomes for the fi rst choice and outcomes
for a second choice, then the total number of possible
outcomes is m × n.
BUILD YOUR VOCABULARY (pages 169–170)
EXAMPLE Use Fundamental Counting Principle
FLOWERS Chloe wants to buy a bouquet of flowers in a vase. The flower shop has roses, daffodils, and tulips, and has four different vases from which to choose. Use the Fundamental Counting Principle to find the total number of possible outcomes of a bouquet made up of two types of flowers in a vase.
number of outcomes for f lower choice
· number of
outcomes for vase choice
= total
number of outcomes
· =
There are different outcomes.
Check Your Progress PASTA A restaurant offers a pasta bar where customers can choose from fettucine, linguine, and macaroni for their pasta choice, and three types of sauce. Use the Fundamental Counting Principle to find the total number of outcomes of a pasta dish with one type of pasta and one sauce.
HOMEWORKASSIGNMENTPage(s):
Exercises:
0168-0195 CH07-881040.indd 1840168-0195 CH07-881040.indd 184 12/3/07 4:41:06 PM12/3/07 4:41:06 PM

Math Connects, Course 1 185
Cop
yrig
ht ©
Gle
ncoe
/McG
raw
-Hill
, a d
ivis
ion
of T
he M
cGra
w-H
ill C
ompa
nies
, Inc
.
A survey is a question or set of questions designed to collect data about a specifi c group of people.
The population is the being studied in a survey.
A sample is a randomly selected group that is surveyed to
represent a whole .
BUILD YOUR VOCABULARY (pages 169–170)
EXAMPLES Make Predictions Using Proportions
Julia asked every sixth person in the school cafeteria to name the kind of activity he or she would like to do for the school’s spring outing.
Spring Outing
Activity Students
amusement park 15
baseball game 10
water park 10
art museum 5
What is the probability that a student will prefer an amusement park?
P(amusement park) =
number of students that prefer an amusement park
______ number of students surveyed
=
So, the probability that a student will prefer an amusement
park is .
7–6 Making Predictions
MAIN IDEA
• Predict the actions of a larger group using a sample.
0168-0195 CH07-881040.indd 1850168-0195 CH07-881040.indd 185 12/3/07 4:41:07 PM12/3/07 4:41:07 PM

7–6
186 Math Connects, Course 1
Copyright ©
Glencoe/M
cGraw
-Hill, a division of T
he McG
raw-H
ill Com
panies, Inc. There are 408 students at Julia’s school. Predict how many students prefer going to an amusement park.
Let a represent the number of students who prefer an amusement park.
_ = a _ 408
Write a proportion.
= a _ 408
Simplify 15 _ 40
by dividing the numerator and
denominator by the GCF, 5.
3 _ 8 =
a _ 408
× 51
× 51
Since 8 × 51 = 408, multiply 3 by 51 to fi nd a.
3 _ 8 = a =
Of the 408 students, about will prefer going to an amusement park.
Check Your Progress HOCKEY Kyle asked every third hockey player in his league what type of snack they prefer to have after a hockey game.
Post Game Snack
Snack Students
fruit 12
chips 18
cookies 10
a. What is the probability that a hockey player will prefer cookies for their snack?
b. There are 128 hockey players in Kyle’s league. Predict how many of the hockey players prefer cookies for their snack after a game.
HOMEWORKASSIGNMENTPage(s):
Exercises:
Use mental math to solve the proportion
1 _ 10
= x _ 100
(Lesson 6–4).
REVIEW IT
0168-0195 CH07-881040.indd 1860168-0195 CH07-881040.indd 186 12/3/07 4:41:07 PM12/3/07 4:41:07 PM

Math Connects, Course 1 187
Cop
yrig
ht ©
Gle
ncoe
/McG
raw
-Hill
, a d
ivis
ion
of T
he M
cGra
w-H
ill C
ompa
nies
, Inc
.7–7 Problem-Solving Investigation:
Solve a Simpler Problem
EXAMPLE
Solve. Use the solve a simpler problem strategy.
BAKE SALE Elmwood Middle School received 620 contributions for its bake sale. If 40% of the contributions were cookies, how many cookies did the school receive?
UNDERSTAND You know the school received
contributions, and of them were
cookies. You need to fi nd the number of cookies the school received.
PLAN Solve a simpler problem by fi nding 10% of the number of contributions and then use the result to fi nd 40% of the number of contributions.
SOLVE Since 10% = 10 _ 100
or 1 _ 10
, 1 out of every 10
contributions was cookies.
620 ÷ 10 =
Since there are four 10% in 40%, multiply 62
by 4. 62 × 4 =
So, the school received cookies.
CHECK You know that 40% = 40 _ 100
or 2 _ 5 . Since 2 _
5
of 620 is 248, the answer is reasonable.
Check Your Progress TALENT SHOW A total of 310 people attended a talent show at Jefferson Middle School. If 70% of those who attended were adults, how many adults attended the talent show?
MAIN IDEA
• Solve problems by solving a simpler problem.
0168-0195 CH07-881040.indd 1870168-0195 CH07-881040.indd 187 12/3/07 4:41:08 PM12/3/07 4:41:08 PM

188 Math Connects, Course 1
Copyright ©
Glencoe/M
cGraw
-Hill, a division of T
he McG
raw-H
ill Com
panies, Inc.
EXAMPLES Estimate the Percent of a Number
Estimate 49% of 302.
49% is close to or .
Round 302 to .
of is . 1 _ 2 or half means to divide by 2.
So, 49% of 302 is about .
Estimate 80% of 1,605.
80% is .
Round 1,605 to since it is divisible by 10.
1 _ 10
of 1,600 is . 1 _ 10
or 1 tenth means divide by 10.
So, 8 _ 10
of 1,600 is 8 × 160 or .
Thus, 80% of 1,605 is about .
Check Your Progress Estimate each percent.
a. 26% of 122 b. 40% of 1,207
7–8 Estimating with Percents
MAIN IDEA
• Estimate the percent of a number.
KEY CONCEPTS
Percent-Fraction Equivalents
20% = 1 _ 5
25% = 1 _ 4
30% = 3 _ 10
33 1 _ 3 % = 1 _
3
40% = 2 _ 5
50% = 1 _ 2
60% = 3 _ 5
66 2 _ 3 % = 2 _
3
70% = 7 _ 10
75% = 3 _ 4
80% = 4 _ 5
90% = 9 _ 10
100% = 1
0168-0195 CH07-881040.indd 1880168-0195 CH07-881040.indd 188 12/3/07 4:41:08 PM12/3/07 4:41:08 PM

7–8
Math Connects, Course 1 189
Cop
yrig
ht ©
Gle
ncoe
/McG
raw
-Hill
, a d
ivis
ion
of T
he M
cGra
w-H
ill C
ompa
nies
, Inc
.EXAMPLE
MONEY A CD that originally cost $11.90 is on sale for 30% off. If you have $7, would you have enough money to buy the CD?
To determine whether you have enough money to buy the CD,
you need to estimate 70% of .
METHOD 1 Use a proportion.
70% ≈ 75% or and $11.90 ≈
3 _ 4 = x _
12 Write the proportion.
3 _ 4 =
x _ 12
× 3
× 3
Since 4 × 3 = 12, multiply 3 by 3.
x =
METHOD 2 Use mental math.
70% = and $11.90 ≈
7 _ 10
of 12 is 8.4 or .
Since is more than $7, you would not have
enough money.
Check Your Progress MONEY A poster that originally cost $14.90 is on sale for 40% off. If you have $10, would you have enough to buy the poster?
HOMEWORKASSIGNMENTPage(s):
Exercises:
0168-0195 CH07-881040.indd 1890168-0195 CH07-881040.indd 189 12/3/07 4:41:08 PM12/3/07 4:41:08 PM

7–8
190 Math Connects, Course 1
Copyright ©
Glencoe/M
cGraw
-Hill, a division of T
he McG
raw-H
ill Com
panies, Inc.EXAMPLE
TEST EXAMPLE Claire Favorite City
Percent of Students
Los Angeles 23%
New York City 26%
Miami 33%
Boston 18%
surveyed her classmates about their favorite vacation city in the United States. Predict the number of students out of 234 who would prefer New York City.
A 20 C 110
B 60 D 240
Read the Item
You need to estimate the number of students out of 234 who would prefer New York City. 26% of the students chose New York City.
Solve the Item
26% is about 25% or . Round 234 to .
1 _ 4 of 240 is .
So, about would prefer New York City.
The answer is .
Check Your Progress Type of Restaurant
Percent of Students
Fast Food 8
Italian 12
Asian 33
Mexican 23
Steakhouse 24
MULTIPLE CHOICE Monica surveyed her basketball team about their favorite type of restaurant. Predict the number of students out of 318 who would prefer an Italian restaurant.
F 32 H 120
G 50 J 200
0168-0195 CH07-881040.indd 1900168-0195 CH07-881040.indd 190 12/3/07 4:41:09 PM12/3/07 4:41:09 PM

Math Connects, Course 1 191
Cop
yrig
ht ©
Gle
ncoe
/McG
raw
-Hill
, a d
ivis
ion
of T
he M
cGra
w-H
ill C
ompa
nies
, Inc
.
BRINGING IT ALL TOGETHER
STUDY GUIDE
® VOCABULARYPUZZLEMAKER
BUILD YOUR VOCABULARY
Use your Chapter 7 Foldable to help you study for your chapter test.
To make a crossword puzzle, word search, or jumble puzzle of the vocabulary words in Chapter 7, go to:
glencoe.com
You can use your completed Vocabulary Builder (pages 169–170) to help you solve the puzzle.
7-1
Percents and Fractions
Match each percent to the equivalent fraction in simplest form.
1. 75% 2. 82% a. 41 _ 50
b. 11 _ 20
c. 3 _ 4
d. 2 _ 5 e. 6 _
25 3. 24% 4. 55%
5. SURVEYS Felicia surveyed her class about their favorite kind of movies. Two fi fths of the students said they liked comedies best. Write this fraction as a percent.
7-2
Circle Graphs
Complete each sentence.
6. A circle graph is used to
.
7. The percentages of the sections of a circle graph always add
up to .
8. In a circle graph, you can identify the greatest and least values
of a set of data by .
9. The interior of the circle graph represents a .
C H A P T E R
7
0168-0195 CH07-881040.indd 1910168-0195 CH07-881040.indd 191 12/3/07 4:41:09 PM12/3/07 4:41:09 PM
192 Math Connects, Course 1
Copyright ©
Glencoe/M
cGraw
-Hill, a division of T
he McG
raw-H
ill Com
panies, Inc.
Chapter 7 BRINGING IT ALL TOGETHER
7-3
Percents and Decimals
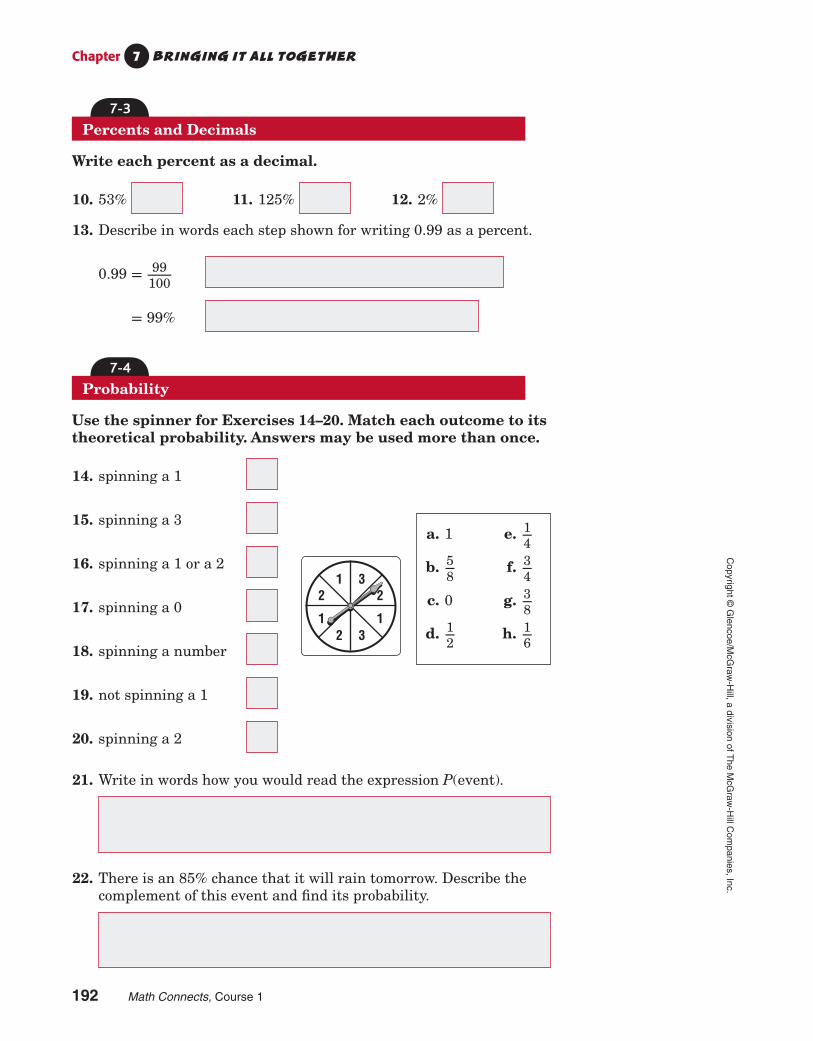
Write each percent as a decimal.
10. 53% 11. 125% 12. 2%
13. Describe in words each step shown for writing 0.99 as a percent.
0.99 = 99 _ 100
= 99%
7-4
Probability
Use the spinner for Exercises 14–20. Match each outcome to its theoretical probability. Answers may be used more than once.
14. spinning a 1
15. spinning a 3 a. 1 e. 1 _
4
b. 5 _ 8 f. 3 _
4
c. 0 g. 3 _ 8
d. 1 _ 2 h. 1 _
6
16. spinning a 1 or a 2
17. spinning a 0
18. spinning a number
19. not spinning a 1
20. spinning a 2
21. Write in words how you would read the expression P(event).
22. There is an 85% chance that it will rain tomorrow. Describe the complement of this event and fi nd its probability.
0168-0195 CH07-881040.indd 1920168-0195 CH07-881040.indd 192 12/3/07 4:41:09 PM12/3/07 4:41:09 PM

Math Connects, Course 1 193
Cop
yrig
ht ©
Gle
ncoe
/McG
raw
-Hill
, a d
ivis
ion
of T
he M
cGra
w-H
ill C
ompa
nies
, Inc
.
Chapter 7 BRINGING IT ALL TOGETHER
7-5
Sample Spaces
Jessica is getting dressed for school. She can choose pink pants or red pants, a white shirt or a cream shirt, and tan shoes or black shoes.
23. Use a tree diagram to fi nd how many possible outfi ts she can wear.
24. What is the probability she will choose pink pants, a white shirt, and tan shoes?
7-6
Making Predictions
25. Write the three characteristics of a good sample.
26. The table shows the results of a survey. Predict how many students out of 364 would prefer to have a talent show for a school assembly.
School Assembly
Science Fair 6
Poetry Reading 5
Talent Show 17
0168-0195 CH07-881040.indd 1930168-0195 CH07-881040.indd 193 12/3/07 4:41:10 PM12/3/07 4:41:10 PM

194 Math Connects, Course 1
Copyright ©
Glencoe/M
cGraw
-Hill, a division of T
he McG
raw-H
ill Com
panies, Inc.
Chapter 7 BRINGING IT ALL TOGETHER
7-7
Problem-Solving Investigation: Solve a Simpler Problem
Solve. Use the solve a simpler problem strategy.
27. AMUSEMENT PARKS An amusement park offers a discount of 20% to students. Admission tickets are $40. About how much money would students pay with the discount?
28. CARS On average, 15 cars pass over Wilson Bridge every hour. At this rate, how many cars pass over Wilson Bridge in one week?
7-8
Estimating with Percents
Write the fraction for each percent.
29. 20% = 30. 30% = 31. 50% =
32. 100% = 33. 33 1 _ 3 % =
34. 66 2 _
3 % =
Estimate each percent.
35. 23% of 90
36. 47% of 18
37. 61% of 29
0168-0195 CH07-881040.indd 1940168-0195 CH07-881040.indd 194 12/3/07 4:41:10 PM12/3/07 4:41:10 PM

Math Connects, Course 1 195
Cop
yrig
ht ©
Gle
ncoe
/McG
raw
-Hill
, a d
ivis
ion
of T
he M
cGra
w-H
ill C
ompa
nies
, Inc
.
Checklist
ARE YOU READY FOR THE CHAPTER TEST?
Student Signature Parent/Guardian Signature
Teacher Signature
C H A P T E R
7
Visit glencoe.com to access your textbook, more examples, self-check quizzes, and practice tests to help you study the concepts in Chapter 7.
Check the one that applies. Suggestions to help you study are given with each item.
I completed the review of all or most lessons without using my notes or asking for help.
• You are probably ready for the Chapter Test.
• You may want to take the Chapter 7 Practice Test on page 411 of your textbook as a fi nal check.
I used my Foldables or Study Notebook to complete the review of all or most lessons.
• You should complete the Chapter 7 Study Guide and Review on pages 406–410 of your textbook.
• If you are unsure of any concepts or skills, refer back to the specifi c lesson(s).
• You may want to take the Chapter 7 Practice Test on page 411 of your textbook.
I asked for help from someone else to complete the review of all or most lessons.
• You should review the examples and concepts in your Study Notebook and Chapter 7 Foldables.
• Then complete the Chapter 7 Study Guide and Review on pages 406–410 of your textbook.
• If you are unsure of any concepts or skills, refer back to the specifi c lesson(s).
• You may also want to take the Chapter 7 Practice Test on page 411 of your textbook.
0168-0195 CH07-881040.indd 1950168-0195 CH07-881040.indd 195 12/3/07 4:41:10 PM12/3/07 4:41:10 PM
Related Documents