2014 EDITION UGU DISTRICT PROFILE CENSUS DATA 2011

Welcome message from author
This document is posted to help you gain knowledge. Please leave a comment to let me know what you think about it! Share it to your friends and learn new things together.
Transcript

2014 EDITION
UGU DISTRICT PROFILE
CENSUS DATA 2011

2014 EDITION
CONTENT
General Orientation
• Vision of Ugu DM• Ugu DM Family• Local Houses of TA leaders • % Traditional Areas in proportion to District Municipal Areas (2011)• Political Party Rulling
• Voting Distribution Per LM (2014)
Demography of each District and its LM’s Social Services
Economy
• General Valuation Roll• (Reference is still to be included)
Infrastructure/Municipal Services
Outline of Development Priorities
Directory of Municipalities and House of Traditional Leaders

“A place where everyone benefits equally from socio-economic opportunities and services”
Ugu’s Mission
“To create an enabling environment for social and economic development resulting in the provision of quality drinking water and access to decent sanitation by ensuring
community participation and co-ordination of the public and private sector”
VISION
DC21

GENERAL ORIENTATION
2014 EDITION

2014 EDITION
DISTRICT CODE DISTRICT NAME AREA KM2 % AREA KM2
DC21 Ugu 5046 5.4DC22 Umgungundlovu 8942 9.6DC23 Uthukela 11329 12.1DC24 Umzinyathi 8079 8.7DC25 Amajuba 6910 7.4DC26 Zululand 15305 16.4DC27 Umkhanyakude 12818 13.7DC28 Uthungulu 8215 8.8DC29 Ilembe 3260 3.5DC43 Harry Gwala 11128 11.9ETHEKWINI Ethekwini Metropolitan Municipality 2292 2.5Total 93324 100
DC21
DC22
DC23
DC24
DC25
DC26
DC27
DC28
DC29
DC43
ETHEKWINI
0
2
4
6
8
10
12
14
16
18
% o
f Are
a pe
r Dis
tric
t

UGU DM
2014 EDITION
GENERAL ORIENTATION
Harry GwalaUgu

UGUDISTRICT FAMILY

2014 EDITION
Source: cogta website

% Traditional Aeas in proportion to District Municipal Areas (2011)
2014 EDITION
65.3 %
34.7 %
Ilembe District Municipality
District Area
Traditional Authority Area

2014 EDITION
Voting Distribution Per LM (2014)
!(
!(
!(
!(!(
!(
!(
!(!(
!(
!(
!(
!(
!(!(!(
!(
!(
!(
!(
!(
!(
!(
Harry GwalaDistrict Municipality
UguDistrict Municipality
Uvongo
Umzinto
Marburg
uMzumbe
Shad Bay
Mtwalume
Ramsgate
Gamalakhe
Merlewood
San Lameer
Southbroom
Park Rynie
Port Edward
Umdoni Beach
Splash Rocks
Banana Beach
Orange RocksBeacon Rocks
Marina Beach
Kellerman Rocks
North Sands Bluff
Umzumbe
Vulamehlo
UMuziwabantu
Ezinqoleni
Umdoni
Hibiscus Coast
EASTERN CAPE
0 10 20 30 405Kilometers
¶Data Sources-Department of Co-operative Governance and Traditional Affairs-Stats SA
Legend
Political Party with the highest votes (2014)
Ex TLC's
!( Main Towns
ANC
0.00%
10.00%
20.00%
30.00%
40.00%
50.00%
60.00%
70.00%
80.00%
90.00%
Vulamehlo Umdoni Umzumbe UMuziwabantu Ezinqoleni Hibiscus Coast
KZN211 KZN212 KZN213 KZN214 KZN215 KZN216
Perc
enag
e of
Vot
es (%
)
ANC
DA
EFF

DEMOGRAPHY
2014 EDITION

2014 EDITION
census data 2011 IDP 2014/15
The analysis of the population demographics of Ugu District Municipality is based on the Census 2011 (statistics South Africa). The population of Ezinqoleni as per the Statistics South Africa 2011 (Stats SA11) is approximately 722 484 people. The municipality experienced a positive growth rate of 2.6 % population having increased from 704 030 to 722 484.

% of Population Distribution Per LM (1996-2011)
2014 EDITION
!(
!(
!(
!(!(
!(
!(
!(!(
!(
!(
!(
!(
!(!(!(
!(
!(
!(
!(
!(
!(
!(
Harry GwalaDistrict Municipality
UguDistrict Municipality
Uvongo
Marburg
uMzumbe
Shad Bay
Mtwalume
Ramsgate
Gamalakhe
Merlewood
San LameerSouthbroom
Park Rynie
Port Edward
Umdoni Beach
Splash Rocks
Banana Beach
Orange RocksBeacon Rocks
Marina Beach
Shelly Beach
Kellerman Rocks
North Sands Bluff
Umzumbe
Vulamehlo
UMuziwabantu
Ezinqoleni
Hibiscus Coast
Umdoni
EASTERN CAPE
0 10 20 30 405Kilometers
¶Data Sources-Department of Co-operative Governance and Traditional Affairs-Stats SA
Legend
% Population 2011
16
17 - 23
24 - 38
Ex TLC's
Main Towns
0.00
5.00
10.00
15.00
20.00
25.00
30.00
35.00
40.00
Vulamehlo Umdoni Umzumbe UMuziwabantu Ezinqoleni Hibiscus Coast
KZN211 KZN212 KZN213 KZN214 KZN215 KZN216
Popu
latio
n Pe
rcen
tage
(%)
Local Municipality
Population Distribution
% Population 1996
% Population 2001
% Population 2011

Race Composition
2014 EDITION
UMDONI
VULAMEHLO
99.04%
0.14% 0.60% 0.19%
0.02%
Black African
Coloured
Indian or Asian
White
Other
70.62%
1023%
18.13%
9.90%0.12%
Black African
Coloured
Indian or Asian
White
Other

2014 EDITION
UMUZIWABANTU
UMZUMBE
99.77%
0.09%
0.05%0.06%
0.03%
Black African
Coloured
Indian or Asian
White
Other
97.38%
1.61%
0.44% 0.52%
0.05%
Black African
Coloured
Indian or Asian
White
Other

98.84%
0.16%
0.26% 0.71%
0.03%
Black African
Coloured
Indian or Asian
White
Other
81.66%
1.31% 5.50%
11.45%
0.08%
Black African
Coloured
Indian or Asian
White
Other
EZINQOLENI
HIBISCUS COAST

2014 EDITION
% Distribution of Population Per LM (2011)
!(
!(
!(
!(!(
!(
!(
!(!(
!(
!(
!(
!(
!(!(!(
!(
!(
!(
!(
!(
!(
!(
Harry GwalaDistrict Municipality
UguDistrict Municipality
Uvongo
Umzinto
Marburg
uMzumbe
Shad Bay
Mtwalume
Ramsgate
Gamalakhe
Merlewood
San LameerSouthbroom
Park Rynie
Port Edward
Umdoni Beach
Splash Rocks
Banana Beach
Orange RocksBeacon Rocks
Marina Beach
Kellerman Rocks
North Sands Bluff
Umzumbe
Vulamehlo
UMuziwabantu
Ezinqoleni
Hibiscus Coast
Umdoni
EASTERN CAPE
0 10 20 30 405Kilometers
¶Data Sources-Department of Co-operative Governance and Traditional Affairs-Stats SA
(13%)
(11%)
(11%)
(22%)
(7%)(35%)
Legend
!( Placenames
% Population 2011
Ex TLC's
7
8 - 11
11
12 - 13
14 - 22
23 - 35
0.00
5.00
10.00
15.00
20.00
25.00
30.00
35.00
40.00
Vulamehlo Umdoni Umzumbe UMuziwabantu Ezinqoleni Hibiscus Coast
KZN211 KZN212 KZN213 KZN214 KZN215 KZN216
Popu
latio
n Pe
rcen
tage
(%)
Local Municipality
Population Distribution
% Population 1996
% Population 2001
% Population 2011
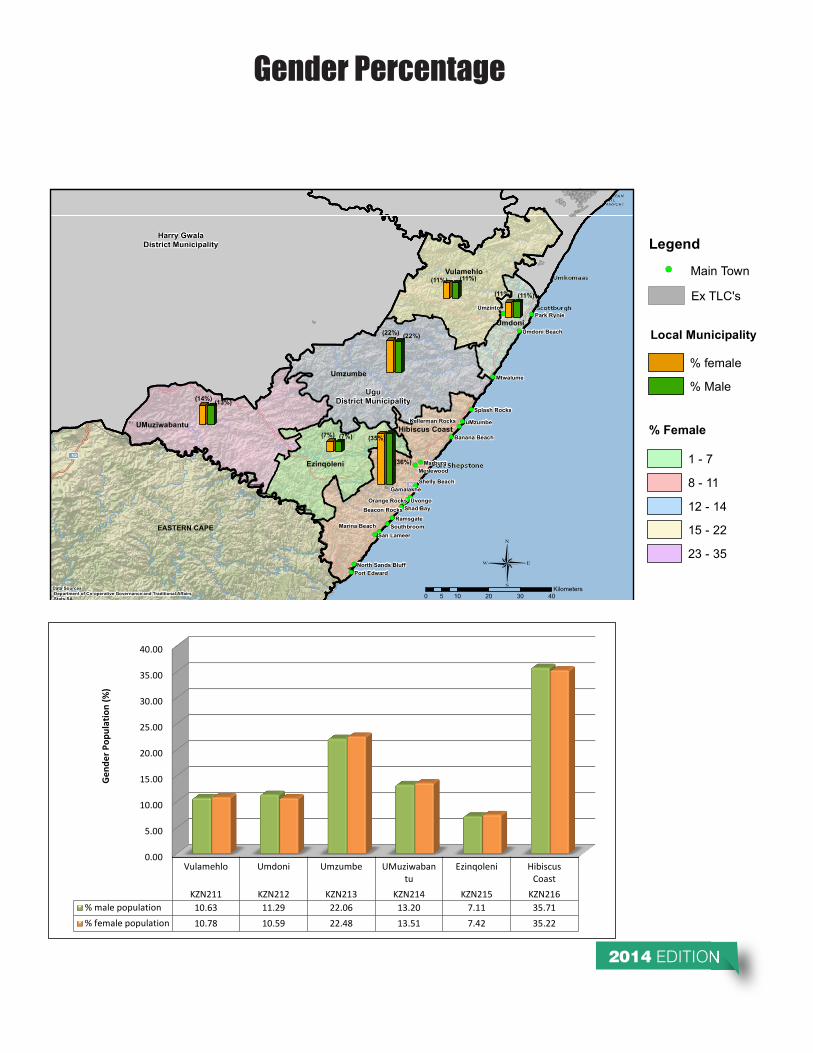
Gender Percentage
2014 EDITION
!(
!(
!(
!(!(
!(
!(
!(!(
!(
!(
!(
!(
!(!(!(
!(
!(
!(
!(
!(
!(
!(
Harry GwalaDistrict Municipality
UguDistrict Municipality
Uvongo
Umzinto
Marburg
uMzumbe
Shad Bay
Mtwalume
Ramsgate
Gamalakhe
Merlewood
San LameerSouthbroom
Park Rynie
Port Edward
Umdoni Beach
Splash Rocks
Banana Beach
Orange RocksBeacon Rocks
Marina Beach
Shelly Beach
Kellerman Rocks
North Sands Bluff
Umzumbe
Vulamehlo
UMuziwabantu
Ezinqoleni
Hibiscus Coast
Umdoni
EASTERN CAPE
0 10 20 30 405Kilometers
¶Data Sources-Department of Co-operative Governance and Traditional Affairs-Stats SA
(11%) (11%)
(11%) (11%)
(22%) (22%)
(14%) (13%)
(7%) (7%) (35%)
(36%)
Legend
% Female
Local Municipality
% female
% Male
!( Main Town
Ex TLC's
1 - 7
8 - 11
12 - 14
15 - 22
23 - 35
0.00
5.00
10.00
15.00
20.00
25.00
30.00
35.00
40.00
Vulamehlo Umdoni Umzumbe UMuziwabantu
Ezinqoleni HibiscusCoast
KZN211 KZN212 KZN213 KZN214 KZN215 KZN216% male population 10.63 11.29 22.06 13.20 7.11 35.71% female population 10.78 10.59 22.48 13.51 7.42 35.22
Gen
der P
opul
atio
n (%
)

Gender & Age Pyramid of Ugu
2014 EDITION
8 000 000.00 6 000 000.00 4 000 000.00 2 000 000.00 0.00 2 000 000.00 4 000 000.00 6 000 000.00 8 000 000.0010 000 000.00
0 to 4
5 to 9
10 to 14
15 to 19
20 to 24
25 to 29
30 to 34
35 to 39
40 to 44
45 to 49
50 to 54
55 to 59
60 to 64
65 to 69
70 to 74
75 to 79
80+
Axis
Titl
e
Females
Males

SOCIALSERVICES

2014 EDITION
!(
!(
!(
!(
!(
!(
!(
!(!(
!(
!(
!(
!(
!(!(
!(
!(
!(
!(
!(
!(
!.
!(
!(
!.
!.
!.
!.
!.
!.
!.
!.
Harry Gwala District Municipality
Umgungundlovu District Municipality
Umzumbe
Vulamehlo
UMuziwabantu
Ezinqoleni
Hibiscus Coast
Umdoni
Eastern Cape
¶Data Source: KZN Department of Education KZN Department of Transport Demarcation Board Stats SA 0 9 18 274.5
Kilometers
Road Surface Types
Legend!. Ex TLC'S
!( Main Towns
Road Surface Type
Blacktop
Concrete
Gravel
Earth
District Municipality
Local Municipality
Provincial Boundary


2014 EDITION
NoSchooling2011
NoSchooling2001
NoSchooling1996
SomePrimary2011
SomePrimary2001
SomePrimary1996
CompletePrimary 2011
CompletePrimary 2001
CompletePrimary 1996
SomeSecondary2011
SomeSecondary2001
SomeSecondary1996 Grade12_2011 Grade12_2001 Grade12_1996 Higher 2011 Higher 2001 Higher 1996 Unspecified
2011Unspecified
2001Unspecified
1996NotApplicable
2011NotApplicable
2001NotApplicable
1996KZN211 Vulamehlo 10347 19096 28580 23376 28174 31390 4003 4911 5720 18621 15951 15536 9202 4674 2700 930 780 517 33 0 2020 10891 9376 13147KZN212 Umdoni 4895 9878 8695 17965 16758 13692 3673 3689 3129 21520 15673 13062 15801 8071 5982 4023 3039 2339 166 0 2235 10832 5268 5066KZN213 Umzumbe 15642 39467 44717 51455 72596 53046 8862 12700 10572 41293 36603 28966 18065 7912 4454 3103 2194 1024 66 0 2406 22490 22296 21646KZN214 UMuziwabantu 8812 17818 21066 34035 35476 27339 5842 6100 4972 23625 16134 11516 7681 3385 1904 2217 1464 804 71 0 2451 14273 11950 12051KZN215 Ezinqoleni 4297 11625 13083 17898 20263 14935 2908 3387 2770 13869 10290 7227 4543 2267 1184 1077 635 315 22 0 1821 7925 6308 6213KZN216 Hibiscus Coast 13647 34552 36134 61514 63330 49725 11869 13552 11487 72204 52408 41274 46789 24365 16244 17499 8804 7066 480 0 8693 32132 20813 20578
0
10
20
30
40
50
60
70
80
POPU
LATI
ON
PER
LOCA
L M
UN
ICIP
ALIT
YTh
ousa
nds
uGu District Municipality Education Levels 2011,2001,1996
!(
!(
!(
!(
!(
!(
!(
!(!(
!(
!(
!(
!(
!(!(
!(
!(
!(
!(
!(
!(
!.
!(
!(
!.
!.
!.
!.
!.
!.
!.
!.
Harry GwalaDistrict Municipality
UguDistrict Municipality
UmgungundlovuDistrict Municipality
Umzumbe
Vulamehlo
UMuziwabantu
EzinqoleniHibiscus Coast
Umdoni
EASTERN CAPE
¶Data Source: KZN Department of Education Demarcation Board Stats SA 0 8.5 17 25.54.25
Kilometers
LegendPlaceNames
!. Ex TLC'S
!( Main Towns
Education Levels
Local Municipality
District Municipality
No Schooling
Some Primary
Complete Primary
Some Secondary
Grade 12
Higher
Unspecified
Not Applicable
Provincial Boundary
Education Levels Per LM (2011)

2014 EDITION
NoSchooling2011
NoSchooling2001
NoSchooling1996
SomePrimary2011
SomePrimary2001
SomePrimary1996
CompletePrimary 2011
CompletePrimary 2001
CompletePrimary 1996
SomeSecondary2011
SomeSecondary2001
SomeSecondary1996 Grade12_2011 Grade12_2001 Grade12_1996 Higher 2011 Higher 2001 Higher 1996 Unspecified
2011Unspecified
2001Unspecified
1996NotApplicable
2011NotApplicable
2001NotApplicable
1996KZN211 Vulamehlo 10347 19096 28580 23376 28174 31390 4003 4911 5720 18621 15951 15536 9202 4674 2700 930 780 517 33 0 2020 10891 9376 13147KZN212 Umdoni 4895 9878 8695 17965 16758 13692 3673 3689 3129 21520 15673 13062 15801 8071 5982 4023 3039 2339 166 0 2235 10832 5268 5066KZN213 Umzumbe 15642 39467 44717 51455 72596 53046 8862 12700 10572 41293 36603 28966 18065 7912 4454 3103 2194 1024 66 0 2406 22490 22296 21646KZN214 UMuziwabantu 8812 17818 21066 34035 35476 27339 5842 6100 4972 23625 16134 11516 7681 3385 1904 2217 1464 804 71 0 2451 14273 11950 12051KZN215 Ezinqoleni 4297 11625 13083 17898 20263 14935 2908 3387 2770 13869 10290 7227 4543 2267 1184 1077 635 315 22 0 1821 7925 6308 6213KZN216 Hibiscus Coast 13647 34552 36134 61514 63330 49725 11869 13552 11487 72204 52408 41274 46789 24365 16244 17499 8804 7066 480 0 8693 32132 20813 20578
0
10
20
30
40
50
60
70
80
POPU
LATI
ON
PER
LOCA
L M
UN
ICIP
ALIT
YTh
ousa
nds
uGu District Municipality Education Levels 2011,2001,1996

Educational status
With regards to the educational levels in the Ugu District Municipality, the highest enrolment is at the primary and high school level accounting for 75% of the total population. The numbers for tertiary education and further education centres are still low but showing signs of improvement from previous years.Source : Ugu 2011 IDP 2014/15

2014 EDITION
Educational Level Per LM
!(
!(
!(
!(
!(
!(
!(
!(
!(
!(
!(
!(!(
!(
!(
!.
!(
!.
!.
!(
!.
!.
UthunguluDistrict Municipality
UmzinyathiDistrict Municipality
UmgungundlovuDistrict Municipality
EthekwiniDistrict Municipality ¶Data Source: KZN Department of Education
Demarcation Board Stats SA 0 7 14 213.5
Kilometers
LegendPlaceNamesHierachy D
!. Ex TLC'S
!( Main Towns
Education Levels
NoSchooling
SomePrimary
CompletePrimary
SomeSecondary
Grade 12_Std10
Higher
Unspecified
NotApplicable
Local Municipality
District Municipality
Provincial_Boundary
Lesotho_Boundary

TOURISM
Source : Ugu 2011 IDP 2014/15
Municipal EntityThe municipal entity known as Ugu –South Coast Tourism Board (USCT) has been mandated to identify market gaps and needs, develop new tourist projects, attract new tourist (domestic and international) and strategically market the destination.
Since its formal inception there’s been in improving the distribution of tourism spend in the entire district, better improvement of the events that are hosted by the municipal areas outside our tourist hub.
Challenges range from lack of skills, lack of well package tourism products, lack of well packaged black economic empowerment transactions in the industry and failure to unlock public sector owned land for the tourism industry. Key factors impacting on the development of tourism in underdeveloped areas of Ugu are poor road access, ownership of land, and environmental degradation across the district.
The tourism investment opportunities in the area consist of: • The development of a conference centre that can accommodate between 250
to1000 people, • The development of the Hibberdene Small Craft Harbour • Redevelopment of Margate Airport infrastructure to accommodate low cost carriers, • Redevelopment of the Furniture Industry in the District • Hotels and Beachfront Leisure facilities, • Development of Tourist Packages for international markets, • African / Asian Cuisine Outlets.

2014 EDITION

KEY CHALLENGESThere are several challenges in the district with regard to environment sustainability – most notably the sheer lack of clear regulations, standards, supporting policy, incentives and appropriate research and development existing in the district currently.
Further challenges relate to accessing financing capital and institutional infrastructural support. All industries should be assessing their current activities in terms of green principles and also investigating new opportunities that are presented through adopting a green approach.
There is a need to have a “greening” strategy for the district that addresses both urban and rural development challenges. In particular municipalities need to develop green strategies for service delivery and support sustainable live-lihoods that address the needs of different human settlement typologies. With this in mind, three strategic objectives have been identified which are:
• To advance alternative energy generation capacity, • To manage the pressures of biodiversity and environmental quality• To ensure efficient environmental monitoring,
regulation and disaster management.
Source : Ugu 2011 IDP 2014/15

ECONOMY

2014 EDITION
Poverty Index Per LM (2011)
!(
!(
!(
!(
!(
!(
!(
!( !(
!(
!(
!(
!(!(
!(
!(!(
!(
!(
!(!(
!(
!(
!(
!(
!(
!(
!(
!(
!(
!(
GAMALAKHE - A
INDUDUDU - A
MNAMFU - A
MOGUNTIA - A
Kelso
Bazley
Uvongo
Sezela
Munster
Umzinto
Margate
Marburg
Harding
UmzumbeKozameni
Ramsgate
Sea Park
Mtwalume
SouthportKwaMshiwa
Southbroom
Umtentweni
Park Rynie
Scottburgh
Hibberdene
Pennington
Palm Beach
Leisure Bay
Port Edward
Shelly Beach
Sunwich Port
Marina Beach
Port Shepstone
Glenmore Beach
Thistles Settlement
EASTERN CAPE
¶ Data Sources:- Department of Co-operative Goverance and Traditional Affairs- Stats SA
0 8 16 24 324Kilometers
VulamehloLocal Municipality
Harry GwalaDistrict Municipality
UMuziwabantuLocal Municipality
EzinqoleniLocal Municipality
UmzumbeLocal Municipality
UmdoniLocal Municipality
Hibiscus CoastLocal Municipality
UmgungundlovuDistrict Municipality EThekwini
Metropolatan Municipality
PEOPLE-CENTRED SUSTAINABLE CO-OPRATIVE GOVERNANCE WHICH FOCUSES ON EFFECTIVE SERVICE DELIVERY RESPONSIVE TO THE NEEDS OF THE COMMUNITIES
LegendPopulation Density
402- 8742
8743 - 13677
13678 - 23170
23171 - 34354
34355 - 48704
LegendPoverty Index (2011)
0 - 11
12 - 24
25 - 36
37 - 50
51 - 76
Legend % Employment (1996)
0 - 113
114 - 284
285 - 428
429 - 596
597 - 864
LegendUnemployment Status
LegendEmployment Status
Legend% Employment (2011)
288 - 477
478 - 666
667 - 947
948 - 2062
2063 - 3900
Legend% Employment (2001)
145 - 389
390 - 643
644 - 1097
1098 - 1526
1527 - 4687
1996
2001
2011
1996
2001
2011
0 - 151
152 - 410
411 - 594
595 - 757
758 - 955
81 - 462
463 - 963
964 - 1424
1425 - 2553
2554 - 4182
0 - 203
204 - 386
387 - 749
750 - 1019
1020 - 1529
Legend% Unemployment (1996)
Legend% Unemployment (2001)
Legend% Unemployment (2011)

Source : Ugu 2011 IDP 2014/15
The spatial pattern of the Ugu District Municipality resembles a “T” shape where areas along the coast have a well developed infrastructure and thus a reasonable economic growth, whereas the hinterland is characterized by the poor infrastructural provision and high unemployment levels.
Ugu has some of the best examples of unspoiled sub-tropical bush-land and forest, as well as cultivated land and small rural villages, contrasted by bustling urban centres and major industrial complexes.
Ugu District Municipality is a favourite tourist destination, and includes the well established coastal towns of Port Shepstone, Pennington, Margate and Hibberdene. The modern N2 highway runs through Ugu parallel to the sea, passing Port Shepstone, the seat of the District Municipality.
The key sectors of the Ugu District economy are Agriculture, Manufacturing, Community Service Construction, Trade &Tourism, the Informal Sector, and Transport. Port Shepstone is the main commercial centre and major source of employment. There has been a gradual change in rural settlement patterns, from a much dispersed scattered settlement pattern to a concentration of residential sites around the access roads.
The change has also partly been encouraged by a decline in agricultural activities over the last 100 years combined with a growing dependence on wage employment (dominated by migrant employment on the mines) and state grants


2014 EDITION
Employment Status Per LM (1996- 2011)
!(
!(
!(
!(
!(
!(
!(
!( !(
!(
!(
!(
!(!(
!(
!(!(
!(
!(
!(!(
!(
!(
!(
!(
!(
!(
!(
!(
!(
!(
GAMALAKHE - A
INDUDUDU - A
MNAMFU - A
MOGUNTIA - A
Kelso
Bazley
Uvongo
Sezela
Munster
Umzinto
Margate
Marburg
Harding
UmzumbeKozameni
Ramsgate
Sea Park
Mtwalume
SouthportKwaMshiwa
Southbroom
Umtentweni
Park Rynie
Scottburgh
Hibberdene
Pennington
Palm Beach
Leisure Bay
Port Edward
Shelly Beach
Sunwich Port
Marina Beach
Port Shepstone
Glenmore Beach
Thistles Settlement
EASTERN CAPE
¶ Data Sources:- Department of Co-operative Goverance and Traditional Affairs- Stats SA
0 8 16 24 324Kilometers
VulamehloLocal Municipality
Harry GwalaDistrict Municipality
UMuziwabantuLocal Municipality
EzinqoleniLocal Municipality
UmzumbeLocal Municipality
UmdoniLocal Municipality
Hibiscus CoastLocal Municipality
UmgungundlovuDistrict Municipality EThekwini
Metropolatan Municipality
PEOPLE-CENTRED SUSTAINABLE CO-OPRATIVE GOVERNANCE WHICH FOCUSES ON EFFECTIVE SERVICE DELIVERY RESPONSIVE TO THE NEEDS OF THE COMMUNITIES
LegendPopulation Density
402- 8742
8743 - 13677
13678 - 23170
23171 - 34354
34355 - 48704
LegendPoverty Index (2011)
0 - 11
12 - 24
25 - 36
37 - 50
51 - 76
Legend % Employment (1996)
0 - 113
114 - 284
285 - 428
429 - 596
597 - 864
LegendUnemployment Status
LegendEmployment Status
Legend% Employment (2011)
288 - 477
478 - 666
667 - 947
948 - 2062
2063 - 3900
Legend% Employment (2001)
145 - 389
390 - 643
644 - 1097
1098 - 1526
1527 - 4687
1996
2001
2011
1996
2001
2011
0 - 151
152 - 410
411 - 594
595 - 757
758 - 955
81 - 462
463 - 963
964 - 1424
1425 - 2553
2554 - 4182
0 - 203
204 - 386
387 - 749
750 - 1019
1020 - 1529
Legend% Unemployment (1996)
Legend% Unemployment (2001)
Legend% Unemployment (2011)
KZN213:Umzumbe
KZN214:UMuziwabant
u
KZN215:Ezingoleni
KZN216:Hibiscus Coast
KZN211:Vulamehlo
KZN212:Umdoni
Employed 1996 7993 5813 3803 47388 6447 13509Employed 2001 9544 7975 4602 44662 5664 13508Employed 2011 12630 11128 5876 64194 5894 16698
010000200003000040000500006000070000
Num
ber o
f peo
ple
Employment

2014 EDITION
Unemployment Status Per LM (1996- 2011)
!(
!(
!(
!(
!(
!(
!(
!( !(
!(
!(
!(
!(!(
!(
!(!(
!(
!(
!(!(
!(
!(
!(
!(
!(
!(
!(
!(
!(
!(
GAMALAKHE - A
INDUDUDU - A
MNAMFU - A
MOGUNTIA - A
Kelso
Bazley
Uvongo
Sezela
Munster
Umzinto
Margate
Marburg
Harding
UmzumbeKozameni
Ramsgate
Sea Park
Mtwalume
SouthportKwaMshiwa
Southbroom
Umtentweni
Park Rynie
Scottburgh
Hibberdene
Pennington
Palm Beach
Leisure Bay
Port Edward
Shelly Beach
Sunwich Port
Marina Beach
Port Shepstone
Glenmore Beach
Thistles Settlement
EASTERN CAPE
¶ Data Sources:- Department of Co-operative Goverance and Traditional Affairs- Stats SA
0 8 16 24 324Kilometers
VulamehloLocal Municipality
Harry GwalaDistrict Municipality
UMuziwabantuLocal Municipality
EzinqoleniLocal Municipality
UmzumbeLocal Municipality
UmdoniLocal Municipality
Hibiscus CoastLocal Municipality
UmgungundlovuDistrict Municipality EThekwini
Metropolatan Municipality
PEOPLE-CENTRED SUSTAINABLE CO-OPRATIVE GOVERNANCE WHICH FOCUSES ON EFFECTIVE SERVICE DELIVERY RESPONSIVE TO THE NEEDS OF THE COMMUNITIES
LegendPopulation Density
402- 8742
8743 - 13677
13678 - 23170
23171 - 34354
34355 - 48704
LegendPoverty Index (2011)
0 - 11
12 - 24
25 - 36
37 - 50
51 - 76
Legend % Employment (1996)
0 - 113
114 - 284
285 - 428
429 - 596
597 - 864
LegendUnemployment Status
LegendEmployment Status
Legend% Employment (2011)
288 - 477
478 - 666
667 - 947
948 - 2062
2063 - 3900
Legend% Employment (2001)
145 - 389
390 - 643
644 - 1097
1098 - 1526
1527 - 4687
1996
2001
2011
1996
2001
2011
0 - 151
152 - 410
411 - 594
595 - 757
758 - 955
81 - 462
463 - 963
964 - 1424
1425 - 2553
2554 - 4182
0 - 203
204 - 386
387 - 749
750 - 1019
1020 - 1529
Legend% Unemployment (1996)
Legend% Unemployment (2001)
Legend% Unemployment (2011)
KZN213:Umzumbe
KZN214:UMuziwaban
tu
KZN215:Ezingoleni
KZN216:Hibiscus
Coast
KZN211:Vulamehlo
KZN212:Umdoni
Unemployed 1996 17897 6426 5140 18287 9454 4728Unemployed 2001 24489 9547 7345 32044 11024 9815Unemployed 2011 13604 5489 4185 25003 6551 8337
05000
100001500020000250003000035000
Num
ber o
f peo
ple
Unemployment

2014 EDITION
Index of Multiple Deprivation: Poverty Headcount 2011
in relation to War Room Location and Functionality
'
'
'
''
'
'
'
' '
'
'
'
''
''
'
'
'
'
'
'
'
'
'
' '
'
'
'
'
'
'
'
'
'
'
'
''
'
'
'
'
'
''
'
'
'
'
'
'
'
'
'
'
'
'
'
'
'
'
'
'
'
' ''
'''
'
'
'
'
'
'
'
'
''
'
''
'''
'
'
'
'
'
'
'
'
'
'
'
'
'
'
'
''
'
'
'
''
'
'
''
'
'
'
'
'
'
'
'
'
'
'
'
''
'
'
'
'
'
''
'
'
'
'
'
'
'
'
''
'
'
'
'
'
'
'
'
'
'
'
'
'
!(
!(
!(
!(
!(
!(
!(
!( !(
!(
!(
!(
!(!(
!(
!(!(
!(
!(
!(!(
!(
!(
!(
!(
!(
!(
!(
!(
!(
!(
GAMALAKHE - A
INDUDUDU - A
MNAMFU - A
MOGUNTIA - A
Kelso
Bazley
Uvongo
Sezela
Munster
Umzinto
Margate
Marburg
Harding
UmzumbeKozameni
Ramsgate
Sea Park
Mtwalume
SouthportKwaMshiwa
Southbroom
Umtentweni
Park Rynie
Scottburgh
Hibberdene
Pennington
Palm Beach
Leisure Bay
Port Edward
Shelly Beach
Sunwich Port
Marina Beach
Port Shepstone
Glenmore Beach
Thistles Settlement
EASTERN CAPE
4
6
3
2
3
4
6
5
2
5
4
3
5
2
2
5
8
3
5
1
9
42
6
8
7
7
51
1
9
7
99
3
18
7
1
8
6
4
9
17
18
13
10
29
10
18
12
22
26
15
11
16
23
25
15
13
12
1721
14
24
14
20
¶ Data Sources:- Department of Co-operative Goverance and Traditional Affairs- Stats SA
0 8 16 24 324Kilometers
VulamehloLocal Municipality
Harry GwalaDistrict Municipality
UMuziwabantuLocal Municipality
EzinqoleniLocal Municipality
UmzumbeLocal Municipality
UmdoniLocal Municipality
Hibiscus CoastLocal Municipality
UmgungundlovuDistrict Municipality EThekwini
Metropolatan Municipality
PEOPLE-CENTRED SUSTAINABLE CO-OPRATIVE GOVERNANCE WHICH FOCUSES ON EFFECTIVE SERVICE DELIVERY RESPONSIVE TO THE NEEDS OF THE COMMUNITIES
LegendPopulation Density
402- 8742
8743 - 13677
13678 - 23170
23171 - 34354
34355 - 48704
LegendPoverty Index (2011)
0 - 11
12 - 24
25 - 36
37 - 50
51 - 76
Legend % Employment (1996)
0 - 113
114 - 284
285 - 428
429 - 596
597 - 864
LegendUnemployment Status
LegendEmployment Status
Legend% Employment (2011)
288 - 477
478 - 666
667 - 947
948 - 2062
2063 - 3900
Legend% Employment (2001)
145 - 389
390 - 643
644 - 1097
1098 - 1526
1527 - 4687
1996
2001
2011
1996
2001
2011
0 - 151
152 - 410
411 - 594
595 - 757
758 - 955
81 - 462
463 - 963
964 - 1424
1425 - 2553
2554 - 4182
0 - 203
204 - 386
387 - 749
750 - 1019
1020 - 1529
Legend% Unemployment (1996)
Legend% Unemployment (2001)
Legend% Unemployment (2011)

INFRASTRUCTURE
2014 EDITION

Source : Ugu 2011 IDP 2014/15

2014 EDITION
% Formal and Informal Housing Per LM (2011)
^̀
^̀
^̀
^̀
^̀
^̀
^̀
^̀
^̀
^̀ ^̀
^̀
^̀
^̀
^̀^̀
^̀
^̀^̀
^̀
^̀
^̀̂̀^̀
^̀
^̀
^̀^̀
^̀
^̀
^̀
EASTERN CAPE
Vulamehlo
Umdoni
Umzumbe
UMuziwabantu
Ezinqoleni
HibiscusCoast
Glenmore Beach
Marina Beach
Mtwalume
Palm Beach
Pennington
Sunwich Port
Umzumbe
Umzinto
Port Shepstone
Harding Hibberdene
Scottburgh
Park Rynie
Sezela
Sea ParkUmtentweni
Marburg
MargateUvongo
Ramsgate
Port Edward
Thistles SettlementKwaMshiwa
Kozameni
Bazley
Kelso
Leisure Bay
Munster
Shelly Beach
Southbroom
Southport
INDI
AN O
CEAN
0 7 14 21 283.5KilometersSource:
- Department of Co-operative Governance and Traditional Affairs
ETHEKWINI
UMGUNGUNDLOVUDM
HARRY GWALADM
% Formal and Informal Housing Per LM (2011)
Legend
Formal Housing (%)
^̀ Main Towns
Formal Housing
Informal Housing
160 - 560
560 - 939
939 - 1443
1443 - 2215
2215 - 3652
Vulamehlo Umdoni Umzumbe Umuziwabantu Ezinqoleni Hibiscus Coast
97
85
9795
98
93
3
15
35
2
7
% Formal & Informal Housing per LM (2011)Formal Informal

2014 EDITION
% Households With and Without Access to Piped Water Per LM (2011)
^̀
^̀
^̀
^̀
^̀
^̀
^̀
^̀
^̀
^̀ ^̀
^̀
^̀
^̀
^̀^̀
^̀
^̀^̀
^̀
^̀
^̀̂̀^̀
^̀
^̀
^̀^̀
^̀
^̀
^̀
EASTERN CAPE
Vulamehlo
Umdoni
Umzumbe
UMuziwabantu
Ezinqoleni
HibiscusCoast
Glenmore Beach
Marina Beach
Mtwalume
Palm Beach
Pennington
Sunwich Port
Umzumbe
Umzinto
Port Shepstone
Harding Hibberdene
Scottburgh
Park Rynie
Sezela
Sea ParkUmtentweni
Marburg
MargateUvongo
Ramsgate
Port Edward
Thistles SettlementKwaMshiwa
Kozameni
Bazley
Kelso
Leisure Bay
Munster
Shelly Beach
Southbroom
Southport
INDI
AN O
CEAN
0 7 14 21 283.5KilometersSource:
- Department of Co-operative Governance and Traditional Affairs
ETHEKWINI
UMGUNGUNDLOVUDM
HARRY GWALADM
% Households With and Without Access to Piped Water Per LM (2011)
Legend
No Access to Piped Water (%)
No Access
With Access
^̀ Main Towns
11 - 158
158 - 481
481 - 1238
1238 - 1847
1847 - 3172
0
10
20
30
40
50
60
70
80
90
100
14
95
9
4032
91
86
5
91
6068
9
% Households With and Without Access to Piped Water (2011)
% With Access % Without Access
0
5000
10000
15000
20000
25000
30000
Vulamehlo Umdoni Umzumbe Umuziwabantu Ezinqoleni Hibiscus Coast1996 545 6819 340 1137 346 199082001 311 5885 360 1134 248 161192011 903 9288 1782 2231 783 29226
Hous
ehol
ds
Households With Access to Piped Water (1996 - 2011)

2014 EDITION
% Households With and Without Access to Sanitation (2011)
^̀
^̀
^̀
^̀
^̀
^̀
^̀
^̀
^̀
^̀ ^̀
^̀
^̀
^̀
^̀^̀
^̀
^̀^̀
^̀
^̀
^̀̂̀^̀
^̀
^̀
^̀^̀
^̀
^̀
^̀
EASTERN CAPE
Vulamehlo
Umdoni
Umzumbe
UMuziwabantu
Ezinqoleni
HibiscusCoast
Glenmore Beach
Marina Beach
Mtwalume
Palm Beach
Pennington
Sunwich Port
Umzumbe
Umzinto
Port Shepstone
Harding Hibberdene
Scottburgh
Park Rynie
Sezela
Sea ParkUmtentweni
Marburg
MargateUvongo
Ramsgate
Port Edward
Thistles SettlementKwaMshiwa
Kozameni
Bazley
Kelso
Leisure Bay
Munster
Shelly Beach
Southbroom
Southport
INDI
AN O
CEAN
0 7 14 21 283.5KilometersSource:
- Department of Co-operative Governance and Traditional Affairs
ETHEKWINI
UMGUNGUNDLOVUDM
HARRY GWALADM
% Households With and Without Access to Sanitation (2011)
With Sanitation
Without Sanitation
Legend
Households with Access to Sanitation (%)
^̀ Main Towns
20 - 237
237 - 581
581 - 1349
1349 - 2204
2204 - 3365
0
5000
10000
15000
20000
25000
30000
35000
40000
Vulamehlo Umdoni Umzumbe Umuziwabantu Ezinqoleni Hibiscus Coast1996 881 7094 232 1340 501 206652001 3347 8586 5945 3678 1175 221192011 3626 11483 4100 5788 821 35292
Hous
ehol
ds
Households With Access to Sanitation (1996-2011)
0
10
20
30
40
50
60
70
80
90
100
7280
49
65
45
81
2820
51
35
55
19
% Households With and Without Access to Sanitation (2011)
Households With Access to Sanitation (%) Households Without Access to Sanitation (%)

2014 EDITION
% Households With and Wthout Access to Electricity (2011)
^̀
^̀
^̀
^̀
^̀
^̀
^̀
^̀
^̀
^̀ ^̀
^̀
^̀
^̀
^̀^̀
^̀
^̀^̀
^̀
^̀
^̀̂̀^̀
^̀
^̀
^̀^̀
^̀
^̀
^̀
EASTERN CAPE
Vulamehlo
Umdoni
Umzumbe
UMuziwabantu
Ezinqoleni
HibiscusCoast
Glenmore Beach
Marina Beach
Mtwalume
Palm Beach
Pennington
Sunwich Port
Umzumbe
Umzinto
Port Shepstone
Harding Hibberdene
Scottburgh
Park Rynie
Sezela
Sea ParkUmtentweni
Marburg
MargateUvongo
Ramsgate
Port Edward
Thistles SettlementKwaMshiwa
Kozameni
Bazley
Kelso
Leisure Bay
Munster
Shelly Beach
Southbroom
Southport
INDI
AN O
CEAN
0 7 14 21 283.5KilometersSource:
- Department of Co-operative Governance and Traditional Affairs
ETHEKWINI
UMGUNGUNDLOVUDM
HARRY GWALADM
% Households With and Without Access to Electricity (2011)
Legend
Households with Access to Electricity (%)
^̀ Main Towns
With Electricity
Without Electrcity
71 - 518
518 - 987
987 - 1461
1461 - 2174
2174 - 3271
0
20000
40000
60000
80000
100000
120000
140000
160000
Vulamehlo Umdoni Umzumbe Umuziwabantu Ezinqoleni Hibiscus Coast1996 5484 23371 7434 3698 3996 805712001 6835 27928 20133 9300 6832 929032011 13107 46675 37368 33463 20486 157409
Hous
ehol
ds
Households With Access to Electricity (1996-2011)
0
10
20
30
40
50
60
70
80
90
100
8389 87 90 88 91
1711 13 10 12 9
% Households With and Without Access to Electricity (2011)
% With Electricity % Without Electricity

2014 EDITION
% Households With and Without Access to Refuse Removal (2011)
^̀
^̀
^̀
^̀
^̀
^̀
^̀
^̀
^̀
^̀ ^̀
^̀
^̀
^̀
^̀^̀
^̀
^̀^̀
^̀
^̀
^̀̂̀^̀
^̀
^̀
^̀^̀
^̀
^̀
^̀
EASTERN CAPE
Vulamehlo
Umdoni
Umzumbe
UMuziwabantu
Ezinqoleni
HibiscusCoast
Glenmore Beach
Marina Beach
Mtwalume
Palm Beach
Pennington
Sunwich Port
Umzumbe
Umzinto
Port Shepstone
Harding Hibberdene
Scottburgh
Park Rynie
Sezela
Sea ParkUmtentweni
Marburg
MargateUvongo
Ramsgate
Port Edward
Thistles SettlementKwaMshiwa
Kozameni
Bazley
Kelso
Leisure Bay
Munster
Shelly Beach
Southbroom
Southport
INDI
AN O
CEAN
0 7 14 21 283.5KilometersSource:
- Department of Co-operative Governance and Traditional Affairs
ETHEKWINI
UMGUNGUNDLOVUDM
HARRY GWALADM
% Households With and Without Access to Refuse Removal (2011)
Legend
Households with Access to Refuse Removal (%)
^̀ Main Towns
With Refuse Removal
Without Refuse Removal
3 - 115
115 - 302
302 - 1148
1148 - 2025
2025 - 3000
Vulamehlo Umdoni Umzumbe Umuziwabantu Ezinqoleni Hibiscus Coast
11
96
8
80
35
92
89
6
92
20
65
8
% Households With and Without Access to Refuse Removal (2011)
% with Refuse Removal % without Refuse Removal

2014 EDITION
Value of MIG Funding Per LM(October 2009 - July 2014 )
!!
!!
!!
!!
!!!!
!!
!!
!!
!!
!!
!!
!!
!!
!!!!
!!
!!
!!
!!
!!
!!
!!
!!
!!!!
!!
!!
!!
!!
!!
!!
!!
!!!!
!!
!!
!!
!!
!!!!
!!
!!
!!
!!
!!
!!
!!
!!
!!
!!
!!
!!
!!
!!
!!
!!
!!
!!
!! !!
!!
!!!!
!!
!!
!!
!!!!
!!
!!
!!
!!
!!
!!
!!
!!
!!
!!
!!!!
!!
!!
!!
!!
!!
!!
!!
!!
!!
!! !!
!!!!
!!
!!
!!
!!!!
!!
!!
!!
!! !!
!!!!
!!
!!
!!
!!!! !!
!!
!!
!!
!! !!!!
!!!!
!!!!!!
!!!!
!!
!!
!!
!!
!!
!!
!!
!!
!!
!!
!!
!!
!!
!!
!!!!
!!
!!
!!
!!!!
!!
!!
!!
!!
!!
!!
!!
!! !!
!!
!!
!!!!
!!
!!
!!
!!
!!
!!
!! !!
!! !!!!
!!!!!!
!!!!!!
!!!!
!!
!!!! !!!! !!
!!
!!
!!
!!
!! !!!!!!
!!
!!
!!
!!
!!
!!!!
!!!!
!!
!!
!!
!!
!!!!
!!
!!
!!
!! !!!!!! !!
!!
!!
!!
!!
!!
!!
!!
!!
!!
!!
!!
!!
!!
!!
!! !!
!!!! !!
!!
!!
!!
!!!!
!!!!
!!
!!!!
!!
!!
!!
!!
!!
!!
!!
!!
!!!!
!!
!!
!!
!!
!!
!!!!
!!
!!!!!!
!!
!!
!!
!!
!!!!
!!!!
!!
!!
!!
!!
!!
!!
!!
!!
!!
!!
!!!!
!!
!!
!!
!!!!
!! !!
!!
!!
!!
!!
!!
!!
!!
!!
!!!!
!!
!!
!!!!
!!
!!
!!!!
!!
!!
!!
!!
!!
!!
!!!!
!!!!
!!
!! !!
!!
!!
!!
!!
!!
!!
!!
!!
!!!!
!!
!!
!!
!!
!!
!!
!!
!!
!!
!!
!!
!!
!!!!
!!
!!
!!
!!
!!!!
!!
!!
!!
!!
!!
!!
!!
!!
!!!!
!!
!!
!!
!!
!!
!!!!
!!
!!
!!
!!
!!
!!
!!!!
!!
!!
!!
!!
!!
!!
!!
!!
!!
!!!!
!!
!!!!
!!
!!
!!
!!
!!
!!
!!
!!
!! !!
!!
!!
!!
!!
!!
!!
!!
!!
!!
!!
!!
!!
!!
!!
!!!!
!!
!!
!!
!!
!!
!!
!! !!
!!
!!
!!
!!
!!
!!
!!
!!
!!
!!!! !!
!!
!!
!!
!!
!!
!!
!!
!!
!!
!!
!!
!!!!!!
!!
!!
!!
!!
!!
!!
!!
!!
!!
!!
!!
!!
!!
!!
!!
!! !!
!!
!!
!!
!!
!!
!!
!!
!!
!!
!!
!!
!! !!
!!
!!
!!
!!
!!
!!
!!
!!
!!
!!!!
!!
!!
!!
!!!!!!
!!
!!
!!
!!
!!
!!
!!
!!
!!
!!
!!
!!
!!
!!
!!
!! !!
!!
!!
!!
!!
!!
!!
!!
^̀
^̀
^̀
^̀
^̀
^̀
^̀
^̀
^̀
^̀ ^̀
^̀
^̀
^̀
^̀^̀
^̀
^̀^̀
^̀
^̀
^̀̂̀^̀
^̀
^̀
^̀^̀
^̀
^̀
^̀
EASTERN CAPE
Vulamehlo
Umdoni
Umzumbe
UMuziwabantu
Ezinqoleni
HibiscusCoast
Glenmore Beach
Marina Beach
Mtwalume
Palm Beach
Pennington
Sunwich Port
Umzumbe
Umzinto
Port Shepstone
Harding Hibberdene
Scottburgh
Park Rynie
Sezela
Sea ParkUmtentweni
Marburg
MargateUvongo
Ramsgate
Port Edward
Thistles SettlementKwaMshiwa
Kozameni
Bazley
Kelso
Leisure Bay
Munster
Shelly Beach
Southbroom
Southport
INDI
AN O
CEAN
0 7 14 21 283.5KilometersSource:
- Department of Co-operative Governance and Traditional Affairs
ETHEKWINI
UMGUNGUNDLOVUDM
HARRY GWALADM
Value of MIG Funding Per LM (October 2009 - July 2014)
!! MIG Projects
Legend
^̀ Main Towns
Value of MIG Funding Per LM (Rands)
Vulamehlo
Umzumbe
Umuziwabantu
Umdoni
Hibiscus Coast
Ezinqoleni
R 0.00
R 200.00
R 400.00
R 600.00
R 800.00
R 1 000.00
R 1 200.00
R 1 400.00
R 1 600.00
R 1 800.00
R 2 000.00
Vulamehlo Umdoni Umzumbe Umuziwabantu Ezinqoleni Hibiscus CoastValue of MIG Funding Per LM R 892 292 283.61 R 318 211 852.54 R 1 167 456 796.62 R 503 042 934.05 R 328 291 748.74 R 1 838 627 369.05
Mill
ions
Value of MIG Funding Per LM

Value of MIG Funding Per LM (October 2009 - July 2014)
!! MIG Projects
Legend
^̀ Main Towns
Value of MIG Funding Per LM (Rands)
Vulamehlo
Umzumbe
Umuziwabantu
Umdoni
Hibiscus Coast
Ezinqoleni
2014 EDITION
Value of MIG Funding Per Service Type LM (October 2009 - July 2014 )
·
ð
)
)
)¹
ð
)
)
¹
)
)"
"
"
)
è
""
"
è
""
"
"
è
"
"è
)
""
·
"
)
))
)
¹
)
"
¹ï
"
)
è
)
)
"
¹
¹
)è
è
""
"
è
è
)
)
)
)
·
"
"
è
"
¹
¹
)
®̄
¹
¹
¹
)
)
)
) ¹
))
)
)
®̄
))
)
)
)
) )
))
)
)
)
)) )
)
,
)
) ))
)
)
"ï¹
¹è
)
è
""
"¹
¹
¹
¹
¹)
)
)
)
"""
è
"
""
"
è
"
"
""
"
" è
®̄
¹
·
"
"
"
"
"
"
) )
) ))
)))
)))
))
¹è ¹ ¹¹ ¹
¹)
)
"
ï )))
"è
"
"
"è
"" "
è
"
)
)
ï¹
·
"
"
) ")) )
)
)
)
)
)
)
)
)
)
)
""è
")
)
è¹
¹)
"
"è
"è
"
"
è
"
"
)
·"
·
¹
¹
)
g
gg
¹
" )
g
J
)
)
è
)
" ""
)
)
)
"
)
)
)
)
)
))
)
èg
))
è g
)
¹
¹"
"
"
)
¹
è"
è
)
"è
"
·
"è
è
"
"
"
"
"""
èè
"
) )
"
)
)
)
""
"
è
è ¹
)
g
,
)
"
)
¹
)
¹
"
ï)
)
)
)
)
))
g
")
)
)
"!r
¹
è)
)
)
)
¹)
)
)
)
)
)
)
)
)
)
)
)
)
¹!r
®̄
®̄
Jg
"
¹ ¹¹
¹¹
®̄
!r
®̄
®̄
®̄
®̄ ®̄
®̄
®̄
®̄
®̄
®̄
®̄®̄
g
¹
¹
¹
¹
)
)
))
)
)
)
)
)
)
))
)
)
"
"
"
"
"
"
"
"è "
"
è
")
¹
)
)
)
)
)
)))
)
)
)
)
)
)
)
¹
)
)
)
ð
)
¹
)
) ¹
)
®̄
ä
)
)
)
)
)
)
ð)
è
"
è
""è
è
õ
f
)
)
)
)
)
"
)
)
¹
è
¹)
)
)
)
)
¹
ä
ð
^̀
^̀
^̀
^̀
^̀
^̀
^̀
^̀
^̀
^̀ ^̀
^̀
^̀
^̀
^̀^̀
^̀
^̀^̀
^̀
^̀
^̀̂̀^̀
^̀
^̀
^̀^̀
^̀
^̀
^̀
EASTERN CAPE
Vulamehlo
Umdoni
Umzumbe
UMuziwabantu
Ezinqoleni
HibiscusCoast
Glenmore Beach
Marina Beach
Mtwalume
Palm Beach
Pennington
Sunwich Port
Umzumbe
Umzinto
Port Shepstone
Harding Hibberdene
Scottburgh
Park Rynie
Sezela
Sea ParkUmtentweni
Marburg
MargateUvongo
Ramsgate
Port Edward
Thistles SettlementKwaMshiwa
Kozameni
Bazley
Kelso
Leisure Bay
Munster
Shelly Beach
Southbroom
Southport
INDI
AN O
CEAN
0 7 14 21 283.5KilometersSource:
- Department of Co-operative Governance and Traditional Affairs
ETHEKWINI
UMGUNGUNDLOVUDM
HARRY GWALADM
Value of MIG Funding Per Service Type (October 2009 - July 2014)
Value of MIG Funding Per LM (Rands)
Legend
^̀ Main Towns
MIG Projects Per Service Type
Umdoni
Ezinqoleni
Umuziwabantu
Vulamehlo
Umzumbe
Bus Shelters
ï Cemeteries / Crematorium
®̄ Child care facilities
Disaster Management Facilities
õ Local Amenities
, Markets
¹ Multi purpose community halls
· Other
f Pedestrian Bridges
) Road & Stormwater
è Sanitation
ä Sidewalks
ð Solid waste disposal site
Sport Facility
J Stormwater
" Street / Community Lighting
g Taxi Ranks
" Water
!r Beaches and amusement facilities
Hibiscus Coast

UMZUMBE
2014 EDITION
UMUZIWABANTU
EZINQOLENI
HIBISCUS COAST
R 0.00 R 200 000 000.00 R 400 000 000.00 R 600 000 000.00 R 800 000 000.00 R 1 000 000 000.00 R 1 200 000 000.00 R 1 400 000 000.00
Beaches and Amusement facilities
Child Care Facilities
Markets
Multi purpose community halls
Other
Pedestrian Bridges
Road & Stormwater
Sanitation
Sidewalks
Solid Waste Disposal Site
Sport Facility
Stormwater
Street / Community Lighting
Taxi Ranks
Water
HIBI
SCU
S CO
AST
R 36 711 720.90
R 18 500 000.01
R 1 000 000.00
R 52 383 793.76
R 3 947 982.00
R 659 102.00
R 56 990 877.76
R 199 295 515.86
R 2 145 450.80
R 3 650 790.89
R 36 874 041.74
R 10 568 010.91
R 11 853 171.53
R 30 328 721.21
R 1 373 718 189.68
R 0.00 R 20 000 000.00 R 40 000 000.00 R 60 000 000.00 R 80 000 000.00 R 100 000 000.00 R 120 000 000.00 R 140 000 000.00 R 160 000 000.00 R 180 000 000.00
Multi purpose community halls
Other
Road & Stormwater
Sanitation
Sport Facility
Street / Community Lighting
Water
EZIN
QO
LEN
I
R 7 189 932.00
R 0.00
R 78 389 627.74
R 53 685 515.00
R 19 600 000.00
R 8 292 297.00
R 161 134 377.00
R 0.00 R 50 000 000.00 R 100 000 000.00 R 150 000 000.00 R 200 000 000.00 R 250 000 000.00
Cemetries/ Crematoriums
Multi purpose community halls
Other
Road & Stormwater
Sanitation
Solid Waste Disposal Site
Sport Facility
Water
UM
UZI
WAB
ANTU
R 1 677 268.00
R 15 992 606.94
R 0.00
R 121 271 599.48
R 114 343 432.00
R 12 604 980.00
R 2 081 572.38
R 235 071 475.25
R 0.00 R 100 000 000.00 R 200 000 000.00 R 300 000 000.00 R 400 000 000.00 R 500 000 000.00 R 600 000 000.00
Cemetries/ Crematoriums
Child Care Facilities
Markets
Multi purpose community halls
Other
Road & Stormwater
Sanitation
Sport Facility
Street / Community Lighting
WaterU
MZU
MBE
R 2 000 000.00
R 2 558 515.20
R 5 053 916.00
R 25 479 123.05
R 0.00
R 303 229 058.00
R 267 299 000.00
R 37 532 448.52
R 1 140 000.00
R 523 164 735.87

R 0.00 R 20 000 000.00 R 40 000 000.00 R 60 000 000.00 R 80 000 000.00 R 100 000 000.00 R 120 000 000.00 R 140 000 000.00 R 160 000 000.00
Bus Shelters
Cemetries/ Crematoriums
Disaster Management facilities
Multi purpose community halls
Other
Road & Stormwater
Sanitation
Sport Facility
Street / Community Lighting
Water
UM
DON
I
R 600 000.00
R 12 930 349.00
R 5 063 380.00
R 11 682 509.00
R 0.00
R 67 698 602.29
R 144 739 621.00
R 18 039 159.25
R 1 489 885.00
R 55 968 347.00
UMDONI
R 0.00 R 100 000 000.00 R 200 000 000.00 R 300 000 000.00 R 400 000 000.00 R 500 000 000.00 R 600 000 000.00 R 700 000 000.00 R 800 000 000.00
Local Amenities
Multi purpose community halls
Other
Road & Stormwater
Sanitation
Solid Waste Disposal Site
Sport Facility
Street / Community Lighting
Water
VULA
MEH
LO
R 4 000 000.00
R 5 722 698.39
R 0.00
R 24 733 055.36
R 1 000 000.00
R 6 036 283.03
R 28 169 763.10
R 285 000.00
R 1 202 334.07
VULAMEHLO

2014 EDITION
UGU DISTRICT MUNICIPALITY CONTACT DETAILS
Municipal Demarcation Board Code: DC21Location of Head Office: Port Shepstone is 133 km southeast of Kokstad and 130 km south-west of DurbanMunicipal Area (km²): 5866 km²Population (estimated): ± 704 028Local Municipalities: Hibiscus Coast, Ezinqoleni, Umdoni, Umuziwabantu, Umzumbe and Vulamehlo.
Members of CouncilHis Worship the Mayor: Cllr. N.H GumedeSpeaker: Cllr. Sthembiso CeleDeputy Mayor: Cllr. Mondli ChilizaOther Exco Members: Cllr. S. Mahomed,Cllr. I.Mavundla, Cllr. S. Nyawuza, Cllr T Vezi
AdministrationMunicipal Manager: Mr. D. Dhanplan NaidooDeputy Municipal Manager: M. MnyanduGM - Corporate Services: P. NtebeGM - Water Services: M. PawandiwaGM - Infrastructure & Economic Development: Z. MbonaneGM - Treasury: V. Hukum
Contact DetailsPhysical Address: 28 Connor Street, Port Shepstone, 4240Postal Address: PO Box 33, Port Shepstone, 4240Tel: +27 (0)39 688 5700 /2,039 688 5702Fax: +27 (0)39 682 1720/4820Website: www.ugu.org.za, [email protected]
Related Documents
![Ugu District Youth Development Programmes - Drugs and Substance Abuse Awareness Workshop[1]](https://static.cupdf.com/doc/110x72/55720a27497959fc0b8c0071/ugu-district-youth-development-programmes-drugs-and-substance-abuse-awareness-workshop1.jpg)


