Uganda’s Ethnic Diversity A Descriptive Analysis of Ethnicity and Economic Well-Being in Uganda 2009 August 2009 Fanaka Kwa Wote A Think tank for Prosperity, Peace and Progress in the Great Lakes Email: [email protected] Web: http://www.kwawote.org

Welcome message from author
This document is posted to help you gain knowledge. Please leave a comment to let me know what you think about it! Share it to your friends and learn new things together.
Transcript

Uganda’s Ethnic Diversity
A Descriptive Analysis of Ethnicity and Economic Well-Being in Uganda 2009
August 2009 Fanaka Kwa Wote
A Think tank for Prosperity, Peace and Progress in the Great Lakes
Email: [email protected] Web: http://www.kwawote.org

ii
TABLE OF CONTENTS
EXECUTIVE SUMMARY...........................................................................................................1
1. ABSTRACT ............................................................................................................................3
2. SOURCES OF DATA AND THEIR LIMITATIONS .....................................................4
3. POPULATION CHARACTERISTICS ............................................................................4
3.1 Ethnic Composition.................................................................................................................4
3.2 Education and Literacy ..........................................................................................................5 3.2.1 Primary School net Enrolment ........................................................................................................ 5 3.2.2 Secondary School net Enrolment .................................................................................................... 7 3.2.3 Literacy ............................................................................................................................................. 7
4. FERTILITY............................................................................................................................9
5. SANITATION AND HEALTH......................................................................................... 10
6. HOUSEHOLD WELFARE............................................................................................... 12 6.1 Main source of livelihood for the household ............................................................................... 12 6.2 Ownership of selected Assets ....................................................................................................... 13 6.3 Use of Basic necessities ................................................................................................................ 14 6.4 Household facilities and Amenities..............................................................................................15
7. RURAL POVERTY............................................................................................................ 17
8. COMPUTATION OF A COMPOSITE INDEX............................................................ 18 8.1 Rationale and methodology .......................................................................................................... 18
9. SUMMARY OF FINDINGS ............................................................................................. 21
Education and Literacy ............................................................................................................... 21 Fertility ..................................................................................................................................................... 21 Sanitation and Health ..............................................................................................................................21 Household Welfare .................................................................................................................................. 21 Basic necessities ...................................................................................................................................... 22 Basic Facilities ......................................................................................................................................... 22
10. Ranking of Ethnic groups ............................................................................................... 22 (a) Personal Characteristics..................................................................................................................... 23 (b) Household Characteristics................................................................................................................. 23
11. RURAL POVERTY.......................................................................................................... 23
12. CONCLUSION.................................................................................................................. 23
13. REFERENCES.................................................................................................................. 25
14. ANNEXES.......................................................................................................................... 26

1
Executive Summary Uganda is one of the most ethnically diverse countries in Africa, with over 60 indigenous groups recognized in her Constitution. This is a reality that can be harnessed for good or not. But Uganda’s long history of political upheaval, beginning from the time of colonization, has often revolved around ethnicity. On multiple occasions, those in power have used their position to benefit their kinsmen at the expense or to the exclusion of other ethnic groups. In Uganda today, issues over land and power have pitted ethnic groups against one another, and the government of Uganda has not yet enacted policy that effectively addresses these longstanding issues. With national elections just a year and a half away, scheduled for March 13, 2011, ethnic politics are coming to the forefront of the political scene in Uganda. Ethnicity is one of many identities that an individual possesses, and may be more or less salient depending on the individual and the society. In Uganda, ethnicity is today and has historically been an identity by which people can be relatively easily mobilized and collectively make demands from those political actors who are sensitive to their democratic demands. But historically, ethnic politics has sometimes led to unfavourable outcomes, including the destruction of lives and property. It is easy to recall recent examples of ethnic-based violence, including the experiences of Uganda’s own neighbours, including Rwanda, Kenya, Southern Sudan and the Democratic Republic of Congo. This violence takes lives and destroys the very fabric of society. With this in mind, the aim of this report is to contribute to a fact-based and objective national discussion on how Uganda can develop and progress in a multi-ethnic environment. In every part of Uganda there is room and need for progress, innovation, entrepreneurship and development. Different communities have different resources, skills and ideas to share, as well as different development needs. This report aims to shift the focus from politics to policy, in hopes that Uganda’s diversity can be harnessed productively and in a way that benefits the entire nation, not specific individuals, families, ethnic groups or regions. We have therefore endeavoured to take a closer look at the relationship between ethnicity and economic well-being in Uganda today. In this report we have used data exclusively from the government of Uganda’s own statistics, which are public documents and available for all to use in the Uganda Bureau of Statistics in Kampala. Specifically, we have analyzed data from the UBOS Census 1991 and 2002, and the 2008 UBOS study, “Spatial Trends of Poverty and Inequality in Uganda: 2002-2005”. We have focused on the variables and indicators in these data sets that we believe are best able to describe the economic well-being on Uganda’s many ethnic groups. While there are economic challenges that affect Ugandans in every corner of the country, our research demonstrates that there are nevertheless profound inequalities and disparities in economic well-being across ethnic groups. Uganda’s top 21 most populous ethnic groups have been ranked in this report, according to nine indicators of economic-well being. These take into account indicators of health and educational status, as well as proxies for household consumption. Based on this composite index, the five highest performing groups are: Baganda, Banyoro, Batoro, Banyankole, and Bahororo. The lowest performing groups are: Iteso, Madi, Langi, Acholi, and Karimojong.
2
In this report we do not attempt to answer the question of why such disparities exist, nor do we suggest that an individual is better or worse off in economic terms as a direct result of his or her being a member of a certain group. Instead, we provide the facts as objectively as possible given the government data available. We present the facts in a way that we hope will be useful to policymakers, and that will help promote a national debate on how to confront Uganda’s diverse challenges and take advantage of her many opportunities. The ethnic demands that have been made in Uganda’s recent history ironically come from ethnic groups who are generally more privileged in economic terms. While ethnicity can be used as a useful vehicle for economic competition, as citizens of Uganda who share a common future, there is need to recognize the potential dangers ethnically-based demands pose for national unity. There are a multitude of possible explanations for why certain groups have fared better than others – historical, cultural, organizational, and many more, which we shall not explore further here. What is important as we seek a peaceful and prosperous way forward is that inequalities are not ignored but addressed, and that we tackle our mutual challenges together, advocating for policy that improves the lives of all Ugandans regardless of tribe, religion, gender, language, age or ability.
3
1. Abstract There are a number of indigenous communities in Uganda representing Uganda’s diverse
cultural heritage. The organized ethnic, religious systems and leadership are normally utilized
in the mobilization of communities for development activities. Notable among these is the
Bulungi bwasi normally organised by the Baganda community to mobilise people to work on
infrastructure, like roads, for the good of their community and the good of the nation. Ethnic
composition creates increased social cohesion, strengthens cultural identity and promotes bio-
cultural identity, solidarity and cooperation that are important in the development process.
When these ethnic groups interrelate in the workplace, religious and educational institutions
and when they inter-marry, mutual understanding of cultures and customs is enhanced,
leading to harmony and social cohesion.
However, in some instances this diversity can lead to tensions within and between the
indigenous groups. The ethnic groups however need to realise the importance of living side-
by-side and gaining from their counterparts for individual and national development.
The non-indigenous groups, which form a minority, on the other hand freely interact with the
indigenous ones as the people of Uganda are all embracing. The indigenous communities also
are keen to learn from these foreign communities.
The 1995 Constitution of the Republic of Uganda recognises and respects the diverse ethnic
groups, ideological and cultural diversity. It recognises the role traditional or cultural leaders
and institutions play in national development.
Ethnic beliefs have been used to cultivate values and norms that form the core of humanity to
promote tolerance and appreciation of other people’s identity, peace in families, communities
and nations. Elements of ethnicity like music, dance, drama, plays, songs, artistic drawings,
sculpture and beliefs are a useful medium of communication that are used to transmit
educative information on development issues to improve the quality of life of people.
The diverse ethnic and religious groups have indigenous talents in crafts, pottery, traditional
knowledge, medicine, drama, dance and music that can be harnessed to support job creation

4
in the creative industry sector to generate incomes to reduce poverty. These can be built upon
as a starting point for development of knowledge based economy for rapid economic growth.
2. Sources of data and their limitations The analysis in this report has been done on the already existing data, primarily from
Population and Housing Censuses and Poverty reports. The following are the shortcomings of
the study:
(i) Most of the studies from which was data was extracted were carried out sometime
ago. There is a possibility that some of the indicators may have changed with
time.
(ii) Detailed data from Kaabong, Moroto and Abim districts could not be got both
from the report on poverty and the 2002 Population and Housing census reports.
(iii) Apart from the Population and Housing Census, most of the studies undertaken
(such as the far more detailed Household Surveys) do not include ethnicity as a
key variable, hence having a limitation on the analysis undertaken.
3. Population characteristics
3.1 Ethnic Composition Table 1 below shows that the 21 majority ethnic groups in Uganda constituted 94 percent of
the Uganda population in 2002, decreasing slightly from 95 percent in 1991. The Baganda
and Banyankole reflected themselves as the largest and second largest ethnic groups in both
censuses. The Bakiga, who were the third largest in tribe in 1991, became the fourth largest
in 2002.

5
Table 1: Distribution of the population by the main Ethnic groups
1991 2002 Ethnic group
Number (‘000s) Percent
Number (‘000s) Percent
Baganda 3,016.0 18.8 4,126.1 17.7 Banyankole 1,643.2 10.2 2,330.0 10.0 Basoga 1,370.9 8.5 2,062.8 8.9 Bakiga 1,391.4 8.7 1,679.5 7.2 Iteso 999.5 6.2 1,566.9 6.7 Langi 977.7 6.1 1,483.8 6.4 Acholi 734.7 4.6 1,141.1 4.9 Bagisu 751.3 4.7 1,117.2 4.8 Lugbara 588.8 3.7 1,022.1 4.4 Banyoro/Bagungu 495.4 3.1 715.8 3.1 Bakhonzo 361.7 2.3 608.7 2.6 Batoro/Batuku/Basongora 488.0 3.0 637.6 2.7 Alur/Jonam 395.6 2.5 659.6 2.8 Bafumbira 203.0 1.3 448.9 1.9 Bagwere 275.6 1.7 408.7 1.8 Jopadhola 247.6 1.5 359.7 1.5 Banyole 228.9 1.4 340.5 1.5 Banyarwanda 329.7 2.1 314.6 1.4 Madi 178.6 1.1 296.2 1.3 Basamia 185.3 1.2 279.9 1.2 Karimojong/Dodoth/Tepeth 346.1 2.2 282.4 1.2 Other Ugandans 856.0 5.3 1,405.6 6.0 Total 16,065.0 100 23,287.6 100
3.2 Education and Literacy
3.2.1 Primary School net Enrolment
This is the proportion of the children aged 6-12 who are enrolled in primary school to all
those children of official primary school going age (6-12 years). It is a measure of the extent
to which the population eligible to participate in primary education is actually enrolled. The
net primary school rate can be used in monitoring the level of participation in primary
education, thereby also identifying the non-enrolled school-age population.

6
Figure 1: Primary Net Enrolment rates by Sex by Ethnicity, 2002
Comparison of the primary school net enrolment rates shows that the Sabiny and Baruli had
the highest primary school net enrolment rates of 92 percent, followed by the Bahororo,
Baganda and Bagisu with 91 percent. The rest of the major ethnic groups had primary school
enrolment rates of 80 percent or above, apart from Karimojong, 22 percent; Alur, 77 percent
and Bafumbira 79 percent. The gender gaps in net primary enrolment rates are small, with the
exception of six ethnic groups, which had their net enrolment of the boys being higher than
that of girls by at least two percentage points. These were Alur 7 percent, Lugbara, Acholi
and Kakwa 4 percent, Madi 3 percent and Langi 2 percent.

7
3.2.2 Secondary School net Enrolment Secondary School Net Enrolment Rate is the proportion of people aged 13-19 who were
enrolled in secondary school to all those children aged 13-19 years. At the national level the
proportion of children of official secondary school going age who were actually enrolled in
secondary school was low, at only 23 percent. Nineteen of the 26 main ethnic groups of
Uganda had their net secondary school enrolment rates below the national average (Figure 1
above and Annex A.1 below)
3.2.3 Literacy
At the national level, the literacy rate among the population increased from 54 percent in
1991 to 70 percent in 2002. The ethnic group with the highest literacy rate during the two
censuses has remained the Baganda.

8
Figure 2: Literacy levels for the four most literate ethnic groups and the four least literate ethnic groups in 2002 for 1991 and 2002 (basing on the 21 major ethnic groups in 2002)
1 Includes Bagungu, 2 Includes Batuku and Basongora, 3 Includes Dodoth and Tepeth
The ethnic groups that experienced the highest increase in literacy rate between the two
censuses were the Bakhonzo, Banyankole, Bafumbira and Bakiga, each experiencing an
increase of above 20 percentage points. The literacy rates for the Karimojong have remained
extremely low compared to other ethnic groups, increasing marginally from 8 percent in 1991
to 13 percent in 2002.

9
Figure 3: Increase in literacy rates for the 4 ethnic groups with the greatest increase and least increase, 1991-2002
It follows from the information on literacy and enrolment above that special interventions
focused towards improving the education levels of the Karimojong children and adults ought
to be done. This could combine both the formal education system and the adult literacy
programmes.
4. Fertility In this section fertility is studied in relation to risky births, teenage motherhood and Total
Fertility Rates (TFR). Teenage motherhood is a major social and health challenge to both the
mother child and her child. Teenage mothers may find it difficult to continue with education
partly due to the cultural beliefs and the nature of the present education system. The
deliveries of teenage mothers also tend to be riskier than those of slightly older women.
Overall, about 18 percent of the teenagers aged 12-19 years had at least 1 child, according to
the 2002 population and housing census. There was some differential in teenage fertility
across the major ethnic groups. The Bagwere, Alur, Basamia and Langi had the highest

10
proportion of teenage mothers, at about 23 percent; while the Madi had the lowest, at 9
percent.
“Risky births” refer to mothers who give birth “Too Early”, “Too Many”, “Too Close” or
“Too Late”.1 Births which are “Too Early” are births born to women below the age of 20
years, while births which are “Too Many” are born to women who have given birth to 4 or
more children, “Too Close” are births with less than 2 years between births, while “Too Late”
births refer to women who are 35 years or older when they deliver. The rate of high-risk
births is associated with populations with high TFRs, and is among the factors that may
contribute to relatively high infant and maternal morbidity and mortality rates.
Table 2 above shows that, overall, 54 percent of births in the last 12 months were high risk
births, with about 1 in 3 of these births being from the category of “Too Many”. There were
no high differentials in high-risk births across women of different ethnic groups. Births
occurring to Bagwere and Banyole women had a slightly higher chance of being high-risk
births as compared to births to women of other ethnic backgrounds. On the other hand, births
to Madi women had the lowest chance of being high-risk births
The Total Fertility Rate (TFR) is the number of live births a woman would have at the end of
her reproductive period if she were subject to the present age pattern of child bearing
throughout her reproductive period. The highest TFR was observed was among the Bagwere
and Banyole, where on average a woman would give birth to 7.9 children if the current
pattern of fertility were to continue. The Baganda had the lowest TFR of 5.9.
5. Sanitation and Health Sanitation is vital to national health, and therefore is among the many development
programmes being promoted by government. Lack of toilet facilities and use of unsafe toilet
facilities poses a health problem.
The results indicate that toilet coverage is not universal in all the households headed by the
major ethnic groups. The households with the lowest safe toilet coverage were headed by
1 The “Too Close” phenomena is not analysed here since the 2002 census did not collect data that could lead to the computation of this indicator. The figure therefore got in the census for occurrence of any of the risk births is lower than the figure got from the surveys where the phenomena of too close is studied, especially by studying birth histories of women.

11
Karimojong, with 10% coverage, Acholi, with 41% coverage, Iteso, with 45% coverage,
Jopadhola, with 55% coverage and Langi, with 57% coverage. On the other hand, the
Bahororo, Bakiga, Bakhonzo, Banyankole, and Baganda-headed households had high safe
toilet coverage, each with a proportion of above 80 percent. Figure 4: Access to safe toilet facilities by ethnic head, Uganda 2002
Access to safe water was not also universal. The results indicate that 82 percent of
households headed by the Madi, 78 percent by the Bagungu, 77 percent headed by the
Karimojong and the 75 percent headed by the Basoga had access to safe water. The lowest
rates of access to safe water were observed in households headed by the Bafumbira, 40
percent; Banyarwanda, 41 percent and Banyankole, 48 percent.
Collecting of water for the household is among the home care activities mostly undertaken by
children and women. This activity may impact on the time spent on productive work when
the distance from where the water is collected to the household is long. The results indicate
that nationally, 79 percent of the households were within one kilometre of the nearest water
source. In 50 percent of the households headed by the 26 main ethnic groups, the proportion
of households within 1 km from the main water source was less than the national average.

12
Careless solid waste disposal has negative consequences on the environment and health.
Table 5 below shows usage and accessibility of health and sanitation amenities by households
headed by the 26 main ethnic groups in Uganda. The table indicates that the most popular
solid disposal method among most ethnic groups was throwing the wastes in the gardens.
Throwing of the waste in a heap was also popular. Unfortunately these methods are not
environmentally friendly.
The distance to health outlets has a bearing in accessing of health services. The results
indicate that 86 percent of households headed by the Bagwere were within 5 Kms from the
nearest health facility. This was followed with the Baganda with 82 percent and Bagwere 80
percent. On the lower end of Table 5, the corresponding proportions of households headed by
the Langi, Acholi and Banyarwanda were 58 percent, 63 percent and 66 percent respectively.
Forty-two percent of the household headed by the Baganda, 35 percent headed by the Madi
and 34 headed by the Basoga were within 1 km from a health facility. Similarly, 15 percent
of the households headed by the Langi, 19 percent by the Iteso and 22 percent by the Bakiga
were within 1 Km from a health outlet. 6. Household welfare One of the measures of the quality of life of household members is household welfare. The
information used to study household welfare in this study was on source of the household
livelihood, ownership of selected household assets directly linked to the welfare of
household, and consumption of some selected basic necessities by the household.
6.1 Main source of livelihood for the household
The available data shows that most households in Uganda depended on subsistence farming
as their main source of livelihood. This is more pronounced in households headed by the
Langi, Bafumbira and Bakiga, where more than 80 percent of the households relied on
subsistence farming. On the other hand, the proportion of households headed by the Baganda
and Batoro that depended on subsistence farming as their main source of livelihood was low
as compared to households headed by the other main ethnic groups.

13
Dependence on employment income was higher in households headed by the Baganda, where
more than one quarter of the households were depending on employment income as their
main source of livelihood. Dependence on employment income was very low among
households where the following tribes were the heads: Langi (9 percent), Bakiga (9 percent).
6.2 Ownership of selected Assets
When the permanency of the dwelling unit is looked at, the results show that the Baganda
score highly where 2 in every five households headed by the Baganda had permanent
dwelling units, followed by households headed by the Basoga, where the results show that
one in every five households headed by the Basoga had a permanent dwelling. It is also worth
noting from the results that although in terms of having permanent dwelling units, the Basoga
headed households were second to Baganda, the proportion of Households headed by the
Basoga staying in permanent dwelling units was less than half that of the Baganda.
Figure 4: Proportion of permanent owner occupied dwelling units by selected ethnicity of the household head, Uganda 2002
Data on the proportion of permanent owner occupied dwelling units indicates a large
difference between the Baganda and other tribes. Thirty-one percent of the Baganda-headed
households that were “owner occupied” consisted of permanent dwelling units, followed with
the Basoga and Banyoro with 12 percent and 10 percent respectively. The rest of the
households headed by other tribes had proportions of below 10 percent of the owner occupied
dwellings being permanent.

14
6.3 Use of Basic necessities
Consumption of basic necessities is among the issues considered when measuring the well-
being of the household. Data was collected on a set of five items during the 2002 census.
These were: use of soap for bathing, consumption of sugar for at least once a day, use of
shoes by household members, owning clothing and ownership of a blanket by every child in
the household. The results of the analysis are shown in Figure 5 and Table 7 below.
Figure 5: Proportion of households that consumed all basic necessities1 by ethnic group of head, Uganda 2002
More than half of the households headed by seventeen of the 21 main ethnic groups did not
consume sugar at least once a day or did not have each household having at least a pair of
shoes. Ownership of blankets by children was very low. Children in two of every three
households headed by the major 21 ethnic groups that had children did not have blankets.
Consumption of all the five basic necessities was very low, with only 1 in five households
having children consuming all the five basic necessities nationally. The proportion is only
higher in 5 of the 21 main ethnic group headed households.

15
6.4 Household facilities and Amenities
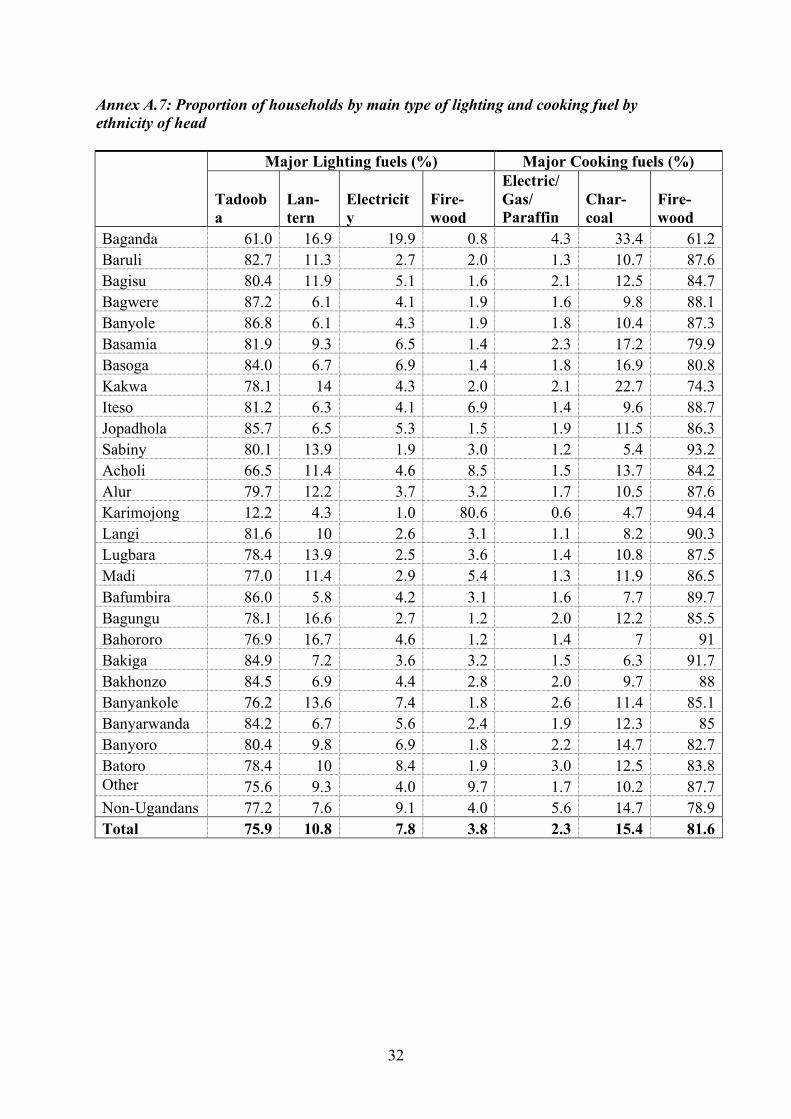
Use of electricity for lighting in the county was very low, with only about 8 percent of the
households in the country using this category of fuel for lighting. Households headed by the
Baganda had the highest chance of using electricity for lighting as compared to households
headed by other ethnic groups, with about one in every five of these households using
electricity for lighting. Those headed by the Karimojong had only one percent of households
having electricity as their main type of lighting fuel. Firewood continues to be used by
households as the main source of lighting fuel, with 81 percent of the households headed by
the Karimojong, 9 percent of the households headed by the Acholi, 7 percent of the
households of Ateso heads and 5 percent of the households headed by the Madi using
firewood as main source for lighting. Figure 6: Proportion of Households that used a specified type of lighting fuel by ethnic group of Household head, Uganda 2002

16
The results indicate that there is heavy dependence by the Ugandan population on wood fuel
as a source of cooking. This poses a danger as it impacts negatively on the environment, in
addition to exposing women to smoke from these wood fuels. Four percent of the households
headed by the Baganda were using either electricity, gas or paraffin as their major type of
fuel for cooking while less than 1 percent of the households where the Karimojong were
heads were using this type of fuel for cooking. Also, thirteen of the 21 main ethnic groups
headed households had less than 2 percent of their households depending on electricity, gas
or paraffin as their main source of cooking.
In this report, basic facilities include safe toilet facilities, a built bathroom and a built kitchen.
Ownership of basic facilities was not universal among households headed by Uganda’s main
ethnic groups. Lack of basic facilities was common among households headed by the
Karimojong, Acholi, Iteso, Banyarwanda, Madi and Jopadhola, where 81 percent, 31 percent,
24 percent, 23 percent, 21 percent and 20 percent respectively had none of the 3 basic
facilities.
Figure 6: The five highest and lowest proportion of households that consumed all the basic necessities by the ethnicity of the head among the 21 major Uganda ethnic groups, Uganda 2002
Households where the Baganda were the household heads had a high chance of owning the
three basic facilities as compared to the other households. Also, in more than 60 percent of

17
the households headed by the Banyoro, Baganda, Batoro and Banyankole owned radios,
while in other ethnic headed households ownership of radios was less than half.
7. Rural Poverty
Annex A.10 and Figure 7 classify the majority ethnic groups in the rural sub-counties by the
proportion of people below the poverty line in those sub-counties. The aim is to get a picture
of the levels of poverty of the ethnic groups by using information on the proportion of people
living below the poverty line in the sub-counties where they are the major ethnic group.
Taking the example of 23.9 percent reflected under the Banyankole, for instance implies that
23.9 percent of the sub-counties where the Banyankole were the majority ethnic group had a
proportion of between 10% to less than 15% of their population below the poverty line.
The results in Annex A10 indicate that among sub-counties where the Baganda were the
majority, 21 percent of them had less than 10 percent of their population below the poverty
line. This was the highest proportion across all major ethnic groups that were dominant in
sub-counties.
Figure 7: Proportion of Sub-counties having less than 30 percent of its population below the poverty line by major ethnic group in the Sub-counties

18
The other sub-counties that had less than 10 percent of their population below the poverty
line had the Banyankole and Batoro or Bahororo as the main ethnic group. In sub-counties
where the Banyankole or Banyoro were the major ethnic group, 3 percent of them had less
than 10 percent of their population below the poverty line; the corresponding proportion for
sub-counties where Bahororo were majority was 17 percent.
Figure 7 above shows a representation of the proportion of sub-counties having less than 30
percent of its population below the poverty line by the major ethnic group in the sub-counties.
The information indicates that sub-counties having major ethnic groups predominant in
central and western Uganda have relatively lower poverty rates as compared to the rest of the
sub-counties. For the major ethnic groups not shown above, the sub-counties in which they
are the main ethnic group have 30 percent or more of their population below the poverty
level.
Sub-counties that have a very high proportion of their population below the poverty line are
dominated by ethnic groups primarily located in northern and eastern Uganda. For instance,
among the sub-counties where the Kakwa were the majority, 75 percent of them had 60
percent or more of their population below the poverty line. Likewise, the proportions for the
Acholi, Alur, Karimojong, Langi and Madi are 84 percent, 12 percent, 100 percent, 22
percent, 33 percent and 50 percent respectively.
This is consistent with the earlier analysis, which ranked ethnic groups by household welfare,
amenities, ownership of assets, levels of education and related indicators.
8. Computation of a composite index
8.1 Rationale and methodology In order to compute the composite index used to rank households headed by the major ethnic
groups in the country, it was necessary to compare it with selected indicators. Since the well-
being of a household can be partly measured by its ability to consume basic necessities, the
indicator on consumption of the basic needs by the households was used as a proxy for the
composite index.

19
Nine of the indicators that had been analysed earlier were used as inputs (sub-indices) into
the computation of the composite index. Initially, the indicator of the proportion of
households with all the basic necessities was chosen as the dependent variable and the rest of
the indicators as dependent variables. The following steps were used in the computation of
the composite index:
a) Choosing of variables to include in the composite index;
b) Statistically testing for a correlation between the dependent variable and a set of
independent variables;
c) Assigning different weights to the sub-indices generated using a regression method
prorated to add up to one.
d) Finally using weights assigned a multiple linear regression model was used to
compute the composite index.

20
Figure 7: Composite Index by the most five ranked and least five ranked major ethnic groups
By using a multiple linear regression, a composite index was constructed and Figure 7 above
shows the ranking of the ethnic groups of the highest five ranked and lowest five ranked by
this method. Additional details are shown in Annex A.9.
21
9. Summary of Findings
The current report provides an overview of the socio-economic characteristics of the 21
major ethnic groups in Uganda. The population of the 21 main ethnic groups in the country
constituted 95 percent of the population in 2002 from 94 in 1991.
Education and Literacy
The results show that among the major ethnic groups the most literate tribe in 1991 and 2002
was the Baganda, its literacy rate increasing from 78 percent in 1991 to 88 percent in 2002.
The three ethnic groups of the Banyankole, Bafumbira and Bakiga experienced the highest
increase in their literacy rates between the two censuses.
All ethnic groups had net primary enrolment rates of 80 percent or above apart from
the Karimojong, Alur and Bafumbira.
Fertility
Fertility rates were high among women belonging to the major ethnic groups in the country,
with all groups having a Total Fertility Rate of above 6 apart from the Baganda women with
5.9.
Sanitation and Health
Nationally 78 percent of the households were within 1 km of a water source, with only 8 in
21 households headed by the main ethnic groups in the country having a proportion higher
than the above. Similarly, toilet coverage was low among households of ethnic groups that
are predominant in northern and eastern Uganda as compared to ethnic groups from the other
regions.
Accessibility of health services by households partly depends on distance to health
outlets. Not all households were within 5 kms from a health facility, with the highest
proportion of these households being among households headed by the Bagwere, at 86
percent, and the lowest by the Langi, at 56 percent.
Household Welfare
Information used to study household welfare in this report is on household livelihood,
ownership of selected household assets and consumption of selected basic necessities.

22
Dependency on employment income as the main source of livelihood was highest in
households headed by the Baganda (28 percent) and lowest in households headed by the
Langi (9 percent) and the Bakiga (9 percent). Staying in permanent dwelling units by
households was very low among most ethnic groups in 2002. The highest proportion was
recorded among households where the Baganda were the heads with 2 in every 5 dwelling
units. Also, in nine of the 21 main ethnic groups households, the proportion of households
staying in permanent dwelling was below 10 percent.
Basic necessities
Among the five basic necessities, use of soap for bathing was most common, where
nationally 91 percent of the household used soap for bathing. This was only lower in 6 out of
21 main ethnic group headed households. Nationally only 48 percent of the households
consumed sugar at least once a day, with 16 of the 21 ethnic groups headed households being
below this value.
Basic Facilities
All the main ethnic group headed households had less than 10 percent of their households
using electricity as the main source of lighting apart from the Baganda, at 20 percent. The
tadooba was the most popular type of method for lighting among all the major ethnic group
headed households, with the exception of households headed by the Karimojong who had
firewood as their main lighting fuel.
There was heavy dependence on wood fuel as the main source of cooking. Thirteen of
the 21 main ethnic groups headed households had less than 2 percent of their households
depending on electricity, gas or paraffin as the main source of cooking fuel.
10. Ranking of Ethnic groups
Using the indicator on consumption of the basic needs by the households as a proxy for a
composite index, correlations were constructed between this indicator and some other
selected 10 indicators. These indicators were:

23
(a) Personal Characteristics i. Literacy rates
ii. Secondary School Net Enrolment rates
iii. Proportion of Teenage mothers
(b) Household Characteristics iv. Proportion of Households with main of Livelihood of Employment Income
v. Percentage of permanent dwelling units
vi. Proportion of Households with safe Toilet facility
vii. Households with safe source of water
viii. Proportion of Households using electricity as main lighting source
ix. Proportion of owner occupied households with permanent dwelling units
x. Proportion of Households having all (five) selected basic facilities
Using a multiple linear regression, a composite index was constructed and basing on this the
Baganda were the highest ranked ethnic group and the Karimojong the lowest ranked ethnic
group.
11. Rural Poverty Among sub-counties where the Baganda were the majority, 21 percent of them had less than
10 percent of their population below the poverty line. This was the highest proportion across
all major ethnic groups that were dominant in sub-counties. Sub-counties that had a very
high proportion of their population below the poverty line are dominated by ethnic groups
dominant in northern and eastern Uganda. This is consistent with the analysis that ranked
ethnic groups by household welfare, amenities, ownership of assets, levels of education and
related indicators.
12. Conclusion Our data show that while many economic and human development challenges cut across
ethnic groups, there remain stark inequalities between Uganda’s main ethnic groups. This is
evident both from our analysis of the census data, and also from a closer look at the UBOS
study, “Spatial Trends of Poverty and Inequality in Uganda: 2002-2005.” Poverty rates, for
example, are much higher in northern and northeastern Uganda, which are regions inhabited

24
predominantly by the Lugbara, Madi, Acholi, Langi, Iteso and Karimojong, than in much of
western and central Uganda, which are inhabited primarily by groups such as the Baganda,
Banyoro, Banyankole, Bakiga, Batoro and others. We recognize that intermarriage and
migration, among other factors, add some margin of error to our findings, but the overall
trends remain. As previously mentioned, this study does not attempt to answer the question of
why such disparities exist, but rather attempts to describe trends in economic well-being
across ethnic groups as objectively as possible. Further research may help answer the
questions of not only why such inequalities continue to exist in Uganda today, but also how
these inequalities can be reduced to promote a more integrated, productive and prosperous
society.
We do not make policy prescriptions here, but hope that policymakers, researchers,
civil society and others are able to build upon and use this report in a way that improves the
lives and livelihoods of all Ugandans.

25
13. References MGLSD 2006: Uganda National Culture Policy. UBOS 2008: 2002 PHC, Analytical report on Household Characteristics UBOS 2008: Spatial Trends of Poverty and Inequality in Uganda, 2002-2005

26
14. Annexes Annex A.1: Primary and Secondary School Net Enrolment rates by Sex and Ethnicity
Primary School Net Enrolment rates (%)
Secondary School Net Enrolment rates (%)
Male Female Total Male Female Total Baganda 90.7 91.3 91.0 33.0 37.8 35.5 Baruli 91.5 92.1 91.8 21.7 22.0 21.8 Bagisu 90.6 91.3 91.0 28.4 29.0 28.7 Bagwere 85.4 86.3 85.9 20.1 17.0 18.5 Banyole 87.1 87.6 87.3 21.0 19.0 20.0 Basamia 90.1 90.2 90.1 27.7 21.8 24.7 Basoga 89.2 90.2 89.7 27.1 25.4 26.3 Kakwa 84.2 79.9 82.1 21.1 13.2 17.2 Iteso 87.6 87.1 87.4 21.9 17.4 19.7 Jopadhola 86.8 86.2 86.5 21.5 17.3 19.4 Sabiny 91.7 92.3 92.0 35.9 34.8 35.4 Acholi 84.2 80.5 82.4 26.5 17.4 22.0 Alur 80.5 73.7 77.1 13.8 8.4 11.1 Karimo-jong 22.5 21.8 22.1 3.8 3.2 3.5 Langi 81.1 78.8 79.9 22.4 13.0 17.8 Lugbara 85.8 81.9 83.9 19.3 11.9 15.6 Madi 84.0 81.2 82.7 24.3 17.5 21.0 Bafumbira 79.6 78.3 79.0 14.8 11.7 13.2 Bagungu 83.8 83.7 83.7 17.0 14.4 15.7 Bahororo 90.4 91.9 91.2 20.1 25.1 22.6 Bakiga 83.5 83.9 83.7 14.5 13.8 14.2 Bakhonzo 87.1 87.0 87.0 26.6 23.5 25.0 Banyankole 87.7 88.7 88.2 18.7 21.4 20.1 Banya-rwanda 84.0 86.0 85.0 15.1 18.8 16.9 Banyoro 87.8 89.5 88.6 22.7 25.6 24.2 Batoro 83.7 85.4 84.6 17.6 20.6 19.1 Other Ugandans 80.9 81.4 81.1 22.4 18.9 20.7 Non-Ugandans 83.7 83.2 83.4 23.0 17.8 20.6 Total 85.9 85.7 85.8 23.5 22.5 23.0

27
Annex A.2: Literate Population and literacy rate by Ethnicity, 1991-2002
Population Literate
(‘000s) Literacy rate (%) Ethnic group 1991 2002 1991 2002
Percent Increase
Baganda 1512.1 2402.4 78.2 87.6 9.4 Banyankole 581.4 1158.9 53.1 74.2 21.1 Basoga 461.8 871.8 51.7 68.5 16.8 Bakiga 426.3 750.9 47.4 67.7 20.3 Iteso 315.8 607.1 46.6 61.6 15.0 Langi 336.2 641.6 51.9 68.6 16.7 Acholi 227.8 456.6 45.6 62.0 16.4 Bagisu 279.8 481.2 55.0 66.0 11.0 Lugbara 181.9 422.7 46.5 64.0 17.5 Banyoro/Bagungu 208.9 359.0 64.3 78.1 13.8 Bakhonzo 103.5 269.0 46.3 68.4 22.1 Batoro/Batuku/Basongora 189.0 317.6 57.6 74.9 17.3 Alur/Jonam 126.7 251.9 47.6 59.0 11.4 Bafumbira 47.9 172.6 37.8 58.5 20.7 Bagwere 87.3 146.8 47.5 58.3 10.8 Jopadhola 82.8 129.8 48.8 57.0 8.2 Banyole 70.1 125.7 47.4 60.8 13.4 Banyarwanda 95.1 134.9 45.8 62.7 16.9 Madi 61.1 131.0 50.0 66.7 16.7 Basamia 68.7 115.0 57.3 65.6 8.3 Karimojong/Dodoth/Tepeth 17.3 25.2 7.8 13.2 5.4 Other Ugandans 283.1 565.7 50.6 63.2 12.6 Total 5941.1 10782.0 54.0 69.6 15.6

28
Annex A.3: Proportion of Teenage mothers, Births in the last 12 months that were High Risk and Total fertility Rates by Ethnicity, 2002
Ethnicity Teenage mothers (%) Risky Births (%)
(12-19 Years) Too Early Too Many
Either of three1
Adjusted TFR
Baganda 17.1 23.9 24.8 50.1 5.9 Baruli 18.0 20.4 37.3 58.8 7.7 Bagisu 19.7 20.8 34.0 56.0 7.1 Bagwere 23.8 20.6 39.9 61.7 7.9 Banyole 21.6 20.5 40.2 61.5 7.9 Basamia 22.8 23.4 33.9 58.1 7.1 Basoga 19.9 19.6 38.7 59.4 7.6 Kakwa 16.6 16.3 30.4 48.5 6.8 Iteso 19.3 17.8 38.0 57.1 7.4 Jopadhola 22.3 19.3 38.7 59.1 7.5 Sabiny 15.7 16.2 35.1 52.0 7.8 Acholi 21.5 19.6 31.8 53.0 6.9 Alur 23.2 20.7 32.1 54.6 6.9 Karimojong 19.9 19.4 27.4 49.5 6.6 Langi 22.7 21.1 36.3 58.5 7.5 Lugbara 13.1 14.0 34.5 50.3 7.1 Madi 9.0 11.8 31.3 45.2 6.6 Bafumbira 12.3 14.9 34.2 50.6 7.3 Bagungu 24.3 24.5 32.8 58.2 6.9 Bahororo 7.2 11.2 32.3 45.1 6.6 Bakiga 11.7 13.4 35.2 49.9 7.3 Bakhonzo 17.4 20.3 35.6 56.6 7.8 Banyankole 12.2 14.3 32.7 48.4 6.9 Banyarwanda 17.1 17.5 33.5 52.5 7.0 Banyoro 18.4 20.8 33.3 55.1 6.9 Batoro 18.8 23.1 29.6 53.8 6.4 Other Ugandans 20.1 19.7 34.5 55.6 7.2 Non-Ugandans 19.1 18.8 30.8 51.3 6.4 Total 17.5 19.0 33.3 53.7 7.0 1 Either “Too early”, “Too many” or “Too late”

29
Annex A.4: Use and access to safe health and Sanitation amenities
Ethnicity
% With Safe water Drinking sources
% Of House-holds within 1 km from water source
% Of house-holds With safe toilet facility
Proportion of Households with a specified solid waste disposal method
Within 5 kms from health facility (%)
Within 1 kms from health facility (%)
Skip Bin Pit Heap Garden
Baganda 66.6 85.7 82.3 9.2 17.8 13.0 45.1 81.6 42.0
Baruli 57.3 62.3 64.4 2.2 24.7 23.0 31.2 61.2 18.2
Bagisu 69.4 85.7 72.0 2.6 28.9 8.5 55.0 78.1 32.1
Bagwere 62.4 78.6 63.8 2.5 31.9 27.2 26.9 80.2 27.2
Banyole 65.2 76.7 61.7 2.7 34.5 20.9 29.8 73.2 25.0
Basamia 50.8 76.8 63.6 4.3 33.7 14.4 32.9 73.5 29.6
Basoga 75.5 77.7 70.1 3.9 23.6 16.0 47.4 79.0 34.4
Kakwa 66.4 84.3 66.5 4.4 35.7 41.5 11.4 61.5 26.3
Iteso 64.8 66.0 45.0 2.4 23.5 25.6 39.3 67.4 19.2
Jopadhola 63.1 80.8 55.0 3.5 36.4 15.7 34.8 80.0 26.4
Sabiny 62.3 87.7 67.0 0.6 22.4 8.8 66.4 83.3 30.1
Acholi 50.1 75.0 41.2 3.3 24.1 62.7 3.7 63.4 25.6
Alur 61.3 83.6 66.9 2.8 37.7 33.7 17.8 76.4 28.1
Karimojong 77.4 67.5 9.7 0.9 4.8 40.2 16.4 68.7 30.1
Langi 59.3 73.9 57 1.2 20.7 59.8 12.1 58.3 14.5
Lugbara 67.3 79.6 62.1 1.9 26.4 42.2 23.2 73.3 25.2
Madi 82.2 83.1 60.7 1.5 43.7 39.1 8.1 85.5 35.1
Bafumbira 39.6 61.7 77.1 3.1 13.2 16.6 61.9 66.5 22.9
Bagungu 78.3 81.7 60.1 1.8 34.3 40.8 10.7 72.8 24.2
Bahororo 64.0 88.5 90.7 2.1 16.5 10.9 66.6 83.7 35.8
Bakiga 52.1 76.9 84.8 2.1 18.9 13.9 60.8 67.8 22.1
Bakhonzo 61.8 73.1 84.0 2.8 31.0 15.5 47.4 77.9 30.1
Banyankole 48.3 77.0 83.5 4.3 16.1 18.7 54.9 70.4 26.4 Banyarwanda 40.7 71.4 63.9 3.6 13.1 16.7 54.5 65.9 23.4
Banyoro 58.7 83.4 73.4 4.2 28.9 19.5 36.0 74.5 28.4
Batoro 48.9 88.8 82.2 5.7 22.7 14.5 50.2 74.8 30.4 Other Ugandans 57.8 74.7 60.5 2.8 25.4 32.7 30.8 71.1 27.1 Non-Ugandans 59.3 80.3 64.6 6.6 20.8 18.9 42.4 72.6 29.4
Total 60.9 78.5 69.7 4.3 22.6 23.8 40.2 73.3 29.1

30
Annex A.5: Source of household livelihood and type of dwelling unit
Source of household livelihood (%) Status of dwelling unit (%)
Ethnicity Subsistence farming
Employment income
Business enterprise
Permanent dwelling Temporary
Owner occupied and permanent
Baganda 46.3 27.8 11.8 43.2 35.5 31.1 Baruli 70.3 10.8 7.8 14.1 70.8 8.8 Bagisu 72.1 11.1 5.2 10.4 83.7 4.5 Bagwere 76.5 10.2 4.4 12.4 70.5 6.8 Banyole 75.6 9.9 4.7 12.7 71.3 7.2 Basamia 68.0 14.4 7.0 17.9 74.6 8.5 Basoga 67.8 13.7 7.2 20.8 52.9 11.6 Kakwa 67.5 16.6 5.9 10.4 86.1 2.9 Iteso 77.2 11.5 3.7 9.4 86.2 3.5 Jopadhola 74.3 13.8 4.0 13.6 76.7 6.5 Sabiny 79.6 8.6 3.7 3.5 94.3 1.4 Acholi 69.9 12.6 3.5 8.5 89.1 2.3 Alur 75.3 12.2 3.6 8.3 88.8 2.7 Karimojong 73.2 9.7 1.5 3.0 96.0 0.5 Langi 81.5 9.0 2.7 5.4 91.0 2.1 Lugbara 78.1 11.9 3.4 7.2 89.6 2.4 Madi 78.7 11.4 2.5 4.7 94.0 1.2 Bafumbira 81.4 9.6 2.9 9.3 82.4 4.6 Bagungu 64.1 11.1 9.1 10.4 81.6 5.5 Bahororo 73.9 11.4 6.1 8.0 80.5 4.2 Bakiga 80.7 9.4 3.6 7.1 86.2 2.7 Bakhonzo 78.1 10.6 4.6 10.1 82.2 4.2 Banyankole 70.9 13.7 7.3 14.9 73.8 6.6 Banyarwanda 65.1 14.3 6.3 15.3 70.7 7.8 Banyoro 63.1 16.9 9.2 18.7 68.7 10 Batoro 56.5 21.0 10.2 15.5 76.1 6.6 Other Ugandans 72.5 11.1 4.5 8.9 85.9 3.9 Non-Ugandans 56.9 15.5 6.3 15.4 74.5 5.8 Total 67.9 15.2 6.4 17.5 71.1 8.9

31
Annex A.6: Distribution of households by use of basic necessities, by ethnic head Proportion of Households (%)
Used soap for bathing
Consumed sugar at least once a day
Every house-hold member had a pair of shoes
Every house-hold member had at least 2 sets of clothing
Every child had a blanket
That had all the basic necessities
Baganda 95.3 70.1 71.8 88.3 49.5 38.9 Baruli 94.4 53.9 44.3 79.2 34.1 19.5 Bagisu 93.3 68.8 37.5 73.3 31.1 18.3 Bagwere 90.4 41.4 21.4 62.3 17.8 10.0 Banyole 90.8 48.2 24.3 63.6 21.2 11.3 Basamia 94.2 46.2 42.1 73.9 36.4 19.4 Basoga 93.1 61.3 38.7 73.9 36.1 22.0 Kakwa 93.1 58.2 44.2 81.3 30.6 19.1 Iteso 91.5 33.6 21.0 74.8 14.1 7.7 Jopadhola 92.3 42.1 31.8 71.3 23.8 13.2 Sabiny 94.9 68.7 48.1 80.9 33.4 21.1 Acholi 75.1 24.3 23.4 58.8 26.8 10.6 Alur 89.5 35.7 36.3 81.7 30.3 13.2 Karimojong 26.4 12.9 9.5 23.3 5.6 3.2 Langi 91.5 32.0 21.3 77.2 20.7 8.9 Lugbara 90.8 43.2 35.1 80.9 25.7 13.8 Madi 88.1 39.3 39.3 85.7 32.3 15.3 Bafumbira 94.2 29.8 39.5 85.4 33.1 12.3 Bagungu 95.0 56.8 37.1 85.4 24.0 14.3 Bahororo 94.6 37.7 57.7 85.1 47.9 21.9 Bakiga 93.1 30.1 40.6 84.1 36.5 12.9 Bakhonzo 88.7 38.6 41.4 76.1 33.2 16.0 Banyankole 94.7 42.2 55.7 83.7 45.9 21.8 Banya-rwanda 92.4 42.2 49.5 79.6 36.1 18.9 Banyoro 96.3 60.0 56.3 85.5 46.7 27.4 Batoro 94.7 60.9 56.0 81.9 42.2 27.3 Other Ugandans 84.9 45.0 35.9 72.3 28.9 15.3 Non-Ugandans 86.7 43.3 44.0 75.8 30.4 16.6 Total 91.3 48.2 44.0 78.6 34.8 20.2
32
Annex A.7: Proportion of households by main type of lighting and cooking fuel by ethnicity of head Major Lighting fuels (%) Major Cooking fuels (%)
Tadooba
Lan-tern
Electricity
Fire-wood
Electric/Gas/ Paraffin
Char-coal
Fire-wood
Baganda 61.0 16.9 19.9 0.8 4.3 33.4 61.2 Baruli 82.7 11.3 2.7 2.0 1.3 10.7 87.6 Bagisu 80.4 11.9 5.1 1.6 2.1 12.5 84.7 Bagwere 87.2 6.1 4.1 1.9 1.6 9.8 88.1 Banyole 86.8 6.1 4.3 1.9 1.8 10.4 87.3 Basamia 81.9 9.3 6.5 1.4 2.3 17.2 79.9 Basoga 84.0 6.7 6.9 1.4 1.8 16.9 80.8 Kakwa 78.1 14 4.3 2.0 2.1 22.7 74.3 Iteso 81.2 6.3 4.1 6.9 1.4 9.6 88.7 Jopadhola 85.7 6.5 5.3 1.5 1.9 11.5 86.3 Sabiny 80.1 13.9 1.9 3.0 1.2 5.4 93.2 Acholi 66.5 11.4 4.6 8.5 1.5 13.7 84.2 Alur 79.7 12.2 3.7 3.2 1.7 10.5 87.6 Karimojong 12.2 4.3 1.0 80.6 0.6 4.7 94.4 Langi 81.6 10 2.6 3.1 1.1 8.2 90.3 Lugbara 78.4 13.9 2.5 3.6 1.4 10.8 87.5 Madi 77.0 11.4 2.9 5.4 1.3 11.9 86.5 Bafumbira 86.0 5.8 4.2 3.1 1.6 7.7 89.7 Bagungu 78.1 16.6 2.7 1.2 2.0 12.2 85.5 Bahororo 76.9 16.7 4.6 1.2 1.4 7 91 Bakiga 84.9 7.2 3.6 3.2 1.5 6.3 91.7 Bakhonzo 84.5 6.9 4.4 2.8 2.0 9.7 88 Banyankole 76.2 13.6 7.4 1.8 2.6 11.4 85.1 Banyarwanda 84.2 6.7 5.6 2.4 1.9 12.3 85 Banyoro 80.4 9.8 6.9 1.8 2.2 14.7 82.7 Batoro 78.4 10 8.4 1.9 3.0 12.5 83.8 Other Ugandans
75.6 9.3 4.0 9.7 1.7 10.2 87.7 Non-Ugandans 77.2 7.6 9.1 4.0 5.6 14.7 78.9 Total 75.9 10.8 7.8 3.8 2.3 15.4 81.6

33
Annex A.8: Proportion of households by ownership of basic facilities by ethnicity of head
Ethnicity
% With all basic facilities
% With a built bathroom
% With a built Kitchen
% Has no Basic facility
% Owns Radio
Baganda 32.4 55.8 51.5 9.7 65.2 Baruli 16.9 27.9 51.0 20.8 56.7 Bagisu 19.5 30.1 56.2 14.8 43.3 Bagwere 20.7 32.6 68.9 12.8 37.8 Banyole 18.4 29.6 59.3 18.0 41.0 Basamia 18.1 31.0 57.8 17.4 48.4 Basoga 24.2 39.1 56.6 14.7 45.3 Kakwa 24.8 40.7 60.0 14.3 43.6 Iteso 11.5 21.3 60.6 23.7 39.8 Jopadhola 14.7 26.3 59.1 20.3 40.3 Sabiny 12.4 17.5 65.7 12.8 35.9 Acholi 11.5 23.4 48.7 31.2 32.1 Alur 27.5 39.7 61.8 15.9 42.3 Karimojong 3.7 10.1 12.9 81.0 9.7 Langi 13.4 21.7 68.4 16.6 38.9 Lugbara 28.4 42.8 63.3 17.1 38 Madi 19.9 33.4 50.5 21.3 29.8 Bafumbira 22.1 31.7 62.1 11.7 40.1 Bagungu 16.4 26.9 48.4 25.0 56.1 Bahororo 23.3 27.9 73.6 5.2 64.3 Bakiga 20.9 27.0 62.1 8.9 49.9 Bakhonzo 22.4 29.5 57.5 9.4 41.9 Banyankole 21.5 30.4 61.4 9.6 62.2 Banyarwanda 19.0 31.9 47.8 22.7 48.1 Banyoro 21.2 31.8 55.7 15.0 67.7 Batoro 21.4 30.1 60.9 10.4 63.4 Other Ugandans 17.0 26.0 53.7 22.0 39.3 Non-Ugandans 20.5 33.1 45.8 22.9 41.9 Total 21.8 34.5 57.0 15.6 49.2

34
Annex A.9: Ranking of Ethnic groups by a Composite Index
Ethnic group
That had all the basic necessities (%)
Employment income (%)
Permanent dwelling (%)
% Of HHS With safe toilet facility
With all basic facilities (%)
Owning Radio (%)
Using Electricity for lighting (%)
Sec, school.
NER
Primary. School
NER Composite Index
Baganda 38.9 27.8 43.2 82.3 32.4 65.2 19.9 35.5 91.0 45.8
Banyoro 27.4 16.9 18.7 73.4 21.2 67.7 6.9 24.2 88.6 35.2
Batoro 27.3 21 15.5 82.2 21.4 63.4 8.4 19.1 84.6 35.1
Banyankole 21.8 13.7 14.9 83.5 21.5 62.2 7.4 20.1 88.2 34.0
Bahororo 21.9 11.4 8 90.7 23.3 64.3 4.6 22.6 91.2 33.9
Basoga 22.0 13.7 20.8 70.1 24.2 45.3 6.9 26.3 89.7 31.9
Basamia 19.4 14.4 17.9 63.6 18.1 48.4 6.5 24.7 90.1 30.6
Bakhonzo 16.0 10.6 10.1 84 22.4 41.9 4.4 25 87 29.9
Baruli 19.5 10.8 14.1 64.4 16.9 56.7 2.7 21.8 91.8 29.8
Bagisu 18.3 11.1 10.4 72 19.5 43.3 5.1 28.7 91.0 29.5
Banyarwanda 18.9 14.3 15.3 63.9 19 48.1 5.6 16.9 85.0 28.9
Bakiga 12.9 9.4 7.1 84.8 20.9 49.9 3.6 14.2 83.7 28.8
Kakwa 19.1 16.6 10.4 66.5 24.8 43.6 4.3 17.2 82.1 28.3
Bagungu 14.3 11.1 10.4 60.1 16.4 56.1 2.7 15.7 83.7 27.5
Banyole 11.3 9.9 12.7 61.7 18.4 41.0 4.3 20 87.3 26.7
Bafumbira 12.3 9.6 9.3 77.1 22.1 40.1 4.2 13.2 79.0 26.7
Bagwere 10.0 10.2 12.4 63.8 20.7 37.8 4.1 18.5 85.9 26.4
Jopadhola 13.2 13.8 13.6 55 14.7 40.3 5.3 19.4 86.5 26.3
Alur 13.2 12.2 8.3 66.9 27.5 42.3 3.7 11.1 77.1 26.2
Sabiny 21.1 8.6 3.5 67 12.4 35.9 1.9 35.4 92.0 26.1
Lugbara 13.8 11.9 7.2 62.1 28.4 38.0 2.5 15.6 83.9 25.7
Iteso 7.7 11.5 9.4 45 11.5 39.8 4.1 19.7 87.4 23.8
Madi 15.3 11.4 4.7 60.7 19.9 29.8 2.9 21 82.7 23.7
Langi 8.9 9 5.4 57 13.4 38.9 2.6 17.8 79.9 23.2
Acholi 10.6 12.6 8.5 41.2 11.5 32.1 4.6 22 82.4 22.3
Karimojong 3.2 9.7 3.0 9.7 3.7 9.7 1.0 3.5 22.1 6.9

35
Annex A10: Proportion of Sub-Counties by majority ethnic group, ordered by the percentage of individuals below the poverty line in the Sub-counties, (Uganda, 2005)
Proportion of the Population in the Sub-counties below the
poverty line
Major Ethnic groups
Below 10%
10% or more but less than 15%
15% or more but less than 20%
20% or more but less than 30%
30% or more but less than 40%
40% or more but less than 50%
50% or more but less than 60%
More than 60% Total
Proportion of Sub-counties where the Ethnic group is a majority Baganda 20.5 4.5 22.4 46.2 6.4 0.0 0.0 0.0 100 Banyankole 3.3 23.9 37.0 25.0 10.9 0.0 0.0 0.0 100 Batoro 0.0 23.8 61.9 9.5 4.8 0.0 0.0 0.0 100 Banyoro 3.3 33.3 40.0 23.3 0.0 0.0 0.0 0.0 100 Bakiga 0.0 3.8 39.6 49.1 7.5 0.0 0.0 0.0 100 Bakhonzo 0.0 4.5 31.8 59.1 4.5 0.0 0.0 0.0 100 Bahororo 16.7 50.0 33.3 0.0 0.0 0.0 0.0 0.0 100 Bafumbira 0.0 7.1 14.3 71.4 7.1 0.0 0.0 0.0 100 Basoga 0.0 0.0 1.4 4.3 77.1 17.1 0.0 0.0 100 Baruli 0.0 9.1 0.0 18.2 63.6 9.1 0.0 0.0 100 Bagwere 0.0 0.0 0.0 0.0 5.0 75.0 20.0 0.0 100 Banyole 0.0 0.0 0.0 0.0 71.4 28.6 0.0 0.0 100 Bagisu 0.0 0.0 0.0 8.7 84.8 6.5 0.0 0.0 100 Basamia 0.0 0.0 0.0 27.3 63.6 9.1 0.0 0.0 100 Kakwa 0.0 0.0 0.0 0.0 0.0 0.0 25.0 75.0 100 Iteso 0.0 0.0 0.0 0.0 15.0 78.3 5.0 1.7 100 Jopadhola 0.0 0.0 0.0 0.0 100.0 0.0 0.0 0.0 100 Sabiny 0.0 0.0 0.0 0.0 86.7 13.3 0.0 0.0 100 Acholi 0.0 0.0 0.0 3.6 0.0 0.0 12.5 83.9 100 Alur 0.0 0.0 0.0 17.6 5.9 23.5 41.2 11.8 100 Karimojong 0.0 0.0 0.0 0.0 0.0 0.0 0.0 100.0 100 Langi 0.0 0.0 0.0 0.0 0.0 24.4 53.3 22.2 100 Lugbara 0.0 0.0 0.0 2.8 2.8 25.0 36.1 33.3 100 Madi 0.0 0.0 0.0 0.0 0.0 0.0 50.0 50.0 100 Bagungu 0.0 0.0 0.0 0.0 100.0 0.0 0.0 0.0 100 Banyarwanda
0.0 0.0 0.0 0.0 100.0 0.0 0.0 0.0 100 National 4.5 6.4 15.6 21.0 21.4 13.1 7.7 10.3 100
For more information please email Fanaka Kwa Wote at: [email protected]
Related Documents