UGANDA PUBLIC FINANCIAL MANAGEMENT REFORM STRATEGY (July 2018 – June 2023) THE REPUBLIC OF UGANDA

Welcome message from author
This document is posted to help you gain knowledge. Please leave a comment to let me know what you think about it! Share it to your friends and learn new things together.
Transcript
UG
AN
DA
PU
BLIC
FIN
AN
CIA
L MA
NA
GE
ME
NT
RE
FO
RM
ST
RA
TE
GY
(Ju
ly 20
18 Ju
ne
20
23
)
VU
MINISTRY OF FINANCE, PLANNING AND ECONOMIC DEVELOPMENT
Plot 2-12& 2A, Sir Apollo Kaggwa Road P.O.Box 8147 KampalaDIR: (256)-414-231390 FAX:(256)-414-230163 OR (256)-414-341286
UGANDA PUBLIC FINANCIALMANAGEMENT REFORM STRATEGY
(July 2018 – June 2023)
THE REPUBLIC OF UGANDA

UG
AN
DA
PU
BLIC
FIN
AN
CIA
L MA
NA
GE
ME
NT
RE
FO
RM
ST
RA
TE
GY
(Ju
ly 20
18 Ju
ne
20
23
)
UGANDA PUBLIC FINANCIALMANAGEMENT REFORM STRATEGY
(July 2018 – June 2023)
THE REPUBLIC OF UGANDA

1Uganda Public Financial Management Reform Strategy
UGANDA PUBLIC FINANCIALMANAGEMENT REFORM STRATEGY
(July 2018 – June 2023)
Reform Goal“To enhance resource mobilisation, improve planning and public investment management, and strengthen accountability for quality, effective and efficient service delivery”
2 Uganda Public Financial Management Reform Strategy
TABLE OF CONTENTS TABLE OF CONTENTS ..................................................................................................................................................... 2 ACRONYMS AND ABBREVIATIONS .............................................................................................................................. 4 FOREWORD ...................................................................................................................................................................... 8 ACKNOWLEDGEMENT ................................................................................................................................................... 9 EXECUTIVE SUMMARY ................................................................................................................................................ 10 1 BACKGROUND: PFM REFORM PROGRESS AND CURRENT PERFORMANCE...... 16
1.1 Introduction ............................................................................................................................................. 16 1.2 Economic and Policy Context .................................................................................................................. 16 1.3 Progress towards PFM Reforms in Uganda (1986 -2018) ....................................................................... 18
1.3.1 Level 1 Progress: Impact on Service Delivery .................................................................................. 20 1.3.2 Level 2 Progress: PFM Outcomes .................................................................................................... 20 1.3.3 Level 3 Progress: PFM Reform Programme ..................................................................................... 23
1.4 Summary of PFM Strengths and Weaknesses ......................................................................................... 23 1.5 Opportunities for future PFM reforms .................................................................................................... 26 1.6 Threats ..................................................................................................................................................... 27 1.7 Lessons and Emerging Priorities for PFM reform .................................................................................... 28
2 SITUATION ANALYSIS OF PFM PRIORITY AREAS .................................................... 31 2.1 Sustainable Resource Mobilization ......................................................................................................... 31 2.2 Planning and Budgeting ........................................................................................................................... 34 2.3 Public Investment Management ............................................................................................................. 38 2.4 Accountability Systems and compliance in Budget Execution ................................................................ 41 2.5 Local Government PFM for Service Delivery ........................................................................................... 45 2.6 External Oversight and Governance of PFM Reforms ............................................................................. 47
3 PFM REFORM STRATEGY FY2018/19 to FY2022/23 ...................................................... 51 3.1 PFM Reform Principles ............................................................................................................................ 51 3.2 Overall Vision, Goal and Purpose ............................................................................................................ 51 3.3 Theory of Change .................................................................................................................................... 52 3.4 Approach to Sequencing of PFM reforms ............................................................................................... 53 3.5 Reform Priority Areas and Key Interventions .......................................................................................... 56
3.5.1 Sustainable Resource Mobilisation ................................................................................................. 56 3.5.2 Planning and Budgeting ................................................................................................................... 59 3.5.3 Public Investment Management ..................................................................................................... 63 3.5.4 Accountability systems and compliance in budget execution ........................................................ 66 3.5.5 Local Government PFM for Service Delivery ................................................................................... 70 3.5.6 External Oversight and Governance of PFM Reforms ..................................................................... 73
3.6 PFM Reform Strategy Contribution to Wider Policy Objectives ............................................................. 76
3.6.1 International policy and PFM standards ......................................................................................... 76 3.6.2 EAC Regional Integration Policy ...................................................................................................... 76 3.6.3 National Development Plan (NDP II) ............................................................................................... 77 3.6.4 Accountability Sector Investment Plan (ASSIP) ............................................................................... 78 3.6.5 Fiscal Decentralisation ..................................................................................................................... 79
3.7 Other Reforms Complementary to PFM.................................................................................................. 79 3.8 Institutional Linkages to the PFM Reform Strategy................................................................................. 80
4 IMPLEMENTATION PLAN ................................................................................................ 82
3Uganda Public Financial Management Reform Strategy
TABLE OF CONTENTS TABLE OF CONTENTS ..................................................................................................................................................... 2 ACRONYMS AND ABBREVIATIONS .............................................................................................................................. 4 FOREWORD ...................................................................................................................................................................... 8 ACKNOWLEDGEMENT ................................................................................................................................................... 9 EXECUTIVE SUMMARY ................................................................................................................................................ 10 1 BACKGROUND: PFM REFORM PROGRESS AND CURRENT PERFORMANCE...... 16
1.1 Introduction ............................................................................................................................................. 16 1.2 Economic and Policy Context .................................................................................................................. 16 1.3 Progress towards PFM Reforms in Uganda (1986 -2018) ....................................................................... 18
1.3.1 Level 1 Progress: Impact on Service Delivery .................................................................................. 20 1.3.2 Level 2 Progress: PFM Outcomes .................................................................................................... 20 1.3.3 Level 3 Progress: PFM Reform Programme ..................................................................................... 23
1.4 Summary of PFM Strengths and Weaknesses ......................................................................................... 23 1.5 Opportunities for future PFM reforms .................................................................................................... 26 1.6 Threats ..................................................................................................................................................... 27 1.7 Lessons and Emerging Priorities for PFM reform .................................................................................... 28
2 SITUATION ANALYSIS OF PFM PRIORITY AREAS .................................................... 31 2.1 Sustainable Resource Mobilization ......................................................................................................... 31 2.2 Planning and Budgeting ........................................................................................................................... 34 2.3 Public Investment Management ............................................................................................................. 38 2.4 Accountability Systems and compliance in Budget Execution ................................................................ 41 2.5 Local Government PFM for Service Delivery ........................................................................................... 45 2.6 External Oversight and Governance of PFM Reforms ............................................................................. 47
3 PFM REFORM STRATEGY FY2018/19 to FY2022/23 ...................................................... 51 3.1 PFM Reform Principles ............................................................................................................................ 51 3.2 Overall Vision, Goal and Purpose ............................................................................................................ 51 3.3 Theory of Change .................................................................................................................................... 52 3.4 Approach to Sequencing of PFM reforms ............................................................................................... 53 3.5 Reform Priority Areas and Key Interventions .......................................................................................... 56
3.5.1 Sustainable Resource Mobilisation ................................................................................................. 56 3.5.2 Planning and Budgeting ................................................................................................................... 59 3.5.3 Public Investment Management ..................................................................................................... 63 3.5.4 Accountability systems and compliance in budget execution ........................................................ 66 3.5.5 Local Government PFM for Service Delivery ................................................................................... 70 3.5.6 External Oversight and Governance of PFM Reforms ..................................................................... 73
3.6 PFM Reform Strategy Contribution to Wider Policy Objectives ............................................................. 76
3.6.1 International policy and PFM standards ......................................................................................... 76 3.6.2 EAC Regional Integration Policy ...................................................................................................... 76 3.6.3 National Development Plan (NDP II) ............................................................................................... 77 3.6.4 Accountability Sector Investment Plan (ASSIP) ............................................................................... 78 3.6.5 Fiscal Decentralisation ..................................................................................................................... 79
3.7 Other Reforms Complementary to PFM.................................................................................................. 79 3.8 Institutional Linkages to the PFM Reform Strategy................................................................................. 80
4 IMPLEMENTATION PLAN ................................................................................................ 82
4.1 PFM Implementation Institutional Framework ....................................................................................... 82 4.2 National Coordination Arrangements ..................................................................................................... 82 4.3 Accountability Sector ............................................................................................................................... 82 4.4 The Public Expenditure Management Committee (PEMCOM) ............................................................... 83
4.4.1 PFM Technical Sub-Committees ...................................................................................................... 84 4.4.2 PFM Reform Secretariat .................................................................................................................. 85
4.5 Key PFM Reform Implementing Institutions ........................................................................................... 88 4.6 Financing of PFM Reforms ....................................................................................................................... 88
5 CHANGE MANAGEMENT AND COMMUNICATION .................................................. 94 5.1 Rationale for Change Management and Communications ..................................................................... 94 5.2 Change Management Strategies for PFM reform ................................................................................... 94 5.3 Internal Communications ........................................................................................................................ 96 5.4 External Communications........................................................................................................................ 97
6 RISK MANAGEMENT ......................................................................................................... 99 6.1 Approach to Risk Management ............................................................................................................... 99 6.2 Risk Management Process and Method .................................................................................................. 99
7 SUSTAINABILITY PLAN ................................................................................................. 103 7.1 Mainstreaming of Reforms into Recurrent Government Budget.......................................................... 103 7.2 Staffing and Public Administration Structures ...................................................................................... 104 7.3 Capacity Building Approach ................................................................................................................... 104
8 MONITORING AND EVALUATION .............................................................................. 106 8.1 Strategic Results Framework ................................................................................................................. 106 8.2 M&E Framework and Process ............................................................................................................... 106 8.3 M&E Roles and Responsibilities ............................................................................................................ 107 8.4 Embedding Learning and Feedback ....................................................................................................... 107 8.5 Web-based Monitoring & Evaluation .................................................................................................... 108 8.6 Link between the PFM Reform Strategy with GOU's Performance Assessment System ...................... 108 8.7 Mechanism for updating the Results Framework of the PFM Reform Strategy ................................... 109
Annex A: List of Documents Consulted .............................................................................................................. 110 Annex B: Summary of performance against the PFM Outcome Indicators (as defined in PFM Strategy 2014-2018) .................................................................................................................................................. 111 Annex C: Costed Implementation Plan ................................................................................................................ 113 Annex D: Strategic Results Framework - High-level Objectives and Intermediate Outcomes ............... 149 Annex E: PFM Reform Strategy List of Technical and Core Design Team .................................................. 161 Annex F: List of Persons Consulted ...................................................................................................................... 163
4 Uganda Public Financial Management Reform Strategy
ACRONYMS AND ABBREVIATIONS ACCA Association of Chartered Certified Accountants AFS Annual Financial Statements AG Accountant General AGA Autonomous Government Agency AGO Accountant General’s Office AMIS Aid Management Information System AO Accounting Officer ASSIP Accountability Sector Strategic Investment Plan ASWG Accountability Sector Working Group ASYCUDA Automated System for Customs Data BCC Budget Call Circular BEB Best Evaluated Bidder BoU Bank of Uganda BUBU Buy Uganda Build Uganda CAO Chief Administrative Officer CC Contracts Committee CEMAS Computerized Education Management and Accounting System CF Contingencies Fund CFE Certified Fraud Examiner CFO Chief Financial Officer CG Central Government CIA Certified Internal Auditor CIFA Country Integrated Fiduciary Assessment CIID Criminal Intelligence and Investigations Division CIPS Chartered Institute of Purchasing and Supplies CISA Certified Information Systems Auditor CoA Chart of Accounts COFOG Classification of the Functions of Government COSASE Committee of State Authorities and State Enterprises CPA Country Poverty Assessment CSBAG Civil Society Budget Advocacy Group CSO Civil Society Organization DB Directorate of Budget DBA Database Administrator DC Development Committee DDCP Directorate of Debt and Cash Policy DEA Directorate of Economic Affairs DEI Directorate of Ethics and Integrity DFID UK Department for International Development DLG District Local Government DMS Debt Management Strategy DP Development Partner DRC Disaster Recovery Centre DRM Domestic Revenue Mobilisation DRS Disaster Recovery Site DST Deputy Secretary to the Treasury EAC East African Community EAPF East African Procurement Forum EC European Commission / Evaluation Committee EDMS Electronic Data Management System EFMP Economic Financial Management Programme
5Uganda Public Financial Management Reform Strategy
ACRONYMS AND ABBREVIATIONS ACCA Association of Chartered Certified Accountants AFS Annual Financial Statements AG Accountant General AGA Autonomous Government Agency AGO Accountant General’s Office AMIS Aid Management Information System AO Accounting Officer ASSIP Accountability Sector Strategic Investment Plan ASWG Accountability Sector Working Group ASYCUDA Automated System for Customs Data BCC Budget Call Circular BEB Best Evaluated Bidder BoU Bank of Uganda BUBU Buy Uganda Build Uganda CAO Chief Administrative Officer CC Contracts Committee CEMAS Computerized Education Management and Accounting System CF Contingencies Fund CFE Certified Fraud Examiner CFO Chief Financial Officer CG Central Government CIA Certified Internal Auditor CIFA Country Integrated Fiduciary Assessment CIID Criminal Intelligence and Investigations Division CIPS Chartered Institute of Purchasing and Supplies CISA Certified Information Systems Auditor CoA Chart of Accounts COFOG Classification of the Functions of Government COSASE Committee of State Authorities and State Enterprises CPA Country Poverty Assessment CSBAG Civil Society Budget Advocacy Group CSO Civil Society Organization DB Directorate of Budget DBA Database Administrator DC Development Committee DDCP Directorate of Debt and Cash Policy DEA Directorate of Economic Affairs DEI Directorate of Ethics and Integrity DFID UK Department for International Development DLG District Local Government DMS Debt Management Strategy DP Development Partner DRC Disaster Recovery Centre DRM Domestic Revenue Mobilisation DRS Disaster Recovery Site DST Deputy Secretary to the Treasury EAC East African Community EAPF East African Procurement Forum EC European Commission / Evaluation Committee EDMS Electronic Data Management System EFMP Economic Financial Management Programme
EFT Electronic Funds Transfer e-GP Electronic Government Procurement EPR Economic Performance Report ERP Enterprise Resource Planning EXCO Executive Committee FINMAP Financial Management and Accountability Programme FMS Fiduciary (Financial) Management System FS Financial Secretary FY Financial Year (Fiscal Year) GAPP Governance, Accountability, Participation, Performance Programme GFS Government Financial Statistics GFSM Government Financial Statistics Manual GoU Government of Uganda GPP Government Procurement Portal GPRS Growth and Poverty Reduction Strategy GSPS Growth and Social Protection Strategy HCM Human Capital Management HCMC Head Change Management and Communication HFAM Head Finance and Administration Manager HOD Heads of Department HOP Head of Procurement HPDU Head Procurement and Disposal Unit HPME Head Planning Monitoring and Evaluation HR Human Resource HSE High Spend Entity IaaS Infrastructure as a Service IAG Internal Auditor General ICPAU Institute of Certified Public Accountants of Uganda ICSC Implementation Coordination Steering Committee ICT Information Communication Technology IFMS Integrated Financial Management System IG Inspectorate of Government IGG Inspector General of Government IMC Internal Monitoring Committee IMEM Integrated Macro-Economic Model IMF International Monetary Fund INTOSAI International Organization of Supreme Audit Institutions IPPS Integrated Personnel and Payroll System IPPU Institute of Procurement Professionals of Uganda IPS Institute of Parliamentary Studies IPSAS International Public Sector Accounting Standards IRD Internal Revenue Department ITAS Integrated Tax Administration System ITF In-house Training Facility KCCA Kampala Capital City Authority KPI Key Performance Indicator LAN Local Area Network LG Local Government LGAC Local Government Accounts Committee LGFC Local Government Finance Commission LMTP Large Medium Tax Payers MAAIF Ministry of Agriculture, Animal Industry and Fisheries
6 Uganda Public Financial Management Reform Strategy
MALGs Ministries, Agencies, and Local Governments MCs Municipal Councils MDAs Ministries, Departments and Agencies MDG Millennium Development Goals MoES Ministry of Education and Sports MoFPED Ministry of Finance, Planning and Economic Development MoH Ministry of Health MoLG Ministry of Local Government MLHUD Ministry of Lands, Housing and Urban Development MoPS Ministry of Public Service MoU Memorandum of Understanding MoWE Ministry of Water and Environment MoWT Ministry of Works and Transport MSU Management Support Unit MTEF Medium Term Expenditure Framework MTFFO Medium Term Fiscal Framework MTN Mobile Telecommunication Network NBI National data transmission Backbone Infrastructure NDP National Development Plan NPA National Planning Authority NITA-U National Information Technology Authority, Uganda NMS National Medical Stores NRM National Resistance Movement NSIS National Security Information System NSSF National Social Security Fund NTR Non Tax Revenue OAG Office of the Auditor General OBT Output-based Budgeting Tool OPM Office of the Prime Minister PAC Public Accounts Committee PAD Project Appraisal Document PAP Project Analysis and Public Investment Management Department PBB Program-Based Budgeting / Performance-Based Budgeting PBS Program Budgeting System PC Programme Coordinator PDE Procuring and Disposing Entity PDU Procurement and Disposal Unit PE Public Enterprise PEFA Public Expenditure and Financial Accountability PEMCOM Public Expenditure Management Committee PFAA Public Finance and Accountability Act PFM Public Financial Management PID Programme Implementation Document PIMS Public Investment Management System PIP Public Investment Plan PM Project Manager PMO Project Management Office PPCs Project Preparation Committees PPDA Public Procurement and Disposal of Public Assets Authority PPMS Public Procurement Management System PPPs Public-Private Partnerships PRAM Priority Reform Action Matrix
7Uganda Public Financial Management Reform Strategy
MALGs Ministries, Agencies, and Local Governments MCs Municipal Councils MDAs Ministries, Departments and Agencies MDG Millennium Development Goals MoES Ministry of Education and Sports MoFPED Ministry of Finance, Planning and Economic Development MoH Ministry of Health MoLG Ministry of Local Government MLHUD Ministry of Lands, Housing and Urban Development MoPS Ministry of Public Service MoU Memorandum of Understanding MoWE Ministry of Water and Environment MoWT Ministry of Works and Transport MSU Management Support Unit MTEF Medium Term Expenditure Framework MTFFO Medium Term Fiscal Framework MTN Mobile Telecommunication Network NBI National data transmission Backbone Infrastructure NDP National Development Plan NPA National Planning Authority NITA-U National Information Technology Authority, Uganda NMS National Medical Stores NRM National Resistance Movement NSIS National Security Information System NSSF National Social Security Fund NTR Non Tax Revenue OAG Office of the Auditor General OBT Output-based Budgeting Tool OPM Office of the Prime Minister PAC Public Accounts Committee PAD Project Appraisal Document PAP Project Analysis and Public Investment Management Department PBB Program-Based Budgeting / Performance-Based Budgeting PBS Program Budgeting System PC Programme Coordinator PDE Procuring and Disposing Entity PDU Procurement and Disposal Unit PE Public Enterprise PEFA Public Expenditure and Financial Accountability PEMCOM Public Expenditure Management Committee PFAA Public Finance and Accountability Act PFM Public Financial Management PID Programme Implementation Document PIMS Public Investment Management System PIP Public Investment Plan PM Project Manager PMO Project Management Office PPCs Project Preparation Committees PPDA Public Procurement and Disposal of Public Assets Authority PPMS Public Procurement Management System PPPs Public-Private Partnerships PRAM Priority Reform Action Matrix
PS/ST Permanent Secretary/Secretary to the Treasury PSC Public Service Commission PSIP Public Sector Investment Program PTC Programme Technical Committee PUSATI Public University and Self-Accounting Tertiary Institution RCIP Regional Communications Infrastructure Program RDBMS Relational Database Management System REAP Resource Enhancement and Accountability Programme RFP Request for Proposals RFQ Request for Quotation RoP Register of Providers SaaS Software as a Service SBD Standard Bidding Document SLA Service Level Agreement SME Small and Medium Enterprises SNG Sub-National Government SO Standing Order SOE State Owned Enterprise STP Straight Through Processing SUGAR Strengthening Uganda’s Anti-Corruption Response Programme SWG Sector Working Group TA Technical Assistance TIU Transparency International Uganda ToR Terms of Reference TPD Tax Policy Department TSA Treasury Single Account UBOS Uganda Bureau of Statistics UGX Uganda Shillings UNRA Uganda National Roads Authority UPSSO Uganda Public Service Standing Orders URA Uganda Revenue Authority URF Uganda Road Fund USMID Uganda Support to Municipal Infrastructure Development Programme WB World Bank
8 Uganda Public Financial Management Reform Strategy
FOREWORD Uganda’s Public Financial Management (PFM) Reform Strategy encapsulates the Country’s aspirations towards strengthening governance systems of which accountability retains core focus for the next phase of PFM reforms between 2018 to 2023.
The introduction of this new strategic direction is opportune, particularly in the face of several diagnostics studies that have helped point crucial aspects in Uganda’s PFM eco-system that needed improvement. Key among these was the Public Expenditure and Financial Accountability (PEFA) assessment undertaken in 2016. Results from the assessments, affirmed that the PFM reforms have been successful in strengthening the fundamentals of public financial management in Uganda.
These outcomes reflect Governments’ strategic focus of PFM reforms over the past 20 years where the bulk of effort has been directed towards strengthening PFM systems. Previous PFM reforms aimed at strengthening budgeting, financial management, audit and procurement systems at all levels of government in order to ensure efficient, effective and accountable use of public resources for improved service delivery. The new PFM reforms strategy, however, ushers in a paradigm shift: a results-based approach to fix the gaps that have hampered the established PFM systems’ potential to deepen service delivery efficiently and effectively. We believe this represents the next phase of reforms.
The proposed reforms will also seek to leverage the established policy frameworks to deepen compliance to accountability stipulations and guidelines. This includes the recognition of the citizens’ role in strengthening the public accountability chain through fostering downward accountability.
The NRM Government remains committed to strengthening systems critical to the attainment of middle income status. The PFM reforms strategy is envisioned to enhance systems for resource mobilizations while boosting capacities and the attendant policy frameworks designed to increase return on Public Investments and value for money.
I commend this strategy to all those involved in the cause of transformation.
For God and My Country
Hon. Matia Kasaija Minister of Finance, Planning and Economic Development
ACKNOWLEDGEMENT I am pleased to share the Public Financial Management (PFM) Reforms Strategy (FY 2018/19 – FY2022/23). The design of the strategy was informed by various studies including the Public Expenditure and Financial Accountability (PEFA) assessment in 2016, the Mid-term review of the Third Financial Management and Accountability Programme (FINMAP III), the Government’s prime implementation framework. In addition, the strategy benefitted from wide stakeholder consultations, internal and external audit reports, as well as other oversight reports, and diagnostic studies undertaken for Government of Uganda by the World Bank and the International Monetary Fund (IMF), amongst others. A critical analysis of historical issues affecting PFM was undertaken and the Strength, Weaknesses, Threat and Opportunities (SWOT) approach was used to distil all current PFM issues, which act as barriers to effective service delivery, and proposed actions for improving management of public resources. Additionally, the design of this Public Financial Management (PFM) Reform Strategy would not have been possible without the contribution of a number of persons and institutions. Government is particularly indebted to the Deputy Secretary to the Treasury and Task Manager FINMAP III, Mr. Patrick Ocailap, and the Accountant General, Mr. Lawrence Semakula, who provided stewardship to the design process assisted by the Technical Design Team. More specifically, I wish to recognize the efforts of the Core Design Team led by Ag. Director Financial Management Services, Mr. Godfrey Ssemugooma, as well as the other members including: Mr. Anthony Kintu, Ms. Bernadette N. Kizito, Mr. Conrad Kahima, Ms. Esther Akullo Owor, Ms. Getrude Basiima, Mr.Hannington Ashaba, Mr. John Byaruhanga, Ms. Justine Ayebare, Mr. Hussein Isingoma, Mr. Joseph Enyimu, Mr. Moses Ogwapus, Mr. Onesmus Mulondo, Ms. Rossetti Nabumba, Mr. Stephen Barungi; and, Mr. Emmanuel Mugabi. Special compliments go to the PFM Reform Secretariat led by the Programme Coordinator of the FINMAP III, Mr. Johnson Mutesigensi, and all Programme Coordination Office (PCO) staff for providing necessary support to the design process. I am also very grateful to our esteemed Development Partners (DPs) for their continued contributions of both financial and technical support during this design process. In this regard, we recognise the support from the Governments of Denmark, Germany through KfW, the United Kingdom through DFID, Norway, World Bank, International Monetary Fund and specifically the European Union (EU). The EU provided financial and technical support to Government by facilitating consultants; Ms. Hazel Granger of Adam Smith International and Mr. Nick Roberts (PFM Advisor). Last but not least, we extend our appreciation to all stakeholders who spared their valuable time to contribute to this PFM Reform Strategy including the Accountability Sector Working Group, Central and Local Government entities, Civil Society Organizations led by Mr. Julius Mukunda, the Executive Director of Civil Society Budget Advocacy Group (CSBAG), and Private Sector, Academia and Research Institutions. Finally, we hope the implementation of the interventions provided herein will be useful in steering PFM reforms in the public sector towards the intended goal, with specific focus on key service delivery sectors of Health, Education, Energy, Water, Agriculture and Roads. In conclusion, I would like to again re-iterate Government’s commitment to continuous improvement in Public Financial Management for ensuring improved service delivery. Keith Muhakanizi Permanent Secretary/Secretary to the Treasury Ministry of Finance, Planning and Economic Development
9Uganda Public Financial Management Reform Strategy
FOREWORD Uganda’s Public Financial Management (PFM) Reform Strategy encapsulates the Country’s aspirations towards strengthening governance systems of which accountability retains core focus for the next phase of PFM reforms between 2018 to 2023.
The introduction of this new strategic direction is opportune, particularly in the face of several diagnostics studies that have helped point crucial aspects in Uganda’s PFM eco-system that needed improvement. Key among these was the Public Expenditure and Financial Accountability (PEFA) assessment undertaken in 2016. Results from the assessments, affirmed that the PFM reforms have been successful in strengthening the fundamentals of public financial management in Uganda.
These outcomes reflect Governments’ strategic focus of PFM reforms over the past 20 years where the bulk of effort has been directed towards strengthening PFM systems. Previous PFM reforms aimed at strengthening budgeting, financial management, audit and procurement systems at all levels of government in order to ensure efficient, effective and accountable use of public resources for improved service delivery. The new PFM reforms strategy, however, ushers in a paradigm shift: a results-based approach to fix the gaps that have hampered the established PFM systems’ potential to deepen service delivery efficiently and effectively. We believe this represents the next phase of reforms.
The proposed reforms will also seek to leverage the established policy frameworks to deepen compliance to accountability stipulations and guidelines. This includes the recognition of the citizens’ role in strengthening the public accountability chain through fostering downward accountability.
The NRM Government remains committed to strengthening systems critical to the attainment of middle income status. The PFM reforms strategy is envisioned to enhance systems for resource mobilizations while boosting capacities and the attendant policy frameworks designed to increase return on Public Investments and value for money.
I commend this strategy to all those involved in the cause of transformation.
For God and My Country
Hon. Matia Kasaija Minister of Finance, Planning and Economic Development
ACKNOWLEDGEMENT I am pleased to share the Public Financial Management (PFM) Reforms Strategy (FY 2018/19 – FY2022/23). The design of the strategy was informed by various studies including the Public Expenditure and Financial Accountability (PEFA) assessment in 2016, the Mid-term review of the Third Financial Management and Accountability Programme (FINMAP III), the Government’s prime implementation framework. In addition, the strategy benefitted from wide stakeholder consultations, internal and external audit reports, as well as other oversight reports, and diagnostic studies undertaken for Government of Uganda by the World Bank and the International Monetary Fund (IMF), amongst others. A critical analysis of historical issues affecting PFM was undertaken and the Strength, Weaknesses, Threat and Opportunities (SWOT) approach was used to distil all current PFM issues, which act as barriers to effective service delivery, and proposed actions for improving management of public resources. Additionally, the design of this Public Financial Management (PFM) Reform Strategy would not have been possible without the contribution of a number of persons and institutions. Government is particularly indebted to the Deputy Secretary to the Treasury and Task Manager FINMAP III, Mr. Patrick Ocailap, and the Accountant General, Mr. Lawrence Semakula, who provided stewardship to the design process assisted by the Technical Design Team. More specifically, I wish to recognize the efforts of the Core Design Team led by Ag. Director Financial Management Services, Mr. Godfrey Ssemugooma, as well as the other members including: Mr. Anthony Kintu, Ms. Bernadette N. Kizito, Mr. Conrad Kahima, Ms. Esther Akullo Owor, Ms. Getrude Basiima, Mr.Hannington Ashaba, Mr. John Byaruhanga, Ms. Justine Ayebare, Mr. Hussein Isingoma, Mr. Joseph Enyimu, Mr. Moses Ogwapus, Mr. Onesmus Mulondo, Ms. Rossetti Nabumba, Mr. Stephen Barungi; and, Mr. Emmanuel Mugabi. Special compliments go to the PFM Reform Secretariat led by the Programme Coordinator of the FINMAP III, Mr. Johnson Mutesigensi, and all Programme Coordination Office (PCO) staff for providing necessary support to the design process. I am also very grateful to our esteemed Development Partners (DPs) for their continued contributions of both financial and technical support during this design process. In this regard, we recognise the support from the Governments of Denmark, Germany through KfW, the United Kingdom through DFID, Norway, World Bank, International Monetary Fund and specifically the European Union (EU). The EU provided financial and technical support to Government by facilitating consultants; Ms. Hazel Granger of Adam Smith International and Mr. Nick Roberts (PFM Advisor). Last but not least, we extend our appreciation to all stakeholders who spared their valuable time to contribute to this PFM Reform Strategy including the Accountability Sector Working Group, Central and Local Government entities, Civil Society Organizations led by Mr. Julius Mukunda, the Executive Director of Civil Society Budget Advocacy Group (CSBAG), and Private Sector, Academia and Research Institutions. Finally, we hope the implementation of the interventions provided herein will be useful in steering PFM reforms in the public sector towards the intended goal, with specific focus on key service delivery sectors of Health, Education, Energy, Water, Agriculture and Roads. In conclusion, I would like to again re-iterate Government’s commitment to continuous improvement in Public Financial Management for ensuring improved service delivery. Keith Muhakanizi Permanent Secretary/Secretary to the Treasury Ministry of Finance, Planning and Economic Development
10 Uganda Public Financial Management Reform Strategy
EXECUTIVE SUMMARY Introduction This Strategy is intended to provide the focus and prioritisation for a new phase of Public Financial Management (PFM) reforms from FY2018/19 to FY2022/23, following the conclusion of the PFM Reform Strategy FY2014/15-FY2017/18. These reforms supported the Government’s goal of poverty eradication through the achievement of good governance, sustainable growth and a stable macroeconomic environment. As set out in Uganda’s Vision 2040 and National Development Plan II, the drive towards middle income status requires significant investment in infrastructure, as well as supporting economic growth through a well-educated, healthy workforce, among other things. Public Financial Management plays an important role in ensuring that public spending is allocated towards Government’s priorities, there are adequate resources and that those resources are managed efficiently and effectively to deliver quality services and investments that yield an economic return. Lessons from past PFM reforms Government has been engaged in Public Financial Management (PFM) reforms since the 1980s and has made significant progress. Most recently, as recognised in the PEFA Assessment 2016, PFM performance has improved in budget credibility, transparency, policy-based budgeting and budget execution controls. This is attributed to several reforms, prominent among which includes the ratification of the new PFM Act (2015), the Treasury Single Account (TSA), payroll reforms, introducing Program-Based Budgeting (PBB) and other important reforms such as deepening the rollout and use of the Integrated Financial Management System (IFMS). These interventions received significant support through Government’s Financial Management and Accountability Programme (FINMAP), which started in 2007.
Nonetheless, a number of challenges continue. In particular, in the areas of Public Investment Management, sustainable resource mobilisation, PFM regulatory compliance, managing and reducing expenditure arrears, strengthening the Medium-Term Expenditure Framework (MTEF), integrating financial management and accountability systems, and audit scrutiny and follow up.
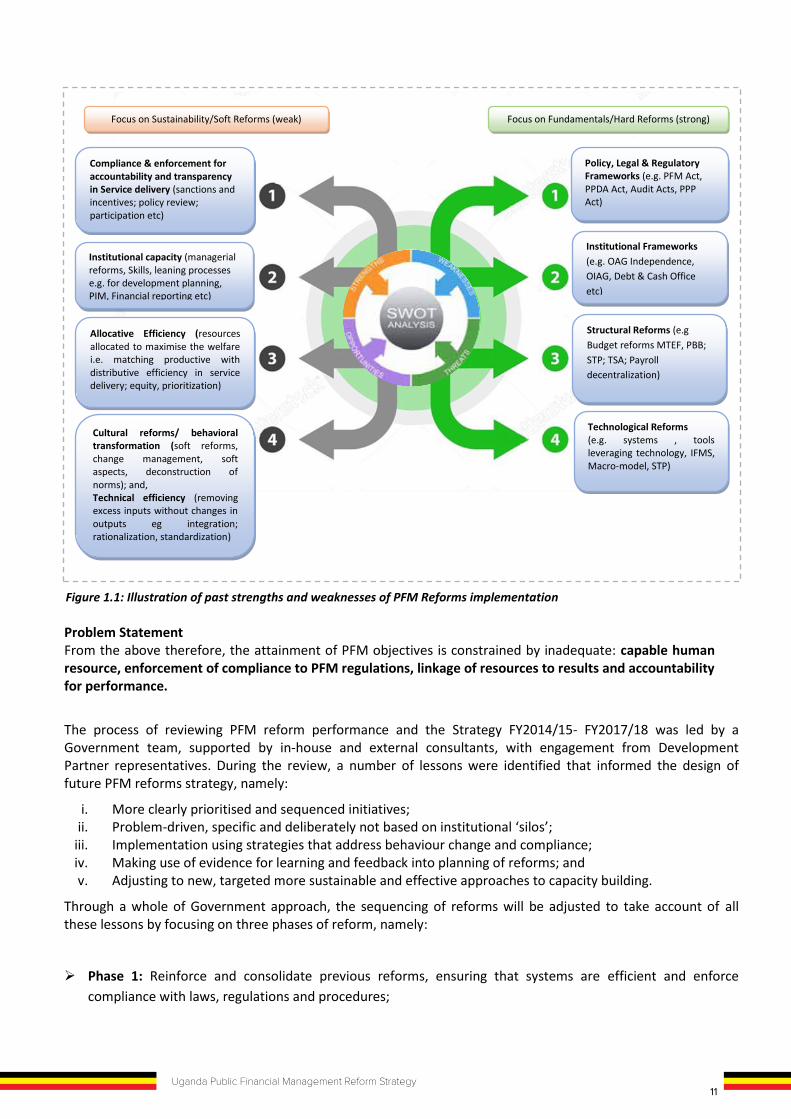
Figure 1.1 below (Illustration of past strengths and weaknesses of PFM Reforms implementation) provides a systems view of the mix of PFM Reforms, depicting the thrust of implementation to date. On the one hand, the majority of successes have been in delivering structured, hard reform pertaining to legal frameworks, structural and technological reforms. These have tended to be robust and are clearly visible and measurable, such as the roll out of Information Technology (IT) or drafting and enactment of legal reforms. The next phase of the strategy will focus on enhancing compliance and enforcement of existing guidelines.
On the other hand, analysis of key outcomes suggests that challenges are still being encountered in the actualisation of soft PFM reforms – particularly cultural and behavioural reforms. These relate to weaknesses in delivery of strategic (such as linkage of resources to results and accountability for performance) and managerial reforms, which render reform gains unsustainable. To counter these, the reform focus will mainly be on capacity enhancement and change management.
Problem Statement From the above therefore, the attainment of PFM objectives is constrained by inadequate: capable human resource, enforcement of compliance to PFM regulations, linkage of resources to results and accountability for performance.
The process of reviewing PFM reform performance and the Strategy FY2014/15- FY2017/18 was led by a Government team, supported by in-house and external consultants, with engagement from Development Partner representatives. During the review, a number of lessons were identified that informed the design of future PFM reforms strategy, namely:
i. More clearly prioritised and sequenced initiatives; ii. Problem-driven, specific and deliberately not based on institutional ‘silos’;
iii. Implementation using strategies that address behaviour change and compliance; iv. Making use of evidence for learning and feedback into planning of reforms; and v. Adjusting to new, targeted more sustainable and effective approaches to capacity building.
Through a whole of Government approach, the sequencing of reforms will be adjusted to take account of all these lessons by focusing on three phases of reform, namely:
Phase 1: Reinforce and consolidate previous reforms, ensuring that systems are efficient and enforce compliance with laws, regulations and procedures;
Project Managers
Work stream TAs
Compliance & enforcement for accountability and transparency in Service delivery (sanctions and incentives; policy review; participation etc)
Institutional capacity (managerial reforms, Skills, leaning processes e.g. for development planning, PIM, Financial reporting etc)
Allocative Efficiency (resources allocated to maximise the welfare i.e. matching productive with distributive efficiency in service delivery; equity, prioritization)
Cultural reforms/ behavioral transformation (soft reforms, change management, soft aspects, deconstruction of norms); and, Technical efficiency (removing excess inputs without changes in outputs eg integration; rationalization, standardization)
Policy, Legal & Regulatory Frameworks (e.g. PFM Act, PPDA Act, Audit Acts, PPP Act)
Institutional Frameworks (e.g. OAG Independence, OIAG, Debt & Cash Office etc)
Structural Reforms (e.g Budget reforms MTEF, PBB; STP; TSA; Payroll decentralization)
Technological Reforms (e.g. systems , tools leveraging technology, IFMS, Macro-model, STP)
Focus on Sustainability/Soft Reforms (weak) Focus on Fundamentals/Hard Reforms (strong)
Figure 1.1: Illustration of past strengths and weaknesses of PFM Reforms implementation
10 Uganda Public Financial Management Reform Strategy
EXECUTIVE SUMMARY Introduction This Strategy is intended to provide the focus and prioritisation for a new phase of Public Financial Management (PFM) reforms from FY2018/19 to FY2022/23, following the conclusion of the PFM Reform Strategy FY2014/15-FY2017/18. These reforms supported the Government’s goal of poverty eradication through the achievement of good governance, sustainable growth and a stable macroeconomic environment. As set out in Uganda’s Vision 2040 and National Development Plan II, the drive towards middle income status requires significant investment in infrastructure, as well as supporting economic growth through a well-educated, healthy workforce, among other things. Public Financial Management plays an important role in ensuring that public spending is allocated towards Government’s priorities, there are adequate resources and that those resources are managed efficiently and effectively to deliver quality services and investments that yield an economic return. Lessons from past PFM reforms Government has been engaged in Public Financial Management (PFM) reforms since the 1980s and has made significant progress. Most recently, as recognised in the PEFA Assessment 2016, PFM performance has improved in budget credibility, transparency, policy-based budgeting and budget execution controls. This is attributed to several reforms, prominent among which includes the ratification of the new PFM Act (2015), the Treasury Single Account (TSA), payroll reforms, introducing Program-Based Budgeting (PBB) and other important reforms such as deepening the rollout and use of the Integrated Financial Management System (IFMS). These interventions received significant support through Government’s Financial Management and Accountability Programme (FINMAP), which started in 2007.
Nonetheless, a number of challenges continue. In particular, in the areas of Public Investment Management, sustainable resource mobilisation, PFM regulatory compliance, managing and reducing expenditure arrears, strengthening the Medium-Term Expenditure Framework (MTEF), integrating financial management and accountability systems, and audit scrutiny and follow up.
Figure 1.1 below (Illustration of past strengths and weaknesses of PFM Reforms implementation) provides a systems view of the mix of PFM Reforms, depicting the thrust of implementation to date. On the one hand, the majority of successes have been in delivering structured, hard reform pertaining to legal frameworks, structural and technological reforms. These have tended to be robust and are clearly visible and measurable, such as the roll out of Information Technology (IT) or drafting and enactment of legal reforms. The next phase of the strategy will focus on enhancing compliance and enforcement of existing guidelines.
On the other hand, analysis of key outcomes suggests that challenges are still being encountered in the actualisation of soft PFM reforms – particularly cultural and behavioural reforms. These relate to weaknesses in delivery of strategic (such as linkage of resources to results and accountability for performance) and managerial reforms, which render reform gains unsustainable. To counter these, the reform focus will mainly be on capacity enhancement and change management.
Problem Statement From the above therefore, the attainment of PFM objectives is constrained by inadequate: capable human resource, enforcement of compliance to PFM regulations, linkage of resources to results and accountability for performance.
The process of reviewing PFM reform performance and the Strategy FY2014/15- FY2017/18 was led by a Government team, supported by in-house and external consultants, with engagement from Development Partner representatives. During the review, a number of lessons were identified that informed the design of future PFM reforms strategy, namely:
i. More clearly prioritised and sequenced initiatives; ii. Problem-driven, specific and deliberately not based on institutional ‘silos’;
iii. Implementation using strategies that address behaviour change and compliance; iv. Making use of evidence for learning and feedback into planning of reforms; and v. Adjusting to new, targeted more sustainable and effective approaches to capacity building.
Through a whole of Government approach, the sequencing of reforms will be adjusted to take account of all these lessons by focusing on three phases of reform, namely:
Phase 1: Reinforce and consolidate previous reforms, ensuring that systems are efficient and enforce compliance with laws, regulations and procedures;
Project Managers
Work stream TAs
Compliance & enforcement for accountability and transparency in Service delivery (sanctions and incentives; policy review; participation etc)
Institutional capacity (managerial reforms, Skills, leaning processes e.g. for development planning, PIM, Financial reporting etc)
Allocative Efficiency (resources allocated to maximise the welfare i.e. matching productive with distributive efficiency in service delivery; equity, prioritization)
Cultural reforms/ behavioral transformation (soft reforms, change management, soft aspects, deconstruction of norms); and, Technical efficiency (removing excess inputs without changes in outputs eg integration; rationalization, standardization)
Policy, Legal & Regulatory Frameworks (e.g. PFM Act, PPDA Act, Audit Acts, PPP Act)
Institutional Frameworks (e.g. OAG Independence, OIAG, Debt & Cash Office etc)
Structural Reforms (e.g Budget reforms MTEF, PBB; STP; TSA; Payroll decentralization)
Technological Reforms (e.g. systems , tools leveraging technology, IFMS, Macro-model, STP)
Focus on Sustainability/Soft Reforms (weak) Focus on Fundamentals/Hard Reforms (strong)
Figure 1.1: Illustration of past strengths and weaknesses of PFM Reforms implementation
11Uganda Public Financial Management Reform Strategy
EXECUTIVE SUMMARY Introduction This Strategy is intended to provide the focus and prioritisation for a new phase of Public Financial Management (PFM) reforms from FY2018/19 to FY2022/23, following the conclusion of the PFM Reform Strategy FY2014/15-FY2017/18. These reforms supported the Government’s goal of poverty eradication through the achievement of good governance, sustainable growth and a stable macroeconomic environment. As set out in Uganda’s Vision 2040 and National Development Plan II, the drive towards middle income status requires significant investment in infrastructure, as well as supporting economic growth through a well-educated, healthy workforce, among other things. Public Financial Management plays an important role in ensuring that public spending is allocated towards Government’s priorities, there are adequate resources and that those resources are managed efficiently and effectively to deliver quality services and investments that yield an economic return. Lessons from past PFM reforms Government has been engaged in Public Financial Management (PFM) reforms since the 1980s and has made significant progress. Most recently, as recognised in the PEFA Assessment 2016, PFM performance has improved in budget credibility, transparency, policy-based budgeting and budget execution controls. This is attributed to several reforms, prominent among which includes the ratification of the new PFM Act (2015), the Treasury Single Account (TSA), payroll reforms, introducing Program-Based Budgeting (PBB) and other important reforms such as deepening the rollout and use of the Integrated Financial Management System (IFMS). These interventions received significant support through Government’s Financial Management and Accountability Programme (FINMAP), which started in 2007.
Nonetheless, a number of challenges continue. In particular, in the areas of Public Investment Management, sustainable resource mobilisation, PFM regulatory compliance, managing and reducing expenditure arrears, strengthening the Medium-Term Expenditure Framework (MTEF), integrating financial management and accountability systems, and audit scrutiny and follow up.
Figure 1.1 below (Illustration of past strengths and weaknesses of PFM Reforms implementation) provides a systems view of the mix of PFM Reforms, depicting the thrust of implementation to date. On the one hand, the majority of successes have been in delivering structured, hard reform pertaining to legal frameworks, structural and technological reforms. These have tended to be robust and are clearly visible and measurable, such as the roll out of Information Technology (IT) or drafting and enactment of legal reforms. The next phase of the strategy will focus on enhancing compliance and enforcement of existing guidelines.
On the other hand, analysis of key outcomes suggests that challenges are still being encountered in the actualisation of soft PFM reforms – particularly cultural and behavioural reforms. These relate to weaknesses in delivery of strategic (such as linkage of resources to results and accountability for performance) and managerial reforms, which render reform gains unsustainable. To counter these, the reform focus will mainly be on capacity enhancement and change management.
Problem Statement From the above therefore, the attainment of PFM objectives is constrained by inadequate: capable human resource, enforcement of compliance to PFM regulations, linkage of resources to results and accountability for performance.
The process of reviewing PFM reform performance and the Strategy FY2014/15- FY2017/18 was led by a Government team, supported by in-house and external consultants, with engagement from Development Partner representatives. During the review, a number of lessons were identified that informed the design of future PFM reforms strategy, namely:
i. More clearly prioritised and sequenced initiatives; ii. Problem-driven, specific and deliberately not based on institutional ‘silos’;
iii. Implementation using strategies that address behaviour change and compliance; iv. Making use of evidence for learning and feedback into planning of reforms; and v. Adjusting to new, targeted more sustainable and effective approaches to capacity building.
Through a whole of Government approach, the sequencing of reforms will be adjusted to take account of all these lessons by focusing on three phases of reform, namely:
Phase 1: Reinforce and consolidate previous reforms, ensuring that systems are efficient and enforce compliance with laws, regulations and procedures;
Project Managers
Work stream TAs
Compliance & enforcement for accountability and transparency in Service delivery (sanctions and incentives; policy review; participation etc)
Institutional capacity (managerial reforms, Skills, leaning processes e.g. for development planning, PIM, Financial reporting etc)
Allocative Efficiency (resources allocated to maximise the welfare i.e. matching productive with distributive efficiency in service delivery; equity, prioritization)
Cultural reforms/ behavioral transformation (soft reforms, change management, soft aspects, deconstruction of norms); and, Technical efficiency (removing excess inputs without changes in outputs eg integration; rationalization, standardization)
Policy, Legal & Regulatory Frameworks (e.g. PFM Act, PPDA Act, Audit Acts, PPP Act)
Institutional Frameworks (e.g. OAG Independence, OIAG, Debt & Cash Office etc)
Structural Reforms (e.g Budget reforms MTEF, PBB; STP; TSA; Payroll decentralization)
Technological Reforms (e.g. systems , tools leveraging technology, IFMS, Macro-model, STP)
Focus on Sustainability/Soft Reforms (weak) Focus on Fundamentals/Hard Reforms (strong)
Figure 1.1: Illustration of past strengths and weaknesses of PFM Reforms implementation

12 Uganda Public Financial Management Reform Strategy
Phase 2: Review performance and effectiveness of the systems and reforms, identify mitigating actions, take steps to remove barriers and address problems identified; and
Phase 3: Upgrade, develop and strengthen systems towards higher standards in PFM practices.
Reform Goal The goal of the reform is “To enhance resource mobilisation, improve planning and public investment management, and strengthen accountability for quality, effective and efficient service delivery” PFM reform Priorities FY2018/19 – FY2022/23 Six technical areas for reform have been identified as priorities in the Strategy, namely: OBJECTIVE 1: TO ENHANCE RESOURCE MOBILIZATION FOR UGANDA'S SUSTAINABLE DEVELOPMENT Problems: Outcomes:
1. Low compliance culture and administration efficiency gaps;
2. Shadow economy, low literacy, complex tax regime and compliance procedures;
3. Revenue loss due to international taxation challenges;
4. Weak coordination of revenue mobilisation across Government;
5. Gaps in legal and regulatory framework;
6. Public Debt risk exposure; and, management needs e.g. negotiation of loans.
1.1 – Enhanced enabling environment for revenue mobilisation: DRM Strategy; performance monitoring; enabling legal and regulatory framework.
1.2 – Tax compliance improved through increased efficiency in revenue administration: Review and reform URA IT systems and data integrity; operationalise Compliance Improvement Plan and risk management; Simplified system & services.
1.3 – Enhanced collections from new revenue opportunities including oil, gas and mineral sectors: Legal framework and procedures.
1.4 – Sustainable debt and development financing: loan negotiation; operationalise debt management strategy.
OBJECTIVE 2: TO ENHANCE POLICY-BASED PLANNING AND BUDGETING FOR ALLOCATIVE EFFICIENCY Problems: Outcomes:
1. Mis-alignment of budgets with strategic plans;
2. Weak multi-year planning and inaccuracy of medium-term costs, especially projects;
3. Inadequate, non-discretionary resources for local service delivery;
4. Gender inequality impacts not adequately addressed in budgets; and,
5. Insufficient analysis and use of evidence to inform policy development.
2.1 - Budget aligned to strategic plans and medium term budgets: Strengthen institutional capacity of the planning and budgeting function (including Central and LG development economists and budget officers at all levels).
2.2 - Multi-year commitments reflected in annual budgets: Costing exercise to improve accuracy and comprehensiveness; Link to PIM work on project preparation and costing.
2.3 - Enhanced planning and budget responsiveness to gender and equity; Deepen capacity for Gender-Equity Budgeting key service sectors.
2.4 - Increased equity and discretion of resources allocated to LGs for improved service delivery: Reform of inter-governmental fiscal transfers.
2.5 - Evidence-based economic and fiscal policy-making strengthened: Dissemination of evidence; harmonised M&E.
OBJECTIVE 3: TO STRENGTHEN PUBLIC INVESTMENT MANAGEMENT (PIM) FOR INCREASED DEVELOPMENT RETURNS ON PUBLIC SPENDING Problems: Outcomes:
1. Low returns on public investment, under-execution of large projects;
2. Too many projects, un-constrained selection, weak plans & budgets;
3. Procurement delays, cost escalation, low value for money;
4. Poor asset management and sub-optimal use of assets; and,
5. Fiscal risks arising from PPPs and public enterprises not monitored.
3.1 - Efficient identification, selection and management of public investment projects (PIPs) and public-private partnerships (PPPs): Comprehensive project cycle management approach, monitoring and guidelines; PIP clean-up; project appraisal.
3.2 - Enhanced VfM in public procurement for large, complex public procurements: Capacity, transparency and automation.
3.3 - Optimal utilisation and maintenance of public assets: automation and capacity building in asset management.
3.4 - Enhanced accountability in resource utilisation and results for project delivery: selected strategic evaluation.
OBJECTIVE 4: TO STRENGTHEN THE EFFECTIVENESS OF ACCOUNTABILITY SYSTEMS AND COMPLIANCE IN BUDGET EXECUTION Problems: Outcomes:
1. Incomplete and stand-alone accountability systems – risk of inaccuracy, inefficiency, fraud;
2. Build-up of expenditure arrears, weak commitment controls;
3. Non-compliance with procurement and PFM procedures;
4. Vulnerability of IT Systems security; and,
5. Need for consolidation of cash management reforms and debt issuance following TSA introduction.
4.1 – Effectiveness and accuracy of public service payroll and pension management systems enhanced: Roll out and integration of IT systems; infrastructure enhancement.
4.2 - Comprehensiveness and improved quality of financial reporting: Roadmap for accrual accounting.
4.3 – Strengthened effectiveness and integrity of accountability systems: IT security and enhanced governance of IT.
4.4 – Strengthened effectiveness of commitment controls and cash management: cash management support; reporting and clearing of arrears; link to budget & planning.
4.5 - Enhanced assurance (Governance, risk and control) by the internal audit function for compliance of PFM systems: assurance, inspection & risk management.
4.6 – Increased PFM compliance through incentives and sanctions mechanisms: enhance incentives & sanctions.
OBJECTIVE 5: TO IMPROVE TRANSPARENCY AND ACCOUNTABILITY OF LOCAL GOVERNMENT PFM SYSTEMS Problems: Outcomes:
1. Insufficient resources; administrative units expanded;
2. Lack of discretion over budgeting;
3. Weak local government planning and budgeting; centralised / uncoordinated planning;
4. Weak oversight and unclear roles of audit committees; and,
5. Low VfM in procurements (mismatch
5.1 Increased contribution of LG own-source revenue: revenue management systems and capacity support.
5.2 Effective planning and budgeting at local governments; simplified planning framework; costed standards.
5.3 Improved quality of audit and coordinated follow up of recommendations by LGPACs and regional audit committees
5.4 Enhanced accountability and performance monitoring in delivery of services in key sectors (roads, education, health and agriculture services); PETS and M&E enhancement.
5.5 Enhanced integrity and value for money of local
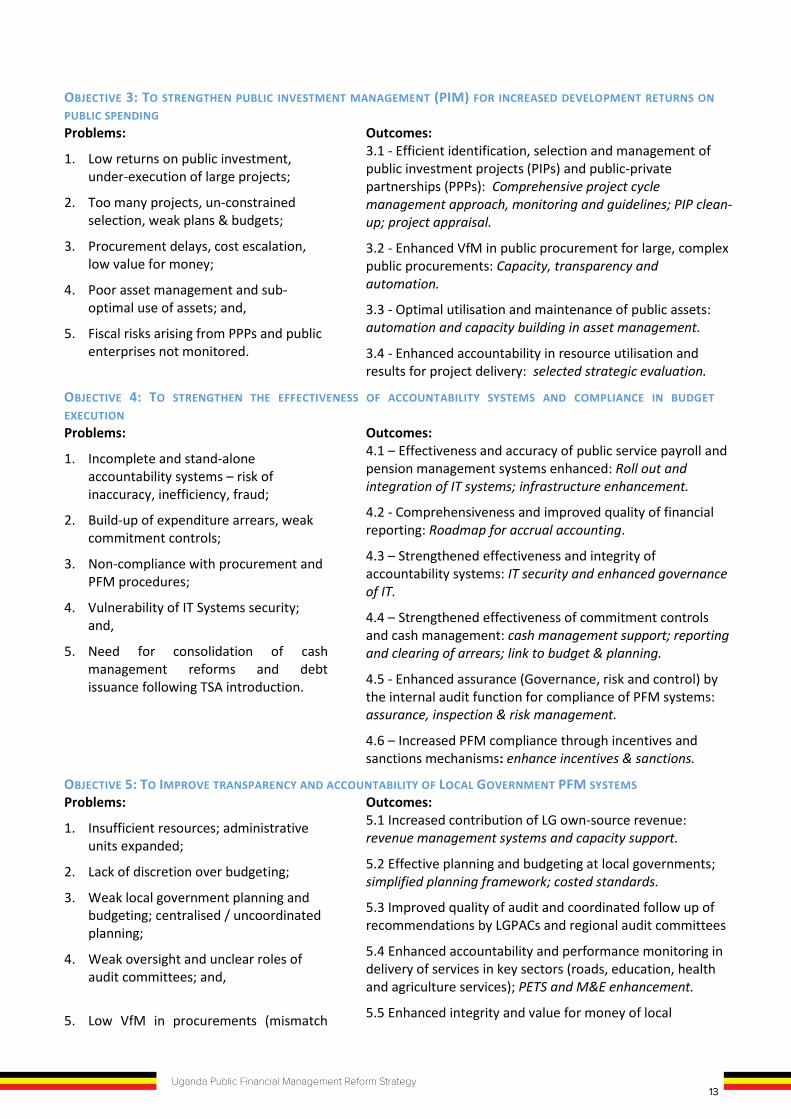
13Uganda Public Financial Management Reform Strategy
Phase 2: Review performance and effectiveness of the systems and reforms, identify mitigating actions, take steps to remove barriers and address problems identified; and
Phase 3: Upgrade, develop and strengthen systems towards higher standards in PFM practices.
Reform Goal The goal of the reform is “To enhance resource mobilisation, improve planning and public investment management, and strengthen accountability for quality, effective and efficient service delivery” PFM reform Priorities FY2018/19 – FY2022/23 Six technical areas for reform have been identified as priorities in the Strategy, namely: OBJECTIVE 1: TO ENHANCE RESOURCE MOBILIZATION FOR UGANDA'S SUSTAINABLE DEVELOPMENT Problems: Outcomes:
1. Low compliance culture and administration efficiency gaps;
2. Shadow economy, low literacy, complex tax regime and compliance procedures;
3. Revenue loss due to international taxation challenges;
4. Weak coordination of revenue mobilisation across Government;
5. Gaps in legal and regulatory framework;
6. Public Debt risk exposure; and, management needs e.g. negotiation of loans.
1.1 – Enhanced enabling environment for revenue mobilisation: DRM Strategy; performance monitoring; enabling legal and regulatory framework.
1.2 – Tax compliance improved through increased efficiency in revenue administration: Review and reform URA IT systems and data integrity; operationalise Compliance Improvement Plan and risk management; Simplified system & services.
1.3 – Enhanced collections from new revenue opportunities including oil, gas and mineral sectors: Legal framework and procedures.
1.4 – Sustainable debt and development financing: loan negotiation; operationalise debt management strategy.
OBJECTIVE 2: TO ENHANCE POLICY-BASED PLANNING AND BUDGETING FOR ALLOCATIVE EFFICIENCY Problems: Outcomes:
1. Mis-alignment of budgets with strategic plans;
2. Weak multi-year planning and inaccuracy of medium-term costs, especially projects;
3. Inadequate, non-discretionary resources for local service delivery;
4. Gender inequality impacts not adequately addressed in budgets; and,
5. Insufficient analysis and use of evidence to inform policy development.
2.1 - Budget aligned to strategic plans and medium term budgets: Strengthen institutional capacity of the planning and budgeting function (including Central and LG development economists and budget officers at all levels).
2.2 - Multi-year commitments reflected in annual budgets: Costing exercise to improve accuracy and comprehensiveness; Link to PIM work on project preparation and costing.
2.3 - Enhanced planning and budget responsiveness to gender and equity; Deepen capacity for Gender-Equity Budgeting key service sectors.
2.4 - Increased equity and discretion of resources allocated to LGs for improved service delivery: Reform of inter-governmental fiscal transfers.
2.5 - Evidence-based economic and fiscal policy-making strengthened: Dissemination of evidence; harmonised M&E.
OBJECTIVE 3: TO STRENGTHEN PUBLIC INVESTMENT MANAGEMENT (PIM) FOR INCREASED DEVELOPMENT RETURNS ON PUBLIC SPENDING Problems: Outcomes:
1. Low returns on public investment, under-execution of large projects;
2. Too many projects, un-constrained selection, weak plans & budgets;
3. Procurement delays, cost escalation, low value for money;
4. Poor asset management and sub-optimal use of assets; and,
5. Fiscal risks arising from PPPs and public enterprises not monitored.
3.1 - Efficient identification, selection and management of public investment projects (PIPs) and public-private partnerships (PPPs): Comprehensive project cycle management approach, monitoring and guidelines; PIP clean-up; project appraisal.
3.2 - Enhanced VfM in public procurement for large, complex public procurements: Capacity, transparency and automation.
3.3 - Optimal utilisation and maintenance of public assets: automation and capacity building in asset management.
3.4 - Enhanced accountability in resource utilisation and results for project delivery: selected strategic evaluation.
OBJECTIVE 4: TO STRENGTHEN THE EFFECTIVENESS OF ACCOUNTABILITY SYSTEMS AND COMPLIANCE IN BUDGET EXECUTION Problems: Outcomes:
1. Incomplete and stand-alone accountability systems – risk of inaccuracy, inefficiency, fraud;
2. Build-up of expenditure arrears, weak commitment controls;
3. Non-compliance with procurement and PFM procedures;
4. Vulnerability of IT Systems security; and,
5. Need for consolidation of cash management reforms and debt issuance following TSA introduction.
4.1 – Effectiveness and accuracy of public service payroll and pension management systems enhanced: Roll out and integration of IT systems; infrastructure enhancement.
4.2 - Comprehensiveness and improved quality of financial reporting: Roadmap for accrual accounting.
4.3 – Strengthened effectiveness and integrity of accountability systems: IT security and enhanced governance of IT.
4.4 – Strengthened effectiveness of commitment controls and cash management: cash management support; reporting and clearing of arrears; link to budget & planning.
4.5 - Enhanced assurance (Governance, risk and control) by the internal audit function for compliance of PFM systems: assurance, inspection & risk management.
4.6 – Increased PFM compliance through incentives and sanctions mechanisms: enhance incentives & sanctions.
OBJECTIVE 5: TO IMPROVE TRANSPARENCY AND ACCOUNTABILITY OF LOCAL GOVERNMENT PFM SYSTEMS Problems: Outcomes:
1. Insufficient resources; administrative units expanded;
2. Lack of discretion over budgeting;
3. Weak local government planning and budgeting; centralised / uncoordinated planning;
4. Weak oversight and unclear roles of audit committees; and,
5. Low VfM in procurements (mismatch
5.1 Increased contribution of LG own-source revenue: revenue management systems and capacity support.
5.2 Effective planning and budgeting at local governments; simplified planning framework; costed standards.
5.3 Improved quality of audit and coordinated follow up of recommendations by LGPACs and regional audit committees
5.4 Enhanced accountability and performance monitoring in delivery of services in key sectors (roads, education, health and agriculture services); PETS and M&E enhancement.
5.5 Enhanced integrity and value for money of local

14 Uganda Public Financial Management Reform Strategy
between Supply & Demand) government procurements: integrity survey & plans.
OBJECTIVE 6: TO STRENGTHEN OVERSIGHT AND PFM GOVERNANCE FOR THE SUSTAINABILITY OF DEVELOPMENT OUTCOMES Problems: Outcomes:
1. Backlog in legislative scrutiny;
2. Weak coordination and tracking of progress and impact of PFM reforms;
3. Non-compliance with PFM systems and reforms partly due to weak change management and communication;
4. Weak downward accountability chain / citizen engagement; and,
5. Constraining and inefficient public administration structures.
6.1 Enhanced impact of financial and VfM audit reporting and oversight; Risk-based coordination and streamlining.
6.2 Improved coordination and monitoring of PFM processes within the accountability sector.
6.3 Sustained uptake of reforms through improved learning and coordination of PFM reform processes.
6.4 Increased demand for downward accountability to citizens for public spending and service delivery performance.
6.5 Cost-effective public administration through rationalisation of the administrative units.
Governance of PFM Reform This strategy will be delivered through a number of programmes, in addition to the Government’s joint-funded PFM reform programme (formerly FINMAP). The successor programme to FINMAP will have a key role in leading, coordinating and monitoring all other PFM reform programmes. The overall governance and high level policy direction of PFM reforms will continue to be led by the Public Expenditure Management Committee (PEMCOM), chaired by the Permanent Secretary/Secretary to the Treasury, with close coordination with the Accountability Sector. In particular, an annual PFM performance review will be introduced, which will inform the annual performance assessment and planning of the Accountability Sector. Furthermore, new technical sub-group structures will be established to strengthen planning and implementation of the six priorities PFM reform areas, which will be aligned to and closely coordinated with the Accountability Sector Technical Working Groups. Change management Implementing reforms requires changing systems, procedures, norms and behaviours. While it is important to identify the correct technical solutions to PFM problems, it is also important to adopt a systematic approach to managing change. In particular, since resistance to change is a normal consequence of reform, the change management strategy underpinning the PFM reform strategy will seek to understand and address stakeholders’ concerns, fears and needs alongside reforms. Risk Management Recognising that it will not be possible to eliminate all risks in the delivery of PFM reforms, associated risks will be identified and managed actively. PEMCOM will consider high level risks and take action to mitigate, or escalate risks to minimise likelihood and impact. PFM Reform cluster heads and PS/ST will support PEMCOM in this task, still facilitated by the PFM secretariat, which will coordinate the regular monitoring and documentation of any identified and/or emerging risks. Sustainability Sustainability is the ultimate goal of the PFM reform strategy, which aims to finance PFM activities and reforms independently and embed PFM systems without continuous external assistance. This strategy seeks to establish a sustainability plan, linked to the implementation plan. This will identify recurrent costs associated with PFM reform activities that need to be mainstreamed into GoU operations. In addition, PFM staffing and public administration structures will be reviewed to ensure that administrative structures are commensurate with the current needs for effective PFM. Finally, the strategy seeks to explore new ways of delivering capacity building and training for PFM across Government. More sustainable delivery modalities will be considered, such as training of trainers, e-learning platforms, a comprehensive needs assessment, comprehensive training programmes, and collaboration with relevant external training providers or
professional bodies. Drawing from lessons from the previous strategy, specific reforms will be deepened in the key service delivery sectors of Education, Health, Agriculture, Water, Roads, and Energy. While the strategy maintains a whole of government approach, this element of prioritization aims to refocus the reform strategy in sustaining its contribution to key service delivery outcomes.
Monitoring and Evaluation This strategy presents a results framework of performance indicators and targets for monitoring progress of PFM reforms. As far as possible, these indicators are harmonised with existing Monitoring and Evaluation frameworks, including the Accountability Sector, the National M&E framework where the Government Annual Performance Review (GAPR) under the Office of the Prime Minister is managed, and the National Development Plan (NDP II), among others. Monitoring and Evaluation of the strategy will take place at 5 levels: (i) impact on service delivery; (ii) PFM system-level outcomes; (iii) PFM effectiveness (intermediate outcomes) from the 6 priority reform areas; (iv) efficiency (outputs against inputs); and, (v) economy (delivery of activities and resources utilised). A mid-term and final evaluation will assess performance and impacts against Levels 1 and 2. Level 3 will be assessed at least annually as part of the annual performance review. Levels 4 and 5 will be assessed at programme level, at least quarterly, through relevant delivery (programme) modalities and, where possible consolidated for tracking and learning from delivery efficiency and economy across the PFM reform strategy implementation plan.
15Uganda Public Financial Management Reform Strategy
between Supply & Demand) government procurements: integrity survey & plans.
OBJECTIVE 6: TO STRENGTHEN OVERSIGHT AND PFM GOVERNANCE FOR THE SUSTAINABILITY OF DEVELOPMENT OUTCOMES Problems: Outcomes:
1. Backlog in legislative scrutiny;
2. Weak coordination and tracking of progress and impact of PFM reforms;
3. Non-compliance with PFM systems and reforms partly due to weak change management and communication;
4. Weak downward accountability chain / citizen engagement; and,
5. Constraining and inefficient public administration structures.
6.1 Enhanced impact of financial and VfM audit reporting and oversight; Risk-based coordination and streamlining.
6.2 Improved coordination and monitoring of PFM processes within the accountability sector.
6.3 Sustained uptake of reforms through improved learning and coordination of PFM reform processes.
6.4 Increased demand for downward accountability to citizens for public spending and service delivery performance.
6.5 Cost-effective public administration through rationalisation of the administrative units.
Governance of PFM Reform This strategy will be delivered through a number of programmes, in addition to the Government’s joint-funded PFM reform programme (formerly FINMAP). The successor programme to FINMAP will have a key role in leading, coordinating and monitoring all other PFM reform programmes. The overall governance and high level policy direction of PFM reforms will continue to be led by the Public Expenditure Management Committee (PEMCOM), chaired by the Permanent Secretary/Secretary to the Treasury, with close coordination with the Accountability Sector. In particular, an annual PFM performance review will be introduced, which will inform the annual performance assessment and planning of the Accountability Sector. Furthermore, new technical sub-group structures will be established to strengthen planning and implementation of the six priorities PFM reform areas, which will be aligned to and closely coordinated with the Accountability Sector Technical Working Groups. Change management Implementing reforms requires changing systems, procedures, norms and behaviours. While it is important to identify the correct technical solutions to PFM problems, it is also important to adopt a systematic approach to managing change. In particular, since resistance to change is a normal consequence of reform, the change management strategy underpinning the PFM reform strategy will seek to understand and address stakeholders’ concerns, fears and needs alongside reforms. Risk Management Recognising that it will not be possible to eliminate all risks in the delivery of PFM reforms, associated risks will be identified and managed actively. PEMCOM will consider high level risks and take action to mitigate, or escalate risks to minimise likelihood and impact. PFM Reform cluster heads and PS/ST will support PEMCOM in this task, still facilitated by the PFM secretariat, which will coordinate the regular monitoring and documentation of any identified and/or emerging risks. Sustainability Sustainability is the ultimate goal of the PFM reform strategy, which aims to finance PFM activities and reforms independently and embed PFM systems without continuous external assistance. This strategy seeks to establish a sustainability plan, linked to the implementation plan. This will identify recurrent costs associated with PFM reform activities that need to be mainstreamed into GoU operations. In addition, PFM staffing and public administration structures will be reviewed to ensure that administrative structures are commensurate with the current needs for effective PFM. Finally, the strategy seeks to explore new ways of delivering capacity building and training for PFM across Government. More sustainable delivery modalities will be considered, such as training of trainers, e-learning platforms, a comprehensive needs assessment, comprehensive training programmes, and collaboration with relevant external training providers or
professional bodies. Drawing from lessons from the previous strategy, specific reforms will be deepened in the key service delivery sectors of Education, Health, Agriculture, Water, Roads, and Energy. While the strategy maintains a whole of government approach, this element of prioritization aims to refocus the reform strategy in sustaining its contribution to key service delivery outcomes.
Monitoring and Evaluation This strategy presents a results framework of performance indicators and targets for monitoring progress of PFM reforms. As far as possible, these indicators are harmonised with existing Monitoring and Evaluation frameworks, including the Accountability Sector, the National M&E framework where the Government Annual Performance Review (GAPR) under the Office of the Prime Minister is managed, and the National Development Plan (NDP II), among others. Monitoring and Evaluation of the strategy will take place at 5 levels: (i) impact on service delivery; (ii) PFM system-level outcomes; (iii) PFM effectiveness (intermediate outcomes) from the 6 priority reform areas; (iv) efficiency (outputs against inputs); and, (v) economy (delivery of activities and resources utilised). A mid-term and final evaluation will assess performance and impacts against Levels 1 and 2. Level 3 will be assessed at least annually as part of the annual performance review. Levels 4 and 5 will be assessed at programme level, at least quarterly, through relevant delivery (programme) modalities and, where possible consolidated for tracking and learning from delivery efficiency and economy across the PFM reform strategy implementation plan.
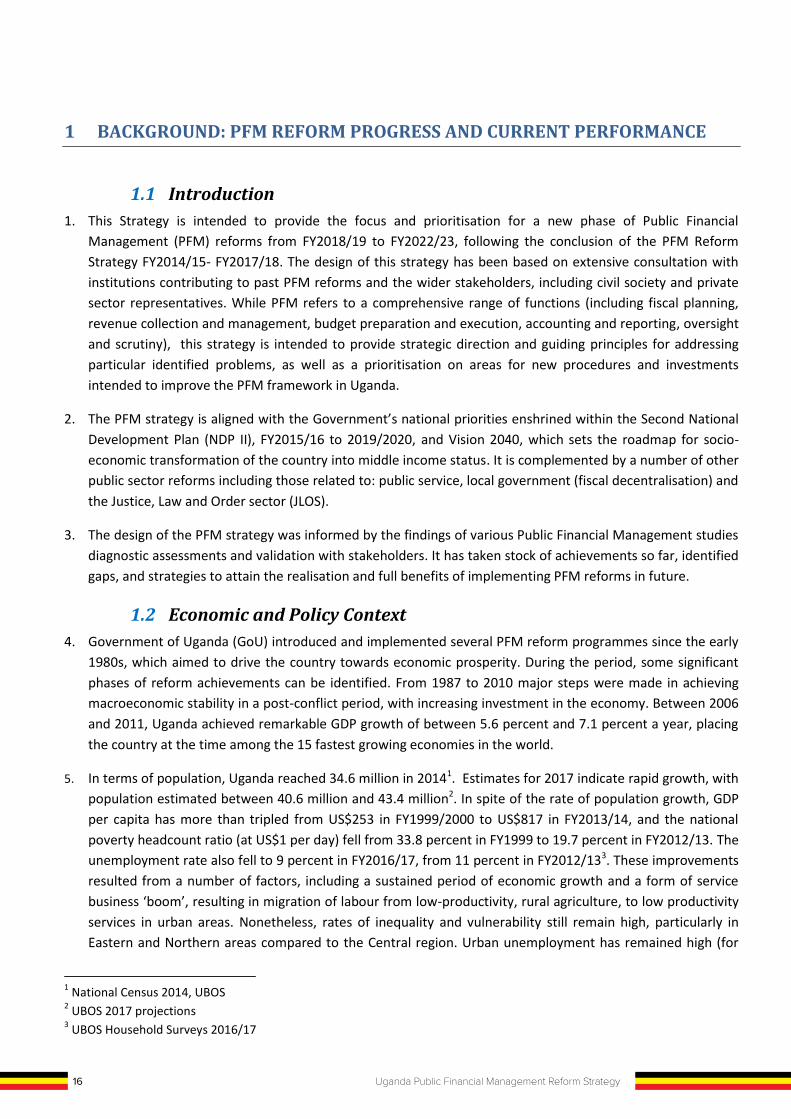
16 Uganda Public Financial Management Reform Strategy
1 BACKGROUND: PFM REFORM PROGRESS AND CURRENT PERFORMANCE
1.1 Introduction 1. This Strategy is intended to provide the focus and prioritisation for a new phase of Public Financial
Management (PFM) reforms from FY2018/19 to FY2022/23, following the conclusion of the PFM Reform Strategy FY2014/15- FY2017/18. The design of this strategy has been based on extensive consultation with institutions contributing to past PFM reforms and the wider stakeholders, including civil society and private sector representatives. While PFM refers to a comprehensive range of functions (including fiscal planning, revenue collection and management, budget preparation and execution, accounting and reporting, oversight and scrutiny), this strategy is intended to provide strategic direction and guiding principles for addressing particular identified problems, as well as a prioritisation on areas for new procedures and investments intended to improve the PFM framework in Uganda.
2. The PFM strategy is aligned with the Government’s national priorities enshrined within the Second National Development Plan (NDP II), FY2015/16 to 2019/2020, and Vision 2040, which sets the roadmap for socio-economic transformation of the country into middle income status. It is complemented by a number of other public sector reforms including those related to: public service, local government (fiscal decentralisation) and the Justice, Law and Order sector (JLOS).
3. The design of the PFM strategy was informed by the findings of various Public Financial Management studies diagnostic assessments and validation with stakeholders. It has taken stock of achievements so far, identified gaps, and strategies to attain the realisation and full benefits of implementing PFM reforms in future.
1.2 Economic and Policy Context 4. Government of Uganda (GoU) introduced and implemented several PFM reform programmes since the early
1980s, which aimed to drive the country towards economic prosperity. During the period, some significant phases of reform achievements can be identified. From 1987 to 2010 major steps were made in achieving macroeconomic stability in a post-conflict period, with increasing investment in the economy. Between 2006 and 2011, Uganda achieved remarkable GDP growth of between 5.6 percent and 7.1 percent a year, placing the country at the time among the 15 fastest growing economies in the world.
5. In terms of population, Uganda reached 34.6 million in 20141. Estimates for 2017 indicate rapid growth, with population estimated between 40.6 million and 43.4 million2. In spite of the rate of population growth, GDP per capita has more than tripled from US$253 in FY1999/2000 to US$817 in FY2013/14, and the national poverty headcount ratio (at US$1 per day) fell from 33.8 percent in FY1999 to 19.7 percent in FY2012/13. The unemployment rate also fell to 9 percent in FY2016/17, from 11 percent in FY2012/133. These improvements resulted from a number of factors, including a sustained period of economic growth and a form of service business ‘boom’, resulting in migration of labour from low-productivity, rural agriculture, to low productivity services in urban areas. Nonetheless, rates of inequality and vulnerability still remain high, particularly in Eastern and Northern areas compared to the Central region. Urban unemployment has remained high (for
1 National Census 2014, UBOS 2 UBOS 2017 projections 3 UBOS Household Surveys 2016/17
example, at 21 percent in Kampala). The Labour force participation rate diminished from 60 percent in FY2012/13 to 52 percent in FY2016/17, and the largest share of employment remains in subsistence agriculture, at nearly 40 percent in FY 2016/17, compared to 36.6 percent in FY 2012/13.
6. Economic growth slowed down in recent years, following challenges arising from the effects of the global financial crisis, falling commodity prices, among other domestic shocks, which saw the strengthening of the United States dollar against the Uganda shilling and, in turn, this brought about inflationary pressures observed in increased domestic prices. Nonetheless, real GDP is estimated to have expanded to 5.8 percent in 2017/18 and remained above that of the rest of the World, at 3.9 percent and Sub-Saharan Africa economies, at 3.4 percent4. Over 50 percent of the registered growth in Uganda was contributed by the services sector, which grew by 6.5 per cent in FY2015/16 from 4.8 percent registered in FY2014/15 as indicated in the Table 1. Other key sectors such as agriculture are projected to have grown at 3.2 percent while the Industrial Sector grew at 4 percent.
Table 1.1: Selected Economic Indicators FY2013-14 FY2014-15 FY2015-16 FY2016/17 FY2017/18*
GDP at current prices (billion shillings) 69,276 76,517 83,091 91,718 101,829 GDP per capita (UGX ‘000) 2,038 2,188 2,316 2,485 2,684 Real GDP growth (percent) 5.1% 5.2% 4.7% 4.0% 5.8% CPI (annual average change) (percent) 5.4% 3.0% 6.6% 5.7% n/a Gross government debt (percent of GDP)
37.0% 40.2%
External terms of trade (annual percentage change)
4.7% 18.8% 5.3% 0.04% n/a
Current account balance (percent of GDP)
7.5% 6.9% 4.9% 3.4% n/a
Total external debt (percent of GDP) 24.3% 27.3% Gross official reserves (months of import value)
5.2 5.0 5.6 5.4 n/a
Overall fiscal balance (percent of GDP) 4.0% 4.3% 4.8% 3.9% n/a Domestic Revenue (percent of GDP) 11.6% 12.9% 13.5% 13.6% 14.0% *Preliminary Source: MoFPED figures
7. The discovery of oil and gas in Uganda provides the country with an opportunity to generate additional
investment, employment and resources within which to finance other public investments for future generations. World Bank projections indicate that GDP growth rates could exceed 9 percent per year over the next two decades through a combination of demand and supply effects directly generated by oil activities5. While there are major opportunities from this sector, a number of oil producing nations have experienced economic challenges related to oil production. In order to manage these risks, Government should deliberately invest in growth-generating infrastructure to expand the non-oil sectors of the economy, to also promote local content and value addition in oil sector activities and to ensure that domestic revenues from other (non-oil) sources are expanded to sustain revenue mobilisation beyond the life of oil production. Since Uganda is commencing the production phase of the oil sector, the achievement of these objectives will
4 World Economic Outlook, IMF, April 2018 5 Economic Diversification and Growth in the era of oil and volatility, Uganda Country Economic Memorandum, World Bank, 2015
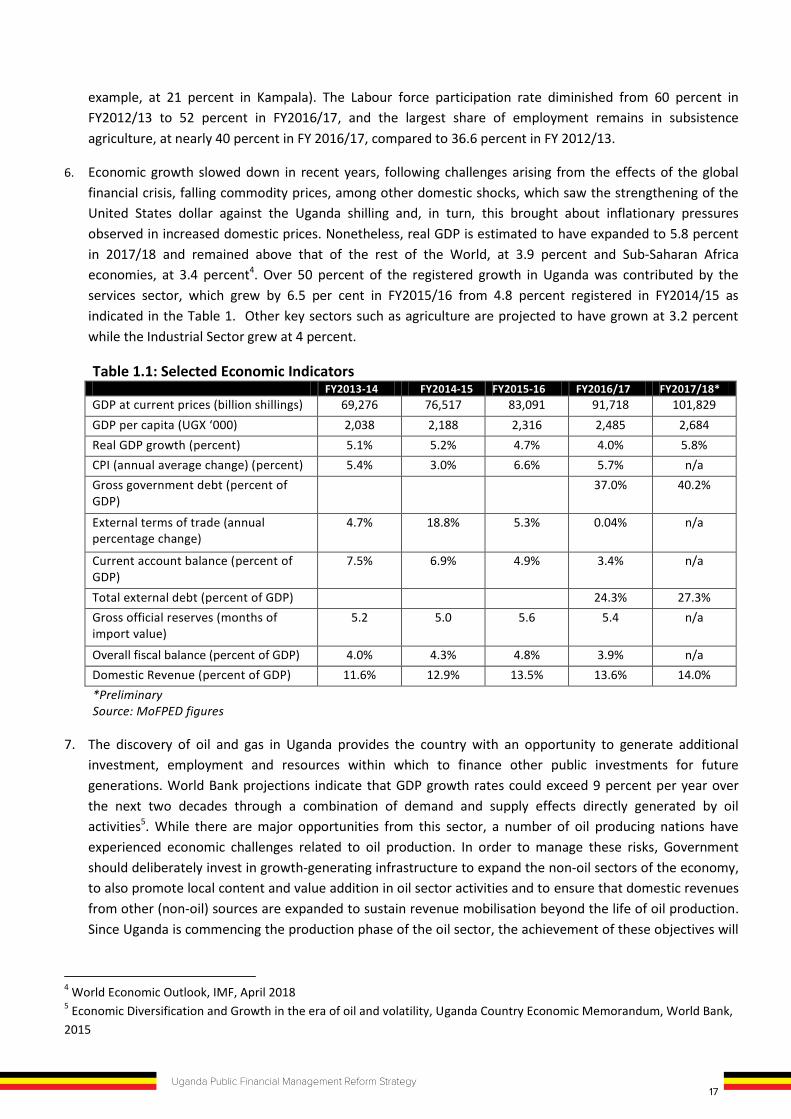
17Uganda Public Financial Management Reform Strategy
1 BACKGROUND: PFM REFORM PROGRESS AND CURRENT PERFORMANCE
1.1 Introduction 1. This Strategy is intended to provide the focus and prioritisation for a new phase of Public Financial
Management (PFM) reforms from FY2018/19 to FY2022/23, following the conclusion of the PFM Reform Strategy FY2014/15- FY2017/18. The design of this strategy has been based on extensive consultation with institutions contributing to past PFM reforms and the wider stakeholders, including civil society and private sector representatives. While PFM refers to a comprehensive range of functions (including fiscal planning, revenue collection and management, budget preparation and execution, accounting and reporting, oversight and scrutiny), this strategy is intended to provide strategic direction and guiding principles for addressing particular identified problems, as well as a prioritisation on areas for new procedures and investments intended to improve the PFM framework in Uganda.
2. The PFM strategy is aligned with the Government’s national priorities enshrined within the Second National Development Plan (NDP II), FY2015/16 to 2019/2020, and Vision 2040, which sets the roadmap for socio-economic transformation of the country into middle income status. It is complemented by a number of other public sector reforms including those related to: public service, local government (fiscal decentralisation) and the Justice, Law and Order sector (JLOS).
3. The design of the PFM strategy was informed by the findings of various Public Financial Management studies diagnostic assessments and validation with stakeholders. It has taken stock of achievements so far, identified gaps, and strategies to attain the realisation and full benefits of implementing PFM reforms in future.
1.2 Economic and Policy Context 4. Government of Uganda (GoU) introduced and implemented several PFM reform programmes since the early
1980s, which aimed to drive the country towards economic prosperity. During the period, some significant phases of reform achievements can be identified. From 1987 to 2010 major steps were made in achieving macroeconomic stability in a post-conflict period, with increasing investment in the economy. Between 2006 and 2011, Uganda achieved remarkable GDP growth of between 5.6 percent and 7.1 percent a year, placing the country at the time among the 15 fastest growing economies in the world.
5. In terms of population, Uganda reached 34.6 million in 20141. Estimates for 2017 indicate rapid growth, with population estimated between 40.6 million and 43.4 million2. In spite of the rate of population growth, GDP per capita has more than tripled from US$253 in FY1999/2000 to US$817 in FY2013/14, and the national poverty headcount ratio (at US$1 per day) fell from 33.8 percent in FY1999 to 19.7 percent in FY2012/13. The unemployment rate also fell to 9 percent in FY2016/17, from 11 percent in FY2012/133. These improvements resulted from a number of factors, including a sustained period of economic growth and a form of service business ‘boom’, resulting in migration of labour from low-productivity, rural agriculture, to low productivity services in urban areas. Nonetheless, rates of inequality and vulnerability still remain high, particularly in Eastern and Northern areas compared to the Central region. Urban unemployment has remained high (for
1 National Census 2014, UBOS 2 UBOS 2017 projections 3 UBOS Household Surveys 2016/17
example, at 21 percent in Kampala). The Labour force participation rate diminished from 60 percent in FY2012/13 to 52 percent in FY2016/17, and the largest share of employment remains in subsistence agriculture, at nearly 40 percent in FY 2016/17, compared to 36.6 percent in FY 2012/13.
6. Economic growth slowed down in recent years, following challenges arising from the effects of the global financial crisis, falling commodity prices, among other domestic shocks, which saw the strengthening of the United States dollar against the Uganda shilling and, in turn, this brought about inflationary pressures observed in increased domestic prices. Nonetheless, real GDP is estimated to have expanded to 5.8 percent in 2017/18 and remained above that of the rest of the World, at 3.9 percent and Sub-Saharan Africa economies, at 3.4 percent4. Over 50 percent of the registered growth in Uganda was contributed by the services sector, which grew by 6.5 per cent in FY2015/16 from 4.8 percent registered in FY2014/15 as indicated in the Table 1. Other key sectors such as agriculture are projected to have grown at 3.2 percent while the Industrial Sector grew at 4 percent.
Table 1.1: Selected Economic Indicators FY2013-14 FY2014-15 FY2015-16 FY2016/17 FY2017/18*
GDP at current prices (billion shillings) 69,276 76,517 83,091 91,718 101,829 GDP per capita (UGX ‘000) 2,038 2,188 2,316 2,485 2,684 Real GDP growth (percent) 5.1% 5.2% 4.7% 4.0% 5.8% CPI (annual average change) (percent) 5.4% 3.0% 6.6% 5.7% n/a Gross government debt (percent of GDP)
37.0% 40.2%
External terms of trade (annual percentage change)
4.7% 18.8% 5.3% 0.04% n/a
Current account balance (percent of GDP)
7.5% 6.9% 4.9% 3.4% n/a
Total external debt (percent of GDP) 24.3% 27.3% Gross official reserves (months of import value)
5.2 5.0 5.6 5.4 n/a
Overall fiscal balance (percent of GDP) 4.0% 4.3% 4.8% 3.9% n/a Domestic Revenue (percent of GDP) 11.6% 12.9% 13.5% 13.6% 14.0% *Preliminary Source: MoFPED figures
7. The discovery of oil and gas in Uganda provides the country with an opportunity to generate additional
investment, employment and resources within which to finance other public investments for future generations. World Bank projections indicate that GDP growth rates could exceed 9 percent per year over the next two decades through a combination of demand and supply effects directly generated by oil activities5. While there are major opportunities from this sector, a number of oil producing nations have experienced economic challenges related to oil production. In order to manage these risks, Government should deliberately invest in growth-generating infrastructure to expand the non-oil sectors of the economy, to also promote local content and value addition in oil sector activities and to ensure that domestic revenues from other (non-oil) sources are expanded to sustain revenue mobilisation beyond the life of oil production. Since Uganda is commencing the production phase of the oil sector, the achievement of these objectives will
4 World Economic Outlook, IMF, April 2018 5 Economic Diversification and Growth in the era of oil and volatility, Uganda Country Economic Memorandum, World Bank, 2015
18 Uganda Public Financial Management Reform Strategy
be underpinned by effective public financial management, from sustainable resource mobilisation to management of public investment projects, such as the oil refinery and pipeline.
8. Through the Government’s National Development Plans (I and II), and Vision 2040, a clear objective has been set to drive Uganda towards middle income status. This will require a significant scaling up of investment in infrastructure, including energy and roads, as well as delivering key public services that strengthen human capital through investment in education, water and health. PFM has an important role to play in ensuring that there are sufficient and sustainable resources available for public investment, and that investment projects achieve the highest possible economic return. The risk of debt distress is low, but increasing due to insufficient domestic revenue, under-execution of public investments and increased non-concessional borrowing, which has weakened the growth and development impact of public investment on economic and social objective6.
9. The Accountability Sector goal, which is drawn from the NDP II, therefore aims to “Strengthen mechanisms for quality, effective and efficient service delivery”, which will help to create fiscal space for allocating resources towards the scaling up of public investment and improving service delivery.
1.3 Progress towards PFM Reforms in Uganda (1986 -2018) 10. Since 1980, a series of public sector reforms have been implemented in Uganda, as summarised in the table
below. In particular, these phases have broadly focused on the three main PFM outcomes of fiscal discipline, strategic resource allocation and efficiency in service delivery. In particular, while early phases appeared to have progressed towards service delivery, later phases have reverted back to more fundamental controls to ensure basic fiduciary controls are in place, typically in response to corruption cases or evidence of non-compliance. This reinforces the findings documented in PFM literature that PFM reforms are often over-ambitious in terms of the time it takes to fully achieve the desired outcomes, and that basic fiscal control is needed to provide a firm foundation for further reforms in allocative efficiency and service delivery.
Table 1.2: Phases of PFM Reform 1986 - Present Period Key Reforms Achieved Focus of Reforms 1986-1990 1. Structural adjustment reforms
2. Medium term expenditure framework instituted to enable predictability of the budget and enable harmonization of aid
Focused on improving efficiency in service delivery
1990-2002 1. Further structural reforms e.g. reduced tariffs 2. URA established 3. Fiscal decentralisation strategy 4. Budget Act 2001
Establishment of fiscal discipline and the strategic allocation of resources for poverty eradication
2002 - 2012
1. Enactment of the public finance Act 2003 2. Enhanced institutional setup for PFM 3. Automation of financial management systems 4. Professional scheme for accreditation of staff 5. Implementation of Output Based reform within Results
Oriented Management reforms
Focused on Effectiveness of public service delivery
2012-2018 1. Institution of the Treasury single account, straight The focus in the Strategy 6 Debt Sustainability Analysis Report, 2016, Ministry of Finance, Planning and Economic Development
Period Key Reforms Achieved Focus of Reforms through processing
2. Decentralisation of payroll & pension management 3. Enactment of Public Finance Management Act 2015
that legalised above reforms and more 4. Macro-Economic forecasting reform-IMEM 5. Programme Based Budgeting System 6. Independence of office of the Auditor General reform 7. Strengthening the legislative oversight – PAC 8. Automation of government systems reforms from
manual to computer based 9. Tax administration reform (e.g. e-Tax, TIN reform) 10. Aid and debt Management reforms (AMP) 11. Decentralisation of the internal audit function 12. Public procurement reform 13. Budget transparency reform
2014-2018 was: (i) Budget credibility (ii) Budget control (iii) Compliance with PFM rules and regulations
9. The PFM Strategy 2014-2018 was comprehensive in its coverage of PFM functions, with an overall goal “To strengthen Public Financial Management at all levels of government to ensure efficient, effective and accountable use of public resources as a basis for improved service delivery”. Underlying this goal, was an objective to achieve the three typical PFM outcomes of:
I. Aggregate fiscal discipline II. Allocative efficiency; and
III. Operational efficiency in public expenditure and revenue management.
10. Within this all-encompassing goal was a particular focus on achieving the intermediate outcomes of Budget credibility, control and compliance with set rules and regulations. These were to be sequenced around two stages:
I. Encourage effective service delivery by removing barriers in PFM systems and capacities while reinforcing compliance with regulations and avoidance of leakages; and
II. Strengthen mechanisms for instilling accountability for performance, while hardening the link between results and resources.
11. Over the implementation period of the PFM reform strategy 2014-2018, a number of significant reforms were achieved, including: the enactment of the Public Finance Management Act 2015; strengthened policy framework for macroeconomic management; enhanced management and reporting of public expenditure through the Treasury Single account (TSA); further rollout, upgrading and use of the Integrated Financial Management System (IFMS); a reduction in the number of ‘ghost’ workers, in particular, through the successful decentralisation of payroll and pensions management and more effective verification, with the operationalization of Integrated Personnel and payroll system (IPPS); improved policy-based budgeting through the newly deployed Programme Based Budgeting (PBB) system for improved budget formulation, planning and budgeting; enhanced control and management of public funds; improved quality of financial reporting at Ministries, Departments and Agencies (MDAs) and Local Governments (LGs); and enhanced scrutiny and oversight of collection and utilisation of public funds.
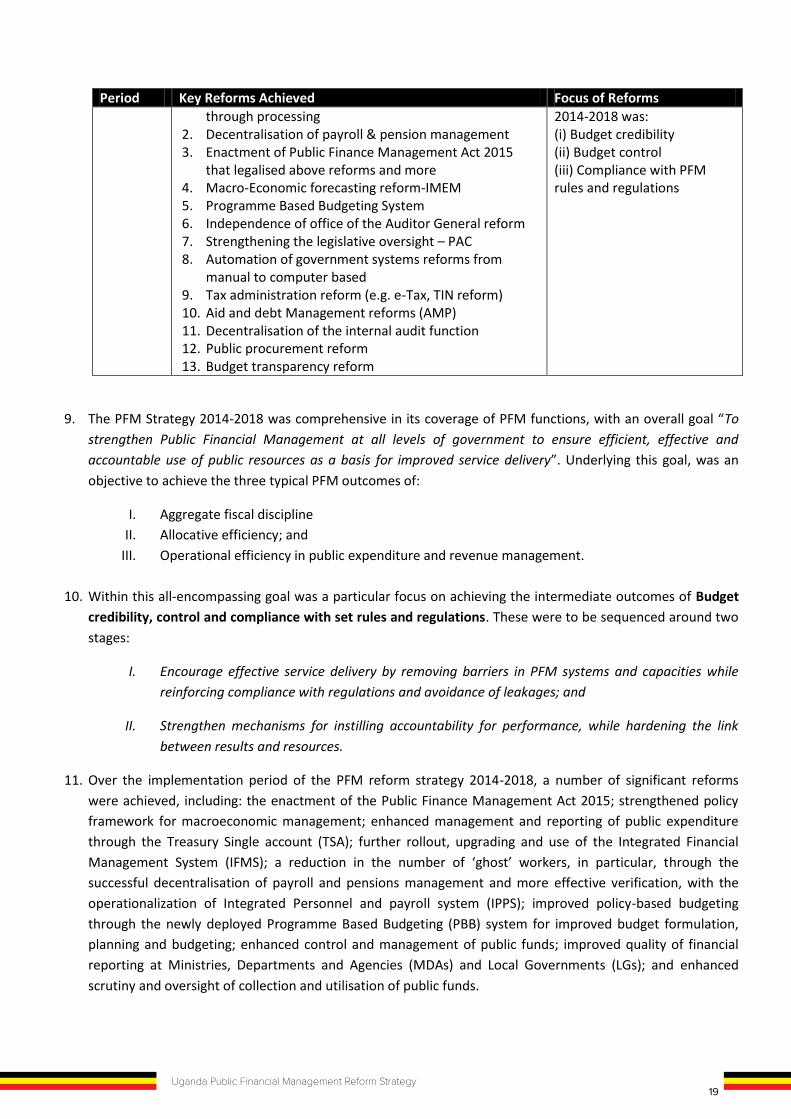
19Uganda Public Financial Management Reform Strategy
be underpinned by effective public financial management, from sustainable resource mobilisation to management of public investment projects, such as the oil refinery and pipeline.
8. Through the Government’s National Development Plans (I and II), and Vision 2040, a clear objective has been set to drive Uganda towards middle income status. This will require a significant scaling up of investment in infrastructure, including energy and roads, as well as delivering key public services that strengthen human capital through investment in education, water and health. PFM has an important role to play in ensuring that there are sufficient and sustainable resources available for public investment, and that investment projects achieve the highest possible economic return. The risk of debt distress is low, but increasing due to insufficient domestic revenue, under-execution of public investments and increased non-concessional borrowing, which has weakened the growth and development impact of public investment on economic and social objective6.
9. The Accountability Sector goal, which is drawn from the NDP II, therefore aims to “Strengthen mechanisms for quality, effective and efficient service delivery”, which will help to create fiscal space for allocating resources towards the scaling up of public investment and improving service delivery.
1.3 Progress towards PFM Reforms in Uganda (1986 -2018) 10. Since 1980, a series of public sector reforms have been implemented in Uganda, as summarised in the table
below. In particular, these phases have broadly focused on the three main PFM outcomes of fiscal discipline, strategic resource allocation and efficiency in service delivery. In particular, while early phases appeared to have progressed towards service delivery, later phases have reverted back to more fundamental controls to ensure basic fiduciary controls are in place, typically in response to corruption cases or evidence of non-compliance. This reinforces the findings documented in PFM literature that PFM reforms are often over-ambitious in terms of the time it takes to fully achieve the desired outcomes, and that basic fiscal control is needed to provide a firm foundation for further reforms in allocative efficiency and service delivery.
Table 1.2: Phases of PFM Reform 1986 - Present Period Key Reforms Achieved Focus of Reforms 1986-1990 1. Structural adjustment reforms
2. Medium term expenditure framework instituted to enable predictability of the budget and enable harmonization of aid
Focused on improving efficiency in service delivery
1990-2002 1. Further structural reforms e.g. reduced tariffs 2. URA established 3. Fiscal decentralisation strategy 4. Budget Act 2001
Establishment of fiscal discipline and the strategic allocation of resources for poverty eradication
2002 - 2012
1. Enactment of the public finance Act 2003 2. Enhanced institutional setup for PFM 3. Automation of financial management systems 4. Professional scheme for accreditation of staff 5. Implementation of Output Based reform within Results
Oriented Management reforms
Focused on Effectiveness of public service delivery
2012-2018 1. Institution of the Treasury single account, straight The focus in the Strategy 6 Debt Sustainability Analysis Report, 2016, Ministry of Finance, Planning and Economic Development
Period Key Reforms Achieved Focus of Reforms through processing
2. Decentralisation of payroll & pension management 3. Enactment of Public Finance Management Act 2015
that legalised above reforms and more 4. Macro-Economic forecasting reform-IMEM 5. Programme Based Budgeting System 6. Independence of office of the Auditor General reform 7. Strengthening the legislative oversight – PAC 8. Automation of government systems reforms from
manual to computer based 9. Tax administration reform (e.g. e-Tax, TIN reform) 10. Aid and debt Management reforms (AMP) 11. Decentralisation of the internal audit function 12. Public procurement reform 13. Budget transparency reform
2014-2018 was: (i) Budget credibility (ii) Budget control (iii) Compliance with PFM rules and regulations
9. The PFM Strategy 2014-2018 was comprehensive in its coverage of PFM functions, with an overall goal “To strengthen Public Financial Management at all levels of government to ensure efficient, effective and accountable use of public resources as a basis for improved service delivery”. Underlying this goal, was an objective to achieve the three typical PFM outcomes of:
I. Aggregate fiscal discipline II. Allocative efficiency; and
III. Operational efficiency in public expenditure and revenue management.
10. Within this all-encompassing goal was a particular focus on achieving the intermediate outcomes of Budget credibility, control and compliance with set rules and regulations. These were to be sequenced around two stages:
I. Encourage effective service delivery by removing barriers in PFM systems and capacities while reinforcing compliance with regulations and avoidance of leakages; and
II. Strengthen mechanisms for instilling accountability for performance, while hardening the link between results and resources.
11. Over the implementation period of the PFM reform strategy 2014-2018, a number of significant reforms were achieved, including: the enactment of the Public Finance Management Act 2015; strengthened policy framework for macroeconomic management; enhanced management and reporting of public expenditure through the Treasury Single account (TSA); further rollout, upgrading and use of the Integrated Financial Management System (IFMS); a reduction in the number of ‘ghost’ workers, in particular, through the successful decentralisation of payroll and pensions management and more effective verification, with the operationalization of Integrated Personnel and payroll system (IPPS); improved policy-based budgeting through the newly deployed Programme Based Budgeting (PBB) system for improved budget formulation, planning and budgeting; enhanced control and management of public funds; improved quality of financial reporting at Ministries, Departments and Agencies (MDAs) and Local Governments (LGs); and enhanced scrutiny and oversight of collection and utilisation of public funds.

20 Uganda Public Financial Management Reform Strategy
12. In order to assess the impact of these reforms, the strategy set out a measurement framework on 2 levels: (1) Impact on service delivery; and (2) PFM system performance outcomes. Below level 2 were also Programme-level results, demonstrated through performance of the main joint basket-funded PFM reform programme, FINMAP III.
1.3.1 Level 1 Progress: Impact on Service Delivery 13. At Level 1, service delivery outcomes in key sectors have been broadly positive, although there has been
insufficient progress to meet some of the original sector targets. The PFM Reform Strategy 2014-2018 expected that effective PFM systems would benefit service delivery by improving the targeting of resources to where they are needed most; reducing leakages in the system; and enhanced quality and value for money through stronger budget execution and accountability processes (e.g. procurement, revenue management, reporting, etc.). In the review of indicators provided in Annex B, there was evidence of improvement against all the key service delivery indicators, including education enrolment, infant and maternal mortality rates, energy supply, and rural access to improved water supply. Nonetheless, in some cases, the improvements were below target. For example, the Maternal Mortality Ratio reduced from 438 per 100,000 (UDHS 2011) to 336 per 100,000 (UDHS 2016) live births, which is still far below the HSDP target of 121 per 100,000 live births by 20207. In the education sector, inadequate capitation grants and lack of resources for construction of vocational training centres in every district were sighted as challenges to the delivery of tertiary education targets8.
14. The full impact of PFM reforms has not yet been felt at sector level, where budget execution bottlenecks remain, such as in the health sector9. In spite of recent PFM reforms and enhanced fiduciary controls, health sector entities and districts are reporting low budget absorption rates, ranging from 80-90 percent in FY2014/15 and FY2015/16. The bottlenecks identified included weak procurement processes, funds release mechanisms, delays in effecting payments and institutional weaknesses, such as the quality of the operations of the finance committee and Health Sector Technical Working group. A lack of understanding of core PFM systems (e.g. OBT, PBS and IFMS) was also reported, suggesting a lack of guidance, training and access at the level of vote controllers in the health sector.
1.3.2 Level 2 Progress: PFM Outcomes 15. At Level 2, PFM outcomes measured using the PFM Strategy indicators, shows a more mixed performance.
The first set of indicators, showing measures of budget credibility and control have improved, while others have deteriorated. Most notably, the percentage of the national budget funded from domestic revenue has improved from 71percent to 87percent. There has been some improvement in the deviations in composition of expenditure outturn compared to the budget, from 21 percent to 7 percent10. Nonetheless, there was a worsening of expenditure arrears, from 7 percent of total expenditure to 10 percent, and an expansion of nation debt as a percentage of domestic revenue from 86 percent to 100 percent.
16. On compliance with PFM systems, most indicators have improved. These include the percentage of clean audit reports (for central government and statutory bodies), implementation of internal audit recommendations and the value of contracts audited that are rated ‘satisfactory’. However, there was a slight worsening in the percentage of external audit and procurement recommendations implemented.
7 Annual Health Sector Performance Report (AHSPR), FY2016/17 8 Education and Sports Sector Annual Performance Report, FY2016/17 9 Uganda health sector budget execution bottlenecks report, USAID (2017) 10 Uganda PEFA Assessment 2016
17. Sixteen PFM performance indicator scores improved, as measured by PEFA 2016. The PEFA framework does not capture all aspects and underlying drivers of PFM performance, but provides an overview of PFM system performance, strengths and weaknesses. Insofar as the assessors were able to draw comparisons between the 2016 performance and the 2012 PEFA Assessment, 16 out of 28 indicators were found to have improved (see Table 1.3 below), indicating some improvement across all PEFA Pillars, except in the area of Management of Assets and Liabilities and External Scrutiny and Audit.
Table 1.3: Improved PEFA Scores (2012 – 2016) PEFA Indicator 2012 2016 Reason for improvement PI-1 Aggregate expenditure out-turn compared to initially approved budget (excluding externally financed project expenditure)
C A
Improved adherence to budget as TSA introduced, accounting officers more responsible and payroll improved
PI-2 Composition of expenditure out-turn compared to original approved budget D+ C+
Similar reasons to PI-1
PI-3 Aggregate revenue out-turn compared to original approved budget D B Improved URA estimates
PI-7 Extent of unreported government operations. D+ C+
Loan financed projects are included in fiscal reports
PI-8 Transparency of inter-governmental fiscal relations. D+ C Sub-national Governments have sufficient time to
prepare their budget after 2nd budget call circular PI-11 Orderliness and participation in the annual budget process C+ A
Impact of PFMA 2014: Existence of, and adherence to, a fixed budget calendar; and timely budget approval by the legislature
PI-12 Multi-year perspective in fiscal planning, expenditure policy and budgeting C+ B
Medium-term Fiscal Framework improved and used
PI-16 Predictability in the availability of funds for commitment of expenditures C+ B
Improved due to MDA planning horizon 3 months from one month
PI-17 Recording and management of cash balances, debt and guarantees B A Debt Management Strategy, TSA and PFM Act have
improved recoding and management PI-18 Effectiveness of payroll controls
D+ C+
Improvements recognize the reforms in IPPS, payroll audits and biometric data etc. To improve further would need the automatic transfer between IFMIS -IPPS
PI-19 Competition, value for money and controls in procurement D+ C+
The score has improved due to creation of a procurement tribunal and provision of more procurement information to the public.
PI-20 Effectiveness of internal controls for non-salary expenditure C B
Tightening of controls in IFMS; new PFM Act/Regulations instructions and penalties have increased awareness of internal controls and procedures
PI-21 Effectiveness of internal audit C B
Improved management responses to IA recommendations
PI-22 Timeliness and regularity of accounts reconciliation B A Improved score due to absence of suspense
accounts PI-24 Quality and timeliness of in-year budget reports C+ B More timely production of the reports and
increased automation of transactions in the MDAs. PI-25 Quality and timeliness of annual financial statements C+ B+
Greater compliance with IPSAS; more IFMIS automation and better in-year accounting disciplines such as on-going reconciliations
Source: PEFA 2016 Assessment Report
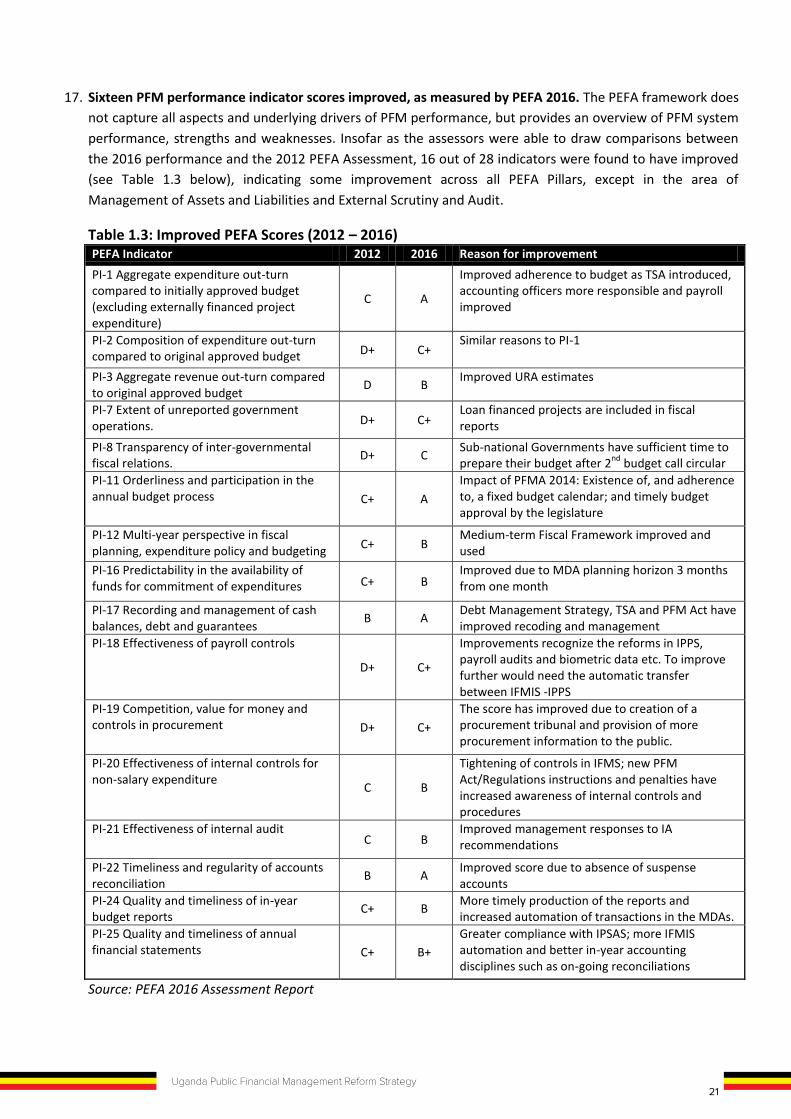
21Uganda Public Financial Management Reform Strategy
12. In order to assess the impact of these reforms, the strategy set out a measurement framework on 2 levels: (1) Impact on service delivery; and (2) PFM system performance outcomes. Below level 2 were also Programme-level results, demonstrated through performance of the main joint basket-funded PFM reform programme, FINMAP III.
1.3.1 Level 1 Progress: Impact on Service Delivery 13. At Level 1, service delivery outcomes in key sectors have been broadly positive, although there has been
insufficient progress to meet some of the original sector targets. The PFM Reform Strategy 2014-2018 expected that effective PFM systems would benefit service delivery by improving the targeting of resources to where they are needed most; reducing leakages in the system; and enhanced quality and value for money through stronger budget execution and accountability processes (e.g. procurement, revenue management, reporting, etc.). In the review of indicators provided in Annex B, there was evidence of improvement against all the key service delivery indicators, including education enrolment, infant and maternal mortality rates, energy supply, and rural access to improved water supply. Nonetheless, in some cases, the improvements were below target. For example, the Maternal Mortality Ratio reduced from 438 per 100,000 (UDHS 2011) to 336 per 100,000 (UDHS 2016) live births, which is still far below the HSDP target of 121 per 100,000 live births by 20207. In the education sector, inadequate capitation grants and lack of resources for construction of vocational training centres in every district were sighted as challenges to the delivery of tertiary education targets8.
14. The full impact of PFM reforms has not yet been felt at sector level, where budget execution bottlenecks remain, such as in the health sector9. In spite of recent PFM reforms and enhanced fiduciary controls, health sector entities and districts are reporting low budget absorption rates, ranging from 80-90 percent in FY2014/15 and FY2015/16. The bottlenecks identified included weak procurement processes, funds release mechanisms, delays in effecting payments and institutional weaknesses, such as the quality of the operations of the finance committee and Health Sector Technical Working group. A lack of understanding of core PFM systems (e.g. OBT, PBS and IFMS) was also reported, suggesting a lack of guidance, training and access at the level of vote controllers in the health sector.
1.3.2 Level 2 Progress: PFM Outcomes 15. At Level 2, PFM outcomes measured using the PFM Strategy indicators, shows a more mixed performance.
The first set of indicators, showing measures of budget credibility and control have improved, while others have deteriorated. Most notably, the percentage of the national budget funded from domestic revenue has improved from 71percent to 87percent. There has been some improvement in the deviations in composition of expenditure outturn compared to the budget, from 21 percent to 7 percent10. Nonetheless, there was a worsening of expenditure arrears, from 7 percent of total expenditure to 10 percent, and an expansion of nation debt as a percentage of domestic revenue from 86 percent to 100 percent.
16. On compliance with PFM systems, most indicators have improved. These include the percentage of clean audit reports (for central government and statutory bodies), implementation of internal audit recommendations and the value of contracts audited that are rated ‘satisfactory’. However, there was a slight worsening in the percentage of external audit and procurement recommendations implemented.
7 Annual Health Sector Performance Report (AHSPR), FY2016/17 8 Education and Sports Sector Annual Performance Report, FY2016/17 9 Uganda health sector budget execution bottlenecks report, USAID (2017) 10 Uganda PEFA Assessment 2016
17. Sixteen PFM performance indicator scores improved, as measured by PEFA 2016. The PEFA framework does not capture all aspects and underlying drivers of PFM performance, but provides an overview of PFM system performance, strengths and weaknesses. Insofar as the assessors were able to draw comparisons between the 2016 performance and the 2012 PEFA Assessment, 16 out of 28 indicators were found to have improved (see Table 1.3 below), indicating some improvement across all PEFA Pillars, except in the area of Management of Assets and Liabilities and External Scrutiny and Audit.
Table 1.3: Improved PEFA Scores (2012 – 2016) PEFA Indicator 2012 2016 Reason for improvement PI-1 Aggregate expenditure out-turn compared to initially approved budget (excluding externally financed project expenditure)
C A
Improved adherence to budget as TSA introduced, accounting officers more responsible and payroll improved
PI-2 Composition of expenditure out-turn compared to original approved budget D+ C+
Similar reasons to PI-1
PI-3 Aggregate revenue out-turn compared to original approved budget D B Improved URA estimates
PI-7 Extent of unreported government operations. D+ C+
Loan financed projects are included in fiscal reports
PI-8 Transparency of inter-governmental fiscal relations. D+ C Sub-national Governments have sufficient time to
prepare their budget after 2nd budget call circular PI-11 Orderliness and participation in the annual budget process C+ A
Impact of PFMA 2014: Existence of, and adherence to, a fixed budget calendar; and timely budget approval by the legislature
PI-12 Multi-year perspective in fiscal planning, expenditure policy and budgeting C+ B
Medium-term Fiscal Framework improved and used
PI-16 Predictability in the availability of funds for commitment of expenditures C+ B
Improved due to MDA planning horizon 3 months from one month
PI-17 Recording and management of cash balances, debt and guarantees B A Debt Management Strategy, TSA and PFM Act have
improved recoding and management PI-18 Effectiveness of payroll controls
D+ C+
Improvements recognize the reforms in IPPS, payroll audits and biometric data etc. To improve further would need the automatic transfer between IFMIS -IPPS
PI-19 Competition, value for money and controls in procurement D+ C+
The score has improved due to creation of a procurement tribunal and provision of more procurement information to the public.
PI-20 Effectiveness of internal controls for non-salary expenditure C B
Tightening of controls in IFMS; new PFM Act/Regulations instructions and penalties have increased awareness of internal controls and procedures
PI-21 Effectiveness of internal audit C B
Improved management responses to IA recommendations
PI-22 Timeliness and regularity of accounts reconciliation B A Improved score due to absence of suspense
accounts PI-24 Quality and timeliness of in-year budget reports C+ B More timely production of the reports and
increased automation of transactions in the MDAs. PI-25 Quality and timeliness of annual financial statements C+ B+
Greater compliance with IPSAS; more IFMIS automation and better in-year accounting disciplines such as on-going reconciliations
Source: PEFA 2016 Assessment Report
22 Uganda Public Financial Management Reform Strategy
18. Improved PEFA scores provide some evidence of the positive impact of key PFM reforms. In particular, the following reforms appear to have made a positive contribution to PFM outcomes:
i) Treasury Single Account: improved the predictability of funds to MDALGs for budget execution. In-year resource allocation has improved through daily consolidation of all bank and cash balances, enabling more frequent and accurate accounts reconciliation and reporting, which has had a positive impact on aggregate expenditure control. The Budget website and inclusion of loan-financed projects in fiscal reports has also improved budget transparency and comprehensiveness of reporting;
ii) PFM Act 2015: a new budget calendar has improved orderliness of the budget process. This has improved budget transparency, by allowing more time for Local Government to prepare their budgets after the second budget call circular; and introduced a Charter of Fiscal Responsibility. The PFMA has also provided a stronger enabling framework for effective cash management by aligning budget execution with cash planning and ensuring releases are made in line with an annual cash flow plans;
iii) Payroll automation and decentralisation: improved expenditure controls, accuracy and reliability of budgeting for payroll and reduced leakage and inefficiency from errors in payroll by enhancing accountability by Accounting Officers for management of the wage bill and payroll data;
iv) IFMS roll-outs and tighter controls: improved predictability and controls in budget execution, as well as more comprehensive and timely reporting. IFMS has been rolled out to additional entities and been upgraded to include additional functionality and security features to enhance the integrity and quality of financial information. Controls over manual transactions have been strengthened through the use of e-cash payments with enhanced system security, a new system for transfers between the Consolidated Fund and Treasury holding accounts, setting cash withdrawal limits and streamlined approval and authorisation processes;
v) Enhanced macroeconomic analysis and debt management: investment in an Integrated Macroeconomic Model (IMEM) and improved underlying economic data have enhanced aggregate expenditure controls and fiscal strategy by providing more credible medium-term resource envelope and planning of resources. Debt management has improved through regular debt sustainability analysis, charter of fiscal responsibility, improved MTFF and development of debt management strategy. Reporting on domestic and external debt also improved with implementation of the Debt Management Financial Accountability System (DMFAS) and regular reporting on debt stock and servicing. Furthermore, investment in the Aid Management Platform has helped enhance reporting and recording of aid information;
vi) Programme-based budgeting: performance information has improved with the progressive alignment of national and sector plans and budgets with Government priorities. A certificate of compliance is produced annually by the National Planning Authority (NPA) to measure the level of compliance of budget and plans with the Second National Development Plan (NDP II).
19. Three indicator scores deteriorated. Stock and monitoring of expenditure payment arrears (PI-4) went from C+ to D+ due to significant worsening level of arrears. Effectiveness of measures for taxpayer registration and tax assessment (PI-14) reduced from B to C because the 2012 score on tax audit and fraud investigation was
deemed to have been overly generous. Availability of information on resources received by service delivery units (PI-23) declined due to lack of expenditure tracking information.
1.3.3 Level 3 Progress: PFM Reform Programme 20. At the programme level (Level 3 and below), the FINMAP III Mid-Term Review concluded that the delivery
of activities in the Programme up to June 2016 was rated as satisfactory, but the overall objective of the Programme11 was unlikely to be met. Two factors were highlighted as an explanation: (i) the link between the underlying barriers identified in the PFM Strategy 2014-2018 and selection of FINMAP activities was not clear; and (ii) several of the programmed activities, including performance based-budgeting, debt management strengthening, public investment management and PFM systems implementation were delayed.
21. PFM reforms under FINMAP have been effective where requirements were specified clearly from the start, but less effective in bringing about behaviour change. Clearly specified reforms that worked well, included investment in IT systems, or where reforms are central to the core work of a department, as was the case with IFMS and OBT, for example. The reform implementation has been less responsive and adaptive when rapid policy advice was needed to address a specific need arising. It has also been less effective in bringing about the behaviour change required when reforms are introduced.
1.4 Summary of PFM Strengths and Weaknesses 22. As discussed above, the PEFA assessment framework provides a high-level assessment of a country’s PFM
strengths and weaknesses. This section summarizes the results of PEFA 2016 and implications for the key PFM functional areas and three high level outcomes of aggregate fiscal discipline, strategic allocation of resources and efficient service delivery. A deeper situation analysis of the priority reform areas arising from this diagnosis is provided in Section 2.
23. Uganda’s PFM systems are relatively strong (PEFA ‘A’-rated) in budget classification and documentation, transparency and preparation of the budget, aggregate expenditure outturn and debt management. Weaknesses (below PEFA ‘C’) are in the areas of public investment management.
Table 1.4: PEFA 2016 Performance Indicator Assessment PEFA Indicator Score PI-1. Aggregate expenditure outturn A PI-4. Budget classification A PI-5. Budget documentation A PI-9. Public access to fiscal information A PI-13. Debt management A PI-17. Budget preparation process A PI-3. Revenue outturn B+ PI-6. Central government operations outside financial reports B+ PI-26. Internal audit B+
11 “to encourage effective service delivery by removing barriers in PFM systems while reinforcing compliance with regulations and avoidance of leakage”
23Uganda Public Financial Management Reform Strategy
18. Improved PEFA scores provide some evidence of the positive impact of key PFM reforms. In particular, the following reforms appear to have made a positive contribution to PFM outcomes:
i) Treasury Single Account: improved the predictability of funds to MDALGs for budget execution. In-year resource allocation has improved through daily consolidation of all bank and cash balances, enabling more frequent and accurate accounts reconciliation and reporting, which has had a positive impact on aggregate expenditure control. The Budget website and inclusion of loan-financed projects in fiscal reports has also improved budget transparency and comprehensiveness of reporting;
ii) PFM Act 2015: a new budget calendar has improved orderliness of the budget process. This has improved budget transparency, by allowing more time for Local Government to prepare their budgets after the second budget call circular; and introduced a Charter of Fiscal Responsibility. The PFMA has also provided a stronger enabling framework for effective cash management by aligning budget execution with cash planning and ensuring releases are made in line with an annual cash flow plans;
iii) Payroll automation and decentralisation: improved expenditure controls, accuracy and reliability of budgeting for payroll and reduced leakage and inefficiency from errors in payroll by enhancing accountability by Accounting Officers for management of the wage bill and payroll data;
iv) IFMS roll-outs and tighter controls: improved predictability and controls in budget execution, as well as more comprehensive and timely reporting. IFMS has been rolled out to additional entities and been upgraded to include additional functionality and security features to enhance the integrity and quality of financial information. Controls over manual transactions have been strengthened through the use of e-cash payments with enhanced system security, a new system for transfers between the Consolidated Fund and Treasury holding accounts, setting cash withdrawal limits and streamlined approval and authorisation processes;
v) Enhanced macroeconomic analysis and debt management: investment in an Integrated Macroeconomic Model (IMEM) and improved underlying economic data have enhanced aggregate expenditure controls and fiscal strategy by providing more credible medium-term resource envelope and planning of resources. Debt management has improved through regular debt sustainability analysis, charter of fiscal responsibility, improved MTFF and development of debt management strategy. Reporting on domestic and external debt also improved with implementation of the Debt Management Financial Accountability System (DMFAS) and regular reporting on debt stock and servicing. Furthermore, investment in the Aid Management Platform has helped enhance reporting and recording of aid information;
vi) Programme-based budgeting: performance information has improved with the progressive alignment of national and sector plans and budgets with Government priorities. A certificate of compliance is produced annually by the National Planning Authority (NPA) to measure the level of compliance of budget and plans with the Second National Development Plan (NDP II).
19. Three indicator scores deteriorated. Stock and monitoring of expenditure payment arrears (PI-4) went from C+ to D+ due to significant worsening level of arrears. Effectiveness of measures for taxpayer registration and tax assessment (PI-14) reduced from B to C because the 2012 score on tax audit and fraud investigation was
deemed to have been overly generous. Availability of information on resources received by service delivery units (PI-23) declined due to lack of expenditure tracking information.
1.3.3 Level 3 Progress: PFM Reform Programme 20. At the programme level (Level 3 and below), the FINMAP III Mid-Term Review concluded that the delivery
of activities in the Programme up to June 2016 was rated as satisfactory, but the overall objective of the Programme11 was unlikely to be met. Two factors were highlighted as an explanation: (i) the link between the underlying barriers identified in the PFM Strategy 2014-2018 and selection of FINMAP activities was not clear; and (ii) several of the programmed activities, including performance based-budgeting, debt management strengthening, public investment management and PFM systems implementation were delayed.
21. PFM reforms under FINMAP have been effective where requirements were specified clearly from the start, but less effective in bringing about behaviour change. Clearly specified reforms that worked well, included investment in IT systems, or where reforms are central to the core work of a department, as was the case with IFMS and OBT, for example. The reform implementation has been less responsive and adaptive when rapid policy advice was needed to address a specific need arising. It has also been less effective in bringing about the behaviour change required when reforms are introduced.
1.4 Summary of PFM Strengths and Weaknesses 22. As discussed above, the PEFA assessment framework provides a high-level assessment of a country’s PFM
strengths and weaknesses. This section summarizes the results of PEFA 2016 and implications for the key PFM functional areas and three high level outcomes of aggregate fiscal discipline, strategic allocation of resources and efficient service delivery. A deeper situation analysis of the priority reform areas arising from this diagnosis is provided in Section 2.
23. Uganda’s PFM systems are relatively strong (PEFA ‘A’-rated) in budget classification and documentation, transparency and preparation of the budget, aggregate expenditure outturn and debt management. Weaknesses (below PEFA ‘C’) are in the areas of public investment management.
Table 1.4: PEFA 2016 Performance Indicator Assessment PEFA Indicator Score PI-1. Aggregate expenditure outturn A PI-4. Budget classification A PI-5. Budget documentation A PI-9. Public access to fiscal information A PI-13. Debt management A PI-17. Budget preparation process A PI-3. Revenue outturn B+ PI-6. Central government operations outside financial reports B+ PI-26. Internal audit B+
11 “to encourage effective service delivery by removing barriers in PFM systems while reinforcing compliance with regulations and avoidance of leakage”

24 Uganda Public Financial Management Reform Strategy
PEFA Indicator Score PI-29. Annual financial reports B+ PI-19 Revenue administration B PI-21. Predictability of in-year resource allocation B PI-23. Payroll controls B PI-27. Financial data integrity B PI-28. In-year budget reports B PI-14. Macroeconomic and fiscal forecasting B PI-15. Fiscal strategy B PI-7. Transfers to subnational governments C+ PI-10. Fiscal risk reporting C+ PI-18. Legislative scrutiny of budgets C+ PI-20. Accounting for revenue C+ PI-25. Internal controls on non-salary expenditure C+ PI-8. Performance information for service delivery C PI-12. Public asset management C PI-24. Procurement C PI-31. Legislative scrutiny of audit reports C PI-2. Expenditure composition outturn D+ PI-16. Medium-term perspective in expenditure budgeting D+ PI-22. Expenditure arrears D+ PI-30. External audit D+ PI-11. Public investment management D
24. Against the seven pillars of PEFA, the following strengths and weaknesses were identified:
i. Budget reliability is good at the aggregate level, but there are deviations in composition. Aggregate expenditure and revenue outturns do not deviate significantly from the budget. While there were improvements in the scale of in-year adjustments, from around 20percent to 7percent of the total budget, fiscal discipline is undermined by frequent in-year adjustments. This creates uncertainty for future commitments of resources and is likely to affect the ability of delivery units to execute their plans efficiently, particularly investment projects;
ii. Budget transparency is strong on public access to budget information and comprehensiveness of financial reports, but weak on inter-governmental fiscal transfers and performance information on results and impacts. Only a small percentage of expenditure and revenue falls outside of Government financial reports. This provides a basis for standardised analysis of expenditure and supports accountability for allocation decisions. However, Local Government fiscal transfers are insufficient and non-discretionary. Performance information does not cover resources received by delivery units and is based mostly on outputs rather than outcomes,
making it difficult to link spending to results. Performance monitoring is expected to improve over time with the move towards program-based budgeting;
iii. Management of assets and liabilities is relatively strong on debt management, but public investment management and management of physical and financial assets is weak. There are a range of options for financing investments, which are planned at the strategic level through the medium-term fiscal framework, Charter of Fiscal responsibility and monitored through regular debt sustainability analysis. However, poor planning and appraisal of projects leads to low returns from public investment and there are delivery challenges throughout the PIM cycle.
iv. Policy-based fiscal strategy is reliable and budgeting is based on an orderly budget process, but lacks an effective medium-term perspective. Macroeconomic and fiscal projections are robust and macro-management is underpinned by the Charter of Fiscal Responsibility. However, as multi-year commitments from sector plans and public investment projects are not sufficiently costed into the MTEF, there is an important missing link between strategic policy objectives and resource allocation;
v. Budget execution is underpinned by a relatively efficient tax administration, payroll controls and predictable resource allocations, but undermined by weak commitment controls. Timely releases and aggregate budget credibility means that resources are relatively predictable. However, while progress has been made to clear expenditure arrears, new arrears are being accumulated;
vi. Accounting and reporting is comprehensive, timely and relatively accurate, but with some gaps and errors due to lack of integration of systems. Treasury operations, comprehensive financial reports and regular in-year reporting ensure budgets are executed broadly as intended within approved fiscal targets. There is a lack of information on resources received by service delivery units. Gaps in IFMS coverage mean that financial reports directly from the system are not comprehensive and use of standalone systems can cause errors or misreporting to occur.
vii. External scrutiny and audit is of high quality and independent, but undermined by ongoing delays in legislative scrutiny of audit findings. All entities of central government are audited annually to an international standard. A number of specialised and value for money audits are also undertaken. Most actions raised in OAG reports are implemented by management. Delays in audit scrutiny cause a weak link in the accountability for allocating resources in accordance with budget and service delivery standards.
25. Fiduciary risks in Uganda’s PFM include unreliable medium-term budgets, expenditure arrears, inadequate local government fiscal transfers, weak public investment management, lack of integration of accountability systems and weak links between strategic plans, budgets and results. Based on the weaknesses identified in the PEFA assessment and recent fiduciary risk assessments undertaken, a number of risks have been identified, summarised as follows:
i. Risk to resource allocation and fiscal discipline due to frequent in-year adjustments and unreliability of medium-term budgets, making it difficult for service delivery units to plan and execute budgets efficiently across the whole of Government;
ii. Risk to resource allocation and service delivery from inadequacies in the fiscal transfers to Local Government;
25Uganda Public Financial Management Reform Strategy
PEFA Indicator Score PI-29. Annual financial reports B+ PI-19 Revenue administration B PI-21. Predictability of in-year resource allocation B PI-23. Payroll controls B PI-27. Financial data integrity B PI-28. In-year budget reports B PI-14. Macroeconomic and fiscal forecasting B PI-15. Fiscal strategy B PI-7. Transfers to subnational governments C+ PI-10. Fiscal risk reporting C+ PI-18. Legislative scrutiny of budgets C+ PI-20. Accounting for revenue C+ PI-25. Internal controls on non-salary expenditure C+ PI-8. Performance information for service delivery C PI-12. Public asset management C PI-24. Procurement C PI-31. Legislative scrutiny of audit reports C PI-2. Expenditure composition outturn D+ PI-16. Medium-term perspective in expenditure budgeting D+ PI-22. Expenditure arrears D+ PI-30. External audit D+ PI-11. Public investment management D
24. Against the seven pillars of PEFA, the following strengths and weaknesses were identified:
i. Budget reliability is good at the aggregate level, but there are deviations in composition. Aggregate expenditure and revenue outturns do not deviate significantly from the budget. While there were improvements in the scale of in-year adjustments, from around 20percent to 7percent of the total budget, fiscal discipline is undermined by frequent in-year adjustments. This creates uncertainty for future commitments of resources and is likely to affect the ability of delivery units to execute their plans efficiently, particularly investment projects;
ii. Budget transparency is strong on public access to budget information and comprehensiveness of financial reports, but weak on inter-governmental fiscal transfers and performance information on results and impacts. Only a small percentage of expenditure and revenue falls outside of Government financial reports. This provides a basis for standardised analysis of expenditure and supports accountability for allocation decisions. However, Local Government fiscal transfers are insufficient and non-discretionary. Performance information does not cover resources received by delivery units and is based mostly on outputs rather than outcomes,
making it difficult to link spending to results. Performance monitoring is expected to improve over time with the move towards program-based budgeting;
iii. Management of assets and liabilities is relatively strong on debt management, but public investment management and management of physical and financial assets is weak. There are a range of options for financing investments, which are planned at the strategic level through the medium-term fiscal framework, Charter of Fiscal responsibility and monitored through regular debt sustainability analysis. However, poor planning and appraisal of projects leads to low returns from public investment and there are delivery challenges throughout the PIM cycle.
iv. Policy-based fiscal strategy is reliable and budgeting is based on an orderly budget process, but lacks an effective medium-term perspective. Macroeconomic and fiscal projections are robust and macro-management is underpinned by the Charter of Fiscal Responsibility. However, as multi-year commitments from sector plans and public investment projects are not sufficiently costed into the MTEF, there is an important missing link between strategic policy objectives and resource allocation;
v. Budget execution is underpinned by a relatively efficient tax administration, payroll controls and predictable resource allocations, but undermined by weak commitment controls. Timely releases and aggregate budget credibility means that resources are relatively predictable. However, while progress has been made to clear expenditure arrears, new arrears are being accumulated;
vi. Accounting and reporting is comprehensive, timely and relatively accurate, but with some gaps and errors due to lack of integration of systems. Treasury operations, comprehensive financial reports and regular in-year reporting ensure budgets are executed broadly as intended within approved fiscal targets. There is a lack of information on resources received by service delivery units. Gaps in IFMS coverage mean that financial reports directly from the system are not comprehensive and use of standalone systems can cause errors or misreporting to occur.
vii. External scrutiny and audit is of high quality and independent, but undermined by ongoing delays in legislative scrutiny of audit findings. All entities of central government are audited annually to an international standard. A number of specialised and value for money audits are also undertaken. Most actions raised in OAG reports are implemented by management. Delays in audit scrutiny cause a weak link in the accountability for allocating resources in accordance with budget and service delivery standards.
25. Fiduciary risks in Uganda’s PFM include unreliable medium-term budgets, expenditure arrears, inadequate local government fiscal transfers, weak public investment management, lack of integration of accountability systems and weak links between strategic plans, budgets and results. Based on the weaknesses identified in the PEFA assessment and recent fiduciary risk assessments undertaken, a number of risks have been identified, summarised as follows:
i. Risk to resource allocation and fiscal discipline due to frequent in-year adjustments and unreliability of medium-term budgets, making it difficult for service delivery units to plan and execute budgets efficiently across the whole of Government;
ii. Risk to resource allocation and service delivery from inadequacies in the fiscal transfers to Local Government;
26 Uganda Public Financial Management Reform Strategy
iii. Prioritisation of public investment projects not based on economic analysis and weak public investment management and management of assets poses risk to achieving adequate returns on investment, value for money and under-execution;
iv. Risk to appropriate resource allocation due to weak link between strategic plans and budgeting, and lack of multi-year commitments being included in budget;
v. Risk to domestic revenue due to non-compliance and weaknesses in administration efficiency;
vi. Risk to service delivery and resource allocation caused by build-up of expenditure arrears and weak commitment controls;
vii. Lack of compliance with PFM procedures, particularly procurement regulations and systems, and gaps, lack of integration and security of PFM IT systems;
viii. Risk to government accountability for delivery against the budget and for efficient service delivery due to the delay in legislative scrutiny of audit reports.
1.5 Opportunities for future PFM reforms 26. Through previous and ongoing reform efforts, relative strengths in the PFM systems and complementary
reforms or changes in the context for PFM reform, there are a number of opportunities that could be exploited to enhance the effectiveness of PFM reforms and used to mitigate some of the key risks.
27. There is significant potential to improve domestic revenue collections with enhanced administrative and policy efforts. Recent tax gap analysis and studies of revenue potential reveal that Uganda has potential to improve domestic revenue from 14percent GDP to around 20percent. New activities in the extractive industries (oil and mining) provide additional revenue opportunities. Reaping growth benefits from public investment should also enhance economic activity that will yield additional revenues. Furthermore, there is political commitment and support from development partners to drive performance in this area through a collaborative medium-term strategy.
28. Internal control and compliance could be further enhanced through the Treasury Single Account. The TSA provides an opportunity to capture more of government operations on PFM systems and to strengthen controls and data integrity. The continued roll-out of IFMS and investment in new and more integrated PFM systems improves coverage and quality of financial data and reporting. E-Government policy and strategy supports investment in more effective and efficient coordination of public sector IT systems. The introduction of performance contracts provides stronger leadership incentives to drive improved performance and ensure compliance with PFM systems.
29. Use of IT systems for procurement and contract management could enhance efficiency and compliance. Piloting of E-Procurement provides an opportunity to test a platform for enhancing transparency, competition and reporting to ensure government gets value for money from procurements.
30. Program-based Budgeting provides an opportunity to enhance the linkage between strategic planning and budgeting. Government’s strategic planning framework (Visions 2040; NDP II; Sector Working Group Approach) ensures there are defined national priorities that must be accomplished within the agreed time frames. The introduction of Program-Based Budgeting provides an opportunity to strengthen the link between high-level outcomes and budgeting for service delivery.
31. There remains a range of available sustainable financing options for key investments. The low risk of debt distress and sound macroeconomic management ensures Uganda’s risk rating improves and broadens access to lower cost borrowing opportunities. Development Partners’ ongoing commitment to PFM reform ensures there are also opportunities for non-concessional loans and grants.
32. The national and international policy framework demonstrates high level political commitment to reform, strengthened by a growing civil society. There remains strong political leadership on PFM reforms. In addition, at the EAC level, there is a platform for more harmonised policy on PFM across member countries. The PFM Act 2015 provides a clear framework for PFM and strengthened provisions in key areas e.g. new budget calendar and alignment of budgets to plans, gender and equity budgeting, empowered internal audit function, and fiscal responsibility. An active civil society supports accountability to citizens at all levels and growing public interest (e.g. attendance at public hearings), including professional institutes that regulate the quality of PFM cadres. Government is also committed to embarking on public sector reform, including possible restructuring of PFM functions to enhance effectiveness to deliver quality services.
1.6 Threats 33. In addition to the internal vulnerabilities highlighted in the above analysis of key weaknesses, there are a
number of external threats that may undermine PFM reform effectiveness in future if not addressed.
34. Oil sector governance if not managed effectively, poses a threat to economic diversity and sustainable resources for future generations. Ineffective oil governance could undermine economic growth, such as crowding out private sector investment due to government borrowing driving up interest rates and therefore heightening the cost of private lending. A focus on oil revenues as a means of financing budget deficits threatens to undermine efforts to diversify sustainable revenue sources over the long-term.
35. The creation of several non-viable public administrative units undermines service delivery. The expansion of districts with diminished real value of resources does not provide adequate capacity for effective and efficient delivery of services. In particular, the squeeze on resources at local government level has particularly affected allocation of resources to, for instance, the internal audit function, which creates vulnerabilities in the management of PFM.
36. Inadequate collaboration and coordination between sectors, leads to poorly integrated multi-sectoral plans and lack of strategic plans among some MDAs and sectors. Limited knowledge and understanding among MDAs of monitoring and evaluation principles, reporting and measuring of results, impacts on their productivity. This is further compounded by the existence of multiple results frameworks across government, and multiple ‘centres’ for M&E control across Government.
37. Weaknesses in management and leadership across public service, leads to inadequate preparation and management of change brought about by PFM reforms. In particular, as Government attempts to keep up to date with frequent changes to technologies and business processes, particularly through the process of automation of systems, change management will be a continuous requirement.
38. IT systems are vulnerable to attack. Threats of cyber-attacks are common across the world and yet they are increasing in complexity and frequency. Weak governance of IT across Government leaves PFM accountability systems vulnerable to disruption or data ‘disaster’.
39. Government remains at risk of corruption, unethical behaviour and rent-seeking activities. While there are efforts to enhance Government’s response to these through strengthening anti-corruption institutions,
27Uganda Public Financial Management Reform Strategy
iii. Prioritisation of public investment projects not based on economic analysis and weak public investment management and management of assets poses risk to achieving adequate returns on investment, value for money and under-execution;
iv. Risk to appropriate resource allocation due to weak link between strategic plans and budgeting, and lack of multi-year commitments being included in budget;
v. Risk to domestic revenue due to non-compliance and weaknesses in administration efficiency;
vi. Risk to service delivery and resource allocation caused by build-up of expenditure arrears and weak commitment controls;
vii. Lack of compliance with PFM procedures, particularly procurement regulations and systems, and gaps, lack of integration and security of PFM IT systems;
viii. Risk to government accountability for delivery against the budget and for efficient service delivery due to the delay in legislative scrutiny of audit reports.
1.5 Opportunities for future PFM reforms 26. Through previous and ongoing reform efforts, relative strengths in the PFM systems and complementary
reforms or changes in the context for PFM reform, there are a number of opportunities that could be exploited to enhance the effectiveness of PFM reforms and used to mitigate some of the key risks.
27. There is significant potential to improve domestic revenue collections with enhanced administrative and policy efforts. Recent tax gap analysis and studies of revenue potential reveal that Uganda has potential to improve domestic revenue from 14percent GDP to around 20percent. New activities in the extractive industries (oil and mining) provide additional revenue opportunities. Reaping growth benefits from public investment should also enhance economic activity that will yield additional revenues. Furthermore, there is political commitment and support from development partners to drive performance in this area through a collaborative medium-term strategy.
28. Internal control and compliance could be further enhanced through the Treasury Single Account. The TSA provides an opportunity to capture more of government operations on PFM systems and to strengthen controls and data integrity. The continued roll-out of IFMS and investment in new and more integrated PFM systems improves coverage and quality of financial data and reporting. E-Government policy and strategy supports investment in more effective and efficient coordination of public sector IT systems. The introduction of performance contracts provides stronger leadership incentives to drive improved performance and ensure compliance with PFM systems.
29. Use of IT systems for procurement and contract management could enhance efficiency and compliance. Piloting of E-Procurement provides an opportunity to test a platform for enhancing transparency, competition and reporting to ensure government gets value for money from procurements.
30. Program-based Budgeting provides an opportunity to enhance the linkage between strategic planning and budgeting. Government’s strategic planning framework (Visions 2040; NDP II; Sector Working Group Approach) ensures there are defined national priorities that must be accomplished within the agreed time frames. The introduction of Program-Based Budgeting provides an opportunity to strengthen the link between high-level outcomes and budgeting for service delivery.
31. There remains a range of available sustainable financing options for key investments. The low risk of debt distress and sound macroeconomic management ensures Uganda’s risk rating improves and broadens access to lower cost borrowing opportunities. Development Partners’ ongoing commitment to PFM reform ensures there are also opportunities for non-concessional loans and grants.
32. The national and international policy framework demonstrates high level political commitment to reform, strengthened by a growing civil society. There remains strong political leadership on PFM reforms. In addition, at the EAC level, there is a platform for more harmonised policy on PFM across member countries. The PFM Act 2015 provides a clear framework for PFM and strengthened provisions in key areas e.g. new budget calendar and alignment of budgets to plans, gender and equity budgeting, empowered internal audit function, and fiscal responsibility. An active civil society supports accountability to citizens at all levels and growing public interest (e.g. attendance at public hearings), including professional institutes that regulate the quality of PFM cadres. Government is also committed to embarking on public sector reform, including possible restructuring of PFM functions to enhance effectiveness to deliver quality services.
1.6 Threats 33. In addition to the internal vulnerabilities highlighted in the above analysis of key weaknesses, there are a
number of external threats that may undermine PFM reform effectiveness in future if not addressed.
34. Oil sector governance if not managed effectively, poses a threat to economic diversity and sustainable resources for future generations. Ineffective oil governance could undermine economic growth, such as crowding out private sector investment due to government borrowing driving up interest rates and therefore heightening the cost of private lending. A focus on oil revenues as a means of financing budget deficits threatens to undermine efforts to diversify sustainable revenue sources over the long-term.
35. The creation of several non-viable public administrative units undermines service delivery. The expansion of districts with diminished real value of resources does not provide adequate capacity for effective and efficient delivery of services. In particular, the squeeze on resources at local government level has particularly affected allocation of resources to, for instance, the internal audit function, which creates vulnerabilities in the management of PFM.
36. Inadequate collaboration and coordination between sectors, leads to poorly integrated multi-sectoral plans and lack of strategic plans among some MDAs and sectors. Limited knowledge and understanding among MDAs of monitoring and evaluation principles, reporting and measuring of results, impacts on their productivity. This is further compounded by the existence of multiple results frameworks across government, and multiple ‘centres’ for M&E control across Government.
37. Weaknesses in management and leadership across public service, leads to inadequate preparation and management of change brought about by PFM reforms. In particular, as Government attempts to keep up to date with frequent changes to technologies and business processes, particularly through the process of automation of systems, change management will be a continuous requirement.
38. IT systems are vulnerable to attack. Threats of cyber-attacks are common across the world and yet they are increasing in complexity and frequency. Weak governance of IT across Government leaves PFM accountability systems vulnerable to disruption or data ‘disaster’.
39. Government remains at risk of corruption, unethical behaviour and rent-seeking activities. While there are efforts to enhance Government’s response to these through strengthening anti-corruption institutions,
28 Uganda Public Financial Management Reform Strategy
investigations and the judiciary, there are still challenges. As long as the system of sanctions and rewards is ineffective, there will remain vulnerabilities in PFM functions and systems.
40. Private markets and suppliers have not yet matured to meet the increasing demands of public sector procurement, financing and innovation. A weak regulatory framework for key sectors also limits the setting and control of standards, as well as reducing the options for collaboration across government on compliance, such as on payment of taxes.
41. There is a weak culture and demand for accountability by the public. Whilst there are efforts in improving demand for accountability such as through the regular participation of CSOs in PFM dialogue, there still exits, lack of downward accountability to citizens’ that forms a continued threat to the effectiveness of PFM.
1.7 Lessons and Emerging Priorities for PFM reform 42. Overall, the review of progress highlights some positive evidence of impact and further opportunities that
PFM reforms may have on achieving further gains, if used effectively. However, there are constraints that continue to act as barriers to reform. These are mainly in the areas of procurement, commitment controls (as measured by the continued build-up of expenditure arrears), medium-term expenditure budgeting, management of public investments, the ongoing backlog in Parliamentary scrutiny of audit reports, tax compliance and arrears management and local government service delivery. These weaknesses are partly a result of ongoing challenges with the underpinning infrastructure for PFM, including limited coverage of IFMS, delayed integration of several PFM systems like IFMS and IPPS/HCM, AMIS, DMFAS, e-Tax, and e-procurement among others. Other challenges include limited internet infrastructure to support these systems, inadequate technical capacity to operate the IFMS, and limited printing and display of the payroll at local government units. The causes of these challenges are further elaborated in Section 2.
43. Progress has been made against both ‘Stage 1’ and ‘Stage 2’ objectives, with room for further consolidation. Against the 2-stage objectives in the PFM reform strategy 2014-2018, evidence from PEFA and the review of PFM outcome indicators suggests that, while there has been improvement against the ‘Stage 1’ objective (removing barriers and reinforcing compliance), it is not yet fully achieved and warrants further strengthening, due to weaknesses, including enforcement of rules and regulations. Some progress has been made against ‘Stage 2’ (accountability for performance and hardening the link between results and resources), including financial accountability and the introduction of reporting against outcomes. However, without a strong platform at Stage 1, barriers to effective linkages between results and resources remain, particularly inadequate capacity in the design and implementation of relevant projects or programmes that contribute to effective service delivery and weaknesses in capacity and financing of Local Governments.
44. Some reforms have successfully delivered results and their mainstreaming will provide resource ‘space’ for new reforms under the future strategy. The following reforms are now delivering results that should be maximised and sustained for effective PFM; macroeconomic modelling and forecasting, budget transparency initiatives, aid management system support, establishment of the Treasury Single Account, payroll decentralisation, the establishment of OAG regional offices, and support to enhancing the quality and scope of audits.
45. There is a need for greater learning and feedback on reform processes. This is needed to indicate to leadership and managers how and when reforms are working or not, including integrating feedback into established systems and processes. These feedback loops should be established within existing review modalities like the, Accountability Sector Joint Annual Review (ASJAR), Government Annual Performance Review (GAPR), PEMCOM and other institutional arrangements where PFM issues are discussed.
46. The strategy should provide a limited and clear set of problem-driven priorities on which to base reform activities, policy dialogue and monitoring of progress. Past PFM reform strategies have been comprehensive, but not adequately prioritised. This poses a risk for the governance of the reform agenda, particularly if it requires PEMCOM to track a range of reforms that is too broad. In particular, there is a risk to successful reform when activities are undertaken in silos, and complementarities between reforms are not fully exploited or integrated. The performance reviews also indicated room for improvement in the strategy design and governance arrangements for effective leadership and focus for PFM reforms. For example, the High Level Action Matrix now known as the Priority Reform Action Matrix(PRAM), used by PEMCOM to target specific PFM-related problems has had more influence on design and monitoring of PFM reforms than former PFM strategies.
47. There is need to better understand and manage behaviours, incentives and capacity needs related to PFM reforms. In order to address issues of operational efficiency, integrity and compliance with PFM procedures and fiduciary controls, the main instruments of PFM reform programmes have been legal, regulatory and automation of systems. However, surrounding those systems and frameworks are people, with capacity needs, a variety of incentives and behaviours, fears and interests. Some new systems may be misunderstood, or difficult to operate, or there may be fears about whether new, more efficient, transparent ways of working will affect individuals’ job security or other incentives. When introducing reforms, it is important to understand the behaviour change required for the successful implementation of the reform. Where there is lack of compliance with new systems or procedures, there is need to investigate the challenges and incentives faced by those implementing the reforms in order to address them effectively, and ensure there is engagement and support for reform. These behaviour concerns and capacity gaps need to be understood, carefully managed, and monitored, through capacity enhancement and change management support to strengthen compliance and, where necessary, enforcement.
48. The review of progress and the SWOT analysis highlight several priorities for further PFM reform effort. In particular, the following six areas outlined below describe the priorities for further reform effort:
i. Sustainable Resource Mobilisation: In order to achieve Uganda’s development goals to become a middle-income country, significant investment in infrastructure is required to unlock potential and reap growth. The Government therefore needs to mobilise domestic revenue and ensure any external resources mobilised that contribute to public debt is sustainable, i.e. that any borrowing is on the most favourable terms possible, which is sustainable as long as investments are effective and should deliver additional growth;
ii. Strategic planning and budgeting: To ensure that national economic and development objectives can be delivered efficiently and effectively, there needs to be a clear link between strategic plans and budgets; ensure that multi-annual commitments are properly budgeted for; a clear, reliable medium-term framework for effective planning and delivery, particularly of public investment projects; and, to ensure that annual budgets are credible and are properly costed;
iii. Public Investment Management: Economic growth is strong, but not as strong as expected due to factors including under-execution of externally-financed investment projects and over-spending of recurrent costs, causing a build-up of arrears, which has been financed through costly borrowing. While the risk of debt distress risk is low, risks increase as Government scales up investment, so to ensure that debt is sustainable, it is essential to achieve a higher economic return and value for money from public investment, indicating that there needs to be a sustained effort to strengthen Public Investment Management;
29Uganda Public Financial Management Reform Strategy
investigations and the judiciary, there are still challenges. As long as the system of sanctions and rewards is ineffective, there will remain vulnerabilities in PFM functions and systems.
40. Private markets and suppliers have not yet matured to meet the increasing demands of public sector procurement, financing and innovation. A weak regulatory framework for key sectors also limits the setting and control of standards, as well as reducing the options for collaboration across government on compliance, such as on payment of taxes.
41. There is a weak culture and demand for accountability by the public. Whilst there are efforts in improving demand for accountability such as through the regular participation of CSOs in PFM dialogue, there still exits, lack of downward accountability to citizens’ that forms a continued threat to the effectiveness of PFM.
1.7 Lessons and Emerging Priorities for PFM reform 42. Overall, the review of progress highlights some positive evidence of impact and further opportunities that
PFM reforms may have on achieving further gains, if used effectively. However, there are constraints that continue to act as barriers to reform. These are mainly in the areas of procurement, commitment controls (as measured by the continued build-up of expenditure arrears), medium-term expenditure budgeting, management of public investments, the ongoing backlog in Parliamentary scrutiny of audit reports, tax compliance and arrears management and local government service delivery. These weaknesses are partly a result of ongoing challenges with the underpinning infrastructure for PFM, including limited coverage of IFMS, delayed integration of several PFM systems like IFMS and IPPS/HCM, AMIS, DMFAS, e-Tax, and e-procurement among others. Other challenges include limited internet infrastructure to support these systems, inadequate technical capacity to operate the IFMS, and limited printing and display of the payroll at local government units. The causes of these challenges are further elaborated in Section 2.
43. Progress has been made against both ‘Stage 1’ and ‘Stage 2’ objectives, with room for further consolidation. Against the 2-stage objectives in the PFM reform strategy 2014-2018, evidence from PEFA and the review of PFM outcome indicators suggests that, while there has been improvement against the ‘Stage 1’ objective (removing barriers and reinforcing compliance), it is not yet fully achieved and warrants further strengthening, due to weaknesses, including enforcement of rules and regulations. Some progress has been made against ‘Stage 2’ (accountability for performance and hardening the link between results and resources), including financial accountability and the introduction of reporting against outcomes. However, without a strong platform at Stage 1, barriers to effective linkages between results and resources remain, particularly inadequate capacity in the design and implementation of relevant projects or programmes that contribute to effective service delivery and weaknesses in capacity and financing of Local Governments.
44. Some reforms have successfully delivered results and their mainstreaming will provide resource ‘space’ for new reforms under the future strategy. The following reforms are now delivering results that should be maximised and sustained for effective PFM; macroeconomic modelling and forecasting, budget transparency initiatives, aid management system support, establishment of the Treasury Single Account, payroll decentralisation, the establishment of OAG regional offices, and support to enhancing the quality and scope of audits.
45. There is a need for greater learning and feedback on reform processes. This is needed to indicate to leadership and managers how and when reforms are working or not, including integrating feedback into established systems and processes. These feedback loops should be established within existing review modalities like the, Accountability Sector Joint Annual Review (ASJAR), Government Annual Performance Review (GAPR), PEMCOM and other institutional arrangements where PFM issues are discussed.
46. The strategy should provide a limited and clear set of problem-driven priorities on which to base reform activities, policy dialogue and monitoring of progress. Past PFM reform strategies have been comprehensive, but not adequately prioritised. This poses a risk for the governance of the reform agenda, particularly if it requires PEMCOM to track a range of reforms that is too broad. In particular, there is a risk to successful reform when activities are undertaken in silos, and complementarities between reforms are not fully exploited or integrated. The performance reviews also indicated room for improvement in the strategy design and governance arrangements for effective leadership and focus for PFM reforms. For example, the High Level Action Matrix now known as the Priority Reform Action Matrix(PRAM), used by PEMCOM to target specific PFM-related problems has had more influence on design and monitoring of PFM reforms than former PFM strategies.
47. There is need to better understand and manage behaviours, incentives and capacity needs related to PFM reforms. In order to address issues of operational efficiency, integrity and compliance with PFM procedures and fiduciary controls, the main instruments of PFM reform programmes have been legal, regulatory and automation of systems. However, surrounding those systems and frameworks are people, with capacity needs, a variety of incentives and behaviours, fears and interests. Some new systems may be misunderstood, or difficult to operate, or there may be fears about whether new, more efficient, transparent ways of working will affect individuals’ job security or other incentives. When introducing reforms, it is important to understand the behaviour change required for the successful implementation of the reform. Where there is lack of compliance with new systems or procedures, there is need to investigate the challenges and incentives faced by those implementing the reforms in order to address them effectively, and ensure there is engagement and support for reform. These behaviour concerns and capacity gaps need to be understood, carefully managed, and monitored, through capacity enhancement and change management support to strengthen compliance and, where necessary, enforcement.
48. The review of progress and the SWOT analysis highlight several priorities for further PFM reform effort. In particular, the following six areas outlined below describe the priorities for further reform effort:
i. Sustainable Resource Mobilisation: In order to achieve Uganda’s development goals to become a middle-income country, significant investment in infrastructure is required to unlock potential and reap growth. The Government therefore needs to mobilise domestic revenue and ensure any external resources mobilised that contribute to public debt is sustainable, i.e. that any borrowing is on the most favourable terms possible, which is sustainable as long as investments are effective and should deliver additional growth;
ii. Strategic planning and budgeting: To ensure that national economic and development objectives can be delivered efficiently and effectively, there needs to be a clear link between strategic plans and budgets; ensure that multi-annual commitments are properly budgeted for; a clear, reliable medium-term framework for effective planning and delivery, particularly of public investment projects; and, to ensure that annual budgets are credible and are properly costed;
iii. Public Investment Management: Economic growth is strong, but not as strong as expected due to factors including under-execution of externally-financed investment projects and over-spending of recurrent costs, causing a build-up of arrears, which has been financed through costly borrowing. While the risk of debt distress risk is low, risks increase as Government scales up investment, so to ensure that debt is sustainable, it is essential to achieve a higher economic return and value for money from public investment, indicating that there needs to be a sustained effort to strengthen Public Investment Management;
30 Uganda Public Financial Management Reform Strategy
iv. Effectiveness of accountability systems and compliance in budget execution: As resources are prioritised towards infrastructure investment to generate growth, this requires deliberate focus on efficiency and value for money in other areas of Government. To ensure the PFM system supports efficient delivery of public investment and services, PFM functions need to operate efficiently and effectively, through compliance with regulations and enhanced internal controls. Improved commitment controls are needed to prevent further expenditure arrears, IT systems need to be secure, integrated and monitored to protect data integrity and mitigate fiduciary risk, with internal audit providing internal assurance;
v. Local Government PFM systems: To further strengthen efficiency and effective service delivery fiscal decentralisation will play a key role, and therefore needs to be adequately resourced to build capacity to improve performance and ensure the objectives of fiscal decentralisation can be achieved; and
vi. Oversight and Governance of PFM: Overarching the above, is a need for good financial governance, ensuring that systems of oversight are effective and that Government is accountable to citizens; there are performance incentives and sanctions in place to deliver reform; and Government agencies work together with stakeholders to improve the impact of PFM reforms.
2 SITUATION ANALYSIS OF PFM PRIORITY AREAS
Based on the six priority reform areas identified in Section 1, this section outlines the situation analysis of each. The analysis is based on several diagnostic studies and assessments (referenced in more detail in Annex A) and, through comparison with good practice, indicates areas of focus for reform efforts.
2.1 Sustainable Resource Mobilization 1. Over the long-term, Governments aims to operate on a balanced budget. That is, domestic revenue sources
fully finance the budget without recourse to borrowing, since they offer a more stable flow of resources to budget units. Borrowing can be justified on the basis of investment that will reap higher economic returns for future generations. The contracting of debt therefore needs to be justified and carefully managed to ensure that it is sustainable. Similarly, the mobilisation of domestic revenue is, ideally, developed and implemented in line with tax policy principles, such as fairness, equity, simplicity, economic and administrative efficiency. While tax policy objectives are often focused on revenue mobilisation, their influence on economic investment decisions and behaviour is also recognised and tax instruments are sometimes deployed for wider socio-economic policy reasons. The process of designing policy and its passage into law requires analysis and evidence, as well as consultation with those likely to be affected, to ensure successful implementation.
Figure 2.1: Good Practice Principles and Components of Revenue Policy and Administration
2. A comprehensive approach to revenue mobilisation therefore considers policy and legal framework, administration in line with law and their impacts on tax compliance. In particular, the administration of the tax law is typically underpinned by the Organisation for Economic Co-operation and Development (OECD) ‘four pillars of tax compliance’ including: registration, filing, correct reporting and on-time payment. In order to ensure efficiency of tax administration, limited resources should be deployed in line with revenue risks using strategies developed with an understanding of taxpayer needs, motivations and behaviours. Good
Policy Legislation
Compliance Administration
4 Pillars:- Registration- Filing- Payment- Declaration
ParliamentCivil society
URA; MDAs; LGsTaxpayersUsers of services
MoFPED with:URA, CSOs, Private sector, MDAs etc.
Fair, equitable, efficient, adequate, neutral, easy to administer, simple, broad-
based, encourages voluntary compliance
Clear, well-defined, complete, supports
effective administration, stable /
predictable
Transparent, easy to comply, risk-based, fair, efficient, underpinned
by law, appropriate
Timely, in line with liability, accurate,
honest
Other tax jurisdictionsPeer networksInternational institutionsNational 3rd parties
31Uganda Public Financial Management Reform Strategy
iv. Effectiveness of accountability systems and compliance in budget execution: As resources are prioritised towards infrastructure investment to generate growth, this requires deliberate focus on efficiency and value for money in other areas of Government. To ensure the PFM system supports efficient delivery of public investment and services, PFM functions need to operate efficiently and effectively, through compliance with regulations and enhanced internal controls. Improved commitment controls are needed to prevent further expenditure arrears, IT systems need to be secure, integrated and monitored to protect data integrity and mitigate fiduciary risk, with internal audit providing internal assurance;
v. Local Government PFM systems: To further strengthen efficiency and effective service delivery fiscal decentralisation will play a key role, and therefore needs to be adequately resourced to build capacity to improve performance and ensure the objectives of fiscal decentralisation can be achieved; and
vi. Oversight and Governance of PFM: Overarching the above, is a need for good financial governance, ensuring that systems of oversight are effective and that Government is accountable to citizens; there are performance incentives and sanctions in place to deliver reform; and Government agencies work together with stakeholders to improve the impact of PFM reforms.
2 SITUATION ANALYSIS OF PFM PRIORITY AREAS
Based on the six priority reform areas identified in Section 1, this section outlines the situation analysis of each. The analysis is based on several diagnostic studies and assessments (referenced in more detail in Annex A) and, through comparison with good practice, indicates areas of focus for reform efforts.
2.1 Sustainable Resource Mobilization 1. Over the long-term, Governments aims to operate on a balanced budget. That is, domestic revenue sources
fully finance the budget without recourse to borrowing, since they offer a more stable flow of resources to budget units. Borrowing can be justified on the basis of investment that will reap higher economic returns for future generations. The contracting of debt therefore needs to be justified and carefully managed to ensure that it is sustainable. Similarly, the mobilisation of domestic revenue is, ideally, developed and implemented in line with tax policy principles, such as fairness, equity, simplicity, economic and administrative efficiency. While tax policy objectives are often focused on revenue mobilisation, their influence on economic investment decisions and behaviour is also recognised and tax instruments are sometimes deployed for wider socio-economic policy reasons. The process of designing policy and its passage into law requires analysis and evidence, as well as consultation with those likely to be affected, to ensure successful implementation.
Figure 2.1: Good Practice Principles and Components of Revenue Policy and Administration
2. A comprehensive approach to revenue mobilisation therefore considers policy and legal framework, administration in line with law and their impacts on tax compliance. In particular, the administration of the tax law is typically underpinned by the Organisation for Economic Co-operation and Development (OECD) ‘four pillars of tax compliance’ including: registration, filing, correct reporting and on-time payment. In order to ensure efficiency of tax administration, limited resources should be deployed in line with revenue risks using strategies developed with an understanding of taxpayer needs, motivations and behaviours. Good
Policy Legislation
Compliance Administration
4 Pillars:- Registration- Filing- Payment- Declaration
ParliamentCivil society
URA; MDAs; LGsTaxpayersUsers of services
MoFPED with:URA, CSOs, Private sector, MDAs etc.
Fair, equitable, efficient, adequate, neutral, easy to administer, simple, broad-
based, encourages voluntary compliance
Clear, well-defined, complete, supports
effective administration, stable /
predictable
Transparent, easy to comply, risk-based, fair, efficient, underpinned
by law, appropriate
Timely, in line with liability, accurate,
honest
Other tax jurisdictionsPeer networksInternational institutionsNational 3rd parties
32 Uganda Public Financial Management Reform Strategy
practice in tax administration follows approaches that are commensurate with the nature of the problem, beginning with support, followed by controls and then enforcement.
Nature of the problem and underlying causes:
3. Domestic revenues are insufficient to finance the fiscal deficit and infrastructure investment financing needs. There have been modest improvements in domestic revenue mobilisation in recent years, taking the revenue to GDP ratio from just under 12percent in 2013/14 to around 14percent in 2016/17. Nonetheless, this is still low by regional and sub-Saharan standards and recent estimates put the potential at around 20percent12. Due to continuing aid dependency, which is by nature less predictable, there is still, uncertainty in the flow of resources for service delivery. An analysis of the tax gap present in the Value Added Tax system estimated the gap to be approximately 60percent13. Since VAT currently contributes around 4percent of GDP, this gap offers significant potential for improvement, if the causes of the gap can be addressed. Tax policy changes, such as rationalising VAT exempt supplies, updating the excise law, gaming and betting tax and other measures have had a positive impact, along with efforts to improve non-tax revenue, which increased from 0.2percent of GDP to 0.3percent. Nonetheless, the significant unmet potential requires a more comprehensive approach.
4. There is inadequate Government coordination on revenue mobilisation. Revenue policy, procedures and systems across Government are not well coordinated or supported and there is no holistic strategy for revenue mobilisation. Systems for relevant data management are not integrated or shared and the legal framework and procedures for sharing of data between MDAs to support tax compliance strategies is still unclear. The wider regulatory framework is not being leveraged to support tax collection; such as through the regulation of alcohol, real estate, or tourism, for example. GoU signed up to the 2015 Addis Tax Initiative that commits Governments and Development Partners to engage in development co-operation efforts to boost tax collection, cut illicit financial flows, and strengthen policies for inclusive development and attainment of the SDGs. In response, holistic Government and stakeholder approach to domestic revenue mobilisation (DRM) is already underway through the development of a medium-term DRM strategy. This is expected to strengthen coordination on revenue issues across Government and is drawing on a range of recent studies and diagnostics, including the Tax Administration Diagnostic Assessment Tool (TADAT) undertaken in 2015.
5. Weak compliance culture, a large ‘shadow’ economy and weaknesses in tax administration result in significant compliance gaps and revenue losses. There is a weak tax compliance culture, which is exacerbated by corruption perceptions, a weak link between tax payment and delivery of public services and a low level of literacy and proper accounting practices. Measures of compliance have identified poor rates of on-time filing and payments, for example14. Uganda is also characterised by a large shadow economy, with at least 85 percent of taxpayers being micro, small and medium-sized. Simplification of tax policy and procedures may help improve voluntary compliance in this sector, by improving the practicality and ease of payments in circumstances in which normal filing procedures are too complex.
6. While significant investment has improved automation of tax administration systems, there remain inefficiencies and capacity gaps in the revenue administration. Significant investment in tax administration systems have been made over the past 10 years, including an Integrated Tax Administration System (ITAS),
12 Tax Revenue Potential and Effort, Langford and Ohlenberg, IGC, 2015 13 IMF RA-GAP analysis of Uganda VAT, IMF 2014 14 TADAT P4.10 on-time filing scored ‘D+’ and P5.11 on-time payments scored ‘D’
Customs systems15, a data warehouse, and a digital cargo tracking system, among others. These systems have made the registration, filing, and payment of obligations easier to comply with and have enabled monitoring of taxpayer information. Other revenue administration efficiency drives have included the Taxpayer Registration Expansion Programme (TREP). PEFA scores indicate that there is relatively efficient administration, which reflects the impact of some of these investments. However, the TADAT (2015) made a more comprehensive assessment of tax administration, revealing some areas of weakness compared to international good practice, particularly in measures of efficiency and managing compliance, such as use of risk management and mitigation actions16. A Compliance Improvement Plan has been drafted but there is little evidence that this has been or is being implemented. There is also inadequate risk identification, assessment and management; analysis of data; maintenance and accuracy of taxpayer registration and payment data; and, use of third party data for validation17.
7. Taxation of international transactions, companies and individuals poses a significant risk of revenue loss and is challenging to address in all countries, world-wide. Base erosion and profit-shifting, through unfavourable double tax agreements and transfer pricing, among other channels, are among the key risks posed by international tax planning. For countries like Uganda that attract investors, but invest little overseas, there tends to be a one-way flow of corporate profits out of the country unless policy and administration is capable of ensuring that they retain an appropriate allocation of taxing rights; and, the ability and mechanisms to identify and collect tax liabilities. Globally, multinational enterprises are taking advantage of tax officials’ inadequate understanding, particularly in developing countries. Cabinet approved Uganda’s Double Taxation Agreement (DTA) Policy and the related Model Tax Treaty, but further effort is required to review and renegotiate existing treaties, and ensure that the tax administration has capacity to identify and address international tax avoidance. A tax planning department in URA has been established for this purpose, but requires further capacity enhancement to be fully operationalized.
8. Economic activity is changing, but emerging sectors are not yet fully or appropriately captured in the tax net. Several policy reforms have taken place, including streamlining exemptions provided in VAT and other laws, in line with more recent economic realities, such as the Lotteries and Gaming Act, 2015; and updates to the Income Tax, Excise Duty Act, VAT, and Stamps Duty. A significant effort has been made to put in place an appropriate fiscal regime for the emerging oil and gas sector, based on international good practice. Nonetheless, further review and strengthening are needed to ensure that new opportunities for revenue mobilization are exploited, based on analysis of impacts, consultation and international practice. There may also be opportunities to enhance revenue through reform of existing tax policy and law e.g. excise duty rates, corporate income tax and withholding tax18.
9. Widespread tax evasion, lack of transparency of tax expenditures and policies that disproportionately affect vulnerable groups, contribute to a sense of unfairness and inequity, which undermines voluntary compliance. Exemptions, reliefs and investment incentives (‘Tax expenditures’) are not well-documented and monitored, making them less transparent with unclear rationale compared to spending through the budget, and as such, more at risk of political interference and perceived unfairness.
10. The risk of debt distress is low but increasing due to non-concessional borrowing and weak absorption capacity for implementing projects. Public debt stock was estimated at 40 percent of GDP (US$10.3 billion)
15 RADDeX and ASYCUDA World 16 TADAT POA2 Risk Management scored 17 TADAT POA6 Accuracy of Reporting scored ‘D’; TADAT POA8.22 efficiency of processing & accounting systems scored ‘D+’ 18 IMF paper on Medium-term Revenue Strategy, 2017
33Uganda Public Financial Management Reform Strategy
practice in tax administration follows approaches that are commensurate with the nature of the problem, beginning with support, followed by controls and then enforcement.
Nature of the problem and underlying causes:
3. Domestic revenues are insufficient to finance the fiscal deficit and infrastructure investment financing needs. There have been modest improvements in domestic revenue mobilisation in recent years, taking the revenue to GDP ratio from just under 12percent in 2013/14 to around 14percent in 2016/17. Nonetheless, this is still low by regional and sub-Saharan standards and recent estimates put the potential at around 20percent12. Due to continuing aid dependency, which is by nature less predictable, there is still, uncertainty in the flow of resources for service delivery. An analysis of the tax gap present in the Value Added Tax system estimated the gap to be approximately 60percent13. Since VAT currently contributes around 4percent of GDP, this gap offers significant potential for improvement, if the causes of the gap can be addressed. Tax policy changes, such as rationalising VAT exempt supplies, updating the excise law, gaming and betting tax and other measures have had a positive impact, along with efforts to improve non-tax revenue, which increased from 0.2percent of GDP to 0.3percent. Nonetheless, the significant unmet potential requires a more comprehensive approach.
4. There is inadequate Government coordination on revenue mobilisation. Revenue policy, procedures and systems across Government are not well coordinated or supported and there is no holistic strategy for revenue mobilisation. Systems for relevant data management are not integrated or shared and the legal framework and procedures for sharing of data between MDAs to support tax compliance strategies is still unclear. The wider regulatory framework is not being leveraged to support tax collection; such as through the regulation of alcohol, real estate, or tourism, for example. GoU signed up to the 2015 Addis Tax Initiative that commits Governments and Development Partners to engage in development co-operation efforts to boost tax collection, cut illicit financial flows, and strengthen policies for inclusive development and attainment of the SDGs. In response, holistic Government and stakeholder approach to domestic revenue mobilisation (DRM) is already underway through the development of a medium-term DRM strategy. This is expected to strengthen coordination on revenue issues across Government and is drawing on a range of recent studies and diagnostics, including the Tax Administration Diagnostic Assessment Tool (TADAT) undertaken in 2015.
5. Weak compliance culture, a large ‘shadow’ economy and weaknesses in tax administration result in significant compliance gaps and revenue losses. There is a weak tax compliance culture, which is exacerbated by corruption perceptions, a weak link between tax payment and delivery of public services and a low level of literacy and proper accounting practices. Measures of compliance have identified poor rates of on-time filing and payments, for example14. Uganda is also characterised by a large shadow economy, with at least 85 percent of taxpayers being micro, small and medium-sized. Simplification of tax policy and procedures may help improve voluntary compliance in this sector, by improving the practicality and ease of payments in circumstances in which normal filing procedures are too complex.
6. While significant investment has improved automation of tax administration systems, there remain inefficiencies and capacity gaps in the revenue administration. Significant investment in tax administration systems have been made over the past 10 years, including an Integrated Tax Administration System (ITAS),
12 Tax Revenue Potential and Effort, Langford and Ohlenberg, IGC, 2015 13 IMF RA-GAP analysis of Uganda VAT, IMF 2014 14 TADAT P4.10 on-time filing scored ‘D+’ and P5.11 on-time payments scored ‘D’
Customs systems15, a data warehouse, and a digital cargo tracking system, among others. These systems have made the registration, filing, and payment of obligations easier to comply with and have enabled monitoring of taxpayer information. Other revenue administration efficiency drives have included the Taxpayer Registration Expansion Programme (TREP). PEFA scores indicate that there is relatively efficient administration, which reflects the impact of some of these investments. However, the TADAT (2015) made a more comprehensive assessment of tax administration, revealing some areas of weakness compared to international good practice, particularly in measures of efficiency and managing compliance, such as use of risk management and mitigation actions16. A Compliance Improvement Plan has been drafted but there is little evidence that this has been or is being implemented. There is also inadequate risk identification, assessment and management; analysis of data; maintenance and accuracy of taxpayer registration and payment data; and, use of third party data for validation17.
7. Taxation of international transactions, companies and individuals poses a significant risk of revenue loss and is challenging to address in all countries, world-wide. Base erosion and profit-shifting, through unfavourable double tax agreements and transfer pricing, among other channels, are among the key risks posed by international tax planning. For countries like Uganda that attract investors, but invest little overseas, there tends to be a one-way flow of corporate profits out of the country unless policy and administration is capable of ensuring that they retain an appropriate allocation of taxing rights; and, the ability and mechanisms to identify and collect tax liabilities. Globally, multinational enterprises are taking advantage of tax officials’ inadequate understanding, particularly in developing countries. Cabinet approved Uganda’s Double Taxation Agreement (DTA) Policy and the related Model Tax Treaty, but further effort is required to review and renegotiate existing treaties, and ensure that the tax administration has capacity to identify and address international tax avoidance. A tax planning department in URA has been established for this purpose, but requires further capacity enhancement to be fully operationalized.
8. Economic activity is changing, but emerging sectors are not yet fully or appropriately captured in the tax net. Several policy reforms have taken place, including streamlining exemptions provided in VAT and other laws, in line with more recent economic realities, such as the Lotteries and Gaming Act, 2015; and updates to the Income Tax, Excise Duty Act, VAT, and Stamps Duty. A significant effort has been made to put in place an appropriate fiscal regime for the emerging oil and gas sector, based on international good practice. Nonetheless, further review and strengthening are needed to ensure that new opportunities for revenue mobilization are exploited, based on analysis of impacts, consultation and international practice. There may also be opportunities to enhance revenue through reform of existing tax policy and law e.g. excise duty rates, corporate income tax and withholding tax18.
9. Widespread tax evasion, lack of transparency of tax expenditures and policies that disproportionately affect vulnerable groups, contribute to a sense of unfairness and inequity, which undermines voluntary compliance. Exemptions, reliefs and investment incentives (‘Tax expenditures’) are not well-documented and monitored, making them less transparent with unclear rationale compared to spending through the budget, and as such, more at risk of political interference and perceived unfairness.
10. The risk of debt distress is low but increasing due to non-concessional borrowing and weak absorption capacity for implementing projects. Public debt stock was estimated at 40 percent of GDP (US$10.3 billion)
15 RADDeX and ASYCUDA World 16 TADAT POA2 Risk Management scored 17 TADAT POA6 Accuracy of Reporting scored ‘D’; TADAT POA8.22 efficiency of processing & accounting systems scored ‘D+’ 18 IMF paper on Medium-term Revenue Strategy, 2017
34 Uganda Public Financial Management Reform Strategy
in 2017 compared to 17 percent in 2006. The government assesses the risk of debt distress as moderate19 and external assessments rate it as low20. This is largely due to the high proportion of concessional loans (71 percent in 2017). Nonetheless, vulnerabilities are increasing due to the increasing trend towards non-concessional loan contracting, combined with a significant proportion of external loans that remain undisbursed. This indicates low absorption capacity of government to deliver externally financed projects, which is likely to negatively affect growth targets. Stress tests of debt distress arising from export shocks and lower economic performance indicate a breach of the threshold of a key indicator of debt distress, the present value of debt to exports.
11. There is a lack of coordination across government debt management, recording and analysis of the impacts and risks from debt contracting. There are adequate legal frameworks, management structures, good quality reporting and analysis in place for debt management, including a system for recording debt (DMFAS). Debt is also well-coordinated with macroeconomic policy and there is a medium-term debt management strategy. However, there is a need to fully operationalise the strategy and the Debt Directorate structure at MoFPED. For example, draft procedures for external borrowing need to be approved and implemented. A recent Debt Management Performance Assessment (DeMPA)21 identified a need to strengthen coordination between entities issuing guarantees, including formalising the procedures for external borrowing, issuing of guarantees and including guarantees in DMFAS. There is also a need for further capacity building in loan negotiation and appraisal of external financing to ensure that Uganda obtains the best terms and the fiscal impact of the loans is fully understood. For domestic borrowing, the DeMPA recommended that targets are included in Government’s borrowing plans and that the debt unit of MoFPED participates in regular market engagement with BoU.
2.2 Planning and Budgeting 12. The aim of Government planning and budgeting is to ensure there are clearly articulated national
development objectives, prioritised to reflect the available resources, and that limited resources are allocated efficiently to where they can best support the achievement of those priorities. A key element of this is ensuring that plans can be adequately translated into budgets and activities that are feasible and ensure plans are delivered in practice.
13. Figure 2.2 illustrates the interaction between planning activities and the budget cycle. There are both top-down and bottom-up planning and budgeting functions that need to be reconciled through the budget constraint and effective decision-making processes on priorities and trade-offs between options, informed by evidence and analysis. This requires close coordination with the Public Investment Management cycle (discussed further in Section 2.3). Having well-defined, accurately costed plans, which have outputs and results pre-agreed enables more accurate reporting during implementation, monitoring and evaluation of efficiency and effectiveness. The monitoring and evaluation helps to manage delivery in line with plans and to identify what works well or not so well, to inform future planning, costing and overall design of interventions that make an impact in the priority areas of government investment and delivery of services.
19 MoFPED Debt Sustainability Analysis, October 2017 20 For example, the World Bank Bank-IMF DSA 2017 21 Debt Management Performance Assessment (DeMPA) 2018
35Uganda Public Financial Management Reform Strategy
in 2017 compared to 17 percent in 2006. The government assesses the risk of debt distress as moderate19 and external assessments rate it as low20. This is largely due to the high proportion of concessional loans (71 percent in 2017). Nonetheless, vulnerabilities are increasing due to the increasing trend towards non-concessional loan contracting, combined with a significant proportion of external loans that remain undisbursed. This indicates low absorption capacity of government to deliver externally financed projects, which is likely to negatively affect growth targets. Stress tests of debt distress arising from export shocks and lower economic performance indicate a breach of the threshold of a key indicator of debt distress, the present value of debt to exports.
11. There is a lack of coordination across government debt management, recording and analysis of the impacts and risks from debt contracting. There are adequate legal frameworks, management structures, good quality reporting and analysis in place for debt management, including a system for recording debt (DMFAS). Debt is also well-coordinated with macroeconomic policy and there is a medium-term debt management strategy. However, there is a need to fully operationalise the strategy and the Debt Directorate structure at MoFPED. For example, draft procedures for external borrowing need to be approved and implemented. A recent Debt Management Performance Assessment (DeMPA)21 identified a need to strengthen coordination between entities issuing guarantees, including formalising the procedures for external borrowing, issuing of guarantees and including guarantees in DMFAS. There is also a need for further capacity building in loan negotiation and appraisal of external financing to ensure that Uganda obtains the best terms and the fiscal impact of the loans is fully understood. For domestic borrowing, the DeMPA recommended that targets are included in Government’s borrowing plans and that the debt unit of MoFPED participates in regular market engagement with BoU.
2.2 Planning and Budgeting 12. The aim of Government planning and budgeting is to ensure there are clearly articulated national
development objectives, prioritised to reflect the available resources, and that limited resources are allocated efficiently to where they can best support the achievement of those priorities. A key element of this is ensuring that plans can be adequately translated into budgets and activities that are feasible and ensure plans are delivered in practice.
13. Figure 2.2 illustrates the interaction between planning activities and the budget cycle. There are both top-down and bottom-up planning and budgeting functions that need to be reconciled through the budget constraint and effective decision-making processes on priorities and trade-offs between options, informed by evidence and analysis. This requires close coordination with the Public Investment Management cycle (discussed further in Section 2.3). Having well-defined, accurately costed plans, which have outputs and results pre-agreed enables more accurate reporting during implementation, monitoring and evaluation of efficiency and effectiveness. The monitoring and evaluation helps to manage delivery in line with plans and to identify what works well or not so well, to inform future planning, costing and overall design of interventions that make an impact in the priority areas of government investment and delivery of services.
19 MoFPED Debt Sustainability Analysis, October 2017 20 For example, the World Bank Bank-IMF DSA 2017 21 Debt Management Performance Assessment (DeMPA) 2018
Figure 2.2: Mapping of linkages between planning and budget cycle
-Multi-year commitments are not forming part of the budget constraint. -Lack of general understanding of the basic concepts of planning, monitoring and evaluation across government with no specialized sector level planning capability
Compliance with NDP: Weaknesses and gaps in the quality and scope of Sector, MDA Plans and their alignment to high-level priorities set in the NDP II. ‘Compliance’ with the NDP is found to be between 60 and 70% (NPA).
MTEF ideally links policies and plans to the budget. Supposed to reduce the imbalance between what is affordable, available and expenditure requirement.
The MTEF itself is not effective, with changes to MTEF being made annually with no clear reconciliation between the MTEF and annual budgets.
PBB and Gender budgeting reforms in the budget process: To target the positive impact of gender equality on growth and development, gender budgeting has made progress, but is not yet fully integrated and mainstreamed across sectors and MDALGs in a meaningful way.
SECT
OR
LEVE
L NA
TION
AL
LEVE
L PROGRAM
BASED BUDGETING (PBB) & GENDER BUDGETING
Unreliable medium-term perspective for allocation: Sector and MDA plans that are developed are not well linked to the medium-term expenditure framework (MTEF).
Linking oversight with Learning: There remains a weak link between planning, reporting of results and evidence on what works to inform policy, which will be essential to the success of program-based budgeting.
Sub-optimal execution: In-year budget adjustments leading to variations in budget composition outturn (of between 7% and 20% in recent years), have contributed to budget under-execution in some delivery areas (notably investment projects) and a risk of build-up of arrears in others.
36 Uganda Public Financial Management Reform Strategy
Nature of the problem and underlying causes:
14. The weak planning system is a major constraint to attainment of budget credibility at both Sector and District Level. There is a lack of general understanding of the basic concepts of planning, monitoring and evaluation across government with inadequate specialised development planning capability at sector level (e.g. health, education and agriculture). Moreover, desk officers require sufficient sector knowledge to guide their respective sector institutions. There is inadequate availability of real-time or up-to-date statistical data to inform the planning process. This is partly due to a weak underlying institutional framework for planning and uncoordinated capacity development. These weaknesses are manifested through; (i) poorly developed results frameworks, (ii) poorly costed and sequenced plans to inform multiyear budgeting, (iv) weak spatial representation of plans, (v) low absorptive capacity of funds due to inadequate project planning, (vi) poor structuring and negotiation of Public Private Partnership (PPP) projects and (vii) poorly developed and selected projects
15. There are weaknesses and gaps in the quality and scope of Sector Plans and their alignment to high-level priorities set in the NDP II. The National planning framework (e.g. NDP II) provides the high-level development objectives, which are translated into sector level plans, through the Sector Wide (SWaP). The budget should then be developed on the basis of sector and aligned individual MDALG plans. The NPA issues an annual budget certificate of compliance to ensure alignment with the NDP II. In FY2016/17, only seven (7) out of sixteen (16) sectors had approved development plans, six (6) sectors had draft plans that were aligned but not approved and three (3) sectors had no plans. Furthermore, only 19 out of 130 MDAs had approved plans aligned to the NDPII, while a dismal 26 out of 133 Local Governments had approved and aligned plans. This is due to a lack of planning capacity at the sector and line ministry level, particularly in the definition of outcomes and outputs. There is also inadequate strategic leadership and capacity in sectors to manage trade-offs between the submissions of MDAs so that limited resources are allocated towards national priorities, particularly in terms of strategic prioritisation or selection of projects. ‘Compliance’ with the NDP is found to be between 60 and 70percent (NPA). There may be a number of reasons for this, including the effectiveness of the NDP itself in providing clear priorities in the face of changing economic and other circumstances. NPA has begun providing training to sectors failing to submit strategic plans, but there is also a need to enhance engagement between NPA and MoFPED (DEA). For example, for NPA to submit a policy statement through DEA to inform the budget strategy at the beginning of the budget formulation process and against which the NPA compliance certificate may be assessed on an annual basis.
16. There remains a weak link between planning, reporting of results and evidence to inform policy, which will be essential to the success of program-based budgeting. Where sector plans exist they identify targets, expected results and deliverables. The budget process converts the available resources into outputs and results for tracking. The budget process itself scored well (e.g. in 2016 PEFA assessments) and is deemed to be orderly, highly participatory, providing sufficient time and information for MDAs to plan and for Government to prioritise annual budget allocations. The PBB approach has begun to develop institutional processes to ensure that plans and reports capture outcomes and outputs. This has been supported by training of planning and budget staff and the deployment of graduate economists to MDAs to support budget preparation. Nonetheless, the 2016/17 NPA and Budget Monitoring and Accountability Unit (BMAU) reports indicate that linkages between outcomes and outputs in the PBB are still ill-defined. More sectors are now monitored by the Budget Monitoring and Accountability Unit (BMAU) and the Office of the Prime Minister’s drive to embed performance indicators and reporting across Government has been further strengthened by performance-based contracts for Accounting Officers. Government’ efforts to enhance M&E have created multiple results frameworks and responsibility centres for M&E, which are not harmonised and
therefore do not make the best use of resources for M&E activities. At the level of evaluating effectiveness of projects and services, there is insufficient evaluation attained by the different stakeholders, additionally while evaluations are undertaken, lessons from evaluation evidence do not inform the design and planning of new projects or policies. Further capacity building is needed to ensure that plans are developed on the basis of evidence and analysis.
17. Sector plans that are developed are not well linked to the medium-term expenditure framework (MTEF). Despite robust macro-fiscal forecasts and clear fiscal policy objectives, the medium-term perspective in budgeting is not sufficiently reliable to enable government to plan budget allocations in accordance with priorities. Macroeconomic management is underpinned by the Charter of Fiscal Responsibility, which provides the basis for a predictable and sustainable medium-term fiscal strategy and for budget policy decisions to align with fiscal targets. The Charter includes fiscal targets for reducing the fiscal deficit to below 3percent of GDP and to maintain the value of public debt below 50 percent of GDP. Adherence to the medium-term strategy is, however, undermined by weaknesses in medium-term budgeting, in which forward-year estimates do not provide a predictable baseline for future budget ceilings and allocations. MTEF ceilings are provided to MDAs only at the second budget Call Circular (BCC) and sector plans are therefore not developed in a constrained context of budget ceilings22. There is a lack of analysis of economic and fiscal impacts, and planning for investment projects currently fails to adequately capture medium-term commitments and associated recurrent costs. The MTEF is therefore not comprehensive in its representation of the Government’s multi-year commitments and medium-term costs. A further cause of this gap is weaknesses in costing methodologies, budget analysis and assessment of risks and fiscal impacts, none of which are well developed in sector plans. It also reflects the lack of adequate project preparation prior to introducing projects into plans and budgets (discussed further in Section 2.3).
18. The MTEF itself is not effective, with changes to MTEF being made annually with no clear reconciliation between the MTEF and annual budgets. Challenges with the MTEF have persisted for several years since it was introduced in the 1990s. The macro-fiscal framework is fully developed and determines the medium-term resource envelope on a top-down basis. It is therefore not validated or linked to any bottom-up analysis of cost-drivers and commitments, nor does it provide a sufficient constraining framework on the selection and prioritisation of projects and plans. Furthermore, there is no requirement to compare and reconcile the second year of the previous MTEF with the current annual budget, and this is not carried out systematically or analysed. These inaccuracies in the medium-term projections, combined with additional pressures arising, and changes in priorities, contribute to regular amendments to MTEF outer years23.
19. In-year budget adjustments leading to variations in budget composition outturn (of between 7percent and 20percent in recent years), have contributed to budget under-execution in some delivery areas (notably investment projects) and a risk of build-up of arrears in others. Frequent in-year adjustments are partly due to weakness in planning and monitoring of costs and arrears. In particular24: (i) there is insufficient budgeting for recurrent costs e.g. utilities; (ii) inaccurate project costing and recurrent costs associated with investment projects often not included in budgets; (iii) arrears not fully budgeted for, including court awards, which can be unpredictable; and, (iv) fiscal impact analysis of new policies in the MTFF and budget preparation is not complete (i.e. there is still non-compliance with the requirement for policy proposals to be accompanied by a certificate of financial implication before approval by cabinet). While, on the whole, legislative scrutiny of
22 NPA analysis of compliance with NDP; PEFA PI-16.2 and 16.3 = D 23 PEFA PI-16.4 = D 24 PEFA PI 2.2 = D; PEFA PI-11.3 = D; PEFA PI-15.1 = D; PEFA PI 21.4 = C; PEFA PI-22.1 = D; IMF Staff Report 2017 (Under-execution of capital projects)
37Uganda Public Financial Management Reform Strategy
Nature of the problem and underlying causes:
14. The weak planning system is a major constraint to attainment of budget credibility at both Sector and District Level. There is a lack of general understanding of the basic concepts of planning, monitoring and evaluation across government with inadequate specialised development planning capability at sector level (e.g. health, education and agriculture). Moreover, desk officers require sufficient sector knowledge to guide their respective sector institutions. There is inadequate availability of real-time or up-to-date statistical data to inform the planning process. This is partly due to a weak underlying institutional framework for planning and uncoordinated capacity development. These weaknesses are manifested through; (i) poorly developed results frameworks, (ii) poorly costed and sequenced plans to inform multiyear budgeting, (iv) weak spatial representation of plans, (v) low absorptive capacity of funds due to inadequate project planning, (vi) poor structuring and negotiation of Public Private Partnership (PPP) projects and (vii) poorly developed and selected projects
15. There are weaknesses and gaps in the quality and scope of Sector Plans and their alignment to high-level priorities set in the NDP II. The National planning framework (e.g. NDP II) provides the high-level development objectives, which are translated into sector level plans, through the Sector Wide (SWaP). The budget should then be developed on the basis of sector and aligned individual MDALG plans. The NPA issues an annual budget certificate of compliance to ensure alignment with the NDP II. In FY2016/17, only seven (7) out of sixteen (16) sectors had approved development plans, six (6) sectors had draft plans that were aligned but not approved and three (3) sectors had no plans. Furthermore, only 19 out of 130 MDAs had approved plans aligned to the NDPII, while a dismal 26 out of 133 Local Governments had approved and aligned plans. This is due to a lack of planning capacity at the sector and line ministry level, particularly in the definition of outcomes and outputs. There is also inadequate strategic leadership and capacity in sectors to manage trade-offs between the submissions of MDAs so that limited resources are allocated towards national priorities, particularly in terms of strategic prioritisation or selection of projects. ‘Compliance’ with the NDP is found to be between 60 and 70percent (NPA). There may be a number of reasons for this, including the effectiveness of the NDP itself in providing clear priorities in the face of changing economic and other circumstances. NPA has begun providing training to sectors failing to submit strategic plans, but there is also a need to enhance engagement between NPA and MoFPED (DEA). For example, for NPA to submit a policy statement through DEA to inform the budget strategy at the beginning of the budget formulation process and against which the NPA compliance certificate may be assessed on an annual basis.
16. There remains a weak link between planning, reporting of results and evidence to inform policy, which will be essential to the success of program-based budgeting. Where sector plans exist they identify targets, expected results and deliverables. The budget process converts the available resources into outputs and results for tracking. The budget process itself scored well (e.g. in 2016 PEFA assessments) and is deemed to be orderly, highly participatory, providing sufficient time and information for MDAs to plan and for Government to prioritise annual budget allocations. The PBB approach has begun to develop institutional processes to ensure that plans and reports capture outcomes and outputs. This has been supported by training of planning and budget staff and the deployment of graduate economists to MDAs to support budget preparation. Nonetheless, the 2016/17 NPA and Budget Monitoring and Accountability Unit (BMAU) reports indicate that linkages between outcomes and outputs in the PBB are still ill-defined. More sectors are now monitored by the Budget Monitoring and Accountability Unit (BMAU) and the Office of the Prime Minister’s drive to embed performance indicators and reporting across Government has been further strengthened by performance-based contracts for Accounting Officers. Government’ efforts to enhance M&E have created multiple results frameworks and responsibility centres for M&E, which are not harmonised and
therefore do not make the best use of resources for M&E activities. At the level of evaluating effectiveness of projects and services, there is insufficient evaluation attained by the different stakeholders, additionally while evaluations are undertaken, lessons from evaluation evidence do not inform the design and planning of new projects or policies. Further capacity building is needed to ensure that plans are developed on the basis of evidence and analysis.
17. Sector plans that are developed are not well linked to the medium-term expenditure framework (MTEF). Despite robust macro-fiscal forecasts and clear fiscal policy objectives, the medium-term perspective in budgeting is not sufficiently reliable to enable government to plan budget allocations in accordance with priorities. Macroeconomic management is underpinned by the Charter of Fiscal Responsibility, which provides the basis for a predictable and sustainable medium-term fiscal strategy and for budget policy decisions to align with fiscal targets. The Charter includes fiscal targets for reducing the fiscal deficit to below 3percent of GDP and to maintain the value of public debt below 50 percent of GDP. Adherence to the medium-term strategy is, however, undermined by weaknesses in medium-term budgeting, in which forward-year estimates do not provide a predictable baseline for future budget ceilings and allocations. MTEF ceilings are provided to MDAs only at the second budget Call Circular (BCC) and sector plans are therefore not developed in a constrained context of budget ceilings22. There is a lack of analysis of economic and fiscal impacts, and planning for investment projects currently fails to adequately capture medium-term commitments and associated recurrent costs. The MTEF is therefore not comprehensive in its representation of the Government’s multi-year commitments and medium-term costs. A further cause of this gap is weaknesses in costing methodologies, budget analysis and assessment of risks and fiscal impacts, none of which are well developed in sector plans. It also reflects the lack of adequate project preparation prior to introducing projects into plans and budgets (discussed further in Section 2.3).
18. The MTEF itself is not effective, with changes to MTEF being made annually with no clear reconciliation between the MTEF and annual budgets. Challenges with the MTEF have persisted for several years since it was introduced in the 1990s. The macro-fiscal framework is fully developed and determines the medium-term resource envelope on a top-down basis. It is therefore not validated or linked to any bottom-up analysis of cost-drivers and commitments, nor does it provide a sufficient constraining framework on the selection and prioritisation of projects and plans. Furthermore, there is no requirement to compare and reconcile the second year of the previous MTEF with the current annual budget, and this is not carried out systematically or analysed. These inaccuracies in the medium-term projections, combined with additional pressures arising, and changes in priorities, contribute to regular amendments to MTEF outer years23.
19. In-year budget adjustments leading to variations in budget composition outturn (of between 7percent and 20percent in recent years), have contributed to budget under-execution in some delivery areas (notably investment projects) and a risk of build-up of arrears in others. Frequent in-year adjustments are partly due to weakness in planning and monitoring of costs and arrears. In particular24: (i) there is insufficient budgeting for recurrent costs e.g. utilities; (ii) inaccurate project costing and recurrent costs associated with investment projects often not included in budgets; (iii) arrears not fully budgeted for, including court awards, which can be unpredictable; and, (iv) fiscal impact analysis of new policies in the MTFF and budget preparation is not complete (i.e. there is still non-compliance with the requirement for policy proposals to be accompanied by a certificate of financial implication before approval by cabinet). While, on the whole, legislative scrutiny of
22 NPA analysis of compliance with NDP; PEFA PI-16.2 and 16.3 = D 23 PEFA PI-16.4 = D 24 PEFA PI 2.2 = D; PEFA PI-11.3 = D; PEFA PI-15.1 = D; PEFA PI 21.4 = C; PEFA PI-22.1 = D; IMF Staff Report 2017 (Under-execution of capital projects)
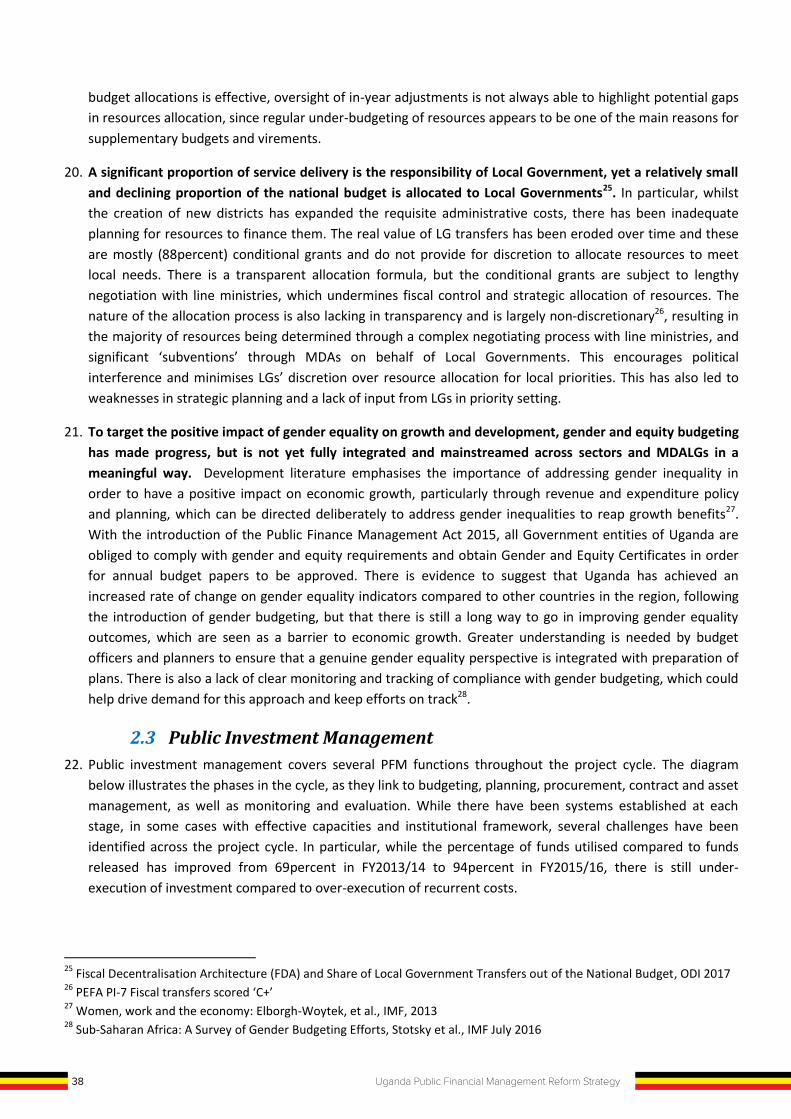
38 Uganda Public Financial Management Reform Strategy
budget allocations is effective, oversight of in-year adjustments is not always able to highlight potential gaps in resources allocation, since regular under-budgeting of resources appears to be one of the main reasons for supplementary budgets and virements.
20. A significant proportion of service delivery is the responsibility of Local Government, yet a relatively small and declining proportion of the national budget is allocated to Local Governments25. In particular, whilst the creation of new districts has expanded the requisite administrative costs, there has been inadequate planning for resources to finance them. The real value of LG transfers has been eroded over time and these are mostly (88percent) conditional grants and do not provide for discretion to allocate resources to meet local needs. There is a transparent allocation formula, but the conditional grants are subject to lengthy negotiation with line ministries, which undermines fiscal control and strategic allocation of resources. The nature of the allocation process is also lacking in transparency and is largely non-discretionary26, resulting in the majority of resources being determined through a complex negotiating process with line ministries, and significant ‘subventions’ through MDAs on behalf of Local Governments. This encourages political interference and minimises LGs’ discretion over resource allocation for local priorities. This has also led to weaknesses in strategic planning and a lack of input from LGs in priority setting.
21. To target the positive impact of gender equality on growth and development, gender and equity budgeting has made progress, but is not yet fully integrated and mainstreamed across sectors and MDALGs in a meaningful way. Development literature emphasises the importance of addressing gender inequality in order to have a positive impact on economic growth, particularly through revenue and expenditure policy and planning, which can be directed deliberately to address gender inequalities to reap growth benefits27. With the introduction of the Public Finance Management Act 2015, all Government entities of Uganda are obliged to comply with gender and equity requirements and obtain Gender and Equity Certificates in order for annual budget papers to be approved. There is evidence to suggest that Uganda has achieved an increased rate of change on gender equality indicators compared to other countries in the region, following the introduction of gender budgeting, but that there is still a long way to go in improving gender equality outcomes, which are seen as a barrier to economic growth. Greater understanding is needed by budget officers and planners to ensure that a genuine gender equality perspective is integrated with preparation of plans. There is also a lack of clear monitoring and tracking of compliance with gender budgeting, which could help drive demand for this approach and keep efforts on track28.
2.3 Public Investment Management 22. Public investment management covers several PFM functions throughout the project cycle. The diagram
below illustrates the phases in the cycle, as they link to budgeting, planning, procurement, contract and asset management, as well as monitoring and evaluation. While there have been systems established at each stage, in some cases with effective capacities and institutional framework, several challenges have been identified across the project cycle. In particular, while the percentage of funds utilised compared to funds released has improved from 69percent in FY2013/14 to 94percent in FY2015/16, there is still under-execution of investment compared to over-execution of recurrent costs.
25 Fiscal Decentralisation Architecture (FDA) and Share of Local Government Transfers out of the National Budget, ODI 2017 26 PEFA PI-7 Fiscal transfers scored ‘C+’ 27 Women, work and the economy: Elborgh-Woytek, et al., IMF, 2013 28 Sub-Saharan Africa: A Survey of Gender Budgeting Efforts, Stotsky et al., IMF July 2016
Figure 2.3: Uganda’s challenges in each stage of the Public Investment Cycle29
Nature of the problem and underlying causes:
23. Public investment in Uganda is under-executed and does not achieve the economic returns required from investments, due to weak public investment management. The World Bank Economic Update 2016 estimated that only US$0.70 has been generated out of every US$1 invested in infrastructure over the past decade. The IMF’s Public Investment Index shows that East African countries achieve low value for money from public resources, ranking Tanzania 48th, Uganda 46th, Kenya 44th and Rwanda 12th out of 71 countries surveyed. PIM has been identified as a key weakness in the PEFA 2016 assessment30 and by IMF31 as posing a significant risk to the achievement of the infrastructure investment required in order to deliver the NDP II and Vision 2040.
24. The lack of a coordinated project cycle management approach poses risks and causes problems at all stages of the project cycle. Recent efforts to strengthen PIM include establishing new structures, such as the Project Appraisal and Public-Private Partnership (PAP) Department under the Budget Directorate and adoption of a PIM Action Plan, based on a diagnostic study undertaken in 2016. The Development Committee has issued new guidelines on the project appraisal process. MDAs are also required to submit a statement of multi-year commitments as part of the annual budget process, with the implication that any MDAs deemed to be over-committed will be prevented from initiating new projects. Nonetheless, projects are included in budgets and plans based on an unconstrained sector planning process and, while a process and guidelines for appraisal of economic costs and benefits has been introduced, this has not yet been implemented on a consistent basis. This means that there could be resources allocated to projects that do not have the highest relative return and are not well aligned to strategic priorities. As a result, the current Public Investment Plan (PIP) contains too many projects, on which there is little reliable baseline information
29 Adapted from M. Miller and S. Mustapha (2016), “Public investment management: A public financial management introductory guide” 30 PEFA PI-11 scored ‘D’ 31 Enhancing the Performance of Public Investment Management, IMF Technical Assistance report, May 2017
Ineffective appraisal and alignment to priorities: Provides no basis for selection and lead to low returns, wasted resource & risk of arrears/ delays due to inadequate costing
Too many projects and inappropriate costing/ lack of integration of commitments to MTEF: Leads to build up of arrears, reallocations and constraints of releases, which can cause delays in procurement
Inappropriate costing and lack of monitoring & evaluation: Leads to ineffective asset management, reduced asset/ project lifetime; lack of learning for better design and budgeting for future projects
Lack of competition in procurement and weak contract management: Risk to efficient and effective delivery; delays and cost overruns lead to further arrears and affects quality and timeliness of delivery
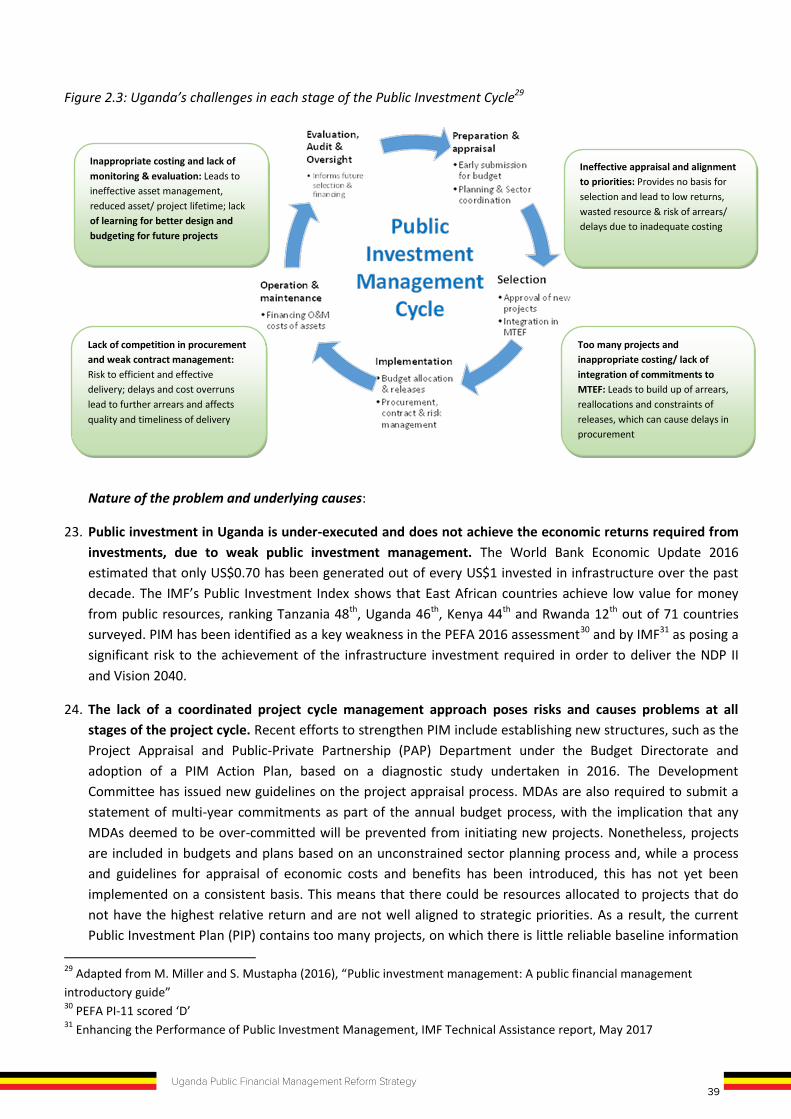
39Uganda Public Financial Management Reform Strategy
budget allocations is effective, oversight of in-year adjustments is not always able to highlight potential gaps in resources allocation, since regular under-budgeting of resources appears to be one of the main reasons for supplementary budgets and virements.
20. A significant proportion of service delivery is the responsibility of Local Government, yet a relatively small and declining proportion of the national budget is allocated to Local Governments25. In particular, whilst the creation of new districts has expanded the requisite administrative costs, there has been inadequate planning for resources to finance them. The real value of LG transfers has been eroded over time and these are mostly (88percent) conditional grants and do not provide for discretion to allocate resources to meet local needs. There is a transparent allocation formula, but the conditional grants are subject to lengthy negotiation with line ministries, which undermines fiscal control and strategic allocation of resources. The nature of the allocation process is also lacking in transparency and is largely non-discretionary26, resulting in the majority of resources being determined through a complex negotiating process with line ministries, and significant ‘subventions’ through MDAs on behalf of Local Governments. This encourages political interference and minimises LGs’ discretion over resource allocation for local priorities. This has also led to weaknesses in strategic planning and a lack of input from LGs in priority setting.
21. To target the positive impact of gender equality on growth and development, gender and equity budgeting has made progress, but is not yet fully integrated and mainstreamed across sectors and MDALGs in a meaningful way. Development literature emphasises the importance of addressing gender inequality in order to have a positive impact on economic growth, particularly through revenue and expenditure policy and planning, which can be directed deliberately to address gender inequalities to reap growth benefits27. With the introduction of the Public Finance Management Act 2015, all Government entities of Uganda are obliged to comply with gender and equity requirements and obtain Gender and Equity Certificates in order for annual budget papers to be approved. There is evidence to suggest that Uganda has achieved an increased rate of change on gender equality indicators compared to other countries in the region, following the introduction of gender budgeting, but that there is still a long way to go in improving gender equality outcomes, which are seen as a barrier to economic growth. Greater understanding is needed by budget officers and planners to ensure that a genuine gender equality perspective is integrated with preparation of plans. There is also a lack of clear monitoring and tracking of compliance with gender budgeting, which could help drive demand for this approach and keep efforts on track28.
2.3 Public Investment Management 22. Public investment management covers several PFM functions throughout the project cycle. The diagram
below illustrates the phases in the cycle, as they link to budgeting, planning, procurement, contract and asset management, as well as monitoring and evaluation. While there have been systems established at each stage, in some cases with effective capacities and institutional framework, several challenges have been identified across the project cycle. In particular, while the percentage of funds utilised compared to funds released has improved from 69percent in FY2013/14 to 94percent in FY2015/16, there is still under-execution of investment compared to over-execution of recurrent costs.
25 Fiscal Decentralisation Architecture (FDA) and Share of Local Government Transfers out of the National Budget, ODI 2017 26 PEFA PI-7 Fiscal transfers scored ‘C+’ 27 Women, work and the economy: Elborgh-Woytek, et al., IMF, 2013 28 Sub-Saharan Africa: A Survey of Gender Budgeting Efforts, Stotsky et al., IMF July 2016
Figure 2.3: Uganda’s challenges in each stage of the Public Investment Cycle29
Nature of the problem and underlying causes:
23. Public investment in Uganda is under-executed and does not achieve the economic returns required from investments, due to weak public investment management. The World Bank Economic Update 2016 estimated that only US$0.70 has been generated out of every US$1 invested in infrastructure over the past decade. The IMF’s Public Investment Index shows that East African countries achieve low value for money from public resources, ranking Tanzania 48th, Uganda 46th, Kenya 44th and Rwanda 12th out of 71 countries surveyed. PIM has been identified as a key weakness in the PEFA 2016 assessment30 and by IMF31 as posing a significant risk to the achievement of the infrastructure investment required in order to deliver the NDP II and Vision 2040.
24. The lack of a coordinated project cycle management approach poses risks and causes problems at all stages of the project cycle. Recent efforts to strengthen PIM include establishing new structures, such as the Project Appraisal and Public-Private Partnership (PAP) Department under the Budget Directorate and adoption of a PIM Action Plan, based on a diagnostic study undertaken in 2016. The Development Committee has issued new guidelines on the project appraisal process. MDAs are also required to submit a statement of multi-year commitments as part of the annual budget process, with the implication that any MDAs deemed to be over-committed will be prevented from initiating new projects. Nonetheless, projects are included in budgets and plans based on an unconstrained sector planning process and, while a process and guidelines for appraisal of economic costs and benefits has been introduced, this has not yet been implemented on a consistent basis. This means that there could be resources allocated to projects that do not have the highest relative return and are not well aligned to strategic priorities. As a result, the current Public Investment Plan (PIP) contains too many projects, on which there is little reliable baseline information
29 Adapted from M. Miller and S. Mustapha (2016), “Public investment management: A public financial management introductory guide” 30 PEFA PI-11 scored ‘D’ 31 Enhancing the Performance of Public Investment Management, IMF Technical Assistance report, May 2017
Ineffective appraisal and alignment to priorities: Provides no basis for selection and lead to low returns, wasted resource & risk of arrears/ delays due to inadequate costing
Too many projects and inappropriate costing/ lack of integration of commitments to MTEF: Leads to build up of arrears, reallocations and constraints of releases, which can cause delays in procurement
Inappropriate costing and lack of monitoring & evaluation: Leads to ineffective asset management, reduced asset/ project lifetime; lack of learning for better design and budgeting for future projects
Lack of competition in procurement and weak contract management: Risk to efficient and effective delivery; delays and cost overruns lead to further arrears and affects quality and timeliness of delivery
40 Uganda Public Financial Management Reform Strategy
and insufficient costing, particularly of medium-term commitments that should be integrated into the MTEF. Projects are sometimes approved with funds allocated before preliminary critical path actions have been taken. This is a particular problem with large infrastructure projects requiring land acquisition.
25. Planning and appraisal of projects is weak, undermining effective project identification, selection and the quality of project delivery from the outset. While reforms have been introduced to integrate project appraisal in the planning stage, there are significant capacity gaps in project development (i.e. project identification, appraisal, negotiation and investment prioritisation) including understanding and leveraging opportunities for PPPs. The monitoring of major investment projects would benefit from more rigorous monitoring at a central level with annual reviews in each sector to ensure informed budget allocations and understanding of challenges and constraints.
26. The Development Committee also needs further strengthening. In particular, there is a lack of separation of powers among technical representatives of the DC, meaning that projects are not reviewed thoroughly and independently with adequate technical and analytical input from each relevant institution. Development of competent support structures for each institution represented at the DC is needed to undertake effective analysis and appraisal of proposed projects. In addition, whereas the DC is supposed to review/appraise fully developed projects, its currently handling the planning process for projects for example from concept note level which should be a function of sectors and MDAs guided by NPA. There is need to consider separation of project development (idea identification, project selection, prefeasibility and feasibility study) from project appraisal for making financial decision. Moreover, strengthening capacity of sector level development committees will further enhance existing Swap arrangements of coordination.
27. In-year budget adjustments cause uncertainty in the execution of investment projects, which require certainty and medium-term planning. There is a weak communication flow between the Sector MDAs and LGs about changes in the MTEF allocations. Information flow from the centre to the beneficiaries on the scope of works, attendant costs and duration is often flawed, late or not available. This makes it difficult for beneficiaries to make any follow up. The uncertainty and lack of accountability in this area can lead to delays in procurement, also affecting the success of PIM. Delays and cost overruns lead to further arrears and affects quality and timeliness of delivery.
28. At the stage of implementation, there is low value for money from procurements. Some progress has been made in enhancing procurement processes, through the regulatory role of PPDA and standard procedures set in the legal and regulatory framework. Nonetheless, competition is still limited among public sector suppliers and weak compliance with procurement procedures means that a number of procurements are still not subject to open competition.
29. Management of live supplier contracts and maintenance of public assets is also weak, leading to wasted resources, financial and non-financial risks and delays and cost overruns32. Over the last 3-4 years, on average, 71percent of contracts were delivered on time and 64percent to the planned budget. The PFM Act 2015 provides for increased transparency of recording and reporting on assets and investments. However, the stock of non-financial assets is not reported comprehensively and there are maintenance issues, including missing title deeds, out of date valuation, deterioration in the condition of assets and poor stores management, according to audit reports. This reduces the effective lifetime of assets and reduces value for money and the economic return from public investment. There is also a lack of risk management approach in project implementation and contract management, particularly in the assessment of fiscal risks, especially
32 PEFA PI 24.1 and 24.2 Procurement methods scored ‘D’
from Public-Private Partnerships and public corporations. While enhanced fiscal risk statements are supporting the assessment of fiscal risks, further work is needed to embed this approach across Government, for example, by ensuring that there are processes in place for the Macroeconomic Management Department to identify, assess and track fiscal risks arising. Fiduciary, technical delivery and other risks also need to be actively managed throughout the project cycle. Recent reforms have begun to pilot the use of the IFMS Fixed Assets Management module to track the use of government assets.
30. There is a lack of information for tracking actual expenditures from externally funded projects. While progress has been made on tracking external financing for a few key projects, through the aid management system, there are delays in reporting and there is need to roll this approach out to capture all externally financed projects and actual expenditures. Some projects carry over balances from one financial year to the next, which are not effectively monitored and captured as commitments in the preparation of budgets. Significant off-budget support that is not synchronised with the GoU budget and reports poses a substantial risk to the credibility of budgets and the effective planning and management of investments, including leading to duplication of effort, double accounting and diversions or adjustments required in implementation. Treasury is currently rolling out IFMS and TSA to key development partners and loan-funded projects on a sector by sector basis. Over time, this may capture a large part of externally financed expenditure in GoU systems. For on-budget projects, there is already partial payment information, but off-budget funding is more problematic to capture in the system.
31. While there is some monitoring and evaluation in place, M&E throughout and at the end of the project cycle is inadequate and learning from experience does not inform future planning and budgeting significantly. There are evaluations undertaken of a number of investment projects and BMAU monitors budget execution in selected sectors annually. However, it is unclear how the findings of those monitoring an evaluation exercises are taken into account in the design of future projects.
2.4 Accountability Systems and compliance in Budget Execution 32. Several accountability systems and procedures together comprise the PFM ‘system’ or functions across
Government. For example, the core system for recording, reporting and managing financial transactions is the Integrated Financial Management System (IFMS). For revenue collections, the URA has a number of IT-based systems (outlined in section 2.1.1.). Budget preparation takes place within the Program-based Budgeting System (PBS). Salaries and pensions are managed through the Integrated Payroll and Pensions System (IPPS), soon to be transitioned to Human Capital Management (HCM). Procurements are undertaken through the online procurement portal and monitored through Procurement Performance Monitoring System (PPMS). E-Government Procurement (e-GP) is being piloted for online management of procurement procedures, and when rolled out will replace the PPMS. Aid and Debt management systems separately capture information on externally financed projects and debt issuance. All of the above are underpinned by Government’s internet provision and ICT infrastructure. Around these systems are legislation, policies, regulations, accounting standards and procedures designed to provide the structure, powers, roles and responsibilities of the institutions and individuals operating the systems to achieve the desired PFM outcomes. Internal audit provides compliance assurance and identifies any violations with these procedures and frameworks.
41Uganda Public Financial Management Reform Strategy
and insufficient costing, particularly of medium-term commitments that should be integrated into the MTEF. Projects are sometimes approved with funds allocated before preliminary critical path actions have been taken. This is a particular problem with large infrastructure projects requiring land acquisition.
25. Planning and appraisal of projects is weak, undermining effective project identification, selection and the quality of project delivery from the outset. While reforms have been introduced to integrate project appraisal in the planning stage, there are significant capacity gaps in project development (i.e. project identification, appraisal, negotiation and investment prioritisation) including understanding and leveraging opportunities for PPPs. The monitoring of major investment projects would benefit from more rigorous monitoring at a central level with annual reviews in each sector to ensure informed budget allocations and understanding of challenges and constraints.
26. The Development Committee also needs further strengthening. In particular, there is a lack of separation of powers among technical representatives of the DC, meaning that projects are not reviewed thoroughly and independently with adequate technical and analytical input from each relevant institution. Development of competent support structures for each institution represented at the DC is needed to undertake effective analysis and appraisal of proposed projects. In addition, whereas the DC is supposed to review/appraise fully developed projects, its currently handling the planning process for projects for example from concept note level which should be a function of sectors and MDAs guided by NPA. There is need to consider separation of project development (idea identification, project selection, prefeasibility and feasibility study) from project appraisal for making financial decision. Moreover, strengthening capacity of sector level development committees will further enhance existing Swap arrangements of coordination.
27. In-year budget adjustments cause uncertainty in the execution of investment projects, which require certainty and medium-term planning. There is a weak communication flow between the Sector MDAs and LGs about changes in the MTEF allocations. Information flow from the centre to the beneficiaries on the scope of works, attendant costs and duration is often flawed, late or not available. This makes it difficult for beneficiaries to make any follow up. The uncertainty and lack of accountability in this area can lead to delays in procurement, also affecting the success of PIM. Delays and cost overruns lead to further arrears and affects quality and timeliness of delivery.
28. At the stage of implementation, there is low value for money from procurements. Some progress has been made in enhancing procurement processes, through the regulatory role of PPDA and standard procedures set in the legal and regulatory framework. Nonetheless, competition is still limited among public sector suppliers and weak compliance with procurement procedures means that a number of procurements are still not subject to open competition.
29. Management of live supplier contracts and maintenance of public assets is also weak, leading to wasted resources, financial and non-financial risks and delays and cost overruns32. Over the last 3-4 years, on average, 71percent of contracts were delivered on time and 64percent to the planned budget. The PFM Act 2015 provides for increased transparency of recording and reporting on assets and investments. However, the stock of non-financial assets is not reported comprehensively and there are maintenance issues, including missing title deeds, out of date valuation, deterioration in the condition of assets and poor stores management, according to audit reports. This reduces the effective lifetime of assets and reduces value for money and the economic return from public investment. There is also a lack of risk management approach in project implementation and contract management, particularly in the assessment of fiscal risks, especially
32 PEFA PI 24.1 and 24.2 Procurement methods scored ‘D’
from Public-Private Partnerships and public corporations. While enhanced fiscal risk statements are supporting the assessment of fiscal risks, further work is needed to embed this approach across Government, for example, by ensuring that there are processes in place for the Macroeconomic Management Department to identify, assess and track fiscal risks arising. Fiduciary, technical delivery and other risks also need to be actively managed throughout the project cycle. Recent reforms have begun to pilot the use of the IFMS Fixed Assets Management module to track the use of government assets.
30. There is a lack of information for tracking actual expenditures from externally funded projects. While progress has been made on tracking external financing for a few key projects, through the aid management system, there are delays in reporting and there is need to roll this approach out to capture all externally financed projects and actual expenditures. Some projects carry over balances from one financial year to the next, which are not effectively monitored and captured as commitments in the preparation of budgets. Significant off-budget support that is not synchronised with the GoU budget and reports poses a substantial risk to the credibility of budgets and the effective planning and management of investments, including leading to duplication of effort, double accounting and diversions or adjustments required in implementation. Treasury is currently rolling out IFMS and TSA to key development partners and loan-funded projects on a sector by sector basis. Over time, this may capture a large part of externally financed expenditure in GoU systems. For on-budget projects, there is already partial payment information, but off-budget funding is more problematic to capture in the system.
31. While there is some monitoring and evaluation in place, M&E throughout and at the end of the project cycle is inadequate and learning from experience does not inform future planning and budgeting significantly. There are evaluations undertaken of a number of investment projects and BMAU monitors budget execution in selected sectors annually. However, it is unclear how the findings of those monitoring an evaluation exercises are taken into account in the design of future projects.
2.4 Accountability Systems and compliance in Budget Execution 32. Several accountability systems and procedures together comprise the PFM ‘system’ or functions across
Government. For example, the core system for recording, reporting and managing financial transactions is the Integrated Financial Management System (IFMS). For revenue collections, the URA has a number of IT-based systems (outlined in section 2.1.1.). Budget preparation takes place within the Program-based Budgeting System (PBS). Salaries and pensions are managed through the Integrated Payroll and Pensions System (IPPS), soon to be transitioned to Human Capital Management (HCM). Procurements are undertaken through the online procurement portal and monitored through Procurement Performance Monitoring System (PPMS). E-Government Procurement (e-GP) is being piloted for online management of procurement procedures, and when rolled out will replace the PPMS. Aid and Debt management systems separately capture information on externally financed projects and debt issuance. All of the above are underpinned by Government’s internet provision and ICT infrastructure. Around these systems are legislation, policies, regulations, accounting standards and procedures designed to provide the structure, powers, roles and responsibilities of the institutions and individuals operating the systems to achieve the desired PFM outcomes. Internal audit provides compliance assurance and identifies any violations with these procedures and frameworks.
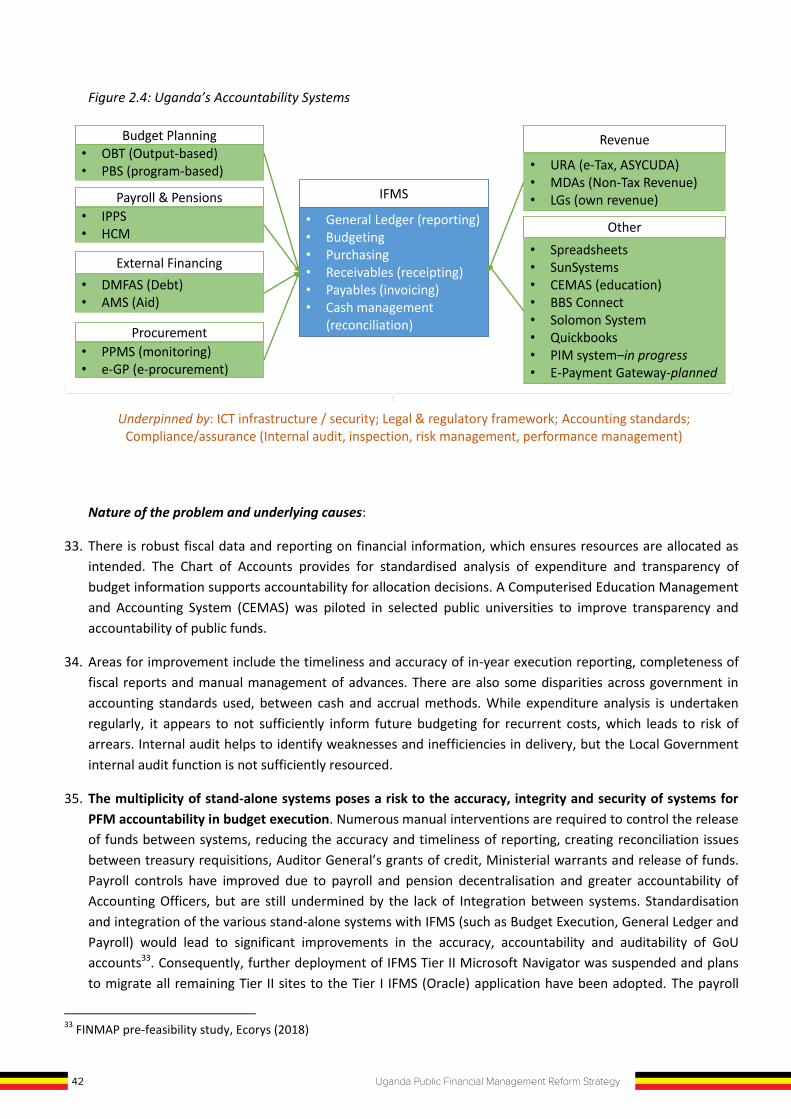
42 Uganda Public Financial Management Reform Strategy
Figure 2.4: Uganda’s Accountability Systems
Nature of the problem and underlying causes:
33. There is robust fiscal data and reporting on financial information, which ensures resources are allocated as intended. The Chart of Accounts provides for standardised analysis of expenditure and transparency of budget information supports accountability for allocation decisions. A Computerised Education Management and Accounting System (CEMAS) was piloted in selected public universities to improve transparency and accountability of public funds.
34. Areas for improvement include the timeliness and accuracy of in-year execution reporting, completeness of fiscal reports and manual management of advances. There are also some disparities across government in accounting standards used, between cash and accrual methods. While expenditure analysis is undertaken regularly, it appears to not sufficiently inform future budgeting for recurrent costs, which leads to risk of arrears. Internal audit helps to identify weaknesses and inefficiencies in delivery, but the Local Government internal audit function is not sufficiently resourced.
35. The multiplicity of stand-alone systems poses a risk to the accuracy, integrity and security of systems for PFM accountability in budget execution. Numerous manual interventions are required to control the release of funds between systems, reducing the accuracy and timeliness of reporting, creating reconciliation issues between treasury requisitions, Auditor General’s grants of credit, Ministerial warrants and release of funds. Payroll controls have improved due to payroll and pension decentralisation and greater accountability of Accounting Officers, but are still undermined by the lack of Integration between systems. Standardisation and integration of the various stand-alone systems with IFMS (such as Budget Execution, General Ledger and Payroll) would lead to significant improvements in the accuracy, accountability and auditability of GoU accounts33. Consequently, further deployment of IFMS Tier II Microsoft Navigator was suspended and plans to migrate all remaining Tier II sites to the Tier I IFMS (Oracle) application have been adopted. The payroll
33 FINMAP pre-feasibility study, Ecorys (2018)
• General Ledger (reporting)• Budgeting• Purchasing• Receivables (receipting)• Payables (invoicing)• Cash management
(reconciliation)
IFMS
• URA (e-Tax, ASYCUDA)• MDAs (Non-Tax Revenue)• LGs (own revenue)
Revenue• OBT (Output-based)• PBS (program-based)
Budget Planning
• PPMS (monitoring)• e-GP (e-procurement)
Procurement
• IPPS• HCM
Payroll & Pensions
• DMFAS (Debt)• AMS (Aid)
External Financing• Spreadsheets• SunSystems• CEMAS (education)• BBS Connect• Solomon System• Quickbooks• PIM system–in progress• E-Payment Gateway-planned
Other
Underpinned by: ICT infrastructure / security; Legal & regulatory framework; Accounting standards; Compliance/assurance (Internal audit, inspection, risk management, performance management)
system ensures that resources are used consistently with approved allocations, but does require further integration with IFMS to strengthen accuracy and integrity of the data and to ensure efficiency (costs per output).
36. There is a weak governance structure for managing and investing in IT systems across Government. The underpinning IT infrastructure, speed, connectivity and security is essential for the effectiveness of PFM accountability systems. Nonetheless, there are a number of issues with PFM IT systems reported34, namely: poor connectivity, power outages and hardware requirements that cause challenges for systems roll-out; security risks and data stored in conditions that are inadequately protected and maintained. The National Information Technology Authority Uganda (NITA-U), with support from the World Bank, is deploying the National Backbone Infrastructure (NBI) to link major centres of population and the international border crossings with a high-speed fibre-optic network. This initiative will need to be developed in close collaboration with PFM institutions to ensure that systems are supported most cost-effectively.
37. The lack of comprehensive reporting of government operations and commitments means it is difficult to assess fiscal risks and to audit effectively. Coverage of IFMS is still not complete, capturing about 80-90percent of government expenditure. While the remaining share is captured through manual systems, the incomplete coverage makes it difficult to get accurate and up to date financial reports from the system for audit and other monitoring purposes. Budget execution reports cover only about 77percent of public expenditure, due to the exclusion of public corporations and extra-budgetary units. Pension liabilities and tax expenditures are also not reported comprehensively. Expenditure coverage of some donor-funded projects is not complete and can be difficult to distinguish between capital and recurrent costs. The basis for accounting does not include provisions for contingent liabilities (as required by IPSAS) and accounting for commitments. The OAG reported that contingent liabilities are expanding at an unsustainable rate. For example, in the audit report ending 201735, the value of contingent liabilities increased by 14percent on the previous year to UGX7.45 trillion, most of which were due to legal proceedings against Government.
38. While expenditure arrears are being serviced, new arrears are still arising and are increasing. The Government audit report 2017 reported an increase in domestic arrears from UGX 1.32 trillion in 2014/15, to UGX 2.91 trillion in 2016/17. Furthermore, an amount of UGX 1.11 trillion was incurred irregularly as domestic arrears outside the approved estimates appropriated by Parliament. Expenditure arrears indicate that budget allocations are insufficient to meet the service levels expected. It is also partly due to weak commitment controls, spending outside IFMS and off-contract spending36.
39. Non-compliance with PFM regulations, such as mischarging of budget expenditure, failure to keep proper books of account and non-payment of taxes are regularly reported by internal and external audit37. While there may be some deliberate mischarging, there is also an incentive to mischarge budget expenditure in order to overcome budget constraints caused by in-year cuts and virements. Without the flexibility of programme-based budgeting, spending units have little discretion over how budgets can be spent to deliver results. The input-based spending rules are contrary to the programme-based budgeting approach that has been rolled out to MDALGs. Furthermore, uncertainty over the credibility of budget allocations caused by frequent in-year virements creates an incentive to plan budgets by holding back essential expenditures for
34 Summarised by Ecorys (2018) 35 Annual report of the Auditor General on the results of audits for the year 2017, OAG (2017) 36 PEFA PI-22. Expenditure arrears scored ‘D+’ 37 Internal and external audit reports of Government regularly document these irregularities. The PEFA indicator PI-25. Internal controls on non-salary expenditure scored ‘C+’
43Uganda Public Financial Management Reform Strategy
Figure 2.4: Uganda’s Accountability Systems
Nature of the problem and underlying causes:
33. There is robust fiscal data and reporting on financial information, which ensures resources are allocated as intended. The Chart of Accounts provides for standardised analysis of expenditure and transparency of budget information supports accountability for allocation decisions. A Computerised Education Management and Accounting System (CEMAS) was piloted in selected public universities to improve transparency and accountability of public funds.
34. Areas for improvement include the timeliness and accuracy of in-year execution reporting, completeness of fiscal reports and manual management of advances. There are also some disparities across government in accounting standards used, between cash and accrual methods. While expenditure analysis is undertaken regularly, it appears to not sufficiently inform future budgeting for recurrent costs, which leads to risk of arrears. Internal audit helps to identify weaknesses and inefficiencies in delivery, but the Local Government internal audit function is not sufficiently resourced.
35. The multiplicity of stand-alone systems poses a risk to the accuracy, integrity and security of systems for PFM accountability in budget execution. Numerous manual interventions are required to control the release of funds between systems, reducing the accuracy and timeliness of reporting, creating reconciliation issues between treasury requisitions, Auditor General’s grants of credit, Ministerial warrants and release of funds. Payroll controls have improved due to payroll and pension decentralisation and greater accountability of Accounting Officers, but are still undermined by the lack of Integration between systems. Standardisation and integration of the various stand-alone systems with IFMS (such as Budget Execution, General Ledger and Payroll) would lead to significant improvements in the accuracy, accountability and auditability of GoU accounts33. Consequently, further deployment of IFMS Tier II Microsoft Navigator was suspended and plans to migrate all remaining Tier II sites to the Tier I IFMS (Oracle) application have been adopted. The payroll
33 FINMAP pre-feasibility study, Ecorys (2018)
• General Ledger (reporting)• Budgeting• Purchasing• Receivables (receipting)• Payables (invoicing)• Cash management
(reconciliation)
IFMS
• URA (e-Tax, ASYCUDA)• MDAs (Non-Tax Revenue)• LGs (own revenue)
Revenue• OBT (Output-based)• PBS (program-based)
Budget Planning
• PPMS (monitoring)• e-GP (e-procurement)
Procurement
• IPPS• HCM
Payroll & Pensions
• DMFAS (Debt)• AMS (Aid)
External Financing• Spreadsheets• SunSystems• CEMAS (education)• BBS Connect• Solomon System• Quickbooks• PIM system–in progress• E-Payment Gateway-planned
Other
Underpinned by: ICT infrastructure / security; Legal & regulatory framework; Accounting standards; Compliance/assurance (Internal audit, inspection, risk management, performance management)
system ensures that resources are used consistently with approved allocations, but does require further integration with IFMS to strengthen accuracy and integrity of the data and to ensure efficiency (costs per output).
36. There is a weak governance structure for managing and investing in IT systems across Government. The underpinning IT infrastructure, speed, connectivity and security is essential for the effectiveness of PFM accountability systems. Nonetheless, there are a number of issues with PFM IT systems reported34, namely: poor connectivity, power outages and hardware requirements that cause challenges for systems roll-out; security risks and data stored in conditions that are inadequately protected and maintained. The National Information Technology Authority Uganda (NITA-U), with support from the World Bank, is deploying the National Backbone Infrastructure (NBI) to link major centres of population and the international border crossings with a high-speed fibre-optic network. This initiative will need to be developed in close collaboration with PFM institutions to ensure that systems are supported most cost-effectively.
37. The lack of comprehensive reporting of government operations and commitments means it is difficult to assess fiscal risks and to audit effectively. Coverage of IFMS is still not complete, capturing about 80-90percent of government expenditure. While the remaining share is captured through manual systems, the incomplete coverage makes it difficult to get accurate and up to date financial reports from the system for audit and other monitoring purposes. Budget execution reports cover only about 77percent of public expenditure, due to the exclusion of public corporations and extra-budgetary units. Pension liabilities and tax expenditures are also not reported comprehensively. Expenditure coverage of some donor-funded projects is not complete and can be difficult to distinguish between capital and recurrent costs. The basis for accounting does not include provisions for contingent liabilities (as required by IPSAS) and accounting for commitments. The OAG reported that contingent liabilities are expanding at an unsustainable rate. For example, in the audit report ending 201735, the value of contingent liabilities increased by 14percent on the previous year to UGX7.45 trillion, most of which were due to legal proceedings against Government.
38. While expenditure arrears are being serviced, new arrears are still arising and are increasing. The Government audit report 2017 reported an increase in domestic arrears from UGX 1.32 trillion in 2014/15, to UGX 2.91 trillion in 2016/17. Furthermore, an amount of UGX 1.11 trillion was incurred irregularly as domestic arrears outside the approved estimates appropriated by Parliament. Expenditure arrears indicate that budget allocations are insufficient to meet the service levels expected. It is also partly due to weak commitment controls, spending outside IFMS and off-contract spending36.
39. Non-compliance with PFM regulations, such as mischarging of budget expenditure, failure to keep proper books of account and non-payment of taxes are regularly reported by internal and external audit37. While there may be some deliberate mischarging, there is also an incentive to mischarge budget expenditure in order to overcome budget constraints caused by in-year cuts and virements. Without the flexibility of programme-based budgeting, spending units have little discretion over how budgets can be spent to deliver results. The input-based spending rules are contrary to the programme-based budgeting approach that has been rolled out to MDALGs. Furthermore, uncertainty over the credibility of budget allocations caused by frequent in-year virements creates an incentive to plan budgets by holding back essential expenditures for
34 Summarised by Ecorys (2018) 35 Annual report of the Auditor General on the results of audits for the year 2017, OAG (2017) 36 PEFA PI-22. Expenditure arrears scored ‘D+’ 37 Internal and external audit reports of Government regularly document these irregularities. The PEFA indicator PI-25. Internal controls on non-salary expenditure scored ‘C+’

44 Uganda Public Financial Management Reform Strategy
mid-year supplementary budget requests, which are less likely to be denied. The introduction of performance-based contracts for Accounting Officers has provided stronger incentives to ensure compliance with PFM systems, but there are still challenges in operationalising this reform due to the failure to conduct independent validation of the status, or the extent to which, the agreed recommendations or actions are implemented. Accounting Officers do not always receive adequate support in understanding and implementing recommendations, which is needed in order to be compliant with expectations. Nonetheless, ineffective performance incentives and sanctions across other levels of operations are insufficient to encourage compliance and address poor performance.
40. In particular, there is low compliance with procurement regulations, including poor records management and lack of competition which leads to low value for money in procurements. Procurement reform efforts have focused around establishing a policy unit, strengthening PPDA’s regulatory and auditing role, widening the coverage of the Government Procurement Portal (GPP) and Procurement Performance Monitoring System (PPMS), and training procurement officers. However, efficiency of service delivery and VfM is still undermined by non-compliance with government procurement procedures. Audit reports and PPDA audits regularly cite non-compliance with procedures, including poor record keeping, inadequate procurement planning and budgeting, use of wrong procurement methods, weak contract supervision and management, lack of market assessment and applicability, and political interference. These factors lead to high process costs associated with tendering and testing the market, uncoordinated purchases across government, out-dated market intelligence and non-rotation of pre-qualified service providers. Corruption in public procurement was also revealed to be significant in the PPDA’s 2016 Procurement Integrity Survey, which reported that 86percent of service providers and 51percent of officials openly admitted that corruption influences procurement decisions.
41. The PFMA has strengthened the functional independence of internal audit (under an Internal Auditor General) and the scope and quality of internal audit has been enhanced through investment in capacity and audit tools. While internal audit coverage and quality provides assurance, sub optimal compliance with procedures indicates some weakness in the follow-up of recommendations as well as insufficient incentives for compliance.
42. The integrated debt and cash policy directorate is not fully operational and cash forecasts are not yet sufficiently frequent or accurate. Recent literature on fiscal management advocates for the integration of liquidity management (cash and debt management). The introduction of the TSA facilitates decision making on investment of any budget surplus and/or borrowing to finance a deficit. The administrative structures for integration of debt and cash policy directorate have been established and now need to be fully operationalised, particularly functions related to debt issuance, debt servicing, recording and reporting (accounting) and to align debt issuance to the cash projections. A cash flow forecast is prepared quarterly on the basis of actual cash inflows and outflows and budgetary units are provided reliable information on commitment ceilings at least quarterly in advance. However, cash forecasting needs to be provided on a daily basis, underpinned by information flows between AGO and the cash flow unit of the Debt Directorate38. The market for domestic debt issuance is relatively unresponsive to needs arising when there is a domestic revenue shortfall and this can still lead to in-year cash rationing and budget adjustments.
38 DeMPA 2017
2.5 Local Government PFM for Service Delivery 43. The Government’s fiscal decentralisation strategy, introduced in the early 2000s, provided a framework and
set of principles for the architecture of service delivery through Central and Local Government structures. When the NRM Government embarked on the journey to decentralization it viewed local governments as a cornerstone of service delivery, taking services closer to the people. The decentralised process in Uganda is based on devolution of powers, functions and responsibilities to popularly elected local governments. The devolution process is intended to improve service delivery by shifting responsibility for policy implementation to the local beneficiaries themselves; to promote good governance, to develop, broaden and deepen political and administrative competence in the management of public affairs, etc.
Figure 2.5: Roles and Responsibilities in Decentralised Government
44. Uganda’s decentralised service delivery framework revolves around the relationship between policy makers, service providers, and consumers of public services. PFM systems and policy play an important role in providing the underpinning structures for allocation and management of local resources, from central government policy and planning down to local delivery units. At the level of Central Government (CG), good practice suggests that there should be adequate resources provided to LGs, discretion to spend according to local needs, timely release of funds and a coordinated budget and planning process. Ideally, LGs, would undertake a participatory planning process, ensure they are compliant with laws and regulations, provide transparency and accountability in their operations, have adequate skills and knowledge to execute their plans and provide services that meet users’ needs. That is, services are: accessible, dependable, relevant, responsive, sustainable, and cost-effective.
Nature of the problem and underlying causes:
45. Inadequate resources are having a negative impact on the quality of public services provided by local governments. As discussed in Section 2.2, the real value of local government fiscal transfers has been declining over 15 years, by 13percent from its peak of UShs 80,303 per capita in 2002/03 to UShs 69,858 in the 2017/18 budget, for non-wage and development grants (ODI, 2017). Uganda has also experienced a rapid
CG:PolicyLegal
FinancingNational standards
TrainingMonitoring/supervision
LG:Setting local prioritiesBudgeting & planning
Budget executionPerformance reporting
Service delivery: education; health; water and sanitation; rural feeder roads; agricultural
services, municipal services –solid waste, street lighting etc.
Citizens / Private Sector / Users of Public ServicesPayment of taxes & charges
Effective Use of ServicesCompliance with laws & regulations
Participation in planning & monitoringVoting
45Uganda Public Financial Management Reform Strategy
mid-year supplementary budget requests, which are less likely to be denied. The introduction of performance-based contracts for Accounting Officers has provided stronger incentives to ensure compliance with PFM systems, but there are still challenges in operationalising this reform due to the failure to conduct independent validation of the status, or the extent to which, the agreed recommendations or actions are implemented. Accounting Officers do not always receive adequate support in understanding and implementing recommendations, which is needed in order to be compliant with expectations. Nonetheless, ineffective performance incentives and sanctions across other levels of operations are insufficient to encourage compliance and address poor performance.
40. In particular, there is low compliance with procurement regulations, including poor records management and lack of competition which leads to low value for money in procurements. Procurement reform efforts have focused around establishing a policy unit, strengthening PPDA’s regulatory and auditing role, widening the coverage of the Government Procurement Portal (GPP) and Procurement Performance Monitoring System (PPMS), and training procurement officers. However, efficiency of service delivery and VfM is still undermined by non-compliance with government procurement procedures. Audit reports and PPDA audits regularly cite non-compliance with procedures, including poor record keeping, inadequate procurement planning and budgeting, use of wrong procurement methods, weak contract supervision and management, lack of market assessment and applicability, and political interference. These factors lead to high process costs associated with tendering and testing the market, uncoordinated purchases across government, out-dated market intelligence and non-rotation of pre-qualified service providers. Corruption in public procurement was also revealed to be significant in the PPDA’s 2016 Procurement Integrity Survey, which reported that 86percent of service providers and 51percent of officials openly admitted that corruption influences procurement decisions.
41. The PFMA has strengthened the functional independence of internal audit (under an Internal Auditor General) and the scope and quality of internal audit has been enhanced through investment in capacity and audit tools. While internal audit coverage and quality provides assurance, sub optimal compliance with procedures indicates some weakness in the follow-up of recommendations as well as insufficient incentives for compliance.
42. The integrated debt and cash policy directorate is not fully operational and cash forecasts are not yet sufficiently frequent or accurate. Recent literature on fiscal management advocates for the integration of liquidity management (cash and debt management). The introduction of the TSA facilitates decision making on investment of any budget surplus and/or borrowing to finance a deficit. The administrative structures for integration of debt and cash policy directorate have been established and now need to be fully operationalised, particularly functions related to debt issuance, debt servicing, recording and reporting (accounting) and to align debt issuance to the cash projections. A cash flow forecast is prepared quarterly on the basis of actual cash inflows and outflows and budgetary units are provided reliable information on commitment ceilings at least quarterly in advance. However, cash forecasting needs to be provided on a daily basis, underpinned by information flows between AGO and the cash flow unit of the Debt Directorate38. The market for domestic debt issuance is relatively unresponsive to needs arising when there is a domestic revenue shortfall and this can still lead to in-year cash rationing and budget adjustments.
38 DeMPA 2017
2.5 Local Government PFM for Service Delivery 43. The Government’s fiscal decentralisation strategy, introduced in the early 2000s, provided a framework and
set of principles for the architecture of service delivery through Central and Local Government structures. When the NRM Government embarked on the journey to decentralization it viewed local governments as a cornerstone of service delivery, taking services closer to the people. The decentralised process in Uganda is based on devolution of powers, functions and responsibilities to popularly elected local governments. The devolution process is intended to improve service delivery by shifting responsibility for policy implementation to the local beneficiaries themselves; to promote good governance, to develop, broaden and deepen political and administrative competence in the management of public affairs, etc.
Figure 2.5: Roles and Responsibilities in Decentralised Government
44. Uganda’s decentralised service delivery framework revolves around the relationship between policy makers, service providers, and consumers of public services. PFM systems and policy play an important role in providing the underpinning structures for allocation and management of local resources, from central government policy and planning down to local delivery units. At the level of Central Government (CG), good practice suggests that there should be adequate resources provided to LGs, discretion to spend according to local needs, timely release of funds and a coordinated budget and planning process. Ideally, LGs, would undertake a participatory planning process, ensure they are compliant with laws and regulations, provide transparency and accountability in their operations, have adequate skills and knowledge to execute their plans and provide services that meet users’ needs. That is, services are: accessible, dependable, relevant, responsive, sustainable, and cost-effective.
Nature of the problem and underlying causes:
45. Inadequate resources are having a negative impact on the quality of public services provided by local governments. As discussed in Section 2.2, the real value of local government fiscal transfers has been declining over 15 years, by 13percent from its peak of UShs 80,303 per capita in 2002/03 to UShs 69,858 in the 2017/18 budget, for non-wage and development grants (ODI, 2017). Uganda has also experienced a rapid
CG:PolicyLegal
FinancingNational standards
TrainingMonitoring/supervision
LG:Setting local prioritiesBudgeting & planning
Budget executionPerformance reporting
Service delivery: education; health; water and sanitation; rural feeder roads; agricultural
services, municipal services –solid waste, street lighting etc.
Citizens / Private Sector / Users of Public ServicesPayment of taxes & charges
Effective Use of ServicesCompliance with laws & regulations
Participation in planning & monitoringVoting
46 Uganda Public Financial Management Reform Strategy
increase in the number of districts, from 56 in 2000 to an expected 133 districts by FY 2019/2039. Estimates of the actual resource needs at local level are over 20 percent higher40. At the level of service delivery, while there has been some improvement in the sector outcomes, recent assessments have identified low staffing levels, a continued lack of basic infrastructure and poor maintenance of existing assets41. This lack of infrastructure contributes to the remaining challenges in addressing low doctor to patient ratio, teacher to pupil ratio, and other key outcomes, for example by inadequate housing, which fails to attract teachers and medical staff to work in the regions. PFM functions and capacities are also therefore typically weaker at Local Government level, including procurement systems, non-compliance with PFM regulations, procedures and systems, inefficient processing of the payroll and insufficient internal audit assurance and oversight.
46. There is still dependence on centralised delivery and financing, even in functions legally devolved to LGs. As defined in the Constitution and Local Government Act, service delivery mandates of LGs are clear, but not specific. In practice, some functions devolved to LGs in the law are implemented by Central Government line ministries through centrally financed subventions representing about 68 percent of LG budgets (ODI, 2017). For example, the procurement of drugs, textbooks, agricultural inputs, and other equipment, and some centrally managed projects. In some cases, there are efficiency arguments for subventions, such as economies of scale in procurement of standardised items across all LGs. Nonetheless, in some cases it reflects the lack of holistic implementation of sector devolution that was envisaged in the LG Strategy in 2002. With the exception of education, subventions are more common than LG fiscal transfers.
47. Local government own-source revenue is under-performing and does not provide adequate discretionary resources to pay for locally provided services. LG own source revenues contribute only 5percent of the total LG budget on average42. The legal assignment of revenue sources to local governments is limited to a narrow base and, in practice, is difficult to implement. In particular, property tax is only applicable to commercial property and is based on incomplete or out of date valuations, which are expensive to update. Administration capacity and enforcement powers are also very limited and non-compliance is a significant challenge for most local governments. Recent reforms have supported the deployment of local revenue databases in 93 Districts to develop a comprehensive taxpayer register for each local revenue source. Nonetheless, there is a lack of effective support for staffing, revenue policy alignment with national tax policy, and collaboration with URA and local level systems to facilitate collection.
48. Weaknesses in planning, budgeting and procurement at local level, and poor coordination in budget planning between local and central government ministries, means that limited resources are not well targeted towards needs. There is currently insufficient capacity in budgeting and planning, as well as a lack of coordination and guidance to inform procurement processes, such as pricing standards, and ensuring that local-level plans are taken into account in time in the preparation of plans and budgets by line ministries undertaking procurements on behalf of local governments. The PPDA 2016 Procurement Integrity Survey highlighted widespread corruption and political interference in procurement at LG level with serious impacts in contract management, supervision and quality.
39 Fiscal Decentralisation Architecture (FDA) and Determining the Share of LG Transfers out of the National Budget, ODI (2017) 40 According to ODI (2017), based on 2016/17 per capita budget of UGX 69,858 actual budget, compared to the recommended LG grant of UGX 85,476. 41 OAG (2017) 42 ODI (2017)
49. There remains a lack of capacity for internal audit at local government level, and weak assurance and risk management approaches across the whole of Government. Internal audit quality and scope has improved, but the legal framework and administration structures for internal audit at local government level lacks coherence and clarity, particularly on the role of LGPACs in relation to internal audit committees provided in the PFMA, and insufficient empowerment of LG internal audit functions relative to the newly strengthened central government internal audit status. The increasing complexity of PFM systems, IT security, the drive to enhance PIM and risk management approaches, and managing new sectors, such as oil and gas, mean that the role of internal audit is critical in providing assurance and enhancing compliance.
50. Limited coverage of IT-based systems, capacity and infrastructure at the Local Government level means there is a risk to internal controls. This includes commitment controls and a lack of seamless integration of IFMS, PBS and IPPS, leading to inefficiencies, such as requiring staff to travel to regional centres or Ministry head offices e.g. MoPS for payroll processing.
51. Oversight of Local Government operations is weak and there is a lack of clarity in the assignment of roles and responsibilities between audit committees. For example, the role of the new regional Public Accounts Committees relative to Local Government PACs (LGPACs) is unclear, and there is a poor quality auditing and a lack of follow up of recommendations. This links to (and compounds) the lack of evaluation, evidence-based policy making and expenditure tracking, as discussed in Sections 1.3.2 and 2.2.
2.6 External Oversight and Governance of PFM Reforms 52. External oversight and governance of reforms refers to (a) upward accountability of Government entities to
Parliament and donors; (b) downward accountability to citizens and end-users for the quality of services, administration and overall governance of public spending; and (c) horizontal accountability for managerial and coordination across Government and its partners. A key factor in upward accountability relates to the external oversight functions of audit and Parliamentary scrutiny in identifying non-compliance with regulations. A focus for downward accountability is information provided to the public and engagement through private sector representatives or civil society organisations (CSOs) in order to encourage active public participation in the Government’s planning and budgeting processes as well as in holding Government to account for service provision. Significant strides have been made in strengthening the independence, quality and coverage of external audit, which has been recognised by independent assessments43. Similarly, CSOs play a more active role in PFM reforms, such as attending and actively participating at the PEMCOM in addition to other PFM fora. Nonetheless challenges remain in the upward, downward and horizontal accountability for PFM, as outlined below.
43 For example, PEFA PI 30.1 Audit coverage and standard and 30.4 Supreme Audit institution independence are both rated ‘A’
47Uganda Public Financial Management Reform Strategy
increase in the number of districts, from 56 in 2000 to an expected 133 districts by FY 2019/2039. Estimates of the actual resource needs at local level are over 20 percent higher40. At the level of service delivery, while there has been some improvement in the sector outcomes, recent assessments have identified low staffing levels, a continued lack of basic infrastructure and poor maintenance of existing assets41. This lack of infrastructure contributes to the remaining challenges in addressing low doctor to patient ratio, teacher to pupil ratio, and other key outcomes, for example by inadequate housing, which fails to attract teachers and medical staff to work in the regions. PFM functions and capacities are also therefore typically weaker at Local Government level, including procurement systems, non-compliance with PFM regulations, procedures and systems, inefficient processing of the payroll and insufficient internal audit assurance and oversight.
46. There is still dependence on centralised delivery and financing, even in functions legally devolved to LGs. As defined in the Constitution and Local Government Act, service delivery mandates of LGs are clear, but not specific. In practice, some functions devolved to LGs in the law are implemented by Central Government line ministries through centrally financed subventions representing about 68 percent of LG budgets (ODI, 2017). For example, the procurement of drugs, textbooks, agricultural inputs, and other equipment, and some centrally managed projects. In some cases, there are efficiency arguments for subventions, such as economies of scale in procurement of standardised items across all LGs. Nonetheless, in some cases it reflects the lack of holistic implementation of sector devolution that was envisaged in the LG Strategy in 2002. With the exception of education, subventions are more common than LG fiscal transfers.
47. Local government own-source revenue is under-performing and does not provide adequate discretionary resources to pay for locally provided services. LG own source revenues contribute only 5percent of the total LG budget on average42. The legal assignment of revenue sources to local governments is limited to a narrow base and, in practice, is difficult to implement. In particular, property tax is only applicable to commercial property and is based on incomplete or out of date valuations, which are expensive to update. Administration capacity and enforcement powers are also very limited and non-compliance is a significant challenge for most local governments. Recent reforms have supported the deployment of local revenue databases in 93 Districts to develop a comprehensive taxpayer register for each local revenue source. Nonetheless, there is a lack of effective support for staffing, revenue policy alignment with national tax policy, and collaboration with URA and local level systems to facilitate collection.
48. Weaknesses in planning, budgeting and procurement at local level, and poor coordination in budget planning between local and central government ministries, means that limited resources are not well targeted towards needs. There is currently insufficient capacity in budgeting and planning, as well as a lack of coordination and guidance to inform procurement processes, such as pricing standards, and ensuring that local-level plans are taken into account in time in the preparation of plans and budgets by line ministries undertaking procurements on behalf of local governments. The PPDA 2016 Procurement Integrity Survey highlighted widespread corruption and political interference in procurement at LG level with serious impacts in contract management, supervision and quality.
39 Fiscal Decentralisation Architecture (FDA) and Determining the Share of LG Transfers out of the National Budget, ODI (2017) 40 According to ODI (2017), based on 2016/17 per capita budget of UGX 69,858 actual budget, compared to the recommended LG grant of UGX 85,476. 41 OAG (2017) 42 ODI (2017)
49. There remains a lack of capacity for internal audit at local government level, and weak assurance and risk management approaches across the whole of Government. Internal audit quality and scope has improved, but the legal framework and administration structures for internal audit at local government level lacks coherence and clarity, particularly on the role of LGPACs in relation to internal audit committees provided in the PFMA, and insufficient empowerment of LG internal audit functions relative to the newly strengthened central government internal audit status. The increasing complexity of PFM systems, IT security, the drive to enhance PIM and risk management approaches, and managing new sectors, such as oil and gas, mean that the role of internal audit is critical in providing assurance and enhancing compliance.
50. Limited coverage of IT-based systems, capacity and infrastructure at the Local Government level means there is a risk to internal controls. This includes commitment controls and a lack of seamless integration of IFMS, PBS and IPPS, leading to inefficiencies, such as requiring staff to travel to regional centres or Ministry head offices e.g. MoPS for payroll processing.
51. Oversight of Local Government operations is weak and there is a lack of clarity in the assignment of roles and responsibilities between audit committees. For example, the role of the new regional Public Accounts Committees relative to Local Government PACs (LGPACs) is unclear, and there is a poor quality auditing and a lack of follow up of recommendations. This links to (and compounds) the lack of evaluation, evidence-based policy making and expenditure tracking, as discussed in Sections 1.3.2 and 2.2.
2.6 External Oversight and Governance of PFM Reforms 52. External oversight and governance of reforms refers to (a) upward accountability of Government entities to
Parliament and donors; (b) downward accountability to citizens and end-users for the quality of services, administration and overall governance of public spending; and (c) horizontal accountability for managerial and coordination across Government and its partners. A key factor in upward accountability relates to the external oversight functions of audit and Parliamentary scrutiny in identifying non-compliance with regulations. A focus for downward accountability is information provided to the public and engagement through private sector representatives or civil society organisations (CSOs) in order to encourage active public participation in the Government’s planning and budgeting processes as well as in holding Government to account for service provision. Significant strides have been made in strengthening the independence, quality and coverage of external audit, which has been recognised by independent assessments43. Similarly, CSOs play a more active role in PFM reforms, such as attending and actively participating at the PEMCOM in addition to other PFM fora. Nonetheless challenges remain in the upward, downward and horizontal accountability for PFM, as outlined below.
43 For example, PEFA PI 30.1 Audit coverage and standard and 30.4 Supreme Audit institution independence are both rated ‘A’
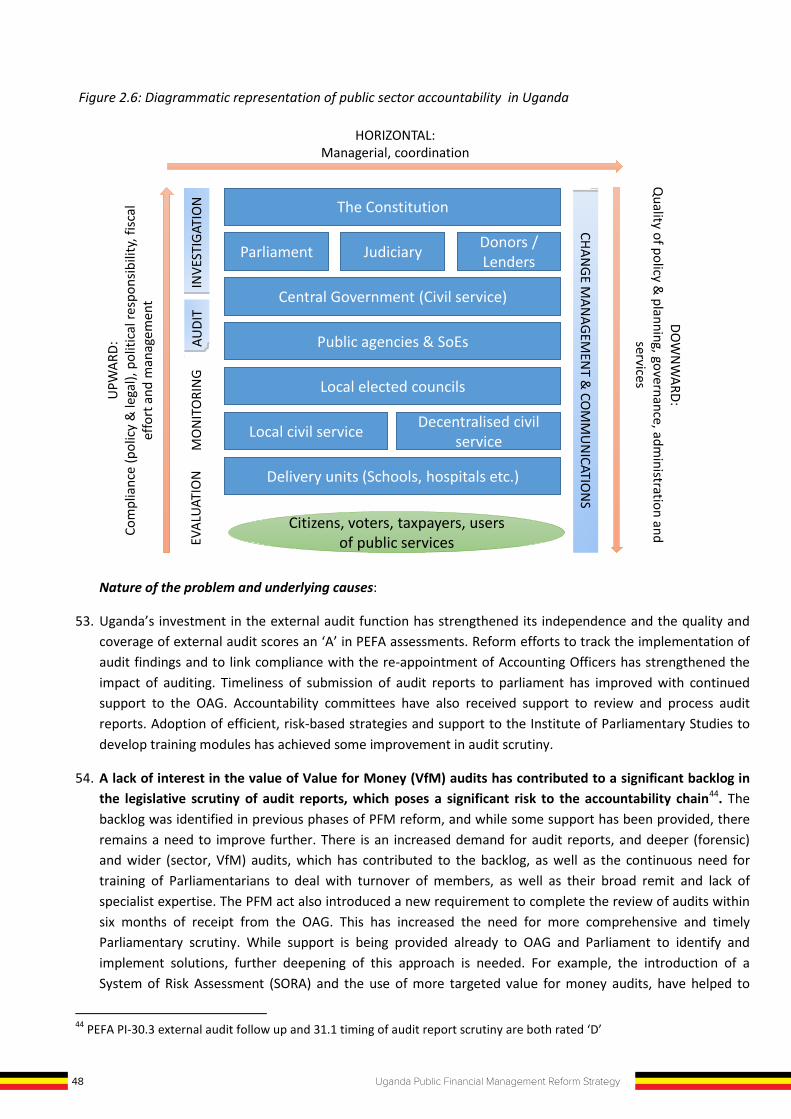
48 Uganda Public Financial Management Reform Strategy
Figure 2.6: Diagrammatic representation of public sector accountability in Uganda
Nature of the problem and underlying causes:
53. Uganda’s investment in the external audit function has strengthened its independence and the quality and coverage of external audit scores an ‘A’ in PEFA assessments. Reform efforts to track the implementation of audit findings and to link compliance with the re-appointment of Accounting Officers has strengthened the impact of auditing. Timeliness of submission of audit reports to parliament has improved with continued support to the OAG. Accountability committees have also received support to review and process audit reports. Adoption of efficient, risk-based strategies and support to the Institute of Parliamentary Studies to develop training modules has achieved some improvement in audit scrutiny.
54. A lack of interest in the value of Value for Money (VfM) audits has contributed to a significant backlog in the legislative scrutiny of audit reports, which poses a significant risk to the accountability chain44. The backlog was identified in previous phases of PFM reform, and while some support has been provided, there remains a need to improve further. There is an increased demand for audit reports, and deeper (forensic) and wider (sector, VfM) audits, which has contributed to the backlog, as well as the continuous need for training of Parliamentarians to deal with turnover of members, as well as their broad remit and lack of specialist expertise. The PFM act also introduced a new requirement to complete the review of audits within six months of receipt from the OAG. This has increased the need for more comprehensive and timely Parliamentary scrutiny. While support is being provided already to OAG and Parliament to identify and implement solutions, further deepening of this approach is needed. For example, the introduction of a System of Risk Assessment (SORA) and the use of more targeted value for money audits, have helped to
44 PEFA PI-30.3 external audit follow up and 31.1 timing of audit report scrutiny are both rated ‘D’
The Constitution
ParliamentDonors / Lenders
Judiciary
Central Government (Civil service)
Public agencies & SoEs
Local elected councils
Local civil serviceDecentralised civil
service
Delivery units (Schools, hospitals etc.)
Citizens, voters, taxpayers, users of public services
DO
WN
WA
RD:
Quality of policy &
planning, governance, administration and
services
UPW
ARD
: Co
mpl
ianc
e (p
olic
y &
lega
l), p
oliti
cal r
espo
nsib
ility
, fis
cal
effo
rt a
nd m
anag
emen
t
CHA
NG
E MA
NAG
EMEN
T & CO
MM
UN
ICATION
SEV
ALU
ATIO
NM
ON
ITO
RIN
GAU
DIT
INVE
STIG
ATIO
N
HORIZONTAL: Managerial, coordination
48 Uganda Public Financial Management Reform Strategy
Figure 2.6: Diagrammatic representation of public sector accountability in Uganda
Nature of the problem and underlying causes:
53. Uganda’s investment in the external audit function has strengthened its independence and the quality and coverage of external audit scores an ‘A’ in PEFA assessments. Reform efforts to track the implementation of audit findings and to link compliance with the re-appointment of Accounting Officers has strengthened the impact of auditing. Timeliness of submission of audit reports to parliament has improved with continued support to the OAG. Accountability committees have also received support to review and process audit reports. Adoption of efficient, risk-based strategies and support to the Institute of Parliamentary Studies to develop training modules has achieved some improvement in audit scrutiny.
54. A lack of interest in the value of Value for Money (VfM) audits has contributed to a significant backlog in the legislative scrutiny of audit reports, which poses a significant risk to the accountability chain44. The backlog was identified in previous phases of PFM reform, and while some support has been provided, there remains a need to improve further. There is an increased demand for audit reports, and deeper (forensic) and wider (sector, VfM) audits, which has contributed to the backlog, as well as the continuous need for training of Parliamentarians to deal with turnover of members, as well as their broad remit and lack of specialist expertise. The PFM act also introduced a new requirement to complete the review of audits within six months of receipt from the OAG. This has increased the need for more comprehensive and timely Parliamentary scrutiny. While support is being provided already to OAG and Parliament to identify and implement solutions, further deepening of this approach is needed. For example, the introduction of a System of Risk Assessment (SORA) and the use of more targeted value for money audits, have helped to
44 PEFA PI-30.3 external audit follow up and 31.1 timing of audit report scrutiny are both rated ‘D’
The Constitution
ParliamentDonors / Lenders
Judiciary
Central Government (Civil service)
Public agencies & SoEs
Local elected councils
Local civil serviceDecentralised civil
service
Delivery units (Schools, hospitals etc.)
Citizens, voters, taxpayers, users of public services
DO
WN
WA
RD:
Quality of policy &
planning, governance, administration and
services
UPW
ARD
: Co
mpl
ianc
e (p
olic
y &
lega
l), p
oliti
cal r
espo
nsib
ility
, fis
cal
effo
rt a
nd m
anag
emen
t
CHA
NG
E MA
NAG
EMEN
T & CO
MM
UN
ICATION
S
EVA
LUAT
ION
MO
NIT
ORI
NG
AUD
ITIN
VEST
IGAT
ION
HORIZONTAL: Managerial, coordination
49Uganda Public Financial Management Reform Strategy
Figure 2.6: Diagrammatic representation of public sector accountability in Uganda
Nature of the problem and underlying causes:
53. Uganda’s investment in the external audit function has strengthened its independence and the quality and coverage of external audit scores an ‘A’ in PEFA assessments. Reform efforts to track the implementation of audit findings and to link compliance with the re-appointment of Accounting Officers has strengthened the impact of auditing. Timeliness of submission of audit reports to parliament has improved with continued support to the OAG. Accountability committees have also received support to review and process audit reports. Adoption of efficient, risk-based strategies and support to the Institute of Parliamentary Studies to develop training modules has achieved some improvement in audit scrutiny.
54. A lack of interest in the value of Value for Money (VfM) audits has contributed to a significant backlog in the legislative scrutiny of audit reports, which poses a significant risk to the accountability chain44. The backlog was identified in previous phases of PFM reform, and while some support has been provided, there remains a need to improve further. There is an increased demand for audit reports, and deeper (forensic) and wider (sector, VfM) audits, which has contributed to the backlog, as well as the continuous need for training of Parliamentarians to deal with turnover of members, as well as their broad remit and lack of specialist expertise. The PFM act also introduced a new requirement to complete the review of audits within six months of receipt from the OAG. This has increased the need for more comprehensive and timely Parliamentary scrutiny. While support is being provided already to OAG and Parliament to identify and implement solutions, further deepening of this approach is needed. For example, the introduction of a System of Risk Assessment (SORA) and the use of more targeted value for money audits, have helped to
44 PEFA PI-30.3 external audit follow up and 31.1 timing of audit report scrutiny are both rated ‘D’
The Constitution
ParliamentDonors / Lenders
Judiciary
Central Government (Civil service)
Public agencies & SoEs
Local elected councils
Local civil serviceDecentralised civil
service
Delivery units (Schools, hospitals etc.)
Citizens, voters, taxpayers, users of public services
DO
WN
WA
RD:
Quality of policy &
planning, governance, administration and
services
UPW
ARD
: Co
mpl
ianc
e (p
olic
y &
lega
l), p
oliti
cal r
espo
nsib
ility
, fis
cal
effo
rt a
nd m
anag
emen
t
CHA
NG
E MA
NAG
EMEN
T & CO
MM
UN
ICATION
S
EVA
LUAT
ION
MO
NIT
ORI
NG
AUD
ITIN
VEST
IGAT
ION
HORIZONTAL: Managerial, coordination
streamline the programme of work for Parliamentary committees. In addition, there remains a lack of sufficient coordination of oversight institutions undertaking audit, inspection and investigations in terms of both coverage and scope. The OAG is unable to undertake audits for all lower local Government, schools and health centres as required by law due to resource constraints. A system of rolling multi-year audits may be more practical and efficient. In some cases, entities are subjected to multiple audits, investigations and monitoring visits, leading to inefficiency in resource utilisation and in the implementation of various recommendations.
55. PFM reforms have not been supported by a systematic approach to change management, which has weakened the level of compliance and engagement in reforms. This is due to a number of factors, including inconsistencies in the legal framework, overlapping mandates of PFM institutions and weaknesses in coordination and communications across of PFM institutions, which sometimes fail to fully engage staff and institutions in the intention of reforms. Engagement of staff in PFM reforms could be improved with more effective communications to promote change management requirements of reforms, and challenge integrity constraints. Coordination arrangements for the implementation of PFM reforms could also be improved, including greater clarity in the roles of Accountability Sector relative to PEMCOM and its sub-committees. Implementation of the reform strategy has generally been led the various Departments and agencies designing and implementing reforms in isolation rather than through a collaborative approach. Increased engagement and monitoring of reforms under the Accountability Sector could help to leverage leadership and change management support. Mechanisms for learning and feedback into the design and adaptation of the reform programme would also help to make systems more responsive to needs and challenges arising.
56. PFM capacity needs are extensive and are not fully met because efforts to deliver training are not well-coordinated or strategic. There are extensive training and capacity needs remaining across PFM functions at both central and local levels of government, which are unlikely to be met solely through the PFM reform agenda. A more strategic approach is therefore needed to leverage and coordinate resources across Government more effectively. The piece-meal approach to PFM training to date has not been effective in delivering the level or quality of training and capacity building to meet needs of PFM cadres and to accompany specific reforms. In the absence of a comprehensive capacity development plan to provide the justification for training, the level of scrutiny required to manage individual trainings is sometimes too onerous and trainings outcomes are not delivered45. Making better use of coordination and collaboration through existing institutions and civil service structures should be considered to develop a more strategic overarching framework, based on an updated comprehensive needs assessment. This could include core training on PFM systems, and performance and integrity standards, as part of induction and regular in-service training for civil servants and cadres.
57. Results of PFM reforms are not adequately coordinated and tracked, making it difficult to assess progress and learn for the design of future reforms. This is a generalised problem across Government and one factor contributing to this is the overlap between various M&E systems, including NPA, OPM, Accountability Sector and PFM institutions. This creates parallel monitoring and duplication of effort. For PFM reform, there is an additional gap in the area of evaluation of capacity building activities, since required competencies are not clearly defined at the start of a reform programme and progress towards reaching required competencies is not measured, making it difficult to ascertain the rate of success in knowledge transfer and remaining capacity gaps. Prioritising and sequencing of reform actions taking into account capacity of institutions and
45 FINMAP Pre-feasibility study (2018)
50 Uganda Public Financial Management Reform Strategy
resources available remains a challenges, evidenced by the large number of activities that have been delayed46.
58. PFM reform is constrained by inefficient Public Administration Structures and a lack of effective enforcement of policy, legal and regulatory frameworks. Vision 2040 highlighted a number of weaknesses in the public administration, including weak institutional structures and systems and an oversized public administration. In the context of PFM reforms, lack of appropriate civil service structures has prevented some reforms being fully mainstreamed, leading to a large number of long-term experts being maintained under the reform programme. This suggests that knowledge transfer to staff is inadequate and/or that there are constraints in embedding new roles in the public service structures.
59. Weak demand for downward accountability affects the level of oversight and scrutiny that civil society has on Government’s use of public resources. Vision 2040 identified weak civil society and civil society participation as a further constraint on Uganda’s development and efficiency of service delivery. There has been progress in constructive engagement with civil society organisations at central level to influence the budget and PFM reform priorities. The nature and capacity for engagement varies widely across sectors impacting on demand pressures from Government. Engagement with civil society remains constrained due to limited revenue flows undermining the social contract and weak capacity of CSO organisations at this level.
46 FINMAP Pre-feasibility study (2018)
3 PFM REFORM STRATEGY FY2018/19 to FY2022/23
3.1 PFM Reform Principles 1 Based on PFM reform experiences to date and the need to ensure that PFM systems operate effectively to
support Government to deliver its national economic and development objectives, the PFM strategy follows a number of principles that should underpin the PFM reforms, namely:
I. To ensure genuine progress is made in a manageable way, the reform effort will be focused on priorities for improvement that are based on consolidating past reforms; addressing the most urgent problems identified by evidence; and, providing a solid platform for delivering national economic objectives;
II. Since the successor programme to FINMAP will be just one delivery modality for PFM reform among others, the strategy will provide an overarching implementation plan and framework for monitoring performance against objectives and outcomes across any number of PFM reform projects or programmes;
III. Commitment to continuous improvement of PFM reforms is required, through learning, monitoring and evaluation at all levels, which should be based on a logical theory of change, and results framework, with appropriate activities and outputs designed to contribute to achievement of agreed outcomes;
IV. Targets and indicators for measuring performance against PFM reform outcomes should be Specific, Measurable, Achievable, Relevant and Time-limited (SMART) within the timeframe for the strategy;
V. Commitment to reform is required for successful delivery at the political, management and technical levels, including active involvement and participation by stakeholders to ensure compliance and conformity with legislation and procedures, as well as ownership of the strategy and consensus on the problems and reform goals;
VI. PFM reform investments should be sustainable, ensure continuity and complementarity between reforms, and make use of synergies with other, relevant reform opportunities across Government; and,
VII. Effective communication and institutional coordination will be required between and within central and local government and with relevant stakeholders in the private sector and civil society.
3.2 Overall Vision, Goal and Purpose 2 With these principles in mind, this updated strategy provides the overall guiding framework for PFM reforms
over the five years from FY2018/19 to FY2022/23. This strategy is informed by lessons from previous PFM reforms, situational analysis and diagnostics, as outlined in Sections 1 and 2. In particular, the six priority areas for reform identified in Section 1.9 will form the basis for the technical reform areas of focus going forward. The strategic direction for PFM reform will be set by an overall vision, goal and purpose.
51Uganda Public Financial Management Reform Strategy
resources available remains a challenges, evidenced by the large number of activities that have been delayed46.
58. PFM reform is constrained by inefficient Public Administration Structures and a lack of effective enforcement of policy, legal and regulatory frameworks. Vision 2040 highlighted a number of weaknesses in the public administration, including weak institutional structures and systems and an oversized public administration. In the context of PFM reforms, lack of appropriate civil service structures has prevented some reforms being fully mainstreamed, leading to a large number of long-term experts being maintained under the reform programme. This suggests that knowledge transfer to staff is inadequate and/or that there are constraints in embedding new roles in the public service structures.
59. Weak demand for downward accountability affects the level of oversight and scrutiny that civil society has on Government’s use of public resources. Vision 2040 identified weak civil society and civil society participation as a further constraint on Uganda’s development and efficiency of service delivery. There has been progress in constructive engagement with civil society organisations at central level to influence the budget and PFM reform priorities. The nature and capacity for engagement varies widely across sectors impacting on demand pressures from Government. Engagement with civil society remains constrained due to limited revenue flows undermining the social contract and weak capacity of CSO organisations at this level.
46 FINMAP Pre-feasibility study (2018)
3 PFM REFORM STRATEGY FY2018/19 to FY2022/23
3.1 PFM Reform Principles 1 Based on PFM reform experiences to date and the need to ensure that PFM systems operate effectively to
support Government to deliver its national economic and development objectives, the PFM strategy follows a number of principles that should underpin the PFM reforms, namely:
I. To ensure genuine progress is made in a manageable way, the reform effort will be focused on priorities for improvement that are based on consolidating past reforms; addressing the most urgent problems identified by evidence; and, providing a solid platform for delivering national economic objectives;
II. Since the successor programme to FINMAP will be just one delivery modality for PFM reform among others, the strategy will provide an overarching implementation plan and framework for monitoring performance against objectives and outcomes across any number of PFM reform projects or programmes;
III. Commitment to continuous improvement of PFM reforms is required, through learning, monitoring and evaluation at all levels, which should be based on a logical theory of change, and results framework, with appropriate activities and outputs designed to contribute to achievement of agreed outcomes;
IV. Targets and indicators for measuring performance against PFM reform outcomes should be Specific, Measurable, Achievable, Relevant and Time-limited (SMART) within the timeframe for the strategy;
V. Commitment to reform is required for successful delivery at the political, management and technical levels, including active involvement and participation by stakeholders to ensure compliance and conformity with legislation and procedures, as well as ownership of the strategy and consensus on the problems and reform goals;
VI. PFM reform investments should be sustainable, ensure continuity and complementarity between reforms, and make use of synergies with other, relevant reform opportunities across Government; and,
VII. Effective communication and institutional coordination will be required between and within central and local government and with relevant stakeholders in the private sector and civil society.
3.2 Overall Vision, Goal and Purpose 2 With these principles in mind, this updated strategy provides the overall guiding framework for PFM reforms
over the five years from FY2018/19 to FY2022/23. This strategy is informed by lessons from previous PFM reforms, situational analysis and diagnostics, as outlined in Sections 1 and 2. In particular, the six priority areas for reform identified in Section 1.9 will form the basis for the technical reform areas of focus going forward. The strategic direction for PFM reform will be set by an overall vision, goal and purpose.

52 Uganda Public Financial Management Reform Strategy
Vision for PFM Reform:
To have excellent and sustainable public financial management that enables socio-economic
transformation
3 The overarching vision for PFM reform reflects the high level objectives set out in the National Development Plan II, which provides the framework for driving Uganda towards middle income status. Section 3.3 explains how PFM systems will support the infrastructure investment and service delivery needed to achieve the goals of NDP II.
Goal of the PFM reform strategy:
To enhance resource mobilisation, improve planning and public investment management, and strengthen accountability for quality, effective and efficient service delivery.
4 As an underpinning structure for service delivery and investment, the purpose of the PFM reform is drawn from the Accountability Sector plan, which describes the role of PFM and accountability in driving the quality and effectiveness of service delivery.
Purpose of PFM reforms:
To improve effectiveness, efficiency and accountable use of public resources at all levels of
government
3.3 Theory of Change 6 The theory of change for the PFM reform strategy outlines the underlying logic of the reforms, in terms of
how resources and activities are expected to translate into outputs, results and impacts on the above PFM outcomes and how the PFM system is expected to contribute to service delivery outcomes. Figure 3.1 below illustrates the logic chain from inputs of resources through activities and outputs to outcomes and impact.
7 Based on the situation analysis and lessons from previous PFM reforms, the interventions selected (discussed in further detail in Section 3.5 below) will focus on the six priority areas for reform. In particular, the activities begin with undertaking diagnostics and research on each priority area of PFM systems, which inform understanding of problems, behaviours and performance of systems. This understanding informs the design of interventions and the development of new policy and legal frameworks (or amendments to improve existing ones). Changes to legal and policy frameworks are operationalised through new procedures, training and performance monitoring, which continues to inform further interventions and improvements. IT systems are also reviewed, better integrated, strengthened and upgraded. IT systems are also supported by security testing and developing procedures for regular maintenance and disaster recovery.
8 By targeting interventions that address the six key problem areas identified, these interventions will contribute to a better-functioning PFM system and achievement of the three PFM outcomes: aggregate fiscal control, resource allocation efficiency and operational efficiency in public expenditure for service delivery.
Better functioning and transparent PFM systems result in more accountable, efficient use of public resources and effective public investment management, which in turn, leads to improved service delivery and achievement of higher returns from public investments. For example, ensuring that procurement procedures introduce more competition into the procurement process should lead to contracts delivering better quality, at more cost-effective prices. This improves the quality and value for money of supplies of goods and services provided on behalf of the government. Greater fiscal transparency, participation and compliance with PFM procedures reduces errors, misuse and other leakages of resources, enabling limited resources to be better targeted toward Government priorities. It also enables more accurate and comprehensive reporting, which can be monitored, audited and strengthened further.
9 While it is important to identify the right technical solutions, based on situation analysis, this strategy recognises that the right solutions are not sufficient. Each reform will require a systematic approach to managing change. Resistance to change is a natural part of the PFM reform process and needs to be anticipated and mitigated through specific planning. This process requires measurable milestones, effective communication and engagement from the top management levels down to technical delivery. The change management and communication approach is detailed further in Section 5.
Figure 3.1: PFM Reform Strategy Theory of Change
3.4 Approach to Sequencing of PFM reforms 10 PFM reform literature is mixed on issues of sequencing and several approaches have emerged. Initially,
reforms focused on adopting best practice. Recognising that ‘best practice’ is not always suitable or achievable for every context, the focus moved to ‘basics first’ to ensure that more nascent systems achieve basic functionality and robust mechanisms as a platform for more advanced reforms. The PEFA assessment
Inpu
tsOu
tput
sOu
tcom
e
Socio-economic transformation: Increased revenue; higher public investment returns; better public service delivery outcomes
Staff, task teams, technical assistance, consultancy, equipment, IT, training etc.
Effectiveness, efficiency and value for money in the control and management of public resources (3 PFM outcomes: Aggregate fiscal control, resource allocation & operational efficiency)
Impa
ctIn
ter-
med
iate
Ou
tcom
es 1. Increased Resource
mobilisation
2. Enhanced budgeting and
planning
3. Improved public investment
management
4. Accountability systems &
compliance in budget execution
5. Local Government PFM
enhanced
6. Effective oversight and
governance of PFM reforms
Installing/rolling out and integrating IT systems; reviewing and proposing changes to policy and legal framework; research studies and process reviews to understand behaviour and performance; training/capacity building; design of training
programmes; introducing new procedures to operationalise policy and legal reforms; communications and change management around PFM reforms
• DRM strategy• Policy & laws• Risk
management• Tax education• Compliance
Plans & results
• PBB / PBS• Medium-term
budgets• Improved
costing• Gender equity
budgeting
• Project appraisal & cycle management
• Assets & risks managed
• Systems integrated & secure
• IFMS complete• PBS, e-GP,
HCM
• Capacity for procurement, planning & budgeting
• Increased resources
• Stronger audit committees
• Citizen engagement
• Reforms coordinated / communicated
Activ
ities
1. Enhanced Resource
Mobilization
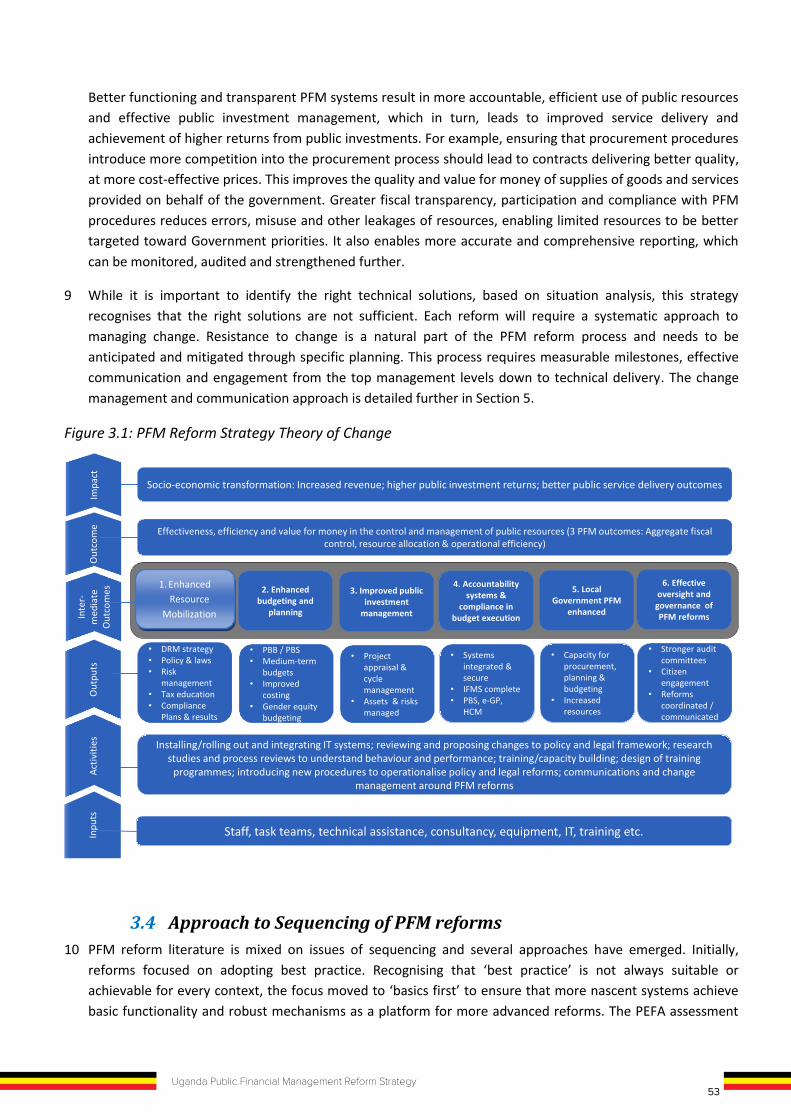
53Uganda Public Financial Management Reform Strategy
Vision for PFM Reform:
To have excellent and sustainable public financial management that enables socio-economic
transformation
3 The overarching vision for PFM reform reflects the high level objectives set out in the National Development Plan II, which provides the framework for driving Uganda towards middle income status. Section 3.3 explains how PFM systems will support the infrastructure investment and service delivery needed to achieve the goals of NDP II.
Goal of the PFM reform strategy:
To enhance resource mobilisation, improve planning and public investment management, and strengthen accountability for quality, effective and efficient service delivery.
4 As an underpinning structure for service delivery and investment, the purpose of the PFM reform is drawn from the Accountability Sector plan, which describes the role of PFM and accountability in driving the quality and effectiveness of service delivery.
Purpose of PFM reforms:
To improve effectiveness, efficiency and accountable use of public resources at all levels of
government
3.3 Theory of Change 6 The theory of change for the PFM reform strategy outlines the underlying logic of the reforms, in terms of
how resources and activities are expected to translate into outputs, results and impacts on the above PFM outcomes and how the PFM system is expected to contribute to service delivery outcomes. Figure 3.1 below illustrates the logic chain from inputs of resources through activities and outputs to outcomes and impact.
7 Based on the situation analysis and lessons from previous PFM reforms, the interventions selected (discussed in further detail in Section 3.5 below) will focus on the six priority areas for reform. In particular, the activities begin with undertaking diagnostics and research on each priority area of PFM systems, which inform understanding of problems, behaviours and performance of systems. This understanding informs the design of interventions and the development of new policy and legal frameworks (or amendments to improve existing ones). Changes to legal and policy frameworks are operationalised through new procedures, training and performance monitoring, which continues to inform further interventions and improvements. IT systems are also reviewed, better integrated, strengthened and upgraded. IT systems are also supported by security testing and developing procedures for regular maintenance and disaster recovery.
8 By targeting interventions that address the six key problem areas identified, these interventions will contribute to a better-functioning PFM system and achievement of the three PFM outcomes: aggregate fiscal control, resource allocation efficiency and operational efficiency in public expenditure for service delivery.
Better functioning and transparent PFM systems result in more accountable, efficient use of public resources and effective public investment management, which in turn, leads to improved service delivery and achievement of higher returns from public investments. For example, ensuring that procurement procedures introduce more competition into the procurement process should lead to contracts delivering better quality, at more cost-effective prices. This improves the quality and value for money of supplies of goods and services provided on behalf of the government. Greater fiscal transparency, participation and compliance with PFM procedures reduces errors, misuse and other leakages of resources, enabling limited resources to be better targeted toward Government priorities. It also enables more accurate and comprehensive reporting, which can be monitored, audited and strengthened further.
9 While it is important to identify the right technical solutions, based on situation analysis, this strategy recognises that the right solutions are not sufficient. Each reform will require a systematic approach to managing change. Resistance to change is a natural part of the PFM reform process and needs to be anticipated and mitigated through specific planning. This process requires measurable milestones, effective communication and engagement from the top management levels down to technical delivery. The change management and communication approach is detailed further in Section 5.
Figure 3.1: PFM Reform Strategy Theory of Change
3.4 Approach to Sequencing of PFM reforms 10 PFM reform literature is mixed on issues of sequencing and several approaches have emerged. Initially,
reforms focused on adopting best practice. Recognising that ‘best practice’ is not always suitable or achievable for every context, the focus moved to ‘basics first’ to ensure that more nascent systems achieve basic functionality and robust mechanisms as a platform for more advanced reforms. The PEFA assessment
Inpu
tsOu
tput
sOu
tcom
e
Socio-economic transformation: Increased revenue; higher public investment returns; better public service delivery outcomes
Staff, task teams, technical assistance, consultancy, equipment, IT, training etc.
Effectiveness, efficiency and value for money in the control and management of public resources (3 PFM outcomes: Aggregate fiscal control, resource allocation & operational efficiency)
Impa
ctIn
ter-
med
iate
Ou
tcom
es 1. Increased Resource
mobilisation
2. Enhanced budgeting and
planning
3. Improved public investment
management
4. Accountability systems &
compliance in budget execution
5. Local Government PFM
enhanced
6. Effective oversight and
governance of PFM reforms
Installing/rolling out and integrating IT systems; reviewing and proposing changes to policy and legal framework; research studies and process reviews to understand behaviour and performance; training/capacity building; design of training
programmes; introducing new procedures to operationalise policy and legal reforms; communications and change management around PFM reforms
• DRM strategy• Policy & laws• Risk
management• Tax education• Compliance
Plans & results
• PBB / PBS• Medium-term
budgets• Improved
costing• Gender equity
budgeting
• Project appraisal & cycle management
• Assets & risks managed
• Systems integrated & secure
• IFMS complete• PBS, e-GP,
HCM
• Capacity for procurement, planning & budgeting
• Increased resources
• Stronger audit committees
• Citizen engagement
• Reforms coordinated / communicated
Activ
ities
1. Enhanced Resource
Mobilization
54 Uganda Public Financial Management Reform Strategy
framework appreciates both approaches by establishing a common standard of ‘good practice’ across countries, with indicative criteria that recognises what a more basic system looks like compared to advanced. Achieving the ‘C’ score is a measure of reaching a basic international standard, from which further advancement can be made by enhancing existing processes and capacity.
11 Nonetheless a linear approach does not always make sense, when some parts of the system are already considered ‘advanced’ while others are still far behind. Most countries, even at a low level of development in PFM, can achieve at least one or two ‘A’ or ‘B’ scores when the rest are rated ‘D’.
12 A more dynamic and context specific approach emerged that consider factors, such as the ‘Plateaus not summits’ approach and ‘Problem-driven iterative adaptation’ (PDIA). These approaches recognise what exists and uses existing strengths to further build up capability. In particular, they focus on the importance of ‘quick wins’ that can be used to gain trust and demonstrate impact of new systems, which, by building compliance with new procedures, can become sustained and embedded in mainstream practice over time. Change or new reforms in this case, only needs to be considered on a need basis (problem-driven) and when the system is already robust enough to enable new reforms, which entail some risk. Recognising that some reforms tend to take place in form and not function and never genuinely achieve the desired outcomes, it is important to learn from the process and understand what underlying constraints there might be, or missing links in the system, that need to be addressed. By taking a more ‘iterative, adaptive’ approach to reform, it is possible to refine systems and procedures through learning and adaptation.
13 Previous PFM reform strategies in Uganda have been based around defined stages of reform, moving from removing barriers, reinforcing compliance, and ensuring controls are in place, then strengthening accountability, and linking results with resources to ensure effective service delivery. While, in principle, this approach is logical, and ensures that there is a strong platform for development, before more advanced reforms are attempted, in practice, these stages have been difficult to logically interpret and apply. This is because there are a number of reforms ongoing at different stages across PFM systems, and some move faster than others. As an example it is difficult to distinguish between reforms that contribute to compliance, and controls and those that strengthen the link between resources and results.
14 This strategy recognises that there will be aspects of the system that have reached different ‘stages’ of reform, but should not be stalled if there is momentum to continue. At the same time there will be other areas that take longer to move past the first stage, but are critical, and require continued support. Some areas may be able to move forward more quickly, but limited resources should not be too focused on these if there are still significant risks or weaknesses in compliance, for example, in other areas. Furthermore, if hurriedly undertaken there may be some missing components or those with weaknesses that could undermine the success of new or more advanced reforms.
15 The reform programme may also need to respond to urgent risks or issues arising. It is also important to ensure that previous reforms are fully embedded and their performance is reviewed. Any problems identified should be addressed, with capacities built around them to achieve their full value. There will need to be understanding and compliance with the new procedures, which may be affected by incentive structures and resistance to change. For example, IT-based accountability systems should be secure, contain accurate data, and have operators who are capable, using them effectively, and supporting their integrity, before any new system developments or upgrades are attempted.
Figure 3.2: PFM Reform Sequencing
16 In order to ensure that the reforms are problem-driven, responsive to issues arising, adaptive based on learning and deliver the greatest value, 3 phases will therefore be applied to the sequencing of the reforms:
Phase 1: Reinforce and consolidate previous reforms, ensuring that systems are used to best effect and there is compliance with laws, regulations and procedures;
Phase 2: Review performance and effectiveness of the systems and reforms, identify mitigating actions, take steps to remove barriers and address problems identified; and
Phase 3: Upgrade, develop and strengthen systems towards higher standards in PFM practices.
Hypothetical Example: DRM
Phase 1: Clean and improve data integrity in e-Tax system, ensure procedures in place to maintain integrity of data and staff have capacity to use the system effectively; ensure recent legislative and policy changes are understood and implemented;
Phase 2: identify and address barriers and performance issues e.g. improve taxpayer services to make voluntary compliance easier, focus resources on highest revenue risks and design appropriate strategies; review efficacy of IT systems; review laws and identify new opportunities to mobilise revenue;
Phase 3: Upgrade/improve IT systems, introduce legislative reforms to mobilise new sources of revenue.
17 The interventions identified in this strategy and sequenced in the implementation plan will not all move through all 3 phases. Some interventions will be focused only on Phase 1 or Phases 1 and 2. While others may be ready to move to Phase 3 more quickly, for example, when there has already been a review and
STAGE 1:Encourage effective service delivery by removing barriers in PFM systems and capacities while reinforcing compliance with regulations an avoidance of leakages
STAGE 2:Strengthen mechanisms for instilling accountability for performance, while hardening the link between results and resources
PHASE 1:Reinforce &
consolidate previous reforms
PHASE 2: Review, remove
barriers & address problems
PHASE 3:Upgrade, develop
and strengthen
FORMER SEQUENCING
MODIFIED SEQUENCING
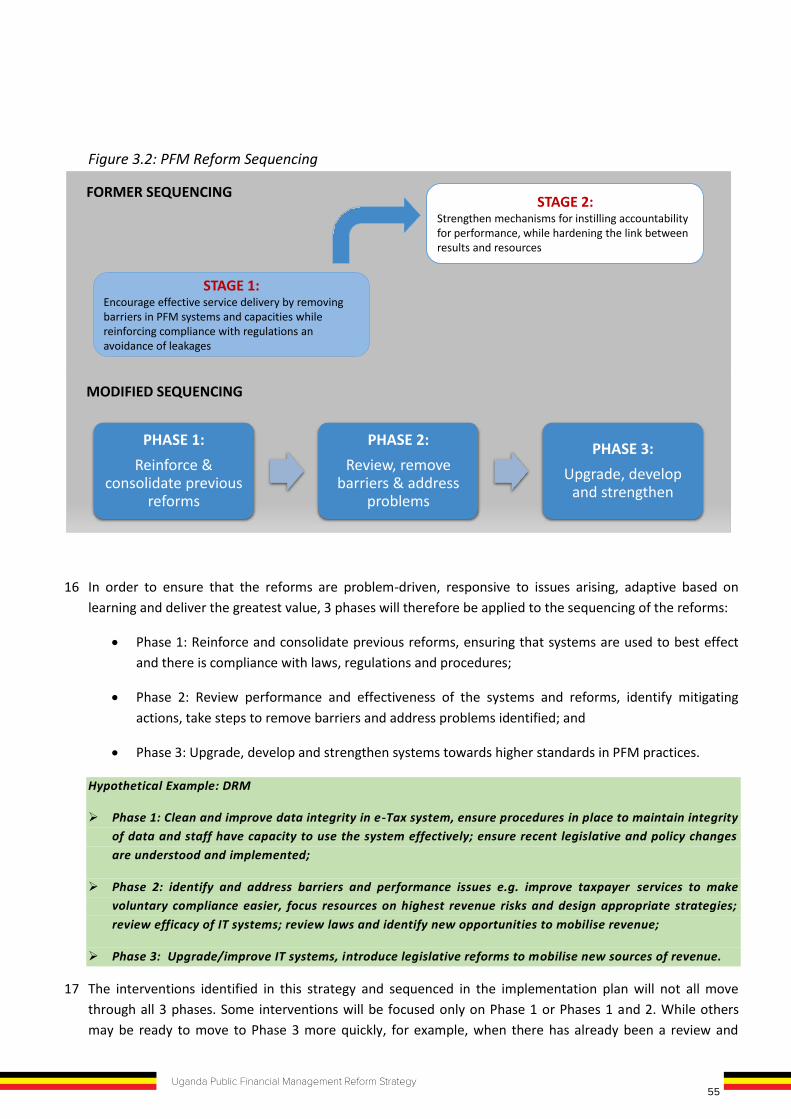
55Uganda Public Financial Management Reform Strategy
framework appreciates both approaches by establishing a common standard of ‘good practice’ across countries, with indicative criteria that recognises what a more basic system looks like compared to advanced. Achieving the ‘C’ score is a measure of reaching a basic international standard, from which further advancement can be made by enhancing existing processes and capacity.
11 Nonetheless a linear approach does not always make sense, when some parts of the system are already considered ‘advanced’ while others are still far behind. Most countries, even at a low level of development in PFM, can achieve at least one or two ‘A’ or ‘B’ scores when the rest are rated ‘D’.
12 A more dynamic and context specific approach emerged that consider factors, such as the ‘Plateaus not summits’ approach and ‘Problem-driven iterative adaptation’ (PDIA). These approaches recognise what exists and uses existing strengths to further build up capability. In particular, they focus on the importance of ‘quick wins’ that can be used to gain trust and demonstrate impact of new systems, which, by building compliance with new procedures, can become sustained and embedded in mainstream practice over time. Change or new reforms in this case, only needs to be considered on a need basis (problem-driven) and when the system is already robust enough to enable new reforms, which entail some risk. Recognising that some reforms tend to take place in form and not function and never genuinely achieve the desired outcomes, it is important to learn from the process and understand what underlying constraints there might be, or missing links in the system, that need to be addressed. By taking a more ‘iterative, adaptive’ approach to reform, it is possible to refine systems and procedures through learning and adaptation.
13 Previous PFM reform strategies in Uganda have been based around defined stages of reform, moving from removing barriers, reinforcing compliance, and ensuring controls are in place, then strengthening accountability, and linking results with resources to ensure effective service delivery. While, in principle, this approach is logical, and ensures that there is a strong platform for development, before more advanced reforms are attempted, in practice, these stages have been difficult to logically interpret and apply. This is because there are a number of reforms ongoing at different stages across PFM systems, and some move faster than others. As an example it is difficult to distinguish between reforms that contribute to compliance, and controls and those that strengthen the link between resources and results.
14 This strategy recognises that there will be aspects of the system that have reached different ‘stages’ of reform, but should not be stalled if there is momentum to continue. At the same time there will be other areas that take longer to move past the first stage, but are critical, and require continued support. Some areas may be able to move forward more quickly, but limited resources should not be too focused on these if there are still significant risks or weaknesses in compliance, for example, in other areas. Furthermore, if hurriedly undertaken there may be some missing components or those with weaknesses that could undermine the success of new or more advanced reforms.
15 The reform programme may also need to respond to urgent risks or issues arising. It is also important to ensure that previous reforms are fully embedded and their performance is reviewed. Any problems identified should be addressed, with capacities built around them to achieve their full value. There will need to be understanding and compliance with the new procedures, which may be affected by incentive structures and resistance to change. For example, IT-based accountability systems should be secure, contain accurate data, and have operators who are capable, using them effectively, and supporting their integrity, before any new system developments or upgrades are attempted.
Figure 3.2: PFM Reform Sequencing
16 In order to ensure that the reforms are problem-driven, responsive to issues arising, adaptive based on learning and deliver the greatest value, 3 phases will therefore be applied to the sequencing of the reforms:
Phase 1: Reinforce and consolidate previous reforms, ensuring that systems are used to best effect and there is compliance with laws, regulations and procedures;
Phase 2: Review performance and effectiveness of the systems and reforms, identify mitigating actions, take steps to remove barriers and address problems identified; and
Phase 3: Upgrade, develop and strengthen systems towards higher standards in PFM practices.
Hypothetical Example: DRM
Phase 1: Clean and improve data integrity in e-Tax system, ensure procedures in place to maintain integrity of data and staff have capacity to use the system effectively; ensure recent legislative and policy changes are understood and implemented;
Phase 2: identify and address barriers and performance issues e.g. improve taxpayer services to make voluntary compliance easier, focus resources on highest revenue risks and design appropriate strategies; review efficacy of IT systems; review laws and identify new opportunities to mobilise revenue;
Phase 3: Upgrade/improve IT systems, introduce legislative reforms to mobilise new sources of revenue.
17 The interventions identified in this strategy and sequenced in the implementation plan will not all move through all 3 phases. Some interventions will be focused only on Phase 1 or Phases 1 and 2. While others may be ready to move to Phase 3 more quickly, for example, when there has already been a review and
STAGE 1:Encourage effective service delivery by removing barriers in PFM systems and capacities while reinforcing compliance with regulations an avoidance of leakages
STAGE 2:Strengthen mechanisms for instilling accountability for performance, while hardening the link between results and resources
PHASE 1:Reinforce &
consolidate previous reforms
PHASE 2: Review, remove
barriers & address problems
PHASE 3:Upgrade, develop
and strengthen
FORMER SEQUENCING
MODIFIED SEQUENCING
56 Uganda Public Financial Management Reform Strategy
satisfactory performance achieved, and a need identified to move ahead to a more advanced standard. There could also be ‘quick wins’ that are possible early on, to provide encouragement and opportunities for further consolidation.
3.5 Reform Priority Areas and Key Interventions This section outlines the six priorities for reform, with a summary of each, including the objective, intermediate outcomes and key interventions required to deliver change in that area. For each of the six areas, a brief narrative explains how the interventions will address the problems identified, key considerations for implementation, and linkages to other strategies and ongoing work that will be continued.
3.5.1 Sustainable Resource Mobilisation
Objective 1: To enhance resource mobilisation for Uganda's sustainable development
18 Objective 1 focuses on financing the National Budget to be able to achieve national economic objectives, including the up scaling of public investment. The aim is to improve domestic revenue mobilisation to be able to finance the fiscal deficit and reduce (or eliminate) aid dependence. Nonetheless, in the process of mobilising domestic revenue, and during a phase that requires major investment in infrastructure, it recognises the need for borrowing. This objective therefore also aims to improve the quality and sustainability of external resources, such as grants, concessional and non-concessional loans.
19 The framework for implementation of domestic revenue mobilisation underpinning this objective shall be the medium-term domestic revenue mobilisation strategy (DRMS). Once completed, it will be the principle guiding framework for implementation and sequencing of interventions under this objective. In order to ensure consistency with the DRMS, the design of this PFM reform strategy objective was undertaken in close consultation with the committee leading on the DRMS, including agreement on high level outcomes and key interventions, as outlined below. It is understood that the detail of specific activities for implementation of this objective is subject to change, based on further analyses, and consensus on priorities, implementation modalities and financing sources. Activities presented in the Implementation plan are therefore somewhat generic and refer specifically to the DRMS, as the main reference document.
Outcomes and Key Interventions:
OUTCOME 1.1 - ENHANCED ENABLING ENVIRONMENT FOR REVENUE MOBILISATION
20 This outcome addresses the problem of the lack of coordination across Government on revenue mobilisation, by introducing a cross-Government campaign to strengthen tax compliance focusing on public sector contractors, linkages with private sector associations, and engagement of civil society with a national education campaign. A strong institutional structure is required to drive the delivery of the strategy, including strengthened mechanisms and systems to enforce compliance, with more effective enforcement managed through a sector-by-sector approach. This can be facilitated using the existing data warehouse analysis tools and providing opportunities for further integration with third party sources across Government to validate tax data and inform compliance strategies, such as Government suppliers, social security, land registry, company registry and other relevant sources.
21 Key interventions (outputs) include:
i. Develop a medium-term Domestic Revenue Mobilisation Strategy that includes establishment of a comprehensive governance arrangement for revenue mobilisation – building synergies through collaborative approaches between central and local governments. In addition, improve data quality and monitoring systems for non-tax revenue (NTR) collected by MALGs. Leverage engagement of Private Sector, Civil Society and other non-state actors in the DRM sub-group for continuous dialogue.
ii. Strengthen tax policy and legal framework for revenue mobilisation with consideration of fairness, equity and simplicity.
iii. Strengthen the tax policy function through establishment of an institutional and policy framework for tax policy analysis and formulation. Includes enhancement of the tax research and analysis function and a coordinated tax policy research programme with key stakeholders’ participation (ie NPA, EPRC, BoU, UBOS) covering aspects of behavioral analysis of tax payers and assessment of tax elasticity to inform tax policy design and regime.
iv. Establish policy framework for transparency in reporting on tax expenditures. Includes annual reporting on tax expenditures for inclusion in the budget and related policy guidelines;
v. Strengthen Performance monitoring and reporting framework for DRM strengthened. Includes a comprehensive results framework and targets to facilitate intermediate and annual assessment for entire DRM System; agree protocols and procedures for data sharing; and establishment of the revenue monitoring function under BMAU.
OUTCOME 1.2 - TAX COMPLIANCE IMPROVED THROUGH INCREASED EFFICIENCY IN REVENUE ADMINISTRATION
22 This outcome aims to improve performance in tax compliance, with a focus on voluntary compliance and revenue risk management, including risk profiling for domestic taxes and customs declarations, and improved targeting of compliance and enforcement activities appropriate to the level of risk. In particular, key compliance gaps identified should be addressed as priority, for instance Value Added Tax (VAT), large and medium income taxpayers in the six high-risk sectors (including withholding tax), and income tax for professionals and high net worth individuals. Understanding taxpayer needs and behaviour will be key to ensuring that the tax system, procedures and taxpayer services address their needs, and encourage compliance.
23 Key interventions (outputs) include:
i. Enhance revenue data integrity and efficacy of IT systems. Includes integration and simplification of the tax administration IT systems with related capacity enhancement; and, establishment of e-payment gateway
ii. Implement the strengthened tax Compliance Improvement Plan (CIP). Includes strengthening risk management policy and framework; and, firming up data analysis along the key processes of registration, filling, payment and valuation;
iii. Strengthen URA capacity for investigation. Includes framework and capacity for investigation of tax evasion and Illicit financial flows in line with DRM strategy;
iv. Enhance administrative capacity and framework for effective international taxation. Includes capacity for audit of international corporations, transactions and high net worth individuals;
v. Establish mechanisms for enhanced contribution of non-tax revenues (NTR). Includes policy and systems for centralised collection and monitoring of NTR.
vi. Enhance taxpayer services and education programme. Includes increased options for tax payer advice and assistance; simplifying compliance requirements based on results from the taxpayer behavioural analysis survey along with a pro-integrity campaign for tax administration.
57Uganda Public Financial Management Reform Strategy
satisfactory performance achieved, and a need identified to move ahead to a more advanced standard. There could also be ‘quick wins’ that are possible early on, to provide encouragement and opportunities for further consolidation.
3.5 Reform Priority Areas and Key Interventions This section outlines the six priorities for reform, with a summary of each, including the objective, intermediate outcomes and key interventions required to deliver change in that area. For each of the six areas, a brief narrative explains how the interventions will address the problems identified, key considerations for implementation, and linkages to other strategies and ongoing work that will be continued.
3.5.1 Sustainable Resource Mobilisation
Objective 1: To enhance resource mobilisation for Uganda's sustainable development
18 Objective 1 focuses on financing the National Budget to be able to achieve national economic objectives, including the up scaling of public investment. The aim is to improve domestic revenue mobilisation to be able to finance the fiscal deficit and reduce (or eliminate) aid dependence. Nonetheless, in the process of mobilising domestic revenue, and during a phase that requires major investment in infrastructure, it recognises the need for borrowing. This objective therefore also aims to improve the quality and sustainability of external resources, such as grants, concessional and non-concessional loans.
19 The framework for implementation of domestic revenue mobilisation underpinning this objective shall be the medium-term domestic revenue mobilisation strategy (DRMS). Once completed, it will be the principle guiding framework for implementation and sequencing of interventions under this objective. In order to ensure consistency with the DRMS, the design of this PFM reform strategy objective was undertaken in close consultation with the committee leading on the DRMS, including agreement on high level outcomes and key interventions, as outlined below. It is understood that the detail of specific activities for implementation of this objective is subject to change, based on further analyses, and consensus on priorities, implementation modalities and financing sources. Activities presented in the Implementation plan are therefore somewhat generic and refer specifically to the DRMS, as the main reference document.
Outcomes and Key Interventions:
OUTCOME 1.1 - ENHANCED ENABLING ENVIRONMENT FOR REVENUE MOBILISATION
20 This outcome addresses the problem of the lack of coordination across Government on revenue mobilisation, by introducing a cross-Government campaign to strengthen tax compliance focusing on public sector contractors, linkages with private sector associations, and engagement of civil society with a national education campaign. A strong institutional structure is required to drive the delivery of the strategy, including strengthened mechanisms and systems to enforce compliance, with more effective enforcement managed through a sector-by-sector approach. This can be facilitated using the existing data warehouse analysis tools and providing opportunities for further integration with third party sources across Government to validate tax data and inform compliance strategies, such as Government suppliers, social security, land registry, company registry and other relevant sources.
21 Key interventions (outputs) include:
i. Develop a medium-term Domestic Revenue Mobilisation Strategy that includes establishment of a comprehensive governance arrangement for revenue mobilisation – building synergies through collaborative approaches between central and local governments. In addition, improve data quality and monitoring systems for non-tax revenue (NTR) collected by MALGs. Leverage engagement of Private Sector, Civil Society and other non-state actors in the DRM sub-group for continuous dialogue.
ii. Strengthen tax policy and legal framework for revenue mobilisation with consideration of fairness, equity and simplicity.
iii. Strengthen the tax policy function through establishment of an institutional and policy framework for tax policy analysis and formulation. Includes enhancement of the tax research and analysis function and a coordinated tax policy research programme with key stakeholders’ participation (ie NPA, EPRC, BoU, UBOS) covering aspects of behavioral analysis of tax payers and assessment of tax elasticity to inform tax policy design and regime.
iv. Establish policy framework for transparency in reporting on tax expenditures. Includes annual reporting on tax expenditures for inclusion in the budget and related policy guidelines;
v. Strengthen Performance monitoring and reporting framework for DRM strengthened. Includes a comprehensive results framework and targets to facilitate intermediate and annual assessment for entire DRM System; agree protocols and procedures for data sharing; and establishment of the revenue monitoring function under BMAU.
OUTCOME 1.2 - TAX COMPLIANCE IMPROVED THROUGH INCREASED EFFICIENCY IN REVENUE ADMINISTRATION
22 This outcome aims to improve performance in tax compliance, with a focus on voluntary compliance and revenue risk management, including risk profiling for domestic taxes and customs declarations, and improved targeting of compliance and enforcement activities appropriate to the level of risk. In particular, key compliance gaps identified should be addressed as priority, for instance Value Added Tax (VAT), large and medium income taxpayers in the six high-risk sectors (including withholding tax), and income tax for professionals and high net worth individuals. Understanding taxpayer needs and behaviour will be key to ensuring that the tax system, procedures and taxpayer services address their needs, and encourage compliance.
23 Key interventions (outputs) include:
i. Enhance revenue data integrity and efficacy of IT systems. Includes integration and simplification of the tax administration IT systems with related capacity enhancement; and, establishment of e-payment gateway
ii. Implement the strengthened tax Compliance Improvement Plan (CIP). Includes strengthening risk management policy and framework; and, firming up data analysis along the key processes of registration, filling, payment and valuation;
iii. Strengthen URA capacity for investigation. Includes framework and capacity for investigation of tax evasion and Illicit financial flows in line with DRM strategy;
iv. Enhance administrative capacity and framework for effective international taxation. Includes capacity for audit of international corporations, transactions and high net worth individuals;
v. Establish mechanisms for enhanced contribution of non-tax revenues (NTR). Includes policy and systems for centralised collection and monitoring of NTR.
vi. Enhance taxpayer services and education programme. Includes increased options for tax payer advice and assistance; simplifying compliance requirements based on results from the taxpayer behavioural analysis survey along with a pro-integrity campaign for tax administration.
58 Uganda Public Financial Management Reform Strategy
OUTCOME 1.3 - ENHANCED COLLECTIONS FROM NEW REVENUE OPPORTUNITIES INCLUDING OIL, GAS AND MINERAL
SECTORS
24 Outcome 1.3 aims to identify potential new sources of domestic revenue and develop proposals and systems to assess and collect revenue from them. In particular, as identified in the problem analysis, as the economy develops, new economic activities and sectors emerge that should contribute to the tax base. For example, commercially viable deposits of oil, gas and minerals have been explored and developed. Recent reforms have focused efforts on establishing a robust fiscal regime, licensing framework and other legal and regulatory provisions. Further improvements, procedures and capacities now need to be built in order to reap the full benefits and ensure that revenues are well-managed. Ongoing support to operationalise Government’s commitment to join the Extractive Industries Transparency Initiative (EITI). This will require engaging a new set of stakeholders, including those in the energy sector.
25 In addition, there may be further opportunities attained from engaging more with other sectors, including the regional economic integration agenda, environmental protection, taxation of emerging sectors (e.g. e-commerce) or from strengthening the wider regulatory framework or institutional framework that could have wider benefits for enabling tax administration. While this would be outside the control of the PFM reform, stakeholder engagement could help identify and collaborate on common aims. New opportunities will be identified and developed through consultative review, leading to legal and policy proposals for submission to Parliament, with estimated fiscal impacts for the budget.
26 Key interventions (outputs) include:
i. Enhance enabling framework for exploiting new revenue opportunities. Includes feasibility and impact analyses of potential new revenue opportunities from emerging sectors, EAC agenda along with attendant enhancement of legal and regulatory frameworks;
ii. Enhance enabling environment for assessment, collection and management of revenue from oil, gas and minerals. Includes establishment of regular reporting frameworks on extractive industries in line with fiscal transparency requirements; and, specialised capacity enhancement in oil, gas and mining
OUTCOME 1.4 - SUSTAINABLE DEBT AND DEVELOPMENT FINANCING
27 This outcome aims to address remaining weak capacities in certain aspects of aid and debt management to ensure that any new debt contracted is sustainable and is managed effectively. This will include ensuring that there are capacity and adequate frameworks for implementing the debt management strategy and operationalizing the debt directorate. This requires capacity to undertake analysis of the nature and wider financial and real impacts of debt to inform the debt contracting and alignment with GoU’s policy framework. In addition, recommendations from the DeMPA will need to be addressed, including strengthening management of GoU contingent liabilities arising from loan guarantees, PPP contracts, borrowing by Local Governments, municipal councils and public parastatals; training on operational risk management and sensitisation with key market players in the domestic debt market, including commercial banks, pension funds, insurance companies, corporations and off-shore investors.
28 Key interventions (outputs) include:
i. Develop a Public Financing Strategy entailing modalities for comprehensive and transparent assessment of existing and potential new financing options from concessional and non-concessional sources , as well as possible grant inflows, focusing on assessment and how best to mobilise the highest quality financing to support national development priorities and ensure debt sustainability. Includes development of a new 5-year Public Debt Management Framework and related institutional frameworks;
ii. Regular market engagement on investment in Government Securities. Including primary and secondary market sensitization and introduction of Diaspora bonds, infrastructure bonds, mobile money bonds and related performance reviews;
iii. Enhance capacity in public debt (loan) negotiation, debt sustainability analysis and Operationalization of the debt management strategy. Including formulation of a contingent liabilities framework; database for contingent liabilities; collaborations with credible research and institutional development organization such as UNCTAD and MEFMI; developing an interface for analysing and disseminating debt statistics and;
iv. Develop support management policy framework with systems to promote aid effectiveness. This includes a framework agreement signing between MoFPED and DPs and related capacity in development Support policy; in addition to the compendium of development partner portfolio.
3.5.2 Planning and Budgeting
Objective 2: To enhance policy-based planning and budgeting for allocative efficiency
29 Objective 2 aims to strengthen budgeting and planning at several levels: (i) high-level Sector plans to be of better quality and prioritised in line with national objectives; (ii) multi-year commitments and cost estimates of sector plans are captured in the MTEF and reflect realistic budget projections; (iii) the MTEF itself is more accurate and credible, validated using bottom-up estimates as well as top-down ceilings and any adjustments are explained and transparent; (iv) Annual budgets include accurate costings, information on fiscal risks, impacts and linked to MTEF.
30 Specifically, these reforms will be deepened in the selected key service delivery sectors, i.e Education, Health, Agriculture, Water, Roads, and Energy. Aspects relating to policy reform, adoption of good practice and related systems for effective planning and budgeting shall maintain a whole of government approach. However technical assistance and capacity development shall be availed to deepen adoption of reforms in the selected priority sectors. This element of prioritization refocuses the reform strategy in sustaining the contribution to key service delivery outcomes.
31 In addition, this result area also seeks to further integrate programme-based budgeting and gender equity budgeting to strengthen the link between resources and outcomes and enhance the strategic allocation of resources to address gender inequalities.
Outcomes and Key Interventions:
2.1 BUDGET ALIGNED TO STRATEGIC PLANS AND MEDIUM TERM BUDGETS
32 This outcome addresses the problem of the lack of fiscal and economic impact analysis. In addition, it provides for the further embedding of programme-based budgeting through use of the PBS tool, assessing
59Uganda Public Financial Management Reform Strategy
OUTCOME 1.3 - ENHANCED COLLECTIONS FROM NEW REVENUE OPPORTUNITIES INCLUDING OIL, GAS AND MINERAL
SECTORS
24 Outcome 1.3 aims to identify potential new sources of domestic revenue and develop proposals and systems to assess and collect revenue from them. In particular, as identified in the problem analysis, as the economy develops, new economic activities and sectors emerge that should contribute to the tax base. For example, commercially viable deposits of oil, gas and minerals have been explored and developed. Recent reforms have focused efforts on establishing a robust fiscal regime, licensing framework and other legal and regulatory provisions. Further improvements, procedures and capacities now need to be built in order to reap the full benefits and ensure that revenues are well-managed. Ongoing support to operationalise Government’s commitment to join the Extractive Industries Transparency Initiative (EITI). This will require engaging a new set of stakeholders, including those in the energy sector.
25 In addition, there may be further opportunities attained from engaging more with other sectors, including the regional economic integration agenda, environmental protection, taxation of emerging sectors (e.g. e-commerce) or from strengthening the wider regulatory framework or institutional framework that could have wider benefits for enabling tax administration. While this would be outside the control of the PFM reform, stakeholder engagement could help identify and collaborate on common aims. New opportunities will be identified and developed through consultative review, leading to legal and policy proposals for submission to Parliament, with estimated fiscal impacts for the budget.
26 Key interventions (outputs) include:
i. Enhance enabling framework for exploiting new revenue opportunities. Includes feasibility and impact analyses of potential new revenue opportunities from emerging sectors, EAC agenda along with attendant enhancement of legal and regulatory frameworks;
ii. Enhance enabling environment for assessment, collection and management of revenue from oil, gas and minerals. Includes establishment of regular reporting frameworks on extractive industries in line with fiscal transparency requirements; and, specialised capacity enhancement in oil, gas and mining
OUTCOME 1.4 - SUSTAINABLE DEBT AND DEVELOPMENT FINANCING
27 This outcome aims to address remaining weak capacities in certain aspects of aid and debt management to ensure that any new debt contracted is sustainable and is managed effectively. This will include ensuring that there are capacity and adequate frameworks for implementing the debt management strategy and operationalizing the debt directorate. This requires capacity to undertake analysis of the nature and wider financial and real impacts of debt to inform the debt contracting and alignment with GoU’s policy framework. In addition, recommendations from the DeMPA will need to be addressed, including strengthening management of GoU contingent liabilities arising from loan guarantees, PPP contracts, borrowing by Local Governments, municipal councils and public parastatals; training on operational risk management and sensitisation with key market players in the domestic debt market, including commercial banks, pension funds, insurance companies, corporations and off-shore investors.
28 Key interventions (outputs) include:
i. Develop a Public Financing Strategy entailing modalities for comprehensive and transparent assessment of existing and potential new financing options from concessional and non-concessional sources , as well as possible grant inflows, focusing on assessment and how best to mobilise the highest quality financing to support national development priorities and ensure debt sustainability. Includes development of a new 5-year Public Debt Management Framework and related institutional frameworks;
ii. Regular market engagement on investment in Government Securities. Including primary and secondary market sensitization and introduction of Diaspora bonds, infrastructure bonds, mobile money bonds and related performance reviews;
iii. Enhance capacity in public debt (loan) negotiation, debt sustainability analysis and Operationalization of the debt management strategy. Including formulation of a contingent liabilities framework; database for contingent liabilities; collaborations with credible research and institutional development organization such as UNCTAD and MEFMI; developing an interface for analysing and disseminating debt statistics and;
iv. Develop support management policy framework with systems to promote aid effectiveness. This includes a framework agreement signing between MoFPED and DPs and related capacity in development Support policy; in addition to the compendium of development partner portfolio.
3.5.2 Planning and Budgeting
Objective 2: To enhance policy-based planning and budgeting for allocative efficiency
29 Objective 2 aims to strengthen budgeting and planning at several levels: (i) high-level Sector plans to be of better quality and prioritised in line with national objectives; (ii) multi-year commitments and cost estimates of sector plans are captured in the MTEF and reflect realistic budget projections; (iii) the MTEF itself is more accurate and credible, validated using bottom-up estimates as well as top-down ceilings and any adjustments are explained and transparent; (iv) Annual budgets include accurate costings, information on fiscal risks, impacts and linked to MTEF.
30 Specifically, these reforms will be deepened in the selected key service delivery sectors, i.e Education, Health, Agriculture, Water, Roads, and Energy. Aspects relating to policy reform, adoption of good practice and related systems for effective planning and budgeting shall maintain a whole of government approach. However technical assistance and capacity development shall be availed to deepen adoption of reforms in the selected priority sectors. This element of prioritization refocuses the reform strategy in sustaining the contribution to key service delivery outcomes.
31 In addition, this result area also seeks to further integrate programme-based budgeting and gender equity budgeting to strengthen the link between resources and outcomes and enhance the strategic allocation of resources to address gender inequalities.
Outcomes and Key Interventions:
2.1 BUDGET ALIGNED TO STRATEGIC PLANS AND MEDIUM TERM BUDGETS
32 This outcome addresses the problem of the lack of fiscal and economic impact analysis. In addition, it provides for the further embedding of programme-based budgeting through use of the PBS tool, assessing
60 Uganda Public Financial Management Reform Strategy
and addressing capacity needs, and reviewing the performance of the PBB approach. The approach to addressing the key coordination challenges involved in strengthening linkages between planning and budgeting will require close coordination between MoFPED, NPA, OPM, MoLG and MoPS, among others. In particular, strengthening sector coordination and sector planning processes will be key to setting and operationalizing performance standards across Government. Strengthening the role of NPA, particularly at the start of the budgeting process will also be important to inform the budget strategy, against which the NPA compliance certificate may be assessed annually.
33 Key interventions include:
i. Establish Programme based planning approach to anchor programme based budgeting reforms in development planning. This will include restructuring NDP III and Sector strategic plans along programs linked to national strategic objectives to ease PBB/S implementation; reconfiguration of national and strategic plans and the accompanying M&E results frameworks in a programme context.
ii. Strengthen institutional capacity for the planning function. Including development planning, policy impact analysis, Sector Working Groups to develop strategic plans;
iii. Enhance institutional frameworks for effective development planning and budgeting through strengthening NPA’s strategic planning function (including an NPA through DEA policy statement to inform budget strategy), streamlined sector planning function and joint collaborative approach between NPA, MoFPED, OPM, Sectors, and MoLG;
iv. Private Sector engagement forum through strengthening coordinated and participatory mechanism at sector level to inform budget preparation (To be monitored in the Priority Reform Action Matrix (PRAM) a tool of the PEMCOM). This includes inclusion of private sector (UMA, PSF, etc) and establish engagement at each sector WG during budget development consultations
v. Functional National Management Information System for effective development planning; vi. Review of Sector and MDA planning guidelines. Includes harmonization with the PFMA, Comprehensive
National development planning framework (CNDPF), National Human Resource Development Planning framework (NHRDPF), planning regulations among other planning frameworks,
vii. Review, develop and disseminate certificate of budget compliance framework to strengthen budget alignment; and
viii. Strengthen Program-Based Budgeting (PBB) reform for the planning and budgeting function in government. Includes training in M&E to conceptualise results frameworks and result hierarchy critical for development strategic plans and budget alignment.
2.2 MULTI-YEAR COMMITMENTS REFLECTED IN ANNUAL BUDGETS
34 This outcome will enhance the credibility of the MTEF by introducing a framework for multi-year budgeting and commitments monitoring, and developing capacity in budgeting and costing, with the initial focus on high-spend votes. It also focuses on operationalising the Charter of Fiscal Responsibility through institutional arrangements for monitoring targets and enhancing the underpinning statistical data. DEA (MoFPED) in liaison with NPA will strengthen the planning function through professionalization of Economists and Statisticians in government (known as ‘common cadre’), development of a certification framework, legal framework, code of ethics, work with Civil Service College to twin with reputable institutions to offer standardised and quality training.
35 Key interventions (outputs) include:
i. Strengthened accuracy and comprehensiveness of multi-year budgeting. Includes review and establishment of policy framework for multi-year budgeting and commitment monitoring;
ii. Introduce Certification Programme on development planning for Economists, Statisticians etc; and, a sustainable apprenticeship programme for improved specialised and standardized sector-level planning across government. This will be an extension of the graduate economists’ scheme.
iii. Enforcement of multiyear commitment reporting as required by the PFMA. This includes enhancing capacity for effective contract management to monitor and report multi-year contract performance and planning.
iv. Policy requirement for annual variance analysis and attendant explanation between the 2nd year of the previous MTEF with the current budget year
v. Government economists trained to improve quality of MDALG plans with a realistic multi-annual perspective.
2.3 ENHANCED PLANNING AND BUDGET RESPONSIVENESS TO GENDER AND EQUITY
36 This outcome aims to maximise opportunities further embed gender and equity considerations in Public Financial Management for sustainable development. Key strategy aspects will include gender equity, environmental equity, and spatial equity among others. In this, strategies will revolve around support compliance with the gender equity budgeting reforms as well greening the planning function of government.
37 Aspects on greening are critical because, for instance, the anticipated benefits accruing from the discovery of oil (a non-renewable natural capital) are key variables already being heavily leveraged in the GoUs economic growth prospects. This is not to mention agriculture and other minerals. Natural capital whose rate of consumption is greater than the rate of replenishment ‘in the planning horizon’ should be considered non-renewable and policies impacting their usage rate which may lead to their overuse or exhaustion in the stipulated time-frame should be cautiously formed. Unintended side-effects of some otherwise effective policies may lead to accelerated depletion of certain natural capital or environmental pollution. Environmental impact assessment, economic valuation of environmental costs vs. benefits, and appraisal of economic costs of potential side-effects in different implementation scenarios thus should be an integral part of policy making and plan development process.
38 Key interventions (outputs) include:
i. Enhance gender and equity budgeting in selected key sectors (Education, Health, Water, Energy and Agriculture). Includes capacity building to deepen GEB planning and budgeting process gender statistics refined in line with M&E methodologies
ii. Embed green concerns in national and sectoral policies and plans. This include selection of instruments (whether market or non-market) to promote green behaviour,
iii. Engender and Green the MTBF. This includes consideration on Climate Expenditure Tracking Framework (CETF) to track climate change related expenses; capacity building for greening the policy formulation process.
2.4 INCREASED EQUITY AND DISCRETION OF RESOURCES ALLOCATED TO LGS FOR IMPROVED SERVICE DELIVERY
39 This outcome addresses the lack of resources and discretionary grants available to Local Government for service delivery through the budget process, by reviewing, rationalising and enhancing the allocation formula. This will require establishing industry norms and service delivery standards, with appropriate costing to inform more effective budget allocations. Complementary to this is also a review of the legal
61Uganda Public Financial Management Reform Strategy
and addressing capacity needs, and reviewing the performance of the PBB approach. The approach to addressing the key coordination challenges involved in strengthening linkages between planning and budgeting will require close coordination between MoFPED, NPA, OPM, MoLG and MoPS, among others. In particular, strengthening sector coordination and sector planning processes will be key to setting and operationalizing performance standards across Government. Strengthening the role of NPA, particularly at the start of the budgeting process will also be important to inform the budget strategy, against which the NPA compliance certificate may be assessed annually.
33 Key interventions include:
i. Establish Programme based planning approach to anchor programme based budgeting reforms in development planning. This will include restructuring NDP III and Sector strategic plans along programs linked to national strategic objectives to ease PBB/S implementation; reconfiguration of national and strategic plans and the accompanying M&E results frameworks in a programme context.
ii. Strengthen institutional capacity for the planning function. Including development planning, policy impact analysis, Sector Working Groups to develop strategic plans;
iii. Enhance institutional frameworks for effective development planning and budgeting through strengthening NPA’s strategic planning function (including an NPA through DEA policy statement to inform budget strategy), streamlined sector planning function and joint collaborative approach between NPA, MoFPED, OPM, Sectors, and MoLG;
iv. Private Sector engagement forum through strengthening coordinated and participatory mechanism at sector level to inform budget preparation (To be monitored in the Priority Reform Action Matrix (PRAM) a tool of the PEMCOM). This includes inclusion of private sector (UMA, PSF, etc) and establish engagement at each sector WG during budget development consultations
v. Functional National Management Information System for effective development planning; vi. Review of Sector and MDA planning guidelines. Includes harmonization with the PFMA, Comprehensive
National development planning framework (CNDPF), National Human Resource Development Planning framework (NHRDPF), planning regulations among other planning frameworks,
vii. Review, develop and disseminate certificate of budget compliance framework to strengthen budget alignment; and
viii. Strengthen Program-Based Budgeting (PBB) reform for the planning and budgeting function in government. Includes training in M&E to conceptualise results frameworks and result hierarchy critical for development strategic plans and budget alignment.
2.2 MULTI-YEAR COMMITMENTS REFLECTED IN ANNUAL BUDGETS
34 This outcome will enhance the credibility of the MTEF by introducing a framework for multi-year budgeting and commitments monitoring, and developing capacity in budgeting and costing, with the initial focus on high-spend votes. It also focuses on operationalising the Charter of Fiscal Responsibility through institutional arrangements for monitoring targets and enhancing the underpinning statistical data. DEA (MoFPED) in liaison with NPA will strengthen the planning function through professionalization of Economists and Statisticians in government (known as ‘common cadre’), development of a certification framework, legal framework, code of ethics, work with Civil Service College to twin with reputable institutions to offer standardised and quality training.
35 Key interventions (outputs) include:
i. Strengthened accuracy and comprehensiveness of multi-year budgeting. Includes review and establishment of policy framework for multi-year budgeting and commitment monitoring;
ii. Introduce Certification Programme on development planning for Economists, Statisticians etc; and, a sustainable apprenticeship programme for improved specialised and standardized sector-level planning across government. This will be an extension of the graduate economists’ scheme.
iii. Enforcement of multiyear commitment reporting as required by the PFMA. This includes enhancing capacity for effective contract management to monitor and report multi-year contract performance and planning.
iv. Policy requirement for annual variance analysis and attendant explanation between the 2nd year of the previous MTEF with the current budget year
v. Government economists trained to improve quality of MDALG plans with a realistic multi-annual perspective.
2.3 ENHANCED PLANNING AND BUDGET RESPONSIVENESS TO GENDER AND EQUITY
36 This outcome aims to maximise opportunities further embed gender and equity considerations in Public Financial Management for sustainable development. Key strategy aspects will include gender equity, environmental equity, and spatial equity among others. In this, strategies will revolve around support compliance with the gender equity budgeting reforms as well greening the planning function of government.
37 Aspects on greening are critical because, for instance, the anticipated benefits accruing from the discovery of oil (a non-renewable natural capital) are key variables already being heavily leveraged in the GoUs economic growth prospects. This is not to mention agriculture and other minerals. Natural capital whose rate of consumption is greater than the rate of replenishment ‘in the planning horizon’ should be considered non-renewable and policies impacting their usage rate which may lead to their overuse or exhaustion in the stipulated time-frame should be cautiously formed. Unintended side-effects of some otherwise effective policies may lead to accelerated depletion of certain natural capital or environmental pollution. Environmental impact assessment, economic valuation of environmental costs vs. benefits, and appraisal of economic costs of potential side-effects in different implementation scenarios thus should be an integral part of policy making and plan development process.
38 Key interventions (outputs) include:
i. Enhance gender and equity budgeting in selected key sectors (Education, Health, Water, Energy and Agriculture). Includes capacity building to deepen GEB planning and budgeting process gender statistics refined in line with M&E methodologies
ii. Embed green concerns in national and sectoral policies and plans. This include selection of instruments (whether market or non-market) to promote green behaviour,
iii. Engender and Green the MTBF. This includes consideration on Climate Expenditure Tracking Framework (CETF) to track climate change related expenses; capacity building for greening the policy formulation process.
2.4 INCREASED EQUITY AND DISCRETION OF RESOURCES ALLOCATED TO LGS FOR IMPROVED SERVICE DELIVERY
39 This outcome addresses the lack of resources and discretionary grants available to Local Government for service delivery through the budget process, by reviewing, rationalising and enhancing the allocation formula. This will require establishing industry norms and service delivery standards, with appropriate costing to inform more effective budget allocations. Complementary to this is also a review of the legal
62 Uganda Public Financial Management Reform Strategy
framework and institutional architecture for decentralised service delivery to improve the effectiveness and efficiency of local service delivery, including development of costing norms for service facilities to guide budget allocation. Reforms under this outcome will be closely ongoing reforms linking allocations (intergovernmental transfers) with performance (more directly linked under outcome 5.4 on enhanced accountability and performance monitoring of service delivery)
40 Key interventions (outputs) include:
i. Review service delivery costs at LG level based on sector standards to establish norms in the target sectors for rural and urban LGs as recommended in the Fiscal Decentralisation Architecture report, including service delivery standards and costing;
ii. Improve the institutional framework for management of inter-governmental fiscal transfers and assignment of roles and responsibilities; and
iii. Enhance enabling legal, policy and reporting framework for local service delivery. Includes, review compliance with the current strategy/policy and legal framework for devolution of services, and assess feasibility of introducing enhanced discretion of funds (reduced earmarking) for LGs, with incentives for improved accountability performance.
2.5 EVIDENCE-BASED ECONOMIC AND FISCAL POLICY MAKING STRENGTHENED
41 This outcome aims to support and drive demand for the use of analysis and evidence in economic and fiscal policy formulation. By harmonising M&E frameworks across Government, limited resources for data collection and review will be used more effectively. In line with embedding a PBB approach, capability for reporting on the quality of service delivery down to local government level will be strengthened. This will include undertaking key strategic evaluations, based on development of a medium-term evaluation and research programme that will guide more regular evaluations. Establishing a means of coordinating, disseminating and making use of evidence to inform policy making will be important to enhance learning from previous experience. For example, commissioning timely analyses for sector performance reviews. Building on existing efforts to monitor delivery against the budget, activities will focus on developing a consistent approach to budget monitoring and improving the dissemination of monitoring information.
42 Key interventions (outputs) include:
i. Enhance ools, procedures and capacities for gathering evidence, including statistics, and undertaking analysis to inform policy. Includes undertaking an impact evaluation of NDP II; and, develop a programme of regular Public Expenditure Tracking review with selected high-spending sectors to guide the formulation of performance outcomes and targets for the remaining period of the NDP;
ii. Strengthen coordination and harmonization of fiscal and monetary policy framework of Government iii. Establish and enhance mechanisms for fostering and requiring the use of evidence in policy
formulation and planning. Includes review and establishing institutional arrangements that provide incentives for policy makers to access and use research in policy formulation e.g. compliance with certificates of fiscal impact, Publication of impact on new policy proposals and significant public investments in the National Budget;
iv. Harmonize monitoring and evaluation framework within Government. Includes developing harmonized guidelines for project ex-ante, mid-term and ex-post evaluation,
v. Enhance reporting capability on service delivery, including at LG level. Includes establishing a working interface between PBS, IFMS and AMP; and, strengthen the GAPR process for follow up of recommendations in service delivery.
vi. Strengthen monitoring of the budget and evidence uptake. This will include mechanisms for dissemination of budget monitoring information; and
vii. Develop an Economic Policy research program that is relevant and timely to inform government policy formulation. MoFPED (DEA) to coordinate Economic Policy research agenda and identify research areas (Research database, tools, system and capacity to be identified as part of implementation); better coordination and management of research, work with EPRC, DEA, NPA and other research institutions both local and international.
viii. Establish an economic research forum to discuss research findings and how to inform policy
3.5.3 Public Investment Management
Objective 3: To strengthen public investment management (PIM) for increased development returns on public spending
43 Objective 3 aims to establish and embed a comprehensive project cycle management approach across Government, focusing initially on selected key sectors. This encompasses support at all stages of the cycle to enhance the economic return from investments as well as value for money, by improving project preparation, independent review processes, use of appraisal in project selection, enhancing procurement and contract management processes, better tracking and management of public assets and strengthening accountability and performance reporting. A significant amount of training and capacity building is required under this objective across a range of PFM institutions. Training will therefore be embedded within existing government programming of training and options for partnerships with relevant external training institutions for delivery of training, including on-line learning will be explored.
Outcomes and Key Interventions:
3.1 EFFICIENT IDENTIFICATION, SELECTION AND MANAGEMENT OF PUBLIC INVESTMENT PROJECTS (PIPS) AND PUBLIC-PRIVATE PARTNERSHIPS (PPPS)
44 This outcome focuses on the planning and budgeting stage of PIM and providing an overarching project cycle management approach, with guidance and support to relevant institutions. In addition to setting up more strategic practices, the aim is also to take stock of and rationalise the existing projects in the PIP and improve the quality of data held on projects. It links closely to Objective 2, in terms of providing strategic direction to Sector Working Groups and MDAs as their plans are developed, as well as improving the quality and comprehensiveness of multi-year commitment planning and costing of projects, and ensuring these are fully captured in the MTEF and annual budgets. Underpinning the strategic prioritisation is an emphasis on project appraisal and feasibility assessment to strengthen project preparation, costing and assessment of potential economic impact to inform project selection and ensure resources are allocated to investments with the highest returns. Development of competent support structures for each institution represented at the Development Committee is also needed to undertake effective analysis and appraisal of proposed projects.
45 Global experience indicates opportunities to mobilise resources and for management of investment in infrastructure more efficiently through the private sector. Nonetheless, the use of PPPs involves significant challenges, including providing an effective legal framework, appraisal and analysis of financially viable PPPs, allocation of sufficient resources to ensure adequate project preparation and delivery, and analysis of fiscal
63Uganda Public Financial Management Reform Strategy
framework and institutional architecture for decentralised service delivery to improve the effectiveness and efficiency of local service delivery, including development of costing norms for service facilities to guide budget allocation. Reforms under this outcome will be closely ongoing reforms linking allocations (intergovernmental transfers) with performance (more directly linked under outcome 5.4 on enhanced accountability and performance monitoring of service delivery)
40 Key interventions (outputs) include:
i. Review service delivery costs at LG level based on sector standards to establish norms in the target sectors for rural and urban LGs as recommended in the Fiscal Decentralisation Architecture report, including service delivery standards and costing;
ii. Improve the institutional framework for management of inter-governmental fiscal transfers and assignment of roles and responsibilities; and
iii. Enhance enabling legal, policy and reporting framework for local service delivery. Includes, review compliance with the current strategy/policy and legal framework for devolution of services, and assess feasibility of introducing enhanced discretion of funds (reduced earmarking) for LGs, with incentives for improved accountability performance.
2.5 EVIDENCE-BASED ECONOMIC AND FISCAL POLICY MAKING STRENGTHENED
41 This outcome aims to support and drive demand for the use of analysis and evidence in economic and fiscal policy formulation. By harmonising M&E frameworks across Government, limited resources for data collection and review will be used more effectively. In line with embedding a PBB approach, capability for reporting on the quality of service delivery down to local government level will be strengthened. This will include undertaking key strategic evaluations, based on development of a medium-term evaluation and research programme that will guide more regular evaluations. Establishing a means of coordinating, disseminating and making use of evidence to inform policy making will be important to enhance learning from previous experience. For example, commissioning timely analyses for sector performance reviews. Building on existing efforts to monitor delivery against the budget, activities will focus on developing a consistent approach to budget monitoring and improving the dissemination of monitoring information.
42 Key interventions (outputs) include:
i. Enhance ools, procedures and capacities for gathering evidence, including statistics, and undertaking analysis to inform policy. Includes undertaking an impact evaluation of NDP II; and, develop a programme of regular Public Expenditure Tracking review with selected high-spending sectors to guide the formulation of performance outcomes and targets for the remaining period of the NDP;
ii. Strengthen coordination and harmonization of fiscal and monetary policy framework of Government iii. Establish and enhance mechanisms for fostering and requiring the use of evidence in policy
formulation and planning. Includes review and establishing institutional arrangements that provide incentives for policy makers to access and use research in policy formulation e.g. compliance with certificates of fiscal impact, Publication of impact on new policy proposals and significant public investments in the National Budget;
iv. Harmonize monitoring and evaluation framework within Government. Includes developing harmonized guidelines for project ex-ante, mid-term and ex-post evaluation,
v. Enhance reporting capability on service delivery, including at LG level. Includes establishing a working interface between PBS, IFMS and AMP; and, strengthen the GAPR process for follow up of recommendations in service delivery.
vi. Strengthen monitoring of the budget and evidence uptake. This will include mechanisms for dissemination of budget monitoring information; and
vii. Develop an Economic Policy research program that is relevant and timely to inform government policy formulation. MoFPED (DEA) to coordinate Economic Policy research agenda and identify research areas (Research database, tools, system and capacity to be identified as part of implementation); better coordination and management of research, work with EPRC, DEA, NPA and other research institutions both local and international.
viii. Establish an economic research forum to discuss research findings and how to inform policy
3.5.3 Public Investment Management
Objective 3: To strengthen public investment management (PIM) for increased development returns on public spending
43 Objective 3 aims to establish and embed a comprehensive project cycle management approach across Government, focusing initially on selected key sectors. This encompasses support at all stages of the cycle to enhance the economic return from investments as well as value for money, by improving project preparation, independent review processes, use of appraisal in project selection, enhancing procurement and contract management processes, better tracking and management of public assets and strengthening accountability and performance reporting. A significant amount of training and capacity building is required under this objective across a range of PFM institutions. Training will therefore be embedded within existing government programming of training and options for partnerships with relevant external training institutions for delivery of training, including on-line learning will be explored.
Outcomes and Key Interventions:
3.1 EFFICIENT IDENTIFICATION, SELECTION AND MANAGEMENT OF PUBLIC INVESTMENT PROJECTS (PIPS) AND PUBLIC-PRIVATE PARTNERSHIPS (PPPS)
44 This outcome focuses on the planning and budgeting stage of PIM and providing an overarching project cycle management approach, with guidance and support to relevant institutions. In addition to setting up more strategic practices, the aim is also to take stock of and rationalise the existing projects in the PIP and improve the quality of data held on projects. It links closely to Objective 2, in terms of providing strategic direction to Sector Working Groups and MDAs as their plans are developed, as well as improving the quality and comprehensiveness of multi-year commitment planning and costing of projects, and ensuring these are fully captured in the MTEF and annual budgets. Underpinning the strategic prioritisation is an emphasis on project appraisal and feasibility assessment to strengthen project preparation, costing and assessment of potential economic impact to inform project selection and ensure resources are allocated to investments with the highest returns. Development of competent support structures for each institution represented at the Development Committee is also needed to undertake effective analysis and appraisal of proposed projects.
45 Global experience indicates opportunities to mobilise resources and for management of investment in infrastructure more efficiently through the private sector. Nonetheless, the use of PPPs involves significant challenges, including providing an effective legal framework, appraisal and analysis of financially viable PPPs, allocation of sufficient resources to ensure adequate project preparation and delivery, and analysis of fiscal

64 Uganda Public Financial Management Reform Strategy
risks47. Capacity for management of PPPs is essential for ensuring effective planning and delivery of PPPs. In particular, it is important to engage Sectors in PPP selection, to align with development objectives of the country.
46 Key interventions (outputs) include:
i. Improve multi-annual planning and management of high value investments in selected sectors/MDAs. Including align MTEF with the multi-year commitments by sectors and MDALGs;
ii. Establish Infrastructure corridor policy. iii. Develop IT-based Integrated Bank of Projects (IBP). Including stocktaking and revalidation of PIP;
automation of projects management aspects in the PIP. This should guide phased and more prioritised selection of projects;
iv. Strengthen capacity for project cycle management of Public Investments. Including strengthened governance and technical support to the Development Committee; and, development sector specific project appraisals.
v. In addition, institutional capacity will be built across the entire project cycle to prepare quality projects, undertaking rigorous appraisal project development (selection, prefeasibility and feasibility studies), and project management, construct the assets efficiently and at minimum cost, and monitor and maintain these assets.
vi. Enhance capacity and agree principles for greening public investment by incorporating changes in the project formulation (DPP preparation), approval, implementation, and post implementation phase and related guidelines. Capacity and tools will be developed to imbibe environmental sustainability into PIM as a key building block. This includes considerations for strengthening the Environmental Clearance Certificate for projects awarded by relevant authorities in line with the national Environmental policy instruments.
vii. Establish Investment project costing methodology/formula. Including deepening usage of approved national parameters, shadow prices and conversion factors for the preparation, appraisal and selection; and Unitary Prices Database developed and disseminated;
viii. Develop modalities for independent and formal appraisal, including introduction of an annual review of major ongoing and new public investment projects for submission to Cabinet as part of the budget cycle;
ix. Enhance governance and institutional arrangements for project selection and appraisal including: review and strengthening National Development Committee (DC); establish appraisal and analysis function with each of the DC representative institutions to enrich the project selection and evaluation process; Strengthen Sector Level Development committees to deepen participation of key stakeholders including CSOs;
x. Strengthen regulatory and institutional framework for management of PPPs including sector role in PPP selection; diagnostic study to harmonize PPP legal framework with other PFM legislation and regulatory framework (PFMA, PPDA, Investment Policy etc)
xi. Strengthen capacity for management of PPPs. Including capacity for assessment of fiscal risks of PIPs and PPPs strengthened (models); and
xii. Strengthen legal framework for PIM. This will also include development of the Public Investment Management Policy, review the PPP act and harmonising the PIMS legal & regulatory framework
3.2 ENHANCED VFM IN PUBLIC PROCUREMENT FOR LARGE, COMPLEX PUBLIC PROCUREMENTS
47 This outcome recognises that there is low VfM across all public procurements, but that the greatest impact with limited resources can be achieved by focusing reform efforts on the largest, most complex
47 Leveraging Public-Private Partnerships to Plug Uganda’s Deficit in Infrastructure Finance, World Bank (2017)
procurements. The intervention approach for large, complex projects focuses on enhancing the legal and regulatory framework, local content policy and introducing techniques and processes to strengthen the independence and quality of large procurements. This will be complemented by reforms under Objective 4 (Accountability systems), which will support the roll out of e-Procurement and developing professional training programmes for procurement cadres. In order to support compliance with procurement systems, reform activities will also focus on developing a professional training programme for procurement cadres. Training under this outcome will be limited to central government, with further support provided to Local Government under Objective 5 (Local Government PFM).
48 Key interventions (outputs) include:
i. Enhance institutional, legal and regulatory framework for governance of public procurement system. Also involves oversight committee of central agencies (MoFPED, PPDA, OPM, NPA) established for large value procurement actions;
ii. Strengthen Capacity in contract management including Identifying priority sectors for rolling out Green Public Procurement; operationalizing and integrating contract management functionality on EGP/IFMS and develop contract management manual; and, developing of technical basis to support Green Public Procurement, developing PPDU staff awareness on Green Public Procurement:
iii. Improve procurement monitoring for managing large and complex procurements in selected sectors/ MDAs. Including introduction independent parallel bid evaluation (IPBEM) in high spend sectors for strategic/complex procurements.
iv. Build capacity and agree principles for greening public procurement systems and functions across government
v. Strengthen capacity in public procurement. Includes development of the Local content implementation strategy and rollout of the E-learning system across government;
3.3 OPTIMAL UTILISATION AND MAINTENANCE OF PUBLIC ASSETS AND INVESTMENTS
49 This outcome aims to address the lack of recording, monitoring and proper maintenance of public assets, primarily through the activation of the asset and inventory modules of IFMS, as well as providing supporting guidance, training and procedures for public asset management.
50 Key interventions (outputs) include:
i. Public Asset and Investment Management policy to provide overall policy guidance on assets and public investments. The formulation of a PIM legal and regulatory framework shall be guided by this policy. This also includes development of guidelines on asset operation and maintenance;
ii. Develop guidelines on Governance of state owned enterprises (SOEs). Including reporting mechanisms e.g. website with a published list of SOEs, information on the assets, income, and number of employees;
iii. Policy for management of G.O.U financial assets developed for management of GoU financial assets. Includes design and pilot the IFMS inventory management module in selected MDAs and LGs
iv. Non-current assets policy operationalised. Including implementation of road map for accrual accounting based on identified priorities
v. Develop a government asset Management Policy framework. This will guide improved recording, accounting and reporting of government assets in line with the PFMA and accounting standards; and,
vi. Develop guidelines on asset operation and maintenance. Includes extension of IFMS functionality for asset & inventory management for all MDALGs.
65Uganda Public Financial Management Reform Strategy
risks47. Capacity for management of PPPs is essential for ensuring effective planning and delivery of PPPs. In particular, it is important to engage Sectors in PPP selection, to align with development objectives of the country.
46 Key interventions (outputs) include:
i. Improve multi-annual planning and management of high value investments in selected sectors/MDAs. Including align MTEF with the multi-year commitments by sectors and MDALGs;
ii. Establish Infrastructure corridor policy. iii. Develop IT-based Integrated Bank of Projects (IBP). Including stocktaking and revalidation of PIP;
automation of projects management aspects in the PIP. This should guide phased and more prioritised selection of projects;
iv. Strengthen capacity for project cycle management of Public Investments. Including strengthened governance and technical support to the Development Committee; and, development sector specific project appraisals.
v. In addition, institutional capacity will be built across the entire project cycle to prepare quality projects, undertaking rigorous appraisal project development (selection, prefeasibility and feasibility studies), and project management, construct the assets efficiently and at minimum cost, and monitor and maintain these assets.
vi. Enhance capacity and agree principles for greening public investment by incorporating changes in the project formulation (DPP preparation), approval, implementation, and post implementation phase and related guidelines. Capacity and tools will be developed to imbibe environmental sustainability into PIM as a key building block. This includes considerations for strengthening the Environmental Clearance Certificate for projects awarded by relevant authorities in line with the national Environmental policy instruments.
vii. Establish Investment project costing methodology/formula. Including deepening usage of approved national parameters, shadow prices and conversion factors for the preparation, appraisal and selection; and Unitary Prices Database developed and disseminated;
viii. Develop modalities for independent and formal appraisal, including introduction of an annual review of major ongoing and new public investment projects for submission to Cabinet as part of the budget cycle;
ix. Enhance governance and institutional arrangements for project selection and appraisal including: review and strengthening National Development Committee (DC); establish appraisal and analysis function with each of the DC representative institutions to enrich the project selection and evaluation process; Strengthen Sector Level Development committees to deepen participation of key stakeholders including CSOs;
x. Strengthen regulatory and institutional framework for management of PPPs including sector role in PPP selection; diagnostic study to harmonize PPP legal framework with other PFM legislation and regulatory framework (PFMA, PPDA, Investment Policy etc)
xi. Strengthen capacity for management of PPPs. Including capacity for assessment of fiscal risks of PIPs and PPPs strengthened (models); and
xii. Strengthen legal framework for PIM. This will also include development of the Public Investment Management Policy, review the PPP act and harmonising the PIMS legal & regulatory framework
3.2 ENHANCED VFM IN PUBLIC PROCUREMENT FOR LARGE, COMPLEX PUBLIC PROCUREMENTS
47 This outcome recognises that there is low VfM across all public procurements, but that the greatest impact with limited resources can be achieved by focusing reform efforts on the largest, most complex
47 Leveraging Public-Private Partnerships to Plug Uganda’s Deficit in Infrastructure Finance, World Bank (2017)
procurements. The intervention approach for large, complex projects focuses on enhancing the legal and regulatory framework, local content policy and introducing techniques and processes to strengthen the independence and quality of large procurements. This will be complemented by reforms under Objective 4 (Accountability systems), which will support the roll out of e-Procurement and developing professional training programmes for procurement cadres. In order to support compliance with procurement systems, reform activities will also focus on developing a professional training programme for procurement cadres. Training under this outcome will be limited to central government, with further support provided to Local Government under Objective 5 (Local Government PFM).
48 Key interventions (outputs) include:
i. Enhance institutional, legal and regulatory framework for governance of public procurement system. Also involves oversight committee of central agencies (MoFPED, PPDA, OPM, NPA) established for large value procurement actions;
ii. Strengthen Capacity in contract management including Identifying priority sectors for rolling out Green Public Procurement; operationalizing and integrating contract management functionality on EGP/IFMS and develop contract management manual; and, developing of technical basis to support Green Public Procurement, developing PPDU staff awareness on Green Public Procurement:
iii. Improve procurement monitoring for managing large and complex procurements in selected sectors/ MDAs. Including introduction independent parallel bid evaluation (IPBEM) in high spend sectors for strategic/complex procurements.
iv. Build capacity and agree principles for greening public procurement systems and functions across government
v. Strengthen capacity in public procurement. Includes development of the Local content implementation strategy and rollout of the E-learning system across government;
3.3 OPTIMAL UTILISATION AND MAINTENANCE OF PUBLIC ASSETS AND INVESTMENTS
49 This outcome aims to address the lack of recording, monitoring and proper maintenance of public assets, primarily through the activation of the asset and inventory modules of IFMS, as well as providing supporting guidance, training and procedures for public asset management.
50 Key interventions (outputs) include:
i. Public Asset and Investment Management policy to provide overall policy guidance on assets and public investments. The formulation of a PIM legal and regulatory framework shall be guided by this policy. This also includes development of guidelines on asset operation and maintenance;
ii. Develop guidelines on Governance of state owned enterprises (SOEs). Including reporting mechanisms e.g. website with a published list of SOEs, information on the assets, income, and number of employees;
iii. Policy for management of G.O.U financial assets developed for management of GoU financial assets. Includes design and pilot the IFMS inventory management module in selected MDAs and LGs
iv. Non-current assets policy operationalised. Including implementation of road map for accrual accounting based on identified priorities
v. Develop a government asset Management Policy framework. This will guide improved recording, accounting and reporting of government assets in line with the PFMA and accounting standards; and,
vi. Develop guidelines on asset operation and maintenance. Includes extension of IFMS functionality for asset & inventory management for all MDALGs.
66 Uganda Public Financial Management Reform Strategy
3.4 ENHANCED ACCOUNTABILITY IN RESOURCE UTILISATION AND RESULTS FOR PROJECT DELIVERY
51 This outcome aims to strengthen the quality, efficiency and use of project monitoring and evaluation information for key strategic projects. In particular, will aim to embed the use of evaluation and evidence on project delivery in the annual performance review process to inform planning and budgeting of projects and PPPs. This will be closely linked to Outcome 2.5, in which key strategic evaluations of large, complex projects will be undertaken. These evaluations will be undertaken as part of the development of an evaluation programme to ensure that evaluations become part of GoU recurrent activity and not dependent on reform programming.
52 Key interventions (outputs) include:
i. Policy requirement for DC and Sectors to consider project evaluation reports. This will be monitored through PEMCOM;
ii. Harmonize standards and guidelines of public investment management for quality control, greater tracking, and monitoring of results. A shared understanding is needed across institutions related to identification, appraisal, implementation, evaluation of projects. This will include guidelines on independent end term evaluations to allow for more effective and continuous monitoring, data collection, and effective evaluation;
iii. Regular performance review and reporting of public projects and PPPs. Especially for investments in the selected frontline service delivery sectors.
3.5.4 Accountability systems and compliance in budget execution
Objective 4: To strengthen the effectiveness of accountability systems and compliance in budget execution
Outcomes and Key Interventions:
4.1 EFFECTIVENESS AND ACCURACY OF PUBLIC SERVICE PAYROLL AND PENSION MANAGEMENT SYSTEMS ENHANCED
53 Achieving this outcome will mainly involve addressing the functional and technical challenges associated with current pension and payroll system, by supporting replacement of the underlying application with a fully automated Human Capital Management (HCM) system
54 Key interventions (outputs) include:
Rollout the Human Capital Management Module to MDALGs and integrated with key Government systems (IFMS, PBS, NSIS, and EDMS). Includes capacity building of stakeholders/MDALGs in decentralised payroll and pension management; skills development in pension and payroll audits; and comprehensive Impact assessment of Pension and Payroll Reforms .
4.2 IMPROVED COMPREHENSIVENESS AND QUALITY OF FINANCIAL REPORTING
55 This outcome recognises that accounting and reporting standards are adequate, but that there is a continued drive towards international and regional frameworks that require higher standards of accounting. Professional training of accounting cadres therefore supports Government’s commitment in the Accounts Act
for all heads of accounts and finance units to be qualified accountants. Progress has been made towards this target already and is expected to be completed during the timeline of the strategy. This also facilitates compliance with the current required reporting and accounting standards. Automation of reporting is required to ensure that data generated by reporting systems is presented in a manner that supports effective decision-making.
56 Accrual accounting and enhanced accounting systems will help address the need to report more comprehensively on government operations, specifically externally financed projects, and public enterprises among others. While accrual accounting is considered a more advanced PFM reform, a long-term goal, the strategy focuses on initial planning of a road map for transitioning towards accrual accounting. An updated capacity needs assessment will ensure that there is capacity to absorb and sustain the planned reforms. As mentioned previously, large-scale professional training programmes will be developed in response to the capacity needs assessment and options for more sustainable delivery methods will be explored to ensure GoU takes up of this recurrent activity following initial support under the reforms.
57 Key interventions (outputs) include:
i. Enhance professionalization of accounting, procurement & IT cadre in MDALGs. Includes development of a comprehensive professional training programmes in audit and procurement for local governments and MDAs;
ii. Improve compliance to accounting standards and guidelines. Includes issuance of a revised financial reporting framework, guidelines and templates in MDAs and Local governments
iii. Plan for transition to accrual accounting developed. Includes configuration of current systems for activation of accrual accounting; and, development of financial reporting policies and guidelines to support accrual accounting.
iv. Enhance financial accounting capacity in LGs (LLGs). Includes design and rollout of simplified spreadsheet for LLGs to standardize financial (including revenue) accounting and reporting based on the simplified accounting guidelines
v. Enhance automation for reporting and analysis of financial data. Includes implementation of PFM Business intelligence and dashboards software to support enhanced reporting.
4.3 STRENGTHENED EFFECTIVENESS AND INTEGRITY OF ACCOUNTABILITY SYSTEMS
58 This outcome seeks to provide a comprehensive, strategic and coordinated effort to strengthen the governance of ICT systems for accountability, including collaboration with other agencies to strengthen network connectivity. In particular, reform activities will aim to improve the integration of the various stand-alone accountability systems and provide stronger IT security and management. This will also involve introducing a cross-government e-payment gateway, rolling out e-Procurement and to complete the roll-out of IFMS to all remaining entities in order to remove manual processes.
59 Cost-effective integration will require the migration and use of common platforms and services - the implementation of which is being led by NITA-U. These include (i) an application and data integration platform, (ii) common internet and connectivity infrastructure and hosting services through a national data centre, and (iii) shared services such as the unified messaging and collaboration systems, short message service (SMS) platforms and e-Payment systems. Making these services available will reduce the costs for implementation (removing the need to duplicate) and integration across the systems. In addition, it will be easier to integrate and share data with other systems and services outside PFM such as National Identification. Accordingly, and consistent with the IT Rationalization Strategy of Government (CT (2012)
67Uganda Public Financial Management Reform Strategy
3.4 ENHANCED ACCOUNTABILITY IN RESOURCE UTILISATION AND RESULTS FOR PROJECT DELIVERY
51 This outcome aims to strengthen the quality, efficiency and use of project monitoring and evaluation information for key strategic projects. In particular, will aim to embed the use of evaluation and evidence on project delivery in the annual performance review process to inform planning and budgeting of projects and PPPs. This will be closely linked to Outcome 2.5, in which key strategic evaluations of large, complex projects will be undertaken. These evaluations will be undertaken as part of the development of an evaluation programme to ensure that evaluations become part of GoU recurrent activity and not dependent on reform programming.
52 Key interventions (outputs) include:
i. Policy requirement for DC and Sectors to consider project evaluation reports. This will be monitored through PEMCOM;
ii. Harmonize standards and guidelines of public investment management for quality control, greater tracking, and monitoring of results. A shared understanding is needed across institutions related to identification, appraisal, implementation, evaluation of projects. This will include guidelines on independent end term evaluations to allow for more effective and continuous monitoring, data collection, and effective evaluation;
iii. Regular performance review and reporting of public projects and PPPs. Especially for investments in the selected frontline service delivery sectors.
3.5.4 Accountability systems and compliance in budget execution
Objective 4: To strengthen the effectiveness of accountability systems and compliance in budget execution
Outcomes and Key Interventions:
4.1 EFFECTIVENESS AND ACCURACY OF PUBLIC SERVICE PAYROLL AND PENSION MANAGEMENT SYSTEMS ENHANCED
53 Achieving this outcome will mainly involve addressing the functional and technical challenges associated with current pension and payroll system, by supporting replacement of the underlying application with a fully automated Human Capital Management (HCM) system
54 Key interventions (outputs) include:
Rollout the Human Capital Management Module to MDALGs and integrated with key Government systems (IFMS, PBS, NSIS, and EDMS). Includes capacity building of stakeholders/MDALGs in decentralised payroll and pension management; skills development in pension and payroll audits; and comprehensive Impact assessment of Pension and Payroll Reforms .
4.2 IMPROVED COMPREHENSIVENESS AND QUALITY OF FINANCIAL REPORTING
55 This outcome recognises that accounting and reporting standards are adequate, but that there is a continued drive towards international and regional frameworks that require higher standards of accounting. Professional training of accounting cadres therefore supports Government’s commitment in the Accounts Act
for all heads of accounts and finance units to be qualified accountants. Progress has been made towards this target already and is expected to be completed during the timeline of the strategy. This also facilitates compliance with the current required reporting and accounting standards. Automation of reporting is required to ensure that data generated by reporting systems is presented in a manner that supports effective decision-making.
56 Accrual accounting and enhanced accounting systems will help address the need to report more comprehensively on government operations, specifically externally financed projects, and public enterprises among others. While accrual accounting is considered a more advanced PFM reform, a long-term goal, the strategy focuses on initial planning of a road map for transitioning towards accrual accounting. An updated capacity needs assessment will ensure that there is capacity to absorb and sustain the planned reforms. As mentioned previously, large-scale professional training programmes will be developed in response to the capacity needs assessment and options for more sustainable delivery methods will be explored to ensure GoU takes up of this recurrent activity following initial support under the reforms.
57 Key interventions (outputs) include:
i. Enhance professionalization of accounting, procurement & IT cadre in MDALGs. Includes development of a comprehensive professional training programmes in audit and procurement for local governments and MDAs;
ii. Improve compliance to accounting standards and guidelines. Includes issuance of a revised financial reporting framework, guidelines and templates in MDAs and Local governments
iii. Plan for transition to accrual accounting developed. Includes configuration of current systems for activation of accrual accounting; and, development of financial reporting policies and guidelines to support accrual accounting.
iv. Enhance financial accounting capacity in LGs (LLGs). Includes design and rollout of simplified spreadsheet for LLGs to standardize financial (including revenue) accounting and reporting based on the simplified accounting guidelines
v. Enhance automation for reporting and analysis of financial data. Includes implementation of PFM Business intelligence and dashboards software to support enhanced reporting.
4.3 STRENGTHENED EFFECTIVENESS AND INTEGRITY OF ACCOUNTABILITY SYSTEMS
58 This outcome seeks to provide a comprehensive, strategic and coordinated effort to strengthen the governance of ICT systems for accountability, including collaboration with other agencies to strengthen network connectivity. In particular, reform activities will aim to improve the integration of the various stand-alone accountability systems and provide stronger IT security and management. This will also involve introducing a cross-government e-payment gateway, rolling out e-Procurement and to complete the roll-out of IFMS to all remaining entities in order to remove manual processes.
59 Cost-effective integration will require the migration and use of common platforms and services - the implementation of which is being led by NITA-U. These include (i) an application and data integration platform, (ii) common internet and connectivity infrastructure and hosting services through a national data centre, and (iii) shared services such as the unified messaging and collaboration systems, short message service (SMS) platforms and e-Payment systems. Making these services available will reduce the costs for implementation (removing the need to duplicate) and integration across the systems. In addition, it will be easier to integrate and share data with other systems and services outside PFM such as National Identification. Accordingly, and consistent with the IT Rationalization Strategy of Government (CT (2012)
68 Uganda Public Financial Management Reform Strategy
112), all PFM IT systems, existing and new, will have to be hosted on these common platforms by the end of the strategy (FY2022/23). NITA-U, in collaboration with MDAs implementing systems, will present for PEMCOM’s approval, a roadmap for migrating existing systems, and guidelines for deployment of new PFM systems requiring them (systems) to use these common platforms as they become established (to be monitored in the PRAM).
60 Key interventions include:
i. Roll out the integrated E-GP. Includes change management and capacity building for the e-GP implementation;
ii. Enhance and integrate Core PFM accountability systems. Includes strengthening of PFM systems establishment of the IT governance committee and develop guidelines for acquisition of PFM systems by MDAs and LGs; and, integration of ICT-based accountability systems (IFMS, HCM, PBS, e-Tax, e-GP, e-Payment Gateway, DFMAS, AMP, PIM Systems;
iii. Roll out IFMS (Oracle and FMSFM) & e-Payment Gateway to all remaining MDALGs. Includes ssetting-up Treasury Service Centers to support optimal use of PFM systems by users; and, upgrade of IFMS (Oracle and FMSFM) databases and applications in line with recommended software lifecycles;
iv. Strengthen of IT Governance and Security of financial accountability systems. Includes implementation of zero-day protection for PFM systems and design and implementation PFM Data archiving system.
4.4 STRENGTHENED EFFECTIVENESS OF COMMITMENT CONTROLS AND CASH MANAGEMENT
61 The aim of this outcome is to address the problem of accumulation of new expenditure arrears by strengthening commitment controls. This will be coordinated closely with activities under Objective 2 relating to monitoring and reporting of commitments and improving multi-year budgeting. The challenge of operationalising the integration of cash and debt management is also tackled by providing support to both functions to improve cash forecasting, and enhancing the roll out of the TSA. Part of the strategy to control expenditure arrears is to improve the sustainability of the public pension scheme, which is a source of spending pressure. This will involve a review and actuarial study of public pensions and improved fund management.
62 Key interventions (outputs) include:
i. Enhance and more sustainable Public Service Pension Scheme. Includes actuarial study of current public service pension scheme; establishment of the Board of Trustees for Public service pension scheme/fund (PSPS); and also legal and regulatory policy review; build capacity of stakeholders to manage the Public Service pension scheme;
ii. Enhance and enforce Commitment Controls. Includes enhancement of commitment controls within IFMS to capture multi-year commitments and arrears; and, development of consolidated guidelines on recognition, ageing, settlement and reporting of arrears;
iii. Enhance mechanisms for regular reporting and verification of arrears by MDALGs operationalised. Includes monthly reporting provided by MDALGs to MOFPED and OPM on the status of clearing domestic arrears; external audit of existing stock of arrears; enforcement of prepayments of utilities across government and development of an arrears clearance strategy with prioritization criteria and institutional responsibilities for monitoring & clearance;
iv. Strengthen Cash management capacity and institutional framework. Including integration of CG and LG TSA and externally financed projects; and, development of instruments for financing liquidity shortfalls and investing surpluses;
v. Implement Active Cash Management. Includes development of guidelines for cash management; building capacity of Debt and Cash policy directorate to execute its cash management function; and also capacity of MDA&LGs in cash flow planning and forecasting
4.5 ENHANCED ASSURANCE (GOVERNANCE, RISK AND CONTROL) BY THE INTERNAL AUDIT FUNCTION FOR COMPLIANCE
OF PFM SYSTEMS
63 In order to strengthen effective management and delivery of government services and operations, Government MDALGs needs to develop and operationalise risk management. Internal audit will therefore play a key role in supporting the establishment and roll out of risk management approaches by operationalizing the risk management strategy across government. This will form a key part of their assurance function. Expanded automation will ensure that internal auditing processes are efficient. In addition, capacity building for internal audit functions will ensure that their audit and recommendations are relevant to government and focused on key risks. Implementation of recommendations will continue to be tracked through the performance monitoring framework.
64 Key interventions (outputs) include:
i. Expand automation of internal audit processes (using, Teammate, IDEA, CAATs) to LGs not currently covered. Includes rollout and training MDAs Audit recommendations tracking system; and, provision of computer assisted audit tools (CAATS) for LGs;
ii. Roll out Risk Management strategy. Includes capacity enhancement for audit of high value investments enhanced; as well as for oil and gas specialized auditing and related tools
iii. Strengthen timeliness and quality of internal audit reporting. Includes building expertise in IT forensic audit for the PFM Systems; Audit of Oil, Revenue Management;
iv. Improve treasury inspection arrangements to enhance compliance and capacity building. Includes establishment of a harmonized Treasury inspection framework for foreign missions as well as capacity enhancement for PFM systems inspection and emerging treasury functions.
4.6 INCREASED PFM COMPLIANCE THROUGH INCENTIVES AND SANCTIONS MECHANISMS
65 This outcome aims to address the ‘soft’ reforms, by reviewing behavioural incentives, rewards and sanctions surrounding compliance with PFM procedures, including inspections with support provided, consultations, dissemination of information and updates and implementation of new procedures.
66 Key interventions (outputs) include:
i. Improve access to information on PFM reforms. Includes strengthening change management and communication processes to enhance ownership of reforms between AGO and Accounting units;
ii. Improve enabling environment for PFM performance management. Includes revision of Uganda Public Service Standing Orders, developing guidelines for discipline and disciplinary procedures for implementation of a comprehensive sanctions and rewards regime and, establishment of recognition and awards system to identify and highlight officers and institutions that demonstrate accountability and good PFM practice at both CG and LG level.
69Uganda Public Financial Management Reform Strategy
112), all PFM IT systems, existing and new, will have to be hosted on these common platforms by the end of the strategy (FY2022/23). NITA-U, in collaboration with MDAs implementing systems, will present for PEMCOM’s approval, a roadmap for migrating existing systems, and guidelines for deployment of new PFM systems requiring them (systems) to use these common platforms as they become established (to be monitored in the PRAM).
60 Key interventions include:
i. Roll out the integrated E-GP. Includes change management and capacity building for the e-GP implementation;
ii. Enhance and integrate Core PFM accountability systems. Includes strengthening of PFM systems establishment of the IT governance committee and develop guidelines for acquisition of PFM systems by MDAs and LGs; and, integration of ICT-based accountability systems (IFMS, HCM, PBS, e-Tax, e-GP, e-Payment Gateway, DFMAS, AMP, PIM Systems;
iii. Roll out IFMS (Oracle and FMSFM) & e-Payment Gateway to all remaining MDALGs. Includes ssetting-up Treasury Service Centers to support optimal use of PFM systems by users; and, upgrade of IFMS (Oracle and FMSFM) databases and applications in line with recommended software lifecycles;
iv. Strengthen of IT Governance and Security of financial accountability systems. Includes implementation of zero-day protection for PFM systems and design and implementation PFM Data archiving system.
4.4 STRENGTHENED EFFECTIVENESS OF COMMITMENT CONTROLS AND CASH MANAGEMENT
61 The aim of this outcome is to address the problem of accumulation of new expenditure arrears by strengthening commitment controls. This will be coordinated closely with activities under Objective 2 relating to monitoring and reporting of commitments and improving multi-year budgeting. The challenge of operationalising the integration of cash and debt management is also tackled by providing support to both functions to improve cash forecasting, and enhancing the roll out of the TSA. Part of the strategy to control expenditure arrears is to improve the sustainability of the public pension scheme, which is a source of spending pressure. This will involve a review and actuarial study of public pensions and improved fund management.
62 Key interventions (outputs) include:
i. Enhance and more sustainable Public Service Pension Scheme. Includes actuarial study of current public service pension scheme; establishment of the Board of Trustees for Public service pension scheme/fund (PSPS); and also legal and regulatory policy review; build capacity of stakeholders to manage the Public Service pension scheme;
ii. Enhance and enforce Commitment Controls. Includes enhancement of commitment controls within IFMS to capture multi-year commitments and arrears; and, development of consolidated guidelines on recognition, ageing, settlement and reporting of arrears;
iii. Enhance mechanisms for regular reporting and verification of arrears by MDALGs operationalised. Includes monthly reporting provided by MDALGs to MOFPED and OPM on the status of clearing domestic arrears; external audit of existing stock of arrears; enforcement of prepayments of utilities across government and development of an arrears clearance strategy with prioritization criteria and institutional responsibilities for monitoring & clearance;
iv. Strengthen Cash management capacity and institutional framework. Including integration of CG and LG TSA and externally financed projects; and, development of instruments for financing liquidity shortfalls and investing surpluses;
v. Implement Active Cash Management. Includes development of guidelines for cash management; building capacity of Debt and Cash policy directorate to execute its cash management function; and also capacity of MDA&LGs in cash flow planning and forecasting
4.5 ENHANCED ASSURANCE (GOVERNANCE, RISK AND CONTROL) BY THE INTERNAL AUDIT FUNCTION FOR COMPLIANCE
OF PFM SYSTEMS
63 In order to strengthen effective management and delivery of government services and operations, Government MDALGs needs to develop and operationalise risk management. Internal audit will therefore play a key role in supporting the establishment and roll out of risk management approaches by operationalizing the risk management strategy across government. This will form a key part of their assurance function. Expanded automation will ensure that internal auditing processes are efficient. In addition, capacity building for internal audit functions will ensure that their audit and recommendations are relevant to government and focused on key risks. Implementation of recommendations will continue to be tracked through the performance monitoring framework.
64 Key interventions (outputs) include:
i. Expand automation of internal audit processes (using, Teammate, IDEA, CAATs) to LGs not currently covered. Includes rollout and training MDAs Audit recommendations tracking system; and, provision of computer assisted audit tools (CAATS) for LGs;
ii. Roll out Risk Management strategy. Includes capacity enhancement for audit of high value investments enhanced; as well as for oil and gas specialized auditing and related tools
iii. Strengthen timeliness and quality of internal audit reporting. Includes building expertise in IT forensic audit for the PFM Systems; Audit of Oil, Revenue Management;
iv. Improve treasury inspection arrangements to enhance compliance and capacity building. Includes establishment of a harmonized Treasury inspection framework for foreign missions as well as capacity enhancement for PFM systems inspection and emerging treasury functions.
4.6 INCREASED PFM COMPLIANCE THROUGH INCENTIVES AND SANCTIONS MECHANISMS
65 This outcome aims to address the ‘soft’ reforms, by reviewing behavioural incentives, rewards and sanctions surrounding compliance with PFM procedures, including inspections with support provided, consultations, dissemination of information and updates and implementation of new procedures.
66 Key interventions (outputs) include:
i. Improve access to information on PFM reforms. Includes strengthening change management and communication processes to enhance ownership of reforms between AGO and Accounting units;
ii. Improve enabling environment for PFM performance management. Includes revision of Uganda Public Service Standing Orders, developing guidelines for discipline and disciplinary procedures for implementation of a comprehensive sanctions and rewards regime and, establishment of recognition and awards system to identify and highlight officers and institutions that demonstrate accountability and good PFM practice at both CG and LG level.

70 Uganda Public Financial Management Reform Strategy
3.5.5 Local Government PFM for Service Delivery
Objective 5: Improved transparency and accountability of Local Government PFM systems
61 Objective 5 aims to strengthen the fiscal and PFM architecture for fiscal decentralisation, in order to empower Local Government to implement the fiscal decentralisation strategy, in collaboration with central government. This links closely with outcome 2.4, which rationalises inter-governmental fiscal transfers to provide more adequate resources for Local Government. This objective also links to the DRM strategy, which will provide direction on steps to enhance local own-source revenue collections, which is also outlined below. Other key aspects requiring reform effort include local government procurement procedures, strengthening internal audit and clarity of the roles of local PACs and regional committees in audit scrutiny, and building capacity to improve the quality and coordination of planning and budgeting for local service delivery.
Outcomes and Key Interventions:
5.1 INCREASED CONTRIBUTION OF LG OWN-SOURCE REVENUE
62 This outcome aims to address the weak performance of local revenue collections by providing support to review and enhance the legal and policy framework as well as administrative capacities for revenue collection.
63 Key interventions (outputs) include:
i. Enhance enabling environment for LG own-source revenue mobilisation, in line with DRM strategy; ii. Roll out Revenue management database to all Local Governments. This provides accurate information
of tax payers and amounts to be charged and involve political leadership in revenue enhancement efforts. Includes updated strategy to build capacity for LG revenue management; and
iii. Revenue management and collection capacity enhanced for local governments, in line with DRM strategy.
5.2 EFFECTIVE PLANNING AND BUDGETING AT LOCAL GOVERNMENTS
64 This outcome aims to address the weaknesses in planning and budgeting at local level, and their coordination with central government budgeting and planning to ensure that resources are allocated efficiently e.g. through centralised procurement, where appropriate, but with proper consideration of the specific needs of individual LGs.
65 Key interventions (outputs) include:
i. Harmonize planning and budgeting cycles between LG and national budgets, in particular: a) Simplified development planning frameworks and formats developed and popularised; b) Review and disseminate NPA planning guidelines for local governments; c) A review of legal framework on LG budgeting cycles; d) NPA Certification of CG budgets to ensure that they are in line with priorities submitted by LGs; and e) Strengthen Planning Units in LGs.
ii. Support planning, budgeting and execution processes (lessons from LGPA) including: a) Support LGs in spatial planning and related Geographical Information System (GIS) equipment and
software to strengthen evidence based strategic planning b) Issue and orientation of LGs on sector grants, budgeting and implementation guidelines (including
issues on social and environmental safeguards) on time; c) Publicize Indicative Planning Figures (IPFs) for LGs on time; d) Provide ample support to LGs to use the PBS and minimize changes to the budgeting and reporting
systems; e) Provide guidance and support to LGs to execute the physical planning function f) Support in the development and use of Statistical Abstracts
iii. Financial management and reporting: Improve linkages between the sector departments and the planning/PFM functions
5.3 IMPROVED QUALITY OF AUDIT AND COORDINATED FOLLOW UP OF RECOMMENDATIONS BY LGPACS AND REGIONAL
AUDIT COMMITTEES
66 This outcome aims to strengthen the quality and resource allocation to the internal audit function and to strengthen follow up of audit (internal and external) recommendations, with consideration of the roles and coordination between LGPACs, Local Government Accounts Committee of Parliament and regional audit committees.
67 Key interventions (outputs) include:
i. Improved effectiveness and capacity of LGPACs and coordination with other audit committees. Includes developing policy, on roles and coordination of LGPACs, district PACs and regional audit committees;
ii. Improved monitoring and reporting on implementation of LG audit recommendations. Includes development of a system to ease tracking implementation of audit recommendations for accounting officers; and
iii. Enhanced quality of internal audit function at LG level. Including assessment, support, and incentives for Local Governments to allocate sufficient resources for the internal audit function.
5.4 ENHANCED ACCOUNTABILITY AND PERFORMANCE MONITORING IN DELIVERY OF SERVICES IN KEY SERVICE SECTORS
(ROADS, EDUCATION, HEALTH AND AGRICULTURE SERVICES) 68 The aim of this outcome is to strengthen performance monitoring of local service delivery and provide a
more formalised and coordinated structure for reporting of performance and dissemination of findings. It also addresses the gap in local level public expenditure tracking and evaluation. This strategy will support renewed efforts to (a) monitor public expenditures to high-spending units to address the identified gap in expenditure tracking; and (b) evaluate the effectiveness of public finances. In order to enhance sustainability of this reform, the strategy will also aim to establish a Government programme for regular Public Expenditure Tracking Surveys (PETS) reviews over a medium to long-term cycle and adoption of Public Expenditure Reviews (PERs). This should foster prioritization of the PETS as feedback mechanism on service delivery across government. Results in this area have bearing on outcomes under 2.5 (on strengthening evidence-based economic and fiscal policy)
69 To evaluate and inform public expenditure patterns, the strategy will seek to maximise outcomes in GoU reforms focused on use of fiscal transfer systems to provide incentives for improved institutional and
71Uganda Public Financial Management Reform Strategy
3.5.5 Local Government PFM for Service Delivery
Objective 5: Improved transparency and accountability of Local Government PFM systems
61 Objective 5 aims to strengthen the fiscal and PFM architecture for fiscal decentralisation, in order to empower Local Government to implement the fiscal decentralisation strategy, in collaboration with central government. This links closely with outcome 2.4, which rationalises inter-governmental fiscal transfers to provide more adequate resources for Local Government. This objective also links to the DRM strategy, which will provide direction on steps to enhance local own-source revenue collections, which is also outlined below. Other key aspects requiring reform effort include local government procurement procedures, strengthening internal audit and clarity of the roles of local PACs and regional committees in audit scrutiny, and building capacity to improve the quality and coordination of planning and budgeting for local service delivery.
Outcomes and Key Interventions:
5.1 INCREASED CONTRIBUTION OF LG OWN-SOURCE REVENUE
62 This outcome aims to address the weak performance of local revenue collections by providing support to review and enhance the legal and policy framework as well as administrative capacities for revenue collection.
63 Key interventions (outputs) include:
i. Enhance enabling environment for LG own-source revenue mobilisation, in line with DRM strategy; ii. Roll out Revenue management database to all Local Governments. This provides accurate information
of tax payers and amounts to be charged and involve political leadership in revenue enhancement efforts. Includes updated strategy to build capacity for LG revenue management; and
iii. Revenue management and collection capacity enhanced for local governments, in line with DRM strategy.
5.2 EFFECTIVE PLANNING AND BUDGETING AT LOCAL GOVERNMENTS
64 This outcome aims to address the weaknesses in planning and budgeting at local level, and their coordination with central government budgeting and planning to ensure that resources are allocated efficiently e.g. through centralised procurement, where appropriate, but with proper consideration of the specific needs of individual LGs.
65 Key interventions (outputs) include:
i. Harmonize planning and budgeting cycles between LG and national budgets, in particular: a) Simplified development planning frameworks and formats developed and popularised; b) Review and disseminate NPA planning guidelines for local governments; c) A review of legal framework on LG budgeting cycles; d) NPA Certification of CG budgets to ensure that they are in line with priorities submitted by LGs; and e) Strengthen Planning Units in LGs.
ii. Support planning, budgeting and execution processes (lessons from LGPA) including: a) Support LGs in spatial planning and related Geographical Information System (GIS) equipment and
software to strengthen evidence based strategic planning b) Issue and orientation of LGs on sector grants, budgeting and implementation guidelines (including
issues on social and environmental safeguards) on time; c) Publicize Indicative Planning Figures (IPFs) for LGs on time; d) Provide ample support to LGs to use the PBS and minimize changes to the budgeting and reporting
systems; e) Provide guidance and support to LGs to execute the physical planning function f) Support in the development and use of Statistical Abstracts
iii. Financial management and reporting: Improve linkages between the sector departments and the planning/PFM functions
5.3 IMPROVED QUALITY OF AUDIT AND COORDINATED FOLLOW UP OF RECOMMENDATIONS BY LGPACS AND REGIONAL
AUDIT COMMITTEES
66 This outcome aims to strengthen the quality and resource allocation to the internal audit function and to strengthen follow up of audit (internal and external) recommendations, with consideration of the roles and coordination between LGPACs, Local Government Accounts Committee of Parliament and regional audit committees.
67 Key interventions (outputs) include:
i. Improved effectiveness and capacity of LGPACs and coordination with other audit committees. Includes developing policy, on roles and coordination of LGPACs, district PACs and regional audit committees;
ii. Improved monitoring and reporting on implementation of LG audit recommendations. Includes development of a system to ease tracking implementation of audit recommendations for accounting officers; and
iii. Enhanced quality of internal audit function at LG level. Including assessment, support, and incentives for Local Governments to allocate sufficient resources for the internal audit function.
5.4 ENHANCED ACCOUNTABILITY AND PERFORMANCE MONITORING IN DELIVERY OF SERVICES IN KEY SERVICE SECTORS
(ROADS, EDUCATION, HEALTH AND AGRICULTURE SERVICES) 68 The aim of this outcome is to strengthen performance monitoring of local service delivery and provide a
more formalised and coordinated structure for reporting of performance and dissemination of findings. It also addresses the gap in local level public expenditure tracking and evaluation. This strategy will support renewed efforts to (a) monitor public expenditures to high-spending units to address the identified gap in expenditure tracking; and (b) evaluate the effectiveness of public finances. In order to enhance sustainability of this reform, the strategy will also aim to establish a Government programme for regular Public Expenditure Tracking Surveys (PETS) reviews over a medium to long-term cycle and adoption of Public Expenditure Reviews (PERs). This should foster prioritization of the PETS as feedback mechanism on service delivery across government. Results in this area have bearing on outcomes under 2.5 (on strengthening evidence-based economic and fiscal policy)
69 To evaluate and inform public expenditure patterns, the strategy will seek to maximise outcomes in GoU reforms focused on use of fiscal transfer systems to provide incentives for improved institutional and
72 Uganda Public Financial Management Reform Strategy
service delivery performance of Local Governments. This will be done by leveraging on the Local Government Performance Assessment system48 (aimed at promoting effective behavior, systems and procedures in order improve LG’s administration and service delivery) and linking it with the aspects of the reform results framework. OPM shall conduct the LG PA exercise in time (starting September) following all the prescribed procedures and in line with the budget calendar. This will ensure that the results are used to inform the appointment of Accounting Officers and allocation of development grants. This will be monitored in PEMCOM.
70 Key interventions (outputs) include:
i. Revise the LG Performance Assessment Manual and process. The revision will focus on timing of the assessment, sharpening some of the indicators and refinement of the weights and explanation on a few others.
ii. Foster immediate Administrative Action based on review of the specific needs identified in line with recommendations in the FY2017/18 report. The Ministry of Finance, Planning and Economic Development shall issue a circular consolidating all issues for attention/redress by LGs including, among others the weaker core areas identified of urgent attention.
iii. Performance Improvement of LGs. The performance improvement will be offered through a mix of mutually reinforcing approaches, including regional and district specific performance improvement clinics as well as local government specific hands-on support. The indicative areas for performance improvement, based on a review of the core weaker areas in the assessment that will be concretized into a Performance Improvement Plan. The support will focus on thematic areas of underperformance and low performing LGs as per the LG PA report.
iv. Recognition of Accounting Officers from LGs. Public recognition/Incentives and acknowledgment of local governments that have complied with the six (6) accountability requirements (as well as the worst performing) as per the LG Performance Assessment.
v. Strengthen LG Governance and participation structures. Including ensuring functionality of community oversight and accountability structures – harmonization of guidelines, ensuring proper constitution and induction/training.
vi. Develop and operationalise core government monitoring and evaluation system based on NDP, sector and MDA plans. Includes Impact evaluations for establishment of the effect of the planning and budgeting system on the desired results.
vii. Enhance performance and accountability for service delivery at LG level. Including a) Undertake Public Expenditure Reviews (PER) to analyze government expenditures focusing on
selected sectors (roads infrastructure, water, education, health, and agriculture services). This will include simplified dissemination measures to foster use and inform the budget planning stages.
b) Dissemination of performance monitoring guidelines developed for LGs, including associated capacity building as well results from the selected sector LG Performance Assessments.
c) Develop a harmonized tracking system for services; d) Annual performance reports published and disseminated on GoU web sites; and e) Undertake selected sector level Public Expenditure tracking surveys (PETS)
48 The system has three dimensions: (1) Budget (1a) and accountability requirements (1b); (2) crosscutting and sector functional processes and systems broken down in measures for districts and municipalities (2a) and for sub-counties, town councils and divisions (2b); and (3) service delivery results.
5.5 ENHANCED INTEGRITY AND VALUE FOR MONEY OF LOCAL GOVERNMENT PROCUREMENTS
71 This outcome aims to address weaknesses in the local government procurement systems and procedures. In particular, the key interventions include strengthening the integrity of LG procurement procedures and developing an enhanced legal framework for LG procurement. The approach to strengthening integrity of procurement is framed by undertaking a procurement integrity survey at LG level with contractors, procurement officials, LG leaders and CSOs, to agree challenges and actions for improvement. On the basis of the survey, a national campaign to strengthen integrity of procurement at HLG level will be developed, including support to the procurement function, as required. The survey will be followed up in 2020 to assess the impact of the campaign.
72 Key interventions (outputs) include:
i. Strengthen integrity of LG procurement procedures. Including undertaking a procurement integrity survey at LG level with contractors, procurement officials, LG leaders, and CSOs to identify actions for improvement;
ii. Enhance legal framework for LG procurement. Including review of legal framework for procurement at LG level and amendments.
iii. Enhance procurement and contract management capacity. Including support to sector departments to appreciate and perform their roles related to procurement and contract management.
3.5.6 External Oversight and Governance of PFM Reforms
Objective 6: To strengthen oversight and PFM governance functions for the sustainability of development outcomes
72 Objective 6 aims to address the most pressing gaps in the accountability chain, in terms of audit scrutiny and stimulating demand for downward accountability. It also aims to strengthen the overarching governance framework and the sustainability of PFM reforms by ensuring effective communication and change management, robust capacity development, programming, monitoring and evaluation of PFM reforms. Furthermore, attainment of PFM reform objectives under this strategy requires a capable and efficient human resource, which is complementary to the achievement of sustainable development outcomes.
Outcomes and Key Interventions:
6.1 ENHANCED IMPACT OF FINANCIAL AND VFM AUDIT REPORTING AND OVERSIGHT
73 This outcome addresses the backlog in parliamentary scrutiny of audit reports and audit follow up by developing an overarching action plan, support, guidance, monitoring and tracking mechanisms, particularly through the OAG’s Management Information System (MIS). This outcome also aims to evaluate the impact of audit recommendations on key sectors and to assess ‘softer’ aspects of reform by developing a better understanding of the political economy drivers for reform to inform more effective political engagement and commitment to reform. To address the reported lack of appreciation of VfM audits, the strategy will sensitise Members of Parliament. OAG will engage further the target audience for audits in the selection of audit cases in order to strengthen buy-in.
73Uganda Public Financial Management Reform Strategy
service delivery performance of Local Governments. This will be done by leveraging on the Local Government Performance Assessment system48 (aimed at promoting effective behavior, systems and procedures in order improve LG’s administration and service delivery) and linking it with the aspects of the reform results framework. OPM shall conduct the LG PA exercise in time (starting September) following all the prescribed procedures and in line with the budget calendar. This will ensure that the results are used to inform the appointment of Accounting Officers and allocation of development grants. This will be monitored in PEMCOM.
70 Key interventions (outputs) include:
i. Revise the LG Performance Assessment Manual and process. The revision will focus on timing of the assessment, sharpening some of the indicators and refinement of the weights and explanation on a few others.
ii. Foster immediate Administrative Action based on review of the specific needs identified in line with recommendations in the FY2017/18 report. The Ministry of Finance, Planning and Economic Development shall issue a circular consolidating all issues for attention/redress by LGs including, among others the weaker core areas identified of urgent attention.
iii. Performance Improvement of LGs. The performance improvement will be offered through a mix of mutually reinforcing approaches, including regional and district specific performance improvement clinics as well as local government specific hands-on support. The indicative areas for performance improvement, based on a review of the core weaker areas in the assessment that will be concretized into a Performance Improvement Plan. The support will focus on thematic areas of underperformance and low performing LGs as per the LG PA report.
iv. Recognition of Accounting Officers from LGs. Public recognition/Incentives and acknowledgment of local governments that have complied with the six (6) accountability requirements (as well as the worst performing) as per the LG Performance Assessment.
v. Strengthen LG Governance and participation structures. Including ensuring functionality of community oversight and accountability structures – harmonization of guidelines, ensuring proper constitution and induction/training.
vi. Develop and operationalise core government monitoring and evaluation system based on NDP, sector and MDA plans. Includes Impact evaluations for establishment of the effect of the planning and budgeting system on the desired results.
vii. Enhance performance and accountability for service delivery at LG level. Including a) Undertake Public Expenditure Reviews (PER) to analyze government expenditures focusing on
selected sectors (roads infrastructure, water, education, health, and agriculture services). This will include simplified dissemination measures to foster use and inform the budget planning stages.
b) Dissemination of performance monitoring guidelines developed for LGs, including associated capacity building as well results from the selected sector LG Performance Assessments.
c) Develop a harmonized tracking system for services; d) Annual performance reports published and disseminated on GoU web sites; and e) Undertake selected sector level Public Expenditure tracking surveys (PETS)
48 The system has three dimensions: (1) Budget (1a) and accountability requirements (1b); (2) crosscutting and sector functional processes and systems broken down in measures for districts and municipalities (2a) and for sub-counties, town councils and divisions (2b); and (3) service delivery results.
5.5 ENHANCED INTEGRITY AND VALUE FOR MONEY OF LOCAL GOVERNMENT PROCUREMENTS
71 This outcome aims to address weaknesses in the local government procurement systems and procedures. In particular, the key interventions include strengthening the integrity of LG procurement procedures and developing an enhanced legal framework for LG procurement. The approach to strengthening integrity of procurement is framed by undertaking a procurement integrity survey at LG level with contractors, procurement officials, LG leaders and CSOs, to agree challenges and actions for improvement. On the basis of the survey, a national campaign to strengthen integrity of procurement at HLG level will be developed, including support to the procurement function, as required. The survey will be followed up in 2020 to assess the impact of the campaign.
72 Key interventions (outputs) include:
i. Strengthen integrity of LG procurement procedures. Including undertaking a procurement integrity survey at LG level with contractors, procurement officials, LG leaders, and CSOs to identify actions for improvement;
ii. Enhance legal framework for LG procurement. Including review of legal framework for procurement at LG level and amendments.
iii. Enhance procurement and contract management capacity. Including support to sector departments to appreciate and perform their roles related to procurement and contract management.
3.5.6 External Oversight and Governance of PFM Reforms
Objective 6: To strengthen oversight and PFM governance functions for the sustainability of development outcomes
72 Objective 6 aims to address the most pressing gaps in the accountability chain, in terms of audit scrutiny and stimulating demand for downward accountability. It also aims to strengthen the overarching governance framework and the sustainability of PFM reforms by ensuring effective communication and change management, robust capacity development, programming, monitoring and evaluation of PFM reforms. Furthermore, attainment of PFM reform objectives under this strategy requires a capable and efficient human resource, which is complementary to the achievement of sustainable development outcomes.
Outcomes and Key Interventions:
6.1 ENHANCED IMPACT OF FINANCIAL AND VFM AUDIT REPORTING AND OVERSIGHT
73 This outcome addresses the backlog in parliamentary scrutiny of audit reports and audit follow up by developing an overarching action plan, support, guidance, monitoring and tracking mechanisms, particularly through the OAG’s Management Information System (MIS). This outcome also aims to evaluate the impact of audit recommendations on key sectors and to assess ‘softer’ aspects of reform by developing a better understanding of the political economy drivers for reform to inform more effective political engagement and commitment to reform. To address the reported lack of appreciation of VfM audits, the strategy will sensitise Members of Parliament. OAG will engage further the target audience for audits in the selection of audit cases in order to strengthen buy-in.
74 Uganda Public Financial Management Reform Strategy
74 Key interventions (outputs) include:
i. Develop capacity for specialised audits across the PFM processes and selected sectors. This includes greening auditing based on the principles set by International Organization of Supreme Audit Institutions (INTOSAI); Energy and Oil Audits, Inculcating climate change in audit policy
ii. MDALGs utilise a shared tracking system to monitor and report on implementation of audit recommendations. Including completion of the OAG MIS and rollout in all regional centres.
iii. Assess the impact of audit recommendations on service delivery in selected key sectors; iv. Improve tracking oversight recommendation by MDALGs. Including implementing a training
programme for Local Government Public Accounts Committees; and, v. Strengthen mechanisms for political engagement on PFM for accountability Including capacity building
for parliamentary PFM and accountability forums; and special studies on Political Economy of Public Financial Management Reforms to inform understanding of the implications for dialogue and operational engagement of non-technical drivers such as ‘political commitment’ and inform strategies for strengthening sustainability of PFM reform.
6.2 IMPROVED COORDINATION AND MONITORING OF PFM PROCESSES WITHIN THE ACCOUNTABILITY SECTOR
75 In order to strengthen coordination of PFM reform delivery, new structures of technical sub-groups will be established under PEMCOM covering all six priority reform areas. Through closer collaboration with the Accountability Sector structures, performance against the strategy will be reviewed annually and key risks managed, with escalation to the appropriate forum for action, where necessary. These structures are elaborated further in Section 4. As part of the communications and change management strategy for PFM reform (see Section 5), this outcome aims to strengthen the consistency of tracking progress against PFM reforms and more effective dissemination of the tracking and results, such as through enhanced data collection, online platforms for monitoring progress and regular updates or communications campaigns.
76 Key interventions (outputs) include:
i. Enhance communication and feedback mechanisms among MDAs and stakeholders implementing the PFM Reform Strategy, including a web-based monitoring system and Action Log;
ii. Improve performance reporting by MDALGs on the implementation of the PFM Reform Strategy, including detailed technical compendium of all PFM KPIs, data collection procedures and reporting guidelines;
iii. Establish new coordination structures for joint planning, implementation and monitoring of the 6 priority reform areas harmonised with the Accountability Sector; and
iv. Introduce an annual review of progress of PFM reforms in collaboration with the Accountability Sectors deepen learning from key stakeholders
6.3 SUSTAINED UPTAKE OF REFORMS THROUGH IMPROVED LEARNING AND COORDINATION OF PFM REFORM PROCESSES
77 Further support to change management and communications is provided under this outcome, including a comprehensive capacity needs assessment and strategic training and capacity building programme. Options for strengthening and facilitating the role of relevant training institutions to deliver PFM training will be explored. For example, this will include exploring the setting up of an e-lab and e-learning platforms for PFM systems. In particular, training programmes to be developed will include strengthening core induction and in-
service training modules for officials and cadres on PFM systems, professionalization of cadres, regulations, enforcement mechanisms, and accountability and integrity standards. This outcome will be attained through enhancement of feedback mechanisms through external reviews by BMAU, EPRC and CSO experts to ensure that learning from experiences has an impact on better policy design and delivery Similarly, this outcome aims to explore and pilot mechanisms for embedding learning from monitoring and evaluation of PFM reforms.
78 Key interventions (outputs) include:
i. Enhance awareness and feedback opportunities for LGs and MDAs in the implementation of the PFM Reform Strategy. Includes establishment of MIS to capture LG performance reporting;
ii. Effective change management and communication on PFM. Includes development of comprehensive (and attendant coordination mechanisms) needs assessment along with tracer studies to assess impact of learning on improvements in governance and service delivery;
iii. Strengthen training modules and systems for induction and in-service training of civil servants on PFM systems and standards;
iv. Establish PFM Centre of excellence for strengthening coordinated learning, research and academia institutions, CSOs as well as international PFM specialised think-tanks and sharing country experience and practices in implementing PFM reforms; and
v. Develop mechanisms for deepening learning from budget monitoring and diagnostics. Includes strengthening systems of budget monitoring and tracking recommendations there from in the selected focus sectors and revenue monitoring
vi. Strengthen Civil Service College as Public Sector Development centre of excellence.
6.4 INCREASED DEMAND FOR DOWNWARD ACCOUNTABILITY TO CITIZENS FOR PUBLIC SPENDING AND SERVICE DELIVERY
PERFORMANCE
79 This outcome aims to strengthen accountability to citizens through dissemination of PFM performance information and studies and to coordinate under the Accountability Sector to develop the Accountability Sector Strategic Investment Plan (ASSIP) community scorecard for measuring the assessment, planning, monitoring and evaluation of service delivery.
80 Key interventions (outputs) include:
i. Enhance public access to PFM reforms performance information and downward accountability feedback mechanisms. Includes developing a budget transparency and communications strategy and community scorecard for citizen driven accountability assessment of service delivery;
ii. Develop a strategy/citizen campaign for popularising and strengthening opportunities in the Whistle Blowers Protection Act 2010 and
iii. Establish structured engagement forums on accountability in Local Governments and CG with the objective of promoting support for change management, accountability and integrity. Includes review and improvement of mechanisms for dialogue on LG accountability
6.5 COST-EFFECTIVE PUBLIC ADMINISTRATION THROUGH RATIONALISATION OF THE ADMINISTRATIVE UNITS
81 This outcome acknowledges the constraints currently posed by rigid and out of date public administration structures by building collaborations with the Public Service Sector to undertake a comprehensive review and rationalisation of structures to ensure that they are commensurate with the current realities and needs. This
75Uganda Public Financial Management Reform Strategy
74 Key interventions (outputs) include:
i. Develop capacity for specialised audits across the PFM processes and selected sectors. This includes greening auditing based on the principles set by International Organization of Supreme Audit Institutions (INTOSAI); Energy and Oil Audits, Inculcating climate change in audit policy
ii. MDALGs utilise a shared tracking system to monitor and report on implementation of audit recommendations. Including completion of the OAG MIS and rollout in all regional centres.
iii. Assess the impact of audit recommendations on service delivery in selected key sectors; iv. Improve tracking oversight recommendation by MDALGs. Including implementing a training
programme for Local Government Public Accounts Committees; and, v. Strengthen mechanisms for political engagement on PFM for accountability Including capacity building
for parliamentary PFM and accountability forums; and special studies on Political Economy of Public Financial Management Reforms to inform understanding of the implications for dialogue and operational engagement of non-technical drivers such as ‘political commitment’ and inform strategies for strengthening sustainability of PFM reform.
6.2 IMPROVED COORDINATION AND MONITORING OF PFM PROCESSES WITHIN THE ACCOUNTABILITY SECTOR
75 In order to strengthen coordination of PFM reform delivery, new structures of technical sub-groups will be established under PEMCOM covering all six priority reform areas. Through closer collaboration with the Accountability Sector structures, performance against the strategy will be reviewed annually and key risks managed, with escalation to the appropriate forum for action, where necessary. These structures are elaborated further in Section 4. As part of the communications and change management strategy for PFM reform (see Section 5), this outcome aims to strengthen the consistency of tracking progress against PFM reforms and more effective dissemination of the tracking and results, such as through enhanced data collection, online platforms for monitoring progress and regular updates or communications campaigns.
76 Key interventions (outputs) include:
i. Enhance communication and feedback mechanisms among MDAs and stakeholders implementing the PFM Reform Strategy, including a web-based monitoring system and Action Log;
ii. Improve performance reporting by MDALGs on the implementation of the PFM Reform Strategy, including detailed technical compendium of all PFM KPIs, data collection procedures and reporting guidelines;
iii. Establish new coordination structures for joint planning, implementation and monitoring of the 6 priority reform areas harmonised with the Accountability Sector; and
iv. Introduce an annual review of progress of PFM reforms in collaboration with the Accountability Sectors deepen learning from key stakeholders
6.3 SUSTAINED UPTAKE OF REFORMS THROUGH IMPROVED LEARNING AND COORDINATION OF PFM REFORM PROCESSES
77 Further support to change management and communications is provided under this outcome, including a comprehensive capacity needs assessment and strategic training and capacity building programme. Options for strengthening and facilitating the role of relevant training institutions to deliver PFM training will be explored. For example, this will include exploring the setting up of an e-lab and e-learning platforms for PFM systems. In particular, training programmes to be developed will include strengthening core induction and in-
service training modules for officials and cadres on PFM systems, professionalization of cadres, regulations, enforcement mechanisms, and accountability and integrity standards. This outcome will be attained through enhancement of feedback mechanisms through external reviews by BMAU, EPRC and CSO experts to ensure that learning from experiences has an impact on better policy design and delivery Similarly, this outcome aims to explore and pilot mechanisms for embedding learning from monitoring and evaluation of PFM reforms.
78 Key interventions (outputs) include:
i. Enhance awareness and feedback opportunities for LGs and MDAs in the implementation of the PFM Reform Strategy. Includes establishment of MIS to capture LG performance reporting;
ii. Effective change management and communication on PFM. Includes development of comprehensive (and attendant coordination mechanisms) needs assessment along with tracer studies to assess impact of learning on improvements in governance and service delivery;
iii. Strengthen training modules and systems for induction and in-service training of civil servants on PFM systems and standards;
iv. Establish PFM Centre of excellence for strengthening coordinated learning, research and academia institutions, CSOs as well as international PFM specialised think-tanks and sharing country experience and practices in implementing PFM reforms; and
v. Develop mechanisms for deepening learning from budget monitoring and diagnostics. Includes strengthening systems of budget monitoring and tracking recommendations there from in the selected focus sectors and revenue monitoring
vi. Strengthen Civil Service College as Public Sector Development centre of excellence.
6.4 INCREASED DEMAND FOR DOWNWARD ACCOUNTABILITY TO CITIZENS FOR PUBLIC SPENDING AND SERVICE DELIVERY
PERFORMANCE
79 This outcome aims to strengthen accountability to citizens through dissemination of PFM performance information and studies and to coordinate under the Accountability Sector to develop the Accountability Sector Strategic Investment Plan (ASSIP) community scorecard for measuring the assessment, planning, monitoring and evaluation of service delivery.
80 Key interventions (outputs) include:
i. Enhance public access to PFM reforms performance information and downward accountability feedback mechanisms. Includes developing a budget transparency and communications strategy and community scorecard for citizen driven accountability assessment of service delivery;
ii. Develop a strategy/citizen campaign for popularising and strengthening opportunities in the Whistle Blowers Protection Act 2010 and
iii. Establish structured engagement forums on accountability in Local Governments and CG with the objective of promoting support for change management, accountability and integrity. Includes review and improvement of mechanisms for dialogue on LG accountability
6.5 COST-EFFECTIVE PUBLIC ADMINISTRATION THROUGH RATIONALISATION OF THE ADMINISTRATIVE UNITS
81 This outcome acknowledges the constraints currently posed by rigid and out of date public administration structures by building collaborations with the Public Service Sector to undertake a comprehensive review and rationalisation of structures to ensure that they are commensurate with the current realities and needs. This
76 Uganda Public Financial Management Reform Strategy
should be supported by a review of PFM administrative structures to feed into development of an appropriate legal and regulatory framework. Government is committed to planning for further reform in this area and will require close policy collaboration and commitment from the wider accountability sector.
82 Key interventions (outputs) include:
i. Review of accountability public administration structures. Including a series of studies and reviews of the cost of public administration vis-à-vis service delivery, PFM structures, salary study and benchmarking;
ii. Follow-up recommendations of studies e.g. Undertake feasibility studies, establish cost effective framework of public sector operations, develop policy on rationalisation of public administration, undertake relevant process-re-engineering and supportive change management and technical support, as required; and
iii. Review legal framework to facilitate recommendations from the above studies and propose amendments, as required.
3.6 PFM Reform Strategy Contribution to Wider Policy Objectives 83 The PFM reform strategy has been designed and will be implemented in line with a number of wider policy
objectives, at international, regional, national and sector levels. This section outlines the most relevant and significant policies and frameworks that will affect the PFM reforms and to which PFM reform will contribute.
3.6.1 International policy and PFM standards 84 Uganda’s PFM reforms are undertaken and measured in line with a number of frameworks that are
internationally recognised benchmarks. Uganda PFM reforms continue to strive to achieve the standards set by these frameworks, while taking into consideration the specific Ugandan context, and ensuring that the means of achieving these standards are tailored to that context. In particular, PFM reforms are measured using the Public Expenditure and Financial Accountability (PEFA) 2016 framework, in conjunction with other ‘sub’-level frameworks, which measure aspects of the PFM system in more detail. Examples of sub-level assessment tools are the IMF’s Tax Administration Diagnostic Assessment Tool (TADAT) and Public Investment Management Assessment (PIMA) tools, and the OECD’s Methodology for Assessing Procurement Systems (MAPS). In addition, international public accounting standards will be references, such as UN’s International Public Sector Accounting Standards (IPSAS), and accounts classification systems of IMF’s Government Financial Statistics (GFS) and OECD’s Classification of the Functions of Government (COFOG).
85 Furthermore, Uganda participates in various global indicator assessments, to which PFM performance contributes, such as World Bank’s ‘Doing Business’ index, the World Economic Forum ‘Global Competitiveness Index’, International Budget Partnership’s ‘Open Budget Index’, among others.
86 At the policy level, Uganda has been a member of the World Trade Organisation (WTO) since 1995 and, as such, national policy on tax, trade and regulation is designed within the parameters defined by compliance with WTO membership rules on tariffs and trade. Additionally, as members of the World Customs Organisation (WCO), Uganda is committed to several standards, for example, on the harmonised system (HS) for coding of traded goods and services and on customs procedures and integrity.
3.6.2 EAC Regional Integration Policy 87 Uganda is a member of the East African Community (EAC) and the Common Market for East and Southern
African Countries (COMESA). Countries in a regional integration context often pursue similar macroeconomic
and fiscal policies and, therefore, to the extent possible, the PFM reform strategy is aligned to the policies of both the EAC and COMESA, where existing policy relates to PFM. For example, EAC member states have harmonised budget processes and Ministers of Finance meet before the budget to agree on EAC-wide measures, which inform national tax policy. Other areas have harmonisation agendas, which set targets and policy standards, such as tax harmonisation and cross-border customs cooperation or the economic convergence criteria, which support the integration towards adoption of a single currency.
88 The PFM reform strategy also recognises that regional integration may deter or restrict national discretion to undertake some reforms, due to EAC-level agreed policy and legal frameworks. One example the East African Customs Management Act, which sets tariff rates and exemptions to which all member states have subscribed through national legislation. The budget calendar also has to adhere to the convention of EAC member states reading their budgets on the same day in mid-June, which can be a restricting factor in allowing adequate legislative scrutiny before approval by 1st July at the start of the Ugandan fiscal year.
3.6.3 National Development Plan (NDP II) 89 The second National Development Plan (NDP II) is the anchor to the Government’s overall development
strategy and sectoral plans and, therefore, provides the policy priorities underpinning the PFM reform strategy, particularly regarding the link between planning and budgeting. An effective PFM system ensures that national policy priorities are delivered, through effective planning and that plans are translated into budgets for adequate resources to be allocated where needed to deliver national economic objectives. In this regard, the PFM strategy contributes most to the NDP II objective number 4: “Strengthen Mechanisms for Quality, Effective and Efficient Service Delivery”. NDP II objectives are organised around sector priorities. The PFM reform strategy therefore contributes to delivery of the NDP II through the achievement of Accountability Sector plans (as shown in Box 1 below).
90 It is recognised this reform strategy shall be updated to take cognizance of recommendations from the NDPII midterm review and ensuing updates (NDPIII) thereof.
Box 1: NDP II Objectives for the Accountability Sector (PFM Strategy elements in BOLD)
1. Increase the tax to GDP ratio 2. Increase access to finance 3. Increase private investments 4. Reduce interest rates 5. Improve Public Financial Management and consistency in the economic development framework 6. Increase insurance penetration 7. Increase national savings to GDP ratio 8. Increase the level of capitalization and widen investment opportunities in the capital markets 9. Improve statistical data production and policy research 10. Enhance the prevention, detection and elimination of corruption 11. Increase demand for accountability 12. Improve compliance with accountability rules and regulations 13. Improve collaboration and networking amongst development institutions. 14. Enhance public contract management and performance
77Uganda Public Financial Management Reform Strategy
should be supported by a review of PFM administrative structures to feed into development of an appropriate legal and regulatory framework. Government is committed to planning for further reform in this area and will require close policy collaboration and commitment from the wider accountability sector.
82 Key interventions (outputs) include:
i. Review of accountability public administration structures. Including a series of studies and reviews of the cost of public administration vis-à-vis service delivery, PFM structures, salary study and benchmarking;
ii. Follow-up recommendations of studies e.g. Undertake feasibility studies, establish cost effective framework of public sector operations, develop policy on rationalisation of public administration, undertake relevant process-re-engineering and supportive change management and technical support, as required; and
iii. Review legal framework to facilitate recommendations from the above studies and propose amendments, as required.
3.6 PFM Reform Strategy Contribution to Wider Policy Objectives 83 The PFM reform strategy has been designed and will be implemented in line with a number of wider policy
objectives, at international, regional, national and sector levels. This section outlines the most relevant and significant policies and frameworks that will affect the PFM reforms and to which PFM reform will contribute.
3.6.1 International policy and PFM standards 84 Uganda’s PFM reforms are undertaken and measured in line with a number of frameworks that are
internationally recognised benchmarks. Uganda PFM reforms continue to strive to achieve the standards set by these frameworks, while taking into consideration the specific Ugandan context, and ensuring that the means of achieving these standards are tailored to that context. In particular, PFM reforms are measured using the Public Expenditure and Financial Accountability (PEFA) 2016 framework, in conjunction with other ‘sub’-level frameworks, which measure aspects of the PFM system in more detail. Examples of sub-level assessment tools are the IMF’s Tax Administration Diagnostic Assessment Tool (TADAT) and Public Investment Management Assessment (PIMA) tools, and the OECD’s Methodology for Assessing Procurement Systems (MAPS). In addition, international public accounting standards will be references, such as UN’s International Public Sector Accounting Standards (IPSAS), and accounts classification systems of IMF’s Government Financial Statistics (GFS) and OECD’s Classification of the Functions of Government (COFOG).
85 Furthermore, Uganda participates in various global indicator assessments, to which PFM performance contributes, such as World Bank’s ‘Doing Business’ index, the World Economic Forum ‘Global Competitiveness Index’, International Budget Partnership’s ‘Open Budget Index’, among others.
86 At the policy level, Uganda has been a member of the World Trade Organisation (WTO) since 1995 and, as such, national policy on tax, trade and regulation is designed within the parameters defined by compliance with WTO membership rules on tariffs and trade. Additionally, as members of the World Customs Organisation (WCO), Uganda is committed to several standards, for example, on the harmonised system (HS) for coding of traded goods and services and on customs procedures and integrity.
3.6.2 EAC Regional Integration Policy 87 Uganda is a member of the East African Community (EAC) and the Common Market for East and Southern
African Countries (COMESA). Countries in a regional integration context often pursue similar macroeconomic
and fiscal policies and, therefore, to the extent possible, the PFM reform strategy is aligned to the policies of both the EAC and COMESA, where existing policy relates to PFM. For example, EAC member states have harmonised budget processes and Ministers of Finance meet before the budget to agree on EAC-wide measures, which inform national tax policy. Other areas have harmonisation agendas, which set targets and policy standards, such as tax harmonisation and cross-border customs cooperation or the economic convergence criteria, which support the integration towards adoption of a single currency.
88 The PFM reform strategy also recognises that regional integration may deter or restrict national discretion to undertake some reforms, due to EAC-level agreed policy and legal frameworks. One example the East African Customs Management Act, which sets tariff rates and exemptions to which all member states have subscribed through national legislation. The budget calendar also has to adhere to the convention of EAC member states reading their budgets on the same day in mid-June, which can be a restricting factor in allowing adequate legislative scrutiny before approval by 1st July at the start of the Ugandan fiscal year.
3.6.3 National Development Plan (NDP II) 89 The second National Development Plan (NDP II) is the anchor to the Government’s overall development
strategy and sectoral plans and, therefore, provides the policy priorities underpinning the PFM reform strategy, particularly regarding the link between planning and budgeting. An effective PFM system ensures that national policy priorities are delivered, through effective planning and that plans are translated into budgets for adequate resources to be allocated where needed to deliver national economic objectives. In this regard, the PFM strategy contributes most to the NDP II objective number 4: “Strengthen Mechanisms for Quality, Effective and Efficient Service Delivery”. NDP II objectives are organised around sector priorities. The PFM reform strategy therefore contributes to delivery of the NDP II through the achievement of Accountability Sector plans (as shown in Box 1 below).
90 It is recognised this reform strategy shall be updated to take cognizance of recommendations from the NDPII midterm review and ensuing updates (NDPIII) thereof.
Box 1: NDP II Objectives for the Accountability Sector (PFM Strategy elements in BOLD)
1. Increase the tax to GDP ratio 2. Increase access to finance 3. Increase private investments 4. Reduce interest rates 5. Improve Public Financial Management and consistency in the economic development framework 6. Increase insurance penetration 7. Increase national savings to GDP ratio 8. Increase the level of capitalization and widen investment opportunities in the capital markets 9. Improve statistical data production and policy research 10. Enhance the prevention, detection and elimination of corruption 11. Increase demand for accountability 12. Improve compliance with accountability rules and regulations 13. Improve collaboration and networking amongst development institutions. 14. Enhance public contract management and performance

78 Uganda Public Financial Management Reform Strategy
91 The NDP II also provides for specific interventions for the accountability sector that relate to PFM, as shown in Box 2, which indicates NDP II interventions that are included in the PFM reform strategy. The PFM reform strategy is therefore aligned to these initiatives. Some PFM reform interventions are initiatives continued from previous accountability sector and PFM reform implementation.
3.6.4 Accountability Sector Investment Plan (ASSIP) 92 The Accountability Sector Strategic Investment Plan (ASSIP) 2017/18 to 2019/20 provides a guiding
framework for improvements in the Accountability Sector and draws its objectives from the NDP II (as outlined above). A number of strategies for addressing each of the Sector objectives were identified in the ASSIP, many of which have been selected for inclusion in the PFM strategy, developed further, or absorbed in sub-sector strategies (such as the medium-term revenue strategy) that provide an overarching framework for a range of interventions and activities. The PFM reform strategy is therefore aligned to the relevant priorities identified under the ASSIP (those highlighted in Bold in Box 1). Figure X below illustrates how the objectives under ASSIP (and NDP II) map on to the 6 priority areas of the PFM strategy.
Box 2: Elements of NDP II Accountability Interventions included in PFM Reform Strategy
a) Develop mechanisms for exploiting capital gains tax: Review new opportunities for revenue mobilization and develop proposals (one of which could be, but not limited to, capital gains tax)
b) Combat international tax evasion schemes in complex sectors to raise more tax e.g. corporate tax c) Maintain Macro Economic stability: strengthen macro management through operationalising the Charter of Fiscal
Responsibility d) Develop an Integrated Planning and Resource Allocation Framework to ensure alignment of the planning and budgeting
instruments. e) Establish a national Project Appraisal Unit to spear head the preparation of investment-ready projects f) Introduce measures to strengthen the capacity of sectors to prepare Bankable projects g) Implement the programme based budgeting to effectively focus on national and sectoral budgets on achieving results h) Establish mechanisms to enhance capacity for development of consistent sectoral and national development plans i) Introduction and roll-out of e-Government Procurement (e-GP) j) Introduce measures to support institutional capabilities to carry out policy research k) Promote active communication between implementers of programmes and the public l) Improve communication and impact of audit findings to stakeholders m) Ensure follow up and implementation of recommendations made by oversight institutions n) Strengthen the enforcement of the regulatory frame work and service delivery standards o) Enforce follow up mechanism on the implementation of the Audit recommendations
Figure 3.3: Alignment of PFM Reform Strategy Objectives with ASSIP
3.6.5 Fiscal Decentralisation 93 The Government of Uganda’s Fiscal Decentralisation Strategy (FDS) 2002 was one of the most significant
reforms introduced to ensure good governance and improved service delivery by local governments. Local Governments play a key role in the implementation of Government policy and delivery of national priorities, including those under the NDP II as well as at the higher level of sector outcomes under global Sustainable Development Goals. Even though the FDS 2002 is still in place, there are a number of weaknesses that have been identified in the operationalisation of the strategy, as outlined in the situation analysis in Section 2 and set out in the Intergovernmental Fiscal Transfers Reform Programme (April 2017). The PFM reform strategy therefore aims to begin removing barriers to the implementation of the Fiscal Decentralisation strategy, and to empower Local Governments to deliver services in line with the original intentions of the FDS.
3.7 Other Reforms Complementary to PFM 94 For the PFM reform strategy to achieve its intended objectives, it is important that partnerships are
strengthened with other complementary reform efforts. Objective 6 of the PFM reform strategy aims to operationalise this coordination through stronger collaboration with relevant institutions and improved communications on PFM reform progress. Relevant complementary reforms include, but are not limited to:
i. Closer working relationship with civil society organisations (CSOs) as part of the regular business of Government, such as participation in PEMCOM, regular MoFPED press briefings and engagement in the budget formulation and consultation process, in addition to other performance reviews;
ii. Intergovernmental fiscal transfer reforms aimed at incentivizing the provision of service delivery results and processes in service delivery units. Within the intergovernmental fiscal transfer reform
ASSIP thematic area
ASSIP (NDP II) Objective PFM Strategy Objective
Increase the tax to GDP ratio Objective 1: Resource mobilisation
Objective 2: Budget & planning
Objective 3: Public Investment ManagementEconomic Management
Improve statistical data production and policy research
Objective 2: Budget & planning
Enhance public contract management and performance
Objective 3: Public Investment Management
Improve PFM and consistency in the economic development framework
Objective 5: Local Government PFM
Improve compliance with accountability rules and regulations
Objective 4: Control and compliance in Accountability systemsObjective 4: Control and compliance in Accountability systems
Objective 6: Oversight and governance of PFM reforms
Increase public demand for accountabilityImprove collaboration and networking amongst development institutions
Improve PFM and consistency in the economic development framework
Resource mobilisation and allocation
Objective 6: Oversight and governance of PFM reforms
Enhance the prevention, detection and elimination of corruption
Audit and Anti-Corruption
Budget execution and accounting
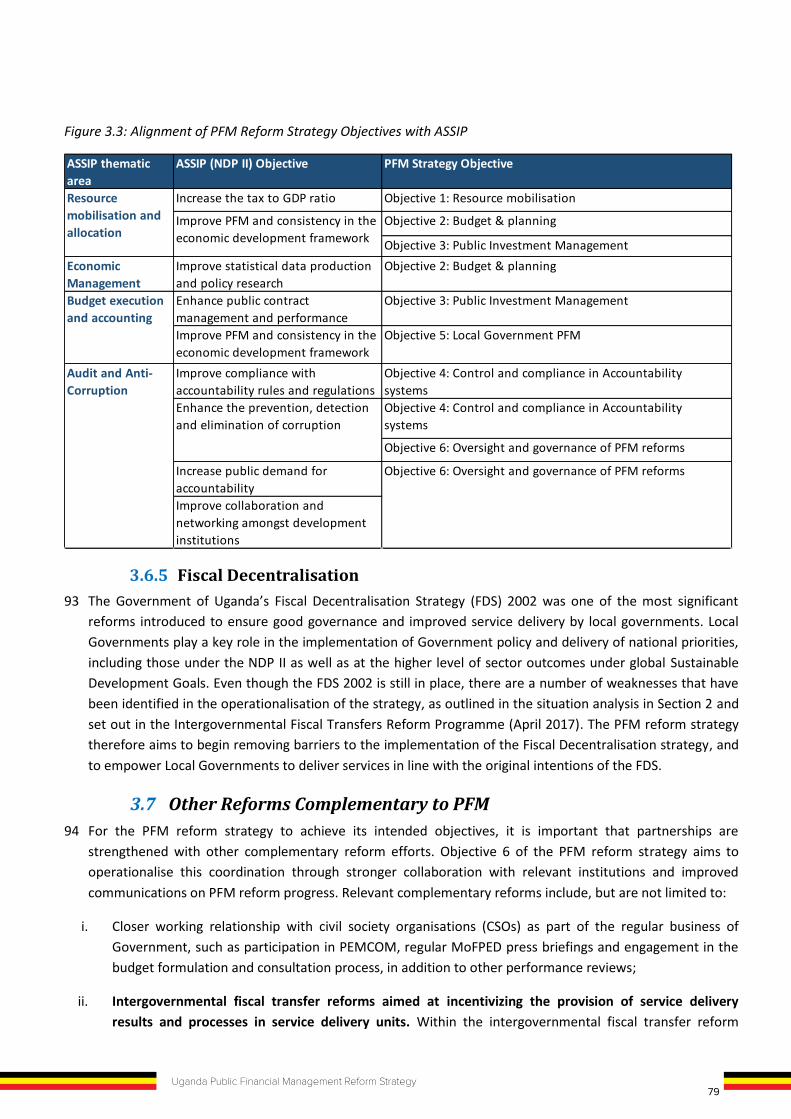
79Uganda Public Financial Management Reform Strategy
91 The NDP II also provides for specific interventions for the accountability sector that relate to PFM, as shown in Box 2, which indicates NDP II interventions that are included in the PFM reform strategy. The PFM reform strategy is therefore aligned to these initiatives. Some PFM reform interventions are initiatives continued from previous accountability sector and PFM reform implementation.
3.6.4 Accountability Sector Investment Plan (ASSIP) 92 The Accountability Sector Strategic Investment Plan (ASSIP) 2017/18 to 2019/20 provides a guiding
framework for improvements in the Accountability Sector and draws its objectives from the NDP II (as outlined above). A number of strategies for addressing each of the Sector objectives were identified in the ASSIP, many of which have been selected for inclusion in the PFM strategy, developed further, or absorbed in sub-sector strategies (such as the medium-term revenue strategy) that provide an overarching framework for a range of interventions and activities. The PFM reform strategy is therefore aligned to the relevant priorities identified under the ASSIP (those highlighted in Bold in Box 1). Figure X below illustrates how the objectives under ASSIP (and NDP II) map on to the 6 priority areas of the PFM strategy.
Box 2: Elements of NDP II Accountability Interventions included in PFM Reform Strategy
a) Develop mechanisms for exploiting capital gains tax: Review new opportunities for revenue mobilization and develop proposals (one of which could be, but not limited to, capital gains tax)
b) Combat international tax evasion schemes in complex sectors to raise more tax e.g. corporate tax c) Maintain Macro Economic stability: strengthen macro management through operationalising the Charter of Fiscal
Responsibility d) Develop an Integrated Planning and Resource Allocation Framework to ensure alignment of the planning and budgeting
instruments. e) Establish a national Project Appraisal Unit to spear head the preparation of investment-ready projects f) Introduce measures to strengthen the capacity of sectors to prepare Bankable projects g) Implement the programme based budgeting to effectively focus on national and sectoral budgets on achieving results h) Establish mechanisms to enhance capacity for development of consistent sectoral and national development plans i) Introduction and roll-out of e-Government Procurement (e-GP) j) Introduce measures to support institutional capabilities to carry out policy research k) Promote active communication between implementers of programmes and the public l) Improve communication and impact of audit findings to stakeholders m) Ensure follow up and implementation of recommendations made by oversight institutions n) Strengthen the enforcement of the regulatory frame work and service delivery standards o) Enforce follow up mechanism on the implementation of the Audit recommendations
Figure 3.3: Alignment of PFM Reform Strategy Objectives with ASSIP
3.6.5 Fiscal Decentralisation 93 The Government of Uganda’s Fiscal Decentralisation Strategy (FDS) 2002 was one of the most significant
reforms introduced to ensure good governance and improved service delivery by local governments. Local Governments play a key role in the implementation of Government policy and delivery of national priorities, including those under the NDP II as well as at the higher level of sector outcomes under global Sustainable Development Goals. Even though the FDS 2002 is still in place, there are a number of weaknesses that have been identified in the operationalisation of the strategy, as outlined in the situation analysis in Section 2 and set out in the Intergovernmental Fiscal Transfers Reform Programme (April 2017). The PFM reform strategy therefore aims to begin removing barriers to the implementation of the Fiscal Decentralisation strategy, and to empower Local Governments to deliver services in line with the original intentions of the FDS.
3.7 Other Reforms Complementary to PFM 94 For the PFM reform strategy to achieve its intended objectives, it is important that partnerships are
strengthened with other complementary reform efforts. Objective 6 of the PFM reform strategy aims to operationalise this coordination through stronger collaboration with relevant institutions and improved communications on PFM reform progress. Relevant complementary reforms include, but are not limited to:
i. Closer working relationship with civil society organisations (CSOs) as part of the regular business of Government, such as participation in PEMCOM, regular MoFPED press briefings and engagement in the budget formulation and consultation process, in addition to other performance reviews;
ii. Intergovernmental fiscal transfer reforms aimed at incentivizing the provision of service delivery results and processes in service delivery units. Within the intergovernmental fiscal transfer reform
ASSIP thematic area
ASSIP (NDP II) Objective PFM Strategy Objective
Increase the tax to GDP ratio Objective 1: Resource mobilisation
Objective 2: Budget & planning
Objective 3: Public Investment ManagementEconomic Management
Improve statistical data production and policy research
Objective 2: Budget & planning
Enhance public contract management and performance
Objective 3: Public Investment Management
Improve PFM and consistency in the economic development framework
Objective 5: Local Government PFM
Improve compliance with accountability rules and regulations
Objective 4: Control and compliance in Accountability systemsObjective 4: Control and compliance in Accountability systems
Objective 6: Oversight and governance of PFM reforms
Increase public demand for accountabilityImprove collaboration and networking amongst development institutions
Improve PFM and consistency in the economic development framework
Resource mobilisation and allocation
Objective 6: Oversight and governance of PFM reforms
Enhance the prevention, detection and elimination of corruption
Audit and Anti-Corruption
Budget execution and accounting

80 Uganda Public Financial Management Reform Strategy
process, the LG Performance Assessment (PA) system is aimed at attaining the third objective of the reform: using the fiscal transfer system to provide incentives for improved institutional and service delivery performance of Local Governments. The overall objective of the LG PA system is to promote effective behavior, systems and procedures of importance for LG’s efficient administration and service delivery.
iii. Public Service reforms that support compliance with PFM procedures and reward good performance, including pay reform and performance incentives, review of public administration structures, review of standing orders and administrative sanctions;
iv. Public-Private Partnerships (PPPs), which help mobilise additional resources for economic development;
v. Justice, Law and Order Sector reforms, which have an impact on the effectiveness of the PFM reform strategy through successful investigation and prosecution of corruption and violations of the PFM Act and its regulations, thus serving as a deterrent;
vi. Anti-corruption initiatives and inter-agency cooperation on investigations and prosecutions to help prevent, detect and address corruption, which support control and compliance in PFM accountability systems and mitigation of fiduciary risks. Opportunities for specific collaboration include assessment of corruption vulnerabilities in the development of a risk management approach across Government, particularly for strategic procurements under PIM;
vii. Local government capacity development and investment in municipal infrastructure, which supports the strengthening of LG PFM systems and ability to deliver better quality services at the local level;
viii. Reforms to the wider regulatory environment, which support formalisation of informal businesses, provide institutional frameworks for monitoring economic activity and for managing tax compliance, such as National ID cards, regulation and licensing of alcohol, real estate, tourism and other activities.
3.8 Institutional Linkages to the PFM Reform Strategy 95 Compared to previous PFM reform strategy phases, there are now more institutions contributing directly to
reforms and more providing an indirect supporting role. Figure 3.4 below represents the key institutions responsible for delivery of the PFM reform and the linkages to complementary institutions playing a supporting role in the PFM reform.
Figure 3.4: Mapping of institutional linkages to PFM reform
Office of the President; OPM; NPA; MoPS, MoFPED
Sectors
MDALGs
Delivery Units
Policy & planning
Budget execution
Audit, evaluation &
oversight
Budget approval
Budget formulation
Accounting
Training institutes
NITA-U (ICT)DEIIG
JLOS (investigation, prosecution); Private Sector
Professional Accounting/ Audit bodies
UBOSPrivate Sector
Complementary institutions
Complementary institutionsEPRC (research);
CSBAG (CSOs); DPs; MoLG; LGFC
PPDA; IAG; URA; DPs (externally financed projects)
EPRC (research); CSBAG (CSOs); DPs; Parliament; PAC / LGPAC / District PACs
AGO Parliament; CSOs
PFM Reform Implementing Institutions
Source: Adapted from Lawson (2015), “Public Financial Management”, Professional Development Reading Pack No. 6, GSDRC
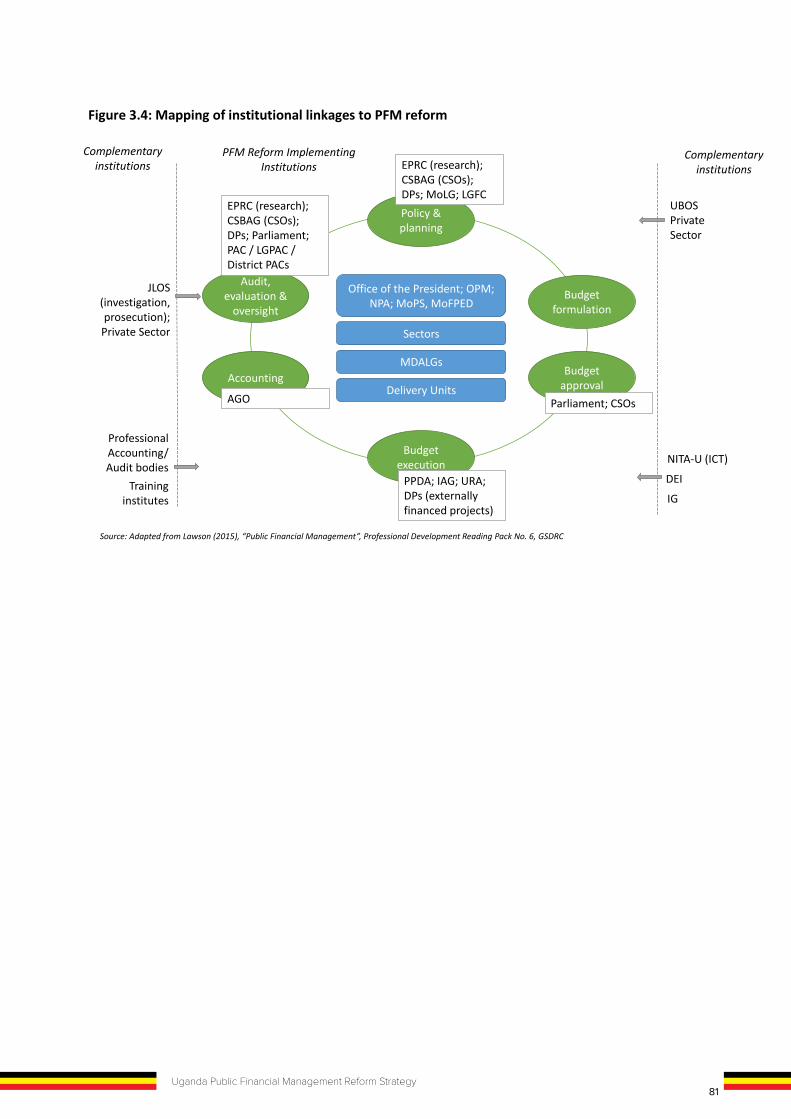
81Uganda Public Financial Management Reform Strategy
process, the LG Performance Assessment (PA) system is aimed at attaining the third objective of the reform: using the fiscal transfer system to provide incentives for improved institutional and service delivery performance of Local Governments. The overall objective of the LG PA system is to promote effective behavior, systems and procedures of importance for LG’s efficient administration and service delivery.
iii. Public Service reforms that support compliance with PFM procedures and reward good performance, including pay reform and performance incentives, review of public administration structures, review of standing orders and administrative sanctions;
iv. Public-Private Partnerships (PPPs), which help mobilise additional resources for economic development;
v. Justice, Law and Order Sector reforms, which have an impact on the effectiveness of the PFM reform strategy through successful investigation and prosecution of corruption and violations of the PFM Act and its regulations, thus serving as a deterrent;
vi. Anti-corruption initiatives and inter-agency cooperation on investigations and prosecutions to help prevent, detect and address corruption, which support control and compliance in PFM accountability systems and mitigation of fiduciary risks. Opportunities for specific collaboration include assessment of corruption vulnerabilities in the development of a risk management approach across Government, particularly for strategic procurements under PIM;
vii. Local government capacity development and investment in municipal infrastructure, which supports the strengthening of LG PFM systems and ability to deliver better quality services at the local level;
viii. Reforms to the wider regulatory environment, which support formalisation of informal businesses, provide institutional frameworks for monitoring economic activity and for managing tax compliance, such as National ID cards, regulation and licensing of alcohol, real estate, tourism and other activities.
3.8 Institutional Linkages to the PFM Reform Strategy 95 Compared to previous PFM reform strategy phases, there are now more institutions contributing directly to
reforms and more providing an indirect supporting role. Figure 3.4 below represents the key institutions responsible for delivery of the PFM reform and the linkages to complementary institutions playing a supporting role in the PFM reform.
Figure 3.4: Mapping of institutional linkages to PFM reform
Office of the President; OPM; NPA; MoPS, MoFPED
Sectors
MDALGs
Delivery Units
Policy & planning
Budget execution
Audit, evaluation &
oversight
Budget approval
Budget formulation
Accounting
Training institutes
NITA-U (ICT)DEIIG
JLOS (investigation, prosecution); Private Sector
Professional Accounting/ Audit bodies
UBOSPrivate Sector
Complementary institutions
Complementary institutionsEPRC (research);
CSBAG (CSOs); DPs; MoLG; LGFC
PPDA; IAG; URA; DPs (externally financed projects)
EPRC (research); CSBAG (CSOs); DPs; Parliament; PAC / LGPAC / District PACs
AGO Parliament; CSOs
PFM Reform Implementing Institutions
Source: Adapted from Lawson (2015), “Public Financial Management”, Professional Development Reading Pack No. 6, GSDRC
82 Uganda Public Financial Management Reform Strategy
4 IMPLEMENTATION PLAN
4.1 PFM Implementation Institutional Framework 1. The prime implementation framework for the PFM reforms has, in recent years, been that of the Financial
Management and Accountability Programme (FINMAP), which has been financed jointly by the Government of Uganda (GoU) and Development Partners (DPs) through a basket fund. Other PFM reform activities outside of FINMAP have been supported directly by GoU and/or other bilateral and multi-lateral DPs. Going forward, the successor programme to FINMAP will continue to provide an important Government-led and jointly funded programme for the delivery and wider coordination of PFM reforms, and will have a key role in leading and monitoring all other programmes and activities that contribute to delivery of the PFM reform strategy.
2. The PFM institutional coordination mechanism set out in Figure 4.1 takes into consideration the multiple stakeholders involved in the implementation of PFM reforms, including representation from Government (at all levels), Development Partners and civil society. The coordination mechanism also aims to leverage the benefits that accrue from the reforms being aligned with the Sector Wide Approach (SWAp), through coordination with the Accountability sector and other complementary sectors.
3. The Ministry of Finance and Economic Planning will take the lead in coordinating the implementation of the strategy under the stewardship of the Permanent Secretary/Secretary to the Treasury (PS/ST). The PS/ST is also chair of the Public Expenditure Management Committee (PEMCOM), which forms the main forum for strategic direction on PFM reforms.
4.2 National Coordination Arrangements 4. National Coordination Arrangements led by the Presidency and the Office Prime Minister provides national
level policy oversight of GoU programmes, including the PFM reforms. The multi-sectoral, political level representation of the Committee ensures the alignment of reforms with policies of other complementary sectors implementing the NDP II. Coordination with Development Partners is at the level of Ambassadors, or equivalent, through the Local Development Partners Group, which coordinates high level dialogue with GoU across DPs.
4.3 Accountability Sector 5. The Accountability Sector comprises 20 public institutions and is coordinated through a Leadership
Committee, Steering Committee, sector working group, technical working groups and a secretariat based in the Ministry of Finance Planning and Economic Development, the responsibilities of which are outlined below:
I. Leadership Committee (Chair: Minister of Finance, Planning and Economic Development): provides strategic direction and political leadership to the sector, guides policy formulation for the sector, articulates sector vision and promotes the highest standards of accountability;
II. Steering Committee (Chair: Permanent Secretary of any one-member institution, except PS/ST): formulates sector policies, coordinates, quality assures and mobilises resources for the implementation of ASSIP;
III. Sector Working Group (Chair: Accountant General): harmonises, coordinates, monitors, evaluates and reports on the sector vision and goals, policy frameworks, plans and performance of all Accountability sector institutions;
IV. Technical Working Groups (Chair: Director of any accountability institution with a Development Partner Co-Chair): Four groups covering Economic Management; Resource Mobilisation and Allocation; Budget Execution and Accounting; and Audit and Anti-corruption. The sub-groups are responsible for analysis of the thematic area technical issues, support to the planning, budgeting, M&E and reporting of the sector working group and public, and stakeholder engagement on the thematic issues.
V. Secretariat: Supports the organisation of the above groups and Committees.
6. The Accountability Sector will provide sector coordination and strategic leadership. Insofar as the technical working groups are overlapping with PFM reform agenda (see Figure 4.1), the relevant TWG will be aligned and will inform PEMCOM, as well as the ASWG, on monitoring of the PFM reform strategy, and issues for consideration in planning future reforms. Figure 4.1: Mapping of overlapping agendas of Accountability Sector Technical Working Groups and PFM Reform Sub-committees
4.4 The Public Expenditure Management Committee (PEMCOM) 7. The Public Expenditure Management Committee (PEMCOM) is a well-established structure for PFM reform,
in operation since the early 2000s. While there is a need to integrate and align structures with that of the Accountability Sector in order to avoid duplication of effort, PEMCOM is recognised to be an effective mechanism for the leadership, coordination and implementation of PFM reforms, cutting across a number of thematic areas under the Accountability Sector. PEMCOM will therefore continue to provide a high-level forum for strategic guidance and control of PFM reforms, but with stronger links into the ASWG and TWGs. It is chaired by the PS/ST and brings together a broad spectrum of stakeholders engaged in PFM, including Heads of MFDAs and programmes or projects under the Accountability Sector, as well as representatives of Development Partners and from civil society.
Economic Management
Budget & Planning
Resource Mobilisation & Allocation Budget Execution & Accounting Audit and Anti-Corruption
Oversight & Governance of PFM
Accountability Systems & Compliance / Local Government PFM
Public Investment Management
Resource Mobilisation
Accountability Sector Technical Working Groups: 4 Thematic Areas
PFM Technical Sub-Committees: 6 Result Areas
Ove
rlap
pin
g ag
end
a
Inspection;Internal
Audit
External Audit;Anti-Corruption;Ethics & Integrity
Accounting policy / management;Management information systems;
Asset Management;Contract Management
Public Investment
Policy/ Management
Revenue/ Tax Policy/
Management
Planning & budgeting
Macroeconomic management;Economic Development Policy
& Research
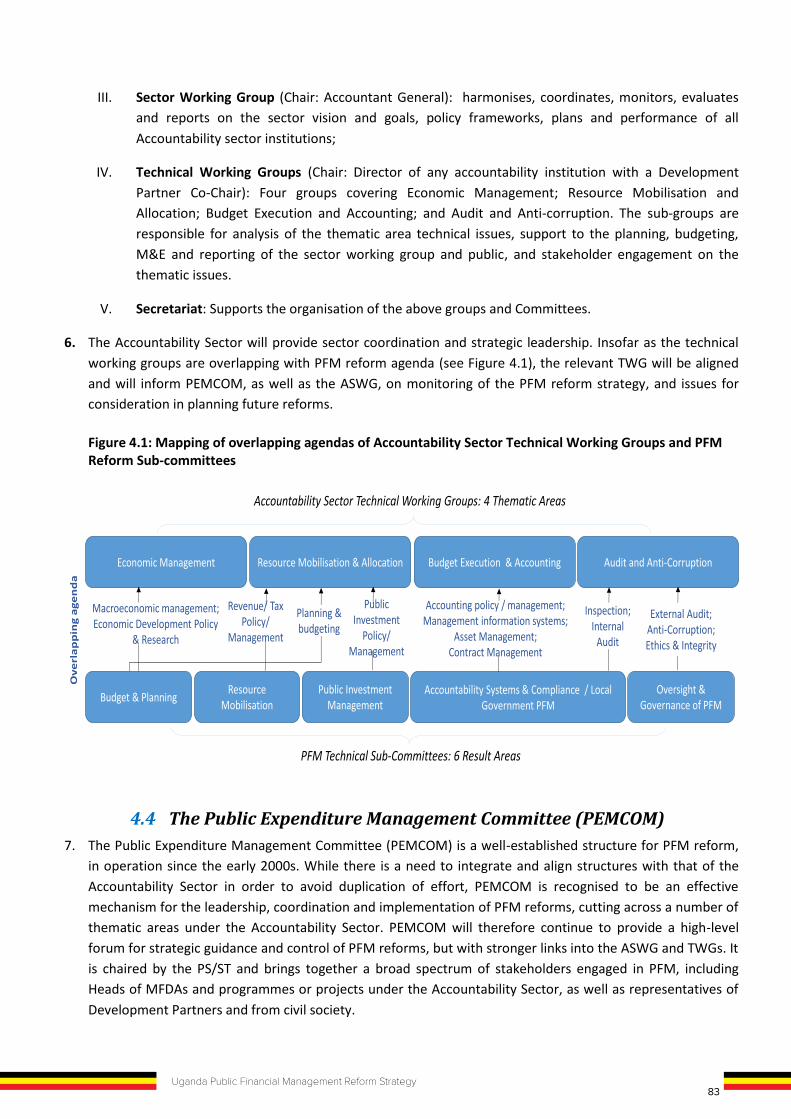
83Uganda Public Financial Management Reform Strategy
4 IMPLEMENTATION PLAN
4.1 PFM Implementation Institutional Framework 1. The prime implementation framework for the PFM reforms has, in recent years, been that of the Financial
Management and Accountability Programme (FINMAP), which has been financed jointly by the Government of Uganda (GoU) and Development Partners (DPs) through a basket fund. Other PFM reform activities outside of FINMAP have been supported directly by GoU and/or other bilateral and multi-lateral DPs. Going forward, the successor programme to FINMAP will continue to provide an important Government-led and jointly funded programme for the delivery and wider coordination of PFM reforms, and will have a key role in leading and monitoring all other programmes and activities that contribute to delivery of the PFM reform strategy.
2. The PFM institutional coordination mechanism set out in Figure 4.1 takes into consideration the multiple stakeholders involved in the implementation of PFM reforms, including representation from Government (at all levels), Development Partners and civil society. The coordination mechanism also aims to leverage the benefits that accrue from the reforms being aligned with the Sector Wide Approach (SWAp), through coordination with the Accountability sector and other complementary sectors.
3. The Ministry of Finance and Economic Planning will take the lead in coordinating the implementation of the strategy under the stewardship of the Permanent Secretary/Secretary to the Treasury (PS/ST). The PS/ST is also chair of the Public Expenditure Management Committee (PEMCOM), which forms the main forum for strategic direction on PFM reforms.
4.2 National Coordination Arrangements 4. National Coordination Arrangements led by the Presidency and the Office Prime Minister provides national
level policy oversight of GoU programmes, including the PFM reforms. The multi-sectoral, political level representation of the Committee ensures the alignment of reforms with policies of other complementary sectors implementing the NDP II. Coordination with Development Partners is at the level of Ambassadors, or equivalent, through the Local Development Partners Group, which coordinates high level dialogue with GoU across DPs.
4.3 Accountability Sector 5. The Accountability Sector comprises 20 public institutions and is coordinated through a Leadership
Committee, Steering Committee, sector working group, technical working groups and a secretariat based in the Ministry of Finance Planning and Economic Development, the responsibilities of which are outlined below:
I. Leadership Committee (Chair: Minister of Finance, Planning and Economic Development): provides strategic direction and political leadership to the sector, guides policy formulation for the sector, articulates sector vision and promotes the highest standards of accountability;
II. Steering Committee (Chair: Permanent Secretary of any one-member institution, except PS/ST): formulates sector policies, coordinates, quality assures and mobilises resources for the implementation of ASSIP;
III. Sector Working Group (Chair: Accountant General): harmonises, coordinates, monitors, evaluates and reports on the sector vision and goals, policy frameworks, plans and performance of all Accountability sector institutions;
IV. Technical Working Groups (Chair: Director of any accountability institution with a Development Partner Co-Chair): Four groups covering Economic Management; Resource Mobilisation and Allocation; Budget Execution and Accounting; and Audit and Anti-corruption. The sub-groups are responsible for analysis of the thematic area technical issues, support to the planning, budgeting, M&E and reporting of the sector working group and public, and stakeholder engagement on the thematic issues.
V. Secretariat: Supports the organisation of the above groups and Committees.
6. The Accountability Sector will provide sector coordination and strategic leadership. Insofar as the technical working groups are overlapping with PFM reform agenda (see Figure 4.1), the relevant TWG will be aligned and will inform PEMCOM, as well as the ASWG, on monitoring of the PFM reform strategy, and issues for consideration in planning future reforms. Figure 4.1: Mapping of overlapping agendas of Accountability Sector Technical Working Groups and PFM Reform Sub-committees
4.4 The Public Expenditure Management Committee (PEMCOM) 7. The Public Expenditure Management Committee (PEMCOM) is a well-established structure for PFM reform,
in operation since the early 2000s. While there is a need to integrate and align structures with that of the Accountability Sector in order to avoid duplication of effort, PEMCOM is recognised to be an effective mechanism for the leadership, coordination and implementation of PFM reforms, cutting across a number of thematic areas under the Accountability Sector. PEMCOM will therefore continue to provide a high-level forum for strategic guidance and control of PFM reforms, but with stronger links into the ASWG and TWGs. It is chaired by the PS/ST and brings together a broad spectrum of stakeholders engaged in PFM, including Heads of MFDAs and programmes or projects under the Accountability Sector, as well as representatives of Development Partners and from civil society.
Economic Management
Budget & Planning
Resource Mobilisation & Allocation Budget Execution & Accounting Audit and Anti-Corruption
Oversight & Governance of PFM
Accountability Systems & Compliance / Local Government PFM
Public Investment Management
Resource Mobilisation
Accountability Sector Technical Working Groups: 4 Thematic Areas
PFM Technical Sub-Committees: 6 Result Areas
Ove
rlap
pin
g ag
end
a
Inspection;Internal
Audit
External Audit;Anti-Corruption;Ethics & Integrity
Accounting policy / management;Management information systems;
Asset Management;Contract Management
Public Investment
Policy/ Management
Revenue/ Tax Policy/
Management
Planning & budgeting
Macroeconomic management;Economic Development Policy
& Research
84 Uganda Public Financial Management Reform Strategy
8. Since 2012, the momentum gained through the tracking of the PFM Priority Action Matrix (PRAM), has focused Management priorities on addressing specific, pressing issues, based on fiduciary risks, and has strengthened the strategic focus of PEMCOM beyond the broad PFM operations and management of the PFM reform programme, FINMAP. The management of FINMAP has been delegated to the Programme Technical Committee (PTC), a sub-committee of PEMCOM. The role of PEMCOM therefore includes:
I. To assess the overall performance of PFM systems and setting the overall direction of PFM reforms, based on a limited set of PFM reform priorities or problems;
II. To monitor and manage PFM reforms and risks, in line with the PFM Reform Strategy, using the PRAM as an instrument to manage this process and select high risk or high priority issues that require mitigating action or escalation;
III. To identify opportunities for complementarity between reforms in the Accountability Sector and beyond and ensuring that these synergies are exploited; and
IV. To identify, design, plan, monitor and evaluate priority PFM processes and systems and ensure their implementation takes place in an integrated and efficient manner.
4.4.1 PFM Technical Sub-Committees 9. The comprehensive planning and coordination of the PFM reform strategy shall be arranged through 5
sub-groups, that brings together the relevant line agencies implementing the 6 main strategic result areas of the PFM reform strategy. This will maintain the strategic (risk-based or issue-focused) agenda of PEMCOM. Due to the problem-driven nature of the result areas, the sub-groups will encourage cross-institutional working (thus avoiding ‘silos’) and some institutions may find that they need to participate in more than one sub-group, depending on the agendas and issues arising. The sub-groups should ensure that all relevant partners are included. In particular, Development Partners will play a key role in the sub-groups to provide coordination on technical and other resource requirements for the implementation of the sub-group reform activities identified.
The Subgroups will include:
I. Sustainable Resource Mobilization (SRM); II. Planning, Budgeting and Public Investments Management;
III. Accountability Systems and Compliance; IV. Local Governments PFM for Service Delivery ; V. Oversight and PFM Reforms Governance
10. Each sub-group will be initiated by PEMCOM and the group will self-select members, leadership, establish
Terms of Reference, agenda and reporting arrangements, aligned to agreed priorities. The frequency of sub-group meetings will be determined by PEMCOM and the sub-groups themselves and will depend on the nature and urgency of the need for joint technical collaboration. Recognising that this is a transitional arrangement, as the Accountability Sector institutional framework is developed; this alignment and sub-group structure will be reviewed annually with the review of ASWG structures to ensure that it meets the needs of stakeholders.
4.4.2 PFM Reform Secretariat 11. The Government’s join PFM reform programme (successor to FINMAP III) will continue to perform the role of
secretariat to PEMCOM and to the PFM Reform Strategy, but will have a closer relationship over time with the Accountability Sector secretariat, due to the periodic interaction and reporting into the Accountability Sector management committee.
85Uganda Public Financial Management Reform Strategy
8. Since 2012, the momentum gained through the tracking of the PFM Priority Action Matrix (PRAM), has focused Management priorities on addressing specific, pressing issues, based on fiduciary risks, and has strengthened the strategic focus of PEMCOM beyond the broad PFM operations and management of the PFM reform programme, FINMAP. The management of FINMAP has been delegated to the Programme Technical Committee (PTC), a sub-committee of PEMCOM. The role of PEMCOM therefore includes:
I. To assess the overall performance of PFM systems and setting the overall direction of PFM reforms, based on a limited set of PFM reform priorities or problems;
II. To monitor and manage PFM reforms and risks, in line with the PFM Reform Strategy, using the PRAM as an instrument to manage this process and select high risk or high priority issues that require mitigating action or escalation;
III. To identify opportunities for complementarity between reforms in the Accountability Sector and beyond and ensuring that these synergies are exploited; and
IV. To identify, design, plan, monitor and evaluate priority PFM processes and systems and ensure their implementation takes place in an integrated and efficient manner.
4.4.1 PFM Technical Sub-Committees 9. The comprehensive planning and coordination of the PFM reform strategy shall be arranged through 5
sub-groups, that brings together the relevant line agencies implementing the 6 main strategic result areas of the PFM reform strategy. This will maintain the strategic (risk-based or issue-focused) agenda of PEMCOM. Due to the problem-driven nature of the result areas, the sub-groups will encourage cross-institutional working (thus avoiding ‘silos’) and some institutions may find that they need to participate in more than one sub-group, depending on the agendas and issues arising. The sub-groups should ensure that all relevant partners are included. In particular, Development Partners will play a key role in the sub-groups to provide coordination on technical and other resource requirements for the implementation of the sub-group reform activities identified.
The Subgroups will include:
I. Sustainable Resource Mobilization (SRM); II. Planning, Budgeting and Public Investments Management;
III. Accountability Systems and Compliance; IV. Local Governments PFM for Service Delivery ; V. Oversight and PFM Reforms Governance
10. Each sub-group will be initiated by PEMCOM and the group will self-select members, leadership, establish
Terms of Reference, agenda and reporting arrangements, aligned to agreed priorities. The frequency of sub-group meetings will be determined by PEMCOM and the sub-groups themselves and will depend on the nature and urgency of the need for joint technical collaboration. Recognising that this is a transitional arrangement, as the Accountability Sector institutional framework is developed; this alignment and sub-group structure will be reviewed annually with the review of ASWG structures to ensure that it meets the needs of stakeholders.
4.4.2 PFM Reform Secretariat 11. The Government’s join PFM reform programme (successor to FINMAP III) will continue to perform the role of
secretariat to PEMCOM and to the PFM Reform Strategy, but will have a closer relationship over time with the Accountability Sector secretariat, due to the periodic interaction and reporting into the Accountability Sector management committee.
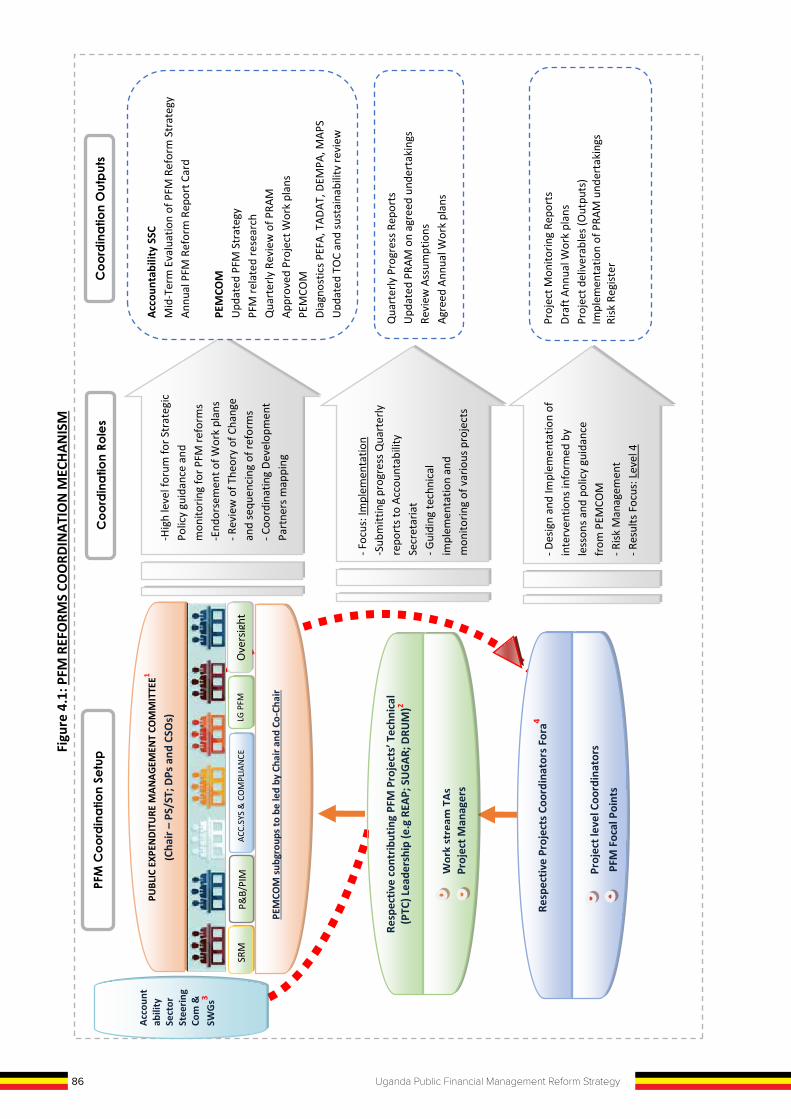
86 Uganda Public Financial Management Reform Strategy
Figu
re 4
.1: P
FM R
EFOR
MS
COOR
DINA
TIO
N M
ECHA
NISM
PUBL
IC E
XPEN
DITU
RE M
ANAG
EMEN
T CO
MM
ITTE
E1 (C
hair –
PS/S
T; D
Ps a
nd C
SOs)
)
SRM
P&
B/PI
M
Over
sight
LG
PFM
AC
C.SY
S &
COM
PLIA
NCE
PFM
Coo
rdin
atio
n Se
tup
Coo
rdin
atio
n Ro
les
-Hig
h le
vel f
orum
for S
trat
egic
Polic
y gu
idan
ce a
nd
mon
itorin
g fo
r PFM
refo
rms
-End
orse
men
t of W
ork
plan
s - R
evie
w o
f The
ory
of C
hang
e an
d se
quen
cing
of re
form
s - C
oord
inat
ing
Deve
lopm
ent
Part
ners
map
ping
- F
ocus
: Im
plem
enta
tion
-Sub
mitt
ing
prog
ress
Qua
rter
ly
repo
rts t
o Ac
coun
tabi
lity
Secr
etar
iat
- Gui
ding
tech
nica
l im
plem
enta
tion
and
mon
itorin
g of
var
ious
pro
ject
s
Resp
ectiv
e Pr
ojec
ts C
oord
inat
ors F
ora4
PFM
Foc
al P
oint
s Pr
ojec
t lev
el C
oord
inat
ors
- Des
ign
and
Impl
emen
tatio
n of
in
terv
entio
ns in
form
ed b
y le
sson
s and
pol
icy g
uida
nce
from
PEM
COM
- R
isk M
anag
emen
t - R
esul
ts F
ocus
: Lev
el 4
Qua
rter
ly P
rogr
ess R
epor
ts
Upda
ted
PRAM
on
agre
ed u
nder
taki
ngs
Revi
ew A
ssum
ptio
ns
Agre
ed A
nnua
l Wor
k pl
ans
Proj
ect M
onito
ring
Repo
rts
Draf
t Ann
ual W
ork
plan
s Pr
ojec
t del
iver
able
s (Ou
tput
s)
Impl
emen
tatio
n of
PRA
M u
nder
taki
ngs
Risk
Reg
ister
Acco
unta
bilit
y SS
C M
id-T
erm
Eva
luat
ion
of P
FM R
efor
m S
trat
egy
Annu
al P
FM R
efor
m R
epor
t Car
d PE
MCO
M
Upda
ted
PFM
Str
ateg
y PF
M re
late
d re
sear
ch
Qua
rter
ly R
evie
w o
f PRA
M
Appr
oved
Pro
ject
Wor
k pl
ans
PEM
COM
Di
agno
stics
PEF
A, T
ADAT
, DEM
PA, M
APS
Upda
ted
TOC
and
sust
aina
bilit
y re
view
Resp
ectiv
e co
ntrib
utin
g PF
M P
roje
cts’
Tech
nica
l (P
TC) L
eade
rshi
p (e
.g R
EAP;
SUG
AR; D
RUM
)2
Proj
ect M
anag
ers
Wor
k st
ream
TAs
PEM
COM
subg
roup
s to
be le
d by
Cha
ir an
d Co
-Cha
ir
Coo
rdin
atio
n O
utpu
ts
Acco
unt
abili
ty
Sect
or
Stee
ring
Com
&
SWGs
3
Note
1: T
he P
ublic
Exp
endi
ture
Man
agem
ent C
omm
ittee
(PEM
COM
): Is
a hi
gh-le
vel f
orum
con
greg
atin
g qu
arte
rly fo
r str
ateg
ic po
licy
guid
ance
and
for
mon
itorin
g pr
ogre
ss in
PFM
refo
rms.
The
PEM
COM
is ch
aire
d by
the
Perm
anen
t Sec
reta
ry/S
ecre
tary
to th
e Tr
easu
ry (P
S/ST
) and
rota
tiona
lly co
-ch
aire
d by
the
PFM
Dev
elop
men
t Par
tner
Wor
king
Gro
up (D
P W
G) re
pres
enta
tive.
Key
civ
il so
ciety
act
ors
invo
lved
as
perm
anen
t mem
bers
are
th
e Ci
vil S
ocie
ty B
udge
t Adv
ocac
y Gr
oup
(CSB
AG).
With
in P
EMCO
M sh
all b
e th
emat
ic w
orki
ng g
roup
s for
dee
per t
echn
ical e
ngag
emen
t and
ove
rsig
ht o
f the
resp
ectiv
e St
rate
gic o
bjec
tives
.
Re
sults
Foc
us le
vel:
PFM
Ref
orm
Out
com
es (i
nclu
ding
Effi
cienc
y an
d Ef
fect
iven
ess o
f Ref
orm
s)
No
te 2
: Va
rious
Pro
gram
me
Tech
nica
l Com
mitt
ees (
PTC)
, cha
ired
by th
e de
signa
ted
PFM
Ref
orm
Pro
ject
s Tas
k M
anag
ers w
ill co
nsist
of t
he p
roje
ct le
vel
man
ager
s and
dev
elop
men
t par
tner
s, pr
ovid
ing
tech
nica
l and
pol
icy g
uida
nce
to th
e re
spec
tive
proj
ects
acr
oss t
he co
untr
y su
ch a
s SUG
AR, G
APP
etc.
Non
-sta
te a
ctor
s pla
y an
impo
rtan
t rol
e in
the
dem
and
side
of a
ccou
ntab
ility
, i.e
. hol
ding
the
stat
e to
acc
ount
ove
r PFM
, res
ourc
e al
loca
tion
and
serv
ice d
eliv
ery.
Resu
lts F
ocus
Leve
l: PF
M In
term
edia
te O
utco
mes
(Inc
ludi
ng re
leva
nce
of re
form
act
iviti
es)
No
te 3
: The
Gov
erna
nce
stru
ctur
e of
the
acco
unta
bilit
y se
ctor
pro
vide
s for
thre
e co
mm
ittee
s nam
ely
Lead
ersh
ip C
omm
ittee
, ste
erin
g co
mm
ittee
and
the
Sect
or W
orki
ng G
roup
. Th
e St
eerin
g co
mm
ittee
form
ulat
es se
ctor
pol
icies
and
prio
ritie
s, an
d is
chai
red
by a
ny o
ne o
f the
Acc
ount
ing
Offi
cers
of
the
Sect
or In
stitu
tions
on
a ro
tatio
nal b
asis
for t
he te
nure
of t
he A
ccou
ntab
ility
Sec
tor S
trat
egic
Inve
stm
ent P
lan.
The
Sect
or W
orki
ng G
roup
(SW
G) im
plem
ents
sec
tor
polic
ies
in li
ne w
ith t
he A
ccou
ntab
ility
Sec
tor
Stra
tegi
c in
vest
men
t pl
an (
ASSI
P), a
nd a
s gu
ided
by
the
abov
e co
mm
ittee
s. Th
e SW
G is
com
prise
d of
tech
nica
l offi
cials
at th
e le
vel o
f Dire
ctor
/Com
miss
ione
r or
equ
ival
ent f
rom
sec
tor
inst
itutio
ns a
nd re
pres
enta
tives
of d
evel
opm
ent p
artn
ers,
priv
ate
sect
or a
nd ci
vil s
ocie
ty.
A gi
ven
Sect
or T
WG
is ch
aire
d by
staf
f at D
irect
or/H
ead
of D
epar
tmen
t le
vel a
nd a
bove
and
co-
chai
red
by a
Dev
elop
men
t Pa
rtne
r/ C
ivil
Socie
ty r
epre
sent
ative
. Th
e su
b-gr
oups
are
res
pons
ible
for
an
alys
is of
the
them
atic
area
tech
nica
l iss
ues,
supp
ort t
o th
e pl
anni
ng, b
udge
ting,
M&
E an
d re
port
ing
of th
e se
ctor
wor
king
gro
up a
nd p
ublic
, and
st
akeh
olde
r eng
agem
ent o
n th
e th
emat
ic iss
ues.
As
par
t of
the
Ref
orm
mon
itorin
g fra
mew
ork,
the
res
pect
ive
PFM
Ref
orm
pro
gram
me
will
be
subm
ittin
g qu
arte
rly p
rogr
ess
repo
rts
to
Acco
unta
bilit
y SW
G Se
cret
aria
t.
The
Secr
etar
iat
will
ana
lyze
the
se a
nd c
onso
lidat
ed in
to a
n an
nual
PFM
Ref
orm
Rep
ort
Card
on
PFM
Ref
orm
s to
gui
de t
he P
EMCO
M a
nd
Stee
ring
Com
mitt
ee.
The
repo
rt ca
rd w
ill b
e pr
esen
ted
to P
EMCO
M d
urin
g th
e ex
pand
ed A
nnua
l PFM
Ref
orm
Rev
iew
conf
eren
ce.
Note
4: P
roje
cts/
Prog
ram
me
Coor
dina
tors
For
a ar
e co
nstit
uted
at p
roje
ct le
vel w
ith a
Lev
el 4
resu
lts fo
cus.
This
is w
ith re
spec
t to
tran
slatin
g in
puts
to
outp
uts
and
atte
ndan
t req
uisit
e ac
coun
tabi
litie
s to
stip
ulat
ed s
take
hold
ers.
Thes
e ar
e ch
aire
d at
sec
tor l
evel
by
Proj
ect C
oord
inat
ors
to m
anag
e pr
ojec
t op
erat
ions
and
impl
emen
tatio
n.
86 Uganda Public Financial Management Reform Strategy
Figu
re 4
.1: P
FM R
EFOR
MS
COOR
DINA
TIO
N M
ECHA
NISM
PUBL
IC E
XPEN
DITU
RE M
ANAG
EMEN
T CO
MM
ITTE
E1 (C
hair –
PS/S
T; D
Ps a
nd C
SOs)
)
SRM
P&
B/PI
M
Over
sight
LG
PFM
AC
C.SY
S &
COM
PLIA
NCE
PFM
Coo
rdin
atio
n Se
tup
Coo
rdin
atio
n Ro
les
-Hig
h le
vel f
orum
for S
trat
egic
Polic
y gu
idan
ce a
nd
mon
itorin
g fo
r PFM
refo
rms
- End
orse
men
t of W
ork
plan
s - R
evie
w o
f The
ory
of C
hang
e an
d se
quen
cing
of re
form
s - C
oord
inat
ing
Deve
lopm
ent
Part
ners
map
ping
- F
ocus
: Im
plem
enta
tion
-Sub
mitt
ing
prog
ress
Qua
rter
ly
repo
rts t
o Ac
coun
tabi
lity
Secr
etar
iat
- Gui
ding
tech
nica
l im
plem
enta
tion
and
mon
itorin
g of
var
ious
pro
ject
s
Resp
ectiv
e Pr
ojec
ts C
oord
inat
ors F
ora4
PFM
Foc
al P
oint
s Pr
ojec
t lev
el C
oord
inat
ors
- Des
ign
and
Impl
emen
tatio
n of
in
terv
entio
ns in
form
ed b
y le
sson
s and
pol
icy g
uida
nce
from
PEM
COM
- R
isk M
anag
emen
t - R
esul
ts F
ocus
: Lev
el 4
Qua
rter
ly P
rogr
ess R
epor
ts
Upda
ted
PRAM
on
agre
ed u
nder
taki
ngs
Revi
ew A
ssum
ptio
ns
Agre
ed A
nnua
l Wor
k pl
ans
Proj
ect M
onito
ring
Repo
rts
Draf
t Ann
ual W
ork
plan
s Pr
ojec
t del
iver
able
s (Ou
tput
s)
Impl
emen
tatio
n of
PRA
M u
nder
taki
ngs
Risk
Reg
ister
Acco
unta
bilit
y SS
C M
id-T
erm
Eva
luat
ion
of P
FM R
efor
m S
trat
egy
Annu
al P
FM R
efor
m R
epor
t Car
d PE
MCO
M
Upda
ted
PFM
Str
ateg
y PF
M re
late
d re
sear
ch
Qua
rter
ly R
evie
w o
f PRA
M
Appr
oved
Pro
ject
Wor
k pl
ans
PEM
COM
Di
agno
stics
PEF
A, T
ADAT
, DEM
PA, M
APS
Upda
ted
TOC
and
sust
aina
bilit
y re
view
Resp
ectiv
e co
ntrib
utin
g PF
M P
roje
cts’
Tech
nica
l (P
TC) L
eade
rshi
p (e
.g R
EAP;
SUG
AR; D
RUM
)2
Proj
ect M
anag
ers
Wor
k st
ream
TAs
PEM
COM
subg
roup
s to
be le
d by
Cha
ir an
d Co
-Cha
ir
Coo
rdin
atio
n O
utpu
ts
Acco
unt
abili
ty
Sect
or
Stee
ring
Com
&
SWGs
3
Note
1: T
he P
ublic
Exp
endi
ture
Man
agem
ent C
omm
ittee
(PEM
COM
): Is
a hi
gh-le
vel f
orum
con
greg
atin
g qu
arte
rly fo
r str
ateg
ic po
licy
guid
ance
and
for
mon
itorin
g pr
ogre
ss in
PFM
refo
rms.
The
PEM
COM
is ch
aire
d by
the
Perm
anen
t Sec
reta
ry/S
ecre
tary
to th
e Tr
easu
ry (P
S/ST
) and
rota
tiona
lly co
-ch
aire
d by
the
PFM
Dev
elop
men
t Par
tner
Wor
king
Gro
up (D
P W
G) re
pres
enta
tive.
Key
civ
il so
ciety
act
ors
invo
lved
as
perm
anen
t mem
bers
are
th
e Ci
vil S
ocie
ty B
udge
t Adv
ocac
y Gr
oup
(CSB
AG).
With
in P
EMCO
M sh
all b
e th
emat
ic w
orki
ng g
roup
s for
dee
per t
echn
ical e
ngag
emen
t and
ove
rsig
ht o
f the
resp
ectiv
e St
rate
gic o
bjec
tives
.
Re
sults
Foc
us le
vel:
PFM
Ref
orm
Out
com
es (i
nclu
ding
Effi
cienc
y an
d Ef
fect
iven
ess o
f Ref
orm
s)
No
te 2
: Va
rious
Pro
gram
me
Tech
nica
l Com
mitt
ees (
PTC)
, cha
ired
by th
e de
signa
ted
PFM
Ref
orm
Pro
ject
s Tas
k M
anag
ers w
ill co
nsist
of t
he p
roje
ct le
vel
man
ager
s and
dev
elop
men
t par
tner
s, pr
ovid
ing
tech
nica
l and
pol
icy g
uida
nce
to th
e re
spec
tive
proj
ects
acr
oss t
he co
untr
y su
ch a
s SUG
AR, G
APP
etc.
Non
-sta
te a
ctor
s pla
y an
impo
rtan
t rol
e in
the
dem
and
side
of a
ccou
ntab
ility
, i.e
. hol
ding
the
stat
e to
acc
ount
ove
r PFM
, res
ourc
e al
loca
tion
and
serv
ice d
eliv
ery.
Resu
lts F
ocus
Leve
l: PF
M In
term
edia
te O
utco
mes
(Inc
ludi
ng re
leva
nce
of re
form
act
iviti
es)
No
te 3
: The
Gov
erna
nce
stru
ctur
e of
the
acco
unta
bilit
y se
ctor
pro
vide
s for
thre
e co
mm
ittee
s nam
ely
Lead
ersh
ip C
omm
ittee
, ste
erin
g co
mm
ittee
and
the
Sect
or W
orki
ng G
roup
. Th
e St
eerin
g co
mm
ittee
form
ulat
es se
ctor
pol
icies
and
prio
ritie
s, an
d is
chai
red
by a
ny o
ne o
f the
Acc
ount
ing
Offi
cers
of
the
Sect
or In
stitu
tions
on
a ro
tatio
nal b
asis
for t
he te
nure
of t
he A
ccou
ntab
ility
Sec
tor S
trat
egic
Inve
stm
ent P
lan.
The
Sect
or W
orki
ng G
roup
(SW
G) im
plem
ents
sec
tor
polic
ies
in li
ne w
ith t
he A
ccou
ntab
ility
Sec
tor
Stra
tegi
c in
vest
men
t pl
an (
ASSI
P), a
nd a
s gu
ided
by
the
abov
e co
mm
ittee
s. Th
e SW
G is
com
prise
d of
tech
nica
l offi
cials
at th
e le
vel o
f Dire
ctor
/Com
miss
ione
r or
equ
ival
ent f
rom
sec
tor
inst
itutio
ns a
nd re
pres
enta
tives
of d
evel
opm
ent p
artn
ers,
priv
ate
sect
or a
nd ci
vil s
ocie
ty.
A gi
ven
Sect
or T
WG
is ch
aire
d by
staf
f at D
irect
or/H
ead
of D
epar
tmen
t le
vel a
nd a
bove
and
co-
chai
red
by a
Dev
elop
men
t Pa
rtne
r/ C
ivil
Socie
ty r
epre
sent
ative
. Th
e su
b-gr
oups
are
res
pons
ible
for
an
alys
is of
the
them
atic
area
tech
nica
l iss
ues,
supp
ort t
o th
e pl
anni
ng, b
udge
ting,
M&
E an
d re
port
ing
of th
e se
ctor
wor
king
gro
up a
nd p
ublic
, and
st
akeh
olde
r eng
agem
ent o
n th
e th
emat
ic iss
ues.
As
par
t of
the
Ref
orm
mon
itorin
g fra
mew
ork,
the
res
pect
ive
PFM
Ref
orm
pro
gram
me
will
be
subm
ittin
g qu
arte
rly p
rogr
ess
repo
rts
to
Acco
unta
bilit
y SW
G Se
cret
aria
t.
The
Secr
etar
iat
will
ana
lyze
the
se a
nd c
onso
lidat
ed in
to a
n an
nual
PFM
Ref
orm
Rep
ort
Card
on
PFM
Ref
orm
s to
gui
de t
he P
EMCO
M a
nd
Stee
ring
Com
mitt
ee.
The
repo
rt ca
rd w
ill b
e pr
esen
ted
to P
EMCO
M d
urin
g th
e ex
pand
ed A
nnua
l PFM
Ref
orm
Rev
iew
conf
eren
ce.
Note
4: P
roje
cts/
Prog
ram
me
Coor
dina
tors
For
a ar
e co
nstit
uted
at p
roje
ct le
vel w
ith a
Lev
el 4
resu
lts fo
cus.
This
is w
ith re
spec
t to
tran
slatin
g in
puts
to
outp
uts
and
atte
ndan
t req
uisit
e ac
coun
tabi
litie
s to
stip
ulat
ed s
take
hold
ers.
Thes
e ar
e ch
aire
d at
sec
tor l
evel
by
Proj
ect C
oord
inat
ors
to m
anag
e pr
ojec
t op
erat
ions
and
impl
emen
tatio
n.
87Uganda Public Financial Management Reform Strategy
Figu
re 4
.1: P
FM R
EFOR
MS
COOR
DINA
TIO
N M
ECHA
NISM
PUBL
IC E
XPEN
DITU
RE M
ANAG
EMEN
T CO
MM
ITTE
E1 (C
hair –
PS/S
T; D
Ps a
nd C
SOs)
)
SRM
P&
B/PI
M
Over
sight
LG
PFM
AC
C.SY
S &
COM
PLIA
NCE
PFM
Coo
rdin
atio
n Se
tup
Coo
rdin
atio
n Ro
les
-Hig
h le
vel f
orum
for S
trat
egic
Polic
y gu
idan
ce a
nd
mon
itorin
g fo
r PFM
refo
rms
-End
orse
men
t of W
ork
plan
s - R
evie
w o
f The
ory
of C
hang
e an
d se
quen
cing
of re
form
s - C
oord
inat
ing
Deve
lopm
ent
Part
ners
map
ping
- F
ocus
: Im
plem
enta
tion
-Sub
mitt
ing
prog
ress
Qua
rter
ly
repo
rts t
o Ac
coun
tabi
lity
Secr
etar
iat
- Gui
ding
tech
nica
l im
plem
enta
tion
and
mon
itorin
g of
var
ious
pro
ject
s
Resp
ectiv
e Pr
ojec
ts C
oord
inat
ors F
ora4
PFM
Foc
al P
oint
s Pr
ojec
t lev
el C
oord
inat
ors
- Des
ign
and
Impl
emen
tatio
n of
in
terv
entio
ns in
form
ed b
y le
sson
s and
pol
icy g
uida
nce
from
PEM
COM
- R
isk M
anag
emen
t - R
esul
ts F
ocus
: Lev
el 4
Qua
rter
ly P
rogr
ess R
epor
ts
Upda
ted
PRAM
on
agre
ed u
nder
taki
ngs
Revi
ew A
ssum
ptio
ns
Agre
ed A
nnua
l Wor
k pl
ans
Proj
ect M
onito
ring
Repo
rts
Draf
t Ann
ual W
ork
plan
s Pr
ojec
t del
iver
able
s (Ou
tput
s)
Impl
emen
tatio
n of
PRA
M u
nder
taki
ngs
Risk
Reg
ister
Acco
unta
bilit
y SS
C M
id-T
erm
Eva
luat
ion
of P
FM R
efor
m S
trat
egy
Annu
al P
FM R
efor
m R
epor
t Car
d PE
MCO
M
Upda
ted
PFM
Str
ateg
y PF
M re
late
d re
sear
ch
Qua
rter
ly R
evie
w o
f PRA
M
Appr
oved
Pro
ject
Wor
k pl
ans
PEM
COM
Di
agno
stics
PEF
A, T
ADAT
, DEM
PA, M
APS
Upda
ted
TOC
and
sust
aina
bilit
y re
view
Resp
ectiv
e co
ntrib
utin
g PF
M P
roje
cts’
Tech
nica
l (P
TC) L
eade
rshi
p (e
.g R
EAP;
SUG
AR; D
RUM
)2
Proj
ect M
anag
ers
Wor
k st
ream
TAs
PEM
COM
subg
roup
s to
be le
d by
Cha
ir an
d Co
-Cha
ir
Coo
rdin
atio
n O
utpu
ts
Acco
unt
abili
ty
Sect
or
Stee
ring
Com
&
SWGs
3
Note
1: T
he P
ublic
Exp
endi
ture
Man
agem
ent C
omm
ittee
(PEM
COM
): Is
a hi
gh-le
vel f
orum
con
greg
atin
g qu
arte
rly fo
r str
ateg
ic po
licy
guid
ance
and
for
mon
itorin
g pr
ogre
ss in
PFM
refo
rms.
The
PEM
COM
is ch
aire
d by
the
Perm
anen
t Sec
reta
ry/S
ecre
tary
to th
e Tr
easu
ry (P
S/ST
) and
rota
tiona
lly co
-ch
aire
d by
the
PFM
Dev
elop
men
t Par
tner
Wor
king
Gro
up (D
P W
G) re
pres
enta
tive.
Key
civ
il so
ciety
act
ors
invo
lved
as
perm
anen
t mem
bers
are
th
e Ci
vil S
ocie
t y B
udge
t Adv
ocac
y Gr
oup
(CSB
AG).
With
in P
EMCO
M sh
all b
e th
emat
ic w
orki
ng g
roup
s for
dee
per t
echn
ical e
ngag
emen
t and
ove
rsig
ht o
f the
resp
ectiv
e St
rate
gic o
bjec
tives
.
Re
sults
Foc
us le
vel:
PFM
Ref
orm
Out
com
es (i
nclu
ding
Effi
cienc
y an
d Ef
fect
iven
ess o
f Ref
orm
s)
No
te 2
: Va
rious
Pro
gram
me
Tech
nica
l Com
mitt
ees (
PTC)
, cha
ired
by th
e de
signa
ted
PFM
Ref
orm
Pro
ject
s Tas
k M
anag
ers w
ill co
nsist
of t
he p
roje
ct le
vel
man
ager
s and
dev
elop
men
t par
tner
s, pr
ovid
ing
tech
nica
l and
pol
icy g
uida
nce
to th
e re
spec
tive
proj
ects
acr
oss t
he co
untr
y su
ch a
s SUG
AR, G
APP
etc.
Non
- sta
te a
ctor
s pla
y an
impo
rtan
t rol
e in
the
dem
and
side
of a
ccou
ntab
ility
, i.e
. hol
ding
the
stat
e to
acc
ount
ove
r PFM
, res
ourc
e al
loca
tion
and
serv
ice d
eliv
ery.
Resu
lts F
ocus
Leve
l: PF
M In
term
edia
te O
utco
mes
(Inc
ludi
ng re
leva
nce
of re
form
act
iviti
es)
No
te 3
: The
Gov
erna
nce
stru
ctur
e of
the
acco
unta
bilit
y se
ctor
pro
vide
s for
thre
e co
mm
ittee
s nam
ely
Lead
ersh
ip C
omm
ittee
, ste
erin
g co
mm
ittee
and
the
Sect
or W
orki
ng G
roup
. Th
e St
eerin
g co
mm
ittee
form
ulat
es se
ctor
pol
icies
and
prio
ritie
s, an
d is
chai
red
by a
ny o
ne o
f the
Acc
ount
ing
Offi
cers
of
the
Sect
or In
stitu
tions
on
a ro
tatio
nal b
asis
for t
he te
nure
of t
he A
ccou
ntab
ility
Sec
tor S
trat
egic
Inve
stm
ent P
lan.
The
Sect
or W
orki
ng G
roup
(SW
G) im
plem
ents
sec
tor
polic
ies
in li
ne w
ith t
he A
ccou
ntab
ility
Sec
tor
Stra
tegi
c in
vest
men
t pl
an (
ASSI
P), a
nd a
s gu
ided
by
the
abov
e co
mm
ittee
s. Th
e SW
G is
com
prise
d of
tech
nica
l offi
cials
at th
e le
vel o
f Dire
ctor
/Com
miss
ione
r or
equ
ival
ent f
rom
sec
tor
inst
itutio
ns a
nd re
pres
enta
tives
of d
evel
opm
ent p
artn
ers,
priv
ate
sect
or a
nd ci
vil s
ocie
ty.
A gi
ven
Sect
or T
WG
is ch
aire
d by
staf
f at D
irect
or/H
ead
of D
epar
tmen
t le
vel a
nd a
bove
and
co-
chai
red
by a
Dev
elop
men
t Pa
rtne
r/ C
ivil
Socie
ty r
epre
sent
ative
. Th
e su
b-gr
oups
are
res
pons
ible
for
an
alys
is of
the
them
atic
area
tech
nica
l iss
ues,
supp
ort t
o th
e pl
anni
ng, b
udge
ting,
M&
E an
d re
port
ing
of th
e se
ctor
wor
king
gro
up a
nd p
ublic
, and
st
akeh
olde
r eng
agem
ent o
n th
e th
emat
ic iss
ues.
As
par
t of
the
Ref
orm
mon
itorin
g fra
mew
ork,
the
res
pect
ive
PFM
Ref
orm
pro
gram
me
will
be
subm
ittin
g qu
arte
rly p
rogr
ess
repo
rts
to
Acco
unta
bilit
y SW
G Se
cret
aria
t.
The
Secr
etar
iat
will
ana
lyze
the
se a
nd c
onso
lidat
ed in
to a
n an
nual
PFM
Ref
orm
Rep
ort
Card
on
PFM
Ref
orm
s to
gui
de t
he P
EMCO
M a
nd
Stee
ring
Com
mitt
ee.
The
repo
rt ca
rd w
ill b
e pr
esen
ted
to P
EMCO
M d
urin
g th
e ex
pand
ed A
nnua
l PFM
Ref
orm
Rev
iew
conf
eren
ce.
Note
4: P
roje
cts/
Prog
ram
me
Coor
dina
tors
For
a ar
e co
nstit
uted
at p
roje
ct le
vel w
ith a
Lev
el 4
resu
lts fo
cus.
This
is w
ith re
spec
t to
tran
slatin
g in
puts
to
outp
uts
and
atte
ndan
t req
uisit
e ac
coun
tabi
litie
s to
stip
ulat
ed s
take
hold
ers.
Thes
e ar
e ch
aire
d at
sec
tor l
evel
by
Proj
ect C
oord
inat
ors
to m
anag
e pr
ojec
t op
erat
ions
and
impl
emen
tatio
n.
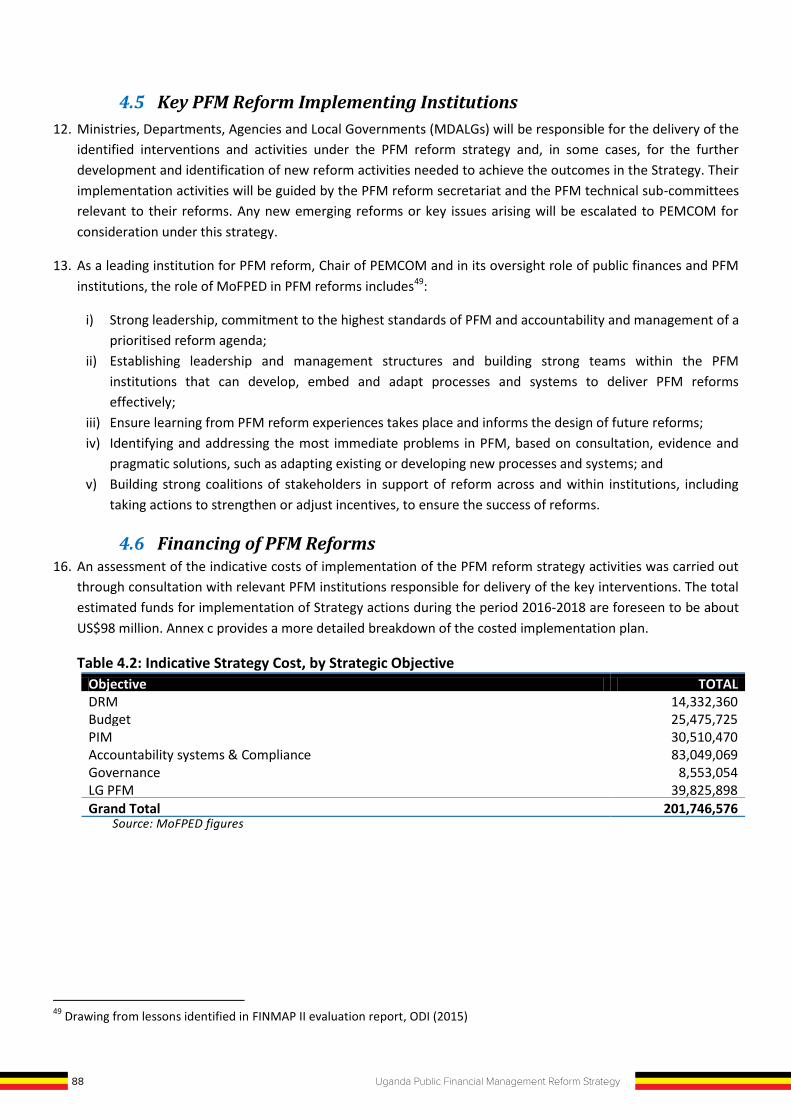
88 Uganda Public Financial Management Reform Strategy
4.5 Key PFM Reform Implementing Institutions 12. Ministries, Departments, Agencies and Local Governments (MDALGs) will be responsible for the delivery of the
identified interventions and activities under the PFM reform strategy and, in some cases, for the further development and identification of new reform activities needed to achieve the outcomes in the Strategy. Their implementation activities will be guided by the PFM reform secretariat and the PFM technical sub-committees relevant to their reforms. Any new emerging reforms or key issues arising will be escalated to PEMCOM for consideration under this strategy.
13. As a leading institution for PFM reform, Chair of PEMCOM and in its oversight role of public finances and PFM institutions, the role of MoFPED in PFM reforms includes49:
i) Strong leadership, commitment to the highest standards of PFM and accountability and management of a prioritised reform agenda;
ii) Establishing leadership and management structures and building strong teams within the PFM institutions that can develop, embed and adapt processes and systems to deliver PFM reforms effectively;
iii) Ensure learning from PFM reform experiences takes place and informs the design of future reforms; iv) Identifying and addressing the most immediate problems in PFM, based on consultation, evidence and
pragmatic solutions, such as adapting existing or developing new processes and systems; and v) Building strong coalitions of stakeholders in support of reform across and within institutions, including
taking actions to strengthen or adjust incentives, to ensure the success of reforms.
4.6 Financing of PFM Reforms 16. An assessment of the indicative costs of implementation of the PFM reform strategy activities was carried out
through consultation with relevant PFM institutions responsible for delivery of the key interventions. The total estimated funds for implementation of Strategy actions during the period 2016-2018 are foreseen to be about US$98 million. Annex c provides a more detailed breakdown of the costed implementation plan.
Table 4.2: Indicative Strategy Cost, by Strategic Objective Objective TOTAL DRM 14,332,360 Budget 25,475,725 PIM 30,510,470 Accountability systems & Compliance 83,049,069 Governance 8,553,054 LG PFM 39,825,898 Grand Total 201,746,576
Source: MoFPED figures
49 Drawing from lessons identified in FINMAP II evaluation report, ODI (2015)
17. It should be stated that the above estimated cost of the strategy was indicative at the time of drafting the strategy and, through implementation over the period of the strategy, costs may necessarily be revised. This is because some of the activities foreseen at the start of the strategy period were not possible to estimate accurately, or are likely to be developed in more detail following the outcome of further diagnostic studies or feasibility reviews. These activities are mainly related to investments in ICT systems, training programs or legislative framework and policy reviews, from which a number of new activities are likely to emerge. In particular, the medium-term domestic revenue strategy, which will form one of the most significant components of the PFM reforms, was not completed at the time of the PFM strategy drafting and, as such, will be subject to cost and activity adaptation during the period of the PFM strategy.
18. For those activities for which more information was known and for which more typical cost drivers could be identified, indicative costing was provided based on unit cost benchmarks from previous years of PFM reform through FINMAP. Typical cost drivers for reform activities (not GoU recurrent costs) include: technical assistance (long term, short term, international and local); consultancy firms (international and local); task team operating/meeting costs; workshops; IT and other office equipment; advertising, communication and publication costs; field visits or in-country transport and professional training.
19. The majority of the costs indicated by the above assessment falls mostly in the area of control and compliance of accountability systems for budget execution, as a result of the significant costs of enhancing and integrating IT-based PFM systems. An associated cost with that is that of in-country field visits, which forms the second greatest cost driver. This is due to the need to roll out, support and test systems across the whole country.
20. An indicative sequencing of costs was undertaken, based on the sequencing principles outlined above in Section 3.4. Institutions responsible for delivery of PFM reforms identified the timing and duration of activities based on most urgent, quick wins or continuation of existing reforms, prioritised in the first 1-2 years, followed by development of new processes, amendments, policies and institutional capacity development. Longer-term, more significant or high-investment developmental reforms were sequenced over a longer-period and some initiated later in the strategy period to allow for initial feasibility assessment, piloting and/or data improvement and consolidation before moving ahead with new system development.
DRM 7% Planning and
Budgeting 13%
Public Investment Management (PIM)
15%
Accountability Systems
41%
LG PFM 4%
Governance and Oversight
20%
INDICATIVE STRATEGY COST SHARE
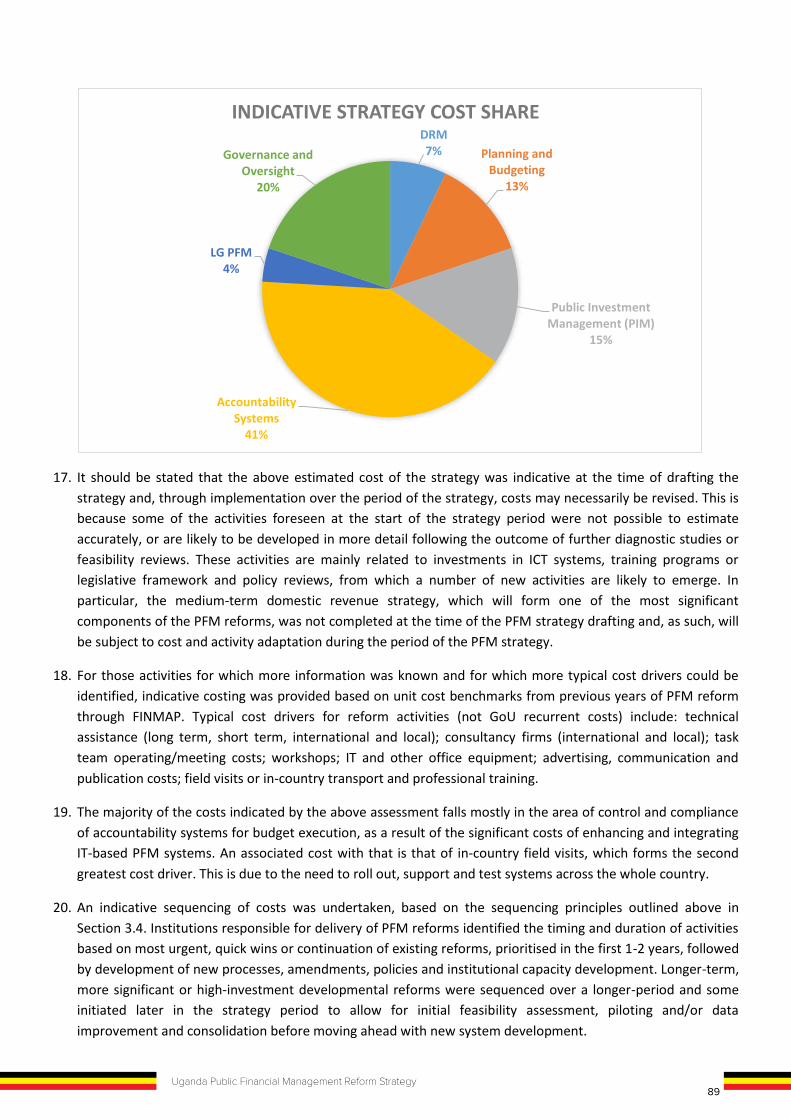
89Uganda Public Financial Management Reform Strategy
4.5 Key PFM Reform Implementing Institutions 12. Ministries, Departments, Agencies and Local Governments (MDALGs) will be responsible for the delivery of the
identified interventions and activities under the PFM reform strategy and, in some cases, for the further development and identification of new reform activities needed to achieve the outcomes in the Strategy. Their implementation activities will be guided by the PFM reform secretariat and the PFM technical sub-committees relevant to their reforms. Any new emerging reforms or key issues arising will be escalated to PEMCOM for consideration under this strategy.
13. As a leading institution for PFM reform, Chair of PEMCOM and in its oversight role of public finances and PFM institutions, the role of MoFPED in PFM reforms includes49:
i) Strong leadership, commitment to the highest standards of PFM and accountability and management of a prioritised reform agenda;
ii) Establishing leadership and management structures and building strong teams within the PFM institutions that can develop, embed and adapt processes and systems to deliver PFM reforms effectively;
iii) Ensure learning from PFM reform experiences takes place and informs the design of future reforms; iv) Identifying and addressing the most immediate problems in PFM, based on consultation, evidence and
pragmatic solutions, such as adapting existing or developing new processes and systems; and v) Building strong coalitions of stakeholders in support of reform across and within institutions, including
taking actions to strengthen or adjust incentives, to ensure the success of reforms.
4.6 Financing of PFM Reforms 16. An assessment of the indicative costs of implementation of the PFM reform strategy activities was carried out
through consultation with relevant PFM institutions responsible for delivery of the key interventions. The total estimated funds for implementation of Strategy actions during the period 2016-2018 are foreseen to be about US$98 million. Annex c provides a more detailed breakdown of the costed implementation plan.
Table 4.2: Indicative Strategy Cost, by Strategic Objective Objective TOTAL DRM 14,332,360 Budget 25,475,725 PIM 30,510,470 Accountability systems & Compliance 83,049,069 Governance 8,553,054 LG PFM 39,825,898 Grand Total 201,746,576
Source: MoFPED figures
49 Drawing from lessons identified in FINMAP II evaluation report, ODI (2015)
17. It should be stated that the above estimated cost of the strategy was indicative at the time of drafting the strategy and, through implementation over the period of the strategy, costs may necessarily be revised. This is because some of the activities foreseen at the start of the strategy period were not possible to estimate accurately, or are likely to be developed in more detail following the outcome of further diagnostic studies or feasibility reviews. These activities are mainly related to investments in ICT systems, training programs or legislative framework and policy reviews, from which a number of new activities are likely to emerge. In particular, the medium-term domestic revenue strategy, which will form one of the most significant components of the PFM reforms, was not completed at the time of the PFM strategy drafting and, as such, will be subject to cost and activity adaptation during the period of the PFM strategy.
18. For those activities for which more information was known and for which more typical cost drivers could be identified, indicative costing was provided based on unit cost benchmarks from previous years of PFM reform through FINMAP. Typical cost drivers for reform activities (not GoU recurrent costs) include: technical assistance (long term, short term, international and local); consultancy firms (international and local); task team operating/meeting costs; workshops; IT and other office equipment; advertising, communication and publication costs; field visits or in-country transport and professional training.
19. The majority of the costs indicated by the above assessment falls mostly in the area of control and compliance of accountability systems for budget execution, as a result of the significant costs of enhancing and integrating IT-based PFM systems. An associated cost with that is that of in-country field visits, which forms the second greatest cost driver. This is due to the need to roll out, support and test systems across the whole country.
20. An indicative sequencing of costs was undertaken, based on the sequencing principles outlined above in Section 3.4. Institutions responsible for delivery of PFM reforms identified the timing and duration of activities based on most urgent, quick wins or continuation of existing reforms, prioritised in the first 1-2 years, followed by development of new processes, amendments, policies and institutional capacity development. Longer-term, more significant or high-investment developmental reforms were sequenced over a longer-period and some initiated later in the strategy period to allow for initial feasibility assessment, piloting and/or data improvement and consolidation before moving ahead with new system development.
DRM 7% Planning and
Budgeting 13%
Public Investment Management (PIM)
15%
Accountability Systems
41%
LG PFM 4%
Governance and Oversight
20%
INDICATIVE STRATEGY COST SHARE
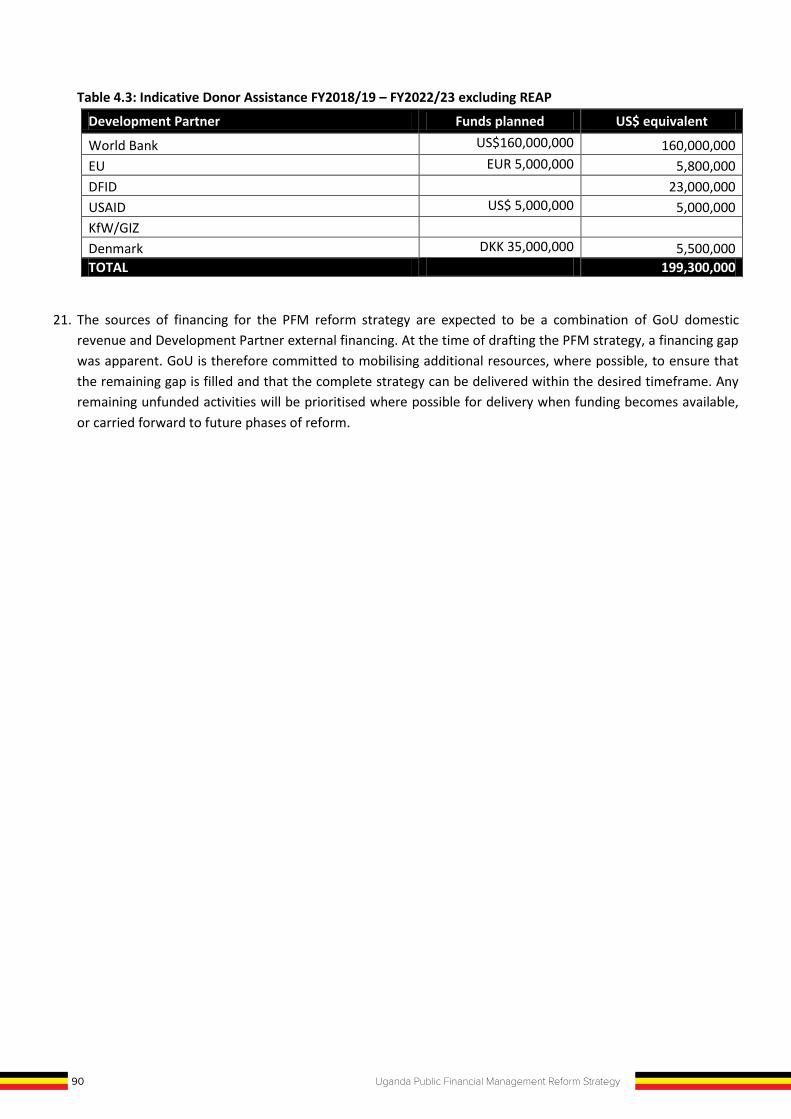
90 Uganda Public Financial Management Reform Strategy
Table 4.3: Indicative Donor Assistance FY2018/19 – FY2022/23 excluding REAP Development Partner Funds planned US$ equivalent World Bank US$160,000,000 160,000,000 EU EUR 5,000,000 5,800,000 DFID 23,000,000 USAID US$ 5,000,000 5,000,000 KfW/GIZ Denmark DKK 35,000,000 5,500,000 TOTAL 199,300,000
21. The sources of financing for the PFM reform strategy are expected to be a combination of GoU domestic revenue and Development Partner external financing. At the time of drafting the PFM strategy, a financing gap was apparent. GoU is therefore committed to mobilising additional resources, where possible, to ensure that the remaining gap is filled and that the complete strategy can be delivered within the desired timeframe. Any remaining unfunded activities will be prioritised where possible for delivery when funding becomes available, or carried forward to future phases of reform.
Table 4.4: Donor Assistance Matrix (excluding funding to successor phase; REAP) Strategic Objective / Outcome
Donor Assistance Committed / Planned
Details
DRM
1.1 Enhanced enabling environment for revenue mobilisation
X
DFID ‘DRUM’ TA for tax policy MTRS process and diagnostic studies (WB/DFID Trust Fund = £9m,
2018-2021); IMF TA/training on MTRS process and strategy for data matching,
management & utilisation
1.2 Tax compliance improved through increased efficiency in revenue administration
X
DFID DRUM TA/training on areas such as the VAT gap, international taxation, tax evasion and tax investigations (to be decided with URA).
USAID extension to TA to URA until 2022 –to be confirmed; EU ‘JAR’ (Justice and Accountability) programme to support DRM
(EUR5m, 2018-2021); IMF TA/ training in fraud detection, analyzing financial data, data
mining & evidence management, and real estate compliance management plan. Also capacity/training in post-clearance customs audits; taxpayer registration, filing & payments
1.3 Enhanced collections from new revenue opportunities including oil, gas and mineral sectors
X DFID DRUM; EU ‘JAR’ programme to support DRM including EITI (EUR5m, 2018-
2021)
1.4 Sustainable debt and Development financing X
Potential area of work for DFID DRUM but more likely under the PIM component. Remains to be discussed/decided with partners.
IMF TA/training on debt sustainability analysis and compilation of debt statistics.
Budget
2.1 Strategic plans and medium term budgets aligned X
IMF TA support/training tightening links between planning, annual budgets and MTEFs; plus program-based budgeting; macro forecasting capacity & policy analysis; fiscal risk management; compilation and dissemination of fiscal data
2.2 Multi-year commitments reflected in annual budgets X IMF TA – see above
2.3 Enhancing Planning and Budget responsiveness to gender equity
X EU ‘JAR’ programme to support GEB (EUR5m, 2018-2021); IMF training on gender based budgeting.
2.4 Increased equity and discretion of resources allocated to LGs for improved service delivery
X
World Bank (P4R) Intergovernmental Fiscal Transfers programme (UgIFT) ($160m over 2019-2022) – focus on education and health;
EU ‘JAR’ programme to support budgeting for enhanced service delivery (EUR5m, 2018-2021);
GAPP TA on legal, policy, regulatory and institutional issues affecting LG governance
ODI-BSI support on fiscal decentralization architecture and Local Government Performance Assessment (DFID funded)
2.5 Evidence-based policy making strengthened X ODI-BSI programme research component (DFID funded)
PIM
3.1 Efficient identification, selection and management of Public Investment Projects (PIPs) and Public-Private Partnerships (PPPs)
X
WB/DFID Trust Fund = £9m, 2018-2021 for DRM and PIM DFID ‘DRUM’ programme to include PIP prioritisation and regulatory
framework for PPP/PIM; EU ‘JAR’ programme to support PIM (EUR5m, 2018-2021); IMF TA/training to strengthen PIM processes and institutions, and
improve fiscal risk management
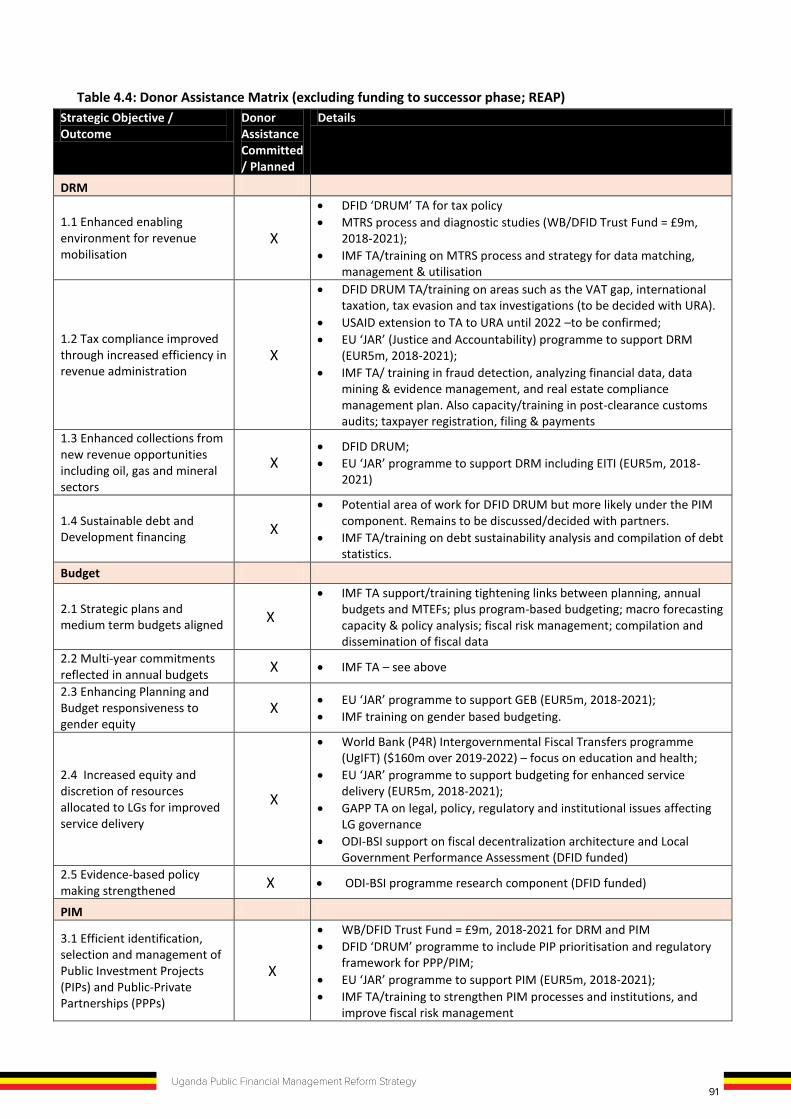
91Uganda Public Financial Management Reform Strategy
Table 4.3: Indicative Donor Assistance FY2018/19 – FY2022/23 excluding REAP Development Partner Funds planned US$ equivalent World Bank US$160,000,000 160,000,000 EU EUR 5,000,000 5,800,000 DFID 23,000,000 USAID US$ 5,000,000 5,000,000 KfW/GIZ Denmark DKK 35,000,000 5,500,000 TOTAL 199,300,000
21. The sources of financing for the PFM reform strategy are expected to be a combination of GoU domestic revenue and Development Partner external financing. At the time of drafting the PFM strategy, a financing gap was apparent. GoU is therefore committed to mobilising additional resources, where possible, to ensure that the remaining gap is filled and that the complete strategy can be delivered within the desired timeframe. Any remaining unfunded activities will be prioritised where possible for delivery when funding becomes available, or carried forward to future phases of reform.
Table 4.4: Donor Assistance Matrix (excluding funding to successor phase; REAP) Strategic Objective / Outcome
Donor Assistance Committed / Planned
Details
DRM
1.1 Enhanced enabling environment for revenue mobilisation
X
DFID ‘DRUM’ TA for tax policy MTRS process and diagnostic studies (WB/DFID Trust Fund = £9m,
2018-2021); IMF TA/training on MTRS process and strategy for data matching,
management & utilisation
1.2 Tax compliance improved through increased efficiency in revenue administration
X
DFID DRUM TA/training on areas such as the VAT gap, international taxation, tax evasion and tax investigations (to be decided with URA).
USAID extension to TA to URA until 2022 –to be confirmed; EU ‘JAR’ (Justice and Accountability) programme to support DRM
(EUR5m, 2018-2021); IMF TA/ training in fraud detection, analyzing financial data, data
mining & evidence management, and real estate compliance management plan. Also capacity/training in post-clearance customs audits; taxpayer registration, filing & payments
1.3 Enhanced collections from new revenue opportunities including oil, gas and mineral sectors
X DFID DRUM; EU ‘JAR’ programme to support DRM including EITI (EUR5m, 2018-
2021)
1.4 Sustainable debt and Development financing X
Potential area of work for DFID DRUM but more likely under the PIM component. Remains to be discussed/decided with partners.
IMF TA/training on debt sustainability analysis and compilation of debt statistics.
Budget
2.1 Strategic plans and medium term budgets aligned X
IMF TA support/training tightening links between planning, annual budgets and MTEFs; plus program-based budgeting; macro forecasting capacity & policy analysis; fiscal risk management; compilation and dissemination of fiscal data
2.2 Multi-year commitments reflected in annual budgets X IMF TA – see above
2.3 Enhancing Planning and Budget responsiveness to gender equity
X EU ‘JAR’ programme to support GEB (EUR5m, 2018-2021); IMF training on gender based budgeting.
2.4 Increased equity and discretion of resources allocated to LGs for improved service delivery
X
World Bank (P4R) Intergovernmental Fiscal Transfers programme (UgIFT) ($160m over 2019-2022) – focus on education and health;
EU ‘JAR’ programme to support budgeting for enhanced service delivery (EUR5m, 2018-2021);
GAPP TA on legal, policy, regulatory and institutional issues affecting LG governance
ODI-BSI support on fiscal decentralization architecture and Local Government Performance Assessment (DFID funded)
2.5 Evidence-based policy making strengthened X ODI-BSI programme research component (DFID funded)
PIM
3.1 Efficient identification, selection and management of Public Investment Projects (PIPs) and Public-Private Partnerships (PPPs)
X
WB/DFID Trust Fund = £9m, 2018-2021 for DRM and PIM DFID ‘DRUM’ programme to include PIP prioritisation and regulatory
framework for PPP/PIM; EU ‘JAR’ programme to support PIM (EUR5m, 2018-2021); IMF TA/training to strengthen PIM processes and institutions, and
improve fiscal risk management
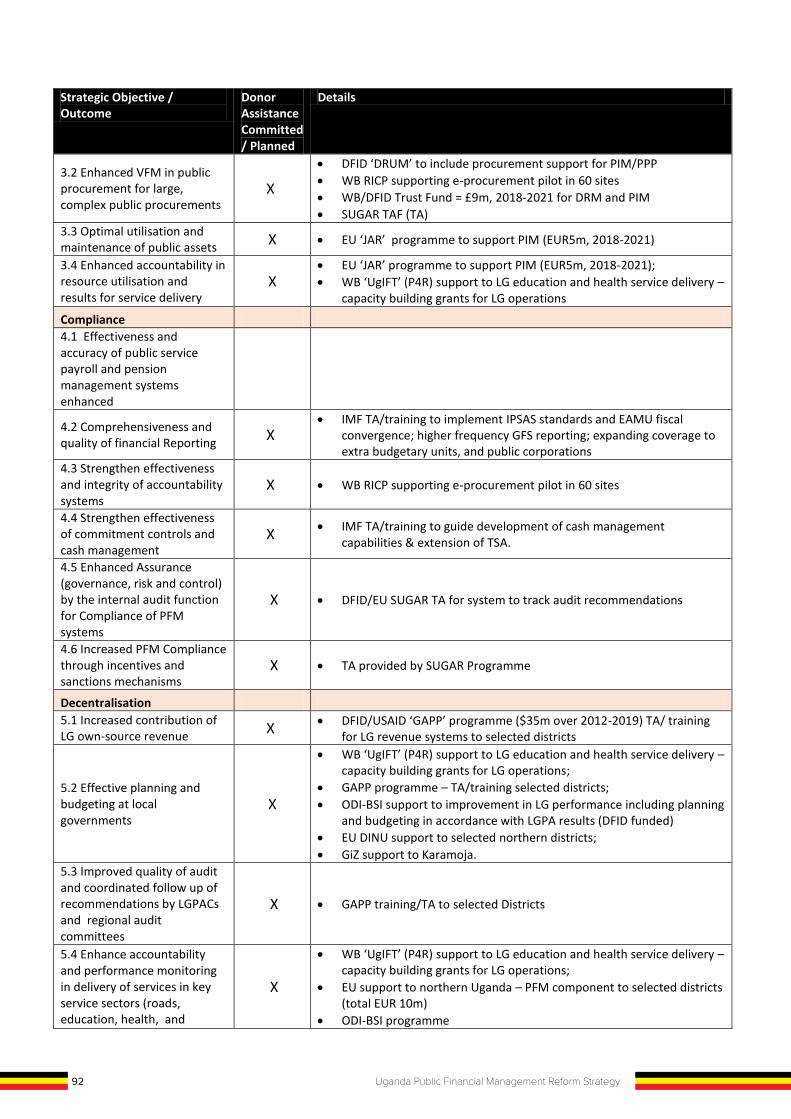
92 Uganda Public Financial Management Reform Strategy
Strategic Objective / Outcome
Donor Assistance Committed / Planned
Details
3.2 Enhanced VFM in public procurement for large, complex public procurements
X DFID ‘DRUM’ to include procurement support for PIM/PPP WB RICP supporting e-procurement pilot in 60 sites WB/DFID Trust Fund = £9m, 2018-2021 for DRM and PIM SUGAR TAF (TA)
3.3 Optimal utilisation and maintenance of public assets X EU ‘JAR’ programme to support PIM (EUR5m, 2018-2021)
3.4 Enhanced accountability in resource utilisation and results for service delivery
X EU ‘JAR’ programme to support PIM (EUR5m, 2018-2021); WB ‘UgIFT’ (P4R) support to LG education and health service delivery –
capacity building grants for LG operations Compliance 4.1 Effectiveness and accuracy of public service payroll and pension management systems enhanced
4.2 Comprehensiveness and quality of financial Reporting X
IMF TA/training to implement IPSAS standards and EAMU fiscal convergence; higher frequency GFS reporting; expanding coverage to extra budgetary units, and public corporations
4.3 Strengthen effectiveness and integrity of accountability systems
X WB RICP supporting e-procurement pilot in 60 sites
4.4 Strengthen effectiveness of commitment controls and cash management
X IMF TA/training to guide development of cash management capabilities & extension of TSA.
4.5 Enhanced Assurance (governance, risk and control) by the internal audit function for Compliance of PFM systems
X DFID/EU SUGAR TA for system to track audit recommendations
4.6 Increased PFM Compliance through incentives and sanctions mechanisms
X TA provided by SUGAR Programme
Decentralisation 5.1 Increased contribution of LG own-source revenue X DFID/USAID ‘GAPP’ programme ($35m over 2012-2019) TA/ training
for LG revenue systems to selected districts
5.2 Effective planning and budgeting at local governments
X
WB ‘UgIFT’ (P4R) support to LG education and health service delivery – capacity building grants for LG operations;
GAPP programme – TA/training selected districts; ODI-BSI support to improvement in LG performance including planning
and budgeting in accordance with LGPA results (DFID funded) EU DINU support to selected northern districts; GiZ support to Karamoja.
5.3 Improved quality of audit and coordinated follow up of recommendations by LGPACs and regional audit committees
X GAPP training/TA to selected Districts
5.4 Enhance accountability and performance monitoring in delivery of services in key service sectors (roads, education, health, and
X
WB ‘UgIFT’ (P4R) support to LG education and health service delivery – capacity building grants for LG operations;
EU support to northern Uganda – PFM component to selected districts (total EUR 10m)
ODI-BSI programme
Strategic Objective / Outcome
Donor Assistance Committed / Planned
Details
agriculture services)
5.5 Enhanced integrity and value for money of local government procurements
X WB ‘UgIFT’ (P4R) support to LG education and health service delivery –
capacity building grants for LG operations TA /training from DFID/USAID ‘GAPP’ programme to selected districts
Governance
6.1 Enhanced impact of financial and VFM audit reporting and oversight
X GIZ PoAT TA/training for OAG stakeholder engagement; results based
management, including impact analysis & use of M&E systems); and strengthening OAG independence
TA provided by SUGAR Programme 6.2 Improved coordination and monitoring of PFM processes within the Accountability Sector
X EU ‘JAR’ TA for coordination of accountability sector & links with JLOS (EUR5m, 2018-2021);
6.3 Sustained uptake of reforms through improved learning and coordination of PFM Reform processes
X IMF TA for PFM legislation and strategy
6.4 Increased demand for downward accountability to citizens for public spending and service delivery performance
X GAPP programme ($35m over 2012-2019)
6.5 Cost-effective public administration through rationalisation of the administrative units
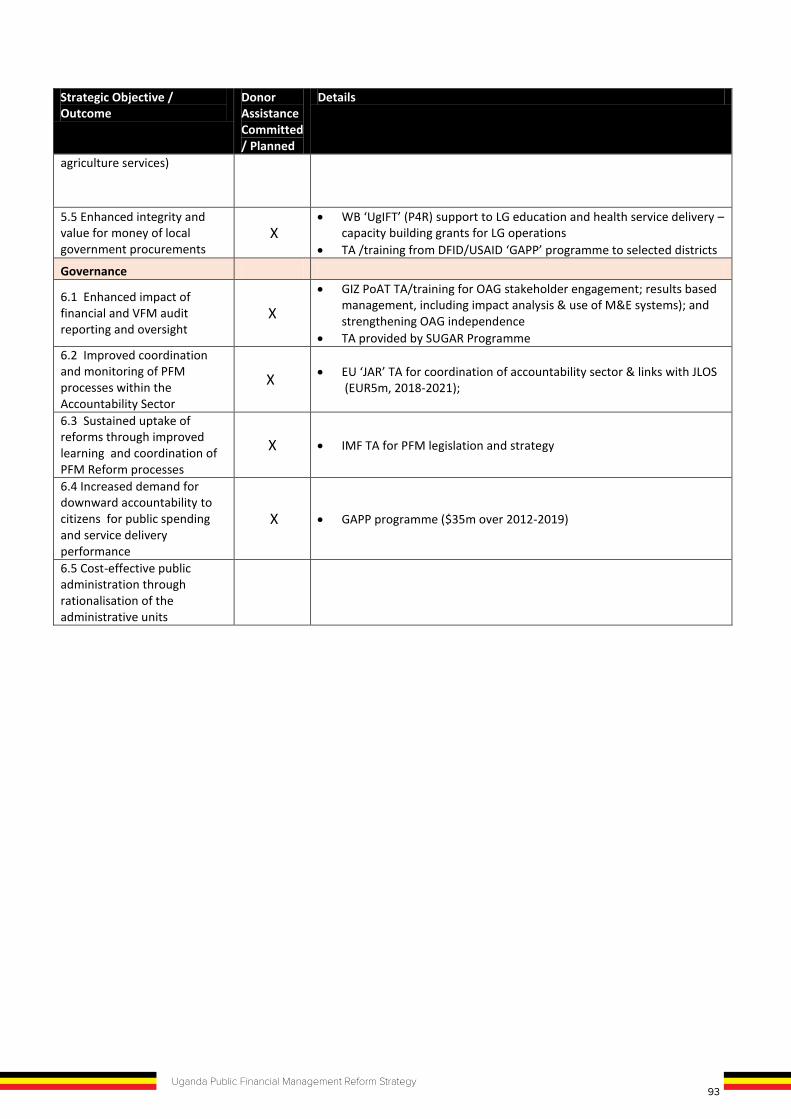
93Uganda Public Financial Management Reform Strategy
Strategic Objective / Outcome
Donor Assistance Committed / Planned
Details
3.2 Enhanced VFM in public procurement for large, complex public procurements
X DFID ‘DRUM’ to include procurement support for PIM/PPP WB RICP supporting e-procurement pilot in 60 sites WB/DFID Trust Fund = £9m, 2018-2021 for DRM and PIM SUGAR TAF (TA)
3.3 Optimal utilisation and maintenance of public assets X EU ‘JAR’ programme to support PIM (EUR5m, 2018-2021)
3.4 Enhanced accountability in resource utilisation and results for service delivery
X EU ‘JAR’ programme to support PIM (EUR5m, 2018-2021); WB ‘UgIFT’ (P4R) support to LG education and health service delivery –
capacity building grants for LG operations Compliance 4.1 Effectiveness and accuracy of public service payroll and pension management systems enhanced
4.2 Comprehensiveness and quality of financial Reporting X
IMF TA/training to implement IPSAS standards and EAMU fiscal convergence; higher frequency GFS reporting; expanding coverage to extra budgetary units, and public corporations
4.3 Strengthen effectiveness and integrity of accountability systems
X WB RICP supporting e-procurement pilot in 60 sites
4.4 Strengthen effectiveness of commitment controls and cash management
X IMF TA/training to guide development of cash management capabilities & extension of TSA.
4.5 Enhanced Assurance (governance, risk and control) by the internal audit function for Compliance of PFM systems
X DFID/EU SUGAR TA for system to track audit recommendations
4.6 Increased PFM Compliance through incentives and sanctions mechanisms
X TA provided by SUGAR Programme
Decentralisation 5.1 Increased contribution of LG own-source revenue X DFID/USAID ‘GAPP’ programme ($35m over 2012-2019) TA/ training
for LG revenue systems to selected districts
5.2 Effective planning and budgeting at local governments
X
WB ‘UgIFT’ (P4R) support to LG education and health service delivery – capacity building grants for LG operations;
GAPP programme – TA/training selected districts; ODI-BSI support to improvement in LG performance including planning
and budgeting in accordance with LGPA results (DFID funded) EU DINU support to selected northern districts; GiZ support to Karamoja.
5.3 Improved quality of audit and coordinated follow up of recommendations by LGPACs and regional audit committees
X GAPP training/TA to selected Districts
5.4 Enhance accountability and performance monitoring in delivery of services in key service sectors (roads, education, health, and
X
WB ‘UgIFT’ (P4R) support to LG education and health service delivery – capacity building grants for LG operations;
EU support to northern Uganda – PFM component to selected districts (total EUR 10m)
ODI-BSI programme
Strategic Objective / Outcome
Donor Assistance Committed / Planned
Details
agriculture services)
5.5 Enhanced integrity and value for money of local government procurements
X WB ‘UgIFT’ (P4R) support to LG education and health service delivery –
capacity building grants for LG operations TA /training from DFID/USAID ‘GAPP’ programme to selected districts
Governance
6.1 Enhanced impact of financial and VFM audit reporting and oversight
X GIZ PoAT TA/training for OAG stakeholder engagement; results based
management, including impact analysis & use of M&E systems); and strengthening OAG independence
TA provided by SUGAR Programme 6.2 Improved coordination and monitoring of PFM processes within the Accountability Sector
X EU ‘JAR’ TA for coordination of accountability sector & links with JLOS (EUR5m, 2018-2021);
6.3 Sustained uptake of reforms through improved learning and coordination of PFM Reform processes
X IMF TA for PFM legislation and strategy
6.4 Increased demand for downward accountability to citizens for public spending and service delivery performance
X GAPP programme ($35m over 2012-2019)
6.5 Cost-effective public administration through rationalisation of the administrative units
94 Uganda Public Financial Management Reform Strategy
5 CHANGE MANAGEMENT AND COMMUNICATION
5.1 Rationale for Change Management and Communications 1. As identified by the situation analysis, weaknesses remain in culture of compliance within the public sector and
in the demand for (and response to) downward accountability for the allocation and use of public resources. It is important that there is a clear flow of information between central government, sector institutions, local governments, delivery units and the wider public. Behaviours and incentives surrounding PFM systems and reforms need to be well understood and addressed through communications, assistance and continuous reinforcement to foster compliance and achieve sustainable impact.
2. A change management and communications strategy for PFM reforms is therefore necessary to ensure that new rules, systems and institutions introduced through reforms are understood, embraced and adopted. Key elements of the change management and communication strategy are drawn from the existing communications strategy provided in the ASSIP and the Change Management and Communications strategy developed under FINMAP III. Implementation will be coordinated through the PFM reform secretariat, in collaboration with Accountability sector secretariat, which will be undertaking similar and complementary activities. In order to enhance the capacity of the PFM secretariat to implement the change management and communications strategy, a number of specific activities have been identified in the PFM reform strategy implementation plan, under Objective 6: oversight and governance of PFM reform, for which resources will need to be provided. In particular, the PFM secretariat will form a central PFM reform centre or resource for coordinating and disseminating information on PFM reforms and progress, as well as for providing support to implementing institutions to deliver change management and communications to individuals and institutions affected by change.
5.2 Change Management Strategies for PFM reform 3. Through the experience of FINMAP III and previous reforms, it was recognised that a viable Change
Management Strategy should be developed. There are many approaches to change management from international practice, most of which are based around three broad areas: behaviourism (with a focus on change rewards), cognitive (changing mind-sets) and humanistic (removing blockages to achieving human potential). All of these approaches recognise that resistance to change is a normal part of the change process, which face inherent disruptions as those affected by the change adjust to the new modalities. The aim of change management is therefore to mitigate these disruptive effects and smoothen the transition from one state to another. A common thread of change management approaches is therefore to identify and address doubts or fears about change, particularly by supporting those affected by change to make sense of their own reality and the real impact of the changes.
4. This strategy follows the method adopted in the FINMAP III Change Management and Communication Plan, based on the change management standards set by the Association of Change Management Professionals (ACMP). The standard provides a holistic and functional framework for guiding the formulation of Strategy and the knowledge, norms, processes, tasks and skills for change management to be effective.
5. Several factors will be critical in ensuring the success of change management, including: executive sponsorship and visibility; stakeholder engagement (at the levels of PEMCOM, technical committees, civil society and the PFM reform secretariat); design of a consistent and systematic change management approach; and establishment of change management plans at the level of each major reform under the PFM reform strategy.
In the implementation of this strategy, it is therefore important to develop a systematic approach to change management, at least for all significant PFM reforms, including new systems, processes, laws, policies or procedures. This approach comprises several steps for any significant PFM reform:
i) Change definition and organisation readiness: assess what change will mean for various stakeholders, any operational adjustments anticipated and readiness of institutions and individuals involved;
ii) Formulation of a sponsorship strategy: identify those accountable for the change and assess their commitment to reform. This involves identifying and enlisting change management champions (CMCs) responsible for leading the transformation process within their areas of influence. CMCs should have a good understanding of PFM and be able to develop and maintain an effective culture that inspires change;
iii) Developing stakeholder engagement strategy: identify those likely to be affected and design approach to keeping them actively involved before, during and after;
iv) Developing a communication plan: approach to facilitating sharing of information on the change, learning from the experience and peer-to-peer sharing of challenges and joint responsibility;
v) Sustainability strategy: how the changes will be embedded within the organisation and if any skills and knowledge need to be imparted; and
vi) Post-implementation change management evaluation: review of whether change brought about the intended outcomes. This requires ensuring there are mechanisms in place to monitor and evaluate the effectiveness of the change management plan.
6. In practice, there is a need for additional resources to support the PFM reform strategy, which will be dedicated to developing plans and supporting the delivery of change management and communications. The following activities will be needed to operationalise the change management approach:
John Kotter’s 8-stage process: 1. Establishing a sense of urgency 2. Creating the guiding coalition 3. Developing a vision and strategy 4. Communicating the change vision 5. Empowering broad based action 6. Generating short term wins 7. Consolidating gains and producing
more change 8. Anchoring new approaches in
culture
ADKARTM Change Management Methodology: Awareness: Of the need for change Desire: to support and participate in
the change Knowledge of how to change Ability to implement the required
skills and behavior Reinforcement: to sustain the
change
Box 5.1: Example change management methodologies
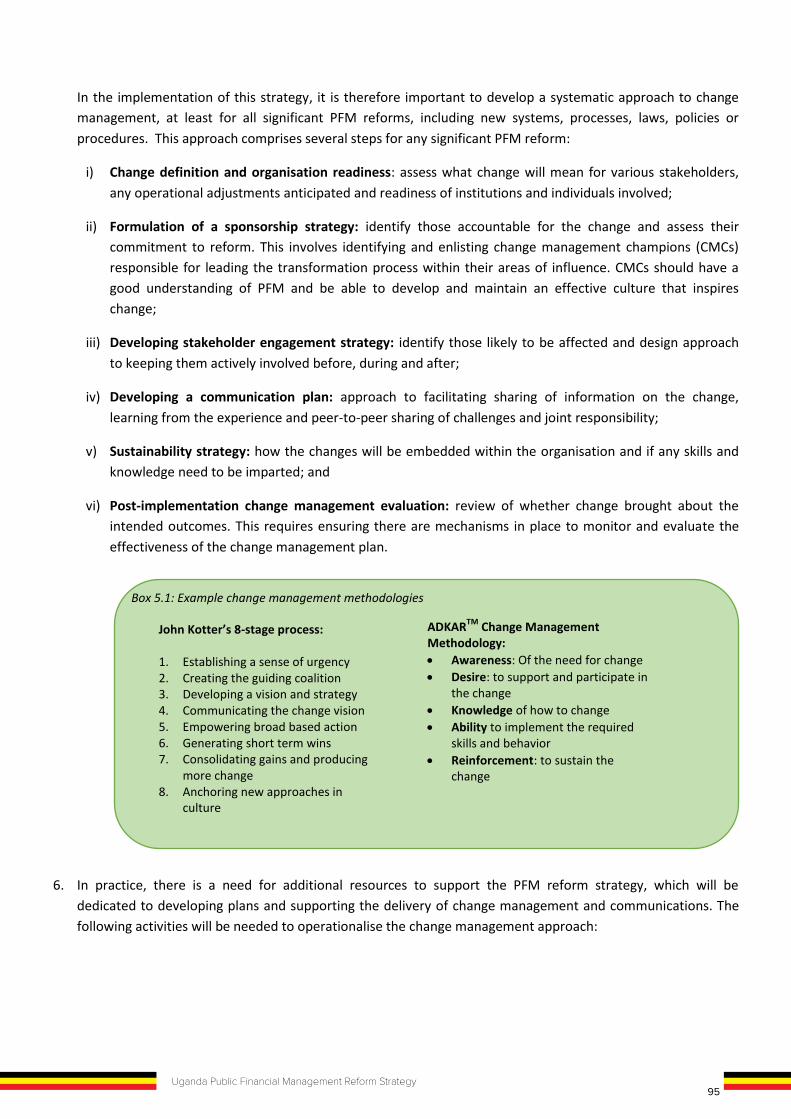
95Uganda Public Financial Management Reform Strategy
5 CHANGE MANAGEMENT AND COMMUNICATION
5.1 Rationale for Change Management and Communications 1. As identified by the situation analysis, weaknesses remain in culture of compliance within the public sector and
in the demand for (and response to) downward accountability for the allocation and use of public resources. It is important that there is a clear flow of information between central government, sector institutions, local governments, delivery units and the wider public. Behaviours and incentives surrounding PFM systems and reforms need to be well understood and addressed through communications, assistance and continuous reinforcement to foster compliance and achieve sustainable impact.
2. A change management and communications strategy for PFM reforms is therefore necessary to ensure that new rules, systems and institutions introduced through reforms are understood, embraced and adopted. Key elements of the change management and communication strategy are drawn from the existing communications strategy provided in the ASSIP and the Change Management and Communications strategy developed under FINMAP III. Implementation will be coordinated through the PFM reform secretariat, in collaboration with Accountability sector secretariat, which will be undertaking similar and complementary activities. In order to enhance the capacity of the PFM secretariat to implement the change management and communications strategy, a number of specific activities have been identified in the PFM reform strategy implementation plan, under Objective 6: oversight and governance of PFM reform, for which resources will need to be provided. In particular, the PFM secretariat will form a central PFM reform centre or resource for coordinating and disseminating information on PFM reforms and progress, as well as for providing support to implementing institutions to deliver change management and communications to individuals and institutions affected by change.
5.2 Change Management Strategies for PFM reform 3. Through the experience of FINMAP III and previous reforms, it was recognised that a viable Change
Management Strategy should be developed. There are many approaches to change management from international practice, most of which are based around three broad areas: behaviourism (with a focus on change rewards), cognitive (changing mind-sets) and humanistic (removing blockages to achieving human potential). All of these approaches recognise that resistance to change is a normal part of the change process, which face inherent disruptions as those affected by the change adjust to the new modalities. The aim of change management is therefore to mitigate these disruptive effects and smoothen the transition from one state to another. A common thread of change management approaches is therefore to identify and address doubts or fears about change, particularly by supporting those affected by change to make sense of their own reality and the real impact of the changes.
4. This strategy follows the method adopted in the FINMAP III Change Management and Communication Plan, based on the change management standards set by the Association of Change Management Professionals (ACMP). The standard provides a holistic and functional framework for guiding the formulation of Strategy and the knowledge, norms, processes, tasks and skills for change management to be effective.
5. Several factors will be critical in ensuring the success of change management, including: executive sponsorship and visibility; stakeholder engagement (at the levels of PEMCOM, technical committees, civil society and the PFM reform secretariat); design of a consistent and systematic change management approach; and establishment of change management plans at the level of each major reform under the PFM reform strategy.
In the implementation of this strategy, it is therefore important to develop a systematic approach to change management, at least for all significant PFM reforms, including new systems, processes, laws, policies or procedures. This approach comprises several steps for any significant PFM reform:
i) Change definition and organisation readiness: assess what change will mean for various stakeholders, any operational adjustments anticipated and readiness of institutions and individuals involved;
ii) Formulation of a sponsorship strategy: identify those accountable for the change and assess their commitment to reform. This involves identifying and enlisting change management champions (CMCs) responsible for leading the transformation process within their areas of influence. CMCs should have a good understanding of PFM and be able to develop and maintain an effective culture that inspires change;
iii) Developing stakeholder engagement strategy: identify those likely to be affected and design approach to keeping them actively involved before, during and after;
iv) Developing a communication plan: approach to facilitating sharing of information on the change, learning from the experience and peer-to-peer sharing of challenges and joint responsibility;
v) Sustainability strategy: how the changes will be embedded within the organisation and if any skills and knowledge need to be imparted; and
vi) Post-implementation change management evaluation: review of whether change brought about the intended outcomes. This requires ensuring there are mechanisms in place to monitor and evaluate the effectiveness of the change management plan.
6. In practice, there is a need for additional resources to support the PFM reform strategy, which will be dedicated to developing plans and supporting the delivery of change management and communications. The following activities will be needed to operationalise the change management approach:
John Kotter’s 8-stage process: 1. Establishing a sense of urgency 2. Creating the guiding coalition 3. Developing a vision and strategy 4. Communicating the change vision 5. Empowering broad based action 6. Generating short term wins 7. Consolidating gains and producing
more change 8. Anchoring new approaches in
culture
ADKARTM Change Management Methodology: Awareness: Of the need for change Desire: to support and participate in
the change Knowledge of how to change Ability to implement the required
skills and behavior Reinforcement: to sustain the
change
Box 5.1: Example change management methodologies
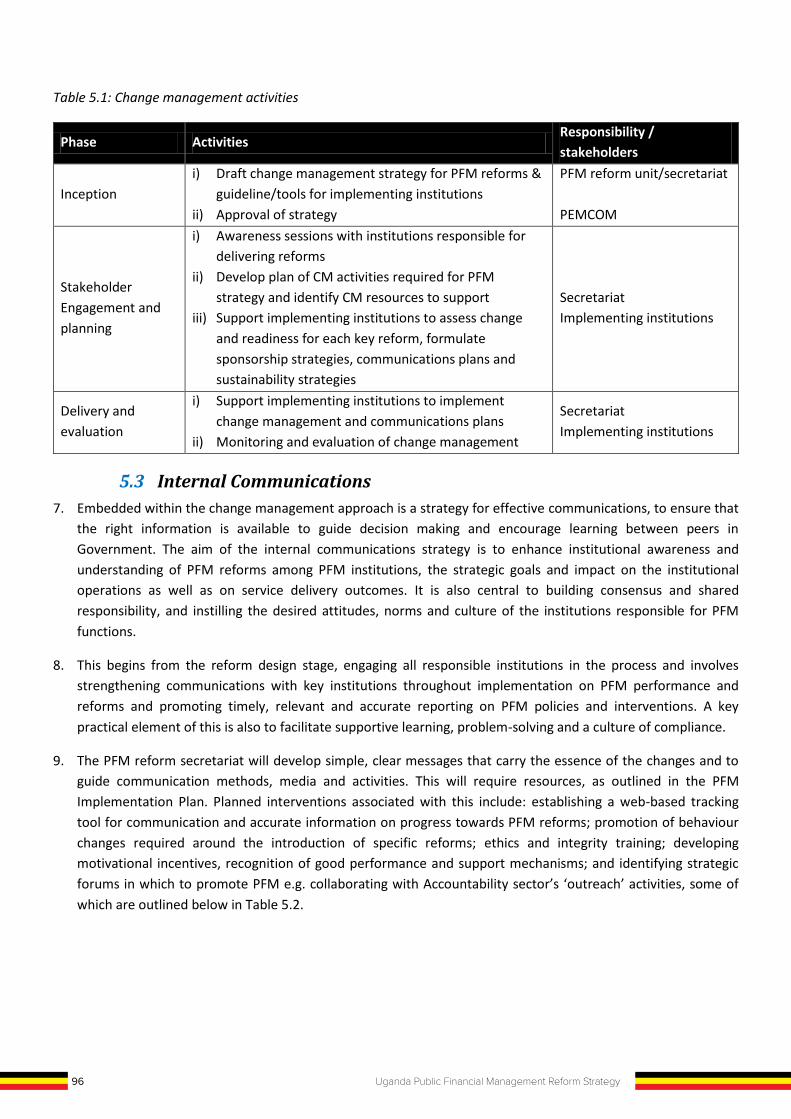
96 Uganda Public Financial Management Reform Strategy
Table 5.1: Change management activities
Phase Activities Responsibility / stakeholders
Inception i) Draft change management strategy for PFM reforms &
guideline/tools for implementing institutions ii) Approval of strategy
PFM reform unit/secretariat PEMCOM
Stakeholder Engagement and planning
i) Awareness sessions with institutions responsible for delivering reforms
ii) Develop plan of CM activities required for PFM strategy and identify CM resources to support
iii) Support implementing institutions to assess change and readiness for each key reform, formulate sponsorship strategies, communications plans and sustainability strategies
Secretariat Implementing institutions
Delivery and evaluation
i) Support implementing institutions to implement change management and communications plans
ii) Monitoring and evaluation of change management
Secretariat Implementing institutions
5.3 Internal Communications 7. Embedded within the change management approach is a strategy for effective communications, to ensure that
the right information is available to guide decision making and encourage learning between peers in Government. The aim of the internal communications strategy is to enhance institutional awareness and understanding of PFM reforms among PFM institutions, the strategic goals and impact on the institutional operations as well as on service delivery outcomes. It is also central to building consensus and shared responsibility, and instilling the desired attitudes, norms and culture of the institutions responsible for PFM functions.
8. This begins from the reform design stage, engaging all responsible institutions in the process and involves strengthening communications with key institutions throughout implementation on PFM performance and reforms and promoting timely, relevant and accurate reporting on PFM policies and interventions. A key practical element of this is also to facilitate supportive learning, problem-solving and a culture of compliance.
9. The PFM reform secretariat will develop simple, clear messages that carry the essence of the changes and to guide communication methods, media and activities. This will require resources, as outlined in the PFM Implementation Plan. Planned interventions associated with this include: establishing a web-based tracking tool for communication and accurate information on progress towards PFM reforms; promotion of behaviour changes required around the introduction of specific reforms; ethics and integrity training; developing motivational incentives, recognition of good performance and support mechanisms; and identifying strategic forums in which to promote PFM e.g. collaborating with Accountability sector’s ‘outreach’ activities, some of which are outlined below in Table 5.2.
Table 5.2: Key components from Accountability sector communications strategy and specific PFM reform communications activities – Internal communications
Activity Target audience Channels/Tools
Accountability Sector: Internal communications
Retreats, meetings, Top management, technical staff, ASWG, Steering committee, leadership committee, staff
Meetings, emails, notices, newsletters, WhatsApp groups, intranet, retreats, memos
PFM Reform – internal communications:
Dissemination of PFM reform strategy;
Sharing information on specific reforms and requirements from MDALGs;
Sharing information on progress of reforms
Training/sensitisation on ethics & integrity of PFM
Implementing institutions
MDALGs
Workshops, meetings, brochures;
Circulars from PS/ST on specific reforms;
Progress reports, web-based indicators, newsletter
Induction / refresher training
5.4 External Communications 10. The aim of the external communications strategy is to enhance public awareness and understanding of PFM
reforms, their impacts on service delivery and to increase demand for accountability. This involves engaging civil society, private sector and other institutions to build collaborative networks and partnerships to support PFM reforms and promoting timely, relevant and accurate reporting on PFM policies and interventions. An external communications strategy will be developed to accompany the PFM reform strategy to set out the long-term reform agenda and promote behaviour change and accountability mechanisms around them. Where possible, will build on existing communications tools and forums for this purpose, such as the Uganda Budget website and feedback mechanisms, partnerships with CSOs to support local community ‘barazas’. Results from PFM reform activities can also be communicated better, such as linking audit findings and their follow up implementation to the public and dissemination or debate through civil society.
97Uganda Public Financial Management Reform Strategy
Table 5.1: Change management activities
Phase Activities Responsibility / stakeholders
Inception i) Draft change management strategy for PFM reforms &
guideline/tools for implementing institutions ii) Approval of strategy
PFM reform unit/secretariat PEMCOM
Stakeholder Engagement and planning
i) Awareness sessions with institutions responsible for delivering reforms
ii) Develop plan of CM activities required for PFM strategy and identify CM resources to support
iii) Support implementing institutions to assess change and readiness for each key reform, formulate sponsorship strategies, communications plans and sustainability strategies
Secretariat Implementing institutions
Delivery and evaluation
i) Support implementing institutions to implement change management and communications plans
ii) Monitoring and evaluation of change management
Secretariat Implementing institutions
5.3 Internal Communications 7. Embedded within the change management approach is a strategy for effective communications, to ensure that
the right information is available to guide decision making and encourage learning between peers in Government. The aim of the internal communications strategy is to enhance institutional awareness and understanding of PFM reforms among PFM institutions, the strategic goals and impact on the institutional operations as well as on service delivery outcomes. It is also central to building consensus and shared responsibility, and instilling the desired attitudes, norms and culture of the institutions responsible for PFM functions.
8. This begins from the reform design stage, engaging all responsible institutions in the process and involves strengthening communications with key institutions throughout implementation on PFM performance and reforms and promoting timely, relevant and accurate reporting on PFM policies and interventions. A key practical element of this is also to facilitate supportive learning, problem-solving and a culture of compliance.
9. The PFM reform secretariat will develop simple, clear messages that carry the essence of the changes and to guide communication methods, media and activities. This will require resources, as outlined in the PFM Implementation Plan. Planned interventions associated with this include: establishing a web-based tracking tool for communication and accurate information on progress towards PFM reforms; promotion of behaviour changes required around the introduction of specific reforms; ethics and integrity training; developing motivational incentives, recognition of good performance and support mechanisms; and identifying strategic forums in which to promote PFM e.g. collaborating with Accountability sector’s ‘outreach’ activities, some of which are outlined below in Table 5.2.
Table 5.2: Key components from Accountability sector communications strategy and specific PFM reform communications activities – Internal communications
Activity Target audience Channels/Tools
Accountability Sector: Internal communications
Retreats, meetings, Top management, technical staff, ASWG, Steering committee, leadership committee, staff
Meetings, emails, notices, newsletters, WhatsApp groups, intranet, retreats, memos
PFM Reform – internal communications:
Dissemination of PFM reform strategy;
Sharing information on specific reforms and requirements from MDALGs;
Sharing information on progress of reforms
Training/sensitisation on ethics & integrity of PFM
Implementing institutions
MDALGs
Workshops, meetings, brochures;
Circulars from PS/ST on specific reforms;
Progress reports, web-based indicators, newsletter
Induction / refresher training
5.4 External Communications 10. The aim of the external communications strategy is to enhance public awareness and understanding of PFM
reforms, their impacts on service delivery and to increase demand for accountability. This involves engaging civil society, private sector and other institutions to build collaborative networks and partnerships to support PFM reforms and promoting timely, relevant and accurate reporting on PFM policies and interventions. An external communications strategy will be developed to accompany the PFM reform strategy to set out the long-term reform agenda and promote behaviour change and accountability mechanisms around them. Where possible, will build on existing communications tools and forums for this purpose, such as the Uganda Budget website and feedback mechanisms, partnerships with CSOs to support local community ‘barazas’. Results from PFM reform activities can also be communicated better, such as linking audit findings and their follow up implementation to the public and dissemination or debate through civil society.
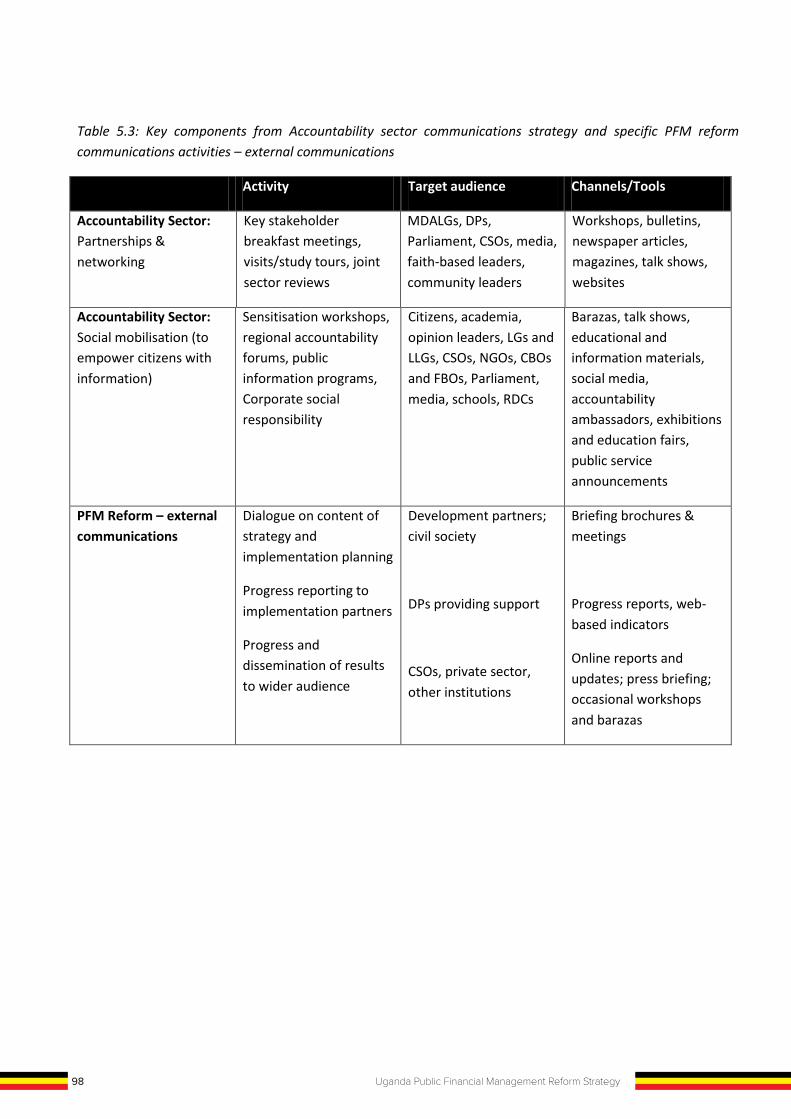
98 Uganda Public Financial Management Reform Strategy
Table 5.3: Key components from Accountability sector communications strategy and specific PFM reform communications activities – external communications
Activity Target audience Channels/Tools
Accountability Sector: Partnerships & networking
Key stakeholder breakfast meetings, visits/study tours, joint sector reviews
MDALGs, DPs, Parliament, CSOs, media, faith-based leaders, community leaders
Workshops, bulletins, newspaper articles, magazines, talk shows, websites
Accountability Sector: Social mobilisation (to empower citizens with information)
Sensitisation workshops, regional accountability forums, public information programs, Corporate social responsibility
Citizens, academia, opinion leaders, LGs and LLGs, CSOs, NGOs, CBOs and FBOs, Parliament, media, schools, RDCs
Barazas, talk shows, educational and information materials, social media, accountability ambassadors, exhibitions and education fairs, public service announcements
PFM Reform – external communications
Dialogue on content of strategy and implementation planning
Progress reporting to implementation partners
Progress and dissemination of results to wider audience
Development partners; civil society
DPs providing support
CSOs, private sector, other institutions
Briefing brochures & meetings
Progress reports, web-based indicators
Online reports and updates; press briefing; occasional workshops and barazas
6 RISK MANAGEMENT
6.1 Approach to Risk Management 1. Risk management is a critical aspect of the successful delivery of any project or programme and ensures that
exposure to risk is acceptable and manageable. While it is not possible to eliminate all risk, having a comprehensive risk management plan and mitigation strategies helps to identify and minimise risk. This requires active management throughout the duration of the PFM reform strategy and therefore this section also sets out the institutional arrangements for identifying, assessing and managing risk.
2. As a first step, during the drafting of the Strategy, a number of assumptions were made in setting the indicators and targets in the results matrix. A number of risks have been identified associated with the likelihood and consequences of those assumptions not being upheld. These and other examples of key risks to successful achievement of the outcomes and objectives of the PFM reform strategy are outlined in Table 6.1 along with example mitigation strategies.
3. This strategy recognises that a risk matrix evolves with time, and should be actively managed, in response to the results of mitigation strategies, changing contexts and other risks arising. This strategy therefore identifies broad risk categories likely to be relevant to the implementation plan and provides a framework for the management and mitigation of risk.
6.2 Risk Management Process and Method 4. The active management of the risk matrix will be undertaken on a day to day basis by the PFM reform
secretariat, with support from the PFM reform sub-groups (where there are specific risks associated with the sub-group activities) and from PEMCOM. The PFM reform secretariat will be responsible for coordinating the assessment and update of the risk register on a monthly basis. They will also identify priority risks to be discussed at PEMCOM for mitigating action e.g. those with a medium-to-high residual risk.
5. The PEMCOM Priority Action Matrix (PRAM) should include high-level risk monitoring of the most significant risks, with a focus on the escalated risks and actions, in order to keep regular track and active management of risks and to ensure that time and effort by PEMCOM allocated to risk management is commensurate with the level of risk.
6. A detailed Risk Register will be developed by the PFM secretariat to record details of all the risks identified at the beginning and during the life of the Strategy. This provides PEMCOM and its wider stakeholders with a documented framework for communicating and managing risks. The register includes a grading in terms of likelihood of occurring and seriousness of impact on the various strategy deliverables. Mitigating strategies and residual risk assessment are identified for each high level risk, with an ‘owner’ identified responsible for active management of the risk. Where the residual risk remains high, mitigation strategies should be reviewed and improved. Mitigating actions include, for example:
i) Preventative actions - planned actions to reduce the likelihood a risk will occur and/or reduce the impact if it does occur;
ii) Contingency actions - planned actions to reduce the immediate impact of the risk when it does occur; and
iii) Recovery actions - planned actions taken once a risk has occurred to allow progress to be made.
99Uganda Public Financial Management Reform Strategy
Table 5.3: Key components from Accountability sector communications strategy and specific PFM reform communications activities – external communications
Activity Target audience Channels/Tools
Accountability Sector: Partnerships & networking
Key stakeholder breakfast meetings, visits/study tours, joint sector reviews
MDALGs, DPs, Parliament, CSOs, media, faith-based leaders, community leaders
Workshops, bulletins, newspaper articles, magazines, talk shows, websites
Accountability Sector: Social mobilisation (to empower citizens with information)
Sensitisation workshops, regional accountability forums, public information programs, Corporate social responsibility
Citizens, academia, opinion leaders, LGs and LLGs, CSOs, NGOs, CBOs and FBOs, Parliament, media, schools, RDCs
Barazas, talk shows, educational and information materials, social media, accountability ambassadors, exhibitions and education fairs, public service announcements
PFM Reform – external communications
Dialogue on content of strategy and implementation planning
Progress reporting to implementation partners
Progress and dissemination of results to wider audience
Development partners; civil society
DPs providing support
CSOs, private sector, other institutions
Briefing brochures & meetings
Progress reports, web-based indicators
Online reports and updates; press briefing; occasional workshops and barazas
6 RISK MANAGEMENT
6.1 Approach to Risk Management 1. Risk management is a critical aspect of the successful delivery of any project or programme and ensures that
exposure to risk is acceptable and manageable. While it is not possible to eliminate all risk, having a comprehensive risk management plan and mitigation strategies helps to identify and minimise risk. This requires active management throughout the duration of the PFM reform strategy and therefore this section also sets out the institutional arrangements for identifying, assessing and managing risk.
2. As a first step, during the drafting of the Strategy, a number of assumptions were made in setting the indicators and targets in the results matrix. A number of risks have been identified associated with the likelihood and consequences of those assumptions not being upheld. These and other examples of key risks to successful achievement of the outcomes and objectives of the PFM reform strategy are outlined in Table 6.1 along with example mitigation strategies.
3. This strategy recognises that a risk matrix evolves with time, and should be actively managed, in response to the results of mitigation strategies, changing contexts and other risks arising. This strategy therefore identifies broad risk categories likely to be relevant to the implementation plan and provides a framework for the management and mitigation of risk.
6.2 Risk Management Process and Method 4. The active management of the risk matrix will be undertaken on a day to day basis by the PFM reform
secretariat, with support from the PFM reform sub-groups (where there are specific risks associated with the sub-group activities) and from PEMCOM. The PFM reform secretariat will be responsible for coordinating the assessment and update of the risk register on a monthly basis. They will also identify priority risks to be discussed at PEMCOM for mitigating action e.g. those with a medium-to-high residual risk.
5. The PEMCOM Priority Action Matrix (PRAM) should include high-level risk monitoring of the most significant risks, with a focus on the escalated risks and actions, in order to keep regular track and active management of risks and to ensure that time and effort by PEMCOM allocated to risk management is commensurate with the level of risk.
6. A detailed Risk Register will be developed by the PFM secretariat to record details of all the risks identified at the beginning and during the life of the Strategy. This provides PEMCOM and its wider stakeholders with a documented framework for communicating and managing risks. The register includes a grading in terms of likelihood of occurring and seriousness of impact on the various strategy deliverables. Mitigating strategies and residual risk assessment are identified for each high level risk, with an ‘owner’ identified responsible for active management of the risk. Where the residual risk remains high, mitigation strategies should be reviewed and improved. Mitigating actions include, for example:
i) Preventative actions - planned actions to reduce the likelihood a risk will occur and/or reduce the impact if it does occur;
ii) Contingency actions - planned actions to reduce the immediate impact of the risk when it does occur; and
iii) Recovery actions - planned actions taken once a risk has occurred to allow progress to be made.
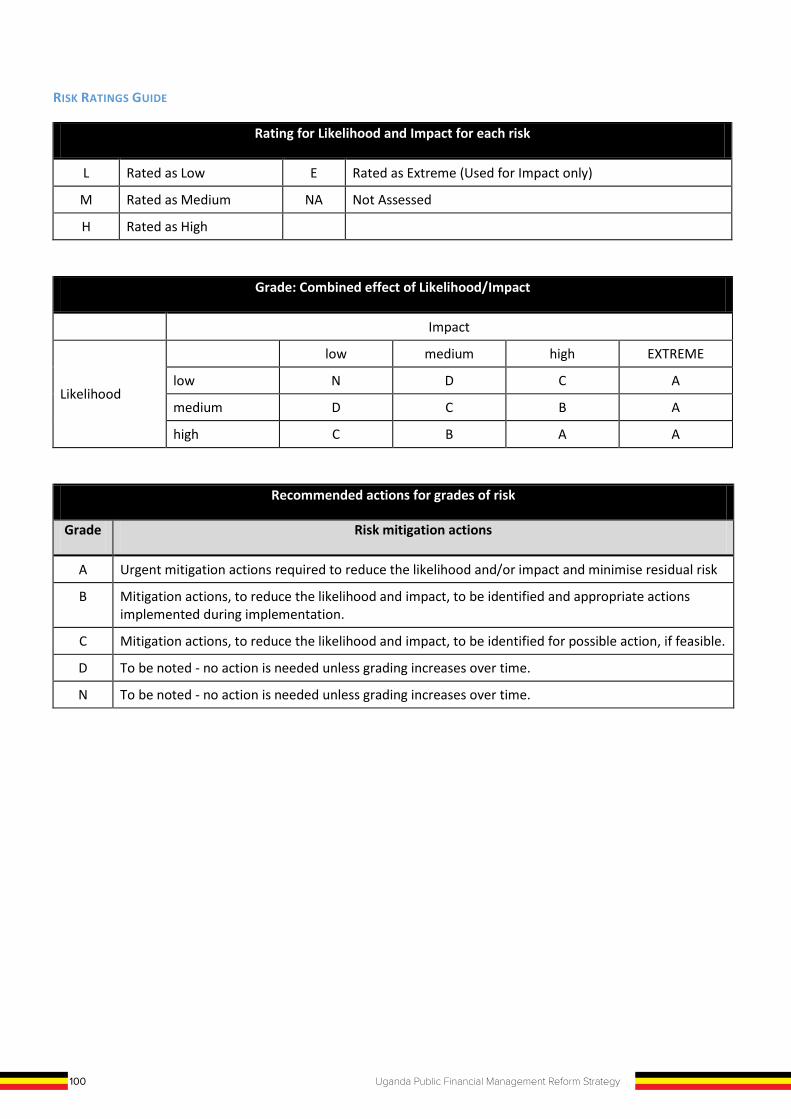
100 Uganda Public Financial Management Reform Strategy
RISK RATINGS GUIDE
Rating for Likelihood and Impact for each risk
L Rated as Low E Rated as Extreme (Used for Impact only)
M Rated as Medium NA Not Assessed
H Rated as High
Grade: Combined effect of Likelihood/Impact
Impact
Likelihood
low medium high EXTREME
low N D C A
medium D C B A
high C B A A
Recommended actions for grades of risk
Grade Risk mitigation actions
A Urgent mitigation actions required to reduce the likelihood and/or impact and minimise residual risk
B Mitigation actions, to reduce the likelihood and impact, to be identified and appropriate actions implemented during implementation.
C Mitigation actions, to reduce the likelihood and impact, to be identified for possible action, if feasible.
D To be noted - no action is needed unless grading increases over time.
N To be noted - no action is needed unless grading increases over time.
Table 6.1: Key risks, risk rating and mitigation actions
Description
Likel
ihoo
d
Impa
ct
Grad
e
Mitigating Action Owner
Lack of commitment to reform undermines impact and sustainability of reform
L H C
Obtain high level commitment at the outset; close monitoring of reform progress and risks; Assign and track clear responsibilities for actions.
PS/ST; PFM objective leads
Corruption not addressed sufficiently and undermines reform or lack of political will to enforce sanctions
M M C
Assessment and active management of key fiduciary risks and progress against reforms; escalation as required
PS/ST
Improvements are not sustained due to inadequate budgeting of recurrent costs
M M C Identify recurrent costs in sustainability plan and capture costs in GoU budgets
PS/ST; Budget Director; DPs
Implementation delays due to procurement challenges
L M D
Develop and follow accurate procurement plans; consider efficiencies/streamlining of processes e.g. framework contracts
PFM reform objective leads; PPDA
High staff turnover in PFM reform programmes and key PFM GoU positions undermines reform progress and creates additional training costs
M M C
Strengthen commitment to reform through communications and change management; improve induction training; training of trainers and peer learning platforms
PFM programme leads; PFM reform objective leads
PEMCOM does not lead PFM reform efficiently and effectively
M M C Strengthen PFM reform secretariat and technical sub-groups to guide PEMCOM agenda
PS/ST and DPs
PFM strategy is not sufficiently focused L M D
PEMCOM to lead/validate selection of activities under PFM reform programmes to align with strategic objectives
PS/ST and DPs
Lack of coordination with Accountability Sector causes overlap or conflicting agendas and activities
M L D
Agree alignment of agendas at all levels of Sector/PFM institutional arrangements and coordinate/review regularly on progress
PS/ST and Accountant General
Inadequate financing of PFM reforms M M C
Regular communication of objectives and dialogue to build consensus and obtain commitments to funding reforms from all partners and GoU.
PS/ST and DPs
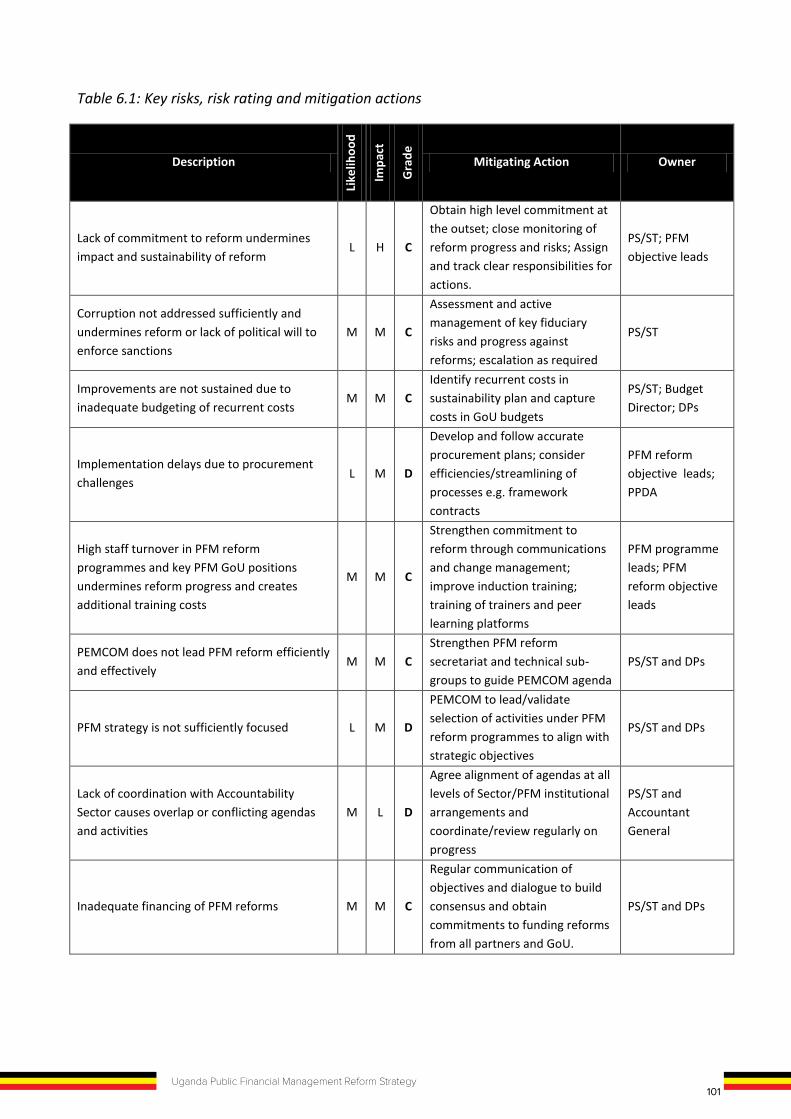
101Uganda Public Financial Management Reform Strategy
RISK RATINGS GUIDE
Rating for Likelihood and Impact for each risk
L Rated as Low E Rated as Extreme (Used for Impact only)
M Rated as Medium NA Not Assessed
H Rated as High
Grade: Combined effect of Likelihood/Impact
Impact
Likelihood
low medium high EXTREME
low N D C A
medium D C B A
high C B A A
Recommended actions for grades of risk
Grade Risk mitigation actions
A Urgent mitigation actions required to reduce the likelihood and/or impact and minimise residual risk
B Mitigation actions, to reduce the likelihood and impact, to be identified and appropriate actions implemented during implementation.
C Mitigation actions, to reduce the likelihood and impact, to be identified for possible action, if feasible.
D To be noted - no action is needed unless grading increases over time.
N To be noted - no action is needed unless grading increases over time.
Table 6.1: Key risks, risk rating and mitigation actions
Description
Likel
ihoo
d
Impa
ct
Grad
e
Mitigating Action Owner
Lack of commitment to reform undermines impact and sustainability of reform
L H C
Obtain high level commitment at the outset; close monitoring of reform progress and risks; Assign and track clear responsibilities for actions.
PS/ST; PFM objective leads
Corruption not addressed sufficiently and undermines reform or lack of political will to enforce sanctions
M M C
Assessment and active management of key fiduciary risks and progress against reforms; escalation as required
PS/ST
Improvements are not sustained due to inadequate budgeting of recurrent costs
M M C Identify recurrent costs in sustainability plan and capture costs in GoU budgets
PS/ST; Budget Director; DPs
Implementation delays due to procurement challenges
L M D
Develop and follow accurate procurement plans; consider efficiencies/streamlining of processes e.g. framework contracts
PFM reform objective leads; PPDA
High staff turnover in PFM reform programmes and key PFM GoU positions undermines reform progress and creates additional training costs
M M C
Strengthen commitment to reform through communications and change management; improve induction training; training of trainers and peer learning platforms
PFM programme leads; PFM reform objective leads
PEMCOM does not lead PFM reform efficiently and effectively
M M C Strengthen PFM reform secretariat and technical sub-groups to guide PEMCOM agenda
PS/ST and DPs
PFM strategy is not sufficiently focused L M D
PEMCOM to lead/validate selection of activities under PFM reform programmes to align with strategic objectives
PS/ST and DPs
Lack of coordination with Accountability Sector causes overlap or conflicting agendas and activities
M L D
Agree alignment of agendas at all levels of Sector/PFM institutional arrangements and coordinate/review regularly on progress
PS/ST and Accountant General
Inadequate financing of PFM reforms M M C
Regular communication of objectives and dialogue to build consensus and obtain commitments to funding reforms from all partners and GoU.
PS/ST and DPs
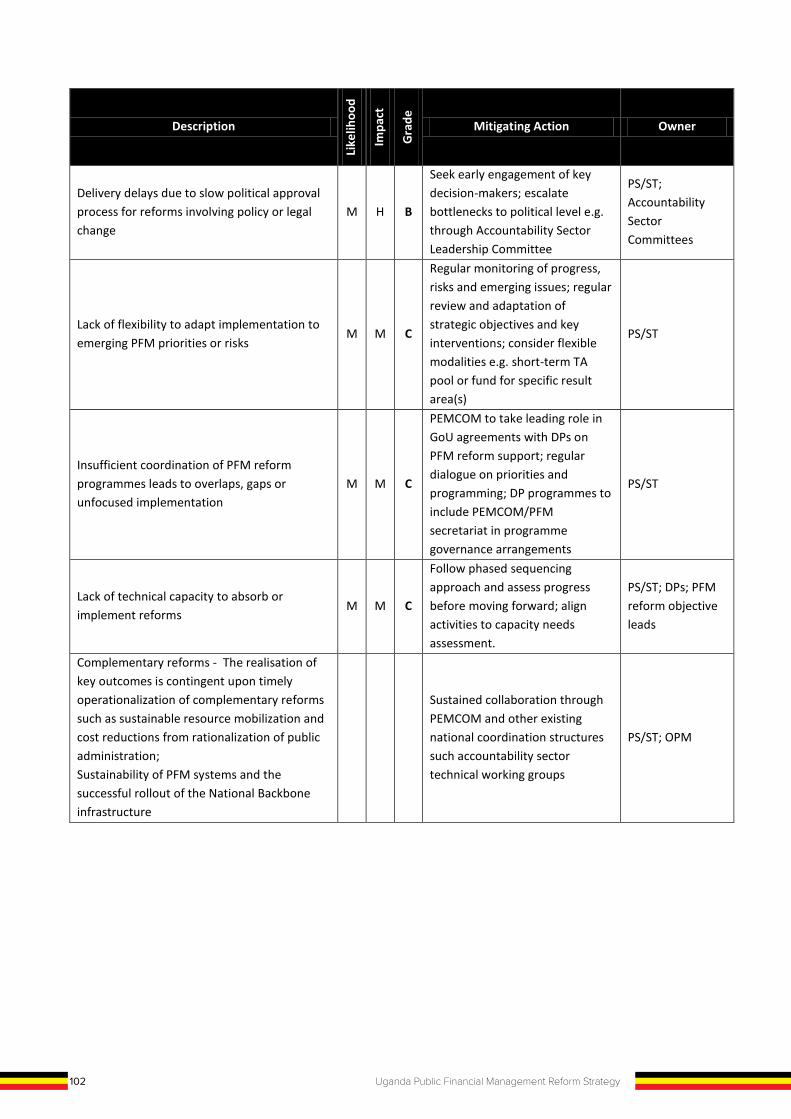
102 Uganda Public Financial Management Reform Strategy
Description
Likel
ihoo
d
Impa
ct
Grad
e
Mitigating Action Owner
Delivery delays due to slow political approval process for reforms involving policy or legal change
M H B
Seek early engagement of key decision-makers; escalate bottlenecks to political level e.g. through Accountability Sector Leadership Committee
PS/ST; Accountability Sector Committees
Lack of flexibility to adapt implementation to emerging PFM priorities or risks
M M C
Regular monitoring of progress, risks and emerging issues; regular review and adaptation of strategic objectives and key interventions; consider flexible modalities e.g. short-term TA pool or fund for specific result area(s)
PS/ST
Insufficient coordination of PFM reform programmes leads to overlaps, gaps or unfocused implementation
M M C
PEMCOM to take leading role in GoU agreements with DPs on PFM reform support; regular dialogue on priorities and programming; DP programmes to include PEMCOM/PFM secretariat in programme governance arrangements
PS/ST
Lack of technical capacity to absorb or implement reforms
M M C
Follow phased sequencing approach and assess progress before moving forward; align activities to capacity needs assessment.
PS/ST; DPs; PFM reform objective leads
Complementary reforms - The realisation of key outcomes is contingent upon timely operationalization of complementary reforms such as sustainable resource mobilization and cost reductions from rationalization of public administration; Sustainability of PFM systems and the successful rollout of the National Backbone infrastructure
Sustained collaboration through PEMCOM and other existing national coordination structures such accountability sector technical working groups
PS/ST; OPM
7 SUSTAINABILITY PLAN
1. Sustainability is the ultimate goal of the PFM reform strategy and is measured by the Government’s ability to (a) finance PFM activities and reforms independently; and (b) embed enhanced capacity to operate and manage PFM systems effectively without continuous external assistance.
2. The Government of Uganda has, over time, expanded the share of domestically-financed PFM reform, through an increased share of the PFM reform programme, FINMAP, funded through the national budget. In addition, a number of reform activities that were initially supported through FINMAP or other reform programmes, have been ‘mainstreamed’ into GoU recurrent budgets. These include, for example:
a. Recurrent costs associated with operating computerised financial management systems; b. New posts and filled vacancies in PFM cadres initiated as consultants or contract staff and
mainstreamed into permanent staff positions; c. Initial training activities around new systems now operationalised as everyday procedures e.g. output-
based budgeting; d. Macro-economic modelling and forecasting; e. Budget transparency initiatives; f. Aid management system support; g. Establishment of the Treasury Single Account; h. Payroll decentralisation; and i. OAG regional offices and support to enhancing the quality and scope of audits.
7.1 Mainstreaming of Reforms into Recurrent Government Budget 3. Insofar as PFM reforms, and operations and maintenance of PFM systems continues to require external
financing support, a sustainability plan is needed to ensure that GoU is able to raise progressively more funds and to plan for transition of items, particularly recurrent costs, into GoU budgets. The principles underpinning sustainability planning for PFM reforms include:
a. IT systems: recurrent costs include internet access, licenses, maintenance, security, audit and technicians. the PFM strategy seeks to provide special funding for the initial 12 months from introducing a new system or upgrade, after which recurrent costs should be mainstreamed into GoU budgets;
b. Training and capacity building: training costs provided under the PFM reform strategy should be limited to training activities directly associated with new reforms and strategic-level design or assistance to develop training programmes and materials (including capacity building of training institutions); General training of PFM cadres, for example, is considered a recurrent cost and therefore should be provided under training plans and GoU departmental budgets;
c. Staffing: the use of contract staff and long-term technical assistance can in some cases become a long term need, particularly that associated with IT-based systems, which require technicians to undertake regular maintenance and security management, for example; in these cases Ministry of Public Service should be consulted in the recruitment of contract staff or TA in order to ensure consistency with public service recruitment procedures, in the event that the staff are absorbed into existing vacancies, or new structures are required to create permanent GoU positions, where relevant;
103Uganda Public Financial Management Reform Strategy
Description
Likel
ihoo
d
Impa
ct
Grad
e
Mitigating Action Owner
Delivery delays due to slow political approval process for reforms involving policy or legal change
M H B
Seek early engagement of key decision-makers; escalate bottlenecks to political level e.g. through Accountability Sector Leadership Committee
PS/ST; Accountability Sector Committees
Lack of flexibility to adapt implementation to emerging PFM priorities or risks
M M C
Regular monitoring of progress, risks and emerging issues; regular review and adaptation of strategic objectives and key interventions; consider flexible modalities e.g. short-term TA pool or fund for specific result area(s)
PS/ST
Insufficient coordination of PFM reform programmes leads to overlaps, gaps or unfocused implementation
M M C
PEMCOM to take leading role in GoU agreements with DPs on PFM reform support; regular dialogue on priorities and programming; DP programmes to include PEMCOM/PFM secretariat in programme governance arrangements
PS/ST
Lack of technical capacity to absorb or implement reforms
M M C
Follow phased sequencing approach and assess progress before moving forward; align activities to capacity needs assessment.
PS/ST; DPs; PFM reform objective leads
Complementary reforms - The realisation of key outcomes is contingent upon timely operationalization of complementary reforms such as sustainable resource mobilization and cost reductions from rationalization of public administration; Sustainability of PFM systems and the successful rollout of the National Backbone infrastructure
Sustained collaboration through PEMCOM and other existing national coordination structures such accountability sector technical working groups
PS/ST; OPM
7 SUSTAINABILITY PLAN
1. Sustainability is the ultimate goal of the PFM reform strategy and is measured by the Government’s ability to (a) finance PFM activities and reforms independently; and (b) embed enhanced capacity to operate and manage PFM systems effectively without continuous external assistance.
2. The Government of Uganda has, over time, expanded the share of domestically-financed PFM reform, through an increased share of the PFM reform programme, FINMAP, funded through the national budget. In addition, a number of reform activities that were initially supported through FINMAP or other reform programmes, have been ‘mainstreamed’ into GoU recurrent budgets. These include, for example:
a. Recurrent costs associated with operating computerised financial management systems; b. New posts and filled vacancies in PFM cadres initiated as consultants or contract staff and
mainstreamed into permanent staff positions; c. Initial training activities around new systems now operationalised as everyday procedures e.g. output-
based budgeting; d. Macro-economic modelling and forecasting; e. Budget transparency initiatives; f. Aid management system support; g. Establishment of the Treasury Single Account; h. Payroll decentralisation; and i. OAG regional offices and support to enhancing the quality and scope of audits.
7.1 Mainstreaming of Reforms into Recurrent Government Budget 3. Insofar as PFM reforms, and operations and maintenance of PFM systems continues to require external
financing support, a sustainability plan is needed to ensure that GoU is able to raise progressively more funds and to plan for transition of items, particularly recurrent costs, into GoU budgets. The principles underpinning sustainability planning for PFM reforms include:
a. IT systems: recurrent costs include internet access, licenses, maintenance, security, audit and technicians. the PFM strategy seeks to provide special funding for the initial 12 months from introducing a new system or upgrade, after which recurrent costs should be mainstreamed into GoU budgets;
b. Training and capacity building: training costs provided under the PFM reform strategy should be limited to training activities directly associated with new reforms and strategic-level design or assistance to develop training programmes and materials (including capacity building of training institutions); General training of PFM cadres, for example, is considered a recurrent cost and therefore should be provided under training plans and GoU departmental budgets;
c. Staffing: the use of contract staff and long-term technical assistance can in some cases become a long term need, particularly that associated with IT-based systems, which require technicians to undertake regular maintenance and security management, for example; in these cases Ministry of Public Service should be consulted in the recruitment of contract staff or TA in order to ensure consistency with public service recruitment procedures, in the event that the staff are absorbed into existing vacancies, or new structures are required to create permanent GoU positions, where relevant;

104 Uganda Public Financial Management Reform Strategy
d. Sitting allowances for recurrent activities e.g. for the sitting of Audit Committees are considered recurrent costs and should be mainstreamed as quickly as possible; and
e. PFM institutions responsible for delivery of PFM reforms should prepare exit strategies for investments financed under the PFM strategy implementation plan and their readiness will be monitored and evaluated during the course of implementation.
4. A comprehensive sustainability plan, based on the above principles, will be developed as part of the Costed Implementation Plan for the PFM reform strategy, which will identify ongoing recurrent costs associated with each reform activity, where relevant, that will need to be taken into account for medium-term budgeting. These costs will inform budget preparation in the coming years, as required, for each of the responsible PFM institutions.
7.2 Staffing and Public Administration Structures 5. One key intervention under Objective 6: Oversight and Governance of PFM Reforms, is to review and
rationalise the public administration structures. This is to ensure that the institutional structures and staffing is commensurate with the current needs and realities of the delivery requirements of Government. In particular, as part of the PFM reforms, the sustainability planning will identify any transitional roles, contract staff or technical assistance that is likely to be required as a recurrent cost to Government for ongoing operation and maintenance of PFM systems and procedures. This will help inform the review and rationalisation of structures to ensure that adequate resources can be committed to fully mainstream the public administration (wage bill) costs arising as a consequence of PFM reform activities. In addition, PFM reform activities may also identify any redundant activities or processes that might have implications for the review of structures, to ensure that resources are re-allocated to where they are needed most.
7.3 Capacity Building Approach 6. Capacity building and training often forms a major part of PFM reform programmes and, without strategic
focus and prioritisation, associated costs can escalate to unsustainable levels, creating dependency on external financing and programme funding for what is essentially recurrent Government activity. A strategic approach to capacity building and training is therefore required for PFM cadres as a whole. Current capacity building efforts are often constrained by uncoordinated approaches across multiple providers of training and across various PFM institutions. Training activities also have a tendency to be supply-driven and not linked in a systematic way to outcomes50.
7. This PFM reform strategy seeks to update the capacity needs assessment undertaken previously for PFM functions across the whole of Government. Training or capacity building activities covered by the reform implementation plan will then be determined by the above principles and priorities identified in a training programme to be developed based on the results of the updated capacity needs assessment.
8. Given the potentially wide-ranging needs and limited resources, training should be designed around cost-efficient approaches, maximizing the opportunities for on-line learning, practical on-the-job support and technical assistance for systems development, as required. Existing training institutions and professional bodies have an important role to play in the delivery of training of PFM cadres. In the past, successful delivery of capacity building has been achieved when Government works with and facilitates these bodies to enhance their training and professional certification offering. For example, working with the Institute of Chartered
50 As identified in the evaluation of FINMAP II (2015)
Public Accountants of Uganda to develop a professional certification programme designed to international standards, but tailored specifically to the Ugandan context.
9. The Civil Service College and Uganda Management Institute are also well-placed to develop sustainable continuous professional development programmes, with initial assistance in establishing relevant curricula and training materials. Training of trainers has also been tested successfully in other countries and provides a cost-effective and sustainable means of training a larger number of staff with limited resources, by identifying a selection of capable potential trainers from within the PFM institutions and equipping them with the skills and materials to provide their own training of colleagues.
105Uganda Public Financial Management Reform Strategy
d. Sitting allowances for recurrent activities e.g. for the sitting of Audit Committees are considered recurrent costs and should be mainstreamed as quickly as possible; and
e. PFM institutions responsible for delivery of PFM reforms should prepare exit strategies for investments financed under the PFM strategy implementation plan and their readiness will be monitored and evaluated during the course of implementation.
4. A comprehensive sustainability plan, based on the above principles, will be developed as part of the Costed Implementation Plan for the PFM reform strategy, which will identify ongoing recurrent costs associated with each reform activity, where relevant, that will need to be taken into account for medium-term budgeting. These costs will inform budget preparation in the coming years, as required, for each of the responsible PFM institutions.
7.2 Staffing and Public Administration Structures 5. One key intervention under Objective 6: Oversight and Governance of PFM Reforms, is to review and
rationalise the public administration structures. This is to ensure that the institutional structures and staffing is commensurate with the current needs and realities of the delivery requirements of Government. In particular, as part of the PFM reforms, the sustainability planning will identify any transitional roles, contract staff or technical assistance that is likely to be required as a recurrent cost to Government for ongoing operation and maintenance of PFM systems and procedures. This will help inform the review and rationalisation of structures to ensure that adequate resources can be committed to fully mainstream the public administration (wage bill) costs arising as a consequence of PFM reform activities. In addition, PFM reform activities may also identify any redundant activities or processes that might have implications for the review of structures, to ensure that resources are re-allocated to where they are needed most.
7.3 Capacity Building Approach 6. Capacity building and training often forms a major part of PFM reform programmes and, without strategic
focus and prioritisation, associated costs can escalate to unsustainable levels, creating dependency on external financing and programme funding for what is essentially recurrent Government activity. A strategic approach to capacity building and training is therefore required for PFM cadres as a whole. Current capacity building efforts are often constrained by uncoordinated approaches across multiple providers of training and across various PFM institutions. Training activities also have a tendency to be supply-driven and not linked in a systematic way to outcomes50.
7. This PFM reform strategy seeks to update the capacity needs assessment undertaken previously for PFM functions across the whole of Government. Training or capacity building activities covered by the reform implementation plan will then be determined by the above principles and priorities identified in a training programme to be developed based on the results of the updated capacity needs assessment.
8. Given the potentially wide-ranging needs and limited resources, training should be designed around cost-efficient approaches, maximizing the opportunities for on-line learning, practical on-the-job support and technical assistance for systems development, as required. Existing training institutions and professional bodies have an important role to play in the delivery of training of PFM cadres. In the past, successful delivery of capacity building has been achieved when Government works with and facilitates these bodies to enhance their training and professional certification offering. For example, working with the Institute of Chartered
50 As identified in the evaluation of FINMAP II (2015)
Public Accountants of Uganda to develop a professional certification programme designed to international standards, but tailored specifically to the Ugandan context.
9. The Civil Service College and Uganda Management Institute are also well-placed to develop sustainable continuous professional development programmes, with initial assistance in establishing relevant curricula and training materials. Training of trainers has also been tested successfully in other countries and provides a cost-effective and sustainable means of training a larger number of staff with limited resources, by identifying a selection of capable potential trainers from within the PFM institutions and equipping them with the skills and materials to provide their own training of colleagues.
106 Uganda Public Financial Management Reform Strategy
8 MONITORING AND EVALUATION
8.1 Strategic Results Framework 1 Annex D presents the results framework that will be used to assess performance against the PFM reform
strategy outcomes. Indicators have been selected at overall outcome (impact) level and at the level of each of the 6 reform objectives (intermediate outcomes). Each indicator has a baseline (2018) and targets for the end of the strategy (2023). Indicators and targets should be Specific, Measurable, Achievable, Relevant and Time-specific (SMART) and representative of the desired outcomes to which the reform interventions are expected to contribute. Where possible, indicators have been drawn from existing Government monitoring and evaluation frameworks, in particular the Accountability Sector Investment Plan, to streamline M&E resources.
2 At the output level, means of verification will be outlined in an accompanying technical Annex. These outputs are to be determined in more detail at the programme level, of each implementing programme and, while those identified in this PFM reform strategy provide a guiding framework, the results framework is likely to be subject to some adaptation, in response to the changing context or needs arising, based on periodic performance review.
8.2 M&E Framework and Process
3. As described in the strategic results framework, the monitoring and evaluation (M&E) of the PFM strategy will be integrated into, and make use of, existing GoU M&E systems and frameworks, where possible, in order to ensure sustainability of reforms and support the establishment and embedding of reforms into operational activities and work plans of PFM institutions.
4. Monitoring and evaluation of the PFM reform strategy will measure the performance of the reforms according to the Theory of Change presented in Section 3.3, using the indicators in the Strategic Results Framework in Annex D and according to delivery of the implementation plan. M&E will therefore be carried out at several levels, namely:
Level 1 – Impact on service delivery outcomes. While changes in these indicators may not be possible to attribute empirically to PFM reforms, it is expected that the supporting role of PFM systems will have a positive impact on public service quality and effectiveness;
Level 2 – Effectiveness (delivery against outcomes). PFM outcomes will be measured using PEFA and equivalent assessment frameworks. PFM reforms that contribute to the overall functioning and effectiveness of PFM systems are expected to have a positive impact on overall PFM assessment scores.
Level 3 – Effectiveness against intermediate outcomes. These are represented by the six high level objectives and their accompanying outcomes. Indicators and targets will be measured at the start (baseline), mid-term review and end of the strategy. The interventions and activities identified in the Implementation Plan are expected to contribute to achieving these outcomes.
Level 4 – Efficiency (Delivery of outputs and key interventions). As defined in the Implementation Plan. These will be monitored at least annually, using defined means of verification for tracking progress.
Level 5 – Economy (Activities and resource inputs). At this level, the focus will be on measuring the efficiency of the contributing reform programmes and activities, in terms of their conversion from resources into outputs.
5. Levels 3 to 5 will be the focus of annual (and in some cases quarterly) monitoring activity throughout the period of the Strategy, while Levels 1 and 2 will be assessed through periodic evaluation, using baseline data from the start of the period, data assessed at a mid-term review, and a final evaluation after the strategy period ends. Some indicators at the Levels 1 and 2 will require PEFA assessment or equivalent, which will only be undertaken periodically and are unlikely to demonstrate significant improvements on an annual basis, but require a more medium-term perspective. Level 3 will be assessed at least annually as part of the annual performance review. Levels 4 and 5 will be assessed at programme level, at least quarterly, through relevant delivery (programme) modalities and, where possible consolidated for tracking and learning from delivery efficiency and economy across the PFM reform strategy implementation plan.
8.3 M&E Roles and Responsibilities
6. The Accountability Sector is responsible for reviewing annual sector performance as an input to the sector planning process. In this regard, therefore, the overall progress against PFM reform objectives and impacts (Levels 1 and 2) will be reviewed by the Accountability Sector, with input from PEMCOM and the PFM reform sub-groups. This annual review process will help to identify lessons and issues arising that will inform annual implementation planning and any adaptation to the PFM reform strategy that may be required to ensure successful delivery of its overarching vision, goal and purpose. This annual adaptation may involve re-calibrating PFM reform indicator targets or proposing new ones, as required, in consultation with PEMCOM.
7. PEMCOM will be responsible for coordination of inputs from the PFM reform sub-groups on the annual assessment of performance against the PFM strategy.
8. The PFM sub-groups will set their own agenda and ToRs, but, as a minimum, should review progress against the relevant PFM reform strategy objective, outcomes and outputs (Levels 3 and 4), in order to report on key milestones to PEMCOM, and to inform the Accountability Sector annual review. During this process any issues and risks to be escalated to PEMCOM for supportive action and decisions, will be identified for submission to the PRAM.
9. The PFM reform secretariat will monitor the progress against activities in the PFM reform implementation plan, with input from the sub-groups and responsible institutions. The secretariat will also be responsible for coordinating information on the efficiency and value for money of the reforms (Level 5), and will provide input to the periodic evaluations, which will provide a cumulative and independent analysis of the efficiency and VfM of implementation.
10. In the case of any indicators required under the results framework that are new to GoU processes, the PFM reform secretariat will be responsible for coordinating and establishing a process for data collection of those indicators and their definition. The data source and responsible ‘owner’ for data collection should be clearly outlined and documented in the technical annex to the results framework.
8.4 Embedding Learning and Feedback
11. Annual or periodic studies and reviews on specific priority issues will also be commissioned by external consultants, EPRC, BMAU or civil society (e.g. CSBAG) in order to ensure there is sufficient independent feedback to inform better implementation and use of lessons learnt. An online monitoring tool for tracking on
107Uganda Public Financial Management Reform Strategy
8 MONITORING AND EVALUATION
8.1 Strategic Results Framework 1 Annex D presents the results framework that will be used to assess performance against the PFM reform
strategy outcomes. Indicators have been selected at overall outcome (impact) level and at the level of each of the 6 reform objectives (intermediate outcomes). Each indicator has a baseline (2018) and targets for the end of the strategy (2023). Indicators and targets should be Specific, Measurable, Achievable, Relevant and Time-specific (SMART) and representative of the desired outcomes to which the reform interventions are expected to contribute. Where possible, indicators have been drawn from existing Government monitoring and evaluation frameworks, in particular the Accountability Sector Investment Plan, to streamline M&E resources.
2 At the output level, means of verification will be outlined in an accompanying technical Annex. These outputs are to be determined in more detail at the programme level, of each implementing programme and, while those identified in this PFM reform strategy provide a guiding framework, the results framework is likely to be subject to some adaptation, in response to the changing context or needs arising, based on periodic performance review.
8.2 M&E Framework and Process
3. As described in the strategic results framework, the monitoring and evaluation (M&E) of the PFM strategy will be integrated into, and make use of, existing GoU M&E systems and frameworks, where possible, in order to ensure sustainability of reforms and support the establishment and embedding of reforms into operational activities and work plans of PFM institutions.
4. Monitoring and evaluation of the PFM reform strategy will measure the performance of the reforms according to the Theory of Change presented in Section 3.3, using the indicators in the Strategic Results Framework in Annex D and according to delivery of the implementation plan. M&E will therefore be carried out at several levels, namely:
Level 1 – Impact on service delivery outcomes. While changes in these indicators may not be possible to attribute empirically to PFM reforms, it is expected that the supporting role of PFM systems will have a positive impact on public service quality and effectiveness;
Level 2 – Effectiveness (delivery against outcomes). PFM outcomes will be measured using PEFA and equivalent assessment frameworks. PFM reforms that contribute to the overall functioning and effectiveness of PFM systems are expected to have a positive impact on overall PFM assessment scores.
Level 3 – Effectiveness against intermediate outcomes. These are represented by the six high level objectives and their accompanying outcomes. Indicators and targets will be measured at the start (baseline), mid-term review and end of the strategy. The interventions and activities identified in the Implementation Plan are expected to contribute to achieving these outcomes.
Level 4 – Efficiency (Delivery of outputs and key interventions). As defined in the Implementation Plan. These will be monitored at least annually, using defined means of verification for tracking progress.
Level 5 – Economy (Activities and resource inputs). At this level, the focus will be on measuring the efficiency of the contributing reform programmes and activities, in terms of their conversion from resources into outputs.
5. Levels 3 to 5 will be the focus of annual (and in some cases quarterly) monitoring activity throughout the period of the Strategy, while Levels 1 and 2 will be assessed through periodic evaluation, using baseline data from the start of the period, data assessed at a mid-term review, and a final evaluation after the strategy period ends. Some indicators at the Levels 1 and 2 will require PEFA assessment or equivalent, which will only be undertaken periodically and are unlikely to demonstrate significant improvements on an annual basis, but require a more medium-term perspective. Level 3 will be assessed at least annually as part of the annual performance review. Levels 4 and 5 will be assessed at programme level, at least quarterly, through relevant delivery (programme) modalities and, where possible consolidated for tracking and learning from delivery efficiency and economy across the PFM reform strategy implementation plan.
8.3 M&E Roles and Responsibilities
6. The Accountability Sector is responsible for reviewing annual sector performance as an input to the sector planning process. In this regard, therefore, the overall progress against PFM reform objectives and impacts (Levels 1 and 2) will be reviewed by the Accountability Sector, with input from PEMCOM and the PFM reform sub-groups. This annual review process will help to identify lessons and issues arising that will inform annual implementation planning and any adaptation to the PFM reform strategy that may be required to ensure successful delivery of its overarching vision, goal and purpose. This annual adaptation may involve re-calibrating PFM reform indicator targets or proposing new ones, as required, in consultation with PEMCOM.
7. PEMCOM will be responsible for coordination of inputs from the PFM reform sub-groups on the annual assessment of performance against the PFM strategy.
8. The PFM sub-groups will set their own agenda and ToRs, but, as a minimum, should review progress against the relevant PFM reform strategy objective, outcomes and outputs (Levels 3 and 4), in order to report on key milestones to PEMCOM, and to inform the Accountability Sector annual review. During this process any issues and risks to be escalated to PEMCOM for supportive action and decisions, will be identified for submission to the PRAM.
9. The PFM reform secretariat will monitor the progress against activities in the PFM reform implementation plan, with input from the sub-groups and responsible institutions. The secretariat will also be responsible for coordinating information on the efficiency and value for money of the reforms (Level 5), and will provide input to the periodic evaluations, which will provide a cumulative and independent analysis of the efficiency and VfM of implementation.
10. In the case of any indicators required under the results framework that are new to GoU processes, the PFM reform secretariat will be responsible for coordinating and establishing a process for data collection of those indicators and their definition. The data source and responsible ‘owner’ for data collection should be clearly outlined and documented in the technical annex to the results framework.
8.4 Embedding Learning and Feedback
11. Annual or periodic studies and reviews on specific priority issues will also be commissioned by external consultants, EPRC, BMAU or civil society (e.g. CSBAG) in order to ensure there is sufficient independent feedback to inform better implementation and use of lessons learnt. An online monitoring tool for tracking on

108 Uganda Public Financial Management Reform Strategy
PFM reforms will be piloted, to streamline the reporting process at the level of implementing institutions, improve coordination and enhance the transparency and communication of reforms to a wider audience.
8.5 Web-based Monitoring & Evaluation 12. A web-based reporting against the M&E framework of the PFM-RS is likely to improve the accessibility, quality
and updating of M&E data, the transparency of progress made, the accountability for results and consequently the interest and engagement of PFM stakeholders in reform processes. It is envisaged to establish in a 3-phased approach in Fiscal Year 2018/19 the functional requirements for such a system, including the related metadata (indicator descriptions), reporting formats, M&E business processes and functionalities/features of the system. Subsequent phases will involve the system development (phase 2, to be completed by the end of FY 2018/19) and the training of administrators, key users as well as the production of supporting manuals (to be completed in FY 2019/20). The system will have different interfaces with different levels of access, i.e. reading rights for selected indicators made available to the wider public and comprehensive reading, writing and validation rights for M&E officers in MoFPED and other votes implementing the PFM Reform Strategy.
8.6 Link between the PFM Reform Strategy with GOU's Performance Assessment System
13. The Government Annual Performance Report (GAPR) provides a comprehensive assessment of Government performance and the results of public spending of the Financial Year. It provides a basis for accountability for performance of MDAs against previously agreed annual output targets and resources utilised across all sectors of government. This is used to brief Cabinet on the overall performance against investment objectives and to inform policy and resource allocations in the next Financial Year. The GAPR also assesses progress against the Government’s commitments made in the NDP, sector objectives, Budget Speech and Ministerial Policy Statements for the financial year. Much of the data for this assessment is provided by the MDALGs and validated by OPM. Where applicable, triangulation with other data producers, including Government inspectorates, the Uganda Bureau of Statistics and non-Governmental sources is undertaken.
14. During the first year of the PFM Reform Strategy (FY2019/20), the requirements for a stronger link between the implementation of the strategy and the Government of Uganda’s performance assessment systems for Central- and Local Government will be explored. It is important to the successful implementation of the PFM reform strategy that votes involved in implementing the strategy plan and report on progress in the same way that they plan and report to the rest of Government. As a first step, a stock-take of the annual work plans of all Central Government votes implementing the PFM reform strategy in order to assess any inconsistency between those plans and the M&E framework of the PFM reform strategy. It is expected that this analysis will result in some adjustment to the indicators for FY 2019/2020 (and beyond) – both at Vote-level and within the PFM reform strategy M&E framework.
15. At the same time, consultations will take place with OPM on how to integrate progress made against the PFM Reform Strategy within the annual GAPR. Regarding the local governments, GoU is currently implementing intergovernmental fiscal transfer reforms. As part of these reforms, a new Local Government Performance Assessment System (LGPAS) and Manual has been designed to help inform transfers. The overall objective of the LGPAS is to promote effective incentives and behaviour, systems and procedures of importance for Local Government’s efficient administration and service delivery. Fiscal Year 2018/19 will be harnessed to harmonize and align the M&E of LG contributions to the PFM reform strategy targets with the LGPAS. From FY 2019/20 onwards, individual votes will be assisted to revise or establish PFM Reform KPIs (and the related business processes) at institutional-, department and/or individual level. Another promising option will be to support
the OAG’s capacity to audit PFM performance in Uganda, both in general and vis-à-vis the SDGs, i.e. engaging with the respective PFM Reporting Framework promoted by AFROSAI-E and GIZ.
8.7 Mechanism for updating the Results Framework of the PFM Reform Strategy
16. Throughout the implementation of the PFM reform strategy, a sound balance should be maintained between (i) a general and persistent adherence to the goal and purpose of the PFM reform strategy and (ii) flexibility to cater for emerging issues and lessons learned throughout the implementation. On an annual basis, a high number of analytical studies and reports is produced for the different PFM areas. These should not only inform the successor strategy, starting on 1st July 2023, but generate inputs for annual updated of the present reform strategy. It is also important to stress the fact than an annual update of the PFM reform strategy will enable harmonisation with any update of the NDP and ASSIP, as well as with sub-sector strategies (e.g. MTRS, PIM, Procurement, Internal Audit, or Fiscal Decentralisation).
17. Updates to the results framework should be agreed at the end of the first quarter of each fiscal year, to provide time to make appropriate in-year budget revisions and to allow time to prepare annual work plans, integrated into the plans of MDAs for the subsequent fiscal year. Proposals for updating the Results Framework and M&E Framework of the PFM Reform Strategy should be consolidated by the PEMCOM Secretariat, presented to and validated by the PEMCOM plenary meeting in September/October and attached to the respective PEMCOM minutes.
109Uganda Public Financial Management Reform Strategy
PFM reforms will be piloted, to streamline the reporting process at the level of implementing institutions, improve coordination and enhance the transparency and communication of reforms to a wider audience.
8.5 Web-based Monitoring & Evaluation 12. A web-based reporting against the M&E framework of the PFM-RS is likely to improve the accessibility, quality
and updating of M&E data, the transparency of progress made, the accountability for results and consequently the interest and engagement of PFM stakeholders in reform processes. It is envisaged to establish in a 3-phased approach in Fiscal Year 2018/19 the functional requirements for such a system, including the related metadata (indicator descriptions), reporting formats, M&E business processes and functionalities/features of the system. Subsequent phases will involve the system development (phase 2, to be completed by the end of FY 2018/19) and the training of administrators, key users as well as the production of supporting manuals (to be completed in FY 2019/20). The system will have different interfaces with different levels of access, i.e. reading rights for selected indicators made available to the wider public and comprehensive reading, writing and validation rights for M&E officers in MoFPED and other votes implementing the PFM Reform Strategy.
8.6 Link between the PFM Reform Strategy with GOU's Performance Assessment System
13. The Government Annual Performance Report (GAPR) provides a comprehensive assessment of Government performance and the results of public spending of the Financial Year. It provides a basis for accountability for performance of MDAs against previously agreed annual output targets and resources utilised across all sectors of government. This is used to brief Cabinet on the overall performance against investment objectives and to inform policy and resource allocations in the next Financial Year. The GAPR also assesses progress against the Government’s commitments made in the NDP, sector objectives, Budget Speech and Ministerial Policy Statements for the financial year. Much of the data for this assessment is provided by the MDALGs and validated by OPM. Where applicable, triangulation with other data producers, including Government inspectorates, the Uganda Bureau of Statistics and non-Governmental sources is undertaken.
14. During the first year of the PFM Reform Strategy (FY2019/20), the requirements for a stronger link between the implementation of the strategy and the Government of Uganda’s performance assessment systems for Central- and Local Government will be explored. It is important to the successful implementation of the PFM reform strategy that votes involved in implementing the strategy plan and report on progress in the same way that they plan and report to the rest of Government. As a first step, a stock-take of the annual work plans of all Central Government votes implementing the PFM reform strategy in order to assess any inconsistency between those plans and the M&E framework of the PFM reform strategy. It is expected that this analysis will result in some adjustment to the indicators for FY 2019/2020 (and beyond) – both at Vote-level and within the PFM reform strategy M&E framework.
15. At the same time, consultations will take place with OPM on how to integrate progress made against the PFM Reform Strategy within the annual GAPR. Regarding the local governments, GoU is currently implementing intergovernmental fiscal transfer reforms. As part of these reforms, a new Local Government Performance Assessment System (LGPAS) and Manual has been designed to help inform transfers. The overall objective of the LGPAS is to promote effective incentives and behaviour, systems and procedures of importance for Local Government’s efficient administration and service delivery. Fiscal Year 2018/19 will be harnessed to harmonize and align the M&E of LG contributions to the PFM reform strategy targets with the LGPAS. From FY 2019/20 onwards, individual votes will be assisted to revise or establish PFM Reform KPIs (and the related business processes) at institutional-, department and/or individual level. Another promising option will be to support
the OAG’s capacity to audit PFM performance in Uganda, both in general and vis-à-vis the SDGs, i.e. engaging with the respective PFM Reporting Framework promoted by AFROSAI-E and GIZ.
8.7 Mechanism for updating the Results Framework of the PFM Reform Strategy
16. Throughout the implementation of the PFM reform strategy, a sound balance should be maintained between (i) a general and persistent adherence to the goal and purpose of the PFM reform strategy and (ii) flexibility to cater for emerging issues and lessons learned throughout the implementation. On an annual basis, a high number of analytical studies and reports is produced for the different PFM areas. These should not only inform the successor strategy, starting on 1st July 2023, but generate inputs for annual updated of the present reform strategy. It is also important to stress the fact than an annual update of the PFM reform strategy will enable harmonisation with any update of the NDP and ASSIP, as well as with sub-sector strategies (e.g. MTRS, PIM, Procurement, Internal Audit, or Fiscal Decentralisation).
17. Updates to the results framework should be agreed at the end of the first quarter of each fiscal year, to provide time to make appropriate in-year budget revisions and to allow time to prepare annual work plans, integrated into the plans of MDAs for the subsequent fiscal year. Proposals for updating the Results Framework and M&E Framework of the PFM Reform Strategy should be consolidated by the PEMCOM Secretariat, presented to and validated by the PEMCOM plenary meeting in September/October and attached to the respective PEMCOM minutes.

110 Uganda Public Financial Management Reform Strategy
Annex A: List of Documents Consulted
1. Accountability Sector Strategic Investment Plan 2017/18 - 2019/20
2. Annual Health Sector Performance Report (AHSPR), FY2016/17
3. Annual report of the Auditor General on the results of audits for the year 2017, OAG (2017)
4. Debt Management Performance Assessment (DeMPA) 2018
5. Debt Sustainability Analysis Report, 2016, Ministry of Finance, Planning and Economic Development
6. Economic Diversification and Growth in the era of oil and volatility, Uganda Country Economic Memorandum, World Bank, 2015
7. Education and Sports Sector Annual Performance Report, FY2016/17
8. Enhancing the Performance of Public Investment Management, IMF Technical Assistance report, May 2017
9. FINMAP II evaluation report, ODI (2015) and FINMAP III Change Management and Communications Strategy
10. FINMAP pre-feasibility study, Ecorys (2018)
11. Fiscal Decentralisation Architecture (FDA) and Determining the Share of LG Transfers out of the National Budget, ODI (2017)
12. Fiscal Decentralisation Architecture and Share of Local Government Transfers out of the National Budget, ODI 2017
13. IMF (2014), Revenue Administration Gap Analysis Program – The Value-Added Tax Gap
14. IMF (2015), Tax Administration Diagnostic Assessment Tool for Uganda
15. IMF (2017), Uganda: A framework for preparing a medium-term revenue strategy
16. IMF RA-GAP analysis of Uganda VAT, IMF 2014
17. M. Miller and S. Mustapha (2016), “Public investment management: A public financial management introductory guide”
18. MoFPED Debt Sustainability Analysis, October 2017
19. National Census 2014, UBOS
20. Republic of Uganda (2014), Second National Development Plan II 2015/16 - 2019/20
21. Sub-Saharan Africa: A Survey of Gender Budgeting Efforts, Stotsky et al., IMF July 2016
22. Tax Revenue Potential and Effort, Langford and Ohlenberg, IGC, 2015
23. UBOS (2017) Household Surveys 2016/17
24. UBOS (2017) Uganda Population Projections
25. Uganda health sector budget execution bottlenecks report, USAID (2017)
26. Uganda PEFA Assessment 2016
27. Women, work and the economy: Elborgh-Woytek, et al., IMF, 2013
28. World Bank (2017), Assessing Uganda’s domestic revenue gaps and how to tap the potential
29. World Bank Bank-IMF DSA 2017
30. World Economic Outlook, World Bank, April 2018
31. World Bank (2017), Leveraging Public-Private Partnerships to Plug Uganda’s Deficit in Infrastructure Finance
Anne
x B:
Sum
mar
y of
per
form
ance
aga
inst
the
PFM
Out
com
e In
dica
tors
(as d
efin
ed in
PFM
Str
ateg
y 20
14-
2018
)
Tabl
e A.
1: P
erfo
rman
ce a
gain
st P
FM O
utco
me
Perf
orm
ance
Indi
cato
rs –
Sta
ge 1
(Ann
ex 4
)
PFM
Out
com
e In
dica
tor
Base
line
2013
/14
2014
/15
2015
/16
2016
/17
Sour
ce
Dom
estic
Rev
enue
as a
% o
f GDP
(exc
ludi
ng d
omes
tic O
il an
d Ga
s re
venu
es)
11.9
%13
.0%
12.9
%13
.8%
FINM
AP II
I Ann
ual R
epor
t 201
6/17
% o
f Nat
iona
l Bud
get f
unde
d fr
om d
omes
tic re
venu
e71
.5%
88.0
%87
.1%
-FI
NMAP
III A
nnua
l Rep
ort 2
016/
17%
of l
ocal
Gov
ernm
ent R
even
ue a
s % o
f GDP
--
--
n/a
Ratio
of n
atio
nal b
udge
t allo
catio
ns to
fron
t lin
e se
rvice
del
iver
y se
ctor
s-
--
-n/
a%
of f
unds
rele
ased
aga
inst
the
orig
inal
app
rove
d bu
dget
103.
0%88
.0%
97.0
%10
4.0%
FINM
AP II
I Ann
ual R
epor
t 201
6/17
Com
posit
ion
of e
xpen
ditu
re o
ut-tu
rn co
mpa
red
to o
rigin
al
appr
oved
bud
get
21.1
%12
.7%
7.0%
-PE
FA A
sses
smen
t 201
6%
of f
unds
util
ised
agai
nst r
elea
ses
88.0
%96
.0%
96.0
%98
.0%
FINM
AP II
I Ann
ual R
epor
t 201
6/17
[PV
of E
xter
nal]
Natio
nal D
ebt a
s % o
f Dom
estic
Rev
enue
--
85.8
%10
0.4%
Debt
Sus
tain
abili
ty A
naly
sis, M
oFED
stoc
k of
arr
ears
as %
of t
otal
exp
endi
ture
s7.
0%1.
0%13
.0%
10.0
%FI
NMAP
III A
nnua
l Rep
ort 2
016/
17Su
pple
men
tary
exp
endi
ture
as a
% o
f app
rove
d bu
dget
5.0%
4.0%
4.6%
3.1%
FINM
AP II
I Ann
ual R
epor
t 201
6/17
% o
f cle
an a
udit
repo
rts,
of w
hich
:CG
58.0
%70
.0%
79.0
%-
FINM
AP II
I Ann
ual R
epor
t 201
6/17
LG
37.4
%-
--
Stat
utor
y Au
thor
ities
41.0
%61
.8%
78.0
%-
FINM
AP II
I Ann
ual R
epor
t 201
6/17
% o
f Ext
erna
l aud
it re
com
men
datio
ns im
plem
ente
d by
MDA
s, LG
s an
d St
atut
ory
Auth
oriti
es28
.0%
-25
.0%
-FI
NMAP
III A
nnua
l Rep
ort 2
016/
16%
of p
rocu
rem
ent a
udit
reco
mm
enda
tions
impl
emen
ted
by M
DAs,
LGs a
nd S
tatu
tory
Aut
horit
ies
77.0
%85
.0%
55.0
%71
.0%
FINM
AP II
I Ann
ual R
epor
t 201
6/17
% o
f int
erna
l aud
it re
com
men
datio
ns in
MDA
s im
plem
ente
d58
.0%
63.3
%66
.2%
69.2
%FI
NMAP
III A
nnua
l Rep
ort 2
016/
17%
of c
ontr
acts
aud
ited
(by
valu
e) th
at a
re ra
ted
satis
fact
ory
28.5
%60
.0%
96.0
%95
.1%
FINM
AP II
I Ann
ual R
epor
t 201
6/17
Budg
et C
redi
bilit
y an
d Co
ntro
l
Impr
oved
Com
plia
nce
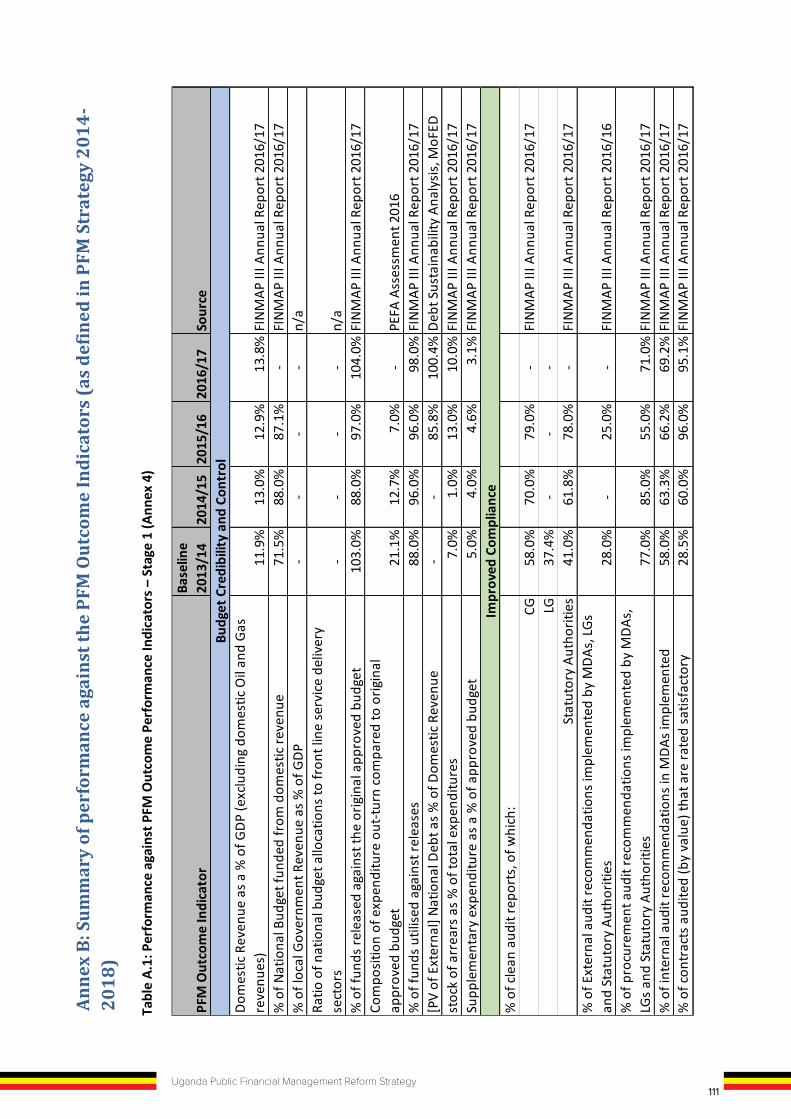
111Uganda Public Financial Management Reform Strategy
Annex A: List of Documents Consulted
1. Accountability Sector Strategic Investment Plan 2017/18 - 2019/20
2. Annual Health Sector Performance Report (AHSPR), FY2016/17
3. Annual report of the Auditor General on the results of audits for the year 2017, OAG (2017)
4. Debt Management Performance Assessment (DeMPA) 2018
5. Debt Sustainability Analysis Report, 2016, Ministry of Finance, Planning and Economic Development
6. Economic Diversification and Growth in the era of oil and volatility, Uganda Country Economic Memorandum, World Bank, 2015
7. Education and Sports Sector Annual Performance Report, FY2016/17
8. Enhancing the Performance of Public Investment Management, IMF Technical Assistance report, May 2017
9. FINMAP II evaluation report, ODI (2015) and FINMAP III Change Management and Communications Strategy
10. FINMAP pre-feasibility study, Ecorys (2018)
11. Fiscal Decentralisation Architecture (FDA) and Determining the Share of LG Transfers out of the National Budget, ODI (2017)
12. Fiscal Decentralisation Architecture and Share of Local Government Transfers out of the National Budget, ODI 2017
13. IMF (2014), Revenue Administration Gap Analysis Program – The Value-Added Tax Gap
14. IMF (2015), Tax Administration Diagnostic Assessment Tool for Uganda
15. IMF (2017), Uganda: A framework for preparing a medium-term revenue strategy
16. IMF RA-GAP analysis of Uganda VAT, IMF 2014
17. M. Miller and S. Mustapha (2016), “Public investment management: A public financial management introductory guide”
18. MoFPED Debt Sustainability Analysis, October 2017
19. National Census 2014, UBOS
20. Republic of Uganda (2014), Second National Development Plan II 2015/16 - 2019/20
21. Sub-Saharan Africa: A Survey of Gender Budgeting Efforts, Stotsky et al., IMF July 2016
22. Tax Revenue Potential and Effort, Langford and Ohlenberg, IGC, 2015
23. UBOS (2017) Household Surveys 2016/17
24. UBOS (2017) Uganda Population Projections
25. Uganda health sector budget execution bottlenecks report, USAID (2017)
26. Uganda PEFA Assessment 2016
27. Women, work and the economy: Elborgh-Woytek, et al., IMF, 2013
28. World Bank (2017), Assessing Uganda’s domestic revenue gaps and how to tap the potential
29. World Bank Bank-IMF DSA 2017
30. World Economic Outlook, World Bank, April 2018
31. World Bank (2017), Leveraging Public-Private Partnerships to Plug Uganda’s Deficit in Infrastructure Finance
Anne
x B:
Sum
mar
y of
per
form
ance
aga
inst
the
PFM
Out
com
e In
dica
tors
(as d
efin
ed in
PFM
Str
ateg
y 20
14-
2018
)
Tabl
e A.
1: P
erfo
rman
ce a
gain
st P
FM O
utco
me
Perf
orm
ance
Indi
cato
rs –
Sta
ge 1
(Ann
ex 4
)
PFM
Out
com
e In
dica
tor
Base
line
2013
/14
2014
/15
2015
/16
2016
/17
Sour
ce
Dom
estic
Rev
enue
as a
% o
f GDP
(exc
ludi
ng d
omes
tic O
il an
d Ga
s re
venu
es)
11.9
%13
.0%
12.9
%13
.8%
FINM
AP II
I Ann
ual R
epor
t 201
6/17
% o
f Nat
iona
l Bud
get f
unde
d fr
om d
omes
tic re
venu
e71
.5%
88.0
%87
.1%
-FI
NMAP
III A
nnua
l Rep
ort 2
016/
17%
of l
ocal
Gov
ernm
ent R
even
ue a
s % o
f GDP
--
--
n/a
Ratio
of n
atio
nal b
udge
t allo
catio
ns to
fron
t lin
e se
rvice
del
iver
y se
ctor
s-
--
-n/
a%
of f
unds
rele
ased
aga
inst
the
orig
inal
app
rove
d bu
dget
103.
0%88
.0%
97.0
%10
4.0%
FINM
AP II
I Ann
ual R
epor
t 201
6/17
Com
posit
ion
of e
xpen
ditu
re o
ut-tu
rn co
mpa
red
to o
rigin
al
appr
oved
bud
get
21.1
%12
.7%
7.0%
-PE
FA A
sses
smen
t 201
6%
of f
unds
util
ised
agai
nst r
elea
ses
88.0
%96
.0%
96.0
%98
.0%
FINM
AP II
I Ann
ual R
epor
t 201
6/17
[PV
of E
xter
nal]
Natio
nal D
ebt a
s % o
f Dom
estic
Rev
enue
--
85.8
%10
0.4%
Debt
Sus
tain
abili
ty A
naly
sis, M
oFED
stoc
k of
arr
ears
as %
of t
otal
exp
endi
ture
s7.
0%1.
0%13
.0%
10.0
%FI
NMAP
III A
nnua
l Rep
ort 2
016/
17Su
pple
men
tary
exp
endi
ture
as a
% o
f app
rove
d bu
dget
5.0%
4.0%
4.6%
3.1%
FINM
AP II
I Ann
ual R
epor
t 201
6/17
% o
f cle
an a
udit
repo
rts,
of w
hich
:CG
58.0
%70
.0%
79.0
%-
FINM
AP II
I Ann
ual R
epor
t 201
6/17
LG
37.4
%-
--
Stat
utor
y Au
thor
ities
41.0
%61
.8%
78.0
%-
FINM
AP II
I Ann
ual R
epor
t 201
6/17
% o
f Ext
erna
l aud
it re
com
men
datio
ns im
plem
ente
d by
MDA
s, LG
s an
d St
atut
ory
Auth
oriti
es28
.0%
-25
.0%
-FI
NMAP
III A
nnua
l Rep
ort 2
016/
16%
of p
rocu
rem
ent a
udit
reco
mm
enda
tions
impl
emen
ted
by M
DAs,
LGs a
nd S
tatu
tory
Aut
horit
ies
77.0
%85
.0%
55.0
%71
.0%
FINM
AP II
I Ann
ual R
epor
t 201
6/17
% o
f int
erna
l aud
it re
com
men
datio
ns in
MDA
s im
plem
ente
d58
.0%
63.3
%66
.2%
69.2
%FI
NMAP
III A
nnua
l Rep
ort 2
016/
17%
of c
ontr
acts
aud
ited
(by
valu
e) th
at a
re ra
ted
satis
fact
ory
28.5
%60
.0%
96.0
%95
.1%
FINM
AP II
I Ann
ual R
epor
t 201
6/17
Budg
et C
redi
bilit
y an
d Co
ntro
l
Impr
oved
Com
plia
nce
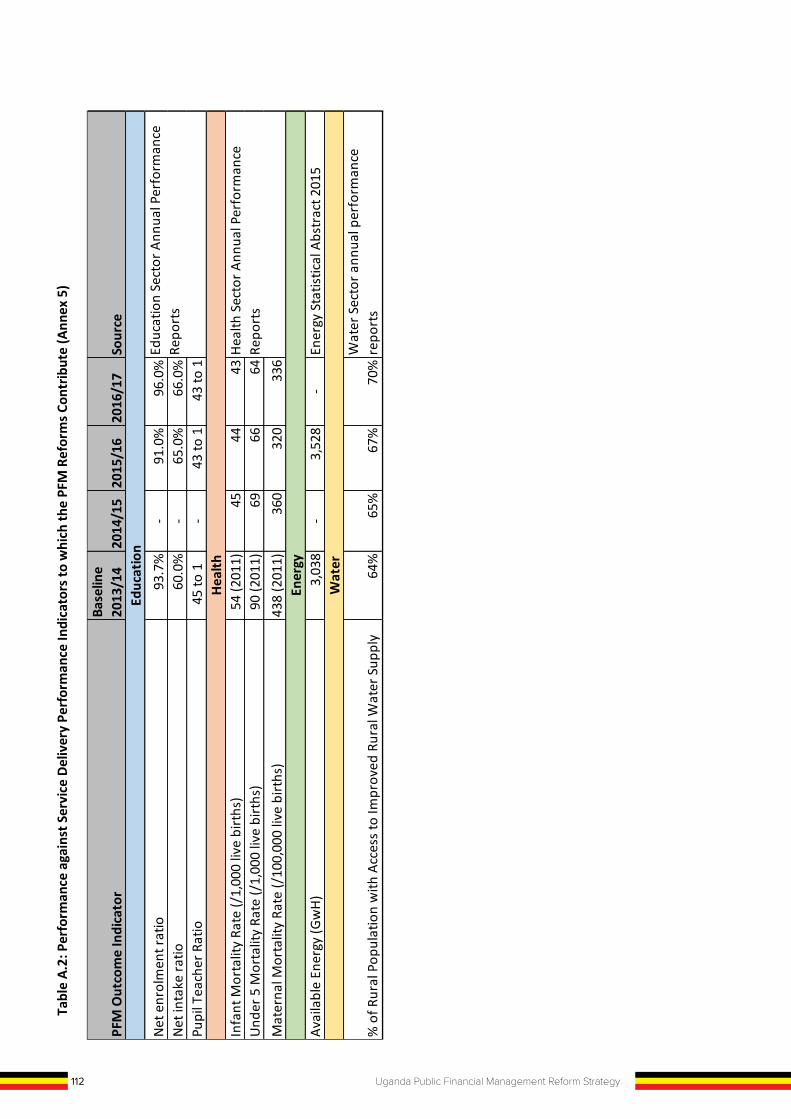
112 Uganda Public Financial Management Reform Strategy
Tabl
e A.
2: P
erfo
rman
ce a
gain
st S
ervi
ce D
eliv
ery
Perfo
rman
ce In
dica
tors
to w
hich
the
PFM
Ref
orm
s Con
trib
ute
(Ann
ex 5
)
PFM
Out
com
e In
dica
tor
Base
line
2013
/14
2014
/15
2015
/16
2016
/17
Sour
ce
Net e
nrol
men
t rat
io93
.7%
-91
.0%
96.0
%Ne
t int
ake
ratio
60.0
%-
65.0
%66
.0%
Pupi
l Tea
cher
Rat
io45
to 1
-43
to 1
43 to
1
Infa
nt M
orta
lity
Rate
(/1,
000
live
birt
hs)
54 (2
011)
4544
43Un
der 5
Mor
talit
y Ra
te (/
1,00
0 liv
e bi
rths
)90
(201
1)69
6664
Mat
erna
l Mor
talit
y Ra
te (/
100,
000
live
birt
hs)
438
(201
1)36
032
033
6
Avai
labl
e En
ergy
(Gw
H)3,
038
-3,
528
-En
ergy
Sta
tistic
al A
bstr
act 2
015
% o
f Rur
al P
opul
atio
n w
ith A
cces
s to
Impr
oved
Rur
al W
ater
Sup
ply
64%
65%
67%
70%
Wat
er S
ecto
r ann
ual p
erfo
rman
ce
repo
rts
Wat
er
Educ
atio
n Se
ctor
Ann
ual P
erfo
rman
ce
Repo
rts
Heal
th S
ecto
r Ann
ual P
erfo
rman
ce
Repo
rts
Educ
atio
n
Heal
th
Ener
gy
Anne
x C:
Cos
ted
Impl
emen
tati
on P
lan
Sum
mar
ized
Cos
ted
Wor
kpla
n by
Inte
rmed
iate
Res
ults
1.1
Enha
nced
ena
blin
g en
viro
nmen
t for
reve
nue
mob
ilisa
tion
2,3
81,9
10
1.2
Tax
com
plia
nce
impr
oved
thro
ugh
incr
ease
d ef
ficie
ncy
in re
venu
e ad
min
istr
atio
n
6
,612
,690
1.3
Enha
nced
col
lect
ions
from
new
reve
nue
oppo
rtun
ities
incl
udin
g oi
l, ga
s an
d m
iner
al s
ecto
rs
1,0
42,4
00
1.4
Sust
aina
ble
debt
and
Dev
elop
men
t fin
anci
ng
4,2
95,3
60
DRM
14
,332
,360
2.1
Budg
ets
alig
ned
to s
trat
egic
pla
ns a
nd m
ediu
m te
rm e
xpen
ditu
re fr
amew
orks
7
,975
,600
2.2
Mul
ti-ye
ar c
omm
itmen
ts re
flect
ed in
ann
ual b
udge
ts
3
78,4
25
2.3
Enha
ncin
g Pl
anni
ng a
nd B
udge
t res
pons
iven
ess
to g
ende
r equ
ity
4
68,3
00
2.4
Incr
ease
d eq
uity
and
dis
cret
ion
of re
sour
ces
allo
cate
d to
LG
s fo
r im
prov
ed s
ervi
ce d
eliv
ery
5
72,8
00
2.5
Evid
ence
-bas
ed p
olic
y m
akin
g st
reng
then
ed
16,0
80,6
00
Plan
ning
and
Bud
getin
g
25
,475
,725
3.1
Effi
cien
t ide
ntifi
catio
n, s
elec
tion
and
man
agem
ent o
f Pub
lic In
vest
men
t Pro
ject
s (P
IPs)
and
Pub
lic-P
rivat
e Pa
rtne
rshi
ps (P
PPs)
19
,752
,490
3.2
Enha
nced
VFM
in p
ublic
pro
cure
men
t for
larg
e, c
ompl
ex p
ublic
pro
cure
men
ts
6,9
31,9
80
3.3
Opt
imal
Util
isat
ion
and
Mai
ntan
ance
of A
sset
s
2
,851
,000
3.4
Enha
nced
acc
ount
abili
ty in
reso
urce
util
isat
ion
and
resu
lts fo
r pro
ject
del
iver
y
975
,000
Publ
ic In
vest
men
t Man
agem
ent (
PIM
)
30
,510
,470
4.1
Effe
ctiv
enes
s an
d ac
cura
cy o
f pub
lic p
ayro
ll an
d pe
nsio
n m
anag
emen
t sys
tem
s in
crea
sed
26,7
43,6
86
4.2
Com
preh
ensi
vene
ss a
nd q
ualit
y of
fina
ncia
l Rep
ortin
g
11
,291
,787
4.3
Stre
ngth
en e
ffect
iven
ess
and
inte
grity
of a
ccou
ntab
ility
sys
tem
s
30
,252
,600
4.4
Stre
ngth
en e
ffect
iven
ess
of c
omm
itmen
t con
trol
s an
d ca
sh m
anag
emen
t
7
,497
,344
113Uganda Public Financial Management Reform Strategy
Tabl
e A.
2: P
erfo
rman
ce a
gain
st S
ervi
ce D
eliv
ery
Perfo
rman
ce In
dica
tors
to w
hich
the
PFM
Ref
orm
s Con
trib
ute
(Ann
ex 5
)
PFM
Out
com
e In
dica
tor
Base
line
2013
/14
2014
/15
2015
/16
2016
/17
Sour
ce
Net e
nrol
men
t rat
io93
.7%
-91
.0%
96.0
%Ne
t int
ake
ratio
60.0
%-
65.0
%66
.0%
Pupi
l Tea
cher
Rat
io45
to 1
-43
to 1
43 to
1
Infa
nt M
orta
lity
Rate
(/1,
000
live
birt
hs)
54 (2
011)
4544
43Un
der 5
Mor
talit
y Ra
te (/
1,00
0 liv
e bi
rths
)90
(201
1)69
6664
Mat
erna
l Mor
talit
y Ra
te (/
100,
000
live
birt
hs)
438
(201
1)36
032
033
6
Avai
labl
e En
ergy
(Gw
H)3,
038
-3,
528
-En
ergy
Sta
tistic
al A
bstr
act 2
015
% o
f Rur
al P
opul
atio
n w
ith A
cces
s to
Impr
oved
Rur
al W
ater
Sup
ply
64%
65%
67%
70%
Wat
er S
ecto
r ann
ual p
erfo
rman
ce
repo
rts
Wat
er
Educ
atio
n Se
ctor
Ann
ual P
erfo
rman
ce
Repo
rts
Heal
th S
ecto
r Ann
ual P
erfo
rman
ce
Repo
rts
Educ
atio
n
Heal
th
Ener
gy
Anne
x C:
Cos
ted
Impl
emen
tati
on P
lan
Sum
mar
ized
Cos
ted
Wor
kpla
n by
Inte
rmed
iate
Res
ults
1.1
Enha
nced
ena
blin
g en
viro
nmen
t for
reve
nue
mob
ilisa
tion
2,3
81,9
10
1.2
Tax
com
plia
nce
impr
oved
thro
ugh
incr
ease
d ef
ficie
ncy
in re
venu
e ad
min
istr
atio
n
6
,612
,690
1.3
Enha
nced
col
lect
ions
from
new
reve
nue
oppo
rtun
ities
incl
udin
g oi
l, ga
s an
d m
iner
al s
ecto
rs
1,0
42,4
00
1.4
Sust
aina
ble
debt
and
Dev
elop
men
t fin
anci
ng
4,2
95,3
60
DRM
14
,332
,360
2.1
Budg
ets
alig
ned
to s
trat
egic
pla
ns a
nd m
ediu
m te
rm e
xpen
ditu
re fr
amew
orks
7
,975
,600
2.2
Mul
ti-ye
ar c
omm
itmen
ts re
flect
ed in
ann
ual b
udge
ts
3
78,4
25
2.3
Enha
ncin
g Pl
anni
ng a
nd B
udge
t res
pons
iven
ess
to g
ende
r equ
ity
4
68,3
00
2.4
Incr
ease
d eq
uity
and
dis
cret
ion
of re
sour
ces
allo
cate
d to
LG
s fo
r im
prov
ed s
ervi
ce d
eliv
ery
5
72,8
00
2.5
Evid
ence
-bas
ed p
olic
y m
akin
g st
reng
then
ed
16,0
80,6
00
Plan
ning
and
Bud
getin
g
25
,475
,725
3.1
Effi
cien
t ide
ntifi
catio
n, s
elec
tion
and
man
agem
ent o
f Pub
lic In
vest
men
t Pro
ject
s (P
IPs)
and
Pub
lic-P
rivat
e Pa
rtne
rshi
ps (P
PPs)
19
,752
,490
3.2
Enha
nced
VFM
in p
ublic
pro
cure
men
t for
larg
e, c
ompl
ex p
ublic
pro
cure
men
ts
6,9
31,9
80
3.3
Opt
imal
Util
isat
ion
and
Mai
ntan
ance
of A
sset
s
2
,851
,000
3.4
Enha
nced
acc
ount
abili
ty in
reso
urce
util
isat
ion
and
resu
lts fo
r pro
ject
del
iver
y
975
,000
Publ
ic In
vest
men
t Man
agem
ent (
PIM
)
30
,510
,470
4.1
Effe
ctiv
enes
s an
d ac
cura
cy o
f pub
lic p
ayro
ll an
d pe
nsio
n m
anag
emen
t sys
tem
s in
crea
sed
26,7
43,6
86
4.2
Com
preh
ensi
vene
ss a
nd q
ualit
y of
fina
ncia
l Rep
ortin
g
11
,291
,787
4.3
Stre
ngth
en e
ffect
iven
ess
and
inte
grity
of a
ccou
ntab
ility
sys
tem
s
30
,252
,600
4.4
Stre
ngth
en e
ffect
iven
ess
of c
omm
itmen
t con
trol
s an
d ca
sh m
anag
emen
t
7
,497
,344
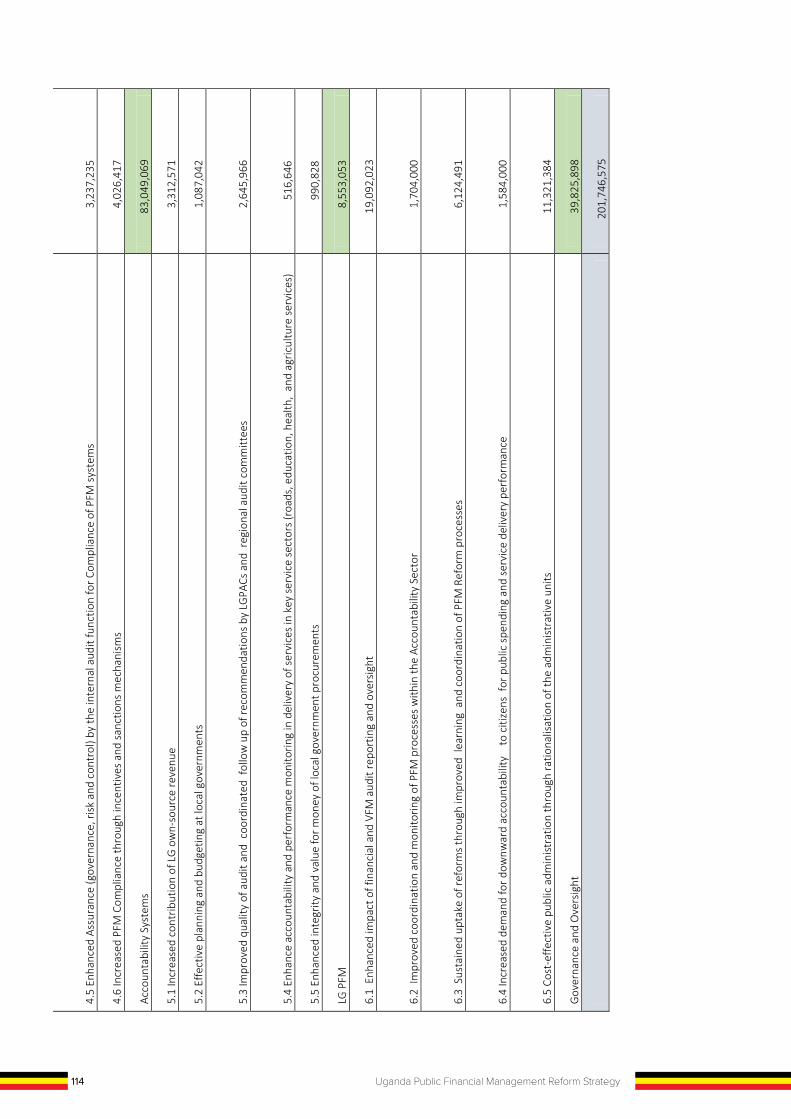
114 Uganda Public Financial Management Reform Strategy
4.5
Enha
nced
Ass
uran
ce (g
over
nanc
e, ri
sk a
nd c
ontr
ol) b
y th
e in
tern
al a
udit
func
tion
for C
ompl
ianc
e of
PFM
sys
tem
s
3,2
37,2
35
4.6
Incr
ease
d PF
M C
ompl
ianc
e th
roug
h in
cent
ives
and
san
ctio
ns m
echa
nism
s
4
,026
,417
Acco
unta
bilit
y Sy
stem
s
83
,049
,069
5.1
Incr
ease
d co
ntrib
utio
n of
LG
ow
n-so
urce
reve
nue
3,3
12,5
71
5.2
Effe
ctiv
e pl
anni
ng a
nd b
udge
ting
at lo
cal g
over
nmen
ts
1,0
87,0
42
5.3
Impr
oved
qua
lity
of a
udit
and
coo
rdin
ated
fol
low
up
of re
com
men
datio
ns b
y LG
PACs
and
reg
iona
l aud
it co
mm
ittee
s
2
,645
,966
5.4
Enha
nce
acco
unta
bilit
y an
d pe
rfor
man
ce m
onito
ring
in d
eliv
ery
of s
ervi
ces
in k
ey s
ervi
ce s
ecto
rs (r
oads
, edu
catio
n, h
ealth
, an
d ag
ricul
ture
ser
vice
s)
5
16,6
46
5.5
Enha
nced
inte
grity
and
val
ue fo
r mon
ey o
f loc
al g
over
nmen
t pro
cure
men
ts
9
90,8
28
LG P
FM
8,5
53,0
53
6.1
Enh
ance
d im
pact
of f
inan
cial
and
VFM
aud
it re
port
ing
and
over
sigh
t
19
,092
,023
6.2
Impr
oved
coo
rdin
atio
n an
d m
onito
ring
of P
FM p
roce
sses
with
in th
e Ac
coun
tabi
lity
Sect
or
1,7
04,0
00
6.3
Sus
tain
ed u
ptak
e of
refo
rms
thro
ugh
impr
oved
lea
rnin
g a
nd c
oord
inat
ion
of P
FM R
efor
m p
roce
sses
6
,124
,491
6.4
Incr
ease
d de
man
d fo
r dow
nwar
d ac
coun
tabi
lity
to
citi
zens
for
pub
lic s
pend
ing
and
serv
ice
deliv
ery
perf
orm
ance
1
,584
,000
6.5
Cost
-effe
ctiv
e pu
blic
adm
inist
ratio
n th
roug
h ra
tiona
lisat
ion
of th
e ad
min
istr
ativ
e un
its
11,3
21,3
84
Gov
erna
nce
and
Ove
rsig
ht
39,8
25,8
98
201
,746
,575
Obj
ectiv
e 1:
To
impr
ove
Reso
urce
Mob
iliza
tion
for S
usta
inab
le D
evel
opm
ent
Impl
emen
ting
Inst
itutio
ns:
MoF
PED
(D
EA,
Deb
t),
URA
, M
oLG
, M
DAL
Gs
Ke
y St
akeh
olde
rs: C
SOs,
priv
ate
sect
or/t
ax a
ccou
ntan
ts, R
egul
ator
y Au
thor
ities
, NIT
A-U
, BoU
O
utpu
ts
Key
Activ
ities
Le
ad In
stitu
tion
2018 / 19
2019 / 20
2020 / 21
2021 / 22
2022 / 23
IND
ICAT
IVE
Cost
(U
SD)
1.1
Enha
nced
ena
blin
g en
viro
nmen
t for
reve
nue
mob
ilisa
tion
2,3
81,9
10
1.1.
1.
Stro
ng
esta
blis
hed
gove
rnan
ce
arra
ngem
ent f
or re
venu
e m
obili
satio
n 1.
1.1.
1.D
evel
op
med
ium
-ter
m
Dom
estic
Re
venu
e M
obili
satio
n (D
RM)
Stra
tegy
, in
clud
ing
iden
tific
atio
n of
sp
ecifi
c as
sist
ance
nec
essa
ry t
o ac
hiev
e su
cces
sful
an
d tim
ely
inte
rven
tion
MO
FPED
/DEA
X
5
8,41
0
1.1.
1.2.
Und
erta
ke c
ompr
ehen
sive
cap
acity
ne
eds
asse
ssm
ent
for
deliv
ery
of
DRM
st
rate
gy
and
deve
lop
prog
ram
me
for
capa
city
enh
ance
men
t
MO
FPED
/DEA
X
100
,000
1.1.
1.3.
Est
ablis
h ap
proa
ches
& p
olic
ies
to
supp
ort
regu
latio
n of
the
eco
nom
y to
eas
e re
venu
e m
obili
satio
n
MO
FPED
/DEA
X
8
3,00
0
1.1.
1.4.
Es
tabl
ish
cros
s-go
vern
men
t co
mm
itmen
t an
d in
stitu
tiona
l ar
rang
emen
ts fo
r de
liver
y an
d ov
ersi
ght
of
prog
ress
ag
ains
t th
e D
RM
stra
tegy
, in
clud
ing
priv
ate
sect
or a
nd c
ivil
soci
ety
enga
gem
ent
MO
FPED
/DEA
X
3
3,00
0
1.1.
2.
Stre
ngth
ened
po
licy
and
lega
l fr
amew
ork
for
reve
nue
mob
ilisa
tion,
with
co
nsid
erat
ion
of
fairn
ess,
eq
uity
an
d si
mpl
icity
1.1.
2.1.
Und
erta
ke c
onsu
ltativ
e re
view
of
tax
polic
y an
d le
gisl
atio
n,
in
line
with
pr
iorit
ies
in
DRM
st
rate
gy,
to
impr
ove
effic
ienc
y, s
impl
icity
, fai
rnes
s an
d eq
uity
MO
FPED
/DEA
X
X
208
,000
1.1.
2.2.
Str
engt
hen
capa
city
for
tax
pol
icy
anal
ysis
and
des
ign,
incl
udin
g pr
oces
s an
d to
ols
for
econ
omic
an
d fis
cal
impa
ct
repo
rtin
g
MO
FPED
/DEA
X X
X X
263
,600
1.1.
2.3.
Dev
elop
refo
rm p
ropo
sals
and
lega
l am
endm
ents
id
entif
ied
in
1.1.
2.1.
, in
clud
ing
econ
omic
and
fis
cal
impa
cts
for
subm
issi
on to
Min
ister
s
MO
FPED
/DEA
X
208
,000
1.1.
3.
Esta
blis
h po
licy
fram
ewor
k fo
r re
port
ing
of ta
x ex
pend
iture
s 1.
1.3.
1.
Def
ine
and
iden
tify,
w
ith
cons
ulta
tion,
wha
t is
con
side
red
to b
e 'ta
x ex
pend
iture
'
MO
FPED
/DEA
X
4
4,60
0
115Uganda Public Financial Management Reform Strategy
4.5
Enha
nced
Ass
uran
ce (g
over
nanc
e, ri
sk a
nd c
ontr
ol) b
y th
e in
tern
al a
udit
func
tion
for C
ompl
ianc
e of
PFM
sys
tem
s
3,2
37,2
35
4.6
Incr
ease
d PF
M C
ompl
ianc
e th
roug
h in
cent
ives
and
san
ctio
ns m
echa
nism
s
4
,026
,417
Acco
unta
bilit
y Sy
stem
s
83
,049
,069
5.1
Incr
ease
d co
ntrib
utio
n of
LG
ow
n-so
urce
reve
nue
3,3
12,5
71
5.2
Effe
ctiv
e pl
anni
ng a
nd b
udge
ting
at lo
cal g
over
nmen
ts
1,0
87,0
42
5.3
Impr
oved
qua
lity
of a
udit
and
coo
rdin
ated
fol
low
up
of re
com
men
datio
ns b
y LG
PACs
and
reg
iona
l aud
it co
mm
ittee
s
2
,645
,966
5.4
Enha
nce
acco
unta
bilit
y an
d pe
rfor
man
ce m
onito
ring
in d
eliv
ery
of s
ervi
ces
in k
ey s
ervi
ce s
ecto
rs (r
oads
, edu
catio
n, h
ealth
, an
d ag
ricul
ture
ser
vice
s)
5
16,6
46
5.5
Enha
nced
inte
grity
and
val
ue fo
r mon
ey o
f loc
al g
over
nmen
t pro
cure
men
ts
9
90,8
28
LG P
FM
8,5
53,0
53
6.1
Enh
ance
d im
pact
of f
inan
cial
and
VFM
aud
it re
port
ing
and
over
sigh
t
19
,092
,023
6.2
Impr
oved
coo
rdin
atio
n an
d m
onito
ring
of P
FM p
roce
sses
with
in th
e Ac
coun
tabi
lity
Sect
or
1,7
04,0
00
6.3
Sus
tain
ed u
ptak
e of
refo
rms
thro
ugh
impr
oved
lea
rnin
g a
nd c
oord
inat
ion
of P
FM R
efor
m p
roce
sses
6
,124
,491
6.4
Incr
ease
d de
man
d fo
r dow
nwar
d ac
coun
tabi
lity
to
citi
zens
for
pub
lic s
pend
ing
and
serv
ice
deliv
ery
perf
orm
ance
1
,584
,000
6.5
Cost
-effe
ctiv
e pu
blic
adm
inist
ratio
n th
roug
h ra
tiona
lisat
ion
of th
e ad
min
istr
ativ
e un
its
11,3
21,3
84
Gov
erna
nce
and
Ove
rsig
ht
39,8
25,8
98
201
,746
,575
Obj
ectiv
e 1:
To
impr
ove
Reso
urce
Mob
iliza
tion
for S
usta
inab
le D
evel
opm
ent
Impl
emen
ting
Inst
itutio
ns:
MoF
PED
(D
EA,
Deb
t),
URA
, M
oLG
, M
DAL
Gs
Ke
y St
akeh
olde
rs: C
SOs,
priv
ate
sect
or/t
ax a
ccou
ntan
ts, R
egul
ator
y Au
thor
ities
, NIT
A-U
, BoU
O
utpu
ts
Key
Activ
ities
Le
ad In
stitu
tion
2018 / 19
2019 / 20
2020 / 21
2021 / 22
2022 / 23
IND
ICAT
IVE
Cost
(U
SD)
1.1
Enha
nced
ena
blin
g en
viro
nmen
t for
reve
nue
mob
ilisa
tion
2,3
81,9
10
1.1.
1.
Stro
ng
esta
blis
hed
gove
rnan
ce
arra
ngem
ent f
or re
venu
e m
obili
satio
n 1.
1.1.
1.D
evel
op
med
ium
-ter
m
Dom
estic
Re
venu
e M
obili
satio
n (D
RM)
Stra
tegy
, in
clud
ing
iden
tific
atio
n of
sp
ecifi
c as
sist
ance
nec
essa
ry t
o ac
hiev
e su
cces
sful
an
d tim
ely
inte
rven
tion
MO
FPED
/DEA
X
5
8,41
0
1.1.
1.2.
Und
erta
ke c
ompr
ehen
sive
cap
acity
ne
eds
asse
ssm
ent
for
deliv
ery
of
DRM
st
rate
gy
and
deve
lop
prog
ram
me
for
capa
city
enh
ance
men
t
MO
FPED
/DEA
X
100
,000
1.1.
1.3.
Est
ablis
h ap
proa
ches
& p
olic
ies
to
supp
ort
regu
latio
n of
the
eco
nom
y to
eas
e re
venu
e m
obili
satio
n
MO
FPED
/DEA
X
8
3,00
0
1.1.
1.4.
Es
tabl
ish
cros
s-go
vern
men
t co
mm
itmen
t an
d in
stitu
tiona
l ar
rang
emen
ts fo
r de
liver
y an
d ov
ersi
ght
of
prog
ress
ag
ains
t th
e D
RM
stra
tegy
, in
clud
ing
priv
ate
sect
or a
nd c
ivil
soci
ety
enga
gem
ent
MO
FPED
/DEA
X
3
3,00
0
1.1.
2.
Stre
ngth
ened
po
licy
and
lega
l fr
amew
ork
for
reve
nue
mob
ilisa
tion,
with
co
nsid
erat
ion
of
fairn
ess,
eq
uity
an
d si
mpl
icity
1.1.
2.1.
Und
erta
ke c
onsu
ltativ
e re
view
of
tax
polic
y an
d le
gisl
atio
n,
in
line
with
pr
iorit
ies
in
DRM
st
rate
gy,
to
impr
ove
effic
ienc
y, s
impl
icity
, fai
rnes
s an
d eq
uity
MO
FPED
/DEA
X
X
208
,000
1.1.
2.2.
Str
engt
hen
capa
city
for
tax
pol
icy
anal
ysis
and
des
ign,
incl
udin
g pr
oces
s an
d to
ols
for
econ
omic
an
d fis
cal
impa
ct
repo
rtin
g
MO
FPED
/DEA
X X
X X
263
,600
1.1.
2.3.
Dev
elop
refo
rm p
ropo
sals
and
lega
l am
endm
ents
id
entif
ied
in
1.1.
2.1.
, in
clud
ing
econ
omic
and
fis
cal
impa
cts
for
subm
issi
on to
Min
ister
s
MO
FPED
/DEA
X
208
,000
1.1.
3.
Esta
blis
h po
licy
fram
ewor
k fo
r re
port
ing
of ta
x ex
pend
iture
s 1.
1.3.
1.
Def
ine
and
iden
tify,
w
ith
cons
ulta
tion,
wha
t is
con
side
red
to b
e 'ta
x ex
pend
iture
'
MO
FPED
/DEA
X
4
4,60
0
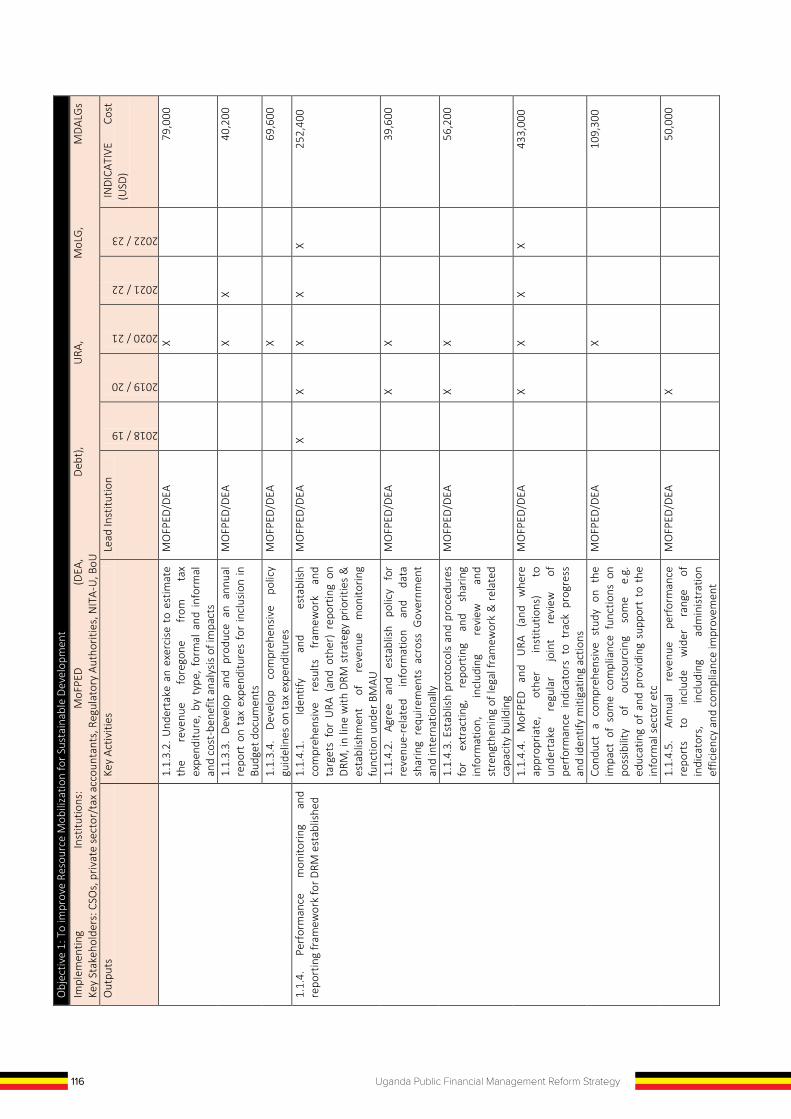
116 Uganda Public Financial Management Reform Strategy
Obj
ectiv
e 1:
To
impr
ove
Reso
urce
Mob
iliza
tion
for S
usta
inab
le D
evel
opm
ent
Impl
emen
ting
Inst
itutio
ns:
MoF
PED
(D
EA,
Deb
t),
URA
, M
oLG
, M
DAL
Gs
Ke
y St
akeh
olde
rs: C
SOs,
priv
ate
sect
or/t
ax a
ccou
ntan
ts, R
egul
ator
y Au
thor
ities
, NIT
A-U
, BoU
O
utpu
ts
Key
Activ
ities
Le
ad In
stitu
tion
2018 / 19
2019 / 20
2020 / 21
2021 / 22
2022 / 23
IND
ICAT
IVE
Cost
(U
SD)
1.1.
3.2.
Und
erta
ke a
n ex
erci
se t
o es
timat
e th
e re
venu
e fo
rego
ne
from
ta
x ex
pend
iture
, by
typ
e, f
orm
al a
nd in
form
al
and
cost
-ben
efit
anal
ysis
of i
mpa
cts
MO
FPED
/DEA
X
7
9,00
0
1.1.
3.3.
Dev
elop
and
pro
duce
an
annu
al
repo
rt o
n ta
x ex
pend
iture
s fo
r in
clus
ion
in
Budg
et d
ocum
ents
MO
FPED
/DEA
X
X
4
0,20
0
1.1.
3.4.
D
evel
op
com
preh
ensi
ve
polic
y gu
idel
ines
on
tax
expe
nditu
res
MO
FPED
/DEA
X
6
9,60
0
1.1.
4.
Perf
orm
ance
m
onito
ring
and
repo
rtin
g fr
amew
ork
for D
RM e
stab
lishe
d 1.
1.4.
1.
Iden
tify
and
esta
blis
h co
mpr
ehen
sive
re
sults
fr
amew
ork
and
targ
ets
for
URA
(an
d ot
her)
rep
ortin
g on
D
RM, i
n lin
e w
ith D
RM s
trat
egy
prio
ritie
s &
es
tabl
ishm
ent
of
reve
nue
mon
itorin
g fu
nctio
n un
der B
MAU
MO
FPED
/DEA
X
X X
X X
252
,400
1.1.
4.2.
Ag
ree
and
esta
blis
h po
licy
for
reve
nue-
rela
ted
info
rmat
ion
and
data
sh
arin
g re
quire
men
ts a
cros
s G
over
nmen
t an
d in
tern
atio
nally
MO
FPED
/DEA
X X
3
9,60
0
1.1.
4.3.
Est
ablis
h pr
otoc
ols
and
proc
edur
es
for
extr
actin
g,
repo
rtin
g an
d sh
arin
g in
form
atio
n,
incl
udin
g re
view
an
d st
reng
then
ing
of le
gal f
ram
ewor
k &
rel
ated
ca
paci
ty b
uild
ing
MO
FPED
/DEA
X X
5
6,20
0
1.1.
4.4.
M
oFPE
D
and
URA
(a
nd
whe
re
appr
opria
te,
othe
r in
stitu
tions
) to
un
dert
ake
regu
lar
join
t re
view
of
pe
rfor
man
ce i
ndic
ator
s to
tra
ck p
rogr
ess
and
iden
tify
miti
gatin
g ac
tions
MO
FPED
/DEA
X X
X X
433
,000
Cond
uct
a co
mpr
ehen
sive
stu
dy o
n th
e im
pact
of
som
e co
mpl
ianc
e fu
nctio
ns o
n po
ssib
ility
of
ou
tsou
rcin
g so
me
e.g.
ed
ucat
ing
of a
nd p
rovi
ding
sup
port
to
the
info
rmal
sec
tor e
tc
MO
FPED
/DEA
X
109
,300
1.1.
4.5.
An
nual
re
venu
e pe
rfor
man
ce
repo
rts
to
incl
ude
wid
er
rang
e of
in
dica
tors
, in
clud
ing
adm
inis
trat
ion
effic
ienc
y an
d co
mpl
ianc
e im
prov
emen
t
MO
FPED
/DEA
X
5
0,00
0
Obj
ectiv
e 1:
To
impr
ove
Reso
urce
Mob
iliza
tion
for S
usta
inab
le D
evel
opm
ent
Impl
emen
ting
Inst
itutio
ns:
MoF
PED
(D
EA,
Deb
t),
URA
, M
oLG
, M
DAL
Gs
Ke
y St
akeh
olde
rs: C
SOs,
priv
ate
sect
or/t
ax a
ccou
ntan
ts, R
egul
ator
y Au
thor
ities
, NIT
A-U
, BoU
O
utpu
ts
Key
Activ
ities
Le
ad In
stitu
tion
2018 / 19
2019 / 20
2020 / 21
2021 / 22
2022 / 23
IND
ICAT
IVE
Cost
(U
SD)
1.1.
4.6
Tech
nica
l as
sist
ance
in
im
plem
enta
tion
of
DRM
an
d re
late
d m
onito
ring
& e
valu
atio
n fr
amew
ork
MO
FPED
/DEA
X
X X
X X
254
,000
1.2
Tax
com
plia
nce
impr
oved
thro
ugh
incr
ease
d ef
ficie
ncy
in re
venu
e ad
min
istr
atio
n
6
,612
,690
1.
2.1.
En
hanc
ed
reve
nue
data
in
tegr
ity
and
effic
acy
of IT
sys
tem
s 1.
2.1.
1. C
apac
ity a
nd e
xerc
ise
to i
mpr
ove
data
in
tegr
ity
in
reve
nue
adm
inis
trat
ion
syst
ems,
as
a
pre-
cond
ition
to
an
y IT
sy
stem
upg
rade
MO
FPED
/DEA
X
203
,000
1.2.
1.2.
St
reng
then
an
d im
plem
ent
proc
edur
es
for
ongo
ing
mai
nten
ance
of
da
ta in
tegr
ity
MO
FPED
/DEA
X
1
3,00
0
1.2.
1.3.
Ass
ess
effic
acy
and
inte
grat
ion
of IT
sy
stem
s fo
r tax
adm
inis
trat
ion
MO
FPED
/DEA
X
113
,000
1.2.
1.4.
Dev
elop
an
actio
n pl
an t
o ad
dres
s is
sues
iden
tifie
d in
act
ivity
1.2
.1.3
. M
OFP
ED/D
EA
X X
13,
000
1.2.
1.5.
Impl
emen
t act
ion
plan
iden
tifie
d in
ac
tivity
1.2
.1.4
. e.
g. I
T sy
stem
upg
rade
s (e
tax
2 et
c.)
MO
FPED
/DEA
2
,701
,000
1.2.
1.6.
Su
ppor
t es
tabl
ishm
ent
of
e-pa
ymen
t/m
-pay
men
t ga
tew
ay
and
enha
nced
di
gitis
atio
n of
re
venu
e ad
min
istr
atio
n/co
llect
ion
MO
FPED
/DEA
X
-
1.2.
2 Im
plem
enta
tion
of
the
tax
Com
plia
nce
Impr
ovem
ent
Plan
(C
IP)
stre
ngth
ened
1.2.
2.1.
Re
view
an
d up
date
Co
mpl
ianc
e Im
prov
emen
t Pla
n M
OFP
ED/D
EA
X
67,
500
1.2.
2.2.
Est
ablis
h da
ta a
naly
sis
team
(s) w
ith
Term
s of
Ref
eren
ce,
incl
udin
g pr
oduc
tion
of
mon
itorin
g re
port
s ac
ross
ta
xes
and
Cust
oms
to r
evie
w c
ompl
ianc
e in
dica
tors
(r
egis
trat
ion,
fil
ing,
pa
ymen
t, va
luat
ion,
cl
assi
ficat
ion
etc)
MO
FPED
/DEA
533
,600
1.2.
2.3.
O
pera
tiona
lise
CIP
thro
ugh
deci
sion
s m
ade
at (
Dom
estic
& C
usto
ms)
Ri
sk M
anag
emen
t Com
mitt
ees
MO
FPED
/DEA
X
2
7,00
0
1.2.
2.4.
Re
view
ris
k m
anag
emen
t po
licy
and
oper
atio
nal f
ram
ewor
k M
OFP
ED/D
EA
X
X
29,
600
Dev
elop
cap
acity
in ri
sk m
anag
emen
t M
OFP
ED/D
EA
X
X
1
97,0
70
1.2.
2.5.
Im
plem
ent/
Ope
ratio
nalis
e ris
k m
anag
emen
t po
licy
and
fram
ewor
k e.
g.
MO
FPED
/DEA
631
,000
117Uganda Public Financial Management Reform Strategy
Obj
ectiv
e 1:
To
impr
ove
Reso
urce
Mob
iliza
tion
for S
usta
inab
le D
evel
opm
ent
Impl
emen
ting
Inst
itutio
ns:
MoF
PED
(D
EA,
Deb
t),
URA
, M
oLG
, M
DAL
Gs
Ke
y St
akeh
olde
rs: C
SOs,
priv
ate
sect
or/t
ax a
ccou
ntan
ts, R
egul
ator
y Au
thor
ities
, NIT
A-U
, BoU
O
utpu
ts
Key
Activ
ities
Le
ad In
stitu
tion
2018 / 19
2019 / 20
2020 / 21
2021 / 22
2022 / 23
IND
ICAT
IVE
Cost
(U
SD)
1.1.
3.2.
Und
erta
ke a
n ex
erci
se t
o es
timat
e th
e re
venu
e fo
rego
ne
from
ta
x ex
pend
iture
, by
typ
e, f
orm
al a
nd in
form
al
and
cost
-ben
efit
anal
ysis
of i
mpa
cts
MO
FPED
/DEA
X
7
9,00
0
1.1.
3.3.
Dev
elop
and
pro
duce
an
annu
al
repo
rt o
n ta
x ex
pend
iture
s fo
r in
clus
ion
in
Budg
et d
ocum
ents
MO
FPED
/DEA
X
X
4
0,20
0
1.1.
3.4.
D
evel
op
com
preh
ensi
ve
polic
y gu
idel
ines
on
tax
expe
nditu
res
MO
FPED
/DEA
X
6
9,60
0
1.1.
4.
Perf
orm
ance
m
onito
ring
and
repo
rtin
g fr
amew
ork
for D
RM e
stab
lishe
d 1.
1.4.
1.
Iden
tify
and
esta
blis
h co
mpr
ehen
sive
re
sults
fr
amew
ork
and
targ
ets
for
URA
(an
d ot
her)
rep
ortin
g on
D
RM, i
n lin
e w
ith D
RM s
trat
egy
prio
ritie
s &
es
tabl
ishm
ent
of
reve
nue
mon
itorin
g fu
nctio
n un
der B
MAU
MO
FPED
/DEA
X
X X
X X
252
,400
1.1.
4.2.
Ag
ree
and
esta
blis
h po
licy
for
reve
nue-
rela
ted
info
rmat
ion
and
data
sh
arin
g re
quire
men
ts a
cros
s G
over
nmen
t an
d in
tern
atio
nally
MO
FPED
/DEA
X X
3
9,60
0
1.1.
4.3.
Est
ablis
h pr
otoc
ols
and
proc
edur
es
for
extr
actin
g,
repo
rtin
g an
d sh
arin
g in
form
atio
n,
incl
udin
g re
view
an
d st
reng
then
ing
of le
gal f
ram
ewor
k &
rel
ated
ca
paci
ty b
uild
ing
MO
FPED
/DEA
X X
5
6,20
0
1.1.
4.4.
M
oFPE
D
and
URA
(a
nd
whe
re
appr
opria
te,
othe
r in
stitu
tions
) to
un
dert
ake
regu
lar
join
t re
view
of
pe
rfor
man
ce i
ndic
ator
s to
tra
ck p
rogr
ess
and
iden
tify
miti
gatin
g ac
tions
MO
FPED
/DEA
X X
X X
433
,000
Cond
uct
a co
mpr
ehen
sive
stu
dy o
n th
e im
pact
of
som
e co
mpl
ianc
e fu
nctio
ns o
n po
ssib
ility
of
ou
tsou
rcin
g so
me
e.g.
ed
ucat
ing
of a
nd p
rovi
ding
sup
port
to
the
info
rmal
sec
tor e
tc
MO
FPED
/DEA
X
109
,300
1.1.
4.5.
An
nual
re
venu
e pe
rfor
man
ce
repo
rts
to
incl
ude
wid
er
rang
e of
in
dica
tors
, in
clud
ing
adm
inis
trat
ion
effic
ienc
y an
d co
mpl
ianc
e im
prov
emen
t
MO
FPED
/DEA
X
5
0,00
0
Obj
ectiv
e 1:
To
impr
ove
Reso
urce
Mob
iliza
tion
for S
usta
inab
le D
evel
opm
ent
Impl
emen
ting
Inst
itutio
ns:
MoF
PED
(D
EA,
Deb
t),
URA
, M
oLG
, M
DAL
Gs
Ke
y St
akeh
olde
rs: C
SOs,
priv
ate
sect
or/t
ax a
ccou
ntan
ts, R
egul
ator
y Au
thor
ities
, NIT
A-U
, BoU
O
utpu
ts
Key
Activ
ities
Le
ad In
stitu
tion
2018 / 19
2019 / 20
2020 / 21
2021 / 22
2022 / 23
IND
ICAT
IVE
Cost
(U
SD)
1.1.
4.6
Tech
nica
l as
sist
ance
in
im
plem
enta
tion
of
DRM
an
d re
late
d m
onito
ring
& e
valu
atio
n fr
amew
ork
MO
FPED
/DEA
X
X X
X X
254
,000
1.2
Tax
com
plia
nce
impr
oved
thro
ugh
incr
ease
d ef
ficie
ncy
in re
venu
e ad
min
istr
atio
n
6
,612
,690
1.
2.1.
En
hanc
ed
reve
nue
data
in
tegr
ity
and
effic
acy
of IT
sys
tem
s 1.
2.1.
1. C
apac
ity a
nd e
xerc
ise
to i
mpr
ove
data
in
tegr
ity
in
reve
nue
adm
inis
trat
ion
syst
ems,
as
a
pre-
cond
ition
to
an
y IT
sy
stem
upg
rade
MO
FPED
/DEA
X
203
,000
1.2.
1.2.
St
reng
then
an
d im
plem
ent
proc
edur
es
for
ongo
ing
mai
nten
ance
of
da
ta in
tegr
ity
MO
FPED
/DEA
X
1
3,00
0
1.2.
1.3.
Ass
ess
effic
acy
and
inte
grat
ion
of IT
sy
stem
s fo
r tax
adm
inis
trat
ion
MO
FPED
/DEA
X
113
,000
1.2.
1.4.
Dev
elop
an
actio
n pl
an t
o ad
dres
s is
sues
iden
tifie
d in
act
ivity
1.2
.1.3
. M
OFP
ED/D
EA
X X
13,
000
1.2.
1.5.
Impl
emen
t act
ion
plan
iden
tifie
d in
ac
tivity
1.2
.1.4
. e.
g. I
T sy
stem
upg
rade
s (e
tax
2 et
c.)
MO
FPED
/DEA
2
,701
,000
1.2.
1.6.
Su
ppor
t es
tabl
ishm
ent
of
e-pa
ymen
t/m
-pay
men
t ga
tew
ay
and
enha
nced
di
gitis
atio
n of
re
venu
e ad
min
istr
atio
n/co
llect
ion
MO
FPED
/DEA
X
-
1.2.
2 Im
plem
enta
tion
of
the
tax
Com
plia
nce
Impr
ovem
ent
Plan
(C
IP)
stre
ngth
ened
1.2.
2.1.
Re
view
an
d up
date
Co
mpl
ianc
e Im
prov
emen
t Pla
n M
OFP
ED/D
EA
X
67,
500
1.2.
2.2.
Est
ablis
h da
ta a
naly
sis
team
(s) w
ith
Term
s of
Ref
eren
ce,
incl
udin
g pr
oduc
tion
of
mon
itorin
g re
port
s ac
ross
ta
xes
and
Cust
oms
to r
evie
w c
ompl
ianc
e in
dica
tors
(r
egis
trat
ion,
fil
ing,
pa
ymen
t, va
luat
ion,
cl
assi
ficat
ion
etc)
MO
FPED
/DEA
533
,600
1.2.
2.3.
O
pera
tiona
lise
CIP
thro
ugh
deci
sion
s m
ade
at (
Dom
estic
& C
usto
ms)
Ri
sk M
anag
emen
t Com
mitt
ees
MO
FPED
/DEA
X
2
7,00
0
1.2.
2.4.
Re
view
ris
k m
anag
emen
t po
licy
and
oper
atio
nal f
ram
ewor
k M
OFP
ED/D
EA
X
X
29,
600
Dev
elop
cap
acity
in ri
sk m
anag
emen
t M
OFP
ED/D
EA
X
X
1
97,0
70
1.2.
2.5.
Im
plem
ent/
Ope
ratio
nalis
e ris
k m
anag
emen
t po
licy
and
fram
ewor
k e.
g.
MO
FPED
/DEA
631
,000

118 Uganda Public Financial Management Reform Strategy
Obj
ectiv
e 1:
To
impr
ove
Reso
urce
Mob
iliza
tion
for S
usta
inab
le D
evel
opm
ent
Impl
emen
ting
Inst
itutio
ns:
MoF
PED
(D
EA,
Deb
t),
URA
, M
oLG
, M
DAL
Gs
Ke
y St
akeh
olde
rs: C
SOs,
priv
ate
sect
or/t
ax a
ccou
ntan
ts, R
egul
ator
y Au
thor
ities
, NIT
A-U
, BoU
O
utpu
ts
Key
Activ
ities
Le
ad In
stitu
tion
2018 / 19
2019 / 20
2020 / 21
2021 / 22
2022 / 23
IND
ICAT
IVE
Cost
(U
SD)
Risk
Man
agem
ent C
omm
ittee
s
1.2.
2.6.
Es
tabl
ish
and
impl
emen
t da
ta
anal
ysis
re
quire
men
ts
to
info
rm
risk
man
agem
ent
fram
ewor
k an
d co
mpl
ianc
e st
rate
gies
, inc
ludi
ng u
se /
ana
lysi
s of
thi
rd
part
y da
ta
MO
FPED
/DEA
X
X
-
1.2.
3.
URA
ca
paci
ty
for
inve
stig
atio
n st
reng
then
ed,
in l
ine
with
cap
acity
nee
ds
asse
ssm
ent /
enh
ance
men
t pla
n
1.2.
3.1.
Dev
elop
fram
ewor
k an
d ca
paci
ty to
un
dert
ake
inve
stig
atio
n of
tax
evas
ion
MO
FPED
/DEA
X
X
180
,500
1.2.
3.2.
Dev
elop
fram
ewor
k an
d ca
paci
ty to
un
dert
ake
inve
stig
atio
n of
illi
cit
finan
cial
flo
ws
MO
FPED
/DEA
X
180
,500
1.2.
3.3.
Es
tabl
ish
inst
itutio
nal
arra
ngem
ents
and
pro
cedu
res
(with
in U
RA
and
acro
ss G
over
nmen
t) f
or u
nder
taki
ng
join
t exe
rcis
es to
inve
stig
ate
tax
evas
ion,
in
line
with
DRM
str
ateg
y
MO
FPED
/DEA
X
X
4
6,00
0
1.2.
4 En
hanc
ed
adm
inis
trat
ive
capa
city
an
d fr
amew
ork
for
effe
ctiv
e in
tern
atio
nal
taxa
tion
1.2.
4.1.
Rev
iew
and
str
engt
hen
lega
l an
d po
licy
fram
ewor
k on
line
with
th
e D
RM
reco
mm
enda
tions
(e
.g.
addr
essi
ng
inte
rnat
iona
l ta
xatio
n, i
nclu
ding
Hig
h N
et
Wor
th In
divi
dual
s (H
NW
Is)s
MO
FPED
/DEA
X
X X
4
6,00
0
1.2.
4.2.
Enh
ance
adm
inis
trat
ion
capa
city
to
audi
t, in
vest
igat
e an
d en
forc
e ta
xatio
n of
in
tern
atio
nal c
orpo
ratio
ns a
nd tr
ansa
ctio
ns
MO
FPED
/DEA
X X
559
,400
1.2.
4.3.
Est
ablis
h an
d st
reng
then
exc
hang
e of
in
form
atio
n an
d m
utua
l as
sist
ance
ac
ross
ta
x ju
risdi
ctio
ns
to
stre
ngth
en
inte
rnat
iona
l tax
atio
n
MO
FPED
/DEA
X
742
,300
1.2.
5 M
echa
nism
s in
pla
ce f
or e
nhan
ced
cont
ribut
ion
of n
on-t
ax re
venu
es (N
TR)
1.2.
5.1.
Dev
elop
a p
olic
y on
cen
tral
ised
co
llect
ion
of N
TR
MO
FPED
/DEA
X
3
8,00
0
1.2.
5.2.
St
reng
then
fr
amew
ork
for
repo
rtin
g an
d m
onito
ring
of N
TR c
olle
ctio
n M
OFP
ED/D
EA
X
33,
000
1.2.
6
Enha
nced
ta
xpay
er
serv
ices
an
d ta
xpay
er e
duca
tion
prog
ram
me
1.2.
6.1.
En
hanc
ed
taxp
ayer
ed
ucat
ion
stra
tegy
de
velo
ped,
in
lin
e w
ith
DRM
st
rate
gy a
nd C
IP
MO
FPED
/DEA
8
8,22
0
1.2.
6.2.
Est
ablis
h/im
plem
ent
arra
ngem
ents
fo
r op
erat
iona
lisin
g th
e CI
P an
d M
OFP
ED/D
EA
X
50,
000
Obj
ectiv
e 1:
To
impr
ove
Reso
urce
Mob
iliza
tion
for S
usta
inab
le D
evel
opm
ent
Impl
emen
ting
Inst
itutio
ns:
MoF
PED
(D
EA,
Deb
t),
URA
, M
oLG
, M
DAL
Gs
Ke
y St
akeh
olde
rs: C
SOs,
priv
ate
sect
or/t
ax a
ccou
ntan
ts, R
egul
ator
y Au
thor
ities
, NIT
A-U
, BoU
O
utpu
ts
Key
Activ
ities
Le
ad In
stitu
tion
2018 / 19
2019 / 20
2020 / 21
2021 / 22
2022 / 23
IND
ICAT
IVE
Cost
(U
SD)
educ
atio
n/se
rvic
es s
trat
egy
1.2.
6.3.
Impl
emen
t a p
rom
otio
n of
inte
grity
ca
mpa
ign,
bas
ed o
n ta
xpay
er c
onsu
ltatio
n fe
edba
ck
MO
FPED
/DEA
X X
120
,000
1.3
Enha
nced
col
lect
ions
from
new
reve
nue
oppo
rtun
ities
incl
udin
g oi
l, ga
s an
d m
iner
al s
ecto
rs
1,0
42,4
00
1.3.
1 En
hanc
ed e
nabl
ing
fram
ewor
k fo
r ex
ploi
ting
new
reve
nue
oppo
rtun
ities
1.
3.1.
1. U
nder
take
con
sulta
tive
revi
ew o
f fe
asib
ility
an
d im
pact
of
po
tent
ial
new
op
port
uniti
es
for
reve
nue
enha
ncem
ent
e.g.
reg
iona
l eco
nom
ic in
tegr
atio
n ag
enda
, en
viro
nmen
tal
prot
ectio
n,
taxa
tion
of
emer
ging
se
ctor
s,
oppo
rtun
ities
fr
om
enha
nced
re
gula
tory
fr
amew
ork
or
infr
astr
uctu
re
MO
FPED
/DEA
X X
169
,200
1.3.
1.2.
Dev
elop
pro
posa
ls f
rom
1.3
.1.1
. in
to
legi
slativ
e re
form
s/am
endm
ents
fo
r su
bmis
sion
to
Parli
amen
t, w
ith e
stim
ated
fis
cal i
mpa
ct fo
r bud
get
MO
FPED
/DEA
X
6
4,60
0
1.3.
1.3.
Es
tabl
ish
adm
inis
trat
ive
arra
ngem
ents
for
im
plem
enta
tion
of n
ew
mea
sure
s
MO
FPED
/DEA
X
1
3,00
0
1.3.
2. E
nhan
ced
enab
ling
envi
ronm
ent
for
asse
ssm
ent,
colle
ctio
n an
d m
anag
emen
t of
reve
nue
from
oil,
gas
and
min
eral
s
1.3.
2.1.
Und
erta
ke re
view
and
alig
nmen
t of
PFM
law
s an
d at
tend
ant
regu
latio
ns a
nd
guid
elin
es fo
r oil,
gas
and
min
eral
s re
venu
e m
anag
emen
t
MO
FPED
/DEA
X
3
4,60
0
1.3.
2.2.
Und
erta
ke r
evie
w o
f fis
cal r
egim
es
and
prop
ose
enha
ncem
ent
mea
sure
s (e
.g.
oil "
win
dfal
l" ta
x), i
n lin
e w
ith D
RM s
trat
egy
MO
FPED
/DEA
X
3
4,60
0
1.3.
2.3.
Upd
ate
and
inco
rpor
ate
the
Oil
and
Gas
sec
tor
in t
he L
ong-
term
Exp
endi
ture
Fr
amew
ork
(LTE
F)
MO
FPED
/DEA
X
183
,200
1.3.
2.4.
For
mul
ate
the
Oil
and
Gas
Fis
cal
rule
for U
gand
a M
OFP
ED/D
EA
1
83,2
00
1.3.
2.5.
Del
iver
spe
cial
ised
tra
inin
g in
oil,
ga
s an
d m
inin
g le
gisl
ativ
e fr
amew
orks
and
re
venu
e m
anag
emen
t, in
lin
e w
ith D
RM
capa
city
nee
ds a
sses
smen
t
MO
FPED
/DEA
X
360
,000
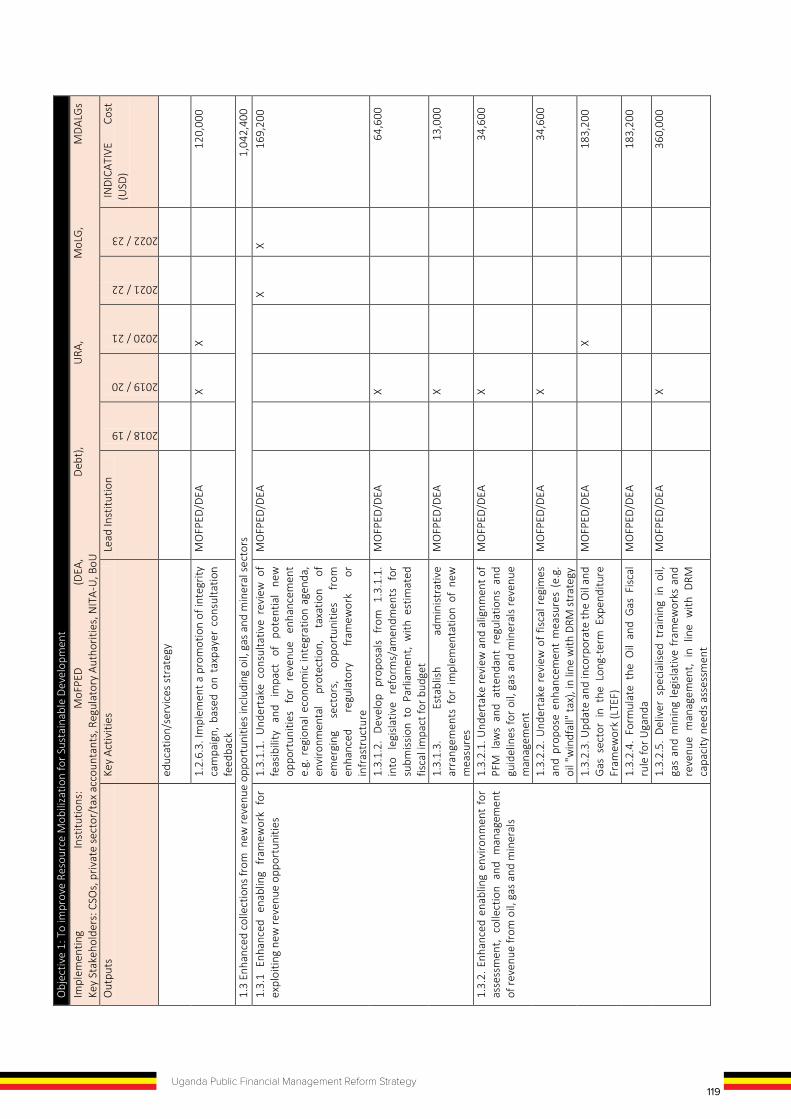
119Uganda Public Financial Management Reform Strategy
Obj
ectiv
e 1:
To
impr
ove
Reso
urce
Mob
iliza
tion
for S
usta
inab
le D
evel
opm
ent
Impl
emen
ting
Inst
itutio
ns:
MoF
PED
(D
EA,
Deb
t),
URA
, M
oLG
, M
DAL
Gs
Ke
y St
akeh
olde
rs: C
SOs,
priv
ate
sect
or/t
ax a
ccou
ntan
ts, R
egul
ator
y Au
thor
ities
, NIT
A-U
, BoU
O
utpu
ts
Key
Activ
ities
Le
ad In
stitu
tion
2018 / 19
2019 / 20
2020 / 21
2021 / 22
2022 / 23
IND
ICAT
IVE
Cost
(U
SD)
Risk
Man
agem
ent C
omm
ittee
s
1.2.
2.6.
Es
tabl
ish
and
impl
emen
t da
ta
anal
ysis
re
quire
men
ts
to
info
rm
risk
man
agem
ent
fram
ewor
k an
d co
mpl
ianc
e st
rate
gies
, inc
ludi
ng u
se /
ana
lysi
s of
thi
rd
part
y da
ta
MO
FPED
/DEA
X
X
-
1.2.
3.
URA
ca
paci
ty
for
inve
stig
atio
n st
reng
then
ed,
in l
ine
with
cap
acity
nee
ds
asse
ssm
ent /
enh
ance
men
t pla
n
1.2.
3.1.
Dev
elop
fram
ewor
k an
d ca
paci
ty to
un
dert
ake
inve
stig
atio
n of
tax
evas
ion
MO
FPED
/DEA
X
X
180
,500
1.2.
3.2.
Dev
elop
fram
ewor
k an
d ca
paci
ty to
un
dert
ake
inve
stig
atio
n of
illi
cit
finan
cial
flo
ws
MO
FPED
/DEA
X
180
,500
1.2.
3.3.
Es
tabl
ish
inst
itutio
nal
arra
ngem
ents
and
pro
cedu
res
(with
in U
RA
and
acro
ss G
over
nmen
t) f
or u
nder
taki
ng
join
t exe
rcis
es to
inve
stig
ate
tax
evas
ion,
in
line
with
DRM
str
ateg
y
MO
FPED
/DEA
X
X
4
6,00
0
1.2.
4 En
hanc
ed
adm
inis
trat
ive
capa
city
an
d fr
amew
ork
for
effe
ctiv
e in
tern
atio
nal
taxa
tion
1.2.
4.1.
Rev
iew
and
str
engt
hen
lega
l an
d po
licy
fram
ewor
k on
line
with
th
e D
RM
reco
mm
enda
tions
(e
.g.
addr
essi
ng
inte
rnat
iona
l ta
xatio
n, i
nclu
ding
Hig
h N
et
Wor
th In
divi
dual
s (H
NW
Is)s
MO
FPED
/DEA
X
X X
4
6,00
0
1.2.
4.2.
Enh
ance
adm
inis
trat
ion
capa
city
to
audi
t, in
vest
igat
e an
d en
forc
e ta
xatio
n of
in
tern
atio
nal c
orpo
ratio
ns a
nd tr
ansa
ctio
ns
MO
FPED
/DEA
X X
559
,400
1.2.
4.3.
Est
ablis
h an
d st
reng
then
exc
hang
e of
in
form
atio
n an
d m
utua
l as
sist
ance
ac
ross
ta
x ju
risdi
ctio
ns
to
stre
ngth
en
inte
rnat
iona
l tax
atio
n
MO
FPED
/DEA
X
742
,300
1.2.
5 M
echa
nism
s in
pla
ce f
or e
nhan
ced
cont
ribut
ion
of n
on-t
ax re
venu
es (N
TR)
1.2.
5.1.
Dev
elop
a p
olic
y on
cen
tral
ised
co
llect
ion
of N
TR
MO
FPED
/DEA
X
3
8,00
0
1.2.
5.2.
St
reng
then
fr
amew
ork
for
repo
rtin
g an
d m
onito
ring
of N
TR c
olle
ctio
n M
OFP
ED/D
EA
X
33,
000
1.2.
6
Enha
nced
ta
xpay
er
serv
ices
an
d ta
xpay
er e
duca
tion
prog
ram
me
1.2.
6.1.
En
hanc
ed
taxp
ayer
ed
ucat
ion
stra
tegy
de
velo
ped,
in
lin
e w
ith
DRM
st
rate
gy a
nd C
IP
MO
FPED
/DEA
8
8,22
0
1.2.
6.2.
Est
ablis
h/im
plem
ent
arra
ngem
ents
fo
r op
erat
iona
lisin
g th
e CI
P an
d M
OFP
ED/D
EA
X
50,
000
Obj
ectiv
e 1:
To
impr
ove
Reso
urce
Mob
iliza
tion
for S
usta
inab
le D
evel
opm
ent
Impl
emen
ting
Inst
itutio
ns:
MoF
PED
(D
EA,
Deb
t),
URA
, M
oLG
, M
DAL
Gs
Ke
y St
akeh
olde
rs: C
SOs,
priv
ate
sect
or/t
ax a
ccou
ntan
ts, R
egul
ator
y Au
thor
ities
, NIT
A-U
, BoU
O
utpu
ts
Key
Activ
ities
Le
ad In
stitu
tion
2018 / 19
2019 / 20
2020 / 21
2021 / 22
2022 / 23
IND
ICAT
IVE
Cost
(U
SD)
educ
atio
n/se
rvic
es s
trat
egy
1.2.
6.3.
Impl
emen
t a p
rom
otio
n of
inte
grity
ca
mpa
ign,
bas
ed o
n ta
xpay
er c
onsu
ltatio
n fe
edba
ck
MO
FPED
/DEA
X X
120
,000
1.3
Enha
nced
col
lect
ions
from
new
reve
nue
oppo
rtun
ities
incl
udin
g oi
l, ga
s an
d m
iner
al s
ecto
rs
1,0
42,4
00
1.3.
1 En
hanc
ed e
nabl
ing
fram
ewor
k fo
r ex
ploi
ting
new
reve
nue
oppo
rtun
ities
1.
3.1.
1. U
nder
take
con
sulta
tive
revi
ew o
f fe
asib
ility
an
d im
pact
of
po
tent
ial
new
op
port
uniti
es
for
reve
nue
enha
ncem
ent
e.g.
reg
iona
l eco
nom
ic in
tegr
atio
n ag
enda
, en
viro
nmen
tal
prot
ectio
n,
taxa
tion
of
emer
ging
se
ctor
s,
oppo
rtun
ities
fr
om
enha
nced
re
gula
tory
fr
amew
ork
or
infr
astr
uctu
re
MO
FPED
/DEA
X X
169
,200
1.3.
1.2.
Dev
elop
pro
posa
ls f
rom
1.3
.1.1
. in
to
legi
slativ
e re
form
s/am
endm
ents
fo
r su
bmis
sion
to
Parli
amen
t, w
ith e
stim
ated
fis
cal i
mpa
ct fo
r bud
get
MO
FPED
/DEA
X
6
4,60
0
1.3.
1.3.
Es
tabl
ish
adm
inis
trat
ive
arra
ngem
ents
for
im
plem
enta
tion
of n
ew
mea
sure
s
MO
FPED
/DEA
X
1
3,00
0
1.3.
2. E
nhan
ced
enab
ling
envi
ronm
ent
for
asse
ssm
ent,
colle
ctio
n an
d m
anag
emen
t of
reve
nue
from
oil,
gas
and
min
eral
s
1.3.
2.1.
Und
erta
ke re
view
and
alig
nmen
t of
PFM
law
s an
d at
tend
ant
regu
latio
ns a
nd
guid
elin
es fo
r oil,
gas
and
min
eral
s re
venu
e m
anag
emen
t
MO
FPED
/DEA
X
3
4,60
0
1.3.
2.2.
Und
erta
ke r
evie
w o
f fis
cal r
egim
es
and
prop
ose
enha
ncem
ent
mea
sure
s (e
.g.
oil "
win
dfal
l" ta
x), i
n lin
e w
ith D
RM s
trat
egy
MO
FPED
/DEA
X
3
4,60
0
1.3.
2.3.
Upd
ate
and
inco
rpor
ate
the
Oil
and
Gas
sec
tor
in t
he L
ong-
term
Exp
endi
ture
Fr
amew
ork
(LTE
F)
MO
FPED
/DEA
X
183
,200
1.3.
2.4.
For
mul
ate
the
Oil
and
Gas
Fis
cal
rule
for U
gand
a M
OFP
ED/D
EA
1
83,2
00
1.3.
2.5.
Del
iver
spe
cial
ised
tra
inin
g in
oil,
ga
s an
d m
inin
g le
gisl
ativ
e fr
amew
orks
and
re
venu
e m
anag
emen
t, in
lin
e w
ith D
RM
capa
city
nee
ds a
sses
smen
t
MO
FPED
/DEA
X
360
,000
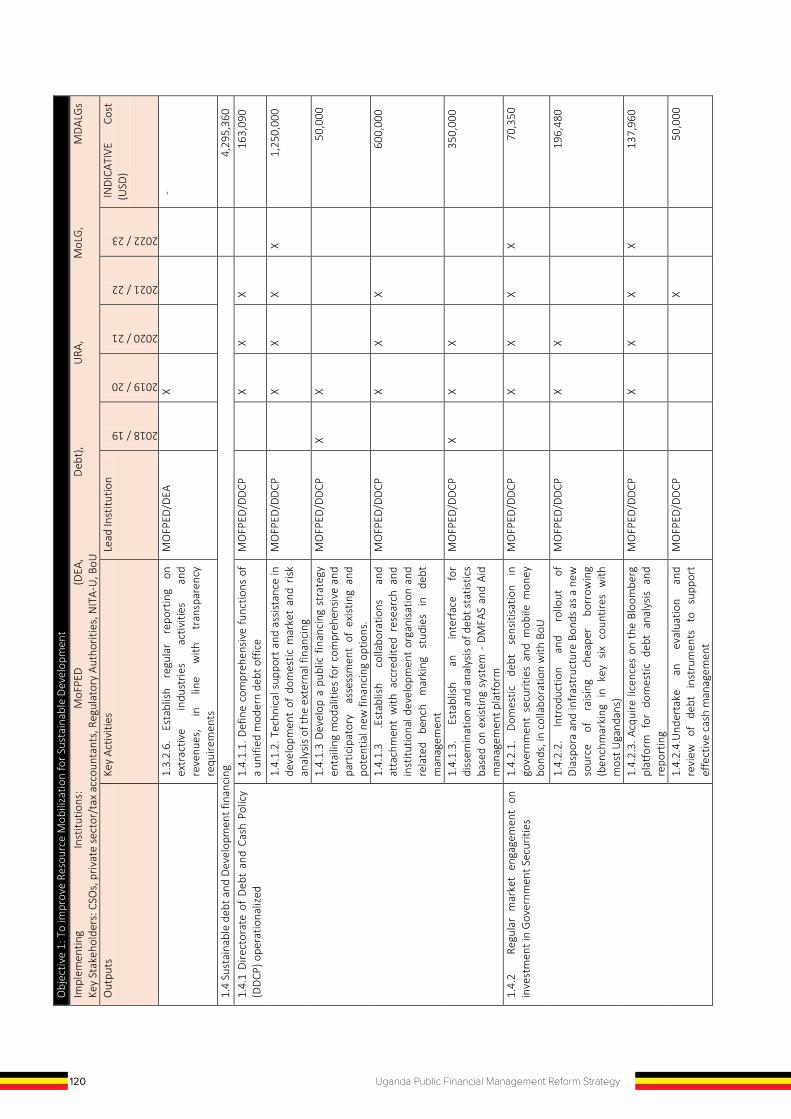
120 Uganda Public Financial Management Reform Strategy
Obj
ectiv
e 1:
To
impr
ove
Reso
urce
Mob
iliza
tion
for S
usta
inab
le D
evel
opm
ent
Impl
emen
ting
Inst
itutio
ns:
MoF
PED
(D
EA,
Deb
t),
URA
, M
oLG
, M
DAL
Gs
Ke
y St
akeh
olde
rs: C
SOs,
priv
ate
sect
or/t
ax a
ccou
ntan
ts, R
egul
ator
y Au
thor
ities
, NIT
A-U
, BoU
O
utpu
ts
Key
Activ
ities
Le
ad In
stitu
tion
2018 / 19
2019 / 20
2020 / 21
2021 / 22
2022 / 23
IND
ICAT
IVE
Cost
(U
SD)
1.3.
2.6.
Es
tabl
ish
regu
lar
repo
rtin
g on
ex
trac
tive
indu
strie
s ac
tiviti
es
and
reve
nues
, in
lin
e w
ith
tran
spar
ency
re
quire
men
ts
MO
FPED
/DEA
X
-
1.4
Sust
aina
ble
debt
and
Dev
elop
men
t fin
anci
ng
4,2
95,3
60
1.4.
1 D
irect
orat
e of
Deb
t an
d Ca
sh P
olic
y (D
DCP
) ope
ratio
naliz
ed
1.4.
1.1.
Def
ine
com
preh
ensi
ve fu
nctio
ns o
f a
unifi
ed m
oder
n de
bt o
ffice
M
OFP
ED/D
DCP
X X
X
163
,090
1.4.
1.2.
Tec
hnic
al s
uppo
rt a
nd a
ssis
tanc
e in
de
velo
pmen
t of
dom
estic
mar
ket
and
risk
anal
ysis
of t
he e
xter
nal f
inan
cing
MO
FPED
/DD
CP
X
X X
X
1,2
50,0
00
1.4.
1.3
Dev
elop
a p
ublic
fin
anci
ng s
trat
egy
enta
iling
mod
aliti
es fo
r co
mpr
ehen
sive
and
pa
rtic
ipat
ory
ass
essm
ent
of e
xist
ing
and
pote
ntia
l new
fina
ncin
g op
tions
.
MO
FPED
/DD
CP
X X
50,
000
1.4.
1.3
.Est
ablis
h co
llabo
ratio
ns
and
atta
chm
ent
with
acc
redi
ted
rese
arch
and
in
stitu
tiona
l dev
elop
men
t or
gani
satio
n an
d re
late
d be
nch
mar
king
st
udie
s in
de
bt
man
agem
ent
MO
FPED
/DD
CP
X
X X
6
00,0
00
1.4.
1.3.
Es
tabl
ish
an
inte
rfac
e fo
r di
ssem
inat
ion
and
anal
ysis
of d
ebt s
tatis
tics
base
d on
exi
stin
g sy
stem
- D
MFA
S an
d Ai
d m
anag
emen
t pla
tfor
m
MO
FPED
/DD
CP
X X
X
3
50,0
00
1.4.
2
Regu
lar
mar
ket
enga
gem
ent
on
inve
stm
ent i
n G
over
nmen
t Sec
uriti
es
1.4.
2.1.
D
omes
tic
debt
se
nsiti
satio
n in
go
vern
men
t se
curit
ies
and
mob
ile m
oney
bo
nds,
in c
olla
bora
tion
with
BoU
MO
FPED
/DD
CP
X
X X
X
70,
350
1.4.
2.2.
In
trod
uctio
n an
d ro
llout
of
D
iasp
ora
and
infr
astr
uctu
re B
onds
as
a ne
w
sour
ce
of
raisi
ng
chea
per
borr
owin
g (b
ench
mar
king
in
key
six c
ount
ires
with
m
ost U
gand
ans)
MO
FPED
/DD
CP
X
X
1
96,4
80
1.4.
2.3.
Acq
uire
lice
nces
on
the
Bloo
mbe
rg
plat
form
for
dom
estic
deb
t an
alys
is a
nd
repo
rtin
g
MO
FPED
/DD
CP
X
X X
X
1
37,9
60
1.4.
2.4.
Und
erta
ke
an
eval
uatio
n an
d re
view
of
de
bt
inst
rum
ents
to
su
ppor
t ef
fect
ive
cash
man
agem
ent
MO
FPED
/DD
CP
X
50,
000
Obj
ectiv
e 1:
To
impr
ove
Reso
urce
Mob
iliza
tion
for S
usta
inab
le D
evel
opm
ent
Impl
emen
ting
Inst
itutio
ns:
MoF
PED
(D
EA,
Deb
t),
URA
, M
oLG
, M
DAL
Gs
Ke
y St
akeh
olde
rs: C
SOs,
priv
ate
sect
or/t
ax a
ccou
ntan
ts, R
egul
ator
y Au
thor
ities
, NIT
A-U
, BoU
O
utpu
ts
Key
Activ
ities
Le
ad In
stitu
tion
2018 / 19
2019 / 20
2020 / 21
2021 / 22
2022 / 23
IND
ICAT
IVE
Cost
(U
SD)
1.4.
3. E
nhan
ced
capa
city
in
publ
ic d
ebt
(loan
) neg
otia
tion
and
oper
atio
nalis
ing
the
debt
man
agem
ent s
trat
egy
1.4.
3.1.
D
raft
cl
ear
polic
y gu
idel
ines
on
un
solic
ited
expr
essi
ons
of
inte
rest
in
fin
anci
ng g
over
nmen
t pro
ject
s
MO
FPED
/DD
CP
X
X
67,
600
1.4.
3.2.
Dev
elop
dat
abas
e of
con
tinge
nt
liabi
litie
s am
ong
SOEs
and
dra
ft c
ontin
gent
lia
bilit
ies
guid
elin
es
MO
FPED
/DD
CP
X
X
63,
200
1.4
.3.3
.Deb
t Su
stai
nabi
lity
trac
king
TO
OL
on n
ew n
ew fi
nanc
ing
mod
eliti
es
MO
FPED
/DD
CP
X
X X
88,
100
1.4.
3.4.
Del
iver
tra
inin
g to
ope
ratio
nalis
e th
e M
ediu
m
Term
D
ebt
Man
agem
ent
Stra
tegy
(M
TDS)
, D
MFA
S, D
SA
- pr
ojec
t cy
le
man
agem
ent,P
ublic
D
ebt
Port
folio
m
anag
emen
t an
d an
alys
is,
debt
su
stai
nabi
lity
anal
ysis
,, an
alys
is a
nd r
ecor
d of
gu
aran
tees
an
d co
ntin
gent
lia
bilit
ies
aris
ing
out
of p
ublic
and
PPP
inve
stm
ents
, an
d pr
icin
g of
fin
anci
al
prod
ucts
and
mar
ket
cond
uct
in
dom
estic
de
bt,
stre
ngth
en n
egot
iatio
n sk
ills
MO
FPED
/DD
CP
X
X X
X
4
00,0
00
1.4.
3.5.
Mid
term
Rev
iew
of t
he P
ublic
Deb
t m
anag
emen
t Fra
mew
ork
(PD
MF
2018
) M
OFP
ED/D
DCP
X
X X
8
5,90
0
1.4.
3.6.
Dev
elop
a S
trat
egy
and
mon
itorin
g fr
amew
ork
for
impr
ovem
ent
of
th
e Co
untr
y's
Cred
it ra
ting
MO
FPED
/DD
CP
X
X
1
52,6
80
1.4
.3.7
. U
nder
take
a D
ebt
Man
agem
ent
Asse
ssm
ent
ba
sed
on
the
DEM
PA
asse
ssm
ent f
ram
ewor
k
MO
FPED
/DD
CP
X
X
3
00,0
00
1.4.
4 D
evel
opm
ent
supp
ort
man
agem
ent
polic
y fr
amew
ork
esta
blis
hed
with
sys
tem
s to
pro
mot
e ai
d ef
fect
iven
ess
1.4.
4.1.
Fr
amew
ork
Agre
emen
t si
gned
be
twee
n M
OFP
ED a
nd th
e D
Ps
MO
FPED
/DD
CP
X
-
1.4.
4.2.
Cap
acity
bui
ldin
g ac
tiviti
es f
or a
id
man
agem
ent,
in
line
with
po
licy
and
stra
tegy
MO
FPED
/DD
CP
X
1
50,0
00
1.4.
4.3
Dev
elop
a
com
pedi
um
on
deve
lopm
ent p
artn
er p
ortf
olio
for e
ffect
ive
deve
lopm
ent s
uppo
rt fi
nanc
ing
MO
FPED
/DD
CP
X X
120,
000
TOTA
L CO
ST
1
4,33
2,36
0
121Uganda Public Financial Management Reform Strategy
Obj
ectiv
e 1:
To
impr
ove
Reso
urce
Mob
iliza
tion
for S
usta
inab
le D
evel
opm
ent
Impl
emen
ting
Inst
itutio
ns:
MoF
PED
(D
EA,
Deb
t),
URA
, M
oLG
, M
DAL
Gs
Ke
y St
akeh
olde
rs: C
SOs,
priv
ate
sect
or/t
ax a
ccou
ntan
ts, R
egul
ator
y Au
thor
ities
, NIT
A-U
, BoU
O
utpu
ts
Key
Activ
ities
Le
ad In
stitu
tion
2018 / 19
2019 / 20
2020 / 21
2021 / 22
2022 / 23
IND
ICAT
IVE
Cost
(U
SD)
1.3.
2.6.
Es
tabl
ish
regu
lar
repo
rtin
g on
ex
trac
tive
indu
strie
s ac
tiviti
es
and
reve
nues
, in
lin
e w
ith
tran
spar
ency
re
quire
men
ts
MO
FPED
/DEA
X
-
1.4
Sust
aina
ble
debt
and
Dev
elop
men
t fin
anci
ng
4,2
95,3
60
1.4.
1 D
irect
orat
e of
Deb
t an
d Ca
sh P
olic
y (D
DCP
) ope
ratio
naliz
ed
1.4.
1.1.
Def
ine
com
preh
ensi
ve fu
nctio
ns o
f a
unifi
ed m
oder
n de
bt o
ffice
M
OFP
ED/D
DCP
X X
X
163
,090
1.4.
1.2.
Tec
hnic
al s
uppo
rt a
nd a
ssis
tanc
e in
de
velo
pmen
t of
dom
estic
mar
ket
and
risk
anal
ysis
of t
he e
xter
nal f
inan
cing
MO
FPED
/DD
CP
X
X X
X
1,2
50,0
00
1.4.
1.3
Dev
elop
a p
ublic
fin
anci
ng s
trat
egy
enta
iling
mod
aliti
es fo
r co
mpr
ehen
sive
and
pa
rtic
ipat
ory
ass
essm
ent
of e
xist
ing
and
pote
ntia
l new
fina
ncin
g op
tions
.
MO
FPED
/DD
CP
X X
50,
000
1.4.
1.3
.Est
ablis
h co
llabo
ratio
ns
and
atta
chm
ent
with
acc
redi
ted
rese
arch
and
in
stitu
tiona
l dev
elop
men
t or
gani
satio
n an
d re
late
d be
nch
mar
king
st
udie
s in
de
bt
man
agem
ent
MO
FPED
/DD
CP
X
X X
6
00,0
00
1.4.
1.3.
Es
tabl
ish
an
inte
rfac
e fo
r di
ssem
inat
ion
and
anal
ysis
of d
ebt s
tatis
tics
base
d on
exi
stin
g sy
stem
- D
MFA
S an
d Ai
d m
anag
emen
t pla
tfor
m
MO
FPED
/DD
CP
X X
X
3
50,0
00
1.4.
2
Regu
lar
mar
ket
enga
gem
ent
on
inve
stm
ent i
n G
over
nmen
t Sec
uriti
es
1.4.
2.1.
D
omes
tic
debt
se
nsiti
satio
n in
go
vern
men
t se
curit
ies
and
mob
ile m
oney
bo
nds,
in c
olla
bora
tion
with
BoU
MO
FPED
/DD
CP
X
X X
X
70,
350
1.4.
2.2.
In
trod
uctio
n an
d ro
llout
of
D
iasp
ora
and
infr
astr
uctu
re B
onds
as
a ne
w
sour
ce
of
raisi
ng
chea
per
borr
owin
g (b
ench
mar
king
in
key
six c
ount
ires
with
m
ost U
gand
ans)
MO
FPED
/DD
CP
X
X
1
96,4
80
1.4.
2.3.
Acq
uire
lice
nces
on
the
Bloo
mbe
rg
plat
form
for
dom
estic
deb
t an
alys
is a
nd
repo
rtin
g
MO
FPED
/DD
CP
X
X X
X
1
37,9
60
1.4.
2.4.
Und
erta
ke
an
eval
uatio
n an
d re
view
of
de
bt
inst
rum
ents
to
su
ppor
t ef
fect
ive
cash
man
agem
ent
MO
FPED
/DD
CP
X
50,
000
Obj
ectiv
e 1:
To
impr
ove
Reso
urce
Mob
iliza
tion
for S
usta
inab
le D
evel
opm
ent
Impl
emen
ting
Inst
itutio
ns:
MoF
PED
(D
EA,
Deb
t),
URA
, M
oLG
, M
DAL
Gs
Ke
y St
akeh
olde
rs: C
SOs,
priv
ate
sect
or/t
ax a
ccou
ntan
ts, R
egul
ator
y Au
thor
ities
, NIT
A-U
, BoU
O
utpu
ts
Key
Activ
ities
Le
ad In
stitu
tion
2018 / 19
2019 / 20
2020 / 21
2021 / 22
2022 / 23
IND
ICAT
IVE
Cost
(U
SD)
1.4.
3. E
nhan
ced
capa
city
in
publ
ic d
ebt
(loan
) neg
otia
tion
and
oper
atio
nalis
ing
the
debt
man
agem
ent s
trat
egy
1.4.
3.1.
D
raft
cl
ear
polic
y gu
idel
ines
on
un
solic
ited
expr
essi
ons
of
inte
rest
in
fin
anci
ng g
over
nmen
t pro
ject
s
MO
FPED
/DD
CP
X
X
67,
600
1.4.
3.2.
Dev
elop
dat
abas
e of
con
tinge
nt
liabi
litie
s am
ong
SOEs
and
dra
ft c
ontin
gent
lia
bilit
ies
guid
elin
es
MO
FPED
/DD
CP
X
X
63,
200
1.4
.3.3
.Deb
t Su
stai
nabi
lity
trac
king
TO
OL
on n
ew n
ew fi
nanc
ing
mod
eliti
es
MO
FPED
/DD
CP
X
X X
88,
100
1.4.
3.4.
Del
iver
tra
inin
g to
ope
ratio
nalis
e th
e M
ediu
m
Term
D
ebt
Man
agem
ent
Stra
tegy
(M
TDS)
, D
MFA
S, D
SA
- pr
ojec
t cy
le
man
agem
ent,P
ublic
D
ebt
Port
folio
m
anag
emen
t an
d an
alys
is,
debt
su
stai
nabi
lity
anal
ysis
,, an
alys
is a
nd r
ecor
d of
gu
aran
tees
an
d co
ntin
gent
lia
bilit
ies
aris
ing
out
of p
ublic
and
PPP
inve
stm
ents
, an
d pr
icin
g of
fin
anci
al
prod
ucts
and
mar
ket
cond
uct
in
dom
estic
de
bt,
stre
ngth
en n
egot
iatio
n sk
ills
MO
FPED
/DD
CP
X
X X
X
4
00,0
00
1.4.
3.5.
Mid
term
Rev
iew
of t
he P
ublic
Deb
t m
anag
emen
t Fra
mew
ork
(PD
MF
2018
) M
OFP
ED/D
DCP
X
X X
8
5,90
0
1.4.
3.6.
Dev
elop
a S
trat
egy
and
mon
itorin
g fr
amew
ork
for
impr
ovem
ent
of
th
e Co
untr
y's
Cred
it ra
ting
MO
FPED
/DD
CP
X
X
1
52,6
80
1.4
.3.7
. U
nder
take
a D
ebt
Man
agem
ent
Asse
ssm
ent
ba
sed
on
the
DEM
PA
asse
ssm
ent f
ram
ewor
k
MO
FPED
/DD
CP
X
X
3
00,0
00
1.4.
4 D
evel
opm
ent
supp
ort
man
agem
ent
polic
y fr
amew
ork
esta
blis
hed
with
sys
tem
s to
pro
mot
e ai
d ef
fect
iven
ess
1.4.
4.1.
Fr
amew
ork
Agre
emen
t si
gned
be
twee
n M
OFP
ED a
nd th
e D
Ps
MO
FPED
/DD
CP
X
-
1.4.
4.2.
Cap
acity
bui
ldin
g ac
tiviti
es f
or a
id
man
agem
ent,
in
line
with
po
licy
and
stra
tegy
MO
FPED
/DD
CP
X
1
50,0
00
1.4.
4.3
Dev
elop
a
com
pedi
um
on
deve
lopm
ent p
artn
er p
ortf
olio
for e
ffect
ive
deve
lopm
ent s
uppo
rt fi
nanc
ing
MO
FPED
/DD
CP
X X
120,
000
TOTA
L CO
ST
1
4,33
2,36
0

122 Uganda Public Financial Management Reform Strategy
Obj
ectiv
e 2:
To
Enha
nce
Polic
y-Ba
sed
Budg
etin
g &
Pla
nnin
g fo
r Allo
cativ
e Ef
ficie
ncy
Impl
emen
ting
Inst
itutio
ns:
NPA
, M
oFPE
D (B
udge
t; D
EA-M
acro
); M
DAL
Gs
(Eco
nom
ists
) Ke
y St
akeh
olde
rs: O
PM, U
BOS,
LG
FC, C
SOs,
priv
ate
sect
or, M
oLG
Out
puts
Ke
y Ac
tiviti
es
Lead
Inst
itutio
n
2018 / 19
2019 / 20
2020 / 21
2021 / 22
2022 / 23
IND
ICAT
IVE
Cost
(USD
)
2.1
Budg
ets
alig
ned
to s
trat
egic
pla
ns a
nd m
ediu
m te
rm e
xpen
ditu
re fr
amew
orks
7,
975,
600
2.1.
1 St
reng
then
ing
capa
city
in
mac
ro-fi
scal
po
licy
anal
ysis
Del
iver
tr
aini
ng
in
fisca
l im
pact
an
alys
is
and
fore
cast
ing
(em
bedd
ing
IMEM
) M
OFP
ED/D
EA
X X
67
2,00
0
Und
erta
ke
Impa
ct
anal
ysis
of
4 se
lect
ed
polic
ies
or
prog
ram
mes
M
OFP
ED/D
EA
X
X
12
0,00
0
DEA
and
NPA
to
unde
rtak
e ec
onom
ic a
naly
sis
to in
form
the
bu
dget
str
ateg
y in
clud
ing
use
of th
e M
acro
econ
omic
mod
el.
MO
FPED
/DEA
X X
X X
200,
000
2.
1.2.
Im
prov
ed
plan
ning
at
se
ctor
le
vel
thro
ugh
a jo
int
appr
oach
be
twee
n N
PA,
MoF
PED
, OPM
and
MoL
G
Esta
blis
h te
chni
cal c
omm
ittee
on
plan
ning
and
bud
getin
g w
ith
plan
of
w
ork
for
a cr
oss-
gove
rnm
ent
appr
oach
to
st
reng
then
ing
plan
ning
at
se
ctor
le
vel
incl
udin
g of
en
gage
men
t of p
rivat
e se
ctor
and
CSO
s
MO
FPED
/DB
X X
10
0,00
0
Res
truc
ture
ND
P III
and
Sec
tor s
trat
egic
pla
ns a
long
pro
gram
s lin
ked
to
natio
nal
stra
tegi
c ob
ject
ives
to
ea
se
PBB/
S im
plem
enta
tion
– St
reng
then
the
Prog
ram
app
roac
h in
ND
P.
NPA
X X
X
250,
000
Dis
sem
inat
ion
of
Stre
ngth
enin
g Se
ctor
W
orki
ng
Gro
up
Gui
delin
es
MO
FPED
/DB
X
60,0
00
Perio
dic
revi
ew o
f th
e fu
nctio
nalit
y of
SW
Gs
and
rela
ted
capa
city
to d
evel
op s
trat
egic
pla
ns e
nhan
ced
M
OFP
ED/D
B
X
X
360,
000
2.
1.3
Prof
essi
onal
izat
ion
of t
he d
evel
opm
ent
plan
ning
func
tion
of g
over
nmen
t M
oFPE
D to
take
lead
in P
rofe
ssio
naliz
atio
n of
Eco
nom
ists
and
St
atis
ticia
ns
MO
FPED
/DEA
X
X
35
,000
Ap
pren
tices
hip
prog
ram
fo
r Ec
onom
ists
, St
atis
ticia
ns,
Mon
itorin
g &
Eva
luat
ion
staf
f as
an e
xten
sion
of t
he g
radu
ate
Econ
omis
t sch
eme.
MO
FPED
/DEA
X X
X X
1,
000,
000
HoD
s, H
oF a
nd P
lann
ing
Uni
ts fo
r MAL
Gs
trai
ned
in U
nder
take
ba
sic
PFM
con
cept
s tr
aini
ng e
.g re
sults
fram
ewor
k M
OFP
ED/D
B
X X
X X
4,
000,
000
Ce
rtifi
catio
n po
licy
fram
ewor
k an
d gu
idel
ines
dev
elop
ed
MO
FPED
/DB
X X
10
0,00
0
2.1.
4 M
acro
econ
omic
m
anag
emen
t w
ith
a m
ediu
m
term
ou
tlook
al
igne
d w
ith
the
Nat
iona
l str
ateg
ic o
bjec
tives
Esta
blis
h in
stitu
tiona
l ar
rang
emen
ts,
proc
edur
es
and
mon
itorin
g to
op
erat
iona
lise
the
Char
ter
of
Fisc
al
Resp
onsi
bilit
y
MO
FPED
/DB
X X
Upd
atin
g th
e SA
M (
Nat
iona
l Sta
tistic
al S
yste
m e
nhan
ced
for
polic
y fo
rmul
atio
n)
MO
FPED
/DB/
DEA
Obj
ectiv
e 2:
To
Enha
nce
Polic
y-Ba
sed
Budg
etin
g &
Pla
nnin
g fo
r Allo
cativ
e Ef
ficie
ncy
Impl
emen
ting
Inst
itutio
ns:
NPA
, M
oFPE
D (B
udge
t; D
EA-M
acro
); M
DAL
Gs
(Eco
nom
ists
) Ke
y St
akeh
olde
rs: O
PM, U
BOS,
LG
FC, C
SOs,
priv
ate
sect
or, M
oLG
Out
puts
Ke
y Ac
tiviti
es
Lead
Inst
itutio
n
2018 / 19
2019 / 20
2020 / 21
2021 / 22
2022 / 23 IN
DIC
ATIV
E Co
st (U
SD)
2.1.
5 St
reng
then
ing
Pr
ogra
m-B
ased
Bu
dget
ing
(PBB
) re
form
fo
r th
e pl
anni
ng
func
tion
in g
over
nmen
t
PBB
and
PBS
rolle
d ou
t to
MD
ALG
s M
OFP
ED/D
B X
X X
X X
280,
000
Re
view
& s
tren
gthe
ning
of
PBB
ref
orm
and
impl
emen
tatio
n of
PBB
in M
DAL
Gs
MO
FPED
/DB
X X
X X
X
16
0,00
0
Enha
nce
func
tiona
lity
of
PBS
tool
to
in
clud
e pl
anni
ng
(mul
tiyea
r pla
nnin
g at
vot
e le
vel)
MO
FPED
/DB
X
X
29
8,60
0
Fina
lisat
ion
and
Diss
emin
atio
n of
the
PBB
man
ual
MO
FPED
/DB
X
40,0
00
2.2.
2.
Gov
ernm
ent
Econ
omis
ts
trai
ned
to
impr
ove
qual
ity
of
MD
ALG
pl
ans
with
a
real
istic
mul
ti-an
nual
per
spec
tive
Dev
elop
pr
ogra
mm
e an
d in
stitu
tiona
l ar
rang
emen
ts
for
prof
essi
onal
izat
ion
of ‘
com
mon
cad
re’
e.g.
Com
preh
ensi
ve
(cer
tifie
d) tr
aini
ng fo
r MD
ALG
Eco
nom
ists
and
Sta
tistic
ians
MO
FPED
/DB
X
X
20
0,00
0
Trai
ning
HoD
s, H
oF a
nd H
eads
of
Plan
ning
uni
ts in
MAL
Gs
in
Budg
et re
form
s M
OFP
ED/D
B
X
100,
000
2.
2 M
ulti-
year
com
mitm
ents
refle
cted
in a
nnua
l bud
gets
378,
425
2
.2.1
St
reng
then
ed
accu
racy
an
d co
mpr
ehen
sive
ness
of m
ulti-
year
bud
getin
g Re
view
an
d es
tabl
ish
polic
y fr
amew
ork
for
mul
ti-ye
ar
budg
etin
g an
d co
mm
itmen
t mon
itorin
g M
OFP
ED/D
B
X X
170,
400
Capa
city
bui
ldin
g ac
tiviti
es t
o en
hanc
e bu
dget
ing
accu
racy
in
high
-spe
nd v
otes
M
OFP
ED/D
B
X X
X
208,
025
2.
3 En
hanc
ing
Plan
ning
and
Bud
get r
espo
nsiv
enes
s to
gen
der e
quity
468,
300
2.
3.1
Enha
nced
gen
der-
equi
ty b
udge
ting
in
sele
cted
key
sec
tors
(e.
g. E
duca
tion,
Hea
lth,
Agric
ultu
re)
Revi
ew
and
impr
ove
mon
itorin
g an
d ev
alua
tion
met
hodo
logi
es fo
r GEB
M
OFP
ED/D
B
X X
X
167,
500
Ca
paci
ty b
uild
ing
activ
ities
for
GEB
pla
nnin
g an
d bu
dget
ing
proc
ess
in s
elec
ted
sect
ors
MO
FPED
/DB
X
X
12
0,00
0
Gen
der
stat
istic
s re
fined
for
key
sec
tors
, in
lin
e w
ith M
&E
met
hodo
logi
es
MO
FPED
/DB
X
X
18
0,80
0
2.4
Incr
ease
d eq
uity
and
dis
cret
ion
of re
sour
ces
allo
cate
d to
LG
s fo
r im
prov
ed s
ervi
ce d
eliv
ery
57
2,80
0
2.4.
1 A
grad
ual
incr
ease
in
shar
e of
cen
tral
re
venu
e fo
r LG
se
rvic
e de
liver
y,
as
reco
mm
ende
d in
the
Fis
cal
Dec
entr
alis
atio
n Ar
chite
ctur
e re
port
Revi
ew s
ervi
ce d
eliv
ery
cost
s at
LG
lev
el b
ased
on
sect
or
stan
dard
s to
est
ablis
h no
rms
in t
he t
arge
t se
ctor
s fo
r ru
ral
and
urba
n LG
s.
MoL
G/L
GFC
X
X X
160,
000
Dev
elop
co
mpr
ehen
sive
re
port
fo
r N
atio
nal
Budg
et
docu
men
ts o
n LG
fisc
al t
rans
fers
, inc
ludi
ng e
stim
ates
of l
ocal
ow
n-so
urce
reve
nue
colle
ctio
n
MoL
G/L
GFC
X X
X
20
,000

122 Uganda Public Financial Management Reform Strategy
Obj
ectiv
e 2:
To
Enha
nce
Polic
y-Ba
sed
Budg
etin
g &
Pla
nnin
g fo
r Allo
cativ
e Ef
ficie
ncy
Impl
emen
ting
Inst
itutio
ns:
NPA
, M
oFPE
D (B
udge
t; D
EA-M
acro
); M
DAL
Gs
(Eco
nom
ists
) Ke
y St
akeh
olde
rs: O
PM, U
BOS,
LG
FC, C
SOs,
priv
ate
sect
or, M
oLG
Out
puts
Ke
y Ac
tiviti
es
Lead
Inst
itutio
n
2018 / 19
2019 / 20
2020 / 21
2021 / 22
2022 / 23
IND
ICAT
IVE
Cost
(USD
)
2.1
Budg
ets
alig
ned
to s
trat
egic
pla
ns a
nd m
ediu
m te
rm e
xpen
ditu
re fr
amew
orks
7,
975,
600
2.1.
1 St
reng
then
ing
capa
city
in
mac
ro-fi
scal
po
licy
anal
ysis
Del
iver
tr
aini
ng
in
fisca
l im
pact
an
alys
is
and
fore
cast
ing
(em
bedd
ing
IMEM
) M
OFP
ED/D
EA
X X
67
2,00
0
Und
erta
ke
Impa
ct
anal
ysis
of
4 se
lect
ed
polic
ies
or
prog
ram
mes
M
OFP
ED/D
EA
X
X
12
0,00
0
DEA
and
NPA
to
unde
rtak
e ec
onom
ic a
naly
sis
to in
form
the
bu
dget
str
ateg
y in
clud
ing
use
of th
e M
acro
econ
omic
mod
el.
MO
FPED
/DEA
X X
X X
200,
000
2.
1.2.
Im
prov
ed
plan
ning
at
se
ctor
le
vel
thro
ugh
a jo
int
appr
oach
be
twee
n N
PA,
MoF
PED
, OPM
and
MoL
G
Esta
blis
h te
chni
cal c
omm
ittee
on
plan
ning
and
bud
getin
g w
ith
plan
of
w
ork
for
a cr
oss-
gove
rnm
ent
appr
oach
to
st
reng
then
ing
plan
ning
at
se
ctor
le
vel
incl
udin
g of
en
gage
men
t of p
rivat
e se
ctor
and
CSO
s
MO
FPED
/DB
X X
10
0,00
0
Res
truc
ture
ND
P III
and
Sec
tor s
trat
egic
pla
ns a
long
pro
gram
s lin
ked
to
natio
nal
stra
tegi
c ob
ject
ives
to
ea
se
PBB/
S im
plem
enta
tion
– St
reng
then
the
Prog
ram
app
roac
h in
ND
P.
NPA
X X
X
250,
000
Dis
sem
inat
ion
of
Stre
ngth
enin
g Se
ctor
W
orki
ng
Gro
up
Gui
delin
es
MO
FPED
/DB
X
60,0
00
Perio
dic
revi
ew o
f th
e fu
nctio
nalit
y of
SW
Gs
and
rela
ted
capa
city
to d
evel
op s
trat
egic
pla
ns e
nhan
ced
M
OFP
ED/D
B
X
X
360,
000
2.
1.3
Prof
essi
onal
izat
ion
of t
he d
evel
opm
ent
plan
ning
func
tion
of g
over
nmen
t M
oFPE
D to
take
lead
in P
rofe
ssio
naliz
atio
n of
Eco
nom
ists
and
St
atis
ticia
ns
MO
FPED
/DEA
X
X
35
,000
Ap
pren
tices
hip
prog
ram
fo
r Ec
onom
ists
, St
atis
ticia
ns,
Mon
itorin
g &
Eva
luat
ion
staf
f as
an e
xten
sion
of t
he g
radu
ate
Econ
omis
t sch
eme.
MO
FPED
/DEA
X X
X X
1,
000,
000
HoD
s, H
oF a
nd P
lann
ing
Uni
ts fo
r MAL
Gs
trai
ned
in U
nder
take
ba
sic
PFM
con
cept
s tr
aini
ng e
.g re
sults
fram
ewor
k M
OFP
ED/D
B
X X
X X
4,
000,
000
Ce
rtifi
catio
n po
licy
fram
ewor
k an
d gu
idel
ines
dev
elop
ed
MO
FPED
/DB
X X
10
0,00
0
2.1.
4 M
acro
econ
omic
m
anag
emen
t w
ith
a m
ediu
m
term
ou
tlook
al
igne
d w
ith
the
Nat
iona
l str
ateg
ic o
bjec
tives
Esta
blis
h in
stitu
tiona
l ar
rang
emen
ts,
proc
edur
es
and
mon
itorin
g to
op
erat
iona
lise
the
Char
ter
of
Fisc
al
Resp
onsi
bilit
y
MO
FPED
/DB
X X
Upd
atin
g th
e SA
M (
Nat
iona
l Sta
tistic
al S
yste
m e
nhan
ced
for
polic
y fo
rmul
atio
n)
MO
FPED
/DB/
DEA
Obj
ectiv
e 2:
To
Enha
nce
Polic
y-Ba
sed
Budg
etin
g &
Pla
nnin
g fo
r Allo
cativ
e Ef
ficie
ncy
Impl
emen
ting
Inst
itutio
ns:
NPA
, M
oFPE
D (B
udge
t; D
EA-M
acro
); M
DAL
Gs
(Eco
nom
ists
) Ke
y St
akeh
olde
rs: O
PM, U
BOS,
LG
FC, C
SOs,
priv
ate
sect
or, M
oLG
Out
puts
Ke
y Ac
tiviti
es
Lead
Inst
itutio
n
2018 / 19
2019 / 20
2020 / 21
2021 / 22
2022 / 23
IND
ICAT
IVE
Cost
(USD
)
2.1.
5 St
reng
then
ing
Pr
ogra
m-B
ased
Bu
dget
ing
(PBB
) re
form
fo
r th
e pl
anni
ng
func
tion
in g
over
nmen
t
PBB
and
PBS
rolle
d ou
t to
MD
ALG
s M
OFP
ED/D
B X
X X
X X
280,
000
Re
view
& s
tren
gthe
ning
of
PBB
ref
orm
and
impl
emen
tatio
n of
PBB
in M
DAL
Gs
MO
FPED
/DB
X X
X X
X
16
0,00
0
Enha
nce
func
tiona
lity
of
PBS
tool
to
in
clud
e pl
anni
ng
(mul
tiyea
r pla
nnin
g at
vot
e le
vel)
MO
FPED
/DB
X
X
29
8,60
0
Fina
lisat
ion
and
Diss
emin
atio
n of
the
PBB
man
ual
MO
FPED
/DB
X
40,0
00
2.2.
2.
Gov
ernm
ent
Econ
omis
ts
trai
ned
to
impr
ove
qual
ity
of
MD
ALG
pl
ans
with
a
real
istic
mul
ti-an
nual
per
spec
tive
Dev
elop
pr
ogra
mm
e an
d in
stitu
tiona
l ar
rang
emen
ts
for
prof
essi
onal
izat
ion
of ‘
com
mon
cad
re’
e.g.
Com
preh
ensi
ve
(cer
tifie
d) tr
aini
ng fo
r MD
ALG
Eco
nom
ists
and
Sta
tistic
ians
MO
FPED
/DB
X
X
20
0,00
0
Trai
ning
HoD
s, H
oF a
nd H
eads
of
Plan
ning
uni
ts in
MAL
Gs
in
Budg
et re
form
s M
OFP
ED/D
B
X
100,
000
2.
2 M
ulti-
year
com
mitm
ents
refle
cted
in a
nnua
l bud
gets
378,
425
2
.2.1
St
reng
then
ed
accu
racy
an
d co
mpr
ehen
sive
ness
of m
ulti-
year
bud
getin
g Re
view
an
d es
tabl
ish
polic
y fr
amew
ork
for
mul
ti-ye
ar
budg
etin
g an
d co
mm
itmen
t mon
itorin
g M
OFP
ED/D
B
X X
170,
400
Capa
city
bui
ldin
g ac
tiviti
es t
o en
hanc
e bu
dget
ing
accu
racy
in
high
-spe
nd v
otes
M
OFP
ED/D
B
X X
X
208,
025
2.
3 En
hanc
ing
Plan
ning
and
Bud
get r
espo
nsiv
enes
s to
gen
der e
quity
468,
300
2.
3.1
Enha
nced
gen
der-
equi
ty b
udge
ting
in
sele
cted
key
sec
tors
(e.
g. E
duca
tion,
Hea
lth,
Agric
ultu
re)
Revi
ew
and
impr
ove
mon
itorin
g an
d ev
alua
tion
met
hodo
logi
es fo
r GEB
M
OFP
ED/D
B
X X
X
167,
500
Ca
paci
ty b
uild
ing
activ
ities
for
GEB
pla
nnin
g an
d bu
dget
ing
proc
ess
in s
elec
ted
sect
ors
MO
FPED
/DB
X
X
12
0,00
0
Gen
der
stat
istic
s re
fined
for
key
sec
tors
, in
lin
e w
ith M
&E
met
hodo
logi
es
MO
FPED
/DB
X
X
18
0,80
0
2.4
Incr
ease
d eq
uity
and
dis
cret
ion
of re
sour
ces
allo
cate
d to
LG
s fo
r im
prov
ed s
ervi
ce d
eliv
ery
57
2,80
0
2.4.
1 A
grad
ual
incr
ease
in
shar
e of
cen
tral
re
venu
e fo
r LG
se
rvic
e de
liver
y,
as
reco
mm
ende
d in
the
Fis
cal
Dec
entr
alis
atio
n Ar
chite
ctur
e re
port
Revi
ew s
ervi
ce d
eliv
ery
cost
s at
LG
lev
el b
ased
on
sect
or
stan
dard
s to
est
ablis
h no
rms
in t
he t
arge
t se
ctor
s fo
r ru
ral
and
urba
n LG
s.
MoL
G/L
GFC
X
X X
160,
000
Dev
elop
co
mpr
ehen
sive
re
port
fo
r N
atio
nal
Budg
et
docu
men
ts o
n LG
fisc
al t
rans
fers
, inc
ludi
ng e
stim
ates
of l
ocal
ow
n-so
urce
reve
nue
colle
ctio
n
MoL
G/L
GFC
X X
X
20
,000
123Uganda Public Financial Management Reform Strategy
Obj
ectiv
e 2:
To
Enha
nce
Polic
y-Ba
sed
Budg
etin
g &
Pla
nnin
g fo
r Allo
cativ
e Ef
ficie
ncy
Impl
emen
ting
Inst
itutio
ns:
NPA
, M
oFPE
D (B
udge
t; D
EA-M
acro
); M
DAL
Gs
(Eco
nom
ists
) Ke
y St
akeh
olde
rs: O
PM, U
BOS,
LG
FC, C
SOs,
priv
ate
sect
or, M
oLG
Out
puts
Ke
y Ac
tiviti
es
Lead
Inst
itutio
n
2018 / 19
2019 / 20
2020 / 21
2021 / 22
2022 / 23
IND
ICAT
IVE
Cost
(USD
)
2.1
Budg
ets
alig
ned
to s
trat
egic
pla
ns a
nd m
ediu
m te
rm e
xpen
ditu
re fr
amew
orks
7,
975,
600
2.1.
1 St
reng
then
ing
capa
city
in
mac
ro-fi
scal
po
licy
anal
ysis
Del
iver
tr
aini
ng
in
fisca
l im
pact
an
alys
is
and
fore
cast
ing
(em
bedd
ing
IMEM
) M
OFP
ED/D
EA
X X
67
2,00
0
Und
erta
ke
Impa
ct
anal
ysis
of
4 se
lect
ed
polic
ies
or
prog
ram
mes
M
OFP
ED/D
EA
X
X
12
0,00
0
DEA
and
NPA
to
unde
rtak
e ec
onom
ic a
naly
sis
to in
form
the
bu
dget
str
ateg
y in
clud
ing
use
of th
e M
acro
econ
omic
mod
el.
MO
FPED
/DEA
X X
X X
200,
000
2.
1.2.
Im
prov
ed
plan
ning
at
se
ctor
le
vel
thro
ugh
a jo
int
appr
oach
be
twee
n N
PA,
MoF
PED
, OPM
and
MoL
G
Esta
blis
h te
chni
cal c
omm
ittee
on
plan
ning
and
bud
getin
g w
ith
plan
of
w
ork
for
a cr
oss-
gove
rnm
ent
appr
oach
to
st
reng
then
ing
plan
ning
at
se
ctor
le
vel
incl
udin
g of
en
gage
men
t of p
rivat
e se
ctor
and
CSO
s
MO
FPED
/DB
X X
10
0,00
0
Res
truc
ture
ND
P III
and
Sec
tor s
trat
egic
pla
ns a
long
pro
gram
s lin
ked
to
natio
nal
stra
tegi
c ob
ject
ives
to
ea
se
PBB/
S im
plem
enta
tion
– St
reng
then
the
Prog
ram
app
roac
h in
ND
P.
NPA
X X
X
250,
000
Dis
sem
inat
ion
of
Stre
ngth
enin
g Se
ctor
W
orki
ng
Gro
up
Gui
delin
es
MO
FPED
/DB
X
60,0
00
Perio
dic
revi
ew o
f th
e fu
nctio
nalit
y of
SW
Gs
and
rela
ted
capa
city
to d
evel
op s
trat
egic
pla
ns e
nhan
ced
M
OFP
ED/D
B
X
X
360,
000
2.
1.3
Prof
essi
onal
izat
ion
of t
he d
evel
opm
ent
plan
ning
func
tion
of g
over
nmen
t M
oFPE
D to
take
lead
in P
rofe
ssio
naliz
atio
n of
Eco
nom
ists
and
St
atis
ticia
ns
MO
FPED
/DEA
X
X
35
,000
Ap
pren
tices
hip
prog
ram
fo
r Ec
onom
ists
, St
atis
ticia
ns,
Mon
itorin
g &
Eva
luat
ion
staf
f as
an e
xten
sion
of t
he g
radu
ate
Econ
omis
t sch
eme.
MO
FPED
/DEA
X X
X X
1,
000,
000
HoD
s, H
oF a
nd P
lann
ing
Uni
ts fo
r MAL
Gs
trai
ned
in U
nder
take
ba
sic
PFM
con
cept
s tr
aini
ng e
.g re
sults
fram
ewor
k M
OFP
ED/D
B
X X
X X
4,
000,
000
Ce
rtifi
catio
n po
licy
fram
ewor
k an
d gu
idel
ines
dev
elop
ed
MO
FPED
/DB
X X
10
0,00
0
2.1.
4 M
acro
econ
omic
m
anag
emen
t w
ith
a m
ediu
m
term
ou
tlook
al
igne
d w
ith
the
Nat
iona
l str
ateg
ic o
bjec
tives
Esta
blis
h in
stitu
tiona
l ar
rang
emen
ts,
proc
edur
es
and
mon
itorin
g to
op
erat
iona
lise
the
Char
ter
of
Fisc
al
Resp
onsi
bilit
y
MO
FPED
/DB
X X
Upd
atin
g th
e SA
M (
Nat
iona
l Sta
tistic
al S
yste
m e
nhan
ced
for
polic
y fo
rmul
atio
n)
MO
FPED
/DB/
DEA
Obj
ectiv
e 2:
To
Enha
nce
Polic
y-Ba
sed
Budg
etin
g &
Pla
nnin
g fo
r Allo
cativ
e Ef
ficie
ncy
Impl
emen
ting
Inst
itutio
ns:
NPA
, M
oFPE
D (B
udge
t; D
EA-M
acro
); M
DAL
Gs
(Eco
nom
ists
) Ke
y St
akeh
olde
rs: O
PM, U
BOS,
LG
FC, C
SOs,
priv
ate
sect
or, M
oLG
Out
puts
Ke
y Ac
tiviti
es
Lead
Inst
itutio
n
2018 / 19
2019 / 20
2020 / 21
2021 / 22
2022 / 23
IND
ICAT
IVE
Cost
(USD
)
2.1.
5 St
reng
then
ing
Pr
ogra
m-B
ased
Bu
dget
ing
(PBB
) re
form
fo
r th
e pl
anni
ng
func
tion
in g
over
nmen
t
PBB
and
PBS
rolle
d ou
t to
MD
ALG
s M
OFP
ED/D
B X
X X
X X
280,
000
Re
view
& s
tren
gthe
ning
of
PBB
ref
orm
and
impl
emen
tatio
n of
PBB
in M
DAL
Gs
MO
FPED
/DB
X X
X X
X
16
0,00
0
Enha
nce
func
tiona
lity
of
PBS
tool
to
in
clud
e pl
anni
ng
(mul
tiyea
r pla
nnin
g at
vot
e le
vel)
MO
FPED
/DB
X
X
29
8,60
0
Fina
lisat
ion
and
Diss
emin
atio
n of
the
PBB
man
ual
MO
FPED
/DB
X
40,0
00
2.2.
2.
Gov
ernm
ent
Econ
omis
ts
trai
ned
to
impr
ove
qual
ity
of
MD
ALG
pl
ans
with
a
real
istic
mul
ti-an
nual
per
spec
tive
Dev
elop
pr
ogra
mm
e an
d in
stitu
tiona
l ar
rang
emen
ts
for
prof
essi
onal
izat
ion
of ‘
com
mon
cad
re’
e.g.
Com
preh
ensi
ve
(cer
tifie
d) tr
aini
ng fo
r MD
ALG
Eco
nom
ists
and
Sta
tistic
ians
MO
FPED
/DB
X
X
20
0,00
0
Trai
ning
HoD
s, H
oF a
nd H
eads
of
Plan
ning
uni
ts in
MAL
Gs
in
Budg
et re
form
s M
OFP
ED/D
B
X
100,
000
2.
2 M
ulti-
year
com
mitm
ents
refle
cted
in a
nnua
l bud
gets
378,
425
2
.2.1
St
reng
then
ed
accu
racy
an
d co
mpr
ehen
sive
ness
of m
ulti-
year
bud
getin
g Re
view
an
d es
tabl
ish
polic
y fr
amew
ork
for
mul
ti-ye
ar
budg
etin
g an
d co
mm
itmen
t mon
itorin
g M
OFP
ED/D
B
X X
170,
400
Capa
city
bui
ldin
g ac
tiviti
es t
o en
hanc
e bu
dget
ing
accu
racy
in
high
-spe
nd v
otes
M
OFP
ED/D
B
X X
X
208,
025
2.
3 En
hanc
ing
Plan
ning
and
Bud
get r
espo
nsiv
enes
s to
gen
der e
quity
468,
300
2.
3.1
Enha
nced
gen
der-
equi
ty b
udge
ting
in
sele
cted
key
sec
tors
(e.
g. E
duca
tion,
Hea
lth,
Agric
ultu
re)
Revi
ew
and
impr
ove
mon
itorin
g an
d ev
alua
tion
met
hodo
logi
es fo
r GEB
M
OFP
ED/D
B
X X
X
167,
500
Ca
paci
ty b
uild
ing
activ
ities
for
GEB
pla
nnin
g an
d bu
dget
ing
proc
ess
in s
elec
ted
sect
ors
MO
FPED
/DB
X
X
12
0,00
0
Gen
der
stat
istic
s re
fined
for
key
sec
tors
, in
lin
e w
ith M
&E
met
hodo
logi
es
MO
FPED
/DB
X
X
18
0,80
0
2.4
Incr
ease
d eq
uity
and
dis
cret
ion
of re
sour
ces
allo
cate
d to
LG
s fo
r im
prov
ed s
ervi
ce d
eliv
ery
57
2,80
0
2.4.
1 A
grad
ual
incr
ease
in
shar
e of
cen
tral
re
venu
e fo
r LG
se
rvic
e de
liver
y,
as
reco
mm
ende
d in
the
Fis
cal
Dec
entr
alis
atio
n Ar
chite
ctur
e re
port
Revi
ew s
ervi
ce d
eliv
ery
cost
s at
LG
lev
el b
ased
on
sect
or
stan
dard
s to
est
ablis
h no
rms
in t
he t
arge
t se
ctor
s fo
r ru
ral
and
urba
n LG
s.
MoL
G/L
GFC
X
X X
160,
000
Dev
elop
co
mpr
ehen
sive
re
port
fo
r N
atio
nal
Budg
et
docu
men
ts o
n LG
fisc
al t
rans
fers
, inc
ludi
ng e
stim
ates
of l
ocal
ow
n-so
urce
reve
nue
colle
ctio
n
MoL
G/L
GFC
X X
X
20
,000
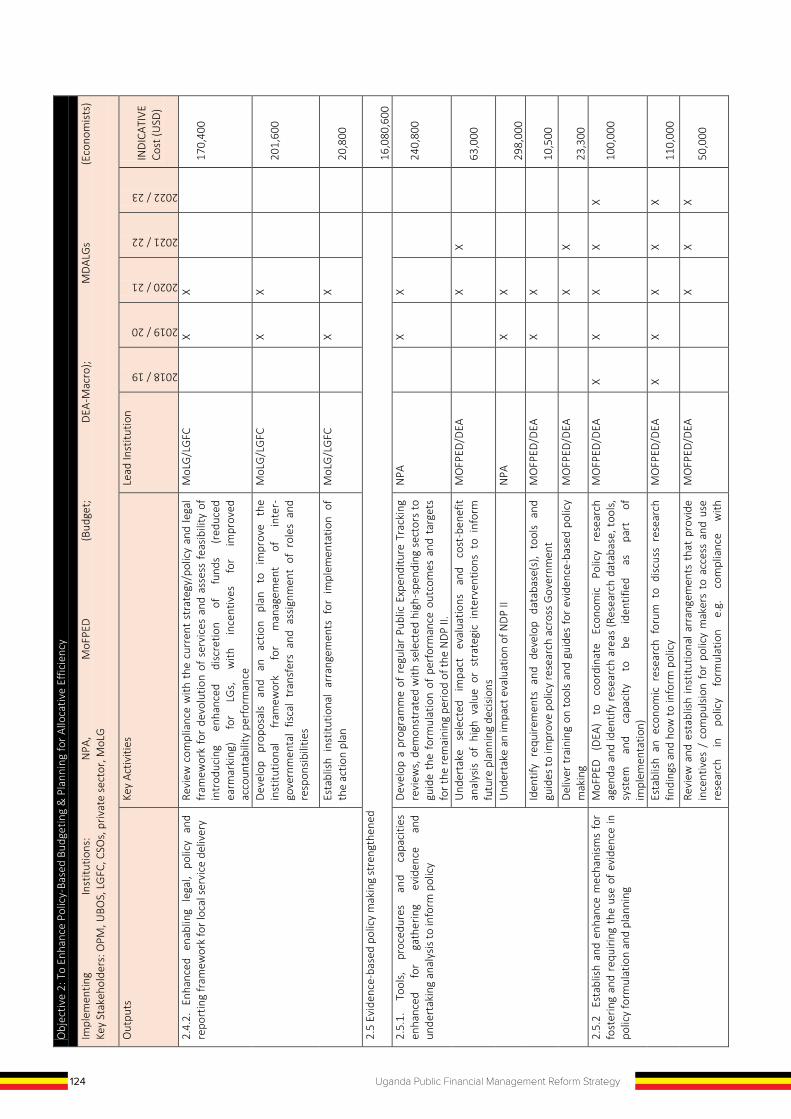
124 Uganda Public Financial Management Reform Strategy
Obj
ectiv
e 2:
To
Enha
nce
Polic
y-Ba
sed
Budg
etin
g &
Pla
nnin
g fo
r Allo
cativ
e Ef
ficie
ncy
Impl
emen
ting
Inst
itutio
ns:
NPA
, M
oFPE
D (B
udge
t; D
EA-M
acro
); M
DAL
Gs
(Eco
nom
ists
) Ke
y St
akeh
olde
rs: O
PM, U
BOS,
LG
FC, C
SOs,
priv
ate
sect
or, M
oLG
Out
puts
Ke
y Ac
tiviti
es
Lead
Inst
itutio
n
2018 / 19
2019 / 20
2020 / 21
2021 / 22
2022 / 23
IND
ICAT
IVE
Cost
(USD
)
2.4.
2.
Enha
nced
en
ablin
g le
gal,
polic
y an
d re
port
ing
fram
ewor
k fo
r loc
al s
ervi
ce d
eliv
ery
Revi
ew c
ompl
ianc
e w
ith t
he c
urre
nt s
trat
egy/
polic
y an
d le
gal
fram
ewor
k fo
r de
volu
tion
of s
ervi
ces
and
asse
ss fe
asib
ility
of
intr
oduc
ing
enha
nced
di
scre
tion
of
fund
s (r
educ
ed
earm
arki
ng)
for
LGs,
w
ith
ince
ntiv
es
for
impr
oved
ac
coun
tabi
lity
perf
orm
ance
MoL
G/L
GFC
X X
170,
400
Dev
elop
pr
opos
als
and
an
actio
n pl
an
to
impr
ove
the
inst
itutio
nal
fram
ewor
k fo
r m
anag
emen
t of
in
ter-
gove
rnm
enta
l fis
cal
tran
sfer
s an
d as
sign
men
t of
rol
es a
nd
resp
onsi
bilit
ies
MoL
G/L
GFC
X X
201,
600
Esta
blis
h in
stitu
tiona
l ar
rang
emen
ts f
or i
mpl
emen
tatio
n of
th
e ac
tion
plan
M
oLG
/LG
FC
X
X
20,8
00
2.5
Evid
ence
-bas
ed p
olic
y m
akin
g st
reng
then
ed
16
,080
,600
2.
5.1.
To
ols,
pr
oced
ures
an
d ca
paci
ties
enha
nced
fo
r ga
ther
ing
evid
ence
an
d un
dert
akin
g an
alys
is to
info
rm p
olic
y
Dev
elop
a p
rogr
amm
e of
reg
ular
Pub
lic E
xpen
ditu
re T
rack
ing
revi
ews,
dem
onst
rate
d w
ith s
elec
ted
high
-spe
ndin
g se
ctor
s to
gu
ide
the
form
ulat
ion
of p
erfo
rman
ce o
utco
mes
and
tar
gets
fo
r the
rem
aini
ng p
erio
d of
the
ND
P II.
NPA
X X
240,
800
Und
erta
ke
sele
cted
im
pact
ev
alua
tions
an
d co
st-b
enef
it an
alys
is o
f hi
gh v
alue
or
stra
tegi
c in
terv
entio
ns t
o in
form
fu
ture
pla
nnin
g de
cisio
ns
MO
FPED
/DEA
X
X
63
,000
Und
erta
ke a
n im
pact
eva
luat
ion
of N
DP
II N
PA
X
X
29
8,00
0
Iden
tify
requ
irem
ents
and
dev
elop
dat
abas
e(s)
, to
ols
and
guid
es to
impr
ove
polic
y re
sear
ch a
cros
s G
over
nmen
t M
OFP
ED/D
EA
X
X
10,5
00
Del
iver
trai
ning
on
tool
s an
d gu
ides
for
evid
ence
-bas
ed p
olic
y m
akin
g M
OFP
ED/D
EA
X X
23,3
00
2.5.
2 E
stab
lish
and
enha
nce
mec
hani
sms
for
fost
erin
g an
d re
quiri
ng t
he u
se o
f evi
denc
e in
po
licy
form
ulat
ion
and
plan
ning
MoF
PED
(D
EA)
to
coor
dina
te
Econ
omic
Po
licy
rese
arch
ag
enda
and
iden
tify
rese
arch
are
as (R
esea
rch
data
base
, too
ls,
syst
em
and
capa
city
to
be
id
entif
ied
as
part
of
im
plem
enta
tion)
MO
FPED
/DEA
X
X X
X X
100,
000
Esta
blis
h an
eco
nom
ic r
esea
rch
foru
m t
o di
scus
s re
sear
ch
findi
ngs
and
how
to in
form
pol
icy
MO
FPED
/DEA
X
X X
X X
110,
000
Re
view
and
est
ablis
h in
stitu
tiona
l arr
ange
men
ts t
hat
prov
ide
ince
ntiv
es /
com
puls
ion
for
polic
y m
aker
s to
acc
ess
and
use
rese
arch
in
po
licy
form
ulat
ion
e.g.
co
mpl
ianc
e w
ith
MO
FPED
/DEA
X
X X
50
,000
Obj
ectiv
e 2:
To
Enha
nce
Polic
y-Ba
sed
Budg
etin
g &
Pla
nnin
g fo
r Allo
cativ
e Ef
ficie
ncy
Impl
emen
ting
Inst
itutio
ns:
NPA
, M
oFPE
D (B
udge
t; D
EA-M
acro
); M
DAL
Gs
(Eco
nom
ists
) Ke
y St
akeh
olde
rs: O
PM, U
BOS,
LG
FC, C
SOs,
priv
ate
sect
or, M
oLG
Out
puts
Ke
y Ac
tiviti
es
Lead
Inst
itutio
n
2018 / 19
2019 / 20
2020 / 21
2021 / 22
2022 / 23 IN
DIC
ATIV
E Co
st (U
SD)
cert
ifica
tes
of fi
scal
impa
ct
Esta
blis
h m
echa
nism
fo
r id
entif
ying
, co
mpi
ling
and
com
mun
icat
ing
findi
ngs
from
re
leva
nt
rese
arch
to
po
licy
mak
ers
MO
FPED
/DB
X
X
50,0
00
2.5.
3 H
arm
oniz
ed m
onito
ring
and
eval
uatio
n fr
amew
orks
with
in G
over
nmen
t Re
view
and
har
mon
ise
mon
itorin
g an
d ev
alua
tion
fram
ewor
ks
in G
over
nmen
t N
PA
X
X
10
0,00
0
Har
mon
ised
gui
delin
es f
or p
roje
ct e
x-an
te, m
id-t
erm
and
ex-
post
eva
luat
ion
deve
lope
d N
PA
X
X
12
6,00
0
Nat
iona
l com
pend
ium
for m
onito
ring
indi
cato
rs
NPA
X
X X
50
,000
2.
5.4.
Enh
ance
men
t of
rep
ortin
g ca
pabi
lity
on
serv
ice
deliv
ery
Esta
blis
h an
inte
rfac
e be
twee
n PB
S, IF
MS,
AM
P, IP
PS, B
OT
and
OTI
MS
MO
FPED
/DB
X X
-
Es
tabl
ish
an
inte
rfac
e be
twee
n PB
S,
Inte
rgra
ted
Bank
of
Pr
ojec
ts, E
duca
tion
Man
agem
ent
Info
rmat
ion
Syst
em, H
ealth
M
anag
emen
t Inf
orm
atio
n Sy
stem
and
NIR
A
MO
FPED
/DB
X
X X
3,98
4,00
0
Tech
nica
l Sup
port
to P
BS
MO
FPED
/DB
X
X X
X
10
,000
,000
St
reng
then
th
e G
APR
to
enha
nce
follo
w
up
of
reco
mm
enda
tions
in s
ervi
ce d
eliv
ery
MO
FPED
/DB
X
X
80,0
00
2.5.
5. S
tren
gthe
ned
mon
itorin
g of
the
bud
get
and
evid
ence
upt
ake
Dev
elop
gui
delin
es a
nd m
anua
ls fo
r mon
itorin
g th
e bu
dget
M
OFP
ED/D
B
X
X
60
,000
D
isse
min
atio
n of
bud
get m
onito
ring
info
rmat
ion
MO
FPED
/DB
X
X X
60,0
00
2.5.
6. Im
plem
enta
tion
of th
e BT
A St
rate
gy
Publ
icat
ion
of
the
BTA
Stra
tegy
: pr
oduc
e an
d pu
blic
ise
sim
plifi
ed o
r pop
ular
ver
sion
s of
the
BTA
Stra
tegy
. M
OFP
ED/D
B
X X
110,
000
Se
nsiti
ze t
he p
ublic
on
thei
r rig
ht t
o bu
dget
inf
orm
atio
n,
enha
nce
budg
et
liter
acy
amon
g th
e po
pula
ce
and
raise
aw
aren
ess
on t
he i
mpo
rtan
ce o
f bu
dget
tra
nspa
renc
y an
d ac
coun
tabi
lity.
MO
FPED
/DB
X
X
10
0,00
0
Capa
city
nee
ds a
sses
smen
t to
det
erm
ine
the
know
ledg
e ga
p an
d cr
itica
l ski
ll se
t req
uire
d fo
r effe
ctiv
e ex
ecut
ion
of th
e BT
A re
late
d fu
nctio
ns
by t
he
polic
y m
aker
s,
seni
or
staf
f an
d co
mm
unic
atio
n O
ffice
rs in
MD
As.
MO
FPED
/DB
X X
50,0
00
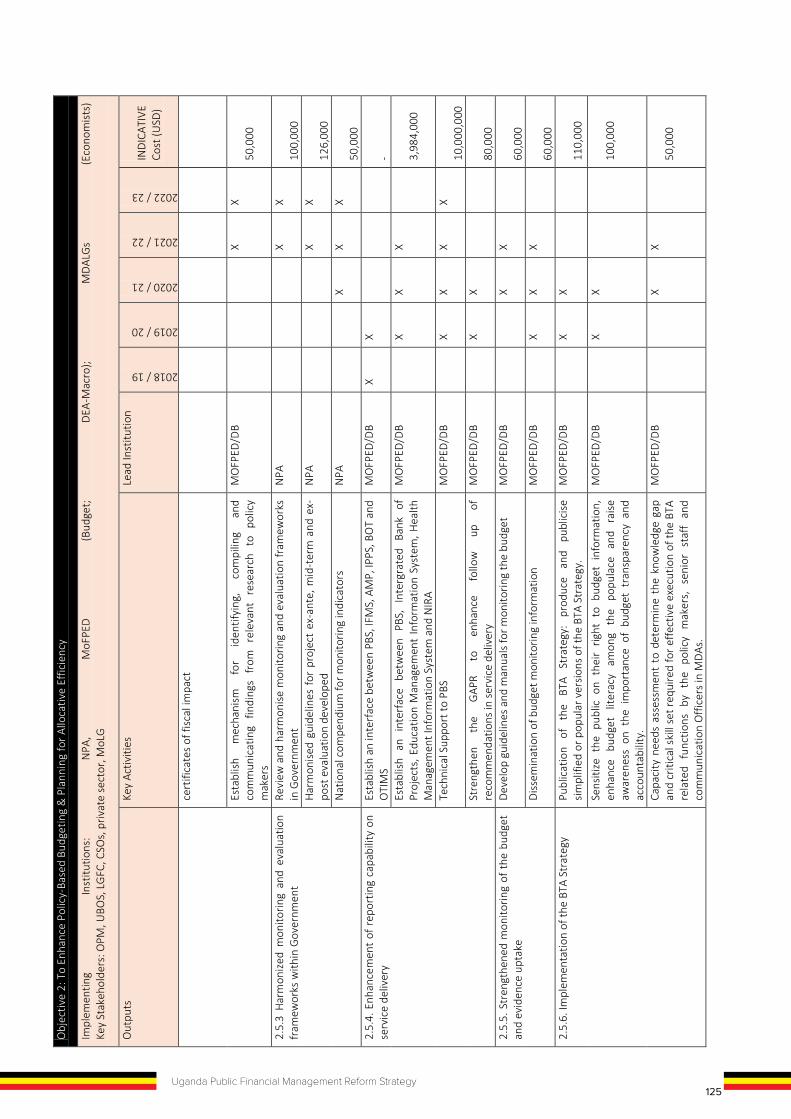
124 Uganda Public Financial Management Reform Strategy
Obj
ectiv
e 2:
To
Enha
nce
Polic
y-Ba
sed
Budg
etin
g &
Pla
nnin
g fo
r Allo
cativ
e Ef
ficie
ncy
Impl
emen
ting
Inst
itutio
ns:
NPA
, M
oFPE
D (B
udge
t; D
EA-M
acro
); M
DAL
Gs
(Eco
nom
ists
) Ke
y St
akeh
olde
rs: O
PM, U
BOS,
LG
FC, C
SOs,
priv
ate
sect
or, M
oLG
Out
puts
Ke
y Ac
tiviti
es
Lead
Inst
itutio
n
2018 / 19
2019 / 20
2020 / 21
2021 / 22
2022 / 23
IND
ICAT
IVE
Cost
(USD
)
2.4.
2.
Enha
nced
en
ablin
g le
gal,
polic
y an
d re
port
ing
fram
ewor
k fo
r loc
al s
ervi
ce d
eliv
ery
Revi
ew c
ompl
ianc
e w
ith t
he c
urre
nt s
trat
egy/
polic
y an
d le
gal
fram
ewor
k fo
r de
volu
tion
of s
ervi
ces
and
asse
ss fe
asib
ility
of
intr
oduc
ing
enha
nced
di
scre
tion
of
fund
s (r
educ
ed
earm
arki
ng)
for
LGs,
w
ith
ince
ntiv
es
for
impr
oved
ac
coun
tabi
lity
perf
orm
ance
MoL
G/L
GFC
X X
170,
400
Dev
elop
pr
opos
als
and
an
actio
n pl
an
to
impr
ove
the
inst
itutio
nal
fram
ewor
k fo
r m
anag
emen
t of
in
ter-
gove
rnm
enta
l fis
cal
tran
sfer
s an
d as
sign
men
t of
rol
es a
nd
resp
onsi
bilit
ies
MoL
G/L
GFC
X X
201,
600
Esta
blis
h in
stitu
tiona
l ar
rang
emen
ts f
or i
mpl
emen
tatio
n of
th
e ac
tion
plan
M
oLG
/LG
FC
X
X
20,8
00
2.5
Evid
ence
-bas
ed p
olic
y m
akin
g st
reng
then
ed
16
,080
,600
2.
5.1.
To
ols,
pr
oced
ures
an
d ca
paci
ties
enha
nced
fo
r ga
ther
ing
evid
ence
an
d un
dert
akin
g an
alys
is to
info
rm p
olic
y
Dev
elop
a p
rogr
amm
e of
reg
ular
Pub
lic E
xpen
ditu
re T
rack
ing
revi
ews,
dem
onst
rate
d w
ith s
elec
ted
high
-spe
ndin
g se
ctor
s to
gu
ide
the
form
ulat
ion
of p
erfo
rman
ce o
utco
mes
and
tar
gets
fo
r the
rem
aini
ng p
erio
d of
the
ND
P II.
NPA
X X
240,
800
Und
erta
ke
sele
cted
im
pact
ev
alua
tions
an
d co
st-b
enef
it an
alys
is o
f hi
gh v
alue
or
stra
tegi
c in
terv
entio
ns t
o in
form
fu
ture
pla
nnin
g de
cisio
ns
MO
FPED
/DEA
X
X
63
,000
Und
erta
ke a
n im
pact
eva
luat
ion
of N
DP
II N
PA
X
X
29
8,00
0
Iden
tify
requ
irem
ents
and
dev
elop
dat
abas
e(s)
, to
ols
and
guid
es to
impr
ove
polic
y re
sear
ch a
cros
s G
over
nmen
t M
OFP
ED/D
EA
X
X
10,5
00
Del
iver
trai
ning
on
tool
s an
d gu
ides
for
evid
ence
-bas
ed p
olic
y m
akin
g M
OFP
ED/D
EA
X X
23,3
00
2.5.
2 E
stab
lish
and
enha
nce
mec
hani
sms
for
fost
erin
g an
d re
quiri
ng t
he u
se o
f evi
denc
e in
po
licy
form
ulat
ion
and
plan
ning
MoF
PED
(D
EA)
to
coor
dina
te
Econ
omic
Po
licy
rese
arch
ag
enda
and
iden
tify
rese
arch
are
as (R
esea
rch
data
base
, too
ls,
syst
em
and
capa
city
to
be
id
entif
ied
as
part
of
im
plem
enta
tion)
MO
FPED
/DEA
X
X X
X X
100,
000
Esta
blis
h an
eco
nom
ic r
esea
rch
foru
m t
o di
scus
s re
sear
ch
findi
ngs
and
how
to in
form
pol
icy
MO
FPED
/DEA
X
X X
X X
110,
000
Re
view
and
est
ablis
h in
stitu
tiona
l arr
ange
men
ts t
hat
prov
ide
ince
ntiv
es /
com
puls
ion
for
polic
y m
aker
s to
acc
ess
and
use
rese
arch
in
po
licy
form
ulat
ion
e.g.
co
mpl
ianc
e w
ith
MO
FPED
/DEA
X
X X
50
,000
Obj
ectiv
e 2:
To
Enha
nce
Polic
y-Ba
sed
Budg
etin
g &
Pla
nnin
g fo
r Allo
cativ
e Ef
ficie
ncy
Impl
emen
ting
Inst
itutio
ns:
NPA
, M
oFPE
D (B
udge
t; D
EA-M
acro
); M
DAL
Gs
(Eco
nom
ists
) Ke
y St
akeh
olde
rs: O
PM, U
BOS,
LG
FC, C
SOs,
priv
ate
sect
or, M
oLG
Out
puts
Ke
y Ac
tiviti
es
Lead
Inst
itutio
n
2018 / 19
2019 / 20
2020 / 21
2021 / 22
2022 / 23
IND
ICAT
IVE
Cost
(USD
)
cert
ifica
tes
of fi
scal
impa
ct
Esta
blis
h m
echa
nism
fo
r id
entif
ying
, co
mpi
ling
and
com
mun
icat
ing
findi
ngs
from
re
leva
nt
rese
arch
to
po
licy
mak
ers
MO
FPED
/DB
X
X
50,0
00
2.5.
3 H
arm
oniz
ed m
onito
ring
and
eval
uatio
n fr
amew
orks
with
in G
over
nmen
t Re
view
and
har
mon
ise
mon
itorin
g an
d ev
alua
tion
fram
ewor
ks
in G
over
nmen
t N
PA
X
X
10
0,00
0
Har
mon
ised
gui
delin
es f
or p
roje
ct e
x-an
te, m
id-t
erm
and
ex-
post
eva
luat
ion
deve
lope
d N
PA
X
X
12
6,00
0
Nat
iona
l com
pend
ium
for m
onito
ring
indi
cato
rs
NPA
X
X X
50
,000
2.
5.4.
Enh
ance
men
t of
rep
ortin
g ca
pabi
lity
on
serv
ice
deliv
ery
Esta
blis
h an
inte
rfac
e be
twee
n PB
S, IF
MS,
AM
P, IP
PS, B
OT
and
OTI
MS
MO
FPED
/DB
X X
-
Es
tabl
ish
an
inte
rfac
e be
twee
n PB
S,
Inte
rgra
ted
Bank
of
Pr
ojec
ts, E
duca
tion
Man
agem
ent
Info
rmat
ion
Syst
em, H
ealth
M
anag
emen
t Inf
orm
atio
n Sy
stem
and
NIR
A
MO
FPED
/DB
X
X X
3,98
4,00
0
Tech
nica
l Sup
port
to P
BS
MO
FPED
/DB
X
X X
X
10
,000
,000
St
reng
then
th
e G
APR
to
enha
nce
follo
w
up
of
reco
mm
enda
tions
in s
ervi
ce d
eliv
ery
MO
FPED
/DB
X
X
80,0
00
2.5.
5. S
tren
gthe
ned
mon
itorin
g of
the
bud
get
and
evid
ence
upt
ake
Dev
elop
gui
delin
es a
nd m
anua
ls fo
r mon
itorin
g th
e bu
dget
M
OFP
ED/D
B
X
X
60
,000
D
isse
min
atio
n of
bud
get m
onito
ring
info
rmat
ion
MO
FPED
/DB
X
X X
60,0
00
2.5.
6. Im
plem
enta
tion
of th
e BT
A St
rate
gy
Publ
icat
ion
of
the
BTA
Stra
tegy
: pr
oduc
e an
d pu
blic
ise
sim
plifi
ed o
r pop
ular
ver
sion
s of
the
BTA
Stra
tegy
. M
OFP
ED/D
B
X X
110,
000
Se
nsiti
ze t
he p
ublic
on
thei
r rig
ht t
o bu
dget
inf
orm
atio
n,
enha
nce
budg
et
liter
acy
amon
g th
e po
pula
ce
and
raise
aw
aren
ess
on t
he i
mpo
rtan
ce o
f bu
dget
tra
nspa
renc
y an
d ac
coun
tabi
lity.
MO
FPED
/DB
X
X
10
0,00
0
Capa
city
nee
ds a
sses
smen
t to
det
erm
ine
the
know
ledg
e ga
p an
d cr
itica
l ski
ll se
t req
uire
d fo
r effe
ctiv
e ex
ecut
ion
of th
e BT
A re
late
d fu
nctio
ns
by t
he
polic
y m
aker
s,
seni
or
staf
f an
d co
mm
unic
atio
n O
ffice
rs in
MD
As.
MO
FPED
/DB
X X
50,0
00
125Uganda Public Financial Management Reform Strategy
Obj
ectiv
e 2:
To
Enha
nce
Polic
y-Ba
sed
Budg
etin
g &
Pla
nnin
g fo
r Allo
cativ
e Ef
ficie
ncy
Impl
emen
ting
Inst
itutio
ns:
NPA
, M
oFPE
D (B
udge
t; D
EA-M
acro
); M
DAL
Gs
(Eco
nom
ists
) Ke
y St
akeh
olde
rs: O
PM, U
BOS,
LG
FC, C
SOs,
priv
ate
sect
or, M
oLG
Out
puts
Ke
y Ac
tiviti
es
Lead
Inst
itutio
n
2018 / 19
2019 / 20
2020 / 21
2021 / 22
2022 / 23
IND
ICAT
IVE
Cost
(USD
)
2.4.
2.
Enha
nced
en
ablin
g le
gal,
polic
y an
d re
port
ing
fram
ewor
k fo
r loc
al s
ervi
ce d
eliv
ery
Revi
ew c
ompl
ianc
e w
ith t
he c
urre
nt s
trat
egy/
polic
y an
d le
gal
fram
ewor
k fo
r de
volu
tion
of s
ervi
ces
and
asse
ss fe
asib
ility
of
intr
oduc
ing
enha
nced
di
scre
tion
of
fund
s (r
educ
ed
earm
arki
ng)
for
LGs,
w
ith
ince
ntiv
es
for
impr
oved
ac
coun
tabi
lity
perf
orm
ance
MoL
G/L
GFC
X X
170,
400
Dev
elop
pr
opos
als
and
an
actio
n pl
an
to
impr
ove
the
inst
itutio
nal
fram
ewor
k fo
r m
anag
emen
t of
in
ter-
gove
rnm
enta
l fis
cal
tran
sfer
s an
d as
sign
men
t of
rol
es a
nd
resp
onsi
bilit
ies
MoL
G/L
GFC
X X
201,
600
Esta
blis
h in
stitu
tiona
l ar
rang
emen
ts f
or i
mpl
emen
tatio
n of
th
e ac
tion
plan
M
oLG
/LG
FC
X
X
20,8
00
2.5
Evid
ence
-bas
ed p
olic
y m
akin
g st
reng
then
ed
16
,080
,600
2.
5.1.
To
ols,
pr
oced
ures
an
d ca
paci
ties
enha
nced
fo
r ga
ther
ing
evid
ence
an
d un
dert
akin
g an
alys
is to
info
rm p
olic
y
Dev
elop
a p
rogr
amm
e of
reg
ular
Pub
lic E
xpen
ditu
re T
rack
ing
revi
ews,
dem
onst
rate
d w
ith s
elec
ted
high
-spe
ndin
g se
ctor
s to
gu
ide
the
form
ulat
ion
of p
erfo
rman
ce o
utco
mes
and
tar
gets
fo
r the
rem
aini
ng p
erio
d of
the
ND
P II.
NPA
X X
240,
800
Und
erta
ke
sele
cted
im
pact
ev
alua
tions
an
d co
st-b
enef
it an
alys
is o
f hi
gh v
alue
or
stra
tegi
c in
terv
entio
ns t
o in
form
fu
ture
pla
nnin
g de
cisio
ns
MO
FPED
/DEA
X
X
63
,000
Und
erta
ke a
n im
pact
eva
luat
ion
of N
DP
II N
PA
X
X
29
8,00
0
Iden
tify
requ
irem
ents
and
dev
elop
dat
abas
e(s)
, to
ols
and
guid
es to
impr
ove
polic
y re
sear
ch a
cros
s G
over
nmen
t M
OFP
ED/D
EA
X
X
10,5
00
Del
iver
trai
ning
on
tool
s an
d gu
ides
for
evid
ence
-bas
ed p
olic
y m
akin
g M
OFP
ED/D
EA
X X
23,3
00
2.5.
2 E
stab
lish
and
enha
nce
mec
hani
sms
for
fost
erin
g an
d re
quiri
ng t
he u
se o
f evi
denc
e in
po
licy
form
ulat
ion
and
plan
ning
MoF
PED
(D
EA)
to
coor
dina
te
Econ
omic
Po
licy
rese
arch
ag
enda
and
iden
tify
rese
arch
are
as (R
esea
rch
data
base
, too
ls,
syst
em
and
capa
city
to
be
id
entif
ied
as
part
of
im
plem
enta
tion)
MO
FPED
/DEA
X
X X
X X
100,
000
Esta
blis
h an
eco
nom
ic r
esea
rch
foru
m t
o di
scus
s re
sear
ch
findi
ngs
and
how
to in
form
pol
icy
MO
FPED
/DEA
X
X X
X X
110,
000
Re
view
and
est
ablis
h in
stitu
tiona
l arr
ange
men
ts t
hat
prov
ide
ince
ntiv
es /
com
puls
ion
for
polic
y m
aker
s to
acc
ess
and
use
rese
arch
in
po
licy
form
ulat
ion
e.g.
co
mpl
ianc
e w
ith
MO
FPED
/DEA
X
X X
50
,000
Obj
ectiv
e 2:
To
Enha
nce
Polic
y-Ba
sed
Budg
etin
g &
Pla
nnin
g fo
r Allo
cativ
e Ef
ficie
ncy
Impl
emen
ting
Inst
itutio
ns:
NPA
, M
oFPE
D (B
udge
t; D
EA-M
acro
); M
DAL
Gs
(Eco
nom
ists
) Ke
y St
akeh
olde
rs: O
PM, U
BOS,
LG
FC, C
SOs,
priv
ate
sect
or, M
oLG
Out
puts
Ke
y Ac
tiviti
es
Lead
Inst
itutio
n
2018 / 19
2019 / 20
2020 / 21
2021 / 22
2022 / 23
IND
ICAT
IVE
Cost
(USD
)
cert
ifica
tes
of fi
scal
impa
ct
Esta
blis
h m
echa
nism
fo
r id
entif
ying
, co
mpi
ling
and
com
mun
icat
ing
findi
ngs
from
re
leva
nt
rese
arch
to
po
licy
mak
ers
MO
FPED
/DB
X
X
50,0
00
2.5.
3 H
arm
oniz
ed m
onito
ring
and
eval
uatio
n fr
amew
orks
with
in G
over
nmen
t Re
view
and
har
mon
ise
mon
itorin
g an
d ev
alua
tion
fram
ewor
ks
in G
over
nmen
t N
PA
X
X
10
0,00
0
Har
mon
ised
gui
delin
es f
or p
roje
ct e
x-an
te, m
id-t
erm
and
ex-
post
eva
luat
ion
deve
lope
d N
PA
X
X
12
6,00
0
Nat
iona
l com
pend
ium
for m
onito
ring
indi
cato
rs
NPA
X
X X
50
,000
2.
5.4.
Enh
ance
men
t of
rep
ortin
g ca
pabi
lity
on
serv
ice
deliv
ery
Esta
blis
h an
inte
rfac
e be
twee
n PB
S, IF
MS,
AM
P, IP
PS, B
OT
and
OTI
MS
MO
FPED
/DB
X X
-
Es
tabl
ish
an
inte
rfac
e be
twee
n PB
S,
Inte
rgra
ted
Bank
of
Pr
ojec
ts, E
duca
tion
Man
agem
ent
Info
rmat
ion
Syst
em, H
ealth
M
anag
emen
t Inf
orm
atio
n Sy
stem
and
NIR
A
MO
FPED
/DB
X
X X
3,98
4,00
0
Tech
nica
l Sup
port
to P
BS
MO
FPED
/DB
X
X X
X
10
,000
,000
St
reng
then
th
e G
APR
to
enha
nce
follo
w
up
of
reco
mm
enda
tions
in s
ervi
ce d
eliv
ery
MO
FPED
/DB
X
X
80,0
00
2.5.
5. S
tren
gthe
ned
mon
itorin
g of
the
bud
get
and
evid
ence
upt
ake
Dev
elop
gui
delin
es a
nd m
anua
ls fo
r mon
itorin
g th
e bu
dget
M
OFP
ED/D
B
X
X
60
,000
D
isse
min
atio
n of
bud
get m
onito
ring
info
rmat
ion
MO
FPED
/DB
X
X X
60,0
00
2.5.
6. Im
plem
enta
tion
of th
e BT
A St
rate
gy
Publ
icat
ion
of
the
BTA
Stra
tegy
: pr
oduc
e an
d pu
blic
ise
sim
plifi
ed o
r pop
ular
ver
sion
s of
the
BTA
Stra
tegy
. M
OFP
ED/D
B
X X
110,
000
Se
nsiti
ze t
he p
ublic
on
thei
r rig
ht t
o bu
dget
inf
orm
atio
n,
enha
nce
budg
et
liter
acy
amon
g th
e po
pula
ce
and
raise
aw
aren
ess
on t
he i
mpo
rtan
ce o
f bu
dget
tra
nspa
renc
y an
d ac
coun
tabi
lity.
MO
FPED
/DB
X
X
10
0,00
0
Capa
city
nee
ds a
sses
smen
t to
det
erm
ine
the
know
ledg
e ga
p an
d cr
itica
l ski
ll se
t req
uire
d fo
r effe
ctiv
e ex
ecut
ion
of th
e BT
A re
late
d fu
nctio
ns
by t
he
polic
y m
aker
s,
seni
or
staf
f an
d co
mm
unic
atio
n O
ffice
rs in
MD
As.
MO
FPED
/DB
X X
50,0
00

126 Uganda Public Financial Management Reform Strategy
Obj
ectiv
e 2:
To
Enha
nce
Polic
y-Ba
sed
Budg
etin
g &
Pla
nnin
g fo
r Allo
cativ
e Ef
ficie
ncy
Impl
emen
ting
Inst
itutio
ns:
NPA
, M
oFPE
D (B
udge
t; D
EA-M
acro
); M
DAL
Gs
(Eco
nom
ists
) Ke
y St
akeh
olde
rs: O
PM, U
BOS,
LG
FC, C
SOs,
priv
ate
sect
or, M
oLG
Out
puts
Ke
y Ac
tiviti
es
Lead
Inst
itutio
n
2018 / 19
2019 / 20
2020 / 21
2021 / 22
2022 / 23
IND
ICAT
IVE
Cost
(USD
)
Publ
icat
ion
and
diss
emin
atio
n of
bud
get
docu
men
ts t
hat
are
in s
impl
e fo
rmat
s an
d ar
e us
er fr
iend
ly c
onta
inin
g sp
ecifi
c LG
an
nual
bud
get
estim
ates
and
per
form
ance
. Th
e do
cum
ents
sh
ould
tar
get
dive
rse
audi
ence
s. S
uch
docu
men
ts s
houl
d be
pu
blis
hed
in lo
cal l
angu
ages
.
MO
FPED
/DB
X X
48,0
00
Prov
isio
n of
ade
quat
e fin
anci
al, h
uman
and
logi
stic
al s
uppo
rt
need
ed
for
budg
et
tran
spar
ency
an
d ac
coun
tabi
lity
prog
ram
mes
as
part
of t
he d
eliv
ery
of th
e fu
nctio
n of
the
loca
l go
vern
men
t. Th
e in
itiat
ives
sh
ould
in
clud
e pu
blic
atio
ns,
web
site
s,
and
disp
lays
of
bu
dget
in
form
atio
n on
pu
blic
no
ticeb
oard
s, r
adio
and
TV
talk
sho
ws
and
othe
r fo
rms
of
med
ia e
ngag
emen
t.
MO
FPED
/DB
X X
90,0
00
Dev
elop
ing
and
sust
aini
ng m
echa
nism
s an
d ac
tions
that
allo
w
effe
ctiv
e ci
tizen
en
gage
men
t in
bu
dget
de
cisi
on-m
akin
g,
impl
emen
tatio
n an
d m
onito
ring;
enc
oura
ge c
itize
n fe
edba
ck
and
resp
onse
to
su
ch
feed
back
. Th
is
wou
ld
enha
nce
acco
unta
bilit
y fo
r pub
lic e
xpen
ditu
re.
MO
FPED
/DB
X
X X
10
0,00
0
Capa
city
bui
ldin
g of
acc
ount
ing
offic
ers
and
polic
y m
aker
s in
pr
omot
ing
budg
et t
rans
pare
ncy
and
acco
unta
bilit
y w
ith t
heir
sect
ors
or M
DAs
MO
FPED
/DB
X
X X
17
7,00
0
TOTA
L CO
ST
25
,475
,725
O
bjec
tive
3: T
o st
reng
then
pub
lic in
vest
men
t man
agem
ent (
PIM
) for
incr
ease
d de
velo
pmen
t ret
urns
on
publ
ic s
pend
ing
Impl
emen
ting
Inst
itutio
ns:
MoF
PED
(PAP
, Bu
dget
), AG
O,
PPD
A,
NPA
, D
evel
opm
ent
Com
mitt
ee
Key
Stak
ehol
ders
: OPM
, MD
ALG
s, S
WG
s, C
SOs,
priv
ate
sect
or
Out
puts
Ke
y Ac
tiviti
es
Lead
Inst
itutio
n
2018 / 19
2019 / 20 2020 / 21
2021 / 22
2022 / 23 IN
DIC
ATIV
E Co
st
(USD
)
3.1
Effi
cien
t ide
ntifi
catio
n, s
elec
tion
and
man
agem
ent o
f Pub
lic In
vest
men
t Pro
ject
s (P
IPs)
and
Pub
lic-P
rivat
e Pa
rtne
rshi
ps (P
PPs)
19
,752
,490
3.
1.1
Impr
oved
m
ulti-
annu
al
plan
ning
an
d m
anag
emen
t of
hi
gh
valu
e in
vest
men
ts in
sel
ecte
d se
ctor
s/M
DAs
Des
ign
& i
mpl
emen
t sy
stem
s fo
r m
anag
ing
high
val
ue/m
ulti
annu
al p
roje
cts
in s
elec
ted
sect
ors/
MD
As
MO
FPED
/DB
X
X
X
X
X
2
86,6
95
Alig
n M
TEF
with
the
mul
ti-ye
ar c
omm
itmen
ts b
y se
ctor
s an
d M
DAL
Gs
MO
FPED
/DB
X
X
Esta
blis
h po
licy
on im
plem
enta
tion
of i
nfra
stru
ctur
e co
rrid
ors
to
bett
er
man
age
com
pens
atio
n fo
r la
rge
infr
astr
uctu
re
inve
stm
ents
MO
FPED
/DB
X
X
3.1.
2 IT
-bas
ed
Inte
grat
ed
Bank
of
Pr
ojec
ts (I
BP) d
evel
oped
(inc
l aut
omat
ion
of p
roje
cts
man
agem
ent
aspe
cts
in t
he
PIP)
Stoc
ktak
ing
and
verif
icat
ion
of p
roje
ct in
form
atio
n M
OFP
ED/D
B
X
X
2
83,4
20
Busi
ness
pr
oces
s m
appi
ng
and
requ
irem
ents
an
alys
is
of
PIM
/PPP
sys
tem
M
OFP
ED/D
B
Phas
e tw
o of
the
IBP
lin
king
the
pre
-inve
stm
ent
phas
e to
im
plem
enta
tion,
iden
tific
atio
n an
d M
onito
ring
and
eval
uatio
n M
OFP
ED/D
B
X
X
7
72,7
10
Dev
elop
and
rol
l-out
of
Inte
grat
ed B
ank
of P
roje
cts
(IBP)
, co
mpl
ete
with
dat
a co
llect
ion
mod
ule
MO
FPED
/DB
X
4
12,8
60
3.1.
3 Ca
paci
ty s
tren
gthe
ned
for
proj
ect
cycl
e m
anag
emen
t of P
IM
Dia
gnos
tic
Stud
ies
in
sele
cted
se
ctor
s m
anag
ing
larg
e in
vest
men
t pro
ject
s M
OFP
ED/D
B
X
X
X
X
5
38,4
00
Dev
elop
gu
idel
ines
on
(in
cl.
finan
cial
ap
prai
sal,
impl
emen
tatio
n pl
anni
ng,
Mon
itorin
g an
d Ev
alua
tion
hand
book
for p
ublic
inve
stm
ents
)
MO
FPED
/DB
X
X
5
84,5
70
Sect
or S
peci
fic p
roje
ct p
repa
ratio
n an
d ap
prai
sal
man
uals
de
velo
ped
in li
aiso
n w
ith t
he P
AP D
epar
tmen
t to
str
engt
hen
PIM
s by
im
prov
ing
the
qual
ity a
nd r
eadi
ness
of
proj
ects
in
spec
ific
sect
ors(
the
tech
nica
l sec
reta
riat
of t
he D
evel
opm
ent
Com
mitt
ee);
MO
FPED
/DB
X
X
6
60,0
20
Stre
ngth
en
the
capa
city
an
d ro
le
of
the
Dev
elop
men
t Co
mm
ittee
(D
C) i
n un
dert
akin
g in
depe
nden
t pr
ojec
t re
view
an
d ap
prai
sal.
MO
FPED
/DB
X
X
X
X
2
09,8
00
Dev
elop
men
t of
Se
ctor
Sp
ecifi
c pr
ojec
t pr
epar
atio
n an
d ap
prai
sal m
anua
ls
Bui
ld
Capa
city
in
th
e en
tire
proj
ect
cycl
e (id
entif
icat
ion,
pr
epar
atio
n, a
ppra
isal,
impl
emen
tatio
n &
ex-
post
eva
luat
ion)
M
OFP
ED/D
B
X X
X
7
51,6
00
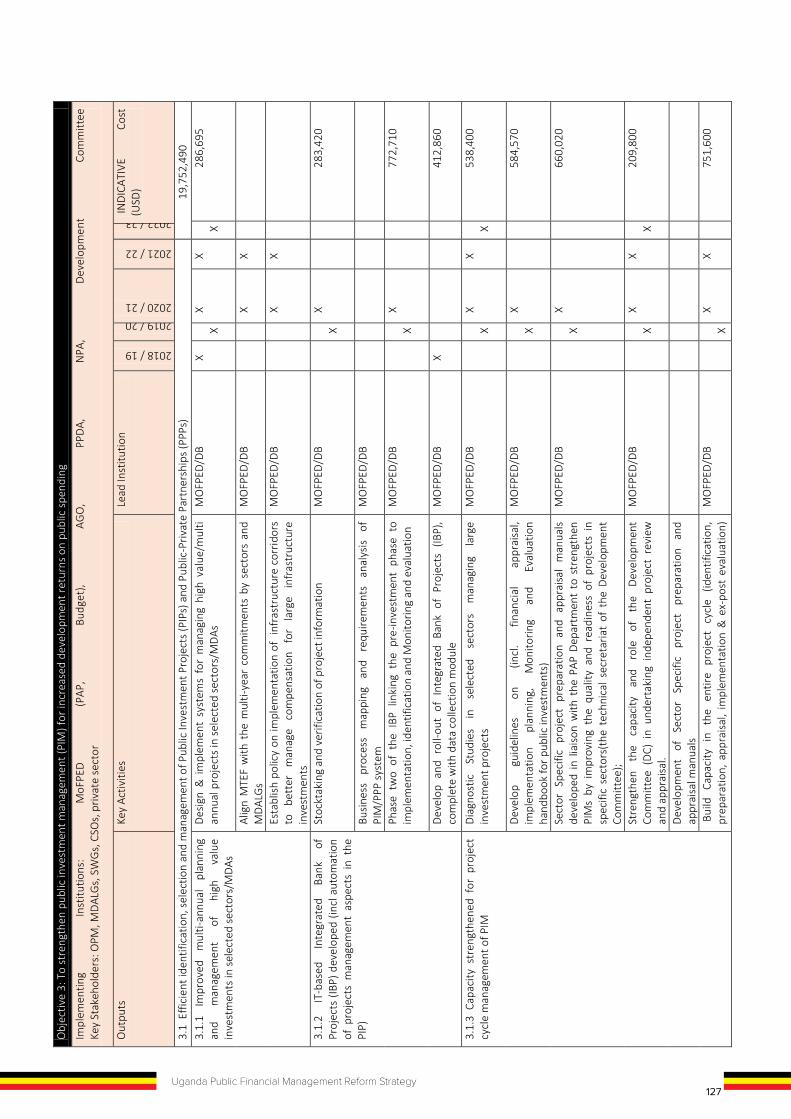
127Uganda Public Financial Management Reform Strategy
Obj
ectiv
e 2:
To
Enha
nce
Polic
y-Ba
sed
Budg
etin
g &
Pla
nnin
g fo
r Allo
cativ
e Ef
ficie
ncy
Impl
emen
ting
Inst
itutio
ns:
NPA
, M
oFPE
D (B
udge
t; D
EA-M
acro
); M
DAL
Gs
(Eco
nom
ists
) Ke
y St
akeh
olde
rs: O
PM, U
BOS,
LG
FC, C
SOs,
priv
ate
sect
or, M
oLG
Out
puts
Ke
y Ac
tiviti
es
Lead
Inst
itutio
n
2018 / 19
2019 / 20
2020 / 21
2021 / 22
2022 / 23
IND
ICAT
IVE
Cost
(USD
)
Publ
icat
ion
and
diss
emin
atio
n of
bud
get
docu
men
ts t
hat
are
in s
impl
e fo
rmat
s an
d ar
e us
er fr
iend
ly c
onta
inin
g sp
ecifi
c LG
an
nual
bud
get
estim
ates
and
per
form
ance
. Th
e do
cum
ents
sh
ould
tar
get
dive
rse
audi
ence
s. S
uch
docu
men
ts s
houl
d be
pu
blis
hed
in lo
cal l
angu
ages
.
MO
FPED
/DB
X X
48,0
00
Prov
isio
n of
ade
quat
e fin
anci
al, h
uman
and
logi
stic
al s
uppo
rt
need
ed
for
budg
et
tran
spar
ency
an
d ac
coun
tabi
lity
prog
ram
mes
as
part
of t
he d
eliv
ery
of th
e fu
nctio
n of
the
loca
l go
vern
men
t. Th
e in
itiat
ives
sh
ould
in
clud
e pu
blic
atio
ns,
web
site
s,
and
disp
lays
of
bu
dget
in
form
atio
n on
pu
blic
no
ticeb
oard
s, r
adio
and
TV
talk
sho
ws
and
othe
r fo
rms
of
med
ia e
ngag
emen
t.
MO
FPED
/DB
X X
90,0
00
Dev
elop
ing
and
sust
aini
ng m
echa
nism
s an
d ac
tions
that
allo
w
effe
ctiv
e ci
tizen
en
gage
men
t in
bu
dget
de
cisi
on-m
akin
g,
impl
emen
tatio
n an
d m
onito
ring;
enc
oura
ge c
itize
n fe
edba
ck
and
resp
onse
to
su
ch
feed
back
. Th
is
wou
ld
enha
nce
acco
unta
bilit
y fo
r pub
lic e
xpen
ditu
re.
MO
FPED
/DB
X
X X
10
0,00
0
Capa
city
bui
ldin
g of
acc
ount
ing
offic
ers
and
polic
y m
aker
s in
pr
omot
ing
budg
et t
rans
pare
ncy
and
acco
unta
bilit
y w
ith t
heir
sect
ors
or M
DAs
MO
FPED
/DB
X
X X
17
7,00
0
TOTA
L CO
ST
25
,475
,725
O
bjec
tive
3: T
o st
reng
then
pub
lic in
vest
men
t man
agem
ent (
PIM
) for
incr
ease
d de
velo
pmen
t ret
urns
on
publ
ic s
pend
ing
Impl
emen
ting
Inst
itutio
ns:
MoF
PED
(PAP
, Bu
dget
), AG
O,
PPD
A,
NPA
, D
evel
opm
ent
Com
mitt
ee
Key
Stak
ehol
ders
: OPM
, MD
ALG
s, S
WG
s, C
SOs,
priv
ate
sect
or
Out
puts
Ke
y Ac
tiviti
es
Lead
Inst
itutio
n
2018 / 19
2019 / 20 2020 / 21
2021 / 22
2022 / 23 IN
DIC
ATIV
E Co
st
(USD
)
3.1
Effi
cien
t ide
ntifi
catio
n, s
elec
tion
and
man
agem
ent o
f Pub
lic In
vest
men
t Pro
ject
s (P
IPs)
and
Pub
lic-P
rivat
e Pa
rtne
rshi
ps (P
PPs)
19
,752
,490
3.
1.1
Impr
oved
m
ulti-
annu
al
plan
ning
an
d m
anag
emen
t of
hi
gh
valu
e in
vest
men
ts in
sel
ecte
d se
ctor
s/M
DAs
Des
ign
& i
mpl
emen
t sy
stem
s fo
r m
anag
ing
high
val
ue/m
ulti
annu
al p
roje
cts
in s
elec
ted
sect
ors/
MD
As
MO
FPED
/DB
X
X
X
X
X
2
86,6
95
Alig
n M
TEF
with
the
mul
ti-ye
ar c
omm
itmen
ts b
y se
ctor
s an
d M
DAL
Gs
MO
FPED
/DB
X
X
Esta
blis
h po
licy
on im
plem
enta
tion
of i
nfra
stru
ctur
e co
rrid
ors
to
bett
er
man
age
com
pens
atio
n fo
r la
rge
infr
astr
uctu
re
inve
stm
ents
MO
FPED
/DB
X
X
3.1.
2 IT
-bas
ed
Inte
grat
ed
Bank
of
Pr
ojec
ts (I
BP) d
evel
oped
(inc
l aut
omat
ion
of p
roje
cts
man
agem
ent
aspe
cts
in t
he
PIP)
Stoc
ktak
ing
and
verif
icat
ion
of p
roje
ct in
form
atio
n M
OFP
ED/D
B
X
X
2
83,4
20
Busi
ness
pr
oces
s m
appi
ng
and
requ
irem
ents
an
alys
is
of
PIM
/PPP
sys
tem
M
OFP
ED/D
B
Phas
e tw
o of
the
IBP
lin
king
the
pre
-inve
stm
ent
phas
e to
im
plem
enta
tion,
iden
tific
atio
n an
d M
onito
ring
and
eval
uatio
n M
OFP
ED/D
B
X
X
7
72,7
10
Dev
elop
and
rol
l-out
of
Inte
grat
ed B
ank
of P
roje
cts
(IBP)
, co
mpl
ete
with
dat
a co
llect
ion
mod
ule
MO
FPED
/DB
X
4
12,8
60
3.1.
3 Ca
paci
ty s
tren
gthe
ned
for
proj
ect
cycl
e m
anag
emen
t of P
IM
Dia
gnos
tic
Stud
ies
in
sele
cted
se
ctor
s m
anag
ing
larg
e in
vest
men
t pro
ject
s M
OFP
ED/D
B
X
X
X
X
5
38,4
00
Dev
elop
gu
idel
ines
on
(in
cl.
finan
cial
ap
prai
sal,
impl
emen
tatio
n pl
anni
ng,
Mon
itorin
g an
d Ev
alua
tion
hand
book
for p
ublic
inve
stm
ents
)
MO
FPED
/DB
X
X
5
84,5
70
Sect
or S
peci
fic p
roje
ct p
repa
ratio
n an
d ap
prai
sal
man
uals
de
velo
ped
in li
aiso
n w
ith t
he P
AP D
epar
tmen
t to
str
engt
hen
PIM
s by
im
prov
ing
the
qual
ity a
nd r
eadi
ness
of
proj
ects
in
spec
ific
sect
ors(
the
tech
nica
l sec
reta
riat
of t
he D
evel
opm
ent
Com
mitt
ee);
MO
FPED
/DB
X
X
6
60,0
20
Stre
ngth
en
the
capa
city
an
d ro
le
of
the
Dev
elop
men
t Co
mm
ittee
(D
C) i
n un
dert
akin
g in
depe
nden
t pr
ojec
t re
view
an
d ap
prai
sal.
MO
FPED
/DB
X
X
X
X
2
09,8
00
Dev
elop
men
t of
Se
ctor
Sp
ecifi
c pr
ojec
t pr
epar
atio
n an
d ap
prai
sal m
anua
ls
Bui
ld
Capa
city
in
th
e en
tire
proj
ect
cycl
e (id
entif
icat
ion,
pr
epar
atio
n, a
ppra
isal,
impl
emen
tatio
n &
ex-
post
eva
luat
ion)
M
OFP
ED/D
B
X X
X
7
51,6
00
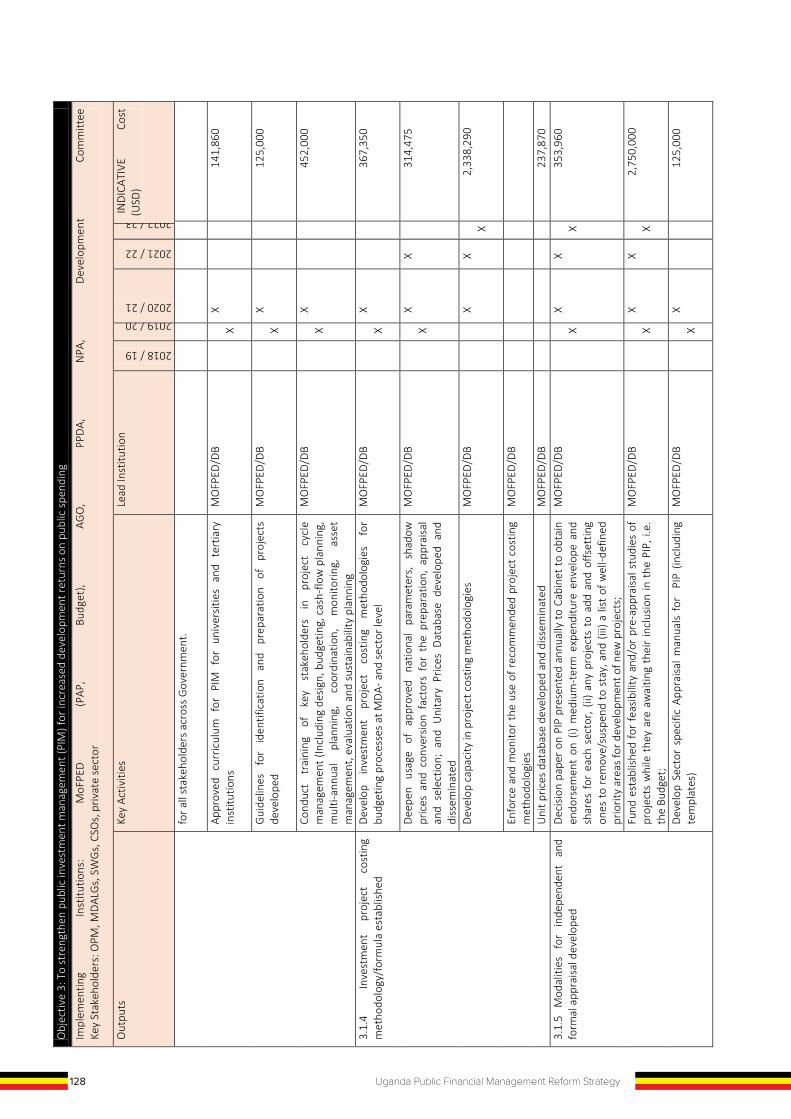
128 Uganda Public Financial Management Reform Strategy
Obj
ectiv
e 3:
To
stre
ngth
en p
ublic
inve
stm
ent m
anag
emen
t (PI
M) f
or in
crea
sed
deve
lopm
ent r
etur
ns o
n pu
blic
spe
ndin
g
Impl
emen
ting
Inst
itutio
ns:
MoF
PED
(PAP
, Bu
dget
), AG
O,
PPD
A,
NPA
, D
evel
opm
ent
Com
mitt
ee
Key
Stak
ehol
ders
: OPM
, MD
ALG
s, S
WG
s, C
SOs,
priv
ate
sect
or
Out
puts
Ke
y Ac
tiviti
es
Lead
Inst
itutio
n
2018 / 19
2019 / 20 2020 / 21
2021 / 22
2022 / 23 IN
DIC
ATIV
E Co
st
(USD
)
for a
ll st
akeh
olde
rs a
cros
s G
over
nmen
t.
Appr
oved
cur
ricul
um f
or P
IM f
or u
nive
rsiti
es a
nd t
ertia
ry
inst
itutio
ns
MO
FPED
/DB
X
X
1
41,8
60
Gui
delin
es
for
iden
tific
atio
n an
d pr
epar
atio
n of
pr
ojec
ts
deve
lope
d M
OFP
ED/D
B
X
X
1
25,0
00
Cond
uct
trai
ning
of
ke
y st
akeh
olde
rs
in
proj
ect
cycl
e m
anag
emen
t (In
clud
ing
desi
gn, b
udge
ting,
cas
h-flo
w p
lann
ing,
m
ulti-
annu
al
plan
ning
, co
ordi
natio
n,
mon
itorin
g,
asse
t m
anag
emen
t, ev
alua
tion
and
sust
aina
bilit
y pl
anni
ng
MO
FPED
/DB
X
X
4
52,0
00
3.1.
4
Inve
stm
ent
proj
ect
cost
ing
met
hodo
logy
/for
mul
a es
tabl
ishe
d D
evel
op
inve
stm
ent
proj
ect
cost
ing
met
hodo
logi
es
for
budg
etin
g pr
oces
ses
at M
DA-
and
sec
tor l
evel
M
OFP
ED/D
B
X
X
3
67,3
50
Dee
pen
usag
e of
ap
prov
ed
natio
nal
para
met
ers,
sh
adow
pr
ices
and
con
vers
ion
fact
ors
for
the
prep
arat
ion,
app
raisa
l an
d se
lect
ion;
and
Uni
tary
Pric
es D
atab
ase
deve
lope
d an
d di
ssem
inat
ed
MO
FPED
/DB
X
X
X
314
,475
Dev
elop
cap
acity
in p
roje
ct c
ostin
g m
etho
dolo
gies
M
OFP
ED/D
B
X
X
X
2,3
38,2
90
Enfo
rce
and
mon
itor
the
use
of r
ecom
men
ded
proj
ect
cost
ing
met
hodo
logi
es
MO
FPED
/DB
Uni
t pric
es d
atab
ase
deve
lope
d an
d di
ssem
inat
ed
MO
FPED
/DB
237
,870
3.
1.5
Mod
aliti
es
for
inde
pend
ent
and
form
al a
ppra
isal d
evel
oped
D
ecis
ion
pape
r on
PIP
pre
sent
ed a
nnua
lly to
Cab
inet
to o
btai
n en
dors
emen
t on
(i)
med
ium
-ter
m e
xpen
ditu
re e
nvel
ope
and
shar
es f
or e
ach
sect
or, (
ii) a
ny p
roje
cts
to a
dd a
nd o
ffset
ting
ones
to r
emov
e/su
spen
d to
sta
y, a
nd (i
ii) a
list
of w
ell-d
efin
ed
prio
rity
area
s fo
r dev
elop
men
t of n
ew p
roje
cts;
MO
FPED
/DB
X
X
X
X
3
53,9
60
Fund
est
ablis
hed
for
feas
ibili
ty a
nd/o
r pr
e-ap
prai
sal s
tudi
es o
f pr
ojec
ts w
hile
the
y ar
e aw
aitin
g th
eir
incl
usio
n in
the
PIP
, i.e
. th
e Bu
dget
;
MO
FPED
/DB
X
X
X
X
2,7
50,0
00
Dev
elop
Sec
tor
spec
ific
Appr
aisa
l man
uals
for
PI
P (in
clud
ing
tem
plat
es)
MO
FPED
/DB
X
X
1
25,0
00
Obj
ectiv
e 3:
To
stre
ngth
en p
ublic
inve
stm
ent m
anag
emen
t (PI
M) f
or in
crea
sed
deve
lopm
ent r
etur
ns o
n pu
blic
spe
ndin
g
Impl
emen
ting
Inst
itutio
ns:
MoF
PED
(PAP
, Bu
dget
), AG
O,
PPD
A,
NPA
, D
evel
opm
ent
Com
mitt
ee
Key
Stak
ehol
ders
: OPM
, MD
ALG
s, S
WG
s, C
SOs,
priv
ate
sect
or
Out
puts
Ke
y Ac
tiviti
es
Lead
Inst
itutio
n
2018 / 19
2019 / 20 2020 / 21
2021 / 22
2022 / 23 IN
DIC
ATIV
E Co
st
(USD
)
3.1.
6.
Gov
erna
nce
and
inst
itutio
nal
arra
ngem
ents
for
pro
ject
sel
ectio
n an
d ap
prai
sal s
tren
gthe
ned
Revi
ew a
nd e
valu
ate
inst
itutio
nal
arra
ngem
ents
for
pro
ject
ap
prai
sal e
.g. D
evel
opm
ent C
omm
ittee
and
Gui
delin
es
MO
FPED
/DB
X
X
5
06,0
50
Impl
emen
t act
ions
iden
tifie
d in
the
revi
ew
MO
FPED
/DB
X
X
X
X
3
08,4
00
3.1.
7.
Regu
lato
ry
and
inst
itutio
nal
fram
ewor
k fo
r m
anag
emen
t of
PP
Ps
stre
ngth
ened
;
Dia
gnos
tic
stud
y on
le
gal
fram
ewor
k an
d pr
opos
e en
hanc
emen
ts
MO
FPED
/DB
X
X
1
25,0
00
Impl
emen
t rec
omm
enda
tions
of d
iagn
ostic
stu
dy
MO
FPED
/DB
X
X
2
50,0
00
3.1.
8 Ca
paci
ty f
or m
anag
emen
t of
PPP
s st
reng
then
ed
Dia
gnos
tic
stud
y on
PP
P fr
amew
ork
(inst
itutio
nal
and
regu
lato
ry)
MO
FPED
/DB
X
X
1
25,0
00
3.1.
9 Ca
paci
ty fo
r ris
k as
sess
men
t of
PIP
s an
d PP
Ps s
tren
gthe
ned
Dev
elop
gui
delin
es a
nd p
roce
dure
s fo
r PI
P an
d PP
P fis
cal r
isk
man
agem
ent a
nd a
naly
sis
durin
g pr
ojec
t app
raisa
l M
OFP
ED/D
B
X
X
2
54,0
00
Trai
ning
fo
r in
PP
P fis
cal
risk
man
agem
ent
and
anal
ysis
(a
sses
smen
t for
thei
r im
plie
d fis
cal c
omm
itmen
ts a
nd ri
sks)
M
OFP
ED/D
B
X
X
1
45,0
00
3.1.
10 S
tren
gthe
ned
lega
l fra
mew
ork
for
PIM
G
uide
on
resp
onsi
bilit
ies
for
all s
take
hold
ers
with
in t
he P
IMS
clea
rly d
efin
ed (
Iden
tific
atio
n, m
appi
ng a
nd r
eeng
inee
ring
of
proc
esse
s in
the
PIM
sys
tem
, in
volv
ing
MD
As-S
WG
s, N
PA,
OPM
, MFP
ED a
nd D
C);
MO
FPED
/DB
X
X
X
200
,900
Inde
pend
ent
Revi
ew i
mpl
emen
tatio
n of
the
man
dato
ry 4
-ph
ase
proj
ect
life
cycl
e (1
. Id
entif
icat
ion
phas
e,
2.
Pre-
inve
stm
ent
phas
e, 3
.Inve
stm
ent
phas
e, 4
. O
pera
tion
and
ex-
post
pha
se);
for s
elec
ted
high
val
ue in
vest
men
t pro
ject
s
MO
FPED
/DB
X
X
4
50,0
00
Dev
elop
men
t of
the
Pub
lic I
nves
tmen
t M
anag
emen
t Po
licy,
in
clud
ing
unde
rtak
ing
a re
view
of
the
PPP
act
in o
rder
to
harm
onis
e th
e PI
MS
fram
ewor
k w
ith
the
PPP
lega
l &
re
gula
tory
fram
ewor
k.
MO
FPED
/DB
X
X
3,2
93,3
00
Dev
elop
im
plem
enta
tion
stra
tegy
an
d gu
idel
ines
fo
r op
erat
iona
lisat
ion
of th
e PI
M p
olic
y M
OFP
ED/D
B
X
157
,170
Revi
ew a
nd a
men
dmen
t of t
he P
FM a
nd P
PP A
ct
MO
FPED
/DB
X
X
2,2
31,7
90
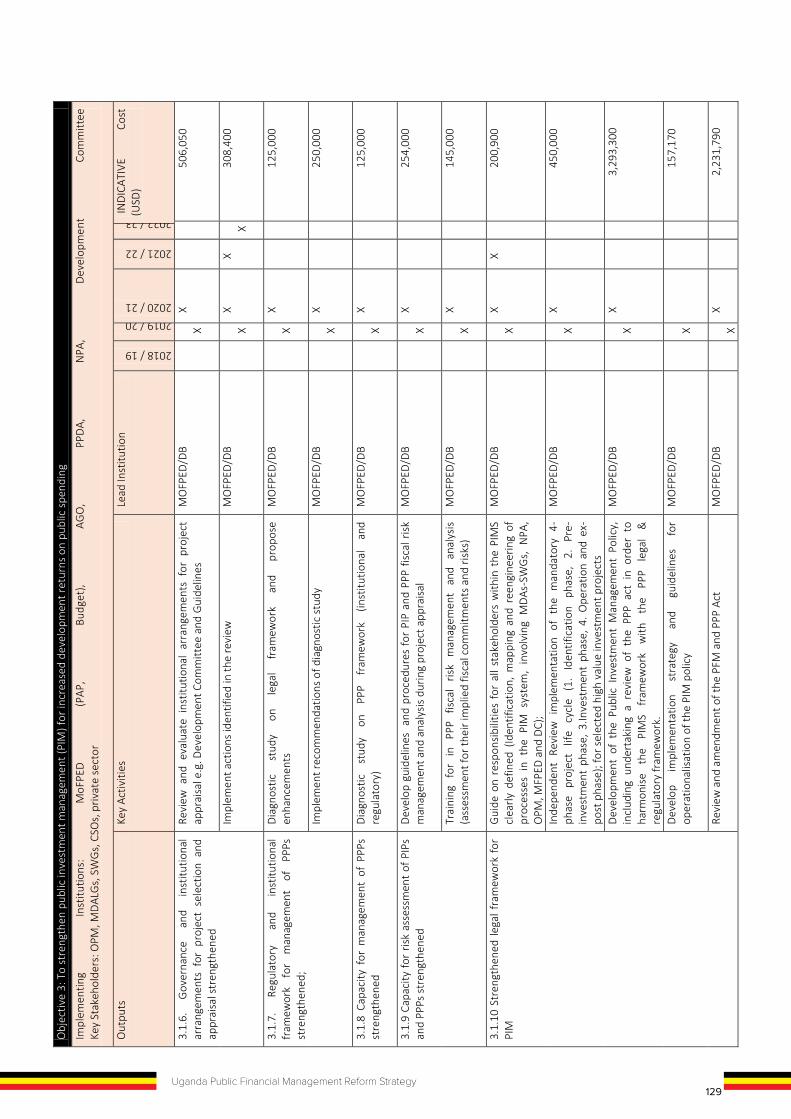
129Uganda Public Financial Management Reform Strategy
Obj
ectiv
e 3:
To
stre
ngth
en p
ublic
inve
stm
ent m
anag
emen
t (PI
M) f
or in
crea
sed
deve
lopm
ent r
etur
ns o
n pu
blic
spe
ndin
g
Impl
emen
ting
Inst
itutio
ns:
MoF
PED
(PAP
, Bu
dget
), AG
O,
PPD
A,
NPA
, D
evel
opm
ent
Com
mitt
ee
Key
Stak
ehol
ders
: OPM
, MD
ALG
s, S
WG
s, C
SOs,
priv
ate
sect
or
Out
puts
Ke
y Ac
tiviti
es
Lead
Inst
itutio
n
2018 / 19
2019 / 20 2020 / 21
2021 / 22
2022 / 23 IN
DIC
ATIV
E Co
st
(USD
)
for a
ll st
akeh
olde
rs a
cros
s G
over
nmen
t.
Appr
oved
cur
ricul
um f
or P
IM f
or u
nive
rsiti
es a
nd t
ertia
ry
inst
itutio
ns
MO
FPED
/DB
X
X
1
41,8
60
Gui
delin
es
for
iden
tific
atio
n an
d pr
epar
atio
n of
pr
ojec
ts
deve
lope
d M
OFP
ED/D
B
X
X
1
25,0
00
Cond
uct
trai
ning
of
ke
y st
akeh
olde
rs
in
proj
ect
cycl
e m
anag
emen
t (In
clud
ing
desi
gn, b
udge
ting,
cas
h-flo
w p
lann
ing,
m
ulti-
annu
al
plan
ning
, co
ordi
natio
n,
mon
itorin
g,
asse
t m
anag
emen
t, ev
alua
tion
and
sust
aina
bilit
y pl
anni
ng
MO
FPED
/DB
X
X
4
52,0
00
3.1.
4
Inve
stm
ent
proj
ect
cost
ing
met
hodo
logy
/for
mul
a es
tabl
ishe
d D
evel
op
inve
stm
ent
proj
ect
cost
ing
met
hodo
logi
es
for
budg
etin
g pr
oces
ses
at M
DA-
and
sec
tor l
evel
M
OFP
ED/D
B
X
X
3
67,3
50
Dee
pen
usag
e of
ap
prov
ed
natio
nal
para
met
ers,
sh
adow
pr
ices
and
con
vers
ion
fact
ors
for
the
prep
arat
ion,
app
raisa
l an
d se
lect
ion;
and
Uni
tary
Pric
es D
atab
ase
deve
lope
d an
d di
ssem
inat
ed
MO
FPED
/DB
X
X
X
314
,475
Dev
elop
cap
acity
in p
roje
ct c
ostin
g m
etho
dolo
gies
M
OFP
ED/D
B
X
X
X
2,3
38,2
90
Enfo
rce
and
mon
itor
the
use
of r
ecom
men
ded
proj
ect
cost
ing
met
hodo
logi
es
MO
FPED
/DB
Uni
t pric
es d
atab
ase
deve
lope
d an
d di
ssem
inat
ed
MO
FPED
/DB
237
,870
3.
1.5
Mod
aliti
es
for
inde
pend
ent
and
form
al a
ppra
isal d
evel
oped
D
ecis
ion
pape
r on
PIP
pre
sent
ed a
nnua
lly to
Cab
inet
to o
btai
n en
dors
emen
t on
(i)
med
ium
-ter
m e
xpen
ditu
re e
nvel
ope
and
shar
es f
or e
ach
sect
or, (
ii) a
ny p
roje
cts
to a
dd a
nd o
ffset
ting
ones
to r
emov
e/su
spen
d to
sta
y, a
nd (i
ii) a
list
of w
ell-d
efin
ed
prio
rity
area
s fo
r dev
elop
men
t of n
ew p
roje
cts;
MO
FPED
/DB
X
X
X
X
3
53,9
60
Fund
est
ablis
hed
for
feas
ibili
ty a
nd/o
r pr
e-ap
prai
sal s
tudi
es o
f pr
ojec
ts w
hile
the
y ar
e aw
aitin
g th
eir
incl
usio
n in
the
PIP
, i.e
. th
e Bu
dget
;
MO
FPED
/DB
X
X
X
X
2,7
50,0
00
Dev
elop
Sec
tor
spec
ific
Appr
aisa
l man
uals
for
PI
P (in
clud
ing
tem
plat
es)
MO
FPED
/DB
X
X
1
25,0
00
Obj
ectiv
e 3:
To
stre
ngth
en p
ublic
inve
stm
ent m
anag
emen
t (PI
M) f
or in
crea
sed
deve
lopm
ent r
etur
ns o
n pu
blic
spe
ndin
g
Impl
emen
ting
Inst
itutio
ns:
MoF
PED
(PAP
, Bu
dget
), AG
O,
PPD
A,
NPA
, D
evel
opm
ent
Com
mitt
ee
Key
Stak
ehol
ders
: OPM
, MD
ALG
s, S
WG
s, C
SOs,
priv
ate
sect
or
Out
puts
Ke
y Ac
tiviti
es
Lead
Inst
itutio
n
2018 / 19
2019 / 20 2020 / 21
2021 / 22
2022 / 23 IN
DIC
ATIV
E Co
st
(USD
)
3.1.
6.
Gov
erna
nce
and
inst
itutio
nal
arra
ngem
ents
for
pro
ject
sel
ectio
n an
d ap
prai
sal s
tren
gthe
ned
Revi
ew a
nd e
valu
ate
inst
itutio
nal
arra
ngem
ents
for
pro
ject
ap
prai
sal e
.g. D
evel
opm
ent C
omm
ittee
and
Gui
delin
es
MO
FPED
/DB
X
X
5
06,0
50
Impl
emen
t act
ions
iden
tifie
d in
the
revi
ew
MO
FPED
/DB
X
X
X
X
3
08,4
00
3.1.
7.
Regu
lato
ry
and
inst
itutio
nal
fram
ewor
k fo
r m
anag
emen
t of
PP
Ps
stre
ngth
ened
;
Dia
gnos
tic
stud
y on
le
gal
fram
ewor
k an
d pr
opos
e en
hanc
emen
ts
MO
FPED
/DB
X
X
1
25,0
00
Impl
emen
t rec
omm
enda
tions
of d
iagn
ostic
stu
dy
MO
FPED
/DB
X
X
2
50,0
00
3.1.
8 Ca
paci
ty f
or m
anag
emen
t of
PPP
s st
reng
then
ed
Dia
gnos
tic
stud
y on
PP
P fr
amew
ork
(inst
itutio
nal
and
regu
lato
ry)
MO
FPED
/DB
X
X
1
25,0
00
3.1.
9 Ca
paci
ty fo
r ris
k as
sess
men
t of
PIP
s an
d PP
Ps s
tren
gthe
ned
Dev
elop
gui
delin
es a
nd p
roce
dure
s fo
r PI
P an
d PP
P fis
cal r
isk
man
agem
ent a
nd a
naly
sis
durin
g pr
ojec
t app
raisa
l M
OFP
ED/D
B
X
X
2
54,0
00
Trai
ning
fo
r in
PP
P fis
cal
risk
man
agem
ent
and
anal
ysis
(a
sses
smen
t for
thei
r im
plie
d fis
cal c
omm
itmen
ts a
nd ri
sks)
M
OFP
ED/D
B
X
X
1
45,0
00
3.1.
10 S
tren
gthe
ned
lega
l fra
mew
ork
for
PIM
G
uide
on
resp
onsi
bilit
ies
for
all s
take
hold
ers
with
in t
he P
IMS
clea
rly d
efin
ed (
Iden
tific
atio
n, m
appi
ng a
nd r
eeng
inee
ring
of
proc
esse
s in
the
PIM
sys
tem
, in
volv
ing
MD
As-S
WG
s, N
PA,
OPM
, MFP
ED a
nd D
C);
MO
FPED
/DB
X
X
X
200
,900
Inde
pend
ent
Revi
ew i
mpl
emen
tatio
n of
the
man
dato
ry 4
-ph
ase
proj
ect
life
cycl
e (1
. Id
entif
icat
ion
phas
e,
2.
Pre-
inve
stm
ent
phas
e, 3
.Inve
stm
ent
phas
e, 4
. O
pera
tion
and
ex-
post
pha
se);
for s
elec
ted
high
val
ue in
vest
men
t pro
ject
s
MO
FPED
/DB
X
X
4
50,0
00
Dev
elop
men
t of
the
Pub
lic I
nves
tmen
t M
anag
emen
t Po
licy,
in
clud
ing
unde
rtak
ing
a re
view
of
the
PPP
act
in o
rder
to
harm
onis
e th
e PI
MS
fram
ewor
k w
ith
the
PPP
lega
l &
re
gula
tory
fram
ewor
k.
MO
FPED
/DB
X
X
3,2
93,3
00
Dev
elop
im
plem
enta
tion
stra
tegy
an
d gu
idel
ines
fo
r op
erat
iona
lisat
ion
of th
e PI
M p
olic
y M
OFP
ED/D
B
X
157
,170
Revi
ew a
nd a
men
dmen
t of t
he P
FM a
nd P
PP A
ct
MO
FPED
/DB
X
X
2,2
31,7
90
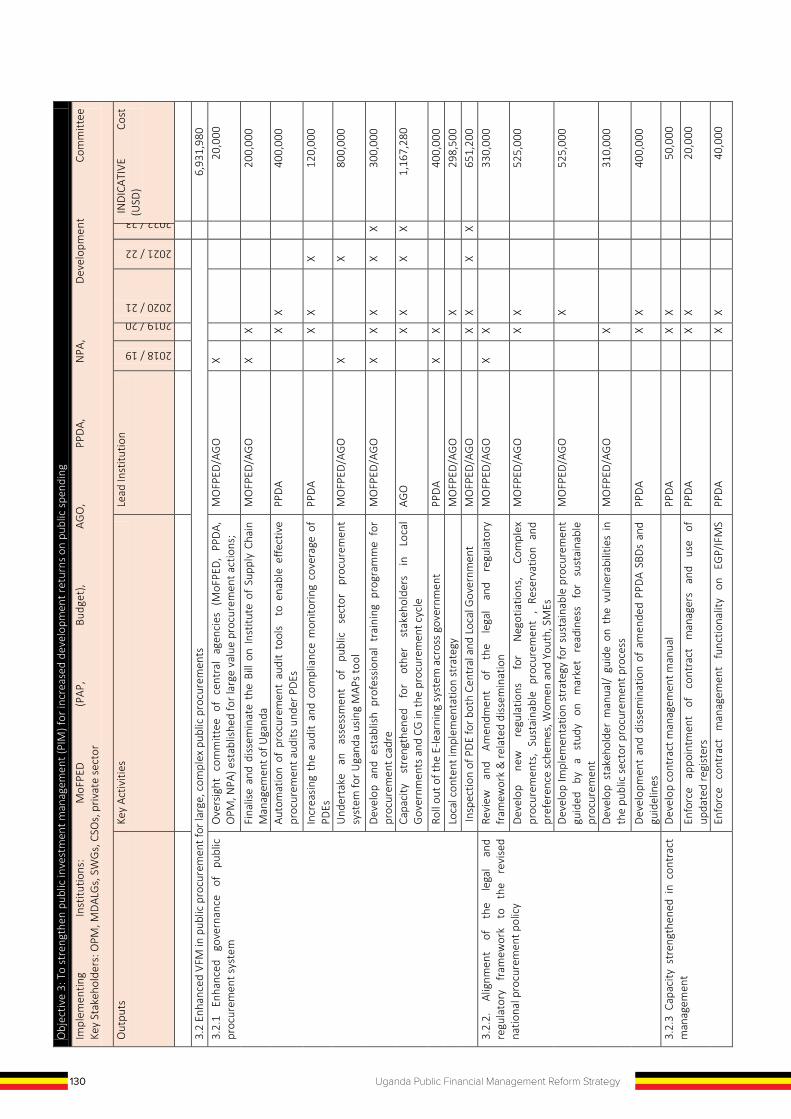
130 Uganda Public Financial Management Reform Strategy
Obj
ectiv
e 3:
To
stre
ngth
en p
ublic
inve
stm
ent m
anag
emen
t (PI
M) f
or in
crea
sed
deve
lopm
ent r
etur
ns o
n pu
blic
spe
ndin
g
Impl
emen
ting
Inst
itutio
ns:
MoF
PED
(PAP
, Bu
dget
), AG
O,
PPD
A,
NPA
, D
evel
opm
ent
Com
mitt
ee
Key
Stak
ehol
ders
: OPM
, MD
ALG
s, S
WG
s, C
SOs,
priv
ate
sect
or
Out
puts
Ke
y Ac
tiviti
es
Lead
Inst
itutio
n
2018 / 19
2019 / 20 2020 / 21
2021 / 22
2022 / 23 IN
DIC
ATIV
E Co
st
(USD
)
3.
2 En
hanc
ed V
FM in
pub
lic p
rocu
rem
ent f
or la
rge,
com
plex
pub
lic p
rocu
rem
ents
6,9
31,9
80
3.2.
1 En
hanc
ed
gove
rnan
ce
of
publ
ic
proc
urem
ent s
yste
m
Ove
rsig
ht c
omm
ittee
of
cent
ral
agen
cies
(M
oFPE
D,
PPDA
, O
PM, N
PA) e
stab
lishe
d fo
r lar
ge v
alue
pro
cure
men
t act
ions
; M
OFP
ED/A
GO
X
20,
000
Fina
lise
and
diss
emin
ate
the
Bill
on In
stitu
te o
f Su
pply
Cha
in
Man
agem
ent o
f Uga
nda
MO
FPED
/AG
O
X X
200
,000
Auto
mat
ion
of p
rocu
rem
ent
audi
t to
ols
to
enab
le e
ffect
ive
proc
urem
ent a
udits
und
er P
DEs
PP
DA
X
X
400
,000
Incr
easi
ng t
he a
udit
and
com
plia
nce
mon
itorin
g co
vera
ge o
f PD
Es
PPDA
X X
X
1
20,0
00
Und
erta
ke
an
asse
ssm
ent
of
publ
ic
sect
or
proc
urem
ent
syst
em fo
r Uga
nda
usin
g M
APs
tool
M
OFP
ED/A
GO
X
X
8
00,0
00
Dev
elop
and
est
ablis
h pr
ofes
sion
al t
rain
ing
prog
ram
me
for
proc
urem
ent c
adre
M
OFP
ED/A
GO
X
X X
X X
3
00,0
00
Capa
city
st
reng
then
ed
for
othe
r st
akeh
olde
rs
in
Loca
l G
over
nmen
ts a
nd C
G in
the
proc
urem
ent c
ycle
AG
O
X
X X
X
1
,167
,280
Roll
out o
f the
E-le
arni
ng s
yste
m a
cros
s go
vern
men
t PP
DA
X X
400
,000
Lo
cal c
onte
nt im
plem
enta
tion
stra
tegy
M
OFP
ED/A
GO
X
2
98,5
00
Insp
ectio
n of
PD
E fo
r bot
h Ce
ntra
l and
Loc
al G
over
nmen
t
M
OFP
ED/A
GO
X X
X X
6
51,2
00
3.2.
2.
Alig
nmen
t of
th
e le
gal
and
regu
lato
ry
fram
ewor
k to
th
e re
vise
d na
tiona
l pro
cure
men
t pol
icy
Revi
ew
and
Amen
dmen
t of
th
e le
gal
and
regu
lato
ry
fram
ewor
k &
rela
ted
diss
emin
atio
n M
OFP
ED/A
GO
X
X
3
30,0
00
Dev
elop
ne
w
regu
latio
ns
for
Neg
otia
tions
, Co
mpl
ex
proc
urem
ents
, Su
stai
nabl
e pr
ocur
emen
t ,
Rese
rvat
ion
and
pref
eren
ce s
chem
es, W
omen
and
You
th, S
MEs
MO
FPED
/AG
O
X
X
525
,000
Dev
elop
Impl
emen
tatio
n st
rate
gy fo
r sus
tain
able
pro
cure
men
t gu
ided
by
a
stud
y on
m
arke
t re
adin
ess
for
sust
aina
ble
proc
urem
ent
MO
FPED
/AG
O
X
525
,000
Dev
elop
sta
keho
lder
man
ual/
guid
e on
the
vul
nera
bilit
ies
in
the
publ
ic s
ecto
r pro
cure
men
t pro
cess
M
OFP
ED/A
GO
X
3
10,0
00
Dev
elop
men
t an
d di
ssem
inat
ion
of a
men
ded
PPDA
SBD
s an
d gu
idel
ines
PP
DA
X
X
400
,000
3.2.
3 Ca
paci
ty s
tren
gthe
ned
in c
ontr
act
man
agem
ent
Dev
elop
con
trac
t man
agem
ent m
anua
l PP
DA
X
X
5
0,00
0
Enfo
rce
appo
intm
ent
of
cont
ract
m
anag
ers
and
use
of
upda
ted
regi
ster
s PP
DA
X
X
2
0,00
0
Enfo
rce
cont
ract
m
anag
emen
t fu
nctio
nalit
y on
EG
P/IF
MS
PPDA
X X
40,
000
Obj
ectiv
e 3:
To
stre
ngth
en p
ublic
inve
stm
ent m
anag
emen
t (PI
M) f
or in
crea
sed
deve
lopm
ent r
etur
ns o
n pu
blic
spe
ndin
g
Impl
emen
ting
Inst
itutio
ns:
MoF
PED
(PAP
, Bu
dget
), AG
O,
PPD
A,
NPA
, D
evel
opm
ent
Com
mitt
ee
Key
Stak
ehol
ders
: OPM
, MD
ALG
s, S
WG
s, C
SOs,
priv
ate
sect
or
Out
puts
Ke
y Ac
tiviti
es
Lead
Inst
itutio
n
2018 / 19
2019 / 20 2020 / 21
2021 / 22
2022 / 23 IN
DIC
ATIV
E Co
st
(USD
)
(inte
grat
ed)
Trai
ning
of s
elec
ted
MD
As in
con
trac
t man
agem
ent
PPDA
X X
1
50,0
00
3.2.
4 Im
prov
ed p
rocu
rem
ent
mon
itorin
g fo
r m
anag
ing
larg
e an
d co
mpl
ex
proc
urem
ents
in s
elec
ted
sect
ors/
MD
As
Intr
oduc
e in
depe
nden
t pa
ralle
l bid
eva
luat
ion
(IPBE
M) i
n hi
gh
spen
d se
ctor
s fo
r str
ateg
ic/c
ompl
ex p
rocu
rem
ents
PP
DA
X
X X
12
0,00
0.00
Capa
city
str
engt
hene
d fo
r IPB
EM
PPDA
X X
X
80,
000.
00
Dev
elop
gui
delin
es a
nd m
anua
ls fo
r IPB
EM
PPDA
X X
X
25,
000.
00
3.3
Opt
imal
Util
isat
ion
and
Mai
nten
ance
of A
sset
s
2,8
51,0
00
3.3.
1 Pu
blic
As
set
Man
agem
ent
Polic
y (fi
nanc
ial
and
non-
finan
cial
) fr
amew
ork
deve
lope
d
Base
line
stud
y of
ass
et m
anag
emen
t sy
stem
(no
n-fin
anci
al
asse
ts)
MO
FPED
/AG
O
X X
200
,000
Dev
elop
pub
lic a
sset
man
agem
ent p
olic
y (n
on-fi
nanc
ial a
sset
s)
MO
FPED
/AG
O
X X
150
,000
Und
erta
ke a
sco
ping
stu
dy o
n Fi
nanc
ial a
sset
and
inve
stm
ent
to e
stab
lish
curr
ent p
ract
ices
and
rela
ted
gaps
M
OFP
ED/A
GO
X
X
1
00,0
00
Und
erta
ke b
ench
mar
king
stu
dy o
n as
set
man
agem
ent
in
publ
ic s
ecto
r M
OFP
ED/A
GO
X
1
50,0
00
Dev
elop
fin
anci
al a
sset
man
agem
ent
polic
y, i
mpl
emen
tatio
n st
rate
gy a
nd g
uide
lines
M
OFP
ED/A
GO
X
X
1
10,0
00
Dev
elop
a g
over
nmen
t inv
estm
ent p
olic
y, r
elat
ed s
trat
egy
and
guid
elin
es
MO
FPED
/AG
O
X X
135
,000
Dev
elop
an
d im
plem
ent
a go
vern
ance
fr
amew
ork
and
guid
elin
es fo
r pub
lic c
orpo
ratio
ns a
nd s
tate
ow
ned
ente
rpris
es
(incl
udin
g re
port
ing
mec
hani
sms
e.g.
web
site
with
a p
ublis
hed
list o
f SO
Es, i
nfor
mat
ion
on th
e as
sets
, inc
ome,
and
num
ber o
f em
ploy
ees)
MO
FPED
/AG
O
X
X
8
0,00
0
3.3.
2 G
uide
lines
on
pu
blic
as
set
oper
atio
n an
d m
aint
enan
ce d
evel
oped
Bu
sine
ss p
roce
ss m
appi
ng a
nd r
equi
rem
ents
ana
lysi
s fo
r fix
ed
asse
ts
MO
FPED
/AG
O
X
X
1
5,00
0
Dev
elop
ass
et o
pera
tion
and
mai
nten
ance
gui
delin
es
MO
FPED
/AG
O
X
X
225
,000
Esta
blis
h a
fram
ewor
k fo
r m
onito
ring,
ev
alua
tion
and
repo
rtin
g on
gov
ernm
ent
asse
ts (I
nclu
ding
ass
et m
anag
emen
t m
onito
ring
bala
nce
scor
e ca
rd)
MO
FPED
/AG
O
X
X
176
,000
Revi
ew o
f sta
ffing
nor
ms
for i
nven
tory
man
agem
ent c
adre
M
OFP
ED/A
GO
X
X
30,
000
3.3.
3 N
on-c
urre
nt
asse
ts
polic
y op
erat
iona
lised
D
esig
n an
d Pi
lot
the
IFM
S in
vent
ory
man
agem
ent
mod
ule
in
sele
cted
MD
As a
nd L
Gs
MO
FPED
/AG
O
X X
800
,000
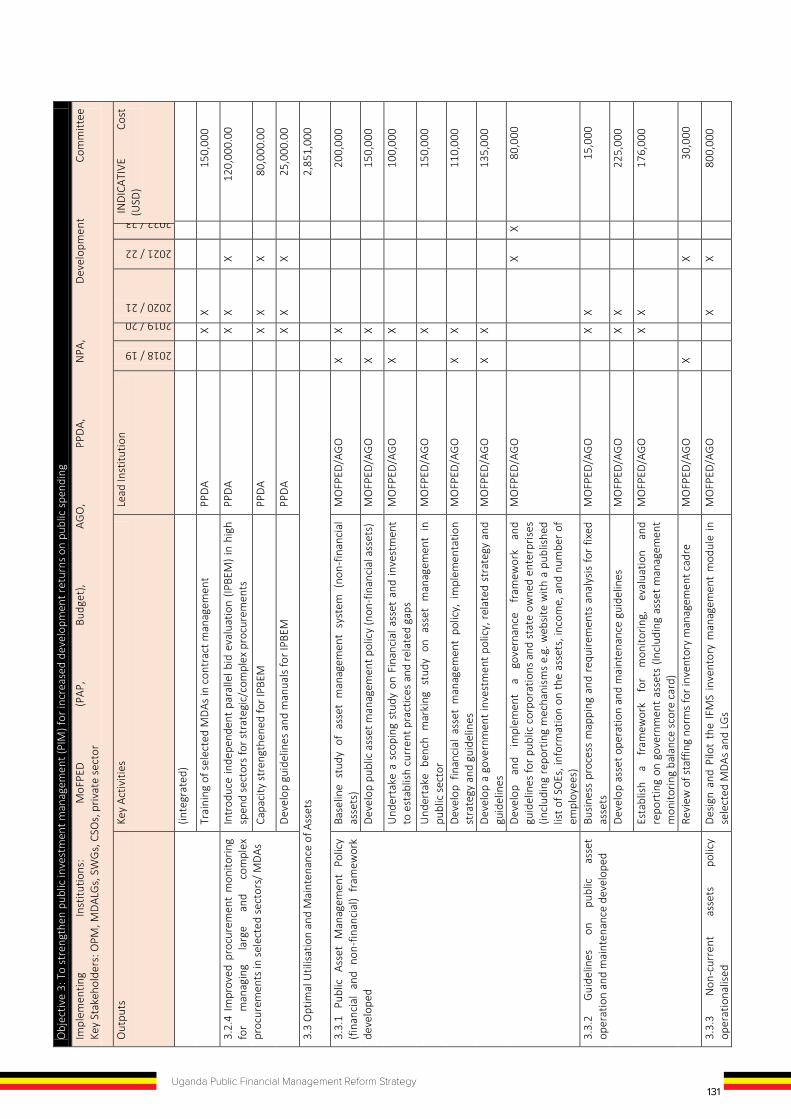
131Uganda Public Financial Management Reform Strategy
Obj
ectiv
e 3:
To
stre
ngth
en p
ublic
inve
stm
ent m
anag
emen
t (PI
M) f
or in
crea
sed
deve
lopm
ent r
etur
ns o
n pu
blic
spe
ndin
g
Impl
emen
ting
Inst
itutio
ns:
MoF
PED
(PAP
, Bu
dget
), AG
O,
PPD
A,
NPA
, D
evel
opm
ent
Com
mitt
ee
Key
Stak
ehol
ders
: OPM
, MD
ALG
s, S
WG
s, C
SOs,
priv
ate
sect
or
Out
puts
Ke
y Ac
tiviti
es
Lead
Inst
itutio
n
2018 / 19
2019 / 20 2020 / 21
2021 / 22
2022 / 23 IN
DIC
ATIV
E Co
st
(USD
)
3.
2 En
hanc
ed V
FM in
pub
lic p
rocu
rem
ent f
or la
rge,
com
plex
pub
lic p
rocu
rem
ents
6,9
31,9
80
3.2.
1 En
hanc
ed
gove
rnan
ce
of
publ
ic
proc
urem
ent s
yste
m
Ove
rsig
ht c
omm
ittee
of
cent
ral
agen
cies
(M
oFPE
D,
PPDA
, O
PM, N
PA) e
stab
lishe
d fo
r lar
ge v
alue
pro
cure
men
t act
ions
; M
OFP
ED/A
GO
X
20,
000
Fina
lise
and
diss
emin
ate
the
Bill
on In
stitu
te o
f Su
pply
Cha
in
Man
agem
ent o
f Uga
nda
MO
FPED
/AG
O
X X
200
,000
Auto
mat
ion
of p
rocu
rem
ent
audi
t to
ols
to
enab
le e
ffect
ive
proc
urem
ent a
udits
und
er P
DEs
PP
DA
X
X
400
,000
Incr
easi
ng t
he a
udit
and
com
plia
nce
mon
itorin
g co
vera
ge o
f PD
Es
PPDA
X X
X
1
20,0
00
Und
erta
ke
an
asse
ssm
ent
of
publ
ic
sect
or
proc
urem
ent
syst
em fo
r Uga
nda
usin
g M
APs
tool
M
OFP
ED/A
GO
X
X
8
00,0
00
Dev
elop
and
est
ablis
h pr
ofes
sion
al t
rain
ing
prog
ram
me
for
proc
urem
ent c
adre
M
OFP
ED/A
GO
X
X X
X X
3
00,0
00
Capa
city
st
reng
then
ed
for
othe
r st
akeh
olde
rs
in
Loca
l G
over
nmen
ts a
nd C
G in
the
proc
urem
ent c
ycle
AG
O
X
X X
X
1
,167
,280
Roll
out o
f the
E-le
arni
ng s
yste
m a
cros
s go
vern
men
t PP
DA
X X
400
,000
Lo
cal c
onte
nt im
plem
enta
tion
stra
tegy
M
OFP
ED/A
GO
X
2
98,5
00
Insp
ectio
n of
PD
E fo
r bot
h Ce
ntra
l and
Loc
al G
over
nmen
t
M
OFP
ED/A
GO
X X
X X
6
51,2
00
3.2.
2.
Alig
nmen
t of
th
e le
gal
and
regu
lato
ry
fram
ewor
k to
th
e re
vise
d na
tiona
l pro
cure
men
t pol
icy
Revi
ew
and
Amen
dmen
t of
th
e le
gal
and
regu
lato
ry
fram
ewor
k &
rela
ted
diss
emin
atio
n M
OFP
ED/A
GO
X
X
3
30,0
00
Dev
elop
ne
w
regu
latio
ns
for
Neg
otia
tions
, Co
mpl
ex
proc
urem
ents
, Su
stai
nabl
e pr
ocur
emen
t ,
Rese
rvat
ion
and
pref
eren
ce s
chem
es, W
omen
and
You
th, S
MEs
MO
FPED
/AG
O
X
X
525
,000
Dev
elop
Impl
emen
tatio
n st
rate
gy fo
r sus
tain
able
pro
cure
men
t gu
ided
by
a
stud
y on
m
arke
t re
adin
ess
for
sust
aina
ble
proc
urem
ent
MO
FPED
/AG
O
X
525
,000
Dev
elop
sta
keho
lder
man
ual/
guid
e on
the
vul
nera
bilit
ies
in
the
publ
ic s
ecto
r pro
cure
men
t pro
cess
M
OFP
ED/A
GO
X
3
10,0
00
Dev
elop
men
t an
d di
ssem
inat
ion
of a
men
ded
PPDA
SBD
s an
d gu
idel
ines
PP
DA
X
X
400
,000
3.2.
3 Ca
paci
ty s
tren
gthe
ned
in c
ontr
act
man
agem
ent
Dev
elop
con
trac
t man
agem
ent m
anua
l PP
DA
X
X
5
0,00
0
Enfo
rce
appo
intm
ent
of
cont
ract
m
anag
ers
and
use
of
upda
ted
regi
ster
s PP
DA
X
X
2
0,00
0
Enfo
rce
cont
ract
m
anag
emen
t fu
nctio
nalit
y on
EG
P/IF
MS
PPDA
X X
40,
000
Obj
ectiv
e 3:
To
stre
ngth
en p
ublic
inve
stm
ent m
anag
emen
t (PI
M) f
or in
crea
sed
deve
lopm
ent r
etur
ns o
n pu
blic
spe
ndin
g
Impl
emen
ting
Inst
itutio
ns:
MoF
PED
(PAP
, Bu
dget
), AG
O,
PPD
A,
NPA
, D
evel
opm
ent
Com
mitt
ee
Key
Stak
ehol
ders
: OPM
, MD
ALG
s, S
WG
s, C
SOs,
priv
ate
sect
or
Out
puts
Ke
y Ac
tiviti
es
Lead
Inst
itutio
n
2018 / 19
2019 / 20 2020 / 21
2021 / 22
2022 / 23 IN
DIC
ATIV
E Co
st
(USD
)
(inte
grat
ed)
Trai
ning
of s
elec
ted
MD
As in
con
trac
t man
agem
ent
PPDA
X X
1
50,0
00
3.2.
4 Im
prov
ed p
rocu
rem
ent
mon
itorin
g fo
r m
anag
ing
larg
e an
d co
mpl
ex
proc
urem
ents
in s
elec
ted
sect
ors/
MD
As
Intr
oduc
e in
depe
nden
t pa
ralle
l bid
eva
luat
ion
(IPBE
M) i
n hi
gh
spen
d se
ctor
s fo
r str
ateg
ic/c
ompl
ex p
rocu
rem
ents
PP
DA
X
X X
12
0,00
0.00
Capa
city
str
engt
hene
d fo
r IPB
EM
PPDA
X X
X
80,
000.
00
Dev
elop
gui
delin
es a
nd m
anua
ls fo
r IPB
EM
PPDA
X X
X
25,
000.
00
3.3
Opt
imal
Util
isat
ion
and
Mai
nten
ance
of A
sset
s
2,8
51,0
00
3.3.
1 Pu
blic
As
set
Man
agem
ent
Polic
y (fi
nanc
ial
and
non-
finan
cial
) fr
amew
ork
deve
lope
d
Base
line
stud
y of
ass
et m
anag
emen
t sy
stem
(no
n-fin
anci
al
asse
ts)
MO
FPED
/AG
O
X X
200
,000
Dev
elop
pub
lic a
sset
man
agem
ent p
olic
y (n
on-fi
nanc
ial a
sset
s)
MO
FPED
/AG
O
X X
150
,000
Und
erta
ke a
sco
ping
stu
dy o
n Fi
nanc
ial a
sset
and
inve
stm
ent
to e
stab
lish
curr
ent p
ract
ices
and
rela
ted
gaps
M
OFP
ED/A
GO
X
X
1
00,0
00
Und
erta
ke b
ench
mar
king
stu
dy o
n as
set
man
agem
ent
in
publ
ic s
ecto
r M
OFP
ED/A
GO
X
1
50,0
00
Dev
elop
fin
anci
al a
sset
man
agem
ent
polic
y, i
mpl
emen
tatio
n st
rate
gy a
nd g
uide
lines
M
OFP
ED/A
GO
X
X
1
10,0
00
Dev
elop
a g
over
nmen
t inv
estm
ent p
olic
y, r
elat
ed s
trat
egy
and
guid
elin
es
MO
FPED
/AG
O
X X
135
,000
Dev
elop
an
d im
plem
ent
a go
vern
ance
fr
amew
ork
and
guid
elin
es fo
r pub
lic c
orpo
ratio
ns a
nd s
tate
ow
ned
ente
rpris
es
(incl
udin
g re
port
ing
mec
hani
sms
e.g.
web
site
with
a p
ublis
hed
list o
f SO
Es, i
nfor
mat
ion
on th
e as
sets
, inc
ome,
and
num
ber o
f em
ploy
ees)
MO
FPED
/AG
O
X
X
8
0,00
0
3.3.
2 G
uide
lines
on
pu
blic
as
set
oper
atio
n an
d m
aint
enan
ce d
evel
oped
Bu
sine
ss p
roce
ss m
appi
ng a
nd r
equi
rem
ents
ana
lysi
s fo
r fix
ed
asse
ts
MO
FPED
/AG
O
X
X
1
5,00
0
Dev
elop
ass
et o
pera
tion
and
mai
nten
ance
gui
delin
es
MO
FPED
/AG
O
X
X
225
,000
Esta
blis
h a
fram
ewor
k fo
r m
onito
ring,
ev
alua
tion
and
repo
rtin
g on
gov
ernm
ent
asse
ts (I
nclu
ding
ass
et m
anag
emen
t m
onito
ring
bala
nce
scor
e ca
rd)
MO
FPED
/AG
O
X
X
176
,000
Revi
ew o
f sta
ffing
nor
ms
for i
nven
tory
man
agem
ent c
adre
M
OFP
ED/A
GO
X
X
30,
000
3.3.
3 N
on-c
urre
nt
asse
ts
polic
y op
erat
iona
lised
D
esig
n an
d Pi
lot
the
IFM
S in
vent
ory
man
agem
ent
mod
ule
in
sele
cted
MD
As a
nd L
Gs
MO
FPED
/AG
O
X X
800
,000
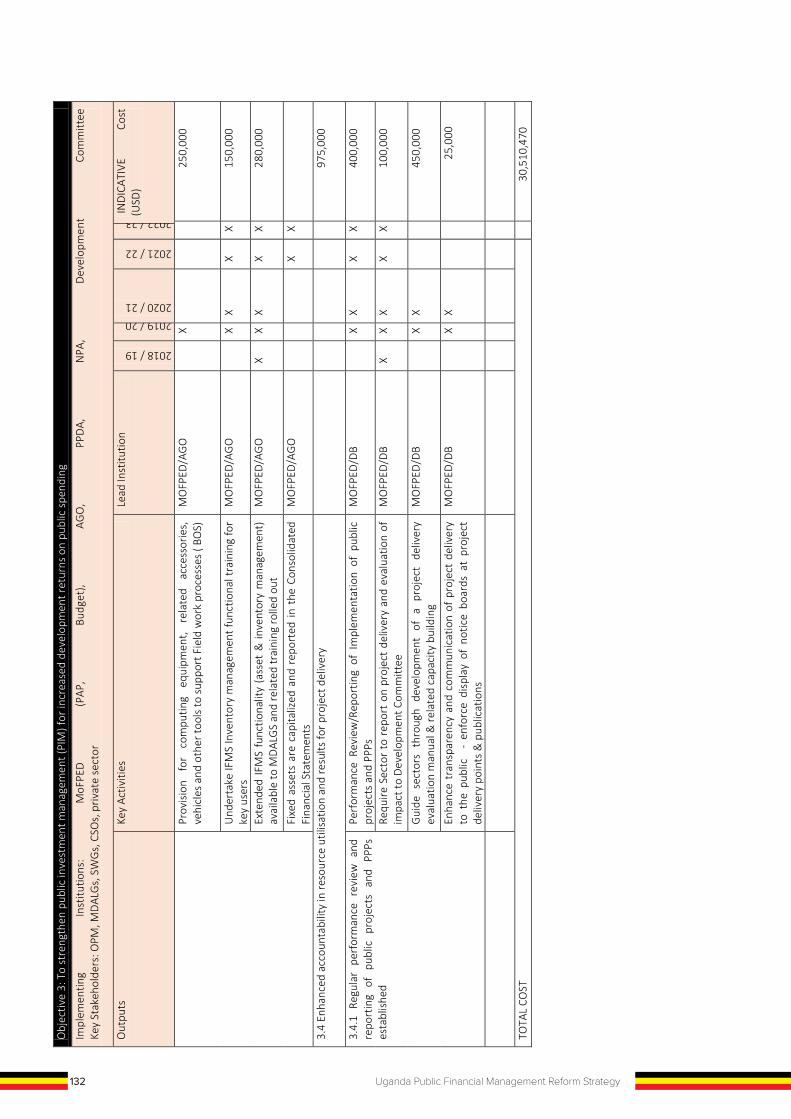
132 Uganda Public Financial Management Reform Strategy
Obj
ectiv
e 3:
To
stre
ngth
en p
ublic
inve
stm
ent m
anag
emen
t (PI
M) f
or in
crea
sed
deve
lopm
ent r
etur
ns o
n pu
blic
spe
ndin
g
Impl
emen
ting
Inst
itutio
ns:
MoF
PED
(PAP
, Bu
dget
), AG
O,
PPD
A,
NPA
, D
evel
opm
ent
Com
mitt
ee
Key
Stak
ehol
ders
: OPM
, MD
ALG
s, S
WG
s, C
SOs,
priv
ate
sect
or
Out
puts
Ke
y Ac
tiviti
es
Lead
Inst
itutio
n
2018 / 19
2019 / 20 2020 / 21
2021 / 22
2022 / 23 IN
DIC
ATIV
E Co
st
(USD
)
Prov
isio
n fo
r co
mpu
ting
equi
pmen
t, re
late
d ac
cess
orie
s,
vehi
cles
and
oth
er to
ols
to s
uppo
rt F
ield
wor
k pr
oces
ses
( BO
S)
MO
FPED
/AG
O
X
250
,000
Und
erta
ke IF
MS
Inve
ntor
y m
anag
emen
t fun
ctio
nal t
rain
ing
for
key
user
s M
OFP
ED/A
GO
X X
X X
1
50,0
00
Exte
nded
IFM
S fu
nctio
nalit
y (a
sset
& in
vent
ory
man
agem
ent)
av
aila
ble
to M
DAL
GS
and
rela
ted
trai
ning
rolle
d ou
t M
OFP
ED/A
GO
X
X X
X X
2
80,0
00
Fixe
d as
sets
are
cap
italiz
ed a
nd r
epor
ted
in t
he C
onso
lidat
ed
Fina
ncia
l Sta
tem
ents
M
OFP
ED/A
GO
X X
3.4
Enha
nced
acc
ount
abili
ty in
reso
urce
util
isat
ion
and
resu
lts fo
r pro
ject
del
iver
y
975
,000
3.4.
1 Re
gula
r pe
rfor
man
ce r
evie
w a
nd
repo
rtin
g of
pu
blic
pr
ojec
ts
and
PPPs
es
tabl
ishe
d
Perf
orm
ance
Rev
iew
/Rep
ortin
g of
Im
plem
enta
tion
of p
ublic
pr
ojec
ts a
nd P
PPs
MO
FPED
/DB
X
X X
X
400
,000
Requ
ire S
ecto
r to
rep
ort
on p
roje
ct d
eliv
ery
and
eval
uatio
n of
im
pact
to D
evel
opm
ent C
omm
ittee
M
OFP
ED/D
B X
X X
X X
1
00,0
00
Gui
de s
ecto
rs t
hrou
gh d
evel
opm
ent
of a
pro
ject
del
iver
y ev
alua
tion
man
ual &
rela
ted
capa
city
bui
ldin
g M
OFP
ED/D
B
X X
4
50,0
00
Enha
nce
tran
spar
ency
and
com
mun
icat
ion
of p
roje
ct d
eliv
ery
to t
he p
ublic
-
enfo
rce
disp
lay
of n
otic
e bo
ards
at
proj
ect
deliv
ery
poin
ts &
pub
licat
ions
MO
FPED
/DB
X
X
2
5,00
0
TOTA
L CO
ST
30
,510
,470
O
bjec
tive
4: T
o st
reng
then
the
effe
ctiv
enes
s of
acc
ount
abili
ty s
yste
ms
and
com
plia
nce
in b
udge
t exe
cutio
n Im
plem
entin
g In
stitu
tions
: M
oFPE
D (B
udge
t, Ai
d,
Deb
t),
AGO
, M
oLG
, M
DAL
Gs,
PP
DA,
MoP
S
Key
Stak
ehol
ders
: NIT
A-U
, URA
, BoU
O
utpu
ts
Key
Activ
ities
Le
ad In
stitu
tion
2018 / 19
2019 / 20
2020 / 21
2021 / 22
2022 / 23
IND
ICAT
IVE
Cost
(USD
)
4.1
Effe
ctiv
enes
s an
d ac
cura
cy o
f pub
lic p
ayro
ll an
d pe
nsio
n m
anag
emen
t sys
tem
s in
crea
sed
26
,743
,686
4.
1.1
HCM
rolle
d ou
t to
MD
ALG
s Im
plem
ent H
CM R
ollo
ut w
ork
plan
/roa
dmap
M
oPS
X
X X
7,84
7,11
2
Inte
grat
e H
CM w
ith o
ther
ad
ditio
nal
Gov
ernm
ent
syst
ems
(Pen
sion
Fund
Info
rmat
ion
Syst
em -
PFIS
) M
oPS
X
X
14
8,30
8
Impl
emen
t H
CM a
nd i
nteg
rate
with
key
Gov
ernm
ent
ICT
syst
ems
(IFM
S, P
BS, N
SIS,
NSS
F,PD
MS,
EDM
S)
MoP
S
X
9,
419,
612
U
nder
take
HCM
Pos
t im
plem
enta
tion
revi
ew
MoP
S
X X
X X
4,
345,
334
Im
plem
ent B
ackl
og R
evie
ws/
Chan
ge R
eque
sts
MoP
S
X X
X X
979,
800
Ro
llout
HCM
to n
ewly
est
ablis
hed
vote
s M
oPS
X
X X
42
5,44
0
Und
erta
ke T
echn
ical
, Fun
ctio
nal a
nd E
nd-U
ser
Trai
ning
acr
oss
MD
ALG
s M
oPS
X
X X
1,89
8,04
0
Cond
uct
Tech
nica
l and
Fun
ctio
nal
Sup
port
clin
ics
to s
usta
in
adop
tion
and
utili
zatio
n of
au
tom
ated
H
R fu
nctio
ns
at
MD
ALG
s
MoP
S
X X
X X
1,
430,
040
Skill
s de
velo
pmen
t in
pens
ions
and
pay
roll
audi
ts
MoP
S
X
100,
000
Bu
ild c
apac
ity o
f st
akeh
olde
rs/M
ALG
s -
dece
ntra
lised
pay
roll
and
pens
ion
man
agem
ent
MoP
S X
X
150,
000
4.
2 Co
mpr
ehen
sive
ness
and
qua
lity
of fi
nanc
ial R
epor
ting
11
,291
,787
4.
2.1
Enha
nced
pr
ofes
sion
aliz
atio
n of
ac
coun
ting,
Pr
ocur
emen
t &
IT
ca
dre
in M
DAL
Gs
Dev
elop
pro
fess
iona
l tra
inin
g pr
ogra
mm
es &
impl
emen
tatio
n ar
rang
emen
ts
MO
FPED
/AG
O
X X
X X
X
10
0,00
0
Impl
emen
t IT/
IS p
rofe
ssio
nal t
rain
ing
prog
ram
mes
M
OFP
ED/A
GO
X
X X
X X
4,
224,
200
Im
plem
ent
Acco
untin
g/Au
dit
prof
essi
onal
tr
aini
ng
prog
ram
mes
and
oth
er tr
aini
ng p
rogr
amm
es
MO
FPED
/AG
O
X X
X X
X
36
8,00
0
Impl
emen
t Pr
ocur
emen
t/In
vent
ory
Man
agem
ent
prof
essi
onal
tr
aini
ng p
rogr
amm
es
MO
FPED
/AG
O
X X
X X
X
19
3,20
0
Und
erta
ke T
race
r st
udie
s fo
r se
lect
ed S
tudy
coh
orts
to a
sses
s im
pact
of
le
arni
ng
on
impr
ovem
ents
in
go
vern
ance
an
d se
rvic
es d
eliv
ered
MO
FPED
/AG
O
X
X
45,4
00
Equi
ppin
g In
-hou
se t
rain
ing
faci
lity
and
enha
ncem
ent
of t
he
AGO
Lib
rary
M
OFP
ED/A
GO
X X
X
210,
000
133Uganda Public Financial Management Reform Strategy
Obj
ectiv
e 3:
To
stre
ngth
en p
ublic
inve
stm
ent m
anag
emen
t (PI
M) f
or in
crea
sed
deve
lopm
ent r
etur
ns o
n pu
blic
spe
ndin
g
Impl
emen
ting
Inst
itutio
ns:
MoF
PED
(PAP
, Bu
dget
), AG
O,
PPD
A,
NPA
, D
evel
opm
ent
Com
mitt
ee
Key
Stak
ehol
ders
: OPM
, MD
ALG
s, S
WG
s, C
SOs,
priv
ate
sect
or
Out
puts
Ke
y Ac
tiviti
es
Lead
Inst
itutio
n
2018 / 19
2019 / 20 2020 / 21
2021 / 22
2022 / 23 IN
DIC
ATIV
E Co
st
(USD
)
Prov
isio
n fo
r co
mpu
ting
equi
pmen
t, re
late
d ac
cess
orie
s,
vehi
cles
and
oth
er to
ols
to s
uppo
rt F
ield
wor
k pr
oces
ses
( BO
S)
MO
FPED
/AG
O
X
250
,000
Und
erta
ke IF
MS
Inve
ntor
y m
anag
emen
t fun
ctio
nal t
rain
ing
for
key
user
s M
OFP
ED/A
GO
X X
X X
1
50,0
00
Exte
nded
IFM
S fu
nctio
nalit
y (a
sset
& in
vent
ory
man
agem
ent)
av
aila
ble
to M
DAL
GS
and
rela
ted
trai
ning
rolle
d ou
t M
OFP
ED/A
GO
X
X X
X X
2
80,0
00
Fixe
d as
sets
are
cap
italiz
ed a
nd r
epor
ted
in t
he C
onso
lidat
ed
Fina
ncia
l Sta
tem
ents
M
OFP
ED/A
GO
X X
3.4
Enha
nced
acc
ount
abili
ty in
reso
urce
util
isat
ion
and
resu
lts fo
r pro
ject
del
iver
y
975
,000
3.4.
1 Re
gula
r pe
rfor
man
ce r
evie
w a
nd
repo
rtin
g of
pu
blic
pr
ojec
ts
and
PPPs
es
tabl
ishe
d
Perf
orm
ance
Rev
iew
/Rep
ortin
g of
Im
plem
enta
tion
of p
ublic
pr
ojec
ts a
nd P
PPs
MO
FPED
/DB
X
X X
X
400
,000
Requ
ire S
ecto
r to
rep
ort
on p
roje
ct d
eliv
ery
and
eval
uatio
n of
im
pact
to D
evel
opm
ent C
omm
ittee
M
OFP
ED/D
B X
X X
X X
1
00,0
00
Gui
de s
ecto
rs t
hrou
gh d
evel
opm
ent
of a
pro
ject
del
iver
y ev
alua
tion
man
ual &
rela
ted
capa
city
bui
ldin
g M
OFP
ED/D
B
X X
4
50,0
00
Enha
nce
tran
spar
ency
and
com
mun
icat
ion
of p
roje
ct d
eliv
ery
to t
he p
ublic
-
enfo
rce
disp
lay
of n
otic
e bo
ards
at
proj
ect
deliv
ery
poin
ts &
pub
licat
ions
MO
FPED
/DB
X
X
2
5,00
0
TOTA
L CO
ST
30
,510
,470
O
bjec
tive
4: T
o st
reng
then
the
effe
ctiv
enes
s of
acc
ount
abili
ty s
yste
ms
and
com
plia
nce
in b
udge
t exe
cutio
n Im
plem
entin
g In
stitu
tions
: M
oFPE
D (B
udge
t, Ai
d,
Deb
t),
AGO
, M
oLG
, M
DAL
Gs,
PP
DA,
MoP
S
Key
Stak
ehol
ders
: NIT
A-U
, URA
, BoU
O
utpu
ts
Key
Activ
ities
Le
ad In
stitu
tion
2018 / 19
2019 / 20
2020 / 21
2021 / 22
2022 / 23
IND
ICAT
IVE
Cost
(USD
)
4.1
Effe
ctiv
enes
s an
d ac
cura
cy o
f pub
lic p
ayro
ll an
d pe
nsio
n m
anag
emen
t sys
tem
s in
crea
sed
26
,743
,686
4.
1.1
HCM
rolle
d ou
t to
MD
ALG
s Im
plem
ent H
CM R
ollo
ut w
ork
plan
/roa
dmap
M
oPS
X
X X
7,84
7,11
2
Inte
grat
e H
CM w
ith o
ther
ad
ditio
nal
Gov
ernm
ent
syst
ems
(Pen
sion
Fund
Info
rmat
ion
Syst
em -
PFIS
) M
oPS
X
X
14
8,30
8
Impl
emen
t H
CM a
nd i
nteg
rate
with
key
Gov
ernm
ent
ICT
syst
ems
(IFM
S, P
BS, N
SIS,
NSS
F,PD
MS,
EDM
S)
MoP
S
X
9,
419,
612
U
nder
take
HCM
Pos
t im
plem
enta
tion
revi
ew
MoP
S
X X
X X
4,
345,
334
Im
plem
ent B
ackl
og R
evie
ws/
Chan
ge R
eque
sts
MoP
S
X X
X X
979,
800
Ro
llout
HCM
to n
ewly
est
ablis
hed
vote
s M
oPS
X
X X
42
5,44
0
Und
erta
ke T
echn
ical
, Fun
ctio
nal a
nd E
nd-U
ser
Trai
ning
acr
oss
MD
ALG
s M
oPS
X
X X
1,89
8,04
0
Cond
uct
Tech
nica
l and
Fun
ctio
nal
Sup
port
clin
ics
to s
usta
in
adop
tion
and
utili
zatio
n of
au
tom
ated
H
R fu
nctio
ns
at
MD
ALG
s
MoP
S
X X
X X
1,
430,
040
Skill
s de
velo
pmen
t in
pens
ions
and
pay
roll
audi
ts
MoP
S
X
100,
000
Bu
ild c
apac
ity o
f st
akeh
olde
rs/M
ALG
s -
dece
ntra
lised
pay
roll
and
pens
ion
man
agem
ent
MoP
S X
X
150,
000
4.
2 Co
mpr
ehen
sive
ness
and
qua
lity
of fi
nanc
ial R
epor
ting
11
,291
,787
4.
2.1
Enha
nced
pr
ofes
sion
aliz
atio
n of
ac
coun
ting,
Pr
ocur
emen
t &
IT
ca
dre
in M
DAL
Gs
Dev
elop
pro
fess
iona
l tra
inin
g pr
ogra
mm
es &
impl
emen
tatio
n ar
rang
emen
ts
MO
FPED
/AG
O
X X
X X
X
10
0,00
0
Impl
emen
t IT/
IS p
rofe
ssio
nal t
rain
ing
prog
ram
mes
M
OFP
ED/A
GO
X
X X
X X
4,
224,
200
Im
plem
ent
Acco
untin
g/Au
dit
prof
essi
onal
tr
aini
ng
prog
ram
mes
and
oth
er tr
aini
ng p
rogr
amm
es
MO
FPED
/AG
O
X X
X X
X
36
8,00
0
Impl
emen
t Pr
ocur
emen
t/In
vent
ory
Man
agem
ent
prof
essi
onal
tr
aini
ng p
rogr
amm
es
MO
FPED
/AG
O
X X
X X
X
19
3,20
0
Und
erta
ke T
race
r st
udie
s fo
r se
lect
ed S
tudy
coh
orts
to a
sses
s im
pact
of
le
arni
ng
on
impr
ovem
ents
in
go
vern
ance
an
d se
rvic
es d
eliv
ered
MO
FPED
/AG
O
X
X
45,4
00
Equi
ppin
g In
-hou
se t
rain
ing
faci
lity
and
enha
ncem
ent
of t
he
AGO
Lib
rary
M
OFP
ED/A
GO
X X
X
210,
000
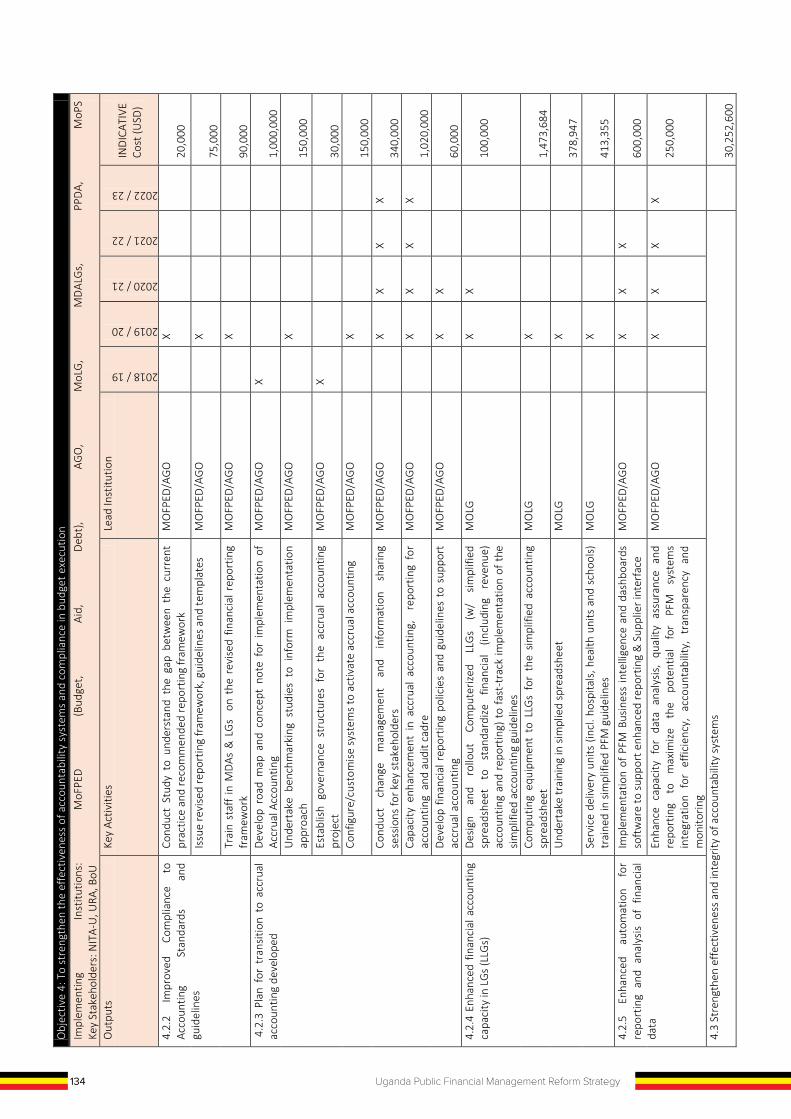
134 Uganda Public Financial Management Reform Strategy
Obj
ectiv
e 4:
To
stre
ngth
en th
e ef
fect
iven
ess
of a
ccou
ntab
ility
sys
tem
s an
d co
mpl
ianc
e in
bud
get e
xecu
tion
Impl
emen
ting
Inst
itutio
ns:
MoF
PED
(Bud
get,
Aid,
D
ebt)
, AG
O,
MoL
G,
MD
ALG
s,
PPDA
, M
oPS
Ke
y St
akeh
olde
rs: N
ITA-
U, U
RA, B
oU
Out
puts
Ke
y Ac
tiviti
es
Lead
Inst
itutio
n
2018 / 19
2019 / 20
2020 / 21
2021 / 22
2022 / 23
IND
ICAT
IVE
Cost
(USD
)
4.2.
2 Im
prov
ed
Com
plia
nce
to
Acco
untin
g St
anda
rds
and
guid
elin
es
Cond
uct
Stud
y to
und
erst
and
the
gap
betw
een
the
curr
ent
prac
tice
and
reco
mm
ende
d re
port
ing
fram
ewor
k M
OFP
ED/A
GO
X
20
,000
Is
sue
revi
sed
repo
rtin
g fr
amew
ork,
gui
delin
es a
nd te
mpl
ates
M
OFP
ED/A
GO
X
75
,000
Tr
ain
staf
f in
MD
As &
LG
s o
n th
e re
vise
d fin
anci
al r
epor
ting
fram
ewor
k M
OFP
ED/A
GO
X
90
,000
4
.2.3
Pla
n fo
r tr
ansit
ion
to a
ccru
al
acco
untin
g de
velo
ped
Dev
elop
roa
d m
ap a
nd c
once
pt n
ote
for
impl
emen
tatio
n of
Ac
crua
l Acc
ount
ing
MO
FPED
/AG
O
X
1,00
0,00
0
Und
erta
ke b
ench
mar
king
stu
dies
to
info
rm i
mpl
emen
tatio
n ap
proa
ch
MO
FPED
/AG
O
X
15
0,00
0
Esta
blis
h go
vern
ance
str
uctu
res
for
the
accr
ual
acco
untin
g pr
ojec
t M
OFP
ED/A
GO
X
30
,000
Co
nfig
ure/
cust
omis
e sy
stem
s to
act
ivat
e ac
crua
l acc
ount
ing
MO
FPED
/AG
O
X
15
0,00
0
Cond
uct
chan
ge
man
agem
ent
and
info
rmat
ion
shar
ing
sess
ions
for k
ey s
take
hold
ers
MO
FPED
/AG
O
X
X X
X
34
0,00
0
Capa
city
enh
ance
men
t in
acc
rual
acc
ount
ing,
re
port
ing
for
acco
untin
g a
nd a
udit
cadr
e M
OFP
ED/A
GO
X X
X X
1,
020,
000
D
evel
op f
inan
cial
rep
ortin
g po
licie
s an
d gu
idel
ines
to
supp
ort
accr
ual a
ccou
ntin
g M
OFP
ED/A
GO
X X
60
,000
4.
2.4
Enha
nced
fin
anci
al a
ccou
ntin
g ca
paci
ty in
LG
s (L
LGs)
D
esig
n an
d ro
llout
Co
mpu
teriz
ed
LLG
s (w
/ si
mpl
ified
sp
read
shee
t to
st
anda
rdiz
e fin
anci
al
(incl
udin
g re
venu
e)
acco
untin
g an
d re
port
ing)
to
fast
-tra
ck im
plem
enta
tion
of t
he
sim
plifi
ed a
ccou
ntin
g gu
idel
ines
MO
LG
X
X
10
0,00
0
Com
putin
g eq
uipm
ent
to L
LGs
for
the
simpl
ified
acc
ount
ing
spre
adsh
eet
MO
LG
X
1,47
3,68
4
Und
erta
ke tr
aini
ng in
sim
plie
d sp
read
shee
t M
OLG
X
378,
947
Se
rvic
e de
liver
y un
its (i
ncl.
hosp
itals
, hea
lth u
nits
and
sch
ools)
tr
aine
d in
sim
plifi
ed P
FM g
uide
lines
M
OLG
X
413,
355
4.
2.5
Enha
nced
au
tom
atio
n fo
r re
port
ing
and
anal
ysis
of
finan
cial
da
ta
Impl
emen
tatio
n of
PFM
Bus
ines
s in
telli
genc
e an
d da
shbo
ards
so
ftw
are
to s
uppo
rt e
nhan
ced
repo
rtin
g &
Sup
plie
r int
erfa
ce
MO
FPED
/AG
O
X
X X
60
0,00
0
Enha
nce
capa
city
for
dat
a an
alys
is,
qual
ity a
ssur
ance
and
re
port
ing
to
max
imiz
e th
e po
tent
ial
for
PFM
sy
stem
s in
tegr
atio
n fo
r ef
ficie
ncy,
acc
ount
abili
ty,
tran
spar
ency
and
m
onito
ring
MO
FPED
/AG
O
X
X X
X
25
0,00
0
4.3
Stre
ngth
en e
ffect
iven
ess
and
inte
grity
of a
ccou
ntab
ility
sys
tem
s
30,2
52,6
00
Obj
ectiv
e 4:
To
stre
ngth
en th
e ef
fect
iven
ess
of a
ccou
ntab
ility
sys
tem
s an
d co
mpl
ianc
e in
bud
get e
xecu
tion
Impl
emen
ting
Inst
itutio
ns:
MoF
PED
(Bud
get,
Aid,
D
ebt)
, AG
O,
MoL
G,
MD
ALG
s,
PPDA
, M
oPS
Ke
y St
akeh
olde
rs: N
ITA-
U, U
RA, B
oU
Out
puts
Ke
y Ac
tiviti
es
Lead
Inst
itutio
n
2018 / 19
2019 / 20
2020 / 21
2021 / 22
2022 / 23
IND
ICAT
IVE
Cost
(USD
)
4.3.
1 In
tegr
ated
E-G
P ro
lled
out
Dee
pen
rollo
ut a
nd u
sage
of E
-GP
acro
ss g
over
nmen
t M
OFP
ED/A
GO
X
X X
X X
3,
587,
500
Im
plem
ent
inte
grat
ion
betw
een
EGP
and
othe
r go
vern
men
t sy
stem
s M
OFP
ED/A
GO
X
X
650,
000
Ch
ange
m
anag
emen
t an
d ca
paci
ty
build
ing
for
the
EGP
impl
emen
tatio
n M
OFP
ED/A
GO
X
X X
X X
4,
295,
600
4.
3.3
Core
PF
M
acco
unta
bilit
y sy
stem
s en
hanc
ed a
nd in
tegr
ated
St
reng
then
PF
M
syst
ems
Gov
erna
nce
Com
mitt
ee
fo
r ac
quis
ition
& M
onito
ring
of P
FM sy
stem
s by
MD
As a
nd L
Gs
MO
FPED
/AG
O
X
-
Revi
ew,
deve
lop
and
impl
emen
t ro
ad m
ap f
or i
nteg
ratin
g go
vern
men
t IC
T-ba
sed
acco
unta
bilit
y sy
stem
s,
incl
udin
g gu
idel
ines
on
acqu
isitio
n of
sys
tem
s by
MD
As
NIT
AU -
RCIP
X
600,
000
Inte
grat
e IC
T-ba
sed
acco
unta
bilit
y sy
stem
s (
IFM
S, H
CM, P
BS,
e-Ta
x, e
-GP,
e-P
aym
ent G
atew
ay, D
FMAS
, AM
P, P
IM S
yste
ms)
M
OFP
ED/A
GO
X
X X
X X
950,
000
Esta
blis
h PF
M s
yste
ms
acad
emy
and
stre
ngth
en e
-lear
ning
for
sust
aina
ble
man
agem
ent o
f sys
tem
s M
OFP
ED/A
GO
X
X X
485,
000
Build
cap
acity
of
vario
us s
take
hold
ers
to u
tilis
e in
tegr
ated
sy
stem
s an
d op
erat
iona
lise
guid
elin
es
on
acqu
isitio
n of
sy
stem
s
NIT
AU -
RCIP
X X
400,
000
Upg
rade
of
IF
MS
(Ora
cle
and
FMSF
M)
data
base
s an
d ap
plic
atio
ns in
line
reco
mm
ende
d so
ftw
are
lifec
ycle
M
OFP
ED/A
GO
X X
2,
000,
000
Enha
nce/
rollo
ut
appr
opria
te
ICT
infr
astr
uctu
re
(NBI
co
nnec
tivity
, pow
er, c
entr
alis
ed h
ostin
g, D
R)
NIT
AU -
RCIP
-
4.3.
4 IF
MS
(Ora
cle
and
FMSF
M) &
e-
Paym
ent
Gat
eway
rol
led
out
to a
ll re
mai
ning
MD
ALG
s
Rollo
ut o
f IFM
S (O
racl
e) to
the
rem
aini
ng M
DAL
Gs
MO
FPED
/AG
O/M
OLG
X X
5,
300,
000
Se
t-up
Tre
asur
y Se
rvic
e Ce
nter
s to
sup
port
opt
imal
use
of P
FM
syst
ems
by u
sers
M
OFP
ED/A
GO
/MO
LG
X
X
1,00
0,00
0
Und
erta
ke P
FM s
yste
ms
func
tiona
l (ne
w &
ref
resh
er) t
rain
ing
for s
taff
in M
DAs
and
LG
s M
OFP
ED/A
GO
/MO
LG
X
X X
X
60
0,00
0
Esta
blis
h/Ro
llout
e-P
aym
ent G
atew
ay
MO
FPED
/AG
O/M
OLG
X X
150,
000
Pr
ovid
e fu
nctio
nal
supp
ort
to e
nhan
ce o
ptim
al u
se o
f PF
M
syst
ems
MO
FPED
/AG
O/M
OLG
X X
X X
420,
000
4.
3.5
IT G
over
nanc
e an
d Se
curit
y of
fin
anci
al
acco
unta
bilit
y sy
stem
s st
reng
then
ed
Enha
nce/
rollo
ut
appr
opria
te
ICT
infr
astr
uctu
re
(NBI
co
nnec
tivity
, pow
er, c
entr
alis
ed h
ostin
g, D
isas
ter R
ecov
ery)
N
ITAU
- RC
IP
20
0,00
0
Build
Nat
iona
l Dat
a Ce
ntre
to U
ptim
e Ti
er 3
sta
ndar
d N
ITAU
- RC
IP
2,50
0,00
0
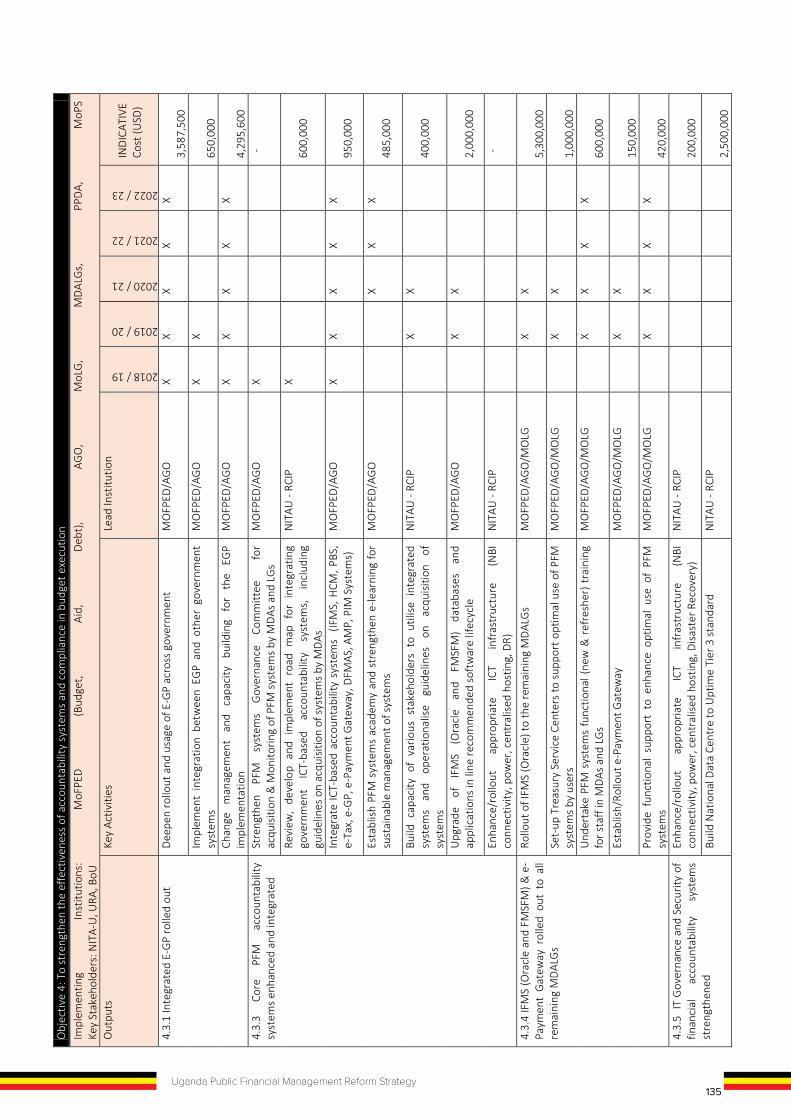
135Uganda Public Financial Management Reform Strategy
Obj
ectiv
e 4:
To
stre
ngth
en th
e ef
fect
iven
ess
of a
ccou
ntab
ility
sys
tem
s an
d co
mpl
ianc
e in
bud
get e
xecu
tion
Impl
emen
ting
Inst
itutio
ns:
MoF
PED
(Bud
get,
Aid,
D
ebt)
, AG
O,
MoL
G,
MD
ALG
s,
PPDA
, M
oPS
Ke
y St
akeh
olde
rs: N
ITA-
U, U
RA, B
oU
Out
puts
Ke
y Ac
tiviti
es
Lead
Inst
itutio
n
2018 / 19
2019 / 20
2020 / 21
2021 / 22
2022 / 23
IND
ICAT
IVE
Cost
(USD
)
4.2.
2 Im
prov
ed
Com
plia
nce
to
Acco
untin
g St
anda
rds
and
guid
elin
es
Cond
uct
Stud
y to
und
erst
and
the
gap
betw
een
the
curr
ent
prac
tice
and
reco
mm
ende
d re
port
ing
fram
ewor
k M
OFP
ED/A
GO
X
20
,000
Is
sue
revi
sed
repo
rtin
g fr
amew
ork,
gui
delin
es a
nd te
mpl
ates
M
OFP
ED/A
GO
X
75
,000
Tr
ain
staf
f in
MD
As &
LG
s o
n th
e re
vise
d fin
anci
al r
epor
ting
fram
ewor
k M
OFP
ED/A
GO
X
90
,000
4
.2.3
Pla
n fo
r tr
ansit
ion
to a
ccru
al
acco
untin
g de
velo
ped
Dev
elop
roa
d m
ap a
nd c
once
pt n
ote
for
impl
emen
tatio
n of
Ac
crua
l Acc
ount
ing
MO
FPED
/AG
O
X
1,00
0,00
0
Und
erta
ke b
ench
mar
king
stu
dies
to
info
rm i
mpl
emen
tatio
n ap
proa
ch
MO
FPED
/AG
O
X
15
0,00
0
Esta
blis
h go
vern
ance
str
uctu
res
for
the
accr
ual
acco
untin
g pr
ojec
t M
OFP
ED/A
GO
X
30
,000
Co
nfig
ure/
cust
omis
e sy
stem
s to
act
ivat
e ac
crua
l acc
ount
ing
MO
FPED
/AG
O
X
15
0,00
0
Cond
uct
chan
ge
man
agem
ent
and
info
rmat
ion
shar
ing
sess
ions
for k
ey s
take
hold
ers
MO
FPED
/AG
O
X
X X
X
34
0,00
0
Capa
city
enh
ance
men
t in
acc
rual
acc
ount
ing,
re
port
ing
for
acco
untin
g a
nd a
udit
cadr
e M
OFP
ED/A
GO
X X
X X
1,
020,
000
D
evel
op f
inan
cial
rep
ortin
g po
licie
s an
d gu
idel
ines
to
supp
ort
accr
ual a
ccou
ntin
g M
OFP
ED/A
GO
X X
60
,000
4.
2.4
Enha
nced
fin
anci
al a
ccou
ntin
g ca
paci
ty in
LG
s (L
LGs)
D
esig
n an
d ro
llout
Co
mpu
teriz
ed
LLG
s (w
/ si
mpl
ified
sp
read
shee
t to
st
anda
rdiz
e fin
anci
al
(incl
udin
g re
venu
e)
acco
untin
g an
d re
port
ing)
to
fast
-tra
ck im
plem
enta
tion
of t
he
sim
plifi
ed a
ccou
ntin
g gu
idel
ines
MO
LG
X
X
10
0,00
0
Com
putin
g eq
uipm
ent
to L
LGs
for
the
simpl
ified
acc
ount
ing
spre
adsh
eet
MO
LG
X
1,47
3,68
4
Und
erta
ke tr
aini
ng in
sim
plie
d sp
read
shee
t M
OLG
X
378,
947
Se
rvic
e de
liver
y un
its (i
ncl.
hosp
itals
, hea
lth u
nits
and
sch
ools)
tr
aine
d in
sim
plifi
ed P
FM g
uide
lines
M
OLG
X
413,
355
4.
2.5
Enha
nced
au
tom
atio
n fo
r re
port
ing
and
anal
ysis
of
finan
cial
da
ta
Impl
emen
tatio
n of
PFM
Bus
ines
s in
telli
genc
e an
d da
shbo
ards
so
ftw
are
to s
uppo
rt e
nhan
ced
repo
rtin
g &
Sup
plie
r int
erfa
ce
MO
FPED
/AG
O
X
X X
60
0,00
0
Enha
nce
capa
city
for
dat
a an
alys
is,
qual
ity a
ssur
ance
and
re
port
ing
to
max
imiz
e th
e po
tent
ial
for
PFM
sy
stem
s in
tegr
atio
n fo
r ef
ficie
ncy,
acc
ount
abili
ty,
tran
spar
ency
and
m
onito
ring
MO
FPED
/AG
O
X
X X
X
25
0,00
0
4.3
Stre
ngth
en e
ffect
iven
ess
and
inte
grity
of a
ccou
ntab
ility
sys
tem
s
30,2
52,6
00
Obj
ectiv
e 4:
To
stre
ngth
en th
e ef
fect
iven
ess
of a
ccou
ntab
ility
sys
tem
s an
d co
mpl
ianc
e in
bud
get e
xecu
tion
Impl
emen
ting
Inst
itutio
ns:
MoF
PED
(Bud
get,
Aid,
D
ebt)
, AG
O,
MoL
G,
MD
ALG
s,
PPDA
, M
oPS
Ke
y St
akeh
olde
rs: N
ITA-
U, U
RA, B
oU
Out
puts
Ke
y Ac
tiviti
es
Lead
Inst
itutio
n
2018 / 19
2019 / 20
2020 / 21
2021 / 22
2022 / 23
IND
ICAT
IVE
Cost
(USD
)
4.3.
1 In
tegr
ated
E-G
P ro
lled
out
Dee
pen
rollo
ut a
nd u
sage
of E
-GP
acro
ss g
over
nmen
t M
OFP
ED/A
GO
X
X X
X X
3,
587,
500
Im
plem
ent
inte
grat
ion
betw
een
EGP
and
othe
r go
vern
men
t sy
stem
s M
OFP
ED/A
GO
X
X
650,
000
Ch
ange
m
anag
emen
t an
d ca
paci
ty
build
ing
for
the
EGP
impl
emen
tatio
n M
OFP
ED/A
GO
X
X X
X X
4,
295,
600
4.
3.3
Core
PF
M
acco
unta
bilit
y sy
stem
s en
hanc
ed a
nd in
tegr
ated
St
reng
then
PF
M
syst
ems
Gov
erna
nce
Com
mitt
ee
fo
r ac
quis
ition
& M
onito
ring
of P
FM sy
stem
s by
MD
As a
nd L
Gs
MO
FPED
/AG
O
X
-
Revi
ew,
deve
lop
and
impl
emen
t ro
ad m
ap f
or i
nteg
ratin
g go
vern
men
t IC
T-ba
sed
acco
unta
bilit
y sy
stem
s,
incl
udin
g gu
idel
ines
on
acqu
isitio
n of
sys
tem
s by
MD
As
NIT
AU -
RCIP
X
600,
000
Inte
grat
e IC
T-ba
sed
acco
unta
bilit
y sy
stem
s (
IFM
S, H
CM, P
BS,
e-Ta
x, e
-GP,
e-P
aym
ent G
atew
ay, D
FMAS
, AM
P, P
IM S
yste
ms)
M
OFP
ED/A
GO
X
X X
X X
950,
000
Esta
blis
h PF
M s
yste
ms
acad
emy
and
stre
ngth
en e
-lear
ning
for
sust
aina
ble
man
agem
ent o
f sys
tem
s M
OFP
ED/A
GO
X
X X
485,
000
Build
cap
acity
of
vario
us s
take
hold
ers
to u
tilis
e in
tegr
ated
sy
stem
s an
d op
erat
iona
lise
guid
elin
es
on
acqu
isitio
n of
sy
stem
s
NIT
AU -
RCIP
X X
400,
000
Upg
rade
of
IF
MS
(Ora
cle
and
FMSF
M)
data
base
s an
d ap
plic
atio
ns in
line
reco
mm
ende
d so
ftw
are
lifec
ycle
M
OFP
ED/A
GO
X X
2,
000,
000
Enha
nce/
rollo
ut
appr
opria
te
ICT
infr
astr
uctu
re
(NBI
co
nnec
tivity
, pow
er, c
entr
alis
ed h
ostin
g, D
R)
NIT
AU -
RCIP
-
4.3.
4 IF
MS
(Ora
cle
and
FMSF
M) &
e-
Paym
ent
Gat
eway
rol
led
out
to a
ll re
mai
ning
MD
ALG
s
Rollo
ut o
f IFM
S (O
racl
e) to
the
rem
aini
ng M
DAL
Gs
MO
FPED
/AG
O/M
OLG
X X
5,
300,
000
Se
t-up
Tre
asur
y Se
rvic
e Ce
nter
s to
sup
port
opt
imal
use
of P
FM
syst
ems
by u
sers
M
OFP
ED/A
GO
/MO
LG
X
X
1,00
0,00
0
Und
erta
ke P
FM s
yste
ms
func
tiona
l (ne
w &
ref
resh
er) t
rain
ing
for s
taff
in M
DAs
and
LG
s M
OFP
ED/A
GO
/MO
LG
X
X X
X
60
0,00
0
Esta
blis
h/Ro
llout
e-P
aym
ent G
atew
ay
MO
FPED
/AG
O/M
OLG
X X
150,
000
Pr
ovid
e fu
nctio
nal
supp
ort
to e
nhan
ce o
ptim
al u
se o
f PF
M
syst
ems
MO
FPED
/AG
O/M
OLG
X X
X X
420,
000
4.
3.5
IT G
over
nanc
e an
d Se
curit
y of
fin
anci
al
acco
unta
bilit
y sy
stem
s st
reng
then
ed
Enha
nce/
rollo
ut
appr
opria
te
ICT
infr
astr
uctu
re
(NBI
co
nnec
tivity
, pow
er, c
entr
alis
ed h
ostin
g, D
isas
ter R
ecov
ery)
N
ITAU
- RC
IP
20
0,00
0
Build
Nat
iona
l Dat
a Ce
ntre
to U
ptim
e Ti
er 3
sta
ndar
d N
ITAU
- RC
IP
2,50
0,00
0

136 Uganda Public Financial Management Reform Strategy
Obj
ectiv
e 4:
To
stre
ngth
en th
e ef
fect
iven
ess
of a
ccou
ntab
ility
sys
tem
s an
d co
mpl
ianc
e in
bud
get e
xecu
tion
Impl
emen
ting
Inst
itutio
ns:
MoF
PED
(Bud
get,
Aid,
D
ebt)
, AG
O,
MoL
G,
MD
ALG
s,
PPDA
, M
oPS
Ke
y St
akeh
olde
rs: N
ITA-
U, U
RA, B
oU
Out
puts
Ke
y Ac
tiviti
es
Lead
Inst
itutio
n
2018 / 19
2019 / 20
2020 / 21
2021 / 22
2022 / 23
IND
ICAT
IVE
Cost
(USD
)
Sing
le r
edun
dant
enc
rypt
. gi
gabi
t+ e
ther
net
pipe
for
PFM
co
nnec
tivity
a n
etw
ork
conn
ectio
n to
eac
h PF
M o
f MD
ALG
s N
ITAU
- RC
IP
20
0,00
0
Net
wor
k lin
ks t
o th
e PF
M p
ipe
to c
onne
ct a
ll PF
M u
sers
and
se
rver
s M
OFP
ED/A
GO
100,
000
Ph
ysic
al &
ele
ctro
nic
secu
rity
mea
sure
s fo
r ICT
equ
ipm
ent
MO
FPED
/AG
O
X
X
10
0,00
0
Acce
ss t
o PF
M a
pps
thro
ugh
encr
ypte
d lin
ks /
use
r id
ent.
iden
tific
atio
n M
OFP
ED/A
GO
X X
287,
500
Re
mot
e ac
cess
to N
BI th
roug
h co
ntro
lled
conn
ectio
ns
MO
FPED
/AG
O
X
X
10
0,00
0
Build
Dis
aste
r Rec
over
y Ce
ntre
to U
ptim
e Ti
er 3
sta
ndar
d N
ITAU
- RC
IP
2,50
0,00
0
Impr
ove
envi
ronm
ent o
f exi
stin
g da
ta c
entr
es (D
Cs)
NIT
AU -
RCIP
25
,000
Ro
llout
upg
rade
of
Fore
ign
Miss
ions
FM
S &
Fix
ed A
sset
s M
odul
e M
OFP
ED/A
GO
X X
X X
990,
000
PF
M D
ata
war
ehou
se fo
r fin
anci
al d
ata
and
tran
sact
ion
MO
FPED
/AG
O
X
X X
22
5,00
0
Des
ign
and
impl
emen
t PFM
Dat
a ar
chiv
ing
syst
em
MO
FPED
/AG
O
X
X X
1,00
0,00
0
Impl
emen
t Net
wor
k Ac
cess
Con
trol
(NAC
) M
OFP
ED/A
GO
X X
X
287,
500
Im
plem
ent S
ecur
ity In
form
atio
n &
Eve
nt M
anag
emen
t (SI
EM)
MO
FPED
/AG
O
X
20
0,00
0
Impl
emen
t Net
wor
k Pa
cket
Cap
ture
Sys
tem
M
OFP
ED/A
GO
X
115,
000
Im
plem
ent Z
ero
day
prot
ectio
n M
OFP
ED/A
GO
X
115,
000
Im
plem
ent C
isco
ISE
MO
FPED
/AG
O
X
20
0,00
0
Impl
emen
t Cis
co P
rime
MO
FPED
/AG
O
X
23
0,00
0
impl
emen
t End
Poi
nt S
ecur
ity
MO
FPED
/AG
O
X
11
5,00
0
Impl
emen
t D
ell
EMC
inte
grat
ed
prot
ectio
n fo
r co
nver
ged
infr
astr
uctu
re
MO
FPED
/AG
O
X
57,5
00
Impl
emen
t Im
perv
a W
eb A
pplic
atio
n Fi
rew
all
MO
FPED
/AG
O
X
92,0
00
Obj
ectiv
e 4:
To
stre
ngth
en th
e ef
fect
iven
ess
of a
ccou
ntab
ility
sys
tem
s an
d co
mpl
ianc
e in
bud
get e
xecu
tion
Impl
emen
ting
Inst
itutio
ns:
MoF
PED
(Bud
get,
Aid,
D
ebt)
, AG
O,
MoL
G,
MD
ALG
s,
PPDA
, M
oPS
Ke
y St
akeh
olde
rs: N
ITA-
U, U
RA, B
oU
Out
puts
Ke
y Ac
tiviti
es
Lead
Inst
itutio
n
2018 / 19
2019 / 20
2020 / 21
2021 / 22
2022 / 23
IND
ICAT
IVE
Cost
(USD
)
Enha
nce
the
Min
istr
y W
ebsi
tes
- See
bel
ow fo
r cos
ting
MO
FPED
/AG
O
-
ICT
infr
astr
uctu
ral s
uppo
rt to
For
eign
Mis
sion
s FM
S M
OFP
ED/A
GO
X
175,
000
4.
4 St
reng
then
effe
ctiv
enes
s of
com
mitm
ent c
ontr
ols
and
cash
man
agem
ent
7,49
7,34
4
4.4.
1 En
hanc
ed
and
mor
e su
stai
nabl
e Pu
blic
Ser
vice
Pen
sion
Sche
me
to m
inim
ise
pens
ion
arre
ars
Und
erta
ke a
ctua
rial
stud
y of
cur
rent
pub
lic s
ervi
ce p
ensio
n sc
hem
e M
oPS
X
92,4
00
Und
erta
ke le
gal a
nd re
gula
tory
pol
icy
revi
ew
MoP
S
X X
227,
500
Es
tabl
ish
boar
d of
tr
ust
for
Publ
ic
serv
ice
pens
ion
sche
me/
fund
M
oPS
X
X X
X
96
6,60
0
Build
cap
acity
of
stak
ehol
ders
to
man
age
the
PS p
ensi
on
sche
me
MoP
S
X
380,
250
U
nder
take
cha
nge
man
agem
ent’
MoP
S
X X
480,
000
Es
tabl
ish
Info
rmat
ion
syst
em fo
r the
PSP
S M
oPS
X
1,57
9,05
4
Dev
elop
pol
icie
s re
gula
tions
and
gui
delin
es
MoP
S
X X
208,
000
Be
nchm
arki
ng S
tudy
on
pens
ion
fund
gov
erna
nce,
Sch
eme,
D
esig
n, In
vest
men
t, tr
ansit
ion
man
agem
ent a
nd c
ontr
ols
MoP
S
X X
X
330,
240
Tr
aini
ng a
nd C
apac
ity B
uild
ing
Inte
rven
tions
for
the
Boa
rd o
f Tr
uste
es
of
the
fund
, In
vest
men
t M
anag
ers,
Cu
stod
ians
, Ad
min
istr
ator
s an
d st
aff o
f the
fund
MoP
S
X
X X
720,
000
Dev
elop
ing
and
diss
emin
atin
g IE
C m
ater
ials
on
the
PSPF
M
oPS
X
90,5
00
Prov
idin
g ad
min
istr
ativ
e Su
ppor
t to
Pro
ject
Im
plem
enta
tion
and
the
Inte
r-M
inis
teria
l Co
mm
ittee
on
the
Refo
rm o
f th
e PS
PS
MoP
S
X X
X X
140,
800
4.4.
2 Co
mm
itmen
t Co
ntro
ls
enha
nced
and
enf
orce
d En
hanc
e co
mm
itmen
t co
ntro
ls w
ithin
IFM
S to
cap
ture
mul
ti-ye
ar c
omm
itmen
ts a
nd a
rrea
rs
MO
FPED
/AG
O
X X
15
0,00
0
Cons
olid
ated
gui
delin
es o
n re
cogn
ition
, ag
eing
, se
ttle
men
t an
d re
port
ing
of a
rrea
rs
MO
FPED
/AG
O
X X
25,0
00
4.4.
3 En
hanc
ed
mec
hani
sms
for
regu
lar
repo
rtin
g an
d ve
rific
atio
n of
ar
rear
s by
MD
ALG
s op
erat
iona
lised
Mon
thly
rep
orts
pro
vide
d by
MD
ALG
s to
MO
FPED
and
OPM
on
the
stat
us o
f cle
arin
g do
mes
tic a
rrea
rs
MO
FPED
/AG
O
X X
X X
X
Appr
oved
arr
ears
cle
aran
ce s
trat
egy
with
prio
ritis
atio
n cr
iteria
an
d in
stitu
tiona
l res
pons
ibili
ties
for m
onito
ring
& c
lear
ance
M
OFP
ED/A
GO
X
X
-
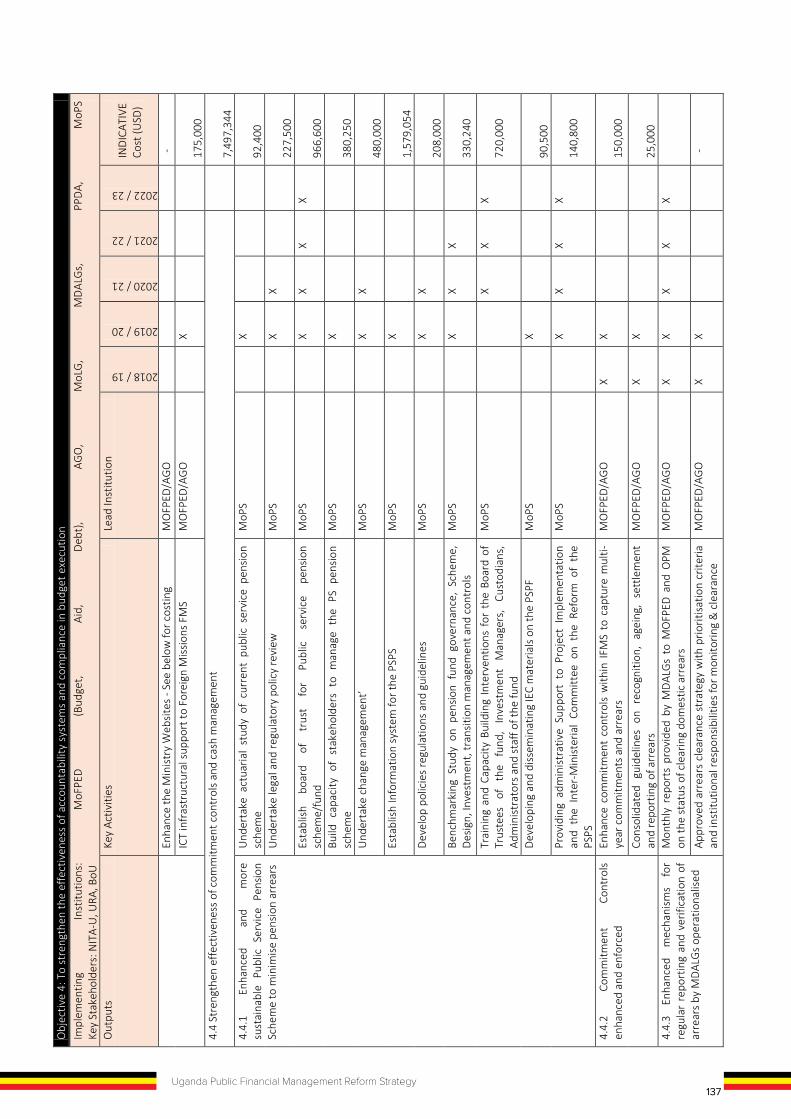
137Uganda Public Financial Management Reform Strategy
Obj
ectiv
e 4:
To
stre
ngth
en th
e ef
fect
iven
ess
of a
ccou
ntab
ility
sys
tem
s an
d co
mpl
ianc
e in
bud
get e
xecu
tion
Impl
emen
ting
Inst
itutio
ns:
MoF
PED
(Bud
get,
Aid,
D
ebt)
, AG
O,
MoL
G,
MD
ALG
s,
PPDA
, M
oPS
Ke
y St
akeh
olde
rs: N
ITA-
U, U
RA, B
oU
Out
puts
Ke
y Ac
tiviti
es
Lead
Inst
itutio
n
2018 / 19
2019 / 20
2020 / 21
2021 / 22
2022 / 23
IND
ICAT
IVE
Cost
(USD
)
Sing
le r
edun
dant
enc
rypt
. gi
gabi
t+ e
ther
net
pipe
for
PFM
co
nnec
tivity
a n
etw
ork
conn
ectio
n to
eac
h PF
M o
f MD
ALG
s N
ITAU
- RC
IP
20
0,00
0
Net
wor
k lin
ks t
o th
e PF
M p
ipe
to c
onne
ct a
ll PF
M u
sers
and
se
rver
s M
OFP
ED/A
GO
100,
000
Ph
ysic
al &
ele
ctro
nic
secu
rity
mea
sure
s fo
r ICT
equ
ipm
ent
MO
FPED
/AG
O
X
X
10
0,00
0
Acce
ss t
o PF
M a
pps
thro
ugh
encr
ypte
d lin
ks /
use
r id
ent.
iden
tific
atio
n M
OFP
ED/A
GO
X X
287,
500
Re
mot
e ac
cess
to N
BI th
roug
h co
ntro
lled
conn
ectio
ns
MO
FPED
/AG
O
X
X
10
0,00
0
Build
Dis
aste
r Rec
over
y Ce
ntre
to U
ptim
e Ti
er 3
sta
ndar
d N
ITAU
- RC
IP
2,50
0,00
0
Impr
ove
envi
ronm
ent o
f exi
stin
g da
ta c
entr
es (D
Cs)
NIT
AU -
RCIP
25
,000
Ro
llout
upg
rade
of
Fore
ign
Miss
ions
FM
S &
Fix
ed A
sset
s M
odul
e M
OFP
ED/A
GO
X X
X X
990,
000
PF
M D
ata
war
ehou
se fo
r fin
anci
al d
ata
and
tran
sact
ion
MO
FPED
/AG
O
X
X X
22
5,00
0
Des
ign
and
impl
emen
t PFM
Dat
a ar
chiv
ing
syst
em
MO
FPED
/AG
O
X
X X
1,00
0,00
0
Impl
emen
t Net
wor
k Ac
cess
Con
trol
(NAC
) M
OFP
ED/A
GO
X X
X
287,
500
Im
plem
ent S
ecur
ity In
form
atio
n &
Eve
nt M
anag
emen
t (SI
EM)
MO
FPED
/AG
O
X
20
0,00
0
Impl
emen
t Net
wor
k Pa
cket
Cap
ture
Sys
tem
M
OFP
ED/A
GO
X
115,
000
Im
plem
ent Z
ero
day
prot
ectio
n M
OFP
ED/A
GO
X
115,
000
Im
plem
ent C
isco
ISE
MO
FPED
/AG
O
X
20
0,00
0
Impl
emen
t Cis
co P
rime
MO
FPED
/AG
O
X
23
0,00
0
impl
emen
t End
Poi
nt S
ecur
ity
MO
FPED
/AG
O
X
11
5,00
0
Impl
emen
t D
ell
EMC
inte
grat
ed
prot
ectio
n fo
r co
nver
ged
infr
astr
uctu
re
MO
FPED
/AG
O
X
57,5
00
Impl
emen
t Im
perv
a W
eb A
pplic
atio
n Fi
rew
all
MO
FPED
/AG
O
X
92,0
00
Obj
ectiv
e 4:
To
stre
ngth
en th
e ef
fect
iven
ess
of a
ccou
ntab
ility
sys
tem
s an
d co
mpl
ianc
e in
bud
get e
xecu
tion
Impl
emen
ting
Inst
itutio
ns:
MoF
PED
(Bud
get,
Aid,
D
ebt)
, AG
O,
MoL
G,
MD
ALG
s,
PPDA
, M
oPS
Ke
y St
akeh
olde
rs: N
ITA-
U, U
RA, B
oU
Out
puts
Ke
y Ac
tiviti
es
Lead
Inst
itutio
n
2018 / 19
2019 / 20
2020 / 21
2021 / 22
2022 / 23
IND
ICAT
IVE
Cost
(USD
)
Enha
nce
the
Min
istr
y W
ebsi
tes
- See
bel
ow fo
r cos
ting
MO
FPED
/AG
O
-
ICT
infr
astr
uctu
ral s
uppo
rt to
For
eign
Mis
sion
s FM
S M
OFP
ED/A
GO
X
175,
000
4.
4 St
reng
then
effe
ctiv
enes
s of
com
mitm
ent c
ontr
ols
and
cash
man
agem
ent
7,49
7,34
4
4.4.
1 En
hanc
ed
and
mor
e su
stai
nabl
e Pu
blic
Ser
vice
Pen
sion
Sche
me
to m
inim
ise
pens
ion
arre
ars
Und
erta
ke a
ctua
rial
stud
y of
cur
rent
pub
lic s
ervi
ce p
ensio
n sc
hem
e M
oPS
X
92,4
00
Und
erta
ke le
gal a
nd re
gula
tory
pol
icy
revi
ew
MoP
S
X X
227,
500
Es
tabl
ish
boar
d of
tr
ust
for
Publ
ic
serv
ice
pens
ion
sche
me/
fund
M
oPS
X
X X
X
96
6,60
0
Build
cap
acity
of
stak
ehol
ders
to
man
age
the
PS p
ensi
on
sche
me
MoP
S
X
380,
250
U
nder
take
cha
nge
man
agem
ent’
MoP
S
X X
480,
000
Es
tabl
ish
Info
rmat
ion
syst
em fo
r the
PSP
S M
oPS
X
1,57
9,05
4
Dev
elop
pol
icie
s re
gula
tions
and
gui
delin
es
MoP
S
X X
208,
000
Be
nchm
arki
ng S
tudy
on
pens
ion
fund
gov
erna
nce,
Sch
eme,
D
esig
n, In
vest
men
t, tr
ansit
ion
man
agem
ent a
nd c
ontr
ols
MoP
S
X X
X
330,
240
Tr
aini
ng a
nd C
apac
ity B
uild
ing
Inte
rven
tions
for
the
Boa
rd o
f Tr
uste
es
of
the
fund
, In
vest
men
t M
anag
ers,
Cu
stod
ians
, Ad
min
istr
ator
s an
d st
aff o
f the
fund
MoP
S
X
X X
720,
000
Dev
elop
ing
and
diss
emin
atin
g IE
C m
ater
ials
on
the
PSPF
M
oPS
X
90,5
00
Prov
idin
g ad
min
istr
ativ
e Su
ppor
t to
Pro
ject
Im
plem
enta
tion
and
the
Inte
r-M
inis
teria
l Co
mm
ittee
on
the
Refo
rm o
f th
e PS
PS
MoP
S
X X
X X
140,
800
4.4.
2 Co
mm
itmen
t Co
ntro
ls
enha
nced
and
enf
orce
d En
hanc
e co
mm
itmen
t co
ntro
ls w
ithin
IFM
S to
cap
ture
mul
ti-ye
ar c
omm
itmen
ts a
nd a
rrea
rs
MO
FPED
/AG
O
X X
15
0,00
0
Cons
olid
ated
gui
delin
es o
n re
cogn
ition
, ag
eing
, se
ttle
men
t an
d re
port
ing
of a
rrea
rs
MO
FPED
/AG
O
X X
25,0
00
4.4.
3 En
hanc
ed
mec
hani
sms
for
regu
lar
repo
rtin
g an
d ve
rific
atio
n of
ar
rear
s by
MD
ALG
s op
erat
iona
lised
Mon
thly
rep
orts
pro
vide
d by
MD
ALG
s to
MO
FPED
and
OPM
on
the
stat
us o
f cle
arin
g do
mes
tic a
rrea
rs
MO
FPED
/AG
O
X X
X X
X
Appr
oved
arr
ears
cle
aran
ce s
trat
egy
with
prio
ritis
atio
n cr
iteria
an
d in
stitu
tiona
l res
pons
ibili
ties
for m
onito
ring
& c
lear
ance
M
OFP
ED/A
GO
X
X
-
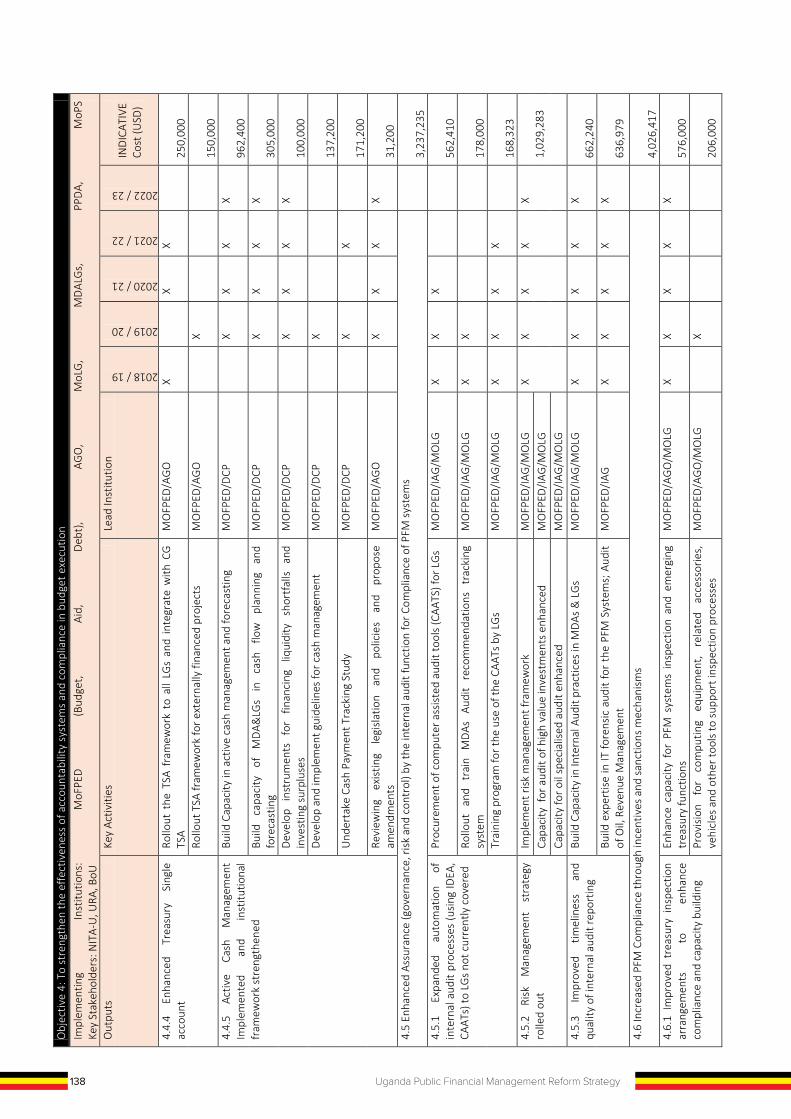
138 Uganda Public Financial Management Reform Strategy
Obj
ectiv
e 4:
To
stre
ngth
en th
e ef
fect
iven
ess
of a
ccou
ntab
ility
sys
tem
s an
d co
mpl
ianc
e in
bud
get e
xecu
tion
Impl
emen
ting
Inst
itutio
ns:
MoF
PED
(Bud
get,
Aid,
D
ebt)
, AG
O,
MoL
G,
MD
ALG
s,
PPDA
, M
oPS
Ke
y St
akeh
olde
rs: N
ITA-
U, U
RA, B
oU
Out
puts
Ke
y Ac
tiviti
es
Lead
Inst
itutio
n
2018 / 19
2019 / 20
2020 / 21
2021 / 22
2022 / 23
IND
ICAT
IVE
Cost
(USD
)
4.4.
4 En
hanc
ed
Trea
sury
Si
ngle
ac
coun
t Ro
llout
the
TSA
fra
mew
ork
to a
ll LG
s an
d in
tegr
ate
with
CG
TS
A M
OFP
ED/A
GO
X
X
X
250,
000
Ro
llout
TSA
fram
ewor
k fo
r ext
erna
lly fi
nanc
ed p
roje
cts
MO
FPED
/AG
O
X
15
0,00
0
4.4.
5 Ac
tive
Cash
M
anag
emen
t Im
plem
ente
d an
d in
stitu
tiona
l fr
amew
ork
stre
ngth
ened
Build
Cap
acity
in a
ctiv
e ca
sh m
anag
emen
t and
fore
cast
ing
MO
FPED
/DCP
X X
X X
962,
400
Bu
ild
capa
city
of
M
DA&
LGs
in
cash
flo
w
plan
ning
an
d fo
reca
stin
g M
OFP
ED/D
CP
X
X X
X
30
5,00
0
Dev
elop
in
stru
men
ts
for
finan
cing
liq
uidi
ty
shor
tfal
ls
and
inve
stin
g su
rplu
ses
MO
FPED
/DCP
X X
X X
100,
000
D
evel
op a
nd im
plem
ent g
uide
lines
for c
ash
man
agem
ent
MO
FPED
/DCP
X
137,
200
U
nder
take
Cas
h Pa
ymen
t Tra
ckin
g St
udy
MO
FPED
/DCP
X
X
171,
200
Re
view
ing
exis
ting
legi
slat
ion
and
polic
ies
and
prop
ose
amen
dmen
ts
MO
FPED
/AG
O
X
X X
X
31,2
00
4.5
Enha
nced
Ass
uran
ce (g
over
nanc
e, ri
sk a
nd c
ontr
ol) b
y th
e in
tern
al a
udit
func
tion
for C
ompl
ianc
e of
PFM
sys
tem
s
3,23
7,23
5
4.5.
1 Ex
pand
ed
auto
mat
ion
of
inte
rnal
aud
it pr
oces
ses
(usi
ng ID
EA,
CAAT
s) to
LG
s no
t cur
rent
ly c
over
ed
Proc
urem
ent o
f com
pute
r ass
iste
d au
dit t
ools
(CAA
TS) f
or L
Gs
MO
FPED
/IAG
/MO
LG
X X
X
56
2,41
0
Rollo
ut
and
trai
n M
DAs
Au
dit
reco
mm
enda
tions
tr
acki
ng
syst
em
MO
FPED
/IAG
/MO
LG
X X
17
8,00
0
Trai
ning
pro
gram
for t
he u
se o
f the
CAA
Ts b
y LG
s M
OFP
ED/IA
G/M
OLG
X
X X
X
168,
323
4.
5.2
Risk
M
anag
emen
t st
rate
gy
rolle
d ou
t Im
plem
ent r
isk
man
agem
ent f
ram
ewor
k M
OFP
ED/IA
G/M
OLG
X
X X
X X
1,
029,
283
Ca
paci
ty f
or a
udit
of h
igh
valu
e in
vest
men
ts e
nhan
ced
MO
FPED
/IAG
/MO
LG
Capa
city
for o
il sp
ecia
lised
aud
it en
hanc
ed
MO
FPED
/IAG
/MO
LG
4.5.
3 Im
prov
ed
timel
ines
s an
d qu
ality
of i
nter
nal a
udit
repo
rtin
g Bu
ild C
apac
ity in
Inte
rnal
Aud
it pr
actic
es in
MD
As &
LG
s M
OFP
ED/IA
G/M
OLG
X
X X
X X
662,
240
Bu
ild e
xper
tise
in IT
fore
nsic
aud
it fo
r th
e PF
M S
yste
ms;
Aud
it of
Oil,
Rev
enue
Man
agem
ent
MO
FPED
/IAG
X
X X
X X
636,
979
4.
6 In
crea
sed
PFM
Com
plia
nce
thro
ugh
ince
ntiv
es a
nd s
anct
ions
mec
hani
sms
4,02
6,41
7
4.6.
1 Im
prov
ed t
reas
ury
insp
ectio
n ar
rang
emen
ts
to
enha
nce
com
plia
nce
and
capa
city
bui
ldin
g
Enha
nce
capa
city
for
PFM
sys
tem
s in
spec
tion
and
emer
ging
tr
easu
ry fu
nctio
ns
MO
FPED
/AG
O/M
OLG
X
X X
X X
576,
000
Pr
ovis
ion
for
com
putin
g eq
uipm
ent,
rela
ted
acce
ssor
ies,
ve
hicl
es a
nd o
ther
tool
s to
sup
port
insp
ectio
n pr
oces
ses
MO
FPED
/AG
O/M
OLG
X
206,
000
Obj
ectiv
e 4:
To
stre
ngth
en th
e ef
fect
iven
ess
of a
ccou
ntab
ility
sys
tem
s an
d co
mpl
ianc
e in
bud
get e
xecu
tion
Impl
emen
ting
Inst
itutio
ns:
MoF
PED
(Bud
get,
Aid,
D
ebt)
, AG
O,
MoL
G,
MD
ALG
s,
PPDA
, M
oPS
Ke
y St
akeh
olde
rs: N
ITA-
U, U
RA, B
oU
Out
puts
Ke
y Ac
tiviti
es
Lead
Inst
itutio
n
2018 / 19
2019 / 20
2020 / 21
2021 / 22
2022 / 23
IND
ICAT
IVE
Cost
(USD
)
Esta
blis
h an
d im
plem
ent
a ha
rmon
ised
Tre
asur
y i
nspe
ctio
n fr
amew
ork
for f
orei
gn m
issi
ons
MO
FPED
/AG
O/M
OLG
X X
81
,120
U
nder
com
preh
ensi
ve s
ensi
tizat
ion
on t
he P
FM l
egal
and
re
gula
tory
fram
ewor
k M
OFP
ED/A
GO
/MO
LG
X X
X
60
0,00
0
Und
erta
ke a
com
preh
ensi
ve P
FM p
olic
y re
view
and
form
ulat
e ap
prop
riate
pol
icie
s/gu
idel
ines
to a
ddre
ss e
mer
ging
issu
es
MO
FPED
/AG
O/M
OLG
X
X X
110,
000
4.
6.2
Impr
oved
ac
cess
to
in
form
atio
n on
PFM
refo
rms
Stre
ngth
en
chan
ge
man
agem
ent
and
com
mun
icat
ion
proc
esse
s to
enh
ance
ow
ners
hip
of re
form
s be
twee
n AG
O a
nd
Acco
untin
g un
its
MO
FPED
/AG
O/M
OLG
X
X X
X X
380,
000
Enha
nce
MoF
PED
web
site
and
in-
hous
e in
form
atio
n sh
arin
g ne
twor
k M
OFP
ED/A
GO
/MO
LG
X
15
0,00
0
4.6.
3 Im
prov
ed
enab
ling
envi
ronm
ent
for
PFM
per
form
ance
m
anag
emen
t
Revi
sion
of
stan
ding
ord
ers
and
disc
iplin
ary
proc
esse
s fo
r im
plem
enta
tion
of a
com
preh
ensi
ve s
anct
ions
and
rew
ards
re
gim
e
MoP
S X
534,
798
Dev
elop
ing
guid
elin
es f
or i
mpl
emen
ting
the
disc
iplin
e an
d di
scip
linar
y pr
oced
ures
pro
vide
d in
the
Publ
ic S
ervi
ce S
tand
ing
Ord
ers
(PSS
Os)
MoP
S X
X
267,
399
Revi
sed
vers
ion
of P
SSO
and
gui
delin
es f
or im
plem
entin
g th
e ne
w
disc
iplin
ary
proc
edur
es
proc
edur
es
diss
emin
ated
to
M
DAL
Gs
MoP
S
X
X X
591,
100
Chan
ge
man
agem
ent
supp
ort
on
impl
emen
tatio
n of
th
e re
vise
d PS
SO p
rovi
ded
to M
DAL
Gs
MoP
S
X X
X X
305,
000
Co
nduc
t m
onito
ring
and
supp
ort
supe
rvis
ion
sess
ions
to
su
stai
n co
mpl
ianc
e of
the
rew
ards
and
san
ctio
ns c
omm
ittee
w
ith
revi
sed
stan
ding
or
ders
an
d gu
idel
ines
fo
r im
plem
enta
tion
of d
isci
plin
ary
proc
edur
es in
MD
ALG
s
MoP
S
X X
X X
225,
000
TOTA
L CO
ST
83
,049
,069
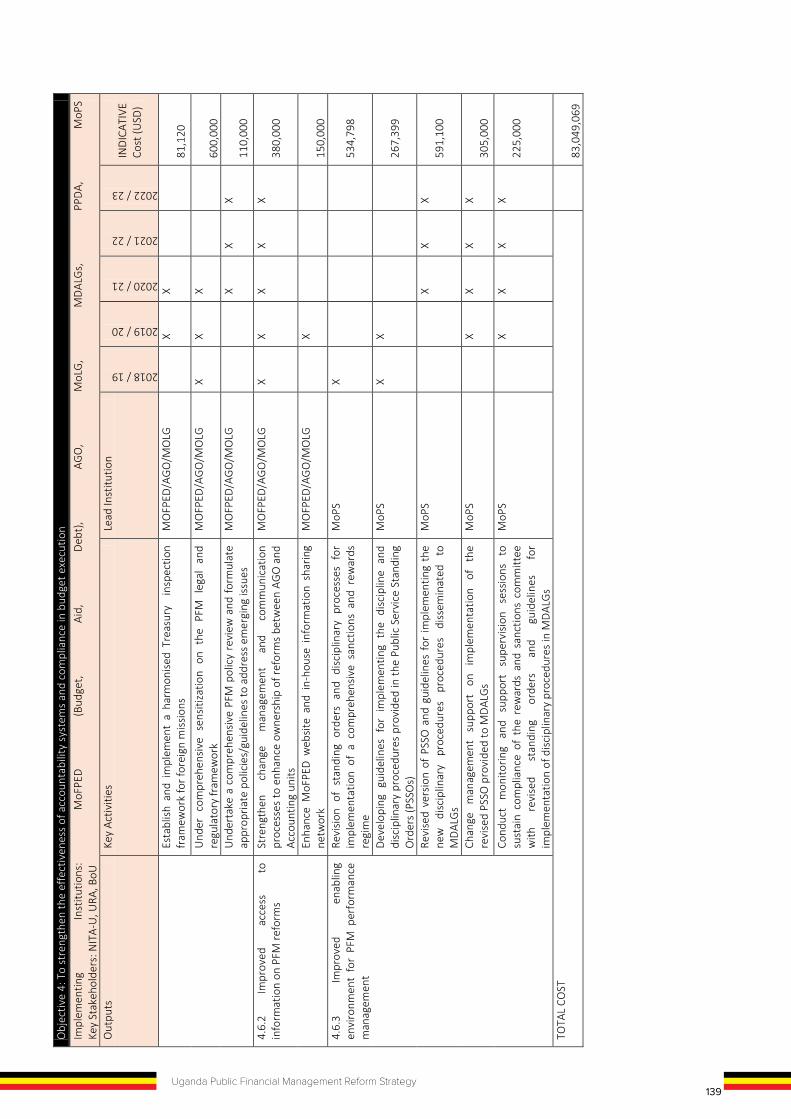
139Uganda Public Financial Management Reform Strategy
Obj
ectiv
e 4:
To
stre
ngth
en th
e ef
fect
iven
ess
of a
ccou
ntab
ility
sys
tem
s an
d co
mpl
ianc
e in
bud
get e
xecu
tion
Impl
emen
ting
Inst
itutio
ns:
MoF
PED
(Bud
get,
Aid,
D
ebt)
, AG
O,
MoL
G,
MD
ALG
s,
PPDA
, M
oPS
Ke
y St
akeh
olde
rs: N
ITA-
U, U
RA, B
oU
Out
puts
Ke
y Ac
tiviti
es
Lead
Inst
itutio
n
2018 / 19
2019 / 20
2020 / 21
2021 / 22
2022 / 23
IND
ICAT
IVE
Cost
(USD
)
4.4.
4 En
hanc
ed
Trea
sury
Si
ngle
ac
coun
t Ro
llout
the
TSA
fra
mew
ork
to a
ll LG
s an
d in
tegr
ate
with
CG
TS
A M
OFP
ED/A
GO
X
X
X
250,
000
Ro
llout
TSA
fram
ewor
k fo
r ext
erna
lly fi
nanc
ed p
roje
cts
MO
FPED
/AG
O
X
15
0,00
0
4.4.
5 Ac
tive
Cash
M
anag
emen
t Im
plem
ente
d an
d in
stitu
tiona
l fr
amew
ork
stre
ngth
ened
Build
Cap
acity
in a
ctiv
e ca
sh m
anag
emen
t and
fore
cast
ing
MO
FPED
/DCP
X X
X X
962,
400
Bu
ild
capa
city
of
M
DA&
LGs
in
cash
flo
w
plan
ning
an
d fo
reca
stin
g M
OFP
ED/D
CP
X
X X
X
30
5,00
0
Dev
elop
in
stru
men
ts
for
finan
cing
liq
uidi
ty
shor
tfal
ls
and
inve
stin
g su
rplu
ses
MO
FPED
/DCP
X X
X X
100,
000
D
evel
op a
nd im
plem
ent g
uide
lines
for c
ash
man
agem
ent
MO
FPED
/DCP
X
137,
200
U
nder
take
Cas
h Pa
ymen
t Tra
ckin
g St
udy
MO
FPED
/DCP
X
X
171,
200
Re
view
ing
exis
ting
legi
slat
ion
and
polic
ies
and
prop
ose
amen
dmen
ts
MO
FPED
/AG
O
X
X X
X
31,2
00
4.5
Enha
nced
Ass
uran
ce (g
over
nanc
e, ri
sk a
nd c
ontr
ol) b
y th
e in
tern
al a
udit
func
tion
for C
ompl
ianc
e of
PFM
sys
tem
s
3,23
7,23
5
4.5.
1 Ex
pand
ed
auto
mat
ion
of
inte
rnal
aud
it pr
oces
ses
(usi
ng ID
EA,
CAAT
s) to
LG
s no
t cur
rent
ly c
over
ed
Proc
urem
ent o
f com
pute
r ass
iste
d au
dit t
ools
(CAA
TS) f
or L
Gs
MO
FPED
/IAG
/MO
LG
X X
X
56
2,41
0
Rollo
ut
and
trai
n M
DAs
Au
dit
reco
mm
enda
tions
tr
acki
ng
syst
em
MO
FPED
/IAG
/MO
LG
X X
17
8,00
0
Trai
ning
pro
gram
for t
he u
se o
f the
CAA
Ts b
y LG
s M
OFP
ED/IA
G/M
OLG
X
X X
X
168,
323
4.
5.2
Risk
M
anag
emen
t st
rate
gy
rolle
d ou
t Im
plem
ent r
isk
man
agem
ent f
ram
ewor
k M
OFP
ED/IA
G/M
OLG
X
X X
X X
1,
029,
283
Ca
paci
ty f
or a
udit
of h
igh
valu
e in
vest
men
ts e
nhan
ced
MO
FPED
/IAG
/MO
LG
Capa
city
for o
il sp
ecia
lised
aud
it en
hanc
ed
MO
FPED
/IAG
/MO
LG
4.5.
3 Im
prov
ed
timel
ines
s an
d qu
ality
of i
nter
nal a
udit
repo
rtin
g Bu
ild C
apac
ity in
Inte
rnal
Aud
it pr
actic
es in
MD
As &
LG
s M
OFP
ED/IA
G/M
OLG
X
X X
X X
662,
240
Bu
ild e
xper
tise
in IT
fore
nsic
aud
it fo
r th
e PF
M S
yste
ms;
Aud
it of
Oil,
Rev
enue
Man
agem
ent
MO
FPED
/IAG
X
X X
X X
636,
979
4.
6 In
crea
sed
PFM
Com
plia
nce
thro
ugh
ince
ntiv
es a
nd s
anct
ions
mec
hani
sms
4,02
6,41
7
4.6.
1 Im
prov
ed t
reas
ury
insp
ectio
n ar
rang
emen
ts
to
enha
nce
com
plia
nce
and
capa
city
bui
ldin
g
Enha
nce
capa
city
for
PFM
sys
tem
s in
spec
tion
and
emer
ging
tr
easu
ry fu
nctio
ns
MO
FPED
/AG
O/M
OLG
X
X X
X X
576,
000
Pr
ovis
ion
for
com
putin
g eq
uipm
ent,
rela
ted
acce
ssor
ies,
ve
hicl
es a
nd o
ther
tool
s to
sup
port
insp
ectio
n pr
oces
ses
MO
FPED
/AG
O/M
OLG
X
206,
000
Obj
ectiv
e 4:
To
stre
ngth
en th
e ef
fect
iven
ess
of a
ccou
ntab
ility
sys
tem
s an
d co
mpl
ianc
e in
bud
get e
xecu
tion
Impl
emen
ting
Inst
itutio
ns:
MoF
PED
(Bud
get,
Aid,
D
ebt)
, AG
O,
MoL
G,
MD
ALG
s,
PPDA
, M
oPS
Ke
y St
akeh
olde
rs: N
ITA-
U, U
RA, B
oU
Out
puts
Ke
y Ac
tiviti
es
Lead
Inst
itutio
n
2018 / 19
2019 / 20
2020 / 21
2021 / 22
2022 / 23
IND
ICAT
IVE
Cost
(USD
)
Esta
blis
h an
d im
plem
ent
a ha
rmon
ised
Tre
asur
y i
nspe
ctio
n fr
amew
ork
for f
orei
gn m
issi
ons
MO
FPED
/AG
O/M
OLG
X X
81
,120
U
nder
com
preh
ensi
ve s
ensi
tizat
ion
on t
he P
FM l
egal
and
re
gula
tory
fram
ewor
k M
OFP
ED/A
GO
/MO
LG
X X
X
60
0,00
0
Und
erta
ke a
com
preh
ensi
ve P
FM p
olic
y re
view
and
form
ulat
e ap
prop
riate
pol
icie
s/gu
idel
ines
to a
ddre
ss e
mer
ging
issu
es
MO
FPED
/AG
O/M
OLG
X
X X
110,
000
4.
6.2
Impr
oved
ac
cess
to
in
form
atio
n on
PFM
refo
rms
Stre
ngth
en
chan
ge
man
agem
ent
and
com
mun
icat
ion
proc
esse
s to
enh
ance
ow
ners
hip
of re
form
s be
twee
n AG
O a
nd
Acco
untin
g un
its
MO
FPED
/AG
O/M
OLG
X
X X
X X
380,
000
Enha
nce
MoF
PED
web
site
and
in-
hous
e in
form
atio
n sh
arin
g ne
twor
k M
OFP
ED/A
GO
/MO
LG
X
15
0,00
0
4.6.
3 Im
prov
ed
enab
ling
envi
ronm
ent
for
PFM
per
form
ance
m
anag
emen
t
Revi
sion
of
stan
ding
ord
ers
and
disc
iplin
ary
proc
esse
s fo
r im
plem
enta
tion
of a
com
preh
ensi
ve s
anct
ions
and
rew
ards
re
gim
e
MoP
S X
534,
798
Dev
elop
ing
guid
elin
es f
or i
mpl
emen
ting
the
disc
iplin
e an
d di
scip
linar
y pr
oced
ures
pro
vide
d in
the
Publ
ic S
ervi
ce S
tand
ing
Ord
ers
(PSS
Os)
MoP
S X
X
267,
399
Revi
sed
vers
ion
of P
SSO
and
gui
delin
es f
or im
plem
entin
g th
e ne
w
disc
iplin
ary
proc
edur
es
proc
edur
es
diss
emin
ated
to
M
DAL
Gs
MoP
S
X
X X
591,
100
Chan
ge
man
agem
ent
supp
ort
on
impl
emen
tatio
n of
th
e re
vise
d PS
SO p
rovi
ded
to M
DAL
Gs
MoP
S
X X
X X
305,
000
Co
nduc
t m
onito
ring
and
supp
ort
supe
rvis
ion
sess
ions
to
su
stai
n co
mpl
ianc
e of
the
rew
ards
and
san
ctio
ns c
omm
ittee
w
ith
revi
sed
stan
ding
or
ders
an
d gu
idel
ines
fo
r im
plem
enta
tion
of d
isci
plin
ary
proc
edur
es in
MD
ALG
s
MoP
S
X X
X X
225,
000
TOTA
L CO
ST
83
,049
,069
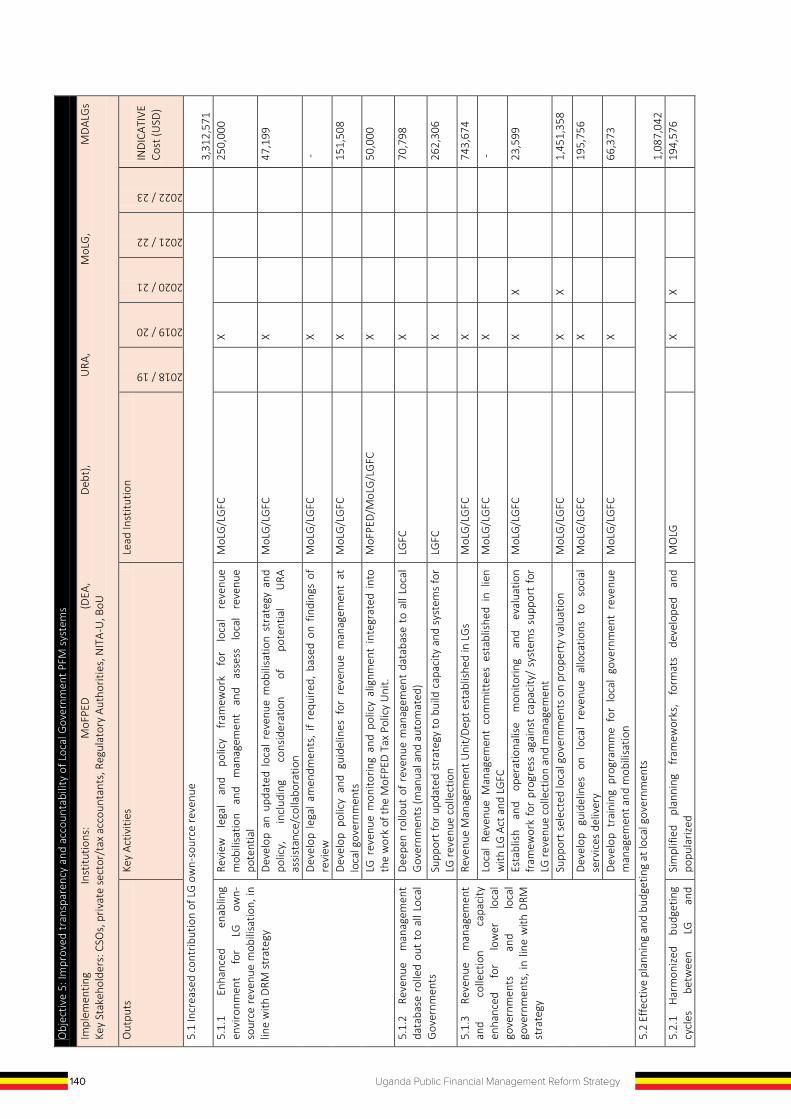
140 Uganda Public Financial Management Reform Strategy
Obj
ectiv
e 5:
Impr
oved
tran
spar
ency
and
acc
ount
abili
ty o
f Loc
al G
over
nmen
t PFM
sys
tem
s
Impl
emen
ting
Inst
itutio
ns:
MoF
PED
(D
EA,
Deb
t),
URA
, M
oLG
, M
DAL
Gs
Ke
y St
akeh
olde
rs: C
SOs,
priv
ate
sect
or/t
ax a
ccou
ntan
ts, R
egul
ator
y Au
thor
ities
, NIT
A-U
, BoU
Out
puts
Ke
y Ac
tiviti
es
Lead
Inst
itutio
n
2018 / 19
2019 / 20
2020 / 21
2021 / 22
2022 / 23
IND
ICAT
IVE
Cost
(USD
)
5.1
Incr
ease
d co
ntrib
utio
n of
LG
ow
n-so
urce
reve
nue
3,31
2,57
1
5.1.
1 En
hanc
ed
enab
ling
envi
ronm
ent
for
LG
own-
sour
ce r
even
ue m
obili
satio
n, in
lin
e w
ith D
RM s
trat
egy
Revi
ew
lega
l an
d po
licy
fram
ewor
k fo
r lo
cal
reve
nue
mob
ilisa
tion
and
man
agem
ent
and
asse
ss
loca
l re
venu
e po
tent
ial
MoL
G/L
GFC
X
250,
000
Dev
elop
an
upda
ted
loca
l re
venu
e m
obili
satio
n st
rate
gy a
nd
polic
y,
incl
udin
g co
nsid
erat
ion
of
pote
ntia
l U
RA
assi
stan
ce/c
olla
bora
tion
MoL
G/L
GFC
X
47,1
99
Dev
elop
lega
l am
endm
ents
, if
requ
ired,
bas
ed o
n fin
ding
s of
re
view
M
oLG
/LG
FC
X
-
Dev
elop
pol
icy
and
guid
elin
es f
or r
even
ue m
anag
emen
t at
lo
cal g
over
nmen
ts
MoL
G/L
GFC
X
151,
508
LG r
even
ue m
onito
ring
and
polic
y al
ignm
ent
inte
grat
ed i
nto
the
wor
k of
the
MoF
PED
Tax
Pol
icy
Uni
t. M
oFPE
D/M
oLG
/LG
FC
X
50
,000
5.1.
2 Re
venu
e m
anag
emen
t da
taba
se r
olle
d ou
t to
all
Loca
l G
over
nmen
ts
Dee
pen
rollo
ut o
f re
venu
e m
anag
emen
t da
taba
se t
o al
l Loc
al
Gov
ernm
ents
(man
ual a
nd a
utom
ated
) LG
FC
X
70
,798
Supp
ort f
or u
pdat
ed s
trat
egy
to b
uild
cap
acity
and
sys
tem
s fo
r LG
reve
nue
colle
ctio
n LG
FC
X
26
2,30
6
5.1.
3 Re
venu
e m
anag
emen
t an
d co
llect
ion
capa
city
en
hanc
ed
for
low
er
loca
l go
vern
men
ts
and
loca
l go
vern
men
ts, i
n lin
e w
ith D
RM
stra
tegy
Reve
nue
Man
agem
ent U
nit/
Dept
est
ablis
hed
in L
Gs
M
oLG
/LG
FC
X
74
3,67
4
Loca
l Re
venu
e M
anag
emen
t co
mm
ittee
s es
tabl
ishe
d in
lie
n w
ith L
G A
ct a
nd L
GFC
M
oLG
/LG
FC
X
-
Esta
blis
h an
d op
erat
iona
lise
mon
itorin
g an
d ev
alua
tion
fram
ewor
k fo
r pr
ogre
ss a
gain
st c
apac
ity/
syst
ems
supp
ort
for
LG re
venu
e co
llect
ion
and
man
agem
ent
MoL
G/L
GFC
X X
23,5
99
Supp
ort s
elec
ted
loca
l gov
ernm
ents
on
prop
erty
val
uatio
n M
oLG
/LG
FC
X
X
1,
451,
358
Dev
elop
gu
idel
ines
on
lo
cal
reve
nue
allo
catio
ns
to
soci
al
serv
ices
del
iver
y
MoL
G/L
GFC
X
195,
756
Dev
elop
tra
inin
g pr
ogra
mm
e fo
r lo
cal
gove
rnm
ent
reve
nue
man
agem
ent a
nd m
obili
satio
n M
oLG
/LG
FC
X
66
,373
5.2
Effe
ctiv
e pl
anni
ng a
nd b
udge
ting
at lo
cal g
over
nmen
ts
1,08
7,04
2
5.2.
1 H
arm
oniz
ed
budg
etin
g cy
cles
be
twee
n LG
an
d Si
mpl
ified
pl
anni
ng
fram
ewor
ks,
form
ats
deve
lope
d an
d po
pula
rized
M
OLG
X X
194,
576
Obj
ectiv
e 5:
Impr
oved
tran
spar
ency
and
acc
ount
abili
ty o
f Loc
al G
over
nmen
t PFM
sys
tem
s
Impl
emen
ting
Inst
itutio
ns:
MoF
PED
(D
EA,
Deb
t),
URA
, M
oLG
, M
DAL
Gs
Ke
y St
akeh
olde
rs: C
SOs,
priv
ate
sect
or/t
ax a
ccou
ntan
ts, R
egul
ator
y Au
thor
ities
, NIT
A-U
, BoU
Out
puts
Ke
y Ac
tiviti
es
Lead
Inst
itutio
n
2018 / 19
2019 / 20
2020 / 21
2021 / 22
2022 / 23 IN
DIC
ATIV
E Co
st (U
SD)
Nat
iona
l bud
gets
Re
view
NPA
pla
nnin
g gu
idel
ines
for l
ocal
gov
ernm
ents
M
OLG
X
X
193,
809
Revi
ew o
f leg
al fr
amew
ork
on L
G b
udge
ting
cycl
es
MO
LG
X
X
19
4,39
9
NPA
Cer
tific
atio
n of
CG
bud
gets
to e
nsur
e th
at th
ey a
re in
line
w
ith p
riorit
ies
subm
itted
by
LGs
MO
LG
-
Stre
ngth
en P
lann
ing
Uni
ts in
LG
s M
OLG
X X
504,
258
5.3
Impr
oved
qua
lity
of a
udit
and
coo
rdin
ated
fol
low
up
of re
com
men
datio
ns b
y LG
PACs
and
reg
iona
l aud
it co
mm
ittee
s
2,
645,
966
5.
3.1.
Im
prov
ed
effe
ctiv
enes
s an
d ca
paci
ty
of
LGPA
Cs
and
coor
dina
tion
with
oth
er a
udit
com
mitt
ees
Dev
elop
pol
icy
to c
larif
y an
d st
ream
line
role
s an
d co
ordi
natio
n of
LG
PACs
, dis
tric
t PAC
s an
d re
gion
al a
udit
com
mitt
ees
Mol
G/M
oFPE
D-IA
G
X
-
Esta
blis
h an
d m
anag
e ch
ange
in in
stitu
tiona
l arr
ange
men
ts t
o im
plem
ent p
olic
y on
role
s of
aud
it co
mm
ittee
s M
olG
/MoF
PED
-IAG
X
174,
871
Dev
elop
tr
aini
ng
prog
ram
me,
sy
stem
s an
d gu
idel
ines
fo
r LG
PACs
and
regi
onal
aud
it co
mm
ittee
s to
ope
ratio
nalis
e po
licy
on a
udit
com
mitt
ees
Mol
G/M
oFPE
D-IA
G
X
X
20
9,82
7
Cons
ulta
ncy
to c
ondu
ct a
Cap
acity
Nee
ds A
sess
men
t of
the
In
tern
al A
udit
Func
tion
in L
Gs
Mol
G/M
oFPE
D-IA
G
X
X
20
0,00
0
5.3.
2.
Impr
oved
m
onito
ring
and
repo
rtin
g on
im
plem
enta
tion
of
LG
audi
t re
com
men
datio
ns
Dev
elop
a s
yste
m to
trac
k au
dit r
ecom
men
datio
ns fo
llow
up
to
guid
e ac
coun
ting
offic
ers
Mol
G/M
oFPE
D-IA
G
X
15
0,00
0
Supp
ort
AOs
unde
rsta
nd
and
impl
emen
t au
dit
reco
mm
enda
tions
M
olG
/MoF
PED
-IAG
X
780,
672
5.3.
3.
Enha
nced
qu
ality
of
in
tern
al
audi
t as
sura
nce
func
tion
at L
G le
vel
Asse
ss,
supp
ort
and
ince
ntiv
ise
LGs
to
allo
cate
su
ffici
ent
reso
urce
s to
inte
rnal
aud
it fu
nctio
n
Mol
G/M
oFPE
D-IA
G
X
X X
X 1,
130,
596
5.4
Enha
nce
acco
unta
bilit
y an
d pe
rfor
man
ce m
onito
ring
in d
eliv
ery
of s
ervi
ces
in k
ey s
ervi
ce s
ecto
rs (r
oads
, edu
catio
n, h
ealth
, an
d ag
ricul
ture
ser
vice
s)
516,
646
5.4.
1 En
hanc
ed
perf
orm
ance
an
d ac
coun
tabi
lity
for
serv
ice
deliv
ery
at L
G le
vel
Dis
sem
inat
ion
of
perf
orm
ance
m
onito
ring
guid
elin
es
deve
lope
d by
LG
, inc
ludi
ng a
ssoc
iate
d ca
paci
ty b
uild
ing
MO
LG
X
X 19
1,15
4
Dev
elop
a h
arm
oniz
ed tr
acki
ng s
yste
m fo
r ser
vice
s M
OLG
X
102,
746
Annu
al p
erfo
rman
ce r
epor
ts p
ublis
hed
and
diss
emin
ated
on
GoU
web
site
s M
OLG
102,
746
Und
erta
ke
sele
cted
lo
cal-l
evel
Pu
blic
Ex
pend
iture
tr
acki
ng
surv
eys
(PET
S)
and
Publ
ic
Expe
nditu
re
Revi
ews
(PER
), in
co
ordi
natio
n w
ith P
ET a
ctiv
ities
und
er 2
.5.1
MO
LG
X X
12
0,00
0
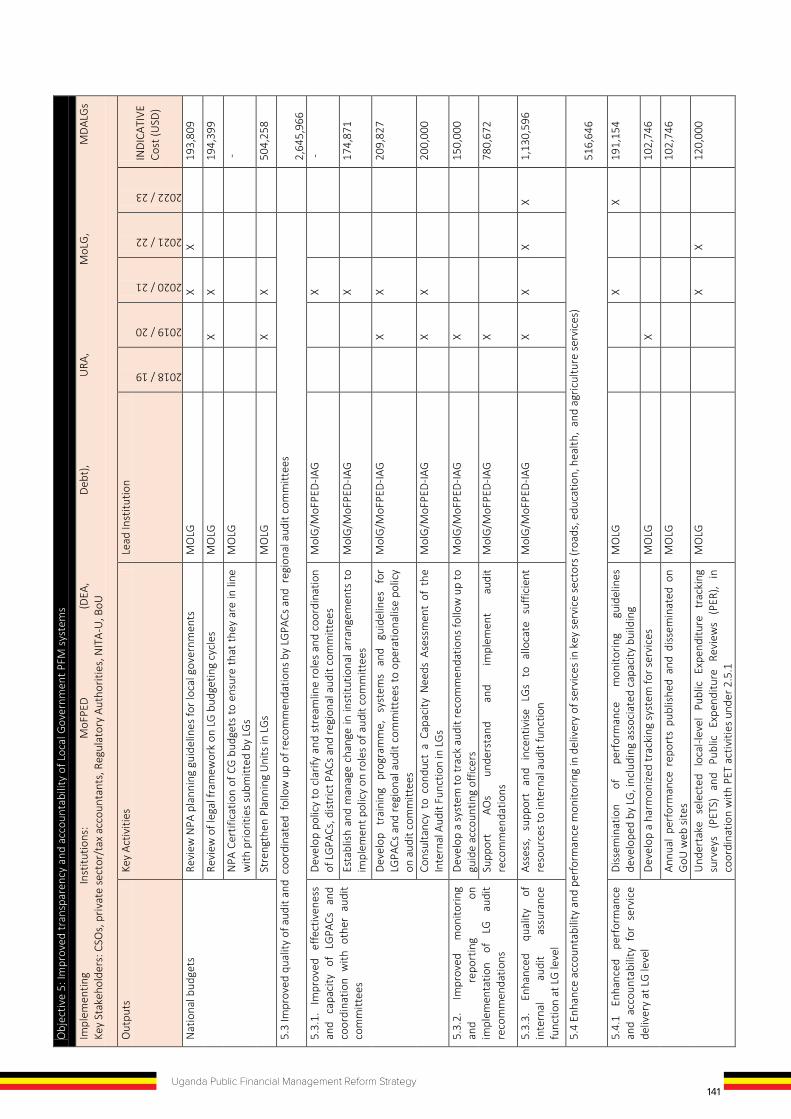
140 Uganda Public Financial Management Reform Strategy
Obj
ectiv
e 5:
Impr
oved
tran
spar
ency
and
acc
ount
abili
ty o
f Loc
al G
over
nmen
t PFM
sys
tem
s
Impl
emen
ting
Inst
itutio
ns:
MoF
PED
(D
EA,
Deb
t),
URA
, M
oLG
, M
DAL
Gs
Ke
y St
akeh
olde
rs: C
SOs,
priv
ate
sect
or/t
ax a
ccou
ntan
ts, R
egul
ator
y Au
thor
ities
, NIT
A-U
, BoU
Out
puts
Ke
y Ac
tiviti
es
Lead
Inst
itutio
n
2018 / 19
2019 / 20
2020 / 21
2021 / 22
2022 / 23
IND
ICAT
IVE
Cost
(USD
)
5.1
Incr
ease
d co
ntrib
utio
n of
LG
ow
n-so
urce
reve
nue
3,31
2,57
1
5.1.
1 En
hanc
ed
enab
ling
envi
ronm
ent
for
LG
own-
sour
ce r
even
ue m
obili
satio
n, in
lin
e w
ith D
RM s
trat
egy
Revi
ew
lega
l an
d po
licy
fram
ewor
k fo
r lo
cal
reve
nue
mob
ilisa
tion
and
man
agem
ent
and
asse
ss
loca
l re
venu
e po
tent
ial
MoL
G/L
GFC
X
250,
000
Dev
elop
an
upda
ted
loca
l re
venu
e m
obili
satio
n st
rate
gy a
nd
polic
y,
incl
udin
g co
nsid
erat
ion
of
pote
ntia
l U
RA
assi
stan
ce/c
olla
bora
tion
MoL
G/L
GFC
X
47,1
99
Dev
elop
lega
l am
endm
ents
, if
requ
ired,
bas
ed o
n fin
ding
s of
re
view
M
oLG
/LG
FC
X
-
Dev
elop
pol
icy
and
guid
elin
es f
or r
even
ue m
anag
emen
t at
lo
cal g
over
nmen
ts
MoL
G/L
GFC
X
151,
508
LG r
even
ue m
onito
ring
and
polic
y al
ignm
ent
inte
grat
ed i
nto
the
wor
k of
the
MoF
PED
Tax
Pol
icy
Uni
t. M
oFPE
D/M
oLG
/LG
FC
X
50
,000
5.1.
2 Re
venu
e m
anag
emen
t da
taba
se r
olle
d ou
t to
all
Loca
l G
over
nmen
ts
Dee
pen
rollo
ut o
f re
venu
e m
anag
emen
t da
taba
se t
o al
l Loc
al
Gov
ernm
ents
(man
ual a
nd a
utom
ated
) LG
FC
X
70
,798
Supp
ort f
or u
pdat
ed s
trat
egy
to b
uild
cap
acity
and
sys
tem
s fo
r LG
reve
nue
colle
ctio
n LG
FC
X
26
2,30
6
5.1.
3 Re
venu
e m
anag
emen
t an
d co
llect
ion
capa
city
en
hanc
ed
for
low
er
loca
l go
vern
men
ts
and
loca
l go
vern
men
ts, i
n lin
e w
ith D
RM
stra
tegy
Reve
nue
Man
agem
ent U
nit/
Dept
est
ablis
hed
in L
Gs
M
oLG
/LG
FC
X
74
3,67
4
Loca
l Re
venu
e M
anag
emen
t co
mm
ittee
s es
tabl
ishe
d in
lie
n w
ith L
G A
ct a
nd L
GFC
M
oLG
/LG
FC
X
-
Esta
blis
h an
d op
erat
iona
lise
mon
itorin
g an
d ev
alua
tion
fram
ewor
k fo
r pr
ogre
ss a
gain
st c
apac
ity/
syst
ems
supp
ort
for
LG re
venu
e co
llect
ion
and
man
agem
ent
MoL
G/L
GFC
X X
23,5
99
Supp
ort s
elec
ted
loca
l gov
ernm
ents
on
prop
erty
val
uatio
n M
oLG
/LG
FC
X
X
1,
451,
358
Dev
elop
gu
idel
ines
on
lo
cal
reve
nue
allo
catio
ns
to
soci
al
serv
ices
del
iver
y
MoL
G/L
GFC
X
195,
756
Dev
elop
tra
inin
g pr
ogra
mm
e fo
r lo
cal
gove
rnm
ent
reve
nue
man
agem
ent a
nd m
obili
satio
n M
oLG
/LG
FC
X
66
,373
5.2
Effe
ctiv
e pl
anni
ng a
nd b
udge
ting
at lo
cal g
over
nmen
ts
1,08
7,04
2
5.2.
1 H
arm
oniz
ed
budg
etin
g cy
cles
be
twee
n LG
an
d Si
mpl
ified
pl
anni
ng
fram
ewor
ks,
form
ats
deve
lope
d an
d po
pula
rized
M
OLG
X X
194,
576
Obj
ectiv
e 5:
Impr
oved
tran
spar
ency
and
acc
ount
abili
ty o
f Loc
al G
over
nmen
t PFM
sys
tem
s
Impl
emen
ting
Inst
itutio
ns:
MoF
PED
(D
EA,
Deb
t),
URA
, M
oLG
, M
DAL
Gs
Ke
y St
akeh
olde
rs: C
SOs,
priv
ate
sect
or/t
ax a
ccou
ntan
ts, R
egul
ator
y Au
thor
ities
, NIT
A-U
, BoU
Out
puts
Ke
y Ac
tiviti
es
Lead
Inst
itutio
n
2018 / 19
2019 / 20
2020 / 21
2021 / 22
2022 / 23
IND
ICAT
IVE
Cost
(USD
)
Nat
iona
l bud
gets
Re
view
NPA
pla
nnin
g gu
idel
ines
for l
ocal
gov
ernm
ents
M
OLG
X
X
193,
809
Revi
ew o
f leg
al fr
amew
ork
on L
G b
udge
ting
cycl
es
MO
LG
X
X
19
4,39
9
NPA
Cer
tific
atio
n of
CG
bud
gets
to e
nsur
e th
at th
ey a
re in
line
w
ith p
riorit
ies
subm
itted
by
LGs
MO
LG
-
Stre
ngth
en P
lann
ing
Uni
ts in
LG
s M
OLG
X X
504,
258
5.3
Impr
oved
qua
lity
of a
udit
and
coo
rdin
ated
fol
low
up
of re
com
men
datio
ns b
y LG
PACs
and
reg
iona
l aud
it co
mm
ittee
s
2,
645,
966
5.
3.1.
Im
prov
ed
effe
ctiv
enes
s an
d ca
paci
ty
of
LGPA
Cs
and
coor
dina
tion
with
oth
er a
udit
com
mitt
ees
Dev
elop
pol
icy
to c
larif
y an
d st
ream
line
role
s an
d co
ordi
natio
n of
LG
PACs
, dis
tric
t PAC
s an
d re
gion
al a
udit
com
mitt
ees
Mol
G/M
oFPE
D-IA
G
X
-
Esta
blis
h an
d m
anag
e ch
ange
in in
stitu
tiona
l arr
ange
men
ts t
o im
plem
ent p
olic
y on
role
s of
aud
it co
mm
ittee
s M
olG
/MoF
PED
-IAG
X
174,
871
Dev
elop
tr
aini
ng
prog
ram
me,
sy
stem
s an
d gu
idel
ines
fo
r LG
PACs
and
regi
onal
aud
it co
mm
ittee
s to
ope
ratio
nalis
e po
licy
on a
udit
com
mitt
ees
Mol
G/M
oFPE
D-IA
G
X
X
20
9,82
7
Cons
ulta
ncy
to c
ondu
ct a
Cap
acity
Nee
ds A
sess
men
t of
the
In
tern
al A
udit
Func
tion
in L
Gs
Mol
G/M
oFPE
D-IA
G
X
X
20
0,00
0
5.3.
2.
Impr
oved
m
onito
ring
and
repo
rtin
g on
im
plem
enta
tion
of
LG
audi
t re
com
men
datio
ns
Dev
elop
a s
yste
m to
trac
k au
dit r
ecom
men
datio
ns fo
llow
up
to
guid
e ac
coun
ting
offic
ers
Mol
G/M
oFPE
D-IA
G
X
15
0,00
0
Supp
ort
AOs
unde
rsta
nd
and
impl
emen
t au
dit
reco
mm
enda
tions
M
olG
/MoF
PED
-IAG
X
780,
672
5.3.
3.
Enha
nced
qu
ality
of
in
tern
al
audi
t as
sura
nce
func
tion
at L
G le
vel
Asse
ss,
supp
ort
and
ince
ntiv
ise
LGs
to
allo
cate
su
ffici
ent
reso
urce
s to
inte
rnal
aud
it fu
nctio
n
Mol
G/M
oFPE
D-IA
G
X
X X
X 1,
130,
596
5.4
Enha
nce
acco
unta
bilit
y an
d pe
rfor
man
ce m
onito
ring
in d
eliv
ery
of s
ervi
ces
in k
ey s
ervi
ce s
ecto
rs (r
oads
, edu
catio
n, h
ealth
, an
d ag
ricul
ture
ser
vice
s)
516,
646
5.4.
1 En
hanc
ed
perf
orm
ance
an
d ac
coun
tabi
lity
for
serv
ice
deliv
ery
at L
G le
vel
Dis
sem
inat
ion
of
perf
orm
ance
m
onito
ring
guid
elin
es
deve
lope
d by
LG
, inc
ludi
ng a
ssoc
iate
d ca
paci
ty b
uild
ing
MO
LG
X
X 19
1,15
4
Dev
elop
a h
arm
oniz
ed tr
acki
ng s
yste
m fo
r ser
vice
s M
OLG
X
102,
746
Annu
al p
erfo
rman
ce r
epor
ts p
ublis
hed
and
diss
emin
ated
on
GoU
web
site
s M
OLG
102,
746
Und
erta
ke
sele
cted
lo
cal-l
evel
Pu
blic
Ex
pend
iture
tr
acki
ng
surv
eys
(PET
S)
and
Publ
ic
Expe
nditu
re
Revi
ews
(PER
), in
co
ordi
natio
n w
ith P
ET a
ctiv
ities
und
er 2
.5.1
MO
LG
X X
12
0,00
0
141Uganda Public Financial Management Reform Strategy
Obj
ectiv
e 5:
Impr
oved
tran
spar
ency
and
acc
ount
abili
ty o
f Loc
al G
over
nmen
t PFM
sys
tem
s
Impl
emen
ting
Inst
itutio
ns:
MoF
PED
(D
EA,
Deb
t),
URA
, M
oLG
, M
DAL
Gs
Ke
y St
akeh
olde
rs: C
SOs,
priv
ate
sect
or/t
ax a
ccou
ntan
ts, R
egul
ator
y Au
thor
ities
, NIT
A-U
, BoU
Out
puts
Ke
y Ac
tiviti
es
Lead
Inst
itutio
n
2018 / 19
2019 / 20
2020 / 21
2021 / 22
2022 / 23
IND
ICAT
IVE
Cost
(USD
)
Nat
iona
l bud
gets
Re
view
NPA
pla
nnin
g gu
idel
ines
for l
ocal
gov
ernm
ents
M
OLG
X
X
193,
809
Revi
ew o
f leg
al fr
amew
ork
on L
G b
udge
ting
cycl
es
MO
LG
X
X
19
4,39
9
NPA
Cer
tific
atio
n of
CG
bud
gets
to e
nsur
e th
at th
ey a
re in
line
w
ith p
riorit
ies
subm
itted
by
LGs
MO
LG
-
Stre
ngth
en P
lann
ing
Uni
ts in
LG
s M
OLG
X X
504,
258
5.3
Impr
oved
qua
lity
of a
udit
and
coo
rdin
ated
fol
low
up
of re
com
men
datio
ns b
y LG
PACs
and
reg
iona
l aud
it co
mm
ittee
s
2,
645,
966
5.
3.1.
Im
prov
ed
effe
ctiv
enes
s an
d ca
paci
ty
of
LGPA
Cs
and
coor
dina
tion
with
oth
er a
udit
com
mitt
ees
Dev
elop
pol
icy
to c
larif
y an
d st
ream
line
role
s an
d co
ordi
natio
n of
LG
PACs
, dis
tric
t PAC
s an
d re
gion
al a
udit
com
mitt
ees
Mol
G/M
oFPE
D-IA
G
X
-
Esta
blis
h an
d m
anag
e ch
ange
in in
stitu
tiona
l arr
ange
men
ts t
o im
plem
ent p
olic
y on
role
s of
aud
it co
mm
ittee
s M
olG
/MoF
PED
-IAG
X
174,
871
Dev
elop
tr
aini
ng
prog
ram
me,
sy
stem
s an
d gu
idel
ines
fo
r LG
PACs
and
regi
onal
aud
it co
mm
ittee
s to
ope
ratio
nalis
e po
licy
on a
udit
com
mitt
ees
Mol
G/M
oFPE
D-IA
G
X
X
20
9,82
7
Cons
ulta
ncy
to c
ondu
ct a
Cap
acity
Nee
ds A
sess
men
t of
the
In
tern
al A
udit
Func
tion
in L
Gs
Mol
G/M
oFPE
D-IA
G
X
X
20
0,00
0
5.3.
2.
Impr
oved
m
onito
ring
and
repo
rtin
g on
im
plem
enta
tion
of
LG
audi
t re
com
men
datio
ns
Dev
elop
a s
yste
m to
trac
k au
dit r
ecom
men
datio
ns fo
llow
up
to
guid
e ac
coun
ting
offic
ers
Mol
G/M
oFPE
D-IA
G
X
15
0,00
0
Supp
ort
AOs
unde
rsta
nd
and
impl
emen
t au
dit
reco
mm
enda
tions
M
olG
/MoF
PED
-IAG
X
780,
672
5.3.
3.
Enha
nced
qu
ality
of
in
tern
al
audi
t as
sura
nce
func
tion
at L
G le
vel
Asse
ss,
supp
ort
and
ince
ntiv
ise
LGs
to
allo
cate
su
ffici
ent
reso
urce
s to
inte
rnal
aud
it fu
nctio
n
Mol
G/M
oFPE
D-IA
G
X
X X
X 1,
130,
596
5.4
Enha
nce
acco
unta
bilit
y an
d pe
rfor
man
ce m
onito
ring
in d
eliv
ery
of s
ervi
ces
in k
ey s
ervi
ce s
ecto
rs (r
oads
, edu
catio
n, h
ealth
, an
d ag
ricul
ture
ser
vice
s)
516,
646
5.4.
1 En
hanc
ed
perf
orm
ance
an
d ac
coun
tabi
lity
for
serv
ice
deliv
ery
at L
G le
vel
Dis
sem
inat
ion
of
perf
orm
ance
m
onito
ring
guid
elin
es
deve
lope
d by
LG
, inc
ludi
ng a
ssoc
iate
d ca
paci
ty b
uild
ing
MO
LG
X
X 19
1,15
4
Dev
elop
a h
arm
oniz
ed tr
acki
ng s
yste
m fo
r ser
vice
s M
OLG
X
102,
746
Annu
al p
erfo
rman
ce r
epor
ts p
ublis
hed
and
diss
emin
ated
on
GoU
web
site
s M
OLG
102,
746
Und
erta
ke
sele
cted
lo
cal-l
evel
Pu
blic
Ex
pend
iture
tr
acki
ng
surv
eys
(PET
S)
and
Publ
ic
Expe
nditu
re
Revi
ews
(PER
), in
co
ordi
natio
n w
ith P
ET a
ctiv
ities
und
er 2
.5.1
MO
LG
X X
12
0,00
0
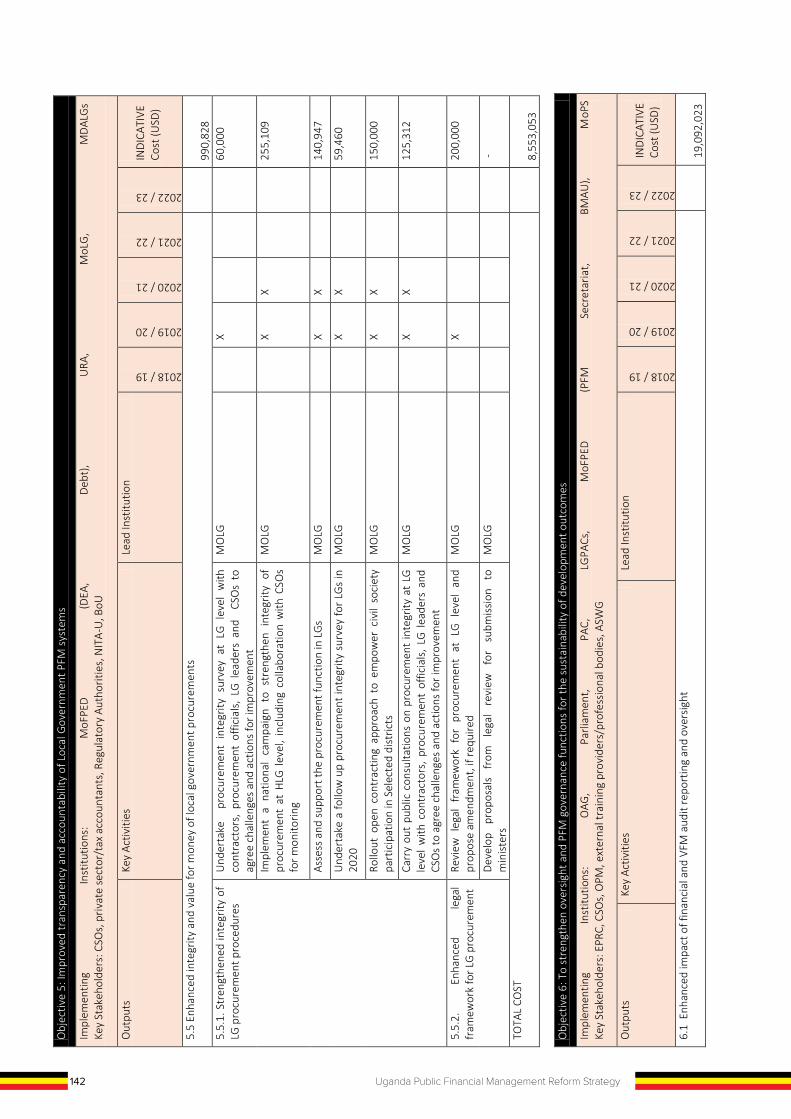
142 Uganda Public Financial Management Reform Strategy
Obj
ectiv
e 5:
Impr
oved
tran
spar
ency
and
acc
ount
abili
ty o
f Loc
al G
over
nmen
t PFM
sys
tem
s
Impl
emen
ting
Inst
itutio
ns:
MoF
PED
(D
EA,
Deb
t),
URA
, M
oLG
, M
DAL
Gs
Ke
y St
akeh
olde
rs: C
SOs,
priv
ate
sect
or/t
ax a
ccou
ntan
ts, R
egul
ator
y Au
thor
ities
, NIT
A-U
, BoU
Out
puts
Ke
y Ac
tiviti
es
Lead
Inst
itutio
n
2018 / 19
2019 / 20
2020 / 21
2021 / 22
2022 / 23
IND
ICAT
IVE
Cost
(USD
)
5.5
Enha
nced
inte
grity
and
val
ue fo
r mon
ey o
f loc
al g
over
nmen
t pro
cure
men
ts
99
0,82
8
5.5.
1. S
tren
gthe
ned
inte
grity
of
LG p
rocu
rem
ent p
roce
dure
s U
nder
take
pr
ocur
emen
t in
tegr
ity s
urve
y at
LG
lev
el w
ith
cont
ract
ors,
pro
cure
men
t of
ficia
ls,
LG l
eade
rs a
nd
CSO
s to
ag
ree
chal
leng
es a
nd a
ctio
ns fo
r im
prov
emen
t
MO
LG
X
60
,000
Impl
emen
t a
natio
nal
cam
paig
n to
str
engt
hen
inte
grity
of
proc
urem
ent
at H
LG l
evel
, in
clud
ing
colla
bora
tion
with
CSO
s fo
r mon
itorin
g
MO
LG
X
X
25
5,10
9
Asse
ss a
nd s
uppo
rt th
e pr
ocur
emen
t fun
ctio
n in
LG
s M
OLG
X X
140,
947
Und
erta
ke a
follo
w u
p pr
ocur
emen
t int
egrit
y su
rvey
for
LGs
in
2020
M
OLG
X X
59,4
60
Rollo
ut o
pen
cont
ract
ing
appr
oach
to
empo
wer
civ
il so
ciet
y pa
rtic
ipat
ion
in S
elec
ted
dist
ricts
M
OLG
X X
150,
000
Carr
y ou
t pu
blic
con
sulta
tions
on
proc
urem
ent
inte
grity
at
LG
leve
l with
con
trac
tors
, pr
ocur
emen
t of
ficia
ls,
LG l
eade
rs a
nd
CSO
s to
agr
ee c
halle
nges
and
act
ions
for i
mpr
ovem
ent
MO
LG
X
X
12
5,31
2
5.5.
2.
Enha
nced
le
gal
fram
ewor
k fo
r LG
pro
cure
men
t Re
view
leg
al f
ram
ewor
k fo
r pr
ocur
emen
t at
LG
lev
el a
nd
prop
ose
amen
dmen
t, if
requ
ired
MO
LG
X
20
0,00
0
Dev
elop
pr
opos
als
from
le
gal
revi
ew
for
subm
issi
on
to
min
iste
rs
MO
LG
-
TOTA
L CO
ST
8,55
3,05
3
Obj
ectiv
e 6:
To
stre
ngth
en o
vers
ight
and
PFM
gov
erna
nce
func
tions
for t
he s
usta
inab
ility
of d
evel
opm
ent o
utco
mes
Impl
emen
ting
Inst
itutio
ns:
OAG
, Pa
rliam
ent,
PAC,
LG
PACs
, M
oFPE
D
(PFM
Se
cret
aria
t, BM
AU),
MoP
S
Key
Stak
ehol
ders
: EPR
C, C
SOs,
OPM
, ext
erna
l tra
inin
g pr
ovid
ers/
prof
essi
onal
bod
ies,
ASW
G
Out
puts
Ke
y Ac
tiviti
es
Lea
d In
stitu
tion
2018 / 19
2019 / 20
2020 / 21
2021 / 22
2022 / 23
IND
ICAT
IVE
Cost
(USD
)
6.1
Enh
ance
d im
pact
of f
inan
cial
and
VFM
aud
it re
port
ing
and
over
sigh
t
19,0
92,0
23
Obj
ectiv
e 6:
To
stre
ngth
en o
vers
ight
and
PFM
gov
erna
nce
func
tions
for t
he s
usta
inab
ility
of d
evel
opm
ent o
utco
mes
Impl
emen
ting
Inst
itutio
ns:
OAG
, Pa
rliam
ent,
PAC,
LG
PACs
, M
oFPE
D
(PFM
Se
cret
aria
t, BM
AU),
MoP
S
Key
Stak
ehol
ders
: EPR
C, C
SOs,
OPM
, ext
erna
l tra
inin
g pr
ovid
ers/
prof
essi
onal
bod
ies,
ASW
G
Out
puts
Ke
y Ac
tiviti
es
Lea
d In
stitu
tion
2018 / 19
2019 / 20
2020 / 21
2021 / 22
2022 / 23 IN
DIC
ATIV
E Co
st (U
SD)
6.1.
1 M
DAL
Gs
utili
se
a sh
ared
tra
ckin
g sy
stem
to
mon
itor
and
repo
rt o
n th
e im
plem
enta
tion
of
audi
t re
com
men
datio
ns
OAG
Man
agem
ent
Info
rmat
ion
Syst
em c
ompl
eted
(D
evel
oped
an
d te
sted
) O
AG/P
arlia
men
t X
X
X
4,75
7,42
3
Adm
inis
trat
or a
nd K
ey U
ser
trai
ning
com
plet
ed f
or t
he O
AG
Man
agem
ent I
nfor
mat
ion
Syst
em
OAG
X
X
397,
000
6.
1.2
The
impa
ct o
f au
dit
reco
mm
enda
tions
on
se
rvic
e de
liver
y is
asse
ssed
in
sele
cted
key
se
ctor
s
Rigo
rous
eva
luat
ion
of th
e im
pact
of a
udit
reco
mm
enda
tions
on
serv
ice
deliv
ery
in U
gand
a's
heal
th s
ecto
r B
MAU
/EPR
C/O
PM
X
X
X
350,
000
Ri
goro
us e
valu
atio
n of
the
impa
ct o
f aud
it re
com
men
datio
ns o
n se
rvic
e de
liver
y in
Uga
nda'
s ag
ricul
ture
sec
tor
BM
AU/E
PRC/
OPM
X
X
X
35
0,00
0
6.1.
3 Im
prov
ed t
rack
ing
of
follo
w
up
of
over
sigh
t re
com
men
datio
n by
M
DAL
Gs
Trac
king
sys
tem
for O
AG &
Par
liam
ent
OAG
X
X
X
1,19
2,16
5
Trai
ning
pr
ogra
m
for
Loca
l G
over
nmen
t Pu
blic
Ac
coun
ts
Com
mitt
ees
(LG
PACs
) IA
G/M
OLG
X
X
450,
000
An
IC
T-ba
sed
follo
w-u
p m
echa
nism
fo
r M
oLG
to
tr
ack
reco
mm
enda
tions
mad
e by
LG
-PAC
s es
tabl
ishe
d M
OLG
450,
000
Ef
fect
ive
Stak
ehol
der
Enga
gem
ent
and
supp
ort
to l
egis
lativ
e ov
ersi
ght
OAG
X
X
X
38
7,22
0
Actio
n pl
an
targ
etin
g im
prov
ed
perf
orm
ance
on
tr
easu
ry
mem
oran
da
MO
FPED
/AG
O
X
X
X
356,
000
Sy
stem
est
ablis
hed
for
the
trac
king
of
actio
ns u
pon
trea
sury
m
emor
anda
M
OFP
ED/A
GO
X
X
235,
000
6.
1.4
Mec
hani
sms
for
polit
ical
en
gage
men
t on
PF
M
for
acco
unta
bilit
y st
reng
then
ed
Capa
city
bui
ldin
g fo
r pa
rliam
enta
ry P
FM a
nd a
ccou
ntab
ility
fo
rum
s P
ARLI
AMEN
T
X
X
45
2,00
0
Cabi
net
enga
gem
ent
on
PFM
(s
emin
ars,
w
orks
hops
, po
licy
brie
fs)
PAR
LIAM
ENT
X
X
256,
000
St
udy
on P
oliti
cal
Econ
omy
of P
ublic
Fin
anci
al M
anag
emen
t Re
form
s to
inf
orm
und
erst
andi
ng o
f im
plic
atio
ns f
or d
ialo
gue
and
oper
atio
nal
enga
gem
ent
of n
on-t
echn
ical
driv
ers
such
as
‘pol
itica
l com
mitm
ent’
and
info
rm s
trat
egie
s fo
r st
reng
then
ing
sust
aina
bilit
y of
PFM
refo
rm
BM
AU/E
PRC/
OPM
X
X
X
35
1,00
0
6.1.
5 Su
stai
nabl
e ca
paci
ty
build
ing
in a
udit
repo
rtin
g an
d su
ppor
t to
au
dit
serv
ices
Cons
truc
tion
of C
ente
r for
Aud
it Ex
celle
nce
OAG
X
X
X
6,98
5,00
0
Capa
city
bu
ilt
in
Fina
ncia
l, Pe
rfor
man
ce,
Fore
nsic
Au
dit
in
addi
tion
to s
peci
aliz
ed a
udit
area
s an
d ex
tern
al a
udit
supp
ort
func
tions
.
OAG
X
X
X
2,08
1,90
0
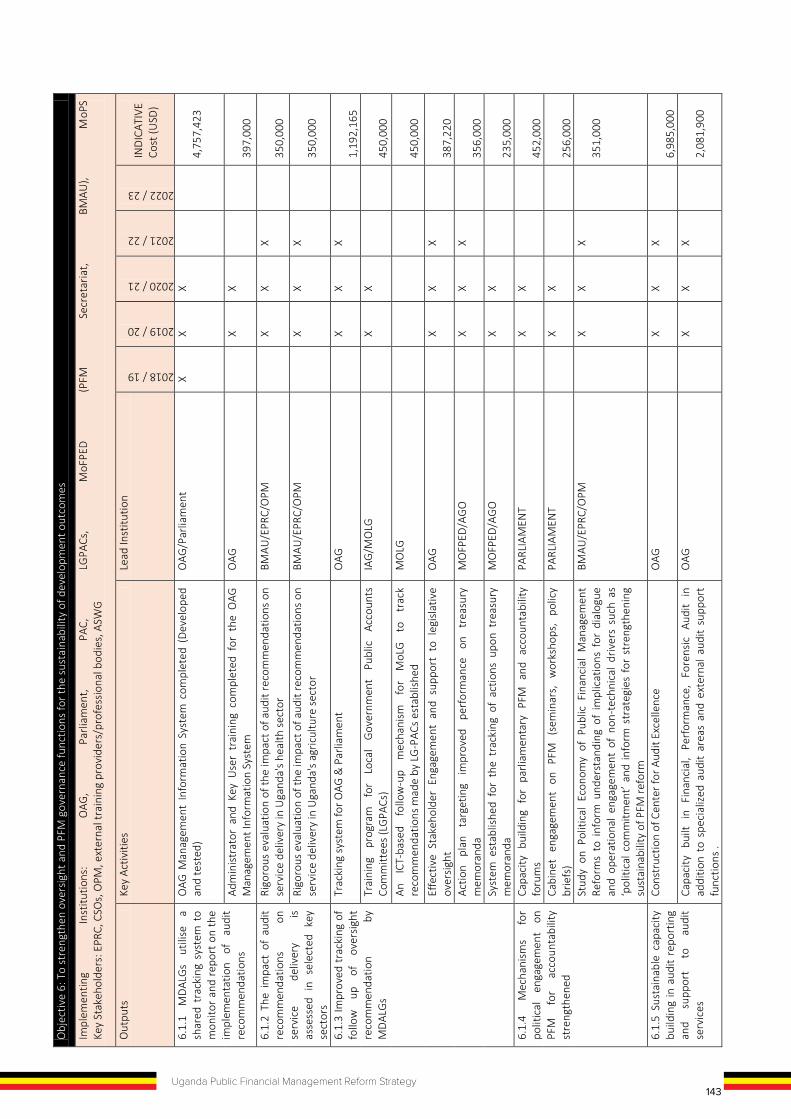
142 Uganda Public Financial Management Reform Strategy
Obj
ectiv
e 5:
Impr
oved
tran
spar
ency
and
acc
ount
abili
ty o
f Loc
al G
over
nmen
t PFM
sys
tem
s
Impl
emen
ting
Inst
itutio
ns:
MoF
PED
(D
EA,
Deb
t),
URA
, M
oLG
, M
DAL
Gs
Ke
y St
akeh
olde
rs: C
SOs,
priv
ate
sect
or/t
ax a
ccou
ntan
ts, R
egul
ator
y Au
thor
ities
, NIT
A-U
, BoU
Out
puts
Ke
y Ac
tiviti
es
Lead
Inst
itutio
n
2018 / 19
2019 / 20
2020 / 21
2021 / 22
2022 / 23
IND
ICAT
IVE
Cost
(USD
)
5.5
Enha
nced
inte
grity
and
val
ue fo
r mon
ey o
f loc
al g
over
nmen
t pro
cure
men
ts
99
0,82
8
5.5.
1. S
tren
gthe
ned
inte
grity
of
LG p
rocu
rem
ent p
roce
dure
s U
nder
take
pr
ocur
emen
t in
tegr
ity s
urve
y at
LG
lev
el w
ith
cont
ract
ors,
pro
cure
men
t of
ficia
ls,
LG l
eade
rs a
nd
CSO
s to
ag
ree
chal
leng
es a
nd a
ctio
ns fo
r im
prov
emen
t
MO
LG
X
60
,000
Impl
emen
t a
natio
nal
cam
paig
n to
str
engt
hen
inte
grity
of
proc
urem
ent
at H
LG l
evel
, in
clud
ing
colla
bora
tion
with
CSO
s fo
r mon
itorin
g
MO
LG
X
X
25
5,10
9
Asse
ss a
nd s
uppo
rt th
e pr
ocur
emen
t fun
ctio
n in
LG
s M
OLG
X X
140,
947
Und
erta
ke a
follo
w u
p pr
ocur
emen
t int
egrit
y su
rvey
for
LGs
in
2020
M
OLG
X X
59,4
60
Rollo
ut o
pen
cont
ract
ing
appr
oach
to
empo
wer
civ
il so
ciet
y pa
rtic
ipat
ion
in S
elec
ted
dist
ricts
M
OLG
X X
150,
000
Carr
y ou
t pu
blic
con
sulta
tions
on
proc
urem
ent
inte
grity
at
LG
leve
l with
con
trac
tors
, pr
ocur
emen
t of
ficia
ls,
LG l
eade
rs a
nd
CSO
s to
agr
ee c
halle
nges
and
act
ions
for i
mpr
ovem
ent
MO
LG
X
X
12
5,31
2
5.5.
2.
Enha
nced
le
gal
fram
ewor
k fo
r LG
pro
cure
men
t Re
view
leg
al f
ram
ewor
k fo
r pr
ocur
emen
t at
LG
lev
el a
nd
prop
ose
amen
dmen
t, if
requ
ired
MO
LG
X
20
0,00
0
Dev
elop
pr
opos
als
from
le
gal
revi
ew
for
subm
issi
on
to
min
iste
rs
MO
LG
-
TOTA
L CO
ST
8,55
3,05
3
Obj
ectiv
e 6:
To
stre
ngth
en o
vers
ight
and
PFM
gov
erna
nce
func
tions
for t
he s
usta
inab
ility
of d
evel
opm
ent o
utco
mes
Impl
emen
ting
Inst
itutio
ns:
OAG
, Pa
rliam
ent,
PAC,
LG
PACs
, M
oFPE
D
(PFM
Se
cret
aria
t, BM
AU),
MoP
S
Key
Stak
ehol
ders
: EPR
C, C
SOs,
OPM
, ext
erna
l tra
inin
g pr
ovid
ers/
prof
essi
onal
bod
ies,
ASW
G
Out
puts
Ke
y Ac
tiviti
es
Lea
d In
stitu
tion
2018 / 19
2019 / 20
2020 / 21
2021 / 22
2022 / 23
IND
ICAT
IVE
Cost
(USD
)
6.1
Enh
ance
d im
pact
of f
inan
cial
and
VFM
aud
it re
port
ing
and
over
sigh
t
19,0
92,0
23
Obj
ectiv
e 6:
To
stre
ngth
en o
vers
ight
and
PFM
gov
erna
nce
func
tions
for t
he s
usta
inab
ility
of d
evel
opm
ent o
utco
mes
Impl
emen
ting
Inst
itutio
ns:
OAG
, Pa
rliam
ent,
PAC,
LG
PACs
, M
oFPE
D
(PFM
Se
cret
aria
t, BM
AU),
MoP
S
Key
Stak
ehol
ders
: EPR
C, C
SOs,
OPM
, ext
erna
l tra
inin
g pr
ovid
ers/
prof
essi
onal
bod
ies,
ASW
G
Out
puts
Ke
y Ac
tiviti
es
Lea
d In
stitu
tion
2018 / 19
2019 / 20
2020 / 21
2021 / 22
2022 / 23
IND
ICAT
IVE
Cost
(USD
)
6.1.
1 M
DAL
Gs
utili
se
a sh
ared
tra
ckin
g sy
stem
to
mon
itor
and
repo
rt o
n th
e im
plem
enta
tion
of
audi
t re
com
men
datio
ns
OAG
Man
agem
ent
Info
rmat
ion
Syst
em c
ompl
eted
(D
evel
oped
an
d te
sted
) O
AG/P
arlia
men
t X
X
X
4,75
7,42
3
Adm
inis
trat
or a
nd K
ey U
ser
trai
ning
com
plet
ed f
or t
he O
AG
Man
agem
ent I
nfor
mat
ion
Syst
em
OAG
X
X
397,
000
6.
1.2
The
impa
ct o
f au
dit
reco
mm
enda
tions
on
se
rvic
e de
liver
y is
asse
ssed
in
sele
cted
key
se
ctor
s
Rigo
rous
eva
luat
ion
of th
e im
pact
of a
udit
reco
mm
enda
tions
on
serv
ice
deliv
ery
in U
gand
a's
heal
th s
ecto
r B
MAU
/EPR
C/O
PM
X
X
X
350,
000
Ri
goro
us e
valu
atio
n of
the
impa
ct o
f aud
it re
com
men
datio
ns o
n se
rvic
e de
liver
y in
Uga
nda'
s ag
ricul
ture
sec
tor
BM
AU/E
PRC/
OPM
X
X
X
35
0,00
0
6.1.
3 Im
prov
ed t
rack
ing
of
follo
w
up
of
over
sigh
t re
com
men
datio
n by
M
DAL
Gs
Trac
king
sys
tem
for O
AG &
Par
liam
ent
OAG
X
X
X
1,19
2,16
5
Trai
ning
pr
ogra
m
for
Loca
l G
over
nmen
t Pu
blic
Ac
coun
ts
Com
mitt
ees
(LG
PACs
) IA
G/M
OLG
X
X
450,
000
An
IC
T-ba
sed
follo
w-u
p m
echa
nism
fo
r M
oLG
to
tr
ack
reco
mm
enda
tions
mad
e by
LG
-PAC
s es
tabl
ishe
d M
OLG
450,
000
Ef
fect
ive
Stak
ehol
der
Enga
gem
ent
and
supp
ort
to l
egis
lativ
e ov
ersi
ght
OAG
X
X
X
38
7,22
0
Actio
n pl
an
targ
etin
g im
prov
ed
perf
orm
ance
on
tr
easu
ry
mem
oran
da
MO
FPED
/AG
O
X
X
X
356,
000
Sy
stem
est
ablis
hed
for
the
trac
king
of
actio
ns u
pon
trea
sury
m
emor
anda
M
OFP
ED/A
GO
X
X
235,
000
6.
1.4
Mec
hani
sms
for
polit
ical
en
gage
men
t on
PF
M
for
acco
unta
bilit
y st
reng
then
ed
Capa
city
bui
ldin
g fo
r pa
rliam
enta
ry P
FM a
nd a
ccou
ntab
ility
fo
rum
s P
ARLI
AMEN
T
X
X
45
2,00
0
Cabi
net
enga
gem
ent
on
PFM
(s
emin
ars,
w
orks
hops
, po
licy
brie
fs)
PAR
LIAM
ENT
X
X
256,
000
St
udy
on P
oliti
cal
Econ
omy
of P
ublic
Fin
anci
al M
anag
emen
t Re
form
s to
inf
orm
und
erst
andi
ng o
f im
plic
atio
ns f
or d
ialo
gue
and
oper
atio
nal
enga
gem
ent
of n
on-t
echn
ical
driv
ers
such
as
‘pol
itica
l com
mitm
ent’
and
info
rm s
trat
egie
s fo
r st
reng
then
ing
sust
aina
bilit
y of
PFM
refo
rm
BM
AU/E
PRC/
OPM
X
X
X
35
1,00
0
6.1.
5 Su
stai
nabl
e ca
paci
ty
build
ing
in a
udit
repo
rtin
g an
d su
ppor
t to
au
dit
serv
ices
Cons
truc
tion
of C
ente
r for
Aud
it Ex
celle
nce
OAG
X
X
X
6,98
5,00
0
Capa
city
bu
ilt
in
Fina
ncia
l, Pe
rfor
man
ce,
Fore
nsic
Au
dit
in
addi
tion
to s
peci
aliz
ed a
udit
area
s an
d ex
tern
al a
udit
supp
ort
func
tions
.
OAG
X
X
X
2,08
1,90
0
143Uganda Public Financial Management Reform Strategy
Obj
ectiv
e 5:
Impr
oved
tran
spar
ency
and
acc
ount
abili
ty o
f Loc
al G
over
nmen
t PFM
sys
tem
s
Impl
emen
ting
Inst
itutio
ns:
MoF
PED
(D
EA,
Deb
t),
URA
, M
oLG
, M
DAL
Gs
Ke
y St
akeh
olde
rs: C
SOs,
priv
ate
sect
or/t
ax a
ccou
ntan
ts, R
egul
ator
y Au
thor
ities
, NIT
A-U
, BoU
Out
puts
Ke
y Ac
tiviti
es
Lead
Inst
itutio
n
2018 / 19
2019 / 20
2020 / 21
2021 / 22
2022 / 23
IND
ICAT
IVE
Cost
(USD
)
5.5
Enha
nced
inte
grity
and
val
ue fo
r mon
ey o
f loc
al g
over
nmen
t pro
cure
men
ts
99
0,82
8
5.5.
1. S
tren
gthe
ned
inte
grity
of
LG p
rocu
rem
ent p
roce
dure
s U
nder
take
pr
ocur
emen
t in
tegr
ity s
urve
y at
LG
lev
el w
ith
cont
ract
ors,
pro
cure
men
t of
ficia
ls,
LG l
eade
rs a
nd
CSO
s to
ag
ree
chal
leng
es a
nd a
ctio
ns fo
r im
prov
emen
t
MO
LG
X
60
,000
Impl
emen
t a
natio
nal
cam
paig
n to
str
engt
hen
inte
grity
of
proc
urem
ent
at H
LG l
evel
, in
clud
ing
colla
bora
tion
with
CSO
s fo
r mon
itorin
g
MO
LG
X
X
25
5,10
9
Asse
ss a
nd s
uppo
rt th
e pr
ocur
emen
t fun
ctio
n in
LG
s M
OLG
X X
140,
947
Und
erta
ke a
follo
w u
p pr
ocur
emen
t int
egrit
y su
rvey
for
LGs
in
2020
M
OLG
X X
59,4
60
Rollo
ut o
pen
cont
ract
ing
appr
oach
to
empo
wer
civ
il so
ciet
y pa
rtic
ipat
ion
in S
elec
ted
dist
ricts
M
OLG
X X
150,
000
Carr
y ou
t pu
blic
con
sulta
tions
on
proc
urem
ent
inte
grity
at
LG
leve
l with
con
trac
tors
, pr
ocur
emen
t of
ficia
ls,
LG l
eade
rs a
nd
CSO
s to
agr
ee c
halle
nges
and
act
ions
for i
mpr
ovem
ent
MO
LG
X
X
12
5,31
2
5.5.
2.
Enha
nced
le
gal
fram
ewor
k fo
r LG
pro
cure
men
t Re
view
leg
al f
ram
ewor
k fo
r pr
ocur
emen
t at
LG
lev
el a
nd
prop
ose
amen
dmen
t, if
requ
ired
MO
LG
X
20
0,00
0
Dev
elop
pr
opos
als
from
le
gal
revi
ew
for
subm
issi
on
to
min
iste
rs
MO
LG
-
TOTA
L CO
ST
8,55
3,05
3
Obj
ectiv
e 6:
To
stre
ngth
en o
vers
ight
and
PFM
gov
erna
nce
func
tions
for t
he s
usta
inab
ility
of d
evel
opm
ent o
utco
mes
Impl
emen
ting
Inst
itutio
ns:
OAG
, Pa
rliam
ent,
PAC,
LG
PACs
, M
oFPE
D
(PFM
Se
cret
aria
t, BM
AU),
MoP
S
Key
Stak
ehol
ders
: EPR
C, C
SOs,
OPM
, ext
erna
l tra
inin
g pr
ovid
ers/
prof
essi
onal
bod
ies,
ASW
G
Out
puts
Ke
y Ac
tiviti
es
Lea
d In
stitu
tion
2018 / 19
2019 / 20
2020 / 21
2021 / 22
2022 / 23
IND
ICAT
IVE
Cost
(USD
)
6.1
Enh
ance
d im
pact
of f
inan
cial
and
VFM
aud
it re
port
ing
and
over
sigh
t
19,0
92,0
23
Obj
ectiv
e 6:
To
stre
ngth
en o
vers
ight
and
PFM
gov
erna
nce
func
tions
for t
he s
usta
inab
ility
of d
evel
opm
ent o
utco
mes
Impl
emen
ting
Inst
itutio
ns:
OAG
, Pa
rliam
ent,
PAC,
LG
PACs
, M
oFPE
D
(PFM
Se
cret
aria
t, BM
AU),
MoP
S
Key
Stak
ehol
ders
: EPR
C, C
SOs,
OPM
, ext
erna
l tra
inin
g pr
ovid
ers/
prof
essi
onal
bod
ies,
ASW
G
Out
puts
Ke
y Ac
tiviti
es
Lea
d In
stitu
tion
2018 / 19
2019 / 20
2020 / 21
2021 / 22
2022 / 23
IND
ICAT
IVE
Cost
(USD
)
6.1.
1 M
DAL
Gs
utili
se
a sh
ared
tra
ckin
g sy
stem
to
mon
itor
and
repo
rt o
n th
e im
plem
enta
tion
of
audi
t re
com
men
datio
ns
OAG
Man
agem
ent
Info
rmat
ion
Syst
em c
ompl
eted
(D
evel
oped
an
d te
sted
) O
AG/P
arlia
men
t X
X
X
4,75
7,42
3
Adm
inis
trat
or a
nd K
ey U
ser
trai
ning
com
plet
ed f
or t
he O
AG
Man
agem
ent I
nfor
mat
ion
Syst
em
OAG
X
X
397,
000
6.
1.2
The
impa
ct o
f au
dit
reco
mm
enda
tions
on
se
rvic
e de
liver
y is
asse
ssed
in
sele
cted
key
se
ctor
s
Rigo
rous
eva
luat
ion
of th
e im
pact
of a
udit
reco
mm
enda
tions
on
serv
ice
deliv
ery
in U
gand
a's
heal
th s
ecto
r B
MAU
/EPR
C/O
PM
X
X
X
350,
000
Ri
goro
us e
valu
atio
n of
the
impa
ct o
f aud
it re
com
men
datio
ns o
n se
rvic
e de
liver
y in
Uga
nda'
s ag
ricul
ture
sec
tor
BM
AU/E
PRC/
OPM
X
X
X
35
0,00
0
6.1.
3 Im
prov
ed t
rack
ing
of
follo
w
up
of
over
sigh
t re
com
men
datio
n by
M
DAL
Gs
Trac
king
sys
tem
for O
AG &
Par
liam
ent
OAG
X
X
X
1,19
2,16
5
Trai
ning
pr
ogra
m
for
Loca
l G
over
nmen
t Pu
blic
Ac
coun
ts
Com
mitt
ees
(LG
PACs
) IA
G/M
OLG
X
X
450,
000
An
IC
T-ba
sed
follo
w-u
p m
echa
nism
fo
r M
oLG
to
tr
ack
reco
mm
enda
tions
mad
e by
LG
-PAC
s es
tabl
ishe
d M
OLG
450,
000
Ef
fect
ive
Stak
ehol
der
Enga
gem
ent
and
supp
ort
to l
egis
lativ
e ov
ersi
ght
OAG
X
X
X
38
7,22
0
Actio
n pl
an
targ
etin
g im
prov
ed
perf
orm
ance
on
tr
easu
ry
mem
oran
da
MO
FPED
/AG
O
X
X
X
356,
000
Sy
stem
est
ablis
hed
for
the
trac
king
of
actio
ns u
pon
trea
sury
m
emor
anda
M
OFP
ED/A
GO
X
X
235,
000
6.
1.4
Mec
hani
sms
for
polit
ical
en
gage
men
t on
PF
M
for
acco
unta
bilit
y st
reng
then
ed
Capa
city
bui
ldin
g fo
r pa
rliam
enta
ry P
FM a
nd a
ccou
ntab
ility
fo
rum
s P
ARLI
AMEN
T
X
X
45
2,00
0
Cabi
net
enga
gem
ent
on
PFM
(s
emin
ars,
w
orks
hops
, po
licy
brie
fs)
PAR
LIAM
ENT
X
X
256,
000
St
udy
on P
oliti
cal
Econ
omy
of P
ublic
Fin
anci
al M
anag
emen
t Re
form
s to
inf
orm
und
erst
andi
ng o
f im
plic
atio
ns f
or d
ialo
gue
and
oper
atio
nal
enga
gem
ent
of n
on-t
echn
ical
driv
ers
such
as
‘pol
itica
l com
mitm
ent’
and
info
rm s
trat
egie
s fo
r st
reng
then
ing
sust
aina
bilit
y of
PFM
refo
rm
BM
AU/E
PRC/
OPM
X
X
X
35
1,00
0
6.1.
5 Su
stai
nabl
e ca
paci
ty
build
ing
in a
udit
repo
rtin
g an
d su
ppor
t to
au
dit
serv
ices
Cons
truc
tion
of C
ente
r for
Aud
it Ex
celle
nce
OAG
X
X
X
6,98
5,00
0
Capa
city
bu
ilt
in
Fina
ncia
l, Pe
rfor
man
ce,
Fore
nsic
Au
dit
in
addi
tion
to s
peci
aliz
ed a
udit
area
s an
d ex
tern
al a
udit
supp
ort
func
tions
.
OAG
X
X
X
2,08
1,90
0
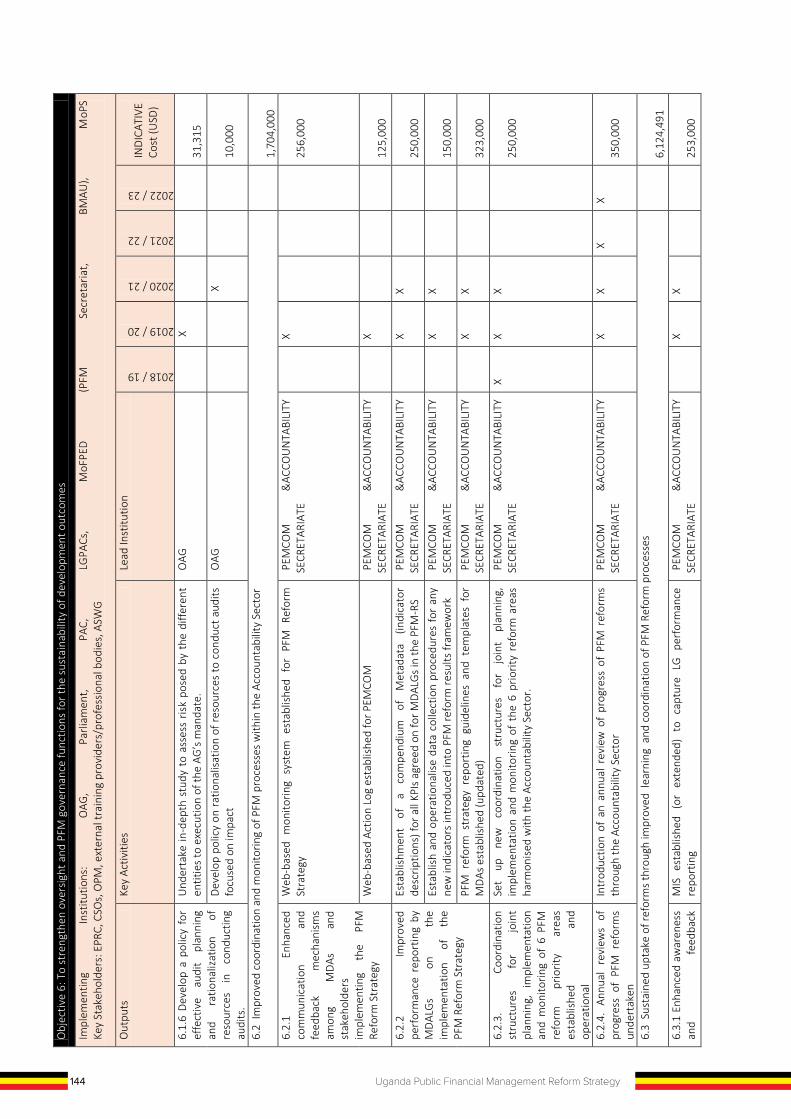
144 Uganda Public Financial Management Reform Strategy
Obj
ectiv
e 6:
To
stre
ngth
en o
vers
ight
and
PFM
gov
erna
nce
func
tions
for t
he s
usta
inab
ility
of d
evel
opm
ent o
utco
mes
Impl
emen
ting
Inst
itutio
ns:
OAG
, Pa
rliam
ent,
PAC,
LG
PACs
, M
oFPE
D
(PFM
Se
cret
aria
t, BM
AU),
MoP
S
Key
Stak
ehol
ders
: EPR
C, C
SOs,
OPM
, ext
erna
l tra
inin
g pr
ovid
ers/
prof
essi
onal
bod
ies,
ASW
G
Out
puts
Ke
y Ac
tiviti
es
Lea
d In
stitu
tion
2018 / 19
2019 / 20
2020 / 21
2021 / 22
2022 / 23
IND
ICAT
IVE
Cost
(USD
)
6.1.
6 D
evel
op a
pol
icy
for
effe
ctiv
e au
dit
plan
ning
an
d ra
tiona
lizat
ion
of
reso
urce
s in
co
nduc
ting
audi
ts.
Und
erta
ke in
-dep
th s
tudy
to
asse
ss r
isk
pose
d by
the
diff
eren
t en
titie
s to
exe
cutio
n of
the
AG’s
man
date
. O
AG
X
31
,315
D
evel
op p
olic
y on
ratio
nalis
atio
n of
reso
urce
s to
con
duct
aud
its
focu
sed
on im
pact
O
AG
X
10
,000
6.2
Impr
oved
coo
rdin
atio
n an
d m
onito
ring
of P
FM p
roce
sses
with
in th
e Ac
coun
tabi
lity
Sect
or
1,70
4,00
0
6.2.
1 En
hanc
ed
com
mun
icat
ion
and
feed
back
m
echa
nism
s am
ong
MD
As
and
stak
ehol
ders
im
plem
entin
g th
e PF
M
Refo
rm S
trat
egy
Web
-bas
ed m
onito
ring
syst
em e
stab
lishe
d fo
r PF
M R
efor
m
Stra
tegy
P
EMCO
M
&AC
COU
NTA
BILI
TY
SECR
ETAR
IATE
X
256,
000
Web
-bas
ed A
ctio
n Lo
g es
tabl
ishe
d fo
r PEM
COM
P
EMCO
M
&AC
COU
NTA
BILI
TY
SECR
ETAR
IATE
X
125,
000
6.
2.2
Impr
oved
pe
rfor
man
ce r
epor
ting
by
MD
ALG
s on
th
e im
plem
enta
tion
of
the
PFM
Ref
orm
Str
ateg
y
Esta
blis
hmen
t of
a
com
pend
ium
of
M
etad
ata
(indi
cato
r de
scrip
tions
) for
all
KPIs
agr
eed
on fo
r MD
ALG
s in
the
PFM
-RS
PEM
COM
&
ACCO
UN
TABI
LITY
SE
CRET
ARIA
TE
X
X
25
0,00
0
Esta
blis
h an
d op
erat
iona
lise
data
col
lect
ion
proc
edur
es fo
r an
y ne
w in
dica
tors
intr
oduc
ed in
to P
FM re
form
resu
lts fr
amew
ork
PEM
COM
&
ACCO
UN
TABI
LITY
SE
CRET
ARIA
TE
X
X
15
0,00
0
PFM
ref
orm
str
ateg
y re
port
ing
guid
elin
es a
nd t
empl
ates
for
M
DAs
est
ablis
hed
(upd
ated
) P
EMCO
M
&AC
COU
NTA
BILI
TY
SECR
ETAR
IATE
X X
323,
000
6.
2.3.
Co
ordi
natio
n st
ruct
ures
fo
r jo
int
plan
ning
, im
plem
enta
tion
and
mon
itorin
g of
6 P
FM
refo
rm
prio
rity
area
s es
tabl
ishe
d an
d op
erat
iona
l
Set
up
new
co
ordi
natio
n st
ruct
ures
fo
r jo
int
plan
ning
, im
plem
enta
tion
and
mon
itorin
g of
the
6 p
riorit
y re
form
are
as
harm
onis
ed w
ith th
e Ac
coun
tabi
lity
Sect
or.
PEM
COM
&
ACCO
UN
TABI
LITY
SE
CRET
ARIA
TE
X X
X
25
0,00
0
6.2.
4. A
nnua
l re
view
s of
pr
ogre
ss o
f PF
M r
efor
ms
unde
rtak
en
Intr
oduc
tion
of a
n an
nual
rev
iew
of
prog
ress
of
PFM
ref
orm
s th
roug
h th
e Ac
coun
tabi
lity
Sect
or
PEM
COM
&
ACCO
UN
TABI
LITY
SE
CRET
ARIA
TE
X
X X
X
35
0,00
0
6.3
Sus
tain
ed u
ptak
e of
refo
rms
thro
ugh
impr
oved
lea
rnin
g a
nd c
oord
inat
ion
of P
FM R
efor
m p
roce
sses
6,
124,
491
6.
3.1
Enha
nced
aw
aren
ess
and
feed
back
M
IS e
stab
lishe
d (o
r ex
tend
ed)
to c
aptu
re L
G p
erfo
rman
ce
repo
rtin
g P
EMCO
M
&AC
COU
NTA
BILI
TY
SECR
ETAR
IATE
X X
253,
000
Obj
ectiv
e 6:
To
stre
ngth
en o
vers
ight
and
PFM
gov
erna
nce
func
tions
for t
he s
usta
inab
ility
of d
evel
opm
ent o
utco
mes
Impl
emen
ting
Inst
itutio
ns:
OAG
, Pa
rliam
ent,
PAC,
LG
PACs
, M
oFPE
D
(PFM
Se
cret
aria
t, BM
AU),
MoP
S
Key
Stak
ehol
ders
: EPR
C, C
SOs,
OPM
, ext
erna
l tra
inin
g pr
ovid
ers/
prof
essi
onal
bod
ies,
ASW
G
Out
puts
Ke
y Ac
tiviti
es
Lea
d In
stitu
tion
2018 / 19
2019 / 20
2020 / 21
2021 / 22
2022 / 23 IN
DIC
ATIV
E Co
st (U
SD)
oppo
rtun
ities
fo
r LG
s in
th
e im
plem
enta
tion
of t
he
PFM
Ref
orm
Str
ateg
y
IT b
ased
too
l dev
elop
ed f
or c
aptu
ring
in r
eal-t
ime
feed
back
of
LGs
on th
e im
plem
enta
tion
of th
e PF
M-R
S su
ch a
s SM
S P
EMCO
M
&AC
COU
NTA
BILI
TY
SECR
ETAR
IATE
X X
350,
000
6.3.
2 Ef
fect
ive
chan
ge
man
agem
ent
and
com
mun
icat
ion
on P
FM
Dev
elop
com
preh
ensi
ve s
usta
inab
ility
pla
n fo
r PFM
refo
rms
PEM
COM
&
ACCO
UN
TABI
LITY
SE
CRET
ARIA
TE
X
X
12
5,00
0
Upd
ate
com
preh
ensi
ve c
apac
ity n
eeds
ass
essm
ent f
or P
FM a
nd
deve
lop
trai
ning
/cap
acity
enh
ance
men
t pla
n P
EMCO
M
&AC
COU
NTA
BILI
TY
SECR
ETAR
IATE
X X
450,
000
U
nder
take
fea
sibi
lity
asse
ssm
ent
for
sust
aina
ble
deliv
ery
of
PFM
cap
acity
dev
elop
men
t and
trai
ning
man
agem
ent o
ptio
ns
PEM
COM
&
ACCO
UN
TABI
LITY
SE
CRET
ARIA
TE
X
X
25
3,00
0
Annu
al a
sses
smen
t of
the
PFM
cap
acity
bui
ldin
g pr
ogra
mm
e ag
ains
t the
CN
A/en
hanc
emen
t pla
n P
EMCO
M
&AC
COU
NTA
BILI
TY
SECR
ETAR
IATE
X X
X X
256,
145
U
nder
take
a P
FM p
erfo
rman
ce a
sses
emen
t ba
sed
on t
he P
EFA
fram
ewor
k PE
MCO
M
&AC
COU
NTA
BILI
TY
SECR
ETAR
IATE
X
150,
000
U
nder
take
Mid
term
Rev
iew
of t
he P
FM s
trat
egy
PEM
COM
&
ACCO
UN
TABI
LITY
SE
CRET
ARIA
TE
X
15
0,00
0
Und
erta
ke T
race
r st
udie
s fo
r se
lect
ed
Stud
y co
hort
s to
ass
ess
impa
ct o
f lea
rnin
g on
impr
ovem
ents
in g
over
nanc
e an
d se
rvic
es
deliv
ered
PEM
COM
&
ACCO
UN
TABI
LITY
SE
CRET
ARIA
TE
X
X X
X
18
8,80
0
Awar
enes
s ca
mpa
ign
on
prov
isio
ns
on
PFM
A in
lo
cal
gove
rnm
ents
to d
eman
d ac
coun
tabi
lity
PEM
COM
&
ACCO
UN
TABI
LITY
SE
CRET
ARIA
TE
X
X X
X
35
0,00
0
6.3.
3.
Trai
ning
m
odul
es
and
syst
ems
for
indu
ctio
n an
d in
-ser
vice
tra
inin
g of
ci
vil
serv
ants
on
PF
M
syst
ems
and
stan
dard
st
reng
then
ed
Revi
ew a
nd im
prov
e tr
aini
ng m
odul
es a
nd s
yste
ms
for i
nduc
tion
and
in-s
ervi
ce t
rain
ing
of c
ivil
serv
ants
on
PFM
sys
tem
s an
d st
anda
rds
MO
PS
X
X X
X
35
4,00
0
6.3.
4 O
nlin
e pe
er
men
tors
hip
and
supp
ort
unde
rtak
en
Esta
blis
hmen
t an
d op
erat
iona
lisat
ion
of
an
e-la
b fo
r PF
M
pilo
ted
MO
PS
X
X X
X
1,01
2,68
2
Dev
elop
men
t an
d ro
llout
of a
tra
inin
g pr
ogra
mm
e on
Fin
anci
al
man
agem
ent f
or b
oth
finan
cial
and
Non
-Fin
anci
al M
anag
ers
MO
PS
X
X X
X
24
6,30
0
6.3.
5. C
ivil
Serv
ice
Colle
ge
Uga
nda
(CSC
U)
Trai
ning
Ca
paci
ty e
nhan
cem
ent
for
CSCU
sta
ff an
d fa
culty
of t
rain
ers
on
PFM
mod
ules
M
OPS
X X
X X
525,
100

144 Uganda Public Financial Management Reform Strategy
Obj
ectiv
e 6:
To
stre
ngth
en o
vers
ight
and
PFM
gov
erna
nce
func
tions
for t
he s
usta
inab
ility
of d
evel
opm
ent o
utco
mes
Impl
emen
ting
Inst
itutio
ns:
OAG
, Pa
rliam
ent,
PAC,
LG
PACs
, M
oFPE
D
(PFM
Se
cret
aria
t, BM
AU),
MoP
S
Key
Stak
ehol
ders
: EPR
C, C
SOs,
OPM
, ext
erna
l tra
inin
g pr
ovid
ers/
prof
essi
onal
bod
ies,
ASW
G
Out
puts
Ke
y Ac
tiviti
es
Lea
d In
stitu
tion
2018 / 19
2019 / 20
2020 / 21
2021 / 22
2022 / 23
IND
ICAT
IVE
Cost
(USD
)
6.1.
6 D
evel
op a
pol
icy
for
effe
ctiv
e au
dit
plan
ning
an
d ra
tiona
lizat
ion
of
reso
urce
s in
co
nduc
ting
audi
ts.
Und
erta
ke in
-dep
th s
tudy
to
asse
ss r
isk
pose
d by
the
diff
eren
t en
titie
s to
exe
cutio
n of
the
AG’s
man
date
. O
AG
X
31
,315
D
evel
op p
olic
y on
ratio
nalis
atio
n of
reso
urce
s to
con
duct
aud
its
focu
sed
on im
pact
O
AG
X
10
,000
6.2
Impr
oved
coo
rdin
atio
n an
d m
onito
ring
of P
FM p
roce
sses
with
in th
e Ac
coun
tabi
lity
Sect
or
1,70
4,00
0
6.2.
1 En
hanc
ed
com
mun
icat
ion
and
feed
back
m
echa
nism
s am
ong
MD
As
and
stak
ehol
ders
im
plem
entin
g th
e PF
M
Refo
rm S
trat
egy
Web
-bas
ed m
onito
ring
syst
em e
stab
lishe
d fo
r PF
M R
efor
m
Stra
tegy
P
EMCO
M
&AC
COU
NTA
BILI
TY
SECR
ETAR
IATE
X
256,
000
Web
-bas
ed A
ctio
n Lo
g es
tabl
ishe
d fo
r PEM
COM
P
EMCO
M
&AC
COU
NTA
BILI
TY
SECR
ETAR
IATE
X
125,
000
6.
2.2
Impr
oved
pe
rfor
man
ce r
epor
ting
by
MD
ALG
s on
th
e im
plem
enta
tion
of
the
PFM
Ref
orm
Str
ateg
y
Esta
blis
hmen
t of
a
com
pend
ium
of
M
etad
ata
(indi
cato
r de
scrip
tions
) for
all
KPIs
agr
eed
on fo
r MD
ALG
s in
the
PFM
-RS
PEM
COM
&
ACCO
UN
TABI
LITY
SE
CRET
ARIA
TE
X
X
25
0,00
0
Esta
blis
h an
d op
erat
iona
lise
data
col
lect
ion
proc
edur
es fo
r an
y ne
w in
dica
tors
intr
oduc
ed in
to P
FM re
form
resu
lts fr
amew
ork
PEM
COM
&
ACCO
UN
TABI
LITY
SE
CRET
ARIA
TE
X
X
15
0,00
0
PFM
ref
orm
str
ateg
y re
port
ing
guid
elin
es a
nd t
empl
ates
for
M
DAs
est
ablis
hed
(upd
ated
) P
EMCO
M
&AC
COU
NTA
BILI
TY
SECR
ETAR
IATE
X X
323,
000
6.
2.3.
Co
ordi
natio
n st
ruct
ures
fo
r jo
int
plan
ning
, im
plem
enta
tion
and
mon
itorin
g of
6 P
FM
refo
rm
prio
rity
area
s es
tabl
ishe
d an
d op
erat
iona
l
Set
up
new
co
ordi
natio
n st
ruct
ures
fo
r jo
int
plan
ning
, im
plem
enta
tion
and
mon
itorin
g of
the
6 p
riorit
y re
form
are
as
harm
onis
ed w
ith th
e Ac
coun
tabi
lity
Sect
or.
PEM
COM
&
ACCO
UN
TABI
LITY
SE
CRET
ARIA
TE
X X
X
25
0,00
0
6.2.
4. A
nnua
l re
view
s of
pr
ogre
ss o
f PF
M r
efor
ms
unde
rtak
en
Intr
oduc
tion
of a
n an
nual
rev
iew
of
prog
ress
of
PFM
ref
orm
s th
roug
h th
e Ac
coun
tabi
lity
Sect
or
PEM
COM
&
ACCO
UN
TABI
LITY
SE
CRET
ARIA
TE
X
X X
X
35
0,00
0
6.3
Sus
tain
ed u
ptak
e of
refo
rms
thro
ugh
impr
oved
lea
rnin
g a
nd c
oord
inat
ion
of P
FM R
efor
m p
roce
sses
6,
124,
491
6.
3.1
Enha
nced
aw
aren
ess
and
feed
back
M
IS e
stab
lishe
d (o
r ex
tend
ed)
to c
aptu
re L
G p
erfo
rman
ce
repo
rtin
g P
EMCO
M
&AC
COU
NTA
BILI
TY
SECR
ETAR
IATE
X X
253,
000
Obj
ectiv
e 6:
To
stre
ngth
en o
vers
ight
and
PFM
gov
erna
nce
func
tions
for t
he s
usta
inab
ility
of d
evel
opm
ent o
utco
mes
Impl
emen
ting
Inst
itutio
ns:
OAG
, Pa
rliam
ent,
PAC,
LG
PACs
, M
oFPE
D
(PFM
Se
cret
aria
t, BM
AU),
MoP
S
Key
Stak
ehol
ders
: EPR
C, C
SOs,
OPM
, ext
erna
l tra
inin
g pr
ovid
ers/
prof
essi
onal
bod
ies,
ASW
G
Out
puts
Ke
y Ac
tiviti
es
Lea
d In
stitu
tion
2018 / 19
2019 / 20
2020 / 21
2021 / 22
2022 / 23
IND
ICAT
IVE
Cost
(USD
)
oppo
rtun
ities
fo
r LG
s in
th
e im
plem
enta
tion
of t
he
PFM
Ref
orm
Str
ateg
y
IT b
ased
too
l dev
elop
ed f
or c
aptu
ring
in r
eal-t
ime
feed
back
of
LGs
on th
e im
plem
enta
tion
of th
e PF
M-R
S su
ch a
s SM
S P
EMCO
M
&AC
COU
NTA
BILI
TY
SECR
ETAR
IATE
X X
350,
000
6.3.
2 Ef
fect
ive
chan
ge
man
agem
ent
and
com
mun
icat
ion
on P
FM
Dev
elop
com
preh
ensi
ve s
usta
inab
ility
pla
n fo
r PFM
refo
rms
PEM
COM
&
ACCO
UN
TABI
LITY
SE
CRET
ARIA
TE
X
X
12
5,00
0
Upd
ate
com
preh
ensi
ve c
apac
ity n
eeds
ass
essm
ent f
or P
FM a
nd
deve
lop
trai
ning
/cap
acity
enh
ance
men
t pla
n P
EMCO
M
&AC
COU
NTA
BILI
TY
SECR
ETAR
IATE
X X
450,
000
U
nder
take
fea
sibi
lity
asse
ssm
ent
for
sust
aina
ble
deliv
ery
of
PFM
cap
acity
dev
elop
men
t and
trai
ning
man
agem
ent o
ptio
ns
PEM
COM
&
ACCO
UN
TABI
LITY
SE
CRET
ARIA
TE
X
X
25
3,00
0
Annu
al a
sses
smen
t of
the
PFM
cap
acity
bui
ldin
g pr
ogra
mm
e ag
ains
t the
CN
A/en
hanc
emen
t pla
n P
EMCO
M
&AC
COU
NTA
BILI
TY
SECR
ETAR
IATE
X X
X X
256,
145
U
nder
take
a P
FM p
erfo
rman
ce a
sses
emen
t ba
sed
on t
he P
EFA
fram
ewor
k PE
MCO
M
&AC
COU
NTA
BILI
TY
SECR
ETAR
IATE
X
150,
000
U
nder
take
Mid
term
Rev
iew
of t
he P
FM s
trat
egy
PEM
COM
&
ACCO
UN
TABI
LITY
SE
CRET
ARIA
TE
X
15
0,00
0
Und
erta
ke T
race
r st
udie
s fo
r se
lect
ed
Stud
y co
hort
s to
ass
ess
impa
ct o
f lea
rnin
g on
impr
ovem
ents
in g
over
nanc
e an
d se
rvic
es
deliv
ered
PEM
COM
&
ACCO
UN
TABI
LITY
SE
CRET
ARIA
TE
X
X X
X
18
8,80
0
Awar
enes
s ca
mpa
ign
on
prov
isio
ns
on
PFM
A in
lo
cal
gove
rnm
ents
to d
eman
d ac
coun
tabi
lity
PEM
COM
&
ACCO
UN
TABI
LITY
SE
CRET
ARIA
TE
X
X X
X
35
0,00
0
6.3.
3.
Trai
ning
m
odul
es
and
syst
ems
for
indu
ctio
n an
d in
-ser
vice
tra
inin
g of
ci
vil
serv
ants
on
PF
M
syst
ems
and
stan
dard
st
reng
then
ed
Revi
ew a
nd im
prov
e tr
aini
ng m
odul
es a
nd s
yste
ms
for i
nduc
tion
and
in-s
ervi
ce t
rain
ing
of c
ivil
serv
ants
on
PFM
sys
tem
s an
d st
anda
rds
MO
PS
X
X X
X
35
4,00
0
6.3.
4 O
nlin
e pe
er
men
tors
hip
and
supp
ort
unde
rtak
en
Esta
blis
hmen
t an
d op
erat
iona
lisat
ion
of
an
e-la
b fo
r PF
M
pilo
ted
MO
PS
X
X X
X
1,01
2,68
2
Dev
elop
men
t an
d ro
llout
of a
tra
inin
g pr
ogra
mm
e on
Fin
anci
al
man
agem
ent f
or b
oth
finan
cial
and
Non
-Fin
anci
al M
anag
ers
MO
PS
X
X X
X
24
6,30
0
6.3.
5. C
ivil
Serv
ice
Colle
ge
Uga
nda
(CSC
U)
Trai
ning
Ca
paci
ty e
nhan
cem
ent
for
CSCU
sta
ff an
d fa
culty
of t
rain
ers
on
PFM
mod
ules
M
OPS
X X
X X
525,
100
145Uganda Public Financial Management Reform Strategy
Obj
ectiv
e 6:
To
stre
ngth
en o
vers
ight
and
PFM
gov
erna
nce
func
tions
for t
he s
usta
inab
ility
of d
evel
opm
ent o
utco
mes
Impl
emen
ting
Inst
itutio
ns:
OAG
, Pa
rliam
ent,
PAC,
LG
PACs
, M
oFPE
D
(PFM
Se
cret
aria
t, BM
AU),
MoP
S
Key
Stak
ehol
ders
: EPR
C, C
SOs,
OPM
, ext
erna
l tra
inin
g pr
ovid
ers/
prof
essi
onal
bod
ies,
ASW
G
Out
puts
Ke
y Ac
tiviti
es
Lea
d In
stitu
tion
2018 / 19
2019 / 20
2020 / 21
2021 / 22
2022 / 23
IND
ICAT
IVE
Cost
(USD
)
6.1.
6 D
evel
op a
pol
icy
for
effe
ctiv
e au
dit
plan
ning
an
d ra
tiona
lizat
ion
of
reso
urce
s in
co
nduc
ting
audi
ts.
Und
erta
ke in
-dep
th s
tudy
to
asse
ss r
isk
pose
d by
the
diff
eren
t en
titie
s to
exe
cutio
n of
the
AG’s
man
date
. O
AG
X
31
,315
D
evel
op p
olic
y on
ratio
nalis
atio
n of
reso
urce
s to
con
duct
aud
its
focu
sed
on im
pact
O
AG
X
10
,000
6.2
Impr
oved
coo
rdin
atio
n an
d m
onito
ring
of P
FM p
roce
sses
with
in th
e Ac
coun
tabi
lity
Sect
or
1,70
4,00
0
6.2.
1 En
hanc
ed
com
mun
icat
ion
and
feed
back
m
echa
nism
s am
ong
MD
As
and
stak
ehol
ders
im
plem
entin
g th
e PF
M
Refo
rm S
trat
egy
Web
-bas
ed m
onito
ring
syst
em e
stab
lishe
d fo
r PF
M R
efor
m
Stra
tegy
P
EMCO
M
&AC
COU
NTA
BILI
TY
SECR
ETAR
IATE
X
256,
000
Web
-bas
ed A
ctio
n Lo
g es
tabl
ishe
d fo
r PEM
COM
P
EMCO
M
&AC
COU
NTA
BILI
TY
SECR
ETAR
IATE
X
125,
000
6.
2.2
Impr
oved
pe
rfor
man
ce r
epor
ting
by
MD
ALG
s on
th
e im
plem
enta
tion
of
the
PFM
Ref
orm
Str
ateg
y
Esta
blis
hmen
t of
a
com
pend
ium
of
M
etad
ata
(indi
cato
r de
scrip
tions
) for
all
KPIs
agr
eed
on fo
r MD
ALG
s in
the
PFM
-RS
PEM
COM
&
ACCO
UN
TABI
LITY
SE
CRET
ARIA
TE
X
X
25
0,00
0
Esta
blis
h an
d op
erat
iona
lise
data
col
lect
ion
proc
edur
es fo
r an
y ne
w in
dica
tors
intr
oduc
ed in
to P
FM re
form
resu
lts fr
amew
ork
PEM
COM
&
ACCO
UN
TABI
LITY
SE
CRET
ARIA
TE
X
X
15
0,00
0
PFM
ref
orm
str
ateg
y re
port
ing
guid
elin
es a
nd t
empl
ates
for
M
DAs
est
ablis
hed
(upd
ated
) P
EMCO
M
&AC
COU
NTA
BILI
TY
SECR
ETAR
IATE
X X
323,
000
6.
2.3.
Co
ordi
natio
n st
ruct
ures
fo
r jo
int
plan
ning
, im
plem
enta
tion
and
mon
itorin
g of
6 P
FM
refo
rm
prio
rity
area
s es
tabl
ishe
d an
d op
erat
iona
l
Set
up
new
co
ordi
natio
n st
ruct
ures
fo
r jo
int
plan
ning
, im
plem
enta
tion
and
mon
itorin
g of
the
6 p
riorit
y re
form
are
as
harm
onis
ed w
ith th
e Ac
coun
tabi
lity
Sect
or.
PEM
COM
&
ACCO
UN
TABI
LITY
SE
CRET
ARIA
TE
X X
X
25
0,00
0
6.2.
4. A
nnua
l re
view
s of
pr
ogre
ss o
f PF
M r
efor
ms
unde
rtak
en
Intr
oduc
tion
of a
n an
nual
rev
iew
of
prog
ress
of
PFM
ref
orm
s th
roug
h th
e Ac
coun
tabi
lity
Sect
or
PEM
COM
&
ACCO
UN
TABI
LITY
SE
CRET
ARIA
TE
X
X X
X
35
0,00
0
6.3
Sus
tain
ed u
ptak
e of
refo
rms
thro
ugh
impr
oved
lea
rnin
g a
nd c
oord
inat
ion
of P
FM R
efor
m p
roce
sses
6,
124,
491
6.
3.1
Enha
nced
aw
aren
ess
and
feed
back
M
IS e
stab
lishe
d (o
r ex
tend
ed)
to c
aptu
re L
G p
erfo
rman
ce
repo
rtin
g P
EMCO
M
&AC
COU
NTA
BILI
TY
SECR
ETAR
IATE
X X
253,
000
Obj
ectiv
e 6:
To
stre
ngth
en o
vers
ight
and
PFM
gov
erna
nce
func
tions
for t
he s
usta
inab
ility
of d
evel
opm
ent o
utco
mes
Impl
emen
ting
Inst
itutio
ns:
OAG
, Pa
rliam
ent,
PAC,
LG
PACs
, M
oFPE
D
(PFM
Se
cret
aria
t, BM
AU),
MoP
S
Key
Stak
ehol
ders
: EPR
C, C
SOs,
OPM
, ext
erna
l tra
inin
g pr
ovid
ers/
prof
essi
onal
bod
ies,
ASW
G
Out
puts
Ke
y Ac
tiviti
es
Lea
d In
stitu
tion
2018 / 19
2019 / 20
2020 / 21
2021 / 22
2022 / 23
IND
ICAT
IVE
Cost
(USD
)
oppo
rtun
ities
fo
r LG
s in
th
e im
plem
enta
tion
of t
he
PFM
Ref
orm
Str
ateg
y
IT b
ased
too
l dev
elop
ed f
or c
aptu
ring
in r
eal-t
ime
feed
back
of
LGs
on th
e im
plem
enta
tion
of th
e PF
M-R
S su
ch a
s SM
S P
EMCO
M
&AC
COU
NTA
BILI
TY
SECR
ETAR
IATE
X X
350,
000
6.3.
2 Ef
fect
ive
chan
ge
man
agem
ent
and
com
mun
icat
ion
on P
FM
Dev
elop
com
preh
ensi
ve s
usta
inab
ility
pla
n fo
r PFM
refo
rms
PEM
COM
&
ACCO
UN
TABI
LITY
SE
CRET
ARIA
TE
X
X
12
5,00
0
Upd
ate
com
preh
ensi
ve c
apac
ity n
eeds
ass
essm
ent f
or P
FM a
nd
deve
lop
trai
ning
/cap
acity
enh
ance
men
t pla
n P
EMCO
M
&AC
COU
NTA
BILI
TY
SECR
ETAR
IATE
X X
450,
000
U
nder
take
fea
sibi
lity
asse
ssm
ent
for
sust
aina
ble
deliv
ery
of
PFM
cap
acity
dev
elop
men
t and
trai
ning
man
agem
ent o
ptio
ns
PEM
COM
&
ACCO
UN
TABI
LITY
SE
CRET
ARIA
TE
X
X
25
3,00
0
Annu
al a
sses
smen
t of
the
PFM
cap
acity
bui
ldin
g pr
ogra
mm
e ag
ains
t the
CN
A/en
hanc
emen
t pla
n P
EMCO
M
&AC
COU
NTA
BILI
TY
SECR
ETAR
IATE
X X
X X
256,
145
U
nder
take
a P
FM p
erfo
rman
ce a
sses
emen
t ba
sed
on t
he P
EFA
fram
ewor
k PE
MCO
M
&AC
COU
NTA
BILI
TY
SECR
ETAR
IATE
X
150,
000
U
nder
take
Mid
term
Rev
iew
of t
he P
FM s
trat
egy
PEM
COM
&
ACCO
UN
TABI
LITY
SE
CRET
ARIA
TE
X
15
0,00
0
Und
erta
ke T
race
r st
udie
s fo
r se
lect
ed
Stud
y co
hort
s to
ass
ess
impa
ct o
f lea
rnin
g on
impr
ovem
ents
in g
over
nanc
e an
d se
rvic
es
deliv
ered
PEM
COM
&
ACCO
UN
TABI
LITY
SE
CRET
ARIA
TE
X
X X
X
18
8,80
0
Awar
enes
s ca
mpa
ign
on
prov
isio
ns
on
PFM
A in
lo
cal
gove
rnm
ents
to d
eman
d ac
coun
tabi
lity
PEM
COM
&
ACCO
UN
TABI
LITY
SE
CRET
ARIA
TE
X
X X
X
35
0,00
0
6.3.
3.
Trai
ning
m
odul
es
and
syst
ems
for
indu
ctio
n an
d in
-ser
vice
tra
inin
g of
ci
vil
serv
ants
on
PF
M
syst
ems
and
stan
dard
st
reng
then
ed
Revi
ew a
nd im
prov
e tr
aini
ng m
odul
es a
nd s
yste
ms
for i
nduc
tion
and
in-s
ervi
ce t
rain
ing
of c
ivil
serv
ants
on
PFM
sys
tem
s an
d st
anda
rds
MO
PS
X
X X
X
35
4,00
0
6.3.
4 O
nlin
e pe
er
men
tors
hip
and
supp
ort
unde
rtak
en
Esta
blis
hmen
t an
d op
erat
iona
lisat
ion
of
an
e-la
b fo
r PF
M
pilo
ted
MO
PS
X
X X
X
1,01
2,68
2
Dev
elop
men
t an
d ro
llout
of a
tra
inin
g pr
ogra
mm
e on
Fin
anci
al
man
agem
ent f
or b
oth
finan
cial
and
Non
-Fin
anci
al M
anag
ers
MO
PS
X
X X
X
24
6,30
0
6.3.
5. C
ivil
Serv
ice
Colle
ge
Uga
nda
(CSC
U)
Trai
ning
Ca
paci
ty e
nhan
cem
ent
for
CSCU
sta
ff an
d fa
culty
of t
rain
ers
on
PFM
mod
ules
M
OPS
X X
X X
525,
100
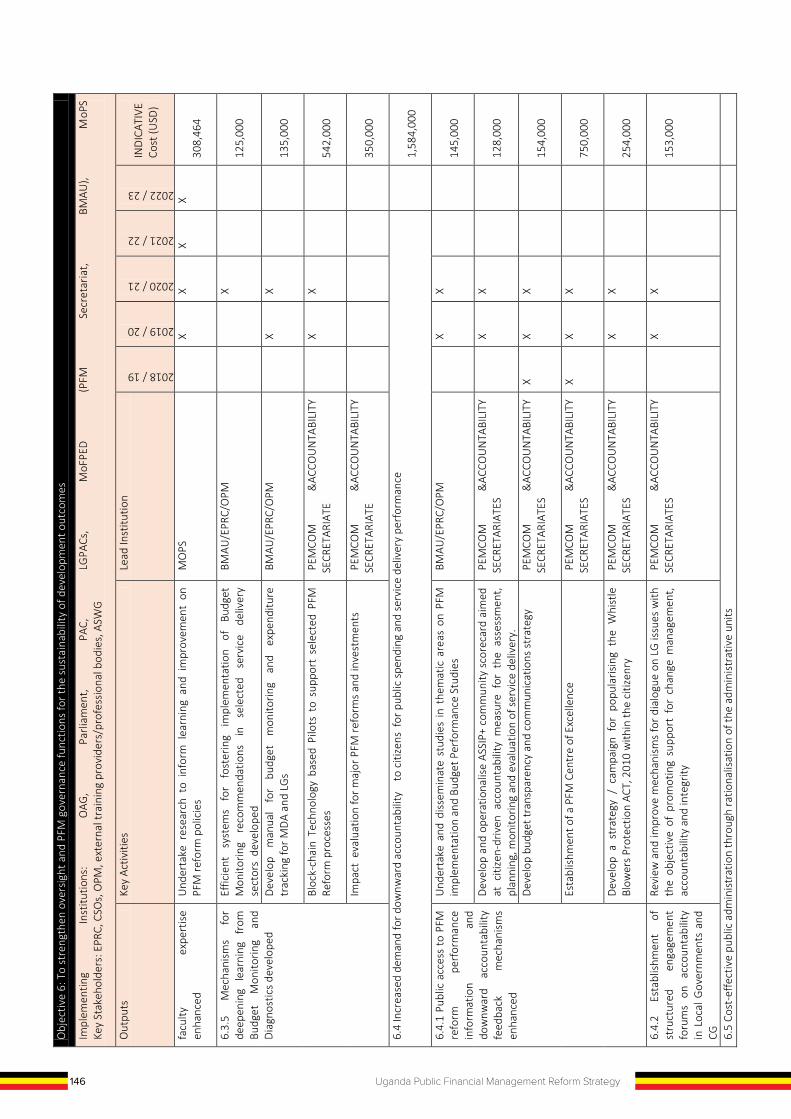
146 Uganda Public Financial Management Reform Strategy
Obj
ectiv
e 6:
To
stre
ngth
en o
vers
ight
and
PFM
gov
erna
nce
func
tions
for t
he s
usta
inab
ility
of d
evel
opm
ent o
utco
mes
Impl
emen
ting
Inst
itutio
ns:
OAG
, Pa
rliam
ent,
PAC,
LG
PACs
, M
oFPE
D
(PFM
Se
cret
aria
t, BM
AU),
MoP
S
Key
Stak
ehol
ders
: EPR
C, C
SOs,
OPM
, ext
erna
l tra
inin
g pr
ovid
ers/
prof
essi
onal
bod
ies,
ASW
G
Out
puts
Ke
y Ac
tiviti
es
Lea
d In
stitu
tion
2018 / 19
2019 / 20
2020 / 21
2021 / 22
2022 / 23
IND
ICAT
IVE
Cost
(USD
)
facu
lty
expe
rtis
e en
hanc
ed
Und
erta
ke r
esea
rch
to i
nfor
m l
earn
ing
and
impr
ovem
ent
on
PFM
refo
rm p
olic
ies
MO
PS
X
X X
X
30
8,46
4
6.3.
5 M
echa
nism
s fo
r de
epen
ing
lear
ning
fr
om
Budg
et
Mon
itorin
g an
d D
iagn
ostic
s de
velo
ped
Effic
ient
sy
stem
s fo
r fo
ster
ing
impl
emen
tatio
n of
Bu
dget
M
onito
ring
reco
mm
enda
tions
in
se
lect
ed
serv
ice
deliv
ery
sect
ors
dev
elop
ed
BM
AU/E
PRC/
OPM
X
125,
000
Dev
elop
m
anua
l fo
r bu
dget
m
onito
ring
and
expe
nditu
re
trac
king
for M
DA
and
LGs
BM
AU/E
PRC/
OPM
X X
135,
000
Bloc
k-ch
ain
Tech
nolo
gy b
ased
Pilo
ts t
o su
ppor
t se
lect
ed P
FM
Refo
rm p
roce
sses
P
EMCO
M
&AC
COU
NTA
BILI
TY
SECR
ETAR
IATE
X X
542,
000
Impa
ct e
valu
atio
n fo
r maj
or P
FM re
form
s an
d in
vest
men
ts
PEM
COM
&
ACCO
UN
TABI
LITY
SE
CRET
ARIA
TE
35
0,00
0
6.4
Incr
ease
d de
man
d fo
r dow
nwar
d ac
coun
tabi
lity
to
citi
zens
for
pub
lic s
pend
ing
and
serv
ice
deliv
ery
perf
orm
ance
1,
584,
000
6.4.
1 Pu
blic
acc
ess
to P
FM
refo
rm
perf
orm
ance
in
form
atio
n an
d do
wnw
ard
acco
unta
bilit
y fe
edba
ck
mec
hani
sms
enha
nced
Und
erta
ke a
nd d
isse
min
ate
stud
ies
in t
hem
atic
are
as o
n PF
M
impl
emen
tatio
n an
d Bu
dget
Per
form
ance
Stu
dies
B
MAU
/EPR
C/O
PM
X
X
14
5,00
0
Dev
elop
and
ope
ratio
nalis
e AS
SIP+
com
mun
ity s
core
card
aim
ed
at c
itize
n-dr
iven
acc
ount
abili
ty m
easu
re f
or t
he a
sses
smen
t, pl
anni
ng, m
onito
ring
and
eval
uatio
n of
ser
vice
del
iver
y.
PEM
COM
&
ACCO
UN
TABI
LITY
SE
CRET
ARIA
TES
X X
128,
000
Dev
elop
bud
get t
rans
pare
ncy
and
com
mun
icat
ions
str
ateg
y P
EMCO
M
&AC
COU
NTA
BILI
TY
SECR
ETAR
IATE
S
X X
X
15
4,00
0
Esta
blis
hmen
t of a
PFM
Cen
tre
of E
xcel
lenc
e P
EMCO
M
&AC
COU
NTA
BILI
TY
SECR
ETAR
IATE
S
X X
X
75
0,00
0
Dev
elop
a s
trat
egy
/ ca
mpa
ign
for
popu
laris
ing
the
Whi
stle
Bl
ower
s Pr
otec
tion
ACT,
201
0 w
ithin
the
citiz
enry
P
EMCO
M
&AC
COU
NTA
BILI
TY
SECR
ETAR
IATE
S
X
X
25
4,00
0
6.4.
2 Es
tabl
ishm
ent
of
stru
ctur
ed
enga
gem
ent
foru
ms
on
acco
unta
bilit
y in
Loc
al G
over
nmen
ts a
nd
CG
Revi
ew a
nd im
prov
e m
echa
nism
s fo
r dia
logu
e on
LG
issu
es w
ith
the
obje
ctiv
e of
pro
mot
ing
supp
ort
for
chan
ge m
anag
emen
t, ac
coun
tabi
lity
and
inte
grity
PEM
COM
&
ACCO
UN
TABI
LITY
SE
CRET
ARIA
TES
X X
153,
000
6.5
Cost
-effe
ctiv
e pu
blic
adm
inist
ratio
n th
roug
h ra
tiona
lisat
ion
of th
e ad
min
istr
ativ
e un
its
Obj
ectiv
e 6:
To
stre
ngth
en o
vers
ight
and
PFM
gov
erna
nce
func
tions
for t
he s
usta
inab
ility
of d
evel
opm
ent o
utco
mes
Impl
emen
ting
Inst
itutio
ns:
OAG
, Pa
rliam
ent,
PAC,
LG
PACs
, M
oFPE
D
(PFM
Se
cret
aria
t, BM
AU),
MoP
S
Key
Stak
ehol
ders
: EPR
C, C
SOs,
OPM
, ext
erna
l tra
inin
g pr
ovid
ers/
prof
essi
onal
bod
ies,
ASW
G
Out
puts
Ke
y Ac
tiviti
es
Lea
d In
stitu
tion
2018 / 19
2019 / 20
2020 / 21
2021 / 22
2022 / 23 IN
DIC
ATIV
E Co
st (U
SD)
11,3
21,3
84
6.5.
1 Pu
blic
adm
inis
trat
ion
stru
ctur
es ra
tiona
lised
U
nder
take
ind
epen
dent
ana
lysi
s to
rev
iew
the
cos
t of
pub
lic
adm
inis
trat
ion
visa
vie
ser
vice
del
iver
y M
OPS
X
919,
000
An
alys
is o
f exi
stin
g St
ruct
ures
and
job
eval
uatio
ns
MO
PS
X
X
16
8,00
0
Sala
ry a
nd re
mun
erat
ion
stud
y/re
view
M
OPS
X X
X X
65
,000
Es
tabl
ish
cost
effe
ctiv
e fr
amew
ork
of o
pera
tions
for
the
Pub
lic
Sect
or
MO
PS
X
X X
X
65,0
00
Benc
hmar
k st
udie
s to
ef
ficie
nt
sect
or
coun
trie
s th
at
have
un
derg
one
publ
ic s
ecto
r tra
nsfo
rmat
ion
proc
esse
s M
OPS
X X
103,
200
Dev
elop
po
licy
and
road
map
on
ra
tiona
lisat
ion
of
publ
ic
adm
inis
trat
ion
MO
PS
X
75,0
00
Feas
ibili
ty
st
udy
on
publ
ic
sect
or
tran
sfor
mat
ion
stra
tegy
/impl
emen
tatio
n ro
adm
ap
MO
PS
X
56,0
00
Chan
ge M
anag
emen
t an
d Co
mm
unic
atio
n Pl
an d
evel
oped
with
H
uman
Res
ourc
e an
d In
dust
rial R
elat
ions
M
OPS
X X
X X
1,
873,
000
Map
, Ana
lyse
and
Opt
imiz
e/Re
-eng
inee
r Cu
mbe
rsom
e Sy
stem
s an
d Pr
oces
ses
MO
PS
X
X X
27
2,20
0
Und
erst
udy
and
benc
hmar
k be
st
prac
tices
in
in
stitu
tiona
l re
view
an
d sy
stem
s re
-eng
inee
ring
in
coun
trie
s th
at
have
un
derg
one
publ
ic s
ecto
r tra
nsfo
rmat
ion
proc
esse
s
MO
PS
X
X
67,1
20
Prov
ide
Tech
nica
l Su
ppor
t to
MD
ALG
S on
Im
plem
enta
tion
of
Stru
ctur
es, s
yste
ms;
an
d M
onito
r an
d ev
alua
tion
perf
orm
ance
of
str
uctu
res
and
syst
ems
MO
PS
X
X X
X
22
2,00
0
Und
erta
ke
revi
ew
and
ratio
nalis
atio
n of
G
over
nmen
t In
stitu
tions
M
OPS
X X
X X
994,
240
Und
erta
ke j
ob e
valu
atio
n fo
r jo
bs i
n th
e Pu
blic
Ser
vice
for
im
prov
ed e
ffici
ency
and
ser
vice
del
iver
y M
OPS
X X
X X
834,
300
Revi
ew, S
impl
ify a
nd O
ptim
ize
sele
cted
Gov
ernm
ent P
roce
sses
M
OPS
X X
X X
678,
240
Scal
e up
impl
emen
tatio
n of
Ser
vice
Uga
nda
Cent
res
acro
ss t
he
coun
try
MO
PS
X
X X
X
3,98
7,48
4
6.5.
2 Le
gisl
ativ
e fr
amew
ork
revi
ewed
Re
view
lega
l fra
mew
ork
and
mak
e re
com
men
datio
ns t
hat
will
al
low
for a
new
dis
pens
atio
n in
gov
erna
nce.
P
EMCO
M&
ACCO
UN
TABI
LITY
SE
CTO
R
X
20,8
00

146 Uganda Public Financial Management Reform Strategy
Obj
ectiv
e 6:
To
stre
ngth
en o
vers
ight
and
PFM
gov
erna
nce
func
tions
for t
he s
usta
inab
ility
of d
evel
opm
ent o
utco
mes
Impl
emen
ting
Inst
itutio
ns:
OAG
, Pa
rliam
ent,
PAC,
LG
PACs
, M
oFPE
D
(PFM
Se
cret
aria
t, BM
AU),
MoP
S
Key
Stak
ehol
ders
: EPR
C, C
SOs,
OPM
, ext
erna
l tra
inin
g pr
ovid
ers/
prof
essi
onal
bod
ies,
ASW
G
Out
puts
Ke
y Ac
tiviti
es
Lea
d In
stitu
tion
2018 / 19
2019 / 20
2020 / 21
2021 / 22
2022 / 23
IND
ICAT
IVE
Cost
(USD
)
facu
lty
expe
rtis
e en
hanc
ed
Und
erta
ke r
esea
rch
to i
nfor
m l
earn
ing
and
impr
ovem
ent
on
PFM
refo
rm p
olic
ies
MO
PS
X
X X
X
30
8,46
4
6.3.
5 M
echa
nism
s fo
r de
epen
ing
lear
ning
fr
om
Budg
et
Mon
itorin
g an
d D
iagn
ostic
s de
velo
ped
Effic
ient
sy
stem
s fo
r fo
ster
ing
impl
emen
tatio
n of
Bu
dget
M
onito
ring
reco
mm
enda
tions
in
se
lect
ed
serv
ice
deliv
ery
sect
ors
dev
elop
ed
BM
AU/E
PRC/
OPM
X
125,
000
Dev
elop
m
anua
l fo
r bu
dget
m
onito
ring
and
expe
nditu
re
trac
king
for M
DA
and
LGs
BM
AU/E
PRC/
OPM
X X
135,
000
Bloc
k-ch
ain
Tech
nolo
gy b
ased
Pilo
ts t
o su
ppor
t se
lect
ed P
FM
Refo
rm p
roce
sses
P
EMCO
M
&AC
COU
NTA
BILI
TY
SECR
ETAR
IATE
X X
542,
000
Impa
ct e
valu
atio
n fo
r maj
or P
FM re
form
s an
d in
vest
men
ts
PEM
COM
&
ACCO
UN
TABI
LITY
SE
CRET
ARIA
TE
35
0,00
0
6.4
Incr
ease
d de
man
d fo
r dow
nwar
d ac
coun
tabi
lity
to
citi
zens
for
pub
lic s
pend
ing
and
serv
ice
deliv
ery
perf
orm
ance
1,
584,
000
6.4.
1 Pu
blic
acc
ess
to P
FM
refo
rm
perf
orm
ance
in
form
atio
n an
d do
wnw
ard
acco
unta
bilit
y fe
edba
ck
mec
hani
sms
enha
nced
Und
erta
ke a
nd d
isse
min
ate
stud
ies
in t
hem
atic
are
as o
n PF
M
impl
emen
tatio
n an
d Bu
dget
Per
form
ance
Stu
dies
B
MAU
/EPR
C/O
PM
X
X
14
5,00
0
Dev
elop
and
ope
ratio
nalis
e AS
SIP+
com
mun
ity s
core
card
aim
ed
at c
itize
n-dr
iven
acc
ount
abili
ty m
easu
re f
or t
he a
sses
smen
t, pl
anni
ng, m
onito
ring
and
eval
uatio
n of
ser
vice
del
iver
y.
PEM
COM
&
ACCO
UN
TABI
LITY
SE
CRET
ARIA
TES
X X
128,
000
Dev
elop
bud
get t
rans
pare
ncy
and
com
mun
icat
ions
str
ateg
y P
EMCO
M
&AC
COU
NTA
BILI
TY
SECR
ETAR
IATE
S
X X
X
15
4,00
0
Esta
blis
hmen
t of a
PFM
Cen
tre
of E
xcel
lenc
e P
EMCO
M
&AC
COU
NTA
BILI
TY
SECR
ETAR
IATE
S
X X
X
75
0,00
0
Dev
elop
a s
trat
egy
/ ca
mpa
ign
for
popu
laris
ing
the
Whi
stle
Bl
ower
s Pr
otec
tion
ACT,
201
0 w
ithin
the
citiz
enry
P
EMCO
M
&AC
COU
NTA
BILI
TY
SECR
ETAR
IATE
S
X
X
25
4,00
0
6.4.
2 Es
tabl
ishm
ent
of
stru
ctur
ed
enga
gem
ent
foru
ms
on
acco
unta
bilit
y in
Loc
al G
over
nmen
ts a
nd
CG
Revi
ew a
nd im
prov
e m
echa
nism
s fo
r dia
logu
e on
LG
issu
es w
ith
the
obje
ctiv
e of
pro
mot
ing
supp
ort
for
chan
ge m
anag
emen
t, ac
coun
tabi
lity
and
inte
grity
PEM
COM
&
ACCO
UN
TABI
LITY
SE
CRET
ARIA
TES
X X
153,
000
6.5
Cost
-effe
ctiv
e pu
blic
adm
inist
ratio
n th
roug
h ra
tiona
lisat
ion
of th
e ad
min
istr
ativ
e un
its
Obj
ectiv
e 6:
To
stre
ngth
en o
vers
ight
and
PFM
gov
erna
nce
func
tions
for t
he s
usta
inab
ility
of d
evel
opm
ent o
utco
mes
Impl
emen
ting
Inst
itutio
ns:
OAG
, Pa
rliam
ent,
PAC,
LG
PACs
, M
oFPE
D
(PFM
Se
cret
aria
t, BM
AU),
MoP
S
Key
Stak
ehol
ders
: EPR
C, C
SOs,
OPM
, ext
erna
l tra
inin
g pr
ovid
ers/
prof
essi
onal
bod
ies,
ASW
G
Out
puts
Ke
y Ac
tiviti
es
Lea
d In
stitu
tion
2018 / 19
2019 / 20
2020 / 21
2021 / 22
2022 / 23
IND
ICAT
IVE
Cost
(USD
)
11,3
21,3
84
6.5.
1 Pu
blic
adm
inis
trat
ion
stru
ctur
es ra
tiona
lised
U
nder
take
ind
epen
dent
ana
lysi
s to
rev
iew
the
cos
t of
pub
lic
adm
inis
trat
ion
visa
vie
ser
vice
del
iver
y M
OPS
X
919,
000
An
alys
is o
f exi
stin
g St
ruct
ures
and
job
eval
uatio
ns
MO
PS
X
X
16
8,00
0
Sala
ry a
nd re
mun
erat
ion
stud
y/re
view
M
OPS
X X
X X
65
,000
Es
tabl
ish
cost
effe
ctiv
e fr
amew
ork
of o
pera
tions
for
the
Pub
lic
Sect
or
MO
PS
X
X X
X
65,0
00
Benc
hmar
k st
udie
s to
ef
ficie
nt
sect
or
coun
trie
s th
at
have
un
derg
one
publ
ic s
ecto
r tra
nsfo
rmat
ion
proc
esse
s M
OPS
X X
103,
200
Dev
elop
po
licy
and
road
map
on
ra
tiona
lisat
ion
of
publ
ic
adm
inis
trat
ion
MO
PS
X
75,0
00
Feas
ibili
ty
st
udy
on
publ
ic
sect
or
tran
sfor
mat
ion
stra
tegy
/impl
emen
tatio
n ro
adm
ap
MO
PS
X
56,0
00
Chan
ge M
anag
emen
t an
d Co
mm
unic
atio
n Pl
an d
evel
oped
with
H
uman
Res
ourc
e an
d In
dust
rial R
elat
ions
M
OPS
X X
X X
1,
873,
000
Map
, Ana
lyse
and
Opt
imiz
e/Re
-eng
inee
r Cu
mbe
rsom
e Sy
stem
s an
d Pr
oces
ses
MO
PS
X
X X
27
2,20
0
Und
erst
udy
and
benc
hmar
k be
st
prac
tices
in
in
stitu
tiona
l re
view
an
d sy
stem
s re
-eng
inee
ring
in
coun
trie
s th
at
have
un
derg
one
publ
ic s
ecto
r tra
nsfo
rmat
ion
proc
esse
s
MO
PS
X
X
67,1
20
Prov
ide
Tech
nica
l Su
ppor
t to
MD
ALG
S on
Im
plem
enta
tion
of
Stru
ctur
es, s
yste
ms;
an
d M
onito
r an
d ev
alua
tion
perf
orm
ance
of
str
uctu
res
and
syst
ems
MO
PS
X
X X
X
22
2,00
0
Und
erta
ke
revi
ew
and
ratio
nalis
atio
n of
G
over
nmen
t In
stitu
tions
M
OPS
X X
X X
994,
240
Und
erta
ke j
ob e
valu
atio
n fo
r jo
bs i
n th
e Pu
blic
Ser
vice
for
im
prov
ed e
ffici
ency
and
ser
vice
del
iver
y M
OPS
X X
X X
834,
300
Revi
ew, S
impl
ify a
nd O
ptim
ize
sele
cted
Gov
ernm
ent P
roce
sses
M
OPS
X X
X X
678,
240
Scal
e up
impl
emen
tatio
n of
Ser
vice
Uga
nda
Cent
res
acro
ss t
he
coun
try
MO
PS
X
X X
X
3,98
7,48
4
6.5.
2 Le
gisl
ativ
e fr
amew
ork
revi
ewed
Re
view
lega
l fra
mew
ork
and
mak
e re
com
men
datio
ns t
hat
will
al
low
for a
new
dis
pens
atio
n in
gov
erna
nce.
P
EMCO
M&
ACCO
UN
TABI
LITY
SE
CTO
R
X
20,8
00
147Uganda Public Financial Management Reform Strategy
Obj
ectiv
e 6:
To
stre
ngth
en o
vers
ight
and
PFM
gov
erna
nce
func
tions
for t
he s
usta
inab
ility
of d
evel
opm
ent o
utco
mes
Impl
emen
ting
Inst
itutio
ns:
OAG
, Pa
rliam
ent,
PAC,
LG
PACs
, M
oFPE
D
(PFM
Se
cret
aria
t, BM
AU),
MoP
S
Key
Stak
ehol
ders
: EPR
C, C
SOs,
OPM
, ext
erna
l tra
inin
g pr
ovid
ers/
prof
essi
onal
bod
ies,
ASW
G
Out
puts
Ke
y Ac
tiviti
es
Lea
d In
stitu
tion
2018 / 19
2019 / 20
2020 / 21
2021 / 22
2022 / 23
IND
ICAT
IVE
Cost
(USD
)
facu
lty
expe
rtis
e en
hanc
ed
Und
erta
ke r
esea
rch
to i
nfor
m l
earn
ing
and
impr
ovem
ent
on
PFM
refo
rm p
olic
ies
MO
PS
X
X X
X
30
8,46
4
6.3.
5 M
echa
nism
s fo
r de
epen
ing
lear
ning
fr
om
Budg
et
Mon
itorin
g an
d D
iagn
ostic
s de
velo
ped
Effic
ient
sy
stem
s fo
r fo
ster
ing
impl
emen
tatio
n of
Bu
dget
M
onito
ring
reco
mm
enda
tions
in
se
lect
ed
serv
ice
deliv
ery
sect
ors
dev
elop
ed
BM
AU/E
PRC/
OPM
X
125,
000
Dev
elop
m
anua
l fo
r bu
dget
m
onito
ring
and
expe
nditu
re
trac
king
for M
DA
and
LGs
BM
AU/E
PRC/
OPM
X X
135,
000
Bloc
k-ch
ain
Tech
nolo
gy b
ased
Pilo
ts t
o su
ppor
t se
lect
ed P
FM
Refo
rm p
roce
sses
P
EMCO
M
&AC
COU
NTA
BILI
TY
SECR
ETAR
IATE
X X
542,
000
Impa
ct e
valu
atio
n fo
r maj
or P
FM re
form
s an
d in
vest
men
ts
PEM
COM
&
ACCO
UN
TABI
LITY
SE
CRET
ARIA
TE
35
0,00
0
6.4
Incr
ease
d de
man
d fo
r dow
nwar
d ac
coun
tabi
lity
to
citi
zens
for
pub
lic s
pend
ing
and
serv
ice
deliv
ery
perf
orm
ance
1,
584,
000
6.4.
1 Pu
blic
acc
ess
to P
FM
refo
rm
perf
orm
ance
in
form
atio
n an
d do
wnw
ard
acco
unta
bilit
y fe
edba
ck
mec
hani
sms
enha
nced
Und
erta
ke a
nd d
isse
min
ate
stud
ies
in t
hem
atic
are
as o
n PF
M
impl
emen
tatio
n an
d Bu
dget
Per
form
ance
Stu
dies
B
MAU
/EPR
C/O
PM
X
X
14
5,00
0
Dev
elop
and
ope
ratio
nalis
e AS
SIP+
com
mun
ity s
core
card
aim
ed
at c
itize
n-dr
iven
acc
ount
abili
ty m
easu
re f
or t
he a
sses
smen
t, pl
anni
ng, m
onito
ring
and
eval
uatio
n of
ser
vice
del
iver
y.
PEM
COM
&
ACCO
UN
TABI
LITY
SE
CRET
ARIA
TES
X X
128,
000
Dev
elop
bud
get t
rans
pare
ncy
and
com
mun
icat
ions
str
ateg
y P
EMCO
M
&AC
COU
NTA
BILI
TY
SECR
ETAR
IATE
S
X X
X
15
4,00
0
Esta
blis
hmen
t of a
PFM
Cen
tre
of E
xcel
lenc
e P
EMCO
M
&AC
COU
NTA
BILI
TY
SECR
ETAR
IATE
S
X X
X
75
0,00
0
Dev
elop
a s
trat
egy
/ ca
mpa
ign
for
popu
laris
ing
the
Whi
stle
Bl
ower
s Pr
otec
tion
ACT,
201
0 w
ithin
the
citiz
enry
P
EMCO
M
&AC
COU
NTA
BILI
TY
SECR
ETAR
IATE
S
X
X
25
4,00
0
6.4.
2 Es
tabl
ishm
ent
of
stru
ctur
ed
enga
gem
ent
foru
ms
on
acco
unta
bilit
y in
Loc
al G
over
nmen
ts a
nd
CG
Revi
ew a
nd im
prov
e m
echa
nism
s fo
r dia
logu
e on
LG
issu
es w
ith
the
obje
ctiv
e of
pro
mot
ing
supp
ort
for
chan
ge m
anag
emen
t, ac
coun
tabi
lity
and
inte
grity
PEM
COM
&
ACCO
UN
TABI
LITY
SE
CRET
ARIA
TES
X X
153,
000
6.5
Cost
-effe
ctiv
e pu
blic
adm
inist
ratio
n th
roug
h ra
tiona
lisat
ion
of th
e ad
min
istr
ativ
e un
its
Obj
ectiv
e 6:
To
stre
ngth
en o
vers
ight
and
PFM
gov
erna
nce
func
tions
for t
he s
usta
inab
ility
of d
evel
opm
ent o
utco
mes
Impl
emen
ting
Inst
itutio
ns:
OAG
, Pa
rliam
ent,
PAC,
LG
PACs
, M
oFPE
D
(PFM
Se
cret
aria
t, BM
AU),
MoP
S
Key
Stak
ehol
ders
: EPR
C, C
SOs,
OPM
, ext
erna
l tra
inin
g pr
ovid
ers/
prof
essi
onal
bod
ies,
ASW
G
Out
puts
Ke
y Ac
tiviti
es
Lea
d In
stitu
tion
2018 / 19
2019 / 20
2020 / 21
2021 / 22
2022 / 23
IND
ICAT
IVE
Cost
(USD
)
11,3
21,3
84
6.5.
1 Pu
blic
adm
inis
trat
ion
stru
ctur
es ra
tiona
lised
U
nder
take
ind
epen
dent
ana
lysi
s to
rev
iew
the
cos
t of
pub
lic
adm
inis
trat
ion
visa
vie
ser
vice
del
iver
y M
OPS
X
919,
000
An
alys
is o
f exi
stin
g St
ruct
ures
and
job
eval
uatio
ns
MO
PS
X
X
16
8,00
0
Sala
ry a
nd re
mun
erat
ion
stud
y/re
view
M
OPS
X X
X X
65
,000
Es
tabl
ish
cost
effe
ctiv
e fr
amew
ork
of o
pera
tions
for
the
Pub
lic
Sect
or
MO
PS
X
X X
X
65,0
00
Benc
hmar
k st
udie
s to
ef
ficie
nt
sect
or
coun
trie
s th
at
have
un
derg
one
publ
ic s
ecto
r tra
nsfo
rmat
ion
proc
esse
s M
OPS
X X
103,
200
Dev
elop
po
licy
and
road
map
on
ra
tiona
lisat
ion
of
publ
ic
adm
inis
trat
ion
MO
PS
X
75,0
00
Feas
ibili
ty
st
udy
on
publ
ic
sect
or
tran
sfor
mat
ion
stra
tegy
/impl
emen
tatio
n ro
adm
ap
MO
PS
X
56,0
00
Chan
ge M
anag
emen
t an
d Co
mm
unic
atio
n Pl
an d
evel
oped
with
H
uman
Res
ourc
e an
d In
dust
rial R
elat
ions
M
OPS
X X
X X
1,
873,
000
Map
, Ana
lyse
and
Opt
imiz
e/Re
-eng
inee
r Cu
mbe
rsom
e Sy
stem
s an
d Pr
oces
ses
MO
PS
X
X X
27
2,20
0
Und
erst
udy
and
benc
hmar
k be
st
prac
tices
in
in
stitu
tiona
l re
view
an
d sy
stem
s re
-eng
inee
ring
in
coun
trie
s th
at
have
un
derg
one
publ
ic s
ecto
r tra
nsfo
rmat
ion
proc
esse
s
MO
PS
X
X
67,1
20
Prov
ide
Tech
nica
l Su
ppor
t to
MD
ALG
S on
Im
plem
enta
tion
of
Stru
ctur
es, s
yste
ms;
an
d M
onito
r an
d ev
alua
tion
perf
orm
ance
of
str
uctu
res
and
syst
ems
MO
PS
X
X X
X
22
2,00
0
Und
erta
ke
revi
ew
and
ratio
nalis
atio
n of
G
over
nmen
t In
stitu
tions
M
OPS
X X
X X
994,
240
Und
erta
ke j
ob e
valu
atio
n fo
r jo
bs i
n th
e Pu
blic
Ser
vice
for
im
prov
ed e
ffici
ency
and
ser
vice
del
iver
y M
OPS
X X
X X
834,
300
Revi
ew, S
impl
ify a
nd O
ptim
ize
sele
cted
Gov
ernm
ent P
roce
sses
M
OPS
X X
X X
678,
240
Scal
e up
impl
emen
tatio
n of
Ser
vice
Uga
nda
Cent
res
acro
ss t
he
coun
try
MO
PS
X
X X
X
3,98
7,48
4
6.5.
2 Le
gisl
ativ
e fr
amew
ork
revi
ewed
Re
view
lega
l fra
mew
ork
and
mak
e re
com
men
datio
ns t
hat
will
al
low
for a
new
dis
pens
atio
n in
gov
erna
nce.
P
EMCO
M&
ACCO
UN
TABI
LITY
SE
CTO
R
X
20,8
00
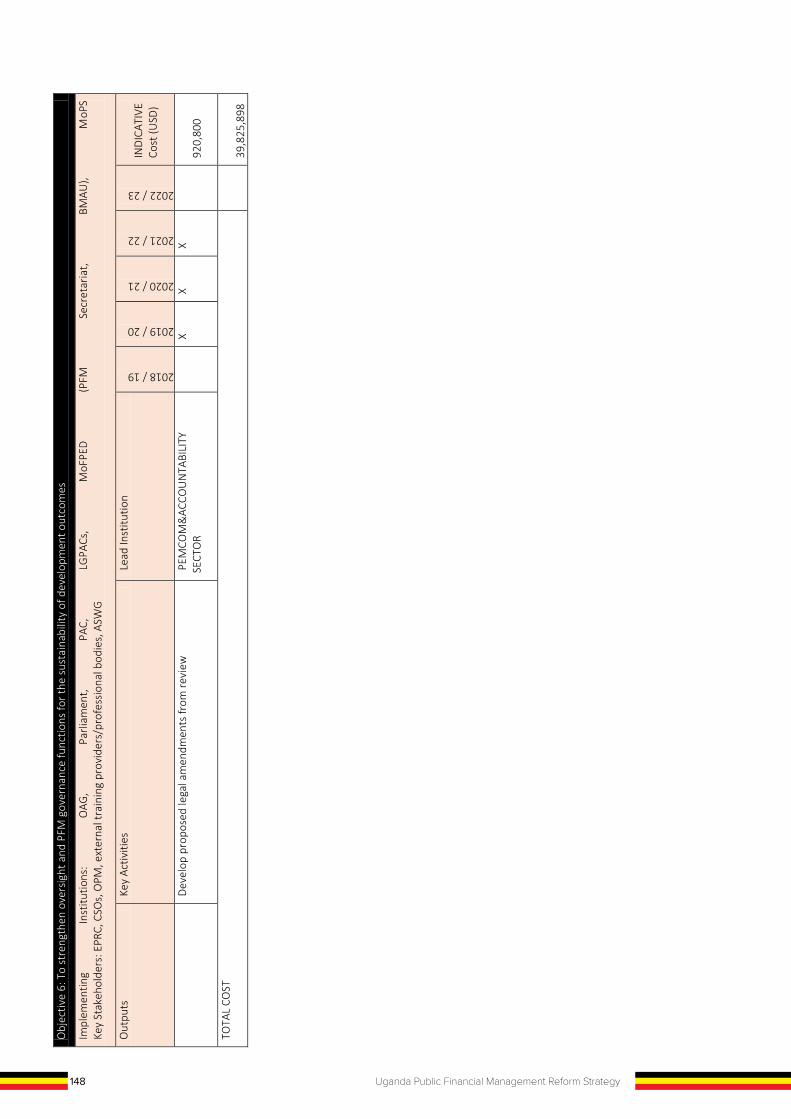
148 Uganda Public Financial Management Reform Strategy
Obj
ectiv
e 6:
To
stre
ngth
en o
vers
ight
and
PFM
gov
erna
nce
func
tions
for t
he s
usta
inab
ility
of d
evel
opm
ent o
utco
mes
Impl
emen
ting
Inst
itutio
ns:
OAG
, Pa
rliam
ent,
PAC,
LG
PACs
, M
oFPE
D
(PFM
Se
cret
aria
t, BM
AU),
MoP
S
Key
Stak
ehol
ders
: EPR
C, C
SOs,
OPM
, ext
erna
l tra
inin
g pr
ovid
ers/
prof
essi
onal
bod
ies,
ASW
G
Out
puts
Ke
y Ac
tiviti
es
Lea
d In
stitu
tion
2018 / 19
2019 / 20
2020 / 21
2021 / 22
2022 / 23
IND
ICAT
IVE
Cost
(USD
)
Dev
elop
pro
pose
d le
gal a
men
dmen
ts fr
om re
view
P
EMCO
M&
ACCO
UN
TABI
LITY
SE
CTO
R
X
X X
92
0,80
0
TOTA
L CO
ST
39
,825
,898
Anne
x D
: Str
ateg
ic R
esul
ts F
ram
ewor
k - H
igh-
leve
l Obj
ecti
ves
and
Inte
rmed
iate
Out
com
es
Ø L
evel
1 –
Impa
ct o
n se
rvic
e de
liver
y ou
tcom
es. W
hile
cha
nges
in th
ese
indi
cato
rs m
ay n
ot b
e po
ssib
le to
att
ribut
e em
piric
ally
to P
FM re
form
s, it
is e
xpec
ted
that
the
supp
ortin
g ro
le o
f PFM
sys
tem
s w
ill h
ave
a po
sitiv
e im
pact
on
publ
ic se
rvic
e qu
ality
and
effe
ctiv
enes
s;
Ø L
evel
2 –
Effe
ctiv
enes
s (d
eliv
ery
agai
nst o
utco
mes
). PF
M o
utco
mes
will
be
mea
sure
d us
ing
PEFA
and
equ
ival
ent a
sses
smen
t fra
mew
orks
. PFM
refo
rms
that
con
trib
ute
to th
e ov
eral
l fun
ctio
ning
and
ef
fect
iven
ess o
f PFM
syst
ems
are
expe
cted
to h
ave
a po
sitiv
e im
pact
on
over
all P
FM a
sses
smen
t sco
res.
Ø L
evel
3 –
Effe
ctiv
enes
s ag
ains
t int
erm
edia
te o
utco
mes
. The
se a
re re
pres
ente
d by
the
six h
igh
leve
l obj
ectiv
es a
nd th
eir a
ccom
pany
ing
outc
omes
. Ind
icat
ors
and
targ
ets
will
be
mea
sure
d at
the
star
t (b
asel
ine)
, mid
-ter
m re
view
and
end
of t
he st
rate
gy. T
he in
terv
entio
ns a
nd a
ctiv
ities
iden
tifie
d in
the
Impl
emen
tatio
n Pl
an a
re e
xpec
ted
to c
ontr
ibut
e to
ach
ievi
ng th
ese
outc
omes
.
Ø L
evel
4 –
Effi
cien
cy (D
eliv
ery
of o
utpu
ts a
nd k
ey in
terv
entio
ns).
As d
efin
ed in
the
Impl
emen
tatio
n Pl
an. T
hese
will
be
mon
itore
d at
leas
t an
nual
ly, u
sing
defin
ed m
eans
of v
erifi
catio
n fo
r tr
acki
ng
prog
ress
.
Ø L
evel
5 –
Eco
nom
y (A
ctiv
ities
and
reso
urce
inpu
ts).
At th
is le
vel,
the
focu
s w
ill b
e on
mea
surin
g th
e ef
ficie
ncy
of th
e co
ntrib
utin
g re
form
pro
gram
mes
and
act
iviti
es, i
n te
rms
of th
eir c
onve
rsio
n fr
om
reso
urce
s in
to o
utpu
ts.
Leve
l 1 -
Impa
ct o
n se
rvic
e de
liver
y an
d ec
onom
ic tr
ansf
orm
atio
n (d
eliv
ery
of N
DPII)
Key
Sect
ors:
Edu
catio
n, H
ealth
, Wat
er, E
nerg
y, W
orks
& T
rans
port
, Agr
icul
ture
Sect
or /
Them
e #
Indi
cato
r
Base
line
2017
/18
Targ
et
2018
/19
Targ
et
2019
/20
Targ
et
2020
/21
Targ
et
2021
/22
Targ
et
2022
/23
Assu
mpt
ions
Econ
omic
tran
sfor
mat
ion
1 Ec
onom
ic g
row
th:
Real
ann
ual
GD
P gr
owth
G
APR
/ M
oFPE
D A
nnua
l Bu
dget
Pe
rfor
man
ce
Repo
rt
5.8%
Targ
et s
et in
ND
PII
- th
eref
ore
assu
mes
ob
ject
ives
/key
pr
ojec
ts in
ND
PII a
re d
eliv
ered
; no
si
gnifi
cant
ad
vers
e ec
onom
ic s
hock
s 2
Publ
ic
inve
stm
ent
effic
ienc
y:
Publ
ic
Inve
stm
ent
Man
agem
ent I
ndex
ASS
IP
/ IM
F PI
M
asse
ssm
ent
1.4
4 (2
011)
2.
05
2.26
3 In
fras
truc
ture
del
iver
y (N
DPI
I):
Gro
ss
capi
tal
form
atio
n as
a
perc
enta
ge o
f GD
P
Gov
ernm
ent
Annu
al
Perf
orm
ance
Rep
ort
23%
(F
Y16/
17)
28
%
4 Pr
ogre
ss
to
mid
dle
inco
me
stat
us: G
DP
per c
apita
(USD
) G
over
nmen
t An
nual
Pe
rfor
man
ce R
epor
t 7
77
(FY1
6/17
)
1,03
3
Sect
or-le
vel
serv
ice
deliv
ery
perf
orm
ance
5
Sele
cted
KP
Is
per
sect
or:
Educ
atio
n,
Hea
lth,
Wat
er,
Ener
gy, T
rans
port
, Agr
icul
ture
Gov
ernm
ent
Annu
al
Perf
orm
ance
Rep
ort
Var
ious
(T
BD)
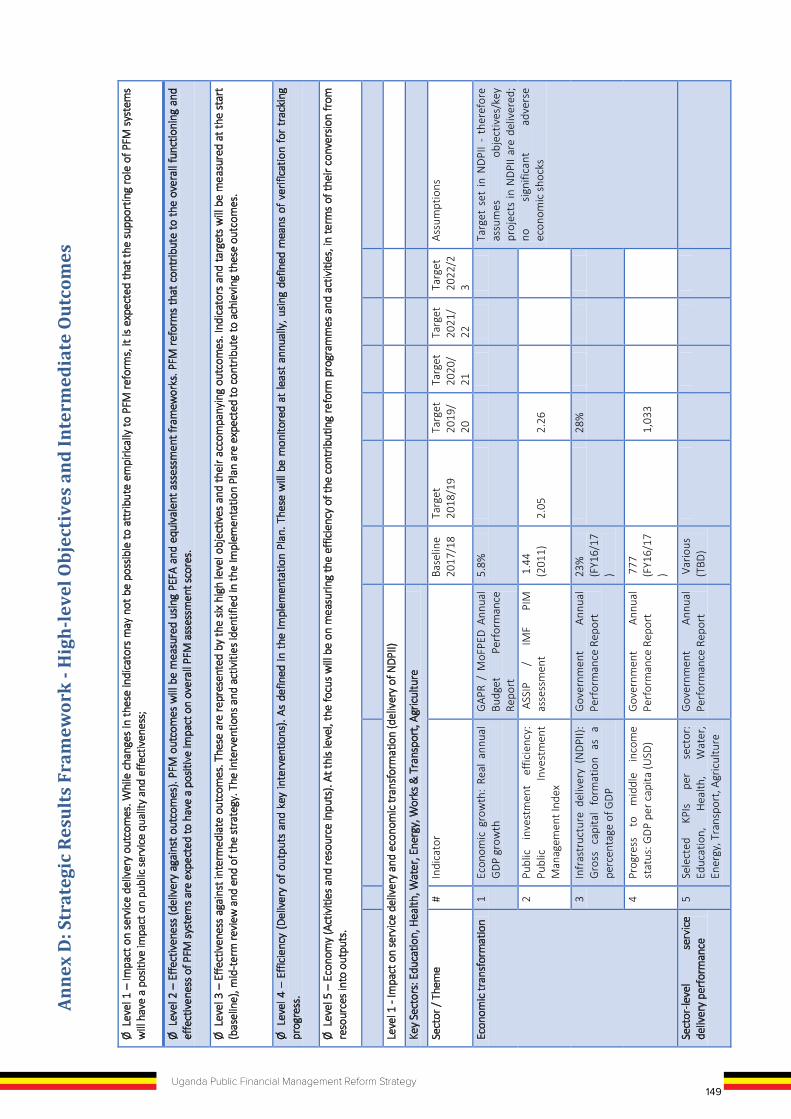
149Uganda Public Financial Management Reform Strategy
Obj
ectiv
e 6:
To
stre
ngth
en o
vers
ight
and
PFM
gov
erna
nce
func
tions
for t
he s
usta
inab
ility
of d
evel
opm
ent o
utco
mes
Impl
emen
ting
Inst
itutio
ns:
OAG
, Pa
rliam
ent,
PAC,
LG
PACs
, M
oFPE
D
(PFM
Se
cret
aria
t, BM
AU),
MoP
S
Key
Stak
ehol
ders
: EPR
C, C
SOs,
OPM
, ext
erna
l tra
inin
g pr
ovid
ers/
prof
essi
onal
bod
ies,
ASW
G
Out
puts
Ke
y Ac
tiviti
es
Lea
d In
stitu
tion
2018 / 19
2019 / 20
2020 / 21
2021 / 22
2022 / 23
IND
ICAT
IVE
Cost
(USD
)
Dev
elop
pro
pose
d le
gal a
men
dmen
ts fr
om re
view
P
EMCO
M&
ACCO
UN
TABI
LITY
SE
CTO
R
X
X X
92
0,80
0
TOTA
L CO
ST
39
,825
,898
Anne
x D
: Str
ateg
ic R
esul
ts F
ram
ewor
k - H
igh-
leve
l Obj
ecti
ves
and
Inte
rmed
iate
Out
com
es
Ø L
evel
1 –
Impa
ct o
n se
rvic
e de
liver
y ou
tcom
es. W
hile
cha
nges
in th
ese
indi
cato
rs m
ay n
ot b
e po
ssib
le to
att
ribut
e em
piric
ally
to P
FM re
form
s, it
is e
xpec
ted
that
the
supp
ortin
g ro
le o
f PFM
sys
tem
s w
ill h
ave
a po
sitiv
e im
pact
on
publ
ic se
rvic
e qu
ality
and
effe
ctiv
enes
s;
Ø L
evel
2 –
Effe
ctiv
enes
s (d
eliv
ery
agai
nst o
utco
mes
). PF
M o
utco
mes
will
be
mea
sure
d us
ing
PEFA
and
equ
ival
ent a
sses
smen
t fra
mew
orks
. PFM
refo
rms
that
con
trib
ute
to th
e ov
eral
l fun
ctio
ning
and
ef
fect
iven
ess o
f PFM
syst
ems
are
expe
cted
to h
ave
a po
sitiv
e im
pact
on
over
all P
FM a
sses
smen
t sco
res.
Ø L
evel
3 –
Effe
ctiv
enes
s ag
ains
t int
erm
edia
te o
utco
mes
. The
se a
re re
pres
ente
d by
the
six h
igh
leve
l obj
ectiv
es a
nd th
eir a
ccom
pany
ing
outc
omes
. Ind
icat
ors
and
targ
ets
will
be
mea
sure
d at
the
star
t (b
asel
ine)
, mid
-ter
m re
view
and
end
of t
he st
rate
gy. T
he in
terv
entio
ns a
nd a
ctiv
ities
iden
tifie
d in
the
Impl
emen
tatio
n Pl
an a
re e
xpec
ted
to c
ontr
ibut
e to
ach
ievi
ng th
ese
outc
omes
.
Ø L
evel
4 –
Effi
cien
cy (D
eliv
ery
of o
utpu
ts a
nd k
ey in
terv
entio
ns).
As d
efin
ed in
the
Impl
emen
tatio
n Pl
an. T
hese
will
be
mon
itore
d at
leas
t an
nual
ly, u
sing
defin
ed m
eans
of v
erifi
catio
n fo
r tr
acki
ng
prog
ress
.
Ø L
evel
5 –
Eco
nom
y (A
ctiv
ities
and
reso
urce
inpu
ts).
At th
is le
vel,
the
focu
s w
ill b
e on
mea
surin
g th
e ef
ficie
ncy
of th
e co
ntrib
utin
g re
form
pro
gram
mes
and
act
iviti
es, i
n te
rms
of th
eir c
onve
rsio
n fr
om
reso
urce
s in
to o
utpu
ts.
Leve
l 1 -
Impa
ct o
n se
rvic
e de
liver
y an
d ec
onom
ic tr
ansf
orm
atio
n (d
eliv
ery
of N
DPII)
Key
Sect
ors:
Edu
catio
n, H
ealth
, Wat
er, E
nerg
y, W
orks
& T
rans
port
, Agr
icul
ture
Sect
or /
Them
e #
Indi
cato
r
Base
line
2017
/18
Targ
et
2018
/19
Targ
et
2019
/20
Targ
et
2020
/21
Targ
et
2021
/22
Targ
et
2022
/23
Assu
mpt
ions
Econ
omic
tran
sfor
mat
ion
1 Ec
onom
ic g
row
th:
Real
ann
ual
GD
P gr
owth
G
APR
/ M
oFPE
D A
nnua
l Bu
dget
Pe
rfor
man
ce
Repo
rt
5.8%
Targ
et s
et in
ND
PII
- th
eref
ore
assu
mes
ob
ject
ives
/key
pr
ojec
ts in
ND
PII a
re d
eliv
ered
; no
si
gnifi
cant
ad
vers
e ec
onom
ic s
hock
s 2
Publ
ic
inve
stm
ent
effic
ienc
y:
Publ
ic
Inve
stm
ent
Man
agem
ent I
ndex
ASS
IP
/ IM
F PI
M
asse
ssm
ent
1.4
4 (2
011)
2.
05
2.26
3 In
fras
truc
ture
del
iver
y (N
DPI
I):
Gro
ss
capi
tal
form
atio
n as
a
perc
enta
ge o
f GD
P
Gov
ernm
ent
Annu
al
Perf
orm
ance
Rep
ort
23%
(F
Y16/
17)
28
%
4 Pr
ogre
ss
to
mid
dle
inco
me
stat
us: G
DP
per c
apita
(USD
) G
over
nmen
t An
nual
Pe
rfor
man
ce R
epor
t 7
77
(FY1
6/17
)
1,03
3
Sect
or-le
vel
serv
ice
deliv
ery
perf
orm
ance
5
Sele
cted
KP
Is
per
sect
or:
Educ
atio
n,
Hea
lth,
Wat
er,
Ener
gy, T
rans
port
, Agr
icul
ture
Gov
ernm
ent
Annu
al
Perf
orm
ance
Rep
ort
Var
ious
(T
BD)
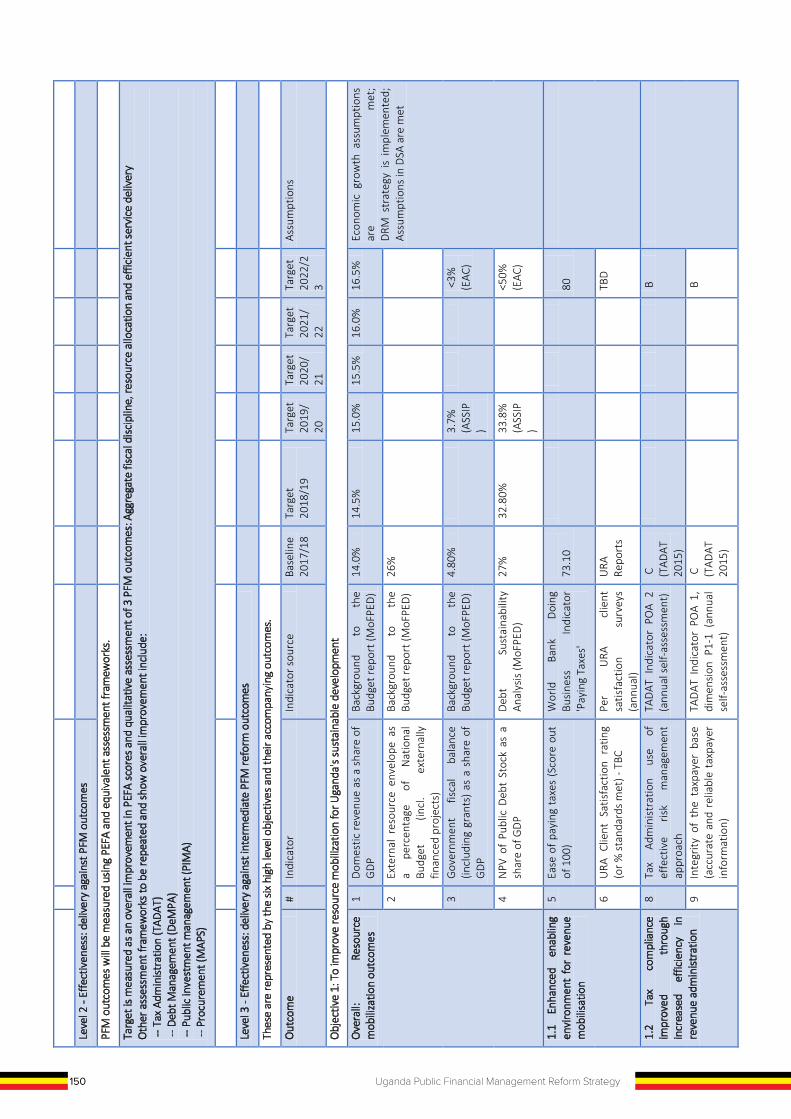
150 Uganda Public Financial Management Reform Strategy
Leve
l 2 -
Effe
ctiv
enes
s: d
eliv
ery
agai
nst P
FM o
utco
mes
PFM
out
com
es w
ill b
e m
easu
red
usin
g PE
FA a
nd e
quiv
alen
t ass
essm
ent f
ram
ewor
ks.
Targ
et is
mea
sure
d as
an
over
all i
mpr
ovem
ent i
n PE
FA s
core
s and
qua
litat
ive
asse
ssm
ent o
f 3 P
FM o
utco
mes
: Agg
rega
te fi
scal
dis
cipl
ine,
reso
urce
allo
catio
n an
d ef
ficie
nt se
rvic
e de
liver
y O
ther
ass
essm
ent f
ram
ewor
ks to
be
repe
ated
and
sho
w o
vera
ll im
prov
emen
t inc
lude
: --
Tax
Adm
inist
ratio
n (T
ADAT
) --
Deb
t Man
agem
ent (
DeM
PA)
-- P
ublic
inve
stm
ent m
anag
emen
t (PI
MA)
--
Pro
cure
men
t (M
APS)
Leve
l 3 -
Effe
ctiv
enes
s: d
eliv
ery
agai
nst i
nter
med
iate
PFM
refo
rm o
utco
mes
Thes
e ar
e re
pres
ente
d by
the
six h
igh
leve
l obj
ectiv
es a
nd th
eir a
ccom
pany
ing
outc
omes
.
Out
com
e #
Indi
cato
r In
dica
tor s
ourc
e Ba
selin
e 20
17/1
8 Ta
rget
20
18/1
9 Ta
rget
20
19/
20
Targ
et
2020
/21
Targ
et
2021
/22
Targ
et
2022
/23
Assu
mpt
ions
Obj
ectiv
e 1:
To
impr
ove
reso
urce
mob
iliza
tion
for U
gand
a's s
usta
inab
le d
evel
opm
ent
Ove
rall:
Re
sour
ce
mob
iliza
tion
outc
omes
1
Dom
estic
reve
nue
as a
sha
re o
f G
DP
Back
grou
nd
to
the
Budg
et re
port
(MoF
PED
) 14
.0%
14
.5%
15
.0%
15
.5%
16
.0%
16
.5%
Ec
onom
ic g
row
th a
ssum
ptio
ns
are
met
; D
RM s
trat
egy
is i
mpl
emen
ted;
As
sum
ptio
ns in
DSA
are
met
2
Exte
rnal
res
ourc
e en
velo
pe a
s a
perc
enta
ge
of
Nat
iona
l Bu
dget
(in
cl.
exte
rnal
ly
finan
ced
proj
ects
)
Back
grou
nd
to
the
Budg
et re
port
(MoF
PED
) 26
%
3 G
over
nmen
t fis
cal
bala
nce
(incl
udin
g gr
ants
) as
a s
hare
of
GD
P
Back
grou
nd
to
the
Budg
et re
port
(MoF
PED
) 4.
80%
3.7%
(A
SSIP
)
<3%
(E
AC)
4 N
PV o
f Pu
blic
Deb
t St
ock
as a
sh
are
of G
DP
Deb
t Su
stai
nabi
lity
Anal
ysis
(MoF
PED
) 27
%
32.8
0%
33.8
%
(ASS
IP)
<50%
(E
AC)
1.1
Enha
nced
en
ablin
g en
viro
nmen
t fo
r re
venu
e m
obili
satio
n
5 Ea
se o
f pay
ing
taxe
s (S
core
out
of
100
) W
orld
Ba
nk
Doi
ng
Busi
ness
In
dica
tor
'Pay
ing
Taxe
s'
73
.10
80
6 U
RA C
lient
Sat
isfa
ctio
n ra
ting
(or %
sta
ndar
ds m
et) -
TBC
Pe
r U
RA
clie
nt
satis
fact
ion
surv
eys
(ann
ual)
URA
Re
port
s
TB
D
1.2
Tax
com
plia
nce
impr
oved
th
roug
h in
crea
sed
effic
ienc
y in
re
venu
e ad
min
istra
tion
8 Ta
x Ad
min
istr
atio
n us
e of
ef
fect
ive
risk
man
agem
ent
appr
oach
TAD
AT I
ndic
ator
PO
A 2
(ann
ual s
elf-a
sses
smen
t)
C
(TAD
AT
2015
)
B
9 In
tegr
ity o
f th
e ta
xpay
er b
ase
(acc
urat
e an
d re
liabl
e ta
xpay
er
info
rmat
ion)
TAD
AT I
ndic
ator
PO
A 1,
di
men
sion
P1-
1 (a
nnua
l se
lf-as
sess
men
t)
C
(TAD
AT
2015
)
B
1 1 Pe
rcen
tage
ex
pans
ion
of
taxp
ayer
regi
ster
U
RA
(KPI
s re
port
ed
in
annu
al
reve
nue
perf
orm
ance
repo
rt)
18%
25
%
1 2 Vo
lunt
ary
com
plia
nce:
% V
AT
on-t
ime
filin
g by
ta
xpay
er
offic
e (L
TO, M
TO, S
TO)
URA
(K
PIs
repo
rted
in
an
nual
re
venu
e pe
rfor
man
ce re
port
)
97%
(L
TO);
89%
(M
TO);
64%
(S
TO)
(FY2
016/
17)
100
%;
95%
; 80
%
1 3 Ta
x au
dit
annu
al '
yiel
d' (
valu
e of
am
ount
s re
cove
red
from
as
sess
men
t iss
ued)
URA
(K
PIs
repo
rted
in
an
nual
re
venu
e pe
rfor
man
ce re
port
)
UG
X 68
.91
bn
(FY2
016/
17)
[TBC
in
D
RM
Stra
teg
y]
1 4 Va
lue
reco
vere
d fr
om c
usto
ms
enfo
rcem
ent i
nter
vent
ions
U
RA
(KPI
s re
port
ed
in
annu
al
reve
nue
perf
orm
ance
repo
rt)
UG
X 51
.56
bn
(FY2
016/
17)
[TBC
in
D
RM
Stra
teg
y]
1 5 St
ock
of ta
x ar
rear
s U
RA
(KPI
s re
port
ed
in
annu
al
reve
nue
perf
orm
ance
repo
rt)
UG
X 2,
082.
90
bn
(FY2
016/
17)
[TBC
in
D
RM
Stra
teg
y]
1.3
Enha
nced
col
lect
ions
fr
om
ne
w
reve
nue
oppo
rtun
ities
in
clud
ing
oil,
gas
and
min
eral
se
ctor
s
1 6 N
et
estim
ated
re
venu
e fr
om
appr
oved
mea
sure
s in
Nat
iona
l Bu
dget
, as
% G
DP
URA
An
nual
Re
venu
e Pe
rfor
man
ce R
epor
t 0
.19%
(B
udge
t 20
16/1
7)
[TBC
in
D
RM
Stra
teg
y]
1 7 Pr
ogre
ss
tow
ards
EI
TI
mem
bers
hip
As
repo
rted
by
Ac
coun
tabi
lity
Sect
or
Com
mit
men
t (2
013)
App
lica-
tion
Com
pl-
ianc
e
1.4
Sust
aina
ble
debt
and
De
velo
pmen
t fin
anci
ng
1 8 Ra
tio o
f to
tal
nom
inal
int
eres
t pa
ymen
ts t
o to
tal g
over
nmen
t re
venu
e
Deb
t Su
stai
nabi
lity
Anal
ysis
(MoF
PED
) 16
%
12%
1 9 Pr
opot
ion
of
Dom
estic
D
ebt
mat
urin
g in
on
e ye
ar
as
a pe
rcen
tage
of
tota
l do
mes
tic
Deb
t
Mid
term
D
ebt
Stra
tegy
(M
TDS)
0.
362
0.38
18

150 Uganda Public Financial Management Reform Strategy
Leve
l 2 -
Effe
ctiv
enes
s: d
eliv
ery
agai
nst P
FM o
utco
mes
PFM
out
com
es w
ill b
e m
easu
red
usin
g PE
FA a
nd e
quiv
alen
t ass
essm
ent f
ram
ewor
ks.
Targ
et is
mea
sure
d as
an
over
all i
mpr
ovem
ent i
n PE
FA s
core
s and
qua
litat
ive
asse
ssm
ent o
f 3 P
FM o
utco
mes
: Agg
rega
te fi
scal
dis
cipl
ine,
reso
urce
allo
catio
n an
d ef
ficie
nt se
rvic
e de
liver
y O
ther
ass
essm
ent f
ram
ewor
ks to
be
repe
ated
and
sho
w o
vera
ll im
prov
emen
t inc
lude
: --
Tax
Adm
inist
ratio
n (T
ADAT
) - -
Deb
t Man
agem
ent (
DeM
PA)
-- P
ublic
inve
stm
ent m
anag
emen
t (PI
MA)
- -
Pro
cure
men
t (M
APS)
Leve
l 3 -
Effe
ctiv
enes
s: d
eliv
ery
agai
nst i
nter
med
iate
PFM
refo
rm o
utco
mes
Thes
e ar
e re
pres
ente
d by
the
six h
igh
leve
l obj
ectiv
es a
nd th
eir a
ccom
pany
ing
outc
omes
.
Out
com
e #
Indi
cato
r In
dica
tor s
ourc
e Ba
selin
e 20
17/1
8 Ta
rget
20
18/1
9 Ta
rget
20
19/
20
Targ
et
2020
/21
Targ
et
2021
/22
Targ
et
2022
/23
Assu
mpt
ions
Obj
ectiv
e 1:
To
impr
ove
reso
urce
mob
iliza
tion
for U
gand
a's s
usta
inab
le d
evel
opm
ent
Ove
rall:
Re
sour
ce
mob
iliza
tion
outc
omes
1
Dom
estic
reve
nue
as a
sha
re o
f G
DP
Back
grou
nd
to
the
Budg
et re
port
(MoF
PED
) 14
.0%
14
.5%
15
.0%
15
.5%
16
.0%
16
.5%
Ec
onom
ic g
row
th a
ssum
ptio
ns
are
met
; D
RM s
trat
egy
is i
mpl
emen
ted;
As
sum
ptio
ns in
DSA
are
met
2
Exte
rnal
res
ourc
e en
velo
pe a
s a
perc
enta
ge
of
Nat
iona
l Bu
dget
(in
cl.
exte
rnal
ly
finan
ced
proj
ects
)
Back
grou
nd
to
the
Budg
et re
port
(MoF
PED
) 26
%
3 G
over
nmen
t fis
cal
bala
nce
(incl
udin
g gr
ants
) as
a s
hare
of
GD
P
Back
grou
nd
to
the
Budg
et re
port
(MoF
PED
) 4.
80%
3.7%
(A
SSIP
)
<3%
(E
AC)
4 N
PV o
f Pu
blic
Deb
t St
ock
as a
sh
are
of G
DP
Deb
t Su
stai
nabi
lity
Anal
ysis
(MoF
PED
) 27
%
32.8
0%
33.8
%
(ASS
IP)
<50%
(E
AC)
1.1
Enha
nced
en
ablin
g en
viro
nmen
t fo
r re
venu
e m
obili
satio
n
5 Ea
se o
f pay
ing
taxe
s (S
core
out
of
100
) W
orld
Ba
nk
Doi
ng
Busi
ness
In
dica
tor
'Pay
ing
Taxe
s'
73
.10
80
6 U
RA C
lient
Sat
isfa
ctio
n ra
ting
(or %
sta
ndar
ds m
et) -
TBC
Pe
r U
RA
clie
nt
satis
fact
ion
surv
eys
(ann
ual)
URA
Re
port
s
TB
D
1.2
Tax
com
plia
nce
impr
oved
th
roug
h i n
crea
sed
effic
ienc
y in
r e
venu
e ad
min
istra
tion
8 Ta
x Ad
min
istr
atio
n us
e of
ef
fect
ive
risk
man
agem
ent
appr
oach
TAD
AT I
ndic
ator
PO
A 2
(ann
ual s
elf-a
sses
smen
t)
C
(TAD
AT
2015
)
B
9 In
tegr
ity o
f th
e ta
xpay
er b
ase
(acc
urat
e an
d re
liabl
e ta
xpay
er
info
rmat
ion)
TAD
AT I
ndic
ator
PO
A 1,
di
men
sion
P1-
1 (a
nnua
l se
lf-as
sess
men
t)
C
(TAD
AT
2015
)
B
1 1 Pe
rcen
tage
ex
pans
ion
of
taxp
ayer
regi
ster
U
RA
(KPI
s re
port
ed
in
annu
al
reve
nue
perf
orm
ance
repo
rt)
18%
25
%
1 2 Vo
lunt
ary
com
plia
nce:
% V
AT
on-t
ime
filin
g by
ta
xpay
er
offic
e (L
TO, M
TO, S
TO)
URA
(K
PIs
repo
rted
in
an
nual
re
venu
e pe
rfor
man
ce re
port
)
97%
(L
TO);
89%
(M
TO);
64%
(S
TO)
(FY2
016/
17)
100
%;
95%
; 80
%
1 3 Ta
x au
dit
annu
al '
yiel
d' (
valu
e of
am
ount
s re
cove
red
from
as
sess
men
t iss
ued)
URA
(K
PIs
repo
rted
in
an
nual
re
venu
e pe
rfor
man
ce re
port
)
UG
X 68
.91
bn
(FY2
016/
17)
[TBC
in
D
RM
Stra
teg
y]
1 4 Va
lue
reco
vere
d fr
om c
usto
ms
enfo
rcem
ent i
nter
vent
ions
U
RA
(KPI
s re
port
ed
in
annu
al
reve
nue
perf
orm
ance
repo
rt)
UG
X 51
.56
bn
(FY2
016/
17)
[TBC
in
D
RM
Stra
teg
y]
1 5 St
ock
of ta
x ar
rear
s U
RA
(KPI
s re
port
ed
in
annu
al
reve
nue
perf
orm
ance
repo
rt)
UG
X 2,
082.
90
bn
(FY2
016/
17)
[TBC
in
D
RM
Stra
teg
y]
1.3
Enha
nced
col
lect
ions
fr
om
ne
w
reve
nue
oppo
rtun
ities
in
clud
ing
oil,
gas
and
min
eral
se
ctor
s
1 6 N
et
estim
ated
re
venu
e fr
om
appr
oved
mea
sure
s in
Nat
iona
l Bu
dget
, as
% G
DP
URA
An
nual
Re
venu
e Pe
rfor
man
ce R
epor
t 0
.19%
(B
udge
t 20
16/1
7)
[TBC
in
D
RM
Stra
teg
y]
1 7 Pr
ogre
ss
tow
ards
EI
TI
mem
bers
hip
As
repo
rted
by
Ac
coun
tabi
lity
Sect
or
Com
mit
men
t (2
013)
App
lica-
tion
Com
pl-
ianc
e
1.4
Sust
aina
ble
debt
and
De
velo
pmen
t fin
anci
ng
1 8 Ra
tio o
f to
tal
nom
inal
int
eres
t pa
ymen
ts t
o to
tal g
over
nmen
t re
venu
e
Deb
t Su
stai
nabi
lity
Anal
ysis
(MoF
PED
) 16
%
12%
1 9 Pr
opot
ion
of
Dom
estic
D
ebt
mat
urin
g in
on
e ye
ar
as
a pe
rcen
tage
of
tota
l do
mes
tic
Deb
t
Mid
term
D
ebt
Stra
tegy
(M
TDS)
0.
362
0.38
18
151Uganda Public Financial Management Reform Strategy
Leve
l 2 -
Effe
ctiv
enes
s: d
eliv
ery
agai
nst P
FM o
utco
mes
PFM
out
com
es w
ill b
e m
easu
red
usin
g PE
FA a
nd e
quiv
alen
t ass
essm
ent f
ram
ewor
ks.
Targ
et is
mea
sure
d as
an
over
all i
mpr
ovem
ent i
n PE
FA s
core
s and
qua
litat
ive
asse
ssm
ent o
f 3 P
FM o
utco
mes
: Agg
rega
te fi
scal
dis
cipl
ine,
reso
urce
allo
catio
n an
d ef
ficie
nt se
rvic
e de
liver
y O
ther
ass
essm
ent f
ram
ewor
ks to
be
repe
ated
and
sho
w o
vera
ll im
prov
emen
t inc
lude
: --
Tax
Adm
inist
ratio
n (T
ADAT
) --
Deb
t Man
agem
ent (
DeM
PA)
-- P
ublic
inve
stm
ent m
anag
emen
t (PI
MA)
--
Pro
cure
men
t (M
APS)
Leve
l 3 -
Effe
ctiv
enes
s: d
eliv
ery
agai
nst i
nter
med
iate
PFM
refo
rm o
utco
mes
Thes
e ar
e re
pres
ente
d by
the
six h
igh
leve
l obj
ectiv
es a
nd th
eir a
ccom
pany
ing
outc
omes
.
Out
com
e #
Indi
cato
r In
dica
tor s
ourc
e Ba
selin
e 20
17/1
8 Ta
rget
20
18/1
9 Ta
rget
20
19/
20
Targ
et
2020
/21
Targ
et
2021
/22
Targ
et
2022
/23
Assu
mpt
ions
Obj
ectiv
e 1:
To
impr
ove
reso
urce
mob
iliza
tion
for U
gand
a's s
usta
inab
le d
evel
opm
ent
Ove
rall:
Re
sour
ce
mob
iliza
tion
outc
omes
1
Dom
estic
reve
nue
as a
sha
re o
f G
DP
Back
grou
nd
to
the
Budg
et re
port
(MoF
PED
) 14
.0%
14
.5%
15
.0%
15
.5%
16
.0%
16
.5%
Ec
onom
ic g
row
th a
ssum
ptio
ns
are
met
; D
RM s
trat
egy
is i
mpl
emen
ted;
As
sum
ptio
ns in
DSA
are
met
2
Exte
rnal
res
ourc
e en
velo
pe a
s a
perc
enta
ge
of
Nat
iona
l Bu
dget
(in
cl.
exte
rnal
ly
finan
ced
proj
ects
)
Back
grou
nd
to
the
Budg
et re
port
(MoF
PED
) 26
%
3 G
over
nmen
t fis
cal
bala
nce
(incl
udin
g gr
ants
) as
a s
hare
of
GD
P
Back
grou
nd
to
the
Budg
et re
port
(MoF
PED
) 4.
80%
3.7%
(A
SSIP
)
<3%
(E
AC)
4 N
PV o
f Pu
blic
Deb
t St
ock
as a
sh
are
of G
DP
Deb
t Su
stai
nabi
lity
Anal
ysis
(MoF
PED
) 27
%
32.8
0%
33.8
%
(ASS
IP)
<50%
(E
AC)
1.1
Enha
nced
en
ablin
g en
viro
nmen
t fo
r re
venu
e m
obili
satio
n
5 Ea
se o
f pay
ing
taxe
s (S
core
out
of
100
) W
orld
Ba
nk
Doi
ng
Busi
ness
In
dica
tor
'Pay
ing
Taxe
s'
73
.10
80
6 U
RA C
lient
Sat
isfa
ctio
n ra
ting
(or %
sta
ndar
ds m
et) -
TBC
Pe
r U
RA
clie
nt
satis
fact
ion
surv
eys
(ann
ual)
URA
Re
port
s
TB
D
1.2
Tax
com
plia
nce
impr
oved
th
roug
h in
crea
sed
effic
ienc
y in
re
venu
e ad
min
istra
tion
8 Ta
x Ad
min
istr
atio
n us
e of
ef
fect
ive
risk
man
agem
ent
appr
oach
TAD
AT I
ndic
ator
PO
A 2
(ann
ual s
elf-a
sses
smen
t)
C
(TAD
AT
2015
)
B
9 In
tegr
ity o
f th
e ta
xpay
er b
ase
(acc
urat
e an
d re
liabl
e ta
xpay
er
info
rmat
ion)
TAD
AT I
ndic
ator
PO
A 1,
di
men
sion
P1-
1 (a
nnua
l se
lf-as
sess
men
t)
C
(TAD
AT
2015
)
B
1 1 Pe
rcen
tage
ex
pans
ion
of
taxp
ayer
regi
ster
U
RA
(KPI
s re
port
ed
in
annu
al
reve
nue
perf
orm
ance
repo
rt)
18%
25
%
1 2 Vo
lunt
ary
com
plia
nce:
% V
AT
on-t
ime
filin
g by
ta
xpay
er
offic
e (L
TO, M
TO, S
TO)
URA
(K
PIs
repo
rted
in
an
nual
re
venu
e pe
rfor
man
ce re
port
)
97%
(L
TO);
89%
(M
TO);
64%
(S
TO)
(FY2
016/
17)
100
%;
95%
; 80
%
1 3 Ta
x au
dit
annu
al '
yiel
d' (
valu
e of
am
ount
s re
cove
red
from
as
sess
men
t iss
ued)
URA
(K
PIs
repo
rted
in
an
nual
re
venu
e pe
rfor
man
ce re
port
)
UG
X 68
.91
bn
(FY2
016/
17)
[TBC
in
D
RM
Stra
teg
y]
1 4 Va
lue
reco
vere
d fr
om c
usto
ms
enfo
rcem
ent i
nter
vent
ions
U
RA
(KPI
s re
port
ed
in
annu
al
reve
nue
perf
orm
ance
repo
rt)
UG
X 51
.56
bn
(FY2
016/
17)
[TBC
in
D
RM
Stra
teg
y]
1 5 St
ock
of ta
x ar
rear
s U
RA
(KPI
s re
port
ed
in
annu
al
reve
nue
perf
orm
ance
repo
rt)
UG
X 2,
082.
90
bn
(FY2
016/
17)
[TBC
in
D
RM
Stra
teg
y]
1.3
Enha
nced
col
lect
ions
fr
om
ne
w
reve
nue
o ppo
rtun
ities
in
clud
ing
oil,
gas
and
min
eral
s e
ctor
s
1 6 N
et
estim
ated
re
venu
e fr
om
appr
oved
mea
sure
s in
Nat
iona
l Bu
dget
, as
% G
DP
URA
An
nual
Re
venu
e Pe
rfor
man
ce R
epor
t 0
.19%
(B
udge
t 20
16/1
7)
[TBC
in
D
RM
Stra
teg
y]
1 7 Pr
ogre
ss
tow
ards
EI
TI
mem
bers
hip
As
repo
rted
by
Ac
coun
tabi
lity
Sect
or
Com
mit
men
t (2
013)
App
lica-
tion
Com
pl-
ianc
e
1.4
Sust
aina
ble
debt
and
De
velo
pmen
t fin
anci
ng
1 8 Ra
tio o
f to
tal
nom
inal
int
eres
t pa
ymen
ts t
o to
tal g
over
nmen
t re
venu
e
Deb
t Su
stai
nabi
lity
Anal
ysis
(MoF
PED
) 16
%
12%
1 9 Pr
opot
ion
of
Dom
estic
D
ebt
mat
urin
g in
on
e ye
ar
as
a pe
rcen
tage
of
tota
l do
mes
tic
Deb
t
Mid
term
D
ebt
Stra
tegy
(M
TDS)
0.
362
0.38
18
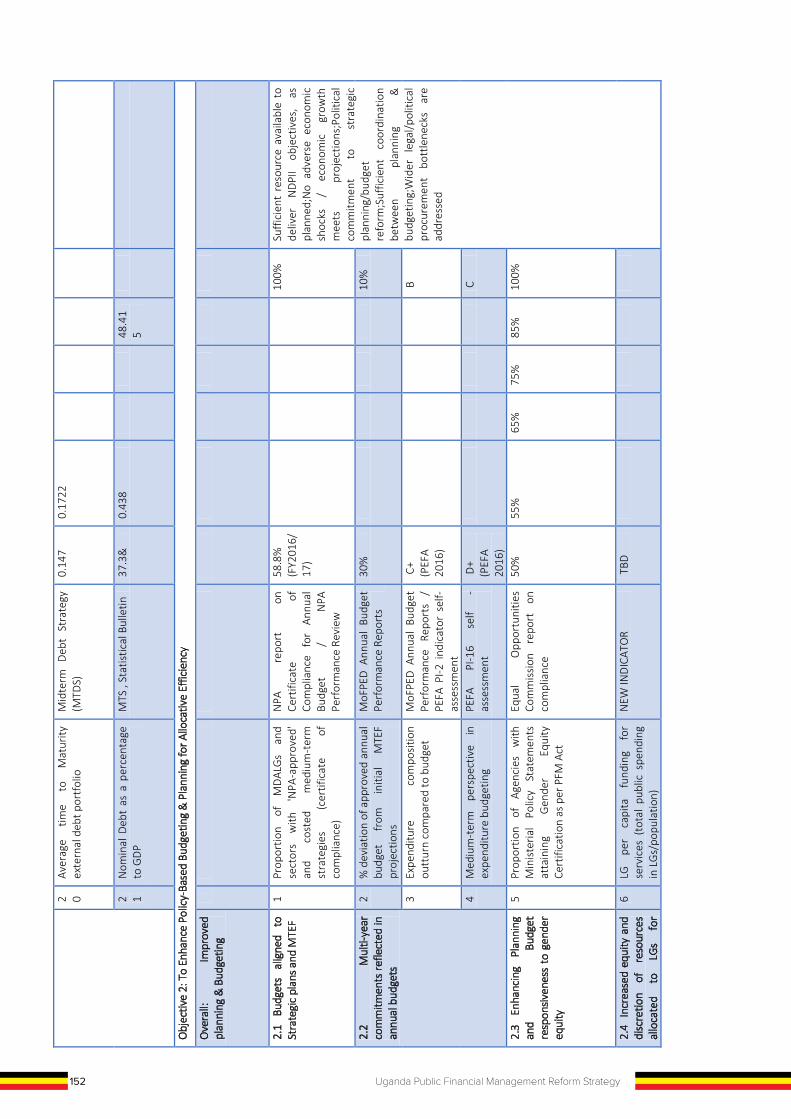
152 Uganda Public Financial Management Reform Strategy
2 0 Av
erag
e tim
e to
M
atur
ity
exte
rnal
deb
t por
tfol
io
Mid
term
D
ebt
Stra
tegy
(M
TDS)
0.
147
0.17
22
2 1 N
omin
al D
ebt
as a
per
cent
age
to G
DP
M
TS ,
Stat
istic
al B
ulle
tin
37.3
&
0.43
8
48
.41
5
Obj
ectiv
e 2:
To
Enha
nce
Polic
y-Ba
sed
Budg
etin
g &
Pla
nnin
g fo
r Allo
cativ
e Ef
ficie
ncy
Ove
rall:
Im
prov
ed
plan
ning
& B
udge
ting
2.1
Budg
ets
alig
ned
to
Stra
tegi
c pl
ans a
nd M
TEF
1 Pr
opor
tion
of
MD
ALG
s an
d se
ctor
s w
ith
'NPA
-app
rove
d'
and
cost
ed
med
ium
-ter
m
stra
tegi
es
(cer
tific
ate
of
com
plia
nce)
NPA
re
port
on
Ce
rtifi
cate
of
Co
mpl
ianc
e fo
r An
nual
Bu
dget
/
NPA
Pe
rfor
man
ce R
evie
w
58.8
%
(FY2
016/
17)
100%
Su
ffici
ent
reso
urce
ava
ilabl
e to
de
liver
N
DPI
I ob
ject
ives
, as
pl
anne
d;N
o ad
vers
e ec
onom
ic
shoc
ks
/ ec
onom
ic
grow
th
mee
ts
proj
ectio
ns;P
oliti
cal
com
mitm
ent
to
stra
tegi
c pl
anni
ng/b
udge
t re
form
;Suf
ficie
nt
coor
dina
tion
betw
een
plan
ning
&
bu
dget
ing;
Wid
er
lega
l/pol
itica
l pr
ocur
emen
t bo
ttle
neck
s ar
e ad
dres
sed
2.2
Mul
ti-ye
ar
com
mitm
ents
refle
cted
in
annu
al b
udge
ts
2 %
dev
iatio
n of
app
rove
d an
nual
bu
dget
fr
om
initi
al
MTE
F pr
ojec
tions
MoF
PED
Ann
ual
Budg
et
Perf
orm
ance
Rep
orts
30
%
10%
3 Ex
pend
iture
co
mpo
sitio
n ou
ttur
n co
mpa
red
to b
udge
t M
oFPE
D A
nnua
l Bu
dget
Pe
rfor
man
ce
Repo
rts
/ PE
FA P
I-2 i
ndic
ator
sel
f-as
sess
men
t
C+
(PEF
A 20
16)
B
4 M
ediu
m-t
erm
pe
rspe
ctiv
e in
ex
pend
iture
bud
getin
g PE
FA
PI-1
6 se
lf -
asse
ssm
ent
D+
(PEF
A 20
16)
C
2.3
Enha
ncin
g Pl
anni
ng
and
Budg
et
resp
onsiv
enes
s to
gen
der
e qui
ty
5 Pr
opor
tion
of
Agen
cies
w
ith
Min
iste
rial
Polic
y St
atem
ents
at
tain
ing
Gen
der
Equi
ty
Cert
ifica
tion
as p
er P
FM A
ct
Equa
l O
ppor
tuni
ties
Com
mis
sion
re
port
on
co
mpl
ianc
e
50%
55
%
65%
75
%
85%
10
0%
2.4
Incr
ease
d eq
uity
and
di
scre
tion
of
reso
urce
s al
loca
ted
to
LGs
for
6 LG
pe
r ca
pita
fu
ndin
g fo
r se
rvic
es (
tota
l pu
blic
spe
ndin
g in
LG
s/po
pula
tion)
NEW
IND
ICAT
OR
T
BD
impr
oved
serv
ice
deliv
ery
7 Sh
are
of
budg
et
rele
ased
to
LG
s as
a p
erce
ntag
e of
tot
al
natio
nal b
udge
t re
leas
ed. (
excl
. Li
ne m
inis
try
subv
entio
ns)
Incl
udes
su
bven
tions
th
roug
h lin
e m
inis
trie
s]
0
8 D
iscr
etio
nary
fin
anci
ng
as
a sh
are
of L
G b
udge
t An
nual
bu
dget
pe
rfor
man
ce re
port
13
%
18%
2.5
Evid
ence
-bas
ed p
olic
y m
akin
g st
reng
then
ed
9 Ce
rtifi
catio
n of
com
plia
nce
with
fisc
al im
pact
requ
irem
ent
NEW
IND
ICAT
OR
T
BD
1 0 %
pl
anne
d PE
TS
and
Impa
ct
Eval
uatio
ns u
nder
take
n*
NEW
IND
ICAT
OR
T
BD
Obj
ectiv
e 3:
To
stre
ngth
en p
ublic
inve
stm
ent m
anag
emen
t (PI
M) f
or in
crea
sed
deve
lopm
ent r
etur
ns o
n pu
blic
spe
ndin
g
Ove
rall:
PIM
effe
ctiv
enes
s 1
Budg
et
exec
utio
n of
pu
blic
in
vest
men
ts
(%
deve
lopm
ent/
capi
tal
spen
ding
ou
ttur
n as
% b
udge
t)
MoF
PED
Bac
kgro
und
to
the
Budg
et
76%
10
0%
Suffi
cien
t re
sour
ce a
vaila
ble
to
deliv
er
larg
e pr
ojec
ts;
Proc
urem
ent
bott
lene
cks
addr
esse
d;
Polit
ical
com
mitm
ent
to P
IM;
Capa
city
/ski
lls
suffi
cien
t to
ab
sorb
TA
on
Pr
ojec
t Cy
cle
man
agem
ent a
nd a
ppra
isal
2 Pu
blic
in
vest
men
t ef
ficie
ncy
gap
(PIM
inde
x)
IMF
PIM
In
dex
repo
rt
(201
1) -
to
be u
pdat
ed
for U
gand
a
50%
25
%
3.1
Ef
ficie
nt
iden
tific
atio
n,
sele
ctio
n an
d m
anag
emen
t of
Pu
blic
In
vest
men
t Pr
ojec
ts (P
IPs)
and
Pub
lic-
Priv
ate
Part
ners
hips
(P
PPs)
3 Pr
opor
tion
of
maj
or
proj
ects
su
bjec
ted
to
inde
pend
ent
appr
aisa
l
NEW
IN
DIC
ATO
R
PAP/
DC
TBD
4 Va
lue
of c
ost
over
-run
s re
lativ
e to
cos
t es
timat
es a
t tim
e of
pr
ojec
t app
raisa
l
NEW
IN
DIC
ATO
R
PAP/
DC
TBD
5 Ra
te o
f on
-tim
e co
mpl
etio
n of
PI
Ps
NEW
IN
DIC
ATO
R
PAP/
DC
50%
75
%
6 Pu
blic
In
vest
men
t M
anag
emen
t per
form
ance
PE
FA
indi
cato
r PI
-11
(ann
ual S
elf-a
sses
smen
t)
D (
PEFA
20
16)
C
3.2
Enha
nced
VF
M
in
publ
ic
proc
urem
ent
for
larg
e,
com
plex
pu
blic
pr
ocur
emen
ts
7 Pr
opor
tion
(by
valu
e)
of
cont
ract
s su
bjec
t to
op
en
com
petit
ion
abov
e th
e de
fined
th
resh
old
PPDA
an
nual
re
port
(P
PMS
data
); Ac
coun
tabi
lity
Sect
or
Perf
orm
ance
repo
rt
71.
8%
(FY1
6/17
)
80%
(ASS
IP)
80%
80
%
80%
80
%
8 Pe
rcen
tage
of
co
ntra
cts
(by
valu
e)
com
plet
ed
with
in
orig
inal
con
trac
t tim
e
PPDA
an
nual
re
port
(P
PMS
data
) 6
6%
(FY1
6/17
)
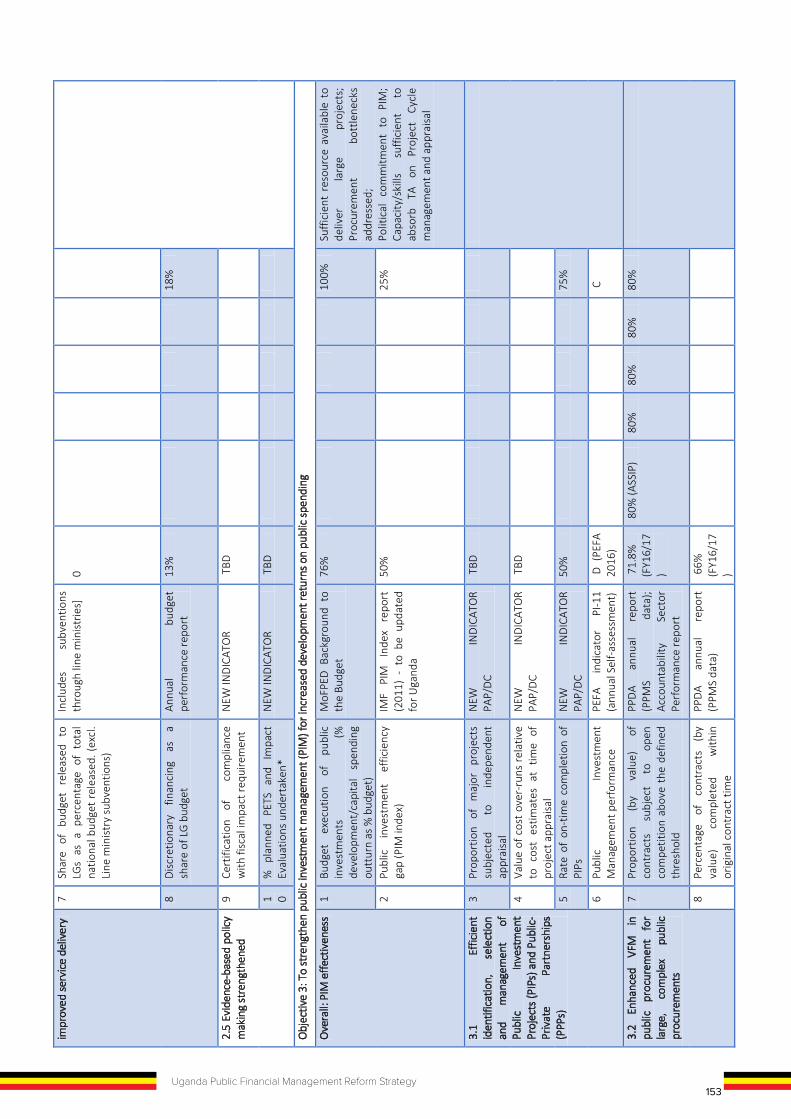
153Uganda Public Financial Management Reform Strategy
2 0 Av
erag
e tim
e to
M
atur
ity
exte
rnal
deb
t por
tfol
io
Mid
term
D
ebt
Stra
tegy
(M
TDS)
0.
147
0.17
22
2 1 N
omin
al D
ebt
as a
per
cent
age
to G
DP
M
TS ,
Stat
istic
al B
ulle
tin
37.3
&
0.43
8
48
.41
5
Obj
ectiv
e 2:
To
Enha
nce
Polic
y-Ba
sed
Budg
etin
g &
Pla
nnin
g fo
r Allo
cativ
e Ef
ficie
ncy
Ove
rall:
Im
prov
ed
plan
ning
& B
udge
ting
2.1
Budg
ets
alig
ned
to
Stra
tegi
c pl
ans a
nd M
TEF
1 Pr
opor
tion
of
MD
ALG
s an
d se
ctor
s w
ith
'NPA
-app
rove
d'
and
cost
ed
med
ium
-ter
m
stra
tegi
es
(cer
tific
ate
of
com
plia
nce)
NPA
re
port
on
Ce
rtifi
cate
of
Co
mpl
ianc
e fo
r An
nual
Bu
dget
/
NPA
Pe
rfor
man
ce R
evie
w
58.8
%
(FY2
016/
17)
100%
Su
ffici
ent
reso
urce
ava
ilabl
e to
de
liver
N
DPI
I ob
ject
ives
, as
pl
anne
d;N
o ad
vers
e ec
onom
ic
shoc
ks
/ ec
onom
ic
grow
th
mee
ts
proj
ectio
ns;P
oliti
cal
com
mitm
ent
to
stra
tegi
c pl
anni
ng/b
udge
t re
form
;Suf
ficie
nt
coor
dina
tion
betw
een
plan
ning
&
bu
dget
ing;
Wid
er
lega
l/pol
itica
l pr
ocur
emen
t bo
ttle
neck
s ar
e ad
dres
sed
2.2
Mul
ti-ye
ar
com
mitm
ents
refle
cted
in
annu
al b
udge
ts
2 %
dev
iatio
n of
app
rove
d an
nual
bu
dget
fr
om
initi
al
MTE
F pr
ojec
tions
MoF
PED
Ann
ual
Budg
et
Perf
orm
ance
Rep
orts
30
%
10%
3 Ex
pend
iture
co
mpo
sitio
n ou
ttur
n co
mpa
red
to b
udge
t M
oFPE
D A
nnua
l Bu
dget
Pe
rfor
man
ce
Repo
rts
/ PE
FA P
I-2 i
ndic
ator
sel
f-as
sess
men
t
C+
(PEF
A 20
16)
B
4 M
ediu
m-t
erm
pe
rspe
ctiv
e in
ex
pend
iture
bud
getin
g PE
FA
PI-1
6 se
lf -
asse
ssm
ent
D+
(PEF
A 20
16)
C
2.3
Enha
ncin
g Pl
anni
ng
and
Budg
et
resp
onsiv
enes
s to
gen
der
equi
ty
5 Pr
opor
tion
of
Agen
cies
w
ith
Min
iste
rial
Polic
y St
atem
ents
at
tain
ing
Gen
der
Equi
ty
Cert
ifica
tion
as p
er P
FM A
ct
Equa
l O
ppor
tuni
ties
Com
mis
sion
re
port
on
co
mpl
ianc
e
50%
55
%
65%
75
%
85%
10
0%
2.4
Incr
ease
d eq
uity
and
di
scre
tion
of
reso
urce
s al
loca
ted
to
LGs
for
6 LG
pe
r ca
pita
fu
ndin
g fo
r se
rvic
es (
tota
l pu
blic
spe
ndin
g in
LG
s/po
pula
tion)
NEW
IND
ICAT
OR
T
BD
impr
oved
serv
ice
deliv
ery
7 Sh
are
of
budg
et
rele
ased
to
LG
s as
a p
erce
ntag
e of
tot
al
natio
nal b
udge
t re
leas
ed. (
excl
. Li
ne m
inis
try
subv
entio
ns)
Incl
udes
su
bven
tions
th
roug
h lin
e m
inis
trie
s]
0
8 D
iscr
etio
nary
fin
anci
ng
as
a sh
are
of L
G b
udge
t An
nual
bu
dget
pe
rfor
man
ce re
port
13
%
18%
2.5
Evid
ence
-bas
ed p
olic
y m
akin
g st
reng
then
ed
9 Ce
rtifi
catio
n of
com
plia
nce
with
fisc
al im
pact
requ
irem
ent
NEW
IND
ICAT
OR
T
BD
1 0 %
pl
anne
d PE
TS
and
Impa
ct
Eval
uatio
ns u
nder
take
n*
NEW
IND
ICAT
OR
T
BD
Obj
ectiv
e 3:
To
stre
ngth
en p
ublic
inve
stm
ent m
anag
emen
t (PI
M) f
or in
crea
sed
deve
lopm
ent r
etur
ns o
n pu
blic
spe
ndin
g
Ove
rall:
PIM
effe
ctiv
enes
s 1
Budg
et
exec
utio
n of
pu
blic
in
vest
men
ts
(%
deve
lopm
ent/
capi
tal
spen
ding
ou
ttur
n as
% b
udge
t)
MoF
PED
Bac
kgro
und
to
the
Budg
et
76%
10
0%
Suffi
cien
t re
sour
ce a
vaila
ble
to
deliv
er
larg
e pr
ojec
ts;
Proc
urem
ent
bott
lene
cks
addr
esse
d;
Polit
ical
com
mitm
ent
to P
IM;
Capa
city
/ski
lls
suffi
cien
t to
ab
sorb
TA
on
Pr
ojec
t Cy
cle
man
agem
ent a
nd a
ppra
isal
2 Pu
blic
in
vest
men
t ef
ficie
ncy
gap
(PIM
inde
x)
IMF
PIM
In
dex
repo
rt
(201
1) -
to
be u
pdat
ed
for U
gand
a
50%
25
%
3.1
Ef
ficie
nt
iden
tific
atio
n,
sele
ctio
n an
d m
anag
emen
t of
Pu
blic
In
vest
men
t Pr
ojec
ts (P
IPs)
and
Pub
lic-
Priv
ate
Part
ners
hips
(P
PPs)
3 Pr
opor
tion
of
maj
or
proj
ects
su
bjec
ted
to
inde
pend
ent
appr
aisa
l
NEW
IN
DIC
ATO
R
PAP/
DC
TBD
4 Va
lue
of c
ost
over
-run
s re
lativ
e to
cos
t es
timat
es a
t tim
e of
pr
ojec
t app
raisa
l
NEW
IN
DIC
ATO
R
PAP/
DC
TBD
5 Ra
te o
f on
-tim
e co
mpl
etio
n of
PI
Ps
NEW
IN
DIC
ATO
R
PAP/
DC
50%
75
%
6 Pu
blic
In
vest
men
t M
anag
emen
t per
form
ance
PE
FA
indi
cato
r PI
-11
(ann
ual S
elf-a
sses
smen
t)
D (
PEFA
20
16)
C
3.2
Enha
nced
VF
M
in
publ
ic
proc
urem
ent
for
larg
e,
com
plex
pu
blic
pr
ocur
emen
ts
7 Pr
opor
tion
(by
valu
e)
of
cont
ract
s su
bjec
t to
op
en
com
petit
ion
abov
e th
e de
fined
th
resh
old
PPDA
an
nual
re
port
(P
PMS
data
); Ac
coun
tabi
lity
Sect
or
Perf
orm
ance
repo
rt
71.
8%
(FY1
6/17
)
80%
(ASS
IP)
80%
80
%
80%
80
%
8 Pe
rcen
tage
of
co
ntra
cts
(by
valu
e)
com
plet
ed
with
in
orig
inal
con
trac
t tim
e
PPDA
an
nual
re
port
(P
PMS
data
) 6
6%
(FY1
6/17
)
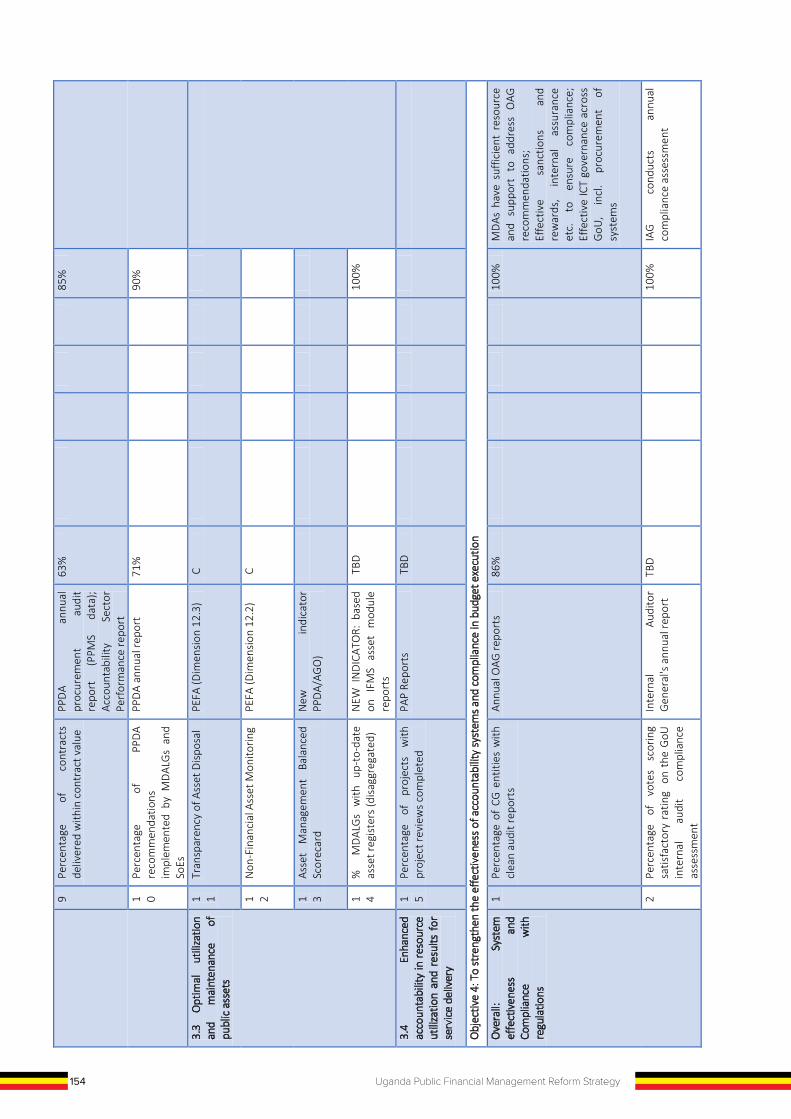
154 Uganda Public Financial Management Reform Strategy
9 Pe
rcen
tage
of
co
ntra
cts
deliv
ered
with
in c
ontr
act v
alue
PP
DA
annu
al
proc
urem
ent
audi
t re
port
(P
PMS
data
); Ac
coun
tabi
lity
Sect
or
Perf
orm
ance
repo
rt
63%
85
%
1 0 Pe
rcen
tage
of
PP
DA
reco
mm
enda
tions
im
plem
ente
d by
MD
ALG
s an
d So
Es
PPDA
ann
ual r
epor
t 71
%
90%
3.3
Opt
imal
ut
iliza
tion
and
mai
nten
ance
of
pu
blic
ass
ets
1 1 Tr
ansp
aren
cy o
f Ass
et D
ispo
sal
PEFA
(Dim
ensi
on 1
2.3)
C
1 2 N
on-F
inan
cial
Ass
et M
onito
ring
PEFA
(Dim
ensi
on 1
2.2)
C
1 3 As
set
Man
agem
ent
Bala
nced
Sc
orec
ard
New
in
dica
tor
PPD
A/AG
O)
1 4 %
MD
ALG
s w
ith
up-t
o-da
te
asse
t reg
iste
rs (d
isag
greg
ated
) N
EW I
ND
ICAT
OR:
bas
ed
on
IFM
S as
set
mod
ule
repo
rts
TBD
10
0%
3.4
Enha
nced
ac
coun
tabi
lity
in r
esou
rce
utili
zatio
n an
d re
sults
for
se
rvic
e de
liver
y
1 5 Pe
rcen
tage
of
pr
ojec
ts
with
pr
ojec
t rev
iew
s co
mpl
eted
PA
P Re
port
s T
BD
Obj
ectiv
e 4:
To
stre
ngth
en th
e ef
fect
iven
ess
of a
ccou
ntab
ility
syst
ems a
nd c
ompl
ianc
e in
bud
get e
xecu
tion
Ove
rall:
Sy
stem
ef
fect
iven
ess
and
Com
plia
nce
with
re
gula
tions
1 Pe
rcen
tage
of
CG e
ntiti
es w
ith
clea
n au
dit r
epor
ts
Annu
al O
AG re
port
s 86
%
100%
M
DAs
hav
e su
ffici
ent
reso
urce
an
d su
ppor
t to
add
ress
OAG
re
com
men
datio
ns;
Effe
ctiv
e sa
nctio
ns
and
rew
ards
, in
tern
al
assu
ranc
e et
c.
to
ensu
re
com
plia
nce;
Ef
fect
ive
ICT
gove
rnan
ce a
cros
s G
oU,
incl
. pr
ocur
emen
t of
sy
stem
s
2 Pe
rcen
tage
of
vo
tes
scor
ing
sa
tisfa
ctor
y ra
ting
on
the
GoU
in
tern
al
audi
t co
mpl
ianc
e as
sess
men
t
Inte
rnal
Au
dito
r G
ener
al's
annu
al re
port
TB
D
100%
IA
G
cond
ucts
an
nual
co
mpl
ianc
e as
sess
men
t
4.1
Ef
fect
iven
ess
and
accu
racy
of p
ublic
pay
roll
and
pens
ion
man
agem
ent
syst
ems
incr
ease
d
2 In
tegr
atio
n of
pa
yrol
l an
d pe
rson
nel r
ecor
ds
PEFA
PI
-23.
1 (A
nnua
l se
lf-as
sess
men
t an
d pe
riod
full
PEFA
)
C (
PEFA
20
16)
B
3 In
tern
al c
ontr
ol o
f pay
roll
PEFA
PI
-23.
3
(Ann
ual
self-
asse
ssm
ent
and
perio
d fu
ll PE
FA)
C (
PEFA
20
16)
B
4.2
Com
preh
ensiv
enes
s an
d qu
ality
of
fin
anci
al
Repo
rtin
g
4 Fi
nanc
ial d
ata
inte
grity
PE
FA P
I-27
(Ann
ual s
elf-
asse
ssm
ent
and
perio
d fu
ll PE
FA)
C+
(PEF
A 20
16)
A
5 In
-yea
r bud
get r
epor
ts
PEFA
PI-2
8 (A
nnua
l sel
f-as
sess
men
t an
d pe
riod
full
PEFA
)
B (
PEFA
20
16)
A
4.3
Stre
ngth
en
effe
ctiv
enes
s an
d in
tegr
ity o
f acc
ount
abili
ty
syst
ems
6 Pr
opor
tion
of n
atio
nal
budg
et
exec
uted
thro
ugh
IFM
S AG
O re
port
s 79
%
100%
7 Pe
rcen
tage
of
IT
in
tegr
atio
n an
d se
curit
y ac
tions
im
plem
ente
d
IT A
udit
Repo
rts
TBD
8 Pe
rcen
tage
of
IT O
AG s
ecur
ity
audi
t re
com
men
datio
ns
impl
emen
ted
OAG
sy
stem
au
dit
repo
rts
TBD
OAG
un
dert
akes
an
nual
IC
T se
curit
y au
dits
on
core
sys
tem
s (IF
MS,
H
CM,
PBS,
e-
GP
and
AIM
S)
9 Pe
rcen
tage
of
IT
sy
stem
s in
tegr
ated
ba
sed
on
the
appr
oved
road
map
Qua
rter
ly
NIT
AU
prog
ress
repo
rts
TBD
Dep
ende
nt
on
the
proc
urem
ent
of
the
syst
ems
inte
grat
ion
bus
unde
r NIT
AU
4.4
Stre
ngth
en
effe
ctiv
enes
s of
co
mm
itmen
t con
trol
s an
d ca
sh m
anag
emen
t
1 0 St
ock
of e
xpen
ditu
re a
rrea
rs a
s a
perc
enta
ge
of
tota
l ex
pend
iture
(FY
n-2)
MoF
PED
, Ann
ual B
udge
t Pe
rfor
man
ce R
epor
t 10
%
5%
1 1 Su
pple
men
tary
bu
dget
as
pe
rcen
tage
of a
ppro
ved
budg
et
MoF
PED
, Ann
ual B
udge
t Pe
rfor
man
ce R
epor
t 7%
3%
4.5
Enha
nced
Ass
uran
ce
(gov
erna
nce,
ris
k an
d co
ntro
l) by
the
int
erna
l au
dit
func
tion
for
Com
plia
nce
of
PFM
sy
stem
s
1 2 Pe
rcen
tage
of
in
tern
al
audi
t re
com
men
datio
ns
impl
emen
ted
annu
ally
ac
ross
M
DAL
Gs
Annu
al
cons
olid
ated
in
tern
al a
udit
repo
rt
0.69
80
%
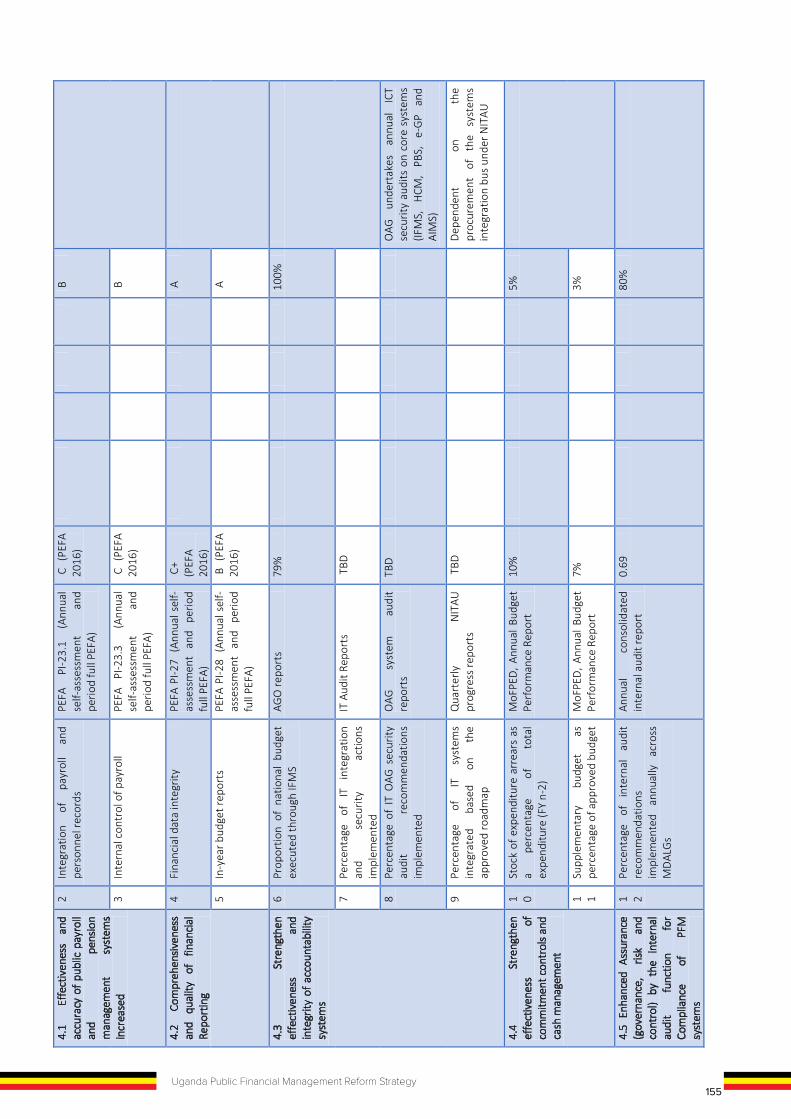
154 Uganda Public Financial Management Reform Strategy
9 Pe
rcen
tage
of
co
ntra
cts
deliv
ered
with
in c
ontr
act v
alue
PP
DA
annu
al
proc
urem
ent
audi
t re
port
(P
PMS
data
); Ac
coun
tabi
lity
Sect
or
Perf
orm
ance
repo
rt
63%
85
%
1 0 Pe
rcen
tage
of
PP
DA
reco
mm
enda
tions
im
plem
ente
d by
MD
ALG
s an
d So
Es
PPDA
ann
ual r
epor
t 71
%
90%
3.3
Opt
imal
ut
iliza
tion
and
mai
nten
ance
of
pu
blic
ass
ets
1 1 Tr
ansp
aren
cy o
f Ass
et D
ispo
sal
PEFA
(Dim
ensi
on 1
2.3)
C
1 2 N
on-F
inan
cial
Ass
et M
onito
ring
PEFA
(Dim
ensi
on 1
2.2)
C
1 3 As
set
Man
agem
ent
Bala
nced
Sc
orec
ard
New
in
dica
tor
PPD
A/AG
O)
1 4 %
MD
ALG
s w
ith
up-t
o-da
te
asse
t reg
iste
rs (d
isag
greg
ated
) N
EW I
ND
ICAT
OR:
bas
ed
on
IFM
S as
set
mod
ule
repo
rts
TBD
10
0%
3.4
Enha
nced
ac
coun
tabi
lity
in r
esou
rce
utili
zatio
n an
d re
sults
for
se
rvic
e de
liver
y
1 5 Pe
rcen
tage
of
pr
ojec
ts
with
pr
ojec
t rev
iew
s co
mpl
eted
PA
P Re
port
s T
BD
Obj
ectiv
e 4:
To
stre
ngth
en th
e ef
fect
iven
ess
of a
ccou
ntab
ility
syst
ems a
nd c
ompl
ianc
e in
bud
get e
xecu
tion
Ove
rall:
Sy
stem
ef
fect
iven
ess
and
C om
plia
nce
with
re
gula
tions
1 Pe
rcen
tage
of
CG e
ntiti
es w
ith
clea
n au
dit r
epor
ts
Annu
al O
AG re
port
s 86
%
100%
M
DAs
hav
e su
ffici
ent
reso
urce
an
d su
ppor
t to
add
ress
OAG
re
com
men
datio
ns;
Effe
ctiv
e sa
nctio
ns
and
rew
ards
, in
tern
al
assu
ranc
e et
c.
to
ensu
re
com
plia
nce;
Ef
fect
ive
ICT
gove
rnan
ce a
cros
s G
oU,
incl
. pr
ocur
emen
t of
sy
stem
s
2 Pe
rcen
tage
of
vo
tes
scor
ing
sa
tisfa
ctor
y ra
ting
on
the
GoU
in
tern
al
audi
t co
mpl
ianc
e as
sess
men
t
Inte
rnal
Au
dito
r G
ener
al's
annu
al re
port
TB
D
100%
IA
G
cond
ucts
an
nual
co
mpl
ianc
e as
sess
men
t
4.1
Ef
fect
iven
ess
and
accu
racy
of p
ublic
pay
roll
and
pens
ion
man
agem
ent
syst
ems
incr
ease
d
2 In
tegr
atio
n of
pa
yrol
l an
d pe
rson
nel r
ecor
ds
PEFA
PI
-23.
1 (A
nnua
l se
lf-as
sess
men
t an
d pe
riod
full
PEFA
)
C (
PEFA
20
16)
B
3 In
tern
al c
ontr
ol o
f pay
roll
PEFA
PI
-23.
3
(Ann
ual
self-
asse
ssm
ent
and
perio
d fu
ll PE
FA)
C (
PEFA
20
16)
B
4.2
Com
preh
ensiv
enes
s an
d qu
ality
of
fin
anci
al
Repo
rtin
g
4 Fi
nanc
ial d
ata
inte
grity
PE
FA P
I-27
(Ann
ual s
elf-
asse
ssm
ent
and
perio
d fu
ll PE
FA)
C+
(PEF
A 20
16)
A
5 In
-yea
r bud
get r
epor
ts
PEFA
PI-2
8 (A
nnua
l sel
f-as
sess
men
t an
d pe
riod
full
PEFA
)
B (
PEFA
20
16)
A
4.3
Stre
ngth
en
effe
ctiv
enes
s an
d in
tegr
ity o
f acc
ount
abili
ty
syst
ems
6 Pr
opor
tion
of n
atio
nal
budg
et
exec
uted
thro
ugh
IFM
S AG
O re
port
s 79
%
100%
7 Pe
rcen
tage
of
IT
in
tegr
atio
n an
d se
curit
y ac
tions
im
plem
ente
d
IT A
udit
Repo
rts
TBD
8 Pe
rcen
tage
of
IT O
AG s
ecur
ity
audi
t re
com
men
datio
ns
impl
emen
ted
OAG
sy
stem
au
dit
repo
rts
TBD
OAG
un
dert
akes
an
nual
IC
T se
curit
y au
dits
on
core
sys
tem
s (IF
MS,
H
CM,
PBS,
e-
GP
and
AIM
S)
9 Pe
rcen
tage
of
IT
sy
stem
s in
tegr
ated
ba
sed
on
the
appr
oved
road
map
Qua
rter
ly
NIT
AU
prog
ress
repo
rts
TBD
Dep
ende
nt
on
the
proc
urem
ent
of
the
syst
ems
inte
grat
ion
bus
unde
r NIT
AU
4.4
Stre
ngth
en
effe
ctiv
enes
s of
co
mm
itmen
t con
trol
s an
d ca
sh m
anag
emen
t
1 0 St
ock
of e
xpen
ditu
re a
rrea
rs a
s a
perc
enta
ge
of
tota
l ex
pend
iture
(FY
n-2)
MoF
PED
, Ann
ual B
udge
t Pe
rfor
man
ce R
epor
t 10
%
5%
1 1 Su
pple
men
tary
bu
dget
as
pe
rcen
tage
of a
ppro
ved
budg
et
MoF
PED
, Ann
ual B
udge
t Pe
rfor
man
ce R
epor
t 7%
3%
4.5
Enha
nced
Ass
uran
ce
(gov
erna
nce,
ris
k an
d co
ntro
l) by
the
int
erna
l au
dit
func
tion
for
Com
plia
nce
of
PFM
sy
stem
s
1 2 Pe
rcen
tage
of
in
tern
al
audi
t re
com
men
datio
ns
impl
emen
ted
annu
ally
ac
ross
M
DAL
Gs
Annu
al
cons
olid
ated
in
tern
al a
udit
repo
rt
0.69
80
%
155Uganda Public Financial Management Reform Strategy
9 Pe
rcen
tage
of
co
ntra
cts
deliv
ered
with
in c
ontr
act v
alue
PP
DA
annu
al
proc
urem
ent
audi
t re
port
(P
PMS
data
); Ac
coun
tabi
lity
Sect
or
Perf
orm
ance
repo
rt
63%
85
%
1 0 Pe
rcen
tage
of
PP
DA
reco
mm
enda
tions
im
plem
ente
d by
MD
ALG
s an
d So
Es
PPDA
ann
ual r
epor
t 71
%
90%
3.3
Opt
imal
ut
iliza
tion
and
mai
nten
ance
of
pu
blic
ass
ets
1 1 Tr
ansp
aren
cy o
f Ass
et D
ispo
sal
PEFA
(Dim
ensi
on 1
2.3)
C
1 2 N
on-F
inan
cial
Ass
et M
onito
ring
PEFA
(Dim
ensi
on 1
2.2)
C
1 3 As
set
Man
agem
ent
Bala
nced
Sc
orec
ard
New
in
dica
tor
PPD
A/AG
O)
1 4 %
MD
ALG
s w
ith
up-t
o-da
te
asse
t reg
iste
rs (d
isag
greg
ated
) N
EW I
ND
ICAT
OR:
bas
ed
on
IFM
S as
set
mod
ule
repo
rts
TBD
10
0%
3.4
Enha
nced
ac
coun
tabi
lity
in r
esou
rce
utili
zatio
n an
d re
sults
for
se
rvic
e de
liver
y
1 5 Pe
rcen
tage
of
pr
ojec
ts
with
pr
ojec
t rev
iew
s co
mpl
eted
PA
P Re
port
s T
BD
Obj
ectiv
e 4:
To
stre
ngth
en th
e ef
fect
iven
ess
of a
ccou
ntab
ility
syst
ems a
nd c
ompl
ianc
e in
bud
get e
xecu
tion
Ove
rall:
Sy
stem
ef
fect
iven
ess
and
Com
plia
nce
with
re
gula
tions
1 Pe
rcen
tage
of
CG e
ntiti
es w
ith
clea
n au
dit r
epor
ts
Annu
al O
AG re
port
s 86
%
100%
M
DAs
hav
e su
ffici
ent
reso
urce
an
d su
ppor
t to
add
ress
OAG
re
com
men
datio
ns;
Effe
ctiv
e sa
nctio
ns
and
rew
ards
, in
tern
al
assu
ranc
e et
c.
to
ensu
re
com
plia
nce;
Ef
fect
ive
ICT
gove
rnan
ce a
cros
s G
oU,
incl
. pr
ocur
emen
t of
sy
stem
s
2 Pe
rcen
tage
of
vo
tes
scor
ing
sa
tisfa
ctor
y ra
ting
on
the
GoU
in
tern
al
audi
t co
mpl
ianc
e as
sess
men
t
Inte
rnal
Au
dito
r G
ener
al's
annu
al re
port
TB
D
100%
IA
G
cond
ucts
an
nual
co
mpl
ianc
e as
sess
men
t
4.1
Ef
fect
iven
ess
and
accu
racy
of p
ublic
pay
roll
and
pens
ion
man
agem
ent
syst
ems
incr
ease
d
2 In
tegr
atio
n of
pa
yrol
l an
d pe
rson
nel r
ecor
ds
PEFA
PI
-23.
1 (A
nnua
l se
lf-as
sess
men
t an
d pe
riod
full
PEFA
)
C (
PEFA
20
16)
B
3 In
tern
al c
ontr
ol o
f pay
roll
PEFA
PI
-23.
3
(Ann
ual
self-
asse
ssm
ent
and
perio
d fu
ll PE
FA)
C (
PEFA
20
16)
B
4.2
Com
preh
ensiv
enes
s an
d qu
ality
of
fin
anci
al
Repo
rtin
g
4 Fi
nanc
ial d
ata
inte
grity
PE
FA P
I-27
(Ann
ual s
elf-
asse
ssm
ent
and
perio
d fu
ll PE
FA)
C+
(PEF
A 20
16)
A
5 In
-yea
r bud
get r
epor
ts
PEFA
PI-2
8 (A
nnua
l sel
f-as
sess
men
t an
d pe
riod
full
PEFA
)
B (
PEFA
20
16)
A
4.3
Stre
ngth
en
effe
ctiv
enes
s an
d in
tegr
ity o
f acc
ount
abili
ty
syst
ems
6 Pr
opor
tion
of n
atio
nal
budg
et
exec
uted
thro
ugh
IFM
S AG
O re
port
s 79
%
100%
7 Pe
rcen
tage
of
IT
in
tegr
atio
n an
d se
curit
y ac
tions
im
plem
ente
d
IT A
udit
Repo
rts
TBD
8 Pe
rcen
tage
of
IT O
AG s
ecur
ity
audi
t re
com
men
datio
ns
impl
emen
ted
OAG
sy
stem
au
dit
repo
rts
TBD
OAG
un
dert
akes
an
nual
IC
T se
curit
y au
dits
on
core
sys
tem
s (IF
MS,
H
CM,
PBS,
e-
GP
and
AIM
S)
9 Pe
rcen
tage
of
IT
sy
stem
s in
tegr
ated
ba
sed
on
the
appr
oved
road
map
Qua
rter
ly
NIT
AU
prog
ress
repo
rts
TBD
Dep
ende
nt
on
the
proc
urem
ent
of
the
syst
ems
inte
grat
ion
bus
unde
r NIT
AU
4.4
Stre
ngth
en
effe
ctiv
enes
s of
co
mm
itmen
t con
trol
s an
d ca
sh m
anag
emen
t
1 0 St
ock
of e
xpen
ditu
re a
rrea
rs a
s a
perc
enta
ge
of
tota
l ex
pend
iture
(FY
n-2)
MoF
PED
, Ann
ual B
udge
t Pe
rfor
man
ce R
epor
t 10
%
5%
1 1 Su
pple
men
tary
bu
dget
as
pe
rcen
tage
of a
ppro
ved
budg
et
MoF
PED
, Ann
ual B
udge
t Pe
rfor
man
ce R
epor
t 7%
3%
4.5
Enha
nced
Ass
uran
ce
(gov
erna
nce,
ris
k an
d co
ntro
l) by
the
int
erna
l au
dit
func
tion
for
Com
plia
nce
of
PFM
sy
stem
s
1 2 Pe
rcen
tage
of
in
tern
al
audi
t re
com
men
datio
ns
impl
emen
ted
annu
ally
ac
ross
M
DAL
Gs
Annu
al
cons
olid
ated
in
tern
al a
udit
repo
rt
0.69
80
%

156 Uganda Public Financial Management Reform Strategy
1 3
Perc
enta
ge o
f en
titie
s w
ith u
p to
-dat
e ris
k re
gist
ers
Qua
rter
ly IA
G re
port
s TB
D
100%
In
tern
al
Audi
t in
M
ALG
s to
in
clud
e re
view
of
risk
regi
ster
s in
thei
r qua
rter
ly re
port
s
4.6
Incr
ease
d PF
M
com
plia
nce
thro
ugh
ince
ntiv
es a
nd s
anct
ions
m
echa
nism
s
1 4 N
o.
adm
inis
trat
ive
sanc
tions
ap
plie
d*;
PSC
Annu
al
Repo
rts;
Ed
uc S
C; H
ealth
SC
TBD
1 5 Pe
rcen
tage
s of
vo
tes
with
fu
nctio
nal
Rew
ards
an
d Sa
nctio
ns c
omm
ittee
s
MoP
S an
nual
repo
rt
TBD
10
0%
1 6 Pe
rcen
tage
of
LG v
otes
with
co
nstit
uted
Re
war
ds
and
Sanc
tions
com
mitt
ees
MoP
S an
nual
repo
rt
TBD
10
0%
1 7 Pe
rcen
tage
of
vo
tes
that
re
cogn
ize
and
rew
ard
good
pe
rfor
man
ce
MoP
S an
nual
repo
rt
TBD
10
0%
1 8 Pe
rcen
tage
of
LG
s th
at
com
plie
d w
ith a
ll th
e si
x (6
) Ac
coun
tabi
lity
requ
irem
ents
(L
GPA
F)
Loca
l G
over
nmen
t Pe
rfor
man
ce
Asse
ssm
ent
Fram
ewor
k (L
GPA
F)
6%
TBD
1 9 Re
cogn
ition
of
LG
s th
at
com
plie
d w
ith a
ll th
e si
x (6
) Ac
coun
tabi
lity
requ
irem
ents
(L
GPA
F)
LGPA
F 6%
2 0 %
ac
coun
ting
offic
ers
com
plia
nce
with
per
form
ance
co
ntra
ct
LGPA
F an
d IA
G
TBD
10
0%
Obj
ectiv
e 5:
Impr
oved
tran
spar
ency
and
acc
ount
abili
ty o
f Loc
al G
over
nmen
t PFM
syst
ems
Ove
rall:
LG
PF
M
cont
ribut
ion
to
serv
ice
1 %
HLG
with
cle
an a
udit
repo
rts
Annu
al O
AG re
port
s 85
.7%
LGs
have
su
ffici
ent
reso
urce
an
d su
ppor
t to
add
ress
OAG
deliv
ery
2 O
vera
ll av
erag
e pe
rfor
man
ce
on c
ross
cutt
ing
mea
sure
s fo
r di
stric
t and
LG
s
LGPA
F Al
l 56
%;
LG
s 55
%;
MCs
58
%
re
com
men
datio
ns a
nd c
ompl
y w
ith
regu
latio
ns;
Polit
ical
com
mitm
ent t
o re
form
re
sour
ce
allo
catio
ns
and
disc
retio
nary
gr
ants
to
LG
s;
Effe
ctiv
e co
ordi
natio
n w
ith
MD
As o
n de
volv
ed f
unct
ions
; W
ider
pro
cure
men
t is
sues
are
ad
dres
sed
acro
ss G
over
nmen
t
3 Pr
opor
tion
of
LGs
that
co
mpl
ied
with
all
the
six
(6)
Acco
unta
bilit
y re
quire
men
ts
LGPA
F 6.
0%
4 LG
pe
rfor
man
ce
on
finan
cial
m
anag
emen
t an
d re
port
ing,
by
sect
or
(%
scor
e)
(Oth
er
para
met
ers
on
Proc
urem
ent,
gove
rnan
ce a
nd t
rans
pare
ncy;
m
onito
ring
and
supe
rvisi
on)
OPM
LG
PAF
annu
al
repo
rts
(dim
ensi
on
on
FM a
nd r
epor
ting
unde
r ov
eral
l se
ctor
pe
rfor
man
ce s
core
s)
Educ
atio
n 22
%
Hea
lth
21%
Agric
ultu
re (N
/A)
Wat
er
32%
5.1
Incr
ease
d co
ntrib
utio
n of
LG
ow
n-so
urce
reve
nue
1 LG
ow
n-so
urce
rev
enue
as
a pe
rcen
tage
of t
otal
LG
bud
gets
ex
clud
ing
win
dfal
ls
LG
audi
ted
final
ac
coun
ts;
Acco
unta
bilit
y Se
ctor
Pe
rfor
man
ce
repo
rt
Rura
l: 4%
E
xclu
de
Win
dfal
ls
11
%
(ASS
IP)
Assu
mes
cu
rren
t le
gal
and
polic
y fr
amew
ork
prov
ides
su
ffici
ent
pote
ntia
l to
re
ach
targ
et
- m
ay
requ
ire
mor
e st
ruct
ural
refo
rms
Urb
an:
20%
30%
2 Pe
rcen
tage
in
crea
se
of
Loca
l Re
venu
e Co
llect
ion
LG
audi
ted
final
ac
coun
ts;
Acco
unta
bilit
y Se
ctor
Pe
rfor
man
ce
repo
rt
N
ew In
dica
tor
5.2
Effe
ctiv
e pl
anni
ng a
nd
budg
etin
g at
lo
cal
gove
rnm
ents
3 %
LG
s w
ith r
even
ue c
olle
ctio
n ra
tio (
outt
urn
agai
nst
plan
ned)
w
ithin
10%
dev
iatio
n
Annu
al L
GPA
F (R
even
ue
mob
ilisa
tion
indi
cato
r)
40%
50
%
4 %
LG
s w
ith a
ppro
ved
plan
s by
Co
unci
l An
nual
LG
PAF
repo
rt
(OPM
) 56
%
70%
5 Pe
rcen
tage
of
fu
nds
utili
zed
agai
nst f
unds
rele
ased
in L
Gs
TBD
(L
G
audi
ted
final
ac
coun
ts; A
nnua
l bud
get
perf
orm
ance
re
port
, AG
O)
(FY1
6/17
)
6 Ex
pend
iture
(ab
sorp
tion)
as
a pr
opor
tion
of b
udge
t re
leas
ed
by S
ecto
r (Ke
y Se
ctor
s)
TBD
(L
G
audi
ted
final
ac
coun
ts; A
nnua
l bud
get
perf
orm
ance
re
port
, AG
O)
Educ
atio
n
Hea
lth
Wat
er
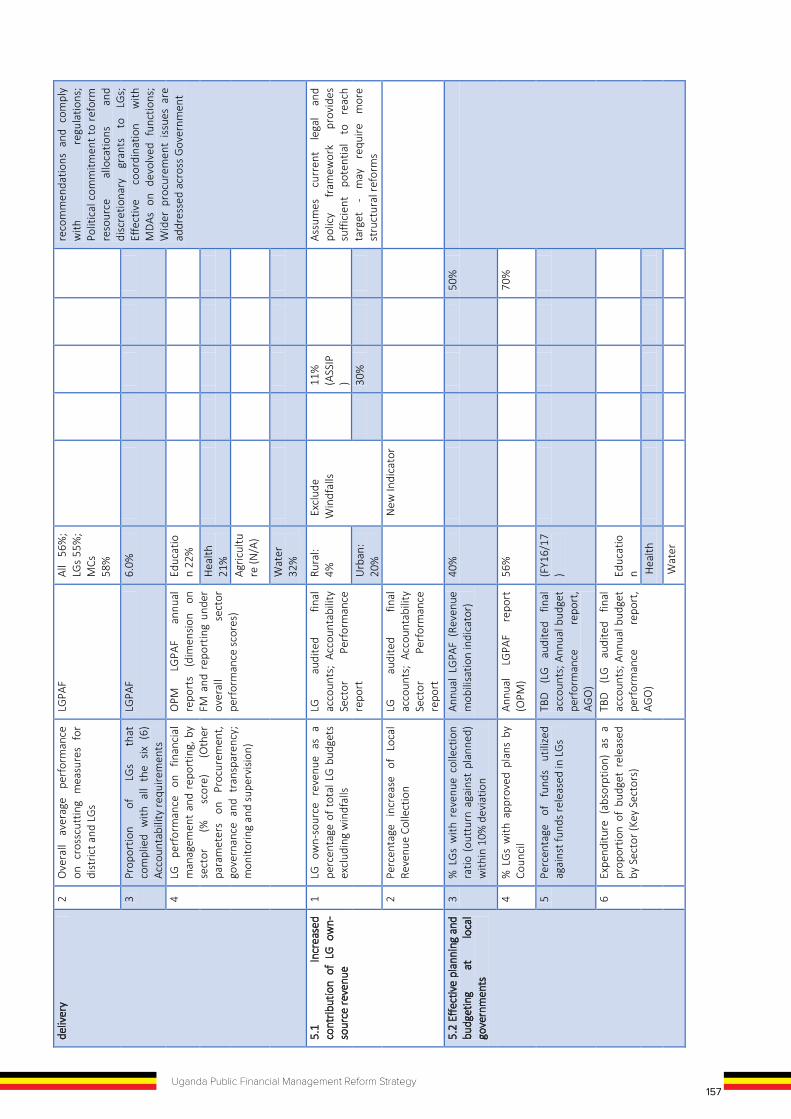
156 Uganda Public Financial Management Reform Strategy
1 3
Perc
enta
ge o
f en
titie
s w
ith u
p to
-dat
e ris
k re
gist
ers
Qua
rter
ly IA
G re
port
s TB
D
100%
In
tern
al
Audi
t in
M
ALG
s to
in
clud
e re
view
of
risk
regi
ster
s in
thei
r qua
rter
ly re
port
s
4.6
Incr
ease
d PF
M
com
plia
nce
thro
ugh
i nce
ntiv
es a
nd s
anct
ions
m
echa
nism
s
1 4 N
o.
adm
inis
trat
ive
sanc
tions
ap
plie
d*;
PSC
Annu
al
Repo
rts;
Ed
uc S
C; H
ealth
SC
TBD
1 5 Pe
rcen
tage
s of
vo
tes
with
fu
nctio
nal
Rew
ards
an
d Sa
nctio
ns c
omm
ittee
s
MoP
S an
nual
repo
rt
TBD
10
0%
1 6 Pe
rcen
tage
of
LG v
otes
with
co
nstit
uted
Re
war
ds
and
Sanc
tions
com
mitt
ees
MoP
S an
nual
repo
rt
TBD
10
0%
1 7 Pe
rcen
tage
of
vo
tes
that
re
cogn
ize
and
rew
ard
good
pe
rfor
man
ce
MoP
S an
nual
repo
rt
TBD
10
0%
1 8 Pe
rcen
tage
of
LG
s th
at
com
plie
d w
ith a
ll th
e si
x (6
) Ac
coun
tabi
lity
requ
irem
ents
(L
GPA
F)
Loca
l G
over
nmen
t Pe
rfor
man
ce
Asse
ssm
ent
Fram
ewor
k (L
GPA
F)
6%
TBD
1 9 Re
cogn
ition
of
LG
s th
at
com
plie
d w
ith a
ll th
e si
x (6
) Ac
coun
tabi
lity
requ
irem
ents
(L
GPA
F)
LGPA
F 6%
2 0 %
ac
coun
ting
offic
ers
com
plia
nce
with
per
form
ance
co
ntra
ct
LGPA
F an
d IA
G
TBD
10
0%
Obj
ectiv
e 5:
Impr
oved
tran
spar
ency
and
acc
ount
abili
ty o
f Loc
al G
over
nmen
t PFM
syst
ems
Ove
rall:
LG
PF
M
cont
ribut
ion
to
serv
ice
1 %
HLG
with
cle
an a
udit
repo
rts
Annu
al O
AG re
port
s 85
.7%
LGs
have
su
ffici
ent
reso
urce
an
d su
ppor
t to
add
ress
OAG
deliv
ery
2 O
vera
ll av
erag
e pe
rfor
man
ce
on c
ross
cutt
ing
mea
sure
s fo
r di
stric
t and
LG
s
LGPA
F Al
l 56
%;
LG
s 55
%;
MCs
58
%
re
com
men
datio
ns a
nd c
ompl
y w
ith
regu
latio
ns;
Polit
ical
com
mitm
ent t
o re
form
re
sour
ce
allo
catio
ns
and
disc
retio
nary
gr
ants
to
LG
s;
Effe
ctiv
e co
ordi
natio
n w
ith
MD
As o
n de
volv
ed f
unct
ions
; W
ider
pro
cure
men
t is
sues
are
ad
dres
sed
acro
ss G
over
nmen
t
3 Pr
opor
tion
of
LGs
that
co
mpl
ied
with
all
the
six
(6)
Acco
unta
bilit
y re
quire
men
ts
LGPA
F 6.
0%
4 LG
pe
rfor
man
ce
on
finan
cial
m
anag
emen
t an
d re
port
ing,
by
sect
or
(%
scor
e)
(Oth
er
para
met
ers
on
Proc
urem
ent,
gove
rnan
ce a
nd t
rans
pare
ncy;
m
onito
ring
and
supe
rvisi
on)
OPM
LG
PAF
annu
al
repo
rts
(dim
ensi
on
on
FM a
nd r
epor
ting
unde
r ov
eral
l se
ctor
pe
rfor
man
ce s
core
s)
Educ
atio
n 22
%
Hea
lth
21%
Agric
ultu
re (N
/A)
Wat
er
32%
5.1
Incr
ease
d co
ntrib
utio
n of
LG
ow
n-so
urce
reve
nue
1 LG
ow
n-so
urce
rev
enue
as
a pe
rcen
tage
of t
otal
LG
bud
gets
ex
clud
ing
win
dfal
ls
LG
audi
ted
final
ac
coun
ts;
Acco
unta
bilit
y Se
ctor
Pe
rfor
man
ce
repo
rt
Rura
l: 4%
E
xclu
de
Win
dfal
ls
11
%
(ASS
IP)
Assu
mes
cu
rren
t le
gal
and
polic
y fr
amew
ork
prov
ides
su
ffici
ent
pote
ntia
l to
re
ach
targ
et
- m
ay
requ
ire
mor
e st
ruct
ural
refo
rms
Urb
an:
20%
30%
2 Pe
rcen
tage
in
crea
se
of
Loca
l Re
venu
e Co
llect
ion
LG
audi
ted
final
ac
coun
ts;
Acco
unta
bilit
y Se
ctor
Pe
rfor
man
ce
repo
rt
N
ew In
dica
tor
5.2
Effe
ctiv
e pl
anni
ng a
nd
budg
etin
g at
lo
cal
gove
rnm
ents
3 %
LG
s w
ith r
even
ue c
olle
ctio
n ra
tio (
outt
urn
agai
nst
plan
ned)
w
ithin
10%
dev
iatio
n
Annu
al L
GPA
F (R
even
ue
mob
ilisa
tion
indi
cato
r)
40%
50
%
4 %
LG
s w
ith a
ppro
ved
plan
s by
Co
unci
l An
nual
LG
PAF
repo
rt
(OPM
) 56
%
70%
5 Pe
rcen
tage
of
fu
nds
utili
zed
agai
nst f
unds
rele
ased
in L
Gs
TBD
(L
G
audi
ted
final
ac
coun
ts; A
nnua
l bud
get
perf
orm
ance
re
port
, AG
O)
(FY1
6/17
)
6 Ex
pend
iture
(ab
sorp
tion)
as
a pr
opor
tion
of b
udge
t re
leas
ed
by S
ecto
r (Ke
y Se
ctor
s)
TBD
(L
G
audi
ted
final
ac
coun
ts; A
nnua
l bud
get
perf
orm
ance
re
port
, AG
O)
Educ
atio
n
Hea
lth
Wat
er
157Uganda Public Financial Management Reform Strategy
1 3
Perc
enta
ge o
f en
titie
s w
ith u
p to
-dat
e ris
k re
gist
ers
Qua
rter
ly IA
G re
port
s TB
D
100%
In
tern
al
Audi
t in
M
ALG
s to
in
clud
e re
view
of
risk
regi
ster
s in
thei
r qua
rter
ly re
port
s
4.6
Incr
ease
d PF
M
com
plia
nce
thro
ugh
ince
ntiv
es a
nd s
anct
ions
m
echa
nism
s
1 4 N
o.
adm
inis
trat
ive
sanc
tions
ap
plie
d*;
PSC
Annu
al
Repo
rts;
Ed
uc S
C; H
ealth
SC
TBD
1 5 Pe
rcen
tage
s of
vo
tes
with
fu
nctio
nal
Rew
ards
an
d Sa
nctio
ns c
omm
ittee
s
MoP
S an
nual
repo
rt
TBD
10
0%
1 6 Pe
rcen
tage
of
LG v
otes
with
co
nstit
uted
Re
war
ds
and
Sanc
tions
com
mitt
ees
MoP
S an
nual
repo
rt
TBD
10
0%
1 7 Pe
rcen
tage
of
vo
tes
that
re
cogn
ize
and
rew
ard
good
pe
rfor
man
ce
MoP
S an
nual
repo
rt
TBD
10
0%
1 8 Pe
rcen
tage
of
LG
s th
at
com
plie
d w
ith a
ll th
e si
x (6
) Ac
coun
tabi
lity
requ
irem
ents
(L
GPA
F)
Loca
l G
over
nmen
t Pe
rfor
man
ce
Asse
ssm
ent
Fram
ewor
k (L
GPA
F)
6%
TBD
1 9 Re
cogn
ition
of
LG
s th
at
com
plie
d w
ith a
ll th
e si
x (6
) Ac
coun
tabi
lity
requ
irem
ents
(L
GPA
F)
LGPA
F 6%
2 0 %
ac
coun
ting
offic
ers
com
plia
nce
with
per
form
ance
co
ntra
ct
LGPA
F an
d IA
G
TBD
10
0%
Obj
ectiv
e 5:
Impr
oved
tran
spar
ency
and
acc
ount
abili
ty o
f Loc
al G
over
nmen
t PFM
syst
ems
Ove
rall:
LG
PF
M
cont
ribut
ion
to
serv
ice
1 %
HLG
with
cle
an a
udit
repo
rts
Annu
al O
AG re
port
s 85
.7%
LGs
have
su
ffici
ent
reso
urce
an
d su
ppor
t to
add
ress
OAG
deliv
ery
2 O
vera
ll av
erag
e pe
rfor
man
ce
on c
ross
cutt
ing
mea
sure
s fo
r di
stric
t and
LG
s
LGPA
F Al
l 56
%;
LG
s 55
%;
MCs
58
%
re
com
men
datio
ns a
nd c
ompl
y w
ith
regu
latio
ns;
Polit
ical
com
mitm
ent t
o re
form
re
sour
ce
allo
catio
ns
and
disc
retio
nary
gr
ants
to
LG
s;
Effe
ctiv
e co
ordi
natio
n w
ith
MD
As o
n de
volv
ed f
unct
ions
; W
ider
pro
cure
men
t is
sues
are
ad
dres
sed
acro
ss G
over
nmen
t
3 Pr
opor
tion
of
LGs
that
co
mpl
ied
with
all
the
six
(6)
Acco
unta
bilit
y re
quire
men
ts
LGPA
F 6.
0%
4 LG
pe
rfor
man
ce
on
finan
cial
m
anag
emen
t an
d re
port
ing,
by
sect
or
(%
scor
e)
(Oth
er
para
met
ers
on
Proc
urem
ent,
gove
rnan
ce a
nd t
rans
pare
ncy;
m
onito
ring
and
supe
rvisi
on)
OPM
LG
PAF
annu
al
repo
rts
(dim
ensi
on
on
FM a
nd r
epor
ting
unde
r ov
eral
l se
ctor
pe
rfor
man
ce s
core
s)
Educ
atio
n 22
%
Hea
lth
21%
Agric
ultu
re (N
/A)
Wat
er
32%
5.1
Incr
ease
d co
ntrib
utio
n of
LG
ow
n-so
urce
reve
nue
1 LG
ow
n-so
urce
rev
enue
as
a pe
rcen
tage
of t
otal
LG
bud
gets
ex
clud
ing
win
dfal
ls
LG
audi
ted
final
ac
coun
ts;
Acco
unta
bilit
y Se
ctor
Pe
rfor
man
ce
repo
rt
Rura
l: 4%
E
xclu
de
Win
dfal
ls
11
%
(ASS
IP)
Assu
mes
cu
rren
t le
gal
and
polic
y fr
amew
ork
prov
ides
su
ffici
ent
pote
ntia
l to
re
ach
targ
et
- m
ay
requ
ire
mor
e st
ruct
ural
refo
rms
Urb
an:
20%
30%
2 Pe
rcen
tage
in
crea
se
of
Loca
l Re
venu
e Co
llect
ion
LG
audi
ted
final
ac
coun
ts;
Acco
unta
bilit
y Se
ctor
Pe
rfor
man
ce
repo
rt
N
ew In
dica
tor
5.2
Effe
ctiv
e pl
anni
ng a
nd
budg
etin
g at
lo
cal
gove
rnm
ents
3 %
LG
s w
ith r
even
ue c
olle
ctio
n ra
tio (
outt
urn
agai
nst
plan
ned)
w
ithin
10%
dev
iatio
n
Annu
al L
GPA
F (R
even
ue
mob
ilisa
tion
indi
cato
r)
40%
50
%
4 %
LG
s w
ith a
ppro
ved
plan
s by
Co
unci
l An
nual
LG
PAF
repo
rt
(OPM
) 56
%
70%
5 Pe
rcen
tage
of
fu
nds
utili
zed
agai
nst f
unds
rele
ased
in L
Gs
TBD
(L
G
audi
ted
final
ac
coun
ts; A
nnua
l bud
get
perf
orm
ance
re
port
, AG
O)
(FY1
6/17
)
6 Ex
pend
iture
(ab
sorp
tion)
as
a pr
opor
tion
of b
udge
t re
leas
ed
by S
ecto
r (Ke
y Se
ctor
s)
TBD
(L
G
audi
ted
final
ac
coun
ts; A
nnua
l bud
get
perf
orm
ance
re
port
, AG
O)
Educ
atio
n
Hea
lth
Wat
er

158 Uganda Public Financial Management Reform Strategy
5.3
Impr
oved
qua
lity
of
audi
t an
d
coor
dina
ted
fo
llow
up
of
re
com
men
datio
ns
by
LGPA
Cs
and
re
gion
al
audi
t com
mitt
ees
7 Pe
rcen
tage
of
LG
PACs
su
bmitt
ing
quar
terly
rep
orts
to
thei
r cou
ncils
MoL
G
Insp
ectio
n Re
port
s/Su
bmis
sion
of
LG
PAC
Repo
rts
to
Parli
amen
t
55%
Su
bmis
sion
of
LG
PAC
Repo
rts
to
Parli
amen
t
75
%
8 Pe
rcen
tage
of
LG
PAC
audi
t re
com
men
datio
ns
impl
emen
ted
Inte
rnal
Au
dito
r G
ener
al's
annu
al re
port
66
%
75%
5.4
Enha
nce
acco
unta
bilit
y an
d pe
rfor
man
ce
mon
itorin
g in
del
iver
y of
ser
vice
s in
ke
y se
rvic
e se
ctor
s (r
oads
, edu
catio
n, h
ealth
, an
d ag
ricul
ture
serv
ices
)
9 %
LG
s su
bmitt
ing
annu
al
perf
orm
ance
repo
rts
on ti
me
LGPA
F an
nual
repo
rt
51%
1 0 %
LG
s su
bmitt
ing
all 4
qua
rter
ly
perf
orm
ance
repo
rts
on ti
me
LGPA
F an
nual
repo
rt
30%
5.5
Enha
nced
in
tegr
ity
and
valu
e fo
r m
oney
of
loca
l go
vern
men
t pr
ocur
emen
ts
1 1 LG
co
mpl
ianc
e w
ith
proc
urem
ent
and
cont
ract
m
anag
emen
t pr
oced
ures
(%
sc
ore)
LGPA
F an
nual
re
port
-
com
posi
te
indi
cato
r of
pr
ocur
emen
t an
d co
ntra
ct m
anag
emen
t
60%
1 2 LG
pr
ocur
emen
t co
rrup
tion
perc
eptio
n PP
DA
proc
urem
ent
inte
grity
sur
vey
[PPD
A to
co
nfirm
]
Obj
ectiv
e 6:
To
stre
ngth
en o
vers
ight
and
PFM
gov
erna
nce
func
tions
for t
he su
stai
nabi
lity
of d
evel
opm
ent o
utco
mes
Ove
rall:
gov
erna
nce
and
over
sight
of P
FM re
form
1
Gov
ernm
ent
effe
ctiv
enes
s in
dex
(-2.5
wea
k; 2
.5 s
tron
g)
Wor
ldw
ide
gove
rnan
ce
indi
cato
rs (
Wor
ld B
ank)
; Ac
coun
tabi
lity
Sect
or
Perf
orm
ance
Indi
cato
r
-0.5
7 (2
016)
GoU
im
prov
es
in
deliv
ery
of
ND
PII;
Sanc
tions
and
rew
ards
fo
r fo
llow
ing
proc
edur
es
are
effe
ctiv
e; D
eliv
ery
of s
ervi
ces
agai
nst
budg
et/p
lans
; fe
edba
ck
from
citi
zens
rea
ches
GoU
and
is
act
ed u
pon
2 Co
rrup
tion
perc
eptio
n in
dex
(0=h
ighl
y co
rrup
t; 10
0=ve
ry
clea
n)
Tran
spar
ency
In
tern
atio
nal
Corr
uptio
n Pe
rcep
tion
Inde
x;
Acco
unta
bilit
y Se
ctor
Pe
rfor
man
ce In
dica
tor
26
(201
7 CP
I)
3 Le
vel o
f sat
isfa
ctio
n w
ith p
ublic
se
rvic
e de
liver
y (N
SDS
or,
in
futu
re, '
citiz
en s
core
card
')
Nat
iona
l Ser
vice
Del
iver
y Su
rvey
Rep
ort;
Repo
rted
in
Acc
ount
abili
ty S
ecto
r Pe
rfor
man
ce R
epor
t
[see
20
15
NSD
S]
6.1
Enh
ance
d im
pact
of
finan
cial
and
VFM
aud
it re
port
ing
and
over
sight
1 %
ex
tern
al
audi
t re
com
men
datio
ns
impl
emen
ted
by M
DAL
Gs
OAG
ann
ual a
udit
repo
rt
of g
over
nmen
t 25
%
30%
35
%
40%
50
%
60%
Au
dit
reco
mm
enda
tions
ar
e cl
ear,
unde
rsto
od
and
MD
As
have
re
sour
ces/
supp
ort
to
addr
ess
them
; Pa
rliam
enta
ry
com
mitt
ees
revi
ew
VfM
re
port
s;
Trea
sury
m
emor
anda
ar
e is
sued
on
tim
e,
follo
win
g pa
rliam
enta
ry s
crut
iny
of a
udit
repo
rts
2 N
o. V
fM r
epor
ts a
dopt
ed b
y Pa
rliam
ent
and
subm
itted
to
Ex
ecut
ive
as
a %
of
re
port
s ta
bled
in th
e pl
enar
y
Parli
amen
tary
re
cord
s (A
ccou
ntab
ility
se
ctor
in
dica
tor)
10%
(2
015/
16)
60%
80
%
(ASS
IP)
100%
10
0%
100%
3 %
act
ions
take
n re
port
ed in
the
Trea
sury
M
emor
anda
in
lin
e w
ith P
arlia
men
tary
reso
lutio
ns
MoF
PED
, Ac
coun
tant
G
ener
al's
Repo
rts
50%
(F
INM
AP
2014
/15
)
50%
60
%
70%
80
%
90%
6.2
Im
prov
ed
coor
dina
tion
and
mon
itorin
g of
PF
M
proc
esse
s w
ithin
th
e Ac
coun
tabi
lity
Sect
or
4 Pe
rcen
tage
of
in
dica
tors
in
PF
M-R
S re
sults
fram
ewor
k th
at
are
colle
cted
, tr
acke
d an
d on
line.
PFM
Mon
itorin
g Sy
stem
(P
FM
Refo
rm
Secr
etar
iat)
0%
80%
10
0%
100%
10
0%
100%
5 Fu
nctio
nal P
FM S
ub-g
roup
s PR
AM Jo
int R
atin
g 0%
20
%
40%
60
%
80%
10
0%
6.3
Sus
tain
ed u
ptak
e of
re
form
s th
roug
h im
prov
ed
lear
ning
an
d co
ordi
natio
n of
PF
M
Refo
rm p
roce
sses
6 %
ac
tiviti
es/f
unct
ions
in
su
stai
nabi
lity
plan
m
ains
trea
med
(c
umul
ativ
e va
lue)
NEW
IND
ICAT
OR
0%
20%
40
%
60%
80
%
100%
7 %
ca
paci
ty
build
ing
plan
de
liver
ed (c
umul
ativ
e)
NEW
IND
ICAT
OR
0%
20%
40
%
60%
80
%
100%
6.4
Incr
ease
d de
man
d fo
r do
wnw
ard
acco
unta
bilit
y
to
citiz
ens
for
publ
ic
spen
ding
an
d se
rvic
e de
liver
y pe
rfor
man
ce
8 N
o.
citiz
ens
part
icip
atin
g in
ci
tizen
sco
reca
rd a
sses
smen
t N
EW IN
DIC
ATO
R 0
9 %
LG
s co
nduc
ted
disc
ussio
ns
with
pub
lic to
pro
vide
feed
back
on
st
atus
of
ac
tivity
im
plem
enta
tion
LGPA
F an
nual
re
port
-
dim
ensi
on
7 of
co
mpo
site
in
dica
tor
on
gove
rnan
ce,
over
sigh
t, ac
coun
tabi
lity
&
tran
spar
ency
52%
6.5
Cost
-effe
ctiv
e pu
blic
ad
min
istra
tion
thro
ugh
Ratio
naliz
atio
n of
th
e
1 0 G
over
nmen
t em
ploy
ees
as %
po
pula
tion
Wor
ld
Bank
W
orld
Ec
onom
ic In
dica
tors
TB
D
TBD
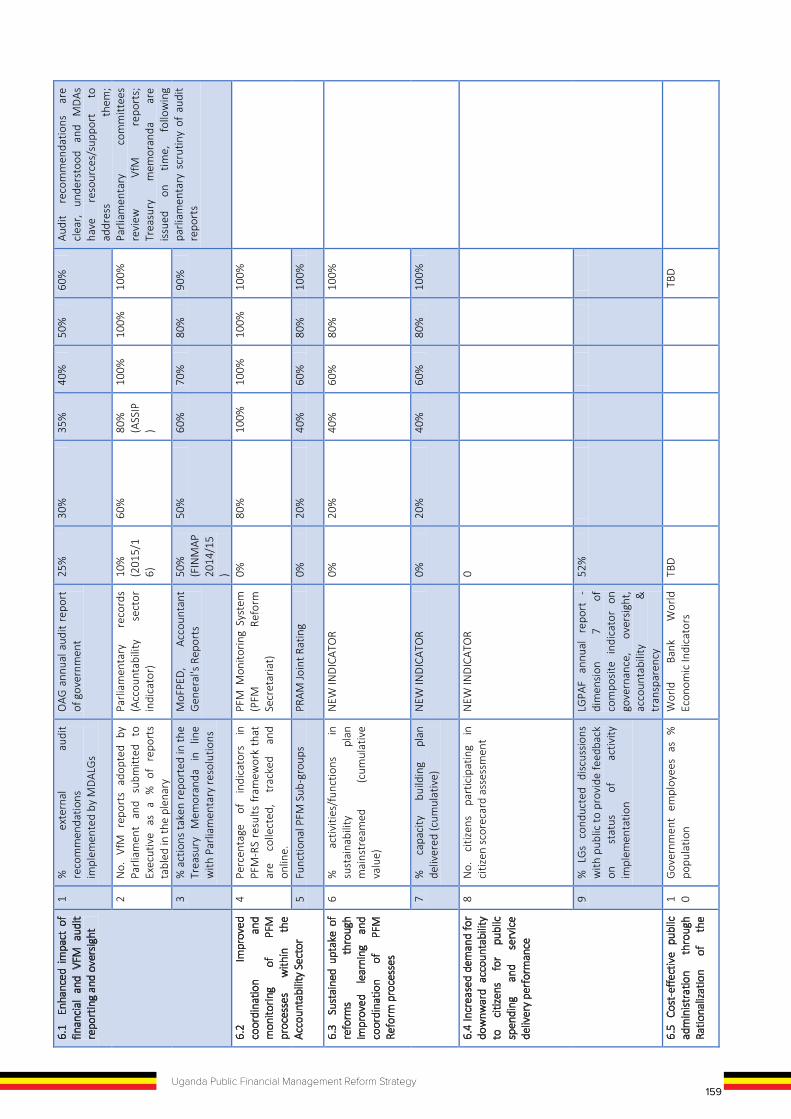
158 Uganda Public Financial Management Reform Strategy
5.3
Impr
oved
qua
lity
of
audi
t an
d
coor
dina
ted
f o
llow
up
of
re
com
men
datio
ns
by
L GPA
Cs
and
re
gion
al
audi
t com
mitt
ees
7 Pe
rcen
tage
of
LG
PACs
su
bmitt
ing
quar
terly
rep
orts
to
thei
r cou
ncils
MoL
G
Insp
ectio
n Re
port
s/Su
bmis
sion
of
LG
PAC
Repo
rts
to
Parli
amen
t
55%
Su
bmis
sion
of
LG
PAC
Repo
rts
to
Parli
amen
t
75
%
8 Pe
rcen
tage
of
LG
PAC
audi
t re
com
men
datio
ns
impl
emen
ted
Inte
rnal
Au
dito
r G
ener
al's
annu
al re
port
66
%
75%
5.4
Enha
nce
acco
unta
bilit
y an
d pe
rfor
man
ce
mon
itorin
g i n
del
iver
y of
ser
vice
s in
ke
y se
rvic
e se
ctor
s (r
oads
, edu
catio
n, h
ealth
, a n
d ag
ricul
ture
serv
ices
)
9 %
LG
s su
bmitt
ing
annu
al
perf
orm
ance
repo
rts
on ti
me
LGPA
F an
nual
repo
rt
51%
1 0 %
LG
s su
bmitt
ing
all 4
qua
rter
ly
perf
orm
ance
repo
rts
on ti
me
LGPA
F an
nual
repo
rt
30%
5.5
Enha
nced
in
tegr
ity
and
valu
e fo
r m
oney
of
loca
l go
vern
men
t pr
ocur
emen
ts
1 1 LG
co
mpl
ianc
e w
ith
proc
urem
ent
and
cont
ract
m
anag
emen
t pr
oced
ures
(%
sc
ore)
LGPA
F an
nual
re
port
-
com
posi
te
indi
cato
r of
pr
ocur
emen
t an
d co
ntra
ct m
anag
emen
t
60%
1 2 LG
pr
ocur
emen
t co
rrup
tion
perc
eptio
n PP
DA
proc
urem
ent
inte
grity
sur
vey
[PPD
A to
co
nfirm
]
Obj
ectiv
e 6:
To
stre
ngth
en o
vers
ight
and
PFM
gov
erna
nce
func
tions
for t
he su
stai
nabi
lity
of d
evel
opm
ent o
utco
mes
Ove
rall:
gov
erna
nce
and
over
sight
of P
FM re
form
1
Gov
ernm
ent
effe
ctiv
enes
s in
dex
(-2.5
wea
k; 2
.5 s
tron
g)
Wor
ldw
ide
gove
rnan
ce
indi
cato
rs (
Wor
ld B
ank)
; Ac
coun
tabi
lity
Sect
or
Perf
orm
ance
Indi
cato
r
-0.5
7 (2
016)
GoU
im
prov
es
in
deliv
ery
of
ND
PII;
Sanc
tions
and
rew
ards
fo
r fo
llow
ing
proc
edur
es
are
effe
ctiv
e; D
eliv
ery
of s
ervi
ces
agai
nst
budg
et/p
lans
; fe
edba
ck
from
citi
zens
rea
ches
GoU
and
is
act
ed u
pon
2 Co
rrup
tion
perc
eptio
n in
dex
(0=h
ighl
y co
rrup
t; 10
0=ve
ry
clea
n)
Tran
spar
ency
In
tern
atio
nal
Corr
uptio
n Pe
rcep
tion
Inde
x;
Acco
unta
bilit
y Se
ctor
Pe
rfor
man
ce In
dica
tor
26
(201
7 CP
I)
3 Le
vel o
f sat
isfa
ctio
n w
ith p
ublic
se
rvic
e de
liver
y (N
SDS
or,
in
futu
re, '
citiz
en s
core
card
')
Nat
iona
l Ser
vice
Del
iver
y Su
rvey
Rep
ort;
Repo
rted
in
Acc
ount
abili
ty S
ecto
r Pe
rfor
man
ce R
epor
t
[see
20
15
NSD
S]
6.1
Enh
ance
d im
pact
of
finan
cial
and
VFM
aud
it re
port
ing
and
over
sight
1 %
ex
tern
al
audi
t re
com
men
datio
ns
impl
emen
ted
by M
DAL
Gs
OAG
ann
ual a
udit
repo
rt
of g
over
nmen
t 25
%
30%
35
%
40%
50
%
60%
Au
dit
reco
mm
enda
tions
ar
e cl
ear,
unde
rsto
od
and
MD
As
have
re
sour
ces/
supp
ort
to
addr
ess
them
; Pa
rliam
enta
ry
com
mitt
ees
revi
ew
VfM
re
port
s;
Trea
sury
m
emor
anda
ar
e is
sued
on
tim
e,
follo
win
g pa
rliam
enta
ry s
crut
iny
of a
udit
repo
rts
2 N
o. V
fM r
epor
ts a
dopt
ed b
y Pa
rliam
ent
and
subm
itted
to
Ex
ecut
ive
as
a %
of
re
port
s ta
bled
in th
e pl
enar
y
Parli
amen
tary
re
cord
s (A
ccou
ntab
ility
se
ctor
in
dica
tor)
10%
(2
015/
16)
60%
80
%
(ASS
IP)
100%
10
0%
100%
3 %
act
ions
take
n re
port
ed in
the
Trea
sury
M
emor
anda
in
lin
e w
ith P
arlia
men
tary
reso
lutio
ns
MoF
PED
, Ac
coun
tant
G
ener
al's
Repo
rts
50%
(F
INM
AP
2014
/15
)
50%
60
%
70%
80
%
90%
6.2
Im
prov
ed
coor
dina
tion
and
mon
itorin
g of
PF
M
proc
esse
s w
ithin
th
e Ac
coun
tabi
lity
Sect
or
4 Pe
rcen
tage
of
in
dica
tors
in
PF
M-R
S re
sults
fram
ewor
k th
at
are
colle
cted
, tr
acke
d an
d on
line.
PFM
Mon
itorin
g Sy
stem
(P
FM
Refo
rm
Secr
etar
iat)
0%
80%
10
0%
100%
10
0%
100%
5 Fu
nctio
nal P
FM S
ub-g
roup
s PR
AM Jo
int R
atin
g 0%
20
%
40%
60
%
80%
10
0%
6.3
Sus
tain
ed u
ptak
e of
re
form
s th
roug
h im
prov
ed
lear
ning
an
d co
ordi
natio
n of
PF
M
Refo
rm p
roce
sses
6 %
ac
tiviti
es/f
unct
ions
in
su
stai
nabi
lity
plan
m
ains
trea
med
(c
umul
ativ
e va
lue)
NEW
IND
ICAT
OR
0%
20%
40
%
60%
80
%
100%
7 %
ca
paci
ty
build
ing
plan
de
liver
ed (c
umul
ativ
e)
NEW
IND
ICAT
OR
0%
20%
40
%
60%
80
%
100%
6.4
Incr
ease
d de
man
d fo
r do
wnw
ard
acco
unta
bilit
y
to
citiz
ens
for
publ
ic
spen
ding
an
d se
rvic
e de
liver
y pe
rfor
man
ce
8 N
o.
citiz
ens
part
icip
atin
g in
ci
tizen
sco
reca
rd a
sses
smen
t N
EW IN
DIC
ATO
R 0
9 %
LG
s co
nduc
ted
disc
ussio
ns
with
pub
lic to
pro
vide
feed
back
on
st
atus
of
ac
tivity
im
plem
enta
tion
LGPA
F an
nual
re
port
-
dim
ensi
on
7 of
co
mpo
site
in
dica
tor
on
gove
rnan
ce,
over
sigh
t, ac
coun
tabi
lity
&
tran
spar
ency
52%
6.5
Cost
-effe
ctiv
e pu
blic
ad
min
istra
tion
thro
ugh
Ratio
naliz
atio
n of
th
e
1 0 G
over
nmen
t em
ploy
ees
as %
po
pula
tion
Wor
ld
Bank
W
orld
Ec
onom
ic In
dica
tors
TB
D
TBD
159Uganda Public Financial Management Reform Strategy
5.3
Impr
oved
qua
lity
of
audi
t an
d
coor
dina
ted
fo
llow
up
of
re
com
men
datio
ns
by
LGPA
Cs
and
re
gion
al
audi
t com
mitt
ees
7 Pe
rcen
tage
of
LG
PACs
su
bmitt
ing
quar
terly
rep
orts
to
thei
r cou
ncils
MoL
G
Insp
ectio
n Re
port
s/Su
bmis
sion
of
LG
PAC
Repo
rts
to
Parli
amen
t
55%
Su
bmis
sion
of
LG
PAC
Repo
rts
to
Parli
amen
t
75
%
8 Pe
rcen
tage
of
LG
PAC
audi
t re
com
men
datio
ns
impl
emen
ted
Inte
rnal
Au
dito
r G
ener
al's
annu
al re
port
66
%
75%
5.4
Enha
nce
acco
unta
bilit
y an
d pe
rfor
man
ce
mon
itorin
g in
del
iver
y of
ser
vice
s in
ke
y se
rvic
e se
ctor
s (r
oads
, edu
catio
n, h
ealth
, an
d ag
ricul
ture
serv
ices
)
9 %
LG
s su
bmitt
ing
annu
al
perf
orm
ance
repo
rts
on ti
me
LGPA
F an
nual
repo
rt
51%
1 0 %
LG
s su
bmitt
ing
all 4
qua
rter
ly
perf
orm
ance
repo
rts
on ti
me
LGPA
F an
nual
repo
rt
30%
5.5
Enha
nced
in
tegr
ity
and
valu
e fo
r m
oney
of
loca
l go
vern
men
t pr
ocur
emen
ts
1 1 LG
co
mpl
ianc
e w
ith
proc
urem
ent
and
cont
ract
m
anag
emen
t pr
oced
ures
(%
sc
ore)
LGPA
F an
nual
re
port
-
com
posi
te
indi
cato
r of
pr
ocur
emen
t an
d co
ntra
ct m
anag
emen
t
60%
1 2 LG
pr
ocur
emen
t co
rrup
tion
perc
eptio
n PP
DA
proc
urem
ent
inte
grity
sur
vey
[PPD
A to
co
nfirm
]
Obj
ectiv
e 6:
To
stre
ngth
en o
vers
ight
and
PFM
gov
erna
nce
func
tions
for t
he su
stai
nabi
lity
of d
evel
opm
ent o
utco
mes
Ove
rall:
gov
erna
nce
and
over
sight
of P
FM re
form
1
Gov
ernm
ent
effe
ctiv
enes
s in
dex
(-2.5
wea
k; 2
.5 s
tron
g)
Wor
ldw
ide
gove
rnan
ce
indi
cato
rs (
Wor
ld B
ank)
; Ac
coun
tabi
lity
Sect
or
Perf
orm
ance
Indi
cato
r
-0.5
7 (2
016)
GoU
im
prov
es
in
deliv
ery
of
ND
PII;
Sanc
tions
and
rew
ards
fo
r fo
llow
ing
proc
edur
es
are
effe
ctiv
e; D
eliv
ery
of s
ervi
ces
agai
nst
budg
et/p
lans
; fe
edba
ck
from
citi
zens
rea
ches
GoU
and
is
act
ed u
pon
2 Co
rrup
tion
perc
eptio
n in
dex
(0=h
ighl
y co
rrup
t; 10
0=ve
ry
clea
n)
Tran
spar
ency
In
tern
atio
nal
Corr
uptio
n Pe
rcep
tion
Inde
x;
Acco
unta
bilit
y Se
ctor
Pe
rfor
man
ce In
dica
tor
26
(201
7 CP
I)
3 Le
vel o
f sat
isfa
ctio
n w
ith p
ublic
se
rvic
e de
liver
y (N
SDS
or,
in
futu
re, '
citiz
en s
core
card
')
Nat
iona
l Ser
vice
Del
iver
y Su
rvey
Rep
ort;
Repo
rted
in
Acc
ount
abili
ty S
ecto
r Pe
rfor
man
ce R
epor
t
[see
20
15
NSD
S]
6.1
Enh
ance
d im
pact
of
finan
cial
and
VFM
aud
it re
port
ing
and
over
sight
1 %
ex
tern
al
audi
t re
com
men
datio
ns
impl
emen
ted
by M
DAL
Gs
OAG
ann
ual a
udit
repo
rt
of g
over
nmen
t 25
%
30%
35
%
40%
50
%
60%
Au
dit
reco
mm
enda
tions
ar
e cl
ear,
unde
rsto
od
and
MD
As
have
re
sour
ces/
supp
ort
to
addr
ess
them
; Pa
rliam
enta
ry
com
mitt
ees
revi
ew
VfM
re
port
s;
Trea
sury
m
emor
anda
ar
e is
sued
on
tim
e,
follo
win
g pa
rliam
enta
ry s
crut
iny
of a
udit
repo
rts
2 N
o. V
fM r
epor
ts a
dopt
ed b
y Pa
rliam
ent
and
subm
itted
to
Ex
ecut
ive
as
a %
of
re
port
s ta
bled
in th
e pl
enar
y
Parli
amen
tary
re
cord
s (A
ccou
ntab
ility
se
ctor
in
dica
tor)
10%
(2
015/
16)
60%
80
%
(ASS
IP)
100%
10
0%
100%
3 %
act
ions
take
n re
port
ed in
the
Trea
sury
M
emor
anda
in
lin
e w
ith P
arlia
men
tary
reso
lutio
ns
MoF
PED
, Ac
coun
tant
G
ener
al's
Repo
rts
50%
(F
INM
AP
2014
/15
)
50%
60
%
70%
80
%
90%
6.2
Im
prov
ed
coor
dina
tion
and
mon
itorin
g of
PF
M
proc
esse
s w
ithin
th
e Ac
coun
tabi
lity
Sect
or
4 Pe
rcen
tage
of
in
dica
tors
in
PF
M-R
S re
sults
fram
ewor
k th
at
are
colle
cted
, tr
acke
d an
d on
line.
PFM
Mon
itorin
g Sy
stem
(P
FM
Refo
rm
Secr
etar
iat)
0%
80%
10
0%
100%
10
0%
100%
5 Fu
nctio
nal P
FM S
ub-g
roup
s PR
AM Jo
int R
atin
g 0%
20
%
40%
60
%
80%
10
0%
6.3
Sus
tain
ed u
ptak
e of
re
form
s th
roug
h i m
prov
ed
lear
ning
an
d co
ordi
natio
n of
PF
M
R efo
rm p
roce
sses
6 %
ac
tiviti
es/f
unct
ions
in
su
stai
nabi
lity
plan
m
ains
trea
med
(c
umul
ativ
e va
lue)
NEW
IND
ICAT
OR
0%
20%
40
%
60%
80
%
100%
7 %
ca
paci
ty
build
ing
plan
de
liver
ed (c
umul
ativ
e)
NEW
IND
ICAT
OR
0%
20%
40
%
60%
80
%
100%
6.4
Incr
ease
d de
man
d fo
r do
wnw
ard
acco
unta
bilit
y
to
citiz
ens
for
publ
ic
spen
ding
an
d se
rvic
e d e
liver
y pe
rfor
man
ce
8 N
o.
citiz
ens
part
icip
atin
g in
ci
tizen
sco
reca
rd a
sses
smen
t N
EW IN
DIC
ATO
R 0
9 %
LG
s co
nduc
ted
disc
ussio
ns
with
pub
lic to
pro
vide
feed
back
on
st
atus
of
ac
tivity
im
plem
enta
tion
LGPA
F an
nual
re
port
-
dim
ensi
on
7 of
co
mpo
site
in
dica
tor
on
gove
rnan
ce,
over
sigh
t, ac
coun
tabi
lity
&
tran
spar
ency
52%
6.5
Cost
-effe
ctiv
e pu
blic
ad
min
istra
tion
thro
ugh
Ratio
naliz
atio
n of
th
e
1 0 G
over
nmen
t em
ploy
ees
as %
po
pula
tion
Wor
ld
Bank
W
orld
Ec
onom
ic In
dica
tors
TB
D
TBD
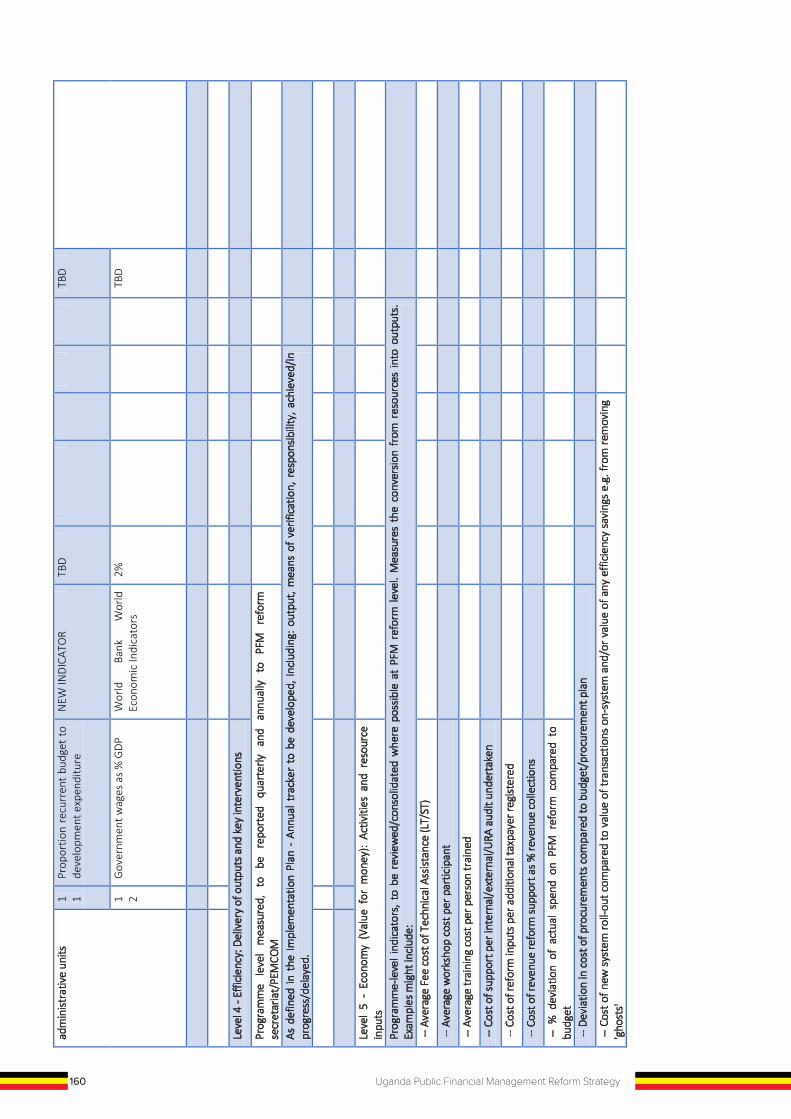
160 Uganda Public Financial Management Reform Strategy
adm
inist
rativ
e un
its
1 1 Pr
opor
tion
recu
rren
t bu
dget
to
deve
lopm
ent e
xpen
ditu
re
NEW
IND
ICAT
OR
TBD
T
BD
1 2 G
over
nmen
t wag
es a
s %
GD
P W
orld
Ba
nk
Wor
ld
Econ
omic
Indi
cato
rs
2%
TBD
Leve
l 4 -
Effic
ienc
y: D
eliv
ery
of o
utpu
ts a
nd k
ey in
terv
entio
ns
Prog
ram
me
leve
l m
easu
red,
to
be
re
port
ed
quar
terly
an
d an
nual
ly
to
PFM
re
form
se
cret
aria
t/PE
MCO
M
As d
efin
ed in
the
Impl
emen
tatio
n Pl
an -
Ann
ual t
rack
er t
o be
dev
elop
ed, i
nclu
ding
: out
put,
mea
ns o
f ve
rific
atio
n, r
espo
nsib
ility
, ach
ieve
d/in
pr
ogre
ss/d
elay
ed.
Leve
l 5
- Ec
onom
y (V
alue
for
mon
ey):
Activ
ities
and
res
ourc
e in
puts
Prog
ram
me-
leve
l ind
icat
ors,
to
be r
evie
wed
/con
solid
ated
whe
re p
ossib
le a
t PF
M r
efor
m le
vel.
Mea
sure
s th
e co
nver
sion
from
res
ourc
es in
to o
utpu
ts.
Exam
ples
mig
ht in
clud
e:
-- A
vera
ge F
ee c
ost o
f Tec
hnic
al A
ssist
ance
(LT/
ST)
-- A
vera
ge w
orks
hop
cost
per
par
ticip
ant
-- A
vera
ge tr
aini
ng c
ost p
er p
erso
n tr
aine
d
-- C
ost o
f sup
port
per
inte
rnal
/ext
erna
l/URA
aud
it un
dert
aken
-- C
ost o
f ref
orm
inpu
ts p
er a
dditi
onal
taxp
ayer
regi
ster
ed
-- C
ost o
f rev
enue
refo
rm s
uppo
rt a
s % re
venu
e co
llect
ions
-- %
dev
iatio
n of
act
ual
spen
d on
PFM
ref
orm
com
pare
d to
bu
dget
-- D
evia
tion
in c
ost o
f pro
cure
men
ts c
ompa
red
to b
udge
t/pr
ocur
emen
t pla
n
-- C
ost o
f new
sys
tem
roll-
out c
ompa
red
to v
alue
of t
rans
actio
ns o
n-sy
stem
and
/or v
alue
of a
ny e
ffici
ency
sav
ings
e.g
. fro
m re
mov
ing
'gho
sts'
Annex E: PFM Reform Strategy List of Technical and Core Design Team A) Steering Committee /PEMCOM
PS/ST – Chair DST, US/AO, DEA,AG,DCM,,DB ,IAG, H/BMAU, PS – MoPS, PS – MoLG, OAG, ED-PPDA, CSBAG representative & All members of the PFM Donor group B) Technical Design Team
1. Mr. Godfrey Ssemugooma Ag. Director FMS (Chair)
2. Mr Stephen Ojambo C/TIP/AGO
3. Mr. Aiden Rujumba C/FMS/AGO
4. Mr David Kiyingi C/PPM/AGO
5. Mr. Kakama Godwin Commissioner BPED/ DB
6. Mr James Wokadala Commissioner/ PAP/ DB
7. Mr Ismail Magona Commissioner/ISSD/DB
8. Mr. Charles Byaruhanga Budget Advisor
9. Mr. Robert Okudi Commissioner (DARC) /DCM
10. Dr. Albert Musisi Commissioner Macro/DEA
11. Mr. Moses Bekabye Economic Affairs Advisor/DEA
12. Mr. Stephen Enabu Internal Audit/IAD
13. Mr. James Tibenkana Head Planning/MFPED
14. Mr. Johnson Mutesigensi PC FINMAP MSU
15. Mr. Paulo Kyama CMC – FINMAP MSU
16. Ms Florence Baleke OAG
17. Ms. Watera Josephine Parliament of Uganda
18. Mr. Patrick Kakembo Manager MIS/PPDA
19. Mr. Edwin Muhumuza Manager Performance Mgt/PPDA
20. Mr. Ismail Ahmad Ministry of Local Government
21. Mr Johnson Gumisiriza Local Government Finance Commission
22. Mr. Robert Bataringaya AC/Policy & Planning - MoPS
23. Mr. Allan Muhereza AC/IPPS/MoPS
24. Mr Robert Muwanga PC/RCIP/NITAU
25. Mr. Peter Kahigi NITAU
26. Mr Daniel Omara URA
27. Mr Nick Roberts PFM DP Consultant
28. Ms. Hazel Granger External Consultant PFM
B) Core Team Members
1. Ms. Bernadette N. Kizito SFMS/AGO
2. Mr Stephen Barungi PFMS/SM/ AGO
3. Mr Hussein Isingoma AC/IAD
4. Ms. Esther Akullo Owor Head/PLANNING FINMAP MSU
5. Mr. Mugabi Emmanuel S/M&E FINMAP MSU
6. Ms. Rossetti Nabumba BMAU/DB
7. Mr Hannington Ashaba AC/PAP/ DB
8. Ms Justine Ayebare Economist/BPED/DB
9. Mr. Moses Ogwapus Ag.C/TPD / DEA
10. Mr. Onesmus Mulondo SFMS/MOLG
11. Mr. Anthony Kintu Coordinator/Accountability Secretariat
12. Mr. Byaruhanga John Economic Development Policy & Research Department (EDP&RD)
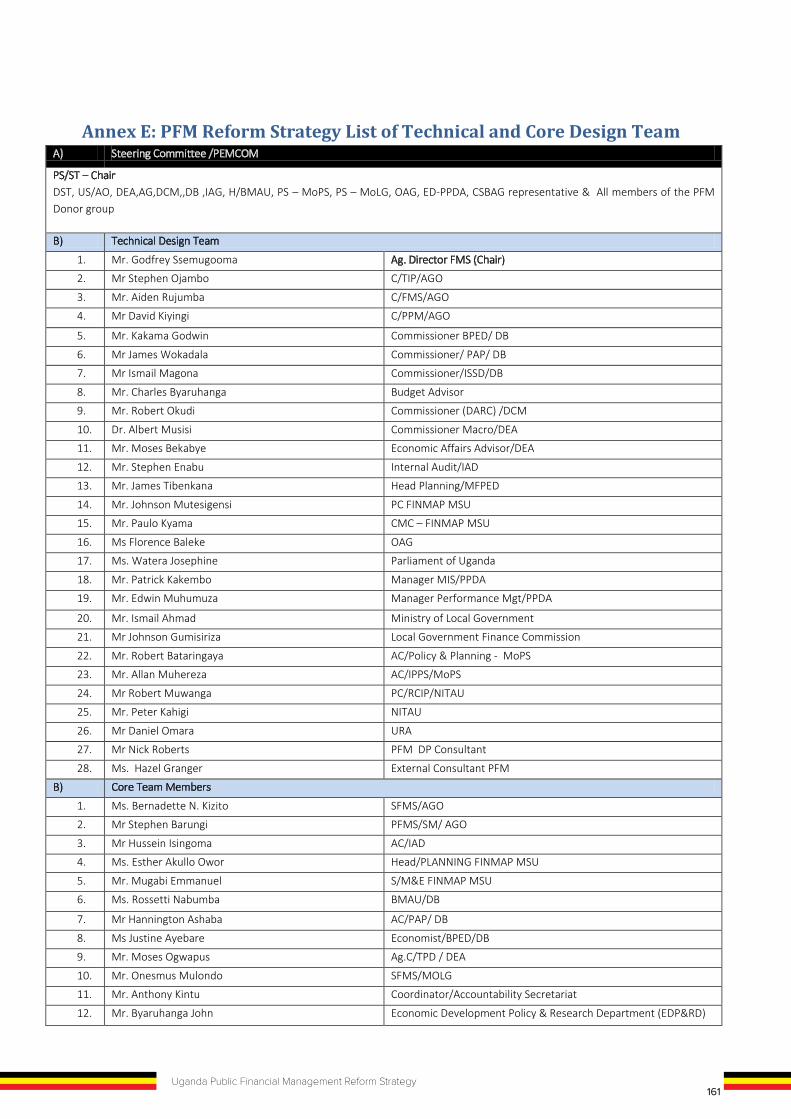
161Uganda Public Financial Management Reform Strategy
adm
inist
rativ
e un
its
1 1 Pr
opor
tion
recu
rren
t bu
dget
to
deve
lopm
ent e
xpen
ditu
re
NEW
IND
ICAT
OR
TBD
T
BD
1 2 G
over
nmen
t wag
es a
s %
GD
P W
orld
Ba
nk
Wor
ld
Econ
omic
Indi
cato
rs
2%
TBD
Leve
l 4 -
Effic
ienc
y: D
eliv
ery
of o
utpu
ts a
nd k
ey in
terv
entio
ns
Prog
ram
me
leve
l m
easu
red,
to
be
re
port
ed
quar
terly
an
d an
nual
ly
to
PFM
re
form
se
cret
aria
t/PE
MCO
M
As d
efin
ed in
the
Impl
emen
tatio
n Pl
an -
Ann
ual t
rack
er t
o be
dev
elop
ed, i
nclu
ding
: out
put,
mea
ns o
f ve
rific
atio
n, r
espo
nsib
ility
, ach
ieve
d/in
pr
ogre
ss/d
elay
ed.
Leve
l 5
- Ec
onom
y (V
alue
for
mon
ey):
Activ
ities
and
res
ourc
e in
puts
Prog
ram
me-
leve
l ind
icat
ors,
to
be r
evie
wed
/con
solid
ated
whe
re p
ossib
le a
t PF
M r
efor
m le
vel.
Mea
sure
s th
e co
nver
sion
from
res
ourc
es in
to o
utpu
ts.
Exam
ples
mig
ht in
clud
e:
-- A
vera
ge F
ee c
ost o
f Tec
hnic
al A
ssist
ance
(LT/
ST)
-- A
vera
ge w
orks
hop
cost
per
par
ticip
ant
-- A
vera
ge tr
aini
ng c
ost p
er p
erso
n tr
aine
d
-- C
ost o
f sup
port
per
inte
rnal
/ext
erna
l/URA
aud
it un
dert
aken
-- C
ost o
f ref
orm
inpu
ts p
er a
dditi
onal
taxp
ayer
regi
ster
ed
-- C
ost o
f rev
enue
refo
rm s
uppo
rt a
s % re
venu
e co
llect
ions
-- %
dev
iatio
n of
act
ual
spen
d on
PFM
ref
orm
com
pare
d to
bu
dget
-- D
evia
tion
in c
ost o
f pro
cure
men
ts c
ompa
red
to b
udge
t/pr
ocur
emen
t pla
n
-- C
ost o
f new
sys
tem
roll-
out c
ompa
red
to v
alue
of t
rans
actio
ns o
n-sy
stem
and
/or v
alue
of a
ny e
ffici
ency
sav
ings
e.g
. fro
m re
mov
ing
'gho
sts'
Annex E: PFM Reform Strategy List of Technical and Core Design Team A) Steering Committee /PEMCOM
PS/ST – Chair DST, US/AO, DEA,AG,DCM,,DB ,IAG, H/BMAU, PS – MoPS, PS – MoLG, OAG, ED-PPDA, CSBAG representative & All members of the PFM Donor group B) Technical Design Team
1. Mr. Godfrey Ssemugooma Ag. Director FMS (Chair)
2. Mr Stephen Ojambo C/TIP/AGO
3. Mr. Aiden Rujumba C/FMS/AGO
4. Mr David Kiyingi C/PPM/AGO
5. Mr. Kakama Godwin Commissioner BPED/ DB
6. Mr James Wokadala Commissioner/ PAP/ DB
7. Mr Ismail Magona Commissioner/ISSD/DB
8. Mr. Charles Byaruhanga Budget Advisor
9. Mr. Robert Okudi Commissioner (DARC) /DCM
10. Dr. Albert Musisi Commissioner Macro/DEA
11. Mr. Moses Bekabye Economic Affairs Advisor/DEA
12. Mr. Stephen Enabu Internal Audit/IAD
13. Mr. James Tibenkana Head Planning/MFPED
14. Mr. Johnson Mutesigensi PC FINMAP MSU
15. Mr. Paulo Kyama CMC – FINMAP MSU
16. Ms Florence Baleke OAG
17. Ms. Watera Josephine Parliament of Uganda
18. Mr. Patrick Kakembo Manager MIS/PPDA
19. Mr. Edwin Muhumuza Manager Performance Mgt/PPDA
20. Mr. Ismail Ahmad Ministry of Local Government
21. Mr Johnson Gumisiriza Local Government Finance Commission
22. Mr. Robert Bataringaya AC/Policy & Planning - MoPS
23. Mr. Allan Muhereza AC/IPPS/MoPS
24. Mr Robert Muwanga PC/RCIP/NITAU
25. Mr. Peter Kahigi NITAU
26. Mr Daniel Omara URA
27. Mr Nick Roberts PFM DP Consultant
28. Ms. Hazel Granger External Consultant PFM
B) Core Team Members
1. Ms. Bernadette N. Kizito SFMS/AGO
2. Mr Stephen Barungi PFMS/SM/ AGO
3. Mr Hussein Isingoma AC/IAD
4. Ms. Esther Akullo Owor Head/PLANNING FINMAP MSU
5. Mr. Mugabi Emmanuel S/M&E FINMAP MSU
6. Ms. Rossetti Nabumba BMAU/DB
7. Mr Hannington Ashaba AC/PAP/ DB
8. Ms Justine Ayebare Economist/BPED/DB
9. Mr. Moses Ogwapus Ag.C/TPD / DEA
10. Mr. Onesmus Mulondo SFMS/MOLG
11. Mr. Anthony Kintu Coordinator/Accountability Secretariat
12. Mr. Byaruhanga John Economic Development Policy & Research Department (EDP&RD)

162 Uganda Public Financial Management Reform Strategy
13. Mr. Joseph Enyimu Ag. AC - Economic Development Policy & Research Department (EDP&RD)
14. Ms. Getrude Basiima Economist /PAP/ DB
15. Mr. Conrad Kahima M&E FINMAP MSU
C) Human Resources Team 1. Mr. Denis Kaggwa AC HR/AGO 2. Mr. Allan Muhereza AC/HRM 3. Mr. Nelson Kahandi PHRO 4. Mr. Yusuf Mawanda SAO/FINMAP D) Finance and Operations Team 1. Ms Jennifer Muhuruzi AGO/TSAM 2. Mr. Aziz Ssetaala AGO/PSA 3 Mr. Swaleh Ssenteza Internal Audit/MoFPED 4 Mr. Paul Ankunda FAM/FINMAP
5. Mr. Mubaraka Nansamba Ag. AC FMS E) Procurement Team 1. Mr. David Kiyingi AC/Procurement Policy 2. Mr. Moses Zziwa FINMAP Contracts Committee 3. Mr. Patrick Kagaba HOP/FINMAP 4. Mr. Uthman Segawa Director Legal, PPDA
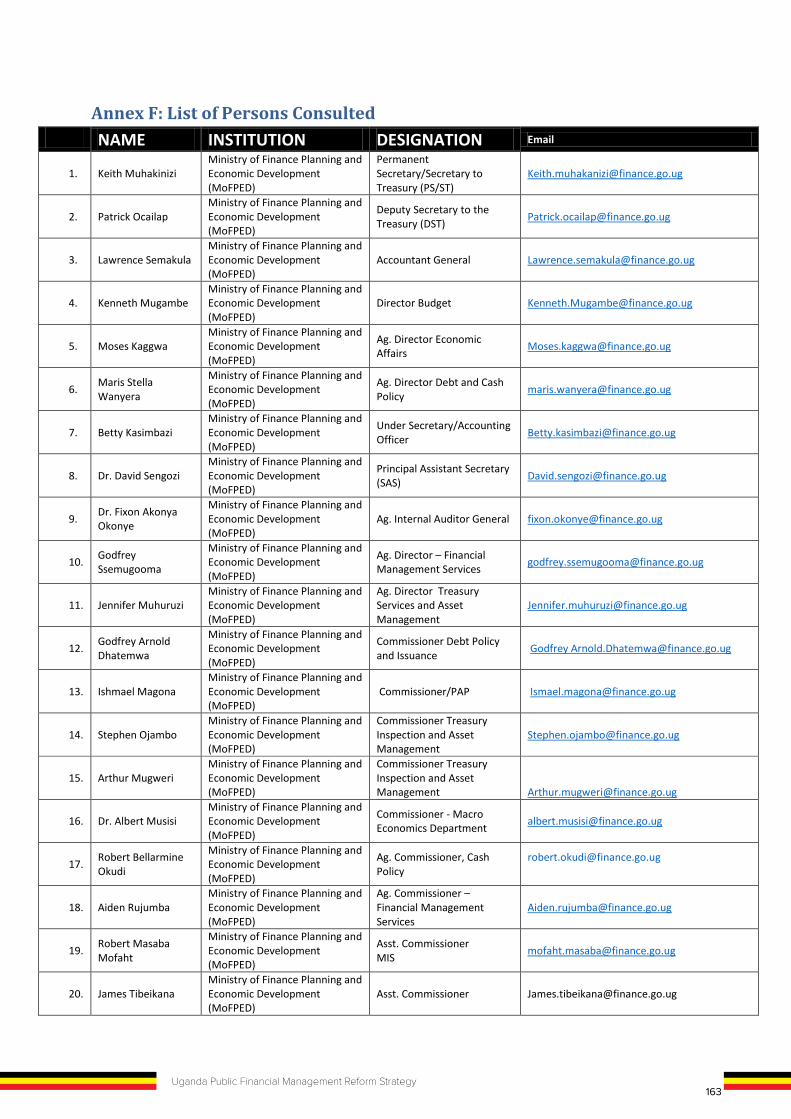
163Uganda Public Financial Management Reform Strategy
13. Mr. Joseph Enyimu Ag. AC - Economic Development Policy & Research Department (EDP&RD)
14. Ms. Getrude Basiima Economist /PAP/ DB
15. Mr. Conrad Kahima M&E FINMAP MSU
C) Human Resources Team 1. Mr. Denis Kaggwa AC HR/AGO 2. Mr. Allan Muhereza AC/HRM 3. Mr. Nelson Kahandi PHRO 4. Mr. Yusuf Mawanda SAO/FINMAP D) Finance and Operations Team 1. Ms Jennifer Muhuruzi AGO/TSAM 2. Mr. Aziz Ssetaala AGO/PSA 3 Mr. Swaleh Ssenteza Internal Audit/MoFPED 4 Mr. Paul Ankunda FAM/FINMAP
5. Mr. Mubaraka Nansamba Ag. AC FMS E) Procurement Team 1. Mr. David Kiyingi AC/Procurement Policy 2. Mr. Moses Zziwa FINMAP Contracts Committee 3. Mr. Patrick Kagaba HOP/FINMAP 4. Mr. Uthman Segawa Director Legal, PPDA
Annex F: List of Persons Consulted NAME INSTITUTION DESIGNATION Email
1. Keith Muhakinizi Ministry of Finance Planning and Economic Development (MoFPED)
Permanent Secretary/Secretary to Treasury (PS/ST)
2. Patrick Ocailap Ministry of Finance Planning and Economic Development (MoFPED)
Deputy Secretary to the Treasury (DST) [email protected]
3. Lawrence Semakula Ministry of Finance Planning and Economic Development (MoFPED)
Accountant General [email protected]
4. Kenneth Mugambe Ministry of Finance Planning and Economic Development (MoFPED)
Director Budget [email protected]
5. Moses Kaggwa Ministry of Finance Planning and Economic Development (MoFPED)
Ag. Director Economic Affairs [email protected]
6. Maris Stella Wanyera
Ministry of Finance Planning and Economic Development (MoFPED)
Ag. Director Debt and Cash Policy [email protected]
7. Betty Kasimbazi Ministry of Finance Planning and Economic Development (MoFPED)
Under Secretary/Accounting Officer [email protected]
8. Dr. David Sengozi Ministry of Finance Planning and Economic Development (MoFPED)
Principal Assistant Secretary (SAS) [email protected]
9. Dr. Fixon Akonya Okonye
Ministry of Finance Planning and Economic Development (MoFPED)
Ag. Internal Auditor General [email protected]
10. Godfrey Ssemugooma
Ministry of Finance Planning and Economic Development (MoFPED)
Ag. Director – Financial Management Services [email protected]
11. Jennifer Muhuruzi Ministry of Finance Planning and Economic Development (MoFPED)
Ag. Director Treasury Services and Asset Management
12. Godfrey Arnold Dhatemwa
Ministry of Finance Planning and Economic Development (MoFPED)
Commissioner Debt Policy and Issuance Godfrey [email protected]
13. Ishmael Magona Ministry of Finance Planning and Economic Development (MoFPED)
Commissioner/PAP [email protected]
14. Stephen Ojambo Ministry of Finance Planning and Economic Development (MoFPED)
Commissioner Treasury Inspection and Asset Management
15. Arthur Mugweri Ministry of Finance Planning and Economic Development (MoFPED)
Commissioner Treasury Inspection and Asset Management [email protected]
16. Dr. Albert Musisi Ministry of Finance Planning and Economic Development (MoFPED)
Commissioner - Macro Economics Department [email protected]
17. Robert Bellarmine Okudi
Ministry of Finance Planning and Economic Development (MoFPED)
Ag. Commissioner, Cash Policy
18. Aiden Rujumba Ministry of Finance Planning and Economic Development (MoFPED)
Ag. Commissioner – Financial Management Services
19. Robert Masaba Mofaht
Ministry of Finance Planning and Economic Development (MoFPED)
Asst. Commissioner MIS [email protected]
20. James Tibeikana Ministry of Finance Planning and Economic Development (MoFPED)
Asst. Commissioner [email protected]
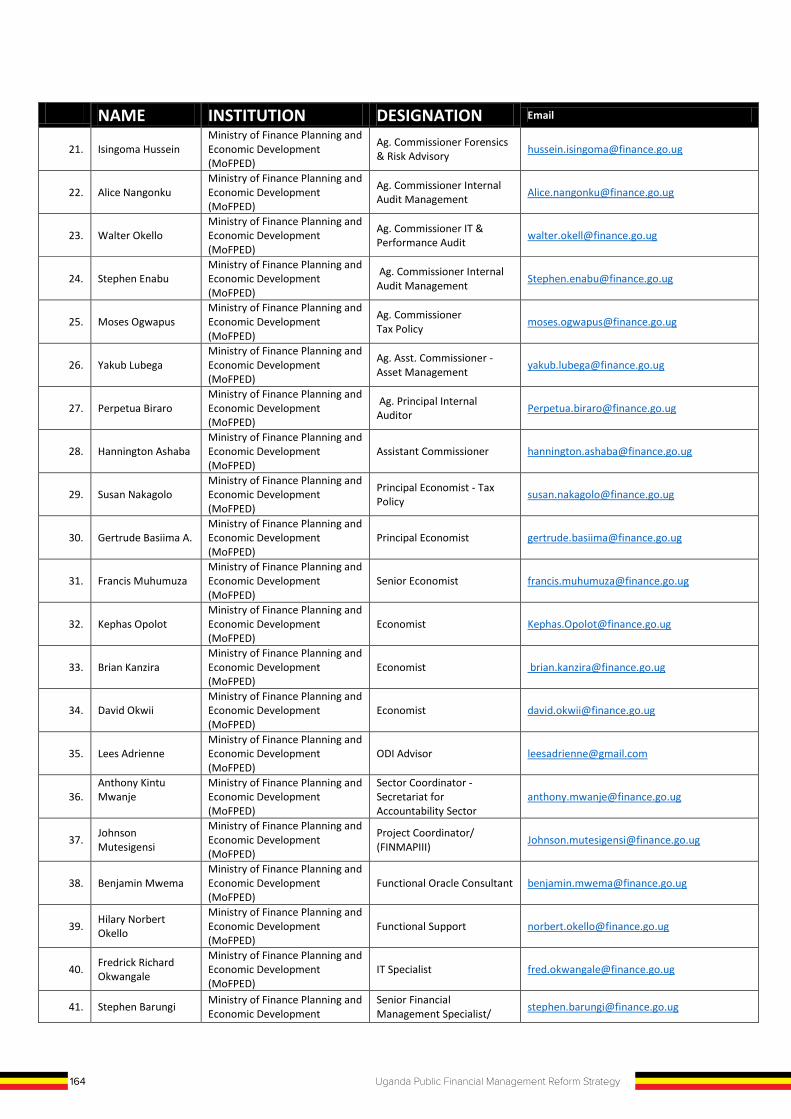
164 Uganda Public Financial Management Reform Strategy
NAME INSTITUTION DESIGNATION Email
21. Isingoma Hussein Ministry of Finance Planning and Economic Development (MoFPED)
Ag. Commissioner Forensics & Risk Advisory [email protected]
22. Alice Nangonku Ministry of Finance Planning and Economic Development (MoFPED)
Ag. Commissioner Internal Audit Management [email protected]
23. Walter Okello Ministry of Finance Planning and Economic Development (MoFPED)
Ag. Commissioner IT & Performance Audit [email protected]
24. Stephen Enabu Ministry of Finance Planning and Economic Development (MoFPED)
Ag. Commissioner Internal Audit Management [email protected]
25. Moses Ogwapus Ministry of Finance Planning and Economic Development (MoFPED)
Ag. Commissioner Tax Policy [email protected]
26. Yakub Lubega Ministry of Finance Planning and Economic Development (MoFPED)
Ag. Asst. Commissioner - Asset Management [email protected]
27. Perpetua Biraro Ministry of Finance Planning and Economic Development (MoFPED)
Ag. Principal Internal Auditor [email protected]
28. Hannington Ashaba Ministry of Finance Planning and Economic Development (MoFPED)
Assistant Commissioner [email protected]
29. Susan Nakagolo Ministry of Finance Planning and Economic Development (MoFPED)
Principal Economist - Tax Policy [email protected]
30. Gertrude Basiima A. Ministry of Finance Planning and Economic Development (MoFPED)
Principal Economist [email protected]
31. Francis Muhumuza Ministry of Finance Planning and Economic Development (MoFPED)
Senior Economist [email protected]
32. Kephas Opolot Ministry of Finance Planning and Economic Development (MoFPED)
Economist [email protected]
33. Brian Kanzira Ministry of Finance Planning and Economic Development (MoFPED)
Economist [email protected]
34. David Okwii Ministry of Finance Planning and Economic Development (MoFPED)
Economist [email protected]
35. Lees Adrienne Ministry of Finance Planning and Economic Development (MoFPED)
ODI Advisor [email protected]
36. Anthony Kintu Mwanje
Ministry of Finance Planning and Economic Development (MoFPED)
Sector Coordinator - Secretariat for Accountability Sector
37. Johnson Mutesigensi
Ministry of Finance Planning and Economic Development (MoFPED)
Project Coordinator/ (FINMAPIII) [email protected]
38. Benjamin Mwema Ministry of Finance Planning and Economic Development (MoFPED)
Functional Oracle Consultant [email protected]
39. Hilary Norbert Okello
Ministry of Finance Planning and Economic Development (MoFPED)
Functional Support [email protected]
40. Fredrick Richard Okwangale
Ministry of Finance Planning and Economic Development (MoFPED)
IT Specialist [email protected]
41. Stephen Barungi Ministry of Finance Planning and Economic Development
Senior Financial Management Specialist/ [email protected]
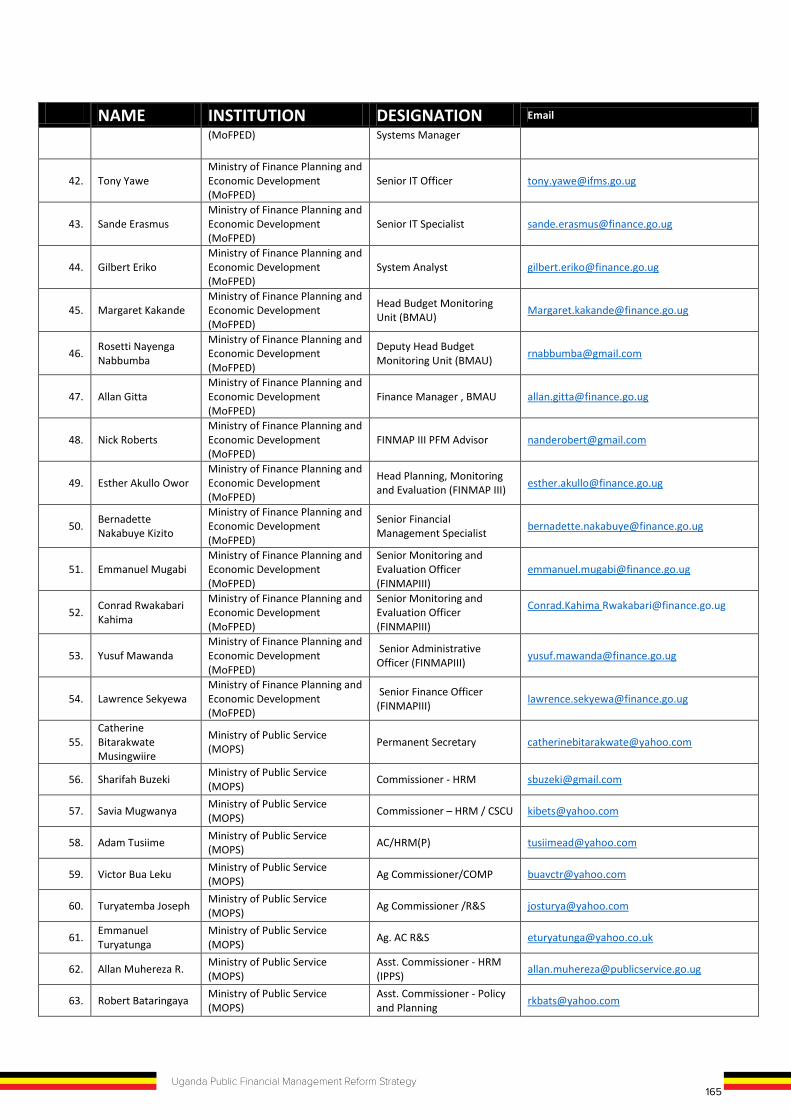
165Uganda Public Financial Management Reform Strategy
NAME INSTITUTION DESIGNATION Email
(MoFPED) Systems Manager
42. Tony Yawe Ministry of Finance Planning and Economic Development (MoFPED)
Senior IT Officer [email protected]
43. Sande Erasmus Ministry of Finance Planning and Economic Development (MoFPED)
Senior IT Specialist [email protected]
44. Gilbert Eriko Ministry of Finance Planning and Economic Development (MoFPED)
System Analyst [email protected]
45. Margaret Kakande Ministry of Finance Planning and Economic Development (MoFPED)
Head Budget Monitoring Unit (BMAU) [email protected]
46. Rosetti Nayenga Nabbumba
Ministry of Finance Planning and Economic Development (MoFPED)
Deputy Head Budget Monitoring Unit (BMAU) [email protected]
47. Allan Gitta Ministry of Finance Planning and Economic Development (MoFPED)
Finance Manager , BMAU [email protected]
48. Nick Roberts Ministry of Finance Planning and Economic Development (MoFPED)
FINMAP III PFM Advisor [email protected]
49. Esther Akullo Owor Ministry of Finance Planning and Economic Development (MoFPED)
Head Planning, Monitoring and Evaluation (FINMAP III) [email protected]
50. Bernadette Nakabuye Kizito
Ministry of Finance Planning and Economic Development (MoFPED)
Senior Financial Management Specialist [email protected]
51. Emmanuel Mugabi Ministry of Finance Planning and Economic Development (MoFPED)
Senior Monitoring and Evaluation Officer (FINMAPIII)
52. Conrad Rwakabari Kahima
Ministry of Finance Planning and Economic Development (MoFPED)
Senior Monitoring and Evaluation Officer (FINMAPIII)
Conrad.Kahima [email protected]
53. Yusuf Mawanda Ministry of Finance Planning and Economic Development (MoFPED)
Senior Administrative Officer (FINMAPIII) [email protected]
54. Lawrence Sekyewa Ministry of Finance Planning and Economic Development (MoFPED)
Senior Finance Officer (FINMAPIII) [email protected]
55. Catherine Bitarakwate Musingwiire
Ministry of Public Service (MOPS) Permanent Secretary [email protected]
56. Sharifah Buzeki Ministry of Public Service (MOPS) Commissioner - HRM [email protected]
57. Savia Mugwanya Ministry of Public Service (MOPS) Commissioner – HRM / CSCU [email protected]
58. Adam Tusiime Ministry of Public Service (MOPS) AC/HRM(P) [email protected]
59. Victor Bua Leku Ministry of Public Service (MOPS) Ag Commissioner/COMP [email protected]
60. Turyatemba Joseph Ministry of Public Service (MOPS) Ag Commissioner /R&S [email protected]
61. Emmanuel Turyatunga
Ministry of Public Service (MOPS) Ag. AC R&S [email protected]
62. Allan Muhereza R. Ministry of Public Service (MOPS)
Asst. Commissioner - HRM (IPPS) [email protected]
63. Robert Bataringaya Ministry of Public Service (MOPS)
Asst. Commissioner - Policy and Planning [email protected]
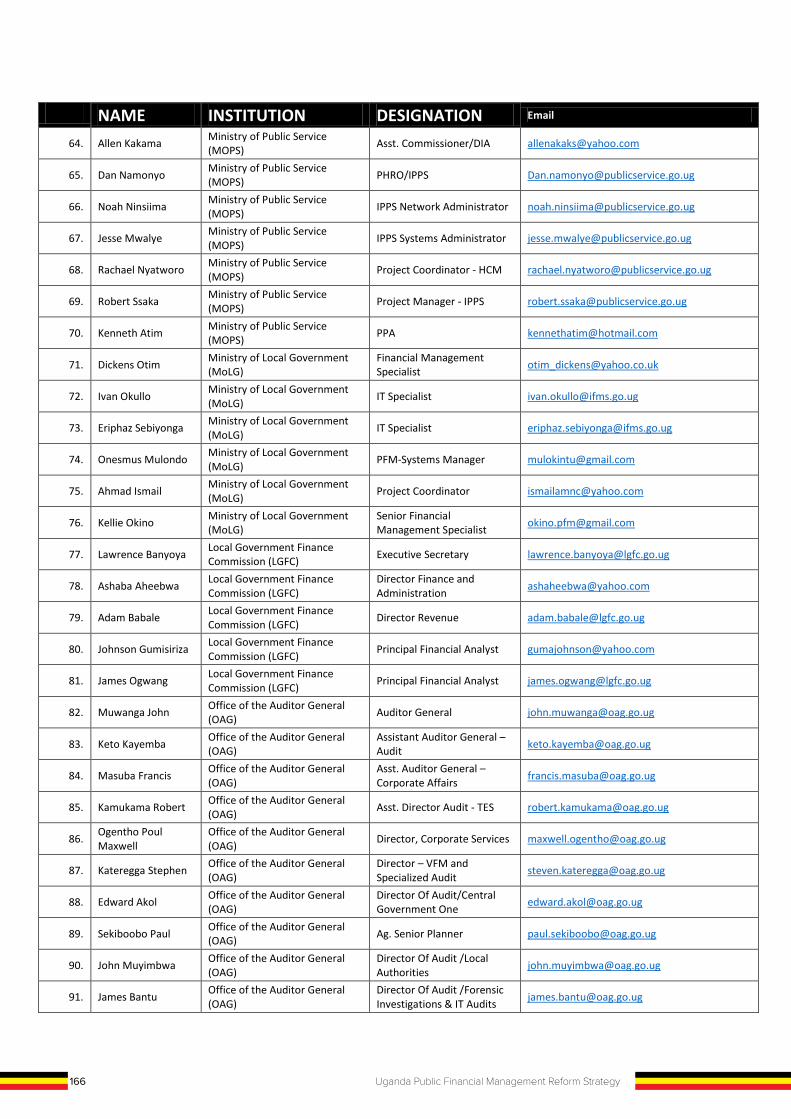
166 Uganda Public Financial Management Reform Strategy
NAME INSTITUTION DESIGNATION Email
64. Allen Kakama Ministry of Public Service (MOPS) Asst. Commissioner/DIA [email protected]
65. Dan Namonyo Ministry of Public Service (MOPS) PHRO/IPPS [email protected]
66. Noah Ninsiima Ministry of Public Service (MOPS) IPPS Network Administrator [email protected]
67. Jesse Mwalye Ministry of Public Service (MOPS) IPPS Systems Administrator [email protected]
68. Rachael Nyatworo Ministry of Public Service (MOPS) Project Coordinator - HCM [email protected]
69. Robert Ssaka Ministry of Public Service (MOPS) Project Manager - IPPS [email protected]
70. Kenneth Atim Ministry of Public Service (MOPS) PPA [email protected]
71. Dickens Otim Ministry of Local Government (MoLG)
Financial Management Specialist [email protected]
72. Ivan Okullo Ministry of Local Government (MoLG) IT Specialist [email protected]
73. Eriphaz Sebiyonga Ministry of Local Government (MoLG) IT Specialist [email protected]
74. Onesmus Mulondo Ministry of Local Government (MoLG) PFM-Systems Manager [email protected]
75. Ahmad Ismail Ministry of Local Government (MoLG) Project Coordinator [email protected]
76. Kellie Okino Ministry of Local Government (MoLG)
Senior Financial Management Specialist [email protected]
77. Lawrence Banyoya Local Government Finance Commission (LGFC) Executive Secretary [email protected]
78. Ashaba Aheebwa Local Government Finance Commission (LGFC)
Director Finance and Administration [email protected]
79. Adam Babale Local Government Finance Commission (LGFC) Director Revenue [email protected]
80. Johnson Gumisiriza Local Government Finance Commission (LGFC) Principal Financial Analyst [email protected]
81. James Ogwang Local Government Finance Commission (LGFC) Principal Financial Analyst [email protected]
82. Muwanga John Office of the Auditor General (OAG) Auditor General [email protected]
83. Keto Kayemba Office of the Auditor General (OAG)
Assistant Auditor General – Audit [email protected]
84. Masuba Francis Office of the Auditor General (OAG)
Asst. Auditor General – Corporate Affairs [email protected]
85. Kamukama Robert Office of the Auditor General (OAG) Asst. Director Audit - TES [email protected]
86. Ogentho Poul Maxwell
Office of the Auditor General (OAG) Director, Corporate Services [email protected]
87. Kateregga Stephen Office of the Auditor General (OAG)
Director – VFM and Specialized Audit [email protected]
88. Edward Akol Office of the Auditor General (OAG)
Director Of Audit/Central Government One [email protected]
89. Sekiboobo Paul Office of the Auditor General (OAG) Ag. Senior Planner [email protected]
90. John Muyimbwa Office of the Auditor General (OAG)
Director Of Audit /Local Authorities [email protected]
91. James Bantu Office of the Auditor General (OAG)
Director Of Audit /Forensic Investigations & IT Audits [email protected]
167Uganda Public Financial Management Reform Strategy
NAME INSTITUTION DESIGNATION Email
92. Anthony Kimuli Office of the Auditor General (OAG)
Assistant Director Of Audit/CG2 [email protected]
93. Fredrick Akyaire Office of the Auditor General (OAG)
Assistant Director Of Audit /LA [email protected]
94. Sheila Semugooma Office of the Auditor General (OAG)
Assistant Director Of Audit /LA [email protected]
95. Robert Kamukama Office of the Auditor General (OAG) Assistant Director Of Audit [email protected]
96. Liz Nambuya Office of the Auditor General (OAG)
Assistant Director Of Audit /VFM [email protected]
97. Joseph Hirya Office of the Auditor General (OAG)
Director Of Audit /Central Government Two [email protected]
98. `Kibuuka Office of the Auditor General (OAG)
Manager – Finance and Admin [email protected]
99. Didas Tumuhairwe Office of the Auditor General (OAG) Manager-HRMD [email protected]
100. Abdul Muwanika Office of the Prime Minister (OPM)
Ag. Asst. Commissioner , Monitoring and Evaluation [email protected]
101. Ibrahim Wandera Office of the Prime Minister (OPM) Ag. Senior Economist [email protected]
102. Timothy Lubanga Office of the Prime Minister (OPM)
Asst. Commissioner - Monitoring and Evaluation [email protected]
103. Hadard Arinaitwe Office of the Prime Minister (OPM) Economist [email protected]
104. `Mbabazi Office of the Prime Minister (OPM) Information Systems Officer [email protected]
105. Dison Okumu Parliament of Uganda Director, Corporate and Planning Services [email protected]
106. George Muwonge Parliament of Uganda Assistant Director Planning and Policy Development [email protected]
107. Josephine Semakula Watera Parliament of Uganda Principal M&E Officer [email protected]
108. Catherin Ninsiima Parliament of Uganda M&E Officer [email protected]
109. William Kanyesigye Jinja District Local Government Chief Administrative Officer (CAO) [email protected]
110. Norbert Turyahikayo Jinja District Local Government Deputy Administrative
Officer (CAO) [email protected]
111. David Nabeeta Jinja District Local Government District Education Officer [email protected]
112. Dr. Nantanale Dyogo Jinja District Local Government District Health Officer [email protected]
113. James Bulyerali Wasswa Jinja District Local Government District Internal Auditor [email protected]
114. Paul Mulawe Jinja District Local Government Principal Accountant [email protected]
115. Prossy Kasiko Jinja District Local Government Senior Human Resource Officer [email protected]
116. Rebecca Nabirye Jinja District Local Government Accounts Assistant [email protected]
117. Ronald Elijah Kafifi Jinja District Local Government Principal Finance Officer [email protected]
118. Anthony Martin Lukwago
Masaka District Local Government
Chief Administrative Officer (CAO) [email protected]
119. Allen Namaganda Masaka District Local Government Accounts Assistant [email protected]

168 Uganda Public Financial Management Reform Strategy
NAME INSTITUTION DESIGNATION Email
120. Jessica Nakabira Kyanda
Masaka District Local Government Ag. Accountant [email protected]
121. Pascole Kabuye Masaka District Local Government CAO Representative [email protected]
122. Michael Newman Byamugisha
National Information Technology Authority Uganda (NITA-U)
Ag. RCIP – Coordinator [email protected]
123. Robert Muwanga National Information Technology Authority Uganda (NITA-U)
Project Coordinator - RCIP [email protected]
124. Peter Kahiigi National Information Technology Authority Uganda (NITA-U)
Director - E-Government Services [email protected]
125. Arnold Mangeni National Information Technology Authority Uganda (NITA-U)
Director - Information Security [email protected]
126. Dr. Fredrick Kitoogo E.
National Information Technology Authority Uganda (NITA-U)
Director - Planning, Research and Development [email protected]
127. Vivian Ddambya National Information Technology Authority Uganda (NITA-U)
Director - Technical Services [email protected]
128. Richard Obita National Information Technology Authority Uganda (NITA-U)
IT Services Manager [email protected]
129. Rowena Turinawe National Information Technology Authority Uganda (NITA-U)
Manager - Portfolio Management [email protected]
130. Allan Kyazze National Information Technology Authority Uganda (NITA-U)
Network Manager [email protected]
131. Dr. Joseph Muvawala
National Planning Authority (NPA) Executive Director [email protected]
132. Paul Okitoi National Planning Authority (NPA) Manager Strategic Planning [email protected]
133. Catherine Mayanja National Planning Authority (NPA)
Ag. Head Governance and Public Sector Management
134. Job Lakal Economic Policy Research Centre (EPRC)
Research Analyst - Macroeconomics Dept [email protected]
135. Musa Muyanja Lwanga
Economic Policy Research Centre (EPRC)
Research Analyst - Trade & Regional Integration Dept [email protected]
136. Paul Lakuma Economic Policy Research Centre (EPRC)
Research Fellow - Macroeconomics Dept [email protected]
137. Brian Sserunjogi Economic Policy Research Centre (EPRC)
Research Fellow - Macroeconomics Dept [email protected]
138. Dr. Ezra Munyambonera
Economic Policy Research Centre (EPRC)
Senior Research Fellow - Macroeconomics Dept [email protected]
139. Benson Turyamwe Public Procurement and Disposal Authority (PPDA) Ag. Executive Director [email protected]
140. Aloysius Byaruhanga
Public Procurement and Disposal Authority (PPDA)
Ag. Director Performance Monitoring [email protected]
141. Ojambo Moses Public Procurement and Disposal Authority (PPDA)
Director Capacity Building & Advisory Services [email protected]
142. Uthman Segawa Public Procurement and Disposal Authority (PPDA)
Director Legal and Investigations [email protected]
143. Patrick Kakembo Public Procurement and Disposal Authority (PPDA) Ag. Director, Corporate [email protected]
169Uganda Public Financial Management Reform Strategy
NAME INSTITUTION DESIGNATION Email
144. Bradford Ochieng Public Procurement and Disposal Authority (PPDA) Director, Corporate [email protected]
145. Gideon Badagawa Private Sector Foundation Uganda (PSFU) Executive Director [email protected]
146. Elijah Tugume Private Sector Foundation Uganda (PSFU) Finance Manager CEDP [email protected] or [email protected]
147. Francis Kisirinya Private Sector Foundation Uganda (PSFU) Director Corporate Affairs [email protected]
148. Allan Ssenyondwa Uganda Manufacturers Association (UMA) IPO - Director [email protected] or [email protected]
149. Richard Bright Kimuli
Uganda Bureau of Statistics (UBOS) Census Technical Officer [email protected]
150. Chris Mukiza N. (Phd)
Uganda Bureau of Statistics (UBOS)
Director – Macro Economic Statistics [email protected]
151. Doris Akol Uganda Revenue Authority (URA) Commissioner General [email protected]
152. Nockline Opiyo Uganda Revenue Authority (URA) Ag. Asst. Commissioner – IT [email protected]
153. Marion Atukunda Uganda Revenue Authority (URA)
Ag. Manager - Strategy Dev’t and Management [email protected]
154. Milly Nalukwago Uganda Revenue Authority (URA)
Asst. Comm – Research and Planning [email protected]
155. Silajji Baguma Kanyesigye
Uganda Revenue Authority (URA)
Asst. Commissioner - Domestic Taxes [email protected]
156. Diana Kisaka Uganda Revenue Authority (URA)
Asst. Commissioner – Finance [email protected]
157. William Kiganda Uganda Revenue Authority (URA)
Asst. Commissioner - Human Resources [email protected]
158. Joseph Mwangala Uganda Revenue Authority (URA)
Asst. Commissioner - Internal Audit [email protected]
159. Stella Nyapendi Uganda Revenue Authority (URA)
Asst. Commissioner - Policy and Rulings [email protected]
160. Vincent Seruma Uganda Revenue Authority (URA)
Asst. Commissioner - Public and Corporate Affairs [email protected],ug
161. James Kisaale Uganda Revenue Authority (URA)
Asst. Commissioner - Trade Customs [email protected]
162. Herbert Rusoke Uganda Revenue Authority (URA)
Commissioner – Corporate Services [email protected]
163. Patience Rubagumya Tumusiime
Uganda Revenue Authority (URA)
Commissioner - Legal and Board Affairs [email protected]
164. Henry Saka Uganda Revenue Authority (URA)
Commissioner Domestic Taxes (Ag. Comm. General) [email protected]
165. Patrick Mukiibi Uganda Revenue Authority (URA)
Commissioner Tax Investigations [email protected]
166. Sarah Banage Uganda Revenue Authority (URA)
Executive Asst. – Commissioner General [email protected]
167. Sheena H. Namitala Uganda Revenue Authority (URA)
Manager - Strategy Dev’t and Management [email protected]
168. Nelson Bwire Uganda Revenue Authority (URA) Officer – Budget [email protected]
169. Charles Lukwago Uganda Revenue Authority (URA) Supervisor – Budget [email protected]
170. Denis Kato Uganda Revenue Authority (URA)
Supervisor - Strategy Dev’t and Mgt [email protected]
171. Frank Mulumba Uganda Revenue Authority (URA)
Supervisor - Strategy Dev’t and Mgt [email protected]
172. Dr. Martin Brownbridge Bank of Uganda (BoU) Advisor to Governor [email protected]

170 Uganda Public Financial Management Reform Strategy
NAME INSTITUTION DESIGNATION Email
173. Daniel Omara Bank of Uganda (BoU) [email protected]
174. Martin Morris Wabwire Budget Strengthening Local Sector Planning and
Budgeting Advisor [email protected]
175. Julius Mukunda Civil Society Budget Advocacy Group (CSBAG) Executive Director [email protected]
176. John Mark Agong Civil Society Budget Advocacy Group (CSBAG) Budget Policy Specialist [email protected]
177. Sophie Nampewo Njuba
Civil Society Budget Advocacy Group (CSBAG) Budget Policy Specialist [email protected]
178. Jeff Wadulo Gidaguyi
Civil Society Budget Advocacy Group (CSBAG) Parliamentary Liaison Officer [email protected]
179. Lyvia Kakonge USAID Democracy, Law and Rights Advisor [email protected]
180. Steve Rozner USAID Fiscal Advisor [email protected]
181. Felix Kazahura USAID Governance Specialist [email protected]
182. Eva Matsiko GAPP Chief of Party [email protected]
183. Albert Oduman GAPP Governance Advisor [email protected]
184. Magoola B Kalyebbi USAID-LPFM II Project Tax Administration Specialist [email protected]
185. Joseph Mawejje World Bank Economist [email protected]
186. Rachel Sebude World Bank Economist [email protected]
187. Babara Magezi World Bank Economist [email protected]
188. Paul Kamuchwezi World Bank Economist [email protected]
189. Thomas Tiedemann European Union Deputy Head of Section, Operations [email protected]
190. Tarik Kubach European Union PFM Programme Officer [email protected]
191. Hanne Fritzen DANIDA Counsellor, Danish Embassy [email protected]
192. Cate Najjuma DANIDA Senior Programme Advisor - Economist [email protected]
193. Orla Kelly DFID Governance Adviser [email protected]
194. Paul Mullard DFID Senior Economic Adviser [email protected]
195. Bhavna Sharma DFID Governance Adviser [email protected]
196. Laura Chappell DFID Governance Adviser [email protected]
197. Joyce Kokuteta Ngaiza DFID Governance Adviser [email protected]
198. Einar Fogh GIZ Head of Component - Strengthening External Audit [email protected]
199. Paul Rwabutara GIZ Technical Advisor- Strengthening External Audit [email protected]
200. Oliver Jünger KfW Director Kampala Office [email protected]
201. Samuel kajoba Norway Embassy Senior Programme Officer
202. Clara Mira International Monetary Fund (IMF)
Resident Representative for Uganda [email protected]
203. Alice Owuor International Monetary Fund (IMF) DRM Expert [email protected]
204. Liz Samula International Monetary Fund (IMF) Economist [email protected]

UG
AN
DA
PU
BLIC
FIN
AN
CIA
L MA
NA
GE
ME
NT
RE
FO
RM
ST
RA
TE
GY
(Ju
ly 20
18 Ju
ne
20
23
)
VU
MINISTRY OF FINANCE, PLANNING AND ECONOMIC DEVELOPMENT
Plot 2-12& 2A, Sir Apollo Kaggwa Road P.O.Box 8147 KampalaDIR: (256)-414-231390 FAX:(256)-414-230163 OR (256)-414-341286
UGANDA PUBLIC FINANCIALMANAGEMENT REFORM STRATEGY
(July 2018 – June 2023)
THE REPUBLIC OF UGANDA
Related Documents