UGANDA BUREAU OF STATISTICS 2021 STATISTICAL ABSTRACT

Welcome message from author
This document is posted to help you gain knowledge. Please leave a comment to let me know what you think about it! Share it to your friends and learn new things together.
Transcript
UGANDA BUREAU OF STATISTICS
2021
STATISTICAL ABSTRACT

ii
FOREWORD
The Uganda Bureau of Statistics (UBOS) is committed to the production and dissemination of integrated
statistical information that meets the National and International standards quality requirements.
Specifically, indicators are required for monitoring the progress towards achieving the goal of the Third
National Development Plan (NDP III) which covers Financial Years (FY) 2020/21-2024/25 “increasing
household incomes and improving the quality of life of Ugandans”, other requirements include,
updating the international developments frameworks such as the United Nations (UN) Sustainable
Development Goals (SDGs), the Africa Union (AU) Agenda 2063, and the East African Community (EAC)
Agenda 2050. This Statistical Abstract is the prime annual publication through which UBOS disseminates
key statistical information derived from the latest censuses, surveys and administrative records of
Ministries, Departments and Agencies (MDAs), Higher Local Governments (HLGs) and some Civil Society
Organisations (CSOs). The information is critical in tracking progress, implementation, decision-making as
well as service delivery.
The information presented in the 2021 Statistical Abstract covers statistics on the Environmental,
Demographic, Socio-economic, Production and Macroeconomic sectors. Information on these sectors is
structured based on either a Calendar Year (CY) starting from January to December or Financial Year
(FY) starting from July to June, depending on data availability.
The Bureau appreciates the continued cooperation of the MDAs, HLGs and CSOs in providing the
requisite data for production of this publication. In a special way, we wish to thank the 2020 Statistical
Abstract Committee that compiled this publication and Government of Uganda (GoU) for continued
support to statistical production. The Bureau welcomes constructive comments from stakeholders that aim
at enhancing the quality of its future publications.
Copies of this publication are available at the Bureau’s Head Office located at Statistics House, Plot 9,
Colville Street, Kampala and the official UBOS website: www.ubos.org.
It’s our sincere hope that the statistical information in this publication will be used by all stakeholders to
make informed decisions.
Imelda Atai Musana (PhD)
For: Executive Director
iii
Table of Contents
FOREWORD ....................................................................................................................................................................................ii
Table of Contents ..........................................................................................................................................................................iii
A Map of Uganda Showing Population Distribution by District -2021 ......................................................................................vi
List of Acronyms......................................................................................................................................................................... vii
Executive Summary .....................................................................................................................................................................x
Glossary ................................................................................................................................................................................. xviii
National Standard indicator Framework ............................................................................................................................... xxx
CHAPTER ONE: ENVIRONMENT STATISTICS .........................................................................................................................1
1.0 Administrative Units ..............................................................................................................................................................1
1.1 Land Cover ...............................................................................................................................................................................1
1.2 Forests .....................................................................................................................................................................................3
1.2.1 Forests Cover .......................................................................................................................................................................................... 3
1.2.2 Local and Central Forest Reserves ........................................................................................................................................................... 3
1.2.3 Production of Round Wood ....................................................................................................................................................................... 4
1.3 CLIMATE ...................................................................................................................................................................................5
1.3.1 Rainfall and Rain-days .............................................................................................................................................................................. 5
1.3.2 Temperature ........................................................................................................................................................................................... 8
1.3.3 Relative Humidity ...................................................................................................................................................................................... 9
1.4 Water Supply .......................................................................................................................................................................... 10
1.4.1 Water Produced and supplied - Metered ................................................................................................................................................. 10
1.4.2 Water produced - Unmetered .................................................................................................................................................................. 10
1.5 Waste Statistics .................................................................................................................................................................... 11
1.5.1 Municipal Solid Waste ............................................................................................................................................................................. 11
1.5.2 Hazardous Waste Collected by Licensed waste agents ........................................................................................................................... 12
1.5.3 Electronic Waste (E-Waste) .................................................................................................................................................................... 12
CHAPTER TWO: DEMOGRAPHY AND SOCIOECONOMIC STATISTICS ............................................................................ 14
2.1.1 Population Trends ................................................................................................................................................................................... 14
2.1.2 Population Distribution by Age and Sex ................................................................................................................................................... 15
2.1.3 Population in Urban Areas ...................................................................................................................................................................... 16
2.1.4 Marital Status ......................................................................................................................................................................................... 17
2.1.5 Fertility ......................................................................................................................................................................................... 18
2.1.6 Mortality ......................................................................................................................................................................................... 19
2.1.7 Life Expectancy at Birth ........................................................................................................................................................................... 19
2.1.8 Households ......................................................................................................................................................................................... 20
2.2 Education ............................................................................................................................................................................... 21
2.2.1 Pre-Primary School Education ................................................................................................................................................................. 21
2.2.2 Primary School Education ....................................................................................................................................................................... 22
2.2.3 Secondary School Education................................................................................................................................................................... 25
2.2.4 Tertiary Education ................................................................................................................................................................................... 29
2.2.5 Literacy ......................................................................................................................................................................................... 30
2.3 Labour Statistics .................................................................................................................................................................. 31
2.3.1 Work concept ......................................................................................................................................................................................... 31
2.3.2 Key Labour Market Indicators of the Working Population ........................................................................................................................ 31
2.3.3 Key Labour Market Indicators of the employed population ...................................................................................................................... 32
2.3.4 Unemployment ........................................................................................................................................................................................ 38
2.3.5 Activities of Children ................................................................................................................................................................................ 40
2.3.6 Employment in the Civil Service .............................................................................................................................................................. 42
2.3.7 Social Security ....................................................................................................................................................................................... 44
iv
2.3.8 Migrant Workers ...................................................................................................................................................................................... 45
2.4 Household Expenditure and Poverty ................................................................................................................................ 48
2.4.1 Share of Household Expenditure by item group ....................................................................................................................................... 48
2.4.2 Share of household food by source ......................................................................................................................................................... 49
2.4.3 Income Mobility - Quintile Analysis .......................................................................................................................................................... 50
2.4.4 Changes in Income Poverty Status (2015/16-2019/20) ............................................................................................................................ 50
2.4.5 Household Welfare Correlates ................................................................................................................................................................. 51
2.5 Health Statistics .................................................................................................................................................................. 55
2.5.1 Health Facilities ....................................................................................................................................................................................... 55
2.5.2 Human Resources for Health .................................................................................................................................................................. 55
2.5.3 Health Sector financing ........................................................................................................................................................................... 57
2.5.4 Leading Causes of Death ........................................................................................................................................................................ 58
2.5.5 Maternal Health Care .............................................................................................................................................................................. 58
2.5.6 Tuberculosis Detection and Treatment .................................................................................................................................................... 60
2.5.7 Causes of Under-five Health Facility Based Mortality ............................................................................................................................... 60
2.5.8 New Outpatient Department utilization Rate ............................................................................................................................................ 61
2.5.9 Selected Health Sector Performance Assessment................................................................................................................................... 62
2.5.10 Birth notification in health facilities ......................................................................................................................................................... 62
2.5.11 Contraceptive use ................................................................................................................................................................................. 63
2.5.12 Gender Based Violence ......................................................................................................................................................................... 64
2.6 Crime Statistics..................................................................................................................................................................... 65
2.6.1 Annual Crime Rate .................................................................................................................................................................................. 65
2.6.2 Victims of Crime ...................................................................................................................................................................................... 66
2.6.3 Perpetrators of Crime .............................................................................................................................................................................. 67
2.6.4 Serious Crimes Investigated and Prosecuted .......................................................................................................................................... 67
2.6.5 Traffic and Road Safety........................................................................................................................................................................... 68
2.6.6 Prison Statistics ....................................................................................................................................................................................... 72
CHAPTER THREE: PRODUCTION STATISTICS ..................................................................................................................... 78
3.1 Agriculture and Fisheries .................................................................................................................................................... 78
3.1.1 Major Cash Crops ................................................................................................................................................................................... 78
3.1.2 Area and production of Food Crops, 2020 ............................................................................................................................................... 78
3.2 Industry Statistics ................................................................................................................................................................. 80
3.2.1 Index of Production (Manufacturing) ......................................................................................................................................................... 80
3.3 ENERGY .................................................................................................................................................................................. 81
3.3.1 Import of Petroleum products .................................................................................................................................................................. 81
3.3.2 Petroleum Sales ...................................................................................................................................................................................... 81
3.3.3: Annual Average Retail Prices for Petroleum Products ............................................................................................................................ 82
3.3.4 Electricity ......................................................................................................................................................................................... 82
3.4 Building and Construction Statistics ................................................................................................................................ 85
3.4.1: Building Statistics ................................................................................................................................................................................... 85
3.4.2: Building Plans submitted ........................................................................................................................................................................ 85
3.4.3: Plans Approved ...................................................................................................................................................................................... 86
3.4.4: Occupational Permits Issued .................................................................................................................................................................. 86
3.4.5: Plans Deferred ....................................................................................................................................................................................... 87
3.4.6 Plans Rejected ........................................................................................................................................................................................ 87
3.4.7 Consumption of Cement .......................................................................................................................................................................... 88
3.5 Mineral Statistics .................................................................................................................................................................. 89
3.5.1: Mineral Production by Quantity ............................................................................................................................................................... 89
3.5.2: Mineral Production by Value ................................................................................................................................................................... 90
3.6 Transport and Communication Statistics ......................................................................................................................... 91
3.6.1 Roads transport ....................................................................................................................................................................................... 91
3.6.2 Newly registered motor vehicles .............................................................................................................................................................. 93
3.6.3 Licensed Transport Vehicles for Public Use. ........................................................................................................................................... 93
v
3.6.4 Air Transport ......................................................................................................................................................................................... 94
3.6.5 Water Passenger Transport .................................................................................................................................................................... 95
3.6.6 Railway Transport statistics ..................................................................................................................................................................... 95
3.7 Communication Statistics .................................................................................................................................................... 96
3.7.1 Postal and Courier Services .................................................................................................................................................................... 96
3.7.2 Mobile Money Transactions .................................................................................................................................................................... 96
3.8 Migration and Tourism ........................................................................................................................................................ 97
3.8.1 International Arrivals and Departures ...................................................................................................................................................... 97
3.8.2 Wildlife Tourism .................................................................................................................................................................................... 101
3.8.3 Accommodation Statistics ..................................................................................................................................................................... 103
CHAPTER FOUR: MACROECONOMIC STATISTICS ................................................................................................................ 105
4.1 National Accounts .............................................................................................................................................................. 105
4.1.1 Gross Domestic Product ........................................................................................................................................................................ 105
4.1.2 Gross Domestic Product by Broad Economic Sectors ........................................................................................................................... 106
4.1.3 Agriculture, forestry and fishing sector ................................................................................................................................................... 107
4.1.4 Industry sector ...................................................................................................................................................................................... 108
4.1.5 Services sector ...................................................................................................................................................................................... 109
4.1.6 GDP by Expenditure .............................................................................................................................................................................. 113
4.1.7 GDP by Institutional sectors .................................................................................................................................................................. 115
4.1.8 Balance of Payments ............................................................................................................................................................................ 117
4.2 Price Statistics .................................................................................................................................................................... 118
4.2.1 Consumer Price Index (CPI).................................................................................................................................................................. 118
4.2.2 Producer Price Index – Manufacturing & Utilities ................................................................................................................................... 121
4.2.3 The Producer Price Index-Hotels & Restaurants ................................................................................................................................... 125
4.2.4 Construction Sector Indices ................................................................................................................................................................... 126
4.3 External Trade ...................................................................................................................................................................... 127
4.3.1 Summary of External Trade Statistics .................................................................................................................................................... 127
4.3.2 Exports ....................................................................................................................................................................................... 128
4.3.3 Exports by Destination .......................................................................................................................................................................... 128
4.3.4 Performance of Formal Commodity Exports .......................................................................................................................................... 128
4.3.5 Imports ....................................................................................................................................................................................... 129
4.3.6 Total Imports by Regional blocs ............................................................................................................................................................ 129
4.3.7 Main Products Formally Imported .......................................................................................................................................................... 130
4.3.8 Total Trade Balance performance ......................................................................................................................................................... 130
4.3.9 Informal Exports and Imports ................................................................................................................................................................ 131
4.3.10 Informal Exports by Country of Destination .......................................................................................................................................... 131
4.3.11 Performance of Informal Exports by Border Station ............................................................................................................................. 131
4.3.12 Informal Imports by Country of origin ................................................................................................................................................... 132
4.3.13 Performance of Informal Imports by Border Stations ........................................................................................................................... 132
4.4 Government Finance Statistics (GFS) ............................................................................................................................. 134
4.4.0 Introduction ....................................................................................................................................................................................... 134
4.4.1 Central Government Revenue. .............................................................................................................................................................. 134
4.4.2 Central Government Expenditure .......................................................................................................................................................... 136
4.4.3 Local Government Revenue .................................................................................................................................................................. 137
4.4.4 Local Government Expenditure ............................................................................................................................................................. 137
4.5 Banking and Currency ....................................................................................................................................................... 138
4.5.1 Depository Corporations Survey ............................................................................................................................................................ 138
4.5.2 Commercial Banks Assets and Liabilities .............................................................................................................................................. 138
4.5.3 Commercial Banks outstanding Loans and Advances ........................................................................................................................... 139
4.5.4 Structure of Interest Rates ..................................................................................................................................................................... 139
4.5.5 Exchange Rates .................................................................................................................................................................................... 140
4.6 Insurance .............................................................................................................................................................................. 142
4.6.1 Life Insurance Incomings and Outgoings ................................................................................................................................................ 142
vi
4.6.2 Non-Life Insurance Incomings and Outgoings ........................................................................................................................................ 142
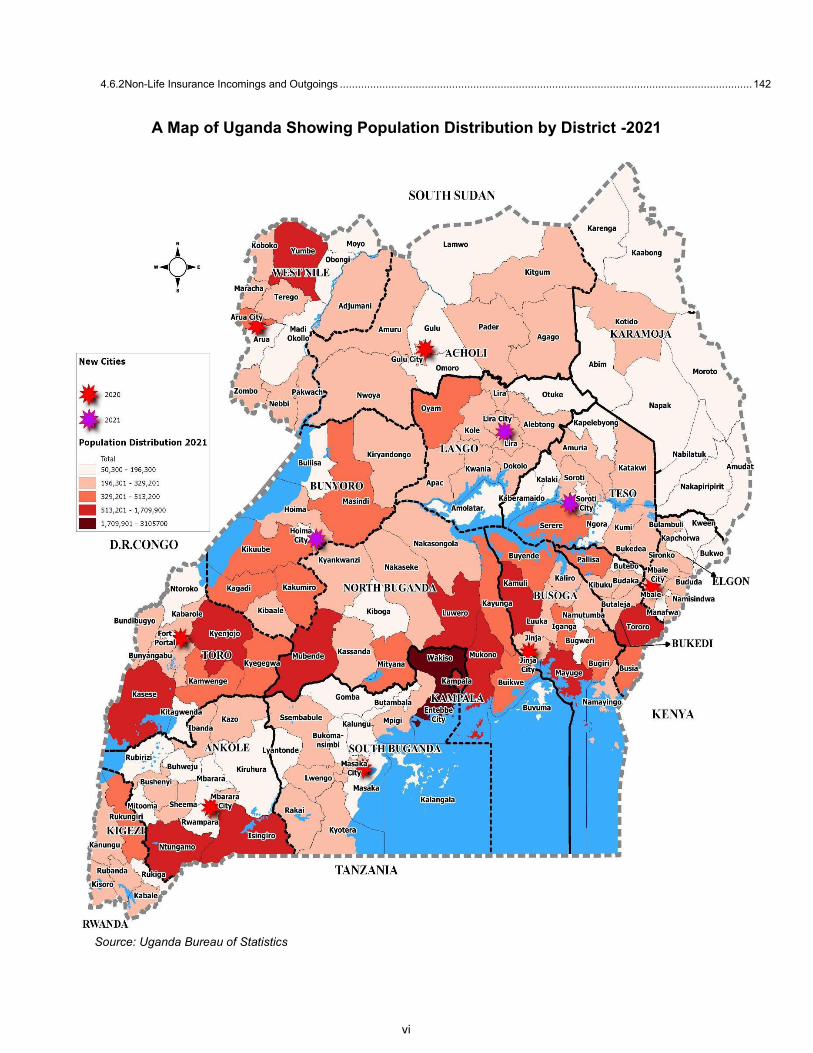
A Map of Uganda Showing Population Distribution by District -2021
Source: Uganda Bureau of Statistics
vii
List of Acronyms
ASL Above Sea Level
Bill.Shs Billion Shillings
BOP Balance of Payments
BMUs Beach Management Units
CAA Civil Aviation Authority
CBR Crude Birth Rate
CDR Crude Death Rate
CG Central Government
CFR Central Forest Reserve
COMESA Common Market for Eastern and Southern Africa
CIS Community Information System
CPAE Consumption Per Adult Equivalent
CPI Consumer Price Index
CSI Construction Sector Index
CY Calendar Year
DAP Deposit Administrative Plan
DMBs Deposit Money Banks
DRC Democratic Republic of Congo
DWD Directorate of Water Development
DPT3 Diphtheria, Pertussis and Tetanus
EPR Employment to Population Ratio
EAC East African Community
EPS Express Penalty Scheme
EU European Union
FISIM Financial Intermediation Services Indirectly Measured
FY Fiscal Year
GDP Gross Domestic Product
GIR Gross Intake Ratio
GO Gross Output
GFS Government Finance Statistics
GWh Giga Watt Hours
H/C Health Centre
HEP Hydro-Electric Power
HFO Heavy Fuel Oil
HFI Health Facility Inventory
HH Household
HSSP Health Sector Strategic Plan
IoP Index of Production
viii
IC Intermediate Consumption
ICBT Informal Cross Border Trade
ICLS International Classification of Labour Statistics
IDO Industrial Diesel Oil
IER Informal employment rate
ILO International Labor Organisation
IMR Infant Mortality Rate
IPT Intermittent Presumptive Treatment
IRTS International Recommendations for Tourism Statistics
ISCO International Standard Classification of Occupation
ISIC International Standard Industrial Classification
KCCA Kampala Capital City Authority
KWh Kilo Watt Hours
LFR Local Forest Reserve
LFPR Labour Force Participation Rate
LPG Liquefied Petroleum Gas
LPR Low pay rate
MAAIF Ministry of Agriculture, Animal Industry and Fisheries
Mbps Megabits per second
MFPED Ministry of Finance, Planning and Economic Development
MGLSD Ministry of Gender, Labour and Social Development
MoES Ministry of Education and Sports
MOH Ministry of Health
Mill.Shs Million shillings
Mm Millimetres
MRH Mean Relative Humidity
Mt Metric tonnes
MTN Mobile Telephone Network
MW Mega Watts
MWE Ministry of Water and Environment
na Not Available
nes Not elsewhere specified
NFA National Forestry Authority
NSDS National Service Delivery Survey
NTEs Non-Traditional Exports
NWSC National Water and Sewerage Corporation
OPD Out-Patient Department
OPI Occupational Permits Issued
OPV Oral Polio Vaccine
PPI Producer Price Index
PHP Private Health Practitioner
PLE Primary Leaving Examinations
ix
PPI-M Producer Price Index-Manufacturing
PPI-H&R Producer Price Index-Hotels and Restaurants
PNFP Private Not For Profit
PS Plans Submitted
RH Relative Humidity
SADC Southern African Development Community
SDR Special Drawing Rights
Shs Shillings
SITC Standard International Trade Classification
Sq.Kms Square Kilometres
TEs Traditional Exports
THF Tropical High Forest
TFR Total Fertility Rate
TT Tetanus
UA Urban Authorities
UBOS Uganda Bureau of Statistics
UCDA Uganda Coffee Development Authority
UDHS Uganda Demographic and Health Survey
UEDCL Uganda Electricity Distribution Company Limited
UETCL Uganda Electricity Transmission Company Limited
UHSBS Uganda HIV/AIDS Sero-Behavioural Survey
ULFS Urban Labour Force Survey
UNDP United Nations Development Programme
UNEPI Uganda National Expanded Programme on Immunisation
UNHS Uganda National Household Survey
UNMHCP Uganda National Minimum Health Care Package
UPE Universal Primary Education
UPHC Uganda Population and Housing Census
URA Uganda Revenue Authority
USE Universal Secondary Education
UTA Uganda Tea Association
UTL Uganda Telecommunication Limited
VA Value Added
VAT Value Added Tax
VCs Vulnerable Children
WHO World Health Organisation
x
Executive Summary
The Statistical Abstract is an annual publication compiled by Uganda Bureau of Statistics (UBOS), and
provides the statistical summary on various socio-economic indicators for Uganda. Some of the Calendar
Year (CY) 2020 and Financial Year (FY) 2020/21 data presented in this edition are provisional and could
be revised in subsequent publications. Similarly, some figures in this edition may vary from those in the
earlier editions due to the updates that have taken place. Besides, the names and numbers of
administrative units has been increasing over the last twenty years so those in this publication may not
directly correspond to the ones in earlier publications.
This publication is divided into four major chapters which are all preceded by a glossary of definitions and
by general information on Uganda. A set of Statistical Appendix Tables that are serialised, using a
combination of numbers and letters of the alphabets, such as Table 1.1 A, Table 2.3 B etc, is also
provided for the readers’ information. The reader is encouraged to refer to such tables while reading the
text. The breakdown of chapters is as below.
Chapter One: Presents environmental statistics related to land, climate, forestry and water supply with
the following highlights:
Land Area by coverage by 2017
Uganda has a total area of 241,555 square kilometers.
Open water bodies covered 37,460 square kilometers.
Wetlands cover 7,621 square kilometers.
Land area is 196,237 square kilometers.
Agricultural land increased from 105,308 sq. kms in 2015 to 106,662 sq. kms in 2017; and
Built up land area covered 1,387 square kilometers.
Forests
Forest cover reduced significantly by 60.4 percent between 1990 and 2015.
Woodlands cover declined to 12,391 sq km in 2017 from 28,347 sq km in 2000.
Total forest cover declined by 25.4 percent between 2010 and 2015.
528,593 (99.8%) hectares of the total forest is under Central Forest Reserve and 1,002 under
Local Forest Reserve; and
Round wood production increased to 1,165,063 tonnes in 2018 from 1,075,035 tonnes in 2017.
xi
Chapter Two: Presents Demographic and Socio-Economic Statistics relating to Population, Education,
Labour Force, Employment and Earning, Income and Expenditure, Public Health and Crime. Below are
highlights:
Demographic and Socio-Economic Statistics
Uganda’s population is projected at 42.9 million people (2021 midyear projections)
According to 2014 –National Population and Housing Census (NPHC) results;
o Uganda population was 34.6 million persons.
o Annual population growth rate between 2002 and 2014 censuses was 3.03 percent.
o 2014 population density was 174 persons per square kilometer.
o Sex ratio was 94.5 percent in 2014; and
o Life expectancy at birth in 2014 was 63.7 years with at 62.8 years compared to 64.5
years for females.
According to the 2016 UDHS (Uganda Demographic and Health Survey);
o Total fertility was 5.4 children per woman.
o Infant mortality rate was 43 deaths per 1000 live birth; and
o Under five mortality rate was 64 deaths per 1000 live birth.
Education
The enrollment rate at pre-primary level decreased to 8 percent in 2017 from 18 percent
registered in 2016.
Primary school enrolment was at 8.8 million in 2017.
Secondary school enrolment stood at 1,370,583 in 2017.
99 percent of the students who registered for Uganda Certificate of Education (UCE) exams in
2019, sat for the examinations.
8 percent of the students who sat for UCE exams in 2019 failed.
In 2017, more than two thirds of pupils attending primary school had adequate sitting space; and.
228,563 students were orphans in 2017.
Labour Force, Employment and Earnings
The total working population was estimated at 15.9 million persons in 2019/20; an increase from
15.1 million persons in 2016/17.
The Employment to Population Ratio (EPR) during the period 2019/20 was 38.8 percent implying
that less than half of the Working Age Population was employed in 2019/20.
There was an increase in the proportion of working persons in purely subsistence agriculture from
39% in 2016/17 to about 48% in 2019/20.
According to UNHS 2019/20, the highest percentage of the working population (68%) was
engaged in Agriculture, forestry and fishing industry.
The percentage of population in employment in Uganda decreased from 9 million persons in
2016/17 to 8.3million in 2019/20.
Less than a third of persons in employment (25%) had completed either secondary or post-
primary/secondary training;
xii
The median cash earnings (nominal) for an employee in Uganda was UGX. 200,000 in 2019/20;
an increase from UGX 176,000 in 2016/17;
The overall unemployment rate was 8.8 percent in 2019/20, a decrease from 9.2 percent
registered in 2016/17; and
The average size of the civil service as at December 2020 was 329,633 persons.
Income and Expenditure
Updates in the Uganda National Panel Survey (UNPS) data sets/waves from 2005/06 to 2019/20
indicate that, the largest share of household expenditure continues to be food (40.5%), followed
by housing, water, electricity, gas and other fuel (18.2%), education (8.6%); and
According to the 2018/19 and 2019/20 UNPS 76% of the households remained in the bottom 40%
of the wealth quintile while 10% where able to remain in the top 60% of the wealth quintile.
Health
The number of functional healthcare facilities decreased to 6,232 recorded in 2019/20, from 6,904
in 2018/19 irrespective of the ownership status.
The human resource statistics for health indicate that in FY 2019/20, the percentage of approved
posts filled country wide in health facilities slightly increased to 73 percent from 71 percent in
2017/18;
Government allocation on health FY 2019/20 was 7.2 percent, which was the same as in FY
2018/19.
The per capita health expenditure in FY 2019/20 was Uganda Shillings 57,715 (about US$ 16)
compared to Uganda Shillings 55,339 registered in the previous FY 2018/19;
Malaria continues to be the leading cause of death followed by Pneumonia.
The health facility based maternal mortality for 2019/20 was 99 deaths per 100,000 live deliveries,
a slight increase from 92 recorded in 2018/19.
Haemorrhage still remains the leading cause of maternal illness and mortality in the country
accounting for 42 percent of the deaths in 2019/20 with a slight decrease from 46 percent in
2018/19; and
The TB case detection rate increased from 78 percent in 2018/19 to 82 percent in 2019/20 and
still below the HSDP target of 84 percent.
Crime
The Annual Crime Rate (ACR) stood at 502, i.e out of every 100,000 people, 502 were victims of
crime in 2020;
The number of crimes reported to Police decreased from 215,224 in 2019 to 195,931 in 2020;
There were more male (122,226) than female (75,052) victims of crime in 2020;
A total of 17,992 vehicles were involved in road accident crashes in 2020 compared to 18,978
vehicles reported in 2019;
A total of 12,249 road traffic crashes were recorded by the Uganda Police Force in 2020;
A total of 13,012 Casualties were reported in 2020 of which 30 persons died;
xiii
About 29.8 percent of road accident crashes occurred between 4:00-7:59pm in 2020; and
295 prisoners occupied space meant for 100 prisoners in 2020 compared to 345 prisoners
recorded in 2019.
Chapter Three: Presents statistics on production, which for purposes of this Abstract includes Agriculture
and Fisheries, Industry, Producer Prices, Energy, Building and Construction, Transport and
Communications, Tourism and Migration. Below are the highlights of the chapter:
Agriculture
In 2020, there was a 15 percent increase in the volume of coffee produced, from 313,000 Metric
Tonnes (MT) to 360,000 Metric Tonnes (MT);
Tea production increased by 25 percent (from 60,000 MT to 75,000 MT) in 2020 while Cotton
production increased to 35,000MT from 33,000MT produced in 2019 hence registering six
percent increment; and
Production of plantains, specifically Banana Food (Matooke), increased by 4.2 percent i.e. to 9.8
million MT from 9.4 million MT in 2019.
Index of production
The index of production increased by 3 percent in 2020 from an average index of 277.7 in 2019 to
an average index of 285.9 in 2020.
Energy
Total import of petroleum products decreased by 7 percent from 2,198,739 cubic meters in 2019
to 2,047,237 to cubic meters recorded in 2020;
A total of 2.068 billion litres of selected petroleum products were sold in 2020 reflecting a 7.0
percent decrease in 2020 compared to 2.224 billion litres of sales in 2019;
Total installed capacity of electricity power sources increased by 1.3 percent from 1252.843 MW
in 2019 to 1269.053 MW in 2020;
Total Electricity generated decreased by 0.07 percent from 4,411.8 GWh in 2019 to 4,411.6 GWh
in 2020;and
Electricity purchased by Uganda Electricity Transmission Company from the generating
companies increased by 0.16 percent from 4,384 GWh in 2019 to 4,391 GWh in 2020.
Building and construction
During 2020, the majority (59.7%) of Building Plans submitted were for residential structures, followed
by commercial structures (27.2%), mixed-use structures (6.7) and institutional structures (2.7%); and
Total Net Domestic Supply of cement registered a 20.2 percent increase in 2020, with 3,226.5
thousand tonnes from 2,684.8 thousand tonnes in 2019.
Minerals
There was a decrease in the total value of the minerals produced from 148.1 billion shillings in
2019 to 124.1 billion shillings in 2020.
xiv
Transport
The total national road length during the FY2019/20 increased by nearly one percent from
20,856.km in 2018/19 to 21,010 km in FY 2019/20;
The number of newly registered motor vehicles and motor cycles reduced by 0.2 percent to
145,132 in 2020 from 145,455 recorded in CY 2019;
There was 52.3 percent decrease in the aircraft movement at Entebbe Airport in 2020 compared
to 1.3 percent rise registered in CY 2019;
In CY 2020, there was a 74.6 percent decrease in total number of passengers transported using
registered ferry operators from 4.5 million in 2019 to 1.2 million passengers in CY2020; and
A total of 196,935 metric tonnes was hauled in 2020 indicating an increase in haulage of 1.7
percent compared to 193,693 metric tonnes hauled in 2019.
Communication
The total number of mobile money registered customers increased by almost 5.1 percent from
26.7 Million customers in 2019 to 28.0 Million customers in 2020; and
The total volume of letters handled by Posta Uganda decreased by 43 percent in 2020, from
819,574 letters in 2019 to 467,508 letters in 2020.
Migration and Tourism
Uganda registered about 1.3 million people arriving and departing out of the country in 2020
compared to 2.3 million travellers recorded in 2019, reflecting a 43 percent decline;
There were about 0.6 million persons entering the country (arrivals) and about 0.7 million leaving
the country (departures);
In 2020, about 473,000 visitors entered Uganda through the eight ports of entry/exit and about
485,000 visitors left the country; and
The main reason for visitors into Uganda in 2020 was carrying out business or doing professional
work which constituted to more than half (55%) of the visitors.
Chapter Four: Presents Macro-Economic Statistics including National Accounts, Prices, External Trade,
Public Finance, Banking, Currency and Insurance. Below are the highlights:
The preliminary Gross Domestic Product (GDP) estimates for the FY2020/21 indicate that the
Ugandan economy grew by 3.4 percent, compared to 3.0 percent growth registered in
FY2019/20.
In nominal terms, GDP stood at Uganda Shillings 147,962 billion;
GDP per capita increased from Uganda Shillings 3,403,000 in FY2019/20 to Uganda Shillings
3,492,000 in FY2020/21;
The Services sector continue to be the lead contributor to GDP, accounting for 41.9 percent of the
overall GDP in FY2020/21;
The Final Consumption Expenditure (FCE) recorded a growth of 6.6 percent in FY2020/21,
compared to 3.2 percent in FY2019/20; and
xv
In terms of Institutions, the Household Institution, was the lead contributor to the GDP, estimated
at Uganda Shillings 76.69 Trillion in FY2020/21 and contributing 51.8 percent to GDP.
Balance of Payments
The overall Balance of Payments (BoP) was a deficit of United States Dollars 182 million in
2020/21 following a previous deficit of United States Dollars 146 million recorded in 2019/20;
The current account balance registered a deficit of United States Dollars 4,135 million in
FY2020/21 compared to a deficit of United States Dollars 2,504 million in FY2019/20.
The capital account position grew from a surplus of United States Dollars 69 million in FY2019/20
to United States Dollars 171 million in 2020/21; and
The financial account showed a net borrowing position of United States Dollars of 2,910 million in
2020/21, up from USD 1,623 million recorded in 2019/20.
Consumer Price Index (CPI)
Calendar Year (CY) 2020 registered a higher annual average inflation of 3.8 percent compared to
the annual average inflation of 2.9 percent in CY2019;
The annual average Core Inflation increased to 4.7 percent in CY2020 from the 3.6 percent
recorded during the CY2019;
The annual average Food Crops inflation for CY2020 decreased to minus 3.6 percent from minus
3.2 percent recorded for the CY2019; and
During the CY2020, the annual average EFU inflation increased to 4.6 percent from 4.2 percent
recorded during the CY 2019.
PPI-Manufacturing and Utilities
The PPI-M&U (Combined) registered an annual average increase of 2.8 percent from 178.05
recorded in CY2019 to 182.98 for CY2020;
The PPI-M (Local) for the CY2020 increased by 2.1 percent from an annual average of 172.03
registered in CY2019 to 175.62 to CY2020; and
The PPI-M (Export) on average registered an annual increase of 2.0 percent from 198.51 annual
average index in the FY2018/19 to 202.53 in FY2019/20.
PPI- Hotels and Restaurants
The Annual Average Producer Prices for the Hotels and Restaurants Sector dropped by 0.1
percent in the CY2020, compared with an increase of 1.8 percent for the CY2019..
Construction Sector Index (CSI)
The average prices in the construction industry decreased by 2.01 percent in CY2020 compared
to CY2019; and
Between CY2016 and CY2020, the overall construction sector registered the highest increase of
inputs in CY2016 (3.6 percent), followed by an increase of 2.5 percent in CY2018.
xvi
External Trade
During the CY2020, the total International Merchandise Trade was United States Dollars 12,554.5
million, representing a 6.0 percent increase in international trade in goods from US$ 11,849.4
million recorded in 2019.
Total export earnings (Formal and Informal exports combined) increased by 4.7 percent to United
States Dollars 4,286.8 million from United States Dollars 4,095.7 million recorded in 2019;
Similarly, the total imports bill increased by 6.6 percent to United States Dollars 8,267.7 million in
2020 from United States Dollars 7,753.8 million registered in 2019;
The overall annual trade deficit increased to United States Dollars 3,980.9 million in 2020 from
United States Dollars 3,658.1 million recorded in CY2019;
Formal exports earnings were US$ 4,149.0 million while informal exports earnings were worth
United States Dollars 137.8 million;
Total imports bill increased significantly by 6.6 percent to United States Dollars 8,267.7 million in
CY2020 from United States Dollars 7,753.8 million registered in CY2019;
The Formal and informal import bills in CY2020 stood at United States Dollars 8,250.5 million and
United States Dollars 17.2 million respectively from United States Dollars 7,696.0 million and
United States Dollars 57.8 million recorded in CY2019.
Government Finance Statistics (GFS)
In the FY2019/20, the net Central Government revenue (excludes tax refunds and government
taxes) was Uganda Shillings 18,434 billion compared to Uganda Shillings 17,262 billion collected
in the FY2018/19; and
Central government expenditure increased by 38.4 percent from Uganda Shillings 20,968 billion
for the FY2018/19 to Uganda Shillings 29,013 billion for FY2019/20.
Banking and Currency
The Net Foreign Assets (NFA) which shows a country’s level of indebtedness, increased by 16.9
percent from Uganda Shillings 13,878 billion as at June 2019 to Uganda Shillings 16,224 billion
as at June 2020;
Net Domestic Assets (NDA) grew by 31.4 percent, from Uganda Shillings 10,535 billion in June
2019 to Uganda Shillings 13,845 billion in June 2020;
M1 increased by 26.6 percent from Uganda Shillings 10,018 billion in June 2019 to Uganda
Shillings 12,678 billion in June 2020;
M2 increased by 24.9 percent from Uganda Shillings 17,279 billion in June 2019 to Uganda
Shillings 21,575 billion in June 2020;
M3 increased by 23.2 percent from Uganda Shillings 24,405 billion in June 2019 to Uganda
Shillings 30,069 billion in June 2020;
Total assets of commercial banks in shillings increased by 18.0 percent from Uganda Shillings
30,559 billion as at June 2019 to Uganda Shillings 36,060 billion as at June 2020;
Total commercial banks liabilities increased by 18.1 percent from Uganda Shillings 25,591 billion
as at June 2019 to Uganda Shillings 30,223 billion as at June 2020;
xvii
Net capital increased from Uganda Shillings 4,594 billion in June 2019 to 5,406 billion shillings in
June 2019, representing a 17.7 percent increase;
The Central Bank Rate (CBR), which is the rate at which commercial banks can borrow from the
Central Bank decreased to 7.0 percent in June 2020 from 10.0 percent in June 2019;
Commercial bank rate decreased to 11.0 percent in June 2020 from 15.0 percent in June 2019;
and
The average buying rate for foreign exchange (US dollar) depreciated from Uganda Shillings
3,690 in CY2019 to Uganda Shillings 3,704 in CY2020 while the average selling rate depreciated
from Uganda Shillings 3,703 shillings in CY2019 to Uganda Shillings 3,717 shillings in CY2020.
Insurance
Life insurance Gross premium incomings increased by 27.3 percent in CY2019, from Uganda
Shillings 217 shillings in CY2018 to Uganda Shillings 276 billion in 2019;
Life group insurance category declined by 3.6 percent in gross premium incomings in the same
period, from Uganda Shillings 66 billion in CY2018 to Uganda Shillings 63 billion in CY2019;
Life insurance for reinsurance outgoings category decreased by 0.8 percent from Uganda
Shillings 34.5 billion in CY2018 to Uganda Shillings 34.2 billion in CY2019;
The Net Incurred claims on life insurance registered 15.1 percent increase in CY2019 compared
to 31.4 percent registered in CY2018. The value of life paid and outstanding claims increased
from Uganda Shillings 57 billion in CY2018 to Uganda Shillings 66 billion in 2019;
Non-life Insurance premium incomings increased from Uganda Shillings 333 billion in CY2018 to
Uganda Shillings 340 billion in CY2019, representing a growth of 2.2 percent;
Marine insurance registered an increase of 19.8 percent in 2019 from an earlier decline of 0.9
percent in CY2018;
Miscellaneous accidents in non-life insurance premium incomings recorded a decline of Uganda
Shillings 40.0 percent in CY2019;
Outgoings in form of reinsurance registered a growth of 18.9 percent in CY2019 from Uganda
Shillings 136 billion to Uganda Shillings 162 billion;.
Non-Life premium income declined by 9.0 percent in CY2019 from Uganda Shillings 195 billion to
Uganda Shillings 177 billion in 2019; and
Net incurred claims on non-life insurance increased by 22.4 percent in CY2019 from an earlier
decline of 5.8 percent in CY2018.
xviii
Glossary
A nursery school A place where children are prepared for entry into primary school education.
Accident fatality
risk
The number of accidental deaths per 100,000 populations.
Accident Severity Determined by or classified according to the most severe casualty involved in an accident.
Severity is also used to rank accidents
Adult A person aged 18 years and above, as per the Constitution of Uganda.
Agriculture The growing of crops and rearing of animals for food, other human needs or economic
gain.
An orphan A child below 18 years of age who has lost either one or both parents.
Assault/Attack This is the threatening/attacking someone in a way that frightens him/her. In most of the
cases violence is involved i.e. inflicting severe or aggravated bodily injury.
Asset Anything valuable that an entity owns, benefits from or has use of, in generating income.
Aviation fuel More purified kerosene fuel used in aviation gas-turbine engines.
Base period The reference period, to which a series of index numbers relate, It is usually expressed as
100.
BCG (Bacillus
Camete Guerin)
A vaccine against Tuberculosis.
Bio-mass energy Energy that is obtained from fuel wood, charcoal and crop residues.
Broad money –
(M2)
Consists of the currency in circulation, as well as the demand, time and savings deposits.
The deposits are those held by the private sector.
Broad money -
(M2)A
Equivalent to (M2) plus certificates of deposit.
Broad money -
(M3)
Equivalent to (M2) A plus foreign currency deposits.
Careless Driving A person whose conduct is inconsiderate in disregard for the right of others and that
endangers or is likely to endanger person or property.
Casualty (Victim) Person who sustains a slight, serious or fatal injury.
Child A juvenile. A person aged below 18 years.
Child labour Work that is mentally, physically, socially and/or morally dangerous and harmful to
children. Hazardous work which by its nature or the circumstances under which it is
performed, jeopardises the health, safety and morals of a child. Also includes work or
activities that interfere with children’s school attendance.
xix
Child Labour
measurement
framework
National and international standards are used to define child labour. Based on these
standards, children become child Labourers if they are aged 5-11 years and engaged in
economic activities for at least one hour a week, or, aged 12-13 years and engaged in
economic activities for at least 14 hours per week, or, aged 14-17 years and involved in
economic activities for at least 43 hours a week, or 14-17 years and engaged in work
regarded as hazardous. According to this definition, household chores are not among
activities grouped in child labour.
Child work A child is regarded to be involved in child work, if she/he is aged 5-17 years and was
involved in economic activities for at least one hour during the reference week, by
extension, therefore, such a child will be regarded as a child worker.
Civil Servants Employees of line ministries, teaching service, police, prison, public universities and local
governments.
Cohabiting A state where a man and woman are not officially married but are living together in a
sexual union.
Completion rate The total number of new entrants in the last grade of any education level, regardless of
age, expressed as a percentage of the population at the entrance age to the last grade of
that education level.
Crime An unlawful act or omission punishable by law.
Crime Rate The incidence of crime per 100,000 people.
Damage of
property
The abstract measure of property not being intact, and may refer to any household item
which suffered after a crime incidence.
Day Care A place that looks after children between 0 - 2 years and their parents pick them in the
evening.
Defrauding This is the act of depriving an individual, organisation, or even a household of their
money, or property through deceitful trickery or cheating methods. It is also a deliberate
deception to secure unfair or unlawful gain.
Diesel fuel Fuel used for internal combustion in diesel engines and as a burner material in heating
installations such as furnaces. Another name for this product is automotive gasoil.
Divorced A condition where legally married couples legally separate for life and each stays away
from the other thereafter. However, either of the two (man or woman) can re-marry.
DMBs Deposit Money Banks. Commercial banks in Uganda’s institutional settings.
DPT A vaccine against Diphtheria, Pertussis (whooping cough) and Tetanus.
Driver In relation to a motor vehicle, means a person who drives, or attempts to drive, or is in
charge of a motor vehicle (including a cycle) or an instructor of a learner driver. In relation
to animals, means a person who guides cattle, in singular or in herds, or flocks, pack
saddle animals on a road. But in relation to a towed vehicle, a person who drives the
towing vehicle.
xx
Earnings for
persons in paid
employment
For paid employment jobs, earnings include: direct wages and salaries, bonuses and
gratuities, commissions and tips, directors’ fees, profit-sharing bonuses and other forms of
profit-related pay, remuneration for time not worked as well as free or subsidised goods
and services from an employer.
Economic
activity
Covers all market production and certain types of non-market production, including
production and processing of primary products for own consumption, own-account
construction (owner occupied dwellings) and other production of fixed assets for own use.
Employed
Persons
Persons who work for wage or salary in cash or in kind or both and have a formal job
attachment.
Employment Restricted to only the working age population who were engaged in any activity to
produce goods or provide services for pay or profit. “For pay or profit” refers to work done
as part of a transaction in exchange for remuneration payable in the form of wages or
salaries for time worked or work done, or in the form of profits derived from the goods and
services produced through market transactions.
Employment
status
The status of an economically active person with respect to his/her position at his/her
place of work and his/her mode of remuneration.
Engineering
plant
Movable plant or equipment being a self-propelled vehicle or trailer designed or
constructed for the special purposes of engineering operations which, where proceeding
on a road, does not carry any load greater than such as is necessary for its propulsion or
equipment.
Enterprise A single legal entity or a combination of legal entities. It may also be a sole legal unit
carrying out one or more activities at one or more locations. It may alternatively be several
establishments.
Establishment An economic unit engaged in one or predominantly one kind of economic activity under
single ownership or control and is situated at a single physical location.
Exports Outward flows comprising goods leaving the economic territory of a country to the rest of
the world.
Fatal Accident An accident in which death occurs at the scene of the accident or within one year of the
accident as a result of injuries sustained in the accident.
Foreign
Reserves
Consist of those external assets available to and controlled by central banks for direct
financing of balance of payments imbalances, for indirectly regulating the magnitude of
such imbalances through intervention in exchange markets to affect the currency
exchange rate, and/or for other purposes. Included are monetary gold, Special Drawing
Rights (SDRs), reserve position in the fund, foreign exchange assets (consisting of
currency, deposits and securities) and other claims.
General
Hospitals
Health facilities that provide preventive, outpatient curative, maternity, inpatient health
services, emergency surgery, blood transfusion, laboratory and other general services.
They also provide in-service training, consultation and research in support of community-
xxi
based health care programmes.
Gross Domestic
Product
The value of goods and services produced within the economic territory of the country.
Gross Enrolment
Rate
The ratio of pupils in primary school (regardless of age) to the country’s total population
aged 6-12 years.
Gross Enrolment
Ratio
Total enrolment in a specific level of education (Pre-primary, Primary, Secondary and
Tertiary), regardless of age, expressed as a percentage of the eligible official school-age
population corresponding to the same level of education in a given school-year.
Gross Intake
Rate
The ratio of the pupils enrolled in Primary One regardless of age to the country total
population aged six years.
Gross Intake
Ratio
The total number of new entrants in the last grade of a given level of education,
regardless of age, expressed as percentage of the total population of the theoretical
entrance age to the last grade of that education level.
Gross Output The production value as compiled from total receipts from industrial and non-industrial
goods and services in an economy, adjusted for stock changes but excluding Excise Duty
and Indirect Taxes. This is Gross Output at factor cost.
Growth Rate The number of people added to (or subtracted from) a population in a year due to natural
increase and net migration expressed as a percentage of the population at the beginning
of the time period.
Hazardous work Refers to a situation where a person is engaged in work for more than 43 hours a week or
works under conditions that entail them to work at night.
Health Centre II Out-patient clinic treating common diseases and offering antenatal care. It is supposed to
be led by an enrolled nurse, working with a midwife, two nursing assistants and a health
assistant. According to the Ugandan Government's Health Policy, every parish is
supposed to have a Health Centre II.
Health Centre III Health Centre with facilities which include an operation room and a section for minor
surgery. It is headed by a clinical officer, offers the continuous basic preventive and
curative care and provides support supervision of the community and the Health Centre II
facilities under its jurisdiction. According to the Ugandan Government's Health Policy,
every sub-county is supposed to have a Health Centre III.
Health Centre IV A mini-hospital that provides the kind of services found at Health Centre III, but in addition
has separate wards in which to admit men, women and children. It should have a senior
medical officer and another doctor as well as a theatre for carrying out emergency
operations. According to the Ugandan Government's Health Policy, every county or
xxii
parliamentary constituency is supposed to have a Health Centre IV.
Heavy Fuel Oil Residual fuel obtained after refinery of petroleum products. It is used in ships and
industrial large-scale heating installations as a fuel in furnaces or boilers.
Home based
child care
An arrangement where a mother in the community looks after children at a cost in her
premises and trains them basic skills necessary for proper upbringing.
Imports
Inward flows of goods from the rest of the world into the economic territory of a country.
Incarciration
Rate/Imprisonme
nt Rate
The number of in mates confined in prison or jail per 100,000 persons of the population.
Incidence of
Crime
The total number of crimes reported per population of interest over a given period of time
in a defined area (territory/country).
Index Number A number that shows relative change in price or volume between the base period and
another period.
Industry This is an economic activity undertaken by a business establishment as specified in the
International System of Industrial Classification (ISIC).
Infant Mortality
Rate
The number of deaths of infants under one year of age per 1,000 live births in a given
period.
Inflation The persistent increase in the general level of prices of goods and services in an
economy over a period of time
Informal
employment rate
(IER)
Persons in informal employment comprise of:
Employees whose employers’ do not pay contributions to their social security or,
if they do, do not benefit from annual leave or payment in lieu of leave not taken,
or paid sick leave in case of illness or injury or income tax deduction.
• Employers and own account workers employed in their own businesses or places
of work that are not registered for income tax and/or Value Added Tax (VAT).
• Members of producers’ cooperatives employed in their cooperatives that are not
registered.
• Own account workers engaged in the production of goods exclusively for own
final use by their household (such as subsistence farming or do it yourself
construction of own dwellings), if considered employed according to the 13th
International Classification of Labour Services (ICLS) Edition definition of
employment.
• Contributing family workers, irrespective of whether they work in formal or
xxiii
informal sector enterprises.
Intermediate
Consumption
The value of goods and services that are used in the process of production of other goods
and services rather than final consumption
Juvenile A person below 18 years of age (Children Statute, 1997).
Kerosene This is fuel used as an illuminant for lighting and in some cases for cooking.
Labour force The labour force consists of all persons of working age who were either employed or
unemployed.
Labour
underutilisation
Labour underutilisation is a broad concept that encompasses unemployment and other
forms of mal-employment such as with insufficiency of the volume of work (labour slack),
low remuneration (low earnings) and incompatibility of education and occupation (skill
mismatch). For the present purpose, labour underutilisation is defined to be the aggregate
of labour slack (unemployed, time related under employment as well as those marginally
attached to the labour force), low earnings and skill mismatch.
Large Business Business establishment employing 100 or more persons.
Life Expectancy The average number of years a person could expect to live if current mortality trends were
to continue for the rest of that person's life. Most commonly cited as life expectancy at
birth.
Liquid Petroleum
Gas
Liquid Petroleum Gas (LPG) consists of hydrocarbons, which are gaseous under
conditions of normal temperature and pressure but are liquefied by compression or
cooling to facilitate storage, handling and transportation.
Literacy rate The percentage of population aged 10 years and above that can read with understanding
and write a simple sentence meaningfully in any language.
Loan Money or securities supplied by one party (the lender) to a second party (the borrower) in
a transaction in return for a promised future payment by the borrower. Such transactions
normally include the payment of interest due to the lender as per agreed repayment
schedules between the two parties.
Low pay rate Low pay rate (LPR) or inadequate earnings rate refers to the proportion of the employed
persons with hourly/monthly earnings less than 2/3 of median hourly/median earnings of
full-time workers (persons working 40-48 hours a week); cf. Resolution on employment-
related income by the 16th ICLS (1998).
Marginally
attached to the
labour force
Discouraged workers and other inactive persons with labour force attachment.
Micro Hydro
Power Stations
Hydro Power Stations generating electricity in the range of 5 KW – 100 KW
Mini Hydro Hydro Power Stations generating electricity in the range of 101 KW – 1 MW
xxiv
Power Stations
Minor Accident Accident where no persons are injured.
Minor Injury Injury of a minor character such as a sprain, bruise or cut not judged to be severe or slight
shock requiring roadside attention.
Motor vehicle Any self-propelled automobile intended or adapted for use on the road.
National Referral
Hospitals
In addition to the services offered at the regional referral hospital, they provide
comprehensive specialist services and are involved in teaching and health research.
Net Enrolment
Rate
The ratio of pupils in primary school aged 6 – 12 to the country total population aged 6 -12
years.
Net Enrolment
Ratio
The Enrolment of the official age-group for a given level of education (Pre-primary,
Primary and Secondary) expressed as a percentage of the corresponding population.
Net Intake Rate The ratio of the pupils aged six in primary one to the country total population aged 6
years.
Net Intake Ratio The number of new entrants of official age expressed as a proportion of the official school
entry age (3 years for pre- primary, 6 years for primary, 13 years for secondary and 19
years for tertiary).
Non-traditional
exports
Refers to commodities other than traditional exports (Coffee, Cotton, Tea, and Tobacco)
that have recently featured in Uganda’s export trade.
Numeracy rate The Percentage of pupils who can use numbers, complete sequences, make additions,
subtraction, simple multiplication, simple division, simple weights and measures, money
counting, telling time, interpret a pictograph and draw a pictogram.
Occupation Refers to the nature of task and duties performed during the reference period preceding
the interview by persons in paid employment, unpaid family work or self-employment jobs.
Orphan A child whose biological parent or both parents are dead. Single orphans are children who
have lost one biological parent, while double orphans are those who have lost both
biological parents.
Other crimes in
general
Include threatening violence, human trafficking, abduction, kidnap, arson (general),
malicious damage to property, escapes from lawful custody, rescues from lawful custody,
examination leakage and stealing, piracy, criminal trespass, domestic violence, attempted
suicide, attempted murder (by shooting), attempted murder ( other than shooting), other
penal code offences (not categorised)
Overdraft A type of a short-term loan particularly used to supply short-term credit to tide over the
production cycle or finance for seasonal requirements.
Pass Rate The percentage of pupils/students that passed exams at a given level of education.
Passengers Travellers in a car, bus, train, plane or ship who are not driving or part of the other crew.

xxv
These also include those embarked and disembarked.
Pedestrian Any person travelling on foot.
Permissible light
work
Light work refers to non-hazardous activities done by children in their homes under
observation and supervision by their families in an environment free of exploitation.
Persons in
employment
Refers to all persons of working age who, during a short reference period, were engaged
in any activity to produce goods or provide services for pay or profit. For “pay or profit”
refers to work done as part of a transaction in exchange for remuneration payable in the
form of wages or salaries for the time worked or work done. The payment may also be in
the form of profits derived from the goods and services produced through market
transactions.
Petrol A light hydrocarbon fuel used in positive ignition engines. Another name used for this type
of fuel is premium motor spirit.
Population
pyramid
A pictorial representation of the age distribution of a given population. Its shape is
determined by the past birth and death rates in that population.
Poverty Gap (P1) The sum over all individuals of the shortfall of their real private consumption per adult
equivalent from the poverty line, divided by the poverty line. It is the measure of the depth
of poverty, however, with limitations since it is insensitive to how consumption is
distributed among the poor mainly below the poverty line. P1 is the per capita cost of
eradicating poverty, as a percentage of the poverty line, if money could be targeted
perfectly.
Poverty
Headcount (P0)
The P0 indicator is “headcount”: the percentage of individuals estimated to be living in
households with real private consumption per adult equivalent below the poverty line
Prison Place where people are legally kept while awaiting trial or as a punishment for crimes they
have committed..
Prison capacity This is the number of inmates a prison can safely accommodate which is 01 prisoner per
every 3.6m2 of accommodation space.
Prison
occupancy rate
Is the number of inmates accommodated per available accommodation space of one
prisoner expressed as a percentage.
Prisoner A person deprived of liberty and kept under involuntary restraint, confinement, or custody.
Producer Price The amount receivable by the producer from the purchaser for a unit of a good or service
produced as output minus any VAT, or similar deductible tax, invoiced to the purchaser. It
excludes any transport charges invoiced separately by the producer.
Proportional
morbidity ratio
The proportion attributable to a given cause of illness. It is a proxy for the prevalence of
sickness in a population.
Pupil-Classroom
Ratio (PCR)
The average number of pupils (students) per classroom at a specific level of education in
a given school year.
xxvi
Pupil-Stance
Ratio (PSR)
The average number of pupils (students) per latrine stance at a specific level of education
in a given school year.
Pupil-Teacher
Ratio (PTR)
The average number of pupils (students) per teacher at a specific level of education in a
given school year.
Reckless/Danger
ous Driving
A mental state in which the driver displays a wanton disregard for the rules of the road;
the driver misjudges common driving procedures, often causing accidents and other
damages.
Regional Referral
Hospitals
In addition to the services offered at the general hospital, these hospitals offer specialist
services such as psychiatry, ear, nose and throat, radiology, pathology, ophthalmology as
well as higher level surgical and medical services, including teaching and research.
Relative
Humidity
A measure (expressed as a percentage value) of the amount of water vapour/moisture in
the air (at a specific temperature) compared to the maximum amount of water vapour air
could hold at that temperature. Warm air can hold more moisture than cold air. Relative
humidity of 100 percent, therefore, indicates that the air is holding all the water it can at
the current temperature and any additional moisture at that point will result in
condensation and precipitation.
Residents Persons whose usual residence is in Uganda, including those whose nationality is not
Ugandan.
Retained
Reserves
The increase in value of a currency or the increase in value of fixed assets consisting
mainly of freehold land and buildings.
Revaluation
reserves
Reserves arising due to the revaluation of fixed assets but cannot be paid out as
dividends because they are not realised profits. They merely restate the value of an asset.
Separated A situation where married couples separate from each other without legalising the
separation, and hence can re-unite after some time. However, they are still regarded as
married from the legal point of view.
Serious Accident Accident in which a person is admitted in the hospital as an “in-patient” or any of the
following injuries whether or not one is admitted in the hospital, or sustains: fractures,
concussion, internal injuries, crashing, severe cuts and lacerations.
Serious Injury Injury for which a person is admitted in hospital as an ‘in-patient’, or any of the following
injuries whether or not the person is admitted in hospital: fractures, concussion, internal
injuries, crashing, burns, severe cuts and lacerations or severe general shock requiring
medical treatment.
Single A man or woman who has never been married or never been in a consensual union.
Skill mismatch or
skill inadequate
employment
Skill mismatch measures the incompatibility between education and occupation. Workers
whose educational attainment is above the skill requirement of their jobs are in some
sense underutilised. The return on investment in their education and training is below
optimum and somewhat wasted.
xxvii
Solid waste Any semi-solid or solid matter created by human or animal activities, and which are
disposed because they are hazardous or useless.
Squared Poverty
Gap (P2)
The sum over all individuals of the square of the shortfall of their real private consumption
per adult equivalent and the poverty line divided by the poverty line. The reason to square
the shortfall is to give greater weight to those who are living far below the line. The
indicator caters for a policy which also makes transfers from someone just below the
poverty line to the poorest person which P1 does not reflect.
Teaching Service Teachers of primary and secondary schools, technical or commercial institutes as well as
other tertiary institutions, colleges and establishments.
The
Employment-to-
population ratio
(EPR)
The number of employed persons in the working age population given as a percentage of
the total number of persons in the working age population. It is one of the measures of
the extent of job creation in the economy. The indicator is calculated as:
EPR (%) = (Number of employed persons in working age population) Total number of persons in the working age population (× 100)
The labour force
participation rate
(LFPR)
The labour force participation rate measures the proportion of the working age population
that is economically active .i.e. working and unemployed. LFPR is the number of persons
in the labour force given as a percentage of the working age population. The indicator is
calculated as:
(LFPR (%) = (Number of persons who are employed + Number of persons who are unemployedTotal number of persons in the working age population (× 100)
The Performance
index
A measure of the quality of passing at all levels of education.
The
Unemployment
Rate (UR)
Unemployment rate (UR) is the percentage of the labour force that is unemployed. It is
calculated as follows:
UR(%) = Number of unemployed persons in the working age populationTotal number of persons in the labour force (× 100)
Theft The taking of another person's property without that person's freely-given consent.
Time-related
underemployment
(TRE)
The time-related underemployed includes all employed persons whose hours of work “are
insufficient in relation to an alternative employment situation in which the person is willing
and available to engage.” Hence, the criteria of time-related underemployment at the
national level can be summarised as: (i) willingness to work additional hours; (ii)
availability to work additional hours and, (iii) having worked below a threshold of working
hours (less than 40 hours a week).
Total Fertility
Rate (TFR)
The average number of children that would be born alive to a woman (or group of women)
during her lifetime if she were to pass through her childbearing years conforming to the
age-specific fertility rates of a given period.
xxviii
Trade Balance The difference in value between the country’s visible imports and exports.
Traditional
Exports
Long-term export cash crops introduced to Uganda long time ago (Coffee, Cotton, Tea
and Tobacco).
Traffic Accident Crashes between vehicles; between vehicles and pedestrians; between vehicles and
animals; or between vehicles and fixed obstacles.
Transition Rate The number of pupils (or students) admitted to the first grade of a higher level of
education in a given year, expressed as a percentage of the number of pupils (or
students) enrolled in the final grade of the lower level of education in the previous year.
Treasury Bill Short-term bearer securities with maturities of 91 days, 182 days, 273 days or 364 days
issued by Bank of Uganda.
Under-utilisation An aggregate of persons who were unemployed, in time related under-employment and
potential labour force.
Unemployment Persons of working age are classified as unemployed if, during a short reference period
such as a day or a week, they (a) were without work, i.e. did not work for even one hour in
any economic activity (paid employment, self-employment, or unpaid work for a family
business or farm); (b) were available for work; and (c) had taken active steps to seek work
during the past four weeks.
Value Added The value of outcome when factors of production interact to produce and avail goods and
services. Value added is the difference between the value of gross output and the value of
intermediate inputs.
Value Added Tax
(VAT)
A form of consumption tax. From the perspective of the buyer, it is a tax on the purchase
price. From the seller’s perspective, it is a tax only on the value added to a product,
material or service.
Victim A person who is offended as a result of a criminal act.
Wage Bill All cash payments made by employers in return for labour provided by the employees.
The payments include salaries and wages, overtime, holiday pay, bonuses, commissions,
sick leave and any other allowances paid in cash to the employees.
Widowed A situation where one partner in a marriage is dead. It applies to both monogamous and
polygamous marriages. In case of polygamous marriages where the man is dead, the
women are referred to as widows. However, where a man loses one of his many wives,
he cannot be referred to as a widower.
Work Comprises of own-use production work, employment work, unpaid trainee work, volunteer
work and other forms of work. Work excludes activities that do not involve producing
goods or services (e.g. begging and stealing), self-care (e.g. personal grooming and
hygiene) and activities that cannot be performed by another person on one’s own behalf
(e.g. sleeping, learning and activities for own recreation).

xxix
Working age While no international standard on age limits exists, for purposes of statistical
measurement, the working age population is commonly defined as persons aged 15 years
and older, but this may vary from country to country.
Working persons Persons of working age are classified as working or employed if, during a short reference
period such as a day or a week, (i) they did some work (even for just one hour) for pay,
profit or family gain, in cash or in kind; or (ii) they were attached to a job or had an
enterprise from which they were ‘temporarily’ absent during this period (for such reasons
as illness, maternity, parental leave, holiday, training, industrial dispute).
Working Poor Individuals forming part of the working population but whose incomes fell below the official
poverty line.
Working Poverty
Rate (WPR)
WPR is the proportion of the employed population living in households that are classified
as poor, i.e. their consumption or income levels are below a determined national poverty
line. The direct measurement of the indicator can be expressed as:
WPR = Number of employed persons in poor households (Number of working poor) Total number of employed persons (× 100) Worst Forms of
Child Labour
According to ILO convention No.182 (1999), the worst forms of child labour include:
(i) Child slavery or practice similar to slavery, such as sale and trafficking of
children, debt bondage and serfdom, use of children in armed conflict;
(ii) Use, procurement and offering of a child for prostitution and pornography;
(iii) Use of children in illicit activities such as drug trafficking; and
(iv) Work that is likely to harm the health, safety and morals of children.
Youth For statistical purposes, the United Nations defines youth, as those persons between the
ages of 15 and 24 years, without prejudice to other definitions by Member States. In
practice, however, many national statistics offices apply their own definitions of youth
which often differ from the international standard. Under the Uganda Constitution, a youth
is a person aged 18-30 years.
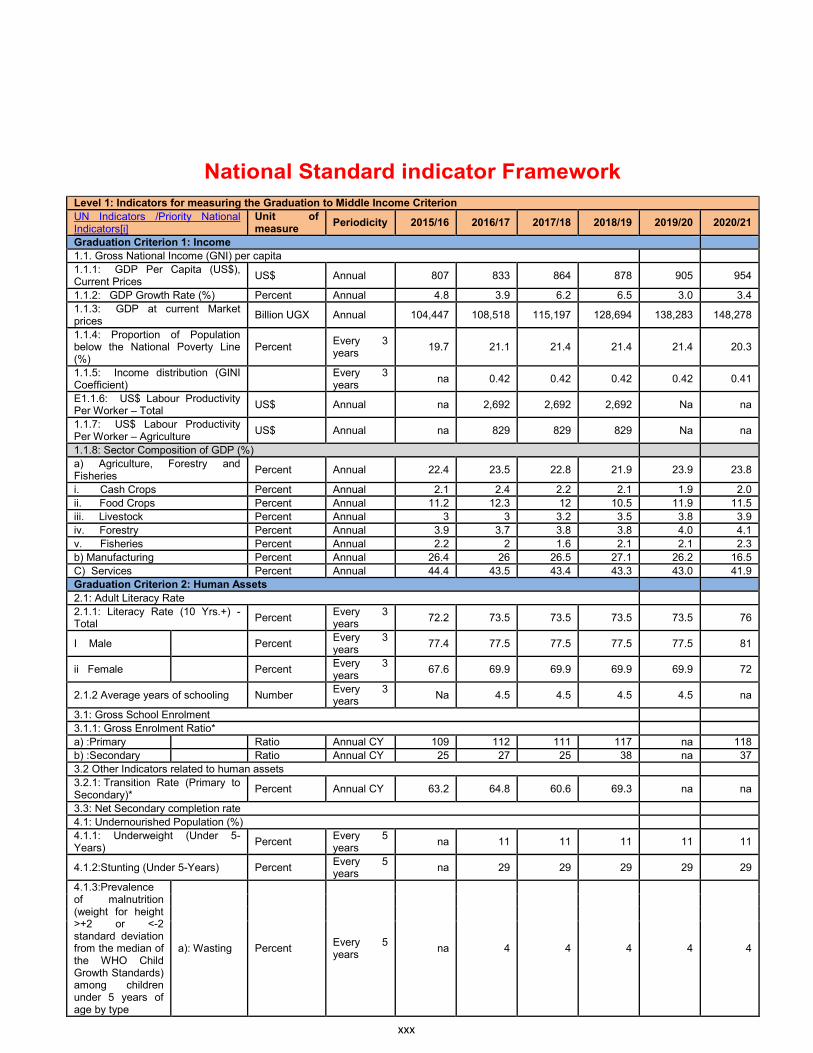
xxx
National Standard indicator Framework
Level 1: Indicators for measuring the Graduation to Middle Income Criterion
UN Indicators /Priority National Indicators[i]
Unit of measure
Periodicity 2015/16 2016/17 2017/18 2018/19 2019/20 2020/21
Graduation Criterion 1: Income
1.1. Gross National Income (GNI) per capita
1.1.1: GDP Per Capita (US$), Current Prices
US$ Annual 807 833 864 878 905 954
1.1.2: GDP Growth Rate (%) Percent Annual 4.8 3.9 6.2 6.5 3.0 3.4
1.1.3: GDP at current Market prices
Billion UGX Annual 104,447 108,518 115,197 128,694 138,283 148,278
1.1.4: Proportion of Population below the National Poverty Line (%)
Percent Every 3 years
19.7 21.1 21.4 21.4 21.4 20.3
1.1.5: Income distribution (GINI Coefficient)
Every 3 years
na 0.42 0.42 0.42 0.42 0.41
E1.1.6: US$ Labour Productivity Per Worker – Total
US$ Annual na 2,692 2,692 2,692 Na na
1.1.7: US$ Labour Productivity Per Worker – Agriculture
US$ Annual na 829 829 829 Na na
1.1.8: Sector Composition of GDP (%)
a) Agriculture, Forestry and Fisheries
Percent Annual 22.4 23.5 22.8 21.9 23.9 23.8
i. Cash Crops Percent Annual 2.1 2.4 2.2 2.1 1.9 2.0
ii. Food Crops Percent Annual 11.2 12.3 12 10.5 11.9 11.5
iii. Livestock Percent Annual 3 3 3.2 3.5 3.8 3.9
iv. Forestry Percent Annual 3.9 3.7 3.8 3.8 4.0 4.1
v. Fisheries Percent Annual 2.2 2 1.6 2.1 2.1 2.3
b) Manufacturing Percent Annual 26.4 26 26.5 27.1 26.2 16.5
C) Services Percent Annual 44.4 43.5 43.4 43.3 43.0 41.9
Graduation Criterion 2: Human Assets
2.1: Adult Literacy Rate
2.1.1: Literacy Rate (10 Yrs.+) - Total
Percent Every 3 years
72.2 73.5 73.5 73.5 73.5 76
I Male Percent Every 3 years
77.4 77.5 77.5 77.5 77.5 81
ii Female Percent Every 3 years
67.6 69.9 69.9 69.9 69.9 72
2.1.2 Average years of schooling Number Every 3 years
Na 4.5 4.5 4.5 4.5 na
3.1: Gross School Enrolment
3.1.1: Gross Enrolment Ratio*
a) :Primary Ratio Annual CY 109 112 111 117 na 118
b) :Secondary Ratio Annual CY 25 27 25 38 na 37
3.2 Other Indicators related to human assets
3.2.1: Transition Rate (Primary to Secondary)*
Percent Annual CY 63.2 64.8 60.6 69.3 na na
3.3: Net Secondary completion rate
4.1: Undernourished Population (%)
4.1.1: Underweight (Under 5-Years)
Percent Every 5 years
na 11 11 11 11 11
4.1.2:Stunting (Under 5-Years) Percent Every 5 years
na 29 29 29 29 29
4.1.3:Prevalence of malnutrition (weight for height >+2 or <-2 standard deviation from the median of the WHO Child Growth Standards) among children under 5 years of age by type
a): Wasting Percent Every 5 years
na 4 4 4 4 4
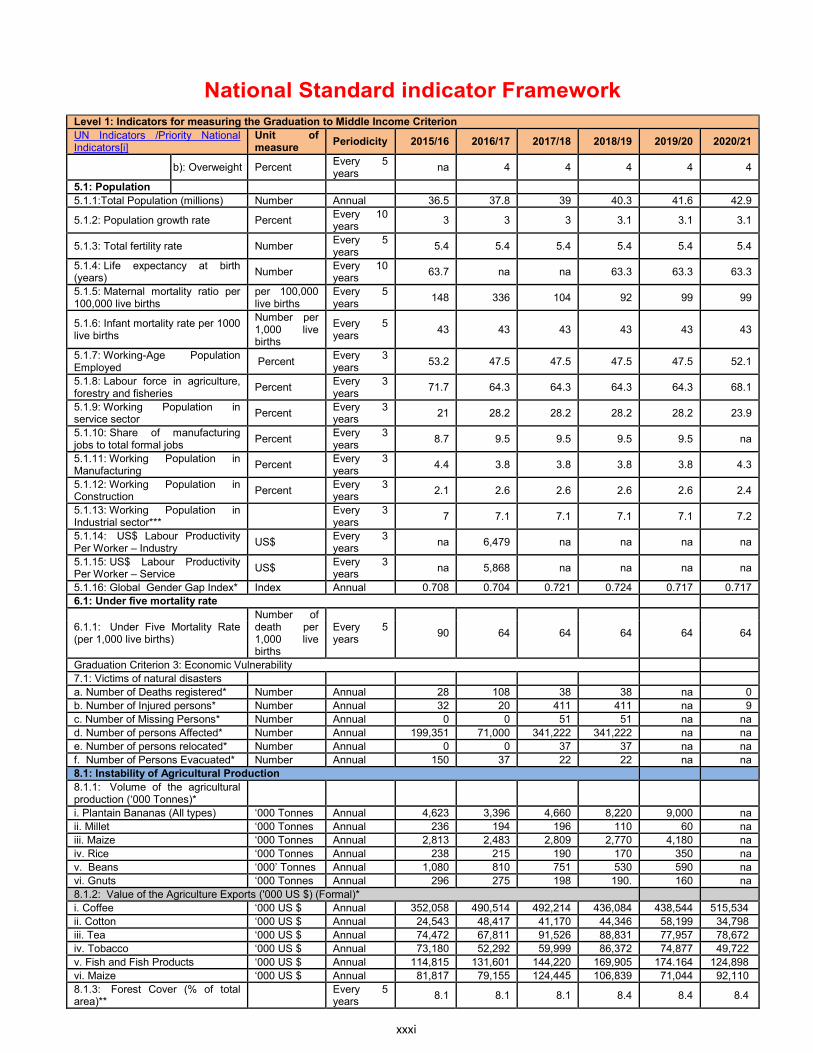
xxxi
National Standard indicator Framework
Level 1: Indicators for measuring the Graduation to Middle Income Criterion
UN Indicators /Priority National Indicators[i]
Unit of measure
Periodicity 2015/16 2016/17 2017/18 2018/19 2019/20 2020/21
b): Overweight Percent Every 5 years
na 4 4 4 4 4
5.1: Population
5.1.1:Total Population (millions) Number Annual 36.5 37.8 39 40.3 41.6 42.9
5.1.2: Population growth rate Percent Every 10 years
3 3 3 3.1 3.1 3.1
5.1.3: Total fertility rate Number Every 5 years
5.4 5.4 5.4 5.4 5.4 5.4
5.1.4: Life expectancy at birth (years)
Number Every 10 years
63.7 na na 63.3 63.3 63.3
5.1.5: Maternal mortality ratio per 100,000 live births
per 100,000 live births
Every 5 years
148 336 104 92 99 99
5.1.6: Infant mortality rate per 1000 live births
Number per 1,000 live births
Every 5 years
43 43 43 43 43 43
5.1.7: Working-Age Population Employed
Percent Every 3 years
53.2 47.5 47.5 47.5 47.5 52.1
5.1.8: Labour force in agriculture, forestry and fisheries
Percent Every 3 years
71.7 64.3 64.3 64.3 64.3 68.1
5.1.9: Working Population in service sector
Percent Every 3 years
21 28.2 28.2 28.2 28.2 23.9
5.1.10: Share of manufacturing jobs to total formal jobs
Percent Every 3 years
8.7 9.5 9.5 9.5 9.5 na
5.1.11: Working Population in Manufacturing
Percent Every 3 years
4.4 3.8 3.8 3.8 3.8 4.3
5.1.12: Working Population in Construction
Percent Every 3 years
2.1 2.6 2.6 2.6 2.6 2.4
5.1.13: Working Population in Industrial sector***
Every 3 years
7 7.1 7.1 7.1 7.1 7.2
5.1.14: US$ Labour Productivity Per Worker – Industry
US$ Every 3 years
na 6,479 na na na na
5.1.15: US$ Labour Productivity Per Worker – Service
US$ Every 3 years
na 5,868 na na na na
5.1.16: Global Gender Gap Index* Index Annual 0.708 0.704 0.721 0.724 0.717 0.717
6.1: Under five mortality rate
6.1.1: Under Five Mortality Rate (per 1,000 live births)
Number of death per 1,000 live births
Every 5 years
90 64 64 64 64 64
Graduation Criterion 3: Economic Vulnerability
7.1: Victims of natural disasters
a. Number of Deaths registered* Number Annual 28 108 38 38 na 0
b. Number of Injured persons* Number Annual 32 20 411 411 na 9
c. Number of Missing Persons* Number Annual 0 0 51 51 na na
d. Number of persons Affected* Number Annual 199,351 71,000 341,222 341,222 na na
e. Number of persons relocated* Number Annual 0 0 37 37 na na
f. Number of Persons Evacuated* Number Annual 150 37 22 22 na na
8.1: Instability of Agricultural Production
8.1.1: Volume of the agricultural production (‘000 Tonnes)*
i. Plantain Bananas (All types) ‘000 Tonnes Annual 4,623 3,396 4,660 8,220 9,000 na
ii. Millet ‘000 Tonnes Annual 236 194 196 110 60 na
iii. Maize ‘000 Tonnes Annual 2,813 2,483 2,809 2,770 4,180 na
iv. Rice ‘000 Tonnes Annual 238 215 190 170 350 na
v. Beans ‘000’ Tonnes Annual 1,080 810 751 530 590 na
vi. Gnuts ‘000 Tonnes Annual 296 275 198 190. 160 na
8.1.2: Value of the Agriculture Exports ('000 US $) (Formal)*
i. Coffee ‘000 US $ Annual 352,058 490,514 492,214 436,084 438,544 515,534
ii. Cotton ‘000 US $ Annual 24,543 48,417 41,170 44,346 58,199 34,798
iii. Tea ‘000 US $ Annual 74,472 67,811 91,526 88,831 77,957 78,672
iv. Tobacco ‘000 US $ Annual 73,180 52,292 59,999 86,372 74,877 49,722
v. Fish and Fish Products ‘000 US $ Annual 114,815 131,601 144,220 169,905 174.164 124,898
vi. Maize ‘000 US $ Annual 81,817 79,155 124,445 106,839 71,044 92,110
8.1.3: Forest Cover (% of total area)**
Every 5 years
8.1 8.1 8.1 8.4 8.4 8.4
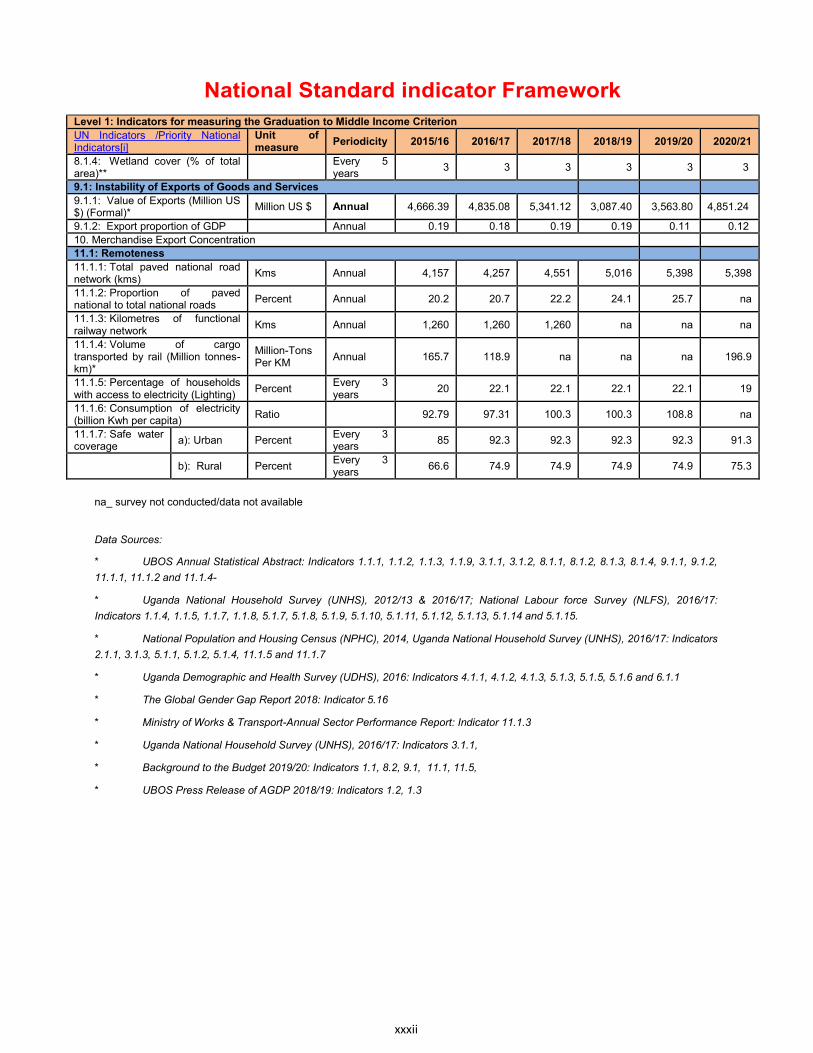
xxxii
National Standard indicator Framework
Level 1: Indicators for measuring the Graduation to Middle Income Criterion
UN Indicators /Priority National Indicators[i]
Unit of measure
Periodicity 2015/16 2016/17 2017/18 2018/19 2019/20 2020/21
8.1.4: Wetland cover (% of total area)**
Every 5 years
3 3 3 3 3 3
9.1: Instability of Exports of Goods and Services
9.1.1: Value of Exports (Million US $) (Formal)*
Million US $ Annual 4,666.39 4,835.08 5,341.12 3,087.40 3,563.80 4,851.24
9.1.2: Export proportion of GDP Annual 0.19 0.18 0.19 0.19 0.11 0.12
10. Merchandise Export Concentration
11.1: Remoteness
11.1.1: Total paved national road network (kms)
Kms Annual 4,157 4,257 4,551 5,016 5,398 5,398
11.1.2: Proportion of paved national to total national roads
Percent Annual 20.2 20.7 22.2 24.1 25.7 na
11.1.3: Kilometres of functional railway network
Kms Annual 1,260 1,260 1,260 na na na
11.1.4: Volume of cargo transported by rail (Million tonnes-km)*
Million-Tons Per KM
Annual 165.7 118.9 na na na 196.9
11.1.5: Percentage of households with access to electricity (Lighting)
Percent Every 3 years
20 22.1 22.1 22.1 22.1 19
11.1.6: Consumption of electricity (billion Kwh per capita)
Ratio 92.79 97.31 100.3 100.3 108.8 na
11.1.7: Safe water coverage
a): Urban Percent Every 3 years
85 92.3 92.3 92.3 92.3 91.3
b): Rural Percent Every 3 years
66.6 74.9 74.9 74.9 74.9 75.3
na_ survey not conducted/data not available
Data Sources:
* UBOS Annual Statistical Abstract: Indicators 1.1.1, 1.1.2, 1.1.3, 1.1.9, 3.1.1, 3.1.2, 8.1.1, 8.1.2, 8.1.3, 8.1.4, 9.1.1, 9.1.2,
11.1.1, 11.1.2 and 11.1.4-
* Uganda National Household Survey (UNHS), 2012/13 & 2016/17; National Labour force Survey (NLFS), 2016/17:
Indicators 1.1.4, 1.1.5, 1.1.7, 1.1.8, 5.1.7, 5.1.8, 5.1.9, 5.1.10, 5.1.11, 5.1.12, 5.1.13, 5.1.14 and 5.1.15.
* National Population and Housing Census (NPHC), 2014, Uganda National Household Survey (UNHS), 2016/17: Indicators
2.1.1, 3.1.3, 5.1.1, 5.1.2, 5.1.4, 11.1.5 and 11.1.7
* Uganda Demographic and Health Survey (UDHS), 2016: Indicators 4.1.1, 4.1.2, 4.1.3, 5.1.3, 5.1.5, 5.1.6 and 6.1.1
* The Global Gender Gap Report 2018: Indicator 5.16
* Ministry of Works & Transport-Annual Sector Performance Report: Indicator 11.1.3
* Uganda National Household Survey (UNHS), 2016/17: Indicators 3.1.1,
* Background to the Budget 2019/20: Indicators 1.1, 8.2, 9.1, 11.1, 11.5,
* UBOS Press Release of AGDP 2018/19: Indicators 1.2, 1.3
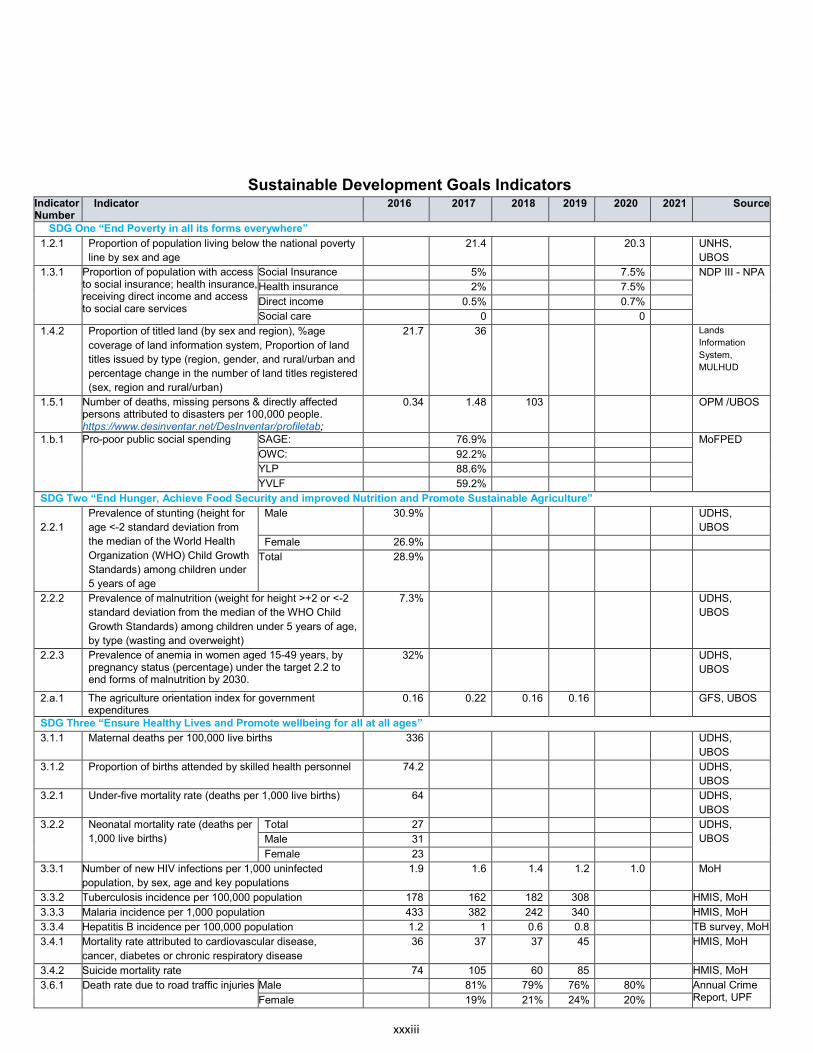
xxxiii
Sustainable Development Goals Indicators Indicator Number
Indicator 2016 2017 2018 2019 2020 2021 Source
SDG One “End Poverty in all its forms everywhere” 1.2.1 Proportion of population living below the national poverty
line by sex and age
21.4 20.3 UNHS,
UBOS
1.3.1 Proportion of population with access to social insurance; health insurance, receiving direct income and access to social care services
Social Insurance 5% 7.5% NDP III - NPA
Health insurance 2% 7.5%
Direct income 0.5% 0.7%
Social care 0 0
1.4.2 Proportion of titled land (by sex and region), %age
coverage of land information system, Proportion of land
titles issued by type (region, gender, and rural/urban and
percentage change in the number of land titles registered
(sex, region and rural/urban)
21.7 36 Lands
Information
System,
MULHUD
1.5.1 Number of deaths, missing persons & directly affected persons attributed to disasters per 100,000 people. https://www.desinventar.net/DesInventar/profiletab;
0.34 1.48 103 OPM /UBOS
1.b.1 Pro-poor public social spending SAGE: 76.9% MoFPED
OWC: 92.2%
YLP 88.6%
YVLF 59.2%
SDG Two “End Hunger, Achieve Food Security and improved Nutrition and Promote Sustainable Agriculture”
2.2.1
Prevalence of stunting (height for
age <-2 standard deviation from
the median of the World Health
Organization (WHO) Child Growth
Standards) among children under
5 years of age
Male 30.9% UDHS,
UBOS
Female 26.9%
Total 28.9%
2.2.2 Prevalence of malnutrition (weight for height >+2 or <-2
standard deviation from the median of the WHO Child
Growth Standards) among children under 5 years of age,
by type (wasting and overweight)
7.3% UDHS,
UBOS
2.2.3 Prevalence of anemia in women aged 15-49 years, by pregnancy status (percentage) under the target 2.2 to end forms of malnutrition by 2030.
32%
UDHS,
UBOS
2.a.1 The agriculture orientation index for government expenditures
0.16 0.22 0.16 0.16 GFS, UBOS
SDG Three “Ensure Healthy Lives and Promote wellbeing for all at all ages” 3.1.1 Maternal deaths per 100,000 live births 336 UDHS,
UBOS
3.1.2 Proportion of births attended by skilled health personnel 74.2 UDHS,
UBOS
3.2.1 Under-five mortality rate (deaths per 1,000 live births) 64 UDHS,
UBOS
3.2.2 Neonatal mortality rate (deaths per
1,000 live births)
Total 27 UDHS,
UBOS Male 31
Female 23
3.3.1 Number of new HIV infections per 1,000 uninfected
population, by sex, age and key populations
1.9 1.6 1.4 1.2 1.0 MoH
3.3.2 Tuberculosis incidence per 100,000 population 178 162 182 308 HMIS, MoH
3.3.3 Malaria incidence per 1,000 population 433 382 242 340 HMIS, MoH
3.3.4 Hepatitis B incidence per 100,000 population 1.2 1 0.6 0.8 TB survey, MoH
3.4.1 Mortality rate attributed to cardiovascular disease,
cancer, diabetes or chronic respiratory disease
36 37 37 45 HMIS, MoH
3.4.2 Suicide mortality rate 74 105 60 85 HMIS, MoH
3.6.1 Death rate due to road traffic injuries Male 81% 79% 76% 80% Annual Crime Report, UPF Female 19% 21% 24% 20%
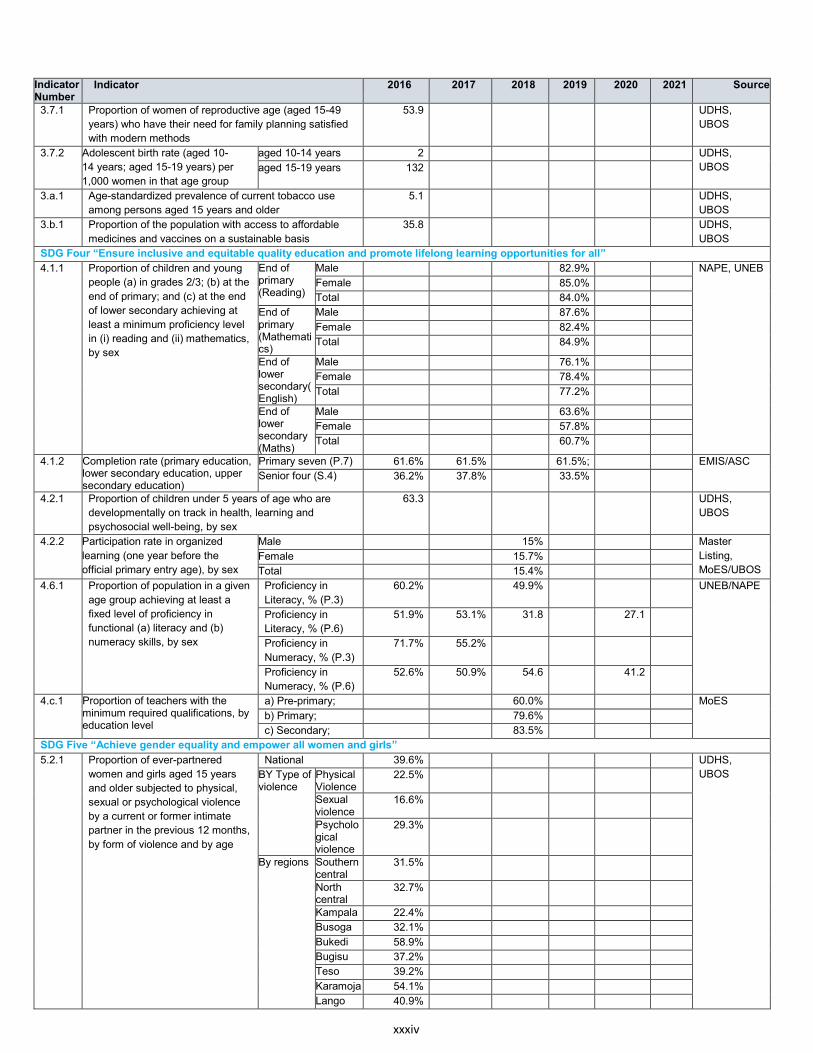
xxxiv
Indicator Number
Indicator 2016 2017 2018 2019 2020 2021 Source
3.7.1 Proportion of women of reproductive age (aged 15-49
years) who have their need for family planning satisfied
with modern methods
53.9 UDHS,
UBOS
3.7.2 Adolescent birth rate (aged 10-
14 years; aged 15-19 years) per
1,000 women in that age group
aged 10-14 years 2 UDHS,
UBOS aged 15-19 years 132
3.a.1 Age-standardized prevalence of current tobacco use
among persons aged 15 years and older
5.1 UDHS,
UBOS
3.b.1 Proportion of the population with access to affordable
medicines and vaccines on a sustainable basis
35.8 UDHS,
UBOS
SDG Four “Ensure inclusive and equitable quality education and promote lifelong learning opportunities for all” 4.1.1 Proportion of children and young
people (a) in grades 2/3; (b) at the
end of primary; and (c) at the end
of lower secondary achieving at
least a minimum proficiency level
in (i) reading and (ii) mathematics,
by sex
End of primary (Reading)
Male 82.9% NAPE, UNEB
Female 85.0%
Total 84.0%
End of primary (Mathematics)
Male 87.6%
Female 82.4%
Total 84.9%
End of lower secondary(English)
Male 76.1%
Female 78.4%
Total 77.2%
End of lower secondary (Maths)
Male 63.6%
Female 57.8%
Total 60.7%
4.1.2 Completion rate (primary education, lower secondary education, upper secondary education)
Primary seven (P.7) 61.6% 61.5% 61.5%; EMIS/ASC
Senior four (S.4) 36.2% 37.8% 33.5%
4.2.1 Proportion of children under 5 years of age who are
developmentally on track in health, learning and
psychosocial well-being, by sex
63.3 UDHS,
UBOS
4.2.2 Participation rate in organized
learning (one year before the
official primary entry age), by sex
Male 15% Master
Listing,
MoES/UBOS
Female 15.7%
Total 15.4%
4.6.1 Proportion of population in a given
age group achieving at least a
fixed level of proficiency in
functional (a) literacy and (b)
numeracy skills, by sex
Proficiency in
Literacy, % (P.3)
60.2% 49.9% UNEB/NAPE
Proficiency in
Literacy, % (P.6)
51.9% 53.1% 31.8 27.1
Proficiency in
Numeracy, % (P.3)
71.7% 55.2%
Proficiency in
Numeracy, % (P.6)
52.6% 50.9% 54.6 41.2
4.c.1 Proportion of teachers with the minimum required qualifications, by education level
a) Pre-primary; 60.0% MoES
b) Primary; 79.6%
c) Secondary; 83.5%
SDG Five “Achieve gender equality and empower all women and girls” 5.2.1 Proportion of ever-partnered
women and girls aged 15 years
and older subjected to physical,
sexual or psychological violence
by a current or former intimate
partner in the previous 12 months,
by form of violence and by age
National 39.6% UDHS,
UBOS BY Type of violence
Physical Violence
22.5%
Sexual violence
16.6%
Psychological violence
29.3%
By regions Southern central
31.5%
North central
32.7%
Kampala 22.4%
Busoga 32.1%
Bukedi 58.9%
Bugisu 37.2%
Teso 39.2%
Karamoja 54.1%
Lango 40.9%
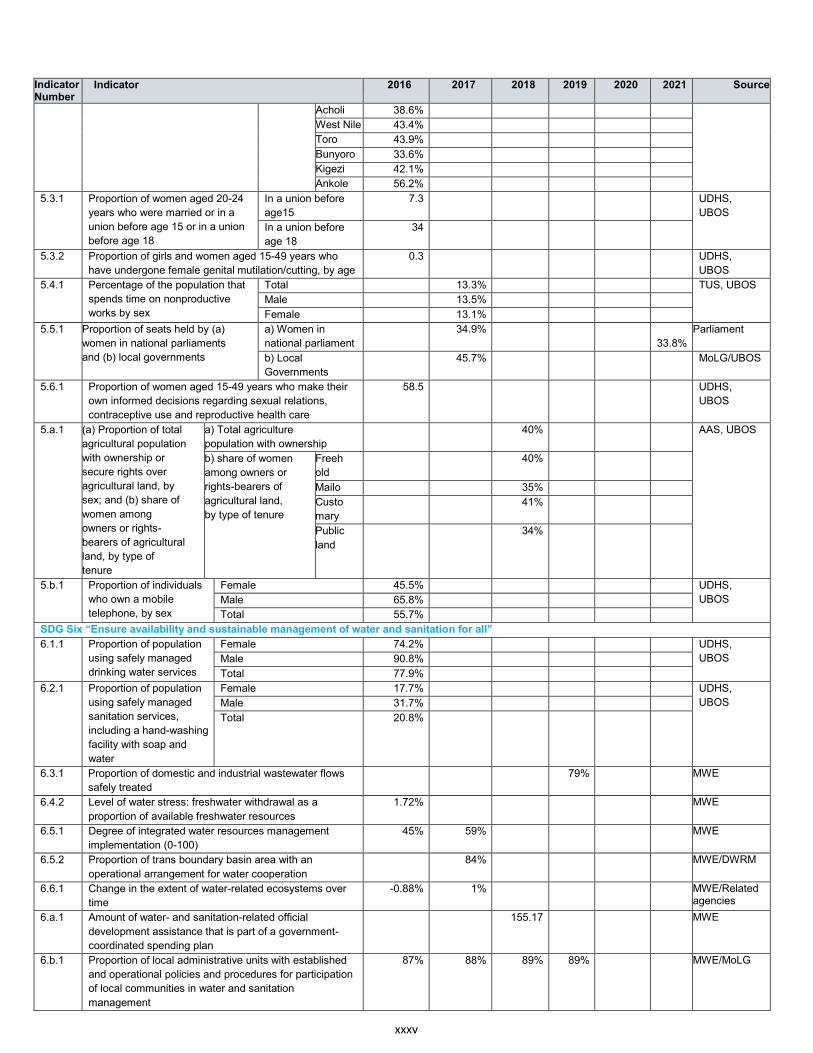
xxxv
Indicator Number
Indicator 2016 2017 2018 2019 2020 2021 Source
Acholi 38.6%
West Nile 43.4%
Toro 43.9%
Bunyoro 33.6%
Kigezi 42.1%
Ankole 56.2%
5.3.1
Proportion of women aged 20-24
years who were married or in a
union before age 15 or in a union
before age 18
In a union before
age15
7.3 UDHS,
UBOS
In a union before
age 18
34
5.3.2 Proportion of girls and women aged 15-49 years who
have undergone female genital mutilation/cutting, by age
0.3 UDHS,
UBOS
5.4.1 Percentage of the population that
spends time on nonproductive
works by sex
Total 13.3% TUS, UBOS
Male 13.5%
Female 13.1%
5.5.1 Proportion of seats held by (a)
women in national parliaments
and (b) local governments
a) Women in
national parliament
34.9%
33.8%
Parliament
b) Local
Governments
45.7% MoLG/UBOS
5.6.1 Proportion of women aged 15-49 years who make their
own informed decisions regarding sexual relations,
contraceptive use and reproductive health care
58.5 UDHS,
UBOS
5.a.1 (a) Proportion of total
agricultural population
with ownership or
secure rights over
agricultural land, by
sex; and (b) share of
women among
owners or rights-
bearers of agricultural
land, by type of
tenure
a) Total agriculture
population with ownership
40%
AAS, UBOS
b) share of women
among owners or
rights-bearers of
agricultural land,
by type of tenure
Freeh
old
40%
Mailo 35%
Custo
mary
41%
Public
land
34%
5.b.1 Proportion of individuals
who own a mobile
telephone, by sex
Female 45.5% UDHS,
UBOS Male 65.8%
Total 55.7%
SDG Six “Ensure availability and sustainable management of water and sanitation for all” 6.1.1 Proportion of population
using safely managed
drinking water services
Female 74.2% UDHS,
UBOS Male 90.8%
Total 77.9%
6.2.1 Proportion of population
using safely managed
sanitation services,
including a hand-washing
facility with soap and
water
Female 17.7% UDHS,
UBOS Male 31.7%
Total 20.8%
6.3.1 Proportion of domestic and industrial wastewater flows
safely treated
79% MWE
6.4.2 Level of water stress: freshwater withdrawal as a
proportion of available freshwater resources
1.72% MWE
6.5.1 Degree of integrated water resources management
implementation (0-100)
45% 59% MWE
6.5.2 Proportion of trans boundary basin area with an
operational arrangement for water cooperation
84% MWE/DWRM
6.6.1 Change in the extent of water-related ecosystems over
time
-0.88% 1% MWE/Related agencies
6.a.1 Amount of water- and sanitation-related official
development assistance that is part of a government-
coordinated spending plan
155.17 MWE
6.b.1 Proportion of local administrative units with established
and operational policies and procedures for participation
of local communities in water and sanitation
management
87% 88% 89% 89% MWE/MoLG
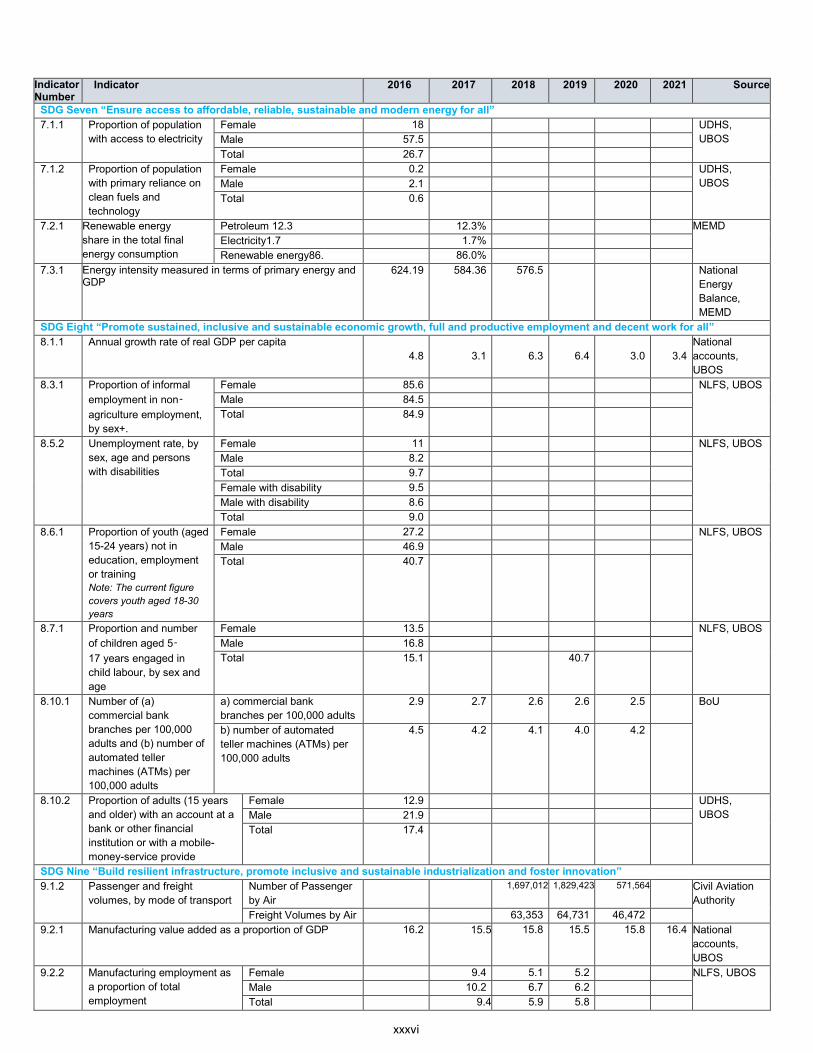
xxxvi
Indicator Number
Indicator 2016 2017 2018 2019 2020 2021 Source
SDG Seven “Ensure access to affordable, reliable, sustainable and modern energy for all” 7.1.1 Proportion of population
with access to electricity
Female 18 UDHS,
UBOS Male 57.5
Total 26.7
7.1.2 Proportion of population
with primary reliance on
clean fuels and
technology
Female 0.2 UDHS,
UBOS Male 2.1
Total 0.6
7.2.1 Renewable energy
share in the total final
energy consumption
Petroleum 12.3 12.3% MEMD
Electricity1.7 1.7%
Renewable energy86. 86.0%
7.3.1 Energy intensity measured in terms of primary energy and GDP
624.19 584.36 576.5 National
Energy
Balance,
MEMD
SDG Eight “Promote sustained, inclusive and sustainable economic growth, full and productive employment and decent work for all” 8.1.1 Annual growth rate of real GDP per capita
4.8
3.1
6.3
6.4
3.0
3.4
National
accounts,
UBOS
8.3.1 Proportion of informal
employment in non‑
agriculture employment,
by sex+.
Female 85.6 NLFS, UBOS
Male 84.5
Total 84.9
8.5.2 Unemployment rate, by
sex, age and persons
with disabilities
Female 11 NLFS, UBOS
Male 8.2
Total 9.7
Female with disability 9.5
Male with disability 8.6
Total 9.0
8.6.1 Proportion of youth (aged
15-24 years) not in
education, employment
or training Note: The current figure
covers youth aged 18-30
years
Female 27.2 NLFS, UBOS
Male 46.9
Total 40.7
8.7.1 Proportion and number
of children aged 5‑
17 years engaged in
child labour, by sex and
age
Female 13.5 NLFS, UBOS
Male 16.8
Total 15.1 40.7
8.10.1 Number of (a)
commercial bank
branches per 100,000
adults and (b) number of
automated teller
machines (ATMs) per
100,000 adults
a) commercial bank
branches per 100,000 adults
2.9 2.7 2.6 2.6 2.5 BoU
b) number of automated
teller machines (ATMs) per
100,000 adults
4.5 4.2 4.1 4.0 4.2
8.10.2 Proportion of adults (15 years
and older) with an account at a
bank or other financial
institution or with a mobile-
money-service provide
Female 12.9 UDHS,
UBOS Male 21.9
Total 17.4
SDG Nine “Build resilient infrastructure, promote inclusive and sustainable industrialization and foster innovation” 9.1.2 Passenger and freight
volumes, by mode of transport
Number of Passenger
by Air
1,697,012 1,829,423 571,564 Civil Aviation
Authority
Freight Volumes by Air 63,353 64,731 46,472
9.2.1 Manufacturing value added as a proportion of GDP 16.2 15.5 15.8 15.5 15.8 16.4 National
accounts,
UBOS
9.2.2 Manufacturing employment as
a proportion of total
employment
Female 9.4 5.1 5.2 NLFS, UBOS
Male 10.2 6.7 6.2
Total 9.4 5.9 5.8
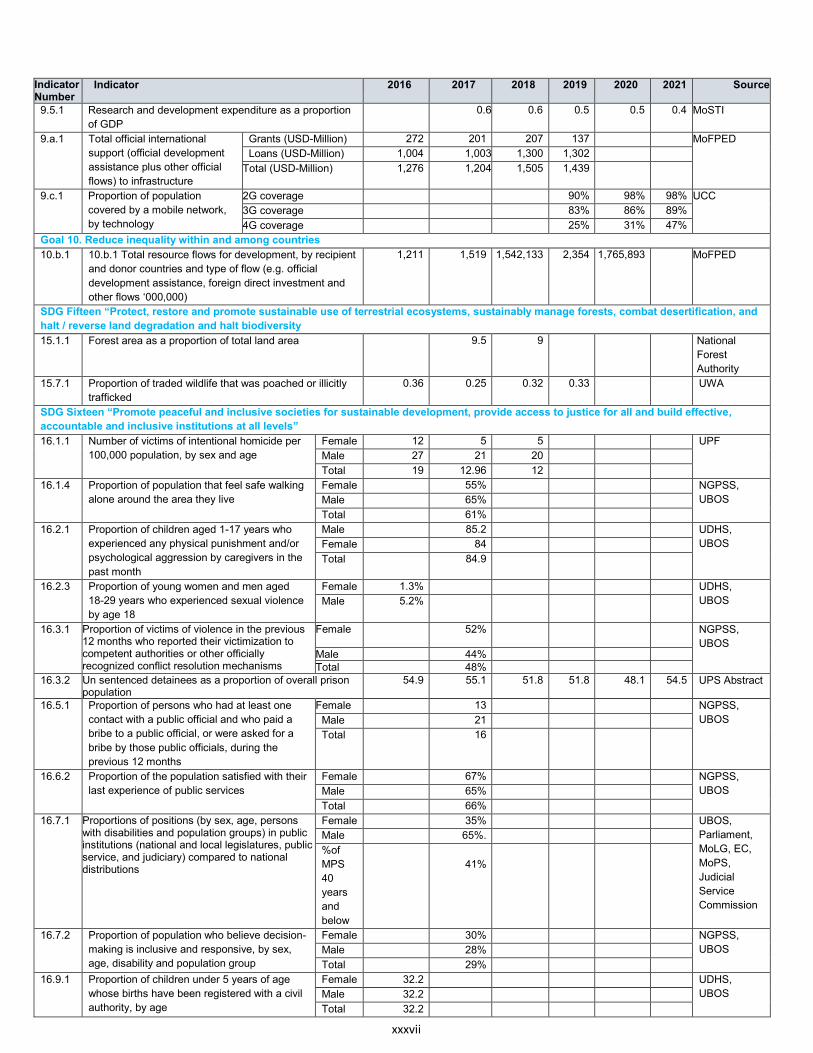
xxxvii
Indicator Number
Indicator 2016 2017 2018 2019 2020 2021 Source
9.5.1 Research and development expenditure as a proportion
of GDP
0.6 0.6 0.5 0.5 0.4 MoSTI
9.a.1 Total official international
support (official development
assistance plus other official
flows) to infrastructure
Grants (USD-Million) 272 201 207 137 MoFPED
Loans (USD-Million) 1,004 1,003 1,300 1,302
Total (USD-Million) 1,276 1,204 1,505 1,439
9.c.1 Proportion of population
covered by a mobile network,
by technology
2G coverage 90% 98% 98% UCC
3G coverage 83% 86% 89%
4G coverage 25% 31% 47%
Goal 10. Reduce inequality within and among countries
10.b.1 10.b.1 Total resource flows for development, by recipient
and donor countries and type of flow (e.g. official
development assistance, foreign direct investment and
other flows ‘000,000)
1,211 1,519 1,542,133 2,354 1,765,893 MoFPED
SDG Fifteen “Protect, restore and promote sustainable use of terrestrial ecosystems, sustainably manage forests, combat desertification, and
halt / reverse land degradation and halt biodiversity
15.1.1 Forest area as a proportion of total land area 9.5 9 National
Forest
Authority
15.7.1 Proportion of traded wildlife that was poached or illicitly
trafficked
0.36 0.25 0.32 0.33 UWA
SDG Sixteen “Promote peaceful and inclusive societies for sustainable development, provide access to justice for all and build effective,
accountable and inclusive institutions at all levels” 16.1.1 Number of victims of intentional homicide per
100,000 population, by sex and age
Female 12 5 5 UPF
Male 27 21 20
Total 19 12.96 12
16.1.4 Proportion of population that feel safe walking
alone around the area they live
Female 55% NGPSS,
UBOS Male 65%
Total 61%
16.2.1 Proportion of children aged 1-17 years who
experienced any physical punishment and/or
psychological aggression by caregivers in the
past month
Male 85.2 UDHS,
UBOS Female 84
Total 84.9
16.2.3 Proportion of young women and men aged
18-29 years who experienced sexual violence
by age 18
Female 1.3% UDHS,
UBOS Male 5.2%
16.3.1 Proportion of victims of violence in the previous 12 months who reported their victimization to competent authorities or other officially recognized conflict resolution mechanisms
Female 52%
NGPSS,
UBOS Male 44% Total 48%
16.3.2 Un sentenced detainees as a proportion of overall prison population
54.9 55.1 51.8 51.8 48.1 54.5 UPS Abstract
16.5.1 Proportion of persons who had at least one
contact with a public official and who paid a
bribe to a public official, or were asked for a
bribe by those public officials, during the
previous 12 months
Female 13 NGPSS,
UBOS Male 21
Total 16
16.6.2 Proportion of the population satisfied with their
last experience of public services
Female 67% NGPSS,
UBOS Male 65%
Total 66%
16.7.1 Proportions of positions (by sex, age, persons with disabilities and population groups) in public institutions (national and local legislatures, public service, and judiciary) compared to national distributions
Female 35% UBOS,
Parliament,
MoLG, EC,
MoPS,
Judicial
Service
Commission
Male 65%.
%of
MPS
40
years
and
below
41%
16.7.2 Proportion of population who believe decision-
making is inclusive and responsive, by sex,
age, disability and population group
Female 30% NGPSS,
UBOS Male 28%
Total 29%
16.9.1 Proportion of children under 5 years of age
whose births have been registered with a civil
authority, by age
Female 32.2 UDHS,
UBOS Male 32.2
Total 32.2
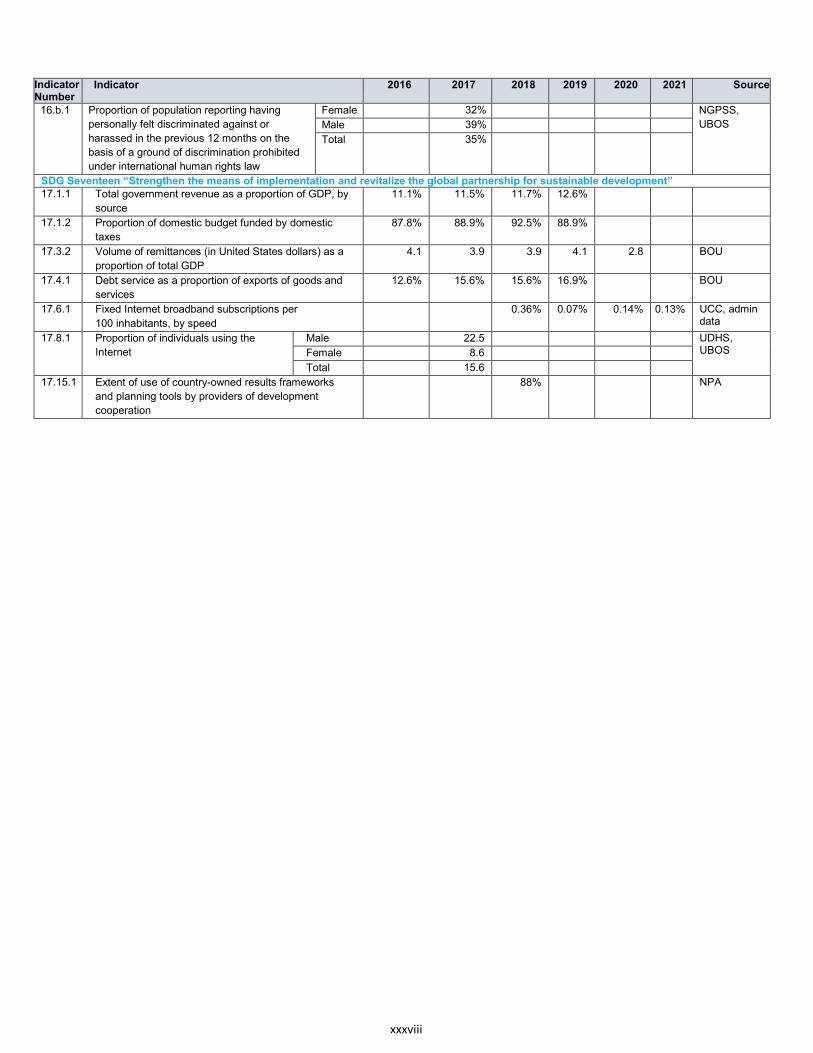
xxxviii
Indicator Number
Indicator 2016 2017 2018 2019 2020 2021 Source
16.b.1 Proportion of population reporting having
personally felt discriminated against or
harassed in the previous 12 months on the
basis of a ground of discrimination prohibited
under international human rights law
Female 32% NGPSS,
UBOS Male 39%
Total 35%
SDG Seventeen “Strengthen the means of implementation and revitalize the global partnership for sustainable development” 17.1.1 Total government revenue as a proportion of GDP, by
source
11.1% 11.5% 11.7% 12.6%
17.1.2 Proportion of domestic budget funded by domestic
taxes
87.8% 88.9% 92.5% 88.9%
17.3.2 Volume of remittances (in United States dollars) as a
proportion of total GDP
4.1 3.9 3.9 4.1 2.8 BOU
17.4.1 Debt service as a proportion of exports of goods and
services
12.6% 15.6% 15.6% 16.9% BOU
17.6.1 Fixed Internet broadband subscriptions per
100 inhabitants, by speed
0.36% 0.07% 0.14% 0.13% UCC, admin data
17.8.1 Proportion of individuals using the
Internet
Male 22.5 UDHS, UBOS Female 8.6
Total 15.6
17.15.1 Extent of use of country-owned results frameworks
and planning tools by providers of development
cooperation
88% NPA
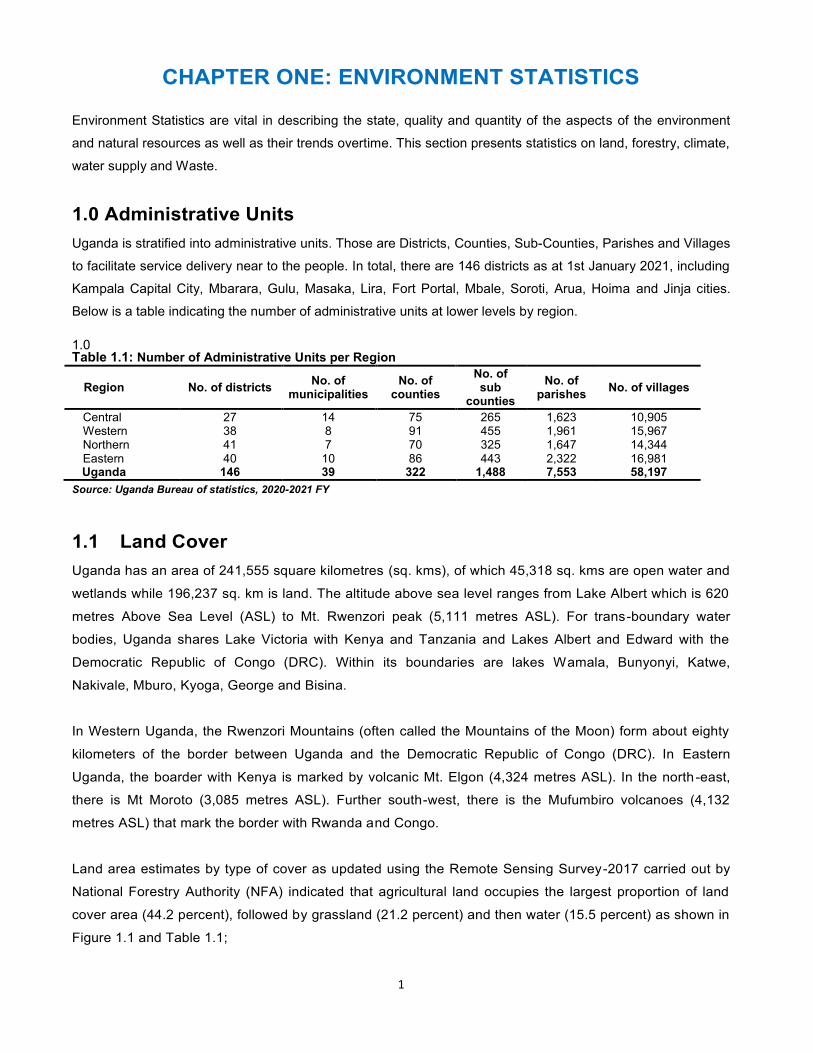
1
CHAPTER ONE: ENVIRONMENT STATISTICS Environment Statistics are vital in describing the state, quality and quantity of the aspects of the environment
and natural resources as well as their trends overtime. This section presents statistics on land, forestry, climate,
water supply and Waste.
1.0 Administrative Units
Uganda is stratified into administrative units. Those are Districts, Counties, Sub-Counties, Parishes and Villages
to facilitate service delivery near to the people. In total, there are 146 districts as at 1st January 2021, including
Kampala Capital City, Mbarara, Gulu, Masaka, Lira, Fort Portal, Mbale, Soroti, Arua, Hoima and Jinja cities.
Below is a table indicating the number of administrative units at lower levels by region.
1.0 Table 1.1: Number of Administrative Units per Region
Region No. of districts No. of
municipalities No. of
counties
No. of sub
counties
No. of parishes
No. of villages
Central 27 14 75 265 1,623 10,905 Western 38 8 91 455 1,961 15,967 Northern 41 7 70 325 1,647 14,344 Eastern 40 10 86 443 2,322 16,981 Uganda 146 39 322 1,488 7,553 58,197
Source: Uganda Bureau of statistics, 2020-2021 FY
1.1 Land Cover
Uganda has an area of 241,555 square kilometres (sq. kms), of which 45,318 sq. kms are open water and
wetlands while 196,237 sq. km is land. The altitude above sea level ranges from Lake Albert which is 620
metres Above Sea Level (ASL) to Mt. Rwenzori peak (5,111 metres ASL). For trans-boundary water
bodies, Uganda shares Lake Victoria with Kenya and Tanzania and Lakes Albert and Edward with the
Democratic Republic of Congo (DRC). Within its boundaries are lakes Wamala, Bunyonyi, Katwe,
Nakivale, Mburo, Kyoga, George and Bisina.
In Western Uganda, the Rwenzori Mountains (often called the Mountains of the Moon) form about eighty
kilometers of the border between Uganda and the Democratic Republic of Congo (DRC). In Eastern
Uganda, the boarder with Kenya is marked by volcanic Mt. Elgon (4,324 metres ASL). In the north-east,
there is Mt Moroto (3,085 metres ASL). Further south-west, there is the Mufumbiro volcanoes (4,132
metres ASL) that mark the border with Rwanda and Congo.
Land area estimates by type of cover as updated using the Remote Sensing Survey-2017 carried out by
National Forestry Authority (NFA) indicated that agricultural land occupies the largest proportion of land
cover area (44.2 percent), followed by grassland (21.2 percent) and then water (15.5 percent) as shown in
Figure 1.1 and Table 1.1;
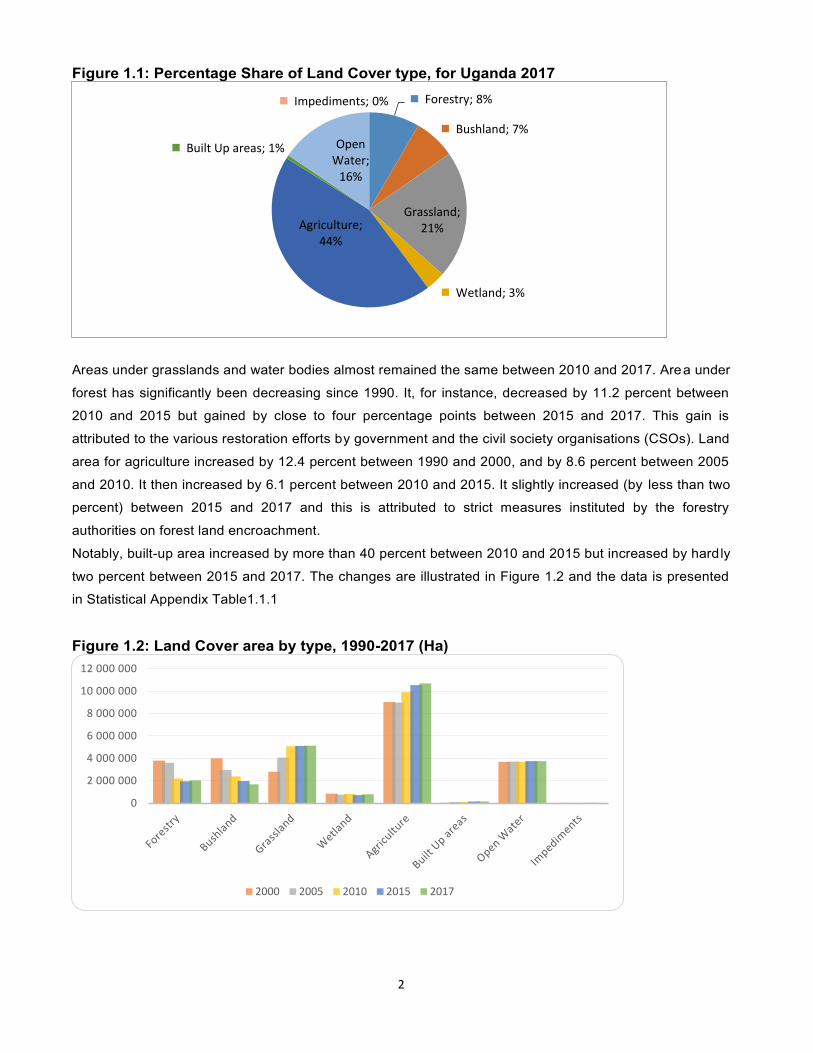
2
Figure 1.1: Percentage Share of Land Cover type, for Uganda 2017
Areas under grasslands and water bodies almost remained the same between 2010 and 2017. Area under
forest has significantly been decreasing since 1990. It, for instance, decreased by 11.2 percent between
2010 and 2015 but gained by close to four percentage points between 2015 and 2017. This gain is
attributed to the various restoration efforts by government and the civil society organisations (CSOs). Land
area for agriculture increased by 12.4 percent between 1990 and 2000, and by 8.6 percent between 2005
and 2010. It then increased by 6.1 percent between 2010 and 2015. It slightly increased (by less than two
percent) between 2015 and 2017 and this is attributed to strict measures instituted by the forestry
authorities on forest land encroachment.
Notably, built-up area increased by more than 40 percent between 2010 and 2015 but increased by hardly
two percent between 2015 and 2017. The changes are illustrated in Figure 1.2 and the data is presented
in Statistical Appendix Table1.1.1
Figure 1.2: Land Cover area by type, 1990-2017 (Ha)
Forestry; 8%
Bushland; 7%
Grassland;
21%
Wetland; 3%
Agriculture;
44%
Built Up areas; 1% Open
Water;
16%
Impediments; 0%
0
2 000 000
4 000 000
6 000 000
8 000 000
10 000 000
12 000 000
2000 2005 2010 2015 2017
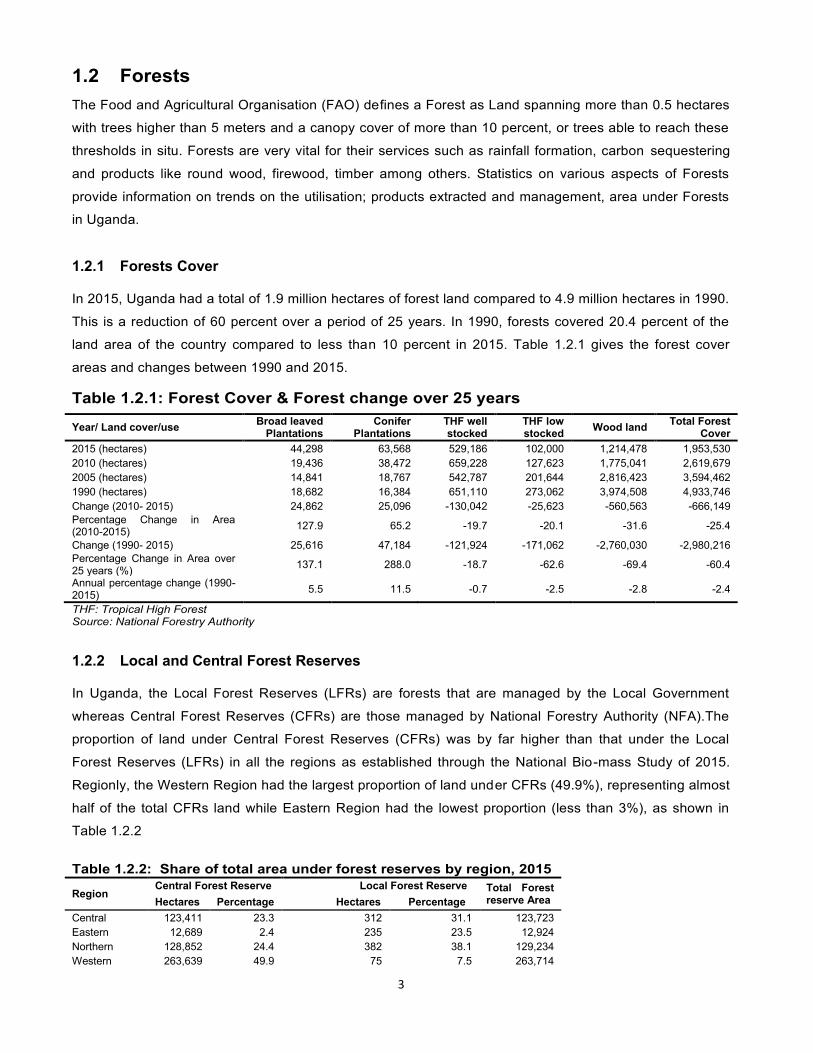
3
1.2 Forests
The Food and Agricultural Organisation (FAO) defines a Forest as Land spanning more than 0.5 hectares
with trees higher than 5 meters and a canopy cover of more than 10 percent, or trees able to reach these
thresholds in situ. Forests are very vital for their services such as rainfall formation, carbon sequestering
and products like round wood, firewood, timber among others. Statistics on various aspects of Forests
provide information on trends on the utilisation; products extracted and management, area under Forests
in Uganda.
1.2.1 Forests Cover
In 2015, Uganda had a total of 1.9 million hectares of forest land compared to 4.9 million hectares in 1990.
This is a reduction of 60 percent over a period of 25 years. In 1990, forests covered 20.4 percent of the
land area of the country compared to less than 10 percent in 2015. Table 1.2.1 gives the forest cover
areas and changes between 1990 and 2015.
Table 1.2.1: Forest Cover & Forest change over 25 years
Year/ Land cover/use Broad leaved
Plantations Conifer
Plantations THF well stocked
THF low stocked
Wood land Total Forest
Cover
2015 (hectares) 44,298 63,568 529,186 102,000 1,214,478 1,953,530
2010 (hectares) 19,436 38,472 659,228 127,623 1,775,041 2,619,679
2005 (hectares) 14,841 18,767 542,787 201,644 2,816,423 3,594,462
1990 (hectares) 18,682 16,384 651,110 273,062 3,974,508 4,933,746
Change (2010- 2015) 24,862 25,096 -130,042 -25,623 -560,563 -666,149
Percentage Change in Area (2010-2015)
127.9 65.2 -19.7 -20.1 -31.6 -25.4
Change (1990- 2015) 25,616 47,184 -121,924 -171,062 -2,760,030 -2,980,216
Percentage Change in Area over 25 years (%)
137.1 288.0 -18.7 -62.6 -69.4 -60.4
Annual percentage change (1990-2015)
5.5 11.5 -0.7 -2.5 -2.8 -2.4
THF: Tropical High Forest Source: National Forestry Authority
1.2.2 Local and Central Forest Reserves
In Uganda, the Local Forest Reserves (LFRs) are forests that are managed by the Local Government
whereas Central Forest Reserves (CFRs) are those managed by National Forestry Authority (NFA).The
proportion of land under Central Forest Reserves (CFRs) was by far higher than that under the Local
Forest Reserves (LFRs) in all the regions as established through the National Bio-mass Study of 2015.
Regionly, the Western Region had the largest proportion of land under CFRs (49.9%), representing almost
half of the total CFRs land while Eastern Region had the lowest proportion (less than 3%), as shown in
Table 1.2.2
Table 1.2.2: Share of total area under forest reserves by region, 2015
Region Central Forest Reserve Local Forest Reserve Total Forest
reserve Area Hectares Percentage Hectares Percentage
Central 123,411 23.3 312 31.1 123,723
Eastern 12,689 2.4 235 23.5 12,924
Northern 128,852 24.4 382 38.1 129,234
Western 263,639 49.9 75 7.5 263,714
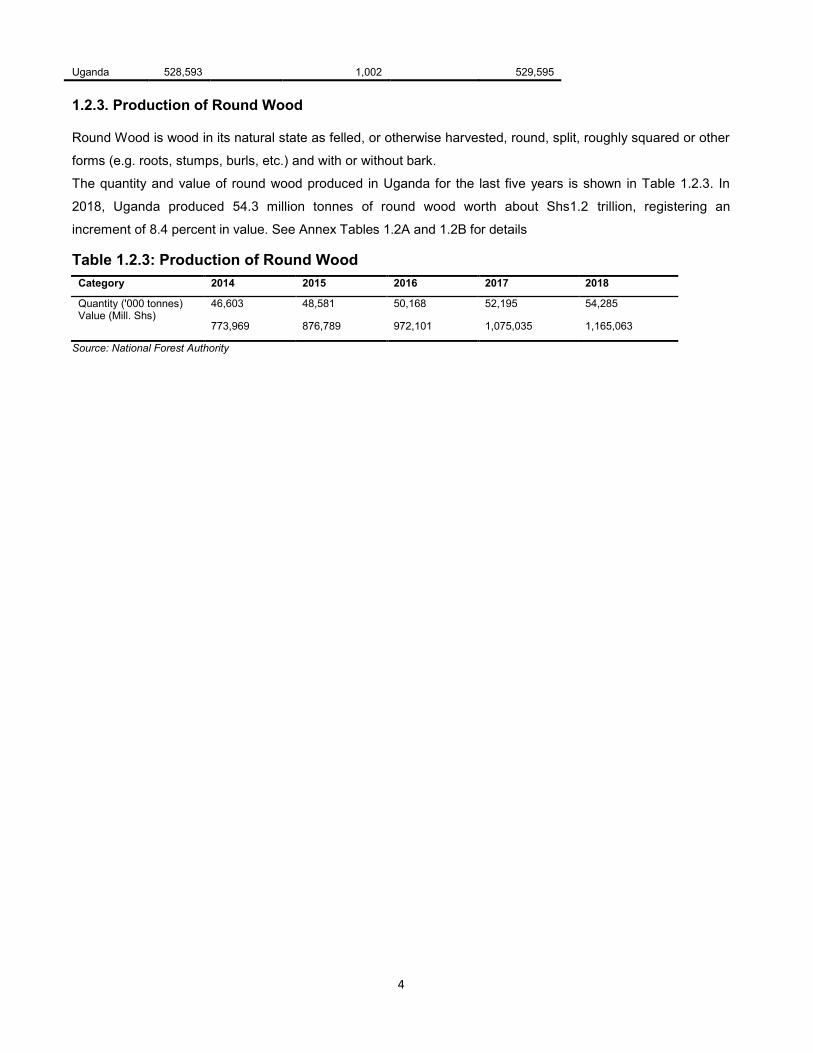
4
Uganda 528,593 1,002 529,595
1.2.3. Production of Round Wood
Round Wood is wood in its natural state as felled, or otherwise harvested, round, split, roughly squared or other
forms (e.g. roots, stumps, burls, etc.) and with or without bark.
The quantity and value of round wood produced in Uganda for the last five years is shown in Table 1.2.3. In
2018, Uganda produced 54.3 million tonnes of round wood worth about Shs1.2 trillion, registering an
increment of 8.4 percent in value. See Annex Tables 1.2A and 1.2B for details
Table 1.2.3: Production of Round Wood
Category 2014 2015 2016 2017 2018
Quantity ('000 tonnes) Value (Mill. Shs)
46,603 48,581 50,168 52,195 54,285
773,969 876,789 972,101 1,075,035 1,165,063
Source: National Forest Authority
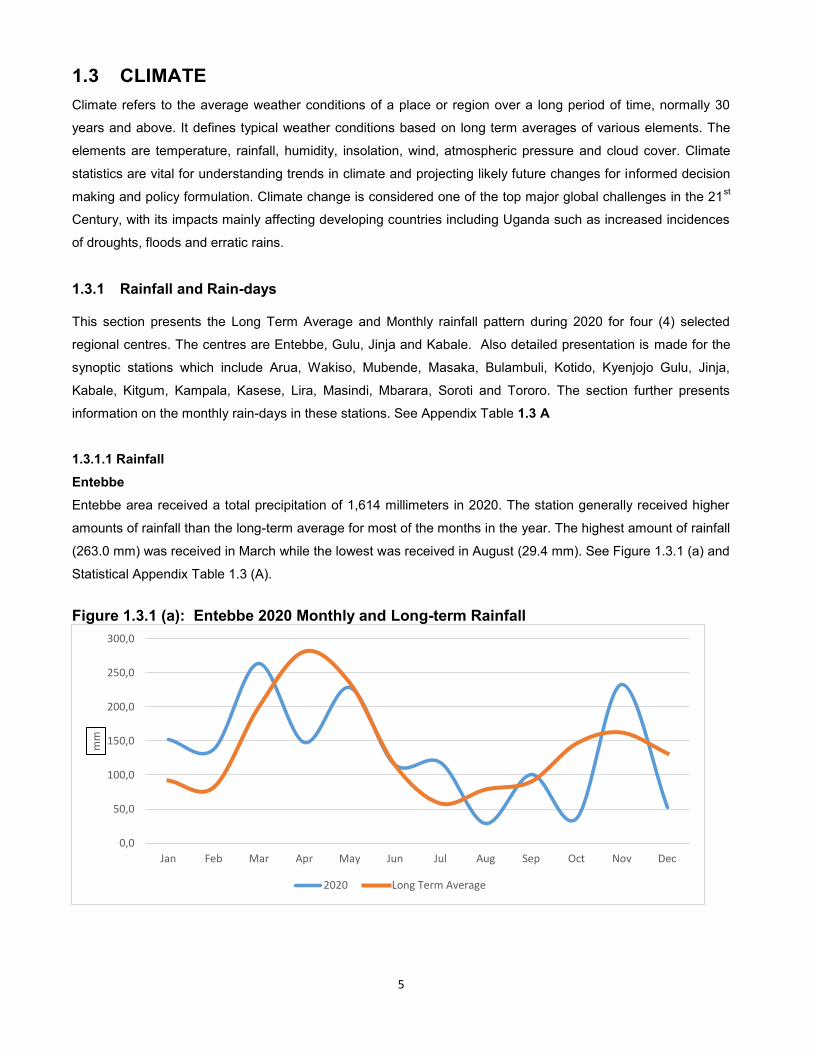
5
1.3 CLIMATE
Climate refers to the average weather conditions of a place or region over a long period of time, normally 30
years and above. It defines typical weather conditions based on long term averages of various elements. The
elements are temperature, rainfall, humidity, insolation, wind, atmospheric pressure and cloud cover. Climate
statistics are vital for understanding trends in climate and projecting likely future changes for informed decision
making and policy formulation. Climate change is considered one of the top major global challenges in the 21st
Century, with its impacts mainly affecting developing countries including Uganda such as increased incidences
of droughts, floods and erratic rains.
1.3.1 Rainfall and Rain-days
This section presents the Long Term Average and Monthly rainfall pattern during 2020 for four (4) selected
regional centres. The centres are Entebbe, Gulu, Jinja and Kabale. Also detailed presentation is made for the
synoptic stations which include Arua, Wakiso, Mubende, Masaka, Bulambuli, Kotido, Kyenjojo Gulu, Jinja,
Kabale, Kitgum, Kampala, Kasese, Lira, Masindi, Mbarara, Soroti and Tororo. The section further presents
information on the monthly rain-days in these stations. See Appendix Table 1.3 A
1.3.1.1 Rainfall
Entebbe
Entebbe area received a total precipitation of 1,614 millimeters in 2020. The station generally received higher
amounts of rainfall than the long-term average for most of the months in the year. The highest amount of rainfall
(263.0 mm) was received in March while the lowest was received in August (29.4 mm). See Figure 1.3.1 (a) and
Statistical Appendix Table 1.3 (A).
Figure 1.3.1 (a): Entebbe 2020 Monthly and Long-term Rainfall
0,0
50,0
100,0
150,0
200,0
250,0
300,0
Jan Feb Mar Apr May Jun Jul Aug Sep Oct Nov Dec
mm
2020 Long Term Average
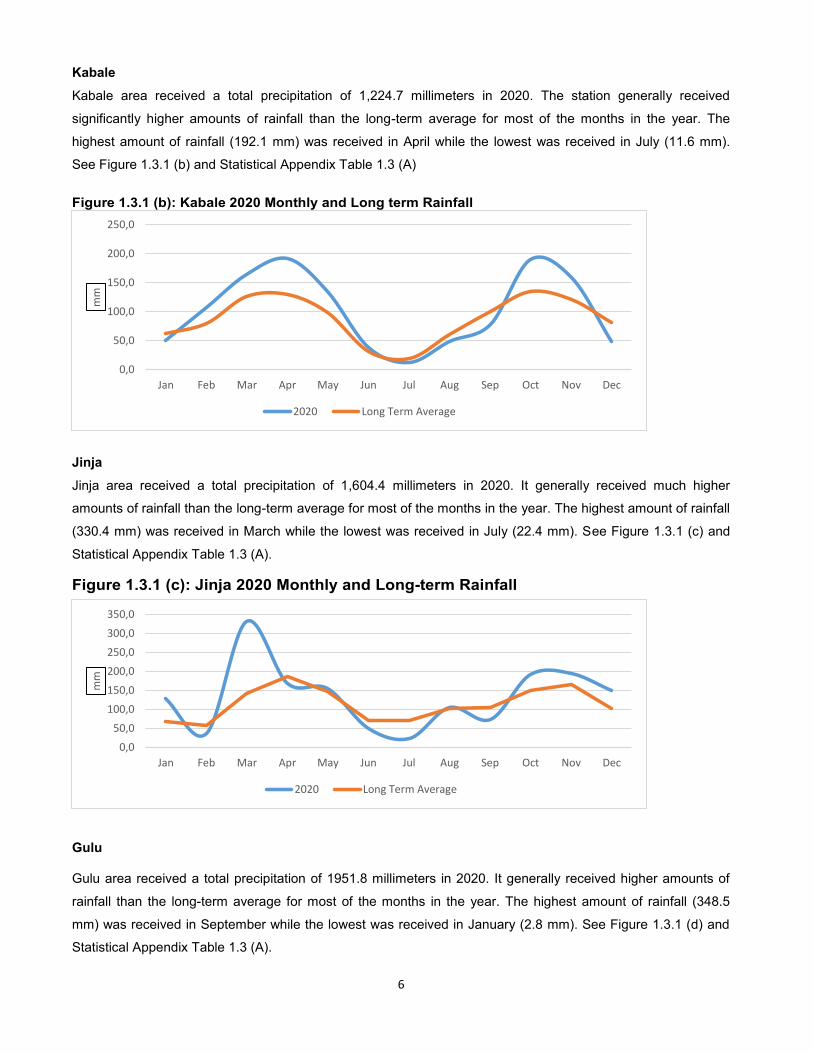
6
Kabale
Kabale area received a total precipitation of 1,224.7 millimeters in 2020. The station generally received
significantly higher amounts of rainfall than the long-term average for most of the months in the year. The
highest amount of rainfall (192.1 mm) was received in April while the lowest was received in July (11.6 mm).
See Figure 1.3.1 (b) and Statistical Appendix Table 1.3 (A)
Figure 1.3.1 (b): Kabale 2020 Monthly and Long term Rainfall
Jinja
Jinja area received a total precipitation of 1,604.4 millimeters in 2020. It generally received much higher
amounts of rainfall than the long-term average for most of the months in the year. The highest amount of rainfall
(330.4 mm) was received in March while the lowest was received in July (22.4 mm). See Figure 1.3.1 (c) and
Statistical Appendix Table 1.3 (A).
Figure 1.3.1 (c): Jinja 2020 Monthly and Long-term Rainfall
Gulu Gulu area received a total precipitation of 1951.8 millimeters in 2020. It generally received higher amounts of
rainfall than the long-term average for most of the months in the year. The highest amount of rainfall (348.5
mm) was received in September while the lowest was received in January (2.8 mm). See Figure 1.3.1 (d) and
Statistical Appendix Table 1.3 (A).
0,0
50,0
100,0
150,0
200,0
250,0
Jan Feb Mar Apr May Jun Jul Aug Sep Oct Nov Dec
mm
2020 Long Term Average
0,0
50,0
100,0
150,0
200,0
250,0
300,0
350,0
Jan Feb Mar Apr May Jun Jul Aug Sep Oct Nov Dec
mm
2020 Long Term Average
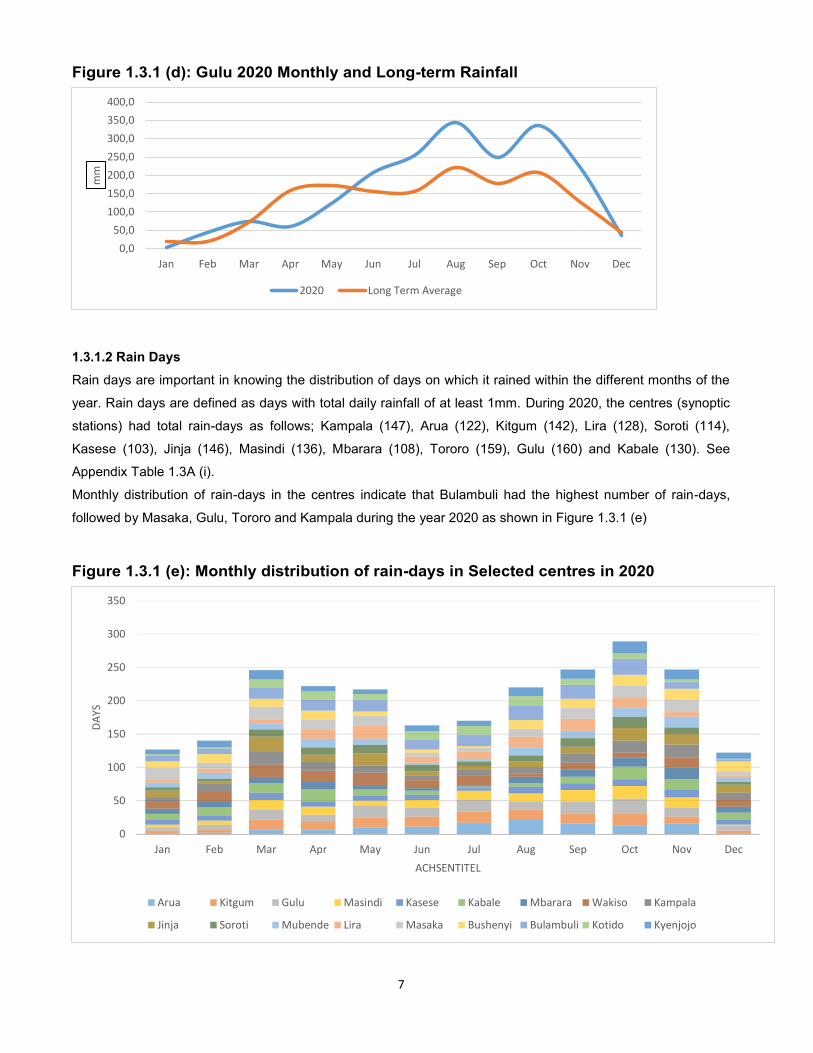
7
Figure 1.3.1 (d): Gulu 2020 Monthly and Long-term Rainfall
1.3.1.2 Rain Days
Rain days are important in knowing the distribution of days on which it rained within the different months of the
year. Rain days are defined as days with total daily rainfall of at least 1mm. During 2020, the centres (synoptic
stations) had total rain-days as follows; Kampala (147), Arua (122), Kitgum (142), Lira (128), Soroti (114),
Kasese (103), Jinja (146), Masindi (136), Mbarara (108), Tororo (159), Gulu (160) and Kabale (130). See
Appendix Table 1.3A (i).
Monthly distribution of rain-days in the centres indicate that Bulambuli had the highest number of rain-days,
followed by Masaka, Gulu, Tororo and Kampala during the year 2020 as shown in Figure 1.3.1 (e)
Figure 1.3.1 (e): Monthly distribution of rain-days in Selected centres in 2020
0,0
50,0
100,0
150,0
200,0
250,0
300,0
350,0
400,0
Jan Feb Mar Apr May Jun Jul Aug Sep Oct Nov Dec
mm
2020 Long Term Average
0
50
100
150
200
250
300
350
Jan Feb Mar Apr May Jun Jul Aug Sep Oct Nov Dec
DA
YS
ACHSENTITEL
Arua Kitgum Gulu Masindi Kasese Kabale Mbarara Wakiso Kampala
Jinja Soroti Mubende Lira Masaka Bushenyi Bulambuli Kotido Kyenjojo
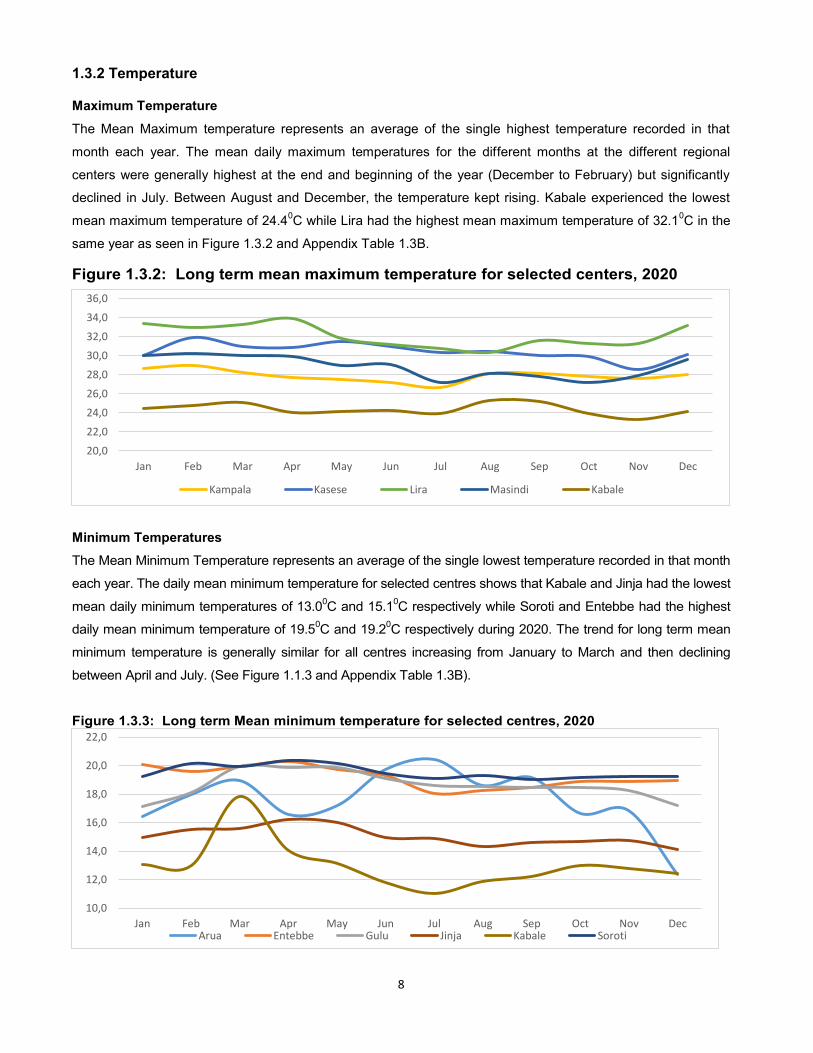
8
1.3.2 Temperature
Maximum Temperature
The Mean Maximum temperature represents an average of the single highest temperature recorded in that
month each year. The mean daily maximum temperatures for the different months at the different regional
centers were generally highest at the end and beginning of the year (December to February) but significantly
declined in July. Between August and December, the temperature kept rising. Kabale experienced the lowest
mean maximum temperature of 24.40C while Lira had the highest mean maximum temperature of 32.1
0C in the
same year as seen in Figure 1.3.2 and Appendix Table 1.3B.
Figure 1.3.2: Long term mean maximum temperature for selected centers, 2020
Minimum Temperatures
The Mean Minimum Temperature represents an average of the single lowest temperature recorded in that month
each year. The daily mean minimum temperature for selected centres shows that Kabale and Jinja had the lowest
mean daily minimum temperatures of 13.00C and 15.1
0C respectively while Soroti and Entebbe had the highest
daily mean minimum temperature of 19.50C and 19.2
0C respectively during 2020. The trend for long term mean
minimum temperature is generally similar for all centres increasing from January to March and then declining
between April and July. (See Figure 1.1.3 and Appendix Table 1.3B).
Figure 1.3.3: Long term Mean minimum temperature for selected centres, 2020
20,0
22,0
24,0
26,0
28,0
30,0
32,0
34,0
36,0
Jan Feb Mar Apr May Jun Jul Aug Sep Oct Nov Dec
Kampala Kasese Lira Masindi Kabale
10,0
12,0
14,0
16,0
18,0
20,0
22,0
Jan Feb Mar Apr May Jun Jul Aug Sep Oct Nov DecArua Entebbe Gulu Jinja Kabale Soroti
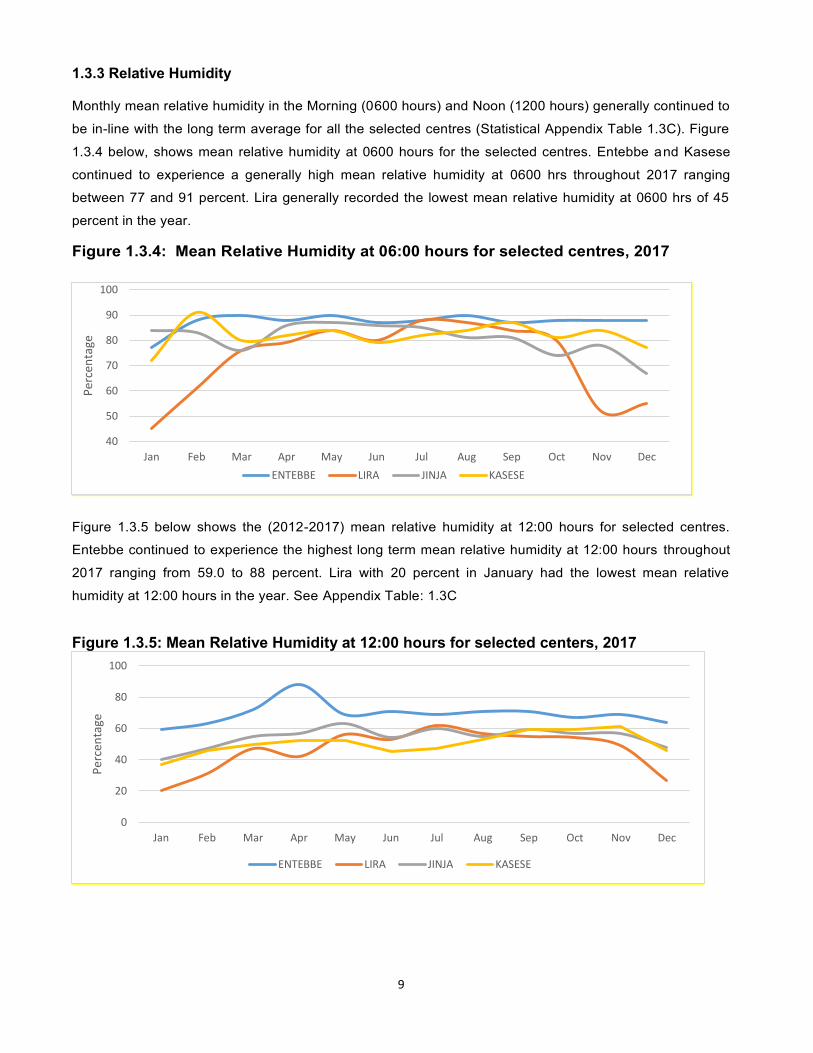
9
1.3.3 Relative Humidity
Monthly mean relative humidity in the Morning (0600 hours) and Noon (1200 hours) generally continued to
be in-line with the long term average for all the selected centres (Statistical Appendix Table 1.3C). Figure
1.3.4 below, shows mean relative humidity at 0600 hours for the selected centres. Entebbe and Kasese
continued to experience a generally high mean relative humidity at 0600 hrs throughout 2017 ranging
between 77 and 91 percent. Lira generally recorded the lowest mean relative humidity at 0600 hrs of 45
percent in the year.
Figure 1.3.4: Mean Relative Humidity at 06:00 hours for selected centres, 2017
Figure 1.3.5 below shows the (2012-2017) mean relative humidity at 12:00 hours for selected centres.
Entebbe continued to experience the highest long term mean relative humidity at 12:00 hours throughout
2017 ranging from 59.0 to 88 percent. Lira with 20 percent in January had the lowest mean relative
humidity at 12:00 hours in the year. See Appendix Table: 1.3C
Figure 1.3.5: Mean Relative Humidity at 12:00 hours for selected centers, 2017
40
50
60
70
80
90
100
Jan Feb Mar Apr May Jun Jul Aug Sep Oct Nov Dec
Pe
rce
nta
ge
ENTEBBE LIRA JINJA KASESE
0
20
40
60
80
100
Jan Feb Mar Apr May Jun Jul Aug Sep Oct Nov Dec
Pe
rce
nta
ge
ENTEBBE LIRA JINJA KASESE
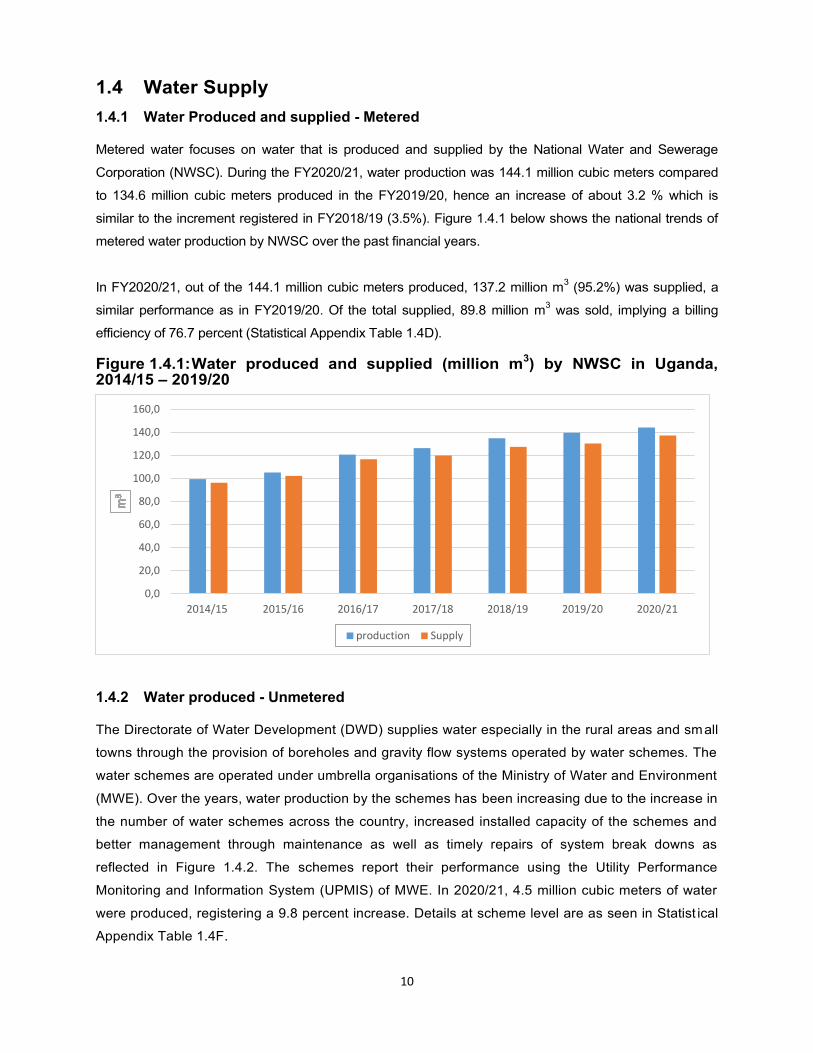
10
1.4 Water Supply
1.4.1 Water Produced and supplied - Metered
Metered water focuses on water that is produced and supplied by the National Water and Sewerage
Corporation (NWSC). During the FY2020/21, water production was 144.1 million cubic meters compared
to 134.6 million cubic meters produced in the FY2019/20, hence an increase of about 3.2 % which is
similar to the increment registered in FY2018/19 (3.5%). Figure 1.4.1 below shows the national trends of
metered water production by NWSC over the past financial years.
In FY2020/21, out of the 144.1 million cubic meters produced, 137.2 million m3 (95.2%) was supplied, a
similar performance as in FY2019/20. Of the total supplied, 89.8 million m3 was sold, implying a billing
efficiency of 76.7 percent (Statistical Appendix Table 1.4D).
Figure 1.4.1: Water produced and supplied (million m3) by NWSC in Uganda, 2014/15 – 2019/20
1.4.2 Water produced - Unmetered
The Directorate of Water Development (DWD) supplies water especially in the rural areas and small
towns through the provision of boreholes and gravity flow systems operated by water schemes. The
water schemes are operated under umbrella organisations of the Ministry of Water and Environment
(MWE). Over the years, water production by the schemes has been increasing due to the increase in
the number of water schemes across the country, increased installed capacity of the schemes and
better management through maintenance as well as timely repairs of system break downs as
reflected in Figure 1.4.2. The schemes report their performance using the Utility Performance
Monitoring and Information System (UPMIS) of MWE. In 2020/21, 4.5 million cubic meters of water
were produced, registering a 9.8 percent increase. Details at scheme level are as seen in Statist ical
Appendix Table 1.4F.
0,0
20,0
40,0
60,0
80,0
100,0
120,0
140,0
160,0
2014/15 2015/16 2016/17 2017/18 2018/19 2019/20 2020/21
production Supply
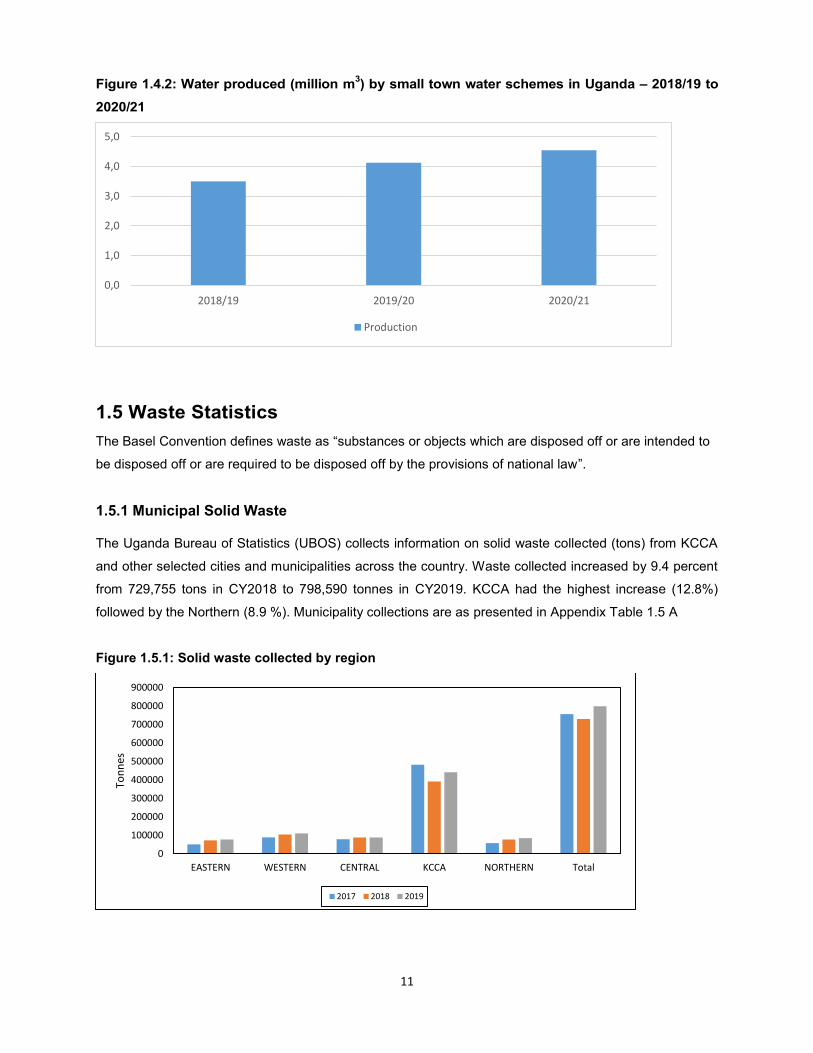
11
Figure 1.4.2: Water produced (million m3) by small town water schemes in Uganda – 2018/19 to
2020/21
1.5 Waste Statistics
The Basel Convention defines waste as “substances or objects which are disposed off or are intended to
be disposed off or are required to be disposed off by the provisions of national law”.
1.5.1 Municipal Solid Waste
The Uganda Bureau of Statistics (UBOS) collects information on solid waste collected (tons) from KCCA
and other selected cities and municipalities across the country. Waste collected increased by 9.4 percent
from 729,755 tons in CY2018 to 798,590 tonnes in CY2019. KCCA had the highest increase (12.8%)
followed by the Northern (8.9 %). Municipality collections are as presented in Appendix Table 1.5 A
Figure 1.5.1: Solid waste collected by region
0,0
1,0
2,0
3,0
4,0
5,0
2018/19 2019/20 2020/21
Production
0
100000
200000
300000
400000
500000
600000
700000
800000
900000
EASTERN WESTERN CENTRAL KCCA NORTHERN Total
To
nn
es
2017 2018 2019
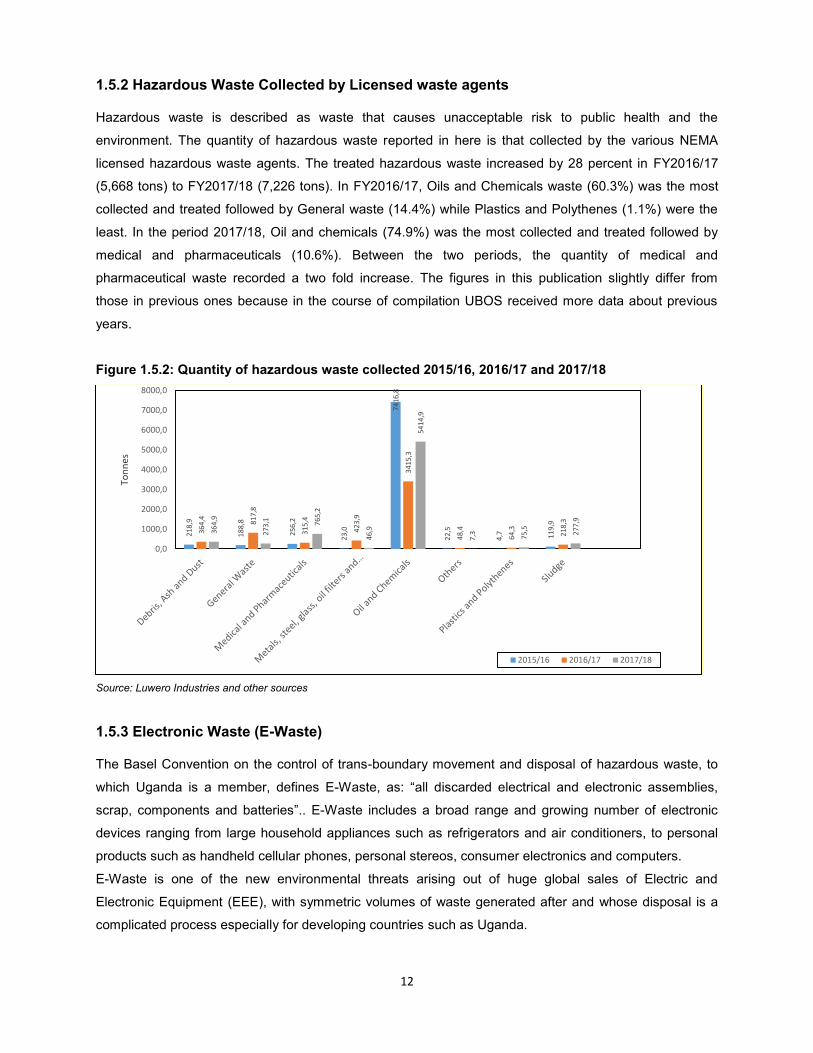
12
1.5.2 Hazardous Waste Collected by Licensed waste agents
Hazardous waste is described as waste that causes unacceptable risk to public health and the
environment. The quantity of hazardous waste reported in here is that collected by the various NEMA
licensed hazardous waste agents. The treated hazardous waste increased by 28 percent in FY2016/17
(5,668 tons) to FY2017/18 (7,226 tons). In FY2016/17, Oils and Chemicals waste (60.3%) was the most
collected and treated followed by General waste (14.4%) while Plastics and Polythenes (1.1%) were the
least. In the period 2017/18, Oil and chemicals (74.9%) was the most collected and treated followed by
medical and pharmaceuticals (10.6%). Between the two periods, the quantity of medical and
pharmaceutical waste recorded a two fold increase. The figures in this publication slightly differ from
those in previous ones because in the course of compilation UBOS received more data about previous
years.
Figure 1.5.2: Quantity of hazardous waste collected 2015/16, 2016/17 and 2017/18
Source: Luwero Industries and other sources
1.5.3 Electronic Waste (E-Waste)
The Basel Convention on the control of trans-boundary movement and disposal of hazardous waste, to
which Uganda is a member, defines E-Waste, as: “all discarded electrical and electronic assemblies,
scrap, components and batteries”.. E-Waste includes a broad range and growing number of electronic
devices ranging from large household appliances such as refrigerators and air conditioners, to personal
products such as handheld cellular phones, personal stereos, consumer electronics and computers.
E-Waste is one of the new environmental threats arising out of huge global sales of Electric and
Electronic Equipment (EEE), with symmetric volumes of waste generated after and whose disposal is a
complicated process especially for developing countries such as Uganda.
21
8,9
18
8,8
25
6,2
23
,0
74
16
,8
22
,5
4,7
11
9,9
36
4,4
81
7,8
31
5,4
42
3,9
34
15
,3
48
,4
64
,3
21
8,3
36
4,9
27
3,1
76
5,2
46
,9
54
14
,9
7,3
75
,5
27
7,9
0,0
1000,0
2000,0
3000,0
4000,0
5000,0
6000,0
7000,0
8000,0
To
nn
es
2015/16 2016/17 2017/18
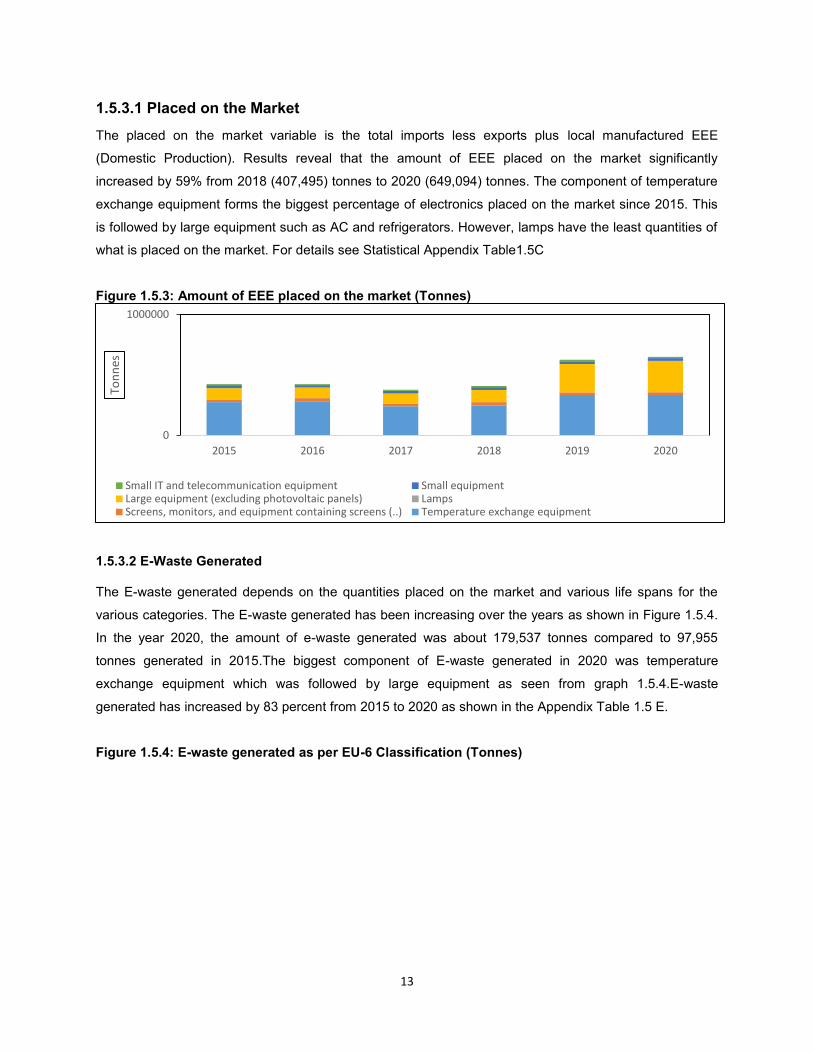
13
1.5.3.1 Placed on the Market
The placed on the market variable is the total imports less exports plus local manufactured EEE
(Domestic Production). Results reveal that the amount of EEE placed on the market significantly
increased by 59% from 2018 (407,495) tonnes to 2020 (649,094) tonnes. The component of temperature
exchange equipment forms the biggest percentage of electronics placed on the market since 2015. This
is followed by large equipment such as AC and refrigerators. However, lamps have the least quantities of
what is placed on the market. For details see Statistical Appendix Table1.5C
Figure 1.5.3: Amount of EEE placed on the market (Tonnes)
1.5.3.2 E-Waste Generated The E-waste generated depends on the quantities placed on the market and various life spans for the
various categories. The E-waste generated has been increasing over the years as shown in Figure 1.5.4.
In the year 2020, the amount of e-waste generated was about 179,537 tonnes compared to 97,955
tonnes generated in 2015.The biggest component of E-waste generated in 2020 was temperature
exchange equipment which was followed by large equipment as seen from graph 1.5.4.E-waste
generated has increased by 83 percent from 2015 to 2020 as shown in the Appendix Table 1.5 E.
Figure 1.5.4: E-waste generated as per EU-6 Classification (Tonnes)
0
1000000
2015 2016 2017 2018 2019 2020
To
nn
es
Small IT and telecommunication equipment Small equipmentLarge equipment (excluding photovoltaic panels) LampsScreens, monitors, and equipment containing screens (..) Temperature exchange equipment
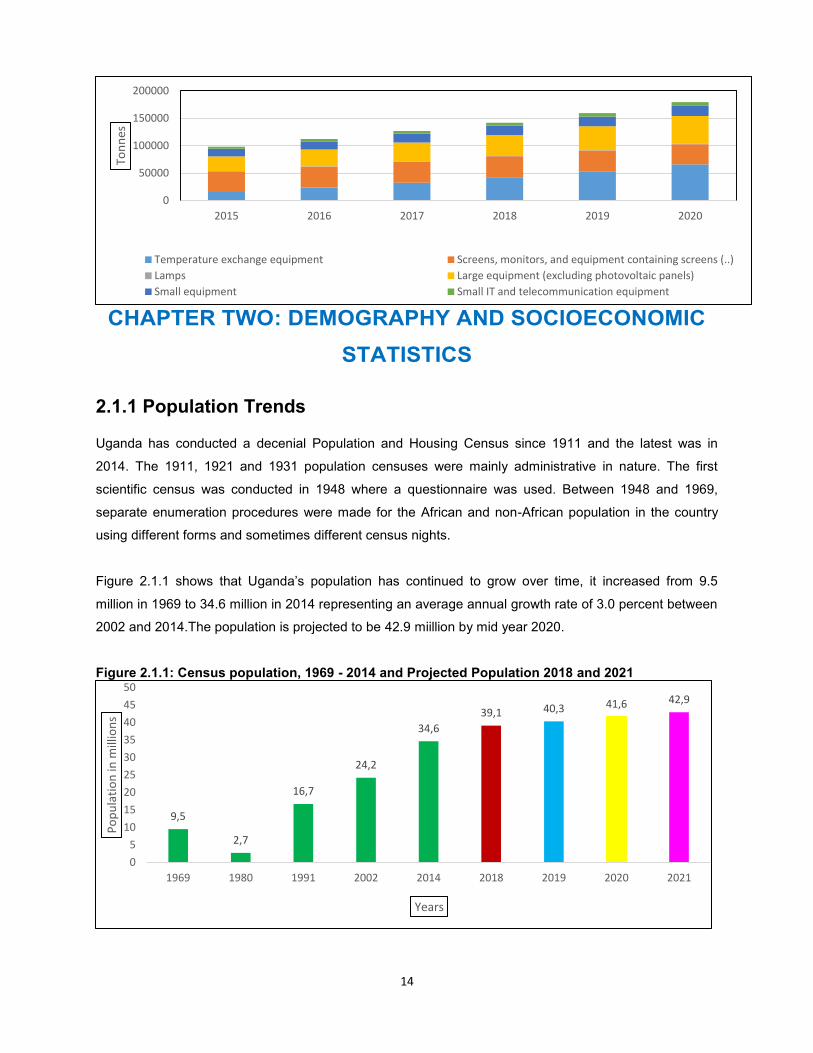
14
CHAPTER TWO: DEMOGRAPHY AND SOCIOECONOMIC
STATISTICS
2.1.1 Population Trends
Uganda has conducted a decenial Population and Housing Census since 1911 and the latest was in
2014. The 1911, 1921 and 1931 population censuses were mainly administrative in nature. The first
scientific census was conducted in 1948 where a questionnaire was used. Between 1948 and 1969,
separate enumeration procedures were made for the African and non-African population in the country
using different forms and sometimes different census nights.
Figure 2.1.1 shows that Uganda’s population has continued to grow over time, it increased from 9.5
million in 1969 to 34.6 million in 2014 representing an average annual growth rate of 3.0 percent between
2002 and 2014.The population is projected to be 42.9 miillion by mid year 2020.
Figure 2.1.1: Census population, 1969 - 2014 and Projected Population 2018 and 2021
0
50000
100000
150000
200000
2015 2016 2017 2018 2019 2020
To
nn
es
Temperature exchange equipment Screens, monitors, and equipment containing screens (..)
Lamps Large equipment (excluding photovoltaic panels)
Small equipment Small IT and telecommunication equipment
9,5
2,7
16,7
24,2
34,6
39,1 40,3 41,6 42,9
0
5
10
15
20
25
30
35
40
45
50
1969 1980 1991 2002 2014 2018 2019 2020 2021
Po
pu
lati
on
in m
illi
on
s
Years
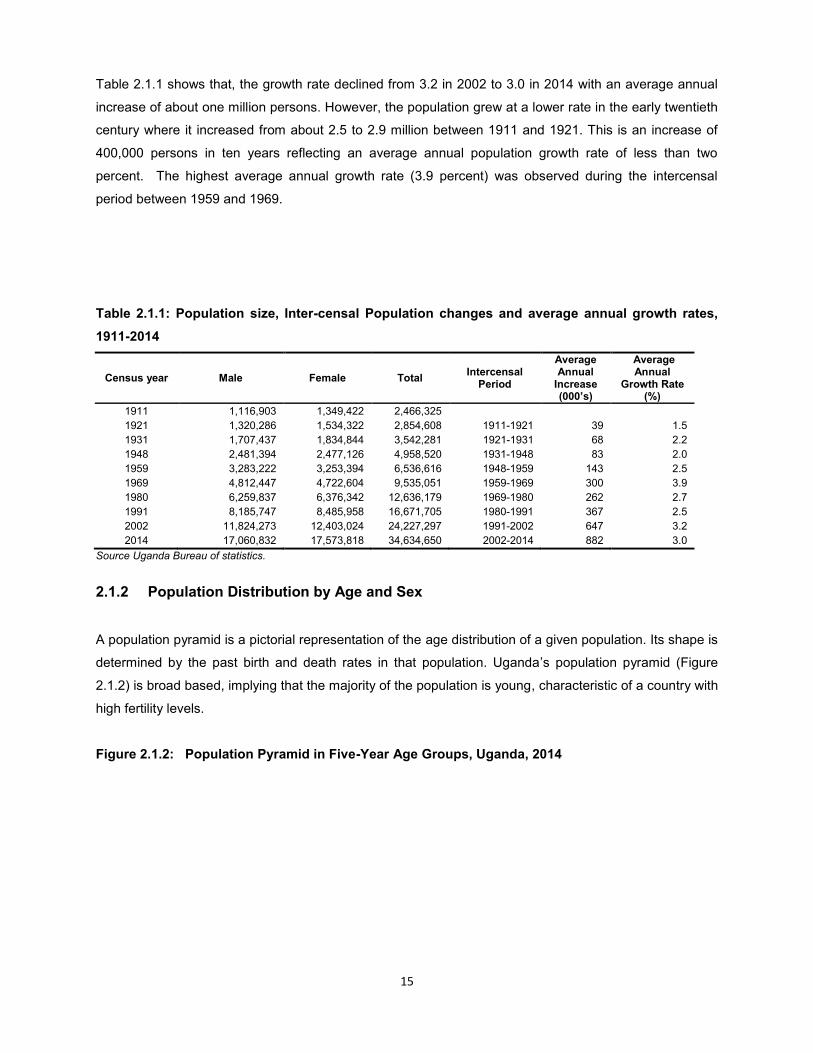
15
Table 2.1.1 shows that, the growth rate declined from 3.2 in 2002 to 3.0 in 2014 with an average annual
increase of about one million persons. However, the population grew at a lower rate in the early twentieth
century where it increased from about 2.5 to 2.9 million between 1911 and 1921. This is an increase of
400,000 persons in ten years reflecting an average annual population growth rate of less than two
percent. The highest average annual growth rate (3.9 percent) was observed during the intercensal
period between 1959 and 1969.
Table 2.1.1: Population size, Inter-censal Population changes and average annual growth rates,
1911-2014
Census year Male Female Total Intercensal
Period
Average Annual
Increase (000’s)
Average Annual
Growth Rate (%)
1911 1,116,903 1,349,422 2,466,325
1921 1,320,286 1,534,322 2,854,608 1911-1921 39 1.5
1931 1,707,437 1,834,844 3,542,281 1921-1931 68 2.2
1948 2,481,394 2,477,126 4,958,520 1931-1948 83 2.0
1959 3,283,222 3,253,394 6,536,616 1948-1959 143 2.5
1969 4,812,447 4,722,604 9,535,051 1959-1969 300 3.9
1980 6,259,837 6,376,342 12,636,179 1969-1980 262 2.7
1991 8,185,747 8,485,958 16,671,705 1980-1991 367 2.5
2002 11,824,273 12,403,024 24,227,297 1991-2002 647 3.2
2014 17,060,832 17,573,818 34,634,650 2002-2014 882 3.0
Source Uganda Bureau of statistics.
2.1.2 Population Distribution by Age and Sex
A population pyramid is a pictorial representation of the age distribution of a given population. Its shape is
determined by the past birth and death rates in that population. Uganda’s population pyramid (Figure
2.1.2) is broad based, implying that the majority of the population is young, characteristic of a country with
high fertility levels.
Figure 2.1.2: Population Pyramid in Five-Year Age Groups, Uganda, 2014
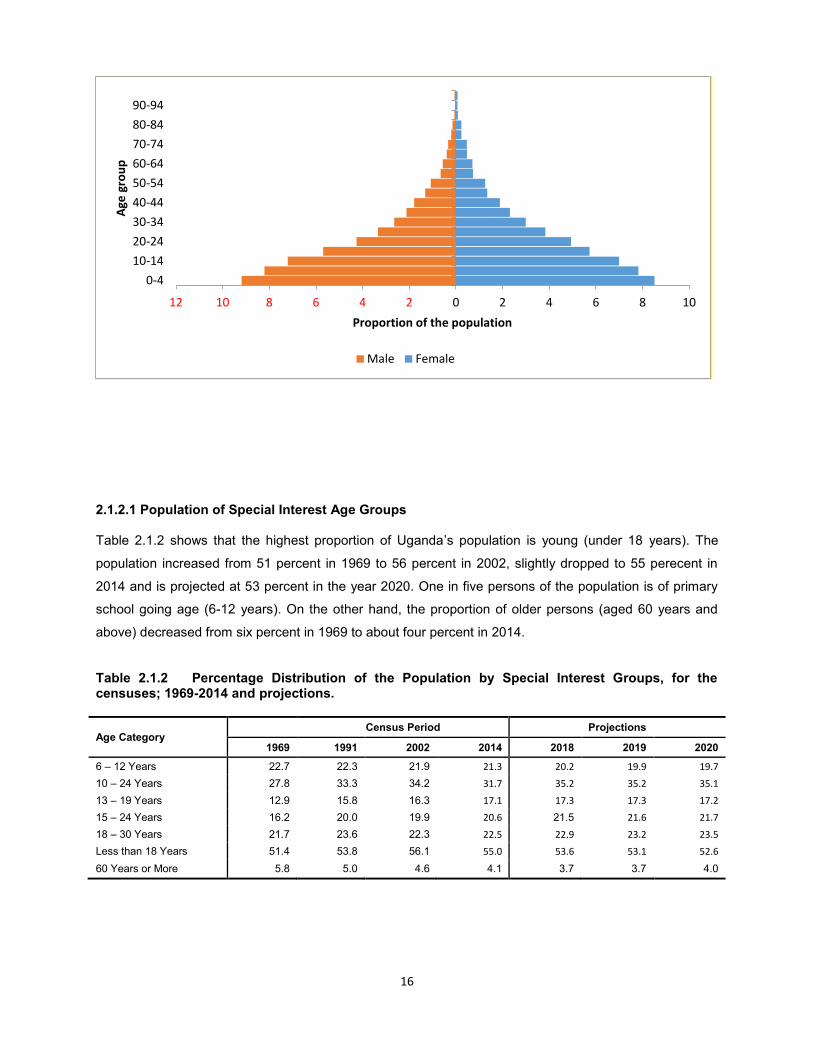
16
2.1.2.1 Population of Special Interest Age Groups Table 2.1.2 shows that the highest proportion of Uganda’s population is young (under 18 years). The
population increased from 51 percent in 1969 to 56 percent in 2002, slightly dropped to 55 perecent in
2014 and is projected at 53 percent in the year 2020. One in five persons of the population is of primary
school going age (6-12 years). On the other hand, the proportion of older persons (aged 60 years and
above) decreased from six percent in 1969 to about four percent in 2014.
Table 2.1.2 Percentage Distribution of the Population by Special Interest Groups, for the censuses; 1969-2014 and projections.
Age Category Census Period Projections
1969 1991 2002 2014 2018 2019 2020
6 – 12 Years 22.7 22.3 21.9 21.3 20.2 19.9 19.7
10 – 24 Years 27.8 33.3 34.2 31.7 35.2 35.2 35.1
13 – 19 Years 12.9 15.8 16.3 17.1 17.3 17.3 17.2
15 – 24 Years 16.2 20.0 19.9 20.6 21.5 21.6 21.7
18 – 30 Years 21.7 23.6 22.3 22.5 22.9 23.2 23.5
Less than 18 Years 51.4 53.8 56.1 55.0 53.6 53.1 52.6
60 Years or More 5.8 5.0 4.6 4.1 3.7 3.7 4.0
12 10 8 6 4 2 0 2 4 6 8 10
0-4
10-14
20-24
30-34
40-44
50-54
60-64
70-74
80-84
90-94
Proportion of the population
Ag
e g
rou
p
Male Female
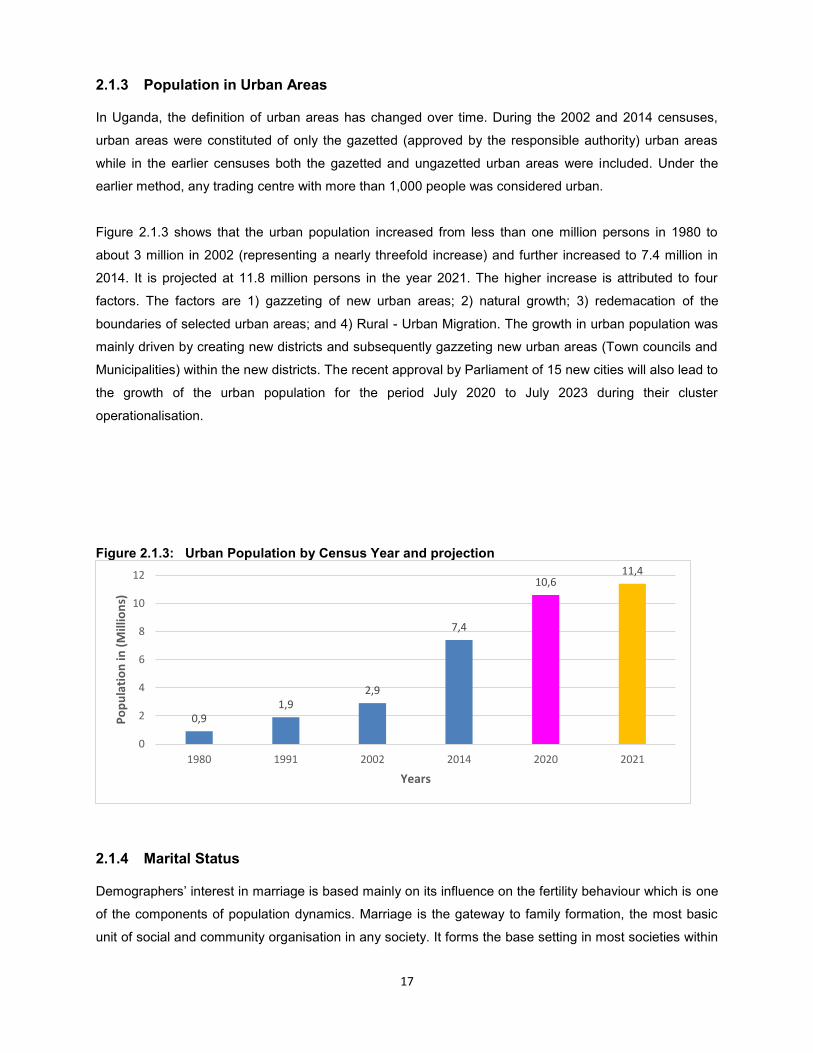
17
2.1.3 Population in Urban Areas
In Uganda, the definition of urban areas has changed over time. During the 2002 and 2014 censuses,
urban areas were constituted of only the gazetted (approved by the responsible authority) urban areas
while in the earlier censuses both the gazetted and ungazetted urban areas were included. Under the
earlier method, any trading centre with more than 1,000 people was considered urban.
Figure 2.1.3 shows that the urban population increased from less than one million persons in 1980 to
about 3 million in 2002 (representing a nearly threefold increase) and further increased to 7.4 million in
2014. It is projected at 11.8 million persons in the year 2021. The higher increase is attributed to four
factors. The factors are 1) gazzeting of new urban areas; 2) natural growth; 3) redemacation of the
boundaries of selected urban areas; and 4) Rural - Urban Migration. The growth in urban population was
mainly driven by creating new districts and subsequently gazzeting new urban areas (Town councils and
Municipalities) within the new districts. The recent approval by Parliament of 15 new cities will also lead to
the growth of the urban population for the period July 2020 to July 2023 during their cluster
operationalisation.
Figure 2.1.3: Urban Population by Census Year and projection
2.1.4 Marital Status
Demographers’ interest in marriage is based mainly on its influence on the fertility behaviour which is one
of the components of population dynamics. Marriage is the gateway to family formation, the most basic
unit of social and community organisation in any society. It forms the base setting in most societies within
0,9
1,9
2,9
7,4
10,6 11,4
0
2
4
6
8
10
12
1980 1991 2002 2014 2020 2021
Po
pu
lati
on
in
(M
illi
on
s)
Years
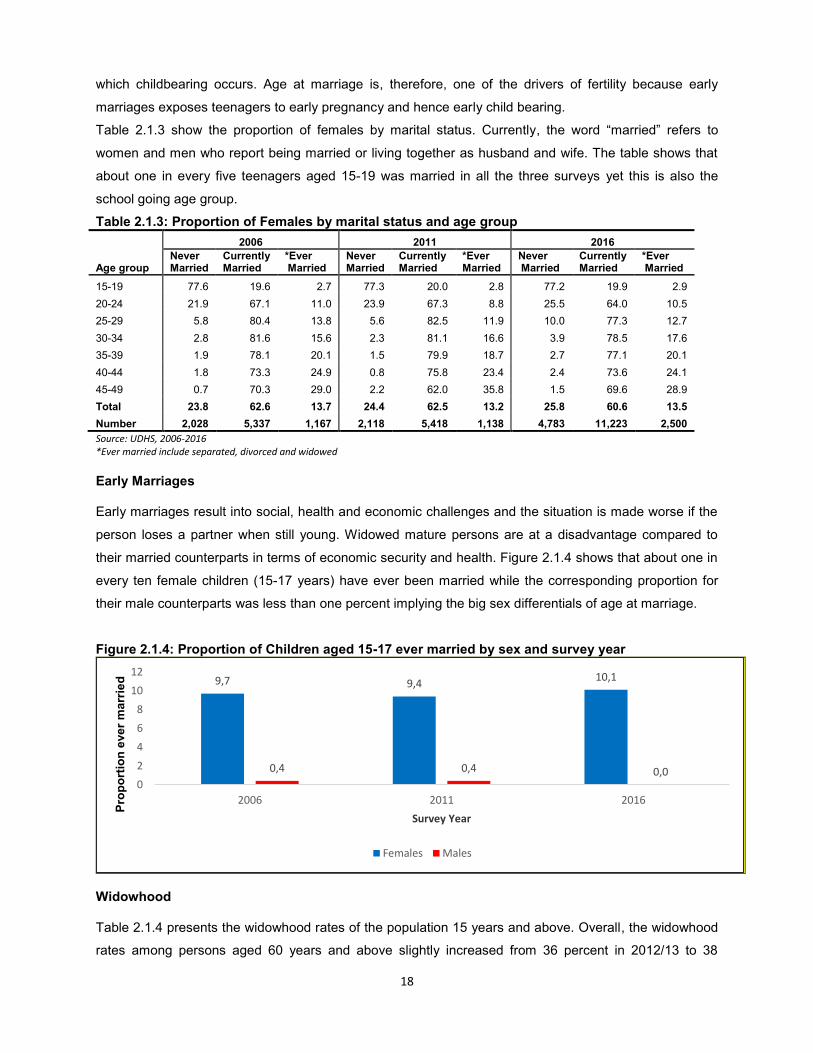
18
which childbearing occurs. Age at marriage is, therefore, one of the drivers of fertility because early
marriages exposes teenagers to early pregnancy and hence early child bearing.
Table 2.1.3 show the proportion of females by marital status. Currently, the word “married” refers to
women and men who report being married or living together as husband and wife. The table shows that
about one in every five teenagers aged 15-19 was married in all the three surveys yet this is also the
school going age group.
Table 2.1.3: Proportion of Females by marital status and age group
2006 2011 2016
Age group Never Married
Currently Married
*Ever Married
Never Married
Currently Married
*Ever Married
Never Married
Currently Married
*Ever Married
15-19 77.6 19.6 2.7 77.3 20.0 2.8 77.2 19.9 2.9
20-24 21.9 67.1 11.0 23.9 67.3 8.8 25.5 64.0 10.5
25-29 5.8 80.4 13.8 5.6 82.5 11.9 10.0 77.3 12.7
30-34 2.8 81.6 15.6 2.3 81.1 16.6 3.9 78.5 17.6
35-39 1.9 78.1 20.1 1.5 79.9 18.7 2.7 77.1 20.1
40-44 1.8 73.3 24.9 0.8 75.8 23.4 2.4 73.6 24.1
45-49 0.7 70.3 29.0 2.2 62.0 35.8 1.5 69.6 28.9
Total 23.8 62.6 13.7 24.4 62.5 13.2 25.8 60.6 13.5
Number 2,028 5,337 1,167 2,118 5,418 1,138 4,783 11,223 2,500
Source: UDHS, 2006-2016
*Ever married include separated, divorced and widowed
Early Marriages Early marriages result into social, health and economic challenges and the situation is made worse if the
person loses a partner when still young. Widowed mature persons are at a disadvantage compared to
their married counterparts in terms of economic security and health. Figure 2.1.4 shows that about one in
every ten female children (15-17 years) have ever been married while the corresponding proportion for
their male counterparts was less than one percent implying the big sex differentials of age at marriage.
Figure 2.1.4: Proportion of Children aged 15-17 ever married by sex and survey year
Widowhood Table 2.1.4 presents the widowhood rates of the population 15 years and above. Overall, the widowhood
rates among persons aged 60 years and above slightly increased from 36 percent in 2012/13 to 38
9,7 9,4 10,1
0,4 0,4 0,0 0
2
4
6
8
10
12
2006 2011 2016
Pro
po
rtio
n e
ve
r m
arr
ied
Survey Year
Females Males
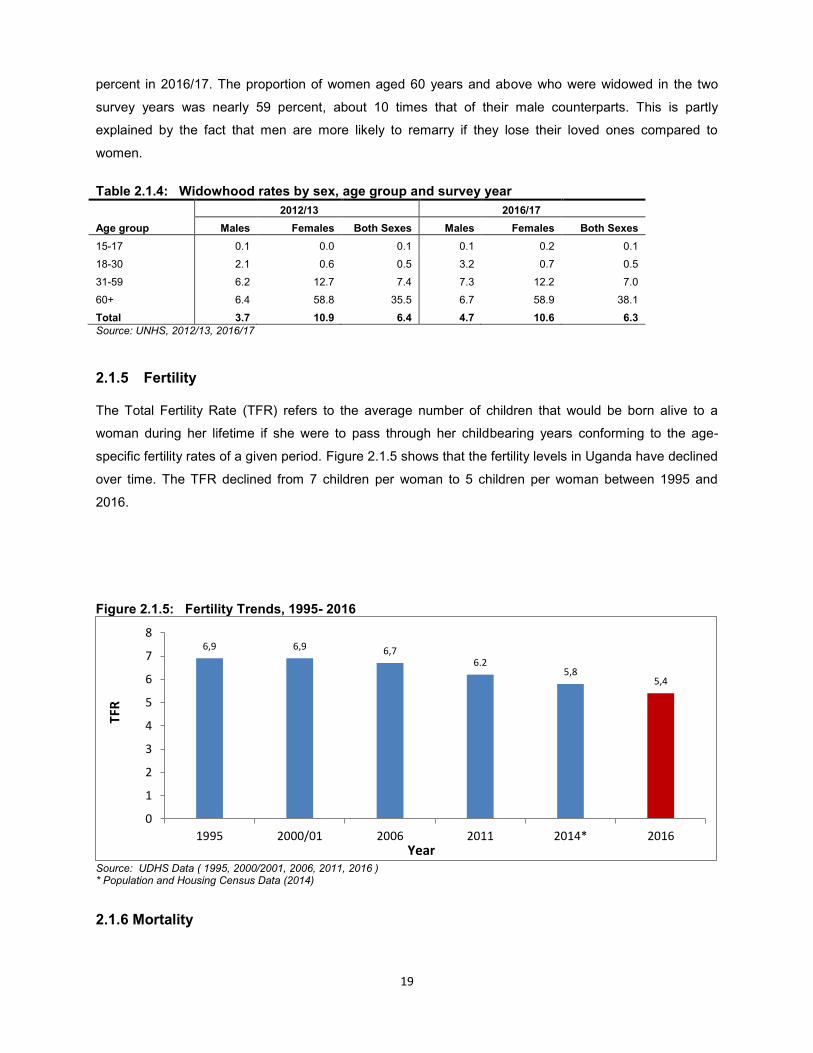
19
percent in 2016/17. The proportion of women aged 60 years and above who were widowed in the two
survey years was nearly 59 percent, about 10 times that of their male counterparts. This is partly
explained by the fact that men are more likely to remarry if they lose their loved ones compared to
women.
Table 2.1.4: Widowhood rates by sex, age group and survey year
Age group
2012/13 2016/17
Males Females Both Sexes Males Females Both Sexes
15-17 0.1 0.0 0.1 0.1 0.2 0.1
18-30 2.1 0.6 0.5 3.2 0.7 0.5
31-59 6.2 12.7 7.4 7.3 12.2 7.0
60+ 6.4 58.8 35.5 6.7 58.9 38.1
Total 3.7 10.9 6.4 4.7 10.6 6.3 Source: UNHS, 2012/13, 2016/17
2.1.5 Fertility
The Total Fertility Rate (TFR) refers to the average number of children that would be born alive to a
woman during her lifetime if she were to pass through her childbearing years conforming to the age-
specific fertility rates of a given period. Figure 2.1.5 shows that the fertility levels in Uganda have declined
over time. The TFR declined from 7 children per woman to 5 children per woman between 1995 and
2016.
Figure 2.1.5: Fertility Trends, 1995- 2016
Source: UDHS Data ( 1995, 2000/2001, 2006, 2011, 2016 ) * Population and Housing Census Data (2014)
2.1.6 Mortality
6,9 6,9 6,7 6.2
5,8 5,4
0
1
2
3
4
5
6
7
8
1995 2000/01 2006 2011 2014* 2016
TF
R
Year
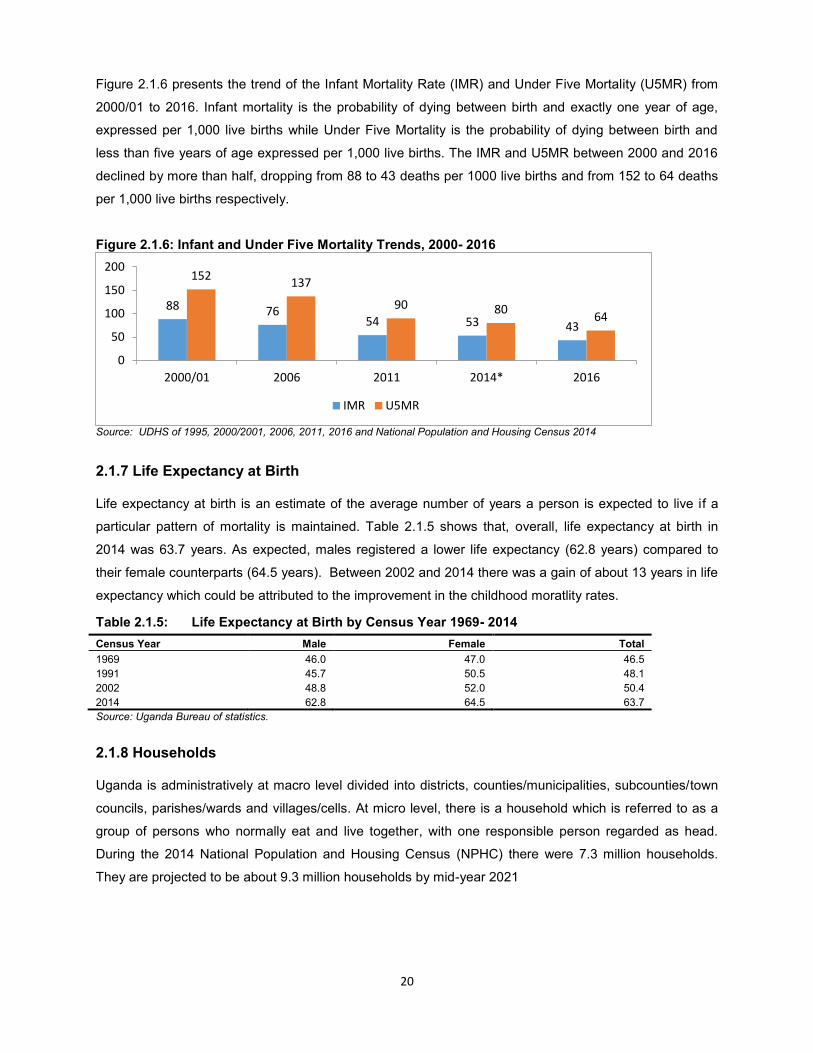
20
Figure 2.1.6 presents the trend of the Infant Mortality Rate (IMR) and Under Five Mortality (U5MR) from
2000/01 to 2016. Infant mortality is the probability of dying between birth and exactly one year of age,
expressed per 1,000 live births while Under Five Mortality is the probability of dying between birth and
less than five years of age expressed per 1,000 live births. The IMR and U5MR between 2000 and 2016
declined by more than half, dropping from 88 to 43 deaths per 1000 live births and from 152 to 64 deaths
per 1,000 live births respectively.
Figure 2.1.6: Infant and Under Five Mortality Trends, 2000- 2016
Source: UDHS of 1995, 2000/2001, 2006, 2011, 2016 and National Population and Housing Census 2014
2.1.7 Life Expectancy at Birth
Life expectancy at birth is an estimate of the average number of years a person is expected to live if a
particular pattern of mortality is maintained. Table 2.1.5 shows that, overall, life expectancy at birth in
2014 was 63.7 years. As expected, males registered a lower life expectancy (62.8 years) compared to
their female counterparts (64.5 years). Between 2002 and 2014 there was a gain of about 13 years in life
expectancy which could be attributed to the improvement in the childhood moratlity rates.
Table 2.1.5: Life Expectancy at Birth by Census Year 1969- 2014
Census Year Male Female Total
1969 46.0 47.0 46.5
1991 45.7 50.5 48.1
2002 48.8 52.0 50.4
2014 62.8 64.5 63.7
Source: Uganda Bureau of statistics.
2.1.8 Households
Uganda is administratively at macro level divided into districts, counties/municipalities, subcounties/town
councils, parishes/wards and villages/cells. At micro level, there is a household which is referred to as a
group of persons who normally eat and live together, with one responsible person regarded as head.
During the 2014 National Population and Housing Census (NPHC) there were 7.3 million households.
They are projected to be about 9.3 million households by mid-year 2021
88 76 54 53 43
152 137
90 80 64
0
50
100
150
200
2000/01 2006 2011 2014* 2016
IMR U5MR
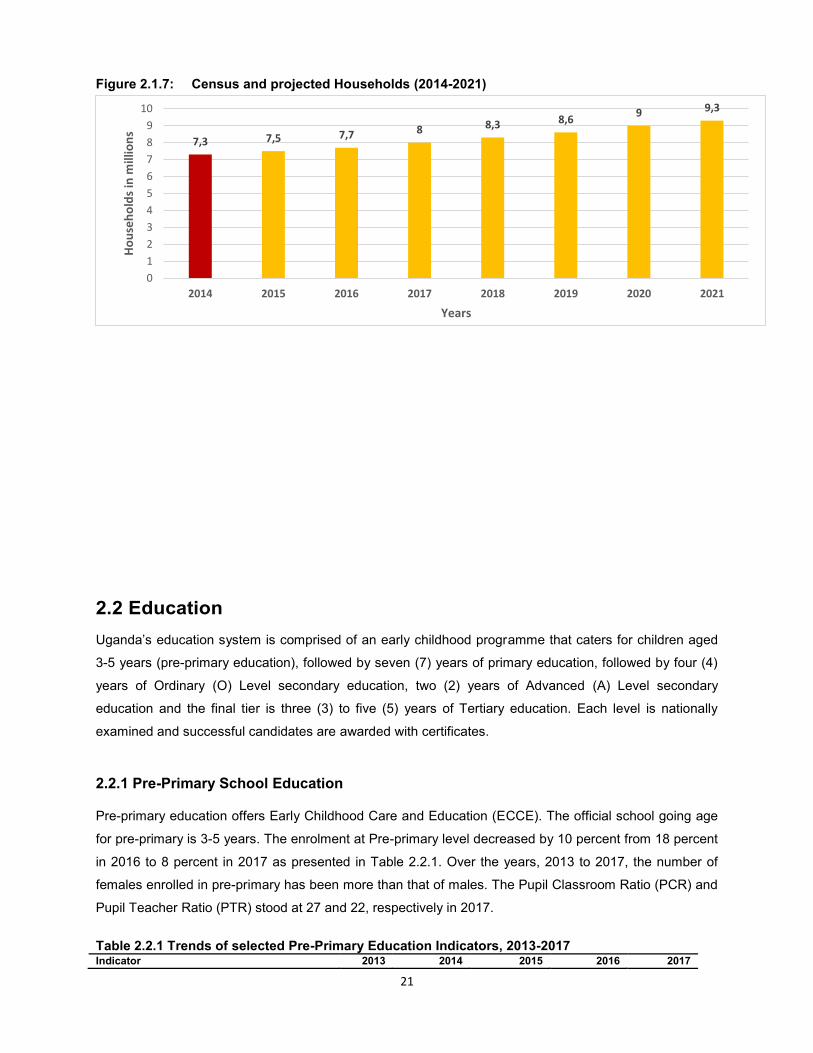
21
Figure 2.1.7: Census and projected Households (2014-2021)
2.2 Education
Uganda’s education system is comprised of an early childhood programme that caters for children aged
3-5 years (pre-primary education), followed by seven (7) years of primary education, followed by four (4)
years of Ordinary (O) Level secondary education, two (2) years of Advanced (A) Level secondary
education and the final tier is three (3) to five (5) years of Tertiary education. Each level is nationally
examined and successful candidates are awarded with certificates.
2.2.1 Pre-Primary School Education
Pre-primary education offers Early Childhood Care and Education (ECCE). The official school going age
for pre-primary is 3-5 years. The enrolment at Pre-primary level decreased by 10 percent from 18 percent
in 2016 to 8 percent in 2017 as presented in Table 2.2.1. Over the years, 2013 to 2017, the number of
females enrolled in pre-primary has been more than that of males. The Pupil Classroom Ratio (PCR) and
Pupil Teacher Ratio (PTR) stood at 27 and 22, respectively in 2017.
Table 2.2.1 Trends of selected Pre-Primary Education Indicators, 2013-2017 Indicator 2013 2014 2015 2016 2017
7,3 7,5 7,7 8 8,3 8,6 9 9,3
0
1
2
3
4
5
6
7
8
9
10
2014 2015 2016 2017 2018 2019 2020 2021
Ho
use
ho
lds
in m
illi
on
s
Years
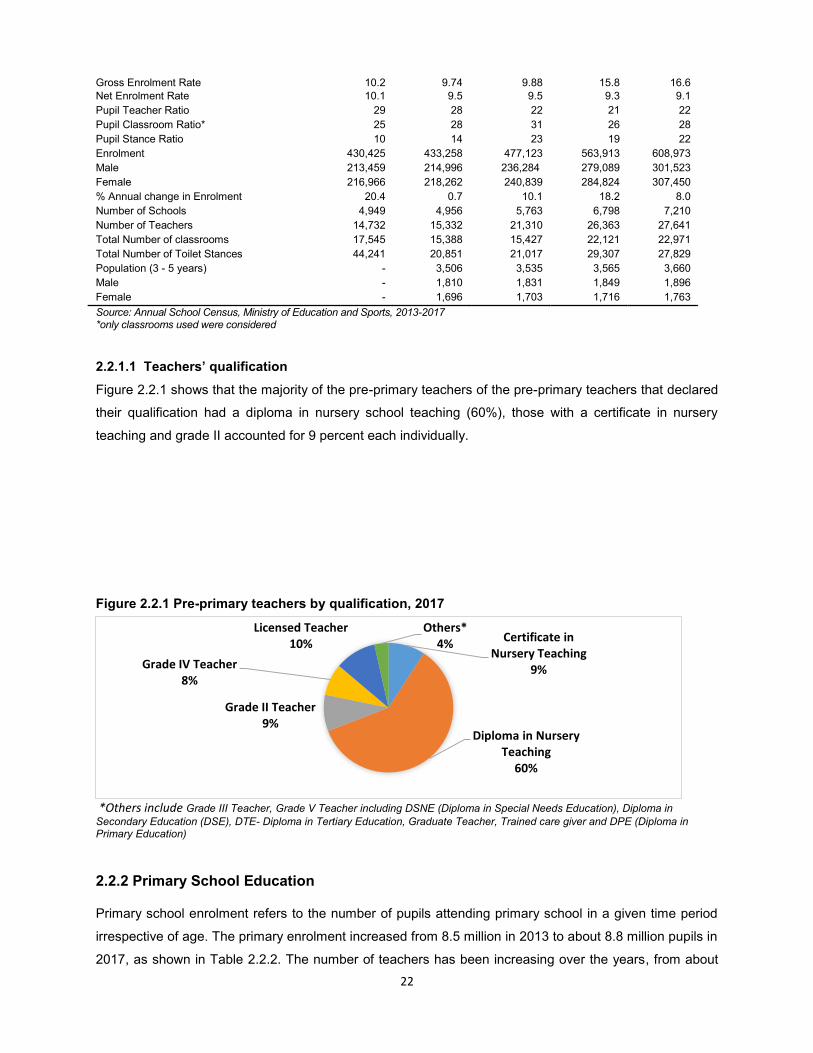
22
Gross Enrolment Rate 10.2 9.74 9.88 15.8 16.6
Net Enrolment Rate 10.1 9.5 9.5 9.3 9.1
Pupil Teacher Ratio 29 28 22 21
22
Pupil Classroom Ratio* 25 28 31 26 28
Pupil Stance Ratio 10 14 23 19 22
Enrolment 430,425 433,258 477,123 563,913 608,973
Male 213,459 214,996 236,284 279,089 301,523
Female 216,966 218,262 240,839 284,824 307,450
% Annual change in Enrolment 20.4 0.7 10.1 18.2 8.0
Number of Schools 4,949 4,956 5,763 6,798 7,210
Number of Teachers 14,732 15,332 21,310 26,363 27,641
Total Number of classrooms 17,545 15,388 15,427 22,121 22,971
Total Number of Toilet Stances 44,241 20,851 21,017 29,307 27,829
Population (3 - 5 years) - 3,506 3,535 3,565 3,660
Male - 1,810 1,831 1,849 1,896
Female - 1,696 1,703 1,716 1,763
Source: Annual School Census, Ministry of Education and Sports, 2013-2017 *only classrooms used were considered
2.2.1.1 Teachers’ qualification
Figure 2.2.1 shows that the majority of the pre-primary teachers of the pre-primary teachers that declared
their qualification had a diploma in nursery school teaching (60%), those with a certificate in nursery
teaching and grade II accounted for 9 percent each individually.
Figure 2.2.1 Pre-primary teachers by qualification, 2017
*Others include Grade III Teacher, Grade V Teacher including DSNE (Diploma in Special Needs Education), Diploma in
Secondary Education (DSE), DTE- Diploma in Tertiary Education, Graduate Teacher, Trained care giver and DPE (Diploma in Primary Education)
2.2.2 Primary School Education
Primary school enrolment refers to the number of pupils attending primary school in a given time period
irrespective of age. The primary enrolment increased from 8.5 million in 2013 to about 8.8 million pupils in
2017, as shown in Table 2.2.2. The number of teachers has been increasing over the years, from about
Certificate in
Nursery Teaching
9%
Diploma in Nursery
Teaching
60%
Grade II Teacher
9%
Grade IV Teacher
8%
Licensed Teacher
10%
Others*
4%
23
186,000 in 2013 to 207,000 in 2017. The Pupil Teacher Ratio (PTR) has remained constant, though, at
43 pupils per teacher since 2015.
Table 2.2.2: Key Primary Education Indicators, 2013-2017 Indicator 2013 2014 2015 2016 2017
Gross Enrolment Ratio 113 117 109 112 111
Pupil Teacher Ratio 46 46 43 43 43
Pupil Classroom Ratio 57 58 63 54 55
Pupil Stance Ratio 63 53 52 47 50
Enrolment (‘000) 8,459 8,773 8,264 8,656 8,841
Male 4,219 4,377 4,122 4,294 4,396
Female 4,240 4,395 4,142 4,361 4,445
% Annual change in Enrolment 1.6 3.7 -5.8 4.7 2.1
Number of Schools 18,079 18,408 18,889 19,718 20,305
Number of Teachers (‘000) 185 191 193 203 207
Number of classrooms 148,711 149,591 131,325 160,381 164,833
Number of Toilet Stances 133,367 165,791 159,130 182,576 178,261
Population (6 - 12 years in 000’s) - 7,297 7,463 7,618 7,788
Male - 3,691 3,790 3,887 3,990
Female - 3,606 3,673 3,731 3,797
Source: Annual School Census,Ministry of Education and Sports, 2013-2017
2.2.2.1 Pupil Enrolment
Table 2.2.3 shows that enrollment decreases as pupils’ progress to higher classes. In 2017, enrolment
decreased from about 2.0 million in P.1 to about 0.62 million in P.7.
Table 2.2.3: Primary School Enrolment by class Class 2013 2014 2015 2016 2017
Primary 1 1,883,803 1,932,489 1,842,006 1,888,847 1,965,606
Primary 2 1,307,745 1,349,233 1,277,974 1,352,893 1,365,311
Primary 3 1,312,592 1,362,786 1,283,194 1,349,293 1,377,947
Primary 4 1,317,315 1,359,448 1,272,522 1,328,035 1,365,908
Primary 5 1,138,789 1,178,273 1,101,698 1,156,465 1,170,640
Primary 6 920,045 963,083 901,939 958,298 971,231
Primary 7 579,431 627,343 584,984 622,093 623,946
Total 8,459,720 8,772,655 8,264,317 8,655,924 8,840,589
Source: Annual School Census,Ministry of Education and Sports, 2013-2017
2.2.2.2 Sitting space
Adequate sitting space refers to at most three pupils per standard desk. Table 2.2.4 shows that in 2017,
more than two thirds (67 percent) of the pupils enrolled in primary had adequate sitting space. The share
of pupils with adequate sitting space increased with the level of class.
Table 2.2.4: Primary school pupils with adequate sitting space by class, 2017
Class Enrolment in 2017 Pupils with adequate space Share of pupils with adequate space
total Enrolment
Primary 1 1,965,606 1,071,795 54.5
Primary 2 1,365,311 862,380 63.2
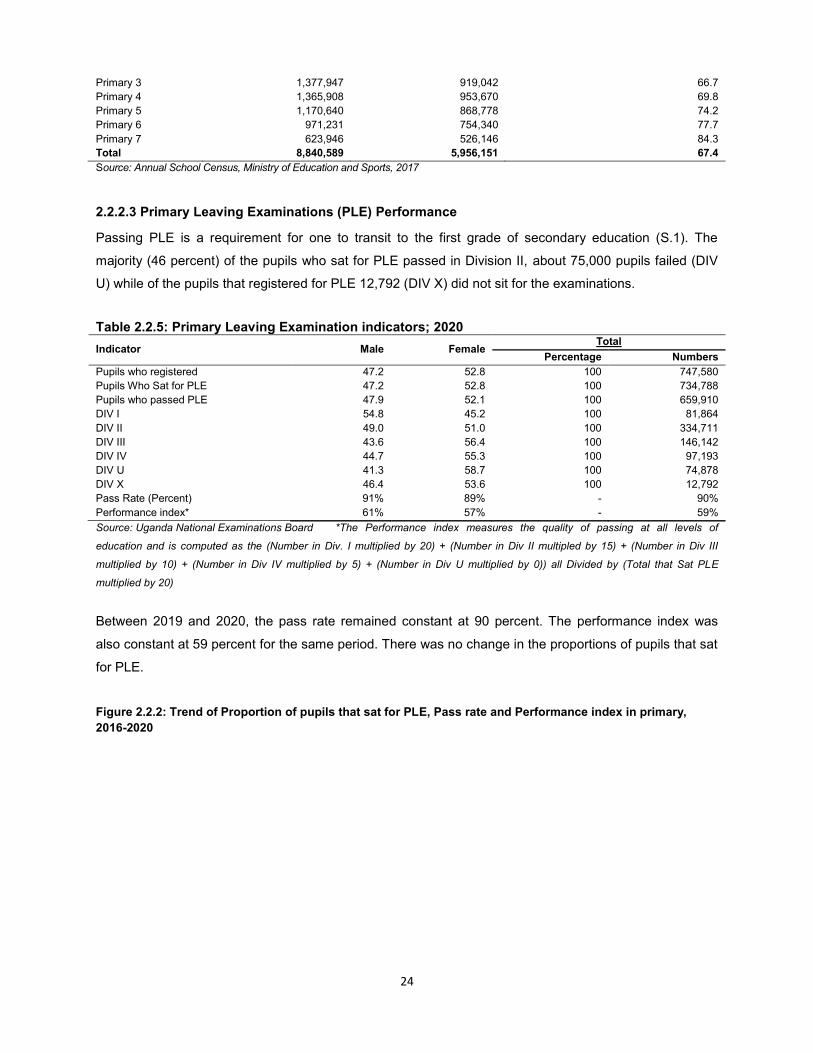
24
Primary 3 1,377,947 919,042 66.7
Primary 4 1,365,908 953,670 69.8
Primary 5 1,170,640 868,778 74.2
Primary 6 971,231 754,340 77.7
Primary 7 623,946 526,146 84.3
Total 8,840,589 5,956,151 67.4
Source: Annual School Census, Ministry of Education and Sports, 2017
2.2.2.3 Primary Leaving Examinations (PLE) Performance
Passing PLE is a requirement for one to transit to the first grade of secondary education (S.1). The
majority (46 percent) of the pupils who sat for PLE passed in Division II, about 75,000 pupils failed (DIV
U) while of the pupils that registered for PLE 12,792 (DIV X) did not sit for the examinations.
Table 2.2.5: Primary Leaving Examination indicators; 2020
Indicator Male Female Total
Percentage Numbers
Pupils who registered 47.2 52.8 100 747,580
Pupils Who Sat for PLE 47.2 52.8 100 734,788
Pupils who passed PLE 47.9 52.1 100 659,910
DIV I 54.8 45.2 100 81,864
DIV II 49.0 51.0 100 334,711
DIV III 43.6 56.4 100 146,142
DIV IV 44.7 55.3 100 97,193
DIV U 41.3 58.7 100 74,878
DIV X 46.4 53.6 100 12,792
Pass Rate (Percent) 91% 89% - 90%
Performance index* 61% 57% - 59%
Source: Uganda National Examinations Board *The Performance index measures the quality of passing at all levels of
education and is computed as the (Number in Div. I multiplied by 20) + (Number in Div II multipled by 15) + (Number in Div III
multiplied by 10) + (Number in Div IV multiplied by 5) + (Number in Div U multiplied by 0)) all Divided by (Total that Sat PLE
multiplied by 20)
Between 2019 and 2020, the pass rate remained constant at 90 percent. The performance index was
also constant at 59 percent for the same period. There was no change in the proportions of pupils that sat
for PLE.
Figure 2.2.2: Trend of Proportion of pupils that sat for PLE, Pass rate and Performance index in primary,
2016-2020
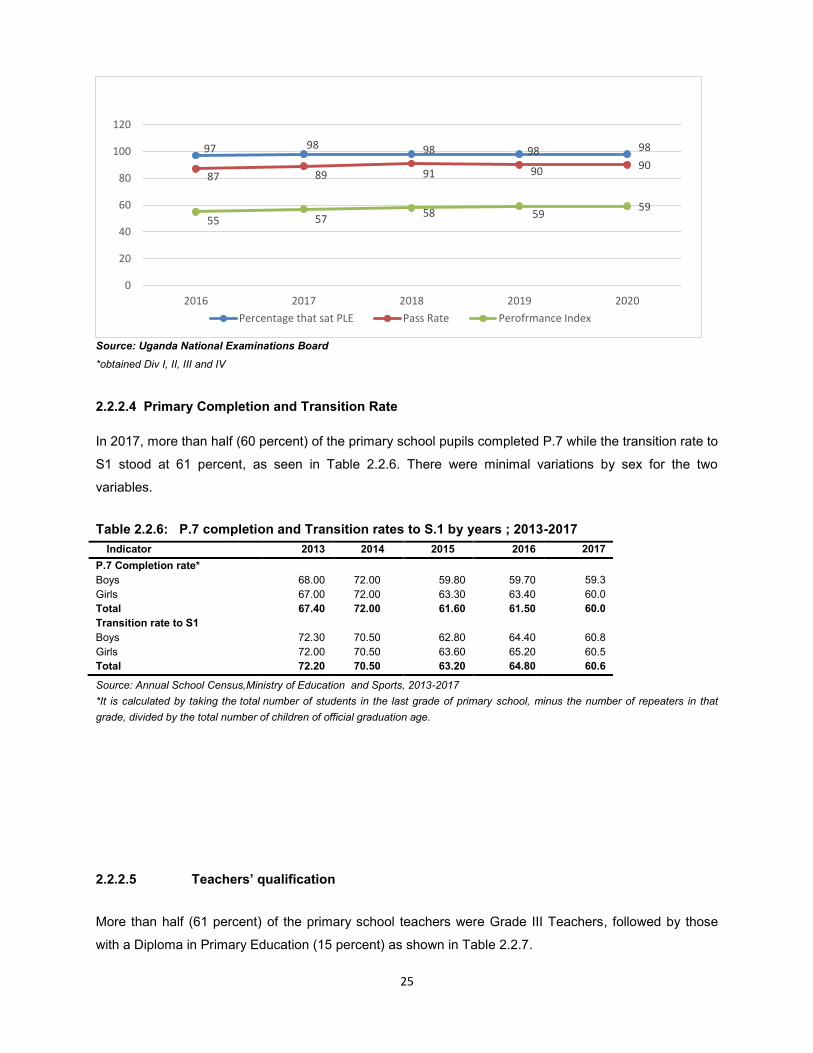
25
Source: Uganda National Examinations Board
*obtained Div I, II, III and IV
2.2.2.4 Primary Completion and Transition Rate
In 2017, more than half (60 percent) of the primary school pupils completed P.7 while the transition rate to
S1 stood at 61 percent, as seen in Table 2.2.6. There were minimal variations by sex for the two
variables.
Table 2.2.6: P.7 completion and Transition rates to S.1 by years ; 2013-2017
Indicator 2013 2014 2015 2016 2017
P.7 Completion rate*
Boys 68.00 72.00 59.80 59.70 59.3
Girls 67.00 72.00 63.30 63.40 60.0
Total 67.40 72.00 61.60 61.50 60.0
Transition rate to S1
Boys 72.30 70.50 62.80 64.40 60.8
Girls 72.00 70.50 63.60 65.20 60.5
Total 72.20 70.50 63.20 64.80 60.6
Source: Annual School Census,Ministry of Education and Sports, 2013-2017
*It is calculated by taking the total number of students in the last grade of primary school, minus the number of repeaters in that
grade, divided by the total number of children of official graduation age.
2.2.2.5 Teachers’ qualification
More than half (61 percent) of the primary school teachers were Grade III Teachers, followed by those
with a Diploma in Primary Education (15 percent) as shown in Table 2.2.7.
97 98 98 98 98
87 89 91 90 90
55 57 58 59
59
0
20
40
60
80
100
120
2016 2017 2018 2019 2020
Percentage that sat PLE Pass Rate Perofrmance Index
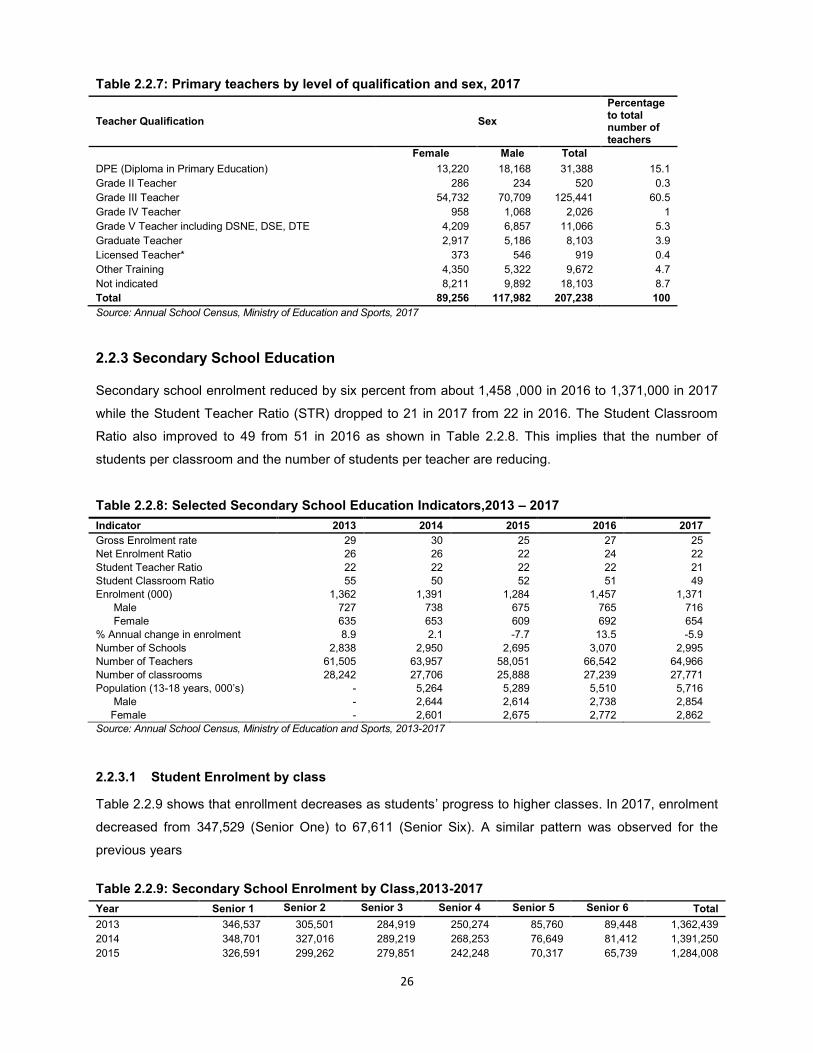
26
Table 2.2.7: Primary teachers by level of qualification and sex, 2017
Teacher Qualification Sex
Percentage to total number of teachers
Female Male Total
DPE (Diploma in Primary Education) 13,220 18,168 31,388 15.1
Grade II Teacher 286 234 520 0.3
Grade III Teacher 54,732 70,709 125,441 60.5
Grade IV Teacher 958 1,068 2,026 1
Grade V Teacher including DSNE, DSE, DTE 4,209 6,857 11,066 5.3
Graduate Teacher 2,917 5,186 8,103 3.9
Licensed Teacher* 373 546 919 0.4
Other Training 4,350 5,322 9,672 4.7
Not indicated 8,211 9,892 18,103 8.7
Total 89,256 117,982 207,238 100
Source: Annual School Census, Ministry of Education and Sports, 2017
2.2.3 Secondary School Education
Secondary school enrolment reduced by six percent from about 1,458 ,000 in 2016 to 1,371,000 in 2017
while the Student Teacher Ratio (STR) dropped to 21 in 2017 from 22 in 2016. The Student Classroom
Ratio also improved to 49 from 51 in 2016 as shown in Table 2.2.8. This implies that the number of
students per classroom and the number of students per teacher are reducing.
Table 2.2.8: Selected Secondary School Education Indicators,2013 – 2017
Indicator 2013 2014 2015 2016 2017
Gross Enrolment rate 29 30 25 27 25
Net Enrolment Ratio 26 26 22 24 22
Student Teacher Ratio 22 22 22 22 21
Student Classroom Ratio 55 50 52 51 49
Enrolment (000) 1,362 1,391 1,284 1,457 1,371
Male 727 738 675 765 716
Female 635 653 609 692 654
% Annual change in enrolment 8.9 2.1 -7.7 13.5 -5.9
Number of Schools 2,838 2,950 2,695 3,070 2,995
Number of Teachers 61,505 63,957 58,051 66,542 64,966
Number of classrooms 28,242 27,706 25,888 27,239 27,771
Population (13-18 years, 000’s) - 5,264 5,289 5,510 5,716
Male - 2,644 2,614 2,738 2,854
Female - 2,601 2,675 2,772 2,862
Source: Annual School Census, Ministry of Education and Sports, 2013-2017
2.2.3.1 Student Enrolment by class
Table 2.2.9 shows that enrollment decreases as students’ progress to higher classes. In 2017, enrolment
decreased from 347,529 (Senior One) to 67,611 (Senior Six). A similar pattern was observed for the
previous years
Table 2.2.9: Secondary School Enrolment by Class,2013-2017
Year Senior 1 Senior 2 Senior 3 Senior 4 Senior 5 Senior 6 Total
2013 346,537 305,501 284,919 250,274 85,760 89,448 1,362,439
2014 348,701 327,016 289,219 268,253 76,649 81,412 1,391,250
2015 326,591 299,262 279,851 242,248 70,317 65,739 1,284,008
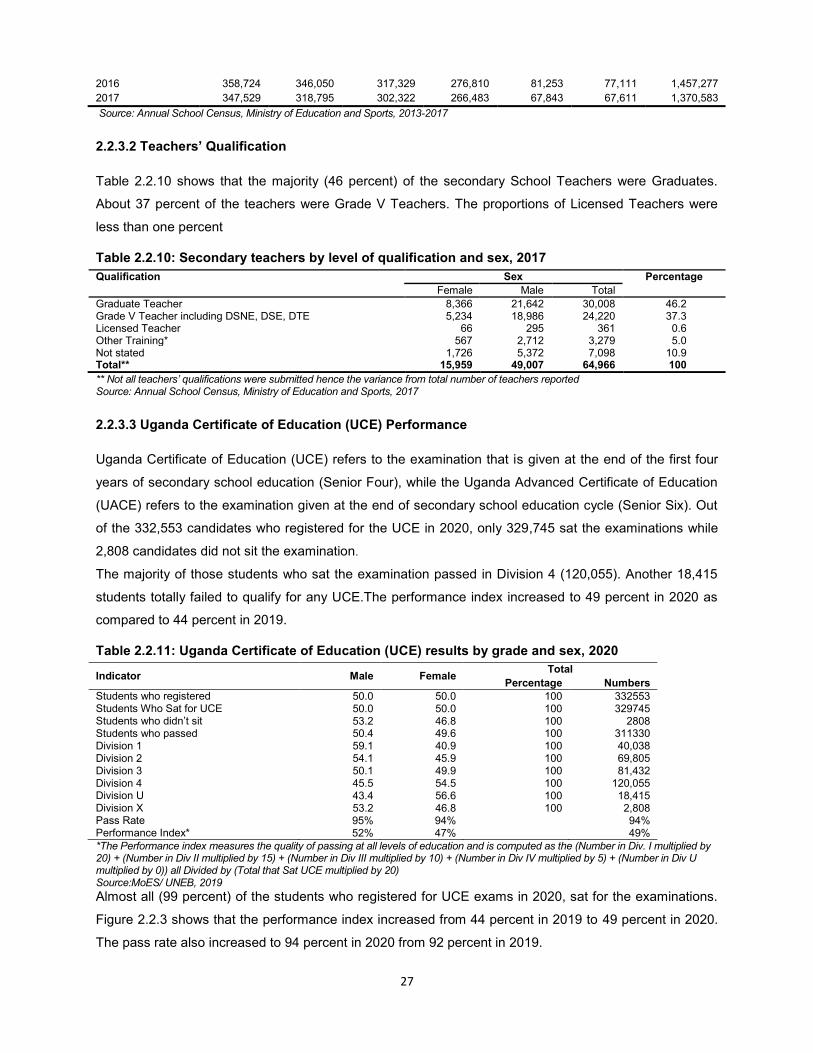
27
2016 358,724 346,050 317,329 276,810 81,253 77,111 1,457,277
2017 347,529 318,795 302,322 266,483 67,843 67,611 1,370,583
Source: Annual School Census, Ministry of Education and Sports, 2013-2017
2.2.3.2 Teachers’ Qualification
Table 2.2.10 shows that the majority (46 percent) of the secondary School Teachers were Graduates.
About 37 percent of the teachers were Grade V Teachers. The proportions of Licensed Teachers were
less than one percent
Table 2.2.10: Secondary teachers by level of qualification and sex, 2017
Qualification Sex Percentage
Female Male Total
Graduate Teacher 8,366 21,642 30,008 46.2 Grade V Teacher including DSNE, DSE, DTE 5,234 18,986 24,220 37.3 Licensed Teacher 66 295 361 0.6 Other Training* 567 2,712 3,279 5.0 Not stated 1,726 5,372 7,098 10.9 Total** 15,959 49,007 64,966 100
** Not all teachers’ qualifications were submitted hence the variance from total number of teachers reported Source: Annual School Census, Ministry of Education and Sports, 2017
2.2.3.3 Uganda Certificate of Education (UCE) Performance
Uganda Certificate of Education (UCE) refers to the examination that is given at the end of the first four
years of secondary school education (Senior Four), while the Uganda Advanced Certificate of Education
(UACE) refers to the examination given at the end of secondary school education cycle (Senior Six). Out
of the 332,553 candidates who registered for the UCE in 2020, only 329,745 sat the examinations while
2,808 candidates did not sit the examination.
The majority of those students who sat the examination passed in Division 4 (120,055). Another 18,415
students totally failed to qualify for any UCE.The performance index increased to 49 percent in 2020 as
compared to 44 percent in 2019.
Table 2.2.11: Uganda Certificate of Education (UCE) results by grade and sex, 2020
Indicator Male Female Total
Percentage Numbers Students who registered 50.0 50.0 100 332553 Students Who Sat for UCE 50.0 50.0 100 329745 Students who didn’t sit 53.2 46.8 100 2808 Students who passed 50.4 49.6 100 311330 Division 1 59.1 40.9 100 40,038 Division 2 54.1 45.9 100 69,805 Division 3 50.1 49.9 100 81,432 Division 4 45.5 54.5 100 120,055 Division U 43.4 56.6 100 18,415 Division X 53.2 46.8 100 2,808 Pass Rate 95% 94% 94% Performance Index* 52% 47% 49% *The Performance index measures the quality of passing at all levels of education and is computed as the (Number in Div. I multiplied by 20) + (Number in Div II multiplied by 15) + (Number in Div III multiplied by 10) + (Number in Div IV multiplied by 5) + (Number in Div U multiplied by 0)) all Divided by (Total that Sat UCE multiplied by 20) Source:MoES/ UNEB, 2019
Almost all (99 percent) of the students who registered for UCE exams in 2020, sat for the examinations.
Figure 2.2.3 shows that the performance index increased from 44 percent in 2019 to 49 percent in 2020.
The pass rate also increased to 94 percent in 2020 from 92 percent in 2019.
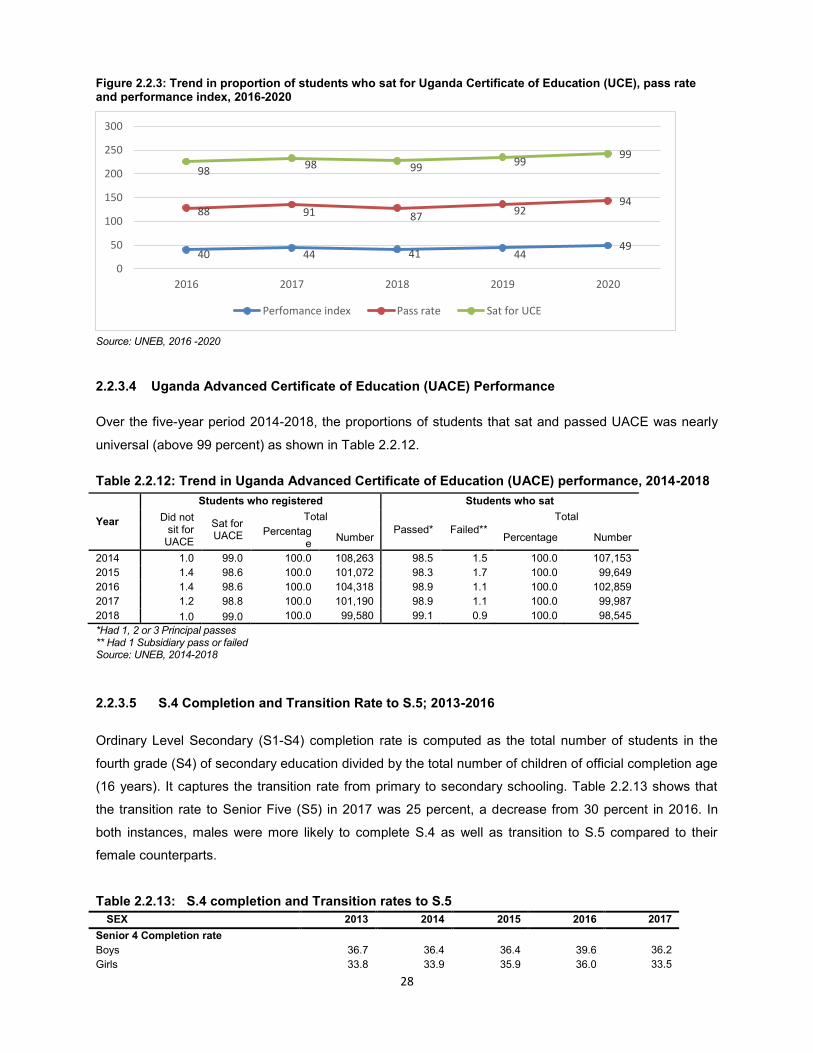
28
Figure 2.2.3: Trend in proportion of students who sat for Uganda Certificate of Education (UCE), pass rate and performance index, 2016-2020
Source: UNEB, 2016 -2020
2.2.3.4 Uganda Advanced Certificate of Education (UACE) Performance
Over the five-year period 2014-2018, the proportions of students that sat and passed UACE was nearly
universal (above 99 percent) as shown in Table 2.2.12.
Table 2.2.12: Trend in Uganda Advanced Certificate of Education (UACE) performance, 2014-2018
Year
Students who registered Students who sat
Did not sit for
UACE
Sat for UACE
Total Passed* Failed**
Total
Percentage
Number Percentage Number
2014 1.0 99.0 100.0 108,263 98.5 1.5 100.0 107,153
2015 1.4 98.6 100.0 101,072 98.3 1.7 100.0 99,649
2016 1.4 98.6 100.0 104,318 98.9 1.1 100.0 102,859
2017 1.2 98.8 100.0 101,190 98.9 1.1 100.0 99,987
2018 1.0 99.0 100.0 99,580 99.1 0.9 100.0 98,545
*Had 1, 2 or 3 Principal passes ** Had 1 Subsidiary pass or failed Source: UNEB, 2014-2018
2.2.3.5 S.4 Completion and Transition Rate to S.5; 2013-2016
Ordinary Level Secondary (S1-S4) completion rate is computed as the total number of students in the
fourth grade (S4) of secondary education divided by the total number of children of official completion age
(16 years). It captures the transition rate from primary to secondary schooling. Table 2.2.13 shows that
the transition rate to Senior Five (S5) in 2017 was 25 percent, a decrease from 30 percent in 2016. In
both instances, males were more likely to complete S.4 as well as transition to S.5 compared to their
female counterparts.
Table 2.2.13: S.4 completion and Transition rates to S.5
SEX 2013 2014 2015 2016 2017
Senior 4 Completion rate
Boys 36.7 36.4 36.4 39.6 36.2
Girls 33.8 33.9 35.9 36.0 33.5
40 44 41 44 49
88 91 87 92
94
98 98 99
99 99
0
50
100
150
200
250
300
2016 2017 2018 2019 2020
Perfomance index Pass rate Sat for UCE
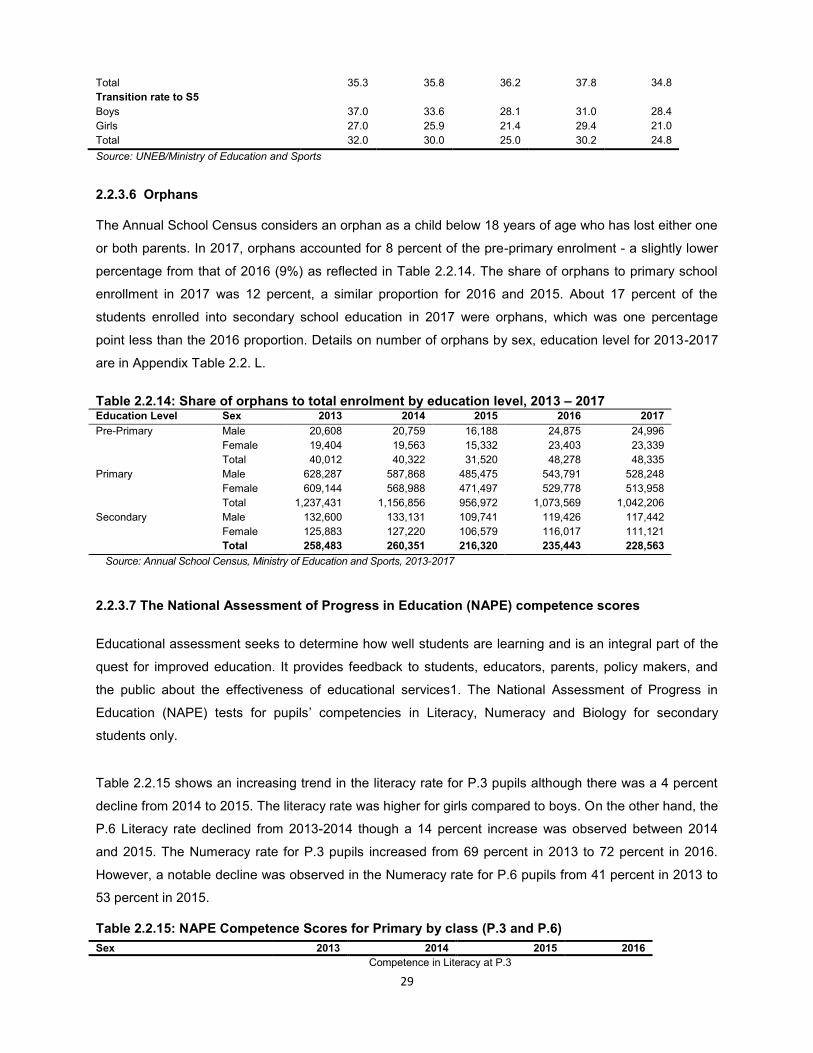
29
Total 35.3 35.8 36.2 37.8 34.8
Transition rate to S5
Boys 37.0 33.6 28.1 31.0 28.4
Girls 27.0 25.9 21.4 29.4 21.0
Total 32.0 30.0 25.0 30.2 24.8
Source: UNEB/Ministry of Education and Sports
2.2.3.6 Orphans The Annual School Census considers an orphan as a child below 18 years of age who has lost either one
or both parents. In 2017, orphans accounted for 8 percent of the pre-primary enrolment - a slightly lower
percentage from that of 2016 (9%) as reflected in Table 2.2.14. The share of orphans to primary school
enrollment in 2017 was 12 percent, a similar proportion for 2016 and 2015. About 17 percent of the
students enrolled into secondary school education in 2017 were orphans, which was one percentage
point less than the 2016 proportion. Details on number of orphans by sex, education level for 2013-2017
are in Appendix Table 2.2. L.
Table 2.2.14: Share of orphans to total enrolment by education level, 2013 – 2017 Education Level Sex 2013 2014 2015 2016 2017
Pre-Primary Male 20,608 20,759 16,188 24,875 24,996
Female 19,404 19,563 15,332 23,403 23,339
Total 40,012 40,322 31,520 48,278 48,335
Primary Male 628,287 587,868 485,475 543,791 528,248
Female 609,144 568,988 471,497 529,778 513,958
Total 1,237,431 1,156,856 956,972 1,073,569 1,042,206
Secondary Male 132,600 133,131 109,741 119,426 117,442
Female 125,883 127,220 106,579 116,017 111,121
Total 258,483 260,351 216,320 235,443 228,563
Source: Annual School Census, Ministry of Education and Sports, 2013-2017
2.2.3.7 The National Assessment of Progress in Education (NAPE) competence scores
Educational assessment seeks to determine how well students are learning and is an integral part of the
quest for improved education. It provides feedback to students, educators, parents, policy makers, and
the public about the effectiveness of educational services1. The National Assessment of Progress in
Education (NAPE) tests for pupils’ competencies in Literacy, Numeracy and Biology for secondary
students only.
Table 2.2.15 shows an increasing trend in the literacy rate for P.3 pupils although there was a 4 percent
decline from 2014 to 2015. The literacy rate was higher for girls compared to boys. On the other hand, the
P.6 Literacy rate declined from 2013-2014 though a 14 percent increase was observed between 2014
and 2015. The Numeracy rate for P.3 pupils increased from 69 percent in 2013 to 72 percent in 2016.
However, a notable decline was observed in the Numeracy rate for P.6 pupils from 41 percent in 2013 to
53 percent in 2015.
Table 2.2.15: NAPE Competence Scores for Primary by class (P.3 and P.6)
Sex 2013 2014 2015 2016
Competence in Literacy at P.3
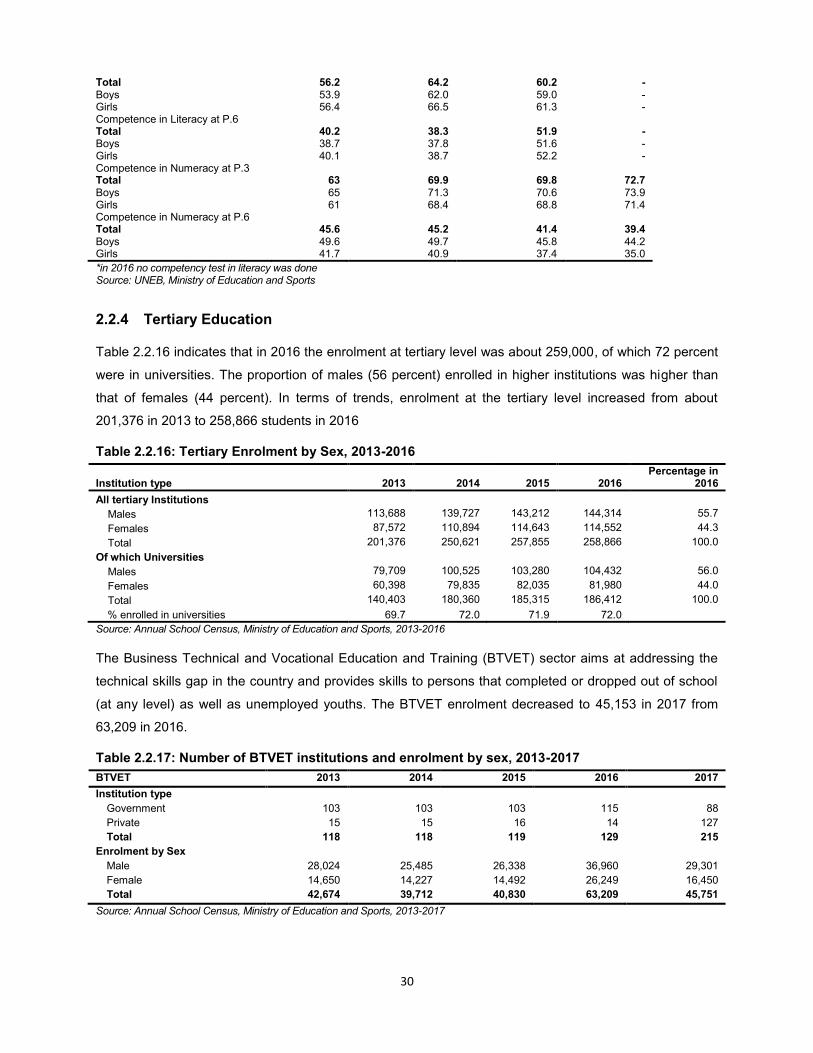
30
Total 56.2 64.2 60.2 - Boys 53.9 62.0 59.0 - Girls 56.4 66.5 61.3 - Competence in Literacy at P.6 Total 40.2 38.3 51.9 - Boys 38.7 37.8 51.6 - Girls 40.1 38.7 52.2 - Competence in Numeracy at P.3 Total 63 69.9 69.8 72.7 Boys 65 71.3 70.6 73.9 Girls 61 68.4 68.8 71.4 Competence in Numeracy at P.6 Total 45.6 45.2 41.4 39.4 Boys 49.6 49.7 45.8 44.2 Girls 41.7 40.9 37.4 35.0
*in 2016 no competency test in literacy was done Source: UNEB, Ministry of Education and Sports
2.2.4 Tertiary Education
Table 2.2.16 indicates that in 2016 the enrolment at tertiary level was about 259,000, of which 72 percent
were in universities. The proportion of males (56 percent) enrolled in higher institutions was higher than
that of females (44 percent). In terms of trends, enrolment at the tertiary level increased from about
201,376 in 2013 to 258,866 students in 2016
Table 2.2.16: Tertiary Enrolment by Sex, 2013-2016
Institution type 2013 2014 2015 2016 Percentage in
2016
All tertiary Institutions
Males 113,688 139,727 143,212 144,314 55.7
Females 87,572 110,894 114,643 114,552 44.3
Total 201,376 250,621 257,855 258,866 100.0
Of which Universities
Males 79,709 100,525 103,280 104,432 56.0
Females 60,398 79,835 82,035 81,980 44.0
Total 140,403 180,360 185,315 186,412 100.0
% enrolled in universities 69.7 72.0 71.9 72.0
Source: Annual School Census, Ministry of Education and Sports, 2013-2016
The Business Technical and Vocational Education and Training (BTVET) sector aims at addressing the
technical skills gap in the country and provides skills to persons that completed or dropped out of school
(at any level) as well as unemployed youths. The BTVET enrolment decreased to 45,153 in 2017 from
63,209 in 2016.
Table 2.2.17: Number of BTVET institutions and enrolment by sex, 2013-2017
BTVET 2013 2014 2015 2016 2017
Institution type
Government 103 103 103 115 88
Private 15 15 16 14 127
Total 118 118 119 129 215
Enrolment by Sex
Male 28,024 25,485 26,338 36,960 29,301
Female 14,650 14,227 14,492 26,249 16,450
Total 42,674 39,712 40,830 63,209 45,751
Source: Annual School Census, Ministry of Education and Sports, 2013-2017
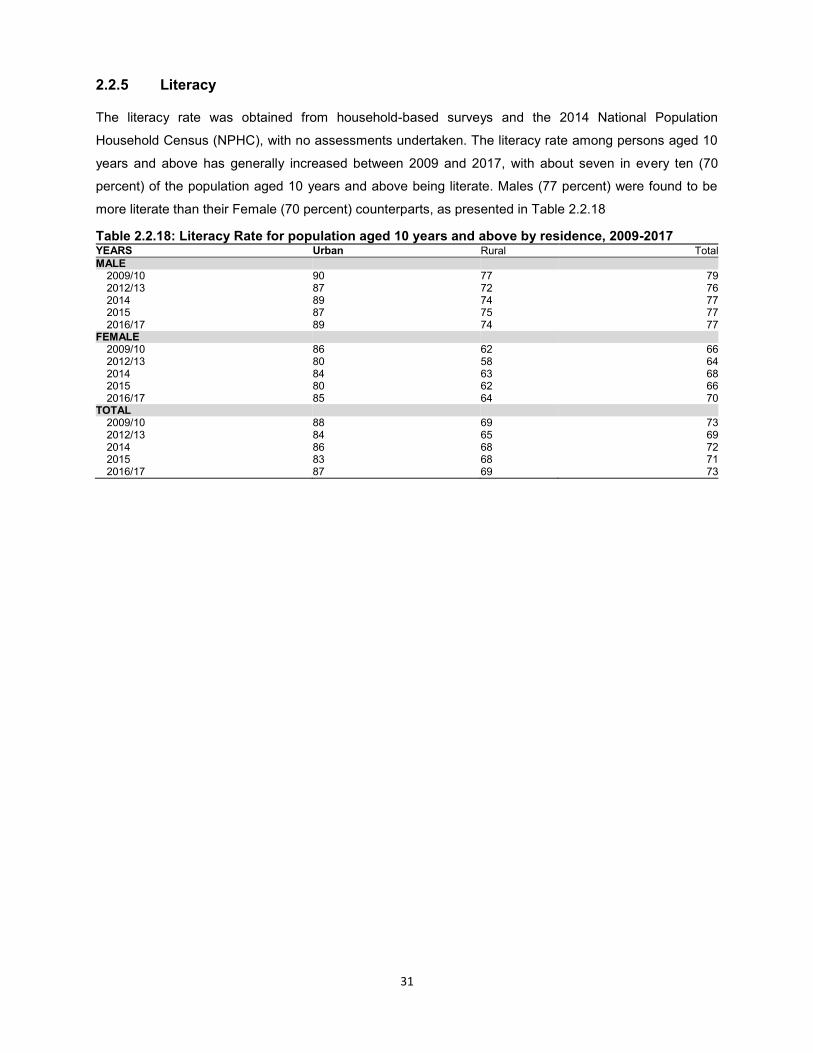
31
2.2.5 Literacy
The literacy rate was obtained from household-based surveys and the 2014 National Population
Household Census (NPHC), with no assessments undertaken. The literacy rate among persons aged 10
years and above has generally increased between 2009 and 2017, with about seven in every ten (70
percent) of the population aged 10 years and above being literate. Males (77 percent) were found to be
more literate than their Female (70 percent) counterparts, as presented in Table 2.2.18
Table 2.2.18: Literacy Rate for population aged 10 years and above by residence, 2009-2017 YEARS Urban Rural Total MALE
2009/10 90 77 79 2012/13 87 72 76 2014 89 74 77 2015 87 75 77 2016/17 89 74 77
FEMALE 2009/10 86 62 66 2012/13 80 58 64 2014 84 63 68 2015 80 62 66 2016/17 85 64 70
TOTAL 2009/10 88 69 73 2012/13 84 65 69 2014 86 68 72 2015 83 68 71 2016/17 87 69 73
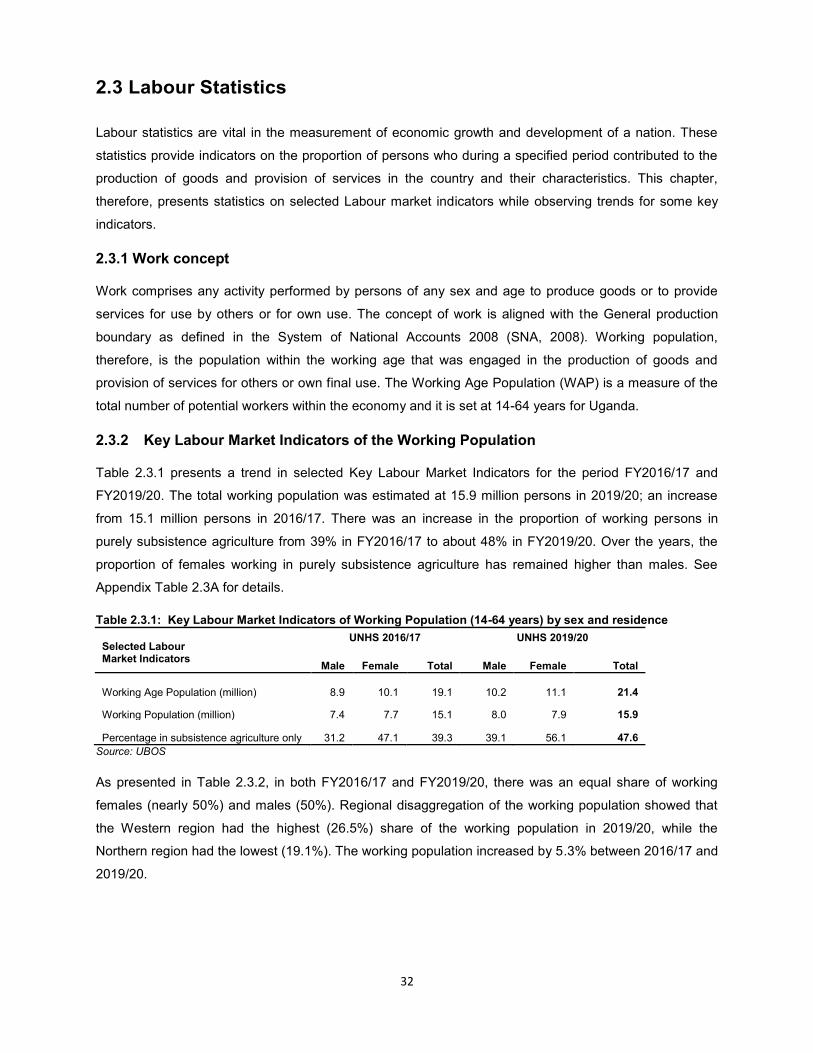
32
2.3 Labour Statistics
Labour statistics are vital in the measurement of economic growth and development of a nation. These
statistics provide indicators on the proportion of persons who during a specified period contributed to the
production of goods and provision of services in the country and their characteristics. This chapter,
therefore, presents statistics on selected Labour market indicators while observing trends for some key
indicators.
2.3.1 Work concept
Work comprises any activity performed by persons of any sex and age to produce goods or to provide
services for use by others or for own use. The concept of work is aligned with the General production
boundary as defined in the System of National Accounts 2008 (SNA, 2008). Working population,
therefore, is the population within the working age that was engaged in the production of goods and
provision of services for others or own final use. The Working Age Population (WAP) is a measure of the
total number of potential workers within the economy and it is set at 14-64 years for Uganda.
2.3.2 Key Labour Market Indicators of the Working Population
Table 2.3.1 presents a trend in selected Key Labour Market Indicators for the period FY2016/17 and
FY2019/20. The total working population was estimated at 15.9 million persons in 2019/20; an increase
from 15.1 million persons in 2016/17. There was an increase in the proportion of working persons in
purely subsistence agriculture from 39% in FY2016/17 to about 48% in FY2019/20. Over the years, the
proportion of females working in purely subsistence agriculture has remained higher than males. See
Appendix Table 2.3A for details.
Table 2.3.1: Key Labour Market Indicators of Working Population (14-64 years) by sex and residence Selected Labour Market Indicators
UNHS 2016/17 UNHS 2019/20
Male Female Total Male Female Total
Working Age Population (million) 8.9 10.1 19.1 10.2 11.1 21.4
Working Population (million) 7.4 7.7 15.1 8.0 7.9 15.9
Percentage in subsistence agriculture only 31.2 47.1 39.3 39.1 56.1 47.6
Source: UBOS
As presented in Table 2.3.2, in both FY2016/17 and FY2019/20, there was an equal share of working
females (nearly 50%) and males (50%). Regional disaggregation of the working population showed that
the Western region had the highest (26.5%) share of the working population in 2019/20, while the
Northern region had the lowest (19.1%). The working population increased by 5.3% between 2016/17 and
2019/20.
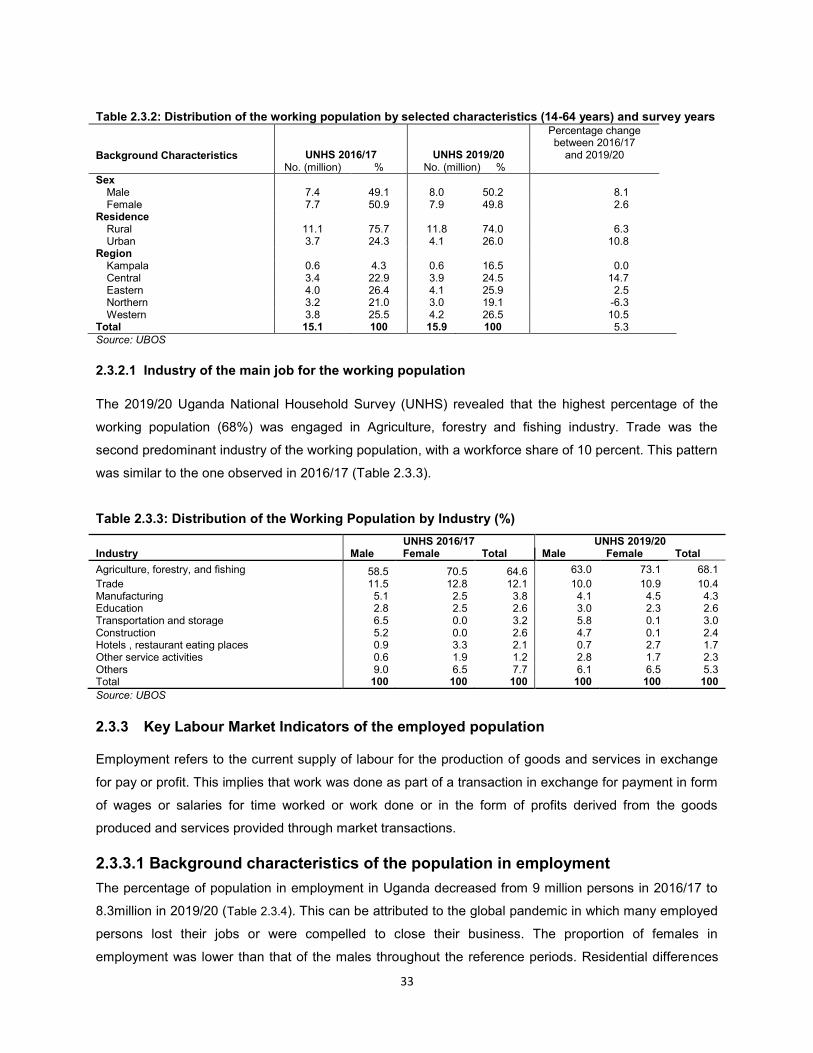
33
Table 2.3.2: Distribution of the working population by selected characteristics (14-64 years) and survey years
Background Characteristics UNHS 2016/17 UNHS 2019/20
Percentage change between 2016/17
and 2019/20 No. (million) % No. (million) %
Sex
Male 7.4 49.1 8.0 50.2 8.1 Female 7.7 50.9 7.9 49.8 2.6
Residence
Rural 11.1 75.7 11.8 74.0 6.3 Urban 3.7 24.3 4.1 26.0 10.8
Region
Kampala 0.6 4.3 0.6 16.5 0.0 Central 3.4 22.9 3.9 24.5 14.7 Eastern 4.0 26.4 4.1 25.9 2.5 Northern 3.2 21.0 3.0 19.1 -6.3 Western 3.8 25.5 4.2 26.5 10.5
Total 15.1 100 15.9 100 5.3 Source: UBOS
2.3.2.1 Industry of the main job for the working population
The 2019/20 Uganda National Household Survey (UNHS) revealed that the highest percentage of the
working population (68%) was engaged in Agriculture, forestry and fishing industry. Trade was the
second predominant industry of the working population, with a workforce share of 10 percent. This pattern
was similar to the one observed in 2016/17 (Table 2.3.3).
Table 2.3.3: Distribution of the Working Population by Industry (%)
UNHS 2016/17 UNHS 2019/20 Industry Male Female Total Male Female Total
Agriculture, forestry, and fishing 58.5 70.5 64.6 63.0 73.1 68.1
Trade 11.5 12.8 12.1 10.0 10.9 10.4 Manufacturing 5.1 2.5 3.8 4.1 4.5 4.3 Education 2.8 2.5 2.6 3.0 2.3 2.6 Transportation and storage 6.5 0.0 3.2 5.8 0.1 3.0 Construction 5.2 0.0 2.6 4.7 0.1 2.4 Hotels , restaurant eating places 0.9 3.3 2.1 0.7 2.7 1.7 Other service activities 0.6 1.9 1.2 2.8 1.7 2.3 Others 9.0 6.5 7.7 6.1 6.5 5.3 Total 100 100 100 100 100 100
Source: UBOS
2.3.3 Key Labour Market Indicators of the employed population
Employment refers to the current supply of labour for the production of goods and services in exchange
for pay or profit. This implies that work was done as part of a transaction in exchange for payment in form
of wages or salaries for time worked or work done or in the form of profits derived from the goods
produced and services provided through market transactions.
2.3.3.1 Background characteristics of the population in employment
The percentage of population in employment in Uganda decreased from 9 million persons in 2016/17 to
8.3million in 2019/20 (Table 2.3.4). This can be attributed to the global pandemic in which many employed
persons lost their jobs or were compelled to close their business. The proportion of females in
employment was lower than that of the males throughout the reference periods. Residential differences
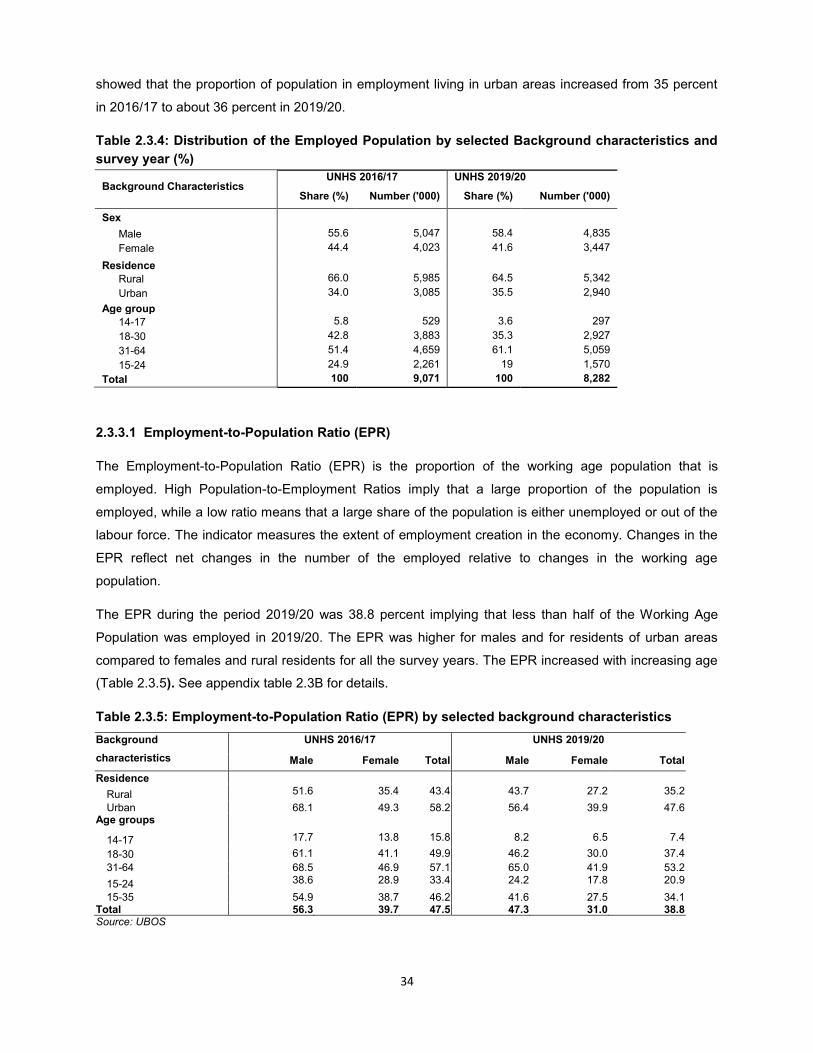
34
showed that the proportion of population in employment living in urban areas increased from 35 percent
in 2016/17 to about 36 percent in 2019/20.
Table 2.3.4: Distribution of the Employed Population by selected Background characteristics and
survey year (%)
Background Characteristics UNHS 2016/17 UNHS 2019/20
Share (%) Number ('000) Share (%) Number ('000)
Sex
Male 55.6 5,047 58.4 4,835
Female 44.4 4,023 41.6 3,447
Residence Rural 66.0 5,985 64.5 5,342
Urban 34.0 3,085 35.5 2,940
Age group 14-17 5.8 529 3.6 297
18-30 42.8 3,883 35.3 2,927
31-64 51.4 4,659 61.1 5,059
15-24 24.9 2,261 19 1,570
Total 100 9,071 100 8,282
2.3.3.1 Employment-to-Population Ratio (EPR)
The Employment-to-Population Ratio (EPR) is the proportion of the working age population that is
employed. High Population-to-Employment Ratios imply that a large proportion of the population is
employed, while a low ratio means that a large share of the population is either unemployed or out of the
labour force. The indicator measures the extent of employment creation in the economy. Changes in the
EPR reflect net changes in the number of the employed relative to changes in the working age
population.
The EPR during the period 2019/20 was 38.8 percent implying that less than half of the Working Age
Population was employed in 2019/20. The EPR was higher for males and for residents of urban areas
compared to females and rural residents for all the survey years. The EPR increased with increasing age
(Table 2.3.5). See appendix table 2.3B for details.
Table 2.3.5: Employment-to-Population Ratio (EPR) by selected background characteristics
Background
characteristics
UNHS 2016/17 UNHS 2019/20
Male Female Total Male Female Total
Residence Rural 51.6 35.4 43.4 43.7 27.2 35.2
Urban 68.1 49.3 58.2 56.4 39.9 47.6 Age groups
14-17 17.7 13.8 15.8 8.2 6.5 7.4
18-30 61.1 41.1 49.9 46.2 30.0 37.4
31-64 68.5 46.9 57.1 65.0 41.9 53.2
15-24 38.6 28.9 33.4 24.2 17.8 20.9
15-35 54.9 38.7 46.2 41.6 27.5 34.1 Total 56.3 39.7 47.5 47.3 31.0 38.8 Source: UBOS
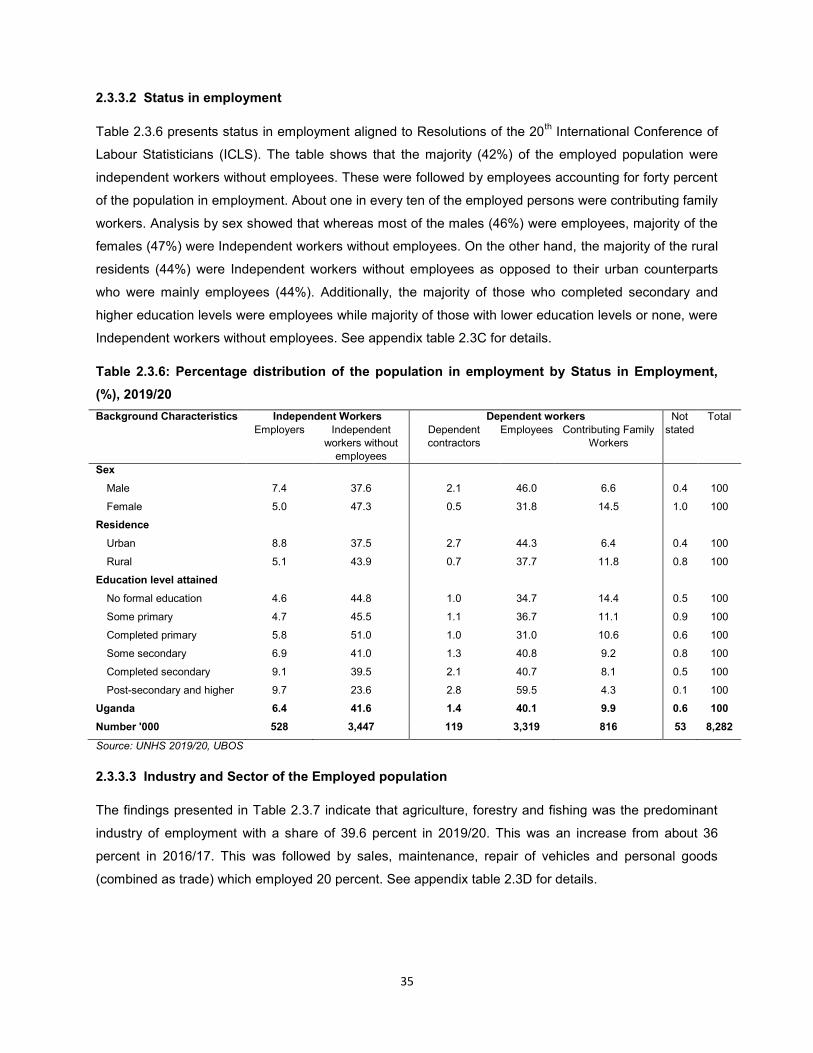
35
2.3.3.2 Status in employment
Table 2.3.6 presents status in employment aligned to Resolutions of the 20th International Conference of
Labour Statisticians (ICLS). The table shows that the majority (42%) of the employed population were
independent workers without employees. These were followed by employees accounting for forty percent
of the population in employment. About one in every ten of the employed persons were contributing family
workers. Analysis by sex showed that whereas most of the males (46%) were employees, majority of the
females (47%) were Independent workers without employees. On the other hand, the majority of the rural
residents (44%) were Independent workers without employees as opposed to their urban counterparts
who were mainly employees (44%). Additionally, the majority of those who completed secondary and
higher education levels were employees while majority of those with lower education levels or none, were
Independent workers without employees. See appendix table 2.3C for details.
Table 2.3.6: Percentage distribution of the population in employment by Status in Employment,
(%), 2019/20
Background Characteristics Independent Workers Dependent workers Not stated
Total Employers Independent
workers without
employees
Dependent contractors
Employees Contributing Family Workers
Sex
Male 7.4 37.6 2.1 46.0 6.6 0.4 100
Female 5.0 47.3 0.5 31.8 14.5 1.0 100
Residence
Urban 8.8 37.5 2.7 44.3 6.4 0.4 100
Rural 5.1 43.9 0.7 37.7 11.8 0.8 100
Education level attained
No formal education 4.6 44.8 1.0 34.7 14.4 0.5 100
Some primary 4.7 45.5 1.1 36.7 11.1 0.9 100
Completed primary 5.8 51.0 1.0 31.0 10.6 0.6 100
Some secondary 6.9 41.0 1.3 40.8 9.2 0.8 100
Completed secondary 9.1 39.5 2.1 40.7 8.1 0.5 100
Post-secondary and higher 9.7 23.6 2.8 59.5 4.3 0.1 100
Uganda 6.4 41.6 1.4 40.1 9.9 0.6 100
Number '000 528 3,447 119 3,319 816 53 8,282
Source: UNHS 2019/20, UBOS
2.3.3.3 Industry and Sector of the Employed population
The findings presented in Table 2.3.7 indicate that agriculture, forestry and fishing was the predominant
industry of employment with a share of 39.6 percent in 2019/20. This was an increase from about 36
percent in 2016/17. This was followed by sales, maintenance, repair of vehicles and personal goods
(combined as trade) which employed 20 percent. See appendix table 2.3D for details.
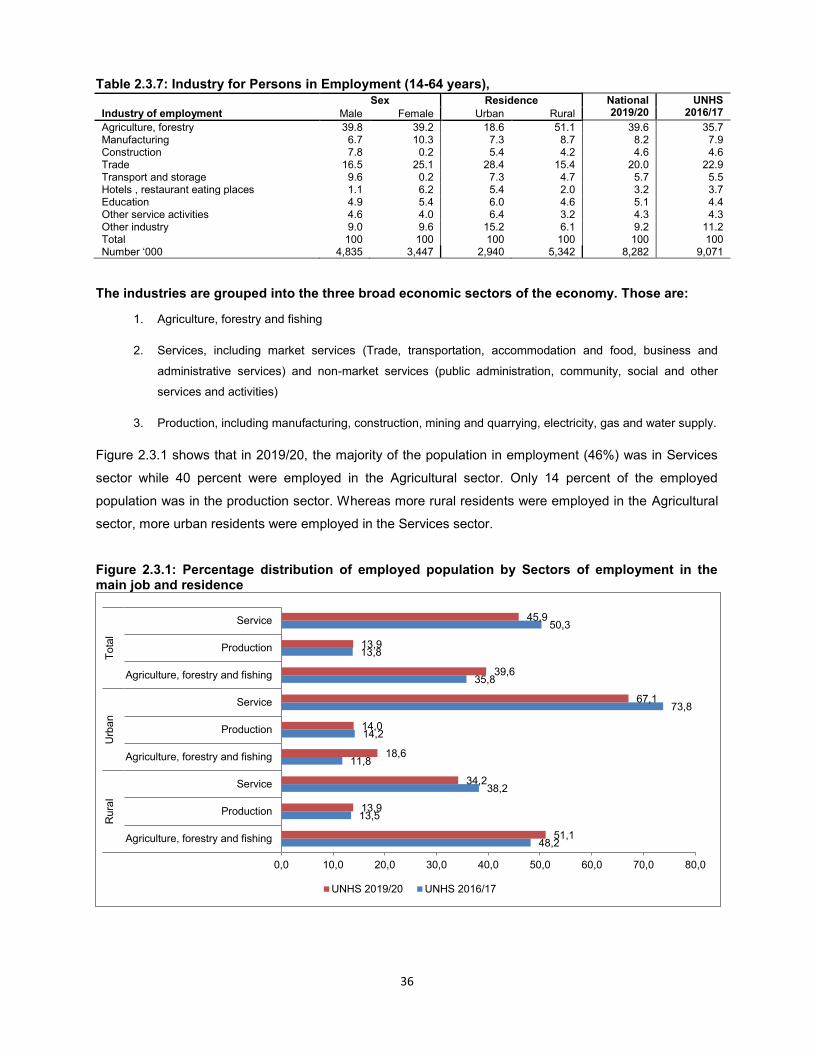
36
Table 2.3.7: Industry for Persons in Employment (14-64 years),
Sex Residence National
2019/20 UNHS
2016/17 Industry of employment Male Female Urban Rural
Agriculture, forestry 39.8 39.2 18.6 51.1 39.6 35.7 Manufacturing 6.7 10.3 7.3 8.7 8.2 7.9 Construction 7.8 0.2 5.4 4.2 4.6 4.6 Trade 16.5 25.1 28.4 15.4 20.0 22.9 Transport and storage 9.6 0.2 7.3 4.7 5.7 5.5 Hotels , restaurant eating places 1.1 6.2 5.4 2.0 3.2 3.7 Education 4.9 5.4 6.0 4.6 5.1 4.4 Other service activities 4.6 4.0 6.4 3.2 4.3 4.3 Other industry 9.0 9.6 15.2 6.1 9.2 11.2 Total 100 100 100 100 100 100 Number ‘000 4,835 3,447 2,940 5,342 8,282 9,071
The industries are grouped into the three broad economic sectors of the economy. Those are:
1. Agriculture, forestry and fishing
2. Services, including market services (Trade, transportation, accommodation and food, business and
administrative services) and non-market services (public administration, community, social and other
services and activities)
3. Production, including manufacturing, construction, mining and quarrying, electricity, gas and water supply.
Figure 2.3.1 shows that in 2019/20, the majority of the population in employment (46%) was in Services
sector while 40 percent were employed in the Agricultural sector. Only 14 percent of the employed
population was in the production sector. Whereas more rural residents were employed in the Agricultural
sector, more urban residents were employed in the Services sector.
Figure 2.3.1: Percentage distribution of employed population by Sectors of employment in the main job and residence
48,2
13,5
38,2
11,8
14,2
73,8
35,8
13,8
50,3
51,1
13,9
34,2
18,6
14,0
67,1
39,6
13,9
45,9
0,0 10,0 20,0 30,0 40,0 50,0 60,0 70,0 80,0
Agriculture, forestry and fishing
Production
Service
Agriculture, forestry and fishing
Production
Service
Agriculture, forestry and fishing
Production
Service
Rura
lU
rba
nT
ota
l
UNHS 2019/20 UNHS 2016/17

37
2.3.3.4 Occupation of the Employed population
Occupation refers to the tasks or duties or job a person usually pursues to earn income in form of pay or
profit. The findings in Table 2.3.8 show that overall, skilled agricultural, forestry and fishery workers had
the highest proportion of the employed population (25%) followed by Service and sales workers (24%) in
2019/20. The results further show that the proportion of persons employed in occupations requiring high
qualifications such as technicians and associate professionals was low (6.3% and below) with negligible
gender disparities observed. See appendix table 2.3.E for details.
Table 2.3.8: Occupation of the employed population aged 14-64 years by sex and Residence,
percent
Occupations of the main job
Sex Residence National
Male Female Rural Urban
UNHS 2019/20
Skilled agricultural, forestry and fishery workers 25.2 24.9 12.6 32 25.1 Service and sales workers 17.7 33.7 34.8 18.5 24.3 Elementary occupations 23.3 20.9 17.6 24.8 22.3 Craft and related trades workers 11.8 9.7 10.9 10.9 10.9 Professionals 6.7 5.6 8.6 4.9 6.3 Plant and machine operators and assemblers 10.3 0.7 8.1 5.3 6.3 Technicians and Associate Professionals 2.7 2.3 4.2 1.6 2.5 Others 2.4 2.2 3.1 1.8 2.3 Total 100 100 100 100 100 Number (‘000) 4,835 3,447 5,342 2,940 8,282
UNHS 2016/17 Skilled agricultural, forestry and fishery workers 25.4 29.8 36.9 8.7 25.4 Service and sales workers 23.2 39.8 25.0 41.7 23.2 Craft and related trades workers 10.8 5.6 8.3 8.8 10.8 Elementary occupations 22.3 14.4 19.5 17.2 22.3 Professionals 6.7 6.6 4.9 10.1 6.7 Plant and machine operators and assemblers 7.6 0.4 3.5 6.0 7.6 Technicians and Associate Professionals 2.6 1.5 1.0 4.2 2.6 Others 1.6 1.9 0.9 3.4 1.6 Total 100 100 100 100 100 Number (‘000) 5,047 4,023 5,985 3,085 9,071
2.3.3.4 Education Status of the Employed population
The results in Table 2.3.9 indicate that the education level attained by the majority of persons in
employment was low with less than a third of the employed persons (25%) having completed either
secondary or post-primary/secondary training. See appendix table 2.3F for details.
Table 2.3.9: Table 2.3.9: Education level attained for Persons in Employment (14-64 years)
Education Level attained
Male Female Total
Number Percentage Number Percentage Number Percentage
No formal education 317,202 6.6 551,298 16.1 868,500 10.6
Some primary 1,604,249 33.5 1,175,275 34.4 2,779,523 33.9
Completed primary 698,499 14.6 420,771 12.3 1,119,270 13.6
Some secondary 857,950 17.9 575,766 16.9 1,433,717 17.5
Completed secondary 599,337 12.5 315,560 9.2 914,897 11.2
Post-secondary plus 710,268 14.8 379,175 11.0 1,089,443 13.3
Total 4,787,504 100 3,417,846 100 8,205,349 100
Source: UNHS 2019/20
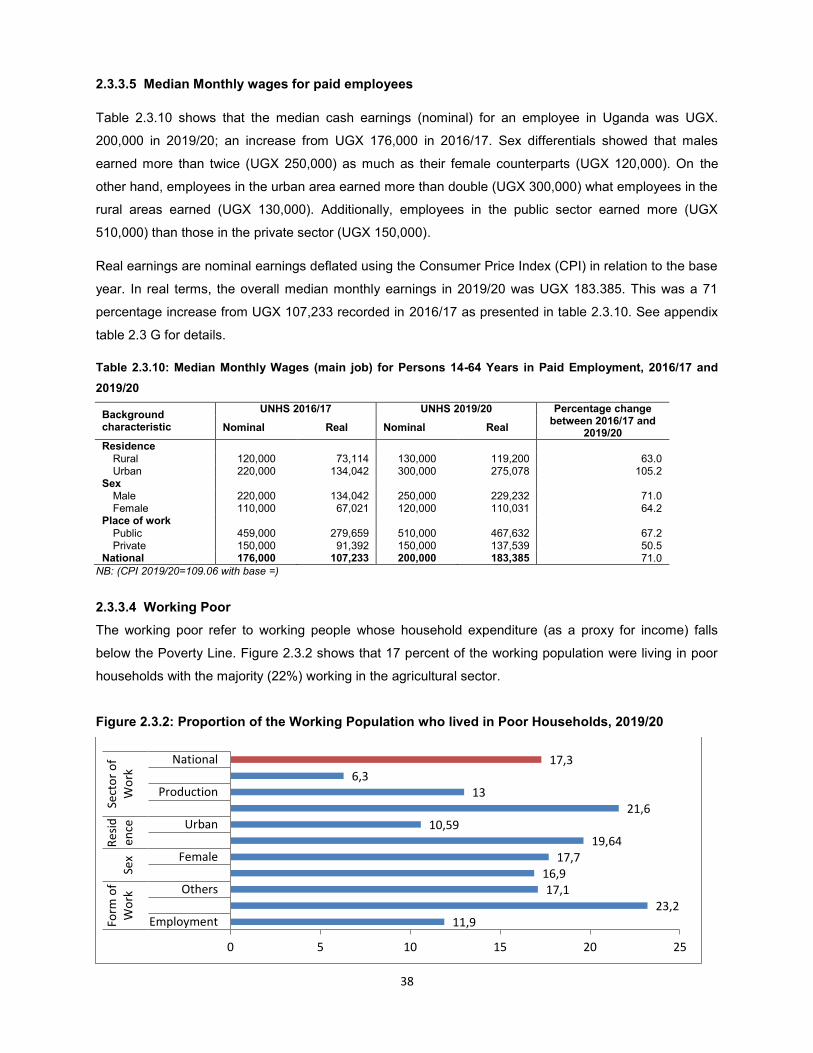
38
2.3.3.5 Median Monthly wages for paid employees
Table 2.3.10 shows that the median cash earnings (nominal) for an employee in Uganda was UGX.
200,000 in 2019/20; an increase from UGX 176,000 in 2016/17. Sex differentials showed that males
earned more than twice (UGX 250,000) as much as their female counterparts (UGX 120,000). On the
other hand, employees in the urban area earned more than double (UGX 300,000) what employees in the
rural areas earned (UGX 130,000). Additionally, employees in the public sector earned more (UGX
510,000) than those in the private sector (UGX 150,000).
Real earnings are nominal earnings deflated using the Consumer Price Index (CPI) in relation to the base
year. In real terms, the overall median monthly earnings in 2019/20 was UGX 183.385. This was a 71
percentage increase from UGX 107,233 recorded in 2016/17 as presented in table 2.3.10. See appendix
table 2.3 G for details.
Table 2.3.10: Median Monthly Wages (main job) for Persons 14-64 Years in Paid Employment, 2016/17 and
2019/20
Background characteristic
UNHS 2016/17 UNHS 2019/20 Percentage change between 2016/17 and
2019/20 Nominal Real Nominal Real
Residence Rural 120,000 73,114 130,000 119,200 63.0 Urban 220,000 134,042 300,000 275,078 105.2
Sex
Male 220,000 134,042 250,000 229,232 71.0 Female 110,000 67,021 120,000 110,031 64.2
Place of work
Public 459,000 279,659 510,000 467,632 67.2 Private 150,000 91,392 150,000 137,539 50.5
National 176,000 107,233 200,000 183,385 71.0 NB: (CPI 2019/20=109.06 with base =)
2.3.3.4 Working Poor
The working poor refer to working people whose household expenditure (as a proxy for income) falls
below the Poverty Line. Figure 2.3.2 shows that 17 percent of the working population were living in poor
households with the majority (22%) working in the agricultural sector.
Figure 2.3.2: Proportion of the Working Population who lived in Poor Households, 2019/20
11,9
23,2
17,1
16,9
17,7
19,64
10,59
21,6
13
6,3
17,3
0 5 10 15 20 25
Employment
Others
Female
Urban
Production
National
Fo
rm o
f
Wo
rkS
ex
Re
sid
en
ce
Se
cto
r o
f
Wo
rk
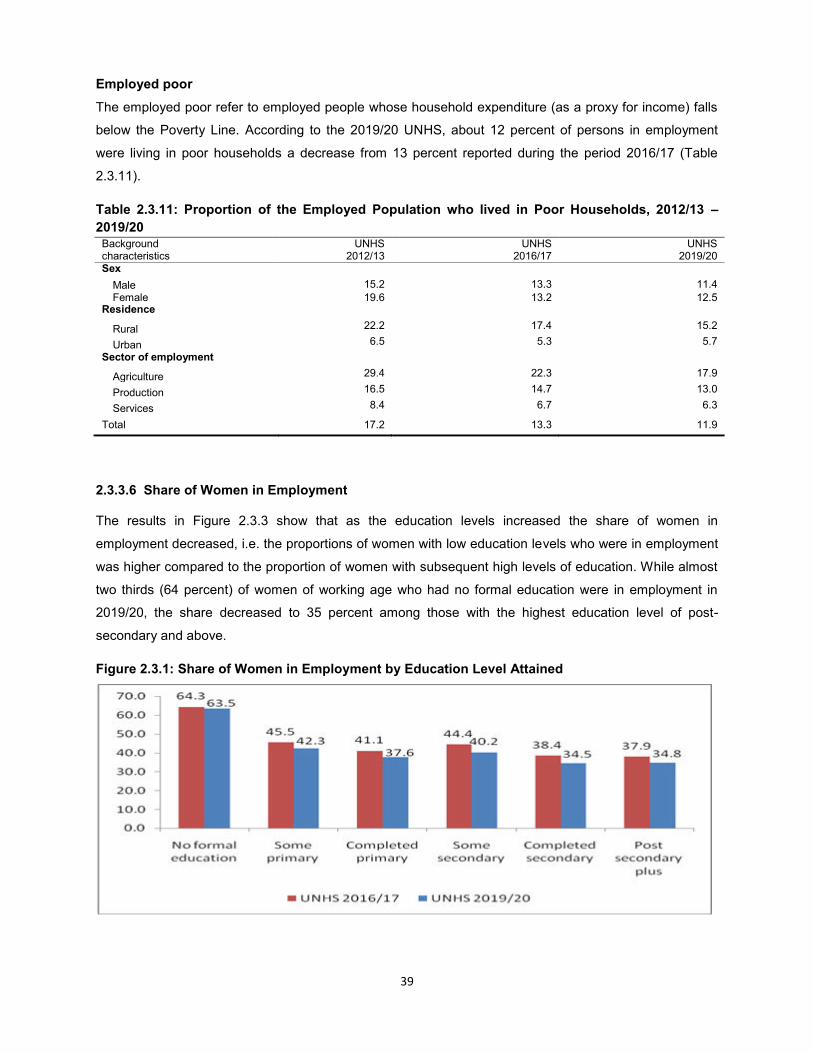
39
Employed poor
The employed poor refer to employed people whose household expenditure (as a proxy for income) falls
below the Poverty Line. According to the 2019/20 UNHS, about 12 percent of persons in employment
were living in poor households a decrease from 13 percent reported during the period 2016/17 (Table
2.3.11).
Table 2.3.11: Proportion of the Employed Population who lived in Poor Households, 2012/13 –
2019/20 Background characteristics
UNHS 2012/13
UNHS 2016/17
UNHS 2019/20
Sex
Male 15.2 13.3 11.4
Female 19.6 13.2 12.5 Residence
Rural 22.2 17.4 15.2
Urban 6.5 5.3 5.7
Sector of employment
Agriculture 29.4 22.3 17.9
Production 16.5 14.7 13.0
Services 8.4 6.7 6.3
Total 17.2 13.3 11.9
2.3.3.6 Share of Women in Employment The results in Figure 2.3.3 show that as the education levels increased the share of women in
employment decreased, i.e. the proportions of women with low education levels who were in employment
was higher compared to the proportion of women with subsequent high levels of education. While almost
two thirds (64 percent) of women of working age who had no formal education were in employment in
2019/20, the share decreased to 35 percent among those with the highest education level of post-
secondary and above.
Figure 2.3.1: Share of Women in Employment by Education Level Attained
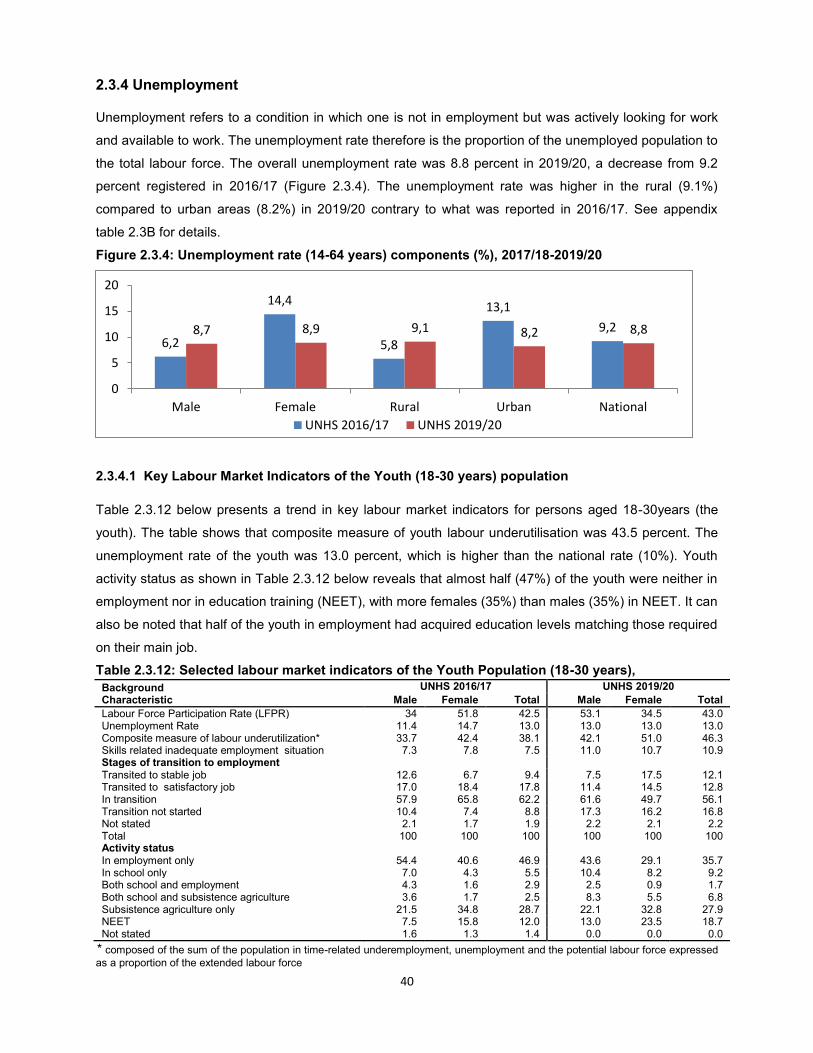
40
2.3.4 Unemployment
Unemployment refers to a condition in which one is not in employment but was actively looking for work
and available to work. The unemployment rate therefore is the proportion of the unemployed population to
the total labour force. The overall unemployment rate was 8.8 percent in 2019/20, a decrease from 9.2
percent registered in 2016/17 (Figure 2.3.4). The unemployment rate was higher in the rural (9.1%)
compared to urban areas (8.2%) in 2019/20 contrary to what was reported in 2016/17. See appendix
table 2.3B for details.
Figure 2.3.4: Unemployment rate (14-64 years) components (%), 2017/18-2019/20
2.3.4.1 Key Labour Market Indicators of the Youth (18-30 years) population
Table 2.3.12 below presents a trend in key labour market indicators for persons aged 18-30years (the
youth). The table shows that composite measure of youth labour underutilisation was 43.5 percent. The
unemployment rate of the youth was 13.0 percent, which is higher than the national rate (10%). Youth
activity status as shown in Table 2.3.12 below reveals that almost half (47%) of the youth were neither in
employment nor in education training (NEET), with more females (35%) than males (35%) in NEET. It can
also be noted that half of the youth in employment had acquired education levels matching those required
on their main job.
Table 2.3.12: Selected labour market indicators of the Youth Population (18-30 years),
Background Characteristic
UNHS 2016/17 UNHS 2019/20
Male Female Total Male Female Total
Labour Force Participation Rate (LFPR) 34 51.8 42.5 53.1 34.5 43.0 Unemployment Rate 11.4 14.7 13.0 13.0 13.0 13.0 Composite measure of labour underutilization* 33.7 42.4 38.1 42.1 51.0 46.3 Skills related inadequate employment situation 7.3 7.8 7.5 11.0 10.7 10.9 Stages of transition to employment Transited to stable job 12.6 6.7 9.4 7.5 17.5 12.1 Transited to satisfactory job 17.0 18.4 17.8 11.4 14.5 12.8 In transition 57.9 65.8 62.2 61.6 49.7 56.1 Transition not started 10.4 7.4 8.8 17.3 16.2 16.8 Not stated 2.1 1.7 1.9 2.2 2.1 2.2 Total 100 100 100 100 100 100 Activity status
In employment only 54.4 40.6 46.9 43.6 29.1 35.7 In school only 7.0 4.3 5.5 10.4 8.2 9.2 Both school and employment 4.3 1.6 2.9 2.5 0.9 1.7 Both school and subsistence agriculture 3.6 1.7 2.5 8.3 5.5 6.8 Subsistence agriculture only 21.5 34.8 28.7 22.1 32.8 27.9 NEET 7.5 15.8 12.0 13.0 23.5 18.7 Not stated 1.6 1.3 1.4 0.0 0.0 0.0
* composed of the sum of the population in time-related underemployment, unemployment and the potential labour force expressed as a proportion of the extended labour force
6,2
14,4
5,8
13,1
9,2 8,7 8,9 9,1 8,2 8,8
0
5
10
15
20
Male Female Rural Urban National
UNHS 2016/17 UNHS 2019/20
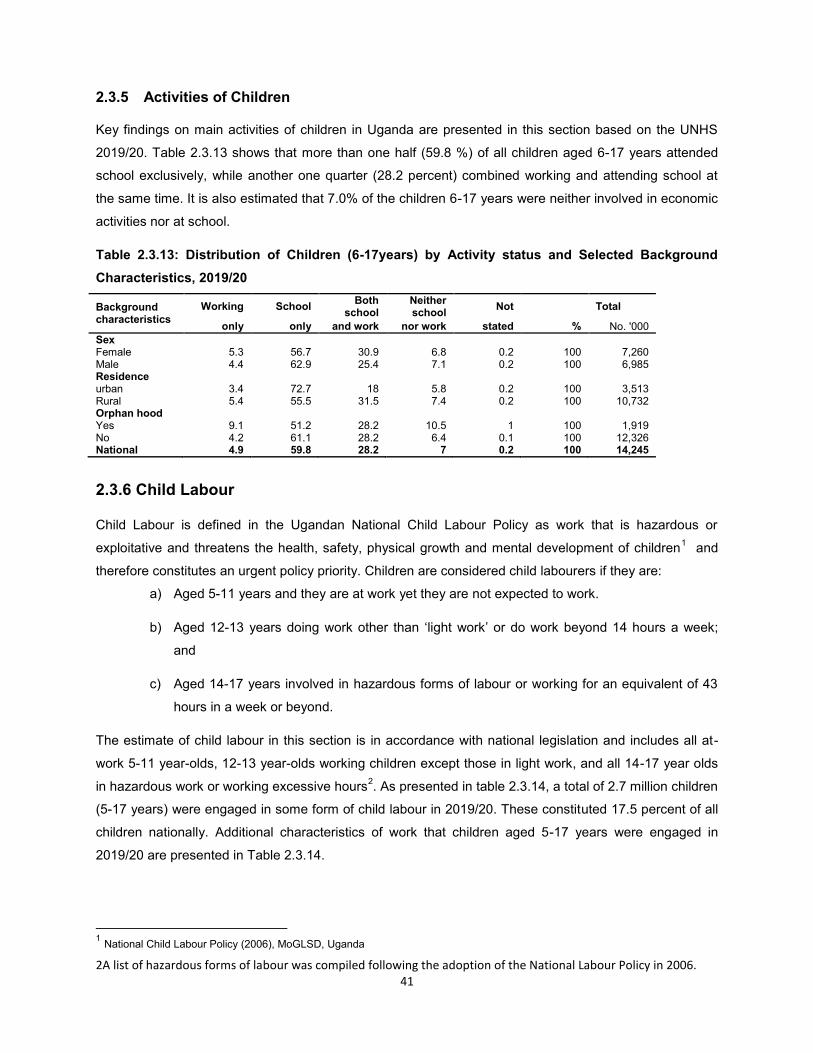
41
2.3.5 Activities of Children
Key findings on main activities of children in Uganda are presented in this section based on the UNHS
2019/20. Table 2.3.13 shows that more than one half (59.8 %) of all children aged 6-17 years attended
school exclusively, while another one quarter (28.2 percent) combined working and attending school at
the same time. It is also estimated that 7.0% of the children 6-17 years were neither involved in economic
activities nor at school.
Table 2.3.13: Distribution of Children (6-17years) by Activity status and Selected Background
Characteristics, 2019/20
Background characteristics
Working School Both
school Neither school
Not Total
only only and work nor work stated % No. '000
Sex Female 5.3 56.7 30.9 6.8 0.2 100 7,260
Male 4.4 62.9 25.4 7.1 0.2 100 6,985 Residence
urban 3.4 72.7 18 5.8 0.2 100 3,513 Rural 5.4 55.5 31.5 7.4 0.2 100 10,732 Orphan hood
Yes 9.1 51.2 28.2 10.5 1 100 1,919 No 4.2 61.1 28.2 6.4 0.1 100 12,326 National 4.9 59.8 28.2 7 0.2 100 14,245
2.3.6 Child Labour Child Labour is defined in the Ugandan National Child Labour Policy as work that is hazardous or
exploitative and threatens the health, safety, physical growth and mental development of children1 and
therefore constitutes an urgent policy priority. Children are considered child labourers if they are:
a) Aged 5-11 years and they are at work yet they are not expected to work.
b) Aged 12-13 years doing work other than ‘light work’ or do work beyond 14 hours a week;
and
c) Aged 14-17 years involved in hazardous forms of labour or working for an equivalent of 43
hours in a week or beyond.
The estimate of child labour in this section is in accordance with national legislation and includes all at-
work 5-11 year-olds, 12-13 year-olds working children except those in light work, and all 14-17 year olds
in hazardous work or working excessive hours2. As presented in table 2.3.14, a total of 2.7 million children
(5-17 years) were engaged in some form of child labour in 2019/20. These constituted 17.5 percent of all
children nationally. Additional characteristics of work that children aged 5-17 years were engaged in
2019/20 are presented in Table 2.3.14.
1 National Child Labour Policy (2006), MoGLSD, Uganda
2A list of hazardous forms of labour was compiled following the adoption of the National Labour Policy in 2006.
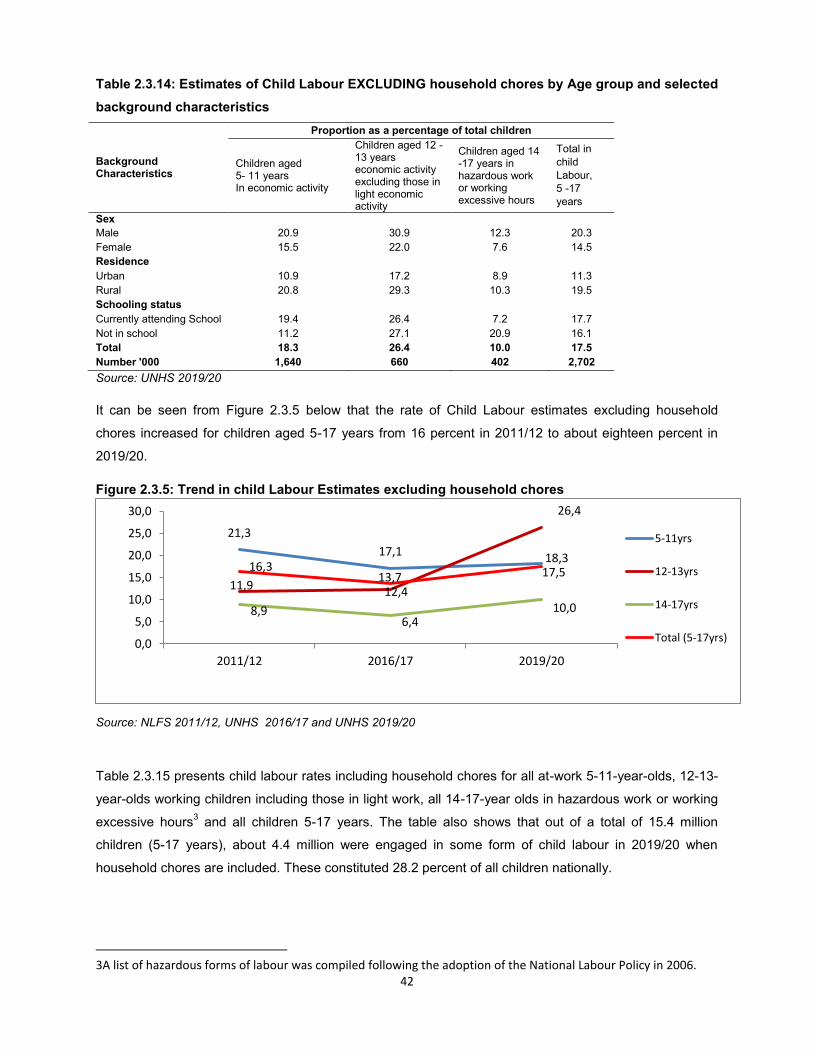
42
Table 2.3.14: Estimates of Child Labour EXCLUDING household chores by Age group and selected
background characteristics
Background Characteristics
Proportion as a percentage of total children
Children aged 5- 11 years In economic activity
Children aged 12 - 13 years economic activity excluding those in light economic activity
Children aged 14 -17 years in hazardous work or working excessive hours
Total in
child
Labour, 5 -17
years
Sex
Male 20.9 30.9 12.3 20.3
Female 15.5 22.0 7.6 14.5
Residence
Urban 10.9 17.2 8.9 11.3
Rural 20.8 29.3 10.3 19.5
Schooling status
Currently attending School 19.4 26.4 7.2 17.7
Not in school 11.2 27.1 20.9 16.1
Total 18.3 26.4 10.0 17.5
Number '000 1,640 660 402 2,702
Source: UNHS 2019/20
It can be seen from Figure 2.3.5 below that the rate of Child Labour estimates excluding household
chores increased for children aged 5-17 years from 16 percent in 2011/12 to about eighteen percent in
2019/20.
Figure 2.3.5: Trend in child Labour Estimates excluding household chores
Source: NLFS 2011/12, UNHS 2016/17 and UNHS 2019/20
Table 2.3.15 presents child labour rates including household chores for all at-work 5-11-year-olds, 12-13-
year-olds working children including those in light work, all 14-17-year olds in hazardous work or working
excessive hours3 and all children 5-17 years. The table also shows that out of a total of 15.4 million
children (5-17 years), about 4.4 million were engaged in some form of child labour in 2019/20 when
household chores are included. These constituted 28.2 percent of all children nationally.
3A list of hazardous forms of labour was compiled following the adoption of the National Labour Policy in 2006.
21,3
17,1 18,3
11,9 12,4
26,4
8,9 6,4
10,0
16,3 13,7 17,5
0,0
5,0
10,0
15,0
20,0
25,0
30,0
2011/12 2016/17 2019/20
5-11yrs
12-13yrs
14-17yrs
Total (5-17yrs)
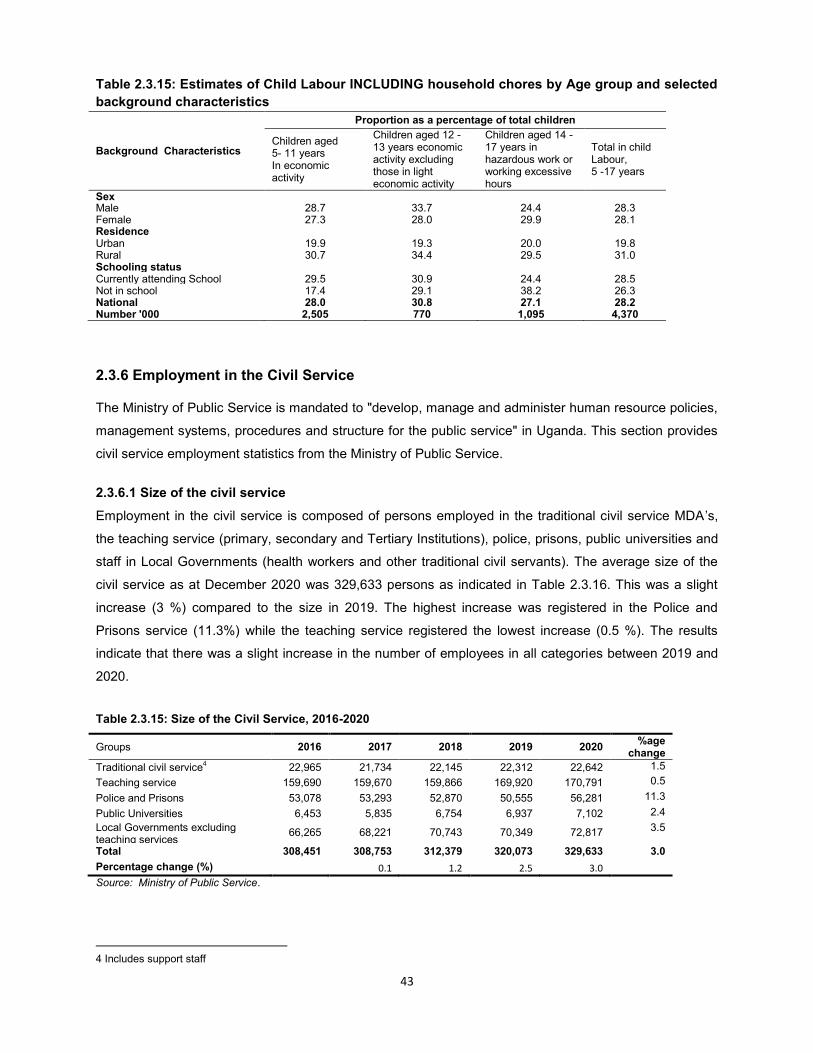
43
Table 2.3.15: Estimates of Child Labour INCLUDING household chores by Age group and selected
background characteristics
Background Characteristics
Proportion as a percentage of total children
Children aged 5- 11 years In economic activity
Children aged 12 - 13 years economic activity excluding those in light economic activity
Children aged 14 -17 years in hazardous work or working excessive hours
Total in child Labour, 5 -17 years
Sex
Male 28.7 33.7 24.4 28.3 Female 27.3 28.0 29.9 28.1 Residence Urban 19.9 19.3 20.0 19.8 Rural 30.7 34.4 29.5 31.0 Schooling status Currently attending School 29.5 30.9 24.4 28.5 Not in school 17.4 29.1 38.2 26.3 National 28.0 30.8 27.1 28.2 Number '000 2,505
770
1,095
4,370
2.3.6 Employment in the Civil Service
The Ministry of Public Service is mandated to "develop, manage and administer human resource policies,
management systems, procedures and structure for the public service" in Uganda. This section provides
civil service employment statistics from the Ministry of Public Service.
2.3.6.1 Size of the civil service
Employment in the civil service is composed of persons employed in the traditional civil service MDA’s,
the teaching service (primary, secondary and Tertiary Institutions), police, prisons, public universities and
staff in Local Governments (health workers and other traditional civil servants). The average size of the
civil service as at December 2020 was 329,633 persons as indicated in Table 2.3.16. This was a slight
increase (3 %) compared to the size in 2019. The highest increase was registered in the Police and
Prisons service (11.3%) while the teaching service registered the lowest increase (0.5 %). The results
indicate that there was a slight increase in the number of employees in all categories between 2019 and
2020.
Table 2.3.15: Size of the Civil Service, 2016-2020
Groups 2016 2017 2018 2019 2020 %age
change
Traditional civil service4 22,965 21,734 22,145 22,312 22,642 1.5
Teaching service 159,690 159,670 159,866 169,920 170,791 0.5
Police and Prisons 53,078 53,293 52,870 50,555 56,281 11.3
Public Universities 6,453 5,835 6,754 6,937 7,102 2.4
Local Governments excluding teaching services
66,265 68,221 70,743 70,349 72,817 3.5
Total 308,451 308,753 312,379 320,073 329,633 3.0
Percentage change (%) 0.1 1.2 2.5 3.0
Source: Ministry of Public Service.
4 Includes support staff
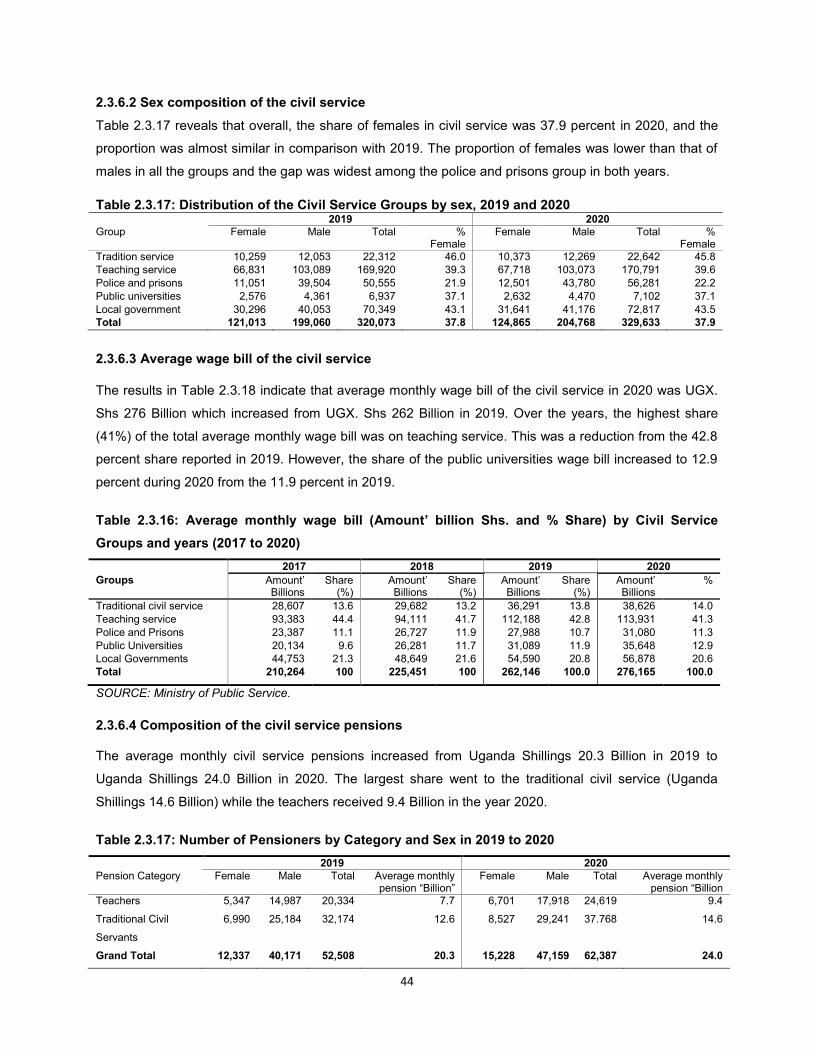
44
2.3.6.2 Sex composition of the civil service
Table 2.3.17 reveals that overall, the share of females in civil service was 37.9 percent in 2020, and the
proportion was almost similar in comparison with 2019. The proportion of females was lower than that of
males in all the groups and the gap was widest among the police and prisons group in both years.
Table 2.3.17: Distribution of the Civil Service Groups by sex, 2019 and 2020 2019 2020 Group Female Male Total %
Female Female Male Total %
Female Tradition service 10,259 12,053 22,312 46.0 10,373 12,269 22,642 45.8 Teaching service 66,831 103,089 169,920 39.3 67,718 103,073 170,791 39.6 Police and prisons 11,051 39,504 50,555 21.9 12,501 43,780 56,281 22.2
Public universities 2,576 4,361 6,937 37.1 2,632 4,470 7,102 37.1
Local government 30,296 40,053 70,349 43.1 31,641 41,176 72,817 43.5 Total 121,013 199,060 320,073 37.8 124,865 204,768 329,633 37.9
2.3.6.3 Average wage bill of the civil service
The results in Table 2.3.18 indicate that average monthly wage bill of the civil service in 2020 was UGX.
Shs 276 Billion which increased from UGX. Shs 262 Billion in 2019. Over the years, the highest share
(41%) of the total average monthly wage bill was on teaching service. This was a reduction from the 42.8
percent share reported in 2019. However, the share of the public universities wage bill increased to 12.9
percent during 2020 from the 11.9 percent in 2019.
Table 2.3.16: Average monthly wage bill (Amount’ billion Shs. and % Share) by Civil Service
Groups and years (2017 to 2020)
2017 2018 2019 2020
Groups Amount’ Billions
Share (%)
Amount’ Billions
Share (%)
Amount’ Billions
Share (%)
Amount’ Billions
%
Traditional civil service 28,607 13.6 29,682 13.2 36,291 13.8 38,626 14.0 Teaching service 93,383 44.4 94,111 41.7 112,188 42.8 113,931 41.3
Police and Prisons 23,387 11.1 26,727 11.9 27,988 10.7 31,080 11.3 Public Universities 20,134 9.6 26,281 11.7 31,089 11.9 35,648 12.9 Local Governments 44,753 21.3 48,649 21.6 54,590 20.8 56,878 20.6 Total 210,264 100 225,451 100 262,146 100.0 276,165 100.0
SOURCE: Ministry of Public Service.
2.3.6.4 Composition of the civil service pensions The average monthly civil service pensions increased from Uganda Shillings 20.3 Billion in 2019 to
Uganda Shillings 24.0 Billion in 2020. The largest share went to the traditional civil service (Uganda
Shillings 14.6 Billion) while the teachers received 9.4 Billion in the year 2020.
Table 2.3.17: Number of Pensioners by Category and Sex in 2019 to 2020
2019 2020 Pension Category Female Male Total Average monthly
pension “Billion” Female Male Total Average monthly
pension “Billion Teachers 5,347 14,987 20,334 7.7 6,701 17,918 24,619 9.4
Traditional Civil
Servants
6,990 25,184 32,174 12.6 8,527 29,241 37.768 14.6
Grand Total 12,337 40,171 52,508 20.3 15,228 47,159 62,387 24.0
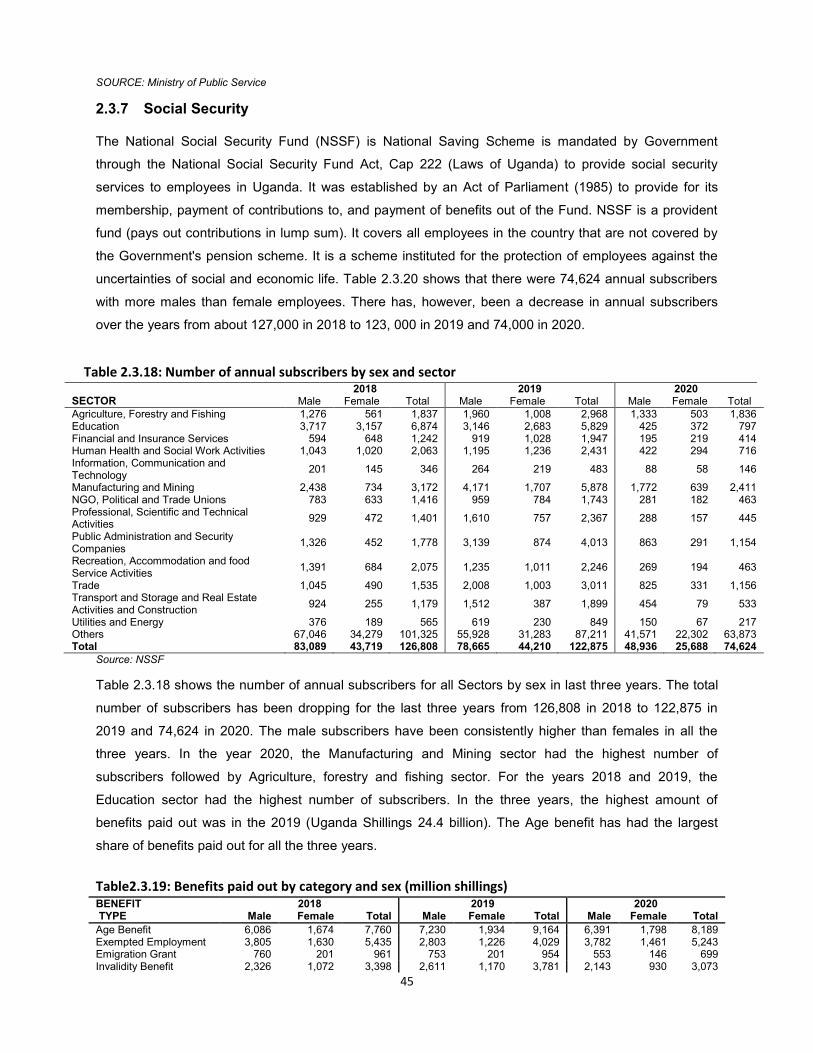
45
SOURCE: Ministry of Public Service
2.3.7 Social Security
The National Social Security Fund (NSSF) is National Saving Scheme is mandated by Government
through the National Social Security Fund Act, Cap 222 (Laws of Uganda) to provide social security
services to employees in Uganda. It was established by an Act of Parliament (1985) to provide for its
membership, payment of contributions to, and payment of benefits out of the Fund. NSSF is a provident
fund (pays out contributions in lump sum). It covers all employees in the country that are not covered by
the Government's pension scheme. It is a scheme instituted for the protection of employees against the
uncertainties of social and economic life. Table 2.3.20 shows that there were 74,624 annual subscribers
with more males than female employees. There has, however, been a decrease in annual subscribers
over the years from about 127,000 in 2018 to 123, 000 in 2019 and 74,000 in 2020.
Table 2.3.18: Number of annual subscribers by sex and sector SECTOR
2018 2019 2020 Male Female Total Male Female Total Male Female Total
Agriculture, Forestry and Fishing 1,276 561 1,837 1,960 1,008 2,968 1,333 503 1,836 Education 3,717 3,157 6,874 3,146 2,683 5,829 425 372 797 Financial and Insurance Services 594 648 1,242 919 1,028 1,947 195 219 414 Human Health and Social Work Activities 1,043 1,020 2,063 1,195 1,236 2,431 422 294 716 Information, Communication and Technology
201 145 346 264 219 483 88 58 146
Manufacturing and Mining 2,438 734 3,172 4,171 1,707 5,878 1,772 639 2,411 NGO, Political and Trade Unions 783 633 1,416 959 784 1,743 281 182 463 Professional, Scientific and Technical Activities
929 472 1,401 1,610 757 2,367 288 157 445
Public Administration and Security Companies
1,326 452 1,778 3,139 874 4,013 863 291 1,154
Recreation, Accommodation and food Service Activities
1,391 684 2,075 1,235 1,011 2,246 269 194 463
Trade 1,045 490 1,535 2,008 1,003 3,011 825 331 1,156 Transport and Storage and Real Estate Activities and Construction
924 255 1,179 1,512 387 1,899 454 79 533
Utilities and Energy 376 189 565 619 230 849 150 67 217 Others 67,046 34,279 101,325 55,928 31,283 87,211 41,571 22,302 63,873 Total 83,089 43,719 126,808 78,665 44,210 122,875 48,936 25,688 74,624
Source: NSSF
Table 2.3.18 shows the number of annual subscribers for all Sectors by sex in last three years. The total
number of subscribers has been dropping for the last three years from 126,808 in 2018 to 122,875 in
2019 and 74,624 in 2020. The male subscribers have been consistently higher than females in all the
three years. In the year 2020, the Manufacturing and Mining sector had the highest number of
subscribers followed by Agriculture, forestry and fishing sector. For the years 2018 and 2019, the
Education sector had the highest number of subscribers. In the three years, the highest amount of
benefits paid out was in the 2019 (Uganda Shillings 24.4 billion). The Age benefit has had the largest
share of benefits paid out for all the three years.
Table2.3.19: Benefits paid out by category and sex (million shillings) BENEFIT 2018 2019 2020 TYPE Male Female Total Male Female Total Male Female Total
Age Benefit 6,086 1,674 7,760 7,230 1,934 9,164 6,391 1,798 8,189 Exempted Employment 3,805 1,630 5,435 2,803 1,226 4,029 3,782 1,461 5,243 Emigration Grant 760 201 961 753 201 954 553 146 699 Invalidity Benefit 2,326 1,072 3,398 2,611 1,170 3,781 2,143 930 3,073
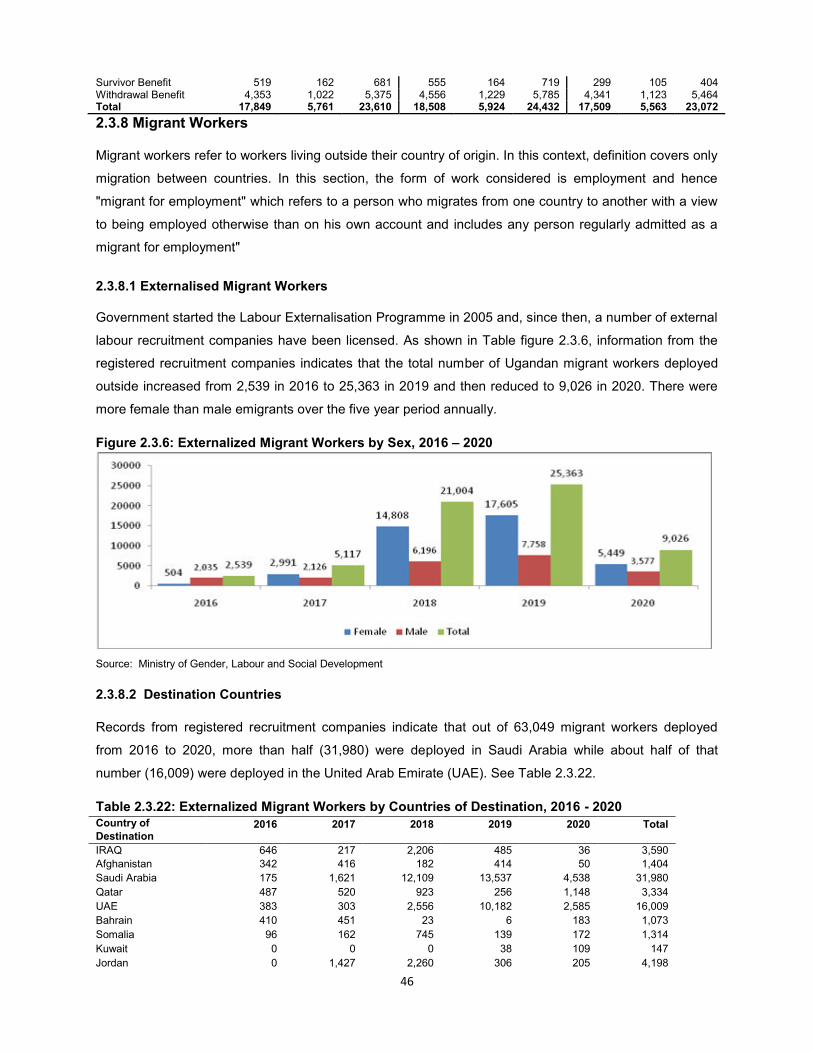
46
Survivor Benefit 519 162 681 555 164 719 299 105 404 Withdrawal Benefit 4,353 1,022 5,375 4,556 1,229 5,785 4,341 1,123 5,464 Total 17,849 5,761 23,610 18,508 5,924 24,432 17,509 5,563 23,072
2.3.8 Migrant Workers
Migrant workers refer to workers living outside their country of origin. In this context, definition covers only
migration between countries. In this section, the form of work considered is employment and hence
"migrant for employment" which refers to a person who migrates from one country to another with a view
to being employed otherwise than on his own account and includes any person regularly admitted as a
migrant for employment"
2.3.8.1 Externalised Migrant Workers
Government started the Labour Externalisation Programme in 2005 and, since then, a number of external
labour recruitment companies have been licensed. As shown in Table figure 2.3.6, information from the
registered recruitment companies indicates that the total number of Ugandan migrant workers deployed
outside increased from 2,539 in 2016 to 25,363 in 2019 and then reduced to 9,026 in 2020. There were
more female than male emigrants over the five year period annually.
Figure 2.3.6: Externalized Migrant Workers by Sex, 2016 – 2020
Source: Ministry of Gender, Labour and Social Development
2.3.8.2 Destination Countries
Records from registered recruitment companies indicate that out of 63,049 migrant workers deployed
from 2016 to 2020, more than half (31,980) were deployed in Saudi Arabia while about half of that
number (16,009) were deployed in the United Arab Emirate (UAE). See Table 2.3.22.
Table 2.3.22: Externalized Migrant Workers by Countries of Destination, 2016 - 2020 Country of
Destination 2016 2017 2018 2019 2020 Total
IRAQ 646 217 2,206 485 36 3,590
Afghanistan 342 416 182 414 50 1,404
Saudi Arabia 175 1,621 12,109 13,537 4,538 31,980
Qatar 487 520 923 256 1,148 3,334
UAE 383 303 2,556 10,182 2,585 16,009
Bahrain 410 451 23 6 183 1,073
Somalia 96 162 745 139 172 1,314
Kuwait 0 0 0 38 109 147
Jordan 0 1,427 2,260 306 205 4,198
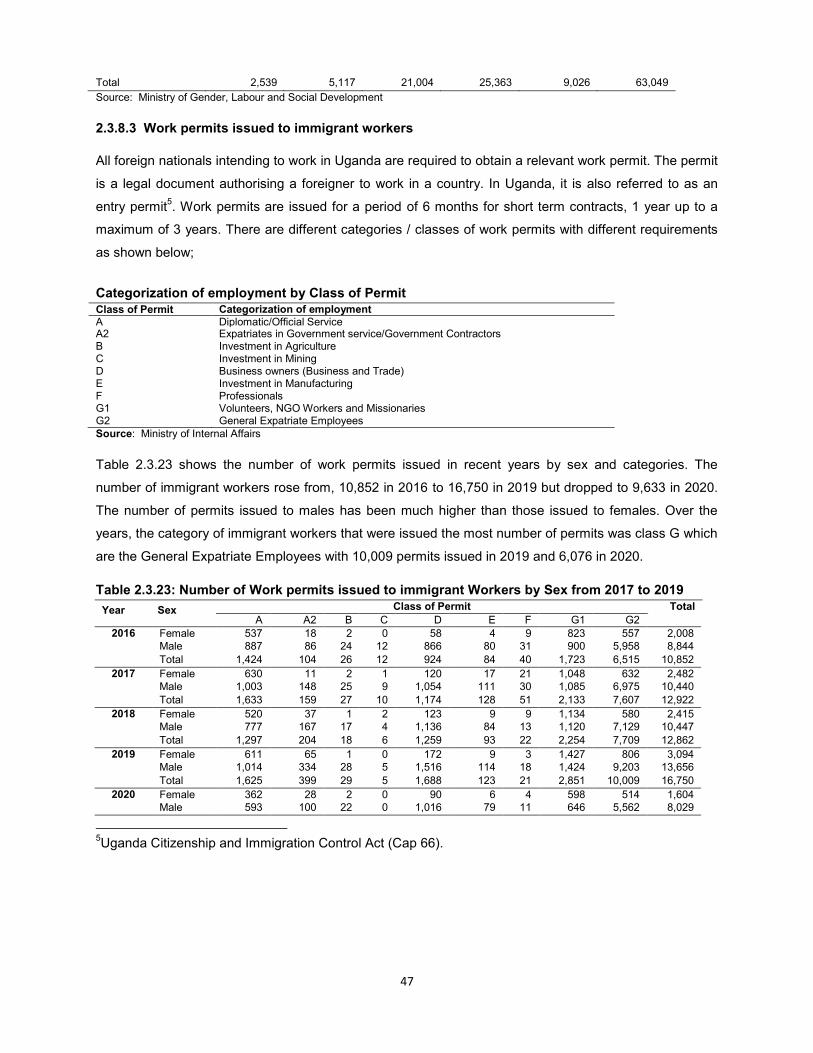
47
Total 2,539 5,117 21,004 25,363 9,026 63,049
Source: Ministry of Gender, Labour and Social Development
2.3.8.3 Work permits issued to immigrant workers
All foreign nationals intending to work in Uganda are required to obtain a relevant work permit. The permit
is a legal document authorising a foreigner to work in a country. In Uganda, it is also referred to as an
entry permit5. Work permits are issued for a period of 6 months for short term contracts, 1 year up to a
maximum of 3 years. There are different categories / classes of work permits with different requirements
as shown below;
Categorization of employment by Class of Permit Class of Permit Categorization of employment A Diplomatic/Official Service A2 Expatriates in Government service/Government Contractors B Investment in Agriculture C Investment in Mining D Business owners (Business and Trade) E Investment in Manufacturing F Professionals G1 Volunteers, NGO Workers and Missionaries G2 General Expatriate Employees Source: Ministry of Internal Affairs
Table 2.3.23 shows the number of work permits issued in recent years by sex and categories. The
number of immigrant workers rose from, 10,852 in 2016 to 16,750 in 2019 but dropped to 9,633 in 2020.
The number of permits issued to males has been much higher than those issued to females. Over the
years, the category of immigrant workers that were issued the most number of permits was class G which
are the General Expatriate Employees with 10,009 permits issued in 2019 and 6,076 in 2020.
Table 2.3.23: Number of Work permits issued to immigrant Workers by Sex from 2017 to 2019
Year Sex Class of Permit Total
A A2 B C D E F G1 G2
2016 Female 537 18 2 0 58 4 9 823 557 2,008 Male 887 86 24 12 866 80 31 900 5,958 8,844
Total 1,424 104 26 12 924 84 40 1,723 6,515 10,852
2017 Female 630 11 2 1 120 17 21 1,048 632 2,482 Male 1,003 148 25 9 1,054 111 30 1,085 6,975 10,440
Total 1,633 159 27 10 1,174 128 51 2,133 7,607 12,922
2018 Female 520 37 1 2 123 9 9 1,134 580 2,415 Male 777 167 17 4 1,136 84 13 1,120 7,129 10,447
Total 1,297 204 18 6 1,259 93 22 2,254 7,709 12,862
2019 Female 611 65 1 0 172 9 3 1,427 806 3,094 Male 1,014 334 28 5 1,516 114 18 1,424 9,203 13,656
Total 1,625 399 29 5 1,688 123 21 2,851 10,009 16,750
2020 Female 362 28 2 0 90 6 4 598 514 1,604 Male 593 100 22 0 1,016 79 11 646 5,562 8,029
5Uganda Citizenship and Immigration Control Act (Cap 66).
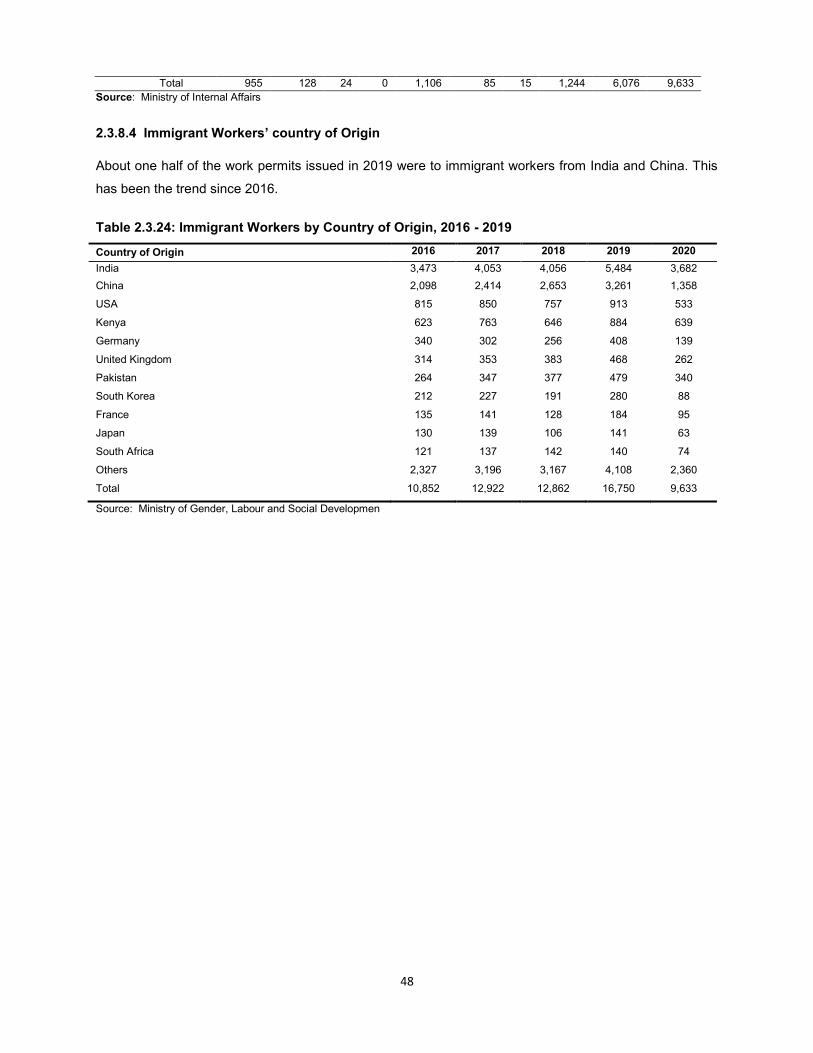
48
Total 955 128 24 0 1,106 85 15 1,244 6,076 9,633
Source: Ministry of Internal Affairs
2.3.8.4 Immigrant Workers’ country of Origin
About one half of the work permits issued in 2019 were to immigrant workers from India and China. This
has been the trend since 2016.
Table 2.3.24: Immigrant Workers by Country of Origin, 2016 - 2019
Country of Origin 2016 2017 2018 2019 2020
India 3,473 4,053 4,056 5,484 3,682
China 2,098 2,414 2,653 3,261 1,358
USA 815 850 757 913 533
Kenya 623 763 646 884 639
Germany 340 302 256 408 139
United Kingdom 314 353 383 468 262
Pakistan 264 347 377 479 340
South Korea 212 227 191 280 88
France 135 141 128 184 95
Japan 130 139 106 141 63
South Africa 121 137 142 140 74
Others 2,327 3,196 3,167 4,108 2,360
Total 10,852 12,922 12,862 16,750 9,633
Source: Ministry of Gender, Labour and Social Developmen
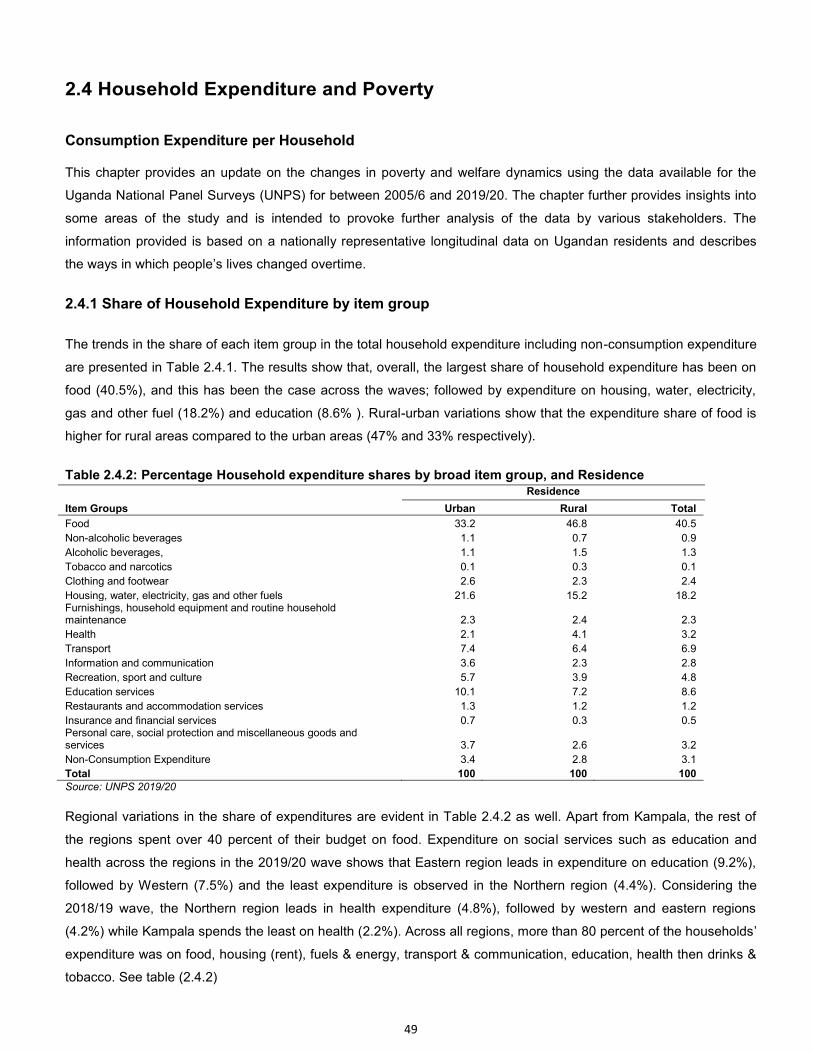
49
2.4 Household Expenditure and Poverty
Consumption Expenditure per Household
This chapter provides an update on the changes in poverty and welfare dynamics using the data available for the
Uganda National Panel Surveys (UNPS) for between 2005/6 and 2019/20. The chapter further provides insights into
some areas of the study and is intended to provoke further analysis of the data by various stakeholders. The
information provided is based on a nationally representative longitudinal data on Ugandan residents and describes
the ways in which people’s lives changed overtime.
2.4.1 Share of Household Expenditure by item group
The trends in the share of each item group in the total household expenditure including non-consumption expenditure
are presented in Table 2.4.1. The results show that, overall, the largest share of household expenditure has been on
food (40.5%), and this has been the case across the waves; followed by expenditure on housing, water, electricity,
gas and other fuel (18.2%) and education (8.6% ). Rural-urban variations show that the expenditure share of food is
higher for rural areas compared to the urban areas (47% and 33% respectively).
Table 2.4.2: Percentage Household expenditure shares by broad item group, and Residence Residence
Item Groups Urban Rural Total
Food 33.2 46.8 40.5
Non-alcoholic beverages 1.1 0.7 0.9
Alcoholic beverages, 1.1 1.5 1.3
Tobacco and narcotics 0.1 0.3 0.1
Clothing and footwear 2.6 2.3 2.4
Housing, water, electricity, gas and other fuels 21.6 15.2 18.2 Furnishings, household equipment and routine household maintenance 2.3 2.4 2.3
Health 2.1 4.1 3.2
Transport 7.4 6.4 6.9
Information and communication 3.6 2.3 2.8
Recreation, sport and culture 5.7 3.9 4.8
Education services 10.1 7.2 8.6
Restaurants and accommodation services 1.3 1.2 1.2
Insurance and financial services 0.7 0.3 0.5 Personal care, social protection and miscellaneous goods and services 3.7 2.6 3.2
Non-Consumption Expenditure 3.4 2.8 3.1
Total 100 100 100 Source: UNPS 2019/20
Regional variations in the share of expenditures are evident in Table 2.4.2 as well. Apart from Kampala, the rest of
the regions spent over 40 percent of their budget on food. Expenditure on social services such as education and
health across the regions in the 2019/20 wave shows that Eastern region leads in expenditure on education (9.2%),
followed by Western (7.5%) and the least expenditure is observed in the Northern region (4.4%). Considering the
2018/19 wave, the Northern region leads in health expenditure (4.8%), followed by western and eastern regions
(4.2%) while Kampala spends the least on health (2.2%). Across all regions, more than 80 percent of the households’
expenditure was on food, housing (rent), fuels & energy, transport & communication, education, health then drinks &
tobacco. See table (2.4.2)
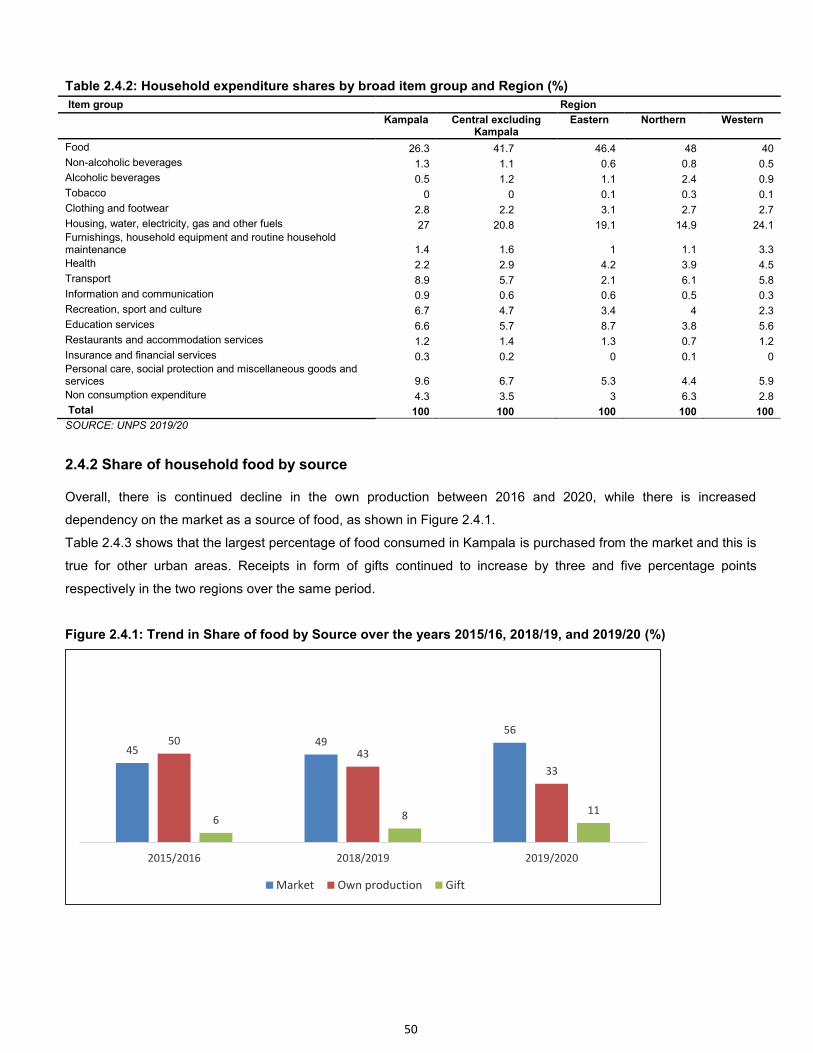
50
Table 2.4.2: Household expenditure shares by broad item group and Region (%)
Item group Region
Kampala Central excluding
Kampala Eastern Northern Western
Food 26.3 41.7 46.4 48 40
Non-alcoholic beverages 1.3 1.1 0.6 0.8 0.5
Alcoholic beverages 0.5 1.2 1.1 2.4 0.9
Tobacco 0 0 0.1 0.3 0.1
Clothing and footwear 2.8 2.2 3.1 2.7 2.7
Housing, water, electricity, gas and other fuels 27 20.8 19.1 14.9 24.1 Furnishings, household equipment and routine household maintenance 1.4 1.6 1 1.1 3.3
Health 2.2 2.9 4.2 3.9 4.5
Transport 8.9 5.7 2.1 6.1 5.8
Information and communication 0.9 0.6 0.6 0.5 0.3
Recreation, sport and culture 6.7 4.7 3.4 4 2.3
Education services 6.6 5.7 8.7 3.8 5.6
Restaurants and accommodation services 1.2 1.4 1.3 0.7 1.2
Insurance and financial services 0.3 0.2 0 0.1 0 Personal care, social protection and miscellaneous goods and services 9.6 6.7 5.3 4.4 5.9
Non consumption expenditure 4.3 3.5 3 6.3 2.8
Total 100 100 100 100 100
SOURCE: UNPS 2019/20
2.4.2 Share of household food by source
Overall, there is continued decline in the own production between 2016 and 2020, while there is increased
dependency on the market as a source of food, as shown in Figure 2.4.1.
Table 2.4.3 shows that the largest percentage of food consumed in Kampala is purchased from the market and this is
true for other urban areas. Receipts in form of gifts continued to increase by three and five percentage points
respectively in the two regions over the same period.
Figure 2.4.1: Trend in Share of food by Source over the years 2015/16, 2018/19, and 2019/20 (%)
45 49
56 50
43
33
6 8 11
2015/2016 2018/2019 2019/2020
Market Own production Gift
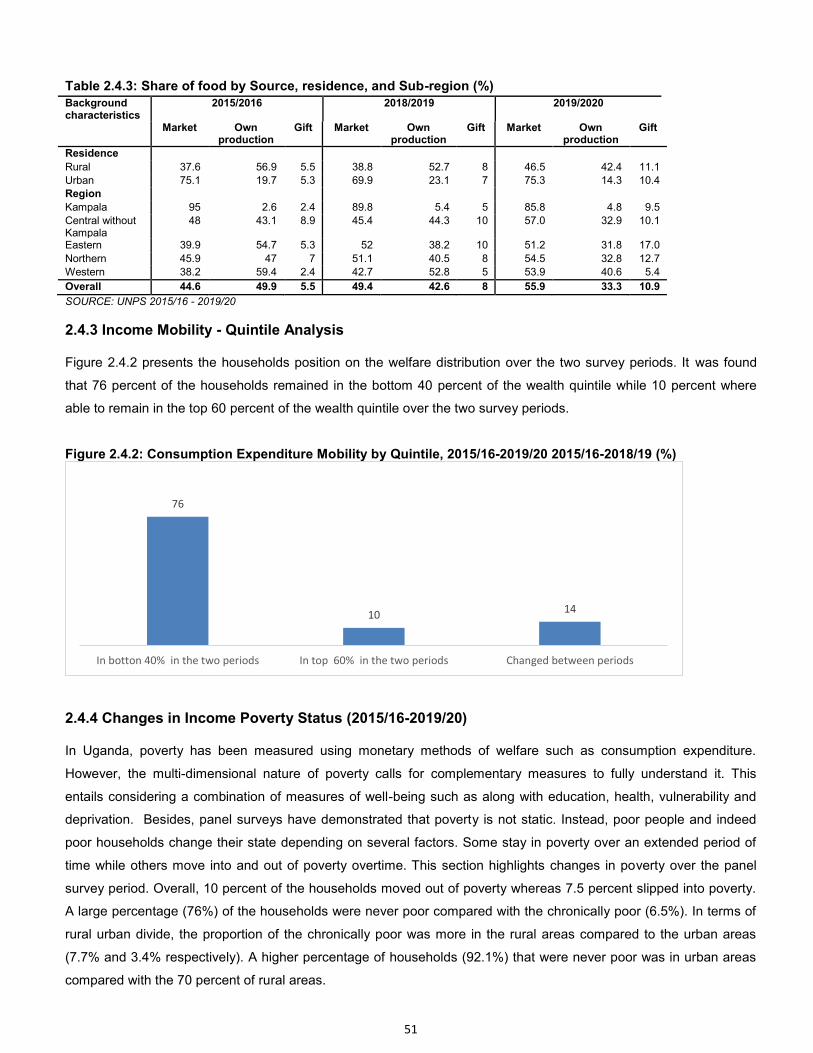
51
Table 2.4.3: Share of food by Source, residence, and Sub-region (%) Background characteristics
2015/2016 2018/2019 2019/2020
Market Own production
Gift Market Own production
Gift Market Own production
Gift
Residence
Rural 37.6 56.9 5.5 38.8 52.7 8 46.5 42.4 11.1
Urban 75.1 19.7 5.3 69.9 23.1 7 75.3 14.3 10.4
Region
Kampala 95 2.6 2.4 89.8 5.4 5 85.8 4.8 9.5
Central without Kampala
48 43.1 8.9 45.4 44.3 10 57.0 32.9 10.1
Eastern 39.9 54.7 5.3 52 38.2 10 51.2 31.8 17.0
Northern 45.9 47 7 51.1 40.5 8 54.5 32.8 12.7
Western 38.2 59.4 2.4 42.7 52.8 5 53.9 40.6 5.4
Overall 44.6 49.9 5.5 49.4 42.6 8 55.9 33.3 10.9
SOURCE: UNPS 2015/16 - 2019/20
2.4.3 Income Mobility - Quintile Analysis
Figure 2.4.2 presents the households position on the welfare distribution over the two survey periods. It was found
that 76 percent of the households remained in the bottom 40 percent of the wealth quintile while 10 percent where
able to remain in the top 60 percent of the wealth quintile over the two survey periods.
Figure 2.4.2: Consumption Expenditure Mobility by Quintile, 2015/16-2019/20 2015/16-2018/19 (%)
2.4.4 Changes in Income Poverty Status (2015/16-2019/20)
In Uganda, poverty has been measured using monetary methods of welfare such as consumption expenditure.
However, the multi-dimensional nature of poverty calls for complementary measures to fully understand it. This
entails considering a combination of measures of well-being such as along with education, health, vulnerability and
deprivation. Besides, panel surveys have demonstrated that poverty is not static. Instead, poor people and indeed
poor households change their state depending on several factors. Some stay in poverty over an extended period of
time while others move into and out of poverty overtime. This section highlights changes in poverty over the panel
survey period. Overall, 10 percent of the households moved out of poverty whereas 7.5 percent slipped into poverty.
A large percentage (76%) of the households were never poor compared with the chronically poor (6.5%). In terms of
rural urban divide, the proportion of the chronically poor was more in the rural areas compared to the urban areas
(7.7% and 3.4% respectively). A higher percentage of households (92.1%) that were never poor was in urban areas
compared with the 70 percent of rural areas.
76
10 14
In botton 40% in the two periods In top 60% in the two periods Changed between periods
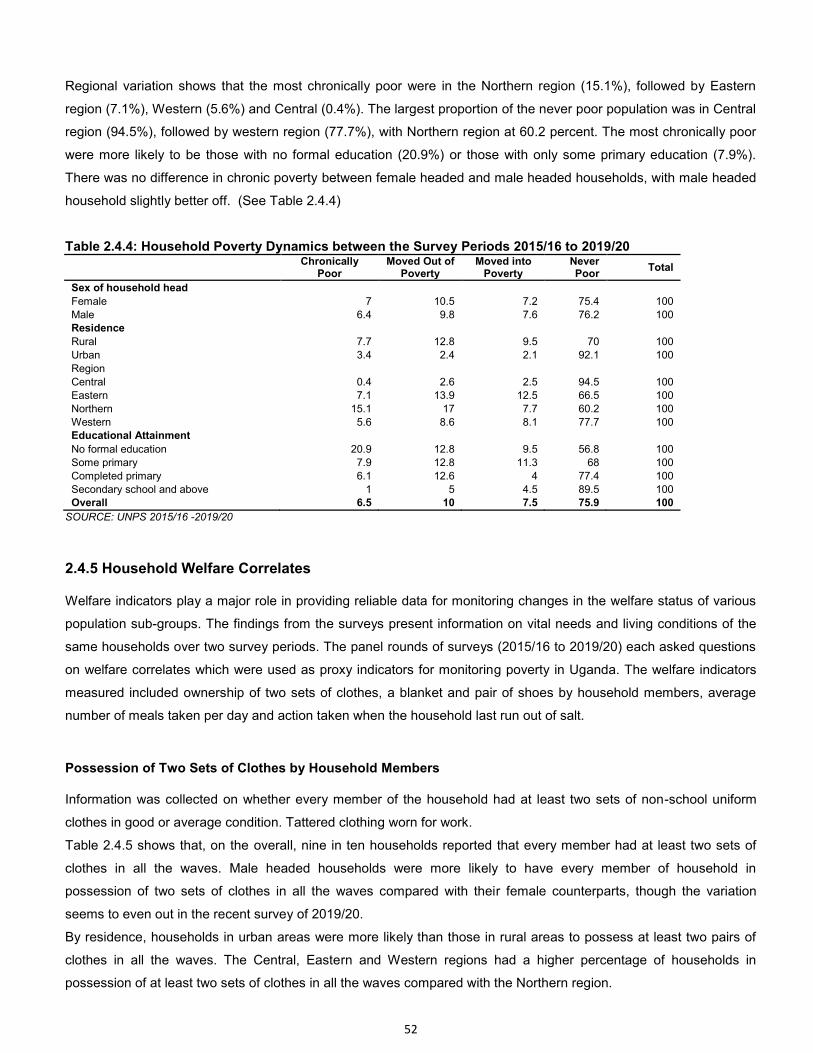
52
Regional variation shows that the most chronically poor were in the Northern region (15.1%), followed by Eastern
region (7.1%), Western (5.6%) and Central (0.4%). The largest proportion of the never poor population was in Central
region (94.5%), followed by western region (77.7%), with Northern region at 60.2 percent. The most chronically poor
were more likely to be those with no formal education (20.9%) or those with only some primary education (7.9%).
There was no difference in chronic poverty between female headed and male headed households, with male headed
household slightly better off. (See Table 2.4.4)
Table 2.4.4: Household Poverty Dynamics between the Survey Periods 2015/16 to 2019/20
Chronically
Poor Moved Out of
Poverty Moved into
Poverty Never Poor
Total
Sex of household head Female 7 10.5 7.2 75.4 100
Male 6.4 9.8 7.6 76.2 100
Residence Rural 7.7 12.8 9.5 70 100
Urban 3.4 2.4 2.1 92.1 100
Region Central 0.4 2.6 2.5 94.5 100
Eastern 7.1 13.9 12.5 66.5 100
Northern 15.1 17 7.7 60.2 100
Western 5.6 8.6 8.1 77.7 100
Educational Attainment No formal education 20.9 12.8 9.5 56.8 100
Some primary 7.9 12.8 11.3 68 100
Completed primary 6.1 12.6 4 77.4 100
Secondary school and above 1 5 4.5 89.5 100 Overall 6.5 10 7.5 75.9 100
SOURCE: UNPS 2015/16 -2019/20
2.4.5 Household Welfare Correlates
Welfare indicators play a major role in providing reliable data for monitoring changes in the welfare status of various
population sub-groups. The findings from the surveys present information on vital needs and living conditions of the
same households over two survey periods. The panel rounds of surveys (2015/16 to 2019/20) each asked questions
on welfare correlates which were used as proxy indicators for monitoring poverty in Uganda. The welfare indicators
measured included ownership of two sets of clothes, a blanket and pair of shoes by household members, average
number of meals taken per day and action taken when the household last run out of salt.
Possession of Two Sets of Clothes by Household Members
Information was collected on whether every member of the household had at least two sets of non-school uniform
clothes in good or average condition. Tattered clothing worn for work.
Table 2.4.5 shows that, on the overall, nine in ten households reported that every member had at least two sets of
clothes in all the waves. Male headed households were more likely to have every member of household in
possession of two sets of clothes in all the waves compared with their female counterparts, though the variation
seems to even out in the recent survey of 2019/20.
By residence, households in urban areas were more likely than those in rural areas to possess at least two pairs of
clothes in all the waves. The Central, Eastern and Western regions had a higher percentage of households in
possession of at least two sets of clothes in all the waves compared with the Northern region.
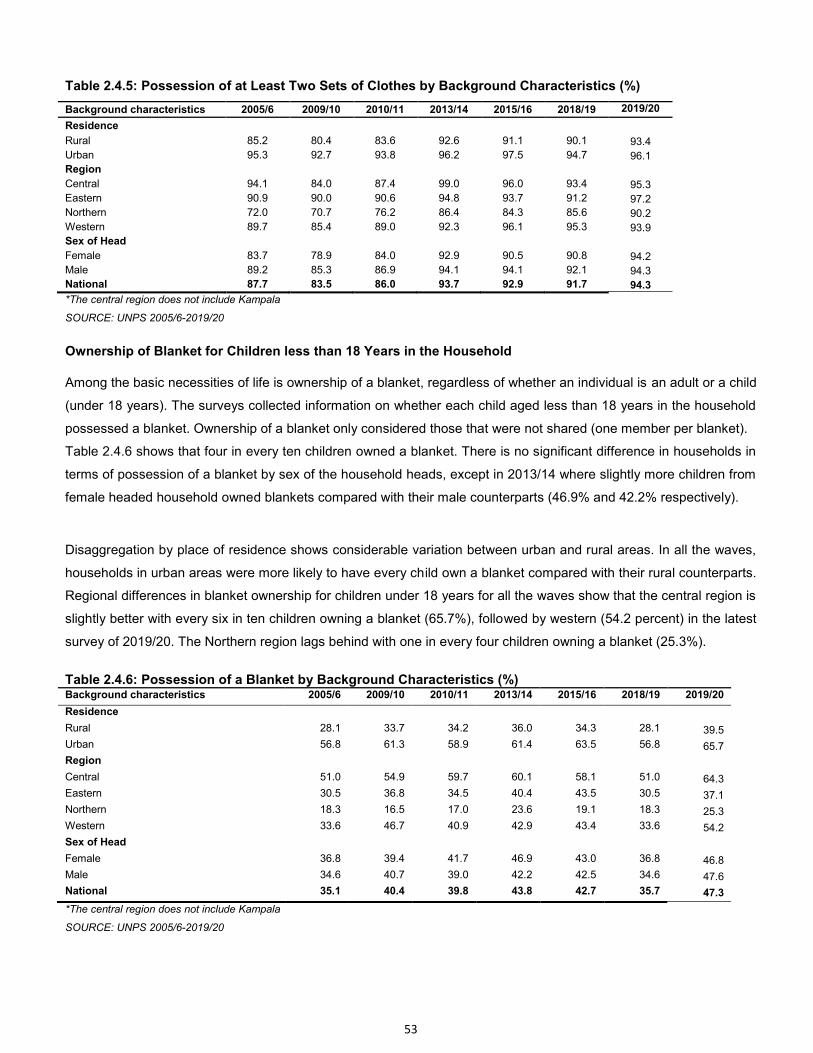
53
Table 2.4.5: Possession of at Least Two Sets of Clothes by Background Characteristics (%)
Background characteristics 2005/6 2009/10 2010/11 2013/14 2015/16 2018/19 2019/20
Residence
Rural 85.2 80.4 83.6 92.6 91.1 90.1 93.4
Urban 95.3 92.7 93.8 96.2 97.5 94.7 96.1 Region
Central 94.1 84.0 87.4 99.0 96.0 93.4 95.3
Eastern 90.9 90.0 90.6 94.8 93.7 91.2 97.2
Northern 72.0 70.7 76.2 86.4 84.3 85.6 90.2
Western 89.7 85.4 89.0 92.3 96.1 95.3 93.9 Sex of Head
Female 83.7 78.9 84.0 92.9 90.5 90.8 94.2
Male 89.2 85.3 86.9 94.1 94.1 92.1 94.3
National 87.7 83.5 86.0 93.7 92.9 91.7 94.3
*The central region does not include Kampala
SOURCE: UNPS 2005/6-2019/20
Ownership of Blanket for Children less than 18 Years in the Household
Among the basic necessities of life is ownership of a blanket, regardless of whether an individual is an adult or a child
(under 18 years). The surveys collected information on whether each child aged less than 18 years in the household
possessed a blanket. Ownership of a blanket only considered those that were not shared (one member per blanket).
Table 2.4.6 shows that four in every ten children owned a blanket. There is no significant difference in households in
terms of possession of a blanket by sex of the household heads, except in 2013/14 where slightly more children from
female headed household owned blankets compared with their male counterparts (46.9% and 42.2% respectively).
Disaggregation by place of residence shows considerable variation between urban and rural areas. In all the waves,
households in urban areas were more likely to have every child own a blanket compared with their rural counterparts.
Regional differences in blanket ownership for children under 18 years for all the waves show that the central region is
slightly better with every six in ten children owning a blanket (65.7%), followed by western (54.2 percent) in the latest
survey of 2019/20. The Northern region lags behind with one in every four children owning a blanket (25.3%).
Table 2.4.6: Possession of a Blanket by Background Characteristics (%) Background characteristics 2005/6 2009/10 2010/11 2013/14 2015/16 2018/19 2019/20
Residence
Rural 28.1 33.7 34.2 36.0 34.3 28.1 39.5
Urban 56.8 61.3 58.9 61.4 63.5 56.8 65.7
Region
Central 51.0 54.9 59.7 60.1 58.1 51.0 64.3
Eastern 30.5 36.8 34.5 40.4 43.5 30.5 37.1
Northern 18.3 16.5 17.0 23.6 19.1 18.3 25.3
Western 33.6 46.7 40.9 42.9 43.4 33.6 54.2
Sex of Head
Female 36.8 39.4 41.7 46.9 43.0 36.8 46.8
Male 34.6 40.7 39.0 42.2 42.5 34.6 47.6
National 35.1 40.4 39.8 43.8 42.7 35.7 47.3
*The central region does not include Kampala
SOURCE: UNPS 2005/6-2019/20
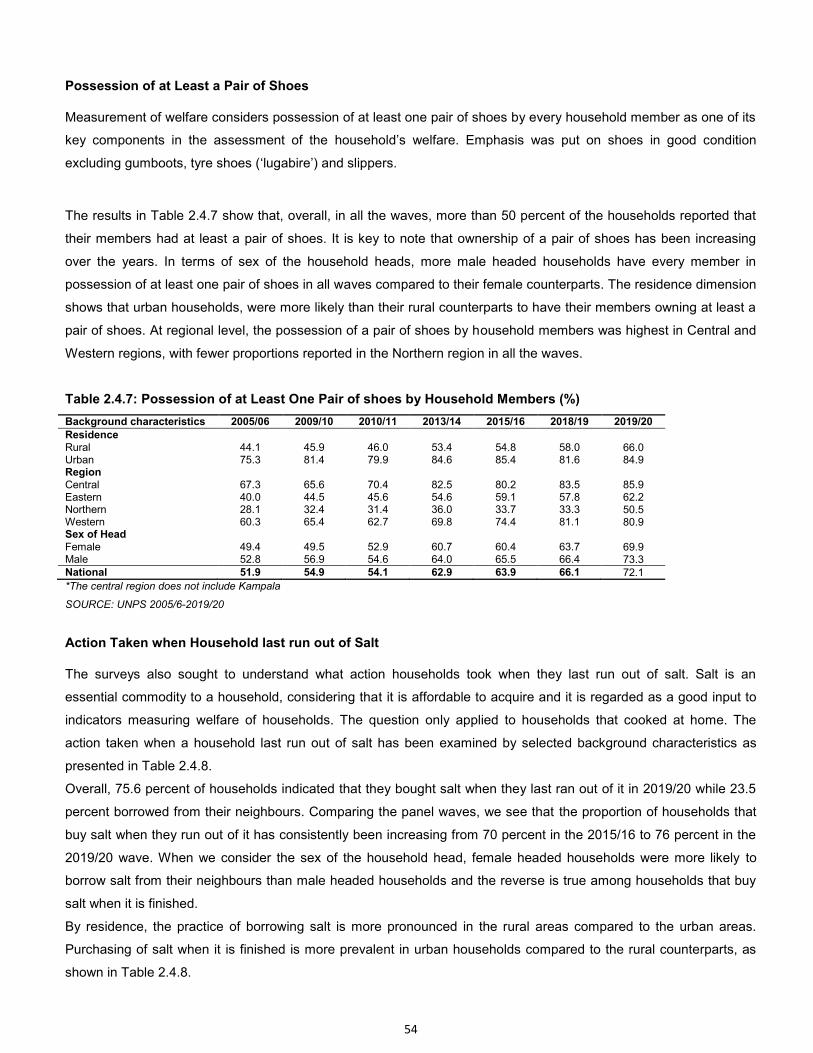
54
Possession of at Least a Pair of Shoes
Measurement of welfare considers possession of at least one pair of shoes by every household member as one of its
key components in the assessment of the household’s welfare. Emphasis was put on shoes in good condition
excluding gumboots, tyre shoes (‘lugabire’) and slippers.
The results in Table 2.4.7 show that, overall, in all the waves, more than 50 percent of the households reported that
their members had at least a pair of shoes. It is key to note that ownership of a pair of shoes has been increasing
over the years. In terms of sex of the household heads, more male headed households have every member in
possession of at least one pair of shoes in all waves compared to their female counterparts. The residence dimension
shows that urban households, were more likely than their rural counterparts to have their members owning at least a
pair of shoes. At regional level, the possession of a pair of shoes by household members was highest in Central and
Western regions, with fewer proportions reported in the Northern region in all the waves.
Table 2.4.7: Possession of at Least One Pair of shoes by Household Members (%)
Background characteristics 2005/06 2009/10 2010/11 2013/14 2015/16 2018/19 2019/20
Residence
Rural 44.1 45.9 46.0 53.4 54.8 58.0 66.0 Urban 75.3 81.4 79.9 84.6 85.4 81.6 84.9 Region
Central 67.3 65.6 70.4 82.5 80.2 83.5 85.9 Eastern 40.0 44.5 45.6 54.6 59.1 57.8 62.2 Northern 28.1 32.4 31.4 36.0 33.7 33.3 50.5 Western 60.3 65.4 62.7 69.8 74.4 81.1 80.9 Sex of Head
Female 49.4 49.5 52.9 60.7 60.4 63.7 69.9 Male 52.8 56.9 54.6 64.0 65.5 66.4 73.3 National 51.9 54.9 54.1 62.9 63.9 66.1 72.1
*The central region does not include Kampala
SOURCE: UNPS 2005/6-2019/20
Action Taken when Household last run out of Salt
The surveys also sought to understand what action households took when they last run out of salt. Salt is an
essential commodity to a household, considering that it is affordable to acquire and it is regarded as a good input to
indicators measuring welfare of households. The question only applied to households that cooked at home. The
action taken when a household last run out of salt has been examined by selected background characteristics as
presented in Table 2.4.8.
Overall, 75.6 percent of households indicated that they bought salt when they last ran out of it in 2019/20 while 23.5
percent borrowed from their neighbours. Comparing the panel waves, we see that the proportion of households that
buy salt when they run out of it has consistently been increasing from 70 percent in the 2015/16 to 76 percent in the
2019/20 wave. When we consider the sex of the household head, female headed households were more likely to
borrow salt from their neighbours than male headed households and the reverse is true among households that buy
salt when it is finished.
By residence, the practice of borrowing salt is more pronounced in the rural areas compared to the urban areas.
Purchasing of salt when it is finished is more prevalent in urban households compared to the rural counterparts, as
shown in Table 2.4.8.
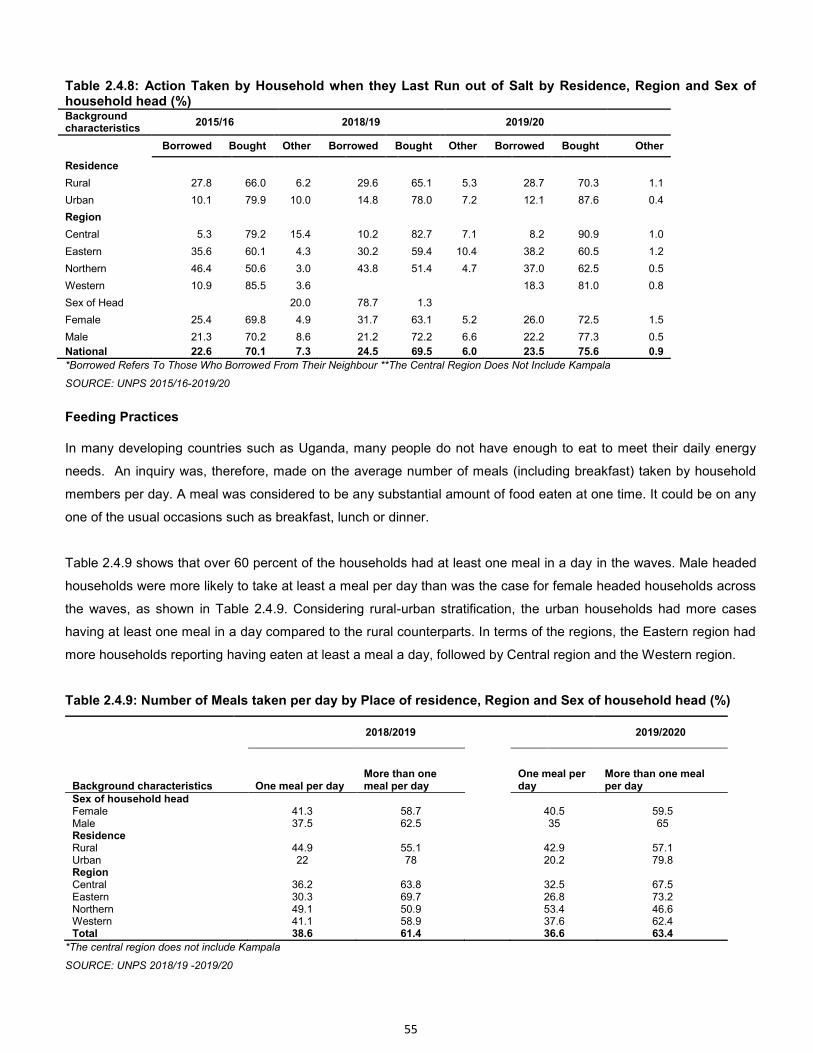
55
Table 2.4.8: Action Taken by Household when they Last Run out of Salt by Residence, Region and Sex of household head (%) Background characteristics
2015/16 2018/19 2019/20
Borrowed Bought Other Borrowed Bought Other Borrowed Bought Other
Residence
Rural 27.8 66.0 6.2 29.6 65.1 5.3 28.7 70.3 1.1
Urban 10.1 79.9 10.0 14.8 78.0 7.2 12.1 87.6 0.4
Region
Central 5.3 79.2 15.4 10.2 82.7 7.1 8.2 90.9 1.0
Eastern 35.6 60.1 4.3 30.2 59.4 10.4 38.2 60.5 1.2
Northern 46.4 50.6 3.0 43.8 51.4 4.7 37.0 62.5 0.5
Western 10.9 85.5 3.6
18.3 81.0 0.8
Sex of Head
20.0 78.7 1.3
Female 25.4 69.8 4.9 31.7 63.1 5.2 26.0 72.5 1.5
Male 21.3 70.2 8.6 21.2 72.2 6.6 22.2 77.3 0.5
National 22.6 70.1 7.3 24.5 69.5 6.0 23.5 75.6 0.9
*Borrowed Refers To Those Who Borrowed From Their Neighbour **The Central Region Does Not Include Kampala
SOURCE: UNPS 2015/16-2019/20
Feeding Practices
In many developing countries such as Uganda, many people do not have enough to eat to meet their daily energy
needs. An inquiry was, therefore, made on the average number of meals (including breakfast) taken by household
members per day. A meal was considered to be any substantial amount of food eaten at one time. It could be on any
one of the usual occasions such as breakfast, lunch or dinner.
Table 2.4.9 shows that over 60 percent of the households had at least one meal in a day in the waves. Male headed
households were more likely to take at least a meal per day than was the case for female headed households across
the waves, as shown in Table 2.4.9. Considering rural-urban stratification, the urban households had more cases
having at least one meal in a day compared to the rural counterparts. In terms of the regions, the Eastern region had
more households reporting having eaten at least a meal a day, followed by Central region and the Western region.
Table 2.4.9: Number of Meals taken per day by Place of residence, Region and Sex of household head (%)
2018/2019
2019/2020
Background characteristics One meal per day More than one meal per day
One meal per day
More than one meal per day
Sex of household head
Female 41.3 58.7
40.5 59.5 Male 37.5 62.5
35 65
Residence
Rural 44.9 55.1
42.9 57.1 Urban 22 78
20.2 79.8
Region
Central 36.2 63.8
32.5 67.5 Eastern 30.3 69.7
26.8 73.2
Northern 49.1 50.9
53.4 46.6 Western 41.1 58.9
37.6 62.4
Total 38.6 61.4 36.6 63.4
*The central region does not include Kampala
SOURCE: UNPS 2018/19 -2019/20
56
2.5 Health Statistics
Health statistics include both empirical data and estimates related to health, such as mortality, morbidity, risk factors,
health service coverage, and health systems. This section presents statistics on some of the key aspects of public
health. These include status of healthcare facilities, health human resources, morbidity and other selected health
sector performance indicators.
2.5.1 Health Facilities
Health facilities in Uganda include hospitals and health centres (IV, III and II). Figure 2.5.1 shows that the number of
functional healthcare facilities has generally decreased irrespective of the ownership status, making a total of 6,232 in
2019/20. There was a 9.7 percentage decrease from 6,904 facilities in 2018/19. A total of 672 health facilities,
therefore, became non functional.
Figure: 2.5.1: Number of Functional Healthcare facilities by Financial Year and Ownership, 2015/16-2019/20
Note: PNFP includes community owned facilities. Source: Ministry of Health
2.5.2 Human Resources for Health
Table 2.5.2 shows that in the FY2019/20 the percentage of approved posts filled countrywide in health facilities
slightly increased to 73 percent from 71 percent in 2017/18. Kawempe National Referral Hospital had the least
percentage of approved posts filled in FY2019/20 while at the district level, there was a slight increase from 73 in
FY2017/18 to 75 percent in FY2019/20. The district health offices registered a decrease from 78 in FY2017/18 to 69
percent in FY2019/20 partly due to an increase in number of approved posts.
1202
2373
2795 2793
1809
873 947 1009 982 1229
2932 3084 3133 3129 3194
0
500
1000
1500
2000
2500
3000
3500
2015/16 2016/17 2017/18 2018/19 2019/20
Nu
mb
er
Financial Year
Private for Profit Private Not for Profit Government
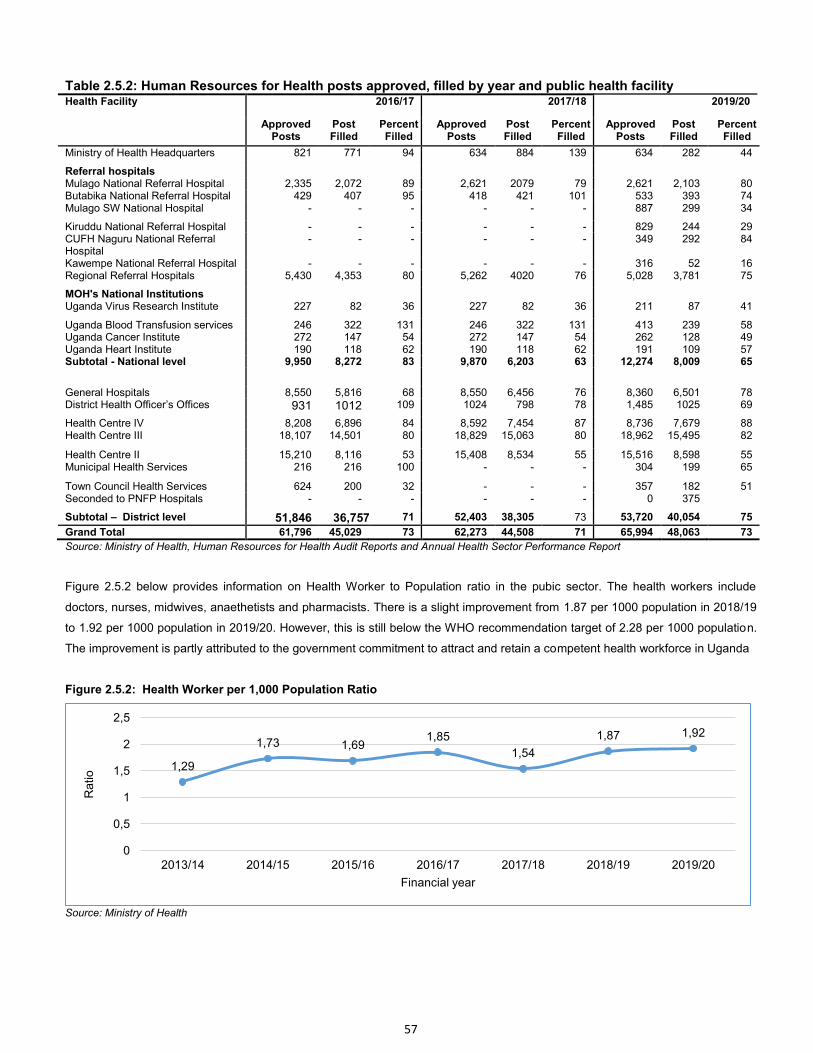
57
Table 2.5.2: Human Resources for Health posts approved, filled by year and public health facility Health Facility 2016/17 2017/18 2019/20
Approved Posts
Post Filled
Percent Filled
Approved Posts
Post Filled
Percent Filled
Approved Posts
Post Filled
Percent Filled
Ministry of Health Headquarters 821 771 94 634 884 139 634 282 44
Referral hospitals Mulago National Referral Hospital 2,335 2,072 89 2,621 2079 79 2,621 2,103 80 Butabika National Referral Hospital 429 407 95 418 421 101 533 393 74 Mulago SW National Hospital - - - - - - 887 299 34
Kiruddu National Referral Hospital - - - - - - 829 244 29 CUFH Naguru National Referral Hospital
- - - - - - 349 292 84
Kawempe National Referral Hospital - - - - - - 316 52 16 Regional Referral Hospitals 5,430 4,353 80 5,262 4020 76 5,028 3,781 75
MOH's National Institutions Uganda Virus Research Institute 227 82 36 227 82 36 211 87 41
Uganda Blood Transfusion services 246 322 131 246 322 131 413 239 58 Uganda Cancer Institute 272 147 54 272 147 54 262 128 49 Uganda Heart Institute 190 118 62 190 118 62 191 109 57 Subtotal - National level 9,950 8,272 83 9,870 6,203 63 12,274 8,009 65
General Hospitals 8,550 5,816 68 8,550 6,456 76 8,360 6,501 78 District Health Officer’s Offices 931 1012 109 1024 798 78 1,485 1025 69
Health Centre IV 8,208 6,896 84 8,592 7,454 87 8,736 7,679 88 Health Centre III 18,107 14,501 80 18,829 15,063 80 18,962 15,495 82
Health Centre II 15,210 8,116 53 15,408 8,534 55 15,516 8,598 55 Municipal Health Services 216 216 100 - - - 304 199 65
Town Council Health Services 624 200 32 - - - 357 182 51 Seconded to PNFP Hospitals - - - - - - 0 375
Subtotal – District level 51,846 36,757 71 52,403 38,305 73 53,720 40,054 75
Grand Total 61,796 45,029 73 62,273 44,508 71 65,994 48,063 73
Source: Ministry of Health, Human Resources for Health Audit Reports and Annual Health Sector Performance Report
Figure 2.5.2 below provides information on Health Worker to Population ratio in the pubic sector. The health workers include
doctors, nurses, midwives, anaethetists and pharmacists. There is a slight improvement from 1.87 per 1000 population in 2018/19
to 1.92 per 1000 population in 2019/20. However, this is still below the WHO recommendation target of 2.28 per 1000 population.
The improvement is partly attributed to the government commitment to attract and retain a competent health workforce in Uganda
Figure 2.5.2: Health Worker per 1,000 Population Ratio
Source: Ministry of Health
1,29
1,73 1,69 1,85
1,54
1,87 1,92
0
0,5
1
1,5
2
2,5
2013/14 2014/15 2015/16 2016/17 2017/18 2018/19 2019/20
Ra
tio
Financial year
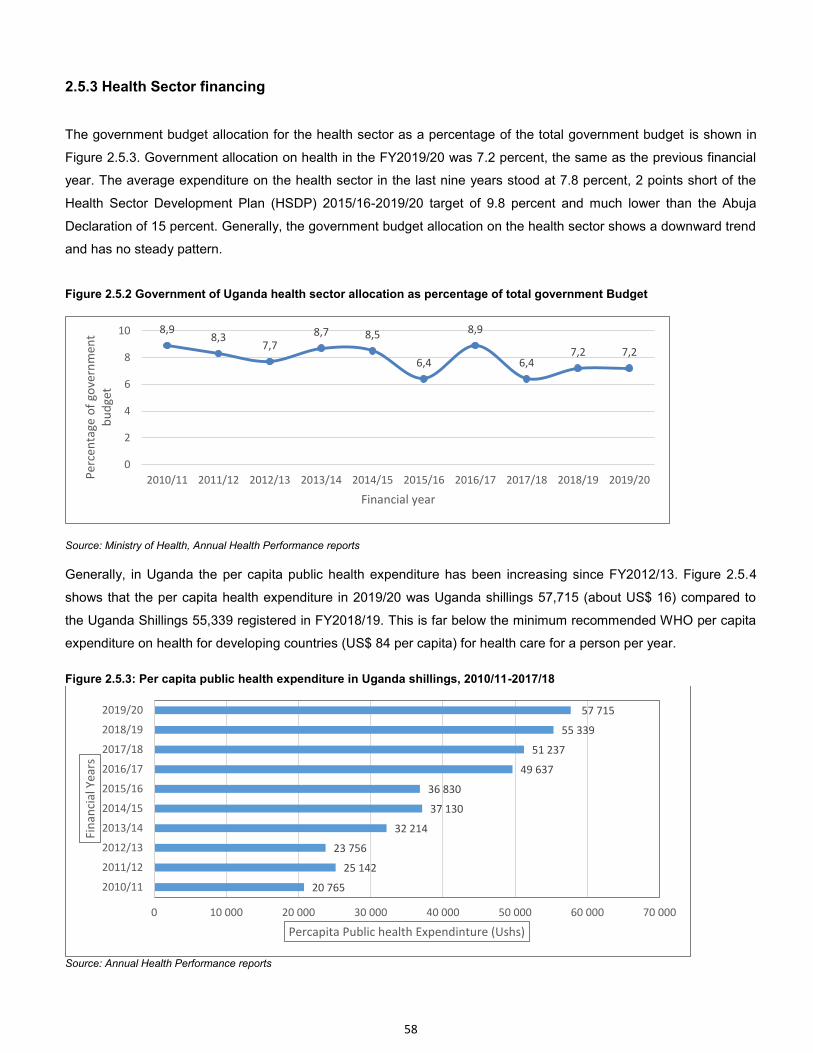
58
2.5.3 Health Sector financing
The government budget allocation for the health sector as a percentage of the total government budget is shown in
Figure 2.5.3. Government allocation on health in the FY2019/20 was 7.2 percent, the same as the previous financial
year. The average expenditure on the health sector in the last nine years stood at 7.8 percent, 2 points short of the
Health Sector Development Plan (HSDP) 2015/16-2019/20 target of 9.8 percent and much lower than the Abuja
Declaration of 15 percent. Generally, the government budget allocation on the health sector shows a downward trend
and has no steady pattern.
Figure 2.5.2 Government of Uganda health sector allocation as percentage of total government Budget
Source: Ministry of Health, Annual Health Performance reports
Generally, in Uganda the per capita public health expenditure has been increasing since FY2012/13. Figure 2.5.4
shows that the per capita health expenditure in 2019/20 was Uganda shillings 57,715 (about US$ 16) compared to
the Uganda Shillings 55,339 registered in FY2018/19. This is far below the minimum recommended WHO per capita
expenditure on health for developing countries (US$ 84 per capita) for health care for a person per year.
Figure 2.5.3: Per capita public health expenditure in Uganda shillings, 2010/11-2017/18
Source: Annual Health Performance reports
8,9 8,3
7,7 8,7 8,5
6,4
8,9
6,4 7,2 7,2
0
2
4
6
8
10
2010/11 2011/12 2012/13 2013/14 2014/15 2015/16 2016/17 2017/18 2018/19 2019/20Pe
rce
nta
ge
of
go
ve
rnm
en
t
bu
dg
et
Financial year
20 765
25 142
23 756
32 214
37 130
36 830
49 637
51 237
55 339
57 715
0 10 000 20 000 30 000 40 000 50 000 60 000 70 000
2010/11
2011/12
2012/13
2013/14
2014/15
2015/16
2016/17
2017/18
2018/19
2019/20
Percapita Public health Expendinture (Ushs)
Fin
an
cia
l Y
ea
rs
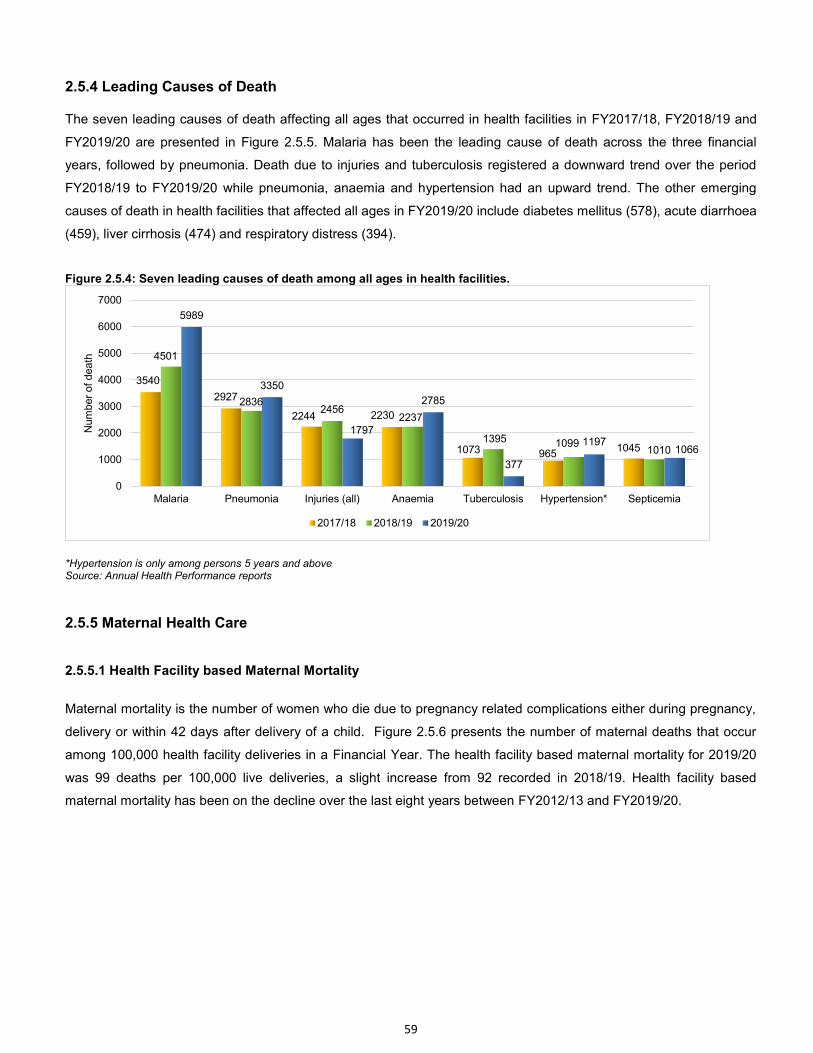
59
2.5.4 Leading Causes of Death
The seven leading causes of death affecting all ages that occurred in health facilities in FY2017/18, FY2018/19 and
FY2019/20 are presented in Figure 2.5.5. Malaria has been the leading cause of death across the three financial
years, followed by pneumonia. Death due to injuries and tuberculosis registered a downward trend over the period
FY2018/19 to FY2019/20 while pneumonia, anaemia and hypertension had an upward trend. The other emerging
causes of death in health facilities that affected all ages in FY2019/20 include diabetes mellitus (578), acute diarrhoea
(459), liver cirrhosis (474) and respiratory distress (394).
Figure 2.5.4: Seven leading causes of death among all ages in health facilities.
*Hypertension is only among persons 5 years and above Source: Annual Health Performance reports
2.5.5 Maternal Health Care
2.5.5.1 Health Facility based Maternal Mortality
Maternal mortality is the number of women who die due to pregnancy related complications either during pregnancy,
delivery or within 42 days after delivery of a child. Figure 2.5.6 presents the number of maternal deaths that occur
among 100,000 health facility deliveries in a Financial Year. The health facility based maternal mortality for 2019/20
was 99 deaths per 100,000 live deliveries, a slight increase from 92 recorded in 2018/19. Health facility based
maternal mortality has been on the decline over the last eight years between FY2012/13 and FY2019/20.
3540
2927
2244 2230
1073 965 1045
4501
2836 2456
2237
1395 1099 1010
5989
3350
1797
2785
377
1197 1066
0
1000
2000
3000
4000
5000
6000
7000
Malaria Pneumonia Injuries (all) Anaemia Tuberculosis Hypertension* Septicemia
Num
ber
of death
2017/18 2018/19 2019/20
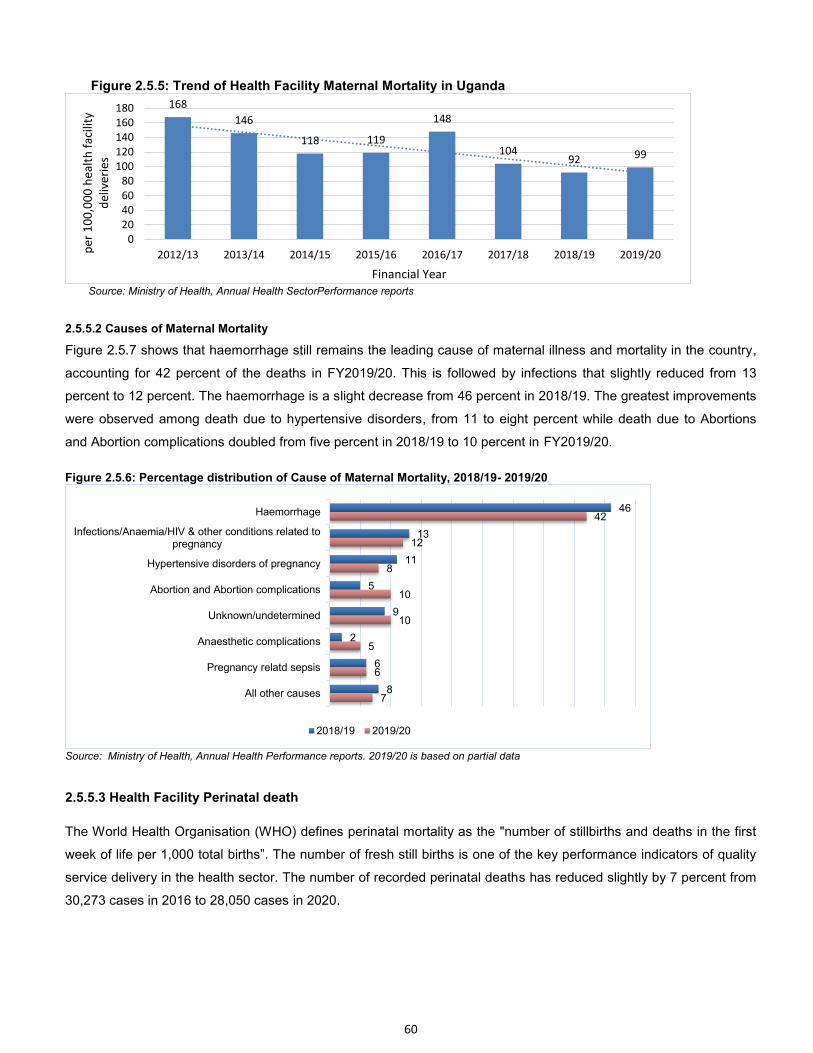
60
Figure 2.5.5: Trend of Health Facility Maternal Mortality in Uganda
Source: Ministry of Health, Annual Health SectorPerformance reports
2.5.5.2 Causes of Maternal Mortality
Figure 2.5.7 shows that haemorrhage still remains the leading cause of maternal illness and mortality in the country,
accounting for 42 percent of the deaths in FY2019/20. This is followed by infections that slightly reduced from 13
percent to 12 percent. The haemorrhage is a slight decrease from 46 percent in 2018/19. The greatest improvements
were observed among death due to hypertensive disorders, from 11 to eight percent while death due to Abortions
and Abortion complications doubled from five percent in 2018/19 to 10 percent in FY2019/20.
Figure 2.5.6: Percentage distribution of Cause of Maternal Mortality, 2018/19- 2019/20
Source: Ministry of Health, Annual Health Performance reports. 2019/20 is based on partial data
2.5.5.3 Health Facility Perinatal death
The World Health Organisation (WHO) defines perinatal mortality as the "number of stillbirths and deaths in the first
week of life per 1,000 total births”. The number of fresh still births is one of the key performance indicators of quality
service delivery in the health sector. The number of recorded perinatal deaths has reduced slightly by 7 percent from
30,273 cases in 2016 to 28,050 cases in 2020.
168
146
118 119
148
104 92 99
0
20
40
60
80
100
120
140
160
180
2012/13 2013/14 2014/15 2015/16 2016/17 2017/18 2018/19 2019/20pe
r 1
00
,00
0 h
ea
lth
fa
cili
ty
de
live
rie
s
Financial Year
46
13
11
5
9
2
6
8
42
12
8
10
10
5
6
7
Haemorrhage
Infections/Anaemia/HIV & other conditions related topregnancy
Hypertensive disorders of pregnancy
Abortion and Abortion complications
Unknown/undetermined
Anaesthetic complications
Pregnancy relatd sepsis
All other causes
2018/19 2019/20
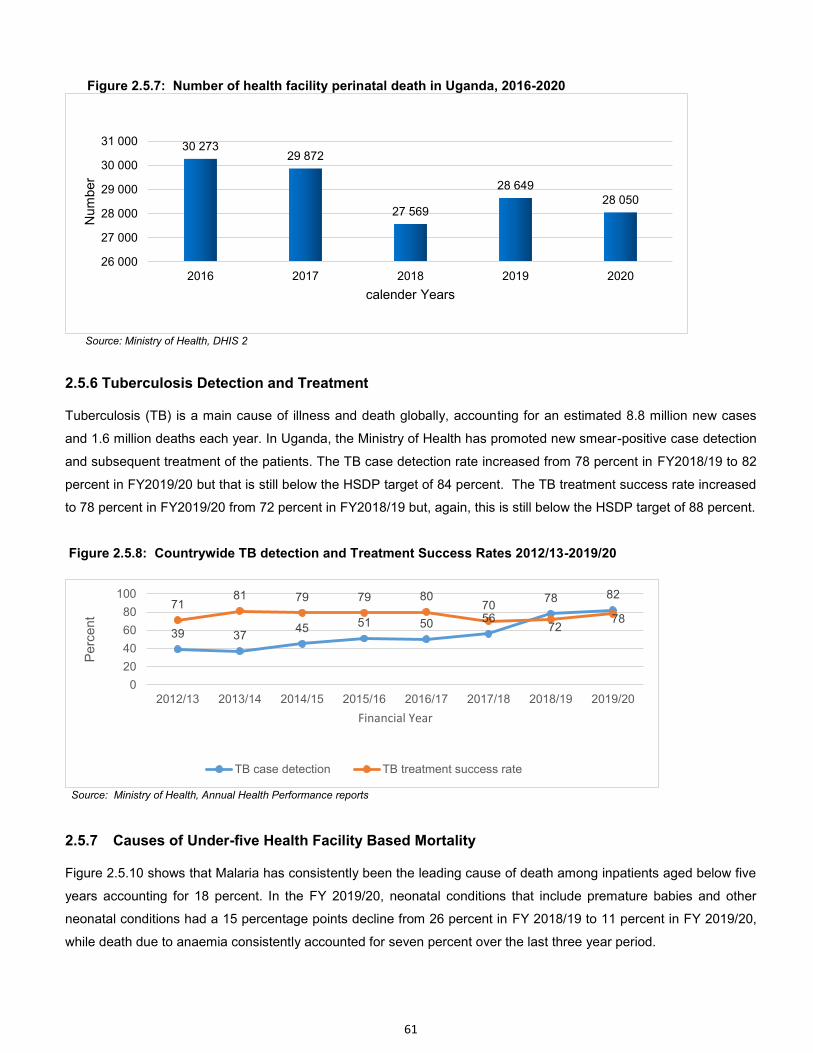
61
Figure 2.5.7: Number of health facility perinatal death in Uganda, 2016-2020
Source: Ministry of Health, DHIS 2
2.5.6 Tuberculosis Detection and Treatment
Tuberculosis (TB) is a main cause of illness and death globally, accounting for an estimated 8.8 million new cases
and 1.6 million deaths each year. In Uganda, the Ministry of Health has promoted new smear-positive case detection
and subsequent treatment of the patients. The TB case detection rate increased from 78 percent in FY2018/19 to 82
percent in FY2019/20 but that is still below the HSDP target of 84 percent. The TB treatment success rate increased
to 78 percent in FY2019/20 from 72 percent in FY2018/19 but, again, this is still below the HSDP target of 88 percent.
Figure 2.5.8: Countrywide TB detection and Treatment Success Rates 2012/13-2019/20
Source: Ministry of Health, Annual Health Performance reports
2.5.7 Causes of Under-five Health Facility Based Mortality
Figure 2.5.10 shows that Malaria has consistently been the leading cause of death among inpatients aged below five
years accounting for 18 percent. In the FY 2019/20, neonatal conditions that include premature babies and other
neonatal conditions had a 15 percentage points decline from 26 percent in FY 2018/19 to 11 percent in FY 2019/20,
while death due to anaemia consistently accounted for seven percent over the last three year period.
30 273 29 872
27 569
28 649 28 050
26 000
27 000
28 000
29 000
30 000
31 000
2016 2017 2018 2019 2020
Num
ber
calender Years
39 37 45 51 50 56
78 82 71
81 79 79 80 70
72 78
0
20
40
60
80
100
2012/13 2013/14 2014/15 2015/16 2016/17 2017/18 2018/19 2019/20
Perc
ent
Financial Year
TB case detection TB treatment success rate
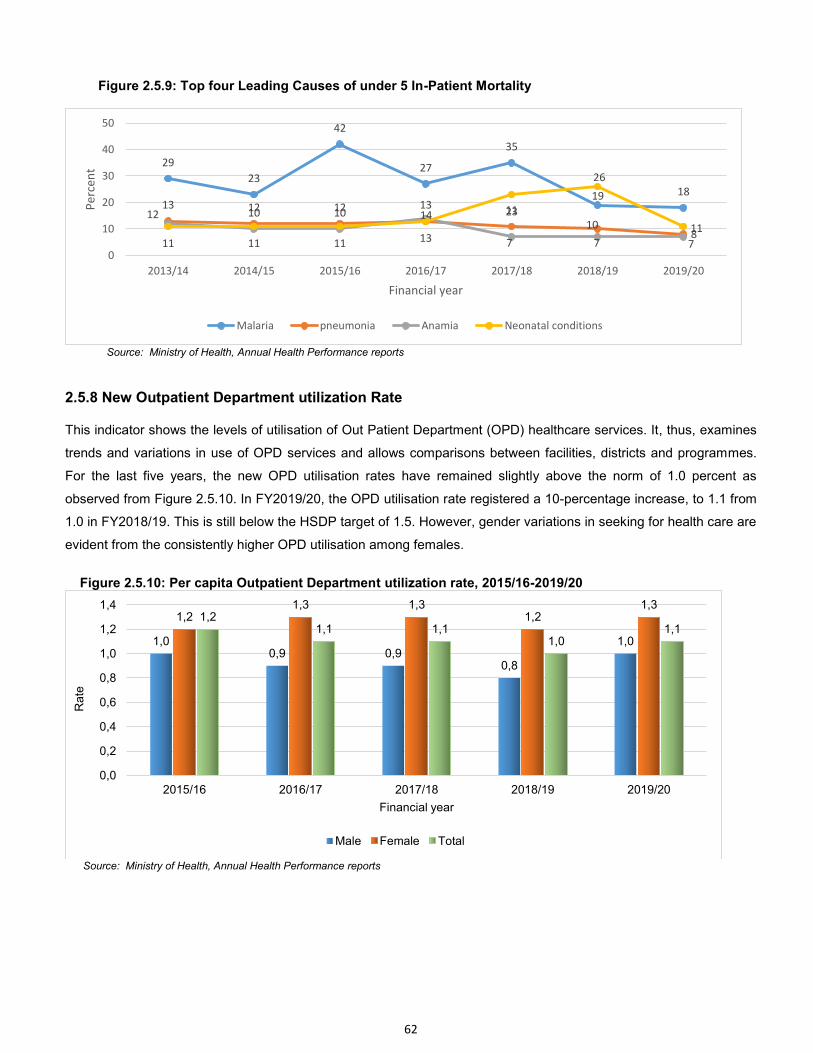
62
Figure 2.5.9: Top four Leading Causes of under 5 In-Patient Mortality
Source: Ministry of Health, Annual Health Performance reports
2.5.8 New Outpatient Department utilization Rate
This indicator shows the levels of utilisation of Out Patient Department (OPD) healthcare services. It, thus, examines
trends and variations in use of OPD services and allows comparisons between facilities, districts and programmes.
For the last five years, the new OPD utilisation rates have remained slightly above the norm of 1.0 percent as
observed from Figure 2.5.10. In FY2019/20, the OPD utilisation rate registered a 10-percentage increase, to 1.1 from
1.0 in FY2018/19. This is still below the HSDP target of 1.5. However, gender variations in seeking for health care are
evident from the consistently higher OPD utilisation among females.
Figure 2.5.10: Per capita Outpatient Department utilization rate, 2015/16-2019/20
Source: Ministry of Health, Annual Health Performance reports
29
23
42
27
35
19 18 13 12 12 13 11
10 8
12 10 10 14
7 7 7 11 11 11 13
23
26
11
0
10
20
30
40
50
2013/14 2014/15 2015/16 2016/17 2017/18 2018/19 2019/20
Pe
rce
nt
Financial year
Malaria pneumonia Anamia Neonatal conditions
1,0 0,9 0,9
0,8
1,0
1,2 1,3 1,3
1,2 1,3
1,2 1,1 1,1
1,0 1,1
0,0
0,2
0,4
0,6
0,8
1,0
1,2
1,4
2015/16 2016/17 2017/18 2018/19 2019/20
Rate
Financial year
Male Female Total
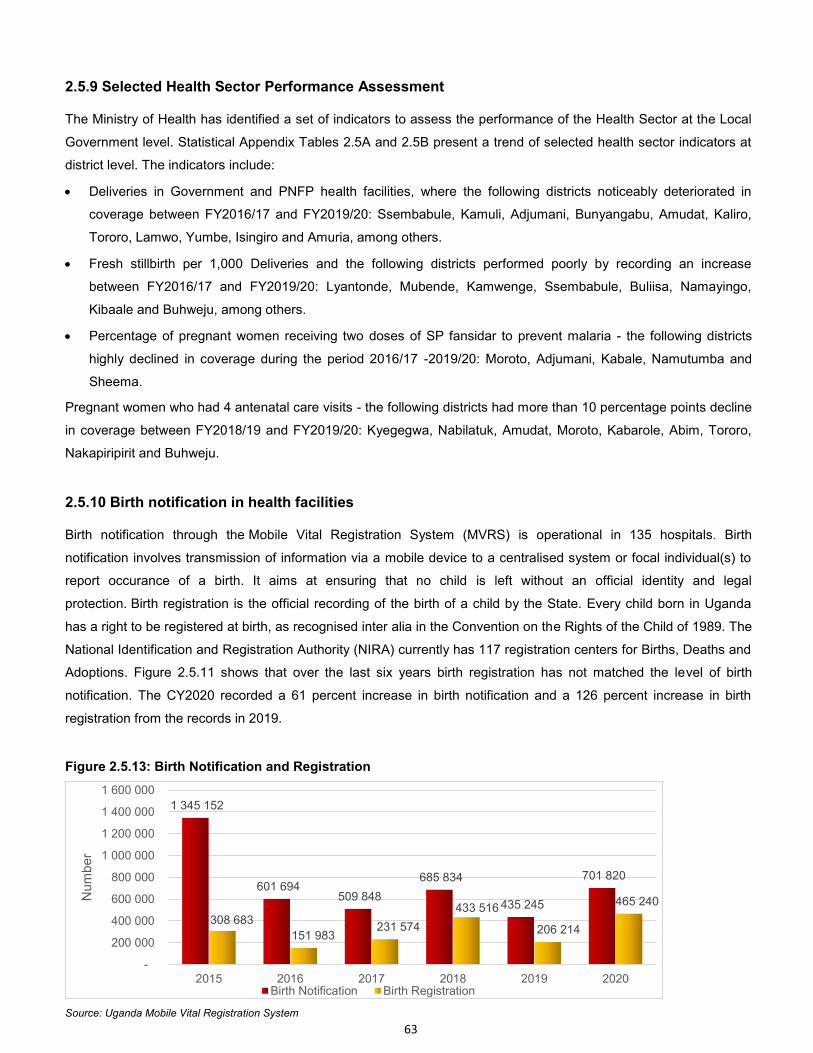
63
2.5.9 Selected Health Sector Performance Assessment
The Ministry of Health has identified a set of indicators to assess the performance of the Health Sector at the Local
Government level. Statistical Appendix Tables 2.5A and 2.5B present a trend of selected health sector indicators at
district level. The indicators include:
Deliveries in Government and PNFP health facilities, where the following districts noticeably deteriorated in
coverage between FY2016/17 and FY2019/20: Ssembabule, Kamuli, Adjumani, Bunyangabu, Amudat, Kaliro,
Tororo, Lamwo, Yumbe, Isingiro and Amuria, among others.
Fresh stillbirth per 1,000 Deliveries and the following districts performed poorly by recording an increase
between FY2016/17 and FY2019/20: Lyantonde, Mubende, Kamwenge, Ssembabule, Buliisa, Namayingo,
Kibaale and Buhweju, among others.
Percentage of pregnant women receiving two doses of SP fansidar to prevent malaria - the following districts
highly declined in coverage during the period 2016/17 -2019/20: Moroto, Adjumani, Kabale, Namutumba and
Sheema.
Pregnant women who had 4 antenatal care visits - the following districts had more than 10 percentage points decline
in coverage between FY2018/19 and FY2019/20: Kyegegwa, Nabilatuk, Amudat, Moroto, Kabarole, Abim, Tororo,
Nakapiripirit and Buhweju.
2.5.10 Birth notification in health facilities
Birth notification through the Mobile Vital Registration System (MVRS) is operational in 135 hospitals. Birth
notification involves transmission of information via a mobile device to a centralised system or focal individual(s) to
report occurance of a birth. It aims at ensuring that no child is left without an official identity and legal
protection. Birth registration is the official recording of the birth of a child by the State. Every child born in Uganda
has a right to be registered at birth, as recognised inter alia in the Convention on the Rights of the Child of 1989. The
National Identification and Registration Authority (NIRA) currently has 117 registration centers for Births, Deaths and
Adoptions. Figure 2.5.11 shows that over the last six years birth registration has not matched the level of birth
notification. The CY2020 recorded a 61 percent increase in birth notification and a 126 percent increase in birth
registration from the records in 2019.
Figure 2.5.13: Birth Notification and Registration
Source: Uganda Mobile Vital Registration System
1 345 152
601 694 509 848
685 834
435 245
701 820
308 683
151 983 231 574
433 516
206 214
465 240
-
200 000
400 000
600 000
800 000
1 000 000
1 200 000
1 400 000
1 600 000
2015 2016 2017 2018 2019 2020
Num
ber
Birth Notification Birth Registration
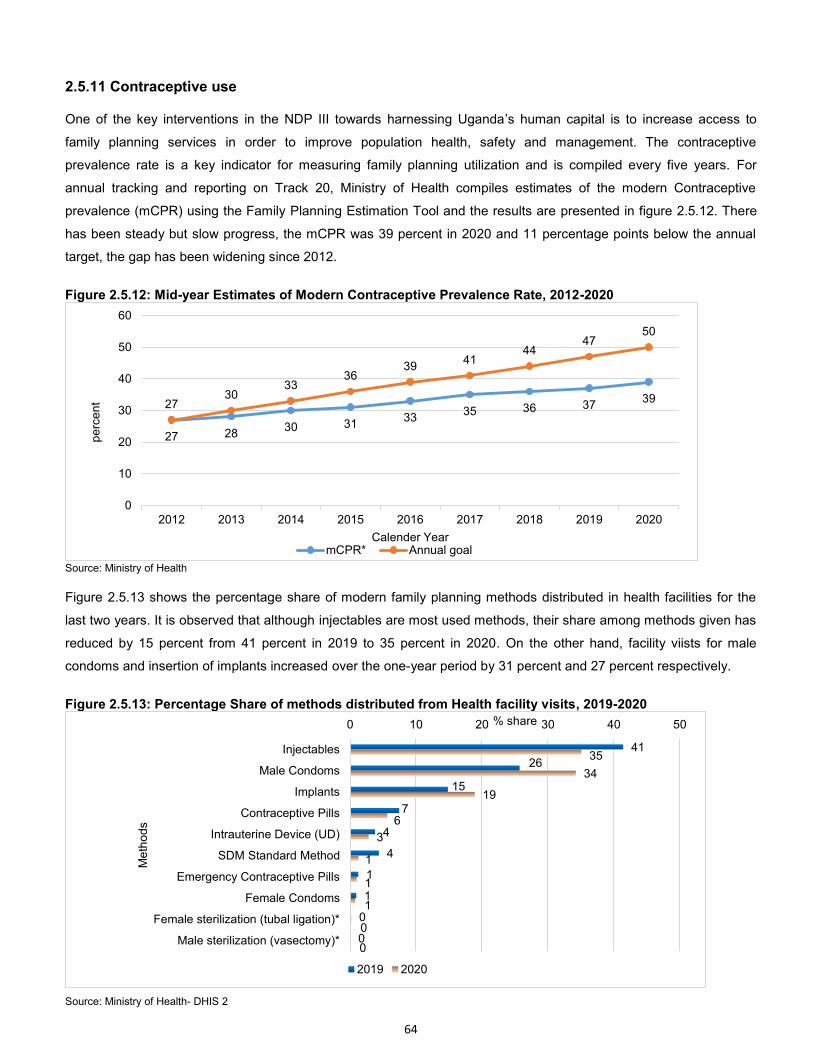
64
2.5.11 Contraceptive use
One of the key interventions in the NDP III towards harnessing Uganda’s human capital is to increase access to
family planning services in order to improve population health, safety and management. The contraceptive
prevalence rate is a key indicator for measuring family planning utilization and is compiled every five years. For
annual tracking and reporting on Track 20, Ministry of Health compiles estimates of the modern Contraceptive
prevalence (mCPR) using the Family Planning Estimation Tool and the results are presented in figure 2.5.12. There
has been steady but slow progress, the mCPR was 39 percent in 2020 and 11 percentage points below the annual
target, the gap has been widening since 2012.
Figure 2.5.12: Mid-year Estimates of Modern Contraceptive Prevalence Rate, 2012-2020
Source: Ministry of Health
Figure 2.5.13 shows the percentage share of modern family planning methods distributed in health facilities for the
last two years. It is observed that although injectables are most used methods, their share among methods given has
reduced by 15 percent from 41 percent in 2019 to 35 percent in 2020. On the other hand, facility viists for male
condoms and insertion of implants increased over the one-year period by 31 percent and 27 percent respectively.
Figure 2.5.13: Percentage Share of methods distributed from Health facility visits, 2019-2020
Source: Ministry of Health- DHIS 2
27 28 30 31
33 35 36 37
39 27 30
33 36
39 41
44 47
50
0
10
20
30
40
50
60
2012 2013 2014 2015 2016 2017 2018 2019 2020
pe
rce
nt
Calender Year mCPR* Annual goal
41
26
15
7
4
4
1
1
0
0
35
34
19
6
3
1
1
1
0
0
0 10 20 30 40 50
Injectables
Male Condoms
Implants
Contraceptive Pills
Intrauterine Device (UD)
SDM Standard Method
Emergency Contraceptive Pills
Female Condoms
Female sterilization (tubal ligation)*
Male sterilization (vasectomy)*
% share
Me
tho
ds
2019 2020
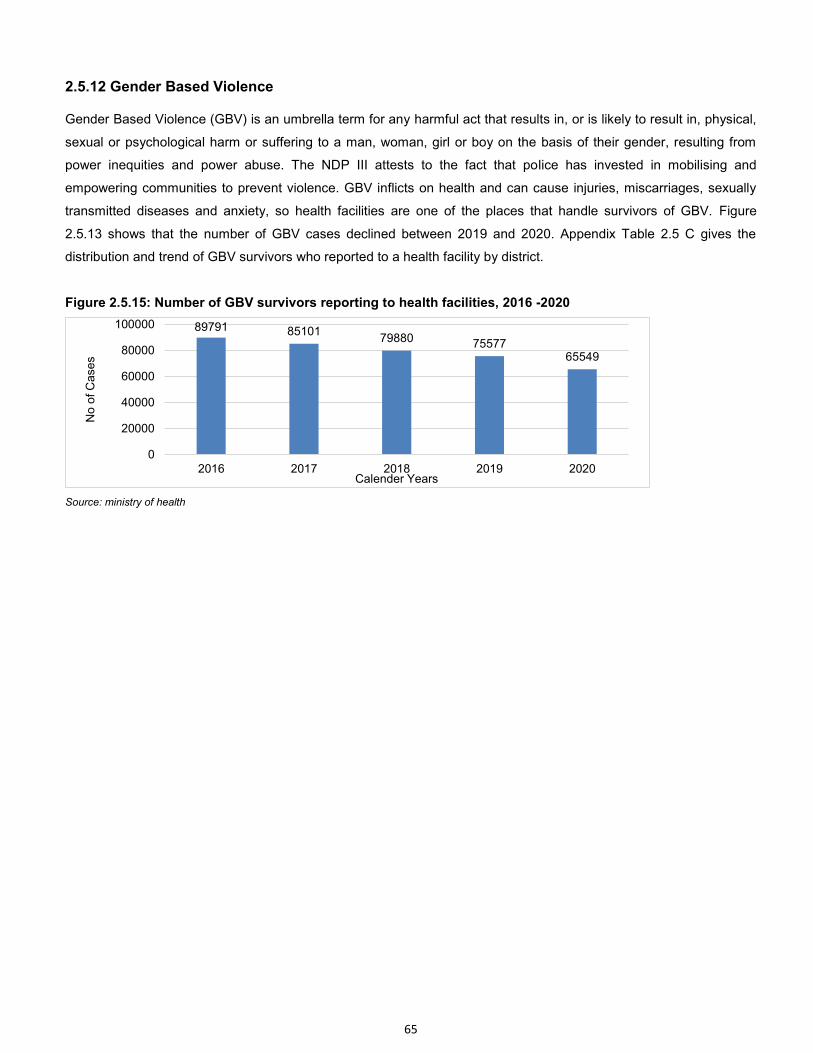
65
2.5.12 Gender Based Violence
Gender Based Violence (GBV) is an umbrella term for any harmful act that results in, or is likely to result in, physical,
sexual or psychological harm or suffering to a man, woman, girl or boy on the basis of their gender, resulting from
power inequities and power abuse. The NDP III attests to the fact that police has invested in mobilising and
empowering communities to prevent violence. GBV inflicts on health and can cause injuries, miscarriages, sexually
transmitted diseases and anxiety, so health facilities are one of the places that handle survivors of GBV. Figure
2.5.13 shows that the number of GBV cases declined between 2019 and 2020. Appendix Table 2.5 C gives the
distribution and trend of GBV survivors who reported to a health facility by district.
Figure 2.5.15: Number of GBV survivors reporting to health facilities, 2016 -2020
Source: ministry of health
89791 85101 79880 75577
65549
0
20000
40000
60000
80000
100000
2016 2017 2018 2019 2020
No o
f C
ase
s
Calender Years
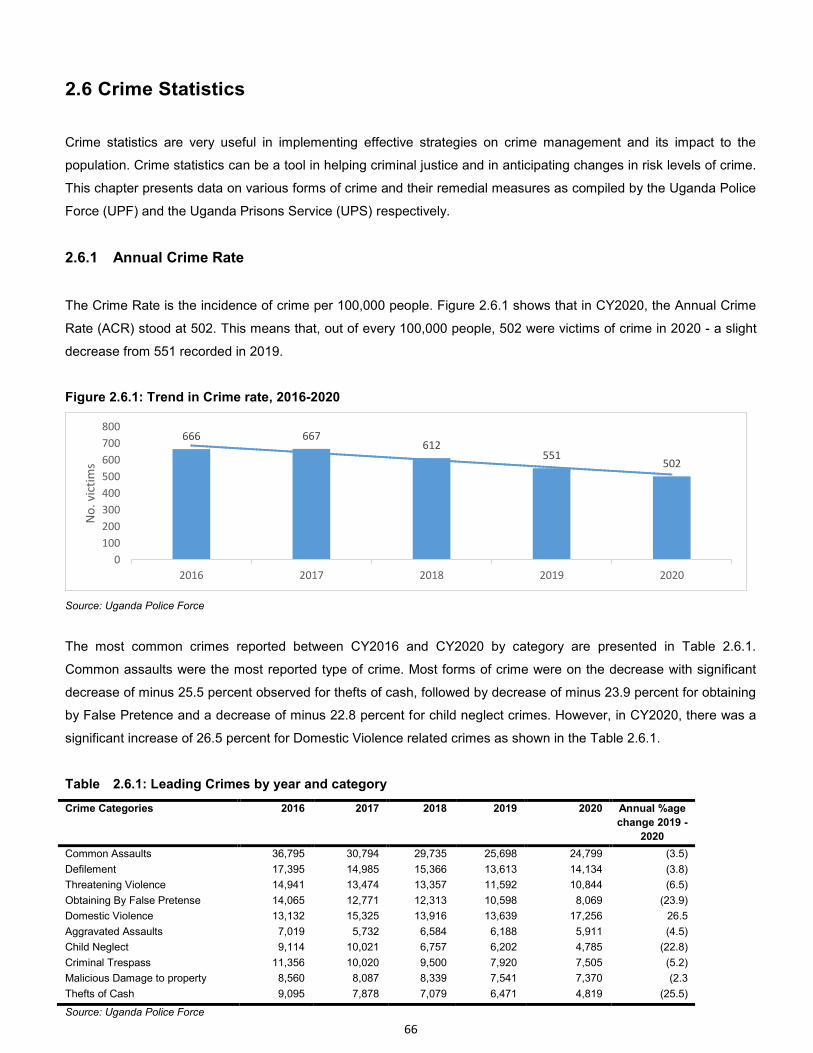
66
2.6 Crime Statistics
Crime statistics are very useful in implementing effective strategies on crime management and its impact to the
population. Crime statistics can be a tool in helping criminal justice and in anticipating changes in risk levels of crime.
This chapter presents data on various forms of crime and their remedial measures as compiled by the Uganda Police
Force (UPF) and the Uganda Prisons Service (UPS) respectively.
2.6.1 Annual Crime Rate
The Crime Rate is the incidence of crime per 100,000 people. Figure 2.6.1 shows that in CY2020, the Annual Crime
Rate (ACR) stood at 502. This means that, out of every 100,000 people, 502 were victims of crime in 2020 - a slight
decrease from 551 recorded in 2019.
Figure 2.6.1: Trend in Crime rate, 2016-2020
Source: Uganda Police Force
The most common crimes reported between CY2016 and CY2020 by category are presented in Table 2.6.1.
Common assaults were the most reported type of crime. Most forms of crime were on the decrease with significant
decrease of minus 25.5 percent observed for thefts of cash, followed by decrease of minus 23.9 percent for obtaining
by False Pretence and a decrease of minus 22.8 percent for child neglect crimes. However, in CY2020, there was a
significant increase of 26.5 percent for Domestic Violence related crimes as shown in the Table 2.6.1.
Table 2.6.1: Leading Crimes by year and category
Crime Categories 2016 2017 2018 2019 2020 Annual %age
change 2019 -
2020
Common Assaults 36,795 30,794 29,735 25,698 24,799 (3.5)
Defilement 17,395 14,985 15,366 13,613 14,134 (3.8)
Threatening Violence 14,941 13,474 13,357 11,592 10,844 (6.5)
Obtaining By False Pretense 14,065 12,771 12,313 10,598 8,069 (23.9)
Domestic Violence 13,132 15,325 13,916 13,639 17,256 26.5
Aggravated Assaults 7,019 5,732 6,584 6,188 5,911 (4.5)
Child Neglect 9,114 10,021 6,757 6,202 4,785 (22.8)
Criminal Trespass 11,356 10,020 9,500 7,920 7,505 (5.2)
Malicious Damage to property 8,560 8,087 8,339 7,541 7,370 (2.3
Thefts of Cash 9,095 7,878 7,079 6,471 4,819 (25.5)
Source: Uganda Police Force
666 667 612
551 502
0
100
200
300
400
500
600
700
800
2016 2017 2018 2019 2020
No
. vi
ctim
s
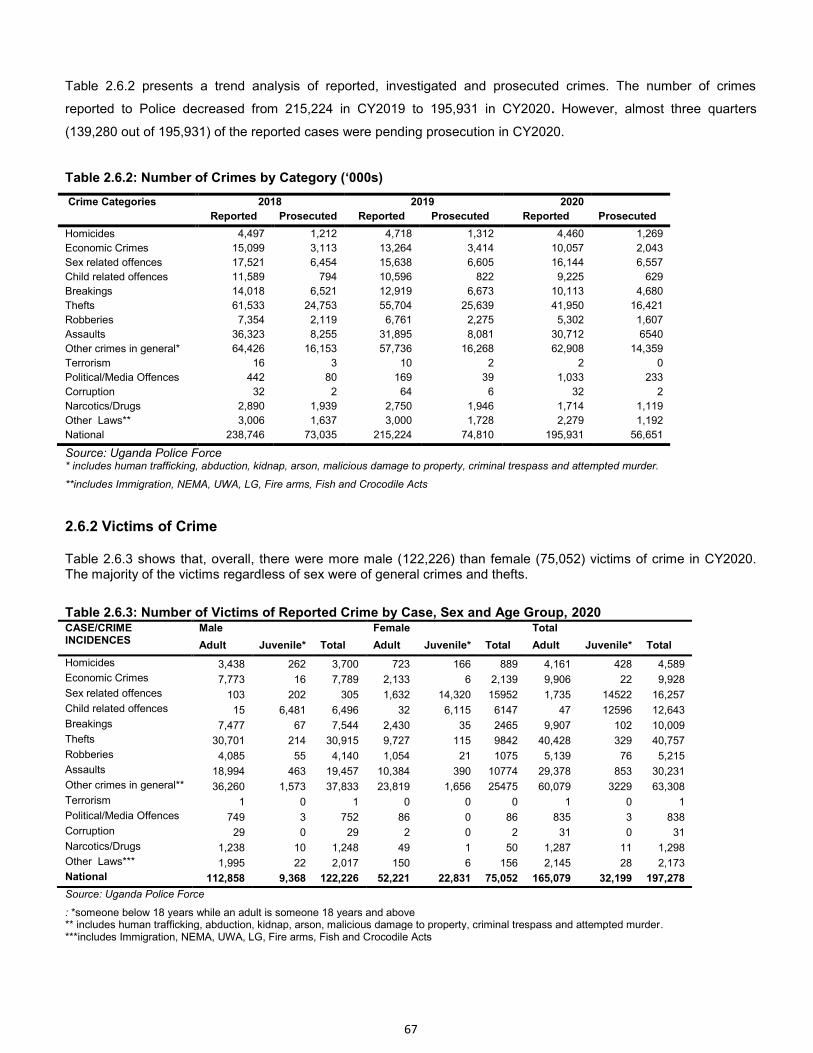
67
Table 2.6.2 presents a trend analysis of reported, investigated and prosecuted crimes. The number of crimes
reported to Police decreased from 215,224 in CY2019 to 195,931 in CY2020. However, almost three quarters
(139,280 out of 195,931) of the reported cases were pending prosecution in CY2020.
Table 2.6.2: Number of Crimes by Category (‘000s)
Crime Categories 2018 2019 2020
Reported Prosecuted Reported Prosecuted Reported Prosecuted
Homicides 4,497 1,212 4,718 1,312 4,460 1,269
Economic Crimes 15,099 3,113 13,264 3,414 10,057 2,043
Sex related offences 17,521 6,454 15,638 6,605 16,144 6,557
Child related offences 11,589 794 10,596 822 9,225 629
Breakings 14,018 6,521 12,919 6,673 10,113 4,680
Thefts 61,533 24,753 55,704 25,639 41,950 16,421
Robberies 7,354 2,119 6,761 2,275 5,302 1,607
Assaults 36,323 8,255 31,895 8,081 30,712 6540
Other crimes in general* 64,426 16,153 57,736 16,268 62,908 14,359
Terrorism 16 3 10 2 2 0
Political/Media Offences 442 80 169 39 1,033 233
Corruption 32 2 64 6 32 2
Narcotics/Drugs 2,890 1,939 2,750 1,946 1,714 1,119
Other Laws** 3,006 1,637 3,000 1,728 2,279 1,192
National 238,746 73,035 215,224 74,810 195,931 56,651
Source: Uganda Police Force * includes human trafficking, abduction, kidnap, arson, malicious damage to property, criminal trespass and attempted murder.
**includes Immigration, NEMA, UWA, LG, Fire arms, Fish and Crocodile Acts
2.6.2 Victims of Crime
Table 2.6.3 shows that, overall, there were more male (122,226) than female (75,052) victims of crime in CY2020. The majority of the victims regardless of sex were of general crimes and thefts.
Table 2.6.3: Number of Victims of Reported Crime by Case, Sex and Age Group, 2020 CASE/CRIME INCIDENCES
Male Female Total
Adult Juvenile* Total Adult Juvenile* Total Adult Juvenile* Total
Homicides 3,438 262 3,700 723 166 889 4,161 428 4,589
Economic Crimes 7,773 16 7,789 2,133 6 2,139 9,906 22 9,928
Sex related offences 103 202 305 1,632 14,320 15952 1,735 14522 16,257
Child related offences 15 6,481 6,496 32 6,115 6147 47 12596 12,643
Breakings 7,477 67 7,544 2,430 35 2465 9,907 102 10,009
Thefts 30,701 214 30,915 9,727 115 9842 40,428 329 40,757
Robberies 4,085 55 4,140 1,054 21 1075 5,139 76 5,215
Assaults 18,994 463 19,457 10,384 390 10774 29,378 853 30,231
Other crimes in general** 36,260 1,573 37,833 23,819 1,656 25475 60,079 3229 63,308
Terrorism 1 0 1 0 0 0 1 0 1
Political/Media Offences 749 3 752 86 0 86 835 3 838
Corruption 29 0 29 2 0 2 31 0 31
Narcotics/Drugs 1,238 10 1,248 49 1 50 1,287 11 1,298
Other Laws*** 1,995 22 2,017 150 6 156 2,145 28 2,173
National 112,858 9,368 122,226 52,221 22,831 75,052 165,079 32,199 197,278
Source: Uganda Police Force
: *someone below 18 years while an adult is someone 18 years and above ** includes human trafficking, abduction, kidnap, arson, malicious damage to property, criminal trespass and attempted murder. ***includes Immigration, NEMA, UWA, LG, Fire arms, Fish and Crocodile Acts
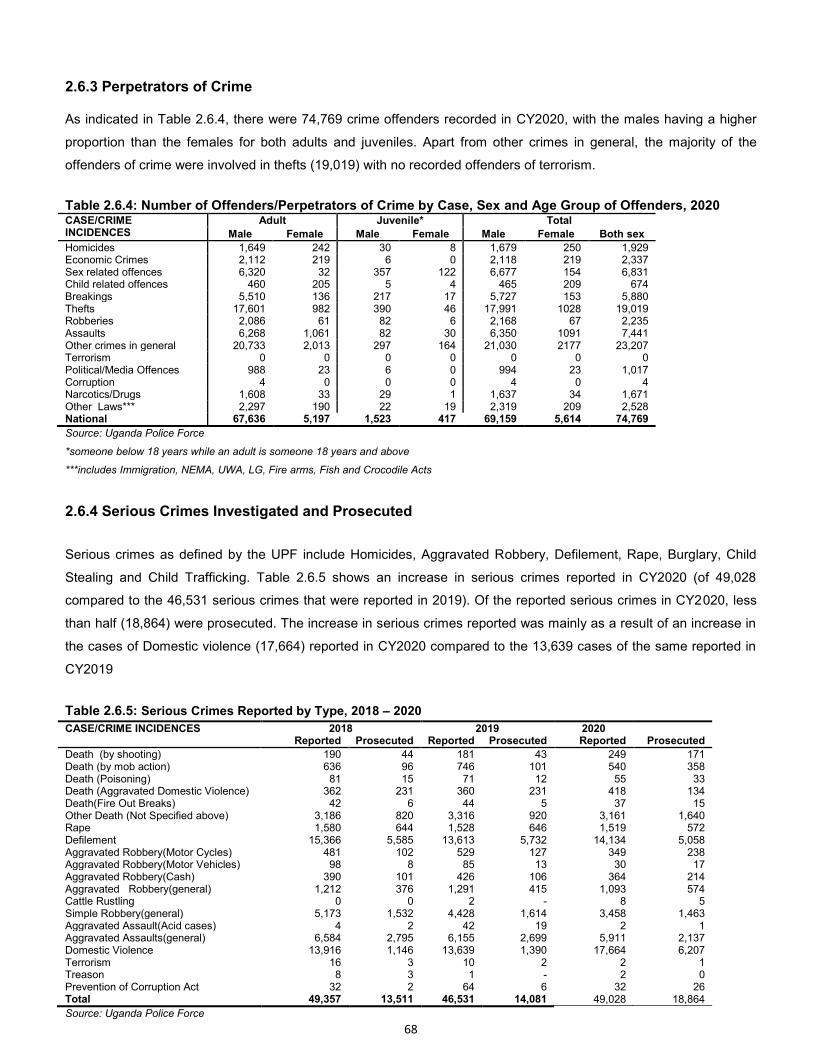
68
2.6.3 Perpetrators of Crime
As indicated in Table 2.6.4, there were 74,769 crime offenders recorded in CY2020, with the males having a higher
proportion than the females for both adults and juveniles. Apart from other crimes in general, the majority of the
offenders of crime were involved in thefts (19,019) with no recorded offenders of terrorism.
Table 2.6.4: Number of Offenders/Perpetrators of Crime by Case, Sex and Age Group of Offenders, 2020 CASE/CRIME INCIDENCES
Adult Juvenile* Total
Male Female Male Female Male Female Both sex
Homicides 1,649 242 30 8 1,679 250 1,929 Economic Crimes 2,112 219 6 0 2,118 219 2,337 Sex related offences 6,320 32 357 122 6,677 154 6,831 Child related offences 460 205 5 4 465 209 674 Breakings 5,510 136 217 17 5,727 153 5,880 Thefts 17,601 982 390 46 17,991 1028 19,019 Robberies 2,086 61 82 6 2,168 67 2,235 Assaults 6,268 1,061 82 30 6,350 1091 7,441 Other crimes in general 20,733 2,013 297 164 21,030 2177 23,207 Terrorism 0 0 0 0 0 0 0 Political/Media Offences 988 23 6 0 994 23 1,017 Corruption 4 0 0 0 4 0 4 Narcotics/Drugs 1,608 33 29 1 1,637 34 1,671 Other Laws*** 2,297 190 22 19 2,319 209 2,528 National 67,636 5,197 1,523 417 69,159 5,614 74,769
Source: Uganda Police Force
*someone below 18 years while an adult is someone 18 years and above
***includes Immigration, NEMA, UWA, LG, Fire arms, Fish and Crocodile Acts
2.6.4 Serious Crimes Investigated and Prosecuted
Serious crimes as defined by the UPF include Homicides, Aggravated Robbery, Defilement, Rape, Burglary, Child
Stealing and Child Trafficking. Table 2.6.5 shows an increase in serious crimes reported in CY2020 (of 49,028
compared to the 46,531 serious crimes that were reported in 2019). Of the reported serious crimes in CY2020, less
than half (18,864) were prosecuted. The increase in serious crimes reported was mainly as a result of an increase in
the cases of Domestic violence (17,664) reported in CY2020 compared to the 13,639 cases of the same reported in
CY2019
Table 2.6.5: Serious Crimes Reported by Type, 2018 – 2020
CASE/CRIME INCIDENCES 2018 2019 2020 Reported Prosecuted Reported Prosecuted Reported Prosecuted
Death (by shooting) 190 44 181 43 249 171 Death (by mob action) 636 96 746 101 540 358 Death (Poisoning) 81 15 71 12 55 33 Death (Aggravated Domestic Violence) 362 231 360 231 418 134 Death(Fire Out Breaks) 42 6 44 5 37 15 Other Death (Not Specified above) 3,186 820 3,316 920 3,161 1,640 Rape 1,580 644 1,528 646 1,519 572 Defilement 15,366 5,585 13,613 5,732 14,134 5,058 Aggravated Robbery(Motor Cycles) 481 102 529 127 349 238 Aggravated Robbery(Motor Vehicles) 98 8 85 13 30 17 Aggravated Robbery(Cash) 390 101 426 106 364 214 Aggravated Robbery(general) 1,212 376 1,291 415 1,093 574 Cattle Rustling 0 0 2 - 8 5 Simple Robbery(general) 5,173 1,532 4,428 1,614 3,458 1,463 Aggravated Assault(Acid cases) 4 2 42 19 2 1 Aggravated Assaults(general) 6,584 2,795 6,155 2,699 5,911 2,137 Domestic Violence 13,916 1,146 13,639 1,390 17,664 6,207 Terrorism 16 3 10 2 2 1 Treason 8 3 1 - 2 0 Prevention of Corruption Act 32 2 64 6 32 26 Total 49,357 13,511 46,531 14,081 49,028 18,864
Source: Uganda Police Force
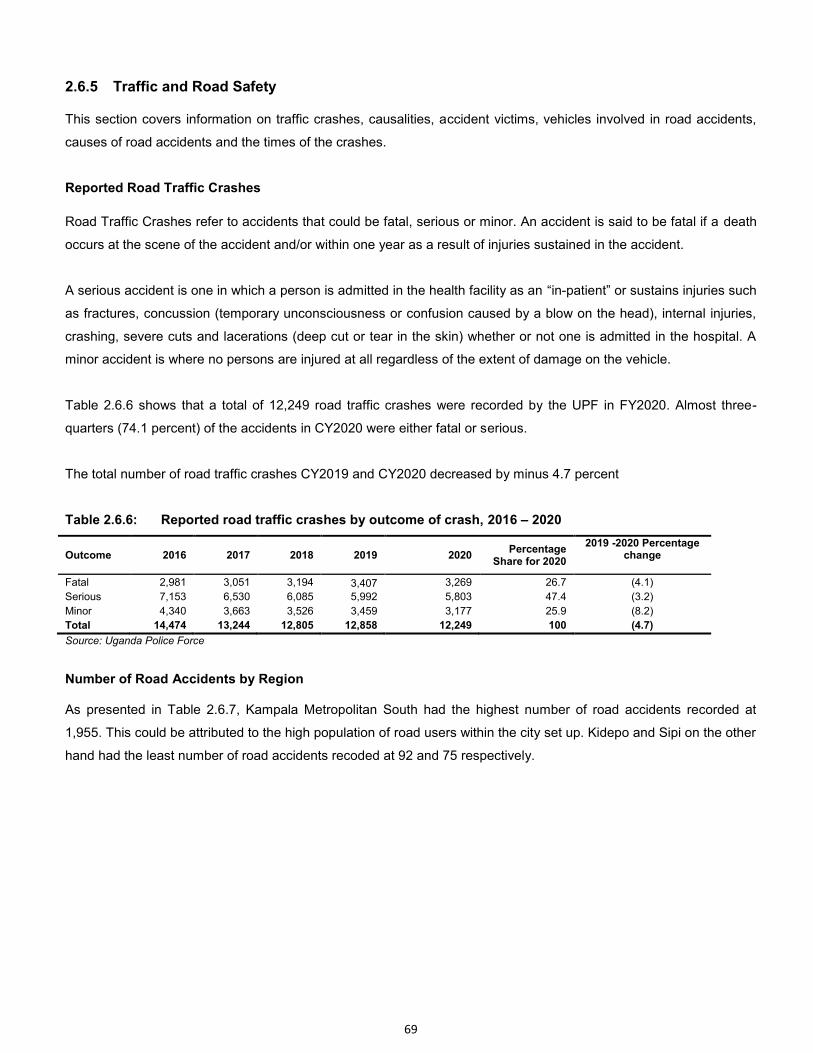
69
2.6.5 Traffic and Road Safety
This section covers information on traffic crashes, causalities, accident victims, vehicles involved in road accidents,
causes of road accidents and the times of the crashes.
Reported Road Traffic Crashes
Road Traffic Crashes refer to accidents that could be fatal, serious or minor. An accident is said to be fatal if a death
occurs at the scene of the accident and/or within one year as a result of injuries sustained in the accident.
A serious accident is one in which a person is admitted in the health facility as an “in-patient” or sustains injuries such
as fractures, concussion (temporary unconsciousness or confusion caused by a blow on the head), internal injuries,
crashing, severe cuts and lacerations (deep cut or tear in the skin) whether or not one is admitted in the hospital. A
minor accident is where no persons are injured at all regardless of the extent of damage on the vehicle.
Table 2.6.6 shows that a total of 12,249 road traffic crashes were recorded by the UPF in FY2020. Almost three-
quarters (74.1 percent) of the accidents in CY2020 were either fatal or serious.
The total number of road traffic crashes CY2019 and CY2020 decreased by minus 4.7 percent
Table 2.6.6: Reported road traffic crashes by outcome of crash, 2016 – 2020
Outcome 2016 2017 2018 2019 2020 Percentage
Share for 2020
2019 -2020 Percentage change
Fatal 2,981 3,051 3,194 3,407 3,269 26.7 (4.1)
Serious 7,153 6,530 6,085 5,992 5,803 47.4 (3.2)
Minor 4,340 3,663 3,526 3,459 3,177 25.9 (8.2)
Total 14,474 13,244 12,805 12,858 12,249 100 (4.7)
Source: Uganda Police Force
Number of Road Accidents by Region As presented in Table 2.6.7, Kampala Metropolitan South had the highest number of road accidents recorded at
1,955. This could be attributed to the high population of road users within the city set up. Kidepo and Sipi on the other
hand had the least number of road accidents recoded at 92 and 75 respectively.
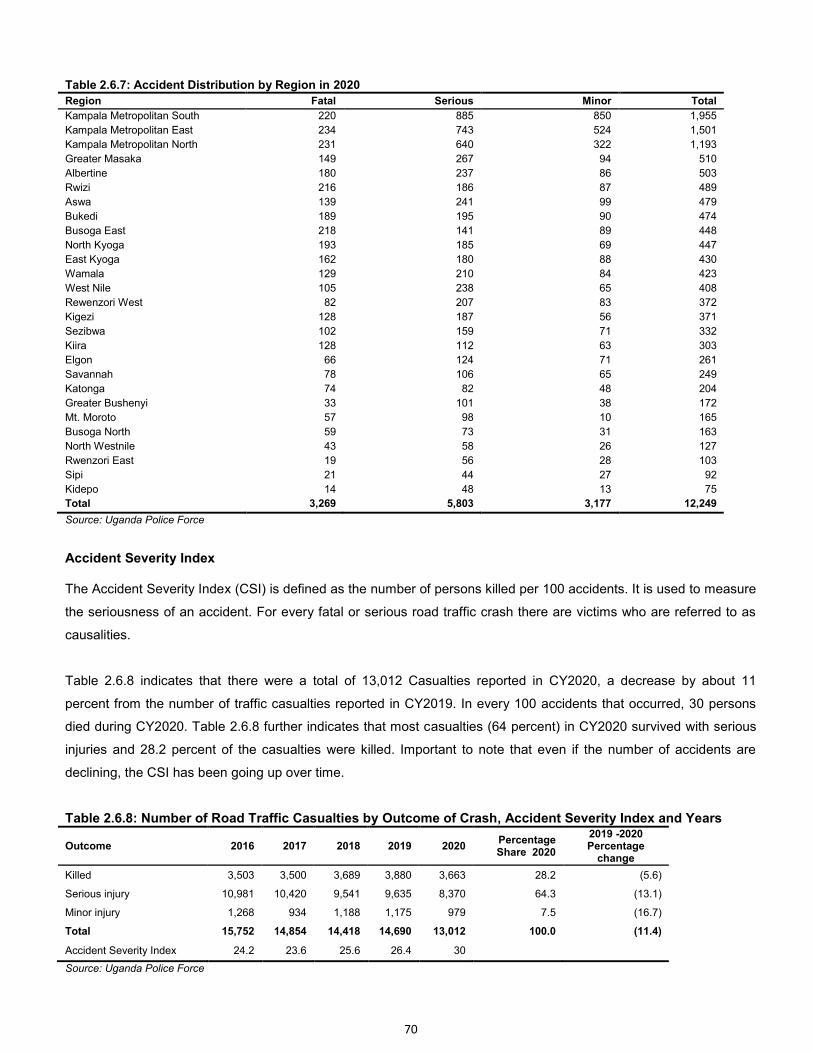
70
Table 2.6.7: Accident Distribution by Region in 2020 Region Fatal Serious Minor Total
Kampala Metropolitan South 220 885 850 1,955
Kampala Metropolitan East 234 743 524 1,501
Kampala Metropolitan North 231 640 322 1,193
Greater Masaka 149 267 94 510
Albertine 180 237 86 503
Rwizi 216 186 87 489
Aswa 139 241 99 479
Bukedi 189 195 90 474
Busoga East 218 141 89 448
North Kyoga 193 185 69 447
East Kyoga 162 180 88 430
Wamala 129 210 84 423
West Nile 105 238 65 408
Rewenzori West 82 207 83 372
Kigezi 128 187 56 371
Sezibwa 102 159 71 332
Kiira 128 112 63 303
Elgon 66 124 71 261
Savannah 78 106 65 249
Katonga 74 82 48 204
Greater Bushenyi 33 101 38 172
Mt. Moroto 57 98 10 165
Busoga North 59 73 31 163
North Westnile 43 58 26 127
Rwenzori East 19 56 28 103
Sipi 21 44 27 92
Kidepo 14 48 13 75
Total 3,269 5,803 3,177 12,249
Source: Uganda Police Force
Accident Severity Index The Accident Severity Index (CSI) is defined as the number of persons killed per 100 accidents. It is used to measure
the seriousness of an accident. For every fatal or serious road traffic crash there are victims who are referred to as
causalities.
Table 2.6.8 indicates that there were a total of 13,012 Casualties reported in CY2020, a decrease by about 11
percent from the number of traffic casualties reported in CY2019. In every 100 accidents that occurred, 30 persons
died during CY2020. Table 2.6.8 further indicates that most casualties (64 percent) in CY2020 survived with serious
injuries and 28.2 percent of the casualties were killed. Important to note that even if the number of accidents are
declining, the CSI has been going up over time.
Table 2.6.8: Number of Road Traffic Casualties by Outcome of Crash, Accident Severity Index and Years
Outcome 2016 2017 2018 2019 2020 Percentage Share 2020
2019 -2020 Percentage
change
Killed 3,503 3,500 3,689 3,880 3,663 28.2 (5.6)
Serious injury 10,981 10,420 9,541 9,635 8,370 64.3 (13.1)
Minor injury 1,268 934 1,188 1,175 979 7.5 (16.7)
Total 15,752 14,854 14,418 14,690 13,012 100.0 (11.4)
Accident Severity Index 24.2 23.6 25.6 26.4 30
Source: Uganda Police Force
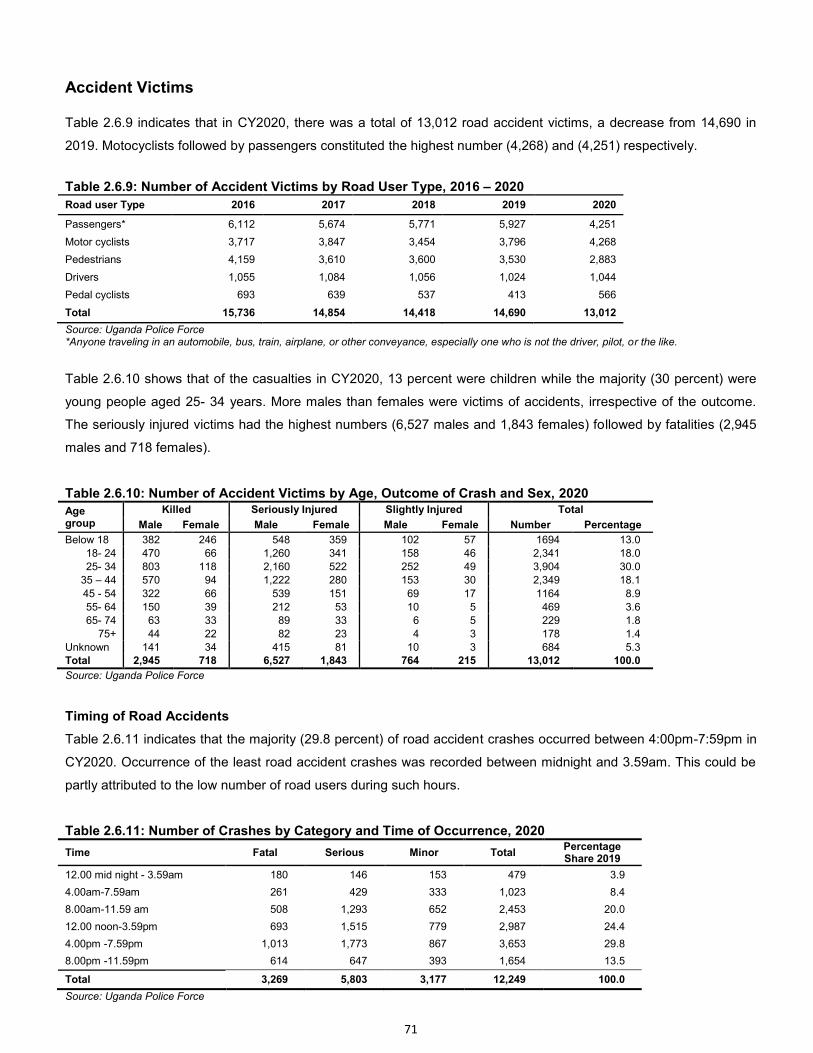
71
Accident Victims Table 2.6.9 indicates that in CY2020, there was a total of 13,012 road accident victims, a decrease from 14,690 in
2019. Motocyclists followed by passengers constituted the highest number (4,268) and (4,251) respectively.
Table 2.6.9: Number of Accident Victims by Road User Type, 2016 – 2020
Road user Type 2016 2017 2018 2019 2020
Passengers* 6,112 5,674 5,771 5,927 4,251
Motor cyclists 3,717 3,847 3,454 3,796 4,268
Pedestrians 4,159 3,610 3,600 3,530 2,883
Drivers 1,055 1,084 1,056 1,024 1,044
Pedal cyclists 693 639 537 413 566
Total 15,736 14,854 14,418 14,690 13,012
Source: Uganda Police Force *Anyone traveling in an automobile, bus, train, airplane, or other conveyance, especially one who is not the driver, pilot, or the like.
Table 2.6.10 shows that of the casualties in CY2020, 13 percent were children while the majority (30 percent) were
young people aged 25- 34 years. More males than females were victims of accidents, irrespective of the outcome.
The seriously injured victims had the highest numbers (6,527 males and 1,843 females) followed by fatalities (2,945
males and 718 females).
Table 2.6.10: Number of Accident Victims by Age, Outcome of Crash and Sex, 2020
Age group
Killed Seriously Injured Slightly Injured Total
Male Female Male Female Male Female Number Percentage
Below 18 382 246 548 359 102 57 1694 13.0
18- 24 470 66 1,260 341 158 46 2,341 18.0
25- 34 803 118 2,160 522 252 49 3,904 30.0
35 – 44 570 94 1,222 280 153 30 2,349 18.1
45 - 54 322 66 539 151 69 17 1164 8.9
55- 64 150 39 212 53 10 5 469 3.6
65- 74 63 33 89 33 6 5 229 1.8
75+ 44 22 82 23 4 3 178 1.4
Unknown 141 34 415 81 10 3 684 5.3
Total 2,945 718 6,527 1,843 764 215 13,012 100.0
Source: Uganda Police Force
Timing of Road Accidents
Table 2.6.11 indicates that the majority (29.8 percent) of road accident crashes occurred between 4:00pm-7:59pm in
CY2020. Occurrence of the least road accident crashes was recorded between midnight and 3.59am. This could be
partly attributed to the low number of road users during such hours.
Table 2.6.11: Number of Crashes by Category and Time of Occurrence, 2020
Time Fatal Serious Minor Total Percentage Share 2019
12.00 mid night - 3.59am 180 146 153 479 3.9
4.00am-7.59am 261 429 333 1,023 8.4
8.00am-11.59 am 508 1,293 652 2,453 20.0
12.00 noon-3.59pm 693 1,515 779 2,987 24.4
4.00pm -7.59pm 1,013 1,773 867 3,653 29.8
8.00pm -11.59pm 614 647 393 1,654 13.5
Total 3,269 5,803 3,177 12,249 100.0
Source: Uganda Police Force
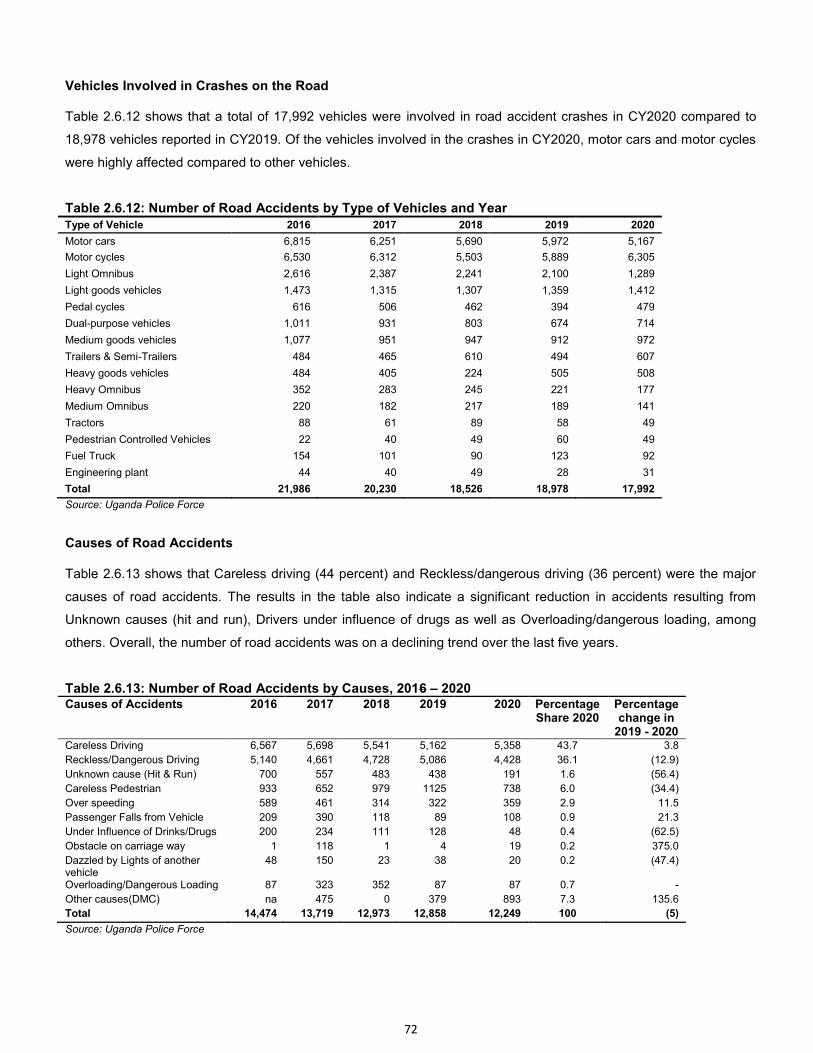
72
Vehicles Involved in Crashes on the Road Table 2.6.12 shows that a total of 17,992 vehicles were involved in road accident crashes in CY2020 compared to
18,978 vehicles reported in CY2019. Of the vehicles involved in the crashes in CY2020, motor cars and motor cycles
were highly affected compared to other vehicles.
Table 2.6.12: Number of Road Accidents by Type of Vehicles and Year Type of Vehicle 2016 2017 2018 2019 2020
Motor cars 6,815 6,251 5,690 5,972 5,167
Motor cycles 6,530 6,312 5,503 5,889 6,305
Light Omnibus 2,616 2,387 2,241 2,100 1,289
Light goods vehicles 1,473 1,315 1,307 1,359 1,412
Pedal cycles 616 506 462 394 479
Dual-purpose vehicles 1,011 931 803 674 714
Medium goods vehicles 1,077 951 947 912 972
Trailers & Semi-Trailers 484 465 610 494 607
Heavy goods vehicles 484 405 224 505 508
Heavy Omnibus 352 283 245 221 177
Medium Omnibus 220 182 217 189 141
Tractors 88 61 89 58 49
Pedestrian Controlled Vehicles 22 40 49 60 49
Fuel Truck 154 101 90 123 92
Engineering plant 44 40 49 28 31
Total 21,986 20,230 18,526 18,978 17,992
Source: Uganda Police Force
Causes of Road Accidents Table 2.6.13 shows that Careless driving (44 percent) and Reckless/dangerous driving (36 percent) were the major
causes of road accidents. The results in the table also indicate a significant reduction in accidents resulting from
Unknown causes (hit and run), Drivers under influence of drugs as well as Overloading/dangerous loading, among
others. Overall, the number of road accidents was on a declining trend over the last five years.
Table 2.6.13: Number of Road Accidents by Causes, 2016 – 2020 Causes of Accidents 2016 2017 2018 2019 2020 Percentage
Share 2020 Percentage change in
2019 - 2020 Careless Driving 6,567 5,698 5,541 5,162 5,358 43.7 3.8
Reckless/Dangerous Driving 5,140 4,661 4,728 5,086 4,428 36.1 (12.9)
Unknown cause (Hit & Run) 700 557 483 438 191 1.6 (56.4)
Careless Pedestrian 933 652 979 1125 738 6.0 (34.4)
Over speeding 589 461 314 322 359 2.9 11.5
Passenger Falls from Vehicle 209 390 118 89 108 0.9 21.3
Under Influence of Drinks/Drugs 200 234 111 128 48 0.4 (62.5)
Obstacle on carriage way 1 118 1 4 19 0.2 375.0
Dazzled by Lights of another vehicle
48 150 23 38 20 0.2 (47.4)
Overloading/Dangerous Loading 87 323 352 87 87 0.7 -
Other causes(DMC) na 475 0 379 893 7.3 135.6
Total 14,474 13,719 12,973 12,858 12,249 100 (5)
Source: Uganda Police Force
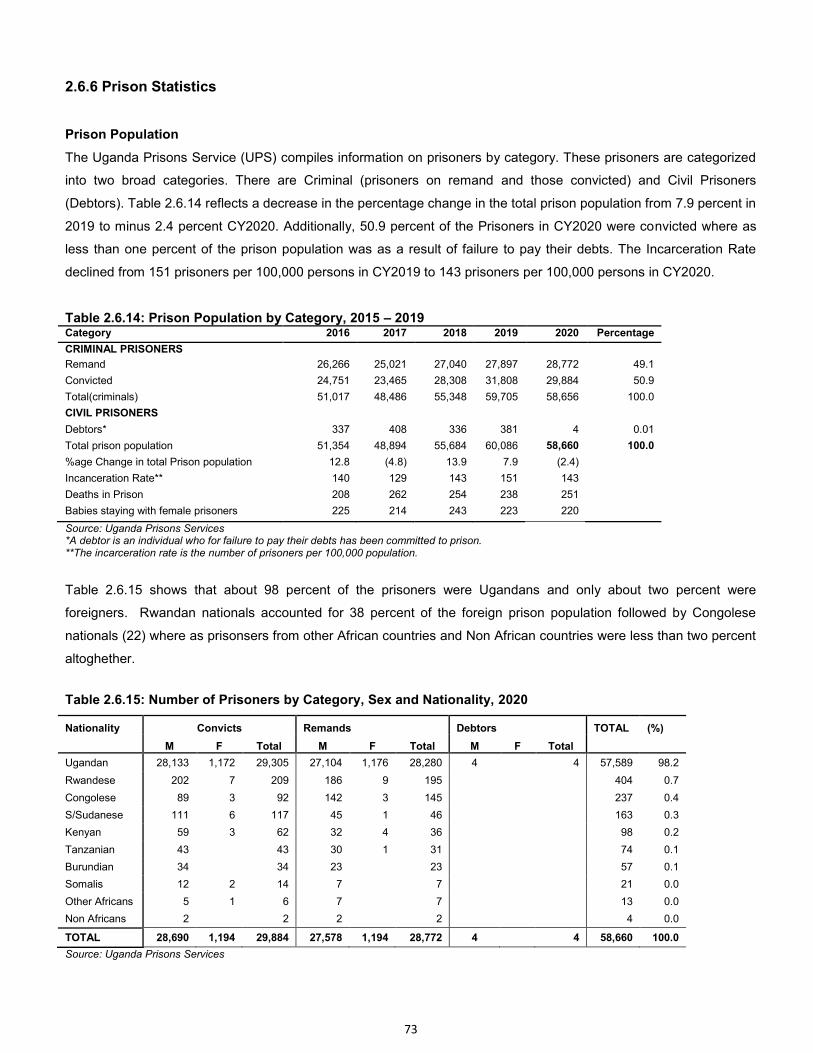
73
2.6.6 Prison Statistics
Prison Population
The Uganda Prisons Service (UPS) compiles information on prisoners by category. These prisoners are categorized
into two broad categories. There are Criminal (prisoners on remand and those convicted) and Civil Prisoners
(Debtors). Table 2.6.14 reflects a decrease in the percentage change in the total prison population from 7.9 percent in
2019 to minus 2.4 percent CY2020. Additionally, 50.9 percent of the Prisoners in CY2020 were convicted where as
less than one percent of the prison population was as a result of failure to pay their debts. The Incarceration Rate
declined from 151 prisoners per 100,000 persons in CY2019 to 143 prisoners per 100,000 persons in CY2020.
Table 2.6.14: Prison Population by Category, 2015 – 2019 Category 2016 2017 2018 2019 2020 Percentage
CRIMINAL PRISONERS
Remand 26,266 25,021 27,040 27,897 28,772 49.1
Convicted 24,751 23,465 28,308 31,808 29,884 50.9
Total(criminals) 51,017 48,486 55,348 59,705 58,656 100.0
CIVIL PRISONERS
Debtors* 337 408 336 381 4 0.01
Total prison population 51,354 48,894 55,684 60,086 58,660 100.0
%age Change in total Prison population 12.8 (4.8) 13.9 7.9 (2.4)
Incanceration Rate** 140 129 143 151
143
Deaths in Prison 208 262 254 238 251
Babies staying with female prisoners 225 214 243 223 220
Source: Uganda Prisons Services *A debtor is an individual who for failure to pay their debts has been committed to prison. **The incarceration rate is the number of prisoners per 100,000 population.
Table 2.6.15 shows that about 98 percent of the prisoners were Ugandans and only about two percent were
foreigners. Rwandan nationals accounted for 38 percent of the foreign prison population followed by Congolese
nationals (22) where as prisonsers from other African countries and Non African countries were less than two percent
altoghether.
Table 2.6.15: Number of Prisoners by Category, Sex and Nationality, 2020
Nationality Convicts Remands Debtors TOTAL (%)
M F Total M F Total M F Total Ugandan 28,133 1,172 29,305 27,104 1,176 28,280 4
4 57,589 98.2
Rwandese 202 7 209 186 9 195
404 0.7
Congolese 89 3 92 142 3 145
237 0.4
S/Sudanese 111 6 117 45 1 46
163 0.3
Kenyan 59 3 62 32 4 36
98 0.2
Tanzanian 43
43 30 1 31
74 0.1
Burundian 34
34 23
23
57 0.1
Somalis 12 2 14 7
7
21 0.0
Other Africans 5 1 6 7
7
13 0.0
Non Africans 2
2 2
2
4 0.0
TOTAL 28,690 1,194 29,884 27,578 1,194 28,772 4
4 58,660 100.0
Source: Uganda Prisons Services
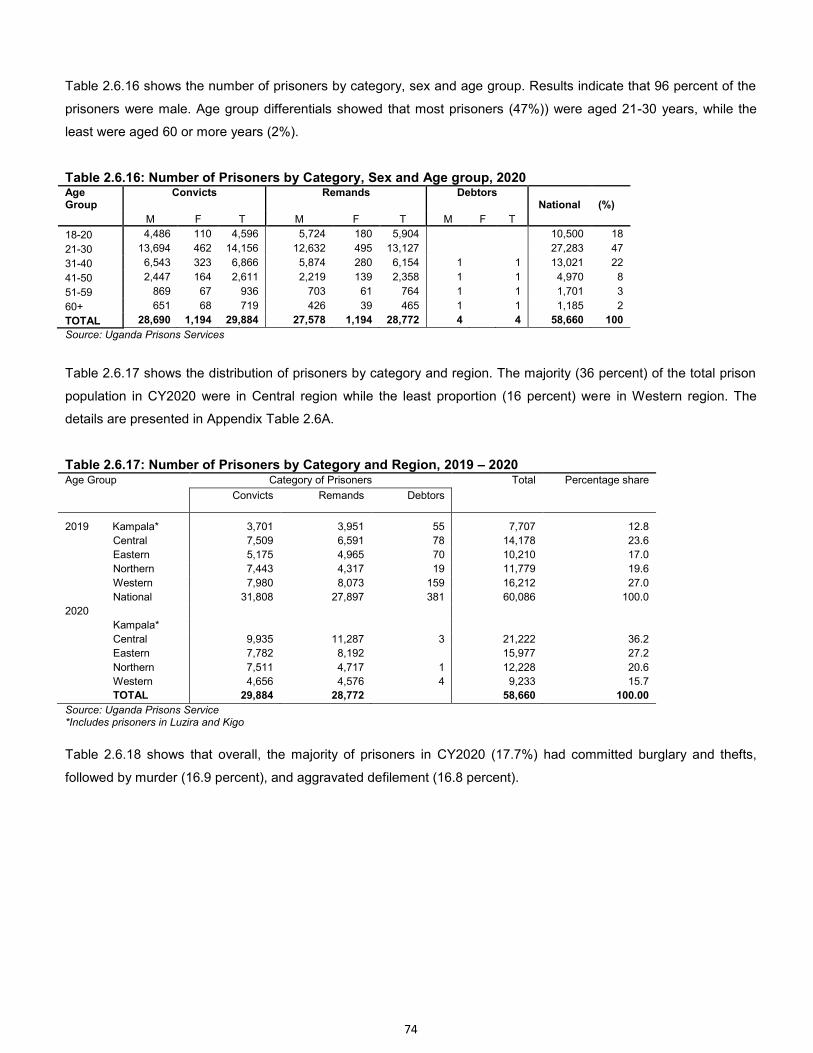
74
Table 2.6.16 shows the number of prisoners by category, sex and age group. Results indicate that 96 percent of the
prisoners were male. Age group differentials showed that most prisoners (47%)) were aged 21-30 years, while the
least were aged 60 or more years (2%).
Table 2.6.16: Number of Prisoners by Category, Sex and Age group, 2020 Age Group
Convicts
Remands
Debtors National (%)
M F T M F T M F T 18-20 4,486 110 4,596 5,724 180 5,904
10,500 18
21-30 13,694 462 14,156 12,632 495 13,127
27,283 47
31-40 6,543 323 6,866 5,874 280 6,154 1
1 13,021 22
41-50 2,447 164 2,611 2,219 139 2,358 1
1 4,970 8
51-59 869 67 936 703 61 764 1
1 1,701 3
60+ 651 68 719 426 39 465 1
1 1,185 2
TOTAL 28,690 1,194 29,884 27,578 1,194 28,772 4
4 58,660 100
Source: Uganda Prisons Services
Table 2.6.17 shows the distribution of prisoners by category and region. The majority (36 percent) of the total prison
population in CY2020 were in Central region while the least proportion (16 percent) were in Western region. The
details are presented in Appendix Table 2.6A.
Table 2.6.17: Number of Prisoners by Category and Region, 2019 – 2020 Age Group Category of Prisoners Total Percentage share
Convicts Remands Debtors
2019 Kampala* 3,701 3,951 55 7,707 12.8
Central 7,509 6,591 78 14,178 23.6
Eastern 5,175 4,965 70 10,210 17.0
Northern 7,443 4,317 19 11,779 19.6
Western 7,980 8,073 159 16,212 27.0
National 31,808 27,897 381 60,086 100.0
2020
Kampala*
Central 9,935 11,287 3 21,222 36.2
Eastern 7,782 8,192 15,977 27.2
Northern 7,511 4,717 1 12,228 20.6
Western 4,656 4,576 4 9,233 15.7
TOTAL 29,884 28,772 58,660 100.00
Source: Uganda Prisons Service *Includes prisoners in Luzira and Kigo
Table 2.6.18 shows that overall, the majority of prisoners in CY2020 (17.7%) had committed burglary and thefts,
followed by murder (16.9 percent), and aggravated defilement (16.8 percent).
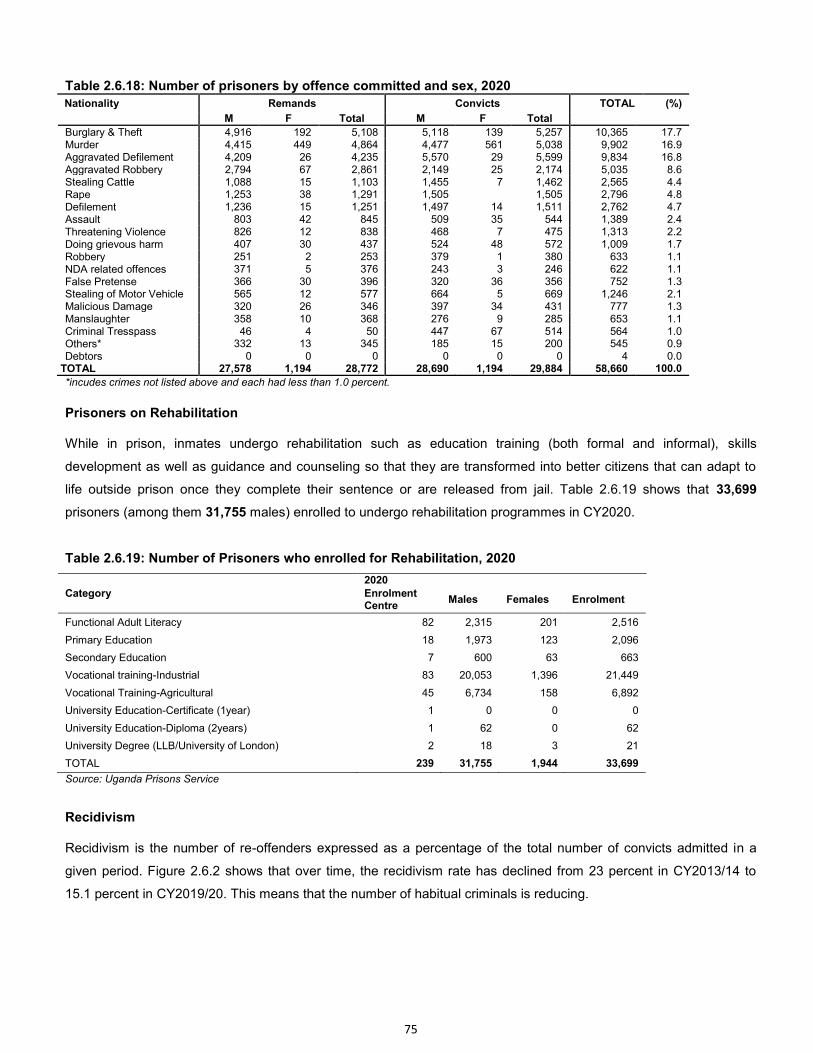
75
Table 2.6.18: Number of prisoners by offence committed and sex, 2020
Nationality Remands Convicts TOTAL (%)
M F Total M F Total
Burglary & Theft 4,916 192 5,108 5,118 139 5,257 10,365 17.7 Murder 4,415 449 4,864 4,477 561 5,038 9,902 16.9 Aggravated Defilement 4,209 26 4,235 5,570 29 5,599 9,834 16.8 Aggravated Robbery 2,794 67 2,861 2,149 25 2,174 5,035 8.6 Stealing Cattle 1,088 15 1,103 1,455 7 1,462 2,565 4.4 Rape 1,253 38 1,291 1,505 1,505 2,796 4.8 Defilement 1,236 15 1,251 1,497 14 1,511 2,762 4.7 Assault 803 42 845 509 35 544 1,389 2.4 Threatening Violence 826 12 838 468 7 475 1,313 2.2 Doing grievous harm 407 30 437 524 48 572 1,009 1.7 Robbery 251 2 253 379 1 380 633 1.1 NDA related offences 371 5 376 243 3 246 622 1.1 False Pretense 366 30 396 320 36 356 752 1.3 Stealing of Motor Vehicle 565 12 577 664 5 669 1,246 2.1 Malicious Damage 320 26 346 397 34 431 777 1.3 Manslaughter 358 10 368 276 9 285 653 1.1 Criminal Tresspass 46 4 50 447 67 514 564 1.0 Others* 332 13 345 185 15 200 545 0.9 Debtors 0 0 0 0 0 0 4 0.0
TOTAL 27,578 1,194 28,772 28,690 1,194 29,884 58,660 100.0
*incudes crimes not listed above and each had less than 1.0 percent.
Prisoners on Rehabilitation While in prison, inmates undergo rehabilitation such as education training (both formal and informal), skills
development as well as guidance and counseling so that they are transformed into better citizens that can adapt to
life outside prison once they complete their sentence or are released from jail. Table 2.6.19 shows that 33,699
prisoners (among them 31,755 males) enrolled to undergo rehabilitation programmes in CY2020.
Table 2.6.19: Number of Prisoners who enrolled for Rehabilitation, 2020
Category
2020
Enrolment Centre
Males Females Enrolment
Functional Adult Literacy 82 2,315 201 2,516
Primary Education 18 1,973 123 2,096
Secondary Education 7 600 63 663
Vocational training-Industrial 83 20,053 1,396 21,449
Vocational Training-Agricultural 45 6,734 158 6,892
University Education-Certificate (1year) 1 0 0 0
University Education-Diploma (2years) 1 62 0 62
University Degree (LLB/University of London) 2 18 3 21
TOTAL 239 31,755 1,944 33,699
Source: Uganda Prisons Service
Recidivism Recidivism is the number of re-offenders expressed as a percentage of the total number of convicts admitted in a
given period. Figure 2.6.2 shows that over time, the recidivism rate has declined from 23 percent in CY2013/14 to
15.1 percent in CY2019/20. This means that the number of habitual criminals is reducing.
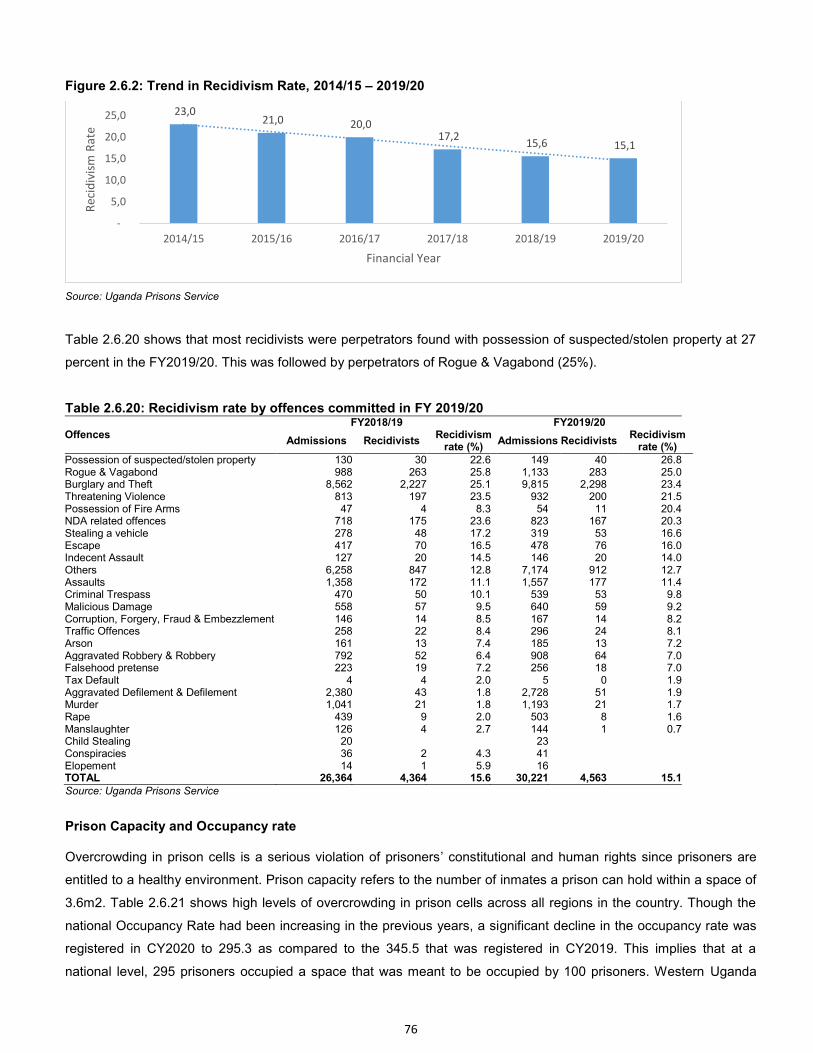
76
Figure 2.6.2: Trend in Recidivism Rate, 2014/15 – 2019/20
Source: Uganda Prisons Service
Table 2.6.20 shows that most recidivists were perpetrators found with possession of suspected/stolen property at 27
percent in the FY2019/20. This was followed by perpetrators of Rogue & Vagabond (25%).
Table 2.6.20: Recidivism rate by offences committed in FY 2019/20
Offences FY2018/19 FY2019/20
Admissions Recidivists Recidivism
rate (%) Admissions Recidivists
Recidivism rate (%)
Possession of suspected/stolen property 130 30 22.6 149 40 26.8 Rogue & Vagabond 988 263 25.8 1,133 283 25.0 Burglary and Theft 8,562 2,227 25.1 9,815 2,298 23.4 Threatening Violence 813 197 23.5 932 200 21.5 Possession of Fire Arms 47 4 8.3 54 11 20.4 NDA related offences 718 175 23.6 823 167 20.3 Stealing a vehicle 278 48 17.2 319 53 16.6 Escape 417 70 16.5 478 76 16.0 Indecent Assault 127 20 14.5 146 20 14.0 Others 6,258 847 12.8 7,174 912 12.7 Assaults 1,358 172 11.1 1,557 177 11.4 Criminal Trespass 470 50 10.1 539 53 9.8 Malicious Damage 558 57 9.5 640 59 9.2 Corruption, Forgery, Fraud & Embezzlement 146 14 8.5 167 14 8.2 Traffic Offences 258 22 8.4 296 24 8.1 Arson 161 13 7.4 185 13 7.2 Aggravated Robbery & Robbery 792 52 6.4 908 64 7.0 Falsehood pretense 223 19 7.2 256 18 7.0 Tax Default 4 4 2.0 5 0 1.9 Aggravated Defilement & Defilement 2,380 43 1.8 2,728 51 1.9 Murder 1,041 21 1.8 1,193 21 1.7 Rape 439 9 2.0 503 8 1.6 Manslaughter 126 4 2.7 144 1 0.7 Child Stealing 20 23 Conspiracies 36 2 4.3 41 Elopement 14 1 5.9 16 TOTAL 26,364 4,364 15.6 30,221 4,563 15.1 Source: Uganda Prisons Service
Prison Capacity and Occupancy rate Overcrowding in prison cells is a serious violation of prisoners’ constitutional and human rights since prisoners are
entitled to a healthy environment. Prison capacity refers to the number of inmates a prison can hold within a space of
3.6m2. Table 2.6.21 shows high levels of overcrowding in prison cells across all regions in the country. Though the
national Occupancy Rate had been increasing in the previous years, a significant decline in the occupancy rate was
registered in CY2020 to 295.3 as compared to the 345.5 that was registered in CY2019. This implies that at a
national level, 295 prisoners occupied a space that was meant to be occupied by 100 prisoners. Western Uganda
23,0 21,0 20,0
17,2 15,6 15,1
-
5,0
10,0
15,0
20,0
25,0
2014/15 2015/16 2016/17 2017/18 2018/19 2019/20
Re
cid
ivis
m R
ate
Financial Year
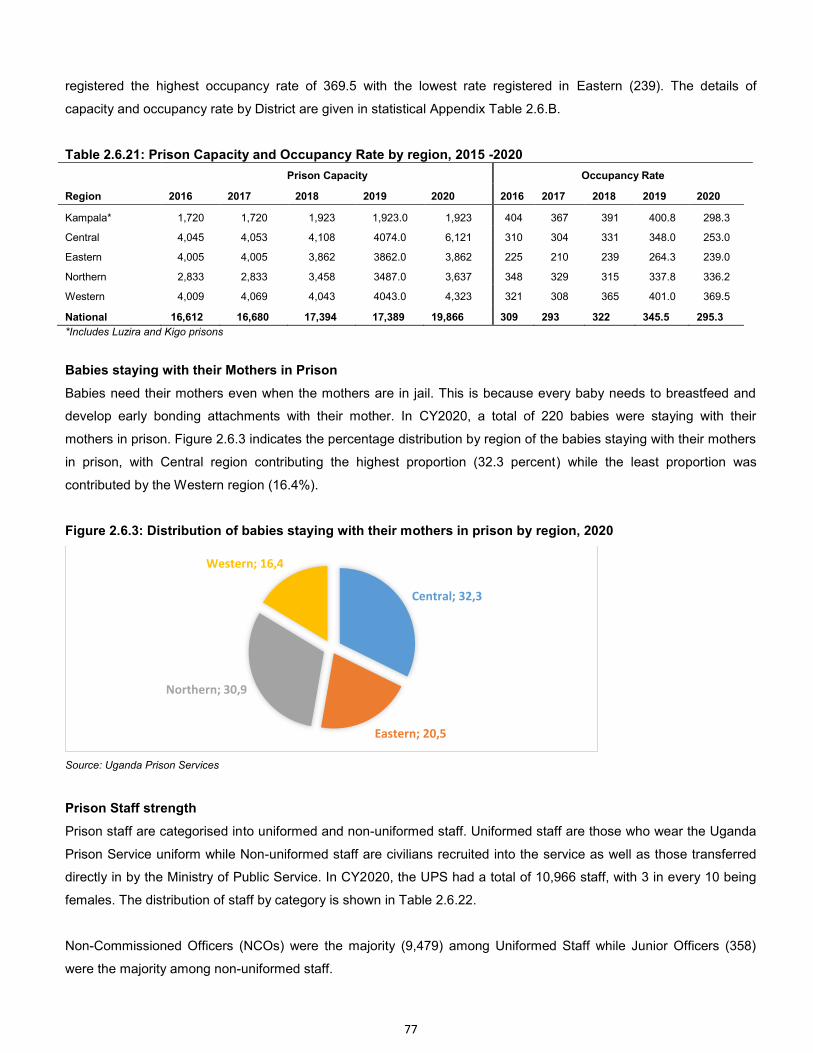
77
registered the highest occupancy rate of 369.5 with the lowest rate registered in Eastern (239). The details of
capacity and occupancy rate by District are given in statistical Appendix Table 2.6.B.
Table 2.6.21: Prison Capacity and Occupancy Rate by region, 2015 -2020
Region
Prison Capacity Occupancy Rate
2016 2017 2018 2019 2020 2016 2017 2018 2019 2020
Kampala* 1,720 1,720 1,923 1,923.0 1,923 404 367 391 400.8 298.3
Central 4,045 4,053 4,108 4074.0 6,121 310 304 331 348.0 253.0
Eastern 4,005 4,005 3,862 3862.0 3,862 225 210 239 264.3 239.0
Northern 2,833 2,833 3,458 3487.0 3,637 348 329 315 337.8 336.2
Western 4,009 4,069 4,043 4043.0 4,323 321 308 365 401.0 369.5
National 16,612 16,680 17,394 17,389 19,866 309 293 322 345.5 295.3
*Includes Luzira and Kigo prisons
Babies staying with their Mothers in Prison
Babies need their mothers even when the mothers are in jail. This is because every baby needs to breastfeed and
develop early bonding attachments with their mother. In CY2020, a total of 220 babies were staying with their
mothers in prison. Figure 2.6.3 indicates the percentage distribution by region of the babies staying with their mothers
in prison, with Central region contributing the highest proportion (32.3 percent) while the least proportion was
contributed by the Western region (16.4%).
Figure 2.6.3: Distribution of babies staying with their mothers in prison by region, 2020
Source: Uganda Prison Services
Prison Staff strength
Prison staff are categorised into uniformed and non-uniformed staff. Uniformed staff are those who wear the Uganda
Prison Service uniform while Non-uniformed staff are civilians recruited into the service as well as those transferred
directly in by the Ministry of Public Service. In CY2020, the UPS had a total of 10,966 staff, with 3 in every 10 being
females. The distribution of staff by category is shown in Table 2.6.22.
Non-Commissioned Officers (NCOs) were the majority (9,479) among Uniformed Staff while Junior Officers (358)
were the majority among non-uniformed staff.
Central; 32,3
Eastern; 20,5
Northern; 30,9
Western; 16,4
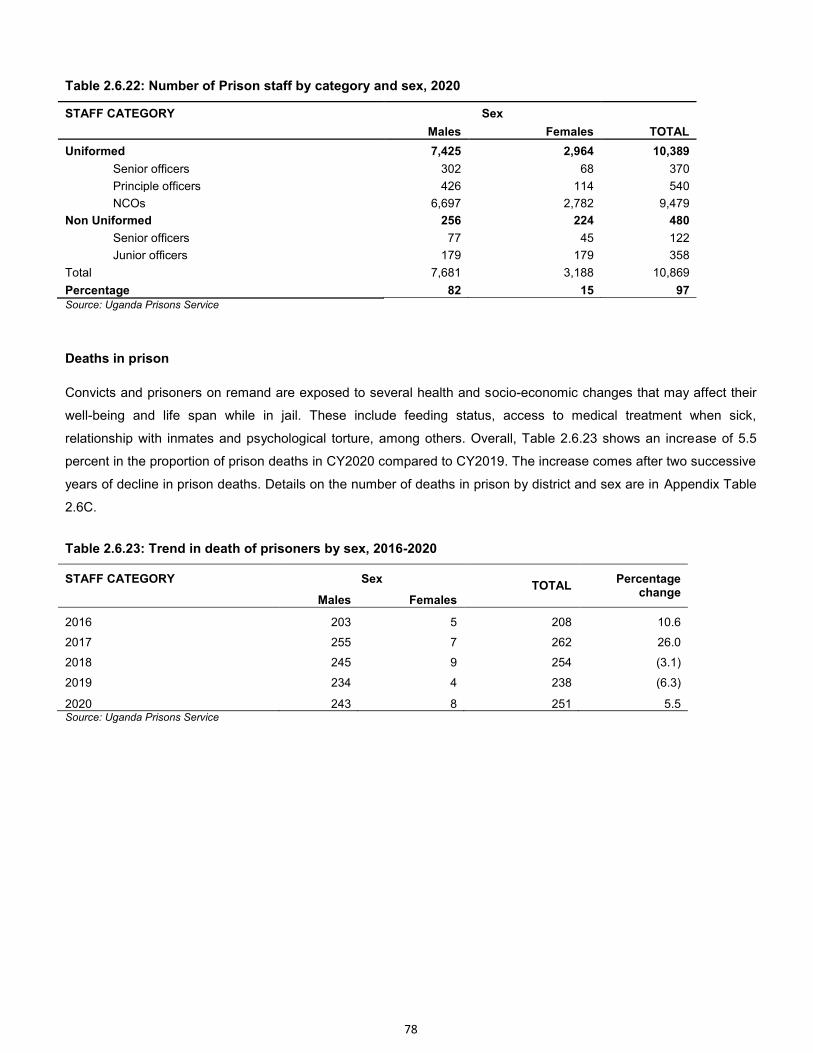
78
Table 2.6.22: Number of Prison staff by category and sex, 2020
STAFF CATEGORY Sex Males Females TOTAL
Uniformed 7,425 2,964 10,389
Senior officers 302 68 370
Principle officers 426 114 540
NCOs 6,697 2,782 9,479
Non Uniformed 256 224 480
Senior officers 77 45 122
Junior officers 179 179 358
Total 7,681 3,188 10,869
Percentage 82 15 97 Source: Uganda Prisons Service
Deaths in prison
Convicts and prisoners on remand are exposed to several health and socio-economic changes that may affect their
well-being and life span while in jail. These include feeding status, access to medical treatment when sick,
relationship with inmates and psychological torture, among others. Overall, Table 2.6.23 shows an increase of 5.5
percent in the proportion of prison deaths in CY2020 compared to CY2019. The increase comes after two successive
years of decline in prison deaths. Details on the number of deaths in prison by district and sex are in Appendix Table
2.6C.
Table 2.6.23: Trend in death of prisoners by sex, 2016-2020
STAFF CATEGORY Sex TOTAL
Percentage change
Males Females
2016 203 5 208 10.6
2017 255 7 262 26.0
2018 245 9 254 (3.1)
2019 234 4 238 (6.3)
2020 243 8 251 5.5 Source: Uganda Prisons Service
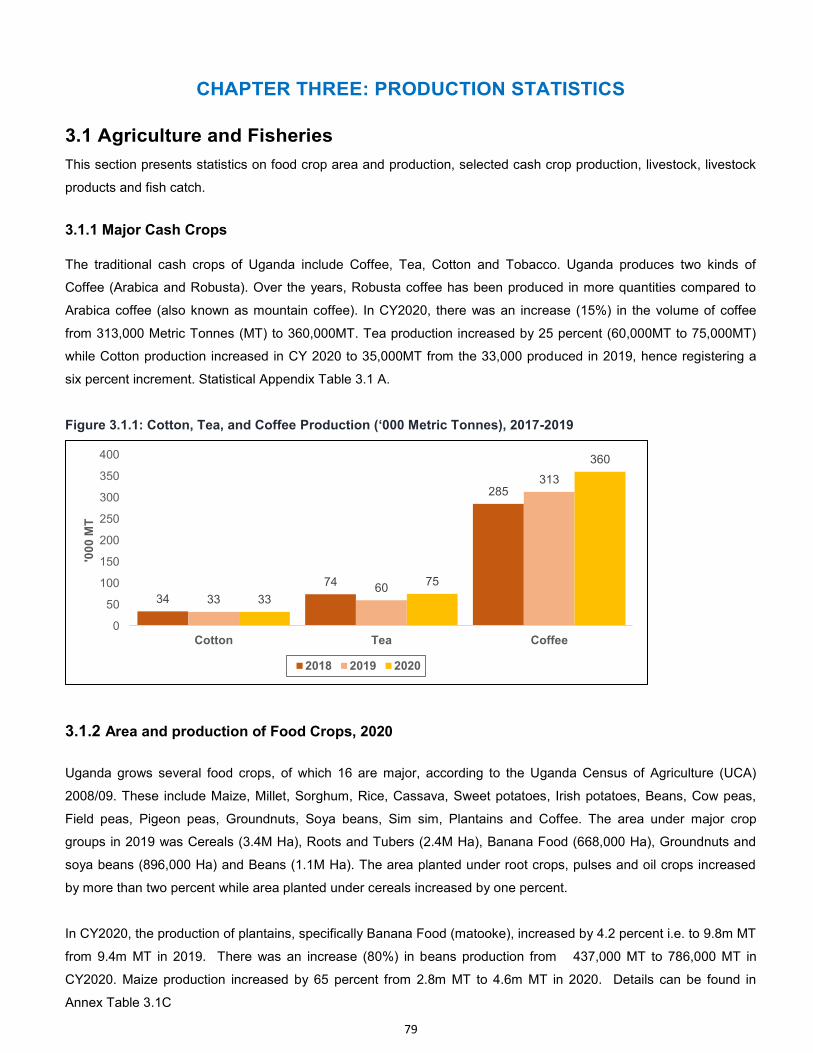
79
CHAPTER THREE: PRODUCTION STATISTICS
3.1 Agriculture and Fisheries
This section presents statistics on food crop area and production, selected cash crop production, livestock, livestock
products and fish catch.
3.1.1 Major Cash Crops
The traditional cash crops of Uganda include Coffee, Tea, Cotton and Tobacco. Uganda produces two kinds of
Coffee (Arabica and Robusta). Over the years, Robusta coffee has been produced in more quantities compared to
Arabica coffee (also known as mountain coffee). In CY2020, there was an increase (15%) in the volume of coffee
from 313,000 Metric Tonnes (MT) to 360,000MT. Tea production increased by 25 percent (60,000MT to 75,000MT)
while Cotton production increased in CY 2020 to 35,000MT from the 33,000 produced in 2019, hence registering a
six percent increment. Statistical Appendix Table 3.1 A.
Figure 3.1.1: Cotton, Tea, and Coffee Production (‘000 Metric Tonnes), 2017-2019
3.1.2 Area and production of Food Crops, 2020
Uganda grows several food crops, of which 16 are major, according to the Uganda Census of Agriculture (UCA)
2008/09. These include Maize, Millet, Sorghum, Rice, Cassava, Sweet potatoes, Irish potatoes, Beans, Cow peas,
Field peas, Pigeon peas, Groundnuts, Soya beans, Sim sim, Plantains and Coffee. The area under major crop
groups in 2019 was Cereals (3.4M Ha), Roots and Tubers (2.4M Ha), Banana Food (668,000 Ha), Groundnuts and
soya beans (896,000 Ha) and Beans (1.1M Ha). The area planted under root crops, pulses and oil crops increased
by more than two percent while area planted under cereals increased by one percent.
In CY2020, the production of plantains, specifically Banana Food (matooke), increased by 4.2 percent i.e. to 9.8m MT
from 9.4m MT in 2019. There was an increase (80%) in beans production from 437,000 MT to 786,000 MT in
CY2020. Maize production increased by 65 percent from 2.8m MT to 4.6m MT in 2020. Details can be found in
Annex Table 3.1C
34
74
285
33 60
313
33
75
360
0
50
100
150
200
250
300
350
400
Cotton Tea Coffee
'00
0 M
T
2018 2019 2020
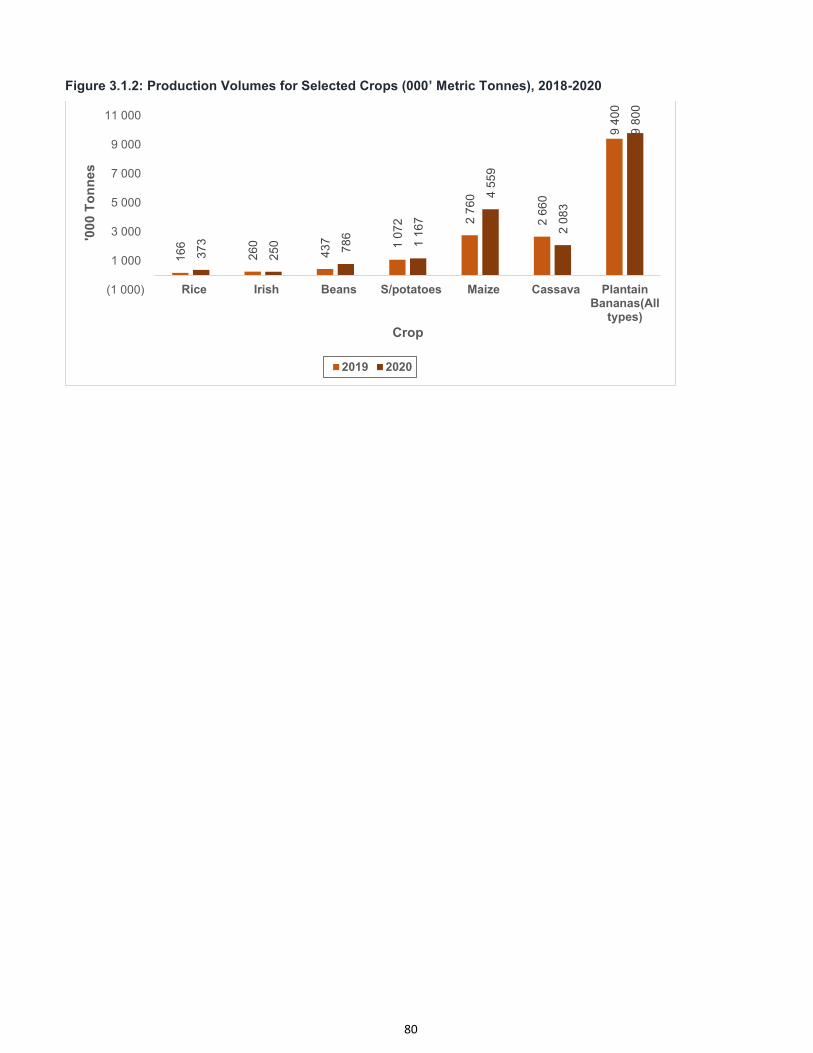
80
Figure 3.1.2: Production Volumes for Selected Crops (000’ Metric Tonnes), 2018-2020
16
6
26
0
43
7
1 0
72
2 7
60
2 6
60
9 4
00
37
3
25
0
78
6
1 1
67
4 5
59
2 0
83
9 8
00
(1 000)
1 000
3 000
5 000
7 000
9 000
11 000
Rice Irish Beans S/potatoes Maize Cassava PlantainBananas(All
types)
'000 T
on
nes
Crop
2019 2020
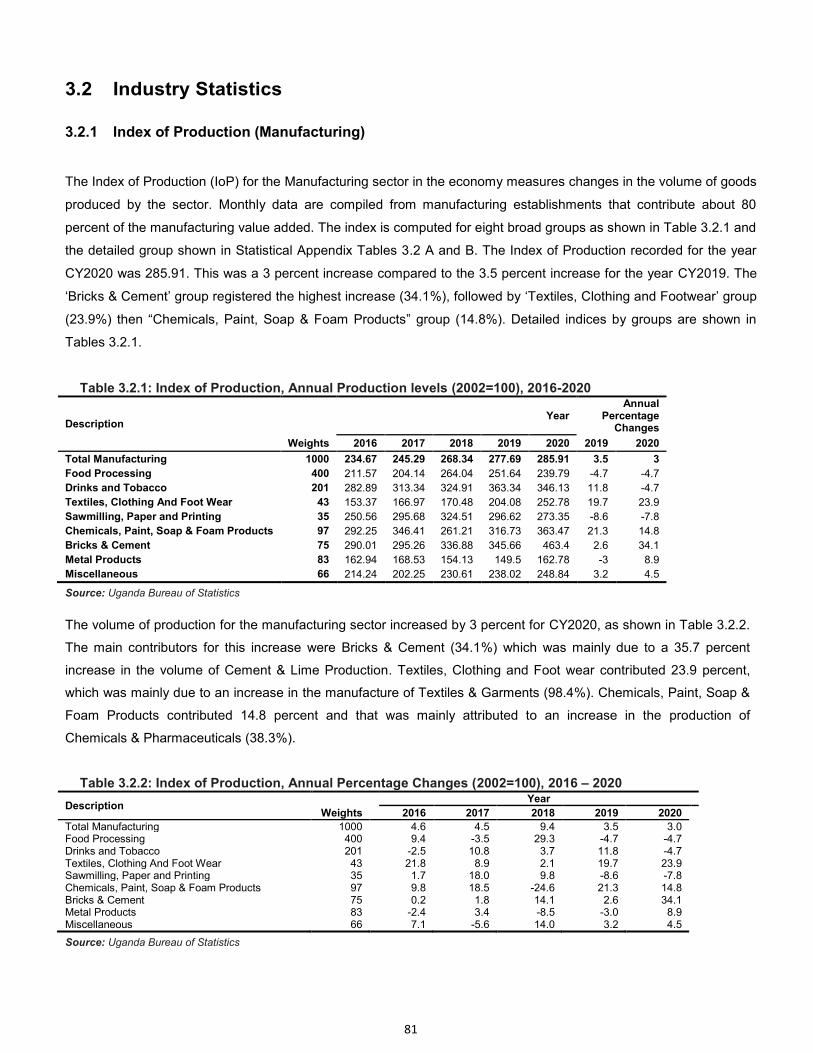
81
3.2 Industry Statistics
3.2.1 Index of Production (Manufacturing)
The Index of Production (IoP) for the Manufacturing sector in the economy measures changes in the volume of goods
produced by the sector. Monthly data are compiled from manufacturing establishments that contribute about 80
percent of the manufacturing value added. The index is computed for eight broad groups as shown in Table 3.2.1 and
the detailed group shown in Statistical Appendix Tables 3.2 A and B. The Index of Production recorded for the year
CY2020 was 285.91. This was a 3 percent increase compared to the 3.5 percent increase for the year CY2019. The
‘Bricks & Cement’ group registered the highest increase (34.1%), followed by ‘Textiles, Clothing and Footwear’ group
(23.9%) then “Chemicals, Paint, Soap & Foam Products” group (14.8%). Detailed indices by groups are shown in
Tables 3.2.1.
Table 3.2.1: Index of Production, Annual Production levels (2002=100), 2016-2020
Description Year
Annual Percentage
Changes
Weights 2016 2017 2018 2019 2020 2019 2020
Total Manufacturing 1000 234.67 245.29 268.34 277.69 285.91 3.5 3
Food Processing 400 211.57 204.14 264.04 251.64 239.79 -4.7 -4.7
Drinks and Tobacco 201 282.89 313.34 324.91 363.34 346.13 11.8 -4.7
Textiles, Clothing And Foot Wear 43 153.37 166.97 170.48 204.08 252.78 19.7 23.9
Sawmilling, Paper and Printing 35 250.56 295.68 324.51 296.62 273.35 -8.6 -7.8
Chemicals, Paint, Soap & Foam Products 97 292.25 346.41 261.21 316.73 363.47 21.3 14.8
Bricks & Cement 75 290.01 295.26 336.88 345.66 463.4 2.6 34.1
Metal Products 83 162.94 168.53 154.13 149.5 162.78 -3 8.9
Miscellaneous 66 214.24 202.25 230.61 238.02 248.84 3.2 4.5
Source: Uganda Bureau of Statistics
The volume of production for the manufacturing sector increased by 3 percent for CY2020, as shown in Table 3.2.2.
The main contributors for this increase were Bricks & Cement (34.1%) which was mainly due to a 35.7 percent
increase in the volume of Cement & Lime Production. Textiles, Clothing and Foot wear contributed 23.9 percent,
which was mainly due to an increase in the manufacture of Textiles & Garments (98.4%). Chemicals, Paint, Soap &
Foam Products contributed 14.8 percent and that was mainly attributed to an increase in the production of
Chemicals & Pharmaceuticals (38.3%).
Table 3.2.2: Index of Production, Annual Percentage Changes (2002=100), 2016 – 2020
Description Year
Weights 2016 2017 2018 2019 2020
Total Manufacturing 1000 4.6 4.5 9.4 3.5 3.0 Food Processing 400 9.4 -3.5 29.3 -4.7 -4.7 Drinks and Tobacco 201 -2.5 10.8 3.7 11.8 -4.7 Textiles, Clothing And Foot Wear 43 21.8 8.9 2.1 19.7 23.9 Sawmilling, Paper and Printing 35 1.7 18.0 9.8 -8.6 -7.8 Chemicals, Paint, Soap & Foam Products 97 9.8 18.5 -24.6 21.3 14.8 Bricks & Cement 75 0.2 1.8 14.1 2.6 34.1 Metal Products 83 -2.4 3.4 -8.5 -3.0 8.9 Miscellaneous 66 7.1 -5.6 14.0 3.2 4.5
Source: Uganda Bureau of Statistics
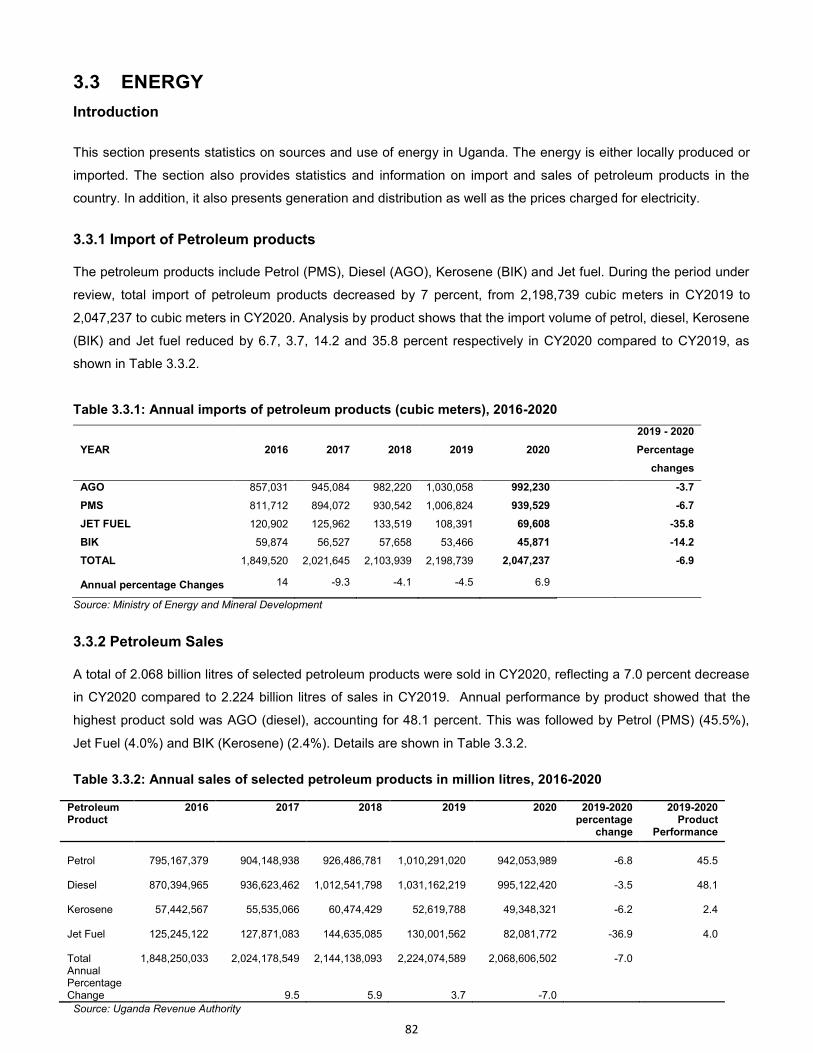
82
3.3 ENERGY
Introduction
This section presents statistics on sources and use of energy in Uganda. The energy is either locally produced or
imported. The section also provides statistics and information on import and sales of petroleum products in the
country. In addition, it also presents generation and distribution as well as the prices charged for electricity.
3.3.1 Import of Petroleum products
The petroleum products include Petrol (PMS), Diesel (AGO), Kerosene (BIK) and Jet fuel. During the period under
review, total import of petroleum products decreased by 7 percent, from 2,198,739 cubic meters in CY2019 to
2,047,237 to cubic meters in CY2020. Analysis by product shows that the import volume of petrol, diesel, Kerosene
(BIK) and Jet fuel reduced by 6.7, 3.7, 14.2 and 35.8 percent respectively in CY2020 compared to CY2019, as
shown in Table 3.3.2.
Table 3.3.1: Annual imports of petroleum products (cubic meters), 2016-2020
YEAR 2016 2017 2018 2019 2020
2019 - 2020
Percentage
changes
AGO 857,031 945,084 982,220 1,030,058 992,230 -3.7
PMS 811,712 894,072 930,542 1,006,824 939,529 -6.7
JET FUEL 120,902 125,962 133,519 108,391 69,608 -35.8
BIK 59,874 56,527 57,658 53,466 45,871 -14.2
TOTAL 1,849,520 2,021,645 2,103,939 2,198,739 2,047,237 -6.9
Annual percentage Changes 14 -9.3 -4.1 -4.5 6.9
Source: Ministry of Energy and Mineral Development
3.3.2 Petroleum Sales
A total of 2.068 billion litres of selected petroleum products were sold in CY2020, reflecting a 7.0 percent decrease
in CY2020 compared to 2.224 billion litres of sales in CY2019. Annual performance by product showed that the
highest product sold was AGO (diesel), accounting for 48.1 percent. This was followed by Petrol (PMS) (45.5%),
Jet Fuel (4.0%) and BIK (Kerosene) (2.4%). Details are shown in Table 3.3.2.
Table 3.3.2: Annual sales of selected petroleum products in million litres, 2016-2020
Petroleum Product
2016 2017 2018 2019 2020 2019-2020 percentage
change
2019-2020 Product
Performance
Petrol
795,167,379
904,148,938
926,486,781
1,010,291,020
942,053,989 -6.8 45.5
Diesel
870,394,965
936,623,462
1,012,541,798
1,031,162,219
995,122,420 -3.5 48.1
Kerosene
57,442,567
55,535,066
60,474,429
52,619,788
49,348,321 -6.2 2.4
Jet Fuel
125,245,122
127,871,083
144,635,085
130,001,562
82,081,772 -36.9 4.0
Total
1,848,250,033
2,024,178,549
2,144,138,093
2,224,074,589
2,068,606,502 -7.0 Annual
Percentage Change 9.5 5.9 3.7 -7.0
Source: Uganda Revenue Authority
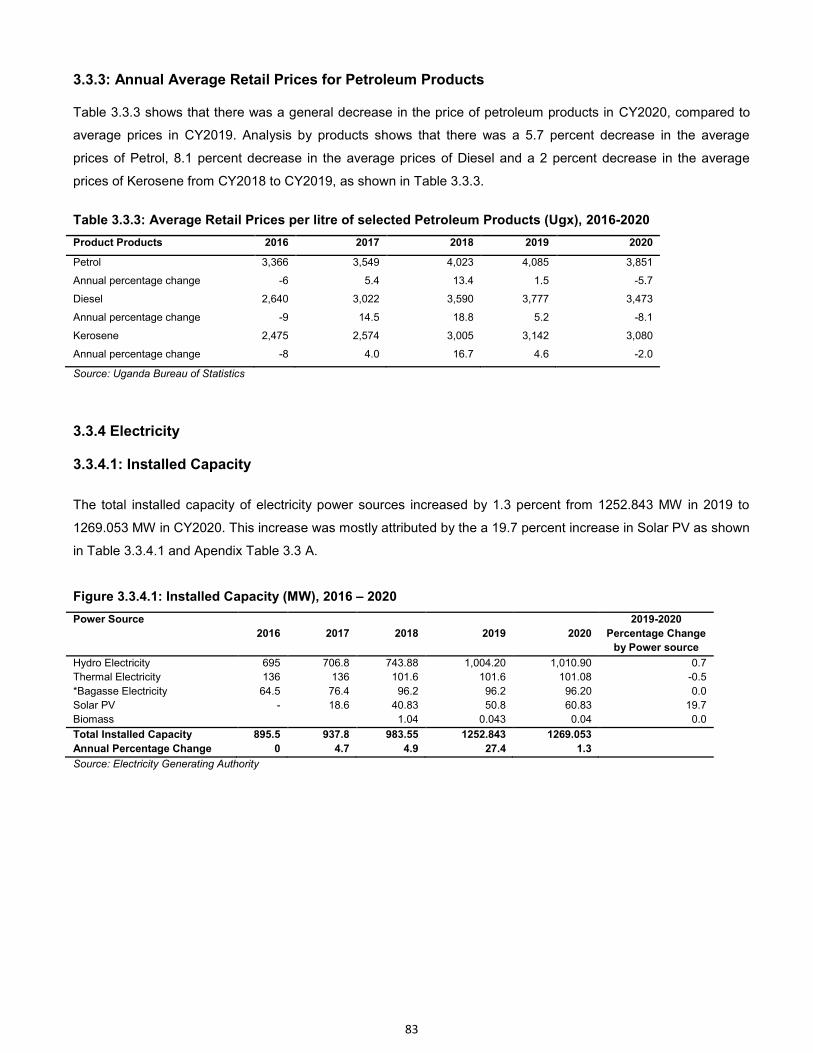
83
3.3.3: Annual Average Retail Prices for Petroleum Products
Table 3.3.3 shows that there was a general decrease in the price of petroleum products in CY2020, compared to
average prices in CY2019. Analysis by products shows that there was a 5.7 percent decrease in the average
prices of Petrol, 8.1 percent decrease in the average prices of Diesel and a 2 percent decrease in the average
prices of Kerosene from CY2018 to CY2019, as shown in Table 3.3.3.
Table 3.3.3: Average Retail Prices per litre of selected Petroleum Products (Ugx), 2016-2020
Product Products 2016 2017 2018 2019 2020
Petrol 3,366 3,549 4,023 4,085 3,851
Annual percentage change -6 5.4 13.4 1.5 -5.7
Diesel 2,640 3,022 3,590 3,777 3,473
Annual percentage change -9 14.5 18.8 5.2 -8.1
Kerosene 2,475 2,574 3,005 3,142 3,080
Annual percentage change -8 4.0 16.7 4.6 -2.0
Source: Uganda Bureau of Statistics
3.3.4 Electricity
3.3.4.1: Installed Capacity
The total installed capacity of electricity power sources increased by 1.3 percent from 1252.843 MW in 2019 to
1269.053 MW in CY2020. This increase was mostly attributed by the a 19.7 percent increase in Solar PV as shown
in Table 3.3.4.1 and Apendix Table 3.3 A.
Figure 3.3.4.1: Installed Capacity (MW), 2016 – 2020
Power Source
2016 2017 2018 2019 2020
2019-2020
Percentage Change
by Power source
Hydro Electricity 695 706.8 743.88 1,004.20 1,010.90 0.7
Thermal Electricity 136 136 101.6 101.6 101.08 -0.5
*Bagasse Electricity 64.5 76.4 96.2 96.2 96.20 0.0
Solar PV - 18.6 40.83 50.8 60.83 19.7
Biomass 1.04 0.043 0.04 0.0
Total Installed Capacity 895.5 937.8 983.55 1252.843 1269.053
Annual Percentage Change 0 4.7 4.9 27.4 1.3
Source: Electricity Generating Authority
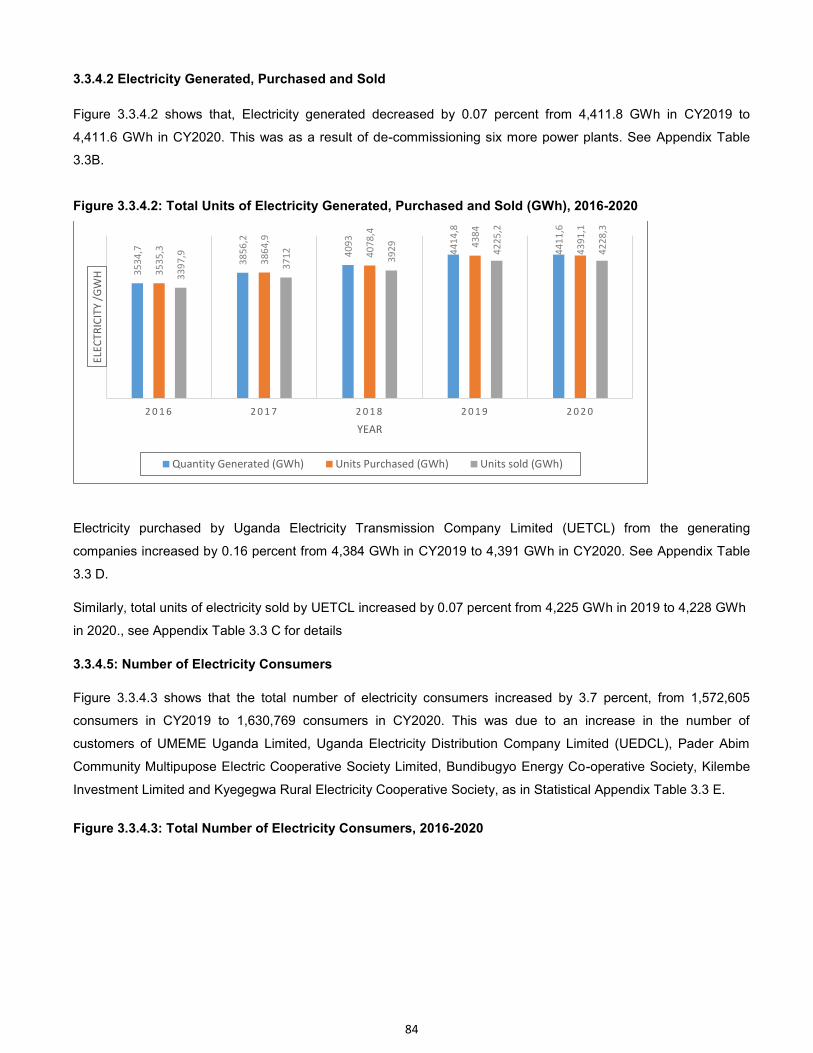
84
3.3.4.2 Electricity Generated, Purchased and Sold
Figure 3.3.4.2 shows that, Electricity generated decreased by 0.07 percent from 4,411.8 GWh in CY2019 to
4,411.6 GWh in CY2020. This was as a result of de-commissioning six more power plants. See Appendix Table
3.3B.
Figure 3.3.4.2: Total Units of Electricity Generated, Purchased and Sold (GWh), 2016-2020
Electricity purchased by Uganda Electricity Transmission Company Limited (UETCL) from the generating
companies increased by 0.16 percent from 4,384 GWh in CY2019 to 4,391 GWh in CY2020. See Appendix Table
3.3 D.
Similarly, total units of electricity sold by UETCL increased by 0.07 percent from 4,225 GWh in 2019 to 4,228 GWh
in 2020., see Appendix Table 3.3 C for details
3.3.4.5: Number of Electricity Consumers
Figure 3.3.4.3 shows that the total number of electricity consumers increased by 3.7 percent, from 1,572,605
consumers in CY2019 to 1,630,769 consumers in CY2020. This was due to an increase in the number of
customers of UMEME Uganda Limited, Uganda Electricity Distribution Company Limited (UEDCL), Pader Abim
Community Multipupose Electric Cooperative Society Limited, Bundibugyo Energy Co-operative Society, Kilembe
Investment Limited and Kyegegwa Rural Electricity Cooperative Society, as in Statistical Appendix Table 3.3 E.
Figure 3.3.4.3: Total Number of Electricity Consumers, 2016-2020
35
34
,7
38
56
,2
40
93
44
14
,8
44
11
,6
35
35
,3
38
64
,9
40
78
,4
43
84
43
91
,1
33
97
,9
37
12
39
29
42
25
,2
42
28
,3
2 0 1 6 2 0 1 7 2 0 1 8 2 0 1 9 2 0 2 0
ELE
CT
RIC
ITY
/G
WH
YEAR
Quantity Generated (GWh) Units Purchased (GWh) Units sold (GWh)
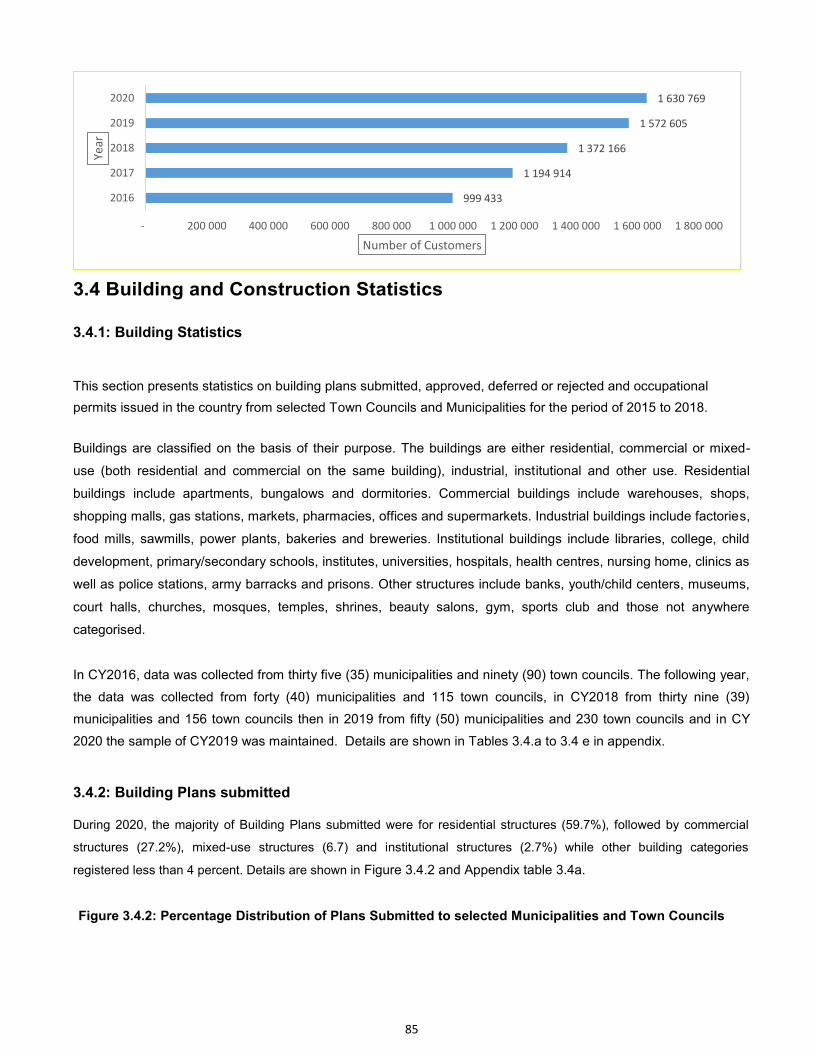
85
3.4 Building and Construction Statistics
3.4.1: Building Statistics
This section presents statistics on building plans submitted, approved, deferred or rejected and occupational
permits issued in the country from selected Town Councils and Municipalities for the period of 2015 to 2018.
Buildings are classified on the basis of their purpose. The buildings are either residential, commercial or mixed-
use (both residential and commercial on the same building), industrial, institutional and other use. Residential
buildings include apartments, bungalows and dormitories. Commercial buildings include warehouses, shops,
shopping malls, gas stations, markets, pharmacies, offices and supermarkets. Industrial buildings include factories,
food mills, sawmills, power plants, bakeries and breweries. Institutional buildings include libraries, college, child
development, primary/secondary schools, institutes, universities, hospitals, health centres, nursing home, clinics as
well as police stations, army barracks and prisons. Other structures include banks, youth/child centers, museums,
court halls, churches, mosques, temples, shrines, beauty salons, gym, sports club and those not anywhere
categorised.
In CY2016, data was collected from thirty five (35) municipalities and ninety (90) town councils. The following year,
the data was collected from forty (40) municipalities and 115 town councils, in CY2018 from thirty nine (39)
municipalities and 156 town councils then in 2019 from fifty (50) municipalities and 230 town councils and in CY
2020 the sample of CY2019 was maintained. Details are shown in Tables 3.4.a to 3.4 e in appendix.
3.4.2: Building Plans submitted
During 2020, the majority of Building Plans submitted were for residential structures (59.7%), followed by commercial
structures (27.2%), mixed-use structures (6.7) and institutional structures (2.7%) while other building categories
registered less than 4 percent. Details are shown in Figure 3.4.2 and Appendix table 3.4a.
Figure 3.4.2: Percentage Distribution of Plans Submitted to selected Municipalities and Town Councils
999 433
1 194 914
1 372 166
1 572 605
1 630 769
- 200 000 400 000 600 000 800 000 1 000 000 1 200 000 1 400 000 1 600 000 1 800 000
2016
2017
2018
2019
2020
Number of Customers
Ye
ar
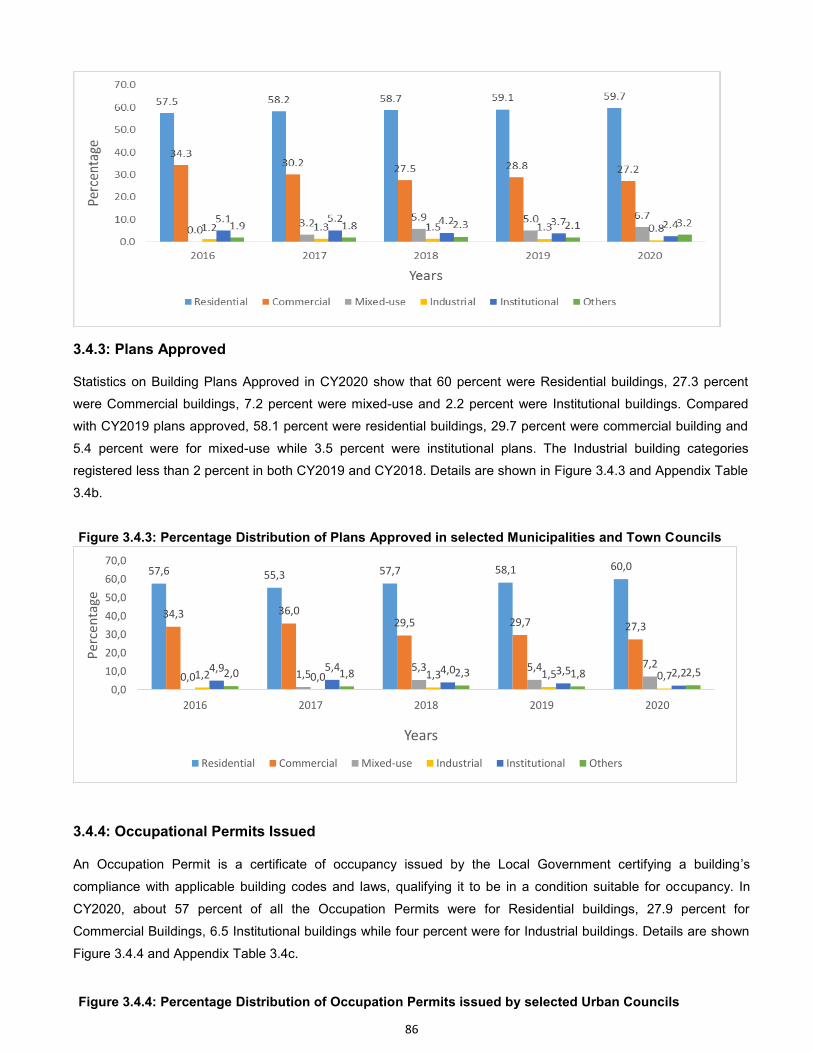
86
3.4.3: Plans Approved
Statistics on Building Plans Approved in CY2020 show that 60 percent were Residential buildings, 27.3 percent
were Commercial buildings, 7.2 percent were mixed-use and 2.2 percent were Institutional buildings. Compared
with CY2019 plans approved, 58.1 percent were residential buildings, 29.7 percent were commercial building and
5.4 percent were for mixed-use while 3.5 percent were institutional plans. The Industrial building categories
registered less than 2 percent in both CY2019 and CY2018. Details are shown in Figure 3.4.3 and Appendix Table
3.4b.
Figure 3.4.3: Percentage Distribution of Plans Approved in selected Municipalities and Town Councils
3.4.4: Occupational Permits Issued
An Occupation Permit is a certificate of occupancy issued by the Local Government certifying a building’s
compliance with applicable building codes and laws, qualifying it to be in a condition suitable for occupancy. In
CY2020, about 57 percent of all the Occupation Permits were for Residential buildings, 27.9 percent for
Commercial Buildings, 6.5 Institutional buildings while four percent were for Industrial buildings. Details are shown
Figure 3.4.4 and Appendix Table 3.4c.
Figure 3.4.4: Percentage Distribution of Occupation Permits issued by selected Urban Councils
57,6 55,3 57,7 58,1 60,0
34,3 36,0 29,5 29,7 27,3
0,0 1,5 5,3 5,4 7,2
1,2 0,0 1,3 1,5 0,7 4,9 5,4 4,0 3,5 2,2 2,0 1,8 2,3 1,8 2,5
0,0
10,0
20,0
30,0
40,0
50,0
60,0
70,0
2016 2017 2018 2019 2020
Pe
rce
nta
ge
Years
Residential Commercial Mixed-use Industrial Institutional Others
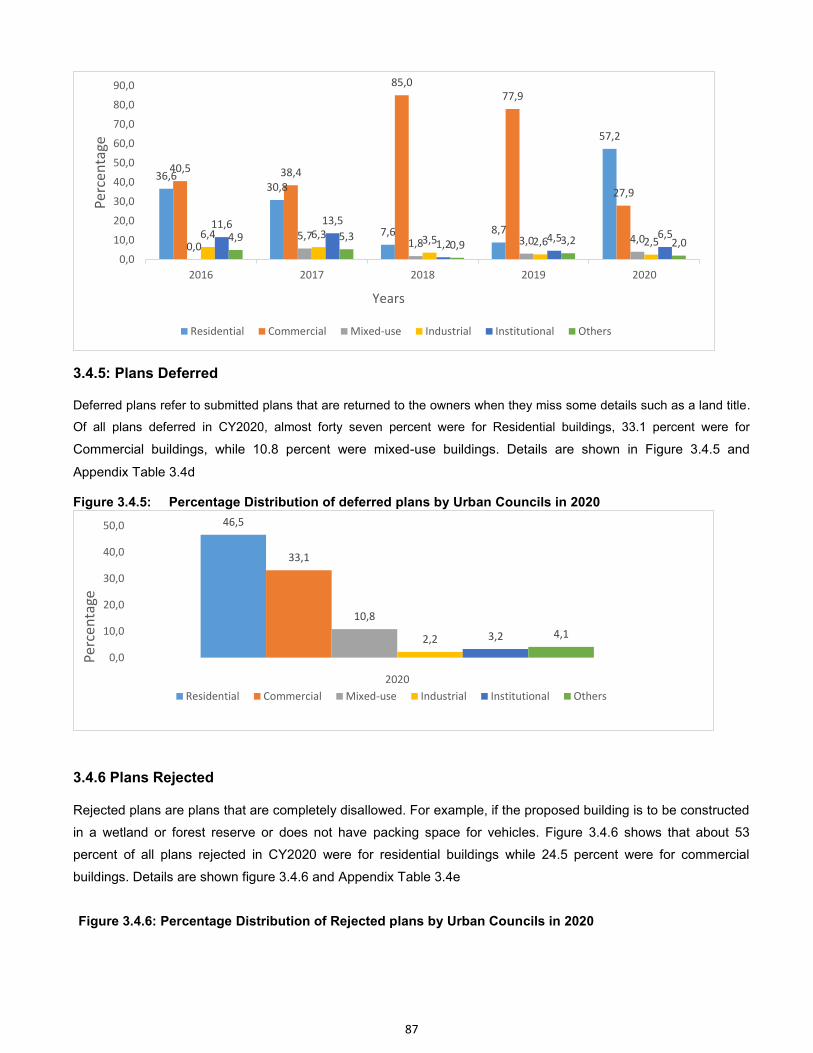
87
3.4.5: Plans Deferred
Deferred plans refer to submitted plans that are returned to the owners when they miss some details such as a land title.
Of all plans deferred in CY2020, almost forty seven percent were for Residential buildings, 33.1 percent were for
Commercial buildings, while 10.8 percent were mixed-use buildings. Details are shown in Figure 3.4.5 and
Appendix Table 3.4d
Figure 3.4.5: Percentage Distribution of deferred plans by Urban Councils in 2020
3.4.6 Plans Rejected
Rejected plans are plans that are completely disallowed. For example, if the proposed building is to be constructed
in a wetland or forest reserve or does not have packing space for vehicles. Figure 3.4.6 shows that about 53
percent of all plans rejected in CY2020 were for residential buildings while 24.5 percent were for commercial
buildings. Details are shown figure 3.4.6 and Appendix Table 3.4e
Figure 3.4.6: Percentage Distribution of Rejected plans by Urban Councils in 2020
36,6 30,8
7,6 8,7
57,2
40,5 38,4
85,0
77,9
27,9
0,0 5,7
1,8 3,0 4,0 6,4 6,3 3,5 2,6 2,5
11,6 13,5
1,2 4,5 6,5 4,9 5,3
0,9 3,2 2,0
0,0
10,0
20,0
30,0
40,0
50,0
60,0
70,0
80,0
90,0
2016 2017 2018 2019 2020
Pe
rce
nta
ge
Years
Residential Commercial Mixed-use Industrial Institutional Others
46,5
33,1
10,8
2,2 3,2 4,1
0,0
10,0
20,0
30,0
40,0
50,0
Pe
rce
nta
ge
2020
Residential Commercial Mixed-use Industrial Institutional Others
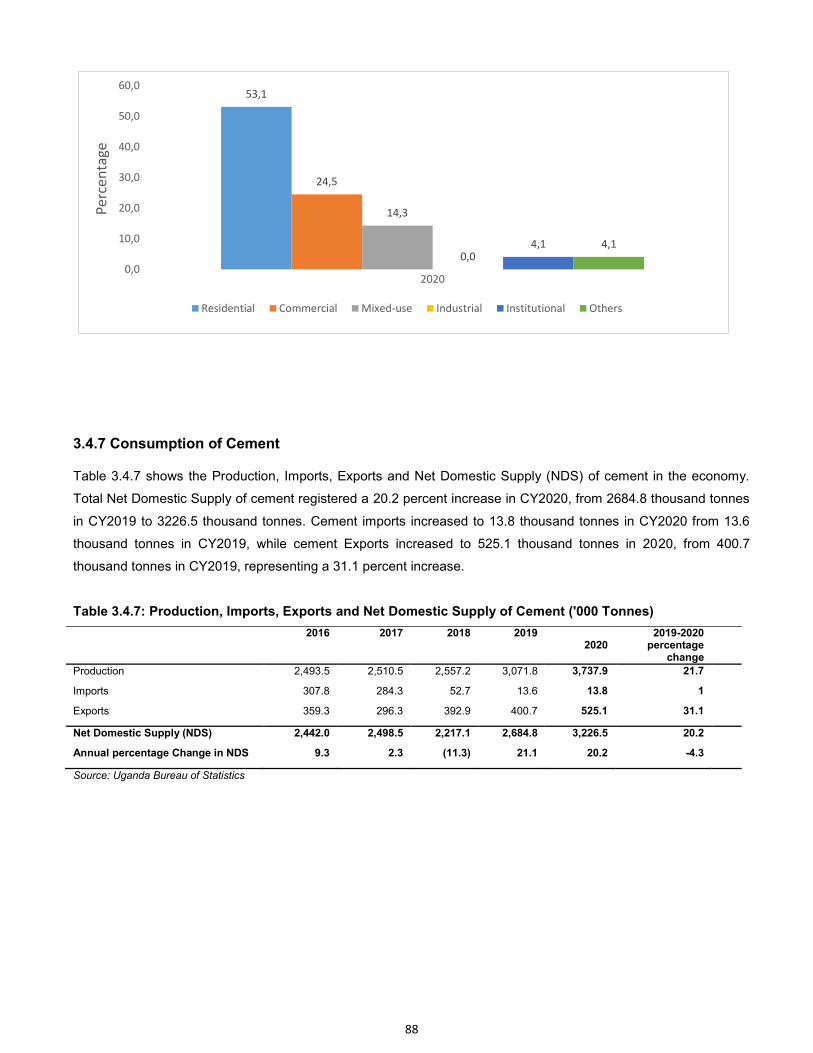
88
3.4.7 Consumption of Cement
Table 3.4.7 shows the Production, Imports, Exports and Net Domestic Supply (NDS) of cement in the economy.
Total Net Domestic Supply of cement registered a 20.2 percent increase in CY2020, from 2684.8 thousand tonnes
in CY2019 to 3226.5 thousand tonnes. Cement imports increased to 13.8 thousand tonnes in CY2020 from 13.6
thousand tonnes in CY2019, while cement Exports increased to 525.1 thousand tonnes in 2020, from 400.7
thousand tonnes in CY2019, representing a 31.1 percent increase.
Table 3.4.7: Production, Imports, Exports and Net Domestic Supply of Cement ('000 Tonnes)
2016 2017 2018 2019 2020
2019-2020 percentage
change
Production 2,493.5 2,510.5 2,557.2 3,071.8 3,737.9 21.7
Imports 307.8 284.3 52.7 13.6 13.8 1
Exports 359.3 296.3 392.9 400.7 525.1 31.1
Net Domestic Supply (NDS) 2,442.0 2,498.5 2,217.1 2,684.8 3,226.5 20.2
Annual percentage Change in NDS 9.3 2.3 (11.3) 21.1 20.2 -4.3
Source: Uganda Bureau of Statistics
53,1
24,5
14,3
0,0 4,1 4,1
0,0
10,0
20,0
30,0
40,0
50,0
60,0
Pe
rce
nta
ge
2020
Residential Commercial Mixed-use Industrial Institutional Others
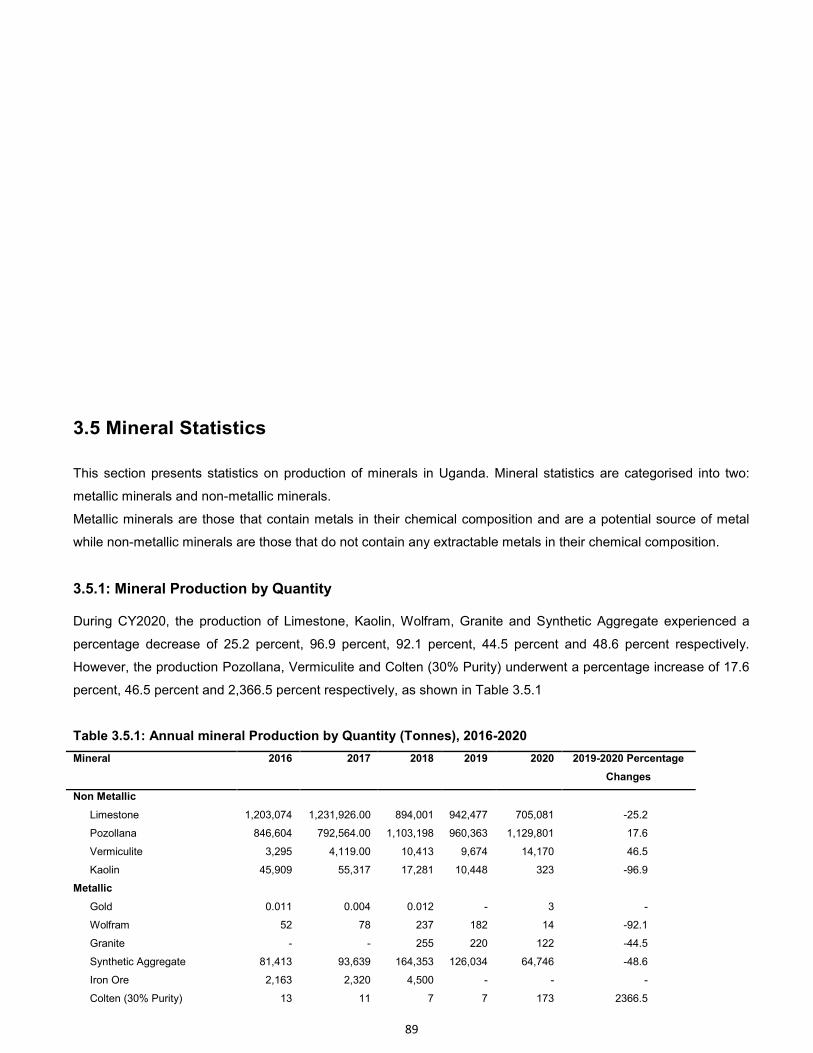
89
3.5 Mineral Statistics
This section presents statistics on production of minerals in Uganda. Mineral statistics are categorised into two:
metallic minerals and non-metallic minerals.
Metallic minerals are those that contain metals in their chemical composition and are a potential source of metal
while non-metallic minerals are those that do not contain any extractable metals in their chemical composition.
3.5.1: Mineral Production by Quantity
During CY2020, the production of Limestone, Kaolin, Wolfram, Granite and Synthetic Aggregate experienced a
percentage decrease of 25.2 percent, 96.9 percent, 92.1 percent, 44.5 percent and 48.6 percent respectively.
However, the production Pozollana, Vermiculite and Colten (30% Purity) underwent a percentage increase of 17.6
percent, 46.5 percent and 2,366.5 percent respectively, as shown in Table 3.5.1
Table 3.5.1: Annual mineral Production by Quantity (Tonnes), 2016-2020
Mineral 2016 2017 2018 2019 2020 2019-2020 Percentage
Changes
Non Metallic
Limestone 1,203,074 1,231,926.00 894,001 942,477 705,081 -25.2
Pozollana 846,604 792,564.00 1,103,198 960,363 1,129,801 17.6
Vermiculite 3,295 4,119.00 10,413 9,674 14,170 46.5
Kaolin 45,909 55,317 17,281 10,448 323 -96.9
Metallic
Gold 0.011 0.004 0.012 - 3 -
Wolfram 52 78 237 182 14 -92.1
Granite - - 255 220 122 -44.5
Synthetic Aggregate 81,413 93,639 164,353 126,034 64,746 -48.6
Iron Ore 2,163 2,320 4,500 - - -
Colten (30% Purity) 13 11 7 7 173 2366.5
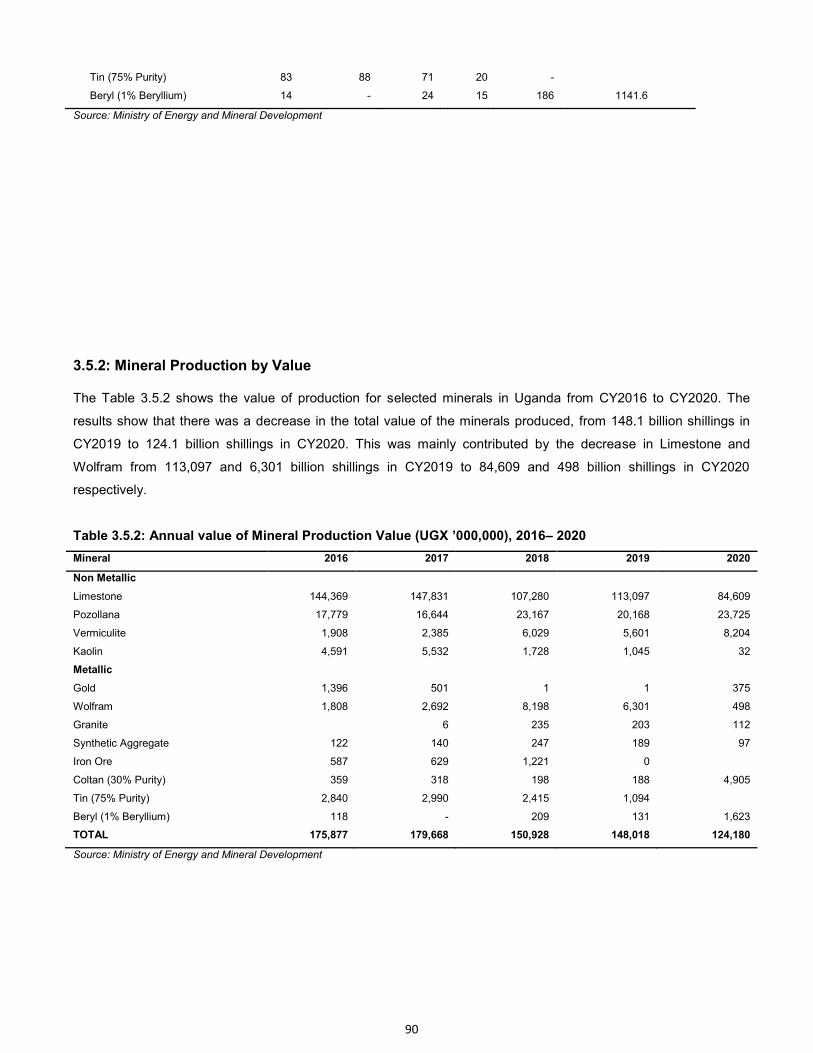
90
Tin (75% Purity) 83 88 71 20 -
Beryl (1% Beryllium) 14 - 24 15 186 1141.6
Source: Ministry of Energy and Mineral Development
3.5.2: Mineral Production by Value
The Table 3.5.2 shows the value of production for selected minerals in Uganda from CY2016 to CY2020. The
results show that there was a decrease in the total value of the minerals produced, from 148.1 billion shillings in
CY2019 to 124.1 billion shillings in CY2020. This was mainly contributed by the decrease in Limestone and
Wolfram from 113,097 and 6,301 billion shillings in CY2019 to 84,609 and 498 billion shillings in CY2020
respectively.
Table 3.5.2: Annual value of Mineral Production Value (UGX ’000,000), 2016– 2020
Mineral 2016 2017 2018 2019 2020
Non Metallic
Limestone 144,369 147,831 107,280 113,097 84,609
Pozollana 17,779 16,644 23,167 20,168 23,725
Vermiculite 1,908 2,385 6,029 5,601 8,204
Kaolin 4,591 5,532 1,728 1,045 32
Metallic
Gold 1,396 501 1 1 375
Wolfram 1,808 2,692 8,198 6,301 498
Granite 6 235 203 112
Synthetic Aggregate 122 140 247 189 97
Iron Ore 587 629 1,221 0
Coltan (30% Purity) 359 318 198 188 4,905
Tin (75% Purity) 2,840 2,990 2,415 1,094
Beryl (1% Beryllium) 118 - 209 131 1,623
TOTAL 175,877 179,668 150,928 148,018 124,180
Source: Ministry of Energy and Mineral Development
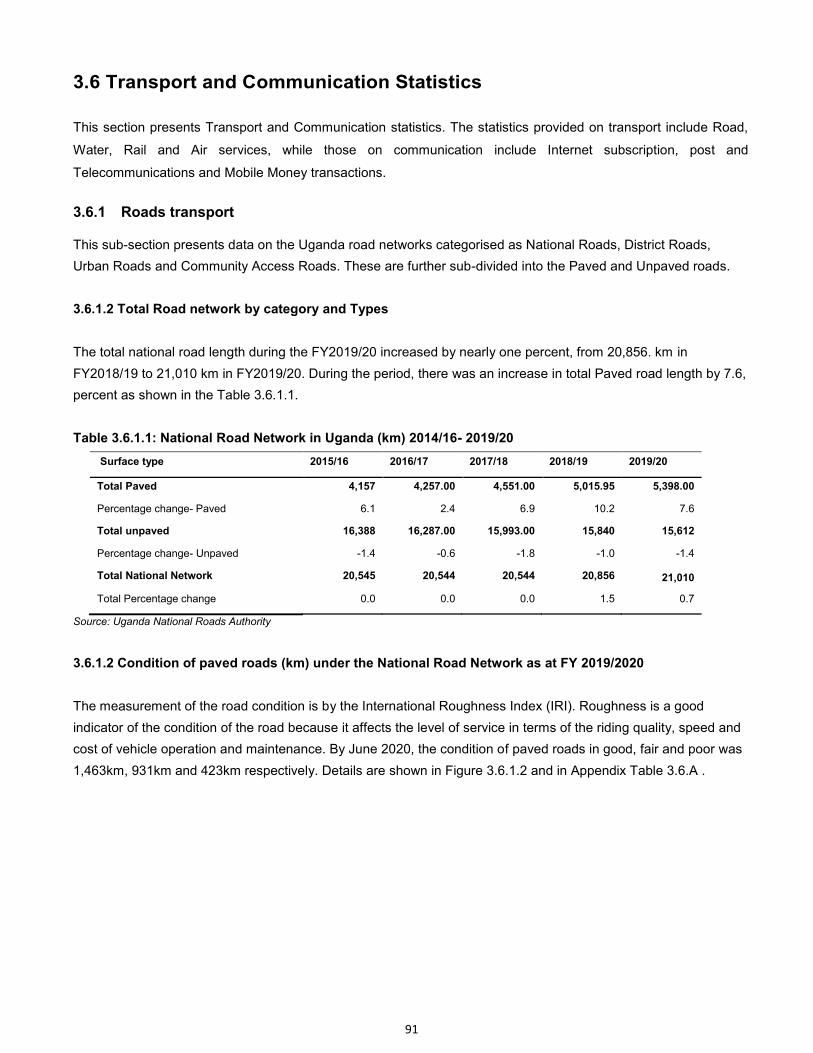
91
3.6 Transport and Communication Statistics
This section presents Transport and Communication statistics. The statistics provided on transport include Road,
Water, Rail and Air services, while those on communication include Internet subscription, post and
Telecommunications and Mobile Money transactions.
3.6.1 Roads transport
This sub-section presents data on the Uganda road networks categorised as National Roads, District Roads,
Urban Roads and Community Access Roads. These are further sub-divided into the Paved and Unpaved roads.
3.6.1.2 Total Road network by category and Types
The total national road length during the FY2019/20 increased by nearly one percent, from 20,856. km in
FY2018/19 to 21,010 km in FY2019/20. During the period, there was an increase in total Paved road length by 7.6,
percent as shown in the Table 3.6.1.1.
Table 3.6.1.1: National Road Network in Uganda (km) 2014/16- 2019/20
Surface type 2015/16 2016/17 2017/18 2018/19 2019/20
Total Paved 4,157 4,257.00 4,551.00 5,015.95 5,398.00
Percentage change- Paved 6.1 2.4 6.9 10.2 7.6
Total unpaved 16,388 16,287.00 15,993.00 15,840 15,612
Percentage change- Unpaved -1.4 -0.6 -1.8 -1.0 -1.4
Total National Network 20,545 20,544 20,544 20,856 21,010
Total Percentage change 0.0 0.0 0.0 1.5 0.7
Source: Uganda National Roads Authority
3.6.1.2 Condition of paved roads (km) under the National Road Network as at FY 2019/2020
The measurement of the road condition is by the International Roughness Index (IRI). Roughness is a good
indicator of the condition of the road because it affects the level of service in terms of the riding quality, speed and
cost of vehicle operation and maintenance. By June 2020, the condition of paved roads in good, fair and poor was
1,463km, 931km and 423km respectively. Details are shown in Figure 3.6.1.2 and in Appendix Table 3.6.A .
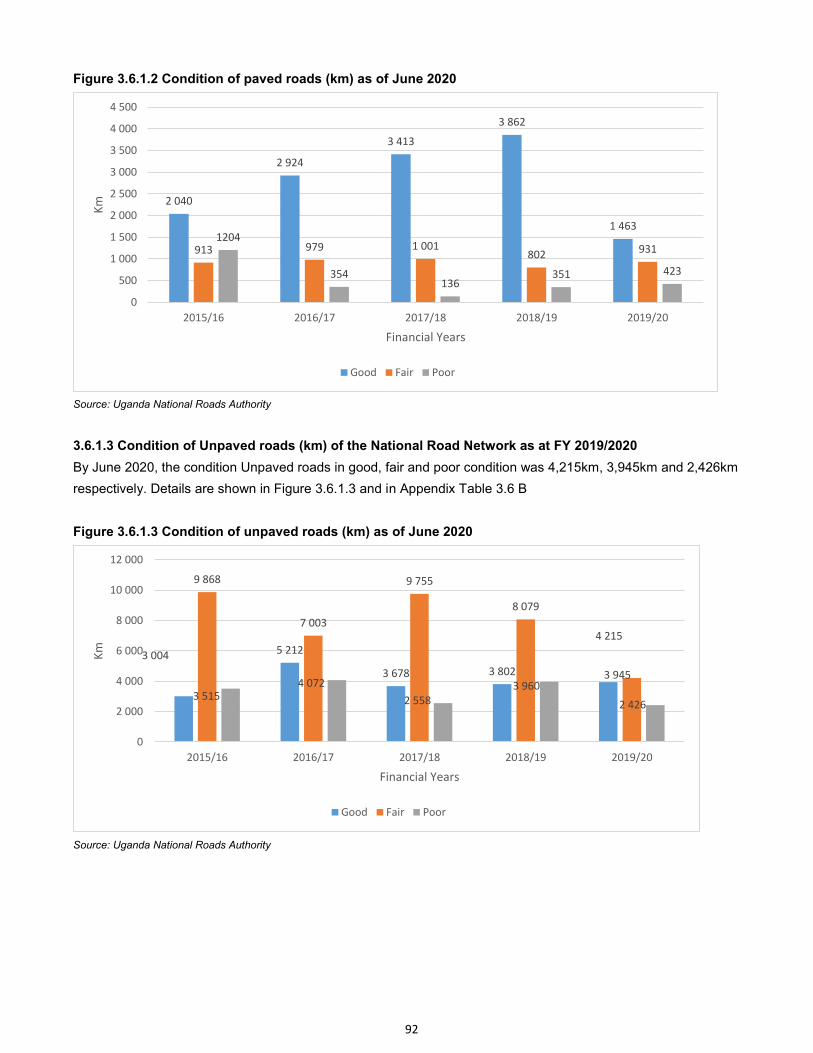
92
Figure 3.6.1.2 Condition of paved roads (km) as of June 2020
Source: Uganda National Roads Authority
3.6.1.3 Condition of Unpaved roads (km) of the National Road Network as at FY 2019/2020
By June 2020, the condition Unpaved roads in good, fair and poor condition was 4,215km, 3,945km and 2,426km
respectively. Details are shown in Figure 3.6.1.3 and in Appendix Table 3.6 B
Figure 3.6.1.3 Condition of unpaved roads (km) as of June 2020
Source: Uganda National Roads Authority
2 040
2 924
3 413
3 862
1 463
913 979 1 001 802
931 1204
354 136
351 423
0
500
1 000
1 500
2 000
2 500
3 000
3 500
4 000
4 500
2015/16 2016/17 2017/18 2018/19 2019/20
Km
Financial Years
Good Fair Poor
3 004 5 212
3 678 3 802 3 945
9 868
7 003
9 755
8 079
4 215
3 515 4 072
2 558
3 960
2 426
0
2 000
4 000
6 000
8 000
10 000
12 000
2015/16 2016/17 2017/18 2018/19 2019/20
Km
Financial Years
Good Fair Poor
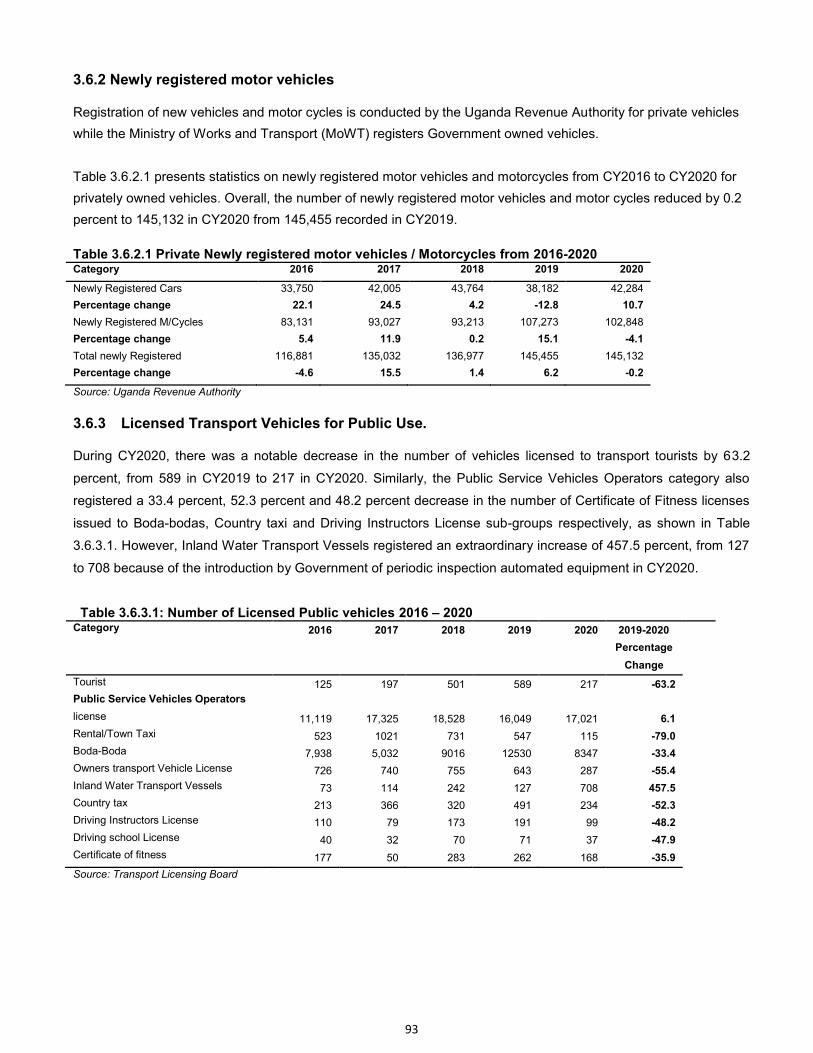
93
3.6.2 Newly registered motor vehicles
Registration of new vehicles and motor cycles is conducted by the Uganda Revenue Authority for private vehicles
while the Ministry of Works and Transport (MoWT) registers Government owned vehicles.
Table 3.6.2.1 presents statistics on newly registered motor vehicles and motorcycles from CY2016 to CY2020 for
privately owned vehicles. Overall, the number of newly registered motor vehicles and motor cycles reduced by 0.2
percent to 145,132 in CY2020 from 145,455 recorded in CY2019.
Table 3.6.2.1 Private Newly registered motor vehicles / Motorcycles from 2016-2020 Category 2016 2017 2018 2019 2020
Newly Registered Cars 33,750 42,005 43,764 38,182 42,284
Percentage change 22.1 24.5 4.2 -12.8 10.7
Newly Registered M/Cycles 83,131 93,027 93,213 107,273 102,848
Percentage change 5.4 11.9 0.2 15.1 -4.1
Total newly Registered 116,881 135,032 136,977 145,455 145,132
Percentage change -4.6 15.5 1.4 6.2 -0.2
Source: Uganda Revenue Authority
3.6.3 Licensed Transport Vehicles for Public Use.
During CY2020, there was a notable decrease in the number of vehicles licensed to transport tourists by 63.2
percent, from 589 in CY2019 to 217 in CY2020. Similarly, the Public Service Vehicles Operators category also
registered a 33.4 percent, 52.3 percent and 48.2 percent decrease in the number of Certificate of Fitness licenses
issued to Boda-bodas, Country taxi and Driving Instructors License sub-groups respectively, as shown in Table
3.6.3.1. However, Inland Water Transport Vessels registered an extraordinary increase of 457.5 percent, from 127
to 708 because of the introduction by Government of periodic inspection automated equipment in CY2020.
Table 3.6.3.1: Number of Licensed Public vehicles 2016 – 2020 Category 2016 2017 2018 2019 2020 2019-2020
Percentage
Change
Tourist 125 197 501 589 217 -63.2
Public Service Vehicles Operators
license 11,119 17,325 18,528 16,049 17,021 6.1
Rental/Town Taxi 523 1021 731 547 115 -79.0
Boda-Boda 7,938 5,032 9016 12530 8347 -33.4
Owners transport Vehicle License 726 740 755 643 287 -55.4
Inland Water Transport Vessels 73 114 242 127 708 457.5
Country tax 213 366 320 491 234 -52.3
Driving Instructors License 110 79 173 191 99 -48.2
Driving school License 40 32 70 71 37 -47.9
Certificate of fitness 177 50 283 262 168 -35.9
Source: Transport Licensing Board
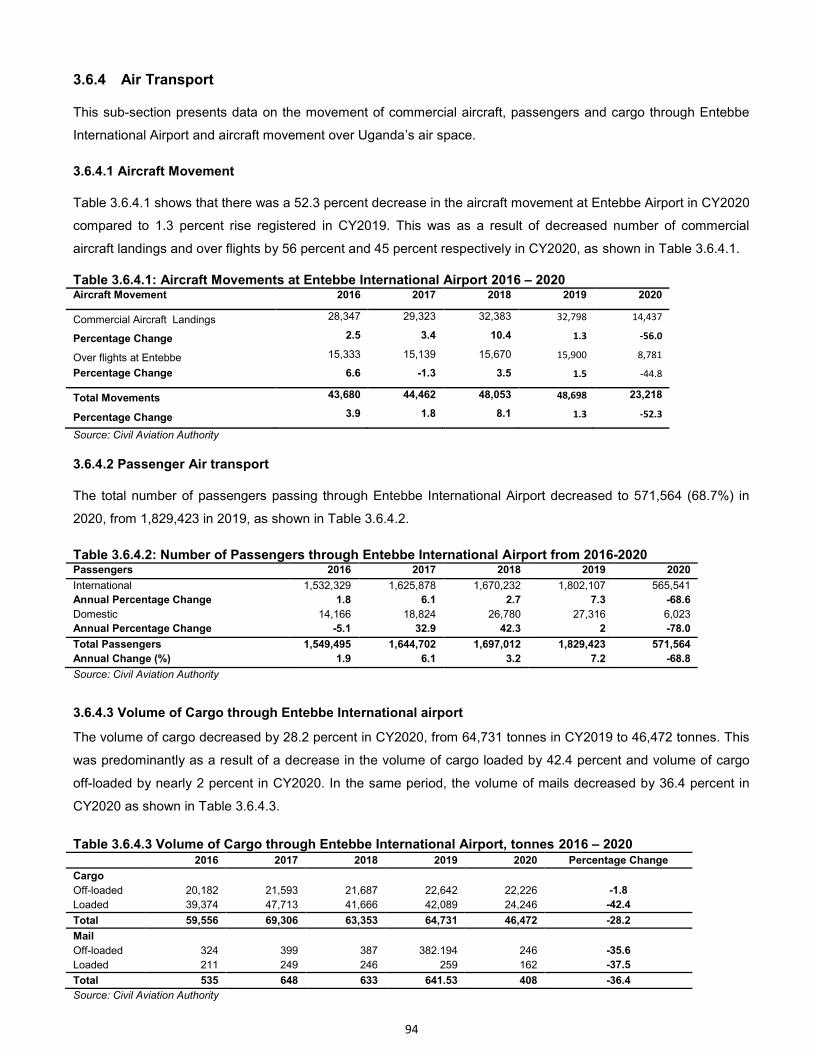
94
3.6.4 Air Transport
This sub-section presents data on the movement of commercial aircraft, passengers and cargo through Entebbe
International Airport and aircraft movement over Uganda’s air space.
3.6.4.1 Aircraft Movement Table 3.6.4.1 shows that there was a 52.3 percent decrease in the aircraft movement at Entebbe Airport in CY2020
compared to 1.3 percent rise registered in CY2019. This was as a result of decreased number of commercial
aircraft landings and over flights by 56 percent and 45 percent respectively in CY2020, as shown in Table 3.6.4.1.
Table 3.6.4.1: Aircraft Movements at Entebbe International Airport 2016 – 2020 Aircraft Movement 2016 2017 2018 2019 2020
Commercial Aircraft Landings 28,347 29,323 32,383 32,798 14,437
Percentage Change 2.5 3.4 10.4 1.3 -56.0
Over flights at Entebbe 15,333 15,139 15,670 15,900 8,781
Percentage Change 6.6 -1.3 3.5 1.5 -44.8
Total Movements 43,680 44,462 48,053 48,698 23,218
Percentage Change 3.9 1.8 8.1 1.3 -52.3
Source: Civil Aviation Authority
3.6.4.2 Passenger Air transport The total number of passengers passing through Entebbe International Airport decreased to 571,564 (68.7%) in
2020, from 1,829,423 in 2019, as shown in Table 3.6.4.2.
Table 3.6.4.2: Number of Passengers through Entebbe International Airport from 2016-2020 Passengers 2016 2017 2018 2019 2020
International 1,532,329 1,625,878 1,670,232 1,802,107 565,541
Annual Percentage Change 1.8 6.1 2.7 7.3 -68.6
Domestic 14,166 18,824 26,780 27,316 6,023
Annual Percentage Change -5.1 32.9 42.3 2 -78.0
Total Passengers 1,549,495 1,644,702 1,697,012 1,829,423 571,564
Annual Change (%) 1.9 6.1 3.2 7.2 -68.8
Source: Civil Aviation Authority
3.6.4.3 Volume of Cargo through Entebbe International airport The volume of cargo decreased by 28.2 percent in CY2020, from 64,731 tonnes in CY2019 to 46,472 tonnes. This
was predominantly as a result of a decrease in the volume of cargo loaded by 42.4 percent and volume of cargo
off-loaded by nearly 2 percent in CY2020. In the same period, the volume of mails decreased by 36.4 percent in
CY2020 as shown in Table 3.6.4.3.
Table 3.6.4.3 Volume of Cargo through Entebbe International Airport, tonnes 2016 – 2020 2016 2017 2018 2019 2020 Percentage Change
Cargo
Off-loaded 20,182 21,593 21,687 22,642 22,226 -1.8
Loaded 39,374 47,713 41,666 42,089 24,246 -42.4
Total 59,556 69,306 63,353 64,731 46,472 -28.2
Off-loaded 324 399 387 382.194 246 -35.6
Loaded 211 249 246 259 162 -37.5
Total 535 648 633 641.53 408 -36.4
Source: Civil Aviation Authority
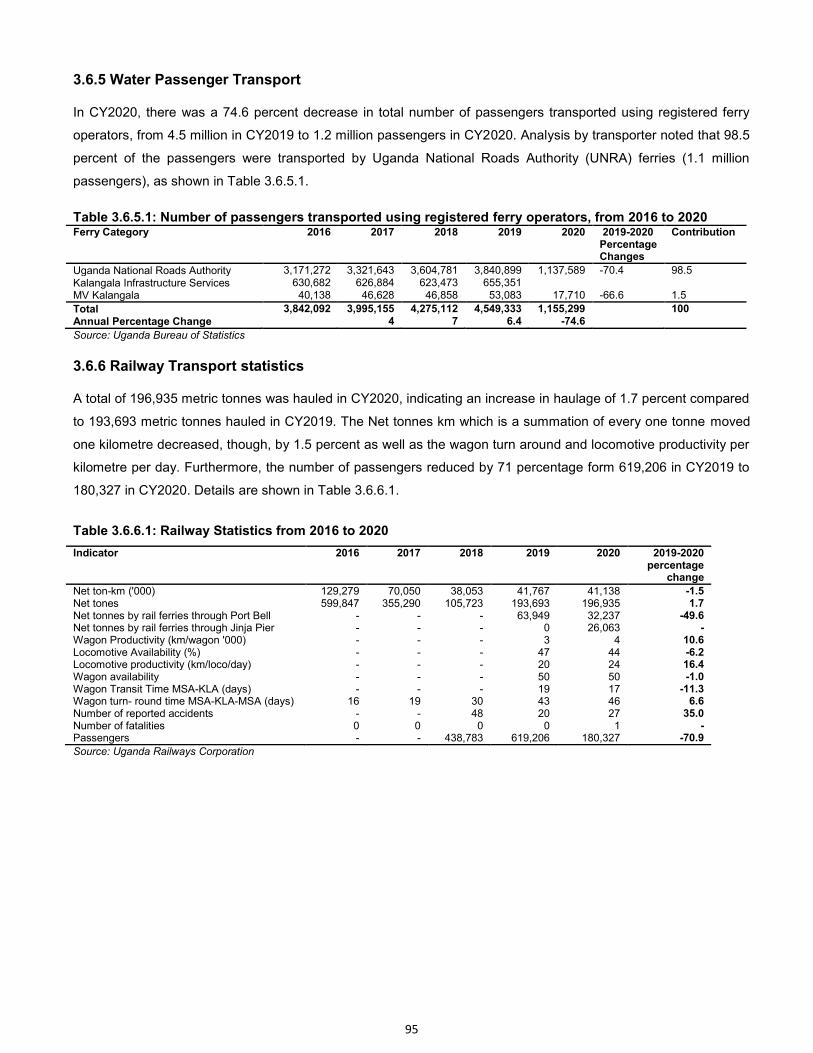
95
3.6.5 Water Passenger Transport
In CY2020, there was a 74.6 percent decrease in total number of passengers transported using registered ferry
operators, from 4.5 million in CY2019 to 1.2 million passengers in CY2020. Analysis by transporter noted that 98.5
percent of the passengers were transported by Uganda National Roads Authority (UNRA) ferries (1.1 million
passengers), as shown in Table 3.6.5.1.
Table 3.6.5.1: Number of passengers transported using registered ferry operators, from 2016 to 2020 Ferry Category 2016 2017 2018 2019 2020 2019-2020
Percentage Changes
Contribution
Uganda National Roads Authority 3,171,272 3,321,643 3,604,781 3,840,899 1,137,589 -70.4 98.5 Kalangala Infrastructure Services 630,682 626,884 623,473 655,351 MV Kalangala 40,138 46,628 46,858 53,083 17,710 -66.6 1.5
Total 3,842,092 3,995,155 4,275,112 4,549,333 1,155,299 100 Annual Percentage Change 4 7 6.4 -74.6
Source: Uganda Bureau of Statistics
3.6.6 Railway Transport statistics
A total of 196,935 metric tonnes was hauled in CY2020, indicating an increase in haulage of 1.7 percent compared
to 193,693 metric tonnes hauled in CY2019. The Net tonnes km which is a summation of every one tonne moved
one kilometre decreased, though, by 1.5 percent as well as the wagon turn around and locomotive productivity per
kilometre per day. Furthermore, the number of passengers reduced by 71 percentage form 619,206 in CY2019 to
180,327 in CY2020. Details are shown in Table 3.6.6.1.
Table 3.6.6.1: Railway Statistics from 2016 to 2020
Indicator 2016 2017 2018 2019 2020 2019-2020 percentage
change
Net ton-km ('000) 129,279 70,050 38,053 41,767 41,138 -1.5 Net tones 599,847 355,290 105,723 193,693 196,935 1.7 Net tonnes by rail ferries through Port Bell - - - 63,949 32,237 -49.6 Net tonnes by rail ferries through Jinja Pier - - - 0 26,063 - Wagon Productivity (km/wagon '000) - - - 3 4 10.6 Locomotive Availability (%) - - - 47 44 -6.2 Locomotive productivity (km/loco/day) - - - 20 24 16.4 Wagon availability - - - 50 50 -1.0 Wagon Transit Time MSA-KLA (days) - - - 19 17 -11.3 Wagon turn- round time MSA-KLA-MSA (days) 16 19 30 43 46 6.6 Number of reported accidents - - 48 20 27 35.0 Number of fatalities 0 0 0 0 1 - Passengers - - 438,783 619,206 180,327 -70.9
Source: Uganda Railways Corporation
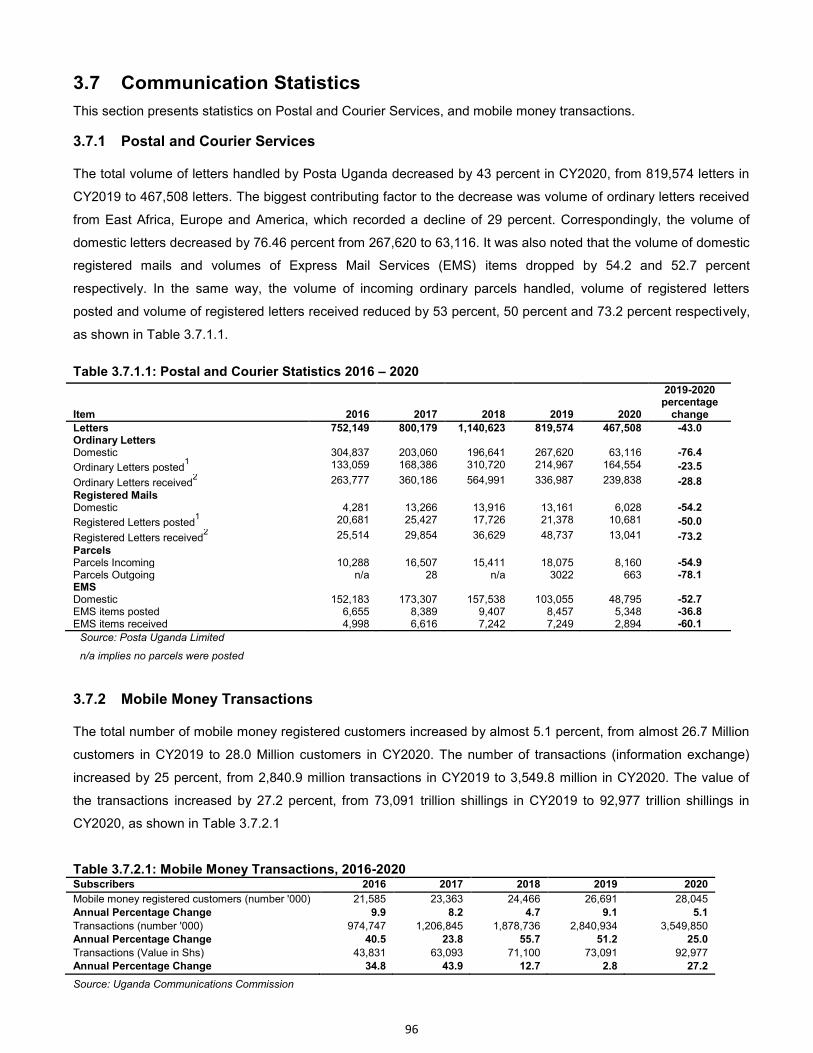
96
3.7 Communication Statistics
This section presents statistics on Postal and Courier Services, and mobile money transactions. 3.7.1 Postal and Courier Services
The total volume of letters handled by Posta Uganda decreased by 43 percent in CY2020, from 819,574 letters in
CY2019 to 467,508 letters. The biggest contributing factor to the decrease was volume of ordinary letters received
from East Africa, Europe and America, which recorded a decline of 29 percent. Correspondingly, the volume of
domestic letters decreased by 76.46 percent from 267,620 to 63,116. It was also noted that the volume of domestic
registered mails and volumes of Express Mail Services (EMS) items dropped by 54.2 and 52.7 percent
respectively. In the same way, the volume of incoming ordinary parcels handled, volume of registered letters
posted and volume of registered letters received reduced by 53 percent, 50 percent and 73.2 percent respectively,
as shown in Table 3.7.1.1.
Table 3.7.1.1: Postal and Courier Statistics 2016 – 2020 2019-2020
percentage Item 2016 2017 2018 2019 2020 change
Letters 752,149 800,179 1,140,623 819,574 467,508 -43.0 Ordinary Letters Domestic 304,837 203,060 196,641 267,620 63,116 -76.4
Ordinary Letters posted1 133,059 168,386 310,720 214,967 164,554 -23.5
Ordinary Letters received2 263,777 360,186 564,991 336,987 239,838 -28.8
Registered Mails Domestic 4,281 13,266 13,916 13,161 6,028 -54.2
Registered Letters posted1 20,681 25,427 17,726 21,378 10,681 -50.0
Registered Letters received2 25,514 29,854 36,629 48,737 13,041 -73.2
Parcels Parcels Incoming 10,288 16,507 15,411 18,075 8,160 -54.9 Parcels Outgoing n/a 28 n/a 3022 663 -78.1 EMS Domestic 152,183 173,307 157,538 103,055 48,795 -52.7 EMS items posted 6,655 8,389 9,407 8,457 5,348 -36.8 EMS items received 4,998 6,616 7,242 7,249 2,894 -60.1
Source: Posta Uganda Limited
n/a implies no parcels were posted
3.7.2 Mobile Money Transactions
The total number of mobile money registered customers increased by almost 5.1 percent, from almost 26.7 Million
customers in CY2019 to 28.0 Million customers in CY2020. The number of transactions (information exchange)
increased by 25 percent, from 2,840.9 million transactions in CY2019 to 3,549.8 million in CY2020. The value of
the transactions increased by 27.2 percent, from 73,091 trillion shillings in CY2019 to 92,977 trillion shillings in
CY2020, as shown in Table 3.7.2.1
Table 3.7.2.1: Mobile Money Transactions, 2016-2020 Subscribers 2016 2017 2018 2019 2020
Mobile money registered customers (number '000) 21,585 23,363 24,466 26,691 28,045
Annual Percentage Change 9.9 8.2 4.7 9.1 5.1
Transactions (number '000) 974,747 1,206,845 1,878,736 2,840,934 3,549,850
Annual Percentage Change 40.5 23.8 55.7 51.2 25.0
Transactions (Value in Shs) 43,831 63,093 71,100 73,091 92,977
Annual Percentage Change 34.8 43.9 12.7 2.8 27.2 Source: Uganda Communications Commission
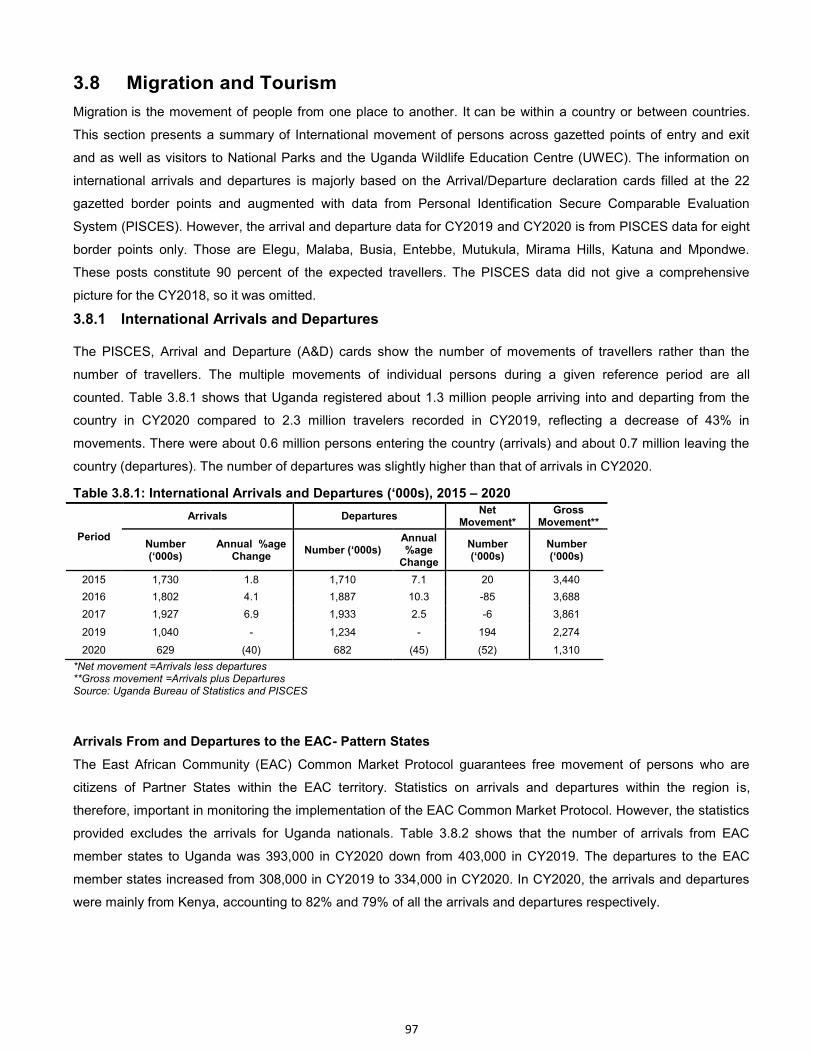
97
3.8 Migration and Tourism
Migration is the movement of people from one place to another. It can be within a country or between countries.
This section presents a summary of International movement of persons across gazetted points of entry and exit
and as well as visitors to National Parks and the Uganda Wildlife Education Centre (UWEC). The information on
international arrivals and departures is majorly based on the Arrival/Departure declaration cards filled at the 22
gazetted border points and augmented with data from Personal Identification Secure Comparable Evaluation
System (PISCES). However, the arrival and departure data for CY2019 and CY2020 is from PISCES data for eight
border points only. Those are Elegu, Malaba, Busia, Entebbe, Mutukula, Mirama Hills, Katuna and Mpondwe.
These posts constitute 90 percent of the expected travellers. The PISCES data did not give a comprehensive
picture for the CY2018, so it was omitted.
3.8.1 International Arrivals and Departures
The PISCES, Arrival and Departure (A&D) cards show the number of movements of travellers rather than the
number of travellers. The multiple movements of individual persons during a given reference period are all
counted. Table 3.8.1 shows that Uganda registered about 1.3 million people arriving into and departing from the
country in CY2020 compared to 2.3 million travelers recorded in CY2019, reflecting a decrease of 43% in
movements. There were about 0.6 million persons entering the country (arrivals) and about 0.7 million leaving the
country (departures). The number of departures was slightly higher than that of arrivals in CY2020.
Table 3.8.1: International Arrivals and Departures (‘000s), 2015 – 2020
Period
Arrivals Departures Net
Movement* Gross
Movement**
Number (‘000s)
Annual %age Change
Number (‘000s) Annual %age
Change
Number (‘000s)
Number (‘000s)
2015 1,730 1.8 1,710 7.1 20 3,440
2016 1,802 4.1 1,887 10.3 -85 3,688
2017 1,927 6.9 1,933 2.5 -6 3,861
2019 1,040 - 1,234 - 194 2,274
2020 629 (40) 682 (45) (52) 1,310
*Net movement =Arrivals less departures **Gross movement =Arrivals plus Departures Source: Uganda Bureau of Statistics and PISCES
Arrivals From and Departures to the EAC- Pattern States
The East African Community (EAC) Common Market Protocol guarantees free movement of persons who are
citizens of Partner States within the EAC territory. Statistics on arrivals and departures within the region is,
therefore, important in monitoring the implementation of the EAC Common Market Protocol. However, the statistics
provided excludes the arrivals for Uganda nationals. Table 3.8.2 shows that the number of arrivals from EAC
member states to Uganda was 393,000 in CY2020 down from 403,000 in CY2019. The departures to the EAC
member states increased from 308,000 in CY2019 to 334,000 in CY2020. In CY2020, the arrivals and departures
were mainly from Kenya, accounting to 82% and 79% of all the arrivals and departures respectively.
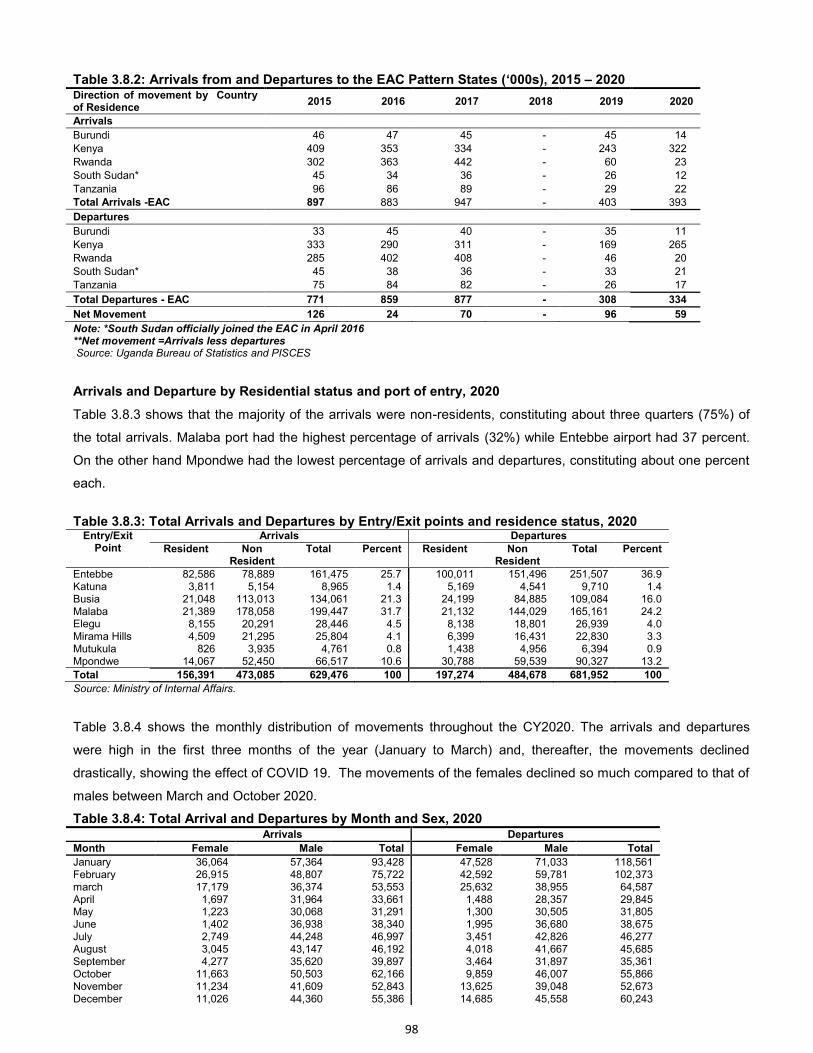
98
Table 3.8.2: Arrivals from and Departures to the EAC Pattern States (‘000s), 2015 – 2020 Direction of movement by Country of Residence
2015 2016 2017 2018 2019 2020
Arrivals
Burundi 46 47 45 - 45 14
Kenya 409 353 334 - 243 322
Rwanda 302 363 442 - 60 23
South Sudan* 45 34 36 - 26 12
Tanzania 96 86 89 - 29 22
Total Arrivals -EAC 897 883 947 - 403 393
Departures
Burundi 33 45 40 - 35 11
Kenya 333 290 311 - 169 265
Rwanda 285 402 408 - 46 20
South Sudan* 45 38 36 - 33 21
Tanzania 75 84 82 - 26 17
Total Departures - EAC 771 859 877 - 308 334
Net Movement 126 24 70 - 96 59
Note: *South Sudan officially joined the EAC in April 2016 **Net movement =Arrivals less departures Source: Uganda Bureau of Statistics and PISCES
Arrivals and Departure by Residential status and port of entry, 2020
Table 3.8.3 shows that the majority of the arrivals were non-residents, constituting about three quarters (75%) of
the total arrivals. Malaba port had the highest percentage of arrivals (32%) while Entebbe airport had 37 percent.
On the other hand Mpondwe had the lowest percentage of arrivals and departures, constituting about one percent
each.
Table 3.8.3: Total Arrivals and Departures by Entry/Exit points and residence status, 2020
Entry/Exit Point
Arrivals Departures Resident Non
Resident Total Percent Resident Non
Resident Total Percent
Entebbe 82,586 78,889 161,475 25.7 100,011 151,496 251,507 36.9 Katuna 3,811 5,154 8,965 1.4 5,169 4,541 9,710 1.4 Busia 21,048 113,013 134,061 21.3 24,199 84,885 109,084 16.0 Malaba 21,389 178,058 199,447 31.7 21,132 144,029 165,161 24.2 Elegu 8,155 20,291 28,446 4.5 8,138 18,801 26,939 4.0 Mirama Hills 4,509 21,295 25,804 4.1 6,399 16,431 22,830 3.3 Mutukula 826 3,935 4,761 0.8 1,438 4,956 6,394 0.9 Mpondwe 14,067 52,450 66,517 10.6 30,788 59,539 90,327 13.2
Total 156,391 473,085 629,476 100 197,274 484,678 681,952 100
Source: Ministry of Internal Affairs.
Table 3.8.4 shows the monthly distribution of movements throughout the CY2020. The arrivals and departures
were high in the first three months of the year (January to March) and, thereafter, the movements declined
drastically, showing the effect of COVID 19. The movements of the females declined so much compared to that of
males between March and October 2020.
Table 3.8.4: Total Arrival and Departures by Month and Sex, 2020 Arrivals Departures
Month Female Male Total Female Male Total
January 36,064 57,364 93,428 47,528 71,033 118,561 February 26,915 48,807 75,722 42,592 59,781 102,373 march 17,179 36,374 53,553 25,632 38,955 64,587 April 1,697 31,964 33,661 1,488 28,357 29,845 May 1,223 30,068 31,291 1,300 30,505 31,805 June 1,402 36,938 38,340 1,995 36,680 38,675 July 2,749 44,248 46,997 3,451 42,826 46,277 August 3,045 43,147 46,192 4,018 41,667 45,685 September 4,277 35,620 39,897 3,464 31,897 35,361 October 11,663 50,503 62,166 9,859 46,007 55,866 November 11,234 41,609 52,843 13,625 39,048 52,673 December 11,026 44,360 55,386 14,685 45,558 60,243
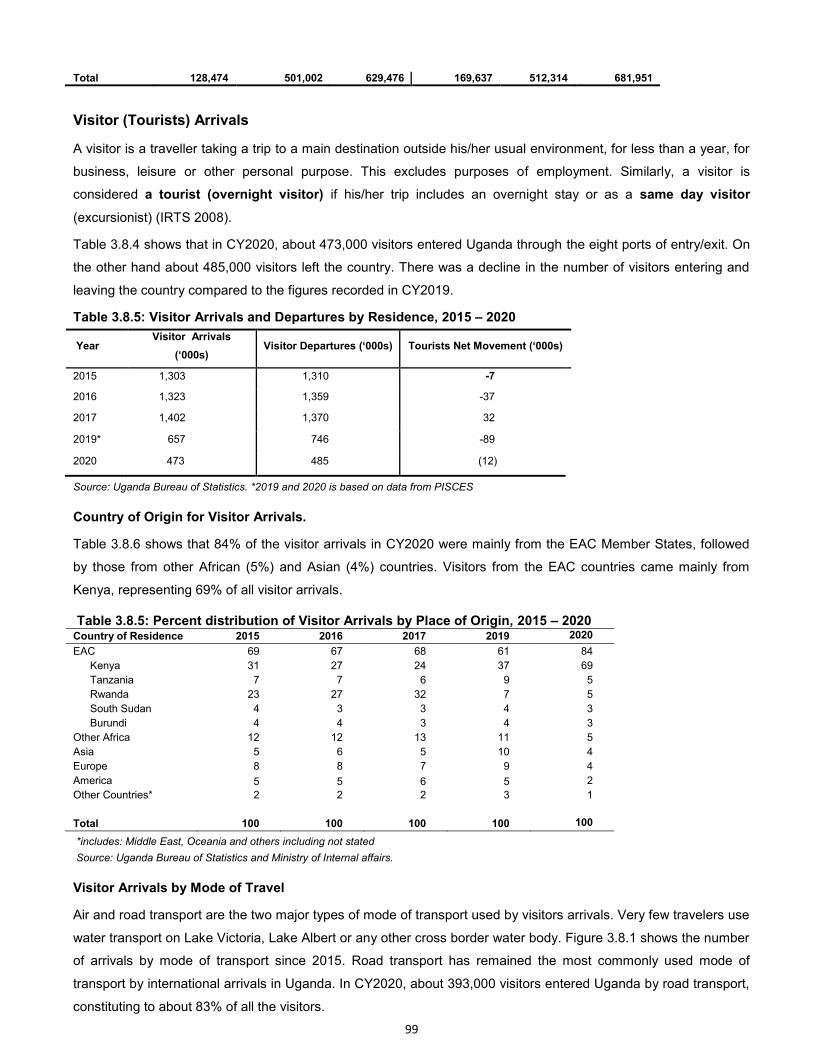
99
Total 128,474 501,002 629,476 169,637 512,314 681,951
Visitor (Tourists) Arrivals
A visitor is a traveller taking a trip to a main destination outside his/her usual environment, for less than a year, for
business, leisure or other personal purpose. This excludes purposes of employment. Similarly, a visitor is
considered a tourist (overnight visitor) if his/her trip includes an overnight stay or as a same day visitor
(excursionist) (IRTS 2008).
Table 3.8.4 shows that in CY2020, about 473,000 visitors entered Uganda through the eight ports of entry/exit. On
the other hand about 485,000 visitors left the country. There was a decline in the number of visitors entering and
leaving the country compared to the figures recorded in CY2019.
Table 3.8.5: Visitor Arrivals and Departures by Residence, 2015 – 2020
Year Visitor Arrivals
(‘000s) Visitor Departures (‘000s) Tourists Net Movement (‘000s)
2015 1,303 1,310 -7
2016 1,323 1,359 -37
2017 1,402 1,370 32
2019* 657 746 -89
2020 473 485 (12)
Source: Uganda Bureau of Statistics. *2019 and 2020 is based on data from PISCES
Country of Origin for Visitor Arrivals.
Table 3.8.6 shows that 84% of the visitor arrivals in CY2020 were mainly from the EAC Member States, followed
by those from other African (5%) and Asian (4%) countries. Visitors from the EAC countries came mainly from
Kenya, representing 69% of all visitor arrivals.
Table 3.8.5: Percent distribution of Visitor Arrivals by Place of Origin, 2015 – 2020 Country of Residence 2015 2016 2017 2019 2020
EAC 69 67 68 61 84
Kenya 31 27 24 37 69
Tanzania 7 7 6 9 5
Rwanda 23 27 32 7 5
South Sudan 4 3 3 4 3
Burundi 4 4 3 4 3
Other Africa 12 12 13 11 5
Asia 5 6 5 10 4
Europe 8 8 7 9 4
America 5 5 6 5 2
Other Countries* 2 2 2 3 1
Total 100 100 100 100 100
*includes: Middle East, Oceania and others including not stated
Source: Uganda Bureau of Statistics and Ministry of Internal affairs.
Visitor Arrivals by Mode of Travel
Air and road transport are the two major types of mode of transport used by visitors arrivals. Very few travelers use
water transport on Lake Victoria, Lake Albert or any other cross border water body. Figure 3.8.1 shows the number
of arrivals by mode of transport since 2015. Road transport has remained the most commonly used mode of
transport by international arrivals in Uganda. In CY2020, about 393,000 visitors entered Uganda by road transport,
constituting to about 83% of all the visitors.
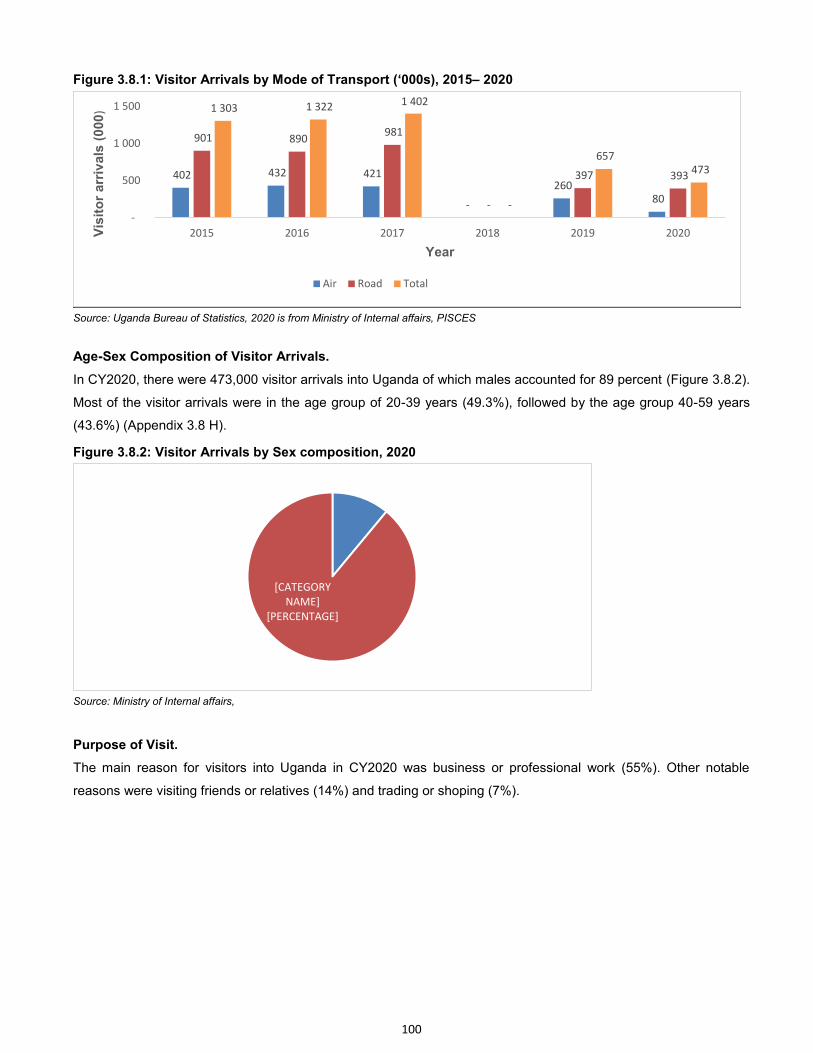
100
Figure 3.8.1: Visitor Arrivals by Mode of Transport (‘000s), 2015– 2020
Source: Uganda Bureau of Statistics, 2020 is from Ministry of Internal affairs, PISCES
Age-Sex Composition of Visitor Arrivals.
In CY2020, there were 473,000 visitor arrivals into Uganda of which males accounted for 89 percent (Figure 3.8.2).
Most of the visitor arrivals were in the age group of 20-39 years (49.3%), followed by the age group 40-59 years
(43.6%) (Appendix 3.8 H).
Figure 3.8.2: Visitor Arrivals by Sex composition, 2020
Source: Ministry of Internal affairs,
Purpose of Visit.
The main reason for visitors into Uganda in CY2020 was business or professional work (55%). Other notable
reasons were visiting friends or relatives (14%) and trading or shoping (7%).
402 432 421
-
260 80
901 890 981
-
397 393
1 303 1 322 1 402
-
657
473
-
500
1 000
1 500
2015 2016 2017 2018 2019 2020Vis
ito
r arr
ivals
(000
)
Year
Air Road Total
[CATEGORY NAME]
[PERCENTAGE]
[CATEGORY
NAME]
[PERCENTAGE]
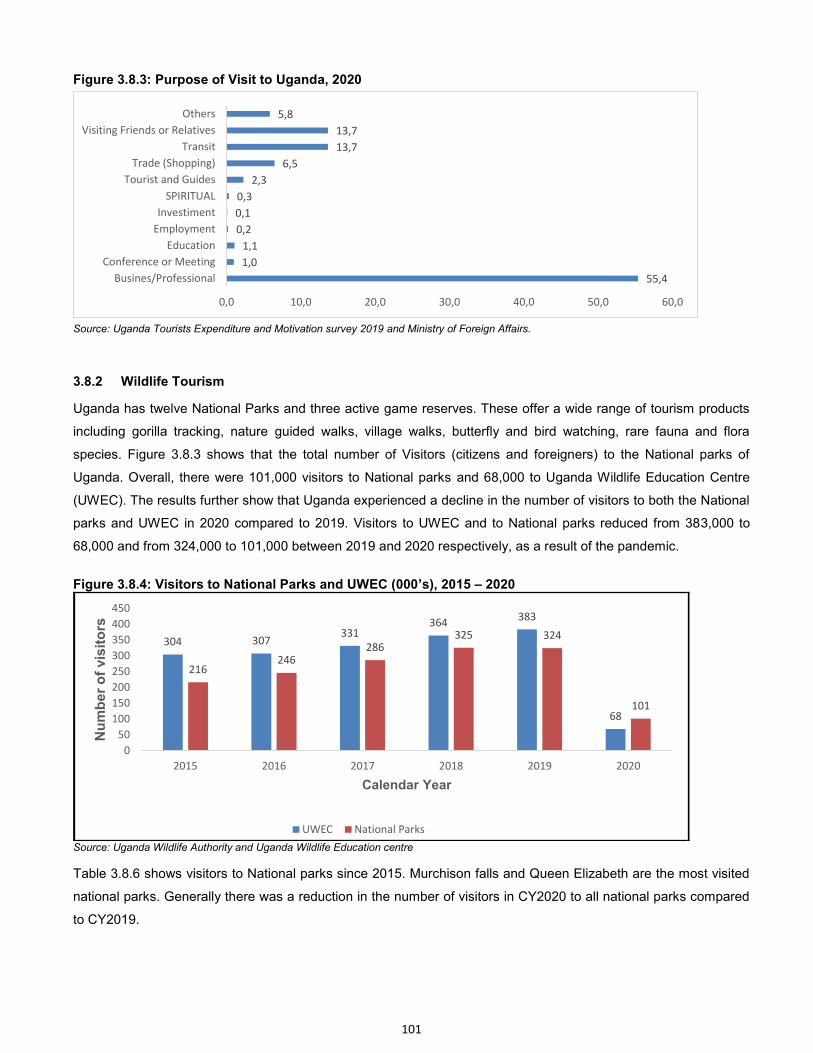
101
Figure 3.8.3: Purpose of Visit to Uganda, 2020
Source: Uganda Tourists Expenditure and Motivation survey 2019 and Ministry of Foreign Affairs.
3.8.2 Wildlife Tourism
Uganda has twelve National Parks and three active game reserves. These offer a wide range of tourism products
including gorilla tracking, nature guided walks, village walks, butterfly and bird watching, rare fauna and flora
species. Figure 3.8.3 shows that the total number of Visitors (citizens and foreigners) to the National parks of
Uganda. Overall, there were 101,000 visitors to National parks and 68,000 to Uganda Wildlife Education Centre
(UWEC). The results further show that Uganda experienced a decline in the number of visitors to both the National
parks and UWEC in 2020 compared to 2019. Visitors to UWEC and to National parks reduced from 383,000 to
68,000 and from 324,000 to 101,000 between 2019 and 2020 respectively, as a result of the pandemic.
Figure 3.8.4: Visitors to National Parks and UWEC (000’s), 2015 – 2020
Source: Uganda Wildlife Authority and Uganda Wildlife Education centre
Table 3.8.6 shows visitors to National parks since 2015. Murchison falls and Queen Elizabeth are the most visited
national parks. Generally there was a reduction in the number of visitors in CY2020 to all national parks compared
to CY2019.
55,4
1,0
1,1
0,2
0,1
0,3
2,3
6,5
13,7
13,7
5,8
0,0 10,0 20,0 30,0 40,0 50,0 60,0
Busines/Professional
Conference or Meeting
Education
Employment
Investiment
SPIRITUAL
Tourist and Guides
Trade (Shopping)
Transit
Visiting Friends or Relatives
Others
304 307 331
364 383
68
216 246
286 325 324
101
0
50
100
150
200
250
300
350
400
450
2015 2016 2017 2018 2019 2020
Nu
mb
er
of
vis
ito
rs
Calendar Year
UWEC National Parks
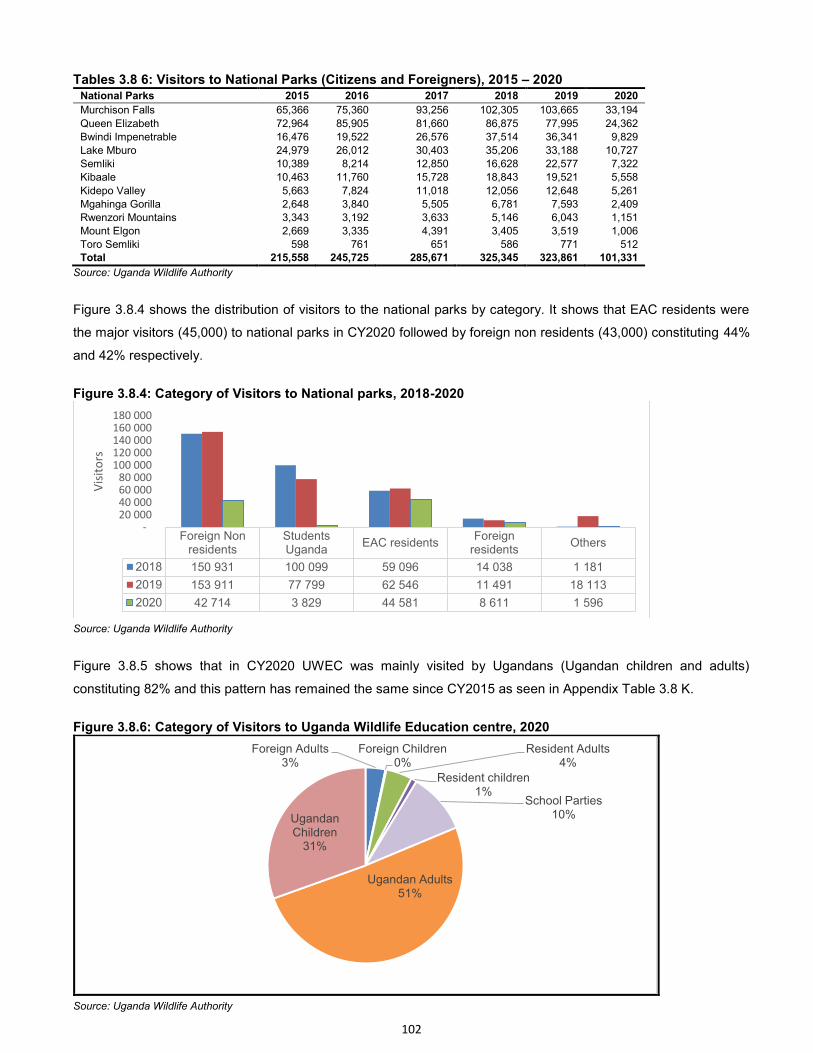
102
Tables 3.8 6: Visitors to National Parks (Citizens and Foreigners), 2015 – 2020 National Parks 2015 2016 2017 2018 2019 2020
Murchison Falls 65,366 75,360 93,256 102,305 103,665 33,194
Queen Elizabeth 72,964 85,905 81,660 86,875 77,995 24,362
Bwindi Impenetrable 16,476 19,522 26,576 37,514 36,341 9,829
Lake Mburo 24,979 26,012 30,403 35,206 33,188 10,727
Semliki 10,389 8,214 12,850 16,628 22,577 7,322
Kibaale 10,463 11,760 15,728 18,843 19,521 5,558
Kidepo Valley 5,663 7,824 11,018 12,056 12,648 5,261
Mgahinga Gorilla 2,648 3,840 5,505 6,781 7,593 2,409
Rwenzori Mountains 3,343 3,192 3,633 5,146 6,043 1,151
Mount Elgon 2,669 3,335 4,391 3,405 3,519 1,006
Toro Semliki 598 761 651 586 771 512
Total 215,558 245,725 285,671 325,345 323,861 101,331
Source: Uganda Wildlife Authority
Figure 3.8.4 shows the distribution of visitors to the national parks by category. It shows that EAC residents were
the major visitors (45,000) to national parks in CY2020 followed by foreign non residents (43,000) constituting 44%
and 42% respectively.
Figure 3.8.4: Category of Visitors to National parks, 2018-2020
Source: Uganda Wildlife Authority
Figure 3.8.5 shows that in CY2020 UWEC was mainly visited by Ugandans (Ugandan children and adults)
constituting 82% and this pattern has remained the same since CY2015 as seen in Appendix Table 3.8 K.
Figure 3.8.6: Category of Visitors to Uganda Wildlife Education centre, 2020
Source: Uganda Wildlife Authority
Foreign Nonresidents
StudentsUganda
EAC residentsForeign
residentsOthers
2018 150 931 100 099 59 096 14 038 1 181
2019 153 911 77 799 62 546 11 491 18 113
2020 42 714 3 829 44 581 8 611 1 596
- 20 000 40 000 60 000 80 000
100 000 120 000 140 000 160 000 180 000
Vis
ito
rs
Foreign Adults 3%
Foreign Children 0%
Resident Adults 4%
Resident children 1%
School Parties 10%
Ugandan Adults 51%
Ugandan Children
31%
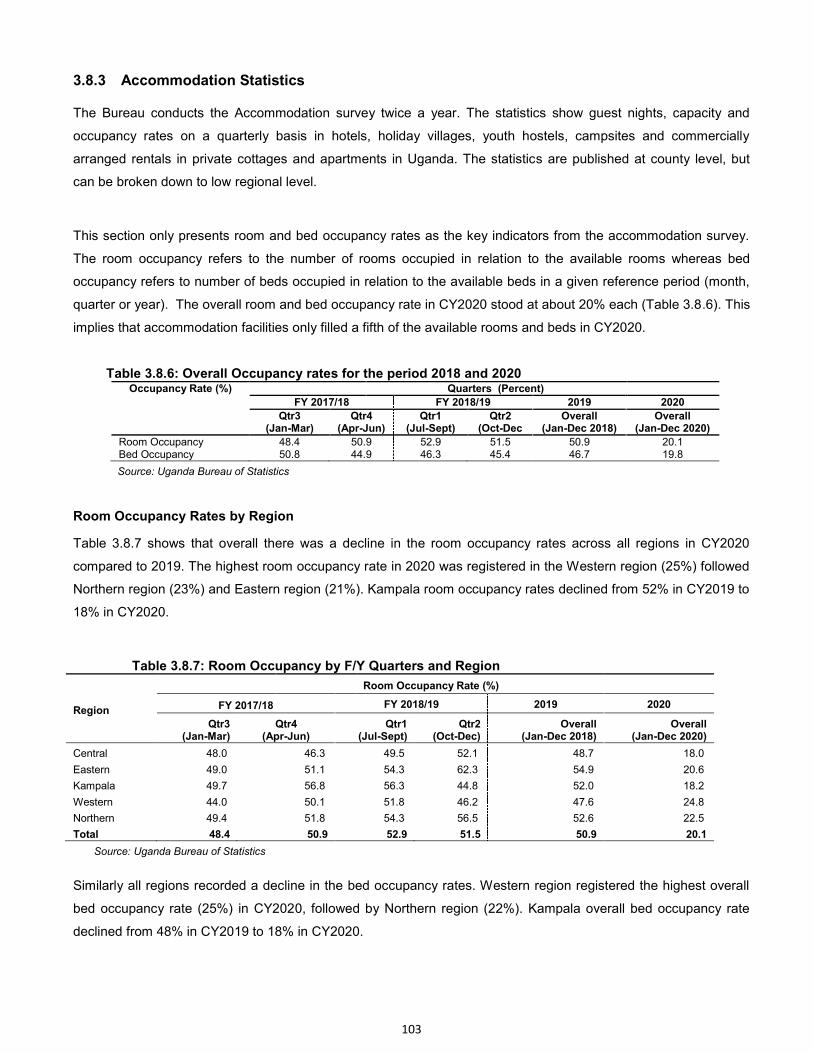
103
3.8.3 Accommodation Statistics
The Bureau conducts the Accommodation survey twice a year. The statistics show guest nights, capacity and
occupancy rates on a quarterly basis in hotels, holiday villages, youth hostels, campsites and commercially
arranged rentals in private cottages and apartments in Uganda. The statistics are published at county level, but
can be broken down to low regional level.
This section only presents room and bed occupancy rates as the key indicators from the accommodation survey.
The room occupancy refers to the number of rooms occupied in relation to the available rooms whereas bed
occupancy refers to number of beds occupied in relation to the available beds in a given reference period (month,
quarter or year). The overall room and bed occupancy rate in CY2020 stood at about 20% each (Table 3.8.6). This
implies that accommodation facilities only filled a fifth of the available rooms and beds in CY2020.
Table 3.8.6: Overall Occupancy rates for the period 2018 and 2020 Occupancy Rate (%) Quarters (Percent)
FY 2017/18 FY 2018/19 2019 2020
Qtr3 (Jan-Mar)
Qtr4 (Apr-Jun)
Qtr1 (Jul-Sept)
Qtr2 (Oct-Dec
Overall (Jan-Dec 2018)
Overall (Jan-Dec 2020)
Room Occupancy 48.4 50.9 52.9 51.5 50.9 20.1 Bed Occupancy 50.8 44.9 46.3 45.4 46.7 19.8
Source: Uganda Bureau of Statistics
Room Occupancy Rates by Region
Table 3.8.7 shows that overall there was a decline in the room occupancy rates across all regions in CY2020
compared to 2019. The highest room occupancy rate in 2020 was registered in the Western region (25%) followed
Northern region (23%) and Eastern region (21%). Kampala room occupancy rates declined from 52% in CY2019 to
18% in CY2020.
Table 3.8.7: Room Occupancy by F/Y Quarters and Region
Region
Room Occupancy Rate (%)
FY 2017/18 FY 2018/19 2019 2020
Qtr3 (Jan-Mar)
Qtr4 (Apr-Jun)
Qtr1 (Jul-Sept)
Qtr2 (Oct-Dec)
Overall (Jan-Dec 2018)
Overall (Jan-Dec 2020)
Central 48.0 46.3 49.5 52.1 48.7 18.0
Eastern 49.0 51.1 54.3 62.3 54.9 20.6
Kampala 49.7 56.8 56.3 44.8 52.0 18.2
Western 44.0 50.1 51.8 46.2 47.6 24.8
Northern 49.4 51.8 54.3 56.5 52.6 22.5
Total 48.4 50.9 52.9 51.5 50.9 20.1
Source: Uganda Bureau of Statistics
Similarly all regions recorded a decline in the bed occupancy rates. Western region registered the highest overall
bed occupancy rate (25%) in CY2020, followed by Northern region (22%). Kampala overall bed occupancy rate
declined from 48% in CY2019 to 18% in CY2020.
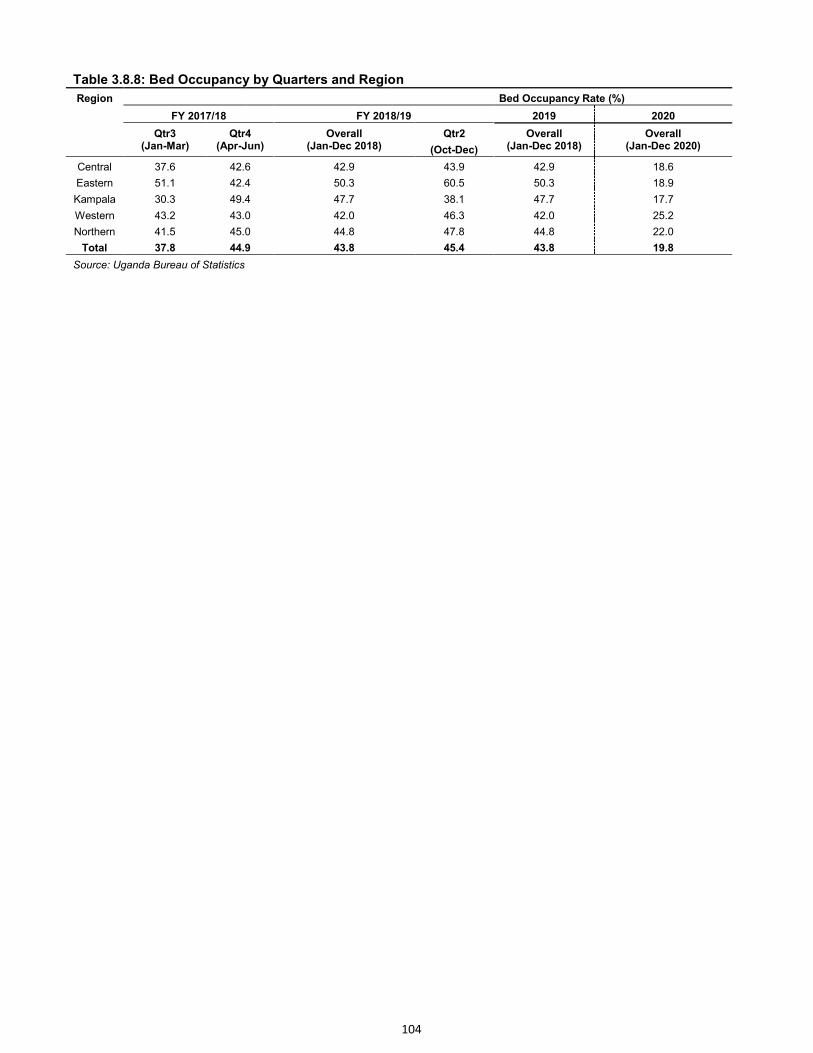
104
Table 3.8.8: Bed Occupancy by Quarters and Region
Region Bed Occupancy Rate (%)
FY 2017/18 FY 2018/19 2019 2020
Qtr3 (Jan-Mar)
Qtr4 (Apr-Jun)
Overall (Jan-Dec 2018)
Qtr2
(Oct-Dec)
Overall (Jan-Dec 2018)
Overall (Jan-Dec 2020)
Central 37.6 42.6 42.9
50.3
47.7
42.0
44.8
43.8
43.9 42.9 18.6
Eastern 51.1 42.4 60.5 50.3 18.9
Kampala 30.3 49.4 38.1 47.7 17.7
Western 43.2 43.0 46.3 42.0 25.2
Northern 41.5 45.0 47.8 44.8 22.0
Total 37.8 44.9 45.4 43.8 19.8
Source: Uganda Bureau of Statistics
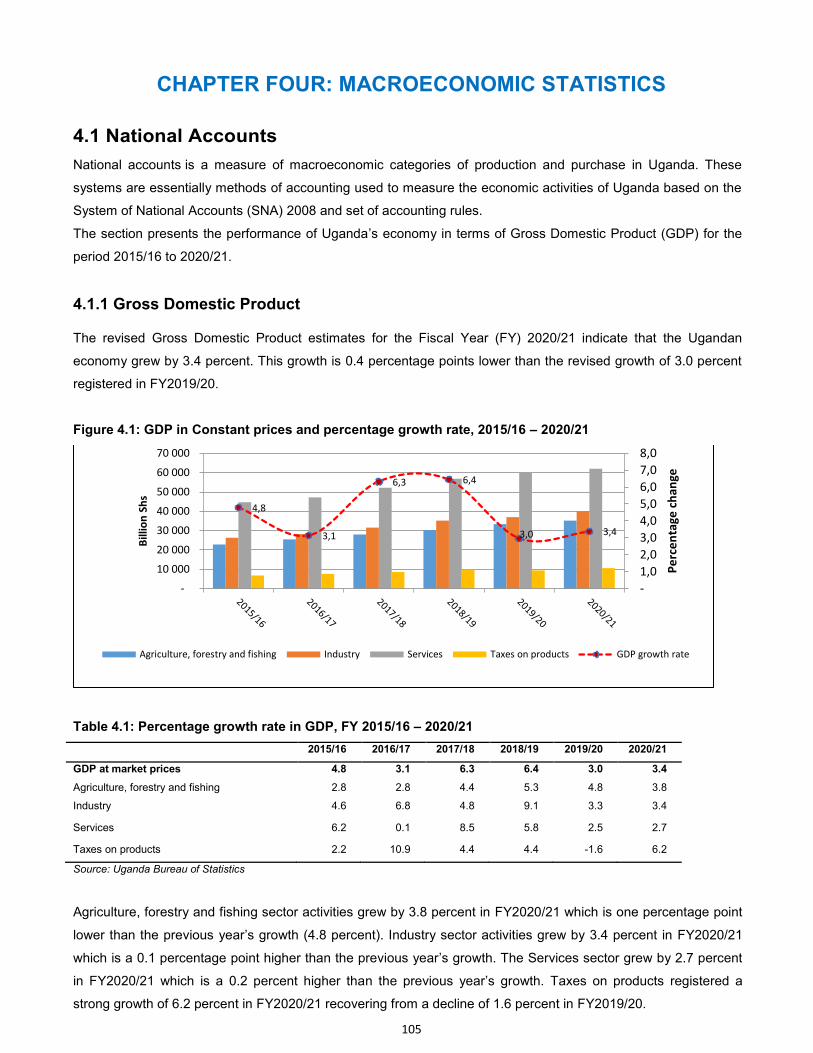
105
CHAPTER FOUR: MACROECONOMIC STATISTICS
4.1 National Accounts
National accounts is a measure of macroeconomic categories of production and purchase in Uganda. These
systems are essentially methods of accounting used to measure the economic activities of Uganda based on the
System of National Accounts (SNA) 2008 and set of accounting rules.
The section presents the performance of Uganda’s economy in terms of Gross Domestic Product (GDP) for the
period 2015/16 to 2020/21.
4.1.1 Gross Domestic Product
The revised Gross Domestic Product estimates for the Fiscal Year (FY) 2020/21 indicate that the Ugandan
economy grew by 3.4 percent. This growth is 0.4 percentage points lower than the revised growth of 3.0 percent
registered in FY2019/20.
Figure 4.1: GDP in Constant prices and percentage growth rate, 2015/16 – 2020/21
Table 4.1: Percentage growth rate in GDP, FY 2015/16 – 2020/21
2015/16 2016/17 2017/18 2018/19 2019/20 2020/21
GDP at market prices 4.8 3.1 6.3 6.4 3.0 3.4
Agriculture, forestry and fishing 2.8 2.8 4.4 5.3 4.8 3.8
Industry 4.6 6.8 4.8 9.1 3.3 3.4
Services 6.2 0.1 8.5 5.8 2.5 2.7
Taxes on products 2.2 10.9 4.4 4.4 -1.6 6.2
Source: Uganda Bureau of Statistics
Agriculture, forestry and fishing sector activities grew by 3.8 percent in FY2020/21 which is one percentage point
lower than the previous year’s growth (4.8 percent). Industry sector activities grew by 3.4 percent in FY2020/21
which is a 0.1 percentage point higher than the previous year’s growth. The Services sector grew by 2.7 percent
in FY2020/21 which is a 0.2 percent higher than the previous year’s growth. Taxes on products registered a
strong growth of 6.2 percent in FY2020/21 recovering from a decline of 1.6 percent in FY2019/20.
4,8
3,1
6,3 6,4
3,0 3,4
-
1,0
2,0
3,0
4,0
5,0
6,0
7,0
8,0
-
10 000
20 000
30 000
40 000
50 000
60 000
70 000
Pe
rce
nta
ge
ch
an
ge
Bil
lio
n S
hs
Agriculture, forestry and fishing Industry Services Taxes on products GDP growth rate
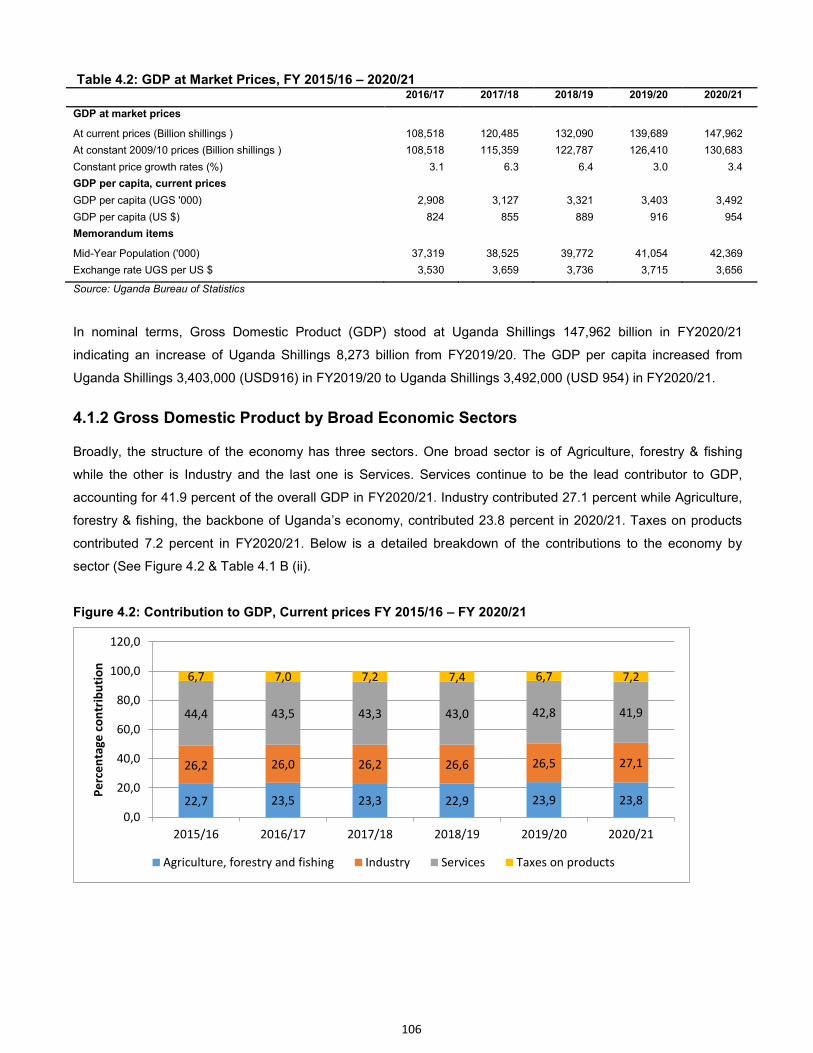
106
Table 4.2: GDP at Market Prices, FY 2015/16 – 2020/21 2016/17 2017/18 2018/19 2019/20 2020/21
GDP at market prices
At current prices (Billion shillings ) 108,518 120,485 132,090 139,689 147,962
At constant 2009/10 prices (Billion shillings ) 108,518 115,359 122,787 126,410 130,683
Constant price growth rates (%) 3.1 6.3 6.4 3.0 3.4
GDP per capita, current prices
GDP per capita (UGS '000) 2,908 3,127 3,321 3,403 3,492
GDP per capita (US $) 824 855 889 916 954
Memorandum items
Mid-Year Population ('000) 37,319 38,525 39,772 41,054 42,369
Exchange rate UGS per US $ 3,530 3,659 3,736 3,715 3,656
Source: Uganda Bureau of Statistics
In nominal terms, Gross Domestic Product (GDP) stood at Uganda Shillings 147,962 billion in FY2020/21
indicating an increase of Uganda Shillings 8,273 billion from FY2019/20. The GDP per capita increased from
Uganda Shillings 3,403,000 (USD916) in FY2019/20 to Uganda Shillings 3,492,000 (USD 954) in FY2020/21.
4.1.2 Gross Domestic Product by Broad Economic Sectors
Broadly, the structure of the economy has three sectors. One broad sector is of Agriculture, forestry & fishing
while the other is Industry and the last one is Services. Services continue to be the lead contributor to GDP,
accounting for 41.9 percent of the overall GDP in FY2020/21. Industry contributed 27.1 percent while Agriculture,
forestry & fishing, the backbone of Uganda’s economy, contributed 23.8 percent in 2020/21. Taxes on products
contributed 7.2 percent in FY2020/21. Below is a detailed breakdown of the contributions to the economy by
sector (See Figure 4.2 & Table 4.1 B (ii).
Figure 4.2: Contribution to GDP, Current prices FY 2015/16 – FY 2020/21
22,7 23,5 23,3 22,9 23,9 23,8
26,2 26,0 26,2 26,6 26,5 27,1
44,4 43,5 43,3 43,0 42,8 41,9
6,7 7,0 7,2 7,4 6,7 7,2
0,0
20,0
40,0
60,0
80,0
100,0
120,0
2015/16 2016/17 2017/18 2018/19 2019/20 2020/21
Pe
rce
nta
ge
co
ntr
ibu
tio
n
Agriculture, forestry and fishing Industry Services Taxes on products
107
4.1.3 Agriculture, forestry and fishing sector
The value added for the agricultural activities grew by 3.8 percent in FY2020/21, from a growth of 4.8 percent in
FY2019/20. The growth is attributed to favourable weather in FY2020/21. In nominal terms, the gross value
added was recorded at Uganda Shillings 35,213 billion in FY2020/21, compared to the revised value added of
Uganda Shillings 33,426 billion in FY2019/20. The performance of the agricultural activities was majorly driven by
the good performance in food crop, cash crop and livestock activities. However, fishing activities declined by 8.8
percent in FY2020/21 compared to a small growth of 0.3 percent in FY2019/20. The sector contributed 23.8
percent to GDP in FY2020/21 compared to 23.9 percent in FY2019/20 (See Appendix Tables 4.1 B(ii), 4.1 C(i)
and 4.1 C(ii)).
4.1.3.1 Cash crops
The value added for cash crop growing activities grew by 7.7 percent in FY2020/21, compared to 7.8 percent
growth in FY2019/20. The major drivers to this growth were the good performance in coffee (5.2%), Cotton
(10.6%), Tea (36.8%) and Cocoa (18.5%) growing activities. In spite of the good performance of cash crop
growing activities, a decline was registered in growing activities of sugarcane (3.3%) and Tobacco (1.4%). In
nominal prices, the sector recorded a value addition of Uganda Shillings 2,904 billion in FY2020/21, compared to
Uganda Shillings 2,748 billion in FY2019/20. The cash crops contributed 2.0 percent to GDP in both FY2020/21
and FY2019/20 (See Appendix Tables 4.1 B(ii), 4.1 C(i) and 4.1 C(ii)).
4.1.3.2 Food crops
The value added for food crop growing activities recorded a growth of 4.1 percent in 2020/21, compared to a
growth of 4.6 percent in FY2020/21. The growth in value added was realised in Bananas, Rice, Beans,
Groundnuts, Sorghum, Simsim, Cassava, fruits and sunflower growing activities. On the other side, there was a
decline in value added for maize and Irish potato growing activities. In nominal prices, the sector recorded a value
addition of Uganda Shillings 17,011 billion in FY2020/21, compared to Uganda Shillings 16,177 billion in
FY2019/20. The food crops growing activities contributed 11.5 percent to GDP in FY2020/21 compared to 11.6
percent in FY2019/20 (See Appendix Tables 4.1 B(ii), 4.1 C(i) and 4.1 C(ii)).
4.1.3.3 Livestock
The livestock raring activities include keeping of animals and birds such as cattle, goats, sheep and chicken. The
value added for livestock activities registered a growth of 7.8 percent in FY2020/21 compared to the 7.9 percent
growth in FY2019/20. In nominal prices, the sector recorded a value addition of Uganda Shillings 5,835 billion in
FY2020/21 compared to Uganda Shillings 5,268 billion in FY2019/20. The livestock keeping activities contributed
3.9 percent to GDP in FY2020/21 from 3.8 percent in FY2017/18 (See Appendix Tables 4.1 B (ii), 4.1 C (i) and
4.1 C (ii)).
4.1.3.4 Forestry
The forestry activities include Logging, Gathering of non-wood forest products and Support services to forestry,
among other products. The value added for forestry activities registered a growth of 2.9 percent in FY2020/21,
compared to a growth of 3.3 percent recorded in FY2019/20. In nominal prices, the sector recorded a value
addition of Uganda Shillings 6,102 billion in FY2020/21 compared to Uganda Shillings 5,751 billion in FY2019/20.
108
The forestry activities contributed 4.1 percent to GDP in FY2020/21, which was similar to FY2019/20 (See
Appendix Tables 4.1 B (ii), 4.1 C (i) and 4.1 C (ii)).
4.1.3.5 Fishing
The fishing activities include fishing in fresh water lakes and rivers as well as fish farming. The value added for
fishing activities registered a decline of 8.8 percent in FY2020/21, compared to a growth of 0.3 percent recorded
in FY2019/20. This decline is mainly attributed to the decrease in fish catch in 2020. In nominal prices, the sector
recorded a value addition of Uganda Shillings 3,351 billion in FY2020/21, compared to Uganda Shillings 3,462
billion in FY2019/20. The fishing activities contributed 2.3 percent to the GDP in FY2020/21, which was 0.2
percentage points lower than the 2.5 percent contribution in FY2019/20 (See Appendix Tables 4.1 B(ii), 4.1 C(i)
and 4.1 C(ii)).
4.1.4 Industry sector
The value added for the Industry sector activities include Mining and quarrying, Manufacturing, Water and waste
management activities, Electricity generation and supply as well as Construction activities. The overall industry
activities grew by 3.4 percent in FY2020/21, compared to 3.2 percent in FY2019/20. This is attributed to the
growth in Mining & quarrying activities which grew by 6.0 percent in FY2020/21 compared to 16.5 percent in
FY2019/20. Manufacturing activities picked up with a growth of 2.2 percent in FY2020/21, from 1.3 percent in
FY2019/20. In nominal terms, the sector recorded a gross value added of Uganda Shillings 40,076 billion in
FY2020/21 compared to Uganda Shillings 37,004 billion recorded in FY2019/20, contributing 27.1 percent to GDP
in FY2020/21 compared to 26.5 percent in FY2019/20 (See Appendix Tables 4.1 B(ii), 4.1 C(i) and 4.1 C(ii)).
4.1.4.1 Mining and quarrying activities
Mining and quarrying activities include Extraction of crude petroleum and natural gas, Mining of metal ores, Other
mining and quarrying as well as Mining support service activities. The value added for mining and quarrying
activities grew by 6.0 percent in FY2020/21, following a growth of 16.5 percent in FY2019/20. In nominal prices,
the activity recorded a value addition of Uganda Shillings 2,627 billion in FY2020/21 compared to Uganda
Shillings 2,266 billion in FY2019/20. Mining and quarrying activities, the least among the Industry sector,
contributed 1.8 percent to GDP in FY2020/21 compared to 1.6 percent in FY2019/20 (See Appendix Tables 4.1
B(ii), 4.1 C(i) and 4.1 C(ii)).
4.1.4.2 Manufacturing activities
Manufacturing activities include manufacture of Food products, Beverages, Tobacco products, Textiles, wearing
and apparel products as well as Paper and paper products. The value added for manufacturing activities grew by
2.2 percent in FY2020/21, compared to 1.3 percent recorded in FY2019/20. Manufacturing activities contributed
16.5 percent to the GDP in 2020/21. In nominal prices, the activity recorded a value addition of Uganda Shillings
24,373 billion in FY2020/21, compared to Uganda Shillings 22,064 billion in FY2019/20 (See Appendix Tables 4.1
B(ii), 4.1 C(i) and 4.1 C(ii)).
4.1.4.3 Electricity activities
Electricity activities include Electricity, gas and steam as well as Air conditioning supply. The value added for
electricity activities grew by 11.3 percent in FY2020/21, compared to 10.9 percent recorded in FY2019/20. In
nominal prices, the activity recorded a value addition of Uganda Shillings 2,134 billion in FY2020/21, compared to
109
Uganda Shillings 1,932 billion in FY2019/20. Electricity activities contributed 1.4 percent to GDP in FY2020/21
same as FY2019/20 (See Appendix Tables 4.1 B(ii), 4.1 C(i) and 4.1 C(ii)).
4.1.4.4 Water supply activities
Water supply activities include Water supply, Sewerage, Waste management and Remediation activities. The
value added for water supply activities grew by 4.8 percent in FY2020/21, compared to 4.1 percent recorded in
FY2019/21. In nominal prices, the activity recorded a value addition of Uganda Shillings 3,258 billion in
FY2020/21 compared to Uganda Shillings 3,119 billion in FY2019/20. Water supply activities contributed 2.2
percent to GDP in FY2018/19 same as FY2017/18 (See Appendix Tables 4.1 B(ii), 4.1 C(i) and 4.1 C(ii)).
4.1.4.5 Construction activities
Construction activities include Construction of buildings, Civil engineering and specialised construction activities.
The value added for construction activities grew by 3.3 percent in FY2020/21, compared to a growth of 3.8
percent recorded in FY2019/20. The growth has continued to be driven by both private and public construction
activities. The public sector investments have continued to be dominated by civil construction of dams and roads
& bridges. In nominal prices, the activity recorded a value addition of Uganda Shillings 7,685 billion in FY2020/21
compared to Uganda Shillings 7,623 billion in FY2019/20. Construction activities contributed 5.2 percent to GDP
in FY2020/21 compared to 5.5 percent in FY2019/20 (See Appendix Tables 4.1 B(ii), 4.1 C(i) and 4.1 C(ii)).
4.1.5 Services sector
The value added in the service sector includes Wholesale and retail trade, Repairs, transport and storage,
Accommodation and food services, Information and communication, Financial and insurance activities, Real
estate activities, Professional, scientific and technical services, Administrative and support services, Public
administration, education, health, arts, entertainment and recreation as well as Other service activities. The
overall services sector activities value added grew by 2.7 percent in FY2020/21, compared to 2.5 percent in
FY2019/20. The main contributors to the growth in services sector were Public administration, Real estate
activities, Information and communication then Health & social work activities. The sector contributed 41.9
percent to GDP growth in FY2020/21, compared to 42.8 percent in FY2019/20. In nominal terms, the gross value
added was recorded at Uganda Shillings 62,051 billion in FY2020/21, compared to Uganda Shillings 59,840
billion recorded in FY2019/20 (See Appendix Tables 4.1 B(ii), 4.1 C(i) and 4.1 C(ii)).
4.1.5.1 Trade and repairs
Trade and repairs activities include Wholesale, retail trade and sales as well as Repair of motor vehicles. The
value added for trade and repairs activities registered a decline of 0.7 percent in FY2020/21, compared to a
decline of 1.3 percent recorded in FY2019/20. In nominal prices, the activity recorded a value addition of Uganda
Shillings 11,728 billion in FY2020/21 compared to Uganda Shillings 11,758 billion in FY2019/20. Trade and
repairs activities contributed 7.9 percent to GDP in FY2020/21 as compared to 8.4 percent in FY2019/20 (See
Appendix Tables 4.1 B(ii), 4.1 C(i) and 4.1 C(ii)).
4.1.5.2 Transport and storage activities
Transport and storage activities include Road, rail, water and air transport, Warehousing as well as Posts and
courier activities. The value added for Transport and storage activities declined by 0.3 percent in FY2020/21, from
110
a decline of 1.7 percent in FY2019/20. This was attributed to Warehousing and support activities and to Postal
services which have both contracted in the last two years. There was, however, a growth in road transport of 6.3
percent in FY2020/21, recovering from a decline of 2.1 percent in FY2019/20. In nominal terms, the activity
recorded a value addition of Uganda Shillings 4,804 billion in FY2020/21 compared to Uganda Shillings 4,792
billion in FY2019/20. Transport and storage activities contributed 3.2 percent to GDP in FY2020/21, compared to
3.4 percent in FY2019/20 (See Appendix Tables 4.1 B(ii), 4.1 C(i) and 4.1 C(ii)).
4.1.5.3 Accommodation and food activities
Accommodation and food service activities include; accommodation and restaurants activities. The value added
for Accommodation and food service activities declined by 0.6 percent in FY2020/21, from a decline of 8.6
percent in FY2019/20. In nominal prices, the activities recorded a value addition of Uganda Shillings 3,549 billion
in FY2020/21, compared to Uganda Shillings 3,645 billion in FY2019/20. Accommodation and food service
activities contributed 2.4 percent of GDP in FY2020/21, compared to 2.6 percent in FY2019/20 (See Appendix
Tables 4.1 B(ii), 4.1 C(i) and 4.1 C(ii)).
4.1.5.4 Information and communication activities
The value added for Information and communication services grew by 11.8 percent in FY2020/21, from 19.6
percent in 2019/20. The largest contributor to the growth of Information and communication services was
telecommunications (14.7 percent). In nominal prices, the activity recorded a value addition of Uganda Shillings
2,678 billion in FY2020/21 compared to Uganda Shillings 2,555 billion in FY2019/20. Information and
communication service activities contributed 1.8 percent to GDP in FY2020/21 equivalent to FY2019/20 (See
Appendix Tables 4.1 B(ii), 4.1 C(i) and 4.1 C(ii)).
4.1.5.5 Financial and insurance activities
Financial and insurance activities include services of the Central bank, Financial intermediaries, Financial
auxiliaries, Credit institutions and Micro-deposit taking institutions (MDI’s) as well as other Financial corporations.
The sector grew by 8.0 percent in FY2020/21, from a 9.6 percent growth registered in FY2019/20. In nominal
prices, the activity recorded a value addition of Uganda Shillings 4,103 billion in FY2020/21, compared to Uganda
Shillings 3,816 billion in FY2019/20. Financial and insurance activities contribution to GDP was 2.8 percent in
FY2020/21, compared to 2.7 percent in FY2019/20 (See Appendix Tables 4.1 B(ii), 4.1 C(i) and 4.1 C(ii)).
4.1.5.6 Real estate activities
Real estate activities include Real estate on own or lease and Real estate on fee or contract. The sector grew by
3.9 percent in FY2020/21, compared to the 5.1 percent registered in FY2019/20. Real estate on fee or contract
and Real estate on own or lease grew by 20.3 and 3.4 percent respectively. In nominal prices, the activity
recorded a value addition of Uganda Shillings 9,273 billion in FY2020/21 compared to Uganda Shillings 8,907
billion in FY2019/20. Real estate activities contributed 6.3 percent to GDP in FY2019/20, which is 0.1 percentage
point less than the contribution of the previous fiscal year (See Appendix Tables 4.1 B(ii), 4.1 C(i) and 4.1 C(ii)).
4.1.5.7 Professional, scientific and technical activities
Professional, Scientific and Technical services include Legal & accounting services, Head offices & management,
Architectural & engineering services, Science, research and development, Advertising & market research,
Veterinary services as well as Other business services. The activities grew by 2.1 percent in FY2020/21, following
111
a growth of 2.8 percent registered in FY2019/20. In nominal prices, Professional, scientific and technical activities
realised a value added of Uganda Shillings 2,964 billion in FY2020/21 compared to 2,902 billion in FY2019/20.
The overall activity contributed 2.0 percent to GDP in FY2020/21, compared to 2.1 percent contribution registered
in FY2019/20 (See Appendix Tables 4.1 B(ii), 4.1 C(i) and 4.1 C(ii)).
4.1.5.8 Administrative and support activities
Administrative and support activities include Rental & leasing, Employment activities, Travel, tour & reservation,
Security and investigation, Buildings and landscaping as well as Office administration & business support. The
activities grew by 2.3 percent in FY2020/21, compared to 7.5 percent growth registered in FY2019/20.
In nominal prices, the activity recorded a value addition of Uganda Shillings 2,840 billion in FY2020/21, compared
to Uganda Shillings 2,577 billion in FY2019/20. Administrative and Support activities contributed 1.9 percent to
GDP in FY2020/21, compared to 1.8 percent contribution registered in FY2019/20 (See Appendix Tables 4.1 B(ii),
4.1 C(i) and 4.1 C(ii)).
4.1.5.9 Public administration activities
This includes Public administration, Defence and Compulsory social security services. The activities grew by 12.6
percent in FY2020/21, from 16.2 percent growth in FY2019/20. The activities contribution to GDP was recorded at
3.0 percent, from 2.8 percent in FY2019/20. In nominal prices, the activity recorded a value addition of Uganda
Shillings 4,455 billion in FY2020/21 compared to Uganda Shillings 3,865 billion in FY2019/20 (See Appendix
Tables 4.1 B(ii), 4.1 C(i) and 4.1 C(ii)).
4.1.5.10 Education activities
Education services comprise of both private and public services. The activities declined by 4.2 percent in
FY2020/21, compared to a decline of 2 percent in 2019/20. The continuous decline is attributed to the closure of
the majority of school activities in the two periods. (See Appendix Tables 4.1 B(ii), 4.1 C(i) and 4.1 C(ii)).
In nominal prices, the activity recorded a value addition of Uganda Shillings 5,565 billion shillings in FY2020/21
compared to Uganda Shillings 5,767 billion shillings in FY2019/20. Education activities contributed 3.8 percent to
GDP in FY2020/21, compared to 4.1 percent contribution registered in FY2019/20.
4.1.5.11 Human health and social work activities
Human health and social work activities include Public health, Private health and Social work. The activities grew
by 7.1 percent in FY2020/21, compared to a 1.0 percent growth registered in FY2019/20. In nominal prices,
Human health and Social work activities realised a value addition of Uganda Shillings 5,078 billion in FY2020/21
compared to Uganda Shillings 4,496 in FY2019/20. The share of the activities to GDP was recorded at 3.4
percent in FY2020/21 from 3.2 percent recorded in 2019/20 (See Appendix Tables 4.1 B(ii), 4.1 C(i) and 4.1 C(ii)).
4.1.5.12 Arts, entertainment and recreation activities
Arts, Entertainment and Recreation activities include Creative, arts & entertainment, Libraries, archives and
museums, Gambling and betting as well as Sports, amusement and recreation activities. The activities declined
by 13.7 percent in FY2020/21, compared to a decline of 8.1 percent registered in FY2019/20. In nominal prices,
Arts, Entertainment and Recreation activities realised a value addition of Uganda Shillings 229 billion in
112
FY2020/21 compared to Uganda Shillings 251 in FY2019/20. The share of the activities to GDP remained
constant at 0.2 percent in FY2020/21 and FY2019/20 (See Appendix Tables 4.1 B(ii), 4.1 C(i) and 4.1 C(ii)).
4.1.5.13 Other service activities
Other Service activities include Membership organisations, Computers & personal goods repair as well as
Computers and personal goods repair. This activity grew by 2.9 percent in FY2020/21, compared to a 1.4 percent
registered in FY2019/20. In nominal prices, Other service activities realised a value addition of Uganda Shillings
3,679 billion in FY2020/21, compared to 3,455 in FY2019/20. The share of the activities to GDP remained
constant at 2.5 percent in FY2020/21 and FY2019/20 (See Appendix Tables 4.1 B(ii), 4.1 C(i) and 4.1 C(ii)).
4.1.5.14 Activities of households as employers
Activities of households as employers grew by 2.7 percent in FY2020/21, compared to a 2.8 percent registered in
FY2019/20. In nominal prices, Activities of households as employers realised a value addition of Uganda Shillings
1,107 billion in FY2020/21, compared to Uganda Shillings 1,053 in FY2019/20. The share of the activities to GDP
was recorded at 0.7 percent in FY2020/21, from 0.8 percent recorded in 2019/20 (See Appendix Tables 4.1 B(ii),
4.1 C(i) and 4.1 C(ii)).
113
4.1.6 GDP by Expenditure
GDP by expenditure approach measures the allocation of total production during the year among alternative uses
and, therefore, the expenditure approach takes into account three main aggregates. The aggregates are Final
Consumption Expenditure (Household, Government, Non-Profit Institutions Serving Households (NPISH)), Gross
Capital Formation, and the Net Exports (Exports less Imports). Below is an explanation of the expenditure sectors
of GDP.
4.1.6.1 Final Consumption Expenditure (FCE)
The Final Consumption Expenditure (FCE) recorded a growth of 6.6 percent in FY2020/21, compared to 3.2
percent in FY2019/20. The FCE in nominal terms was recorded at Uganda Shillings 122,348 billion. The share of
the FCE recorded at 82.7 percent of the GDP in FY2020/21 compared to 80.7 percentage in FY2019/20 (See
Appendix Tables 4.1 J(i) and 4.1 J(ii)).
4.1.6.2 Households Final Consumption Expenditure (HFCE)
The household final consumption expenditure accounted for about 82.9 percent of the final consumption
expenditure in FY2020/21. The HFCE grew by 7.1 percent in FY2020/21 compared to 3.2 percent. In nominal
terms, the HFCE was estimated at Uganda Shillings 101,477 billion in FY2020/21. The share of HFCE stood at
68.6 percent of GDP in FY2020/21 (See Appendix Tables 4.1 J(i) and 4.1 J(ii)).
4.1.6.3 Government Final Consumption Expenditure (GFCE)
The government final consumption expenditure accounted for about 12.0 percent of the final consumption
expenditure in FY2020/21. The GFCE recorded a further growth of 6.5 percent in FY2020/21, following a strong
growth of 12.7 percent in FY2019/20. In nominal terms, the GFCE was estimated at Uganda Shillings 14,730
billion in FY2020/21, from Uganda Shillings 13,286 billion in FY2019/20. The contribution of GFCE to GDP stood
at 9.9 percent of GDP in FY2020/21 (See Appendix Tables 4.1 J(i) and 4.1 J(ii)).
4.1.6.4 Gross Fixed Capital Formation (GFCF)
Gross fixed capital formation consists of expenditure on Dwellings, Other buildings and structures, Buildings other
than dwellings, Other structures, Land improvements, Machinery and equipment, Transport equipment,
Information and Communication Technologies (ICT) equipment, Other machinery and equipment, Research and
development, Mineral exploration and evaluation then Computer software and databases. In FY2020/21. Gross
fixed capital formation recorded a growth of 4.4 percent from a decline of 0.1 percent in FY2019/20. The GFCF
contributed 23.3 percentage points to the total GDP by expenditure in FY2020/21. Construction (Dwellings, other
buildings, other structures) have a share of 60.7 percent of GFCF recorded in FY2020/21 compared to 61.8
percent in FY2019/20. In nominal terms, the GFCF was estimated at 34,538 billion shillings in FY2020/21 from
32,852 billion shillings in FY2019/20 (See 4.1 Appendix Tables J(i) and 4.1 J(ii)).
4.1.6.5 Exports and imports of goods and services
Export of goods and services declined by 0.7 percent in FY2020/21 compared to a decline of 1.2 percent
recorded in FY2019/20. However, Export of goods grew by 12.5 percent while services declined by 30.3 percent
in the period under study.
114
Import of goods and services grew by 20.6 percent in FY2020/21 compared to the growth of 0.4 percent recorded
in FY2019/20. Import of goods grew by 33.3 percent while services contracted by 0.3 percent in the period under
study (See Appendix Tables 4.1 J(i) and 4.1 J(ii)).
In nominal terms, the value of exports of goods and services was recorded at 20,253 billion shillings in FY2020/21
from 20,396 billion shillings in the previous year. The value of imports of goods and services was recorded at
30,786 billion shillings in FY2020/21 from 25,533 billion shillings in FY2019/20 (See Appendix Tables 4.1 J(i) and
4.1 J(ii)).
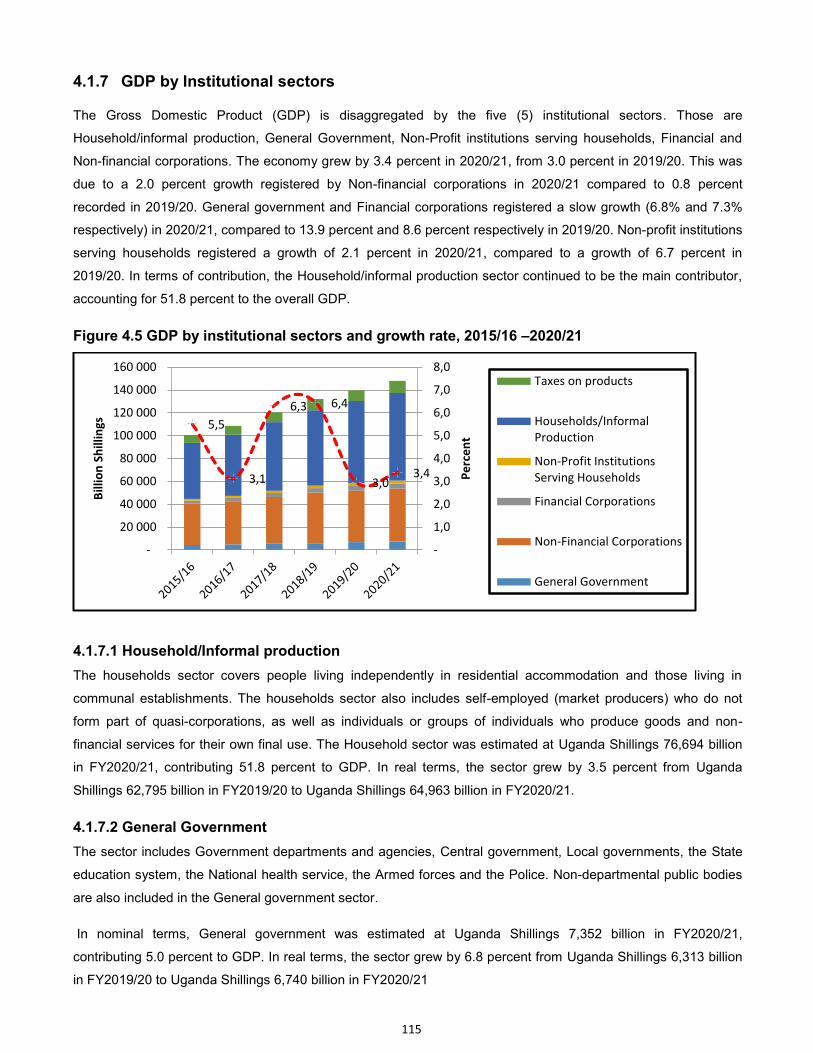
115
4.1.7 GDP by Institutional sectors
The Gross Domestic Product (GDP) is disaggregated by the five (5) institutional sectors. Those are
Household/informal production, General Government, Non-Profit institutions serving households, Financial and
Non-financial corporations. The economy grew by 3.4 percent in 2020/21, from 3.0 percent in 2019/20. This was
due to a 2.0 percent growth registered by Non-financial corporations in 2020/21 compared to 0.8 percent
recorded in 2019/20. General government and Financial corporations registered a slow growth (6.8% and 7.3%
respectively) in 2020/21, compared to 13.9 percent and 8.6 percent respectively in 2019/20. Non-profit institutions
serving households registered a growth of 2.1 percent in 2020/21, compared to a growth of 6.7 percent in
2019/20. In terms of contribution, the Household/informal production sector continued to be the main contributor,
accounting for 51.8 percent to the overall GDP.
Figure 4.5 GDP by institutional sectors and growth rate, 2015/16 –2020/21
4.1.7.1 Household/Informal production
The households sector covers people living independently in residential accommodation and those living in
communal establishments. The households sector also includes self-employed (market producers) who do not
form part of quasi-corporations, as well as individuals or groups of individuals who produce goods and non-
financial services for their own final use. The Household sector was estimated at Uganda Shillings 76,694 billion
in FY2020/21, contributing 51.8 percent to GDP. In real terms, the sector grew by 3.5 percent from Uganda
Shillings 62,795 billion in FY2019/20 to Uganda Shillings 64,963 billion in FY2020/21.
4.1.7.2 General Government
The sector includes Government departments and agencies, Central government, Local governments, the State
education system, the National health service, the Armed forces and the Police. Non-departmental public bodies
are also included in the General government sector.
In nominal terms, General government was estimated at Uganda Shillings 7,352 billion in FY2020/21,
contributing 5.0 percent to GDP. In real terms, the sector grew by 6.8 percent from Uganda Shillings 6,313 billion
in FY2019/20 to Uganda Shillings 6,740 billion in FY2020/21
5,5
3,1
6,3 6,4
3,0 3,4
-
1,0
2,0
3,0
4,0
5,0
6,0
7,0
8,0
-
20 000
40 000
60 000
80 000
100 000
120 000
140 000
160 000
Pe
rce
nt
Bil
lio
n S
hil
lin
gs
Taxes on products
Households/Informal
Production
Non-Profit Institutions
Serving Households
Financial Corporations
Non-Financial Corporations
General Government
116
4.1.7.3 Non-Profit institutions serving households
Non-profit institutions serving households (NPISH) are institutions that provide goods and services, either free or
below the market prices. They mainly derive their income from grants and donations and are not controlled by
government. For example, charity organisations, Trade unions, Religious organisations, Associations and Political
parties. The NPISH sector was estimated at Uganda Shillings 2,607 billion in FY2020/21, contributing 1.8 percent
to GDP. In real terms, the sector grew by 2.1 percent from 2,460 billion shillings in FY2019/20 to 2,511 billion
shillings in FY2020/21. The sector was mainly driven by Human health and social work services as well as
Education.
4.1.7.4 Financial corporations
The Financial corporations sector consists of institutional units that are independent legal entities and market
producers whose principal activity is the production of financial services. Such institutional units comprise all
corporations and quasi corporations that are principally engaged in financial intermediation and auxiliary financial
activities. The Financial Corporations sector was estimated at Uganda Shillings 4,414 billion in FY2020/21,
contributing 3.0 percent to GDP. In real terms, the sector grew by 7.3 percent, from Uganda Shillings 3,862 billion
in FY2019/20 to Uganda Shillings 4,142 billion in FY2020/21.
4.1.7.5 Non-Financial corporations
The sector players produce goods and services for the market and do not, as a primary activity, deal in financial
assets and liabilities. This sector includes both public and private retailers, manufacturers, utilities, business
service providers (such as accountancy and law firms), caterers, haulage companies, airlines, construction
companies and farms, among others. Non-Financial Corporations sector was estimated at Uganda Shillings
46,272 billion in FY2020/21, contributing 31.3 percent to GDP. In real terms, the sector grew marginally by 2.0
percent from Uganda Shillings 42,795 billion in FY2019/20 to Uganda Shillings 43,630 billion in FY2020/21. The
sector was mainly driven by Manufacturing, followed by Trade & repairs services, Real estate activities, Education
and Construction services.
117
4.1.8 Balance of Payments
Balance of Payments (BoP) statement summarises all transactions between a country's residents and its non-
residents involving Goods, services and income; Financial claims on and liabilities to the rest of the world; as well
as Transfers such as gifts. Within the BoP, there are three separate categories under which different transactions
are categorised: Those are; the Current account, the Capital account and the Financial account. The overall BoP
balance stood at a deficit United States Dollars 182 million in 2020/21 following a previous deficit of United States
Dollars 146 million recorded in 2019/20 (See Appendix Table 4.1N)
4.1.8.1 Current Account Balance
The Current account is the sum of the Balance of trade (goods and services exports less imports), Net income
from abroad and Net current transfers. The Current account balance registered a deficit of United States Dollars
4,135 million in 2020/21 compared to a deficit of United States Dollars 2,504 million in 2019/20 translating into
United States Dollars 1,631 million deficit over the period. This was mainly attributed to the growing deficit noted
in Net export of services from United States Dollars 1,260 million in 2019/20 to United States Dollars 2,052 million
in 2020/21. Goods and primary income balances also significantly contributed to the current account deficit (See
Appendix Table 4.1N)
4.1.8.2 Capital and Financial Account Balance The Capital account, combined with the Financial account, represents the transfer of capital to help pay for the
current account, which includes the Trade of goods and services. Capital account measures the inflow and
outflow of short-term and long-term capital transfers. These are mainly Non-produced and Non-financial assets
such as Land, Leases, Licenses, Grants and Market assets (eg trade names, copyrights etc). The capital account
position grew from United States Dollars 69 million surplus recorded in 2019/20 to United States Dollars 171
recorded in 2020/21.
Financial account components include Direct investment, Portfolio investment and Reserve assets, which are
broken down by sector. The Financial account shows a Net borrowing position of United States Dolars 2,910
million in 2020/21, up from United States Dollars 1,623 million recorded in 2019/20. This was attributed to an
increase in other investment from from United States Dollars 974 Million in 2019/20 to from United States Dollars
2,004 Million in 2020/21 and portfolio investment balance contracted from from United States Dollars 321 Million
in 2019/20 to a deficit of from United States Dollars 43 Million in 2020/21. (See Appendix Table 4.1N)
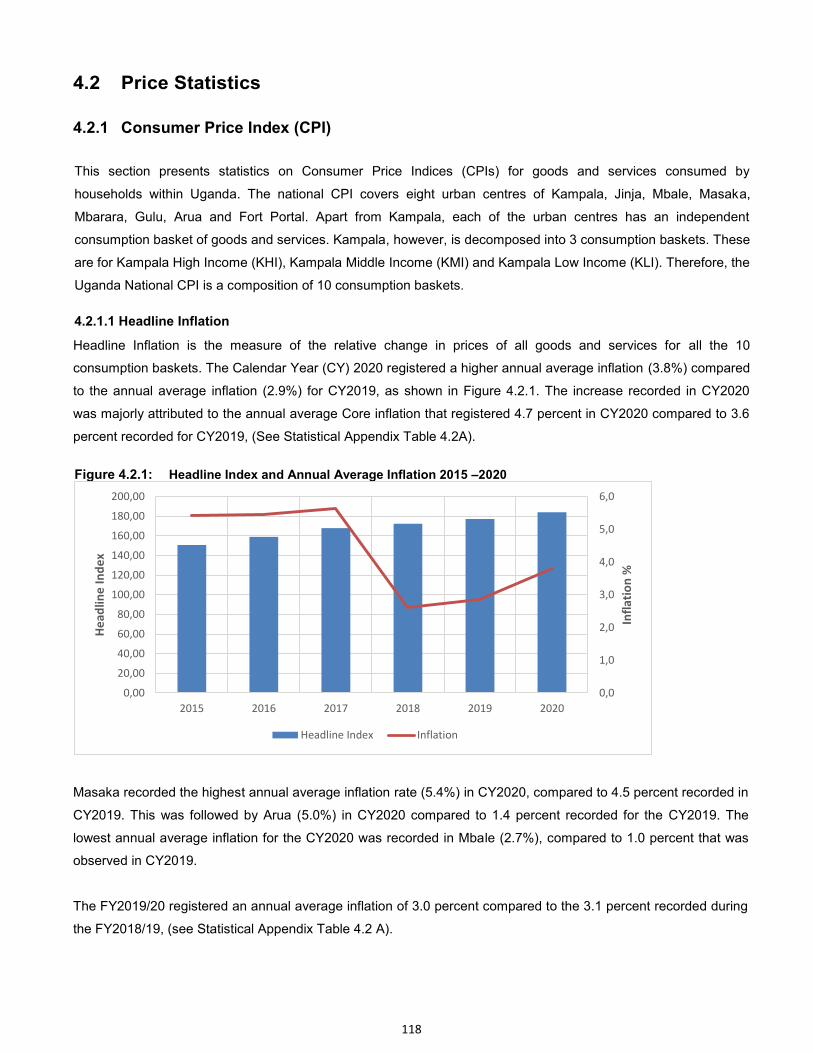
118
4.2 Price Statistics
4.2.1 Consumer Price Index (CPI)
This section presents statistics on Consumer Price Indices (CPIs) for goods and services consumed by
households within Uganda. The national CPI covers eight urban centres of Kampala, Jinja, Mbale, Masaka,
Mbarara, Gulu, Arua and Fort Portal. Apart from Kampala, each of the urban centres has an independent
consumption basket of goods and services. Kampala, however, is decomposed into 3 consumption baskets. These
are for Kampala High Income (KHI), Kampala Middle Income (KMI) and Kampala Low Income (KLI). Therefore, the
Uganda National CPI is a composition of 10 consumption baskets.
4.2.1.1 Headline Inflation Headline Inflation is the measure of the relative change in prices of all goods and services for all the 10
consumption baskets. The Calendar Year (CY) 2020 registered a higher annual average inflation (3.8%) compared
to the annual average inflation (2.9%) for CY2019, as shown in Figure 4.2.1. The increase recorded in CY2020
was majorly attributed to the annual average Core inflation that registered 4.7 percent in CY2020 compared to 3.6
percent recorded for CY2019, (See Statistical Appendix Table 4.2A).
Figure 4.2.1: Headline Index and Annual Average Inflation 2015 –2020
Masaka recorded the highest annual average inflation rate (5.4%) in CY2020, compared to 4.5 percent recorded in
CY2019. This was followed by Arua (5.0%) in CY2020 compared to 1.4 percent recorded for the CY2019. The
lowest annual average inflation for the CY2020 was recorded in Mbale (2.7%), compared to 1.0 percent that was
observed in CY2019.
The FY2019/20 registered an annual average inflation of 3.0 percent compared to the 3.1 percent recorded during
the FY2018/19, (see Statistical Appendix Table 4.2 A).
0,0
1,0
2,0
3,0
4,0
5,0
6,0
0,00
20,00
40,00
60,00
80,00
100,00
120,00
140,00
160,00
180,00
200,00
2015 2016 2017 2018 2019 2020
Infl
ati
on
%
He
ad
lin
e I
nd
ex
Headline Index Inflation
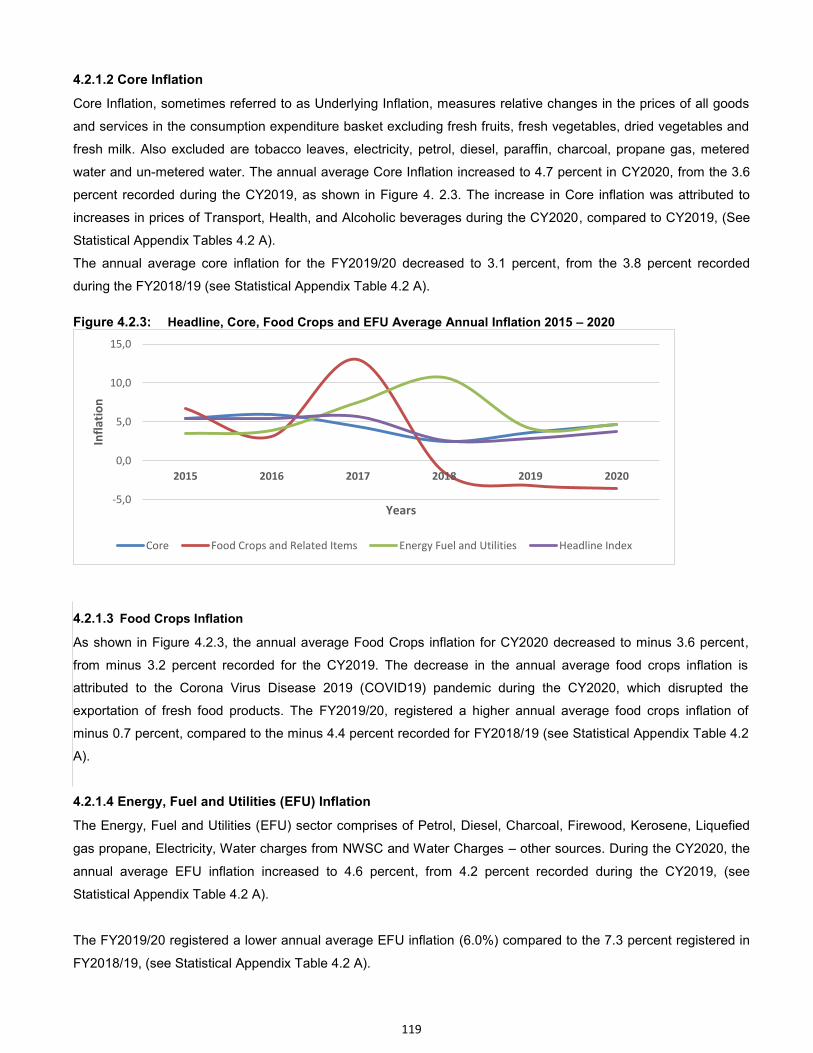
119
4.2.1.2 Core Inflation Core Inflation, sometimes referred to as Underlying Inflation, measures relative changes in the prices of all goods
and services in the consumption expenditure basket excluding fresh fruits, fresh vegetables, dried vegetables and
fresh milk. Also excluded are tobacco leaves, electricity, petrol, diesel, paraffin, charcoal, propane gas, metered
water and un-metered water. The annual average Core Inflation increased to 4.7 percent in CY2020, from the 3.6
percent recorded during the CY2019, as shown in Figure 4. 2.3. The increase in Core inflation was attributed to
increases in prices of Transport, Health, and Alcoholic beverages during the CY2020, compared to CY2019, (See
Statistical Appendix Tables 4.2 A).
The annual average core inflation for the FY2019/20 decreased to 3.1 percent, from the 3.8 percent recorded
during the FY2018/19 (see Statistical Appendix Table 4.2 A).
Figure 4.2.3: Headline, Core, Food Crops and EFU Average Annual Inflation 2015 – 2020
4.2.1.3 Food Crops Inflation As shown in Figure 4.2.3, the annual average Food Crops inflation for CY2020 decreased to minus 3.6 percent,
from minus 3.2 percent recorded for the CY2019. The decrease in the annual average food crops inflation is
attributed to the Corona Virus Disease 2019 (COVID19) pandemic during the CY2020, which disrupted the
exportation of fresh food products. The FY2019/20, registered a higher annual average food crops inflation of
minus 0.7 percent, compared to the minus 4.4 percent recorded for FY2018/19 (see Statistical Appendix Table 4.2
A).
4.2.1.4 Energy, Fuel and Utilities (EFU) Inflation The Energy, Fuel and Utilities (EFU) sector comprises of Petrol, Diesel, Charcoal, Firewood, Kerosene, Liquefied
gas propane, Electricity, Water charges from NWSC and Water Charges – other sources. During the CY2020, the
annual average EFU inflation increased to 4.6 percent, from 4.2 percent recorded during the CY2019, (see
Statistical Appendix Table 4.2 A).
The FY2019/20 registered a lower annual average EFU inflation (6.0%) compared to the 7.3 percent registered in
FY2018/19, (see Statistical Appendix Table 4.2 A).
-5,0
0,0
5,0
10,0
15,0
2015 2016 2017 2018 2019 2020
Infl
ati
on
Years
Core Food Crops and Related Items Energy Fuel and Utilities Headline Index
120
4.2.1.5 Major Inflation drivers during the Calendar Year 2020 During CY2020, the national annual average Index rose by 3.8 percent. The main driver was Transport that
registered 14.5 percent in CY2020 compared to 7.8 percent recorded for CY2019. Other drivers were Food and
Non-Alcoholic Beverages that registered 1.8 percent in CY2020 compared to minus 0.2 percent in CY2019, and
Housing, Water, Electricity, Gas and Other Fuels registered 4.0 percent in CY2020 compared to 2.9 percent in
CY2019, (See Statistical Appendix Table 4.2 E).
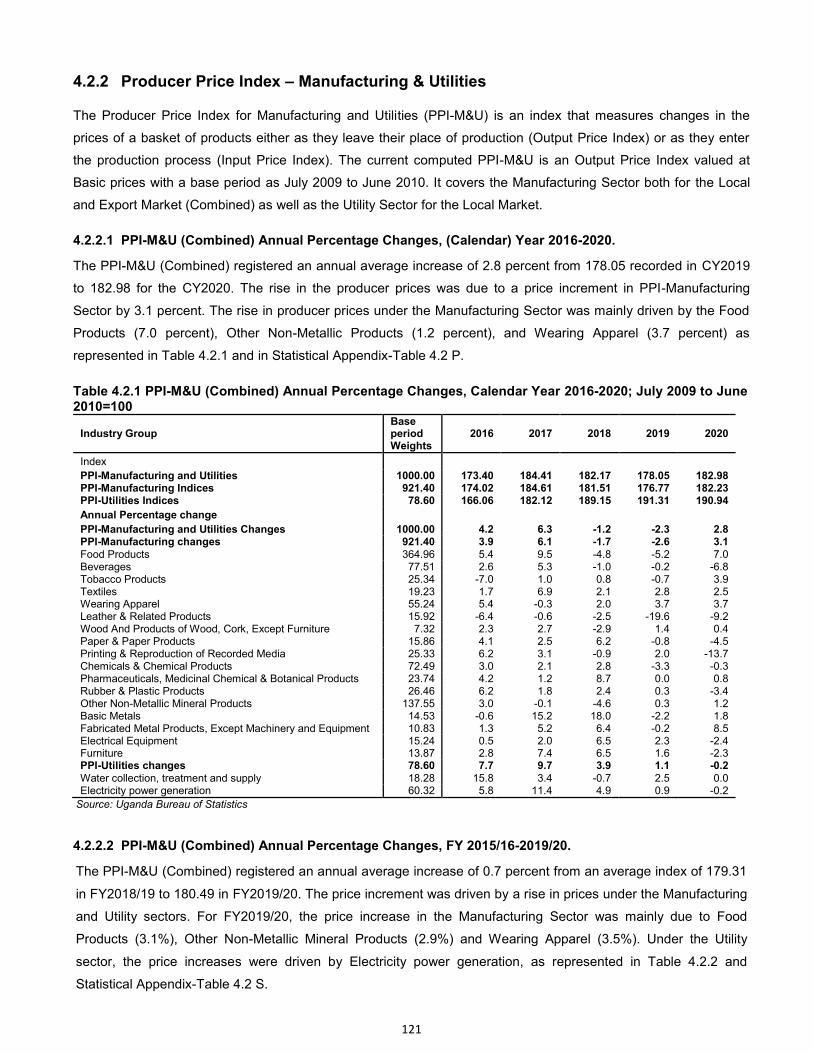
121
4.2.2 Producer Price Index – Manufacturing & Utilities
The Producer Price Index for Manufacturing and Utilities (PPI-M&U) is an index that measures changes in the
prices of a basket of products either as they leave their place of production (Output Price Index) or as they enter
the production process (Input Price Index). The current computed PPI-M&U is an Output Price Index valued at
Basic prices with a base period as July 2009 to June 2010. It covers the Manufacturing Sector both for the Local
and Export Market (Combined) as well as the Utility Sector for the Local Market.
4.2.2.1 PPI-M&U (Combined) Annual Percentage Changes, (Calendar) Year 2016-2020. The PPI-M&U (Combined) registered an annual average increase of 2.8 percent from 178.05 recorded in CY2019
to 182.98 for the CY2020. The rise in the producer prices was due to a price increment in PPI-Manufacturing
Sector by 3.1 percent. The rise in producer prices under the Manufacturing Sector was mainly driven by the Food
Products (7.0 percent), Other Non-Metallic Products (1.2 percent), and Wearing Apparel (3.7 percent) as
represented in Table 4.2.1 and in Statistical Appendix-Table 4.2 P.
Table 4.2.1 PPI-M&U (Combined) Annual Percentage Changes, Calendar Year 2016-2020; July 2009 to June 2010=100
Industry Group Base period Weights
2016 2017 2018 2019 2020
Index
PPI-Manufacturing and Utilities 1000.00 173.40 184.41 182.17 178.05 182.98 PPI-Manufacturing Indices 921.40 174.02 184.61 181.51 176.77 182.23 PPI-Utilities Indices 78.60 166.06 182.12 189.15 191.31 190.94
Annual Percentage change
PPI-Manufacturing and Utilities Changes 1000.00 4.2 6.3 -1.2 -2.3 2.8 PPI-Manufacturing changes 921.40 3.9 6.1 -1.7 -2.6 3.1 Food Products 364.96 5.4 9.5 -4.8 -5.2 7.0 Beverages 77.51 2.6 5.3 -1.0 -0.2 -6.8 Tobacco Products 25.34 -7.0 1.0 0.8 -0.7 3.9 Textiles 19.23 1.7 6.9 2.1 2.8 2.5 Wearing Apparel 55.24 5.4 -0.3 2.0 3.7 3.7 Leather & Related Products 15.92 -6.4 -0.6 -2.5 -19.6 -9.2 Wood And Products of Wood, Cork, Except Furniture 7.32 2.3 2.7 -2.9 1.4 0.4 Paper & Paper Products 15.86 4.1 2.5 6.2 -0.8 -4.5 Printing & Reproduction of Recorded Media 25.33 6.2 3.1 -0.9 2.0 -13.7 Chemicals & Chemical Products 72.49 3.0 2.1 2.8 -3.3 -0.3 Pharmaceuticals, Medicinal Chemical & Botanical Products 23.74 4.2 1.2 8.7 0.0 0.8 Rubber & Plastic Products 26.46 6.2 1.8 2.4 0.3 -3.4 Other Non-Metallic Mineral Products 137.55 3.0 -0.1 -4.6 0.3 1.2 Basic Metals 14.53 -0.6 15.2 18.0 -2.2 1.8 Fabricated Metal Products, Except Machinery and Equipment 10.83 1.3 5.2 6.4 -0.2 8.5 Electrical Equipment 15.24 0.5 2.0 6.5 2.3 -2.4 Furniture 13.87 2.8 7.4 6.5 1.6 -2.3 PPI-Utilities changes 78.60 7.7 9.7 3.9 1.1 -0.2 Water collection, treatment and supply 18.28 15.8 3.4 -0.7 2.5 0.0 Electricity power generation 60.32 5.8 11.4 4.9 0.9 -0.2
Source: Uganda Bureau of Statistics
4.2.2.2 PPI-M&U (Combined) Annual Percentage Changes, FY 2015/16-2019/20. The PPI-M&U (Combined) registered an annual average increase of 0.7 percent from an average index of 179.31
in FY2018/19 to 180.49 in FY2019/20. The price increment was driven by a rise in prices under the Manufacturing
and Utility sectors. For FY2019/20, the price increase in the Manufacturing Sector was mainly due to Food
Products (3.1%), Other Non-Metallic Mineral Products (2.9%) and Wearing Apparel (3.5%). Under the Utility
sector, the price increases were driven by Electricity power generation, as represented in Table 4.2.2 and
Statistical Appendix-Table 4.2 S.
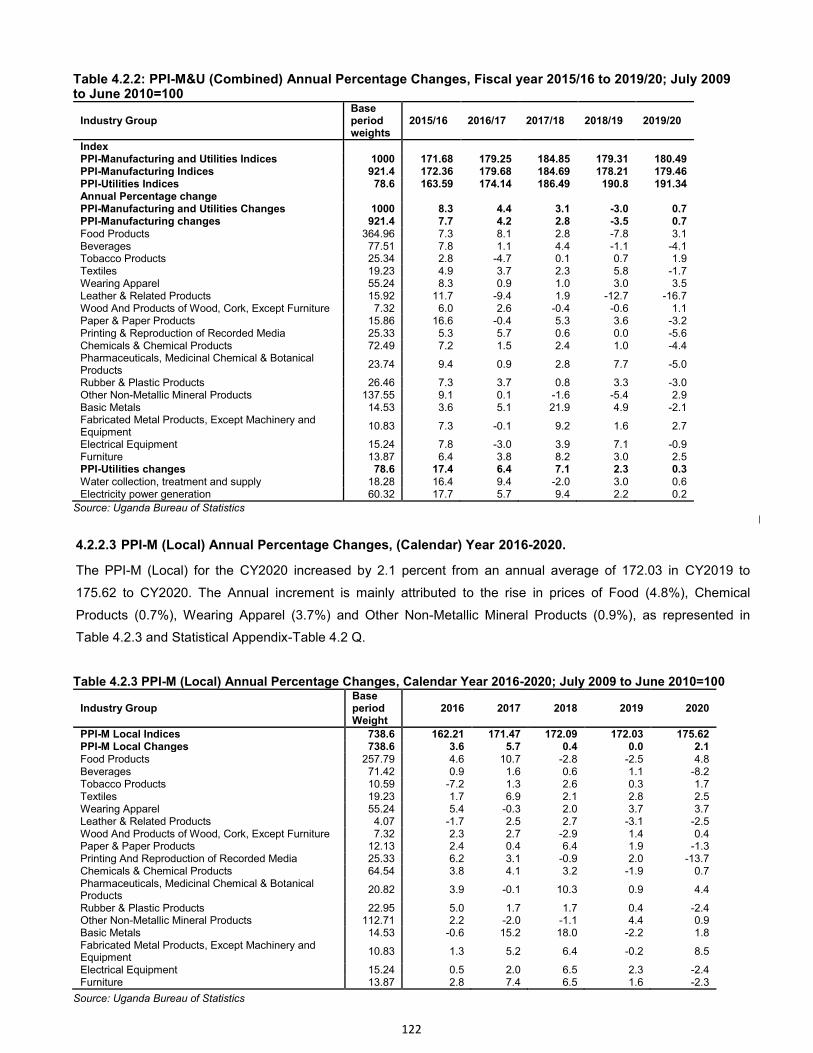
122
Table 4.2.2: PPI-M&U (Combined) Annual Percentage Changes, Fiscal year 2015/16 to 2019/20; July 2009 to June 2010=100
Industry Group Base period weights
2015/16 2016/17 2017/18 2018/19 2019/20
Index PPI-Manufacturing and Utilities Indices 1000 171.68 179.25 184.85 179.31 180.49
PPI-Manufacturing Indices 921.4 172.36 179.68 184.69 178.21 179.46 PPI-Utilities Indices 78.6 163.59 174.14 186.49 190.8 191.34 Annual Percentage change
PPI-Manufacturing and Utilities Changes 1000 8.3 4.4 3.1 -3.0 0.7 PPI-Manufacturing changes 921.4 7.7 4.2 2.8 -3.5 0.7 Food Products 364.96 7.3 8.1 2.8 -7.8 3.1 Beverages 77.51 7.8 1.1 4.4 -1.1 -4.1 Tobacco Products 25.34 2.8 -4.7 0.1 0.7 1.9 Textiles 19.23 4.9 3.7 2.3 5.8 -1.7 Wearing Apparel 55.24 8.3 0.9 1.0 3.0 3.5 Leather & Related Products 15.92 11.7 -9.4 1.9 -12.7 -16.7 Wood And Products of Wood, Cork, Except Furniture 7.32 6.0 2.6 -0.4 -0.6 1.1 Paper & Paper Products 15.86 16.6 -0.4 5.3 3.6 -3.2 Printing & Reproduction of Recorded Media 25.33 5.3 5.7 0.6 0.0 -5.6 Chemicals & Chemical Products 72.49 7.2 1.5 2.4 1.0 -4.4 Pharmaceuticals, Medicinal Chemical & Botanical Products
23.74 9.4 0.9 2.8 7.7 -5.0
Rubber & Plastic Products 26.46 7.3 3.7 0.8 3.3 -3.0 Other Non-Metallic Mineral Products 137.55 9.1 0.1 -1.6 -5.4 2.9 Basic Metals 14.53 3.6 5.1 21.9 4.9 -2.1 Fabricated Metal Products, Except Machinery and Equipment
10.83 7.3 -0.1 9.2 1.6 2.7
Electrical Equipment 15.24 7.8 -3.0 3.9 7.1 -0.9 Furniture 13.87 6.4 3.8 8.2 3.0 2.5 PPI-Utilities changes 78.6 17.4 6.4 7.1 2.3 0.3 Water collection, treatment and supply 18.28 16.4 9.4 -2.0 3.0 0.6 Electricity power generation 60.32 17.7 5.7 9.4 2.2 0.2
Source: Uganda Bureau of Statistics
4.2.2.3 PPI-M (Local) Annual Percentage Changes, (Calendar) Year 2016-2020. The PPI-M (Local) for the CY2020 increased by 2.1 percent from an annual average of 172.03 in CY2019 to
175.62 to CY2020. The Annual increment is mainly attributed to the rise in prices of Food (4.8%), Chemical
Products (0.7%), Wearing Apparel (3.7%) and Other Non-Metallic Mineral Products (0.9%), as represented in
Table 4.2.3 and Statistical Appendix-Table 4.2 Q.
Table 4.2.3 PPI-M (Local) Annual Percentage Changes, Calendar Year 2016-2020; July 2009 to June 2010=100
Industry Group Base period Weight
2016 2017 2018 2019 2020
PPI-M Local Indices 738.6 162.21 171.47 172.09 172.03 175.62 PPI-M Local Changes 738.6 3.6 5.7 0.4 0.0 2.1 Food Products 257.79 4.6 10.7 -2.8 -2.5 4.8 Beverages 71.42 0.9 1.6 0.6 1.1 -8.2 Tobacco Products 10.59 -7.2 1.3 2.6 0.3 1.7 Textiles 19.23 1.7 6.9 2.1 2.8 2.5 Wearing Apparel 55.24 5.4 -0.3 2.0 3.7 3.7 Leather & Related Products 4.07 -1.7 2.5 2.7 -3.1 -2.5 Wood And Products of Wood, Cork, Except Furniture 7.32 2.3 2.7 -2.9 1.4 0.4 Paper & Paper Products 12.13 2.4 0.4 6.4 1.9 -1.3 Printing And Reproduction of Recorded Media 25.33 6.2 3.1 -0.9 2.0 -13.7 Chemicals & Chemical Products 64.54 3.8 4.1 3.2 -1.9 0.7 Pharmaceuticals, Medicinal Chemical & Botanical Products
20.82 3.9 -0.1 10.3 0.9 4.4
Rubber & Plastic Products 22.95 5.0 1.7 1.7 0.4 -2.4 Other Non-Metallic Mineral Products 112.71 2.2 -2.0 -1.1 4.4 0.9 Basic Metals 14.53 -0.6 15.2 18.0 -2.2 1.8 Fabricated Metal Products, Except Machinery and Equipment
10.83 1.3 5.2 6.4 -0.2 8.5
Electrical Equipment 15.24 0.5 2.0 6.5 2.3 -2.4 Furniture 13.87 2.8 7.4 6.5 1.6 -2.3
Source: Uganda Bureau of Statistics
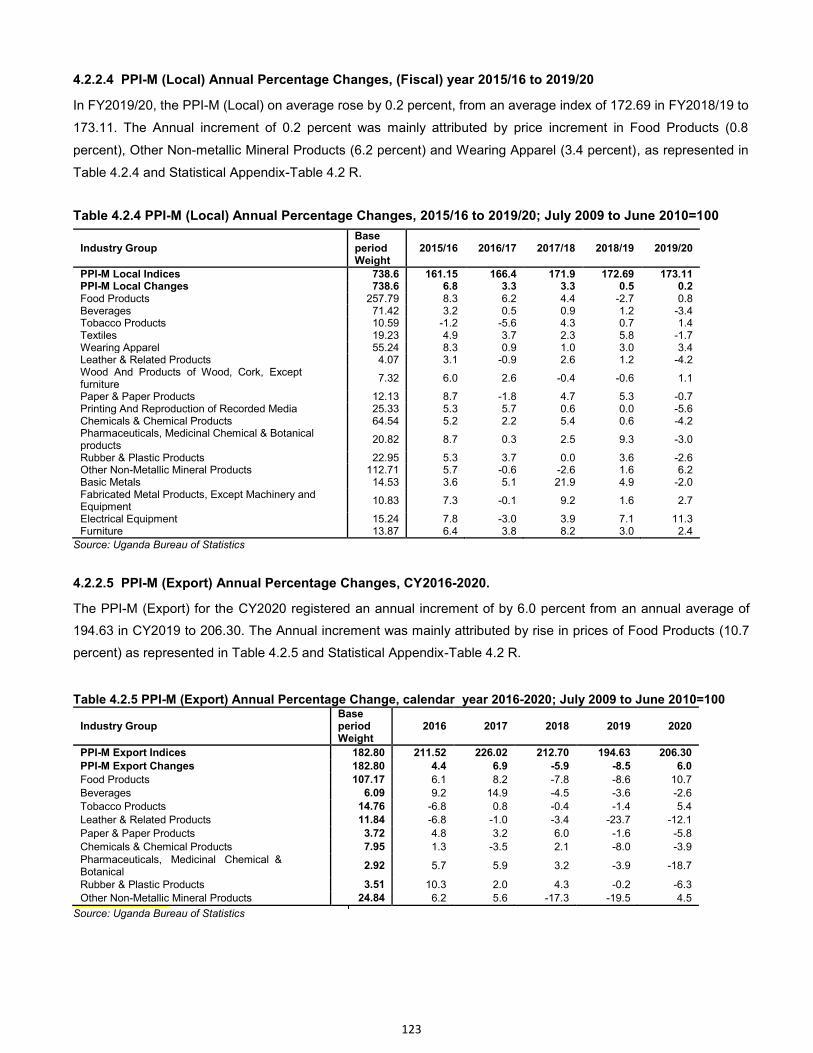
123
4.2.2.4 PPI-M (Local) Annual Percentage Changes, (Fiscal) year 2015/16 to 2019/20 In FY2019/20, the PPI-M (Local) on average rose by 0.2 percent, from an average index of 172.69 in FY2018/19 to
173.11. The Annual increment of 0.2 percent was mainly attributed by price increment in Food Products (0.8
percent), Other Non-metallic Mineral Products (6.2 percent) and Wearing Apparel (3.4 percent), as represented in
Table 4.2.4 and Statistical Appendix-Table 4.2 R.
Table 4.2.4 PPI-M (Local) Annual Percentage Changes, 2015/16 to 2019/20; July 2009 to June 2010=100
Industry Group Base period Weight
2015/16 2016/17 2017/18 2018/19 2019/20
PPI-M Local Indices 738.6 161.15 166.4 171.9 172.69 173.11 PPI-M Local Changes 738.6 6.8 3.3 3.3 0.5 0.2 Food Products 257.79 8.3 6.2 4.4 -2.7 0.8 Beverages 71.42 3.2 0.5 0.9 1.2 -3.4 Tobacco Products 10.59 -1.2 -5.6 4.3 0.7 1.4 Textiles 19.23 4.9 3.7 2.3 5.8 -1.7 Wearing Apparel 55.24 8.3 0.9 1.0 3.0 3.4 Leather & Related Products 4.07 3.1 -0.9 2.6 1.2 -4.2 Wood And Products of Wood, Cork, Except furniture
7.32 6.0 2.6 -0.4 -0.6 1.1
Paper & Paper Products 12.13 8.7 -1.8 4.7 5.3 -0.7 Printing And Reproduction of Recorded Media 25.33 5.3 5.7 0.6 0.0 -5.6 Chemicals & Chemical Products 64.54 5.2 2.2 5.4 0.6 -4.2 Pharmaceuticals, Medicinal Chemical & Botanical products
20.82 8.7 0.3 2.5 9.3 -3.0
Rubber & Plastic Products 22.95 5.3 3.7 0.0 3.6 -2.6 Other Non-Metallic Mineral Products 112.71 5.7 -0.6 -2.6 1.6 6.2 Basic Metals 14.53 3.6 5.1 21.9 4.9 -2.0 Fabricated Metal Products, Except Machinery and Equipment
10.83 7.3 -0.1 9.2 1.6 2.7
Electrical Equipment 15.24 7.8 -3.0 3.9 7.1 11.3 Furniture 13.87 6.4 3.8 8.2 3.0 2.4
Source: Uganda Bureau of Statistics
4.2.2.5 PPI-M (Export) Annual Percentage Changes, CY2016-2020. The PPI-M (Export) for the CY2020 registered an annual increment of by 6.0 percent from an annual average of
194.63 in CY2019 to 206.30. The Annual increment was mainly attributed by rise in prices of Food Products (10.7
percent) as represented in Table 4.2.5 and Statistical Appendix-Table 4.2 R.
Table 4.2.5 PPI-M (Export) Annual Percentage Change, calendar year 2016-2020; July 2009 to June 2010=100
Industry Group Base period Weight
2016 2017 2018 2019 2020
PPI-M Export Indices 182.80 211.52 226.02 212.70 194.63 206.30
PPI-M Export Changes 182.80 4.4 6.9 -5.9 -8.5 6.0
Food Products 107.17 6.1 8.2 -7.8 -8.6 10.7
Beverages 6.09 9.2 14.9 -4.5 -3.6 -2.6
Tobacco Products 14.76 -6.8 0.8 -0.4 -1.4 5.4
Leather & Related Products 11.84 -6.8 -1.0 -3.4 -23.7 -12.1
Paper & Paper Products 3.72 4.8 3.2 6.0 -1.6 -5.8
Chemicals & Chemical Products 7.95 1.3 -3.5 2.1 -8.0 -3.9 Pharmaceuticals, Medicinal Chemical & Botanical
2.92 5.7 5.9 3.2 -3.9 -18.7
Rubber & Plastic Products 3.51 10.3 2.0 4.3 -0.2 -6.3
Other Non-Metallic Mineral Products 24.84 6.2 5.6 -17.3 -19.5 4.5 Source: Uganda Bureau of Statistics
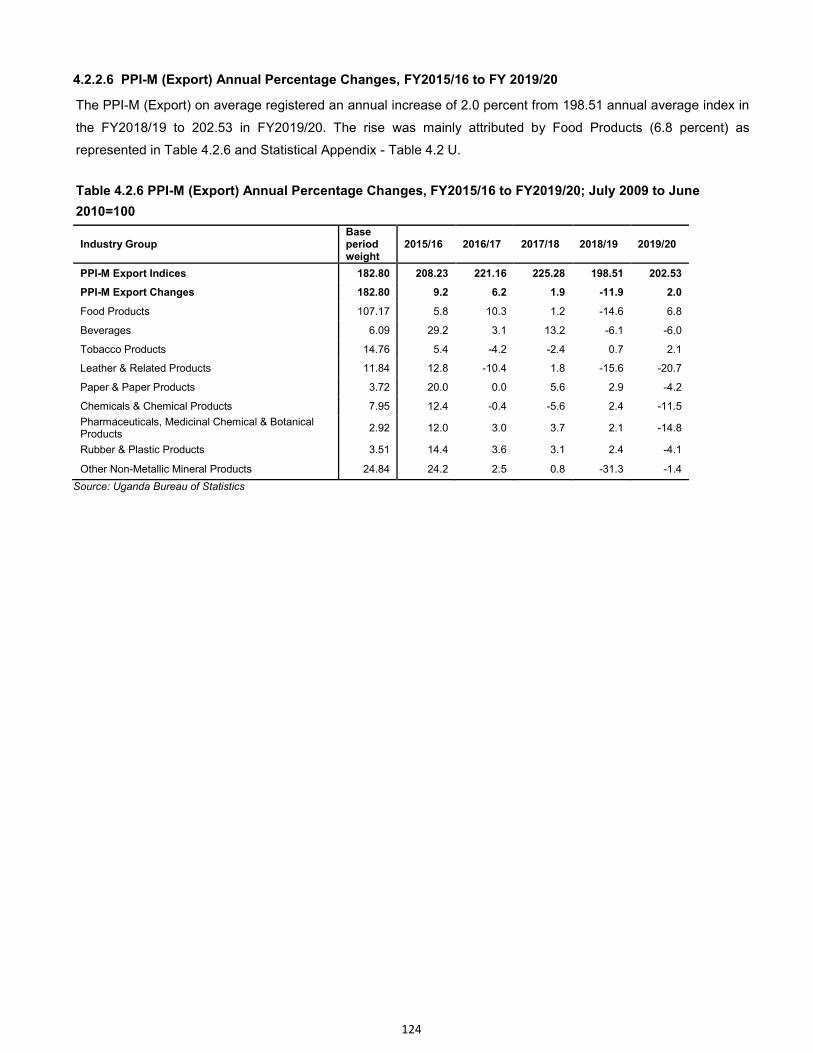
124
4.2.2.6 PPI-M (Export) Annual Percentage Changes, FY2015/16 to FY 2019/20 The PPI-M (Export) on average registered an annual increase of 2.0 percent from 198.51 annual average index in
the FY2018/19 to 202.53 in FY2019/20. The rise was mainly attributed by Food Products (6.8 percent) as
represented in Table 4.2.6 and Statistical Appendix - Table 4.2 U.
Table 4.2.6 PPI-M (Export) Annual Percentage Changes, FY2015/16 to FY2019/20; July 2009 to June
2010=100
Industry Group Base period weight
2015/16 2016/17 2017/18 2018/19 2019/20
PPI-M Export Indices 182.80 208.23 221.16 225.28 198.51 202.53
PPI-M Export Changes 182.80 9.2 6.2 1.9 -11.9 2.0
Food Products 107.17 5.8 10.3 1.2 -14.6 6.8
Beverages 6.09 29.2 3.1 13.2 -6.1 -6.0
Tobacco Products 14.76 5.4 -4.2 -2.4 0.7 2.1
Leather & Related Products 11.84 12.8 -10.4 1.8 -15.6 -20.7
Paper & Paper Products 3.72 20.0 0.0 5.6 2.9 -4.2
Chemicals & Chemical Products 7.95 12.4 -0.4 -5.6 2.4 -11.5
Pharmaceuticals, Medicinal Chemical & Botanical Products
2.92 12.0 3.0 3.7 2.1 -14.8
Rubber & Plastic Products 3.51 14.4 3.6 3.1 2.4 -4.1
Other Non-Metallic Mineral Products 24.84 24.2 2.5 0.8 -31.3 -1.4
Source: Uganda Bureau of Statistics
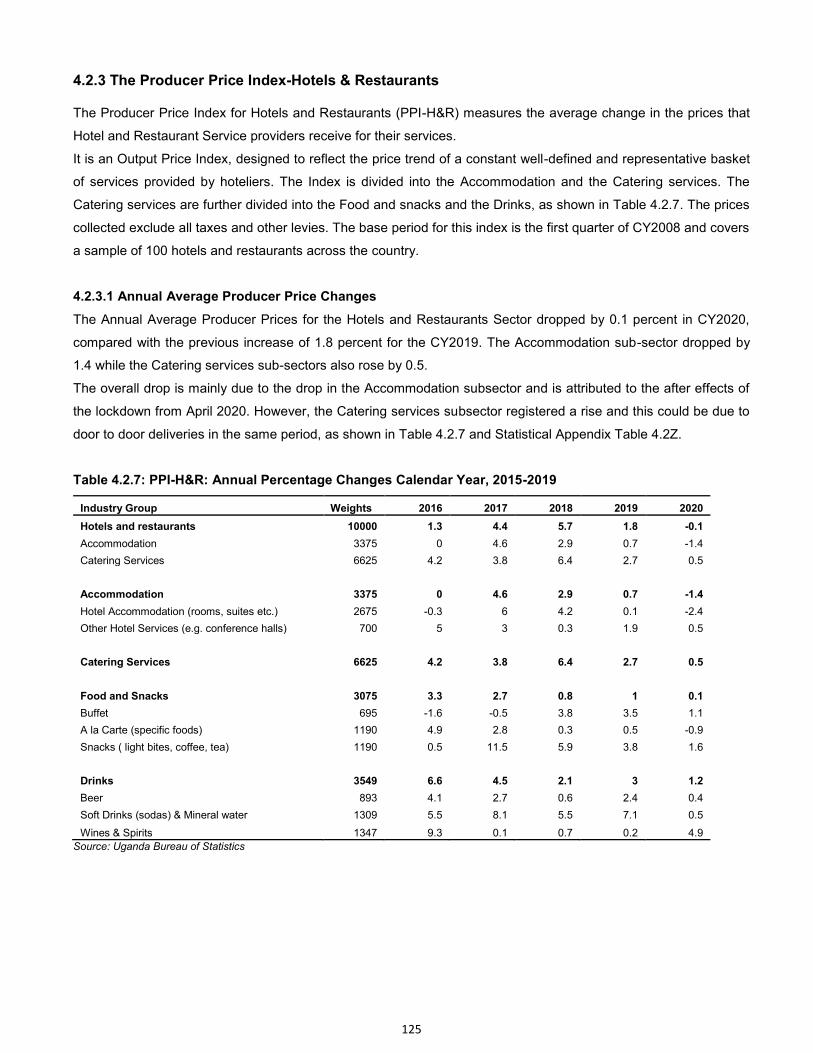
125
4.2.3 The Producer Price Index-Hotels & Restaurants
The Producer Price Index for Hotels and Restaurants (PPI-H&R) measures the average change in the prices that
Hotel and Restaurant Service providers receive for their services.
It is an Output Price Index, designed to reflect the price trend of a constant well-defined and representative basket
of services provided by hoteliers. The Index is divided into the Accommodation and the Catering services. The
Catering services are further divided into the Food and snacks and the Drinks, as shown in Table 4.2.7. The prices
collected exclude all taxes and other levies. The base period for this index is the first quarter of CY2008 and covers
a sample of 100 hotels and restaurants across the country.
4.2.3.1 Annual Average Producer Price Changes
The Annual Average Producer Prices for the Hotels and Restaurants Sector dropped by 0.1 percent in CY2020,
compared with the previous increase of 1.8 percent for the CY2019. The Accommodation sub-sector dropped by
1.4 while the Catering services sub-sectors also rose by 0.5.
The overall drop is mainly due to the drop in the Accommodation subsector and is attributed to the after effects of
the lockdown from April 2020. However, the Catering services subsector registered a rise and this could be due to
door to door deliveries in the same period, as shown in Table 4.2.7 and Statistical Appendix Table 4.2Z.
Table 4.2.7: PPI-H&R: Annual Percentage Changes Calendar Year, 2015-2019
Industry Group Weights 2016 2017 2018 2019 2020
Hotels and restaurants 10000 1.3 4.4 5.7 1.8 -0.1
Accommodation 3375 0 4.6 2.9 0.7 -1.4
Catering Services 6625 4.2 3.8 6.4 2.7 0.5
Accommodation 3375 0 4.6 2.9 0.7 -1.4
Hotel Accommodation (rooms, suites etc.) 2675 -0.3 6 4.2 0.1 -2.4
Other Hotel Services (e.g. conference halls) 700 5 3 0.3 1.9 0.5
Catering Services 6625 4.2 3.8 6.4 2.7 0.5
Food and Snacks 3075 3.3 2.7 0.8 1 0.1
Buffet 695 -1.6 -0.5 3.8 3.5 1.1
A la Carte (specific foods) 1190 4.9 2.8 0.3 0.5 -0.9
Snacks ( light bites, coffee, tea) 1190 0.5 11.5 5.9 3.8 1.6
Drinks 3549 6.6 4.5 2.1 3 1.2
Beer 893 4.1 2.7 0.6 2.4 0.4
Soft Drinks (sodas) & Mineral water 1309 5.5 8.1 5.5 7.1 0.5
Wines & Spirits 1347 9.3 0.1 0.7 0.2 4.9
Source: Uganda Bureau of Statistics
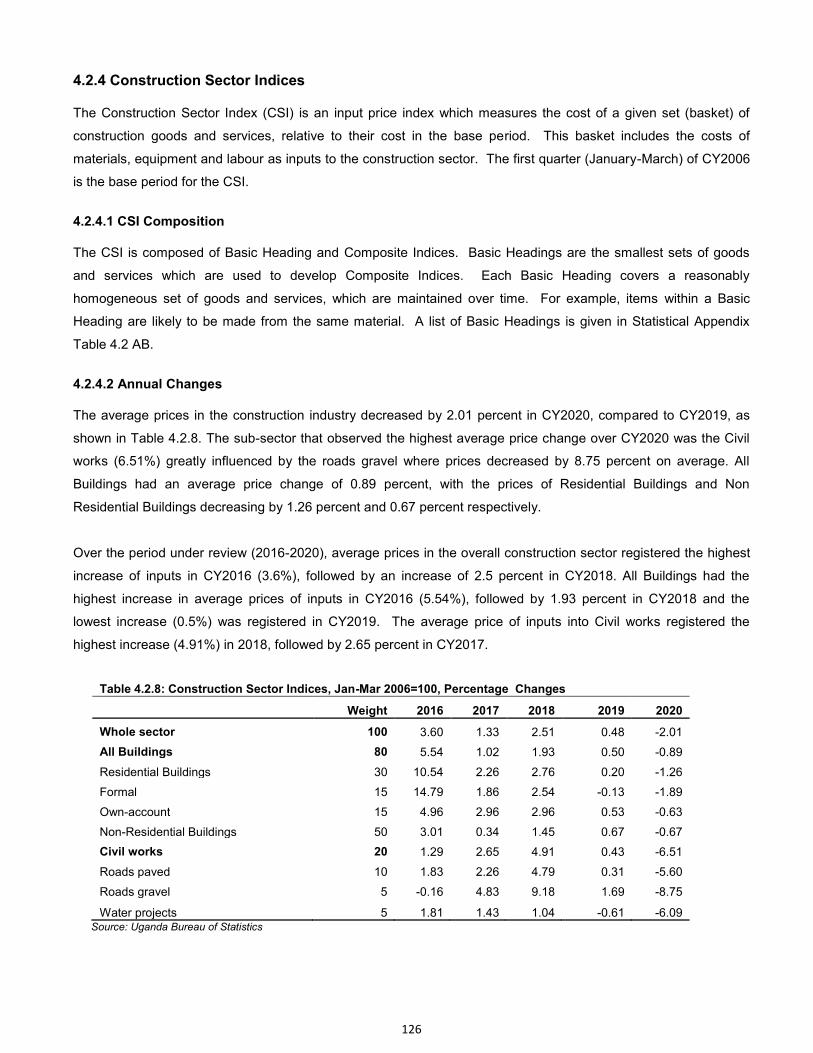
126
4.2.4 Construction Sector Indices
The Construction Sector Index (CSI) is an input price index which measures the cost of a given set (basket) of
construction goods and services, relative to their cost in the base period. This basket includes the costs of
materials, equipment and labour as inputs to the construction sector. The first quarter (January-March) of CY2006
is the base period for the CSI.
4.2.4.1 CSI Composition The CSI is composed of Basic Heading and Composite Indices. Basic Headings are the smallest sets of goods
and services which are used to develop Composite Indices. Each Basic Heading covers a reasonably
homogeneous set of goods and services, which are maintained over time. For example, items within a Basic
Heading are likely to be made from the same material. A list of Basic Headings is given in Statistical Appendix
Table 4.2 AB.
4.2.4.2 Annual Changes The average prices in the construction industry decreased by 2.01 percent in CY2020, compared to CY2019, as
shown in Table 4.2.8. The sub-sector that observed the highest average price change over CY2020 was the Civil
works (6.51%) greatly influenced by the roads gravel where prices decreased by 8.75 percent on average. All
Buildings had an average price change of 0.89 percent, with the prices of Residential Buildings and Non
Residential Buildings decreasing by 1.26 percent and 0.67 percent respectively.
Over the period under review (2016-2020), average prices in the overall construction sector registered the highest
increase of inputs in CY2016 (3.6%), followed by an increase of 2.5 percent in CY2018. All Buildings had the
highest increase in average prices of inputs in CY2016 (5.54%), followed by 1.93 percent in CY2018 and the
lowest increase (0.5%) was registered in CY2019. The average price of inputs into Civil works registered the
highest increase (4.91%) in 2018, followed by 2.65 percent in CY2017.
Table 4.2.8: Construction Sector Indices, Jan-Mar 2006=100, Percentage Changes
Weight 2016 2017 2018 2019 2020
Whole sector 100 3.60 1.33 2.51 0.48 -2.01
All Buildings 80 5.54 1.02 1.93 0.50 -0.89
Residential Buildings 30 10.54 2.26 2.76 0.20 -1.26
Formal 15 14.79 1.86 2.54 -0.13 -1.89
Own-account 15 4.96 2.96 2.96 0.53 -0.63
Non-Residential Buildings 50 3.01 0.34 1.45 0.67 -0.67
Civil works 20 1.29 2.65 4.91 0.43 -6.51
Roads paved 10 1.83 2.26 4.79 0.31 -5.60
Roads gravel 5 -0.16 4.83 9.18 1.69 -8.75
Water projects 5 1.81 1.43 1.04 -0.61 -6.09 Source: Uganda Bureau of Statistics
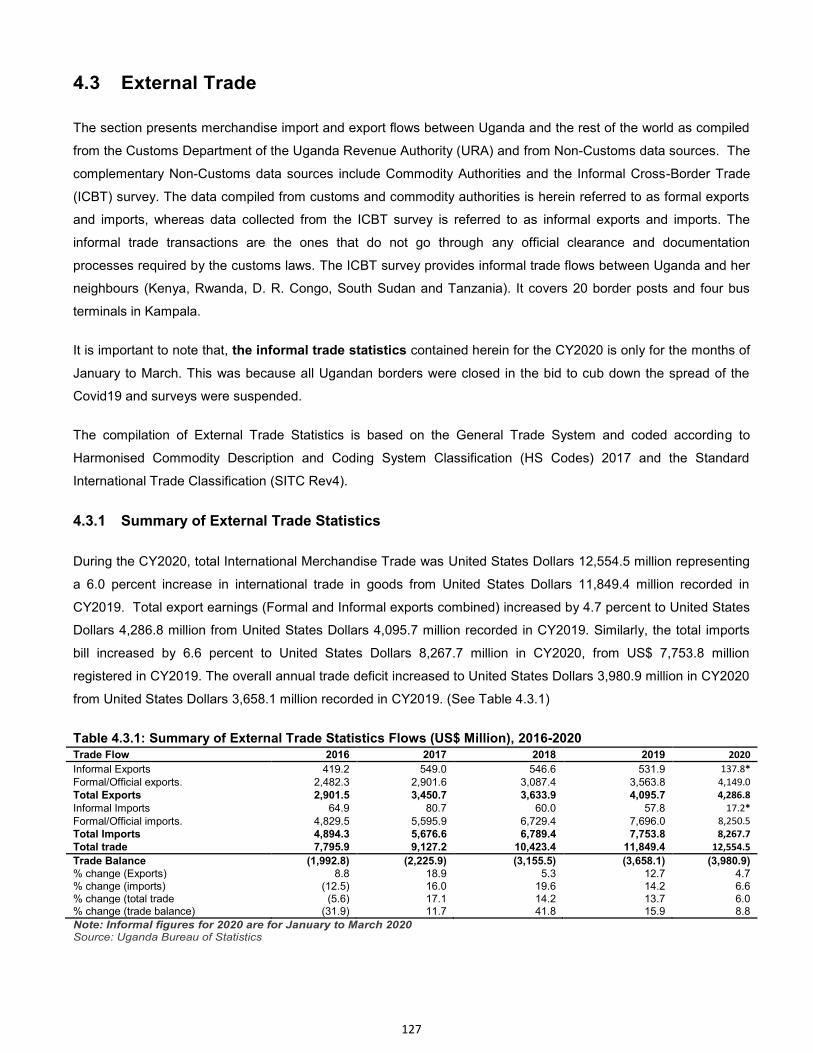
127
4.3 External Trade
The section presents merchandise import and export flows between Uganda and the rest of the world as compiled
from the Customs Department of the Uganda Revenue Authority (URA) and from Non-Customs data sources. The
complementary Non-Customs data sources include Commodity Authorities and the Informal Cross-Border Trade
(ICBT) survey. The data compiled from customs and commodity authorities is herein referred to as formal exports
and imports, whereas data collected from the ICBT survey is referred to as informal exports and imports. The
informal trade transactions are the ones that do not go through any official clearance and documentation
processes required by the customs laws. The ICBT survey provides informal trade flows between Uganda and her
neighbours (Kenya, Rwanda, D. R. Congo, South Sudan and Tanzania). It covers 20 border posts and four bus
terminals in Kampala.
It is important to note that, the informal trade statistics contained herein for the CY2020 is only for the months of
January to March. This was because all Ugandan borders were closed in the bid to cub down the spread of the
Covid19 and surveys were suspended.
The compilation of External Trade Statistics is based on the General Trade System and coded according to
Harmonised Commodity Description and Coding System Classification (HS Codes) 2017 and the Standard
International Trade Classification (SITC Rev4).
4.3.1 Summary of External Trade Statistics
During the CY2020, total International Merchandise Trade was United States Dollars 12,554.5 million representing
a 6.0 percent increase in international trade in goods from United States Dollars 11,849.4 million recorded in
CY2019. Total export earnings (Formal and Informal exports combined) increased by 4.7 percent to United States
Dollars 4,286.8 million from United States Dollars 4,095.7 million recorded in CY2019. Similarly, the total imports
bill increased by 6.6 percent to United States Dollars 8,267.7 million in CY2020, from US$ 7,753.8 million
registered in CY2019. The overall annual trade deficit increased to United States Dollars 3,980.9 million in CY2020
from United States Dollars 3,658.1 million recorded in CY2019. (See Table 4.3.1)
Table 4.3.1: Summary of External Trade Statistics Flows (US$ Million), 2016-2020 Trade Flow 2016 2017 2018 2019 2020
Informal Exports 419.2 549.0 546.6 531.9 137.8*
Formal/Official exports. 2,482.3 2,901.6 3,087.4 3,563.8 4,149.0
Total Exports 2,901.5 3,450.7 3,633.9 4,095.7 4,286.8
Informal Imports 64.9 80.7 60.0 57.8 17.2*
Formal/Official imports. 4,829.5 5,595.9 6,729.4 7,696.0 8,250.5
Total Imports 4,894.3 5,676.6 6,789.4 7,753.8 8,267.7
Total trade 7,795.9 9,127.2 10,423.4 11,849.4 12,554.5
Trade Balance (1,992.8) (2,225.9) (3,155.5) (3,658.1) (3,980.9) % change (Exports) 8.8 18.9 5.3 12.7 4.7 % change (imports) (12.5) 16.0 19.6 14.2 6.6 % change (total trade (5.6) 17.1 14.2 13.7 6.0 % change (trade balance) (31.9) 11.7 41.8 15.9 8.8
Note: Informal figures for 2020 are for January to March 2020 Source: Uganda Bureau of Statistics
128
4.3.2 Exports
In 2020, Formal exports earnings were United States Dollars 4,149.0 million while informal exports earnings were
worth United States Dollars 137.8 million. The informal export earnings were greatly affected by the COVID-19
pandemic which led to the suspension of the surveys for the months of April to December 2020. The closure of the
borders did not affect the formal exports since cargo that goes through Customs offices was allowed to move. For
the period under review, Formal exports progressively increased from United States Dollars 2,482.3 million in
CY2016 to United States Dollars 4,149.0 million in CY2020.
4.3.3 Exports by Destination
The Middle East was the leading region of final destination of Uganda’s exports, accounting for 43.6 percent of
exports in CY2020. This compared to 30.1 percent registered in CY2019. The main country of destination within
the Middle East sub-continent was United Arab Emirates and its export revenue increased from United States
Dollars 1,196.0 million in CY2019 to United States Dollars 1,844.8 million in CY2020, accounting for 43.0 percent
of total exports.
The African continent was the second destination of Uganda’s exports, followed by Europe and then Asia for the
period under review. In CY2020, total exports to the African continent were worth United States Dollars 1,556.2
million, accounting for 36.3 percent of total exports in comparison to US$ 1,873.4 million recorded in CY2019. The
Common Market for Eastern and Southern Africa (COMESA) regional bloc was the main destination, accounting
for 23.8 percent of total exports revenue. In the COMESA bloc, the leading country of destination for Uganda ’s
exports in CY2020 was the Kenya, accounting for 11.4 percent. This was followed by the Democratic Republic of
Congo (D.R.Congo), accounting for 8.0 percent. See Appendix Tables 4.3 F and 4.3 G.
European continent was the third destination of Uganda’s exports, accounting for 12.4 percent of the total exports
in 2020 compared to 16.0 percent registered in CY2019. The European Union (EU) bloc was the main destination
for Uganda’s exports in Europe. However, its market share decreased slightly to 11.6 percent during CY2020, from
12.5 percent registered in CY2019. The major destination countries in the EU bloc were Italy, Netherlands,
Germany and Belgium, representing about 8.9 percent of the market share in CY2020. See Appendix Table 4.3 G.
The average market share for the Asian continent for the period under review (2016 to 2020) was 6.6 percent, with
main export destination countries in CY2020 being India (1.3 percent), Hong Kong (0.9 percent) and China (0.9
percent). It is important to note that, with proper export promotion strategies these countries could absorb more
exports since they are among the main sources of Uganda’s imports and hence a need to narrow the trade deficits.
4.3.4 Performance of Formal Commodity Exports
Gold and Gold compounds were Uganda’s leading commodity export. Their revenue increased to United States
Dollars 1,819.3 million in CY2020 from United States Dollars 1,257.8 million in CY2019. Its share to the total formal
exports increased from 35.3 percent in CY2019 to 43.8 percent in CY2020. Coffee was the second most exported
commodity. Its value increased to United States Dollars 515.5 million in CY2020 from United States Dollars 438.5
million generated in CY2019, as indicated in Appendix Table 4.3 A. Coffee contributed 12.4 percent to total formal
export earnings in 2020, from the 12.3 percent recorded in CY2019. Fish and Fish products were the third highest
129
value of exports, although their value decreased from United States Dollars 174.2 million in CY2019 to United
States Dollars 124.9 million in CY2020. Petroleum Products came fourth, with their export receipts decreasing to
United States Dollars 72.7 million in CY2020 from United States Dollars 127.1 million generated in CY2019, See
Appendix Tables 4.3 A and 4.3 B.
4.3.5 Imports
The total imports bill increased by 6.6 percent to United States Dollars 8,267.7 million in 2020 from United States
Dollars 7,753.8 million registered in CY2019. The Formal and informal import bills in CY2020 stood at United
States Dollars 8,250.5 million and United States Dollars 17.2 million respectively, from United States Dollars
7,696.0 million and United States Dollars 57.8 million recorded in CY2019.
4.3.6 Total Imports by Regional blocs
During the period under review, the Asian continent was the main source of Uganda’s merchandise imports, with
an import bill of United States Dollars 3,339.2 million in CY2020 compared to United States Dollars 3,043.7 million
recorded in CY2019. Its market share to total imports increased to 40.4 percent in CY2020 from 39.3 percent in
CY2019.
The African continent was the second main source, with imports worth United States Dollars 2,897.1 million in
CY2020 (35%) of total imports compared to United States Dollars 2,099.4 million in CY2019. Imports from the
COMESA regional bloc increased by 31.2 percent to United States Dollars 1,327.1 million in CY2020, from United
States Dollars 1,011.4 million in CY2019, while those from other Africa (besides COMESA) increased from United
States Dollars 1,088.0 million in CY2019 to United States Dollars 1,570.0 million in CY2020.
The Middle East was the third biggest region of origin of Uganda’s imports, although its market share to total
imports decreased to 10.5 percent in CY2020 from 17.1 percent realized in CY2019, See Appendix Tables 4.3 L
and 4.3 M. The EU bloc was forth with import expenditure increasing from United States Dollars 559.5 million in
CY2019 to United States Dollars 785.6 million in CY2020. The European Union (EU) represented 9.5 percent of
market share of total imports in CY2020 in comparison to 7.2 percent in CY2019.
China, India, Kenya, Tanzania and United Arab Emirates (UAE) were the main countries from where Uganda
imported her merchandise in CY2020. They constituted a market share of about 52.4 percent. China was the
leading country of origin for Uganda’s merchandise imports (United States Dollars 1,352.0 million) in CY2020,
representing a share of 16.4 percent of total imports compared to United States Dollars 1,256.6 million recorded
in CY2019. India was the second biggest country of origin (United States Dollars 959.1 million) in CY2020
compared to United States Dollars 855.1 million recorded in CY2019. This represented a market share of 11.6
percent in CY2020. Kenya came third (9.4%) though its import bill slightly decreased to United States Dollars
780.4 million in CY2020 from United States Dollars 792.0 million in CY2019. Tanzania followed (9.0%) and its
import bill increased from United States Dollars 476.2 million in CY2019 to United States Dollars 743.7 million in
CY2020. Imports from United Arab Emirates declined from United States Dollars 822.4 in 2019 to United States
Dollars 495.9 million in CY2020. See Appendix Table 4.3 L and Table 4.3 M.
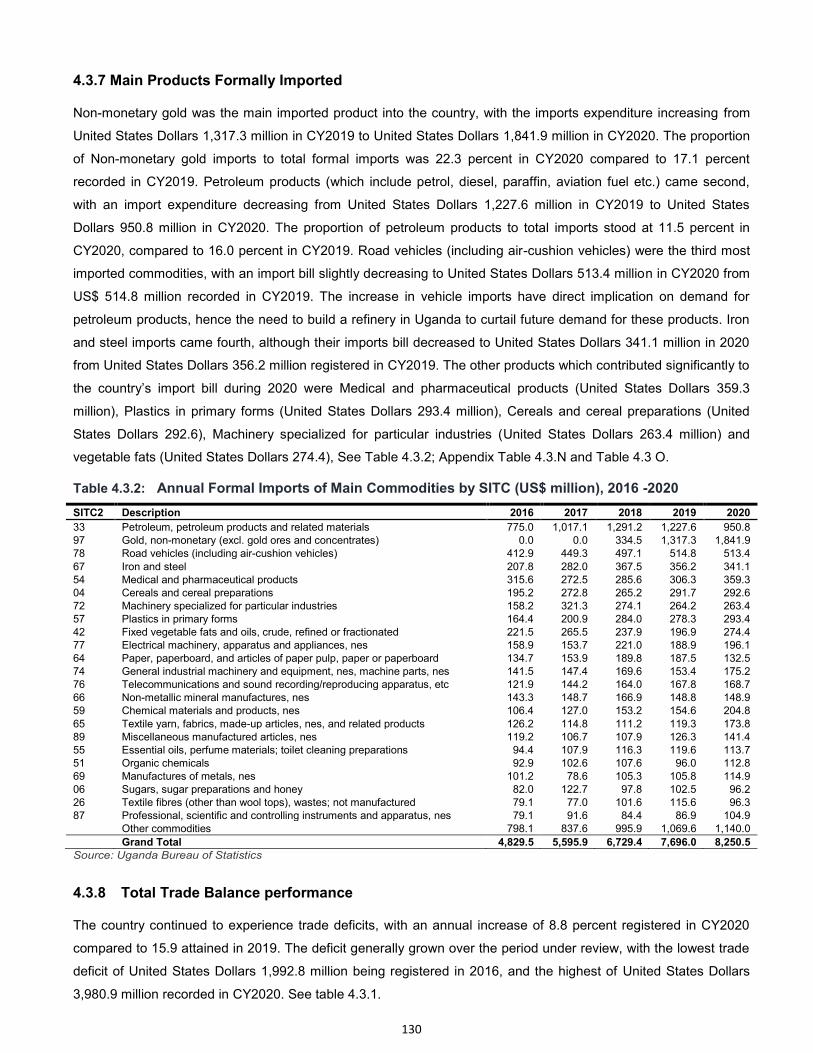
130
4.3.7 Main Products Formally Imported
Non-monetary gold was the main imported product into the country, with the imports expenditure increasing from
United States Dollars 1,317.3 million in CY2019 to United States Dollars 1,841.9 million in CY2020. The proportion
of Non-monetary gold imports to total formal imports was 22.3 percent in CY2020 compared to 17.1 percent
recorded in CY2019. Petroleum products (which include petrol, diesel, paraffin, aviation fuel etc.) came second,
with an import expenditure decreasing from United States Dollars 1,227.6 million in CY2019 to United States
Dollars 950.8 million in CY2020. The proportion of petroleum products to total imports stood at 11.5 percent in
CY2020, compared to 16.0 percent in CY2019. Road vehicles (including air-cushion vehicles) were the third most
imported commodities, with an import bill slightly decreasing to United States Dollars 513.4 million in CY2020 from
US$ 514.8 million recorded in CY2019. The increase in vehicle imports have direct implication on demand for
petroleum products, hence the need to build a refinery in Uganda to curtail future demand for these products. Iron
and steel imports came fourth, although their imports bill decreased to United States Dollars 341.1 million in 2020
from United States Dollars 356.2 million registered in CY2019. The other products which contributed significantly to
the country’s import bill during 2020 were Medical and pharmaceutical products (United States Dollars 359.3
million), Plastics in primary forms (United States Dollars 293.4 million), Cereals and cereal preparations (United
States Dollars 292.6), Machinery specialized for particular industries (United States Dollars 263.4 million) and
vegetable fats (United States Dollars 274.4), See Table 4.3.2; Appendix Table 4.3.N and Table 4.3 O.
Table 4.3.2: Annual Formal Imports of Main Commodities by SITC (US$ million), 2016 -2020
SITC2 Description 2016 2017 2018 2019 2020
33 Petroleum, petroleum products and related materials 775.0 1,017.1 1,291.2 1,227.6 950.8 97 Gold, non-monetary (excl. gold ores and concentrates) 0.0 0.0 334.5 1,317.3 1,841.9 78 Road vehicles (including air-cushion vehicles) 412.9 449.3 497.1 514.8 513.4
67 Iron and steel 207.8 282.0 367.5 356.2 341.1 54 Medical and pharmaceutical products 315.6 272.5 285.6 306.3 359.3 04 Cereals and cereal preparations 195.2 272.8 265.2 291.7 292.6 72 Machinery specialized for particular industries 158.2 321.3 274.1 264.2 263.4 57 Plastics in primary forms 164.4 200.9 284.0 278.3 293.4 42 Fixed vegetable fats and oils, crude, refined or fractionated 221.5 265.5 237.9 196.9 274.4 77 Electrical machinery, apparatus and appliances, nes 158.9 153.7 221.0 188.9 196.1 64 Paper, paperboard, and articles of paper pulp, paper or paperboard 134.7 153.9 189.8 187.5 132.5 74 General industrial machinery and equipment, nes, machine parts, nes 141.5 147.4 169.6 153.4 175.2 76 Telecommunications and sound recording/reproducing apparatus, etc 121.9 144.2 164.0 167.8 168.7 66 Non-metallic mineral manufactures, nes 143.3 148.7 166.9 148.8 148.9 59 Chemical materials and products, nes 106.4 127.0 153.2 154.6 204.8
65 Textile yarn, fabrics, made-up articles, nes, and related products 126.2 114.8 111.2 119.3 173.8 89 Miscellaneous manufactured articles, nes 119.2 106.7 107.9 126.3 141.4 55 Essential oils, perfume materials; toilet cleaning preparations 94.4 107.9 116.3 119.6 113.7 51 Organic chemicals 92.9 102.6 107.6 96.0 112.8 69 Manufactures of metals, nes 101.2 78.6 105.3 105.8 114.9 06 Sugars, sugar preparations and honey 82.0 122.7 97.8 102.5 96.2 26 Textile fibres (other than wool tops), wastes; not manufactured 79.1 77.0 101.6 115.6 96.3 87 Professional, scientific and controlling instruments and apparatus, nes 79.1 91.6 84.4 86.9 104.9
Other commodities 798.1 837.6 995.9 1,069.6 1,140.0
Grand Total 4,829.5 5,595.9 6,729.4 7,696.0 8,250.5
Source: Uganda Bureau of Statistics
4.3.8 Total Trade Balance performance
The country continued to experience trade deficits, with an annual increase of 8.8 percent registered in CY2020
compared to 15.9 attained in 2019. The deficit generally grown over the period under review, with the lowest trade
deficit of United States Dollars 1,992.8 million being registered in 2016, and the highest of United States Dollars
3,980.9 million recorded in CY2020. See table 4.3.1.
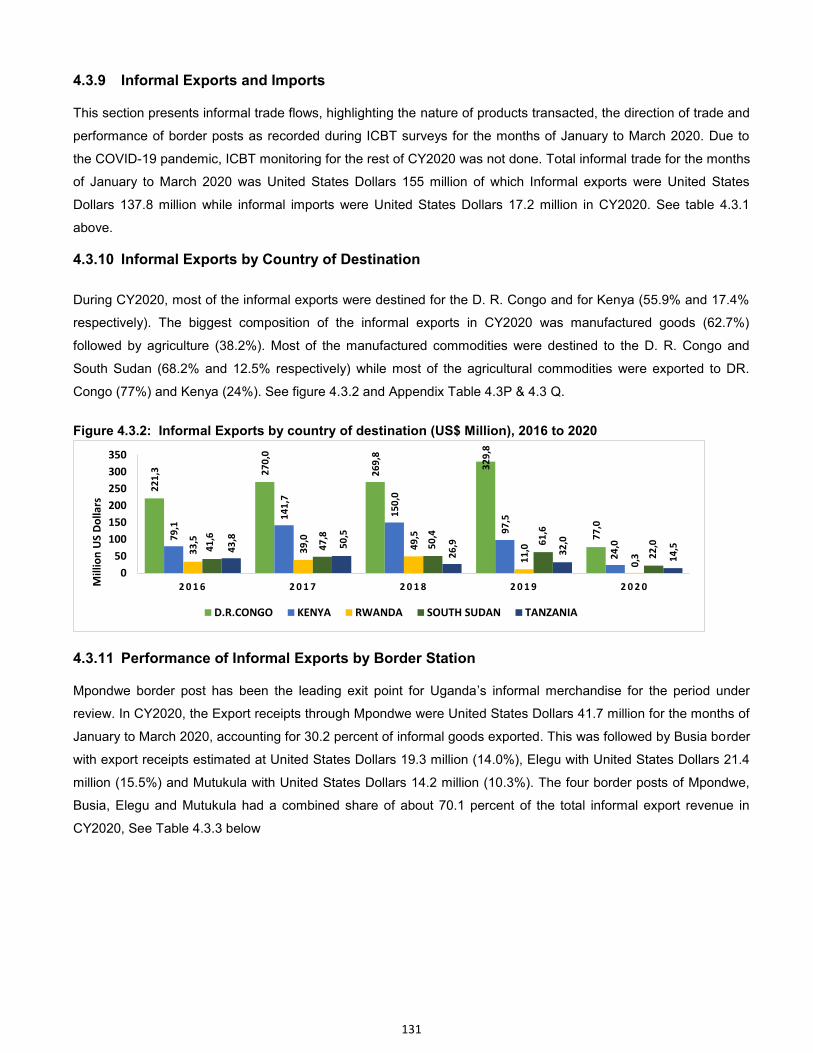
131
4.3.9 Informal Exports and Imports
This section presents informal trade flows, highlighting the nature of products transacted, the direction of trade and
performance of border posts as recorded during ICBT surveys for the months of January to March 2020. Due to
the COVID-19 pandemic, ICBT monitoring for the rest of CY2020 was not done. Total informal trade for the months
of January to March 2020 was United States Dollars 155 million of which Informal exports were United States
Dollars 137.8 million while informal imports were United States Dollars 17.2 million in CY2020. See table 4.3.1
above.
4.3.10 Informal Exports by Country of Destination
During CY2020, most of the informal exports were destined for the D. R. Congo and for Kenya (55.9% and 17.4%
respectively). The biggest composition of the informal exports in CY2020 was manufactured goods (62.7%)
followed by agriculture (38.2%). Most of the manufactured commodities were destined to the D. R. Congo and
South Sudan (68.2% and 12.5% respectively) while most of the agricultural commodities were exported to DR.
Congo (77%) and Kenya (24%). See figure 4.3.2 and Appendix Table 4.3P & 4.3 Q.
Figure 4.3.2: Informal Exports by country of destination (US$ Million), 2016 to 2020
4.3.11 Performance of Informal Exports by Border Station
Mpondwe border post has been the leading exit point for Uganda’s informal merchandise for the period under
review. In CY2020, the Export receipts through Mpondwe were United States Dollars 41.7 million for the months of
January to March 2020, accounting for 30.2 percent of informal goods exported. This was followed by Busia border
with export receipts estimated at United States Dollars 19.3 million (14.0%), Elegu with United States Dollars 21.4
million (15.5%) and Mutukula with United States Dollars 14.2 million (10.3%). The four border posts of Mpondwe,
Busia, Elegu and Mutukula had a combined share of about 70.1 percent of the total informal export revenue in
CY2020, See Table 4.3.3 below
22
1,3
27
0,0
26
9,8
32
9,8
77
,0
79
,1 1
41
,7
15
0,0
97
,5
24
,0
33
,5
39
,0
49
,5
11
,0
0,3
41
,6
47
,8
50
,4
61
,6
22
,0
43
,8
50
,5
26
,9
32
,0
14
,5
0
50
100
150
200
250
300
350
2 0 1 6 2 0 1 7 2 0 1 8 2 0 1 9 2 0 2 0 Mil
lio
n U
S D
oll
ars
D.R.CONGO KENYA RWANDA SOUTH SUDAN TANZANIA
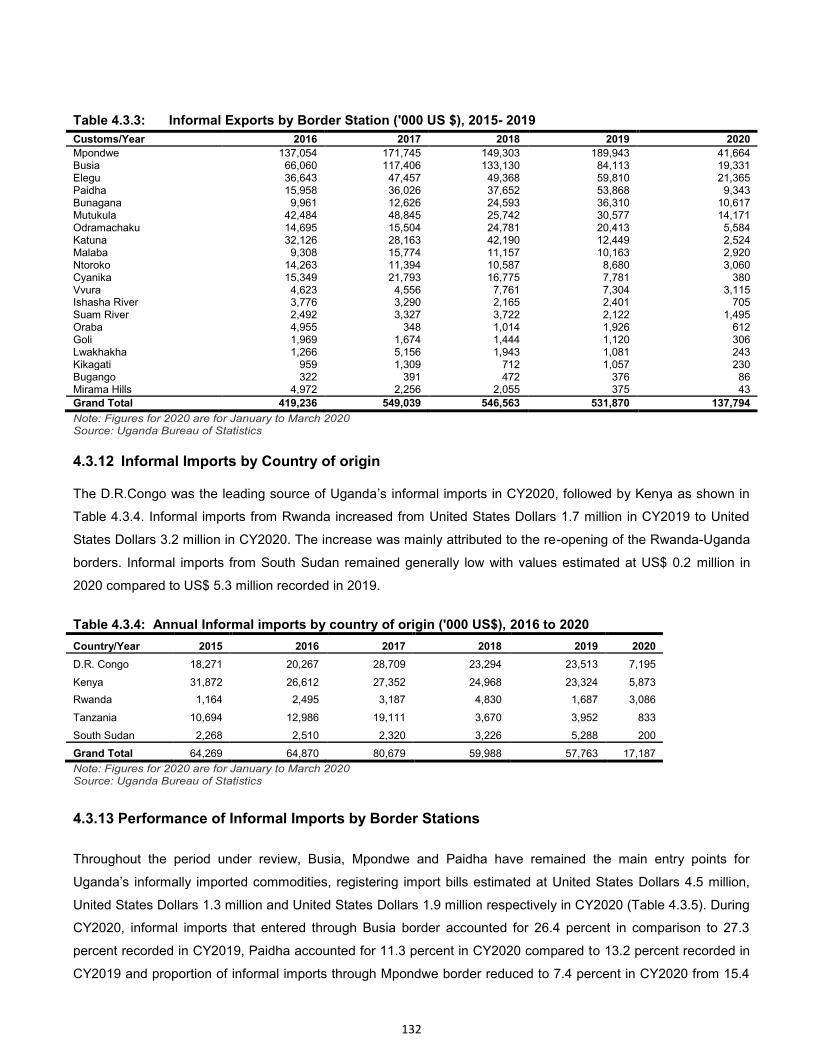
132
Table 4.3.3: Informal Exports by Border Station ('000 US $), 2015- 2019
Customs/Year 2016 2017 2018 2019 2020
Mpondwe 137,054 171,745 149,303 189,943 41,664 Busia 66,060 117,406 133,130 84,113 19,331 Elegu 36,643 47,457 49,368 59,810 21,365 Paidha 15,958 36,026 37,652 53,868 9,343 Bunagana 9,961 12,626 24,593 36,310 10,617 Mutukula 42,484 48,845 25,742 30,577 14,171 Odramachaku 14,695 15,504 24,781 20,413 5,584 Katuna 32,126 28,163 42,190 12,449 2,524 Malaba 9,308 15,774 11,157 10,163 2,920 Ntoroko 14,263 11,394 10,587 8,680 3,060 Cyanika 15,349 21,793 16,775 7,781 380 Vvura 4,623 4,556 7,761 7,304 3,115 Ishasha River 3,776 3,290 2,165 2,401 705 Suam River 2,492 3,327 3,722 2,122 1,495 Oraba 4,955 348 1,014 1,926 612 Goli 1,969 1,674 1,444 1,120 306 Lwakhakha 1,266 5,156 1,943 1,081 243 Kikagati 959 1,309 712 1,057 230 Bugango 322 391 472 376 86 Mirama Hills 4,972 2,256 2,055 375 43
Grand Total 419,236 549,039 546,563 531,870 137,794
Note: Figures for 2020 are for January to March 2020 Source: Uganda Bureau of Statistics
4.3.12 Informal Imports by Country of origin
The D.R.Congo was the leading source of Uganda’s informal imports in CY2020, followed by Kenya as shown in
Table 4.3.4. Informal imports from Rwanda increased from United States Dollars 1.7 million in CY2019 to United
States Dollars 3.2 million in CY2020. The increase was mainly attributed to the re-opening of the Rwanda-Uganda
borders. Informal imports from South Sudan remained generally low with values estimated at US$ 0.2 million in
2020 compared to US$ 5.3 million recorded in 2019.
Table 4.3.4: Annual Informal imports by country of origin ('000 US$), 2016 to 2020
Country/Year 2015 2016 2017 2018 2019 2020
D.R. Congo 18,271 20,267 28,709 23,294 23,513 7,195
Kenya 31,872 26,612 27,352 24,968 23,324 5,873
Rwanda 1,164 2,495 3,187 4,830 1,687 3,086
Tanzania 10,694 12,986 19,111 3,670 3,952 833
South Sudan 2,268 2,510 2,320 3,226 5,288 200
Grand Total 64,269 64,870 80,679 59,988 57,763 17,187
Note: Figures for 2020 are for January to March 2020 Source: Uganda Bureau of Statistics
4.3.13 Performance of Informal Imports by Border Stations
Throughout the period under review, Busia, Mpondwe and Paidha have remained the main entry points for
Uganda’s informally imported commodities, registering import bills estimated at United States Dollars 4.5 million,
United States Dollars 1.3 million and United States Dollars 1.9 million respectively in CY2020 (Table 4.3.5). During
CY2020, informal imports that entered through Busia border accounted for 26.4 percent in comparison to 27.3
percent recorded in CY2019, Paidha accounted for 11.3 percent in CY2020 compared to 13.2 percent recorded in
CY2019 and proportion of informal imports through Mpondwe border reduced to 7.4 percent in CY2020 from 15.4
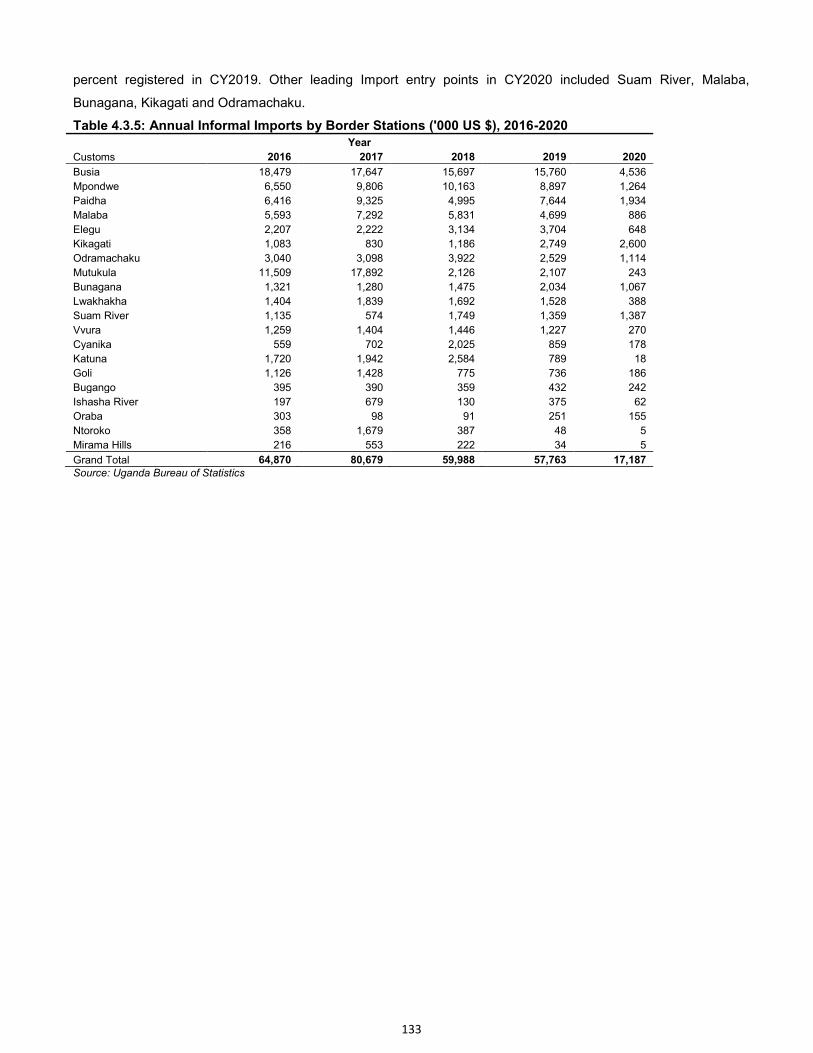
133
percent registered in CY2019. Other leading Import entry points in CY2020 included Suam River, Malaba,
Bunagana, Kikagati and Odramachaku.
Table 4.3.5: Annual Informal Imports by Border Stations ('000 US $), 2016-2020 Year
Customs 2016 2017 2018 2019 2020
Busia 18,479 17,647 15,697 15,760 4,536
Mpondwe 6,550 9,806 10,163 8,897 1,264
Paidha 6,416 9,325 4,995 7,644 1,934
Malaba 5,593 7,292 5,831 4,699 886
Elegu 2,207 2,222 3,134 3,704 648
Kikagati 1,083 830 1,186 2,749 2,600
Odramachaku 3,040 3,098 3,922 2,529 1,114
Mutukula 11,509 17,892 2,126 2,107 243
Bunagana 1,321 1,280 1,475 2,034 1,067
Lwakhakha 1,404 1,839 1,692 1,528 388
Suam River 1,135 574 1,749 1,359 1,387
Vvura 1,259 1,404 1,446 1,227 270
Cyanika 559 702 2,025 859 178
Katuna 1,720 1,942 2,584 789 18
Goli 1,126 1,428 775 736 186
Bugango 395 390 359 432 242
Ishasha River 197 679 130 375 62
Oraba 303 98 91 251 155
Ntoroko 358 1,679 387 48 5
Mirama Hills 216 553 222 34 5
Grand Total 64,870 80,679 59,988 57,763 17,187 Source: Uganda Bureau of Statistics
134
4.4 Government Finance Statistics (GFS)
4.4.0 Introduction
This section provides information on the fiscal operations of the General Government. Fiscal operations include the
revenue, expenditure and financing of government institutional units. Government revenue is further analysed by
type of revenue while Government expenditure is analysed by economic and functional classification according to
GFS Manual 2014. The fiscal statistical information is critical in guiding policy and decision makers to analyse the
impact of the fiscal operations at the level of a government, institutional sector and other sectors of the economy.
Government Finance Statistics (GFS) coverage is currently restricted to the General Government sector which
comprises of Central Government and Local Government (134 districts, 41 municipalities and 203 town councils)
and also non-profit institutions that are controlled and financed by the government (Extra budgetary units).
4.4.1 Central Government Revenue.
In the FY2019/20, the net Central Government revenue (excludes tax refunds and government taxes) was Uganda
Shillings 18,434 billion compared to Uganda Shillings 17,262 billion collected in the FY2018/19. This was a 6.8
percent increment in the net central government revenue.
During the period under review, the largest contributor to the total Central Government revenue was Tax revenue,
accounting for 87.0 percent registered in the FY2019/20 while Non-Tax revenue contributed only 13.0 percent.
Among the Tax revenue, the taxes on goods and services had the largest contribution (Uganda Shillings 8,118
billion), accounting for 44.4 percent of the total revenue in the FY2019/20. This was followed by Taxes on Income,
Profits, and Capital gains (Uganda Shillings 5,272 billion), accounting for 28.6 percent of the total revenue while
the lowest contribution from the tax revenue was Taxes on permission to use goods or perform activities (0.7
percent). (See Figure 4.4.1)
Among the Non-Tax revenue, the largest contribution to the total Central Government revenue was from Other
revenue (6.7%) in the FY2019/20. [See figure 4.4.1 and Appendix Tables 4.4 B (a) & (b)].
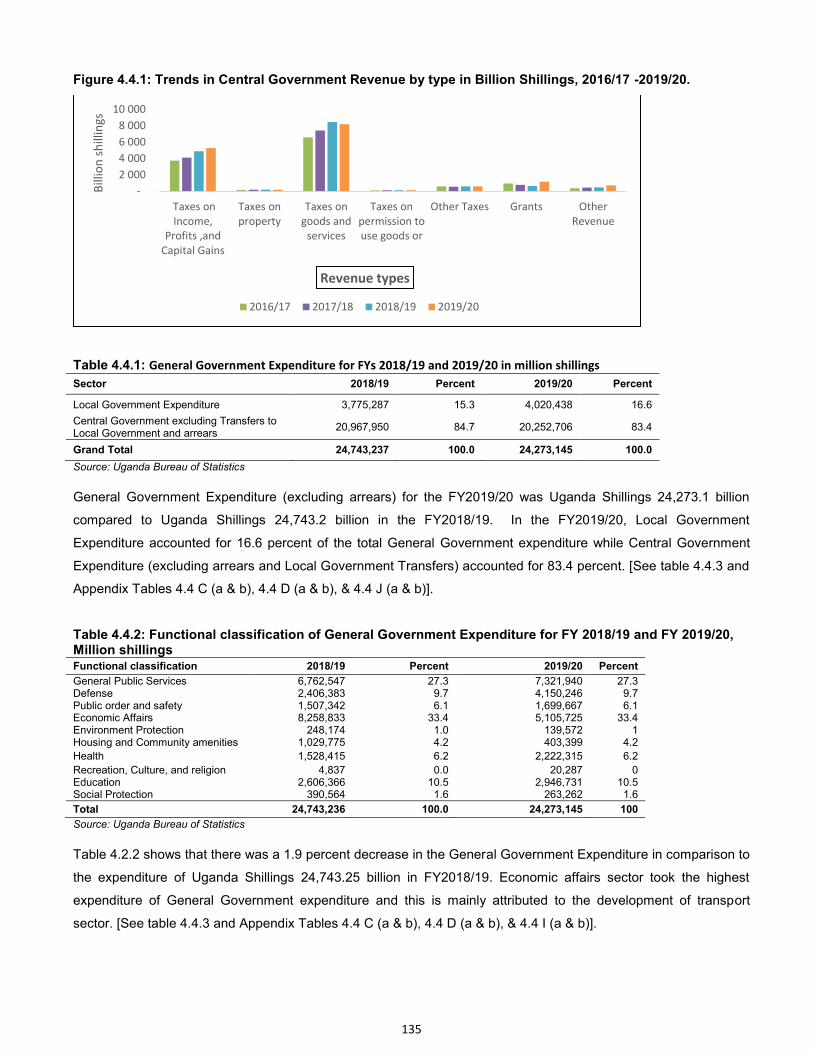
135
Figure 4.4.1: Trends in Central Government Revenue by type in Billion Shillings, 2016/17 -2019/20.
Table 4.4.1: General Government Expenditure for FYs 2018/19 and 2019/20 in million shillings
Sector 2018/19 Percent 2019/20 Percent
Local Government Expenditure 3,775,287 15.3 4,020,438 16.6
Central Government excluding Transfers to Local Government and arrears
20,967,950 84.7 20,252,706 83.4
Grand Total 24,743,237 100.0 24,273,145 100.0
Source: Uganda Bureau of Statistics
General Government Expenditure (excluding arrears) for the FY2019/20 was Uganda Shillings 24,273.1 billion
compared to Uganda Shillings 24,743.2 billion in the FY2018/19. In the FY2019/20, Local Government
Expenditure accounted for 16.6 percent of the total General Government expenditure while Central Government
Expenditure (excluding arrears and Local Government Transfers) accounted for 83.4 percent. [See table 4.4.3 and
Appendix Tables 4.4 C (a & b), 4.4 D (a & b), & 4.4 J (a & b)].
Table 4.4.2: Functional classification of General Government Expenditure for FY 2018/19 and FY 2019/20, Million shillings Functional classification 2018/19 Percent 2019/20 Percent
General Public Services 6,762,547 27.3 7,321,940 27.3 Defense 2,406,383 9.7 4,150,246 9.7 Public order and safety 1,507,342 6.1 1,699,667 6.1 Economic Affairs 8,258,833 33.4 5,105,725 33.4 Environment Protection 248,174 1.0 139,572 1 Housing and Community amenities 1,029,775 4.2 403,399 4.2
Health 1,528,415 6.2 2,222,315 6.2
Recreation, Culture, and religion 4,837 0.0 20,287 0 Education 2,606,366 10.5 2,946,731 10.5 Social Protection 390,564 1.6 263,262 1.6
Total 24,743,236 100.0 24,273,145 100
Source: Uganda Bureau of Statistics
Table 4.2.2 shows that there was a 1.9 percent decrease in the General Government Expenditure in comparison to
the expenditure of Uganda Shillings 24,743.25 billion in FY2018/19. Economic affairs sector took the highest
expenditure of General Government expenditure and this is mainly attributed to the development of transport
sector. [See table 4.4.3 and Appendix Tables 4.4 C (a & b), 4.4 D (a & b), & 4.4 I (a & b)].
-
2 000
4 000
6 000
8 000
10 000
Taxes on
Income,
Profits ,and
Capital Gains
Taxes on
property
Taxes on
goods and
services
Taxes on
permission to
use goods or
Other Taxes Grants Other
Revenue
Bil
lio
n s
hil
lin
gs
Revenue types
2016/17 2017/18 2018/19 2019/20
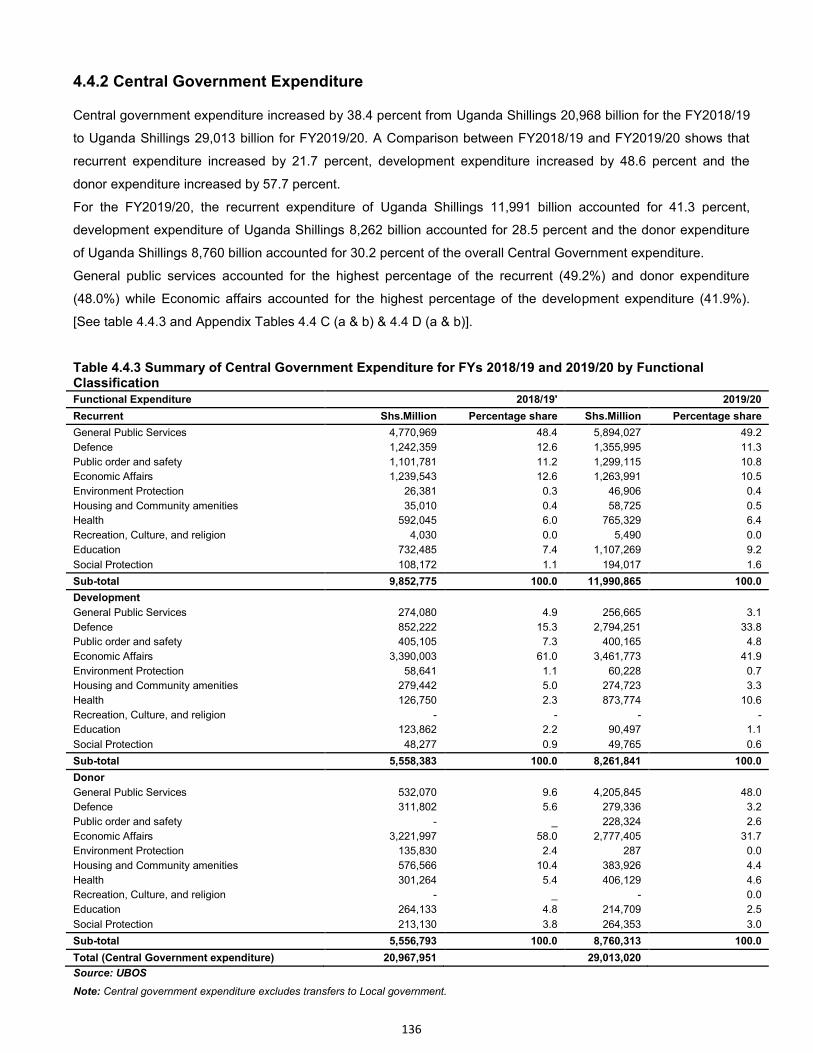
136
4.4.2 Central Government Expenditure
Central government expenditure increased by 38.4 percent from Uganda Shillings 20,968 billion for the FY2018/19
to Uganda Shillings 29,013 billion for FY2019/20. A Comparison between FY2018/19 and FY2019/20 shows that
recurrent expenditure increased by 21.7 percent, development expenditure increased by 48.6 percent and the
donor expenditure increased by 57.7 percent.
For the FY2019/20, the recurrent expenditure of Uganda Shillings 11,991 billion accounted for 41.3 percent,
development expenditure of Uganda Shillings 8,262 billion accounted for 28.5 percent and the donor expenditure
of Uganda Shillings 8,760 billion accounted for 30.2 percent of the overall Central Government expenditure.
General public services accounted for the highest percentage of the recurrent (49.2%) and donor expenditure
(48.0%) while Economic affairs accounted for the highest percentage of the development expenditure (41.9%).
[See table 4.4.3 and Appendix Tables 4.4 C (a & b) & 4.4 D (a & b)].
Table 4.4.3 Summary of Central Government Expenditure for FYs 2018/19 and 2019/20 by Functional Classification Functional Expenditure 2018/19' 2019/20
Recurrent Shs.Million Percentage share Shs.Million Percentage share
General Public Services 4,770,969 48.4 5,894,027 49.2
Defence 1,242,359 12.6 1,355,995 11.3
Public order and safety 1,101,781 11.2 1,299,115 10.8
Economic Affairs 1,239,543 12.6 1,263,991 10.5
Environment Protection 26,381 0.3 46,906 0.4
Housing and Community amenities 35,010 0.4 58,725 0.5
Health 592,045 6.0 765,329 6.4
Recreation, Culture, and religion 4,030 0.0 5,490 0.0
Education 732,485 7.4 1,107,269 9.2
Social Protection 108,172 1.1 194,017 1.6
Sub-total 9,852,775 100.0 11,990,865 100.0
Development
General Public Services 274,080 4.9 256,665 3.1
Defence 852,222 15.3 2,794,251 33.8
Public order and safety 405,105 7.3 400,165 4.8
Economic Affairs 3,390,003 61.0 3,461,773 41.9
Environment Protection 58,641 1.1 60,228 0.7
Housing and Community amenities 279,442 5.0 274,723 3.3
Health 126,750 2.3 873,774 10.6
Recreation, Culture, and religion - - - -
Education 123,862 2.2 90,497 1.1
Social Protection 48,277 0.9 49,765 0.6
Sub-total 5,558,383 100.0 8,261,841 100.0
Donor
General Public Services 532,070 9.6 4,205,845 48.0
Defence 311,802 5.6 279,336 3.2
Public order and safety - _ 228,324 2.6
Economic Affairs 3,221,997 58.0 2,777,405 31.7
Environment Protection 135,830 2.4 287 0.0
Housing and Community amenities 576,566 10.4 383,926 4.4
Health 301,264 5.4 406,129 4.6
Recreation, Culture, and religion - _ - 0.0
Education 264,133 4.8 214,709 2.5
Social Protection 213,130 3.8 264,353 3.0
Sub-total 5,556,793 100.0 8,760,313 100.0
Total (Central Government expenditure) 20,967,951
29,013,020
Source: UBOS
Note: Central government expenditure excludes transfers to Local government.
137
4.4.3 Local Government Revenue
During the FY2019/20, total Local government revenue was Uganda Shillings 4,211.8 billion of which Uganda
Shillings 3,584 billion was revenue from the districts while Uganda Shillings 627.8 billion was revenue from
municipalities. Grants remained the major source of Local government revenue, accounting for 96.3 percent of
total Local Government revenue. Locally raised revenue accounted for only 2.2 percent of the total Local
Government revenue, of which raised taxes accounted for 1.6 percent while the other non-tax revenue accounted
for 98.4 percent. [See Appendix Tables 4.4 I (i&ii)].
4.4.4 Local Government Expenditure
In FY2019/20, Local Government total expenditure rose to Uganda Shillings 4,020.4 billion from Uganda Shillings
3,775.2 billion in the FY2018/19. This was a 6.5 percent increase in local government expenditure. The Education
sector took the largest proportion of Local government expenditure (43.5%), followed by public administration
(29.1%). The Health sector accounted for 14.5 percent of the total Local Government expenditure. The smallest
expenditure at the Local Government was in the Public Order and Safety sector. [See Appendix Tables 4.4 J (i&ii)].
138
4.5 Banking and Currency
This section presents Statistics on the performance of the banking sector for the period July 2019 - June 2020.
4.5.1 Depository Corporations Survey
The Depository Corporation Survey covers Credit and Micro Finance deposit taking institutions and deposits
excluded from broad money. These deposits comprise of loan insurance fund held by individuals at credit
institutions and Micro Deposit Taking Institutions (MDIs).
The Net Foreign Assets (NFA) which shows a country’s level of indebtedness, increased by 16.9 percent from
Uganda Shillings 13,878 billion as at June 2019 to 16,224 billion shillings as at June 2020. The Net Domestic
Assets (NDA) grew by 31.4 percent from Uganda Shillings 10,535 billion in June 2019 to Uganda Shillings 13,845
billion in June 2020. Domestic claims and claims on other sectors each increased from Uganda Shillings 20,084
billion to Uganda Shillings 24,316 billion and Uganda Shillings 16,112 billion to Uganda Shillings 17,421 billion over
the period under review, respectively.
Money Supply
Money supply, which indicates the total stock of money circulating in an economy, includes currency, notes, money
in deposits and liquid assets. Money supply (M1) includes money in circulation and local currency in deposits in
banks increased by 26.6 percent from Uganda Shillings 10,018 billion in June 2019 to Uganda Shillings 12,678
billion in June 2020. This was attributed to the increase in currency in the hands of the people and transferable
deposits from Uganda Shillings 3,993 billion in June 2019 to Uganda Shillings 4,877 billion in June 2020 and
Uganda Shillings 6,025 billion in June 2019 to Uganda Shillings 7,801 billion in June 2020 respectively.
Money supply (M2) includes M1 plus savings and time deposits. It increased by 24.9 percent from Uganda
Shillings 17,279 billion in June 2019 to Uganda Shillings 21,575 billion in June 2020.
Money supply (M3) is the broadest level of money supply. It includes money supply M2 and foreign currency
deposits. It increased by 23.2 percent from Uganda Shillings 24,405 billion shillings in June 2019 to Uganda
Shillings 30,069 billion in June 2020. This is partly due to a 19.1 percent increase in foreign currency deposits,
from Uganda Shillings 7,133 billion in June 2019 to Uganda Shillings 8,494 billion in June 2020 (see Appendix
Table 4.5A)
4.5.2 Commercial Banks Assets and Liabilities
The total assets of commercial banks increased by 18.0 percent from Uganda Shillings 30,559 billion as at June
2019 to Uganda Shillings 36,060 billion as at June 2020. Particularly, assets in loans, advances and overdrafts
increased from Uganda Shillings 14,151 billion in June 2019 to Uganda Shillings 16,049 billion in June 2020. In
addition, deposit assets increased from Uganda Shillings 2,663 billion in June 2019 to Uganda Shillings 3,685
billion in June 2020. Total Commercial banks liabilities increased by 18.1 percent from Uganda Shillings 25,591
billion as at June 2019 to Uganda Shillings 30,223 billion as at June 2020. Additionally, total Capital increased from
Uganda Shillings 4,968 billion in June 2019 to Uganda Shillings 5,837 billion in June 2020, translating into a 17.5
percent increase over the period. Overall, net capital increased from Uganda Shillings 4,594 billion in June 2019 to
Uganda Shillings 5,406 billion in June 2019. This represents a 17.7 percent increase in net capital.
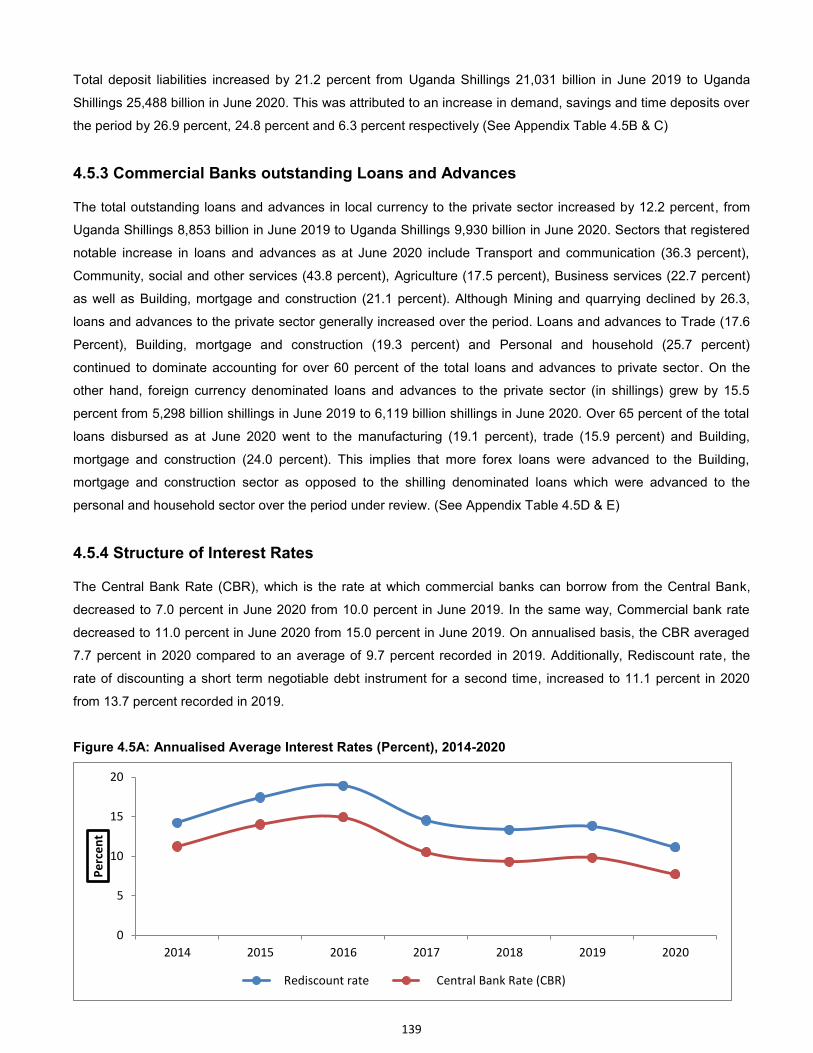
139
Total deposit liabilities increased by 21.2 percent from Uganda Shillings 21,031 billion in June 2019 to Uganda
Shillings 25,488 billion in June 2020. This was attributed to an increase in demand, savings and time deposits over
the period by 26.9 percent, 24.8 percent and 6.3 percent respectively (See Appendix Table 4.5B & C)
4.5.3 Commercial Banks outstanding Loans and Advances
The total outstanding loans and advances in local currency to the private sector increased by 12.2 percent, from
Uganda Shillings 8,853 billion in June 2019 to Uganda Shillings 9,930 billion in June 2020. Sectors that registered
notable increase in loans and advances as at June 2020 include Transport and communication (36.3 percent),
Community, social and other services (43.8 percent), Agriculture (17.5 percent), Business services (22.7 percent)
as well as Building, mortgage and construction (21.1 percent). Although Mining and quarrying declined by 26.3,
loans and advances to the private sector generally increased over the period. Loans and advances to Trade (17.6
Percent), Building, mortgage and construction (19.3 percent) and Personal and household (25.7 percent)
continued to dominate accounting for over 60 percent of the total loans and advances to private sector. On the
other hand, foreign currency denominated loans and advances to the private sector (in shillings) grew by 15.5
percent from 5,298 billion shillings in June 2019 to 6,119 billion shillings in June 2020. Over 65 percent of the total
loans disbursed as at June 2020 went to the manufacturing (19.1 percent), trade (15.9 percent) and Building,
mortgage and construction (24.0 percent). This implies that more forex loans were advanced to the Building,
mortgage and construction sector as opposed to the shilling denominated loans which were advanced to the
personal and household sector over the period under review. (See Appendix Table 4.5D & E)
4.5.4 Structure of Interest Rates
The Central Bank Rate (CBR), which is the rate at which commercial banks can borrow from the Central Bank,
decreased to 7.0 percent in June 2020 from 10.0 percent in June 2019. In the same way, Commercial bank rate
decreased to 11.0 percent in June 2020 from 15.0 percent in June 2019. On annualised basis, the CBR averaged
7.7 percent in 2020 compared to an average of 9.7 percent recorded in 2019. Additionally, Rediscount rate, the
rate of discounting a short term negotiable debt instrument for a second time, increased to 11.1 percent in 2020
from 13.7 percent recorded in 2019.
Figure 4.5A: Annualised Average Interest Rates (Percent), 2014-2020
0
5
10
15
20
2014 2015 2016 2017 2018 2019 2020
Pe
rce
nt
Rediscount rate Central Bank Rate (CBR)
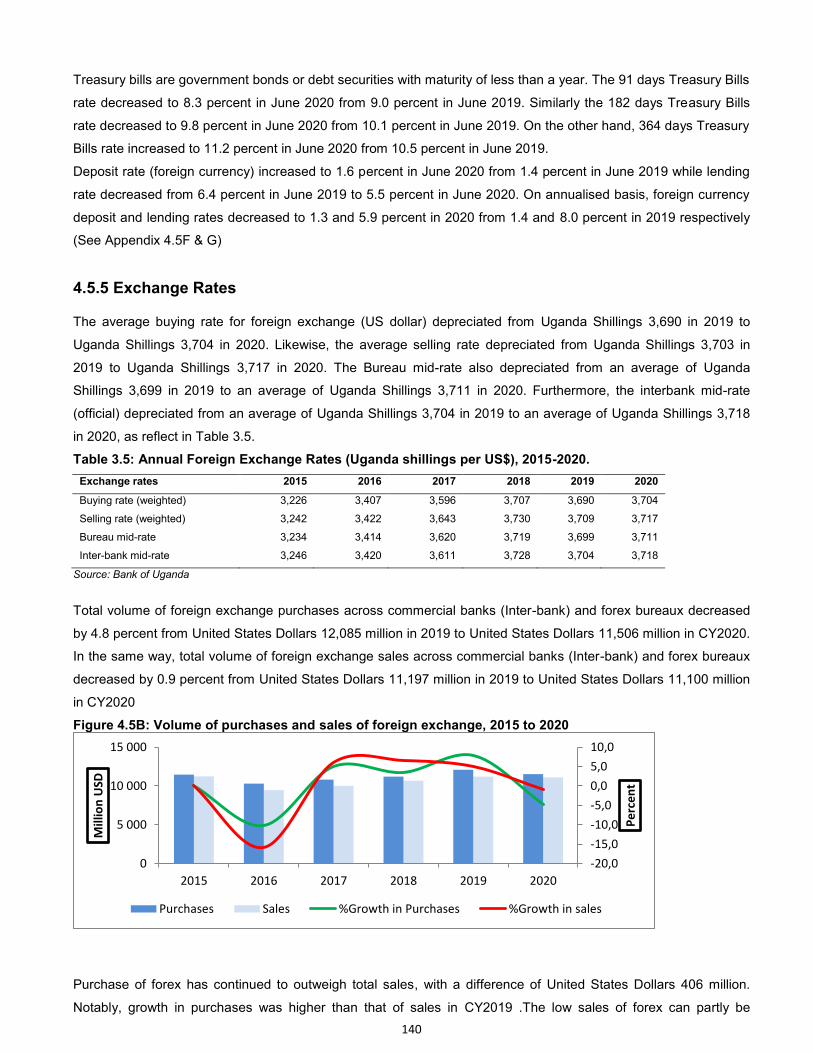
140
Treasury bills are government bonds or debt securities with maturity of less than a year. The 91 days Treasury Bills
rate decreased to 8.3 percent in June 2020 from 9.0 percent in June 2019. Similarly the 182 days Treasury Bills
rate decreased to 9.8 percent in June 2020 from 10.1 percent in June 2019. On the other hand, 364 days Treasury
Bills rate increased to 11.2 percent in June 2020 from 10.5 percent in June 2019.
Deposit rate (foreign currency) increased to 1.6 percent in June 2020 from 1.4 percent in June 2019 while lending
rate decreased from 6.4 percent in June 2019 to 5.5 percent in June 2020. On annualised basis, foreign currency
deposit and lending rates decreased to 1.3 and 5.9 percent in 2020 from 1.4 and 8.0 percent in 2019 respectively
(See Appendix 4.5F & G)
4.5.5 Exchange Rates
The average buying rate for foreign exchange (US dollar) depreciated from Uganda Shillings 3,690 in 2019 to
Uganda Shillings 3,704 in 2020. Likewise, the average selling rate depreciated from Uganda Shillings 3,703 in
2019 to Uganda Shillings 3,717 in 2020. The Bureau mid-rate also depreciated from an average of Uganda
Shillings 3,699 in 2019 to an average of Uganda Shillings 3,711 in 2020. Furthermore, the interbank mid-rate
(official) depreciated from an average of Uganda Shillings 3,704 in 2019 to an average of Uganda Shillings 3,718
in 2020, as reflect in Table 3.5.
Table 3.5: Annual Foreign Exchange Rates (Uganda shillings per US$), 2015-2020.
Exchange rates 2015 2016 2017 2018 2019 2020
Buying rate (weighted) 3,226 3,407 3,596 3,707 3,690 3,704
Selling rate (weighted) 3,242 3,422 3,643 3,730 3,709 3,717
Bureau mid-rate 3,234 3,414 3,620 3,719 3,699 3,711
Inter-bank mid-rate 3,246 3,420 3,611 3,728 3,704 3,718
Source: Bank of Uganda
Total volume of foreign exchange purchases across commercial banks (Inter-bank) and forex bureaux decreased
by 4.8 percent from United States Dollars 12,085 million in 2019 to United States Dollars 11,506 million in CY2020.
In the same way, total volume of foreign exchange sales across commercial banks (Inter-bank) and forex bureaux
decreased by 0.9 percent from United States Dollars 11,197 million in 2019 to United States Dollars 11,100 million
in CY2020
Figure 4.5B: Volume of purchases and sales of foreign exchange, 2015 to 2020
Purchase of forex has continued to outweigh total sales, with a difference of United States Dollars 406 million.
Notably, growth in purchases was higher than that of sales in CY2019 .The low sales of forex can partly be
-20,0
-15,0
-10,0
-5,0
0,0
5,0
10,0
0
5 000
10 000
15 000
2015 2016 2017 2018 2019 2020
Pe
rce
nt
Mil
lio
n U
SD
Purchases Sales %Growth in Purchases %Growth in sales
141
explained by the continued loss of value (depreciation) of the local currency against the US dollar (See Appendix
4.5H &I)
4.6 Insurance
This section presents statistics on insurance services that include the number of life insurance and non-life
insurance policies issued. The statistics cover the period 2012 to 2019.
142
4.6.1 Life Insurance Incomings and Outgoings
Life insurance refers to all policies that cover human related risks. Life policies issued include Individual, Group,
Medical and the Deposit Administrative Plan (DAP).
Gross premium incomings increased by 27.3 percent in CY2019 from Uganda Shillings 217 billion in CY2018 to
Uganda Shillings 276 billion in CY2019. This was attributed to the increase in premium incomings. Life individual
rose from Uganda Shillings 102 billion in 2018 to Uganda Shillings 156 billion in CY2019, DAP that had declined by
17.9 percent in 2018 registered an increase of 17.4 percent from Uganda Shillings 16 billion to Uganda Shillings 19
shillings in CY2019 and medical from Uganda Shillings 32 billion in CY2018 to Uganda Shillings 36 billion in
CY2019.
However, the Life group insurance category declined by 3.6 percent in gross premium incomings in the same
period, from Uganda Shillings 66 billion in 2018 to 63 billion in 2019. (See Table 4.6 A).
The Life insurance for reinsurance outgoings category decreased by 0.8 percent, from Uganda Shillings 34.5 billion
in CY2018 to Uganda Shillings 34.2 billion in CY2019. The main contributor to the decline was the medical
insurance category that decreased from Uganda Shillings 18 billion in CY2018 to Uganda Shillings 12 billion in
CY2019. The life individual insurance category grew from Uganda Shillings 2 billion in 2018 to Uganda Shillings 3
billion in CY2019 (see statistical Appendix Table 4.6 B).
The Net Incurred claims on life insurance registered 15.1 percent increase in CY2019 compared to 31.4 percent
registered in CY2018. The value of life paid and outstanding claims increased from Uganda Shillings 57 billion in
2018 to Uganda Shillings 66 billion in CY2019. The major contributor to the increase was the life individual
insurance category that increased from Uganda Shillings 15 billion in CY2018 to Uganda Shillings 45 billion in
CY2019 (See Appendix table 4.6 D).
4.6.2 Non-Life Insurance Incomings and Outgoings
Non-life insurance refers to policies that cover non-human related risks. These policies include fire,
marine/aviation, motor and miscellaneous accidents.
The value of non-life Insurance premium incomings increased from Uganda Shillings 333 billion shillings in
CY2018 to Uganda Shillings 340 billion in CY2019, representing a growth of 2.2 percent. Marine insurance
registered an increase of 19.8 percent in CY2019 from an earlier decline of 0.9 percent in CY2018, Fire insurance
recorded 19.9 percent increase from Uganda Shillings 955 billion to Uganda Shillings 114 billion; the Motor
insurance category recorded a 4.0 percent increase from Uganda Shillings 144 billion to Uganda Shillings 150
billion in CY2019.
However, the Miscellaneous accidents category in the Non-life insurance premium incomings recorded a decline
of 40.0 percent in CY2019. (Appendix table 4.6E).
143
The outgoings in form of reinsurance registered a growth of 18.9 percent in CY2019, from Uganda Shillings 136
billion to Uganda Shillings 162 billion. The major contributors to the growth were Fire reinsurance that increased by
21.0 percent in CY2019, from Uganda Shillings 75 billion to Uganda Shillings 91 billion and Marine/Aviation
increased by 23.7 percent from Uganda Shillings 22 billion to Uganda Shillings 27 billion in CY2019. (See
Statistical Appendix table 4.6 F).
Non-Life premium income declined by 9.0 percent in CY2019 from Uganda Shillings 195 billion to Uganda Shillings
177 billion in CY2019. The decline was attributed to the decrease in Miscellaneous accidents and marine/aviation
by 73.5 percent and 7.9 percent respectively. However, fire and motor insurance increased by 6.8 percent and 5.4
percent respectively. (See Appendix table 4.6 G).
The Net incurred claims on Non-life insurance increased by 22.4 percent in CY2019 from a decline of 5.8 percent
in CY2018. The main drivers for the increase were Miscellaneous accidents which rose from Uganda Shillings 2
billion to Uganda Shillings 7 billion and Fire insurance that increased from Uganda Shillings 7 billion to Uganda
Shillings 13 billion in CY2019. (See Appendix table 4.6 H).
144
STATISTICAL APPENDIX
1.0 Administrative units ............................................................................................................................................................. 149
Table 1.0 A: Regions, Districts and their Lower Level Administrative Units (Number), 2020 ........................................................................... 149
Table 1.1: National Land Cover statistics (sq. km) .......................................................................................................................................... 151
1.2 Forestry ................................................................................................................................................................................. 151
Table 1.2A: Total production of round-wood timber (‘000 tones), 2014– 2018 ................................................................................................ 151
Table 1.2 B: Value of output of round-wood timber, 2014 - 2018 (Mill. Shs) .................................................................................................... 152
1.3 Climate ................................................................................................................................................................................ 153
Table 1.3 A: Monthly rainfall for selected centres (mm), 2014 – 2020 ............................................................................................................. 153
Table 1.3 A (i): Number of rain-days by month during 2020 ............................................................................................................................ 153
Table 1.3 B: Temperature (Degrees Celsius) for selected centres2015- 2020 ................................................................................................ 154
Table 1.3 C: Relative humidity for selected centers, 2013– 2017 at 6:00 hrs.and 12:00hrs ........................................................................... 158
1.4 Water Supply ....................................................................................................................................................................... 161
Table 1.4 A: Amount of Water produced (cubic meters) by NSWC, 2015/16-2020/21 ..................................................................................... 161
Table 1.4 B: Amount of Water Supplied (Cubic metres) by NSWC, 2015/16-2020/21 ..................................................................................... 162
Table 1.4 C: Amount of Water Sold and Billing efficiency by NSWC, 2020/2021 ............................................................................................ 163
Table 1.4 D: Practical Capacity and Capacity Utilization by NSWC, 2017 -2018 ............................................................................................. 164
Table 1.4 E: Small towns water supply in cubic metres by town, 2018/19 – 2020/21 ...................................................................................... 165
1.5 Waste Statistics .................................................................................................................................................................. 171
Table 1.5 A: Quantity of Municipal Solid Waste Collected (tons) ..................................................................................................................... 171
Table 1.5 B: Quantity of hazardous waste (tons) collected ............................................................................................................................. 171
Table 1.5 C: Electric and Electronic Equipment Placed on the Market ............................................................................................................ 172
Table 1.5 D: E-Waste Generated ................................................................................................................................................................... 172
2.1 Demography Statistics ........................................................................................................................................................ 173
Table 2.1 A: Population by Census Year (1969-2014) .................................................................................................................................... 173
Table 2.1 A (Cont’d): Population by Census Year (1969-2014) ....................................................................................................................... 173
Table 2.1 B: Projected Mid Year Five year age groups, 2018- 2020 (000’s) ................................................................................................... 175
Table 2.1 C: Census Population counts (2002 and 2014) by Region, District and Mid Year Population projections (2015-2021) .................... 176
Table 2.1 D: Census Households counts (2014) by Region, District and Mid Year Projected Households (2015-2021) .................................. 180
2.2 Education Statistics ............................................................................................................................................................. 184
Table 2.2 A Pre-Primary school enrolment by class and sex, 2010-2017 ........................................................................................................ 184
Table 2.2 B: Pre-Primary school PCR and PTR by district, 2012-2017-Eastern Region .................................................................................. 184
Table 2.2C: Primary school enrolment by class and sex ................................................................................................................................. 186
Table 2.2 D: Selected Primary School Indicators by District, 2014 – 2017 ...................................................................................................... 187
Table 2.2 E: Secondary school enrolment, Completion rate and Transition rate to S.4 by class (2010- 2017) ................................................ 189
Table 2.2 F: Secondary Gross (GER) and Net Enrolment Rate (NER) by district, 2013 – 2017 ...................................................................... 190
Table 2.2 G: Student Teacher (STR) and Classroom (SCR) Ratio by District, 2012 – 2017 ............................................................................ 192
2.3 Labour Statistics .................................................................................................................................................................. 194
Table 2.3 A: Working age, working, employed and subsistence agriculture only populations (14 - 64 years), 2019/20 ................................. 194
Table 2.3 B: Labour Force Participation Rate (LFPR), Employment –to-Population Ratio (EPR) and Unemployment Rate (14 - 64 years), 2019/20 ....................................................................................................................................................................................... 195
Table 2.3 C: Status in employment for persons in employment (14 - 64 years), 2019/20 .............................................................................. 196
Table 2.3 D: Industry for persons in employment (14 - 64 years), 2019/20 ................................................................................................... 197
Table 2.3 E: Occupation for persons in employment (14 - 64 years), 2019/20 .............................................................................................. 198
Table 2.3 F: Education level attained for persons in employment (14 - 64 years), 2019/20 ........................................................................... 199
Table 2.3 G: Median monthly earnings for persons in paid employment on main job (14 - 64 years), 2016/17 and 2019/20; Base 2016/17=100 . ....................................................................................................................................................................................... 199
2.5 Health Statistics ................................................................................................................................................................... 200
Table 2.5 A: Deliveries in Government and PNFP health facilities, percent, and 2016/17-2019/20 ............................................................. 200
145
Table 2.5 B: Selected health sector performance indicators, 2016/17 -2019/20 .......................................................................................... 202
Table 2.5 D: Number of GBV survivors who reported to a health facility, 2017-2020 .................................................................................. 205
2.6 Crime Statistics .................................................................................................................................................................... 207
Table 2.6A: Prison Population by District, 2020 .......................................................................................................................................... 207
Table 2.6 B: Prison Capacity and Occupancy Rate by District, 2020 .......................................................................................................... 209
3.1 Production Statistics ........................................................................................................................................................... 211
Table 3.1A: Production Volumes for Selected Cash Crops (Tonnes), 2016- 2020 ...................................................................................... 211
Table 3.1 B: Area planted for selected Food Crops, 2016-2020 (Ha) ......................................................................................................... 211
Table 3.1 C: Crop production for selected Food Crops, 2016-2020 (MT) ................................................................................................... 211
Table 3.2 A: Index of Production (2002 =100), Calendar Year, 2016-2020 ................................................................................................. 212
Table 3.2 B: Index of Production (2002=100), Fiscal year, 2015/16 - 2019/20 ............................................................................................ 213
3.3 Energy Statistics .................................................................................................................................................................. 214
Table 3.3.A: Installed Electricity Capacity in MW (2016-2020) ......................................................................................................... 214
Table 3.3 B: Electricity Generation by Company (GWh), 2016-2020 ............................................................................................... 215
Table 3.3 C: UETCL Sales by UETCL (GWh), 2016 – 2020 ............................................................................................................ 215
Table 3.3 D: UETCL Purchases by UETCL (GWh), 2016 – 2020 .................................................................................................... 216
Table 3.3 E: Total Number of Consumers, 2015-2019 ..................................................................................................................... 216
3.4 Building and Construction Statistics ................................................................................................................................. 217
Table 3.4a Showing Number of Plans Submitted from 2016 to 2020 .......................................................................................................... 217
Table 3.4b Showing Number of Plans Approved from 2016 to 2020 ........................................................................................................... 217
Table 3.4c Showing Number of Occupational Permits Issued from 2016 to 2020 ....................................................................................... 217
Table 3.4d Showing Number of Plans Deferred from 2017 to 2020 ............................................................................................................ 217
Table 3.4e Showing Number of Plans Rejected from 2017 to 2020 ............................................................................................................ 218
3.5 Mineral Statistics ................................................................................................................................................................. 218
Table 3.5 A: Annual value of mineral Production Value (UGX ‘000,000), 2015-2019 .................................................................................. 218
3.6 Transport and Communication ........................................................................................................................................... 219
Table 3.6A: Condition of paved roads (km) as of June 2020 ....................................................................................................................... 219
Table 3.6 B: Condition of Unpaved roads (km) as of June 2020 ................................................................................................................. 219
3.7 Tourism and Migration ......................................................................................................................................................... 220
Table 3.6A: Total Arrival and Departures, 2015 – 2020 .............................................................................................................................. 220
Tables 3.6 B: Total Arrival and Departures by Sex, 2015 – 2020 ................................................................................................................ 221
Tables 3.6 C: Migration Statistics: Total Arrivals and Departures by Residence Status – Entebbe entry points, 2020 ................................. 222
Tables 3.6 D: Migration Statistics: Total Arrivals and Departures by Residence Status - Busia and Mirama, 2020. .................................... 222
Tables 3.6 E: Migration Statistics: Total Arrivals and Departures by Residence Status - Mutukula and Mpondwe, 2020 ............................. 223
Tables 3.6 F: Migration Statistics: Total Arrivals and Departures by Residence Status- Elegu and Katuna. 2020 ....................................... 223
Table 3.6 G: Visitor Arrivals by Country of Usual residence, 2015 – 2020 .................................................................................................. 224
Tables 3.6 H: Selected Tourism Indicators, 2015 – 2020 ............................................................................................................................ 224
Table 3.6 J: Visitation to the National Parks, by Month ............................................................................................................................... 225
Table 3.6 K: Visitation to UWEC, by Month, 2015-2020 .............................................................................................................................. 225
Table 3.6 L: Visitation to UWEC, by Category of Visitor, 2015-2020 ........................................................................................................... 225
4.1 National Accounts ............................................................................................................................................................... 226
Table 4.1 A: GDP Summary Statistics, Fiscal Year 2015/16-2020/21 ......................................................................................................... 226
Table 4.1 B (i): Value Added by economic activity at Current prices, 2015/16-2020/2021, Billion Shillings.................................................. 226
Table 4.1 B (ii): Percentage Contribution to GDP by economic activity at Current prices, 2015/16-2020/21 ................................................ 227
Table 4.1 C (i): Value Added by economic activity at Constant 2016/17 prices, 2015/16-2020/21, Billion Shillings ..................................... 227
Table 4.1 C (ii): Percentage change for Value Added by economic activity at Constant 2016/17 prices, 2015/16-2020/21 ......................... 228
Table 4.1 D (i): Implicit Price Deflators for Value Added by economic activity, 2015/16-2020/21 ................................................................. 228
146
Table 4.1 E (i): Formal sector Value Added by economic activity at Current price, 2015/16-2020/21, Billion Shillings ................................. 229
Table 4.1 E (ii): Formal sector Value Added by economic activity at Constant price, 2015/16-2020/2021, Billion Shillings .......................... 229
Table 4.1 F (i): Informal sector Value Added by economic activity at Current price, 2015/16-2020/21, Billion Shillings ............................... 230
Table 4.1 F (ii): Informal sector Value Added by economic activity at Constant price, 2015/16-2020/21, Billion Shillings ............................ 230
Table 4.1 G (i): Market Value Added by economic activity, Current price, 2015/16-2020/21, Billion Shillings .............................................. 231
Table 4.1 G (ii): Market Value Added by economic activity, Constant price, 2015/16-2020/21, Billion Shillings ........................................... 231
Table 4.1 H (i): Non-Market Value Added by economic activity, Current price, FY, Billion Shillings ............................................................. 232
Table 4.1 H (ii): Non-Market Value Added by economic activity, Constant price, 2015/16-2020/21, Billion Shillings ................................... 232
Table 4.1 I (i): Own account production by economic activity in Current prices (Billion Shillings) ................................................................ 233
Table 4.1 I (ii): Own account production by economic activity in Constant 2016/17 prices (Billion Shillings)................................................ 233
Table 4.1 J (i): GDP by Expenditure, Current prices, FY, Billion Shillings.................................................................................................... 234
Table 4.1 J (ii): GDP by Expenditure, Constant 2016/17 prices, FY, Billion Shillings ................................................................................... 234
Table 4.1 K (i): Gross Domestic Product (GDP) by Institutional Sectors in current prices, Billion Shillings, FY ............................................ 235
Table 4.1 K (ii): Gross Domestic Product (GDP) by Institutional Sectors in constant prices, Billion Shillings, FY ......................................... 235
Table 4.1 M: Balance of Payment (Million US$), 2016-2020, Calendar Year .............................................................................................. 236
Table 4.1 N: Balance of Payment (Million US$), 2016/17-2020/21, Fiscal Year .......................................................................................... 237
4.2 Price Statistics ...................................................................................................................................................................... 238
Table 4.2 A: National CPI Breakdown by Major Groups, Uganda (Base: 2016/17 = 100)............................................................................ 238
Table 4.2 B: National CPI for Food and Non Food, Uganda (Base: 2016/17 = 100) .................................................................................... 238
Table 4.2 C: National CPI Breakdown for Food Crops and related items, Other Goods and Services, Uganda (2016/17 = 100) ................. 239
Table 4.2 D: National Annual Average CPI by COICOP Divisions, Uganda (2016/17 = 100) ...................................................................... 239
Table 4.2 E: National Annual Average Inflation by COICOP Divisions, Uganda (Base: 2016/17 = 100) ...................................................... 240
Table 4.2F: Annual Average CPI by COICOP Divisions - Kampala High Income (Base: 2016/17 = 100) .................................................... 240
Table 4.2G: Annual Average CP I by COICOP Divisions - Kampala Middle Income (2016/17 = 100) ......................................................... 241
Table 4.2H: Annual Average CPI by COICOP Divisions - Kampala Low Income (Base: 2016/17 = 100) ..................................................... 241
Table 4.2I: Annual Average CPI by COICOP Divisions - Masaka (Base: 2016/17 = 100) ............................................................................ 242
Table 4.2J: Annual Average CPI by COICOP Divisions-Mbarara (Base: 2016/17 = 100) ............................................................................ 242
Table 4.2K: Annual Average CPI by COICOP Divisions – Fort Portal (Base: 2016/17 = 100) ..................................................................... 243
Table 4.2L: Annual Average CPI by COICOP Divisions - Jinja (Base: 2016/17 = 100) ................................................................................ 243
Table 4.2M: Annual Average CPI by COICOP Divisions - Mbale (Base: 2016/17 = 100) ............................................................................ 244
Table 4.2N: Annual Average CPI by COICOP Divisions - Gulu (Base: 2016/17 = 100) ............................................................................... 244
Table 4.2O: Annual Average CPI by COICOP Divisions – Arua (Base: 2016/17 = 100) .............................................................................. 245
Table 4.2P PPI-M&U (Combined) Annual Indices, Calendar Year 2016-2020, Base period: 2009/10=100 ................................................. 246
Table 4.2Q PPI-M (Local) Annual Indices, Calendar Year 2016-2020, 2009/10=100 .................................................................................. 247
Table 4.2R PPI-M (Export) Annual Indices, Calendar Year 2016-2020, 2009/10=100 ................................................................................ 248
Table 4.2S PPI-Hotels & Restaurants Annual Indices (Jan-Mar, 2008=100) ............................................................................................... 249
Table 4.2T PPI-M (Local) Annual Indices, Fiscal Year 2015/16-2019/20, 2009/10=100 .............................................................................. 250
Table 4.2U PPI-M (Export) Annual Indices, Fiscal Year 2015/16-2019/20, 2009/10=100 ............................................................................ 251
Table 4.2Z PPI-Hotels & Restaurants Annual Indices (Jan-Mar, 2008=100) ............................................................................................... 251
Table 4.2AA Construction Sector Price Indices, Jan-Mar 2006=100 ........................................................................................................... 252
Table 4.2AB Basic Heading Prices, (Jan-March 2006=100) ....................................................................................................................... 252
4.3: External Trade ..................................................................................................................................................................... 253
Table 4.3 A: Formal Exports by value ('000 US $), 2015 - 2019 .................................................................................................................. 253
Table 4.3 B: Formal Exports by percentage share, 2016 to 2020................................................................................................................ 254
Table 4.3 C: Informal Exports by Commodity and value ('000 US $), 2016 to 2020 .................................................................................... 255
Table 4.3 D: Informal Exports by Commodity and percentage share, 2016 to 2020 .................................................................................... 256
147
Table 4.3 E: Formal Exports by quantity, 2016 to 2020............................................................................................................................... 257
Table 4.3 F: Formal and Informal Exports by Region and Country of destination ('000 US$), 2016- 2020 ................................................... 258
Table 4.3 G: Formal and Informal Exports by percentage, region and country of destination, 2016- 2020 .................................................. 260
Table 4.3 H: Formal Exports by SITC grouping and value ('000 US $), 2016 to 2020 ................................................................................ 261
Table 4.3 I: Formal Re-Exports by SITC grouping ('000 US $), 2016 to 2020 ............................................................................................ 263
Table 4.3 J: Formal Re-exports by Commodity grouping ('000 US$), 2016 to 2020 .................................................................................... 265
Table 4.3 K: Annual Formal Re-Exports by destination ('000 US $), 2016 to 2020 ...................................................................................... 266
Table 4.3 L: Formal and Informal Imports by Region and Country of Origin ('000 US $), 2016 to 2020 ....................................................... 268
Table 4.3 M: Formal and Informal Imports by percentage share and country of Origin, 2016-2020 ............................................................. 270
Table 4.3 N: Formal Imports by SITC grouping ('000 US $), 2016 to 2020 .................................................................................................. 272
Table 4.3 O: Formal Imports by percentage share and SITC groupings, 2016 to 2020 ............................................................................... 274
Table 4.3 P: Informal Trade by Country ('000 US $), 2016 to 2020 ............................................................................................................. 275
Table 4.3 Q: Annual Informal Exports by Category and Destination (‘000 US$), 2016 to 2020 ................................................................... 276
4.4 Government Finance Statistics ........................................................................................................................................... 277
Table 4.4 A: Summary of Central Government Budgetary and Financial Operations, 2015/16– 2019/20 (billion shillings) .......................... 277
Table 4.4 B (a): Classification of Central government Revenue, FY 2016/17 – 2020/21 (Million Shs.) ........................................................ 278
Table 4.4 B (b): Classification of Central government Revenue by percentage share, FY 2016/17 - 2020/21* ............................................ 279
Table 4.4 C (a): Functional Classification of Central Government Recurrent Expenditure For FY 2016/17– FY 2020/21 (Million Shs.) ....... 280
Table 4.4 C (b): Functional Classification of Central Government Recurrent Expenditure by percentage share, FY 2016/17 – FY 2020/21 280
Table 4.4 D (a): Functional Classification of Central Government Development (GOU) Expenditure for FY 2016/17 – FY 2020/21 (Shs.
Million) ............................................................................................................................................................................................. 281
Table 4.4 D (b): Functional Classification of Central Government Development Expenditure by percentage share, FY 2016/17 – FY 2020/21
............................................................................................................................................................................................. 281
Table 4.4 E (a): Economic Classification of Central Government Recurrent Expenditure, FY 2016/17 – FY 2020/21 (Shs. Millions) ........... 282
Table 4.4 E (b): Economic Classification of Central Government Recurrent Expenditure, by percentage share, FY 2016/17 – FY 2020/21. ....
............................................................................................................................................................................................. 282
Table 4.4 F (a): Economic Classification of Central Government Development (GOU) Expenditure, FY 2015/16– FY 2016/17– FY
2020/21(Shs. Millions) ................................................................................................................................................................................ 283
Table 4.4 F (b): Economic Classification of Central Government Development (GOU) Expenditure by percentage share, FY 2016/17 – FY
2020/21 ............................................................................................................................................................................................. 283
Table 4.4 G (a): Functional Classification of Donor Funded Central Government Development Expenditure, FY 2016/17–FY 2020/21(Shs.
Millions) ............................................................................................................................................................................................. 284
Table 4.4 G (b): Functional Classification Donor Funded Development Expenditure, percentages share FY 2016/17 –FY 2020/21. .......... 284
Table 4.4 H (a): Transactions in Nonfinancial Assets, FY 2016/17– FY 2020/21 (shs. Millions) .................................................................. 285
Table 4.4 H (b): Transactions in Nonfinancial Assets by percentage share, FY 2016/17 – FY 2020/21 ....................................................... 285
Table 4.4 I (a): Classification of Local Government Revenue by Type for FY 2016/17 – FY 2020/21, (Shs. Million) .................................... 286
Table 4.4 I (b): Classification of Local Government Revenue by Percentage share for FY 2016/17 – FY 2020/21 ...................................... 286
Table 4.4 J (a): Functional Classification of Local Government Expenditure FY 2016/17 – FY 2020/21 (Shs. Million)................................. 287
Table 4.4 J (b): Functional Classification of Local Government Expenditure by percentage share, FY 2016/17 – FY 2020/21 ................... 287
Table 4.4 K (a): Economic Classification of Local Government Expense, FY 2016/17 – FY 2020/21 (Shs. Million) ..................................... 288
Table 4.4 K (b): Economic Classification of Local Government Expense by percentage share, FY 2016/17 – FY 2020/21 ......................... 288
Table 4.4 L (a): Classification of Transactions in Non-Financial Assets for Local government, FY 2016/17 – FY 2020/21 (Shs. Million). ... 289
Table 4.4 L (b): Classification of Transactions in Non-Financial Assets for Local government, FY 2016/17 – FY 2020/21, Percentages. .... 289
Table 4.4 M (a): Classification of Districts’ Revenue by Type for FY 2016/17 – FY 2020/2021 (Shs. Millions) ........................................... 290
Table 4.4 M (b): Classification of Districts’ Revenue by Percentage share, FY 2016/17 – FY 2020/21. ........................................... 290
Table 4.4 N (a): Functional Classification of Districts Expenditure, FY 2016/17 – FY 2020/21 (Shs. Million). .................................. 291
Table 4.4 N (b): Functional Classification of Districts Expenditure by percentage share, FY 2016/17 – FY 2020/21. ....................... 291
Table 4.4 O (a): Economic Classification of District Expense, FY 2016/17 – FY 2020/21 (Shs. Million). .......................................... 292
148
Table 4.4 O (b): Economic Classification of District Expense by Percentage Share, FY 2016/17 – 2020/21. ................................... 292
Table 4.4 P (a): Classification of Transactions in Non-Financial Assets for Districts, FY 2016/17 – FY 2020/21 (Shs. Million). ........ 292
Table 4.4 P (b): Classification of Transactions in Non-Financial Assets for Districts, FY 2016/17 – FY 2020/21, Percentages. ....... 293
Table 4.4 Q (a): Classification of Municipalities’ Revenue by Type for FY 2016/17 – FY 2020/21, (million shillings). ....................... 293
Table 4.4 Q (b): Classification of Municipalities’ Revenue by Percentage share for FY 2016/17 – FY 2020/21. .............................. 294
Table 4.4 R (a): Functional Classification of Municipalities’ Expenditure, FY 2016/17– FY 2020/21 (Shs. Million)............................ 294
Table 4.4 R (b): Functional Classification of Municipalities’ Expenditure by percentage share, FY 2016/17 – FY 2020/21 ............... 295
Table 4.4 S (a): Economic Classification of Municipalities’ Expense, FY 2016/17 – FY 2020/21 (Shs. Million). ................................ 295
Table 4.4 S (b): Economic Classification of Municipalities Expense by Percentage Share, FY 2016/17 – FY 2020/21. ................... 296
Table 4.4 T (a): Classification of Transactions in Non-Financial Assets for Municipalities, FY 2016/17 – FY 2020/21 (Shs. Million).296
Table 4.4 T (b): Classification of Transactions in Non-Financial Assets for Municipalities, FY 2016/17 – FY 2020/21, Percentages. 297
Table 4.4 U (a): Classification of Town councils’ Revenue by Type for FY 2016/17 – FY 2020/21 (Million Shs) .............................. 297
Table 4.4 U (b): Classification of Town Councils’ Revenue by Percentage share for FY 2016/17 – FY 2020/21 ............................. 298
Table 4.4 V (a): Functional Classification of Town Councils’ Expenditure for FY 2016/17 – FY 2020/21 (Shs. Million) .................... 298
Table 4.4 V (b): Functional Classification of Town Councils’ Expenditure by percentage share, FY 2015/16 – FY 2020/21 ............ 299
Table 4.4 W (a): Economic Classification of Town councils Expense, FY 2016/17 – FY 2020/21 (Shs. Million). ............................. 299
Table 4.4 W (b): Economic Classification of Town Councils Expenditure by Percentage Share, FY2016/17 – FY 2020/21. ............ 300
Table 4.4 X (a): Classification of Transactions in Non-Financial Assets for Town Councils, FY 2016/17 – FY 2020/21 (Shs. Million) ....
................................................................................................................................................................................... 300
Table 4.4 X (b): Classification of Transactions in Non-Financial Assets for Town Councils, FY 2016/17 – FY 2020/21 (Percentages) ..
................................................................................................................................................................................... 301
4.5 Banking and Currency ......................................................................................................................................................... 302
Table 4.5 A: Depository Corporation Survey (Billion Shillings), June 2016 – 2020 ............................................................................... 302
Table 4.5 B: Commercial Banks assets (Billion shillings), June 2016- 2020 ........................................................................................ 303
Table 4.5 C: Commercial Banks Liabilities (Billion shillings), June 2016-2020 ................................................................................................ 304
Table 4.5 D: Commercial banks foreign currency loans to the private sector (Billion shillings), June 2016-2020 ............................................. 305
Table 4.5 E: Commercial Banks shillings denominated loans (Billion shillings), June 2016-2020 .................................................................... 305
Table 4.5 F: Structure of Interest Rates, June 2016-2020 ............................................................................................................................... 306
Table 4.5 G: Annualised Average Interest Rates, 2016-2020 ......................................................................................................................... 306
Table 4.5 H: Annual Foreign Exchange Rates (Uganda shillings per US$), 2016-2020 .................................................................................. 307
Table 4.5 I: Volumes of Inter-bank and Bureaux Foreign Exchange Transactions (Mill US $) ......................................................................... 307
4.6 Insurance .............................................................................................................................................................................. 308
Table 4.6 A: Life Insurance Premium Incomings 2012– 2019 (Million shillings)............................................................................................. 308
Table 4.6 B: Life Insurance Reinsurance Outgoings 2012– 2019 (Million shillings) ......................................................................................... 308
Table 4.6 C: Life Insurance Net premium income 2012– 2019 (Million shillings) ............................................................................................. 308
Table 4.6 D: Net Incurred Claims, by Class: Life 2012 – 2019 (Million shillings) ............................................................................................. 308
Table 4.6 E: Non-Life Insurance Premium Incomings 2012–2019 (Million shillings) ...................................................................................... 309
Table 4.6 F: Non-Life Insurance Reinsurance Outgoings 2012–2019 (Million shillings) .................................................................................. 309
Table 4.6 G: Non-Life Insurance Net Premium Income 2012 – 2019 (Million shillings).................................................................................... 309
Table 4.6 H: Net incurred Claims, by Class: Non-Life 2012 –2019 (Million shillings) ....................................................................................... 309
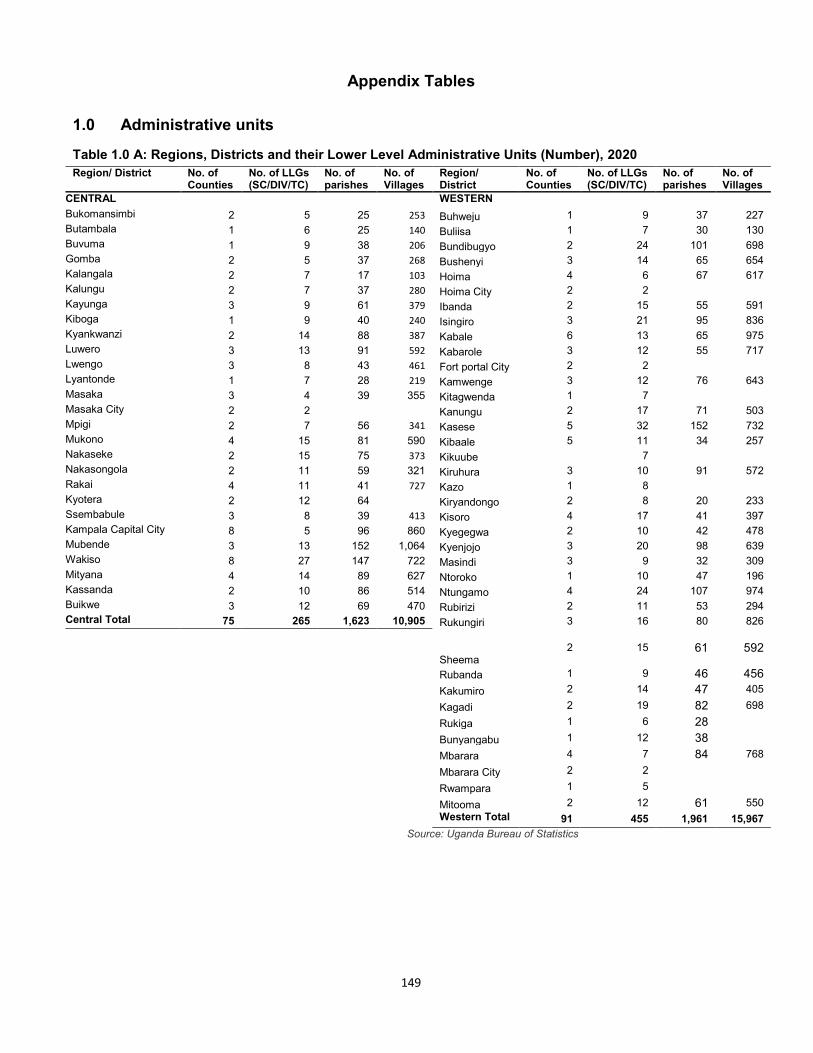
149
Appendix Tables
1.0 Administrative units
Table 1.0 A: Regions, Districts and their Lower Level Administrative Units (Number), 2020
Region/ District No. of Counties
No. of LLGs (SC/DIV/TC)
No. of parishes
No. of Villages
Region/ District
No. of Counties
No. of LLGs (SC/DIV/TC)
No. of parishes
No. of Villages
CENTRAL WESTERN
Bukomansimbi 2 5 25 253 Buhweju 1 9 37 227
Butambala 1 6 25 140 Buliisa 1 7 30 130
Buvuma 1 9 38 206 Bundibugyo 2 24 101 698
Gomba 2 5 37 268 Bushenyi 3 14 65 654
Kalangala 2 7 17 103 Hoima 4 6 67 617
Kalungu 2 7 37 280 Hoima City 2 2
Kayunga 3 9 61 379 Ibanda 2 15 55 591
Kiboga 1 9 40 240 Isingiro 3 21 95 836
Kyankwanzi 2 14 88 387 Kabale 6 13 65 975
Luwero 3 13 91 592 Kabarole 3 12 55 717
Lwengo 3 8 43 461 Fort portal City 2 2
Lyantonde 1 7 28 219 Kamwenge 3 12 76 643
Masaka 3 4 39 355 Kitagwenda 1 7
Masaka City 2 2 Kanungu 2 17 71 503
Mpigi 2 7 56 341 Kasese 5 32 152 732
Mukono 4 15 81 590 Kibaale 5 11 34 257
Nakaseke 2 15 75 373 Kikuube 7
Nakasongola 2 11 59 321 Kiruhura 3 10 91 572
Rakai 4 11 41 727 Kazo 1 8
Kyotera 2 12 64 Kiryandongo 2 8 20 233
Ssembabule 3 8 39 413 Kisoro 4 17 41 397
Kampala Capital City 8 5 96 860 Kyegegwa 2 10 42 478
Mubende 3 13 152 1,064 Kyenjojo 3 20 98 639
Wakiso 8 27 147 722 Masindi 3 9 32 309
Mityana 4 14 89 627 Ntoroko 1 10 47 196
Kassanda 2 10 86 514 Ntungamo 4 24 107 974
Buikwe 3 12 69 470 Rubirizi 2 11 53 294
Central Total 75 265 1,623 10,905 Rukungiri 3 16 80 826
Sheema 2 15 61 592
Rubanda 1 9 46 456 Kakumiro 2 14 47 405
Kagadi 2 19 82 698
Rukiga 1 6 28
Bunyangabu 1 12 38
Mbarara 4 7 84 768
Mbarara City 2 2
Rwampara 1 5
Mitooma 2 12 61 550 Western Total 91 455 1,961 15,967
Source: Uganda Bureau of Statistics
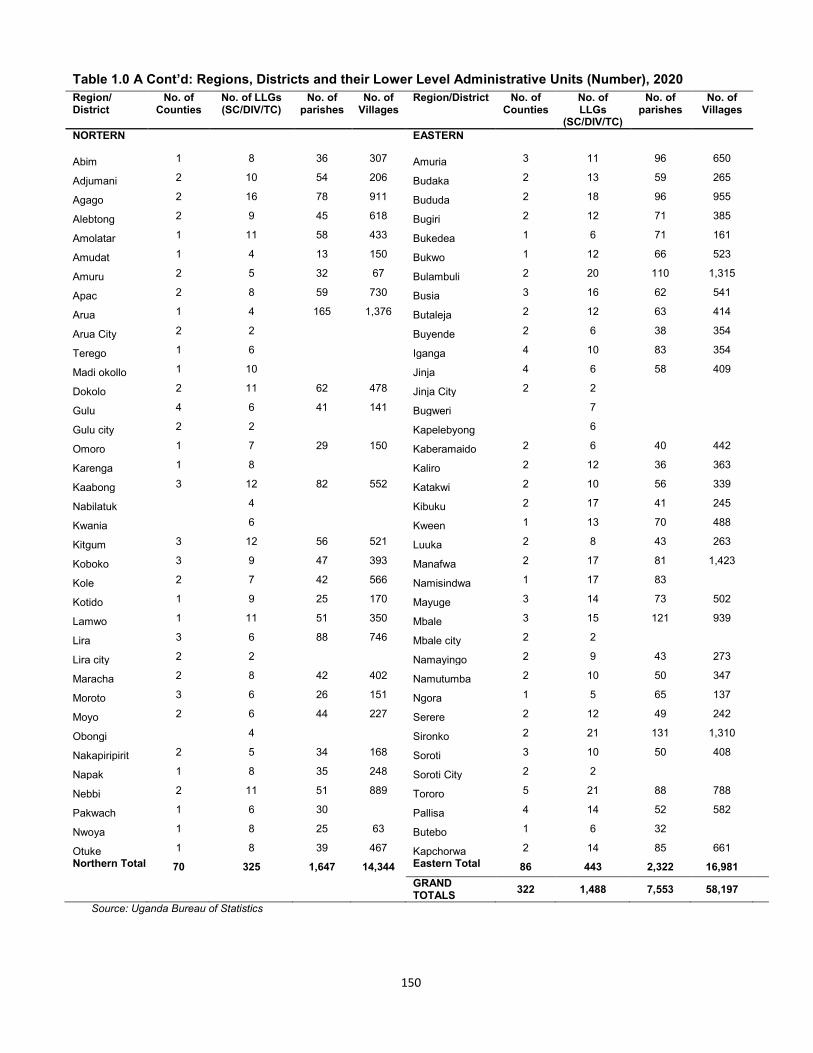
150
Table 1.0 A Cont’d: Regions, Districts and their Lower Level Administrative Units (Number), 2020
Region/ District
No. of Counties
No. of LLGs (SC/DIV/TC)
No. of parishes
No. of Villages
Region/District No. of Counties
No. of LLGs
(SC/DIV/TC)
No. of parishes
No. of Villages
NORTERN EASTERN
Abim 1 8 36 307 Amuria 3 11 96 650
Adjumani 2 10 54 206 Budaka 2 13 59 265
Agago 2 16 78 911 Bududa 2 18 96 955
Alebtong 2 9 45 618 Bugiri 2 12 71 385
Amolatar 1 11 58 433 Bukedea 1 6 71 161
Amudat 1 4 13 150 Bukwo 1 12 66 523
Amuru 2 5 32 67 Bulambuli 2 20 110 1,315
Apac 2 8 59 730 Busia 3 16 62 541
Arua 1 4 165 1,376 Butaleja 2 12 63 414
Arua City 2 2 Buyende 2 6 38 354
Terego 1 6 Iganga 4 10 83 354
Madi okollo 1 10 Jinja 4 6 58 409
Dokolo 2 11 62 478 Jinja City 2 2
Gulu 4 6 41 141 Bugweri 7
Gulu city 2 2 Kapelebyong
6
Omoro 1 7 29 150 Kaberamaido 2 6 40 442
Karenga 1 8 Kaliro 2 12 36 363
Kaabong 3 12 82 552 Katakwi 2 10 56 339
Nabilatuk 4
Kibuku 2 17 41 245
Kwania 6
Kween 1 13 70 488
Kitgum 3 12 56 521 Luuka 2 8 43 263
Koboko 3 9 47 393 Manafwa 2 17 81 1,423
Kole 2 7 42 566 Namisindwa 1 17 83
Kotido 1 9 25 170 Mayuge 3 14 73 502
Lamwo 1 11 51 350 Mbale 3 15 121 939
Lira 3 6 88 746 Mbale city 2 2
Lira city 2 2 Namayingo 2 9 43 273
Maracha 2 8 42 402 Namutumba 2 10 50 347
Moroto 3 6 26 151 Ngora 1 5 65 137
Moyo 2 6 44 227 Serere 2 12 49 242
Obongi 4
Sironko 2 21 131 1,310
Nakapiripirit 2 5 34 168 Soroti 3 10 50 408
Napak 1 8 35 248 Soroti City 2 2
Nebbi 2 11 51 889 Tororo 5 21 88 788
Pakwach 1 6 30 Pallisa 4 14 52 582
Nwoya 1 8 25 63 Butebo 1 6 32
Otuke 1 8 39 467 Kapchorwa 2 14 85 661
Northern Total 70 325 1,647 14,344 Eastern Total 86 443 2,322 16,981
GRAND TOTALS
322 1,488 7,553 58,197
Source: Uganda Bureau of Statistics
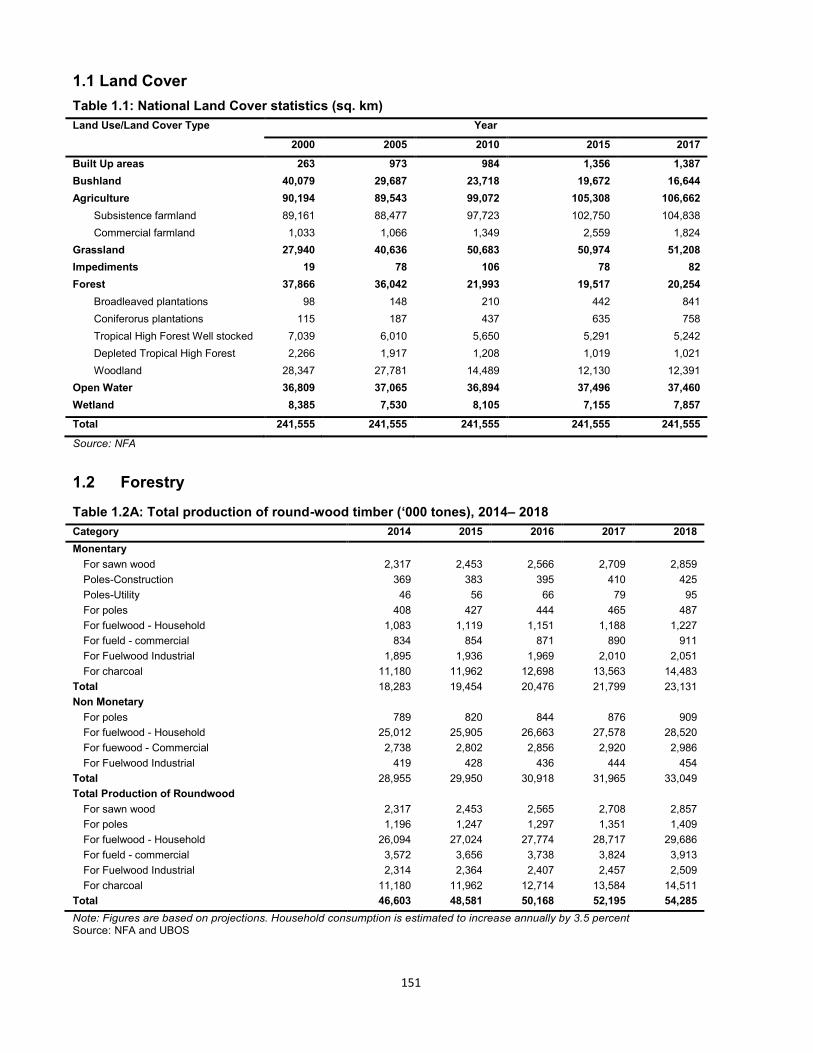
151
1.1 Land Cover
Table 1.1: National Land Cover statistics (sq. km)
Land Use/Land Cover Type Year
2000 2005 2010 2015 2017
Built Up areas 263 973 984 1,356 1,387
Bushland 40,079 29,687 23,718 19,672 16,644
Agriculture 90,194 89,543 99,072 105,308 106,662
Subsistence farmland 89,161 88,477 97,723 102,750 104,838
Commercial farmland 1,033 1,066 1,349 2,559 1,824
Grassland 27,940 40,636 50,683 50,974 51,208
Impediments 19 78 106 78 82
Forest 37,866 36,042 21,993 19,517 20,254
Broadleaved plantations 98 148 210 442 841
Coniferorus plantations 115 187 437 635 758
Tropical High Forest Well stocked 7,039 6,010 5,650 5,291 5,242
Depleted Tropical High Forest 2,266 1,917 1,208 1,019 1,021
Woodland 28,347 27,781 14,489 12,130 12,391
Open Water 36,809 37,065 36,894 37,496 37,460
Wetland 8,385 7,530 8,105 7,155 7,857
Total 241,555 241,555 241,555 241,555 241,555
Source: NFA
1.2 Forestry
Table 1.2A: Total production of round-wood timber (‘000 tones), 2014– 2018
Category 2014 2015 2016 2017 2018
Monentary
For sawn wood 2,317 2,453 2,566 2,709 2,859
Poles-Construction 369 383 395 410 425
Poles-Utility 46 56 66 79 95
For poles 408 427 444 465 487
For fuelwood - Household 1,083 1,119 1,151 1,188 1,227
For fueld - commercial 834 854 871 890 911
For Fuelwood Industrial 1,895 1,936 1,969 2,010 2,051
For charcoal 11,180 11,962 12,698 13,563 14,483
Total 18,283 19,454 20,476 21,799 23,131
Non Monetary
For poles 789 820 844 876 909
For fuelwood - Household 25,012 25,905 26,663 27,578 28,520
For fuewood - Commercial 2,738 2,802 2,856 2,920 2,986
For Fuelwood Industrial 419 428 436 444 454
Total 28,955 29,950 30,918 31,965 33,049
Total Production of Roundwood
For sawn wood 2,317 2,453 2,565 2,708 2,857
For poles 1,196 1,247 1,297 1,351 1,409
For fuelwood - Household 26,094 27,024 27,774 28,717 29,686
For fueld - commercial 3,572 3,656 3,738 3,824 3,913
For Fuelwood Industrial 2,314 2,364 2,407 2,457 2,509
For charcoal 11,180 11,962 12,714 13,584 14,511
Total 46,603 48,581 50,168 52,195 54,285
Note: Figures are based on projections. Household consumption is estimated to increase annually by 3.5 percent Source: NFA and UBOS
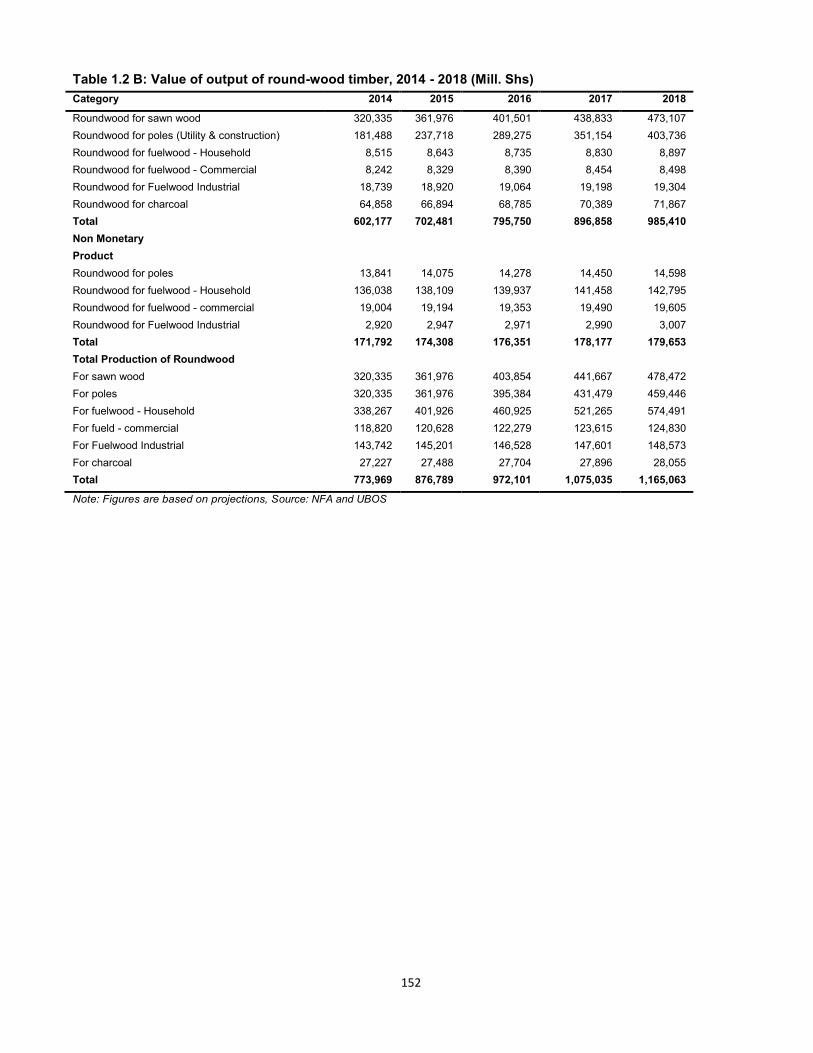
152
Table 1.2 B: Value of output of round-wood timber, 2014 - 2018 (Mill. Shs)
Category 2014 2015 2016 2017 2018
Roundwood for sawn wood 320,335 361,976 401,501 438,833 473,107
Roundwood for poles (Utility & construction) 181,488 237,718 289,275 351,154 403,736
Roundwood for fuelwood - Household 8,515 8,643 8,735 8,830 8,897
Roundwood for fuelwood - Commercial 8,242 8,329 8,390 8,454 8,498
Roundwood for Fuelwood Industrial 18,739 18,920 19,064 19,198 19,304
Roundwood for charcoal 64,858 66,894 68,785 70,389 71,867
Total 602,177 702,481 795,750 896,858 985,410
Non Monetary
Product
Roundwood for poles 13,841 14,075 14,278 14,450 14,598
Roundwood for fuelwood - Household 136,038 138,109 139,937 141,458 142,795
Roundwood for fuelwood - commercial 19,004 19,194 19,353 19,490 19,605
Roundwood for Fuelwood Industrial 2,920 2,947 2,971 2,990 3,007
Total 171,792 174,308 176,351 178,177 179,653
Total Production of Roundwood
For sawn wood 320,335 361,976 403,854 441,667 478,472
For poles 320,335 361,976 395,384 431,479 459,446
For fuelwood - Household 338,267 401,926 460,925 521,265 574,491
For fueld - commercial 118,820 120,628 122,279 123,615 124,830
For Fuelwood Industrial 143,742 145,201 146,528 147,601 148,573
For charcoal 27,227 27,488 27,704 27,896 28,055
Total 773,969 876,789 972,101 1,075,035 1,165,063
Note: Figures are based on projections, Source: NFA and UBOS
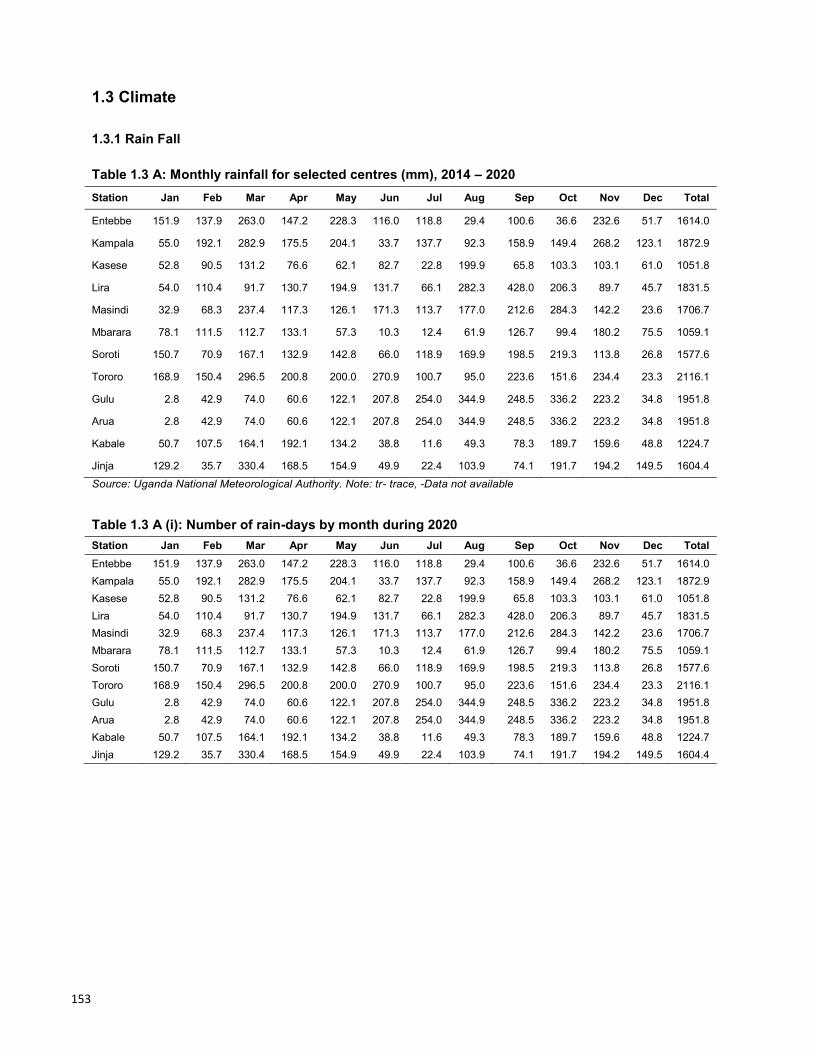
153
1.3 Climate
1.3.1 Rain Fall
Table 1.3 A: Monthly rainfall for selected centres (mm), 2014 – 2020
Station Jan Feb Mar Apr May Jun Jul Aug Sep Oct Nov Dec Total
Entebbe 151.9 137.9 263.0 147.2 228.3 116.0 118.8 29.4 100.6 36.6 232.6 51.7 1614.0
Kampala 55.0 192.1 282.9 175.5 204.1 33.7 137.7 92.3 158.9 149.4 268.2 123.1 1872.9
Kasese 52.8 90.5 131.2 76.6 62.1 82.7 22.8 199.9 65.8 103.3 103.1 61.0 1051.8
Lira 54.0 110.4 91.7 130.7 194.9 131.7 66.1 282.3 428.0 206.3 89.7 45.7 1831.5
Masindi 32.9 68.3 237.4 117.3 126.1 171.3 113.7 177.0 212.6 284.3 142.2 23.6 1706.7
Mbarara 78.1 111.5 112.7 133.1 57.3 10.3 12.4 61.9 126.7 99.4 180.2 75.5 1059.1
Soroti 150.7 70.9 167.1 132.9 142.8 66.0 118.9 169.9 198.5 219.3 113.8 26.8 1577.6
Tororo 168.9 150.4 296.5 200.8 200.0 270.9 100.7 95.0 223.6 151.6 234.4 23.3 2116.1
Gulu 2.8 42.9 74.0 60.6 122.1 207.8 254.0 344.9 248.5 336.2 223.2 34.8 1951.8
Arua 2.8 42.9 74.0 60.6 122.1 207.8 254.0 344.9 248.5 336.2 223.2 34.8 1951.8
Kabale 50.7 107.5 164.1 192.1 134.2 38.8 11.6 49.3 78.3 189.7 159.6 48.8 1224.7
Jinja 129.2 35.7 330.4 168.5 154.9 49.9 22.4 103.9 74.1 191.7 194.2 149.5 1604.4
Source: Uganda National Meteorological Authority. Note: tr- trace, -Data not available
Table 1.3 A (i): Number of rain-days by month during 2020
Station Jan Feb Mar Apr May Jun Jul Aug Sep Oct Nov Dec Total
Entebbe 151.9 137.9 263.0 147.2 228.3 116.0 118.8 29.4 100.6 36.6 232.6 51.7 1614.0
Kampala 55.0 192.1 282.9 175.5 204.1 33.7 137.7 92.3 158.9 149.4 268.2 123.1 1872.9
Kasese 52.8 90.5 131.2 76.6 62.1 82.7 22.8 199.9 65.8 103.3 103.1 61.0 1051.8
Lira 54.0 110.4 91.7 130.7 194.9 131.7 66.1 282.3 428.0 206.3 89.7 45.7 1831.5
Masindi 32.9 68.3 237.4 117.3 126.1 171.3 113.7 177.0 212.6 284.3 142.2 23.6 1706.7
Mbarara 78.1 111.5 112.7 133.1 57.3 10.3 12.4 61.9 126.7 99.4 180.2 75.5 1059.1
Soroti 150.7 70.9 167.1 132.9 142.8 66.0 118.9 169.9 198.5 219.3 113.8 26.8 1577.6
Tororo 168.9 150.4 296.5 200.8 200.0 270.9 100.7 95.0 223.6 151.6 234.4 23.3 2116.1
Gulu 2.8 42.9 74.0 60.6 122.1 207.8 254.0 344.9 248.5 336.2 223.2 34.8 1951.8
Arua 2.8 42.9 74.0 60.6 122.1 207.8 254.0 344.9 248.5 336.2 223.2 34.8 1951.8
Kabale 50.7 107.5 164.1 192.1 134.2 38.8 11.6 49.3 78.3 189.7 159.6 48.8 1224.7
Jinja 129.2 35.7 330.4 168.5 154.9 49.9 22.4 103.9 74.1 191.7 194.2 149.5 1604.4
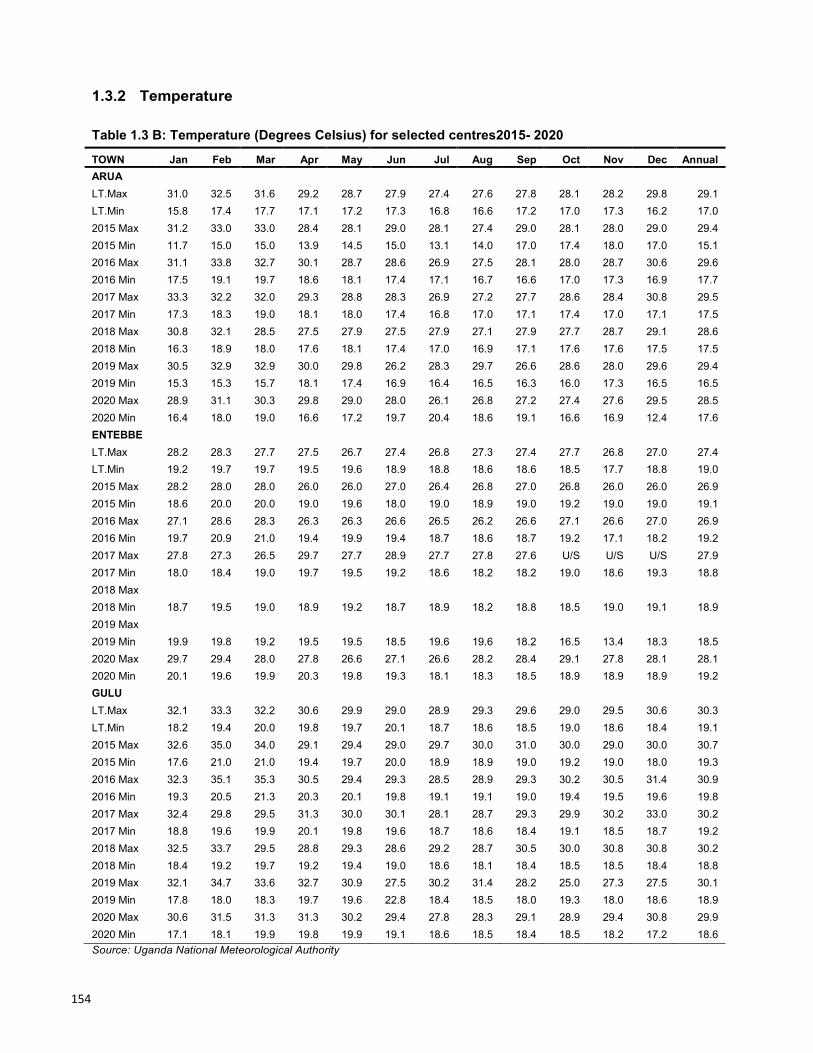
154
1.3.2 Temperature
Table 1.3 B: Temperature (Degrees Celsius) for selected centres2015- 2020
TOWN Jan Feb Mar Apr May Jun Jul Aug Sep Oct Nov Dec Annual
ARUA
LT.Max 31.0 32.5 31.6 29.2 28.7 27.9 27.4 27.6 27.8 28.1 28.2 29.8 29.1
LT.Min 15.8 17.4 17.7 17.1 17.2 17.3 16.8 16.6 17.2 17.0 17.3 16.2 17.0
2015 Max 31.2 33.0 33.0 28.4 28.1 29.0 28.1 27.4 29.0 28.1 28.0 29.0 29.4
2015 Min 11.7 15.0 15.0 13.9 14.5 15.0 13.1 14.0 17.0 17.4 18.0 17.0 15.1
2016 Max 31.1 33.8 32.7 30.1 28.7 28.6 26.9 27.5 28.1 28.0 28.7 30.6 29.6
2016 Min 17.5 19.1 19.7 18.6 18.1 17.4 17.1 16.7 16.6 17.0 17.3 16.9 17.7
2017 Max 33.3 32.2 32.0 29.3 28.8 28.3 26.9 27.2 27.7 28.6 28.4 30.8 29.5
2017 Min 17.3 18.3 19.0 18.1 18.0 17.4 16.8 17.0 17.1 17.4 17.0 17.1 17.5
2018 Max 30.8 32.1 28.5 27.5 27.9 27.5 27.9 27.1 27.9 27.7 28.7 29.1 28.6
2018 Min 16.3 18.9 18.0 17.6 18.1 17.4 17.0 16.9 17.1 17.6 17.6 17.5 17.5
2019 Max 30.5 32.9 32.9 30.0 29.8 26.2 28.3 29.7 26.6 28.6 28.0 29.6 29.4
2019 Min 15.3 15.3 15.7 18.1 17.4 16.9 16.4 16.5 16.3 16.0 17.3 16.5 16.5
2020 Max 28.9 31.1 30.3 29.8 29.0 28.0 26.1 26.8 27.2 27.4 27.6 29.5 28.5
2020 Min 16.4 18.0 19.0 16.6 17.2 19.7 20.4 18.6 19.1 16.6 16.9 12.4 17.6
ENTEBBE
LT.Max 28.2 28.3 27.7 27.5 26.7 27.4 26.8 27.3 27.4 27.7 26.8 27.0 27.4
LT.Min 19.2 19.7 19.7 19.5 19.6 18.9 18.8 18.6 18.6 18.5 17.7 18.8 19.0
2015 Max 28.2 28.0 28.0 26.0 26.0 27.0 26.4 26.8 27.0 26.8 26.0 26.0 26.9
2015 Min 18.6 20.0 20.0 19.0 19.6 18.0 19.0 18.9 19.0 19.2 19.0 19.0 19.1
2016 Max 27.1 28.6 28.3 26.3 26.3 26.6 26.5 26.2 26.6 27.1 26.6 27.0 26.9
2016 Min 19.7 20.9 21.0 19.4 19.9 19.4 18.7 18.6 18.7 19.2 17.1 18.2 19.2
2017 Max 27.8 27.3 26.5 29.7 27.7 28.9 27.7 27.8 27.6 U/S U/S U/S 27.9
2017 Min 18.0 18.4 19.0 19.7 19.5 19.2 18.6 18.2 18.2 19.0 18.6 19.3 18.8
2018 Max
2018 Min 18.7 19.5 19.0 18.9 19.2 18.7 18.9 18.2 18.8 18.5 19.0 19.1 18.9
2019 Max
2019 Min 19.9 19.8 19.2 19.5 19.5 18.5 19.6 19.6 18.2 16.5 13.4 18.3 18.5
2020 Max 29.7 29.4 28.0 27.8 26.6 27.1 26.6 28.2 28.4 29.1 27.8 28.1 28.1
2020 Min 20.1 19.6 19.9 20.3 19.8 19.3 18.1 18.3 18.5 18.9 18.9 18.9 19.2
GULU
LT.Max 32.1 33.3 32.2 30.6 29.9 29.0 28.9 29.3 29.6 29.0 29.5 30.6 30.3
LT.Min 18.2 19.4 20.0 19.8 19.7 20.1 18.7 18.6 18.5 19.0 18.6 18.4 19.1
2015 Max 32.6 35.0 34.0 29.1 29.4 29.0 29.7 30.0 31.0 30.0 29.0 30.0 30.7
2015 Min 17.6 21.0 21.0 19.4 19.7 20.0 18.9 18.9 19.0 19.2 19.0 18.0 19.3
2016 Max 32.3 35.1 35.3 30.5 29.4 29.3 28.5 28.9 29.3 30.2 30.5 31.4 30.9
2016 Min 19.3 20.5 21.3 20.3 20.1 19.8 19.1 19.1 19.0 19.4 19.5 19.6 19.8
2017 Max 32.4 29.8 29.5 31.3 30.0 30.1 28.1 28.7 29.3 29.9 30.2 33.0 30.2
2017 Min 18.8 19.6 19.9 20.1 19.8 19.6 18.7 18.6 18.4 19.1 18.5 18.7 19.2
2018 Max 32.5 33.7 29.5 28.8 29.3 28.6 29.2 28.7 30.5 30.0 30.8 30.8 30.2
2018 Min 18.4 19.2 19.7 19.2 19.4 19.0 18.6 18.1 18.4 18.5 18.5 18.4 18.8
2019 Max 32.1 34.7 33.6 32.7 30.9 27.5 30.2 31.4 28.2 25.0 27.3 27.5 30.1
2019 Min 17.8 18.0 18.3 19.7 19.6 22.8 18.4 18.5 18.0 19.3 18.0 18.6 18.9
2020 Max 30.6 31.5 31.3 31.3 30.2 29.4 27.8 28.3 29.1 28.9 29.4 30.8 29.9
2020 Min 17.1 18.1 19.9 19.8 19.9 19.1 18.6 18.5 18.4 18.5 18.2 17.2 18.6
Source: Uganda National Meteorological Authority
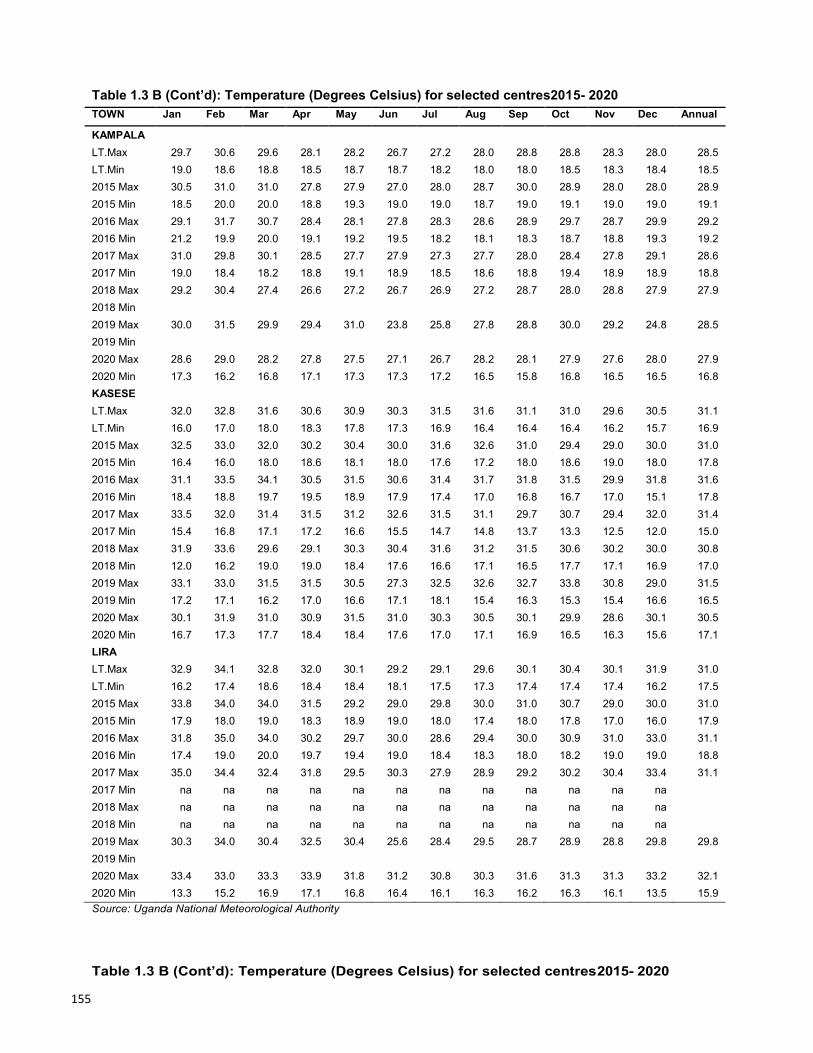
155
Table 1.3 B (Cont’d): Temperature (Degrees Celsius) for selected centres2015- 2020
TOWN Jan Feb Mar Apr May Jun Jul Aug Sep Oct Nov Dec Annual
KAMPALA
LT.Max 29.7 30.6 29.6 28.1 28.2 26.7 27.2 28.0 28.8 28.8 28.3 28.0 28.5
LT.Min 19.0 18.6 18.8 18.5 18.7 18.7 18.2 18.0 18.0 18.5 18.3 18.4 18.5
2015 Max 30.5 31.0 31.0 27.8 27.9 27.0 28.0 28.7 30.0 28.9 28.0 28.0 28.9
2015 Min 18.5 20.0 20.0 18.8 19.3 19.0 19.0 18.7 19.0 19.1 19.0 19.0 19.1
2016 Max 29.1 31.7 30.7 28.4 28.1 27.8 28.3 28.6 28.9 29.7 28.7 29.9 29.2
2016 Min 21.2 19.9 20.0 19.1 19.2 19.5 18.2 18.1 18.3 18.7 18.8 19.3 19.2
2017 Max 31.0 29.8 30.1 28.5 27.7 27.9 27.3 27.7 28.0 28.4 27.8 29.1 28.6
2017 Min 19.0 18.4 18.2 18.8 19.1 18.9 18.5 18.6 18.8 19.4 18.9 18.9 18.8
2018 Max 29.2 30.4 27.4 26.6 27.2 26.7 26.9 27.2 28.7 28.0 28.8 27.9 27.9
2018 Min
2019 Max 30.0 31.5 29.9 29.4 31.0 23.8 25.8 27.8 28.8 30.0 29.2 24.8 28.5
2019 Min
2020 Max 28.6 29.0 28.2 27.8 27.5 27.1 26.7 28.2 28.1 27.9 27.6 28.0 27.9
2020 Min 17.3 16.2 16.8 17.1 17.3 17.3 17.2 16.5 15.8 16.8 16.5 16.5 16.8
KASESE
LT.Max 32.0 32.8 31.6 30.6 30.9 30.3 31.5 31.6 31.1 31.0 29.6 30.5 31.1
LT.Min 16.0 17.0 18.0 18.3 17.8 17.3 16.9 16.4 16.4 16.4 16.2 15.7 16.9
2015 Max 32.5 33.0 32.0 30.2 30.4 30.0 31.6 32.6 31.0 29.4 29.0 30.0 31.0
2015 Min 16.4 16.0 18.0 18.6 18.1 18.0 17.6 17.2 18.0 18.6 19.0 18.0 17.8
2016 Max 31.1 33.5 34.1 30.5 31.5 30.6 31.4 31.7 31.8 31.5 29.9 31.8 31.6
2016 Min 18.4 18.8 19.7 19.5 18.9 17.9 17.4 17.0 16.8 16.7 17.0 15.1 17.8
2017 Max 33.5 32.0 31.4 31.5 31.2 32.6 31.5 31.1 29.7 30.7 29.4 32.0 31.4
2017 Min 15.4 16.8 17.1 17.2 16.6 15.5 14.7 14.8 13.7 13.3 12.5 12.0 15.0
2018 Max 31.9 33.6 29.6 29.1 30.3 30.4 31.6 31.2 31.5 30.6 30.2 30.0 30.8
2018 Min 12.0 16.2 19.0 19.0 18.4 17.6 16.6 17.1 16.5 17.7 17.1 16.9 17.0
2019 Max 33.1 33.0 31.5 31.5 30.5 27.3 32.5 32.6 32.7 33.8 30.8 29.0 31.5
2019 Min 17.2 17.1 16.2 17.0 16.6 17.1 18.1 15.4 16.3 15.3 15.4 16.6 16.5
2020 Max 30.1 31.9 31.0 30.9 31.5 31.0 30.3 30.5 30.1 29.9 28.6 30.1 30.5
2020 Min 16.7 17.3 17.7 18.4 18.4 17.6 17.0 17.1 16.9 16.5 16.3 15.6 17.1
LIRA
LT.Max 32.9 34.1 32.8 32.0 30.1 29.2 29.1 29.6 30.1 30.4 30.1 31.9 31.0
LT.Min 16.2 17.4 18.6 18.4 18.4 18.1 17.5 17.3 17.4 17.4 17.4 16.2 17.5
2015 Max 33.8 34.0 34.0 31.5 29.2 29.0 29.8 30.0 31.0 30.7 29.0 30.0 31.0
2015 Min 17.9 18.0 19.0 18.3 18.9 19.0 18.0 17.4 18.0 17.8 17.0 16.0 17.9
2016 Max 31.8 35.0 34.0 30.2 29.7 30.0 28.6 29.4 30.0 30.9 31.0 33.0 31.1
2016 Min 17.4 19.0 20.0 19.7 19.4 19.0 18.4 18.3 18.0 18.2 19.0 19.0 18.8
2017 Max 35.0 34.4 32.4 31.8 29.5 30.3 27.9 28.9 29.2 30.2 30.4 33.4 31.1
2017 Min na na na na na na na na na na na na
2018 Max na na na na na na na na na na na na
2018 Min na na na na na na na na na na na na
2019 Max 30.3 34.0 30.4 32.5 30.4 25.6 28.4 29.5 28.7 28.9 28.8 29.8 29.8
2019 Min
2020 Max 33.4 33.0 33.3 33.9 31.8 31.2 30.8 30.3 31.6 31.3 31.3 33.2 32.1
2020 Min 13.3 15.2 16.9 17.1 16.8 16.4 16.1 16.3 16.2 16.3 16.1 13.5 15.9
Source: Uganda National Meteorological Authority
Table 1.3 B (Cont’d): Temperature (Degrees Celsius) for selected centres2015- 2020
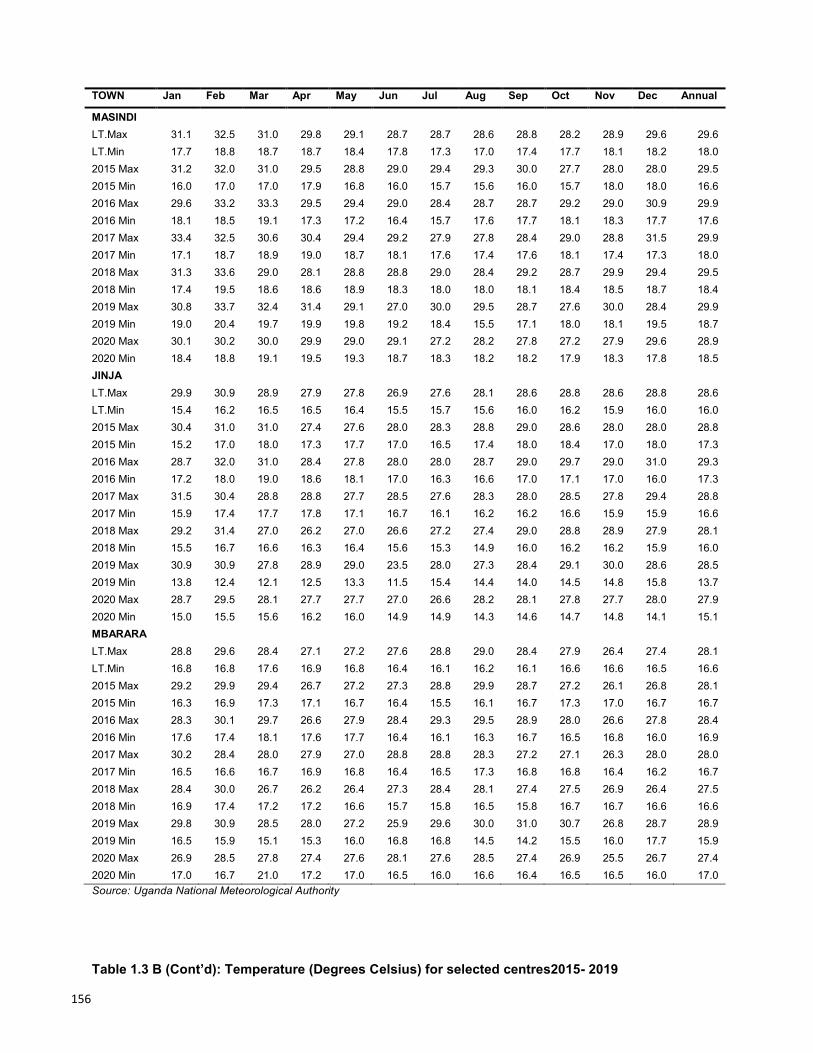
156
TOWN Jan Feb Mar Apr May Jun Jul Aug Sep Oct Nov Dec Annual
MASINDI
LT.Max 31.1 32.5 31.0 29.8 29.1 28.7 28.7 28.6 28.8 28.2 28.9 29.6 29.6
LT.Min 17.7 18.8 18.7 18.7 18.4 17.8 17.3 17.0 17.4 17.7 18.1 18.2 18.0
2015 Max 31.2 32.0 31.0 29.5 28.8 29.0 29.4 29.3 30.0 27.7 28.0 28.0 29.5
2015 Min 16.0 17.0 17.0 17.9 16.8 16.0 15.7 15.6 16.0 15.7 18.0 18.0 16.6
2016 Max 29.6 33.2 33.3 29.5 29.4 29.0 28.4 28.7 28.7 29.2 29.0 30.9 29.9
2016 Min 18.1 18.5 19.1 17.3 17.2 16.4 15.7 17.6 17.7 18.1 18.3 17.7 17.6
2017 Max 33.4 32.5 30.6 30.4 29.4 29.2 27.9 27.8 28.4 29.0 28.8 31.5 29.9
2017 Min 17.1 18.7 18.9 19.0 18.7 18.1 17.6 17.4 17.6 18.1 17.4 17.3 18.0
2018 Max 31.3 33.6 29.0 28.1 28.8 28.8 29.0 28.4 29.2 28.7 29.9 29.4 29.5
2018 Min 17.4 19.5 18.6 18.6 18.9 18.3 18.0 18.0 18.1 18.4 18.5 18.7 18.4
2019 Max 30.8 33.7 32.4 31.4 29.1 27.0 30.0 29.5 28.7 27.6 30.0 28.4 29.9
2019 Min 19.0 20.4 19.7 19.9 19.8 19.2 18.4 15.5 17.1 18.0 18.1 19.5 18.7
2020 Max 30.1 30.2 30.0 29.9 29.0 29.1 27.2 28.2 27.8 27.2 27.9 29.6 28.9
2020 Min 18.4 18.8 19.1 19.5 19.3 18.7 18.3 18.2 18.2 17.9 18.3 17.8 18.5
JINJA
LT.Max 29.9 30.9 28.9 27.9 27.8 26.9 27.6 28.1 28.6 28.8 28.6 28.8 28.6
LT.Min 15.4 16.2 16.5 16.5 16.4 15.5 15.7 15.6 16.0 16.2 15.9 16.0 16.0
2015 Max 30.4 31.0 31.0 27.4 27.6 28.0 28.3 28.8 29.0 28.6 28.0 28.0 28.8
2015 Min 15.2 17.0 18.0 17.3 17.7 17.0 16.5 17.4 18.0 18.4 17.0 18.0 17.3
2016 Max 28.7 32.0 31.0 28.4 27.8 28.0 28.0 28.7 29.0 29.7 29.0 31.0 29.3
2016 Min 17.2 18.0 19.0 18.6 18.1 17.0 16.3 16.6 17.0 17.1 17.0 16.0 17.3
2017 Max 31.5 30.4 28.8 28.8 27.7 28.5 27.6 28.3 28.0 28.5 27.8 29.4 28.8
2017 Min 15.9 17.4 17.7 17.8 17.1 16.7 16.1 16.2 16.2 16.6 15.9 15.9 16.6
2018 Max 29.2 31.4 27.0 26.2 27.0 26.6 27.2 27.4 29.0 28.8 28.9 27.9 28.1
2018 Min 15.5 16.7 16.6 16.3 16.4 15.6 15.3 14.9 16.0 16.2 16.2 15.9 16.0
2019 Max 30.9 30.9 27.8 28.9 29.0 23.5 28.0 27.3 28.4 29.1 30.0 28.6 28.5
2019 Min 13.8 12.4 12.1 12.5 13.3 11.5 15.4 14.4 14.0 14.5 14.8 15.8 13.7
2020 Max 28.7 29.5 28.1 27.7 27.7 27.0 26.6 28.2 28.1 27.8 27.7 28.0 27.9
2020 Min 15.0 15.5 15.6 16.2 16.0 14.9 14.9 14.3 14.6 14.7 14.8 14.1 15.1
MBARARA
LT.Max 28.8 29.6 28.4 27.1 27.2 27.6 28.8 29.0 28.4 27.9 26.4 27.4 28.1
LT.Min 16.8 16.8 17.6 16.9 16.8 16.4 16.1 16.2 16.1 16.6 16.6 16.5 16.6
2015 Max 29.2 29.9 29.4 26.7 27.2 27.3 28.8 29.9 28.7 27.2 26.1 26.8 28.1
2015 Min 16.3 16.9 17.3 17.1 16.7 16.4 15.5 16.1 16.7 17.3 17.0 16.7 16.7
2016 Max 28.3 30.1 29.7 26.6 27.9 28.4 29.3 29.5 28.9 28.0 26.6 27.8 28.4
2016 Min 17.6 17.4 18.1 17.6 17.7 16.4 16.1 16.3 16.7 16.5 16.8 16.0 16.9
2017 Max 30.2 28.4 28.0 27.9 27.0 28.8 28.8 28.3 27.2 27.1 26.3 28.0 28.0
2017 Min 16.5 16.6 16.7 16.9 16.8 16.4 16.5 17.3 16.8 16.8 16.4 16.2 16.7
2018 Max 28.4 30.0 26.7 26.2 26.4 27.3 28.4 28.1 27.4 27.5 26.9 26.4 27.5
2018 Min 16.9 17.4 17.2 17.2 16.6 15.7 15.8 16.5 15.8 16.7 16.7 16.6 16.6
2019 Max 29.8 30.9 28.5 28.0 27.2 25.9 29.6 30.0 31.0 30.7 26.8 28.7 28.9
2019 Min 16.5 15.9 15.1 15.3 16.0 16.8 16.8 14.5 14.2 15.5 16.0 17.7 15.9
2020 Max 26.9 28.5 27.8 27.4 27.6 28.1 27.6 28.5 27.4 26.9 25.5 26.7 27.4
2020 Min 17.0 16.7 21.0 17.2 17.0 16.5 16.0 16.6 16.4 16.5 16.5 16.0 17.0
Source: Uganda National Meteorological Authority
Table 1.3 B (Cont’d): Temperature (Degrees Celsius) for selected centres2015- 2019
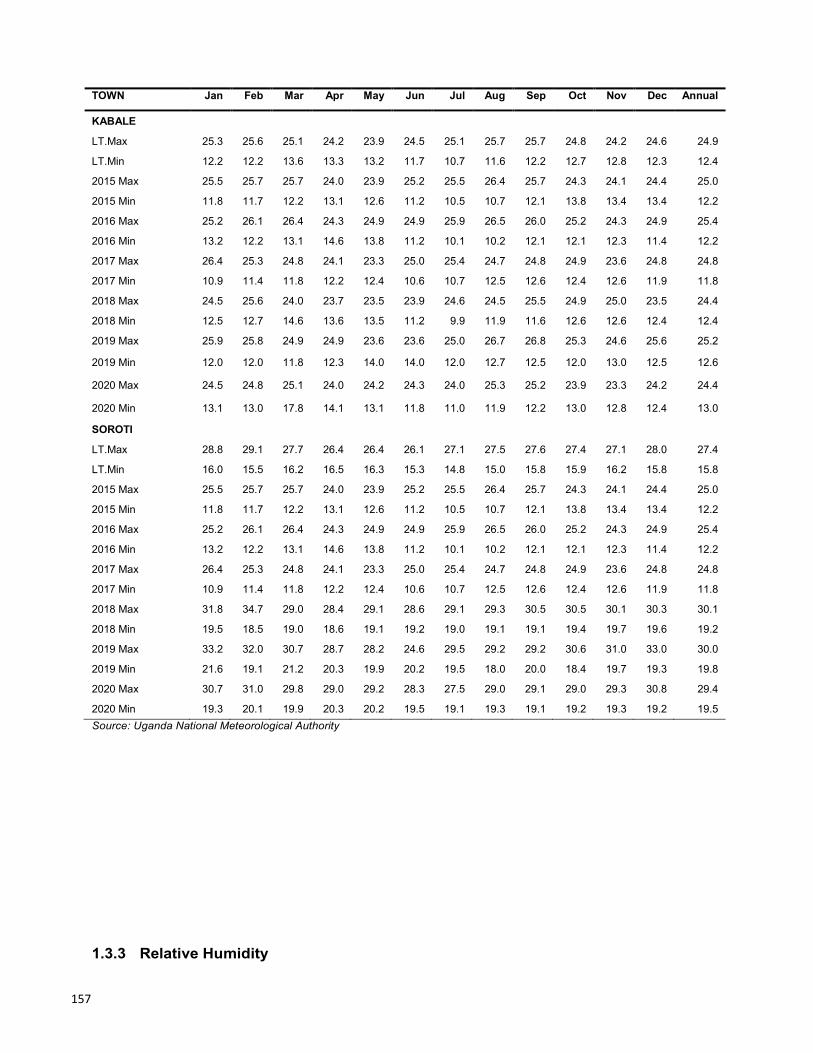
157
TOWN Jan Feb Mar Apr May Jun Jul Aug Sep Oct Nov Dec Annual
KABALE
LT.Max 25.3 25.6 25.1 24.2 23.9 24.5 25.1 25.7 25.7 24.8 24.2 24.6 24.9
LT.Min 12.2 12.2 13.6 13.3 13.2 11.7 10.7 11.6 12.2 12.7 12.8 12.3 12.4
2015 Max 25.5 25.7 25.7 24.0 23.9 25.2 25.5 26.4 25.7 24.3 24.1 24.4 25.0
2015 Min 11.8 11.7 12.2 13.1 12.6 11.2 10.5 10.7 12.1 13.8 13.4 13.4 12.2
2016 Max 25.2 26.1 26.4 24.3 24.9 24.9 25.9 26.5 26.0 25.2 24.3 24.9 25.4
2016 Min 13.2 12.2 13.1 14.6 13.8 11.2 10.1 10.2 12.1 12.1 12.3 11.4 12.2
2017 Max 26.4 25.3 24.8 24.1 23.3 25.0 25.4 24.7 24.8 24.9 23.6 24.8 24.8
2017 Min 10.9 11.4 11.8 12.2 12.4 10.6 10.7 12.5 12.6 12.4 12.6 11.9 11.8
2018 Max 24.5 25.6 24.0 23.7 23.5 23.9 24.6 24.5 25.5 24.9 25.0 23.5 24.4
2018 Min 12.5 12.7 14.6 13.6 13.5 11.2 9.9 11.9 11.6 12.6 12.6 12.4 12.4
2019 Max 25.9 25.8 24.9 24.9 23.6 23.6 25.0 26.7 26.8 25.3 24.6 25.6 25.2
2019 Min 12.0 12.0 11.8 12.3 14.0 14.0 12.0 12.7 12.5 12.0 13.0 12.5 12.6
2020 Max 24.5 24.8 25.1 24.0 24.2 24.3 24.0 25.3 25.2 23.9 23.3 24.2 24.4
2020 Min 13.1 13.0 17.8 14.1 13.1 11.8 11.0 11.9 12.2 13.0 12.8 12.4 13.0
SOROTI
LT.Max 28.8 29.1 27.7 26.4 26.4 26.1 27.1 27.5 27.6 27.4 27.1 28.0 27.4
LT.Min 16.0 15.5 16.2 16.5 16.3 15.3 14.8 15.0 15.8 15.9 16.2 15.8 15.8
2015 Max 25.5 25.7 25.7 24.0 23.9 25.2 25.5 26.4 25.7 24.3 24.1 24.4 25.0
2015 Min 11.8 11.7 12.2 13.1 12.6 11.2 10.5 10.7 12.1 13.8 13.4 13.4 12.2
2016 Max 25.2 26.1 26.4 24.3 24.9 24.9 25.9 26.5 26.0 25.2 24.3 24.9 25.4
2016 Min 13.2 12.2 13.1 14.6 13.8 11.2 10.1 10.2 12.1 12.1 12.3 11.4 12.2
2017 Max 26.4 25.3 24.8 24.1 23.3 25.0 25.4 24.7 24.8 24.9 23.6 24.8 24.8
2017 Min 10.9 11.4 11.8 12.2 12.4 10.6 10.7 12.5 12.6 12.4 12.6 11.9 11.8
2018 Max 31.8 34.7 29.0 28.4 29.1 28.6 29.1 29.3 30.5 30.5 30.1 30.3 30.1
2018 Min 19.5 18.5 19.0 18.6 19.1 19.2 19.0 19.1 19.1 19.4 19.7 19.6 19.2
2019 Max 33.2 32.0 30.7 28.7 28.2 24.6 29.5 29.2 29.2 30.6 31.0 33.0 30.0
2019 Min 21.6 19.1 21.2 20.3 19.9 20.2 19.5 18.0 20.0 18.4 19.7 19.3 19.8
2020 Max 30.7 31.0 29.8 29.0 29.2 28.3 27.5 29.0 29.1 29.0 29.3 30.8 29.4
2020 Min 19.3 20.1 19.9 20.3 20.2 19.5 19.1 19.3 19.1 19.2 19.3 19.2 19.5
Source: Uganda National Meteorological Authority
1.3.3 Relative Humidity
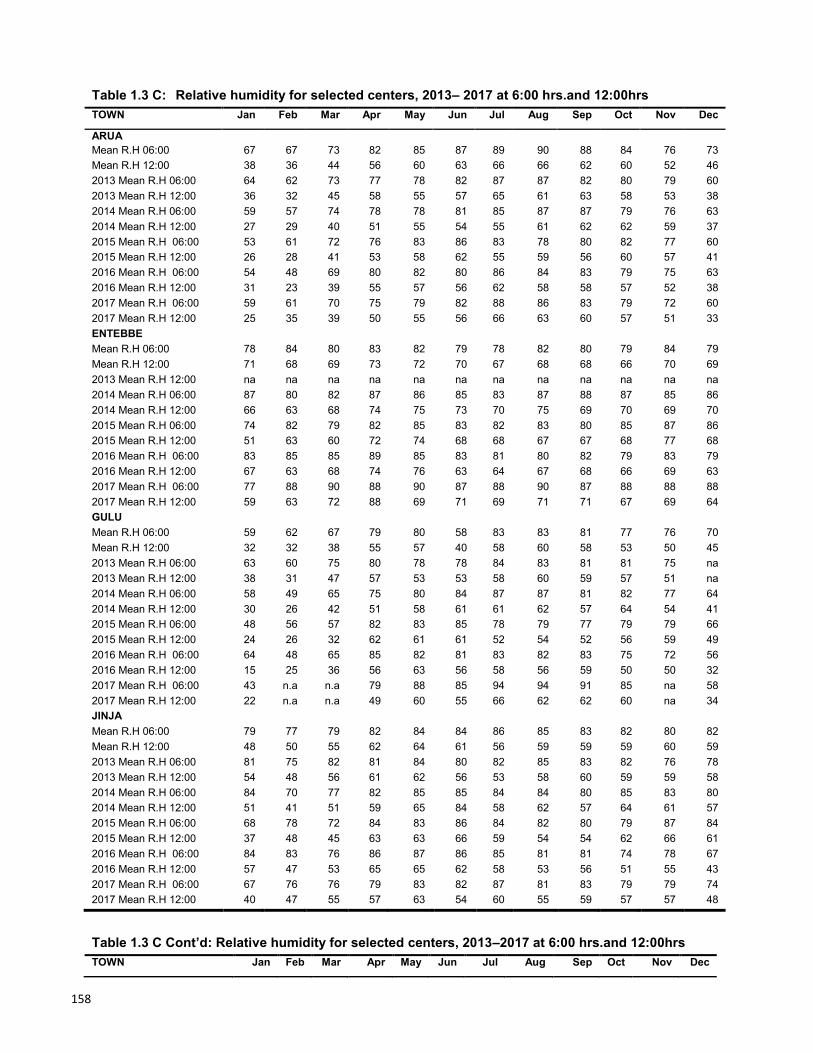
158
Table 1.3 C: Relative humidity for selected centers, 2013– 2017 at 6:00 hrs.and 12:00hrs
TOWN Jan Feb Mar Apr May Jun Jul Aug Sep Oct Nov Dec
ARUA
Mean R.H 06:00 67 67 73 82 85 87 89 90 88 84 76 73
Mean R.H 12:00 38 36 44 56 60 63 66 66 62 60 52 46
2013 Mean R.H 06:00 64 62 73 77 78 82 87 87 82 80 79 60
2013 Mean R.H 12:00 36 32 45 58 55 57 65 61 63 58 53 38
2014 Mean R.H 06:00 59 57 74 78 78 81 85 87 87 79 76 63
2014 Mean R.H 12:00 27 29 40 51 55 54 55 61 62 62 59 37
2015 Mean R.H 06:00 53 61 72 76 83 86 83 78 80 82 77 60
2015 Mean R.H 12:00 26 28 41 53 58 62 55 59 56 60 57 41
2016 Mean R.H 06:00 54 48 69 80 82 80 86 84 83 79 75 63
2016 Mean R.H 12:00 31 23 39 55 57 56 62 58 58 57 52 38
2017 Mean R.H 06:00 59 61 70 75 79 82 88 86 83 79 72 60
2017 Mean R.H 12:00 25 35 39 50 55 56 66 63 60 57 51 33
ENTEBBE
Mean R.H 06:00 78 84 80 83 82 79 78 82 80 79 84 79
Mean R.H 12:00 71 68 69 73 72 70 67 68 68 66 70 69
2013 Mean R.H 12:00 na na na na na na na na na na na na
2014 Mean R.H 06:00 87 80 82 87 86 85 83 87 88 87 85 86
2014 Mean R.H 12:00 66 63 68 74 75 73 70 75 69 70 69 70
2015 Mean R.H 06:00 74 82 79 82 85 83 82 83 80 85 87 86
2015 Mean R.H 12:00 51 63 60 72 74 68 68 67 67 68 77 68
2016 Mean R.H 06:00 83 85 85 89 85 83 81 80 82 79 83 79
2016 Mean R.H 12:00 67 63 68 74 76 63 64 67 68 66 69 63
2017 Mean R.H 06:00 77 88 90 88 90 87 88 90 87 88 88 88
2017 Mean R.H 12:00 59 63 72 88 69 71 69 71 71 67 69 64
GULU
Mean R.H 06:00 59 62 67 79 80 58 83 83 81 77 76 70
Mean R.H 12:00 32 32 38 55 57 40 58 60 58 53 50 45
2013 Mean R.H 06:00 63 60 75 80 78 78 84 83 81 81 75 na
2013 Mean R.H 12:00 38 31 47 57 53 53 58 60 59 57 51 na
2014 Mean R.H 06:00 58 49 65 75 80 84 87 87 81 82 77 64
2014 Mean R.H 12:00 30 26 42 51 58 61 61 62 57 64 54 41
2015 Mean R.H 06:00 48 56 57 82 83 85 78 79 77 79 79 66
2015 Mean R.H 12:00 24 26 32 62 61 61 52 54 52 56 59 49
2016 Mean R.H 06:00 64 48 65 85 82 81 83 82 83 75 72 56
2016 Mean R.H 12:00 15 25 36 56 63 56 58 56 59 50 50 32
2017 Mean R.H 06:00 43 n.a n.a 79 88 85 94 94 91 85 na 58
2017 Mean R.H 12:00 22 n.a n.a 49 60 55 66 62 62 60 na 34
JINJA
Mean R.H 06:00 79 77 79 82 84 84 86 85 83 82 80 82
Mean R.H 12:00 48 50 55 62 64 61 56 59 59 59 60 59
2013 Mean R.H 06:00 81 75 82 81 84 80 82 85 83 82 76 78
2013 Mean R.H 12:00 54 48 56 61 62 56 53 58 60 59 59 58
2014 Mean R.H 06:00 84 70 77 82 85 85 84 84 80 85 83 80
2014 Mean R.H 12:00 51 41 51 59 65 84 58 62 57 64 61 57
2015 Mean R.H 06:00 68 78 72 84 83 86 84 82 80 79 87 84
2015 Mean R.H 12:00 37 48 45 63 63 66 59 54 54 62 66 61
2016 Mean R.H 06:00 84 83 76 86 87 86 85 81 81 74 78 67
2016 Mean R.H 12:00 57 47 53 65 65 62 58 53 56 51 55 43
2017 Mean R.H 06:00 67 76 76 79 83 82 87 81 83 79 79 74
2017 Mean R.H 12:00 40 47 55 57 63 54 60 55 59 57 57 48
Table 1.3 C Cont’d: Relative humidity for selected centers, 2013–2017 at 6:00 hrs.and 12:00hrs
TOWN Jan Feb Mar Apr May Jun Jul Aug Sep Oct Nov Dec
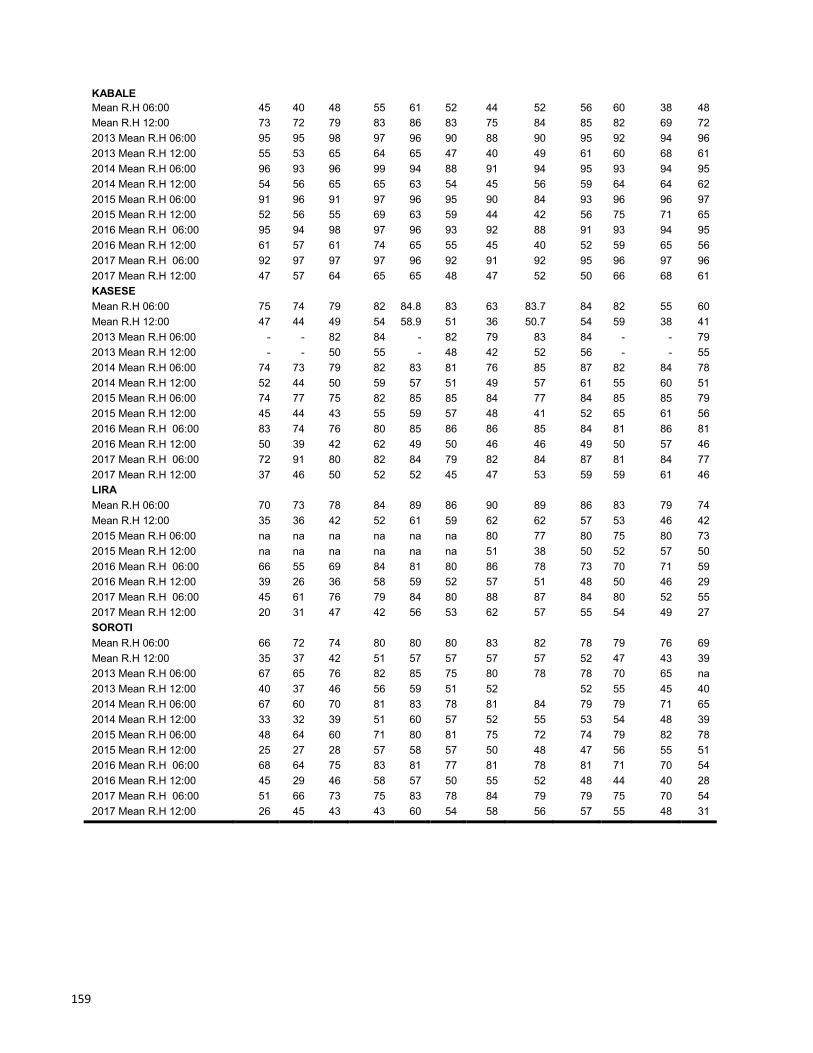
159
KABALE
Mean R.H 06:00 45 40 48 55 61 52 44 52 56 60 38 48
Mean R.H 12:00 73 72 79 83 86 83 75 84 85 82 69 72
2013 Mean R.H 06:00 95 95 98 97 96 90 88 90 95 92 94 96
2013 Mean R.H 12:00 55 53 65 64 65 47 40 49 61 60 68 61
2014 Mean R.H 06:00 96 93 96 99 94 88 91 94 95 93 94 95
2014 Mean R.H 12:00 54 56 65 65 63 54 45 56 59 64 64 62
2015 Mean R.H 06:00 91 96 91 97 96 95 90 84 93 96 96 97
2015 Mean R.H 12:00 52 56 55 69 63 59 44 42 56 75 71 65
2016 Mean R.H 06:00 95 94 98 97 96 93 92 88 91 93 94 95
2016 Mean R.H 12:00 61 57 61 74 65 55 45 40 52 59 65 56
2017 Mean R.H 06:00 92 97 97 97 96 92 91 92 95 96 97 96
2017 Mean R.H 12:00 47 57 64 65 65 48 47 52 50 66 68 61
KASESE
Mean R.H 06:00 75 74 79 82 84.8 83 63 83.7 84 82 55 60
Mean R.H 12:00 47 44 49 54 58.9 51 36 50.7 54 59 38 41
2013 Mean R.H 06:00 - - 82 84 - 82 79 83 84 - - 79
2013 Mean R.H 12:00 - - 50 55 - 48 42 52 56 - - 55
2014 Mean R.H 06:00 74 73 79 82 83 81 76 85 87 82 84 78
2014 Mean R.H 12:00 52 44 50 59 57 51 49 57 61 55 60 51
2015 Mean R.H 06:00 74 77 75 82 85 85 84 77 84 85 85 79
2015 Mean R.H 12:00 45 44 43 55 59 57 48 41 52 65 61 56
2016 Mean R.H 06:00 83 74 76 80 85 86 86 85 84 81 86 81
2016 Mean R.H 12:00 50 39 42 62 49 50 46 46 49 50 57 46
2017 Mean R.H 06:00 72 91 80 82 84 79 82 84 87 81 84 77
2017 Mean R.H 12:00 37 46 50 52 52 45 47 53 59 59 61 46
LIRA
Mean R.H 06:00 70 73 78 84 89 86 90 89 86 83 79 74
Mean R.H 12:00 35 36 42 52 61 59 62 62 57 53 46 42
2015 Mean R.H 06:00 na na na na na na 80 77 80 75 80 73
2015 Mean R.H 12:00 na na na na na na 51 38 50 52 57 50
2016 Mean R.H 06:00 66 55 69 84 81 80 86 78 73 70 71 59
2016 Mean R.H 12:00 39 26 36 58 59 52 57 51 48 50 46 29
2017 Mean R.H 06:00 45 61 76 79 84 80 88 87 84 80 52 55
2017 Mean R.H 12:00 20 31 47 42 56 53 62 57 55 54 49 27
SOROTI
Mean R.H 06:00 66 72 74 80 80 80 83 82 78 79 76 69
Mean R.H 12:00 35 37 42 51 57 57 57 57 52 47 43 39
2013 Mean R.H 06:00 67 65 76 82 85 75 80 78 78 70 65 na
2013 Mean R.H 12:00 40 37 46 56 59 51 52
52 55 45 40
2014 Mean R.H 06:00 67 60 70 81 83 78 81 84 79 79 71 65
2014 Mean R.H 12:00 33 32 39 51 60 57 52 55 53 54 48 39
2015 Mean R.H 06:00 48 64 60 71 80 81 75 72 74 79 82 78
2015 Mean R.H 12:00 25 27 28 57 58 57 50 48 47 56 55 51
2016 Mean R.H 06:00 68 64 75 83 81 77 81 78 81 71 70 54
2016 Mean R.H 12:00 45 29 46 58 57 50 55 52 48 44 40 28
2017 Mean R.H 06:00 51 66 73 75 83 78 84 79 79 75 70 54
2017 Mean R.H 12:00 26 45 43 43 60 54 58 56 57 55 48 31
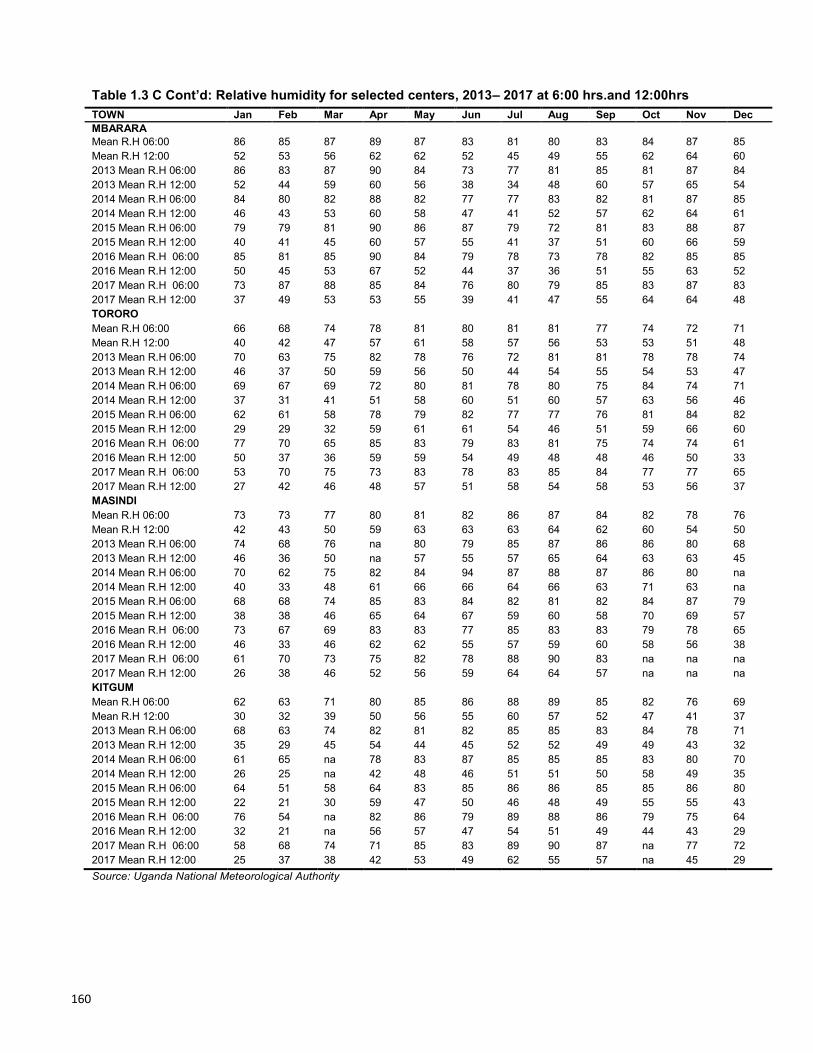
160
Table 1.3 C Cont’d: Relative humidity for selected centers, 2013– 2017 at 6:00 hrs.and 12:00hrs
TOWN Jan Feb Mar Apr May Jun Jul Aug Sep Oct Nov Dec
MBARARA Mean R.H 06:00 86 85 87 89 87 83 81 80 83 84 87 85
Mean R.H 12:00 52 53 56 62 62 52 45 49 55 62 64 60
2013 Mean R.H 06:00 86 83 87 90 84 73 77 81 85 81 87 84
2013 Mean R.H 12:00 52 44 59 60 56 38 34 48 60 57 65 54
2014 Mean R.H 06:00 84 80 82 88 82 77 77 83 82 81 87 85
2014 Mean R.H 12:00 46 43 53 60 58 47 41 52 57 62 64 61
2015 Mean R.H 06:00 79 79 81 90 86 87 79 72 81 83 88 87
2015 Mean R.H 12:00 40 41 45 60 57 55 41 37 51 60 66 59
2016 Mean R.H 06:00 85 81 85 90 84 79 78 73 78 82 85 85
2016 Mean R.H 12:00 50 45 53 67 52 44 37 36 51 55 63 52
2017 Mean R.H 06:00 73 87 88 85 84 76 80 79 85 83 87 83
2017 Mean R.H 12:00 37 49 53 53 55 39 41 47 55 64 64 48
TORORO
Mean R.H 06:00 66 68 74 78 81 80 81 81 77 74 72 71
Mean R.H 12:00 40 42 47 57 61 58 57 56 53 53 51 48
2013 Mean R.H 06:00 70 63 75 82 78 76 72 81 81 78 78 74
2013 Mean R.H 12:00 46 37 50 59 56 50 44 54 55 54 53 47
2014 Mean R.H 06:00 69 67 69 72 80 81 78 80 75 84 74 71
2014 Mean R.H 12:00 37 31 41 51 58 60 51 60 57 63 56 46
2015 Mean R.H 06:00 62 61 58 78 79 82 77 77 76 81 84 82
2015 Mean R.H 12:00 29 29 32 59 61 61 54 46 51 59 66 60
2016 Mean R.H 06:00 77 70 65 85 83 79 83 81 75 74 74 61
2016 Mean R.H 12:00 50 37 36 59 59 54 49 48 48 46 50 33
2017 Mean R.H 06:00 53 70 75 73 83 78 83 85 84 77 77 65
2017 Mean R.H 12:00 27 42 46 48 57 51 58 54 58 53 56 37
MASINDI
Mean R.H 06:00 73 73 77 80 81 82 86 87 84 82 78 76
Mean R.H 12:00 42 43 50 59 63 63 63 64 62 60 54 50
2013 Mean R.H 06:00 74 68 76 na 80 79 85 87 86 86 80 68
2013 Mean R.H 12:00 46 36 50 na 57 55 57 65 64 63 63 45
2014 Mean R.H 06:00 70 62 75 82 84 94 87 88 87 86 80 na
2014 Mean R.H 12:00 40 33 48 61 66 66 64 66 63 71 63 na
2015 Mean R.H 06:00 68 68 74 85 83 84 82 81 82 84 87 79
2015 Mean R.H 12:00 38 38 46 65 64 67 59 60 58 70 69 57
2016 Mean R.H 06:00 73 67 69 83 83 77 85 83 83 79 78 65
2016 Mean R.H 12:00 46 33 46 62 62 55 57 59 60 58 56 38
2017 Mean R.H 06:00 61 70 73 75 82 78 88 90 83 na na na
2017 Mean R.H 12:00 26 38 46 52 56 59 64 64 57 na na na
KITGUM
Mean R.H 06:00 62 63 71 80 85 86 88 89 85 82 76 69
Mean R.H 12:00 30 32 39 50 56 55 60 57 52 47 41 37
2013 Mean R.H 06:00 68 63 74 82 81 82 85 85 83 84 78 71
2013 Mean R.H 12:00 35 29 45 54 44 45 52 52 49 49 43 32
2014 Mean R.H 06:00 61 65 na 78 83 87 85 85 85 83 80 70
2014 Mean R.H 12:00 26 25 na 42 48 46 51 51 50 58 49 35
2015 Mean R.H 06:00 64 51 58 64 83 85 86 86 85 85 86 80
2015 Mean R.H 12:00 22 21 30 59 47 50 46 48 49 55 55 43
2016 Mean R.H 06:00 76 54 na 82 86 79 89 88 86 79 75 64
2016 Mean R.H 12:00 32 21 na 56 57 47 54 51 49 44 43 29
2017 Mean R.H 06:00 58 68 74 71 85 83 89 90 87 na 77 72
2017 Mean R.H 12:00 25 37 38 42 53 49 62 55 57 na 45 29
Source: Uganda National Meteorological Authority
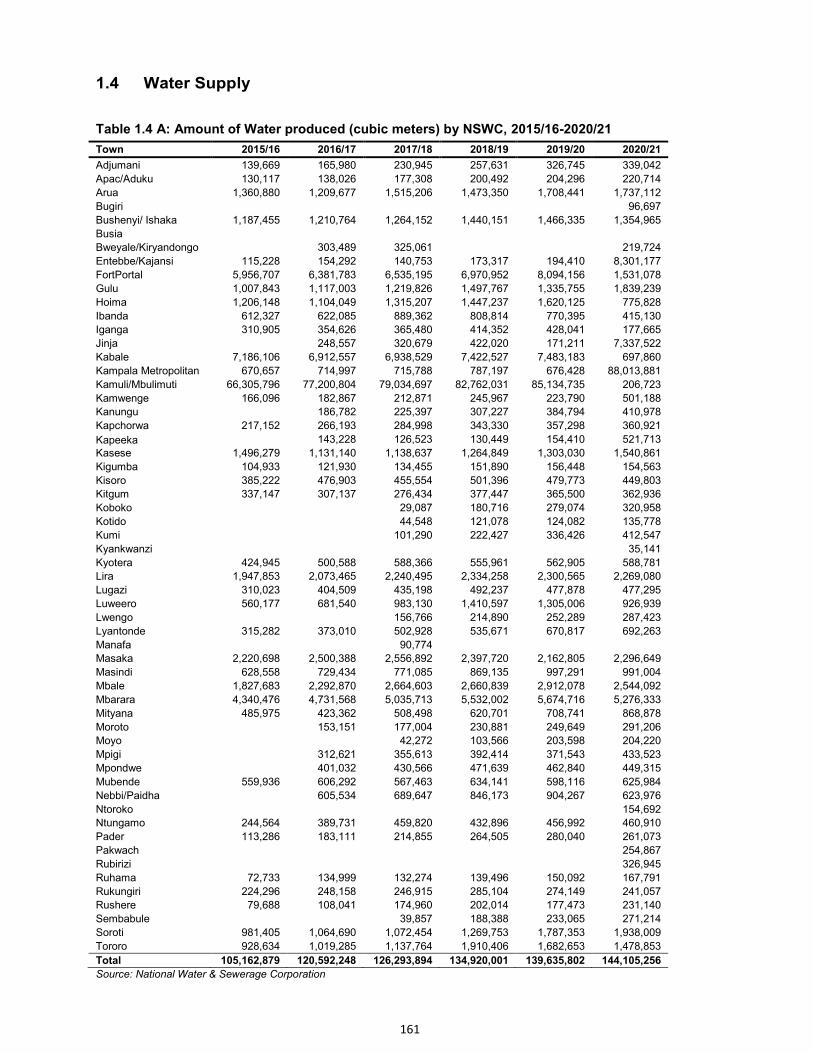
161
1.4 Water Supply
Table 1.4 A: Amount of Water produced (cubic meters) by NSWC, 2015/16-2020/21
Town 2015/16 2016/17 2017/18 2018/19 2019/20 2020/21
Adjumani 139,669 165,980 230,945 257,631 326,745 339,042
Apac/Aduku 130,117 138,026 177,308 200,492 204,296 220,714
Arua 1,360,880 1,209,677 1,515,206 1,473,350 1,708,441 1,737,112
Bugiri
96,697
Bushenyi/ Ishaka 1,187,455 1,210,764 1,264,152 1,440,151 1,466,335 1,354,965
Busia
Bweyale/Kiryandongo
303,489 325,061
219,724
Entebbe/Kajansi 115,228 154,292 140,753 173,317 194,410 8,301,177
FortPortal 5,956,707 6,381,783 6,535,195 6,970,952 8,094,156 1,531,078
Gulu 1,007,843 1,117,003 1,219,826 1,497,767 1,335,755 1,839,239
Hoima 1,206,148 1,104,049 1,315,207 1,447,237 1,620,125 775,828
Ibanda 612,327 622,085 889,362 808,814 770,395 415,130
Iganga 310,905 354,626 365,480 414,352 428,041 177,665
Jinja
248,557 320,679 422,020 171,211 7,337,522
Kabale 7,186,106 6,912,557 6,938,529 7,422,527 7,483,183 697,860
Kampala Metropolitan 670,657 714,997 715,788 787,197 676,428 88,013,881
Kamuli/Mbulimuti 66,305,796 77,200,804 79,034,697 82,762,031 85,134,735 206,723
Kamwenge 166,096 182,867 212,871 245,967 223,790 501,188
Kanungu
186,782 225,397 307,227 384,794 410,978
Kapchorwa 217,152 266,193 284,998 343,330 357,298 360,921
Kapeeka 143,228 126,523 130,449 154,410 521,713
Kasese 1,496,279 1,131,140 1,138,637 1,264,849 1,303,030 1,540,861
Kigumba 104,933 121,930 134,455 151,890 156,448 154,563
Kisoro 385,222 476,903 455,554 501,396 479,773 449,803
Kitgum 337,147 307,137 276,434 377,447 365,500 362,936
Koboko
29,087 180,716 279,074 320,958
Kotido
44,548 121,078 124,082 135,778
Kumi
101,290 222,427 336,426 412,547
Kyankwanzi
35,141
Kyotera 424,945 500,588 588,366 555,961 562,905 588,781
Lira 1,947,853 2,073,465 2,240,495 2,334,258 2,300,565 2,269,080
Lugazi 310,023 404,509 435,198 492,237 477,878 477,295
Luweero 560,177 681,540 983,130 1,410,597 1,305,006 926,939
Lwengo
156,766 214,890 252,289 287,423
Lyantonde 315,282 373,010 502,928 535,671 670,817 692,263
Manafa
90,774
Masaka 2,220,698 2,500,388 2,556,892 2,397,720 2,162,805 2,296,649
Masindi 628,558 729,434 771,085 869,135 997,291 991,004
Mbale 1,827,683 2,292,870 2,664,603 2,660,839 2,912,078 2,544,092
Mbarara 4,340,476 4,731,568 5,035,713 5,532,002 5,674,716 5,276,333
Mityana 485,975 423,362 508,498 620,701 708,741 868,878
Moroto
153,151 177,004 230,881 249,649 291,206
Moyo
42,272 103,566 203,598 204,220
Mpigi
312,621 355,613 392,414 371,543 433,523
Mpondwe
401,032 430,566 471,639 462,840 449,315
Mubende 559,936 606,292 567,463 634,141 598,116 625,984
Nebbi/Paidha
605,534 689,647 846,173 904,267 623,976
Ntoroko
154,692
Ntungamo 244,564 389,731 459,820 432,896 456,992 460,910
Pader 113,286 183,111 214,855 264,505 280,040 261,073
Pakwach
254,867
Rubirizi
326,945
Ruhama 72,733 134,999 132,274 139,496 150,092 167,791
Rukungiri 224,296 248,158 246,915 285,104 274,149 241,057
Rushere 79,688 108,041 174,960 202,014 177,473 231,140
Sembabule 39,857 188,388 233,065 271,214
Soroti 981,405 1,064,690 1,072,454 1,269,753 1,787,353 1,938,009
Tororo 928,634 1,019,285 1,137,764 1,910,406 1,682,653 1,478,853
Total 105,162,879 120,592,248 126,293,894 134,920,001 139,635,802 144,105,256
Source: National Water & Sewerage Corporation
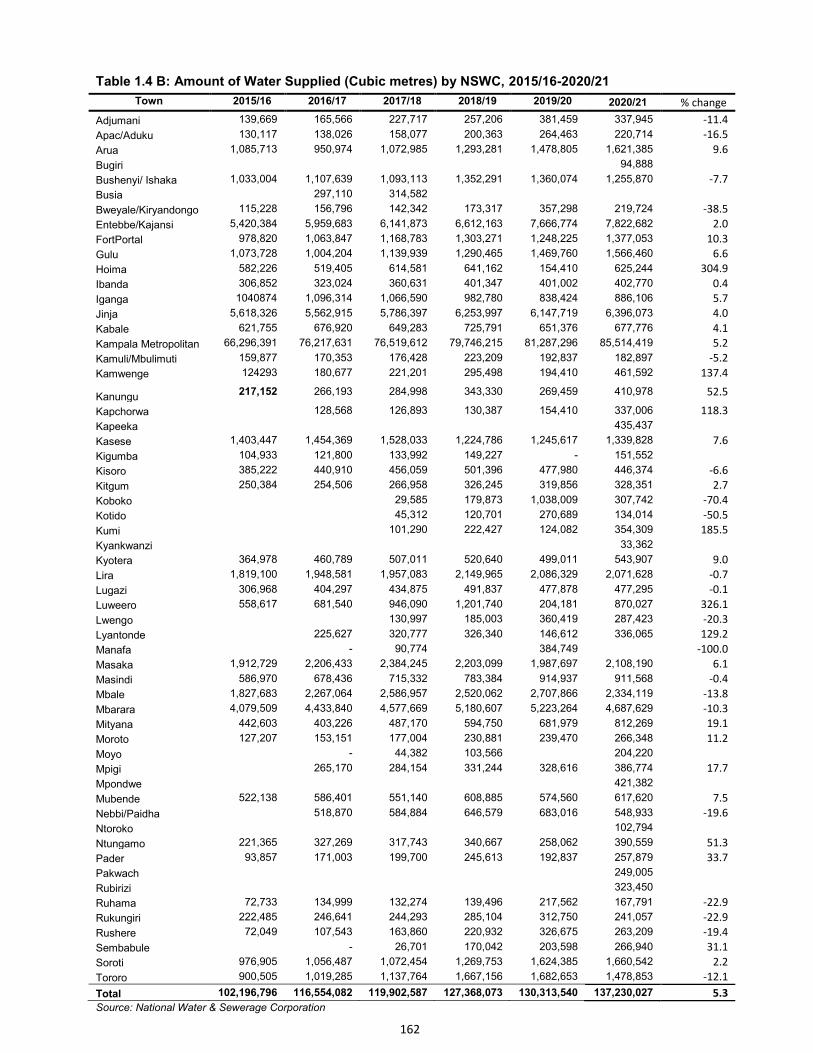
162
Table 1.4 B: Amount of Water Supplied (Cubic metres) by NSWC, 2015/16-2020/21
Town 2015/16 2016/17 2017/18 2018/19 2019/20 2020/21 % change
Adjumani 139,669 165,566 227,717 257,206 381,459 337,945 -11.4
Apac/Aduku 130,117 138,026 158,077 200,363 264,463 220,714 -16.5
Arua 1,085,713 950,974 1,072,985 1,293,281 1,478,805 1,621,385 9.6
Bugiri 94,888
Bushenyi/ Ishaka 1,033,004 1,107,639 1,093,113 1,352,291 1,360,074 1,255,870 -7.7
Busia 297,110 314,582
Bweyale/Kiryandongo 115,228 156,796 142,342 173,317 357,298 219,724 -38.5
Entebbe/Kajansi 5,420,384 5,959,683 6,141,873 6,612,163 7,666,774 7,822,682 2.0
FortPortal 978,820 1,063,847 1,168,783 1,303,271 1,248,225 1,377,053 10.3
Gulu 1,073,728 1,004,204 1,139,939 1,290,465 1,469,760 1,566,460 6.6
Hoima 582,226 519,405 614,581 641,162 154,410 625,244 304.9
Ibanda 306,852 323,024 360,631 401,347 401,002 402,770 0.4
Iganga 1040874 1,096,314 1,066,590 982,780 838,424 886,106 5.7
Jinja 5,618,326 5,562,915 5,786,397 6,253,997 6,147,719 6,396,073 4.0
Kabale 621,755 676,920 649,283 725,791 651,376 677,776 4.1
Kampala Metropolitan 66,296,391 76,217,631 76,519,612 79,746,215 81,287,296 85,514,419 5.2
Kamuli/Mbulimuti 159,877 170,353 176,428 223,209 192,837 182,897 -5.2
Kamwenge 124293 180,677 221,201 295,498 194,410 461,592 137.4
Kanungu 217,152 266,193 284,998 343,330 269,459 410,978 52.5
Kapchorwa 128,568 126,893 130,387 154,410 337,006 118.3
Kapeeka 435,437
Kasese 1,403,447 1,454,369 1,528,033 1,224,786 1,245,617 1,339,828 7.6
Kigumba 104,933 121,800 133,992 149,227 - 151,552
Kisoro 385,222 440,910 456,059 501,396 477,980 446,374 -6.6
Kitgum 250,384 254,506 266,958 326,245 319,856 328,351 2.7
Koboko 29,585 179,873 1,038,009 307,742 -70.4
Kotido 45,312 120,701 270,689 134,014 -50.5
Kumi 101,290 222,427 124,082 354,309 185.5
Kyankwanzi 33,362
Kyotera 364,978 460,789 507,011 520,640 499,011 543,907 9.0
Lira 1,819,100 1,948,581 1,957,083 2,149,965 2,086,329 2,071,628 -0.7
Lugazi 306,968 404,297 434,875 491,837 477,878 477,295 -0.1
Luweero 558,617 681,540 946,090 1,201,740 204,181 870,027 326.1
Lwengo 130,997 185,003 360,419 287,423 -20.3
Lyantonde 225,627 320,777 326,340 146,612 336,065 129.2
Manafa - 90,774
384,749 -100.0
Masaka 1,912,729 2,206,433 2,384,245 2,203,099 1,987,697 2,108,190 6.1
Masindi 586,970 678,436 715,332 783,384 914,937 911,568 -0.4
Mbale 1,827,683 2,267,064 2,586,957 2,520,062 2,707,866 2,334,119 -13.8
Mbarara 4,079,509 4,433,840 4,577,669 5,180,607 5,223,264 4,687,629 -10.3
Mityana 442,603 403,226 487,170 594,750 681,979 812,269 19.1
Moroto 127,207 153,151 177,004 230,881 239,470 266,348 11.2
Moyo - 44,382 103,566 204,220
Mpigi 265,170 284,154 331,244 328,616 386,774 17.7
Mpondwe 421,382
Mubende 522,138 586,401 551,140 608,885 574,560 617,620 7.5
Nebbi/Paidha 518,870 584,884 646,579 683,016 548,933 -19.6
Ntoroko 102,794
Ntungamo 221,365 327,269 317,743 340,667 258,062 390,559 51.3
Pader 93,857 171,003 199,700 245,613 192,837 257,879 33.7
Pakwach 249,005
Rubirizi 323,450
Ruhama 72,733 134,999 132,274 139,496 217,562 167,791 -22.9
Rukungiri 222,485 246,641 244,293 285,104 312,750 241,057 -22.9
Rushere 72,049 107,543 163,860 220,932 326,675 263,209 -19.4
Sembabule - 26,701 170,042 203,598 266,940 31.1
Soroti 976,905 1,056,487 1,072,454 1,269,753 1,624,385 1,660,542 2.2
Tororo 900,505 1,019,285 1,137,764 1,667,156 1,682,653 1,478,853 -12.1
Total 102,196,796 116,554,082 119,902,587 127,368,073 130,313,540 137,230,027 5.3
Source: National Water & Sewerage Corporation
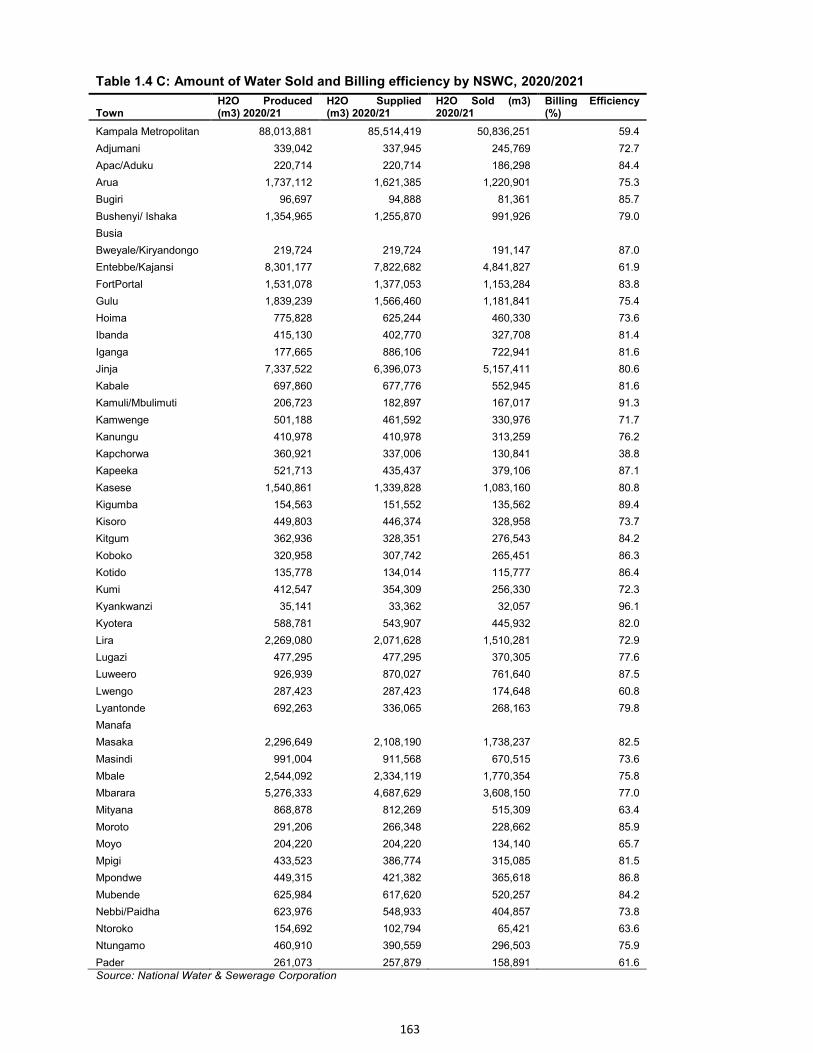
163
Table 1.4 C: Amount of Water Sold and Billing efficiency by NSWC, 2020/2021
Town H2O Produced (m3) 2020/21
H2O Supplied (m3) 2020/21
H2O Sold (m3) 2020/21
Billing Efficiency (%)
Kampala Metropolitan 88,013,881 85,514,419 50,836,251 59.4
Adjumani 339,042 337,945 245,769 72.7
Apac/Aduku 220,714 220,714 186,298 84.4
Arua 1,737,112 1,621,385 1,220,901 75.3
Bugiri 96,697 94,888 81,361 85.7
Bushenyi/ Ishaka 1,354,965 1,255,870 991,926 79.0
Busia Bweyale/Kiryandongo 219,724 219,724 191,147 87.0
Entebbe/Kajansi 8,301,177 7,822,682 4,841,827 61.9
FortPortal 1,531,078 1,377,053 1,153,284 83.8
Gulu 1,839,239 1,566,460 1,181,841 75.4
Hoima 775,828 625,244 460,330 73.6
Ibanda 415,130 402,770 327,708 81.4
Iganga 177,665 886,106 722,941 81.6
Jinja 7,337,522 6,396,073 5,157,411 80.6
Kabale 697,860 677,776 552,945 81.6
Kamuli/Mbulimuti 206,723 182,897 167,017 91.3
Kamwenge 501,188 461,592 330,976 71.7
Kanungu 410,978 410,978 313,259 76.2
Kapchorwa 360,921 337,006 130,841 38.8
Kapeeka 521,713 435,437 379,106 87.1
Kasese 1,540,861 1,339,828 1,083,160 80.8
Kigumba 154,563 151,552 135,562 89.4
Kisoro 449,803 446,374 328,958 73.7
Kitgum 362,936 328,351 276,543 84.2
Koboko 320,958 307,742 265,451 86.3
Kotido 135,778 134,014 115,777 86.4
Kumi 412,547 354,309 256,330 72.3
Kyankwanzi 35,141 33,362 32,057 96.1
Kyotera 588,781 543,907 445,932 82.0
Lira 2,269,080 2,071,628 1,510,281 72.9
Lugazi 477,295 477,295 370,305 77.6
Luweero 926,939 870,027 761,640 87.5
Lwengo 287,423 287,423 174,648 60.8
Lyantonde 692,263 336,065 268,163 79.8
Manafa Masaka 2,296,649 2,108,190 1,738,237 82.5
Masindi 991,004 911,568 670,515 73.6
Mbale 2,544,092 2,334,119 1,770,354 75.8
Mbarara 5,276,333 4,687,629 3,608,150 77.0
Mityana 868,878 812,269 515,309 63.4
Moroto 291,206 266,348 228,662 85.9
Moyo 204,220 204,220 134,140 65.7
Mpigi 433,523 386,774 315,085 81.5
Mpondwe 449,315 421,382 365,618 86.8
Mubende 625,984 617,620 520,257 84.2
Nebbi/Paidha 623,976 548,933 404,857 73.8
Ntoroko 154,692 102,794 65,421 63.6
Ntungamo 460,910 390,559 296,503 75.9
Pader 261,073 257,879 158,891 61.6
Source: National Water & Sewerage Corporation
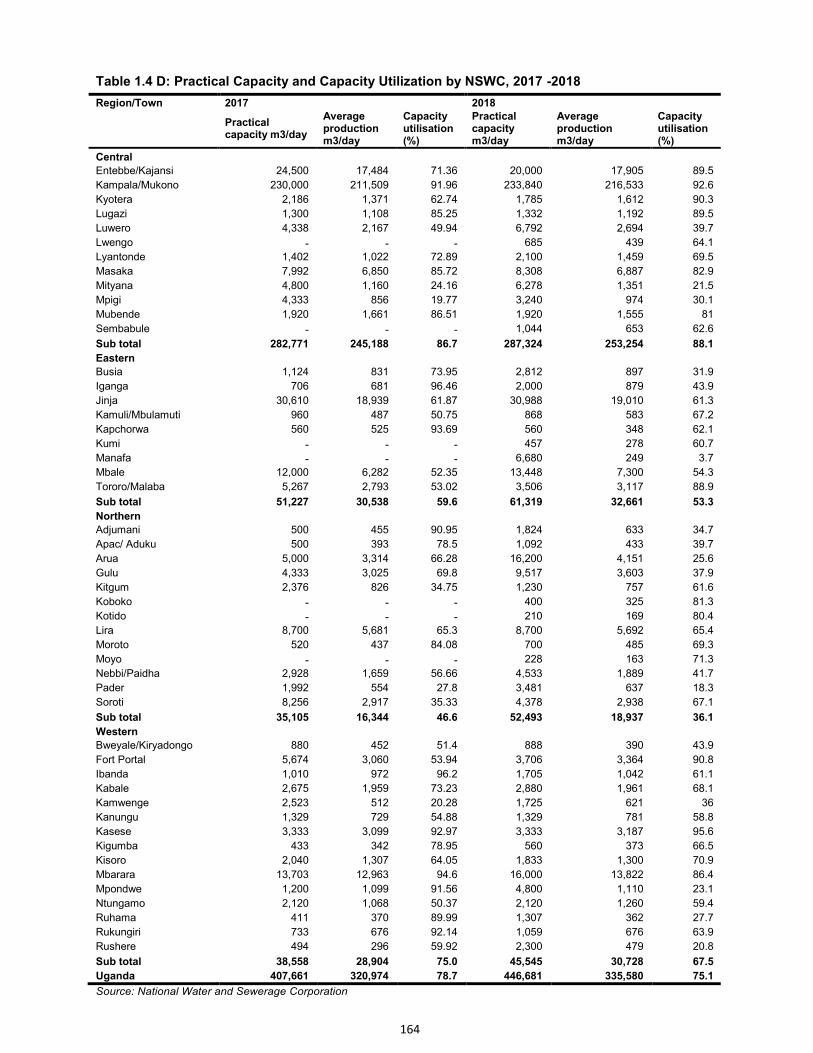
164
Table 1.4 D: Practical Capacity and Capacity Utilization by NSWC, 2017 -2018
Region/Town 2017 2018
Practical capacity m3/day
Average production m3/day
Capacity utilisation (%)
Practical capacity m3/day
Average production m3/day
Capacity utilisation (%)
Central Entebbe/Kajansi 24,500 17,484 71.36 20,000 17,905 89.5
Kampala/Mukono 230,000 211,509 91.96 233,840 216,533 92.6
Kyotera 2,186 1,371 62.74 1,785 1,612 90.3
Lugazi 1,300 1,108 85.25 1,332 1,192 89.5
Luwero 4,338 2,167 49.94 6,792 2,694 39.7
Lwengo - - - 685 439 64.1
Lyantonde 1,402 1,022 72.89 2,100 1,459 69.5
Masaka 7,992 6,850 85.72 8,308 6,887 82.9
Mityana 4,800 1,160 24.16 6,278 1,351 21.5
Mpigi 4,333 856 19.77 3,240 974 30.1
Mubende 1,920 1,661 86.51 1,920 1,555 81
Sembabule - - - 1,044 653 62.6
Sub total 282,771 245,188 86.7 287,324 253,254 88.1
Eastern Busia 1,124 831 73.95 2,812 897 31.9
Iganga 706 681 96.46 2,000 879 43.9
Jinja 30,610 18,939 61.87 30,988 19,010 61.3
Kamuli/Mbulamuti 960 487 50.75 868 583 67.2
Kapchorwa 560 525 93.69 560 348 62.1
Kumi - - - 457 278 60.7
Manafa - - - 6,680 249 3.7
Mbale 12,000 6,282 52.35 13,448 7,300 54.3
Tororo/Malaba 5,267 2,793 53.02 3,506 3,117 88.9
Sub total 51,227 30,538 59.6 61,319 32,661 53.3
Northern
Adjumani 500 455 90.95 1,824 633 34.7
Apac/ Aduku 500 393 78.5 1,092 433 39.7
Arua 5,000 3,314 66.28 16,200 4,151 25.6
Gulu 4,333 3,025 69.8 9,517 3,603 37.9
Kitgum 2,376 826 34.75 1,230 757 61.6
Koboko - - - 400 325 81.3
Kotido - - - 210 169 80.4
Lira 8,700 5,681 65.3 8,700 5,692 65.4
Moroto 520 437 84.08 700 485 69.3
Moyo - - - 228 163 71.3
Nebbi/Paidha 2,928 1,659 56.66 4,533 1,889 41.7
Pader 1,992 554 27.8 3,481 637 18.3
Soroti 8,256 2,917 35.33 4,378 2,938 67.1
Sub total 35,105 16,344 46.6 52,493 18,937 36.1
Western Bweyale/Kiryadongo 880 452 51.4 888 390 43.9
Fort Portal 5,674 3,060 53.94 3,706 3,364 90.8
Ibanda 1,010 972 96.2 1,705 1,042 61.1
Kabale 2,675 1,959 73.23 2,880 1,961 68.1
Kamwenge 2,523 512 20.28 1,725 621 36
Kanungu 1,329 729 54.88 1,329 781 58.8
Kasese 3,333 3,099 92.97 3,333 3,187 95.6
Kigumba 433 342 78.95 560 373 66.5
Kisoro 2,040 1,307 64.05 1,833 1,300 70.9
Mbarara 13,703 12,963 94.6 16,000 13,822 86.4
Mpondwe 1,200 1,099 91.56 4,800 1,110 23.1
Ntungamo 2,120 1,068 50.37 2,120 1,260 59.4
Ruhama 411 370 89.99 1,307 362 27.7
Rukungiri 733 676 92.14 1,059 676 63.9
Rushere 494 296 59.92 2,300 479 20.8
Sub total 38,558 28,904 75.0 45,545 30,728 67.5
Uganda 407,661 320,974 78.7 446,681 335,580 75.1
Source: National Water and Sewerage Corporation
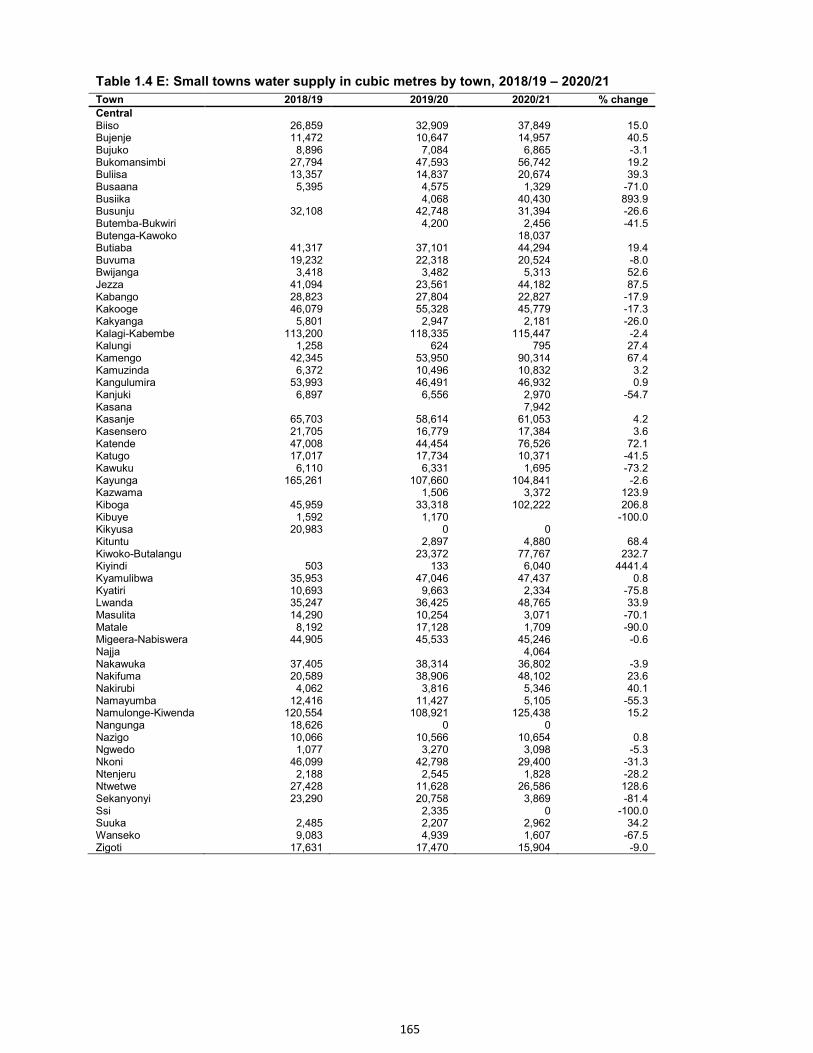
165
Table 1.4 E: Small towns water supply in cubic metres by town, 2018/19 – 2020/21
Town 2018/19 2019/20 2020/21 % change
Central Biiso 26,859 32,909 37,849 15.0
Bujenje 11,472 10,647 14,957 40.5 Bujuko 8,896 7,084 6,865 -3.1 Bukomansimbi 27,794 47,593 56,742 19.2 Buliisa 13,357 14,837 20,674 39.3 Busaana 5,395 4,575 1,329 -71.0 Busiika
4,068 40,430 893.9
Busunju 32,108 42,748 31,394 -26.6 Butemba-Bukwiri
4,200 2,456 -41.5
Butenga-Kawoko
18,037 Butiaba 41,317 37,101 44,294 19.4
Buvuma 19,232 22,318 20,524 -8.0 Bwijanga 3,418 3,482 5,313 52.6 Jezza 41,094 23,561 44,182 87.5 Kabango 28,823 27,804 22,827 -17.9 Kakooge 46,079 55,328 45,779 -17.3 Kakyanga 5,801 2,947 2,181 -26.0 Kalagi-Kabembe 113,200 118,335 115,447 -2.4 Kalungi 1,258 624 795 27.4 Kamengo 42,345 53,950 90,314 67.4 Kamuzinda 6,372 10,496 10,832 3.2 Kangulumira 53,993 46,491 46,932 0.9 Kanjuki 6,897 6,556 2,970 -54.7 Kasana
7,942
Kasanje 65,703 58,614 61,053 4.2 Kasensero 21,705 16,779 17,384 3.6 Katende 47,008 44,454 76,526 72.1 Katugo 17,017 17,734 10,371 -41.5 Kawuku 6,110 6,331 1,695 -73.2 Kayunga 165,261 107,660 104,841 -2.6 Kazwama
1,506 3,372 123.9
Kiboga 45,959 33,318 102,222 206.8 Kibuye 1,592 1,170
-100.0
Kikyusa 20,983 0 0 Kituntu
2,897 4,880 68.4
Kiwoko-Butalangu
23,372 77,767 232.7 Kiyindi 503 133 6,040 4441.4 Kyamulibwa 35,953 47,046 47,437 0.8 Kyatiri 10,693 9,663 2,334 -75.8 Lwanda 35,247 36,425 48,765 33.9 Masulita 14,290 10,254 3,071 -70.1 Matale 8,192 17,128 1,709 -90.0 Migeera-Nabiswera 44,905 45,533 45,246 -0.6 Najja
4,064
Nakawuka 37,405 38,314 36,802 -3.9 Nakifuma 20,589 38,906 48,102 23.6 Nakirubi 4,062 3,816 5,346 40.1 Namayumba 12,416 11,427 5,105 -55.3 Namulonge-Kiwenda 120,554 108,921 125,438 15.2 Nangunga 18,626 0 0
Nazigo 10,066 10,566 10,654 0.8 Ngwedo 1,077 3,270 3,098 -5.3 Nkoni 46,099 42,798 29,400 -31.3 Ntenjeru 2,188 2,545 1,828 -28.2 Ntwetwe 27,428 11,628 26,586 128.6 Sekanyonyi 23,290 20,758 3,869 -81.4 Ssi
2,335 0 -100.0
Suuka 2,485 2,207 2,962 34.2 Wanseko 9,083 4,939 1,607 -67.5 Zigoti 17,631 17,470 15,904 -9.0
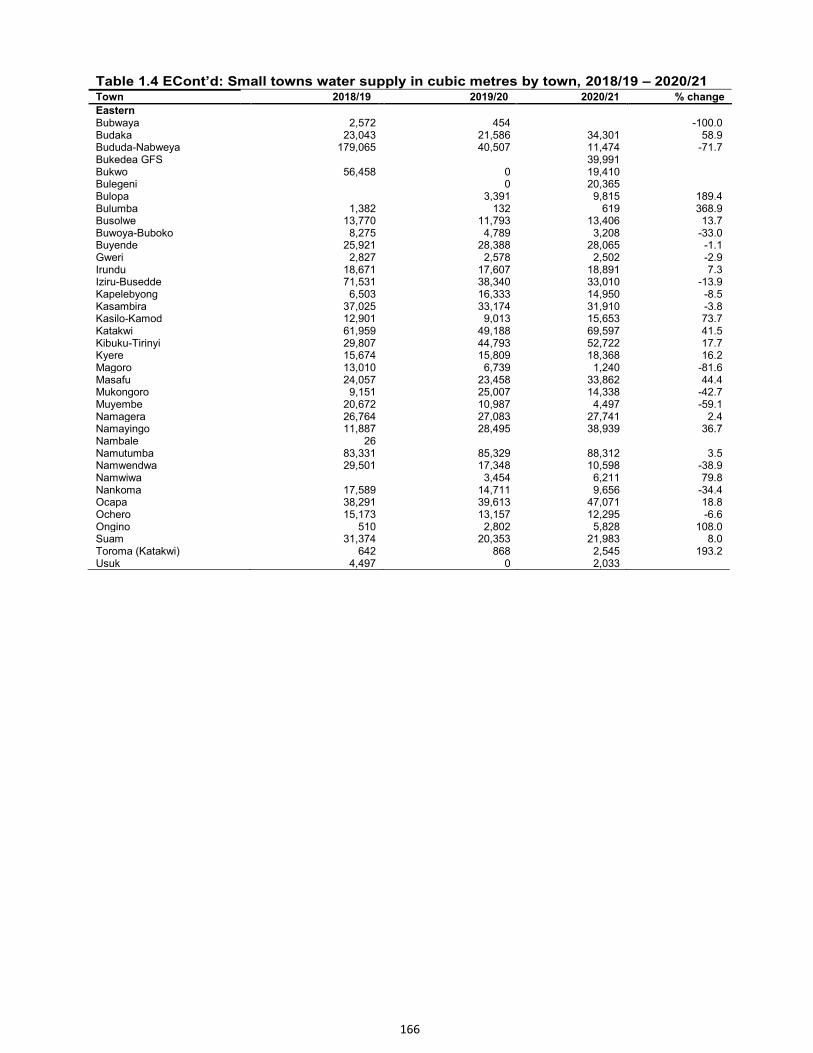
166
Table 1.4 ECont’d: Small towns water supply in cubic metres by town, 2018/19 – 2020/21 Town 2018/19 2019/20 2020/21 % change
Eastern Bubwaya 2,572 454
-100.0
Budaka 23,043 21,586 34,301 58.9 Bududa-Nabweya 179,065 40,507 11,474 -71.7 Bukedea GFS
39,991
Bukwo 56,458 0 19,410 Bulegeni
0 20,365
Bulopa
3,391 9,815 189.4 Bulumba 1,382 132 619 368.9 Busolwe 13,770 11,793 13,406 13.7 Buwoya-Buboko 8,275 4,789 3,208 -33.0 Buyende 25,921 28,388 28,065 -1.1 Gweri 2,827 2,578 2,502 -2.9 Irundu 18,671 17,607 18,891 7.3 Iziru-Busedde 71,531 38,340 33,010 -13.9 Kapelebyong 6,503 16,333 14,950 -8.5 Kasambira 37,025 33,174 31,910 -3.8 Kasilo-Kamod 12,901 9,013 15,653 73.7 Katakwi 61,959 49,188 69,597 41.5 Kibuku-Tirinyi 29,807 44,793 52,722 17.7 Kyere 15,674 15,809 18,368 16.2 Magoro 13,010 6,739 1,240 -81.6 Masafu 24,057 23,458 33,862 44.4 Mukongoro 9,151 25,007 14,338 -42.7 Muyembe 20,672 10,987 4,497 -59.1 Namagera 26,764 27,083 27,741 2.4 Namayingo 11,887 28,495 38,939 36.7 Nambale 26 Namutumba 83,331 85,329 88,312 3.5 Namwendwa 29,501 17,348 10,598 -38.9 Namwiwa 3,454 6,211 79.8 Nankoma 17,589 14,711 9,656 -34.4 Ocapa 38,291 39,613 47,071 18.8 Ochero 15,173 13,157 12,295 -6.6 Ongino 510 2,802 5,828 108.0 Suam 31,374 20,353 21,983 8.0 Toroma (Katakwi) 642 868 2,545 193.2 Usuk 4,497 0 2,033
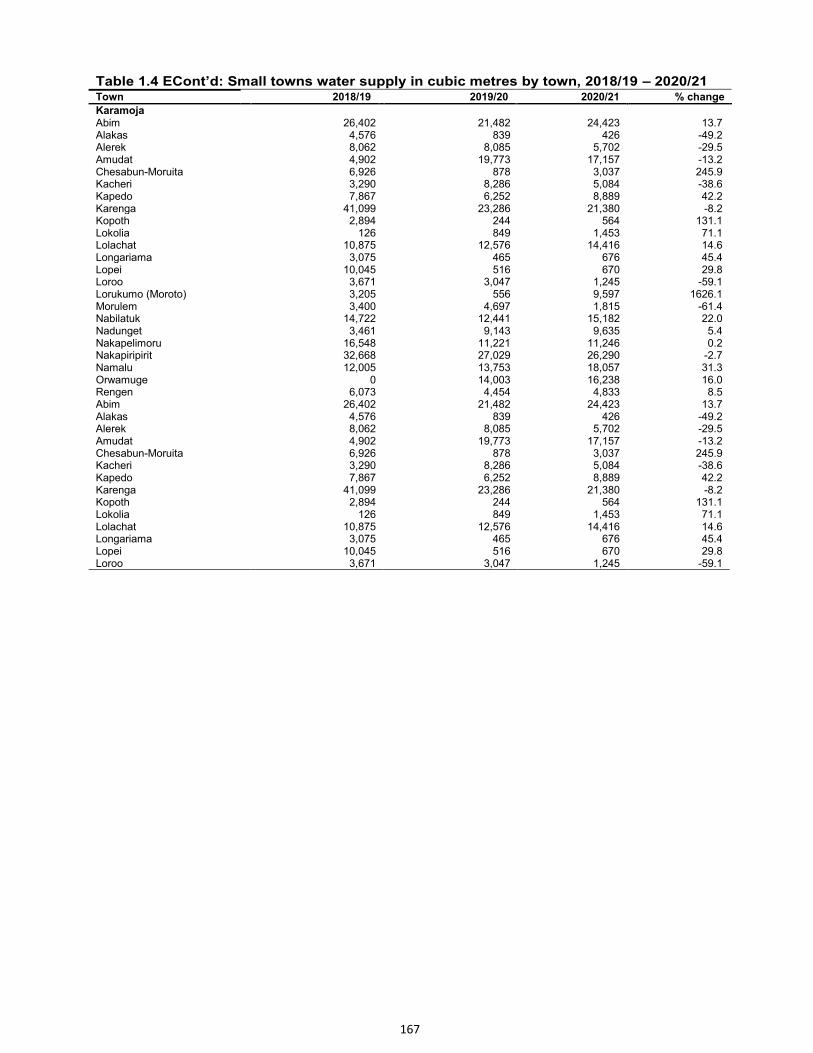
167
Table 1.4 ECont’d: Small towns water supply in cubic metres by town, 2018/19 – 2020/21 Town 2018/19 2019/20 2020/21 % change
Karamoja Abim 26,402 21,482 24,423 13.7
Alakas 4,576 839 426 -49.2 Alerek 8,062 8,085 5,702 -29.5 Amudat 4,902 19,773 17,157 -13.2 Chesabun-Moruita 6,926 878 3,037 245.9 Kacheri 3,290 8,286 5,084 -38.6 Kapedo 7,867 6,252 8,889 42.2 Karenga 41,099 23,286 21,380 -8.2 Kopoth 2,894 244 564 131.1 Lokolia 126 849 1,453 71.1 Lolachat 10,875 12,576 14,416 14.6 Longariama 3,075 465 676 45.4 Lopei 10,045 516 670 29.8 Loroo 3,671 3,047 1,245 -59.1 Lorukumo (Moroto) 3,205 556 9,597 1626.1 Morulem 3,400 4,697 1,815 -61.4 Nabilatuk 14,722 12,441 15,182 22.0 Nadunget 3,461 9,143 9,635 5.4 Nakapelimoru 16,548 11,221 11,246 0.2 Nakapiripirit 32,668 27,029 26,290 -2.7 Namalu 12,005 13,753 18,057 31.3 Orwamuge 0 14,003 16,238 16.0 Rengen 6,073 4,454 4,833 8.5 Abim 26,402 21,482 24,423 13.7 Alakas 4,576 839 426 -49.2 Alerek 8,062 8,085 5,702 -29.5 Amudat 4,902 19,773 17,157 -13.2 Chesabun-Moruita 6,926 878 3,037 245.9 Kacheri 3,290 8,286 5,084 -38.6 Kapedo 7,867 6,252 8,889 42.2 Karenga 41,099 23,286 21,380 -8.2 Kopoth 2,894 244 564 131.1 Lokolia 126 849 1,453 71.1 Lolachat 10,875 12,576 14,416 14.6 Longariama 3,075 465 676 45.4 Lopei 10,045 516 670 29.8 Loroo 3,671 3,047 1,245 -59.1
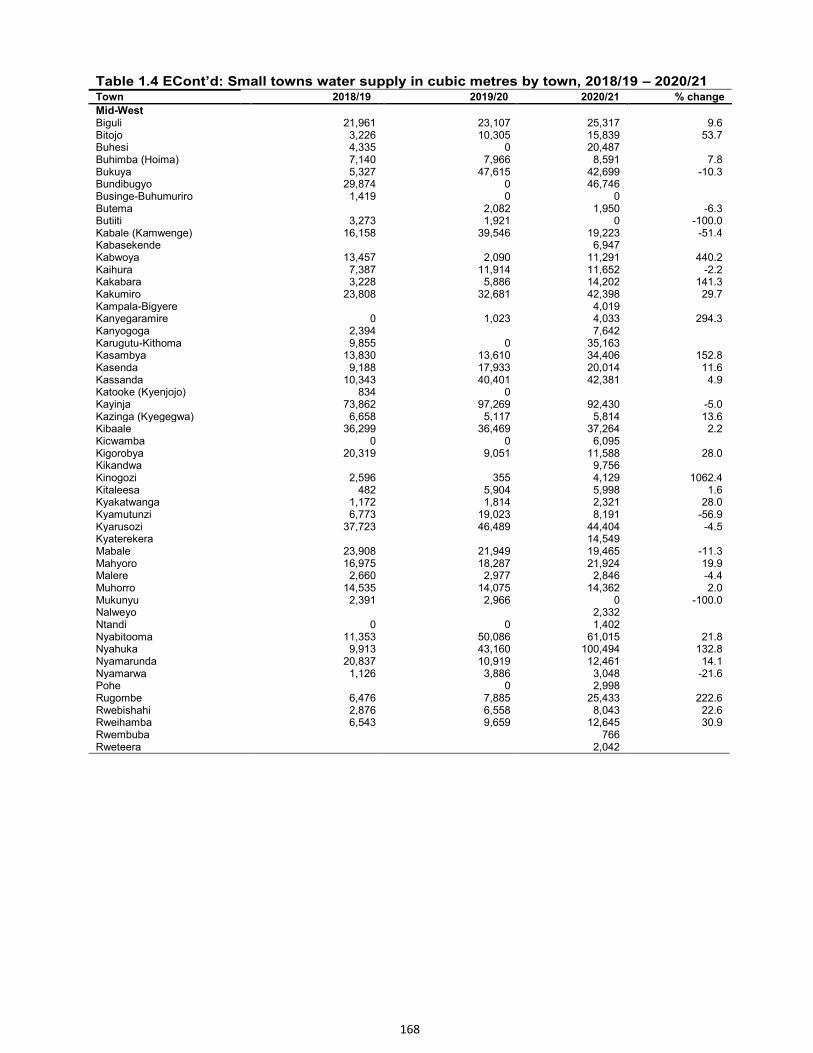
168
Table 1.4 ECont’d: Small towns water supply in cubic metres by town, 2018/19 – 2020/21 Town 2018/19 2019/20 2020/21 % change
Mid-West Biguli 21,961 23,107 25,317 9.6
Bitojo 3,226 10,305 15,839 53.7 Buhesi 4,335 0 20,487
Buhimba (Hoima) 7,140 7,966 8,591 7.8 Bukuya 5,327 47,615 42,699 -10.3 Bundibugyo 29,874 0 46,746
Businge-Buhumuriro 1,419 0 0 Butema
2,082 1,950 -6.3
Butiiti 3,273 1,921 0 -100.0 Kabale (Kamwenge) 16,158 39,546 19,223 -51.4 Kabasekende 6,947 Kabwoya 13,457 2,090 11,291 440.2 Kaihura 7,387 11,914 11,652 -2.2 Kakabara 3,228 5,886 14,202 141.3 Kakumiro 23,808 32,681 42,398 29.7 Kampala-Bigyere 4,019 Kanyegaramire 0 1,023 4,033 294.3 Kanyogoga 2,394 7,642 Karugutu-Kithoma 9,855 0 35,163 Kasambya 13,830 13,610 34,406 152.8 Kasenda 9,188 17,933 20,014 11.6 Kassanda 10,343 40,401 42,381 4.9 Katooke (Kyenjojo) 834 0 Kayinja 73,862 97,269 92,430 -5.0 Kazinga (Kyegegwa) 6,658 5,117 5,814 13.6 Kibaale 36,299 36,469 37,264 2.2 Kicwamba 0 0 6,095 Kigorobya 20,319 9,051 11,588 28.0 Kikandwa 9,756 Kinogozi 2,596 355 4,129 1062.4 Kitaleesa 482 5,904 5,998 1.6 Kyakatwanga 1,172 1,814 2,321 28.0 Kyamutunzi 6,773 19,023 8,191 -56.9 Kyarusozi 37,723 46,489 44,404 -4.5 Kyaterekera 14,549 Mabale 23,908 21,949 19,465 -11.3 Mahyoro 16,975 18,287 21,924 19.9 Malere 2,660 2,977 2,846 -4.4 Muhorro 14,535 14,075 14,362 2.0 Mukunyu 2,391 2,966 0 -100.0 Nalweyo 2,332 Ntandi 0 0 1,402 Nyabitooma 11,353 50,086 61,015 21.8 Nyahuka 9,913 43,160 100,494 132.8 Nyamarunda 20,837 10,919 12,461 14.1 Nyamarwa 1,126 3,886 3,048 -21.6 Pohe 0 2,998 Rugombe 6,476 7,885 25,433 222.6 Rwebishahi 2,876 6,558 8,043 22.6 Rweihamba 6,543 9,659 12,645 30.9 Rwembuba 766 Rweteera 2,042
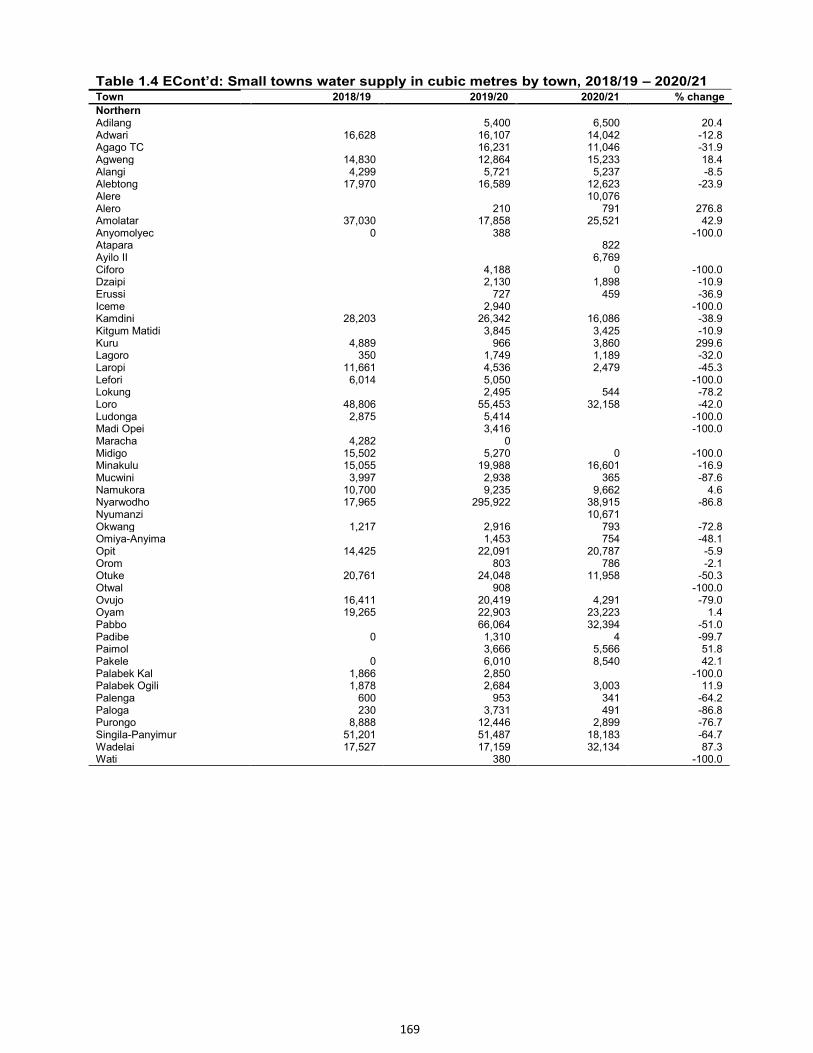
169
Table 1.4 ECont’d: Small towns water supply in cubic metres by town, 2018/19 – 2020/21 Town 2018/19 2019/20 2020/21 % change
Northern Adilang
5,400 6,500 20.4 Adwari 16,628 16,107 14,042 -12.8 Agago TC
16,231 11,046 -31.9
Agweng 14,830 12,864 15,233 18.4 Alangi 4,299 5,721 5,237 -8.5 Alebtong 17,970 16,589 12,623 -23.9 Alere
10,076
Alero
210 791 276.8 Amolatar 37,030 17,858 25,521 42.9 Anyomolyec 0 388 -100.0 Atapara 822 Ayilo II 6,769 Ciforo 4,188 0 -100.0 Dzaipi 2,130 1,898 -10.9 Erussi 727 459 -36.9 Iceme 2,940 -100.0 Kamdini 28,203 26,342 16,086 -38.9 Kitgum Matidi 3,845 3,425 -10.9 Kuru 4,889 966 3,860 299.6 Lagoro 350 1,749 1,189 -32.0 Laropi 11,661 4,536 2,479 -45.3 Lefori 6,014 5,050 -100.0 Lokung 2,495 544 -78.2 Loro 48,806 55,453 32,158 -42.0 Ludonga 2,875 5,414 -100.0 Madi Opei 3,416 -100.0 Maracha 4,282 0 Midigo 15,502 5,270 0 -100.0 Minakulu 15,055 19,988 16,601 -16.9 Mucwini 3,997 2,938 365 -87.6 Namukora 10,700 9,235 9,662 4.6 Nyarwodho 17,965 295,922 38,915 -86.8 Nyumanzi 10,671 Okwang 1,217 2,916 793 -72.8 Omiya-Anyima 1,453 754 -48.1 Opit 14,425 22,091 20,787 -5.9 Orom 803 786 -2.1 Otuke 20,761 24,048 11,958 -50.3 Otwal 908 -100.0 Ovujo 16,411 20,419 4,291 -79.0 Oyam 19,265 22,903 23,223 1.4 Pabbo 66,064 32,394 -51.0 Padibe 0 1,310 4 -99.7 Paimol 3,666 5,566 51.8 Pakele 0 6,010 8,540 42.1 Palabek Kal 1,866 2,850 -100.0 Palabek Ogili 1,878 2,684 3,003 11.9 Palenga 600 953 341 -64.2 Paloga 230 3,731 491 -86.8 Purongo 8,888 12,446 2,899 -76.7 Singila-Panyimur 51,201 51,487 18,183 -64.7 Wadelai 17,527 17,159 32,134 87.3 Wati 380 -100.0
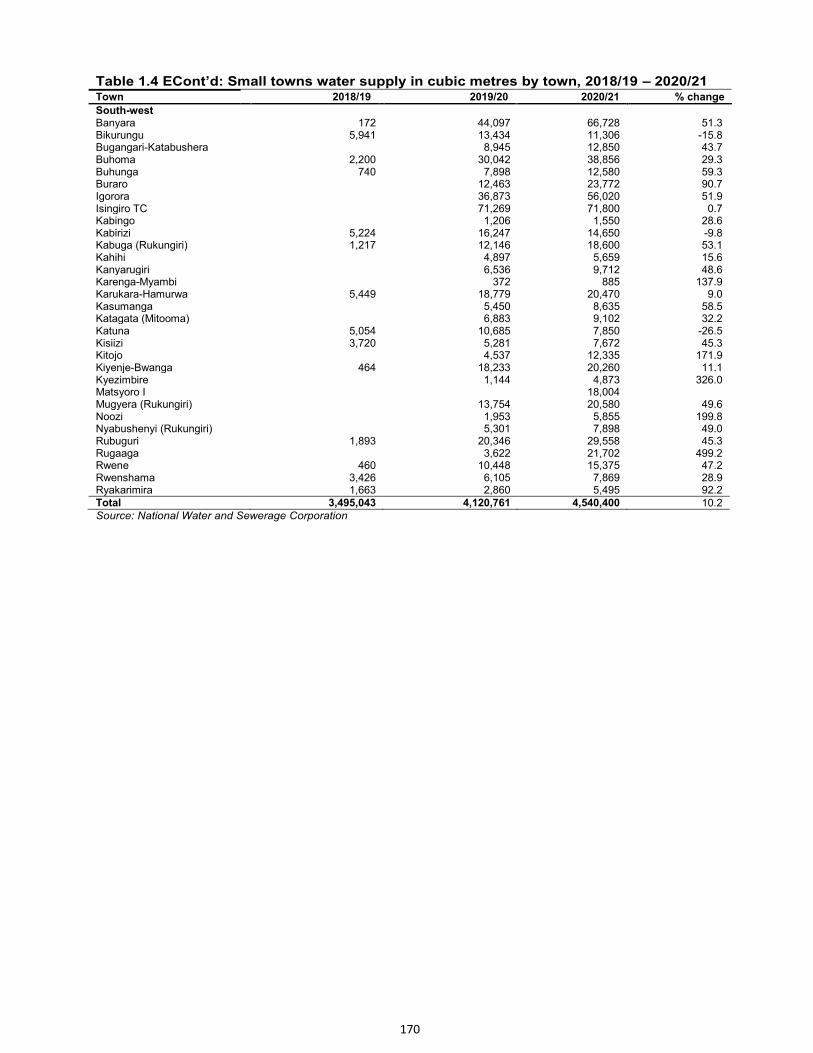
170
Table 1.4 ECont’d: Small towns water supply in cubic metres by town, 2018/19 – 2020/21 Town 2018/19 2019/20 2020/21 % change
South-west Banyara 172 44,097 66,728 51.3
Bikurungu 5,941 13,434 11,306 -15.8 Bugangari-Katabushera
8,945 12,850 43.7
Buhoma 2,200 30,042 38,856 29.3 Buhunga 740 7,898 12,580 59.3 Buraro
12,463 23,772 90.7
Igorora
36,873 56,020 51.9 Isingiro TC
71,269 71,800 0.7
Kabingo
1,206 1,550 28.6 Kabirizi 5,224 16,247 14,650 -9.8 Kabuga (Rukungiri) 1,217 12,146 18,600 53.1 Kahihi 4,897 5,659 15.6 Kanyarugiri 6,536 9,712 48.6 Karenga-Myambi 372 885 137.9 Karukara-Hamurwa 5,449 18,779 20,470 9.0 Kasumanga 5,450 8,635 58.5 Katagata (Mitooma) 6,883 9,102 32.2 Katuna 5,054 10,685 7,850 -26.5 Kisiizi 3,720 5,281 7,672 45.3 Kitojo 4,537 12,335 171.9 Kiyenje-Bwanga 464 18,233 20,260 11.1 Kyezimbire 1,144 4,873 326.0 Matsyoro I 18,004 Mugyera (Rukungiri) 13,754 20,580 49.6 Noozi 1,953 5,855 199.8 Nyabushenyi (Rukungiri) 5,301 7,898 49.0 Rubuguri 1,893 20,346 29,558 45.3 Rugaaga 3,622 21,702 499.2 Rwene 460 10,448 15,375 47.2 Rwenshama 3,426 6,105 7,869 28.9 Ryakarimira 1,663 2,860 5,495 92.2 Total 3,495,043 4,120,761 4,540,400 10.2 Source: National Water and Sewerage Corporation
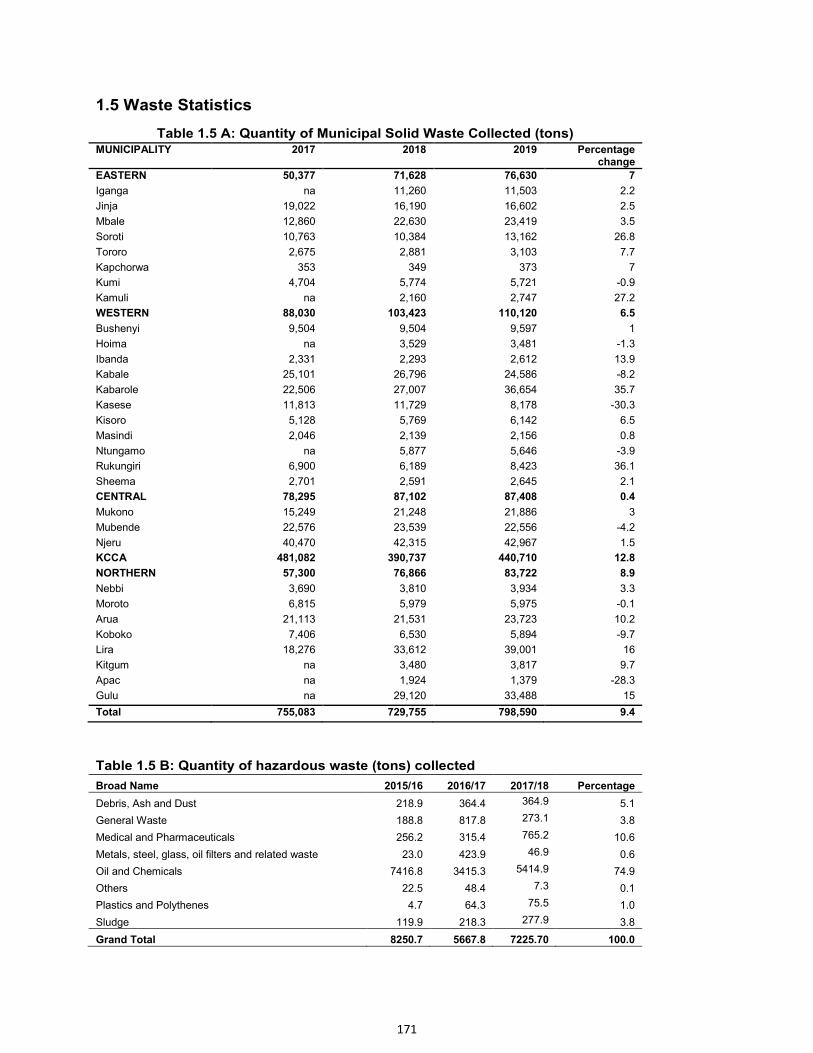
171
1.5 Waste Statistics
Table 1.5 A: Quantity of Municipal Solid Waste Collected (tons) MUNICIPALITY 2017 2018 2019 Percentage
change
EASTERN 50,377 71,628 76,630 7
Iganga na 11,260 11,503 2.2
Jinja 19,022 16,190 16,602 2.5
Mbale 12,860 22,630 23,419 3.5
Soroti 10,763 10,384 13,162 26.8
Tororo 2,675 2,881 3,103 7.7
Kapchorwa 353 349 373 7
Kumi 4,704 5,774 5,721 -0.9
Kamuli na 2,160 2,747 27.2
WESTERN 88,030 103,423 110,120 6.5
Bushenyi 9,504 9,504 9,597 1
Hoima na 3,529 3,481 -1.3
Ibanda 2,331 2,293 2,612 13.9
Kabale 25,101 26,796 24,586 -8.2
Kabarole 22,506 27,007 36,654 35.7
Kasese 11,813 11,729 8,178 -30.3
Kisoro 5,128 5,769 6,142 6.5
Masindi 2,046 2,139 2,156 0.8
Ntungamo na 5,877 5,646 -3.9
Rukungiri 6,900 6,189 8,423 36.1
Sheema 2,701 2,591 2,645 2.1
CENTRAL 78,295 87,102 87,408 0.4
Mukono 15,249 21,248 21,886 3
Mubende 22,576 23,539 22,556 -4.2
Njeru 40,470 42,315 42,967 1.5
KCCA 481,082 390,737 440,710 12.8
NORTHERN 57,300 76,866 83,722 8.9
Nebbi 3,690 3,810 3,934 3.3
Moroto 6,815 5,979 5,975 -0.1
Arua 21,113 21,531 23,723 10.2
Koboko 7,406 6,530 5,894 -9.7
Lira 18,276 33,612 39,001 16
Kitgum na 3,480 3,817 9.7
Apac na 1,924 1,379 -28.3
Gulu na 29,120 33,488 15
Total 755,083 729,755 798,590 9.4
Table 1.5 B: Quantity of hazardous waste (tons) collected
Broad Name 2015/16 2016/17 2017/18 Percentage
Debris, Ash and Dust 218.9 364.4 364.9 5.1
General Waste 188.8 817.8 273.1 3.8
Medical and Pharmaceuticals 256.2 315.4 765.2 10.6
Metals, steel, glass, oil filters and related waste 23.0 423.9 46.9 0.6
Oil and Chemicals 7416.8 3415.3 5414.9 74.9
Others 22.5 48.4 7.3 0.1
Plastics and Polythenes 4.7 64.3 75.5 1.0
Sludge 119.9 218.3 277.9 3.8
Grand Total 8250.7 5667.8 7225.70 100.0
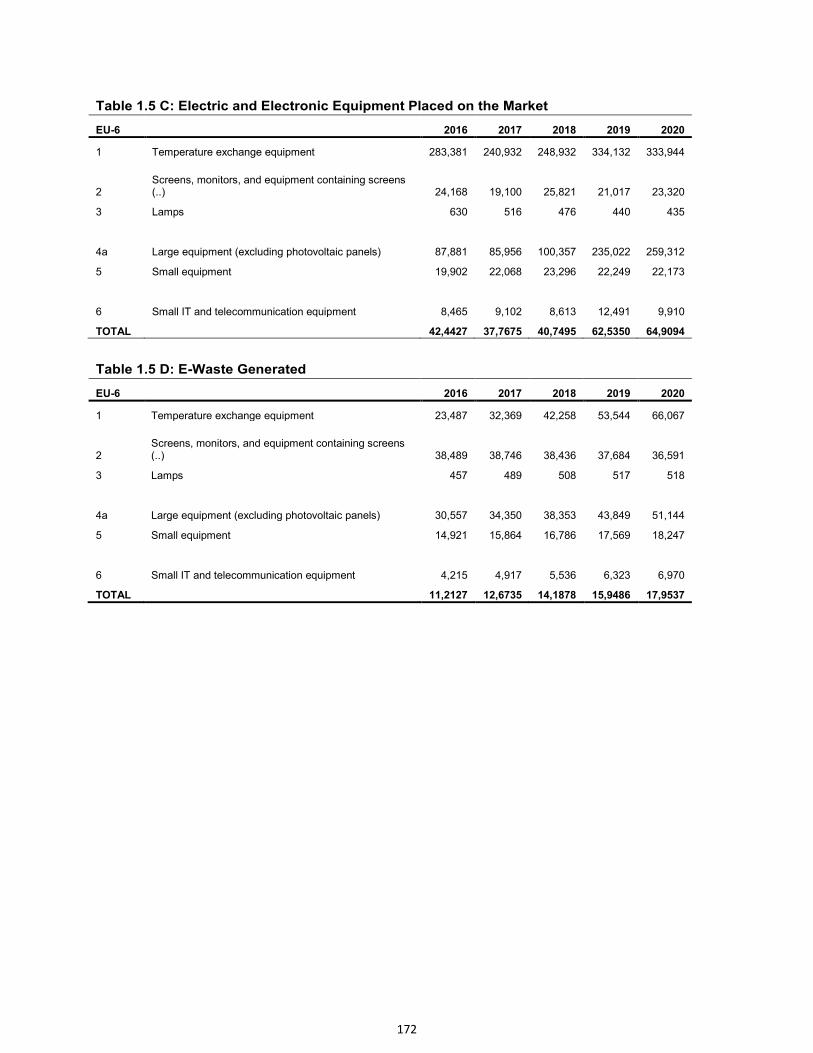
172
Table 1.5 C: Electric and Electronic Equipment Placed on the Market
EU-6 2016 2017 2018 2019 2020
1 Temperature exchange equipment 283,381 240,932 248,932 334,132 333,944
2 Screens, monitors, and equipment containing screens (..) 24,168 19,100 25,821 21,017 23,320
3 Lamps 630 516 476 440 435
4a Large equipment (excluding photovoltaic panels) 87,881 85,956 100,357 235,022 259,312
5 Small equipment 19,902 22,068 23,296 22,249 22,173
6 Small IT and telecommunication equipment 8,465 9,102 8,613 12,491 9,910
TOTAL 42,4427 37,7675 40,7495 62,5350 64,9094
Table 1.5 D: E-Waste Generated
EU-6 2016 2017 2018 2019 2020
1 Temperature exchange equipment 23,487 32,369 42,258 53,544 66,067
2 Screens, monitors, and equipment containing screens (..) 38,489 38,746 38,436 37,684 36,591
3 Lamps 457 489 508 517 518
4a Large equipment (excluding photovoltaic panels) 30,557 34,350 38,353 43,849 51,144
5 Small equipment 14,921 15,864 16,786 17,569 18,247
6 Small IT and telecommunication equipment 4,215 4,917 5,536 6,323 6,970
TOTAL 11,2127 12,6735 14,1878 15,9486 17,9537
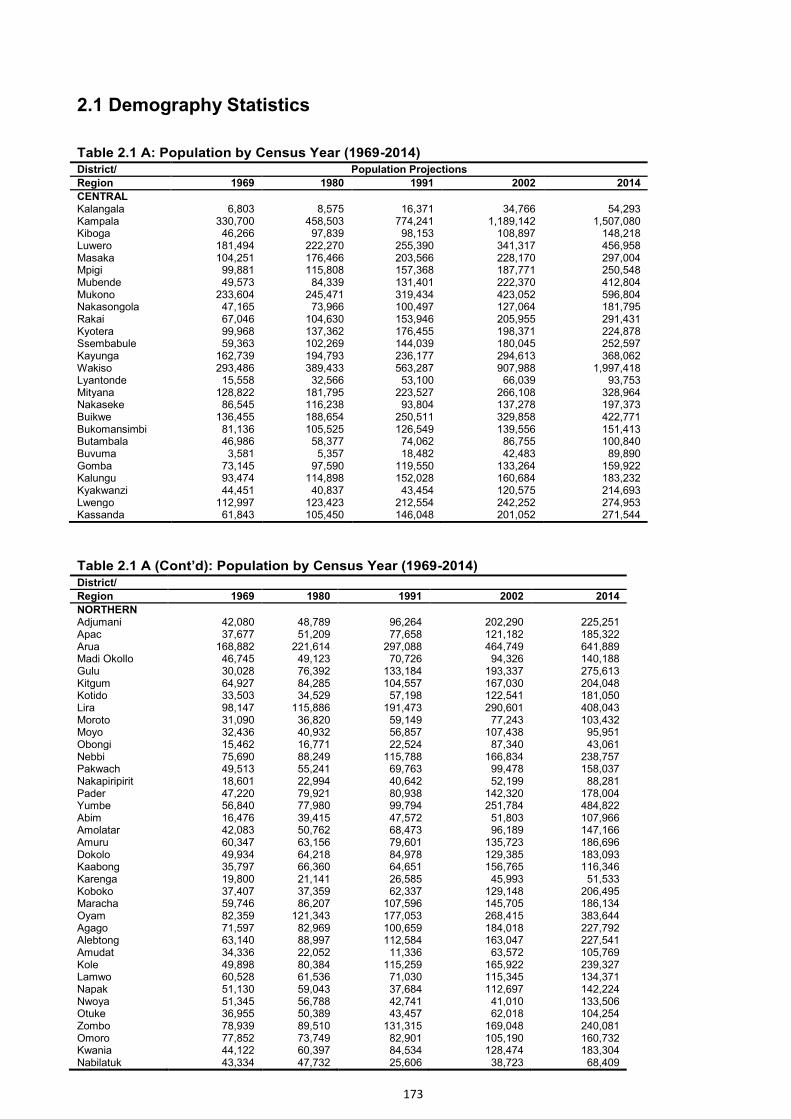
173
2.1 Demography Statistics
Table 2.1 A: Population by Census Year (1969-2014) District/ Population Projections
Region 1969 1980 1991 2002 2014
CENTRAL Kalangala 6,803 8,575 16,371 34,766 54,293
Kampala 330,700 458,503 774,241 1,189,142 1,507,080 Kiboga 46,266 97,839 98,153 108,897 148,218 Luwero 181,494 222,270 255,390 341,317 456,958 Masaka 104,251 176,466 203,566 228,170 297,004 Mpigi 99,881 115,808 157,368 187,771 250,548 Mubende 49,573 84,339 131,401 222,370 412,804 Mukono 233,604 245,471 319,434 423,052 596,804 Nakasongola 47,165 73,966 100,497 127,064 181,795 Rakai 67,046 104,630 153,946 205,955 291,431 Kyotera 99,968 137,362 176,455 198,371 224,878 Ssembabule 59,363 102,269 144,039 180,045 252,597 Kayunga 162,739 194,793 236,177 294,613 368,062 Wakiso 293,486 389,433 563,287 907,988 1,997,418 Lyantonde 15,558 32,566 53,100 66,039 93,753 Mityana 128,822 181,795 223,527 266,108 328,964 Nakaseke 86,545 116,238 93,804 137,278 197,373 Buikwe 136,455 188,654 250,511 329,858 422,771 Bukomansimbi 81,136 105,525 126,549 139,556 151,413 Butambala 46,986 58,377 74,062 86,755 100,840 Buvuma 3,581 5,357 18,482 42,483 89,890 Gomba 73,145 97,590 119,550 133,264 159,922 Kalungu 93,474 114,898 152,028 160,684 183,232 Kyakwanzi 44,451 40,837 43,454 120,575 214,693 Lwengo 112,997 123,423 212,554 242,252 274,953 Kassanda 61,843 105,450 146,048 201,052 271,544
Table 2.1 A (Cont’d): Population by Census Year (1969-2014) District/
Region 1969 1980 1991 2002 2014
NORTHERN Adjumani 42,080 48,789 96,264 202,290 225,251
Apac 37,677 51,209 77,658 121,182 185,322 Arua 168,882 221,614 297,088 464,749 641,889 Madi Okollo 46,745 49,123 70,726 94,326 140,188 Gulu 30,028 76,392 133,184 193,337 275,613 Kitgum 64,927 84,285 104,557 167,030 204,048 Kotido 33,503 34,529 57,198 122,541 181,050 Lira 98,147 115,886 191,473 290,601 408,043 Moroto 31,090 36,820 59,149 77,243 103,432 Moyo 32,436 40,932 56,857 107,438 95,951 Obongi 15,462 16,771 22,524 87,340 43,061 Nebbi 75,690 88,249 115,788 166,834 238,757 Pakwach 49,513 55,241 69,763 99,478 158,037 Nakapiripirit 18,601 22,994 40,642 52,199 88,281 Pader 47,220 79,921 80,938 142,320 178,004 Yumbe 56,840 77,980 99,794 251,784 484,822 Abim 16,476 39,415 47,572 51,803 107,966 Amolatar 42,083 50,762 68,473 96,189 147,166 Amuru 60,347 63,156 79,601 135,723 186,696 Dokolo 49,934 64,218 84,978 129,385 183,093 Kaabong 35,797 66,360 64,651 156,765 116,346 Karenga 19,800 21,141 26,585 45,993 51,533 Koboko 37,407 37,359 62,337 129,148 206,495 Maracha 59,746 86,207 107,596 145,705 186,134 Oyam 82,359 121,343 177,053 268,415 383,644 Agago 71,597 82,969 100,659 184,018 227,792 Alebtong 63,140 88,997 112,584 163,047 227,541 Amudat 34,336 22,052 11,336 63,572 105,769 Kole 49,898 80,384 115,259 165,922 239,327 Lamwo 60,528 61,536 71,030 115,345 134,371 Napak 51,130 59,043 37,684 112,697 142,224 Nwoya 51,345 56,788 42,741 41,010 133,506 Otuke 36,955 50,389 43,457 62,018 104,254 Zombo 78,939 89,510 131,315 169,048 240,081 Omoro 77,852 73,749 82,901 105,190 160,732 Kwania 44,122 60,397 84,534 128,474 183,304 Nabilatuk 43,334 47,732 25,606 38,723 68,409
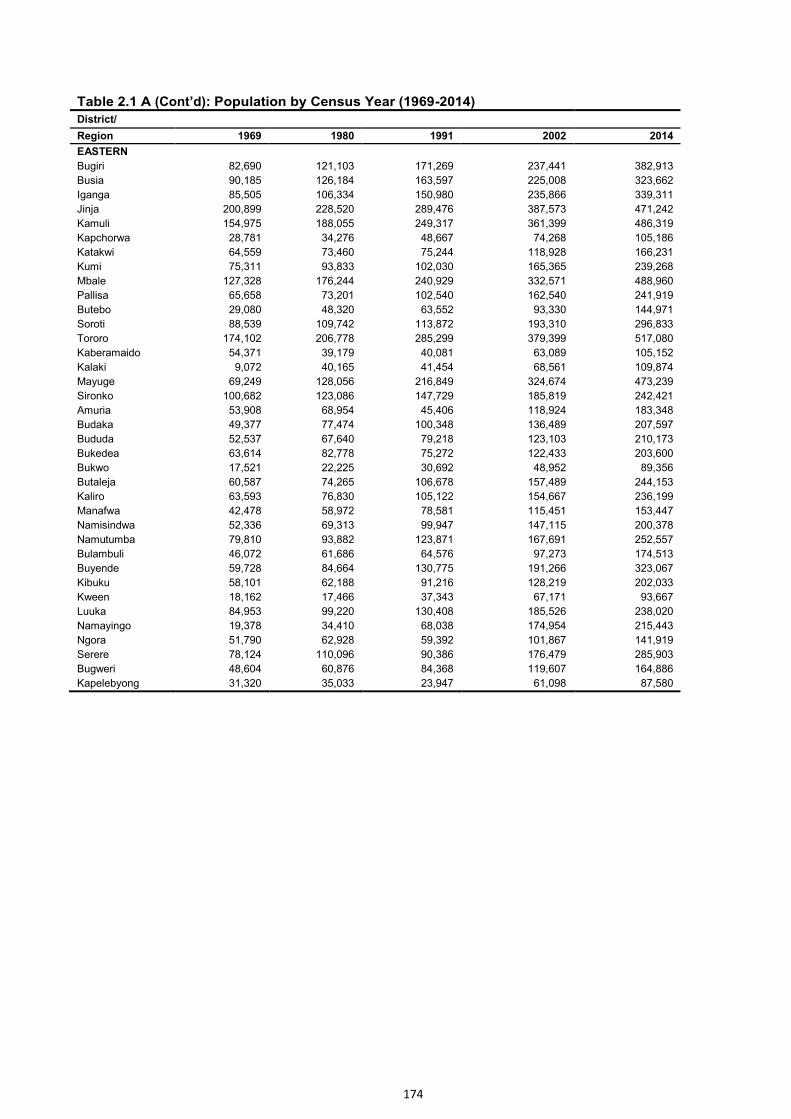
174
Table 2.1 A (Cont’d): Population by Census Year (1969-2014)
District/
Region 1969 1980 1991 2002 2014
EASTERN
Bugiri 82,690 121,103 171,269 237,441 382,913
Busia 90,185 126,184 163,597 225,008 323,662
Iganga 85,505 106,334 150,980 235,866 339,311
Jinja 200,899 228,520 289,476 387,573 471,242
Kamuli 154,975 188,055 249,317 361,399 486,319
Kapchorwa 28,781 34,276 48,667 74,268 105,186
Katakwi 64,559 73,460 75,244 118,928 166,231
Kumi 75,311 93,833 102,030 165,365 239,268
Mbale 127,328 176,244 240,929 332,571 488,960
Pallisa 65,658 73,201 102,540 162,540 241,919
Butebo 29,080 48,320 63,552 93,330 144,971
Soroti 88,539 109,742 113,872 193,310 296,833
Tororo 174,102 206,778 285,299 379,399 517,080
Kaberamaido 54,371 39,179 40,081 63,089 105,152
Kalaki 9,072 40,165 41,454 68,561 109,874
Mayuge 69,249 128,056 216,849 324,674 473,239
Sironko 100,682 123,086 147,729 185,819 242,421
Amuria 53,908 68,954 45,406 118,924 183,348
Budaka 49,377 77,474 100,348 136,489 207,597
Bududa 52,537 67,640 79,218 123,103 210,173
Bukedea 63,614 82,778 75,272 122,433 203,600
Bukwo 17,521 22,225 30,692 48,952 89,356
Butaleja 60,587 74,265 106,678 157,489 244,153
Kaliro 63,593 76,830 105,122 154,667 236,199
Manafwa 42,478 58,972 78,581 115,451 153,447
Namisindwa 52,336 69,313 99,947 147,115 200,378
Namutumba 79,810 93,882 123,871 167,691 252,557
Bulambuli 46,072 61,686 64,576 97,273 174,513
Buyende 59,728 84,664 130,775 191,266 323,067
Kibuku 58,101 62,188 91,216 128,219 202,033
Kween 18,162 17,466 37,343 67,171 93,667
Luuka 84,953 99,220 130,408 185,526 238,020
Namayingo 19,378 34,410 68,038 174,954 215,443
Ngora 51,790 62,928 59,392 101,867 141,919
Serere 78,124 110,096 90,386 176,479 285,903
Bugweri 48,604 60,876 84,368 119,607 164,886
Kapelebyong 31,320 35,033 23,947 61,098 87,580
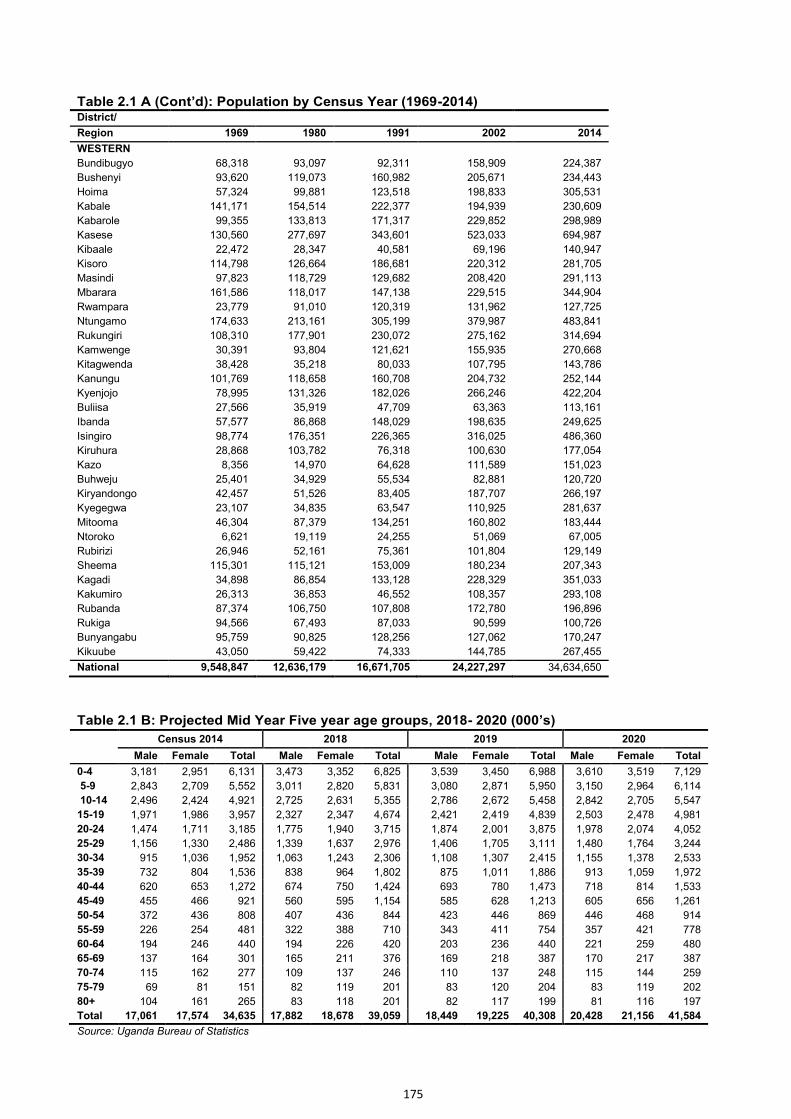
175
Table 2.1 A (Cont’d): Population by Census Year (1969-2014) District/
Region 1969 1980 1991 2002 2014
WESTERN
Bundibugyo 68,318 93,097 92,311 158,909 224,387
Bushenyi 93,620 119,073 160,982 205,671 234,443
Hoima 57,324 99,881 123,518 198,833 305,531
Kabale 141,171 154,514 222,377 194,939 230,609
Kabarole 99,355 133,813 171,317 229,852 298,989
Kasese 130,560 277,697 343,601 523,033 694,987
Kibaale 22,472 28,347 40,581 69,196 140,947
Kisoro 114,798 126,664 186,681 220,312 281,705
Masindi 97,823 118,729 129,682 208,420 291,113
Mbarara 161,586 118,017 147,138 229,515 344,904
Rwampara 23,779 91,010 120,319 131,962 127,725
Ntungamo 174,633 213,161 305,199 379,987 483,841
Rukungiri 108,310 177,901 230,072 275,162 314,694
Kamwenge 30,391 93,804 121,621 155,935 270,668
Kitagwenda 38,428 35,218 80,033 107,795 143,786
Kanungu 101,769 118,658 160,708 204,732 252,144
Kyenjojo 78,995 131,326 182,026 266,246 422,204
Buliisa 27,566 35,919 47,709 63,363 113,161
Ibanda 57,577 86,868 148,029 198,635 249,625
Isingiro 98,774 176,351 226,365 316,025 486,360
Kiruhura 28,868 103,782 76,318 100,630 177,054
Kazo 8,356 14,970 64,628 111,589 151,023
Buhweju 25,401 34,929 55,534 82,881 120,720
Kiryandongo 42,457 51,526 83,405 187,707 266,197
Kyegegwa 23,107 34,835 63,547 110,925 281,637
Mitooma 46,304 87,379 134,251 160,802 183,444
Ntoroko 6,621 19,119 24,255 51,069 67,005
Rubirizi 26,946 52,161 75,361 101,804 129,149
Sheema 115,301 115,121 153,009 180,234 207,343
Kagadi 34,898 86,854 133,128 228,329 351,033
Kakumiro 26,313 36,853 46,552 108,357 293,108
Rubanda 87,374 106,750 107,808 172,780 196,896
Rukiga 94,566 67,493 87,033 90,599 100,726
Bunyangabu 95,759 90,825 128,256 127,062 170,247
Kikuube 43,050 59,422 74,333 144,785 267,455
National 9,548,847 12,636,179 16,671,705 24,227,297 34,634,650
Table 2.1 B: Projected Mid Year Five year age groups, 2018- 2020 (000’s)
Census 2014 2018 2019 2020
Male Female Total Male Female Total Male Female Total Male Female Total
0-4 3,181 2,951 6,131 3,473 3,352 6,825 3,539 3,450 6,988 3,610 3,519 7,129
5-9 2,843 2,709 5,552 3,011 2,820 5,831 3,080 2,871 5,950 3,150 2,964 6,114
10-14 2,496 2,424 4,921 2,725 2,631 5,355 2,786 2,672 5,458 2,842 2,705 5,547
15-19 1,971 1,986 3,957 2,327 2,347 4,674 2,421 2,419 4,839 2,503 2,478 4,981
20-24 1,474 1,711 3,185 1,775 1,940 3,715 1,874 2,001 3,875 1,978 2,074 4,052
25-29 1,156 1,330 2,486 1,339 1,637 2,976 1,406 1,705 3,111 1,480 1,764 3,244
30-34 915 1,036 1,952 1,063 1,243 2,306 1,108 1,307 2,415 1,155 1,378 2,533
35-39 732 804 1,536 838 964 1,802 875 1,011 1,886 913 1,059 1,972
40-44 620 653 1,272 674 750 1,424 693 780 1,473 718 814 1,533
45-49 455 466 921 560 595 1,154 585 628 1,213 605 656 1,261
50-54 372 436 808 407 436 844 423 446 869 446 468 914
55-59 226 254 481 322 388 710 343 411 754 357 421 778
60-64 194 246 440 194 226 420 203 236 440 221 259 480
65-69 137 164 301 165 211 376 169 218 387 170 217 387
70-74 115 162 277 109 137 246 110 137 248 115 144 259
75-79 69 81 151 82 119 201 83 120 204 83 119 202
80+ 104 161 265 83 118 201 82 117 199 81 116 197
Total 17,061 17,574 34,635 17,882 18,678 39,059 18,449 19,225 40,308 20,428 21,156 41,584
Source: Uganda Bureau of Statistics

176
Table 2.1 C: Census Population counts (2002 and 2014) by Region, District and Mid Year Population
projections (2015-2021)
District/ Census Population Population Projections
Region 2002 2014 2015 2016 2017 2018 2019 2020 2021
CENTRAL
Kalangala 34,766 54,293 55,900 58,100 60,300 62,500 64,800 67,200 69,500
Kampala 1,189,142 1,507,080 1,529,400 1,559,700 1,590,100 1,620,600 1,650,800 1,680,600 1,709,900
Kiboga 108,897 148,218 151,200 155,100 159,100 163,100 167,100 171,200 175,200
Luwero 341,317 456,958 465,500 476,900 488,500 500,200 511,900 523,600 535,200
Masaka 228,170 297,004 301,900 308,600 315,400 322,200 328,900 335,700 342,300
Mpigi 187,771 250,548 255,200 261,400 267,600 273,900 280,300 286,600 292,900
Mubende 222,370 412,804 430,200 453,000 476,900 501,900 527,800 554,800 582,900
Mukono 423,052 596,804 610,200 627,900 646,000 664,300 682,800 701,400 720,100
Nakasongola 127,064 181,795 186,100 191,700 197,500 203,400 209,300 215,200 221,300
Rakai 205,955 291,431 282,000 289,000 296,100 303,300 310,500 317,700 324,800
Kyotera 198,371 224,878 242,300 246,100 250,000 253,700 257,400 261,000 264,500
Ssembabule 180,045 252,597 258,200 265,500 273,100 280,700 288,400 296,100 303,900
Kayunga 294,613 368,062 373,200 380,100 387,100 394,000 400,900 407,700 414,300
Wakiso 907,988 1,997,418 2,107,500 2,250,000 2,402,800 2,563,800 2,735,100 2,915,200 3,105,700
Lyantonde 66,039 93,753 95,900 98,800 101,600 104,600 107,500 110,500 113,500
Mityana 266,108 328,964 333,300 339,200 345,200 351,100 356,800 362,500 368,200
Nakaseke 137,278 197,373 202,200 208,400 214,700 221,300 227,900 234,600 241,400
Buikwe 329,858 422,771 429,300 438,300 447,300 456,300 465,200 474,100 482,900
Bukomansimbi 139,556 151,413 152,000 153,000 154,000 154,900 155,800 156,600 157,300
Butambala 86,755 100,840 101,700 103,000 104,300 105,500 106,700 107,800 109,000
Buvuma 42,483 89,890 94,500 100,700 107,200 114,000 121,300 128,900 137,000
Gomba 133,264 159,922 161,700 164,100 166,600 169,100 171,400 173,800 176,100
Kalungu 160,684 183,232 184,600 186,600 188,600 190,500 192,400 194,100 195,800
Kyakwanzi 120,575 214,693 223,200 234,200 245,600 257,600 270,000 282,800 296,100
Lwengo 242,252 274,953 276,900 279,800 282,600 285,400 288,100 290,500 292,900
Kassanda 201,052 271,544 276,800 283,900 291,000 298,200 305,400 312,700 319,900
Source: Uganda Bureau of Statistics
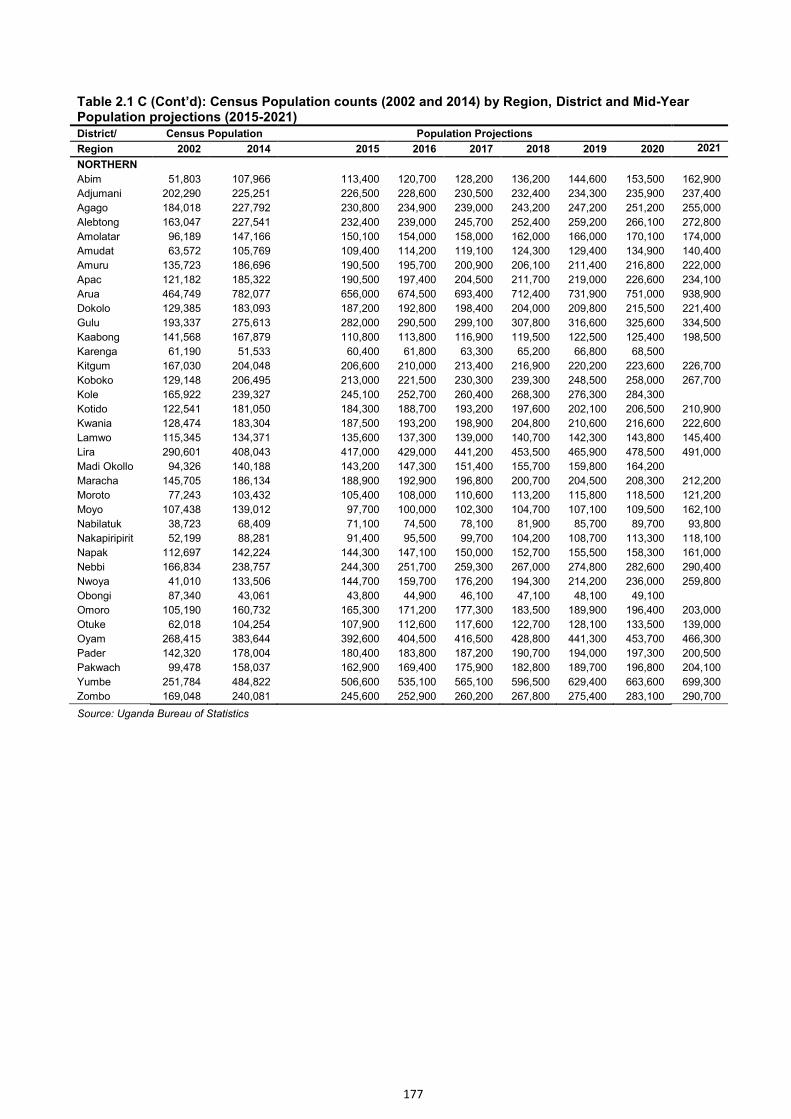
177
Table 2.1 C (Cont’d): Census Population counts (2002 and 2014) by Region, District and Mid-Year Population projections (2015-2021) District/ Census Population Population Projections
Region 2002 2014 2015 2016 2017 2018 2019 2020 2021
NORTHERN
Abim 51,803 107,966 113,400 120,700 128,200 136,200 144,600 153,500 162,900
Adjumani 202,290 225,251 226,500 228,600 230,500 232,400 234,300 235,900 237,400
Agago 184,018 227,792 230,800 234,900 239,000 243,200 247,200 251,200 255,000
Alebtong 163,047 227,541 232,400 239,000 245,700 252,400 259,200 266,100 272,800
Amolatar 96,189 147,166 150,100 154,000 158,000 162,000 166,000 170,100 174,000
Amudat 63,572 105,769 109,400 114,200 119,100 124,300 129,400 134,900 140,400
Amuru 135,723 186,696 190,500 195,700 200,900 206,100 211,400 216,800 222,000
Apac 121,182 185,322 190,500 197,400 204,500 211,700 219,000 226,600 234,100
Arua 464,749 782,077 656,000 674,500 693,400 712,400 731,900 751,000 938,900
Dokolo 129,385 183,093 187,200 192,800 198,400 204,000 209,800 215,500 221,400
Gulu 193,337 275,613 282,000 290,500 299,100 307,800 316,600 325,600 334,500
Kaabong 141,568 167,879 110,800 113,800 116,900 119,500 122,500 125,400 198,500
Karenga 61,190 51,533 60,400 61,800 63,300 65,200 66,800 68,500
Kitgum 167,030 204,048 206,600 210,000 213,400 216,900 220,200 223,600 226,700
Koboko 129,148 206,495 213,000 221,500 230,300 239,300 248,500 258,000 267,700
Kole 165,922 239,327 245,100 252,700 260,400 268,300 276,300 284,300
Kotido 122,541 181,050 184,300 188,700 193,200 197,600 202,100 206,500 210,900
Kwania 128,474 183,304 187,500 193,200 198,900 204,800 210,600 216,600 222,600
Lamwo 115,345 134,371 135,600 137,300 139,000 140,700 142,300 143,800 145,400
Lira 290,601 408,043 417,000 429,000 441,200 453,500 465,900 478,500 491,000
Madi Okollo 94,326 140,188 143,200 147,300 151,400 155,700 159,800 164,200
Maracha 145,705 186,134 188,900 192,900 196,800 200,700 204,500 208,300 212,200
Moroto 77,243 103,432 105,400 108,000 110,600 113,200 115,800 118,500 121,200
Moyo 107,438 139,012 97,700 100,000 102,300 104,700 107,100 109,500 162,100
Nabilatuk 38,723 68,409 71,100 74,500 78,100 81,900 85,700 89,700 93,800
Nakapiripirit 52,199 88,281 91,400 95,500 99,700 104,200 108,700 113,300 118,100
Napak 112,697 142,224 144,300 147,100 150,000 152,700 155,500 158,300 161,000
Nebbi 166,834 238,757 244,300 251,700 259,300 267,000 274,800 282,600 290,400
Nwoya 41,010 133,506 144,700 159,700 176,200 194,300 214,200 236,000 259,800
Obongi 87,340 43,061 43,800 44,900 46,100 47,100 48,100 49,100
Omoro 105,190 160,732 165,300 171,200 177,300 183,500 189,900 196,400 203,000
Otuke 62,018 104,254 107,900 112,600 117,600 122,700 128,100 133,500 139,000
Oyam 268,415 383,644 392,600 404,500 416,500 428,800 441,300 453,700 466,300
Pader 142,320 178,004 180,400 183,800 187,200 190,700 194,000 197,300 200,500
Pakwach 99,478 158,037 162,900 169,400 175,900 182,800 189,700 196,800 204,100
Yumbe 251,784 484,822 506,600 535,100 565,100 596,500 629,400 663,600 699,300
Zombo 169,048 240,081 245,600 252,900 260,200 267,800 275,400 283,100 290,700
Source: Uganda Bureau of Statistics
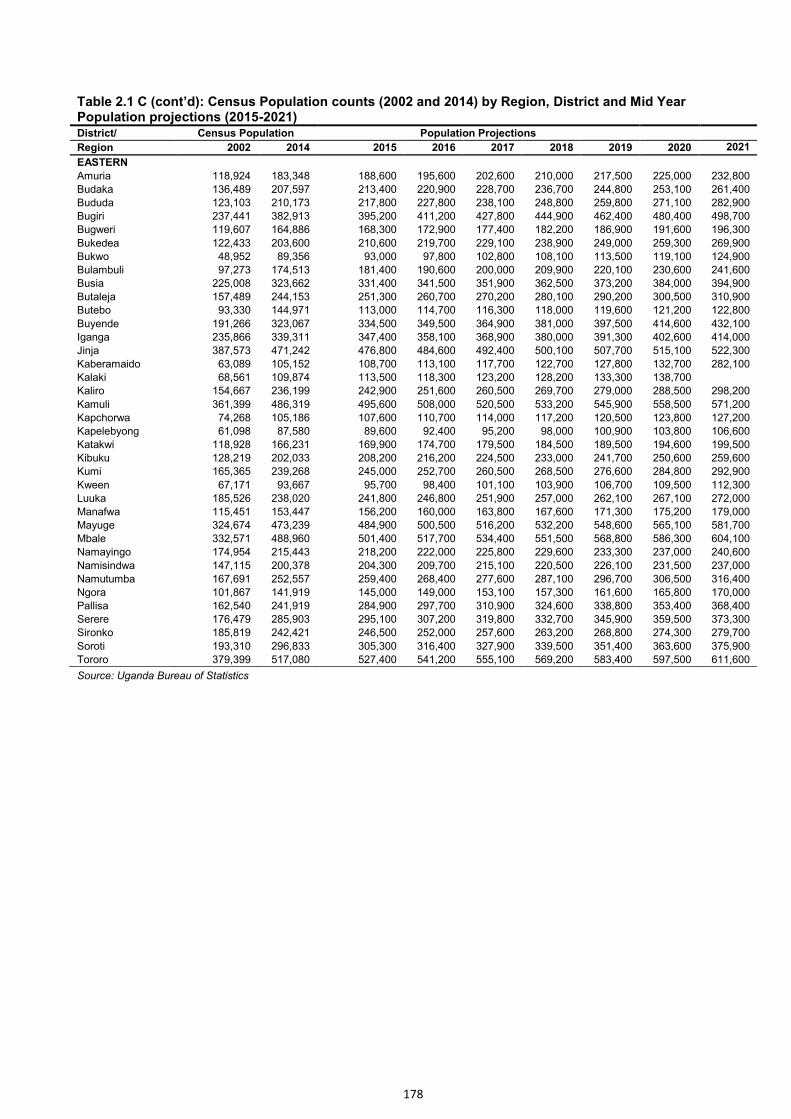
178
Table 2.1 C (cont’d): Census Population counts (2002 and 2014) by Region, District and Mid Year Population projections (2015-2021) District/ Census Population Population Projections
Region 2002 2014 2015 2016 2017 2018 2019 2020 2021
EASTERN
Amuria 118,924 183,348 188,600 195,600 202,600 210,000 217,500 225,000 232,800
Budaka 136,489 207,597 213,400 220,900 228,700 236,700 244,800 253,100 261,400
Bududa 123,103 210,173 217,800 227,800 238,100 248,800 259,800 271,100 282,900
Bugiri 237,441 382,913 395,200 411,200 427,800 444,900 462,400 480,400 498,700
Bugweri 119,607 164,886 168,300 172,900 177,400 182,200 186,900 191,600 196,300
Bukedea 122,433 203,600 210,600 219,700 229,100 238,900 249,000 259,300 269,900
Bukwo 48,952 89,356 93,000 97,800 102,800 108,100 113,500 119,100 124,900
Bulambuli 97,273 174,513 181,400 190,600 200,000 209,900 220,100 230,600 241,600
Busia 225,008 323,662 331,400 341,500 351,900 362,500 373,200 384,000 394,900
Butaleja 157,489 244,153 251,300 260,700 270,200 280,100 290,200 300,500 310,900
Butebo 93,330 144,971 113,000 114,700 116,300 118,000 119,600 121,200 122,800
Buyende 191,266 323,067 334,500 349,500 364,900 381,000 397,500 414,600 432,100
Iganga 235,866 339,311 347,400 358,100 368,900 380,000 391,300 402,600 414,000
Jinja 387,573 471,242 476,800 484,600 492,400 500,100 507,700 515,100 522,300
Kaberamaido 63,089 105,152 108,700 113,100 117,700 122,700 127,800 132,700 282,100
Kalaki 68,561 109,874 113,500 118,300 123,200 128,200 133,300 138,700
Kaliro 154,667 236,199 242,900 251,600 260,500 269,700 279,000 288,500 298,200
Kamuli 361,399 486,319 495,600 508,000 520,500 533,200 545,900 558,500 571,200
Kapchorwa 74,268 105,186 107,600 110,700 114,000 117,200 120,500 123,800 127,200
Kapelebyong 61,098 87,580 89,600 92,400 95,200 98,000 100,900 103,800 106,600
Katakwi 118,928 166,231 169,900 174,700 179,500 184,500 189,500 194,600 199,500
Kibuku 128,219 202,033 208,200 216,200 224,500 233,000 241,700 250,600 259,600
Kumi 165,365 239,268 245,000 252,700 260,500 268,500 276,600 284,800 292,900
Kween 67,171 93,667 95,700 98,400 101,100 103,900 106,700 109,500 112,300
Luuka 185,526 238,020 241,800 246,800 251,900 257,000 262,100 267,100 272,000
Manafwa 115,451 153,447 156,200 160,000 163,800 167,600 171,300 175,200 179,000
Mayuge 324,674 473,239 484,900 500,500 516,200 532,200 548,600 565,100 581,700
Mbale 332,571 488,960 501,400 517,700 534,400 551,500 568,800 586,300 604,100
Namayingo 174,954 215,443 218,200 222,000 225,800 229,600 233,300 237,000 240,600
Namisindwa 147,115 200,378 204,300 209,700 215,100 220,500 226,100 231,500 237,000
Namutumba 167,691 252,557 259,400 268,400 277,600 287,100 296,700 306,500 316,400
Ngora 101,867 141,919 145,000 149,000 153,100 157,300 161,600 165,800 170,000
Pallisa 162,540 241,919 284,900 297,700 310,900 324,600 338,800 353,400 368,400
Serere 176,479 285,903 295,100 307,200 319,800 332,700 345,900 359,500 373,300
Sironko 185,819 242,421 246,500 252,000 257,600 263,200 268,800 274,300 279,700
Soroti 193,310 296,833 305,300 316,400 327,900 339,500 351,400 363,600 375,900
Tororo 379,399 517,080 527,400 541,200 555,100 569,200 583,400 597,500 611,600
Source: Uganda Bureau of Statistics
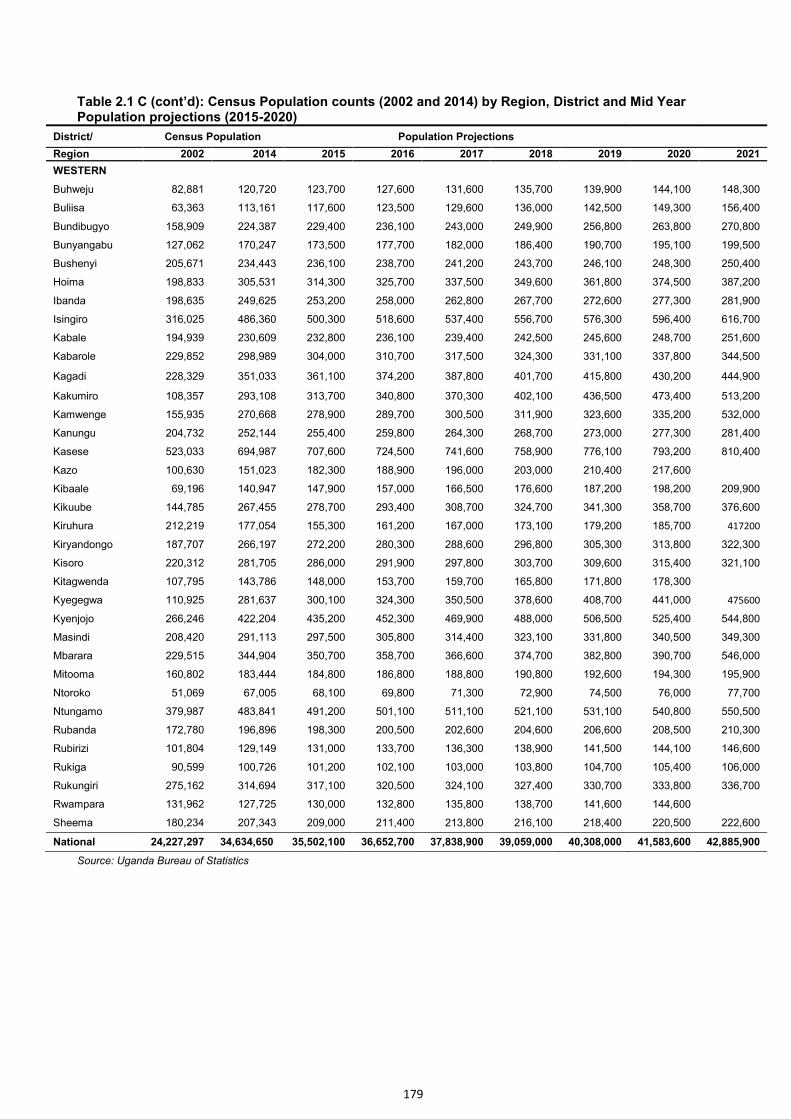
179
Table 2.1 C (cont’d): Census Population counts (2002 and 2014) by Region, District and Mid Year Population projections (2015-2020)
District/ Census Population Population Projections
Region 2002 2014 2015 2016 2017 2018 2019 2020 2021
WESTERN
Buhweju 82,881 120,720 123,700 127,600 131,600 135,700 139,900 144,100 148,300
Buliisa 63,363 113,161 117,600 123,500 129,600 136,000 142,500 149,300 156,400
Bundibugyo 158,909 224,387 229,400 236,100 243,000 249,900 256,800 263,800 270,800
Bunyangabu 127,062 170,247 173,500 177,700 182,000 186,400 190,700 195,100 199,500
Bushenyi 205,671 234,443 236,100 238,700 241,200 243,700 246,100 248,300 250,400
Hoima 198,833 305,531 314,300 325,700 337,500 349,600 361,800 374,500 387,200
Ibanda 198,635 249,625 253,200 258,000 262,800 267,700 272,600 277,300 281,900
Isingiro 316,025 486,360 500,300 518,600 537,400 556,700 576,300 596,400 616,700
Kabale 194,939 230,609 232,800 236,100 239,400 242,500 245,600 248,700 251,600
Kabarole 229,852 298,989 304,000 310,700 317,500 324,300 331,100 337,800 344,500
Kagadi 228,329 351,033 361,100 374,200 387,800 401,700 415,800 430,200 444,900
Kakumiro 108,357 293,108 313,700 340,800 370,300 402,100 436,500 473,400 513,200
Kamwenge 155,935 270,668 278,900 289,700 300,500 311,900 323,600 335,200 532,000
Kanungu 204,732 252,144 255,400 259,800 264,300 268,700 273,000 277,300 281,400
Kasese 523,033 694,987 707,600 724,500 741,600 758,900 776,100 793,200 810,400
Kazo 100,630 151,023 182,300 188,900 196,000 203,000 210,400 217,600
Kibaale 69,196 140,947 147,900 157,000 166,500 176,600 187,200 198,200 209,900
Kikuube 144,785 267,455 278,700 293,400 308,700 324,700 341,300 358,700 376,600
Kiruhura 212,219 177,054 155,300 161,200 167,000 173,100 179,200 185,700 417200
Kiryandongo 187,707 266,197 272,200 280,300 288,600 296,800 305,300 313,800 322,300
Kisoro 220,312 281,705 286,000 291,900 297,800 303,700 309,600 315,400 321,100
Kitagwenda 107,795 143,786 148,000 153,700 159,700 165,800 171,800 178,300
Kyegegwa 110,925 281,637 300,100 324,300 350,500 378,600 408,700 441,000 475600
Kyenjojo 266,246 422,204 435,200 452,300 469,900 488,000 506,500 525,400 544,800
Masindi 208,420 291,113 297,500 305,800 314,400 323,100 331,800 340,500 349,300
Mbarara 229,515 344,904 350,700 358,700 366,600 374,700 382,800 390,700 546,000
Mitooma 160,802 183,444 184,800 186,800 188,800 190,800 192,600 194,300 195,900
Ntoroko 51,069 67,005 68,100 69,800 71,300 72,900 74,500 76,000 77,700
Ntungamo 379,987 483,841 491,200 501,100 511,100 521,100 531,100 540,800 550,500
Rubanda 172,780 196,896 198,300 200,500 202,600 204,600 206,600 208,500 210,300
Rubirizi 101,804 129,149 131,000 133,700 136,300 138,900 141,500 144,100 146,600
Rukiga 90,599 100,726 101,200 102,100 103,000 103,800 104,700 105,400 106,000
Rukungiri 275,162 314,694 317,100 320,500 324,100 327,400 330,700 333,800 336,700
Rwampara 131,962 127,725 130,000 132,800 135,800 138,700 141,600 144,600
Sheema 180,234 207,343 209,000 211,400 213,800 216,100 218,400 220,500 222,600
National 24,227,297 34,634,650 35,502,100 36,652,700 37,838,900 39,059,000 40,308,000 41,583,600 42,885,900
Source: Uganda Bureau of Statistics
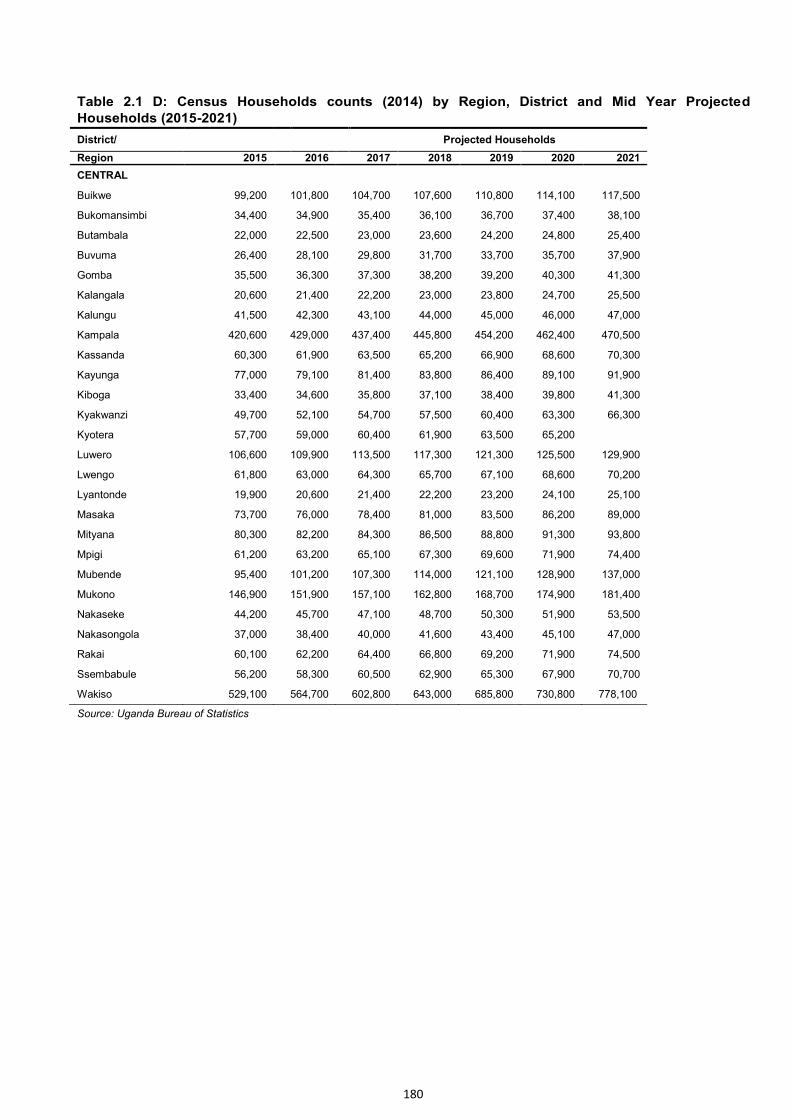
180
Table 2.1 D: Census Households counts (2014) by Region, District and Mid Year Projected
Households (2015-2021)
District/
Projected Households
Region 2015 2016 2017 2018 2019 2020 2021
CENTRAL
Buikwe 99,200 101,800 104,700 107,600 110,800 114,100 117,500
Bukomansimbi 34,400 34,900 35,400 36,100 36,700 37,400 38,100
Butambala 22,000 22,500 23,000 23,600 24,200 24,800 25,400
Buvuma 26,400 28,100 29,800 31,700 33,700 35,700 37,900
Gomba 35,500 36,300 37,300 38,200 39,200 40,300 41,300
Kalangala 20,600 21,400 22,200 23,000 23,800 24,700 25,500
Kalungu 41,500 42,300 43,100 44,000 45,000 46,000 47,000
Kampala 420,600 429,000 437,400 445,800 454,200 462,400 470,500
Kassanda 60,300 61,900 63,500 65,200 66,900 68,600 70,300
Kayunga 77,000 79,100 81,400 83,800 86,400 89,100 91,900
Kiboga 33,400 34,600 35,800 37,100 38,400 39,800 41,300
Kyakwanzi 49,700 52,100 54,700 57,500 60,400 63,300 66,300
Kyotera 57,700 59,000 60,400 61,900 63,500 65,200
Luwero 106,600 109,900 113,500 117,300 121,300 125,500 129,900
Lwengo 61,800 63,000 64,300 65,700 67,100 68,600 70,200
Lyantonde 19,900 20,600 21,400 22,200 23,200 24,100 25,100
Masaka 73,700 76,000 78,400 81,000 83,500 86,200 89,000
Mityana 80,300 82,200 84,300 86,500 88,800 91,300 93,800
Mpigi 61,200 63,200 65,100 67,300 69,600 71,900 74,400
Mubende 95,400 101,200 107,300 114,000 121,100 128,900 137,000
Mukono 146,900 151,900 157,100 162,800 168,700 174,900 181,400
Nakaseke 44,200 45,700 47,100 48,700 50,300 51,900 53,500
Nakasongola 37,000 38,400 40,000 41,600 43,400 45,100 47,000
Rakai 60,100 62,200 64,400 66,800 69,200 71,900 74,500
Ssembabule 56,200 58,300 60,500 62,900 65,300 67,900 70,700
Wakiso 529,100 564,700 602,800 643,000 685,800 730,800 778,100
Source: Uganda Bureau of Statistics
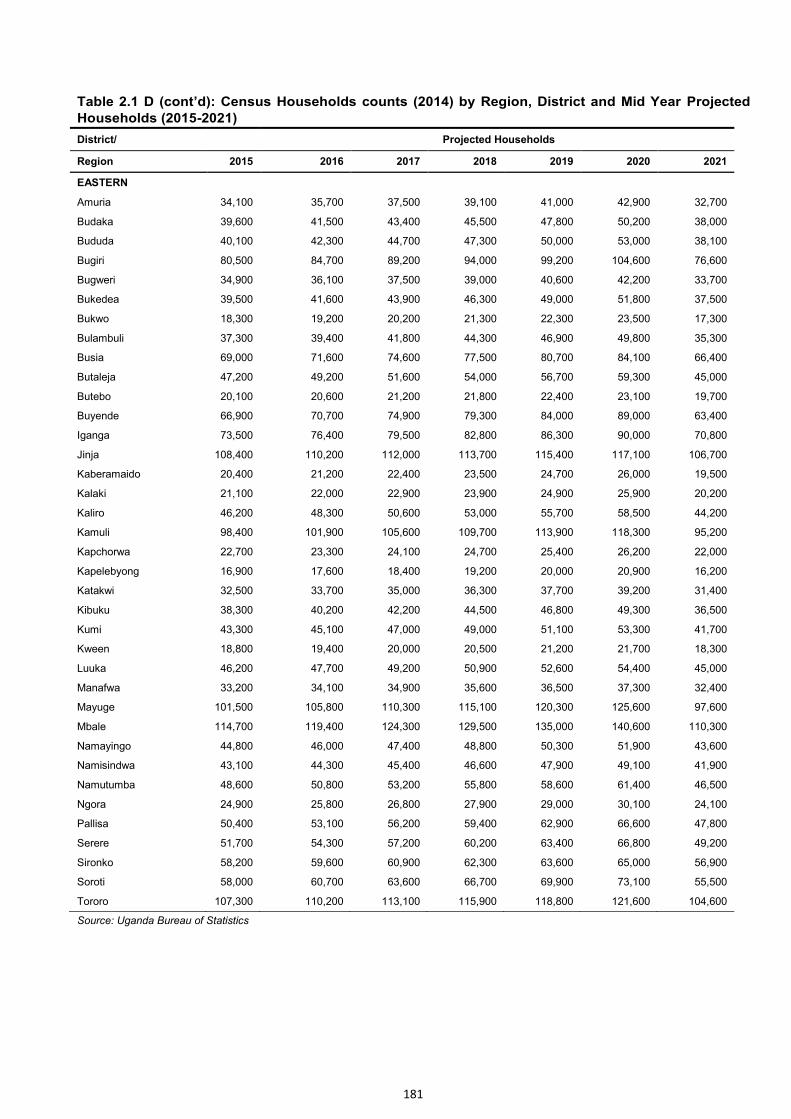
181
Table 2.1 D (cont’d): Census Households counts (2014) by Region, District and Mid Year Projected
Households (2015-2021)
District/
Projected Households
Region 2015 2016 2017 2018 2019 2020 2021
EASTERN
Amuria 34,100 35,700 37,500 39,100 41,000 42,900 32,700
Budaka 39,600 41,500 43,400 45,500 47,800 50,200 38,000
Bududa 40,100 42,300 44,700 47,300 50,000 53,000 38,100
Bugiri 80,500 84,700 89,200 94,000 99,200 104,600 76,600
Bugweri 34,900 36,100 37,500 39,000 40,600 42,200 33,700
Bukedea 39,500 41,600 43,900 46,300 49,000 51,800 37,500
Bukwo 18,300 19,200 20,200 21,300 22,300 23,500 17,300
Bulambuli 37,300 39,400 41,800 44,300 46,900 49,800 35,300
Busia 69,000 71,600 74,600 77,500 80,700 84,100 66,400
Butaleja 47,200 49,200 51,600 54,000 56,700 59,300 45,000
Butebo 20,100 20,600 21,200 21,800 22,400 23,100 19,700
Buyende 66,900 70,700 74,900 79,300 84,000 89,000 63,400
Iganga 73,500 76,400 79,500 82,800 86,300 90,000 70,800
Jinja 108,400 110,200 112,000 113,700 115,400 117,100 106,700
Kaberamaido 20,400 21,200 22,400 23,500 24,700 26,000 19,500
Kalaki 21,100 22,000 22,900 23,900 24,900 25,900 20,200
Kaliro 46,200 48,300 50,600 53,000 55,700 58,500 44,200
Kamuli 98,400 101,900 105,600 109,700 113,900 118,300 95,200
Kapchorwa 22,700 23,300 24,100 24,700 25,400 26,200 22,000
Kapelebyong 16,900 17,600 18,400 19,200 20,000 20,900 16,200
Katakwi 32,500 33,700 35,000 36,300 37,700 39,200 31,400
Kibuku 38,300 40,200 42,200 44,500 46,800 49,300 36,500
Kumi 43,300 45,100 47,000 49,000 51,100 53,300 41,700
Kween 18,800 19,400 20,000 20,500 21,200 21,700 18,300
Luuka 46,200 47,700 49,200 50,900 52,600 54,400 45,000
Manafwa 33,200 34,100 34,900 35,600 36,500 37,300 32,400
Mayuge 101,500 105,800 110,300 115,100 120,300 125,600 97,600
Mbale 114,700 119,400 124,300 129,500 135,000 140,600 110,300
Namayingo 44,800 46,000 47,400 48,800 50,300 51,900 43,600
Namisindwa 43,100 44,300 45,400 46,600 47,900 49,100 41,900
Namutumba 48,600 50,800 53,200 55,800 58,600 61,400 46,500
Ngora 24,900 25,800 26,800 27,900 29,000 30,100 24,100
Pallisa 50,400 53,100 56,200 59,400 62,900 66,600 47,800
Serere 51,700 54,300 57,200 60,200 63,400 66,800 49,200
Sironko 58,200 59,600 60,900 62,300 63,600 65,000 56,900
Soroti 58,000 60,700 63,600 66,700 69,900 73,100 55,500
Tororo 107,300 110,200 113,100 115,900 118,800 121,600 104,600
Source: Uganda Bureau of Statistics
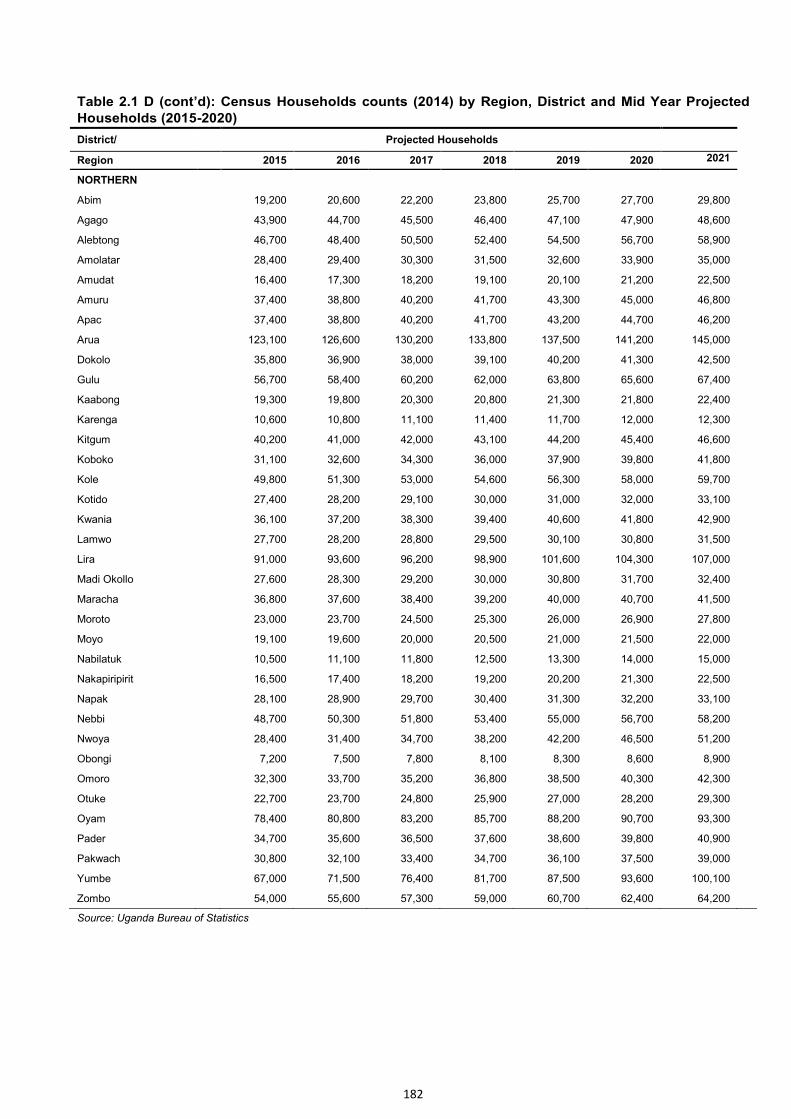
182
Table 2.1 D (cont’d): Census Households counts (2014) by Region, District and Mid Year Projected
Households (2015-2020)
District/
Projected Households
Region 2015 2016 2017 2018 2019 2020 2021
NORTHERN
Abim 19,200 20,600 22,200 23,800 25,700 27,700 29,800
Agago 43,900 44,700 45,500 46,400 47,100 47,900 48,600
Alebtong 46,700 48,400 50,500 52,400 54,500 56,700 58,900
Amolatar 28,400 29,400 30,300 31,500 32,600 33,900 35,000
Amudat 16,400 17,300 18,200 19,100 20,100 21,200 22,500
Amuru 37,400 38,800 40,200 41,700 43,300 45,000 46,800
Apac 37,400 38,800 40,200 41,700 43,200 44,700 46,200
Arua 123,100 126,600 130,200 133,800 137,500 141,200 145,000
Dokolo 35,800 36,900 38,000 39,100 40,200 41,300 42,500
Gulu 56,700 58,400 60,200 62,000 63,800 65,600 67,400
Kaabong 19,300 19,800 20,300 20,800 21,300 21,800 22,400
Karenga 10,600 10,800 11,100 11,400 11,700 12,000 12,300
Kitgum 40,200 41,000 42,000 43,100 44,200 45,400 46,600
Koboko 31,100 32,600 34,300 36,000 37,900 39,800 41,800
Kole 49,800 51,300 53,000 54,600 56,300 58,000 59,700
Kotido 27,400 28,200 29,100 30,000 31,000 32,000 33,100
Kwania 36,100 37,200 38,300 39,400 40,600 41,800 42,900
Lamwo 27,700 28,200 28,800 29,500 30,100 30,800 31,500
Lira 91,000 93,600 96,200 98,900 101,600 104,300 107,000
Madi Okollo 27,600 28,300 29,200 30,000 30,800 31,700 32,400
Maracha 36,800 37,600 38,400 39,200 40,000 40,700 41,500
Moroto 23,000 23,700 24,500 25,300 26,000 26,900 27,800
Moyo 19,100 19,600 20,000 20,500 21,000 21,500 22,000
Nabilatuk 10,500 11,100 11,800 12,500 13,300 14,000 15,000
Nakapiripirit 16,500 17,400 18,200 19,200 20,200 21,300 22,500
Napak 28,100 28,900 29,700 30,400 31,300 32,200 33,100
Nebbi 48,700 50,300 51,800 53,400 55,000 56,700 58,200
Nwoya 28,400 31,400 34,700 38,200 42,200 46,500 51,200
Obongi 7,200 7,500 7,800 8,100 8,300 8,600 8,900
Omoro 32,300 33,700 35,200 36,800 38,500 40,300 42,300
Otuke 22,700 23,700 24,800 25,900 27,000 28,200 29,300
Oyam 78,400 80,800 83,200 85,700 88,200 90,700 93,300
Pader 34,700 35,600 36,500 37,600 38,600 39,800 40,900
Pakwach 30,800 32,100 33,400 34,700 36,100 37,500 39,000
Yumbe 67,000 71,500 76,400 81,700 87,500 93,600 100,100
Zombo 54,000 55,600 57,300 59,000 60,700 62,400 64,200
Source: Uganda Bureau of Statistics
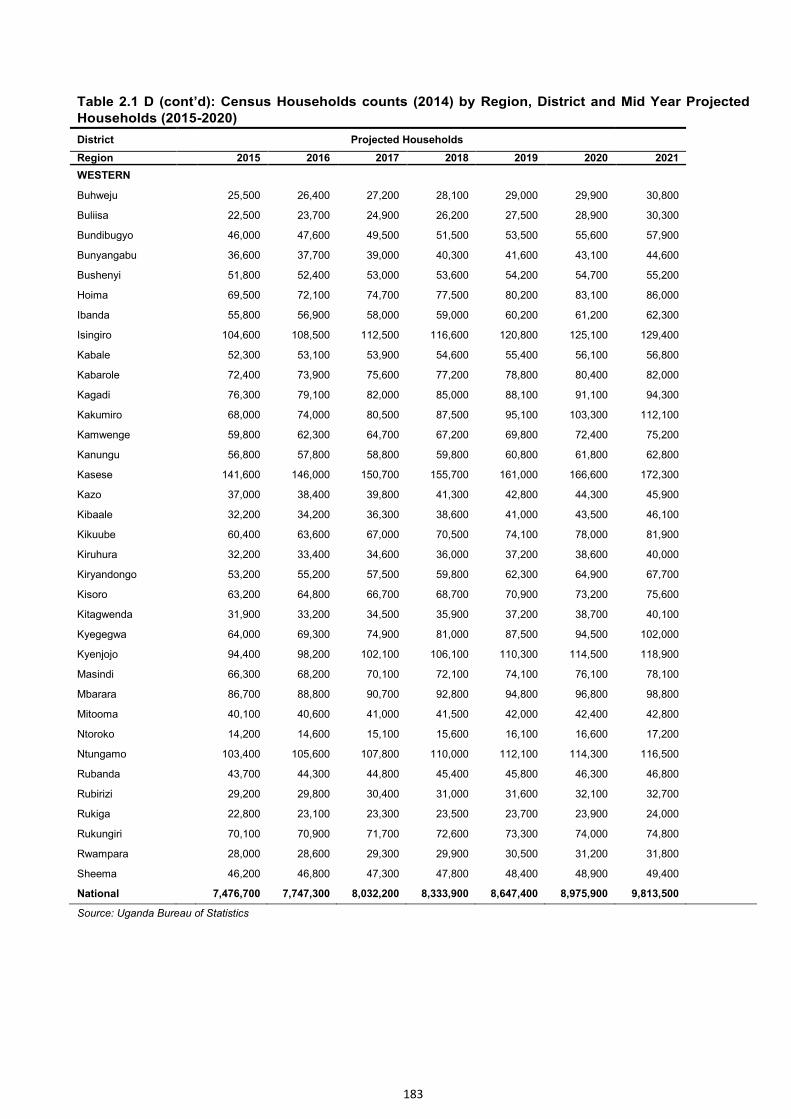
183
Table 2.1 D (cont’d): Census Households counts (2014) by Region, District and Mid Year Projected
Households (2015-2020)
District
Projected Households
Region 2015 2016 2017 2018 2019 2020 2021
WESTERN
Buhweju
25,500 26,400 27,200 28,100 29,000 29,900 30,800
Buliisa
22,500 23,700 24,900 26,200 27,500 28,900 30,300
Bundibugyo
46,000 47,600 49,500 51,500 53,500 55,600 57,900
Bunyangabu
36,600 37,700 39,000 40,300 41,600 43,100 44,600
Bushenyi
51,800 52,400 53,000 53,600 54,200 54,700 55,200
Hoima
69,500 72,100 74,700 77,500 80,200 83,100 86,000
Ibanda
55,800 56,900 58,000 59,000 60,200 61,200 62,300
Isingiro
104,600 108,500 112,500 116,600 120,800 125,100 129,400
Kabale
52,300 53,100 53,900 54,600 55,400 56,100 56,800
Kabarole
72,400 73,900 75,600 77,200 78,800 80,400 82,000
Kagadi
76,300 79,100 82,000 85,000 88,100 91,100 94,300
Kakumiro
68,000 74,000 80,500 87,500 95,100 103,300 112,100
Kamwenge
59,800 62,300 64,700 67,200 69,800 72,400 75,200
Kanungu
56,800 57,800 58,800 59,800 60,800 61,800 62,800
Kasese
141,600 146,000 150,700 155,700 161,000 166,600 172,300
Kazo
37,000 38,400 39,800 41,300 42,800 44,300 45,900
Kibaale
32,200 34,200 36,300 38,600 41,000 43,500 46,100
Kikuube
60,400 63,600 67,000 70,500 74,100 78,000 81,900
Kiruhura
32,200 33,400 34,600 36,000 37,200 38,600 40,000
Kiryandongo
53,200 55,200 57,500 59,800 62,300 64,900 67,700
Kisoro
63,200 64,800 66,700 68,700 70,900 73,200 75,600
Kitagwenda
31,900 33,200 34,500 35,900 37,200 38,700 40,100
Kyegegwa
64,000 69,300 74,900 81,000 87,500 94,500 102,000
Kyenjojo
94,400 98,200 102,100 106,100 110,300 114,500 118,900
Masindi
66,300 68,200 70,100 72,100 74,100 76,100 78,100
Mbarara
86,700 88,800 90,700 92,800 94,800 96,800 98,800
Mitooma
40,100 40,600 41,000 41,500 42,000 42,400 42,800
Ntoroko
14,200 14,600 15,100 15,600 16,100 16,600 17,200
Ntungamo
103,400 105,600 107,800 110,000 112,100 114,300 116,500
Rubanda
43,700 44,300 44,800 45,400 45,800 46,300 46,800
Rubirizi
29,200 29,800 30,400 31,000 31,600 32,100 32,700
Rukiga
22,800 23,100 23,300 23,500 23,700 23,900 24,000
Rukungiri
70,100 70,900 71,700 72,600 73,300 74,000 74,800
Rwampara
28,000 28,600 29,300 29,900 30,500 31,200 31,800
Sheema
46,200 46,800 47,300 47,800 48,400 48,900 49,400
National
7,476,700 7,747,300 8,032,200 8,333,900 8,647,400 8,975,900 9,813,500
Source: Uganda Bureau of Statistics
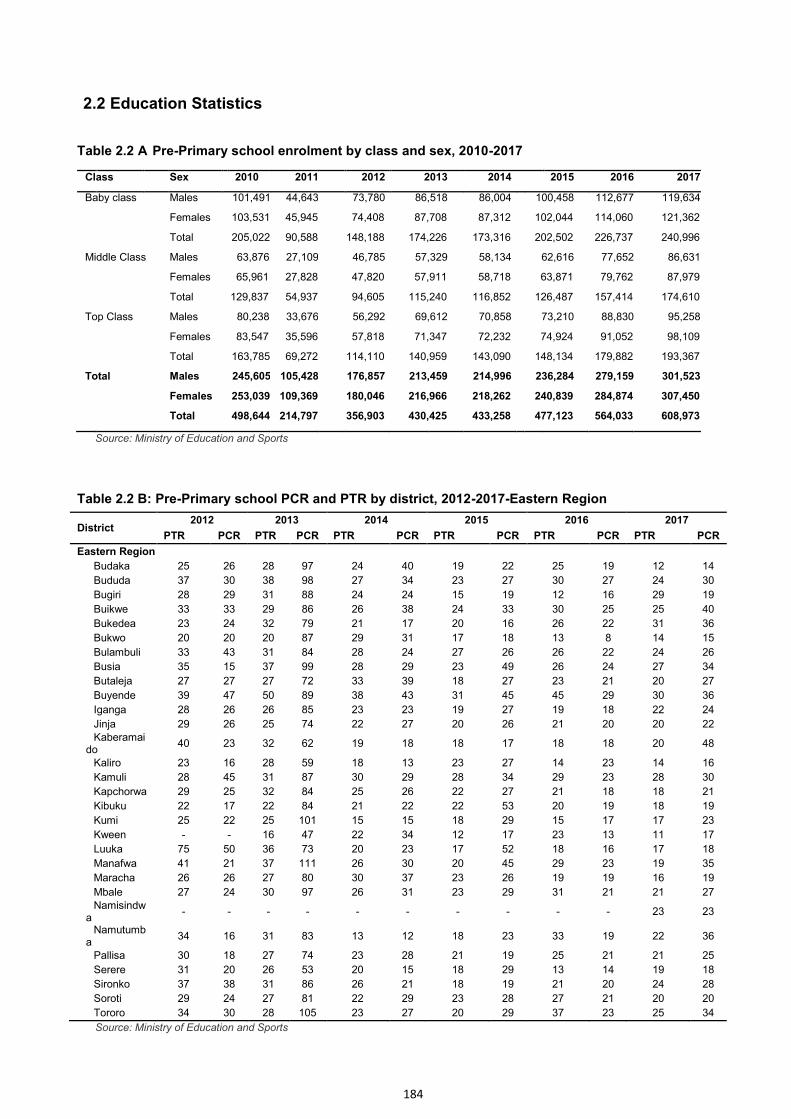
184
2.2 Education Statistics
Table 2.2 A Pre-Primary school enrolment by class and sex, 2010-2017
Class Sex 2010 2011 2012 2013 2014 2015 2016 2017
Baby class Males 101,491 44,643 73,780 86,518 86,004 100,458 112,677 119,634
Females 103,531 45,945 74,408 87,708 87,312 102,044 114,060 121,362
Total 205,022 90,588 148,188 174,226 173,316 202,502 226,737 240,996
Middle Class Males 63,876 27,109 46,785 57,329 58,134 62,616 77,652 86,631
Females 65,961 27,828 47,820 57,911 58,718 63,871 79,762 87,979
Total 129,837 54,937 94,605 115,240 116,852 126,487 157,414 174,610
Top Class Males 80,238 33,676 56,292 69,612 70,858 73,210 88,830 95,258
Females 83,547 35,596 57,818 71,347 72,232 74,924 91,052 98,109
Total 163,785 69,272 114,110 140,959 143,090 148,134 179,882 193,367
Total Males 245,605 105,428 176,857 213,459 214,996 236,284 279,159 301,523
Females 253,039 109,369 180,046 216,966 218,262 240,839 284,874 307,450
Total 498,644 214,797 356,903 430,425 433,258 477,123 564,033 608,973
Source: Ministry of Education and Sports
Table 2.2 B: Pre-Primary school PCR and PTR by district, 2012-2017-Eastern Region
District 2012 2013 2014 2015 2016 2017
PTR PCR PTR PCR PTR PCR PTR PCR PTR PCR PTR PCR
Eastern Region
Budaka 25 26 28 97 24 40 19 22 25 19 12 14
Bududa 37 30 38 98 27 34 23 27 30 27 24 30
Bugiri 28 29 31 88 24 24 15 19 12 16 29 19
Buikwe 33 33 29 86 26 38 24 33 30 25 25 40
Bukedea 23 24 32 79 21 17 20 16 26 22 31 36
Bukwo 20 20 20 87 29 31 17 18 13 8 14 15
Bulambuli 33 43 31 84 28 24 27 26 26 22 24 26
Busia 35 15 37 99 28 29 23 49 26 24 27 34
Butaleja 27 27 27 72 33 39 18 27 23 21 20 27
Buyende 39 47 50 89 38 43 31 45 45 29 30 36
Iganga 28 26 26 85 23 23 19 27 19 18 22 24
Jinja 29 26 25 74 22 27 20 26 21 20 20 22
Kaberamaido
40 23 32 62 19 18 18 17 18 18 20 48
Kaliro 23 16 28 59 18 13 23 27 14 23 14 16
Kamuli 28 45 31 87 30 29 28 34 29 23 28 30
Kapchorwa 29 25 32 84 25 26 22 27 21 18 18 21
Kibuku 22 17 22 84 21 22 22 53 20 19 18 19
Kumi 25 22 25 101 15 15 18 29 15 17 17 23
Kween - - 16 47 22 34 12 17 23 13 11 17
Luuka 75 50 36 73 20 23 17 52 18 16 17 18
Manafwa 41 21 37 111 26 30 20 45 29 23 19 35
Maracha 26 26 27 80 30 37 23 26 19 19 16 19
Mbale 27 24 30 97 26 31 23 29 31 21 21 27
Namisindwa
- - - - - - - - - - 23 23
Namutumba
34 16 31 83 13 12 18 23 33 19 22 36
Pallisa 30 18 27 74 23 28 21 19 25 21 21 25
Serere 31 20 26 53 20 15 18 29 13 14 19 18
Sironko 37 38 31 86 26 21 18 19 21 20 24 28
Soroti 29 24 27 81 22 29 23 28 27 21 20 20
Tororo 34 30 28 105 23 27 20 29 37 23 25 34
Source: Ministry of Education and Sports
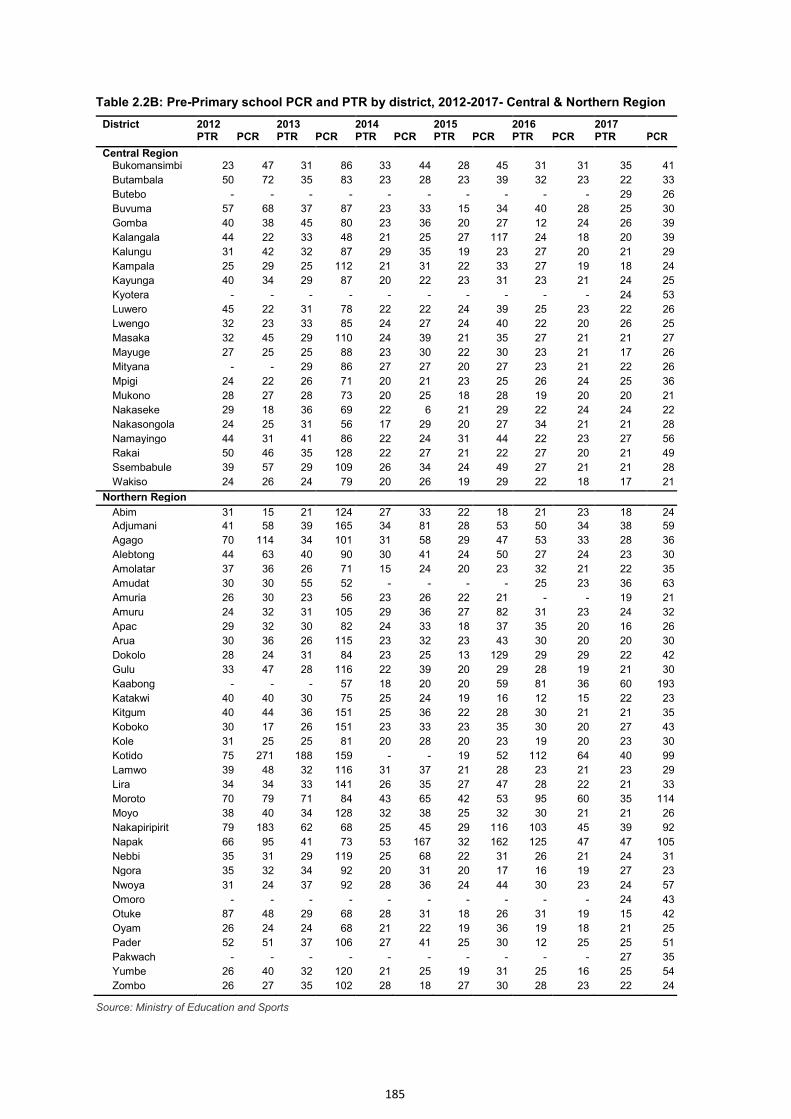
185
Table 2.2B: Pre-Primary school PCR and PTR by district, 2012-2017- Central & Northern Region District 2012 2013 2014 2015 2016 2017 PTR PCR PTR PCR PTR PCR PTR PCR PTR PCR PTR PCR
Central Region Bukomansimbi 23 47 31 86 33 44 28 45 31 31 35 41
Butambala 50 72 35 83 23 28 23 39 32 23 22 33
Butebo - - - - - - - - - - 29 26
Buvuma 57 68 37 87 23 33 15 34 40 28 25 30
Gomba 40 38 45 80 23 36 20 27 12 24 26 39
Kalangala 44 22 33 48 21 25 27 117 24 18 20 39
Kalungu 31 42 32 87 29 35 19 23 27 20 21 29
Kampala 25 29 25 112 21 31 22 33 27 19 18 24
Kayunga 40 34 29 87 20 22 23 31 23 21 24 25
Kyotera - - - - - - - - - - 24 53
Luwero 45 22 31 78 22 22 24 39 25 23 22 26
Lwengo 32 23 33 85 24 27 24 40 22 20 26 25
Masaka 32 45 29 110 24 39 21 35 27 21 21 27
Mayuge 27 25 25 88 23 30 22 30 23 21 17 26
Mityana - - 29 86 27 27 20 27 23 21 22 26
Mpigi 24 22 26 71 20 21 23 25 26 24 25 36
Mukono 28 27 28 73 20 25 18 28 19 20 20 21
Nakaseke 29 18 36 69 22 6 21 29 22 24 24 22
Nakasongola 24 25 31 56 17 29 20 27 34 21 21 28
Namayingo 44 31 41 86 22 24 31 44 22 23 27 56
Rakai 50 46 35 128 22 27 21 22 27 20 21 49
Ssembabule 39 57 29 109 26 34 24 49 27 21 21 28
Wakiso 24 26 24 79 20 26 19 29 22 18 17 21
Northern Region
Abim 31 15 21 124 27 33 22 18 21 23 18 24
Adjumani 41 58 39 165 34 81 28 53 50 34 38 59
Agago 70 114 34 101 31 58 29 47 53 33 28 36
Alebtong 44 63 40 90 30 41 24 50 27 24 23 30
Amolatar 37 36 26 71 15 24 20 23 32 21 22 35
Amudat 30 30 55 52 - - - - 25 23 36 63
Amuria 26 30 23 56 23 26 22 21 - - 19 21
Amuru 24 32 31 105 29 36 27 82 31 23 24 32
Apac 29 32 30 82 24 33 18 37 35 20 16 26
Arua 30 36 26 115 23 32 23 43 30 20 20 30
Dokolo 28 24 31 84 23 25 13 129 29 29 22 42
Gulu 33 47 28 116 22 39 20 29 28 19 21 30
Kaabong - - - 57 18 20 20 59 81 36 60 193
Katakwi 40 40 30 75 25 24 19 16 12 15 22 23
Kitgum 40 44 36 151 25 36 22 28 30 21 21 35
Koboko 30 17 26 151 23 33 23 35 30 20 27 43
Kole 31 25 25 81 20 28 20 23 19 20 23 30
Kotido 75 271 188 159 - - 19 52 112 64 40 99
Lamwo 39 48 32 116 31 37 21 28 23 21 23 29
Lira 34 34 33 141 26 35 27 47 28 22 21 33
Moroto 70 79 71 84 43 65 42 53 95 60 35 114
Moyo 38 40 34 128 32 38 25 32 30 21 21 26
Nakapiripirit 79 183 62 68 25 45 29 116 103 45 39 92
Napak 66 95 41 73 53 167 32 162 125 47 47 105
Nebbi 35 31 29 119 25 68 22 31 26 21 24 31
Ngora 35 32 34 92 20 31 20 17 16 19 27 23
Nwoya 31 24 37 92 28 36 24 44 30 23 24 57
Omoro - - - - - - - - - - 24 43
Otuke 87 48 29 68 28 31 18 26 31 19 15 42
Oyam 26 24 24 68 21 22 19 36 19 18 21 25
Pader 52 51 37 106 27 41 25 30 12 25 25 51
Pakwach - - - - - - - - - - 27 35
Yumbe 26 40 32 120 21 25 19 31 25 16 25 54
Zombo 26 27 35 102 28 18 27 30 28 23 22 24 Source: Ministry of Education and Sports
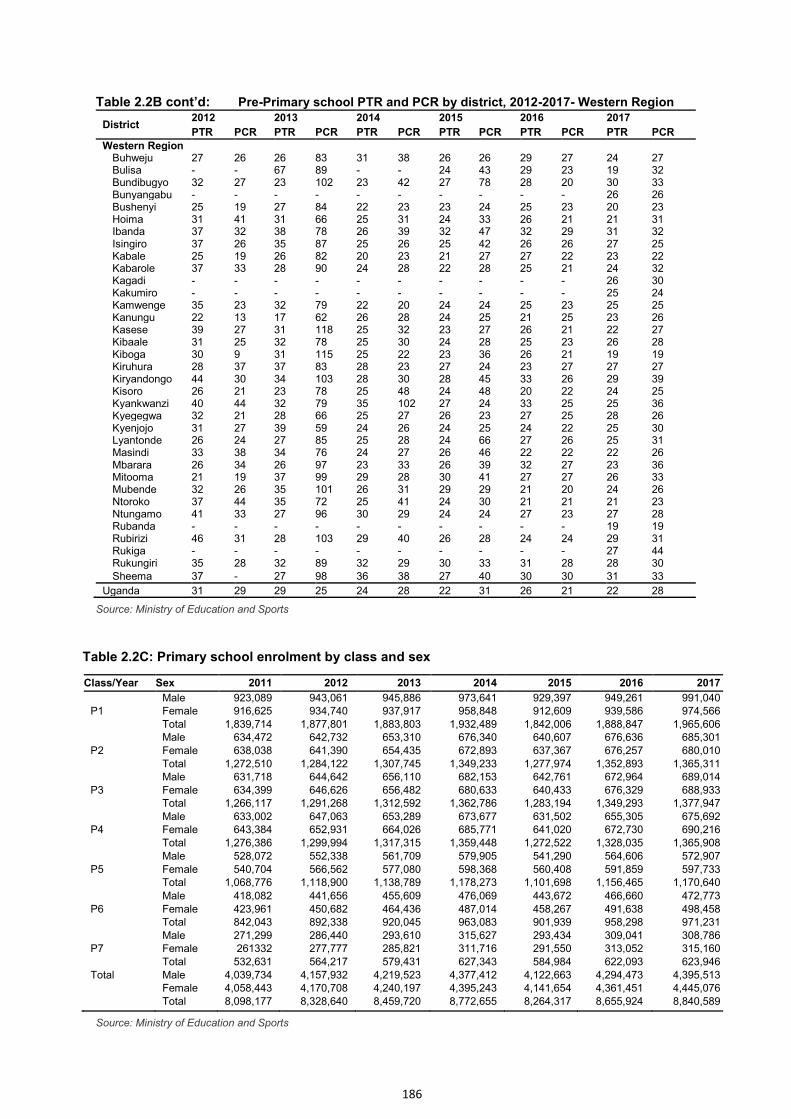
186
Table 2.2B cont’d: Pre-Primary school PTR and PCR by district, 2012-2017- Western Region
District 2012 2013 2014 2015 2016 2017
PTR PCR PTR PCR PTR PCR PTR PCR PTR PCR PTR PCR
Western Region Buhweju 27 26 26 83 31 38 26 26 29 27 24 27 Bulisa - - 67 89 - - 24 43 29 23 19 32 Bundibugyo 32 27 23 102 23 42 27 78 28 20 30 33 Bunyangabu - - - - - - - - - - 26 26 Bushenyi 25 19 27 84 22 23 23 24 25 23 20 23 Hoima 31 41 31 66 25 31 24 33 26 21 21 31 Ibanda 37 32 38 78 26 39 32 47 32 29 31 32 Isingiro 37 26 35 87 25 26 25 42 26 26 27 25 Kabale 25 19 26 82 20 23 21 27 27 22 23 22 Kabarole 37 33 28 90 24 28 22 28 25 21 24 32 Kagadi - - - - - - - - - - 26 30 Kakumiro - - - - - - - - - - 25 24 Kamwenge 35 23 32 79 22 20 24 24 25 23 25 25 Kanungu 22 13 17 62 26 28 24 25 21 25 23 26 Kasese 39 27 31 118 25 32 23 27 26 21 22 27 Kibaale 31 25 32 78 25 30 24 28 25 23 26 28 Kiboga 30 9 31 115 25 22 23 36 26 21 19 19 Kiruhura 28 37 37 83 28 23 27 24 23 27 27 27 Kiryandongo 44 30 34 103 28 30 28 45 33 26 29 39 Kisoro 26 21 23 78 25 48 24 48 20 22 24 25 Kyankwanzi 40 44 32 79 35 102 27 24 33 25 25 36 Kyegegwa 32 21 28 66 25 27 26 23 27 25 28 26 Kyenjojo 31 27 39 59 24 26 24 25 24 22 25 30 Lyantonde 26 24 27 85 25 28 24 66 27 26 25 31 Masindi 33 38 34 76 24 27 26 46 22 22 22 26 Mbarara 26 34 26 97 23 33 26 39 32 27 23 36 Mitooma 21 19 37 99 29 28 30 41 27 27 26 33 Mubende 32 26 35 101 26 31 29 29 21 20 24 26 Ntoroko 37 44 35 72 25 41 24 30 21 21 21 23 Ntungamo 41 33 27 96 30 29 24 24 27 23 27 28 Rubanda - - - - - - - - - - 19 19 Rubirizi 46 31 28 103 29 40 26 28 24 24 29 31 Rukiga - - - - - - - - - - 27 44 Rukungiri 35 28 32 89 32 29 30 33 31 28 28 30 Sheema 37 - 27 98 36 38 27 40 30 30 31 33
Uganda 31 29 29 25 24 28 22 31 26 21 22 28
Source: Ministry of Education and Sports
Table 2.2C: Primary school enrolment by class and sex Class/Year Sex 2011 2012 2013 2014 2015 2016 2017
Male 923,089 943,061 945,886 973,641 929,397 949,261 991,040 P1 Female 916,625 934,740 937,917 958,848 912,609 939,586 974,566 Total 1,839,714 1,877,801 1,883,803 1,932,489 1,842,006 1,888,847 1,965,606 Male 634,472 642,732 653,310 676,340 640,607 676,636 685,301 P2 Female 638,038 641,390 654,435 672,893 637,367 676,257 680,010 Total 1,272,510 1,284,122 1,307,745 1,349,233 1,277,974 1,352,893 1,365,311 Male 631,718 644,642 656,110 682,153 642,761 672,964 689,014 P3 Female 634,399 646,626 656,482 680,633 640,433 676,329 688,933 Total 1,266,117 1,291,268 1,312,592 1,362,786 1,283,194 1,349,293 1,377,947
Male 633,002 647,063 653,289 673,677 631,502 655,305 675,692 P4 Female 643,384 652,931 664,026 685,771 641,020 672,730 690,216
Total 1,276,386 1,299,994 1,317,315 1,359,448 1,272,522 1,328,035 1,365,908
Male 528,072 552,338 561,709 579,905 541,290 564,606 572,907 P5 Female 540,704 566,562 577,080 598,368 560,408 591,859 597,733 Total 1,068,776 1,118,900 1,138,789 1,178,273 1,101,698 1,156,465 1,170,640
Male 418,082 441,656 455,609 476,069 443,672 466,660 472,773 P6 Female 423,961 450,682 464,436 487,014 458,267 491,638 498,458 Total 842,043 892,338 920,045 963,083 901,939 958,298 971,231 Male 271,299 286,440 293,610 315,627 293,434 309,041 308,786 P7 Female 261332 277,777 285,821 311,716 291,550 313,052 315,160 Total 532,631 564,217 579,431 627,343 584,984 622,093 623,946
Total Male 4,039,734 4,157,932 4,219,523 4,377,412 4,122,663 4,294,473 4,395,513 Female 4,058,443 4,170,708 4,240,197 4,395,243 4,141,654 4,361,451 4,445,076
Total 8,098,177 8,328,640 8,459,720 8,772,655 8,264,317 8,655,924 8,840,589
Source: Ministry of Education and Sports
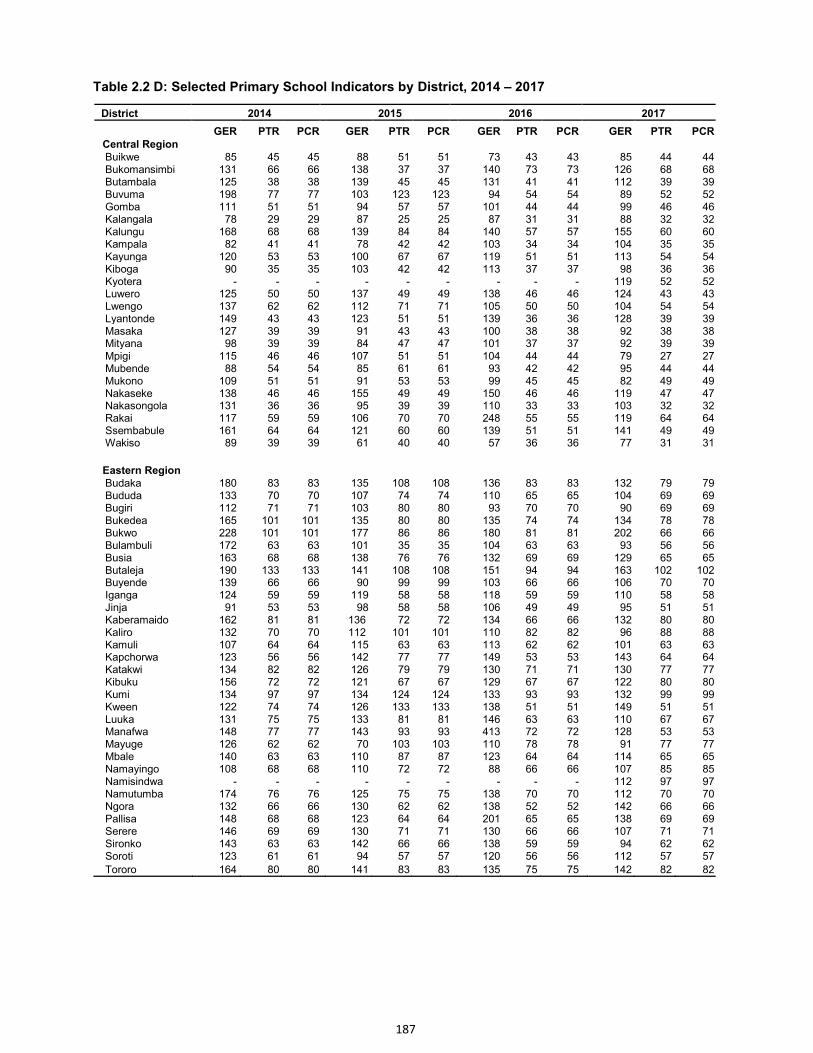
187
Table 2.2 D: Selected Primary School Indicators by District, 2014 – 2017
District 2014 2015 2016 2017
GER PTR PCR GER PTR PCR GER PTR PCR GER PTR PCR Central Region Buikwe 85 45 45 88 51 51 73 43 43 85 44 44 Bukomansimbi 131 66 66 138 37 37 140 73 73 126 68 68 Butambala 125 38 38 139 45 45 131 41 41 112 39 39 Buvuma 198 77 77 103 123 123 94 54 54 89 52 52 Gomba 111 51 51 94 57 57 101 44 44 99 46 46 Kalangala 78 29 29 87 25 25 87 31 31 88 32 32 Kalungu 168 68 68 139 84 84 140 57 57 155 60 60 Kampala 82 41 41 78 42 42 103 34 34 104 35 35 Kayunga 120 53 53 100 67 67 119 51 51 113 54 54 Kiboga 90 35 35 103 42 42 113 37 37 98 36 36 Kyotera - - - - - - - - - 119 52 52 Luwero 125 50 50 137 49 49 138 46 46 124 43 43 Lwengo 137 62 62 112 71 71 105 50 50 104 54 54 Lyantonde 149 43 43 123 51 51 139 36 36 128 39 39 Masaka 127 39 39 91 43 43 100 38 38 92 38 38 Mityana 98 39 39 84 47 47 101 37 37 92 39 39 Mpigi 115 46 46 107 51 51 104 44 44 79 27 27 Mubende 88 54 54 85 61 61 93 42 42 95 44 44 Mukono 109 51 51 91 53 53 99 45 45 82 49 49 Nakaseke 138 46 46 155 49 49 150 46 46 119 47 47 Nakasongola 131 36 36 95 39 39 110 33 33 103 32 32 Rakai 117 59 59 106 70 70 248 55 55 119 64 64 Ssembabule 161 64 64 121 60 60 139 51 51 141 49 49 Wakiso 89 39 39 61 40 40 57 36 36 77 31 31
Eastern Region Budaka 180 83 83 135 108 108 136 83 83 132 79 79 Bududa 133 70 70 107 74 74 110 65 65 104 69 69 Bugiri 112 71 71 103 80 80 93 70 70 90 69 69 Bukedea 165 101 101 135 80 80 135 74 74 134 78 78 Bukwo 228 101 101 177 86 86 180 81 81 202 66 66 Bulambuli 172 63 63 101 35 35 104 63 63 93 56 56 Busia 163 68 68 138 76 76 132 69 69 129 65 65 Butaleja 190 133 133 141 108 108 151 94 94 163 102 102 Buyende 139 66 66 90 99 99 103 66 66 106 70 70 Iganga 124 59 59 119 58 58 118 59 59 110 58 58 Jinja 91 53 53 98 58 58 106 49 49 95 51 51 Kaberamaido 162 81 81 136 72 72 134 66 66 132 80 80 Kaliro 132 70 70 112 101 101 110 82 82 96 88 88 Kamuli 107 64 64 115 63 63 113 62 62 101 63 63 Kapchorwa 123 56 56 142 77 77 149 53 53 143 64 64 Katakwi 134 82 82 126 79 79 130 71 71 130 77 77 Kibuku 156 72 72 121 67 67 129 67 67 122 80 80 Kumi 134 97 97 134 124 124 133 93 93 132 99 99 Kween 122 74 74 126 133 133 138 51 51 149 51 51 Luuka 131 75 75 133 81 81 146 63 63 110 67 67 Manafwa 148 77 77 143 93 93 413 72 72 128 53 53 Mayuge 126 62 62 70 103 103 110 78 78 91 77 77 Mbale 140 63 63 110 87 87 123 64 64 114 65 65 Namayingo 108 68 68 110 72 72 88 66 66 107 85 85 Namisindwa - - - - - - - - - 112 97 97 Namutumba 174 76 76 125 75 75 138 70 70 112 70 70 Ngora 132 66 66 130 62 62 138 52 52 142 66 66 Pallisa 148 68 68 123 64 64 201 65 65 138 69 69 Serere 146 69 69 130 71 71 130 66 66 107 71 71 Sironko 143 63 63 142 66 66 138 59 59 94 62 62 Soroti 123 61 61 94 57 57 120 56 56 112 57 57
Tororo 164 80 80 141 83 83 135 75 75 142 82 82
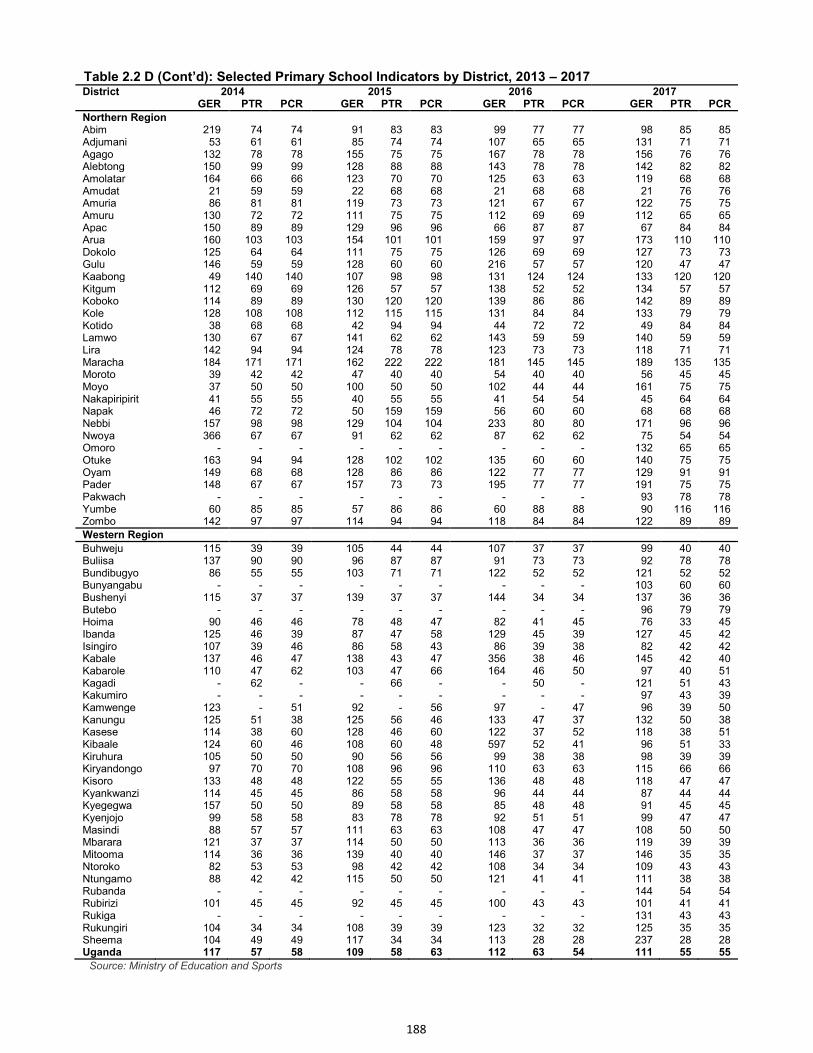
188
Table 2.2 D (Cont’d): Selected Primary School Indicators by District, 2013 – 2017 District 2014 2015 2016 2017 GER PTR PCR GER PTR PCR GER PTR PCR GER PTR PCR
Northern Region Abim 219 74 74 91 83 83 99 77 77 98 85 85 Adjumani 53 61 61 85 74 74 107 65 65 131 71 71 Agago 132 78 78 155 75 75 167 78 78 156 76 76 Alebtong 150 99 99 128 88 88 143 78 78 142 82 82 Amolatar 164 66 66 123 70 70 125 63 63 119 68 68 Amudat 21 59 59 22 68 68 21 68 68 21 76 76 Amuria 86 81 81 119 73 73 121 67 67 122 75 75 Amuru 130 72 72 111 75 75 112 69 69 112 65 65 Apac 150 89 89 129 96 96 66 87 87 67 84 84 Arua 160 103 103 154 101 101 159 97 97 173 110 110 Dokolo 125 64 64 111 75 75 126 69 69 127 73 73 Gulu 146 59 59 128 60 60 216 57 57 120 47 47 Kaabong 49 140 140 107 98 98 131 124 124 133 120 120 Kitgum 112 69 69 126 57 57 138 52 52 134 57 57 Koboko 114 89 89 130 120 120 139 86 86 142 89 89 Kole 128 108 108 112 115 115 131 84 84 133 79 79 Kotido 38 68 68 42 94 94 44 72 72 49 84 84 Lamwo 130 67 67 141 62 62 143 59 59 140 59 59 Lira 142 94 94 124 78 78 123 73 73 118 71 71 Maracha 184 171 171 162 222 222 181 145 145 189 135 135 Moroto 39 42 42 47 40 40 54 40 40 56 45 45 Moyo 37 50 50 100 50 50 102 44 44 161 75 75 Nakapiripirit 41 55 55 40 55 55 41 54 54 45 64 64 Napak 46 72 72 50 159 159 56 60 60 68 68 68 Nebbi 157 98 98 129 104 104 233 80 80 171 96 96 Nwoya 366 67 67 91 62 62 87 62 62 75 54 54 Omoro - - - - - - - - - 132 65 65 Otuke 163 94 94 128 102 102 135 60 60 140 75 75 Oyam 149 68 68 128 86 86 122 77 77 129 91 91 Pader 148 67 67 157 73 73 195 77 77 191 75 75 Pakwach - - - - - - - - - 93 78 78 Yumbe 60 85 85 57 86 86 60 88 88 90 116 116 Zombo 142 97 97 114 94 94 118 84 84 122 89 89
Western Region
Buhweju 115 39 39 105 44 44 107 37 37 99 40 40 Buliisa 137 90 90 96 87 87 91 73 73 92 78 78 Bundibugyo 86 55 55 103 71 71 122 52 52 121 52 52 Bunyangabu - - - - - - - - - 103 60 60 Bushenyi 115 37 37 139 37 37 144 34 34 137 36 36 Butebo - - - - - - - - - 96 79 79 Hoima 90 46 46 78 48 47 82 41 45 76 33 45 Ibanda 125 46 39 87 47 58 129 45 39 127 45 42 Isingiro 107 39 46 86 58 43 86 39 38 82 42 42 Kabale 137 46 47 138 43 47 356 38 46 145 42 40 Kabarole 110 47 62 103 47 66 164 46 50 97 40 51 Kagadi - 62 - - 66 - - 50 - 121 51 43 Kakumiro - - - - - - - - - 97 43 39 Kamwenge 123 - 51 92 - 56 97 - 47 96 39 50 Kanungu 125 51 38 125 56 46 133 47 37 132 50 38 Kasese 114 38 60 128 46 60 122 37 52 118 38 51 Kibaale 124 60 46 108 60 48 597 52 41 96 51 33 Kiruhura 105 50 50 90 56 56 99 38 38 98 39 39 Kiryandongo 97 70 70 108 96 96 110 63 63 115 66 66 Kisoro 133 48 48 122 55 55 136 48 48 118 47 47 Kyankwanzi 114 45 45 86 58 58 96 44 44 87 44 44 Kyegegwa 157 50 50 89 58 58 85 48 48 91 45 45 Kyenjojo 99 58 58 83 78 78 92 51 51 99 47 47 Masindi 88 57 57 111 63 63 108 47 47 108 50 50 Mbarara 121 37 37 114 50 50 113 36 36 119 39 39 Mitooma 114 36 36 139 40 40 146 37 37 146 35 35 Ntoroko 82 53 53 98 42 42 108 34 34 109 43 43 Ntungamo 88 42 42 115 50 50 121 41 41 111 38 38 Rubanda - - - - - - - - - 144 54 54 Rubirizi 101 45 45 92 45 45 100 43 43 101 41 41 Rukiga - - - - - - - - - 131 43 43 Rukungiri 104 34 34 108 39 39 123 32 32 125 35 35 Sheema 104 49 49 117 34 34 113 28 28 237 28 28 Uganda 117 57 58 109 58 63 112 63 54 111 55 55
Source: Ministry of Education and Sports
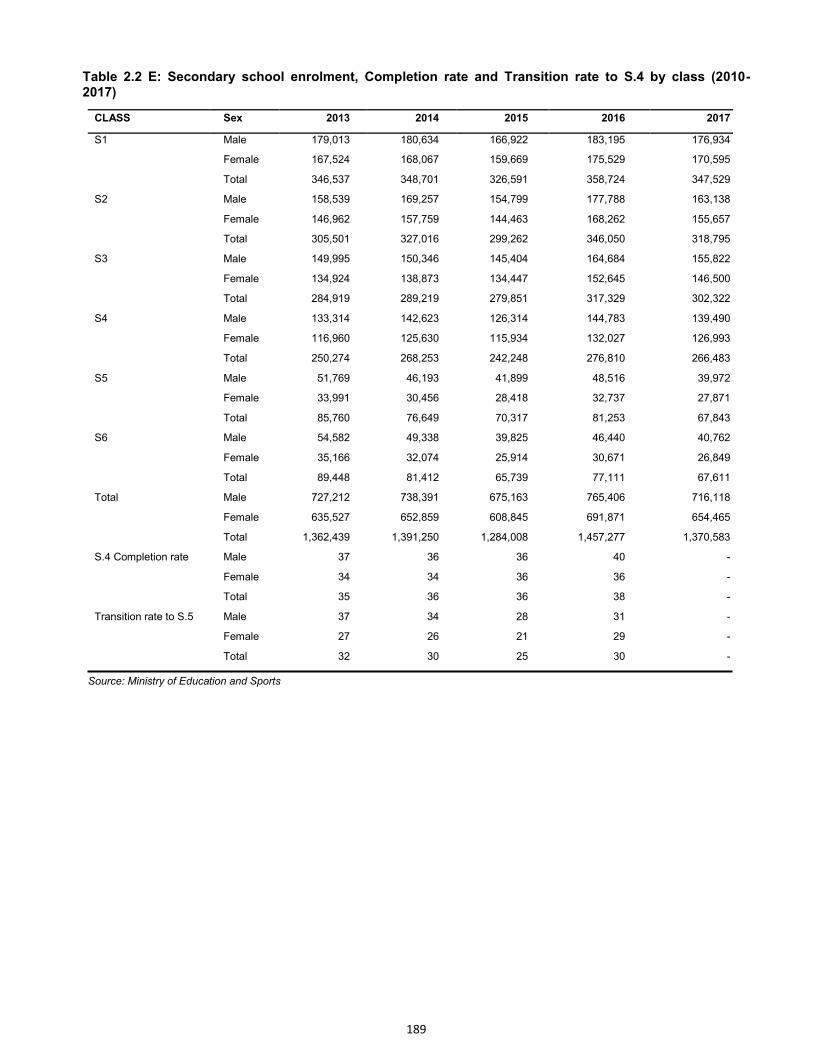
189
Table 2.2 E: Secondary school enrolment, Completion rate and Transition rate to S.4 by class (2010- 2017)
CLASS Sex 2013 2014 2015 2016 2017
S1 Male 179,013 180,634 166,922 183,195 176,934
Female 167,524 168,067 159,669 175,529 170,595
Total 346,537 348,701 326,591 358,724 347,529
S2 Male 158,539 169,257 154,799 177,788 163,138
Female 146,962 157,759 144,463 168,262 155,657
Total 305,501 327,016 299,262 346,050 318,795
S3 Male 149,995 150,346 145,404 164,684 155,822
Female 134,924 138,873 134,447 152,645 146,500
Total 284,919 289,219 279,851 317,329 302,322
S4 Male 133,314 142,623 126,314 144,783 139,490
Female 116,960 125,630 115,934 132,027 126,993
Total 250,274 268,253 242,248 276,810 266,483
S5 Male 51,769 46,193 41,899 48,516 39,972
Female 33,991 30,456 28,418 32,737 27,871
Total 85,760 76,649 70,317 81,253 67,843
S6 Male 54,582 49,338 39,825 46,440 40,762
Female 35,166 32,074 25,914 30,671 26,849
Total 89,448 81,412 65,739 77,111 67,611
Total Male 727,212 738,391 675,163 765,406 716,118
Female 635,527 652,859 608,845 691,871 654,465
Total 1,362,439 1,391,250 1,284,008 1,457,277 1,370,583
S.4 Completion rate Male 37 36 36 40 -
Female 34 34 36 36 -
Total 35 36 36 38 -
Transition rate to S.5 Male 37 34 28 31 -
Female 27 26 21 29 -
Total 32 30 25 30 - Source: Ministry of Education and Sports
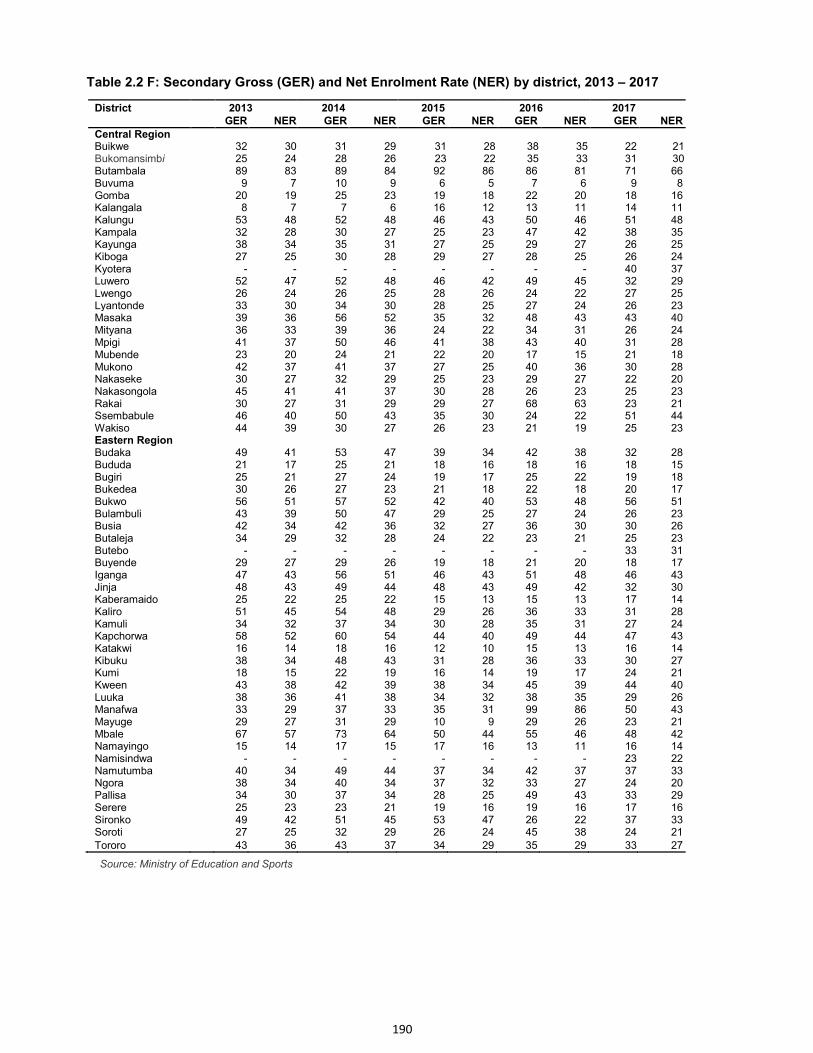
190
Table 2.2 F: Secondary Gross (GER) and Net Enrolment Rate (NER) by district, 2013 – 2017 District 2013 2014 2015 2016 2017 GER NER GER NER GER NER GER NER GER NER
Central Region Buikwe 32 30 31 29 31 28 38 35 22 21 Bukomansimbi 25 24 28 26 23 22 35 33 31 30 Butambala 89 83 89 84 92 86 86 81 71 66 Buvuma 9 7 10 9 6 5 7 6 9 8 Gomba 20 19 25 23 19 18 22 20 18 16 Kalangala 8 7 7 6 16 12 13 11 14 11 Kalungu 53 48 52 48 46 43 50 46 51 48 Kampala 32 28 30 27 25 23 47 42 38 35 Kayunga 38 34 35 31 27 25 29 27 26 25 Kiboga 27 25 30 28 29 27 28 25 26 24 Kyotera - - - - - - - - 40 37 Luwero 52 47 52 48 46 42 49 45 32 29 Lwengo 26 24 26 25 28 26 24 22 27 25 Lyantonde 33 30 34 30 28 25 27 24 26 23 Masaka 39 36 56 52 35 32 48 43 43 40 Mityana 36 33 39 36 24 22 34 31 26 24 Mpigi 41 37 50 46 41 38 43 40 31 28 Mubende 23 20 24 21 22 20 17 15 21 18 Mukono 42 37 41 37 27 25 40 36 30 28 Nakaseke 30 27 32 29 25 23 29 27 22 20 Nakasongola 45 41 41 37 30 28 26 23 25 23 Rakai 30 27 31 29 29 27 68 63 23 21 Ssembabule 46 40 50 43 35 30 24 22 51 44 Wakiso 44 39 30 27 26 23 21 19 25 23 Eastern Region Budaka 49 41 53 47 39 34 42 38 32 28 Bududa 21 17 25 21 18 16 18 16 18 15 Bugiri 25 21 27 24 19 17 25 22 19 18 Bukedea 30 26 27 23 21 18 22 18 20 17 Bukwo 56 51 57 52 42 40 53 48 56 51 Bulambuli 43 39 50 47 29 25 27 24 26 23 Busia 42 34 42 36 32 27 36 30 30 26 Butaleja 34 29 32 28 24 22 23 21 25 23 Butebo - - - - - - - - 33 31 Buyende 29 27 29 26 19 18 21 20 18 17 Iganga 47 43 56 51 46 43 51 48 46 43 Jinja 48 43 49 44 48 43 49 42 32 30 Kaberamaido 25 22 25 22 15 13 15 13 17 14 Kaliro 51 45 54 48 29 26 36 33 31 28 Kamuli 34 32 37 34 30 28 35 31 27 24 Kapchorwa 58 52 60 54 44 40 49 44 47 43 Katakwi 16 14 18 16 12 10 15 13 16 14 Kibuku 38 34 48 43 31 28 36 33 30 27 Kumi 18 15 22 19 16 14 19 17 24 21 Kween 43 38 42 39 38 34 45 39 44 40 Luuka 38 36 41 38 34 32 38 35 29 26 Manafwa 33 29 37 33 35 31 99 86 50 43 Mayuge 29 27 31 29 10 9 29 26 23 21 Mbale 67 57 73 64 50 44 55 46 48 42 Namayingo 15 14 17 15 17 16 13 11 16 14 Namisindwa - - - - - - - - 23 22 Namutumba 40 34 49 44 37 34 42 37 37 33 Ngora 38 34 40 34 37 32 33 27 24 20 Pallisa 34 30 37 34 28 25 49 43 33 29 Serere 25 23 23 21 19 16 19 16 17 16 Sironko 49 42 51 45 53 47 26 22 37 33 Soroti 27 25 32 29 26 24 45 38 24 21 Tororo 43 36 43 37 34 29 35 29 33 27
Source: Ministry of Education and Sports
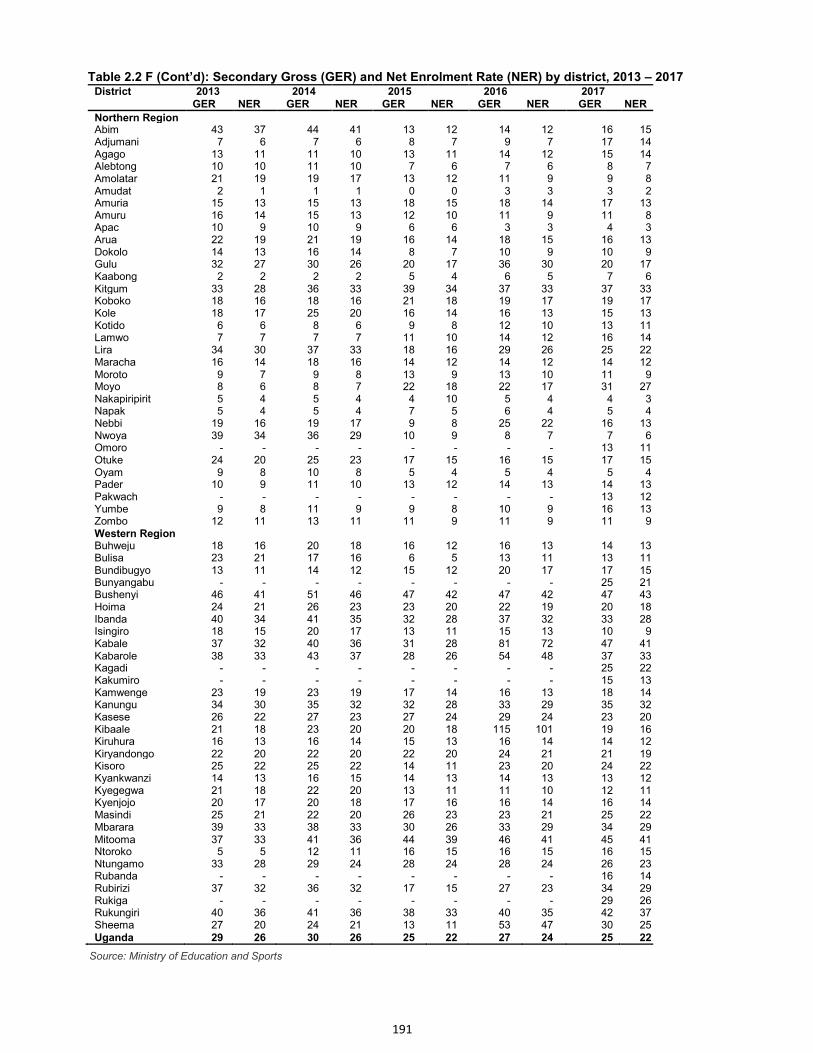
191
Table 2.2 F (Cont’d): Secondary Gross (GER) and Net Enrolment Rate (NER) by district, 2013 – 2017 District 2013 2014 2015 2016 2017 GER NER GER NER GER NER GER NER GER NER
Northern Region Abim 43 37 44 41 13 12 14 12 16 15 Adjumani 7 6 7 6 8 7 9 7 17 14 Agago 13 11 11 10 13 11 14 12 15 14 Alebtong 10 10 11 10 7 6 7 6 8 7 Amolatar 21 19 19 17 13 12 11 9 9 8 Amudat 2 1 1 1 0 0 3 3 3 2 Amuria 15 13 15 13 18 15 18 14 17 13 Amuru 16 14 15 13 12 10 11 9 11 8 Apac 10 9 10 9 6 6 3 3 4 3 Arua 22 19 21 19 16 14 18 15 16 13 Dokolo 14 13 16 14 8 7 10 9 10 9 Gulu 32 27 30 26 20 17 36 30 20 17 Kaabong 2 2 2 2 5 4 6 5 7 6 Kitgum 33 28 36 33 39 34 37 33 37 33 Koboko 18 16 18 16 21 18 19 17 19 17 Kole 18 17 25 20 16 14 16 13 15 13 Kotido 6 6 8 6 9 8 12 10 13 11 Lamwo 7 7 7 7 11 10 14 12 16 14 Lira 34 30 37 33 18 16 29 26 25 22 Maracha 16 14 18 16 14 12 14 12 14 12 Moroto 9 7 9 8 13 9 13 10 11 9 Moyo 8 6 8 7 22 18 22 17 31 27 Nakapiripirit 5 4 5 4 4 10 5 4 4 3 Napak 5 4 5 4 7 5 6 4 5 4 Nebbi 19 16 19 17 9 8 25 22 16 13 Nwoya 39 34 36 29 10 9 8 7 7 6 Omoro - - - - - - - - 13 11 Otuke 24 20 25 23 17 15 16 15 17 15 Oyam 9 8 10 8 5 4 5 4 5 4 Pader 10 9 11 10 13 12 14 13 14 13 Pakwach - - - - - - - - 13 12 Yumbe 9 8 11 9 9 8 10 9 16 13 Zombo 12 11 13 11 11 9 11 9 11 9 Western Region Buhweju 18 16 20 18 16 12 16 13 14 13 Bulisa 23 21 17 16 6 5 13 11 13 11 Bundibugyo 13 11 14 12 15 12 20 17 17 15 Bunyangabu - - - - - - - - 25 21 Bushenyi 46 41 51 46 47 42 47 42 47 43 Hoima 24 21 26 23 23 20 22 19 20 18 Ibanda 40 34 41 35 32 28 37 32 33 28 Isingiro 18 15 20 17 13 11 15 13 10 9 Kabale 37 32 40 36 31 28 81 72 47 41 Kabarole 38 33 43 37 28 26 54 48 37 33 Kagadi - - - - - - - - 25 22 Kakumiro - - - - - - - - 15 13 Kamwenge 23 19 23 19 17 14 16 13 18 14 Kanungu 34 30 35 32 32 28 33 29 35 32 Kasese 26 22 27 23 27 24 29 24 23 20 Kibaale 21 18 23 20 20 18 115 101 19 16 Kiruhura 16 13 16 14 15 13 16 14 14 12 Kiryandongo 22 20 22 20 22 20 24 21 21 19 Kisoro 25 22 25 22 14 11 23 20 24 22 Kyankwanzi 14 13 16 15 14 13 14 13 13 12 Kyegegwa 21 18 22 20 13 11 11 10 12 11 Kyenjojo 20 17 20 18 17 16 16 14 16 14 Masindi 25 21 22 20 26 23 23 21 25 22 Mbarara 39 33 38 33 30 26 33 29 34 29 Mitooma 37 33 41 36 44 39 46 41 45 41 Ntoroko 5 5 12 11 16 15 16 15 16 15 Ntungamo 33 28 29 24 28 24 28 24 26 23 Rubanda - - - - - - - - 16 14 Rubirizi 37 32 36 32 17 15 27 23 34 29 Rukiga - - - - - - - - 29 26 Rukungiri 40 36 41 36 38 33 40 35 42 37 Sheema 27 20 24 21 13 11 53 47 30 25 Uganda 29 26 30 26 25 22 27 24 25 22 Source: Ministry of Education and Sports
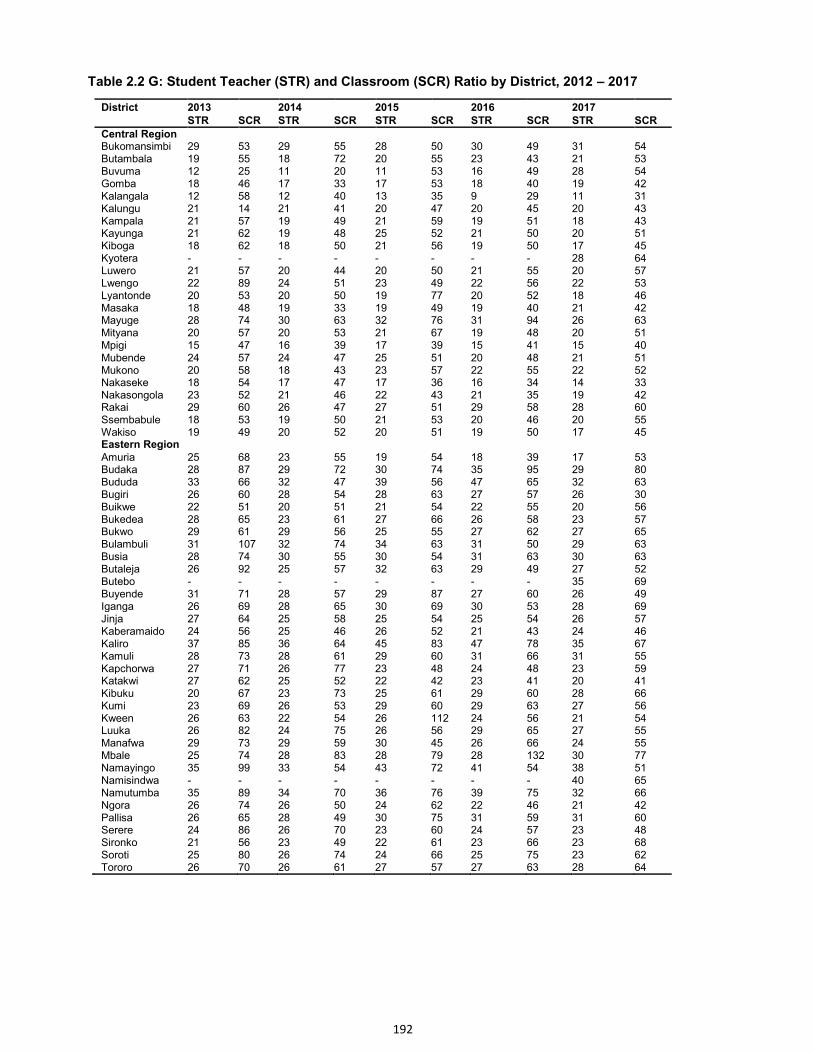
192
Table 2.2 G: Student Teacher (STR) and Classroom (SCR) Ratio by District, 2012 – 2017 District 2013 2014 2015 2016 2017 STR SCR STR SCR STR SCR STR SCR STR SCR
Central Region Bukomansimbi 29 53 29 55 28 50 30 49 31 54 Butambala 19 55 18 72 20 55 23 43 21 53 Buvuma 12 25 11 20 11 53 16 49 28 54 Gomba 18 46 17 33 17 53 18 40 19 42 Kalangala 12 58 12 40 13 35 9 29 11 31 Kalungu 21 14 21 41 20 47 20 45 20 43 Kampala 21 57 19 49 21 59 19 51 18 43 Kayunga 21 62 19 48 25 52 21 50 20 51 Kiboga 18 62 18 50 21 56 19 50 17 45 Kyotera - - - - - - - - 28 64 Luwero 21 57 20 44 20 50 21 55 20 57 Lwengo 22 89 24 51 23 49 22 56 22 53 Lyantonde 20 53 20 50 19 77 20 52 18 46 Masaka 18 48 19 33 19 49 19 40 21 42 Mayuge 28 74 30 63 32 76 31 94 26 63 Mityana 20 57 20 53 21 67 19 48 20 51 Mpigi 15 47 16 39 17 39 15 41 15 40 Mubende 24 57 24 47 25 51 20 48 21 51 Mukono 20 58 18 43 23 57 22 55 22 52 Nakaseke 18 54 17 47 17 36 16 34 14 33 Nakasongola 23 52 21 46 22 43 21 35 19 42 Rakai 29 60 26 47 27 51 29 58 28 60 Ssembabule 18 53 19 50 21 53 20 46 20 55 Wakiso 19 49 20 52 20 51 19 50 17 45 Eastern Region Amuria 25 68 23 55 19 54 18 39 17 53 Budaka 28 87 29 72 30 74 35 95 29 80 Bududa 33 66 32 47 39 56 47 65 32 63 Bugiri 26 60 28 54 28 63 27 57 26 30 Buikwe 22 51 20 51 21 54 22 55 20 56 Bukedea 28 65 23 61 27 66 26 58 23 57 Bukwo 29 61 29 56 25 55 27 62 27 65 Bulambuli 31 107 32 74 34 63 31 50 29 63 Busia 28 74 30 55 30 54 31 63 30 63 Butaleja 26 92 25 57 32 63 29 49 27 52 Butebo - - - - - - - - 35 69 Buyende 31 71 28 57 29 87 27 60 26 49 Iganga 26 69 28 65 30 69 30 53 28 69 Jinja 27 64 25 58 25 54 25 54 26 57 Kaberamaido 24 56 25 46 26 52 21 43 24 46 Kaliro 37 85 36 64 45 83 47 78 35 67 Kamuli 28 73 28 61 29 60 31 66 31 55 Kapchorwa 27 71 26 77 23 48 24 48 23 59 Katakwi 27 62 25 52 22 42 23 41 20 41 Kibuku 20 67 23 73 25 61 29 60 28 66 Kumi 23 69 26 53 29 60 29 63 27 56 Kween 26 63 22 54 26 112 24 56 21 54 Luuka 26 82 24 75 26 56 29 65 27 55 Manafwa 29 73 29 59 30 45 26 66 24 55 Mbale 25 74 28 83 28 79 28 132 30 77 Namayingo 35 99 33 54 43 72 41 54 38 51 Namisindwa - - - - - - - - 40 65 Namutumba 35 89 34 70 36 76 39 75 32 66 Ngora 26 74 26 50 24 62 22 46 21 42 Pallisa 26 65 28 49 30 75 31 59 31 60 Serere 24 86 26 70 23 60 24 57 23 48 Sironko 21 56 23 49 22 61 23 66 23 68 Soroti 25 80 26 74 24 66 25 75 23 62 Tororo 26 70 26 61 27 57 27 63 28 64
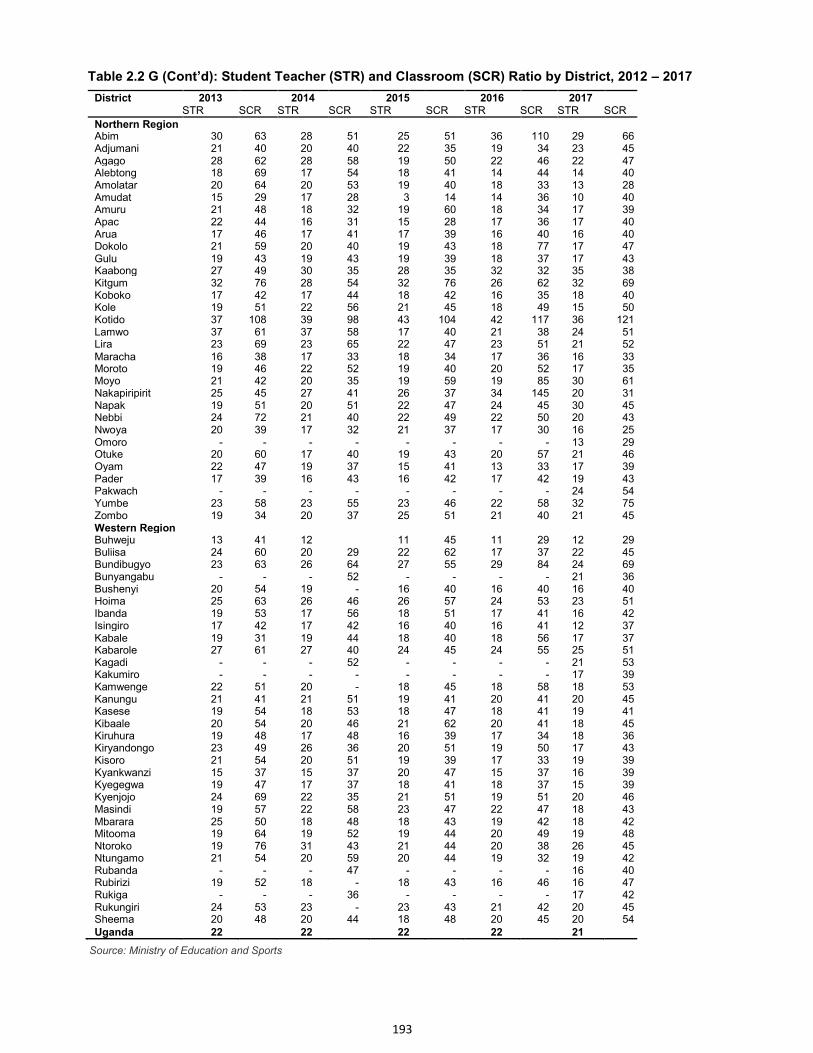
193
Table 2.2 G (Cont’d): Student Teacher (STR) and Classroom (SCR) Ratio by District, 2012 – 2017 District 2013 2014 2015 2016 2017 STR SCR STR SCR STR SCR STR SCR STR SCR
Northern Region Abim 30 63 28 51 25 51 36 110 29 66 Adjumani 21 40 20 40 22 35 19 34 23 45 Agago 28 62 28 58 19 50 22 46 22 47 Alebtong 18 69 17 54 18 41 14 44 14 40 Amolatar 20 64 20 53 19 40 18 33 13 28 Amudat 15 29 17 28 3 14 14 36 10 40 Amuru 21 48 18 32 19 60 18 34 17 39 Apac 22 44 16 31 15 28 17 36 17 40 Arua 17 46 17 41 17 39 16 40 16 40 Dokolo 21 59 20 40 19 43 18 77 17 47 Gulu 19 43 19 43 19 39 18 37 17 43 Kaabong 27 49 30 35 28 35 32 32 35 38 Kitgum 32 76 28 54 32 76 26 62 32 69 Koboko 17 42 17 44 18 42 16 35 18 40 Kole 19 51 22 56 21 45 18 49 15 50 Kotido 37 108 39 98 43 104 42 117 36 121 Lamwo 37 61 37 58 17 40 21 38 24 51 Lira 23 69 23 65 22 47 23 51 21 52 Maracha 16 38 17 33 18 34 17 36 16 33 Moroto 19 46 22 52 19 40 20 52 17 35 Moyo 21 42 20 35 19 59 19 85 30 61 Nakapiripirit 25 45 27 41 26 37 34 145 20 31 Napak 19 51 20 51 22 47 24 45 30 45 Nebbi 24 72 21 40 22 49 22 50 20 43 Nwoya 20 39 17 32 21 37 17 30 16 25 Omoro - - - - - - - - 13 29 Otuke 20 60 17 40 19 43 20 57 21 46 Oyam 22 47 19 37 15 41 13 33 17 39 Pader 17 39 16 43 16 42 17 42 19 43 Pakwach - - - - - - - - 24 54 Yumbe 23 58 23 55 23 46 22 58 32 75 Zombo 19 34 20 37 25 51 21 40 21 45 Western Region Buhweju 13 41 12 11 45 11 29 12 29 Buliisa 24 60 20 29 22 62 17 37 22 45 Bundibugyo 23 63 26 64 27 55 29 84 24 69 Bunyangabu - - - 52 - - - - 21 36 Bushenyi 20 54 19 - 16 40 16 40 16 40 Hoima 25 63 26 46 26 57 24 53 23 51 Ibanda 19 53 17 56 18 51 17 41 16 42 Isingiro 17 42 17 42 16 40 16 41 12 37 Kabale 19 31 19 44 18 40 18 56 17 37 Kabarole 27 61 27 40 24 45 24 55 25 51 Kagadi - - - 52 - - - - 21 53 Kakumiro - - - - - - - - 17 39 Kamwenge 22 51 20 - 18 45 18 58 18 53 Kanungu 21 41 21 51 19 41 20 41 20 45 Kasese 19 54 18 53 18 47 18 41 19 41 Kibaale 20 54 20 46 21 62 20 41 18 45 Kiruhura 19 48 17 48 16 39 17 34 18 36 Kiryandongo 23 49 26 36 20 51 19 50 17 43 Kisoro 21 54 20 51 19 39 17 33 19 39 Kyankwanzi 15 37 15 37 20 47 15 37 16 39 Kyegegwa 19 47 17 37 18 41 18 37 15 39 Kyenjojo 24 69 22 35 21 51 19 51 20 46 Masindi 19 57 22 58 23 47 22 47 18 43 Mbarara 25 50 18 48 18 43 19 42 18 42 Mitooma 19 64 19 52 19 44 20 49 19 48 Ntoroko 19 76 31 43 21 44 20 38 26 45 Ntungamo 21 54 20 59 20 44 19 32 19 42 Rubanda - - - 47 - - - - 16 40 Rubirizi 19 52 18 - 18 43 16 46 16 47 Rukiga - - - 36 - - - - 17 42 Rukungiri 24 53 23 - 23 43 21 42 20 45 Sheema 20 48 20 44 18 48 20 45 20 54 Uganda 22 22 22 22 21 Source: Ministry of Education and Sports
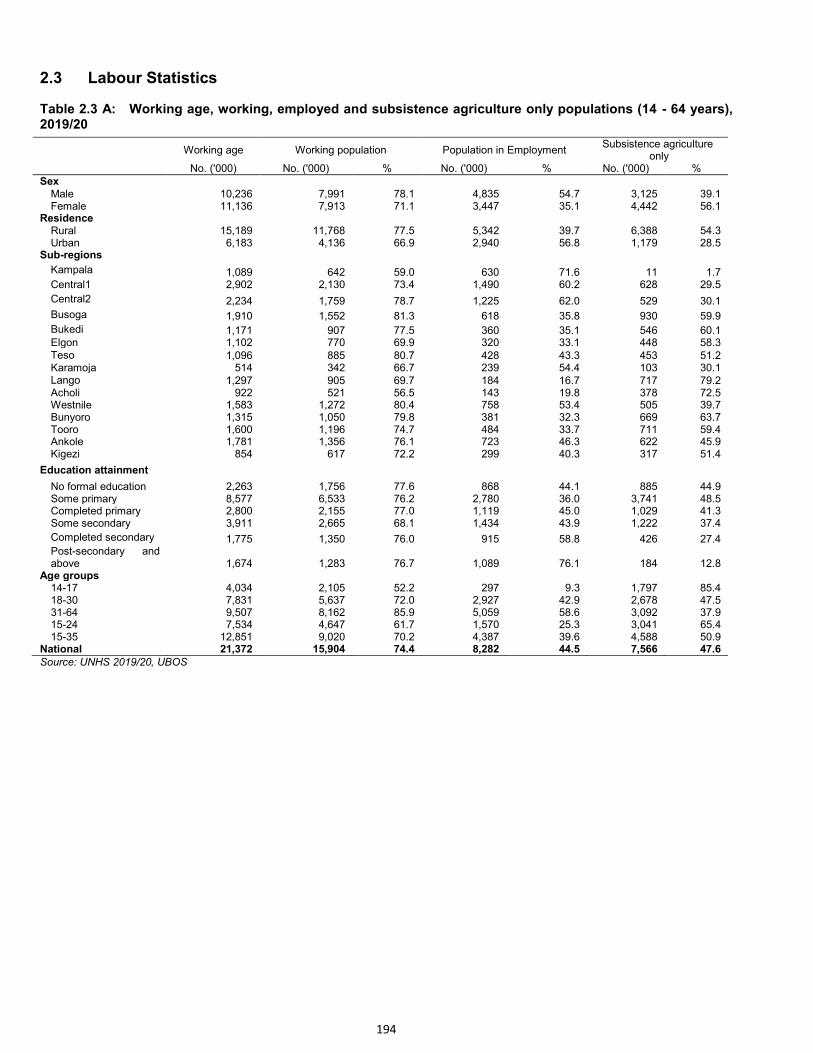
194
2.3 Labour Statistics
Table 2.3 A: Working age, working, employed and subsistence agriculture only populations (14 - 64 years), 2019/20
Working age Working population Population in Employment Subsistence agriculture
only No. ('000) No. ('000) % No. ('000) % No. ('000) % Sex
Male 10,236 7,991 78.1 4,835 54.7 3,125 39.1 Female 11,136 7,913 71.1 3,447 35.1 4,442 56.1
Residence
Rural 15,189 11,768 77.5 5,342 39.7 6,388 54.3 Urban 6,183 4,136 66.9 2,940 56.8 1,179 28.5
Sub-regions
Kampala 1,089 642 59.0 630 71.6 11 1.7 Central1 2,902 2,130 73.4 1,490 60.2 628 29.5
Central2 2,234 1,759 78.7 1,225 62.0 529 30.1
Busoga 1,910 1,552 81.3 618 35.8 930 59.9
Bukedi 1,171 907 77.5 360 35.1 546 60.1 Elgon 1,102 770 69.9 320 33.1 448 58.3 Teso 1,096 885 80.7 428 43.3 453 51.2 Karamoja 514 342 66.7 239 54.4 103 30.1 Lango 1,297 905 69.7 184 16.7 717 79.2 Acholi 922 521 56.5 143 19.8 378 72.5 Westnile 1,583 1,272 80.4 758 53.4 505 39.7 Bunyoro 1,315 1,050 79.8 381 32.3 669 63.7 Tooro 1,600 1,196 74.7 484 33.7 711 59.4 Ankole 1,781 1,356 76.1 723 46.3 622 45.9 Kigezi 854 617 72.2 299 40.3 317 51.4
Education attainment
No formal education 2,263 1,756 77.6 868 44.1 885 44.9 Some primary 8,577 6,533 76.2 2,780 36.0 3,741 48.5 Completed primary 2,800 2,155 77.0 1,119 45.0 1,029 41.3 Some secondary 3,911 2,665 68.1 1,434 43.9 1,222 37.4
Completed secondary 1,775 1,350 76.0 915 58.8 426 27.4 Post-secondary and above 1,674 1,283 76.7 1,089 76.1 184 12.8
Age groups
14-17 4,034 2,105 52.2 297 9.3 1,797 85.4 18-30 7,831 5,637 72.0 2,927 42.9 2,678 47.5 31-64 9,507 8,162 85.9 5,059 58.6 3,092 37.9 15-24 7,534 4,647 61.7 1,570 25.3 3,041 65.4 15-35 12,851 9,020 70.2 4,387 39.6 4,588 50.9
National 21,372 15,904 74.4 8,282 44.5 7,566 47.6 Source: UNHS 2019/20, UBOS
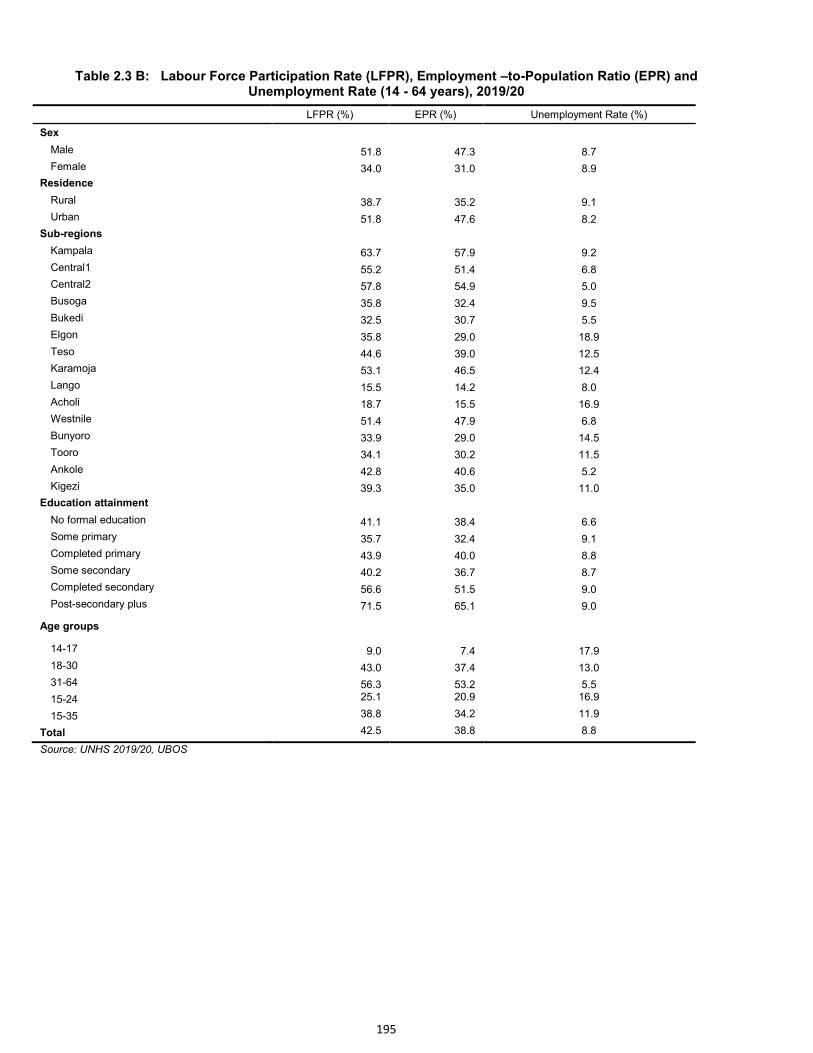
195
Table 2.3 B: Labour Force Participation Rate (LFPR), Employment –to-Population Ratio (EPR) and Unemployment Rate (14 - 64 years), 2019/20
LFPR (%) EPR (%) Unemployment Rate (%)
Sex
Male 51.8 47.3 8.7
Female 34.0 31.0 8.9
Residence
Rural 38.7 35.2 9.1
Urban 51.8 47.6 8.2
Sub-regions
Kampala 63.7 57.9 9.2
Central1 55.2 51.4 6.8
Central2 57.8 54.9 5.0
Busoga 35.8 32.4 9.5
Bukedi 32.5 30.7 5.5
Elgon 35.8 29.0 18.9
Teso 44.6 39.0 12.5
Karamoja 53.1 46.5 12.4
Lango 15.5 14.2 8.0
Acholi 18.7 15.5 16.9
Westnile 51.4 47.9 6.8
Bunyoro 33.9 29.0 14.5
Tooro 34.1 30.2 11.5
Ankole 42.8 40.6 5.2
Kigezi 39.3 35.0 11.0
Education attainment
No formal education 41.1 38.4 6.6
Some primary 35.7 32.4 9.1
Completed primary 43.9 40.0 8.8
Some secondary 40.2 36.7 8.7
Completed secondary 56.6 51.5 9.0
Post-secondary plus 71.5 65.1 9.0
Age groups
14-17 9.0 7.4 17.9
18-30 43.0 37.4 13.0
31-64 56.3 53.2 5.5
15-24 25.1 20.9 16.9
15-35 38.8 34.2 11.9
Total 42.5 38.8 8.8
Source: UNHS 2019/20, UBOS
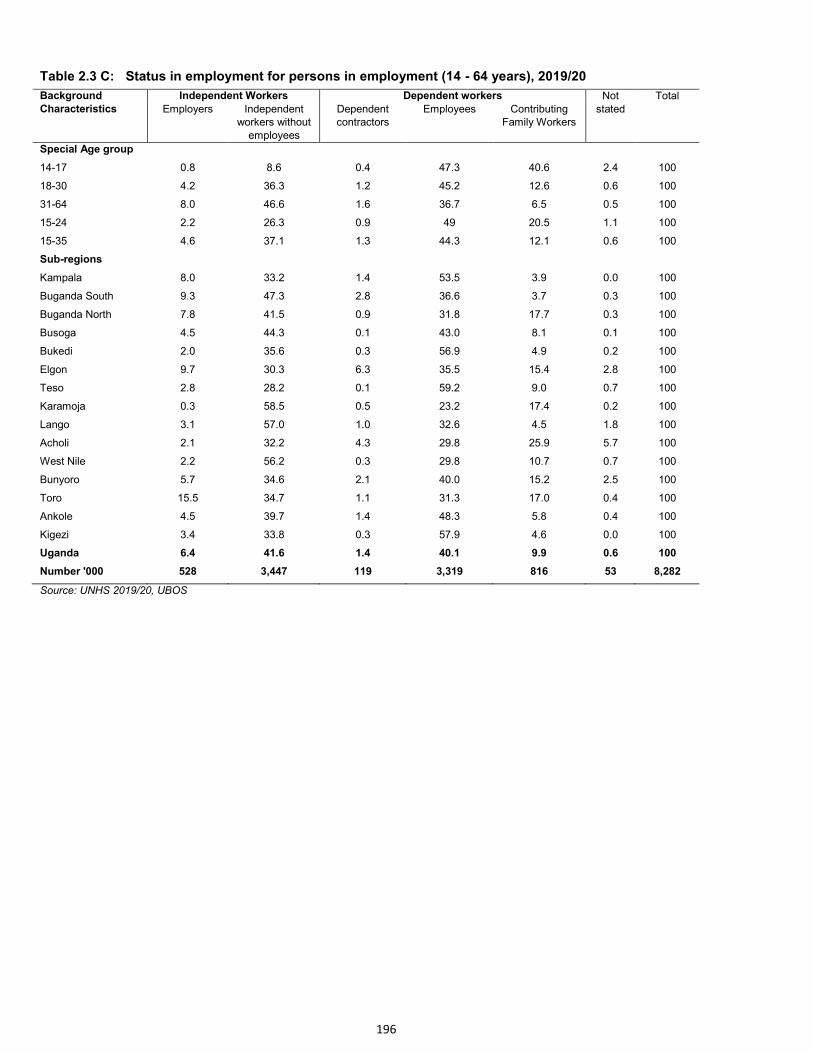
196
Table 2.3 C: Status in employment for persons in employment (14 - 64 years), 2019/20
Background
Characteristics
Independent Workers Dependent workers Not
stated
Total
Employers Independent workers without
employees
Dependent contractors
Employees Contributing Family Workers
Special Age group
14-17 0.8 8.6 0.4 47.3 40.6 2.4 100
18-30 4.2 36.3 1.2 45.2 12.6 0.6 100
31-64 8.0 46.6 1.6 36.7 6.5 0.5 100
15-24 2.2 26.3 0.9 49 20.5 1.1 100
15-35 4.6 37.1 1.3 44.3 12.1 0.6 100
Sub-regions
Kampala 8.0 33.2 1.4 53.5 3.9 0.0 100
Buganda South 9.3 47.3 2.8 36.6 3.7 0.3 100
Buganda North 7.8 41.5 0.9 31.8 17.7 0.3 100
Busoga 4.5 44.3 0.1 43.0 8.1 0.1 100
Bukedi 2.0 35.6 0.3 56.9 4.9 0.2 100
Elgon 9.7 30.3 6.3 35.5 15.4 2.8 100
Teso 2.8 28.2 0.1 59.2 9.0 0.7 100
Karamoja 0.3 58.5 0.5 23.2 17.4 0.2 100
Lango 3.1 57.0 1.0 32.6 4.5 1.8 100
Acholi 2.1 32.2 4.3 29.8 25.9 5.7 100
West Nile 2.2 56.2 0.3 29.8 10.7 0.7 100
Bunyoro 5.7 34.6 2.1 40.0 15.2 2.5 100
Toro 15.5 34.7 1.1 31.3 17.0 0.4 100
Ankole 4.5 39.7 1.4 48.3 5.8 0.4 100
Kigezi 3.4 33.8 0.3 57.9 4.6 0.0 100
Uganda 6.4 41.6 1.4 40.1 9.9 0.6 100
Number '000 528 3,447 119 3,319 816 53 8,282
Source: UNHS 2019/20, UBOS
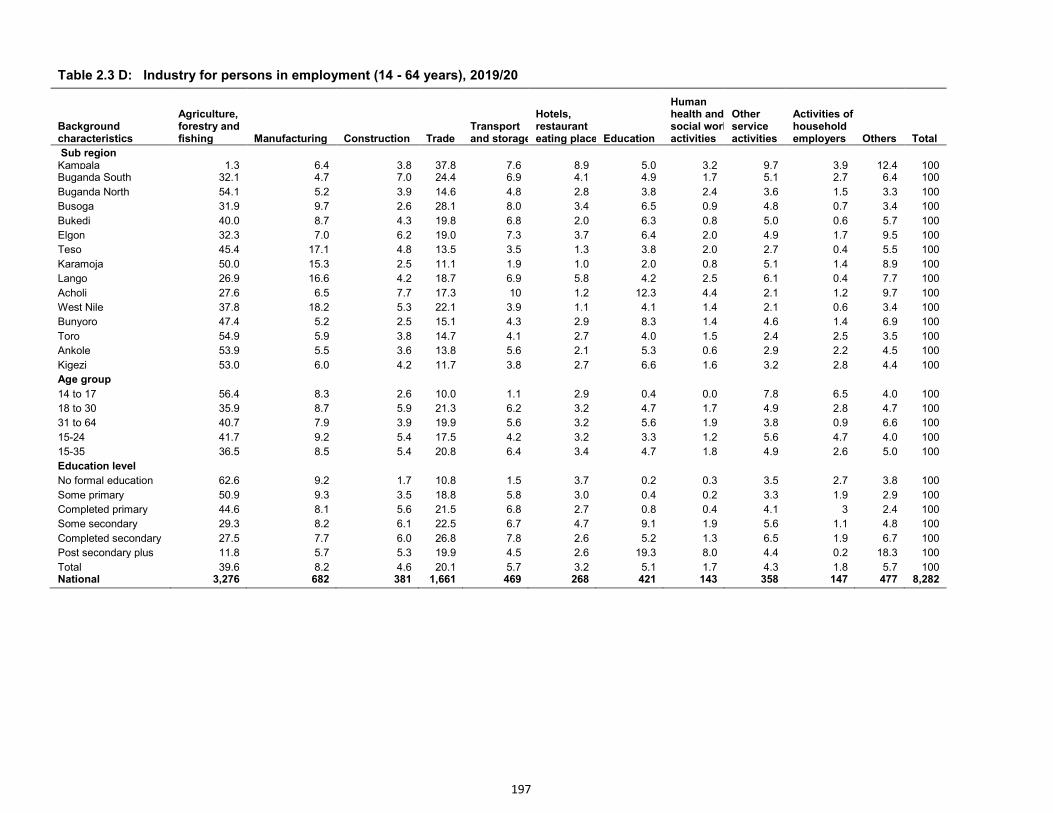
197
Table 2.3 D: Industry for persons in employment (14 - 64 years), 2019/20
Background characteristics
Agriculture, forestry and fishing Manufacturing Construction Trade
Transport and storage
Hotels, restaurant eating placesEducation
Human health and social work activities
Other service activities
Activities of household employers Others Total
Sub region Kampala 1.3 6.4 3.8 37.8 7.6 8.9 5.0 3.2 9.7 3.9 12.4 100
Buganda South 32.1 4.7 7.0 24.4 6.9 4.1 4.9 1.7 5.1 2.7 6.4 100
Buganda North 54.1 5.2 3.9 14.6 4.8 2.8 3.8 2.4 3.6 1.5 3.3 100
Busoga 31.9 9.7 2.6 28.1 8.0 3.4 6.5 0.9 4.8 0.7 3.4 100
Bukedi 40.0 8.7 4.3 19.8 6.8 2.0 6.3 0.8 5.0 0.6 5.7 100
Elgon 32.3 7.0 6.2 19.0 7.3 3.7 6.4 2.0 4.9 1.7 9.5 100
Teso 45.4 17.1 4.8 13.5 3.5 1.3 3.8 2.0 2.7 0.4 5.5 100
Karamoja 50.0 15.3 2.5 11.1 1.9 1.0 2.0 0.8 5.1 1.4 8.9 100
Lango 26.9 16.6 4.2 18.7 6.9 5.8 4.2 2.5 6.1 0.4 7.7 100
Acholi 27.6 6.5 7.7 17.3 10 1.2 12.3 4.4 2.1 1.2 9.7 100
West Nile 37.8 18.2 5.3 22.1 3.9 1.1 4.1 1.4 2.1 0.6 3.4 100
Bunyoro 47.4 5.2 2.5 15.1 4.3 2.9 8.3 1.4 4.6 1.4 6.9 100
Toro 54.9 5.9 3.8 14.7 4.1 2.7 4.0 1.5 2.4 2.5 3.5 100
Ankole 53.9 5.5 3.6 13.8 5.6 2.1 5.3 0.6 2.9 2.2 4.5 100
Kigezi 53.0 6.0 4.2 11.7 3.8 2.7 6.6 1.6 3.2 2.8 4.4 100
Age group 14 to 17 56.4 8.3 2.6 10.0 1.1 2.9 0.4 0.0 7.8 6.5 4.0 100
18 to 30 35.9 8.7 5.9 21.3 6.2 3.2 4.7 1.7 4.9 2.8 4.7 100
31 to 64 40.7 7.9 3.9 19.9 5.6 3.2 5.6 1.9 3.8 0.9 6.6 100
15-24 41.7 9.2 5.4 17.5 4.2 3.2 3.3 1.2 5.6 4.7 4.0 100
15-35 36.5 8.5 5.4 20.8 6.4 3.4 4.7 1.8 4.9 2.6 5.0 100
Education level No formal education 62.6 9.2 1.7 10.8 1.5 3.7 0.2 0.3 3.5 2.7 3.8 100
Some primary 50.9 9.3 3.5 18.8 5.8 3.0 0.4 0.2 3.3 1.9 2.9 100
Completed primary 44.6 8.1 5.6 21.5 6.8 2.7 0.8 0.4 4.1 3 2.4 100
Some secondary 29.3 8.2 6.1 22.5 6.7 4.7 9.1 1.9 5.6 1.1 4.8 100
Completed secondary 27.5 7.7 6.0 26.8 7.8 2.6 5.2 1.3 6.5 1.9 6.7 100
Post secondary plus 11.8 5.7 5.3 19.9 4.5 2.6 19.3 8.0 4.4 0.2 18.3 100
Total 39.6 8.2 4.6 20.1 5.7 3.2 5.1 1.7 4.3 1.8 5.7 100 National 3,276 682 381 1,661 469 268 421 143 358 147 477 8,282
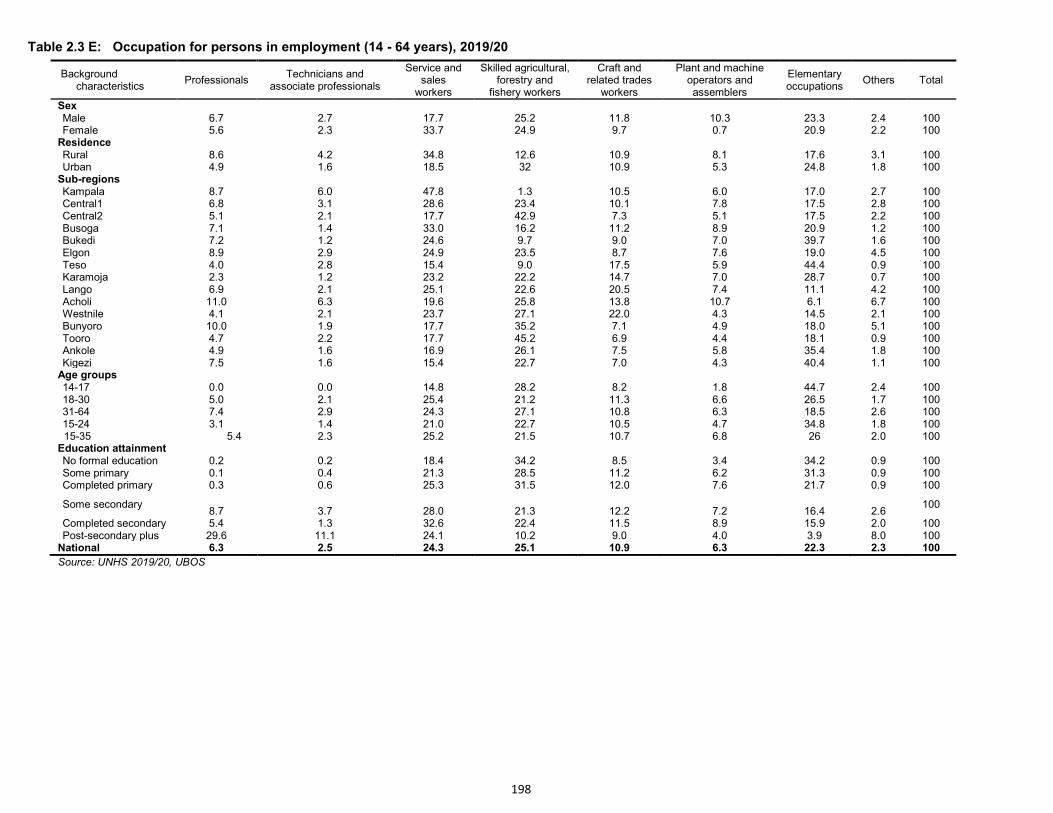
198
Table 2.3 E: Occupation for persons in employment (14 - 64 years), 2019/20
Background characteristics
Professionals Technicians and
associate professionals
Service and sales
workers
Skilled agricultural, forestry and
fishery workers
Craft and related trades
workers
Plant and machine operators and assemblers
Elementary occupations
Others Total
Sex
Male 6.7 2.7 17.7 25.2 11.8 10.3 23.3 2.4 100 Female 5.6 2.3 33.7 24.9 9.7 0.7 20.9 2.2 100
Residence
Rural 8.6 4.2 34.8 12.6 10.9 8.1 17.6 3.1 100 Urban 4.9 1.6 18.5 32 10.9 5.3 24.8 1.8 100
Sub-regions
Kampala 8.7 6.0 47.8 1.3 10.5 6.0 17.0 2.7 100 Central1 6.8 3.1 28.6 23.4 10.1 7.8 17.5 2.8 100 Central2 5.1 2.1 17.7 42.9 7.3 5.1 17.5 2.2 100 Busoga 7.1 1.4 33.0 16.2 11.2 8.9 20.9 1.2 100 Bukedi 7.2 1.2 24.6 9.7 9.0 7.0 39.7 1.6 100 Elgon 8.9 2.9 24.9 23.5 8.7 7.6 19.0 4.5 100 Teso 4.0 2.8 15.4 9.0 17.5 5.9 44.4 0.9 100 Karamoja 2.3 1.2 23.2 22.2 14.7 7.0 28.7 0.7 100 Lango 6.9 2.1 25.1 22.6 20.5 7.4 11.1 4.2 100 Acholi 11.0 6.3 19.6 25.8 13.8 10.7 6.1 6.7 100 Westnile 4.1 2.1 23.7 27.1 22.0 4.3 14.5 2.1 100 Bunyoro 10.0 1.9 17.7 35.2 7.1 4.9 18.0 5.1 100 Tooro 4.7 2.2 17.7 45.2 6.9 4.4 18.1 0.9 100 Ankole 4.9 1.6 16.9 26.1 7.5 5.8 35.4 1.8 100 Kigezi 7.5 1.6 15.4 22.7 7.0 4.3 40.4 1.1 100
Age groups
14-17 0.0 0.0 14.8 28.2 8.2 1.8 44.7 2.4 100 18-30 5.0 2.1 25.4 21.2 11.3 6.6 26.5 1.7 100 31-64 7.4 2.9 24.3 27.1 10.8 6.3 18.5 2.6 100 15-24 3.1 1.4 21.0 22.7 10.5 4.7 34.8 1.8 100
15-35 5.4 2.3 25.2 21.5 10.7 6.8 26 2.0 100 Education attainment
No formal education 0.2 0.2 18.4 34.2 8.5 3.4 34.2 0.9 100 Some primary 0.1 0.4 21.3 28.5 11.2 6.2 31.3 0.9 100 Completed primary 0.3 0.6 25.3 31.5 12.0 7.6 21.7 0.9 100
Some secondary 8.7 3.7 28.0 21.3 12.2 7.2 16.4 2.6
100
Completed secondary 5.4 1.3 32.6 22.4 11.5 8.9 15.9 2.0 100 Post-secondary plus 29.6 11.1 24.1 10.2 9.0 4.0 3.9 8.0 100
National 6.3 2.5 24.3 25.1 10.9 6.3 22.3 2.3 100
Source: UNHS 2019/20, UBOS
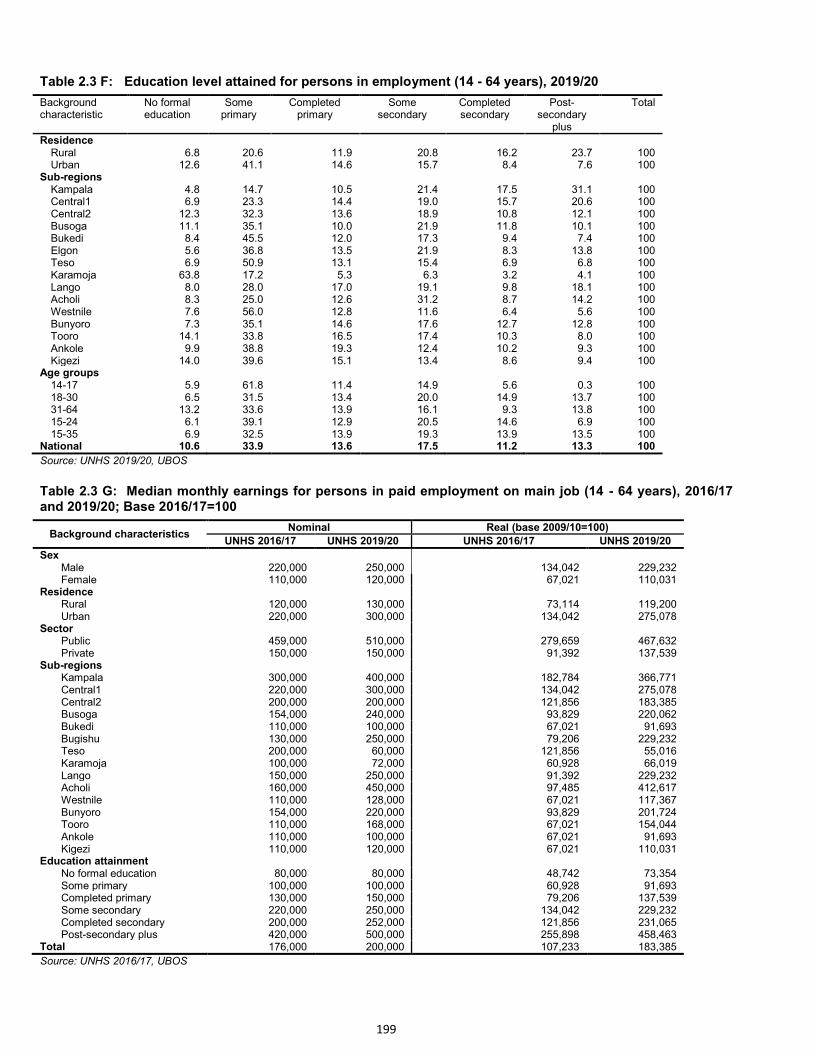
199
Table 2.3 F: Education level attained for persons in employment (14 - 64 years), 2019/20
Background characteristic
No formal education
Some primary
Completed primary
Some secondary
Completed secondary
Post-secondary
plus
Total
Residence Rural 6.8 20.6 11.9 20.8 16.2 23.7 100 Urban 12.6 41.1 14.6 15.7 8.4 7.6 100
Sub-regions Kampala 4.8 14.7 10.5 21.4 17.5 31.1 100 Central1 6.9 23.3 14.4 19.0 15.7 20.6 100 Central2 12.3 32.3 13.6 18.9 10.8 12.1 100 Busoga 11.1 35.1 10.0 21.9 11.8 10.1 100 Bukedi 8.4 45.5 12.0 17.3 9.4 7.4 100 Elgon 5.6 36.8 13.5 21.9 8.3 13.8 100 Teso 6.9 50.9 13.1 15.4 6.9 6.8 100 Karamoja 63.8 17.2 5.3 6.3 3.2 4.1 100 Lango 8.0 28.0 17.0 19.1 9.8 18.1 100 Acholi 8.3 25.0 12.6 31.2 8.7 14.2 100 Westnile 7.6 56.0 12.8 11.6 6.4 5.6 100 Bunyoro 7.3 35.1 14.6 17.6 12.7 12.8 100 Tooro 14.1 33.8 16.5 17.4 10.3 8.0 100 Ankole 9.9 38.8 19.3 12.4 10.2 9.3 100 Kigezi 14.0 39.6 15.1 13.4 8.6 9.4 100
Age groups 14-17 5.9 61.8 11.4 14.9 5.6 0.3 100 18-30 6.5 31.5 13.4 20.0 14.9 13.7 100 31-64 13.2 33.6 13.9 16.1 9.3 13.8 100 15-24 6.1 39.1 12.9 20.5 14.6 6.9 100 15-35 6.9 32.5 13.9 19.3 13.9 13.5 100
National 10.6 33.9 13.6 17.5 11.2 13.3 100
Source: UNHS 2019/20, UBOS
Table 2.3 G: Median monthly earnings for persons in paid employment on main job (14 - 64 years), 2016/17 and 2019/20; Base 2016/17=100
Background characteristics Nominal Real (base 2009/10=100)
UNHS 2016/17 UNHS 2019/20 UNHS 2016/17 UNHS 2019/20
Sex Male 220,000 250,000 134,042 229,232 Female 110,000 120,000 67,021 110,031
Residence Rural 120,000 130,000 73,114 119,200 Urban 220,000 300,000 134,042 275,078
Sector Public 459,000 510,000 279,659 467,632 Private 150,000 150,000 91,392 137,539
Sub-regions Kampala 300,000 400,000 182,784 366,771 Central1 220,000 300,000 134,042 275,078 Central2 200,000 200,000 121,856 183,385 Busoga 154,000 240,000 93,829 220,062 Bukedi 110,000 100,000 67,021 91,693 Bugishu 130,000 250,000 79,206 229,232 Teso 200,000 60,000 121,856 55,016 Karamoja 100,000 72,000 60,928 66,019 Lango 150,000 250,000 91,392 229,232 Acholi 160,000 450,000 97,485 412,617 Westnile 110,000 128,000 67,021 117,367 Bunyoro 154,000 220,000 93,829 201,724 Tooro 110,000 168,000 67,021 154,044 Ankole 110,000 100,000 67,021 91,693 Kigezi 110,000 120,000 67,021 110,031
Education attainment No formal education 80,000 80,000 48,742 73,354 Some primary 100,000 100,000 60,928 91,693 Completed primary 130,000 150,000 79,206 137,539 Some secondary 220,000 250,000 134,042 229,232 Completed secondary 200,000 252,000 121,856 231,065 Post-secondary plus 420,000 500,000 255,898 458,463
Total 176,000 200,000 107,233 183,385
Source: UNHS 2016/17, UBOS
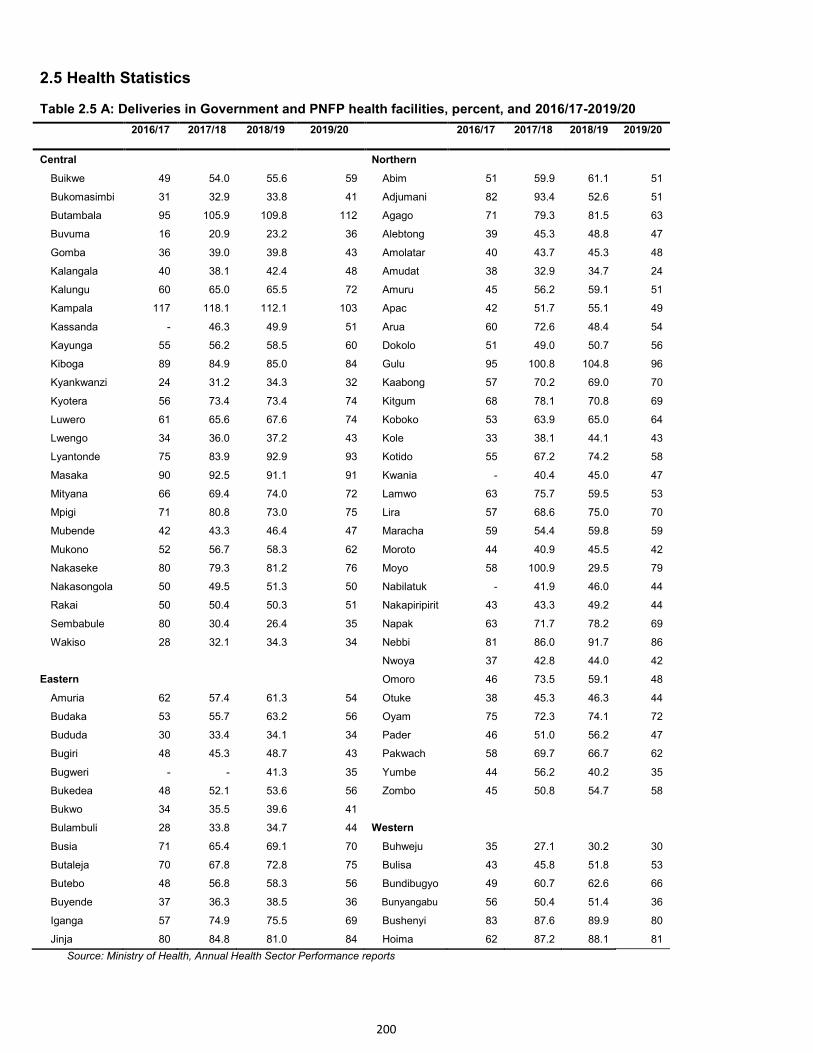
200
2.5 Health Statistics
Table 2.5 A: Deliveries in Government and PNFP health facilities, percent, and 2016/17-2019/20
2016/17 2017/18 2018/19 2019/20 2016/17 2017/18 2018/19 2019/20
Central
Northern
Buikwe 49 54.0 55.6 59 Abim 51 59.9 61.1 51
Bukomasimbi 31 32.9 33.8 41 Adjumani 82 93.4 52.6 51
Butambala 95 105.9 109.8 112 Agago 71 79.3 81.5 63
Buvuma 16 20.9 23.2 36 Alebtong 39 45.3 48.8 47
Gomba 36 39.0 39.8 43 Amolatar 40 43.7 45.3 48
Kalangala 40 38.1 42.4 48 Amudat 38 32.9 34.7 24
Kalungu 60 65.0 65.5 72 Amuru 45 56.2 59.1 51
Kampala 117 118.1 112.1 103 Apac 42 51.7 55.1 49
Kassanda - 46.3 49.9 51 Arua 60 72.6 48.4 54
Kayunga 55 56.2 58.5 60 Dokolo 51 49.0 50.7 56
Kiboga 89 84.9 85.0 84 Gulu 95 100.8 104.8 96
Kyankwanzi 24 31.2 34.3 32 Kaabong 57 70.2 69.0 70
Kyotera 56 73.4 73.4 74 Kitgum 68 78.1 70.8 69
Luwero 61 65.6 67.6 74 Koboko 53 63.9 65.0 64
Lwengo 34 36.0 37.2 43 Kole 33 38.1 44.1 43
Lyantonde 75 83.9 92.9 93 Kotido 55 67.2 74.2 58
Masaka 90 92.5 91.1 91 Kwania - 40.4 45.0 47
Mityana 66 69.4 74.0 72 Lamwo 63 75.7 59.5 53
Mpigi 71 80.8 73.0 75 Lira 57 68.6 75.0 70
Mubende 42 43.3 46.4 47 Maracha 59 54.4 59.8 59
Mukono 52 56.7 58.3 62 Moroto 44 40.9 45.5 42
Nakaseke 80 79.3 81.2 76 Moyo 58 100.9 29.5 79
Nakasongola 50 49.5 51.3 50 Nabilatuk - 41.9 46.0 44
Rakai 50 50.4 50.3 51 Nakapiripirit 43 43.3 49.2 44
Sembabule 80 30.4 26.4 35 Napak 63 71.7 78.2 69
Wakiso 28 32.1 34.3 34 Nebbi 81 86.0 91.7 86
Nwoya 37 42.8 44.0 42
Eastern Omoro 46 73.5 59.1 48
Amuria 62 57.4 61.3 54 Otuke 38 45.3 46.3 44
Budaka 53 55.7 63.2 56 Oyam 75 72.3 74.1 72
Bududa 30 33.4 34.1 34 Pader 46 51.0 56.2 47
Bugiri 48 45.3 48.7 43 Pakwach 58 69.7 66.7 62
Bugweri - - 41.3 35 Yumbe 44 56.2 40.2 35
Bukedea 48 52.1 53.6 56 Zombo 45 50.8 54.7 58
Bukwo 34 35.5 39.6 41
Bulambuli 28 33.8 34.7 44 Western
Busia 71 65.4 69.1 70 Buhweju 35 27.1 30.2 30
Butaleja 70 67.8 72.8 75 Bulisa 43 45.8 51.8 53
Butebo 48 56.8 58.3 56 Bundibugyo 49 60.7 62.6 66
Buyende 37 36.3 38.5 36 Bunyangabu 56 50.4 51.4 36
Iganga 57 74.9 75.5 69 Bushenyi 83 87.6 89.9 80
Jinja 80 84.8 81.0 84 Hoima 62 87.2 88.1 81
Source: Ministry of Health, Annual Health Sector Performance reports
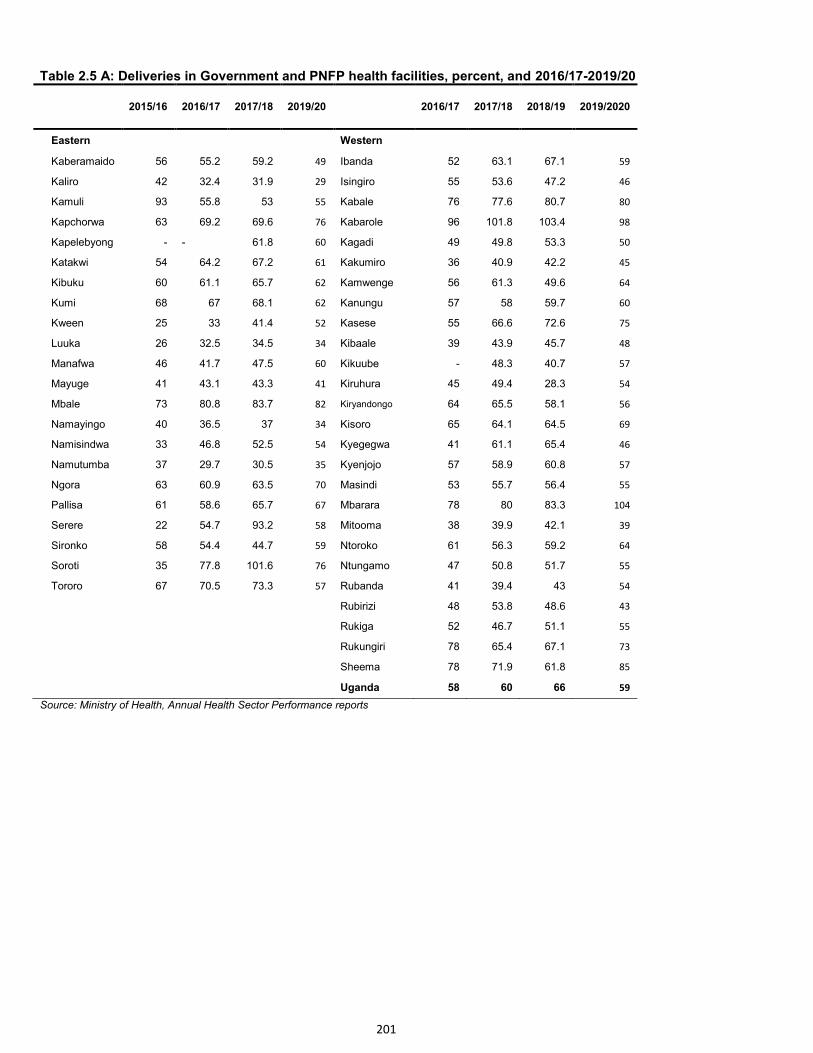
201
Table 2.5 A: Deliveries in Government and PNFP health facilities, percent, and 2016/17-2019/20
2015/16 2016/17 2017/18 2019/20
2016/17 2017/18 2018/19 2019/2020
Eastern
Western
Kaberamaido 56 55.2 59.2 49 Ibanda 52 63.1 67.1 59
Kaliro 42 32.4 31.9 29 Isingiro 55 53.6 47.2 46
Kamuli 93 55.8 53 55 Kabale 76 77.6 80.7 80
Kapchorwa 63 69.2 69.6 76 Kabarole 96 101.8 103.4 98
Kapelebyong - - 61.8 60 Kagadi 49 49.8 53.3 50
Katakwi 54 64.2 67.2 61 Kakumiro 36 40.9 42.2 45
Kibuku 60 61.1 65.7 62 Kamwenge 56 61.3 49.6 64
Kumi 68 67 68.1 62 Kanungu 57 58 59.7 60
Kween 25 33 41.4 52 Kasese 55 66.6 72.6 75
Luuka 26 32.5 34.5 34 Kibaale 39 43.9 45.7 48
Manafwa 46 41.7 47.5 60 Kikuube - 48.3 40.7 57
Mayuge 41 43.1 43.3 41 Kiruhura 45 49.4 28.3 54
Mbale 73 80.8 83.7 82 Kiryandongo 64 65.5 58.1 56
Namayingo 40 36.5 37 34 Kisoro 65 64.1 64.5 69
Namisindwa 33 46.8 52.5 54 Kyegegwa 41 61.1 65.4 46
Namutumba 37 29.7 30.5 35 Kyenjojo 57 58.9 60.8 57
Ngora 63 60.9 63.5 70 Masindi 53 55.7 56.4 55
Pallisa 61 58.6 65.7 67 Mbarara 78 80 83.3 104
Serere 22 54.7 93.2 58 Mitooma 38 39.9 42.1 39
Sironko 58 54.4 44.7 59 Ntoroko 61 56.3 59.2 64
Soroti 35 77.8 101.6 76 Ntungamo 47 50.8 51.7 55
Tororo 67 70.5 73.3 57 Rubanda 41 39.4 43 54
Rubirizi 48 53.8 48.6 43
Rukiga 52 46.7 51.1 55
Rukungiri 78 65.4 67.1 73
Sheema 78 71.9 61.8 85
Uganda 58 60 66 59
Source: Ministry of Health, Annual Health Sector Performance reports
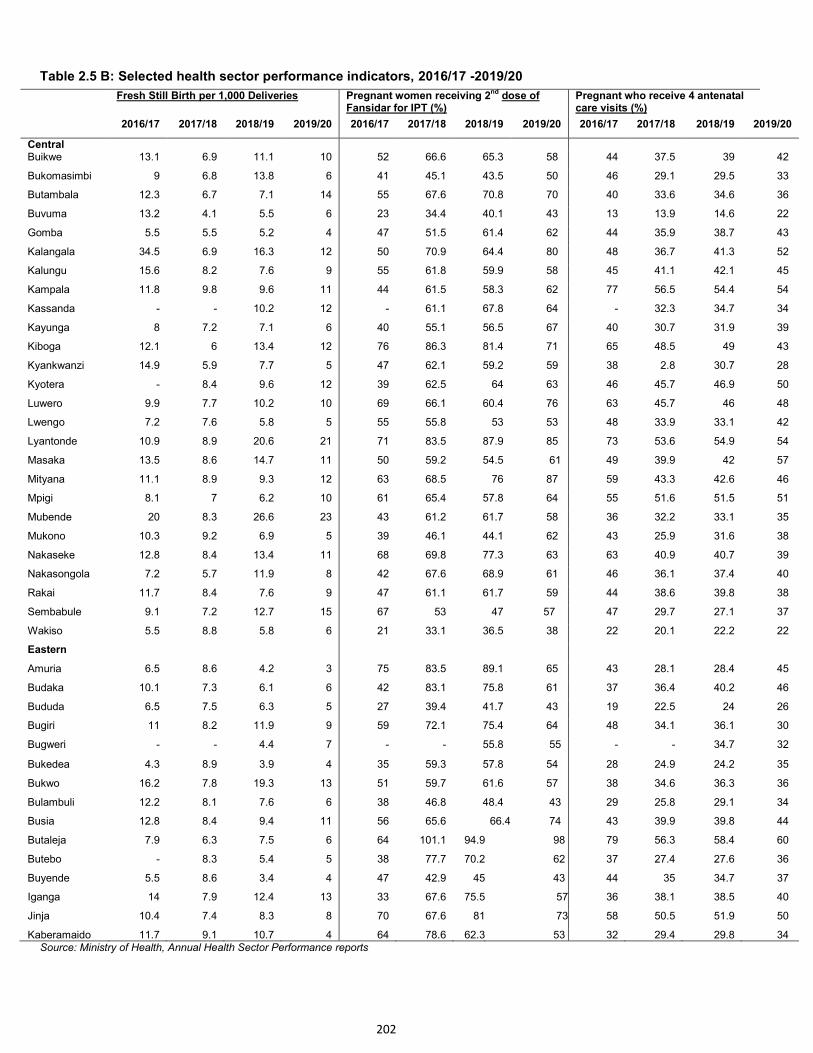
202
Table 2.5 B: Selected health sector performance indicators, 2016/17 -2019/20
Fresh Still Birth per 1,000 Deliveries Pregnant women receiving 2nd
dose of Fansidar for IPT (%)
Pregnant who receive 4 antenatal care visits (%)
2016/17 2017/18 2018/19 2019/20 2016/17 2017/18 2018/19 2019/20 2016/17 2017/18 2018/19 2019/20
Central Buikwe 13.1 6.9 11.1 10 52 66.6 65.3 58 44 37.5 39 42
Bukomasimbi 9 6.8 13.8 6 41 45.1 43.5 50 46 29.1 29.5 33
Butambala 12.3 6.7 7.1 14 55 67.6 70.8 70 40 33.6 34.6 36
Buvuma 13.2 4.1 5.5 6 23 34.4 40.1 43 13 13.9 14.6 22
Gomba 5.5 5.5 5.2 4 47 51.5 61.4 62 44 35.9 38.7 43
Kalangala 34.5 6.9 16.3 12 50 70.9 64.4 80 48 36.7 41.3 52
Kalungu 15.6 8.2 7.6 9 55 61.8 59.9 58 45 41.1 42.1 45
Kampala 11.8 9.8 9.6 11 44 61.5 58.3 62 77 56.5 54.4 54
Kassanda - - 10.2 12 - 61.1 67.8 64 - 32.3 34.7 34
Kayunga 8 7.2 7.1 6 40 55.1 56.5 67 40 30.7 31.9 39
Kiboga 12.1 6 13.4 12 76 86.3 81.4 71 65 48.5 49 43
Kyankwanzi 14.9 5.9 7.7 5 47 62.1 59.2 59 38 2.8 30.7 28
Kyotera - 8.4 9.6 12 39 62.5 64 63 46 45.7 46.9 50
Luwero 9.9 7.7 10.2 10 69 66.1 60.4 76 63 45.7 46 48
Lwengo 7.2 7.6 5.8 5 55 55.8 53 53 48 33.9 33.1 42
Lyantonde 10.9 8.9 20.6 21 71 83.5 87.9 85 73 53.6 54.9 54
Masaka 13.5 8.6 14.7 11 50 59.2 54.5 61 49 39.9 42 57
Mityana 11.1 8.9 9.3 12 63 68.5 76 87 59 43.3 42.6 46
Mpigi 8.1 7 6.2 10 61 65.4 57.8 64 55 51.6 51.5 51
Mubende 20 8.3 26.6 23 43 61.2 61.7 58 36 32.2 33.1 35
Mukono 10.3 9.2 6.9 5 39 46.1 44.1 62 43 25.9 31.6 38
Nakaseke 12.8 8.4 13.4 11 68 69.8 77.3 63 63 40.9 40.7 39
Nakasongola 7.2 5.7 11.9 8 42 67.6 68.9 61 46 36.1 37.4 40
Rakai 11.7 8.4 7.6 9 47 61.1 61.7 59 44 38.6 39.8 38
Sembabule 9.1 7.2 12.7 15 67 53 47 57 47 29.7 27.1 37
Wakiso 5.5 8.8 5.8 6 21 33.1 36.5 38 22 20.1 22.2 22
Eastern
Amuria 6.5 8.6 4.2 3 75 83.5 89.1 65 43 28.1 28.4 45
Budaka 10.1 7.3 6.1 6 42 83.1 75.8 61 37 36.4 40.2 46
Bududa 6.5 7.5 6.3 5 27 39.4 41.7 43 19 22.5 24 26
Bugiri 11 8.2 11.9 9 59 72.1 75.4 64 48 34.1 36.1 30
Bugweri - - 4.4 7 - - 55.8 55 - - 34.7 32
Bukedea 4.3 8.9 3.9 4 35 59.3 57.8 54 28 24.9 24.2 35
Bukwo 16.2 7.8 19.3 13 51 59.7 61.6 57 38 34.6 36.3 36
Bulambuli 12.2 8.1 7.6 6 38 46.8 48.4 43 29 25.8 29.1 34
Busia 12.8 8.4 9.4 11 56 65.6 66.4 74 43 39.9 39.8 44
Butaleja 7.9 6.3 7.5 6 64 101.1 94.9 98 79 56.3 58.4 60
Butebo - 8.3 5.4 5 38 77.7 70.2 62 37 27.4 27.6 36
Buyende 5.5 8.6 3.4 4 47 42.9 45 43 44 35 34.7 37
Iganga 14 7.9 12.4 13 33 67.6 75.5 57 36 38.1 38.5 40
Jinja 10.4 7.4 8.3 8 70 67.6 81 73 58 50.5 51.9 50
Kaberamaido 11.7 9.1 10.7 4 64 78.6 62.3 53 32 29.4 29.8 34 Source: Ministry of Health, Annual Health Sector Performance reports
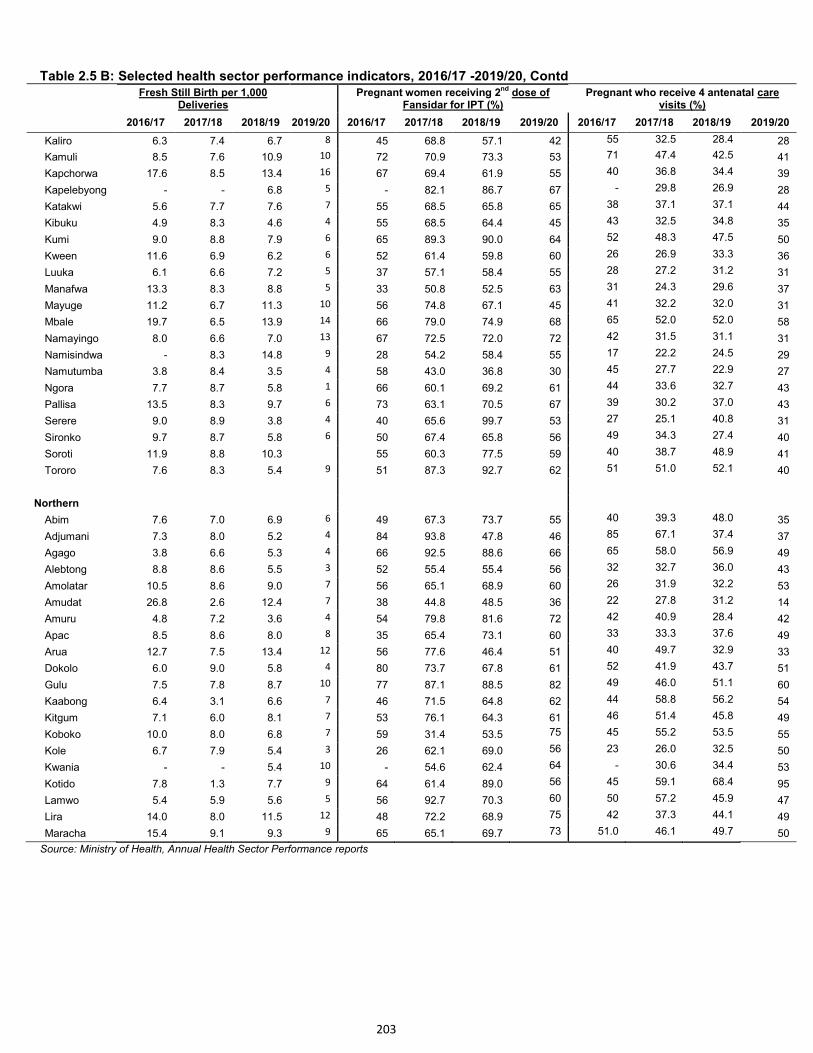
203
Table 2.5 B: Selected health sector performance indicators, 2016/17 -2019/20, Contd
Fresh Still Birth per 1,000
Deliveries
Pregnant women receiving 2nd
dose of Fansidar for IPT (%)
Pregnant who receive 4 antenatal care visits (%)
2016/17 2017/18 2018/19 2019/20 2016/17 2017/18 2018/19 2019/20 2016/17 2017/18 2018/19 2019/20
Kaliro 6.3 7.4 6.7 8 45 68.8 57.1 42 55 32.5 28.4 28
Kamuli 8.5 7.6 10.9 10 72 70.9 73.3 53 71 47.4 42.5 41
Kapchorwa 17.6 8.5 13.4 16 67 69.4 61.9 55 40 36.8 34.4 39
Kapelebyong - - 6.8 5 - 82.1 86.7 67 - 29.8 26.9 28
Katakwi 5.6 7.7 7.6 7 55 68.5 65.8 65 38 37.1 37.1 44
Kibuku 4.9 8.3 4.6 4 55 68.5 64.4 45 43 32.5 34.8 35
Kumi 9.0 8.8 7.9 6 65 89.3 90.0 64 52 48.3 47.5 50
Kween 11.6 6.9 6.2 6 52 61.4 59.8 60 26 26.9 33.3 36
Luuka 6.1 6.6 7.2 5 37 57.1 58.4 55 28 27.2 31.2 31
Manafwa 13.3 8.3 8.8 5 33 50.8 52.5 63 31 24.3 29.6 37
Mayuge 11.2 6.7 11.3 10 56 74.8 67.1 45 41 32.2 32.0 31
Mbale 19.7 6.5 13.9 14 66 79.0 74.9 68 65 52.0 52.0 58
Namayingo 8.0 6.6 7.0 13 67 72.5 72.0 72 42 31.5 31.1 31
Namisindwa - 8.3 14.8 9 28 54.2 58.4 55 17 22.2 24.5 29
Namutumba 3.8 8.4 3.5 4 58 43.0 36.8 30 45 27.7 22.9 27
Ngora 7.7 8.7 5.8 1 66 60.1 69.2 61 44 33.6 32.7 43
Pallisa 13.5 8.3 9.7 6 73 63.1 70.5 67 39 30.2 37.0 43
Serere 9.0 8.9 3.8 4 40 65.6 99.7 53 27 25.1 40.8 31
Sironko 9.7 8.7 5.8 6 50 67.4 65.8 56 49 34.3 27.4 40
Soroti 11.9 8.8 10.3 55 60.3 77.5 59 40 38.7 48.9 41
Tororo 7.6 8.3 5.4 9 51 87.3 92.7 62 51 51.0 52.1 40
Northern
Abim 7.6 7.0 6.9 6 49 67.3 73.7 55 40 39.3 48.0 35
Adjumani 7.3 8.0 5.2 4 84 93.8 47.8 46 85 67.1 37.4 37
Agago 3.8 6.6 5.3 4 66 92.5 88.6 66 65 58.0 56.9 49
Alebtong 8.8 8.6 5.5 3 52 55.4 55.4 56 32 32.7 36.0 43
Amolatar 10.5 8.6 9.0 7 56 65.1 68.9 60 26 31.9 32.2 53
Amudat 26.8 2.6 12.4 7 38 44.8 48.5 36 22 27.8 31.2 14
Amuru 4.8 7.2 3.6 4 54 79.8 81.6 72 42 40.9 28.4 42
Apac 8.5 8.6 8.0 8 35 65.4 73.1 60 33 33.3 37.6 49
Arua 12.7 7.5 13.4 12 56 77.6 46.4 51 40 49.7 32.9 33
Dokolo 6.0 9.0 5.8 4 80 73.7 67.8 61 52 41.9 43.7 51
Gulu 7.5 7.8 8.7 10 77 87.1 88.5 82 49 46.0 51.1 60
Kaabong 6.4 3.1 6.6 7 46 71.5 64.8 62 44 58.8 56.2 54
Kitgum 7.1 6.0 8.1 7 53 76.1 64.3 61 46 51.4 45.8 49
Koboko 10.0 8.0 6.8 7 59 31.4 53.5 75 45 55.2 53.5 55
Kole 6.7 7.9 5.4 3 26 62.1 69.0 56 23 26.0 32.5 50
Kwania - - 5.4 10 - 54.6 62.4 64 - 30.6 34.4 53
Kotido 7.8 1.3 7.7 9 64 61.4 89.0 56 45 59.1 68.4 95
Lamwo 5.4 5.9 5.6 5 56 92.7 70.3 60 50 57.2 45.9 47
Lira 14.0 8.0 11.5 12 48 72.2 68.9 75 42 37.3 44.1 49
Maracha 15.4 9.1 9.3 9 65 65.1 69.7 73 51.0 46.1 49.7 50
Source: Ministry of Health, Annual Health Sector Performance reports
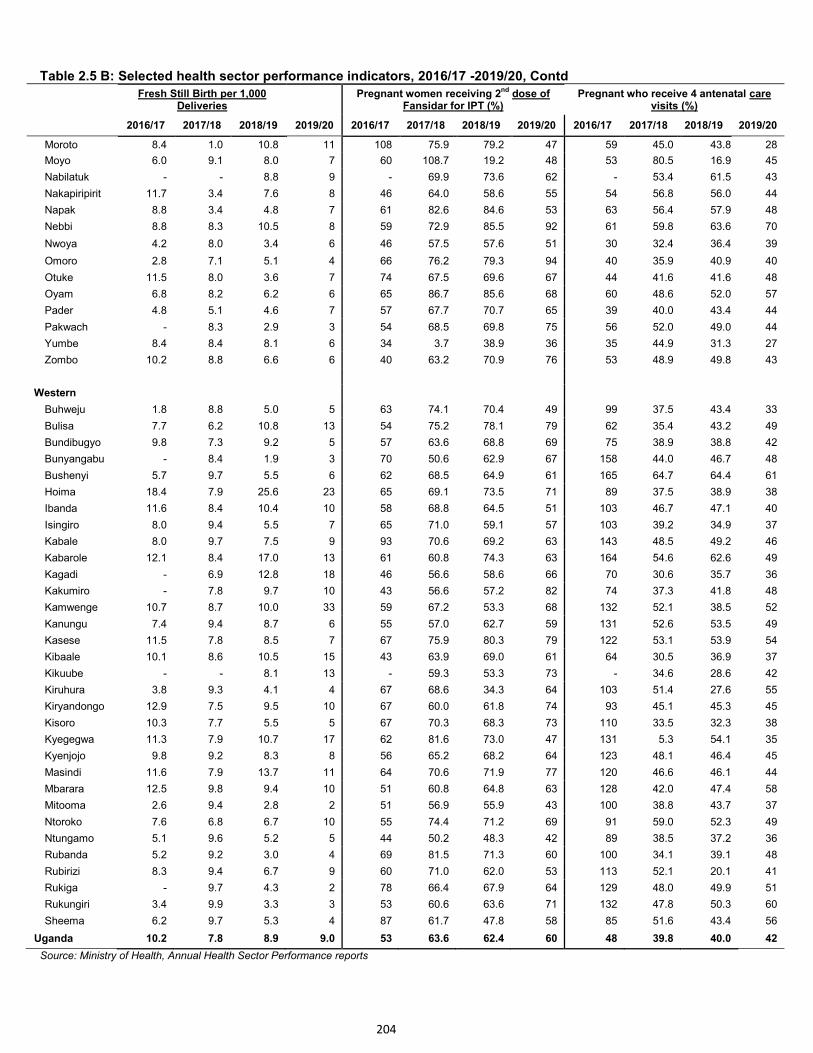
204
Table 2.5 B: Selected health sector performance indicators, 2016/17 -2019/20, Contd
Fresh Still Birth per 1,000
Deliveries
Pregnant women receiving 2nd
dose of Fansidar for IPT (%)
Pregnant who receive 4 antenatal care visits (%)
2016/17 2017/18 2018/19 2019/20 2016/17 2017/18 2018/19 2019/20 2016/17 2017/18 2018/19 2019/20
Moroto 8.4 1.0 10.8 11 108 75.9 79.2 47 59 45.0 43.8 28
Moyo 6.0 9.1 8.0 7 60 108.7 19.2 48 53 80.5 16.9 45
Nabilatuk - - 8.8 9 - 69.9 73.6 62 - 53.4 61.5 43
Nakapiripirit 11.7 3.4 7.6 8 46 64.0 58.6 55 54 56.8 56.0 44
Napak 8.8 3.4 4.8 7 61 82.6 84.6 53 63 56.4 57.9 48
Nebbi 8.8 8.3 10.5 8 59 72.9 85.5 92 61 59.8 63.6 70
Nwoya 4.2 8.0 3.4 6 46 57.5 57.6 51 30 32.4 36.4 39
Omoro 2.8 7.1 5.1 4 66 76.2 79.3 94 40 35.9 40.9 40
Otuke 11.5 8.0 3.6 7 74 67.5 69.6 67 44 41.6 41.6 48
Oyam 6.8 8.2 6.2 6 65 86.7 85.6 68 60 48.6 52.0 57
Pader 4.8 5.1 4.6 7 57 67.7 70.7 65 39 40.0 43.4 44
Pakwach - 8.3 2.9 3 54 68.5 69.8 75 56 52.0 49.0 44
Yumbe 8.4 8.4 8.1 6 34 3.7 38.9 36 35 44.9 31.3 27
Zombo 10.2 8.8 6.6 6 40 63.2 70.9 76 53 48.9 49.8 43
Western
Buhweju 1.8 8.8 5.0 5 63 74.1 70.4 49 99 37.5 43.4 33
Bulisa 7.7 6.2 10.8 13 54 75.2 78.1 79 62 35.4 43.2 49
Bundibugyo 9.8 7.3 9.2 5 57 63.6 68.8 69 75 38.9 38.8 42
Bunyangabu - 8.4 1.9 3 70 50.6 62.9 67 158 44.0 46.7 48
Bushenyi 5.7 9.7 5.5 6 62 68.5 64.9 61 165 64.7 64.4 61
Hoima 18.4 7.9 25.6 23 65 69.1 73.5 71 89 37.5 38.9 38
Ibanda 11.6 8.4 10.4 10 58 68.8 64.5 51 103 46.7 47.1 40
Isingiro 8.0 9.4 5.5 7 65 71.0 59.1 57 103 39.2 34.9 37
Kabale 8.0 9.7 7.5 9 93 70.6 69.2 63 143 48.5 49.2 46
Kabarole 12.1 8.4 17.0 13 61 60.8 74.3 63 164 54.6 62.6 49
Kagadi - 6.9 12.8 18 46 56.6 58.6 66 70 30.6 35.7 36
Kakumiro - 7.8 9.7 10 43 56.6 57.2 82 74 37.3 41.8 48
Kamwenge 10.7 8.7 10.0 33 59 67.2 53.3 68 132 52.1 38.5 52
Kanungu 7.4 9.4 8.7 6 55 57.0 62.7 59 131 52.6 53.5 49
Kasese 11.5 7.8 8.5 7 67 75.9 80.3 79 122 53.1 53.9 54
Kibaale 10.1 8.6 10.5 15 43 63.9 69.0 61 64 30.5 36.9 37
Kikuube - - 8.1 13 - 59.3 53.3 73 - 34.6 28.6 42
Kiruhura 3.8 9.3 4.1 4 67 68.6 34.3 64 103 51.4 27.6 55
Kiryandongo 12.9 7.5 9.5 10 67 60.0 61.8 74 93 45.1 45.3 45
Kisoro 10.3 7.7 5.5 5 67 70.3 68.3 73 110 33.5 32.3 38
Kyegegwa 11.3 7.9 10.7 17 62 81.6 73.0 47 131 5.3 54.1 35
Kyenjojo 9.8 9.2 8.3 8 56 65.2 68.2 64 123 48.1 46.4 45
Masindi 11.6 7.9 13.7 11 64 70.6 71.9 77 120 46.6 46.1 44
Mbarara 12.5 9.8 9.4 10 51 60.8 64.8 63 128 42.0 47.4 58
Mitooma 2.6 9.4 2.8 2 51 56.9 55.9 43 100 38.8 43.7 37
Ntoroko 7.6 6.8 6.7 10 55 74.4 71.2 69 91 59.0 52.3 49
Ntungamo 5.1 9.6 5.2 5 44 50.2 48.3 42 89 38.5 37.2 36
Rubanda 5.2 9.2 3.0 4 69 81.5 71.3 60 100 34.1 39.1 48
Rubirizi 8.3 9.4 6.7 9 60 71.0 62.0 53 113 52.1 20.1 41
Rukiga - 9.7 4.3 2 78 66.4 67.9 64 129 48.0 49.9 51
Rukungiri 3.4 9.9 3.3 3 53 60.6 63.6 71 132 47.8 50.3 60
Sheema 6.2 9.7 5.3 4 87 61.7 47.8 58 85 51.6 43.4 56
Uganda 10.2 7.8 8.9 9.0 53 63.6 62.4 60 48 39.8 40.0 42
Source: Ministry of Health, Annual Health Sector Performance reports
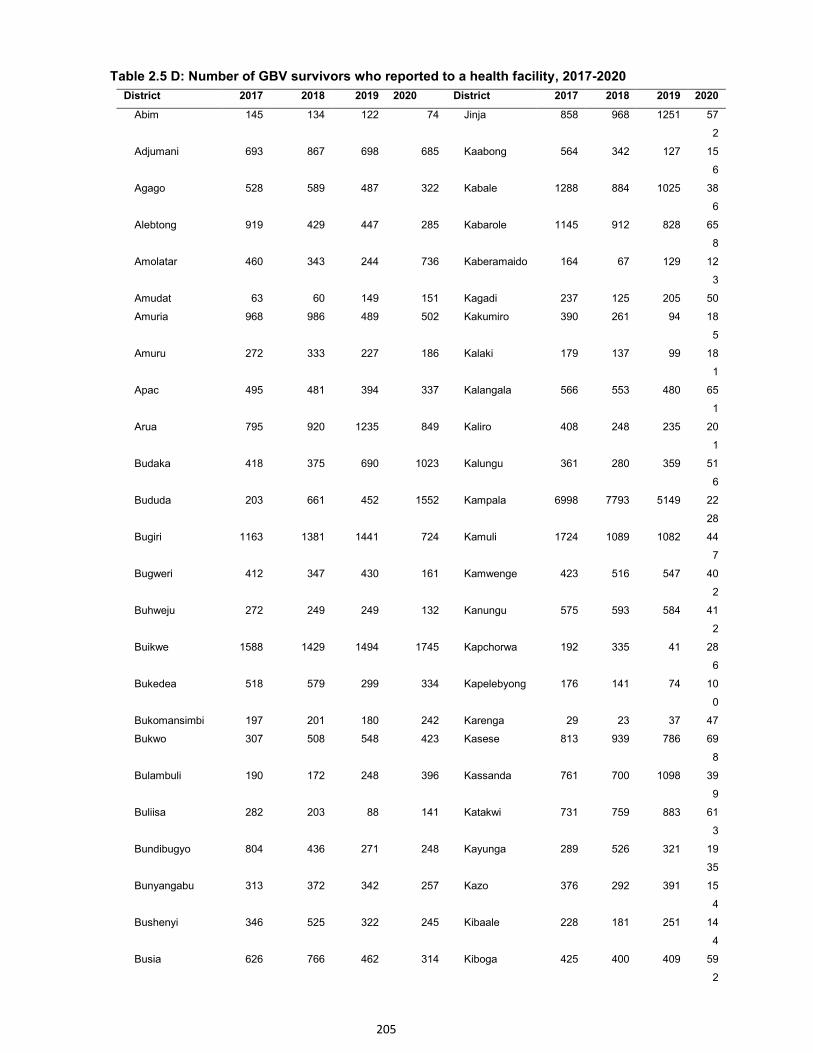
205
Table 2.5 D: Number of GBV survivors who reported to a health facility, 2017-2020
District 2017 2018 2019 2020 District 2017 2018 2019 2020
Abim 145 134 122 74 Jinja 858 968 1251 57
2
Adjumani 693 867 698 685 Kaabong 564 342 127 15
6
Agago 528 589 487 322 Kabale 1288 884 1025 38
6
Alebtong 919 429 447 285 Kabarole 1145 912 828 65
8
Amolatar 460 343 244 736 Kaberamaido 164 67 129 12
3
Amudat 63 60 149 151 Kagadi 237 125 205 50
Amuria 968 986 489 502 Kakumiro 390 261 94 18
5
Amuru 272 333 227 186 Kalaki 179 137 99 18
1
Apac 495 481 394 337 Kalangala 566 553 480 65
1
Arua 795 920 1235 849 Kaliro 408 248 235 20
1
Budaka 418 375 690 1023 Kalungu 361 280 359 51
6
Bududa 203 661 452 1552 Kampala 6998 7793 5149 22
28
Bugiri 1163 1381 1441 724 Kamuli 1724 1089 1082 44
7
Bugweri 412 347 430 161 Kamwenge 423 516 547 40
2
Buhweju 272 249 249 132 Kanungu 575 593 584 41
2
Buikwe 1588 1429 1494 1745 Kapchorwa 192 335 41 28
6
Bukedea 518 579 299 334 Kapelebyong 176 141 74 10
0
Bukomansimbi 197 201 180 242 Karenga 29 23 37 47
Bukwo 307 508 548 423 Kasese 813 939 786 69
8
Bulambuli 190 172 248 396 Kassanda 761 700 1098 39
9
Buliisa 282 203 88 141 Katakwi 731 759 883 61
3
Bundibugyo 804 436 271 248 Kayunga 289 526 321 19
35
Bunyangabu 313 372 342 257 Kazo 376 292 391 15
4
Bushenyi 346 525 322 245 Kibaale 228 181 251 14
4
Busia 626 766 462 314 Kiboga 425 400 409 59
2
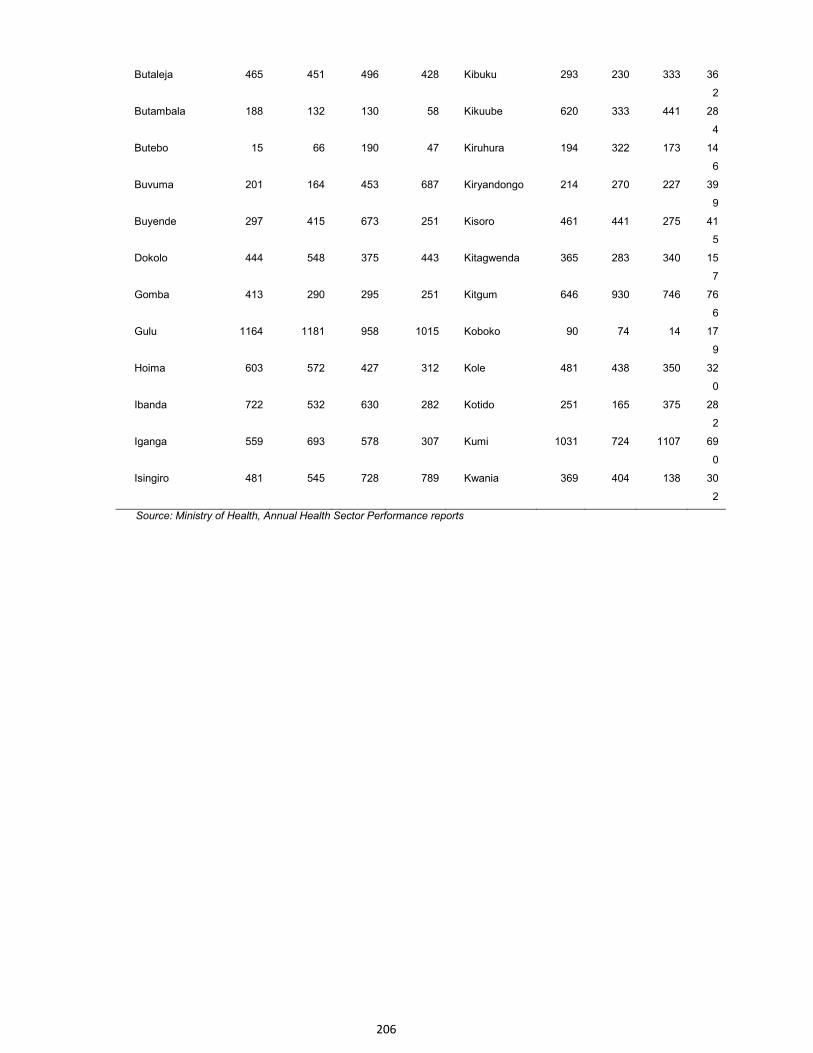
206
Butaleja 465 451 496 428 Kibuku 293 230 333 36
2
Butambala 188 132 130 58 Kikuube 620 333 441 28
4
Butebo 15 66 190 47 Kiruhura 194 322 173 14
6
Buvuma 201 164 453 687 Kiryandongo 214 270 227 39
9
Buyende 297 415 673 251 Kisoro 461 441 275 41
5
Dokolo 444 548 375 443 Kitagwenda 365 283 340 15
7
Gomba 413 290 295 251 Kitgum 646 930 746 76
6
Gulu 1164 1181 958 1015 Koboko 90 74 14 17
9
Hoima 603 572 427 312 Kole 481 438 350 32
0
Ibanda 722 532 630 282 Kotido 251 165 375 28
2
Iganga 559 693 578 307 Kumi 1031 724 1107 69
0
Isingiro 481 545 728 789 Kwania 369 404 138 30
2
Source: Ministry of Health, Annual Health Sector Performance reports
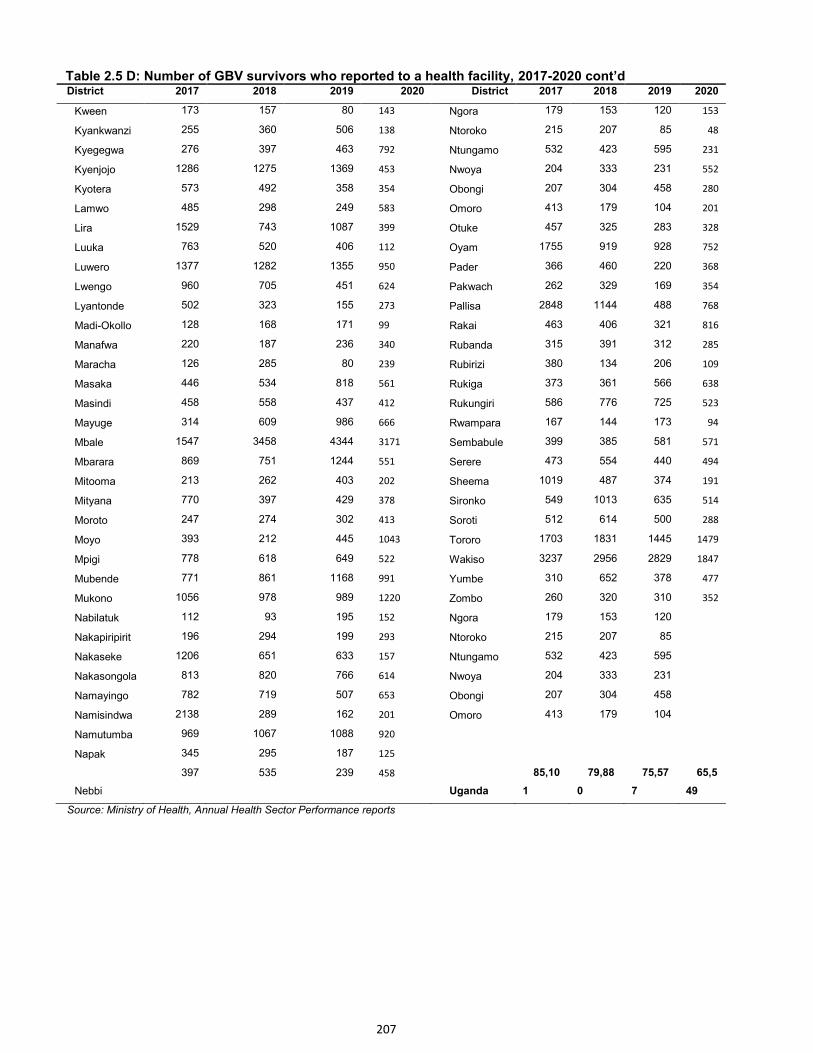
207
Table 2.5 D: Number of GBV survivors who reported to a health facility, 2017-2020 cont’d District 2017 2018 2019 2020 District 2017 2018 2019 2020
Kween 173 157 80 143 Ngora 179 153 120 153
Kyankwanzi 255 360 506 138 Ntoroko 215 207 85 48
Kyegegwa 276 397 463 792 Ntungamo 532 423 595 231
Kyenjojo 1286 1275 1369 453 Nwoya 204 333 231 552
Kyotera 573 492 358 354 Obongi 207 304 458 280
Lamwo 485 298 249 583 Omoro 413 179 104 201
Lira 1529 743 1087 399 Otuke 457 325 283 328
Luuka 763 520 406 112 Oyam 1755 919 928 752
Luwero 1377 1282 1355 950 Pader 366 460 220 368
Lwengo 960 705 451 624 Pakwach 262 329 169 354
Lyantonde 502 323 155 273 Pallisa 2848 1144 488 768
Madi-Okollo 128 168 171 99 Rakai 463 406 321 816
Manafwa 220 187 236 340 Rubanda 315 391 312 285
Maracha 126 285 80 239 Rubirizi 380 134 206 109
Masaka 446 534 818 561 Rukiga 373 361 566 638
Masindi 458 558 437 412 Rukungiri 586 776 725 523
Mayuge 314 609 986 666 Rwampara 167 144 173 94
Mbale 1547 3458 4344 3171 Sembabule 399 385 581 571
Mbarara 869 751 1244 551 Serere 473 554 440 494
Mitooma 213 262 403 202 Sheema 1019 487 374 191
Mityana 770 397 429 378 Sironko 549 1013 635 514
Moroto 247 274 302 413 Soroti 512 614 500 288
Moyo 393 212 445 1043 Tororo 1703 1831 1445 1479
Mpigi 778 618 649 522 Wakiso 3237 2956 2829 1847
Mubende 771 861 1168 991 Yumbe 310 652 378 477
Mukono 1056 978 989 1220 Zombo 260 320 310 352
Nabilatuk 112 93 195 152 Ngora 179 153 120
Nakapiripirit 196 294 199 293 Ntoroko 215 207 85
Nakaseke 1206 651 633 157 Ntungamo 532 423 595
Nakasongola 813 820 766 614 Nwoya 204 333 231
Namayingo 782 719 507 653 Obongi 207 304 458
Namisindwa 2138 289 162 201 Omoro 413 179 104
Namutumba 969 1067 1088 920
Napak 345 295 187 125
Nebbi
397 535 239 458
Uganda
85,10
1
79,88
0
75,57
7
65,5
49
Source: Ministry of Health, Annual Health Sector Performance reports
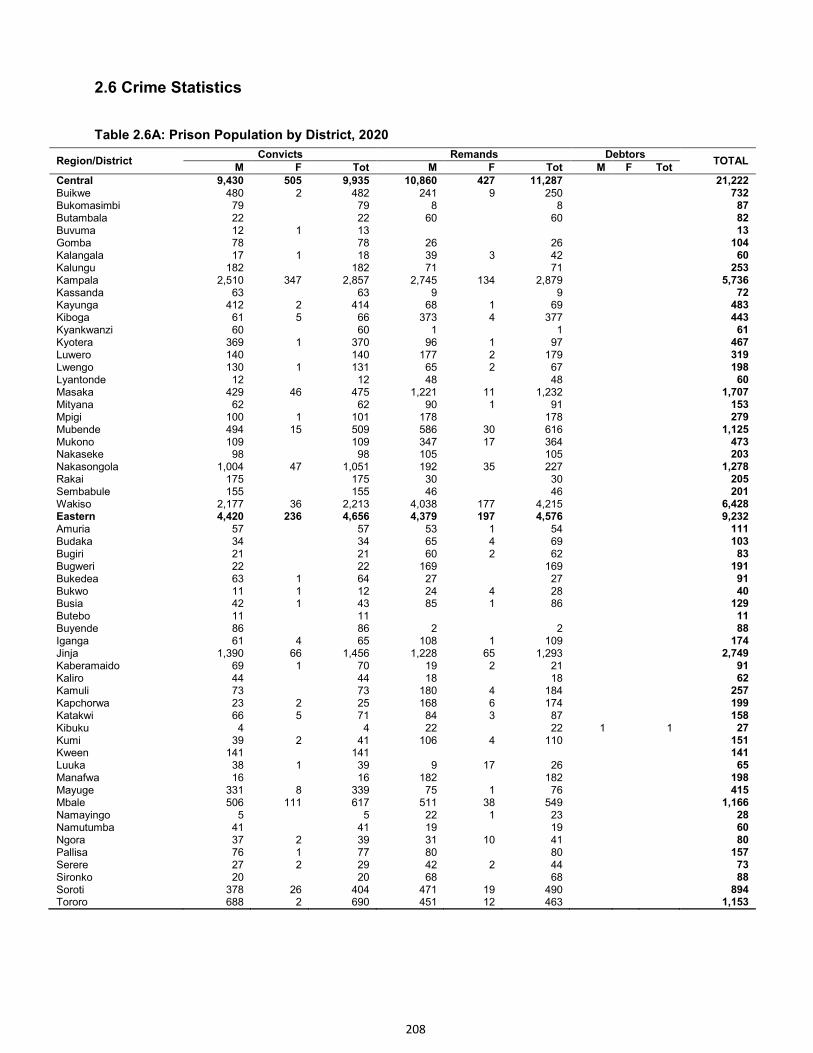
208
2.6 Crime Statistics
Table 2.6A: Prison Population by District, 2020
Region/District Convicts Remands Debtors
TOTAL M F Tot M F Tot M F Tot
Central 9,430 505 9,935 10,860 427 11,287
21,222 Buikwe 480 2 482 241 9 250
732
Bukomasimbi 79
79 8
8
87 Butambala 22
22 60
60
82
Buvuma 12 1 13
13 Gomba 78
78 26
26
104
Kalangala 17 1 18 39 3 42
60 Kalungu 182
182 71
71
253
Kampala 2,510 347 2,857 2,745 134 2,879
5,736 Kassanda 63
63 9
9
72
Kayunga 412 2 414 68 1 69
483 Kiboga 61 5 66 373 4 377
443
Kyankwanzi 60
60 1
1
61 Kyotera 369 1 370 96 1 97
467
Luwero 140
140 177 2 179
319 Lwengo 130 1 131 65 2 67
198
Lyantonde 12
12 48
48
60 Masaka 429 46 475 1,221 11 1,232
1,707
Mityana 62
62 90 1 91
153 Mpigi 100 1 101 178
178
279
Mubende 494 15 509 586 30 616
1,125 Mukono 109
109 347 17 364
473
Nakaseke 98
98 105
105
203 Nakasongola 1,004 47 1,051 192 35 227
1,278
Rakai 175
175 30
30
205 Sembabule 155
155 46
46
201
Wakiso 2,177 36 2,213 4,038 177 4,215
6,428 Eastern 4,420 236 4,656 4,379 197 4,576
9,232
Amuria 57
57 53 1 54
111 Budaka 34
34 65 4 69
103
Bugiri 21
21 60 2 62
83 Bugweri 22
22 169
169
191
Bukedea 63 1 64 27
27
91 Bukwo 11 1 12 24 4 28
40
Busia 42 1 43 85 1 86
129 Butebo 11
11
11
Buyende 86
86 2
2
88 Iganga 61 4 65 108 1 109
174
Jinja 1,390 66 1,456 1,228 65 1,293
2,749 Kaberamaido 69 1 70 19 2 21
91
Kaliro 44
44 18
18
62 Kamuli 73
73 180 4 184
257
Kapchorwa 23 2 25 168 6 174
199 Katakwi 66 5 71 84 3 87
158
Kibuku 4
4 22
22 1
1 27 Kumi 39 2 41 106 4 110
151
Kween 141
141
141 Luuka 38 1 39 9 17 26
65
Manafwa 16
16 182
182
198 Mayuge 331 8 339 75 1 76
415
Mbale 506 111 617 511 38 549
1,166 Namayingo 5
5 22 1 23
28
Namutumba 41
41 19
19
60 Ngora 37 2 39 31 10 41
80
Pallisa 76 1 77 80
80
157 Serere 27 2 29 42 2 44
73
Sironko 20
20 68
68
88 Soroti 378 26 404 471 19 490
894
Tororo 688 2 690 451 12 463
1,153

209
Table 2.6A (Cont’d): Prison Population by District, 2020
Region/District Convicts Remands Debtors
TOTAL M F Tot M F Tot M F Tot
Northern 7,227 284 7,511 4,432 285 4,717
12,228 Abim 448 13 461 24 1 25
486
Adjumani 637
637 56 4 60
697 Agago 131 4 135 103 4 107
242
Alebtong 110
110 124 10 134
244 Amolatar 63
63 47
47
110
Amuru 100 1 101 73 4 77
178 Apac 262 8 270 180 15 195
465
Arua 448 50 498 671 34 705
1,203 Dokolo 127 1 128 57 1 58
186
Gulu 1,429 68 1,497 823 64 887
2,384 Kaabong 73 1 74 41 4 45
119
Kitgum 470 7 477 268 28 296
773 Koboko 15
15
15
Kole 24
24 34 2 36
60 Kotido 52 5 57 117 12 129
186
Kwania 72 1 73 92 5 97
170 Lamwo 104
104
104
Lira 534 70 604 662 56 718
1,322 Moroto 304 11 315 165 7 172
487
Moyo 34
34 49 5 54
88 Nakapiripirit 510 1 511 25 1 26
537
Nebbi 572 1 573 156 2 158
731 Nwoya 66
66 167
167
233
Otuke 36 5 41 23 2 25
66 Oyam 462 36 498 134 16 150
648
Pader 46
46 140
140
186 Yumbe 73
73 66 1 67
140
Zombo 25 1 26 135 7 142
168 Western 7,613 169 7,782 7,907 285 8,192
15,974
Buhweju 16
16 7
7
23 Buliisa 30
30
30
Bundibugyo 19
19 140
140
159 Bunyangabo 768
768 38
38
806
Bushenyi 240 54 294 721 29 750
1,044 Hoima 95 3 98 121 5 126
224
Ibanda 823
823 86 1 87
910 Isingiro 83 3 86 248 2 250
336
Kabale 148 13 161 379 19 398
559 Kabarole 451 33 484 1,322 47 1,369
1,853
Kagadi 76 3 79 167 6 173
252 Kakumiro 63
63 65 2 67
130
Kamwenge 74
74 125 2 127
201 Kanungu 70
70 90 3 93
163
Kasese 1,071 3 1,074 334 5 339
1,413 Kibaale 179
179 101 2 103
282
Kikuube 21
21
21 Kiruhura 90
90 335 3 338
428
Kiryandongo 96 4 100 4 20 24
124 Kisoro 28
28 112 5 117
145
Kitagwenda 22
22 37
37
59 Kyegegwa 2
2 76
76
78
Kyenjojo 24
24 244 4 248
272 Masindi 1,614 33 1,647 976 10 986
2,633
Mbarara 1,201 8 1,209 1,433 80 1,513
2,722 Mitooma 10
10 77
77
87
Ntungamo 84 3 87 159 4 163
250 Rubanda 13 2 15 32 3 35
50
Rukiga 29
29 32
32
61 Rukungiri 132 7 139 347 26 373 3
3 515
Sheema 41
41 99 7 106
147 Grand Total 28,690 1,194 29,884 27,578 1,194 28,772 4
4 58,660
Source: Uganda Police Force
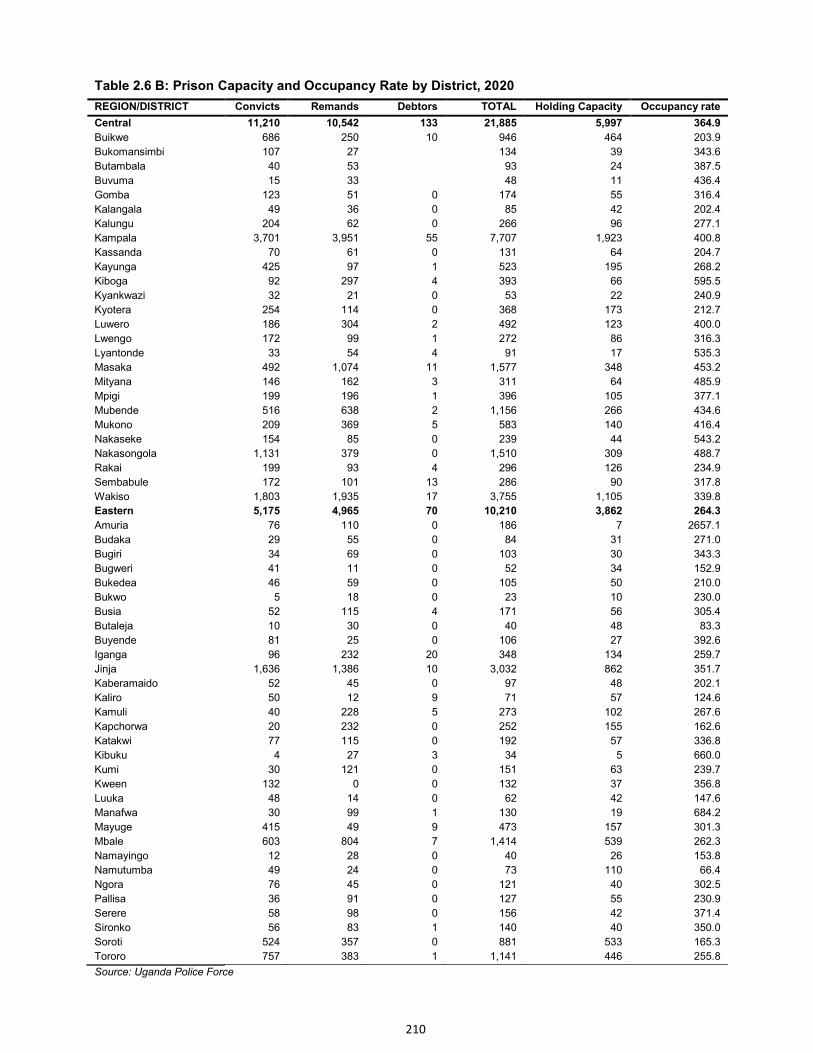
210
Table 2.6 B: Prison Capacity and Occupancy Rate by District, 2020
REGION/DISTRICT Convicts Remands Debtors TOTAL Holding Capacity Occupancy rate
Central 11,210 10,542 133 21,885 5,997 364.9
Buikwe 686 250 10 946 464 203.9
Bukomansimbi 107 27 134 39 343.6
Butambala 40 53 93 24 387.5
Buvuma 15 33 48 11 436.4
Gomba 123 51 0 174 55 316.4
Kalangala 49 36 0 85 42 202.4
Kalungu 204 62 0 266 96 277.1
Kampala 3,701 3,951 55 7,707 1,923 400.8
Kassanda 70 61 0 131 64 204.7
Kayunga 425 97 1 523 195 268.2
Kiboga 92 297 4 393 66 595.5
Kyankwazi 32 21 0 53 22 240.9
Kyotera 254 114 0 368 173 212.7
Luwero 186 304 2 492 123 400.0
Lwengo 172 99 1 272 86 316.3
Lyantonde 33 54 4 91 17 535.3
Masaka 492 1,074 11 1,577 348 453.2
Mityana 146 162 3 311 64 485.9
Mpigi 199 196 1 396 105 377.1
Mubende 516 638 2 1,156 266 434.6
Mukono 209 369 5 583 140 416.4
Nakaseke 154 85 0 239 44 543.2
Nakasongola 1,131 379 0 1,510 309 488.7
Rakai 199 93 4 296 126 234.9
Sembabule 172 101 13 286 90 317.8
Wakiso 1,803 1,935 17 3,755 1,105 339.8
Eastern 5,175 4,965 70 10,210 3,862 264.3
Amuria 76 110 0 186 7 2657.1
Budaka 29 55 0 84 31 271.0
Bugiri 34 69 0 103 30 343.3
Bugweri 41 11 0 52 34 152.9
Bukedea 46 59 0 105 50 210.0
Bukwo 5 18 0 23 10 230.0
Busia 52 115 4 171 56 305.4
Butaleja 10 30 0 40 48 83.3
Buyende 81 25 0 106 27 392.6
Iganga 96 232 20 348 134 259.7
Jinja 1,636 1,386 10 3,032 862 351.7
Kaberamaido 52 45 0 97 48 202.1
Kaliro 50 12 9 71 57 124.6
Kamuli 40 228 5 273 102 267.6
Kapchorwa 20 232 0 252 155 162.6
Katakwi 77 115 0 192 57 336.8
Kibuku 4 27 3 34 5 660.0
Kumi 30 121 0 151 63 239.7
Kween 132 0 0 132 37 356.8
Luuka 48 14 0 62 42 147.6
Manafwa 30 99 1 130 19 684.2
Mayuge 415 49 9 473 157 301.3
Mbale 603 804 7 1,414 539 262.3
Namayingo 12 28 0 40 26 153.8
Namutumba 49 24 0 73 110 66.4
Ngora 76 45 0 121 40 302.5
Pallisa 36 91 0 127 55 230.9
Serere 58 98 0 156 42 371.4
Sironko 56 83 1 140 40 350.0
Soroti 524 357 0 881 533 165.3
Tororo 757 383 1 1,141 446 255.8
Source: Uganda Police Force
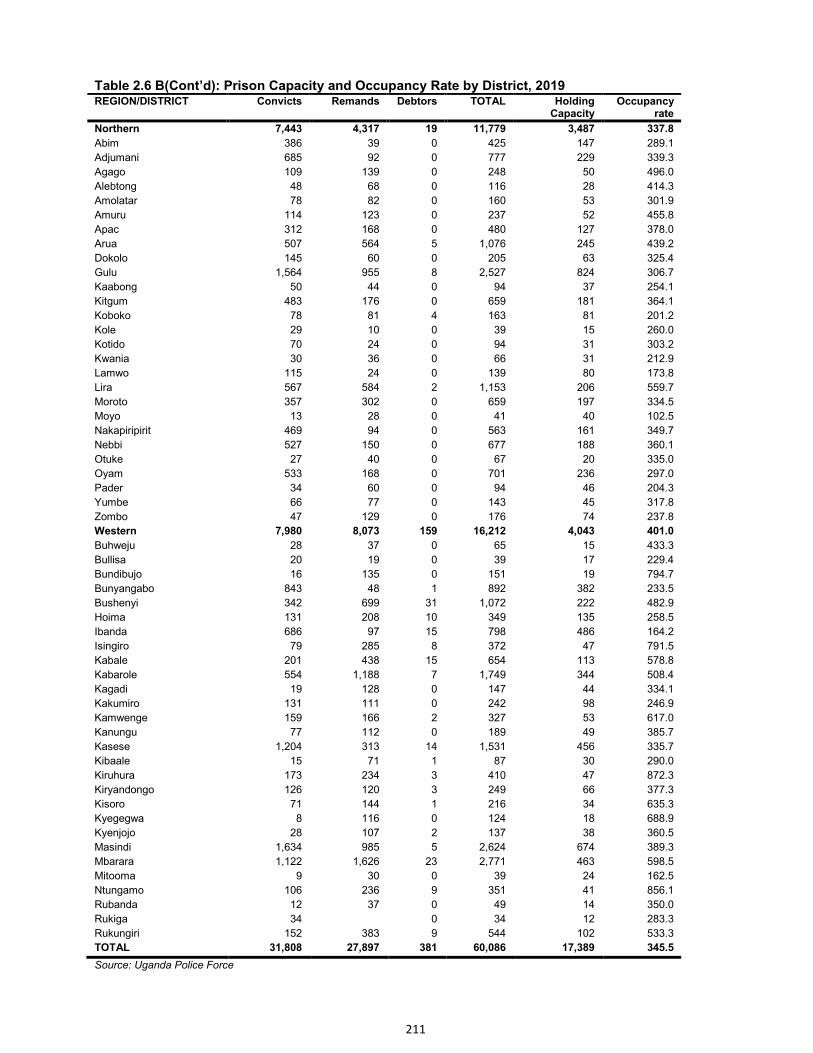
211
Table 2.6 B(Cont’d): Prison Capacity and Occupancy Rate by District, 2019 REGION/DISTRICT Convicts Remands Debtors TOTAL Holding
Capacity Occupancy
rate
Northern 7,443 4,317 19 11,779 3,487 337.8
Abim 386 39 0 425 147 289.1
Adjumani 685 92 0 777 229 339.3
Agago 109 139 0 248 50 496.0
Alebtong 48 68 0 116 28 414.3
Amolatar 78 82 0 160 53 301.9
Amuru 114 123 0 237 52 455.8
Apac 312 168 0 480 127 378.0
Arua 507 564 5 1,076 245 439.2
Dokolo 145 60 0 205 63 325.4
Gulu 1,564 955 8 2,527 824 306.7
Kaabong 50 44 0 94 37 254.1
Kitgum 483 176 0 659 181 364.1
Koboko 78 81 4 163 81 201.2
Kole 29 10 0 39 15 260.0
Kotido 70 24 0 94 31 303.2
Kwania 30 36 0 66 31 212.9
Lamwo 115 24 0 139 80 173.8
Lira 567 584 2 1,153 206 559.7
Moroto 357 302 0 659 197 334.5
Moyo 13 28 0 41 40 102.5
Nakapiripirit 469 94 0 563 161 349.7
Nebbi 527 150 0 677 188 360.1
Otuke 27 40 0 67 20 335.0
Oyam 533 168 0 701 236 297.0
Pader 34 60 0 94 46 204.3
Yumbe 66 77 0 143 45 317.8
Zombo 47 129 0 176 74 237.8
Western 7,980 8,073 159 16,212 4,043 401.0
Buhweju 28 37 0 65 15 433.3
Bullisa 20 19 0 39 17 229.4
Bundibujo 16 135 0 151 19 794.7
Bunyangabo 843 48 1 892 382 233.5
Bushenyi 342 699 31 1,072 222 482.9
Hoima 131 208 10 349 135 258.5
Ibanda 686 97 15 798 486 164.2
Isingiro 79 285 8 372 47 791.5
Kabale 201 438 15 654 113 578.8
Kabarole 554 1,188 7 1,749 344 508.4
Kagadi 19 128 0 147 44 334.1
Kakumiro 131 111 0 242 98 246.9
Kamwenge 159 166 2 327 53 617.0
Kanungu 77 112 0 189 49 385.7
Kasese 1,204 313 14 1,531 456 335.7
Kibaale 15 71 1 87 30 290.0
Kiruhura 173 234 3 410 47 872.3
Kiryandongo 126 120 3 249 66 377.3
Kisoro 71 144 1 216 34 635.3
Kyegegwa 8 116 0 124 18 688.9
Kyenjojo 28 107 2 137 38 360.5
Masindi 1,634 985 5 2,624 674 389.3
Mbarara 1,122 1,626 23 2,771 463 598.5
Mitooma 9 30 0 39 24 162.5
Ntungamo 106 236 9 351 41 856.1
Rubanda 12 37 0 49 14 350.0
Rukiga 34 0 34 12 283.3
Rukungiri 152 383 9 544 102 533.3
TOTAL 31,808 27,897 381 60,086 17,389 345.5
Source: Uganda Police Force
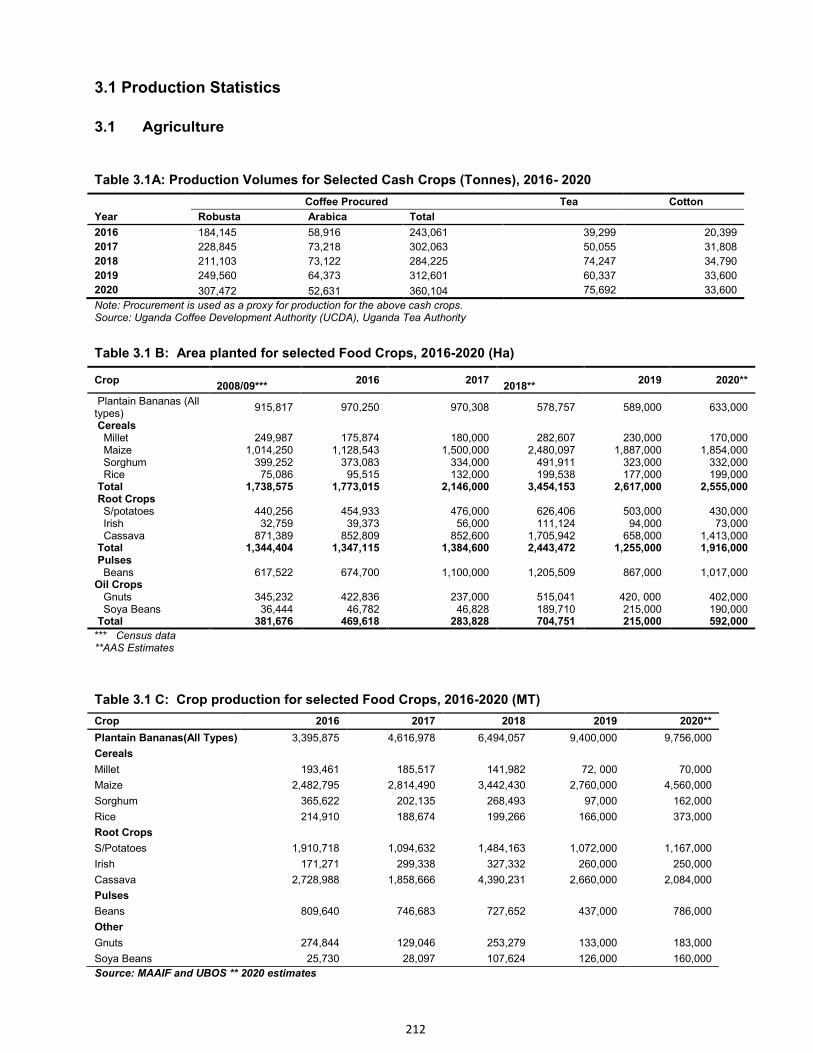
212
3.1 Production Statistics 3.1 Agriculture
Table 3.1A: Production Volumes for Selected Cash Crops (Tonnes), 2016- 2020
Coffee Procured Tea Cotton
Year Robusta Arabica Total
2016 184,145 58,916 243,061 39,299 20,399
2017 228,845 73,218 302,063 50,055 31,808
2018 211,103 73,122 284,225 74,247 34,790
2019 249,560 64,373 312,601 60,337 33,600
2020 307,472 52,631 360,104 75,692 33,600
Note: Procurement is used as a proxy for production for the above cash crops. Source: Uganda Coffee Development Authority (UCDA), Uganda Tea Authority
Table 3.1 B: Area planted for selected Food Crops, 2016-2020 (Ha)
Crop 2008/09***
2016 2017 2018**
2019 2020**
Plantain Bananas (All types)
915,817 970,250 970,308 578,757 589,000 633,000
Cereals
Millet 249,987 175,874 180,000 282,607 230,000 170,000 Maize 1,014,250 1,128,543 1,500,000 2,480,097 1,887,000 1,854,000 Sorghum 399,252 373,083 334,000 491,911 323,000 332,000 Rice 75,086 95,515 132,000 199,538 177,000 199,000 Total 1,738,575 1,773,015 2,146,000 3,454,153 2,617,000 2,555,000 Root Crops
S/potatoes 440,256 454,933 476,000 626,406 503,000 430,000 Irish 32,759 39,373 56,000 111,124 94,000 73,000 Cassava 871,389 852,809 852,600 1,705,942 658,000 1,413,000 Total 1,344,404 1,347,115 1,384,600 2,443,472 1,255,000 1,916,000 Pulses
Beans 617,522 674,700 1,100,000 1,205,509 867,000 1,017,000 Oil Crops
Gnuts 345,232 422,836 237,000 515,041 420, 000 402,000 Soya Beans 36,444 46,782 46,828 189,710 215,000 190,000 Total 381,676 469,618 283,828 704,751 215,000 592,000
*** Census data
**AAS Estimates
Table 3.1 C: Crop production for selected Food Crops, 2016-2020 (MT)
Crop 2016 2017 2018 2019 2020**
Plantain Bananas(All Types) 3,395,875 4,616,978 6,494,057 9,400,000 9,756,000
Cereals
Millet 193,461 185,517 141,982 72, 000 70,000
Maize 2,482,795 2,814,490 3,442,430 2,760,000 4,560,000
Sorghum 365,622 202,135 268,493 97,000 162,000
Rice 214,910 188,674 199,266 166,000 373,000
Root Crops
S/Potatoes 1,910,718 1,094,632 1,484,163 1,072,000 1,167,000
Irish 171,271 299,338 327,332 260,000 250,000
Cassava 2,728,988 1,858,666 4,390,231 2,660,000 2,084,000
Pulses
Beans 809,640 746,683 727,652 437,000 786,000
Other
Gnuts 274,844 129,046 253,279 133,000 183,000
Soya Beans 25,730 28,097 107,624 126,000 160,000
Source: MAAIF and UBOS ** 2020 estimates
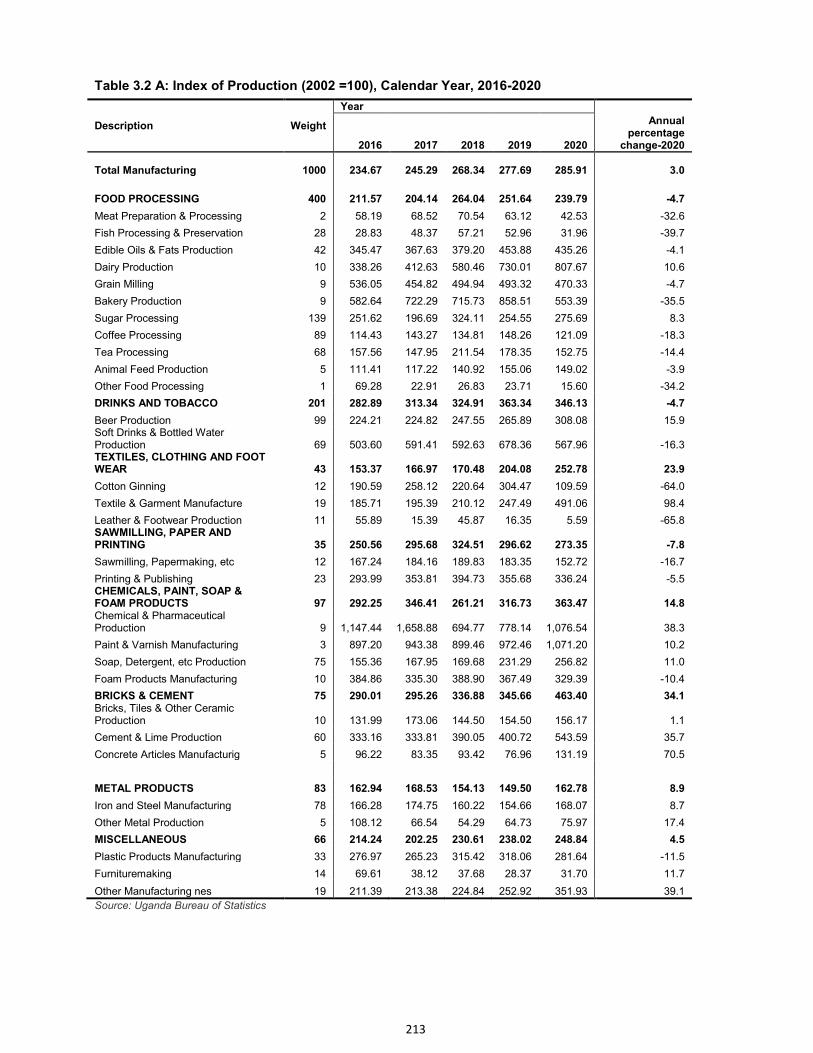
213
Table 3.2 A: Index of Production (2002 =100), Calendar Year, 2016-2020
Description Weight
Year
2016 2017 2018 2019 2020
Annual percentage
change-2020
Total Manufacturing 1000 234.67 245.29 268.34 277.69 285.91 3.0
FOOD PROCESSING 400 211.57 204.14 264.04 251.64 239.79 -4.7
Meat Preparation & Processing 2 58.19 68.52 70.54 63.12 42.53 -32.6
Fish Processing & Preservation 28 28.83 48.37 57.21 52.96 31.96 -39.7
Edible Oils & Fats Production 42 345.47 367.63 379.20 453.88 435.26 -4.1
Dairy Production 10 338.26 412.63 580.46 730.01 807.67 10.6
Grain Milling 9 536.05 454.82 494.94 493.32 470.33 -4.7
Bakery Production 9 582.64 722.29 715.73 858.51 553.39 -35.5
Sugar Processing 139 251.62 196.69 324.11 254.55 275.69 8.3
Coffee Processing 89 114.43 143.27 134.81 148.26 121.09 -18.3
Tea Processing 68 157.56 147.95 211.54 178.35 152.75 -14.4
Animal Feed Production 5 111.41 117.22 140.92 155.06 149.02 -3.9
Other Food Processing 1 69.28 22.91 26.83 23.71 15.60 -34.2
DRINKS AND TOBACCO 201 282.89 313.34 324.91 363.34 346.13 -4.7
Beer Production 99 224.21 224.82 247.55 265.89 308.08 15.9 Soft Drinks & Bottled Water Production 69 503.60 591.41 592.63 678.36 567.96 -16.3 TEXTILES, CLOTHING AND FOOT WEAR 43 153.37 166.97 170.48 204.08 252.78 23.9
Cotton Ginning 12 190.59 258.12 220.64 304.47 109.59 -64.0
Textile & Garment Manufacture 19 185.71 195.39 210.12 247.49 491.06 98.4
Leather & Footwear Production 11 55.89 15.39 45.87 16.35 5.59 -65.8 SAWMILLING, PAPER AND PRINTING 35 250.56 295.68 324.51 296.62 273.35 -7.8
Sawmilling, Papermaking, etc 12 167.24 184.16 189.83 183.35 152.72 -16.7
Printing & Publishing 23 293.99 353.81 394.73 355.68 336.24 -5.5 CHEMICALS, PAINT, SOAP & FOAM PRODUCTS 97 292.25 346.41 261.21 316.73 363.47 14.8 Chemical & Pharmaceutical Production 9 1,147.44 1,658.88 694.77 778.14 1,076.54 38.3
Paint & Varnish Manufacturing 3 897.20 943.38 899.46 972.46 1,071.20 10.2
Soap, Detergent, etc Production 75 155.36 167.95 169.68 231.29 256.82 11.0
Foam Products Manufacturing 10 384.86 335.30 388.90 367.49 329.39 -10.4
BRICKS & CEMENT 75 290.01 295.26 336.88 345.66 463.40 34.1 Bricks, Tiles & Other Ceramic Production 10 131.99 173.06 144.50 154.50 156.17 1.1
Cement & Lime Production 60 333.16 333.81 390.05 400.72 543.59 35.7
Concrete Articles Manufacturig 5 96.22 83.35 93.42 76.96 131.19 70.5
METAL PRODUCTS 83 162.94 168.53 154.13 149.50 162.78 8.9
Iron and Steel Manufacturing 78 166.28 174.75 160.22 154.66 168.07 8.7
Other Metal Production 5 108.12 66.54 54.29 64.73 75.97 17.4
MISCELLANEOUS 66 214.24 202.25 230.61 238.02 248.84 4.5
Plastic Products Manufacturing 33 276.97 265.23 315.42 318.06 281.64 -11.5
Furnituremaking 14 69.61 38.12 37.68 28.37 31.70 11.7
Other Manufacturing nes 19 211.39 213.38 224.84 252.92 351.93 39.1
Source: Uganda Bureau of Statistics
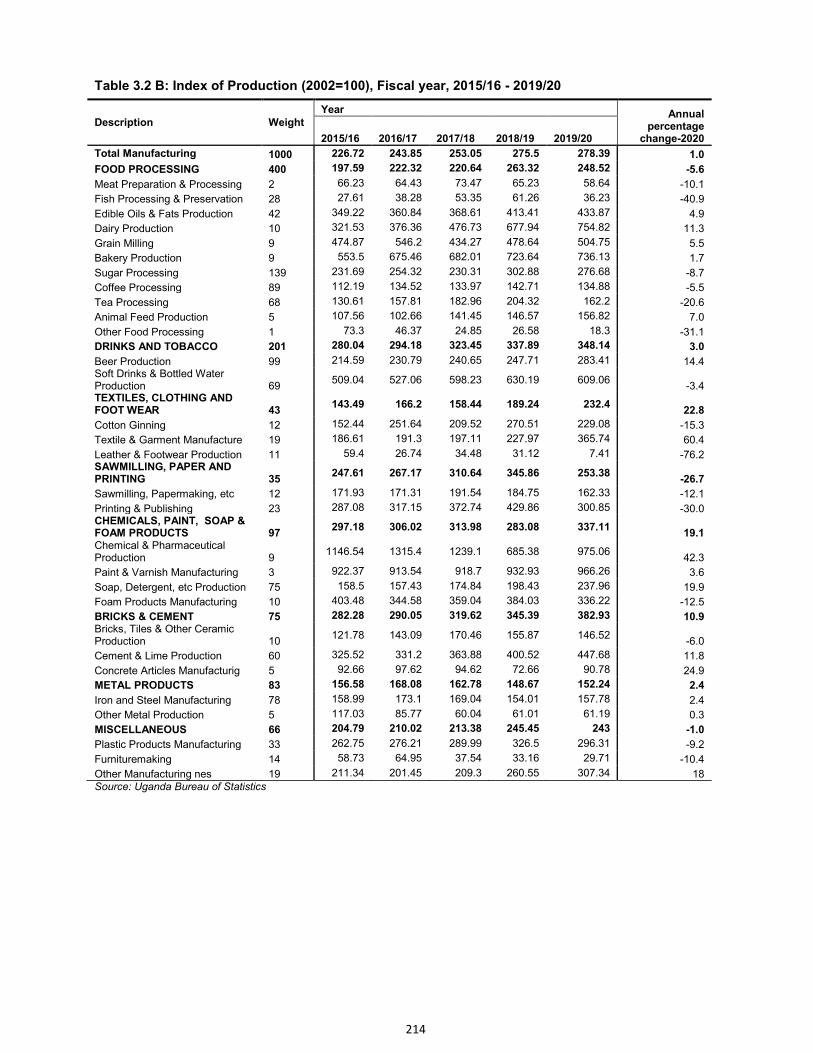
214
Table 3.2 B: Index of Production (2002=100), Fiscal year, 2015/16 - 2019/20
Description Weight Year Annual
percentage change-2020 2015/16 2016/17 2017/18 2018/19 2019/20
Total Manufacturing 1000 226.72 243.85 253.05 275.5 278.39 1.0
FOOD PROCESSING 400 197.59 222.32 220.64 263.32 248.52 -5.6
Meat Preparation & Processing 2 66.23 64.43 73.47 65.23 58.64 -10.1
Fish Processing & Preservation 28 27.61 38.28 53.35 61.26 36.23 -40.9
Edible Oils & Fats Production 42 349.22 360.84 368.61 413.41 433.87 4.9
Dairy Production 10 321.53 376.36 476.73 677.94 754.82 11.3
Grain Milling 9 474.87 546.2 434.27 478.64 504.75 5.5
Bakery Production 9 553.5 675.46 682.01 723.64 736.13 1.7
Sugar Processing 139 231.69 254.32 230.31 302.88 276.68 -8.7
Coffee Processing 89 112.19 134.52 133.97 142.71 134.88 -5.5
Tea Processing 68 130.61 157.81 182.96 204.32 162.2 -20.6
Animal Feed Production 5 107.56 102.66 141.45 146.57 156.82 7.0
Other Food Processing 1 73.3 46.37 24.85 26.58 18.3 -31.1
DRINKS AND TOBACCO 201 280.04 294.18 323.45 337.89 348.14 3.0
Beer Production 99 214.59 230.79 240.65 247.71 283.41 14.4 Soft Drinks & Bottled Water Production 69
509.04 527.06 598.23 630.19 609.06 -3.4
TEXTILES, CLOTHING AND FOOT WEAR 43
143.49 166.2 158.44 189.24 232.4 22.8
Cotton Ginning 12 152.44 251.64 209.52 270.51 229.08 -15.3
Textile & Garment Manufacture 19 186.61 191.3 197.11 227.97 365.74 60.4
Leather & Footwear Production 11 59.4 26.74 34.48 31.12 7.41 -76.2 SAWMILLING, PAPER AND PRINTING 35
247.61 267.17 310.64 345.86 253.38 -26.7
Sawmilling, Papermaking, etc 12 171.93 171.31 191.54 184.75 162.33 -12.1
Printing & Publishing 23 287.08 317.15 372.74 429.86 300.85 -30.0 CHEMICALS, PAINT, SOAP & FOAM PRODUCTS 97
297.18 306.02 313.98 283.08 337.11 19.1
Chemical & Pharmaceutical Production 9
1146.54 1315.4 1239.1 685.38 975.06 42.3
Paint & Varnish Manufacturing 3 922.37 913.54 918.7 932.93 966.26 3.6
Soap, Detergent, etc Production 75 158.5 157.43 174.84 198.43 237.96 19.9
Foam Products Manufacturing 10 403.48 344.58 359.04 384.03 336.22 -12.5
BRICKS & CEMENT 75 282.28 290.05 319.62 345.39 382.93 10.9 Bricks, Tiles & Other Ceramic Production 10
121.78 143.09 170.46 155.87 146.52 -6.0
Cement & Lime Production 60 325.52 331.2 363.88 400.52 447.68 11.8
Concrete Articles Manufacturig 5 92.66 97.62 94.62 72.66 90.78 24.9
METAL PRODUCTS 83 156.58 168.08 162.78 148.67 152.24 2.4
Iron and Steel Manufacturing 78 158.99 173.1 169.04 154.01 157.78 2.4
Other Metal Production 5 117.03 85.77 60.04 61.01 61.19 0.3
MISCELLANEOUS 66 204.79 210.02 213.38 245.45 243 -1.0
Plastic Products Manufacturing 33 262.75 276.21 289.99 326.5 296.31 -9.2
Furnituremaking 14 58.73 64.95 37.54 33.16 29.71 -10.4
Other Manufacturing nes 19 211.34 201.45 209.3 260.55 307.34 18 Source: Uganda Bureau of Statistics
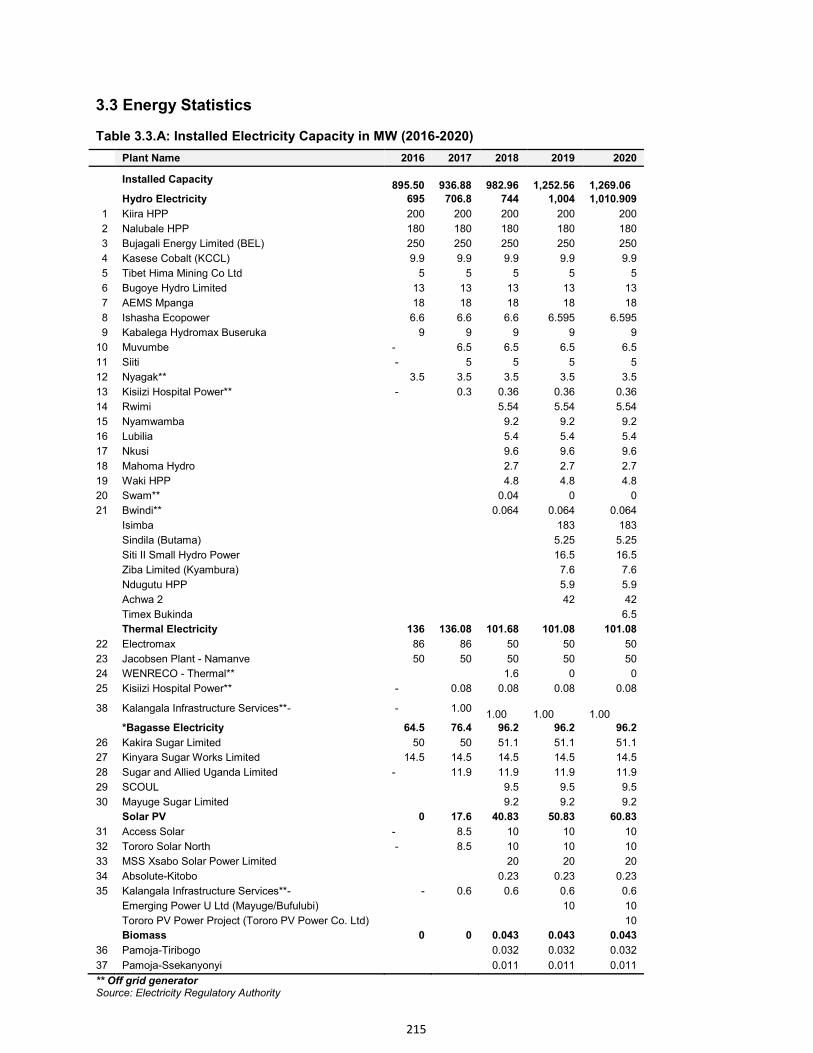
215
3.3 Energy Statistics
Table 3.3.A: Installed Electricity Capacity in MW (2016-2020)
Plant Name 2016 2017 2018 2019 2020
Installed Capacity 895.50
936.88
982.96
1,252.56
1,269.06
Hydro Electricity 695 706.8 744 1,004 1,010.909
1 Kiira HPP 200 200 200 200 200
2 Nalubale HPP 180 180 180 180 180
3 Bujagali Energy Limited (BEL) 250 250 250 250 250
4 Kasese Cobalt (KCCL) 9.9 9.9 9.9 9.9 9.9
5 Tibet Hima Mining Co Ltd 5 5 5 5 5
6 Bugoye Hydro Limited 13 13 13 13 13
7 AEMS Mpanga 18 18 18 18 18
8 Ishasha Ecopower 6.6 6.6 6.6 6.595 6.595
9 Kabalega Hydromax Buseruka 9 9 9 9 9
10 Muvumbe - 6.5 6.5 6.5 6.5
11 Siiti - 5 5 5 5
12 Nyagak** 3.5 3.5 3.5 3.5 3.5
13 Kisiizi Hospital Power** - 0.3 0.36 0.36 0.36
14 Rwimi
5.54 5.54 5.54
15 Nyamwamba
9.2 9.2 9.2
16 Lubilia
5.4 5.4 5.4
17 Nkusi
9.6 9.6 9.6
18 Mahoma Hydro
2.7 2.7 2.7
19 Waki HPP
4.8 4.8 4.8
20 Swam**
0.04 0 0
21 Bwindi**
0.064 0.064 0.064
Isimba
183 183
Sindila (Butama)
5.25 5.25
Siti II Small Hydro Power
16.5 16.5
Ziba Limited (Kyambura)
7.6 7.6
Ndugutu HPP
5.9 5.9
Achwa 2
42 42
Timex Bukinda
6.5
Thermal Electricity 136 136.08 101.68 101.08 101.08
22 Electromax 86 86 50 50 50
23 Jacobsen Plant - Namanve 50 50 50 50 50
24 WENRECO - Thermal**
1.6 0 0
25 Kisiizi Hospital Power** - 0.08 0.08 0.08 0.08
38 Kalangala Infrastructure Services**- - 1.00 1.00
1.00
1.00
*Bagasse Electricity 64.5 76.4 96.2 96.2 96.2
26 Kakira Sugar Limited 50 50 51.1 51.1 51.1
27 Kinyara Sugar Works Limited 14.5 14.5 14.5 14.5 14.5
28 Sugar and Allied Uganda Limited - 11.9 11.9 11.9 11.9
29 SCOUL
9.5 9.5 9.5
30 Mayuge Sugar Limited
9.2 9.2 9.2
Solar PV 0 17.6 40.83 50.83 60.83
31 Access Solar - 8.5 10 10 10
32 Tororo Solar North - 8.5 10 10 10
33 MSS Xsabo Solar Power Limited
20 20 20
34 Absolute-Kitobo
0.23 0.23 0.23
35 Kalangala Infrastructure Services**- - 0.6 0.6 0.6 0.6
Emerging Power U Ltd (Mayuge/Bufulubi)
10 10
Tororo PV Power Project (Tororo PV Power Co. Ltd)
10
Biomass 0 0 0.043 0.043 0.043
36 Pamoja-Tiribogo
0.032 0.032 0.032
37 Pamoja-Ssekanyonyi 0.011 0.011 0.011
** Off grid generator Source: Electricity Regulatory Authority

216
Table 3.3 B: Electricity Generation by Company (GWh), 2016-2020 No. COMPANY 2016 2017 2018 2019 2020
1 Eskom (U) Limited 1,437,742 1,505,918 1,536,217 1,343,508 1,199,075
2 Bujagali Electricity Limited 1,560,846 1,667,055 1,654,909 1,471,736 1,396,096
3 Isimba 887 718,804 857,335
4 Achwa 2 6,364
5 Kilembe Mines Limited (Klm) 31,551 29,477 14,722 15,364 3,845
6 Kakira Sugar Works 148,845 126,081 175,167 161,654 150,245
7 Kinyara Sugar Works 7,919 7,770 5,700 7,479 7,534
8 Sail Kaliro 20,820 15,923 25,590 27,645 30,505
9 Kasese Cobalt Company Limited 58,762 61,544 61,622 57,246 46,801
10 Nyamwamba 30,791 29,935 16,769
11 Lubilia 13,325 16,125 20,356
12 Nkusi 29,337 42,931 69,201
13 Hydromax Nkusi (Waki) 1,090 13,295 18,018
14 Mahoma 3,590 9,637 11,720
15 Sindila 10,263 14,692
16 Ziba 15,899 38,341
17 Siti 2 2,221 6,525
18 Ndugutu 4,837 19,029
19 Majipower Bugoyelimited 65,821 27,400 79,937 73,522 72,433
20 Kabalega Hydromax 37,231 44,932 40,277 50,506 78,401
21 Aemsmpanga 71,774 54,799 81,186 66,526 94,647
22 Ecopowerishasha 23,382 16,456 21,018 14,456 16,836
23 Muvumbe Hydro (U) Limited 15,354 28,479 29,236 35,610
24 Elgon Hydro Siti 11,541 20,004 20,400 24,948
25 Rwimi 6,906 29,205 25,388 28,486
26 Access Solar 3,716 16,441 16,501 17,341 16,945
27 Tororo Solar 6,598 15,863 16,076 16,329
28 Xsabo Solar 280 32,231 31,668
29 Emmerging Solar Power (Bufulubi) 14,949 17,957
30 Tororo Pv Power Project (Tororo Pv Power Co. Ltd) 6,748
31 Jacobsen (U) Limited 4,716 88,705 113,321 69,927 54,492
32 Electromaxx (U) Limited 61,548 153,287 94,012 35,639 3,646
Total 3,534,673 3,856,187 4,093,030 4,414,776 4,411,597
Total Percentage Annual Change 9.10 6.14 7.86 -0.07
Source: Electricity Regulatory Authority
Table 3.3 C: UETCL Sales by UETCL (GWh), 2016 – 2020
Company 2016 2017 2018 2019 2020
Umeme 3178.7 3334.6 3611.8 3821.74 3,884.7 Ferdsult 30.4 4.9 0 0 - Kilembe Investments Ltd 4.9 5.6 6.4 6.8 7.9 Bundibugyo Coop Soc 2.9 2.9 3.1 5.1 9.2 Pacmecs 2.3 2.2 2.3 2.5 2.2 Uedcl 11.2 41.4 68.1 81.6 94.0 Kplc Exports 83.2 225.9 129.2 208.1 132.0 Snel Exports 2.2 2.3 2.2 2.5 2.2 Tanesco Export 77.2 79.2 93.4 81.1 81.4 Regl 2.4 9.3 8.3 7.5 6.7 Krec 2.6 3.8 4.2 4.4 5.5 Wenreco
3.8 3.6
TOTAL 3397.9 3712 3929 4225.2 4,229.47
Source: Uganda Electricity Transmission Company Limited
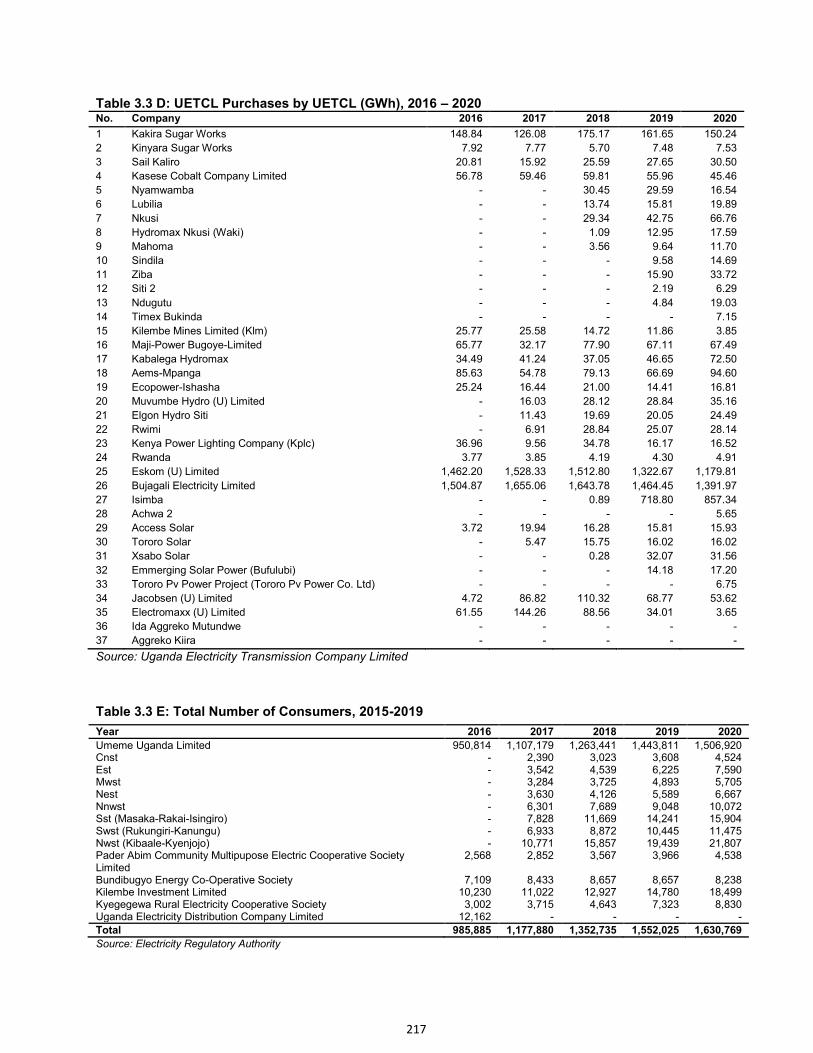
217
Table 3.3 D: UETCL Purchases by UETCL (GWh), 2016 – 2020 No. Company 2016 2017 2018 2019 2020
1 Kakira Sugar Works 148.84 126.08 175.17 161.65 150.24
2 Kinyara Sugar Works 7.92 7.77 5.70 7.48 7.53
3 Sail Kaliro 20.81 15.92 25.59 27.65 30.50
4 Kasese Cobalt Company Limited 56.78 59.46 59.81 55.96 45.46
5 Nyamwamba - - 30.45 29.59 16.54
6 Lubilia - - 13.74 15.81 19.89
7 Nkusi - - 29.34 42.75 66.76
8 Hydromax Nkusi (Waki) - - 1.09 12.95 17.59
9 Mahoma - - 3.56 9.64 11.70
10 Sindila - - - 9.58 14.69
11 Ziba - - - 15.90 33.72
12 Siti 2 - - - 2.19 6.29
13 Ndugutu - - - 4.84 19.03
14 Timex Bukinda - - - - 7.15
15 Kilembe Mines Limited (Klm) 25.77 25.58 14.72 11.86 3.85
16 Maji-Power Bugoye-Limited 65.77 32.17 77.90 67.11 67.49
17 Kabalega Hydromax 34.49 41.24 37.05 46.65 72.50
18 Aems-Mpanga 85.63 54.78 79.13 66.69 94.60
19 Ecopower-Ishasha 25.24 16.44 21.00 14.41 16.81
20 Muvumbe Hydro (U) Limited - 16.03 28.12 28.84 35.16
21 Elgon Hydro Siti - 11.43 19.69 20.05 24.49
22 Rwimi - 6.91 28.84 25.07 28.14
23 Kenya Power Lighting Company (Kplc) 36.96 9.56 34.78 16.17 16.52
24 Rwanda 3.77 3.85 4.19 4.30 4.91
25 Eskom (U) Limited 1,462.20 1,528.33 1,512.80 1,322.67 1,179.81
26 Bujagali Electricity Limited 1,504.87 1,655.06 1,643.78 1,464.45 1,391.97
27 Isimba - - 0.89 718.80 857.34
28 Achwa 2 - - - - 5.65
29 Access Solar 3.72 19.94 16.28 15.81 15.93
30 Tororo Solar - 5.47 15.75 16.02 16.02
31 Xsabo Solar - - 0.28 32.07 31.56
32 Emmerging Solar Power (Bufulubi) - - - 14.18 17.20
33 Tororo Pv Power Project (Tororo Pv Power Co. Ltd) - - - - 6.75
34 Jacobsen (U) Limited 4.72 86.82 110.32 68.77 53.62
35 Electromaxx (U) Limited 61.55 144.26 88.56 34.01 3.65
36 Ida Aggreko Mutundwe - - - - -
37 Aggreko Kiira - - - - -
Source: Uganda Electricity Transmission Company Limited
Table 3.3 E: Total Number of Consumers, 2015-2019
Year 2016 2017 2018 2019 2020
Umeme Uganda Limited 950,814 1,107,179 1,263,441 1,443,811 1,506,920 Cnst - 2,390 3,023 3,608 4,524 Est - 3,542 4,539 6,225 7,590 Mwst - 3,284 3,725 4,893 5,705 Nest - 3,630 4,126 5,589 6,667 Nnwst - 6,301 7,689 9,048 10,072 Sst (Masaka-Rakai-Isingiro) - 7,828 11,669 14,241 15,904 Swst (Rukungiri-Kanungu) - 6,933 8,872 10,445 11,475 Nwst (Kibaale-Kyenjojo) - 10,771 15,857 19,439 21,807 Pader Abim Community Multipupose Electric Cooperative Society Limited
2,568 2,852 3,567 3,966 4,538
Bundibugyo Energy Co-Operative Society 7,109 8,433 8,657 8,657 8,238 Kilembe Investment Limited 10,230 11,022 12,927 14,780 18,499 Kyegegewa Rural Electricity Cooperative Society 3,002 3,715 4,643 7,323 8,830 Uganda Electricity Distribution Company Limited 12,162 - - - -
Total 985,885 1,177,880 1,352,735 1,552,025 1,630,769
Source: Electricity Regulatory Authority
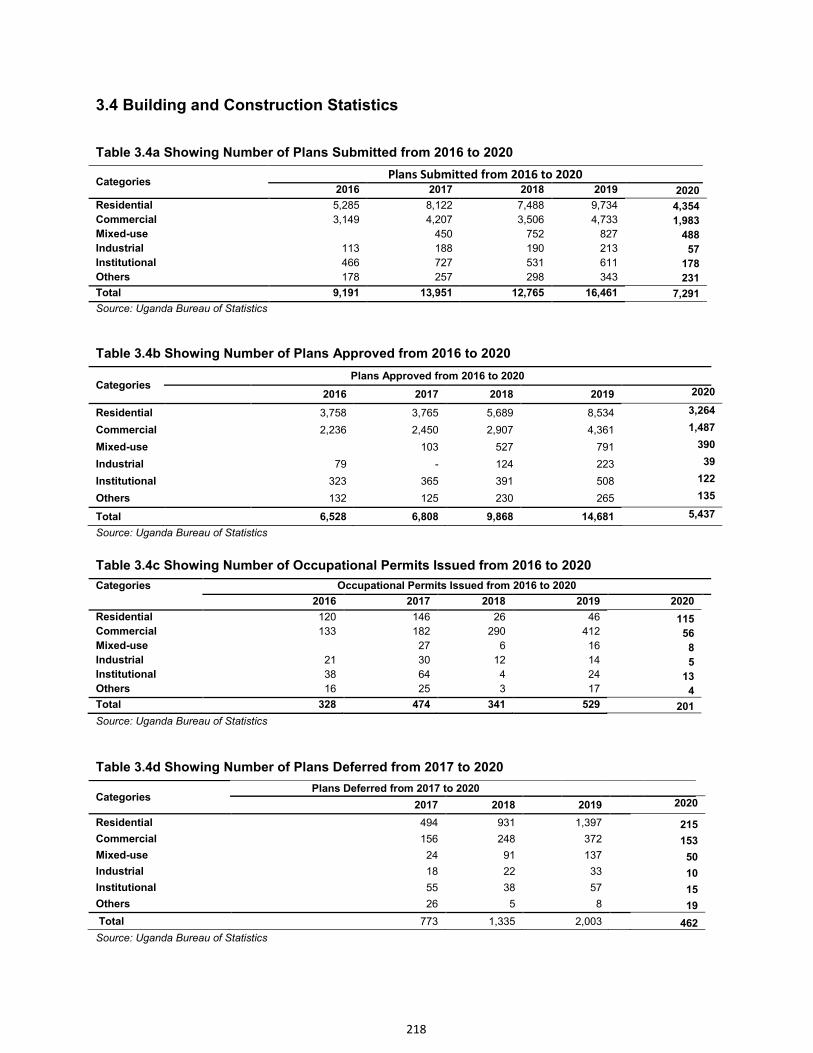
218
3.4 Building and Construction Statistics
Table 3.4a Showing Number of Plans Submitted from 2016 to 2020
Categories Plans Submitted from 2016 to 2020
2016 2017 2018 2019 2020
Residential 5,285 8,122 7,488 9,734 4,354
Commercial 3,149 4,207 3,506 4,733 1,983
Mixed-use 450 752 827 488
Industrial 113 188 190 213 57
Institutional 466 727 531 611 178
Others 178 257 298 343 231
Total 9,191 13,951 12,765 16,461 7,291
Source: Uganda Bureau of Statistics
Table 3.4b Showing Number of Plans Approved from 2016 to 2020
Source: Uganda Bureau of Statistics
Table 3.4c Showing Number of Occupational Permits Issued from 2016 to 2020
Categories Occupational Permits Issued from 2016 to 2020
2016 2017 2018 2019 2020
Residential 120 146 26 46 115 Commercial 133 182 290 412 56 Mixed-use 27 6 16 8 Industrial 21 30 12 14 5 Institutional 38 64 4 24 13 Others 16 25 3 17 4
Total 328 474 341 529 201
Source: Uganda Bureau of Statistics
Table 3.4d Showing Number of Plans Deferred from 2017 to 2020
Source: Uganda Bureau of Statistics
Categories Plans Approved from 2016 to 2020
2016 2017 2018 2019 2020
Residential 3,758 3,765 5,689 8,534 3,264
Commercial 2,236 2,450 2,907 4,361 1,487
Mixed-use 103 527 791 390
Industrial 79 - 124 223 39
Institutional 323 365 391 508 122
Others 132 125 230 265 135
Total 6,528 6,808 9,868 14,681 5,437
Categories Plans Deferred from 2017 to 2020
2017 2018 2019 2020
Residential 494 931 1,397 215
Commercial 156 248 372 153
Mixed-use 24 91 137 50
Industrial 18 22 33 10
Institutional 55 38 57 15
Others 26 5 8 19
Total 773 1,335 2,003 462
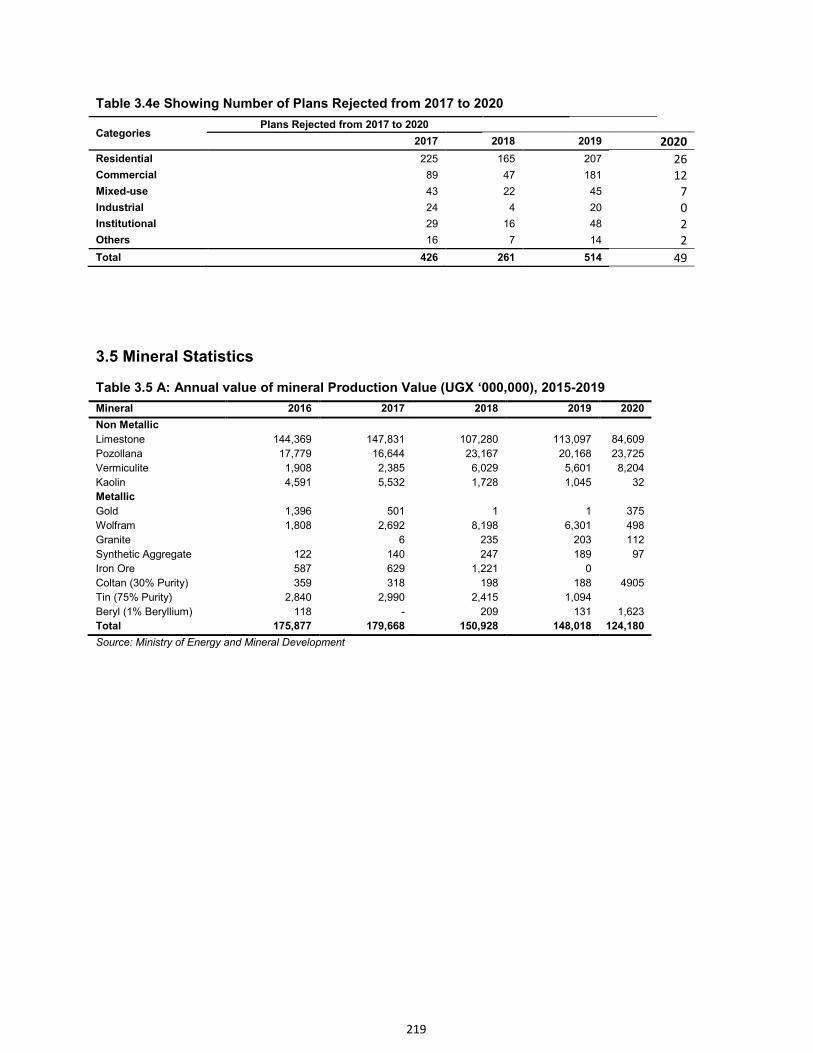
219
Table 3.4e Showing Number of Plans Rejected from 2017 to 2020
Categories Plans Rejected from 2017 to 2020
2017 2018 2019 2020
Residential 225 165 207 26
Commercial 89 47 181 12
Mixed-use 43 22 45 7
Industrial 24 4 20 0
Institutional 29 16 48 2
Others 16 7 14 2
Total 426 261 514 49
3.5 Mineral Statistics
Table 3.5 A: Annual value of mineral Production Value (UGX ‘000,000), 2015-2019
Mineral 2016 2017 2018 2019 2020
Non Metallic
Limestone 144,369 147,831 107,280 113,097 84,609
Pozollana 17,779 16,644 23,167 20,168 23,725
Vermiculite 1,908 2,385 6,029 5,601 8,204
Kaolin 4,591 5,532 1,728 1,045 32
Metallic
Gold 1,396 501 1 1 375
Wolfram 1,808 2,692 8,198 6,301 498
Granite 6 235 203 112
Synthetic Aggregate 122 140 247 189 97
Iron Ore 587 629 1,221 0
Coltan (30% Purity) 359 318 198 188 4905
Tin (75% Purity) 2,840 2,990 2,415 1,094
Beryl (1% Beryllium) 118 - 209 131 1,623
Total 175,877 179,668 150,928 148,018 124,180
Source: Ministry of Energy and Mineral Development
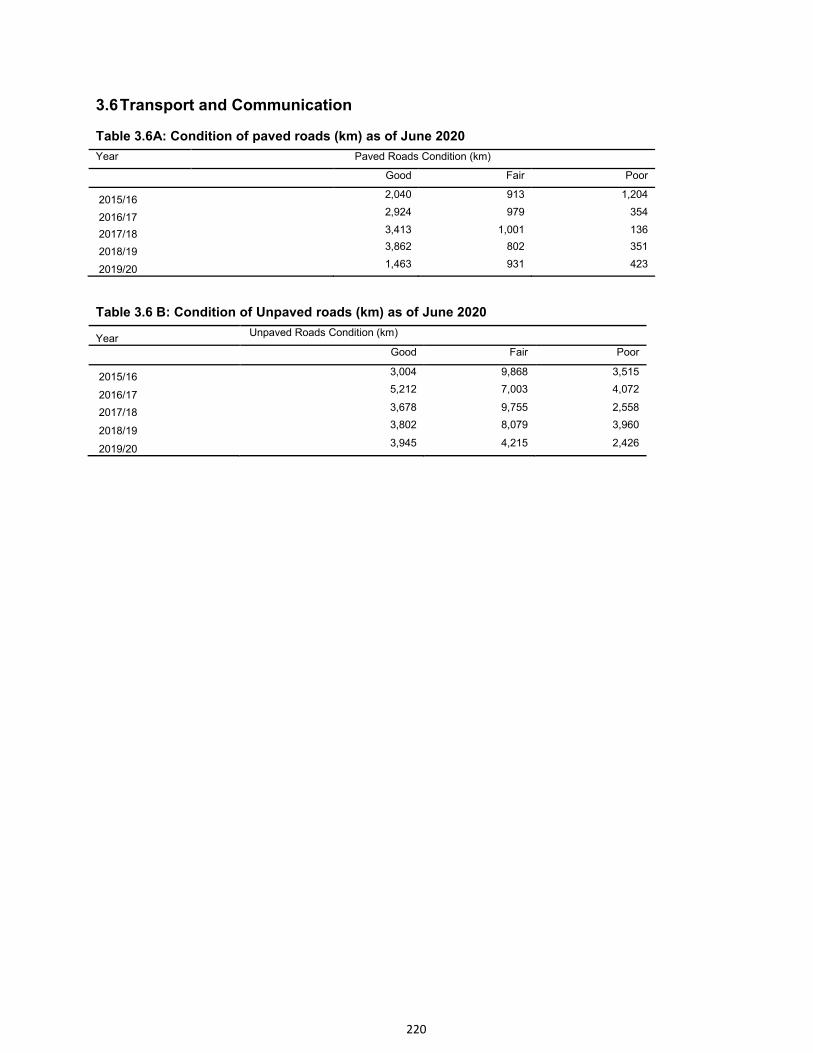
220
3.6 Transport and Communication
Table 3.6A: Condition of paved roads (km) as of June 2020 Year Paved Roads Condition (km)
Good Fair Poor
2015/16 2,040 913 1,204
2016/17 2,924 979 354
2017/18 3,413 1,001 136
2018/19 3,862 802 351
2019/20 1,463 931 423
Table 3.6 B: Condition of Unpaved roads (km) as of June 2020
Year Unpaved Roads Condition (km)
Good Fair Poor
2015/16 3,004 9,868 3,515
2016/17 5,212 7,003 4,072
2017/18 3,678 9,755 2,558
2018/19 3,802 8,079 3,960
2019/20 3,945 4,215 2,426
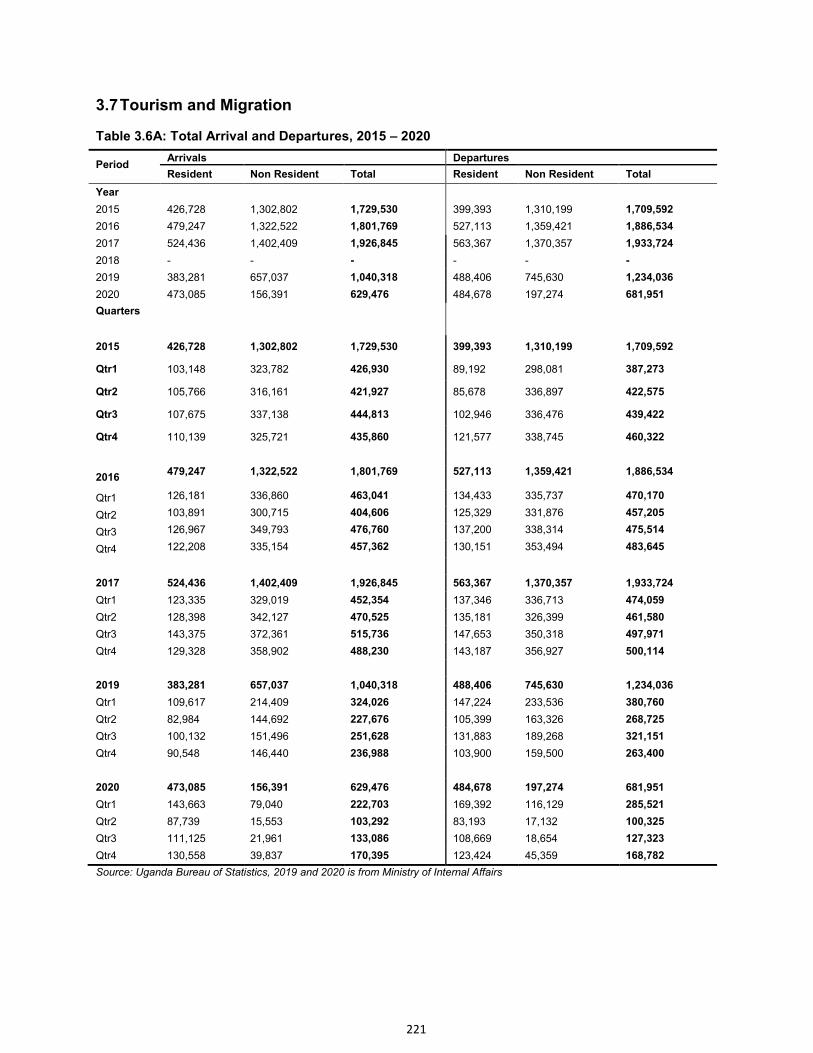
221
3.7 Tourism and Migration
Table 3.6A: Total Arrival and Departures, 2015 – 2020
Period
Arrivals Departures
Resident Non Resident Total Resident Non Resident Total
Year
2015 426,728 1,302,802 1,729,530 399,393 1,310,199 1,709,592
2016 479,247 1,322,522 1,801,769 527,113 1,359,421 1,886,534
2017 524,436 1,402,409 1,926,845 563,367 1,370,357 1,933,724
2018 - - - - - -
2019 383,281 657,037 1,040,318 488,406 745,630 1,234,036
2020 473,085 156,391 629,476 484,678 197,274 681,951
Quarters
2015 426,728 1,302,802 1,729,530 399,393 1,310,199 1,709,592
Qtr1 103,148 323,782 426,930 89,192 298,081 387,273
Qtr2 105,766 316,161 421,927 85,678 336,897 422,575
Qtr3 107,675 337,138 444,813 102,946 336,476 439,422
Qtr4 110,139 325,721 435,860 121,577 338,745 460,322
2016 479,247 1,322,522 1,801,769 527,113 1,359,421 1,886,534
Qtr1 126,181 336,860 463,041 134,433 335,737 470,170
Qtr2 103,891 300,715 404,606 125,329 331,876 457,205
Qtr3 126,967 349,793 476,760 137,200 338,314 475,514
Qtr4 122,208 335,154 457,362 130,151 353,494 483,645
2017 524,436 1,402,409 1,926,845 563,367 1,370,357 1,933,724
Qtr1 123,335 329,019 452,354 137,346 336,713 474,059
Qtr2 128,398 342,127 470,525 135,181 326,399 461,580
Qtr3 143,375 372,361 515,736 147,653 350,318 497,971
Qtr4 129,328 358,902 488,230 143,187 356,927 500,114
2019 383,281 657,037 1,040,318 488,406 745,630 1,234,036
Qtr1 109,617 214,409 324,026 147,224 233,536 380,760
Qtr2 82,984 144,692 227,676 105,399 163,326 268,725
Qtr3 100,132 151,496 251,628 131,883 189,268 321,151
Qtr4 90,548 146,440 236,988 103,900 159,500 263,400
2020 473,085 156,391 629,476 484,678 197,274 681,951
Qtr1 143,663 79,040 222,703 169,392 116,129 285,521
Qtr2 87,739 15,553 103,292 83,193 17,132 100,325
Qtr3 111,125 21,961 133,086 108,669 18,654 127,323
Qtr4 130,558 39,837 170,395 123,424 45,359 168,782
Source: Uganda Bureau of Statistics, 2019 and 2020 is from Ministry of Internal Affairs
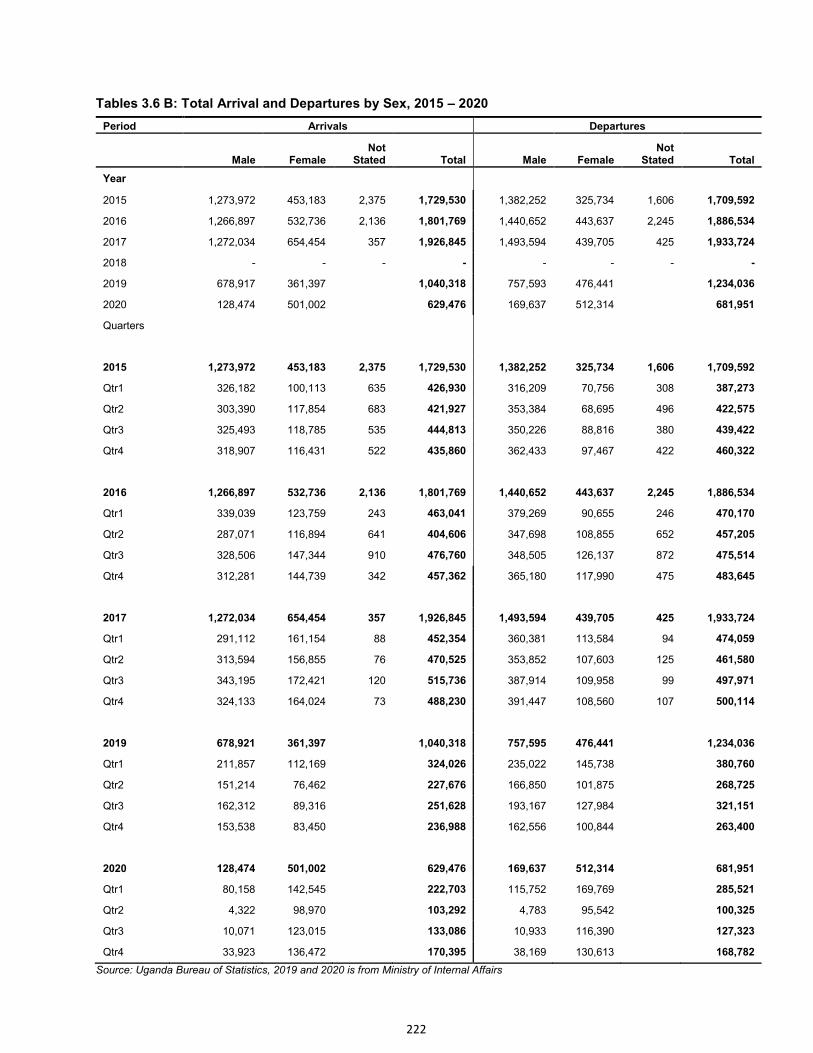
222
Tables 3.6 B: Total Arrival and Departures by Sex, 2015 – 2020
Period Arrivals Departures
Male Female Not
Stated Total Male Female Not
Stated Total
Year
2015 1,273,972 453,183 2,375 1,729,530 1,382,252 325,734 1,606 1,709,592
2016 1,266,897 532,736 2,136 1,801,769 1,440,652 443,637 2,245 1,886,534
2017 1,272,034 654,454 357 1,926,845 1,493,594 439,705 425 1,933,724
2018 - - - - - - - -
2019 678,917 361,397 1,040,318 757,593 476,441 1,234,036
2020 128,474 501,002 629,476 169,637 512,314 681,951
Quarters
2015 1,273,972 453,183 2,375 1,729,530 1,382,252 325,734 1,606 1,709,592
Qtr1 326,182 100,113 635 426,930 316,209 70,756 308 387,273
Qtr2 303,390 117,854 683 421,927 353,384 68,695 496 422,575
Qtr3 325,493 118,785 535 444,813 350,226 88,816 380 439,422
Qtr4 318,907 116,431 522 435,860 362,433 97,467 422 460,322
2016 1,266,897 532,736 2,136 1,801,769 1,440,652 443,637 2,245 1,886,534
Qtr1 339,039 123,759 243 463,041 379,269 90,655 246 470,170
Qtr2 287,071 116,894 641 404,606 347,698 108,855 652 457,205
Qtr3 328,506 147,344 910 476,760 348,505 126,137 872 475,514
Qtr4 312,281 144,739 342 457,362 365,180 117,990 475 483,645
2017 1,272,034 654,454 357 1,926,845 1,493,594 439,705 425 1,933,724
Qtr1 291,112 161,154 88 452,354 360,381 113,584 94 474,059
Qtr2 313,594 156,855 76 470,525 353,852 107,603 125 461,580
Qtr3 343,195 172,421 120 515,736 387,914 109,958 99 497,971
Qtr4 324,133 164,024 73 488,230 391,447 108,560 107 500,114
2019 678,921 361,397 1,040,318 757,595 476,441 1,234,036
Qtr1 211,857 112,169 324,026 235,022 145,738 380,760
Qtr2 151,214 76,462 227,676 166,850 101,875 268,725
Qtr3 162,312 89,316 251,628 193,167 127,984 321,151
Qtr4 153,538 83,450 236,988 162,556 100,844 263,400
2020 128,474 501,002 629,476 169,637 512,314 681,951
Qtr1 80,158 142,545 222,703 115,752 169,769 285,521
Qtr2 4,322 98,970 103,292 4,783 95,542 100,325
Qtr3 10,071 123,015 133,086 10,933 116,390 127,323
Qtr4 33,923 136,472 170,395 38,169 130,613 168,782
Source: Uganda Bureau of Statistics, 2019 and 2020 is from Ministry of Internal Affairs
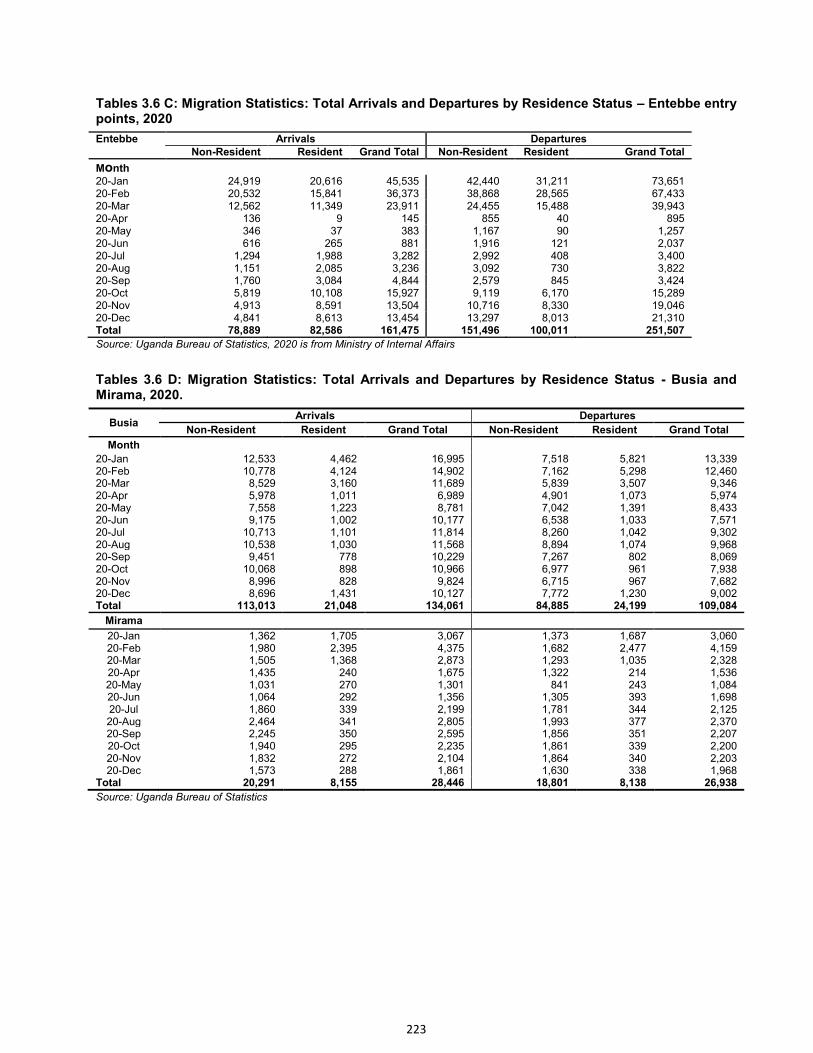
223
Tables 3.6 C: Migration Statistics: Total Arrivals and Departures by Residence Status – Entebbe entry points, 2020
Entebbe Arrivals Departures Non-Resident Resident Grand Total Non-Resident Resident Grand Total
Month
20-Jan 24,919 20,616 45,535 42,440 31,211 73,651 20-Feb 20,532 15,841 36,373 38,868 28,565 67,433 20-Mar 12,562 11,349 23,911 24,455 15,488 39,943 20-Apr 136 9 145 855 40 895 20-May 346 37 383 1,167 90 1,257 20-Jun 616 265 881 1,916 121 2,037 20-Jul 1,294 1,988 3,282 2,992 408 3,400 20-Aug 1,151 2,085 3,236 3,092 730 3,822 20-Sep 1,760 3,084 4,844 2,579 845 3,424 20-Oct 5,819 10,108 15,927 9,119 6,170 15,289 20-Nov 4,913 8,591 13,504 10,716 8,330 19,046 20-Dec 4,841 8,613 13,454 13,297 8,013 21,310 Total 78,889 82,586 161,475 151,496 100,011 251,507
Source: Uganda Bureau of Statistics, 2020 is from Ministry of Internal Affairs
Tables 3.6 D: Migration Statistics: Total Arrivals and Departures by Residence Status - Busia and Mirama, 2020.
Busia Arrivals Departures
Non-Resident Resident Grand Total Non-Resident Resident Grand Total
Month
20-Jan 12,533 4,462 16,995 7,518 5,821 13,339 20-Feb 10,778 4,124 14,902 7,162 5,298 12,460 20-Mar 8,529 3,160 11,689 5,839 3,507 9,346 20-Apr 5,978 1,011 6,989 4,901 1,073 5,974 20-May 7,558 1,223 8,781 7,042 1,391 8,433 20-Jun 9,175 1,002 10,177 6,538 1,033 7,571 20-Jul 10,713 1,101 11,814 8,260 1,042 9,302 20-Aug 10,538 1,030 11,568 8,894 1,074 9,968 20-Sep 9,451 778 10,229 7,267 802 8,069 20-Oct 10,068 898 10,966 6,977 961 7,938 20-Nov 8,996 828 9,824 6,715 967 7,682 20-Dec 8,696 1,431 10,127 7,772 1,230 9,002 Total 113,013 21,048 134,061 84,885 24,199 109,084
Mirama 20-Jan 1,362 1,705 3,067 1,373 1,687 3,060 20-Feb 1,980 2,395 4,375 1,682 2,477 4,159 20-Mar 1,505 1,368 2,873 1,293 1,035 2,328 20-Apr 1,435 240 1,675 1,322 214 1,536 20-May 1,031 270 1,301 841 243 1,084 20-Jun 1,064 292 1,356 1,305 393 1,698 20-Jul 1,860 339 2,199 1,781 344 2,125 20-Aug 2,464 341 2,805 1,993 377 2,370 20-Sep 2,245 350 2,595 1,856 351 2,207 20-Oct 1,940 295 2,235 1,861 339 2,200 20-Nov 1,832 272 2,104 1,864 340 2,203 20-Dec 1,573 288 1,861 1,630 338 1,968
Total 20,291 8,155 28,446 18,801 8,138 26,938
Source: Uganda Bureau of Statistics
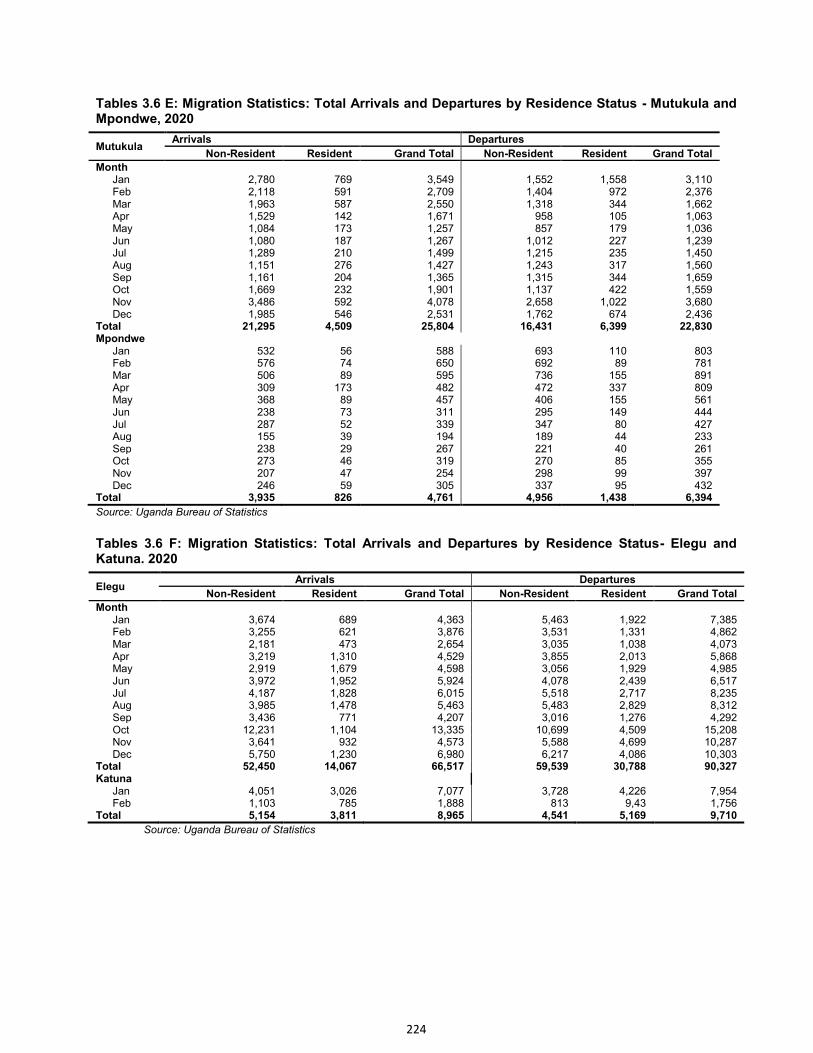
224
Tables 3.6 E: Migration Statistics: Total Arrivals and Departures by Residence Status - Mutukula and Mpondwe, 2020
Mutukula Arrivals Departures
Non-Resident Resident Grand Total Non-Resident Resident Grand Total
Month
Jan 2,780 769 3,549 1,552 1,558 3,110 Feb 2,118 591 2,709 1,404 972 2,376 Mar 1,963 587 2,550 1,318 344 1,662 Apr 1,529 142 1,671 958 105 1,063 May 1,084 173 1,257 857 179 1,036 Jun 1,080 187 1,267 1,012 227 1,239 Jul 1,289 210 1,499 1,215 235 1,450 Aug 1,151 276 1,427 1,243 317 1,560 Sep 1,161 204 1,365 1,315 344 1,659 Oct 1,669 232 1,901 1,137 422 1,559 Nov 3,486 592 4,078 2,658 1,022 3,680 Dec 1,985 546 2,531 1,762 674 2,436
Total 21,295 4,509 25,804 16,431 6,399 22,830 Mpondwe
Jan 532 56 588 693 110 803 Feb 576 74 650 692 89 781 Mar 506 89 595 736 155 891 Apr 309 173 482 472 337 809 May 368 89 457 406 155 561 Jun 238 73 311 295 149 444 Jul 287 52 339 347 80 427 Aug 155 39 194 189 44 233 Sep 238 29 267 221 40 261 Oct 273 46 319 270 85 355 Nov 207 47 254 298 99 397 Dec 246 59 305 337 95 432
Total 3,935 826 4,761 4,956 1,438 6,394
Source: Uganda Bureau of Statistics
Tables 3.6 F: Migration Statistics: Total Arrivals and Departures by Residence Status- Elegu and Katuna. 2020
Elegu Arrivals Departures
Non-Resident Resident Grand Total Non-Resident Resident Grand Total
Month
Jan 3,674 689 4,363 5,463 1,922 7,385 Feb 3,255 621 3,876 3,531 1,331 4,862 Mar 2,181 473 2,654 3,035 1,038 4,073 Apr 3,219 1,310 4,529 3,855 2,013 5,868 May 2,919 1,679 4,598 3,056 1,929 4,985 Jun 3,972 1,952 5,924 4,078 2,439 6,517 Jul 4,187 1,828 6,015 5,518 2,717 8,235 Aug 3,985 1,478 5,463 5,483 2,829 8,312 Sep 3,436 771 4,207 3,016 1,276 4,292 Oct 12,231 1,104 13,335 10,699 4,509 15,208 Nov 3,641 932 4,573 5,588 4,699 10,287 Dec 5,750 1,230 6,980 6,217 4,086 10,303
Total 52,450 14,067 66,517 59,539 30,788 90,327 Katuna
Jan 4,051 3,026 7,077 3,728 4,226 7,954 Feb 1,103 785 1,888 813 9,43 1,756
Total 5,154 3,811 8,965 4,541 5,169 9,710
Source: Uganda Bureau of Statistics
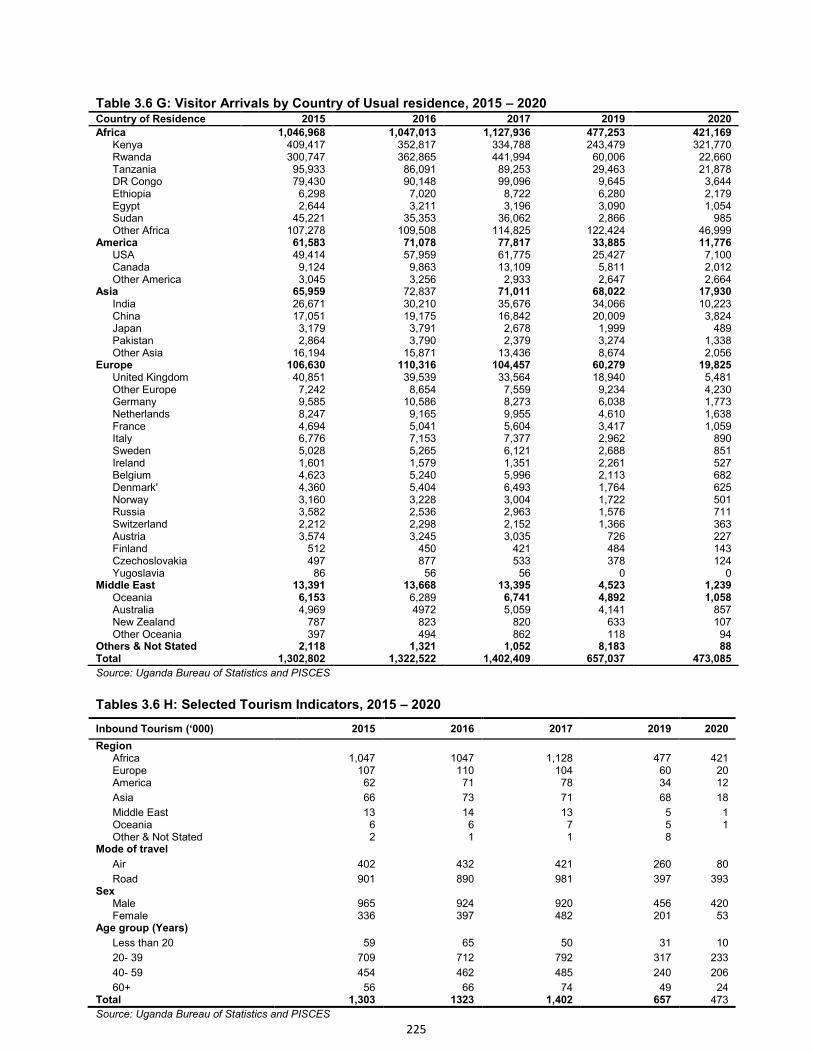
225
Table 3.6 G: Visitor Arrivals by Country of Usual residence, 2015 – 2020
Source: Uganda Bureau of Statistics and PISCES
Tables 3.6 H: Selected Tourism Indicators, 2015 – 2020
Inbound Tourism (‘000) 2015 2016 2017 2019 2020
Region Africa 1,047 1047 1,128 477 421 Europe 107 110 104 60 20 America 62 71 78 34 12
Asia 66 73 71 68 18
Middle East 13 14 13 5 1 Oceania 6 6 7 5 1 Other & Not Stated 2 1 1 8
Mode of travel
Air 402 432 421 260 80
Road 901 890 981 397 393 Sex
Male 965 924 920 456 420 Female 336 397 482 201 53
Age group (Years)
Less than 20 59 65 50 31 10
20- 39 709 712 792 317 233
40- 59 454 462 485 240 206
60+ 56 66 74 49 24 Total 1,303 1323 1,402 657 473
Source: Uganda Bureau of Statistics and PISCES
Country of Residence 2015 2016 2017 2019 2020
Africa 1,046,968 1,047,013 1,127,936 477,253 421,169 Kenya 409,417 352,817 334,788 243,479 321,770 Rwanda 300,747 362,865 441,994 60,006 22,660 Tanzania 95,933 86,091 89,253 29,463 21,878 DR Congo 79,430 90,148 99,096 9,645 3,644 Ethiopia 6,298 7,020 8,722 6,280 2,179 Egypt 2,644 3,211 3,196 3,090 1,054 Sudan 45,221 35,353 36,062 2,866 985 Other Africa 107,278 109,508 114,825 122,424 46,999
America 61,583 71,078 77,817 33,885 11,776 USA 49,414 57,959 61,775 25,427 7,100 Canada 9,124 9,863 13,109 5,811 2,012 Other America 3,045 3,256 2,933 2,647 2,664
Asia 65,959 72,837 71,011 68,022 17,930 India 26,671 30,210 35,676 34,066 10,223 China 17,051 19,175 16,842 20,009 3,824 Japan 3,179 3,791 2,678 1,999 489 Pakistan 2,864 3,790 2,379 3,274 1,338 Other Asia 16,194 15,871 13,436 8,674 2,056
Europe 106,630 110,316 104,457 60,279 19,825 United Kingdom 40,851 39,539 33,564 18,940 5,481 Other Europe 7,242 8,654 7,559 9,234 4,230 Germany 9,585 10,586 8,273 6,038 1,773 Netherlands 8,247 9,165 9,955 4,610 1,638 France 4,694 5,041 5,604 3,417 1,059 Italy 6,776 7,153 7,377 2,962 890 Sweden 5,028 5,265 6,121 2,688 851 Ireland 1,601 1,579 1,351 2,261 527 Belgium 4,623 5,240 5,996 2,113 682 Denmark' 4,360 5,404 6,493 1,764 625 Norway 3,160 3,228 3,004 1,722 501 Russia 3,582 2,536 2,963 1,576 711 Switzerland 2,212 2,298 2,152 1,366 363 Austria 3,574 3,245 3,035 726 227 Finland 512 450 421 484 143 Czechoslovakia 497 877 533 378 124 Yugoslavia 86 56 56 0 0
Middle East 13,391 13,668 13,395 4,523 1,239 Oceania 6,153 6,289 6,741 4,892 1,058 Australia 4,969 4972 5,059 4,141 857 New Zealand 787 823 820 633 107 Other Oceania 397 494 862 118 94
Others & Not Stated 2,118 1,321 1,052 8,183 88 Total 1,302,802 1,322,522 1,402,409 657,037 473,085
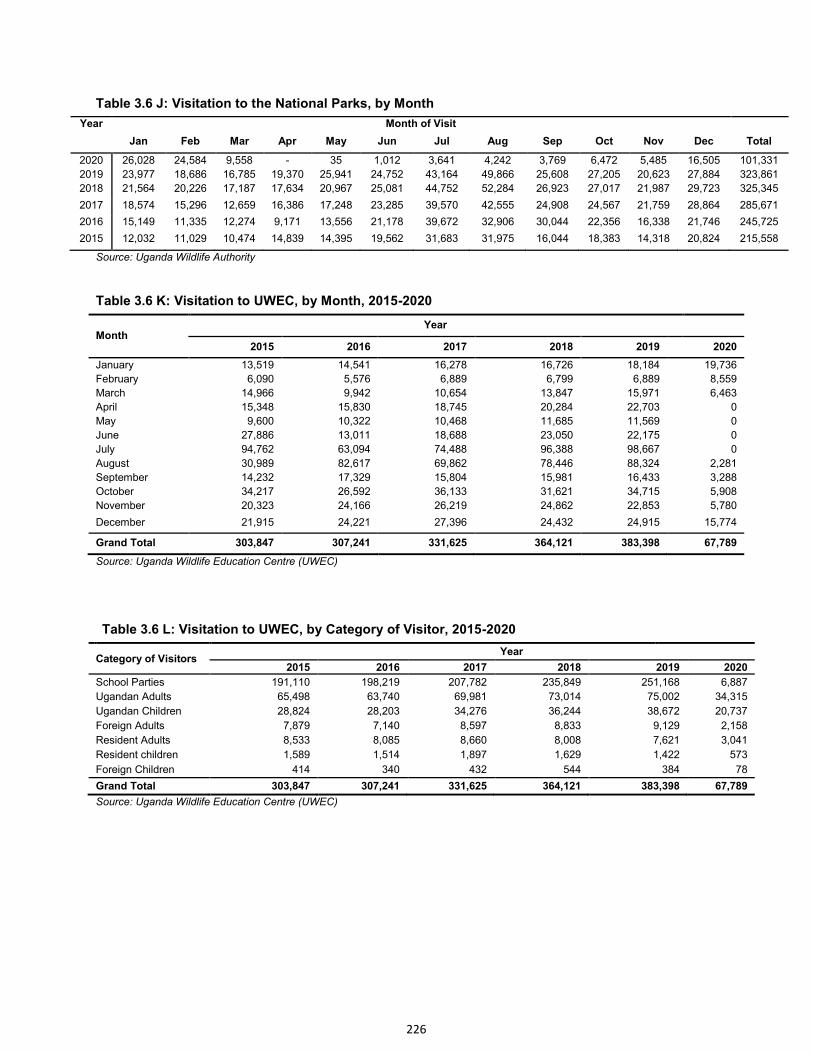
226
Table 3.6 J: Visitation to the National Parks, by Month
Year Month of Visit
Jan Feb Mar Apr May Jun Jul Aug Sep Oct Nov Dec Total
2020 26,028 24,584 9,558 - 35 1,012 3,641 4,242 3,769 6,472 5,485 16,505 101,331
2019 23,977 18,686 16,785 19,370 25,941 24,752 43,164 49,866 25,608 27,205 20,623 27,884 323,861
2018 21,564 20,226 17,187 17,634 20,967 25,081 44,752 52,284 26,923 27,017 21,987 29,723 325,345
2017 18,574 15,296 12,659 16,386 17,248 23,285 39,570 42,555 24,908 24,567 21,759 28,864 285,671
2016 15,149 11,335 12,274 9,171 13,556 21,178 39,672 32,906 30,044 22,356 16,338 21,746 245,725
2015 12,032 11,029 10,474 14,839 14,395 19,562 31,683 31,975 16,044 18,383 14,318 20,824 215,558
Source: Uganda Wildlife Authority
Table 3.6 K: Visitation to UWEC, by Month, 2015-2020
Month Year
2015 2016 2017 2018 2019 2020
January 13,519 14,541 16,278 16,726 18,184 19,736
February 6,090 5,576 6,889 6,799 6,889 8,559
March 14,966 9,942 10,654 13,847 15,971 6,463
April 15,348 15,830 18,745 20,284 22,703 0
May 9,600 10,322 10,468 11,685 11,569 0
June 27,886 13,011 18,688 23,050 22,175 0
July 94,762 63,094 74,488 96,388 98,667 0
August 30,989 82,617 69,862 78,446 88,324 2,281
September 14,232 17,329 15,804 15,981 16,433 3,288
October 34,217 26,592 36,133 31,621 34,715 5,908
November 20,323 24,166 26,219 24,862 22,853 5,780
December 21,915 24,221 27,396 24,432 24,915 15,774
Grand Total 303,847 307,241 331,625 364,121 383,398 67,789
Source: Uganda Wildlife Education Centre (UWEC)
Table 3.6 L: Visitation to UWEC, by Category of Visitor, 2015-2020
Category of Visitors Year
2015 2016 2017 2018 2019 2020
School Parties 191,110 198,219 207,782 235,849 251,168 6,887
Ugandan Adults 65,498 63,740 69,981 73,014 75,002 34,315
Ugandan Children 28,824 28,203 34,276 36,244 38,672 20,737
Foreign Adults 7,879 7,140 8,597 8,833 9,129 2,158
Resident Adults 8,533 8,085 8,660 8,008 7,621 3,041
Resident children 1,589 1,514 1,897 1,629 1,422 573
Foreign Children 414 340 432 544 384 78
Grand Total 303,847 307,241 331,625 364,121 383,398 67,789
Source: Uganda Wildlife Education Centre (UWEC)
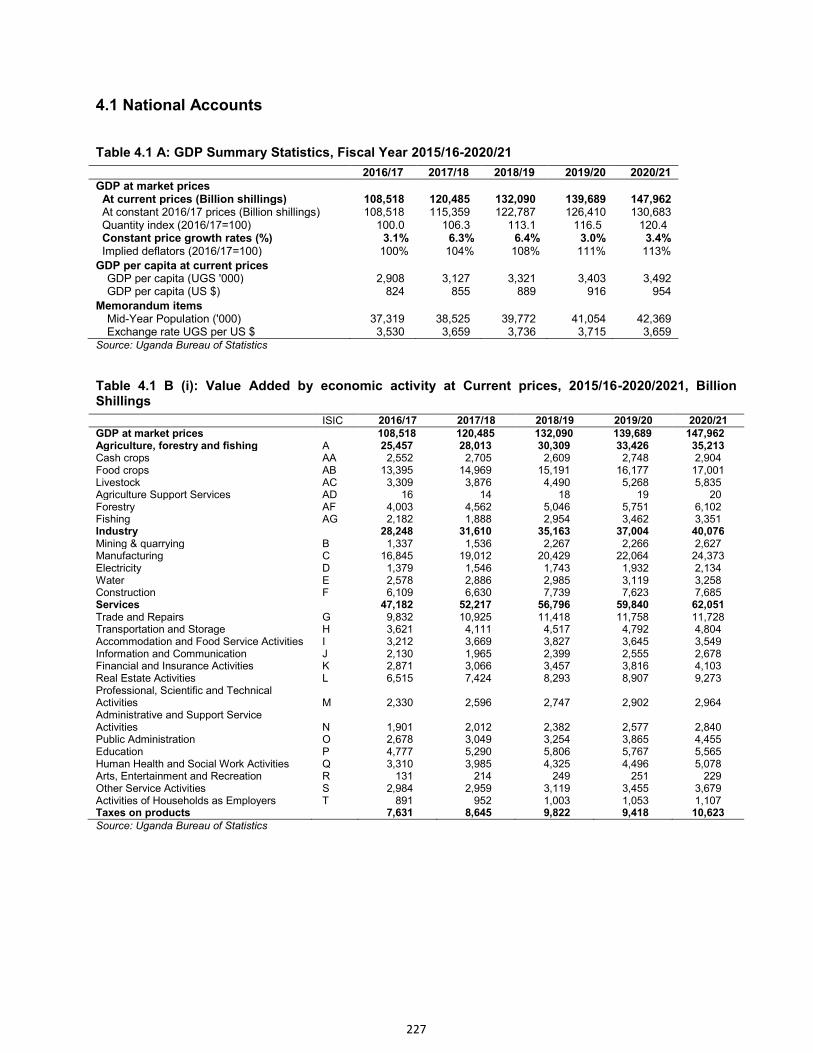
227
4.1 National Accounts
Table 4.1 A: GDP Summary Statistics, Fiscal Year 2015/16-2020/21 2016/17 2017/18 2018/19 2019/20 2020/21
GDP at market prices At current prices (Billion shillings) 108,518 120,485 132,090 139,689 147,962
At constant 2016/17 prices (Billion shillings) 108,518 115,359 122,787 126,410 130,683 Quantity index (2016/17=100) 100.0 106.3 113.1 116.5 120.4 Constant price growth rates (%) 3.1% 6.3% 6.4% 3.0% 3.4% Implied deflators (2016/17=100) 100% 104% 108% 111% 113%
GDP per capita at current prices GDP per capita (UGS '000) 2,908 3,127 3,321 3,403 3,492
GDP per capita (US $) 824 855 889 916 954
Memorandum items Mid-Year Population ('000) 37,319 38,525 39,772 41,054 42,369
Exchange rate UGS per US $ 3,530 3,659 3,736 3,715 3,659 Source: Uganda Bureau of Statistics
Table 4.1 B (i): Value Added by economic activity at Current prices, 2015/16-2020/2021, Billion Shillings
ISIC 2016/17 2017/18 2018/19 2019/20 2020/21 GDP at market prices
108,518 120,485 132,090 139,689 147,962
Agriculture, forestry and fishing A 25,457 28,013 30,309 33,426 35,213 Cash crops AA 2,552 2,705 2,609 2,748 2,904 Food crops AB 13,395 14,969 15,191 16,177 17,001 Livestock AC 3,309 3,876 4,490 5,268 5,835 Agriculture Support Services AD 16 14 18 19 20 Forestry AF 4,003 4,562 5,046 5,751 6,102 Fishing AG 2,182 1,888 2,954 3,462 3,351 Industry
28,248 31,610 35,163 37,004 40,076
Mining & quarrying B 1,337 1,536 2,267 2,266 2,627 Manufacturing C 16,845 19,012 20,429 22,064 24,373 Electricity D 1,379 1,546 1,743 1,932 2,134 Water E 2,578 2,886 2,985 3,119 3,258 Construction F 6,109 6,630 7,739 7,623 7,685 Services
47,182 52,217 56,796 59,840 62,051
Trade and Repairs G 9,832 10,925 11,418 11,758 11,728 Transportation and Storage H 3,621 4,111 4,517 4,792 4,804 Accommodation and Food Service Activities I 3,212 3,669 3,827 3,645 3,549 Information and Communication J 2,130 1,965 2,399 2,555 2,678 Financial and Insurance Activities K 2,871 3,066 3,457 3,816 4,103 Real Estate Activities L 6,515 7,424 8,293 8,907 9,273 Professional, Scientific and Technical Activities M 2,330 2,596 2,747 2,902 2,964 Administrative and Support Service Activities N 1,901 2,012 2,382 2,577 2,840 Public Administration O 2,678 3,049 3,254 3,865 4,455 Education P 4,777 5,290 5,806 5,767 5,565 Human Health and Social Work Activities Q 3,310 3,985 4,325 4,496 5,078 Arts, Entertainment and Recreation R 131 214 249 251 229 Other Service Activities S 2,984 2,959 3,119 3,455 3,679 Activities of Households as Employers T 891 952 1,003 1,053 1,107 Taxes on products
7,631 8,645 9,822 9,418 10,623
Source: Uganda Bureau of Statistics
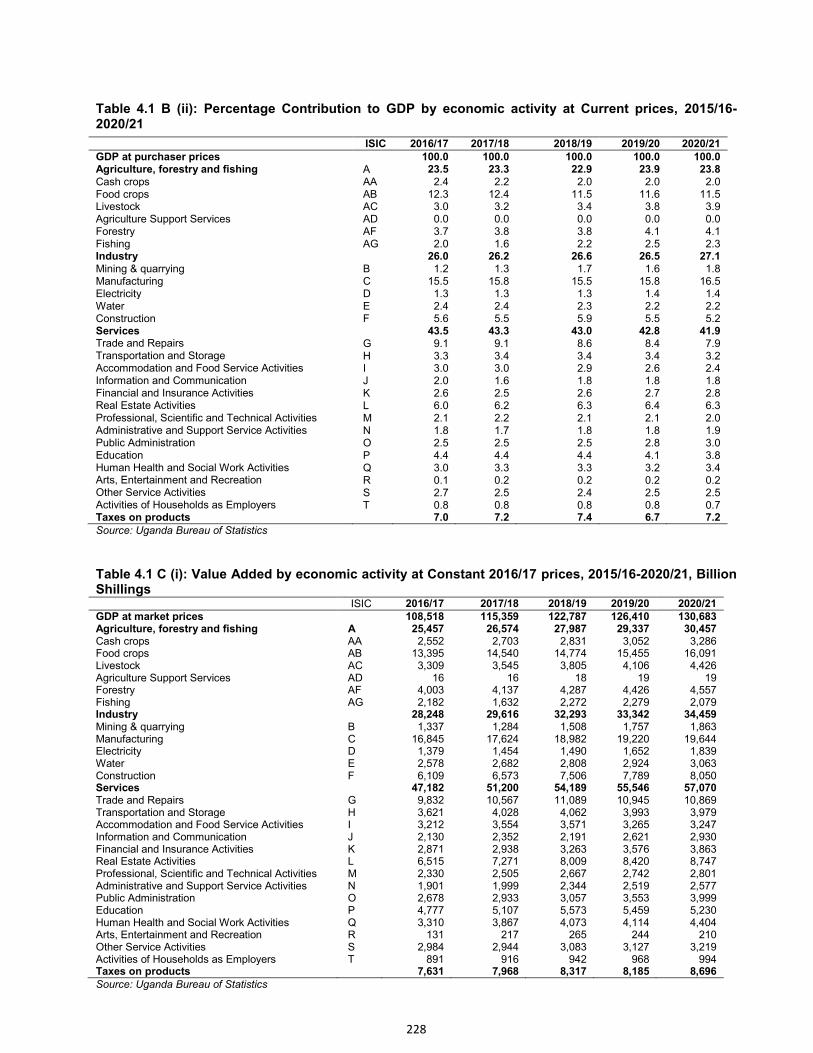
228
Table 4.1 B (ii): Percentage Contribution to GDP by economic activity at Current prices, 2015/16-2020/21
ISIC 2016/17 2017/18 2018/19 2019/20 2020/21 GDP at purchaser prices
100.0 100.0 100.0 100.0 100.0
Agriculture, forestry and fishing A 23.5 23.3 22.9 23.9 23.8 Cash crops AA 2.4 2.2 2.0 2.0 2.0 Food crops AB 12.3 12.4 11.5 11.6 11.5 Livestock AC 3.0 3.2 3.4 3.8 3.9 Agriculture Support Services AD 0.0 0.0 0.0 0.0 0.0 Forestry AF 3.7 3.8 3.8 4.1 4.1 Fishing AG 2.0 1.6 2.2 2.5 2.3 Industry
26.0 26.2 26.6 26.5 27.1
Mining & quarrying B 1.2 1.3 1.7 1.6 1.8 Manufacturing C 15.5 15.8 15.5 15.8 16.5 Electricity D 1.3 1.3 1.3 1.4 1.4 Water E 2.4 2.4 2.3 2.2 2.2 Construction F 5.6 5.5 5.9 5.5 5.2 Services
43.5 43.3 43.0 42.8 41.9
Trade and Repairs G 9.1 9.1 8.6 8.4 7.9 Transportation and Storage H 3.3 3.4 3.4 3.4 3.2 Accommodation and Food Service Activities I 3.0 3.0 2.9 2.6 2.4 Information and Communication J 2.0 1.6 1.8 1.8 1.8 Financial and Insurance Activities K 2.6 2.5 2.6 2.7 2.8 Real Estate Activities L 6.0 6.2 6.3 6.4 6.3 Professional, Scientific and Technical Activities M 2.1 2.2 2.1 2.1 2.0 Administrative and Support Service Activities N 1.8 1.7 1.8 1.8 1.9 Public Administration O 2.5 2.5 2.5 2.8 3.0 Education P 4.4 4.4 4.4 4.1 3.8 Human Health and Social Work Activities Q 3.0 3.3 3.3 3.2 3.4 Arts, Entertainment and Recreation R 0.1 0.2 0.2 0.2 0.2 Other Service Activities S 2.7 2.5 2.4 2.5 2.5 Activities of Households as Employers T 0.8 0.8 0.8 0.8 0.7 Taxes on products
7.0 7.2 7.4 6.7 7.2
Source: Uganda Bureau of Statistics
Table 4.1 C (i): Value Added by economic activity at Constant 2016/17 prices, 2015/16-2020/21, Billion Shillings
ISIC 2016/17 2017/18 2018/19 2019/20 2020/21 GDP at market prices
108,518 115,359 122,787 126,410 130,683
Agriculture, forestry and fishing A 25,457 26,574 27,987 29,337 30,457 Cash crops AA 2,552 2,703 2,831 3,052 3,286 Food crops AB 13,395 14,540 14,774 15,455 16,091 Livestock AC 3,309 3,545 3,805 4,106 4,426 Agriculture Support Services AD 16 16 18 19 19 Forestry AF 4,003 4,137 4,287 4,426 4,557 Fishing AG 2,182 1,632 2,272 2,279 2,079 Industry
28,248 29,616 32,293 33,342 34,459
Mining & quarrying B 1,337 1,284 1,508 1,757 1,863 Manufacturing C 16,845 17,624 18,982 19,220 19,644 Electricity D 1,379 1,454 1,490 1,652 1,839 Water E 2,578 2,682 2,808 2,924 3,063 Construction F 6,109 6,573 7,506 7,789 8,050 Services
47,182 51,200 54,189 55,546 57,070
Trade and Repairs G 9,832 10,567 11,089 10,945 10,869 Transportation and Storage H 3,621 4,028 4,062 3,993 3,979 Accommodation and Food Service Activities I 3,212 3,554 3,571 3,265 3,247 Information and Communication J 2,130 2,352 2,191 2,621 2,930 Financial and Insurance Activities K 2,871 2,938 3,263 3,576 3,863 Real Estate Activities L 6,515 7,271 8,009 8,420 8,747 Professional, Scientific and Technical Activities M 2,330 2,505 2,667 2,742 2,801 Administrative and Support Service Activities N 1,901 1,999 2,344 2,519 2,577 Public Administration O 2,678 2,933 3,057 3,553 3,999 Education P 4,777 5,107 5,573 5,459 5,230 Human Health and Social Work Activities Q 3,310 3,867 4,073 4,114 4,404 Arts, Entertainment and Recreation R 131 217 265 244 210 Other Service Activities S 2,984 2,944 3,083 3,127 3,219 Activities of Households as Employers T 891 916 942 968 994 Taxes on products
7,631 7,968 8,317 8,185 8,696
Source: Uganda Bureau of Statistics
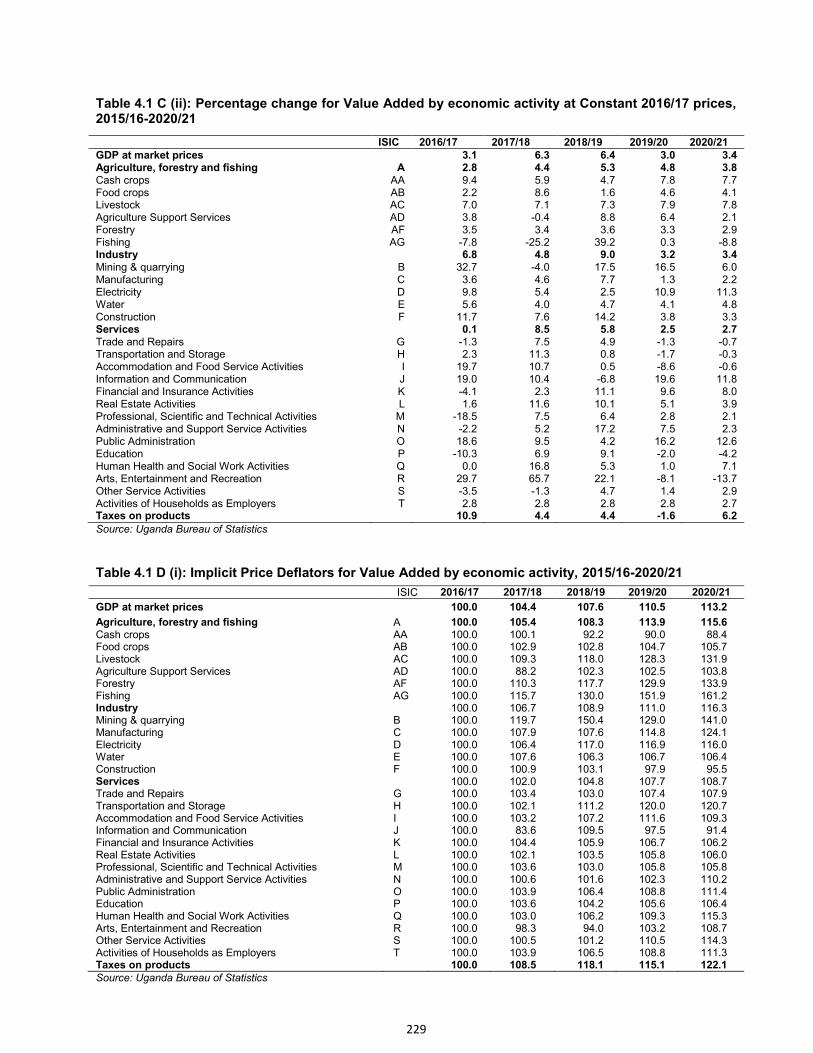
229
Table 4.1 C (ii): Percentage change for Value Added by economic activity at Constant 2016/17 prices, 2015/16-2020/21
Source: Uganda Bureau of Statistics
Table 4.1 D (i): Implicit Price Deflators for Value Added by economic activity, 2015/16-2020/21
ISIC 2016/17 2017/18 2018/19 2019/20 2020/21
GDP at market prices
100.0 104.4 107.6 110.5 113.2
Agriculture, forestry and fishing A 100.0 105.4 108.3 113.9 115.6 Cash crops AA 100.0 100.1 92.2 90.0 88.4 Food crops AB 100.0 102.9 102.8 104.7 105.7 Livestock AC 100.0 109.3 118.0 128.3 131.9 Agriculture Support Services AD 100.0 88.2 102.3 102.5 103.8 Forestry AF 100.0 110.3 117.7 129.9 133.9 Fishing AG 100.0 115.7 130.0 151.9 161.2 Industry
100.0 106.7 108.9 111.0 116.3
Mining & quarrying B 100.0 119.7 150.4 129.0 141.0 Manufacturing C 100.0 107.9 107.6 114.8 124.1 Electricity D 100.0 106.4 117.0 116.9 116.0 Water E 100.0 107.6 106.3 106.7 106.4 Construction F 100.0 100.9 103.1 97.9 95.5 Services
100.0 102.0 104.8 107.7 108.7
Trade and Repairs G 100.0 103.4 103.0 107.4 107.9 Transportation and Storage H 100.0 102.1 111.2 120.0 120.7 Accommodation and Food Service Activities I 100.0 103.2 107.2 111.6 109.3 Information and Communication J 100.0 83.6 109.5 97.5 91.4 Financial and Insurance Activities K 100.0 104.4 105.9 106.7 106.2 Real Estate Activities L 100.0 102.1 103.5 105.8 106.0 Professional, Scientific and Technical Activities M 100.0 103.6 103.0 105.8 105.8 Administrative and Support Service Activities N 100.0 100.6 101.6 102.3 110.2 Public Administration O 100.0 103.9 106.4 108.8 111.4 Education P 100.0 103.6 104.2 105.6 106.4 Human Health and Social Work Activities Q 100.0 103.0 106.2 109.3 115.3 Arts, Entertainment and Recreation R 100.0 98.3 94.0 103.2 108.7 Other Service Activities S 100.0 100.5 101.2 110.5 114.3 Activities of Households as Employers T 100.0 103.9 106.5 108.8 111.3 Taxes on products
100.0 108.5 118.1 115.1 122.1
Source: Uganda Bureau of Statistics
ISIC 2016/17 2017/18 2018/19 2019/20 2020/21 GDP at market prices 3.1 6.3 6.4 3.0 3.4 Agriculture, forestry and fishing A 2.8 4.4 5.3 4.8 3.8 Cash crops AA 9.4 5.9 4.7 7.8 7.7 Food crops AB 2.2 8.6 1.6 4.6 4.1 Livestock AC 7.0 7.1 7.3 7.9 7.8 Agriculture Support Services AD 3.8 -0.4 8.8 6.4 2.1 Forestry AF 3.5 3.4 3.6 3.3 2.9 Fishing AG -7.8 -25.2 39.2 0.3 -8.8 Industry 6.8 4.8 9.0 3.2 3.4 Mining & quarrying B 32.7 -4.0 17.5 16.5 6.0 Manufacturing C 3.6 4.6 7.7 1.3 2.2 Electricity D 9.8 5.4 2.5 10.9 11.3 Water E 5.6 4.0 4.7 4.1 4.8 Construction F 11.7 7.6 14.2 3.8 3.3 Services 0.1 8.5 5.8 2.5 2.7 Trade and Repairs G -1.3 7.5 4.9 -1.3 -0.7 Transportation and Storage H 2.3 11.3 0.8 -1.7 -0.3 Accommodation and Food Service Activities I 19.7 10.7 0.5 -8.6 -0.6 Information and Communication J 19.0 10.4 -6.8 19.6 11.8 Financial and Insurance Activities K -4.1 2.3 11.1 9.6 8.0 Real Estate Activities L 1.6 11.6 10.1 5.1 3.9 Professional, Scientific and Technical Activities M -18.5 7.5 6.4 2.8 2.1 Administrative and Support Service Activities N -2.2 5.2 17.2 7.5 2.3 Public Administration O 18.6 9.5 4.2 16.2 12.6 Education P -10.3 6.9 9.1 -2.0 -4.2 Human Health and Social Work Activities Q 0.0 16.8 5.3 1.0 7.1 Arts, Entertainment and Recreation R 29.7 65.7 22.1 -8.1 -13.7 Other Service Activities S -3.5 -1.3 4.7 1.4 2.9 Activities of Households as Employers T 2.8 2.8 2.8 2.8 2.7 Taxes on products 10.9 4.4 4.4 -1.6 6.2
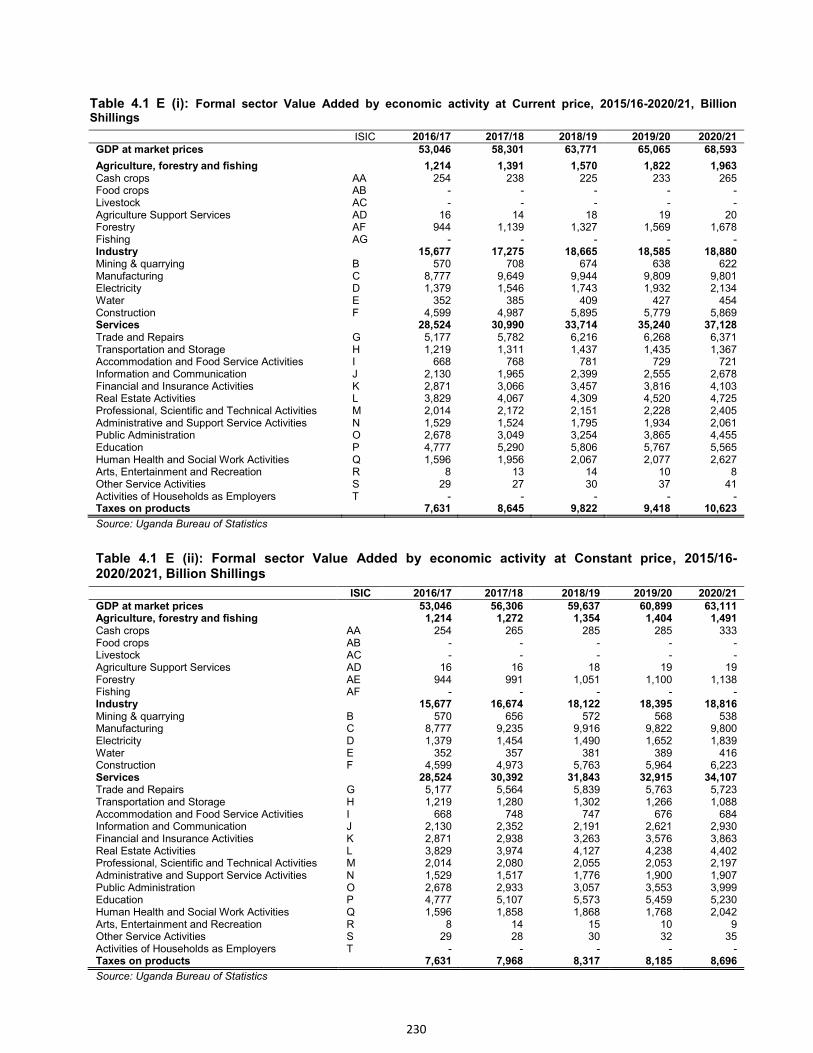
230
Table 4.1 E (i): Formal sector Value Added by economic activity at Current price, 2015/16-2020/21, Billion Shillings
ISIC 2016/17 2017/18 2018/19 2019/20 2020/21 GDP at market prices
53,046 58,301 63,771 65,065 68,593
Agriculture, forestry and fishing
1,214 1,391 1,570 1,822 1,963 Cash crops AA 254 238 225 233 265 Food crops AB - - - - - Livestock AC - - - - - Agriculture Support Services AD 16 14 18 19 20 Forestry AF 944 1,139 1,327 1,569 1,678 Fishing AG - - - - - Industry
15,677 17,275 18,665 18,585 18,880
Mining & quarrying B 570 708 674 638 622 Manufacturing C 8,777 9,649 9,944 9,809 9,801 Electricity D 1,379 1,546 1,743 1,932 2,134 Water E 352 385 409 427 454 Construction F 4,599 4,987 5,895 5,779 5,869 Services
28,524 30,990 33,714 35,240 37,128
Trade and Repairs G 5,177 5,782 6,216 6,268 6,371 Transportation and Storage H 1,219 1,311 1,437 1,435 1,367 Accommodation and Food Service Activities I 668 768 781 729 721 Information and Communication J 2,130 1,965 2,399 2,555 2,678 Financial and Insurance Activities K 2,871 3,066 3,457 3,816 4,103 Real Estate Activities L 3,829 4,067 4,309 4,520 4,725 Professional, Scientific and Technical Activities M 2,014 2,172 2,151 2,228 2,405 Administrative and Support Service Activities N 1,529 1,524 1,795 1,934 2,061 Public Administration O 2,678 3,049 3,254 3,865 4,455 Education P 4,777 5,290 5,806 5,767 5,565 Human Health and Social Work Activities Q 1,596 1,956 2,067 2,077 2,627 Arts, Entertainment and Recreation R 8 13 14 10 8 Other Service Activities S 29 27 30 37 41 Activities of Households as Employers T - - - - - Taxes on products 7,631 8,645 9,822 9,418 10,623
Source: Uganda Bureau of Statistics
Table 4.1 E (ii): Formal sector Value Added by economic activity at Constant price, 2015/16-2020/2021, Billion Shillings
ISIC 2016/17 2017/18 2018/19 2019/20 2020/21 GDP at market prices
53,046 56,306 59,637 60,899 63,111
Agriculture, forestry and fishing
1,214 1,272 1,354 1,404 1,491 Cash crops AA 254 265 285 285 333 Food crops AB - - - - - Livestock AC - - - - - Agriculture Support Services AD 16 16 18 19 19 Forestry AE 944 991 1,051 1,100 1,138 Fishing AF - - - - - Industry
15,677 16,674 18,122 18,395 18,816
Mining & quarrying B 570 656 572 568 538 Manufacturing C 8,777 9,235 9,916 9,822 9,800 Electricity D 1,379 1,454 1,490 1,652 1,839 Water E 352 357 381 389 416 Construction F 4,599 4,973 5,763 5,964 6,223 Services
28,524 30,392 31,843 32,915 34,107
Trade and Repairs G 5,177 5,564 5,839 5,763 5,723 Transportation and Storage H 1,219 1,280 1,302 1,266 1,088 Accommodation and Food Service Activities I 668 748 747 676 684 Information and Communication J 2,130 2,352 2,191 2,621 2,930 Financial and Insurance Activities K 2,871 2,938 3,263 3,576 3,863 Real Estate Activities L 3,829 3,974 4,127 4,238 4,402 Professional, Scientific and Technical Activities M 2,014 2,080 2,055 2,053 2,197 Administrative and Support Service Activities N 1,529 1,517 1,776 1,900 1,907 Public Administration O 2,678 2,933 3,057 3,553 3,999 Education P 4,777 5,107 5,573 5,459 5,230 Human Health and Social Work Activities Q 1,596 1,858 1,868 1,768 2,042 Arts, Entertainment and Recreation R 8 14 15 10 9 Other Service Activities S 29 28 30 32 35 Activities of Households as Employers T - - - - - Taxes on products 7,631 7,968 8,317 8,185 8,696
Source: Uganda Bureau of Statistics
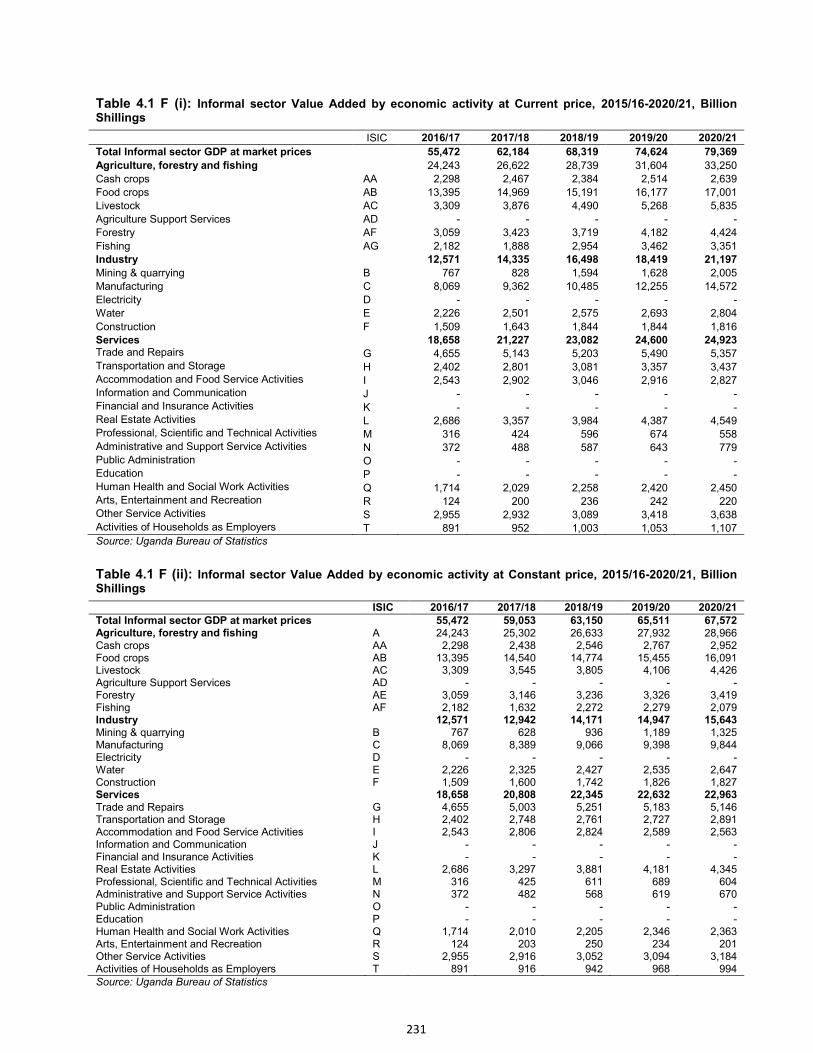
231
Table 4.1 F (i): Informal sector Value Added by economic activity at Current price, 2015/16-2020/21, Billion Shillings
ISIC 2016/17 2017/18 2018/19 2019/20 2020/21
Total Informal sector GDP at market prices 55,472 62,184 68,319 74,624 79,369
Agriculture, forestry and fishing
24,243 26,622 28,739 31,604 33,250
Cash crops AA 2,298 2,467 2,384 2,514 2,639
Food crops AB 13,395 14,969 15,191 16,177 17,001
Livestock AC 3,309 3,876 4,490 5,268 5,835
Agriculture Support Services AD - - - - -
Forestry AF 3,059 3,423 3,719 4,182 4,424
Fishing AG 2,182 1,888 2,954 3,462 3,351
Industry
12,571 14,335 16,498 18,419 21,197
Mining & quarrying B 767 828 1,594 1,628 2,005
Manufacturing C 8,069 9,362 10,485 12,255 14,572
Electricity D - - - - -
Water E 2,226 2,501 2,575 2,693 2,804
Construction F 1,509 1,643 1,844 1,844 1,816
Services
18,658 21,227 23,082 24,600 24,923 Trade and Repairs G 4,655 5,143 5,203 5,490 5,357 Transportation and Storage H 2,402 2,801 3,081 3,357 3,437 Accommodation and Food Service Activities I 2,543 2,902 3,046 2,916 2,827 Information and Communication J - - - - - Financial and Insurance Activities K - - - - - Real Estate Activities L 2,686 3,357 3,984 4,387 4,549 Professional, Scientific and Technical Activities M 316 424 596 674 558 Administrative and Support Service Activities N 372 488 587 643 779 Public Administration O - - - - - Education P - - - - - Human Health and Social Work Activities Q 1,714 2,029 2,258 2,420 2,450 Arts, Entertainment and Recreation R 124 200 236 242 220 Other Service Activities S 2,955 2,932 3,089 3,418 3,638 Activities of Households as Employers T 891 952 1,003 1,053 1,107 Source: Uganda Bureau of Statistics
Table 4.1 F (ii): Informal sector Value Added by economic activity at Constant price, 2015/16-2020/21, Billion Shillings
ISIC 2016/17 2017/18 2018/19 2019/20 2020/21 Total Informal sector GDP at market prices 55,472 59,053 63,150 65,511 67,572 Agriculture, forestry and fishing A 24,243 25,302 26,633 27,932 28,966 Cash crops AA 2,298 2,438 2,546 2,767 2,952 Food crops AB 13,395 14,540 14,774 15,455 16,091 Livestock AC 3,309 3,545 3,805 4,106 4,426 Agriculture Support Services AD - - - - - Forestry AE 3,059 3,146 3,236 3,326 3,419 Fishing AF 2,182 1,632 2,272 2,279 2,079 Industry 12,571 12,942 14,171 14,947 15,643 Mining & quarrying B 767 628 936 1,189 1,325 Manufacturing C 8,069 8,389 9,066 9,398 9,844 Electricity D - - - - - Water E 2,226 2,325 2,427 2,535 2,647 Construction F 1,509 1,600 1,742 1,826 1,827 Services 18,658 20,808 22,345 22,632 22,963 Trade and Repairs G 4,655 5,003 5,251 5,183 5,146 Transportation and Storage H 2,402 2,748 2,761 2,727 2,891 Accommodation and Food Service Activities I 2,543 2,806 2,824 2,589 2,563 Information and Communication J - - - - - Financial and Insurance Activities K - - - - - Real Estate Activities L 2,686 3,297 3,881 4,181 4,345 Professional, Scientific and Technical Activities M 316 425 611 689 604 Administrative and Support Service Activities N 372 482 568 619 670 Public Administration O - - - - - Education P - - - - - Human Health and Social Work Activities Q 1,714 2,010 2,205 2,346 2,363 Arts, Entertainment and Recreation R 124 203 250 234 201 Other Service Activities S 2,955 2,916 3,052 3,094 3,184 Activities of Households as Employers T 891 916 942 968 994 Source: Uganda Bureau of Statistics
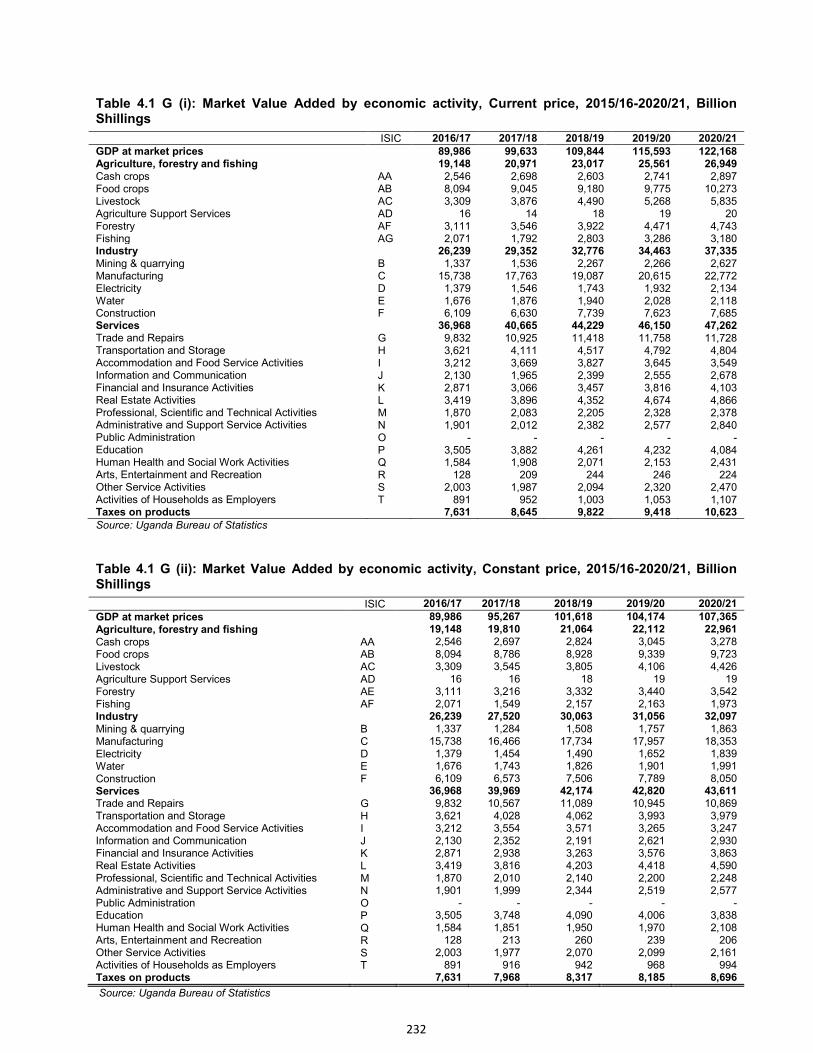
232
Table 4.1 G (i): Market Value Added by economic activity, Current price, 2015/16-2020/21, Billion Shillings
ISIC 2016/17 2017/18 2018/19 2019/20 2020/21 GDP at market prices
89,986 99,633 109,844 115,593 122,168
Agriculture, forestry and fishing
19,148 20,971 23,017 25,561 26,949 Cash crops AA 2,546 2,698 2,603 2,741 2,897 Food crops AB 8,094 9,045 9,180 9,775 10,273 Livestock AC 3,309 3,876 4,490 5,268 5,835 Agriculture Support Services AD 16 14 18 19 20 Forestry AF 3,111 3,546 3,922 4,471 4,743 Fishing AG 2,071 1,792 2,803 3,286 3,180 Industry
26,239 29,352 32,776 34,463 37,335
Mining & quarrying B 1,337 1,536 2,267 2,266 2,627 Manufacturing C 15,738 17,763 19,087 20,615 22,772 Electricity D 1,379 1,546 1,743 1,932 2,134 Water E 1,676 1,876 1,940 2,028 2,118 Construction F 6,109 6,630 7,739 7,623 7,685 Services
36,968 40,665 44,229 46,150 47,262
Trade and Repairs G 9,832 10,925 11,418 11,758 11,728 Transportation and Storage H 3,621 4,111 4,517 4,792 4,804 Accommodation and Food Service Activities I 3,212 3,669 3,827 3,645 3,549 Information and Communication J 2,130 1,965 2,399 2,555 2,678 Financial and Insurance Activities K 2,871 3,066 3,457 3,816 4,103 Real Estate Activities L 3,419 3,896 4,352 4,674 4,866 Professional, Scientific and Technical Activities M 1,870 2,083 2,205 2,328 2,378 Administrative and Support Service Activities N 1,901 2,012 2,382 2,577 2,840 Public Administration O - - - - - Education P 3,505 3,882 4,261 4,232 4,084 Human Health and Social Work Activities Q 1,584 1,908 2,071 2,153 2,431 Arts, Entertainment and Recreation R 128 209 244 246 224 Other Service Activities S 2,003 1,987 2,094 2,320 2,470 Activities of Households as Employers T 891 952 1,003 1,053 1,107 Taxes on products 7,631 8,645 9,822 9,418 10,623 Source: Uganda Bureau of Statistics
Table 4.1 G (ii): Market Value Added by economic activity, Constant price, 2015/16-2020/21, Billion Shillings
ISIC 2016/17 2017/18 2018/19 2019/20 2020/21
GDP at market prices
89,986 95,267 101,618 104,174 107,365 Agriculture, forestry and fishing
19,148 19,810 21,064 22,112 22,961
Cash crops AA 2,546 2,697 2,824 3,045 3,278 Food crops AB 8,094 8,786 8,928 9,339 9,723 Livestock AC 3,309 3,545 3,805 4,106 4,426 Agriculture Support Services AD 16 16 18 19 19 Forestry AE 3,111 3,216 3,332 3,440 3,542 Fishing AF 2,071 1,549 2,157 2,163 1,973 Industry
26,239 27,520 30,063 31,056 32,097
Mining & quarrying B 1,337 1,284 1,508 1,757 1,863 Manufacturing C 15,738 16,466 17,734 17,957 18,353 Electricity D 1,379 1,454 1,490 1,652 1,839 Water E 1,676 1,743 1,826 1,901 1,991 Construction F 6,109 6,573 7,506 7,789 8,050 Services
36,968 39,969 42,174 42,820 43,611
Trade and Repairs G 9,832 10,567 11,089 10,945 10,869 Transportation and Storage H 3,621 4,028 4,062 3,993 3,979 Accommodation and Food Service Activities I 3,212 3,554 3,571 3,265 3,247 Information and Communication J 2,130 2,352 2,191 2,621 2,930 Financial and Insurance Activities K 2,871 2,938 3,263 3,576 3,863 Real Estate Activities L 3,419 3,816 4,203 4,418 4,590 Professional, Scientific and Technical Activities M 1,870 2,010 2,140 2,200 2,248 Administrative and Support Service Activities N 1,901 1,999 2,344 2,519 2,577 Public Administration O - - - - - Education P 3,505 3,748 4,090 4,006 3,838 Human Health and Social Work Activities Q 1,584 1,851 1,950 1,970 2,108 Arts, Entertainment and Recreation R 128 213 260 239 206 Other Service Activities S 2,003 1,977 2,070 2,099 2,161 Activities of Households as Employers T 891 916 942 968 994 Taxes on products 7,631 7,968 8,317 8,185 8,696
Source: Uganda Bureau of Statistics
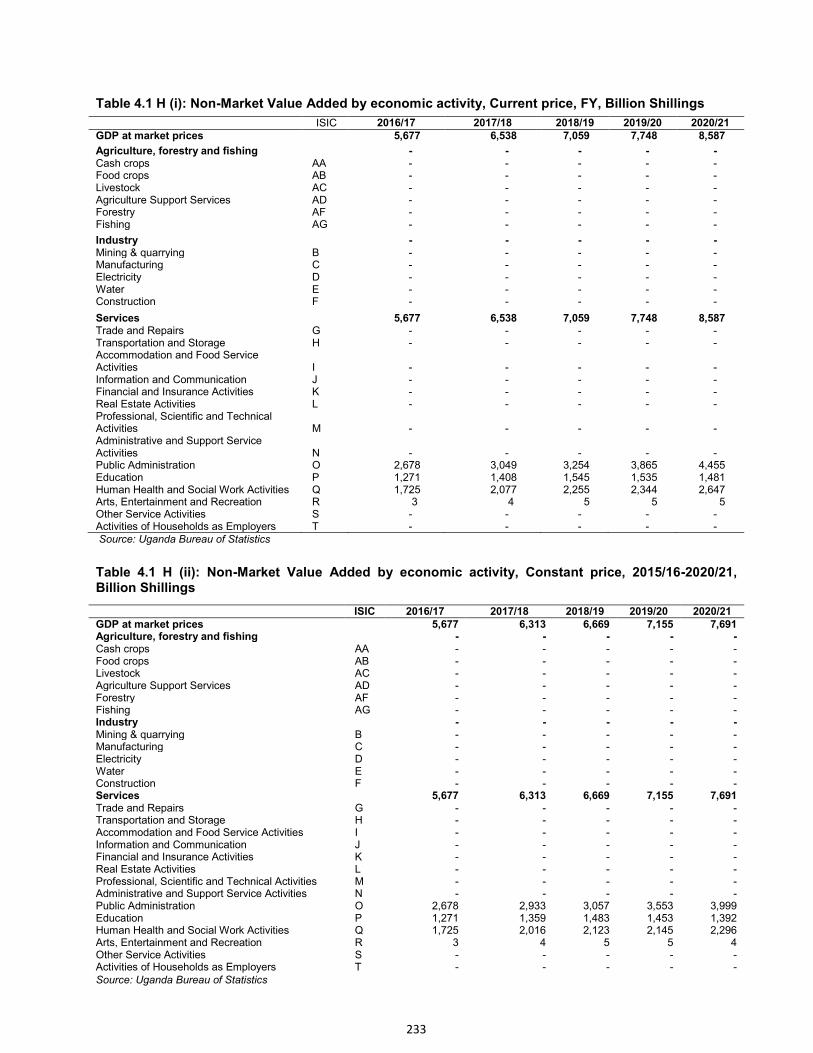
233
Table 4.1 H (i): Non-Market Value Added by economic activity, Current price, FY, Billion Shillings
ISIC 2016/17 2017/18 2018/19 2019/20 2020/21 GDP at market prices
5,677 6,538 7,059 7,748 8,587
Agriculture, forestry and fishing
- - - - - Cash crops AA - - - - - Food crops AB - - - - - Livestock AC - - - - - Agriculture Support Services AD - - - - - Forestry AF - - - - - Fishing AG - - - - -
Industry
- - - - - Mining & quarrying B - - - - - Manufacturing C - - - - - Electricity D - - - - - Water E - - - - - Construction F - - - - -
Services
5,677 6,538 7,059 7,748 8,587 Trade and Repairs G - - - - - Transportation and Storage H - - - - - Accommodation and Food Service Activities I - - - - - Information and Communication J - - - - - Financial and Insurance Activities K - - - - - Real Estate Activities L - - - - - Professional, Scientific and Technical Activities M - - - - - Administrative and Support Service Activities N - - - - - Public Administration O 2,678 3,049 3,254 3,865 4,455 Education P 1,271 1,408 1,545 1,535 1,481 Human Health and Social Work Activities Q 1,725 2,077 2,255 2,344 2,647 Arts, Entertainment and Recreation R 3 4 5 5 5 Other Service Activities S - - - - - Activities of Households as Employers T - - - - - Source: Uganda Bureau of Statistics
Table 4.1 H (ii): Non-Market Value Added by economic activity, Constant price, 2015/16-2020/21, Billion Shillings
Source: Uganda Bureau of Statistics
ISIC 2016/17 2017/18 2018/19 2019/20 2020/21 GDP at market prices
5,677 6,313 6,669 7,155 7,691
Agriculture, forestry and fishing
- - - - - Cash crops AA - - - - - Food crops AB - - - - - Livestock AC - - - - - Agriculture Support Services AD - - - - - Forestry AF - - - - - Fishing AG - - - - - Industry
- - - - -
Mining & quarrying B - - - - - Manufacturing C - - - - - Electricity D - - - - - Water E - - - - - Construction F - - - - - Services
5,677 6,313 6,669 7,155 7,691
Trade and Repairs G - - - - - Transportation and Storage H - - - - - Accommodation and Food Service Activities I - - - - - Information and Communication J - - - - - Financial and Insurance Activities K - - - - - Real Estate Activities L - - - - - Professional, Scientific and Technical Activities M - - - - - Administrative and Support Service Activities N - - - - - Public Administration O 2,678 2,933 3,057 3,553 3,999 Education P 1,271 1,359 1,483 1,453 1,392 Human Health and Social Work Activities Q 1,725 2,016 2,123 2,145 2,296 Arts, Entertainment and Recreation R 3 4 5 5 4 Other Service Activities S - - - - - Activities of Households as Employers T - - - - -
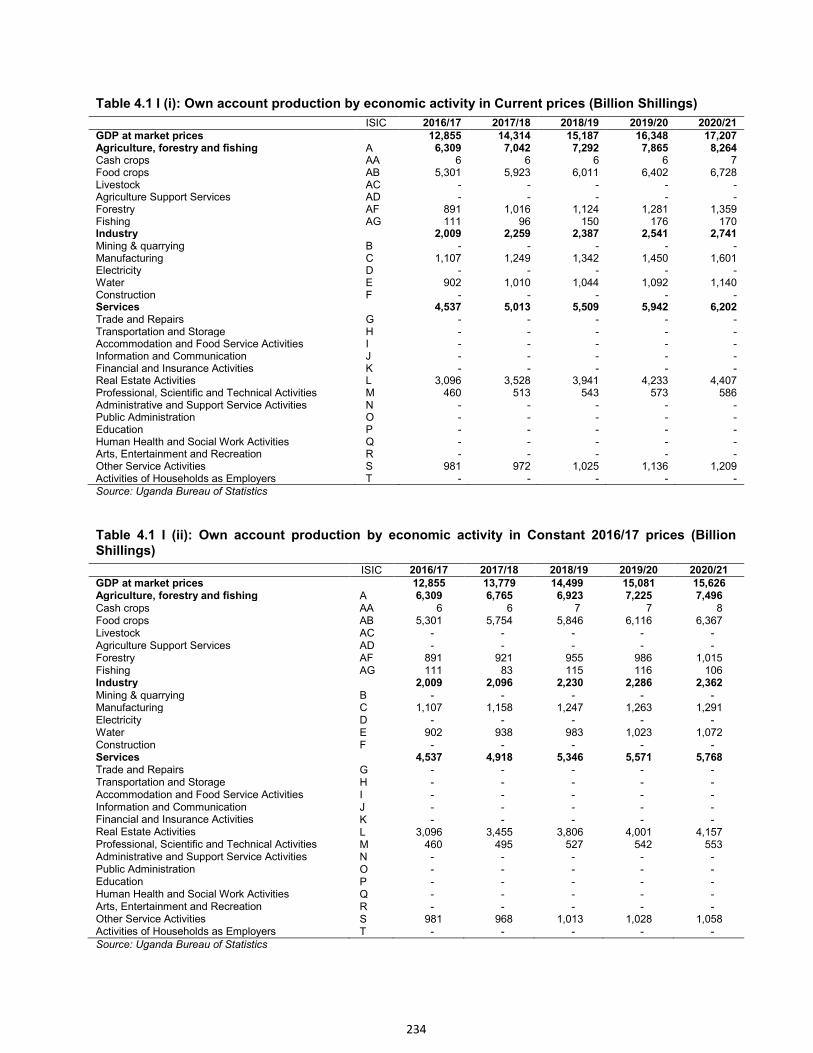
234
Table 4.1 I (i): Own account production by economic activity in Current prices (Billion Shillings)
ISIC 2016/17 2017/18 2018/19 2019/20 2020/21 GDP at market prices
12,855 14,314 15,187 16,348 17,207
Agriculture, forestry and fishing A 6,309 7,042 7,292 7,865 8,264 Cash crops AA 6 6 6 6 7 Food crops AB 5,301 5,923 6,011 6,402 6,728 Livestock AC - - - - - Agriculture Support Services AD - - - - - Forestry AF 891 1,016 1,124 1,281 1,359 Fishing AG 111 96 150 176 170 Industry
2,009 2,259 2,387 2,541 2,741
Mining & quarrying B - - - - - Manufacturing C 1,107 1,249 1,342 1,450 1,601 Electricity D - - - - - Water E 902 1,010 1,044 1,092 1,140 Construction F - - - - - Services
4,537 5,013 5,509 5,942 6,202
Trade and Repairs G - - - - - Transportation and Storage H - - - - - Accommodation and Food Service Activities I - - - - - Information and Communication J - - - - - Financial and Insurance Activities K - - - - - Real Estate Activities L 3,096 3,528 3,941 4,233 4,407 Professional, Scientific and Technical Activities M 460 513 543 573 586 Administrative and Support Service Activities N - - - - - Public Administration O - - - - - Education P - - - - - Human Health and Social Work Activities Q - - - - - Arts, Entertainment and Recreation R - - - - - Other Service Activities S 981 972 1,025 1,136 1,209 Activities of Households as Employers T - - - - - Source: Uganda Bureau of Statistics
Table 4.1 I (ii): Own account production by economic activity in Constant 2016/17 prices (Billion Shillings)
ISIC 2016/17 2017/18 2018/19 2019/20 2020/21 GDP at market prices
12,855 13,779 14,499 15,081 15,626
Agriculture, forestry and fishing A 6,309 6,765 6,923 7,225 7,496 Cash crops AA 6 6 7 7 8 Food crops AB 5,301 5,754 5,846 6,116 6,367 Livestock AC - - - - - Agriculture Support Services AD - - - - - Forestry AF 891 921 955 986 1,015 Fishing AG 111 83 115 116 106 Industry
2,009 2,096 2,230 2,286 2,362
Mining & quarrying B - - - - - Manufacturing C 1,107 1,158 1,247 1,263 1,291 Electricity D - - - - - Water E 902 938 983 1,023 1,072 Construction F - - - - - Services
4,537 4,918 5,346 5,571 5,768
Trade and Repairs G - - - - - Transportation and Storage H - - - - - Accommodation and Food Service Activities I - - - - - Information and Communication J - - - - - Financial and Insurance Activities K - - - - - Real Estate Activities L 3,096 3,455 3,806 4,001 4,157 Professional, Scientific and Technical Activities M 460 495 527 542 553 Administrative and Support Service Activities N - - - - - Public Administration O - - - - - Education P - - - - - Human Health and Social Work Activities Q - - - - - Arts, Entertainment and Recreation R - - - - - Other Service Activities S 981 968 1,013 1,028 1,058 Activities of Households as Employers T - - - - - Source: Uganda Bureau of Statistics
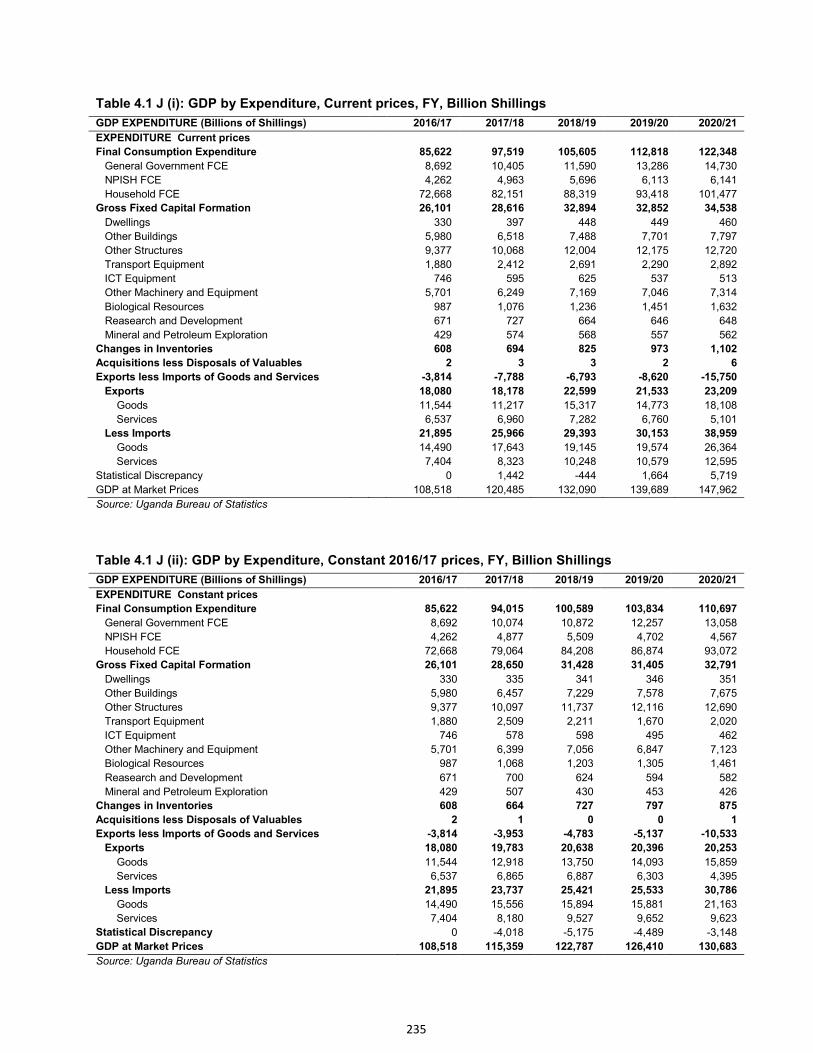
235
Table 4.1 J (i): GDP by Expenditure, Current prices, FY, Billion Shillings GDP EXPENDITURE (Billions of Shillings)
2016/17 2017/18 2018/19 2019/20 2020/21
EXPENDITURE Current prices
Final Consumption Expenditure 85,622 97,519 105,605 112,818 122,348
General Government FCE 8,692 10,405 11,590 13,286 14,730
NPISH FCE
4,262 4,963 5,696 6,113 6,141
Household FCE
72,668 82,151 88,319 93,418 101,477
Gross Fixed Capital Formation 26,101 28,616 32,894 32,852 34,538
Dwellings
330 397 448 449 460
Other Buildings
5,980 6,518 7,488 7,701 7,797
Other Structures
9,377 10,068 12,004 12,175 12,720
Transport Equipment
1,880 2,412 2,691 2,290 2,892
ICT Equipment
746 595 625 537 513
Other Machinery and Equipment 5,701 6,249 7,169 7,046 7,314
Biological Resources
987 1,076 1,236 1,451 1,632
Reasearch and Development 671 727 664 646 648
Mineral and Petroleum Exploration 429 574 568 557 562
Changes in Inventories
608 694 825 973 1,102
Acquisitions less Disposals of Valuables 2 3 3 2 6
Exports less Imports of Goods and Services -3,814 -7,788 -6,793 -8,620 -15,750
Exports
18,080 18,178 22,599 21,533 23,209
Goods
11,544 11,217 15,317 14,773 18,108
Services
6,537 6,960 7,282 6,760 5,101
Less Imports
21,895 25,966 29,393 30,153 38,959
Goods
14,490 17,643 19,145 19,574 26,364
Services
7,404 8,323 10,248 10,579 12,595
Statistical Discrepancy
0 1,442 -444 1,664 5,719
GDP at Market Prices
108,518 120,485 132,090 139,689 147,962
Source: Uganda Bureau of Statistics
Table 4.1 J (ii): GDP by Expenditure, Constant 2016/17 prices, FY, Billion Shillings
GDP EXPENDITURE (Billions of Shillings) 2016/17 2017/18 2018/19 2019/20 2020/21
EXPENDITURE Constant prices
Final Consumption Expenditure 85,622 94,015 100,589 103,834 110,697
General Government FCE 8,692 10,074 10,872 12,257 13,058
NPISH FCE 4,262 4,877 5,509 4,702 4,567
Household FCE 72,668 79,064 84,208 86,874 93,072
Gross Fixed Capital Formation 26,101 28,650 31,428 31,405 32,791
Dwellings 330 335 341 346 351
Other Buildings 5,980 6,457 7,229 7,578 7,675
Other Structures 9,377 10,097 11,737 12,116 12,690
Transport Equipment 1,880 2,509 2,211 1,670 2,020
ICT Equipment 746 578 598 495 462
Other Machinery and Equipment 5,701 6,399 7,056 6,847 7,123
Biological Resources 987 1,068 1,203 1,305 1,461
Reasearch and Development 671 700 624 594 582
Mineral and Petroleum Exploration 429 507 430 453 426
Changes in Inventories 608 664 727 797 875
Acquisitions less Disposals of Valuables 2 1 0 0 1
Exports less Imports of Goods and Services -3,814 -3,953 -4,783 -5,137 -10,533
Exports 18,080 19,783 20,638 20,396 20,253
Goods 11,544 12,918 13,750 14,093 15,859
Services 6,537 6,865 6,887 6,303 4,395
Less Imports 21,895 23,737 25,421 25,533 30,786
Goods 14,490 15,556 15,894 15,881 21,163
Services 7,404 8,180 9,527 9,652 9,623
Statistical Discrepancy 0 -4,018 -5,175 -4,489 -3,148
GDP at Market Prices 108,518 115,359 122,787 126,410 130,683
Source: Uganda Bureau of Statistics
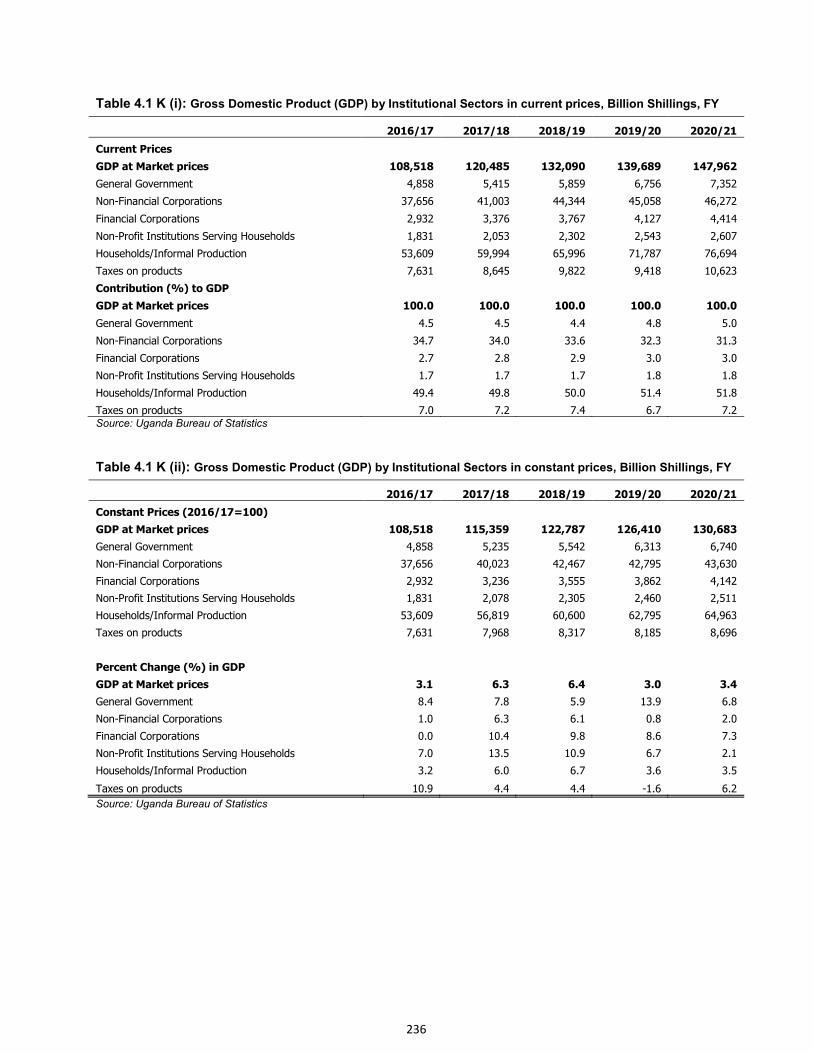
236
Table 4.1 K (i): Gross Domestic Product (GDP) by Institutional Sectors in current prices, Billion Shillings, FY
2016/17 2017/18 2018/19 2019/20 2020/21
Current Prices GDP at Market prices 108,518 120,485 132,090 139,689 147,962
General Government 4,858 5,415 5,859 6,756 7,352
Non-Financial Corporations 37,656 41,003 44,344 45,058 46,272
Financial Corporations 2,932 3,376 3,767 4,127 4,414
Non-Profit Institutions Serving Households 1,831 2,053 2,302 2,543 2,607
Households/Informal Production 53,609 59,994 65,996 71,787 76,694
Taxes on products 7,631 8,645 9,822 9,418 10,623
Contribution (%) to GDP
GDP at Market prices 100.0 100.0 100.0 100.0 100.0
General Government 4.5 4.5 4.4 4.8 5.0
Non-Financial Corporations 34.7 34.0 33.6 32.3 31.3
Financial Corporations 2.7 2.8 2.9 3.0 3.0
Non-Profit Institutions Serving Households 1.7 1.7 1.7 1.8 1.8
Households/Informal Production 49.4 49.8 50.0 51.4 51.8
Taxes on products 7.0 7.2 7.4 6.7 7.2 Source: Uganda Bureau of Statistics
Table 4.1 K (ii): Gross Domestic Product (GDP) by Institutional Sectors in constant prices, Billion Shillings, FY
2016/17 2017/18 2018/19 2019/20 2020/21
Constant Prices (2016/17=100) GDP at Market prices 108,518 115,359 122,787 126,410 130,683
General Government 4,858 5,235 5,542 6,313 6,740
Non-Financial Corporations 37,656 40,023 42,467 42,795 43,630
Financial Corporations 2,932 3,236 3,555 3,862 4,142
Non-Profit Institutions Serving Households 1,831 2,078 2,305 2,460 2,511
Households/Informal Production 53,609 56,819 60,600 62,795 64,963
Taxes on products 7,631 7,968 8,317 8,185 8,696
Percent Change (%) in GDP
GDP at Market prices 3.1 6.3 6.4 3.0 3.4
General Government 8.4 7.8 5.9 13.9 6.8
Non-Financial Corporations 1.0 6.3 6.1 0.8 2.0
Financial Corporations 0.0 10.4 9.8 8.6 7.3
Non-Profit Institutions Serving Households 7.0 13.5 10.9 6.7 2.1
Households/Informal Production 3.2 6.0 6.7 3.6 3.5
Taxes on products 10.9 4.4 4.4 -1.6 6.2
Source: Uganda Bureau of Statistics
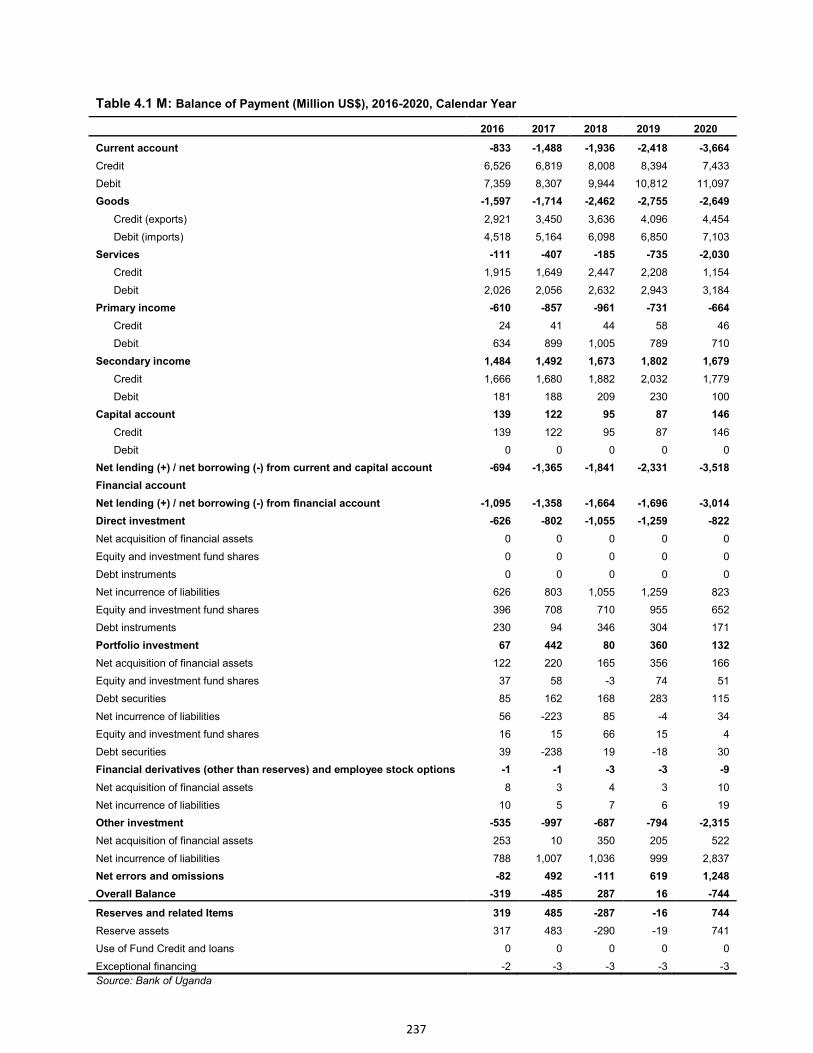
237
Table 4.1 M: Balance of Payment (Million US$), 2016-2020, Calendar Year
2016 2017 2018 2019 2020
Current account -833 -1,488 -1,936 -2,418 -3,664
Credit 6,526 6,819 8,008 8,394 7,433
Debit 7,359 8,307 9,944 10,812 11,097
Goods -1,597 -1,714 -2,462 -2,755 -2,649
Credit (exports) 2,921 3,450 3,636 4,096 4,454
Debit (imports) 4,518 5,164 6,098 6,850 7,103
Services -111 -407 -185 -735 -2,030
Credit 1,915 1,649 2,447 2,208 1,154
Debit 2,026 2,056 2,632 2,943 3,184
Primary income -610 -857 -961 -731 -664
Credit 24 41 44 58 46
Debit 634 899 1,005 789 710
Secondary income 1,484 1,492 1,673 1,802 1,679
Credit 1,666 1,680 1,882 2,032 1,779
Debit 181 188 209 230 100
Capital account 139 122 95 87 146
Credit 139 122 95 87 146
Debit 0 0 0 0 0
Net lending (+) / net borrowing (-) from current and capital account -694 -1,365 -1,841 -2,331 -3,518
Financial account
Net lending (+) / net borrowing (-) from financial account -1,095 -1,358 -1,664 -1,696 -3,014
Direct investment -626 -802 -1,055 -1,259 -822
Net acquisition of financial assets 0 0 0 0 0
Equity and investment fund shares 0 0 0 0 0
Debt instruments 0 0 0 0 0
Net incurrence of liabilities 626 803 1,055 1,259 823
Equity and investment fund shares 396 708 710 955 652
Debt instruments 230 94 346 304 171
Portfolio investment 67 442 80 360 132
Net acquisition of financial assets 122 220 165 356 166
Equity and investment fund shares 37 58 -3 74 51
Debt securities 85 162 168 283 115
Net incurrence of liabilities 56 -223 85 -4 34
Equity and investment fund shares 16 15 66 15 4
Debt securities 39 -238 19 -18 30
Financial derivatives (other than reserves) and employee stock options -1 -1 -3 -3 -9
Net acquisition of financial assets 8 3 4 3 10
Net incurrence of liabilities 10 5 7 6 19
Other investment -535 -997 -687 -794 -2,315
Net acquisition of financial assets 253 10 350 205 522
Net incurrence of liabilities 788 1,007 1,036 999 2,837
Net errors and omissions -82 492 -111 619 1,248
Overall Balance -319 -485 287 16 -744
Reserves and related Items 319 485 -287 -16 744
Reserve assets 317 483 -290 -19 741
Use of Fund Credit and loans 0 0 0 0 0
Exceptional financing -2 -3 -3 -3 -3
Source: Bank of Uganda
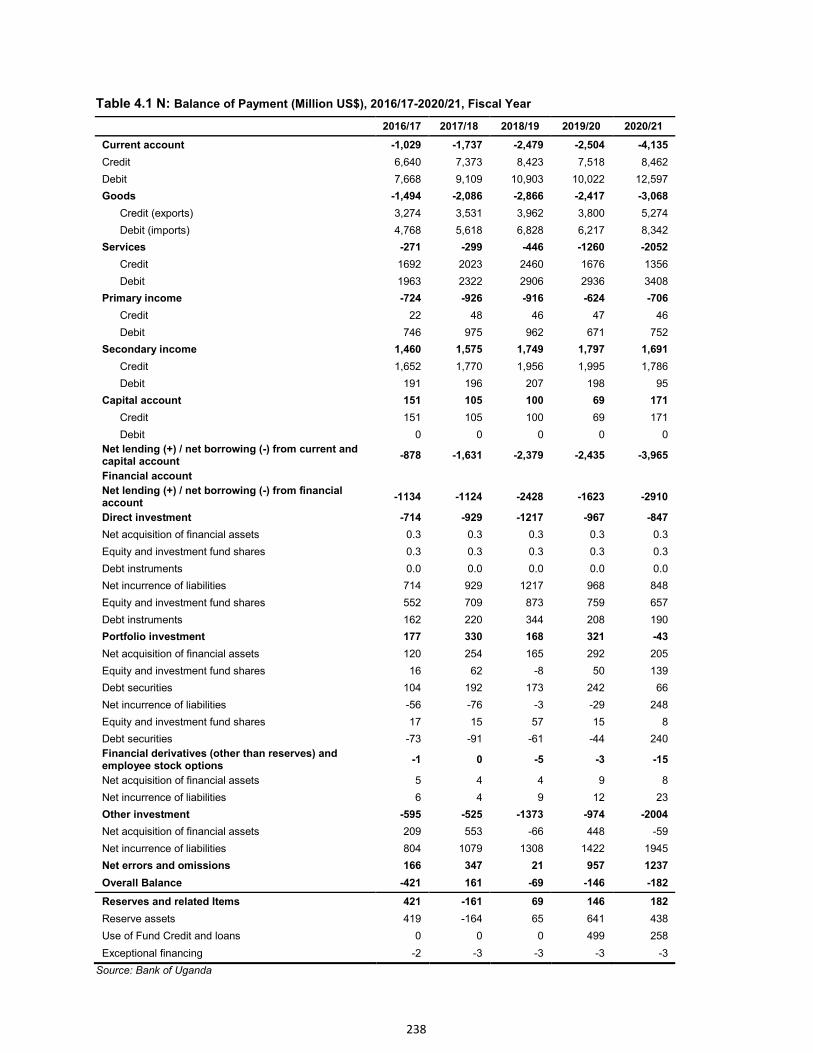
238
Table 4.1 N: Balance of Payment (Million US$), 2016/17-2020/21, Fiscal Year
2016/17 2017/18 2018/19 2019/20 2020/21
Current account -1,029 -1,737 -2,479 -2,504 -4,135
Credit 6,640 7,373 8,423 7,518 8,462
Debit 7,668 9,109 10,903 10,022 12,597
Goods -1,494 -2,086 -2,866 -2,417 -3,068
Credit (exports) 3,274 3,531 3,962 3,800 5,274
Debit (imports) 4,768 5,618 6,828 6,217 8,342
Services -271 -299 -446 -1260 -2052
Credit 1692 2023 2460 1676 1356
Debit 1963 2322 2906 2936 3408
Primary income -724 -926 -916 -624 -706
Credit 22 48 46 47 46
Debit 746 975 962 671 752
Secondary income 1,460 1,575 1,749 1,797 1,691
Credit 1,652 1,770 1,956 1,995 1,786
Debit 191 196 207 198 95
Capital account 151 105 100 69 171
Credit 151 105 100 69 171
Debit 0 0 0 0 0
Net lending (+) / net borrowing (-) from current and capital account
-878 -1,631 -2,379 -2,435 -3,965
Financial account
Net lending (+) / net borrowing (-) from financial account
-1134 -1124 -2428 -1623 -2910
Direct investment -714 -929 -1217 -967 -847
Net acquisition of financial assets 0.3 0.3 0.3 0.3 0.3
Equity and investment fund shares 0.3 0.3 0.3 0.3 0.3
Debt instruments 0.0 0.0 0.0 0.0 0.0
Net incurrence of liabilities 714 929 1217 968 848
Equity and investment fund shares 552 709 873 759 657
Debt instruments 162 220 344 208 190
Portfolio investment 177 330 168 321 -43
Net acquisition of financial assets 120 254 165 292 205
Equity and investment fund shares 16 62 -8 50 139
Debt securities 104 192 173 242 66
Net incurrence of liabilities -56 -76 -3 -29 248
Equity and investment fund shares 17 15 57 15 8
Debt securities -73 -91 -61 -44 240
Financial derivatives (other than reserves) and employee stock options
-1 0 -5 -3 -15
Net acquisition of financial assets 5 4 4 9 8
Net incurrence of liabilities 6 4 9 12 23
Other investment -595 -525 -1373 -974 -2004
Net acquisition of financial assets 209 553 -66 448 -59
Net incurrence of liabilities 804 1079 1308 1422 1945
Net errors and omissions 166 347 21 957 1237
Overall Balance -421 161 -69 -146 -182
Reserves and related Items 421 -161 69 146 182
Reserve assets 419 -164 65 641 438
Use of Fund Credit and loans 0 0 0 499 258
Exceptional financing -2 -3 -3 -3 -3
Source: Bank of Uganda
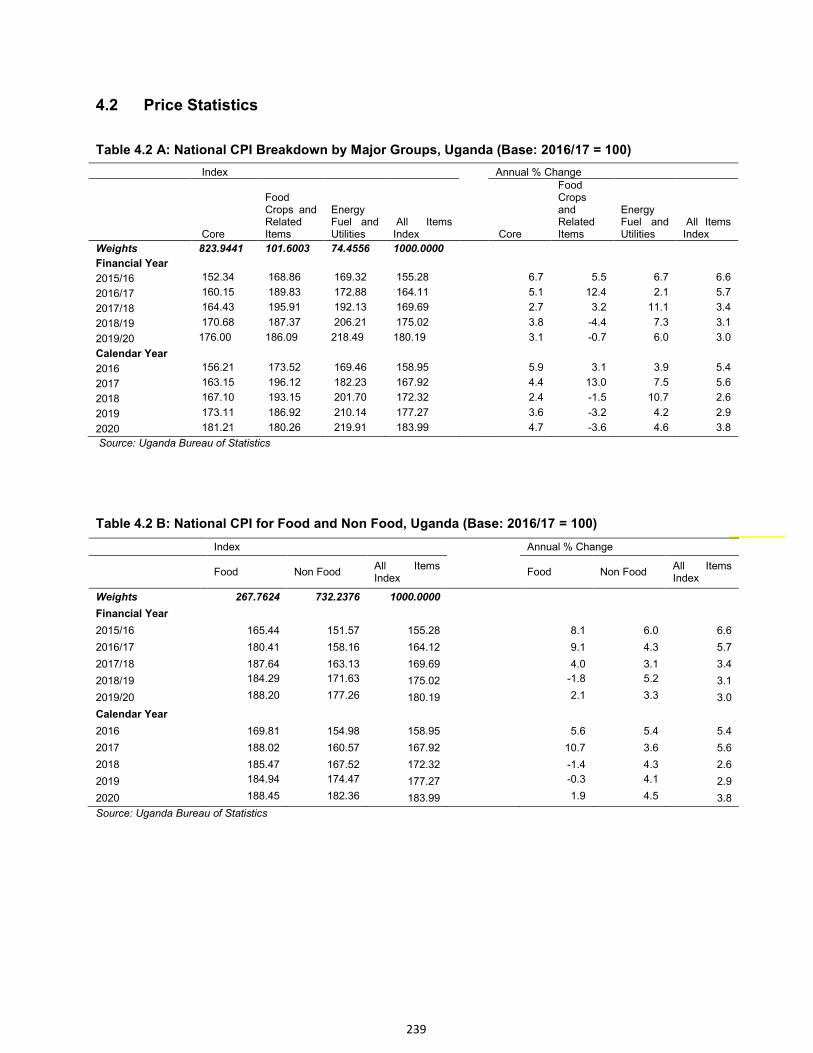
239
4.2 Price Statistics
Table 4.2 A: National CPI Breakdown by Major Groups, Uganda (Base: 2016/17 = 100)
Index
Annual % Change
Core
Food Crops and Related Items
Energy Fuel and Utilities
All Items Index Core
Food Crops and Related Items
Energy Fuel and Utilities
All Items Index
Weights 823.9441 101.6003 74.4556 1000.0000
Financial Year
2015/16 152.34 168.86 169.32 155.28
6.7 5.5 6.7 6.6
2016/17 160.15 189.83 172.88 164.11
5.1 12.4 2.1 5.7
2017/18 164.43 195.91 192.13 169.69
2.7 3.2 11.1 3.4
2018/19 170.68 187.37 206.21 175.02 3.8 -4.4 7.3 3.1
2019/20 176.00 186.09 218.49 180.19 3.1 -0.7 6.0 3.0
Calendar Year
2016 156.21 173.52 169.46 158.95
5.9 3.1 3.9 5.4
2017 163.15 196.12 182.23 167.92
4.4 13.0 7.5 5.6
2018 167.10 193.15 201.70 172.32
2.4 -1.5 10.7 2.6
2019 173.11 186.92 210.14 177.27 3.6 -3.2 4.2 2.9
2020 181.21 180.26 219.91 183.99 4.7 -3.6 4.6 3.8
Source: Uganda Bureau of Statistics
Table 4.2 B: National CPI for Food and Non Food, Uganda (Base: 2016/17 = 100)
Index
Annual % Change
Food Non Food
All Items Index
Food Non Food All Items Index
Weights 267.7624 732.2376 1000.0000
Financial Year
2015/16 165.44 151.57 155.28
8.1 6.0 6.6
2016/17 180.41 158.16 164.12
9.1 4.3 5.7
2017/18 187.64 163.13 169.69
4.0 3.1 3.4
2018/19 184.29 171.63 175.02 -1.8 5.2 3.1
2019/20 188.20 177.26 180.19 2.1 3.3 3.0
Calendar Year
2016 169.81 154.98 158.95
5.6 5.4 5.4
2017 188.02 160.57 167.92
10.7 3.6 5.6
2018 185.47 167.52 172.32
-1.4 4.3 2.6
2019 184.94 174.47 177.27 -0.3 4.1 2.9
2020 188.45 182.36 183.99 1.9 4.5 3.8
Source: Uganda Bureau of Statistics
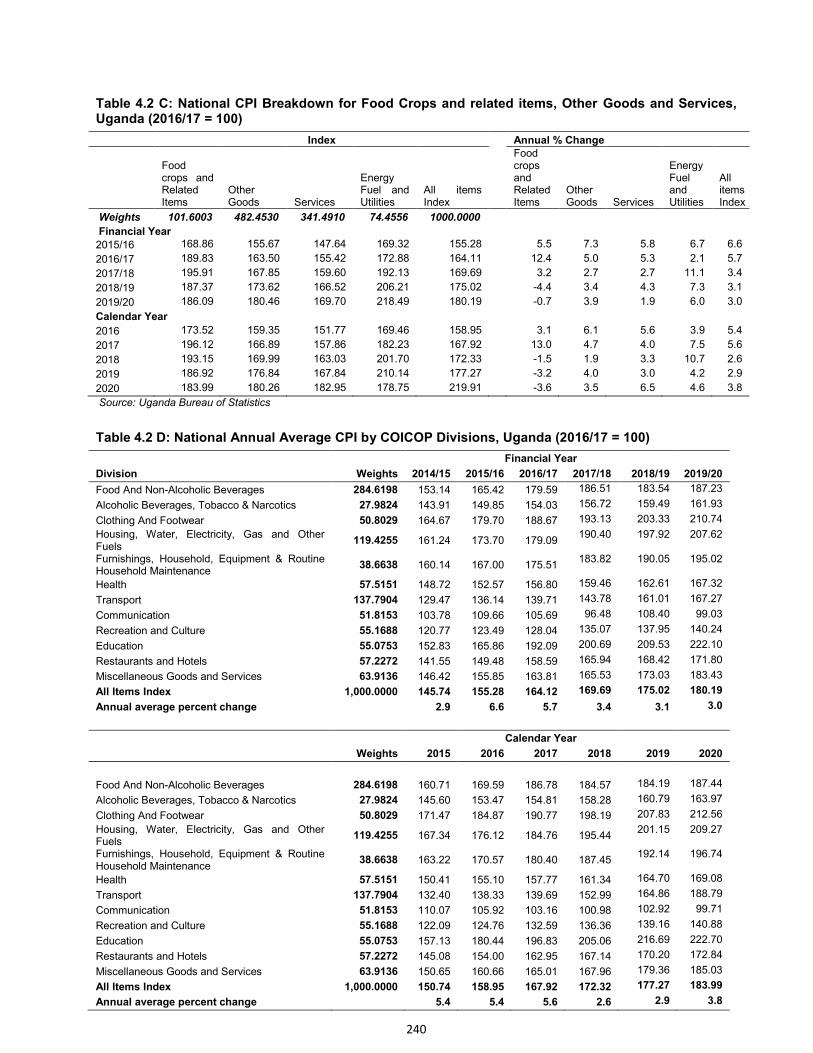
240
Table 4.2 C: National CPI Breakdown for Food Crops and related items, Other Goods and Services, Uganda (2016/17 = 100)
Index Annual % Change
Food crops and Related Items
Other Goods Services
Energy Fuel and Utilities
All items Index
Food crops and Related Items
Other Goods Services
Energy Fuel and Utilities
All items Index
Weights 101.6003 482.4530 341.4910 74.4556 1000.0000 Financial Year
2015/16 168.86 155.67 147.64 169.32 155.28 5.5 7.3 5.8 6.7 6.6
2016/17 189.83 163.50 155.42 172.88 164.11 12.4 5.0 5.3 2.1 5.7
2017/18 195.91 167.85 159.60 192.13 169.69 3.2 2.7 2.7 11.1 3.4
2018/19 187.37 173.62 166.52 206.21 175.02 -4.4 3.4 4.3 7.3 3.1
2019/20 186.09 180.46 169.70 218.49 180.19 -0.7 3.9 1.9 6.0 3.0
Calendar Year
2016 173.52 159.35 151.77 169.46 158.95 3.1 6.1 5.6 3.9 5.4
2017 196.12 166.89 157.86 182.23 167.92 13.0 4.7 4.0 7.5 5.6
2018 193.15 169.99 163.03 201.70 172.33 -1.5 1.9 3.3 10.7 2.6
2019 186.92 176.84 167.84 210.14 177.27 -3.2 4.0 3.0 4.2 2.9
2020 183.99 180.26 182.95 178.75 219.91 -3.6 3.5 6.5 4.6 3.8
Source: Uganda Bureau of Statistics
Table 4.2 D: National Annual Average CPI by COICOP Divisions, Uganda (2016/17 = 100)
Financial Year
Division Weights 2014/15 2015/16 2016/17 2017/18 2018/19 2019/20
Food And Non-Alcoholic Beverages 284.6198 153.14 165.42 179.59 186.51 183.54 187.23
Alcoholic Beverages, Tobacco & Narcotics 27.9824 143.91 149.85 154.03 156.72 159.49 161.93
Clothing And Footwear 50.8029 164.67 179.70 188.67 193.13 203.33 210.74
Housing, Water, Electricity, Gas and Other Fuels
119.4255 161.24 173.70 179.09 190.40 197.92 207.62
Furnishings, Household, Equipment & Routine Household Maintenance
38.6638 160.14 167.00 175.51 183.82 190.05 195.02
Health 57.5151 148.72 152.57 156.80 159.46 162.61 167.32
Transport 137.7904 129.47 136.14 139.71 143.78 161.01 167.27
Communication 51.8153 103.78 109.66 105.69 96.48 108.40 99.03
Recreation and Culture 55.1688 120.77 123.49 128.04 135.07 137.95 140.24
Education 55.0753 152.83 165.86 192.09 200.69 209.53 222.10
Restaurants and Hotels 57.2272 141.55 149.48 158.59 165.94 168.42 171.80
Miscellaneous Goods and Services 63.9136 146.42 155.85 163.81 165.53 173.03 183.43
All Items Index 1,000.0000 145.74 155.28 164.12 169.69 175.02 180.19
Annual average percent change
2.9 6.6 5.7 3.4 3.1 3.0
Calendar Year
Weights 2015 2016 2017 2018 2019 2020
Food And Non-Alcoholic Beverages 284.6198 160.71 169.59 186.78 184.57 184.19 187.44
Alcoholic Beverages, Tobacco & Narcotics 27.9824 145.60 153.47 154.81 158.28 160.79 163.97
Clothing And Footwear 50.8029 171.47 184.87 190.77 198.19 207.83 212.56
Housing, Water, Electricity, Gas and Other Fuels
119.4255 167.34 176.12 184.76 195.44 201.15 209.27
Furnishings, Household, Equipment & Routine Household Maintenance
38.6638 163.22 170.57 180.40 187.45 192.14 196.74
Health 57.5151 150.41 155.10 157.77 161.34 164.70 169.08
Transport 137.7904 132.40 138.33 139.69 152.99 164.86 188.79
Communication 51.8153 110.07 105.92 103.16 100.98 102.92 99.71
Recreation and Culture 55.1688 122.09 124.76 132.59 136.36 139.16 140.88
Education 55.0753 157.13 180.44 196.83 205.06 216.69 222.70
Restaurants and Hotels 57.2272 145.08 154.00 162.95 167.14 170.20 172.84
Miscellaneous Goods and Services 63.9136 150.65 160.66 165.01 167.96 179.36 185.03
All Items Index 1,000.0000 150.74 158.95 167.92 172.32 177.27 183.99
Annual average percent change
5.4 5.4 5.6 2.6 2.9 3.8

241
Source: Uganda Bureau of Statistics
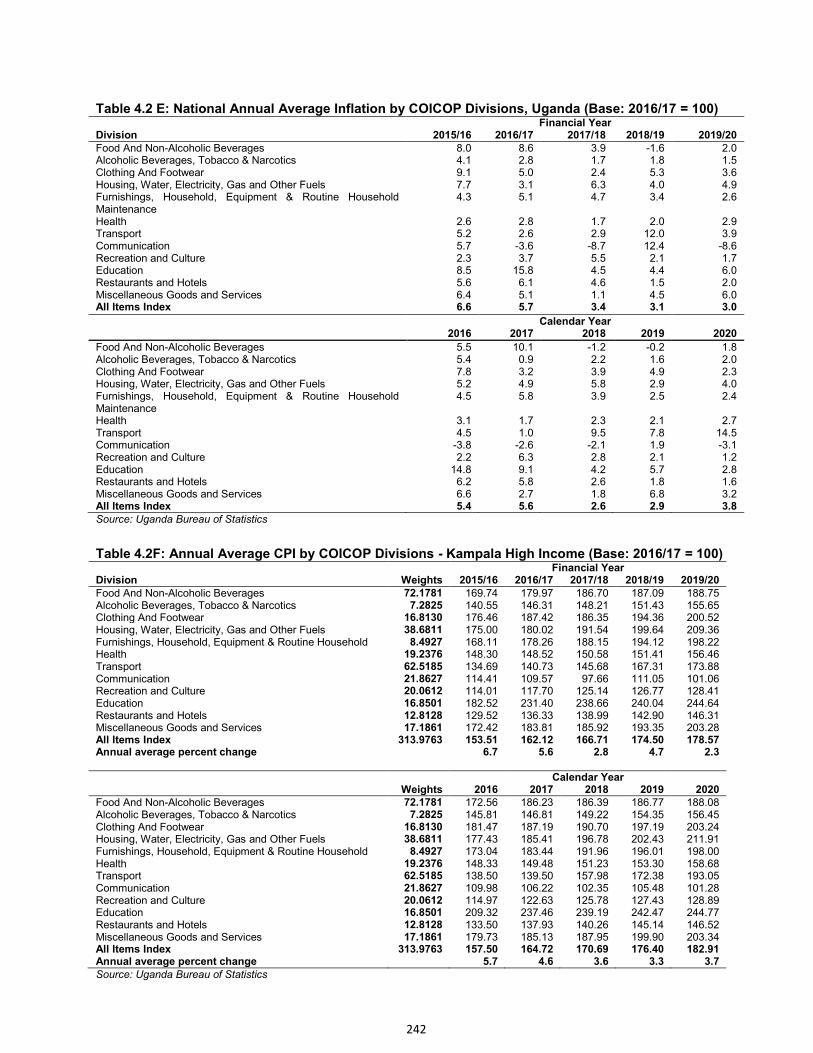
242
Table 4.2 E: National Annual Average Inflation by COICOP Divisions, Uganda (Base: 2016/17 = 100) Financial Year Division 2015/16 2016/17 2017/18 2018/19 2019/20 Food And Non-Alcoholic Beverages 8.0 8.6 3.9 -1.6 2.0 Alcoholic Beverages, Tobacco & Narcotics 4.1 2.8 1.7 1.8 1.5 Clothing And Footwear 9.1 5.0 2.4 5.3 3.6 Housing, Water, Electricity, Gas and Other Fuels 7.7 3.1 6.3 4.0 4.9 Furnishings, Household, Equipment & Routine Household Maintenance
4.3 5.1 4.7 3.4 2.6
Health 2.6 2.8 1.7 2.0 2.9 Transport 5.2 2.6 2.9 12.0 3.9 Communication 5.7 -3.6 -8.7 12.4 -8.6 Recreation and Culture 2.3 3.7 5.5 2.1 1.7 Education 8.5 15.8 4.5 4.4 6.0 Restaurants and Hotels 5.6 6.1 4.6 1.5 2.0 Miscellaneous Goods and Services 6.4 5.1 1.1 4.5 6.0 All Items Index 6.6 5.7 3.4 3.1 3.0 Calendar Year
2016 2017 2018 2019 2020
Food And Non-Alcoholic Beverages 5.5 10.1 -1.2 -0.2 1.8 Alcoholic Beverages, Tobacco & Narcotics 5.4 0.9 2.2 1.6 2.0 Clothing And Footwear 7.8 3.2 3.9 4.9 2.3 Housing, Water, Electricity, Gas and Other Fuels 5.2 4.9 5.8 2.9 4.0 Furnishings, Household, Equipment & Routine Household Maintenance
4.5 5.8 3.9 2.5 2.4
Health 3.1 1.7 2.3 2.1 2.7 Transport 4.5 1.0 9.5 7.8 14.5 Communication -3.8 -2.6 -2.1 1.9 -3.1 Recreation and Culture 2.2 6.3 2.8 2.1 1.2 Education 14.8 9.1 4.2 5.7 2.8 Restaurants and Hotels 6.2 5.8 2.6 1.8 1.6 Miscellaneous Goods and Services 6.6 2.7 1.8 6.8 3.2 All Items Index 5.4 5.6 2.6 2.9 3.8 Source: Uganda Bureau of Statistics
Table 4.2F: Annual Average CPI by COICOP Divisions - Kampala High Income (Base: 2016/17 = 100) Financial Year Division Weights 2015/16 2016/17 2017/18 2018/19 2019/20 Food And Non-Alcoholic Beverages 72.1781 169.74 179.97 186.70 187.09 188.75 Alcoholic Beverages, Tobacco & Narcotics 7.2825 140.55 146.31 148.21 151.43 155.65 Clothing And Footwear 16.8130 176.46 187.42 186.35 194.36 200.52 Housing, Water, Electricity, Gas and Other Fuels 38.6811 175.00 180.02 191.54 199.64 209.36 Furnishings, Household, Equipment & Routine Household 8.4927 168.11 178.26 188.15 194.12 198.22 Health 19.2376 148.30 148.52 150.58 151.41 156.46 Transport 62.5185 134.69 140.73 145.68 167.31 173.88 Communication 21.8627 114.41 109.57 97.66 111.05 101.06 Recreation and Culture 20.0612 114.01 117.70 125.14 126.77 128.41 Education 16.8501 182.52 231.40 238.66 240.04 244.64 Restaurants and Hotels 12.8128 129.52 136.33 138.99 142.90 146.31 Miscellaneous Goods and Services 17.1861 172.42 183.81 185.92 193.35 203.28 All Items Index 313.9763 153.51 162.12 166.71 174.50 178.57 Annual average percent change 6.7 5.6 2.8 4.7 2.3 Calendar Year Weights 2016 2017 2018 2019 2020 Food And Non-Alcoholic Beverages 72.1781 172.56 186.23 186.39 186.77 188.08 Alcoholic Beverages, Tobacco & Narcotics 7.2825 145.81 146.81 149.22 154.35 156.45 Clothing And Footwear 16.8130 181.47 187.19 190.70 197.19 203.24 Housing, Water, Electricity, Gas and Other Fuels 38.6811 177.43 185.41 196.78 202.43 211.91 Furnishings, Household, Equipment & Routine Household 8.4927 173.04 183.44 191.96 196.01 198.00 Health 19.2376 148.33 149.48 151.23 153.30 158.68 Transport 62.5185 138.50 139.50 157.98 172.38 193.05 Communication 21.8627 109.98 106.22 102.35 105.48 101.28 Recreation and Culture 20.0612 114.97 122.63 125.78 127.43 128.89 Education 16.8501 209.32 237.46 239.19 242.47 244.77 Restaurants and Hotels 12.8128 133.50 137.93 140.26 145.14 146.52 Miscellaneous Goods and Services 17.1861 179.73 185.13 187.95 199.90 203.34 All Items Index 313.9763 157.50 164.72 170.69 176.40 182.91 Annual average percent change 5.7 4.6 3.6 3.3 3.7 Source: Uganda Bureau of Statistics
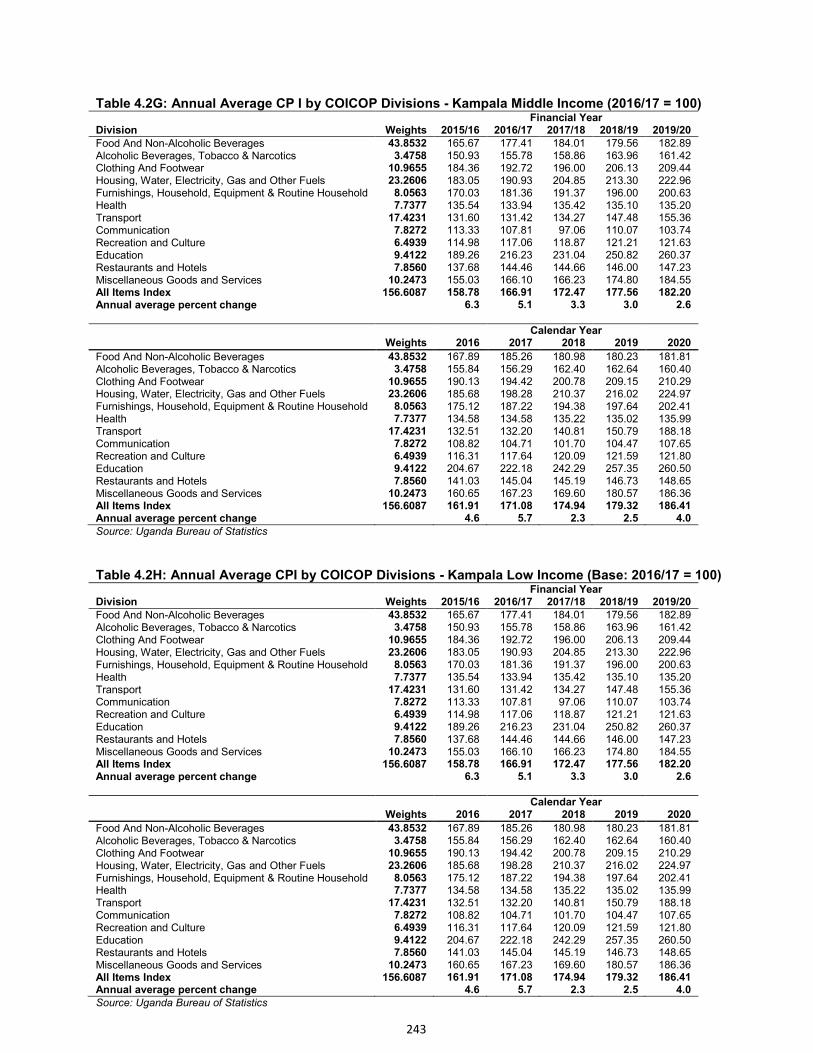
243
Table 4.2G: Annual Average CP I by COICOP Divisions - Kampala Middle Income (2016/17 = 100) Financial Year Division Weights 2015/16 2016/17 2017/18 2018/19 2019/20
Food And Non-Alcoholic Beverages 43.8532 165.67 177.41 184.01 179.56 182.89 Alcoholic Beverages, Tobacco & Narcotics 3.4758 150.93 155.78 158.86 163.96 161.42 Clothing And Footwear 10.9655 184.36 192.72 196.00 206.13 209.44 Housing, Water, Electricity, Gas and Other Fuels 23.2606 183.05 190.93 204.85 213.30 222.96 Furnishings, Household, Equipment & Routine Household 8.0563 170.03 181.36 191.37 196.00 200.63 Health 7.7377 135.54 133.94 135.42 135.10 135.20 Transport 17.4231 131.60 131.42 134.27 147.48 155.36 Communication 7.8272 113.33 107.81 97.06 110.07 103.74 Recreation and Culture 6.4939 114.98 117.06 118.87 121.21 121.63 Education 9.4122 189.26 216.23 231.04 250.82 260.37 Restaurants and Hotels 7.8560 137.68 144.46 144.66 146.00 147.23 Miscellaneous Goods and Services 10.2473 155.03 166.10 166.23 174.80 184.55 All Items Index 156.6087 158.78 166.91 172.47 177.56 182.20 Annual average percent change
6.3 5.1 3.3 3.0 2.6
Calendar Year
Weights 2016 2017 2018 2019 2020
Food And Non-Alcoholic Beverages 43.8532 167.89 185.26 180.98 180.23 181.81 Alcoholic Beverages, Tobacco & Narcotics 3.4758 155.84 156.29 162.40 162.64 160.40 Clothing And Footwear 10.9655 190.13 194.42 200.78 209.15 210.29 Housing, Water, Electricity, Gas and Other Fuels 23.2606 185.68 198.28 210.37 216.02 224.97 Furnishings, Household, Equipment & Routine Household 8.0563 175.12 187.22 194.38 197.64 202.41 Health 7.7377 134.58 134.58 135.22 135.02 135.99 Transport 17.4231 132.51 132.20 140.81 150.79 188.18 Communication 7.8272 108.82 104.71 101.70 104.47 107.65 Recreation and Culture 6.4939 116.31 117.64 120.09 121.59 121.80 Education 9.4122 204.67 222.18 242.29 257.35 260.50 Restaurants and Hotels 7.8560 141.03 145.04 145.19 146.73 148.65 Miscellaneous Goods and Services 10.2473 160.65 167.23 169.60 180.57 186.36 All Items Index 156.6087 161.91 171.08 174.94 179.32 186.41 Annual average percent change
4.6 5.7 2.3 2.5 4.0
Source: Uganda Bureau of Statistics
Table 4.2H: Annual Average CPI by COICOP Divisions - Kampala Low Income (Base: 2016/17 = 100) Financial Year Division Weights 2015/16 2016/17 2017/18 2018/19 2019/20
Food And Non-Alcoholic Beverages 43.8532 165.67 177.41 184.01 179.56 182.89 Alcoholic Beverages, Tobacco & Narcotics 3.4758 150.93 155.78 158.86 163.96 161.42 Clothing And Footwear 10.9655 184.36 192.72 196.00 206.13 209.44 Housing, Water, Electricity, Gas and Other Fuels 23.2606 183.05 190.93 204.85 213.30 222.96 Furnishings, Household, Equipment & Routine Household 8.0563 170.03 181.36 191.37 196.00 200.63 Health 7.7377 135.54 133.94 135.42 135.10 135.20 Transport 17.4231 131.60 131.42 134.27 147.48 155.36 Communication 7.8272 113.33 107.81 97.06 110.07 103.74 Recreation and Culture 6.4939 114.98 117.06 118.87 121.21 121.63 Education 9.4122 189.26 216.23 231.04 250.82 260.37 Restaurants and Hotels 7.8560 137.68 144.46 144.66 146.00 147.23 Miscellaneous Goods and Services 10.2473 155.03 166.10 166.23 174.80 184.55 All Items Index 156.6087 158.78 166.91 172.47 177.56 182.20 Annual average percent change
6.3 5.1 3.3 3.0 2.6
Calendar Year
Weights 2016 2017 2018 2019 2020
Food And Non-Alcoholic Beverages 43.8532 167.89 185.26 180.98 180.23 181.81 Alcoholic Beverages, Tobacco & Narcotics 3.4758 155.84 156.29 162.40 162.64 160.40 Clothing And Footwear 10.9655 190.13 194.42 200.78 209.15 210.29 Housing, Water, Electricity, Gas and Other Fuels 23.2606 185.68 198.28 210.37 216.02 224.97 Furnishings, Household, Equipment & Routine Household 8.0563 175.12 187.22 194.38 197.64 202.41 Health 7.7377 134.58 134.58 135.22 135.02 135.99 Transport 17.4231 132.51 132.20 140.81 150.79 188.18 Communication 7.8272 108.82 104.71 101.70 104.47 107.65 Recreation and Culture 6.4939 116.31 117.64 120.09 121.59 121.80 Education 9.4122 204.67 222.18 242.29 257.35 260.50 Restaurants and Hotels 7.8560 141.03 145.04 145.19 146.73 148.65 Miscellaneous Goods and Services 10.2473 160.65 167.23 169.60 180.57 186.36 All Items Index 156.6087 161.91 171.08 174.94 179.32 186.41 Annual average percent change
4.6 5.7 2.3 2.5 4.0
Source: Uganda Bureau of Statistics
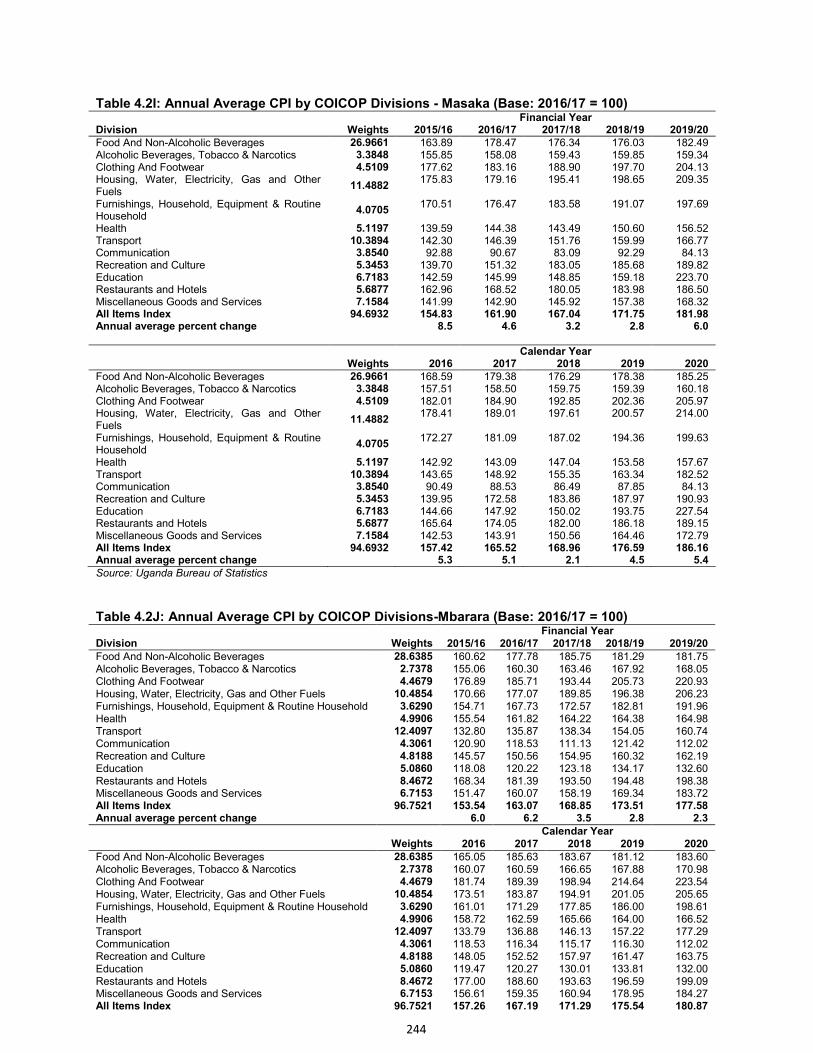
244
Table 4.2I: Annual Average CPI by COICOP Divisions - Masaka (Base: 2016/17 = 100)
Financial Year
Division Weights 2015/16 2016/17 2017/18 2018/19 2019/20 Food And Non-Alcoholic Beverages 26.9661 163.89 178.47 176.34 176.03 182.49 Alcoholic Beverages, Tobacco & Narcotics 3.3848 155.85 158.08 159.43 159.85 159.34 Clothing And Footwear 4.5109 177.62 183.16 188.90 197.70 204.13 Housing, Water, Electricity, Gas and Other Fuels
11.4882 175.83 179.16 195.41 198.65 209.35
Furnishings, Household, Equipment & Routine Household
4.0705 170.51 176.47 183.58 191.07 197.69
Health 5.1197 139.59 144.38 143.49 150.60 156.52 Transport 10.3894 142.30 146.39 151.76 159.99 166.77 Communication 3.8540 92.88 90.67 83.09 92.29 84.13 Recreation and Culture 5.3453 139.70 151.32 183.05 185.68 189.82 Education 6.7183 142.59 145.99 148.85 159.18 223.70 Restaurants and Hotels 5.6877 162.96 168.52 180.05 183.98 186.50 Miscellaneous Goods and Services 7.1584 141.99 142.90 145.92 157.38 168.32 All Items Index 94.6932 154.83 161.90 167.04 171.75 181.98 Annual average percent change
8.5 4.6 3.2 2.8 6.0
Calendar Year
Weights 2016 2017 2018 2019 2020
Food And Non-Alcoholic Beverages 26.9661 168.59 179.38 176.29 178.38 185.25 Alcoholic Beverages, Tobacco & Narcotics 3.3848 157.51 158.50 159.75 159.39 160.18 Clothing And Footwear 4.5109 182.01 184.90 192.85 202.36 205.97 Housing, Water, Electricity, Gas and Other Fuels
11.4882 178.41 189.01 197.61 200.57 214.00
Furnishings, Household, Equipment & Routine Household
4.0705 172.27 181.09 187.02 194.36 199.63
Health 5.1197 142.92 143.09 147.04 153.58 157.67 Transport 10.3894 143.65 148.92 155.35 163.34 182.52 Communication 3.8540 90.49 88.53 86.49 87.85 84.13 Recreation and Culture 5.3453 139.95 172.58 183.86 187.97 190.93 Education 6.7183 144.66 147.92 150.02 193.75 227.54 Restaurants and Hotels 5.6877 165.64 174.05 182.00 186.18 189.15 Miscellaneous Goods and Services 7.1584 142.53 143.91 150.56 164.46 172.79 All Items Index 94.6932 157.42 165.52 168.96 176.59 186.16 Annual average percent change
5.3 5.1 2.1 4.5 5.4
Source: Uganda Bureau of Statistics
Table 4.2J: Annual Average CPI by COICOP Divisions-Mbarara (Base: 2016/17 = 100) Financial Year Division Weights 2015/16 2016/17 2017/18 2018/19 2019/20 Food And Non-Alcoholic Beverages 28.6385 160.62 177.78 185.75 181.29 181.75 Alcoholic Beverages, Tobacco & Narcotics 2.7378 155.06 160.30 163.46 167.92 168.05 Clothing And Footwear 4.4679 176.89 185.71 193.44 205.73 220.93 Housing, Water, Electricity, Gas and Other Fuels 10.4854 170.66 177.07 189.85 196.38 206.23 Furnishings, Household, Equipment & Routine Household 3.6290 154.71 167.73 172.57 182.81 191.96 Health 4.9906 155.54 161.82 164.22 164.38 164.98 Transport 12.4097 132.80 135.87 138.34 154.05 160.74 Communication 4.3061 120.90 118.53 111.13 121.42 112.02 Recreation and Culture 4.8188 145.57 150.56 154.95 160.32 162.19 Education 5.0860 118.08 120.22 123.18 134.17 132.60 Restaurants and Hotels 8.4672 168.34 181.39 193.50 194.48 198.38 Miscellaneous Goods and Services 6.7153 151.47 160.07 158.19 169.34 183.72 All Items Index 96.7521 153.54 163.07 168.85 173.51 177.58 Annual average percent change 6.0 6.2 3.5 2.8 2.3
Calendar Year Weights 2016 2017 2018 2019 2020 Food And Non-Alcoholic Beverages 28.6385 165.05 185.63 183.67 181.12 183.60 Alcoholic Beverages, Tobacco & Narcotics 2.7378 160.07 160.59 166.65 167.88 170.98 Clothing And Footwear 4.4679 181.74 189.39 198.94 214.64 223.54 Housing, Water, Electricity, Gas and Other Fuels 10.4854 173.51 183.87 194.91 201.05 205.65 Furnishings, Household, Equipment & Routine Household 3.6290 161.01 171.29 177.85 186.00 198.61 Health 4.9906 158.72 162.59 165.66 164.00 166.52 Transport 12.4097 133.79 136.88 146.13 157.22 177.29 Communication 4.3061 118.53 116.34 115.17 116.30 112.02 Recreation and Culture 4.8188 148.05 152.52 157.97 161.47 163.75 Education 5.0860 119.47 120.27 130.01 133.81 132.00 Restaurants and Hotels 8.4672 177.00 188.60 193.63 196.59 199.09 Miscellaneous Goods and Services 6.7153 156.61 159.35 160.94 178.95 184.27 All Items Index 96.7521 157.26 167.19 171.29 175.54 180.87
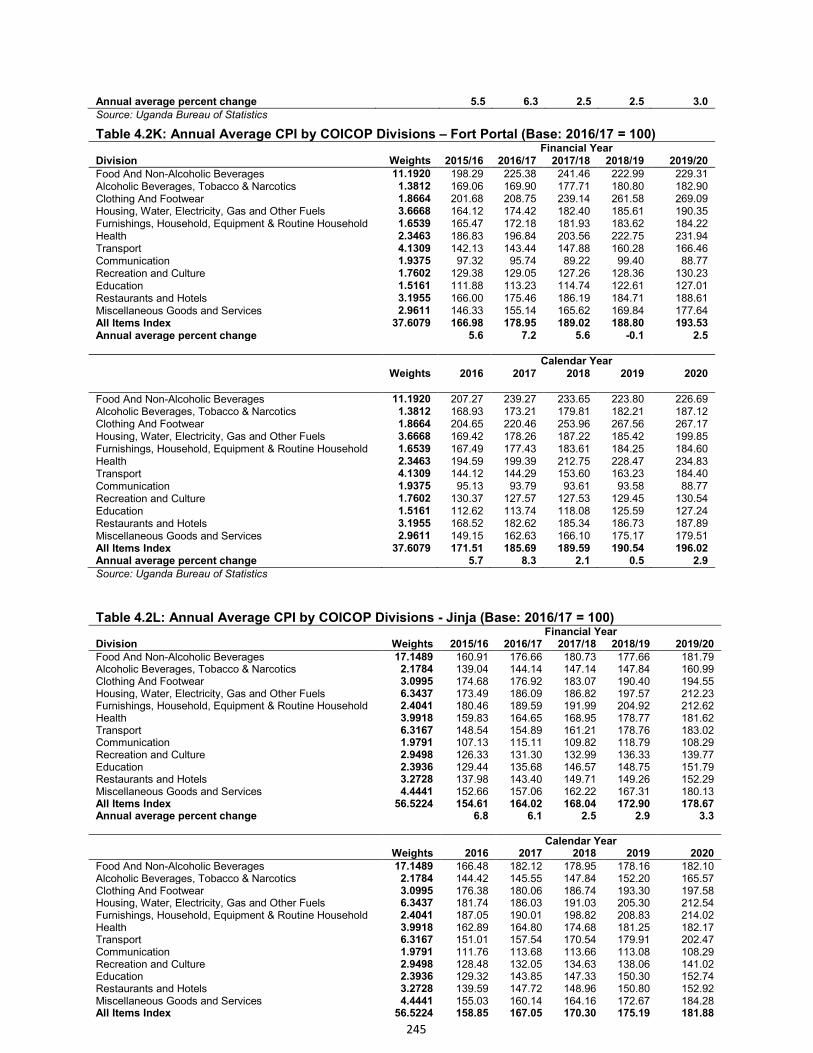
245
Annual average percent change 5.5 6.3 2.5 2.5 3.0
Source: Uganda Bureau of Statistics
Table 4.2K: Annual Average CPI by COICOP Divisions – Fort Portal (Base: 2016/17 = 100) Financial Year Division Weights 2015/16 2016/17 2017/18 2018/19 2019/20
Food And Non-Alcoholic Beverages 11.1920 198.29 225.38 241.46 222.99 229.31 Alcoholic Beverages, Tobacco & Narcotics 1.3812 169.06 169.90 177.71 180.80 182.90 Clothing And Footwear 1.8664 201.68 208.75 239.14 261.58 269.09 Housing, Water, Electricity, Gas and Other Fuels 3.6668 164.12 174.42 182.40 185.61 190.35 Furnishings, Household, Equipment & Routine Household 1.6539 165.47 172.18 181.93 183.62 184.22 Health 2.3463 186.83 196.84 203.56 222.75 231.94 Transport 4.1309 142.13 143.44 147.88 160.28 166.46 Communication 1.9375 97.32 95.74 89.22 99.40 88.77 Recreation and Culture 1.7602 129.38 129.05 127.26 128.36 130.23 Education 1.5161 111.88 113.23 114.74 122.61 127.01 Restaurants and Hotels 3.1955 166.00 175.46 186.19 184.71 188.61 Miscellaneous Goods and Services 2.9611 146.33 155.14 165.62 169.84 177.64 All Items Index 37.6079 166.98 178.95 189.02 188.80 193.53 Annual average percent change 5.6 7.2 5.6 -0.1 2.5
Calendar Year
Weights 2016 2017 2018 2019 2020
Food And Non-Alcoholic Beverages 11.1920 207.27 239.27 233.65 223.80 226.69 Alcoholic Beverages, Tobacco & Narcotics 1.3812 168.93 173.21 179.81 182.21 187.12 Clothing And Footwear 1.8664 204.65 220.46 253.96 267.56 267.17 Housing, Water, Electricity, Gas and Other Fuels 3.6668 169.42 178.26 187.22 185.42 199.85 Furnishings, Household, Equipment & Routine Household 1.6539 167.49 177.43 183.61 184.25 184.60 Health 2.3463 194.59 199.39 212.75 228.47 234.83 Transport 4.1309 144.12 144.29 153.60 163.23 184.40 Communication 1.9375 95.13 93.79 93.61 93.58 88.77 Recreation and Culture 1.7602 130.37 127.57 127.53 129.45 130.54 Education 1.5161 112.62 113.74 118.08 125.59 127.24 Restaurants and Hotels 3.1955 168.52 182.62 185.34 186.73 187.89 Miscellaneous Goods and Services 2.9611 149.15 162.63 166.10 175.17 179.51 All Items Index 37.6079 171.51 185.69 189.59 190.54 196.02 Annual average percent change 5.7 8.3 2.1 0.5 2.9
Source: Uganda Bureau of Statistics
Table 4.2L: Annual Average CPI by COICOP Divisions - Jinja (Base: 2016/17 = 100) Financial Year Division Weights 2015/16 2016/17 2017/18 2018/19 2019/20 Food And Non-Alcoholic Beverages 17.1489 160.91 176.66 180.73 177.66 181.79 Alcoholic Beverages, Tobacco & Narcotics 2.1784 139.04 144.14 147.14 147.84 160.99 Clothing And Footwear 3.0995 174.68 176.92 183.07 190.40 194.55 Housing, Water, Electricity, Gas and Other Fuels 6.3437 173.49 186.09 186.82 197.57 212.23 Furnishings, Household, Equipment & Routine Household 2.4041 180.46 189.59 191.99 204.92 212.62 Health 3.9918 159.83 164.65 168.95 178.77 181.62 Transport 6.3167 148.54 154.89 161.21 178.76 183.02 Communication 1.9791 107.13 115.11 109.82 118.79 108.29 Recreation and Culture 2.9498 126.33 131.30 132.99 136.33 139.77 Education 2.3936 129.44 135.68 146.57 148.75 151.79 Restaurants and Hotels 3.2728 137.98 143.40 149.71 149.26 152.29 Miscellaneous Goods and Services 4.4441 152.66 157.06 162.22 167.31 180.13 All Items Index 56.5224 154.61 164.02 168.04 172.90 178.67 Annual average percent change 6.8 6.1 2.5 2.9 3.3
Calendar Year
Weights 2016 2017 2018 2019 2020
Food And Non-Alcoholic Beverages 17.1489 166.48 182.12 178.95 178.16 182.10 Alcoholic Beverages, Tobacco & Narcotics 2.1784 144.42 145.55 147.84 152.20 165.57 Clothing And Footwear 3.0995 176.38 180.06 186.74 193.30 197.58 Housing, Water, Electricity, Gas and Other Fuels 6.3437 181.74 186.03 191.03 205.30 212.54 Furnishings, Household, Equipment & Routine Household 2.4041 187.05 190.01 198.82 208.83 214.02 Health 3.9918 162.89 164.80 174.68 181.25 182.17 Transport 6.3167 151.01 157.54 170.54 179.91 202.47 Communication 1.9791 111.76 113.68 113.66 113.08 108.29 Recreation and Culture 2.9498 128.48 132.05 134.63 138.06 141.02 Education 2.3936 129.32 143.85 147.33 150.30 152.74 Restaurants and Hotels 3.2728 139.59 147.72 148.96 150.80 152.92 Miscellaneous Goods and Services 4.4441 155.03 160.14 164.16 172.67 184.28 All Items Index 56.5224 158.85 167.05 170.30 175.19 181.88
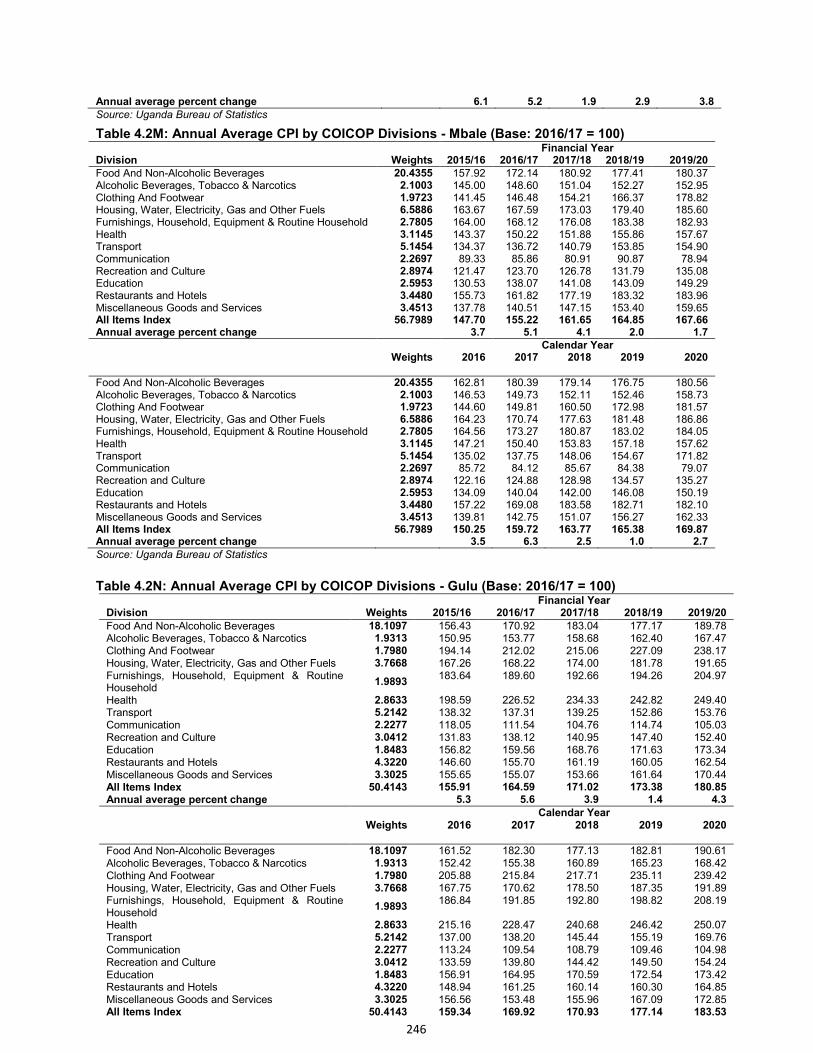
246
Annual average percent change 6.1 5.2 1.9 2.9 3.8 Source: Uganda Bureau of Statistics
Table 4.2M: Annual Average CPI by COICOP Divisions - Mbale (Base: 2016/17 = 100) Financial Year Division Weights 2015/16 2016/17 2017/18 2018/19 2019/20 Food And Non-Alcoholic Beverages 20.4355 157.92 172.14 180.92 177.41 180.37 Alcoholic Beverages, Tobacco & Narcotics 2.1003 145.00 148.60 151.04 152.27 152.95 Clothing And Footwear 1.9723 141.45 146.48 154.21 166.37 178.82 Housing, Water, Electricity, Gas and Other Fuels 6.5886 163.67 167.59 173.03 179.40 185.60 Furnishings, Household, Equipment & Routine Household 2.7805 164.00 168.12 176.08 183.38 182.93 Health 3.1145 143.37 150.22 151.88 155.86 157.67 Transport 5.1454 134.37 136.72 140.79 153.85 154.90 Communication 2.2697 89.33 85.86 80.91 90.87 78.94 Recreation and Culture 2.8974 121.47 123.70 126.78 131.79 135.08 Education 2.5953 130.53 138.07 141.08 143.09 149.29 Restaurants and Hotels 3.4480 155.73 161.82 177.19 183.32 183.96 Miscellaneous Goods and Services 3.4513 137.78 140.51 147.15 153.40 159.65 All Items Index 56.7989 147.70 155.22 161.65 164.85 167.66 Annual average percent change
3.7 5.1 4.1 2.0 1.7
Calendar Year
Weights 2016 2017 2018 2019 2020
Food And Non-Alcoholic Beverages 20.4355 162.81 180.39 179.14 176.75 180.56 Alcoholic Beverages, Tobacco & Narcotics 2.1003 146.53 149.73 152.11 152.46 158.73 Clothing And Footwear 1.9723 144.60 149.81 160.50 172.98 181.57 Housing, Water, Electricity, Gas and Other Fuels 6.5886 164.23 170.74 177.63 181.48 186.86 Furnishings, Household, Equipment & Routine Household 2.7805 164.56 173.27 180.87 183.02 184.05 Health 3.1145 147.21 150.40 153.83 157.18 157.62 Transport 5.1454 135.02 137.75 148.06 154.67 171.82 Communication 2.2697 85.72 84.12 85.67 84.38 79.07 Recreation and Culture 2.8974 122.16 124.88 128.98 134.57 135.27 Education 2.5953 134.09 140.04 142.00 146.08 150.19 Restaurants and Hotels 3.4480 157.22 169.08 183.58 182.71 182.10 Miscellaneous Goods and Services 3.4513 139.81 142.75 151.07 156.27 162.33 All Items Index 56.7989 150.25 159.72 163.77 165.38 169.87 Annual average percent change
3.5 6.3 2.5 1.0 2.7
Source: Uganda Bureau of Statistics
Table 4.2N: Annual Average CPI by COICOP Divisions - Gulu (Base: 2016/17 = 100) Financial Year Division Weights 2015/16 2016/17 2017/18 2018/19 2019/20
Food And Non-Alcoholic Beverages 18.1097 156.43 170.92 183.04 177.17 189.78 Alcoholic Beverages, Tobacco & Narcotics 1.9313 150.95 153.77 158.68 162.40 167.47 Clothing And Footwear 1.7980 194.14 212.02 215.06 227.09 238.17 Housing, Water, Electricity, Gas and Other Fuels 3.7668 167.26 168.22 174.00 181.78 191.65 Furnishings, Household, Equipment & Routine Household
1.9893 183.64 189.60 192.66 194.26 204.97
Health 2.8633 198.59 226.52 234.33 242.82 249.40 Transport 5.2142 138.32 137.31 139.25 152.86 153.76 Communication 2.2277 118.05 111.54 104.76 114.74 105.03 Recreation and Culture 3.0412 131.83 138.12 140.95 147.40 152.40 Education 1.8483 156.82 159.56 168.76 171.63 173.34 Restaurants and Hotels 4.3220 146.60 155.70 161.19 160.05 162.54 Miscellaneous Goods and Services 3.3025 155.65 155.07 153.66 161.64 170.44 All Items Index 50.4143 155.91 164.59 171.02 173.38 180.85 Annual average percent change
5.3 5.6 3.9 1.4 4.3
Calendar Year
Weights 2016 2017 2018 2019 2020
Food And Non-Alcoholic Beverages 18.1097 161.52 182.30 177.13 182.81 190.61 Alcoholic Beverages, Tobacco & Narcotics 1.9313 152.42 155.38 160.89 165.23 168.42 Clothing And Footwear 1.7980 205.88 215.84 217.71 235.11 239.42 Housing, Water, Electricity, Gas and Other Fuels 3.7668 167.75 170.62 178.50 187.35 191.89 Furnishings, Household, Equipment & Routine Household
1.9893 186.84 191.85 192.80 198.82 208.19
Health 2.8633 215.16 228.47 240.68 246.42 250.07 Transport 5.2142 137.00 138.20 145.44 155.19 169.76 Communication 2.2277 113.24 109.54 108.79 109.46 104.98 Recreation and Culture 3.0412 133.59 139.80 144.42 149.50 154.24 Education 1.8483 156.91 164.95 170.59 172.54 173.42 Restaurants and Hotels 4.3220 148.94 161.25 160.14 160.30 164.85 Miscellaneous Goods and Services 3.3025 156.56 153.48 155.96 167.09 172.85 All Items Index 50.4143 159.34 169.92 170.93 177.14 183.53
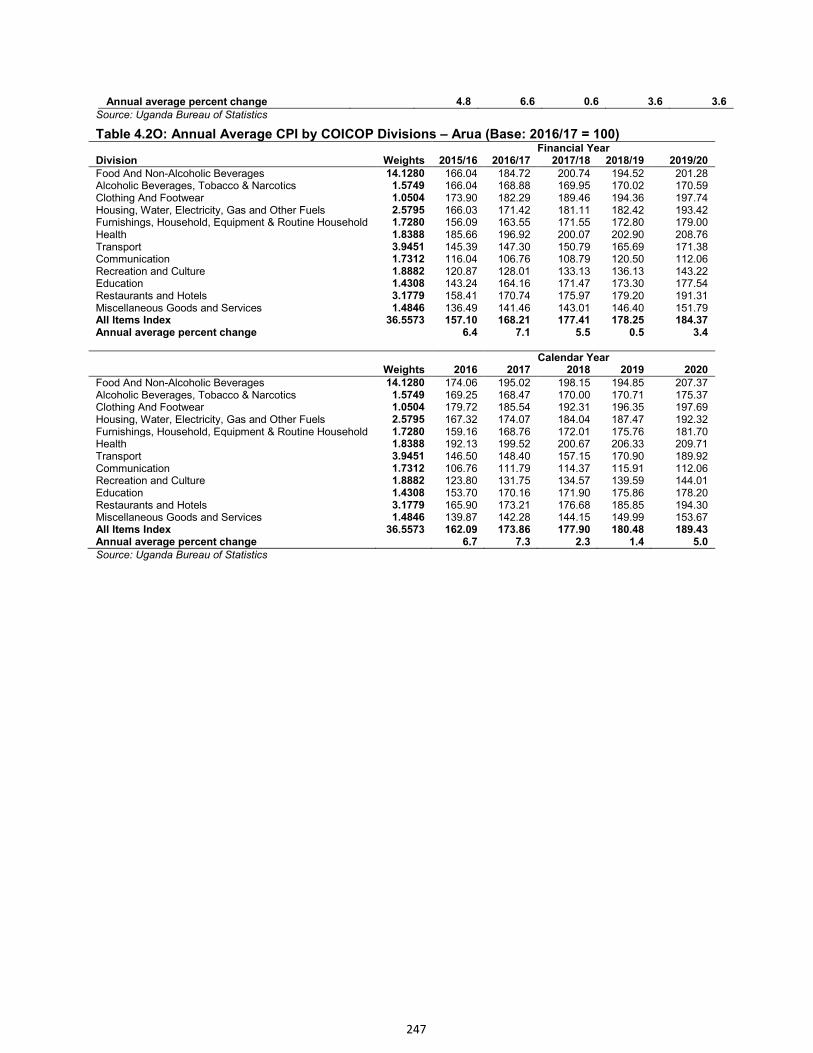
247
Annual average percent change
4.8 6.6 0.6 3.6 3.6
Source: Uganda Bureau of Statistics
Table 4.2O: Annual Average CPI by COICOP Divisions – Arua (Base: 2016/17 = 100) Financial Year Division Weights 2015/16 2016/17 2017/18 2018/19 2019/20 Food And Non-Alcoholic Beverages 14.1280 166.04 184.72 200.74 194.52 201.28 Alcoholic Beverages, Tobacco & Narcotics 1.5749 166.04 168.88 169.95 170.02 170.59 Clothing And Footwear 1.0504 173.90 182.29 189.46 194.36 197.74 Housing, Water, Electricity, Gas and Other Fuels 2.5795 166.03 171.42 181.11 182.42 193.42 Furnishings, Household, Equipment & Routine Household 1.7280 156.09 163.55 171.55 172.80 179.00 Health 1.8388 185.66 196.92 200.07 202.90 208.76 Transport 3.9451 145.39 147.30 150.79 165.69 171.38 Communication 1.7312 116.04 106.76 108.79 120.50 112.06 Recreation and Culture 1.8882 120.87 128.01 133.13 136.13 143.22 Education 1.4308 143.24 164.16 171.47 173.30 177.54 Restaurants and Hotels 3.1779 158.41 170.74 175.97 179.20 191.31 Miscellaneous Goods and Services 1.4846 136.49 141.46 143.01 146.40 151.79 All Items Index 36.5573 157.10 168.21 177.41 178.25 184.37 Annual average percent change 6.4 7.1 5.5 0.5 3.4
Calendar Year
Weights 2016 2017 2018 2019 2020
Food And Non-Alcoholic Beverages 14.1280 174.06 195.02 198.15 194.85 207.37 Alcoholic Beverages, Tobacco & Narcotics 1.5749 169.25 168.47 170.00 170.71 175.37 Clothing And Footwear 1.0504 179.72 185.54 192.31 196.35 197.69 Housing, Water, Electricity, Gas and Other Fuels 2.5795 167.32 174.07 184.04 187.47 192.32 Furnishings, Household, Equipment & Routine Household 1.7280 159.16 168.76 172.01 175.76 181.70 Health 1.8388 192.13 199.52 200.67 206.33 209.71 Transport 3.9451 146.50 148.40 157.15 170.90 189.92 Communication 1.7312 106.76 111.79 114.37 115.91 112.06 Recreation and Culture 1.8882 123.80 131.75 134.57 139.59 144.01 Education 1.4308 153.70 170.16 171.90 175.86 178.20 Restaurants and Hotels 3.1779 165.90 173.21 176.68 185.85 194.30 Miscellaneous Goods and Services 1.4846 139.87 142.28 144.15 149.99 153.67 All Items Index 36.5573 162.09 173.86 177.90 180.48 189.43 Annual average percent change 6.7 7.3 2.3 1.4 5.0 Source: Uganda Bureau of Statistics
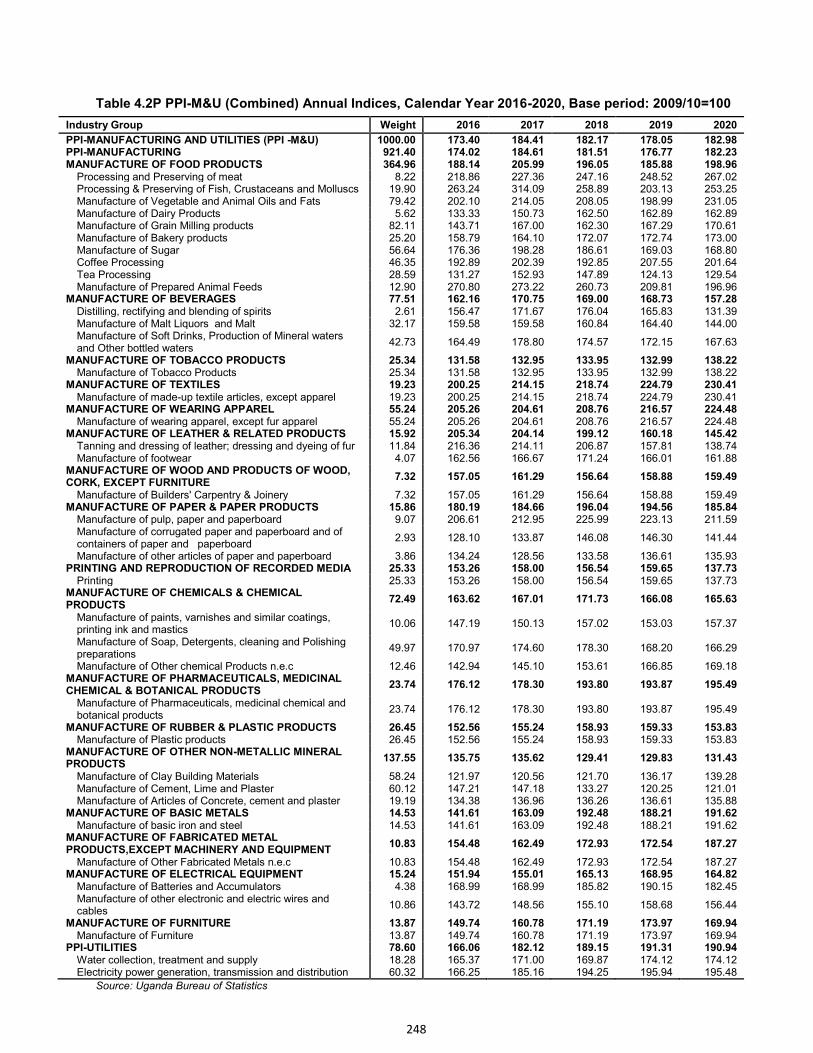
248
Table 4.2P PPI-M&U (Combined) Annual Indices, Calendar Year 2016-2020, Base period: 2009/10=100
Industry Group Weight 2016 2017 2018 2019 2020
PPI-MANUFACTURING AND UTILITIES (PPI -M&U) 1000.00 173.40 184.41 182.17 178.05 182.98 PPI-MANUFACTURING 921.40 174.02 184.61 181.51 176.77 182.23 MANUFACTURE OF FOOD PRODUCTS 364.96 188.14 205.99 196.05 185.88 198.96
Processing and Preserving of meat 8.22 218.86 227.36 247.16 248.52 267.02 Processing & Preserving of Fish, Crustaceans and Molluscs 19.90 263.24 314.09 258.89 203.13 253.25 Manufacture of Vegetable and Animal Oils and Fats 79.42 202.10 214.05 208.05 198.99 231.05 Manufacture of Dairy Products 5.62 133.33 150.73 162.50 162.89 162.89 Manufacture of Grain Milling products 82.11 143.71 167.00 162.30 167.29 170.61 Manufacture of Bakery products 25.20 158.79 164.10 172.07 172.74 173.00 Manufacture of Sugar 56.64 176.36 198.28 186.61 169.03 168.80 Coffee Processing 46.35 192.89 202.39 192.85 207.55 201.64 Tea Processing 28.59 131.27 152.93 147.89 124.13 129.54 Manufacture of Prepared Animal Feeds 12.90 270.80 273.22 260.73 209.81 196.96
MANUFACTURE OF BEVERAGES 77.51 162.16 170.75 169.00 168.73 157.28 Distilling, rectifying and blending of spirits 2.61 156.47 171.67 176.04 165.83 131.39 Manufacture of Malt Liquors and Malt 32.17 159.58 159.58 160.84 164.40 144.00 Manufacture of Soft Drinks, Production of Mineral waters and Other bottled waters
42.73 164.49 178.80 174.57 172.15 167.63
MANUFACTURE OF TOBACCO PRODUCTS 25.34 131.58 132.95 133.95 132.99 138.22 Manufacture of Tobacco Products 25.34 131.58 132.95 133.95 132.99 138.22
MANUFACTURE OF TEXTILES 19.23 200.25 214.15 218.74 224.79 230.41 Manufacture of made-up textile articles, except apparel 19.23 200.25 214.15 218.74 224.79 230.41
MANUFACTURE OF WEARING APPAREL 55.24 205.26 204.61 208.76 216.57 224.48 Manufacture of wearing apparel, except fur apparel 55.24 205.26 204.61 208.76 216.57 224.48
MANUFACTURE OF LEATHER & RELATED PRODUCTS 15.92 205.34 204.14 199.12 160.18 145.42 Tanning and dressing of leather; dressing and dyeing of fur 11.84 216.36 214.11 206.87 157.81 138.74 Manufacture of footwear 4.07 162.56 166.67 171.24 166.01 161.88
MANUFACTURE OF WOOD AND PRODUCTS OF WOOD, CORK, EXCEPT FURNITURE
7.32 157.05 161.29 156.64 158.88 159.49
Manufacture of Builders' Carpentry & Joinery 7.32 157.05 161.29 156.64 158.88 159.49 MANUFACTURE OF PAPER & PAPER PRODUCTS 15.86 180.19 184.66 196.04 194.56 185.84
Manufacture of pulp, paper and paperboard 9.07 206.61 212.95 225.99 223.13 211.59 Manufacture of corrugated paper and paperboard and of containers of paper and paperboard
2.93 128.10 133.87 146.08 146.30 141.44
Manufacture of other articles of paper and paperboard 3.86 134.24 128.56 133.58 136.61 135.93 PRINTING AND REPRODUCTION OF RECORDED MEDIA 25.33 153.26 158.00 156.54 159.65 137.73
Printing 25.33 153.26 158.00 156.54 159.65 137.73 MANUFACTURE OF CHEMICALS & CHEMICAL PRODUCTS
72.49 163.62 167.01 171.73 166.08 165.63
Manufacture of paints, varnishes and similar coatings, printing ink and mastics
10.06 147.19 150.13 157.02 153.03 157.37
Manufacture of Soap, Detergents, cleaning and Polishing preparations
49.97 170.97 174.60 178.30 168.20 166.29
Manufacture of Other chemical Products n.e.c 12.46 142.94 145.10 153.61 166.85 169.18 MANUFACTURE OF PHARMACEUTICALS, MEDICINAL CHEMICAL & BOTANICAL PRODUCTS
23.74 176.12 178.30 193.80 193.87 195.49
Manufacture of Pharmaceuticals, medicinal chemical and botanical products
23.74 176.12 178.30 193.80 193.87 195.49
MANUFACTURE OF RUBBER & PLASTIC PRODUCTS 26.45 152.56 155.24 158.93 159.33 153.83 Manufacture of Plastic products 26.45 152.56 155.24 158.93 159.33 153.83
MANUFACTURE OF OTHER NON-METALLIC MINERAL PRODUCTS
137.55 135.75 135.62 129.41 129.83 131.43
Manufacture of Clay Building Materials 58.24 121.97 120.56 121.70 136.17 139.28 Manufacture of Cement, Lime and Plaster 60.12 147.21 147.18 133.27 120.25 121.01 Manufacture of Articles of Concrete, cement and plaster 19.19 134.38 136.96 136.26 136.61 135.88
MANUFACTURE OF BASIC METALS 14.53 141.61 163.09 192.48 188.21 191.62 Manufacture of basic iron and steel 14.53 141.61 163.09 192.48 188.21 191.62
MANUFACTURE OF FABRICATED METAL PRODUCTS,EXCEPT MACHINERY AND EQUIPMENT
10.83 154.48 162.49 172.93 172.54 187.27
Manufacture of Other Fabricated Metals n.e.c 10.83 154.48 162.49 172.93 172.54 187.27 MANUFACTURE OF ELECTRICAL EQUIPMENT 15.24 151.94 155.01 165.13 168.95 164.82
Manufacture of Batteries and Accumulators 4.38 168.99 168.99 185.82 190.15 182.45 Manufacture of other electronic and electric wires and cables
10.86 143.72 148.56 155.10 158.68 156.44
MANUFACTURE OF FURNITURE 13.87 149.74 160.78 171.19 173.97 169.94 Manufacture of Furniture 13.87 149.74 160.78 171.19 173.97 169.94
PPI-UTILITIES 78.60 166.06 182.12 189.15 191.31 190.94 Water collection, treatment and supply 18.28 165.37 171.00 169.87 174.12 174.12 Electricity power generation, transmission and distribution 60.32 166.25 185.16 194.25 195.94 195.48
Source: Uganda Bureau of Statistics
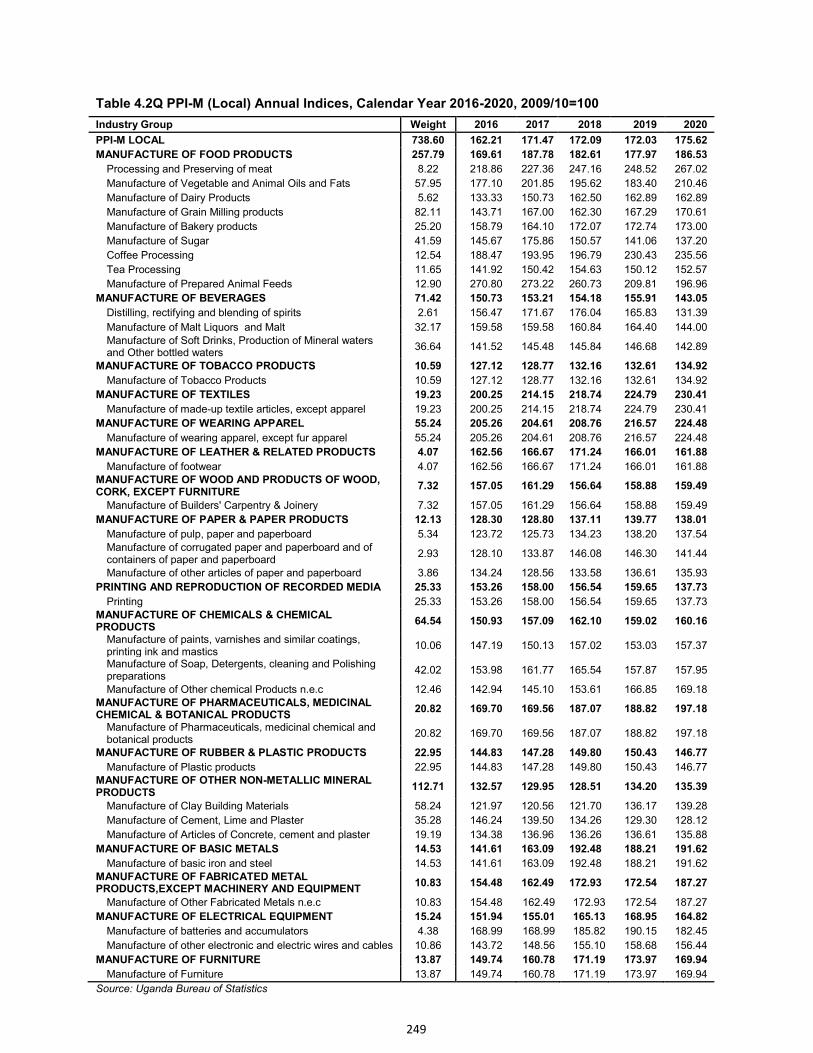
249
Table 4.2Q PPI-M (Local) Annual Indices, Calendar Year 2016-2020, 2009/10=100
Industry Group Weight 2016 2017 2018 2019 2020
PPI-M LOCAL 738.60 162.21 171.47 172.09 172.03 175.62
MANUFACTURE OF FOOD PRODUCTS 257.79 169.61 187.78 182.61 177.97 186.53
Processing and Preserving of meat 8.22 218.86 227.36 247.16 248.52 267.02
Manufacture of Vegetable and Animal Oils and Fats 57.95 177.10 201.85 195.62 183.40 210.46
Manufacture of Dairy Products 5.62 133.33 150.73 162.50 162.89 162.89
Manufacture of Grain Milling products 82.11 143.71 167.00 162.30 167.29 170.61
Manufacture of Bakery products 25.20 158.79 164.10 172.07 172.74 173.00
Manufacture of Sugar 41.59 145.67 175.86 150.57 141.06 137.20
Coffee Processing 12.54 188.47 193.95 196.79 230.43 235.56
Tea Processing 11.65 141.92 150.42 154.63 150.12 152.57
Manufacture of Prepared Animal Feeds 12.90 270.80 273.22 260.73 209.81 196.96
MANUFACTURE OF BEVERAGES 71.42 150.73 153.21 154.18 155.91 143.05
Distilling, rectifying and blending of spirits 2.61 156.47 171.67 176.04 165.83 131.39
Manufacture of Malt Liquors and Malt 32.17 159.58 159.58 160.84 164.40 144.00
Manufacture of Soft Drinks, Production of Mineral waters and Other bottled waters
36.64 141.52 145.48 145.84 146.68 142.89
MANUFACTURE OF TOBACCO PRODUCTS 10.59 127.12 128.77 132.16 132.61 134.92
Manufacture of Tobacco Products 10.59 127.12 128.77 132.16 132.61 134.92
MANUFACTURE OF TEXTILES 19.23 200.25 214.15 218.74 224.79 230.41
Manufacture of made-up textile articles, except apparel 19.23 200.25 214.15 218.74 224.79 230.41
MANUFACTURE OF WEARING APPAREL 55.24 205.26 204.61 208.76 216.57 224.48
Manufacture of wearing apparel, except fur apparel 55.24 205.26 204.61 208.76 216.57 224.48
MANUFACTURE OF LEATHER & RELATED PRODUCTS 4.07 162.56 166.67 171.24 166.01 161.88
Manufacture of footwear 4.07 162.56 166.67 171.24 166.01 161.88 MANUFACTURE OF WOOD AND PRODUCTS OF WOOD, CORK, EXCEPT FURNITURE
7.32 157.05 161.29 156.64 158.88 159.49
Manufacture of Builders' Carpentry & Joinery 7.32 157.05 161.29 156.64 158.88 159.49
MANUFACTURE OF PAPER & PAPER PRODUCTS 12.13 128.30 128.80 137.11 139.77 138.01
Manufacture of pulp, paper and paperboard 5.34 123.72 125.73 134.23 138.20 137.54
Manufacture of corrugated paper and paperboard and of containers of paper and paperboard
2.93 128.10 133.87 146.08 146.30 141.44
Manufacture of other articles of paper and paperboard 3.86 134.24 128.56 133.58 136.61 135.93
PRINTING AND REPRODUCTION OF RECORDED MEDIA 25.33 153.26 158.00 156.54 159.65 137.73
Printing 25.33 153.26 158.00 156.54 159.65 137.73 MANUFACTURE OF CHEMICALS & CHEMICAL PRODUCTS
64.54 150.93 157.09 162.10 159.02 160.16
Manufacture of paints, varnishes and similar coatings, printing ink and mastics
10.06 147.19 150.13 157.02 153.03 157.37
Manufacture of Soap, Detergents, cleaning and Polishing preparations
42.02 153.98 161.77 165.54 157.87 157.95
Manufacture of Other chemical Products n.e.c 12.46 142.94 145.10 153.61 166.85 169.18 MANUFACTURE OF PHARMACEUTICALS, MEDICINAL CHEMICAL & BOTANICAL PRODUCTS
20.82 169.70 169.56 187.07 188.82 197.18
Manufacture of Pharmaceuticals, medicinal chemical and botanical products
20.82 169.70 169.56 187.07 188.82 197.18
MANUFACTURE OF RUBBER & PLASTIC PRODUCTS 22.95 144.83 147.28 149.80 150.43 146.77
Manufacture of Plastic products 22.95 144.83 147.28 149.80 150.43 146.77 MANUFACTURE OF OTHER NON-METALLIC MINERAL PRODUCTS
112.71 132.57 129.95 128.51 134.20 135.39
Manufacture of Clay Building Materials 58.24 121.97 120.56 121.70 136.17 139.28
Manufacture of Cement, Lime and Plaster 35.28 146.24 139.50 134.26 129.30 128.12
Manufacture of Articles of Concrete, cement and plaster 19.19 134.38 136.96 136.26 136.61 135.88
MANUFACTURE OF BASIC METALS 14.53 141.61 163.09 192.48 188.21 191.62
Manufacture of basic iron and steel 14.53 141.61 163.09 192.48 188.21 191.62
MANUFACTURE OF FABRICATED METAL PRODUCTS,EXCEPT MACHINERY AND EQUIPMENT
10.83 154.48 162.49 172.93 172.54 187.27
Manufacture of Other Fabricated Metals n.e.c 10.83 154.48 162.49 172.93 172.54 187.27
MANUFACTURE OF ELECTRICAL EQUIPMENT 15.24 151.94 155.01 165.13 168.95 164.82
Manufacture of batteries and accumulators 4.38 168.99 168.99 185.82 190.15 182.45
Manufacture of other electronic and electric wires and cables 10.86 143.72 148.56 155.10 158.68 156.44
MANUFACTURE OF FURNITURE 13.87 149.74 160.78 171.19 173.97 169.94
Manufacture of Furniture 13.87 149.74 160.78 171.19 173.97 169.94
Source: Uganda Bureau of Statistics
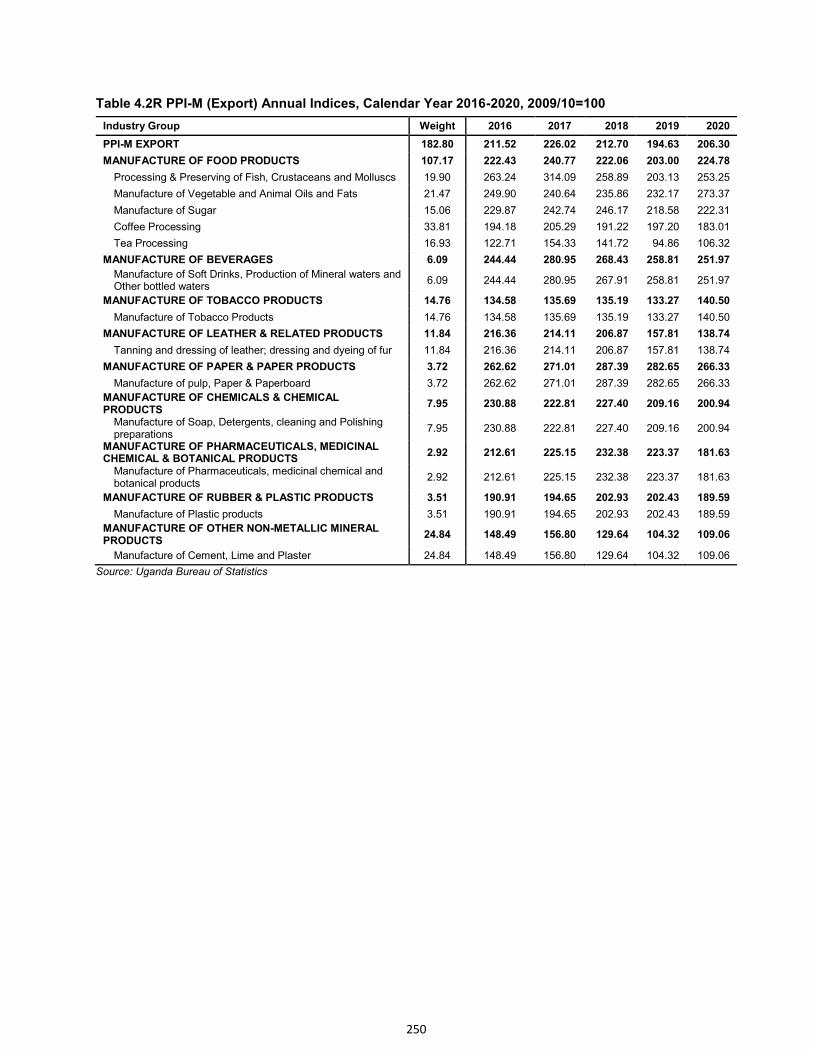
250
Table 4.2R PPI-M (Export) Annual Indices, Calendar Year 2016-2020, 2009/10=100
Industry Group Weight 2016 2017 2018 2019 2020
PPI-M EXPORT 182.80 211.52 226.02 212.70 194.63 206.30
MANUFACTURE OF FOOD PRODUCTS 107.17 222.43 240.77 222.06 203.00 224.78
Processing & Preserving of Fish, Crustaceans and Molluscs 19.90 263.24 314.09 258.89 203.13 253.25
Manufacture of Vegetable and Animal Oils and Fats 21.47 249.90 240.64 235.86 232.17 273.37
Manufacture of Sugar 15.06 229.87 242.74 246.17 218.58 222.31
Coffee Processing 33.81 194.18 205.29 191.22 197.20 183.01
Tea Processing 16.93 122.71 154.33 141.72 94.86 106.32
MANUFACTURE OF BEVERAGES 6.09 244.44 280.95 268.43 258.81 251.97
Manufacture of Soft Drinks, Production of Mineral waters and Other bottled waters
6.09 244.44 280.95 267.91 258.81 251.97
MANUFACTURE OF TOBACCO PRODUCTS 14.76 134.58 135.69 135.19 133.27 140.50
Manufacture of Tobacco Products 14.76 134.58 135.69 135.19 133.27 140.50
MANUFACTURE OF LEATHER & RELATED PRODUCTS 11.84 216.36 214.11 206.87 157.81 138.74
Tanning and dressing of leather; dressing and dyeing of fur 11.84 216.36 214.11 206.87 157.81 138.74
MANUFACTURE OF PAPER & PAPER PRODUCTS 3.72 262.62 271.01 287.39 282.65 266.33
Manufacture of pulp, Paper & Paperboard 3.72 262.62 271.01 287.39 282.65 266.33
MANUFACTURE OF CHEMICALS & CHEMICAL PRODUCTS
7.95 230.88 222.81 227.40 209.16 200.94
Manufacture of Soap, Detergents, cleaning and Polishing preparations
7.95 230.88 222.81 227.40 209.16 200.94
MANUFACTURE OF PHARMACEUTICALS, MEDICINAL CHEMICAL & BOTANICAL PRODUCTS
2.92 212.61 225.15 232.38 223.37 181.63
Manufacture of Pharmaceuticals, medicinal chemical and botanical products
2.92 212.61 225.15 232.38 223.37 181.63
MANUFACTURE OF RUBBER & PLASTIC PRODUCTS 3.51 190.91 194.65 202.93 202.43 189.59
Manufacture of Plastic products 3.51 190.91 194.65 202.93 202.43 189.59
MANUFACTURE OF OTHER NON-METALLIC MINERAL PRODUCTS
24.84 148.49 156.80 129.64 104.32 109.06
Manufacture of Cement, Lime and Plaster 24.84 148.49 156.80 129.64 104.32 109.06
Source: Uganda Bureau of Statistics
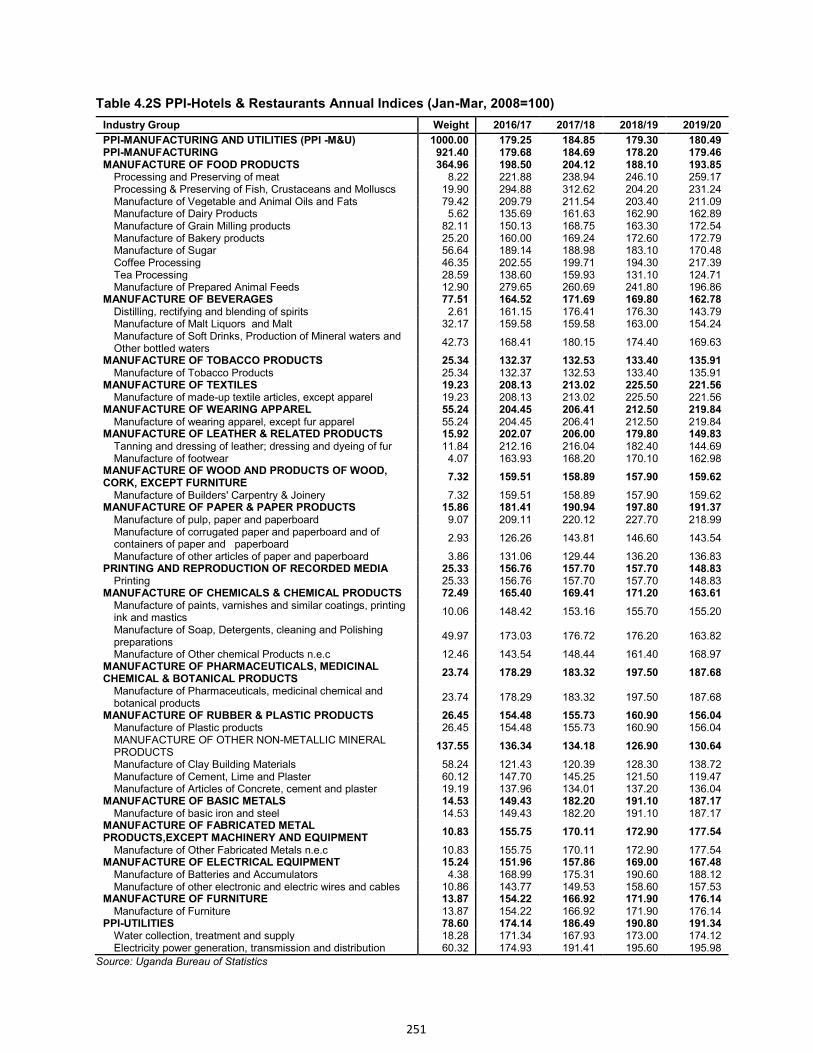
251
Table 4.2S PPI-Hotels & Restaurants Annual Indices (Jan-Mar, 2008=100)
Industry Group Weight 2016/17 2017/18 2018/19 2019/20
PPI-MANUFACTURING AND UTILITIES (PPI -M&U) 1000.00 179.25 184.85 179.30 180.49 PPI-MANUFACTURING 921.40 179.68 184.69 178.20 179.46 MANUFACTURE OF FOOD PRODUCTS 364.96 198.50 204.12 188.10 193.85
Processing and Preserving of meat 8.22 221.88 238.94 246.10 259.17 Processing & Preserving of Fish, Crustaceans and Molluscs 19.90 294.88 312.62 204.20 231.24 Manufacture of Vegetable and Animal Oils and Fats 79.42 209.79 211.54 203.40 211.09 Manufacture of Dairy Products 5.62 135.69 161.63 162.90 162.89 Manufacture of Grain Milling products 82.11 150.13 168.75 163.30 172.54 Manufacture of Bakery products 25.20 160.00 169.24 172.60 172.79 Manufacture of Sugar 56.64 189.14 188.98 183.10 170.48 Coffee Processing 46.35 202.55 199.71 194.30 217.39 Tea Processing 28.59 138.60 159.93 131.10 124.71 Manufacture of Prepared Animal Feeds 12.90 279.65 260.69 241.80 196.86
MANUFACTURE OF BEVERAGES 77.51 164.52 171.69 169.80 162.78 Distilling, rectifying and blending of spirits 2.61 161.15 176.41 176.30 143.79 Manufacture of Malt Liquors and Malt 32.17 159.58 159.58 163.00 154.24 Manufacture of Soft Drinks, Production of Mineral waters and Other bottled waters
42.73 168.41 180.15 174.40 169.63
MANUFACTURE OF TOBACCO PRODUCTS 25.34 132.37 132.53 133.40 135.91 Manufacture of Tobacco Products 25.34 132.37 132.53 133.40 135.91
MANUFACTURE OF TEXTILES 19.23 208.13 213.02 225.50 221.56 Manufacture of made-up textile articles, except apparel 19.23 208.13 213.02 225.50 221.56
MANUFACTURE OF WEARING APPAREL 55.24 204.45 206.41 212.50 219.84 Manufacture of wearing apparel, except fur apparel 55.24 204.45 206.41 212.50 219.84
MANUFACTURE OF LEATHER & RELATED PRODUCTS 15.92 202.07 206.00 179.80 149.83 Tanning and dressing of leather; dressing and dyeing of fur 11.84 212.16 216.04 182.40 144.69 Manufacture of footwear 4.07 163.93 168.20 170.10 162.98
MANUFACTURE OF WOOD AND PRODUCTS OF WOOD, CORK, EXCEPT FURNITURE
7.32 159.51 158.89 157.90 159.62
Manufacture of Builders' Carpentry & Joinery 7.32 159.51 158.89 157.90 159.62 MANUFACTURE OF PAPER & PAPER PRODUCTS 15.86 181.41 190.94 197.80 191.37
Manufacture of pulp, paper and paperboard 9.07 209.11 220.12 227.70 218.99 Manufacture of corrugated paper and paperboard and of containers of paper and paperboard
2.93 126.26 143.81 146.60 143.54
Manufacture of other articles of paper and paperboard 3.86 131.06 129.44 136.20 136.83 PRINTING AND REPRODUCTION OF RECORDED MEDIA 25.33 156.76 157.70 157.70 148.83
Printing 25.33 156.76 157.70 157.70 148.83 MANUFACTURE OF CHEMICALS & CHEMICAL PRODUCTS 72.49 165.40 169.41 171.20 163.61
Manufacture of paints, varnishes and similar coatings, printing ink and mastics
10.06 148.42 153.16 155.70 155.20
Manufacture of Soap, Detergents, cleaning and Polishing preparations
49.97 173.03 176.72 176.20 163.82
Manufacture of Other chemical Products n.e.c 12.46 143.54 148.44 161.40 168.97 MANUFACTURE OF PHARMACEUTICALS, MEDICINAL CHEMICAL & BOTANICAL PRODUCTS
23.74 178.29 183.32 197.50 187.68
Manufacture of Pharmaceuticals, medicinal chemical and botanical products
23.74 178.29 183.32 197.50 187.68
MANUFACTURE OF RUBBER & PLASTIC PRODUCTS 26.45 154.48 155.73 160.90 156.04 Manufacture of Plastic products 26.45 154.48 155.73 160.90 156.04 MANUFACTURE OF OTHER NON-METALLIC MINERAL PRODUCTS
137.55 136.34 134.18 126.90 130.64
Manufacture of Clay Building Materials 58.24 121.43 120.39 128.30 138.72 Manufacture of Cement, Lime and Plaster 60.12 147.70 145.25 121.50 119.47 Manufacture of Articles of Concrete, cement and plaster 19.19 137.96 134.01 137.20 136.04
MANUFACTURE OF BASIC METALS 14.53 149.43 182.20 191.10 187.17 Manufacture of basic iron and steel 14.53 149.43 182.20 191.10 187.17
MANUFACTURE OF FABRICATED METAL PRODUCTS,EXCEPT MACHINERY AND EQUIPMENT
10.83 155.75 170.11 172.90 177.54
Manufacture of Other Fabricated Metals n.e.c 10.83 155.75 170.11 172.90 177.54 MANUFACTURE OF ELECTRICAL EQUIPMENT 15.24 151.96 157.86 169.00 167.48
Manufacture of Batteries and Accumulators 4.38 168.99 175.31 190.60 188.12 Manufacture of other electronic and electric wires and cables 10.86 143.77 149.53 158.60 157.53
MANUFACTURE OF FURNITURE 13.87 154.22 166.92 171.90 176.14 Manufacture of Furniture 13.87 154.22 166.92 171.90 176.14
PPI-UTILITIES 78.60 174.14 186.49 190.80 191.34 Water collection, treatment and supply 18.28 171.34 167.93 173.00 174.12 Electricity power generation, transmission and distribution 60.32 174.93 191.41 195.60 195.98
Source: Uganda Bureau of Statistics
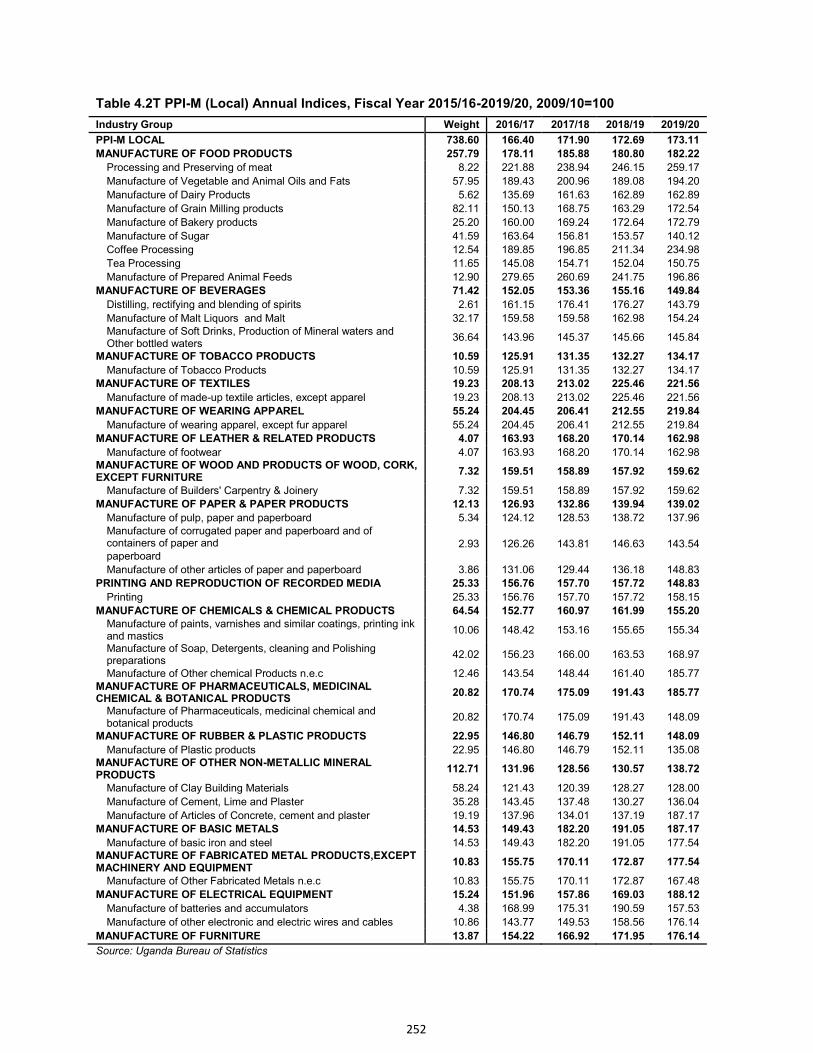
252
Table 4.2T PPI-M (Local) Annual Indices, Fiscal Year 2015/16-2019/20, 2009/10=100
Industry Group Weight 2016/17 2017/18 2018/19 2019/20
PPI-M LOCAL 738.60 166.40 171.90 172.69 173.11
MANUFACTURE OF FOOD PRODUCTS 257.79 178.11 185.88 180.80 182.22
Processing and Preserving of meat 8.22 221.88 238.94 246.15 259.17
Manufacture of Vegetable and Animal Oils and Fats 57.95 189.43 200.96 189.08 194.20
Manufacture of Dairy Products 5.62 135.69 161.63 162.89 162.89
Manufacture of Grain Milling products 82.11 150.13 168.75 163.29 172.54
Manufacture of Bakery products 25.20 160.00 169.24 172.64 172.79
Manufacture of Sugar 41.59 163.64 156.81 153.57 140.12
Coffee Processing 12.54 189.85 196.85 211.34 234.98
Tea Processing 11.65 145.08 154.71 152.04 150.75
Manufacture of Prepared Animal Feeds 12.90 279.65 260.69 241.75 196.86
MANUFACTURE OF BEVERAGES 71.42 152.05 153.36 155.16 149.84
Distilling, rectifying and blending of spirits 2.61 161.15 176.41 176.27 143.79
Manufacture of Malt Liquors and Malt 32.17 159.58 159.58 162.98 154.24 Manufacture of Soft Drinks, Production of Mineral waters and Other bottled waters
36.64 143.96 145.37 145.66 145.84
MANUFACTURE OF TOBACCO PRODUCTS 10.59 125.91 131.35 132.27 134.17
Manufacture of Tobacco Products 10.59 125.91 131.35 132.27 134.17
MANUFACTURE OF TEXTILES 19.23 208.13 213.02 225.46 221.56
Manufacture of made-up textile articles, except apparel 19.23 208.13 213.02 225.46 221.56
MANUFACTURE OF WEARING APPAREL 55.24 204.45 206.41 212.55 219.84
Manufacture of wearing apparel, except fur apparel 55.24 204.45 206.41 212.55 219.84
MANUFACTURE OF LEATHER & RELATED PRODUCTS 4.07 163.93 168.20 170.14 162.98
Manufacture of footwear 4.07 163.93 168.20 170.14 162.98 MANUFACTURE OF WOOD AND PRODUCTS OF WOOD, CORK, EXCEPT FURNITURE
7.32 159.51 158.89 157.92 159.62
Manufacture of Builders' Carpentry & Joinery 7.32 159.51 158.89 157.92 159.62
MANUFACTURE OF PAPER & PAPER PRODUCTS 12.13 126.93 132.86 139.94 139.02
Manufacture of pulp, paper and paperboard 5.34 124.12 128.53 138.72 137.96 Manufacture of corrugated paper and paperboard and of containers of paper and 2.93 126.26 143.81 146.63 143.54 paperboard
Manufacture of other articles of paper and paperboard 3.86 131.06 129.44 136.18 148.83
PRINTING AND REPRODUCTION OF RECORDED MEDIA 25.33 156.76 157.70 157.72 148.83
Printing 25.33 156.76 157.70 157.72 158.15
MANUFACTURE OF CHEMICALS & CHEMICAL PRODUCTS 64.54 152.77 160.97 161.99 155.20 Manufacture of paints, varnishes and similar coatings, printing ink and mastics
10.06 148.42 153.16 155.65 155.34
Manufacture of Soap, Detergents, cleaning and Polishing preparations
42.02 156.23 166.00 163.53 168.97
Manufacture of Other chemical Products n.e.c 12.46 143.54 148.44 161.40 185.77 MANUFACTURE OF PHARMACEUTICALS, MEDICINAL CHEMICAL & BOTANICAL PRODUCTS
20.82 170.74 175.09 191.43 185.77
Manufacture of Pharmaceuticals, medicinal chemical and botanical products
20.82 170.74 175.09 191.43 148.09
MANUFACTURE OF RUBBER & PLASTIC PRODUCTS 22.95 146.80 146.79 152.11 148.09
Manufacture of Plastic products 22.95 146.80 146.79 152.11 135.08 MANUFACTURE OF OTHER NON-METALLIC MINERAL PRODUCTS
112.71 131.96 128.56 130.57 138.72
Manufacture of Clay Building Materials 58.24 121.43 120.39 128.27 128.00
Manufacture of Cement, Lime and Plaster 35.28 143.45 137.48 130.27 136.04
Manufacture of Articles of Concrete, cement and plaster 19.19 137.96 134.01 137.19 187.17
MANUFACTURE OF BASIC METALS 14.53 149.43 182.20 191.05 187.17
Manufacture of basic iron and steel 14.53 149.43 182.20 191.05 177.54 MANUFACTURE OF FABRICATED METAL PRODUCTS,EXCEPT MACHINERY AND EQUIPMENT
10.83 155.75 170.11 172.87 177.54
Manufacture of Other Fabricated Metals n.e.c 10.83 155.75 170.11 172.87 167.48
MANUFACTURE OF ELECTRICAL EQUIPMENT 15.24 151.96 157.86 169.03 188.12
Manufacture of batteries and accumulators 4.38 168.99 175.31 190.59 157.53
Manufacture of other electronic and electric wires and cables 10.86 143.77 149.53 158.56 176.14
MANUFACTURE OF FURNITURE 13.87 154.22 166.92 171.95 176.14
Source: Uganda Bureau of Statistics
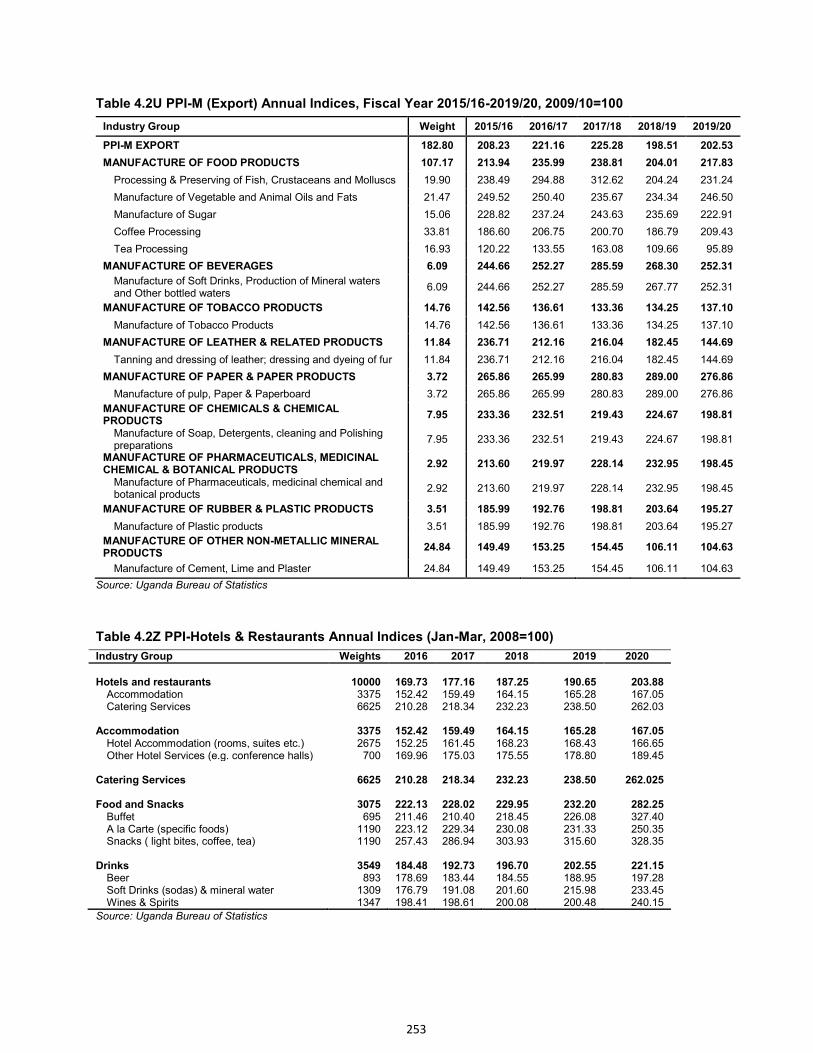
253
Table 4.2U PPI-M (Export) Annual Indices, Fiscal Year 2015/16-2019/20, 2009/10=100
Industry Group Weight 2015/16 2016/17 2017/18 2018/19 2019/20
PPI-M EXPORT 182.80 208.23 221.16 225.28 198.51 202.53
MANUFACTURE OF FOOD PRODUCTS 107.17 213.94 235.99 238.81 204.01 217.83
Processing & Preserving of Fish, Crustaceans and Molluscs 19.90 238.49 294.88 312.62 204.24 231.24
Manufacture of Vegetable and Animal Oils and Fats 21.47 249.52 250.40 235.67 234.34 246.50
Manufacture of Sugar 15.06 228.82 237.24 243.63 235.69 222.91
Coffee Processing 33.81 186.60 206.75 200.70 186.79 209.43
Tea Processing 16.93 120.22 133.55 163.08 109.66 95.89
MANUFACTURE OF BEVERAGES 6.09 244.66 252.27 285.59 268.30 252.31
Manufacture of Soft Drinks, Production of Mineral waters and Other bottled waters
6.09 244.66 252.27 285.59 267.77 252.31
MANUFACTURE OF TOBACCO PRODUCTS 14.76 142.56 136.61 133.36 134.25 137.10
Manufacture of Tobacco Products 14.76 142.56 136.61 133.36 134.25 137.10
MANUFACTURE OF LEATHER & RELATED PRODUCTS 11.84 236.71 212.16 216.04 182.45 144.69
Tanning and dressing of leather; dressing and dyeing of fur 11.84 236.71 212.16 216.04 182.45 144.69
MANUFACTURE OF PAPER & PAPER PRODUCTS 3.72 265.86 265.99 280.83 289.00 276.86
Manufacture of pulp, Paper & Paperboard 3.72 265.86 265.99 280.83 289.00 276.86
MANUFACTURE OF CHEMICALS & CHEMICAL PRODUCTS
7.95 233.36 232.51 219.43 224.67 198.81
Manufacture of Soap, Detergents, cleaning and Polishing preparations
7.95 233.36 232.51 219.43 224.67 198.81
MANUFACTURE OF PHARMACEUTICALS, MEDICINAL CHEMICAL & BOTANICAL PRODUCTS
2.92 213.60 219.97 228.14 232.95 198.45
Manufacture of Pharmaceuticals, medicinal chemical and botanical products
2.92 213.60 219.97 228.14 232.95 198.45
MANUFACTURE OF RUBBER & PLASTIC PRODUCTS 3.51 185.99 192.76 198.81 203.64 195.27
Manufacture of Plastic products 3.51 185.99 192.76 198.81 203.64 195.27
MANUFACTURE OF OTHER NON-METALLIC MINERAL PRODUCTS
24.84 149.49 153.25 154.45 106.11 104.63
Manufacture of Cement, Lime and Plaster 24.84 149.49 153.25 154.45 106.11 104.63
Source: Uganda Bureau of Statistics
Table 4.2Z PPI-Hotels & Restaurants Annual Indices (Jan-Mar, 2008=100)
Industry Group Weights 2016 2017 2018 2019 2020
Hotels and restaurants 10000 169.73 177.16 187.25 190.65 203.88
Accommodation 3375 152.42 159.49 164.15 165.28 167.05 Catering Services 6625 210.28 218.34 232.23 238.50 262.03
Accommodation 3375 152.42 159.49 164.15 165.28 167.05
Hotel Accommodation (rooms, suites etc.) 2675 152.25 161.45 168.23 168.43 166.65 Other Hotel Services (e.g. conference halls) 700 169.96 175.03 175.55 178.80 189.45
Catering Services 6625 210.28 218.34 232.23 238.50 262.025
Food and Snacks 3075 222.13 228.02 229.95 232.20 282.25 Buffet 695 211.46 210.40 218.45 226.08 327.40 A la Carte (specific foods) 1190 223.12 229.34 230.08 231.33 250.35 Snacks ( light bites, coffee, tea) 1190 257.43 286.94 303.93 315.60 328.35
Drinks 3549 184.48 192.73 196.70 202.55 221.15
Beer 893 178.69 183.44 184.55 188.95 197.28 Soft Drinks (sodas) & mineral water 1309 176.79 191.08 201.60 215.98 233.45 Wines & Spirits 1347 198.41 198.61 200.08 200.48 240.15
Source: Uganda Bureau of Statistics
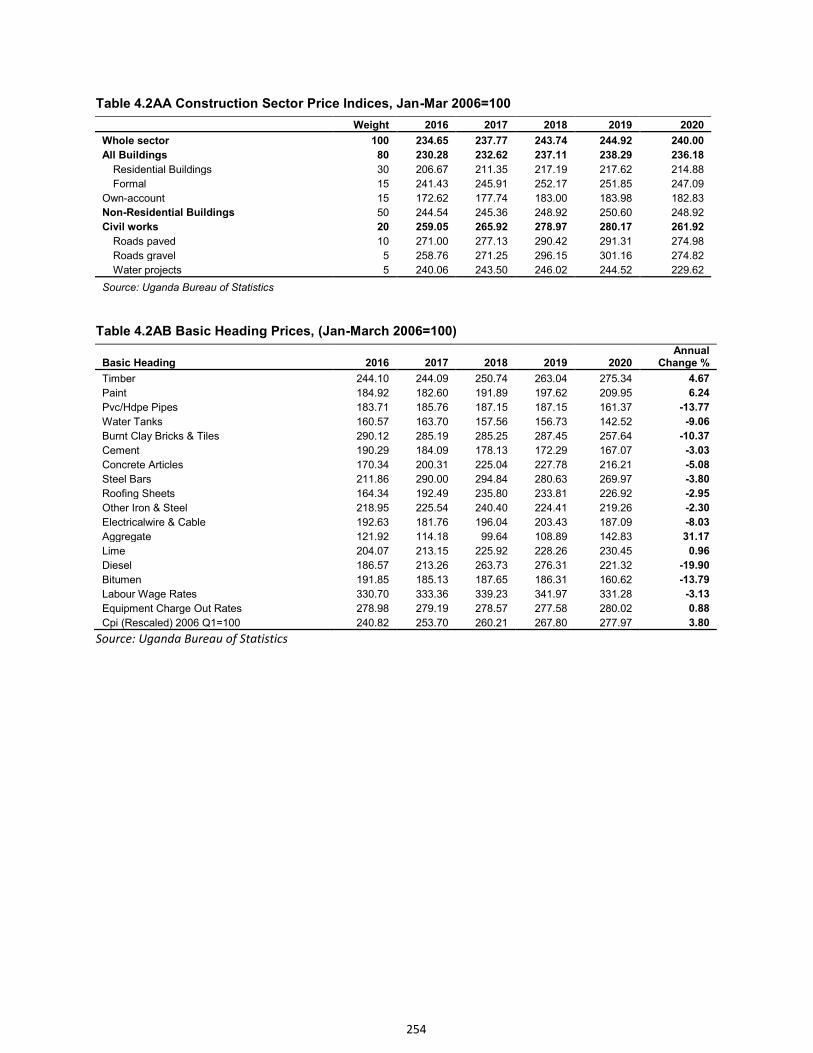
254
Table 4.2AA Construction Sector Price Indices, Jan-Mar 2006=100
Weight 2016 2017 2018 2019 2020
Whole sector 100 234.65 237.77 243.74 244.92 240.00
All Buildings 80 230.28 232.62 237.11 238.29 236.18
Residential Buildings 30 206.67 211.35 217.19 217.62 214.88
Formal 15 241.43 245.91 252.17 251.85 247.09
Own-account 15 172.62 177.74 183.00 183.98 182.83
Non-Residential Buildings 50 244.54 245.36 248.92 250.60 248.92
Civil works 20 259.05 265.92 278.97 280.17 261.92
Roads paved 10 271.00 277.13 290.42 291.31 274.98
Roads gravel 5 258.76 271.25 296.15 301.16 274.82
Water projects 5 240.06 243.50 246.02 244.52 229.62
Source: Uganda Bureau of Statistics
Table 4.2AB Basic Heading Prices, (Jan-March 2006=100)
Basic Heading 2016 2017 2018 2019 2020 Annual
Change %
Timber 244.10 244.09 250.74 263.04 275.34 4.67
Paint 184.92 182.60 191.89 197.62 209.95 6.24
Pvc/Hdpe Pipes 183.71 185.76 187.15 187.15 161.37 -13.77
Water Tanks 160.57 163.70 157.56 156.73 142.52 -9.06
Burnt Clay Bricks & Tiles 290.12 285.19 285.25 287.45 257.64 -10.37
Cement 190.29 184.09 178.13 172.29 167.07 -3.03
Concrete Articles 170.34 200.31 225.04 227.78 216.21 -5.08
Steel Bars 211.86 290.00 294.84 280.63 269.97 -3.80
Roofing Sheets 164.34 192.49 235.80 233.81 226.92 -2.95
Other Iron & Steel 218.95 225.54 240.40 224.41 219.26 -2.30
Electricalwire & Cable 192.63 181.76 196.04 203.43 187.09 -8.03
Aggregate 121.92 114.18 99.64 108.89 142.83 31.17
Lime 204.07 213.15 225.92 228.26 230.45 0.96
Diesel 186.57 213.26 263.73 276.31 221.32 -19.90
Bitumen 191.85 185.13 187.65 186.31 160.62 -13.79
Labour Wage Rates 330.70 333.36 339.23 341.97 331.28 -3.13
Equipment Charge Out Rates 278.98 279.19 278.57 277.58 280.02 0.88
Cpi (Rescaled) 2006 Q1=100 240.82 253.70 260.21 267.80 277.97 3.80
Source: Uganda Bureau of Statistics
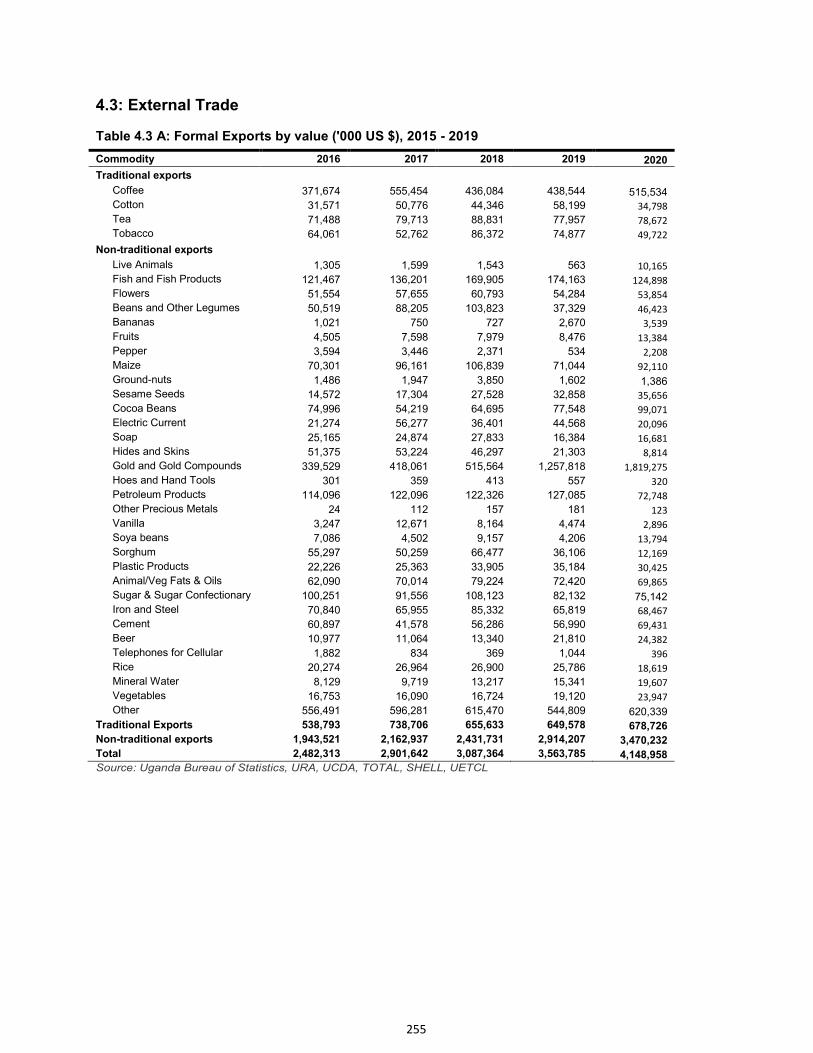
255
4.3: External Trade
Table 4.3 A: Formal Exports by value ('000 US $), 2015 - 2019
Commodity 2016 2017 2018 2019 2020
Traditional exports
Coffee 371,674 555,454 436,084 438,544 515,534 Cotton 31,571 50,776 44,346 58,199 34,798 Tea 71,488 79,713 88,831 77,957 78,672 Tobacco 64,061 52,762 86,372 74,877 49,722
Non-traditional exports
Live Animals 1,305 1,599 1,543 563 10,165 Fish and Fish Products 121,467 136,201 169,905 174,163 124,898 Flowers 51,554 57,655 60,793 54,284 53,854 Beans and Other Legumes 50,519 88,205 103,823 37,329 46,423 Bananas 1,021 750 727 2,670 3,539 Fruits 4,505 7,598 7,979 8,476 13,384 Pepper 3,594 3,446 2,371 534 2,208 Maize 70,301 96,161 106,839 71,044 92,110 Ground-nuts 1,486 1,947 3,850 1,602 1,386 Sesame Seeds 14,572 17,304 27,528 32,858 35,656 Cocoa Beans 74,996 54,219 64,695 77,548 99,071 Electric Current 21,274 56,277 36,401 44,568 20,096 Soap 25,165 24,874 27,833 16,384 16,681 Hides and Skins 51,375 53,224 46,297 21,303 8,814 Gold and Gold Compounds 339,529 418,061 515,564 1,257,818 1,819,275 Hoes and Hand Tools 301 359 413 557 320 Petroleum Products 114,096 122,096 122,326 127,085 72,748 Other Precious Metals 24 112 157 181 123 Vanilla 3,247 12,671 8,164 4,474 2,896 Soya beans 7,086 4,502 9,157 4,206 13,794 Sorghum 55,297 50,259 66,477 36,106 12,169 Plastic Products 22,226 25,363 33,905 35,184 30,425 Animal/Veg Fats & Oils 62,090 70,014 79,224 72,420 69,865 Sugar & Sugar Confectionary 100,251 91,556 108,123 82,132 75,142 Iron and Steel 70,840 65,955 85,332 65,819 68,467 Cement 60,897 41,578 56,286 56,990 69,431 Beer 10,977 11,064 13,340 21,810 24,382 Telephones for Cellular 1,882 834 369 1,044 396 Rice 20,274 26,964 26,900 25,786 18,619 Mineral Water 8,129 9,719 13,217 15,341 19,607 Vegetables 16,753 16,090 16,724 19,120 23,947 Other 556,491 596,281 615,470 544,809 620,339
Traditional Exports 538,793 738,706 655,633 649,578 678,726
Non-traditional exports 1,943,521 2,162,937 2,431,731 2,914,207 3,470,232
Total 2,482,313 2,901,642 3,087,364 3,563,785 4,148,958 Source: Uganda Bureau of Statistics, URA, UCDA, TOTAL, SHELL, UETCL
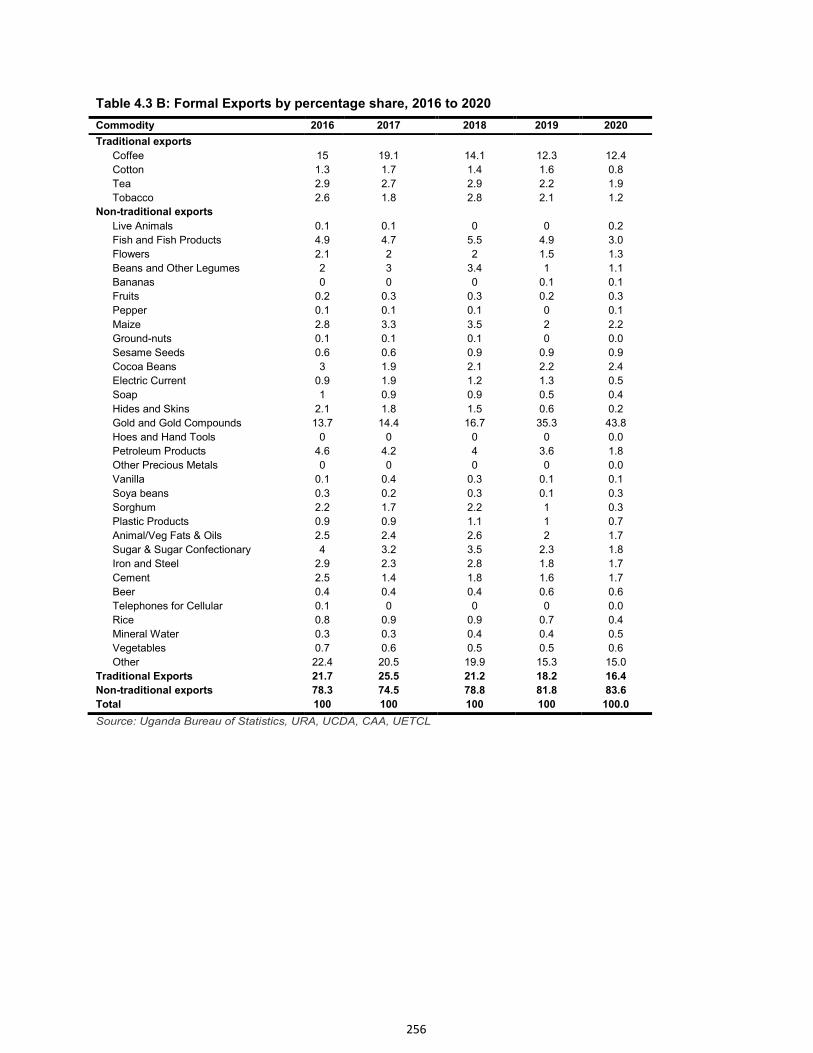
256
Table 4.3 B: Formal Exports by percentage share, 2016 to 2020
Commodity 2016 2017 2018 2019 2020
Traditional exports Coffee 15 19.1 14.1 12.3 12.4
Cotton 1.3 1.7 1.4 1.6 0.8
Tea 2.9 2.7 2.9 2.2 1.9
Tobacco 2.6 1.8 2.8 2.1 1.2
Non-traditional exports Live Animals 0.1 0.1 0 0 0.2
Fish and Fish Products 4.9 4.7 5.5 4.9 3.0
Flowers 2.1 2 2 1.5 1.3
Beans and Other Legumes 2 3 3.4 1 1.1
Bananas 0 0 0 0.1 0.1
Fruits 0.2 0.3 0.3 0.2 0.3
Pepper 0.1 0.1 0.1 0 0.1
Maize 2.8 3.3 3.5 2 2.2
Ground-nuts 0.1 0.1 0.1 0 0.0
Sesame Seeds 0.6 0.6 0.9 0.9 0.9
Cocoa Beans 3 1.9 2.1 2.2 2.4
Electric Current 0.9 1.9 1.2 1.3 0.5
Soap 1 0.9 0.9 0.5 0.4
Hides and Skins 2.1 1.8 1.5 0.6 0.2
Gold and Gold Compounds 13.7 14.4 16.7 35.3 43.8
Hoes and Hand Tools 0 0 0 0 0.0
Petroleum Products 4.6 4.2 4 3.6 1.8
Other Precious Metals 0 0 0 0 0.0
Vanilla 0.1 0.4 0.3 0.1 0.1
Soya beans 0.3 0.2 0.3 0.1 0.3
Sorghum 2.2 1.7 2.2 1 0.3
Plastic Products 0.9 0.9 1.1 1 0.7
Animal/Veg Fats & Oils 2.5 2.4 2.6 2 1.7
Sugar & Sugar Confectionary 4 3.2 3.5 2.3 1.8
Iron and Steel 2.9 2.3 2.8 1.8 1.7
Cement 2.5 1.4 1.8 1.6 1.7
Beer 0.4 0.4 0.4 0.6 0.6
Telephones for Cellular 0.1 0 0 0 0.0
Rice 0.8 0.9 0.9 0.7 0.4
Mineral Water 0.3 0.3 0.4 0.4 0.5
Vegetables 0.7 0.6 0.5 0.5 0.6
Other 22.4 20.5 19.9 15.3 15.0
Traditional Exports 21.7 25.5 21.2 18.2 16.4
Non-traditional exports 78.3 74.5 78.8 81.8 83.6
Total 100 100 100 100 100.0
Source: Uganda Bureau of Statistics, URA, UCDA, CAA, UETCL
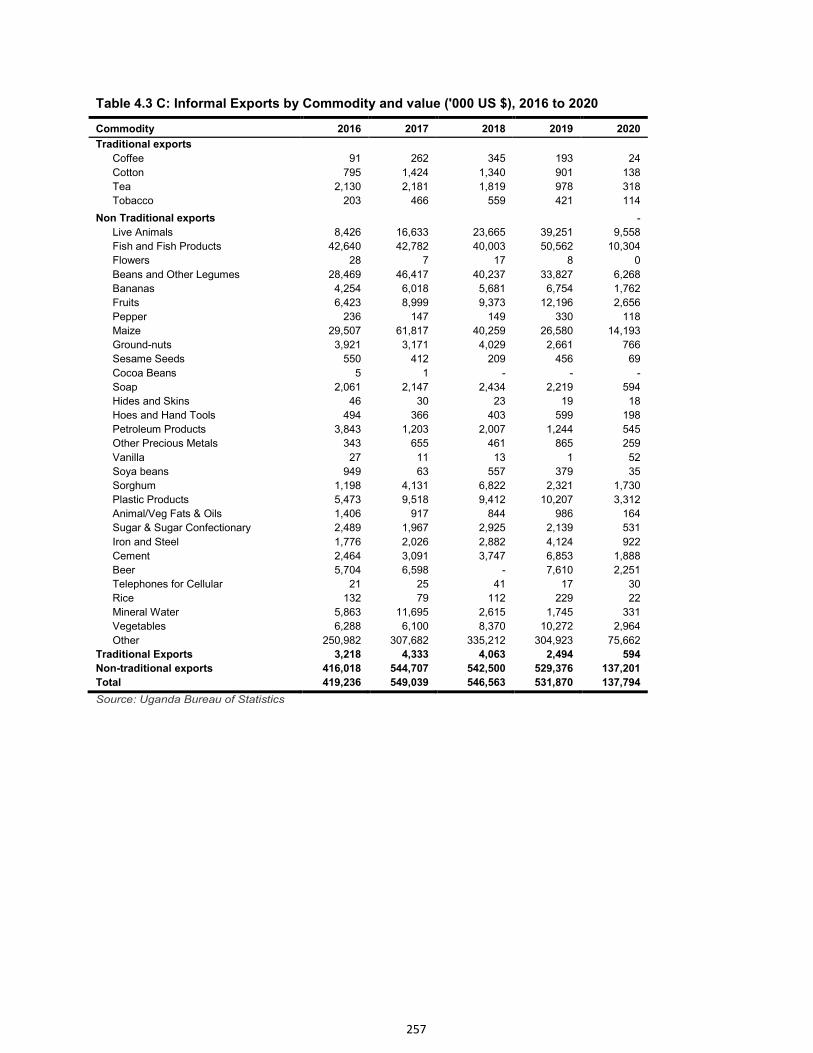
257
Table 4.3 C: Informal Exports by Commodity and value ('000 US $), 2016 to 2020
Commodity 2016 2017 2018 2019 2020
Traditional exports
Coffee 91 262 345 193 24
Cotton 795 1,424 1,340 901 138
Tea 2,130 2,181 1,819 978 318
Tobacco 203 466 559 421 114
Non Traditional exports
-
Live Animals 8,426 16,633 23,665 39,251 9,558
Fish and Fish Products 42,640 42,782 40,003 50,562 10,304
Flowers 28 7 17 8 0
Beans and Other Legumes 28,469 46,417 40,237 33,827 6,268
Bananas 4,254 6,018 5,681 6,754 1,762
Fruits 6,423 8,999 9,373 12,196 2,656
Pepper 236 147 149 330 118
Maize 29,507 61,817 40,259 26,580 14,193
Ground-nuts 3,921 3,171 4,029 2,661 766
Sesame Seeds 550 412 209 456 69
Cocoa Beans 5 1 - - -
Soap 2,061 2,147 2,434 2,219 594
Hides and Skins 46 30 23 19 18
Hoes and Hand Tools 494 366 403 599 198
Petroleum Products 3,843 1,203 2,007 1,244 545
Other Precious Metals 343 655 461 865 259
Vanilla 27 11 13 1 52
Soya beans 949 63 557 379 35
Sorghum 1,198 4,131 6,822 2,321 1,730
Plastic Products 5,473 9,518 9,412 10,207 3,312
Animal/Veg Fats & Oils 1,406 917 844 986 164
Sugar & Sugar Confectionary 2,489 1,967 2,925 2,139 531
Iron and Steel 1,776 2,026 2,882 4,124 922
Cement 2,464 3,091 3,747 6,853 1,888
Beer 5,704 6,598 - 7,610 2,251
Telephones for Cellular 21 25 41 17 30
Rice 132 79 112 229 22
Mineral Water 5,863 11,695 2,615 1,745 331
Vegetables 6,288 6,100 8,370 10,272 2,964
Other 250,982 307,682 335,212 304,923 75,662
Traditional Exports 3,218 4,333 4,063 2,494 594
Non-traditional exports 416,018 544,707 542,500 529,376 137,201
Total 419,236 549,039 546,563 531,870 137,794
Source: Uganda Bureau of Statistics
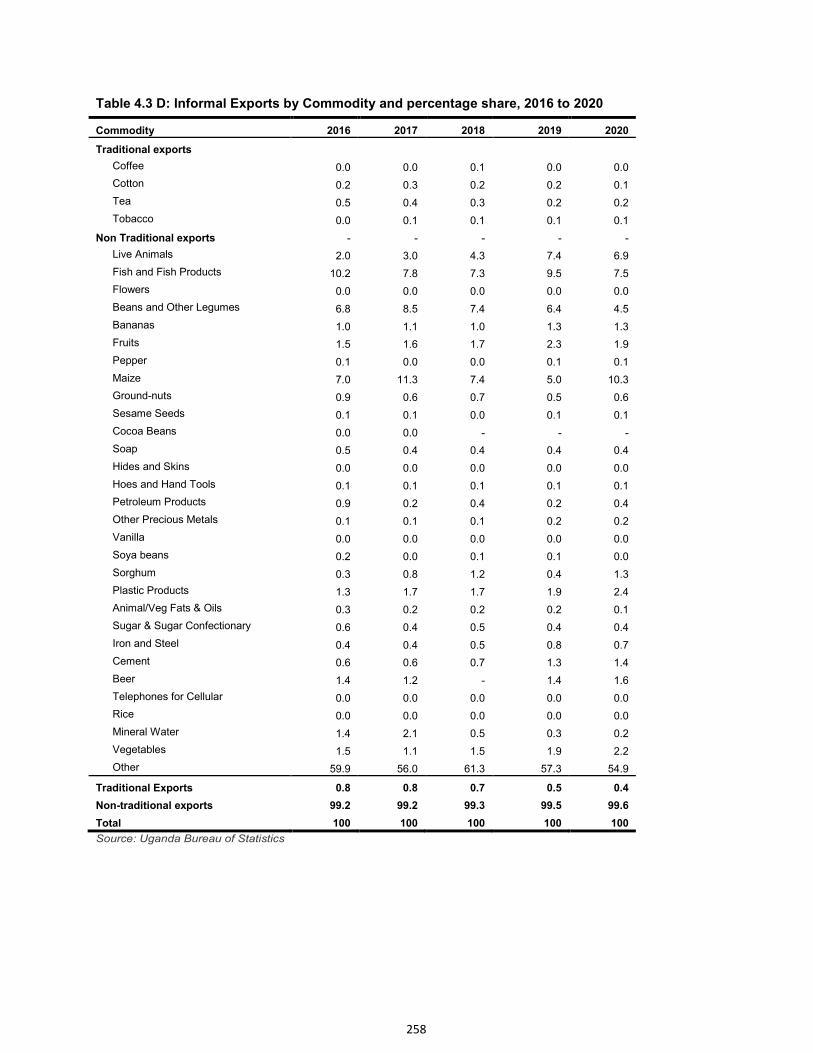
258
Table 4.3 D: Informal Exports by Commodity and percentage share, 2016 to 2020
Commodity 2016 2017 2018 2019 2020
Traditional exports
Coffee 0.0 0.0 0.1 0.0 0.0
Cotton 0.2 0.3 0.2 0.2 0.1
Tea 0.5 0.4 0.3 0.2 0.2
Tobacco 0.0 0.1 0.1 0.1 0.1
Non Traditional exports - - - - -
Live Animals 2.0 3.0 4.3 7.4 6.9
Fish and Fish Products 10.2 7.8 7.3 9.5 7.5
Flowers 0.0 0.0 0.0 0.0 0.0
Beans and Other Legumes 6.8 8.5 7.4 6.4 4.5
Bananas 1.0 1.1 1.0 1.3 1.3
Fruits 1.5 1.6 1.7 2.3 1.9
Pepper 0.1 0.0 0.0 0.1 0.1
Maize 7.0 11.3 7.4 5.0 10.3
Ground-nuts 0.9 0.6 0.7 0.5 0.6
Sesame Seeds 0.1 0.1 0.0 0.1 0.1
Cocoa Beans 0.0 0.0 - - -
Soap 0.5 0.4 0.4 0.4 0.4
Hides and Skins 0.0 0.0 0.0 0.0 0.0
Hoes and Hand Tools 0.1 0.1 0.1 0.1 0.1
Petroleum Products 0.9 0.2 0.4 0.2 0.4
Other Precious Metals 0.1 0.1 0.1 0.2 0.2
Vanilla 0.0 0.0 0.0 0.0 0.0
Soya beans 0.2 0.0 0.1 0.1 0.0
Sorghum 0.3 0.8 1.2 0.4 1.3
Plastic Products 1.3 1.7 1.7 1.9 2.4
Animal/Veg Fats & Oils 0.3 0.2 0.2 0.2 0.1
Sugar & Sugar Confectionary 0.6 0.4 0.5 0.4 0.4
Iron and Steel 0.4 0.4 0.5 0.8 0.7
Cement 0.6 0.6 0.7 1.3 1.4
Beer 1.4 1.2 - 1.4 1.6
Telephones for Cellular 0.0 0.0 0.0 0.0 0.0
Rice 0.0 0.0 0.0 0.0 0.0
Mineral Water 1.4 2.1 0.5 0.3 0.2
Vegetables 1.5 1.1 1.5 1.9 2.2
Other 59.9 56.0 61.3 57.3 54.9
Traditional Exports 0.8 0.8 0.7 0.5 0.4
Non-traditional exports 99.2 99.2 99.3 99.5 99.6
Total 100 100 100 100 100
Source: Uganda Bureau of Statistics
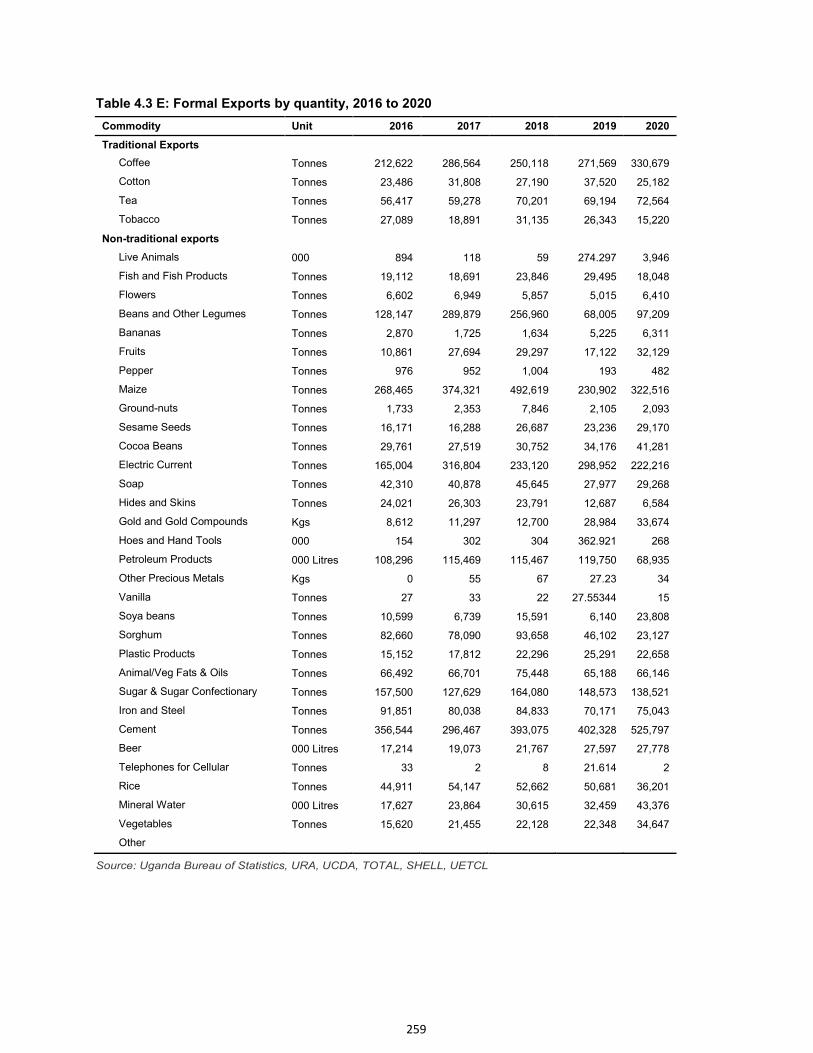
259
Table 4.3 E: Formal Exports by quantity, 2016 to 2020
Commodity Unit 2016 2017 2018 2019 2020
Traditional Exports
Coffee Tonnes 212,622 286,564 250,118 271,569 330,679
Cotton Tonnes 23,486 31,808 27,190 37,520 25,182
Tea Tonnes 56,417 59,278 70,201 69,194 72,564
Tobacco Tonnes 27,089 18,891 31,135 26,343 15,220
Non-traditional exports
Live Animals 000 894 118 59 274.297 3,946
Fish and Fish Products Tonnes 19,112 18,691 23,846 29,495 18,048
Flowers Tonnes 6,602 6,949 5,857 5,015 6,410
Beans and Other Legumes Tonnes 128,147 289,879 256,960 68,005 97,209
Bananas Tonnes 2,870 1,725 1,634 5,225 6,311
Fruits Tonnes 10,861 27,694 29,297 17,122 32,129
Pepper Tonnes 976 952 1,004 193 482
Maize Tonnes 268,465 374,321 492,619 230,902 322,516
Ground-nuts Tonnes 1,733 2,353 7,846 2,105 2,093
Sesame Seeds Tonnes 16,171 16,288 26,687 23,236 29,170
Cocoa Beans Tonnes 29,761 27,519 30,752 34,176 41,281
Electric Current Tonnes 165,004 316,804 233,120 298,952 222,216
Soap Tonnes 42,310 40,878 45,645 27,977 29,268
Hides and Skins Tonnes 24,021 26,303 23,791 12,687 6,584
Gold and Gold Compounds Kgs 8,612 11,297 12,700 28,984 33,674
Hoes and Hand Tools 000 154 302 304 362.921 268
Petroleum Products 000 Litres 108,296 115,469 115,467 119,750 68,935
Other Precious Metals Kgs 0 55 67 27.23 34
Vanilla Tonnes 27 33 22 27.55344 15
Soya beans Tonnes 10,599 6,739 15,591 6,140 23,808
Sorghum Tonnes 82,660 78,090 93,658 46,102 23,127
Plastic Products Tonnes 15,152 17,812 22,296 25,291 22,658
Animal/Veg Fats & Oils Tonnes 66,492 66,701 75,448 65,188 66,146
Sugar & Sugar Confectionary Tonnes 157,500 127,629 164,080 148,573 138,521
Iron and Steel Tonnes 91,851 80,038 84,833 70,171 75,043
Cement Tonnes 356,544 296,467 393,075 402,328 525,797
Beer 000 Litres 17,214 19,073 21,767 27,597 27,778
Telephones for Cellular Tonnes 33 2 8 21.614 2
Rice Tonnes 44,911 54,147 52,662 50,681 36,201
Mineral Water 000 Litres 17,627 23,864 30,615 32,459 43,376
Vegetables Tonnes 15,620 21,455 22,128 22,348 34,647
Other 532,855 879,588 849,655 663,349
Source: Uganda Bureau of Statistics, URA, UCDA, TOTAL, SHELL, UETCL
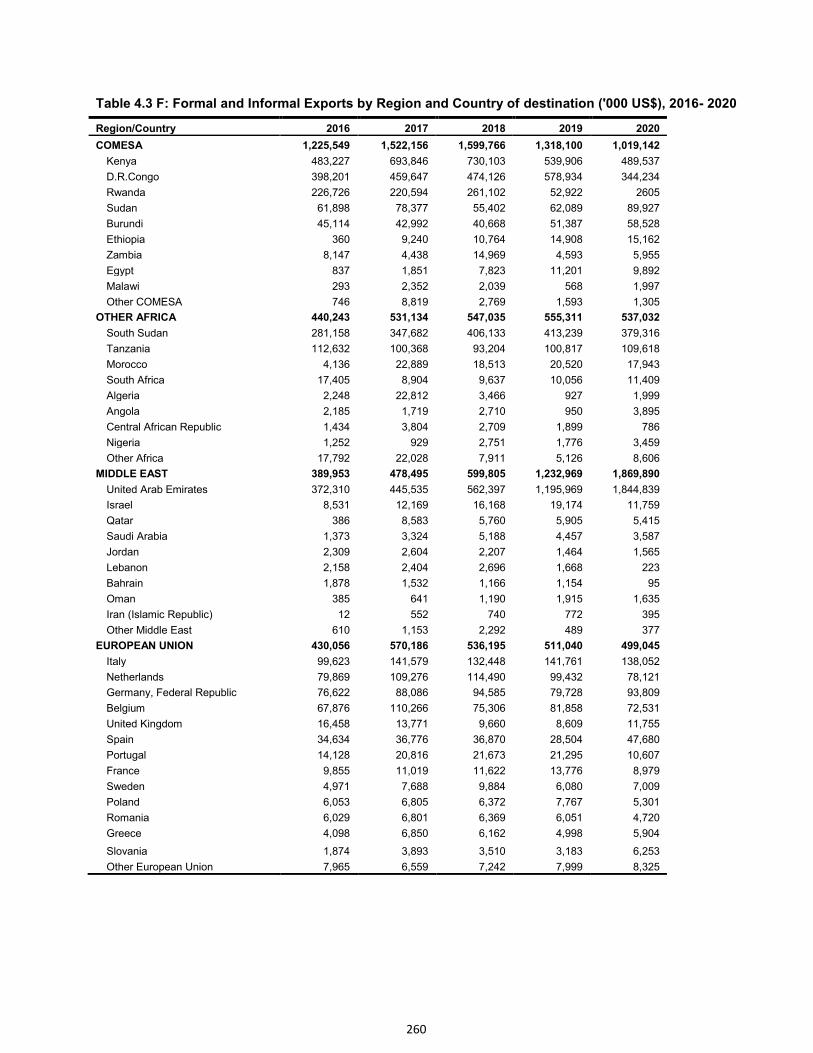
260
Table 4.3 F: Formal and Informal Exports by Region and Country of destination ('000 US$), 2016- 2020
Region/Country 2016 2017 2018 2019 2020
COMESA 1,225,549 1,522,156 1,599,766 1,318,100 1,019,142
Kenya 483,227 693,846 730,103 539,906 489,537
D.R.Congo 398,201 459,647 474,126 578,934 344,234
Rwanda 226,726 220,594 261,102 52,922 2605
Sudan 61,898 78,377 55,402 62,089 89,927
Burundi 45,114 42,992 40,668 51,387 58,528
Ethiopia 360 9,240 10,764 14,908 15,162
Zambia 8,147 4,438 14,969 4,593 5,955
Egypt 837 1,851 7,823 11,201 9,892
Malawi 293 2,352 2,039 568 1,997
Other COMESA 746 8,819 2,769 1,593 1,305
OTHER AFRICA 440,243 531,134 547,035 555,311 537,032
South Sudan 281,158 347,682 406,133 413,239 379,316
Tanzania 112,632 100,368 93,204 100,817 109,618
Morocco 4,136 22,889 18,513 20,520 17,943
South Africa 17,405 8,904 9,637 10,056 11,409
Algeria 2,248 22,812 3,466 927 1,999
Angola 2,185 1,719 2,710 950 3,895
Central African Republic 1,434 3,804 2,709 1,899 786
Nigeria 1,252 929 2,751 1,776 3,459
Other Africa 17,792 22,028 7,911 5,126 8,606
MIDDLE EAST 389,953 478,495 599,805 1,232,969 1,869,890
United Arab Emirates 372,310 445,535 562,397 1,195,969 1,844,839
Israel 8,531 12,169 16,168 19,174 11,759
Qatar 386 8,583 5,760 5,905 5,415
Saudi Arabia 1,373 3,324 5,188 4,457 3,587
Jordan 2,309 2,604 2,207 1,464 1,565
Lebanon 2,158 2,404 2,696 1,668 223
Bahrain 1,878 1,532 1,166 1,154 95
Oman 385 641 1,190 1,915 1,635
Iran (Islamic Republic) 12 552 740 772 395
Other Middle East 610 1,153 2,292 489 377
EUROPEAN UNION 430,056 570,186 536,195 511,040 499,045
Italy 99,623 141,579 132,448 141,761 138,052
Netherlands 79,869 109,276 114,490 99,432 78,121
Germany, Federal Republic 76,622 88,086 94,585 79,728 93,809
Belgium 67,876 110,266 75,306 81,858 72,531
United Kingdom 16,458 13,771 9,660 8,609 11,755
Spain 34,634 36,776 36,870 28,504 47,680
Portugal 14,128 20,816 21,673 21,295 10,607
France 9,855 11,019 11,622 13,776 8,979
Sweden 4,971 7,688 9,884 6,080 7,009
Poland 6,053 6,805 6,372 7,767 5,301
Romania 6,029 6,801 6,369 6,051 4,720
Greece 4,098 6,850 6,162 4,998 5,904
Slovania 1,874 3,893 3,510 3,183 6,253
Other European Union 7,965 6,559 7,242 7,999 8,325
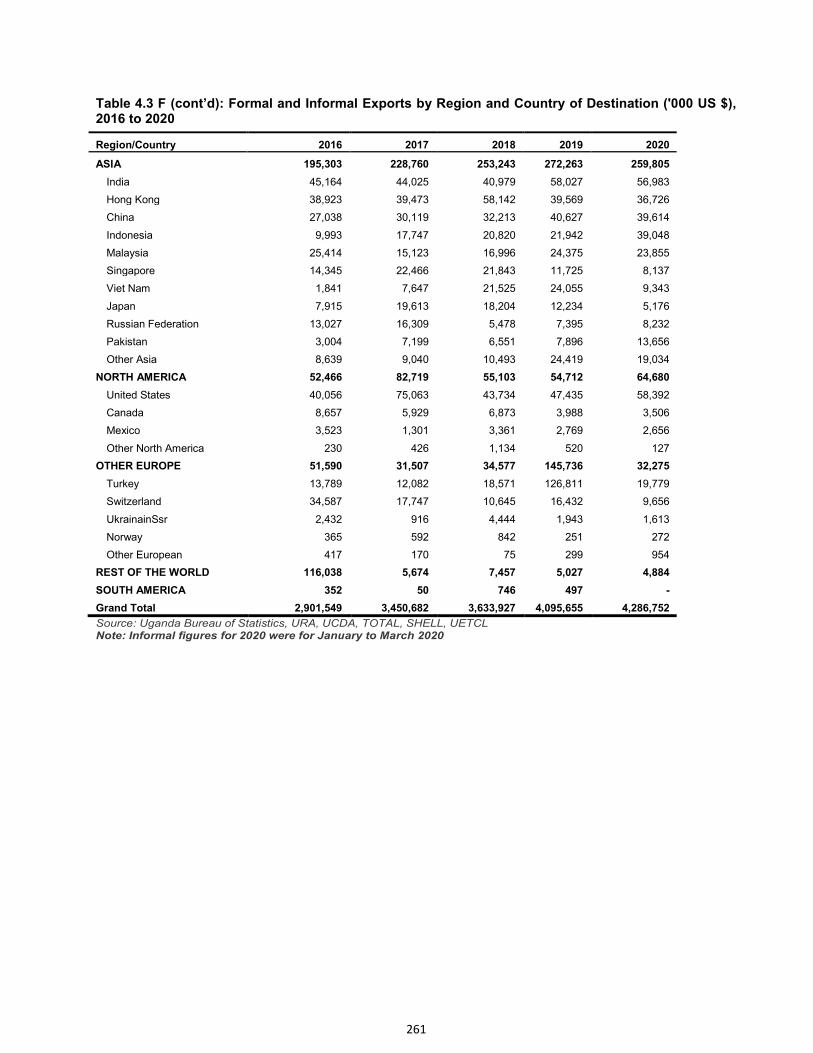
261
Table 4.3 F (cont’d): Formal and Informal Exports by Region and Country of Destination ('000 US $), 2016 to 2020
Region/Country 2016 2017 2018 2019 2020
ASIA 195,303 228,760 253,243 272,263 259,805
India 45,164 44,025 40,979 58,027 56,983
Hong Kong 38,923 39,473 58,142 39,569 36,726
China 27,038 30,119 32,213 40,627 39,614
Indonesia 9,993 17,747 20,820 21,942 39,048
Malaysia 25,414 15,123 16,996 24,375 23,855
Singapore 14,345 22,466 21,843 11,725 8,137
Viet Nam 1,841 7,647 21,525 24,055 9,343
Japan 7,915 19,613 18,204 12,234 5,176
Russian Federation 13,027 16,309 5,478 7,395 8,232
Pakistan 3,004 7,199 6,551 7,896 13,656
Other Asia 8,639 9,040 10,493 24,419 19,034
NORTH AMERICA 52,466 82,719 55,103 54,712 64,680
United States 40,056 75,063 43,734 47,435 58,392
Canada 8,657 5,929 6,873 3,988 3,506
Mexico 3,523 1,301 3,361 2,769 2,656
Other North America 230 426 1,134 520 127
OTHER EUROPE 51,590 31,507 34,577 145,736 32,275
Turkey 13,789 12,082 18,571 126,811 19,779
Switzerland 34,587 17,747 10,645 16,432 9,656
UkrainainSsr 2,432 916 4,444 1,943 1,613
Norway 365 592 842 251 272
Other European 417 170 75 299 954
REST OF THE WORLD 116,038 5,674 7,457 5,027 4,884
SOUTH AMERICA 352 50 746 497 -
Grand Total 2,901,549 3,450,682 3,633,927 4,095,655 4,286,752
Source: Uganda Bureau of Statistics, URA, UCDA, TOTAL, SHELL, UETCL Note: Informal figures for 2020 were for January to March 2020
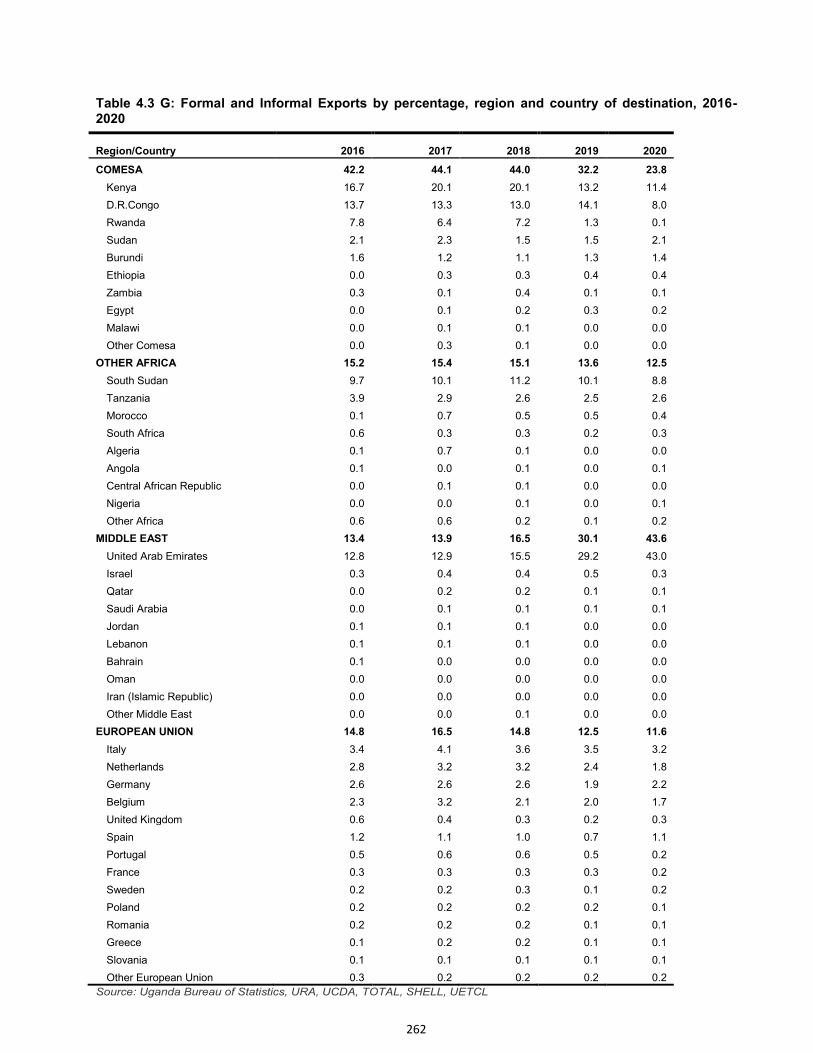
262
Table 4.3 G: Formal and Informal Exports by percentage, region and country of destination, 2016- 2020
Region/Country 2016 2017 2018 2019 2020
COMESA 42.2 44.1 44.0 32.2 23.8
Kenya 16.7 20.1 20.1 13.2 11.4
D.R.Congo 13.7 13.3 13.0 14.1 8.0
Rwanda 7.8 6.4 7.2 1.3 0.1
Sudan 2.1 2.3 1.5 1.5 2.1
Burundi 1.6 1.2 1.1 1.3 1.4
Ethiopia 0.0 0.3 0.3 0.4 0.4
Zambia 0.3 0.1 0.4 0.1 0.1
Egypt 0.0 0.1 0.2 0.3 0.2
Malawi 0.0 0.1 0.1 0.0 0.0
Other Comesa 0.0 0.3 0.1 0.0 0.0
OTHER AFRICA 15.2 15.4 15.1 13.6 12.5
South Sudan 9.7 10.1 11.2 10.1 8.8
Tanzania 3.9 2.9 2.6 2.5 2.6
Morocco 0.1 0.7 0.5 0.5 0.4
South Africa 0.6 0.3 0.3 0.2 0.3
Algeria 0.1 0.7 0.1 0.0 0.0
Angola 0.1 0.0 0.1 0.0 0.1
Central African Republic 0.0 0.1 0.1 0.0 0.0
Nigeria 0.0 0.0 0.1 0.0 0.1
Other Africa 0.6 0.6 0.2 0.1 0.2
MIDDLE EAST 13.4 13.9 16.5 30.1 43.6
United Arab Emirates 12.8 12.9 15.5 29.2 43.0
Israel 0.3 0.4 0.4 0.5 0.3
Qatar 0.0 0.2 0.2 0.1 0.1
Saudi Arabia 0.0 0.1 0.1 0.1 0.1
Jordan 0.1 0.1 0.1 0.0 0.0
Lebanon 0.1 0.1 0.1 0.0 0.0
Bahrain 0.1 0.0 0.0 0.0 0.0
Oman 0.0 0.0 0.0 0.0 0.0
Iran (Islamic Republic) 0.0 0.0 0.0 0.0 0.0
Other Middle East 0.0 0.0 0.1 0.0 0.0
EUROPEAN UNION 14.8 16.5 14.8 12.5 11.6
Italy 3.4 4.1 3.6 3.5 3.2
Netherlands 2.8 3.2 3.2 2.4 1.8
Germany 2.6 2.6 2.6 1.9 2.2
Belgium 2.3 3.2 2.1 2.0 1.7
United Kingdom 0.6 0.4 0.3 0.2 0.3
Spain 1.2 1.1 1.0 0.7 1.1
Portugal 0.5 0.6 0.6 0.5 0.2
France 0.3 0.3 0.3 0.3 0.2
Sweden 0.2 0.2 0.3 0.1 0.2
Poland 0.2 0.2 0.2 0.2 0.1
Romania 0.2 0.2 0.2 0.1 0.1
Greece 0.1 0.2 0.2 0.1 0.1
Slovania 0.1 0.1 0.1 0.1 0.1
Other European Union 0.3 0.2 0.2 0.2 0.2
Source: Uganda Bureau of Statistics, URA, UCDA, TOTAL, SHELL, UETCL
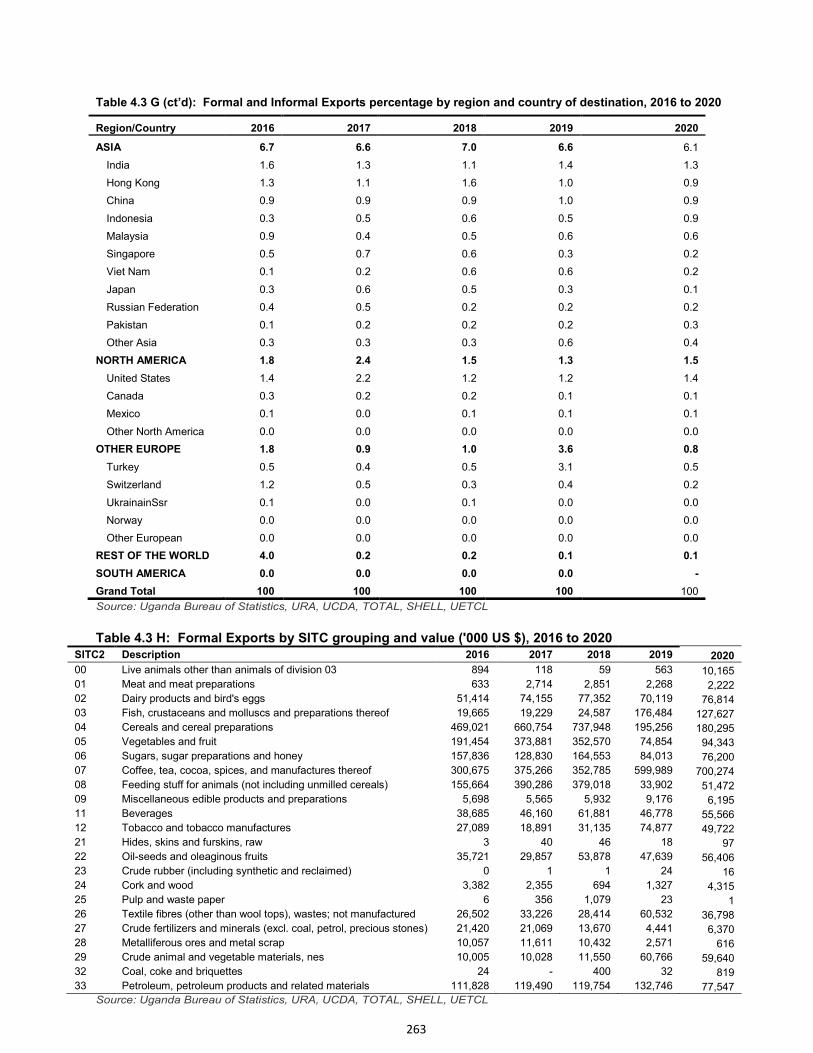
263
Table 4.3 G (ct’d): Formal and Informal Exports percentage by region and country of destination, 2016 to 2020
Source: Uganda Bureau of Statistics, URA, UCDA, TOTAL, SHELL, UETCL
Table 4.3 H: Formal Exports by SITC grouping and value ('000 US $), 2016 to 2020 SITC2 Description 2016 2017 2018 2019 2020
00 Live animals other than animals of division 03 894 118 59 563 10,165 01 Meat and meat preparations 633 2,714 2,851 2,268 2,222
02 Dairy products and bird's eggs 51,414 74,155 77,352 70,119 76,814
03 Fish, crustaceans and molluscs and preparations thereof 19,665 19,229 24,587 176,484 127,627 04 Cereals and cereal preparations 469,021 660,754 737,948 195,256 180,295
05 Vegetables and fruit 191,454 373,881 352,570 74,854 94,343
06 Sugars, sugar preparations and honey 157,836 128,830 164,553 84,013 76,200
07 Coffee, tea, cocoa, spices, and manufactures thereof 300,675 375,266 352,785 599,989 700,274
08 Feeding stuff for animals (not including unmilled cereals) 155,664 390,286 379,018 33,902 51,472 09 Miscellaneous edible products and preparations 5,698 5,565 5,932 9,176 6,195
11 Beverages 38,685 46,160 61,881 46,778 55,566
12 Tobacco and tobacco manufactures 27,089 18,891 31,135 74,877 49,722
21 Hides, skins and furskins, raw 3 40 46 18 97
22 Oil-seeds and oleaginous fruits 35,721 29,857 53,878 47,639 56,406
23 Crude rubber (including synthetic and reclaimed) 0 1 1 24 16 24 Cork and wood 3,382 2,355 694 1,327 4,315
25 Pulp and waste paper 6 356 1,079 23 1
26 Textile fibres (other than wool tops), wastes; not manufactured 26,502 33,226 28,414 60,532 36,798 27 Crude fertilizers and minerals (excl. coal, petrol, precious stones) 21,420 21,069 13,670 4,441 6,370
28 Metalliferous ores and metal scrap 10,057 11,611 10,432 2,571 616
29 Crude animal and vegetable materials, nes 10,005 10,028 11,550 60,766 59,640 32 Coal, coke and briquettes 24 - 400 32 819
33 Petroleum, petroleum products and related materials 111,828 119,490 119,754 132,746 77,547 Source: Uganda Bureau of Statistics, URA, UCDA, TOTAL, SHELL, UETCL
Region/Country 2016 2017 2018 2019 2020
ASIA 6.7 6.6 7.0 6.6 6.1
India 1.6 1.3 1.1 1.4 1.3
Hong Kong 1.3 1.1 1.6 1.0 0.9
China 0.9 0.9 0.9 1.0 0.9
Indonesia 0.3 0.5 0.6 0.5 0.9
Malaysia 0.9 0.4 0.5 0.6 0.6
Singapore 0.5 0.7 0.6 0.3 0.2
Viet Nam 0.1 0.2 0.6 0.6 0.2
Japan 0.3 0.6 0.5 0.3 0.1
Russian Federation 0.4 0.5 0.2 0.2 0.2
Pakistan 0.1 0.2 0.2 0.2 0.3
Other Asia 0.3 0.3 0.3 0.6 0.4
NORTH AMERICA 1.8 2.4 1.5 1.3 1.5
United States 1.4 2.2 1.2 1.2 1.4
Canada 0.3 0.2 0.2 0.1 0.1
Mexico 0.1 0.0 0.1 0.1 0.1
Other North America 0.0 0.0 0.0 0.0 0.0
OTHER EUROPE 1.8 0.9 1.0 3.6 0.8
Turkey 0.5 0.4 0.5 3.1 0.5
Switzerland 1.2 0.5 0.3 0.4 0.2
UkrainainSsr 0.1 0.0 0.1 0.0 0.0
Norway 0.0 0.0 0.0 0.0 0.0
Other European 0.0 0.0 0.0 0.0 0.0
REST OF THE WORLD 4.0 0.2 0.2 0.1 0.1
SOUTH AMERICA 0.0 0.0 0.0 0.0 -
Grand Total 100 100 100 100 100
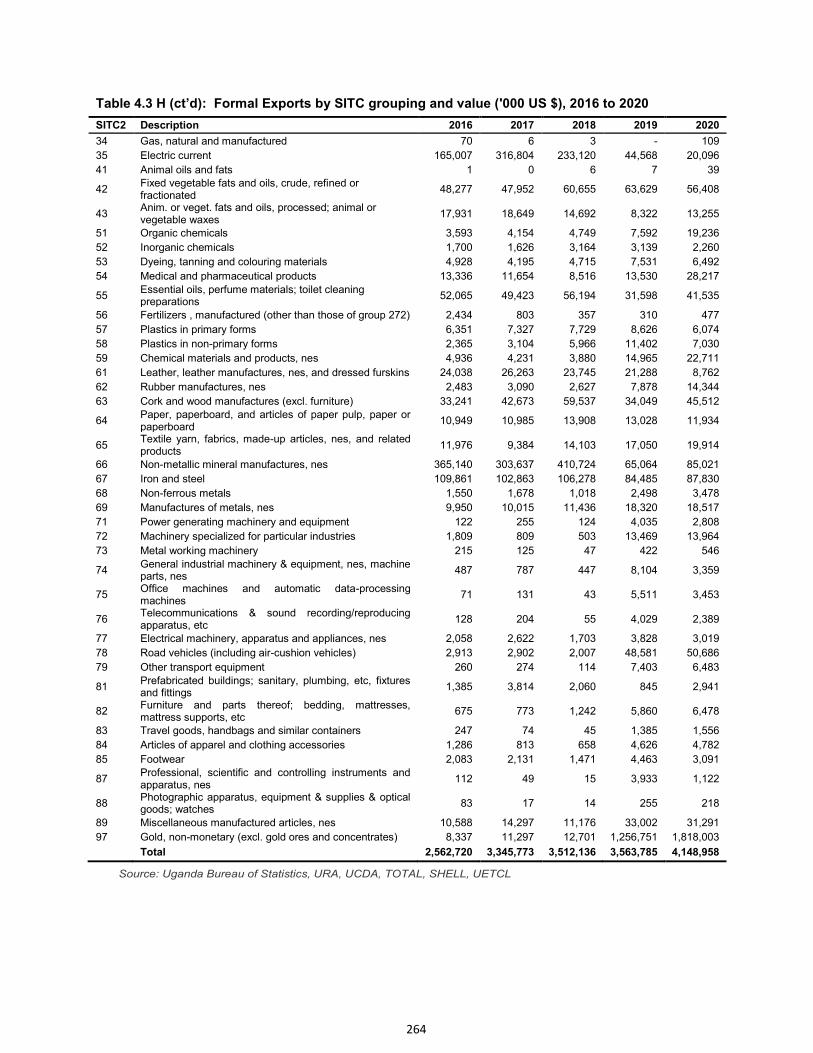
264
Table 4.3 H (ct’d): Formal Exports by SITC grouping and value ('000 US $), 2016 to 2020
SITC2 Description 2016 2017 2018 2019 2020
34 Gas, natural and manufactured 70 6 3 - 109
35 Electric current 165,007 316,804 233,120 44,568 20,096
41 Animal oils and fats 1 0 6 7 39
42 Fixed vegetable fats and oils, crude, refined or fractionated
48,277 47,952 60,655 63,629 56,408
43 Anim. or veget. fats and oils, processed; animal or vegetable waxes
17,931 18,649 14,692 8,322 13,255
51 Organic chemicals 3,593 4,154 4,749 7,592 19,236
52 Inorganic chemicals 1,700 1,626 3,164 3,139 2,260
53 Dyeing, tanning and colouring materials 4,928 4,195 4,715 7,531 6,492
54 Medical and pharmaceutical products 13,336 11,654 8,516 13,530 28,217
55 Essential oils, perfume materials; toilet cleaning preparations
52,065 49,423 56,194 31,598 41,535
56 Fertilizers , manufactured (other than those of group 272) 2,434 803 357 310 477
57 Plastics in primary forms 6,351 7,327 7,729 8,626 6,074
58 Plastics in non-primary forms 2,365 3,104 5,966 11,402 7,030
59 Chemical materials and products, nes 4,936 4,231 3,880 14,965 22,711
61 Leather, leather manufactures, nes, and dressed furskins 24,038 26,263 23,745 21,288 8,762
62 Rubber manufactures, nes 2,483 3,090 2,627 7,878 14,344
63 Cork and wood manufactures (excl. furniture) 33,241 42,673 59,537 34,049 45,512
64 Paper, paperboard, and articles of paper pulp, paper or paperboard
10,949 10,985 13,908 13,028 11,934
65 Textile yarn, fabrics, made-up articles, nes, and related products
11,976 9,384 14,103 17,050 19,914
66 Non-metallic mineral manufactures, nes 365,140 303,637 410,724 65,064 85,021
67 Iron and steel 109,861 102,863 106,278 84,485 87,830
68 Non-ferrous metals 1,550 1,678 1,018 2,498 3,478
69 Manufactures of metals, nes 9,950 10,015 11,436 18,320 18,517
71 Power generating machinery and equipment 122 255 124 4,035 2,808
72 Machinery specialized for particular industries 1,809 809 503 13,469 13,964
73 Metal working machinery 215 125 47 422 546
74 General industrial machinery & equipment, nes, machine parts, nes
487 787 447 8,104 3,359
75 Office machines and automatic data-processing machines
71 131 43 5,511 3,453
76 Telecommunications & sound recording/reproducing apparatus, etc
128 204 55 4,029 2,389
77 Electrical machinery, apparatus and appliances, nes 2,058 2,622 1,703 3,828 3,019
78 Road vehicles (including air-cushion vehicles) 2,913 2,902 2,007 48,581 50,686
79 Other transport equipment 260 274 114 7,403 6,483
81 Prefabricated buildings; sanitary, plumbing, etc, fixtures and fittings
1,385 3,814 2,060 845 2,941
82 Furniture and parts thereof; bedding, mattresses, mattress supports, etc
675 773 1,242 5,860 6,478
83 Travel goods, handbags and similar containers 247 74 45 1,385 1,556
84 Articles of apparel and clothing accessories 1,286 813 658 4,626 4,782
85 Footwear 2,083 2,131 1,471 4,463 3,091
87 Professional, scientific and controlling instruments and apparatus, nes
112 49 15 3,933 1,122
88 Photographic apparatus, equipment & supplies & optical goods; watches
83 17 14 255 218
89 Miscellaneous manufactured articles, nes 10,588 14,297 11,176 33,002 31,291
97 Gold, non-monetary (excl. gold ores and concentrates) 8,337 11,297 12,701 1,256,751 1,818,003
Total 2,562,720 3,345,773 3,512,136 3,563,785 4,148,958
Source: Uganda Bureau of Statistics, URA, UCDA, TOTAL, SHELL, UETCL
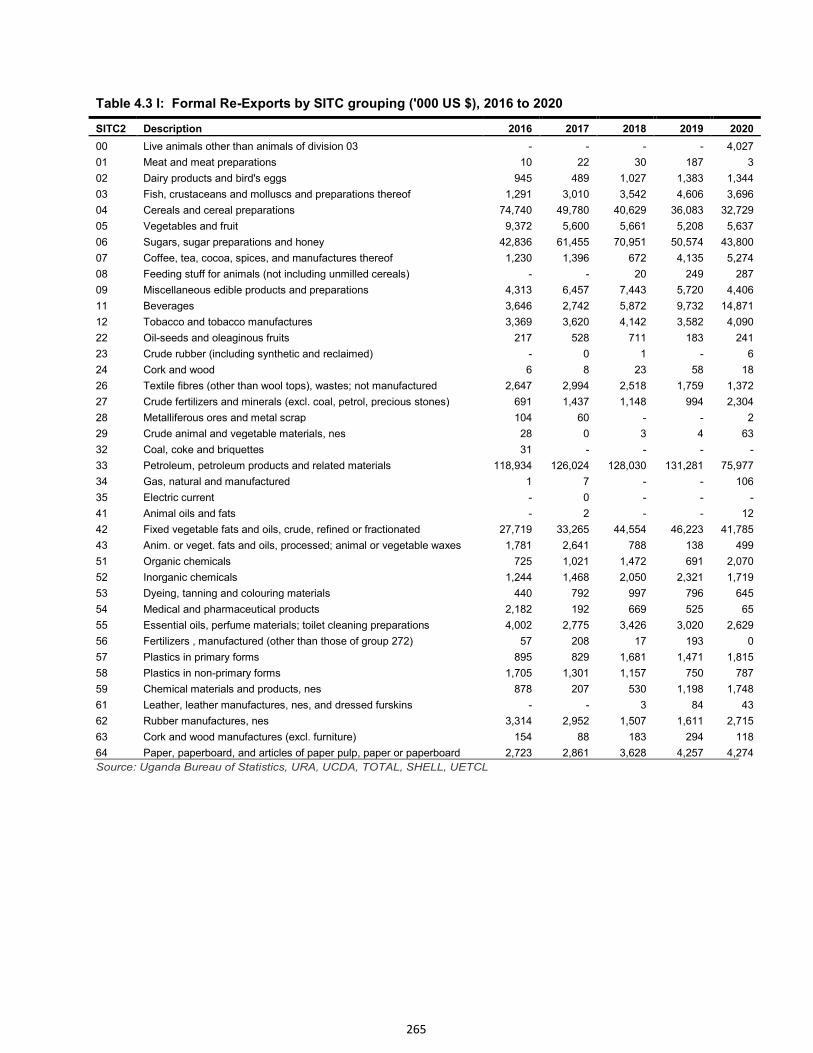
265
Table 4.3 I: Formal Re-Exports by SITC grouping ('000 US $), 2016 to 2020
SITC2 Description 2016 2017 2018 2019 2020
00 Live animals other than animals of division 03 - - - - 4,027
01 Meat and meat preparations 10 22 30 187 3
02 Dairy products and bird's eggs 945 489 1,027 1,383 1,344
03 Fish, crustaceans and molluscs and preparations thereof 1,291 3,010 3,542 4,606 3,696
04 Cereals and cereal preparations 74,740 49,780 40,629 36,083 32,729
05 Vegetables and fruit 9,372 5,600 5,661 5,208 5,637
06 Sugars, sugar preparations and honey 42,836 61,455 70,951 50,574 43,800
07 Coffee, tea, cocoa, spices, and manufactures thereof 1,230 1,396 672 4,135 5,274
08 Feeding stuff for animals (not including unmilled cereals) - - 20 249 287
09 Miscellaneous edible products and preparations 4,313 6,457 7,443 5,720 4,406
11 Beverages 3,646 2,742 5,872 9,732 14,871
12 Tobacco and tobacco manufactures 3,369 3,620 4,142 3,582 4,090
22 Oil-seeds and oleaginous fruits 217 528 711 183 241
23 Crude rubber (including synthetic and reclaimed) - 0 1 - 6
24 Cork and wood 6 8 23 58 18
26 Textile fibres (other than wool tops), wastes; not manufactured 2,647 2,994 2,518 1,759 1,372
27 Crude fertilizers and minerals (excl. coal, petrol, precious stones) 691 1,437 1,148 994 2,304
28 Metalliferous ores and metal scrap 104 60 - - 2
29 Crude animal and vegetable materials, nes 28 0 3 4 63
32 Coal, coke and briquettes 31 - - - -
33 Petroleum, petroleum products and related materials 118,934 126,024 128,030 131,281 75,977
34 Gas, natural and manufactured 1 7 - - 106
35 Electric current - 0 - - -
41 Animal oils and fats - 2 - - 12
42 Fixed vegetable fats and oils, crude, refined or fractionated 27,719 33,265 44,554 46,223 41,785
43 Anim. or veget. fats and oils, processed; animal or vegetable waxes 1,781 2,641 788 138 499
51 Organic chemicals 725 1,021 1,472 691 2,070
52 Inorganic chemicals 1,244 1,468 2,050 2,321 1,719
53 Dyeing, tanning and colouring materials 440 792 997 796 645
54 Medical and pharmaceutical products 2,182 192 669 525 65
55 Essential oils, perfume materials; toilet cleaning preparations 4,002 2,775 3,426 3,020 2,629
56 Fertilizers , manufactured (other than those of group 272) 57 208 17 193 0
57 Plastics in primary forms 895 829 1,681 1,471 1,815
58 Plastics in non-primary forms 1,705 1,301 1,157 750 787
59 Chemical materials and products, nes 878 207 530 1,198 1,748
61 Leather, leather manufactures, nes, and dressed furskins - - 3 84 43
62 Rubber manufactures, nes 3,314 2,952 1,507 1,611 2,715
63 Cork and wood manufactures (excl. furniture) 154 88 183 294 118
64 Paper, paperboard, and articles of paper pulp, paper or paperboard 2,723 2,861 3,628 4,257 4,274
Source: Uganda Bureau of Statistics, URA, UCDA, TOTAL, SHELL, UETCL
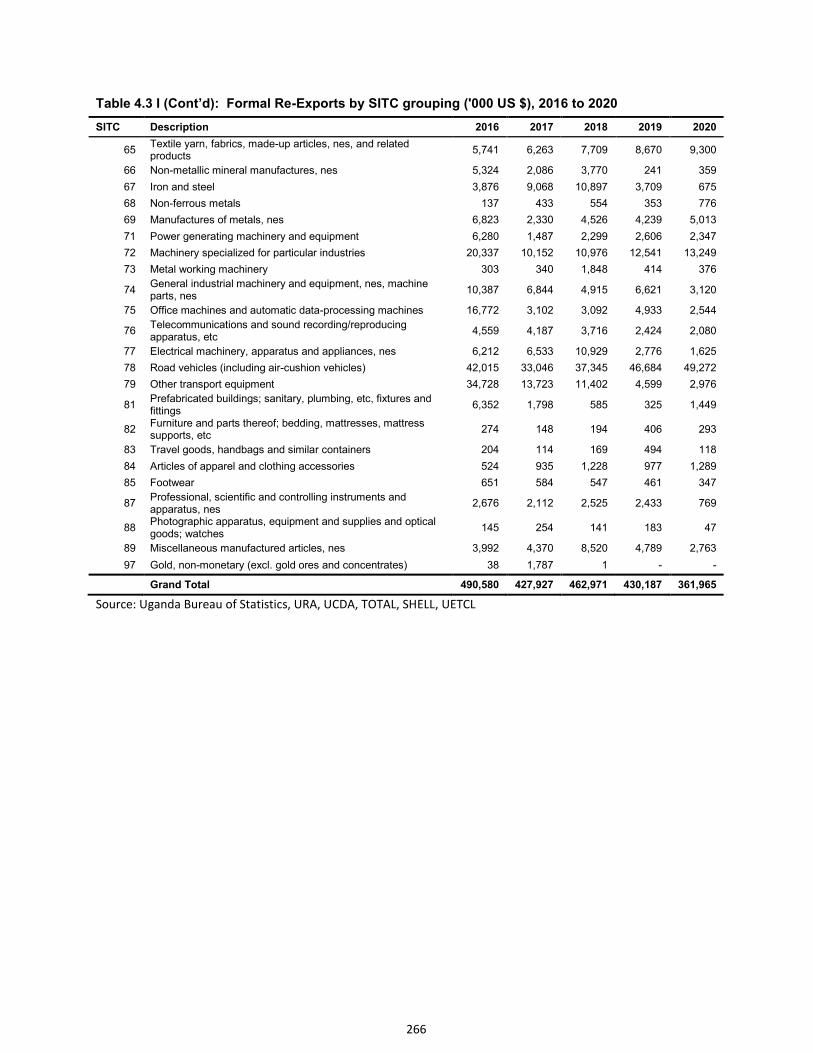
266
Table 4.3 I (Cont’d): Formal Re-Exports by SITC grouping ('000 US $), 2016 to 2020
SITC Description 2016 2017 2018 2019 2020
65 Textile yarn, fabrics, made-up articles, nes, and related products
5,741 6,263 7,709 8,670 9,300
66 Non-metallic mineral manufactures, nes 5,324 2,086 3,770 241 359
67 Iron and steel 3,876 9,068 10,897 3,709 675
68 Non-ferrous metals 137 433 554 353 776
69 Manufactures of metals, nes 6,823 2,330 4,526 4,239 5,013
71 Power generating machinery and equipment 6,280 1,487 2,299 2,606 2,347
72 Machinery specialized for particular industries 20,337 10,152 10,976 12,541 13,249
73 Metal working machinery 303 340 1,848 414 376
74 General industrial machinery and equipment, nes, machine parts, nes
10,387 6,844 4,915 6,621 3,120
75 Office machines and automatic data-processing machines 16,772 3,102 3,092 4,933 2,544
76 Telecommunications and sound recording/reproducing apparatus, etc
4,559 4,187 3,716 2,424 2,080
77 Electrical machinery, apparatus and appliances, nes 6,212 6,533 10,929 2,776 1,625
78 Road vehicles (including air-cushion vehicles) 42,015 33,046 37,345 46,684 49,272
79 Other transport equipment 34,728 13,723 11,402 4,599 2,976
81 Prefabricated buildings; sanitary, plumbing, etc, fixtures and fittings
6,352 1,798 585 325 1,449
82 Furniture and parts thereof; bedding, mattresses, mattress supports, etc
274 148 194 406 293
83 Travel goods, handbags and similar containers 204 114 169 494 118
84 Articles of apparel and clothing accessories 524 935 1,228 977 1,289
85 Footwear 651 584 547 461 347
87 Professional, scientific and controlling instruments and apparatus, nes
2,676 2,112 2,525 2,433 769
88 Photographic apparatus, equipment and supplies and optical goods; watches
145 254 141 183 47
89 Miscellaneous manufactured articles, nes 3,992 4,370 8,520 4,789 2,763
97 Gold, non-monetary (excl. gold ores and concentrates) 38 1,787 1 - -
Grand Total 490,580 427,927 462,971 430,187 361,965
Source: Uganda Bureau of Statistics, URA, UCDA, TOTAL, SHELL, UETCL
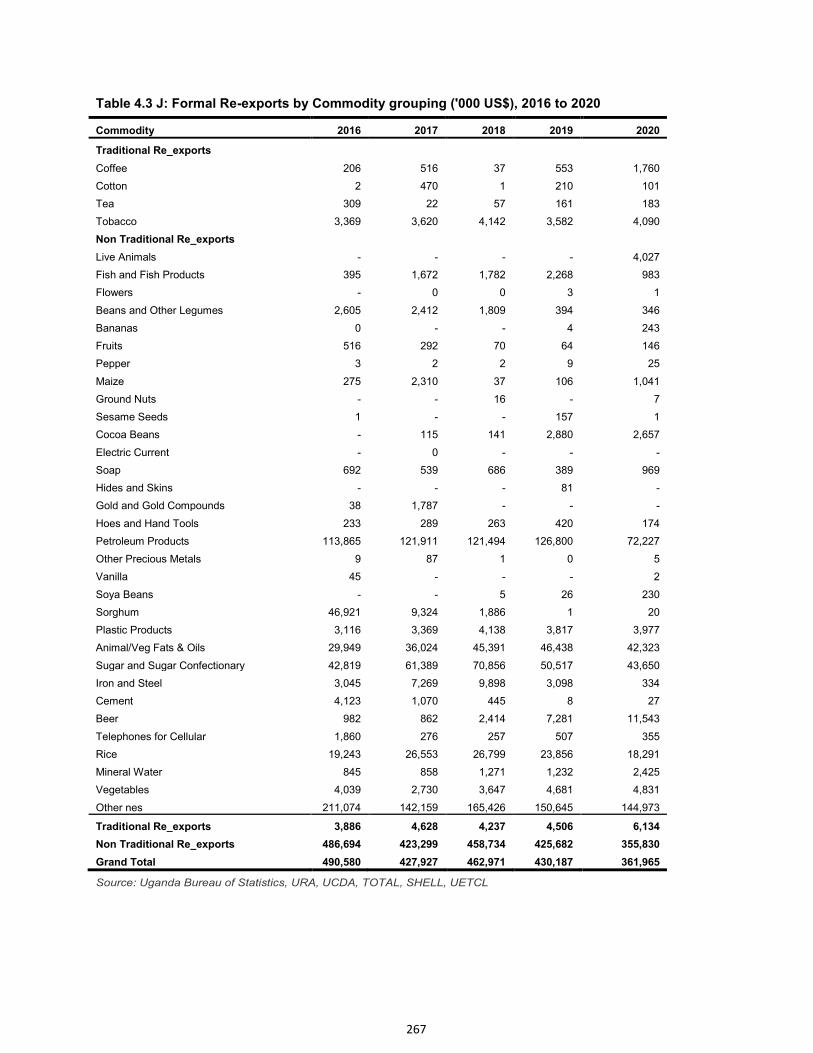
267
Table 4.3 J: Formal Re-exports by Commodity grouping ('000 US$), 2016 to 2020
Commodity 2016 2017 2018 2019 2020
Traditional Re_exports
Coffee 206 516 37 553 1,760
Cotton 2 470 1 210 101
Tea 309 22 57 161 183
Tobacco 3,369 3,620 4,142 3,582 4,090
Non Traditional Re_exports
Live Animals - - - - 4,027
Fish and Fish Products 395 1,672 1,782 2,268 983
Flowers - 0 0 3 1
Beans and Other Legumes 2,605 2,412 1,809 394 346
Bananas 0 - - 4 243
Fruits 516 292 70 64 146
Pepper 3 2 2 9 25
Maize 275 2,310 37 106 1,041
Ground Nuts - - 16 - 7
Sesame Seeds 1 - - 157 1
Cocoa Beans - 115 141 2,880 2,657
Electric Current - 0 - - -
Soap 692 539 686 389 969
Hides and Skins - - - 81 -
Gold and Gold Compounds 38 1,787 - - -
Hoes and Hand Tools 233 289 263 420 174
Petroleum Products 113,865 121,911 121,494 126,800 72,227
Other Precious Metals 9 87 1 0 5
Vanilla 45 - - - 2
Soya Beans - - 5 26 230
Sorghum 46,921 9,324 1,886 1 20
Plastic Products 3,116 3,369 4,138 3,817 3,977
Animal/Veg Fats & Oils 29,949 36,024 45,391 46,438 42,323
Sugar and Sugar Confectionary 42,819 61,389 70,856 50,517 43,650
Iron and Steel 3,045 7,269 9,898 3,098 334
Cement 4,123 1,070 445 8 27
Beer 982 862 2,414 7,281 11,543
Telephones for Cellular 1,860 276 257 507 355
Rice 19,243 26,553 26,799 23,856 18,291
Mineral Water 845 858 1,271 1,232 2,425
Vegetables 4,039 2,730 3,647 4,681 4,831
Other nes 211,074 142,159 165,426 150,645 144,973
Traditional Re_exports 3,886 4,628 4,237 4,506 6,134
Non Traditional Re_exports 486,694 423,299 458,734 425,682 355,830
Grand Total 490,580 427,927 462,971 430,187 361,965
Source: Uganda Bureau of Statistics, URA, UCDA, TOTAL, SHELL, UETCL
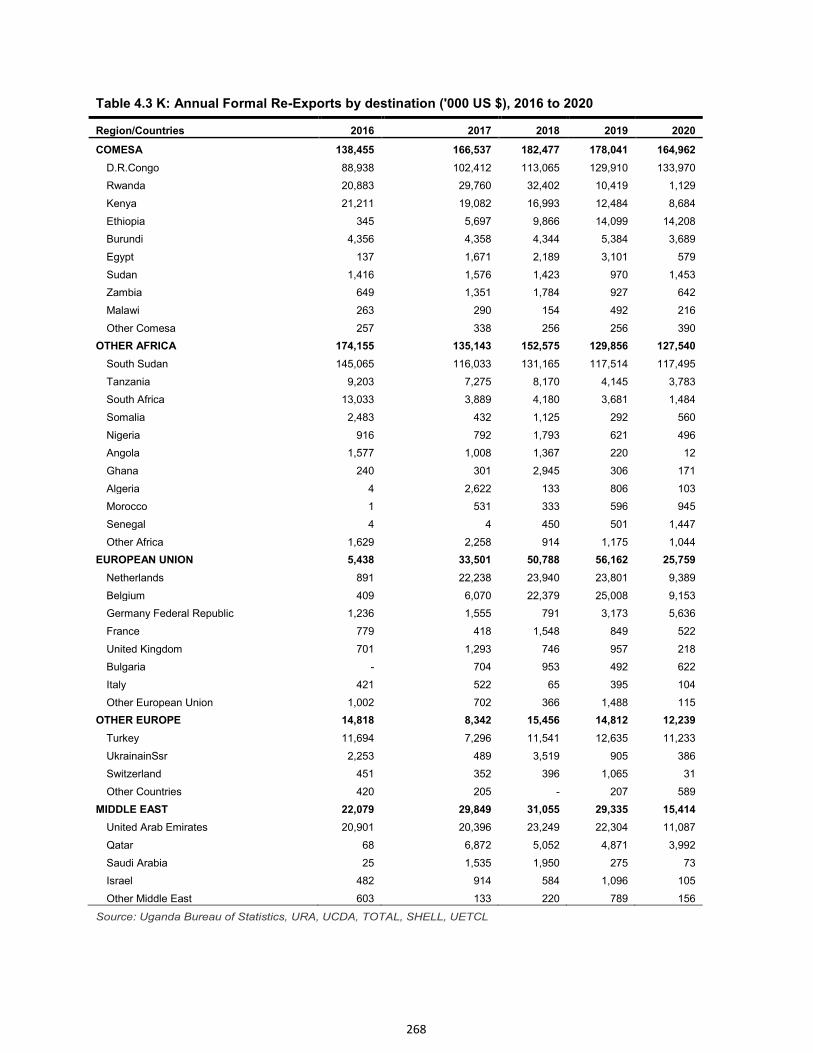
268
Table 4.3 K: Annual Formal Re-Exports by destination ('000 US $), 2016 to 2020
Region/Countries 2016 2017 2018 2019 2020
COMESA 138,455 166,537 182,477 178,041 164,962
D.R.Congo 88,938 102,412 113,065 129,910 133,970
Rwanda 20,883 29,760 32,402 10,419 1,129
Kenya 21,211 19,082 16,993 12,484 8,684
Ethiopia 345 5,697 9,866 14,099 14,208
Burundi 4,356 4,358 4,344 5,384 3,689
Egypt 137 1,671 2,189 3,101 579
Sudan 1,416 1,576 1,423 970 1,453
Zambia 649 1,351 1,784 927 642
Malawi 263 290 154 492 216
Other Comesa 257 338 256 256 390
OTHER AFRICA 174,155 135,143 152,575 129,856 127,540
South Sudan 145,065 116,033 131,165 117,514 117,495
Tanzania 9,203 7,275 8,170 4,145 3,783
South Africa 13,033 3,889 4,180 3,681 1,484
Somalia 2,483 432 1,125 292 560
Nigeria 916 792 1,793 621 496
Angola 1,577 1,008 1,367 220 12
Ghana 240 301 2,945 306 171
Algeria 4 2,622 133 806 103
Morocco 1 531 333 596 945
Senegal 4 4 450 501 1,447
Other Africa 1,629 2,258 914 1,175 1,044
EUROPEAN UNION 5,438 33,501 50,788 56,162 25,759
Netherlands 891 22,238 23,940 23,801 9,389
Belgium 409 6,070 22,379 25,008 9,153
Germany Federal Republic 1,236 1,555 791 3,173 5,636
France 779 418 1,548 849 522
United Kingdom 701 1,293 746 957 218
Bulgaria - 704 953 492 622
Italy 421 522 65 395 104
Other European Union 1,002 702 366 1,488 115
OTHER EUROPE 14,818 8,342 15,456 14,812 12,239
Turkey 11,694 7,296 11,541 12,635 11,233
UkrainainSsr 2,253 489 3,519 905 386
Switzerland 451 352 396 1,065 31
Other Countries 420 205 - 207 589
MIDDLE EAST 22,079 29,849 31,055 29,335 15,414
United Arab Emirates 20,901 20,396 23,249 22,304 11,087
Qatar 68 6,872 5,052 4,871 3,992
Saudi Arabia 25 1,535 1,950 275 73
Israel 482 914 584 1,096 105
Other Middle East 603 133 220 789 156
Source: Uganda Bureau of Statistics, URA, UCDA, TOTAL, SHELL, UETCL
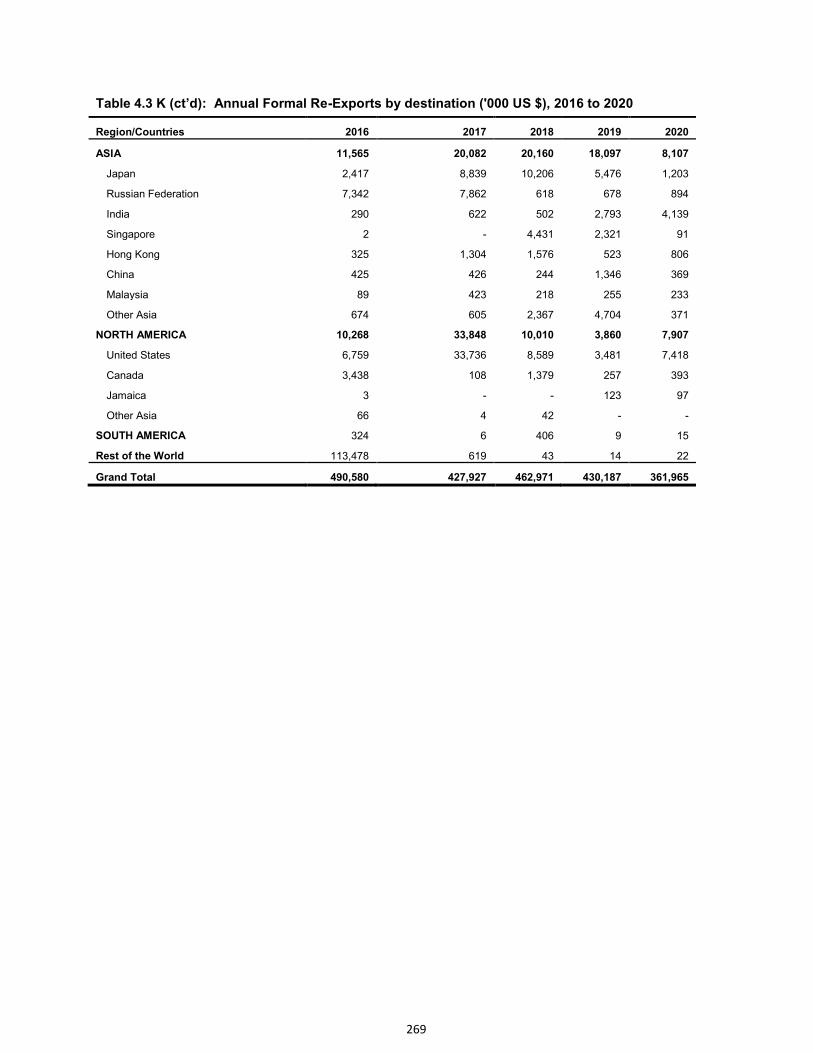
269
Table 4.3 K (ct’d): Annual Formal Re-Exports by destination ('000 US $), 2016 to 2020
Region/Countries 2016 2017 2018 2019 2020
ASIA 11,565 20,082 20,160 18,097 8,107
Japan 2,417 8,839 10,206 5,476 1,203
Russian Federation 7,342 7,862 618 678 894
India 290 622 502 2,793 4,139
Singapore 2 - 4,431 2,321 91
Hong Kong 325 1,304 1,576 523 806
China 425 426 244 1,346 369
Malaysia 89 423 218 255 233
Other Asia 674 605 2,367 4,704 371
NORTH AMERICA 10,268 33,848 10,010 3,860 7,907
United States 6,759 33,736 8,589 3,481 7,418
Canada 3,438 108 1,379 257 393
Jamaica 3 - - 123 97
Other Asia 66 4 42 - -
SOUTH AMERICA 324 6 406 9 15
Rest of the World 113,478 619 43 14 22
Grand Total 490,580 427,927 462,971 430,187 361,965
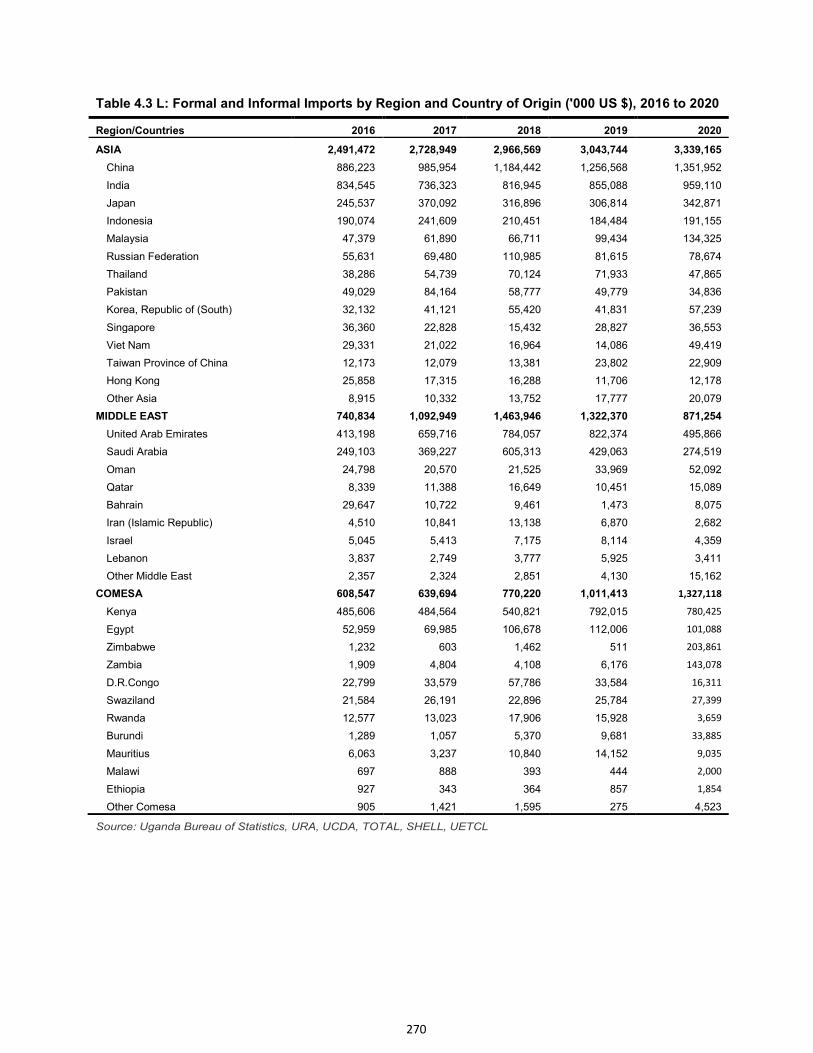
270
Table 4.3 L: Formal and Informal Imports by Region and Country of Origin ('000 US $), 2016 to 2020
Region/Countries 2016 2017 2018 2019 2020
ASIA 2,491,472 2,728,949 2,966,569 3,043,744 3,339,165
China 886,223 985,954 1,184,442 1,256,568 1,351,952
India 834,545 736,323 816,945 855,088 959,110
Japan 245,537 370,092 316,896 306,814 342,871
Indonesia 190,074 241,609 210,451 184,484 191,155
Malaysia 47,379 61,890 66,711 99,434 134,325
Russian Federation 55,631 69,480 110,985 81,615 78,674
Thailand 38,286 54,739 70,124 71,933 47,865
Pakistan 49,029 84,164 58,777 49,779 34,836
Korea, Republic of (South) 32,132 41,121 55,420 41,831 57,239
Singapore 36,360 22,828 15,432 28,827 36,553
Viet Nam 29,331 21,022 16,964 14,086 49,419
Taiwan Province of China 12,173 12,079 13,381 23,802 22,909
Hong Kong 25,858 17,315 16,288 11,706 12,178
Other Asia 8,915 10,332 13,752 17,777 20,079
MIDDLE EAST 740,834 1,092,949 1,463,946 1,322,370 871,254
United Arab Emirates 413,198 659,716 784,057 822,374 495,866
Saudi Arabia 249,103 369,227 605,313 429,063 274,519
Oman 24,798 20,570 21,525 33,969 52,092
Qatar 8,339 11,388 16,649 10,451 15,089
Bahrain 29,647 10,722 9,461 1,473 8,075
Iran (Islamic Republic) 4,510 10,841 13,138 6,870 2,682
Israel 5,045 5,413 7,175 8,114 4,359
Lebanon 3,837 2,749 3,777 5,925 3,411
Other Middle East 2,357 2,324 2,851 4,130 15,162
COMESA 608,547 639,694 770,220 1,011,413 1,327,118
Kenya 485,606 484,564 540,821 792,015 780,425
Egypt 52,959 69,985 106,678 112,006 101,088
Zimbabwe 1,232 603 1,462 511 203,861
Zambia 1,909 4,804 4,108 6,176 143,078
D.R.Congo 22,799 33,579 57,786 33,584 16,311
Swaziland 21,584 26,191 22,896 25,784 27,399
Rwanda 12,577 13,023 17,906 15,928 3,659
Burundi 1,289 1,057 5,370 9,681 33,885
Mauritius 6,063 3,237 10,840 14,152 9,035
Malawi 697 888 393 444 2,000
Ethiopia 927 343 364 857 1,854
Other Comesa 905 1,421 1,595 275 4,523
Source: Uganda Bureau of Statistics, URA, UCDA, TOTAL, SHELL, UETCL
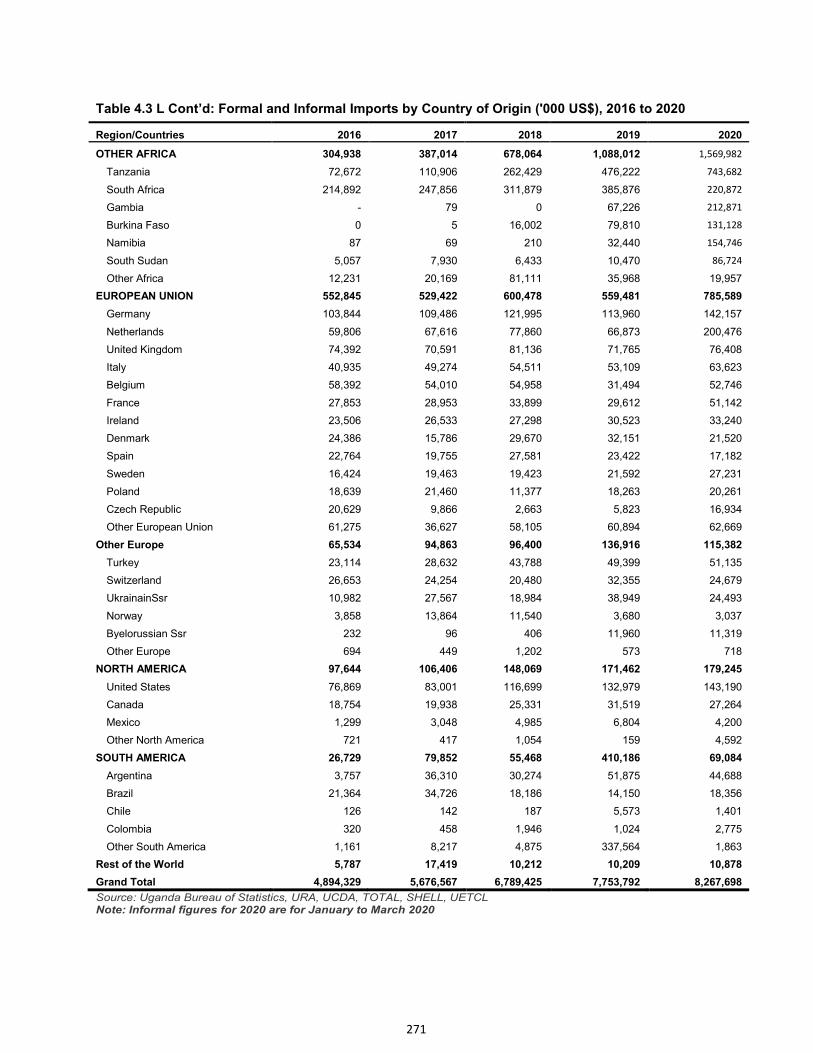
271
Table 4.3 L Cont’d: Formal and Informal Imports by Country of Origin ('000 US$), 2016 to 2020
Region/Countries 2016 2017 2018 2019 2020
OTHER AFRICA 304,938 387,014 678,064 1,088,012 1,569,982
Tanzania 72,672 110,906 262,429 476,222 743,682
South Africa 214,892 247,856 311,879 385,876 220,872
Gambia - 79 0 67,226 212,871
Burkina Faso 0 5 16,002 79,810 131,128
Namibia 87 69 210 32,440 154,746
South Sudan 5,057 7,930 6,433 10,470 86,724
Other Africa 12,231 20,169 81,111 35,968 19,957
EUROPEAN UNION 552,845 529,422 600,478 559,481 785,589
Germany 103,844 109,486 121,995 113,960 142,157
Netherlands 59,806 67,616 77,860 66,873 200,476
United Kingdom 74,392 70,591 81,136 71,765 76,408
Italy 40,935 49,274 54,511 53,109 63,623
Belgium 58,392 54,010 54,958 31,494 52,746
France 27,853 28,953 33,899 29,612 51,142
Ireland 23,506 26,533 27,298 30,523 33,240
Denmark 24,386 15,786 29,670 32,151 21,520
Spain 22,764 19,755 27,581 23,422 17,182
Sweden 16,424 19,463 19,423 21,592 27,231
Poland 18,639 21,460 11,377 18,263 20,261
Czech Republic 20,629 9,866 2,663 5,823 16,934
Other European Union 61,275 36,627 58,105 60,894 62,669
Other Europe 65,534 94,863 96,400 136,916 115,382
Turkey 23,114 28,632 43,788 49,399 51,135
Switzerland 26,653 24,254 20,480 32,355 24,679
UkrainainSsr 10,982 27,567 18,984 38,949 24,493
Norway 3,858 13,864 11,540 3,680 3,037
Byelorussian Ssr 232 96 406 11,960 11,319
Other Europe 694 449 1,202 573 718
NORTH AMERICA 97,644 106,406 148,069 171,462 179,245
United States 76,869 83,001 116,699 132,979 143,190
Canada 18,754 19,938 25,331 31,519 27,264
Mexico 1,299 3,048 4,985 6,804 4,200
Other North America 721 417 1,054 159 4,592
SOUTH AMERICA 26,729 79,852 55,468 410,186 69,084
Argentina 3,757 36,310 30,274 51,875 44,688
Brazil 21,364 34,726 18,186 14,150 18,356
Chile 126 142 187 5,573 1,401
Colombia 320 458 1,946 1,024 2,775
Other South America 1,161 8,217 4,875 337,564 1,863
Rest of the World 5,787 17,419 10,212 10,209 10,878
Grand Total 4,894,329 5,676,567 6,789,425 7,753,792 8,267,698
Source: Uganda Bureau of Statistics, URA, UCDA, TOTAL, SHELL, UETCL Note: Informal figures for 2020 are for January to March 2020
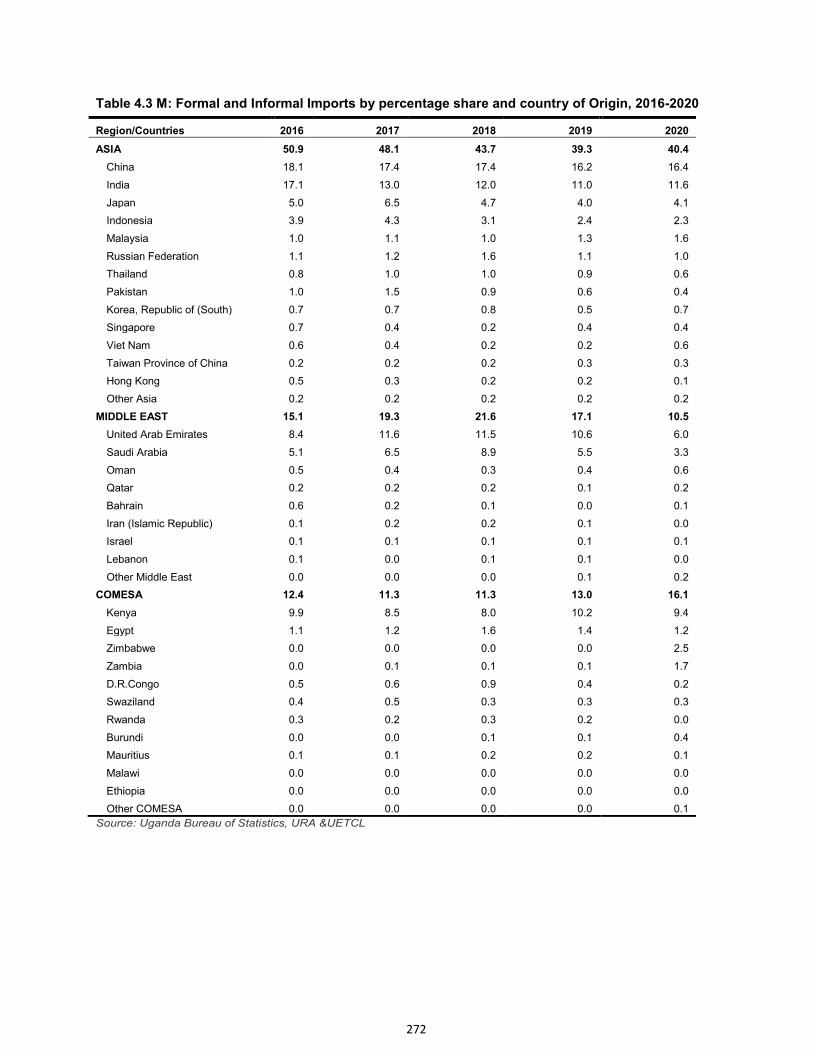
272
Table 4.3 M: Formal and Informal Imports by percentage share and country of Origin, 2016-2020
Region/Countries 2016 2017 2018 2019 2020
ASIA 50.9 48.1 43.7 39.3 40.4
China 18.1 17.4 17.4 16.2 16.4
India 17.1 13.0 12.0 11.0 11.6
Japan 5.0 6.5 4.7 4.0 4.1
Indonesia 3.9 4.3 3.1 2.4 2.3
Malaysia 1.0 1.1 1.0 1.3 1.6
Russian Federation 1.1 1.2 1.6 1.1 1.0
Thailand 0.8 1.0 1.0 0.9 0.6
Pakistan 1.0 1.5 0.9 0.6 0.4
Korea, Republic of (South) 0.7 0.7 0.8 0.5 0.7
Singapore 0.7 0.4 0.2 0.4 0.4
Viet Nam 0.6 0.4 0.2 0.2 0.6
Taiwan Province of China 0.2 0.2 0.2 0.3 0.3
Hong Kong 0.5 0.3 0.2 0.2 0.1
Other Asia 0.2 0.2 0.2 0.2 0.2
MIDDLE EAST 15.1 19.3 21.6 17.1 10.5
United Arab Emirates 8.4 11.6 11.5 10.6 6.0
Saudi Arabia 5.1 6.5 8.9 5.5 3.3
Oman 0.5 0.4 0.3 0.4 0.6
Qatar 0.2 0.2 0.2 0.1 0.2
Bahrain 0.6 0.2 0.1 0.0 0.1
Iran (Islamic Republic) 0.1 0.2 0.2 0.1 0.0
Israel 0.1 0.1 0.1 0.1 0.1
Lebanon 0.1 0.0 0.1 0.1 0.0
Other Middle East 0.0 0.0 0.0 0.1 0.2
COMESA 12.4 11.3 11.3 13.0 16.1
Kenya 9.9 8.5 8.0 10.2 9.4
Egypt 1.1 1.2 1.6 1.4 1.2
Zimbabwe 0.0 0.0 0.0 0.0 2.5
Zambia 0.0 0.1 0.1 0.1 1.7
D.R.Congo 0.5 0.6 0.9 0.4 0.2
Swaziland 0.4 0.5 0.3 0.3 0.3
Rwanda 0.3 0.2 0.3 0.2 0.0
Burundi 0.0 0.0 0.1 0.1 0.4
Mauritius 0.1 0.1 0.2 0.2 0.1
Malawi 0.0 0.0 0.0 0.0 0.0
Ethiopia 0.0 0.0 0.0 0.0 0.0
Other COMESA 0.0 0.0 0.0 0.0 0.1
Source: Uganda Bureau of Statistics, URA &UETCL
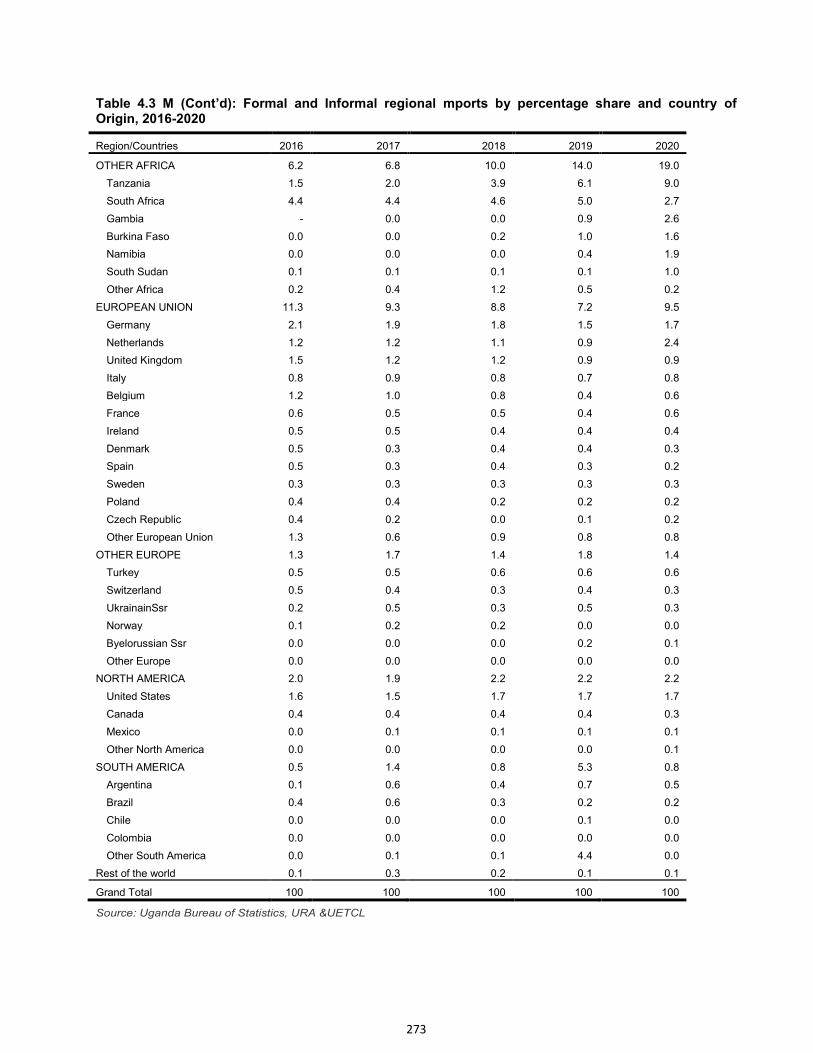
273
Table 4.3 M (Cont’d): Formal and Informal regional mports by percentage share and country of Origin, 2016-2020
Region/Countries 2016 2017 2018 2019 2020
OTHER AFRICA 6.2 6.8 10.0 14.0 19.0
Tanzania 1.5 2.0 3.9 6.1 9.0
South Africa 4.4 4.4 4.6 5.0 2.7
Gambia - 0.0 0.0 0.9 2.6
Burkina Faso 0.0 0.0 0.2 1.0 1.6
Namibia 0.0 0.0 0.0 0.4 1.9
South Sudan 0.1 0.1 0.1 0.1 1.0
Other Africa 0.2 0.4 1.2 0.5 0.2
EUROPEAN UNION 11.3 9.3 8.8 7.2 9.5
Germany 2.1 1.9 1.8 1.5 1.7
Netherlands 1.2 1.2 1.1 0.9 2.4
United Kingdom 1.5 1.2 1.2 0.9 0.9
Italy 0.8 0.9 0.8 0.7 0.8
Belgium 1.2 1.0 0.8 0.4 0.6
France 0.6 0.5 0.5 0.4 0.6
Ireland 0.5 0.5 0.4 0.4 0.4
Denmark 0.5 0.3 0.4 0.4 0.3
Spain 0.5 0.3 0.4 0.3 0.2
Sweden 0.3 0.3 0.3 0.3 0.3
Poland 0.4 0.4 0.2 0.2 0.2
Czech Republic 0.4 0.2 0.0 0.1 0.2
Other European Union 1.3 0.6 0.9 0.8 0.8
OTHER EUROPE 1.3 1.7 1.4 1.8 1.4
Turkey 0.5 0.5 0.6 0.6 0.6
Switzerland 0.5 0.4 0.3 0.4 0.3
UkrainainSsr 0.2 0.5 0.3 0.5 0.3
Norway 0.1 0.2 0.2 0.0 0.0
Byelorussian Ssr 0.0 0.0 0.0 0.2 0.1
Other Europe 0.0 0.0 0.0 0.0 0.0
NORTH AMERICA 2.0 1.9 2.2 2.2 2.2
United States 1.6 1.5 1.7 1.7 1.7
Canada 0.4 0.4 0.4 0.4 0.3
Mexico 0.0 0.1 0.1 0.1 0.1
Other North America 0.0 0.0 0.0 0.0 0.1
SOUTH AMERICA 0.5 1.4 0.8 5.3 0.8
Argentina 0.1 0.6 0.4 0.7 0.5
Brazil 0.4 0.6 0.3 0.2 0.2
Chile 0.0 0.0 0.0 0.1 0.0
Colombia 0.0 0.0 0.0 0.0 0.0
Other South America 0.0 0.1 0.1 4.4 0.0
Rest of the world 0.1 0.3 0.2 0.1 0.1
Grand Total 100 100 100 100 100
Source: Uganda Bureau of Statistics, URA &UETCL
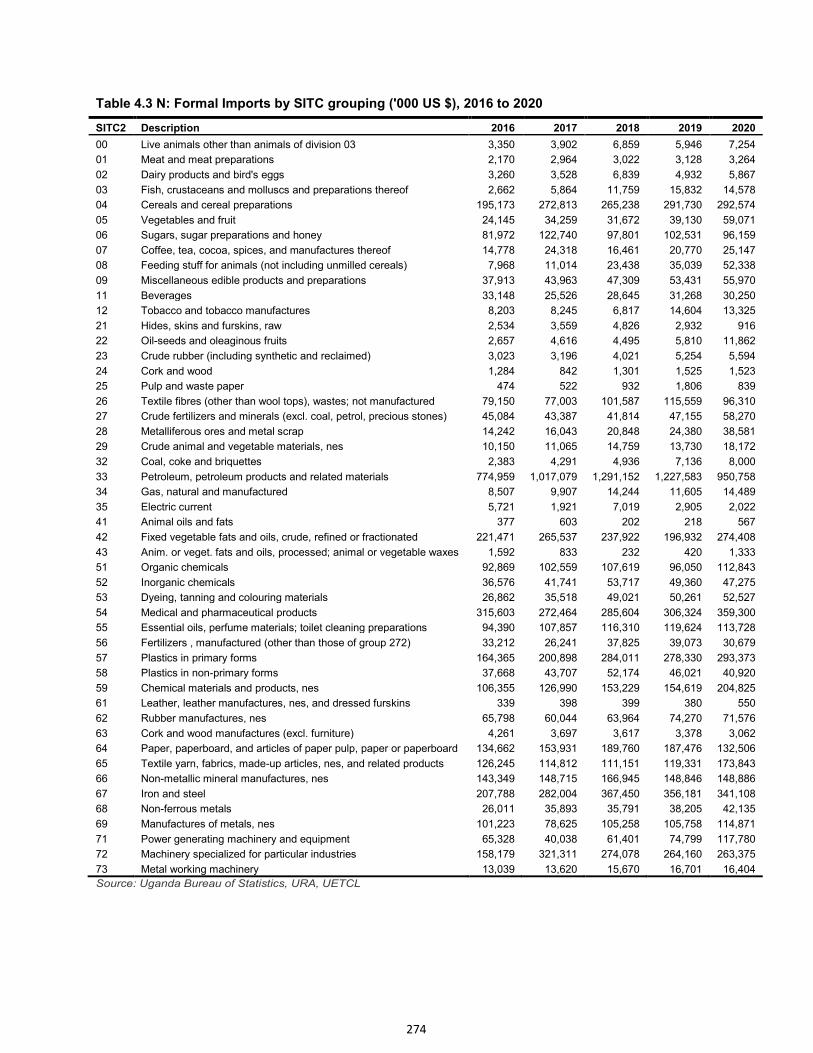
274
Table 4.3 N: Formal Imports by SITC grouping ('000 US $), 2016 to 2020
SITC2 Description 2016 2017 2018 2019 2020
00 Live animals other than animals of division 03 3,350 3,902 6,859 5,946 7,254
01 Meat and meat preparations 2,170 2,964 3,022 3,128 3,264
02 Dairy products and bird's eggs 3,260 3,528 6,839 4,932 5,867
03 Fish, crustaceans and molluscs and preparations thereof 2,662 5,864 11,759 15,832 14,578
04 Cereals and cereal preparations 195,173 272,813 265,238 291,730 292,574
05 Vegetables and fruit 24,145 34,259 31,672 39,130 59,071
06 Sugars, sugar preparations and honey 81,972 122,740 97,801 102,531 96,159
07 Coffee, tea, cocoa, spices, and manufactures thereof 14,778 24,318 16,461 20,770 25,147
08 Feeding stuff for animals (not including unmilled cereals) 7,968 11,014 23,438 35,039 52,338
09 Miscellaneous edible products and preparations 37,913 43,963 47,309 53,431 55,970
11 Beverages 33,148 25,526 28,645 31,268 30,250
12 Tobacco and tobacco manufactures 8,203 8,245 6,817 14,604 13,325
21 Hides, skins and furskins, raw 2,534 3,559 4,826 2,932 916
22 Oil-seeds and oleaginous fruits 2,657 4,616 4,495 5,810 11,862
23 Crude rubber (including synthetic and reclaimed) 3,023 3,196 4,021 5,254 5,594
24 Cork and wood 1,284 842 1,301 1,525 1,523
25 Pulp and waste paper 474 522 932 1,806 839
26 Textile fibres (other than wool tops), wastes; not manufactured 79,150 77,003 101,587 115,559 96,310
27 Crude fertilizers and minerals (excl. coal, petrol, precious stones) 45,084 43,387 41,814 47,155 58,270
28 Metalliferous ores and metal scrap 14,242 16,043 20,848 24,380 38,581
29 Crude animal and vegetable materials, nes 10,150 11,065 14,759 13,730 18,172
32 Coal, coke and briquettes 2,383 4,291 4,936 7,136 8,000
33 Petroleum, petroleum products and related materials 774,959 1,017,079 1,291,152 1,227,583 950,758
34 Gas, natural and manufactured 8,507 9,907 14,244 11,605 14,489
35 Electric current 5,721 1,921 7,019 2,905 2,022
41 Animal oils and fats 377 603 202 218 567
42 Fixed vegetable fats and oils, crude, refined or fractionated 221,471 265,537 237,922 196,932 274,408
43 Anim. or veget. fats and oils, processed; animal or vegetable waxes 1,592 833 232 420 1,333
51 Organic chemicals 92,869 102,559 107,619 96,050 112,843
52 Inorganic chemicals 36,576 41,741 53,717 49,360 47,275
53 Dyeing, tanning and colouring materials 26,862 35,518 49,021 50,261 52,527
54 Medical and pharmaceutical products 315,603 272,464 285,604 306,324 359,300
55 Essential oils, perfume materials; toilet cleaning preparations 94,390 107,857 116,310 119,624 113,728
56 Fertilizers , manufactured (other than those of group 272) 33,212 26,241 37,825 39,073 30,679
57 Plastics in primary forms 164,365 200,898 284,011 278,330 293,373
58 Plastics in non-primary forms 37,668 43,707 52,174 46,021 40,920
59 Chemical materials and products, nes 106,355 126,990 153,229 154,619 204,825
61 Leather, leather manufactures, nes, and dressed furskins 339 398 399 380 550
62 Rubber manufactures, nes 65,798 60,044 63,964 74,270 71,576
63 Cork and wood manufactures (excl. furniture) 4,261 3,697 3,617 3,378 3,062
64 Paper, paperboard, and articles of paper pulp, paper or paperboard 134,662 153,931 189,760 187,476 132,506
65 Textile yarn, fabrics, made-up articles, nes, and related products 126,245 114,812 111,151 119,331 173,843
66 Non-metallic mineral manufactures, nes 143,349 148,715 166,945 148,846 148,886
67 Iron and steel 207,788 282,004 367,450 356,181 341,108
68 Non-ferrous metals 26,011 35,893 35,791 38,205 42,135
69 Manufactures of metals, nes 101,223 78,625 105,258 105,758 114,871
71 Power generating machinery and equipment 65,328 40,038 61,401 74,799 117,780
72 Machinery specialized for particular industries 158,179 321,311 274,078 264,160 263,375
73 Metal working machinery 13,039 13,620 15,670 16,701 16,404
Source: Uganda Bureau of Statistics, URA, UETCL
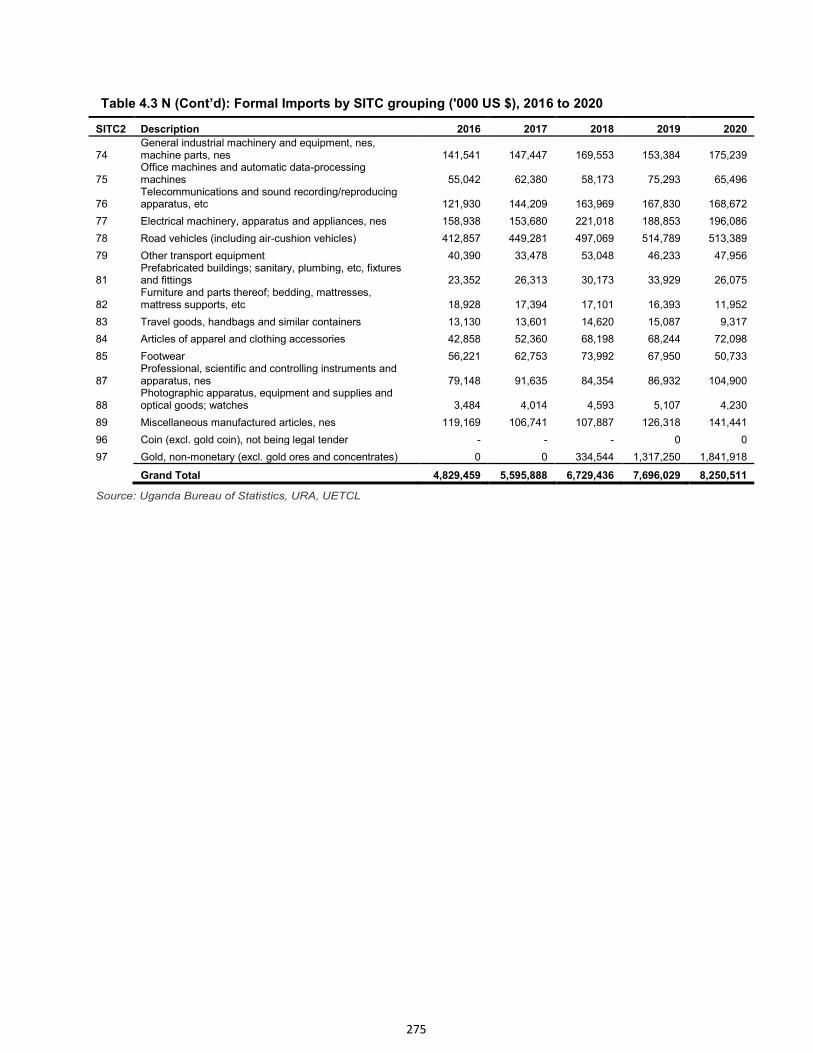
275
Table 4.3 N (Cont’d): Formal Imports by SITC grouping ('000 US $), 2016 to 2020
SITC2 Description 2016 2017 2018 2019 2020
74 General industrial machinery and equipment, nes, machine parts, nes 141,541 147,447 169,553 153,384 175,239
75 Office machines and automatic data-processing machines 55,042 62,380 58,173 75,293 65,496
76 Telecommunications and sound recording/reproducing apparatus, etc 121,930 144,209 163,969 167,830 168,672
77 Electrical machinery, apparatus and appliances, nes 158,938 153,680 221,018 188,853 196,086
78 Road vehicles (including air-cushion vehicles) 412,857 449,281 497,069 514,789 513,389
79 Other transport equipment 40,390 33,478 53,048 46,233 47,956
81 Prefabricated buildings; sanitary, plumbing, etc, fixtures and fittings 23,352 26,313 30,173 33,929 26,075
82 Furniture and parts thereof; bedding, mattresses, mattress supports, etc 18,928 17,394 17,101 16,393 11,952
83 Travel goods, handbags and similar containers 13,130 13,601 14,620 15,087 9,317
84 Articles of apparel and clothing accessories 42,858 52,360 68,198 68,244 72,098
85 Footwear 56,221 62,753 73,992 67,950 50,733
87 Professional, scientific and controlling instruments and apparatus, nes 79,148 91,635 84,354 86,932 104,900
88 Photographic apparatus, equipment and supplies and optical goods; watches 3,484 4,014 4,593 5,107 4,230
89 Miscellaneous manufactured articles, nes 119,169 106,741 107,887 126,318 141,441
96 Coin (excl. gold coin), not being legal tender - - - 0 0
97 Gold, non-monetary (excl. gold ores and concentrates) 0 0 334,544 1,317,250 1,841,918
Grand Total 4,829,459 5,595,888 6,729,436 7,696,029 8,250,511
Source: Uganda Bureau of Statistics, URA, UETCL
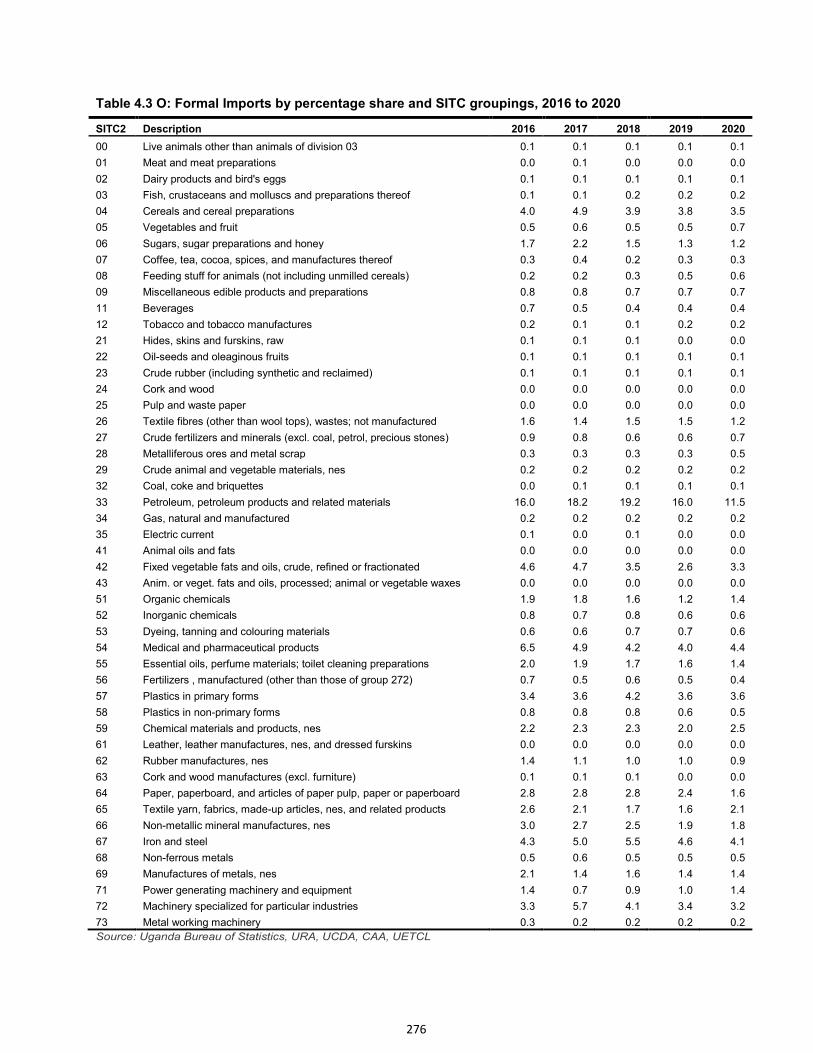
276
Table 4.3 O: Formal Imports by percentage share and SITC groupings, 2016 to 2020
SITC2 Description 2016 2017 2018 2019 2020
00 Live animals other than animals of division 03 0.1 0.1 0.1 0.1 0.1
01 Meat and meat preparations 0.0 0.1 0.0 0.0 0.0
02 Dairy products and bird's eggs 0.1 0.1 0.1 0.1 0.1
03 Fish, crustaceans and molluscs and preparations thereof 0.1 0.1 0.2 0.2 0.2
04 Cereals and cereal preparations 4.0 4.9 3.9 3.8 3.5
05 Vegetables and fruit 0.5 0.6 0.5 0.5 0.7
06 Sugars, sugar preparations and honey 1.7 2.2 1.5 1.3 1.2
07 Coffee, tea, cocoa, spices, and manufactures thereof 0.3 0.4 0.2 0.3 0.3
08 Feeding stuff for animals (not including unmilled cereals) 0.2 0.2 0.3 0.5 0.6
09 Miscellaneous edible products and preparations 0.8 0.8 0.7 0.7 0.7
11 Beverages 0.7 0.5 0.4 0.4 0.4
12 Tobacco and tobacco manufactures 0.2 0.1 0.1 0.2 0.2
21 Hides, skins and furskins, raw 0.1 0.1 0.1 0.0 0.0
22 Oil-seeds and oleaginous fruits 0.1 0.1 0.1 0.1 0.1
23 Crude rubber (including synthetic and reclaimed) 0.1 0.1 0.1 0.1 0.1
24 Cork and wood 0.0 0.0 0.0 0.0 0.0
25 Pulp and waste paper 0.0 0.0 0.0 0.0 0.0
26 Textile fibres (other than wool tops), wastes; not manufactured 1.6 1.4 1.5 1.5 1.2
27 Crude fertilizers and minerals (excl. coal, petrol, precious stones) 0.9 0.8 0.6 0.6 0.7
28 Metalliferous ores and metal scrap 0.3 0.3 0.3 0.3 0.5
29 Crude animal and vegetable materials, nes 0.2 0.2 0.2 0.2 0.2
32 Coal, coke and briquettes 0.0 0.1 0.1 0.1 0.1
33 Petroleum, petroleum products and related materials 16.0 18.2 19.2 16.0 11.5
34 Gas, natural and manufactured 0.2 0.2 0.2 0.2 0.2
35 Electric current 0.1 0.0 0.1 0.0 0.0
41 Animal oils and fats 0.0 0.0 0.0 0.0 0.0
42 Fixed vegetable fats and oils, crude, refined or fractionated 4.6 4.7 3.5 2.6 3.3
43 Anim. or veget. fats and oils, processed; animal or vegetable waxes 0.0 0.0 0.0 0.0 0.0
51 Organic chemicals 1.9 1.8 1.6 1.2 1.4
52 Inorganic chemicals 0.8 0.7 0.8 0.6 0.6
53 Dyeing, tanning and colouring materials 0.6 0.6 0.7 0.7 0.6
54 Medical and pharmaceutical products 6.5 4.9 4.2 4.0 4.4
55 Essential oils, perfume materials; toilet cleaning preparations 2.0 1.9 1.7 1.6 1.4
56 Fertilizers , manufactured (other than those of group 272) 0.7 0.5 0.6 0.5 0.4
57 Plastics in primary forms 3.4 3.6 4.2 3.6 3.6
58 Plastics in non-primary forms 0.8 0.8 0.8 0.6 0.5
59 Chemical materials and products, nes 2.2 2.3 2.3 2.0 2.5
61 Leather, leather manufactures, nes, and dressed furskins 0.0 0.0 0.0 0.0 0.0
62 Rubber manufactures, nes 1.4 1.1 1.0 1.0 0.9
63 Cork and wood manufactures (excl. furniture) 0.1 0.1 0.1 0.0 0.0
64 Paper, paperboard, and articles of paper pulp, paper or paperboard 2.8 2.8 2.8 2.4 1.6
65 Textile yarn, fabrics, made-up articles, nes, and related products 2.6 2.1 1.7 1.6 2.1
66 Non-metallic mineral manufactures, nes 3.0 2.7 2.5 1.9 1.8
67 Iron and steel 4.3 5.0 5.5 4.6 4.1
68 Non-ferrous metals 0.5 0.6 0.5 0.5 0.5
69 Manufactures of metals, nes 2.1 1.4 1.6 1.4 1.4
71 Power generating machinery and equipment 1.4 0.7 0.9 1.0 1.4
72 Machinery specialized for particular industries 3.3 5.7 4.1 3.4 3.2
73 Metal working machinery 0.3 0.2 0.2 0.2 0.2
Source: Uganda Bureau of Statistics, URA, UCDA, CAA, UETCL
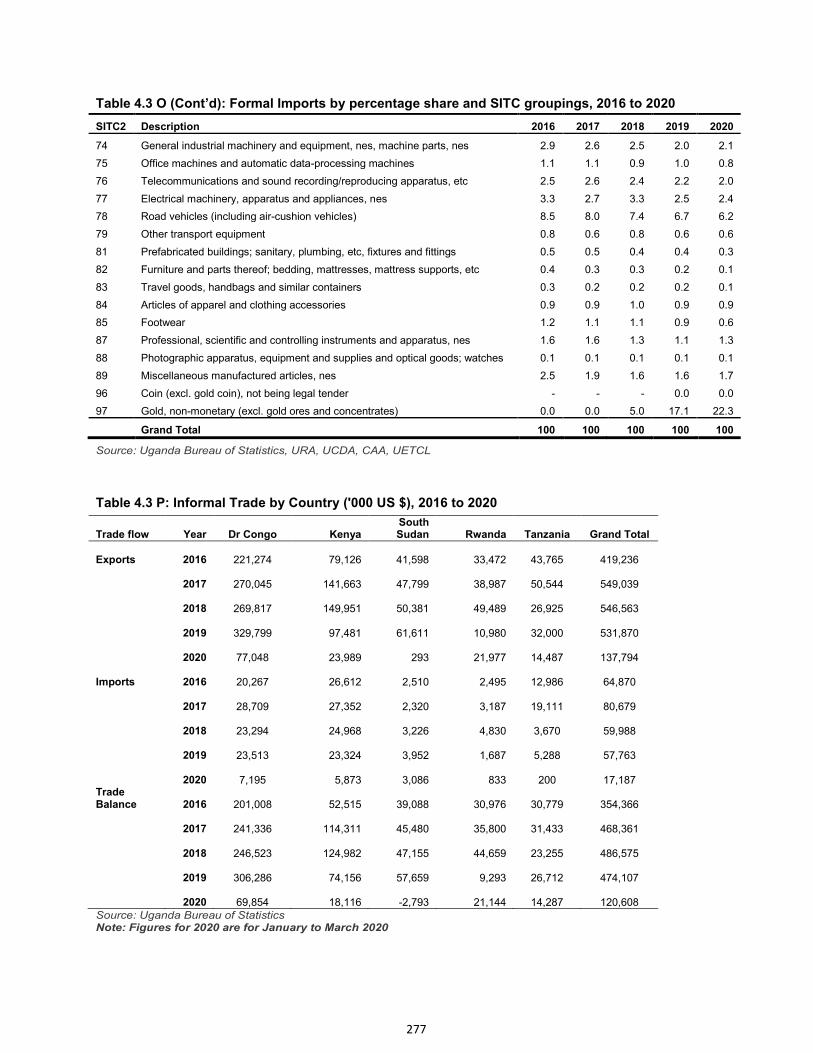
277
Table 4.3 O (Cont’d): Formal Imports by percentage share and SITC groupings, 2016 to 2020
SITC2 Description 2016 2017 2018 2019 2020
74 General industrial machinery and equipment, nes, machine parts, nes 2.9 2.6 2.5 2.0 2.1
75 Office machines and automatic data-processing machines 1.1 1.1 0.9 1.0 0.8
76 Telecommunications and sound recording/reproducing apparatus, etc 2.5 2.6 2.4 2.2 2.0
77 Electrical machinery, apparatus and appliances, nes 3.3 2.7 3.3 2.5 2.4
78 Road vehicles (including air-cushion vehicles) 8.5 8.0 7.4 6.7 6.2
79 Other transport equipment 0.8 0.6 0.8 0.6 0.6
81 Prefabricated buildings; sanitary, plumbing, etc, fixtures and fittings 0.5 0.5 0.4 0.4 0.3
82 Furniture and parts thereof; bedding, mattresses, mattress supports, etc 0.4 0.3 0.3 0.2 0.1
83 Travel goods, handbags and similar containers 0.3 0.2 0.2 0.2 0.1
84 Articles of apparel and clothing accessories 0.9 0.9 1.0 0.9 0.9
85 Footwear 1.2 1.1 1.1 0.9 0.6
87 Professional, scientific and controlling instruments and apparatus, nes 1.6 1.6 1.3 1.1 1.3
88 Photographic apparatus, equipment and supplies and optical goods; watches 0.1 0.1 0.1 0.1 0.1
89 Miscellaneous manufactured articles, nes 2.5 1.9 1.6 1.6 1.7
96 Coin (excl. gold coin), not being legal tender - - - 0.0 0.0
97 Gold, non-monetary (excl. gold ores and concentrates) 0.0 0.0 5.0 17.1 22.3
Grand Total 100 100 100 100 100
Source: Uganda Bureau of Statistics, URA, UCDA, CAA, UETCL
Table 4.3 P: Informal Trade by Country ('000 US $), 2016 to 2020
Trade flow Year Dr Congo Kenya South Sudan Rwanda Tanzania Grand Total
Exports 2016 221,274 79,126 41,598 33,472 43,765 419,236
2017 270,045 141,663 47,799 38,987 50,544 549,039
2018 269,817 149,951 50,381 49,489 26,925 546,563
2019 329,799 97,481 61,611 10,980 32,000 531,870
2020 77,048 23,989 293 21,977 14,487 137,794
Imports 2016 20,267 26,612 2,510 2,495 12,986 64,870
2017 28,709 27,352 2,320 3,187 19,111 80,679
2018 23,294 24,968 3,226 4,830 3,670 59,988
2019 23,513 23,324 3,952 1,687 5,288 57,763
2020 7,195 5,873 3,086 833 200 17,187
Trade Balance 2016 201,008 52,515 39,088 30,976 30,779 354,366
2017 241,336 114,311 45,480 35,800 31,433 468,361
2018 246,523 124,982 47,155 44,659 23,255 486,575
2019 306,286 74,156 57,659 9,293 26,712 474,107
2020 69,854 18,116 -2,793 21,144 14,287 120,608
Source: Uganda Bureau of Statistics Note: Figures for 2020 are for January to March 2020
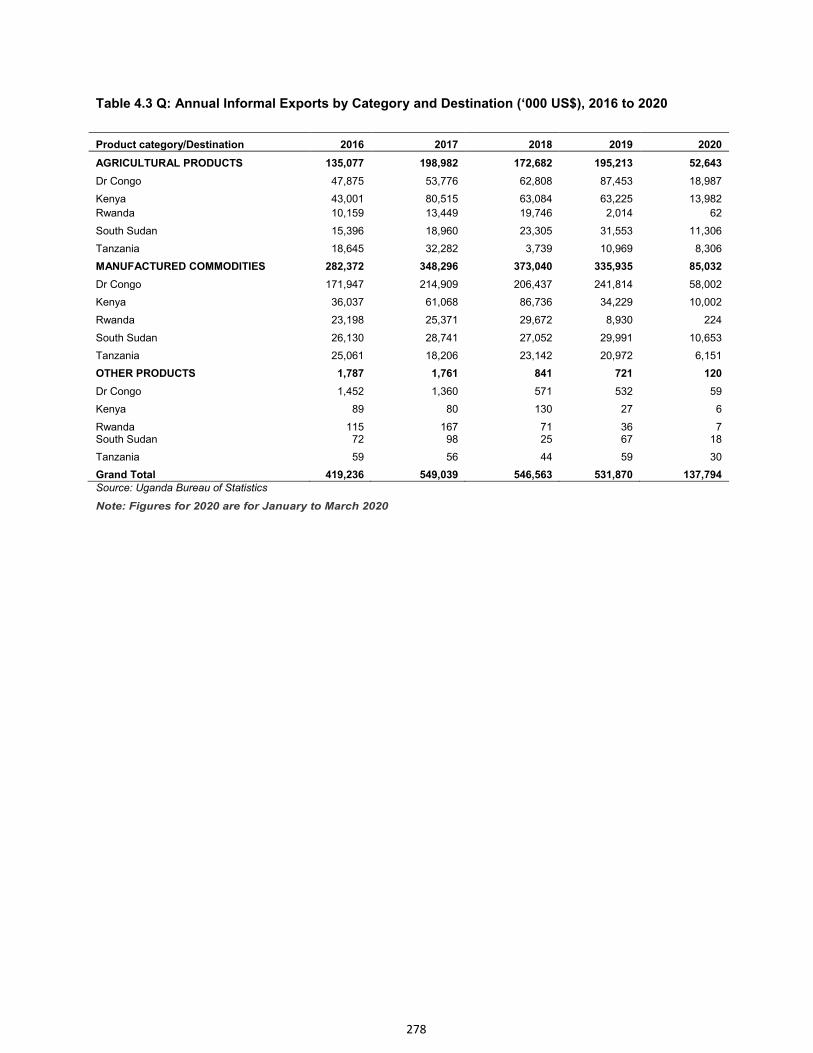
278
Table 4.3 Q: Annual Informal Exports by Category and Destination (‘000 US$), 2016 to 2020
Product category/Destination 2016 2017 2018 2019 2020
AGRICULTURAL PRODUCTS 135,077 198,982 172,682 195,213 52,643
Dr Congo 47,875 53,776 62,808 87,453 18,987
Kenya 43,001 80,515 63,084 63,225 13,982
Rwanda 10,159 13,449 19,746 2,014 62
South Sudan 15,396 18,960 23,305 31,553 11,306
Tanzania 18,645 32,282 3,739 10,969 8,306
MANUFACTURED COMMODITIES 282,372 348,296 373,040 335,935 85,032
Dr Congo 171,947 214,909 206,437 241,814 58,002
Kenya 36,037 61,068 86,736 34,229 10,002
Rwanda 23,198 25,371 29,672 8,930 224
South Sudan 26,130 28,741 27,052 29,991 10,653
Tanzania 25,061 18,206 23,142 20,972 6,151
OTHER PRODUCTS 1,787 1,761 841 721 120
Dr Congo 1,452 1,360 571 532 59
Kenya 89 80 130 27 6
Rwanda 115 167 71 36 7 South Sudan 72 98 25 67 18
Tanzania 59 56 44 59 30
Grand Total 419,236 549,039 546,563 531,870 137,794 Source: Uganda Bureau of Statistics
Note: Figures for 2020 are for January to March 2020
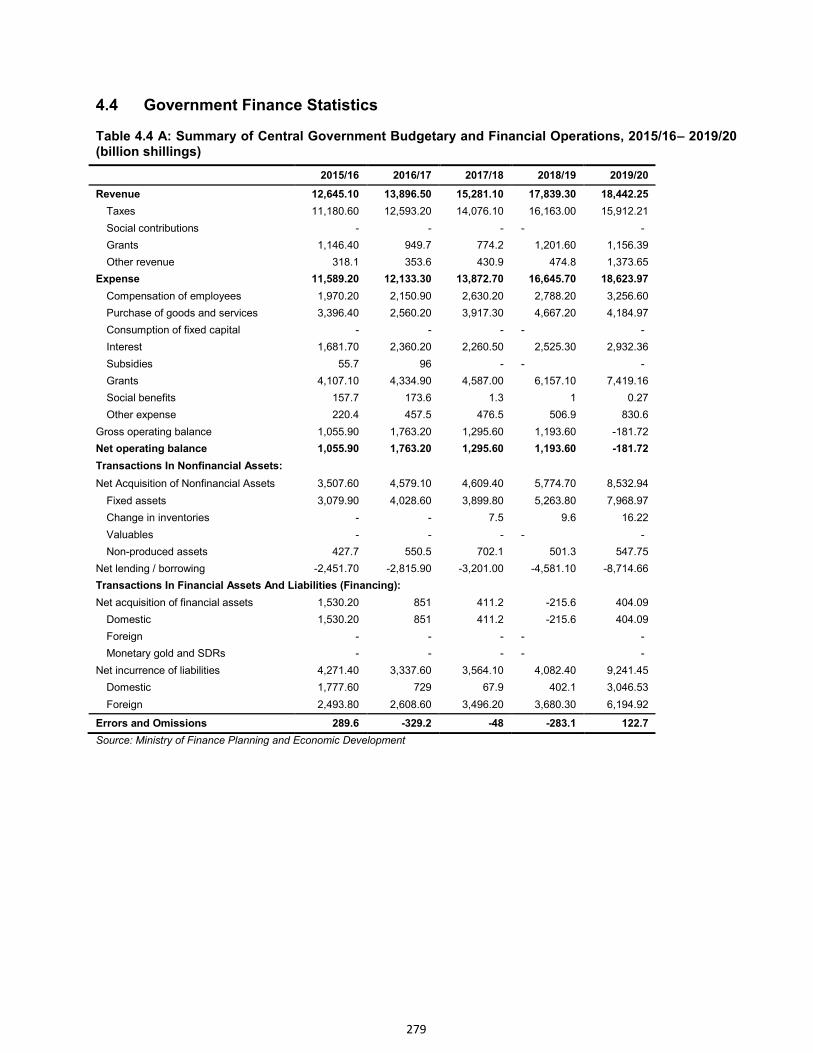
279
4.4 Government Finance Statistics
Table 4.4 A: Summary of Central Government Budgetary and Financial Operations, 2015/16– 2019/20 (billion shillings)
2015/16 2016/17 2017/18 2018/19 2019/20
Revenue 12,645.10 13,896.50 15,281.10 17,839.30 18,442.25
Taxes 11,180.60 12,593.20 14,076.10 16,163.00 15,912.21
Social contributions - - - - -
Grants 1,146.40 949.7 774.2 1,201.60 1,156.39
Other revenue 318.1 353.6 430.9 474.8 1,373.65
Expense 11,589.20 12,133.30 13,872.70 16,645.70 18,623.97
Compensation of employees 1,970.20 2,150.90 2,630.20 2,788.20 3,256.60
Purchase of goods and services 3,396.40 2,560.20 3,917.30 4,667.20 4,184.97
Consumption of fixed capital - - - - -
Interest 1,681.70 2,360.20 2,260.50 2,525.30 2,932.36
Subsidies 55.7 96 - - -
Grants 4,107.10 4,334.90 4,587.00 6,157.10 7,419.16
Social benefits 157.7 173.6 1.3 1 0.27
Other expense 220.4 457.5 476.5 506.9 830.6
Gross operating balance 1,055.90 1,763.20 1,295.60 1,193.60 -181.72
Net operating balance 1,055.90 1,763.20 1,295.60 1,193.60 -181.72
Transactions In Nonfinancial Assets:
Net Acquisition of Nonfinancial Assets 3,507.60 4,579.10 4,609.40 5,774.70 8,532.94
Fixed assets 3,079.90 4,028.60 3,899.80 5,263.80 7,968.97
Change in inventories - - 7.5 9.6 16.22
Valuables - - - - -
Non-produced assets 427.7 550.5 702.1 501.3 547.75
Net lending / borrowing -2,451.70 -2,815.90 -3,201.00 -4,581.10 -8,714.66
Transactions In Financial Assets And Liabilities (Financing):
Net acquisition of financial assets 1,530.20 851 411.2 -215.6 404.09
Domestic 1,530.20 851 411.2 -215.6 404.09
Foreign - - - - -
Monetary gold and SDRs - - - - -
Net incurrence of liabilities 4,271.40 3,337.60 3,564.10 4,082.40 9,241.45
Domestic 1,777.60 729 67.9 402.1 3,046.53
Foreign 2,493.80 2,608.60 3,496.20 3,680.30 6,194.92
Errors and Omissions 289.6 -329.2 -48 -283.1 122.7
Source: Ministry of Finance Planning and Economic Development
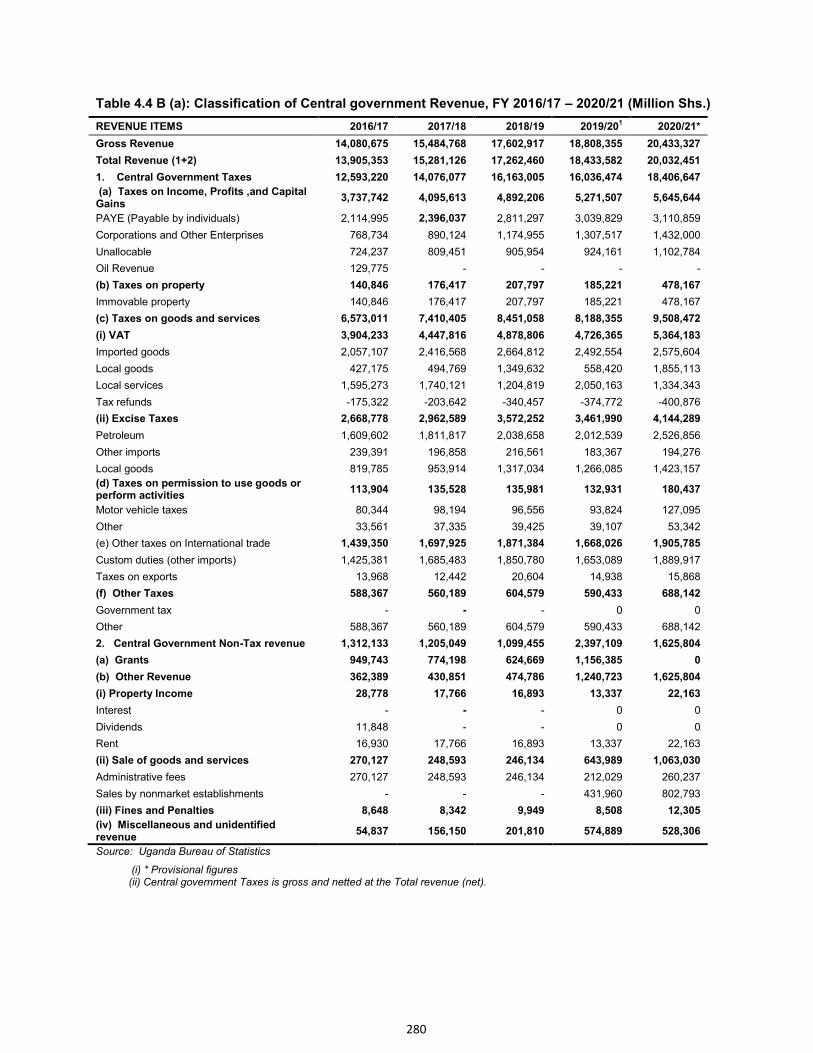
280
Table 4.4 B (a): Classification of Central government Revenue, FY 2016/17 – 2020/21 (Million Shs.)
REVENUE ITEMS 2016/17 2017/18 2018/19 2019/201 2020/21*
Gross Revenue 14,080,675 15,484,768 17,602,917 18,808,355 20,433,327
Total Revenue (1+2) 13,905,353 15,281,126 17,262,460 18,433,582 20,032,451
1. Central Government Taxes 12,593,220 14,076,077 16,163,005 16,036,474 18,406,647
(a) Taxes on Income, Profits ,and Capital Gains
3,737,742 4,095,613 4,892,206 5,271,507 5,645,644
PAYE (Payable by individuals) 2,114,995 2,396,037 2,811,297 3,039,829 3,110,859
Corporations and Other Enterprises 768,734 890,124 1,174,955 1,307,517 1,432,000
Unallocable 724,237 809,451 905,954 924,161 1,102,784
Oil Revenue 129,775 - - - -
(b) Taxes on property 140,846 176,417 207,797 185,221 478,167
Immovable property 140,846 176,417 207,797 185,221 478,167
(c) Taxes on goods and services 6,573,011 7,410,405 8,451,058 8,188,355 9,508,472
(i) VAT 3,904,233 4,447,816 4,878,806 4,726,365 5,364,183
Imported goods 2,057,107 2,416,568 2,664,812 2,492,554 2,575,604
Local goods 427,175 494,769 1,349,632 558,420 1,855,113
Local services 1,595,273 1,740,121 1,204,819 2,050,163 1,334,343
Tax refunds -175,322 -203,642 -340,457 -374,772 -400,876
(ii) Excise Taxes 2,668,778 2,962,589 3,572,252 3,461,990 4,144,289
Petroleum 1,609,602 1,811,817 2,038,658 2,012,539 2,526,856
Other imports 239,391 196,858 216,561 183,367 194,276
Local goods 819,785 953,914 1,317,034 1,266,085 1,423,157
(d) Taxes on permission to use goods or perform activities
113,904 135,528 135,981 132,931 180,437
Motor vehicle taxes 80,344 98,194 96,556 93,824 127,095
Other 33,561 37,335 39,425 39,107 53,342
(e) Other taxes on International trade 1,439,350 1,697,925 1,871,384 1,668,026 1,905,785
Custom duties (other imports) 1,425,381 1,685,483 1,850,780 1,653,089 1,889,917
Taxes on exports 13,968 12,442 20,604 14,938 15,868
(f) Other Taxes 588,367 560,189 604,579 590,433 688,142
Government tax - - - 0 0
Other 588,367 560,189 604,579 590,433 688,142
2. Central Government Non-Tax revenue 1,312,133 1,205,049 1,099,455 2,397,109 1,625,804
(a) Grants 949,743 774,198 624,669 1,156,385 0
(b) Other Revenue 362,389 430,851 474,786 1,240,723 1,625,804
(i) Property Income 28,778 17,766 16,893 13,337 22,163
Interest - - - 0 0
Dividends 11,848 - - 0 0
Rent 16,930 17,766 16,893 13,337 22,163
(ii) Sale of goods and services 270,127 248,593 246,134 643,989 1,063,030
Administrative fees 270,127 248,593 246,134 212,029 260,237
Sales by nonmarket establishments - - - 431,960 802,793
(iii) Fines and Penalties 8,648 8,342 9,949 8,508 12,305
(iv) Miscellaneous and unidentified revenue
54,837 156,150 201,810 574,889 528,306
Source: Uganda Bureau of Statistics
(i) * Provisional figures (ii) Central government Taxes is gross and netted at the Total revenue (net).
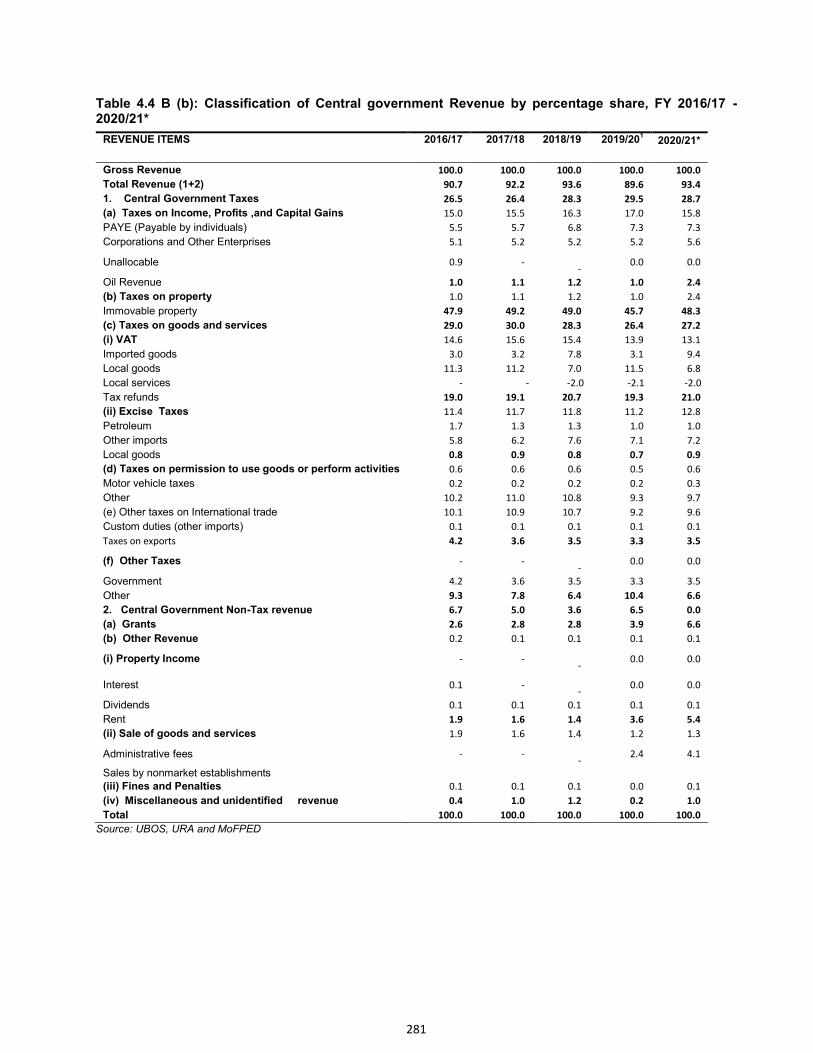
281
Table 4.4 B (b): Classification of Central government Revenue by percentage share, FY 2016/17 - 2020/21*
REVENUE ITEMS 2016/17 2017/18 2018/19 2019/201 2020/21*
Gross Revenue 100.0 100.0 100.0 100.0 100.0
Total Revenue (1+2) 90.7 92.2 93.6 89.6 93.4
1. Central Government Taxes 26.5 26.4 28.3 29.5 28.7
(a) Taxes on Income, Profits ,and Capital Gains 15.0 15.5 16.3 17.0 15.8
PAYE (Payable by individuals) 5.5 5.7 6.8 7.3 7.3
Corporations and Other Enterprises 5.1 5.2 5.2 5.2 5.6
Unallocable 0.9 -
- 0.0 0.0
Oil Revenue 1.0 1.1 1.2 1.0 2.4
(b) Taxes on property 1.0 1.1 1.2 1.0 2.4
Immovable property 47.9 49.2 49.0 45.7 48.3
(c) Taxes on goods and services 29.0 30.0 28.3 26.4 27.2
(i) VAT 14.6 15.6 15.4 13.9 13.1
Imported goods 3.0 3.2 7.8 3.1 9.4
Local goods 11.3 11.2 7.0 11.5 6.8
Local services - - -2.0 -2.1 -2.0
Tax refunds 19.0 19.1 20.7 19.3 21.0
(ii) Excise Taxes 11.4 11.7 11.8 11.2 12.8
Petroleum 1.7 1.3 1.3 1.0 1.0
Other imports 5.8 6.2 7.6 7.1 7.2
Local goods 0.8 0.9 0.8 0.7 0.9
(d) Taxes on permission to use goods or perform activities 0.6 0.6 0.6 0.5 0.6
Motor vehicle taxes 0.2 0.2 0.2 0.2 0.3
Other 10.2 11.0 10.8 9.3 9.7
(e) Other taxes on International trade 10.1 10.9 10.7 9.2 9.6
Custom duties (other imports) 0.1 0.1 0.1 0.1 0.1
Taxes on exports 4.2 3.6 3.5 3.3 3.5
(f) Other Taxes - -
- 0.0 0.0
Government 4.2 3.6 3.5 3.3 3.5
Other 9.3 7.8 6.4 10.4 6.6
2. Central Government Non-Tax revenue 6.7 5.0 3.6 6.5 0.0
(a) Grants 2.6 2.8 2.8 3.9 6.6
(b) Other Revenue 0.2 0.1 0.1 0.1 0.1
(i) Property Income - -
- 0.0 0.0
Interest 0.1 -
- 0.0 0.0
Dividends 0.1 0.1 0.1 0.1 0.1
Rent 1.9 1.6 1.4 3.6 5.4
(ii) Sale of goods and services 1.9 1.6 1.4 1.2 1.3
Administrative fees - -
- 2.4 4.1
Sales by nonmarket establishments
(iii) Fines and Penalties 0.1 0.1 0.1 0.0 0.1
(iv) Miscellaneous and unidentified revenue 0.4 1.0 1.2 0.2 1.0
Total 100.0 100.0 100.0 100.0 100.0
Source: UBOS, URA and MoFPED
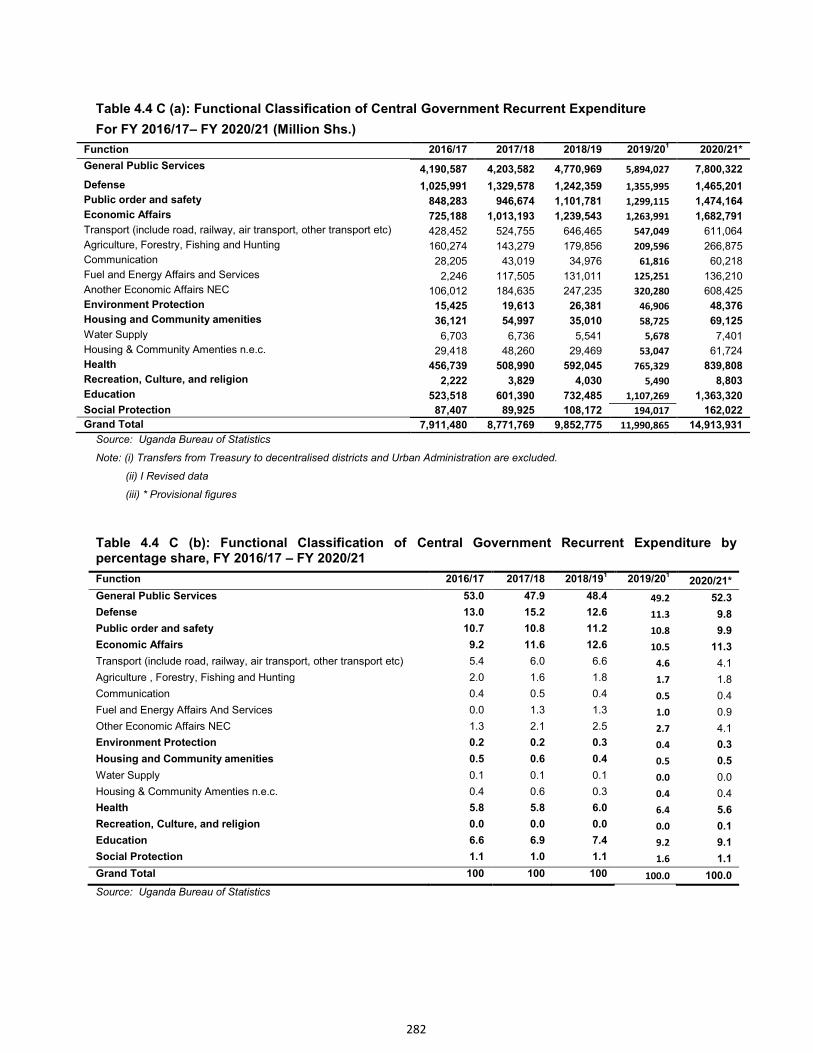
282
Table 4.4 C (a): Functional Classification of Central Government Recurrent Expenditure
For FY 2016/17– FY 2020/21 (Million Shs.)
Function 2016/17 2017/18 2018/19 2019/201 2020/21*
General Public Services 4,190,587 4,203,582 4,770,969 5,894,027 7,800,322
Defense 1,025,991 1,329,578 1,242,359 1,355,995 1,465,201
Public order and safety 848,283 946,674 1,101,781 1,299,115 1,474,164
Economic Affairs 725,188 1,013,193 1,239,543 1,263,991 1,682,791
Transport (include road, railway, air transport, other transport etc) 428,452 524,755 646,465 547,049 611,064
Agriculture, Forestry, Fishing and Hunting 160,274 143,279 179,856 209,596 266,875
Communication 28,205 43,019 34,976 61,816 60,218
Fuel and Energy Affairs and Services 2,246 117,505 131,011 125,251 136,210
Another Economic Affairs NEC 106,012 184,635 247,235 320,280 608,425
Environment Protection 15,425 19,613 26,381 46,906 48,376
Housing and Community amenities 36,121 54,997 35,010 58,725 69,125
Water Supply 6,703 6,736 5,541 5,678 7,401
Housing & Community Amenties n.e.c. 29,418 48,260 29,469 53,047 61,724
Health 456,739 508,990 592,045 765,329 839,808
Recreation, Culture, and religion 2,222 3,829 4,030 5,490 8,803
Education 523,518 601,390 732,485 1,107,269 1,363,320
Social Protection 87,407 89,925 108,172 194,017 162,022
Grand Total 7,911,480 8,771,769 9,852,775 11,990,865 14,913,931
Source: Uganda Bureau of Statistics
Note: (i) Transfers from Treasury to decentralised districts and Urban Administration are excluded.
(ii) I Revised data
(iii) * Provisional figures
Table 4.4 C (b): Functional Classification of Central Government Recurrent Expenditure by percentage share, FY 2016/17 – FY 2020/21
Function 2016/17 2017/18 2018/191 2019/20
1 2020/21*
General Public Services 53.0 47.9 48.4 49.2 52.3
Defense 13.0 15.2 12.6 11.3 9.8
Public order and safety 10.7 10.8 11.2 10.8 9.9
Economic Affairs 9.2 11.6 12.6 10.5 11.3
Transport (include road, railway, air transport, other transport etc) 5.4 6.0 6.6 4.6 4.1
Agriculture , Forestry, Fishing and Hunting 2.0 1.6 1.8 1.7 1.8
Communication 0.4 0.5 0.4 0.5 0.4
Fuel and Energy Affairs And Services 0.0 1.3 1.3 1.0 0.9
Other Economic Affairs NEC 1.3 2.1 2.5 2.7 4.1
Environment Protection 0.2 0.2 0.3 0.4 0.3
Housing and Community amenities 0.5 0.6 0.4 0.5 0.5
Water Supply 0.1 0.1 0.1 0.0 0.0
Housing & Community Amenties n.e.c. 0.4 0.6 0.3 0.4 0.4
Health 5.8 5.8 6.0 6.4 5.6
Recreation, Culture, and religion 0.0 0.0 0.0 0.0 0.1
Education 6.6 6.9 7.4 9.2 9.1
Social Protection 1.1 1.0 1.1 1.6 1.1
Grand Total 100 100 100 100.0 100.0
Source: Uganda Bureau of Statistics
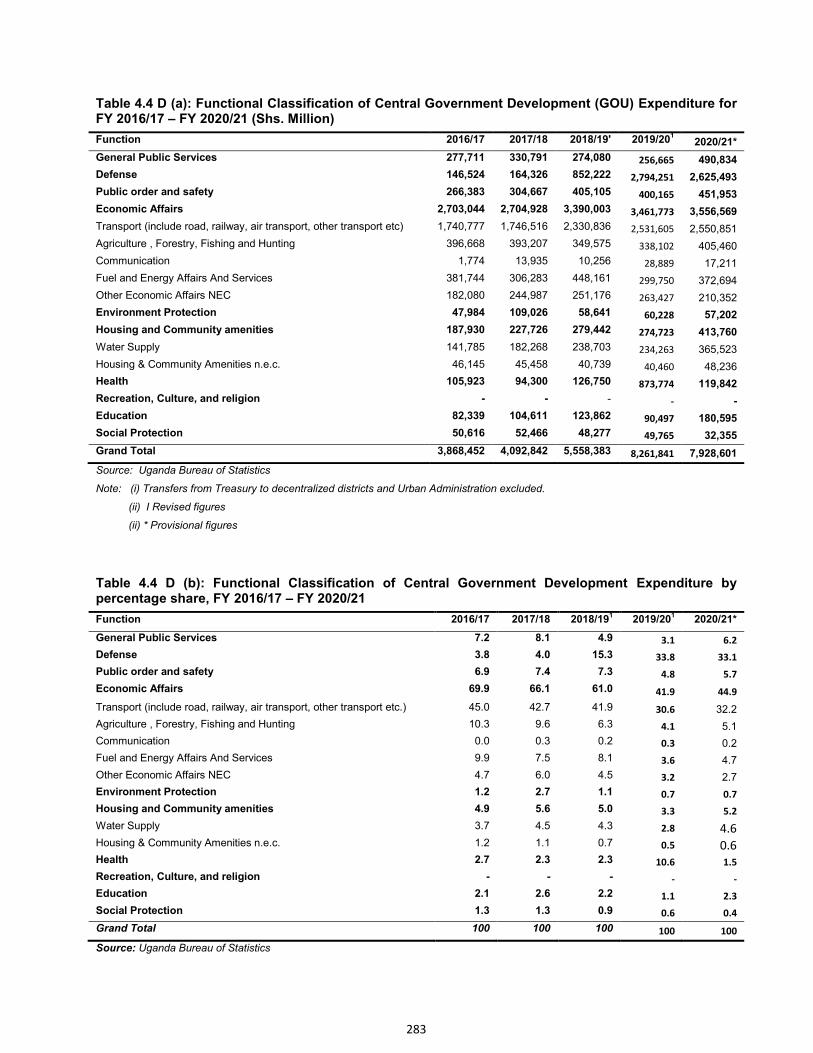
283
Table 4.4 D (a): Functional Classification of Central Government Development (GOU) Expenditure for FY 2016/17 – FY 2020/21 (Shs. Million)
Function 2016/17 2017/18 2018/19' 2019/201 2020/21*
General Public Services 277,711 330,791 274,080 256,665 490,834
Defense 146,524 164,326 852,222 2,794,251 2,625,493
Public order and safety 266,383 304,667 405,105 400,165 451,953
Economic Affairs 2,703,044 2,704,928 3,390,003 3,461,773 3,556,569
Transport (include road, railway, air transport, other transport etc) 1,740,777 1,746,516 2,330,836 2,531,605 2,550,851
Agriculture , Forestry, Fishing and Hunting 396,668 393,207 349,575 338,102 405,460
Communication 1,774 13,935 10,256 28,889 17,211
Fuel and Energy Affairs And Services 381,744 306,283 448,161 299,750 372,694
Other Economic Affairs NEC 182,080 244,987 251,176 263,427 210,352
Environment Protection 47,984 109,026 58,641 60,228 57,202
Housing and Community amenities 187,930 227,726 279,442 274,723 413,760
Water Supply 141,785 182,268 238,703 234,263 365,523
Housing & Community Amenities n.e.c. 46,145 45,458 40,739 40,460 48,236
Health 105,923 94,300 126,750 873,774 119,842
Recreation, Culture, and religion - - - - -
Education 82,339 104,611 123,862 90,497 180,595
Social Protection 50,616 52,466 48,277 49,765 32,355
Grand Total 3,868,452 4,092,842 5,558,383 8,261,841 7,928,601
Source: Uganda Bureau of Statistics
Note: (i) Transfers from Treasury to decentralized districts and Urban Administration excluded.
(ii) I Revised figures
(ii) * Provisional figures
Table 4.4 D (b): Functional Classification of Central Government Development Expenditure by percentage share, FY 2016/17 – FY 2020/21
Function 2016/17 2017/18 2018/191 2019/20
1 2020/21*
General Public Services 7.2 8.1 4.9 3.1 6.2
Defense 3.8 4.0 15.3 33.8 33.1
Public order and safety 6.9 7.4 7.3 4.8 5.7
Economic Affairs 69.9 66.1 61.0 41.9 44.9
Transport (include road, railway, air transport, other transport etc.) 45.0 42.7 41.9 30.6 32.2
Agriculture , Forestry, Fishing and Hunting 10.3 9.6 6.3 4.1 5.1
Communication 0.0 0.3 0.2 0.3 0.2
Fuel and Energy Affairs And Services 9.9 7.5 8.1 3.6 4.7
Other Economic Affairs NEC 4.7 6.0 4.5 3.2 2.7
Environment Protection 1.2 2.7 1.1 0.7 0.7
Housing and Community amenities 4.9 5.6 5.0 3.3 5.2
Water Supply 3.7 4.5 4.3 2.8 4.6 Housing & Community Amenities n.e.c. 1.2 1.1 0.7 0.5 0.6 Health 2.7 2.3 2.3 10.6 1.5
Recreation, Culture, and religion - - - - -
Education 2.1 2.6 2.2 1.1 2.3
Social Protection 1.3 1.3 0.9 0.6 0.4
Grand Total 100 100 100 100 100
Source: Uganda Bureau of Statistics
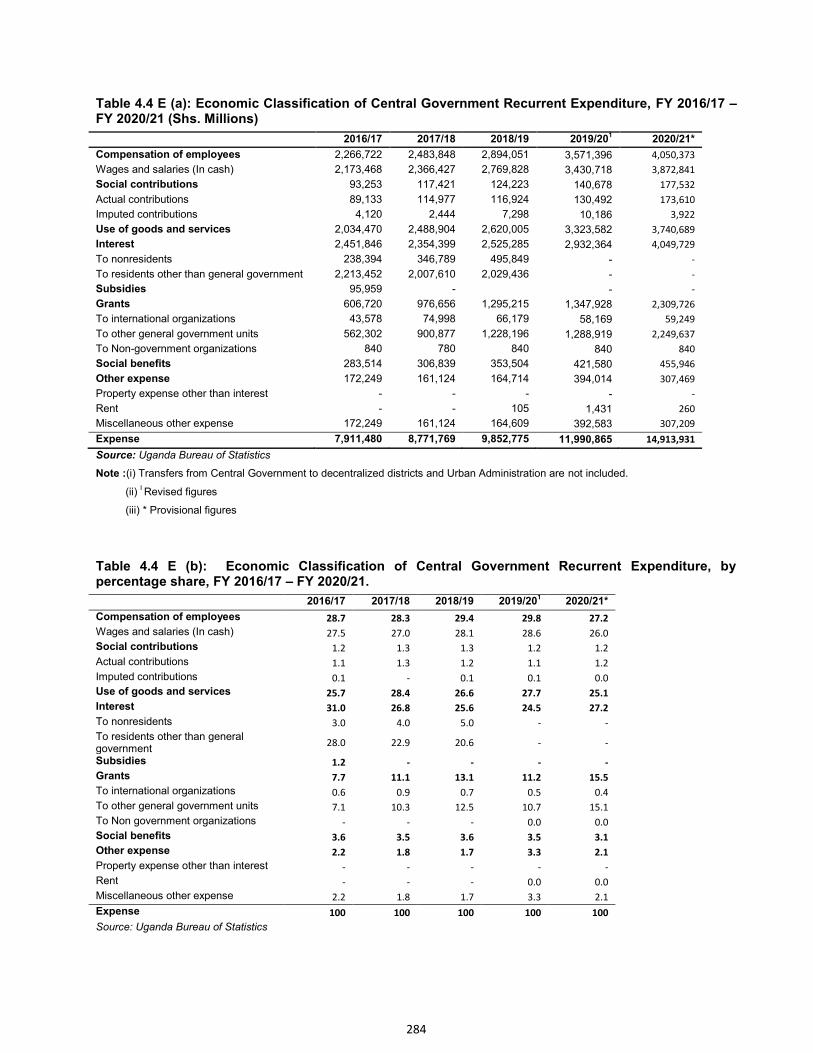
284
Table 4.4 E (a): Economic Classification of Central Government Recurrent Expenditure, FY 2016/17 – FY 2020/21 (Shs. Millions) 2016/17 2017/18 2018/19 2019/20
1 2020/21*
Compensation of employees 2,266,722 2,483,848 2,894,051 3,571,396 4,050,373
Wages and salaries (In cash) 2,173,468 2,366,427 2,769,828 3,430,718 3,872,841
Social contributions 93,253 117,421 124,223 140,678 177,532
Actual contributions 89,133 114,977 116,924 130,492 173,610
Imputed contributions 4,120 2,444 7,298 10,186 3,922
Use of goods and services 2,034,470 2,488,904 2,620,005 3,323,582 3,740,689
Interest 2,451,846 2,354,399 2,525,285 2,932,364 4,049,729
To nonresidents 238,394 346,789 495,849 - -
To residents other than general government 2,213,452 2,007,610 2,029,436 - -
Subsidies 95,959 - - -
Grants 606,720 976,656 1,295,215 1,347,928 2,309,726
To international organizations 43,578 74,998 66,179 58,169 59,249
To other general government units 562,302 900,877 1,228,196 1,288,919 2,249,637
To Non-government organizations 840 780 840 840 840
Social benefits 283,514 306,839 353,504 421,580 455,946
Other expense 172,249 161,124 164,714 394,014 307,469
Property expense other than interest - - - - -
Rent - - 105 1,431 260
Miscellaneous other expense 172,249 161,124 164,609 392,583 307,209
Expense 7,911,480 8,771,769 9,852,775 11,990,865 14,913,931
Source: Uganda Bureau of Statistics
Note :(i) Transfers from Central Government to decentralized districts and Urban Administration are not included.
(ii) I Revised figures
(iii) * Provisional figures
Table 4.4 E (b): Economic Classification of Central Government Recurrent Expenditure, by percentage share, FY 2016/17 – FY 2020/21.
Source: Uganda Bureau of Statistics
2016/17 2017/18 2018/19 2019/201 2020/21*
Compensation of employees 28.7 28.3 29.4 29.8 27.2
Wages and salaries (In cash) 27.5 27.0 28.1 28.6 26.0
Social contributions 1.2 1.3 1.3 1.2 1.2
Actual contributions 1.1 1.3 1.2 1.1 1.2
Imputed contributions 0.1 - 0.1 0.1 0.0
Use of goods and services 25.7 28.4 26.6 27.7 25.1
Interest 31.0 26.8 25.6 24.5 27.2
To nonresidents 3.0 4.0 5.0 - -
To residents other than general government
28.0 22.9 20.6 - -
Subsidies 1.2 - - - -
Grants 7.7 11.1 13.1 11.2 15.5
To international organizations 0.6 0.9 0.7 0.5 0.4
To other general government units 7.1 10.3 12.5 10.7 15.1
To Non government organizations - - - 0.0 0.0
Social benefits 3.6 3.5 3.6 3.5 3.1
Other expense 2.2 1.8 1.7 3.3 2.1
Property expense other than interest - - - - -
Rent - - - 0.0 0.0
Miscellaneous other expense 2.2 1.8 1.7 3.3 2.1
Expense 100 100 100 100 100
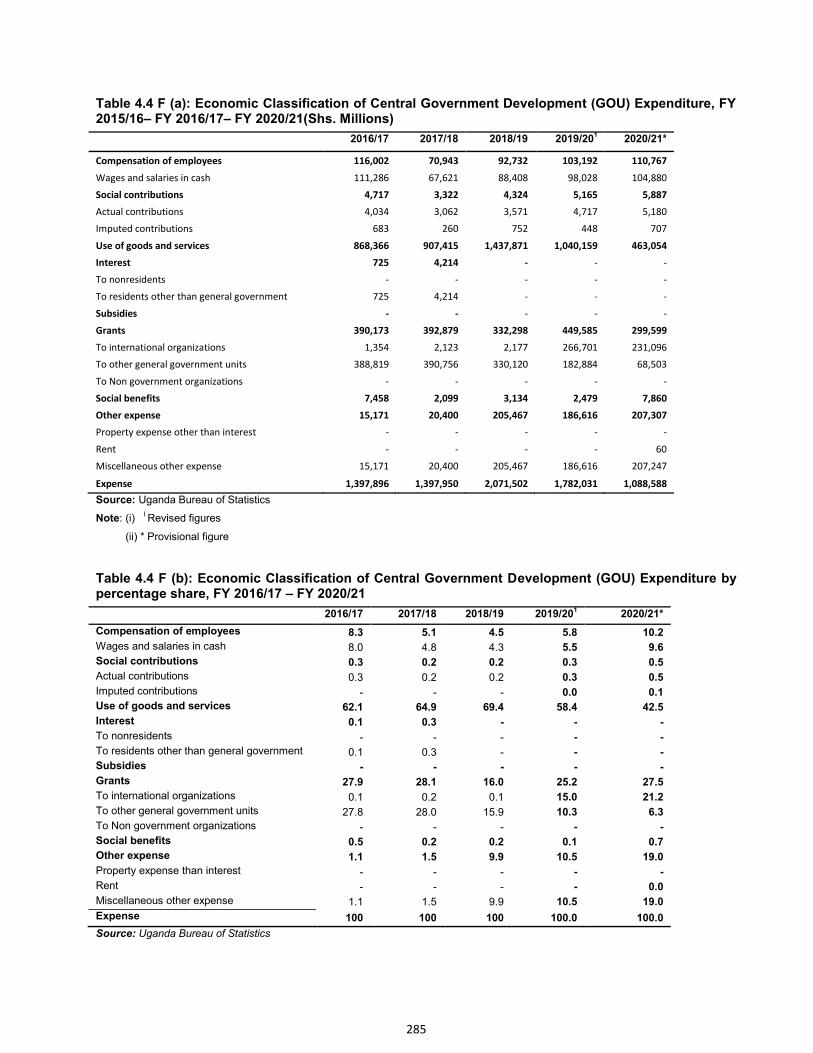
285
Table 4.4 F (a): Economic Classification of Central Government Development (GOU) Expenditure, FY 2015/16– FY 2016/17– FY 2020/21(Shs. Millions)
2016/17 2017/18 2018/19 2019/201 2020/21*
Compensation of employees 116,002 70,943 92,732 103,192 110,767
Wages and salaries in cash 111,286 67,621 88,408 98,028 104,880
Social contributions 4,717 3,322 4,324 5,165 5,887
Actual contributions 4,034 3,062 3,571 4,717 5,180
Imputed contributions 683 260 752 448 707
Use of goods and services 868,366 907,415 1,437,871 1,040,159 463,054
Interest 725 4,214 - - -
To nonresidents - - - - -
To residents other than general government 725 4,214 - - -
Subsidies - - - - -
Grants 390,173 392,879 332,298 449,585 299,599
To international organizations 1,354 2,123 2,177 266,701 231,096
To other general government units 388,819 390,756 330,120 182,884 68,503
To Non government organizations - - - - -
Social benefits 7,458 2,099 3,134 2,479 7,860
Other expense 15,171 20,400 205,467 186,616 207,307
Property expense other than interest - - - - -
Rent - - - - 60
Miscellaneous other expense 15,171 20,400 205,467 186,616 207,247
Expense 1,397,896 1,397,950 2,071,502 1,782,031 1,088,588
Source: Uganda Bureau of Statistics
Note: (i) I Revised figures
(ii) * Provisional figure
Table 4.4 F (b): Economic Classification of Central Government Development (GOU) Expenditure by percentage share, FY 2016/17 – FY 2020/21
2016/17 2017/18 2018/19 2019/201 2020/21*
Compensation of employees 8.3 5.1 4.5 5.8 10.2
Wages and salaries in cash 8.0 4.8 4.3 5.5 9.6
Social contributions 0.3 0.2 0.2 0.3 0.5
Actual contributions 0.3 0.2 0.2 0.3 0.5
Imputed contributions - - - 0.0 0.1
Use of goods and services 62.1 64.9 69.4 58.4 42.5
Interest 0.1 0.3 - - -
To nonresidents - - - - -
To residents other than general government 0.1 0.3 - - -
Subsidies - - - - -
Grants 27.9 28.1 16.0 25.2 27.5
To international organizations 0.1 0.2 0.1 15.0 21.2
To other general government units 27.8 28.0 15.9 10.3 6.3
To Non government organizations - - - - -
Social benefits 0.5 0.2 0.2 0.1 0.7
Other expense 1.1 1.5 9.9 10.5 19.0
Property expense than interest - - - - -
Rent - - - - 0.0
Miscellaneous other expense 1.1 1.5 9.9 10.5 19.0
Expense 100 100 100 100.0 100.0
Source: Uganda Bureau of Statistics
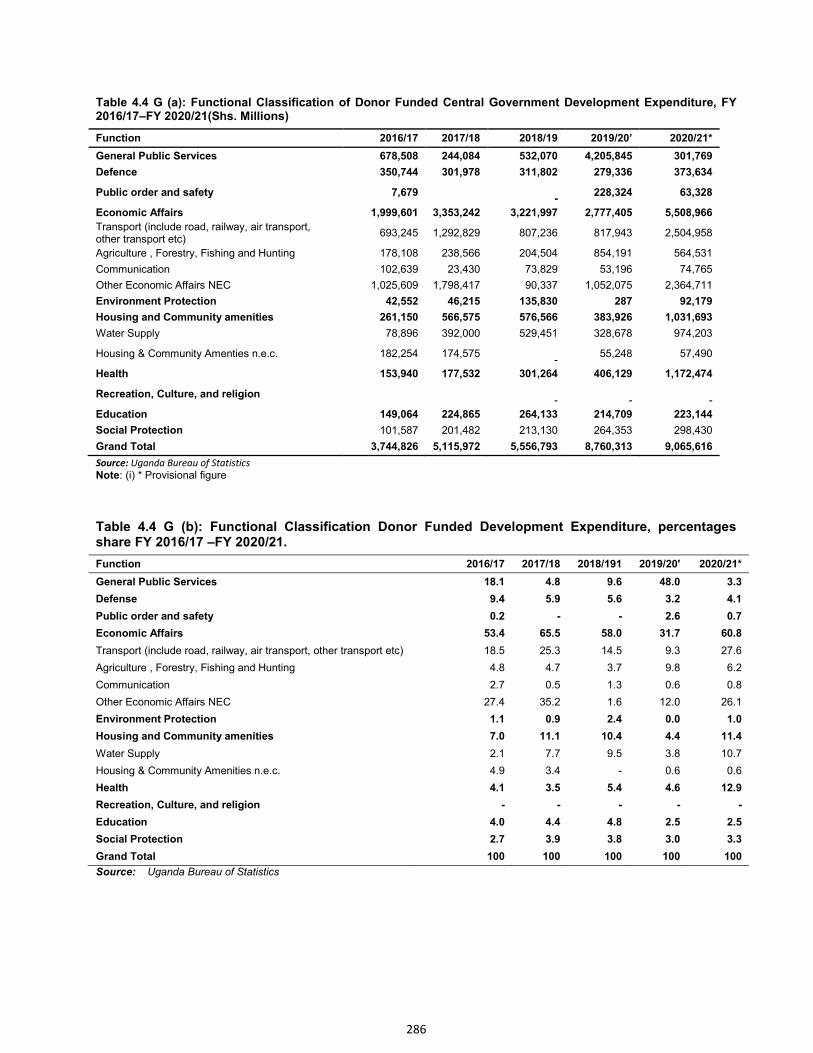
286
Table 4.4 G (a): Functional Classification of Donor Funded Central Government Development Expenditure, FY 2016/17–FY 2020/21(Shs. Millions)
Function 2016/17 2017/18 2018/19 2019/20’ 2020/21*
General Public Services 678,508 244,084 532,070 4,205,845 301,769
Defence 350,744 301,978 311,802 279,336 373,634
Public order and safety 7,679
-
228,324 63,328
Economic Affairs 1,999,601 3,353,242 3,221,997 2,777,405 5,508,966
Transport (include road, railway, air transport, other transport etc)
693,245 1,292,829 807,236 817,943 2,504,958
Agriculture , Forestry, Fishing and Hunting 178,108 238,566 204,504 854,191 564,531
Communication 102,639 23,430 73,829 53,196 74,765
Other Economic Affairs NEC 1,025,609 1,798,417 90,337 1,052,075 2,364,711
Environment Protection 42,552 46,215 135,830 287 92,179
Housing and Community amenities 261,150 566,575 576,566 383,926 1,031,693
Water Supply 78,896 392,000 529,451 328,678 974,203
Housing & Community Amenties n.e.c. 182,254 174,575
- 55,248 57,490
Health 153,940 177,532 301,264 406,129 1,172,474
Recreation, Culture, and religion
-
-
-
Education 149,064 224,865 264,133 214,709 223,144
Social Protection 101,587 201,482 213,130 264,353 298,430
Grand Total 3,744,826 5,115,972 5,556,793 8,760,313 9,065,616
Source: Uganda Bureau of Statistics
Note: (i) * Provisional figure
Table 4.4 G (b): Functional Classification Donor Funded Development Expenditure, percentages share FY 2016/17 –FY 2020/21.
Function 2016/17 2017/18 2018/191 2019/20' 2020/21*
General Public Services 18.1 4.8 9.6 48.0 3.3
Defense 9.4 5.9 5.6 3.2 4.1
Public order and safety 0.2 - - 2.6 0.7
Economic Affairs 53.4 65.5 58.0 31.7 60.8
Transport (include road, railway, air transport, other transport etc) 18.5 25.3 14.5 9.3 27.6
Agriculture , Forestry, Fishing and Hunting 4.8 4.7 3.7 9.8 6.2
Communication 2.7 0.5 1.3 0.6 0.8
Other Economic Affairs NEC 27.4 35.2 1.6 12.0 26.1
Environment Protection 1.1 0.9 2.4 0.0 1.0
Housing and Community amenities 7.0 11.1 10.4 4.4 11.4
Water Supply 2.1 7.7 9.5 3.8 10.7
Housing & Community Amenities n.e.c. 4.9 3.4 - 0.6 0.6
Health 4.1 3.5 5.4 4.6 12.9
Recreation, Culture, and religion - - - - -
Education 4.0 4.4 4.8 2.5 2.5
Social Protection 2.7 3.9 3.8 3.0 3.3
Grand Total 100 100 100 100 100
Source: Uganda Bureau of Statistics
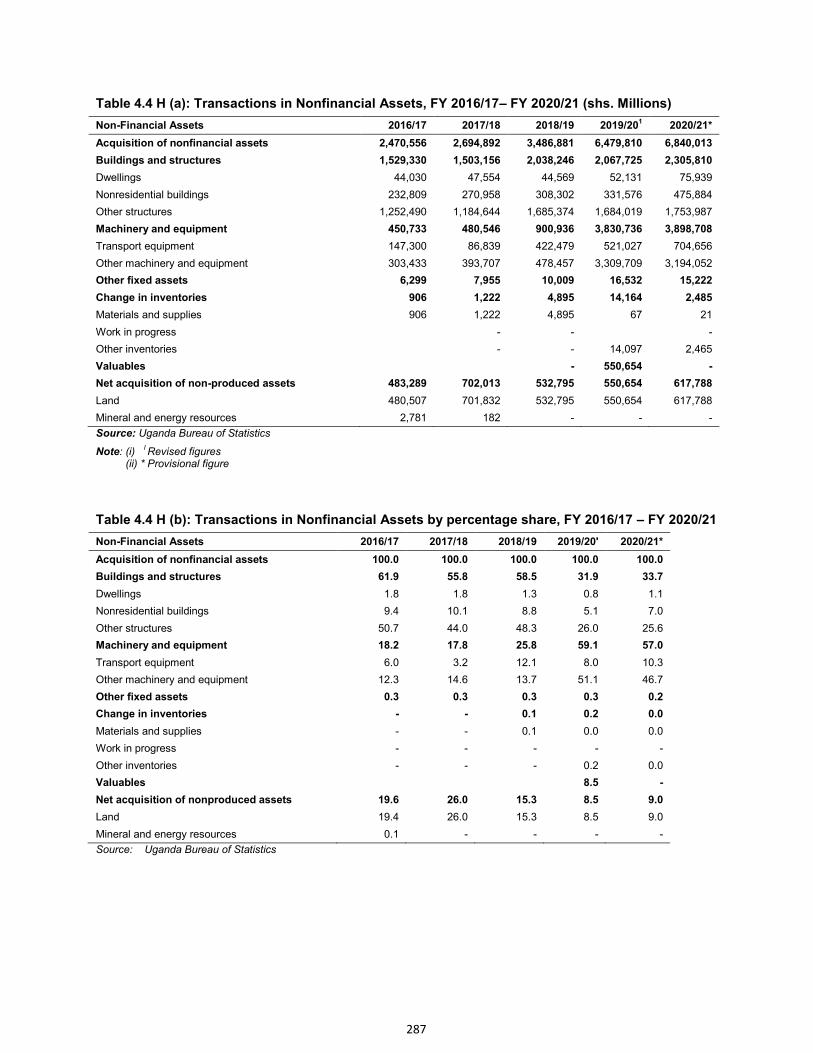
287
Table 4.4 H (a): Transactions in Nonfinancial Assets, FY 2016/17– FY 2020/21 (shs. Millions)
Non-Financial Assets 2016/17 2017/18 2018/19 2019/201 2020/21*
Acquisition of nonfinancial assets 2,470,556 2,694,892 3,486,881 6,479,810 6,840,013
Buildings and structures 1,529,330 1,503,156 2,038,246 2,067,725 2,305,810
Dwellings 44,030 47,554 44,569 52,131 75,939
Nonresidential buildings 232,809 270,958 308,302 331,576 475,884
Other structures 1,252,490 1,184,644 1,685,374 1,684,019 1,753,987
Machinery and equipment 450,733 480,546 900,936 3,830,736 3,898,708
Transport equipment 147,300 86,839 422,479 521,027 704,656
Other machinery and equipment 303,433 393,707 478,457 3,309,709 3,194,052
Other fixed assets 6,299 7,955 10,009 16,532 15,222
Change in inventories 906 1,222 4,895 14,164 2,485
Materials and supplies 906 1,222 4,895 67 21
Work in progress
- -
-
Other inventories
- - 14,097 2,465
Valuables
- 550,654 -
Net acquisition of non-produced assets 483,289 702,013 532,795 550,654 617,788
Land 480,507 701,832 532,795 550,654 617,788
Mineral and energy resources 2,781 182 - - -
Source: Uganda Bureau of Statistics
Note: (i) I Revised figures
(ii) * Provisional figure
Table 4.4 H (b): Transactions in Nonfinancial Assets by percentage share, FY 2016/17 – FY 2020/21
Non-Financial Assets 2016/17 2017/18 2018/19 2019/20' 2020/21*
Acquisition of nonfinancial assets 100.0 100.0 100.0 100.0 100.0
Buildings and structures 61.9 55.8 58.5 31.9 33.7
Dwellings 1.8 1.8 1.3 0.8 1.1
Nonresidential buildings 9.4 10.1 8.8 5.1 7.0
Other structures 50.7 44.0 48.3 26.0 25.6
Machinery and equipment 18.2 17.8 25.8 59.1 57.0
Transport equipment 6.0 3.2 12.1 8.0 10.3
Other machinery and equipment 12.3 14.6 13.7 51.1 46.7
Other fixed assets 0.3 0.3 0.3 0.3 0.2
Change in inventories - - 0.1 0.2 0.0
Materials and supplies - - 0.1 0.0 0.0
Work in progress - - - - -
Other inventories - - - 0.2 0.0
Valuables
8.5 -
Net acquisition of nonproduced assets 19.6 26.0 15.3 8.5 9.0
Land 19.4 26.0 15.3 8.5 9.0
Mineral and energy resources 0.1 - - - -
Source: Uganda Bureau of Statistics
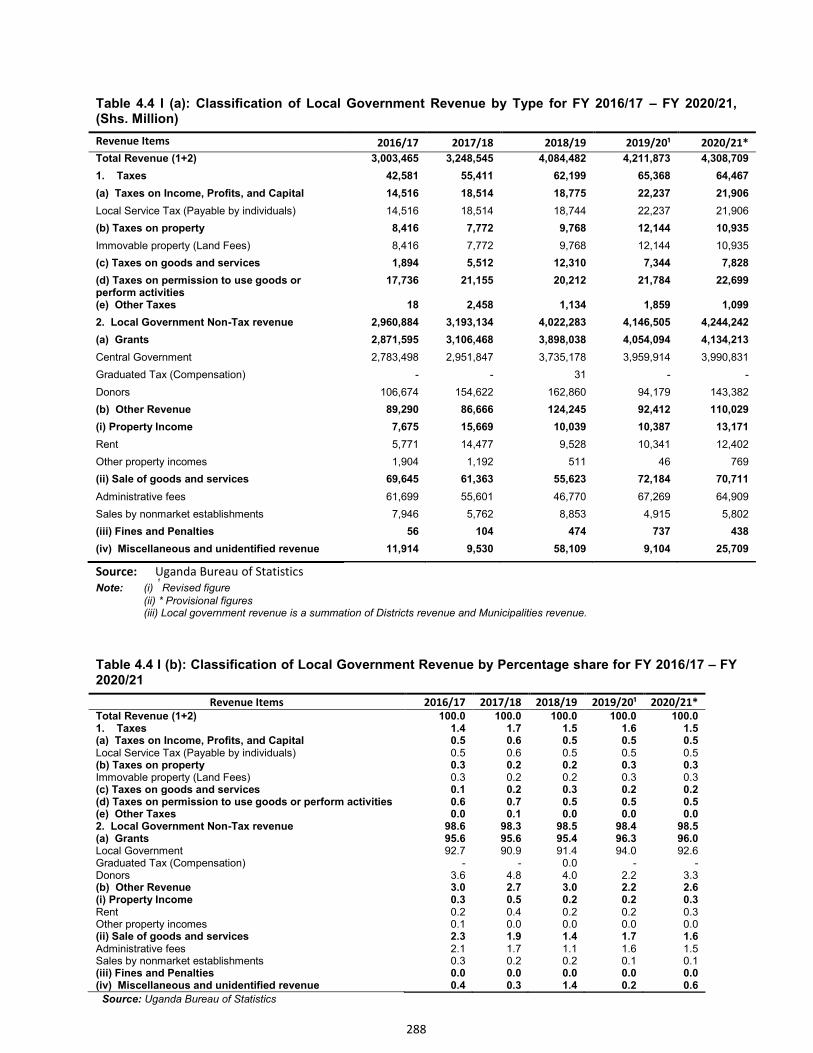
288
Table 4.4 I (a): Classification of Local Government Revenue by Type for FY 2016/17 – FY 2020/21, (Shs. Million)
Revenue Items 2016/17 2017/18 2018/19 2019/20¹ 2020/21*
Total Revenue (1+2) 3,003,465 3,248,545 4,084,482 4,211,873 4,308,709
1. Taxes 42,581 55,411 62,199 65,368 64,467
(a) Taxes on Income, Profits, and Capital 14,516 18,514 18,775 22,237 21,906
Local Service Tax (Payable by individuals) 14,516 18,514 18,744 22,237 21,906
(b) Taxes on property 8,416 7,772 9,768 12,144 10,935
Immovable property (Land Fees) 8,416 7,772 9,768 12,144 10,935
(c) Taxes on goods and services 1,894 5,512 12,310 7,344 7,828
(d) Taxes on permission to use goods or perform activities
17,736 21,155 20,212 21,784 22,699
(e) Other Taxes 18 2,458 1,134 1,859 1,099
2. Local Government Non-Tax revenue 2,960,884 3,193,134 4,022,283 4,146,505 4,244,242
(a) Grants 2,871,595 3,106,468 3,898,038 4,054,094 4,134,213
Central Government 2,783,498 2,951,847 3,735,178 3,959,914 3,990,831
Graduated Tax (Compensation) - - 31 - -
Donors 106,674 154,622 162,860 94,179 143,382
(b) Other Revenue 89,290 86,666 124,245 92,412 110,029
(i) Property Income 7,675 15,669 10,039 10,387 13,171
Rent 5,771 14,477 9,528 10,341 12,402
Other property incomes 1,904 1,192 511 46 769
(ii) Sale of goods and services 69,645 61,363 55,623 72,184 70,711
Administrative fees 61,699 55,601 46,770 67,269 64,909
Sales by nonmarket establishments 7,946 5,762 8,853 4,915 5,802
(iii) Fines and Penalties 56 104 474 737 438
(iv) Miscellaneous and unidentified revenue 11,914 9,530 58,109 9,104 25,709
Source: Uganda Bureau of Statistics
Note: (i) ¹ Revised figure
(ii) * Provisional figures (iii) Local government revenue is a summation of Districts revenue and Municipalities revenue.
Table 4.4 I (b): Classification of Local Government Revenue by Percentage share for FY 2016/17 – FY 2020/21
Revenue Items 2016/17 2017/18 2018/19 2019/20¹ 2020/21* Total Revenue (1+2) 100.0 100.0 100.0 100.0 100.0 1. Taxes 1.4 1.7 1.5 1.6 1.5 (a) Taxes on Income, Profits, and Capital 0.5 0.6 0.5 0.5 0.5 Local Service Tax (Payable by individuals) 0.5 0.6 0.5 0.5 0.5 (b) Taxes on property 0.3 0.2 0.2 0.3 0.3 Immovable property (Land Fees) 0.3 0.2 0.2 0.3 0.3 (c) Taxes on goods and services 0.1 0.2 0.3 0.2 0.2 (d) Taxes on permission to use goods or perform activities 0.6 0.7 0.5 0.5 0.5 (e) Other Taxes 0.0 0.1 0.0 0.0 0.0 2. Local Government Non-Tax revenue 98.6 98.3 98.5 98.4 98.5 (a) Grants 95.6 95.6 95.4 96.3 96.0 Local Government 92.7 90.9 91.4 94.0 92.6 Graduated Tax (Compensation) - - 0.0 - - Donors 3.6 4.8 4.0 2.2 3.3 (b) Other Revenue 3.0 2.7 3.0 2.2 2.6 (i) Property Income 0.3 0.5 0.2 0.2 0.3 Rent 0.2 0.4 0.2 0.2 0.3 Other property incomes 0.1 0.0 0.0 0.0 0.0 (ii) Sale of goods and services 2.3 1.9 1.4 1.7 1.6 Administrative fees 2.1 1.7 1.1 1.6 1.5 Sales by nonmarket establishments 0.3 0.2 0.2 0.1 0.1 (iii) Fines and Penalties 0.0 0.0 0.0 0.0 0.0 (iv) Miscellaneous and unidentified revenue 0.4 0.3 1.4 0.2 0.6
Source: Uganda Bureau of Statistics
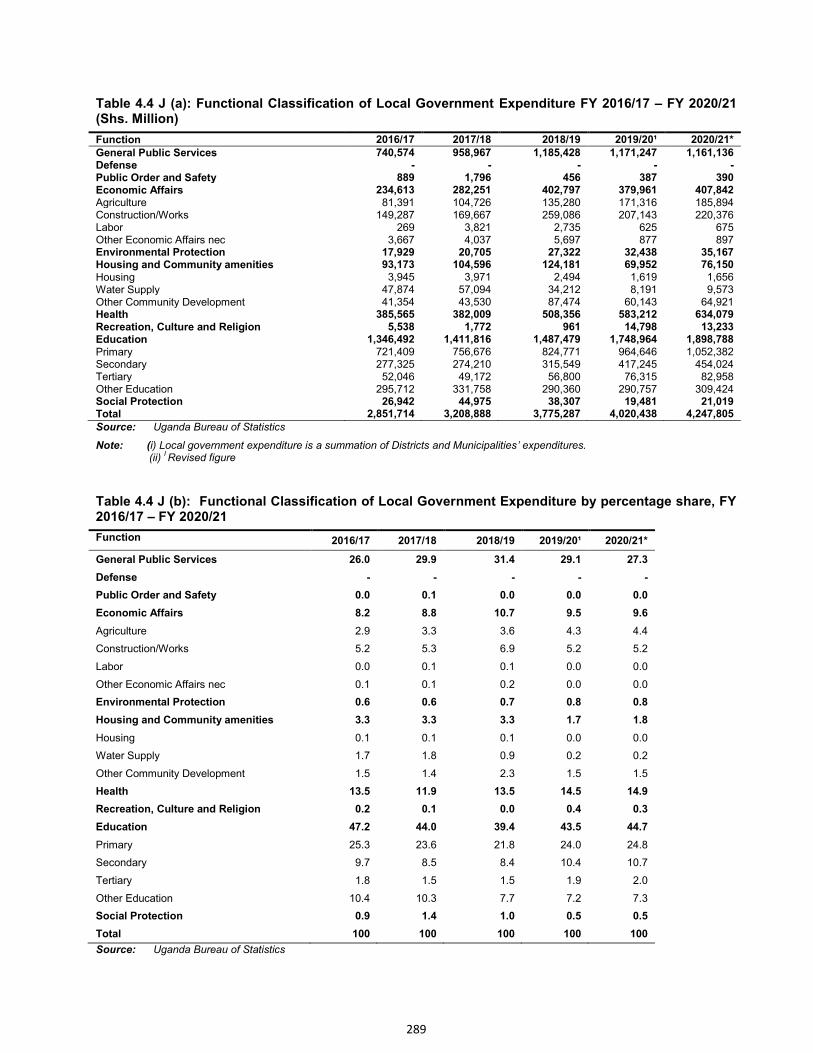
289
Table 4.4 J (a): Functional Classification of Local Government Expenditure FY 2016/17 – FY 2020/21 (Shs. Million)
Function 2016/17 2017/18 2018/19 2019/20¹ 2020/21*
General Public Services 740,574 958,967 1,185,428 1,171,247 1,161,136 Defense - - - - - Public Order and Safety 889 1,796 456 387 390 Economic Affairs 234,613 282,251 402,797 379,961 407,842 Agriculture 81,391 104,726 135,280 171,316 185,894 Construction/Works 149,287 169,667 259,086 207,143 220,376 Labor 269 3,821 2,735 625 675 Other Economic Affairs nec 3,667 4,037 5,697 877 897 Environmental Protection 17,929 20,705 27,322 32,438 35,167 Housing and Community amenities 93,173 104,596 124,181 69,952 76,150 Housing 3,945 3,971 2,494 1,619 1,656 Water Supply 47,874 57,094 34,212 8,191 9,573 Other Community Development 41,354 43,530 87,474 60,143 64,921 Health 385,565 382,009 508,356 583,212 634,079 Recreation, Culture and Religion 5,538 1,772 961 14,798 13,233 Education 1,346,492 1,411,816 1,487,479 1,748,964 1,898,788 Primary 721,409 756,676 824,771 964,646 1,052,382 Secondary 277,325 274,210 315,549 417,245 454,024 Tertiary 52,046 49,172 56,800 76,315 82,958 Other Education 295,712 331,758 290,360 290,757 309,424 Social Protection 26,942 44,975 38,307 19,481 21,019 Total 2,851,714 3,208,888 3,775,287 4,020,438 4,247,805
Source: Uganda Bureau of Statistics
Note: (i) Local government expenditure is a summation of Districts and Municipalities’ expenditures. (ii)
I Revised figure
Table 4.4 J (b): Functional Classification of Local Government Expenditure by percentage share, FY 2016/17 – FY 2020/21
Function 2016/17 2017/18 2018/19 2019/20¹ 2020/21*
General Public Services 26.0 29.9 31.4 29.1 27.3
Defense - - - - -
Public Order and Safety 0.0 0.1 0.0 0.0 0.0
Economic Affairs 8.2 8.8 10.7 9.5 9.6
Agriculture 2.9 3.3 3.6 4.3 4.4
Construction/Works 5.2 5.3 6.9 5.2 5.2
Labor 0.0 0.1 0.1 0.0 0.0
Other Economic Affairs nec 0.1 0.1 0.2 0.0 0.0
Environmental Protection 0.6 0.6 0.7 0.8 0.8
Housing and Community amenities 3.3 3.3 3.3 1.7 1.8
Housing 0.1 0.1 0.1 0.0 0.0
Water Supply 1.7 1.8 0.9 0.2 0.2
Other Community Development 1.5 1.4 2.3 1.5 1.5
Health 13.5 11.9 13.5 14.5 14.9
Recreation, Culture and Religion 0.2 0.1 0.0 0.4 0.3
Education 47.2 44.0 39.4 43.5 44.7
Primary 25.3 23.6 21.8 24.0 24.8
Secondary 9.7 8.5 8.4 10.4 10.7
Tertiary 1.8 1.5 1.5 1.9 2.0
Other Education 10.4 10.3 7.7 7.2 7.3
Social Protection 0.9 1.4 1.0 0.5 0.5
Total 100 100 100 100 100
Source: Uganda Bureau of Statistics

290
Table 4.4 K (a): Economic Classification of Local Government Expense, FY 2016/17 – FY 2020/21 (Shs. Million)
Expense 2016/17 2017/18 2018/19 2019/20¹ 2020/21*
Compensation of Employees 1,539,633 1,662,664 1,969,525 2,189,391 2,424,400
Wages and Salaries 1,527,453 1,640,561 1,967,349 2,173,593 2,412,731
Social Security Contribution 12,180 22,103 2,175 15,798 11,669
Use of Goods and Services 294,211 342,577 274,896 340,601 312,965
Depreciation/CFC 19,568 24,589 37,268 35,722 32,600
Interest 394 137 69 1,974 1,812
Subsidies 96 - - 655 611
Grants 513,497 712,106 732,384 672,970 619,121
Current 552,179 622,644 647,047 619,494 574,166
Capital 62,128 89,462 85,336 53,476 44,955
Social benefits 141,829 179,079 209,513 257,837 240,415
Other Expenses 28,076 14,972 88,762 76,444 69,957
Rent 34 32 8 - -
Other Expenses 34,076 4,742 7,001 8,112 7,220
Total 2,644,147 2,936,125 3,312,416 3,575,592 3,701,881
Source: Uganda Bureau of Statistics Note: (i) * Provisional figure (ii)
1Revised figures
(iii) Local government expense are a summation of Districts expense and Municipalities expense.
Table 4.4 K (b): Economic Classification of Local Government Expense by percentage share, FY 2016/17 – FY 2020/21
Expense 2016/17 2017/18 2018/19 2019/20¹ 2020/21*
Compensation of Employees 58.2 56.6 59.5 61.2 65.5
Wages and Salaries 57.8 55.9 59.4 60.8 65.2
Social Security Contribution 0.5 0.8 0.1 0.4 0.3
Use of Goods and Services 11.1 11.7 8.3 9.5 8.5
Depreciation/CFC 0.7 0.8 1.1 1.0 0.9
Interest 0.0 0.0 0.0 0.1 0.0
Subsidies 0.0 - - 0.0 0.0
Grants 19.4 24.3 22.1 18.8 16.7
Current 20.9 21.2 19.5 17.3 15.5
Capital 2.3 3.0 2.6 1.5 1.2
Social benefits 5.4 6.1 6.3 7.2 6.5
Other Expenses 1.1 0.5 2.7 2.1 1.9
Rent 0.0 0.0 0.0 - -
Other Expenses 1.3 0.2 0.2 0.2 0.2
Total 100 100 100 100 100.0
Source: Uganda Bureau of Statistics
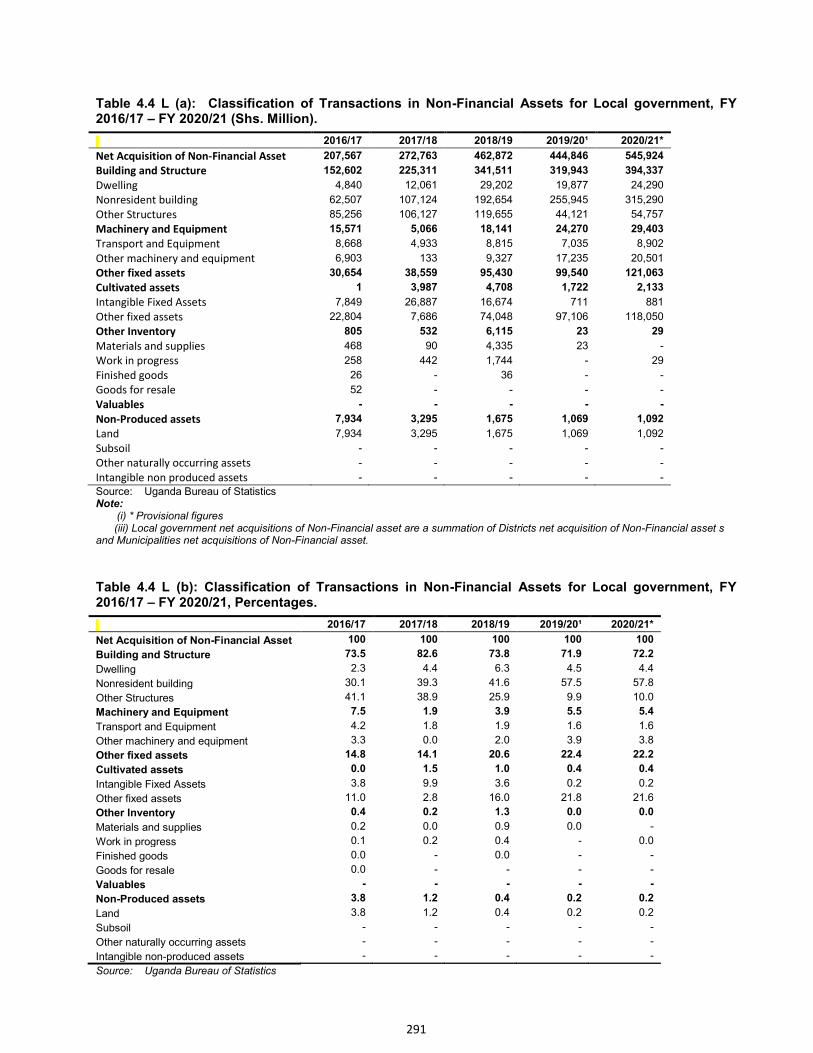
291
Table 4.4 L (a): Classification of Transactions in Non-Financial Assets for Local government, FY 2016/17 – FY 2020/21 (Shs. Million).
2016/17 2017/18 2018/19 2019/20¹ 2020/21*
Net Acquisition of Non-Financial Asset 207,567 272,763 462,872 444,846 545,924
Building and Structure 152,602 225,311 341,511 319,943 394,337
Dwelling 4,840 12,061 29,202 19,877 24,290
Nonresident building 62,507 107,124 192,654 255,945 315,290
Other Structures 85,256 106,127 119,655 44,121 54,757
Machinery and Equipment 15,571 5,066 18,141 24,270 29,403
Transport and Equipment 8,668 4,933 8,815 7,035 8,902
Other machinery and equipment 6,903 133 9,327 17,235 20,501
Other fixed assets 30,654 38,559 95,430 99,540 121,063
Cultivated assets 1 3,987 4,708 1,722 2,133
Intangible Fixed Assets 7,849 26,887 16,674 711 881
Other fixed assets 22,804 7,686 74,048 97,106 118,050
Other Inventory 805 532 6,115 23 29
Materials and supplies 468 90 4,335 23 -
Work in progress 258 442 1,744 - 29
Finished goods 26 - 36 - -
Goods for resale 52 - - - -
Valuables - - - - -
Non-Produced assets 7,934 3,295 1,675 1,069 1,092
Land 7,934 3,295 1,675 1,069 1,092
Subsoil - - - - -
Other naturally occurring assets - - - - -
Intangible non produced assets - - - - -
Source: Uganda Bureau of Statistics Note: (i) * Provisional figures (iii) Local government net acquisitions of Non-Financial asset are a summation of Districts net acquisition of Non-Financial asset s and Municipalities net acquisitions of Non-Financial asset.
Table 4.4 L (b): Classification of Transactions in Non-Financial Assets for Local government, FY 2016/17 – FY 2020/21, Percentages.
2016/17 2017/18 2018/19 2019/20¹ 2020/21*
Net Acquisition of Non-Financial Asset 100 100 100 100 100
Building and Structure 73.5 82.6 73.8 71.9 72.2
Dwelling 2.3 4.4 6.3 4.5 4.4
Nonresident building 30.1 39.3 41.6 57.5 57.8
Other Structures 41.1 38.9 25.9 9.9 10.0
Machinery and Equipment 7.5 1.9 3.9 5.5 5.4
Transport and Equipment 4.2 1.8 1.9 1.6 1.6
Other machinery and equipment 3.3 0.0 2.0 3.9 3.8
Other fixed assets 14.8 14.1 20.6 22.4 22.2
Cultivated assets 0.0 1.5 1.0 0.4 0.4
Intangible Fixed Assets 3.8 9.9 3.6 0.2 0.2
Other fixed assets 11.0 2.8 16.0 21.8 21.6
Other Inventory 0.4 0.2 1.3 0.0 0.0
Materials and supplies 0.2 0.0 0.9 0.0 -
Work in progress 0.1 0.2 0.4 - 0.0
Finished goods 0.0 - 0.0 - -
Goods for resale 0.0 - - - -
Valuables - - - - -
Non-Produced assets 3.8 1.2 0.4 0.2 0.2
Land 3.8 1.2 0.4 0.2 0.2
Subsoil - - - - -
Other naturally occurring assets - - - - -
Intangible non-produced assets - - - - -
Source: Uganda Bureau of Statistics
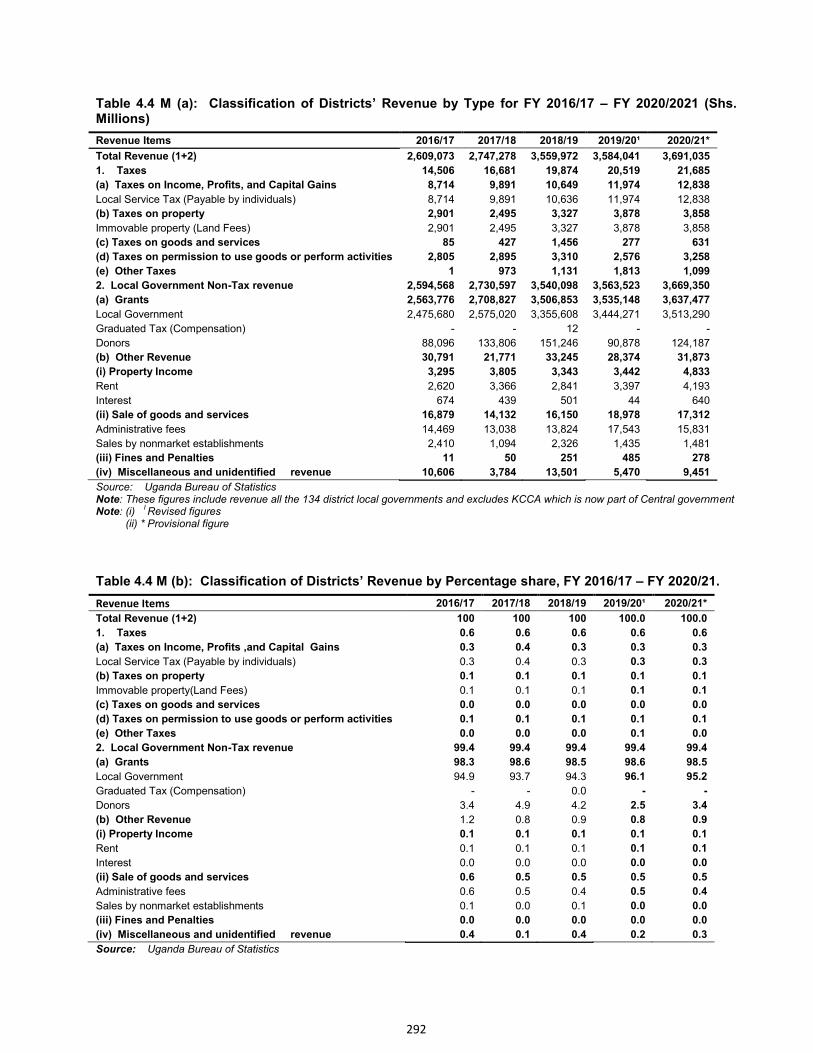
292
Table 4.4 M (a): Classification of Districts’ Revenue by Type for FY 2016/17 – FY 2020/2021 (Shs. Millions)
Revenue Items 2016/17 2017/18 2018/19 2019/20¹ 2020/21*
Total Revenue (1+2) 2,609,073 2,747,278 3,559,972 3,584,041 3,691,035
1. Taxes 14,506 16,681 19,874 20,519 21,685
(a) Taxes on Income, Profits, and Capital Gains 8,714 9,891 10,649 11,974 12,838
Local Service Tax (Payable by individuals) 8,714 9,891 10,636 11,974 12,838
(b) Taxes on property 2,901 2,495 3,327 3,878 3,858
Immovable property (Land Fees) 2,901 2,495 3,327 3,878 3,858
(c) Taxes on goods and services 85 427 1,456 277 631
(d) Taxes on permission to use goods or perform activities 2,805 2,895 3,310 2,576 3,258
(e) Other Taxes 1 973 1,131 1,813 1,099
2. Local Government Non-Tax revenue 2,594,568 2,730,597 3,540,098 3,563,523 3,669,350
(a) Grants 2,563,776 2,708,827 3,506,853 3,535,148 3,637,477
Local Government 2,475,680 2,575,020 3,355,608 3,444,271 3,513,290
Graduated Tax (Compensation) - - 12 - -
Donors 88,096 133,806 151,246 90,878 124,187
(b) Other Revenue 30,791 21,771 33,245 28,374 31,873
(i) Property Income 3,295 3,805 3,343 3,442 4,833
Rent 2,620 3,366 2,841 3,397 4,193
Interest 674 439 501 44 640
(ii) Sale of goods and services 16,879 14,132 16,150 18,978 17,312
Administrative fees 14,469 13,038 13,824 17,543 15,831
Sales by nonmarket establishments 2,410 1,094 2,326 1,435 1,481
(iii) Fines and Penalties 11 50 251 485 278
(iv) Miscellaneous and unidentified revenue 10,606 3,784 13,501 5,470 9,451
Source: Uganda Bureau of Statistics Note: These figures include revenue all the 134 district local governments and excludes KCCA which is now part of Central government Note: (i)
I Revised figures
(ii) * Provisional figure
Table 4.4 M (b): Classification of Districts’ Revenue by Percentage share, FY 2016/17 – FY 2020/21.
Revenue Items 2016/17 2017/18 2018/19 2019/20¹ 2020/21*
Total Revenue (1+2) 100 100 100 100.0 100.0
1. Taxes 0.6 0.6 0.6 0.6 0.6
(a) Taxes on Income, Profits ,and Capital Gains 0.3 0.4 0.3 0.3 0.3
Local Service Tax (Payable by individuals) 0.3 0.4 0.3 0.3 0.3
(b) Taxes on property 0.1 0.1 0.1 0.1 0.1
Immovable property(Land Fees) 0.1 0.1 0.1 0.1 0.1
(c) Taxes on goods and services 0.0 0.0 0.0 0.0 0.0
(d) Taxes on permission to use goods or perform activities 0.1 0.1 0.1 0.1 0.1
(e) Other Taxes 0.0 0.0 0.0 0.1 0.0
2. Local Government Non-Tax revenue 99.4 99.4 99.4 99.4 99.4
(a) Grants 98.3 98.6 98.5 98.6 98.5
Local Government 94.9 93.7 94.3 96.1 95.2
Graduated Tax (Compensation) - - 0.0 - -
Donors 3.4 4.9 4.2 2.5 3.4
(b) Other Revenue 1.2 0.8 0.9 0.8 0.9
(i) Property Income 0.1 0.1 0.1 0.1 0.1
Rent 0.1 0.1 0.1 0.1 0.1
Interest 0.0 0.0 0.0 0.0 0.0
(ii) Sale of goods and services 0.6 0.5 0.5 0.5 0.5
Administrative fees 0.6 0.5 0.4 0.5 0.4
Sales by nonmarket establishments 0.1 0.0 0.1 0.0 0.0
(iii) Fines and Penalties 0.0 0.0 0.0 0.0 0.0
(iv) Miscellaneous and unidentified revenue 0.4 0.1 0.4 0.2 0.3
Source: Uganda Bureau of Statistics
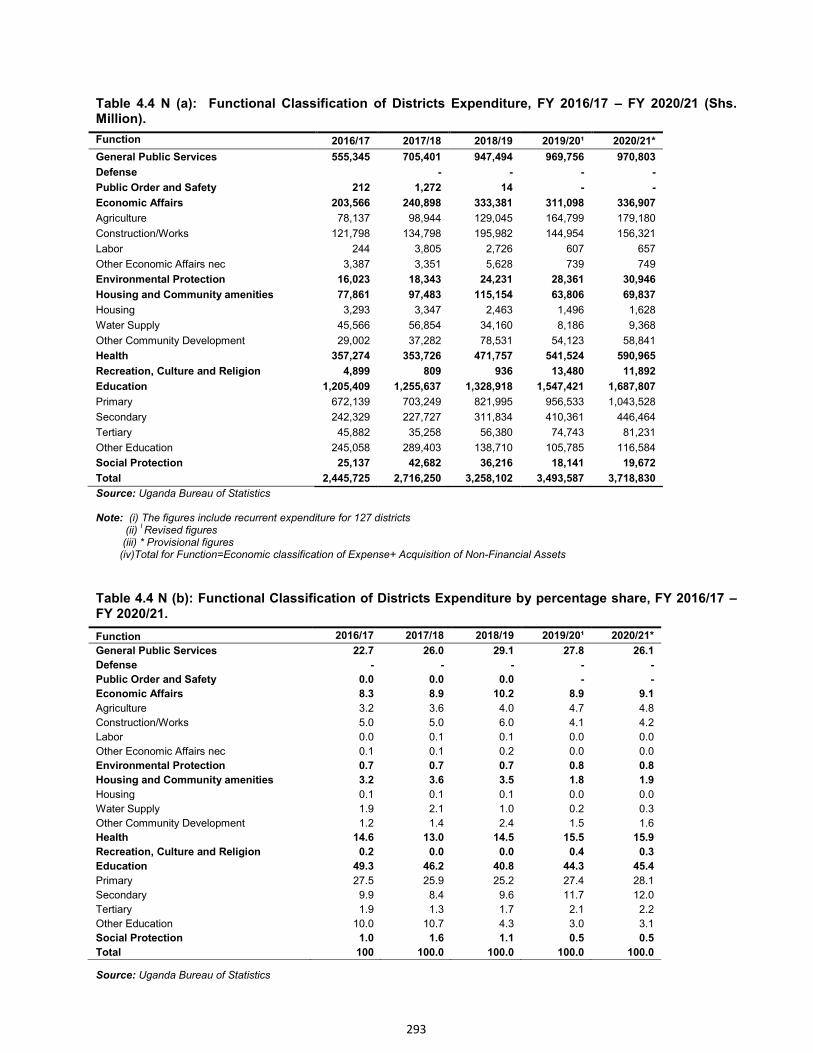
293
Table 4.4 N (a): Functional Classification of Districts Expenditure, FY 2016/17 – FY 2020/21 (Shs. Million).
Function 2016/17 2017/18 2018/19 2019/20¹ 2020/21*
General Public Services 555,345 705,401 947,494 969,756 970,803
Defense
- - - -
Public Order and Safety 212 1,272 14 - -
Economic Affairs 203,566 240,898 333,381 311,098 336,907
Agriculture 78,137 98,944 129,045 164,799 179,180
Construction/Works 121,798 134,798 195,982 144,954 156,321
Labor 244 3,805 2,726 607 657
Other Economic Affairs nec 3,387 3,351 5,628 739 749
Environmental Protection 16,023 18,343 24,231 28,361 30,946
Housing and Community amenities 77,861 97,483 115,154 63,806 69,837
Housing 3,293 3,347 2,463 1,496 1,628
Water Supply 45,566 56,854 34,160 8,186 9,368
Other Community Development 29,002 37,282 78,531 54,123 58,841
Health 357,274 353,726 471,757 541,524 590,965
Recreation, Culture and Religion 4,899 809 936 13,480 11,892
Education 1,205,409 1,255,637 1,328,918 1,547,421 1,687,807
Primary 672,139 703,249 821,995 956,533 1,043,528
Secondary 242,329 227,727 311,834 410,361 446,464
Tertiary 45,882 35,258 56,380 74,743 81,231
Other Education 245,058 289,403 138,710 105,785 116,584
Social Protection 25,137 42,682 36,216 18,141 19,672
Total 2,445,725 2,716,250 3,258,102 3,493,587 3,718,830
Source: Uganda Bureau of Statistics Note: (i) The figures include recurrent expenditure for 127 districts (ii)
I Revised figures
(iii) * Provisional figures (iv)Total for Function=Economic classification of Expense+ Acquisition of Non-Financial Assets
Table 4.4 N (b): Functional Classification of Districts Expenditure by percentage share, FY 2016/17 – FY 2020/21.
Source: Uganda Bureau of Statistics
Function 2016/17 2017/18 2018/19 2019/20¹ 2020/21*
General Public Services 22.7 26.0 29.1 27.8 26.1
Defense - - - - -
Public Order and Safety 0.0 0.0 0.0 - -
Economic Affairs 8.3 8.9 10.2 8.9 9.1
Agriculture 3.2 3.6 4.0 4.7 4.8
Construction/Works 5.0 5.0 6.0 4.1 4.2
Labor 0.0 0.1 0.1 0.0 0.0
Other Economic Affairs nec 0.1 0.1 0.2 0.0 0.0
Environmental Protection 0.7 0.7 0.7 0.8 0.8
Housing and Community amenities 3.2 3.6 3.5 1.8 1.9
Housing 0.1 0.1 0.1 0.0 0.0
Water Supply 1.9 2.1 1.0 0.2 0.3
Other Community Development 1.2 1.4 2.4 1.5 1.6
Health 14.6 13.0 14.5 15.5 15.9
Recreation, Culture and Religion 0.2 0.0 0.0 0.4 0.3
Education 49.3 46.2 40.8 44.3 45.4
Primary 27.5 25.9 25.2 27.4 28.1
Secondary 9.9 8.4 9.6 11.7 12.0
Tertiary 1.9 1.3 1.7 2.1 2.2
Other Education 10.0 10.7 4.3 3.0 3.1
Social Protection 1.0 1.6 1.1 0.5 0.5
Total 100 100.0 100.0 100.0 100.0
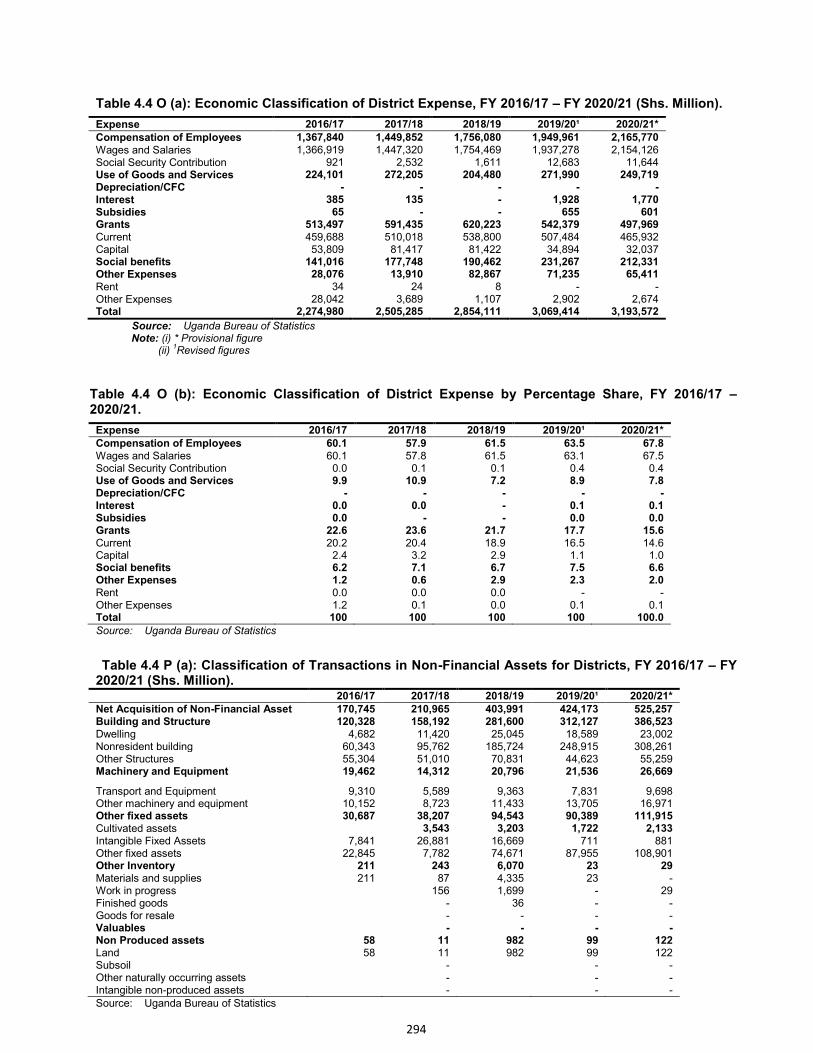
294
Table 4.4 O (a): Economic Classification of District Expense, FY 2016/17 – FY 2020/21 (Shs. Million).
Expense 2016/17 2017/18 2018/19 2019/20¹ 2020/21*
Compensation of Employees 1,367,840 1,449,852 1,756,080 1,949,961 2,165,770 Wages and Salaries 1,366,919 1,447,320 1,754,469 1,937,278 2,154,126 Social Security Contribution 921 2,532 1,611 12,683 11,644 Use of Goods and Services 224,101 272,205 204,480 271,990 249,719 Depreciation/CFC - - - - - Interest 385 135 - 1,928 1,770 Subsidies 65 - - 655 601 Grants 513,497 591,435 620,223 542,379 497,969 Current 459,688 510,018 538,800 507,484 465,932 Capital 53,809 81,417 81,422 34,894 32,037 Social benefits 141,016 177,748 190,462 231,267 212,331 Other Expenses 28,076 13,910 82,867 71,235 65,411 Rent 34 24 8 - - Other Expenses 28,042 3,689 1,107 2,902 2,674 Total 2,274,980 2,505,285 2,854,111 3,069,414 3,193,572
Source: Uganda Bureau of Statistics Note: (i) * Provisional figure (ii)
1Revised figures
Table 4.4 O (b): Economic Classification of District Expense by Percentage Share, FY 2016/17 – 2020/21.
Expense 2016/17 2017/18 2018/19 2019/20¹ 2020/21* Compensation of Employees 60.1 57.9 61.5 63.5 67.8 Wages and Salaries 60.1 57.8 61.5 63.1 67.5 Social Security Contribution 0.0 0.1 0.1 0.4 0.4 Use of Goods and Services 9.9 10.9 7.2 8.9 7.8 Depreciation/CFC - - - - - Interest 0.0 0.0 - 0.1 0.1 Subsidies 0.0 - - 0.0 0.0 Grants 22.6 23.6 21.7 17.7 15.6 Current 20.2 20.4 18.9 16.5 14.6 Capital 2.4 3.2 2.9 1.1 1.0 Social benefits 6.2 7.1 6.7 7.5 6.6 Other Expenses 1.2 0.6 2.9 2.3 2.0 Rent 0.0 0.0 0.0 - - Other Expenses 1.2 0.1 0.0 0.1 0.1 Total 100 100 100 100 100.0
Source: Uganda Bureau of Statistics
Table 4.4 P (a): Classification of Transactions in Non-Financial Assets for Districts, FY 2016/17 – FY 2020/21 (Shs. Million). 2016/17 2017/18 2018/19 2019/20¹ 2020/21* Net Acquisition of Non-Financial Asset 170,745 210,965 403,991 424,173 525,257 Building and Structure 120,328 158,192 281,600 312,127 386,523 Dwelling 4,682 11,420 25,045 18,589 23,002 Nonresident building 60,343 95,762 185,724 248,915 308,261 Other Structures 55,304 51,010 70,831 44,623 55,259 Machinery and Equipment 19,462 14,312 20,796 21,536 26,669
Transport and Equipment 9,310 5,589 9,363 7,831 9,698 Other machinery and equipment 10,152 8,723 11,433 13,705 16,971 Other fixed assets 30,687 38,207 94,543 90,389 111,915 Cultivated assets 3,543 3,203 1,722 2,133 Intangible Fixed Assets 7,841 26,881 16,669 711 881 Other fixed assets 22,845 7,782 74,671 87,955 108,901 Other Inventory 211 243 6,070 23 29 Materials and supplies 211 87 4,335 23 - Work in progress 156 1,699 - 29 Finished goods - 36 - - Goods for resale - - - - Valuables - - - - Non Produced assets 58 11 982 99 122 Land 58 11 982 99 122 Subsoil - - - Other naturally occurring assets - - - Intangible non-produced assets - - - Source: Uganda Bureau of Statistics
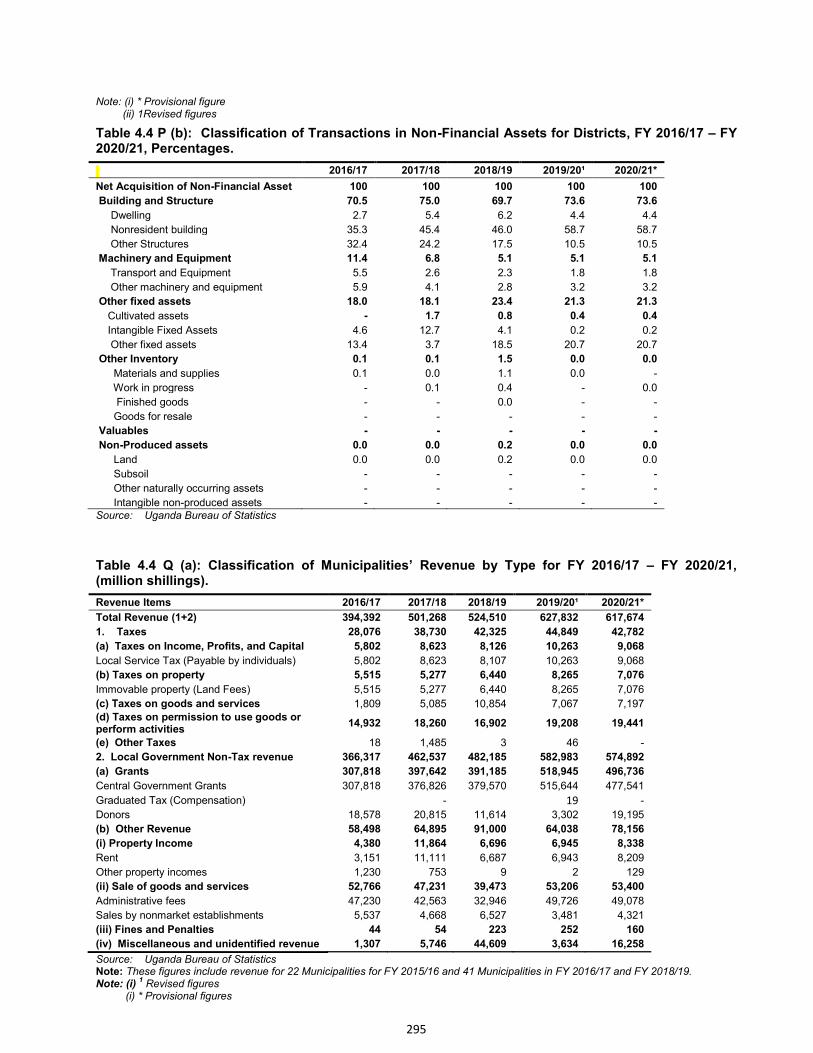
295
Note: (i) * Provisional figure (ii) 1Revised figures
Table 4.4 P (b): Classification of Transactions in Non-Financial Assets for Districts, FY 2016/17 – FY 2020/21, Percentages.
2016/17 2017/18 2018/19 2019/20¹ 2020/21*
Net Acquisition of Non-Financial Asset 100 100 100 100 100
Building and Structure 70.5 75.0 69.7 73.6 73.6
Dwelling 2.7 5.4 6.2 4.4 4.4
Nonresident building 35.3 45.4 46.0 58.7 58.7
Other Structures 32.4 24.2 17.5 10.5 10.5
Machinery and Equipment 11.4 6.8 5.1 5.1 5.1
Transport and Equipment 5.5 2.6 2.3 1.8 1.8
Other machinery and equipment 5.9 4.1 2.8 3.2 3.2
Other fixed assets 18.0 18.1 23.4 21.3 21.3
Cultivated assets - 1.7 0.8 0.4 0.4
Intangible Fixed Assets 4.6 12.7 4.1 0.2 0.2
Other fixed assets 13.4 3.7 18.5 20.7 20.7
Other Inventory 0.1 0.1 1.5 0.0 0.0
Materials and supplies 0.1 0.0 1.1 0.0 -
Work in progress - 0.1 0.4 - 0.0
Finished goods - - 0.0 - -
Goods for resale - - - - -
Valuables - - - - -
Non-Produced assets 0.0 0.0 0.2 0.0 0.0
Land 0.0 0.0 0.2 0.0 0.0
Subsoil - - - - -
Other naturally occurring assets - - - - -
Intangible non-produced assets - - - - - Source: Uganda Bureau of Statistics
Table 4.4 Q (a): Classification of Municipalities’ Revenue by Type for FY 2016/17 – FY 2020/21, (million shillings).
Revenue Items 2016/17 2017/18 2018/19 2019/20¹ 2020/21*
Total Revenue (1+2) 394,392 501,268 524,510 627,832 617,674
1. Taxes 28,076 38,730 42,325 44,849 42,782
(a) Taxes on Income, Profits, and Capital 5,802 8,623 8,126 10,263 9,068
Local Service Tax (Payable by individuals) 5,802 8,623 8,107 10,263 9,068
(b) Taxes on property 5,515 5,277 6,440 8,265 7,076
Immovable property (Land Fees) 5,515 5,277 6,440 8,265 7,076
(c) Taxes on goods and services 1,809 5,085 10,854 7,067 7,197
(d) Taxes on permission to use goods or perform activities
14,932 18,260 16,902 19,208 19,441
(e) Other Taxes 18 1,485 3 46 -
2. Local Government Non-Tax revenue 366,317 462,537 482,185 582,983 574,892
(a) Grants 307,818 397,642 391,185 518,945 496,736
Central Government Grants 307,818 376,826 379,570 515,644 477,541
Graduated Tax (Compensation) -
19 -
Donors 18,578 20,815 11,614 3,302 19,195
(b) Other Revenue 58,498 64,895 91,000 64,038 78,156
(i) Property Income 4,380 11,864 6,696 6,945 8,338
Rent 3,151 11,111 6,687 6,943 8,209
Other property incomes 1,230 753 9 2 129
(ii) Sale of goods and services 52,766 47,231 39,473 53,206 53,400
Administrative fees 47,230 42,563 32,946 49,726 49,078
Sales by nonmarket establishments 5,537 4,668 6,527 3,481 4,321
(iii) Fines and Penalties 44 54 223 252 160
(iv) Miscellaneous and unidentified revenue 1,307 5,746 44,609 3,634 16,258
Source: Uganda Bureau of Statistics Note: These figures include revenue for 22 Municipalities for FY 2015/16 and 41 Municipalities in FY 2016/17 and FY 2018/19. Note: (i)
1 Revised figures
(i) * Provisional figures
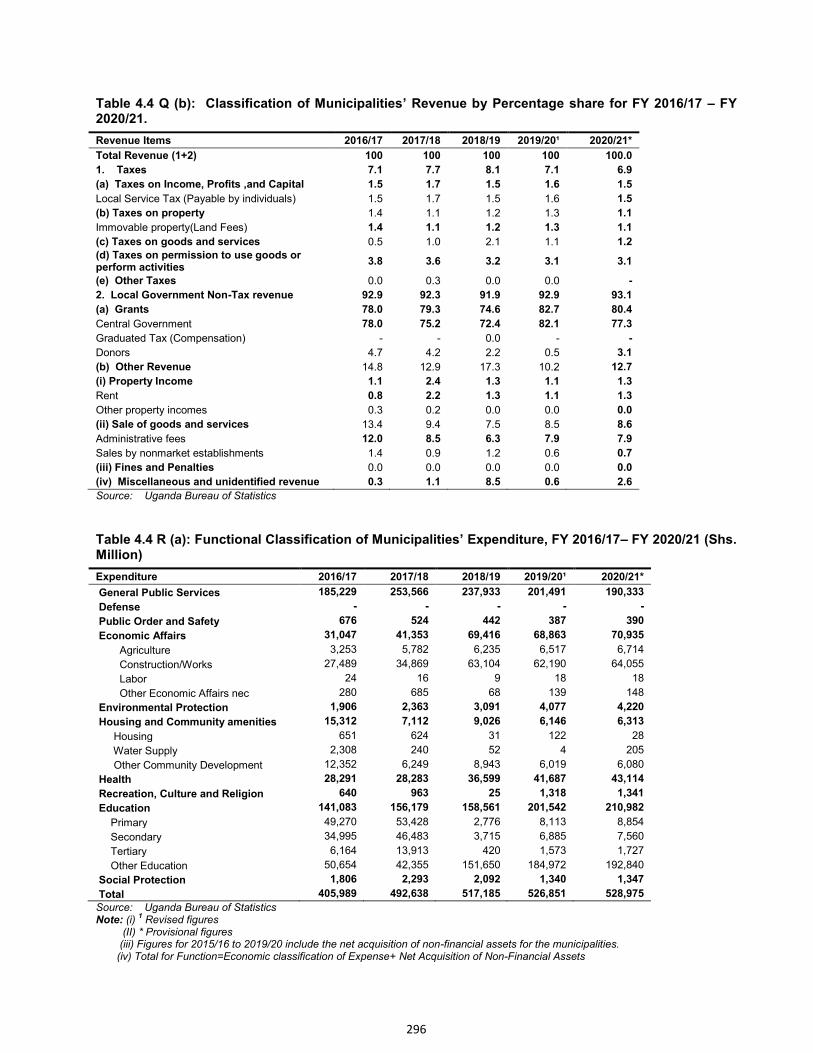
296
Table 4.4 Q (b): Classification of Municipalities’ Revenue by Percentage share for FY 2016/17 – FY 2020/21.
Revenue Items 2016/17 2017/18 2018/19 2019/20¹ 2020/21*
Total Revenue (1+2) 100 100 100 100 100.0
1. Taxes 7.1 7.7 8.1 7.1 6.9
(a) Taxes on Income, Profits ,and Capital 1.5 1.7 1.5 1.6 1.5
Local Service Tax (Payable by individuals) 1.5 1.7 1.5 1.6 1.5
(b) Taxes on property 1.4 1.1 1.2 1.3 1.1
Immovable property(Land Fees) 1.4 1.1 1.2 1.3 1.1
(c) Taxes on goods and services 0.5 1.0 2.1 1.1 1.2
(d) Taxes on permission to use goods or perform activities
3.8 3.6 3.2 3.1 3.1
(e) Other Taxes 0.0 0.3 0.0 0.0 -
2. Local Government Non-Tax revenue 92.9 92.3 91.9 92.9 93.1
(a) Grants 78.0 79.3 74.6 82.7 80.4
Central Government 78.0 75.2 72.4 82.1 77.3
Graduated Tax (Compensation) - - 0.0 - -
Donors 4.7 4.2 2.2 0.5 3.1
(b) Other Revenue 14.8 12.9 17.3 10.2 12.7
(i) Property Income 1.1 2.4 1.3 1.1 1.3
Rent 0.8 2.2 1.3 1.1 1.3
Other property incomes 0.3 0.2 0.0 0.0 0.0
(ii) Sale of goods and services 13.4 9.4 7.5 8.5 8.6
Administrative fees 12.0 8.5 6.3 7.9 7.9
Sales by nonmarket establishments 1.4 0.9 1.2 0.6 0.7
(iii) Fines and Penalties 0.0 0.0 0.0 0.0 0.0
(iv) Miscellaneous and unidentified revenue 0.3 1.1 8.5 0.6 2.6
Source: Uganda Bureau of Statistics
Table 4.4 R (a): Functional Classification of Municipalities’ Expenditure, FY 2016/17– FY 2020/21 (Shs. Million)
Expenditure 2016/17 2017/18 2018/19 2019/20¹ 2020/21*
General Public Services 185,229 253,566 237,933 201,491 190,333
Defense - - - - -
Public Order and Safety 676 524 442 387 390
Economic Affairs 31,047 41,353 69,416 68,863 70,935
Agriculture 3,253 5,782 6,235 6,517 6,714
Construction/Works 27,489 34,869 63,104 62,190 64,055
Labor 24 16 9 18 18
Other Economic Affairs nec 280 685 68 139 148
Environmental Protection 1,906 2,363 3,091 4,077 4,220
Housing and Community amenities 15,312 7,112 9,026 6,146 6,313
Housing 651 624 31 122 28
Water Supply 2,308 240 52 4 205
Other Community Development 12,352 6,249 8,943 6,019 6,080
Health 28,291 28,283 36,599 41,687 43,114
Recreation, Culture and Religion 640 963 25 1,318 1,341
Education 141,083 156,179 158,561 201,542 210,982
Primary 49,270 53,428 2,776 8,113 8,854
Secondary 34,995 46,483 3,715 6,885 7,560
Tertiary 6,164 13,913 420 1,573 1,727
Other Education 50,654 42,355 151,650 184,972 192,840
Social Protection 1,806 2,293 2,092 1,340 1,347
Total 405,989 492,638 517,185 526,851 528,975
Source: Uganda Bureau of Statistics Note: (i)
1 Revised figures
(II) * Provisional figures (iii) Figures for 2015/16 to 2019/20 include the net acquisition of non-financial assets for the municipalities. (iv) Total for Function=Economic classification of Expense+ Net Acquisition of Non-Financial Assets
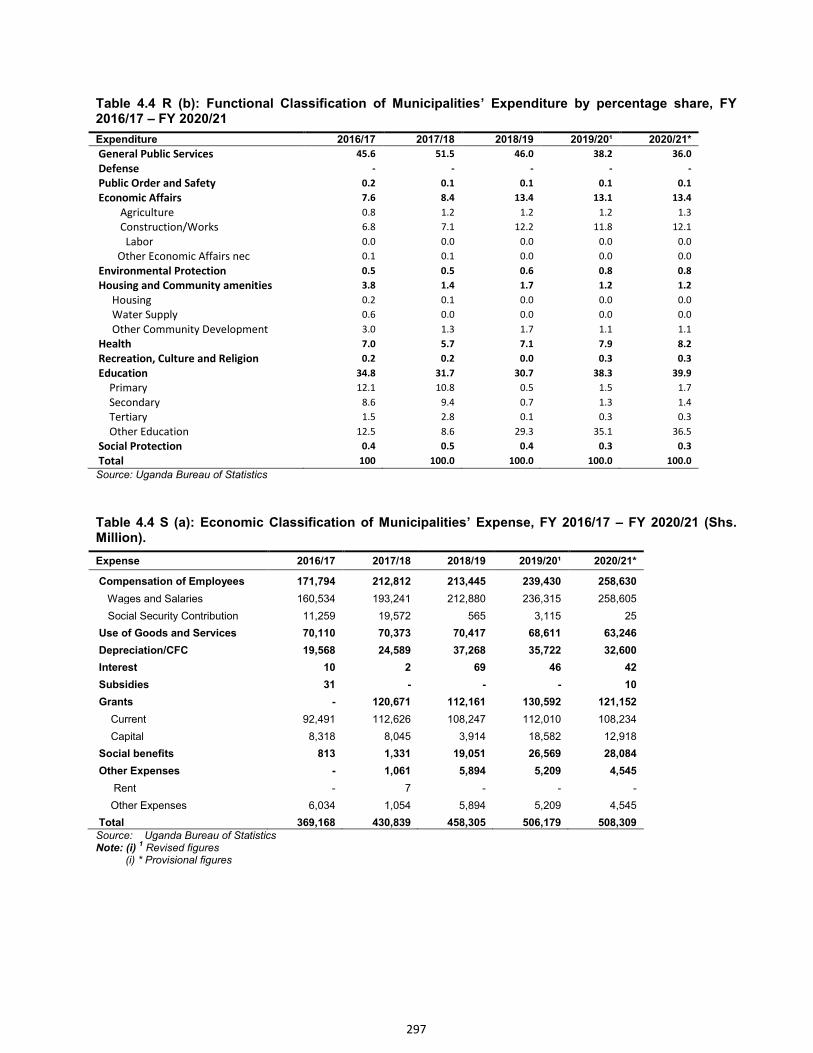
297
Table 4.4 R (b): Functional Classification of Municipalities’ Expenditure by percentage share, FY 2016/17 – FY 2020/21
Expenditure 2016/17 2017/18 2018/19 2019/20¹ 2020/21*
General Public Services 45.6 51.5 46.0 38.2 36.0
Defense - - - - -
Public Order and Safety 0.2 0.1 0.1 0.1 0.1
Economic Affairs 7.6 8.4 13.4 13.1 13.4
Agriculture 0.8 1.2 1.2 1.2 1.3
Construction/Works 6.8 7.1 12.2 11.8 12.1
Labor 0.0 0.0 0.0 0.0 0.0
Other Economic Affairs nec 0.1 0.1 0.0 0.0 0.0
Environmental Protection 0.5 0.5 0.6 0.8 0.8
Housing and Community amenities 3.8 1.4 1.7 1.2 1.2
Housing 0.2 0.1 0.0 0.0 0.0
Water Supply 0.6 0.0 0.0 0.0 0.0
Other Community Development 3.0 1.3 1.7 1.1 1.1
Health 7.0 5.7 7.1 7.9 8.2
Recreation, Culture and Religion 0.2 0.2 0.0 0.3 0.3
Education 34.8 31.7 30.7 38.3 39.9
Primary 12.1 10.8 0.5 1.5 1.7
Secondary 8.6 9.4 0.7 1.3 1.4
Tertiary 1.5 2.8 0.1 0.3 0.3
Other Education 12.5 8.6 29.3 35.1 36.5
Social Protection 0.4 0.5 0.4 0.3 0.3
Total 100 100.0 100.0 100.0 100.0
Source: Uganda Bureau of Statistics
Table 4.4 S (a): Economic Classification of Municipalities’ Expense, FY 2016/17 – FY 2020/21 (Shs. Million).
Expense 2016/17 2017/18 2018/19 2019/20¹ 2020/21*
Compensation of Employees 171,794 212,812 213,445 239,430 258,630
Wages and Salaries 160,534 193,241 212,880 236,315 258,605
Social Security Contribution 11,259 19,572 565 3,115 25
Use of Goods and Services 70,110 70,373 70,417 68,611 63,246
Depreciation/CFC 19,568 24,589 37,268 35,722 32,600
Interest 10 2 69 46 42
Subsidies 31 - - - 10
Grants - 120,671 112,161 130,592 121,152
Current 92,491 112,626 108,247 112,010 108,234
Capital 8,318 8,045 3,914 18,582 12,918
Social benefits 813 1,331 19,051 26,569 28,084
Other Expenses - 1,061 5,894 5,209 4,545
Rent - 7 - - -
Other Expenses 6,034 1,054 5,894 5,209 4,545
Total 369,168 430,839 458,305 506,179 508,309 Source: Uganda Bureau of Statistics Note: (i)
1 Revised figures
(i) * Provisional figures
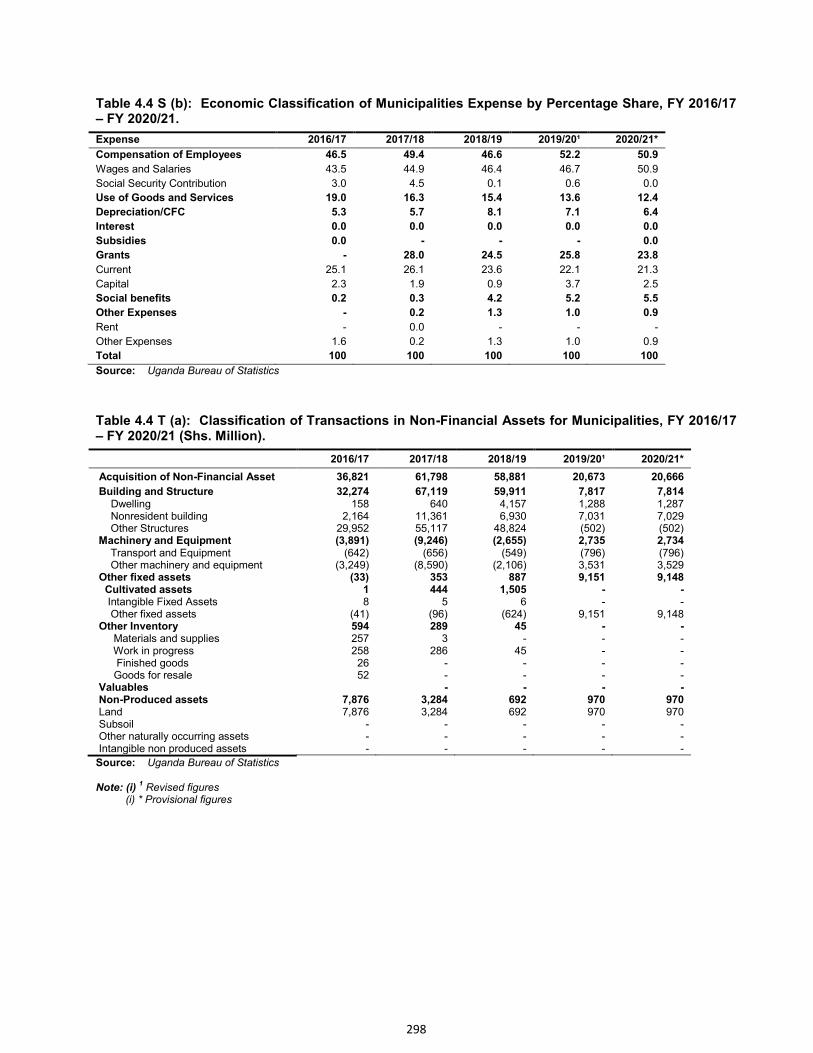
298
Table 4.4 S (b): Economic Classification of Municipalities Expense by Percentage Share, FY 2016/17 – FY 2020/21.
Expense 2016/17 2017/18 2018/19 2019/20¹ 2020/21*
Compensation of Employees 46.5 49.4 46.6 52.2 50.9
Wages and Salaries 43.5 44.9 46.4 46.7 50.9
Social Security Contribution 3.0 4.5 0.1 0.6 0.0
Use of Goods and Services 19.0 16.3 15.4 13.6 12.4
Depreciation/CFC 5.3 5.7 8.1 7.1 6.4
Interest 0.0 0.0 0.0 0.0 0.0
Subsidies 0.0 - - - 0.0
Grants - 28.0 24.5 25.8 23.8
Current 25.1 26.1 23.6 22.1 21.3
Capital 2.3 1.9 0.9 3.7 2.5
Social benefits 0.2 0.3 4.2 5.2 5.5
Other Expenses - 0.2 1.3 1.0 0.9
Rent - 0.0 - - -
Other Expenses 1.6 0.2 1.3 1.0 0.9
Total 100 100 100 100 100
Source: Uganda Bureau of Statistics
Table 4.4 T (a): Classification of Transactions in Non-Financial Assets for Municipalities, FY 2016/17 – FY 2020/21 (Shs. Million).
2016/17 2017/18 2018/19 2019/20¹ 2020/21*
Acquisition of Non-Financial Asset 36,821 61,798 58,881 20,673 20,666
Building and Structure 32,274 67,119 59,911 7,817 7,814 Dwelling 158 640 4,157 1,288 1,287 Nonresident building 2,164 11,361 6,930 7,031 7,029 Other Structures 29,952 55,117 48,824 (502) (502) Machinery and Equipment (3,891) (9,246) (2,655) 2,735 2,734 Transport and Equipment (642) (656) (549) (796) (796) Other machinery and equipment (3,249) (8,590) (2,106) 3,531 3,529 Other fixed assets (33) 353 887 9,151 9,148 Cultivated assets 1 444 1,505 - - Intangible Fixed Assets 8 5 6 - - Other fixed assets (41) (96) (624) 9,151 9,148 Other Inventory 594 289 45 - - Materials and supplies 257 3 - - - Work in progress 258 286 45 - - Finished goods 26 - - - - Goods for resale 52 - - - - Valuables
- - - -
Non-Produced assets 7,876 3,284 692 970 970 Land 7,876 3,284 692 970 970 Subsoil - - - - - Other naturally occurring assets - - - - - Intangible non produced assets - - - - -
Source: Uganda Bureau of Statistics Note: (i)
1 Revised figures
(i) * Provisional figures
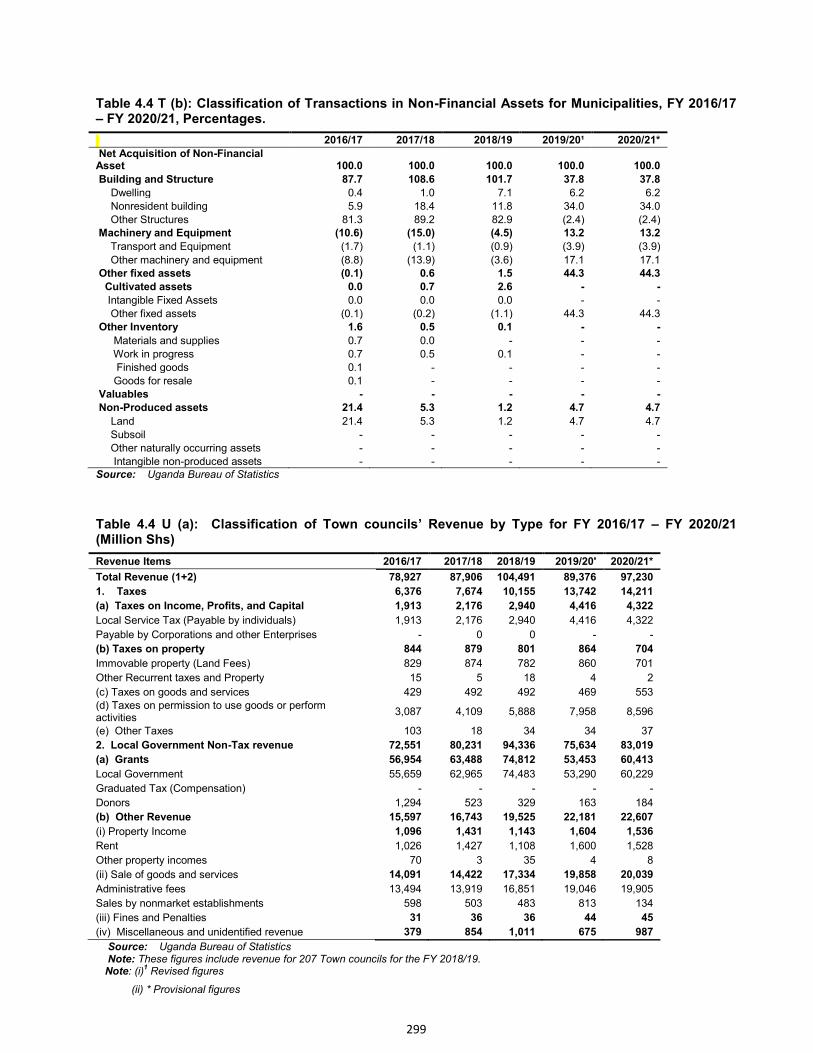
299
Table 4.4 T (b): Classification of Transactions in Non-Financial Assets for Municipalities, FY 2016/17 – FY 2020/21, Percentages.
2016/17 2017/18 2018/19 2019/20¹ 2020/21*
Net Acquisition of Non-Financial Asset 100.0 100.0 100.0 100.0 100.0
Building and Structure 87.7 108.6 101.7 37.8 37.8
Dwelling 0.4 1.0 7.1 6.2 6.2
Nonresident building 5.9 18.4 11.8 34.0 34.0
Other Structures 81.3 89.2 82.9 (2.4) (2.4) Machinery and Equipment (10.6) (15.0) (4.5) 13.2 13.2
Transport and Equipment (1.7) (1.1) (0.9) (3.9) (3.9)
Other machinery and equipment (8.8) (13.9) (3.6) 17.1 17.1
Other fixed assets (0.1) 0.6 1.5 44.3 44.3
Cultivated assets 0.0 0.7 2.6 - -
Intangible Fixed Assets 0.0 0.0 0.0 - -
Other fixed assets (0.1) (0.2) (1.1) 44.3 44.3
Other Inventory 1.6 0.5 0.1 - -
Materials and supplies 0.7 0.0 - - -
Work in progress 0.7 0.5 0.1 - -
Finished goods 0.1 - - - -
Goods for resale 0.1 - - - - Valuables - - - - -
Non-Produced assets 21.4 5.3 1.2 4.7 4.7
Land 21.4 5.3 1.2 4.7 4.7
Subsoil - - - - -
Other naturally occurring assets - - - - -
Intangible non-produced assets - - - - - Source: Uganda Bureau of Statistics
Table 4.4 U (a): Classification of Town councils’ Revenue by Type for FY 2016/17 – FY 2020/21 (Million Shs)
Revenue Items 2016/17 2017/18 2018/19 2019/20' 2020/21*
Total Revenue (1+2) 78,927 87,906 104,491 89,376 97,230
1. Taxes 6,376 7,674 10,155 13,742 14,211
(a) Taxes on Income, Profits, and Capital 1,913 2,176 2,940 4,416 4,322
Local Service Tax (Payable by individuals) 1,913 2,176 2,940 4,416 4,322
Payable by Corporations and other Enterprises - 0 0 - -
(b) Taxes on property 844 879 801 864 704
Immovable property (Land Fees) 829 874 782 860 701
Other Recurrent taxes and Property 15 5 18 4 2
(c) Taxes on goods and services 429 492 492 469 553
(d) Taxes on permission to use goods or perform activities
3,087 4,109 5,888 7,958 8,596
(e) Other Taxes 103 18 34 34 37
2. Local Government Non-Tax revenue 72,551 80,231 94,336 75,634 83,019
(a) Grants 56,954 63,488 74,812 53,453 60,413
Local Government 55,659 62,965 74,483 53,290 60,229
Graduated Tax (Compensation) - - - - -
Donors 1,294 523 329 163 184
(b) Other Revenue 15,597 16,743 19,525 22,181 22,607
(i) Property Income 1,096 1,431 1,143 1,604 1,536
Rent 1,026 1,427 1,108 1,600 1,528
Other property incomes 70 3 35 4 8
(ii) Sale of goods and services 14,091 14,422 17,334 19,858 20,039
Administrative fees 13,494 13,919 16,851 19,046 19,905
Sales by nonmarket establishments 598 503 483 813 134
(iii) Fines and Penalties 31 36 36 44 45
(iv) Miscellaneous and unidentified revenue 379 854 1,011 675 987
Source: Uganda Bureau of Statistics Note: These figures include revenue for 207 Town councils for the FY 2018/19. Note: (i)
1 Revised figures
(ii) * Provisional figures
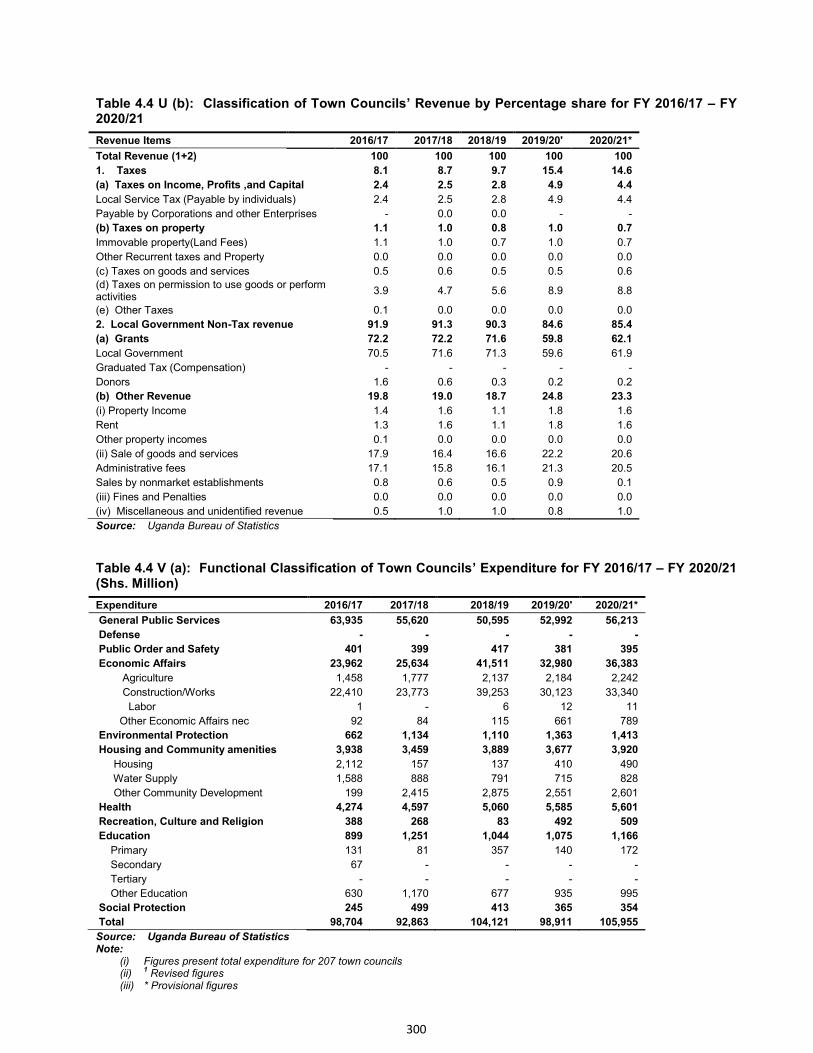
300
Table 4.4 U (b): Classification of Town Councils’ Revenue by Percentage share for FY 2016/17 – FY 2020/21
Revenue Items 2016/17 2017/18 2018/19 2019/20' 2020/21*
Total Revenue (1+2) 100 100 100 100 100
1. Taxes 8.1 8.7 9.7 15.4 14.6
(a) Taxes on Income, Profits ,and Capital 2.4 2.5 2.8 4.9 4.4
Local Service Tax (Payable by individuals) 2.4 2.5 2.8 4.9 4.4
Payable by Corporations and other Enterprises - 0.0 0.0 - -
(b) Taxes on property 1.1 1.0 0.8 1.0 0.7
Immovable property(Land Fees) 1.1 1.0 0.7 1.0 0.7
Other Recurrent taxes and Property 0.0 0.0 0.0 0.0 0.0
(c) Taxes on goods and services 0.5 0.6 0.5 0.5 0.6
(d) Taxes on permission to use goods or perform activities
3.9 4.7 5.6 8.9 8.8
(e) Other Taxes 0.1 0.0 0.0 0.0 0.0
2. Local Government Non-Tax revenue 91.9 91.3 90.3 84.6 85.4
(a) Grants 72.2 72.2 71.6 59.8 62.1
Local Government 70.5 71.6 71.3 59.6 61.9
Graduated Tax (Compensation) - - - - -
Donors 1.6 0.6 0.3 0.2 0.2
(b) Other Revenue 19.8 19.0 18.7 24.8 23.3
(i) Property Income 1.4 1.6 1.1 1.8 1.6
Rent 1.3 1.6 1.1 1.8 1.6
Other property incomes 0.1 0.0 0.0 0.0 0.0
(ii) Sale of goods and services 17.9 16.4 16.6 22.2 20.6
Administrative fees 17.1 15.8 16.1 21.3 20.5
Sales by nonmarket establishments 0.8 0.6 0.5 0.9 0.1
(iii) Fines and Penalties 0.0 0.0 0.0 0.0 0.0
(iv) Miscellaneous and unidentified revenue 0.5 1.0 1.0 0.8 1.0
Source: Uganda Bureau of Statistics
Table 4.4 V (a): Functional Classification of Town Councils’ Expenditure for FY 2016/17 – FY 2020/21 (Shs. Million)
Expenditure 2016/17 2017/18 2018/19 2019/20' 2020/21*
General Public Services 63,935 55,620 50,595 52,992 56,213
Defense - - - - -
Public Order and Safety 401 399 417 381 395
Economic Affairs 23,962 25,634 41,511 32,980 36,383
Agriculture 1,458 1,777 2,137 2,184 2,242
Construction/Works 22,410 23,773 39,253 30,123 33,340
Labor 1 - 6 12 11
Other Economic Affairs nec 92 84 115 661 789
Environmental Protection 662 1,134 1,110 1,363 1,413
Housing and Community amenities 3,938 3,459 3,889 3,677 3,920
Housing 2,112 157 137 410 490
Water Supply 1,588 888 791 715 828
Other Community Development 199 2,415 2,875 2,551 2,601
Health 4,274 4,597 5,060 5,585 5,601
Recreation, Culture and Religion 388 268 83 492 509
Education 899 1,251 1,044 1,075 1,166
Primary 131 81 357 140 172
Secondary 67 - - - -
Tertiary - - - - -
Other Education 630 1,170 677 935 995
Social Protection 245 499 413 365 354
Total 98,704 92,863 104,121 98,911 105,955
Source: Uganda Bureau of Statistics Note:
(i) Figures present total expenditure for 207 town councils (ii)
1 Revised figures
(iii) * Provisional figures
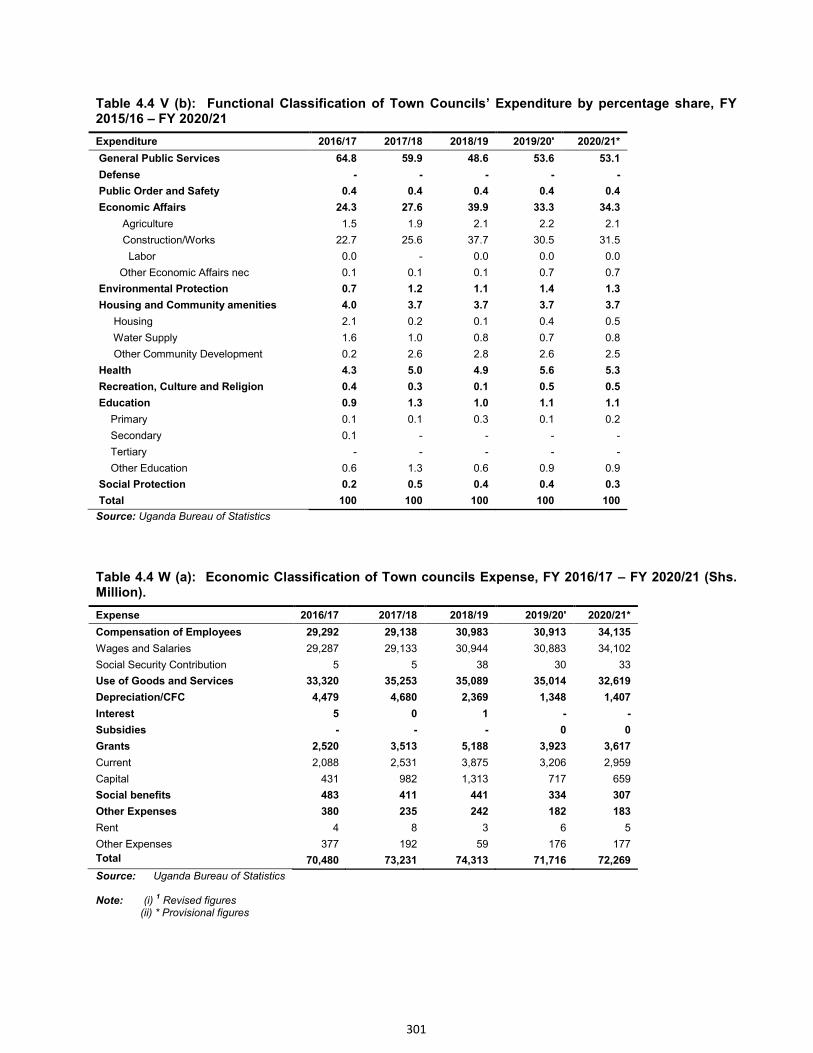
301
Table 4.4 V (b): Functional Classification of Town Councils’ Expenditure by percentage share, FY 2015/16 – FY 2020/21
Expenditure 2016/17 2017/18 2018/19 2019/20' 2020/21*
General Public Services 64.8 59.9 48.6 53.6 53.1
Defense - - - - -
Public Order and Safety 0.4 0.4 0.4 0.4 0.4
Economic Affairs 24.3 27.6 39.9 33.3 34.3
Agriculture 1.5 1.9 2.1 2.2 2.1
Construction/Works 22.7 25.6 37.7 30.5 31.5
Labor 0.0 - 0.0 0.0 0.0
Other Economic Affairs nec 0.1 0.1 0.1 0.7 0.7
Environmental Protection 0.7 1.2 1.1 1.4 1.3
Housing and Community amenities 4.0 3.7 3.7 3.7 3.7
Housing 2.1 0.2 0.1 0.4 0.5
Water Supply 1.6 1.0 0.8 0.7 0.8
Other Community Development 0.2 2.6 2.8 2.6 2.5
Health 4.3 5.0 4.9 5.6 5.3
Recreation, Culture and Religion 0.4 0.3 0.1 0.5 0.5
Education 0.9 1.3 1.0 1.1 1.1
Primary 0.1 0.1 0.3 0.1 0.2
Secondary 0.1 - - - -
Tertiary - - - - -
Other Education 0.6 1.3 0.6 0.9 0.9
Social Protection 0.2 0.5 0.4 0.4 0.3
Total 100 100 100 100 100
Source: Uganda Bureau of Statistics
Table 4.4 W (a): Economic Classification of Town councils Expense, FY 2016/17 – FY 2020/21 (Shs. Million).
Expense 2016/17 2017/18 2018/19 2019/20' 2020/21*
Compensation of Employees 29,292 29,138 30,983 30,913 34,135
Wages and Salaries 29,287 29,133 30,944 30,883 34,102
Social Security Contribution 5 5 38 30 33
Use of Goods and Services 33,320 35,253 35,089 35,014 32,619
Depreciation/CFC 4,479 4,680 2,369 1,348 1,407
Interest 5 0 1 - -
Subsidies - - - 0 0
Grants 2,520 3,513 5,188 3,923 3,617
Current 2,088 2,531 3,875 3,206 2,959
Capital 431 982 1,313 717 659
Social benefits 483 411 441 334 307
Other Expenses 380 235 242 182 183
Rent 4 8 3 6 5
Other Expenses 377 192 59 176 177
Total 70,480 73,231 74,313 71,716 72,269
Source: Uganda Bureau of Statistics Note: (i)
1 Revised figures
(ii) * Provisional figures
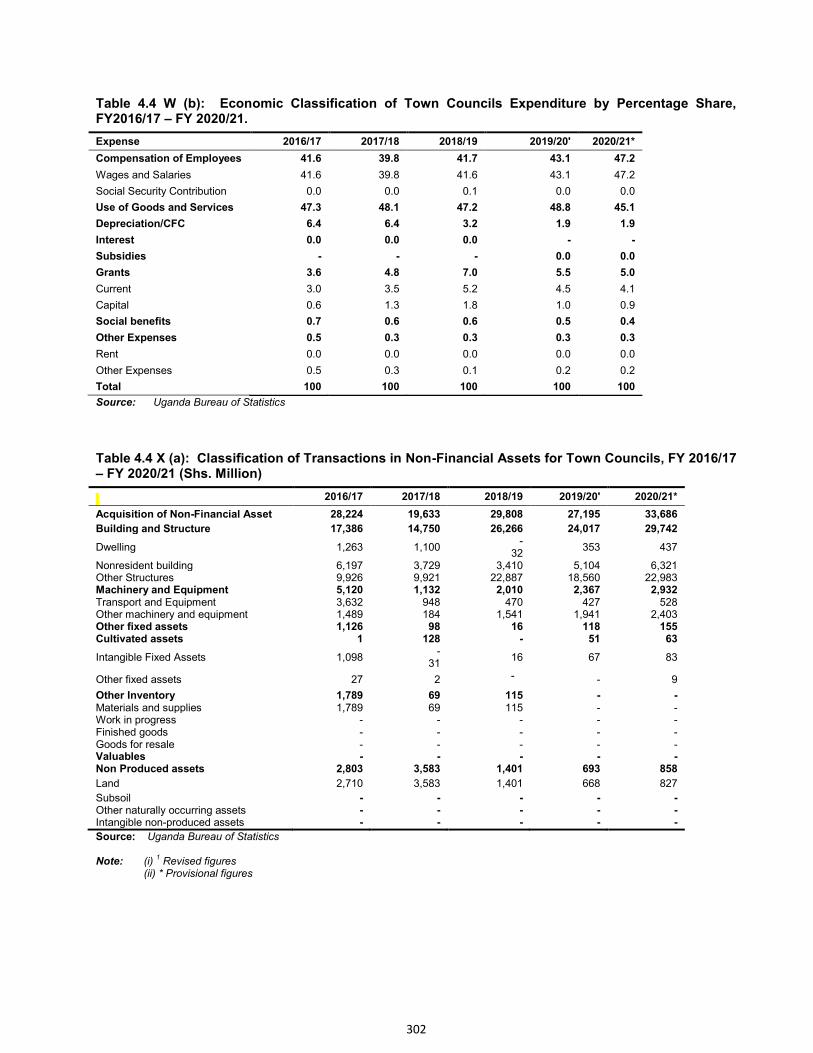
302
Table 4.4 W (b): Economic Classification of Town Councils Expenditure by Percentage Share, FY2016/17 – FY 2020/21.
Expense 2016/17 2017/18 2018/19 2019/20' 2020/21*
Compensation of Employees 41.6 39.8 41.7 43.1 47.2
Wages and Salaries 41.6 39.8 41.6 43.1 47.2
Social Security Contribution 0.0 0.0 0.1 0.0 0.0
Use of Goods and Services 47.3 48.1 47.2 48.8 45.1
Depreciation/CFC 6.4 6.4 3.2 1.9 1.9
Interest 0.0 0.0 0.0 - -
Subsidies - - - 0.0 0.0
Grants 3.6 4.8 7.0 5.5 5.0
Current 3.0 3.5 5.2 4.5 4.1
Capital 0.6 1.3 1.8 1.0 0.9
Social benefits 0.7 0.6 0.6 0.5 0.4
Other Expenses 0.5 0.3 0.3 0.3 0.3
Rent 0.0 0.0 0.0 0.0 0.0
Other Expenses 0.5 0.3 0.1 0.2 0.2
Total 100 100 100 100 100
Source: Uganda Bureau of Statistics
Table 4.4 X (a): Classification of Transactions in Non-Financial Assets for Town Councils, FY 2016/17 – FY 2020/21 (Shs. Million)
2016/17 2017/18 2018/19 2019/20' 2020/21*
Acquisition of Non-Financial Asset 28,224 19,633 29,808 27,195 33,686
Building and Structure 17,386 14,750 26,266 24,017 29,742
Dwelling 1,263 1,100 -
32 353 437
Nonresident building 6,197 3,729 3,410 5,104 6,321 Other Structures 9,926 9,921 22,887 18,560 22,983 Machinery and Equipment 5,120 1,132 2,010 2,367 2,932 Transport and Equipment 3,632 948 470 427 528 Other machinery and equipment 1,489 184 1,541 1,941 2,403 Other fixed assets 1,126 98 16 118 155 Cultivated assets 1 128 - 51 63
Intangible Fixed Assets 1,098 -
31 16 67 83
Other fixed assets 27 2 - - 9
Other Inventory 1,789 69 115 - - Materials and supplies 1,789 69 115 - - Work in progress - - - - - Finished goods - - - - - Goods for resale - - - - - Valuables - - - - - Non Produced assets 2,803 3,583 1,401 693 858
Land 2,710 3,583 1,401 668 827
Subsoil - - - - - Other naturally occurring assets - - - - - Intangible non-produced assets - - - - -
Source: Uganda Bureau of Statistics Note: (i)
1 Revised figures
(ii) * Provisional figures
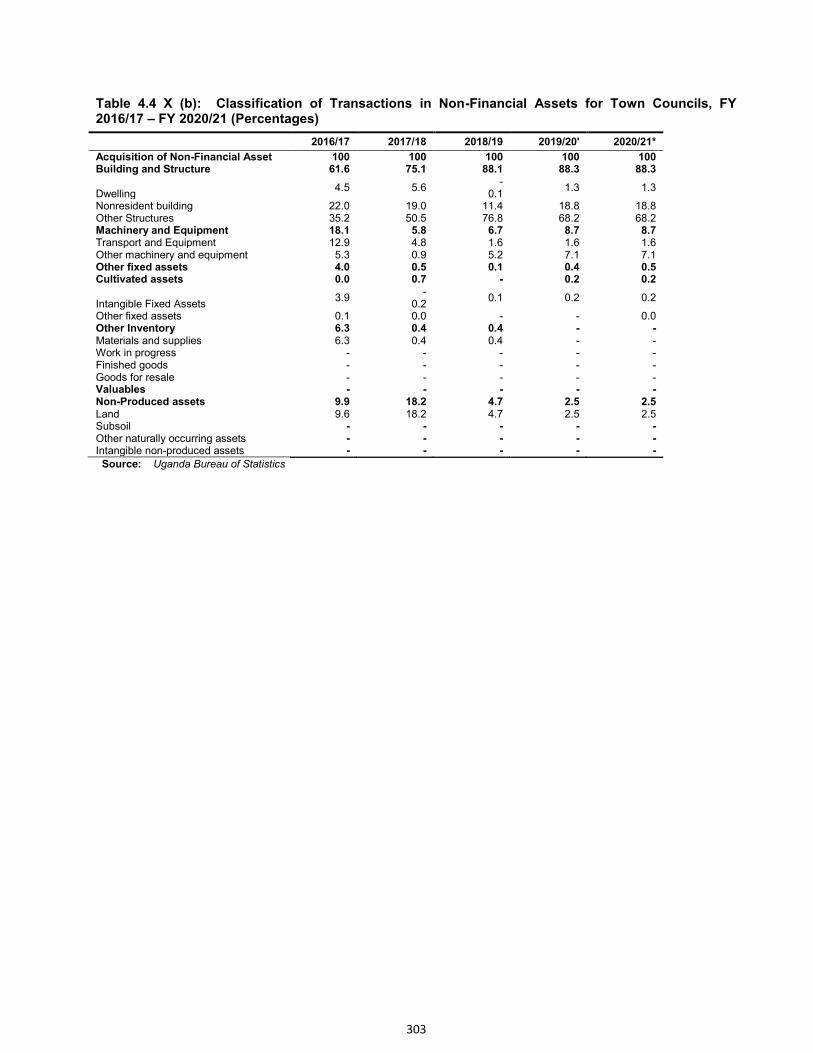
303
Table 4.4 X (b): Classification of Transactions in Non-Financial Assets for Town Councils, FY 2016/17 – FY 2020/21 (Percentages)
2016/17 2017/18 2018/19 2019/20' 2020/21*
Acquisition of Non-Financial Asset 100 100 100 100 100 Building and Structure 61.6 75.1 88.1 88.3 88.3
Dwelling 4.5 5.6
- 0.1
1.3 1.3
Nonresident building 22.0 19.0 11.4 18.8 18.8 Other Structures 35.2 50.5 76.8 68.2 68.2 Machinery and Equipment 18.1 5.8 6.7 8.7 8.7 Transport and Equipment 12.9 4.8 1.6 1.6 1.6 Other machinery and equipment 5.3 0.9 5.2 7.1 7.1 Other fixed assets 4.0 0.5 0.1 0.4 0.5 Cultivated assets 0.0 0.7 - 0.2 0.2
Intangible Fixed Assets 3.9
- 0.2
0.1 0.2 0.2
Other fixed assets 0.1 0.0 - - 0.0 Other Inventory 6.3 0.4 0.4 - - Materials and supplies 6.3 0.4 0.4 - - Work in progress - - - - - Finished goods - - - - - Goods for resale - - - - - Valuables - - - - - Non-Produced assets 9.9 18.2 4.7 2.5 2.5 Land 9.6 18.2 4.7 2.5 2.5 Subsoil - - - - - Other naturally occurring assets - - - - - Intangible non-produced assets - - - - -
Source: Uganda Bureau of Statistics
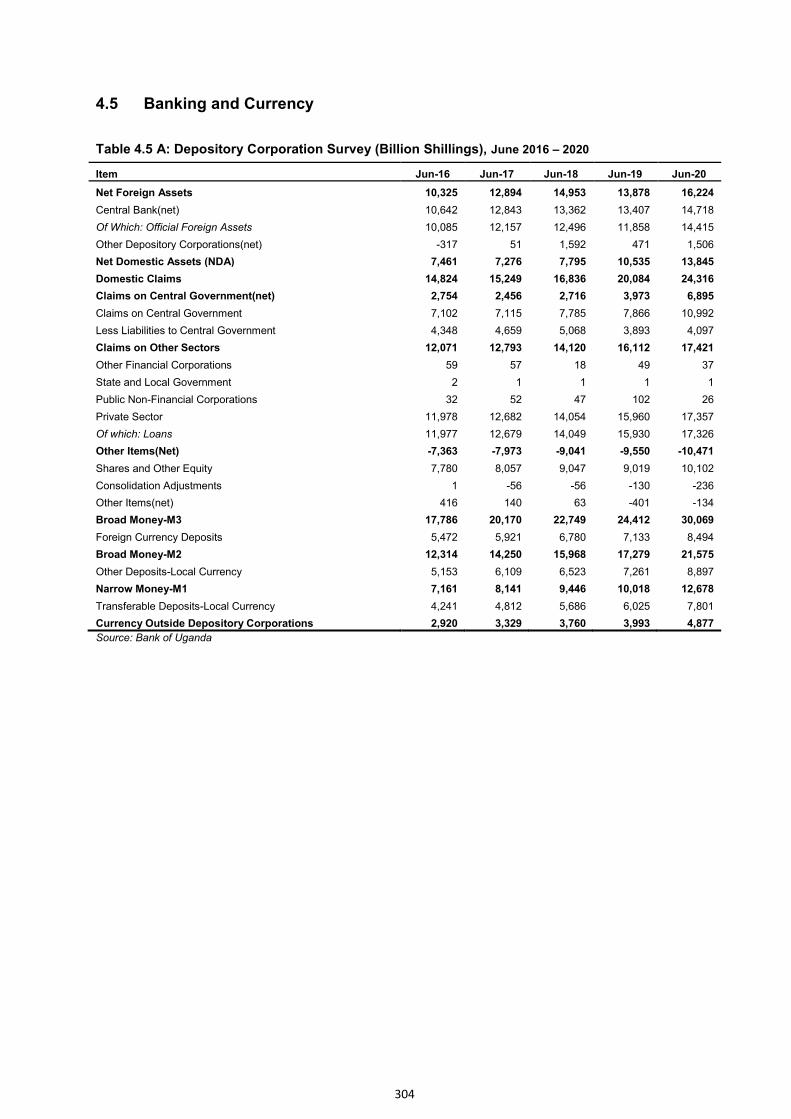
304
4.5 Banking and Currency
Table 4.5 A: Depository Corporation Survey (Billion Shillings), June 2016 – 2020
Item Jun-16 Jun-17 Jun-18 Jun-19 Jun-20
Net Foreign Assets 10,325 12,894 14,953 13,878 16,224
Central Bank(net) 10,642 12,843 13,362 13,407 14,718
Of Which: Official Foreign Assets 10,085 12,157 12,496 11,858 14,415
Other Depository Corporations(net) -317 51 1,592 471 1,506
Net Domestic Assets (NDA) 7,461 7,276 7,795 10,535 13,845
Domestic Claims 14,824 15,249 16,836 20,084 24,316
Claims on Central Government(net) 2,754 2,456 2,716 3,973 6,895
Claims on Central Government 7,102 7,115 7,785 7,866 10,992
Less Liabilities to Central Government 4,348 4,659 5,068 3,893 4,097
Claims on Other Sectors 12,071 12,793 14,120 16,112 17,421
Other Financial Corporations 59 57 18 49 37
State and Local Government 2 1 1 1 1
Public Non-Financial Corporations 32 52 47 102 26
Private Sector 11,978 12,682 14,054 15,960 17,357
Of which: Loans 11,977 12,679 14,049 15,930 17,326
Other Items(Net) -7,363 -7,973 -9,041 -9,550 -10,471
Shares and Other Equity 7,780 8,057 9,047 9,019 10,102
Consolidation Adjustments 1 -56 -56 -130 -236
Other Items(net) 416 140 63 -401 -134
Broad Money-M3 17,786 20,170 22,749 24,412 30,069
Foreign Currency Deposits 5,472 5,921 6,780 7,133 8,494
Broad Money-M2 12,314 14,250 15,968 17,279 21,575
Other Deposits-Local Currency 5,153 6,109 6,523 7,261 8,897
Narrow Money-M1 7,161 8,141 9,446 10,018 12,678
Transferable Deposits-Local Currency 4,241 4,812 5,686 6,025 7,801
Currency Outside Depository Corporations 2,920 3,329 3,760 3,993 4,877
Source: Bank of Uganda
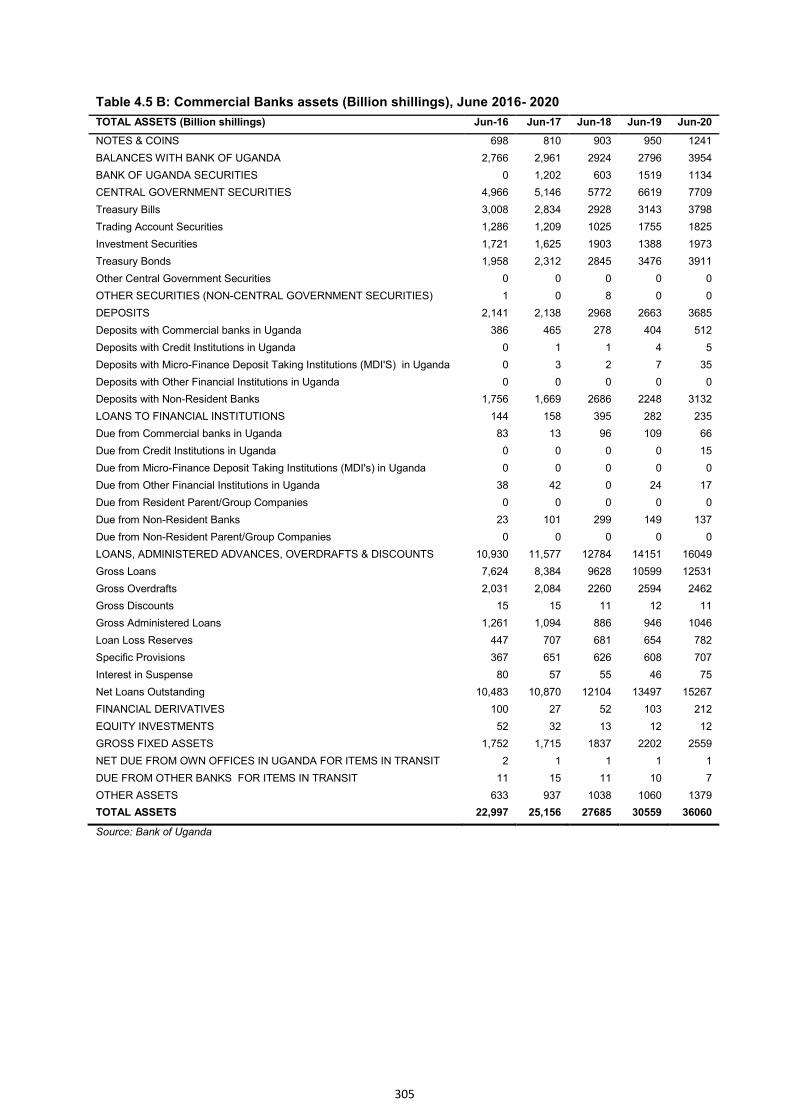
305
Table 4.5 B: Commercial Banks assets (Billion shillings), June 2016- 2020
TOTAL ASSETS (Billion shillings) Jun-16 Jun-17 Jun-18 Jun-19 Jun-20
NOTES & COINS 698 810 903 950 1241
BALANCES WITH BANK OF UGANDA 2,766 2,961 2924 2796 3954
BANK OF UGANDA SECURITIES 0 1,202 603 1519 1134
CENTRAL GOVERNMENT SECURITIES 4,966 5,146 5772 6619 7709
Treasury Bills 3,008 2,834 2928 3143 3798
Trading Account Securities 1,286 1,209 1025 1755 1825
Investment Securities 1,721 1,625 1903 1388 1973
Treasury Bonds 1,958 2,312 2845 3476 3911
Other Central Government Securities 0 0 0 0 0
OTHER SECURITIES (NON-CENTRAL GOVERNMENT SECURITIES) 1 0 8 0 0
DEPOSITS 2,141 2,138 2968 2663 3685
Deposits with Commercial banks in Uganda 386 465 278 404 512
Deposits with Credit Institutions in Uganda 0 1 1 4 5
Deposits with Micro-Finance Deposit Taking Institutions (MDI'S) in Uganda 0 3 2 7 35
Deposits with Other Financial Institutions in Uganda 0 0 0 0 0
Deposits with Non-Resident Banks 1,756 1,669 2686 2248 3132
LOANS TO FINANCIAL INSTITUTIONS 144 158 395 282 235
Due from Commercial banks in Uganda 83 13 96 109 66
Due from Credit Institutions in Uganda 0 0 0 0 15
Due from Micro-Finance Deposit Taking Institutions (MDI's) in Uganda 0 0 0 0 0
Due from Other Financial Institutions in Uganda 38 42 0 24 17
Due from Resident Parent/Group Companies 0 0 0 0 0
Due from Non-Resident Banks 23 101 299 149 137
Due from Non-Resident Parent/Group Companies 0 0 0 0 0
LOANS, ADMINISTERED ADVANCES, OVERDRAFTS & DISCOUNTS 10,930 11,577 12784 14151 16049
Gross Loans 7,624 8,384 9628 10599 12531
Gross Overdrafts 2,031 2,084 2260 2594 2462
Gross Discounts 15 15 11 12 11
Gross Administered Loans 1,261 1,094 886 946 1046
Loan Loss Reserves 447 707 681 654 782
Specific Provisions 367 651 626 608 707
Interest in Suspense 80 57 55 46 75
Net Loans Outstanding 10,483 10,870 12104 13497 15267
FINANCIAL DERIVATIVES 100 27 52 103 212
EQUITY INVESTMENTS 52 32 13 12 12
GROSS FIXED ASSETS 1,752 1,715 1837 2202 2559
NET DUE FROM OWN OFFICES IN UGANDA FOR ITEMS IN TRANSIT 2 1 1 1 1
DUE FROM OTHER BANKS FOR ITEMS IN TRANSIT 11 15 11 10 7
OTHER ASSETS 633 937 1038 1060 1379
TOTAL ASSETS 22,997 25,156 27685 30559 36060
Source: Bank of Uganda
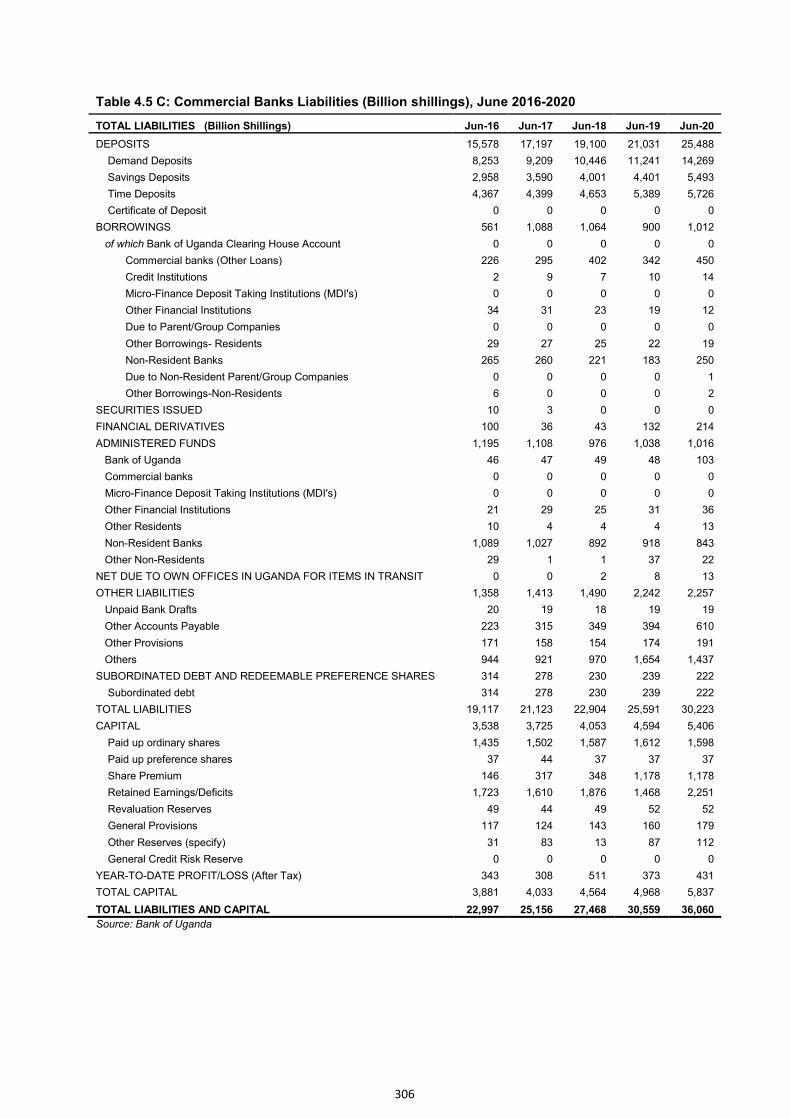
306
Table 4.5 C: Commercial Banks Liabilities (Billion shillings), June 2016-2020
TOTAL LIABILITIES (Billion Shillings) Jun-16 Jun-17 Jun-18 Jun-19 Jun-20
DEPOSITS 15,578 17,197 19,100 21,031 25,488
Demand Deposits 8,253 9,209 10,446 11,241 14,269
Savings Deposits 2,958 3,590 4,001 4,401 5,493
Time Deposits 4,367 4,399 4,653 5,389 5,726
Certificate of Deposit 0 0 0 0 0
BORROWINGS 561 1,088 1,064 900 1,012
of which Bank of Uganda Clearing House Account 0 0 0 0 0
Commercial banks (Other Loans) 226 295 402 342 450
Credit Institutions 2 9 7 10 14
Micro-Finance Deposit Taking Institutions (MDI's) 0 0 0 0 0
Other Financial Institutions 34 31 23 19 12
Due to Parent/Group Companies 0 0 0 0 0
Other Borrowings- Residents 29 27 25 22 19
Non-Resident Banks 265 260 221 183 250
Due to Non-Resident Parent/Group Companies 0 0 0 0 1
Other Borrowings-Non-Residents 6 0 0 0 2
SECURITIES ISSUED 10 3 0 0 0
FINANCIAL DERIVATIVES 100 36 43 132 214
ADMINISTERED FUNDS 1,195 1,108 976 1,038 1,016
Bank of Uganda 46 47 49 48 103
Commercial banks 0 0 0 0 0
Micro-Finance Deposit Taking Institutions (MDI's) 0 0 0 0 0
Other Financial Institutions 21 29 25 31 36
Other Residents 10 4 4 4 13
Non-Resident Banks 1,089 1,027 892 918 843
Other Non-Residents 29 1 1 37 22
NET DUE TO OWN OFFICES IN UGANDA FOR ITEMS IN TRANSIT 0 0 2 8 13
OTHER LIABILITIES 1,358 1,413 1,490 2,242 2,257
Unpaid Bank Drafts 20 19 18 19 19
Other Accounts Payable 223 315 349 394 610
Other Provisions 171 158 154 174 191
Others 944 921 970 1,654 1,437
SUBORDINATED DEBT AND REDEEMABLE PREFERENCE SHARES 314 278 230 239 222
Subordinated debt 314 278 230 239 222
TOTAL LIABILITIES 19,117 21,123 22,904 25,591 30,223
CAPITAL 3,538 3,725 4,053 4,594 5,406
Paid up ordinary shares 1,435 1,502 1,587 1,612 1,598
Paid up preference shares 37 44 37 37 37
Share Premium 146 317 348 1,178 1,178
Retained Earnings/Deficits 1,723 1,610 1,876 1,468 2,251
Revaluation Reserves 49 44 49 52 52
General Provisions 117 124 143 160 179
Other Reserves (specify) 31 83 13 87 112
General Credit Risk Reserve 0 0 0 0 0
YEAR-TO-DATE PROFIT/LOSS (After Tax) 343 308 511 373 431
TOTAL CAPITAL 3,881 4,033 4,564 4,968 5,837
TOTAL LIABILITIES AND CAPITAL 22,997 25,156 27,468 30,559 36,060
Source: Bank of Uganda
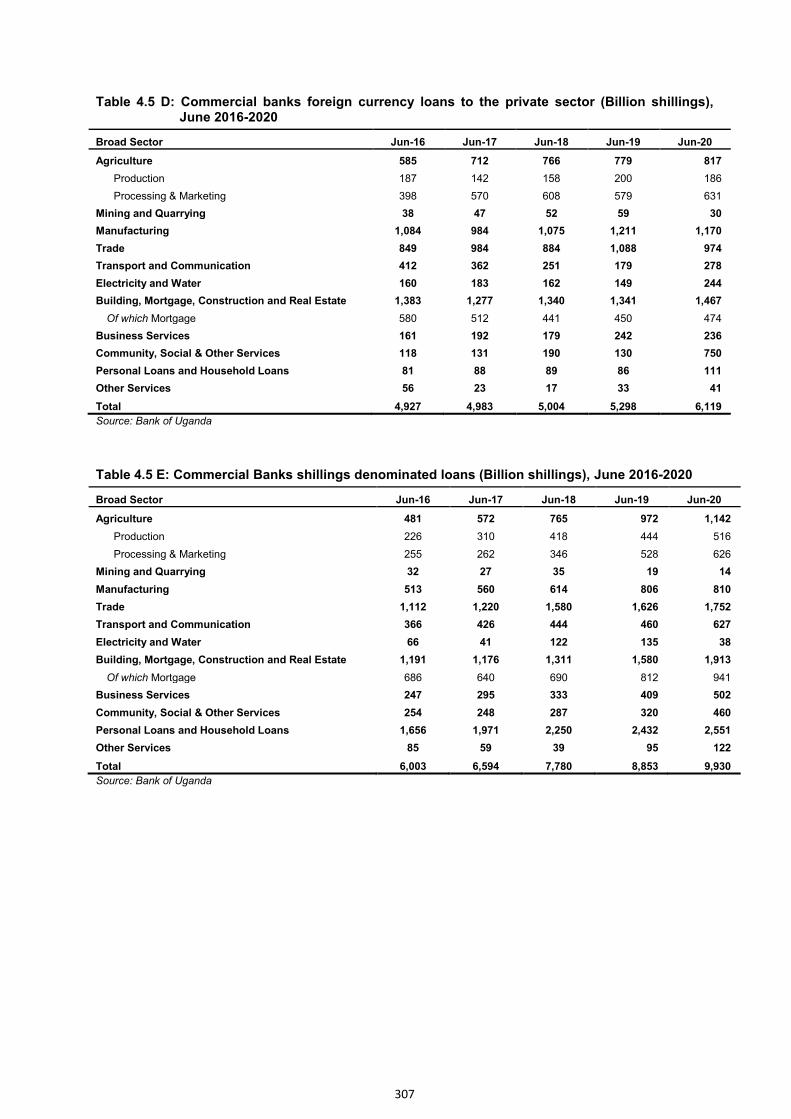
307
Table 4.5 D: Commercial banks foreign currency loans to the private sector (Billion shillings), June 2016-2020
Broad Sector Jun-16 Jun-17 Jun-18 Jun-19 Jun-20
Agriculture 585 712 766 779 817
Production 187 142 158 200 186
Processing & Marketing 398 570 608 579 631
Mining and Quarrying 38 47 52 59 30
Manufacturing 1,084 984 1,075 1,211 1,170
Trade 849 984 884 1,088 974
Transport and Communication 412 362 251 179 278
Electricity and Water 160 183 162 149 244
Building, Mortgage, Construction and Real Estate 1,383 1,277 1,340 1,341 1,467
Of which Mortgage 580 512 441 450 474
Business Services 161 192 179 242 236
Community, Social & Other Services 118 131 190 130 750
Personal Loans and Household Loans 81 88 89 86 111
Other Services 56 23 17 33 41
Total 4,927 4,983 5,004 5,298 6,119
Source: Bank of Uganda
Table 4.5 E: Commercial Banks shillings denominated loans (Billion shillings), June 2016-2020
Broad Sector Jun-16 Jun-17 Jun-18 Jun-19 Jun-20
Agriculture 481 572 765 972 1,142
Production 226 310 418 444 516
Processing & Marketing 255 262 346 528 626
Mining and Quarrying 32 27 35 19 14
Manufacturing 513 560 614 806 810
Trade 1,112 1,220 1,580 1,626 1,752
Transport and Communication 366 426 444 460 627
Electricity and Water 66 41 122 135 38
Building, Mortgage, Construction and Real Estate 1,191 1,176 1,311 1,580 1,913
Of which Mortgage 686 640 690 812 941
Business Services 247 295 333 409 502
Community, Social & Other Services 254 248 287 320 460
Personal Loans and Household Loans 1,656 1,971 2,250 2,432 2,551
Other Services 85 59 39 95 122
Total 6,003 6,594 7,780 8,853 9,930
Source: Bank of Uganda
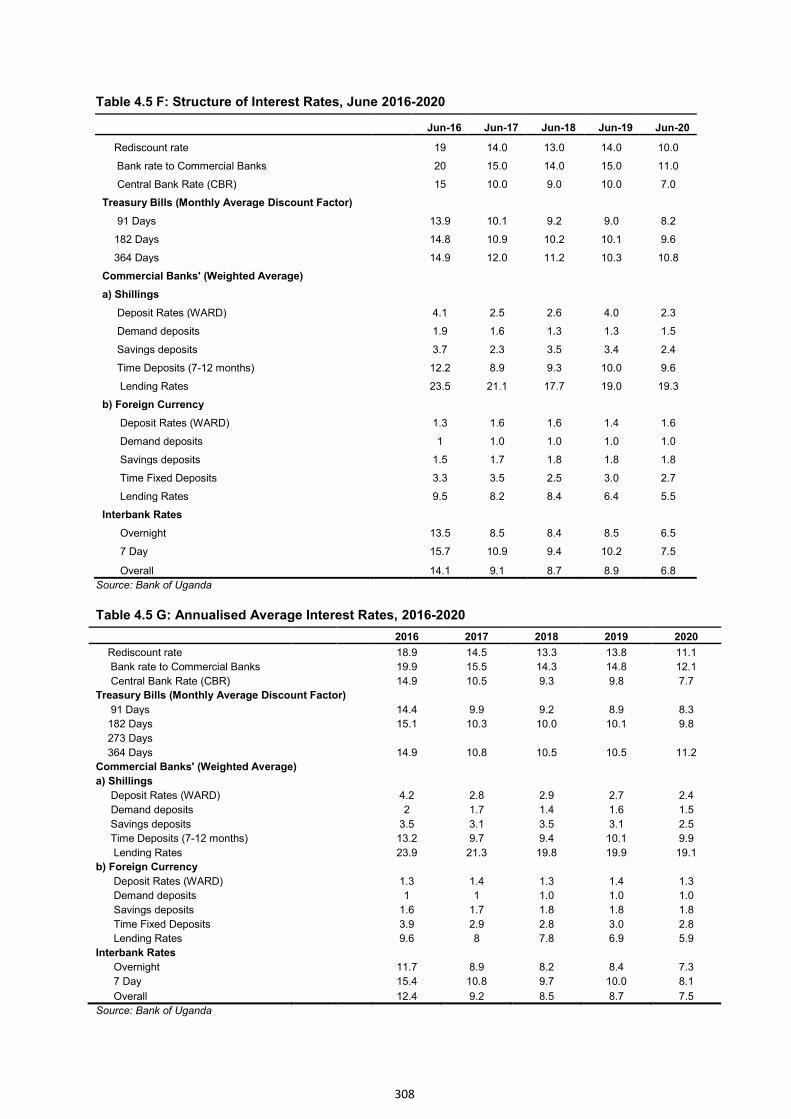
308
Table 4.5 F: Structure of Interest Rates, June 2016-2020
Jun-16 Jun-17 Jun-18 Jun-19 Jun-20
Rediscount rate 19 14.0 13.0 14.0 10.0
Bank rate to Commercial Banks 20 15.0 14.0 15.0 11.0
Central Bank Rate (CBR) 15 10.0 9.0 10.0 7.0
Treasury Bills (Monthly Average Discount Factor)
91 Days 13.9 10.1 9.2 9.0 8.2
182 Days 14.8 10.9 10.2 10.1 9.6
364 Days 14.9 12.0 11.2 10.3 10.8
Commercial Banks' (Weighted Average)
a) Shillings
Deposit Rates (WARD) 4.1 2.5 2.6 4.0 2.3
Demand deposits 1.9 1.6 1.3 1.3 1.5
Savings deposits 3.7 2.3 3.5 3.4 2.4
Time Deposits (7-12 months) 12.2 8.9 9.3 10.0 9.6
Lending Rates 23.5 21.1 17.7 19.0 19.3
b) Foreign Currency
Deposit Rates (WARD) 1.3 1.6 1.6 1.4 1.6
Demand deposits 1 1.0 1.0 1.0 1.0
Savings deposits 1.5 1.7 1.8 1.8 1.8
Time Fixed Deposits 3.3 3.5 2.5 3.0 2.7
Lending Rates 9.5 8.2 8.4 6.4 5.5
Interbank Rates
Overnight 13.5 8.5 8.4 8.5 6.5
7 Day 15.7 10.9 9.4 10.2 7.5
Overall 14.1 9.1 8.7 8.9 6.8
Source: Bank of Uganda
Table 4.5 G: Annualised Average Interest Rates, 2016-2020
2016 2017 2018 2019 2020
Rediscount rate 18.9 14.5 13.3 13.8 11.1
Bank rate to Commercial Banks 19.9 15.5 14.3 14.8 12.1
Central Bank Rate (CBR) 14.9 10.5 9.3 9.8 7.7
Treasury Bills (Monthly Average Discount Factor) 91 Days 14.4 9.9 9.2 8.9 8.3
182 Days 15.1 10.3 10.0 10.1 9.8
273 Days 364 Days 14.9 10.8 10.5 10.5 11.2
Commercial Banks' (Weighted Average) a) Shillings
Deposit Rates (WARD) 4.2 2.8 2.9 2.7 2.4
Demand deposits 2 1.7 1.4 1.6 1.5
Savings deposits 3.5 3.1 3.5 3.1 2.5
Time Deposits (7-12 months) 13.2 9.7 9.4 10.1 9.9
Lending Rates 23.9 21.3 19.8 19.9 19.1
b) Foreign Currency Deposit Rates (WARD) 1.3 1.4 1.3 1.4 1.3
Demand deposits 1 1 1.0 1.0 1.0
Savings deposits 1.6 1.7 1.8 1.8 1.8
Time Fixed Deposits 3.9 2.9 2.8 3.0 2.8
Lending Rates 9.6 8 7.8 6.9 5.9
Interbank Rates Overnight 11.7 8.9 8.2 8.4 7.3
7 Day 15.4 10.8 9.7 10.0 8.1
Overall 12.4 9.2 8.5 8.7 7.5
Source: Bank of Uganda
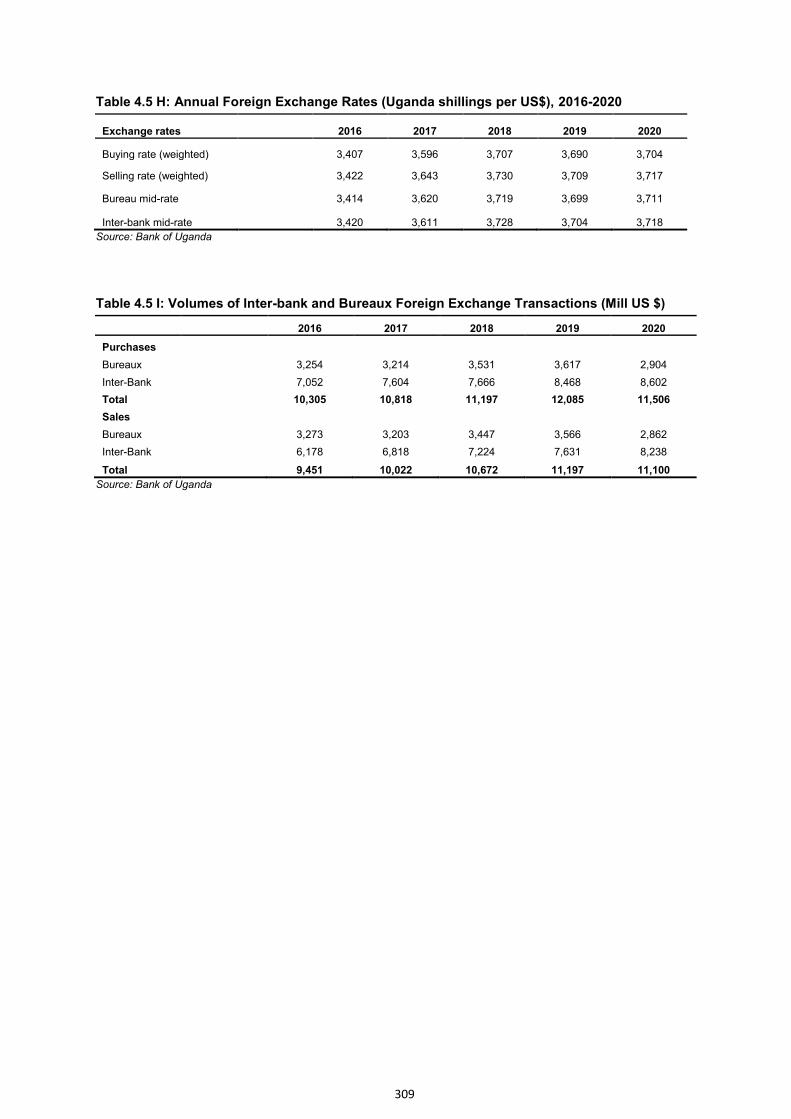
309
Table 4.5 H: Annual Foreign Exchange Rates (Uganda shillings per US$), 2016-2020
Exchange rates 2016 2017 2018 2019 2020
Buying rate (weighted) 3,407 3,596 3,707 3,690 3,704
Selling rate (weighted) 3,422 3,643 3,730 3,709 3,717
Bureau mid-rate 3,414 3,620 3,719 3,699 3,711
Inter-bank mid-rate 3,420 3,611 3,728 3,704 3,718
Source: Bank of Uganda
Table 4.5 I: Volumes of Inter-bank and Bureaux Foreign Exchange Transactions (Mill US $)
2016 2017 2018 2019 2020
Purchases Bureaux 3,254 3,214 3,531 3,617 2,904
Inter-Bank 7,052 7,604 7,666 8,468 8,602
Total 10,305 10,818 11,197 12,085 11,506
Sales Bureaux 3,273 3,203 3,447 3,566 2,862
Inter-Bank 6,178 6,818 7,224 7,631 8,238
Total
9,451 10,022 10,672 11,197 11,100
Source: Bank of Uganda
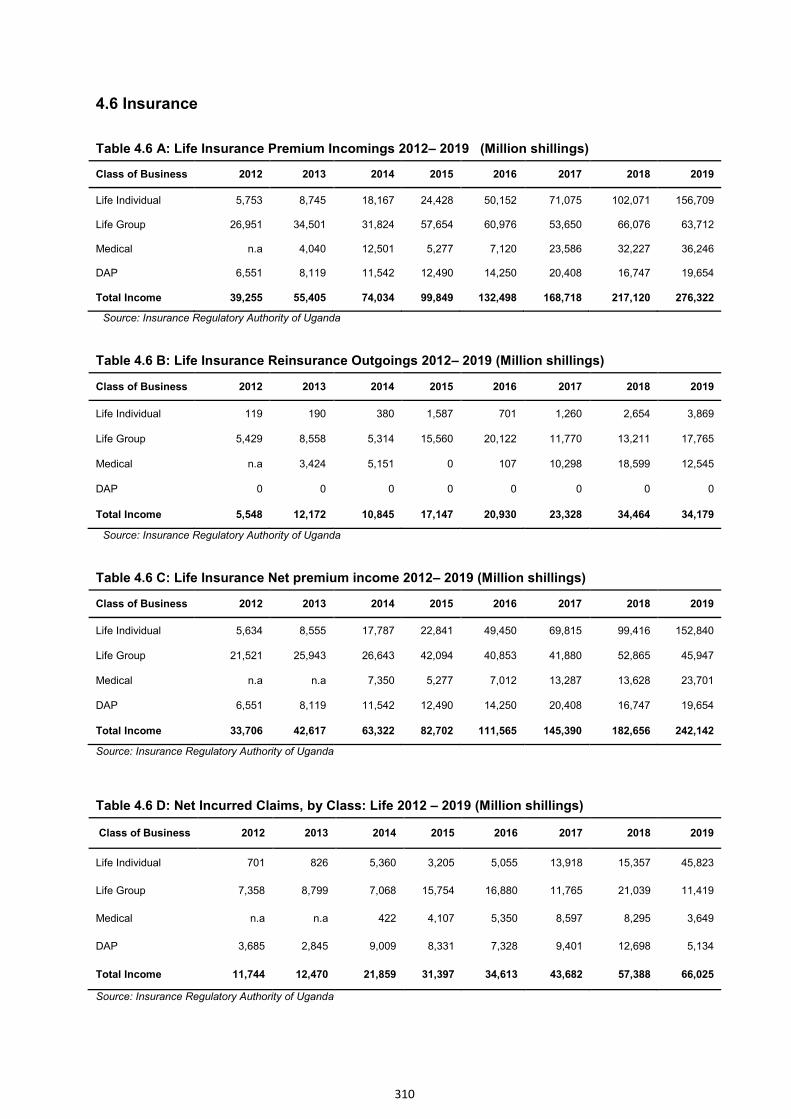
310
4.6 Insurance
Table 4.6 A: Life Insurance Premium Incomings 2012– 2019 (Million shillings)
Class of Business 2012 2013 2014 2015 2016 2017 2018 2019
Life Individual 5,753 8,745 18,167 24,428 50,152 71,075 102,071 156,709
Life Group 26,951 34,501 31,824 57,654 60,976 53,650 66,076 63,712
Medical n.a 4,040 12,501 5,277 7,120 23,586 32,227 36,246
DAP 6,551 8,119 11,542 12,490 14,250 20,408 16,747 19,654
Total Income 39,255 55,405 74,034 99,849 132,498 168,718 217,120 276,322
Source: Insurance Regulatory Authority of Uganda
Table 4.6 B: Life Insurance Reinsurance Outgoings 2012– 2019 (Million shillings)
Class of Business 2012 2013 2014 2015 2016 2017 2018 2019
Life Individual 119 190 380 1,587 701 1,260 2,654 3,869
Life Group 5,429 8,558 5,314 15,560 20,122 11,770 13,211 17,765
Medical n.a 3,424 5,151 0 107 10,298 18,599 12,545
DAP 0 0 0 0 0 0 0 0
Total Income 5,548 12,172 10,845 17,147 20,930 23,328 34,464 34,179
Source: Insurance Regulatory Authority of Uganda
Table 4.6 C: Life Insurance Net premium income 2012– 2019 (Million shillings)
Class of Business 2012 2013 2014 2015 2016 2017 2018 2019
Life Individual 5,634 8,555 17,787 22,841 49,450 69,815 99,416 152,840
Life Group 21,521 25,943 26,643 42,094 40,853 41,880 52,865 45,947
Medical n.a n.a 7,350 5,277 7,012 13,287 13,628 23,701
DAP 6,551 8,119 11,542 12,490 14,250 20,408 16,747 19,654
Total Income 33,706 42,617 63,322 82,702 111,565 145,390 182,656 242,142
Source: Insurance Regulatory Authority of Uganda
Table 4.6 D: Net Incurred Claims, by Class: Life 2012 – 2019 (Million shillings)
Class of Business 2012 2013 2014 2015 2016 2017 2018 2019
Life Individual 701 826 5,360 3,205 5,055 13,918 15,357 45,823
Life Group 7,358 8,799 7,068 15,754 16,880 11,765 21,039 11,419
Medical n.a n.a 422 4,107 5,350 8,597 8,295 3,649
DAP 3,685 2,845 9,009 8,331 7,328 9,401 12,698 5,134
Total Income 11,744 12,470 21,859 31,397 34,613 43,682 57,388 66,025
Source: Insurance Regulatory Authority of Uganda
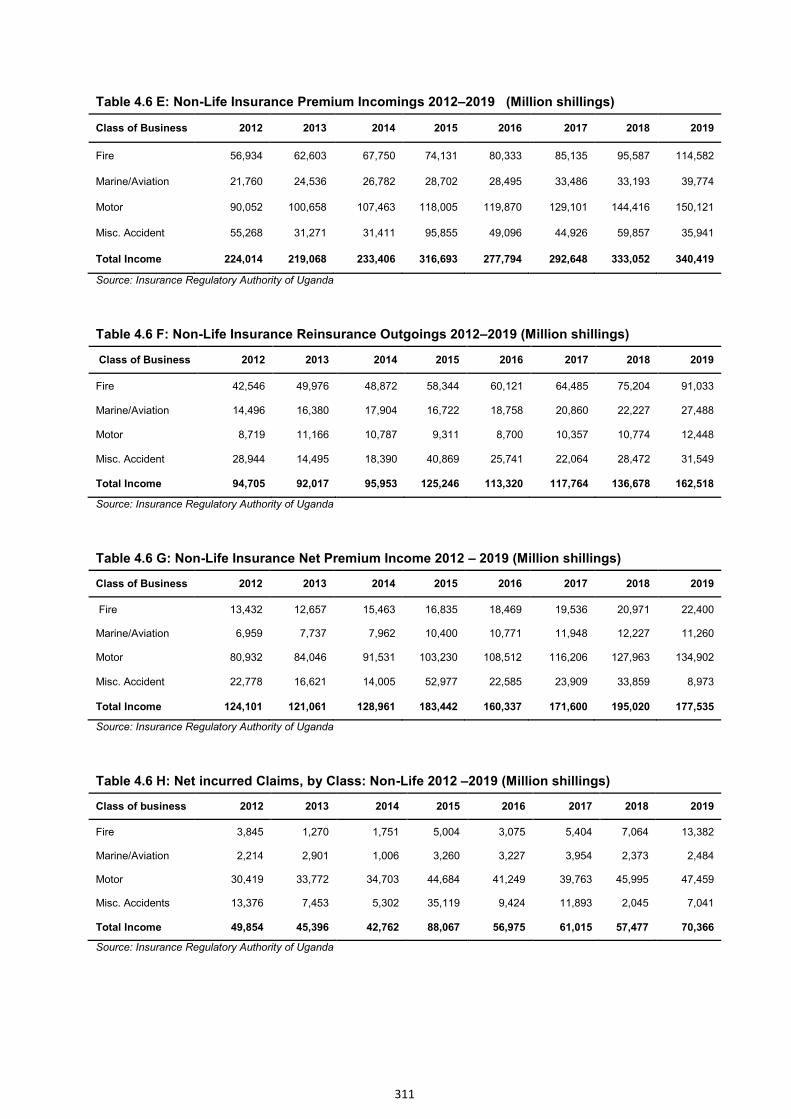
311
Table 4.6 E: Non-Life Insurance Premium Incomings 2012–2019 (Million shillings)
Class of Business 2012 2013 2014 2015 2016 2017 2018 2019
Fire 56,934 62,603 67,750 74,131 80,333 85,135 95,587 114,582
Marine/Aviation 21,760 24,536 26,782 28,702 28,495 33,486 33,193 39,774
Motor 90,052 100,658 107,463 118,005 119,870 129,101 144,416 150,121
Misc. Accident 55,268 31,271 31,411 95,855 49,096 44,926 59,857 35,941
Total Income 224,014 219,068 233,406 316,693 277,794 292,648 333,052 340,419
Source: Insurance Regulatory Authority of Uganda
Table 4.6 F: Non-Life Insurance Reinsurance Outgoings 2012–2019 (Million shillings)
Class of Business 2012 2013 2014 2015 2016 2017 2018 2019
Fire 42,546 49,976 48,872 58,344 60,121 64,485 75,204 91,033
Marine/Aviation 14,496 16,380 17,904 16,722 18,758 20,860 22,227 27,488
Motor 8,719 11,166 10,787 9,311 8,700 10,357 10,774 12,448
Misc. Accident 28,944 14,495 18,390 40,869 25,741 22,064 28,472 31,549
Total Income 94,705 92,017 95,953 125,246 113,320 117,764 136,678 162,518
Source: Insurance Regulatory Authority of Uganda
Table 4.6 G: Non-Life Insurance Net Premium Income 2012 – 2019 (Million shillings)
Class of Business 2012 2013 2014 2015 2016 2017 2018 2019
Fire 13,432 12,657 15,463 16,835 18,469 19,536 20,971 22,400
Marine/Aviation 6,959 7,737 7,962 10,400 10,771 11,948 12,227 11,260
Motor 80,932 84,046 91,531 103,230 108,512 116,206 127,963 134,902
Misc. Accident 22,778 16,621 14,005 52,977 22,585 23,909 33,859 8,973
Total Income 124,101 121,061 128,961 183,442 160,337 171,600 195,020 177,535
Source: Insurance Regulatory Authority of Uganda
Table 4.6 H: Net incurred Claims, by Class: Non-Life 2012 –2019 (Million shillings)
Class of business 2012 2013 2014 2015 2016 2017 2018 2019
Fire 3,845 1,270 1,751 5,004 3,075 5,404 7,064 13,382
Marine/Aviation 2,214 2,901 1,006 3,260 3,227 3,954 2,373 2,484
Motor 30,419 33,772 34,703 44,684 41,249 39,763 45,995 47,459
Misc. Accidents 13,376 7,453 5,302 35,119 9,424 11,893 2,045 7,041
Total Income 49,854 45,396 42,762 88,067 56,975 61,015 57,477 70,366
Source: Insurance Regulatory Authority of Uganda
Related Documents