Slide 1 UDI: At the Intersection of Cost, Quality, and Outcomes 4/19/2016 Karen Conway, GHX Michael Schiller, AHRMM

Welcome message from author
This document is posted to help you gain knowledge. Please leave a comment to let me know what you think about it! Share it to your friends and learn new things together.
Transcript

Slide 1
UDI: At the Intersection of Cost, Quality, and Outcomes
4/19/2016
Karen Conway, GHXMichael Schiller, AHRMM

Slide 2
Getting to Value Requires Systems Thinking

Slide 3
Medical Product Lifecycle
Design
ManufacturePackage/Label
Market
Sell
Distribute
Source
PurchaseReceiveStoreUse
ID and TrackReal World Evidence
Approve
Pay/Charge/Reimburse

Slide 4
UDI for Manufacturers
• Assign• Label• Publish Data to
Global UDI Database (GUDID)
UDI for Providers (Customers
• Capture UDI• Store UDI in List of
Patient’s Implantable Devices in EHRs
• Parse UDI• Pull Data from GUDID• Share UDI as part of
Common Clinical Data Set
Regulatory Requirements

Slide 5
Compliance with the Customer in Mind

Slide 6
Characterized by comprehension of the parts of something as intimately interconnected and explicable only by reference to the whole• Cost, Quality and Outcomes (CQO) refers to a more holistic view
between cost, quality and outcomes as opposed to viewing each independently.
• “This is not about just being able to identify devices. We (FDA) are talking about a holistic approach to integrating medical device information throughout the entire healthcare system. UDI will be a fundamental piece of everything we do going forward”
U.S FDA Center for Devices and Radiological Health
Holistic

Slide 7
ONC and CMS released their final regulations regarding capture and exchange of the UDI in health IT systems.
The ONC ruling:• Includes the UDI within the Common Clinical Data Set (CCDS), which is a summary of
key information on the patient such as medication allergies or immunizations• Health IT systems must be able to parse the UDI data as well as link to the UDI
database, the GUDID
The CMS ruling:• Providers are expected to include all of the CCDS elements that are available, including
the UDI, when they exchange summary of care documents
Meaningful Use 3

Slide 8
CQO: conceptIn 2013, AHRMM launched the Cost, Quality, and Outcomes Movement, a new way of approaching supply chain.
Under the CQO movement, the supply chain can no longer focus exclusively on price, but rather the combination of product cost, the quality of care delivered, and the reimbursement outcomes to support healthcare’s new value-based models.

Slide 9
CQO: definitionThe CQO Movement looks at the intersection of, and the relationship between• Cost: all costs associated with delivering patient care and supporting the care
environment • Quality: patient-centered care aimed at achieving the best possible clinical outcomes • Outcomes: financial reimbursement driven by outstanding clinician care at the
appropriate cost
It is important that these relationships be considered together rather than in separate silos

Slide 10
CQO: collaborationCQO requires supply chain leaders to expand upon, and build new and different types of relationships across the healthcare spectrum including:• Suppliers & Manufacturers• Physician leadership• Clinicians• C-Suite• Distributors• GPOs• Finance
Slide 11
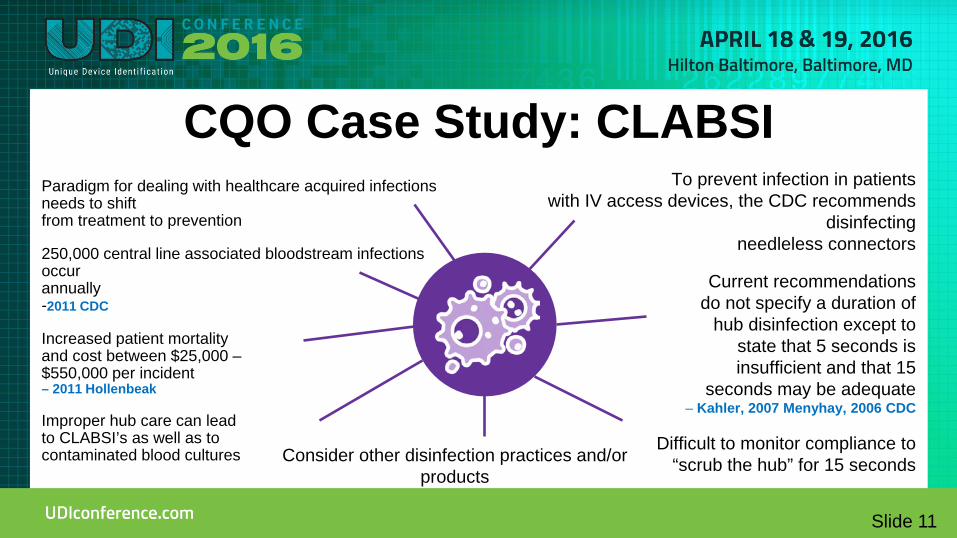
CQO Case Study: CLABSIParadigm for dealing with healthcare acquired infections needs to shift from treatment to prevention
250,000 central line associated bloodstream infections occur annually -2011 CDC
Increased patient mortality and cost between $25,000 –$550,000 per incident – 2011 Hollenbeak
Improper hub care can lead to CLABSI’s as well as to contaminated blood cultures
To prevent infection in patients with IV access devices, the CDC recommends
disinfecting needleless connectors
Current recommendations do not specify a duration of
hub disinfection except to state that 5 seconds is insufficient and that 15
seconds may be adequate – Kahler, 2007 Menyhay, 2006 CDC
Difficult to monitor compliance to “scrub the hub” for 15 secondsConsider other disinfection practices and/or
products

Slide 12
Estimated Cost vs. Outcome = Quality of Patient CareLocation A
1.5 cases per month$ 2,175 / month$26,100 / year
Location B
1 case per month$ 1,450 / month$17,400 / year
TOTAL = $43,500 / year
COST of 1 CLABSI = $45,814

Slide 13
CLABSI Results
Improved patient quality, $94,000 in savingsFacility Rate = 0.93 Facility Rate = 0.63
• 5 Femoral• 2 PICC• 1 Right IJ• 1 Mediport
2013Central line infections
www.cdc.gov/nhsn(National Healthcare Safety Network)
NHSNBenchmark
2014• 4 Femoral• 1 PICC• 1 Subclavian
Hickman
Central line infections
www.cdc.gov/nhsn(National Healthcare Safety Network)
NHSNBenchmark

Slide 14
Cost
OutcomesQualityUDI
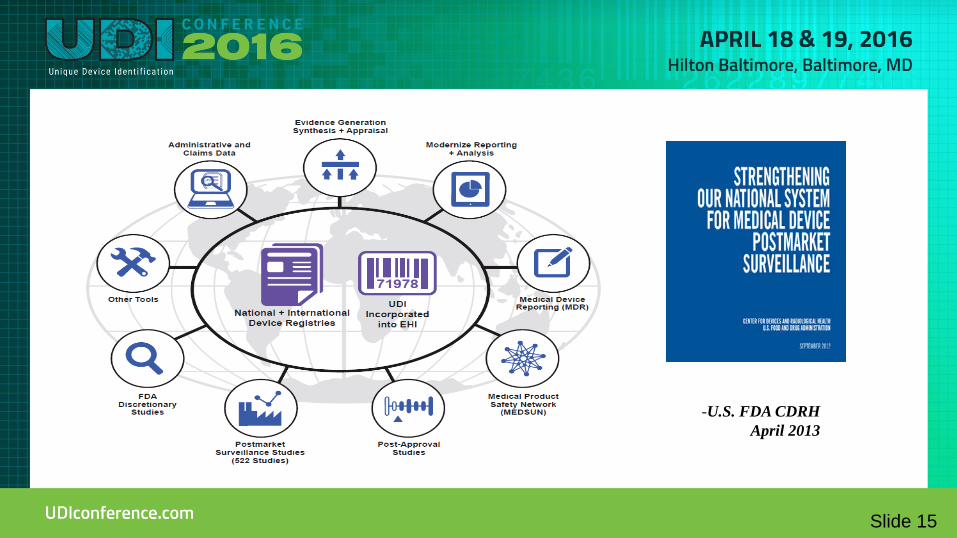
Slide 15
-U.S. FDA CDRH April 2013

Slide 16
Supply Chain
Point of Use
Capture Contracting
Value Analysis
Inventory Management RecallsStandardization
and Utilization
ERP/EHR
Post Market Analysis/CER
Value BasedReimbursement
Demand Forecasting

Slide 17
Business Name Item Number Type Item Number
BD Mfg Catalog Number 329461
BD GTIN 00382903294619
Cardinal Health PV Order Number BF329461
Owens & Minor PV Order Number 0722329461
American Medical Depot Vendor Catalog Number 777127217
Government Sci Source Vendor Catalog Number FSC1482679CS
Alliance Joint Venture Vendor Catalog Number 888021932
Thomas Scientific Vendor Catalog Number 8938M25
VWR International Vendor Catalog Number BD329461
Only UDI compliant code
on list

Slide 18
0 0085412 00000 8
5 0085412 00000 6
Case of 10 Each
2 0085412 00000 4
6 0085412 00000 9
1 EachPack of 1 Each Case of 10 Packs of 1 Each
Each level of packaging requires a unique device identifier

Slide 19
Item Master: the single source of truth“Single Source of Truth (SSOT) refers to the practice of structuring information models and associated schemata such that every data element is stored exactly once.”
-Wikipedia
Write Once, Read Many

Slide 20
Bundled Payments• Bundled payment asks providers to assume financial risk for the cost of services for a
particular treatment or condition, as well as costs associated with preventable complications.
• Different Contracts similar need to measure performance like med surg contracts.
BUNDLED PAYMENTReimbursement to health care providers on the basis of expected costs for clinically-defined episodes.
Epi
sode
Tim
ing
30 days
Diagnostic
2-5 days
Event
90 days
Follow-Up Care
– Home Health– Physicians
– Rehab– Managed Services

Slide 21
Comprehensive Care for Joint Replacement (CJR)
• 2014 figures:
• CMS has implemented the CJR model in 67 geographic areas, defined by metropolitan statistical areas (MSAs) which are counties with a core urban area that has a population of at least 50,000.
• Program begins April 1, 2016
Hip and Knee replacements are the most common inpatient surgery for Medicare beneficiaries
> 400,000 procedures> $7B for hospitalization alone

Slide 22
Clinical variations = CostsR
educ
ed C
osts
Impr
oved
Out
com
es
• Improved quality of care• Improved patient satisfaction• Decreased variability
• Reduce use of costly ‘no-value’ supplies
• Reduce length of stay• Decrease resource consumption
Unchecked, clinical variations can become a major cost for hospitals and healthcare organizations, driving up spend without offering substantial benefits
Source: Vie Healthcare Consulting & Analytics

Slide 23
SurgeonMSDRG 470 Total Knee
Total Knee Volume
Total SpendNot to Exceed Group Average
25 PercentileBest in Class
$8,070STRANG JR, ROBERT T $8,070 1 $8,070 $8,070 $8,070 $8,070WHITMAN, THOMAS L $8,273 89 $736,311 $736,311 $736,311 718,262 STEWART, GREGORY L $8,879 1 $8,879 $8,879 $8,879 8,070 JENKINS, TIMOTHY D $9,167 50 $458,368 $458,368 $458,368 403,518 AIKEN, MARC A $9,244 4 $36,976 $36,976 $36,976 32,281 HOMMEL, GABRIEL J $9,802 13 $127,431 $127,431 $127,431 104,915 TAGERT, BERT E $9,936 63 $625,989 $625,989 $625,989 508,433 TESTERMAN, JOHN R $10,183 27 $274,940 272,608 $268,281 217,900 MINTER, JON E $10,227 105 $1,073,809 1,060,142 $1,043,314 847,388
MILLER, BRUCE M $10,374 121 $1,255,306 1,221,687 $1,202,295 976,514
KREIN, STEVEN W $10,379 18 $186,827 181,739 $178,854 145,266
PARSLEY, BILLY K $10,404 1 $10,404 10,097 $9,936 8,070 FLEENOR, MICHAEL R $10,455 9 $94,099 90,869 $89,427 72,633 JEANSONNE, GREGORY E $10,468 5 $52,340 50,483 $49,682 40,352 MULLINS, DANNY A $10,676 57 $608,549 575,505 $566,371 460,011 FRANCE, JEFFREY J $10,747 33 $354,646 333,187 $327,899 266,322 PARK, JASON C $11,019 93 $1,024,785 938,983 $924,078 750,543 PHILLIPS, JOHN H $11,263 11 $123,888 111,062 $109,300 88,774 RIGGINS, PATRICK J $11,706 10 $117,056 100,966 $99,363 80,704
711 $7,178,674 $6,949,352 $6,870,824 $5,738,026$10,097 $9,774 $9,664 $8,070
Potential Savings =====> $229,321 $307,849 $1,440,648
SURGEON 1SURGEON 2SURGEON 3SURGEON 4SURGEON 5SURGEON 6SURGEON 7SURGEON 8SURGEON 9SURGEON 10SURGEON 11SURGEON 12SURGEON 13SURGEON 14SURGEON 15SURGEON 16SURGEON 17SURGEON 18SURGEON 19

Slide 24
Mea
sure
Valu
e
GOAL Mea
sure
Valu
e
GOAL Mea
sure
Valu
e
GOAL Mea
sure
Valu
e
GOAL Mea
sure
Valu
e
GOAL Mea
sure
Valu
e
GOAL Mea
sure
Valu
e
GOAL Mea
sure
Valu
e
GOAL
470 Major joint replacement or reattachment of lower extremity w/o MCC $3,860
81.51 TOTAL HIP REPLACEMENT 13 $6,349 $5,907 $8,663 $4,405 3.2 0.00 0.00 5.92
81.52 PARTIAL HIP REPLACEMENT 2 $4,399 $3,055 $6,299 $5,722 3.3 0.00 0.00 31.94
81.54 TOTAL KNEE REPLACEMENT 27 $5,131 $6,626 $7,783 $6,823 3.0 0.00 0.00 0.00
Physician Attending Physician of Record SC Goa1 Std Deviation from Lowest CostTotal SC Actual MSCMTotal Cost HPMMargin Total or Exp Payment (greater) - SC + Direct Variable
GOAL MET =
GOAL UNMET =
Risk-Adjusted Mortality
Index (RAMI)
LEGEND
Total Volume
Supply Cost per patient
Total Cost per patient
Margin per patient
Risk-Adjusted Complications
Index (RACI)
Risk-Adjusted Readmission
Index (RARI)
Clinically Adjusted LOS Per
Case
MS-DRG MSDRG Name
Green
Red
Green
Red
Mea
sure
Valu
eGOAL M
easu
re V
alue
GOAL Mea
sure
Valu
e
GOAL Mea
sure
Valu
e
GOAL Mea
sure
Valu
e
GOAL Mea
sure
Valu
e
GOAL Mea
sure
Valu
e
GOAL Mea
sure
Valu
e
GOAL
470 Major joint replacement or reattachment of lower extremity w/o MCC $3,860
81.51 TOTAL HIP REPLACEMENT 42 $5,257 $6,912 3.1 0.00 0.67 0.00
81.52 PARTIAL HIP REPLACEMENT 8 $2,124 $4,189 5.2 0.00 0.00 0.00
81.54 TOTAL KNEE REPLACEMENT 89 $5,397 $7,412 3.1 0.00 0.30 0.42
Physician Attending Physician of Record SC Goa1 Std Deviation from Lowest CostTotal SC Actual MSCMTotal Cost HPMMargin Total or Exp Payment (greater) - SC + Direct Variable
GOAL MET =
GOAL UNMET =
Risk-Adjusted Mortality
Index (RAMI)
LEGEND
Total Volume
Supply Cost per patient
Total Cost per patient
Margin per patient
Risk-Adjusted Complications
Index (RACI)
Risk-Adjusted Readmission
Index (RARI)
Clinically Adjusted LOS Per
Case
MS-DRG MSDRG Name
Green
Red
Green
Red

Slide 25
UDI Demonstration Project - Information Flow

Slide 26
UDI Research Database (UDIR) – Data Model
• Research Data-Mart designed to integrate and rationalize multiple subject-
areas

Slide 27
Cost and ValueTotal Hip and Total Knee Revisions:• 2010 aggregate costs close to $18B• TKA revisions are expected to double by 2015• THA revisions are expected to double by 2026
Clinical and Cost Implications:• Increased procedure time• Need to replace more components• Greater surgical complexity• Higher health care costs• Increased blood and bone loss• Longer recovery times• 41 hours, annually, of surgeon and staff time
Source: The Journal of Arthroplasty, Revision Total Hip and Knee Arthroplasty Implant Identification: Implications for Use of Unique Device Identification 2012 AAHKS Member Survey Results, 2014

Slide 28
Cost and ValueAnnual estimated global costs:• Recall handling costs of $2B - $4B
– Typical medical device recall can take up to about 2 days of effort within a hospital setting• Inventory
– Inventory estimates $516B– Financing costs estimated at $33B– Inventory management costs estimated at $53B - $65B
• Obsolescence costs of $33B• Data cleansing and order process error resolution estimated at $2B - $5B
Annual estimated global value:• Recall handling costs savings estimated at $1B• Inventory management cost reduction estimated at $6B - $8B• Reduced product obsolescence $19B - $27B• Efficient transactions accuracy savings estimated at $1 - $2B
Source: McKinsey & Co., Strength in unity: The promise of global standards in healthcare, October 2012

Slide 29
All great changes are preceded by chaos.— DEEPAK CHOPRA
UDI Adoption
29

Related Documents