UCLA INSTITUTE OF THE ENVIRONMENT RC 2006

Welcome message from author
This document is posted to help you gain knowledge. Please leave a comment to let me know what you think about it! Share it to your friends and learn new things together.
Transcript

U C L A I N S T I T U T E O F T H E E N V I R O N M E N T
R C 2 0 0 6
67532 UCLAR1.qxp 10/17/06 11:21 AM Page C2
Institute of the EnvironmentUniversity of California, Los Angeles619 Charles E. Young Dr. East La Kretz Hall, Suite 300Los Angeles, CA 90095-1496Phone: 310-825-5008Fax: 310-825-9663Email: [email protected] site: http://www.ioe.ucla.edu
This Report Card is printed on 100 percent post-consumer waste paper that is manufactured with windpower.
Natural resource savings from using recycled post-consumer waste fiber in lieu of virgin fiber for this publication:43 trees preserved for the future124 lbs. waterborne waste not created18,268 gallons wastewater flow saved2021 lbs. solid waste not generated3980 lbs. net greenhouse gases prevented30,464,000 BTUs energy not consumed
Savings from the use of emission-freewind-generated electricity:2068 lbs air emissions not generated4920 cubic feet natural gas unused(savings are equivalent to planting 140 trees or not driving 2240 miles)
67532 UCLA RC06.qxp 10/6/06 1:37 PM Page C3

2 From the Director
4 Film and Television
Urban Parks 12
20 Atmospheric Deposition
Innovations in Environmental Monitoring 30
38 About the UCLA Institute of the Environment
RC 2006
67532 UCLA RC06.qxp 10/6/06 1:38 PM Page 1
UCLA INSTITUTE OF THE ENVIRONMENT2
Southern California is one of the world’s
most urbanized areas, and also one of its
most biologically rich and diverse. The
region is in many respects a tangle of
contradictions. It boasts some of the
world’s best-known beaches, and some of
the most challenging problems with
urban runoff. The motion picture indus-
try settled here to enjoy the year-round
good weather and bright skies for film-
ing, then beamed a noir vision of envi-
ronmental degradation and civic corrup-
tion around the globe. Having created
and identified smog, the Los Angeles
region designs and purchases more
advanced-technology and alternate-
fueled vehicles than any other metropol-
itan area. Given these contrasts, it should
be no surprise that UCLA, the biggest
university in the state housed on the
smallest campus in the giant UC system,
has pioneered in creating cross-cutting
and interactive models for research,
teaching and public service dedicated to
solving the most challenging environ-
mental problems facing humans and our
planet.
Now almost a decade old, the
Institute of the Environment has inspired
and collaborated with innovators across
the globe who are grappling with some of
the same fundamental problems. The
more we learn about the environment,
the more we realize no field of knowledge
can be overlooked in an effort to under-
stand the dynamic relationship between
people and the natural world. Art, poli-
tics, business and history must find ways
to interact with science, medicine and
technology—and more—as each of these
disciplines becomes more sophisticated
and specialized.
Starting at the most basic unit of
undergraduate education, this year the
Institute launches the first Environ-
mental Science degree to be offered at
UCLA. This new degree is the result of
an unprecedented collaboration between
17 departments, including courses
offered by the School of Public Health
and the School of Public Affairs. It
builds on the recognition that environ-
mental science is inherently multi-disci-
plinary: the Institute provides a year-long
seminar involving community experts
and visiting scholars as well as faculty
from around the campus. Students will
also learn some of the practical applica-
tions of environmental science through a
capstone course that will engage them in
real-world environmental problems.
As one of the premier research uni-
versities in the world, UCLA continues to
foster collaborative environmental
research projects involving faculty in the
social sciences and policy studies, work-
ing with colleagues in physical sciences,
engineering and life sciences to answer
questions of pressing concern. The pub-
Mary D. Nichols, J.D.Director
UCLA Institute of the Environment
67532 UCLA RC06.qxp 10/6/06 1:39 PM Page 2
SOUTHERN CALIFORNIA ENVIRONMENTAL REPORT CARD 2006 3
lication you now have in your hand—or
on your computer screen—illustrates a
small sample of the kinds of research
underway.
The Southern California
Environmental Report Card is one exam-
ple of an innovative means of engaging
the public and the university in an
informed discussion. The 2006 Report
Card is the ninth in a series of annual
updates on the state of the region’s envi-
ronment. Both the UCLA Institute of the
Environment and the topics we study
have evolved rapidly over a relatively
short time, but the Report Card retains
its original form and function: a collec-
tion of brief essays on important environ-
mental topics, presenting the
researchers’ findings in a context meant
to be useful to both policy makers and
the public. The faculty authors do their
own grading and the grades are pub-
lished as a familiar way of giving feed-
back on how various agencies and insti-
tutions are doing in maintaining and
improving our natural environment.
Editors Ann Carlson, Professor of
Law, and Arthur Winer, Professor of
Environmental Health Sciences in the
School of Public Health, have selected
four articles that demonstrate how our
understanding of the environment and
the ways in which we study it have
changed. For the first time, a single
industry—or in this case what Hollywood
calls The Industry—is put under the
microscope and examined for its environ-
mental performance. Professors Charles
Corbett and Richard Turco took on this
intriguing assignment at the request of
the California Integrated Waste
Management Board, and their work has
shown how complex and important it is to
analyze our environment by economic
sector.
This Report Card next looks at parks
as an indicator of the health of a city and
its people. We tend to think of Nature as
something that exists on the outskirts of
the urban area, along the coast, near the
ocean, or in the mountains and deserts
that surround us. But as recent surveys of
the Los Angeles River show, small bits of
open land can harbor biodiversity in the
most densely developed areas. For
humans, especially children, lack of
access to open land is increasingly
linked to the rise in obesity and diseases
related to a sedentary lifestyle, including
diabetes and heart ailments. Professor
Anastasia Loukaitou-Sideris reports
increased focus on urban parks as inte-
gral parts of a healthy environment.
The third article offers a fresh per-
spective on issues the Report Card has
addressed before. Air pollution and
water pollution are both long-standing
and serious problems that continue to
undermine both human and ecosystem
well being. Professor Keith Stolzenbach
shows the role of gases and particles in
the air as direct and indirect sources of
water pollution within the Los Angeles
basin. A more sophisticated understand-
ing of the relationships between air and
water in turn can lead to more effective
efforts to control the sources.
In their collaborative essay on envi-
ronmental monitoring, Professors
Rundel, Estrin and Kaiser point out that
rapid advances in sophisticated technol-
ogy are helping to frame new scientific
questions that in turn allow us to under-
stand how natural systems respond to
human activity, such as the buildup of
UCLA has pioneered in creating cross-cutting and interactive models for
research, teaching and public service dedicated to solving the most
challenging environmental problems facing humans and our planet.
continued on page 39
67532 UCLA RC06.qxp 10/6/06 1:39 PM Page 3

GRADES A to C
67532 UCLA RC06.qxp 10/6/06 1:39 PM Page 4

by Charles J. Corbett, Ph.D., Associate Professor of Operations and Environmental Management
and Richard P. Turco, Ph.D., Professor, Department of Atmospheric and Oceanic Sciences
SOUTHERN CALIFORNIA ENVIRONMENTAL REPORT CARD 2006 5
The motion picture (or film) industry
holds a powerful and enduring sway over
the imagination of people across the
globe through images served up on the
“big” screen. However, in watching
film—or television—it is easy to over-
look the sprawling industry that lies
behind the scenes, bringing entertain-
ment to life. Even less obvious are the
environmental impacts of filmmaking,
which involve energy consumption,
waste generation, air pollution, green-
house gas emissions and physical dis-
ruptions on location.
This article assesses the potential
environmental effects associated with
activities in the film and television
industry (FTI) from several perspectives,
keeping in mind that only limited data
are available for such an assessment.
Indeed, our analysis relies heavily on
information collected during a recent
two-year study carried out by UCLA’s
Institute of the Environment under con-
tract to the California Integrated Waste
Management Board (CIWMB). The
research is based in part on interviews
with a cross section of individuals, but
with limited access to proprietary infor-
mation. Hence, our findings are more
illustrative than comprehensive regard-
ing current environmental practices
within the FTI.
In this overview, we first provide
estimates of chemical emissions in spe-
cific categories (air pollutants and green-
house gases) associated with FTI activi-
ties. Next, we highlight examples of ben-
eficial practices adopted by the industry
to manage environmental impacts. We
then review the industry’s major trade
publications to gauge the level of atten-
tion being paid to environmental issues.
Finally, we offer a tentative grading of the
FTI that reflects the achievements, and
remaining obstacles, in reducing the
environmental impacts of this complex
enterprise.
ASSESSING ENVIRONMENTALIMPACTS OF THE FTI
To obtain a more fundamental under-
standing of the potential overall environ-
mental impacts of the film and television
industry, we employed a top-down
approach based on the Economic Input-
Output Life Cycle Assessment (EIOLCA)
methodology.1 We explain the complex
assessment below but our bottom line
conclusion is that the film and television
industry is responsible for a significant
amount of both air pollution and green-
house gas emissions.
Under the EIOLCA approach, an
economic input-output analysis is first
performed to determine the economic
activity—both direct and indirect—in
all sectors of the U.S. economy associat-
ed with $1 of final output value in the
film and television industry. The second
step in the analysis yields the levels of
pollutant emissions associated with
each sector that supplies (directly or
indirectly) to the FTI. It is these emis-
sions, in turn, that are employed as a
quantitative measure of environmental
impact, even though actual outcomes—
such as air quality or health conse-
quences—are not explicitly derived.
The sector-specific emissions reflect the
pollution created by each sector activi-
ty, as explained below. These emissions
are defined on a per-dollar basis of
activity in each sector. Hence, the over-
all environmental impacts of the film
and television industry—measured as
67532 UCLA RC06.qxp 10/6/06 1:39 PM Page 5

UCLA INSTITUTE OF THE ENVIRONMENT6
total pollutant emissions—can be
obtained by multiplying the overall out-
put value of the FTI times each sector’s
activity caused by $1 of FTI output,
times the appropriate sector emissions
coefficient(s), and then summing over
all affected sectors.2
The EIOLCA model divides the U.S.
economy into 485 sectors, and deter-
mines economic links between each of
these sectors. Firms in the film and tele-
vision industry purchase goods and serv-
ices from other firms within the industry,
and from firms in the remaining 484 sec-
tors. Each of these supplier firms, in
turn, purchases goods and services from
companies in other sectors, and so on.
Thus, the input-output analysis yields
the economic activity generated in all
sectors directly or indirectly associated
with the FTI; e.g., utilities, transporta-
tion, advertising, real estate, etc.
For each sector in the EIOLCA
model, emission factors, or coefficients,
are specified for key primary pollutants
generated by the activities within that
sector. Primary pollutants are those emit-
ted directly into the atmosphere from
identified sources, although there may be
secondary sources as well that are not
counted (which is most relevant to “par-
ticulate matter,” or fine airborne parti-
cles). In the present analysis, we
highlight the results for two specific cat-
egories of pollutants: “criteria” air pollu-
tants and greenhouse gases (GHGs). The
conventional primary criteria air pollu-
tants include nitrogen dioxide (NO2),
carbon monoxide (CO), sulfur dioxide
(SO2) and particulate matter (PM2.5 and
PM10). The GHGs consist mainly of car-
bon dioxide (CO2), methane (CH4) and
nitrous oxide (N2O). Using the EIOLCA
methodology, releases can be determined
in aggregate for all of the direct and indi-
rect activities connected with FTI output.
The total output is given on an annual
basis in metric tons. Aggregate primary
emissions provide a crude measure of the
environmental impacts (on air quality or
health), and offer a first-order metric for
carrying out relative comparisons with
other economic and industrial sectors. In
the case of GHGs, which are related to
global climate change, the total emis-
sions have been converted into equiva-
lent quantities of carbon dioxide (metric
tons per year) that would yield the same
global warming potential as the actual
GHG emission mix. For an analysis of
California’s contribution to greenhouse
gas emissions more generally, refer to the
article by R. Turco in RC 2001.
It should be noted that the emissions
coefficients for each sector in the EIOL-
CA model are derived using a range of
national databases, including the EPA’s
Toxics Release Inventory and National
Emissions Inventory Database. Even so,
emissions remain uncertain and variable
and the derived aggregate values pre-
sented here should be taken as rough
estimates. In focusing on the FTI, we use
output data from the 1997 Economic
Census for the purpose of estimating FTI
activity in the Los Angeles metropolitan
area (defined as Los Angeles, Orange,
Riverside, San Bernardino and Ventura
Counties), the entire state of California,
and the United States. Five other indus-
tries were also selected for comparison:
aerospace, petroleum refining, apparel,
hotels, and semiconductor manufactur-
ing. Transportation (in its various forms),
though not included as a separate sector,
is included as an input sector to the six
sectors that our analysis focuses on.
Within metro Los Angeles, the FTI makes a larger contribution to
conventional air pollution than four of the five other sectors we studied.
67532 UCLA RC06.qxp 10/6/06 1:39 PM Page 6

SOUTHERN CALIFORNIA ENVIRONMENTAL REPORT CARD 2006 7
Air quality “criteria” pollutantsBased on the methodology described
above, we determined the total emissions
of criteria pollutants that contribute to air
pollution, as shown in Figure 1. Criteria
air pollutants are emitted from a wide
range of sources. In general, emissions of
these pollutants are strictly controlled by
air quality regulations. Nevertheless,
total emissions amount to millions of
metric tons per year. Each panel in Fig. 1
contrasts the total annual output from the
FTI to emissions from five other bench-
mark industrial sectors. The first panel
(far left) shows U.S.-wide emissions per
$1 million of final output in each of the
sectors analyzed. The remaining three
panels give total annual emissions asso-
ciated with the total economic activity of
each of the six sectors within the specif-
ic geographic areas indicated: the Los
Angeles metropolitan area (middle left),
California (middle right), and the U.S.
(far right). Note that the data in Fig. 1
(and those that follow) include all of the
emissions that occur nationwide as a
result of economic activity, say, in the
Los Angeles area or California. For
example, firms in California use power
that may be generated and therefore
cause emissions out-of-state. Also note
that the Census Bureau does not provide
sufficient information to assess the
impacts of petroleum refining in the Los
Angeles region (hence the blank entry).
The results in Fig. 1 indicate that,
wherever data are available, petroleum
refining is the largest source of criteria
pollutants among the sectors studied.
Nonetheless, the FTI in California
accounts for an estimated 140,000 met-
ric tons of criteria pollutants annually.
Petroleum refining, by comparison,
releases more than 550,000 tons.
Emissions for the other four benchmark
sectors amount to about 85,000 metric
tons for hotels, 120,000 tons for the
apparel industry, 155,000 tons related to
the aerospace sector, and 210,000 tons
from semiconductor manufacturing.
The film and television industry con-
tributes to criteria emissions both direct-
ly and indirectly. For example, electricity
consumption generates pollutant emis-
sions at remote power stations. On the
other hand, the use of vehicles for local
transportation results in direct emissions
Figure 1. Criteria pollutant emissions (metric tons per year) for selected sectors within the geographical areas indicated.
Criteria pollutantsper $1M output(metric tons)
Semico
nducto
rHote
ls
Apparel
Petrole
um Re
fining
Aerospa
ce
Film an
d Tele
vision
Indus
try0
5
10
15
20
30
25
35
Criteria pollutantsassociated with LA metro output
(metric tons)
Semico
nducto
rHote
ls
Apparel
Petrole
um Re
fining
Aerospa
ce
Film an
d Tele
vision
Indus
try0
20,000
40,000
UNK
NOW
N
60,000
80,000
120,000
100,000
140,000
Criteria pollutantsassociated with US output
(metric tons)
Semico
nducto
r Hote
ls
Apparel
Petrole
um Re
fining
Aerospa
ce
Film an
d Tele
vision
Indus
try
0
1,000,000
2,000,000
3,000,000
4,000,000
5,000,000
6,000,000
Criteria pollutantsassociated with California output
(metric tons)
Semico
nducto
r Hote
ls
Apparel
Petrole
um Re
fining
Aerospa
ce
Film an
d Tele
vision
Indus
try
0
100,000
200,000
300,000
500,000
400,000
600,000

UCLA INSTITUTE OF THE ENVIRONMENT8
in the area of operations. Within metro
Los Angeles, the FTI makes a larger con-
tribution to conventional air pollution
than four of the other sectors, although
some of the differences are marginal
given the accuracy attainable with the
EIOLCA approach (petroleum refining is
not included in the Los Angeles analysis,
but would be a dominant source of crite-
ria pollutants; similarly, transportation
per se is not quantified as a “source” sec-
tor in this analysis).
Greenhouse gas emissions Figure 2
gives the results for greenhouse gas
emissions from the same sector analysis
as in Figure 1. The GHG burden is relat-
ed mainly to fuel consumption; the total
quantities shown are CO2 equivalents.
The quantitative results are very similar
to those for the criteria pollutants, and
the analysis leads to similar conclusions.
The greenhouse gas emissions associated
with the film and television industry’s
activity in California account for roughly
8,400,000 metric tons of CO2 equiva-
lents. This compares to about 9,000,000
metric tons for the hotel sector,
9,000,000 metric tons for apparel,
11,700,000 for aerospace, 16,200,000
for semiconductor manufacturing, and
33,400,000 for petroleum refining.
While the film and television industry in
California is the smallest of the six sec-
tors studied, it may be surprising that the
GHG emissions are even of the same
order of magnitude as in the other sec-
tors. This may be due to the heavy
reliance of the FTI on transportation and
energy consumption in its normal opera-
tions, combined with the sheer size of the
industry in Los Angeles and in
California. With this rough assessment of
the total impacts of the FTI, we now turn
to some examples of best environmental
practices we encountered.
ENVIRONMENTAL BESTPRACTICES: INDUSTRYEXAMPLES In order to begin to analyze the extent to
which the industry is attempting to mini-
mize its environmental impacts, we inter-
viewed 43 individuals from a range of
areas within the film and television
industry. We noted that many useful ini-
tiatives are already in place: some stu-
Figure 2. Greenhouse gas emissions (metric tons, CO2 equivalent, annually) for selected sectors within the geographical areas indicated.
GHG emissions per $1M output(metric tons CO2 equivalents)
Semico
nducto
rHote
ls
Apparel
Petrole
um Re
fining
Aerospa
ce
Film an
d Tele
vision
Indus
try0
800
600
400
200
1000
1200
1400
1800
1600
2000
GHG associated withLA metro output
(metric tons CO2 equivalents)
Semico
nducto
rHote
ls
Apparel
Petrole
um Re
fining
Aerospa
ce
Film an
d Tele
vision
Indus
try0
3,000,000
2,000,000
1,000,000
4,000,000
5,000,000
6,000,000
8,000,000
7,000,000
9,000,000
UNK
NOW
N
GHG associated withCalifornia output
(metric tons CO2 equivalents)
Semico
nducto
rHote
ls
Apparel
Petrole
um Re
fining
Aerospa
ce
Film an
d Tele
vision
Indus
try0
10,000,000
5,000,000
15,000,000
20,000,000
25,000,000
35,000,000
30,000,000
40,000,000
GHG associated with US output (metric tons CO2 equivalents)
Semico
nducto
r Hote
ls
Apparel
Petrole
um Re
fining
Aerospa
ce
Film an
d Tele
vision
Indus
try
0
50,000,000
100,000,000
150,000,000
250,000,000
200,000,000
300,000,000

SOUTHERN CALIFORNIA ENVIRONMENTAL REPORT CARD 2006 9
dios have advanced recycling programs
in offices and soundstages; several pro-
grams exist to recycle set materials on-
site, or to donate them to other organiza-
tions; and energy efficiency and green
building practices are being more widely
adopted. Nevertheless, our overall
impression is that these practices are the
exception and not the rule, and that more
could be done within the industry to fos-
ter environmentally friendly approaches.
A major challenge—one that differ-
entiates the film and television industry
from many others—is the degree to
which work is controlled by short-lived
production companies rather than by
long-lived firms in stable supply chains,
making it difficult to institutionalize best
practices. Moreover, especially in film-
making, the currently prevailing tenden-
cy within the industry is to operate in a
“stop-and-go” mode. While very little
happens for lengthy periods during a pro-
ject’s early stages, activity switches into
a fast mode once key agreements on
finances or talent are arranged. Several
of those interviewed indicated that more
careful planning of the overall project
and of actual shooting could ultimately
provide cognizant individuals more time
to consider and implement environmen-
tal mitigation policies. Despite these
obstacles, we found a number of innova-
tive environmental practices, two of
which we highlight below.
Carbon-neutral production at TheDay After Tomorrow The Day After
Tomorrow depicts an extreme outcome of
abrupt climate and weather changes
associated with global warming.
Inspired by his personal commitment to
environmental conservation, the film’s
director and co-writer, Roland
Emmerich, sought to ensure that the pro-
duction of The Day After Tomorrow
would not contribute to global warming.
During the production of any motion pic-
ture, CO2 is directly generated by vehi-
cles, generators, trailers, and various
machinery. Future Forests is one of sev-
eral organizations that contracts to offset
CO2 emissions by planting trees or
investing in climate-friendly technology.
Future Forests estimated the carbon
emissions and corresponding forest
planting (or climate-friendly technology
investment) necessary to offset the
impact of those emissions. Future
Forests determined that this film would
generate approximately 10,000 tons of
CO2. Several industry sources confirmed
that the cost of the corresponding carbon
offsets was about $200,000, which was
paid by Emmerich and several of his
associates.
An encouraging development is that
another recent release, Syriana, was also
made carbon neutral. For Syriana,
Warner Brothers and Participant
Productions together paid to offset
the film’s CO2 emissions through
NativeEnergy, an organization with simi-
lar objectives although slightly different
approaches than Future Forests.
The ReUse People salvaging sets fromThe Matrix 2 and 3 The ReUse People
(TRP) is a nonprofit organization that
deconstructs buildings. The two sequels
to The Matrix, known as The Matrix
Reloaded or The Matrix 2, and The
Matrix Revolutions or The Matrix 3, were
both released in 2003 by Warner
Brothers. Parts of both films were shot at
three huge sets and on the streets of
Oakland and Alameda Point. The “cave”
Our overall impression is that more could be done within
the industry to foster environmentally friendly approaches.
67532 UCLA RC06.qxp 10/6/06 1:39 PM Page 9

Professor Corbett’s research and teach-ing focus on environmental issues inbusiness, and revolve around examin-ing links between good business prac-tices and environmental protection.This has included studying the effectsand global diffusion of ISO 9000 andISO 14000 certification; and, mostrecently, the environmental footprintof a project-based industry such as thefilm and television industry.
Dr. Corbett has published in hisfield’s top academic and business journals in several countries. He is a member of the editorial board ofManufacturing and Service OperationsManagement, an associate editor ofOperations Research, past associateeditor of Management Science, andguest editor of three special issues of Production and Operations Manage-ment on Environmental Management &Operations.
Before joining the faculty in1996, Professor Corbett was a visitingscholar at the Owen Graduate School ofManagement at Vanderbilt University.He holds a PhD from INSEAD inFontainebleau, France, and was anAT&T Faculty Fellow in IndustrialEcology during 1997-1999. He servedas Associate Dean of the UCLAAnderson School’s MBA Program from2003-2006.
UCLA INSTITUTE OF THE ENVIRONMENT10
set consisted of 90 tons of material, con-
sisting mainly of wood and polystyrene
blocks. The “tenement” set consisted of
300 tons of material, representing 8
building fronts. The “freeway” set con-
sisted of more than 7,700 tons of con-
crete, 1,500 tons of structural steel and
1,500 tons of lumber. As a result of a
joint project between Warner Brothers,
the city of Alameda, the Alameda County
Waste Management Authority, and The
ReUse People, 97.5% of all the set mate-
rial was ultimately recycled.
The ReUse People dismantled sets
and handled processing and distribution
of the salvaged materials. Thirty-seven
truckloads of lumber were reused in
housing for low-income families in
Mexico, and all the steel was recycled.
Even the k-rail from the freeway set was
crushed and sold off as base rock. TRP’s
work force of 18 people worked 124 days
to complete the project. According to the
Alameda Waste Management Authority,
the 11,000 tons diverted from the landfill
represented 10% of the total annual solid
waste stream for the city of Alameda.
We encountered several other simi-
larly impressive practices in a variety of
productions. For example, the sitcom
According to Jim has largely eliminated
the use of paper in scriptwriting and edit-
ing by using Tablet PCs; the craftsman-
style house featured in the 2001 New
Line Cinema release Life as a House has
been recycled into the Kenter Canyon
Elementary School Library; Warner
Brothers uses re-refined oil for their fleet
by collecting and recycling used oil from
existing vehicles; and Sony Pictures has
received ISO 14001 certification for
its environmental management system.
The Environmental Media Association
(EMA) and the Entertainment Industry
Development Corporation (EIDC) both
maintain online environmental produc-
tion guidelines
WHAT THE FILM ANDTELEVISION INDUSTRYWRITES ABOUT
In addition to the economic sector analy-
sis, and examples of environmental best
practices, we also surveyed the coverage
of environmental issues in the most
important FTI trade publications, the
Hollywood Reporter and Variety. Our
Some aspects of the industry’s environmental
record deserve an A. However, policies to mitigate
environmental impacts remain to be implemented
more systematically.
67532 UCLA RC06.qxp 10/6/06 1:39 PM Page 10

informal content analysis of these publi-
cations basically counted articles with
genuine environmental focus that
appeared from 1991-2004. The results are
summarized in Figure 3. The analysis
suggests that attention given to environ-
mental issues peaked around 1993, but
then tapered off during the mid-1990s.
However, beginning around 1996/97, a
trend toward an increasing frequency of
environment-related themes developed. A
significant acceleration, in fact, occurred
during the most recent period (2002
through 2004). The majority of these stories
focus on the environmental content of pro-
ductions rather than environmental
actions and policies. Until 2003, the EMA
awards concentrated on films and shows
that included environmental messages. In
a positive development, the 2004 EMA
awards included, for the first time, a sep-
arate category for environmental
“process” improvements based on EMA’s
Green Seal checklist. This is likely to
draw further attention to environmental
practices during film development, pro-
duction and distribution.
GRADES: A TO C
As might be expected for such a diverse
industry, encompassing a wide range of
organizations and individuals, it is impos-
sible to assign a single grade for overall
environmental performance. Some
aspects of the industry’s environmental
record deserve an A: e.g., the best prac-
tices highlighted earlier. In fact, because
SOUTHERN CALIFORNIA ENVIRONMENTAL REPORT CARD 2006 11
continued on page 40
14
12
10
8
6
4
2
01992 1994 1996 1998 2000 2002 2004
Environmental articles in The Hollywood Reporter and Variety,1991-2004
Figure 3. Selected articles with environmental themes in trade publications.
Richard Turco is the former Director ofUCLA’s Institute of the Environment,Professor and past Chair of theDepartment of Atmospheric Sciences,and a member of the Institute ofGeophysics and Planetary Physics. Hereceived his Ph.D. in ElectricalEngineering and Physics from theUniversity of Illinois in 1971. Dr.Turco’s work includes research on thestratospheric ozone layer and theozone “hole,” the causes of climatechange on Earth, regional air pollutionand airborne particulates, and globalchemical cycles. In 1983, he jointlydeveloped the theory of “nuclear winter.” Over the last decade, Dr. Turcohas headed a research group buildingan advanced air quality model for theLos Angeles basin. The SurfaceMeteorology and Ozone Generation(SMOG) model was the first to explainthe formation of dense elevated layers of pollution over Los Angeles.Dr. Turco’s 240 publications include atextbook on current environmentalissues, “Earth Under Siege: From AirPollution to Global Change”. He washonored with a MacArthur Fellowshipin 1986, and the Leo Szilard Prize forPhysics in the Public Interest.
67532 UCLAR1.qxp 10/13/06 7:57 AM Page 11

GRADES A to C+
67532 UCLA RC06.qxp 10/6/06 1:39 PM Page 12

by Anastasia Loukaitou-Sideris, Ph.D.
Professor and Chair, Department of Urban Planning
SOUTHERN CALIFORNIA ENVIRONMENTAL REPORT CARD 2006 13
INTRODUCTION
It seems incontestable that urban parks
are a desirable asset for cities. But
Southern California cities have found it
increasingly difficult to provide the
appropriate amount of park acreage with
the right mix of park services. Indeed,
“park wars” in Los Angeles have at times
pitted developers against park advocates,
environmentalists against soccer enthu-
siasts, and inner-city park users against
suburban patrons. These “wars” have
occurred despite the many benefits of
parks. As valued physical settings parks
offer visual and psychological relief in
high-pace urban communities and con-
tribute to the quality of life and overall
sense of well being of urban dwellers.
Parks are also important settings for
involvement in sports and physical activ-
ity. Recently, and increasingly, evidence
from the public health arena has linked
park visits to health benefits for active
users. Parks can also serve as a “substi-
tute for nature” in cities, offering impor-
tant environmental benefits. Their trees
and vegetation reduce ambient heat lev-
els and offer sequestration of air pollu-
tion, while their ‘softscape’ allows natu-
ral water filtration and absorbs runoff.
This article analyses the provision
and politics of open space in Los Angeles
by focusing on three different but inter-
related aspects of park politics: 1) The
increasing difficulty faced by municipal-
ities and counties to provide and main-
tain green open spaces; 2) The
inequitable distribution of parks and
urban greenery throughout the Los
Angeles urban terrain; and 3) The chal-
lenges of addressing different and com-
peting open space needs for an increas-
ingly heterogeneous public.
INADEQUATE SUPPLY
In urban areas that are densely built,
large depositories of land have all but
vanished. Today, the dramatic fiscaliza-
tion of land combined with decreasing
tax revenues for cities have made the
creation of new parks or the expansion
and upgrading of existing ones a very
expensive proposition for cities.
California’s Proposition 13 and similar
tax-cut measures in thirty-seven other
states have seriously challenged munici-
pal budgets and reduced the size of city
coffers. At the same time, parks and open
spaces do not represent a profitable use
of land in a monetary sense, as they do
not produce property or sales tax revenue
for cities. As a result, the supply of pub-
lic parks has not kept pace with the
growing urban population.
Indeed, the growth in urban park
acreage is nowhere near proportional to
the growth of urban areas, especially in
the fast-growing cities of the West Coast.
This is particularly true in the Los
Angeles region. A comprehensive study
of parks in the twenty-five largest metro-
politan areas in the U.S. in 2000 found
that the Los Angeles park system, which
has only 10% of the total city land devot-
ed to parks, lags all other large cities of
the West Coast (see Table 1). Los
Angeles ranks 17th among major U.S.
cities, scoring below other large cities
like New York and Philadelphia. And the
Parks and Recreation Department’s per
capita spending for parks in 2000 of $35
per resident is well below the per capita
spending of San Diego ($83), San
Francisco ($95), Portland ($108), and
Seattle ($153). Park acreage in Los
67532 UCLA RC06.qxp 10/6/06 1:40 PM Page 13

UCLA INSTITUTE OF THE ENVIRONMENT14
Angeles is just 4.2 acres per 1000 resi-
dents, significantly lower than the
national averages, which range from 6.25
to 10.5 acres per 1000 residents. The
magnitude of the Los Angeles’ popula-
tion—triple that of San Diego and quin-
tuple San Francisco’s—makes the provi-
sion of adequate parkland and open
space especially difficult.
Along with population size and den-
sity, limited local government revenue,
particularly in the post-Proposition 13
era, also helps explain the relative
dearth of parkland within Los Angeles.
Between 1972 and 1998 the city of Los
Angeles acquired less than 1,000 acres
for parks, and in the immediate post-
Proposition 13 years had to close 24
recreation centers and reduce the funds
or cut down the operating hours for the
remaining centers.
UNEVEN ALLOCATION
The loss of revenue for park acquisition
and operations has not affected neighbor-
hoods equally. Parks in affluent subur-
ban coastal and valley areas were able to
harness the impact by imposing user fees
for park services. Parks in low-income
communities, however, saw a dramatic
reduction of their staff, space and servic-
es. Similarly, the Quimby Act, a state law
passed in 1975 that requires developers
to pay a fee for park development or set
aside land for parks in the immediate
vicinity of their project, has favored
newer suburban subdivisions and has
done little to increase the park supply in
built-up inner city areas.
A variety of options can be used to
finance parks, ranging from property
taxes, general obligation and revenue
bonds, special assessment districts,
impact fees, user fees, and real estate
transfer taxes. But parks compete with
other public goods and services, such as
education, policing and public libraries,
for limited public funds. Nevertheless,
the strong economic climate and gen-
erosity of voters of the early 1990s
brought substantial additional funding to
Los Angeles parks. In 1992, Los Angeles
County voters passed Proposition A,
which assured $550 million for parks,
with $126 million dedicated to parks in
the city of Los Angeles. In 1996, voters
approved Proposition K, a park bond
assuring $750 million in park improve-
ments for Los Angeles County and $25
million per year for 25 years for the city.
But a Los Angeles Times article
reported that Proposition K projects are
facing delays and cost overruns.
Moreover researchers also found that the
bond funding, which is allocated through
a competitive process, does not reach all
neighborhoods equally: “Communities of
color [and] areas with the largest shares
of young people received half as much
Proposition K funding on a per youth
basis than areas with the least concentra-
Table 1: Comparison of Parks and Open Spaces among Major West Coast Cities.Source: Harnik P. (2000). Inside City Parks, Washington DC: Urban Land Institute.
Between 1972 and 1998 the
city of Los Angeles acquired
less than 1,000 acres for parks.
City
City Population(in 1996)
PopulationDensity
(persons/acre)
Park acreageper 1000residents
Park space as % of city area
Parkexpendituresper resident
Los Angeles 3,554,000 11.8 8.5 10.0%$35
(in 1998-99)
San Diego 1,171,000 5.6 30.8 17.4%$83
(in 1998)
San Francisco 735,000 24.6 10.3 25.4%$95
(in 1998-99)
Seattle 525,000 9.8 11.8 11.5%$153
(in 1997-98)
Portland 481,000 6.0 26.2 15.8%$108
(in 1998-99)
67532 UCLA RC06.qxp 10/6/06 1:40 PM Page 14

SOUTHERN CALIFORNIA ENVIRONMENTAL REPORT CARD 2006 15
tion of children, and more privileged
sub-areas with the highest rates of acces-
sibility received as much if not more
bond funds.” Instead of using the new
revenue to close the open-space gap
between wealthy and poor areas of the
city and county, Proposition K seems to
have exacerbated existing inequalities in
the distribution of parkland. Thus,
researchers have found that Latino
neighborhoods on average have only 1.6
acres per 1,000 population, African-
American neighborhoods enjoy on aver-
age 0.8 acres per 1,000 population,
Asian-Pacific-Islander-dominated neigh-
borhoods have 1.2 acres per 1000 resi-
dents, while white-dominated neighbor-
hoods have on average 17.4 acres per
1000 residents, partly because they
encompass the Santa Monica Mountains.
The dearth of parks in the city is
more pronounced in some neighborhoods.
Table 2 shows a rather dramatic picture of
inequitable supply within the city of Los
Angeles. Inner city council districts con-
tain many fewer neighborhood parks per
1000 children than non-inner city dis-
tricts. I recently authored a study focus-
ing on the supply of parks in relation to
population characteristics and needs, and
found a persistent inequity between two
different city areas (see Figure 1). The
study created a ‘needs index’ for each
neighborhood taking into account its
median household income, percentage of
households under poverty, density of chil-
dren, and average number of people per
household. It found that Los Angeles
inner city neighborhoods had the highest
need for parks yet had a much lower
acreage of neighborhood parks per capita
than the more affluent neighborhoods of
the San Fernando Valley.
Site visits also confirmed a differen-
tial quality among parks in these two
regions. While the inner city parks were
found to have more sport fields and
indoor facilities, their levels of mainte-
nance and cleanliness lagged far behind
their counterparts in the San Fernando
Valley. Moreover, surveys show parks are
Inner City DistrictTable 2: Neighborhood park acreage by council district in Los Angeles.Source: City of Los Angeles, Commission on Children, Youth, and their Families, 1996.
CouncilDistrict
Park acreage
Children 0-17
% children 0-17
Totalpopulation
Park acreage/
1000 children
Park acreage/
1000 persons
1 179.78 67,779 29.6 228,686 2.65 0.79
2 346.83 57,880 24.5 236,537 6.00 1.47
3 327.12 50,714 21.8 232,829 6.45 1.40
4 175.30 37,970 16.0 236,973 4.62 0.74
5 268.25 33,512 14.2 236,414 8.00 1.13
6 218.82 38,797 16.8 231,516 5.64 0.95
7 141.66 68,905 29.8 231,545 2.06 0.61
8 91.74 67,056 29.0 230,289 1.37 0.40
9 77.26 78,903 34.3 229,853 0.98 0.34
10 70.48 57,832 25.6 226,142 1.22 0.31
11 411.34 41,927 17.7 236,846 9.81 1.74
12 532.44 53,432 22.6 236,497 9.96 2.25
13 88.81 58,714 25.4 231,588 1.51 0.38
14 192.38 60,568 26.8 225,852 3.18 0.85
15 264.17 72,487 31.1 233,157 3.64 1.13
67532 UCLA RC06.qxp 10/6/06 1:40 PM Page 15

UCLA INSTITUTE OF THE ENVIRONMENT16
much more important in the lives of inner
city children. For them the neighborhood
park serves as an extension of their
house, a viable alternative to the often
absent back yard and private play space.
Their visits to the park are frequent and
casual. Using bikes, skates, or simply
their feet, inner city children come to the
park on weekdays and weekends to meet
with their peers, and find space for play
and sport activities. For suburban chil-
dren the neighborhood park becomes
important primarily on weekends as a
place for family picnics and sports events
like soccer and baseball. Attachment to
the neighborhood park is less strong, as
the park is only one of many possible
venues for recreation and play.
CHALLENGES OFACCESSIBILITY AND USE
Ironically, despite the scarcity of green
open spaces in the region, many parks
remain underutilized and devoid of
social uses and activities. This paradox
often exists because some parks suffer
from poor accessibility, perception of
lack of safety, and lack of programs or
facilities appealing to the needs and val-
ues of a diverse population. In general,
however, inner city parks tend to be
much more utilized than parks in the out-
lying suburban areas, because of higher
densities, residential overcrowding, and
relative lack of back yards and private
open spaces.
Accessibility of parks remains chal-
lenging in California, where according to
Figure 1: Needs Index and Percent of Minority Populations in the inner city and valley regions of Los Angeles.Source: Loukaitou-Sideris, A. and Stieglitz, O. (2002). “Children in Los Angeles Parks: A Study of Equity, Quality and Children’s Satisfactionwith Neighborhood Parks,” Town Planning Review, 74(4): 467-488.
67532 UCLA RC06.qxp 10/6/06 1:40 PM Page 16

SOUTHERN CALIFORNIA ENVIRONMENTAL REPORT CARD 2006 17
the California Health Interview Survey
conducted by the UCLA Center for
Health Policy Research, more than a
quarter of teenagers in the state reported
having no access to a safe park, play-
ground or open space. Parks and play-
grounds were envisioned in the 1930s as
important neighborhood assets that had
to be in close proximity to residences.
But in Los Angeles, only about a quarter
of the city’s population lives within a
quarter-mile of a neighborhood play-
ground or park facility.
Perceptions of lack of safety can
also affect park visitation and use. A
recent survey of park users by the City
Controller’s office reported that half of
the respondents were reluctant to visit
neighborhood parks out of concern for
their personal safety. A 2006 study by
the RAND Corporation found the most
common user response for suggested
improvements to neighborhood parks
was safety.
A third challenge concerns the fit
between desirable park uses and the
design of parks and open spaces. The
multiplicity of roles the urban park is
now expected to play for a diverse public
may be difficult to address for park sup-
pliers and may create conflict among
competing user groups. What is the prop-
er role or roles urban parks are expected
to serve? Should they be designed as
green oases for peaceful retreat, relax-
ation, and meditation? As facilities for
active recreation and fervent group play?
As social spaces for community involve-
ment and cultural exchange?
The neighborhood park of the early
21st century is typically a few acres of
land expected to serve myriad purposes
and satisfy a multicultural clientele.
Park suppliers try to satisfy these diverse
and conflicting needs by following the
norm of the “average user.” They are
responding to what they believe are uni-
versal needs, but this response may fail
to address cultural patterns of park use.
As a result, and as studies have shown,
contemporary neighborhood parks do not
always offer effective group settings that
take into account the different use pat-
terns of men, women, children, young
adults, the elderly, or different ethnic
groups. The typical neighborhood park
design mixes elements from past park
design models in order to create an easi-
ly reproducible, standardized milieu, one
which seeks to be multiuse, but may also
be insensitive to cultural and social
specificities.
RECOMMENDATIONS
While this article has stressed the chal-
lenges around the provision and alloca-
tion of parks in Los Angeles, develop-
ments in the last few years give us rea-
sons for optimism. For one, voters have
shown their support for urban parks by
approving ballot measures and taxing
themselves to provide future generations
of Californians with more parkland. For
the first time in the last fifty years the
region has been able to identify and des-
ignate large pieces of land for park
space. An important coalition of grass-
roots groups fighting for more parks and
open spaces has slowly emerged. As a
result of their efforts, the abandoned
thirty-two acre rail yard near Chinatown
will be converted into the Cornfield
Park, while the El Toro Marine Corps
Air Station, between Irvine and Lake
Forest, will be transformed into Orange
County’s Great Park. In South Central
A comprehensive study of parks in the twenty-five largest
metropolitan areas in the U.S. in 2000 found that the Los Angeles
park system lags all other large cities of the West Coast.
67532 UCLA RC06.qxp 10/6/06 1:40 PM Page 17

UCLA INSTITUTE OF THE ENVIRONMENT18
Los Angeles the Santa Monica
Mountains Conservancy has converted a
former cement pipe storage yard into the
8.5-acre Augustus F. Hawkins Natural
Park. Other opportunities for park
development exist in efforts to restore
portions of the Los Angeles River and to
create riverfront parks in different
neighborhoods.
Park and Recreation departments
should also not forget that small green
spaces in the neighborhood (in contrast
to more difficult to acquire large parks),
can offer a host of recreational opportu-
nities and environmental benefits. In
cities like Los Angeles where land is
scarce they should look for underuti-
lized or empty lots in neighborhoods,
and along freeways, railway lines, river-
fronts, and waterfronts. Mini-parks and
adventure play grounds can be created
in empty lots, and jogging and biking
paths can be provided along transporta-
tion corridors. Parks should not be seen
in isolation, but rather in connection to
other land uses, such as housing and
schools. Partnerships between Park and
Recreation departments and school dis-
tricts and shared uses should also be
considered in the most dense and
undersupplied neighborhoods of the
region.
In addition to the traditional
patterns of active and passive recreation
we also need to consider less
conventional uses in parks, if these are
deemed appropriate by the surrounding
communities. Cultural events, after-
school programs, urban gardening, even
entrepreneurial activities and
volunteerism can take place in some
parks. At the same time, the educational
and environmental potential of parks,
presently quite unexplored and
underdeveloped, can be cultivated to
offer opportunities for youngsters to learn
more about ecology and nature. Finally,
the design of parks should be location-
specific and respectful of the needs of
the particular community.
In the late 19th century, American
cities acted with great foresight by
ensuring and converting land for
recreational open spaces within their
boundaries. This era gave future
generations of urbanites the great gift of
wonderful city parks. Today these parks
are no longer sufficient to address the
needs of a vastly expanded and
heterogeneous public. We need more
greenery and parks in our cities that can
fulfill a host of different recreational,
social, educational, and environmental
benefits for the sake of current and future
generations of citizens.
67532 UCLA RC06.qxp 10/6/06 1:40 PM Page 18

GRADES
Park Advocates: Grade A. Non-profit
organizations such as the Trust for Public
Land, The Center for Law in the Public
Interest, the Friends of the Los Angeles
River, NorthEast Trees, and many others
have created a movement for urban parks
in Los Angeles and have been instru-
mental in securing new land for urban
parks in the Los Angeles region, and
advocating for ballot measures for park
funding.
Departments of Parks and Recreation:
Grade C+. City bureaucracies have not
displayed the necessary creativity to pro-
vide neighborhoods with open space
opportunities and to match neighborhood
needs with appropriate park design and
programming. The level of maintenance
of different parks within the same park
district often varies, with parks in under-
privileged neighborhoods of the city
showing the greatest wear and tear.
SOURCES
City of Los Angeles, City Controller’s Office(January 2006). Analysis of the MaintenanceActivities of the Department of Recreation andParks.
Harnik, P. (2000). Inside City Parks,Washington DC: The Urban Land Institute.
Loukaitou-Sideris, A. (1995). “Urban Formand Social Context: Cultural Differentiationin the Uses of Urban Parks,” Journal ofEducation and Planning Research, 14:89-102
Loukaitou-Sideris, A. and Stieglitz, O.(2002). “Children in Los Angeles Parks: AStudy of Equity, Quality and Children’sSatisfaction with Neighborhood Parks,” TownPlanning Review, 74(4): 467-488.
RAND Corporation (2005) The Role of Parksin Physical Activity and Health.
Wolch, J. Wilson, JP., and Feherenbach, J.(2005). “Park and Park Funding in LosAngeles: An Equity-Mapping Analysis,”Urban Geography, 26(1):4-35.
Yanez, E. and Muzzy, W. (2005) “HealthyParks, Healthy Communities: AddressingHealth Disparities through Public Financingof Parks, Playgrounds, and Other PhysicalActivity Settings,” Policy Brief, Los Angeles;The Trust for Public Land.
SOUTHERN CALIFORNIA ENVIRONMENTAL REPORT CARD 2006 19
Instead of using the new revenue to close the open-space gap
between wealthy and poor areas of the city and county,
Proposition K seems to have exacerbated existing
inequalities in the distribution of parkland.
Professor Loukaitou-Sideris’ researchfocuses on the public environment ofthe city and her work seeks to inte-grate social and physical issues inurban planning and architecture. Herresearch includes analysis of changesthat have occurred in the public realm;cultural determinants of design andplanning and their implications forpublic policy; quality-of-life issues forurban residents; and transit security.She has served as a consultant to theTransportation Research Board, FederalHighway Administration, SouthernCalifornia Association of Governments,South Bay Cities Council ofGovernment, Los Angeles NeighborhoodInitiative, the Greek Government, andmany municipal governments on issuesof urban design, open space develop-ment, land use and transportation. Sheis the author of numerous articles, theco-author of the book Urban DesignDowntown: Poetics and Politics of Form(University of California Press, 1998),the co-editor of the book Jobs andEconomic Development in MinorityCommunities (Temple University Press,2006), and is currently working on abook about the social uses of sidewalksto be published by the MIT Press.
67532 UCLA RC06.qxp 10/6/06 1:40 PM Page 19

GRADES B+ to C-
67532 UCLA RC06.qxp 10/6/06 1:41 PM Page 20

by Keith D. Stolzenbach, Ph.D.
Professor, Department of Civil and Environmental Engineering
SOUTHERN CALIFORNIA ENVIRONMENTAL REPORT CARD 2006 21
Many of the substances in the atmos-
phere are completely natural, such as the
oxygen we breathe or dust particles that
have been resuspended by wind from the
Earth’s crust. However, human activities
have resulted in the presence of other
substances that we consider pollutants
because they are potentially harmful to
human or ecosystem health. Air pollu-
tants posing a risk to human health
include gases such as ozone, sulfur diox-
ide, nitrogen dioxide, carbon monoxide;
particle-associated components of com-
bustion exhaust including carcinogenic
polycyclic aromatic hydrocarbons; heavy
metals; and particles smaller than 2.5
microns (PM2.5). Previous Southern
California Report Card articles have
dealt with the human health aspects of
regional air quality (RC 1998 and 2003),
particulates (RC 2001), and personal
exposure (RC 2005). In this article, we
discuss atmospheric deposition—the
transfer of substances from the air to the
many surfaces that make up the world we
live in, such as soil, vegetation, water,
pavement, vehicles, and buildings—with
an emphasis on particle deposition. We
do so because to date, atmospheric dep-
osition has largely been neglected in
considering the effects of air pollutants
on human health.
ATMOSPHERIC DEPOSITION
Anyone who has dusted a room or
washed a car has encountered the effects
of atmospheric deposition. Pollutants in
the atmosphere can deposit on all of the
solid surfaces of a watershed and then be
washed off by rain, becoming part of the
storm water runoff that reaches rivers,
lakes, and coastal waters. Pollutants may
also be deposited directly from the
atmosphere onto the surface of a water
body. A secondary, but important, reason
to be concerned about atmospheric dep-
osition is that pollutants that are not
washed off may accumulate on surfaces
such as soil, forming a reservoir of toxic
substances that may later be resuspend-
ed back into the air, causing a threat to
human and ecosystem health even after
the original sources of the pollutant have
been removed.
Substances exist in the atmosphere
either as molecules of gases or as solid or
liquid particles, called aerosols, that
range in size from 0.001 to 100 microns
(it takes a thousand microns to make a
millimeter). Both gases and particles are
deposited on surfaces by one of two gen-
eral mechanisms (Figure 1). Wet deposi-
tion occurs when raindrops drag mole-
cules of gases and particles down with
them as they fall. Dry deposition results
from the combination of molecular diffu-
sion, impaction, and gravitational set-
tling. Wet deposition is the most impor-
tant deposition mode in regions with
appreciable annual rainfall, but in semi-
arid regions such as Southern California
atmospheric deposition is likely to be
dominated by dry deposition processes.
The most rapid dry deposition rate is the
gravitational settling of particles in the
10 to 100 micron size range. As noted
earlier, because the wet and dry deposi-
tion rates for most gases and for very
small particles are slow, atmospheric
deposition has largely been neglected in
considering the effect of air pollutants on
human health. Yet atmospheric deposi-
tion can be a major environmental prob-
lem: acid rain is the most well known
problem of atmospheric deposition and
some of the country’s most important
67532 UCLA RC06.qxp 10/6/06 1:41 PM Page 21

UCLA INSTITUTE OF THE ENVIRONMENT22
water bodies, including Lakes Erie and
Tahoe, have faced significant pollution
from deposits from the atmosphere.
Water pollutants of concern that
may deposit from the atmosphere
include compounds that increase the
acidity of rainfall or fog, nutrients that
may cause excess algal growth (eutroph-
ication), and toxic organic and inorganic
(metals) compounds. Acid rain, primari-
ly caused by the emission of nitrogen
and sulfur from motor vehicles, indus-
tries and power plants, harms vegetation
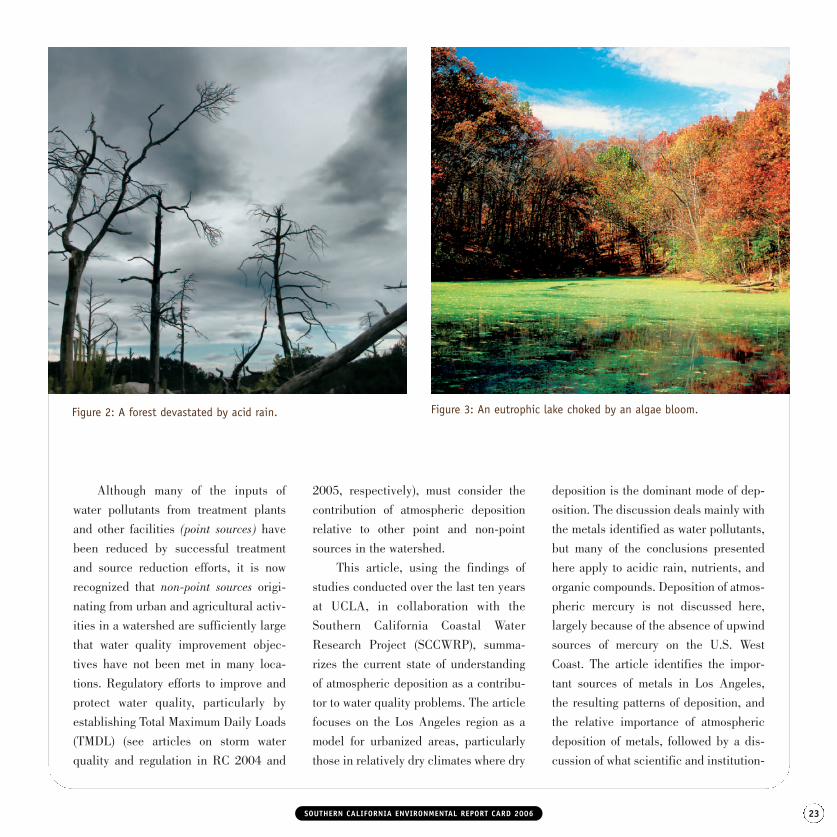
(Figure 2) and impairs water quality.
Acid rain has been one of the longest
standing issues involving atmospheric
deposition in the United States and has
been addressed at the federal level by
the National Atmospheric Deposition
Program (NADP). Eutrophication of
water bodies by excess nutrients results
in lowered, often zero, dissolved oxygen
levels and consequent death of fish and
other organisms in addition to dramatic
changes in taste and odor of the water
(Figure 3). Eutrophication of major
water bodies in the United States,
notably Lake Erie, was one of the driving
forces behind the federal Clean Water
Act of 1972 and is still of concern in
many regions. In California, nutrient
additions by atmospheric deposition are
thought to be a primary cause of the
decrease in the clarity of Lake Tahoe
(Figure 4).
Among the organic compounds of
interest in aquatic systems are pesti-
cides such as DDT, polycyclic aromatic
hydrocarbons (PAHs) and polychlorinat-
ed biphenols (PCBs), all of which are
internationally recognized as important
persistent organic pollutants (POPs).
Metals identified as important water pol-
lutants are copper, cadmium, chromium,
lead, mercury, nickel, and zinc. These
organic compounds and metals are pres-
ent in the sediments of many water bod-
ies and are of concern because of their
effects on aquatic organisms, and, in the
case of lead and mercury, on human
health. Mercury currently receives spe-
cial attention from the NADP because of
its ability to travel long distances as a
gas before entering water bodies by
atmospheric deposition.
Figure 1: Atmospheric deposition processes.
67532 UCLA RC06.qxp 10/6/06 1:41 PM Page 22
SOUTHERN CALIFORNIA ENVIRONMENTAL REPORT CARD 2006 23
Although many of the inputs of
water pollutants from treatment plants
and other facilities (point sources) have
been reduced by successful treatment
and source reduction efforts, it is now
recognized that non-point sources origi-
nating from urban and agricultural activ-
ities in a watershed are sufficiently large
that water quality improvement objec-
tives have not been met in many loca-
tions. Regulatory efforts to improve and
protect water quality, particularly by
establishing Total Maximum Daily Loads
(TMDL) (see articles on storm water
quality and regulation in RC 2004 and
2005, respectively), must consider the
contribution of atmospheric deposition
relative to other point and non-point
sources in the watershed.
This article, using the findings of
studies conducted over the last ten years
at UCLA, in collaboration with the
Southern California Coastal Water
Research Project (SCCWRP), summa-
rizes the current state of understanding
of atmospheric deposition as a contribu-
tor to water quality problems. The article
focuses on the Los Angeles region as a
model for urbanized areas, particularly
those in relatively dry climates where dry
deposition is the dominant mode of dep-
osition. The discussion deals mainly with
the metals identified as water pollutants,
but many of the conclusions presented
here apply to acidic rain, nutrients, and
organic compounds. Deposition of atmos-
pheric mercury is not discussed here,
largely because of the absence of upwind
sources of mercury on the U.S. West
Coast. The article identifies the impor-
tant sources of metals in Los Angeles,
the resulting patterns of deposition, and
the relative importance of atmospheric
deposition of metals, followed by a dis-
cussion of what scientific and institution-
Figure 2: A forest devastated by acid rain. Figure 3: An eutrophic lake choked by an algae bloom.
67532 UCLA RC06.qxp 10/6/06 1:42 PM Page 23

UCLA INSTITUTE OF THE ENVIRONMENT24
al steps can be taken to deal with atmos-
pheric deposition. The article concludes
by awarding grades for past regulation
and monitoring efforts and for forward-
looking attempts to understand and deal
with this important problem.
SOURCES OF METALS TO THEATMOSPHERE
Estimates of pollutant emissions to the
atmosphere have been developed by the
combined efforts of the U.S. Environ-
mental Protection Agency (EPA), the
California Department of Environmental
Protection (CALEPA), and the South
primarily composed of natural material
typical of the earth’s crust but also
contains significant amounts of the
metals we are concerned with here with
regard to water pollution. These metals
have become intimately mixed with the
crustal material, making identification of
their “real” sources difficult.
Recent measurements indicate wild
fires can also be a significant source of
metal laden dust. It is not clear whether
the high level of metals in the atmosphere
following a fire are the result of
resuspension of metal laden soil by the
strong updrafts associated with wildfires,
or if the metals are taken up from the soil
by the vegetation and released by the
burning.
It is now known that resuspended
dust can be transported between
continents and that dust from China often
reaches the U.S. West Coast. Thus it is
likely that contaminants associated with
dust could be transported between
regions in California, although we do not
have any measurements with which to
estimate how important this mode of
transport is for the Los Angeles region,
either as a source or sink.
Coast Air Quality Management District
(SCAQMD) for three categories of
sources. Point sources are fixed sources
associated with specific large industrial
facilities; mobile sources are moving
vehicles; and area sources include con-
struction vehicles, distributed smaller
industrial sources, and resuspended
dust.
The most significant source of
metals to the atmosphere, in Los Angeles
and elsewhere, is resuspension of dust,
often called “fugitive” dust, from roads
by moving vehicles and from other paved
and unpaved surfaces by wind (Figure 5).
Chemical studies of the dust indicate it is
Figure 4: The clarity of Lake Tahoe, as measured by the depth to which a standardsecchi disk can be seen, has decreased over the last three decades.
The most significant source of metals to the atmosphere is resuspension of dust fromroads by moving vehicles andfrom other paved and unpavedsurfaces by wind.
67532 UCLA RC06.qxp 10/6/06 1:42 PM Page 24

SOUTHERN CALIFORNIA ENVIRONMENTAL REPORT CARD 2006 25
Studies focusing on lead in the Los
Angeles region have shown the current
levels of lead present in resuspended
dust far exceed the supply from
contemporary sources now that the main
historical source of lead to the
environment, leaded gasoline, has been
reduced to near zero levels. Lead levels
in the atmosphere and in newly
deposited material appear to be supplied
by resuspension of “old” lead present in
soils and other surfaces. This
phenomenon is likely to be important for
other pollutants subject to atmospheric
deposition.
Regulatory programs designed to
protect human health have successfully
reduced emissions of many substances
from point and mobile sources. However,
tire wear remains a significant source of
zinc and brake pad wear is a significant
source of copper from mobile sources.
The heaviest and largest of the particles
containing copper and zinc may deposit
directly on the road or surrounding area,
but a large fraction is dispersed into the
atmosphere. Some researchers have sug-
gested that weights used to balance tires
are a significant source of lead.
PATTERNS OF ATMOSPHERICDEPOSITION
Scientists from UCLA and elsewhere
have used air quality computer models to
determine the transport and fate of met-
als in the Los Angeles region using as
inputs the estimates of sources described
above. The models indicate about a
fourth to a third of the material emitted
into the atmosphere is deposited within
the region and the rest is carried away by
the wind (Figure 6). Most of the deposit-
ed material falls on land or urban sur-
faces rather than directly on a water sur-
face, but there is some deposition on
coastal waters because of night-time
breezes from the land and because of
persistent Santa Ana winds. Because of
the relatively small total rainfall in
Southern California, dry deposition is
much more important than wet deposi-
tion. The UCLA measurement program
also documented for the first time the
presence of significant amounts of parti-
cles between 10 microns and 100
microns in size in the air above Los
Angeles. Although there are substantial
amounts of metals on particles smaller
than 10 microns, it is the largest parti-
cles that are responsible for most of the
atmospheric deposition of metals.
The pattern of dust and metal con-
centrations in the atmosphere and the
associated deposition on land is rela-
tively uniform spatially in the Los
Angeles urban region, although deposi-
tion near major sources, such as free-
ways, is higher than the regional
background rate within about 100
Paved Road Dust
All Other Sources
Tire Wear
UnpavedRoad Dust
ConstructionDust
Timber andBrush Fires
Atmospheric deposition haslargely been neglected in
considering the effect of airpollutants on human health
yet can be a majorenvironmental problem.
Figure 5: The major sources of atmospheric emission of zinc in the Los Angeles region.
67532 UCLA RC06.qxp 10/6/06 1:42 PM Page 25

UCLA INSTITUTE OF THE ENVIRONMENT26
meters of the road. In the urban areas,
daytime concentration and deposition of
metals is greater than nighttime because
of the influence of traffic on resuspen-
sion. These patterns have been docu-
mented by direct measurements of
deposition using specially designed
deposition surfaces.
The modeled and observed patterns
of atmospheric concentrations and depo-
sition of heavy metals, combined with the
measured properties of regional dust, has
led scientists to hypothesize that dust-
associated substances—including met-
als—deposit relatively close to the origi-
nal source of the material but then are
resuspended and redeposited numerous
times before being carried out of the
region by winds, sequestered on the land
surface, or washed off by rainfall (Figure 7).
Thus deposition from the atmosphere is
only one component of a complex system
of pollutant transport operating at the
land-air boundary.
IMPORTANCE OFATMOSPHERIC DEPOSITION
The relationship between atmospheric
deposition of metals and water quality
has been documented by a combination
of model simulations and water sampling
in the Los Angeles region. The findings
are that nearly all the metals deposited
on impervious urban surfaces wash off
with the next rainfall, but that on more
natural land surfaces between 20% and
30% of the metals are sequestered from
immediate runoff, (although the data on
lead indicate sequestered pollutants may
be available for resuspension by wind
over longer time periods).
Comparison of the mass of metals
reaching the land surface by atmospheric
deposition with the mass found in runoff
and with known mass inputs from other
sources clearly shows atmospheric depo-
sition is a potentially significant source
of metals to water bodies (Figure 8). The
contribution of atmospheric deposition
can be as high as 99% in the case of
lead, for which other contemporary
sources are negligible.
MITIGATION
Important scientific and institutional
steps can be taken to deal with the
effects of atmospheric deposition on
water quality. It is important to refine
current estimates of original sources and
of resuspended dust sources of pollu-
tants. Many emissions estimates are
based on outdated information. Current
estimates of these sources leave many
Atmospheric deposition is apotentially significant sourceof metals to water bodies.
Figure 6: Computed “budget” of zinc emitted in the Los Angeles region.
423 mt/yremitted by all
sources
186 mt/yrdeposited in
model domain
mt/yr = metric tons per year
181 mt/yrdepositedon land
237 mt/yr“blown” outof domain
5 mt/yrdepositedon water
11.3 mt/yrdeposited on
Santa Monica Baywatershed
1.4 mt/yrdeposited on
Santa Monica Bay
67532 UCLA RC06.qxp 10/6/06 1:42 PM Page 26

SOUTHERN CALIFORNIA ENVIRONMENTAL REPORT CARD 2006 27
questions unanswered about the relative
importance of vehicles and wind as
mechanisms for resuspension in urban
regions. In addition, it is vital to assess
the relative magnitude of local and dis-
tant sources of potential pollutants,
including intraregional sources.
Our understanding of key processes
is incomplete. In particular, we need to
know more about the spatial and tempo-
ral variability of resuspension, seques-
tration and wash-off so we can assess the
importance of older sources and design
and evaluate remediation and control
schemes.
The most important institutional
step is to modify air quality regulations to
allow greater consideration of water qual-
ity impacts. Current regulations lump
water quality concerns in a general cate-
gory of “welfare effects” and do not
enable regulators to consider cross-
media issues fully. It is important for air
and water agencies to work together in
ways they have not done previously and
to take a multidisciplinary approach.
This change is long overdue and is key to
progress in dealing with atmospheric
deposition. Fortunately, agencies such as
the California Air Resources Board and
SCCWRP are beginning to interact for
the first time in an interdisciplinary man-
ner to address this issue.
Regulators should continue to
reduce known sources of water pollu-
tants. Efforts are already underway in the
San Francisco Bay area, for example, to
examine the potential benefits of reduc-
ing copper in brake pads, and similar
studies should be undertaken for zinc
in tires.
Land use regulations can take
advantage of what we already know about
patterns of deposition near roads and
freeways by minimizing use of these hot
zones for sensitive uses such as resi-
dences and schools. In some cases it may
be possible to provide vegetative buffer
zones that reduce the size of the high
deposition region near sources.
Finally, regulators should authorize
and fund the extension of routine air
quality monitoring to include particles
larger than 10 microns and identified
water pollutants such as metals, as well
as conduct direct measurement of depo-
sition rates. These measurements would
inform future scientific studies of atmos-
pheric deposition.
Resuspended dust can be transported between
continents, and dust from China often reaches the U.S. West Coast.
Figure 7: Hypothesized processes affecting coarse particle transport.
67532 UCLA RC06.qxp 10/6/06 1:42 PM Page 27
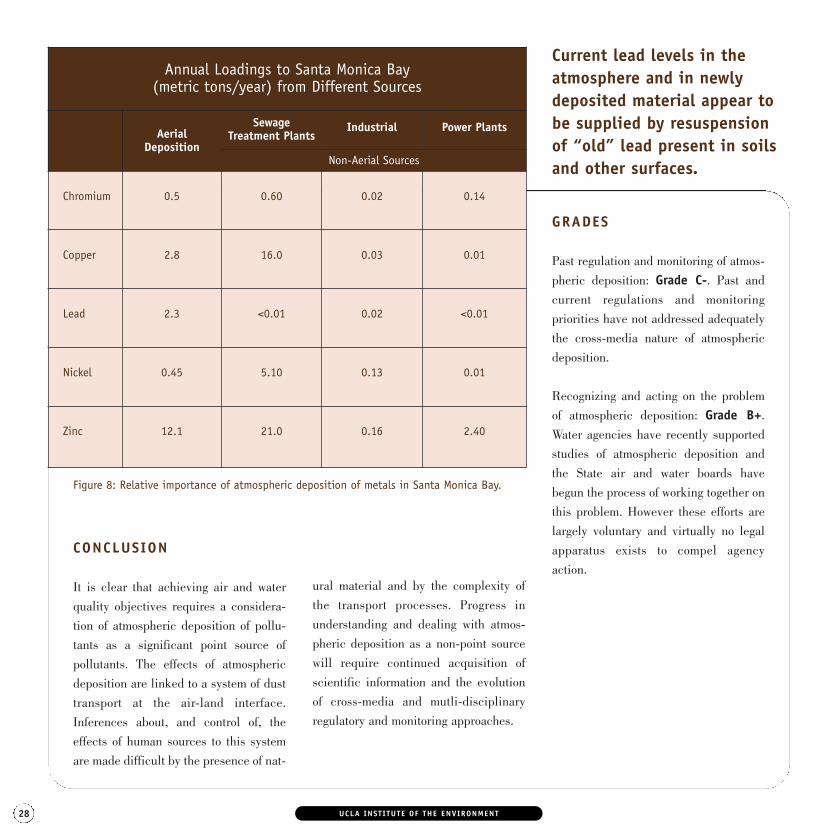
UCLA INSTITUTE OF THE ENVIRONMENT28
CONCLUSION
It is clear that achieving air and water
quality objectives requires a considera-
tion of atmospheric deposition of pollu-
tants as a significant point source of
pollutants. The effects of atmospheric
deposition are linked to a system of dust
transport at the air-land interface.
Inferences about, and control of, the
effects of human sources to this system
are made difficult by the presence of nat-
ural material and by the complexity of
the transport processes. Progress in
understanding and dealing with atmos-
pheric deposition as a non-point source
will require continued acquisition of
scientific information and the evolution
of cross-media and mutli-disciplinary
regulatory and monitoring approaches.
GRADES
Past regulation and monitoring of atmos-
pheric deposition: Grade C-. Past and
current regulations and monitoring
priorities have not addressed adequately
the cross-media nature of atmospheric
deposition.
Recognizing and acting on the problem
of atmospheric deposition: Grade B+.
Water agencies have recently supported
studies of atmospheric deposition and
the State air and water boards have
begun the process of working together on
this problem. However these efforts are
largely voluntary and virtually no legal
apparatus exists to compel agency
action.
Current lead levels in theatmosphere and in newlydeposited material appear tobe supplied by resuspensionof “old” lead present in soilsand other surfaces.
Figure 8: Relative importance of atmospheric deposition of metals in Santa Monica Bay.
Annual Loadings to Santa Monica Bay(metric tons/year) from Different Sources
AerialDeposition
Sewage Treatment Plants
Industrial Power Plants
Non-Aerial Sources
Chromium 0.5 0.60 0.02 0.14
Copper 2.8 16.0 0.03 0.01
Lead 2.3 <0.01 0.02 <0.01
Nickel 0.45 5.10 0.13 0.01
Zinc 12.1 21.0 0.16 2.40
67532 UCLA RC06.qxp 10/6/06 1:42 PM Page 28

ACKNOWLEDGEMENTS
This article could not have been written
without the collaboration of Ken Schiff
and others at the Southern California
Coastal Water Research Project
(SCCWRP). The author also acknowl-
edges the contributions of his colleagues
Professors Sheldon Friedlander, Richard
Turco, and Arthur Winer. Reports and
papers describing the results of atmos-
pheric deposition studies in the Los
Angeles region can be found on the
SCCWRP web site (www.sccwrp.org).
Keith D. Stolzenbach is a Professor inthe Department of Civil andEnvironmental Engineering. Hisresearch deals with environmental fluidmechanics and transport, particularlythe fate and transformation of naturaland anthropogenic substances in natu-ral water bodies and the interactionsbetween physical, chemical, and bio-logical processes. He has beeninvolved with the scientific and policyissues of coastal water quality inBoston and Southern California. Hisresearch during the last eight years hasinvolved measurements and modelingof atmospheric deposition in the LosAngeles regions. Professor Stolzenbachreceived his Ph.D. from MIT in 1971after which he worked for theTennessee Valley Authority for threeyears and then as a faculty member atMIT for eighteen years before movingto UCLA in 1992.
SOUTHERN CALIFORNIA ENVIRONMENTAL REPORT CARD 2006 29
It is important for air and water agencies to work together in ways they have not done previously and to take a
multidisciplinary approach. This change is long overdue and is key to progress in dealing with atmospheric deposition.
67532 UCLA RC06.qxp 10/6/06 1:42 PM Page 29

GRADE A-
67532 UCLA RC06.qxp 10/6/06 1:42 PM Page 30

by Philip W. Rundel, Ph.D., Professor, Department of Ecology and Evolutionary Biology;Deborah Estrin, Ph.D., Professor, Department of Computer Science and Director, Center for Embedded Networked Sensing (CENS); and William Kaiser, Ph.D., Professor, Department of Electrical Engineering
SOUTHERN CALIFORNIA ENVIRONMENTAL REPORT CARD 2006 31
Southern California faces many
challenges in managing our environment,
as do other regions of the country. How
do our human activities affect, and in
turn are affected by, changes in
ecosystem structure, regional climate,
and land use? How will future changes in
land use and predicted changes in
climate in Southern California influence
fundamental ecosystem processes and
critical services on which we depend so
strongly? What will be the spatial and
temporal scales of such changes and will
responses be gradual or abrupt? At their
roots, these questions reflect not just a
curiosity about our future, but a desire
for proactive management to mitigate
undesirable outcomes. We would like to
know the magnitude, pace, and
geography of ecological changes, and to
understand the implications of such
changes for our environment and the
provision of ecosystem services to
humans. Answers to these questions
will require new technologies in
environmental monitoring and remote
sensing.
In past years, articles in the
Southern California Environmental
Report Card have dealt with a variety of
regional issues, for example air pollution,
groundwater pollution, biodiversity, and
invasive species. While it is appropriate
to address these important issues with
focused attention, we also need to under-
stand the complexity of our environment
and the interaction between individual
drivers of change. Human populations
are initiators of ecosystem change as well
as responders to such changes. Growing
human population drives increases in
urbanization and suburbanization in
Southern California, and our needs for
housing, commerce, food, and recreation
have consequences for the structure and
function of both natural ecosystems and
our human environment. Changes in land
use and land cover give rise to funda-
mental changes in ecological structures
and processes, and thus to the ecosystem
services that feed back to us. We all ben-
efit from, and indeed depend on, a rela-
tively high level of sustainability in water
resources, soil fertility, climate condi-
tions, and biodiversity.
Resource managers and policy
administrators in the past have generally
perceived ecosystems, and the organisms
they contain, as passive responders to
climate variation and climate change,
with no reciprocal effect on weather and
climate. We now know, however, that
ecological processes in one part of a
region may have impacts on distant areas
through the atmosphere and its
circulation, and through flows of water
through drainage networks. The
realization that land use and ecosystem
structure have important feedbacks to
weather and climate has been a
transforming paradigm for sustainable
management of our environment.
Appropriately addressing all of
these aspects of environmental impacts
and interdependencies will require an
entirely new generation of technology
innovations. Fortunately, three important
areas of technology advancement are
occurring at the present time: new
technologies for sensors and sensor
platforms, remote sensing technologies,
and technologies for efficient data
transmission and analysis. This article
describes these important new
technological developments, and
highlights examples of their applications
to key environmental problems.
67532 UCLA RC06.qxp 10/6/06 1:43 PM Page 31

UCLA INSTITUTE OF THE ENVIRONMENT32
SENSORS AND SENSORPLATFORMS
The rapid development and miniaturiza-
tion of technologies used in digital cam-
eras, cell phones, and wireless comput-
ers are allowing scientists to develop net-
works of small sensors that will lead to a
new era of monitoring the health and sta-
bility of our environment. Wireless
devices half the size of a cell phone now
exist with sensors to measure light, wind
speed, rainfall, temperature, humidity,
and barometric pressure. Moreover,
these devices store collected data,
process desired data averages or trans-
formations, and then transmit requested
data by radio frequency along a series of
wireless hops to an Internet node.
Deploying arrays of hundreds of
these sensor devices will allow us to fill a
gap between local-scale ecological
observations and environmental data
from scattered regional weather stations.
Such micrometeorological measurements
at fine spatial and temporal scales will
help scientists understand the relation-
ship of broad-scale changes in global cli-
mate and local microclimate that control
many ecosystem and physiological
processes. These sensor networks have
the potential to revolutionize science and
to influence major economic, agricultur-
al, environmental, social, and health
issues, as well as to enhance opportuni-
ties for new educational programs.
Beyond fixed arrays of meteorologi-
cal sensors, new types of sensors and
improved sensor platforms are also being
developed to provide environmental sci-
entists with significant tools for under-
standing fundamental ecosystem
processes in a manner not previously
possible. Multi-spectral video imagers,
acoustic sensors, gas analyzers, and
other high-performance instruments are
now being added to remote, unattended
network deployments (Figures 1 and 2) .
These technologies greatly expand our
ability to monitor the environment to
understand patterns of global change and
changes in levels of water and air pollu-
tion. The use of such instruments is pos-
sible with new platforms that combine
multiple processor and wireless network
modules. These platforms have energy
control systems to allow the nodes them-
selves, and their sensor devices, to oper-
ate only on demand, thus conserving
energy for long-life operations.
Sensors mounted on trams or other
mobile platforms are allowing an innova-
tive approach to the flexible and efficient
deployment of environmental sensors. In
what is termed actuated sensing, fixed
sensors can communicate the local pres-
ence of an unusual dynamic condition
(e.g. a frost or dew point condition or a
rare bird call) to a mobile system, tasking
Sensor networks have the potential to
revolutionize science andinfluence major economic,
agricultural, environmental,social and health issues.
Figure 1. Cable-mounted mobile instrumentation platforms can communicate with fixedenvironmental sensors on the ground.
67532 UCLA RC06.qxp 10/6/06 1:43 PM Page 32

SOUTHERN CALIFORNIA ENVIRONMENTAL REPORT CARD 2006 33
it to move to scan the area to better
understand the spatial and temporal
scales of the phenomenon or animal
presence.
Beyond sensors and sensor plat-
forms themselves, however, other critical
components of these new technologies
consist of the means for coordination of
sensor modalities across multiple spatial
and temporal scales, the infrastructure to
link sensors to a broadly accessible wire-
less network, and of course the reliabili-
ty for long-term deployment with appro-
priate maintenance and calibration of
sensors. Key to the success of these sys-
tems are appropriate tools for the storage
and management of large data sets so
that users can rapidly and efficiently
access multiple configurations of data
sets in real-time.
REMOTE SENSING
Remote sensing of ecological patterns
and processes is a key element of the
new technologies being applied to envi-
ronmental monitoring and ecosystem
model development. Resulting data are
being collected by a combination of
satellite sensors in earth orbit and
instrumentation mounted in small air-
craft. These sensors provide measure-
ments of structural, spectral, and ther-
mal characteristics of the land surface
at a scale broader than that measured by
fixed sensor arrays. Examples of such
sensing instruments are multi-spectral
imaging by the Moderate Resolution
Imaging Spectroradiometer (MODIS),
and radar interferometry, in satellites;
and light detection and ranging LiDAR
(laser altimetry), and thermal imagers,
in aircraft.
MODIS is a key instrument aboard
two NASA satellite systems. These satel-
lites view the entire Earth’s surface every
1 to 2 days, acquiring data in 36 spectral
bands, or groups of wavelengths. The
multi-spectral sensing capability of
MODIS allows it to quantify surface char-
acteristics of the earth such as land cover
type, snow cover, surface temperature,
foliage cover of vegetation, and fire occur-
rence. These data also allow analysis of
leaf area, leaf duration and net primary
productivity at a landscape scale, and
thus provide important inputs to parame-
terize or validate models of ecosystem
sustainability. Data from satellite-based
instruments such as MODIS are allowing
scientists to improve our understanding of
global dynamics and processes, and fur-
ther to develop models to predict spatial
and temporal scales of global change
across the landscape. MODIS has also
been used for other regional analyses in
Southern California. For example, UCLA
researchers have recently used satellite
images from MODIS of the 2003 Southern
California wildfires to assess the expo-
Figure 2. Proposed structure for a new generation of Biological Observatories withnetworked arrays of environmental sensors.
New technologies greatlyexpand our ability to monitorthe environment to understandpatterns of global change andchanges in levels of water andair pollution.
67532 UCLA RC06.qxp 10/6/06 1:43 PM Page 33

UCLA INSTITUTE OF THE ENVIRONMENT34
sures of residents of the region to fine and
coarse particles generated by the fires.
Synthetic aperture radar (SAR)
interferometry is another satellite-car-
ried instrument developed to detect sub-
tle changes in the earth’s surface over
periods of days to years with an unprece-
dented scale (global), accuracy (millime-
ter-level), and reliability (round-the-
clock, all-weather). Over longer time
scales of several years or more, high-res-
olution topographic data collected with
SAR can also be used for large-scale
change detection by comparing eleva-
tions at different times. This technique
allows measurement of catastrophic
changes in topography due to earth-
quakes, landslides, major floods, vol-
canic activity, and glacial melting. For
example, SAR data has been effectively
used to measure seismic displacement
associated with earthquakes in
California.
LiDAR instrumentation mounted in
small aircraft provides the capacity for
three-dimensional characterization of
vegetation structure, and thus the struc-
tural complexity of forest stands (Figure
3). Unlike video sensors, lidar directly
measures the distribution of vegetation
structure along a vertical axis, and can
provide measures of canopy height, stand
basal area, biomass and total cover to a
remarkable level of precision. Such data
have wide application in forest and agri-
cultural management. Key to this tech-
nology is the joint use of high-speed laser
rangefinders, precise inertial navigation
systems to measure the three-dimension-
al movement of the host aircraft, and
paired GPS systems on the aircraft and a
ground station for precise positioning.
DATA TRANSMISSION ANDANALYSIS
As new technologies allow us to collect
massive sets of data across broad geo-
graphical areas in a manner not previous-
ly possible, a critical challenge lies with
how researchers and resource managers
will manage and utilize such large mass-
es of data. The goal, of course is to allow
researchers to access these data streams
in real time, to quickly analyze them, and
to utilize models to apply complex data
streams to help mitigate environmental
problems. Many of the most significant
questions related to the complexities of
our environment lie at interfaces: the
interface of atmosphere with soil systems,
soil with freshwater aquatic systems, and
freshwater with marine ecosystems.
Understanding these complex interac-
tions requires real-time linkages between
data streams from sensor arrays operating
in the air, in plant canopies, in the soil,
and in adjacent waters.
Rapid progress in technologies for
commercial wireless networking, now
widely available to the general public,
has provided an important advancement
for networked sensors both in local area
systems covering a few km2, as well as
for regional systems extending over dis-
tances of 10-100 km. These WiFi tech-
nologies allow inexpensive, energy effi-
Figure 3. Applications of LiDARtechnology (see text).
SAR interferometry can detect subtle changes in
the earth’s surface over periods of days to years with
an unprecedented scale, accuracy and reliability.
67532 UCLA RC06.qxp 10/6/06 1:43 PM Page 34

SOUTHERN CALIFORNIA ENVIRONMENTAL REPORT CARD 2006 35
cient and broadband connectivity
through microservers to the Internet.
Since the WiFi infrastructure is low cost
and self-configuring, its deployment in
natural and urban environments is con-
venient and rapid, accommodating wire-
less sensor arrays over a communication
range of 100-200 m.
Commercial wireless technology also
allows for long-range broadband links that
may connect observation systems over
large regions. One exciting example of new
technologies for data access and transmis-
sion can be seen with HPWREN (High
Performance Wireless Research and
Education Network), a joint effort of the
San Diego Supercomputer Center (SDSC)
and the Scripps Institution of
Oceanography. This exploratory project
has created a high-performance, wide-area
wireless network that spans much of San
Diego County and adjacent counties. It
includes backbone nodes on the UC San
Diego and San Diego State University cam-
puses, as well as a number of remote areas
in San Diego County, including mountain
peaks with hundreds of square miles of
line-of-sight coverage. The HPWREN data
communications infrastructure provides
wireless high-speed Internet access for
emergency data communications by local
government agencies and first responders,
for field researchers from many disciplines
(geophysicists, seismologists, astronomers,
oceanographers, and ecologists), and for
rural Native American learning centers
and schools. In using the high-speed
HPWREN network, with a capacity to
transmit 45 million data bits per second,
emergency workers in mountain and desert
locations and field researchers at remote
sites can wirelessly transmit large amounts
of data in real time. Because of the net-
work’s high speed, images from high-reso-
lution cameras can be instantly transferred
over the network without interfering with
other traffic.
NATIONAL ECOLOGICALOBSERVATORY NETWORK(NEON)
The National Science Foundation (NSF)
is in advanced planning stages for a major
environmental program called the
National Ecological Observatory Network
(NEON). The mission of NEON (Figure 4)
is to increase our understanding of how
U.S. ecosystems and organisms respond
to variations in climate and changes in
land use at regional and continental
scales. Understanding the significance of
land use changes on our environment,
and doing this in a manner relevant for
urban planners and decision makers,
provides a core component of the
Figure 4. Regional distribution of sensor arrays and nodes in the proposed NEON program.
67532 UCLA RC06.qxp 10/6/06 1:43 PM Page 35

program. Land use changes that affect
ecosystems and organisms include the
conversion of land from wild to managed
or urban land cover, and from agricultural
uses to urban environments. The program
will use new technologies, as described
above, to measure important feedbacks
between the biosphere and the
atmosphere that are associated with
alterations in land use, land cover, and
vegetation. NEON will also investigate
interrelationships between climate
dynamics, biodiversity, invasive alien
species, and emerging diseases such west
Nile virus. Thus, NEON programs will
greatly advance our regional efforts
toward environmental sustainability for
Southern California by allowing us to
better understand the environmental
implications of land use policies, and by
helping to mitigate unwanted effects of
global change.
THE FUTURE
As the influence of human activities
continues to change the state of our
environment and natural ecosystems,
resource management efforts have
responded by becoming far more
interdisciplinary, integrative, and
collaborative. Efforts to address the
environmental “grand challenges,” such
as the effects of climate change and land
use on our Southern California
ecosystems, are promoting the
coordination of standard measurement
protocols and data management
infrastructure across our region.
The key goal driving the develop-
ment of new technologies for environ-
mental monitoring continues to be an
improved understanding of the complex
behavior of ecological systems in a world
with dynamic climate variation, and a
means of predicting future environmen-
tal sustainability. These complexities of
our ecological systems in Southern
California arise not only from the dynam-
ic nature of our physical and chemical
environment, but also from our diverse
biological systems and most especially
our human societies. Effective predictive
models for understanding ecological
complexities and their reciprocal impli-
cations for human activities will depend
on the collection of high-quality data,
new approaches to synthesizing and visu-
William Kaiser is a Professor ofElectrical Engineering at UCLA. In1994, he initiated the first wirelessnetworked sensor research with avision of linking the Internet to thephysical world through distributedmonitoring. This research thrustcontinues with development of newrobotic wireless sensor systems forenvironmental monitoring. Kaiserreceived his Ph.D. from Wayne StateUniversity in 1984.
UCLA INSTITUTE OF THE ENVIRONMENT36
Deborah Estrin is a Professor ofComputer Science at UCLA, holds theJon Postel Chair in Computer Networks,and is Director of the NSF-fundedCenter for Embedded NetworkedSensing (CENS). Estrin received herPh.D. (1985) in Computer Science fromthe Massachusetts Institute ofTechnology, her M.S. (1982) fromM.I.T. and her B.S. (1980) from U.C.Berkeley. Professor Estrin chairs theSensors and Sensor Networkssubcommittee of the NationalEcological Observatory Network (NEON)Network Design Committee, has been aco-PI on many NSF and DefenseAdvanced Research Projects Agency(DARPA) funded projects and hasserved on panels and committees formany networking related conferences.
A critical challenge lies with how researchers
and resource managers will manage and utilize
the large masses of data we can now collect.
67532 UCLAR1.qxp 10/13/06 7:57 AM Page 36

alizing these data across multiple spatial
and temporal scales, and knowledge
transfer to allow resource managers and
land use planners to take advantage of
these advances in a real-time collabora-
tive manner.
GRADE A-
Engineers, information technologists,
statisticians, and ecologists are all work-
ing together effectively today in collabo-
rative programs to advance the applica-
tions of new technologies for environ-
mental monitoring and to improve our
understanding of how variations in land
use and climate influence ecosystem
structure and function, as well as the
consequences of these variations for
society. The Center for Embedded
Networked Sensing (CENS) at UCLA has
been a focus of this research, with active
participation of scientists and engineers
from USC, UC Merced, UC Riverside,
and Caltech. More information on
this program is available at
http://research.cens.ucla.edu.
Philip Rundel is Professor of Biology inthe Department of Ecology andEvolutionary Biology at UCLA, and asenior investigator in the Center forEmbedded Networked Sensing (CENS).He joined the faculty of UCLA in 1983after 13 years on the faculty of UCIrvine. He is a plant ecophysiologistwho has worked for many years on avariety of aspects of the ecology ofmediterranean ecosystems of Californiaand similar areas in the world. His workwith CENS involves the developmentand application of new technologies inembedded networked sensing systems,mobile sensing platforms, and wirelesscommunication systems that can be physically embedded in anenvironment and act to reveal eventsand processes that are invisible tomore traditional observationaltechnology. He teaches courses onCalifornia Ecosystems and ConservationBiology.
SOUTHERN CALIFORNIA ENVIRONMENTAL REPORT CARD 2006 37
NEON programs will greatly advance our regional efforts toward environmental sustainability for
Southern California by allowing us to better understandthe environmental implications of land use policies, and
by helping to mitigate unwanted effects of global change.
67532 UCLA RC06.qxp 10/6/06 1:43 PM Page 37
UCLA INSTITUTE OF THE ENVIRONMENT38
The Institute of the Environment formed
in 1997 to bring together a community of
scholars focused on finding sustainable
solutions to major environmental prob-
lems. Our members and constituents rep-
resent a broad array of academic disci-
plines, research interests, policy con-
cerns and outreach avenues. Los Angeles
is our home, and it provides a rich mix-
ture of urban environmental health chal-
lenges and opportunities for enhanced
resource management. But our interests
span the globe, from tropical ecosystems
to innovative energy technologies.
WHAT DO WE DO?
• We create partnerships for new
research that cross the traditional
boundaries of natural science, social
science, humanities, law, business,
public health and public policy, to
name a few.
• We develop new policy solutions
that affect the global, regional and
local environments, and work with
non-governmental organizations,
Environmental Biology, Environmental
Engineering, Environmental Health,
Environmental Systems and Society,
Geography/Environmental Studies,
Geology, and Geophysics and Planetary
Physics. The new program includes 17
different departments.
THE ‘GREENING’ OF UCLA
In June 2005, the IoE moved into the
first LEED (Leadership in Energy and
Environmental Design) certified “green”
building on the UCLA campus. La Kretz
Hall will be the first of many “green”
certified buildings on campus since
the University of California adopted a
policy on Green Building Design, Clean
Energy Standards and Sustainable
Transportation Practices—articulating a
commitment to alternative transportation
planning, green power purchasing and
conservation measures and incorporating
the principles of energy efficiency and
sustainability in the planning, design
and construction of new buildings, and
the renovation of existing structures.
including businesses and environ-
mental organizations, as well as
government agencies to maintain a
lively debate.
• We develop educational programs to
meet the needs of today’s students,
whether they are environmental pro-
fessionals or citizens of the world.
OUR NEW ACADEMICPROGRAM
As an interdisciplinary center, we also
continue to focus on cross-disciplinary
methods of education to train our future
leaders to tackle our most pressing envi-
ronmental problems. This Fall, we are
inaugurating our new interdisciplinary
Environmental Science degree program.
This new major is an innovative dual-
component program that offers students
disciplinary breadth through the
Environmental Science major and
focused, disciplinary depth through a
minor or concentration in one of eight
environmental science areas:
Atmospheric and Oceanic Sciences,
67532 UCLA RC06.qxp 10/6/06 1:43 PM Page 38

SOUTHERN CALIFORNIA ENVIRONMENTAL REPORT CARD 2006 39
greenhouse gases. As it becomes increas-
ingly obvious that current levels of emis-
sions to the atmosphere are causing
measurable effects, understanding the
potential for mitigation and adaptation
takes on a larger importance, even as
society looks for ways to slow or halt the
buildup. “Sound science” is a term of art,
sometimes used by policy makers urging
delay in taking action, but in the case of
global warming the need for science that
can inform local and regional decisions
about urban greening, water infrastruc-
ture, agricultural and forest policies is
growing more urgent every day.
Each of the articles approaches the
question, “So, how are we doing?” using
a different set of analytical tools. But
taken together, they present a remark-
able picture of a region that is making
progress towards sustainability in the
face of enormous challenges. Perhaps
this reflects some bias on the part of the
editors, but I think it more likely that this
approach—a willingness to wade into
messy current issues while keeping one’s
head above water—is characteristic of
the research that is being produced by
the outstanding faculty who give their
time and talent to the work of this
Institute.
A final new campus effort worth
sharing with you is UCLA’s Committee on
Sustainability of which I have been
appointed Co-chair. Working with stu-
dents, administrators, campus operations
managers and all interested members of
the campus community, we have
embarked on an ambitious effort to incor-
porate sustainability into all aspects of
life at UCLA. Though “sustainability” is
a fuzzy term, most of us have a sense that
it means preventing and cleaning up
waste and pollution, using finite
resources efficiently and substituting
renewable resources wherever feasible,
so as to leave enough for future genera-
tions. Here is one of the most widely
accepted definitions:
Sustainability refers to the physical
development and institutional oper-
ating practices that meet the needs
of present users without compromis-
ing the ability of future generations
to meet their own needs, particular-
ly with regard to use and waste of
natural resources. Sustainable prac-
tices support ecological, human, and
economic health and vitality.
Sustainability presumes that
resources are finite, and should be
used conservatively and wisely with
a view to long-term priorities and
consequences of the ways in which
resources are used.
UCLA is looking at itself as well as
others when it rates environmental
performance. We are evaluating how to
operate in a sustainable environment,
looking at all aspects of the campus.
From energy used in buildings to the
food served in dining halls, from the
courses we offer to the long term plans
for campus growth, UCLA is taking the
idea of sustainability seriously. By the
time the 2007 Report Card is released, I
hope to be able to report on the progress
of this effort, which is housed at La Kretz
Hall and incorporated into the IoE.
As always, we welcome your
comments.
continued from page 3
The Report Card is a collection of essays on important
environmental topics, presenting researchers’ findings in a context
meant to be useful to both policy makers and the public.
67532 UCLA RC06.qxp 10/6/06 1:43 PM Page 39

UCLA INSTITUTE OF THE ENVIRONMENT40
industry remain to be implemented in a
more systematic and transparent manner.
Environmental best practices: Grade A.Industry-wide actions: Grade C.
REFERENCES
The report, “Sustainability in the Motion
Picture Industry,” on which this article is
based, was produced under contract to
the California Integrated Waste
Management Board (CIWMB) by Charles
J. Corbett and Richard P. Turco, April
13, 2006. Detailed references and
sources can be found in that report.
ACKNOWLEDGEMENTS
We thank our UCLA student team, espe-
cially Joanna Hankamer, Shannon
Clements and Jeannie Olander. Other
students who contributed are Fatma
Cakir, Patricia Greenwood, Penny Naud,
Kimberly Pargoff, Michael Rabinovitch,
Linh Goc and Todd Steiner. Professor
David Rigby collaborated to estimate the
environmental impacts of the film and
television industry. Professors Barbara
there are a growing number of people in
the industry working to achieve higher
levels of environmental performance, it is
probably inappropriate to assign low
grades to lagging elements during this
period of rapid transition. Nevertheless,
the lack of obvious industry-wide rules
and standards suggests that the FTI as a
whole has yet to devise effective
approaches for implementing progressive
environmental practices. It is possible
that more is being done than we are aware
of. In fact, on the basis of confidentiality,
we have been made aware of additional
environmentally proactive behavior
within the industry that is not reported
here. While green production guides such
as those issued by the EIDC and the
EMA have value, the limited publicly-
available information on environmental
performance, and the lack of third-party
verification mechanisms, do not favor a
conclusion that the FTI is doing all it can.
As an enterprise, the industry obviously
recognizes that its environmental mes-
sages—both on the screen and off—
represent a powerful tool for public
education. However, policies to mitigate
environmental impacts within the
Boyle, Mary Nichols and Gigi Johnson
shared contacts and insights. Many indi-
viduals generously provided time for this
project. Finally, the UCLA team received
exceptional support from the contract
managers at CIWMB (Judith Friedman,
Brenda Smyth, and Kristy Chew).
NOTES
1. Carnegie Mellon University Green DesignInstitute (2005); the Economic Input-OutputLife Cycle Assessment (EIO-LCA) model isavailable at: http://www.eiolca.net. After theanalysis in this report was carried out, theEIOLCA input-output data and sector defini-tions were updated, and we are currentlyreanalyzing the estimates presented here.
2. A correction is made to account for thedifference between the definitions of “finaloutput” and “size” of a sector; refer to the fullreport for more details.
The lack of obvious industry-wide rules and standards suggests
that the FTI as a whole has yet to devise effective approaches for
implementing progressive environmental practices.
continued from page 11
67532 UCLA RC06.qxp 10/6/06 1:43 PM Page 40

Southern California Environmental Report Card 2006UCLA Institute of the Environment
EditorsAnn E. Carlson, J.DArthur M. Winer, Ph.D.
Managing EditorBonnie Barclay
AuthorsCharles J. Corbett, Ph.D.Deborah Estrin, Ph.D.William Kaiser, Ph.D.Anastasia Loukaitou-Sideris, Ph.D.Philip Rundel, Ph.D.Keith D. Stolzenbach, Ph.D.Richard P. Turco, Ph.D.
DesignVita Associates
Printing Pace Lithographers, Inc.
PhotographsBonnie Barclay (10, 19)CORBIS (cover, 4, 12, 20, 30)Robert Reed Hutchinson, UCLA
Photographic Services (11) William Kaiser (36)Scott Quintard, ASUCLA
Photography (37)Ernesto Rodriguez (2) Orit Stieglitz, Ph.D. (18)UCLA Photographic Services (29) Xuan-Mai Vo (36)
RC 2006
Figures/DiagramsCharles J. Corbett, Ph.D. and
Richard P. Turco, Ph.D. (7, 8, 11) City of Los Angeles, Commission on
Children, Youth, and their Families (15)Jason C. Fisher, National Ecological
Observatory Network (32, 33, 35) Peter Harnik, Urban Land Institute (14)Orit Stieglitz, Ph.D. (16)Keith Stolzenbach, Ph.D. (25, 26, 27, 28) The UC Davis Tahoe Environmental
Research Center (24) U.S. E.P.A. (22)
Acting Chancellor, UCLANorman Abrams
Director, IoEMary D. Nichols, J.D.
67532 UCLA RC06.qxp 10/6/06 1:43 PM Page 41

Institute of the EnvironmentUniversity of California, Los Angeles619 Charles E. Young Dr. East La Kretz Hall, Suite 300Los Angeles, CA 90095-1496Phone: 310-825-5008Fax: 310-825-9663Email: [email protected] site: http://www.ioe.ucla.edu
Printed on 100% post-consumer waste paper
67532 UCLA RC06.qxp 10/6/06 1:37 PM Page C1
Related Documents


