Outline UCLA Department of Statistics Statistical Consulting Center Basic R Brigid Wilson [email protected] April 5, 2010 Brigid Wilson [email protected] Basic R UCLA SCC

Welcome message from author
This document is posted to help you gain knowledge. Please leave a comment to let me know what you think about it! Share it to your friends and learn new things together.
Transcript
Outline
UCLA Department of StatisticsStatistical Consulting Center
Basic R
Brigid [email protected]
April 5, 2010
Brigid Wilson [email protected]
Basic R UCLA SCC
Outline
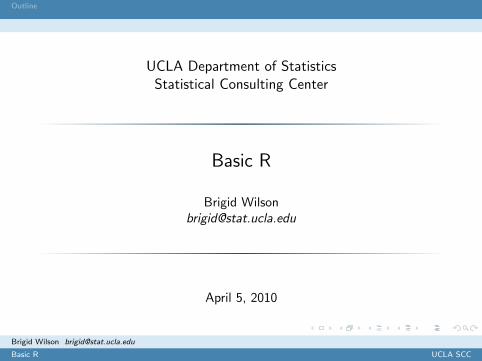
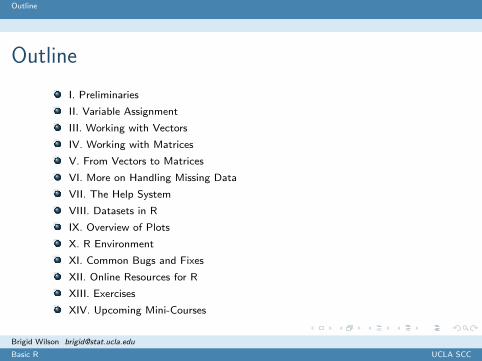
Outline
I. Preliminaries
II. Variable Assignment
III. Working with Vectors
IV. Working with Matrices
V. From Vectors to Matrices
VI. More on Handling Missing Data
VII. The Help System
VIII. Datasets in R
IX. Overview of Plots
X. R Environment
XI. Common Bugs and Fixes
XII. Online Resources for R
XIII. Exercises
XIV. Upcoming Mini-Courses
Brigid Wilson [email protected]
Basic R UCLA SCC

Preliminaries
Software Installation
Installing R on Mac
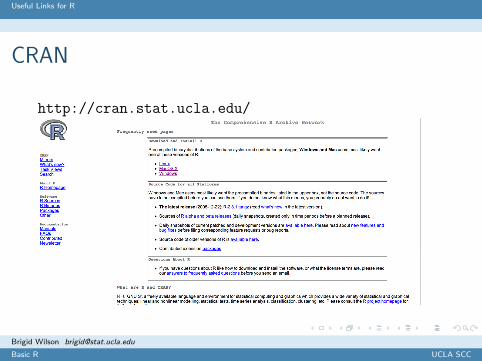
1 Go tohttp://cran.r-project.org
and select MacOS X.
2 Select to download thelatest version: 2.10.1
3 Install and Open. The Rwindow should look likethis:
Brigid Wilson [email protected]
Basic R UCLA SCC
Preliminaries
Software Installation
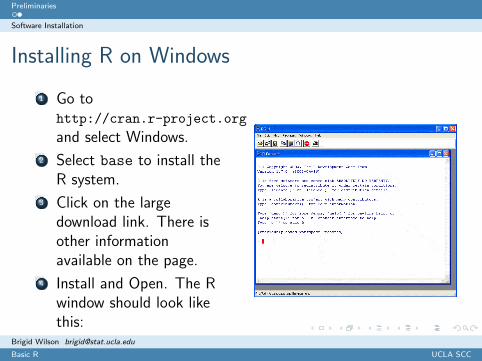
Installing R on Windows
1 Go tohttp://cran.r-project.org
and select Windows.
2 Select base to install theR system.
3 Click on the largedownload link. There isother informationavailable on the page.
4 Install and Open. The Rwindow should look likethis:
Brigid Wilson [email protected]
Basic R UCLA SCC


Variable Assignment
Creating Variables
Creating Variables I
To use R as a calculator, type an equation and hitENTER. (Note how R prints the result.) Your outputshould look like this:
1 2 + 52 [1] 7
Brigid Wilson [email protected]
Basic R UCLA SCC
Variable Assignment
Creating Variables
Creating Variables II
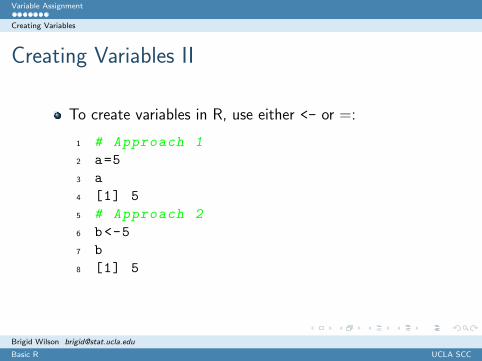
To create variables in R, use either <- or =:
1 # Approach 1
2 a=53 a4 [1] 55 # Approach 2
6 b<-57 b8 [1] 5
Brigid Wilson [email protected]
Basic R UCLA SCC

Variable Assignment
Creating Variables
Creating Variables III
Caution!
Be careful when using <- to compare a variable with anegative number!
1 #Assign a value to a
2 a<--23 #Is a less than -5?
4 a<-55 a6 [1] 5 #Expected FALSE
Brigid Wilson [email protected]
Basic R UCLA SCC

Variable Assignment
Creating Variables
Creating Variables IV
Use spaces so that R will not be confused. It is better to useparentheses instead.
1 a <- 52 a < -23 [1] FALSE
Brigid Wilson [email protected]
Basic R UCLA SCC

Variable Assignment
Creating Variables
Creating Variables V
Caution!
It is important not to name your variables after existingvariables or functions. For example, a bad habit is to nameyour data frames data. data is a function used to load somedatasets.If you give a variable the same name as an existingconstant, that constant is overwritten with the value ofthe variable. So, it is possible to define a new value for π.
Brigid Wilson [email protected]
Basic R UCLA SCC

Variable Assignment
Creating Variables
Creating Variables VI
Caution!
On the other hand, if you give a variable the same name as anexisting function, R will treat the identifier as a variable if usedas a variable, and will treat it as a function when it is used asa function:
c <- 2 #typing c yields "2"
c(c,c) #yields a vector containing two 2s.
Brigid Wilson [email protected]
Basic R UCLA SCC
Variable Assignment
Creating Variables
Creating Variables VII
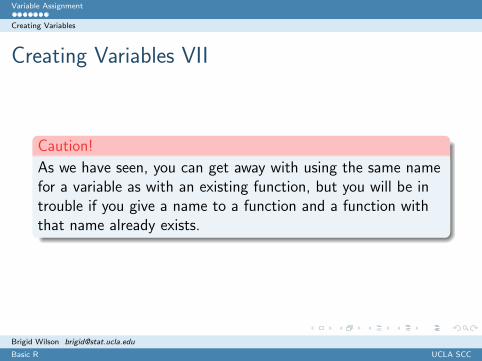
Caution!
As we have seen, you can get away with using the same namefor a variable as with an existing function, but you will be introuble if you give a name to a function and a function withthat name already exists.
Brigid Wilson [email protected]
Basic R UCLA SCC

Working with Vectors
Creating Vectors
Creating Vectors I
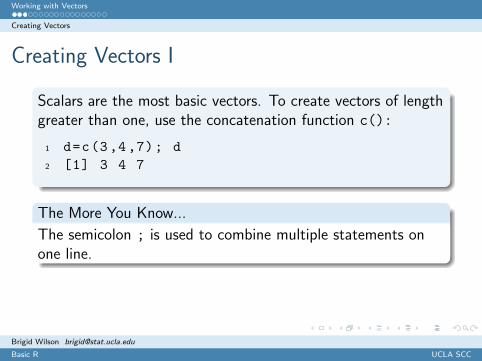
Scalars are the most basic vectors. To create vectors of lengthgreater than one, use the concatenation function c():
1 d=c(3,4,7); d2 [1] 3 4 7
The More You Know...
The semicolon ; is used to combine multiple statements onone line.
Brigid Wilson [email protected]
Basic R UCLA SCC

Working with Vectors
Creating Vectors
Creating Vectors II
To create a null vector:
1 x=c(); x2 NULL
Brigid Wilson [email protected]
Basic R UCLA SCC
Working with Vectors
Creating Vectors
Creating Vectors III
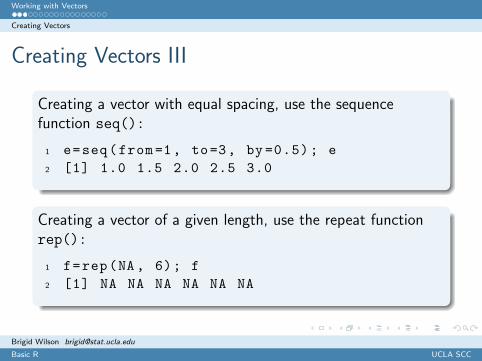
Creating a vector with equal spacing, use the sequencefunction seq():
1 e=seq(from=1, to=3, by=0.5); e2 [1] 1.0 1.5 2.0 2.5 3.0
Creating a vector of a given length, use the repeat functionrep():
1 f=rep(NA, 6); f2 [1] NA NA NA NA NA NA
Brigid Wilson [email protected]
Basic R UCLA SCC

Working with Vectors
Some Vector Functions
Some Useful Vector Functions I
To find the length of the vector, use length():
1 length(d)2 [1] 3
To find the maximum value of the vector, use the maximumfunction max():
1 max(d)2 [1] 7
Brigid Wilson [email protected]
Basic R UCLA SCC
Working with Vectors
Some Vector Functions
Some Useful Vector Functions II
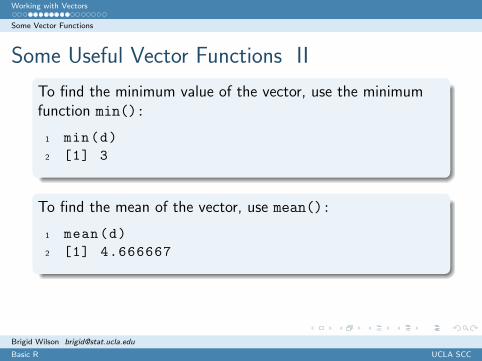
To find the minimum value of the vector, use the minimumfunction min():
1 min(d)2 [1] 3
To find the mean of the vector, use mean():
1 mean(d)2 [1] 4.666667
Brigid Wilson [email protected]
Basic R UCLA SCC
Working with Vectors
Some Vector Functions
Some Useful Vector Functions III
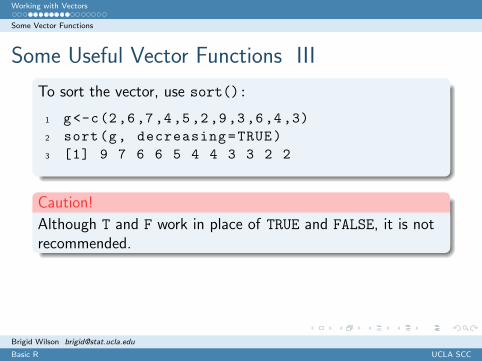
To sort the vector, use sort():
1 g<-c(2,6,7,4,5,2,9,3,6,4,3)2 sort(g, decreasing=TRUE)3 [1] 9 7 6 6 5 4 4 3 3 2 2
Caution!
Although T and F work in place of TRUE and FALSE, it is notrecommended.
Brigid Wilson [email protected]
Basic R UCLA SCC
Working with Vectors
Some Vector Functions
Some Useful Vector Functions IV
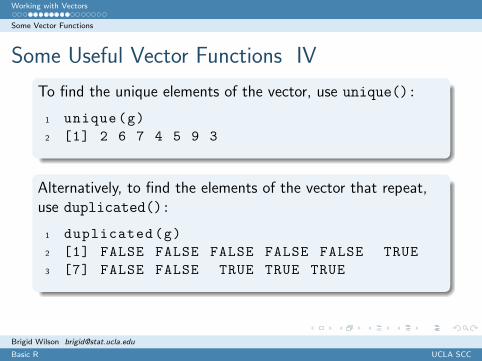
To find the unique elements of the vector, use unique():
1 unique(g)2 [1] 2 6 7 4 5 9 3
Alternatively, to find the elements of the vector that repeat,use duplicated():
1 duplicated(g)2 [1] FALSE FALSE FALSE FALSE FALSE TRUE3 [7] FALSE FALSE TRUE TRUE TRUE
Brigid Wilson [email protected]
Basic R UCLA SCC
Working with Vectors
Some Vector Functions
Some Useful Vector Functions V
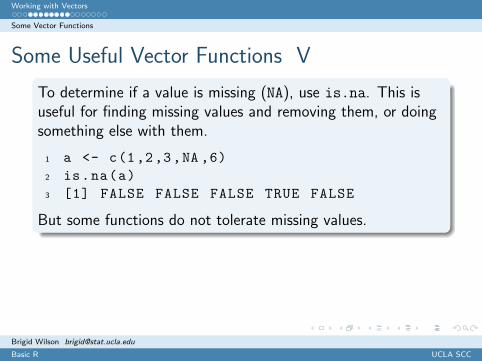
To determine if a value is missing (NA), use is.na. This isuseful for finding missing values and removing them, or doingsomething else with them.
1 a <- c(1,2,3,NA ,6)2 is.na(a)3 [1] FALSE FALSE FALSE TRUE FALSE
But some functions do not tolerate missing values.
Brigid Wilson [email protected]
Basic R UCLA SCC
Working with Vectors
Some Vector Functions
Some Useful Vector Functions VI
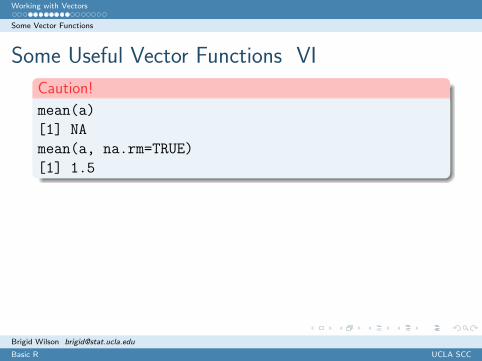
Caution!
mean(a)
[1] NA
mean(a, na.rm=TRUE)
[1] 1.5
Brigid Wilson [email protected]
Basic R UCLA SCC
Working with Vectors
Some Vector Functions
Some Useful Vector Functions VII
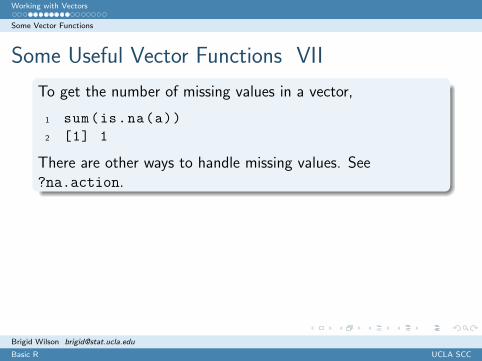
To get the number of missing values in a vector,
1 sum(is.na(a))2 [1] 1
There are other ways to handle missing values. See?na.action.
Brigid Wilson [email protected]
Basic R UCLA SCC
Working with Vectors
Some Vector Functions
Some Useful Vector Functions VIII
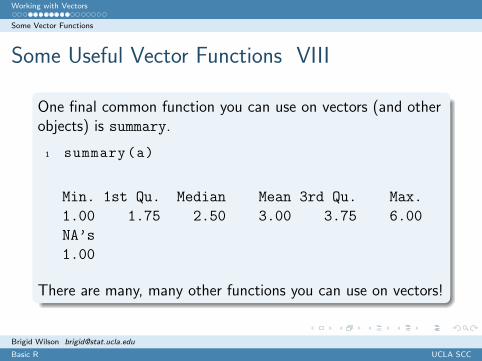
One final common function you can use on vectors (and otherobjects) is summary.
1 summary(a)
Min. 1st Qu. Median Mean 3rd Qu. Max.
1.00 1.75 2.50 3.00 3.75 6.00
NA’s
1.00
There are many, many other functions you can use on vectors!
Brigid Wilson [email protected]
Basic R UCLA SCC

Working with Vectors
Comparisons in R
Comparisons in R
Symbol Meaning! logical NOT& logical AND— logical OR< less than<= less than or equal to> greater than>= greater than or equal to== logical equals! = not equal
Brigid Wilson [email protected]
Basic R UCLA SCC

Working with Vectors
Subsetting with Vectors
Subsetting with Vectors I
To find out what is stored in a given element of the vector,use [ ]:
1 d[2]2 [1] 4
To see if the elements of a vector equal a certain number,use ==:
1 d==32 [1] TRUE FALSE FALSE
Brigid Wilson [email protected]
Basic R UCLA SCC

Working with Vectors
Subsetting with Vectors
Subsetting with Vectors II
To see if any of the elements of a vector do not equal acertain number, use !=:
1 d!=32 [1] FALSE TRUE TRUE
Brigid Wilson [email protected]
Basic R UCLA SCC
Working with Vectors
Subsetting with Vectors
Subsetting with Vectors III
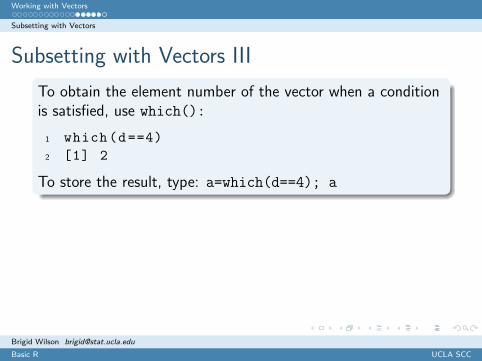
To obtain the element number of the vector when a conditionis satisfied, use which():
1 which(d==4)2 [1] 2
To store the result, type: a=which(d==4); a
Brigid Wilson [email protected]
Basic R UCLA SCC
Working with Vectors
Subsetting with Vectors
Subsetting with Vectors IV
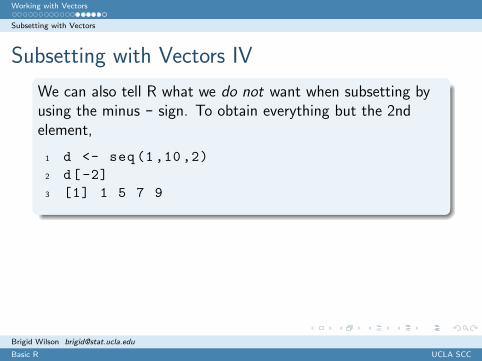
We can also tell R what we do not want when subsetting byusing the minus - sign. To obtain everything but the 2ndelement,
1 d <- seq(1,10,2)2 d[-2]3 [1] 1 5 7 9
Brigid Wilson [email protected]
Basic R UCLA SCC

Working with Vectors
Subsetting with Vectors
Subsetting with Vectors V
We can use subsetting to explicitly tell R what observations wewant to use. To get all elements of d greater than or equal to2,
1 d[d >= 2]2 [1] 3 5 7 9
R will return values of d where the expression within bracketsis TRUE. Think of these statements as: “give me all d suchthat d ≥ 2.”
Brigid Wilson [email protected]
Basic R UCLA SCC

Working with Vectors
Subsetting with Vectors
Exercise 1
Create a vector of the positive odd integers less than 100
Remove the values greater than 60 and less than 80
Find the variance of the remaining set of values
Brigid Wilson [email protected]
Basic R UCLA SCC
Working with Matrices
Part IV
Working with Matrices
Brigid Wilson [email protected]
Basic R UCLA SCC
Working with Matrices
Creating Matrices
Creating Matrices I
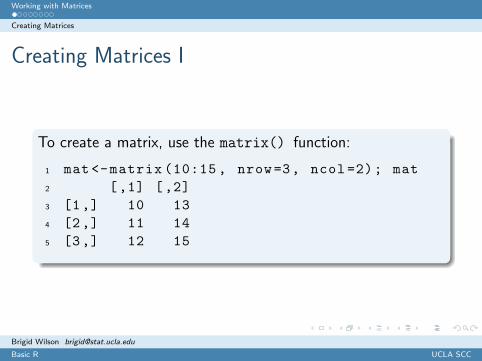
To create a matrix, use the matrix() function:
1 mat <-matrix (10:15 , nrow=3, ncol =2); mat2 [,1] [,2]3 [1,] 10 134 [2,] 11 145 [3,] 12 15
Brigid Wilson [email protected]
Basic R UCLA SCC

Working with Matrices
Some Matrix Functions
Some Useful Matrix Functions I
To add two matrices, use +
1 mat+mat2 [,1] [,2]3 [1,] 20 264 [2,] 22 285 [3,] 24 30
Brigid Wilson [email protected]
Basic R UCLA SCC

Working with Matrices
Some Matrix Functions
Some Useful Matrix Functions II
To find the transpose of a matrix, use t():
1 t(mat)2 [,1] [,2] [,3]3 [1,] 10 11 124 [2,] 13 14 15
Brigid Wilson [email protected]
Basic R UCLA SCC

Working with Matrices
Some Matrix Functions
Some Useful Matrix Functions III
To find the dimensions of a matrix, use dim():
1 dim(mat)2 [1] 3 2
Alternatively, we can find the rows and columns of the matrix,by nrow() and ncol().
Brigid Wilson [email protected]
Basic R UCLA SCC

Working with Matrices
Some Matrix Functions
Some Useful Matrix Functions IV
To multiply two matrices, use %*%.
Note: If you use * instead, you will be performing matrixmultiplication element-wise.
1 mat%*%t(mat)2 [,1] [,2] [,3]3 [1,] 269 292 3154 [2,] 292 317 3425 [3,] 315 342 369
Brigid Wilson [email protected]
Basic R UCLA SCC
Working with Matrices
Subsetting with Matrices
Subsetting with Matrices I
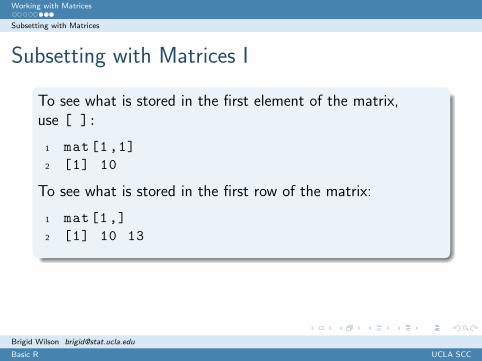
To see what is stored in the first element of the matrix,use [ ]:
1 mat[1,1]2 [1] 10
To see what is stored in the first row of the matrix:
1 mat[1,]2 [1] 10 13
Brigid Wilson [email protected]
Basic R UCLA SCC
Working with Matrices
Subsetting with Matrices
Subsetting with Matrices II
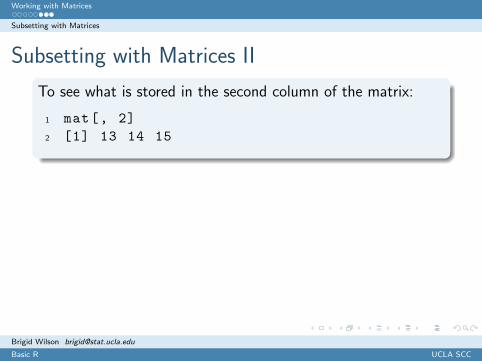
To see what is stored in the second column of the matrix:
1 mat[, 2]2 [1] 13 14 15
Brigid Wilson [email protected]
Basic R UCLA SCC

Working with Matrices
Subsetting with Matrices
Subsetting with Matrices III
To extract elements 1 and 3 from the second column, use c()
and [ ]:
1 mat[c(1,3), 2]2 [1] 13 15
Brigid Wilson [email protected]
Basic R UCLA SCC
From Vectors to Matrices
Part V
From Vectors to Matrices
Brigid Wilson [email protected]
Basic R UCLA SCC

From Vectors to Matrices
Creating Matrices from Vectors
Creating Matrices from Vectors I
To stack two vectors, one below the other, use rbind():
1 mat1 <-rbind(d,d); mat12 [,1] [,2] [,3]3 d 3 4 74 d 3 4 7
Brigid Wilson [email protected]
Basic R UCLA SCC

From Vectors to Matrices
Creating Matrices from Vectors
Creating Matrices from Vectors II
To stack two vectors, one next to the other, use cbind():
1 mat2 <-cbind(d,d); mat22 d d3 [1,] 3 34 [2,] 4 45 [3,] 7 7
Brigid Wilson [email protected]
Basic R UCLA SCC

More Handling Missing Data
Part VI
More on Handling Missing Data
Brigid Wilson [email protected]
Basic R UCLA SCC
More Handling Missing Data
Missing Data in Matrices
Missing Data in Matrices I
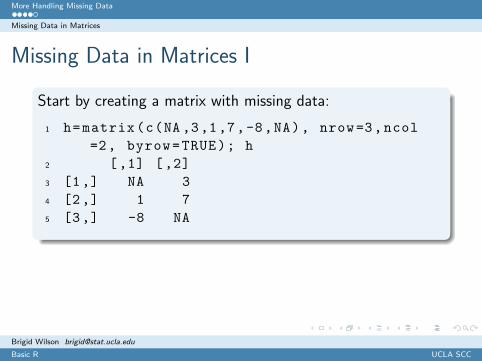
Start by creating a matrix with missing data:
1 h=matrix(c(NA ,3,1,7,-8,NA), nrow=3,ncol=2, byrow=TRUE); h
2 [,1] [,2]3 [1,] NA 34 [2,] 1 75 [3,] -8 NA
Brigid Wilson [email protected]
Basic R UCLA SCC
More Handling Missing Data
Missing Data in Matrices
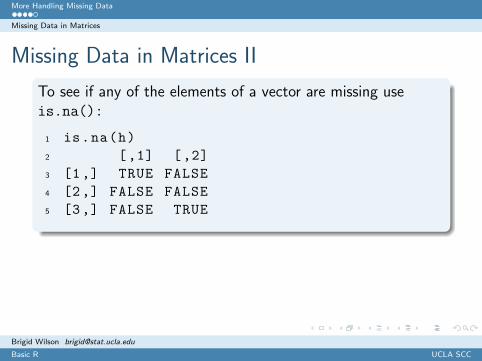
Missing Data in Matrices II
To see if any of the elements of a vector are missing useis.na():
1 is.na(h)2 [,1] [,2]3 [1,] TRUE FALSE4 [2,] FALSE FALSE5 [3,] FALSE TRUE
Brigid Wilson [email protected]
Basic R UCLA SCC

More Handling Missing Data
Missing Data in Matrices
Missing Data in Matrices III
To see how many missing values there are, use sum() andis.na() (TRUE=1, FALSE=0):
1 sum(is.na(h))2 [1] 2
To obtain the element number of the matrix of the missingvalue(s), use which() and is.na():
1 which(is.na(h))2 [1] 1 6
Brigid Wilson [email protected]
Basic R UCLA SCC
More Handling Missing Data
Missing Data in Matrices
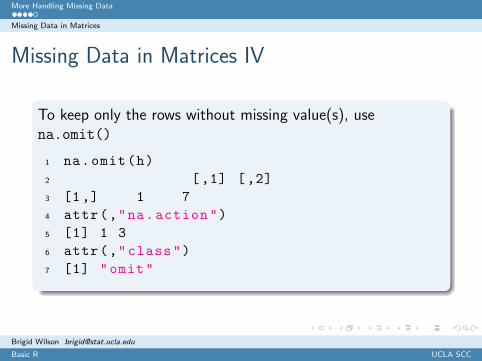
Missing Data in Matrices IV
To keep only the rows without missing value(s), usena.omit()
1 na.omit(h)2 [,1] [,2]3 [1,] 1 74 attr(,"na.action")5 [1] 1 36 attr(,"class")7 [1] "omit"
Brigid Wilson [email protected]
Basic R UCLA SCC

More Handling Missing Data
Missing Data in Matrices
Exercise 2
Find the matrix product of A and B if
Matrix A=2 3 71 6 23 5 1
Matrix B=3 2 9
0 7 85 8 2
Brigid Wilson [email protected]
Basic R UCLA SCC

Getting Help in R
Help with a Function
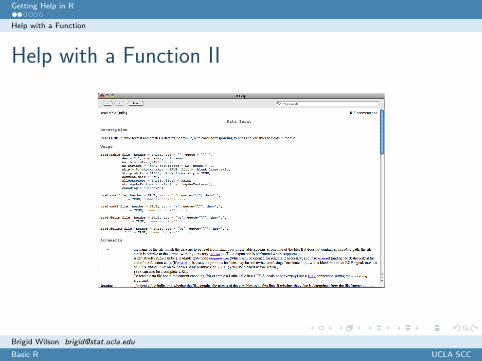
Help with a Function I
To get help with a function in R, use ? followed by the nameof the function.
1 ?read.table
help(function name) also works.
Brigid Wilson [email protected]
Basic R UCLA SCC
Getting Help in R
Help with a Function
Help with a Function II
Brigid Wilson [email protected]
Basic R UCLA SCC
Getting Help in R
Help with a Package
Help with a Package I
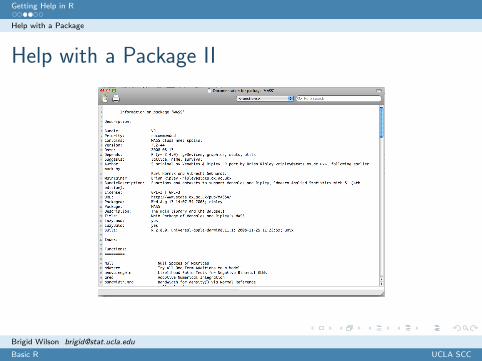
To get help with a package, use help(package="name").
1 help(package="MASS")
Brigid Wilson [email protected]
Basic R UCLA SCC
Getting Help in R
Help with a Package
Help with a Package II
Brigid Wilson [email protected]
Basic R UCLA SCC
Getting Help in R
Searching for Help
Searching for Help I
To search R packages for help with a topic, usehelp.search().
1 help.search("regression")
Brigid Wilson [email protected]
Basic R UCLA SCC

Getting Help in R
Searching for Help
Searching for Help II
Brigid Wilson [email protected]
Basic R UCLA SCC

Datasets in R
Importing Datasets into R
Data from the Internet I
When downloading data from the internet, useread.table(). In the arguments of the function:
header if TRUE, tells R to include variables names whenimporting
sep tells R how the entires in the data set are separated
sep="," when entries are separated by COMMASsep="\t" when entries are separated by TABsep=" " when entries are separated by SPACE
Brigid Wilson [email protected]
Basic R UCLA SCC

Datasets in R
Importing Datasets into R
Data from the Internet II
1 stock.data <-read.table("http://www.google.com/finance/historical?q=NASDAQ:AAPL&output=csv", header=TRUE , sep=",")
Brigid Wilson [email protected]
Basic R UCLA SCC

Datasets in R
Importing Datasets into R
Importing Data from Your Computer I
1 Check what folder R is working with now:
1 getwd()
2 Tell R in what folder the data set is stored (if differentfrom (1)). Suppose your data set is on your desktop:
1 setwd("~/Desktop")
3 Now use the read.table() command to read in thedata, substituting the name of the file for the website.
Brigid Wilson [email protected]
Basic R UCLA SCC

Datasets in R
Importing Datasets into R
Using Data Available in R I
To use a data set available in one of the R packages, installthat package (if needed). Load the package into R, using thelibrary() function.
1 library(alr3)
Extract the data set you want from that package, using thedata() function. In our case, the data set is called UN2.
1 data(UN2)
Brigid Wilson [email protected]
Basic R UCLA SCC

Datasets in R
Working with Datasets in R
Working with Datasets in R I
To use the variable names when working with data, useattach():
1 data(UN2)2 attach(UN2)
Brigid Wilson [email protected]
Basic R UCLA SCC
Datasets in R
Working with Datasets in R
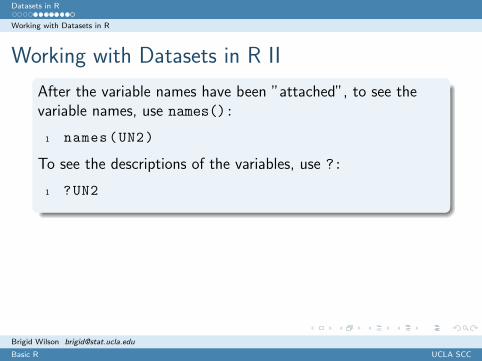
Working with Datasets in R II
After the variable names have been ”attached”, to see thevariable names, use names():
1 names(UN2)
To see the descriptions of the variables, use ?:
1 ?UN2
Brigid Wilson [email protected]
Basic R UCLA SCC

Datasets in R
Working with Datasets in R
Working with Datasets in R III
After modifying variables, use detach() and attach() tosave the results:
1 # Make a copy of the data set
2 UN2.copy <-UN23 detach(UN2)4 attach(UN2.copy)5 # Change the 10th observation for
logFertility
6 UN2.copy[10, 2]<-999
Brigid Wilson [email protected]
Basic R UCLA SCC
Datasets in R
Working with Datasets in R
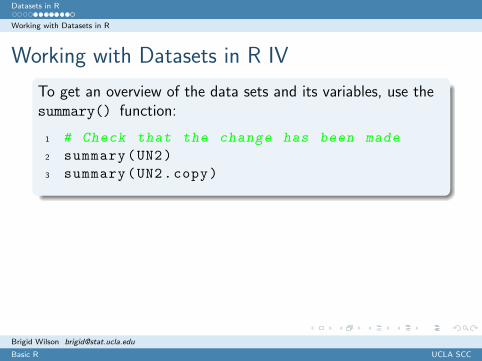
Working with Datasets in R IV
To get an overview of the data sets and its variables, use thesummary() function:
1 # Check that the change has been made
2 summary(UN2)3 summary(UN2.copy)
Brigid Wilson [email protected]
Basic R UCLA SCC
Datasets in R
Working with Datasets in R
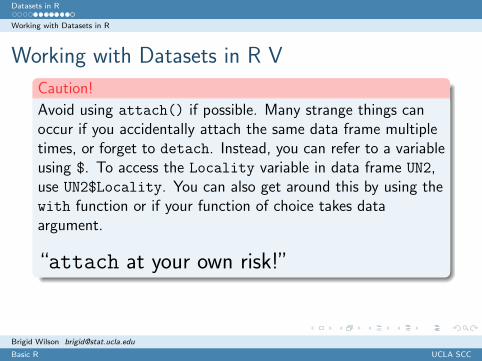
Working with Datasets in R V
Caution!
Avoid using attach() if possible. Many strange things canoccur if you accidentally attach the same data frame multipletimes, or forget to detach. Instead, you can refer to a variableusing $. To access the Locality variable in data frame UN2,use UN2$Locality. You can also get around this by using thewith function or if your function of choice takes dataargument.
“attach at your own risk!”
Brigid Wilson [email protected]
Basic R UCLA SCC

Datasets in R
Working with Datasets in R
Working with Datasets in R VI
To get the mean of all the variables in the data set, usemean():
1 mean(UN2 ,na.rm=TRUE)2 logPPgdp logFertility Purban3 10.993094 1.018016 55.538860
Brigid Wilson [email protected]
Basic R UCLA SCC
Datasets in R
Working with Datasets in R
Working with Datasets in R VII
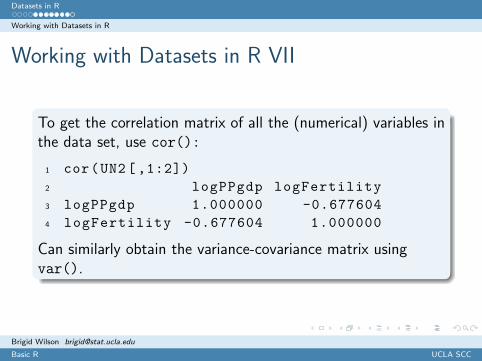
To get the correlation matrix of all the (numerical) variables inthe data set, use cor():
1 cor(UN2 [ ,1:2])2 logPPgdp logFertility3 logPPgdp 1.000000 -0.6776044 logFertility -0.677604 1.000000
Can similarly obtain the variance-covariance matrix usingvar().
Brigid Wilson [email protected]
Basic R UCLA SCC

Datasets in R
Working with Datasets in R
Exercise 3
Load the Animals dataset from the MASS package
Examine the documentation for this dataset
Find the correlation coefficient of brain weight and bodyweight in this dataset
Brigid Wilson [email protected]
Basic R UCLA SCC
Overview of Plots in R
Part IX
Overview of Plots in R
Brigid Wilson [email protected]
Basic R UCLA SCC

Overview of Plots in R
Creating Plots
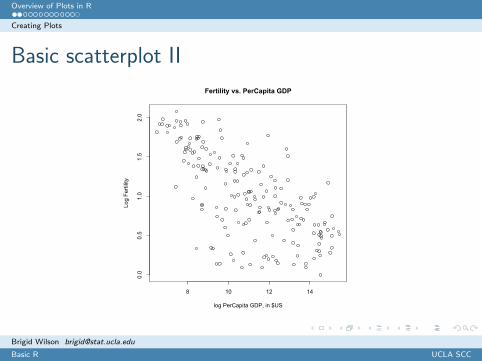
Basic scatterplot I
To make a plot in R, you can use plot():
1 plot(x=UN2$logPPgdp ,2 y = UN2$logFertility ,3 main = "Fertility vs. PerCapita GDP",4 xlab = "log PerCapita GDP , in $US",5 ylab = "Log Fertility")
Brigid Wilson [email protected]
Basic R UCLA SCC
Overview of Plots in R
Creating Plots
Basic scatterplot II
8 10 12 14
0.0
0.5
1.0
1.5
2.0
Fertility vs. PerCapita GDP
log PerCapita GDP, in $US
Log
Ferti
lity
Brigid Wilson [email protected]
Basic R UCLA SCC
Overview of Plots in R
Creating Plots
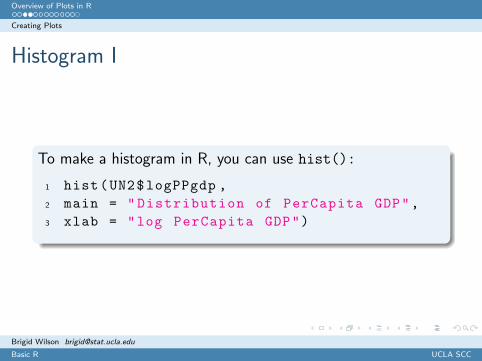
Histogram I
To make a histogram in R, you can use hist():
1 hist(UN2$logPPgdp ,2 main = "Distribution of PerCapita GDP",3 xlab = "log PerCapita GDP")
Brigid Wilson [email protected]
Basic R UCLA SCC

Overview of Plots in R
Creating Plots
Histogram II
Distribution of PerCapita GDP
log PerCapita GDP
Frequency
6 8 10 12 14 16
05
1015
2025
30
Brigid Wilson [email protected]
Basic R UCLA SCC

Overview of Plots in R
Creating Plots
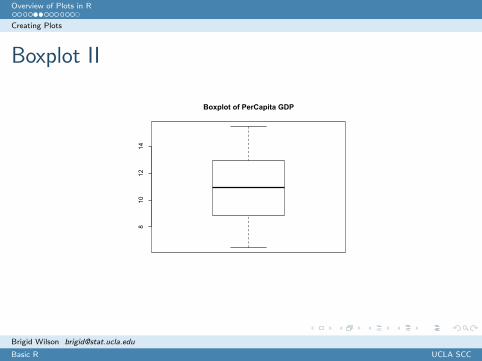
Boxplot I
To make a boxplot in R, you can use boxplot():
1 boxplot(UN2$logPPgdp ,2 main = "Boxplot of PerCapita GDP")
Brigid Wilson [email protected]
Basic R UCLA SCC
Overview of Plots in R
Creating Plots
Boxplot II
810
1214
Boxplot of PerCapita GDP
Brigid Wilson [email protected]
Basic R UCLA SCC
Overview of Plots in R
Creating Plots
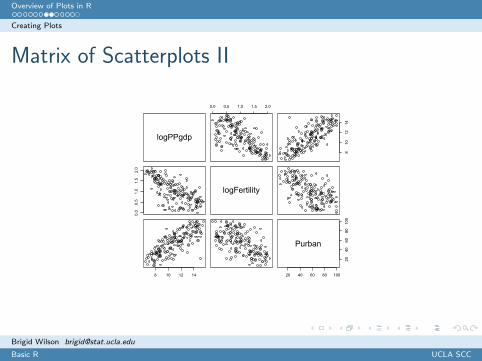
Matrix of Scatterplots I
To make scatterplots of all the numeric variables in yourdataset in R, you can use pairs():
1 pairs(UN2)
Brigid Wilson [email protected]
Basic R UCLA SCC
Overview of Plots in R
Creating Plots
Matrix of Scatterplots II
logPPgdp
0.0 0.5 1.0 1.5 2.0
810
1214
0.0
0.5
1.0
1.5
2.0
logFertility
8 10 12 14 20 40 60 80 100
2040
6080
100
Purban
Brigid Wilson [email protected]
Basic R UCLA SCC
Overview of Plots in R
Creating Plots
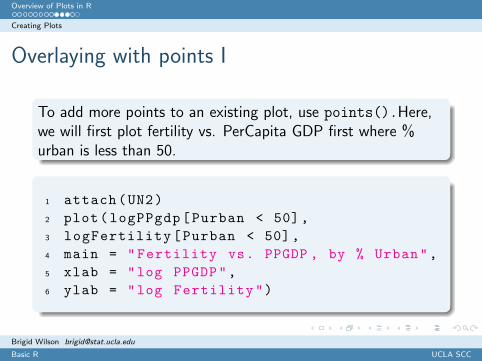
Overlaying with points I
To add more points to an existing plot, use points().Here,we will first plot fertility vs. PerCapita GDP first where %urban is less than 50.
1 attach(UN2)2 plot(logPPgdp[Purban < 50],3 logFertility[Purban < 50],4 main = "Fertility vs. PPGDP , by % Urban",5 xlab = "log PPGDP",6 ylab = "log Fertility")
Brigid Wilson [email protected]
Basic R UCLA SCC

Overview of Plots in R
Creating Plots
Overlaying with points II
We then add in the points where % urban is more than 50 andmark these points with a different color.
1 points(logPPgdp[Purban >= 50],2 logFertility[Purban >= 50],3 col = "red")
Brigid Wilson [email protected]
Basic R UCLA SCC

Overview of Plots in R
Creating Plots
Overlaying with points III
8 10 12 14
0.5
1.0
1.5
2.0
Fertility vs. PPGDP, by % Urban
log PPGDP
log
Ferti
lity
Brigid Wilson [email protected]
Basic R UCLA SCC
Overview of Plots in R
Creating Plots
Overlaying
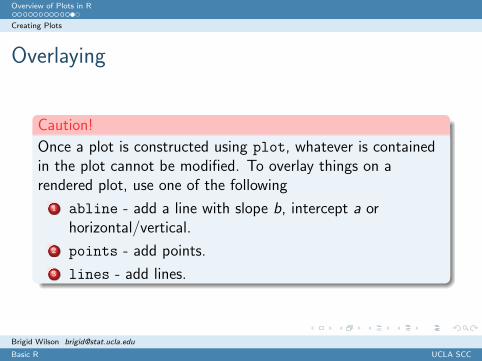
Caution!
Once a plot is constructed using plot, whatever is containedin the plot cannot be modified. To overlay things on arendered plot, use one of the following
1 abline - add a line with slope b, intercept a orhorizontal/vertical.
2 points - add points.
3 lines - add lines.
Brigid Wilson [email protected]
Basic R UCLA SCC
Overview of Plots in R
Saving Plots as a PDF
Saving Plots as a PDF I
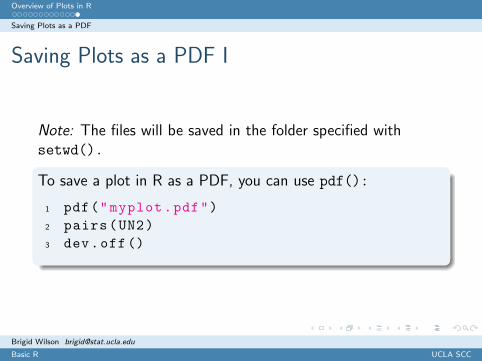
Note: The files will be saved in the folder specified withsetwd().
To save a plot in R as a PDF, you can use pdf():
1 pdf("myplot.pdf")2 pairs(UN2)3 dev.off()
Brigid Wilson [email protected]
Basic R UCLA SCC

R Environment Exporting R Objects to Other Formats
Part X
R Environment
Brigid Wilson [email protected]
Basic R UCLA SCC

R Environment Exporting R Objects to Other Formats
Exploring R Objects
Exploring R Objects I
To see the names of the objects available to be saved (in yourcurrent workspace), use ls().
1 ls()
[1] "UN2" "a" "b" "d" "data" "e" "f" "h" "mat1" "mat2"
Brigid Wilson [email protected]
Basic R UCLA SCC

R Environment Exporting R Objects to Other Formats
Exploring R Objects
Exploring R Objects II
To remove objects from your workspace, use rm().
1 rm(d)2 ls()
[1] "UN2" "a" "b" "data" "e" "f" "h" "mat1" "mat2"
Brigid Wilson [email protected]
Basic R UCLA SCC

R Environment Exporting R Objects to Other Formats
Exploring R Objects
Exploring R Objects III
To remove all the objects from your workspace, type:
1 rm(list=ls())2 ls()
character(0)
Brigid Wilson [email protected]
Basic R UCLA SCC
R Environment Exporting R Objects to Other Formats
Saving and Loading R Objects
Saving and Loading R Objects I
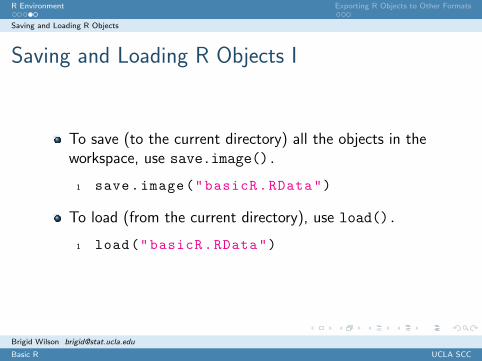
To save (to the current directory) all the objects in theworkspace, use save.image().
1 save.image("basicR.RData")
To load (from the current directory), use load().
1 load("basicR.RData")
Brigid Wilson [email protected]
Basic R UCLA SCC
R Environment Exporting R Objects to Other Formats
Saving and Loading R Objects
Saving and Loading R Objects I
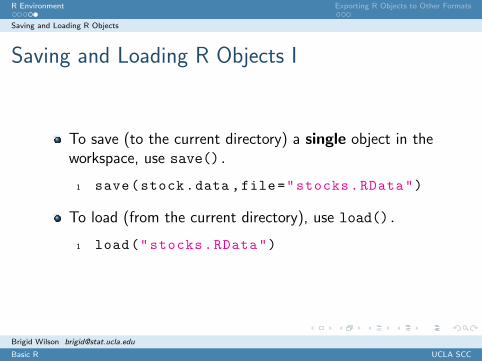
To save (to the current directory) a single object in theworkspace, use save().
1 save(stock.data ,file="stocks.RData")
To load (from the current directory), use load().
1 load("stocks.RData")
Brigid Wilson [email protected]
Basic R UCLA SCC

R Environment Exporting R Objects to Other Formats
Exporting R Objects to Other Formats I
To save (to the current directory) certain objects in theworkspace to be used in Excel, use write.csv().
1 write.csv(stock.data ,2 file="stockdata.csv")
Brigid Wilson [email protected]
Basic R UCLA SCC

R Environment Exporting R Objects to Other Formats
Saving R Commands
Saving R Commands I
To see all of the commands you typed in an R session,click on the Yellow and Green Tablet
Brigid Wilson [email protected]
Basic R UCLA SCC

R Environment Exporting R Objects to Other Formats
Saving R Commands
Saving R Commands IITo save all of the commands you typed in an R session,use:
1 savehistory(file="history.log")
Brigid Wilson [email protected]
Basic R UCLA SCC
R Environment Exporting R Objects to Other Formats
Saving R Commands
Saving R Commands III
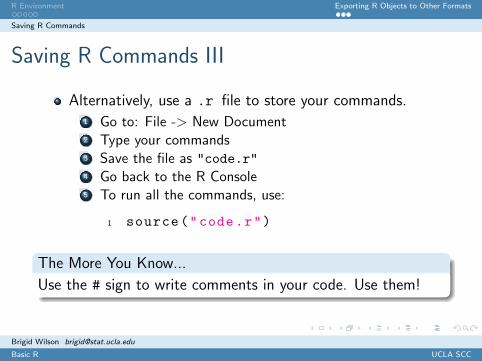
Alternatively, use a .r file to store your commands.1 Go to: File -> New Document2 Type your commands3 Save the file as "code.r"4 Go back to the R Console5 To run all the commands, use:
1 source("code.r")
The More You Know...
Use the # sign to write comments in your code. Use them!
Brigid Wilson [email protected]
Basic R UCLA SCC
Common Bugs and Fixes
Part XI
Common Bugs and Fixes
Brigid Wilson [email protected]
Basic R UCLA SCC

Common Bugs and Fixes
Syntax Error
Error: syntax error
Possible causes:
Incorrect spelling (of the function, variable, etc.)
Including a ”+” when copying code from the Console
Having an extra parenthesis at the end of a function
Having an extra bracket when subsetting
Brigid Wilson [email protected]
Basic R UCLA SCC
Common Bugs and Fixes
Trailing +
Trailing +
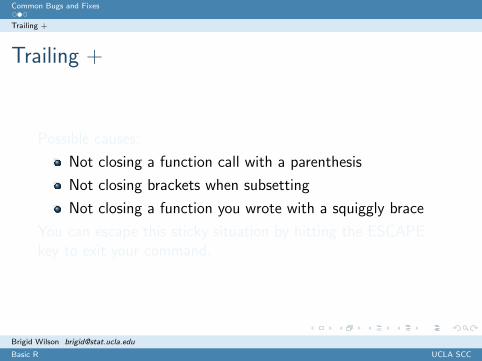
Possible causes:
Not closing a function call with a parenthesis
Not closing brackets when subsetting
Not closing a function you wrote with a squiggly brace
You can escape this sticky situation by hitting the ESCAPEkey to exit your command.
Brigid Wilson [email protected]
Basic R UCLA SCC
Common Bugs and Fixes
Error When Performing Operations
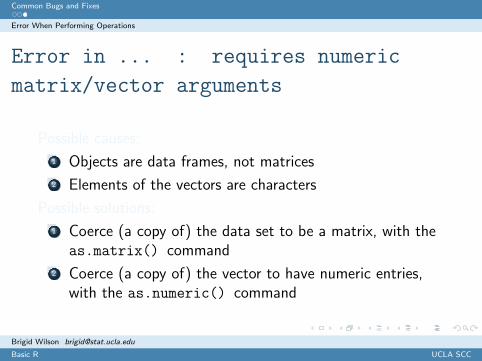
Error in ... : requires numeric
matrix/vector arguments
Possible causes:
1 Objects are data frames, not matrices
2 Elements of the vectors are characters
Possible solutions:
1 Coerce (a copy of) the data set to be a matrix, with theas.matrix() command
2 Coerce (a copy of) the vector to have numeric entries,with the as.numeric() command
Brigid Wilson [email protected]
Basic R UCLA SCC

Useful Links for R
R-Seek Search Engine
http://www.rseek.org
Brigid Wilson [email protected]
Basic R UCLA SCC
Useful Links for R
UCLA Statistics Bootcamp Resources
R Bootcamp is a day-long introduction to R. Handouts anddatasets from Bootcamp 2008 can be found on Ryan Rosario’swebsite: http://www.stat.ucla.edu/∼rosario/boot08/
Brigid Wilson [email protected]
Basic R UCLA SCC
Useful Links for R
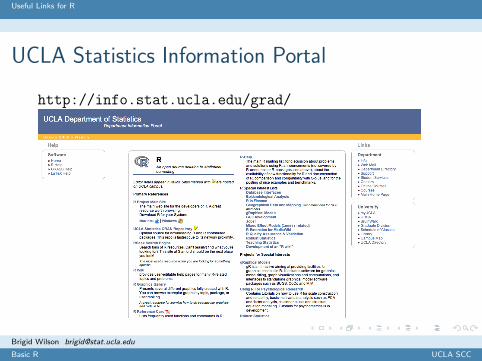
UCLA Statistics Information Portal
http://info.stat.ucla.edu/grad/
Brigid Wilson [email protected]
Basic R UCLA SCC

Useful Links for R
UCLA Statistical Consulting Center E-consulting
and Walk-in Consulting
http://scc.stat.ucla.edu
Brigid Wilson [email protected]
Basic R UCLA SCC

Exercises
Exercise 1
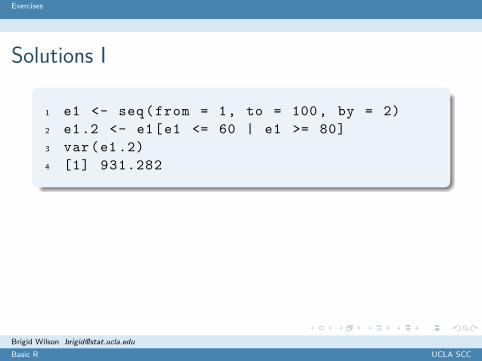
Create a vector of the positive odd integers less than 100
Remove the values greater than 60 and less than 80
Find the variance of the remaining set of values
Brigid Wilson [email protected]
Basic R UCLA SCC

Exercises
Exercise 2
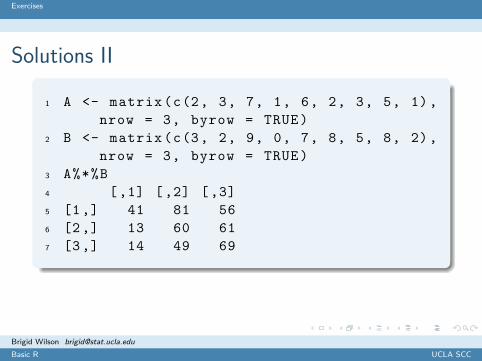
Find the matrix product of A and B if
Matrix A=2 3 71 6 23 5 1
Matrix B=3 2 9
0 7 85 8 2
Brigid Wilson [email protected]
Basic R UCLA SCC

Exercises
Exercise 3
Load the Animals dataset from the MASS package
Examine the documentation for this dataset
Find the correlation coefficient of brain weight and bodyweight in this dataset
Brigid Wilson [email protected]
Basic R UCLA SCC
Exercises
Solutions I
1 e1 <- seq(from = 1, to = 100, by = 2)2 e1.2 <- e1[e1 <= 60 | e1 >= 80]3 var(e1.2)4 [1] 931.282
Brigid Wilson [email protected]
Basic R UCLA SCC
Exercises
Solutions II
1 A <- matrix(c(2, 3, 7, 1, 6, 2, 3, 5, 1),nrow = 3, byrow = TRUE)
2 B <- matrix(c(3, 2, 9, 0, 7, 8, 5, 8, 2),nrow = 3, byrow = TRUE)
3 A%*%B4 [,1] [,2] [,3]5 [1,] 41 81 566 [2,] 13 60 617 [3,] 14 49 69
Brigid Wilson [email protected]
Basic R UCLA SCC

Exercises
Solutions III
1 library(MASS)2 data(Animals)3 ?Animals4 cor(Animals)5 body brain6 body 1.000000000 -0.0053411637 brain -0.005341163 1.000000000
Brigid Wilson [email protected]
Basic R UCLA SCC


Upcoming Mini-Courses
April 7 - R Programming II: Data Manipulation and Functions
April 12 - LaTex I: Writing a Document, Paper, or Thesis
April 14 - LaTeX II: Bibliographies, Style and Math in LaTeX
April 19 - LaTeX III: Sweave, Embedding R in LaTeX
For a schedule of all mini-courses offered please visithttp://scc.stat.ucla.edu/mini-courses.
Brigid Wilson [email protected]
Basic R UCLA SCC
Related Documents