UC Irvine Western Journal of Emergency Medicine: Integrating Emergency Care with Population Health Title WestJEM Volume 22, Issue 3 - May Permalink https://escholarship.org/uc/item/68p498s6 Journal Western Journal of Emergency Medicine: Integrating Emergency Care with Population Health, 22(3) ISSN 1936-900X Authors Louis, Christine Do, Nathan Publication Date 2021 License https://creativecommons.org/licenses/by/4.0/ 4.0 Peer reviewed eScholarship.org Powered by the California Digital Library University of California

Welcome message from author
This document is posted to help you gain knowledge. Please leave a comment to let me know what you think about it! Share it to your friends and learn new things together.
Transcript

UC IrvineWestern Journal of Emergency Medicine: Integrating Emergency Care with Population Health
TitleWestJEM Volume 22, Issue 3 - May
Permalinkhttps://escholarship.org/uc/item/68p498s6
JournalWestern Journal of Emergency Medicine: Integrating Emergency Care with Population Health, 22(3)
ISSN1936-900X
AuthorsLouis, ChristineDo, Nathan
Publication Date2021
Licensehttps://creativecommons.org/licenses/by/4.0/ 4.0 Peer reviewed
eScholarship.org Powered by the California Digital LibraryUniversity of California

Volume 22, Number 3, May 2021 Open Access at WestJEM.com ISSN 1936-900X
West
A Peer-Reviewed, International Professional Journal
Western Journal of Em
ergency Medicine
V
OLU
ME 22, N
UM
BER
3, May 2021
PA
GES 457-802
Western Journal of Emergency Medicine:Integrating Emergency Care with Population Health
Indexed in MEDLINE
Contents continued on page iii
Violence Assessment and Prevention457 Firearms Injury Prevention, Emergency Medicine, and the Public’s Health: A Call for Unity of Purpose CK Kraus, MI Langdorf
459 The Utstein Kloster and its Role in Firearm Violence Policy G Adams
462 Nonfatal Firearm Injuries by Intent in the United States: 2016-2018 Hospital Discharge Records from the Healthcare Cost and Utilization Project K Schnippel, S Burd-Sharps, TR Miller, BA Lawrence, DI Swedler
471 Lethal Means Counseling for Suicidal Adults in the Emergency Department: A Qualitative Study BJ Siry, CE Knoepke, SM Ernestus, DD Matlock, ME Betz
478 Patient Characteristics and Perspectives of Firearm Safety Discussions in the Emergency Department L Hudak, H Schwimmer, W Warnock, S Kilborn, T Moran, J Ackerman, J Rupp
488 Gun Violence and Firearm Injuries in West Michigan: Targeting Prevention C Mattson, J Grill, R Kaylor, M Ydenberg, T Koehler, B Stork
498 Firearm Exposure and Storage Practices in the Homes of Rural Adolescents CA Jennissen, KM Wetjen, CC Wymore, NR Stange, GM Denning, J Liao, KE Wood
510 The Power of an Active Shooter Simulation: Changing Ethical Beliefs MP Janairo, AM Cardell, M Lamberta, N Elahi, A Aghera
518 Self-InflictedGunShotWounds:ARetrospective,ObservationalStudyofU.S.TraumaCenters F Quenzer, A Givner, R Dirks, CJ Coyne, F Ercoli, R Townsend
ACOEP stands with all emergency physicians and providers on the front line. We thank you for your
tireless work and effort.
www.acoep.org
Championing individual physician rights
and workplace fairness
JOIN
CAL/AAEM!
BENEFITS- Western Journal of Emergency Medicine Subscription- CAL/AAEM News Service email updates- Free and discounted registration to CAL/AAEM events- And more!
CAL/AAEM NEWS SERVICE- Healthcare industry news- Public policy- Government issues- Legal cases and court decisions
In collaboration with our official journal
Join the CAL/AAEM Facebook Group to stay up-to-date: www.facebook.com/groups/calaaem
www.aaem.org/calaaemAAEM-0720-255
Volume 22, no. 3: May 2021 i Western Journal of Emergency Medicine
Available in MEDLINE, PubMed, PubMed Central, CINAHL, SCOPUS, Google Scholar, eScholarship, Melvyl, DOAJ, EBSCO, EMBASE, Medscape, HINARI, and MDLinx Emergency Med. Members of OASPA.
Editorial and Publishing Office: WestJEM/Depatment of Emergency Medicine, UC Irvine Health, 333 City Blvd, West, Rt 128-01, Orange, CA 92868, USA Office: 1-714-456-6389; Email: [email protected]
Official Journal of the California Chapter of the American College of Emergency Physicians, the America College of Osteopathic Emergency Physicians, and the California Chapter of the American Academy of Emergency Medicine
Western Journal of Emergency Medicine:Integrating Emergency Care with Population Health
Indexed in MEDLINE, PubMed, and Clarivate Web of Science, Science Citation Index Expanded
Resident EditorsAAEM/RSAJohn J. Campo, MDHarbor-University of California, Los Angeles Medical Center
Tehreem Rehman, MDAdvocate Christ Medical Center
ACOEPJustina Truong, DOKingman Regional Medical Center
Section EditorsBehavioral EmergenciesErin Dehon, PhDUniversity of Mississippi Medical Center
Leslie Zun, MD, MBAChicago Medical School
Marc L. Martel, MDHennepin County Medical Center
Cardiac CareFred A. Severyn, MDUniversity of Colorado School of Medicine
Michael C. Kurz, MDUniversity of Alabama at Birmingham
Sam S. Torbati, MDCedars-Sinai Medical Center
Yanina Purim-Shem-Tov, MD, MSRush University Medical Center
Clinical PracticeCortlyn W. Brown, MDCarolinas Medical Center
Casey Clements, MD, PhD Mayo Clinic
Patrick Meloy, MDEmory University
Nicholas Pettit, DO, PhDIndiana University
Eric Snoey, MDAlameda County Medical Center
David Thompson, MDUniversity of California, San Francisco
Kenneth S. Whitlow, DOKaweah Delta Medical Center
Critical CareChristopher “Kit” Tainter, MDUniversity of California, San Diego
Gabriel Wardi, MDUniversity of California, San Diego
Joseph Shiber, MDUniversity of Florida-College of Medicine
Matt Prekker MD, MPHHennepin County Medical Center
David Page, MDUniversity of Alabama
Erik Melnychuk, MDGeisinger Health
Quincy Tran, MD, PhDUniversity of Maryland
Disaster MedicineChristopher Kang, MDMadigan Army Medical Center
Gentry Wilkerson, MDUniversity of Maryland
EducationDanya Khoujah, MBBS University of Maryland School of Medicine
Jeffrey Druck, MDUniversity of Colorado
John Burkhardt, MD, MAUniversity of Michigan Medical School
Michael Epter, DOMaricopa Medical Center
ED Administration, Quality, SafetyDavid C. Lee, MDNorthshore University Hospital
Gary Johnson, MDUpstate Medical University
Brian J. Yun, MD, MBA, MPHHarvard Medical School
Laura Walker, MDMayo Clinic
León D. Sánchez, MD, MPHBeth Israel Deaconess Medical Center
William Fernandez, MD, MPHUniversity of Texas Health-San Antonio
Emergency Medical Services Daniel Joseph, MDYale University
Joshua B. Gaither, MDUniversity of Arizona, Tuscon
Julian MappUniversity of Texas, San Antonio
Shira A. Schlesinger, MD, MPH Harbor-UCLA Medical Center
GeriatricsCameron Gettel, MDYale School of Medicine
Stephen Meldon, MDCleveland Clinic
Luna Ragsdale, MD, MPHDuke University
Health EquityEmily C. Manchanda, MD, MPHBoston University School of Medicine
Mandy J. Hill, DrPH, MPHUT Health McGovern Medical School
K. Tom Xu, MD, PhDTexas Tech University Health Sciences Center
Infectious DiseaseElissa Schechter-Perkins, MD, MPHBoston University School of Medicine
Ioannis Koutroulis, MD, MBA, PhDDrexel University College of Medicine
Kevin Lunney, MD, MHS, PhDUniversity of Maryland School of Medicine
Robert Derlet, MDFounding Editor, California Journal of Emergency MedicineUniversity of California, Davis
Stephen Liang, MD, MPHSWashington University School of Medicine
Injury PreventionMark Faul, PhD, MACenters for Disease Control and Prevention
Wirachin Hoonpongsimanont, MD, MSBATSEisenhower Medical Center
International MedicineHeather A.. Brown, MD, MPHPrisma Health Richland
Taylor Burkholder, MD, MPHKeck School of Medicine of USC
Christopher Greene, MD, MPHUniversity of Alabama
Chris Mills, MD, MPHSanta Clara Valley Medical Center
Shada Rouhani, MDBrigham and Women’s Hospital
Legal MedicineMelanie S. Heniff, MD, JDIndiana University School of Medicine
Greg P. Moore, MD, JDMadigan Army Medical Center
Statistics and MethodologyShu B. Chan MD, MSResurrection Medical Center
Stormy M. Morales Monks, PhD, MPHTexas Tech Health Science University
Soheil Saadat, MD, MPH, PhDUniversity of California, Irvine
James A. Meltzer, MD, MSAlbert Einstein College of Medicine
MusculoskeletalJuan F. Acosta DO, MSPacific Northwest University
NeurosciencesAntonio Siniscalchi, MDAnnunziata Hospital
Rick Lucarelli, MDMedical City Dallas Hospital
William D. Whetstone, MDUniversity of California, San Francisco
Pediatric Emergency MedicinePaul Walsh, MD, MScUniversity of California, Davis
Muhammad Waseem, MDLincoln Medical & Mental Health Center
Deena Berkowitz, MD, MPHChildren’s National Hospital
Donna Mendez, MD, EdDUniversity of Texas-Houston/McGovern Medical School
Cristina M. Zeretzke-Bien, MDUniversity of Florida
Public HealthJeremy Hess, MD, MPHUniversity of Washington Medical Center
Jacob Manteuffel, MDHenry Ford Hospital
John Ashurst, DOLehigh Valley Health Network
Tony Zitek, MDKendall Regional Medical Center
Trevor Mills, MD, MPHNorthern California VA Health Care
Erik S. Anderson, MDAlameda Health System-Highland Hospital
Technology in Emergency MedicineNikhil Goyal, MDHenry Ford Hospital
Phillips Perera, MDStanford University Medical Center
TraumaPierre Borczuk, MDMassachusetts General Hospital/Havard Medical School
ToxicologyBrandon Wills, DO, MSVirginia Commonwealth University
Jeffrey R. Suchard, MDUniversity of California, Irvine
UltrasoundJ. Matthew Fields, MD Thomas Jefferson University
Shane Summers, MD Brooke Army Medical Center
Robert R. EhrmanWayne State University
Ryan C. Gibbons, MDTemple Health
Mark I. Langdorf, MD, MHPE, Editor-in-Chief University of California, Irvine School of Medicine- Irvine, California
Rick A. McPheeters, DO, Associate Editor Kern Medical- Bakersfield, California
Shahram Lotfipour, MD, MPH, Managing EditorUniversity of California, Irvine School of Medicine- Irvine, California
Niels K. Rathlev, MD, Associate Editor Tufts University School of Medicine-Boston, Massachusetts
Edward Michelson, MD, Associate Editor Texas Tech University- El Paso, Texas
Michael Gottlieb, MD, Associate EditorRush Medical Center-Chicago, Illinois
Chadd K. Kraus, DO, DrPH, Associate EditorGeisinger Health System- Danville, Pennsylvania
Patrick Joseph Maher, MD, MS, Associate EditorIchan School of Medicine at Mount Sinai, New York
Shadi Lahham, MD, MS, Deputy EditorUniversity of California, Irvine School of Medicine- Irvine, California
Gavin Budhram, MD, Associate EditorTufts University- Medford, Massachusetts
Susan R. Wilcox, MD, Associate EditorMassachusetts General Hospital- Boston, Massachusetts
Andrew W. Phillips, MD, Associate EditorUniversity of North Carolina-Chapel Hill, North Carolina
Dan Mayer, MD, Associate EditorAmerican College of Emergency Physicians
Elizabeth Burner, MD, MPH, Associate EditorUniversity of Southern California
Western Journal of Emergency Medicine ii Volume 22, no. 3: May 2021
Available in MEDLINE, PubMed, PubMed Central, Europe PubMed Central, PubMed Central Canada, CINAHL, SCOPUS, Google Scholar, eScholarship, Melvyl, DOAJ, EBSCO, EMBASE, Medscape, HINARI, and MDLinx Emergency Med. Members of OASPA.
Editorial and Publishing Office: WestJEM/Depatment of Emergency Medicine, UC Irvine Health, 333 City Blvd, West, Rt 128-01, Orange, CA 92866, USAOffice: 1-714-456-6389; Email: [email protected]
Official Journal of the California Chapter of the American College of Emergency Physicians, the America College of Osteopathic Emergency Physicians, and the California Chapter of the American Academy of Emergency Medicine
Leila Danishgar, BSExecutive Editorial Director
Maria Nguyen, BSWestJEM Editorial Director
Nicholas Gossett, BSCPC-EM Associate Editorial Director
Associate Marketing Director
Sohrab Kharabaf, BSCPC-EM Associate Editorial Director
Associate Marketing Director
Nathan Do, BSWestJEM Associate Publishing Director
Paul Abdo, BSWestJEM Associate Publishing Director
June Casey, BACopy Editor
Editorial Staff Advisory Board Christine Louis, BS
WestJEM Publishing Director
Cassandra Saucedo, BSCPC-EM Publishing Director
Isabelle Nepomuceno, BSWestJEM Associate Publishing Director
Associate Marketing Director
Ishan Shah, BSCPC-EM Associate Publishing Director
Associate Marketing Director
Trina Nguyen, BSCPC-EM Associate Publishing Director
Shreya Gupta, BSWestJEM Associate Editorial Director
Stephanie Burmeister, MLISWestJEM Staff Liaison
Western Journal of Emergency Medicine:Integrating Emergency Care with Population Health
Indexed in MEDLINE, PubMed, and Clarivate Web of Science, Science Citation Index Expanded
Amin A. Kazzi, MD, MAAEM The American University of Beirut, Beirut, Lebanon
Anwar Al-Awadhi, MDMubarak Al-Kabeer Hospital, Jabriya, Kuwait
Arif A. Cevik, MDUnited Arab Emirates UniversityCollege of Medicine and Health Sciences, Al Ain, United Arab Emirates
Abhinandan A.Desai, MDUniversity of Bombay Grant Medical College, Bombay, India
Bandr Mzahim, MDKing Fahad Medical City, Riyadh, Saudi Arabia
Brent King, MD, MMMUniversity of Texas, Houston
Christopher E. San Miguel, MDOhio State University Wexner Medical Center
Daniel J. Dire, MD University of Texas Health Sciences Center San Antonio
David F.M. Brown, MDMassachusetts General Hospital/Harvard Medical School
Douglas Ander, MDEmory University
Edward Michelson, MDTexas Tech University
Edward Panacek, MD, MPHUniversity of South Alabama
Francesco Della Corte, MDAzienda Ospedaliera Universitaria “Maggiore della Carità,” Novara, Italy
Francis Counselman, MDEastern Virginia Medical School
Gayle Galleta, MDSørlandet Sykehus HF, Akershus Universitetssykehus, Lorenskog, Norway
Hjalti Björnsson, MDIcelandic Society of Emergency Medicine
Jacob (Kobi) Peleg, PhD, MPHTel-Aviv University, Tel-Aviv, Israel
Jaqueline Le, MDDesert Regional Medical Center
Jeffrey Love, MDThe George Washington University School of Medicine and Health Sciences
Jonathan Olshaker, MDBoston University
Katsuhiro Kanemaru, MDUniversity of Miyazaki Hospital,
Miyazaki, JapanKenneth V. Iserson, MD, MBAUniversity of Arizona, Tucson
Khrongwong Musikatavorn, MDKing Chulalongkorn Memorial Hospital, Chulalongkorn University, Bangkok, Thailand
Leslie Zun, MD, MBAChicago Medical School
Linda S. Murphy, MLISUniversity of California, Irvine School of Medicine Librarian
Nadeem Qureshi, MDSt. Louis University, USAEmirates Society of Emergency Medicine, United Arab Emirates
Niels K. Rathlev, MDTufts University School of Medicine
Pablo Aguilera Fuenzalida, MDPontificia Universidad Catolica de Chile, Región Metropolitana, Chile
Peter A. Bell, DO, MBALiberty UniversityCollege of Osteopathic Medicine
Peter Sokolove, MDUniversity of California, San Francisco
Rachel A. Lindor, MD, JDMayo Clinic
Robert M. Rodriguez, MD University of California, San Francisco
Robert Suter, DO, MHAUT Southwestern Medical Center
Robert W. Derlet, MDUniversity of California, Davis
Rosidah Ibrahim, MDHospital Serdang, Selangor, Malaysia
Samuel J. Stratton, MD, MPHOrange County, CA, EMS Agency
Scott Rudkin, MD, MBAUniversity of California, Irvine
Scott Zeller, MDUniversity of California, Riverside
Steven H. Lim, MDChangi General Hospital, Simei, Singapore
Terry Mulligan, DO, MPH, FIFEMACEP Ambassador to the Netherlands Society of Emergency Physicians
Vijay Gautam, MBBSUniversity of London, London, England
Wirachin Hoonpongsimanont, MD, MSBATSSiriraj Hospital, Mahidol University, Bangkok, Thailand
Amal Khalil, MBAUC Irvine Health School of Medicine
Brian Potts, MD, MBACalifornia Chapter Division of AAEM Alta Bates Summit Medical Center
Elena Lopez-Gusman, JDCalifornia ACEPAmerican College of Emergency Physicians
Lori Winston, MDCalifornia ACEPAmerican College of Emergency PhysiciansKaweah Delta Healthcare District
Mark I. Langdorf, MD, MHPEUC Irvine Health School of Medicine
Peter A. Bell, DO, MBAAmerican College of Osteopathic Emergency Physicians
Robert Suter, DO, MHAAmerican College of Osteopathic Emergency PhysiciansUT Southwestern Medical Center
Shahram Lotfipour, MD, MPHUC Irvine Health School of Medicine
Trevor Mills, MD, MPHCalifornia Chapter Division of AAEMNorthern California VA Health Care
Jorge Fernandez, MDUC San Diego Health School of Medicine
Editorial Board
Volume 22, no. 3: May 2021 iii Western Journal of Emergency Medicine
Policies for peer review, author instructions, conflicts of interest and human and animal subjects protections can be found online at www.westjem.com.
JOURNALFOCUSEmergency medicine is a specialty which closely reflects societal challenges and consequences of public policy decisions. The emergency department specifically deals with social injustice, health and economic disparities, violence, substance abuse, and disaster preparedness and response. This journal focuses on how emergency care affects the health of the community and population, and conversely, how these societal challenges affect the composition of the patient population who seek care in the emergency department. The development of better systems to provide emergency care, including technology solutions, is critical to enhancing population health.
Table of ContentsViolence Assessment and Prevention525 Documentation of Screening for Firearm Access by Healthcare Providers in the Veterans Healthcare System: A Retrospective Study CA Brandt, TE Workman, MM Farmer, KM Akgün, EA Abel, M Skanderson, B Bean-Mayberry, Q Zeng-Treitler, M Mason, LA Bastian, JL Goulet, LA Post
533 Assessing Violence Risk in Adolescents in the Pediatric Emergency Department: Systematic Review and Clinical Guidance MM Mroczkowski, JT Walkup, P Appelbaum
Endemic Infections543 EndingthePandemic:AreRapidCOVID-19TestsaStepForwardorBack? T Zitek, JB Fraiman
547 Failure Rates During Reuse of Disposable N95 Masks in Clinical Practice in the Emergency Department R Check, B Kelly, K McMahon, V Balakrishnan, L Rivard, J Pester, D Jeanmonod, RK Jeanmonod
552 EmergencyDepartmentAccessDuringCOVID-19:DisparitiesinUtilizationbyRace/Ethnicity,Insurance, and Income J Lowe, I Brown, R Durseti, M Gallegos, R Ribeira, E Pirrotta, NE Wang
561 ImpactoftheCOVID-19PandemiconEmergencyDepartmentTransfersforaHigherLevelofCare S Lee, AJ Santarelli, H Choi, J Ashurst
565 ProviderAntibodySerologyStudyofVirusintheEmergencyRoom(PASSOVER)Study:Special PopulationCOVID-19Seroprevalence TW Heyming, T Sanger, A Tongol, J Schomberg, K Bacon, B Lara 572 TheImpactofCOVID-19onaLargeCanadianCommunityEmergencyDepartment DD Lee, H Jung, W Lou, D Rauchwerger, LB Chartier, S Masood, S Sathiaseelan, AK Taher
580 Rate of Decompensation of Normoxic Emergency Department Patients with SARS-CoV-2 K Schreyer, D Isenberg, W Satz, NV Lucas, J Rosenbaum, G Zandrow, NT Genile
587 UtilityOfAnEmergencyDepartmentClinicalProtocolForEarlyIdentificationofCoronavirusInfection W Bonadio, K Jackson, L Gottlieb, E Legome
592 ClinicalPredictionTooltoAssesstheLikelihoodofaPositiveSARS-Cov-2(COVID-19)PolymeraseChain Reaction Test in Patients with Flu-like Symptoms BA Lara, F Torres, P Holger, C Perales, S Basauri, H Clausdorff, E Escobedo, F Saldias, S Swadron, P Aguilera
Western Journal of Emergency Medicine:Integrating Emergency Care with Population Health
Indexed in MEDLINE, PubMed, and Clarivate Web of Science, Science Citation Index Expanded
Volume 22, no. 3: May 2021 iv Western Journal of Emergency Medicine
Table of Contents continued599 SARS-CoV-2 Infection and Associated Rates of Diabetic Ketoacidosis in a New York City Emergency Department J Ditkowsky, AC Lieber, ES Leibner, N Genes
603 ChangesinEmergencyDepartmentActivityandtheFirstCOVID-19Lockdown:ACross-sectionalStudy K Honeyford, C Coughlan, R Nijman, P Expert, G Burcea, I Maconochie, A Kinderlerer, GS Cooke, CE Costelloe
608 EstablishmentofanAlternateCareSite(ACS)inImperialCountyDuringCOVID-19 A Breyre, B Sloane, C Herring, K Staats
HealthOutcomes614 Incidence of Acute Kidney Injury After Computed Tomography in Emergency Department Patients with Chronic Kidney Disease: A Propensity Score Matched Analysis M Kene, VA Arasu, AK Mahapatra, J Huang, M Reed
623 StudyofHaloperidolforAbdominalPainintheEmergencyDepartment(SHAPE) K Knudsen, K Stith, LA Vicarel, B Harbert, B Fertel
628 Code Status Documentation Availability and Accuracy Among Emergency Patients with End-stage Disease E Russell, AK Hall, C McKaigney, C Goldie, I Harle, MLA Sivilotti
636 DiabetesPatientSurveillanceintheEmergencyDepartment:ProofofConceptandOpportunities MG Sava, RG Pirrallo, B Helsel, J Tian, P Carbajales-Dale, KC Wang, J Bruch, RW Gimbel
644 Utilization of Educational Videos to Improve Communication and Discharge Instructions A Wray, R Goubert, R Gadepally, M Boysen-Osborn, W Wiechmann, S Toohey
648 NicotinePatchPrescriptionFulfillmentRatesForEmergencyDepartmentPatients C Emerman, D Tracy, J Siff
Health Equity653 Importance of Mentoring on Workplace Engagement of Emergency Medicine Faculty: A Multi- institutional Study RH Lucas, V Dandar
660 Anti-immigrant Rhetoric and the Experiences of Latino Immigrants in the Emergency Department C Ornelas, JR Torres, JR Torres, H Alter, BR Taira, RM Rodriguez
667 Impact of Social Determinants of Health, Health Literacy, Self-perceived Risk, and Trust in the Emergency Physician on Compliance with Follow-up L Gu, J Sutton, DB Diercks
Critical Care672 Performance of Emergency Heart Failure Mortality Risk Grade in the Emergency Department N Garg, R Pekmezaris, G Stevens, AZ Becerra, A Kozikowski, V Patel, G Haddad, P Levy, P Kumar, L Becker
678 EmergencyTrachealIntubationinPatientswithCOVID-19:ASingle-center,RetrospectiveCohortStudy A Hawkins, S Stapleton, G Rodriguez, RM Gonzalez, WE Baker
687 AlteplaseforAcuteIschemicStrokeBeyond3hours:EnthusiasmOutpacesEvidence R Garg
690 Sternal Intraosseous Devices: Review of the Literature JA Laney, J Friedman, AD Fisher
Western Journal of Emergency Medicine:Integrating Emergency Care with Population Health
Indexed in MEDLINE, PubMed, and Clarivate Web of Science, Science Citation Index Expanded

Volume 22, no. 3: May 2021 v Western Journal of Emergency Medicine
Provider Workforce696 HelpUsHelpYou:EngagingEmergencyPhysicianstoIdentifyOrganizationalStrategiesto Reduce Burnout JJ Baugh, AS Raja, JK Takayesu
702 Unheard Victims: Multidisciplinary Incidence and Reporting of Violence in an Emergency Department SS McGuire, A Mullan, C Clements
Population Health710 EmergencyMedicineInfluencers’TwitterUseDuringtheCOVID-19Pandemic:AMixedMethodsAnalysis MK Leibowitz, MR Scudder, M McCabe, JL Chan, MR Klein, NS Trueger, DM McCarthy
719 Universal Screening for Hepatitis C Virus in the ED Using a Best Practice Advisory J Ford, T Chechi, K Toosi, B Mahmood, D Meehleis, M Otmar, N Tran, L May
EmergencyDepartmentOperations726 Increased Emergency Department Hallway Length of Stay is Associated with Development of Delirium KL van Loveren, A Singla, L Sinvani, C Calandrella, T Perera, M Brave, L Becker, T Li
736 Financial Implications of Boarding: A Call for Research MM Canellas, KA Kotkowski, SS Michael, MA Reznek
Emergency Medical Services739 Climate Change Adaptation: Prehospital Data Facilitate the Detection of Acute Heat Illness in India N Ranadive, J Desai, S LM, K Knowlton, P Dutta, P Ganguly, A Tiwari, A Jaiswal, T Shah, B Solanki, D Mavalankar, JJ Hess
750 Paramedic-performedPrehospitalPoint-of-careUltrasoundforPatientswithUndifferentiatedDyspnea:A Pilot Study J Schoeneck, R Coughlin, C Baloescu, D Cone, R Liu, S Kalam, A Medoro, I Medoro, D Joseph, K Burns, J Bohrer-Clancy, C Moore
Behavioral Health756 EffectofthePrescriptionDrugMonitoringProgramonEmergencyDepartmentOpioidPrescribing R Gupta, S Boehmer, D Giampetro, CJ DeFlitch
Disaster Medicine763 Pediatric Emergency Departments and Urgent Care Visits in Houston after Hurricane Harvey SA Fanny, BD Kaziny, AT Cruz, EA Camp, KO Murray, TJ Nichols, CE Chumpitazi
Women’s Health769 Acceptability of Contraceptive Services in the Emergency Department: A Cross-sectional Survey AB Alexander, K Chernoby, N VanderVinne, Y Doos, N Kaur, C Bernard, JA Kline
Technology in Emergency Medicine775 Ultrasound Hypotension Protocol Time-motion Study Using the Multifrequency Single Transducer Versus a Multiple Transducer Ultrasound Device L Sabbadini, R Germano, E Hopkins, JS Haukoos, JL Kendall
Pediatrics782 Intracranial Traumatic Hematoma Detection in Children Using a Portable Near-infrared Spectroscopy Device MP Kirschen, SR Myers, MI Neuman, JA Grubenhoff, R Mannix, N Stence, E Yang, A Woodford, T Rogers, A Nordell, A Vossough, MR Zonfrillo
Table of Contents continued
Western Journal of Emergency Medicine:Integrating Emergency Care with Population Health
Indexed in MEDLINE, PubMed, and Clarivate Web of Science, Science Citation Index Expanded
Volume 22, no. 3: May 2021 vi Western Journal of Emergency Medicine
Education792 VirtualEmergencyMedicineClerkshipCurriculumduringtheCOVID-19Pandemic:Development, Application,andOutcomes KE Redinger, JD Greene
Letter to the Editor799 PresentationofNeuro-COVIDisBroadandPathogenesisDiverse J Finsterer
801 Emergency Medicine Residents Experience Acute Stress While Working in the Emergency Department ML Wong, GA Peters, LD Sanchez
802 Response to: Emergency Medicine Residents Experience Acute Stress While Working in the Emergency Department AJ Janicki, SO Frisch, PD Patterson, A Brown, A Frisch
Table of Contents continued
VITAL STATISTICSWestern Journal of Emergency Medicine (WestJEM): Integrating Emergency Care with Population Health (WestJEM) is the premier open-access Medline-indexed EM journal in the world. As the official journal of the California Chapter of the American College of Emergency Physicians (ACEP), American College of Osteopathic Emergency Physicians (ACOEP), and the California chapter division of the American Academy of Emergency Medicine (AAEM), the journal focuses on how emergency care affects health and health disparities in communities and populations. Additionally, WestJEM focuses on how social conditions impact the composition of patients seeking care in emergency departments worldwide. WestJEM is distributed electronically to 19,000 emergency medicine scholars and 2,800 in print. This includes 90 academic department of emergency medicine subscribers and 7 AAEM State Chapters.
Western Journal of Emergency Medicine vii Volume 22, no. 3: May 2021
International Society Partners
Arizona Chapter Division of theAmerican Academy of Emergency MedicineCalifornia Chapter Division of theAmerican Academy of Emergency MedicineFlorida Chapter Division of theAmerican Academy of Emergency Medicine
Great Lakes Chapter Division of theAmerican Academy of Emergency MedicineTennessee Chapter Division of the American Academy of Emergency Medicine
Professional Society Sponsors
State Chapter Subscriber
American College of Osteopathic Emergency PhysiciansCalifornia ACEP
California Chapter Division of American Academy of Emergency Medicine
This open access publication would not be possible without the generous and continual financial support of our society sponsors, department and chapter subscribers.
Stephanie BurmeisterWestJEM Staff LiaisonPhone: 1-800-884-2236Email: [email protected]
To become a WestJEM departmental sponsor, waive article processing fee, receive print and copies for all faculty and electronic for faculty/residents, and free CME and faculty/fellow position advertisement space, please go to http://westjem.com/subscribe or contact:
Emergency Medicine Association of TurkeyLebanese Academy of Emergency MedicineMediterranean Academy of Emergency Medicine
Norwegian Society for Emergency MedicineSociedad Argentina de Emergencias
Sociedad Chileno Medicina UrgenciaThai Association for Emergency Medicine
Uniformed Services Chapter Division of the American Academy of Emergency Medicine
Virginia Chapter Division of the American Academy of Emergency Medicine
Western Journal of Emergency Medicine:Integrating Emergency Care with Population Health
Indexed in MEDLINE, PubMed, and Clarivate Web of Science, Science Citation Index Expanded
Academic Department of Emergency Medicine SubscriberAlbany Medical CollegeAlbany, NY
Allegheny Health Network Pittsburgh, PA
American University of Beirut Beirut, Lebanon
AMITA Health Resurrection Medical CenterChicago, IL
Arrowhead Regional Medical Center Colton, CA
Baystate Medical CenterSpringfield, MA
Bellevue Hospital CenterNew York, NY
Beth Israel Deaconess Medical CenterBoston, MA
Boston Medical CenterBoston, MA
Brigham and Women’s HospitalBoston, MA
Brown UniversityProvidence, RI
Carl R. Darnall Army Medical CenterFort Hood, TX
Conemaugh Memorial Medical CenterJohnstown, PA
Crozer-Chester Medical CenterUpland, PA
Desert Regional Medical CenterPalm Springs, CA
Eastern Virginia Medical SchoolNorfolk, VA
Einstein Healthcare NetworkPhiladelphia, PA
Eisenhower Medical CenterRancho Mirage, CA
Emory UniversityAtlanta, GA
Geisinger Medical CenterDanville, PA
Grand State Medical Center Allendale, MI
Hennepin County Medical CenterMinneapolis, MN
Henry Ford Medical Center Detroit, MI
INTEGRIS HealthOklahoma City, OK
Kaiser Permenante Medical CenterSan Diego, CA
Kaweah Delta Health Care DistrictVisalia, CA
Kennedy University HospitalsTurnersville, NJ
Kent Emergency Medical Residency Program Warwick, RI
Kern MedicalBakersfield, CA
Lakeland HealthCareSt. Joseph, MI
Lehigh Valley Hospital and Health NetworkAllentown, PA
Loma Linda University Medical CenterLoma Linda, CA
Louisiana State University Health Sciences CenterNew Orleans, LA
Madigan Army Medical CenterTacoma, WA
Maimonides Medical CenterBrooklyn, NY
Maine Medical CenterPortland, ME
Massachusetts General HospitalBoston, MA
Mayo Clinic College of MedicineRochester, MN
Mercy Health - Hackley CampusMuskegon, MI
Merit Health WesleyHattiesburg, MS
Midwestern University Glendale, AZ
New York University Langone HealthNew York, NY
North Shore University HospitalManhasset, NY
Northwestern Medical GroupChicago, IL
Ohio State University Medical CenterColumbus, OH
Ohio Valley Medical CenterWheeling, WV
Oregon Health and Science UniversityPortland, OR
Penn State Milton S. Hershey Medical CenterHershey, PA
Regions Hospital Emergency Medicine Residency ProgramSt. Paul, MN
Rhode Island HospitalProvidence, RI
Robert Wood Johnson University HospitalNew Brunswick, NJ
Rush University Medical CenterChicago, IL
St. Luke’s University Health NetworkBethlehem, PA
Spectrum Health Lakeland St. Joseph, MI
StanfordStanford, CA
SUNY Upstate Medical UniversitySyracuse, NY
Temple UniversityPhiladelphia, PA
Texas Tech University Health Sciences Center El Paso, TX
University of Alabama, BirminghamBirmingham, AL
University of California, Davis Medical CenterSacramento, CA
University of California, IrvineOrange, CA
University of California, Los AngelesLos Angeles, CA
University of California, San DiegoLa Jolla, CA
University of California, San FranciscoSan Francisco, CA
UCSF Fresno CenterFresno, CA
University of ChicagoChicago, IL
University of FloridaGainesville, FL
University of Florida, JacksonvilleJacksonville, FL
University of Illinois at Chicago Chicago, IL
University of IowaIowa City, IA
University of LouisvilleLouisville, KY
University of MarylandBaltimore, MD
University of MassachusettsAmherst, MA
University of MichiganAnn Arbor, MI
University of Missouri, ColumbiaColumbia, MO
University of Nebraska Medical CenterOmaha, NE
University of Nevada, Las VegasLas Vegas, NV
University of Southern AlabamaMobile, AL
University of Southern CaliforniaLos Angeles, CA
University of Tennessee, MemphisMemphis, TN
University of Texas, HoustonHouston, TX
University of WashingtonSeattle, WA
University of Wisconsin Hospitals and ClinicsMadison, WI
Virginia Commonwealth University Medical Center Richmond, VA
Wake Forest UniversityWinston-Salem, NC
Wake Technical Community CollegeRaleigh, NC
Wayne State Detroit, MI
Wright State UniversityDayton, OH
York HosptialYork, ME

Volume 22, no. 3: May 2021 457 Western Journal of Emergency Medicine
Foreward
Firearms Injury Prevention, Emergency Medicine, and the Public’s Health: A Call for Unity of Purpose
Chadd K. Kraus, DO, DrPH*Mark I. Langdorf, MD, MHPE†
Submission history: Submitted March 31, 2021; Accepted April 1, 2021 Electronically published May 7, 2021Full text available through open access at http://escholarship.org/uc/uciem_westjem DOI: 10.5811/westjem.2021.4.52861[West J Emerg Med. 2021;22(3)457–458]
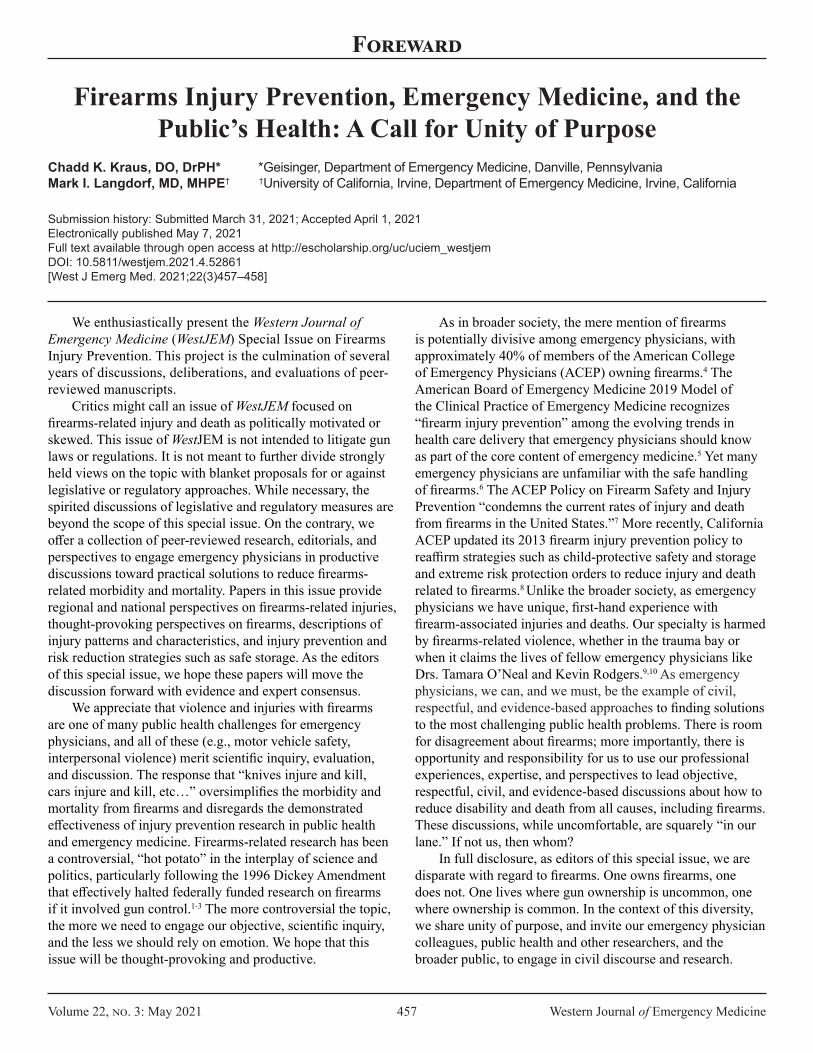
We enthusiastically present the Western Journal of Emergency Medicine (WestJEM) Special Issue on Firearms Injury Prevention. This project is the culmination of several years of discussions, deliberations, and evaluations of peer-reviewed manuscripts.
Critics might call an issue of WestJEM focused on firearms-related injury and death as politically motivated or skewed. This issue of WestJEM is not intended to litigate gun laws or regulations. It is not meant to further divide strongly held views on the topic with blanket proposals for or against legislative or regulatory approaches. While necessary, the spirited discussions of legislative and regulatory measures are beyond the scope of this special issue. On the contrary, we offer a collection of peer-reviewed research, editorials, and perspectives to engage emergency physicians in productive discussions toward practical solutions to reduce firearms-related morbidity and mortality. Papers in this issue provide regional and national perspectives on firearms-related injuries, thought-provoking perspectives on firearms, descriptions of injury patterns and characteristics, and injury prevention and risk reduction strategies such as safe storage. As the editors of this special issue, we hope these papers will move the discussion forward with evidence and expert consensus.
We appreciate that violence and injuries with firearms are one of many public health challenges for emergency physicians, and all of these (e.g., motor vehicle safety, interpersonal violence) merit scientific inquiry, evaluation, and discussion. The response that “knives injure and kill, cars injure and kill, etc…” oversimplifies the morbidity and mortality from firearms and disregards the demonstrated effectiveness of injury prevention research in public health and emergency medicine. Firearms-related research has been a controversial, “hot potato” in the interplay of science and politics, particularly following the 1996 Dickey Amendment that effectively halted federally funded research on firearms if it involved gun control.1-3 The more controversial the topic, the more we need to engage our objective, scientific inquiry, and the less we should rely on emotion. We hope that this issue will be thought-provoking and productive.
Geisinger, Department of Emergency Medicine, Danville, PennsylvaniaUniversity of California, Irvine, Department of Emergency Medicine, Irvine, California
*†
As in broader society, the mere mention of firearms is potentially divisive among emergency physicians, with approximately 40% of members of the American College of Emergency Physicians (ACEP) owning firearms.4 The American Board of Emergency Medicine 2019 Model of the Clinical Practice of Emergency Medicine recognizes “firearm injury prevention” among the evolving trends in health care delivery that emergency physicians should know as part of the core content of emergency medicine.5 Yet many emergency physicians are unfamiliar with the safe handling of firearms.6 The ACEP Policy on Firearm Safety and Injury Prevention “condemns the current rates of injury and death from firearms in the United States.”7 More recently, California ACEP updated its 2013 firearm injury prevention policy to reaffirm strategies such as child-protective safety and storage and extreme risk protection orders to reduce injury and death related to firearms.8 Unlike the broader society, as emergency physicians we have unique, first-hand experience with firearm-associated injuries and deaths. Our specialty is harmed by firearms-related violence, whether in the trauma bay or when it claims the lives of fellow emergency physicians like Drs. Tamara O’Neal and Kevin Rodgers.9,10 As emergency physicians, we can, and we must, be the example of civil, respectful, and evidence-based approaches to finding solutions to the most challenging public health problems. There is room for disagreement about firearms; more importantly, there is opportunity and responsibility for us to use our professional experiences, expertise, and perspectives to lead objective, respectful, civil, and evidence-based discussions about how to reduce disability and death from all causes, including firearms. These discussions, while uncomfortable, are squarely “in our lane.” If not us, then whom?
In full disclosure, as editors of this special issue, we are disparate with regard to firearms. One owns firearms, one does not. One lives where gun ownership is uncommon, one where ownership is common. In the context of this diversity, we share unity of purpose, and invite our emergency physician colleagues, public health and other researchers, and the broader public, to engage in civil discourse and research.

Western Journal of Emergency Medicine 458 Volume 22, no. 3: May 2021
Firearms Violence, Emergency Medicine, and the Public’s Health: A Call for Unity of Purpose Kraus et al.
Address for Correspondence: Chadd Kraus, DO, DrPH, Geisinger Medical Center, Department of Emergency Medicine, 100 North Academy Avenue, Danville, PA 17822. Email: [email protected].
Conflicts of Interest: By the WestJEM article submission agreement, all authors are required to disclose all affiliations, funding sources and financial or management relationships that could be perceived as potential sources of bias. No author has professional or financial relationships with any companies that are relevant to this study. There are no conflicts of interest or sources of funding to declare.
Copyright: © 2021 Kraus et al. This is an open access article distributed in accordance with the terms of the Creative Commons Attribution (CC BY 4.0) License. See: http://creativecommons.org/licenses/by/4.0/
REFERENCES1. Kellerman AL, Rivara FP. Silencing the science on gun research.
JAMA. 2013;309(6):549-50.2. Fessenden M. Why so few scientists are studying the causes of gun
violence. Smithsonian Magazine. July 13, 2015. Available at: https://www.smithsonianmag.com/smart-news/cdc-still-cant-study-causes-gun-violence-180955884/?no-ist. Accessed March 1, 2021.
3. Stark DE, Shah NH. Funding and publication of research on gun violence and other leading causes of death. JAMA. 2017;317:84-5.
4. Greene J. A balancing act: the emergency physician role in firearms safety. Ann Emerg Med. 2019;73(1):PA13-15.
5. American Board of Emergency Medicine. 2019 Model of the Clinical Practice of Emergency Medicine. “20.4.7.4 – Firearm injury prevention.” Available at: https://www.abem.org/public/docs/default-source/default-document-library/2019-em-model_website.pdf?sfvrsn=d75fcdf4_2. Accessed March 28, 2021.
6. Ketterer AR, Ray K, Grossestreurer A, et al. Emergency physicians’ familiarity with safe handling of firearms. West J Emerg Med. 2019;20(1):170-6.
7. American College of Emergency Physicians (ACEP) Firearm Safety and Injury Prevention Policy Statement. Approved October 2019. Available at: https://www.acep.org/globalassets/new-pdfs/policy-statements/firearm-safety-and-injury-prevention.pdf. Accessed March 1, 2021.
8. Fernandez J, Nichols T, Basrai Z, et al. California ACEP firearm injury prevention policy. West J Emerg Med. 2021;22(2):266-9.
9. Brice-Saddler M. The devasting loss of the doctor killed at a Chicago hospital by her former fiancé. The Washington Post. November 20, 2018 Available at: https://www.washingtonpost.com/nation/2018/11/20/greatest-hands-possible-doctor-killed-chicago-hospital-remembered-her-compassion/. Accessed March 1, 2021.
10. Eales T. In memoriam: Kevin G. Rodgers, MD. EM Resident. 1/31/2018. Available at: https://www.emra.org/emresident/article/in-memoriam-kevin-g.-rodgers-md/#:~:text=Army%20veteran%20and%20Indiana%20University,at%20his%20residence%20in%20Indianapolis. Accessed March 1, 2021.
https://www.smithsonianmag.com/smart-news/cdc-still-cant-study-causes-gun-violence-180955884/?no-ist
https://www.smithsonianmag.com/smart-news/cdc-still-cant-study-causes-gun-violence-180955884/?no-ist
Volume 22, no. 3: May 2021 459 Western Journal of Emergency Medicine
Editorial
The Utstein Kloster and Its Role in Firearm Violence Policy
Galen Adams, MD Section Editor: Mark I. Langdorf, MD, MHPE Submission history: Submitted February 1, 2021; Accepted February 8, 2021Electronically published May 4, 2021 Full text available through open access at http://escholarship.org/uc/uciem_westjem DOI: 10.5811/westjem.2021.2.52000[West J Emerg Med. 2021;22(3)459-461]
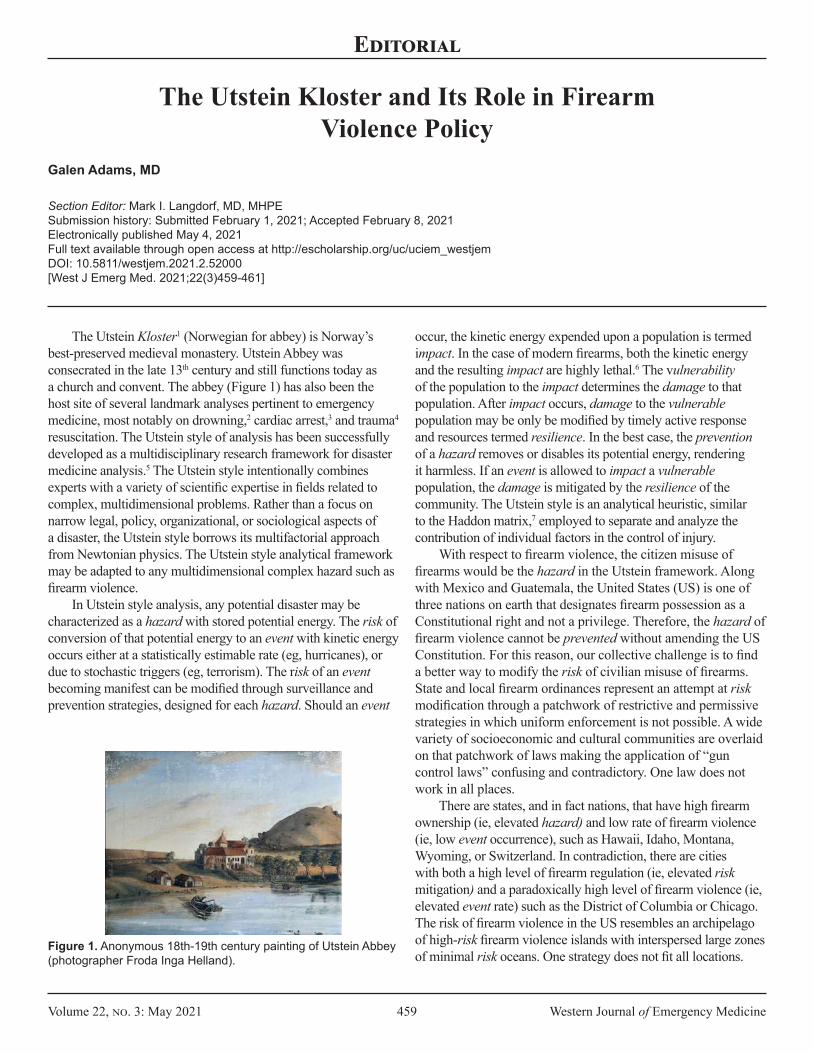
The Utstein Kloster1 (Norwegian for abbey) is Norway’s best-preserved medieval monastery. Utstein Abbey was consecrated in the late 13th century and still functions today as a church and convent. The abbey (Figure 1) has also been the host site of several landmark analyses pertinent to emergency medicine, most notably on drowning,2 cardiac arrest,3 and trauma4 resuscitation. The Utstein style of analysis has been successfully developed as a multidisciplinary research framework for disaster medicine analysis.5 The Utstein style intentionally combines experts with a variety of scientific expertise in fields related to complex, multidimensional problems. Rather than a focus on narrow legal, policy, organizational, or sociological aspects of a disaster, the Utstein style borrows its multifactorial approach from Newtonian physics. The Utstein style analytical framework may be adapted to any multidimensional complex hazard such as firearm violence.
In Utstein style analysis, any potential disaster may be characterized as a hazard with stored potential energy. The risk of conversion of that potential energy to an event with kinetic energy occurs either at a statistically estimable rate (eg, hurricanes), or due to stochastic triggers (eg, terrorism). The risk of an event becoming manifest can be modified through surveillance and prevention strategies, designed for each hazard. Should an event
occur, the kinetic energy expended upon a population is termed impact. In the case of modern firearms, both the kinetic energy and the resulting impact are highly lethal.6 The vulnerability of the population to the impact determines the damage to that population. After impact occurs, damage to the vulnerable population may be only be modified by timely active response and resources termed resilience. In the best case, the prevention of a hazard removes or disables its potential energy, rendering it harmless. If an event is allowed to impact a vulnerable population, the damage is mitigated by the resilience of the community. The Utstein style is an analytical heuristic, similar to the Haddon matrix,7 employed to separate and analyze the contribution of individual factors in the control of injury.
With respect to firearm violence, the citizen misuse of firearms would be the hazard in the Utstein framework. Along with Mexico and Guatemala, the United States (US) is one of three nations on earth that designates firearm possession as a Constitutional right and not a privilege. Therefore, the hazard of firearm violence cannot be prevented without amending the US Constitution. For this reason, our collective challenge is to find a better way to modify the risk of civilian misuse of firearms. State and local firearm ordinances represent an attempt at risk modification through a patchwork of restrictive and permissive strategies in which uniform enforcement is not possible. A wide variety of socioeconomic and cultural communities are overlaid on that patchwork of laws making the application of “gun control laws” confusing and contradictory. One law does not work in all places.
There are states, and in fact nations, that have high firearm ownership (ie, elevated hazard) and low rate of firearm violence (ie, low event occurrence), such as Hawaii, Idaho, Montana, Wyoming, or Switzerland. In contradiction, there are cities with both a high level of firearm regulation (ie, elevated risk mitigation) and a paradoxically high level of firearm violence (ie, elevated event rate) such as the District of Columbia or Chicago. The risk of firearm violence in the US resembles an archipelago of high-risk firearm violence islands with interspersed large zones of minimal risk oceans. One strategy does not fit all locations.
Figure 1. Anonymous 18th-19th century painting of Utstein Abbey (photographer Froda Inga Helland).
Western Journal of Emergency Medicine 460 Volume 22, no. 3: May 2021
The Utstein Kloster and Its Role in Firearm Violence Policy Adams
One possible explanation for these conflicting examples is perhaps that the problem is less about the firearm (ie, hazard) and more about the factors involved in motivating a citizen to misuse firearms. Because Second Amendment arguments lend themselves to primal emotions on both sides, too much energy is expended on the right of firearm possession vs dispossession (ie, prevention) and not enough on identifying and intervening in the factors leading up to the shooting or risk modification.
Americans accept the risk modification over prevention approach with motor vehicle accidents, swimming pool drownings, and air travel. Good policy and the avoidance of polarizing anger is guided by collecting data and using that data to analyze and modify risk. For example, the Haddon matrix has been used to modify the risk associated with motor vehicle travel. By separately analyzing pre-crash, crash, and post-crash factors, data-driven vehicle and highway designs are combined with regulatory, sociological, and psychological solutions to reduce motor vehicle injuries. Very few Americans are prohibited from driving a vehicle and the risk from motor vehicles crashes are mitigated by data-driven solutions.
With the acknowledgment that accidental firearm injury (eg, hunting accidents) is not included in this analysis, the issue of intentional firearm violence has at least four key categories:
• Suicide or self-harm• Intimate partner, family, or business partner violence• Criminal activity• Mass shootings and assassinations
In each category, there are different factors that determine the risk of firearm violence becoming an event. Further, the target population has different vulnerabilities, with many different mitigation strategies. Like motor vehicle speed limits, one strategy does not fit all problem sets.
Suicide by firearm represents over one third of total firearm deaths in the US,8 and there are clear demographic groups (older White males), and predisposing circumstances (financial loss, family loss, loss of community stature) that correlate well with suicidality. These are stochastic triggers that indicate an individual’s likelihood of a firearm-assisted suicide and they are surveillable. A reporting system with data- driven intervention strategies such as peer outreach, psychological resources, or short-term firearm dispossession for identified high-risk individuals, may reduce the risk of a firearm-assisted suicide event in this category.
Intimate partner violence, family conflict, or revenge on business associates are significant subcategories for children and adults. Each of these subcategories involves some level of conflict or rejection, combined with a malign adjustment reaction. Similar to child abuse, or domestic abuse not involving firearms, there are higher risk individuals and precipitating events (eg, divorce, infidelity, family rejection, bankruptcy, larceny, etc) that are surveillable. Individuals undergoing these precipitating events may be screened and have data-driven resources provided such as personal, legal, and/or financial
counselling. Higher risk individuals may be evaluated for short-term firearm dispossession and crisis counseling.
Given the cost of the judicial and prison systems in the US, criminal activity with firearm violence has perhaps the largest total resource allocation of the subsets. Great efforts have been made to predict criminal activity by better understanding the spatial, temporal, and perpetrator-victim associations of specific crimes. The risk modification of criminal behavior has received much less attention. If we assume that all people are born with more or less the same inclination to crime, then poor schools, gang activity, and systemic racial bias that produce disparate justice system outcomes are specific risk factors associated with poor and minority communities. These structural factors contribute to a loss of legitimate academic and/or economic opportunities and are a driver of criminal behavior. Consider, the US has 5% of the world’s population yet 25% of the world’s incarcerated population. Blacks and Hispanics represent 32% of the US population but 56% of the incarcerated population. While Blacks comprise 13% of the US population, 35% of those executed in the past 40 years are Black. Approximately half of those incarcerated will return to prison and 75% of formerly incarcerated people are unemployed.9 Simply stated, the imprisonment of poor and minority populations is not the answer to firearm violence. There is no doubt that the solution to systemic racial bias and its associated criminality is complex and will be difficult to overcome in the short term. That stated, to not address systemic racial bias will increase the risk of segments of our population to criminal behavior and associated firearm violence at a great cost in both lives and dollars.
While the category of mass shootings and assassinations is the most newsworthy and consistently evokes public outcry, it is actually 1-2% of the total firearm violence.10 Similar to criminal activity, great efforts have been made to mitigate mass shootings and assassinations, mainly through various dignitary protection strategies and the improvement of security for vulnerable sites (eg, schools, airports, public buildings). Like police funding for criminal activity, the mitigation of mass shootings and assassinations receives a large amount of the funding. Mass shooters and assassins do have distinct psychological profiles that occasionally include some elements of mental illness, being bullied, grievance, and perhaps the need for notoriety/revenge. Mass shooters are predominantly male and White and are often driven by a malign cause. Once again, these stochastic triggers are surveillable. Once identified, targeted resources directed to these vulnerable individuals with peer counseling, alternatives to violence, and firearm dispossession for recalcitrant individuals may decrease the incidence of these events.
For too long the US has avoided an injury control perspective, largely due to the Dickey Amendment of 1996,11 which prohibited the Centers for Disease Control and Prevention to collect these data. With the repeal of the Dickey Amendment in 2018, a new era of firearm injury control research is now possible. By adopting an injury control model such as the Utstein

Volume 22, no. 3: May 2021 461 Western Journal of Emergency Medicine
Adams The Utstein Kloster and Its Role in Firearm Violence Policy
style analysis or the Haddon matrix, the factors associated with different categories of firearm violence may be identified and analyzed, and data-driven interventions developed and deployed. To remain in the status quo ensures that the US will remain a world leader in preventable firearm deaths. The door to a better way to control firearm injury has been opened. We have the ability to replace the overheated arguments on gun control with data-driven solutions for firearm violence.
A notional system to modify the issue of firearm violence is depicted in Figure 2. This Utstein style framework would require societal investment to identify and intervene in the risk factors of firearm violence. With data comes clarity and rational policies, tailored to each subset of problems and the locations and populations at risk. Informed with data, gun violence policy may improve, and firearm injuries may be reduced.
Figure 2. A notional Utstein framework to reduce firearm violence.
Address for Correspondence: Galen Adams, MD. Email: [email protected].
Conflicts of Interest: By the WestJEM article submission agreement, all authors are required to disclose all affiliations, funding sources and financial or management relationships that could be perceived as potential sources of bias. No author has professional or financial relationships with any companies that are relevant to this study. There are no conflicts of interest or sources of funding to declare.
Copyright: © 2021 Adams. This is an open access article distributed in accordance with the terms of the Creative Commons Attribution (CC BY 4.0) License. See: http://creativecommons.org/licenses/by/4.0/
REFERENCES1. Utstein Abbey, 18/19th century anonymous painting, Photograph
by Frode Inge Helland. Available at: https://en.wikipedia.org/wiki/File:Utstein_kloster_01.jpg. Accessed April 28, 2020.
2. Idris AH, Bierens JJLM, Perkins GD, et al. 2015 Revised Utstein-Style Recommended Guidelines for Uniform Reporting of Data from Drowning-Related Resuscitation: An ILCOR Advisory Statement. Circ Cardiovasc Qual Outcomes. 2017;10(7):e000024.
3. Perkins GD, Jacobs IG, Nadkarni VM, et al. Cardiac arrest and cardiopulmonary resuscitation outcome reports: update of the Utstein Resuscitation Registry Templates for Out-of-Hospital Cardiac Arrest: a statement for healthcare professionals from a task force of the International Liaison Committee on Resuscitation (American Heart Association, European Resuscitation Council, Australian and New Zealand Council on Resuscitation, Heart and Stroke Foundation of Canada, InterAmerican Heart Foundation, Resuscitation Council of Southern Africa, Resuscitation Council of Asia); and the American Heart Association Emergency Cardiovascular Care Committee and the Council on Cardiopulmonary, Critical Care, Perioperative and Resuscitation. Circulation. 2015;132(13):1286-300.
4. Ringdal KG, Coats TJ, Lefering R, et al. The Utstein template for uniform reporting of data following major trauma: a joint revision by SCANTEM, TARN, DGU-TR and RITG. Scand J Trauma Resusc Emerg Med. 2008;16:7.
5. Sundnes KO. Health disaster management: guidelines for evaluation and research in the Utstein style: executive summary. Task Force on Quality Control of Disaster Management. Prehosp Disaster Med. 1999;14(2):43-52.
6. Hargarten SW. The Bullets He Carried. West J Emerg Med. 2020;21(5):1036. Published 2020 Aug 7.
7. Baker SP, Haddon W Jr. Reducing injuries and their results: the scientific approach. Milbank Mem Fund Q Health Soc. 1974;52(4):377-89.
8. Centers for Disease Control and Prevention. Data through 2016: “Guns / Firearm-related deaths”. NSC.org copy of U.S. Government (CDC) data. December 2017. Archived from the original on August 29, 2018. Available at: https://www.cdc.gov/violenceprevention/firearms/fastfact.html. Accessed August 29, 2018.
9. National Association for the Advancement of Colored People. CRIMINAL JUSTICE FACT SHEET. 2020. Available at: https://www.naacp.org/criminal-justice-fact-sheet/. Accessed April 28, 2021.
10. Gun Violence Archive. 2021. Available at: https://www.gunviolencearchive.org. Accessed April 28, 2021.
11. Rostron A. The Dickey Amendment on federal funding for research on gun violence: a legal dissection. Am J Public Health. 2018;108(7):865-7.

Western Journal of Emergency Medicine 462 Volume 22, no. 3: May 2021
Original Research
Nonfatal Firearm Injuries by Intent in the United States: 2016-2018 Hospital Discharge Records from the Healthcare
Cost and Utilization Project Kathryn Schnippel, PhD* Sarah Burd-Sharps, MIA* Ted R. Miller, PhD† Bruce A. Lawrence, PhD† David I. Swedler, PhD†
Section Editor: Mark I. Langdorf, MD, MHPE Submission history: Submitted January 27, 2021; Revision received March 1, 2021; Accepted March 2, 2021Electronically published May 21, 2021 Full text available through open access at http://escholarship.org/uc/uciem_westjem DOI: 10.5811/westjem.2021.3.51925
INTRODUCTIONThe story of gun violence in the United States is often
told through the deaths that are reported through the National
Everytown for Gun Safety Support Fund, New York, New YorkPacific Institute for Research and Evaluation, Calverton, Maryland
*†
Introduction: In addition to the nearly 40,000 firearm deaths each year, nonfatal firearm injuries represent a significant public health burden to communities in the United States. We aimed to describe the incidence and rates of nonfatal firearm injuries.
Methods: We calculated nonfatal firearm injury estimates using the Healthcare Cost and Utilization Project of the Agency for Healthcare Research and Quality, including the Nationwide Emergency Department Samples and the National Inpatient Samples. We used the International Classification of Diseases, 10th Revision, Clinical Modification to identify firearm injury episodes. Deaths in the emergency department (ED) or as inpatients were excluded.
Results: In addition to the 118,171 persons shot and killed by firearms from 2016–2018, 228,380 people were shot (ratio 1.9:1) and treated at a hospital ED or admitted to hospital, a rate of 23.4 nonfatal firearm injury episodes per 100,000 population. The number of nonfatal injury episodes varied by year: 2018 had the lowest at 69,692, compared to 84,776 in 2017 and 73,912 in 2016. Unintentional injury episodes were the most frequent, accounting for 58.5% (n = 81,217) and 38.9% (n = 34,820) of total nonfatal firearm hospital discharges from the ED and inpatients, respectively. Assault episodes were the next most frequent, at 36.3% (n = 50,482) of ED and 49.5% (n = 44,290) of inpatient discharges. The highest rate of nonfatal firearm injury by five-year age group was for 20- to 24-year-olds. With an annual rate of 73.53 per 100,000 population, the rates for ages 20-24 were more than 10 times higher than the rates for patients younger than 15 or 60 years and older. More than half (53.4%, n = 121,884) of hospital-treated, nonfatal firearm injury episodes were patients living in ZIP codes with a median household income in the lowest quartile, compared to 7.5% (n = 17,102) for patients residing in the highest income quartile ZIP codes, a sevenfold difference.
Conclusion: For every person shot and killed by a gun in the US, two more are wounded. Unlike firearm deaths, which are predominantly suicides, most nonfatal firearm injury episodes are unintentional or with an assault intent. Having a reliable source of nonfatal injury data is essential to understanding the incidence of firearm injuries. [West J Emerg Med. 2021;22(3)462–470.]
Vital Statistics System by the US Centers for Disease Control and Prevention (CDC): more than 100 gun deaths each day.1 But an often-overlooked part of today’s gun violence crisis
Volume 22, no. 3: May 2021 463 Western Journal of Emergency Medicine
Schnippel et al. Nonfatal Firearm Injuries by Intent in the US: 2016-2018
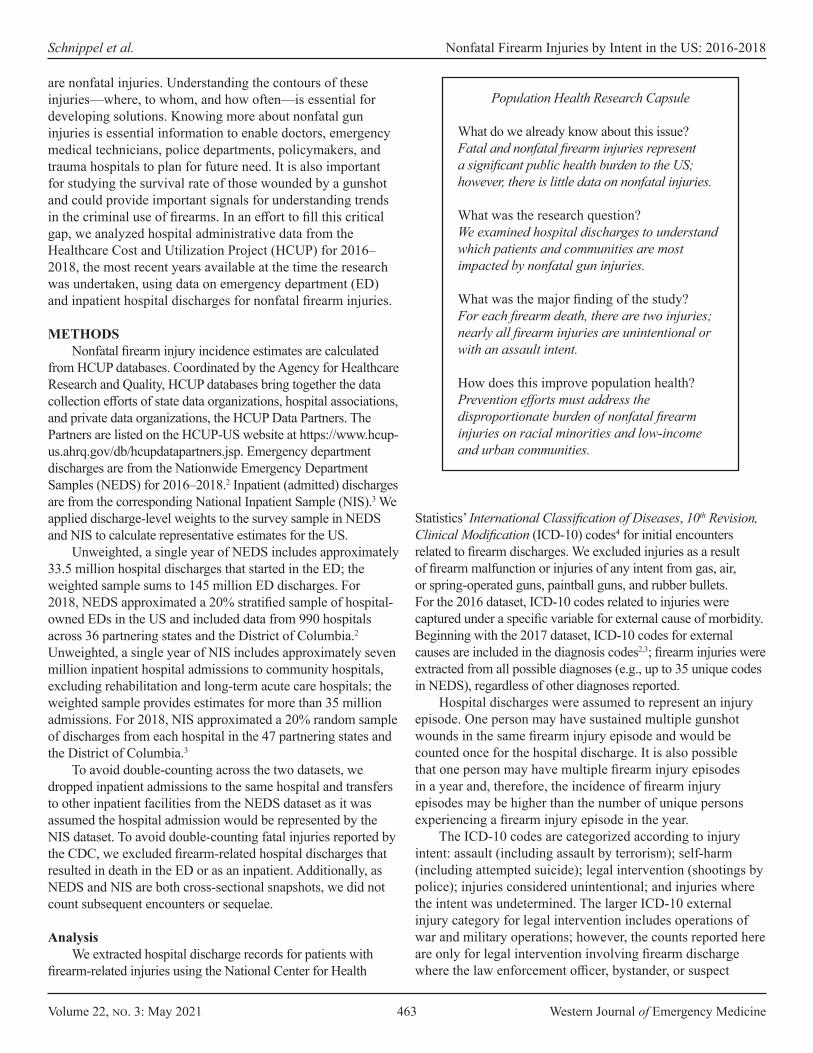
Population Health Research Capsule
What do we already know about this issue?Fatal and nonfatal firearm injuries represent a significant public health burden to the US; however, there is little data on nonfatal injuries.
What was the research question?We examined hospital discharges to understand which patients and communities are most impacted by nonfatal gun injuries.
What was the major finding of the study?For each firearm death, there are two injuries; nearly all firearm injuries are unintentional or with an assault intent.
How does this improve population health?Prevention efforts must address the disproportionate burden of nonfatal firearm injuries on racial minorities and low-income and urban communities.
are nonfatal injuries. Understanding the contours of these injuries—where, to whom, and how often—is essential for developing solutions. Knowing more about nonfatal gun injuries is essential information to enable doctors, emergency medical technicians, police departments, policymakers, and trauma hospitals to plan for future need. It is also important for studying the survival rate of those wounded by a gunshot and could provide important signals for understanding trends in the criminal use of firearms. In an effort to fill this critical gap, we analyzed hospital administrative data from the Healthcare Cost and Utilization Project (HCUP) for 2016–2018, the most recent years available at the time the research was undertaken, using data on emergency department (ED) and inpatient hospital discharges for nonfatal firearm injuries.
METHODSNonfatal firearm injury incidence estimates are calculated
from HCUP databases. Coordinated by the Agency for Healthcare Research and Quality, HCUP databases bring together the data collection efforts of state data organizations, hospital associations, and private data organizations, the HCUP Data Partners. The Partners are listed on the HCUP-US website at https://www.hcup-us.ahrq.gov/db/hcupdatapartners.jsp. Emergency department discharges are from the Nationwide Emergency Department Samples (NEDS) for 2016–2018.2 Inpatient (admitted) discharges are from the corresponding National Inpatient Sample (NIS).3 We applied discharge-level weights to the survey sample in NEDS and NIS to calculate representative estimates for the US.
Unweighted, a single year of NEDS includes approximately 33.5 million hospital discharges that started in the ED; the weighted sample sums to 145 million ED discharges. For 2018, NEDS approximated a 20% stratified sample of hospital-owned EDs in the US and included data from 990 hospitals across 36 partnering states and the District of Columbia.2 Unweighted, a single year of NIS includes approximately seven million inpatient hospital admissions to community hospitals, excluding rehabilitation and long-term acute care hospitals; the weighted sample provides estimates for more than 35 million admissions. For 2018, NIS approximated a 20% random sample of discharges from each hospital in the 47 partnering states and the District of Columbia.3
To avoid double-counting across the two datasets, we dropped inpatient admissions to the same hospital and transfers to other inpatient facilities from the NEDS dataset as it was assumed the hospital admission would be represented by the NIS dataset. To avoid double-counting fatal injuries reported by the CDC, we excluded firearm-related hospital discharges that resulted in death in the ED or as an inpatient. Additionally, as NEDS and NIS are both cross-sectional snapshots, we did not count subsequent encounters or sequelae.
AnalysisWe extracted hospital discharge records for patients with
firearm-related injuries using the National Center for Health
Statistics’ International Classification of Diseases, 10th Revision, Clinical Modification (ICD-10) codes4 for initial encounters related to firearm discharges. We excluded injuries as a result of firearm malfunction or injuries of any intent from gas, air, or spring-operated guns, paintball guns, and rubber bullets. For the 2016 dataset, ICD-10 codes related to injuries were captured under a specific variable for external cause of morbidity. Beginning with the 2017 dataset, ICD-10 codes for external causes are included in the diagnosis codes2,3; firearm injuries were extracted from all possible diagnoses (e.g., up to 35 unique codes in NEDS), regardless of other diagnoses reported.
Hospital discharges were assumed to represent an injury episode. One person may have sustained multiple gunshot wounds in the same firearm injury episode and would be counted once for the hospital discharge. It is also possible that one person may have multiple firearm injury episodes in a year and, therefore, the incidence of firearm injury episodes may be higher than the number of unique persons experiencing a firearm injury episode in the year.
The ICD-10 codes are categorized according to injury intent: assault (including assault by terrorism); self-harm (including attempted suicide); legal intervention (shootings by police); injuries considered unintentional; and injuries where the intent was undetermined. The larger ICD-10 external injury category for legal intervention includes operations of war and military operations; however, the counts reported here are only for legal intervention involving firearm discharge where the law enforcement officer, bystander, or suspect
Western Journal of Emergency Medicine 464 Volume 22, no. 3: May 2021
Nonfatal Firearm Injuries by Intent in the US: 2016-2018 Schnippel et al.
was injured. A full list of included codes is available in the supplemental appendix.
The ICD-10 codes Y90-Y99 are available for supplementary factors related to external injuries. Evidence of alcohol involvement, place of occurrence (e.g., residence, school, business, public space), and activity at time of injury were explored. However, as most firearm injuries had no supplementary factor codes or no information provided in these codes (e.g., coded as unspecified or not applicable), we did not report these supplementary factors.
We provide descriptive statistics using variables as available and coded in the datasets. Injuries were described using injury intent and whether the patient was discharged from the ED or after inpatient admission. For inpatients, the NIS files also include information on the “All Patients Refined Diagnosis Related Groups” (APR DRG) subclassifications for the risk of mortality (minor, moderate, major or extreme likelihood of dying) and the severity of illness (minor, moderate, major, or extreme loss of function).3 Patient individual characteristics were described for gender (male or female) and age from both NEDS and NIS. Combined race and ethnicity (categorized as Asian or Pacific Islander, Black, Hispanic, Native American, White, and other races including mixed race) was available for inpatients only.
Both datasets included the urban-rural classification of the county of patient residence, categorized as the following: large central metro (counties with significant population of a metropolitan statistical area of one million or more); large fringe metro (counties in a metropolitan statistical area but not considered central); medium metro (counties in a metropolitan statistical area of 250,000 to 999,999 population); small metro (counties in a metropolitan statistical area of less than 250,000 population); and micropolitan or noncore (rural).5 Both datasets also included the median household income quartile of the patient ZIP code as categorized in the dataset; the quartiles were defined for each year, with the lowest quartile including ZIP codes with a median income of up to $42,999 in 2016 and $45,999 in 2018. Hospital characteristics common to both datasets were limited to the US Census region (Midwest, Northeast, South, and West).
We calculated annual crude population rates per 100,000 population on the weighted national estimates using the population file from HCUP released in 2020 for the three years 2016–2018.6 All analysis was done in Stata, release 16 (StataCorp., College Station, TX) using the survey commands to account for the weighting.
The HCUP datasets are public use files that do not include any patient-level identifying information; therefore, this was not considered human subject research. Counts less than 10 are suppressed as per restrictions on the dataset. The study is presented in accordance with STROBE reporting guidelines for cross-sectional observational studies.7
RESULTSFrom 2016–2018, hospitals provided an estimated 228,380
episodes of care (95% confidence interval [CI], 213,824 to
242,936) for nonfatal shootings in the United States, a rate of 23.40 per 100,000 population (95% CI, 21.91 to 24.89). Excluding follow-up visits, national estimates include 138,935 (60.8%) nonfatal firearm injury episodes treated only in the ED (95% CI, 125,737 to 152,133) and 89,445 (39.2%) treated as inpatients (95% CI, 83,386 to 95,504).
From the NEDS alone across the three years, there were 63,150 initial encounter episodes where firearm was the mechanism of injury (a weighted national estimate of 264,886) in total for all injury intents. To avoid double-counting NIS admissions, we excluded 26,197 (41.5% of firearm-coded injuries) NEDS discharges to an inpatient admission to the same hospital or transferred as inpatient (weighted estimate of 109,432). Additionally, we excluded from the analyses 3840 patients who died in the ED (10.4%, weighted estimate n = 16,419) and 1,651 patients who died in hospital (8.5%, weighted estimate n = 8,255). The combined weighted estimate of 24,674 deaths excluded represent 85% of the CDC-reported 29,009 firearm injury deaths in medical facilities as inpatient, outpatient or ED, and dead on arrival.
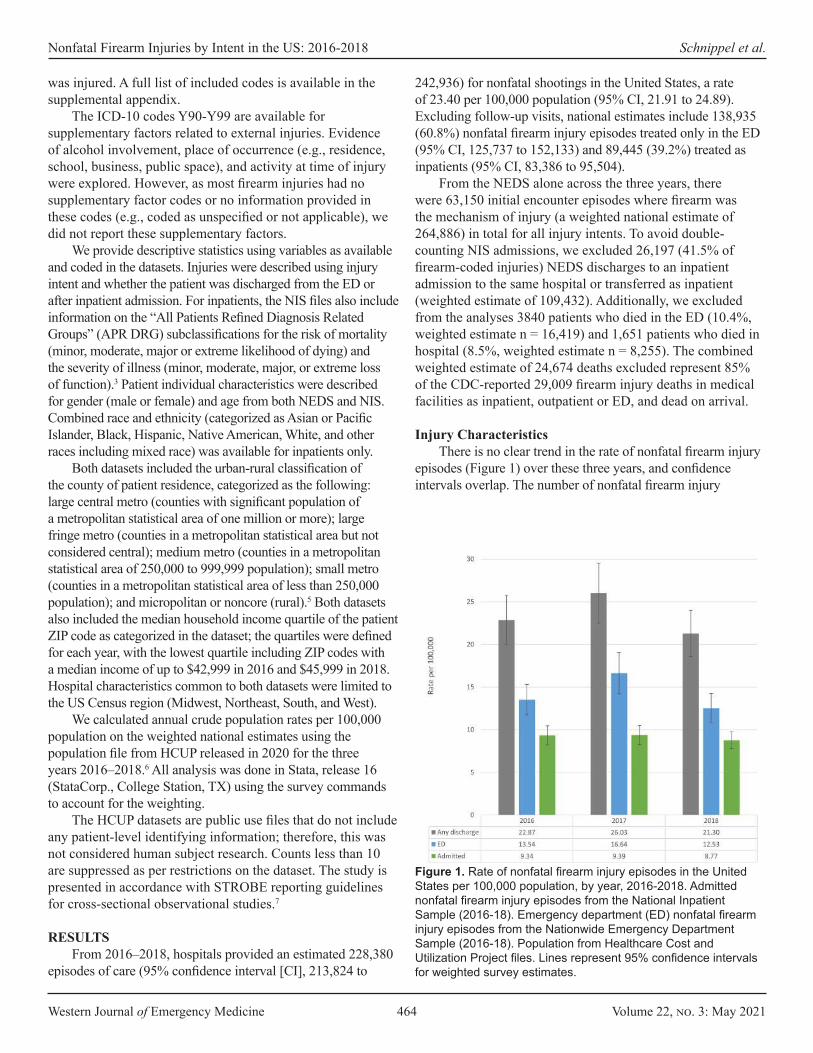
Injury CharacteristicsThere is no clear trend in the rate of nonfatal firearm injury
episodes (Figure 1) over these three years, and confidence intervals overlap. The number of nonfatal firearm injury
Figure 1. Rate of nonfatal firearm injury episodes in the United States per 100,000 population, by year, 2016-2018. Admitted nonfatal firearm injury episodes from the National Inpatient Sample (2016-18). Emergency department (ED) nonfatal firearm injury episodes from the Nationwide Emergency Department Sample (2016-18). Population from Healthcare Cost and Utilization Project files. Lines represent 95% confidence intervals for weighted survey estimates.
Volume 22, no. 3: May 2021 465 Western Journal of Emergency Medicine
Schnippel et al. Nonfatal Firearm Injuries by Intent in the US: 2016-2018
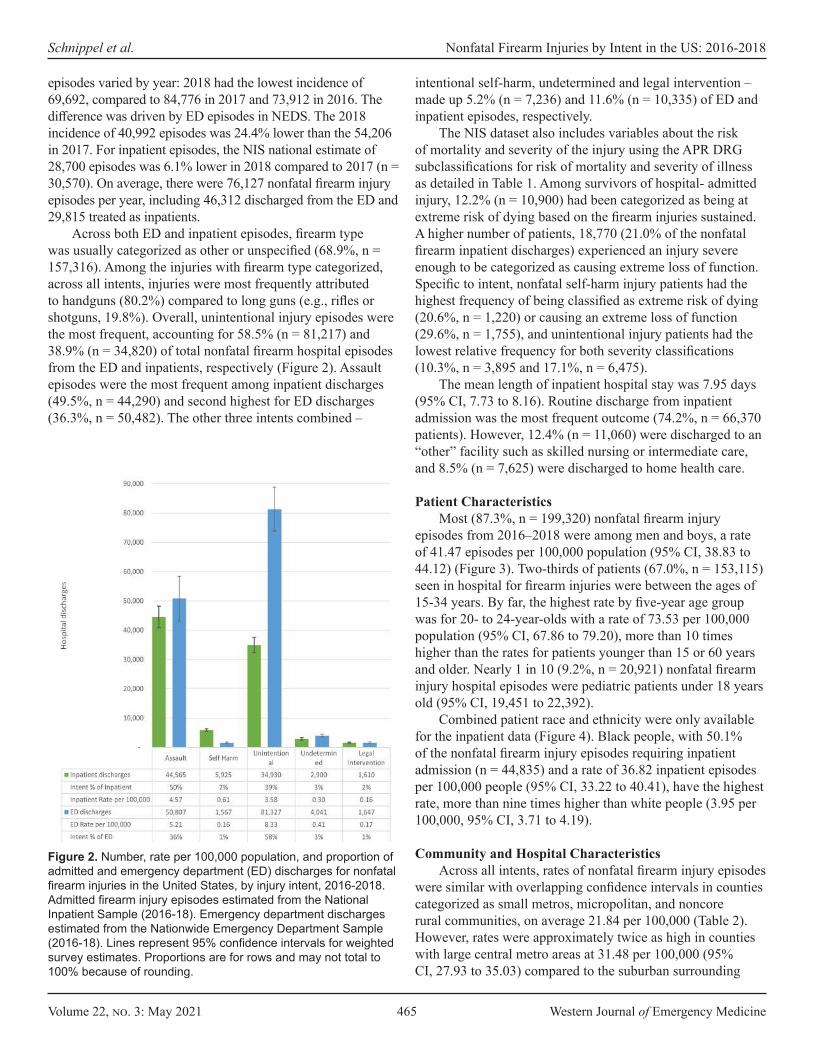
episodes varied by year: 2018 had the lowest incidence of 69,692, compared to 84,776 in 2017 and 73,912 in 2016. The difference was driven by ED episodes in NEDS. The 2018 incidence of 40,992 episodes was 24.4% lower than the 54,206 in 2017. For inpatient episodes, the NIS national estimate of 28,700 episodes was 6.1% lower in 2018 compared to 2017 (n = 30,570). On average, there were 76,127 nonfatal firearm injury episodes per year, including 46,312 discharged from the ED and 29,815 treated as inpatients.
Across both ED and inpatient episodes, firearm type was usually categorized as other or unspecified (68.9%, n = 157,316). Among the injuries with firearm type categorized, across all intents, injuries were most frequently attributed to handguns (80.2%) compared to long guns (e.g., rifles or shotguns, 19.8%). Overall, unintentional injury episodes were the most frequent, accounting for 58.5% (n = 81,217) and 38.9% (n = 34,820) of total nonfatal firearm hospital episodes from the ED and inpatients, respectively (Figure 2). Assault episodes were the most frequent among inpatient discharges (49.5%, n = 44,290) and second highest for ED discharges (36.3%, n = 50,482). The other three intents combined –
intentional self-harm, undetermined and legal intervention – made up 5.2% (n = 7,236) and 11.6% (n = 10,335) of ED and inpatient episodes, respectively.
The NIS dataset also includes variables about the risk of mortality and severity of the injury using the APR DRG subclassifications for risk of mortality and severity of illness as detailed in Table 1. Among survivors of hospital- admitted injury, 12.2% (n = 10,900) had been categorized as being at extreme risk of dying based on the firearm injuries sustained. A higher number of patients, 18,770 (21.0% of the nonfatal firearm inpatient discharges) experienced an injury severe enough to be categorized as causing extreme loss of function. Specific to intent, nonfatal self-harm injury patients had the highest frequency of being classified as extreme risk of dying (20.6%, n = 1,220) or causing an extreme loss of function (29.6%, n = 1,755), and unintentional injury patients had the lowest relative frequency for both severity classifications (10.3%, n = 3,895 and 17.1%, n = 6,475).
The mean length of inpatient hospital stay was 7.95 days (95% CI, 7.73 to 8.16). Routine discharge from inpatient admission was the most frequent outcome (74.2%, n = 66,370 patients). However, 12.4% (n = 11,060) were discharged to an “other” facility such as skilled nursing or intermediate care, and 8.5% (n = 7,625) were discharged to home health care.
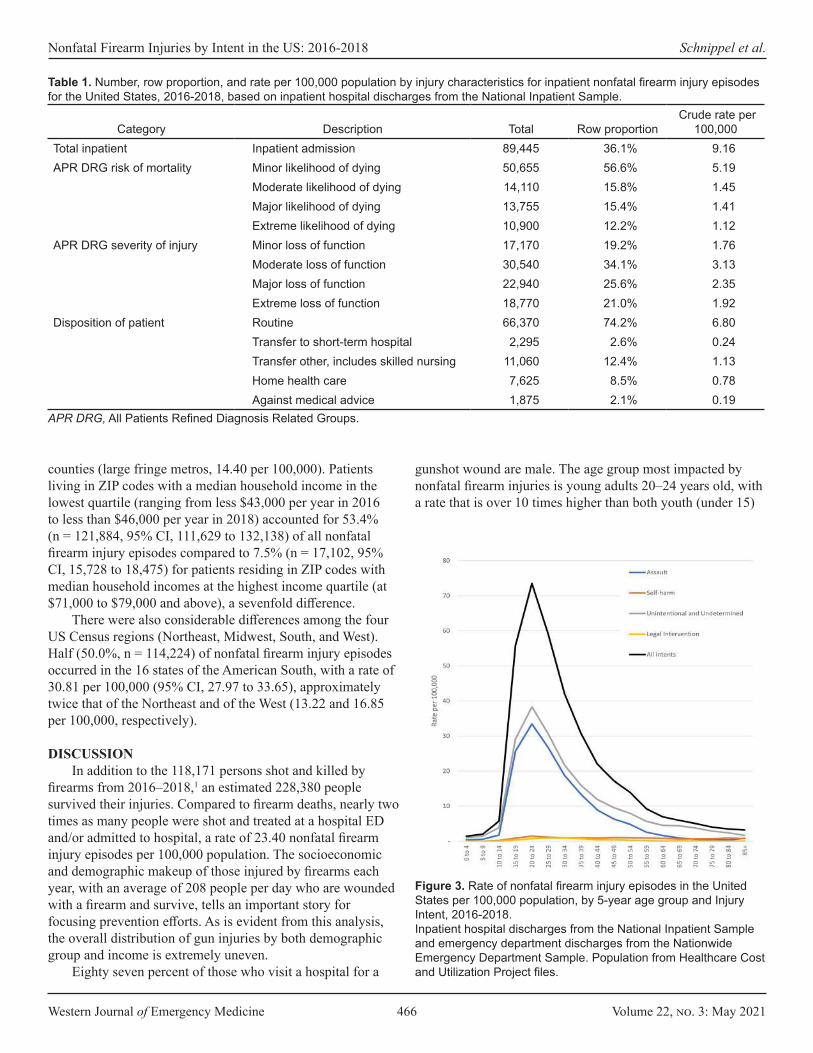
Patient Characteristics Most (87.3%, n = 199,320) nonfatal firearm injury
episodes from 2016–2018 were among men and boys, a rate of 41.47 episodes per 100,000 population (95% CI, 38.83 to 44.12) (Figure 3). Two-thirds of patients (67.0%, n = 153,115) seen in hospital for firearm injuries were between the ages of 15-34 years. By far, the highest rate by five-year age group was for 20- to 24-year-olds with a rate of 73.53 per 100,000 population (95% CI, 67.86 to 79.20), more than 10 times higher than the rates for patients younger than 15 or 60 years and older. Nearly 1 in 10 (9.2%, n = 20,921) nonfatal firearm injury hospital episodes were pediatric patients under 18 years old (95% CI, 19,451 to 22,392).
Combined patient race and ethnicity were only available for the inpatient data (Figure 4). Black people, with 50.1% of the nonfatal firearm injury episodes requiring inpatient admission (n = 44,835) and a rate of 36.82 inpatient episodes per 100,000 people (95% CI, 33.22 to 40.41), have the highest rate, more than nine times higher than white people (3.95 per 100,000, 95% CI, 3.71 to 4.19).
Community and Hospital CharacteristicsAcross all intents, rates of nonfatal firearm injury episodes
were similar with overlapping confidence intervals in counties categorized as small metros, micropolitan, and noncore rural communities, on average 21.84 per 100,000 (Table 2). However, rates were approximately twice as high in counties with large central metro areas at 31.48 per 100,000 (95% CI, 27.93 to 35.03) compared to the suburban surrounding
Figure 2. Number, rate per 100,000 population, and proportion of admitted and emergency department (ED) discharges for nonfatal firearm injuries in the United States, by injury intent, 2016-2018. Admitted firearm injury episodes estimated from the National Inpatient Sample (2016-18). Emergency department discharges estimated from the Nationwide Emergency Department Sample (2016-18). Lines represent 95% confidence intervals for weighted survey estimates. Proportions are for rows and may not total to 100% because of rounding.
Western Journal of Emergency Medicine 466 Volume 22, no. 3: May 2021
Nonfatal Firearm Injuries by Intent in the US: 2016-2018 Schnippel et al.
counties (large fringe metros, 14.40 per 100,000). Patients living in ZIP codes with a median household income in the lowest quartile (ranging from less $43,000 per year in 2016 to less than $46,000 per year in 2018) accounted for 53.4% (n = 121,884, 95% CI, 111,629 to 132,138) of all nonfatal firearm injury episodes compared to 7.5% (n = 17,102, 95% CI, 15,728 to 18,475) for patients residing in ZIP codes with median household incomes at the highest income quartile (at $71,000 to $79,000 and above), a sevenfold difference.
There were also considerable differences among the four US Census regions (Northeast, Midwest, South, and West). Half (50.0%, n = 114,224) of nonfatal firearm injury episodes occurred in the 16 states of the American South, with a rate of 30.81 per 100,000 (95% CI, 27.97 to 33.65), approximately twice that of the Northeast and of the West (13.22 and 16.85 per 100,000, respectively).
DISCUSSIONIn addition to the 118,171 persons shot and killed by
firearms from 2016–2018,1 an estimated 228,380 people survived their injuries. Compared to firearm deaths, nearly two times as many people were shot and treated at a hospital ED and/or admitted to hospital, a rate of 23.40 nonfatal firearm injury episodes per 100,000 population. The socioeconomic and demographic makeup of those injured by firearms each year, with an average of 208 people per day who are wounded with a firearm and survive, tells an important story for focusing prevention efforts. As is evident from this analysis, the overall distribution of gun injuries by both demographic group and income is extremely uneven.
Eighty seven percent of those who visit a hospital for a
Category Description Total Row proportion Crude rate per
100,000 Total inpatient Inpatient admission 89,445 36.1% 9.16 APR DRG risk of mortality Minor likelihood of dying 50,655 56.6% 5.19
Moderate likelihood of dying 14,110 15.8% 1.45 Major likelihood of dying 13,755 15.4% 1.41 Extreme likelihood of dying 10,900 12.2% 1.12
APR DRG severity of injury Minor loss of function 17,170 19.2% 1.76 Moderate loss of function 30,540 34.1% 3.13 Major loss of function 22,940 25.6% 2.35 Extreme loss of function 18,770 21.0% 1.92
Disposition of patient Routine 66,370 74.2% 6.80 Transfer to short-term hospital 2,295 2.6% 0.24 Transfer other, includes skilled nursing 11,060 12.4% 1.13 Home health care 7,625 8.5% 0.78 Against medical advice 1,875 2.1% 0.19
APR DRG, All Patients Refined Diagnosis Related Groups.
Table 1. Number, row proportion, and rate per 100,000 population by injury characteristics for inpatient nonfatal firearm injury episodes for the United States, 2016-2018, based on inpatient hospital discharges from the National Inpatient Sample.
Figure 3. Rate of nonfatal firearm injury episodes in the United States per 100,000 population, by 5-year age group and Injury Intent, 2016-2018. Inpatient hospital discharges from the National Inpatient Sample and emergency department discharges from the Nationwide Emergency Department Sample. Population from Healthcare Cost and Utilization Project files.
gunshot wound are male. The age group most impacted by nonfatal firearm injuries is young adults 20–24 years old, with a rate that is over 10 times higher than both youth (under 15)
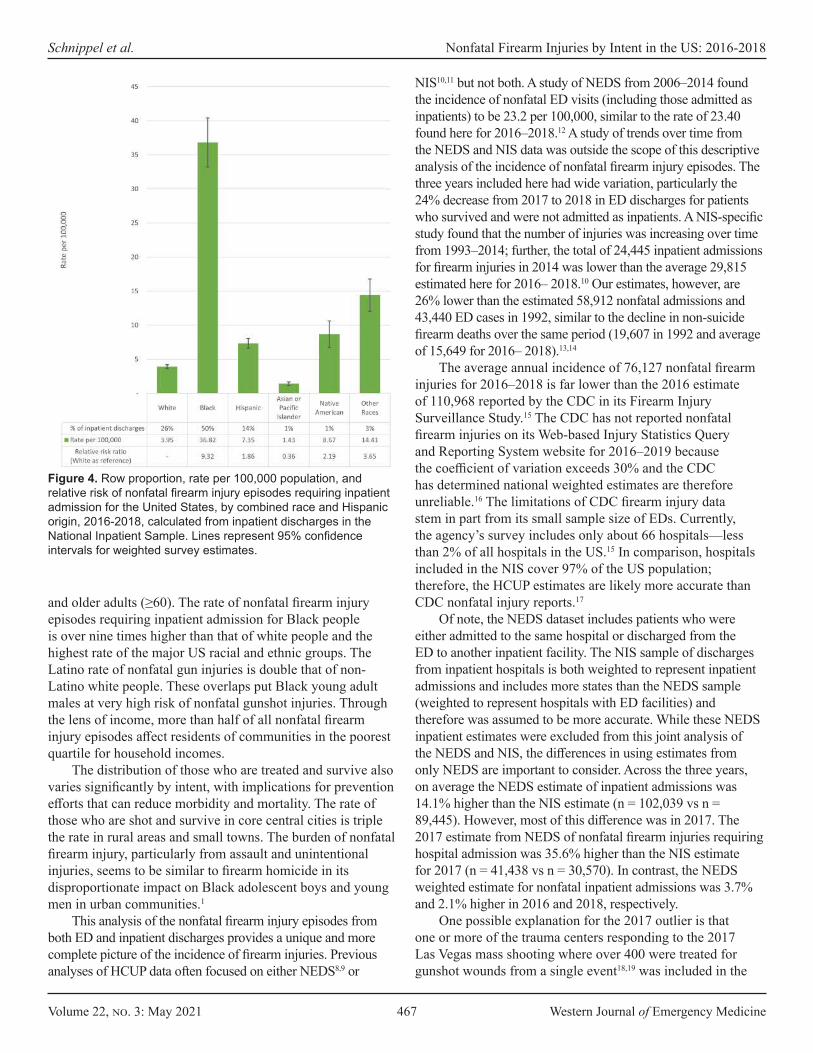
Volume 22, no. 3: May 2021 467 Western Journal of Emergency Medicine
Schnippel et al. Nonfatal Firearm Injuries by Intent in the US: 2016-2018
and older adults (≥60). The rate of nonfatal firearm injury episodes requiring inpatient admission for Black people is over nine times higher than that of white people and the highest rate of the major US racial and ethnic groups. The Latino rate of nonfatal gun injuries is double that of non-Latino white people. These overlaps put Black young adult males at very high risk of nonfatal gunshot injuries. Through the lens of income, more than half of all nonfatal firearm injury episodes affect residents of communities in the poorest quartile for household incomes.
The distribution of those who are treated and survive also varies significantly by intent, with implications for prevention efforts that can reduce morbidity and mortality. The rate of those who are shot and survive in core central cities is triple the rate in rural areas and small towns. The burden of nonfatal firearm injury, particularly from assault and unintentional injuries, seems to be similar to firearm homicide in its disproportionate impact on Black adolescent boys and young men in urban communities.1
This analysis of the nonfatal firearm injury episodes from both ED and inpatient discharges provides a unique and more complete picture of the incidence of firearm injuries. Previous analyses of HCUP data often focused on either NEDS8,9 or
NIS10,11 but not both. A study of NEDS from 2006–2014 found the incidence of nonfatal ED visits (including those admitted as inpatients) to be 23.2 per 100,000, similar to the rate of 23.40 found here for 2016–2018.12 A study of trends over time from the NEDS and NIS data was outside the scope of this descriptive analysis of the incidence of nonfatal firearm injury episodes. The three years included here had wide variation, particularly the 24% decrease from 2017 to 2018 in ED discharges for patients who survived and were not admitted as inpatients. A NIS-specific study found that the number of injuries was increasing over time from 1993–2014; further, the total of 24,445 inpatient admissions for firearm injuries in 2014 was lower than the average 29,815 estimated here for 2016– 2018.10 Our estimates, however, are 26% lower than the estimated 58,912 nonfatal admissions and 43,440 ED cases in 1992, similar to the decline in non-suicide firearm deaths over the same period (19,607 in 1992 and average of 15,649 for 2016– 2018).13,14
The average annual incidence of 76,127 nonfatal firearm injuries for 2016–2018 is far lower than the 2016 estimate of 110,968 reported by the CDC in its Firearm Injury Surveillance Study.15 The CDC has not reported nonfatal firearm injuries on its Web-based Injury Statistics Query and Reporting System website for 2016–2019 because the coefficient of variation exceeds 30% and the CDC has determined national weighted estimates are therefore unreliable.16 The limitations of CDC firearm injury data stem in part from its small sample size of EDs. Currently, the agency’s survey includes only about 66 hospitals—less than 2% of all hospitals in the US.15 In comparison, hospitals included in the NIS cover 97% of the US population; therefore, the HCUP estimates are likely more accurate than CDC nonfatal injury reports.17
Of note, the NEDS dataset includes patients who were either admitted to the same hospital or discharged from the ED to another inpatient facility. The NIS sample of discharges from inpatient hospitals is both weighted to represent inpatient admissions and includes more states than the NEDS sample (weighted to represent hospitals with ED facilities) and therefore was assumed to be more accurate. While these NEDS inpatient estimates were excluded from this joint analysis of the NEDS and NIS, the differences in using estimates from only NEDS are important to consider. Across the three years, on average the NEDS estimate of inpatient admissions was 14.1% higher than the NIS estimate (n = 102,039 vs n = 89,445). However, most of this difference was in 2017. The 2017 estimate from NEDS of nonfatal firearm injuries requiring hospital admission was 35.6% higher than the NIS estimate for 2017 (n = 41,438 vs n = 30,570). In contrast, the NEDS weighted estimate for nonfatal inpatient admissions was 3.7% and 2.1% higher in 2016 and 2018, respectively.
One possible explanation for the 2017 outlier is that one or more of the trauma centers responding to the 2017 Las Vegas mass shooting where over 400 were treated for gunshot wounds from a single event18,19 was included in the
Figure 4. Row proportion, rate per 100,000 population, and relative risk of nonfatal firearm injury episodes requiring inpatient admission for the United States, by combined race and Hispanic origin, 2016-2018, calculated from inpatient discharges in the National Inpatient Sample. Lines represent 95% confidence intervals for weighted survey estimates.
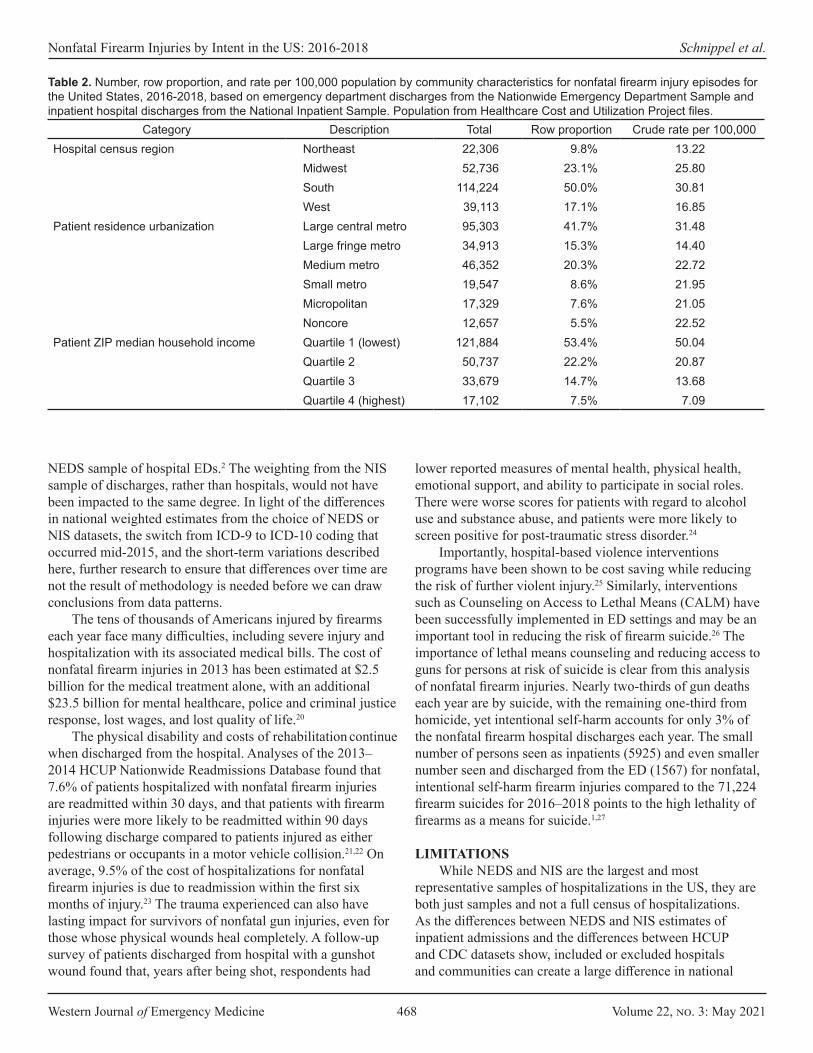
Western Journal of Emergency Medicine 468 Volume 22, no. 3: May 2021
Nonfatal Firearm Injuries by Intent in the US: 2016-2018 Schnippel et al.
Category Description Total Row proportion Crude rate per 100,000 Hospital census region Northeast 22,306 9.8% 13.22
Midwest 52,736 23.1% 25.80 South 114,224 50.0% 30.81 West 39,113 17.1% 16.85
Patient residence urbanization Large central metro 95,303 41.7% 31.48 Large fringe metro 34,913 15.3% 14.40 Medium metro 46,352 20.3% 22.72 Small metro 19,547 8.6% 21.95 Micropolitan 17,329 7.6% 21.05 Noncore 12,657 5.5% 22.52
Patient ZIP median household income Quartile 1 (lowest) 121,884 53.4% 50.04 Quartile 2 50,737 22.2% 20.87 Quartile 3 33,679 14.7% 13.68 Quartile 4 (highest) 17,102 7.5% 7.09
Table 2. Number, row proportion, and rate per 100,000 population by community characteristics for nonfatal firearm injury episodes for the United States, 2016-2018, based on emergency department discharges from the Nationwide Emergency Department Sample and inpatient hospital discharges from the National Inpatient Sample. Population from Healthcare Cost and Utilization Project files.
NEDS sample of hospital EDs.2 The weighting from the NIS sample of discharges, rather than hospitals, would not have been impacted to the same degree. In light of the differences in national weighted estimates from the choice of NEDS or NIS datasets, the switch from ICD-9 to ICD-10 coding that occurred mid-2015, and the short-term variations described here, further research to ensure that differences over time are not the result of methodology is needed before we can draw conclusions from data patterns.
The tens of thousands of Americans injured by firearms each year face many difficulties, including severe injury and hospitalization with its associated medical bills. The cost of nonfatal firearm injuries in 2013 has been estimated at $2.5 billion for the medical treatment alone, with an additional $23.5 billion for mental healthcare, police and criminal justice response, lost wages, and lost quality of life.20
The physical disability and costs of rehabilitation continue when discharged from the hospital. Analyses of the 2013– 2014 HCUP Nationwide Readmissions Database found that 7.6% of patients hospitalized with nonfatal firearm injuries are readmitted within 30 days, and that patients with firearm injuries were more likely to be readmitted within 90 days following discharge compared to patients injured as either pedestrians or occupants in a motor vehicle collision.21,22 On average, 9.5% of the cost of hospitalizations for nonfatal firearm injuries is due to readmission within the first six months of injury.23 The trauma experienced can also have lasting impact for survivors of nonfatal gun injuries, even for those whose physical wounds heal completely. A follow-up survey of patients discharged from hospital with a gunshot wound found that, years after being shot, respondents had
lower reported measures of mental health, physical health, emotional support, and ability to participate in social roles. There were worse scores for patients with regard to alcohol use and substance abuse, and patients were more likely to screen positive for post-traumatic stress disorder.24
Importantly, hospital-based violence interventions programs have been shown to be cost saving while reducing the risk of further violent injury.25 Similarly, interventions such as Counseling on Access to Lethal Means (CALM) have been successfully implemented in ED settings and may be an important tool in reducing the risk of firearm suicide.26 The importance of lethal means counseling and reducing access to guns for persons at risk of suicide is clear from this analysis of nonfatal firearm injuries. Nearly two-thirds of gun deaths each year are by suicide, with the remaining one-third from homicide, yet intentional self-harm accounts for only 3% of the nonfatal firearm hospital discharges each year. The small number of persons seen as inpatients (5925) and even smaller number seen and discharged from the ED (1567) for nonfatal, intentional self-harm firearm injuries compared to the 71,224 firearm suicides for 2016–2018 points to the high lethality of firearms as a means for suicide.1,27
LIMITATIONSWhile NEDS and NIS are the largest and most
representative samples of hospitalizations in the US, they are both just samples and not a full census of hospitalizations. As the differences between NEDS and NIS estimates of inpatient admissions and the differences between HCUP and CDC datasets show, included or excluded hospitals and communities can create a large difference in national
Volume 22, no. 3: May 2021 469 Western Journal of Emergency Medicine
Schnippel et al. Nonfatal Firearm Injuries by Intent in the US: 2016-2018
estimates. This analysis attempted to look across NEDS and NIS by dropping NEDS patients who had an outcome of inpatient admission or transfer to inpatient hospital and assuming that these patients were represented in NIS. If these patients were incorrectly coded in NIS as being subsequent rather than initial visits, the counts presented here would underestimate the burden of injury.
As with other analyses of external causes of injury, the ICD-10 codes may not accurately reflect the intent because of limited information at the time of the hospital encounter. In cases where the intent of a shooting injury is unclear, and in the absence of affirmative documentation on the incident, unintentional injuries may be overestimated and intentional self-harm and assault injuries may be underestimated.28
NEDS and NIS also are both surveys of hospitalizations and exclude nonfatal firearm injuries that may have been managed in clinicians’ offices or urgent care facilities separate from hospitals and therefore likely underestimate less severe injuries from firearms.
CONCLUSIONThere is a persistent and urgent need to understand
nonfatal firearm injury episodes seen in EDs and as inpatients in hospitals across the United States. Nonfatal firearm injury episodes on average occur at a rate twice that of firearm deaths. This descriptive analysis points to large disparities in terms of the high rate and heavy burden of nonfatal firearm injury episodes particularly in low-income, urban communities and among Black adolescent boys and young men. Policies and interventions to reduce gun violence must focus on the most impacted communities and prioritize community- and evidence-based solutions that address these disparities.
Address for Correspondence: Kathryn Schnippel, PhD, Everytown for Gun Safety Support Fund, P.O. Box 3886, New York, NY 10017. Email: [email protected].
Conflicts of Interest: By the WestJEM article submission agreement, all authors are required to disclose all affiliations, funding sources and financial or management relationships that could be perceived as potential sources of bias. No author has professional or financial relationships with any companies that are relevant to this study. There are no conflicts of interest or sources of funding to declare.
Copyright: © 2021 Schnippel et al. This is an open access article distributed in accordance with the terms of the Creative Commons Attribution (CC BY 4.0) License. See: http://creativecommons.org/licenses/by/4.0/
REFERENCES1. Centers for Disease Control and Prevention (CDC), National Center
for Health Statistics (NCHS). Underlying Cause of Death 1999-2019. National Center for Health Statistics (NCHS); 2020. Available at: https://wonder.cdc.gov/controller/datarequest/D76. Accessed September 28, 2020.
2. Healthcare Cost and Utilization Project (HCUP). NEDS Overview. Agency for Healthcare Research and Quality; 2020. Available at: https://www.hcup-us.ahrq.gov/nedsoverview.jsp. Accessed January 26, 2021.
3. Healthcare Cost and Utilization Project (HCUP). HCUP NIS Overview. Agency for Healthcare Research and Quality; 2020. Available at: https://www.hcup-us.ahrq.gov/nisoverview.jsp. Accessed January 26, 2021.
4. International Classification of Diseases, Tenth Revision, Clinical Modification. Centers for Disease Control and Prevention, National Center for Health Statistics. Available at: https://www.cdc.gov/nchs/icd/icd10cm.htm. Accessed November 5, 2020.
5. Ingram DD, Franco SJ. 2013 NCHS Urban-Rural Classification Scheme for Counties. U.S. Department of Health and Human Services, Centers for Disease Control and Prevention, National Center for Health Statistics; 2014.
6. Barrett M, Coffey RM, Levit K. Population Denominator Data Sources and Data for Use with HCUP Databases. Agency for Healthcare Research and Quality; 2019. Available at: https://www.hcup-us.ahrq.gov/reports/methods/2019-02.pdf. Accessed November 5, 2020.
7. von Elm E, Altman DG, Egger M, et al. The Strengthening the Reporting of Observational Studies in Epidemiology (STROBE) statement: guidelines for reporting observational studies. J Clin Epidemiol. 2008;61(4):344-49.
8. Avraham J, Frangos S, DiMaggio C. The epidemiology of firearm injuries managed in US emergency departments. Inj Epidemiol. 2018;5(1):1-6.
9. Kaufman EJ, Wiebe DJ, Xiong RA, et al. Epidemiologic trends in fatal and nonfatal firearm injuries in the US, 2009-2017. JAMA Intern Med. 2021 Feb 1; 181(2):237-44
10. Kalesan B, Zuo Y, Xuan Z, et al. A multi-decade joinpoint analysis of firearm injury severity. Trauma Surg Acute Care Open. 2018;3(1):e000139.
11. Peek-Asa C, Butcher B, Cavanaugh JE. Cost of hospitalization for firearm injuries by firearm type, intent, and payer in the United States. Inj Epidemiol. 2017;4(1):20.
12. Gani F, Sakran JV, Canner JK. Emergency department visits for firearm-related injuries in the United States, 2006–14. Health Aff. 2017;36(10):1729-38.
13. Miller TR, Cohen MA. Costs of gunshot and cut/stab wounds in the United States, with some Canadian comparisons. Accid Anal Prev. 1997;29(3):329-41.
14. Centers for Disease Control and Prevention (CDC), National Center for Health Statistics (NCHS). Compressed Mortality, 1979-1998 Results. National Center for Health Statistics (NCHS). Available at: https://wonder.cdc.gov/controller/datarequest/D16;jsessionid=E19C8
Western Journal of Emergency Medicine 470 Volume 22, no. 3: May 2021
Nonfatal Firearm Injuries by Intent in the US: 2016-2018 Schnippel et al.
0183571C966AEBF0256EC85. Accessed February 18, 2021.15. United States Department of Health and Human Services. Centers
for Disease Control and Prevention. National Center for Injury Prevention and Control. Firearm Injury Surveillance Study, 1993-2016. Inter-university Consortium for Political and Social Research [distributor]; 2020.
16. Centers for Disease Control and Prevention. Web-based Injury Statistics Query and Reporting System (WISQARS) [Online]. National Center for Injury Prevention and Control, Centers for Disease Control and Prevention (producer). Available at: https://www.cdc.gov/ncipc/wisqars. Accessed January 26, 2021.
17. HCUP Nationwide Inpatient Sample (NIS). Agency for Healthcare Research and Quality. Available at: https://www.hcup-us.ahrq.gov/db/nation/nis/nisdbdocumentation.jsp. Accessed December 21, 2019.
18. Woods AW and A. “Is this real?”: Seven hours of chaos, bravery at Las Vegas hospital after mass shooting. The Arizona Republic. Available at: https://www.azcentral.com/story/news/nation/2017/10/30/seven-hours-chaos-bravery-las-vegas-sunrise-hospital-after-mass-shooting/796410001/ Accessed January 11, 2021.
19. Las Vegas marks 3rd year since deadliest US mass shooting. AP NEWS. Available at: https://apnews.com/article/virus-outbreak-las-vegas-las-vegas-mass-shooting-nevada-shootings-ea1ab5537d62f9e3e52bb4f770910452. Accessed January 11, 2021.
20. Follman M, Lurie J, Miller TR, et al. The true cost of gun violence in America: The data the NRA doesn’t want you to see. Mother Jones. Available at: https://www.motherjones.com/politics/2015/04/true-cost-
of-gun-violence-in-america/. Accessed January 26, 2021.21. Rattan R, Parreco J, Namias N, Pust G, Yeh D, Zakrison T. Hidden
costs of hospitalization after firearm injury: national analysis of different hospital readmission. Ann Surg. 2018;267(5):810-15.
22. Kalesan B, Zuo Y, Vasan RS, et al. Risk of 90-day readmission in patients after firearm injury hospitalization: a nationally representative retrospective cohort study. J Inj Violence Res. 2019;11(1):65-80.
23. Spitzer SA, Vail D, Tennakoon L, et al. Readmission risk and costs of firearm injuries in the United States, 2010-2015. PLOS ONE. 2019;14(1):e0209896.
24. Vella MA, Warshauer A, Tortorello G, et al. Long-term functional, psychological, emotional, and social outcomes in survivors of firearm injuries. JAMA Surg. 2019;155(1):1-9.
25. Purtle J, Rich LJ, Bloom SL, et al. Cost−benefit analysis simulation of a hospital-based violence intervention program. Am J Prev Med. 2015;48(2):162-69.
26. Mueller KL, Naganathan S, Griffey RT. Counseling on Access to Lethal Means-Emergency Department (CALM-ED): a quality improvement program for firearm injury prevention. West J Emerg Med. 2020;21(5):1123-30.
27. Conner A, Azrael D, Miller M. Suicide case-fatality rates in the United States, 2007 to 2014: a nationwide population-based study. Ann Intern Med. 2019;171(12):885-95.
28. McKenzie K, Fingerhut L, Walker S, et al. Classifying external causes of injury: history, current approaches, and future directions. Epidemiol Rev. 2012;34(1):4-16.

Volume 22, no. 3: May 2021 471 Western Journal of Emergency Medicine
Original Research
Lethal Means Counseling for Suicidal Adults in the Emergency Department: A Qualitative Study
Bonnie J. Siry, MSSc*Christopher E. Knoepke, PhD, MSW†‡§ Stephanie M. Ernestus, PhD¶
Daniel D. Matlock, MD, MPH‡||#
Marian E. Betz, MD, MPH*#
Section Editor: Erin Dehon, PhD Submission history: Submitted August 11, 2020; Revision received January 29, 2021; Accepted March 8, 2021Electronically published May 7, 2021 Full text available through open access at http://escholarship.org/uc/uciem_westjem DOI: 10.5811/westjem.2021.8.49485
INTRODUCTIONEmergency departments (ED) are the site where patients with
acute suicidal ideation or attempts (SI/SA) are generally sent for immediate evaluation and intervention. There is a spectrum of interventions for patients with SI/SA, from inpatient psychiatric hospitalization to outpatient follow-up. Lethal means counseling (LMC) – counseling meant to reduce access to firearms, medications, and other highly lethal methods is recognized as
University of Colorado School of Medicine, Department of Emergency Medicine, Aurora, Colorado University of Colorado School of Medicine, Division of Cardiology, Aurora, Colorado University of Colorado School of Medicine, Adult & Child Consortium for Outcomes Research & Delivery Science, Aurora, Colorado University of Southern California, USC Suzanne Dworak-Peck School of Social Work, Los Angeles, CaliforniaStonehill College, Department of Psychology, Easton, Massachusetts University of Colorado School of Medicine, Department of Geriatric Medicine, Aurora, ColoradoVA Eastern Colorado Geriatric Research Education and Clinical Center, Aurora, Colorado
*
†
‡
§
¶
||
#
Introduction: Lethal means counseling (to reduce access to firearms or other suicide methods) is a recommended critical yet challenging component of care of suicidal patients. Questions remain about communication strategies for those in acute crisis.
Methods: This qualitative study was an analysis of semi-structured interviews with English-speaking, community-dwelling adults with a history of lived-experience of suicidal ideation or attempts in themselves or a family member. We used a mixed inductive and deductive approach to identify descriptive themes related to communication and decision-making.
Results: Among 27 participants, 14 (52%) had personal and 23 (85%) had family experience with suicide ideation or attempts. Emergent themes fell into two domains: (1) communication in a state of high emotionality; and (2) specific challenges in communication: initiating, maintaining engagement, considering context.
Conclusion: Engaging suicidal individuals in lethal means counseling may be more effective when messaging and approaches consider their emotional state and communication challenges. [West J Emerg Med. 2021;22(3)471-477.]
an essential, evidence-based component of suicide prevention,1 especially for patients being discharged home. Prior work has shown that LMC may positively affect home storage behaviors, especially among parents of suicidal adolescents.2,3
Yet LMC in the ED does not routinely occur with suicidal adults. Even among those being discharged home, counseling is documented in only about half of these patients.4 Identified barriers to counseling include unclear provider responsibilities
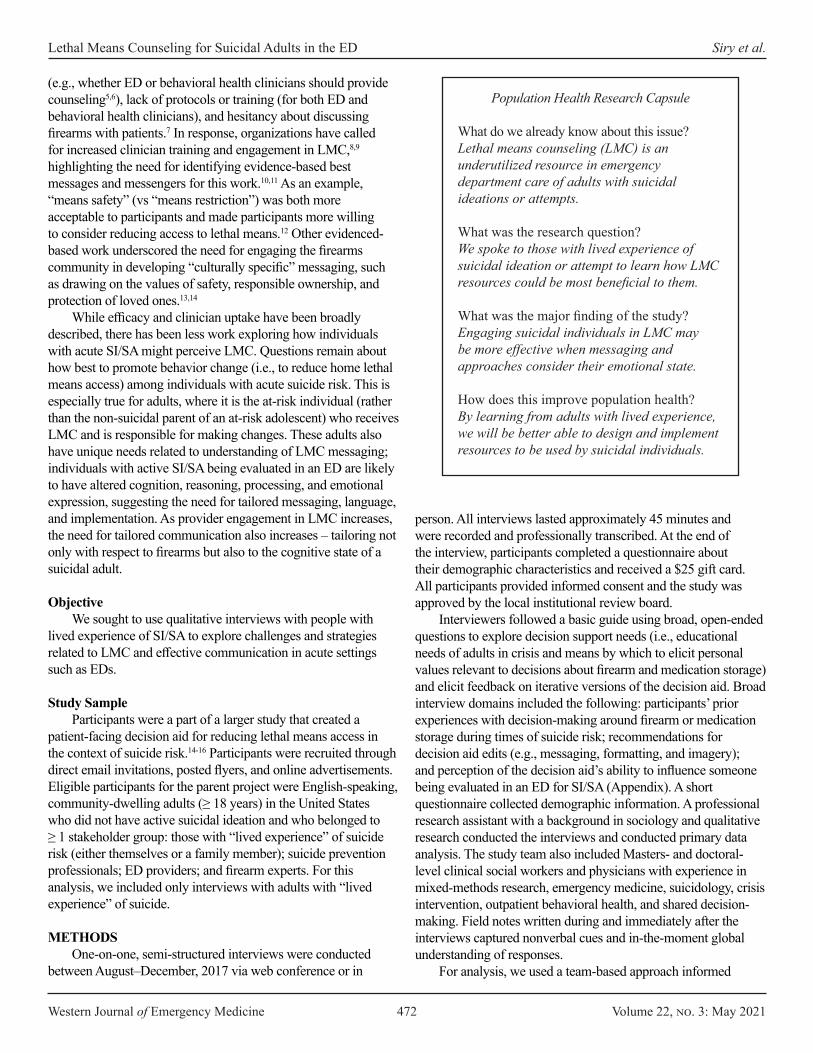
Western Journal of Emergency Medicine 472 Volume 22, no. 3: May 2021
Lethal Means Counseling for Suicidal Adults in the ED Siry et al.
Population Health Research Capsule
What do we already know about this issue?Lethal means counseling (LMC) is an underutilized resource in emergency department care of adults with suicidal ideations or attempts.
What was the research question?We spoke to those with lived experience of suicidal ideation or attempt to learn how LMC resources could be most beneficial to them.
What was the major finding of the study?Engaging suicidal individuals in LMC may be more effective when messaging and approaches consider their emotional state.
How does this improve population health?By learning from adults with lived experience, we will be better able to design and implement resources to be used by suicidal individuals.
(e.g., whether ED or behavioral health clinicians should provide counseling5,6), lack of protocols or training (for both ED and behavioral health clinicians), and hesitancy about discussing firearms with patients.7 In response, organizations have called for increased clinician training and engagement in LMC,8,9 highlighting the need for identifying evidence-based best messages and messengers for this work.10,11 As an example, “means safety” (vs “means restriction”) was both more acceptable to participants and made participants more willing to consider reducing access to lethal means.12 Other evidenced-based work underscored the need for engaging the firearms community in developing “culturally specific” messaging, such as drawing on the values of safety, responsible ownership, and protection of loved ones.13,14
While efficacy and clinician uptake have been broadly described, there has been less work exploring how individuals with acute SI/SA might perceive LMC. Questions remain about how best to promote behavior change (i.e., to reduce home lethal means access) among individuals with acute suicide risk. This is especially true for adults, where it is the at-risk individual (rather than the non-suicidal parent of an at-risk adolescent) who receives LMC and is responsible for making changes. These adults also have unique needs related to understanding of LMC messaging; individuals with active SI/SA being evaluated in an ED are likely to have altered cognition, reasoning, processing, and emotional expression, suggesting the need for tailored messaging, language, and implementation. As provider engagement in LMC increases, the need for tailored communication also increases – tailoring not only with respect to firearms but also to the cognitive state of a suicidal adult.
ObjectiveWe sought to use qualitative interviews with people with
lived experience of SI/SA to explore challenges and strategies related to LMC and effective communication in acute settings such as EDs.
Study SampleParticipants were a part of a larger study that created a
patient-facing decision aid for reducing lethal means access in the context of suicide risk.14-16 Participants were recruited through direct email invitations, posted flyers, and online advertisements. Eligible participants for the parent project were English-speaking, community-dwelling adults (≥ 18 years) in the United States who did not have active suicidal ideation and who belonged to ≥ 1 stakeholder group: those with “lived experience” of suicide risk (either themselves or a family member); suicide prevention professionals; ED providers; and firearm experts. For this analysis, we included only interviews with adults with “lived experience” of suicide.
METHODSOne-on-one, semi-structured interviews were conducted
between August–December, 2017 via web conference or in
person. All interviews lasted approximately 45 minutes and were recorded and professionally transcribed. At the end of the interview, participants completed a questionnaire about their demographic characteristics and received a $25 gift card. All participants provided informed consent and the study was approved by the local institutional review board.
Interviewers followed a basic guide using broad, open-ended questions to explore decision support needs (i.e., educational needs of adults in crisis and means by which to elicit personal values relevant to decisions about firearm and medication storage) and elicit feedback on iterative versions of the decision aid. Broad interview domains included the following: participants’ prior experiences with decision-making around firearm or medication storage during times of suicide risk; recommendations for decision aid edits (e.g., messaging, formatting, and imagery); and perception of the decision aid’s ability to influence someone being evaluated in an ED for SI/SA (Appendix). A short questionnaire collected demographic information. A professional research assistant with a background in sociology and qualitative research conducted the interviews and conducted primary data analysis. The study team also included Masters- and doctoral-level clinical social workers and physicians with experience in mixed-methods research, emergency medicine, suicidology, crisis intervention, outpatient behavioral health, and shared decision-making. Field notes written during and immediately after the interviews captured nonverbal cues and in-the-moment global understanding of responses.
For analysis, we used a team-based approach informed
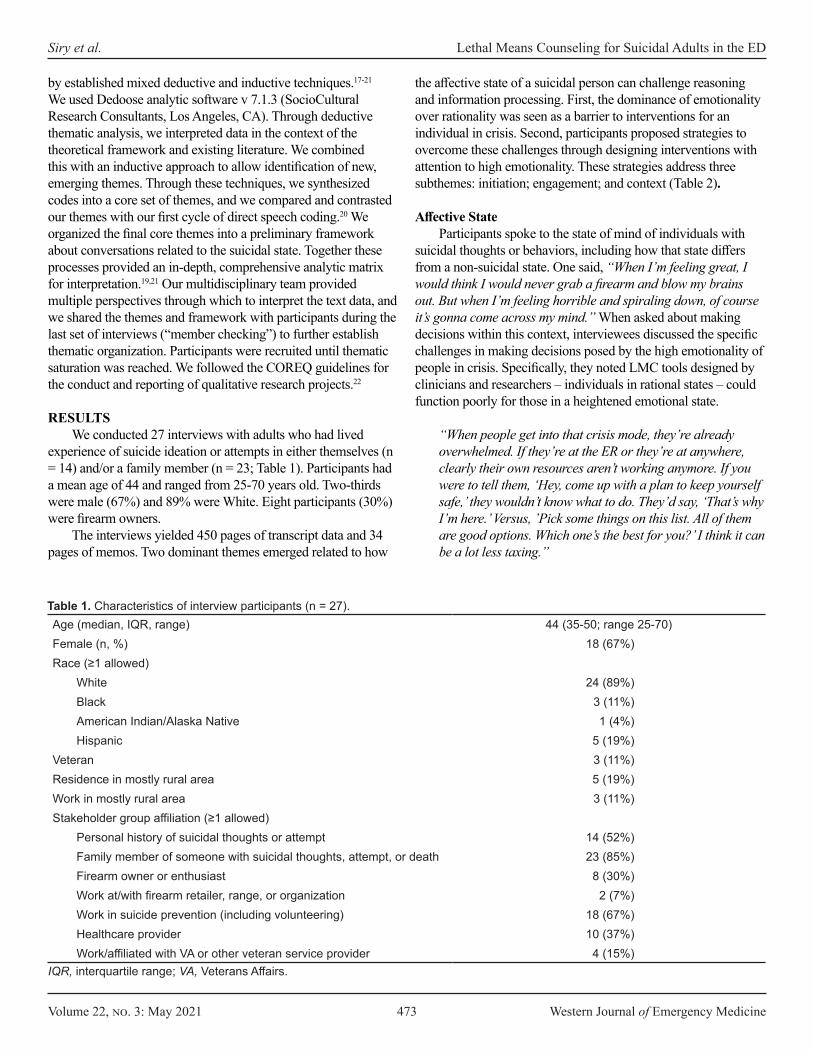
Volume 22, no. 3: May 2021 473 Western Journal of Emergency Medicine
Siry et al. Lethal Means Counseling for Suicidal Adults in the ED
by established mixed deductive and inductive techniques.17-21 We used Dedoose analytic software v 7.1.3 (SocioCultural Research Consultants, Los Angeles, CA). Through deductive thematic analysis, we interpreted data in the context of the theoretical framework and existing literature. We combined this with an inductive approach to allow identification of new, emerging themes. Through these techniques, we synthesized codes into a core set of themes, and we compared and contrasted our themes with our first cycle of direct speech coding.20 We organized the final core themes into a preliminary framework about conversations related to the suicidal state. Together these processes provided an in-depth, comprehensive analytic matrix for interpretation.19,21 Our multidisciplinary team provided multiple perspectives through which to interpret the text data, and we shared the themes and framework with participants during the last set of interviews (“member checking”) to further establish thematic organization. Participants were recruited until thematic saturation was reached. We followed the COREQ guidelines for the conduct and reporting of qualitative research projects.22
RESULTSWe conducted 27 interviews with adults who had lived
experience of suicide ideation or attempts in either themselves (n = 14) and/or a family member (n = 23; Table 1). Participants had a mean age of 44 and ranged from 25-70 years old. Two-thirds were male (67%) and 89% were White. Eight participants (30%) were firearm owners.
The interviews yielded 450 pages of transcript data and 34 pages of memos. Two dominant themes emerged related to how
the affective state of a suicidal person can challenge reasoning and information processing. First, the dominance of emotionality over rationality was seen as a barrier to interventions for an individual in crisis. Second, participants proposed strategies to overcome these challenges through designing interventions with attention to high emotionality. These strategies address three subthemes: initiation; engagement; and context (Table 2).
Affective StateParticipants spoke to the state of mind of individuals with
suicidal thoughts or behaviors, including how that state differs from a non-suicidal state. One said, “When I’m feeling great, I would think I would never grab a firearm and blow my brains out. But when I’m feeling horrible and spiraling down, of course it’s gonna come across my mind.” When asked about making decisions within this context, interviewees discussed the specific challenges in making decisions posed by the high emotionality of people in crisis. Specifically, they noted LMC tools designed by clinicians and researchers – individuals in rational states – could function poorly for those in a heightened emotional state.
“When people get into that crisis mode, they’re already overwhelmed. If they’re at the ER or they’re at anywhere, clearly their own resources aren’t working anymore. If you were to tell them, ‘Hey, come up with a plan to keep yourself safe,’ they wouldn’t know what to do. They’d say, ‘That’s why I’m here.’ Versus, ’Pick some things on this list. All of them are good options. Which one’s the best for you?’ I think it can be a lot less taxing.”
Age (median, IQR, range) 44 (35-50; range 25-70)Female (n, %) 18 (67%)Race (≥1 allowed)
White 24 (89%)Black 3 (11%)American Indian/Alaska Native 1 (4%)Hispanic 5 (19%)
Veteran 3 (11%)Residence in mostly rural area 5 (19%)Work in mostly rural area 3 (11%)Stakeholder group affiliation (≥1 allowed)
Personal history of suicidal thoughts or attempt 14 (52%)Family member of someone with suicidal thoughts, attempt, or death 23 (85%)Firearm owner or enthusiast 8 (30%)Work at/with firearm retailer, range, or organization 2 (7%)Work in suicide prevention (including volunteering) 18 (67%)Healthcare provider 10 (37%)Work/affiliated with VA or other veteran service provider 4 (15%)
Table 1. Characteristics of interview participants (n = 27).
IQR, interquartile range; VA, Veterans Affairs.
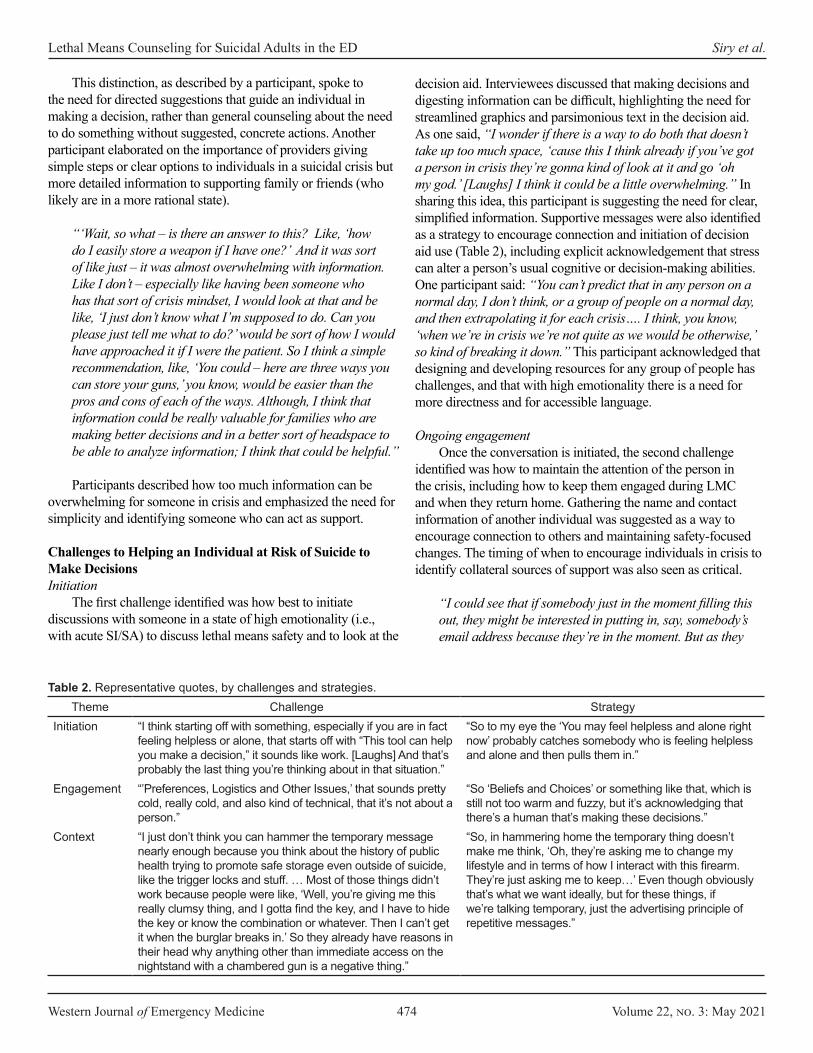
Western Journal of Emergency Medicine 474 Volume 22, no. 3: May 2021
Lethal Means Counseling for Suicidal Adults in the ED Siry et al.
This distinction, as described by a participant, spoke to the need for directed suggestions that guide an individual in making a decision, rather than general counseling about the need to do something without suggested, concrete actions. Another participant elaborated on the importance of providers giving simple steps or clear options to individuals in a suicidal crisis but more detailed information to supporting family or friends (who likely are in a more rational state).
“‘Wait, so what – is there an answer to this? Like, ‘how do I easily store a weapon if I have one?’ And it was sort of like just – it was almost overwhelming with information. Like I don’t – especially like having been someone who has that sort of crisis mindset, I would look at that and be like, ‘I just don’t know what I’m supposed to do. Can you please just tell me what to do?’ would be sort of how I would have approached it if I were the patient. So I think a simple recommendation, like, ‘You could – here are three ways you can store your guns,’ you know, would be easier than the pros and cons of each of the ways. Although, I think that information could be really valuable for families who are making better decisions and in a better sort of headspace to be able to analyze information; I think that could be helpful.”
Participants described how too much information can be overwhelming for someone in crisis and emphasized the need for simplicity and identifying someone who can act as support.
Challenges to Helping an Individual at Risk of Suicide to Make DecisionsInitiation
The first challenge identified was how best to initiate discussions with someone in a state of high emotionality (i.e., with acute SI/SA) to discuss lethal means safety and to look at the
decision aid. Interviewees discussed that making decisions and digesting information can be difficult, highlighting the need for streamlined graphics and parsimonious text in the decision aid. As one said, “I wonder if there is a way to do both that doesn’t take up too much space, ‘cause this I think already if you’ve got a person in crisis they’re gonna kind of look at it and go ‘oh my god.’ [Laughs] I think it could be a little overwhelming.” In sharing this idea, this participant is suggesting the need for clear, simplified information. Supportive messages were also identified as a strategy to encourage connection and initiation of decision aid use (Table 2), including explicit acknowledgement that stress can alter a person’s usual cognitive or decision-making abilities. One participant said: “You can’t predict that in any person on a normal day, I don’t think, or a group of people on a normal day, and then extrapolating it for each crisis…. I think, you know, ‘when we’re in crisis we’re not quite as we would be otherwise,’ so kind of breaking it down.” This participant acknowledged that designing and developing resources for any group of people has challenges, and that with high emotionality there is a need for more directness and for accessible language.
Ongoing engagement Once the conversation is initiated, the second challenge
identified was how to maintain the attention of the person in the crisis, including how to keep them engaged during LMC and when they return home. Gathering the name and contact information of another individual was suggested as a way to encourage connection to others and maintaining safety-focused changes. The timing of when to encourage individuals in crisis to identify collateral sources of support was also seen as critical.
“I could see that if somebody just in the moment filling this out, they might be interested in putting in, say, somebody’s email address because they’re in the moment. But as they
Theme Challenge StrategyInitiation “I think starting off with something, especially if you are in fact
feeling helpless or alone, that starts off with “This tool can help you make a decision,” it sounds like work. [Laughs] And that’s probably the last thing you’re thinking about in that situation.”
“So to my eye the ‘You may feel helpless and alone right now’ probably catches somebody who is feeling helpless and alone and then pulls them in.”
Engagement “’Preferences, Logistics and Other Issues,’ that sounds pretty cold, really cold, and also kind of technical, that it’s not about a person.”
“So ‘Beliefs and Choices’ or something like that, which is still not too warm and fuzzy, but it’s acknowledging that there’s a human that’s making these decisions.”
Context “I just don’t think you can hammer the temporary message nearly enough because you think about the history of public health trying to promote safe storage even outside of suicide, like the trigger locks and stuff. … Most of those things didn’t work because people were like, ‘Well, you’re giving me this really clumsy thing, and I gotta find the key, and I have to hide the key or know the combination or whatever. Then I can’t get it when the burglar breaks in.’ So they already have reasons in their head why anything other than immediate access on the nightstand with a chambered gun is a negative thing.”
“So, in hammering home the temporary thing doesn’t make me think, ‘Oh, they’re asking me to change my lifestyle and in terms of how I interact with this firearm. They’re just asking me to keep…’ Even though obviously that’s what we want ideally, but for these things, if we’re talking temporary, just the advertising principle of repetitive messages.”
Table 2. Representative quotes, by challenges and strategies.
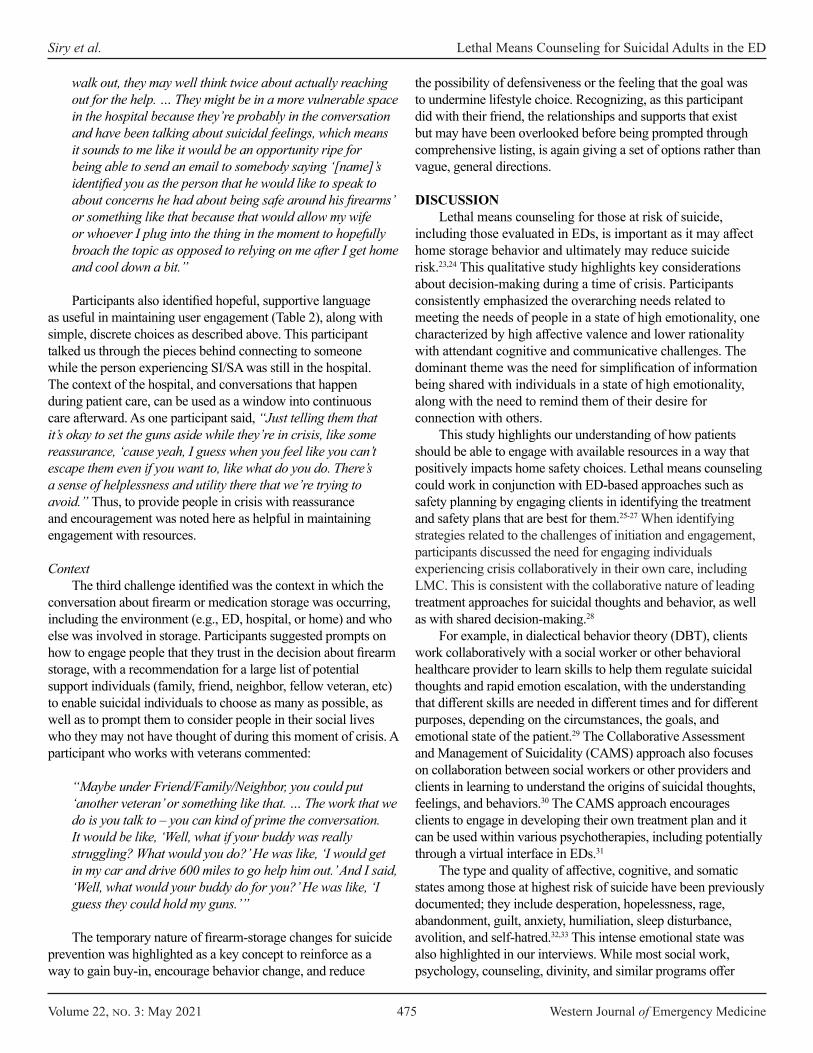
Volume 22, no. 3: May 2021 475 Western Journal of Emergency Medicine
Siry et al. Lethal Means Counseling for Suicidal Adults in the ED
walk out, they may well think twice about actually reaching out for the help. … They might be in a more vulnerable space in the hospital because they’re probably in the conversation and have been talking about suicidal feelings, which means it sounds to me like it would be an opportunity ripe for being able to send an email to somebody saying ‘[name]’s identified you as the person that he would like to speak to about concerns he had about being safe around his firearms’ or something like that because that would allow my wife or whoever I plug into the thing in the moment to hopefully broach the topic as opposed to relying on me after I get home and cool down a bit.”
Participants also identified hopeful, supportive language as useful in maintaining user engagement (Table 2), along with simple, discrete choices as described above. This participant talked us through the pieces behind connecting to someone while the person experiencing SI/SA was still in the hospital. The context of the hospital, and conversations that happen during patient care, can be used as a window into continuous care afterward. As one participant said, “Just telling them that it’s okay to set the guns aside while they’re in crisis, like some reassurance, ‘cause yeah, I guess when you feel like you can’t escape them even if you want to, like what do you do. There’s a sense of helplessness and utility there that we’re trying to avoid.” Thus, to provide people in crisis with reassurance and encouragement was noted here as helpful in maintaining engagement with resources.
ContextThe third challenge identified was the context in which the
conversation about firearm or medication storage was occurring, including the environment (e.g., ED, hospital, or home) and who else was involved in storage. Participants suggested prompts on how to engage people that they trust in the decision about firearm storage, with a recommendation for a large list of potential support individuals (family, friend, neighbor, fellow veteran, etc) to enable suicidal individuals to choose as many as possible, as well as to prompt them to consider people in their social lives who they may not have thought of during this moment of crisis. A participant who works with veterans commented:
“Maybe under Friend/Family/Neighbor, you could put ‘another veteran’ or something like that. … The work that we do is you talk to – you can kind of prime the conversation. It would be like, ‘Well, what if your buddy was really struggling? What would you do?’ He was like, ‘I would get in my car and drive 600 miles to go help him out.’ And I said, ‘Well, what would your buddy do for you?’ He was like, ‘I guess they could hold my guns.’”
The temporary nature of firearm-storage changes for suicide prevention was highlighted as a key concept to reinforce as a way to gain buy-in, encourage behavior change, and reduce
the possibility of defensiveness or the feeling that the goal was to undermine lifestyle choice. Recognizing, as this participant did with their friend, the relationships and supports that exist but may have been overlooked before being prompted through comprehensive listing, is again giving a set of options rather than vague, general directions.
DISCUSSIONLethal means counseling for those at risk of suicide,
including those evaluated in EDs, is important as it may affect home storage behavior and ultimately may reduce suicide risk.23,24 This qualitative study highlights key considerations about decision-making during a time of crisis. Participants consistently emphasized the overarching needs related to meeting the needs of people in a state of high emotionality, one characterized by high affective valence and lower rationality with attendant cognitive and communicative challenges. The dominant theme was the need for simplification of information being shared with individuals in a state of high emotionality, along with the need to remind them of their desire for connection with others.
This study highlights our understanding of how patients should be able to engage with available resources in a way that positively impacts home safety choices. Lethal means counseling could work in conjunction with ED-based approaches such as safety planning by engaging clients in identifying the treatment and safety plans that are best for them.25-27 When identifying strategies related to the challenges of initiation and engagement, participants discussed the need for engaging individuals experiencing crisis collaboratively in their own care, including LMC. This is consistent with the collaborative nature of leading treatment approaches for suicidal thoughts and behavior, as well as with shared decision-making.28
For example, in dialectical behavior theory (DBT), clients work collaboratively with a social worker or other behavioral healthcare provider to learn skills to help them regulate suicidal thoughts and rapid emotion escalation, with the understanding that different skills are needed in different times and for different purposes, depending on the circumstances, the goals, and emotional state of the patient.29 The Collaborative Assessment and Management of Suicidality (CAMS) approach also focuses on collaboration between social workers or other providers and clients in learning to understand the origins of suicidal thoughts, feelings, and behaviors.30 The CAMS approach encourages clients to engage in developing their own treatment plan and it can be used within various psychotherapies, including potentially through a virtual interface in EDs.31
The type and quality of affective, cognitive, and somatic states among those at highest risk of suicide have been previously documented; they include desperation, hopelessness, rage, abandonment, guilt, anxiety, humiliation, sleep disturbance, avolition, and self-hatred.32,33 This intense emotional state was also highlighted in our interviews. While most social work, psychology, counseling, divinity, and similar programs offer
Western Journal of Emergency Medicine 476 Volume 22, no. 3: May 2021
Lethal Means Counseling for Suicidal Adults in the ED Siry et al.
substantive training in responding to clients experiencing strong emotions, most Masters-trained practitioners (who are typically the behavioral health specialists working in EDs) report feeling inadequately prepared to work with clients during their periods of highest suicide risk.34,35 These include assistance in reviewing resources and a collaborative approach to identifying concrete next steps. Training resources exist, such as CALM (counseling on access to lethal means) to help support behavioral health and other providers feel confident in engaging in this collaborative LMC working during and after a suicidal crisis.25
Overall, the framing that participants felt would be most helpful was addressing the facts in a digestible fashion while still encouraging confidence in the person in crisis. In doing this, participants shared sentiment that reflected the transition between someone in a highly charged emotional state and someone in a typical, more rational, deliberative state, where they could successfully participate in their own care. Seeking and incorporating insight from those who have been in this state of mind can help make approaches such as LMC more accessible to clients, in the same way that CAMS, safety planning, and certain components of DBT are structured to engage clients in their own care.27,29,30
This project lent itself to the understanding of the difficulty inherent in reflecting on being in a “hot state” when one is in a “cold state” – including for the individuals interviewed in this project. The “hot-cold empathy gap”36 highlights how it could be possible that reflections and recommendations made by those in a cold state of high rationality might underestimate the volatility of preferences among those in a state of emotionality. While none of our participants identified this dynamic by name, many of them did allude to the labile nature of cognitive processes they either experienced or observed in their loved ones during suicidal crises, and advocated for conservative approaches to communication, facilitation of discussion with healthcare providers, and use of decision support tools.
LIMITATIONSAmong the limitations of this study was that interviews
did not focus solely on the topic discussed here. Thus, although our analysis included 27 individuals, generalizability may be limited. Participation was voluntary with a small incentive, so interviewees may have been particularly passionate about the subject. We did, however, use snowball sampling to contact additional interviewees identified by participants as having unique or influential perspectives. Our interviews did not discuss how intoxication with alcohol or other substances may further affect the cognitive state of an individual with suicide risk. Given the frequent co-occurrence of intoxication and suicidality among ED patients, this is an area that merits further study. Finally, our interviews were in the context of receiving feedback on our specific LMC decision aid. The feedback discussed here is based on broader ideas shared by participants about the considerations needed when communicating with this population of people in crisis.
CONCLUSIONA key component of care of suicidal individuals in acute
care settings – and one that is a policy- and evidence-supported and scalable intervention – is lethal means counseling to reduce access to firearms and other methods of suicide. Incorporating the perspectives of individuals with personal or family-lived experience with suicide can enhance development and delivery of interventions in the ED. Specifically, interventions for those with acute suicide risk should consider the emotional and cognitive states, and needs, of those patients. Directed, digestible information that is supportive, with concrete steps could encourage both collaboration, independence, and engagement in care.
Address for Correspondence: Bonnie J. Siry, MSSc, University of Colorado School of Medicine, Department of Emergency Medicine, 12401 East 17th Avenue, B215, Aurora, CO 80045. Email: [email protected].
Conflicts of Interest: By the WestJEM article submission agreement, all authors are required to disclose all affiliations, funding sources and financial or management relationships that could be perceived as potential sources of bias. No author has professional or financial relationships with any companies that are relevant to this study. There are no conflicts of interest or sources of funding to declare.
Copyright: © 2021 Siry et al. This is an open access article distributed in accordance with the terms of the Creative Commons Attribution (CC BY 4.0) License. See: http://creativecommons.org/licenses/by/4.0/
REFERENCES1. Mann JJ, Apter A, Bertolote J, et al. Suicide prevention strategies: a
systematic review. JAMA. 2005;294(16):2064-74. 2. Miller M, Salhi C, Barber C, et al. Changes in firearm and medication
storage practices in homes of youths at risk for suicide: results of the SAFETY Study, a clustered, emergency department-based, multisite, stepped-wedge trial. Ann Emerg Med. 2020;76(2):194-205.
3. Runyan CW, Becker A, Brandspigel S, et al. Lethal means counseling for parents of youth seeking emergency care for suicidality. West J Emerg Med. 2016;17(1):8-14.
4. Betz ME, Miller M, Barber C, et al. Lethal means access and assessment among suicidal emergency department patients. Depress Anxiety. 2016;33(6):502-11.
5. Betz ME, Arias SA, Miller M, et al. Change in emergency department providers’ beliefs and practices after use of new protocols for suicidal patients. Psychiatr Serv. 2015;66(6):625-31.
6. Diurba S, Johnson RL, Siry BJ, et al. Lethal means assessment and counseling in the emergency department: differences by provider type and personal home firearms. Suicide Life Threat Behav. 2020. 50(5):1054-64.
7. Runyan, CW, Brooks-Russell A, Tung G, et al. Hospital emergency department lethal means counseling for suicidal patients. Am J Prev Med. 2018;54(2):259-65.
Volume 22, no. 3: May 2021 477 Western Journal of Emergency Medicine
Siry et al. Lethal Means Counseling for Suicidal Adults in the ED
8. Bulger EM, Kuhls DA, Campbell BT, et al. Proceedings from the Medical Summit on Firearm Injury Prevention: a public health approach to reduce death and disability in the US. J Am Coll Surg. 2019;229(4):415-30.
9. Pallin R, Spitzer SA, Ranney ML, et al. Preventing firearm-related death and injury. Ann Intern Med. 2019;170(11);ITC81-ITC96.
10. Barber CW, Miller MJ. Reducing a suicidal person’s access to lethal means of suicide: a research agenda. Am J Prev Med. 2014;47(3, Supplement 2):S264-S272.
11. Ranney ML, Fletcher J, Alter H, et al. A Consensus-Driven Agenda for Emergency Medicine Firearm Injury Prevention Research. Ann Emerg Med. 2017;69(2):227-40.
12. Stanley IH., Hom MA, Rogers, et al. Discussing firearm ownership and access as part of suicide risk assessment and prevention: “means safety” versus “means restriction”. Arch Suicide Res. 2016;21(2):237-53.
13. Marino E, Wolsko C, Keys S, et al. Addressing the cultural challenges of firearm restriction in suicide prevention: a test of public health messaging to protect those at risk. Arch Suicide Res. 2018;22(3):394-404.
14. Pallin R, Siry B, Azrael D, et al. “Hey, let me hold your guns for a while”: a qualitative study of messaging for firearm suicide prevention. Behav Sci Law. 2019;37(3):259‐69.
15. Betz, ME, Knoepke CE, Siry B, et al. ‘Lock to Live’: development of a firearm storage decision aid to enhance lethal means counselling and prevent suicide. Inj Prev. 2019;25(Suppl 1):i18-i24.
16. Betz ME, Knoepke CE, Simpson S, et al. An interactive web-based lethal means safety decision aid for suicidal adults (Lock to Live): pilot randomized controlled trial. J Med Internet Res. 2020;22(1):e16253.
17. Braun V, Clarke V. Using thematic analysis in psychology. Qual Res in Psychol. 2006;3(2):77-101.
18. Curry LA, Nembhard IM, Bradley EH. Qualitative and mixed methods provide unique contributions to outcomes research. Circulation. 2020;119(10);1442-52.
19. Fereday J, Muir-Cochrane E. Demonstrating rigor using thematic analysis: A hybrid approach of inductive and deductive coding and theme development. Int J Qual Meth. 2006;5(1):1-11.
20. Saldana J (2013). First Cycle Coding Methods. In Seaman J and Horvai A (Eds.), The Coding Manual for Qualitative Researchers, 2nd Edition (pp 68-206). Los Angeles, CA: Sage.
21. Thomas DR. A general inductive approach for qualitative data analysis. 2003. Available at: http://www.fmhs.auckland.ac.nz/soph/centres/hrmas/_docs/Inductive2003.pdf. Accessed November 12, 2018.
22. Tong A, Sainsbury P, Craig J. Consolidated criteria for reporting qualitative research (COREQ): a 32-item checklist for interviews and
focus groups. Int J Qual Health C. 2007;19(6):349–57. 23. Kruesi MJP, Grossman J, Pennington JM, et al. Suicide and violence
prevention: parent education in the emergency department. J Am Acad Child Psy. 1999;38(3):250-55.
24. Roszko, PJ, Ameli J, Carter PM, et al. Clinician attitudes, screening practices, and interventions to reduce firearm-related injury. Epidemiol Rev. 2016;38(1):87-110.
25. Suicide Prevention Resource Center. CALM: Counseling on Access to Lethal Means. 2020. Available at: http://www.sprc.org/resources-programs/calm-counseling-access-lethal-means. Accessed November 12, 2018.
26. Johnson RM, Frank EM, Ciocca M, et al. Training mental healthcare providers to reduce at-risk patients’ access to lethal means of suicide: evaluation of the CALM Project. Arch Suicide Res. 2011;15(3):259-64.
27. Stanley B, Brown GK. Safety planning intervention: a brief intervention to mitigate suicide risk. Cogn and Behav Pract. 2012;19(2):256-64.
28. Barry, MJ, Edgman-Levitan S. Shared decision making: the pinnacle of patient-centered care. N Engl J Med. 2012;366(9):780-81.
29. DeCou CR, Comtois KA, Landes SJ. Dialectical behavior therapy is effective for the treatment of suicidal behavior: a meta-analysis. Behav Ther. 2019;50(1):60-72.
30. Jobes DA. The Collaborative Assessment and Management of Suicidality (CAMS): an evolving evidence-based clinical approach to suicidal risk. Suicide and Life-Threat. 2012;42(6):640-53.
31. Dimeff LA, Jobes DA, Chalker SA, et al. A novel engagement of suicidality in the emergency department: virtual collaborative assessment and management of suicidality. Gen Hosp Psychiatry. 2020;63:119-26.
32. Cummins N, Scherer S, Krajewski J, et al. A review of depression and suicide risk assessment using speech analysis. Speech Commun. 2015;71:10-49.
33. Hendin H, Maltsberger JT, Szanto K. The role of intense affective states in signaling a suicide crisis. J Nerv Ment Dis. 2007;195(5):363-68.
34. Feldman BN, Freedenthal S. Social work education in suicide intervention and prevention: an unmet need? Suicide and Life-Threat. 2006;36(4):467-80.
35. Schmitz Jr. WM, Allen MH, Feldman BN, et al. Preventing suicide through improved training in suicide risk assessment and care: an American Association of Suicidology Task Force report addressing serious gaps in U.S. mental health training. Suicide and Life-Threat. 2012.42(3);292-304.
36. Loewenstein G. Hot-cold empathy gaps and medical decision making. Health Psychol. 2005;24(4S):S49-56.

Western Journal of Emergency Medicine 478 Volume 22, no. 3: May 2021
Original Research
Patient Characteristics and Perspectives of Firearm Safety Discussions in the Emergency Department
Lauren Hudak, MD, MPH*Henry Schwimmer, MD†
William Warnock, BA‡
Sarah Kilborn, MD§
Tim Moran, PhD*Jeremy Ackerman, MD, PhD*Jonathan Rupp, PhD*
Section Editor: William Fernandez, MD, MPH Submission history: Submitted July 29, 2020; Revision received February 2, 2021; Accepted March 8, 2021Electronically published May 19, 2021Full text available through open access at http://escholarship.org/uc/uciem_westjem DOI: 10.5811/westjem.2021.3.49333
Emory University, Department of Emergency Medicine, Atlanta, GeorgiaAlameda Health System, Highland Hospital, Department of Emergency Medicine, Oakland, CaliforniaEmory University, School of Medicine, Atlanta, GeorgiaVanderbilt University, Department of Emergency Medicine, Nashville, Tennessee
*†
‡
§
Introduction: Firearm injury prevention discussions with emergency department (ED) patients provide a unique opportunity to prevent death and injury in high-risk patient groups. Building mutual understanding of safe firearm practices between patients and providers will aid the development of effective interventions. Examining ED patient baseline characteristics, perspectives on healthcare-based safety discussions, and experience with and access to firearms, will allow practitioners to craft more effective messaging and interventions.
Methods: Using an institutional review board-approved cross-sectional survey modified from a validated national instrument, we recruited 625 patients from three large, urban, academically affiliated EDs in the South to assess patient baseline characteristics, perspectives regarding firearms and firearm safety discussions, and prior violence history, as well as firearm access and safety habits. We compared the degree to which patients were open to discussions regarding firearms across a variety of provider types and clinical scenarios between those with and without gun access.
Results: Of the 625 patients consented and eligible for the study, 306 had access to firearms. The patients with firearm access were predominantly male, were more likely to have military experience, live in an urban or suburban region, and have experienced prior violence when compared to those without firearm access. Patients with and without gun access view firearm safety discussions with their healthcare provider as acceptable and analogous to other behavioral health interventions (i.e., helmet/seat belt use, alcohol/cigarette use). Patients were also accepting of these firearm safety discussions in many clinical contexts and led by multiple provider types. Of the patients with gun access, storage of each type of firearm was reviewed and the primary reason for ownership was for personal protection across all firearm types.
Conclusion: Patients in the ED indicate openness to firearm safety discussions delivered by a variety of providers and in diverse clinical scenarios. Healthcare providers engaging firearm owners in appropriate risk-benefit discussions using a trauma-informed approach is a critical next step in research and intervention. [West J Emerg Med. 2021;22(3)478-487.]
Volume 22, no. 3: May 2021 479 Western Journal of Emergency Medicine
Hudak et al. Patient Characteristics and Perspectives of Firearm Safety Discussions in the ED
Population Health Research Capsule
What do we already know about this issue?Healthcare providers engaging patients in firearm safety discussions is emerging as a promising opportunity to prevent associated firearm injury and death.
What was the research question?What are the characteristics of patients and in which clinical scenarios are firearm safety discussions acceptable?
What was the major finding of the study?ED patients are open to firearm safety discussions delivered by a variety of providers and in diverse clinical scenarios.
How does this improve population health?Healthcare providers can engage patients in firearm safety discussions with the goal of reducing risk for firearm injury and death.
INTRODUCTIONAlthough firearm injury is widely recognized as a public
health epidemic responsible for approximately 40,000 deaths and 130,000 injuries in the United States in 2017 alone, the field has a dearth of rigorous research to guide effective intervention strategies.1 Additionally, there is limited research addressing firearm injury prevention in the healthcare setting, likely contributing to a lack of engagement and general discomfort with the subject among patients and providers. Despite healthcare providers and medical societies advocating for firearm injury risk and safety discussions with patients,2 a minority of providers report initiating these conversations.3 Given concern for rising numbers of violence-related injuries,4 increased social isolation, and prevalence of mental health problems,5,6 as well as escalating firearm and ammunition purchases during the COVID-19 pandemic,7,8 these discussions are more critical now than ever. In fact, physicians and other healthcare providers are uniquely positioned to address this issue, as other potential avenues for intervention are limited due to social distancing and other lockdown measures.
Prior studies have touched on important elements to consider when addressing firearm safety in healthcare populations. The 2015 National Firearm Survey (NFS) used a nationally representative, web-based sample to estimate that 54.7 million people in the US own guns.9 Additionally, two-thirds of non-firearm owners and over one-half of firearm owners felt it is “at least sometimes appropriate” for physicians and other healthcare providers to discuss firearm safety with patients.10 Another study using the NFS sample examined the responses of veterans. They concluded that half of veterans own at least one firearm, with the majority owning both handguns and long guns, citing personal protection as the primary reason for ownership.11 These findings provide an important glimpse into firearm ownership and potential translational healthcare applications. However, the NFS was not designed solely for healthcare-based intervention and thus did not sample from patients in a clinical environment and did not expand upon potentially relevant healthcare-focused variables. Assessing patients’ degree of openness to firearm discussions with different healthcare provider types in specific clinical scenarios is an important next step in firearm injury prevention research.
Another study of 200 ED patients that used a 22-item survey to assess patient demographics, access to firearms, and general attitude toward healthcare-based screening comes closer to understanding ED patients’ views on firearm safety discussions. Their findings indicate the majority of both gun owning (100%) and non-owning patients (87.5%) felt comfortable discussing firearm safety with their healthcare provider, and a majority of patients felt these discussions would result in safer firearm storage changes.12 The patients’ views of different provider types conducting firearm safety discussions and clinical scenarios in which safety discussions are appropriate was not reported. Neither patients’ history of violence nor reasons for gun ownership were reported.
More broadly, healthcare interventions that involve firearm safety or storage counseling, such as lethal means counseling, have become established as effective in healthcare populations, especially in suicidal adult and pediatric mental health populations.13,14 These interventions have gained traction in ED settings,3,15-17 with a focus on providers building knowledge about firearms and safety practices in an effort to build cultural competence to better engage gun owners in safety discussions and primary prevention.18 Such efforts have improved our understanding of healthcare-focused safety discussions. Further exploring the factors that contribute to ED patient attitudes and potential receptivity to intervention is critical to advancing the field and saving lives.
This cross-sectional study addresses these gaps in understanding by surveying the attitudes and experiences of ED patients. The knowledge gained directly contributes to the development of effective intervention with ED patients by evaluating their baseline demographics, firearm-related discussion perspectives, prior experience of violence, and firearm access and safety practices.
METHODSAfter institutional review board approval, registered ED
patients were approached by trained research assistants (RA) during convenience sample shifts from 7 am-7 pm, seven days per week in three academically affiliated urban EDs in Atlanta, Georgia, from October 2018–April 2019. The largest hospital, with annual ED visit volume of approximately
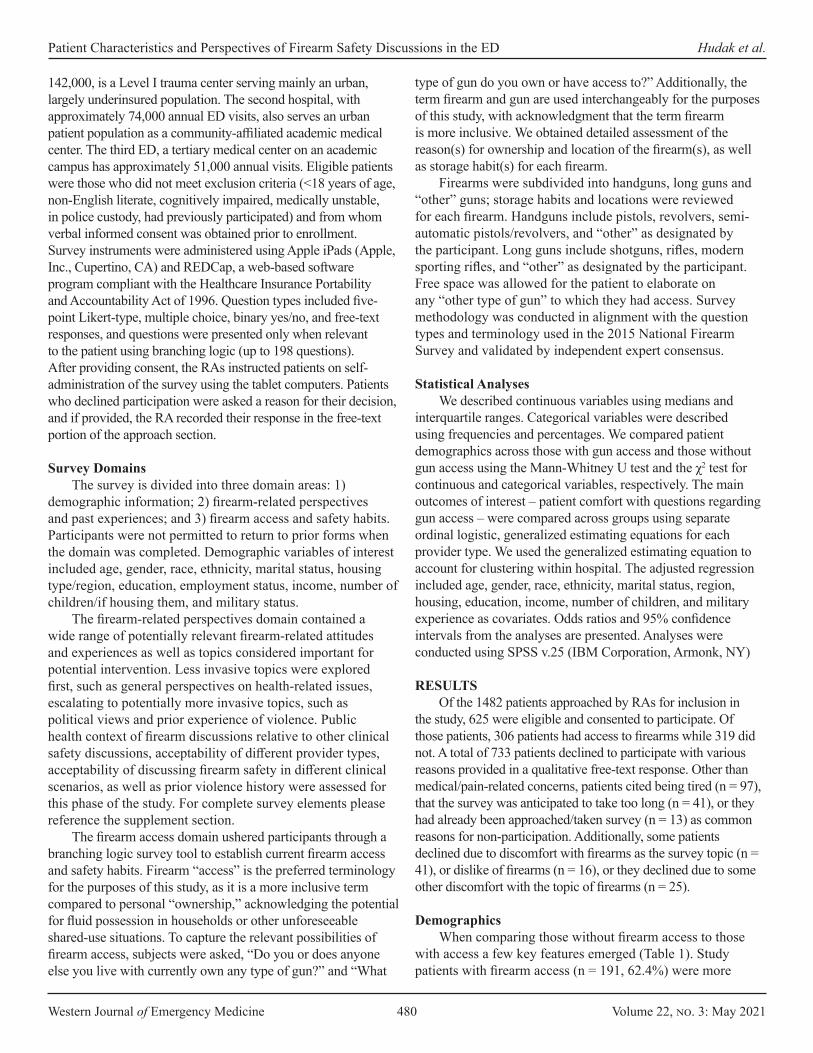
Western Journal of Emergency Medicine 480 Volume 22, no. 3: May 2021
Patient Characteristics and Perspectives of Firearm Safety Discussions in the ED Hudak et al.
142,000, is a Level I trauma center serving mainly an urban, largely underinsured population. The second hospital, with approximately 74,000 annual ED visits, also serves an urban patient population as a community-affiliated academic medical center. The third ED, a tertiary medical center on an academic campus has approximately 51,000 annual visits. Eligible patients were those who did not meet exclusion criteria (<18 years of age, non-English literate, cognitively impaired, medically unstable, in police custody, had previously participated) and from whom verbal informed consent was obtained prior to enrollment. Survey instruments were administered using Apple iPads (Apple, Inc., Cupertino, CA) and REDCap, a web-based software program compliant with the Healthcare Insurance Portability and Accountability Act of 1996. Question types included five-point Likert-type, multiple choice, binary yes/no, and free-text responses, and questions were presented only when relevant to the patient using branching logic (up to 198 questions). After providing consent, the RAs instructed patients on self-administration of the survey using the tablet computers. Patients who declined participation were asked a reason for their decision, and if provided, the RA recorded their response in the free-text portion of the approach section.
Survey DomainsThe survey is divided into three domain areas: 1)
demographic information; 2) firearm-related perspectives and past experiences; and 3) firearm access and safety habits. Participants were not permitted to return to prior forms when the domain was completed. Demographic variables of interest included age, gender, race, ethnicity, marital status, housing type/region, education, employment status, income, number of children/if housing them, and military status.
The firearm-related perspectives domain contained a wide range of potentially relevant firearm-related attitudes and experiences as well as topics considered important for potential intervention. Less invasive topics were explored first, such as general perspectives on health-related issues, escalating to potentially more invasive topics, such as political views and prior experience of violence. Public health context of firearm discussions relative to other clinical safety discussions, acceptability of different provider types, acceptability of discussing firearm safety in different clinical scenarios, as well as prior violence history were assessed for this phase of the study. For complete survey elements please reference the supplement section.
The firearm access domain ushered participants through a branching logic survey tool to establish current firearm access and safety habits. Firearm “access” is the preferred terminology for the purposes of this study, as it is a more inclusive term compared to personal “ownership,” acknowledging the potential for fluid possession in households or other unforeseeable shared-use situations. To capture the relevant possibilities of firearm access, subjects were asked, “Do you or does anyone else you live with currently own any type of gun?” and “What
type of gun do you own or have access to?” Additionally, the term firearm and gun are used interchangeably for the purposes of this study, with acknowledgment that the term firearm is more inclusive. We obtained detailed assessment of the reason(s) for ownership and location of the firearm(s), as well as storage habit(s) for each firearm.
Firearms were subdivided into handguns, long guns and “other” guns; storage habits and locations were reviewed for each firearm. Handguns include pistols, revolvers, semi-automatic pistols/revolvers, and “other” as designated by the participant. Long guns include shotguns, rifles, modern sporting rifles, and “other” as designated by the participant. Free space was allowed for the patient to elaborate on any “other type of gun” to which they had access. Survey methodology was conducted in alignment with the question types and terminology used in the 2015 National Firearm Survey and validated by independent expert consensus.
Statistical Analyses We described continuous variables using medians and
interquartile ranges. Categorical variables were described using frequencies and percentages. We compared patient demographics across those with gun access and those without gun access using the Mann-Whitney U test and the χ2 test for continuous and categorical variables, respectively. The main outcomes of interest – patient comfort with questions regarding gun access – were compared across groups using separate ordinal logistic, generalized estimating equations for each provider type. We used the generalized estimating equation to account for clustering within hospital. The adjusted regression included age, gender, race, ethnicity, marital status, region, housing, education, income, number of children, and military experience as covariates. Odds ratios and 95% confidence intervals from the analyses are presented. Analyses were conducted using SPSS v.25 (IBM Corporation, Armonk, NY)
RESULTSOf the 1482 patients approached by RAs for inclusion in
the study, 625 were eligible and consented to participate. Of those patients, 306 patients had access to firearms while 319 did not. A total of 733 patients declined to participate with various reasons provided in a qualitative free-text response. Other than medical/pain-related concerns, patients cited being tired (n = 97), that the survey was anticipated to take too long (n = 41), or they had already been approached/taken survey (n = 13) as common reasons for non-participation. Additionally, some patients declined due to discomfort with firearms as the survey topic (n = 41), or dislike of firearms (n = 16), or they declined due to some other discomfort with the topic of firearms (n = 25).
DemographicsWhen comparing those without firearm access to those
with access a few key features emerged (Table 1). Study patients with firearm access (n = 191, 62.4%) were more
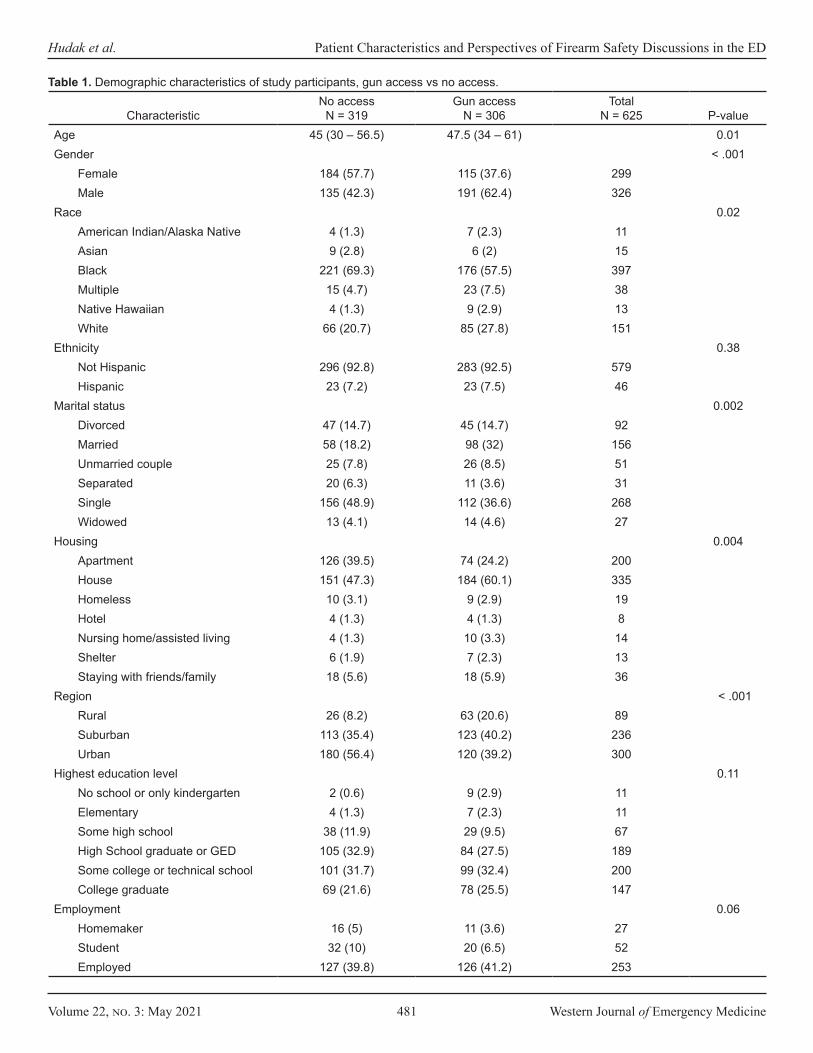
Volume 22, no. 3: May 2021 481 Western Journal of Emergency Medicine
Hudak et al. Patient Characteristics and Perspectives of Firearm Safety Discussions in the ED
CharacteristicNo access
N = 319Gun access
N = 306Total
N = 625 P-valueAge 45 (30 – 56.5) 47.5 (34 – 61) 0.01Gender < .001
Female 184 (57.7) 115 (37.6) 299 Male 135 (42.3) 191 (62.4) 326
Race 0.02American Indian/Alaska Native 4 (1.3) 7 (2.3) 11 Asian 9 (2.8) 6 (2) 15 Black 221 (69.3) 176 (57.5) 397 Multiple 15 (4.7) 23 (7.5) 38 Native Hawaiian 4 (1.3) 9 (2.9) 13 White 66 (20.7) 85 (27.8) 151
Ethnicity 0.38Not Hispanic 296 (92.8) 283 (92.5) 579 Hispanic 23 (7.2) 23 (7.5) 46
Marital status 0.002Divorced 47 (14.7) 45 (14.7) 92 Married 58 (18.2) 98 (32) 156 Unmarried couple 25 (7.8) 26 (8.5) 51 Separated 20 (6.3) 11 (3.6) 31 Single 156 (48.9) 112 (36.6) 268 Widowed 13 (4.1) 14 (4.6) 27
Housing 0.004Apartment 126 (39.5) 74 (24.2) 200 House 151 (47.3) 184 (60.1) 335 Homeless 10 (3.1) 9 (2.9) 19 Hotel 4 (1.3) 4 (1.3) 8 Nursing home/assisted living 4 (1.3) 10 (3.3) 14 Shelter 6 (1.9) 7 (2.3) 13 Staying with friends/family 18 (5.6) 18 (5.9) 36
Region < .001Rural 26 (8.2) 63 (20.6) 89 Suburban 113 (35.4) 123 (40.2) 236 Urban 180 (56.4) 120 (39.2) 300
Highest education level 0.11No school or only kindergarten 2 (0.6) 9 (2.9) 11 Elementary 4 (1.3) 7 (2.3) 11 Some high school 38 (11.9) 29 (9.5) 67 High School graduate or GED 105 (32.9) 84 (27.5) 189 Some college or technical school 101 (31.7) 99 (32.4) 200 College graduate 69 (21.6) 78 (25.5) 147
Employment 0.06Homemaker 16 (5) 11 (3.6) 27 Student 32 (10) 20 (6.5) 52 Employed 127 (39.8) 126 (41.2) 253
Table 1. Demographic characteristics of study participants, gun access vs no access.

Western Journal of Emergency Medicine 482 Volume 22, no. 3: May 2021
Patient Characteristics and Perspectives of Firearm Safety Discussions in the ED Hudak et al.
CharacteristicNo access
N = 319Gun access
N = 306Total
N = 625 P-valueEmployment 0.06
Out of work (<1 year) 25 (7.8) 19 (6.2) 44 Out of work (>1 year) 47 (14.7) 35 (11.4) 82 Retired 50 (15.7) 55 (18) 105 Self-employed 22 (6.9) 42 (13.7) 64
Income 0.01<$15,000 114 (35.7) 77 (25.2) 191 $15,000-25,000 58 (18.2) 45 (14.7) 103 $25,000-35,000 35 (11) 36 (11.8) 71 $35,000-50,000 33 (10.3) 50 (16.3) 83 $50,000-75,000 37 (11.6) 38 (12.4) 75 <$75,000 42 (13.2) 60 (19.6) 102
Number of children 0.020 172 (53.9) 125 (40.8) 297 1 41 (12.9) 44 (14.4) 85 2 51 (16) 58 (19) 109 3 25 (7.8) 31 (10.1) 56 4+ 30 (9.4) 48 (15.7) 78
Number of children in home 0.90 206 (64.6) 191 (62.4) 397 1 49 (15.4) 48 (15.7) 97 2 33 (10.3) 33 (10.8) 66 3 15 (4.7) 15 (4.9) 30 4+ 16 (5) 19 (6.2) 35
Military experience, N (%) 17 (5.3) 42 (13.7) 59 0.001
Table 1. continued.
likely to be male when compared to those without access (n = 135, 42.3%). Black participants formed the majority of both groups (+access n = 176, 57.5%; -access n = 221, 69.3%), but our gun-accessing population self-identified more frequently as White (n = 85, 27.8%) when compared to the no access group (n = 66, 20.7%). Those with firearm access tended to report being married (n = 98, 32.0%) and home-dwelling (n = 184, 60.1%) more often when compared to the non-firearm accessing group (n = 58, 18.2% and n = 151, 47.3%, respectively). The majority of non-firearm accessing individuals reported living in an urban environment (n = 180, 56.4%) in comparison to those with access (n = 120, 39.2%), who were more likely to live in suburban (n = 123, 40.2%) or rural (n = 63, 20.6%) regions. There was no significant difference between education and employment levels in our population, although patients with firearm access were more affluent and had fewer children than the non-access patients. Those with firearm access were also more likely to have military experience (n = 42, 13.7%) than the non-access (n = 17, 5.3%) group.
Perspectives Firearm Discussions Compared to Other Behavioral Health Discussions
We reviewed patient opinion regarding the acceptability of firearm-safety discussions relative to analogous behavioral health topics. Patients generally agreed that firearms should be regarded similarly to other public health topics, such as cigarette smoking, alcohol use, and use of helmets and seatbelts. While agreement was high for both those with and without firearm access, those with access agreed to a lesser extent than their non-accessing counterparts (Table 2).
Firearm Discussions Comparing Healthcare Provider Types As in prior studies, it appears both groups were in
agreement that asking about firearms is appropriate. Patients with gun access were less likely to strongly agree that it is appropriate for providers to conduct medically indicated firearm safety discussions compared with patients without access, although they still generally found such discussions acceptable. Of note, both patients with gun access and those
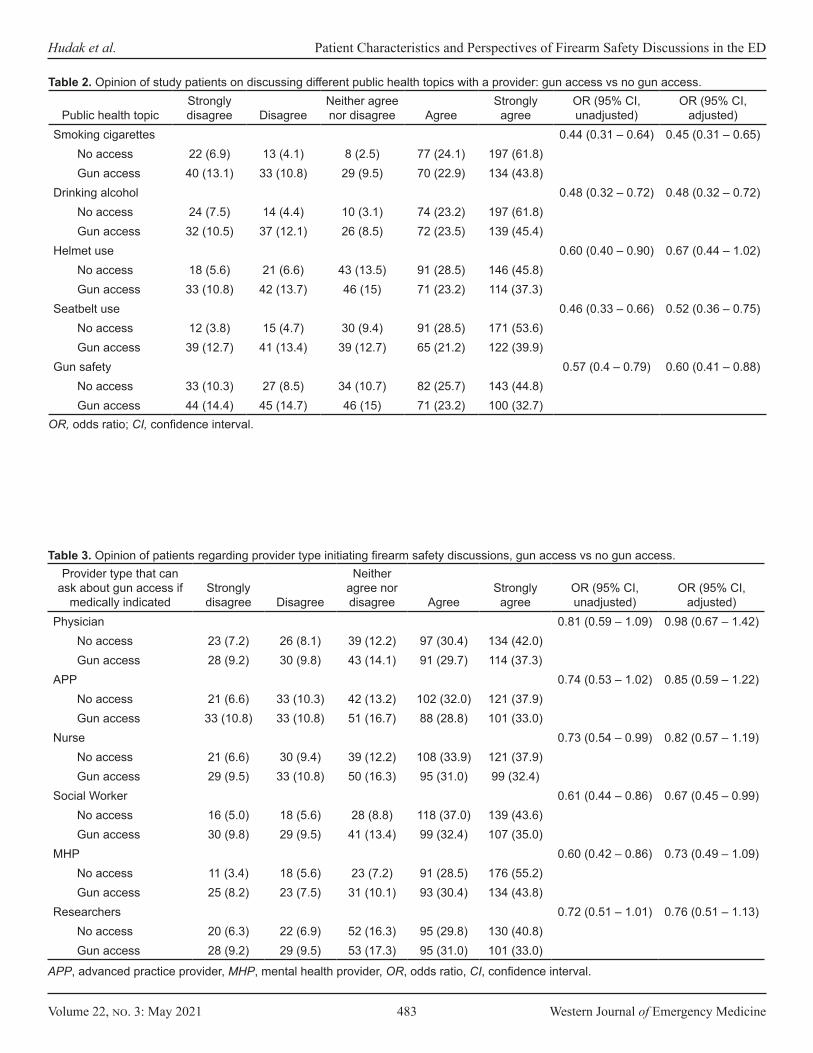
Volume 22, no. 3: May 2021 483 Western Journal of Emergency Medicine
Hudak et al. Patient Characteristics and Perspectives of Firearm Safety Discussions in the ED
Public health topicStrongly disagree Disagree
Neither agree nor disagree Agree
Strongly agree
OR (95% CI, unadjusted)
OR (95% CI, adjusted)
Smoking cigarettes 0.44 (0.31 – 0.64) 0.45 (0.31 – 0.65)No access 22 (6.9) 13 (4.1) 8 (2.5) 77 (24.1) 197 (61.8)Gun access 40 (13.1) 33 (10.8) 29 (9.5) 70 (22.9) 134 (43.8)
Drinking alcohol 0.48 (0.32 – 0.72) 0.48 (0.32 – 0.72)No access 24 (7.5) 14 (4.4) 10 (3.1) 74 (23.2) 197 (61.8)Gun access 32 (10.5) 37 (12.1) 26 (8.5) 72 (23.5) 139 (45.4)
Helmet use 0.60 (0.40 – 0.90) 0.67 (0.44 – 1.02)No access 18 (5.6) 21 (6.6) 43 (13.5) 91 (28.5) 146 (45.8)Gun access 33 (10.8) 42 (13.7) 46 (15) 71 (23.2) 114 (37.3)
Seatbelt use 0.46 (0.33 – 0.66) 0.52 (0.36 – 0.75)No access 12 (3.8) 15 (4.7) 30 (9.4) 91 (28.5) 171 (53.6)Gun access 39 (12.7) 41 (13.4) 39 (12.7) 65 (21.2) 122 (39.9)
Gun safety 0.57 (0.4 – 0.79) 0.60 (0.41 – 0.88)No access 33 (10.3) 27 (8.5) 34 (10.7) 82 (25.7) 143 (44.8)Gun access 44 (14.4) 45 (14.7) 46 (15) 71 (23.2) 100 (32.7)
Table 2. Opinion of study patients on discussing different public health topics with a provider: gun access vs no gun access.
OR, odds ratio; CI, confidence interval.
Provider type that can ask about gun access if
medically indicatedStrongly disagree Disagree
Neither agree nor disagree Agree
Strongly agree
OR (95% CI, unadjusted)
OR (95% CI, adjusted)
Physician 0.81 (0.59 – 1.09) 0.98 (0.67 – 1.42)No access 23 (7.2) 26 (8.1) 39 (12.2) 97 (30.4) 134 (42.0) Gun access 28 (9.2) 30 (9.8) 43 (14.1) 91 (29.7) 114 (37.3)
APP 0.74 (0.53 – 1.02) 0.85 (0.59 – 1.22)No access 21 (6.6) 33 (10.3) 42 (13.2) 102 (32.0) 121 (37.9) Gun access 33 (10.8) 33 (10.8) 51 (16.7) 88 (28.8) 101 (33.0)
Nurse 0.73 (0.54 – 0.99) 0.82 (0.57 – 1.19)No access 21 (6.6) 30 (9.4) 39 (12.2) 108 (33.9) 121 (37.9) Gun access 29 (9.5) 33 (10.8) 50 (16.3) 95 (31.0) 99 (32.4)
Social Worker 0.61 (0.44 – 0.86) 0.67 (0.45 – 0.99)No access 16 (5.0) 18 (5.6) 28 (8.8) 118 (37.0) 139 (43.6) Gun access 30 (9.8) 29 (9.5) 41 (13.4) 99 (32.4) 107 (35.0)
MHP 0.60 (0.42 – 0.86) 0.73 (0.49 – 1.09)No access 11 (3.4) 18 (5.6) 23 (7.2) 91 (28.5) 176 (55.2) Gun access 25 (8.2) 23 (7.5) 31 (10.1) 93 (30.4) 134 (43.8)
Researchers 0.72 (0.51 – 1.01) 0.76 (0.51 – 1.13)No access 20 (6.3) 22 (6.9) 52 (16.3) 95 (29.8) 130 (40.8) Gun access 28 (9.2) 29 (9.5) 53 (17.3) 95 (31.0) 101 (33.0)
Table 3. Opinion of patients regarding provider type initiating firearm safety discussions, gun access vs no gun access.
APP, advanced practice provider, MHP, mental health provider, OR, odds ratio, CI, confidence interval.
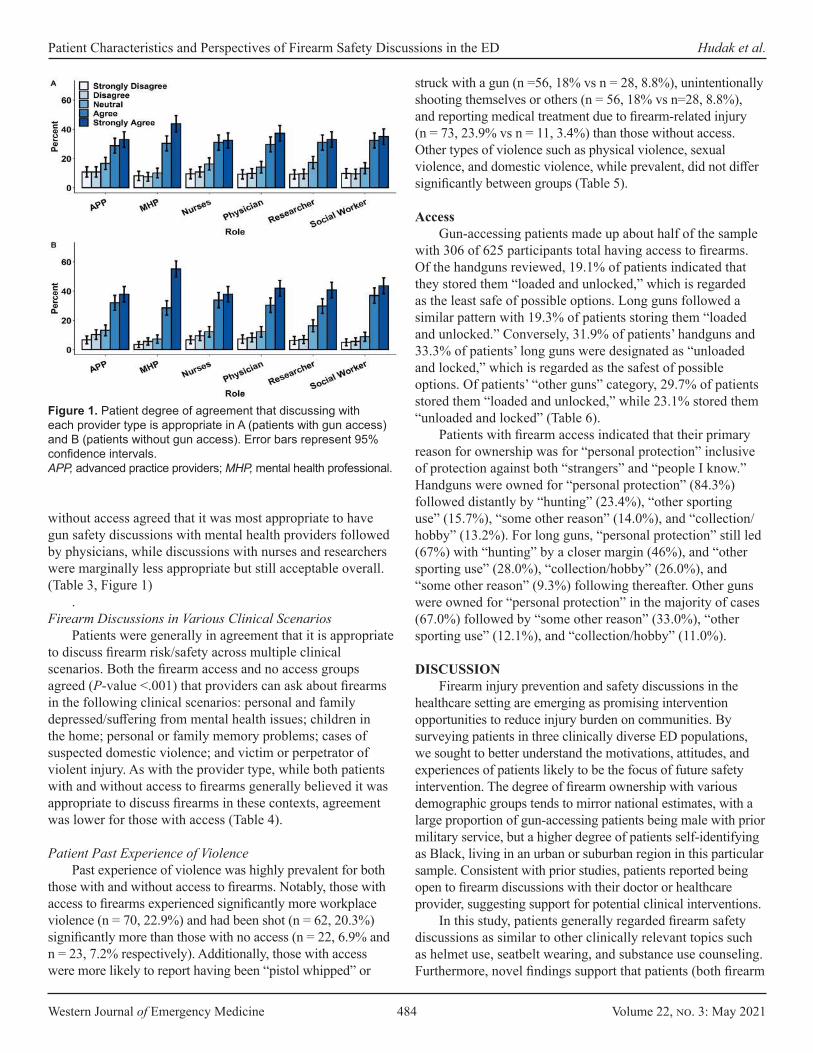
Western Journal of Emergency Medicine 484 Volume 22, no. 3: May 2021
Patient Characteristics and Perspectives of Firearm Safety Discussions in the ED Hudak et al.
without access agreed that it was most appropriate to have gun safety discussions with mental health providers followed by physicians, while discussions with nurses and researchers were marginally less appropriate but still acceptable overall. (Table 3, Figure 1)
. Firearm Discussions in Various Clinical Scenarios
Patients were generally in agreement that it is appropriate to discuss firearm risk/safety across multiple clinical scenarios. Both the firearm access and no access groups agreed (P-value <.001) that providers can ask about firearms in the following clinical scenarios: personal and family depressed/suffering from mental health issues; children in the home; personal or family memory problems; cases of suspected domestic violence; and victim or perpetrator of violent injury. As with the provider type, while both patients with and without access to firearms generally believed it was appropriate to discuss firearms in these contexts, agreement was lower for those with access (Table 4).
Patient Past Experience of ViolencePast experience of violence was highly prevalent for both
those with and without access to firearms. Notably, those with access to firearms experienced significantly more workplace violence (n = 70, 22.9%) and had been shot (n = 62, 20.3%) significantly more than those with no access (n = 22, 6.9% and n = 23, 7.2% respectively). Additionally, those with access were more likely to report having been “pistol whipped” or
struck with a gun (n =56, 18% vs n = 28, 8.8%), unintentionally shooting themselves or others (n = 56, 18% vs n=28, 8.8%), and reporting medical treatment due to firearm-related injury (n = 73, 23.9% vs n = 11, 3.4%) than those without access. Other types of violence such as physical violence, sexual violence, and domestic violence, while prevalent, did not differ significantly between groups (Table 5).
AccessGun-accessing patients made up about half of the sample
with 306 of 625 participants total having access to firearms. Of the handguns reviewed, 19.1% of patients indicated that they stored them “loaded and unlocked,” which is regarded as the least safe of possible options. Long guns followed a similar pattern with 19.3% of patients storing them “loaded and unlocked.” Conversely, 31.9% of patients’ handguns and 33.3% of patients’ long guns were designated as “unloaded and locked,” which is regarded as the safest of possible options. Of patients’ “other guns” category, 29.7% of patients stored them “loaded and unlocked,” while 23.1% stored them “unloaded and locked” (Table 6).
Patients with firearm access indicated that their primary reason for ownership was for “personal protection” inclusive of protection against both “strangers” and “people I know.” Handguns were owned for “personal protection” (84.3%) followed distantly by “hunting” (23.4%), “other sporting use” (15.7%), “some other reason” (14.0%), and “collection/hobby” (13.2%). For long guns, “personal protection” still led (67%) with “hunting” by a closer margin (46%), and “other sporting use” (28.0%), “collection/hobby” (26.0%), and “some other reason” (9.3%) following thereafter. Other guns were owned for “personal protection” in the majority of cases (67.0%) followed by “some other reason” (33.0%), “other sporting use” (12.1%), and “collection/hobby” (11.0%).
DISCUSSION Firearm injury prevention and safety discussions in the
healthcare setting are emerging as promising intervention opportunities to reduce injury burden on communities. By surveying patients in three clinically diverse ED populations, we sought to better understand the motivations, attitudes, and experiences of patients likely to be the focus of future safety intervention. The degree of firearm ownership with various demographic groups tends to mirror national estimates, with a large proportion of gun-accessing patients being male with prior military service, but a higher degree of patients self-identifying as Black, living in an urban or suburban region in this particular sample. Consistent with prior studies, patients reported being open to firearm discussions with their doctor or healthcare provider, suggesting support for potential clinical interventions.
In this study, patients generally regarded firearm safety discussions as similar to other clinically relevant topics such as helmet use, seatbelt wearing, and substance use counseling. Furthermore, novel findings support that patients (both firearm
Figure 1. Patient degree of agreement that discussing with each provider type is appropriate in A (patients with gun access) and B (patients without gun access). Error bars represent 95% confidence intervals.APP, advanced practice providers; MHP, mental health professional.
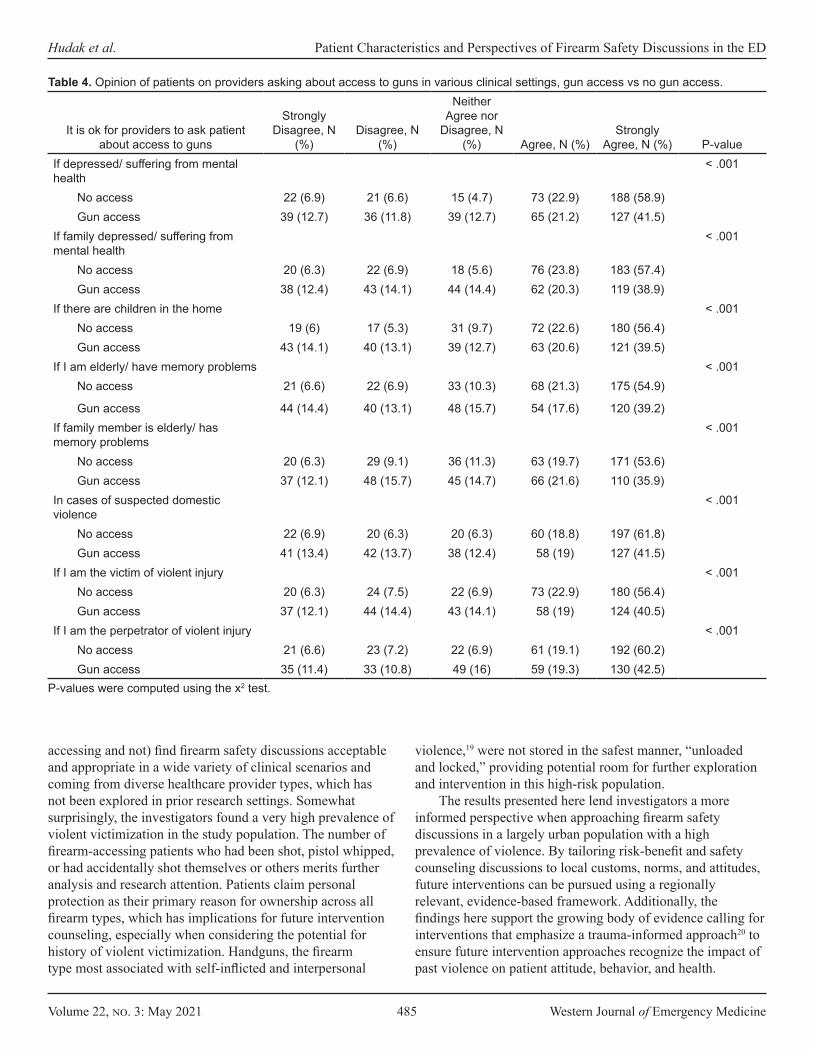
Volume 22, no. 3: May 2021 485 Western Journal of Emergency Medicine
Hudak et al. Patient Characteristics and Perspectives of Firearm Safety Discussions in the ED
accessing and not) find firearm safety discussions acceptable and appropriate in a wide variety of clinical scenarios and coming from diverse healthcare provider types, which has not been explored in prior research settings. Somewhat surprisingly, the investigators found a very high prevalence of violent victimization in the study population. The number of firearm-accessing patients who had been shot, pistol whipped, or had accidentally shot themselves or others merits further analysis and research attention. Patients claim personal protection as their primary reason for ownership across all firearm types, which has implications for future intervention counseling, especially when considering the potential for history of violent victimization. Handguns, the firearm type most associated with self-inflicted and interpersonal
violence,19 were not stored in the safest manner, “unloaded and locked,” providing potential room for further exploration and intervention in this high-risk population.
The results presented here lend investigators a more informed perspective when approaching firearm safety discussions in a largely urban population with a high prevalence of violence. By tailoring risk-benefit and safety counseling discussions to local customs, norms, and attitudes, future interventions can be pursued using a regionally relevant, evidence-based framework. Additionally, the findings here support the growing body of evidence calling for interventions that emphasize a trauma-informed approach20 to ensure future intervention approaches recognize the impact of past violence on patient attitude, behavior, and health.
It is ok for providers to ask patient about access to guns
Strongly Disagree, N
(%)Disagree, N
(%)
Neither Agree nor
Disagree, N (%) Agree, N (%)
Strongly Agree, N (%) P-value
If depressed/ suffering from mental health
< .001
No access 22 (6.9) 21 (6.6) 15 (4.7) 73 (22.9) 188 (58.9)Gun access 39 (12.7) 36 (11.8) 39 (12.7) 65 (21.2) 127 (41.5)
If family depressed/ suffering from mental health
< .001
No access 20 (6.3) 22 (6.9) 18 (5.6) 76 (23.8) 183 (57.4)Gun access 38 (12.4) 43 (14.1) 44 (14.4) 62 (20.3) 119 (38.9)
If there are children in the home < .001No access 19 (6) 17 (5.3) 31 (9.7) 72 (22.6) 180 (56.4)Gun access 43 (14.1) 40 (13.1) 39 (12.7) 63 (20.6) 121 (39.5)
If I am elderly/ have memory problems < .001No access 21 (6.6) 22 (6.9) 33 (10.3) 68 (21.3) 175 (54.9)
Gun access 44 (14.4) 40 (13.1) 48 (15.7) 54 (17.6) 120 (39.2)If family member is elderly/ has memory problems
< .001
No access 20 (6.3) 29 (9.1) 36 (11.3) 63 (19.7) 171 (53.6)Gun access 37 (12.1) 48 (15.7) 45 (14.7) 66 (21.6) 110 (35.9)
In cases of suspected domestic violence
< .001
No access 22 (6.9) 20 (6.3) 20 (6.3) 60 (18.8) 197 (61.8)Gun access 41 (13.4) 42 (13.7) 38 (12.4) 58 (19) 127 (41.5)
If I am the victim of violent injury < .001No access 20 (6.3) 24 (7.5) 22 (6.9) 73 (22.9) 180 (56.4)Gun access 37 (12.1) 44 (14.4) 43 (14.1) 58 (19) 124 (40.5)
If I am the perpetrator of violent injury < .001No access 21 (6.6) 23 (7.2) 22 (6.9) 61 (19.1) 192 (60.2)Gun access 35 (11.4) 33 (10.8) 49 (16) 59 (19.3) 130 (42.5)
Table 4. Opinion of patients on providers asking about access to guns in various clinical settings, gun access vs no gun access.
P-values were computed using the x2 test.
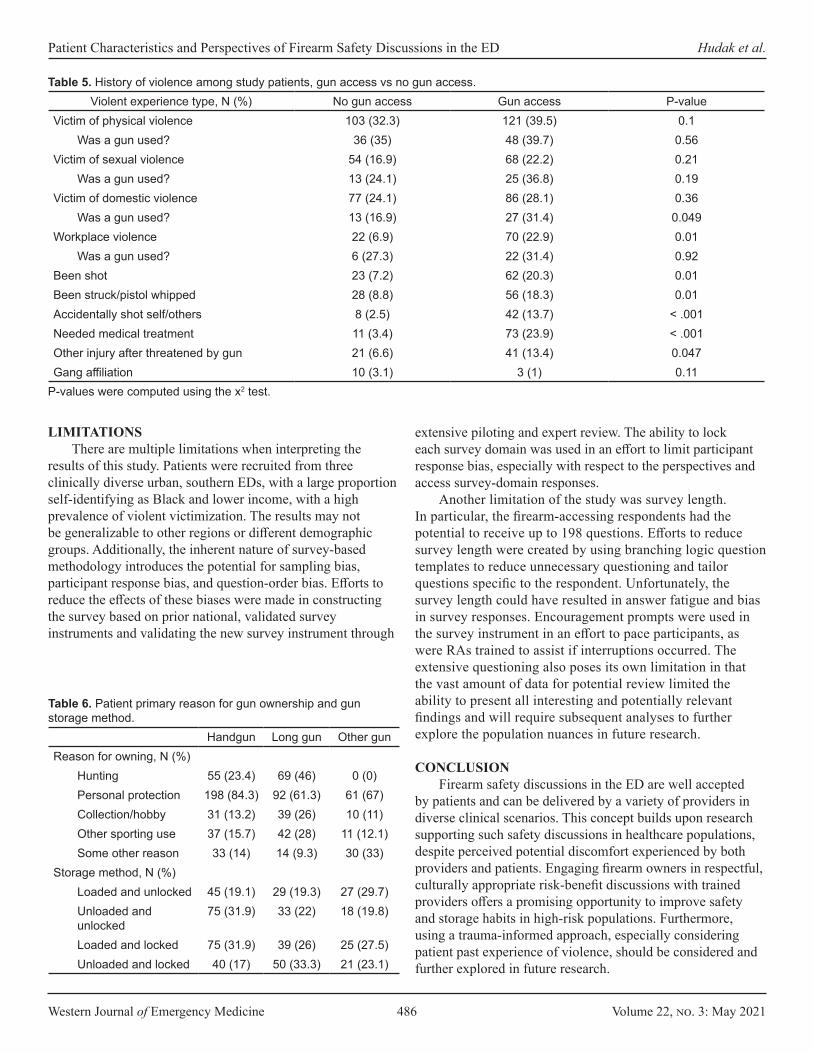
Western Journal of Emergency Medicine 486 Volume 22, no. 3: May 2021
Patient Characteristics and Perspectives of Firearm Safety Discussions in the ED Hudak et al.
LIMITATIONSThere are multiple limitations when interpreting the
results of this study. Patients were recruited from three clinically diverse urban, southern EDs, with a large proportion self-identifying as Black and lower income, with a high prevalence of violent victimization. The results may not be generalizable to other regions or different demographic groups. Additionally, the inherent nature of survey-based methodology introduces the potential for sampling bias, participant response bias, and question-order bias. Efforts to reduce the effects of these biases were made in constructing the survey based on prior national, validated survey instruments and validating the new survey instrument through
extensive piloting and expert review. The ability to lock each survey domain was used in an effort to limit participant response bias, especially with respect to the perspectives and access survey-domain responses.
Another limitation of the study was survey length. In particular, the firearm-accessing respondents had the potential to receive up to 198 questions. Efforts to reduce survey length were created by using branching logic question templates to reduce unnecessary questioning and tailor questions specific to the respondent. Unfortunately, the survey length could have resulted in answer fatigue and bias in survey responses. Encouragement prompts were used in the survey instrument in an effort to pace participants, as were RAs trained to assist if interruptions occurred. The extensive questioning also poses its own limitation in that the vast amount of data for potential review limited the ability to present all interesting and potentially relevant findings and will require subsequent analyses to further explore the population nuances in future research.
CONCLUSION Firearm safety discussions in the ED are well accepted
by patients and can be delivered by a variety of providers in diverse clinical scenarios. This concept builds upon research supporting such safety discussions in healthcare populations, despite perceived potential discomfort experienced by both providers and patients. Engaging firearm owners in respectful, culturally appropriate risk-benefit discussions with trained providers offers a promising opportunity to improve safety and storage habits in high-risk populations. Furthermore, using a trauma-informed approach, especially considering patient past experience of violence, should be considered and further explored in future research.
Violent experience type, N (%) No gun access Gun access P-valueVictim of physical violence 103 (32.3) 121 (39.5) 0.1
Was a gun used? 36 (35) 48 (39.7) 0.56Victim of sexual violence 54 (16.9) 68 (22.2) 0.21
Was a gun used? 13 (24.1) 25 (36.8) 0.19Victim of domestic violence 77 (24.1) 86 (28.1) 0.36
Was a gun used? 13 (16.9) 27 (31.4) 0.049Workplace violence 22 (6.9) 70 (22.9) 0.01
Was a gun used? 6 (27.3) 22 (31.4) 0.92Been shot 23 (7.2) 62 (20.3) 0.01Been struck/pistol whipped 28 (8.8) 56 (18.3) 0.01Accidentally shot self/others 8 (2.5) 42 (13.7) < .001Needed medical treatment 11 (3.4) 73 (23.9) < .001Other injury after threatened by gun 21 (6.6) 41 (13.4) 0.047Gang affiliation 10 (3.1) 3 (1) 0.11
P-values were computed using the x2 test.
Table 5. History of violence among study patients, gun access vs no gun access.
Handgun Long gun Other gun Reason for owning, N (%)
Hunting 55 (23.4) 69 (46) 0 (0)Personal protection 198 (84.3) 92 (61.3) 61 (67)Collection/hobby 31 (13.2) 39 (26) 10 (11)Other sporting use 37 (15.7) 42 (28) 11 (12.1)Some other reason 33 (14) 14 (9.3) 30 (33)
Storage method, N (%) Loaded and unlocked 45 (19.1) 29 (19.3) 27 (29.7)Unloaded and unlocked
75 (31.9) 33 (22) 18 (19.8)
Loaded and locked 75 (31.9) 39 (26) 25 (27.5)Unloaded and locked 40 (17) 50 (33.3) 21 (23.1)
Table 6. Patient primary reason for gun ownership and gun storage method.

Volume 22, no. 3: May 2021 487 Western Journal of Emergency Medicine
Hudak et al. Patient Characteristics and Perspectives of Firearm Safety Discussions in the ED
ACKNOWLEDGMENTThis study was funded by the Emory Medical Care
Foundation 2018-2020 Grant Cycle #0004, $20,805 as Phase 1 of the Emory SAFE FIRST Pilot Study (Survey Assessment of Firearm Experiences, Firearm Injury Risk Screening and Treatment).
The authors have no other funding sources, financial or management relationships, or other competing interests relevant to the work presented here.
The authors wish to acknowledge and thank the Emory SAFE FIRST collaborative team: Omar Danner, MD; Sheryl Heron, MD, MPH; Diane Payne, MD; Bisan Salhi, MD, PhD; Randi Smith, MD, MPH; David Wright, MD; Dan Wu, MD; and expert advisors: Marion (Emmy) Betz, MD, MPH; Matthew Miller, MD, MPH, ScD; Megan Ranney, MD, MPH; and Carmel Salhi, ScD.
A special thanks to the Georgia Tech biomedical engineering research assistant team who contributed to the data collection portion of the study.
Address for Correspondence: Lauren Hudak, MD, MPH, Injury Prevention Research Center at Emory, 49 Jesse Hill Jr. Drive SE, Atlanta, GA, 30303, Steiner Building, Suite 116. Email: [email protected].
Conflicts of Interest: By the WestJEM article submission agreement, all authors are required to disclose all affiliations, funding sources and financial or management relationships that could be perceived as potential sources of bias. No author has professional or financial relationships with any companies that are relevant to this study. There are no conflicts of interest or sources of funding to declare.
Copyright: © 2021 Hudak et al. This is an open access article distributed in accordance with the terms of the Creative Commons Attribution (CC BY 4.0) License. See: http://creativecommons.org/licenses/by/4.0/
providers. Depress Anxiety. 2013;30(10):1013-20.4. Hatchimonji JS, Swendiman RA, Seamon MJ, et al. Trauma does
not quarantine: violence during the COVID-19 pandemic. Ann Surg. 2020;272(2):e53-e54.
5. Gunnell D, Appleby L, Arensman E, et al. Suicide risk and prevention during the COVID-19 pandemic. Lancet Psychiatry. 2020;7(6):468-71.
6. Pfefferbaum B and North CS. Mental health and the Covid-19 pandemic. N Engl J Med. 2020;383(6):510-2.
7. Lang BJ and Lang M. Pandemics, protests and firearms. SSRN. 2020;7(2):131-63.
8. Brauer J. U.S. firearm sales: May 2020 unit sales break records yet again. 2020. Available at: https://smallarmsanalytics.com/v1/pr/2020-06-01.pdf. Accessed July 10, 2020.
9. Azrael D. The stock and flow of U.S. firearms: results from the 2015 National Firearms Survey. JSTOR. 2017;3(5):38-57.
10. Betz ME, Azrael D, Barber C, Miller M. Public opinion regarding whether speaking with patients about firearms is appropriate: results of a national survey. Ann Intern Med. 2016;165(8):543-50.
11. Cleveland EC, Azrael D, Simonetti JA, Miller M. Firearm ownership among American veterans: findings from the 2015 National Firearm Survey. Inj Epidemiol. 2017;4(1):33.
12. Boge LA, Dos Santos C, Burkholder JD, et al. Patients’ perceptions of the role of physicians in questioning and educating in firearms safety: post-FOPA repeal era. South Med J. 2019;112(1):34-8.
13. Yip PS, Caine E, Yousuf S, et al. Means restriction for suicide prevention. Lancet. 2012;379(9834):2393-9.
14. Runyan CW, Becker A, Brandspigel S, et al. Lethal means counseling for parents of youth seeking emergency care for suicidality. West J Emerg Med. 2016;17(1):8-14.
15. Betz ME, Miller M, Barber C, et al. Lethal means access and assessment among suicidal emergency department patients. Depress Anxiety. 2016;33(6):502-11.
16. Cunningham RM, Carter PM, Ranney ML, et al. Prevention of firearm injuries among children and adolescents: consensus-driven research agenda from the Firearm Safety Among Children and Teens (FACTS) Consortium. JAMA Pediatr. 2019;173(8):780-9.
17. Wintemute GJ. What you can do to stop firearm violence. Ann Intern Med. 2017;167(12):886-7.
18. Betz ME, Wintemute GJ. Physician counseling on firearm safety: a new kind of cultural competence. JAMA. 2015;314(5):449-50.
19. Planty M and Truman JL. Firearm violence, 1993-2011. 2013. Available at: https://www.bjs.gov/content/pub/pdf/fv9311.pdf. Accessed July 10, 2020.
20. Test Fischer KR, Bakes KM, Corbin TJ, et al. Trauma-informed care for violently injured patients in the emergency department. Ann Emerg Med. 2019;73(2):193-202.
REFERENCES 1. Centers for Disease Control and Prevention. Injury Prevention &
Control: Data & Statistics (WISQARS). 2019. Available at: https://www.cdc.gov/injury/wisqars/index.html. Accessed December 15, 2019.
2. Weinberger SE, Hoyt DB, Lawrence HC 3rd, et al. Firearm-related injury and death in the United States: a call to action from 8 health professional organizations and the American Bar Association. Ann Intern Med. 2015;162(7):513-6.
3. Betz ME, Miller M, Barber C, et al. Lethal means restriction for suicide prevention: beliefs and behaviors of emergency department
Western Journal of Emergency Medicine 488 Volume 22, no. 3: May 2021
Original Research
Gun Violence and Firearm Injuries in West Michigan: Targeting Prevention
Christopher M. Mattson, DO*Ryan Kaylor, DO†
Tracy J. Koehler, PhD‡
Marc Ydenberg, MD*Justin Grill, DO* Brian R. Stork, MD§
Section Editor: Pierre Borczuk, MDSubmission history: Submitted July 29, 2020; Revision received March 9, 2021; Accepted March 25, 2021Electronically published May 19, 2021Full text available through open access at http://escholarship.org/uc/uciem_westjem DOI: 10.5811/westjem.2021.3.49255
Mercy Health, Department of Emergency Medicine, Muskegon, MichiganNaval Medical Center, Department of Emergency Medicine, San Diego, CaliforniaMercy Health, Department of Scholarly Activity Support, Muskegon, MichiganUniversity of Michigan, Department of Urology, Ann Arbor, Michigan
*†
‡
§
Introduction: Firearm-related deaths and injuries are ongoing public health issues in the United States. We reviewed a series of gun violence- and firearm-related injuries treated at a multi-campus community healthcare system in West Michigan to better understand the demographic and clinical characteristics of these injuries. We also studied hospital charges, and payers responsible, in an effort to identify stakeholders and opportunities for community- and hospital-based prevention.
Methods: We performed a retrospective review of firearm injuries treated at Mercy Health Muskegon (MHM) between May 1, 2015 and June 30, 2019. Demographic data, injury type, Injury Severity Score (ISS), anatomic location and organ systems involved, length of stay (LOS), mortality, time of year, and ZIP code in which the injury occurred were reviewed, as were hospital charges and payers responsible.
Results: Of those reviewed, 307 firearm-related injuries met inclusion criteria for the study. In 69.4% of cases the injury type was attempted murder or intent to do bodily harm. Accidental and self-inflicted injuries accounted for 25% of cases. There was a statistically significant difference in the mechanism of injury between Black and White patients with a higher proportion of Black men injured due to gun violence (P < 0.001). Median ISS was 8 and the most commonly injured organ system was musculoskeletal. Median LOS was one day. Self-inflicted firearm injuries had the highest rate of mortality (50%) followed by attempted murder (7%) and accidental discharge (3.1%; P < 0.001). Median hospital charge was $8,008. In 68% of cases, Medicaid was the payer. MHM received $4.98 million dollars in reimbursement from Medicaid; however, when direct and indirect costs were taken into account, a loss of $12,648 was observed.
Conclusion: Findings from this study reveal that young, Black men are the primary victims of gun violence-related injuries in our West Michigan service area. Hospital care of firearm-related injuries at MHM was predominantly paid for by Medicaid. Multiple stakeholders stand to benefit from funding and supporting community- and hospital-based prevention programs designed to reduce gun violence and firearm-related injuries in our service area. [West J Emerg Med. 2021;22(3)488-497.]
INTRODUCTIONFirearm-related deaths and injuries are ongoing public health
issues in the United States (US) and in West Michigan. The
increasing frequency of these events, most recently in prominent cities such as Atlanta, GA and Boulder, CO, has placed a growing toll on communities nationwide, both in terms of morbidity and
Volume 22, no. 3: May 2021 489 Western Journal of Emergency Medicine
Mattson et al. Gun Violence and Firearm Injuries in West Michigan: Targeting Prevention
Population Health Research Capsule
What do we already know about this issue?Firearm related deaths and injuries are a major public health issue in the United States. Though more heavily publicized, mass shootings make up a minority of these events.
What was the research question?Our goal in this study was to describe the demographic, clinical, and situational characteristics of firearm injuries in our community, as well as analyze outcomes, review hospital charges, and track payers.
What was the major finding of the study?Hospital-based care of gun violence injuries in our community is resource intensive, leads to significant Medicare expenditures, and results in a net loss of revenue for our health care system.
How does this improve population health?These findings will support future resource allocation and firearm-related injury prevention efforts in the community.
mortality, and monetary cost.1 While mass casualty incidents have historically received the majority of media attention, fatalities in mass shooting incidents in the US account for only a fraction of all gun murders that occur nationwide each year.2-4 If we define mass casualty incidents as those events involving four or more victims (excluding the shooter), there were 373 reported deaths in 2018.2 Overall, between 2010–2016 there were more than 595,000 injuries reportedly caused by firearms in the US.5,6 During that same period, firearms were involved in 8133 deaths in the state of Michigan.7
Mercy Health Muskegon (MHM) is a community-based healthcare system located in West Michigan. A member of Trinity Health, MHM through its three hospital campuses provides an estimated 90% of healthcare services to the region it serves.8 Each campus, by way of its associated emergency department (ED), serves a unique patient population. The system’s Hackley and Sherman campuses, for example, serve inner city, suburban, and rural populations. They also accept transfer patients from other hospitals. Alternatively, the Lakeshore campus predominantly serves a rural population. Mercy Health Muskegon established a Level II trauma center on its Hackley Campus on May 1, 2015. The opening of this center has resulted in numerous benefits to the surrounding communities, including having 24-hour access to multiple specialties, a dedicated trauma service, and a trauma coordinator to assist with quality improvement and outcome reporting.
Our goal in this study was to describe the demographic, clinical, and situational characteristics of firearm injuries, as well as outcomes, hospital charges, and payers. This information could be used to support future resource allocation and firearm-related injury prevention efforts.
METHODSAfter obtaining approval from the Mercy Health Grand
Rapids Institutional Review Board, we performed a retrospective review of all firearm-related injuries treated at MHM hospital EDs between May 1, 2015–June 30, 2019. These hospitals included Mercy Health Lakeshore Campus, Mercy Health Muskegon Campus, and Mercy Health Hackley Campus. A start date of May 1, 2015, was chosen because it was the first day Mercy Health Hackley Campus began servicing the community as a Level II trauma center. For the purpose of this study, we defined firearm injuries as any injury resulting from the discharge of a firearm with penetration or abrasion to the subject’s body by the projectile. We used preselected International Classification of Diseases, revisions 9 and 10 (ICD)-9 and ICD-10 diagnostic codes (Supplement 1) to query the hospital charges database to identify patients. After identifying potential charts, two investigators (CM and RK) independently reviewed each patient’s chart to ensure it met criteria for inclusion (Figure 1). Of the 381 cases identified by ICD coding, 74 cases were excluded.
Study variables included the following: age; gender; race; mechanism of injury (e.g., attempted murder, accidental, self-inflicted); firearm involved; method of arrival to hospital
(e.g., ambulance, car); Injury Severity Score (ISS); anatomic location(s) of injury(ies); organ system(s) affected; comorbidities requiring treatment during that visit/stay; length of stay (LOS); mortality; time of year (month); geographic region of injury (ZIP code); hospital charges; and payer. For the purposes of this study, hospital charges included only fees charged by the hospital itself. Other charges related to patient care, such as professional fees charged by emergency physicians, anesthesiologists, and radiologists in private practice, were not captured. Also omitted were charges associated with after-visit care at other facilities (e.g., acute rehabilitation stays, physical therapy visits).
We calculated summary statistics for the data. Quantitative data are shown as mean ± standard deviation or median and interquartile range (IQR) or minimum/maximum values for non-normally distributed variables. Nominal data are shown as percentages. Quantitative data were compared using the Kruskal-Wallis test and nominal variables were compared using the chi-square or Fisher’s exact test when appropriate. We analyzed data using SPSS Statistics, v. 23 (IBM Corp., Armonk, NY).
RESULTSPatient and Clinical Characteristics
A total of 307 firearm-related injuries met inclusion criteria for the study. Table 1 shows the demographic, clinical, and
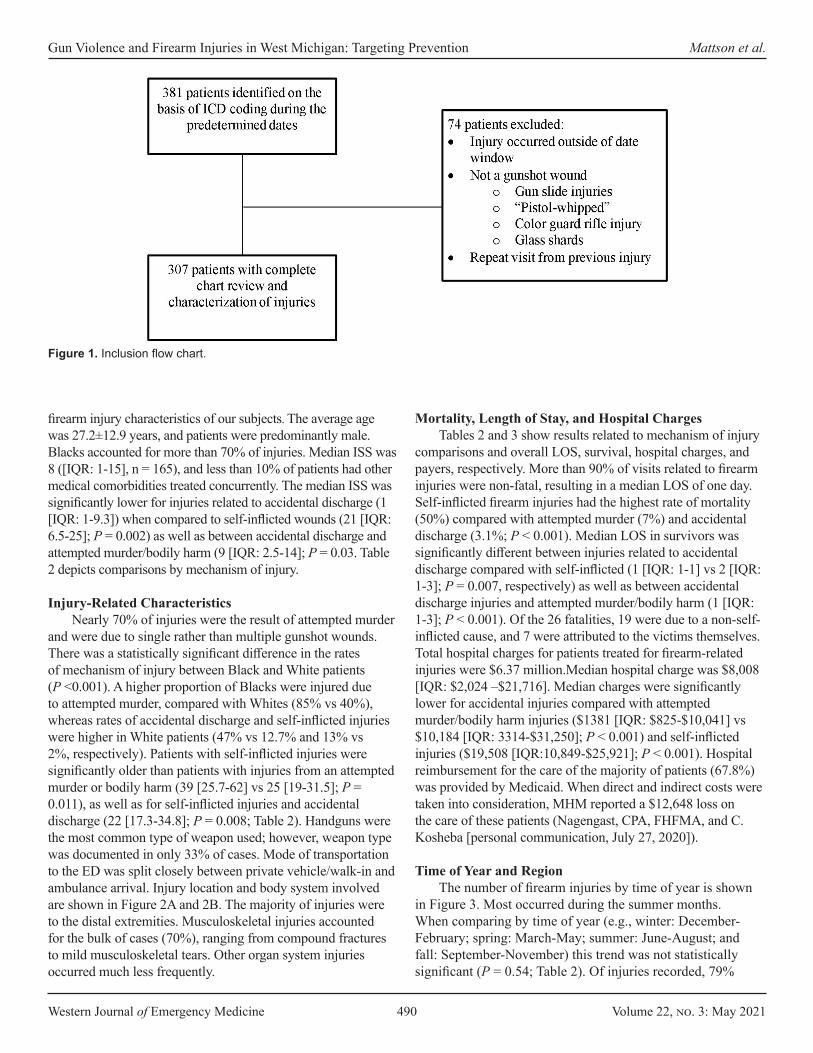
Western Journal of Emergency Medicine 490 Volume 22, no. 3: May 2021
Gun Violence and Firearm Injuries in West Michigan: Targeting Prevention Mattson et al.
firearm injury characteristics of our subjects. The average age was 27.2±12.9 years, and patients were predominantly male. Blacks accounted for more than 70% of injuries. Median ISS was 8 ([IQR: 1-15], n = 165), and less than 10% of patients had other medical comorbidities treated concurrently. The median ISS was significantly lower for injuries related to accidental discharge (1 [IQR: 1-9.3]) when compared to self-inflicted wounds (21 [IQR: 6.5-25]; P = 0.002) as well as between accidental discharge and attempted murder/bodily harm (9 [IQR: 2.5-14]; P = 0.03. Table 2 depicts comparisons by mechanism of injury.
Injury-Related CharacteristicsNearly 70% of injuries were the result of attempted murder
and were due to single rather than multiple gunshot wounds. There was a statistically significant difference in the rates of mechanism of injury between Black and White patients (P <0.001). A higher proportion of Blacks were injured due to attempted murder, compared with Whites (85% vs 40%), whereas rates of accidental discharge and self-inflicted injuries were higher in White patients (47% vs 12.7% and 13% vs 2%, respectively). Patients with self-inflicted injuries were significantly older than patients with injuries from an attempted murder or bodily harm (39 [25.7-62] vs 25 [19-31.5]; P = 0.011), as well as for self-inflicted injuries and accidental discharge (22 [17.3-34.8]; P = 0.008; Table 2). Handguns were the most common type of weapon used; however, weapon type was documented in only 33% of cases. Mode of transportation to the ED was split closely between private vehicle/walk-in and ambulance arrival. Injury location and body system involved are shown in Figure 2A and 2B. The majority of injuries were to the distal extremities. Musculoskeletal injuries accounted for the bulk of cases (70%), ranging from compound fractures to mild musculoskeletal tears. Other organ system injuries occurred much less frequently.
Mortality, Length of Stay, and Hospital ChargesTables 2 and 3 show results related to mechanism of injury
comparisons and overall LOS, survival, hospital charges, and payers, respectively. More than 90% of visits related to firearm injuries were non-fatal, resulting in a median LOS of one day. Self-inflicted firearm injuries had the highest rate of mortality (50%) compared with attempted murder (7%) and accidental discharge (3.1%; P < 0.001). Median LOS in survivors was significantly different between injuries related to accidental discharge compared with self-inflicted (1 [IQR: 1-1] vs 2 [IQR: 1-3]; P = 0.007, respectively) as well as between accidental discharge injuries and attempted murder/bodily harm (1 [IQR: 1-3]; P < 0.001). Of the 26 fatalities, 19 were due to a non-self-inflicted cause, and 7 were attributed to the victims themselves. Total hospital charges for patients treated for firearm-related injuries were $6.37 million.Median hospital charge was $8,008 [IQR: $2,024 –$21,716]. Median charges were significantly lower for accidental injuries compared with attempted murder/bodily harm injuries ($1381 [IQR: $825-$10,041] vs $10,184 [IQR: 3314-$31,250]; P < 0.001) and self-inflicted injuries ($19,508 [IQR:10,849-$25,921]; P < 0.001). Hospital reimbursement for the care of the majority of patients (67.8%) was provided by Medicaid. When direct and indirect costs were taken into consideration, MHM reported a $12,648 loss on the care of these patients (Nagengast, CPA, FHFMA, and C. Kosheba [personal communication, July 27, 2020]).
Time of Year and RegionThe number of firearm injuries by time of year is shown
in Figure 3. Most occurred during the summer months. When comparing by time of year (e.g., winter: December-February; spring: March-May; summer: June-August; and fall: September-November) this trend was not statistically significant (P = 0.54; Table 2). Of injuries recorded, 79%
Figure 1. Inclusion flow chart.

Volume 22, no. 3: May 2021 491 Western Journal of Emergency Medicine
Mattson et al. Gun Violence and Firearm Injuries in West Michigan: Targeting Prevention
occurred within two ZIP codes, which included the cities of Muskegon and Muskegon Heights.
DISCUSSIONOur results showed more than 90% of visits related to
firearm injuries were non-fatal, with ISS scores on the lower end resulting in a median LOS of one day. This appears to be
the result of numerous superficial or distal injuries not requiring prolonged (or any) hospitalization. Many patients were discharged home on the same day as their presentation to the ED. Most injuries occurred within two ZIP codes served by our hospital system with the majority occurring during the warmer months of the year. Characteristics of the patient population and mechanism of injury included high rates of attempted murder/bodily injury involving Black males. These findings are similar to previous demographic studies of gun violence injuries in other communities.1,9,10 Accidental discharge injuries were associated with lower ISS, LOS, and hospital charges, whereas self-inflicted injuries occurred mainly in older adults and were more expensive with higher mortality rates.
Violent CrimeThe high incidence of firearm-related injuries has received
intense scrutiny throughout the nation. In 2018, firearm-related violence made up 26.1% of all aggravated assaults in the United States.11 Recently, gun violence has again erupted in cities such as Atlanta, GA and Boulder, CO, highlighting the continued relevance. During our defined study period, Michigan State Police reported 618 cases involving a firearm in Muskegon County, 36 of which resulted in death.12 As a result, Mercy Health EDs are frequently charged with caring for the victims of firearm injuries.
Blacks were victims of 73% of all firearm-related injuries during the study period. Furthermore, of the 226 events where ZIP code was recorded, we found 80% were clustered within 49442 and 49444. These ZIP codes include the cities of Muskegon and Muskegon Heights. A 2016 FBI statistics report showed the 49442 and 49444 ZIP codes were home to some of the highest violent crimes per capita in the state.13 These same areas have a 74.5% Black population with a poverty rate of 37.9% (national poverty rate estimated to be approximately 15.7%).14 The Muskegon County population (containing both cities previously described) is estimated to be 81.2% White, 14% Black, and 5.8% Hispanic or Latino, for comparison.14 Multiple peer-reviewed sources note that individuals suffering from low socioeconomic status are at increased risk for both committing and being victims of violent crime.15,16 The apparent racial disparity appears to be related to socioeconomic conditions and increased poverty rates in the local Black community, particularly in these areas.
Researchers have attempted to identify individuals who are at increased risk for interpersonal violence. Goldstick et al developed the SaFETY score as a way to predict future firearm violence. This risk-stratification tool identifies very high-risk individuals (e.g., those with a SaFETY score > 5) who are likely candidates for entry into resource-intensive programs.17 Similarly, Kramer et al18 established an algorithmic tool to predict violent reinjury, the “Violent Reinjury Risk Assessment Instrument,” which could help with resource allocation.
In addition to risk stratification, the Flint Youth Injury
Characteristic No. (%)^ Age, years* 27.7 ± 12.9 Gender
Male 273 (88.9) Female 34 (11.1)
Race Black 224 (73.0) White 81 (26.4) Multiracial 2 (0.7)
Ethnicity Hispanic/Latino 9 (2.9)
Injury Severity Score, (n = 165)# 8 [1-15] Patients receiving treatment for comorbidities during management of firearm injury
17 (5.5)
Mechanism of injury Attempted murder 213 (69.4) Accidental discharge/mishandling of a weapon 64 (20.8) Other/unknown 16 (5.2) Self-inflicted 14 (4.6)
Mechanism of arrival (n = 304) Ambulance 154 (50.7) Private vehicle/walking 150 (48.9) Previous gun injury 18 (5.9)
Projectile number Single gunshot 240 (78.2) Multiple gunshots 67 (21.8)
Weapon type (n = 99) Handgun 61 (61.6) Shotgun 6 (6.1) Long gun 3 (3) BB gun/air gun 29 (29.3)
Treating location Hackley Hospital (inner city) 253 (82.4) Mercy Health Muskegon (inner city) 46 (15) Lakeshore Hospital (rural) 8 (2.6)
Table 1. Demographic, clinical and firearm injury characteristics, N = 307.
^Unless otherwise noted.*Mean ± standard deviation.#Median [interquartile range].
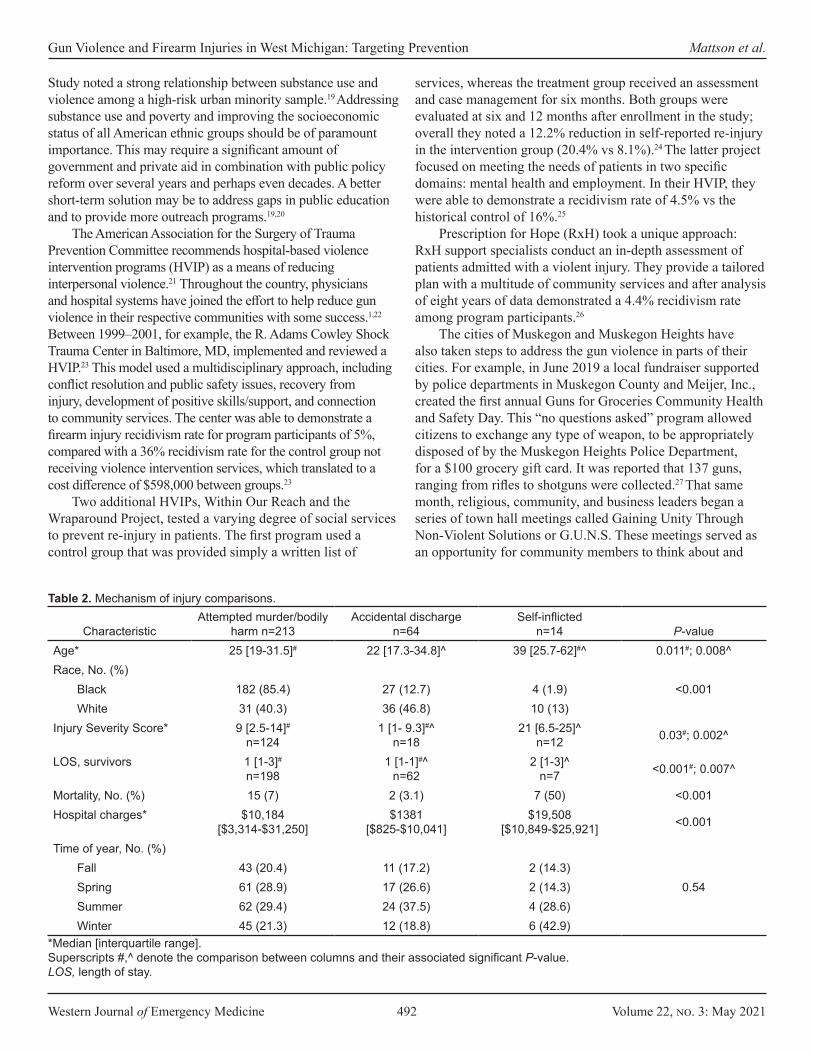
Western Journal of Emergency Medicine 492 Volume 22, no. 3: May 2021
Gun Violence and Firearm Injuries in West Michigan: Targeting Prevention Mattson et al.
Study noted a strong relationship between substance use and violence among a high-risk urban minority sample.19 Addressing substance use and poverty and improving the socioeconomic status of all American ethnic groups should be of paramount importance. This may require a significant amount of government and private aid in combination with public policy reform over several years and perhaps even decades. A better short-term solution may be to address gaps in public education and to provide more outreach programs.19,20
The American Association for the Surgery of Trauma Prevention Committee recommends hospital-based violence intervention programs (HVIP) as a means of reducing interpersonal violence.21 Throughout the country, physicians and hospital systems have joined the effort to help reduce gun violence in their respective communities with some success.1,22 Between 1999–2001, for example, the R. Adams Cowley Shock Trauma Center in Baltimore, MD, implemented and reviewed a HVIP.23 This model used a multidisciplinary approach, including conflict resolution and public safety issues, recovery from injury, development of positive skills/support, and connection to community services. The center was able to demonstrate a firearm injury recidivism rate for program participants of 5%, compared with a 36% recidivism rate for the control group not receiving violence intervention services, which translated to a cost difference of $598,000 between groups.23
Two additional HVIPs, Within Our Reach and the Wraparound Project, tested a varying degree of social services to prevent re-injury in patients. The first program used a control group that was provided simply a written list of
services, whereas the treatment group received an assessment and case management for six months. Both groups were evaluated at six and 12 months after enrollment in the study; overall they noted a 12.2% reduction in self-reported re-injury in the intervention group (20.4% vs 8.1%).24 The latter project focused on meeting the needs of patients in two specific domains: mental health and employment. In their HVIP, they were able to demonstrate a recidivism rate of 4.5% vs the historical control of 16%.25
Prescription for Hope (RxH) took a unique approach: RxH support specialists conduct an in-depth assessment of patients admitted with a violent injury. They provide a tailored plan with a multitude of community services and after analysis of eight years of data demonstrated a 4.4% recidivism rate among program participants.26
The cities of Muskegon and Muskegon Heights have also taken steps to address the gun violence in parts of their cities. For example, in June 2019 a local fundraiser supported by police departments in Muskegon County and Meijer, Inc., created the first annual Guns for Groceries Community Health and Safety Day. This “no questions asked” program allowed citizens to exchange any type of weapon, to be appropriately disposed of by the Muskegon Heights Police Department, for a $100 grocery gift card. It was reported that 137 guns, ranging from rifles to shotguns were collected.27 That same month, religious, community, and business leaders began a series of town hall meetings called Gaining Unity Through Non-Violent Solutions or G.U.N.S. These meetings served as an opportunity for community members to think about and
Characteristic Attempted murder/bodily
harm n=213Accidental discharge
n=64 Self-inflicted
n=14 P-valueAge* 25 [19-31.5]# 22 [17.3-34.8]^ 39 [25.7-62]#^ 0.011#; 0.008^Race, No. (%)
<0.001Black 182 (85.4) 27 (12.7) 4 (1.9) White 31 (40.3) 36 (46.8) 10 (13)
Injury Severity Score* 9 [2.5-14]#
n=1241 [1- 9.3]#^
n=1821 [6.5-25]^
n=12 0.03#; 0.002^
LOS, survivors 1 [1-3]#
n=1981 [1-1]#^
n=622 [1-3]^
n=7 <0.001#; 0.007^
Mortality, No. (%) 15 (7) 2 (3.1) 7 (50) <0.001Hospital charges* $10,184
[$3,314-$31,250]$1381
[$825-$10,041]$19,508
[$10,849-$25,921] <0.001
Time of year, No. (%)
0.54Fall 43 (20.4) 11 (17.2) 2 (14.3) Spring 61 (28.9) 17 (26.6) 2 (14.3) Summer 62 (29.4) 24 (37.5) 4 (28.6) Winter 45 (21.3) 12 (18.8) 6 (42.9)
Table 2. Mechanism of injury comparisons.
*Median [interquartile range]. Superscripts #,^ denote the comparison between columns and their associated significant P-value. LOS, length of stay.
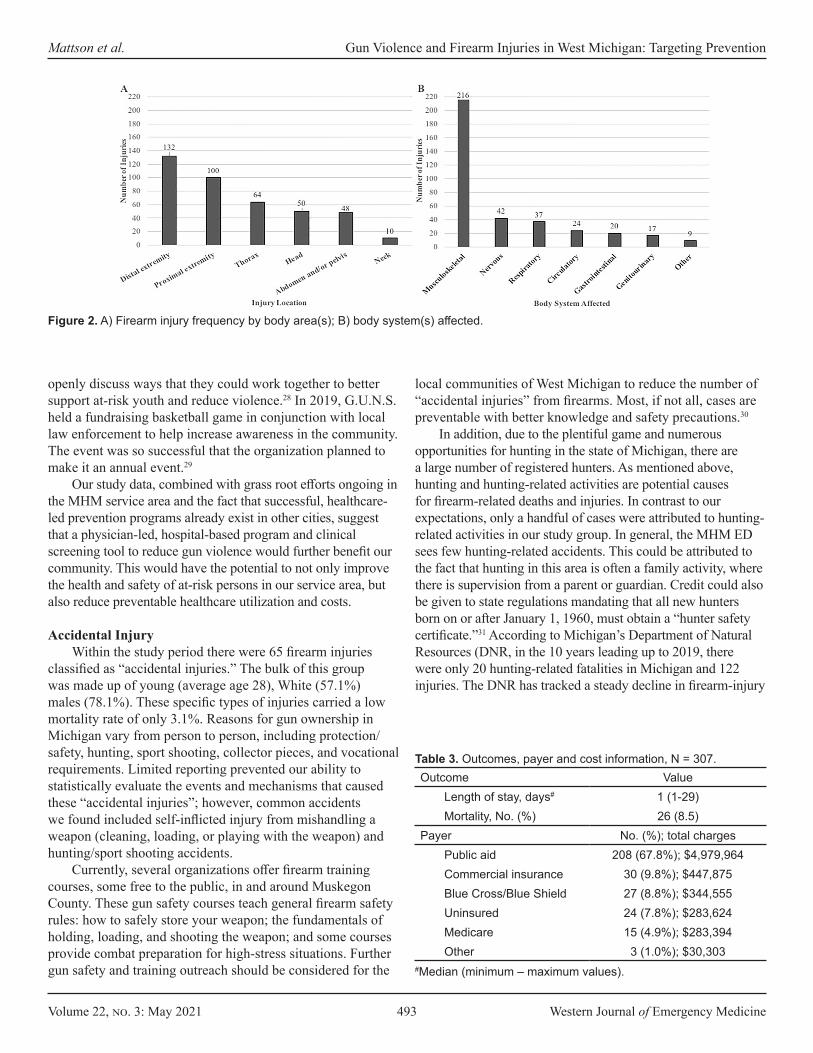
Volume 22, no. 3: May 2021 493 Western Journal of Emergency Medicine
Mattson et al. Gun Violence and Firearm Injuries in West Michigan: Targeting Prevention
openly discuss ways that they could work together to better support at-risk youth and reduce violence.28 In 2019, G.U.N.S. held a fundraising basketball game in conjunction with local law enforcement to help increase awareness in the community. The event was so successful that the organization planned to make it an annual event.29
Our study data, combined with grass root efforts ongoing in the MHM service area and the fact that successful, healthcare-led prevention programs already exist in other cities, suggest that a physician-led, hospital-based program and clinical screening tool to reduce gun violence would further benefit our community. This would have the potential to not only improve the health and safety of at-risk persons in our service area, but also reduce preventable healthcare utilization and costs.
Accidental InjuryWithin the study period there were 65 firearm injuries
classified as “accidental injuries.” The bulk of this group was made up of young (average age 28), White (57.1%) males (78.1%). These specific types of injuries carried a low mortality rate of only 3.1%. Reasons for gun ownership in Michigan vary from person to person, including protection/safety, hunting, sport shooting, collector pieces, and vocational requirements. Limited reporting prevented our ability to statistically evaluate the events and mechanisms that caused these “accidental injuries”; however, common accidents we found included self-inflicted injury from mishandling a weapon (cleaning, loading, or playing with the weapon) and hunting/sport shooting accidents.
Currently, several organizations offer firearm training courses, some free to the public, in and around Muskegon County. These gun safety courses teach general firearm safety rules: how to safely store your weapon; the fundamentals of holding, loading, and shooting the weapon; and some courses provide combat preparation for high-stress situations. Further gun safety and training outreach should be considered for the
local communities of West Michigan to reduce the number of “accidental injuries” from firearms. Most, if not all, cases are preventable with better knowledge and safety precautions.30
In addition, due to the plentiful game and numerous opportunities for hunting in the state of Michigan, there are a large number of registered hunters. As mentioned above, hunting and hunting-related activities are potential causes for firearm-related deaths and injuries. In contrast to our expectations, only a handful of cases were attributed to hunting-related activities in our study group. In general, the MHM ED sees few hunting-related accidents. This could be attributed to the fact that hunting in this area is often a family activity, where there is supervision from a parent or guardian. Credit could also be given to state regulations mandating that all new hunters born on or after January 1, 1960, must obtain a “hunter safety certificate.”31 According to Michigan’s Department of Natural Resources (DNR, in the 10 years leading up to 2019, there were only 20 hunting-related fatalities in Michigan and 122 injuries. The DNR has tracked a steady decline in firearm-injury
Figure 2. A) Firearm injury frequency by body area(s); B) body system(s) affected.
Outcome ValueLength of stay, days# 1 (1-29)Mortality, No. (%) 26 (8.5)
Payer No. (%); total chargesPublic aid 208 (67.8%); $4,979,964Commercial insurance 30 (9.8%); $447,875Blue Cross/Blue Shield 27 (8.8%); $344,555Uninsured 24 (7.8%); $283,624Medicare 15 (4.9%); $283,394Other 3 (1.0%); $30,303
Table 3. Outcomes, payer and cost information, N = 307.
#Median (minimum – maximum values).
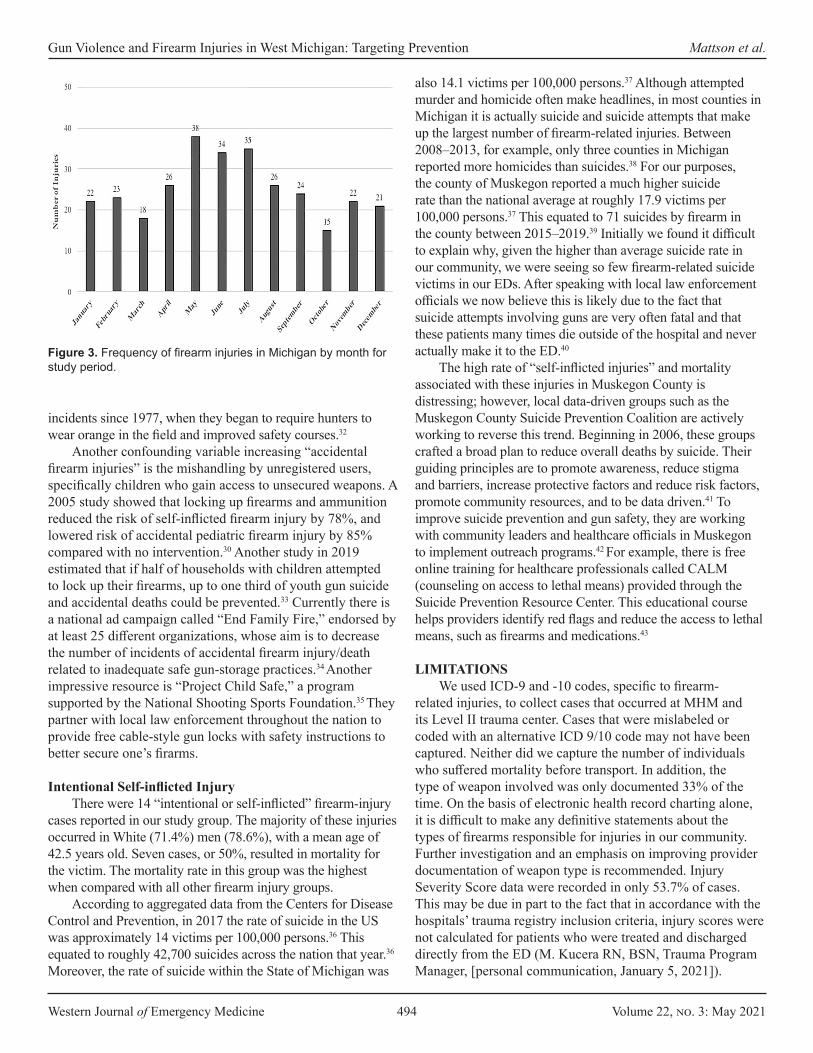
Western Journal of Emergency Medicine 494 Volume 22, no. 3: May 2021
Gun Violence and Firearm Injuries in West Michigan: Targeting Prevention Mattson et al.
incidents since 1977, when they began to require hunters to wear orange in the field and improved safety courses.32
Another confounding variable increasing “accidental firearm injuries” is the mishandling by unregistered users, specifically children who gain access to unsecured weapons. A 2005 study showed that locking up firearms and ammunition reduced the risk of self-inflicted firearm injury by 78%, and lowered risk of accidental pediatric firearm injury by 85% compared with no intervention.30 Another study in 2019 estimated that if half of households with children attempted to lock up their firearms, up to one third of youth gun suicide and accidental deaths could be prevented.33 Currently there is a national ad campaign called “End Family Fire,” endorsed by at least 25 different organizations, whose aim is to decrease the number of incidents of accidental firearm injury/death related to inadequate safe gun-storage practices.34 Another impressive resource is “Project Child Safe,” a program supported by the National Shooting Sports Foundation.35 They partner with local law enforcement throughout the nation to provide free cable-style gun locks with safety instructions to better secure one’s firarms.
Intentional Self-inflicted InjuryThere were 14 “intentional or self-inflicted” firearm-injury
cases reported in our study group. The majority of these injuries occurred in White (71.4%) men (78.6%), with a mean age of 42.5 years old. Seven cases, or 50%, resulted in mortality for the victim. The mortality rate in this group was the highest when compared with all other firearm injury groups.
According to aggregated data from the Centers for Disease Control and Prevention, in 2017 the rate of suicide in the US was approximately 14 victims per 100,000 persons.36 This equated to roughly 42,700 suicides across the nation that year.36
Moreover, the rate of suicide within the State of Michigan was
also 14.1 victims per 100,000 persons.37 Although attempted murder and homicide often make headlines, in most counties in Michigan it is actually suicide and suicide attempts that make up the largest number of firearm-related injuries. Between 2008–2013, for example, only three counties in Michigan reported more homicides than suicides.38 For our purposes, the county of Muskegon reported a much higher suicide rate than the national average at roughly 17.9 victims per 100,000 persons.37 This equated to 71 suicides by firearm in the county between 2015–2019.39 Initially we found it difficult to explain why, given the higher than average suicide rate in our community, we were seeing so few firearm-related suicide victims in our EDs. After speaking with local law enforcement officials we now believe this is likely due to the fact that suicide attempts involving guns are very often fatal and that these patients many times die outside of the hospital and never actually make it to the ED.40
The high rate of “self-inflicted injuries” and mortality associated with these injuries in Muskegon County is distressing; however, local data-driven groups such as the Muskegon County Suicide Prevention Coalition are actively working to reverse this trend. Beginning in 2006, these groups crafted a broad plan to reduce overall deaths by suicide. Their guiding principles are to promote awareness, reduce stigma and barriers, increase protective factors and reduce risk factors, promote community resources, and to be data driven.41 To improve suicide prevention and gun safety, they are working with community leaders and healthcare officials in Muskegon to implement outreach programs.42 For example, there is free online training for healthcare professionals called CALM (counseling on access to lethal means) provided through the Suicide Prevention Resource Center. This educational course helps providers identify red flags and reduce the access to lethal means, such as firearms and medications.43
LIMITATIONSWe used ICD-9 and -10 codes, specific to firearm-
related injuries, to collect cases that occurred at MHM and its Level II trauma center. Cases that were mislabeled or coded with an alternative ICD 9/10 code may not have been captured. Neither did we capture the number of individuals who suffered mortality before transport. In addition, the type of weapon involved was only documented 33% of the time. On the basis of electronic health record charting alone, it is difficult to make any definitive statements about the types of firearms responsible for injuries in our community. Further investigation and an emphasis on improving provider documentation of weapon type is recommended. Injury Severity Score data were recorded in only 53.7% of cases. This may be due in part to the fact that in accordance with the hospitals’ trauma registry inclusion criteria, injury scores were not calculated for patients who were treated and discharged directly from the ED (M. Kucera RN, BSN, Trauma Program Manager, [personal communication, January 5, 2021]).
Figure 3. Frequency of firearm injuries in Michigan by month for study period.
Volume 22, no. 3: May 2021 495 Western Journal of Emergency Medicine
Mattson et al. Gun Violence and Firearm Injuries in West Michigan: Targeting Prevention
In addition, we used hospital charges to the patient/insurer to quantify economic burden. It should be noted that analyzing hospital charges alone does not properly represent the total burden to each patient. This total omits bills issued by private providers and groups (anesthesiologists, radiologists, emergency physicians, etc) or private ambulance services. Furthermore, it does not include any costs incurred after discharge from the hospital, which include acute rehabilitation, visiting nurses, and physical therapy. Victims’ legal fees and lost income/wages as a result of injuries sustained from a firearm were not a part of this study.
We obtained the data in this study from three different MHM EDs in West Michigan. As the frequency and nature of gun violence can vary significantly by community, the results of this study may not be generalizable to other EDs, hospitals, or communities.
CONCLUSIONIn this study, younger Black males were identified to be
the primary victims of gun violence-related injuries in our service area. Hospital visits for these injuries were associated with a net monetary loss for the hospital system and high burden to Medicaid. Review of the literature supports a multi-disciplinary approach to firearm-related injury reduction and costs associated with their care. Hospital-based intervention programs partnered with community resources are an effective tool for injury recidivism and cost reduction. Moving forward, the institution of a hospital-based intervention program with emphasis on the identified high-risk population offers an opportunity to help prevent recurrent injury and decrease financial costs for the system.
ACKNOWLEDGEMENTSWe would like to thank Michelle Kucera, RN, BSN, the
Trauma Program Coordinator at Mercy Health Muskegon for trauma data abstraction. Thanks to Dr. Kristi Nagengast, CPA, FHFMA, Vice President of Finance at Mercy Health and Christi Kosheba, Business Director, Finance at Mercy Health Muskegon for financial data abstraction and interpretation. Thank you to Eric Harris, BAA, CHFP, Senior Financial Analyst at Mercy Health for database construction and management. Thanks to Scott Teichmer, BA, Co-chair at Suicide Prevention Coalition of Muskegon County for expertise regarding suicide in the area. Thank you to Dr. Joseph E. Thomas, Jr., Chief of Police for City of Muskegon Heights for law enforcement expertise and advising. Thanks to Lauren Meldrum, MPH, MYalliance System of Care Project Manager at HealthWest for community outreach expertise. Thank you to Scott Charles, MS, Trauma Outreach Coordinator at Temple University Hospital for gun violence prevention expertise. Finally, thank you to Max McMillen, ELS, Freelance Editor and Manuscript Consultant for assistance with manuscript preparation.
Address for Correspondence: Christopher Mattson, DO, Mercy Health, Department of Emergency Medicine, 1675 Leahy St. Suite 315A, Muskegon, MI 49442. Email: [email protected].
Conflicts of Interest: By the WestJEM article submission agreement, all authors are required to disclose all affiliations, funding sources and financial or management relationships that could be perceived as potential sources of bias. No author has professional or financial relationships with any companies that are relevant to this study. There are no conflicts of interest or sources of funding to declare.
Copyright: © 2021 Mattson et al. This is an open access article distributed in accordance with the terms of the Creative Commons Attribution (CC BY 4.0) License. See: http://creativecommons.org/licenses/by/4.0/
REFERENCES1. Scarlet S, Rogers SO Jr. What is the institutional duty of
trauma systems to respond to gun violence? AMA J Ethics. 2018;20(5):483-91.
2. Gramlich J. What the data says about gun deaths in the U.S. Pew Research Center. 2020. Available at: https://www.pewresearch.org/fact-tank/2019/08/16/what-the-data-says-about-gun-deaths-in-the-u-s/. Accessed June 20, 2020.
3. Swanson JW. Redirecting the mental health and gun violence conversation from mass shootings to suicides. Psychiatr Serv. 2018;69(12):1198-9.
4. Ramchand R, Morral AR. Can the national call to prevent gun violence reduce suicides? Psychiatr Serv. 2018;69(12):1196-7.
5. WISQARS Nonfatal Injury Reports. Centers for Disease Control and Prevention. 2019. Available at: https://webappa.cdc.gov/sasweb/ncipc/nfirates.html Accessed September 21, 2019.
6. The Lancet Child Adolescent Health. #NeverAgain: gun violence and youth activism in America. Lancet Child Adolesc Health. 2018;2(4):229.
7. WISQARS Fatal Injury Reports. Centers for Disease Control and Prevention; Michigan Firearm Deaths and Rates per 100,000. 2020. Available at: https://webappa.cdc.gov/sasweb/ncipc/mortrate.html. Accessed March 20, 2020.
8. Stork BR, Akselberg NJ, Qin Y, et al. Adverse childhood experiences (ACEs) and community physicians: What we’ve learned. Perm J. 2020;24:19.099.
9. Bayouth L, Lukens-Bull K, Gurien L, et al. Twenty years of pediatric gunshot wounds in our community: Have we made a difference? J Pediatr Surg. 2019;54(1):160-4.
10. Klassen AB, Marshall M, Dai M, et al. Emergency medical services response to mass shooting and active shooter incidents, United States, 2014-2015. Prehosp Emerg Care. 2019;23(2):159-66.
11. Morgan R, Oudekerk B. Criminal victimization, 2018. 2019. Available at: https://www.bjs.gov/content/pub/pdf/cv18.pdf.
Western Journal of Emergency Medicine 496 Volume 22, no. 3: May 2021
Gun Violence and Firearm Injuries in West Michigan: Targeting Prevention Mattson et al.
Accessed January 15, 2021.12. Michigan State Police. Michigan incident crime reporting data
for Muskegon County, Michigan: MSP data. 2019. Available at: https://www.michigan.gov/msp/0,4643,7-123-1586_3501_4621---,00.html. Accessed January 3, 2021.
13. Criminal Justice Information Services Division. 2016 Crime in the United States. Federal Bureau of Investigation website. 2016. Available at: https://ucr.fbi.gov/crime-in-the-u.s/2016/crime-in-the-u.s.-2016/tables/table-6/table-6-state-cuts/michigan.xls. Accessed July 26, 2020.
14. U.S. Census Bureau. U.S. Census Bureau QuickFacts: Muskegon Heights city, Michigan; United States; Michigan; Muskegon County, Michigan. 2020. Available at: https://www.census.gov/quickfacts/fact/table/muskegonheightscitymichigan,US,MI,muskegoncountymichigan/PST045219. Accessed May 1, 2020.
15. Harrell E, Langton L, Berzofsky M, et al. Household poverty and nonfatal violent victimization, 2008-2012. 2014. Bureau of Justice Statistics website. Available at: https://www.bjs.gov/index.cfm?ty=pbdetail&iid=5137. Accessed April 23, 2020.
16. Mok PLH, Antonsen S, Pedersen CB, et al. Family income inequalities and trajectories through childhood and self-harm and violence in young adults: a population-based, nested case-control study. Lancet Public Health. 2018;3(10):e498-507.
17. Goldstick JE, Carter PM, Walton MA, et al. Development of the SaFETy Score: a clinical screening tool for predicting future firearm violence risk. Ann Intern Med. 2017;166(10):707-14.
18. Kramer EJ, Dodington J, Hunt A, et al. Violent reinjury risk assessment instrument (VRRAI) for hospital-based violence intervention programs. J Surg Res. 2017;217:177-186.e2.
19. Carter PM, Cranford JA, Buu A, et al. Daily patterns of substance use and violence among a high-risk urban emerging adult sample: results from the Flint Youth Injury Study. Addict Behav. 2020;101:106127.
20. Carter PM, Walton MA, Newton MF, et al. Firearm possession among adolescents presenting to an urban emergency department for assault. Pediatrics. 2013;132(2):213-21.
21. Rosenblatt MS, Joseph KT, Dechert T, et al. American Association for the Surgery of Trauma Prevention Committee topical update: impact of community violence exposure, intimate partner violence, hospital-based violence intervention, building community coalitions and injury prevention program evaluation. J Trauma Acute Care Surg. 2019;87(2):456-62.
22. Walker GN, Dekker AM, Hampton DA, et al. A case for risk stratification in survivors of firearm and interpersonal violence in the urban environment. West J Emerg Med. 2020;21(6):132-40.
23. Cooper C, Eslinger DM, Stolley PD. Hospital-based violence intervention programs work. J Trauma. 2006;61(3):534-7; discussion 537-40.
24. Zun LS, Downey L, Rosen J. The effectiveness of an ED-based violence prevention program. Am J Emerg Med. 2006;24(1):8-13.
25. Smith R, Dobbins S, Evans A, et al. Hospital-based violence intervention: risk reduction resources that are essential for success. J Trauma Acute Care Surg. 2013;74(4):976-80; discussion 980-2.
26. Gomez G, Simons C, St John W, et al. Project Prescription for Hope (RxH): trauma surgeons and community aligned to reduce injury recidivism caused by violence. Am Surg. 2012;78(9):1000-4.
27. Bovia C. “This is not over.” Muskegon Heights Police Chief celebrates success, looks forward to challenges ahead. 2019. Available at: https://www.fox17online.com/2019/06/09/this-is-not-over-muskegon-heights-police-chief-celebrates-success-looks-forward-to-challenges-ahead. Accessed June 15, 2020.
28. U.S. Census Bureau. U.S. Census Bureau QuickFacts: Muskegon Heights city, Michigan; United States; Michigan; Muskegon County, Michigan. Census Bureau QuickFacts. 2020. Available at: https://www.census.gov/quickfacts/fact/table/muskegonheightscitymichigan,US,MI,muskegoncountymichigan/PST045219. Accessed July 25, 2020.
29. Burney W. Muskegon hopes to curb violence through basketball. 2019. Available at: https://www.woodtv.com/news/muskegon-county/muskegon-hopes-to-curb-violence-through-basketball/. Accessed July 25, 2020.
30. Grossman DC, Mueller BA, Riedy C, et al. Gun storage practices and risk of youth suicide and unintentional firearm injuries. JAMA. 2005;293(6):707-14.
31. Michigan Department of Natural Resources. DNR - Hunter Safety Certificate. 2021. Available at: https://www.michigan.gov/dnr/0,4570,7-350-79119_79147_81282---,00.html. Accessed July 8, 2020.
32. Lamphere C. Number of hunting related fatalities has dropped drastically since the 1960s. 2019. Available at: https://www.cadillacnews.com/news/number-of-hunting-related-fatalities-has-dropped-drastically-since-the/article_3372d3cf-7df0-5819-9adc-5a6bacfcb051.html. Accessed July 5 2020.
33. Monuteaux MC, Azrael D, Miller M. Association of increased safe household firearm storage with firearm suicide and unintentional death among US youths. JAMA Pediatr. 2019;173(7):657-62. Erratum in: JAMA Pediatr. 2019;173(7):704.
34. Chokshi N. ‘End Family Fire’ campaign hopes to combat accidental child gun deaths. 2018. Available at: https://www.nytimes.com/2018/08/08/business/media/family-fire-gun-safety.html. Accessed July 2, 2020.
35. Project Child Safety. Get a Safety Kit. 2018. Available at: https://projectchildsafe.org/safety/get-a-safety-kit/. Accessed July 1, 2020.
36. LiveStories Catalog. US Suicide Death Statistics. 2017. Available at: https://www.livestories.com/statistics/us-suicide-deaths-mortality. Accessed June 17, 2020.
37. LiveStories Catalog. Michigan Suicide Death Statistics. 2017. Available at: https://www.livestories.com/statistics/michigan/suicide-deaths-mortality. Accessed June 17, 2020.
38. Mack J. Michigan gun deaths exceed traffic fatalities and 9 more facts on gun deaths. 2019. Available at: https://www.mlive.com/news/kalamazoo/2015/08/8_facts_about_gun_deaths_in_mi.html. Accessed June 17, 2020.
39. Centers for Disease Control and Prevention: CDC Wonder. About
Volume 22, no. 3: May 2021 497 Western Journal of Emergency Medicine
Mattson et al. Gun Violence and Firearm Injuries in West Michigan: Targeting Prevention
underlying causes of death, 1999-2019. 2020. Available at: http://wonder.cdc.gov/ucd-icd10.html. Accessed January 13, 2021.
40. Miller M, Azrael D, Hemenway D. The epidemiology of case fatality rates for suicide in the northeast. Ann Emerg Med. 2004;43(6):723-30.
41. Healthwest: The Muskegon County Suicide Prevention Coalition. Suicide in Muskegon County. 2016. Available at: https://healthwest.net/wp-content/
uploads/2015/10/2016.02.26-Suicide-Prevention-Data.pdf. Accessed July 5, 2020
42. Hargarten SW, Lerner EB, Gorelick M, et al. Gun violence: a biopsychosocial disease. West J Emerg Med. 2018;19(6):1024-7.
43. Suicide Prevention Resource Center. CALM: Counseling on access to lethal means. 2018. Available at: https://www.sprc.org/resources-programs/calm-counseling-access-lethal-means. Accessed July 5, 2020.
Western Journal of Emergency Medicine 498 Volume 22, no. 3: May 2021
Original Research
Firearm Exposure and Storage Practices in the Homes of Rural Adolescents
Charles A. Jennissen, MD*†
Kristel M. Wetjen, BSN‡
Cole C. Wymore, BS*Nicholas R. Stange, BS¶
Gerene M. Denning, PhD*Junlin Liao, PhD§
Kelly E. Wood, MD†
Section Editor: William Fernandez, MD, MPH Submission history: Submitted October 14, 2020; Revision received March 28, 2021; Accepted March 25, 2021Electronically published May 19, 2021 Full text available through open access at http://escholarship.org/uc/uciem_westjem DOI: 10.5811/westjem.2021.3.50263
University of Iowa Carver College of Medicine, Department of Emergency Medicine, Iowa City, IowaUniversity of Iowa Carver College of Medicine, Stead Family Department of Pediatrics, Iowa City, IowaUniversity of Iowa Stead Family Children's Hospital, Department of Surgery, Iowa City, IowaUniversity of Iowa Hospitals and Clinics, Department of Surgery, Iowa City, IowaSaint Louis University School of Medicine, St. Louis. Missouri
*
†
‡
§
¶
Introduction: Rural areas have higher rates of firearm-related unintentional and suicide deaths. Having access to a firearm greatly increases suicide risk. Safe firearm storage can be a major factor in preventing these tragedies. In this study we evaluated firearm exposure and storage practices in rural adolescents’ homes.
Methods: An anonymous survey was administered to a convenience sample of attendees at the 2019 Iowa FFA (formerly Future Farmers of America) Leadership Conference. We performed descriptive, bivariate and multivariable logistic regression analyses.
Results: A total of 1,382 adolescents participated; 51% were males and 49% were females. Respondents were 13-18 years old, and 53% lived on a farm, 18% in the country/not on a farm, and 29% in town. Almost all (96%) self-identified as White/Caucasian. In their homes, 84% reported having rifles/shotguns, 58% reported having handguns, and 56% reported having both rifles/shotguns and handguns. Males were significantly more likely than females to report having firearms in their home (P<0.001). The likelihood of having rifles/shotguns was greater if living on a farm (odds ratio (OR) 4.19, 95% confidence interval (CI), 2.99-5.88) or in the country/not a farm (OR 2.74, 95% CI, 1.78-4.24) compared to those in town. Similarly, the presence of handguns in the home was increased if living on a farm compared to in town (OR 1.70, 95% CI 1.32-2.18). Rifles/shotguns and handguns were stored unlocked and/or loaded at least some of the time in 62% and 58% of homes, respectively. Those who lived on farms compared to in towns were more likely to have rifles/shotguns (OR 1.83, 95% CI 1.35-2.46) and handguns (OR 1.58, 95% CI 1.10-2.27) stored unlocked. For homes with unlocked rifles/shotguns, 46% stored ammunition unlocked. For homes with unlocked handguns, 38% stored ammunition unlocked. Among those aware of firearm storage in their home, 82% (802/974) reported at least one firearm stored either unlocked and/or loaded at least some of the time.
Conclusion: The vast majority of rural adolescents we surveyed live in homes with firearms, and a large proportion of those firearms are not stored safely. Widespread efforts are needed to educate rural families about the importance of proper firearm and ammunition storage. [West J Emerg Med. 2021;22(3)498–509.]

Volume 22, no. 3: May 2021 499 Western Journal of Emergency Medicine
Jennissen et al. Firearm Exposure and Storage Practices in the Homes of Rural Adolescents
Population Health Research Capsule
What do we already know about this issue?Rural areas have higher rates of firearm-related unintentional and suicide deaths. In the majority of these tragedies, the gun involved was obtained from the home.
What was the research question?We sought to determine firearm exposure and storage practices in the homes of rural adolescents who attended a state conference.
What was the major finding of the study?Eighty-five percent of adolescents lived in a home with a firearm. In many homes, firearms and ammunition were stored unsafely.
How does this improve population health?Understanding firearm practices in the homes of rural adolescents will lead to evidence-based education to help prevent firearm-related death and injury.
INTRODUCTION Firearm-related injuries in the United States (US) are the
second leading cause of child and adolescent death, and the nation’s pediatric mortality rate from firearms is the highest in the world.1-3 According to World Health Organization data, the US pediatric firearm-related unintentional and suicide death rates for victims 5-14 years old were 12 and 11 times greater, respectively, than those of 23 other industrialized countries.3 The firearm-related death rate for children 0-4 years old was 33 times higher.3 Moreover, from 2013–2017 the fatality rate for youth in the US increased by 44%.4
Although pediatric firearm injuries may be intentional (eg. homicide, suicide), a large proportion are unintentional. In fact, more than half of pediatric admissions for firearm injuries in children 15 years and younger are for unintentional injuries.5,
6 The majority of unintentional firearm fatalities in children occur in the home, and most occur when the child is playing with a loaded firearm.7 In the US, approximately one-third of homes with children have a firearm present, and it is estimated that approximately 4.6 million US children live in homes with a firearm stored unlocked and loaded.8, 9
Suicide rates among America’s youth are increasing, and tripled for those 10-14 years old from 1999 to 2014.10-
12 Suicide attempts by firearms are highly lethal with over 90% resulting in death.13 In one study, 65% of youths who committed or attempted suicide by firearm obtained the gun from their home.14 Having access to a firearm increases the likelihood of suicide among youth.11
Several studies have shown that firearm-related unintentional and suicide death rates are higher in rural as compared to urban US counties.15-17 In 2019, the Firearm Safety Among Children and Teens (FACTS) Consortium identified as a research priority understanding how the availability, storage, and presence of a firearm in the home affects youth outcomes.18 The objective of our study was to determine firearm exposure and storage practices in the homes of rural adolescents, and to identify demographic factors associated with having firearms present and unsafely stored in the home.
METHODSStudy Population
This was a cross-sectional survey study of a convenience sample of adolescents attending the 2019 Iowa FFA Leadership Conference. FFA (formerly known as Future Farmers of America) is a national organization with local chapters in all 50 states and Puerto Rico. Membership is free, and the organization offers students leadership, personal growth, and career success training through agricultural education. Conference attendees volunteered and anonymously completed a written survey at the study institution’s injury prevention booth. Surveys were completed independently and reviewed by safety-booth staff for completeness. Following the survey, participants were given the opportunity to ask questions about gun safety, offered
printed safety materials, and allowed to spin a wheel for a small prize. All conference attendees were eligible to complete the survey, but study analysis was restricted to those 13-18 years of age.
SurveyThe survey was developed at the study institution by
members of the Injury Prevention Task Force and other individuals interested in firearm injury prevention through a collaborative and iterative process. The survey tool was validated by 20 youth and young adults ages 11-22 years. After completing the written survey, these volunteers explained their responses to the questions and were asked to clarify their answers if a question was not understood. Verbal and written responses to questions were compared for consistency. The survey was revised based on the results.
Demographic data collected included age (years), gender (male, female, other), residence (on a farm, in the country/not on a farm, in town), and race (White/Caucasian, Black/African American, Hispanic Latinx, Asian, other). The five individuals who answered “other” for gender were not included in comparative analyses. Races/ethnicities besides White/Caucasian were categorized as “other races” for study purposes. Study data collected included the presence of firearms and firearm storage methods in the participant’s home. On the survey, the term “firearm” was defined as a weapon “from which a bullet or other projectile is fired by
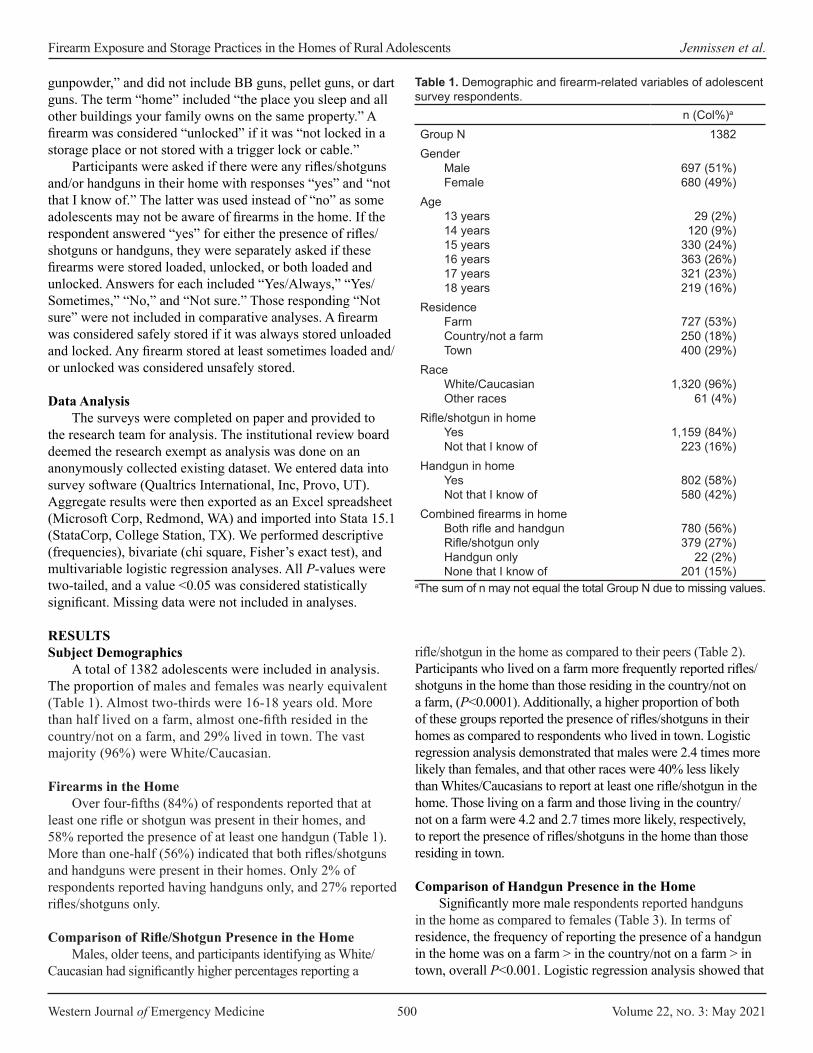
Western Journal of Emergency Medicine 500 Volume 22, no. 3: May 2021
Firearm Exposure and Storage Practices in the Homes of Rural Adolescents Jennissen et al.
gunpowder,” and did not include BB guns, pellet guns, or dart guns. The term “home” included “the place you sleep and all other buildings your family owns on the same property.” A firearm was considered “unlocked” if it was “not locked in a storage place or not stored with a trigger lock or cable.”
Participants were asked if there were any rifles/shotguns and/or handguns in their home with responses “yes” and “not that I know of.” The latter was used instead of “no” as some adolescents may not be aware of firearms in the home. If the respondent answered “yes” for either the presence of rifles/shotguns or handguns, they were separately asked if these firearms were stored loaded, unlocked, or both loaded and unlocked. Answers for each included “Yes/Always,” “Yes/Sometimes,” “No,” and “Not sure.” Those responding “Not sure” were not included in comparative analyses. A firearm was considered safely stored if it was always stored unloaded and locked. Any firearm stored at least sometimes loaded and/or unlocked was considered unsafely stored.
Data AnalysisThe surveys were completed on paper and provided to
the research team for analysis. The institutional review board deemed the research exempt as analysis was done on an anonymously collected existing dataset. We entered data into survey software (Qualtrics International, Inc, Provo, UT). Aggregate results were then exported as an Excel spreadsheet (Microsoft Corp, Redmond, WA) and imported into Stata 15.1 (StataCorp, College Station, TX). We performed descriptive (frequencies), bivariate (chi square, Fisher’s exact test), and multivariable logistic regression analyses. All P-values were two-tailed, and a value <0.05 was considered statistically significant. Missing data were not included in analyses.
RESULTSSubject Demographics
A total of 1382 adolescents were included in analysis. The proportion of males and females was nearly equivalent (Table 1). Almost two-thirds were 16-18 years old. More than half lived on a farm, almost one-fifth resided in the country/not on a farm, and 29% lived in town. The vast majority (96%) were White/Caucasian.
Firearms in the HomeOver four-fifths (84%) of respondents reported that at
least one rifle or shotgun was present in their homes, and 58% reported the presence of at least one handgun (Table 1). More than one-half (56%) indicated that both rifles/shotguns and handguns were present in their homes. Only 2% of respondents reported having handguns only, and 27% reported rifles/shotguns only.
Comparison of Rifle/Shotgun Presence in the HomeMales, older teens, and participants identifying as White/
Caucasian had significantly higher percentages reporting a
rifle/shotgun in the home as compared to their peers (Table 2). Participants who lived on a farm more frequently reported rifles/shotguns in the home than those residing in the country/not on a farm, (P<0.0001). Additionally, a higher proportion of both of these groups reported the presence of rifles/shotguns in their homes as compared to respondents who lived in town. Logistic regression analysis demonstrated that males were 2.4 times more likely than females, and that other races were 40% less likely than Whites/Caucasians to report at least one rifle/shotgun in the home. Those living on a farm and those living in the country/not on a farm were 4.2 and 2.7 times more likely, respectively, to report the presence of rifles/shotguns in the home than those residing in town.
Comparison of Handgun Presence in the HomeSignificantly more male respondents reported handguns
in the home as compared to females (Table 3). In terms of residence, the frequency of reporting the presence of a handgun in the home was on a farm > in the country/not on a farm > in town, overall P<0.001. Logistic regression analysis showed that
n (Col%)a
Group N 1382Gender
MaleFemale
697 (51%) 680 (49%)
Age13 years14 years15 years16 years17 years18 years
29 (2%) 120 (9%)
330 (24%) 363 (26%) 321 (23%) 219 (16%)
Residence Farm Country/not a farm Town
727 (53%) 250 (18%) 400 (29%)
Race White/Caucasian Other races
1,320 (96%) 61 (4%)
Rifle/shotgun in home Yes Not that I know of
1,159 (84%) 223 (16%)
Handgun in home Yes Not that I know of
802 (58%) 580 (42%)
Combined firearms in home Both rifle and handgun Rifle/shotgun only Handgun only None that I know of
780 (56%) 379 (27%)
22 (2%) 201 (15%)
aThe sum of n may not equal the total Group N due to missing values.
Table 1. Demographic and firearm-related variables of adolescent survey respondents.
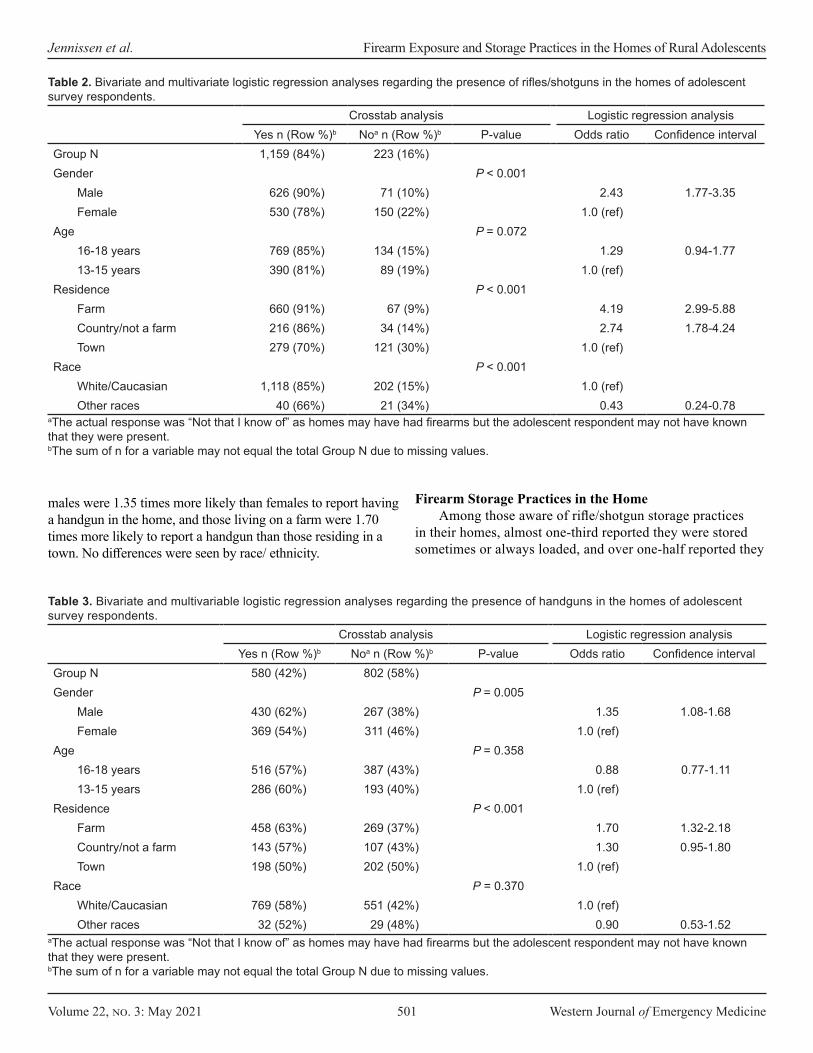
Volume 22, no. 3: May 2021 501 Western Journal of Emergency Medicine
Jennissen et al. Firearm Exposure and Storage Practices in the Homes of Rural Adolescents
males were 1.35 times more likely than females to report having a handgun in the home, and those living on a farm were 1.70 times more likely to report a handgun than those residing in a town. No differences were seen by race/ ethnicity.
Firearm Storage Practices in the HomeAmong those aware of rifle/shotgun storage practices
in their homes, almost one-third reported they were stored sometimes or always loaded, and over one-half reported they
Crosstab analysis Logistic regression analysisYes n (Row %)b Noa n (Row %)b P-value Odds ratio Confidence interval
Group N 1,159 (84%) 223 (16%)Gender P < 0.001
Male 626 (90%) 71 (10%) 2.43 1.77-3.35Female 530 (78%) 150 (22%) 1.0 (ref)
Age P = 0.07216-18 years 769 (85%) 134 (15%) 1.29 0.94-1.7713-15 years 390 (81%) 89 (19%) 1.0 (ref)
Residence P < 0.001Farm 660 (91%) 67 (9%) 4.19 2.99-5.88Country/not a farm 216 (86%) 34 (14%) 2.74 1.78-4.24Town 279 (70%) 121 (30%) 1.0 (ref)
Race P < 0.001White/Caucasian 1,118 (85%) 202 (15%) 1.0 (ref)Other races 40 (66%) 21 (34%) 0.43 0.24-0.78
Table 2. Bivariate and multivariate logistic regression analyses regarding the presence of rifles/shotguns in the homes of adolescent survey respondents.
aThe actual response was “Not that I know of” as homes may have had firearms but the adolescent respondent may not have known that they were present.bThe sum of n for a variable may not equal the total Group N due to missing values.
Crosstab analysis Logistic regression analysisYes n (Row %)b Noa n (Row %)b P-value Odds ratio Confidence interval
Group N 580 (42%) 802 (58%)Gender P = 0.005
Male 430 (62%) 267 (38%) 1.35 1.08-1.68Female 369 (54%) 311 (46%) 1.0 (ref)
Age P = 0.35816-18 years 516 (57%) 387 (43%) 0.88 0.77-1.1113-15 years 286 (60%) 193 (40%) 1.0 (ref)
Residence P < 0.001Farm 458 (63%) 269 (37%) 1.70 1.32-2.18Country/not a farm 143 (57%) 107 (43%) 1.30 0.95-1.80Town 198 (50%) 202 (50%) 1.0 (ref)
Race P = 0.370White/Caucasian 769 (58%) 551 (42%) 1.0 (ref)Other races 32 (52%) 29 (48%) 0.90 0.53-1.52
Table 3. Bivariate and multivariable logistic regression analyses regarding the presence of handguns in the homes of adolescent survey respondents.
aThe actual response was “Not that I know of” as homes may have had firearms but the adolescent respondent may not have known that they were present.bThe sum of n for a variable may not equal the total Group N due to missing values.

Western Journal of Emergency Medicine 502 Volume 22, no. 3: May 2021
Firearm Exposure and Storage Practices in the Homes of Rural Adolescents Jennissen et al.
Rifles/shotguns n (Col %)a
Handgunsn (Col %)b
Stored loadedNo 731 (69%) 472 (60%)Yes, sometimes 219 (21%) 170 (21%)Yes, always 112 (11%) 151 (19%)
Stored unlockedNo 521 (47%) 400 (54%)Yes, sometimes 337 (30%) 209 (28%)Yes, always 251 (23%) 133 (18%)
Stored loaded and unlockedNo 879 (82%) 539 (73%)Yes, sometimes 136 (13%) 124 (17%)Yes, always 58 (5%) 71 (10%)
Overall storageSafe storagec 360 (33%) 275 (37%)Unsafe storaged 716 (67%) 463 (63%)
aDoes not include those who had no rifles/shotguns in the home or were unsure of storage.bDoes not include those who had no handguns in the home or were unsure of storage.cFirearms always stored unloaded and locked.dFirearms stored at least sometimes loaded and/or unlocked.
Table 4. Storage of firearms and of handguns in the homes of adolescent survey respondents.
were stored sometimes or always unlocked (Table 4). Almost one-fifth reported the rifles/shotguns were stored both loaded and unlocked at least some of the time. Overall, only one-third of those with rifles/shotguns in their home indicated they were safely stored at all times, ie, always stored unloaded and locked.
As for adolescents aware of handgun storage in their home, two-fifths reported the handguns were stored loaded, nearly one-half reported they were stored unlocked, and over one-fourth reported they were stored both loaded and unlocked at least some of the time. Like rifles/shotguns, only about one-third of youth with handguns in their home reported they were always stored safely (unloaded and locked). Of respondents overall who were aware of how firearms were stored in their homes, over four-fifths (802/974, 82.3%) reported at least one firearm was stored either unlocked or loaded at least some of the time.
Comparison of Rifle/Shotgun Storage in the HomeAs compared to their peers, males, older adolescents,
and Whites/Caucasians more frequently reported having at least sometimes unlocked rifles/shotguns in the home (Table 5). When comparing storage by residence location, the percentage reporting unlocked rifles/shotguns in their homes was in the following order: those living on farms > those living in the country/not on a farm > those living
in town, overall P<0.001. Logistic regression analysis indicated that males were 1.8 times more likely than females, older teenagers were 1.3 times more likely than younger teenagers, and those living on a farm were 1.8 times more likely than those residing in town to report at least one rifle/shotgun always or sometimes stored unlocked in their homes. In contrast to results for unlocked rifles/shotguns, there were no significant demographic differences with respect to rifles/shotguns being stored loaded in the home.
Comparison of Handgun Storage in the HomeMales had significantly higher percentages reporting
handguns were loaded, unlocked, and both loaded and unlocked as compared to females (Table 6). For those living on a farm, a greater percentage also reported unlocked handguns than those living elsewhere, P<0.001. Logistic regression analysis showed males were 1.6 times, 1.7 times, and 2.7 times more likely than females to report having handguns stored loaded, unlocked, and both loaded and unlocked, respectively. Those living on farms were 1.6 times more likely than those from towns to report an unlocked handgun at least some of the time.
Ammunition Storage Practices Trends were similar when analyzing storage of
ammunition for both rifles/shotguns and handguns (Table 7). For those aware of rifle/shotgun ammunition storage in their homes, 28% said the ammunition was stored unlocked, 31% stated it was locked with the firearms, and 41% reported it was stored and locked separately from the firearms, ie, safely. Among those aware of handgun ammunition storage practices, 25% stated it was stored unlocked in the home, 36% that it was locked with the handguns, and 40% that it was stored and locked separately. Although there were a number of differences among variables and ammunition storage in the home, the only consistent finding was that those living on farms as compared to those living in towns were 1.9 and 1.8 times more likely to have unlocked rifle/shotgun and handgun ammunition, respectively. Those reporting firearms were stored at least sometimes unlocked in the home were significantly more likely to also report unlocked ammunition as compared to respondents in homes where firearms were always kept locked, P<0.001 for both rifles/shotguns and handguns.
Presence of Firearms in the Homes Adolescents Visit Eighty-five percent (1168/1382) of respondents
reported visiting homes with firearms. These homes included those of family members (86%), friends (82%), neighbors (47%), and others (11%). Males had higher proportions than females (90%, 629/696 vs 79%, 537/680, P<0.001) and Whites/Caucasians had greater percentages than other races (85%, 1124/1320 vs. 70%, 43/61, P =
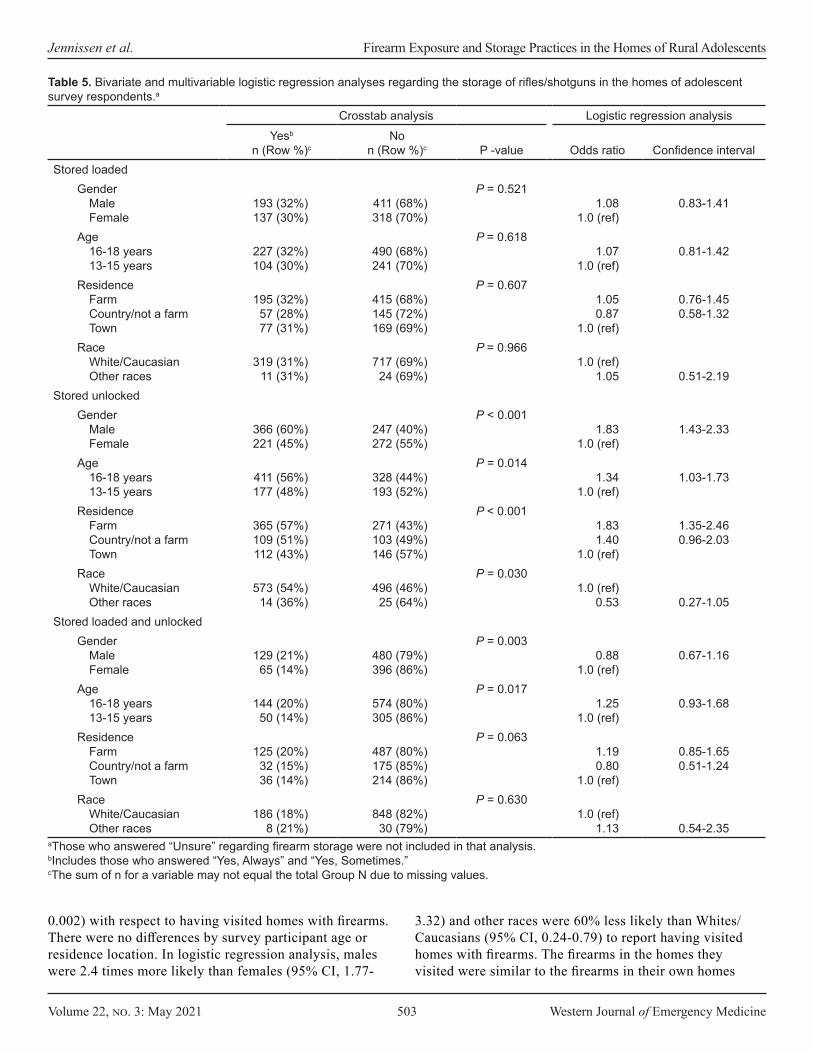
Volume 22, no. 3: May 2021 503 Western Journal of Emergency Medicine
Jennissen et al. Firearm Exposure and Storage Practices in the Homes of Rural Adolescents
Crosstab analysis Logistic regression analysisYesb
n (Row %)cNo
n (Row %)c P -value Odds ratio Confidence intervalStored loaded
Gender Male Female
193 (32%) 137 (30%)
411 (68%) 318 (70%)
P = 0.5211.08
1.0 (ref)0.83-1.41
Age 16-18 years 13-15 years
227 (32%) 104 (30%)
490 (68%) 241 (70%)
P = 0.6181.07
1.0 (ref)0.81-1.42
Residence Farm Country/not a farm Town
195 (32%) 57 (28%) 77 (31%)
415 (68%) 145 (72%) 169 (69%)
P = 0.6071.05 0.87
1.0 (ref)
0.76-1.45 0.58-1.32
Race White/Caucasian Other races
319 (31%) 11 (31%)
717 (69%) 24 (69%)
P = 0.9661.0 (ref)
1.05 0.51-2.19Stored unlocked
Gender Male Female
366 (60%) 221 (45%)
247 (40%) 272 (55%)
P < 0.0011.83
1.0 (ref) 1.43-2.33
Age 16-18 years 13-15 years
411 (56%) 177 (48%)
328 (44%) 193 (52%)
P = 0.0141.34
1.0 (ref)1.03-1.73
Residence Farm Country/not a farm Town
365 (57%) 109 (51%) 112 (43%)
271 (43%) 103 (49%) 146 (57%)
P < 0.0011.83 1.40
1.0 (ref)
1.35-2.46 0.96-2.03
Race White/Caucasian Other races
573 (54%) 14 (36%)
496 (46%) 25 (64%)
P = 0.0301.0 (ref)
0.53 0.27-1.05Stored loaded and unlocked
Gender Male Female
129 (21%) 65 (14%)
480 (79%) 396 (86%)
P = 0.0030.88
1.0 (ref)0.67-1.16
Age 16-18 years 13-15 years
144 (20%) 50 (14%)
574 (80%) 305 (86%)
P = 0.0171.25
1.0 (ref)0.93-1.68
Residence Farm Country/not a farm Town
125 (20%) 32 (15%) 36 (14%)
487 (80%) 175 (85%) 214 (86%)
P = 0.0631.19 0.80
1.0 (ref)
0.85-1.65 0.51-1.24
Race White/Caucasian Other races
186 (18%) 8 (21%)
848 (82%) 30 (79%)
P = 0.6301.0 (ref)
1.13 0.54-2.35aThose who answered “Unsure” regarding firearm storage were not included in that analysis.bIncludes those who answered “Yes, Always” and “Yes, Sometimes.”cThe sum of n for a variable may not equal the total Group N due to missing values.
Table 5. Bivariate and multivariable logistic regression analyses regarding the storage of rifles/shotguns in the homes of adolescent survey respondents.a
0.002) with respect to having visited homes with firearms. There were no differences by survey participant age or residence location. In logistic regression analysis, males were 2.4 times more likely than females (95% CI, 1.77-
3.32) and other races were 60% less likely than Whites/Caucasians (95% CI, 0.24-0.79) to report having visited homes with firearms. The firearms in the homes they visited were similar to the firearms in their own homes
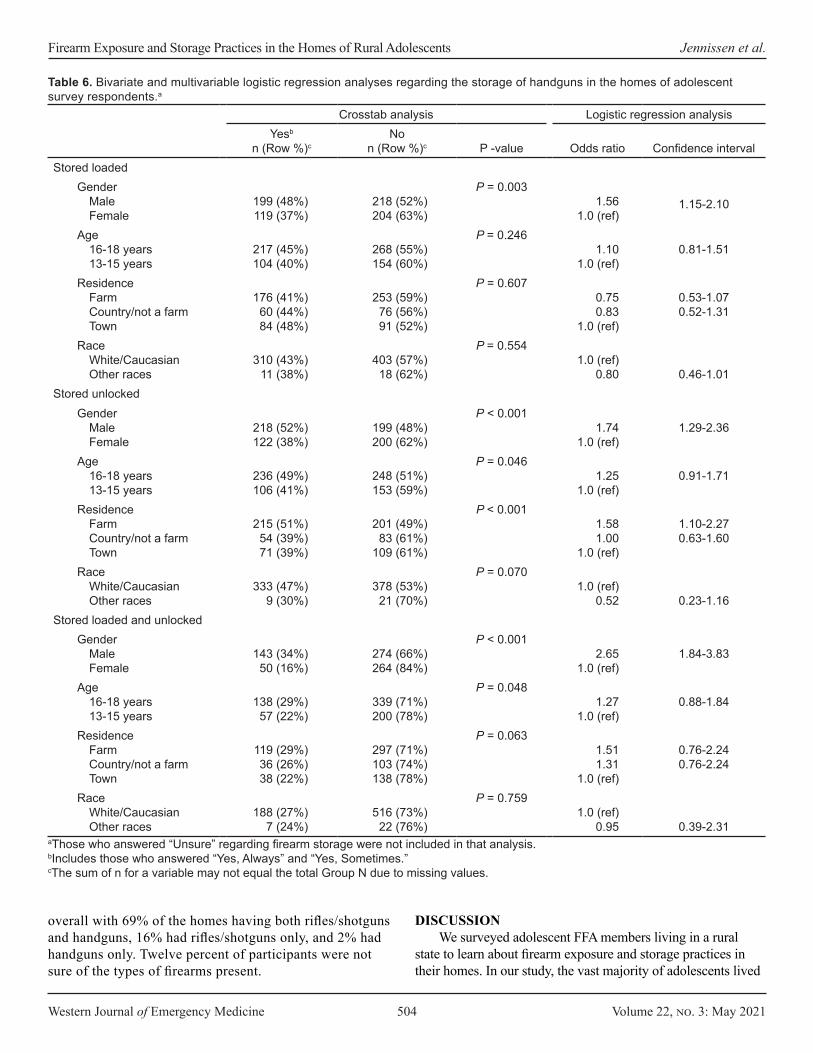
Western Journal of Emergency Medicine 504 Volume 22, no. 3: May 2021
Firearm Exposure and Storage Practices in the Homes of Rural Adolescents Jennissen et al.
Crosstab analysis Logistic regression analysisYesb
n (Row %)cNo
n (Row %)c P -value Odds ratio Confidence intervalStored loaded
Gender Male Female
199 (48%) 119 (37%)
218 (52%) 204 (63%)
P = 0.0031.56
1.0 (ref)1.15-2.10
Age 16-18 years 13-15 years
217 (45%) 104 (40%)
268 (55%) 154 (60%)
P = 0.2461.10
1.0 (ref)0.81-1.51
Residence Farm Country/not a farm Town
176 (41%) 60 (44%) 84 (48%)
253 (59%)76 (56%) 91 (52%)
P = 0.6070.75 0.83
1.0 (ref)
0.53-1.07 0.52-1.31
Race White/Caucasian Other races
310 (43%) 11 (38%)
403 (57%) 18 (62%)
P = 0.5541.0 (ref)
0.80 0.46-1.01Stored unlocked
Gender Male Female
218 (52%) 122 (38%)
199 (48%) 200 (62%)
P < 0.0011.74
1.0 (ref) 1.29-2.36
Age 16-18 years 13-15 years
236 (49%) 106 (41%)
248 (51%) 153 (59%)
P = 0.0461.25
1.0 (ref)0.91-1.71
Residence Farm Country/not a farm Town
215 (51%) 54 (39%) 71 (39%)
201 (49%) 83 (61%)
109 (61%)
P < 0.0011.58 1.00
1.0 (ref)
1.10-2.27 0.63-1.60
Race White/Caucasian Other races
333 (47%) 9 (30%)
378 (53%) 21 (70%)
P = 0.0701.0 (ref)
0.52 0.23-1.16Stored loaded and unlocked
Gender Male Female
143 (34%) 50 (16%)
274 (66%) 264 (84%)
P < 0.0012.65
1.0 (ref)1.84-3.83
Age 16-18 years 13-15 years
138 (29%)57 (22%)
339 (71%) 200 (78%)
P = 0.0481.27
1.0 (ref)0.88-1.84
Residence Farm Country/not a farm Town
119 (29%) 36 (26%)38 (22%)
297 (71%) 103 (74%)138 (78%)
P = 0.0631.51 1.31
1.0 (ref)
0.76-2.24 0.76-2.24
Race White/Caucasian Other races
188 (27%) 7 (24%)
516 (73%)22 (76%)
P = 0.7591.0 (ref)
0.95 0.39-2.31aThose who answered “Unsure” regarding firearm storage were not included in that analysis.bIncludes those who answered “Yes, Always” and “Yes, Sometimes.”cThe sum of n for a variable may not equal the total Group N due to missing values.
overall with 69% of the homes having both rifles/shotguns and handguns, 16% had rifles/shotguns only, and 2% had handguns only. Twelve percent of participants were not sure of the types of firearms present.
DISCUSSION We surveyed adolescent FFA members living in a rural
state to learn about firearm exposure and storage practices in their homes. In our study, the vast majority of adolescents lived
Table 6. Bivariate and multivariable logistic regression analyses regarding the storage of handguns in the homes of adolescent survey respondents.a
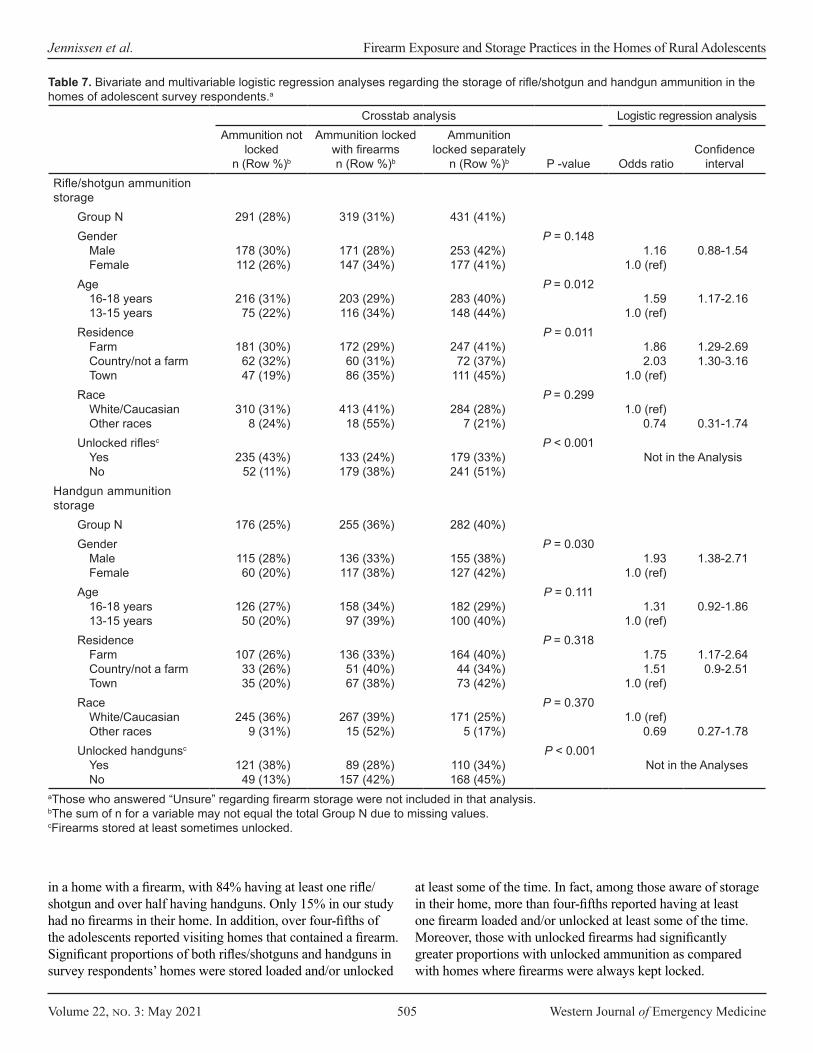
Volume 22, no. 3: May 2021 505 Western Journal of Emergency Medicine
Jennissen et al. Firearm Exposure and Storage Practices in the Homes of Rural Adolescents
Crosstab analysis Logistic regression analysisAmmunition not
locked n (Row %)b
Ammunition locked with firearmsn (Row %)b
Ammunition locked separately
n (Row %)b P -value Odds ratioConfidence
intervalRifle/shotgun ammunition storage
Group N 291 (28%) 319 (31%) 431 (41%)Gender
Male Female
178 (30%)112 (26%)
171 (28%)147 (34%)
253 (42%) 177 (41%)
P = 0.1481.16
1.0 (ref)0.88-1.54
Age 16-18 years 13-15 years
216 (31%) 75 (22%)
203 (29%) 116 (34%)
283 (40%) 148 (44%)
P = 0.0121.59
1.0 (ref)1.17-2.16
Residence Farm Country/not a farm Town
181 (30%) 62 (32%) 47 (19%)
172 (29%) 60 (31%) 86 (35%)
247 (41%) 72 (37%)
111 (45%)
P = 0.0111.86 2.03
1.0 (ref)
1.29-2.69 1.30-3.16
Race White/Caucasian Other races
310 (31%)8 (24%)
413 (41%) 18 (55%)
284 (28%) 7 (21%)
P = 0.2991.0 (ref)
0.74 0.31-1.74Unlocked riflesc
Yes No
235 (43%) 52 (11%)
133 (24%) 179 (38%)
179 (33%) 241 (51%)
P < 0.001Not in the Analysis
Handgun ammunition storage
Group N 176 (25%) 255 (36%) 282 (40%)Gender
Male Female
115 (28%) 60 (20%)
136 (33%) 117 (38%)
155 (38%) 127 (42%)
P = 0.0301.93
1.0 (ref) 1.38-2.71
Age 16-18 years 13-15 years
126 (27%)50 (20%)
158 (34%) 97 (39%)
182 (29%) 100 (40%)
P = 0.1111.31
1.0 (ref)0.92-1.86
Residence Farm Country/not a farm Town
107 (26%)33 (26%)35 (20%)
136 (33%) 51 (40%) 67 (38%)
164 (40%) 44 (34%) 73 (42%)
P = 0.3181.75 1.51
1.0 (ref)
1.17-2.64 0.9-2.51
Race White/Caucasian Other races
245 (36%) 9 (31%)
267 (39%) 15 (52%)
171 (25%) 5 (17%)
P = 0.3701.0 (ref)
0.69 0.27-1.78Unlocked handgunsc
Yes No
121 (38%) 49 (13%)
89 (28%) 157 (42%)
110 (34%) 168 (45%)
P < 0.001Not in the Analyses
Table 7. Bivariate and multivariable logistic regression analyses regarding the storage of rifle/shotgun and handgun ammunition in the homes of adolescent survey respondents.a
aThose who answered “Unsure” regarding firearm storage were not included in that analysis.bThe sum of n for a variable may not equal the total Group N due to missing values.cFirearms stored at least sometimes unlocked.
in a home with a firearm, with 84% having at least one rifle/shotgun and over half having handguns. Only 15% in our study had no firearms in their home. In addition, over four-fifths of the adolescents reported visiting homes that contained a firearm. Significant proportions of both rifles/shotguns and handguns in survey respondents’ homes were stored loaded and/or unlocked
at least some of the time. In fact, among those aware of storage in their home, more than four-fifths reported having at least one firearm loaded and/or unlocked at least some of the time. Moreover, those with unlocked firearms had significantly greater proportions with unlocked ammunition as compared with homes where firearms were always kept locked.

Western Journal of Emergency Medicine 506 Volume 22, no. 3: May 2021
Firearm Exposure and Storage Practices in the Homes of Rural Adolescents Jennissen et al.
Characteristics of Firearms in the HomeThe proportion of rural youth in our study who lived in
a home with at least one firearm was twice that found in a national 2017 Pew Research Center survey of all Americans.19 Similarly, eight Gallup polls from December 2012–October 2019 found that 37-43% of US homes had a firearm.20 The higher proportion observed in our study is consistent with numerous studies showing more frequent gun ownership in rural as compared to urban residences.19,21-24 It is also consistent with a study of 983 households in one rural Iowa county from 1994–1998 where two-thirds of residents reported at least one firearm.25
Although rifles/shotguns were more common, handguns were present in over one-half of the homes in our study. Several studies of firearm injuries and deaths seen at rural trauma centers have shown handguns to be the most common firearm used and the ones most frequently involved in fatal cases.26-28 Our findings of rural homes having high handgun ownership is also consistent with other studies that have demonstrated a high prevalence of handgun carrying among rural youth.29,30
Firearms in the home varied significantly based on where the adolescent lived, with significantly higher rates seen for those living on a farm or in the country but not on a farm. Our results mirror what has been reported in surveys of adults with the highest rates of firearm ownership for those living in rural, followed by suburban, and then urban areas.19,31 Hunting is likely a major contributor to the higher rates of rifle/shotgun presence in the homes of adolescents living on farms and in the country.31 One study found only 2% of metropolitan residents hunted as compared to 18% in cities of <50,000 people.32 In many rural areas, hunting is a part of the culture and receiving a rifle or shotgun as an adolescent is a rite of passage.33
Males in our study were significantly more likely than females to report having a firearm in their home. The basis for this difference remains unknown. However, other studies have shown that males, especially White/Caucasian males, are more likely to own and/or to have grown up in a home with firearms.19,31 Additionally, adolescent males in rural areas are more likely to have engaged in recreational firearm use and to have expressed pro-gun sentiments than their female peers.19,34 Boys are disproportionately affected by firearm mortality accounting for more than 80% of all pediatric firearm deaths.7 The higher rate of home firearms we observed with males may potentially be a contributing factor to this gender-based difference.
Firearm and Ammunition StorageUnsafe storage of firearms in the homes of rural youth
in our study was high. Among those aware of storage practices, the vast majority (82%) reported at least one firearm stored unsafely at least some of the time. A Washington state study reported nearly two-thirds of adult
respondents with firearms stated they were not all safely stored (eg, both locked and unloaded).35 Additionally, we found higher percentages of handguns, as compared to rifles/shotguns, were reported as being stored loaded and unlocked. Consistent with this observation are studies showing that the primary reason Americans state they have a firearm is for protection, and that firearms kept for protection, handguns in particular, are often stored loaded and unlocked for quick access.36-37 Unfortunately, unsafe storage practices increase the risk of unintentional and self-inflicted firearm injuries in children and adolescents as is illustrated by studies showing firearms in the home are much more likely to kill or injure a household member than to be used in self-defense.38,39
Firearms in Homes VisitedOver four-fifths of adolescents (85%) visited homes,
most typically of family members or friends, that contained a firearm. The majority had both rifles/shotguns and handguns. Visiting a home with a firearm can be dangerous especially for younger adolescents. In one study of youth 11-14 years of age, nearly 40% of unintentional firearm deaths happened at the home of a friend, which was a proportion higher than that reported for younger children.40 The authors speculated that the difference may be accounted for by decreased adult supervision of adolescents as compared to younger children.40
Societal Implications The results of our study suggest that rural adolescents
in our state are a very vulnerable population. Previous research has shown that firearm-related unintentional and self-inflicted injuries and hospitalizations are higher in rural than in urban areas15,16,27,41 Similarly, rural youth are three times more likely to die by suicide as compared to their urban counterparts.16,42 The greater presence of firearms in rural homes as well as the relatively high prevalence of improper storage likely contribute to the disproportionate rates of rural adolescent firearm-related injuries and suicides.
PreventionTo protect children and adolescents, parents and
caregivers must prevent unwanted access to firearms.11,43 The safest option would be to remove the firearm from the home, but as seen in our study, rural adolescents have potential access to firearms in the homes of others as well. The second most effective prevention approach is safe storage practices, particularly in homes where youth live and visit. Thus, widespread education and interventional programs are critically needed regarding the safe storage of firearms and ammunition. Another critically important measure is the passage of universal child access prevention (CAP) laws to protect children equally across states and

Volume 22, no. 3: May 2021 507 Western Journal of Emergency Medicine
Jennissen et al. Firearm Exposure and Storage Practices in the Homes of Rural Adolescents
to better ensure the safe storage of firearms in homes.5,44-51 Enforcement of these laws that hold parents and other relevant adults accountable when children and adolescents access firearms in the home might provide a strong impetus for more widespread safe storage of ammunition and firearms.52,53 Reducing child and adolescent firearm access in turn could decrease unintentional and self-inflicted pediatric firearm-related deaths and injuries.10,54
LIMITATIONSLimitations of our study include that it was conducted in
a single Midwestern state with a primarily White/Caucasian population. Thus, our findings may not be generalizable to other states and non-White populations. Additionally, we used a convenience sampling of adolescent FFA members primarily from rural areas attending a state conference; therefore, results may not be representative of the entire state, particularly urban communities. However, the great majority of counties in the state were represented by subjects in the study. Data was self-reported and may be subject to recall bias and social desirability. With regard to social desirability, participants would probably have been more likely to report safe rather than unsafe storage practices. Factors decreasing the social desirability effect included the fact that the surveys were written, completed independently, and collected anonymously.
It is possible that some study participants’ homes had firearms of which the youth were unaware. Thus, the overall proportion of homes with firearms may be higher than that reported. In addition, there were some survey respondents who were unsure of at least one of the three firearm storage questions including 12% (142/1156) of those with rifles/shotguns and 11% (92/801) with handguns. These responses were not included in Table 4 calculations. Similarly, some adolescents were unsure how ammunition was stored in the home (9% for rifle/shotgun and 10% for handguns). Females and younger teenagers had higher proportions unsure of firearm and ammunition storage.
CONCLUSIONThe vast majority of rural adolescents in this study lived
in a home with a firearm and many reported firearms and ammunition were stored unsafely. The likelihood of having a firearm in the home varied significantly based upon where the adolescent lived with highest rates for those living on a farm. Rural families would benefit from education about the importance of safe storage of firearms and ammunition to limit unwanted child and adolescent access. Consideration of the unique cultural and social aspects of rural communities is necessary to develop effective injury prevention strategies for this setting. The implementation of strict and well-enforced universal childhood access prevention laws may be a critical step in protecting youth from firearm-related tragedies.
Address for Correspondence: Charles A. Jennissen, MD, University of Iowa Carver College of Medicine, Department of Emergency Medicine, 200 Hawkins Dr, Iowa City, IA 52242. Email: [email protected].
Conflicts of Interest: By the WestJEM article submission agreement, all authors are required to disclose all affiliations, funding sources and financial or management relationships that could be perceived as potential sources of bias. No author has professional or financial relationships with any companies that are relevant to this study. Internal grant funding was provided for this study from the Injury Prevention Program.
Copyright: © 2021 Jennissen et al. This is an open access article distributed in accordance with the terms of the Creative Commons Attribution (CC BY 4.0) License. See: http://creativecommons.org/licenses/by/4.0/
REFERENCES1. Centers for Disease Control and Prevention (CDC). Rates of
homicide, suicide, and firearm-related death among children--26 industrialized countries. MMWR Morb Mortal Wkly Rep. 1997;46(5):101-5.
2. Cunningham RM, Walton MA, Carter PM. The major causes of death in children and adolescents in the United States. N Engl J Med. 2018;379(25):2468-75.
3. Grinshteyn E, Hemenway D. Violent death rates: the US compared with other high-income OECD countries, 2010. Am J Med. 2016;129(3):266-73.
4. Centers for Disease Control and Prevention. Web-based injury statistics query and reporting system. 2020. Available at: (WISQARS). https://www.cdc.gov/injury/wisqars/. Accessed October 1, 2020.
5. Hamilton EC, Miller CC, Cox CS, et al. Variability of child access prevention laws and pediatric firearm injuries. J Trauma Acute Care Surg. 2018;84(4):613-9.
6. Kalesan B, Vyliparambil MA, Bogue E, et al. Race and ethnicity, neighborhood poverty and pediatric firearm hospitalizations in the United States. Ann Epidemiol. 2016;26(1):1-6.e1-2.
7. Fowler KA, Dahlberg LL, Haileyesus T, et al. Childhood firearm injuries in the United States. Pediatrics. 2017;140(1):e20163486.
8. Azrael D, Cohen J, Salhi C, et al. Firearm storage in gun-owning households with children: results of a 2015 national survey. J Urban Health. 2018;95(3):295-304.
9. Hamilton D, Lemeshow S, Saleska JL, et al K. Who owns guns and how do they keep them? The influence of household characteristics on firearms ownership and storage practices in the United States. Prev Med. 2018;116:134-42.
10. Scott J, Azrael D, Miller M. Firearm storage in homes with children with self-harm risk factors. Pediatrics. 2018;141(3):e20172600.
11. Grossman DC. Reducing youth firearm suicide risk: evidence for opportunities. Pediatrics. 2018;141(3):e20173884.
12. Sullivan EMA, Joseph L, Simon TR, et al. Suicide trends among persons aged 10-24 years - United States, 1994–2012. MMWR Morb
Western Journal of Emergency Medicine 508 Volume 22, no. 3: May 2021
Firearm Exposure and Storage Practices in the Homes of Rural Adolescents Jennissen et al.
Mortal Wkly Rep. 2015;64(8):201-5.13. Elnour AA, Harrison J. Lethality of suicide methods. Inj Prev.
2008;14(1):39-45.14. Grossman DC, Reay DT, Baker SA. Self-inflicted and unintentional
firearm injuries among children and adolescents: the source of the firearm. Arch Pediatr Adolesc Med. 1999;153(8):875-8.
15. Carr BG, Nance ML, Branas CC, et al. Unintentional firearm death across the urban-rural landscape in the United States. J Trauma Acute Care Surg. 2012;73(4):1006-10.
16. Nance ML, Carr BG, Kallan MJ, et al. Variation in pediatric and adolescent firearm mortality rates in rural and urban US counties. Pediatrics. 2010;125(6):1112-8.
17. APM Research Lab. APM survey: Americans’ views on key gun policies. Part three: mandating that guns be stored with locks in place. 2019. Available at: https://www.apmresearchlab.org/gun-survey-storage. Accessed September 20, 2020.
18. Cunningham RM, Carter PM, Ranney ML, et al. Prevention of firearm injuries among children and adolescents: consensus-driven research agenda from the Firearm Safety Among Children and Teens (FACTS) Consortium. JAMA Pediatr. 2019;173(8):780-9.
19. Parker K, Horowitz J, Igielnik R, et al. America’s complex relationship with guns. 2017. Available at: https://www.pewsocialtrends.org/2017/06/22/the-demographics-of-gun-ownership/. Accessed October 3, 2020.
20. Gallup Poll. In Depth: Topics A to Z. Guns. 2019. Available at: https://news.gallup.com/poll/1645/guns.aspx. Accessed October 5, 2020.
21. Cook P, Ludwig J. Guns in America: results of a comprehensive national survey on firearms ownership and use. 1996. Available at: https://www.policefoundation.org/wp-content/uploads/2015/06/Cook-et-al.-1996-Guns-in-America.pdf. Accessed February 22, 2021.
22. Sadowski LS, Munoz SR. Nonfatal and fatal firearm injuries in a rural county. JAMA. 1996;275(22):1762-4.
23. Senturia YD, Christoffel KK, Donovan M. Children’s household exposure to guns: a pediatric practice-based survey. Pediatrics. 1994;93(3):469-75.
24. Shaughnessy AF, Cincotta JA, Adelman A. Family practice patients’ attitudes toward firearm safety as a preventive medicine issue: a HARNET Study. Harrisburg Area Research Network. J Am Board Fam Pract. 1999;12(5):354-9.
25. Nordstrom DL, Zwerling C, Stromquist AM, et al. Rural population survey of behavioral and demographic risk factors for loaded firearms. Inj Prev. 2001;7(2):112-6.
26. Dresang LT. Gun deaths in rural and urban settings: recommendations for prevention. J Am Board Fam Pract. 2001;14(2):107-15.
27. Guetschow B, Lilienthal M, Willey M. Unintentional firearm injuries remain prevalent over a 12 year experience at a rural Midwestern Level 1 trauma center. Iowa Orthop J. 2018;38:45-52.
28. Dodge GG, Cogbill TH, Miller GJ, et al. Gunshot wounds: 10-year experience of a rural, referral trauma center. Am Surg. 1994;60(6):401-4.
29. Rowhani-Rahbar A, Oesterle S, Skinner ML. Initiation age,
cumulative prevalence, and longitudinal patterns of handgun carrying among rural adolescents: a multistate study. J Adolesc Health. 2020;66(4):416-22.
30. Substance Abuse and Mental Health Services Administration (SAMHSA). 2017 NSDUH Detailed Tables. 2018. Available at: https://www.samhsa.gov/data/report/2017-nsduh-detailed-tables. Accessed October 3, 2020.
31. Igielnik R. Rural and urban gun owners have difference experiences, views on gun policy. Pew Research Center. 2017. Available at: https://www.pewresearch.org/fact-tank/2017/07/10/rural-and-urban-gun-owners-have-different-experiences-views-on-gun-policy/. Accessed September 24, 2020.
32. U.S. Department of the Interior, U.S. Fish and Wildlife Service, U.S. Department of Commerce, et al. 2016 National Survey of Fishing, Hunting, and Wildlife-Associated Recreation. 2018. Available at: https://www.census.gov/content/dam/Census/library/publications/2018/demo/fhw16-nat.pdf. Accessed October 6, 2020.
33. Yamane D. The sociology of U.S. gun culture. Sociol Compass. 2017;11(7):e12497.
34. Livingston M, Lee M. Attitudes toward firearms and reasons for firearm ownership among nonurban youth: salience of sex and race. Psychol Rep. 1992;71(2):576-8.
35. Morgan ER, Gomez A, Rowhani-Rahbar A. Firearm ownership, storage practices, and suicide risk factors in Washington state, 2013-2016. Am J Public Health. 2018;108(7):882-8.
36. Siegel MB, Boine CC. The meaning of guns to gun owners in the US: the 2019 National Lawful Use of Guns Survey. Am J Prev Med. 2020;59(5):678-85.
37. Aitken ME, Minster SD, Mullins SH, et al. Parents’ perspectives on safe storage of firearms. J Community Health. 2020;45(3):469-77.
38. Kellermann AL, Reay DT. Protection or peril? An analysis of firearm-related deaths in the home. N Engl J Med. 1986;314(24):1557-60.
39. Kellermann AL, Rivara FP, Rushforth NB, et al. Gun ownership as a risk factor for homicide in the home. N Engl J Med. 1993;329(15):1084-91.
40. Hemenway D, Solnick SJ. Children and unintentional firearm death. Inj Epidemiol. 2015;2(1):26.
41. Branas CC, Nance ML, Elliott MR, et al. Urban-rural shifts in intentional firearm death: different causes, same results. Am J Public Health. 2004;94(10):1750-5.
42. Herrin BR, Gaither JR, Leventhal JM, et al. Rural versus urban hospitalizations for firearm injuries in children and adolescents. Pediatrics. 2018;142(2):e20173318.
43. Dowd MD, Sege RD. Firearm-related injuries affecting the pediatric population. Pediatrics. 2012;130(5):e1416-23.
44. Santaella-Tenorio J, Cerdá M, Villaveces A, et al. What do we know about the association between firearm legislation and firearm-related injuries? Epidemiol Rev. 2016;38(1):140-57.
45. Cummings P, Grossman DC, Rivara FP, et al. State gun safe storage laws and child mortality due to firearms. JAMA. 1997;278(13):1084-6.
46. Webster DW, Vernick JS, Zeoli AM, et al. Association between youth-focused firearm laws and youth suicides. JAMA.
Volume 22, no. 3: May 2021 509 Western Journal of Emergency Medicine
Jennissen et al. Firearm Exposure and Storage Practices in the Homes of Rural Adolescents
2004;292(5):594-601.47. Webster DW, Starnes M. Reexamining the association between child
access prevention gun laws and unintentional shooting deaths of children. Pediatrics. 2000;106(6):1466-9.
48. Lee J, Moriarty KP, Tashjian DB, et al. Guns and states: pediatric firearm injury. J Trauma Acute Care Surg. 2013;75(1):50-3.
49. Hepburn L, Azrael D, Miller M, et al. The effect of child access prevention laws on unintentional child firearm fatalities, 1979-2000. J Trauma. 2006;61(2):423-8.
50. DeSimone J, Markowitz S, Xu J. Child access prevention laws and nonfatal gun injuries. South Econ J. 2013;80(1):5-25.
51. Azad HA, Monuteaux MC, Rees CA, et al. Child access prevention
firearm laws and firearm fatalities among children aged 0 to 14 Years, 1991-2016. JAMA Pediatr. 2020;174(5):463-9.
52. Evans EM, Jennissen CA, Oral R, et al. Child welfare professionals’ determination of when children’s access or potential access to loaded firearms constitutes child neglect. J Trauma Acute Care Surg. 2017;83(5S Suppl 2):S210-6.
53. Jennissen CA, Evans EM, Karsjens AA, et al. Social workers’ determination of when children’s access or potential access to loaded firearms constitutes child neglect. Inj Epidemiol. 2019;6(Suppl 1):29.
54. Simonetti JA, Rowhani-Rahbar A, King C, et al. Evaluation of a community-based safe firearm and ammunition storage intervention. Inj Prev. 2018;24(3):218-23.
Western Journal of Emergency Medicine 510 Volume 22, no. 3: May 2021
Original Research
The Power of an Active Shooter Simulation: Changing Ethical Beliefs
Maria-Pamela Janairo, MD*†
Annemarie Marier Cardell, MD‡
Michael Lamberta, MD‡
Nubaha Elahi, MD§
Amish Aghera, MD‡
Section Editor: Erin Dehon, PhD Submission history: Submitted December 15, 2020; Revision received April 3, 2021; Accepted April 3, 2021 Electronically published May 21, 2021 Full text available through open access at http://escholarship.org/uc/uciem_westjem DOI: 10.5811/westjem.2021.4.51185
INTRODUCTIONAn active shooter (AS), as defined by the Federal
Bureau of Investigation (FBI), is one or more individuals actively engaged in killing or attempting to kill people in
State University of New York Downstate Medical Center, Department of Emergency Medicine, Brooklyn, New YorkKings County Hospital Center, Department of Emergency Medicine, Brooklyn, New YorkMaimonides Medical Center, Department of Emergency Medicine, Brooklyn, New YorkOsceola Regional Medical Center, Department of Emergency Medicine, Kissimmee, Florida
*
†
‡
§
Introduction: During a hospital-based active shooter (AS) event, clinicians may be forced to choose between saving themselves or their patients. The Hartford Consensus survey of clinicians and the public demonstrated mixed feelings on the role of doctors and nurses in these situations. Our objective was to evaluate the effect of simulation on ethical dilemmas during a hospital-based AS simulation. The objective was to determine whether a hospital-based AS event simulation and debrief would impact the ethical beliefs of emergency physicians relating to personal duty and risk. Methods: Forty-eight emergency physicians and physicians-in-training participated in this cohort study based in an urban academic hospital. Simulation scenarios presented ethical dilemmas for participants (eg, they decided between running a code or hiding from a shooter). Surveys based upon the Hartford Consensus were completed before and after the simulation. Questions focused on preparedness and ethical duties of physicians to their patients during an AS incident. We evaluated differences using a chi-squared test. Results: Preparedness for an AS event significantly improved after the simulation (P = 0.0001). Pre-simulation, 56% of participants felt that doctors/nurses have a special duty like police to protect patients who cannot hide/run, and 20% reported that a provider should accept a very high/high level of personal risk to protect patients who cannot hide/run. This was similar to the findings of the Hartford Consensus. Interestingly, post-simulation, percentages decreased to 25% (P = 0.008) and 5% (P = 0.041), respectively. Conclusion: Simulation training influenced ethical beliefs relating to the duty of emergency physicians during a hospital-based AS incident. In addition to traditional learning objectives, ethics should be another important design consideration for planning future simulations in this domain. [West J Emerg Med. 2021;22(3)510-517.]
a populated area. Active shooter incidents have more than doubled between 2011–2018, with 27 reported in 2018.1,2,3 The Hartford Consensus was developed in an effort to address this growing issue, as well as to establish a national protocol
Volume 22, no. 3: May 2021 511 Western Journal of Emergency Medicine
Janairo et al. The Power of an Active Shooter Simulation: Changing Ethical Beliefs
Population Health Research Capsule
What do we already know about this issue?During a hospital based active shooter (AS) event, clinicians may be forced to choose between saving themselves or their patients.
What was the research question?Can simulation based training impact the ethical beliefs of physicians relating to personal duty and risk?
What was the major finding of the study?Simulation training influenced ethical beliefs relating to the duty of physicians during an AS incident.
How does this improve population health?In addition to traditional learning objectives, simulation can impact ethical beliefs and educators should consider this when developing curriculum.
to enhance survivability from AS and intentional mass casualty events by supporting the “run, hide, fight” algorithm to mitigate risk.4 Healthcare settings are uniquely vulnerable targets because patients may be unable to “run, hide, fight.” Making the decision to “run” creates an ethical dilemma for providers who have their own moral obligation not to abandon their patients. In a 2017 survey of the public and healthcare professionals, Jacobs and Burns found that both groups felt doctors and nurses had a special duty to protect patients similar to police officers and firefighters.5
Training healthcare providers how to respond to mass casualty incidents such as active shooters often involves active training exercises such as simulation. Outcomes of such training programs typically focus on improving knowledge and skills around the medical response to preserve life.6,7 The benefit of simulation-based training (SBT), as compared to didactic-based education, is that it allows the learner to have more time hands-on and encourages active participation. When studied side by side, simulation-based education was perceived as more enjoyable by students.20 and when teaching simulated patient emergencies, was found to generate superior team performance.21,22 Additionally, previous studies have used simulation to successfully evaluate resident response to ethical dilemmas.23
For this study, we were interested in using simulation to understand the physician perspective regarding personal duty and safety during an AS event. We hypothesized that the SBT would provide a realistic AS experience and change the perception of emergency physicians with regard to personal risk and duty. The primary study objective was to determine how the ethical beliefs of physician duty and personal risk are affected by a SBT exercise grounded in the “run, hide, fight” approach. Secondary objectives included the effect of SBT on their overall level of risk and preparedness for an AS event.
METHODSStudy Design
This was a cohort study to determine the perceptions of physicians regarding AS events before and after a SBT exercise. Survey questions and response options mirrored those used by the Hartford Consensus.5 The study was classified as “exempt” by the local institutional review board.
The SBT was an active, operations-based functional exercise in crisis management rather than a discussion-based approach. The goal of this approach was to create an experience to allow learners to reflect on their roles when confronted with an in-hospital AS. The operations-based format challenged participants to make quick decisions and to act definitively in their perceived roles during a crisis. Simulation scenarios were designed to replicate the tension that may occur for participants responding to an AS while actively engaged in patient care. During the post-simulation debriefing, facilitators reviewed the “run, hide, fight” protocol while encouraging learners to actively reflect on their beliefs regarding duty to patients and personal safety.
Study Setting and SampleThe study was conducted at a private, urban hospital
in the Northeast with an annual census of 120,000 patients, and associated Accreditation Council for Graduate Medical Education-accredited three-year emergency medicine (EM) residency and pediatric EM (PEM) fellowship programs. Participants consisted of a convenience sample of available EM attendings, EM residents, PEM fellows, and rotating fourth-year medical students who were available for Wednesday conference. We also chose to include available students as they actively contribute as care providers as part of the holistic team in our clinical setting. The SBT exercise was conducted during typical time reserved for education (Wednesday conference), which is generally mandated for all residents and fellows. Trainees were given the opportunity to opt out a day in advance through private correspondence over email, given the potential threat to psychological safety from an active shooter SBT.
MeasurementsParticipants completed surveys immediately before and after
the completion of the SBT exercise. Survey questions closely mirrored those previously used by the Hartford Consensus, with minor adaptations to collect basic data and to specifically reference the clinical environments staffed by physicians working at the local institution. Detailed demographic data regarding race, gender, and age were not included in the survey design due to concerns that with a small cohort of colleagues it would lead to
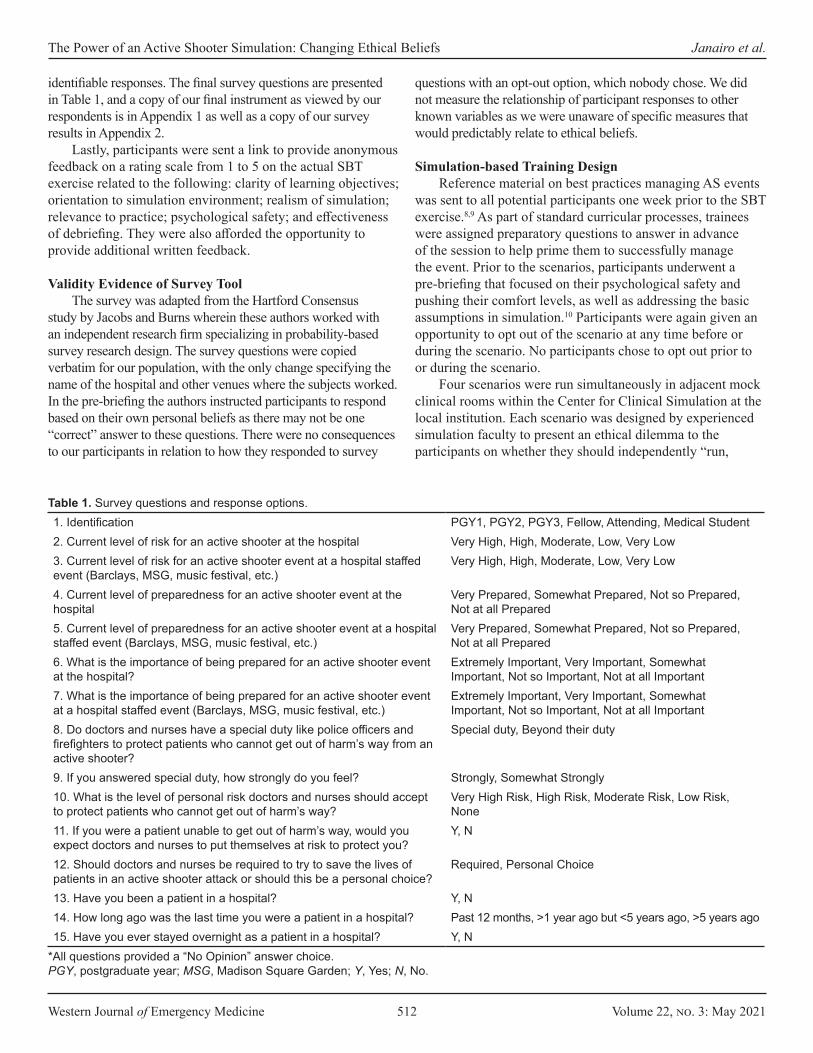
Western Journal of Emergency Medicine 512 Volume 22, no. 3: May 2021
The Power of an Active Shooter Simulation: Changing Ethical Beliefs Janairo et al.
identifiable responses. The final survey questions are presented in Table 1, and a copy of our final instrument as viewed by our respondents is in Appendix 1 as well as a copy of our survey results in Appendix 2.
Lastly, participants were sent a link to provide anonymous feedback on a rating scale from 1 to 5 on the actual SBT exercise related to the following: clarity of learning objectives; orientation to simulation environment; realism of simulation; relevance to practice; psychological safety; and effectiveness of debriefing. They were also afforded the opportunity to provide additional written feedback.
Validity Evidence of Survey Tool The survey was adapted from the Hartford Consensus
study by Jacobs and Burns wherein these authors worked with an independent research firm specializing in probability-based survey research design. The survey questions were copied verbatim for our population, with the only change specifying the name of the hospital and other venues where the subjects worked. In the pre-briefing the authors instructed participants to respond based on their own personal beliefs as there may not be one “correct” answer to these questions. There were no consequences to our participants in relation to how they responded to survey
questions with an opt-out option, which nobody chose. We did not measure the relationship of participant responses to other known variables as we were unaware of specific measures that would predictably relate to ethical beliefs.
Simulation-based Training DesignReference material on best practices managing AS events
was sent to all potential participants one week prior to the SBT exercise.8,9 As part of standard curricular processes, trainees were assigned preparatory questions to answer in advance of the session to help prime them to successfully manage the event. Prior to the scenarios, participants underwent a pre-briefing that focused on their psychological safety and pushing their comfort levels, as well as addressing the basic assumptions in simulation.10 Participants were again given an opportunity to opt out of the scenario at any time before or during the scenario. No participants chose to opt out prior to or during the scenario.
Four scenarios were run simultaneously in adjacent mock clinical rooms within the Center for Clinical Simulation at the local institution. Each scenario was designed by experienced simulation faculty to present an ethical dilemma to the participants on whether they should independently “run,
1. Identification PGY1, PGY2, PGY3, Fellow, Attending, Medical Student2. Current level of risk for an active shooter at the hospital Very High, High, Moderate, Low, Very Low3. Current level of risk for an active shooter event at a hospital staffed event (Barclays, MSG, music festival, etc.)
Very High, High, Moderate, Low, Very Low
4. Current level of preparedness for an active shooter event at the hospital
Very Prepared, Somewhat Prepared, Not so Prepared, Not at all Prepared
5. Current level of preparedness for an active shooter event at a hospital staffed event (Barclays, MSG, music festival, etc.)
Very Prepared, Somewhat Prepared, Not so Prepared, Not at all Prepared
6. What is the importance of being prepared for an active shooter event at the hospital?
Extremely Important, Very Important, Somewhat Important, Not so Important, Not at all Important
7. What is the importance of being prepared for an active shooter event at a hospital staffed event (Barclays, MSG, music festival, etc.)
Extremely Important, Very Important, Somewhat Important, Not so Important, Not at all Important
8. Do doctors and nurses have a special duty like police officers and firefighters to protect patients who cannot get out of harm’s way from an active shooter?
Special duty, Beyond their duty
9. If you answered special duty, how strongly do you feel? Strongly, Somewhat Strongly10. What is the level of personal risk doctors and nurses should accept to protect patients who cannot get out of harm’s way?
Very High Risk, High Risk, Moderate Risk, Low Risk, None
11. If you were a patient unable to get out of harm’s way, would you expect doctors and nurses to put themselves at risk to protect you?
Y, N
12. Should doctors and nurses be required to try to save the lives of patients in an active shooter attack or should this be a personal choice?
Required, Personal Choice
13. Have you been a patient in a hospital? Y, N14. How long ago was the last time you were a patient in a hospital? Past 12 months, >1 year ago but <5 years ago, >5 years ago15. Have you ever stayed overnight as a patient in a hospital? Y, N
Table 1. Survey questions and response options.
*All questions provided a “No Opinion” answer choice.PGY, postgraduate year; MSG, Madison Square Garden; Y, Yes; N, No.
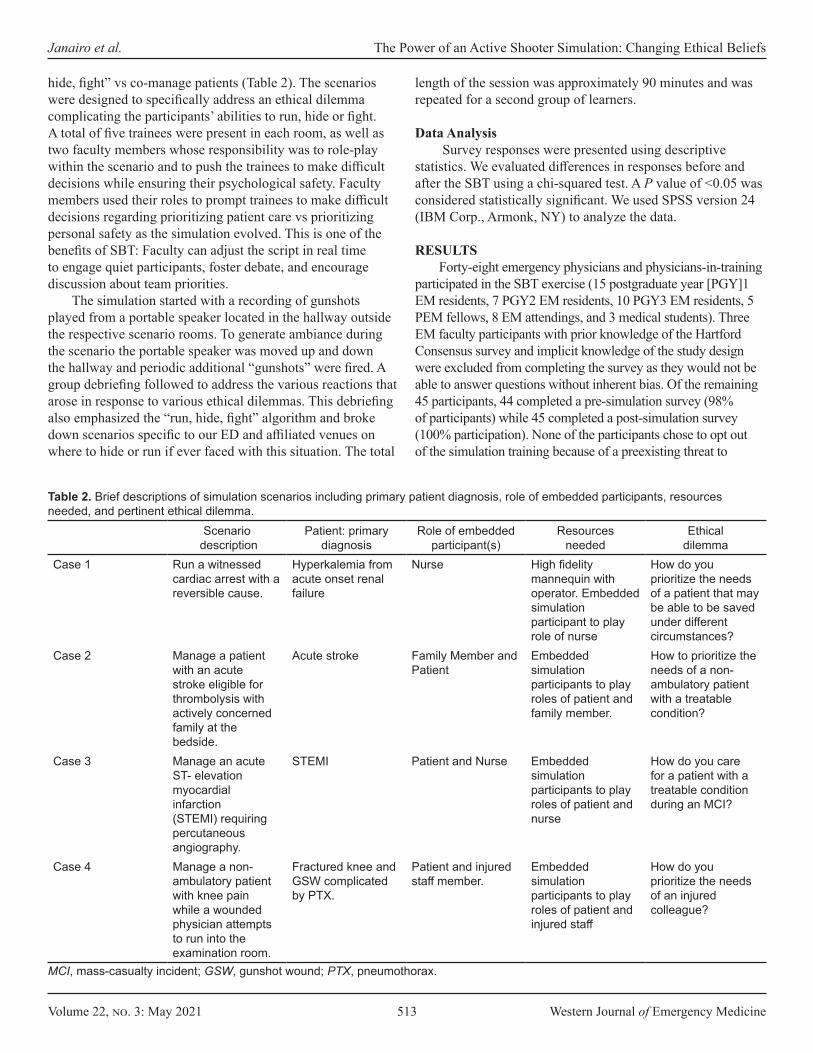
Volume 22, no. 3: May 2021 513 Western Journal of Emergency Medicine
Janairo et al. The Power of an Active Shooter Simulation: Changing Ethical Beliefs
hide, fight” vs co-manage patients (Table 2). The scenarios were designed to specifically address an ethical dilemma complicating the participants’ abilities to run, hide or fight. A total of five trainees were present in each room, as well as two faculty members whose responsibility was to role-play within the scenario and to push the trainees to make difficult decisions while ensuring their psychological safety. Faculty members used their roles to prompt trainees to make difficult decisions regarding prioritizing patient care vs prioritizing personal safety as the simulation evolved. This is one of the benefits of SBT: Faculty can adjust the script in real time to engage quiet participants, foster debate, and encourage discussion about team priorities.
The simulation started with a recording of gunshots played from a portable speaker located in the hallway outside the respective scenario rooms. To generate ambiance during the scenario the portable speaker was moved up and down the hallway and periodic additional “gunshots” were fired. A group debriefing followed to address the various reactions that arose in response to various ethical dilemmas. This debriefing also emphasized the “run, hide, fight” algorithm and broke down scenarios specific to our ED and affiliated venues on where to hide or run if ever faced with this situation. The total
length of the session was approximately 90 minutes and was repeated for a second group of learners.
Data Analysis Survey responses were presented using descriptive
statistics. We evaluated differences in responses before and after the SBT using a chi-squared test. A P value of <0.05 was considered statistically significant. We used SPSS version 24 (IBM Corp., Armonk, NY) to analyze the data.
RESULTSForty-eight emergency physicians and physicians-in-training
participated in the SBT exercise (15 postgraduate year [PGY]1 EM residents, 7 PGY2 EM residents, 10 PGY3 EM residents, 5 PEM fellows, 8 EM attendings, and 3 medical students). Three EM faculty participants with prior knowledge of the Hartford Consensus survey and implicit knowledge of the study design were excluded from completing the survey as they would not be able to answer questions without inherent bias. Of the remaining 45 participants, 44 completed a pre-simulation survey (98% of participants) while 45 completed a post-simulation survey (100% participation). None of the participants chose to opt out of the simulation training because of a preexisting threat to
Scenario description
Patient: primary diagnosis
Role of embedded participant(s)
Resources needed
Ethical dilemma
Case 1 Run a witnessed cardiac arrest with a reversible cause.
Hyperkalemia from acute onset renal failure
Nurse High fidelity mannequin with operator. Embedded simulation participant to play role of nurse
How do you prioritize the needs of a patient that may be able to be saved under different circumstances?
Case 2 Manage a patient with an acute stroke eligible for thrombolysis with actively concerned family at the bedside.
Acute stroke Family Member and Patient
Embedded simulation participants to play roles of patient and family member.
How to prioritize the needs of a non-ambulatory patient with a treatable condition?
Case 3 Manage an acute ST- elevation myocardial infarction (STEMI) requiring percutaneous angiography.
STEMI Patient and Nurse Embedded simulation participants to play roles of patient and nurse
How do you care for a patient with a treatable condition during an MCI?
Case 4 Manage a non-ambulatory patient with knee pain while a wounded physician attempts to run into the examination room.
Fractured knee and GSW complicated by PTX.
Patient and injured staff member.
Embedded simulation participants to play roles of patient and injured staff
How do you prioritize the needs of an injured colleague?
Table 2. Brief descriptions of simulation scenarios including primary patient diagnosis, role of embedded participants, resources needed, and pertinent ethical dilemma.
MCI, mass-casualty incident; GSW, gunshot wound; PTX, pneumothorax.
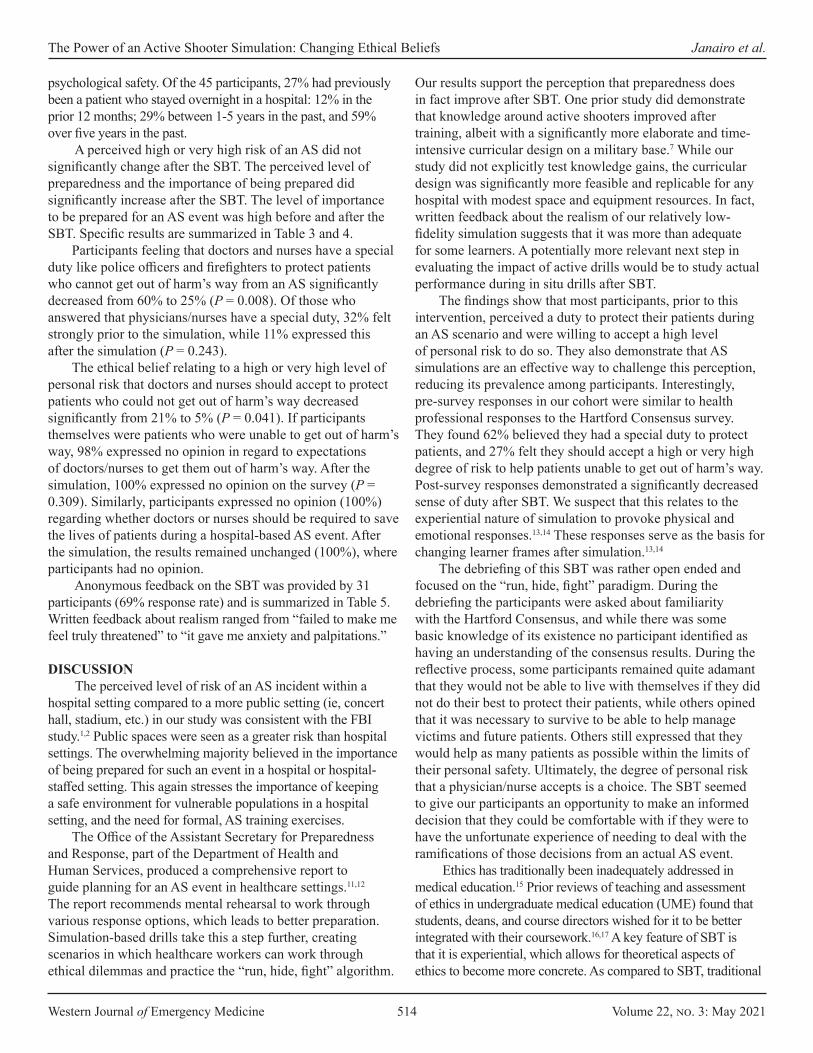
Western Journal of Emergency Medicine 514 Volume 22, no. 3: May 2021
The Power of an Active Shooter Simulation: Changing Ethical Beliefs Janairo et al.
psychological safety. Of the 45 participants, 27% had previously been a patient who stayed overnight in a hospital: 12% in the prior 12 months; 29% between 1-5 years in the past, and 59% over five years in the past.
A perceived high or very high risk of an AS did not significantly change after the SBT. The perceived level of preparedness and the importance of being prepared did significantly increase after the SBT. The level of importance to be prepared for an AS event was high before and after the SBT. Specific results are summarized in Table 3 and 4.
Participants feeling that doctors and nurses have a special duty like police officers and firefighters to protect patients who cannot get out of harm’s way from an AS significantly decreased from 60% to 25% (P = 0.008). Of those who answered that physicians/nurses have a special duty, 32% felt strongly prior to the simulation, while 11% expressed this after the simulation (P = 0.243).
The ethical belief relating to a high or very high level of personal risk that doctors and nurses should accept to protect patients who could not get out of harm’s way decreased significantly from 21% to 5% (P = 0.041). If participants themselves were patients who were unable to get out of harm’s way, 98% expressed no opinion in regard to expectations of doctors/nurses to get them out of harm’s way. After the simulation, 100% expressed no opinion on the survey (P = 0.309). Similarly, participants expressed no opinion (100%) regarding whether doctors or nurses should be required to save the lives of patients during a hospital-based AS event. After the simulation, the results remained unchanged (100%), where participants had no opinion.
Anonymous feedback on the SBT was provided by 31 participants (69% response rate) and is summarized in Table 5. Written feedback about realism ranged from “failed to make me feel truly threatened” to “it gave me anxiety and palpitations.”
DISCUSSION The perceived level of risk of an AS incident within a
hospital setting compared to a more public setting (ie, concert hall, stadium, etc.) in our study was consistent with the FBI study.1,2 Public spaces were seen as a greater risk than hospital settings. The overwhelming majority believed in the importance of being prepared for such an event in a hospital or hospital-staffed setting. This again stresses the importance of keeping a safe environment for vulnerable populations in a hospital setting, and the need for formal, AS training exercises.
The Office of the Assistant Secretary for Preparedness and Response, part of the Department of Health and Human Services, produced a comprehensive report to guide planning for an AS event in healthcare settings.11,12
The report recommends mental rehearsal to work through various response options, which leads to better preparation. Simulation-based drills take this a step further, creating scenarios in which healthcare workers can work through ethical dilemmas and practice the “run, hide, fight” algorithm.
Our results support the perception that preparedness does in fact improve after SBT. One prior study did demonstrate that knowledge around active shooters improved after training, albeit with a significantly more elaborate and time-intensive curricular design on a military base.7 While our study did not explicitly test knowledge gains, the curricular design was significantly more feasible and replicable for any hospital with modest space and equipment resources. In fact, written feedback about the realism of our relatively low-fidelity simulation suggests that it was more than adequate for some learners. A potentially more relevant next step in evaluating the impact of active drills would be to study actual performance during in situ drills after SBT.
The findings show that most participants, prior to this intervention, perceived a duty to protect their patients during an AS scenario and were willing to accept a high level of personal risk to do so. They also demonstrate that AS simulations are an effective way to challenge this perception, reducing its prevalence among participants. Interestingly, pre-survey responses in our cohort were similar to health professional responses to the Hartford Consensus survey. They found 62% believed they had a special duty to protect patients, and 27% felt they should accept a high or very high degree of risk to help patients unable to get out of harm’s way. Post-survey responses demonstrated a significantly decreased sense of duty after SBT. We suspect that this relates to the experiential nature of simulation to provoke physical and emotional responses.13,14 These responses serve as the basis for changing learner frames after simulation.13,14
The debriefing of this SBT was rather open ended and focused on the “run, hide, fight” paradigm. During the debriefing the participants were asked about familiarity with the Hartford Consensus, and while there was some basic knowledge of its existence no participant identified as having an understanding of the consensus results. During the reflective process, some participants remained quite adamant that they would not be able to live with themselves if they did not do their best to protect their patients, while others opined that it was necessary to survive to be able to help manage victims and future patients. Others still expressed that they would help as many patients as possible within the limits of their personal safety. Ultimately, the degree of personal risk that a physician/nurse accepts is a choice. The SBT seemed to give our participants an opportunity to make an informed decision that they could be comfortable with if they were to have the unfortunate experience of needing to deal with the ramifications of those decisions from an actual AS event.
Ethics has traditionally been inadequately addressed in medical education.15 Prior reviews of teaching and assessment of ethics in undergraduate medical education (UME) found that students, deans, and course directors wished for it to be better integrated with their coursework.16,17 A key feature of SBT is that it is experiential, which allows for theoretical aspects of ethics to become more concrete. As compared to SBT, traditional
Volume 22, no. 3: May 2021 515 Western Journal of Emergency Medicine
Janairo et al. The Power of an Active Shooter Simulation: Changing Ethical Beliefs
education using didactics is mostly a passive experience for the learner. Simulation allows for active engagement and has several features that make it well suited for AS training in ways that are not feasible with a traditional classroom format. Simulation allows for feedback grounded in individual and team performance.24 Furthermore, SBT is adaptable to the needs of the learner based on their performance.
Embedded facilitators within a scenario can interact with participants allowing for an experience that will address the learning objectives regardless of their baseline knowledge or their ability to interact within the simulation.25 Using a simulated context allows facilitators to leverage principles of adult learning theory grounded in the belief that education is learner-centric, in stark contrast to didactic-based education
PRE PRE POST POST% Change (post – pre)
% H & VH % L & VL % H & VH % L & VL % H & VH % L & VLWhat is the level of risk at Maimonides Hospital? 18% 48% 24% 36% 6% -12%
PGY1 14% 57% 13% 33% -1% -24%PGY2 11% 56% 14% 86% 3% 30%PGY3 33% 33% 30% 20% -3% -13%PEM fellow 0% 40% 40% 0% 40% -40%Med student 0% 100% 33% 67% 33% -33%Attending 40% 20% 40% 20% 0% 0%
% H & VH % L & VL % H & VH % L & VL % H & VH % L & VLWhat is the current level of preparedness at Maimonides?
7% 23% 53% 9% 47% -14%
PGY1 7% 43% 33% 27% 26% -16%PGY2 11% 0% 57% 0% 46% 0%PGY3 11% 0% 80% 0% 69% 0%PEM fellow 0% 20% 60% 0% 60% -20%Med student 0% 0% 67% 0% 67% 0%Attending 0% 60% 40% 0% 40% -60%
% SD % BD % SD % BD % SD % BDDo doctors and nurses have a special duty like police officers to protect patients?
45% 36% 20% 60% -25% 24%
PGY1 43% 36% 20% 53% -23% 18%PGY2 57% 43% 14% 86% -43% 43%PGY3 67% 33% 30% 70% -37% 37%PEM fellow 20% 20% 20% 20% 0% 0%Med student 50% 0% 0% 67% -50% 67%Attending 20% 60% 20% 60% 0% 0%
% H & VH % L & VL % H & VH % L & VL % H & VH % L & VLWhat is the level of personal risk doctors should accept to protect patients who can’t get out of harm’s way?
17% 33% 4% 53% -12% 20%
PGY1 21% 36% 0% 53% -21% 18%PGY2 29% 14% 14% 43% -14% 29%PGY3 11% 44% 0% 60% -11% 16%PEM fellow 0% 60% 0% 80% 0% 20%Med student 0% 0% 0% 33% 0% 33%Attending 20% 20% 20% 40% 0% 20%
Table 3. Summary results by training year for key questions.
VH, very high; H, high; M, moderate; L, low; VL, very low; SD, special duty; BD, beyond their duty; PGY, postgraduate year; PEM, pediatric emergency medicine.

Western Journal of Emergency Medicine 516 Volume 22, no. 3: May 2021
The Power of an Active Shooter Simulation: Changing Ethical Beliefs Janairo et al.
which is educator-centric.26 Also, the ability to fully control the environment is important as educators can titrate the appropriate level of “stress” for the learner without putting them in actual danger.24 It is because of these benefits that we chose to use simulation to address our educational goals. In our review of the literature regarding the education of ethics in UME, we found that educators should provide “a set of skills for ethical analysis and decision making.”18 The fact that beliefs were altered after SBT suggests that this was an effective method for discussing ethics while simultaneously providing a practical framework to apply lessons AS events, it may also be useful to study other paradigms when “run, hide, fight” may not be feasible. Inaba and colleagues proposed an alternative of “secure, preserve, fight.”19 Training to this mantra using simulation may also serve to further aid healthcare professionals’ ability to protect themselves while still satisfying their duty to the patient.
LIMITATIONS
This study was based out of a single, urban, academic EM program focusing on physicians, and thus its generalizability may be limited. This population may not reflect that of other programs. As with all observational studies, there is potential for confounders not predicted or identified by the authors. Additionally, as a simulation-based exercise the experience is highly dependent on facilitator experience leading to questions of generalizability. While a growing body of evidence supports that skills learned in the simulation laboratory do
translate to practice, it is difficult to predict how quickly skills or practices decay without additional primers. Given that EM providers in particular are placed in a unique social and clinical setting, they are more likely to be prone to workplace violence, which might further impact how they perceive their ethical responsibilities over time. This study did not follow participants longitudinally for the stability of the change in their ethical beliefs. Additionally, we were unable to determine whether there was any hidden facilitator bias during the debrief in shaping the impact of the SBT. Lastly, compared to many mass casualty simulations, this SBT was relatively low fidelity and resource intensive, which may have blunted its potential impact for those participants who had difficulty immersing themselves in the scenario.
CONCLUSION
Active planning and training for an active shooter event is critical. During a hospital-based AS event, clinicians may be forced to choose between saving themselves or their patients. The study demonstrates that simulation training can influence ethical beliefs relating to the duty of doctors and nurses during a hospital-based AS incident. This underscores the power of simulation to significantly impact learners, including relatively low-resource designs such as ours. In addition to traditional learning objectives, ethics should be another important design consideration for planning future simulations in this domain.
Address for Correspondence: Annemarie Cardell, Center for Clinical Simulation, 948 48th St., 4th floor, Brooklyn, NY 11219. Email: [email protected].
Conflicts of Interest: By the WestJEM article submission agreement, all authors are required to disclose all affiliations, funding sources and financial or management relationships that could be perceived as potential sources of bias. No author has professional or financial relationships with any companies that are relevant to this study. There are no conflicts of interest or sources of funding to declare.
Copyright: © 2021 Janairo et al. This is an open access article distributed in accordance with the terms of the Creative Commons Attribution (CC BY 4.0) License. See: http://creativecommons.org/licenses/by/4.0/
Location (question) Pre-survey Post-survey P-valueHospital (high or very high risk) 9% 13% 0.490Hospital-staffed Public Event (high or very high risk) 17% 28% 0.181Hospital (very prepared or somewhat prepared) 7% 57% 0.0001Hospital-staffed Public Event (very prepared or somewhat prepared) 23% 76% 0.0001Hospital (extremely or very important to be prepared) 88% 89% 0.326Hospital-staffed Public Event (extremely or very important to be prepared) 100% 96% 0.329
Table 4. Pre- and post-survey results: perceived risk by location, current level of preparedness by location, and the importance of each location being prepared for active shooter events.
Question Mean ratingClearly conveyed simulation objectives? 4.8Orientation to learning environment? 4.8Relevance to clinical practice? 4.3How safe did you feed during the scenario? 4.5Was the realism sufficient for the exercise? 3.8Quality of debriefing to promote a dialog that enhanced knowledge, reflection, and provide clear/constructive feedback?
4.8
Table 5. Anonymous participant scenario feedback on a scale of 1 (poor) to 5 (excellent).
1= No/Poor or Not at All; 5= Yes/Excellent, or Extremely.
Volume 22, no. 3: May 2021 517 Western Journal of Emergency Medicine
Janairo et al. The Power of an Active Shooter Simulation: Changing Ethical Beliefs
REFERENCES 1. Blair JP, Schweit KW. A Study of Active Shooter Incidents, 2000-
2013. U.S. Department of Justice - Texas State University and Federal Bureau of Investigation. Washington, D.C; 2014.
2. U.S. Department of Justice - the Advanced Law Enforcement Rapid Response Training (ALERRT) Center at Texas State University and the Federal Bureau of Investigation. Active Shooter Incidents in the United States in 2018. Washington, D.C. 2018.
3. Kelen GD, Catlett CL, Kubit JG, et al. Hospital-based shootings in the United States: 2000 to 2011. Ann Emerg Med. 2012;60(6):790-8.
4. Joint Committee to Create A National Policy to Enhance Survivability from Intentional Mass Casualty Shooting Events. Improving Survival from Active Shooter Events: the Hartford Consensus. 2013. Available at: http://www.naemt.org/Files/LEFRTCC/Hartford%20Consensus%20Call%20to%20Action.pdf. Accessed December 10, 2020.
5. Jacobs LM, Burns KJ. The Hartford Consensus: survey of the public and healthcare professionals on active shooter events in hospitals. J Am Coll Surg. 2017;225(3):435-42.
6. Wexler B, Flamm A. Lessons learned from an active shooter full-scale functional exercise in a newly constructed emergency department. Disaster Med Public Health Prep. 2017;11(5):522-5.
7. Kotora JG, Clancy T, Manzon L, et al. Active shooter in the emergency department: a scenario-based training approach for healthcare workers. Am J Disaster Med. 2014; 9(1):39-51.
8. Johnson O, Carlson P, Murphy B, et al. Preparing civilians to survive an active shooter event. Journal of Law Enforcement. 2015; 5(2):1-13.
9. Menes K, Tintinalli J, Plaster L. How one Las Vegas ED saved hundreds of lives after the worst mass shooting in U.S. history. 2017. Available at: https://epmonthly.com/article/not-heroes-wear-capes-one-las-vegas-ed-saved-hundreds-lives-worst-mass-shooting-u-s-history/#:~:text=Kevin%20Menes%2C%20MD-,Dr.,in%20saving%20hundreds%20of%20lives.. Accessed December 10, 2020.
10. Rudolph JW, Raemer DB, Robert S. Establishing a safe container for learning in simulation: the role of the presimulation briefing. Simul Healthc. 2014;9(6):339-49.
11. US Department of Health and Human Services. Incorporating active shooter incident planning into health care facility emergency operations plans. 2014. Available at: https://www.phe.gov/preparedness/planning/Documents/active-shooter-planning-eop2014.
pdf. Accessed December 10, 2020.12. Osterwell N. Hospitals need to plan for active-shooter
scenarios. 2015. Available at: http://www.medscape.com/viewarticle/853533#vp_1. Accessed May 9, 2019.
13. Dieckmann P, Gaba D, Rall M. Deepening the theoretical foundations of patient simulation as social practice. Simul Healthc. 2007;2(3): 184-93.
14. Rudolph, JW, Simon R, Raemer D. Which reality matters? Questions of the path to high engagement in healthcare simulation. Simul Healthc. 2007;2(3):161-3.
15. Dent J, Harden RM, Hunt D. (2017). A Practical Guide for Medical Teachers. 5th edition. London, UK: Elsevier Health Sciences.
16. Mattick K, Bligh J. Teaching and assessing medical ethics: Where are we now? J Med Ethics. 2006;32(3):181-5.
17. Goldie J. Review of ethics curricula in undergraduate medical education. Med Educ. 2000;34(2):108-19.
18. Eckles RE, Meslin EM, Gaffney M, et al. Medical ethics education: Where are we? Where should we be going? A Review. Acad Med. 2005;80(12):1143-52.
19. Inaba K, Eastman AL, Jacobs LM, et al. Active-shooter response at a health care facility. N Engl J Med. 2018;20379(6):583-6.
20. Solymos O, O’Kelly P, Walshe CM. Pilot study comparing simulation-based and didactic lecture-based critical care teaching for final-year medical students. BMC Anesthesiol. 2015;15:153.
21. Daniels K, Arafeh J, Clark A, et al. Prospective randomized trial of simulation versus didactic teaching for obstetrical emergencies. Simul Healthc. 2010;5(1):40-5.
22. Wang CL, Schopp JG, Petscavage JM, et al. Prospective randomized comparison of standard didactic lecture versus high-fidelity simulation for radiology resident contrast reaction management training. AJR Am J Roentgenol. 2011;196(6):1288-95.
23. Gisondi MA, Smith‐Coggins R, Harter PM, et al. Assessment of resident professionalism using high‐fidelity simulation of ethical dilemmas. Acad Emerg Med. 2004;11(9):931-7.
24. McGaghie WC, Issenberg SB, Cohen ER, Barsuk JH, Wayne DB. Does simulation-based medical education with deliberate practice yield better results than traditional clinical education? A meta-analytic comparative review of the evidence. Acad Med. 2011;86(6):706-11.
25. Dieckmann P, Lippert A, Glavin R, et al. When things do not go as expected: scenario life savers. Simul Healthc. 2010;5(4):219-25.
26. Wang EE. Simulation and adult learning. Dis Mon. 2011;57(11):664-78.

Western Journal of Emergency Medicine 518 Volume 22, no. 3: May 2021
Original Research
Self-Inflicted Gun Shot Wounds: A Retrospective, Observational Study of U.S. Trauma Centers
Faith Quenzer, DO*Andrew Givner, MD†
Rachel Dirks, PhD‡
Christopher J. Coyne, MD, MPH*Frank Ercoli, MD†§
Ricard Townsend, MD†§
Section Editor: Patrick Maher, MD, MS Submission history: Submitted July 29, 2020; Revision received April 3, 2021; Accepted April 3, 2021 Electronically published May 19, 2021 Full text available through open access at http://escholarship.org/uc/uciem_westjem DOI: 10.5811/westjem.2021.4.49315
INTRODUCTION Intentional self-harm (suicide) is a growing problem in the
University of California, San Diego, Department of Emergency Medicine, San Diego, CaliforniaDesert Regional Medical Center, Department of Emergency Medicine, Palm Springs, CaliforniaUniversity of California, San Francisco-Fresno, Department of Emergency Medicine, Fresno, CaliforniaDesert Regional Medical Center, Desert Trauma Surgeons, Palm Springs, California
*
†
‡
§
Introduction: Intentional self-harm (suicide) by firearms is a growing problem in the United States. Currently, there are no large studies that have identified risk factors for patients who die from self-inflicted gunshot wounds. Our objectives are to 1) identify risk factors for patients with the highest morbidity and mortality from self-inflicted gunshot wounds (SIGSWs) at trauma centers 2) present the outcomes of victims of SIGSW by handguns (HG) versus all other specified guns (AOG) and 3) compare the presentations and outcomes of victims with head or face (HF) injuries to other regions of the body.
Methods: We performed a retrospective analysis from the National Trauma Database (NTDB) data between 2012 and 2013 of all SIGSW patients who presented to trauma centers. Categorical data included patient characteristics upon presentation and outcomes which were compared between patients with HG injury versus AOG injury using the Chi-Squared test, where AOG includes shotguns, hunting rifles, and military firearms. Additionally, analysis of head and face (HF) injuries versus other bodily injuries (OBI) were compared between the HG group versus AOG group using Chi-squared test.
Results: There were 7,828 SIGSWs, of those, 78% (6,115) were white and 84.3% (6,600) were male. There were 5,139 HG injuries, 1,130 AOG injuries, and 1,405 unidentified gun injuries. The HG group was likely to be older (>55 years old), hypotensive (systolic blood pressure < 90), have a lower Glasgow Coma Score (GCS < 9), use illegal, or use prescription drugs. In comparing HF injuries (4,799) versus other bodily injuries (OBI) (3,028), HF group was more likely to use handguns, expire in ED, require ICU, and have a higher percent of overall mortality. Of the total OBI, the thorax, upper extremities, and abdomen were the most commonly injured.
Conclusion: In our retrospective study of SIGSWs, we were able to demonstrate that SIGSW by handguns are associated with higher rates of mortality versus all other types of firearms. SIGSWs in older white males with handguns are the most at-risk for severe complications. Future efforts should improve screening methods for handguns in suicidal patients and at developing prevention programs. [West J Emerg Med. 2021;22(3)518-524.]
United States (U.S.) and has recently become one of the top ten leading causes of death. Earlier studies have shown that higher
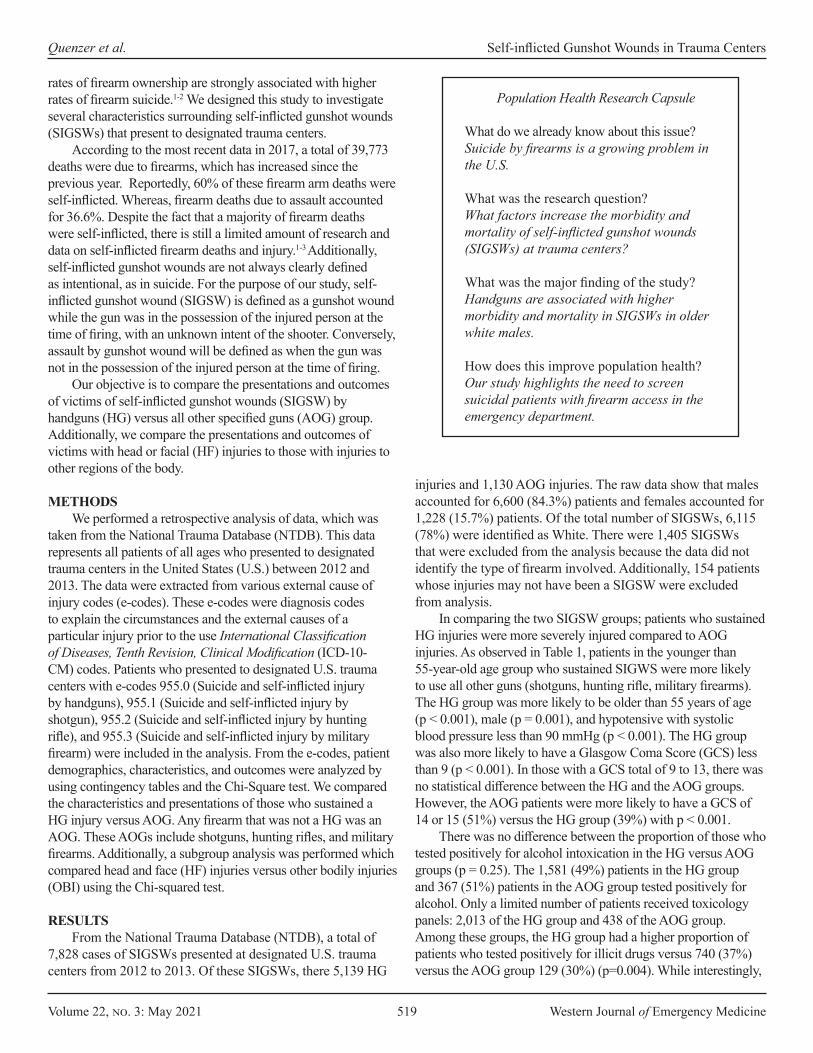
Volume 22, no. 3: May 2021 519 Western Journal of Emergency Medicine
Quenzer et al. Self-inflicted Gunshot Wounds in Trauma Centers
Population Health Research Capsule
What do we already know about this issue?Suicide by firearms is a growing problem in the U.S.
What was the research question?What factors increase the morbidity and mortality of self-inflicted gunshot wounds (SIGSWs) at trauma centers?
What was the major finding of the study?Handguns are associated with higher morbidity and mortality in SIGSWs in older white males.
How does this improve population health?Our study highlights the need to screen suicidal patients with firearm access in the emergency department.
rates of firearm ownership are strongly associated with higher rates of firearm suicide.1-2 We designed this study to investigate several characteristics surrounding self-inflicted gunshot wounds (SIGSWs) that present to designated trauma centers.
According to the most recent data in 2017, a total of 39,773 deaths were due to firearms, which has increased since the previous year. Reportedly, 60% of these firearm arm deaths were self-inflicted. Whereas, firearm deaths due to assault accounted for 36.6%. Despite the fact that a majority of firearm deaths were self-inflicted, there is still a limited amount of research and data on self-inflicted firearm deaths and injury.1-3 Additionally, self-inflicted gunshot wounds are not always clearly defined as intentional, as in suicide. For the purpose of our study, self-inflicted gunshot wound (SIGSW) is defined as a gunshot wound while the gun was in the possession of the injured person at the time of firing, with an unknown intent of the shooter. Conversely, assault by gunshot wound will be defined as when the gun was not in the possession of the injured person at the time of firing.
Our objective is to compare the presentations and outcomes of victims of self-inflicted gunshot wounds (SIGSW) by handguns (HG) versus all other specified guns (AOG) group. Additionally, we compare the presentations and outcomes of victims with head or facial (HF) injuries to those with injuries to other regions of the body.
METHODSWe performed a retrospective analysis of data, which was
taken from the National Trauma Database (NTDB). This data represents all patients of all ages who presented to designated trauma centers in the United States (U.S.) between 2012 and 2013. The data were extracted from various external cause of injury codes (e-codes). These e-codes were diagnosis codes to explain the circumstances and the external causes of a particular injury prior to the use International Classification of Diseases, Tenth Revision, Clinical Modification (ICD-10-CM) codes. Patients who presented to designated U.S. trauma centers with e-codes 955.0 (Suicide and self-inflicted injury by handguns), 955.1 (Suicide and self-inflicted injury by shotgun), 955.2 (Suicide and self-inflicted injury by hunting rifle), and 955.3 (Suicide and self-inflicted injury by military firearm) were included in the analysis. From the e-codes, patient demographics, characteristics, and outcomes were analyzed by using contingency tables and the Chi-Square test. We compared the characteristics and presentations of those who sustained a HG injury versus AOG. Any firearm that was not a HG was an AOG. These AOGs include shotguns, hunting rifles, and military firearms. Additionally, a subgroup analysis was performed which compared head and face (HF) injuries versus other bodily injuries (OBI) using the Chi-squared test.
RESULTSFrom the National Trauma Database (NTDB), a total of
7,828 cases of SIGSWs presented at designated U.S. trauma centers from 2012 to 2013. Of these SIGSWs, there 5,139 HG
injuries and 1,130 AOG injuries. The raw data show that males accounted for 6,600 (84.3%) patients and females accounted for 1,228 (15.7%) patients. Of the total number of SIGSWs, 6,115 (78%) were identified as White. There were 1,405 SIGSWs that were excluded from the analysis because the data did not identify the type of firearm involved. Additionally, 154 patients whose injuries may not have been a SIGSW were excluded from analysis.
In comparing the two SIGSW groups; patients who sustained HG injuries were more severely injured compared to AOG injuries. As observed in Table 1, patients in the younger than 55-year-old age group who sustained SIGWS were more likely to use all other guns (shotguns, hunting rifle, military firearms). The HG group was more likely to be older than 55 years of age (p < 0.001), male (p = 0.001), and hypotensive with systolic blood pressure less than 90 mmHg (p < 0.001). The HG group was also more likely to have a Glasgow Coma Score (GCS) less than 9 (p < 0.001). In those with a GCS total of 9 to 13, there was no statistical difference between the HG and the AOG groups. However, the AOG patients were more likely to have a GCS of 14 or 15 (51%) versus the HG group (39%) with p < 0.001.
There was no difference between the proportion of those who tested positively for alcohol intoxication in the HG versus AOG groups (p = 0.25). The 1,581 (49%) patients in the HG group and 367 (51%) patients in the AOG group tested positively for alcohol. Only a limited number of patients received toxicology panels: 2,013 of the HG group and 438 of the AOG group. Among these groups, the HG group had a higher proportion of patients who tested positively for illicit drugs versus 740 (37%) versus the AOG group 129 (30%) (p=0.004). While interestingly,
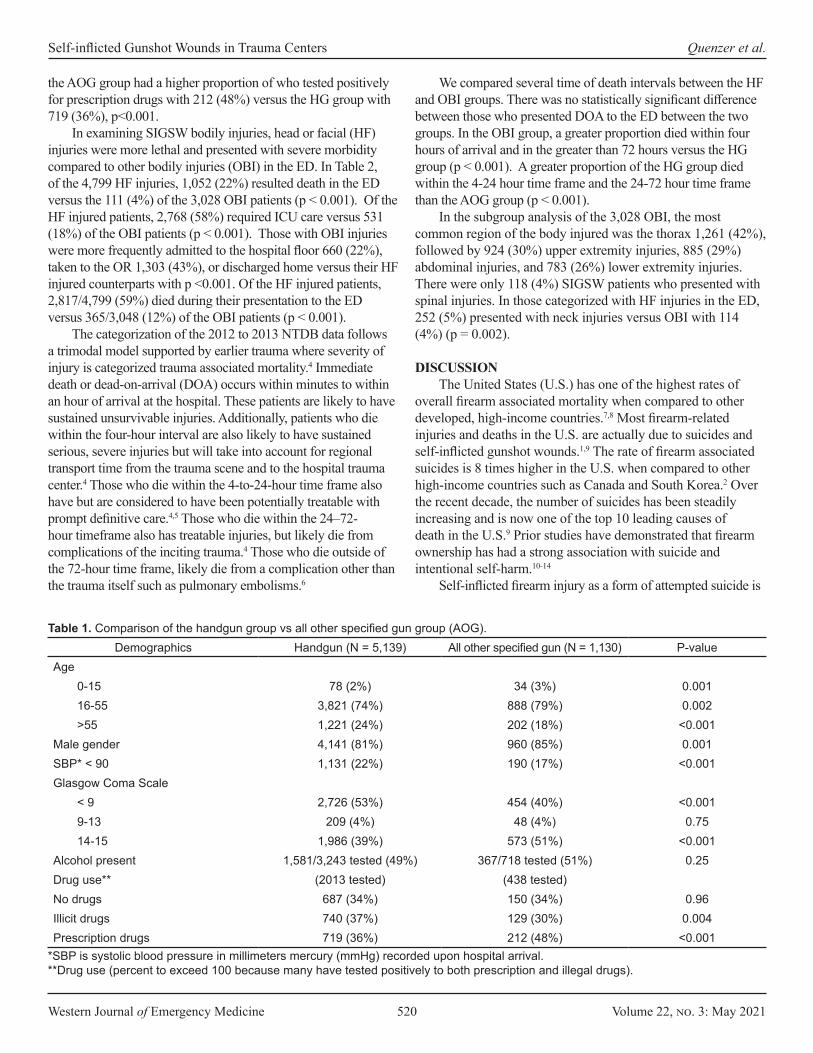
Western Journal of Emergency Medicine 520 Volume 22, no. 3: May 2021
Self-inflicted Gunshot Wounds in Trauma Centers Quenzer et al.
the AOG group had a higher proportion of who tested positively for prescription drugs with 212 (48%) versus the HG group with 719 (36%), p<0.001.
In examining SIGSW bodily injuries, head or facial (HF) injuries were more lethal and presented with severe morbidity compared to other bodily injuries (OBI) in the ED. In Table 2, of the 4,799 HF injuries, 1,052 (22%) resulted death in the ED versus the 111 (4%) of the 3,028 OBI patients (p < 0.001). Of the HF injured patients, 2,768 (58%) required ICU care versus 531 (18%) of the OBI patients (p < 0.001). Those with OBI injuries were more frequently admitted to the hospital floor 660 (22%), taken to the OR 1,303 (43%), or discharged home versus their HF injured counterparts with p <0.001. Of the HF injured patients, 2,817/4,799 (59%) died during their presentation to the ED versus 365/3,048 (12%) of the OBI patients (p < 0.001).
The categorization of the 2012 to 2013 NTDB data follows a trimodal model supported by earlier trauma where severity of injury is categorized trauma associated mortality.4 Immediate death or dead-on-arrival (DOA) occurs within minutes to within an hour of arrival at the hospital. These patients are likely to have sustained unsurvivable injuries. Additionally, patients who die within the four-hour interval are also likely to have sustained serious, severe injuries but will take into account for regional transport time from the trauma scene and to the hospital trauma center.4 Those who die within the 4-to-24-hour time frame also have but are considered to have been potentially treatable with prompt definitive care.4,5 Those who die within the 24–72-hour timeframe also has treatable injuries, but likely die from complications of the inciting trauma.4 Those who die outside of the 72-hour time frame, likely die from a complication other than the trauma itself such as pulmonary embolisms.6
We compared several time of death intervals between the HF and OBI groups. There was no statistically significant difference between those who presented DOA to the ED between the two groups. In the OBI group, a greater proportion died within four hours of arrival and in the greater than 72 hours versus the HG group (p < 0.001). A greater proportion of the HG group died within the 4-24 hour time frame and the 24-72 hour time frame than the AOG group (p < 0.001).
In the subgroup analysis of the 3,028 OBI, the most common region of the body injured was the thorax 1,261 (42%), followed by 924 (30%) upper extremity injuries, 885 (29%) abdominal injuries, and 783 (26%) lower extremity injuries. There were only 118 (4%) SIGSW patients who presented with spinal injuries. In those categorized with HF injuries in the ED, 252 (5%) presented with neck injuries versus OBI with 114 (4%) (p = 0.002).
DISCUSSIONThe United States (U.S.) has one of the highest rates of
overall firearm associated mortality when compared to other developed, high-income countries.7,8 Most firearm-related injuries and deaths in the U.S. are actually due to suicides and self-inflicted gunshot wounds.1,9 The rate of firearm associated suicides is 8 times higher in the U.S. when compared to other high-income countries such as Canada and South Korea.2 Over the recent decade, the number of suicides has been steadily increasing and is now one of the top 10 leading causes of death in the U.S.9 Prior studies have demonstrated that firearm ownership has had a strong association with suicide and intentional self-harm.10-14
Self-inflicted firearm injury as a form of attempted suicide is
Demographics Handgun (N = 5,139) All other specified gun (N = 1,130) P-valueAge
0-15 78 (2%) 34 (3%) 0.00116-55 3,821 (74%) 888 (79%) 0.002>55 1,221 (24%) 202 (18%) <0.001
Male gender 4,141 (81%) 960 (85%) 0.001SBP* < 90 1,131 (22%) 190 (17%) <0.001Glasgow Coma Scale
< 9 2,726 (53%) 454 (40%) <0.0019-13 209 (4%) 48 (4%) 0.7514-15 1,986 (39%) 573 (51%) <0.001
Alcohol present 1,581/3,243 tested (49%) 367/718 tested (51%) 0.25Drug use** (2013 tested) (438 tested)No drugs 687 (34%) 150 (34%) 0.96Illicit drugs 740 (37%) 129 (30%) 0.004Prescription drugs 719 (36%) 212 (48%) <0.001
Table 1. Comparison of the handgun group vs all other specified gun group (AOG).
*SBP is systolic blood pressure in millimeters mercury (mmHg) recorded upon hospital arrival.**Drug use (percent to exceed 100 because many have tested positively to both prescription and illegal drugs).
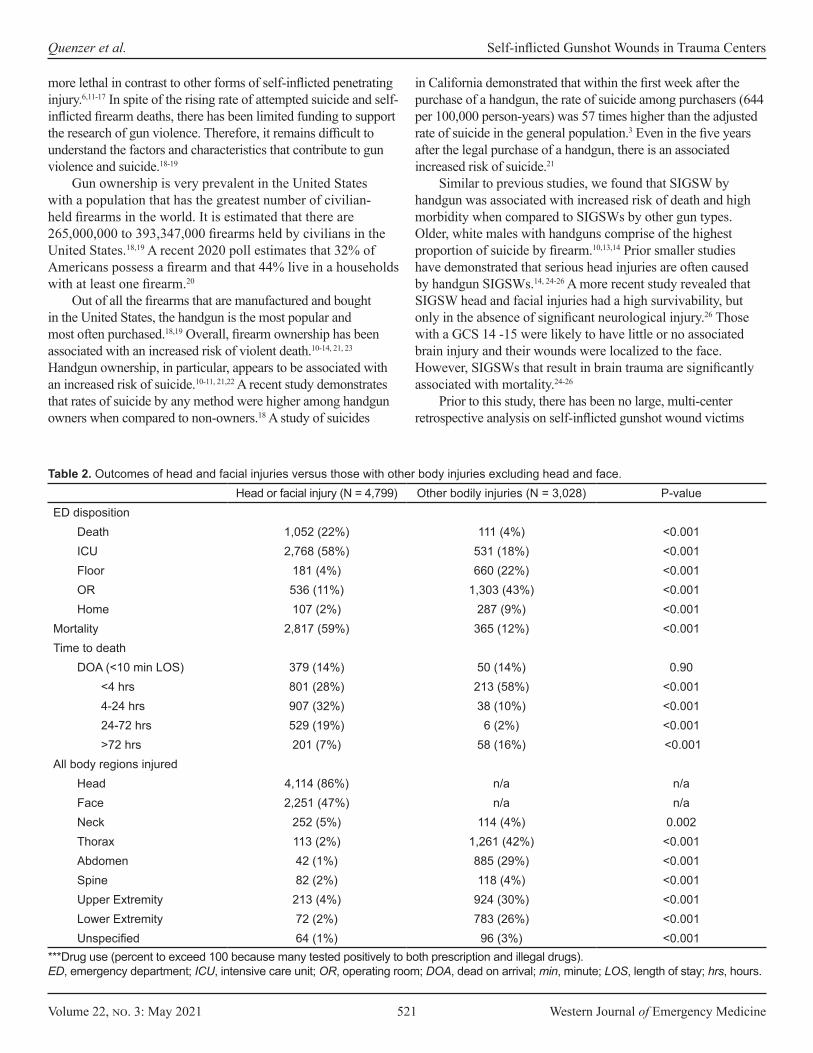
Volume 22, no. 3: May 2021 521 Western Journal of Emergency Medicine
Quenzer et al. Self-inflicted Gunshot Wounds in Trauma Centers
more lethal in contrast to other forms of self-inflicted penetrating injury.6,11-17 In spite of the rising rate of attempted suicide and self-inflicted firearm deaths, there has been limited funding to support the research of gun violence. Therefore, it remains difficult to understand the factors and characteristics that contribute to gun violence and suicide.18-19
Gun ownership is very prevalent in the United States with a population that has the greatest number of civilian-held firearms in the world. It is estimated that there are 265,000,000 to 393,347,000 firearms held by civilians in the United States.18,19 A recent 2020 poll estimates that 32% of Americans possess a firearm and that 44% live in a households with at least one firearm.20
Out of all the firearms that are manufactured and bought in the United States, the handgun is the most popular and most often purchased.18,19 Overall, firearm ownership has been associated with an increased risk of violent death.10-14, 21, 23 Handgun ownership, in particular, appears to be associated with an increased risk of suicide.10-11, 21,22 A recent study demonstrates that rates of suicide by any method were higher among handgun owners when compared to non-owners.18 A study of suicides
in California demonstrated that within the first week after the purchase of a handgun, the rate of suicide among purchasers (644 per 100,000 person-years) was 57 times higher than the adjusted rate of suicide in the general population.3 Even in the five years after the legal purchase of a handgun, there is an associated increased risk of suicide.21
Similar to previous studies, we found that SIGSW by handgun was associated with increased risk of death and high morbidity when compared to SIGSWs by other gun types. Older, white males with handguns comprise of the highest proportion of suicide by firearm.10,13,14 Prior smaller studies have demonstrated that serious head injuries are often caused by handgun SIGSWs.14, 24-26 A more recent study revealed that SIGSW head and facial injuries had a high survivability, but only in the absence of significant neurological injury.26 Those with a GCS 14 -15 were likely to have little or no associated brain injury and their wounds were localized to the face. However, SIGSWs that result in brain trauma are significantly associated with mortality.24-26
Prior to this study, there has been no large, multi-center retrospective analysis on self-inflicted gunshot wound victims
Head or facial injury (N = 4,799) Other bodily injuries (N = 3,028) P-valueED disposition
Death 1,052 (22%) 111 (4%) <0.001ICU 2,768 (58%) 531 (18%) <0.001Floor 181 (4%) 660 (22%) <0.001OR 536 (11%) 1,303 (43%) <0.001Home 107 (2%) 287 (9%) <0.001
Mortality 2,817 (59%) 365 (12%) <0.001Time to death
DOA (<10 min LOS) 379 (14%) 50 (14%) 0.90<4 hrs 801 (28%) 213 (58%) <0.0014-24 hrs 907 (32%) 38 (10%) <0.00124-72 hrs 529 (19%) 6 (2%) <0.001>72 hrs 201 (7%) 58 (16%) <0.001
All body regions injured Head 4,114 (86%) n/a n/aFace 2,251 (47%) n/a n/aNeck 252 (5%) 114 (4%) 0.002Thorax 113 (2%) 1,261 (42%) <0.001Abdomen 42 (1%) 885 (29%) <0.001Spine 82 (2%) 118 (4%) <0.001Upper Extremity 213 (4%) 924 (30%) <0.001Lower Extremity 72 (2%) 783 (26%) <0.001Unspecified 64 (1%) 96 (3%) <0.001
Table 2. Outcomes of head and facial injuries versus those with other body injuries excluding head and face.
***Drug use (percent to exceed 100 because many tested positively to both prescription and illegal drugs).ED, emergency department; ICU, intensive care unit; OR, operating room; DOA, dead on arrival; min, minute; LOS, length of stay; hrs, hours.
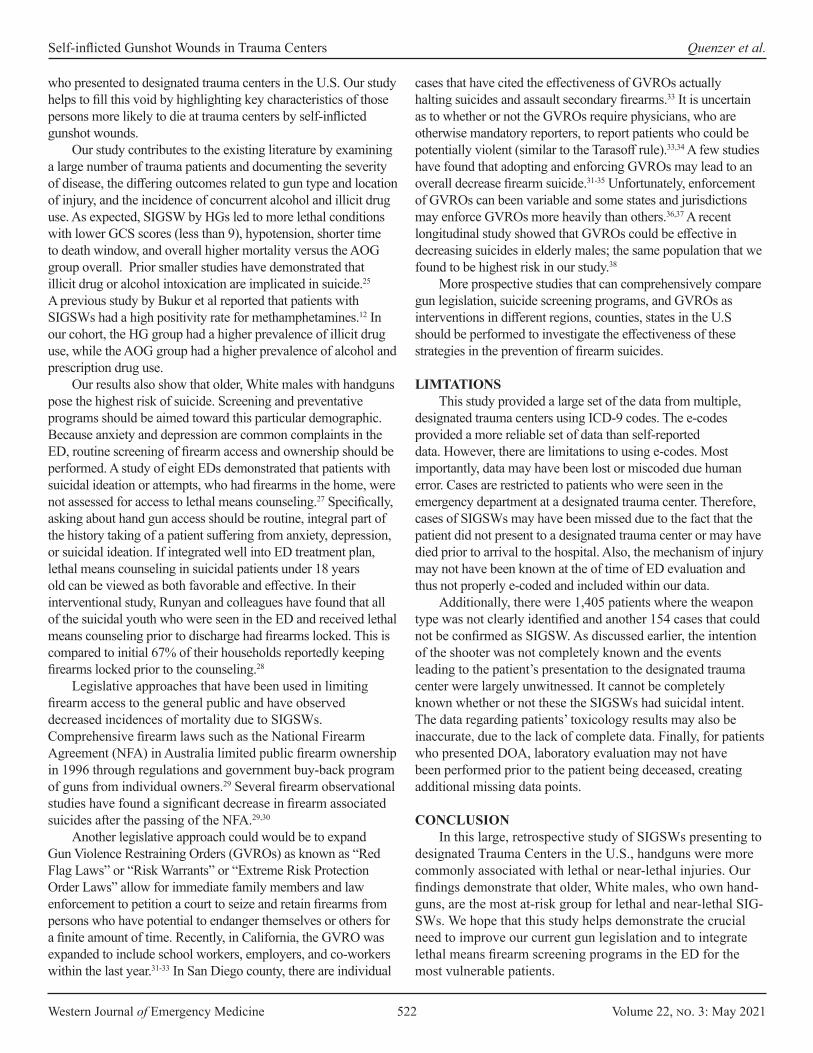
Western Journal of Emergency Medicine 522 Volume 22, no. 3: May 2021
Self-inflicted Gunshot Wounds in Trauma Centers Quenzer et al.
who presented to designated trauma centers in the U.S. Our study helps to fill this void by highlighting key characteristics of those persons more likely to die at trauma centers by self-inflicted gunshot wounds.
Our study contributes to the existing literature by examining a large number of trauma patients and documenting the severity of disease, the differing outcomes related to gun type and location of injury, and the incidence of concurrent alcohol and illicit drug use. As expected, SIGSW by HGs led to more lethal conditions with lower GCS scores (less than 9), hypotension, shorter time to death window, and overall higher mortality versus the AOG group overall. Prior smaller studies have demonstrated that illicit drug or alcohol intoxication are implicated in suicide.25 A previous study by Bukur et al reported that patients with SIGSWs had a high positivity rate for methamphetamines.12 In our cohort, the HG group had a higher prevalence of illicit drug use, while the AOG group had a higher prevalence of alcohol and prescription drug use.
Our results also show that older, White males with handguns pose the highest risk of suicide. Screening and preventative programs should be aimed toward this particular demographic. Because anxiety and depression are common complaints in the ED, routine screening of firearm access and ownership should be performed. A study of eight EDs demonstrated that patients with suicidal ideation or attempts, who had firearms in the home, were not assessed for access to lethal means counseling.27 Specifically, asking about hand gun access should be routine, integral part of the history taking of a patient suffering from anxiety, depression, or suicidal ideation. If integrated well into ED treatment plan, lethal means counseling in suicidal patients under 18 years old can be viewed as both favorable and effective. In their interventional study, Runyan and colleagues have found that all of the suicidal youth who were seen in the ED and received lethal means counseling prior to discharge had firearms locked. This is compared to initial 67% of their households reportedly keeping firearms locked prior to the counseling.28
Legislative approaches that have been used in limiting firearm access to the general public and have observed decreased incidences of mortality due to SIGSWs. Comprehensive firearm laws such as the National Firearm Agreement (NFA) in Australia limited public firearm ownership in 1996 through regulations and government buy-back program of guns from individual owners.29 Several firearm observational studies have found a significant decrease in firearm associated suicides after the passing of the NFA.29,30
Another legislative approach could would be to expand Gun Violence Restraining Orders (GVROs) as known as “Red Flag Laws” or “Risk Warrants” or “Extreme Risk Protection Order Laws” allow for immediate family members and law enforcement to petition a court to seize and retain firearms from persons who have potential to endanger themselves or others for a finite amount of time. Recently, in California, the GVRO was expanded to include school workers, employers, and co-workers within the last year.31-33 In San Diego county, there are individual
cases that have cited the effectiveness of GVROs actually halting suicides and assault secondary firearms.33 It is uncertain as to whether or not the GVROs require physicians, who are otherwise mandatory reporters, to report patients who could be potentially violent (similar to the Tarasoff rule).33,34 A few studies have found that adopting and enforcing GVROs may lead to an overall decrease firearm suicide.31-35 Unfortunately, enforcement of GVROs can been variable and some states and jurisdictions may enforce GVROs more heavily than others.36,37 A recent longitudinal study showed that GVROs could be effective in decreasing suicides in elderly males; the same population that we found to be highest risk in our study.38
More prospective studies that can comprehensively compare gun legislation, suicide screening programs, and GVROs as interventions in different regions, counties, states in the U.S should be performed to investigate the effectiveness of these strategies in the prevention of firearm suicides.
LIMTATIONSThis study provided a large set of the data from multiple,
designated trauma centers using ICD-9 codes. The e-codes provided a more reliable set of data than self-reported data. However, there are limitations to using e-codes. Most importantly, data may have been lost or miscoded due human error. Cases are restricted to patients who were seen in the emergency department at a designated trauma center. Therefore, cases of SIGSWs may have been missed due to the fact that the patient did not present to a designated trauma center or may have died prior to arrival to the hospital. Also, the mechanism of injury may not have been known at the of time of ED evaluation and thus not properly e-coded and included within our data.
Additionally, there were 1,405 patients where the weapon type was not clearly identified and another 154 cases that could not be confirmed as SIGSW. As discussed earlier, the intention of the shooter was not completely known and the events leading to the patient’s presentation to the designated trauma center were largely unwitnessed. It cannot be completely known whether or not these the SIGSWs had suicidal intent. The data regarding patients’ toxicology results may also be inaccurate, due to the lack of complete data. Finally, for patients who presented DOA, laboratory evaluation may not have been performed prior to the patient being deceased, creating additional missing data points.
CONCLUSIONIn this large, retrospective study of SIGSWs presenting to
designated Trauma Centers in the U.S., handguns were more commonly associated with lethal or near-lethal injuries. Our findings demonstrate that older, White males, who own hand-guns, are the most at-risk group for lethal and near-lethal SIG-SWs. We hope that this study helps demonstrate the crucial need to improve our current gun legislation and to integrate lethal means firearm screening programs in the ED for the most vulnerable patients.

Volume 22, no. 3: May 2021 523 Western Journal of Emergency Medicine
Quenzer et al. Self-inflicted Gunshot Wounds in Trauma Centers
ACKNOWLEDGEMENTSThis manuscript is dedicated to Dr. Frank Ercoli whose
life was tragically taken on June 8, 2020 by the very issue that was raised in our research which started in 2018. It would be completely remiss to not mention that he was a great example of a physician-teacher, jazz-musician, philanthropist, and a pillar of his community. Our patients, nurses, healthcare workers, and other physician colleagues admired his tenacious spirit and willingness to thoroughly educate those around him. He will be dearly missed by his family, friends, and all those he who worked so closely with him for decades.
Address for Correspondence: Faith Quenzer, DO, University of California, San Diego Medical Center, Department of Emergency Medicine, 200 West Arbor Drive Mail Code #8676, San Diego, California, 92103. Email: [email protected].
Conflicts of Interest: By the WestJEM article submission agreement, all authors are required to disclose all affiliations, funding sources and financial or management relationships that could be perceived as potential sources of bias. No author has professional or financial relationships with any companies that are relevant to this study. There are no conflicts of interest or sources of funding to declare.
Copyright: © 2021 Quenzer et al. This is an open access article distributed in accordance with the terms of the Creative Commons Attribution (CC BY 4.0) License. See: http://creativecommons.org/licenses/by/4.0/
REFERENCES1. Kochanek KD, Murphy SL, Xu JQ, et al. Deaths: Final data for 2017.
National Vital Statistics Reports. Hyattsville, MD: National Center for Health Statistics. 2019.68;9.
2. Miller M, Barber C, White R, et al. Firearms and Suicide in the United States: Is Risk Independent of Underlying Suicidal Behavior? Am J of Epidemio. 2013;178(6):946-55.
3. Wintemunte GJ, Parham CA, Beaumont JJ, et al. Mortality Among Recent Purchasers of Handguns. NEJM. 1999;341(21):1583-1589.
4. Sobrino J, Shafi S. Timing and causes of death after injuries. Proc (Bayl Univ Med Cent). 2013;26(2):120-3.
5. Phillips B, Turco L, McDonald D, Mause E, Walters RW. A subgroup analysis of penetrating injuries to the pancreas: 777 patients from the National Trauma Data Bank, 2010-2014. J Surg Res. 2018;225:131-41.
6. Acosta JA, Yang JC, Winchell RJ, et al. Lethal injuries and time to death in a level I trauma center. J Am Coll Surg. 1998;186(5):528-33.
7. Krug EG, Powell KE, Dahlberg LL. Firearm-related deaths in the United States and 35 other high- and upper-middle-income countries. Int J Epidemiol. 1998;27(2):214-21.
8. Grinshteyn E, Hemenway D. Violent Death Rates: The US Compared with Other High-income OECD Countries, 2010. Am J Med. 2016;129(3):266-73.
9. Romero MP and Wintemunte GJ. The Epidemiology of Firearm Suicide in the United States. J Urban Health. 2002;79(1):39-48.
10. Siegal M and Rothman E. Firearm Ownership and Suicide Rates Among US Men and Women, 1981-2013. AJPH. 2016;106(7):1316-22.
11. Anestis MD and Houtsma C. The Association Between Gun Ownership and Statewide Overall Suicide Rates. Suicide Life Threat Behav. 2018;48(2):204-17.
12. Bukur M, Inaba K, Barmparsa G, et al. Self-inflicted penetrating injuries at a Level I Trauma Center. Injury. 2011;42:474-7.
13. Spicer RS and Miller TR. Suicide Acts in 8 States: Incidence and Case Fatality Rates by Demographics and Method. Am J Public Health. 2000;90(12):1885–91.
14. Lustenberger T, Inaba K, Schnuriger B, et al. Gunshot Injuries in the Elderly: Patterns and Outcomes. A National Trauma Databank Analysis. World J Surg. 2011;35:528-34.
15. Stark DE and Shah NH. Funding and Publication of Research on Gun Violence and Other Leading Causes of Death. JAMA. 2017;317(1):84-6.
16. Kellermann AK, Rivara FP. Silencing the Science of Gun Research. JAMA. 2013;309(6):549-50.
17. Rubin R. Tale of 2 Agencies: CDC Avoids Gun Violence Research But NIH Funds it. JAMA. 2016;315(16):1689-91.
18. Azrael D, Hepburn L, Hemenway D, et al. The Stock and Flow of U.S. Firearms: Results from the 2015 National Firearms Survey. RSF. 2017;3(5):38-57.
19. Krous WJ. How many Guns Are in the United States? Gun Control Legislation. Washington, DC: United States. Congressional Research Service. 2012:8-9.
20. Saad L. What Percentage of Americans Own Guns? Gallup.com. Available at: https://news.gallup.com/poll/264932/percentage-americans-own-guns.aspx. Accessed March 31, 2021.
21. Cummings P, Koepsell TD, Grossman DC, et al. The association between the purchase of a handgun and homicide or suicide. Am J Public Health. 1997;87(6):974-8.
22. Studdert, DM, Zhang, Y, Swanson, SA, et al. Handgun Ownership and Suicide in California. N Engl J Med. 2020;382:2220-9.
23. Peterson LG, Peterson M, O’Shanick GJ. Self-Inflicted Gunshot Wounds; Lethality of Method Versus Intent. Am J Psychiatry. 1985;142:228-31
24. Selden BS, Goodman JM, Cordell W, et al. Outcome of Self-inflicted Gunshot Wounds of the Brain. Ann Emerg Med. 1988;17(3):115-21.
25. Sherman WD, Apuzzo ML, Heiden JS, et al. Gunshot Wounds to the Brain—A Civilian Experience. West J Med. 1980;132:99-105.
26. Elegbede A, Wasicek PJ, Mermulla S, et al. Survival following Self-Inflicted Gunshots to the Face. Plast Reconstr Surg. 2019;144(2):415-22.
27. Betz ME, Miller M, Barber C, et al. Lethal means access and assessment among suicidal emergency department patients. Depress Anxiety. 2016;33(6):502-11.
28. Runyan C, Becker A, Brandspigel S, et al. Lethal means counseling for parents of youth seeking emergency care for suicidality. West J Emerg Med. 2016;17:8-14.
29. Ozanne-Smith J, Ashby K, Newstead S, Stathakis VZ, Clapperton A. Firearm related deaths: the impact of regulatory reform. Inj Prev.
Western Journal of Emergency Medicine 524 Volume 22, no. 3: May 2021
Self-inflicted Gunshot Wounds in Trauma Centers Quenzer et al.
2004;10(5):280-6.30. Chapman S, Alpers P, Agho K, Jones M. Australia’s 1996 gun law
reforms: faster falls in firearm deaths, firearm suicides, and a decade without mass shootings. Inj Prev. 2006;12(6):365-72.
31. Gun Violence Restraining Orders Webpage. California Courts: The Judicial Branch of California. Available at: https://www.courts.ca.gov/33961.htm. Accessed August 18, 2019.
32. Swanson JW, Easter MM, Robertson AG, et al. J. Gun Violence, Mental Illness, And Laws That Prohibit Gun Possession: Evidence From Two Florida Counties. Health Aff (Millwood). 2016;35(6):1067-75.
33. Elliot, M. The Extreme Risk Protection Order Act of 2019 – Support: A letter to Diane Feinstein. From the Office of San Diego City Attorney. 2019. Available at: https://www.sandiego.gov/sites/default/files/la_190325_erpoa_feinstein.pdf. Accessed August 19, 2019.
34. Tarasoff v Regents of the University of California, 17 Cal 3d 425 (1976).35. Barnhorst A, Wintemute G, Betz ME. ETHICS CASE: How Should
Physicians Make Decisions about Mandatory Reporting When a Pa-tient Might Become Violent? AMA Journal of Ethics. 2018;20(1):29-35.
36. Mann JJ and Michel CA. Prevention of Firearm Suicide in the United States: What Works and What Is Possible. Am J Psychiatry. 2016;173(10):969-79.
37. Kivisto AJ and Phalen PL. Effects of Risk-Based Firearm Seizure Laws in Connecticut and Indiana on Suicide Rates, 1981–2015. Psychiatr Serv. 2018;69(8):855–62.
38. Saadi A, Choi KR, Takada S, et al. The impact of gun violence restraining order laws in the U.S. and firearm suicide among older adults: a longitudinal state-level analysis, 2012–2016. BMC Public Health. 2020; 20(1):334.
Volume 22, no. 3: May 2021 525 Western Journal of Emergency Medicine
Original Research
Documentation of Screening for Firearm Access by Healthcare Providers in the Veterans Healthcare System:
A Retrospective Study Cynthia A. Brandt, MD, MPH†*T. Elizabeth Workman, PhD‡§§
Melissa M. Farmer, PhD§
Kathleen M. Akgün, MD, MS†**Erica A. Abel, PhD†¶
Melissa Skanderson, MSW†
Bevanne Bean-Mayberry, MD, MHS§||
Qing Zeng-Treitler, PhDत
Maryann Mason, PhD#
Lori A. Bastian MD, MPH†**Joseph L. Goulet, PhD†*Lori A. Post, PhD#††
Section Editor: Chadd K. Kraus, DO, DrPH, MPH Submission history: Submitted December 16, 2020; Revision received March 31, 2021; Accepted April 1, 2021 Electronically published May 19, 2021 Full text available through open access at http://escholarship.org/uc/uciem_westjem DOI: 10.5811/westjem.2021.4.51203
Yale School of Medicine, Department of Emergency Medicine, New Haven, Connecticut VA Connecticut Healthcare System, West Haven, Connecticut The George Washington University, Biomedical Informatics Center, Washington, District of ColumbiaCenter for the Study of Healthcare Innovation, Implementation & Policy (CSHIIP), VA Greater Los Angeles Healthcare System, Los Angeles, CaliforniaYale School of Medicine, Department of Psychiatry, New Haven, ConnecticutUCLA David Geffen School of Medicine, Department of Medicine, Los Angeles, CaliforniaNorthwestern University, Department of Emergency Medicine, Chicago, IllinoisYale School of Medicine, Department of Internal Medicine, New Haven, Connecticut Northwestern University, Department of Geriatric Medicine, Chicago, IllinoisVA Medical Center, Washington, District of Columbia
*
†
‡
§
¶
||
#
**††
§§
Introduction: Presence of a firearm is associated with increased risk of violence and suicide. United States military veterans are at disproportionate risk of suicide. Routine healthcare provider screening of firearm access may prompt counseling on safe storage and handling of firearms. The objective of this study was to determine the frequency with which Veterans Health Administration (VHA) healthcare providers document firearm access in electronic health record (EHR) clinical notes, and whether this varied by patient characteristics.
Methods: The study sample is a post-9-11 cohort of veterans in their first year of VHA care, with at least one outpatient care visit between 2012-2017 (N = 762,953). Demographic data, veteran military service characteristics, and clinical comorbidities were obtained from VHA EHR. We extracted clinical notes for outpatient visits to primary, urgent, or emergency clinics (total 105,316,004). Natural language processing and machine learning (ML) approaches were used to identify documentation of firearm access. A taxonomy of firearm terms was identified and manually annotated with text anchored by these terms, and then trained the ML algorithm. The random-forest algorithm achieved 81.9% accuracy in identifying documentation of firearm access.
Results: The proportion of patients with EHR-documented access to one or more firearms during their first year of care in the VHA was relatively low and varied by patient characteristics. Men had significantly higher documentation of firearms than women (9.8% vs 7.1%; P < .001) and veterans >50 years old had the lowest (6.5%). Among veterans with any firearm term present, only 24.4% were classified as positive for access to a firearm (24.7% of men and 20.9% of women).
Conclusion: Natural language processing can identify documentation of access to firearms in clinical notes with acceptable accuracy, but there is a need for investigation into facilitators and barriers for providers and veterans to improve a systemwide process of firearm access screening. Screening, regardless of race/ethnicity, gender, and age, provides additional opportunities to protect veterans from self-harm and violence. [West J Emerg Med. 2021;22(3)525-532.]
Western Journal of Emergency Medicine 526 Volume 22, no. 3: May 2021
Screening for Firearm Access by Healthcare Providers in the VA System Brandt et al.
Population Health Research Capsule
What do we already know about this issue?United States Veterans are more likely to own a firearm and to be at risk for firearm injuries and death than civilian populations.
What was the research question?Our study aimed to determine how frequently VA healthcare providers document firearm access screening.
What was the major finding of the study?Documentation of firearm access for Veterans by healthcare providers was low but higher in men than women.
How does this improve population health?Identifying barriers and facilitators to help healthcare providers increase screening for firearms and counsel safe storage could support prevention efforts.
INTRODUCTIONIn 2020 42% of United States (US) households reported
owning a firearm.1 Firearms in the home increase risk of violent events,2-5 and is a significant threat to public health. Nearly half (44.9%) of all US military veterans own a firearm, with ownership reportedly higher among males (47.2%).6 Veterans are at disproportionate risk for suicide,7 accounting for 20% of suicide deaths despite constituting 13% of the US population. Firearms are involved in 67% of suicides among veterans compared with 50% of the general public.8
While access to firearms is associated with increased risk for injury and death, safe firearm storage is associated with decreased risk.9,10 Public health advocates recommend strategies to restrict access to lethal means as a suicide prevention strategy.11 For firearms these processes include safe storage measures such as gun safes, gun locks, storage of ammunition and guns separately, and storage of guns unloaded and locked. 12 Members of the military tend to store firearms unsafely with 45.2% reporting they store firearms both loaded and unlocked, and an additional 33% store firearms either loaded or unlocked.13,14
Screening veterans for firearms ownership and safe storage is needed to prevent unnecessary injuries and deaths. Healthcare providers are in a position to screen and counsel patients on safe firearm storage.4 Counseling on health and safety is a well-established healthcare practice; there are guidelines for screening and counseling in many areas of health including healthy eating, physical activity, mental health, and injury prevention.15 While firearm-related injuries and deaths are a public health problem, particularly in the US,16 a minority of physicians report engaging in firearm counseling.17 Despite several groups having recommended both targeted and universal screening for firearm access,17-24 there are no current national guidelines for screening in primary care, urgent care or emergency care settings even though gun safety is associated with lower risk of injuries and death.25,26
To understand how current practice may be adapted, more information on the frequency with which healthcare providers document firearm screening is needed. In this study we present results of Veterans Health Administration (VHA) healthcare providers’ documentation of firearm access screening in electronic health record (EHR) notes among VHA patients in outpatient primary care, urgent care, and emergency department (ED) settings.
METHODSThe study is a cross-sectional examination of the
frequency of documentation of screening for veterans’ access to firearms across several healthcare settings using natural language processing (NLP), which refers to automatic computational processing of human language.27 The study was approved by the Veterans Administration Connecticut
Healthcare System Institutional Review Board. The study sample included men and women veterans
from a national, post-9-11 cohort28,29 during their first year of VHA healthcare, defined by the presence of at least one primary care visit from 2012-2017. We obtained data on demographic and veteran military service characteristics from the Defense Manpower Data Center–Contingency Tracking System Deployment File, provided to the VHA from the US Department of Defense. Variables included age, gender, race/ethnicity, marital status, education, rank (e.g., officer, enlisted), military branch (e.g., Army, Marine Corps), and deployment dates. VHA visit information came from EHR data extracted from the Corporate Data Warehouse (CDW). The CDW includes information on healthcare utilization, pharmacy, laboratory, vital signs, coded diagnostic and procedural data (International Classification of Diseases, 9th and 10th revisions, Clinical Modification [ICD-9-CM and ICD-10-CM]) and Current Procedural Terminology (associated with all VHA inpatient and outpatient encounters.30,31
We identified comorbid conditions using ICD-9 and ICD-10 coded diagnoses defined by ≥2 outpatient (on separate days) or ≥1 inpatient code for the condition. This methodology has been used for the identification of psychiatric disorders in administrative data32 and human immunodeficiency virus in Medicaid data.33 Diagnostic code groupings were previously validated.34 Major mental health diagnoses included post-traumatic stress disorders (PTSD), major depressive disorders,
Volume 22, no. 3: May 2021 527 Western Journal of Emergency Medicine
Brandt et al. Screening for Firearm Access by Healthcare Providers in the VA System
alcohol use disorders, and substance use disorders.
Natural Langauge Processing Tool Development and Performance for Firearm Access IdentificationFirearm Taxonomy
For the information extraction process, we developed a coding manual for chart review and a taxonomy for firearms for annotation. A taxonomy was created by by searching existing vocabularies (NCBIO, UMLS, SnoMed) and the literature for published ontologies used for guns, gunlock, and firearms. A Cochrane review on gunshot wounds contained terms such as trauma* or injur* or penetrat* or wound*or perforat* or stab* or gunshot or shot, and the Medical Subject Headings (MeSH) database included the following: “Wounds, Gunshot”[Mesh]) OR “Wounds, Penetrating”[Mesh:NoExp]) OR“Multiple Trauma”[Mesh])) OR “polytrauma.” This list of terms was supplemented with over 120 candidate terms and phrases contained in a national database35 on firearm homicides. We then reviewed and narrowed the phrases down to 27 (shown in Table 1) deemed relevant by VHA clinicians.
AnnotationWe identified 2,584,607 notes with one or more of the
phrases, and annotated 1856 text snippets randomly selected from notes that contained any of the search terms. Each snippet contains a 35-word span before and after a firearm-relevant phrase. The annotation classifications for firearm access were the following: positive (ability to determine that the veteran had current access to at least one firearm); negative (language that the veteran did not have current access to any firearms); and ambiguous (there was insufficient evidence for either a positive or negative classification from the note – an example
might be that the veteran owned a firearm but it was somewhere else). Each snippet was annotated by two of the authors and disagreement adjudicated by their consensus. An inter-annotator agreement was calculated. The annotated snippets served as the reference standard in training and testing.
FeaturesWe used n-grams as features. In clinical text, unigrams
are single words, and bigrams are two words that occur in a sequence. For example, in the phrase “patient owns a shotgun” the unique unigrams are patient, owns, a, and shotgun. In the same phrase, patient_owns, owns_a, a_shotgun are unique bigrams. Alpha or numeric tokens (discrete words and numbers) were counted in the unigrams and bigrams. The features included unique unigrams with a frequency greater than 34, and unique bigrams in the annotation spans with a frequency greater than four. These threshholds are empirically chosen to filter out the less prevalent n-grams and reduce overfitting. The training features for the model (for each document) consisted of binary indications of the presence of each of the identified unigrams and bigrams, along with the offset location of the keyphrase in the snippet.
Training and TestingWe used the annotated snippets to train a random forest
model with 200 estimators or trees. The random forest model maximum depth was set to 15, with maximum features automatically determined by the model and the gini split criterion. Hyperparameters were determined through gridsearch and other testing. We split the 1856 text snippets into 85% for training and 15% for testing. The model performance was measured by accuracy.
ValidationFor validation, we annotated an additional 238 clinical
notes on the note (instead of the snippet) level, with 175 negtive and 63 positive for firearm access. The random forest model was applied to these notes, based on the snippet identified in each document. Figure 1 below is a schematic of this process.
Statistical AnalysisWe conducted all statistical analyses using SAS software
version 9.4 (SAS Institute, Cary, NC). Baseline characteristics of veterans include frequency (percentages) and means (± standard deviations) or median (interquartile range), and differences by age, race, ethnicity and gender were examined using chi-squared test or Student’s t test, as appropriate. We used a multivariable logistic regression model to assess firearm mention and adjust for potential confounding based on the literature. Among those with firearm mention, a logistic model was run to assess firearm access. We examined model fit using quasi-information criterion and residual plots. Hypotheses were tested at a two-sided significance level of α = 0.05.
Term Count Term CountRifle 45,897 38 caliber 58Pistol 32,893 9 mm Beretta 49Shotgun 25,761 Arms dealer 5112 gauge 848 Blue suicide 39 mm Glock 59 Home invasion 2,94045 caliber 417 Minigun 622 caliber 281 Mossberg shotgun 6Semiautomatic 90 Pistol whip 105357 Magnum 140 Revolver 2,295M1 rifle 4 Ruger pistol 5Gun 653,308 Smith and Wesson 253Guns 423,119 Sniper rifle 370Firearm 305,766 Winchester rifle 8Firearms 1,089,875
Table 1. Counts of firearm-related terms found in notes (N = 27 terms).
mm, millimeter.

Western Journal of Emergency Medicine 528 Volume 22, no. 3: May 2021
Screening for Firearm Access by Healthcare Providers in the VA System Brandt et al.
RESULTSThe Cohen kappa score measuring inter-annotator
agreement among the review team members identifying screening documentation incidents was 80%. On the testing dataset (15%), the accuracy was 81.0%. On the final validation dataset, the random forest model achieved 81.9% accuracy, 90.9% specificity, 57.1% sensitivity, and positive predictive value of 69.2% in classifying the 238 test notes. Table 1 demonstrates the frequency of the most common firearm-related terms within the VHA text notes. These counts are non-distinct by patient but demonstrate the breadth of terms used in clinical notes by providers; many of the highly specific terms were present in notes as historical and exposure events for PTSD documentation, and/or noise exposure (out of 105,316,004 outpatient care notes).
We included data during the first year in VHA care for 762,953 veterans in the analytic sample. Table 2 demonstrates the frequency of documentation of access to firearms and other guns by clinicians within one year of entry into VHA healthcare. The mention of any firearm within a clinical note for veterans was 9.8% of men, 7.1% of women, and 6.5% in veterans over 50 years of age. Among the small number of veterans with any firearm term present, only 24% were classified as positive for access to a firearm (24.7% of men and 20.9% of women [data not otherwise shown]). Prevalence patterns by race of any mention/positive access were similar, with the highest rates among Whites (9.6% mention and 26.3% access [data not otherwise shown]). Documentation of firearms was higher in veterans with higher numbers of mental health visits, emergency and urgent care visits than primary care. Documentation of firearms did not vary regardless of the number of primary care visits (data not shown). After adjustment for demographics, utilization, and comorbidities, significant differences in documentation of access remained by age, gender, and among veterans with major depression or PTSD diagnoses.
DISCUSSIONResults demonstrate documentation of firearm access
in clinical notes for less than 10% of contemporary veterans within the first year of enrollment in VHA healthcare, and that nearly one quarter of those with documentation were identified
as having access to a firearm. There was a significantly lower rate of documented access for women veterans, despite data that show high rates of both men and women veterans who live in homes with firearms, and increasing rates of fiream-related suicides among women veterans.6,36 While documentation does not always equate with conversations between providers and patients, the low frequency of documented patient-provider interactions seen in this population suggests that there is a clear opportunity to increase initiation of conversations about firearm access and safety. Barriers to implementation of firearm screening and safety counseling include provider uncertainty about the effectiveness of firearm screening, provider uncertainty about the legality of asking about firearm ownership, and provider unfamiliarity with firearms. Further, provider unfamiliarity with lethal means restriction as a firearm suicide prevention strategy may prohibit uptake of screening and counseling.17,23,37-39 These barriers indicate a need for increased training of healthcare providers on firearm screening and safety counseling and normalizing the opportunities to discuss firearms in a population that has higher rates of firearm ownership and use.
Discussions must be acceptable to providers and to patients for it to be effective. Roszko and colleagues’ review of 53 studies of non-veteran clinician firearm attitudes and practices found that positive attitudes toward firearm discussions were higher than actual documented discussions, with low firearm discussions across all disciplines.17 This is encouraging in that it could indicate healthcare providers may be willing to undergo training in initiating and carrying out these discussions, although it remains to be seen whether attitudes differ among VA providers.
While providers may have positive attitudes toward firearm screening and counseling, recent studies show mixed support by gun owners and veterans for healthcare provider initiation of gun safety conversations.11,40 This suggests that while providers may be willing to initiate these discussions, it is not clear that patients will welcome or participate in them if initiated. Such conversations will need to be clearly delineated as prevention oriented for gun-owning citiziens and families with specific, evidence-based practices such as the following: Homes with locked guns are less likely to have unintentional or self-inflicted injuries with firearms or deaths.41
Figure 1. Application pipeline.EHR, electronic health record; ML, machine learning.
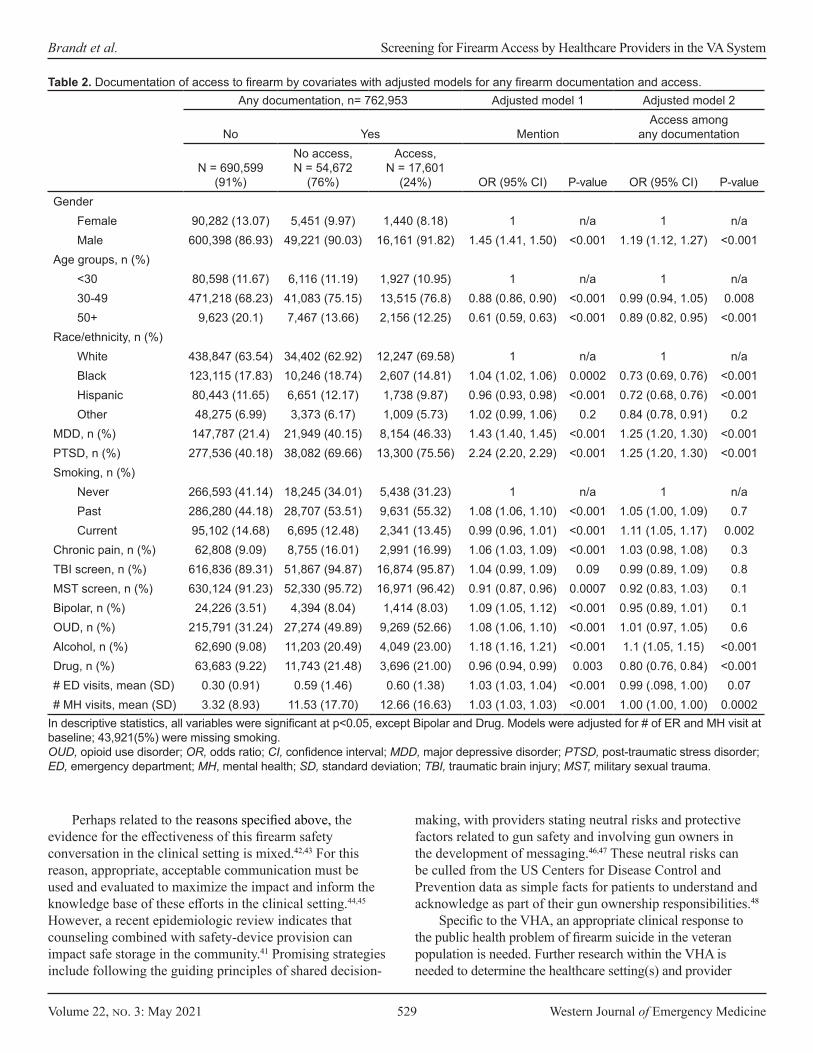
Volume 22, no. 3: May 2021 529 Western Journal of Emergency Medicine
Brandt et al. Screening for Firearm Access by Healthcare Providers in the VA System
Any documentation, n= 762,953 Adjusted model 1 Adjusted model 2
No Yes MentionAccess among
any documentation
N = 690,599 (91%)
No access, N = 54,672
(76%)
Access, N = 17,601
(24%) OR (95% CI) P-value OR (95% CI) P-valueGender
Female 90,282 (13.07) 5,451 (9.97) 1,440 (8.18) 1 n/a 1 n/aMale 600,398 (86.93) 49,221 (90.03) 16,161 (91.82) 1.45 (1.41, 1.50) <0.001 1.19 (1.12, 1.27) <0.001
Age groups, n (%)<30 80,598 (11.67) 6,116 (11.19) 1,927 (10.95) 1 n/a 1 n/a30-49 471,218 (68.23) 41,083 (75.15) 13,515 (76.8) 0.88 (0.86, 0.90) <0.001 0.99 (0.94, 1.05) 0.00850+ 9,623 (20.1) 7,467 (13.66) 2,156 (12.25) 0.61 (0.59, 0.63) <0.001 0.89 (0.82, 0.95) <0.001
Race/ethnicity, n (%)White 438,847 (63.54) 34,402 (62.92) 12,247 (69.58) 1 n/a 1 n/aBlack 123,115 (17.83) 10,246 (18.74) 2,607 (14.81) 1.04 (1.02, 1.06) 0.0002 0.73 (0.69, 0.76) <0.001Hispanic 80,443 (11.65) 6,651 (12.17) 1,738 (9.87) 0.96 (0.93, 0.98) <0.001 0.72 (0.68, 0.76) <0.001Other 48,275 (6.99) 3,373 (6.17) 1,009 (5.73) 1.02 (0.99, 1.06) 0.2 0.84 (0.78, 0.91) 0.2
MDD, n (%) 147,787 (21.4) 21,949 (40.15) 8,154 (46.33) 1.43 (1.40, 1.45) <0.001 1.25 (1.20, 1.30) <0.001PTSD, n (%) 277,536 (40.18) 38,082 (69.66) 13,300 (75.56) 2.24 (2.20, 2.29) <0.001 1.25 (1.20, 1.30) <0.001Smoking, n (%)
Never 266,593 (41.14) 18,245 (34.01) 5,438 (31.23) 1 n/a 1 n/aPast 286,280 (44.18) 28,707 (53.51) 9,631 (55.32) 1.08 (1.06, 1.10) <0.001 1.05 (1.00, 1.09) 0.7Current 95,102 (14.68) 6,695 (12.48) 2,341 (13.45) 0.99 (0.96, 1.01) <0.001 1.11 (1.05, 1.17) 0.002
Chronic pain, n (%) 62,808 (9.09) 8,755 (16.01) 2,991 (16.99) 1.06 (1.03, 1.09) <0.001 1.03 (0.98, 1.08) 0.3TBI screen, n (%) 616,836 (89.31) 51,867 (94.87) 16,874 (95.87) 1.04 (0.99, 1.09) 0.09 0.99 (0.89, 1.09) 0.8MST screen, n (%) 630,124 (91.23) 52,330 (95.72) 16,971 (96.42) 0.91 (0.87, 0.96) 0.0007 0.92 (0.83, 1.03) 0.1Bipolar, n (%) 24,226 (3.51) 4,394 (8.04) 1,414 (8.03) 1.09 (1.05, 1.12) <0.001 0.95 (0.89, 1.01) 0.1OUD, n (%) 215,791 (31.24) 27,274 (49.89) 9,269 (52.66) 1.08 (1.06, 1.10) <0.001 1.01 (0.97, 1.05) 0.6Alcohol, n (%) 62,690 (9.08) 11,203 (20.49) 4,049 (23.00) 1.18 (1.16, 1.21) <0.001 1.1 (1.05, 1.15) <0.001Drug, n (%) 63,683 (9.22) 11,743 (21.48) 3,696 (21.00) 0.96 (0.94, 0.99) 0.003 0.80 (0.76, 0.84) <0.001# ED visits, mean (SD) 0.30 (0.91) 0.59 (1.46) 0.60 (1.38) 1.03 (1.03, 1.04) <0.001 0.99 (.098, 1.00) 0.07# MH visits, mean (SD) 3.32 (8.93) 11.53 (17.70) 12.66 (16.63) 1.03 (1.03, 1.03) <0.001 1.00 (1.00, 1.00) 0.0002
Table 2. Documentation of access to firearm by covariates with adjusted models for any firearm documentation and access.
In descriptive statistics, all variables were significant at p<0.05, except Bipolar and Drug. Models were adjusted for # of ER and MH visit at baseline; 43,921(5%) were missing smoking.OUD, opioid use disorder; OR, odds ratio; CI, confidence interval; MDD, major depressive disorder; PTSD, post-traumatic stress disorder; ED, emergency department; MH, mental health; SD, standard deviation; TBI, traumatic brain injury; MST, military sexual trauma.
Perhaps related to the reasons specified above, the evidence for the effectiveness of this firearm safety conversation in the clinical setting is mixed.42,43 For this reason, appropriate, acceptable communication must be used and evaluated to maximize the impact and inform the knowledge base of these efforts in the clinical setting.44,45 However, a recent epidemiologic review indicates that counseling combined with safety-device provision can impact safe storage in the community.41 Promising strategies include following the guiding principles of shared decision-
making, with providers stating neutral risks and protective factors related to gun safety and involving gun owners in the development of messaging.46,47 These neutral risks can be culled from the US Centers for Disease Control and Prevention data as simple facts for patients to understand and acknowledge as part of their gun ownership responsibilities.48
Specific to the VHA, an appropriate clinical response to the public health problem of firearm suicide in the veteran population is needed. Further research within the VHA is needed to determine the healthcare setting(s) and provider
Western Journal of Emergency Medicine 530 Volume 22, no. 3: May 2021
Screening for Firearm Access by Healthcare Providers in the VA System Brandt et al.
types most appropriate for firearm screening and counseling interventions. This step will require a participatory approach among health services and informatics researchers to improve the feasibility, acceptability, relevance, and sustainability of interventions.49-52 In addition, research is needed to determine the modality and intervention format (electronic, face to face, written) that are most effective for each of the key domains in firearm injury research. Data on the moderators of acceptability and effectiveness (demographics, political views, comorbidities, etc.) of screening and interventions from the veteran and provider perspectives are needed. Only then can researchers begin to measure the short- and longer-term outcomes of such interventions and policies. While this approach is clearly specific to the clinical context and persons involved for veteran prevention with firearms, prevention is likely best on the frontlines of care and where repeated encounters occur with trust-building relationships. Thus, primary care, mental health and ED settings/providers may need to partner with the health services and health informatics researchers to fully address the scope of this need and develop interventions that fit the veteran patients and the VHA system. Equipped with information and curiosity, clinicians can engage their veteran patients as part of routine care, instead of urgent or emergent care, and the health services and health informatics teams can inform us about which methods are most feasible and impactful for veteran quality of life and provider use and sustainability.
LIMITATIONSGiven retrospective studies may introduce sampling
bias53, we included the entire population, not a sample. The results of the NLP algorithm were limited for the first year of entry into VHA healthcare for years 2012-2017, which might underestimate firearm documentation. The identification of firearm documentation for patterns such as temporal changes, variations in types of providers and provider settings, and other patient characteristics will be explored in future work. For example, in this sample there were increases by year (from 3% in 2012 to 21% in 2017). Further research is needed to help explain this increase.
CONCLUSION Natural language processing methods are able to determine
the prevalence of documented firearm screening and safety counseling across a large population of US military veterans. We identified low prevalence of firearm access screening documentation and believe that further investigation into facilitators and barriers is necessary. This work should inform the process for development of systemwide practices to reduce firearm suicide and injury among US veterans, a large group at elevated risk.
ACKNOWLEDGMENTSThis work was funded by Veterans Affairs Health Services
Research and Development Services grants IIR 18-035
Understanding Suicide Risks among LGBT Veterans in VA Care (Goulet, Zeng) and IIR 12-118 Women Veterans Cohort Study 2 (Haskell, Brandt, and Mattocks); and as part of an operational quality improvement project at Veterans Administration (VA) Connecticut and VA Greater Los Angeles for the Department of Veterans Affairs through a specific request from VA Women’s Health Services within the Office of Patient Care Services.
Address for Correspondence: Cynthia A. Brandt, MD, MPH, Yale School of Medicine, Department of Emergency Medicine, 464 Congress Ave., Suite 26, New Haven, CT 06519-1315. Email: [email protected].
Conflicts of Interest: By the WestJEM article submission agreement, all authors are required to disclose all affiliations, funding sources and financial or management relationships that could be perceived as potential sources of bias. No author has professional or financial relationships with any companies that are relevant to this study. There are no conflicts of interest or sources of funding to declare. The views expressed in this paper are those of the authors and do not necessarily represent the views of the United Stated Department of Veterans Affairs, the United States Government, or the affiliated academic institutions.
Copyright: © 2021 Brandt et al. This is an open access article distributed in accordance with the terms of the Creative Commons Attribution (CC BY 4.0) License. See: http://creativecommons.org/licenses/by/4.0/
REFERENCES1. Gun ownership in the U.S. 1972-2020. 2020. Available at: https://www.
statista.com/statistics/249740/percentage-of-households-in-the-united-states-owning-a-firearm/. Accessed December 13, 2020.
2. Dempsey CL, Benedek DM, Zuromski KL, et al. Association of firearm ownership, use, accessibility, and storage practices with suicide risk among US Army soldiers. JAMA Netw Open. 2019;2(6):e195383.
3. Anglemyer A, Horvath T, Rutherford G. The accessibility of firearms and risk for suicide and homicide victimization among household members: a systematic review and meta-analysis. Ann Intern Med. 2014;160(2):101-10.
4. Berrigan J, Azrael D, Hemenway D, Miller M. Firearms training and storage practices among US gun owners: a nationally representative study. Inj Prev. 2019;25(Suppl 1):i31-8.
5. Miller M, Hemenway D, Azrael D. State-level homicide victimization rates in the US in relation to survey measures of household firearm ownership, 2001-2003. Soc Sci Med. 2007;64(3):656-64.
6. Cleveland EC, Azrael D, Simonetti JA, Miller M. Firearm ownership among American veterans: findings from the 2015 National Firearm Survey. Inj Epidemiol. 2017;4(1):33.
7. Adams J, van Dahlen B. Preventing suicide in the United States. Public Health Rep. 2020;136(1):3-5.
8. Waliski A, Matthieu MM, Townsend JC, McGaugh J, Kirchner J. Understanding veteran suicide by firearm. J Veterans Stud. 2017;2(2):91-109.

Volume 22, no. 3: May 2021 531 Western Journal of Emergency Medicine
Brandt et al. Screening for Firearm Access by Healthcare Providers in the VA System
9. Monuteaux MC, Azrael D, Miller M. Association of increased safe household firearm storage with firearm suicide and unintentional death among US youths. JAMA Pediatr. 2019;173(7):657-62.
10. Mann JJ, Michel CA. Prevention of firearm suicide in the United States: what works and what is possible. Am J Psychiatry. 2016;173(10):969-79.
11. Betz ME, Miller M, Barber C, et al. Lethal means access and assessment among suicidal emergency department patients. Depress Anxiety. 2016;33:502-511.
12. What qualifies as a secure gun storage or safety device? 2015. Available at: https://www.atf.gov/firearms/qa/what-qualifies-secure-gun-storage-or-safety-device. Accessed December 13, 2020.
13. Anestis MD, Bandel SL, Butterworth SE, et al. Suicide risk and firearm ownership and storage behavior in a large military sample. Psychiatry Res. 2020;291:113277.
14. Simonetti JA, Azrael D, Miller M. Firearm storage practices and risk perceptions among a nationally representative sample of U.S. Veterans with and without self-harm risk factors. Suicide Life Threat Behav. 2019;49(3):653-64.
15. Health maintenance and counseling. Am Fam Physician. 2020. Available at: https://www.aafp.org/afp/topicModules/viewTopicModule.htm?topicModuleId=64#0. Accessed December 13, 2020.
16. Grinshteyn E, Hemenway D. Violent death rates: the US compared with other high-income OECD countries, 2010. Am J Med. 2016;129(3):266-73.
17. Roszko PJ, Ameli J, Carter PM, Cunningham RM, Ranney ML. Clinician attitudes, screening practices, and interventions to reduce firearm-related injury. Epidemiol Rev. 2016;38(1):87-110.
18. Betz ME, Knoepke CE, Siry B, et al. ‘Lock to Live’: development of a firearm storage decision aid to enhance lethal means counselling and prevent suicide. Inj Prev. 2019;25(Suppl 1):i18-i24.
19. Feldman MD. Guns, doctors and public health. J Gen Intern Med. 2016;31(10):1109-10.
20. Parent B. Physicians asking patients about guns: promoting patient safety, respecting patient Rights. J Gen Intern Med. 2016;31(10):1242-5.
21. Ranney ML, Fletcher J, Alter H, et al. A consensus-driven agenda for emergency medicine firearm injury prevention research. Ann Emerg Med. 2017;69(2):227-40.
22. Weiss RT. Removing the “Silencer”: Coverage and protection of physician speech under the First Amendment. Duke Law J. 2016;65(4):801-42.
23. Wintemute GJ, Betz ME, Ranney ML. Physicians, patients, and firearms. Ann Intern Med. 2016;165(12):893.
24. Wintemute GJ, Betz ME, Ranney ML. Yes, you can: physicians, patients, and firearms. Ann Intern Med. 2016;165(3):205-13.
25. Jakupcak M, Varra EM. Treating Iraq and Afghanistan war veterans with PTSD who are at high risk for suicide. Cogn Behav Pract. 2011;18(1):85-97.
26. Simonetti JA, Azrael D, Rowhani-Rahbar A, Miller M. Firearm storage practices among American veterans. Am J Prev Med. 2018;55(4):445-4.
27. Chowdhury GG. Natural language processing. Annual Review of Information Science and Technology. 2003;37(1):51-89.
28. Haskell SG, Brandt C, Burg M, et al. Incident Cardiovascular risk factors among men and women veterans after return from deployment. Med Care. 2017;55(11):948-955.
29. Haskell SG, Mattocks K, Goulet JL, et al. The burden of illness in the first year home: Do male and female VA users differ in health conditions and healthcare utilization? Womens Health Issues. 2011;21(1):92-7.
30. Nelson JP, Pederson LL, Lewis J. Tobacco use in the Army: illuminating patterns, practices, and options for treatment. Mil Med. 2009;174(2):162-9.
31. McGinnis KA, Brandt CA, Skanderson M, et al. Validating smoking data from the Veteran’s Affairs Health Factors dataset, an electronic data source. Nicotine Tob Res. 2011;13(12):1233-9.
32. Lurie N, Popkin M, Dysken M, Moscovice I, Finch M. Accuracy of diagnoses of schizophrenia in Medicaid claims. Hosp Community Psychiatry. 1992;43(1):69-71.
33. Walkup JT, Wei W, Sambamoorthi U, Crystal S. Sensitivity of an AIDS case-finding algorithm: Who are we missing? Med Care. 2004;42(8):756-63.
34. HCUP. Clinical Classifications Software (CCS) for ICD-9-CM. CCS Classification software website for healthcare cost and utilization project (HCUP). Available at: http://www.hcup-us.ahrq.gov/toolssoftware/ccs/ccs.jsp. Accessed May 3, 2013.
35. Anestis MD. Advancing Suicide Prevention Through a Focus on Firearm Safety. Am J Public Health. 2017;107(11):1701-2.
36. 2019 National Veteran Suicide Prevention Annual Report. Office of Mental Health and Suicide Prevention. In: Affairs UDoV, ed2019.
37. Betz ME, Miller M, Barber C, et al. Lethal means restriction for suicide prevention: beliefs and behaviors of emergency department providers. Depress Anxiety. 2013;30(10):1013-20.
38. Johnson-Young EA, McDonald D, Burrell T, et al. Understanding pediatric residents’ communication decisions regarding anticipatory guidance about firearms. J Health Commun. 2020;25(3):243-50.
39. Runyan CW, Brooks-Russell A, Betz ME. Points of influence for lethal means counseling and safe gun storage practices. J Public Health Manag Pract. 2019;25(1):86-9.
40. ScienceDaily. Firearm injuries becoming more severe. APHA News Releases 2017. Available at: https://www.apha.org/news-and-media/news-releases/apha-news-releases/2017/am-research-release-firearm-injury. Accessed October 14, 2020.
41. Rowhani-Rahbar A, Simonetti JA, Rivara FP. Effectiveness of interventions to promote safe firearm storage. Epidemiol Rev. 2016;38(1):111-24.
42. Kruesi MJ, Grossman J, Pennington JM, Woodward PJ, Duda D, Hirsch JG. Suicide and violence prevention: parent education in the emergency department. J Am Acad Child Adolesc Psychiatry. 1999;38(3):250-5.
43. Brent DA, Baugher M, Birmaher B, Kolko DJ, Bridge J. Compliance with recommendations to remove firearms in families participating in a clinical trial for adolescent depression. J Am Acad Child Adolesc Psychiatry. 2000;39(10):1220-6.
44. Barber C, Frank E, Demicco R. Reducing suicides through partnerships between health professionals and gun owner groups-beyond docs vs Glocks. JAMA Intern Med. 2017;177(1):5-6.

Western Journal of Emergency Medicine 532 Volume 22, no. 3: May 2021
Screening for Firearm Access by Healthcare Providers in the VA System Brandt et al.
45. Barber C, Hemenway D, Miller M. How physicians can reduce suicide-without changing anyone’s mental health. Am J Med. 2016;129(10):1016-7.
46. Betz ME, Wintemute GJ. Physician counseling on firearm safety: a new kind of cultural competence. JAMA. 2015;314(5):449-50.
47. Betz M. How to talk about guns and suicide. 2017. Podcast. Available at: https://www.tedxmilehigh.com/emmy-betz/. Accessed December 14, 2020.
48. Firearm Violence Prevention. 2020. Available at: https://www.cdc.gov/violenceprevention/firearms/fastfact.html. Accessed December 15, 2020.
49. Unertl KM, Schaefbauer CL, Campbell TR, et al. Integrating community-based participatory research and informatics approaches to improve the engagement and health of underserved populations. J Am Med Inform
Assoc. 2016;23(1):60-73.50. Millery M, Aguirre AN, Kukafka R. Does a community-engaged health
informatics platform facilitate resource connectivity? An evaluation framework. AMIA Annu Symp Proc. 2017:1292-301.
51. Millery M, Ramos W, Lien C, Aguirre AN, Kukafka R. Design of a community-engaged health informatics platform with an architecture of participation. AMIA Annu Symp Proc. 2015:905-14.
52. Wang KH, Hambleton I, Linnander E, et al. Towards reducing health information inequities in the Caribbean: our experience building a participatory health informatics project. Ethn Dis. 2020;30(Suppl 1):193-202.
53. Jager KJ, Tripepi G, Chesnaye NC, et al. Where to look for the most frequent biases? Nephrology (Carlton). 2020;25(6):435-41.

Volume 22, no. 3: May 2021 533 Western Journal of Emergency Medicine
Review
Assessing Violence Risk in Adolescents in the Pediatric Emergency Department: Systematic Review and Clinical Guidance
Megan M. Mroczkowski, MD*John T. Walkup, MD†
Paul S. Appelbaum, MD*
Section Editor: Muhammad Waseem, MD Submission history: Submitted July 24, 2020; Revision received January 10, 2021; Accepted January 24, 2021Electronically published May 19, 2021 Full text available through open access at http://escholarship.org/uc/uciem_westjem DOI: 10.5811/westjem.2021.1.49233
BACKGROUNDViolence or aggression among adolescents is a common
problem of enormous public health significance. Physical fighting is the most common form of violence in adolescents.1 In addition to the increased risk for injury and substance abuse, those who fight report less satisfaction with life, poorer relations with family and peers, and a worse perception of school. Within the past 12 months, 32.8% of high school-
Columbia University Irving Medical Center, Department of Psychiatry, New York, New YorkAnn & Robert H. Lurie Children’s Hospital of Northwestern University, Department of Psychiatry and Behavioral Sciences, Chicago, Illinois
*
†
Introduction: Violence risk assessment is one of the most frequent reasons for child and adolescent psychiatry consultation with adolescents in the pediatric emergency department (ED). Here we provide a systematic review of risk factors for violence in adolescents using the risk factor categories from the MacArthur Violence Risk Assessment study. Further, we provide clinical guidance for assessing adolescent violence risk in the pediatric ED.
Methods: For this systematic review, we used the preferred reporting items for systematic reviews and meta-analyses (PRISMA) 2009 checklist. We searched PubMed and PsycINFO databases (1966–July 1, 2020) for studies that reported risk factors for violence in adolescents.
Results: Risk factors for adolescent violence can be organized by MacArthur risk factor categories. Personal characteristics include male gender, younger age, no religious affiliation, lower IQ, and Black, Hispanic, or multiracial race. Historical characteristics include a younger age at first offense, higher number of previous criminal offenses, criminal history in one parent, physical abuse, experiencing poor child-rearing, and low parental education level. Among contextual characteristics, high peer delinquency or violent peer- group membership, low grade point average and poor academic performance, low connectedness to school, truancy, and school failure, along with victimization, are risk factors. Also, firearm access is a risk factor for violence in children and adolescents. Clinical characteristics include substance use, depressive mood, attention deficit hyperactivity disorder, antisocial traits, callous/unemotional traits, grandiosity, and justification of violence.
Conclusion: Using MacArthur risk factor categories as organizing principles, this systematic review recommends the Structured Assessment of Violence Risk in Youth (SAVRY) risk- assessment tool for assessing adolescent violence risk in the pediatric ED. [West J Emerg Med. 2021;22(3)533–542.]
aged youth have been in a fight and 16.6% carried weapons to school.2 Since the 1980s, youths aged 10-17 years constituted less than 12% of the US population but have been offenders in 25% of serious violent victimizations.3
The evolution of violence can be conceptualized to begin in young childhood. Children first learn to manage aggression from their parents as toddlers; poor parenting, such as abuse, neglect, coercive parenting styles, antisocial modeling, and
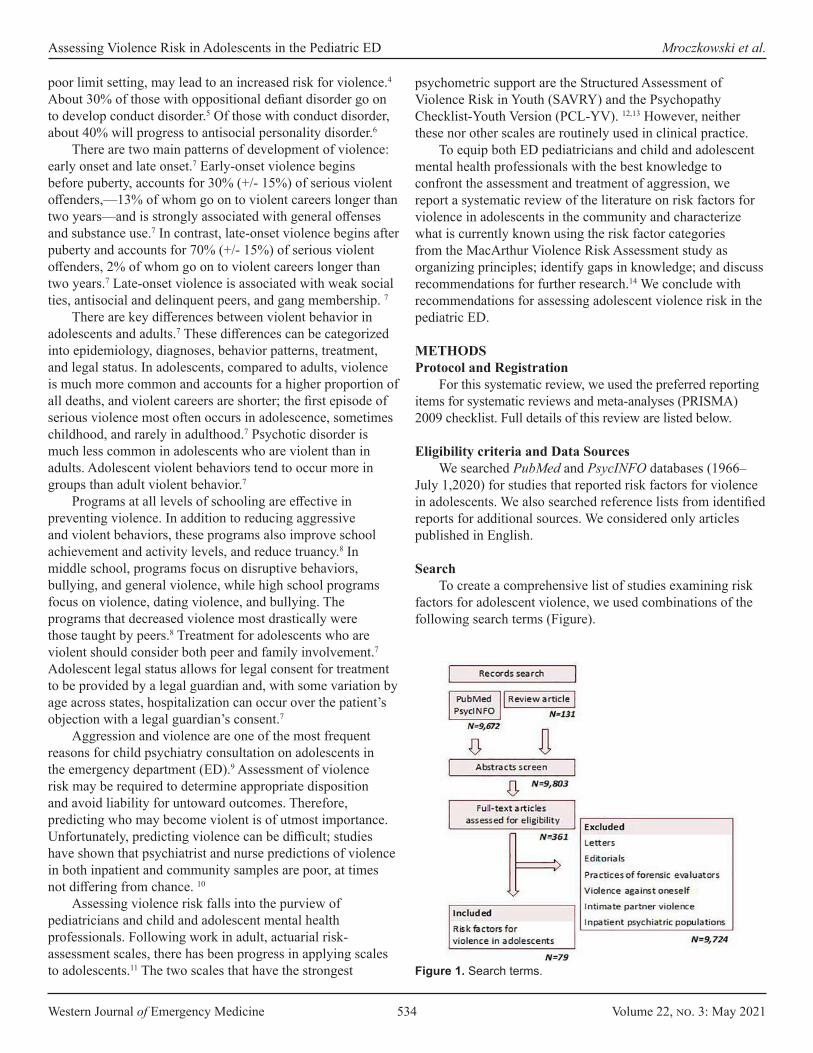
Western Journal of Emergency Medicine 534 Volume 22, no. 3: May 2021
Assessing Violence Risk in Adolescents in the Pediatric ED Mroczkowski et al.
poor limit setting, may lead to an increased risk for violence.4 About 30% of those with oppositional defiant disorder go on to develop conduct disorder.5 Of those with conduct disorder, about 40% will progress to antisocial personality disorder.6
There are two main patterns of development of violence: early onset and late onset.7 Early-onset violence begins before puberty, accounts for 30% (+/- 15%) of serious violent offenders,—13% of whom go on to violent careers longer than two years—and is strongly associated with general offenses and substance use.7 In contrast, late-onset violence begins after puberty and accounts for 70% (+/- 15%) of serious violent offenders, 2% of whom go on to violent careers longer than two years.7 Late-onset violence is associated with weak social ties, antisocial and delinquent peers, and gang membership. 7
There are key differences between violent behavior in adolescents and adults.7 These differences can be categorized into epidemiology, diagnoses, behavior patterns, treatment, and legal status. In adolescents, compared to adults, violence is much more common and accounts for a higher proportion of all deaths, and violent careers are shorter; the first episode of serious violence most often occurs in adolescence, sometimes childhood, and rarely in adulthood.7 Psychotic disorder is much less common in adolescents who are violent than in adults. Adolescent violent behaviors tend to occur more in groups than adult violent behavior.7
Programs at all levels of schooling are effective in preventing violence. In addition to reducing aggressive and violent behaviors, these programs also improve school achievement and activity levels, and reduce truancy.8 In middle school, programs focus on disruptive behaviors, bullying, and general violence, while high school programs focus on violence, dating violence, and bullying. The programs that decreased violence most drastically were those taught by peers.8 Treatment for adolescents who are violent should consider both peer and family involvement.7 Adolescent legal status allows for legal consent for treatment to be provided by a legal guardian and, with some variation by age across states, hospitalization can occur over the patient’s objection with a legal guardian’s consent.7
Aggression and violence are one of the most frequent reasons for child psychiatry consultation on adolescents in the emergency department (ED).9 Assessment of violence risk may be required to determine appropriate disposition and avoid liability for untoward outcomes. Therefore, predicting who may become violent is of utmost importance. Unfortunately, predicting violence can be difficult; studies have shown that psychiatrist and nurse predictions of violence in both inpatient and community samples are poor, at times not differing from chance. 10
Assessing violence risk falls into the purview of pediatricians and child and adolescent mental health professionals. Following work in adult, actuarial risk-assessment scales, there has been progress in applying scales to adolescents.11 The two scales that have the strongest
psychometric support are the Structured Assessment of Violence Risk in Youth (SAVRY) and the Psychopathy Checklist-Youth Version (PCL-YV). 12,13 However, neither these nor other scales are routinely used in clinical practice.
To equip both ED pediatricians and child and adolescent mental health professionals with the best knowledge to confront the assessment and treatment of aggression, we report a systematic review of the literature on risk factors for violence in adolescents in the community and characterize what is currently known using the risk factor categories from the MacArthur Violence Risk Assessment study as organizing principles; identify gaps in knowledge; and discuss recommendations for further research.14 We conclude with recommendations for assessing adolescent violence risk in the pediatric ED.
METHODSProtocol and Registration
For this systematic review, we used the preferred reporting items for systematic reviews and meta-analyses (PRISMA) 2009 checklist. Full details of this review are listed below.
Eligibility criteria and Data SourcesWe searched PubMed and PsycINFO databases (1966–
July 1,2020) for studies that reported risk factors for violence in adolescents. We also searched reference lists from identified reports for additional sources. We considered only articles published in English.
SearchTo create a comprehensive list of studies examining risk
factors for adolescent violence, we used combinations of the following search terms (Figure).
Figure 1. Search terms.
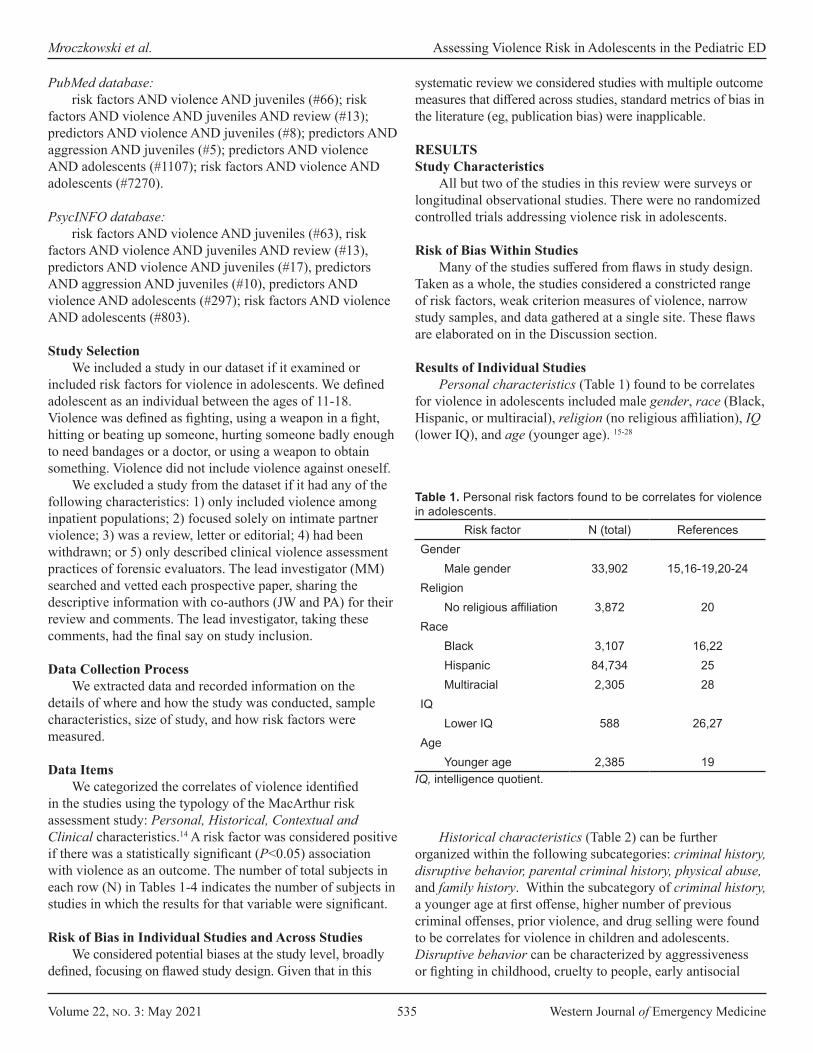
Volume 22, no. 3: May 2021 535 Western Journal of Emergency Medicine
Mroczkowski et al. Assessing Violence Risk in Adolescents in the Pediatric ED
PubMed database:risk factors AND violence AND juveniles (#66); risk
factors AND violence AND juveniles AND review (#13); predictors AND violence AND juveniles (#8); predictors AND aggression AND juveniles (#5); predictors AND violence AND adolescents (#1107); risk factors AND violence AND adolescents (#7270).
PsycINFO database:risk factors AND violence AND juveniles (#63), risk
factors AND violence AND juveniles AND review (#13), predictors AND violence AND juveniles (#17), predictors AND aggression AND juveniles (#10), predictors AND violence AND adolescents (#297); risk factors AND violence AND adolescents (#803).
Study SelectionWe included a study in our dataset if it examined or
included risk factors for violence in adolescents. We defined adolescent as an individual between the ages of 11-18. Violence was defined as fighting, using a weapon in a fight, hitting or beating up someone, hurting someone badly enough to need bandages or a doctor, or using a weapon to obtain something. Violence did not include violence against oneself.
We excluded a study from the dataset if it had any of the following characteristics: 1) only included violence among inpatient populations; 2) focused solely on intimate partner violence; 3) was a review, letter or editorial; 4) had been withdrawn; or 5) only described clinical violence assessment practices of forensic evaluators. The lead investigator (MM) searched and vetted each prospective paper, sharing the descriptive information with co-authors (JW and PA) for their review and comments. The lead investigator, taking these comments, had the final say on study inclusion.
Data Collection ProcessWe extracted data and recorded information on the
details of where and how the study was conducted, sample characteristics, size of study, and how risk factors were measured.
Data ItemsWe categorized the correlates of violence identified
in the studies using the typology of the MacArthur risk assessment study: Personal, Historical, Contextual and Clinical characteristics.14 A risk factor was considered positive if there was a statistically significant (P<0.05) association with violence as an outcome. The number of total subjects in each row (N) in Tables 1-4 indicates the number of subjects in studies in which the results for that variable were significant.
Risk of Bias in Individual Studies and Across StudiesWe considered potential biases at the study level, broadly
defined, focusing on flawed study design. Given that in this
systematic review we considered studies with multiple outcome measures that differed across studies, standard metrics of bias in the literature (eg, publication bias) were inapplicable.
RESULTSStudy Characteristics
All but two of the studies in this review were surveys or longitudinal observational studies. There were no randomized controlled trials addressing violence risk in adolescents.
Risk of Bias Within Studies Many of the studies suffered from flaws in study design.
Taken as a whole, the studies considered a constricted range of risk factors, weak criterion measures of violence, narrow study samples, and data gathered at a single site. These flaws are elaborated on in the Discussion section.
Results of Individual StudiesPersonal characteristics (Table 1) found to be correlates
for violence in adolescents included male gender, race (Black, Hispanic, or multiracial), religion (no religious affiliation), IQ (lower IQ), and age (younger age). 15-28
Risk factor N (total) ReferencesGender
Male gender 33,902 15,16-19,20-24Religion
No religious affiliation 3,872 20Race
Black 3,107 16,22Hispanic 84,734 25Multiracial 2,305 28
IQLower IQ 588 26,27
AgeYounger age 2,385 19
Table 1. Personal risk factors found to be correlates for violence in adolescents.
IQ, intelligence quotient.
Historical characteristics (Table 2) can be further organized within the following subcategories: criminal history, disruptive behavior, parental criminal history, physical abuse, and family history. Within the subcategory of criminal history, a younger age at first offense, higher number of previous criminal offenses, prior violence, and drug selling were found to be correlates for violence in children and adolescents. Disruptive behavior can be characterized by aggressiveness or fighting in childhood, cruelty to people, early antisocial
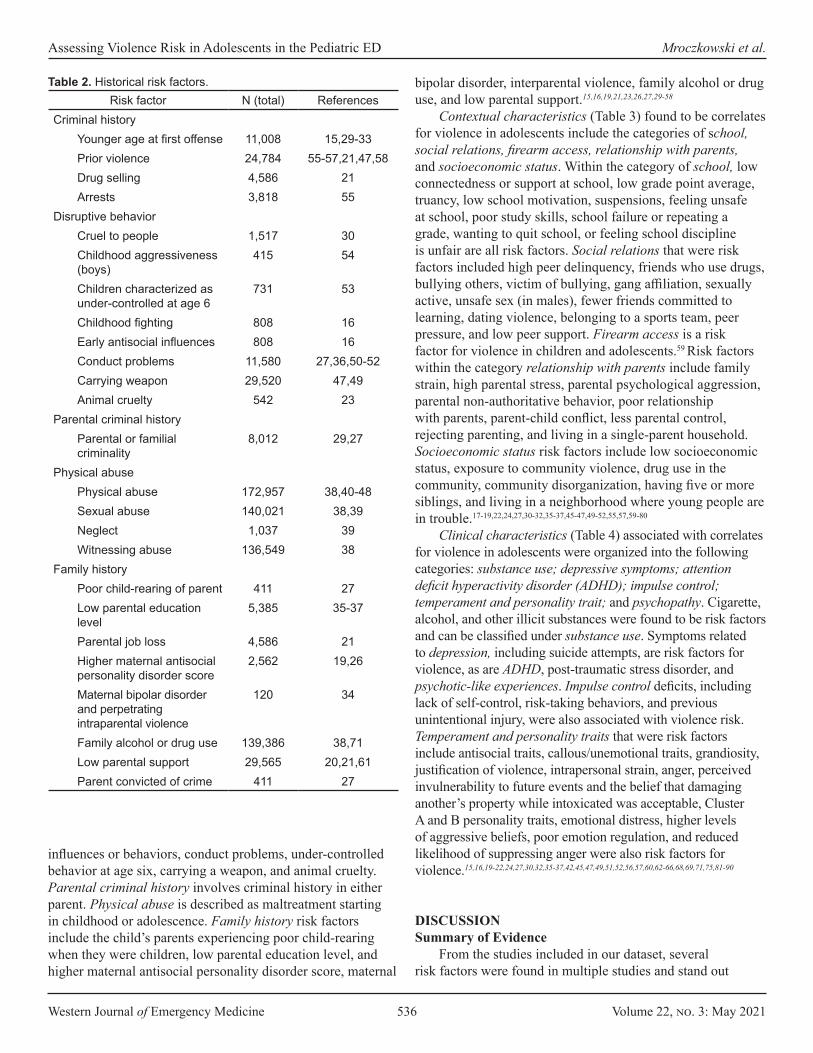
Western Journal of Emergency Medicine 536 Volume 22, no. 3: May 2021
Assessing Violence Risk in Adolescents in the Pediatric ED Mroczkowski et al.
bipolar disorder, interparental violence, family alcohol or drug use, and low parental support.15,16,19,21,23,26,27,29-58
Contextual characteristics (Table 3) found to be correlates for violence in adolescents include the categories of school, social relations, firearm access, relationship with parents, and socioeconomic status. Within the category of school, low connectedness or support at school, low grade point average, truancy, low school motivation, suspensions, feeling unsafe at school, poor study skills, school failure or repeating a grade, wanting to quit school, or feeling school discipline is unfair are all risk factors. Social relations that were risk factors included high peer delinquency, friends who use drugs, bullying others, victim of bullying, gang affiliation, sexually active, unsafe sex (in males), fewer friends committed to learning, dating violence, belonging to a sports team, peer pressure, and low peer support. Firearm access is a risk factor for violence in children and adolescents.59 Risk factors within the category relationship with parents include family strain, high parental stress, parental psychological aggression, parental non-authoritative behavior, poor relationship with parents, parent-child conflict, less parental control, rejecting parenting, and living in a single-parent household. Socioeconomic status risk factors include low socioeconomic status, exposure to community violence, drug use in the community, community disorganization, having five or more siblings, and living in a neighborhood where young people are in trouble.17-19,22,24,27,30-32,35-37,45-47,49-52,55,57,59-80
Clinical characteristics (Table 4) associated with correlates for violence in adolescents were organized into the following categories: substance use; depressive symptoms; attention deficit hyperactivity disorder (ADHD); impulse control; temperament and personality trait; and psychopathy. Cigarette, alcohol, and other illicit substances were found to be risk factors and can be classified under substance use. Symptoms related to depression, including suicide attempts, are risk factors for violence, as are ADHD, post-traumatic stress disorder, and psychotic-like experiences. Impulse control deficits, including lack of self-control, risk-taking behaviors, and previous unintentional injury, were also associated with violence risk. Temperament and personality traits that were risk factors include antisocial traits, callous/unemotional traits, grandiosity, justification of violence, intrapersonal strain, anger, perceived invulnerability to future events and the belief that damaging another’s property while intoxicated was acceptable, Cluster A and B personality traits, emotional distress, higher levels of aggressive beliefs, poor emotion regulation, and reduced likelihood of suppressing anger were also risk factors for violence.15,16,19-22,24,27,30,32,35-37,42,45,47,49,51,52,56,57,60,62-66,68,69,71,75,81-90
DISCUSSION Summary of Evidence
From the studies included in our dataset, several risk factors were found in multiple studies and stand out
Risk factor N (total) ReferencesCriminal history
Younger age at first offense 11,008 15,29-33Prior violence 24,784 55-57,21,47,58Drug selling 4,586 21Arrests 3,818 55
Disruptive behaviorCruel to people 1,517 30Childhood aggressiveness (boys)
415 54
Children characterized as under-controlled at age 6
731 53
Childhood fighting 808 16Early antisocial influences 808 16Conduct problems 11,580 27,36,50-52Carrying weapon 29,520 47,49Animal cruelty 542 23
Parental criminal historyParental or familial criminality
8,012 29,27
Physical abusePhysical abuse 172,957 38,40-48Sexual abuse 140,021 38,39Neglect 1,037 39Witnessing abuse 136,549 38
Family historyPoor child-rearing of parent 411 27Low parental education level
5,385 35-37
Parental job loss 4,586 21Higher maternal antisocial personality disorder score
2,562 19,26
Maternal bipolar disorder and perpetrating intraparental violence
120 34
Family alcohol or drug use 139,386 38,71Low parental support 29,565 20,21,61Parent convicted of crime 411 27
Table 2. Historical risk factors.
influences or behaviors, conduct problems, under-controlled behavior at age six, carrying a weapon, and animal cruelty. Parental criminal history involves criminal history in either parent. Physical abuse is described as maltreatment starting in childhood or adolescence. Family history risk factors include the child’s parents experiencing poor child-rearing when they were children, low parental education level, and higher maternal antisocial personality disorder score, maternal

Volume 22, no. 3: May 2021 537 Western Journal of Emergency Medicine
Mroczkowski et al. Assessing Violence Risk in Adolescents in the Pediatric ED
Risk factor N (total) ReferencesSchool
Low connectedness/support at school
23,886 32,60,62
Low GPA 18,613 27,46,50,60,63, 64Truancy 14,627 30,47Low school motivation 1,517 30Suspensions 12,703 55,63Feel unsafe to go to school
46,756 49,65
Poor study skills 4,432 66School failure/repeat grade
27,302 27,47,67
Wanting to quit school 3,955 51Felt school discipline unfair
282 62
Social relationsHigh peer delinquency 29,902 30,31,55,57,68-
70,18,19,31,64, 66,71,72
Friends who use drugs 3,174 31,71Bullying others 20,054 36,73,74Victim of bullying or violence
21,789 24,71,75
Gang affiliation 1,642 46Sexually active 2,299 22Fewer friends committed to learning
2,055 31
Dating violence 1,080 31Belonging to a sports team
1,642 46
Low peer support/peer rejection
28,898 61,70,72
Practicing unsafe sex (males only)
7,548 45
Peer pressure 4,056 70Access to firearms 12,734 59,76
Relationship with parentsFamily strain 848 75Parental psychological aggression
302 68
High parental stress 1,517 30Parental non-authoritative behavior
2,335 35
Poor relationship with parents
9,603 31,45
Parent-child conflict 12,417 32,55,70,72Less family involvement 1,080 31Less parental control 1,080 31
Table 3. Contextual risk factors.Risk factor N (total) References
Living in single-parent household
10,261 36,45
Rejecting parenting 310 52Socioeconomic status
Low socioeconomic status
49,113 27,30,61,77
Exposure to community violence
3,176 17,18,31,76,78-80
Drug use in neighborhood
4,626 55,64
Community disorganization
3,818 55
5+ siblings 511 27Neighborhoods where young people were in trouble
808 32
GPA, grade point average.
Table 3. Continued.
clearly. Personal risk factors include male gender and race (Black, Hispanic or multi-racial), along with lower IQ and younger age. Historical risk factors include childhood aggressiveness in boys, childhood fighting, early antisocial influences, hyperactivity and withdrawal in childhood, child maltreatment, and higher maternal antisocial personality disorder score. Younger age at first offense and prior violence were described in a multitude of studies. These risk factors fit with the adage that “the best predictor of future behavior is past behavior,” in that those children who were aggressive or in fights were at risk for future violent behavior. Moreover, early influences are also apparent within this category; specifically, maltreatment as a child or early antisocial influences, especially by the mother, were risk factors. Children learn from the actions of their early caretakers, even if these are antisocial in nature. Additionally, children and adolescents who were themselves maltreated are at risk for perpetrating violence on others.
Limitations of the LiteratureThe flaws identified in this body of research can be
organized and addressed using the critique of violence research on persons with mental illness offered by Monahan and Steadman.10 They identified four problems: constricted range of risk factors; weak criterion measures of violence; narrow study sample; and data gathered at a single site.
Restricted range of risk factors The first problem is that different studies focus on
different risk factors, with no study looking comprehensively at the full range of risk factors. While studies may have included several risk factors, unless they are all measured simultaneously, it is unclear how they interact or whether
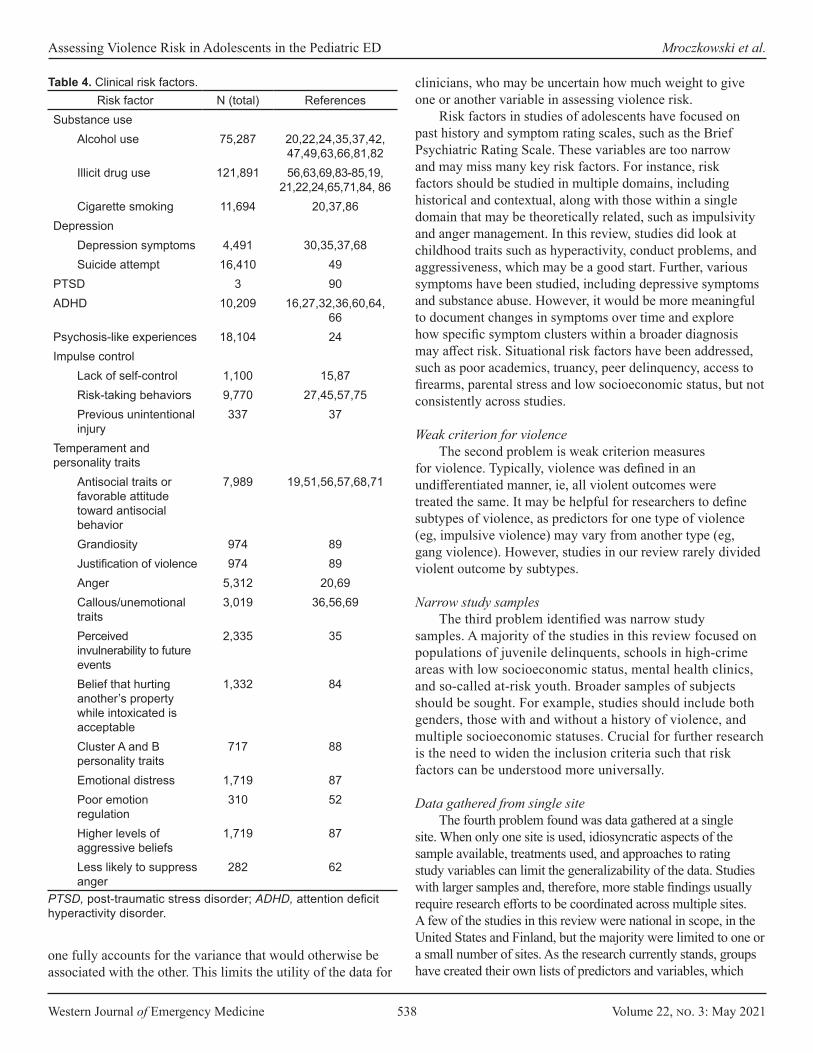
Western Journal of Emergency Medicine 538 Volume 22, no. 3: May 2021
Assessing Violence Risk in Adolescents in the Pediatric ED Mroczkowski et al.
clinicians, who may be uncertain how much weight to give one or another variable in assessing violence risk.
Risk factors in studies of adolescents have focused on past history and symptom rating scales, such as the Brief Psychiatric Rating Scale. These variables are too narrow and may miss many key risk factors. For instance, risk factors should be studied in multiple domains, including historical and contextual, along with those within a single domain that may be theoretically related, such as impulsivity and anger management. In this review, studies did look at childhood traits such as hyperactivity, conduct problems, and aggressiveness, which may be a good start. Further, various symptoms have been studied, including depressive symptoms and substance abuse. However, it would be more meaningful to document changes in symptoms over time and explore how specific symptom clusters within a broader diagnosis may affect risk. Situational risk factors have been addressed, such as poor academics, truancy, peer delinquency, access to firearms, parental stress and low socioeconomic status, but not consistently across studies.
Weak criterion for violence The second problem is weak criterion measures
for violence. Typically, violence was defined in an undifferentiated manner, ie, all violent outcomes were treated the same. It may be helpful for researchers to define subtypes of violence, as predictors for one type of violence (eg, impulsive violence) may vary from another type (eg, gang violence). However, studies in our review rarely divided violent outcome by subtypes.
Narrow study samples The third problem identified was narrow study
samples. A majority of the studies in this review focused on populations of juvenile delinquents, schools in high-crime areas with low socioeconomic status, mental health clinics, and so-called at-risk youth. Broader samples of subjects should be sought. For example, studies should include both genders, those with and without a history of violence, and multiple socioeconomic statuses. Crucial for further research is the need to widen the inclusion criteria such that risk factors can be understood more universally.
Data gathered from single siteThe fourth problem found was data gathered at a single
site. When only one site is used, idiosyncratic aspects of the sample available, treatments used, and approaches to rating study variables can limit the generalizability of the data. Studies with larger samples and, therefore, more stable findings usually require research efforts to be coordinated across multiple sites. A few of the studies in this review were national in scope, in the United States and Finland, but the majority were limited to one or a small number of sites. As the research currently stands, groups have created their own lists of predictors and variables, which
Risk factor N (total) ReferencesSubstance use
Alcohol use 75,287 20,22,24,35,37,42, 47,49,63,66,81,82
Illicit drug use 121,891 56,63,69,83-85,19, 21,22,24,65,71,84, 86
Cigarette smoking 11,694 20,37,86Depression
Depression symptoms 4,491 30,35,37,68Suicide attempt 16,410 49
PTSD 3 90ADHD 10,209 16,27,32,36,60,64,
66Psychosis-like experiences 18,104 24Impulse control
Lack of self-control 1,100 15,87Risk-taking behaviors 9,770 27,45,57,75Previous unintentional injury
337 37
Temperament and personality traits
Antisocial traits or favorable attitude toward antisocial behavior
7,989 19,51,56,57,68,71
Grandiosity 974 89Justification of violence 974 89Anger 5,312 20,69Callous/unemotional traits
3,019 36,56,69
Perceived invulnerability to future events
2,335 35
Belief that hurting another’s property while intoxicated is acceptable
1,332 84
Cluster A and B personality traits
717 88
Emotional distress 1,719 87Poor emotion regulation
310 52
Higher levels of aggressive beliefs
1,719 87
Less likely to suppress anger
282 62
PTSD, post-traumatic stress disorder; ADHD, attention deficit hyperactivity disorder.
Table 4. Clinical risk factors.
one fully accounts for the variance that would otherwise be associated with the other. This limits the utility of the data for
Volume 22, no. 3: May 2021 539 Western Journal of Emergency Medicine
Mroczkowski et al. Assessing Violence Risk in Adolescents in the Pediatric ED
has led to disjointed findings in the literature. Ideally, groups of researchers should combine efforts in a multidisciplinary and multisite fashion to create common predictors and variables to study risk factors in large number of adolescents.
Limitations of the ReviewWe did not rate the potential bias in individual studies.
There were no randomized controlled trials identified in this search. A majority of the studies were surveys or longitudinal observational studies and, therefore, we did not include the study grade in our tables. Furthermore, we included only English-language papers, searching PubMed and PsycINFO, which may have led to the exclusion of some studies.
Implications for Clinical Risk AssessmentClinically, organizing risk factors by MacArthur risk
factor categories may be useful as a means to carry out a risk assessment with an adolescent presenting to the ED with violence risk. Risk assessment may include interviews with the subject, caretaker, family member, and teacher, along with reviewing mental health, school and police records.91 Given the large number of variables that have been associated with violence and likelihood of significant overlap in the variance for which they account, risk assessment tools may be useful, as may tests of psychopathology, intelligence, and psychopathy. In a study of forensic evaluators, the most used of such tests were the Wechsler Intelligence Scales (75%), the Minnesota Multiphasic Personality Inventory (66.2%), and the SAVRY risk-assessment tool (35.1%). 91 Additionally, one third of clinicians surveyed always or almost always used the Psychopathy Checklist: Youth Version (PCL:YV).91 Each of these tests provides further information for risk assessment and includes a portion of the factors identified in this review.
The SAVRY is the violence risk-assessment instrument for adolescents most commonly used by forensic evaluators.91 Its rating form is organized into historical risk factors, social/contextual risk factors, individual/clinical risk factors, and protective factors.12 Historical risk factors include history of violence; early initiation of violence and exposure to violence at home; childhood history of maltreatment; parental/caregiver criminality; and poor school achievement. Social/contextual risk factors include peer delinquency; peer rejection; stress and poor coping; and poor parental management, among others. Individual/clinical risk factors include risk taking/impulsivity; substance use difficulties; anger management problems; attention deficit/hyperactivity difficulties; and low interest/commitment to school, among others. Protective factors include prosocial involvement; strong social support; strong commitment to school; and positive attitude toward intervention and authority.12
Conclusions and Recommendations for Assessing Violence Risk in the Pediatric Emergency DepartmentViolence in adolescents is a problem with large public health significance. Its risk factors can be organized using the
MacArthur risk assessment study categories. The Structured Assessment of Violence Risk in Youth is the most commonly used violence risk-assessment instrument for adolescents by forensic evaluators.91 Given this systematic review, we recommend its use in the pediatric ED to assess adolescent violence risk. Its rating form is organized into historical risk factors, social/contextual risk factors, individual/clinical risk factors, and protective factors.10 Overall, the SAVRY provides a comprehensive means of assessing risk factors as the literature now stands, and likely is best used in combination with clinical interviews and other testing.
Address for Correspondence: Megan M. Mroczkowski, MD, Morgan Stanley Children’s Hospital of NewYork-Presbyterian, Columbia University Irving Medical Center, Department of Psychiatry, 3959 Broadway CHN 619C, New York, NY 10032. Email: [email protected].
Conflicts of Interest: By the WestJEM article submission agreement, all authors are required to disclose all affiliations, funding sources and financial or management relationships that could be perceived as potential sources of bias. No author has professional or financial relationships with any companies that are relevant to this study. There are no conflicts of interest or sources of funding to declare.
Copyright: © 2021 Mroczkowski et al. This is an open access article distributed in accordance with the terms of the Creative Commons Attribution (CC BY 4.0) License. See: http://creativecommons.org/licenses/by/4.0/
REFERENCES1. Pickett W, Molcho M, Elgar FJ, et al C. Trends and socioeconomic
correlates of adolescent physical fighting in 30 countries. Pediatrics. 2013;131(1):e18-26.
2. National Center for Injury Prevention and Control. Youth Violence: Facts at a Glance. 2010. Available at: www.cdc.gov/violenceprevention. Accessed January 3, 2021.
3. Hahn R, Fuqua-Whitley D, Wethington H, et al. The effectiveness of universal school-based programs for the prevention of violent and aggressive behavior: a report on recommendations of the Task Force on Community Preventive Services. MMWR Recomm Rep. 2007;56(RR-7):1-12.
4. Tremblay RE, Nagin DS, Séguin JR, et al. Physical aggression during early childhood: trajectories and predictors. Pediatrics. 2004;114(1):e43-50.
5. Loeber R, Burke JD, Lahey BB, et al. Oppositional defiant and conduct disorder: a review of the past 10 years, Part I. J Am Acad Child Adolesc Psychiatry. 2000;39(12):1468-84.
6. Zoccolillo M, Pickles A, Quinton D, et al. The outcome of childhood conduct disorder: implications for defining adult personality disorder and conduct disorder. Psychol Med. 1992;22(4):971-86.
7. Ash P. Children are different: liability issues in working with

Western Journal of Emergency Medicine 540 Volume 22, no. 3: May 2021
Assessing Violence Risk in Adolescents in the Pediatric ED Mroczkowski et al.
suicidal and dangerous youths. Focus (Am Psychiatr Publ). 2019;17(4):355-9.
8. Hahn R, Fuqua-Whitley D, Wethington H, et al. Effectiveness of universal school-based programs to prevent violent and aggressive behavior: a systematic review. Am J Prev Med. 2007;33(2 Suppl):S114-29.
9. Edelsohn GA, Braitman LE, Rabinovich H, et al. Predictors of urgency in a pediatric psychiatric emergency service. J Am Acad Child Adolesc Psychiatry. 2003;42(10):1197-202.
10. Monahan J, Steadman HJ. Violence and Mental Disorder Developments in Risk Assessment. 1994. Available at: https://press.uchicago.edu/ucp/books/book/chicago/V/bo3684057.html. Accessed January 2, 2021.
11. Vincent GM. Psychopathy and violence risk assessment in youth. Child Adolesc Psychiatr Clin N Am. 2006;15(2):407-28, ix.
12. Borum R, Bartel PA, Forth AE. (2005). Structured assessment of violence risk in youth. In: Grisso T, Vincent G, Seagrave D (Eds.), Mental Health Screening and Assessment in Juvenile Justice (311–323). New York, NY: The Guilford Press.
13. Forth A, Kosson D, Hare R. Hare Psychopathy Checklist: Youth Version. In: Grisso T, Vincent G, Seagrave D (Eds.), Mental Health Screening and Assessment in Juvenile Justice (324-335). New York, NY: The Guilford Press.
14. Appelbaum PS, Robbins PC, Monahan J. Violence and delusions: data from the MacArthur Violence Risk Assessment Study. Am J Psychiatry. 2000;157(4):566-72.
15. Vries AM, Liem M. Recidivism of juvenile homicide offenders. Behav Sci Law. 2011;29(4):483-98.
16. Kosterman R, Graham JW, Hawkins JD, et al. Childhood risk factors for persistence of violence in the transition to adulthood: a social development perspective. Violence and Victims. 2001;16(4):355-69.
17. Frey A, Ruchkin V, Martin A, et al. Adolescents in transition: school and family characteristics in the development of violent behaviors entering high school. Child Psychiatry Hum Dev. 2009;40(1):1-13.
18. Lagasse LL, Hammond J, Liu J, et al. Violence and delinquency, early onset drug use, and psychopathology in drug-exposed youth at 11 years. Ann N Y Acad Sci. 2006;1094:313-8.
19. Reyes JC, Moscoso M, Vélez CN, et al. Risk and protective factors associated with youth violence among secondary school students in a nationally representative sample in Puerto Rico. Bol Asoc Med P R. 2004;96(4):253-60.
20. Gudlaugsdottir GR, Vilhjalmsson R, Kristjansdottir G, et al. Violent behaviour among adolescents in Iceland: a national survey. Int J Epidemiol. 2004;33(5):1046-51.
21. Saner H, Ellickson P. Concurrent risk factors for adolescent violence. J Adolesc Health. 1996;19(2):94-103.
22. Valois RF, Vincent ML, McKeown RE, et al. Adolescent risk behaviors and the potential for violence: a look at what’s coming to campus. J Am Coll Health. 1993;41(4):141-7.
23. Baxendale S, Lester L, Johnston R, et al. Risk factors in adolescents’ involvement in violent behaviours. J Aggress Confl Peace Res. 2015;7(1):2-18.
24. Kinoshita Y, Shimodera S, Nishida A, et al. Psychotic-like experiences are associated with violent behavior in adolescents. Schizophr Res. 2011;126(1-3):245-51.
25. Rajan S, Namdar R, Ruggles KV. Aggressive and violent behaviors in the school environment among a nationally representative sample of adolescent youth. J Sch Health. 2015;85(7):446-57.
26. Loeber R, Green SM, Lahey BB, et al. Physical fighting in childhood as a risk factor for later mental health problems. J Am Acad Child Adolesc Psychiatry. 2000;39(4):421-8.
27. Farrington DP. Early predictors of adolescent aggression and adult violence. Violence Vict. 1989;4(2):79-100.
28. Choi Y, Harachi TW, Gillmore MR, et al. Are multiracial adolescents at greater risk? Comparisons of rates, patterns, and correlates of substance use and violence between monoracial and multiracial adolescents. Am J Orthopsychiatry. 2006;76(1):86-97.
29. Grunwald HE, Lockwood B, Harris PW, et al. Influences of neighborhood context, individual history and parenting behavior on recidivism among juvenile offenders. J Youth Adolesc. 2010;39(9):1067-79.
30. Loeber R, Pardini D, Homish DL, et al. The prediction of violence and homicide in young men. J Consult Clin Psychol. 2005;73(6):1074-88.
31. Fries L, Grogan-Kaylor A, Bares C, et al. Gender differences in predictors of self-reported physical aggression: exploring theoretically relevant dimensions among adolescents from Santiago, Chile. Int Perspect Psychol. 2013;2(4):10.1037/a0034533.
32. Herrenkohl TI, Lee J, Hawkins JD. Risk versus direct protective factors and youth violence: Seattle Social Development Project. Am J Prev Med. 2012;43(2 Suppl 1):S41-56.
33. Tolan PH, Thomas P. The implications of age of onset for delinquency risk. II: Longitudinal data. J Abnorm Child Psychol. 1995;23(2):157-81.
34. Narayan AJ, Chen M, Martinez PP, et al. Interparental violence and maternal mood disorders as predictors of adolescent physical aggression within the family. Aggress Behav. 2015;41(3):253-66.
35. Blitstein JL, Murray DM, Lytle LA, et al. Predictors of violent behavior in an early adolescent cohort: similarities and differences across genders. Health Educ Behav. 2005;32(2):175-94.
36. Sourander A, Elonheimo H, Niemela S, et al F. Childhood predictors of male criminality: a prospective population-based follow-up study from age 8 to late adolescence. J Am Acad Child Adolesc Psychiatry. 2006;45(5):578-86.
37. Mattila VM, Parkkari JP, Rimpelä AH. Risk factors for violence and violence-related injuries among 14- to 18-year-old Finns. J Adolesc Health. 2006;38(5):617-20.
38. Duke NN, Pettingell SL, McMorris BJ, et al. Adolescent violence perpetration: associations with multiple types of adverse childhood experiences. Pediatrics. 2010;125(4):e778-86.
39. Yun I, Ball JD, Lim H. Disentangling the relationship between child maltreatment and violent delinquency: using a nationally representative sample. J Interpers Violence. 2011;26(1):88-110.
40. Stewart A, Livingston M, Dennison S. Transitions and turning points: examining the links between child maltreatment and juvenile offending. Child Abuse Negl. 2008;32(1):51-66.
Volume 22, no. 3: May 2021 541 Western Journal of Emergency Medicine
Mroczkowski et al. Assessing Violence Risk in Adolescents in the Pediatric ED
41. Lansford JE, Miller-Johnson S, Berlin LJ, et al. Early physical abuse and later violent delinquency: a prospective longitudinal study. Child Maltreat. 2007;12(3):233-45.
42. Gover AR. The effects of child maltreatment on violent offending among institutionalized youth. Violence Vict. 2002;17(6):655-68.
43. Crooks CV, Scott KL, Wolfe DA, et al. Understanding the link between childhood maltreatment and violent delinquency: what do schools have to add? Child Maltreat. 2007;12(3):269-80.
44. Lee C, Cronley C, White HR, et al. Racial differences in the consequences of childhood maltreatment for adolescent and young adult depression, heavy drinking, and violence. J Adolesc Health. 2012;50(5):443-9.
45. Thurnherr J, Berchtold A, Michaud PA, et al. Violent adolescents and their educational environment: a multilevel analysis. J Dev Behav Pediatr. 2008;29(5):351-9.
46. Wright DR, Fitzpatrick KM. Violence and minority youth: the effects of risk and asset factors on fighting among African American children and adolescents. Adolescence. 2006;41(162):251-62.
47. Resnick MD, Ireland M, Borowsky I. Youth violence perpetration: What protects? What predicts? Findings from the National Longitudinal Study of Adolescent Health. J Adolesc Health. 2004;35(5):424.e1-10.
48. Widom CS. The cycle of violence. Science. 1989;244(4901):160-6.49. Swahn MH, Bossarte RM, Palmier JB, et al. Psychosocial
characteristics associated with frequent physical fighting: findings from the 2009 National Youth Risk Behavior Survey. Inj Prev. 2013;19(2):143-6.
50. Ellickson PL, McGuigan KA. Early predictors of adolescent violence. Am J Public Health. 2000;90(4):566-72.
51. Kingery PB, Zimmerman RS, Biafora F. Risk factors for violent behaviors among ethnically diverse urban adolescents: beyond race/ethnicity. Sch Psychol. 1996;17(2):171-88.
52. Sitnick SL, Shaw DS, Weaver CM, et al. Early childhood predictors of severe youth violence in low-income male adolescents. Child Dev. 2017;88(1):27-40.
53. Atkins R. The association of personality type in childhood with violence in adolescence. Res Nurs Health. 2007;30(3):308-19.
54. Petras H, Chilcoat HD, Leaf PJ, et al. Utility of TOCA-R scores during the elementary school years in identifying later violence among adolescent males. J Am Acad Child Adolesc Psychiatry. 2004;43(1):88-96.
55. Hemphill SA, Smith R, Toumbourou JW, et al. Modifiable determinants of youth violence in Australia and the United States: A longitudinal study. Aust N Z J Criminol. 2009;42(3):289-309.
56. Brook JS, Brook DW, Whiteman M. Growing up in a violent society: longitudinal predictors of violence in Colombian adolescents. Am J Community Psychol. 2007;40(1-2):82-95.
57. Sijtsema JJ, Kretschmer T, van Os T. The Structured Assessment of Violence Risk in Youth in a large community sample of young adult males and females: the TRAILS study. Psychol Assess. 2015;27(2):669-77.
58. Kaya F, Bilgin H, Singer MI. Contributing factors to aggressive
behaviors in high school students in Turkey. J Sch Nurs. 2012;28(1):56-69.
59. Ruback RB, Shaffer JN, Clark VA. Easy access to firearms: juveniles’ risks for violent offending and violent victimization. J Interpers Violence. 2011;26(10):2111-38.
60. Bernat DH, Oakes JM, Pettingell SL, et al. Risk and direct protective factors for youth violence: results from the National Longitudinal Study of Adolescent Health. Am J Prev Med. 2012;43(2 Suppl 1):S57-66.
61. Pickett W, Iannotti RJ, Simons-Morton B, et al. Social environments and physical aggression among 21,107 students in the United States and Canada. J Sch Health. 2009;79(4):160-8.
62. Thomas SP, Smith H. School connectedness, anger behaviors, and relationships of violent and nonviolent American youth. Perspect Psychiatr Care. 2004;40(4):135-48.
63. Swahn MH, Donovan JE. Correlates and predictors of violent behavior among adolescent drinkers. J Adolesc Health. 2004;34(6):480-92.
64. Herrenkohl TI, Maguin E, Hill KG, et al. Developmental risk factors for youth violence. J Adolesc Health. 2000;26(3):176-86.
65. Murphy SM, McPherson S, Robinson K. Non-medical prescription opioid use and violent behaviour among adolescents. J Child Adolesc Ment Health. 2014;26(1):35-47.
66. Henry DB, Tolan PH, Gorman-Smith D, et al. Risk and direct protective factors for youth violence: results from the Centers for Disease Control and Prevention’s Multisite Violence Prevention Project. Am J Prev Med. 2012;43(2 Suppl 1):S67-75.
67. Borowsky IW, Ireland M, Resnick MD. Violence risk and protective factors among youth held back in school. Ambul Pediatr. 2002;2(6):475-84.
68. Ferguson CJ. Video games and youth violence: a prospective analysis in adolescents. J Youth Adolesc. 2011;40(4):377-91.
69. Swaim RC, Henry KL, Kelly K. Predictors of aggressive behaviors among rural middle school youth. J Prim Prev. 2006;27(3):229-43.
70. Smokowski PR, Guo S, Cotter KL, et al. Multilevel risk factors and developmental assets associated with aggressive behavior in disadvantaged adolescents. Aggress Behav. 2016;42(3):222-38.
71. Brook DW, Brook JS, Rosen Z, et al. Early risk factors for violence in Colombian adolescents. Am J Psychiatry. 2003;160(8):1470-8.
72. Smokowski PR, Guo S, Evans CB, et al. Risk and protective factors across multiple microsystems associated with internalizing symptoms and aggressive behavior in rural adolescents: modeling longitudinal trajectories from the Rural Adaptation Project. Am J Orthopsychiatry. 2017;87(1):94-108.
73. Nansel TR, Overpeck MD, Haynie DL, et al. Relationships between bullying and violence among US youth. Arch Pediatr Adolesc Med. 2003;157(4):348-53.
74. Kim YS, Leventhal BL, Koh YJ, et al. School bullying and youth violence: causes or consequences of psychopathologic behavior? Arch Gen Psychiatry. 2006;63(9):1035-41.
75. Logan-Greene P, Nurius PS, Herting JR, et al. Multi-domain risk and protective factor predictors of violent behavior among at-risk youth. J
Western Journal of Emergency Medicine 542 Volume 22, no. 3: May 2021
Assessing Violence Risk in Adolescents in the Pediatric ED Mroczkowski et al.
Youth Stud. 2011;14(4):413-29.76. Scherzer T, Pinderhughes HL. Violence and gender: reports from
an urban high school. Violence Vict. 2002;17(1):57-72. 77. Djerboua M, Chen BE, Davison CM. Physical fighting, fighting-related
injuries and family affluence among Canadian youth. BMC Public Health. 2016;16(1):199
78. McMahon SD, Todd NR, Martinez A, et al. Aggressive and prosocial behavior: community violence, cognitive, and behavioral predictors among urban African American youth. Am J Community Psychol. 2013;51(3-4):407-21.
79. Weaver CM, Borkowski JG, Whitman TL. Violence breeds violence: childhood exposure and adolescent conduct problems. J Community Psychol. 2008;36(1):96-112.
80. McCabe KM, Lucchini SE, Hough RL, et al. The relation between violence exposure and conduct problems among adolescents: a prospective study. Am J Orthopsychiatry. 2005;75(4):575-84.
81. White HR, Loeber R, Stouthamer-Loeber M, et al. Developmental associations between substance use and violence. Dev Psychopathol. 1999;11(4):785-803.
82. Tschann JM, Flores E, Pasch LA, et al. Emotional distress, alcohol use, and peer violence among Mexican-American and European-American adolescents. J Adolesc Health. 2005;37(1):11-8.
83. Molcho M, Harel Y, Dina LO. Substance use and youth violence. A study among 6th to 10th grade Israeli school children. Int J Adolesc Med Health. 2004;16(3):239-51.
84. Sussman S, Skara S, Weiner MD, et al. Prediction of violence perpetration among high-risk youth. Am J Health Behav. 2004;28(2):134-44.
85. Shetgiri R, Boots DP, Lin H, et al. Predictors of weapon-related behaviors among African American, Latino, and White Youth. J Pediatr. 2016;171:277-82.
86. Sousa S, Correia T, Ramos E, et al. Violence in adolescents: social and behavioural factors. Gac Sanit. 2010;24(1):47-52.
87. Wang FM, Chen JQ, Xiao WQ, et al. Peer physical aggression and its association with aggressive beliefs, empathy, self-control, and cooperation skills among students in a rural town of China. J Interpers Violence. 2012;27(16):3252-67.
88. Johnson JG, Cohen P, Smailes E, et al. Adolescent personality disorders associated with violence and criminal behavior during adolescence and early adulthood. Am J Psychiatry. 2000;157(9):1406-12.
89. Calvete E. Justification of violence and grandiosity schemas as predictors of antisocial behavior in adolescents. J Abnorm Child Psychol. 2008;36(7):1083-95.
90. Heide KM, Solomon EP. Female juvenile murderers: biological and psychological dynamics leading to homicide. Int J Law Psychiatry. 2009;32(4):244-52.
91. Viljoen JL, McLachlan K, Vincent GM. Assessing violence risk and psychopathy in juvenile and adult offenders: a survey of clinical practices. Assessment. 2010;17(3):377-95.
Volume 22, no. 3: May 2021 543 Western Journal of Emergency Medicine
Expert Commentary
Ending the Pandemic: Are Rapid COVID-19 Tests a Step Forward or Back?
Tony Zitek, MD*Joseph B. Fraiman, MD†
Section Editor: Ioannis Koutroulis, MD, MBA, PhD Submission history: Submitted November 1, 2020; Revision received February 19, 2021; Accepted February 19, 2021Electronically published May 19, 2021 Full text available through open access at http://escholarship.org/uc/uciem_westjem DOI: 10.5811/westjem.2021.2.50550
Recent scholarly articles1 and popular media articles2 have pushed for increased availability of rapid (point-of-care) testing for coronavirus disease 2019 (COVID-19). There would indeed be many benefits to having an instantaneous means of accurately determining who has COVID-19 and who does not. However, with our current technologies and our current approach to diagnostic testing, we believe that increasing the use of rapid tests may be harmful as these tests will speed the dissemination of false negative results.
The criterion standard test for COVID-19 is a (non-rapid) laboratory-based, real-time reverse transcription polymerase chain reaction (rRT-PCR) test,3 which is generally performed as a nasal swab and takes at least 24 hours for results. The sensitivity of these rRT-PCR tests are about 70% (60-78%), but they have very high specificity.4 Thus, the issue with rRT-PCR tests for COVID-19 is the substantial false negative rate, which may be even higher if the test is performed by an oral swab rather than a nasal swab.3 False positive tests are less common but may occur from contamination of the specimen or reagents.4 Additionally, some asymptomatic patients who have a positive rRT-PCR test may be harboring remnants of severe acute respiratory syndrome coronavirus 2 (SARS-CoV-2), but may not be contagious.5 These patients (who are neither symptomatic nor contagious) should be considered to have a clinical false positive. No published data have reported
Herbert Wertheim College of Medicine, Florida International University, Department of Emergency Medicine, Miami, FloridaLallie Kemp Regional Medical Center, Department of Emergency Medicine, Independence, Louisiana
*
†
Some experts have promoted the use of rapid testing for COVID-19. However, with the current technologies available, continuing to replace laboratory-based, real-time reverse transcription polymerase chain reaction tests with rapid (point-of-care) tests may lead to an increased number of false negative tests. Moreover, the more rapid dissemination of false negative results that can occur with the use of rapid tests for COVID-19 may lead to increased spread of the novel coronavirus if patients do not understand the concept of false negative tests. One means of combatting this would be to tell patients who have a “negative” rapid COVID-19 test that their test result was “indeterminate.” [West J Emerg Med. 2021;22(3)543–546.]
how often this happens, but for the purposes of the ensuing calculations, we will assume the specificity of laboratory-based rRT-PCR swab tests is 99.5%.
With regard to rapid tests, there are two types: antigen and molecular. Antigen tests detect a viral protein, and molecular tests detect viral RNA. A recent systematic review estimated that when using the rRT-PCR tests as the criterion standard, the rapid antigen tests have a sensitivity of 56.2% (95% confidence interval [CI], 29.5-79.8%) and a specificity of 99.5% (95% CI, 98.1-99.9%) while rapid molecular tests have a sensitivity of 95.2% (95% CI, 86.7-98.3%) and specificity 98.9% (95% CI, 97.3-99.5%).6 Among the molecular tests that were assessed, the Xpert Xpress assay (Cepheid Inc., Sunnyvale, CA) appears to have the highest sensitivity at 99.4% (95% CI, 98.0-99.8%), which is substantially higher than the commonly used ID NOW (Abbott Laboratories, Chicago, IL), which has a sensitivity of 76.8% (95% CI, 72.9-80.3%). However, the specificity of Xpert Xpress appears to be a little lower than that of ID NOW at 96.8% (95% CI, 90.6-99.0%) as compared to 99.6% (95% CI, 98.4-99.9%).6
When interpreting these data, it is important to emphasize that the criterion standard (rRT-PCR) used for these calculations also has moderate sensitivity (around 70%) and imperfect specificity (around 99.5%). Therefore, if the sensitivity and specificity of a rapid antigen test are 56%
Western Journal of Emergency Medicine 544 Volume 22, no. 3: May 2021
Are Rapid COVID-19 Tests a Step Forward or Back? Zitek et al.
and 99.5%, respectively, compared to rRT-PCR, we would expect the overall sensitivity to be about 39% and the overall specificity to be about 99%. Thus, if 1000 people had a rapid antigen test, and 100 (10%) of them truly had COVID‐19, we would expect the following:
-39 of the 100 patients with COVID-19 would be identified with this test (with a true positive result);-48 patients would test positive for COVID-19, but 9 (18.8%) of those would be false positive results; - 952 patients would test negative for COVID-19, but 61 (6.4%) of those would be false negative results.
Thus, in the above scenario and detailed in Table 1, nearly 1 in 5 (18.8%) positive tests represents a false positive, and
preventable transmission for SARS-CoV-2 (typically less than 10 days following initiation of symptoms for mild to moderate COVID-19) is coincident with most waiting periods for results, it seems likely that the delay in results has offered some measure of unrecognized protection. This means that with the increasing use of rapid COVID-19 tests, transmission of SARS-CoV-2 could actually increase. More immediate results mean more immediate false “negatives” and, likely, less concerted self-isolation behavior.
The idea that the wait time for the results of COVID-19 tests is protective is supported by one survey study that asked respondents to describe their isolation behaviors during a hypothetical outbreak involving a potentially fatal contagious respiratory illness. Respondents who were uncertain of their own transmissibility to vulnerable individuals reported they would engage in social isolation behaviors at the same rate that they reported for scenarios in which they knew they would infect vulnerable individuals.8 Therefore, the wait period for the results of an rRT-PCR test likely produces a healthy uncertainty that is more associated with appropriate isolation behavior than the behavior after a (potentially false) negative test result.
We believe the main reason for this is that most patients and some healthcare professionals do not understand the concept of false negative tests. We fear that patients who have false negative tests may immediately return to work or school or get on a plane, even if symptomatic and even if counseled to stay home until symptoms resolve. Worse, some healthcare professionals may not fully understand how to incorporate the sensitivity of a diagnostic test into their decision-making and may not provide appropriate counsel to patients with negative test results. Indeed, previous work has demonstrated that both physicians and patients have trouble interpreting and applying healthcare statistics.9
Even if all physicians knew how to appropriately counsel patients with negative COVID-19 tests, the current testing strategy for COVID-19 often bypasses physician assessment of the patient, compounding the problem of false negative tests. Medical tests have traditionally been ordered and interpreted by physicians. However, tests for COVID-19 can now be done at a drugstore, in a drive-thru testing site, or at home without a healthcare professional’s involvement. While increased access to testing is a good thing, misinterpretation of test results is dangerous. Many tests for COVID-19 are being done without any consideration for the pretest probability, without which we cannot properly assess the results. Most people who get the test just assume that a positive test means they have COVID-19, while a negative test means they do not. With no healthcare professional to counsel the patient, the patient will not know any better.
Now, reconsider the scenario above where 1000 rapid antigen tests were performed on a population where 10% actually had COVID-19. In an ideal world, all of the 61
Diseased Non-diseasedTrue Positives = 39 False Positives = 9 Total Positives = 48False Negatives = 61
True Negatives = 891
Total Negatives = 952
Table 1. The hypothetical results of 1000 rapid antigen tests for COVID-19 in a group with a 10% disease prevalence.
even more concerning, the majority of patients (61%) with COVID-19 (n= 100 by design in the example) would have a negative test (61 false negatives + 39 true negatives = 100 infections). Consequently, we are concerned that without substantial proviso, rapid antigen tests lack sufficient accuracy to be used clinically. In particular, we are concerned about the potential widespread use of the rapid antigen test made by Abbott Laboratories. This test, which is reported to only cost $5, recently gathered attention in the popular media after receiving emergency use status from the US Food and Drug Administration.7 While there are currently insufficient data to precisely report this particular test’s sensitivity and specificity, it is likely similar to the average for antigen tests mentioned above. However, even if a rapid test that has a sensitivity similar to that of rRT-PCR is used, we still believe that replacing the laboratory-based rRT-PCR tests with rapid tests could be harmful, as rapid tests will likely increase the spread of SARS-CoV-2 in patients with false negative results.
Until recently, the impact of false negative COVID-19 tests has likely been dampened both by government-mandated closures and prolonged wait times for rRT-PCR test results. With many businesses and schools closed, a patient with a false negative COVID-19 test had less ability to widely spread SARS-CoV-2. Additionally, days-long delays in access to results have been frustrating to patients and physicians. However, patients’ isolation behavior is likely stricter during the waiting period for results than following a negative result. Because the period of

Volume 22, no. 3: May 2021 545 Western Journal of Emergency Medicine
Zitek et al. Are Rapid COVID-19 Tests a Step Forward or Back?
patients who had false negative results would remain in quarantine despite their negative test results, and they would not spread SARS-CoV-2 to anyone new. However, suppose 20% (12 patients) of those 61 patients with a false negative test return to work, school, or social situations early because they believe they do not have COVID-19. If six of these 12 patients spreads SARS-CoV-2 to just one new person that would not have been exposed to the virus had the patient remained in quarantine for 2-3 more days, then the transition from rRT-PCR tests to rapid antigen tests accounts for six new cases of COVID-19 in this group of 1000 tested patients. Over hundreds of thousands or millions of rapid antigen tests, the increased spread of SARS-CoV-2 through this mechanism could be striking.
At this point, rapid testing for COVID-19 is already widely used. The lack of accuracy of the tests seems to be less important to some decisionmakers than the fact that they give a result quickly. In a few special circumstances where repeated tests for COVID-19 are performed on asymptomatic individuals, such as testing done by the National Football League, rapid testing may be preferred to laboratory-based testing for logistical reasons. However, in typical healthcare settings, rapid tests are not optimal and must be used cautiously. Therefore, as a means to reduce the spreading of SARS-CoV-2 from patients who have had “negative” rapid COVID-19 tests, we recommend two potential solutions. First, negative results of rapid tests should be called “indeterminate.” This is in fact more accurate than saying the test was negative (since possibly over 50% of patients with COVID-19 will have a false negative). For outpatients with possible COVID-19, this would serve as a constant reminder that they should remain in self-isolation until their symptoms resolve even if their test is negative.
Second, in cases where patients are being admitted to the hospital with a clinical presentation suggestive of COVID-19, the patient should continue to be isolated even if they have a negative rapid test. For these patients, additional testing for COVID-19 should be considered, and for some of these patients, a computed tomography (CT) of the chest should be performed. Notably, some society guidelines recommend against the use of CT of the chest for the diagnosis of COVID-19, and the harms of CT with regard to radiation and cost are important to consider.10, 11 However, the combination of rRT-PCR and CT provides a very high sensitivity (about 97%) for COVID-194; thus, the selective use of this strategy could reduce the potential harms of false negative tests discussed above.
In summary, regardless of the type of test used for virologic confirmation of SARS-CoV-2, there are a substantial number of false negative tests. Rapid tests, especially rapid antigen tests, likely have even higher numbers of false negatives. Therefore, policies for quarantine and isolation that rely solely on the results
of a rapid test are bound to result in misdiagnosis and increased viral transmission. Informing patients that their rapid COVID-19 test was negative could result in less self-isolation and increased viral spread. If rapid tests are used, we recommend that negative results instead be called “indeterminate” to remind patients that a negative test does not mean they do not have COVID-19.
Address for Correspondence: Tony Zitek, MD, Herbert Wertheim College of Medicine, Florida International University, Department of Emergency Medicine, 91500 Overseas Hwy, Tavernier, FL 33070. Email: [email protected].
Conflicts of Interest: By the WestJEM article submission agreement, all authors are required to disclose all affiliations, funding sources and financial or management relationships that could be perceived as potential sources of bias. No author has professional or financial relationships with any companies that are relevant to this study. There are no conflicts of interest or sources of funding to declare.
Copyright: © 2021 Zitek et al. This is an open access article distributed in accordance with the terms of the Creative Commons Attribution (CC BY 4.0) License. See: http://creativecommons.org/licenses/by/4.0/
REFERENCES1. Nguyen T, Bang DD, Wolff A. 2019 Novel coronavirus disease
(COVID-19): paving the road for rapid detection and point-of-care diagnostics. Micromachines (Basel). 2020;11(3):306.
2. Goldman D, Kane A, Kounang N. This $5 rapid test is a potential game-changer in COVID testing. 2020. Available at: https://www.cnn.com/2020/08/27/investing/abbott-labs-rapid-covid-test/index.html. Accessed August 30, 2020.
3. Zitek T. The appropriate use of testing for COVID-19. West J Emerg Med. 2020;21(3):470-2.
4. Carpenter CR, Mudd PA, West CP, et al. Diagnosing COVID-19 in the emergency department: a scoping review of clinical examinations, laboratory tests, imaging accuracy, and biases. Acad Emerg Med. 2020;27(8):653-70.
5. Moon SY and Son JS. Infectivity of an asymptomatic patient with Middle East respiratory syndrome coronavirus infection. Clin Infect Dis. 2017;64(10):1457.
6. Dinnes J, Deeks JJ, Adrian A, et al. Rapid, point-of-care antigen and molecular-based tests for diagnosis of SARS-CoV-2 infection. Cochrane Database Syst Rev. 2020;8:CD013705.
7. Krouse S. Abbott’s $5 COVID-19 rapid antigen test gets emergency-use status from FDA. 2020. Available at: https://www.wsj.com/articles/abbotts-5-covid-19-rapid-antigen-test-gets-emergency-use-status-from-fda-11598485933. Accessed August 29, 2020.
8. Kappes A, Nussberger AM, Faber NS, et al. Uncertainty about the impact of social decisions increases prosocial behaviour. Nat Hum
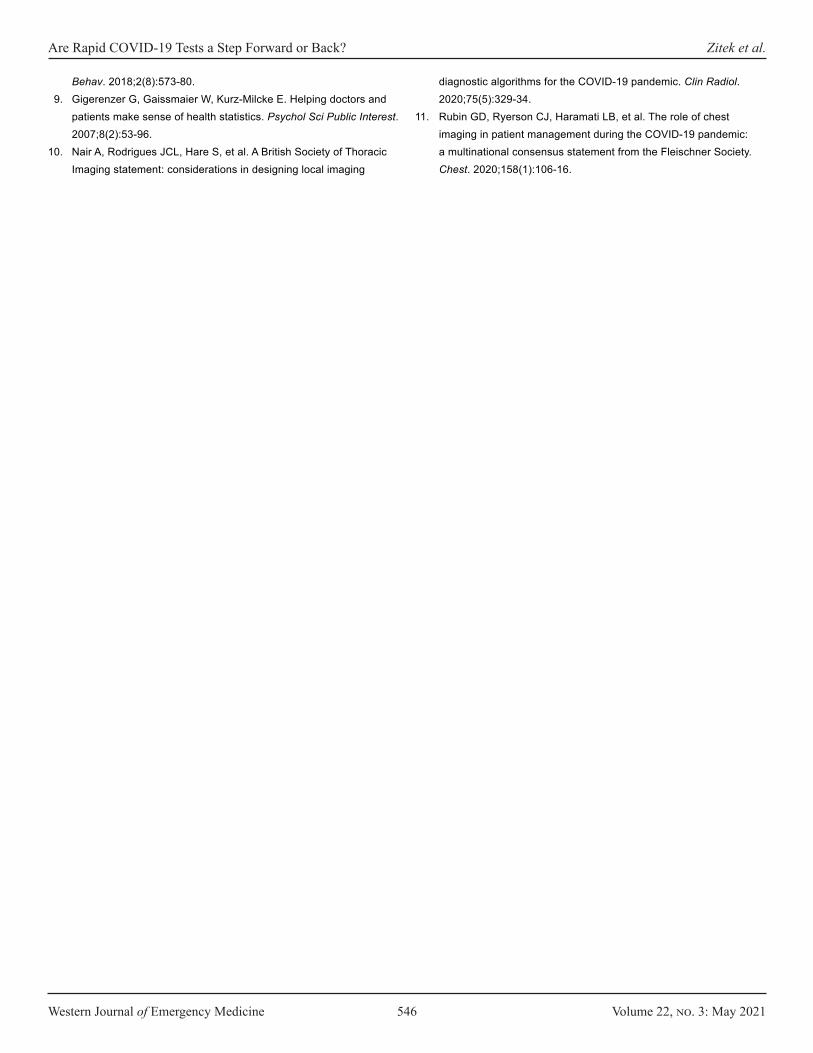
Western Journal of Emergency Medicine 546 Volume 22, no. 3: May 2021
Are Rapid COVID-19 Tests a Step Forward or Back? Zitek et al.
Behav. 2018;2(8):573-80.9. Gigerenzer G, Gaissmaier W, Kurz-Milcke E. Helping doctors and
patients make sense of health statistics. Psychol Sci Public Interest. 2007;8(2):53-96.
10. Nair A, Rodrigues JCL, Hare S, et al. A British Society of Thoracic Imaging statement: considerations in designing local imaging
diagnostic algorithms for the COVID-19 pandemic. Clin Radiol. 2020;75(5):329-34.
11. Rubin GD, Ryerson CJ, Haramati LB, et al. The role of chest imaging in patient management during the COVID-19 pandemic: a multinational consensus statement from the Fleischner Society. Chest. 2020;158(1):106-16.

Volume 22, no. 3: May 2021 547 Western Journal of Emergency Medicine
Original Research
Failure Rates During Reuse of Disposable N95 Masks in Clinical Practice in the Emergency Department
Ronald Check, MD Brian Kelly, DO Kathleen McMahon, DOVamsi Balakrishnan, MD Leah Rivard, MDJohnathan Pester, DO Donald Jeanmonod, MD Rebecca K. Jeanmonod, MD Section Editor: R. Wilkerson, MD Submission history: Submitted September 21, 2020; Revision received January 19, 2021; Accepted January 19, 2021Electronically published April 19, 2021Full text available through open access at http://escholarship.org/uc/uciem_westjem DOI: 10.5811/westjem.2021.1.49960
INTRODUCTIONIn 1970 the United States Congress created the
Occupational Safety and Health Administration (OSHA) to set forth regulations for workplace safety, as well as the National Institute for Occupational Safety and Health (NIOSH) to certify protective equipment and develop recommendations on its
St. Luke’s University Health Network, Department of Emergency Medicine, Bethlehem, Pennsylvania
Introduction: The coronavirus 2019 pandemic caused a shortage of disposable N95 respirators, prompting healthcare entities to extend the use of these masks beyond their intended single-use manufacturer recommendation with a paucity of supporting research.
Methods: We performed a prospective cohort study of ED healthcare workers (HCW) (“subjects”) required to use respirators at an academic, Level I trauma center. Subjects had been previously fit tested and assigned an appropriately sized N95 mask per hospital protocol. Per study protocol, subjects were fit tested periodically throughout their shifts and on multiple shifts over the eight-week study period. Data points collected included the age of the mask, subjective assessment of mask seal quality, and fit test results. We analyzed the data using Fisher’s exact test, and calculated odds ratios (OR) to determine the failure rate of disposable N95 masks following reuse.
Results: A total of 130 HCWs underwent fit testing and 127 were included for analysis. Mask failure rate climbed after day 2 of use, with 33.3% of masks failing at day 3, 42.9% at day 4, and 50% at ≥ day 5. Categorizing the masks into those being used for two or fewer days vs those in use for three or more, failure was more common on day 3 of use or older compared to those in the first two days of use (41.8% vs 8.3%, P < 0.0001) with an OR of failure with an older mask of 7.9 (confidence interval [CI], 2.8-22.3). The healthcare workers’ assessment of poor seal was 33.3% sensitive (CI, 18.6-51.9) and 95.7% specific (CI, 88.8-98.6) for fit test failure.
Conclusion: Disposable N95 masks have significant failure rates following reuse in clinical practice. Healthcare personnel also performed poorly in assessing the integrity of the seal of their disposable respirators. [West J Emerg Med. 2021;22(3)547–551.]
use.1 Initially used in industrial and manufacturing workplaces, disposable respirator masks were introduced in the healthcare setting to protect workers against airborne diseases. The tuberculosis outbreak of 1991 acted as a catalyst to prompt the US Centers for Disease Control and Prevention (CDC) to release guidelines for their use in healthcare facilities.2
Western Journal of Emergency Medicine 548 Volume 22, no. 3: May 2021
Failure Rates with Disposable N95 Masks Check et al.
Population Health Research Capsule
What do we already know about this issue?The COVID-19 (coronavirus disease 2019)pandemic caused a worldwide shortage of disposable N95 respirators, prompting healthcare workers to reuse these masks beyond their intended single use.
What was the research question?What is the failure rate of disposable N95 respirators following reuse in the emergency department?
What was the major finding of the study?N95 respirators have significant failure rates following reuse, specifically after two days of use.
How does this improve population health?Knowing that N95 respirators fail to provide adequate protection following reuse, healthcare systems can alter their masking policies to protect healthcare workers.
Disposable respirator masks approved by NIOSH are designed as single- or limited-use respirators that an individual can mold to one’s face to ensure a proper seal and are intended for a single patient encounter. The NIOSH-certified N95 filtering facepiece respirator (FFR) is the most common disposable respirator used in the healthcare environment and is designed to fit securely on the operator’s face with the mask material meeting a minimum requirement of filtering 95% or greater of a standard test aerosol.3
The coronavirus 2019 pandemic quickly caused worldwide shortages in FFRs and other personal protective equipment (PPE).4 Supply chains and manufacturing have been hampered while demand has increased, and this imbalance in supply and demand will likely continue for some time. With critical shortages, it is neither economically nor logistically feasible to use disposable FFRs solely in their intended single-use capacity. Therefore, the CDC responded by publishing guidelines for healthcare entities to implement protocols for extended use of respirators (donning for multiple patient encounters without doffing), as well as limited reuse protocols (donning and doffing multiple times with the same mask for an extended period of time) to extend the lifetime of their supplies.5
Although this practice would stretch supplies for a longer period of time, there is a concern that extending the clinical use of disposable FFRs beyond their intended design could result in the reduction of protective effectiveness. The effectiveness of FFRs could be reduced by degradation of the filter medium itself or by loss of tight seal to the face such that not all inhaled air travels through the mask filter.6 Studies supporting mask reuse and extended use have been largely performed through simulated scenarios, with only one study to date addressing concerns of mask performance reliability with reuse and extended use.7-9
ObjectivesOur objectives were twofold: to determine the failure
rate of disposable N95 FFRs reused over multiple days in the emergency department (ED), and to evaluate whether healthcare workers (HCW) were able to recognize the functional performance of their masks.
MATERIALS AND METHODSStudy DesignThis was an anonymous, cross-sectional, convenience study of HCWs who were required to reuse disposable N95 FFRs during clinical duties in the ED. The study was reviewed by the institutional review board and found to be exempt.
Study Setting and Population The study was conducted from April 1–June 15, 2020
at a community-based Level I trauma center with an annual census of 55,000. Study subjects (hereafter referred to as HCWs) were physicians (both residents and attendings),
nurses, medical technicians, and radiology technicians who had already been fit tested by the study site and assigned an appropriately sized N95 FFR as per OSHA mandate. During the study period, HCWs at the study site were required to wear N95 FFRs for the duration of their clinical shifts. We excluded HCWs who had failed institutional fit testing and were relegated to use a powered air-purifying respirator hood. We also excluded HCWs for whom no mask was available at the time of enrollment due to supply shortages, HCWs who declined participation, and those who provided their own PPE.
Study Protocol and MeasurementsThe HCWs wore a variety of N95 FFRs supplied by the
hospital. These FFRs were either purchased by the hospital or donated to the hospital by outside organizations and then approved for clinical use after assessment by hospital resource management. Mask types included 3M 1860, 3M 8210, 3M Aura 1870 (3M Company, Saint Paul, MN), Kimberly-Clark 46727 (Kimberly-Clark Corporation, Irving, TX), Milwaukee 50-73-4010 (Milwaukee Electric Tool, Brookfield WI), and Honeywell H801 (Honeywell International, Inc, Charlotte, NC).
Prior to testing, HCWs recorded their impressions of the adequacy of their mask fit (adequate or inadequate) and total number of shifts during which their masks were worn. They subsequently underwent qualitative fit testing using a standardized hood and 3M FT-32 bitter testing solution (Bitrex). The HCWs performed standard maneuvers during fit
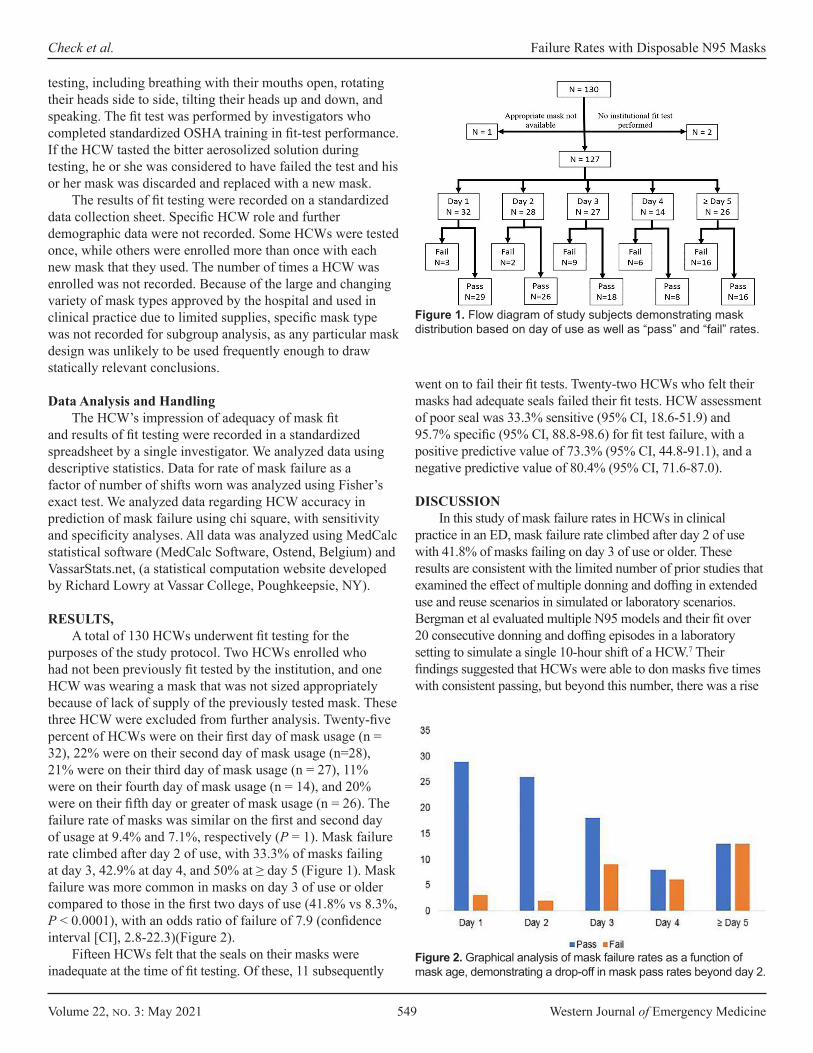
Volume 22, no. 3: May 2021 549 Western Journal of Emergency Medicine
Check et al. Failure Rates with Disposable N95 Masks
testing, including breathing with their mouths open, rotating their heads side to side, tilting their heads up and down, and speaking. The fit test was performed by investigators who completed standardized OSHA training in fit-test performance. If the HCW tasted the bitter aerosolized solution during testing, he or she was considered to have failed the test and his or her mask was discarded and replaced with a new mask.
The results of fit testing were recorded on a standardized data collection sheet. Specific HCW role and further demographic data were not recorded. Some HCWs were tested once, while others were enrolled more than once with each new mask that they used. The number of times a HCW was enrolled was not recorded. Because of the large and changing variety of mask types approved by the hospital and used in clinical practice due to limited supplies, specific mask type was not recorded for subgroup analysis, as any particular mask design was unlikely to be used frequently enough to draw statically relevant conclusions.
Data Analysis and HandlingThe HCW’s impression of adequacy of mask fit
and results of fit testing were recorded in a standardized spreadsheet by a single investigator. We analyzed data using descriptive statistics. Data for rate of mask failure as a factor of number of shifts worn was analyzed using Fisher’s exact test. We analyzed data regarding HCW accuracy in prediction of mask failure using chi square, with sensitivity and specificity analyses. All data was analyzed using MedCalc statistical software (MedCalc Software, Ostend, Belgium) and VassarStats.net, (a statistical computation website developed by Richard Lowry at Vassar College, Poughkeepsie, NY).
RESULTS,A total of 130 HCWs underwent fit testing for the
purposes of the study protocol. Two HCWs enrolled who had not been previously fit tested by the institution, and one HCW was wearing a mask that was not sized appropriately because of lack of supply of the previously tested mask. These three HCW were excluded from further analysis. Twenty-five percent of HCWs were on their first day of mask usage (n = 32), 22% were on their second day of mask usage (n=28), 21% were on their third day of mask usage (n = 27), 11% were on their fourth day of mask usage (n = 14), and 20% were on their fifth day or greater of mask usage (n = 26). The failure rate of masks was similar on the first and second day of usage at 9.4% and 7.1%, respectively (P = 1). Mask failure rate climbed after day 2 of use, with 33.3% of masks failing at day 3, 42.9% at day 4, and 50% at ≥ day 5 (Figure 1). Mask failure was more common in masks on day 3 of use or older compared to those in the first two days of use (41.8% vs 8.3%, P < 0.0001), with an odds ratio of failure of 7.9 (confidence interval [CI], 2.8-22.3)(Figure 2).
Fifteen HCWs felt that the seals on their masks were inadequate at the time of fit testing. Of these, 11 subsequently
Figure 1. Flow diagram of study subjects demonstrating mask distribution based on day of use as well as “pass” and “fail” rates.
went on to fail their fit tests. Twenty-two HCWs who felt their masks had adequate seals failed their fit tests. HCW assessment of poor seal was 33.3% sensitive (95% CI, 18.6-51.9) and 95.7% specific (95% CI, 88.8-98.6) for fit test failure, with a positive predictive value of 73.3% (95% CI, 44.8-91.1), and a negative predictive value of 80.4% (95% CI, 71.6-87.0).
DISCUSSIONIn this study of mask failure rates in HCWs in clinical
practice in an ED, mask failure rate climbed after day 2 of use with 41.8% of masks failing on day 3 of use or older. These results are consistent with the limited number of prior studies that examined the effect of multiple donning and doffing in extended use and reuse scenarios in simulated or laboratory scenarios. Bergman et al evaluated multiple N95 models and their fit over 20 consecutive donning and doffing episodes in a laboratory setting to simulate a single 10-hour shift of a HCW.7 Their findings suggested that HCWs were able to don masks five times with consistent passing, but beyond this number, there was a rise
Figure 2. Graphical analysis of mask failure rates as a function of mask age, demonstrating a drop-off in mask pass rates beyond day 2.
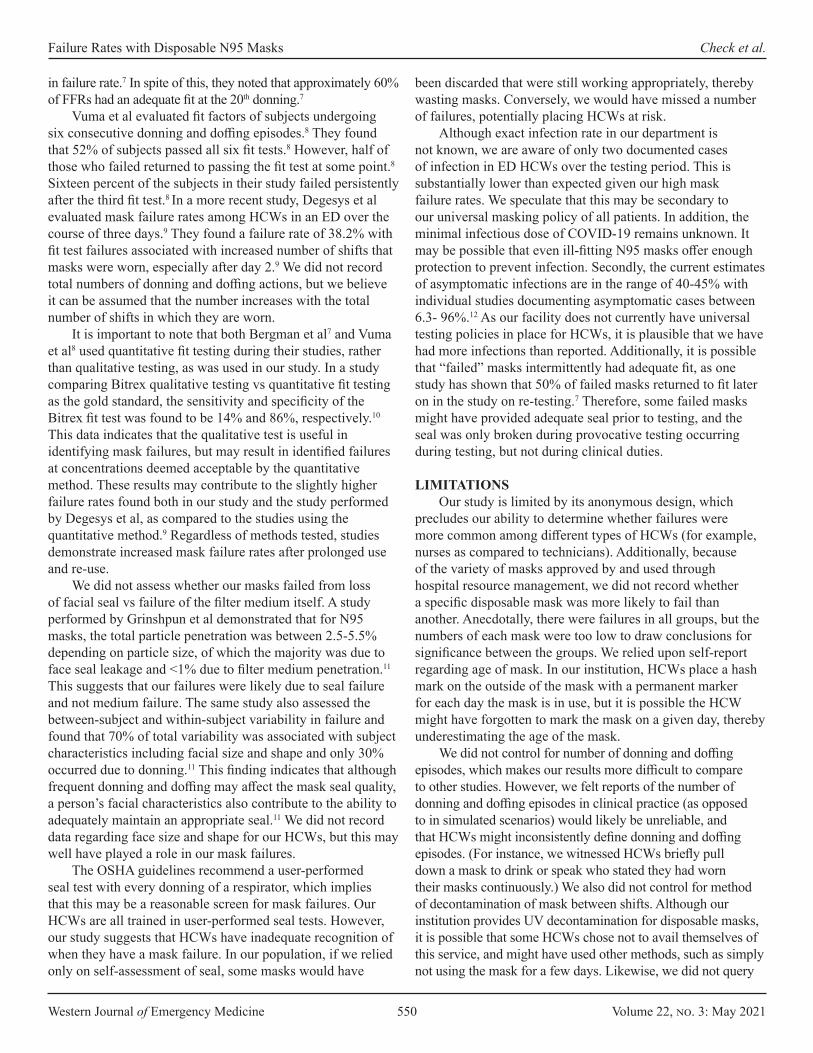
Western Journal of Emergency Medicine 550 Volume 22, no. 3: May 2021
Failure Rates with Disposable N95 Masks Check et al.
in failure rate.7 In spite of this, they noted that approximately 60% of FFRs had an adequate fit at the 20th donning.7
Vuma et al evaluated fit factors of subjects undergoing six consecutive donning and doffing episodes.8 They found that 52% of subjects passed all six fit tests.8 However, half of those who failed returned to passing the fit test at some point.8 Sixteen percent of the subjects in their study failed persistently after the third fit test.8 In a more recent study, Degesys et al evaluated mask failure rates among HCWs in an ED over the course of three days.9 They found a failure rate of 38.2% with fit test failures associated with increased number of shifts that masks were worn, especially after day 2.9 We did not record total numbers of donning and doffing actions, but we believe it can be assumed that the number increases with the total number of shifts in which they are worn.
It is important to note that both Bergman et al7 and Vuma et al8 used quantitative fit testing during their studies, rather than qualitative testing, as was used in our study. In a study comparing Bitrex qualitative testing vs quantitative fit testing as the gold standard, the sensitivity and specificity of the Bitrex fit test was found to be 14% and 86%, respectively.10 This data indicates that the qualitative test is useful in identifying mask failures, but may result in identified failures at concentrations deemed acceptable by the quantitative method. These results may contribute to the slightly higher failure rates found both in our study and the study performed by Degesys et al, as compared to the studies using the quantitative method.9 Regardless of methods tested, studies demonstrate increased mask failure rates after prolonged use and re-use.
We did not assess whether our masks failed from loss of facial seal vs failure of the filter medium itself. A study performed by Grinshpun et al demonstrated that for N95 masks, the total particle penetration was between 2.5-5.5% depending on particle size, of which the majority was due to face seal leakage and <1% due to filter medium penetration.11 This suggests that our failures were likely due to seal failure and not medium failure. The same study also assessed the between-subject and within-subject variability in failure and found that 70% of total variability was associated with subject characteristics including facial size and shape and only 30% occurred due to donning.11 This finding indicates that although frequent donning and doffing may affect the mask seal quality, a person’s facial characteristics also contribute to the ability to adequately maintain an appropriate seal.11 We did not record data regarding face size and shape for our HCWs, but this may well have played a role in our mask failures.
The OSHA guidelines recommend a user-performed seal test with every donning of a respirator, which implies that this may be a reasonable screen for mask failures. Our HCWs are all trained in user-performed seal tests. However, our study suggests that HCWs have inadequate recognition of when they have a mask failure. In our population, if we relied only on self-assessment of seal, some masks would have
been discarded that were still working appropriately, thereby wasting masks. Conversely, we would have missed a number of failures, potentially placing HCWs at risk.
Although exact infection rate in our department is not known, we are aware of only two documented cases of infection in ED HCWs over the testing period. This is substantially lower than expected given our high mask failure rates. We speculate that this may be secondary to our universal masking policy of all patients. In addition, the minimal infectious dose of COVID-19 remains unknown. It may be possible that even ill-fitting N95 masks offer enough protection to prevent infection. Secondly, the current estimates of asymptomatic infections are in the range of 40-45% with individual studies documenting asymptomatic cases between 6.3- 96%.12 As our facility does not currently have universal testing policies in place for HCWs, it is plausible that we have had more infections than reported. Additionally, it is possible that “failed” masks intermittently had adequate fit, as one study has shown that 50% of failed masks returned to fit later on in the study on re-testing.7 Therefore, some failed masks might have provided adequate seal prior to testing, and the seal was only broken during provocative testing occurring during testing, but not during clinical duties.
LIMITATIONSOur study is limited by its anonymous design, which
precludes our ability to determine whether failures were more common among different types of HCWs (for example, nurses as compared to technicians). Additionally, because of the variety of masks approved by and used through hospital resource management, we did not record whether a specific disposable mask was more likely to fail than another. Anecdotally, there were failures in all groups, but the numbers of each mask were too low to draw conclusions for significance between the groups. We relied upon self-report regarding age of mask. In our institution, HCWs place a hash mark on the outside of the mask with a permanent marker for each day the mask is in use, but it is possible the HCW might have forgotten to mark the mask on a given day, thereby underestimating the age of the mask.
We did not control for number of donning and doffing episodes, which makes our results more difficult to compare to other studies. However, we felt reports of the number of donning and doffing episodes in clinical practice (as opposed to in simulated scenarios) would likely be unreliable, and that HCWs might inconsistently define donning and doffing episodes. (For instance, we witnessed HCWs briefly pull down a mask to drink or speak who stated they had worn their masks continuously.) We also did not control for method of decontamination of mask between shifts. Although our institution provides UV decontamination for disposable masks, it is possible that some HCWs chose not to avail themselves of this service, and might have used other methods, such as simply not using the mask for a few days. Likewise, we did not query
Volume 22, no. 3: May 2021 551 Western Journal of Emergency Medicine
Check et al. Failure Rates with Disposable N95 Masks
HCWs as to the storage and care of their masks between uses. Finally, our study was performed at a single institution, and may not be generalizable to all settings.
CONCLUSIONReuse of disposable filtering facepiece respirators
beyond two days in actual clinical practice has a high rate of fit failure. This suggests increased risk of aerosolized infectious disease transmission with reuse of masks. This risk might be mitigated with frequent fit testing. Healthcare workers perform poorly in recognizing the integrity of their own mask seals. Therefore, self-assessment does not appear adequate to determine fit.
Address for Correspondence: Rebecca Jeanmonod, MD, St. Luke’s University Health Network, Department of Emergency Medicine, 801 Ostrum St. Bethlehem, PA 18015. Email: [email protected].
Conflicts of Interest: By the WestJEM article submission agreement, all authors are required to disclose all affiliations, funding sources and financial or management relationships that could be perceived as potential sources of bias. No author has professional or financial relationships with any companies that are relevant to this study. There are no conflicts of interest or sources of funding to declare.
Copyright: © 2021 Check et al. This is an open access article distributed in accordance with the terms of the Creative Commons Attribution (CC BY 4.0) License. See: http://creativecommons.org/licenses/by/4.0/
Healthcare facilities. 1994. Available at: https://www.cdc.gov/mmwr/PDF/rr/rr4313.pdf. Accessed September 20, 2020.
3. Centers for Disease Control and Prevention (CDC). Respiratory Protective Devices, Code of Federal Regulations Title 42, Part 84. 1997. Available at https://www.cdc.gov/niosh/npptl/topics/respirators/pt84abs2.html. Accessed September 20, 2020.
4. Tabah A, Ramanan M, Laupland KB, et al. Personal protective equipment and intensive care unit healthcare worker safety in the COVID-19 era (PPE-SAFE): an international survey. J Crit Care. 2020;59:70-5.
5. Centers for Disease Control and Prevention (CDC). Recommended Guidance for Extended Use and Limited Reuse of N95 Filtering Facepiece Respirators in Healthcare Settings. 2020. Available at https://www.cdc.gov/niosh/topics/hcwcontrols/recommendedguidanceextuse.html. Accessed September 20, 2020.
6. Fisher EM and Shaffer RE. Considerations for recommending extended use and limited reuse of filtering facepiece respirators in healthcare settings. J Occup Environ Hyg. 2014;11(8): 115-28.
7. Bergman MS, Viscusi DJ, Zhuang Z, et al. Impact of multiple consecutive donnings on filtering facepiece respirator fit. Am J Infect Control. 2012;40:375-80
8. Vuma CD, Manganyi J, Wilson K, et al. The effect of fit of multiple consecutive donning and doffing of N95 filtering facepiece respirators. Ann Work Expo Health. 2019;63(8):930-6.
9. Degesys NF, Wang RC, Kwan E, et al. Correlation between N95 extended use and reuse and fit failure in an emergency department. JAMA. 2020;324(1):64-6.
10. Clapham SJ, Stephenson DJ, Wallace DO, et al. Comparison of N95 disposable filtering facepiece fits using Bitrex qualitative and TSI Portacount quantitative fit testing. Int J Occup Environ Health. 2000; 6(1): 50-4.
11. Grinshpun SA, Haruta H, Eninger RM, et al. Performance of an N95 filtering facepiece particulate respirator and a surgical mask during human breathing: two pathways for particle penetration. J Occup Environ Hyg. 2009;6:593-603.
12. Oran DP, Topal EJ. Prevalence of asymptomatic SARS-CoV-2 infection. Ann Intern Med. 2020:M20-3012.
REFERENCES1. Cohen HJ and Birkner, JS. Respiratory protection. Clin in Chest Med.
2012; 33(4): 783–932. Centers for Disease Control and Prevention (CDC). Guidelines for
Preventing the Transmission of Mycobacterium Tuberculosis in
Western Journal of Emergency Medicine 552 Volume 22, no. 3: May 2021
Original Research
Emergency Department Access During COVID-19: Disparities in Utilization by Race/Ethnicity, Insurance, and Income
Jason Lowe, DOIan Brown, MDRam Duriseti, MD, PhDMoises Gallegos, MD, MPHRyan Ribeira, MDElizabeth Pirrotta, MAN. Ewen Wang, MD
Section Editor: Emily Cleveland Manchanda, MD, MPH Submission history: Submitted July 28, 2020; Revision received January 14, 2021; Accepted January 19, 2021Electronically published April 28, 2021 Full text available through open access at http://escholarship.org/uc/uciem_westjem DOI: 10.5811/westjem.2021.1.49279
BACKGROUND As the first cases of coronavrus 2019 (COVID-19)
spread in municipalities across the United States, hospitals
Stanford University School of Medicine, Department of Emergency Medicine, Palo Alto, California
Introduction: In March 2020, shelter-in-place orders were enacted to attenuate the spread of coronavirus 2019 (COVID-19). Emergency departments (EDs) experienced unexpected and dramatic decreases in patient volume, raising concerns about exacerbating health disparities.
Methods: We queried our electronic health record to describe the overall change in visits to a two-ED healthcare system in Northern California from March–June 2020 compared to 2019. We compared weekly absolute numbers and proportional change in visits focusing on race/ethnicity, insurance, household income, and acuity. We calculated the z-score to identify whether there was a statistically significant difference in proportions between 2020 and 2019.
Results: Overall ED volume declined 28% during the study period. The nadir of volume was 52% of 2019 levels and occurred five weeks after a shelter-in-place order was enacted. Patient demographics also shifted. By week 4 (April 5), the proportion of Hispanic patients decreased by 3.3 percentage points (pp) (P = 0.0053) compared to a 6.2 pp increase in White patients (P = 0.000005). The proportion of patients with commercial insurance increased by 11.6 pp, while Medicaid visits decreased by 9.5 pp (P < 0.00001) at the initiation of shelter-in-place orders. For patients from neighborhoods <300% federal poverty levels (FPL), visits were –3.8 pp (P = 0.000046) of baseline compared to +2.9 pp (P = 0.0044) for patients from ZIP codes at >400% FPL the week of the shelter-in-place order. Overall, 2020 evidenced a consistently elevated proportion of high-acuity Emergency Severity Index (ESI) level 1 patients compared to 2019. Increased acuity was also demonstrated by an increase in the admission rate, with a 10.8 pp increase from 2019. Although there was an increased proportion of high-acuity patients, the overall census was decreased.
Conclusion: Our results demonstrate changing ED utilization patterns circa the shelter-in-place orders. Those from historically vulnerable populations such as Hispanics, those from lower socioeconomic areas, and Medicaid users presented at disproportionately lower rates and numbers than other groups. As the pandemic continues, hospitals should use operations data to monitor utilization patterns by demographic, in addition to clinical indicators. Messaging about availability of emergency care and other services should include vulnerable populations to avoid exacerbating healthcare disparities. [West J Emerg Med. 2021;22(3)552–560.]
and healthcare teams prepared to receive a predicted influx of infected and acutely ill patients. Concurrently, state and local governments disseminated shelter-in-place and personal
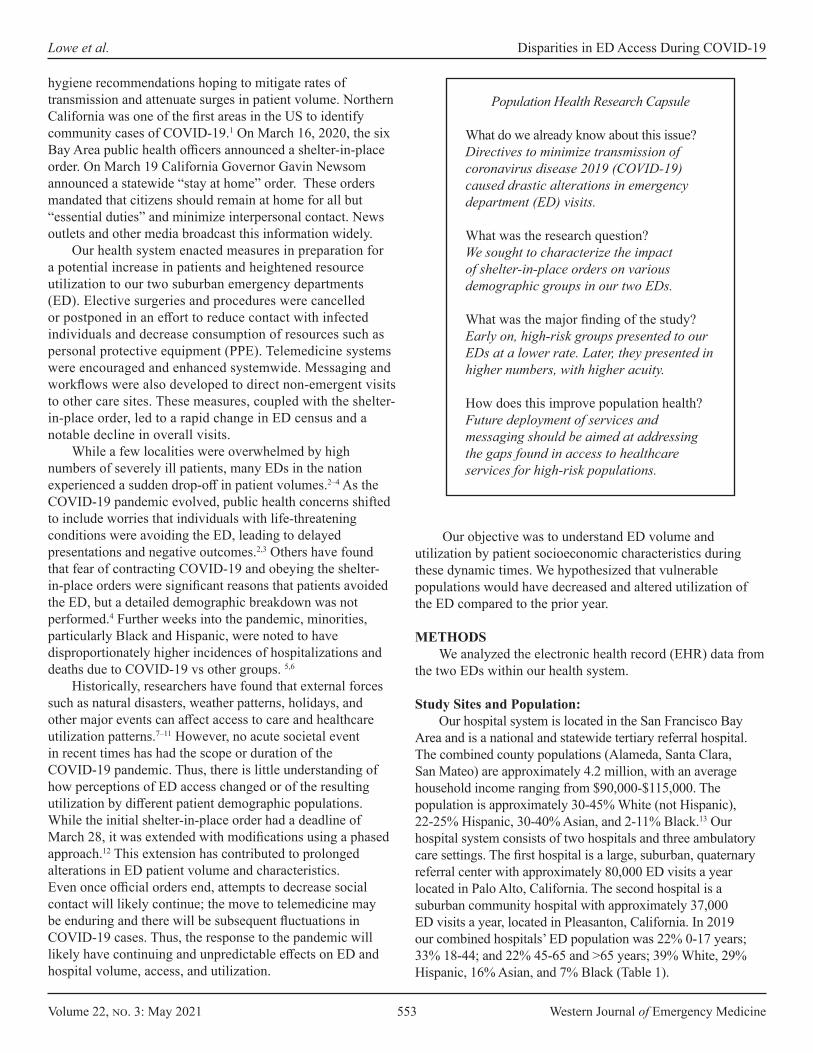
Volume 22, no. 3: May 2021 553 Western Journal of Emergency Medicine
Lowe et al. Disparities in ED Access During COVID-19
Population Health Research Capsule
What do we already know about this issue?Directives to minimize transmission of coronavirus disease 2019 (COVID-19) caused drastic alterations in emergency department (ED) visits.
What was the research question?We sought to characterize the impact of shelter-in-place orders on various demographic groups in our two EDs.
What was the major finding of the study?Early on, high-risk groups presented to our EDs at a lower rate. Later, they presented in higher numbers, with higher acuity.
How does this improve population health?Future deployment of services and messaging should be aimed at addressing the gaps found in access to healthcare services for high-risk populations.
hygiene recommendations hoping to mitigate rates of transmission and attenuate surges in patient volume. Northern California was one of the first areas in the US to identify community cases of COVID-19.1 On March 16, 2020, the six Bay Area public health officers announced a shelter-in-place order. On March 19 California Governor Gavin Newsom announced a statewide “stay at home” order. These orders mandated that citizens should remain at home for all but “essential duties” and minimize interpersonal contact. News outlets and other media broadcast this information widely.
Our health system enacted measures in preparation for a potential increase in patients and heightened resource utilization to our two suburban emergency departments (ED). Elective surgeries and procedures were cancelled or postponed in an effort to reduce contact with infected individuals and decrease consumption of resources such as personal protective equipment (PPE). Telemedicine systems were encouraged and enhanced systemwide. Messaging and workflows were also developed to direct non-emergent visits to other care sites. These measures, coupled with the shelter-in-place order, led to a rapid change in ED census and a notable decline in overall visits.
While a few localities were overwhelmed by high numbers of severely ill patients, many EDs in the nation experienced a sudden drop-off in patient volumes.2–4 As the COVID-19 pandemic evolved, public health concerns shifted to include worries that individuals with life-threatening conditions were avoiding the ED, leading to delayed presentations and negative outcomes.2,3 Others have found that fear of contracting COVID-19 and obeying the shelter-in-place orders were significant reasons that patients avoided the ED, but a detailed demographic breakdown was not performed.4 Further weeks into the pandemic, minorities, particularly Black and Hispanic, were noted to have disproportionately higher incidences of hospitalizations and deaths due to COVID-19 vs other groups. 5,6
Historically, researchers have found that external forces such as natural disasters, weather patterns, holidays, and other major events can affect access to care and healthcare utilization patterns.7–11 However, no acute societal event in recent times has had the scope or duration of the COVID-19 pandemic. Thus, there is little understanding of how perceptions of ED access changed or of the resulting utilization by different patient demographic populations. While the initial shelter-in-place order had a deadline of March 28, it was extended with modifications using a phased approach.12 This extension has contributed to prolonged alterations in ED patient volume and characteristics. Even once official orders end, attempts to decrease social contact will likely continue; the move to telemedicine may be enduring and there will be subsequent fluctuations in COVID-19 cases. Thus, the response to the pandemic will likely have continuing and unpredictable effects on ED and hospital volume, access, and utilization.
Our objective was to understand ED volume and utilization by patient socioeconomic characteristics during these dynamic times. We hypothesized that vulnerable populations would have decreased and altered utilization of the ED compared to the prior year.
METHODSWe analyzed the electronic health record (EHR) data from
the two EDs within our health system.
Study Sites and Population: Our hospital system is located in the San Francisco Bay
Area and is a national and statewide tertiary referral hospital. The combined county populations (Alameda, Santa Clara, San Mateo) are approximately 4.2 million, with an average household income ranging from $90,000-$115,000. The population is approximately 30-45% White (not Hispanic), 22-25% Hispanic, 30-40% Asian, and 2-11% Black.13 Our hospital system consists of two hospitals and three ambulatory care settings. The first hospital is a large, suburban, quaternary referral center with approximately 80,000 ED visits a year located in Palo Alto, California. The second hospital is a suburban community hospital with approximately 37,000 ED visits a year, located in Pleasanton, California. In 2019 our combined hospitals’ ED population was 22% 0-17 years; 33% 18-44; and 22% 45-65 and >65 years; 39% White, 29% Hispanic, 16% Asian, and 7% Black (Table 1).

Western Journal of Emergency Medicine 554 Volume 22, no. 3: May 2021
Disparities in ED Access During COVID-19 Lowe et al.
the seven days from Sunday to Saturday. The week of March 15 was identified as Week 1, which was when our local shelter-in-place order was enacted.
Key Timepoints IdentifiedHealthcare system stops elective procedures: March 13, 2020Bay Area shelter-in-place order: March 16, 2020California stay-at-home order: March 19, 2020Healthcare system resumes elective procedures: May 4, 2020
Demographic Characteristics We grouped age into standard categories of < 18, 18-44, 45-
64, and > 65 years. Gender was categorized as male and female. Insurance was grouped as commercial (private and worker’s compensation), Medicaid, Medicare, and self-pay. Reported race and ethnicity was grouped as Hispanic, Non-Hispanic-White, Black, Asian and Pacific Islander, and Other (including missing <1% and no answer). We were unable to use language as a variable due to lack of availability of reporting.
Census tract was determined from patient street address and then matched to median household income from the US Census American Community Survey 2018 five-year estimates.14 We grouped median household income by comparison to 2018 federal poverty level (FPL) for a family of four ($25,100).15 We used standard categories of <300% FPL, 300-400% FPL, and >400% FPL. For patients missing census tract information, ZIP codes were matched to median household income from 2006-2010 found at Tract2Zip (https://www.psc.isr.umich.edu/dis/census/Features/tract2zip/ ). Groupings were made using the 2010 FPLs for a family of four ($22,050). Thus, we were unable to assign an income level to only 3.5% of addresses.
Clinical CharacteristicsAcuity was represented by Emergency Severity Index
(ESI) triage level. High-acuity trauma and ESI levels of 1 and 2 were categorized as “Resuscitation/Emergent”; low-acuity trauma and ESI level 3 were categorized as “Urgent.” We characterized ESI triage levels 4 and 5 “Semi-/Non-Urgent.” ED disposition was categorized as admission, discharge, transfer, expired, and against medical advice (AMA). Transferred, expired, and AMA categories occurred at least a level of magnitude less than admission and discharge and are not shown separately in our figures.
Primary International Classification of Diseases, Revision 10 (ICD-10) diagnosis code was grouped using Healthcare Cost and Utilization Project (HCUP) Clinical Classification Software (CCS),16 which resulted in 17 groups. These groupings were chosen to represent higher acuity diagnoses, which, if analyzed separately, would not have been large enough to show statistical significance. We identified the top five most populous code groups (circulatory, infection, injury, neurological, and respiratory), with the remaining groups aggregated as “Other.” Because each patient had only one primary diagnosis, the CCS categories are mutually exclusive.
N %Gender
Female 20,045 52%Male 18,503 48%
Age group0 – 17 8,481 22%18 – 44 12,459 32%45 – 64 8,538 22%65+ 8,813 23%
Race/ethnicityBlack 2,533 7%Other 4,265 11%Asian or PI 6,307 16%Hispanic 10,253 27%White 14,933 39%
Insurance mixCommercial 15,180 40%Medicare 9,139 24%Medicaid 12,256 32%
Household income<300% FPL 8,044 21%300-400% FPL 5,229 14%>400% FPL 18,510 48%Data not available 6,508 17%
ESI acuity levelLevels 1 & 2: resus/emergent
6,390 17%
Level 3: urgent 22,703 59%Levels 4 & 5: semi/non-urgent
8,660 23%
Not recorded 538 1%Disposition
Admitted 17,618 27%Discharged 46,044 70%Transfer 993 2%AMA 1,249 2%
PI, Pacific Islander; FPL, federal poverty level; AMA, against medical advice.
Table 1. 2019 baseline demographics.
We analyzed all ED visits starting March 1, 2020, when changes to census numbers were first noted (two weeks before imposition of the shelter-in-place orders) and continued through June 30, 2020. We compared this time period to the identical period in 2019. A five-year review of hospital census data revealed no significant changes in demographics, affirming that 2019 represented an appropriate sample for comparison. Weeks were counted as
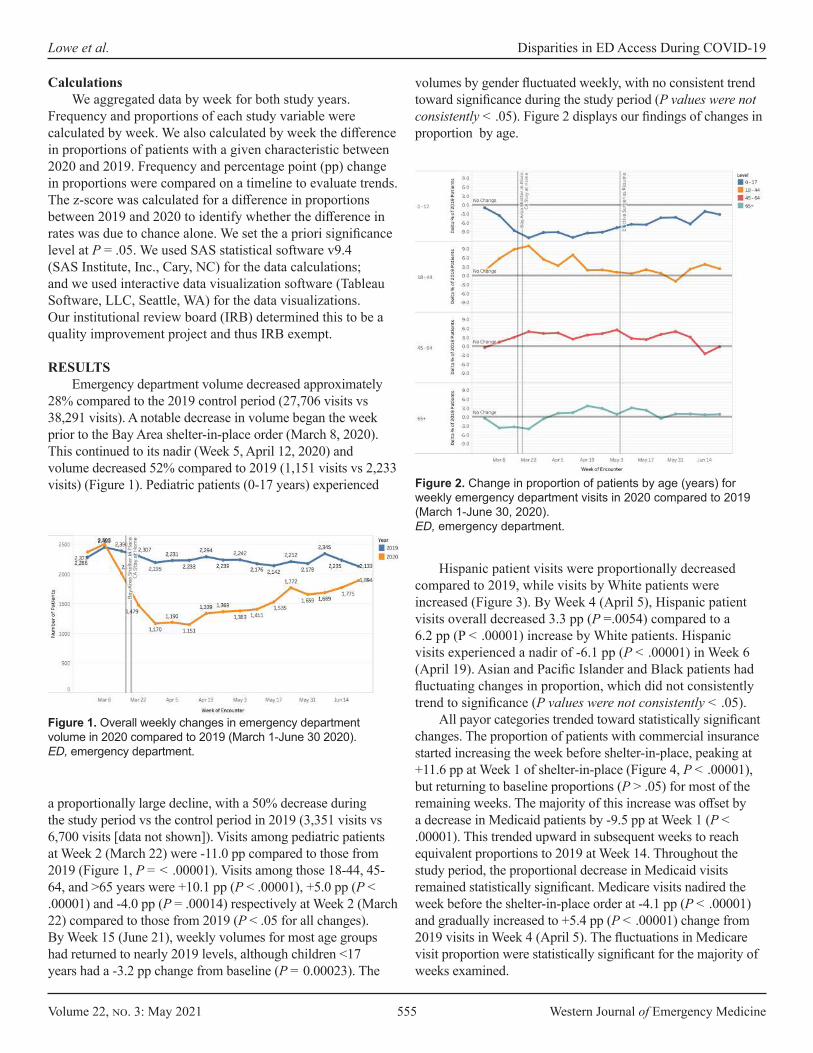
Volume 22, no. 3: May 2021 555 Western Journal of Emergency Medicine
Lowe et al. Disparities in ED Access During COVID-19
CalculationsWe aggregated data by week for both study years.
Frequency and proportions of each study variable were calculated by week. We also calculated by week the difference in proportions of patients with a given characteristic between 2020 and 2019. Frequency and percentage point (pp) change in proportions were compared on a timeline to evaluate trends. The z-score was calculated for a difference in proportions between 2019 and 2020 to identify whether the difference in rates was due to chance alone. We set the a priori significance level at P = .05. We used SAS statistical software v9.4 (SAS Institute, Inc., Cary, NC) for the data calculations; and we used interactive data visualization software (Tableau Software, LLC, Seattle, WA) for the data visualizations. Our institutional review board (IRB) determined this to be a quality improvement project and thus IRB exempt.
RESULTSEmergency department volume decreased approximately
28% compared to the 2019 control period (27,706 visits vs 38,291 visits). A notable decrease in volume began the week prior to the Bay Area shelter-in-place order (March 8, 2020). This continued to its nadir (Week 5, April 12, 2020) and volume decreased 52% compared to 2019 (1,151 visits vs 2,233 visits) (Figure 1). Pediatric patients (0-17 years) experienced
volumes by gender fluctuated weekly, with no consistent trend toward significance during the study period (P values were not consistently < .05). Figure 2 displays our findings of changes in proportion by age.
Figure 1. Overall weekly changes in emergency department volume in 2020 compared to 2019 (March 1-June 30 2020).ED, emergency department.
a proportionally large decline, with a 50% decrease during the study period vs the control period in 2019 (3,351 visits vs 6,700 visits [data not shown]). Visits among pediatric patients at Week 2 (March 22) were -11.0 pp compared to those from 2019 (Figure 1, P = < .00001). Visits among those 18-44, 45-64, and >65 years were +10.1 pp (P < .00001), +5.0 pp (P < .00001) and -4.0 pp (P = .00014) respectively at Week 2 (March 22) compared to those from 2019 (P < .05 for all changes). By Week 15 (June 21), weekly volumes for most age groups had returned to nearly 2019 levels, although children <17 years had a -3.2 pp change from baseline (P = 0.00023). The
Figure 2. Change in proportion of patients by age (years) for weekly emergency department visits in 2020 compared to 2019 (March 1-June 30, 2020).ED, emergency department.
Hispanic patient visits were proportionally decreased compared to 2019, while visits by White patients were increased (Figure 3). By Week 4 (April 5), Hispanic patient visits overall decreased 3.3 pp (P =.0054) compared to a 6.2 pp (P < .00001) increase by White patients. Hispanic visits experienced a nadir of -6.1 pp (P < .00001) in Week 6 (April 19). Asian and Pacific Islander and Black patients had fluctuating changes in proportion, which did not consistently trend to significance (P values were not consistently < .05).
All payor categories trended toward statistically significant changes. The proportion of patients with commercial insurance started increasing the week before shelter-in-place, peaking at +11.6 pp at Week 1 of shelter-in-place (Figure 4, P < .00001), but returning to baseline proportions (P > .05) for most of the remaining weeks. The majority of this increase was offset by a decrease in Medicaid patients by -9.5 pp at Week 1 (P < .00001). This trended upward in subsequent weeks to reach equivalent proportions to 2019 at Week 14. Throughout the study period, the proportional decrease in Medicaid visits remained statistically significant. Medicare visits nadired the week before the shelter-in-place order at -4.1 pp (P < .00001) and gradually increased to +5.4 pp (P < .00001) change from 2019 visits in Week 4 (April 5). The fluctuations in Medicare visit proportion were statistically significant for the majority of weeks examined.

Western Journal of Emergency Medicine 556 Volume 22, no. 3: May 2021
Disparities in ED Access During COVID-19 Lowe et al.
The proportion of patient visits from addresses <300% FPL nadired at –3.8 pp (P = .000046) at week one of shelter in place (Figure 5); changes in proportion were statistically significant for 11 of the 15 weeks (P < .05) examined. In comparison, patient visits from census tracts at >400% FPL were at 2.9 pp (P =.0044) above baseline at Week 1 of shelter in place and generally stayed well above baseline for the remainder of the study period. However, these proportions were statistically significant for only eight of the weeks examined.
We also analyzed visit acuity via the Emergency Severity Index (ESI) and admission rate (Figure 6). At the start of the study period, we observed an increase in lower acuity visits with a +10 pp peak in ESI level 4 and 5 patients at Week 1 of shelter in place (P < .00001). This was driven by a preponderance of COVID-19 testing requests as captured by “chief complaint” (data not shown – ICD-10 codes not existent). There was a consistently higher proportion of ESI level 1 patients throughout the study period vs the control period that was statistically significant for 13 of the 14 post shelter-in-place weeks examined (P = .0015 to P < .00001). During Week 10 (May 17), the proportion of ESI level 1 and 2 patients peaked at 8.7 pp vs 2019. However, due to the overall decrease in ED volume, the absolute number of ESI level 1 and 2 patients was 50% of 2019 levels at Week 5 after shelter in place and, overall, 79% 2019 levels.
Overall, the rate of admissions increased in 2020 (29.0% vs 24.7%) (Figure 6). Admission percent change peaked during Week 3, with a 10.7 pp increase compared to 2019; this attenuated at weeks 11-15 to approximately 4.5 pp. Admission percentage elevation above 2019 levels was statistically significant for all but one of the 14 post-shelter-in-place weeks examined (P = .000036 to P < .00001).
Additionally, we analyzed discharge diagnosis based on HCUP groupings. The circulatory diagnosis group proportion fluctuated throughout, with a slight trend toward an increase that reached statistical significance for 10 of the 15 weeks examined. Respiratory complaints rose sharply through Week 5 (April 12) ( P = .0058 to P < .00001) and then declined. The drop in neurologic complaints reached
Figure 3. Change in proportion of patients by race/ethnicity for weekly emergency department visits in 2020 compared to 2019 (March 1-June 30, 2020).ED, emergency department.
Figure 4. Change in proportion of patients by insurance status for weekly emergency department visits in 2020 compared to 2019 (March 1-June 30, 2020).ED, emergency department.
Figure 5. Change in proportion of patients by federal poverty level categories for weekly ED visits in 2020 compared to 2019. Federal poverty level = $25,100 (March 1-June 30, 2020).ED, emergency department.
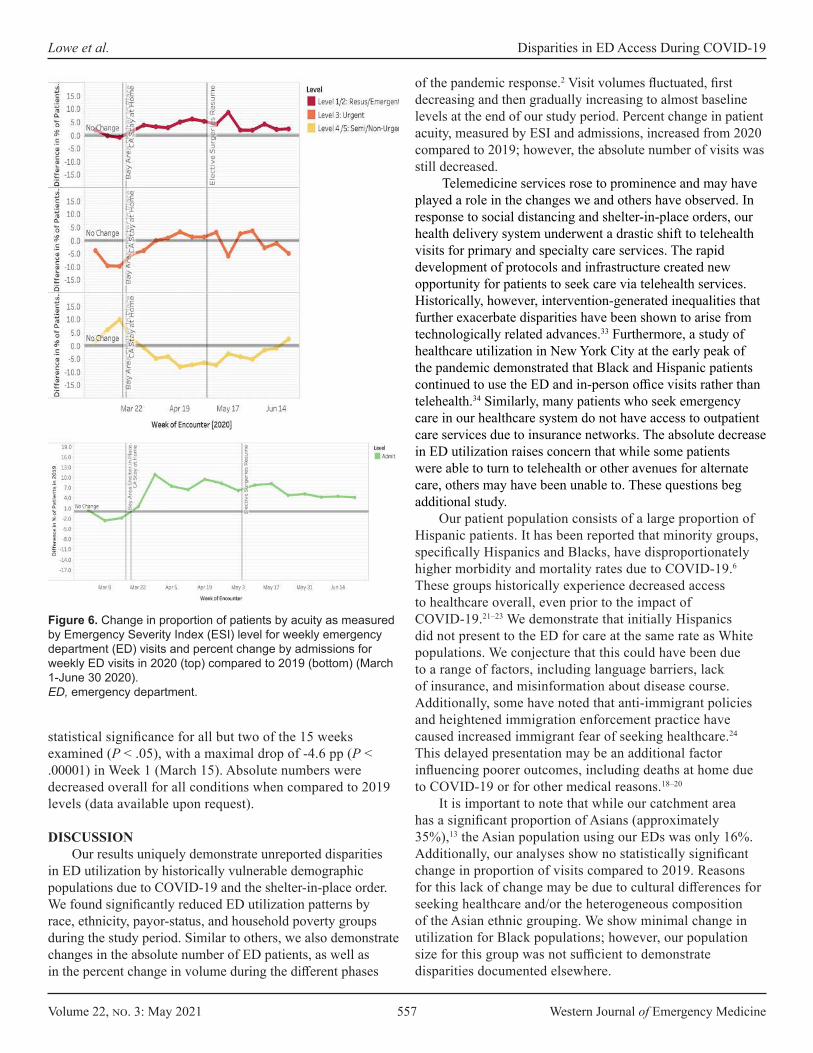
Volume 22, no. 3: May 2021 557 Western Journal of Emergency Medicine
Lowe et al. Disparities in ED Access During COVID-19
of the pandemic response.2 Visit volumes fluctuated, first decreasing and then gradually increasing to almost baseline levels at the end of our study period. Percent change in patient acuity, measured by ESI and admissions, increased from 2020 compared to 2019; however, the absolute number of visits was still decreased.
Telemedicine services rose to prominence and may have played a role in the changes we and others have observed. In response to social distancing and shelter-in-place orders, our health delivery system underwent a drastic shift to telehealth visits for primary and specialty care services. The rapid development of protocols and infrastructure created new opportunity for patients to seek care via telehealth services. Historically, however, intervention-generated inequalities that further exacerbate disparities have been shown to arise from technologically related advances.33 Furthermore, a study of healthcare utilization in New York City at the early peak of the pandemic demonstrated that Black and Hispanic patients continued to use the ED and in-person office visits rather than telehealth.34 Similarly, many patients who seek emergency care in our healthcare system do not have access to outpatient care services due to insurance networks. The absolute decrease in ED utilization raises concern that while some patients were able to turn to telehealth or other avenues for alternate care, others may have been unable to. These questions beg additional study.
Our patient population consists of a large proportion of Hispanic patients. It has been reported that minority groups, specifically Hispanics and Blacks, have disproportionately higher morbidity and mortality rates due to COVID-19.6 These groups historically experience decreased access to healthcare overall, even prior to the impact of COVID-19.21–23 We demonstrate that initially Hispanics did not present to the ED for care at the same rate as White populations. We conjecture that this could have been due to a range of factors, including language barriers, lack of insurance, and misinformation about disease course. Additionally, some have noted that anti-immigrant policies and heightened immigration enforcement practice have caused increased immigrant fear of seeking healthcare.24 This delayed presentation may be an additional factor influencing poorer outcomes, including deaths at home due to COVID-19 or for other medical reasons.18–20
It is important to note that while our catchment area has a significant proportion of Asians (approximately 35%),13 the Asian population using our EDs was only 16%. Additionally, our analyses show no statistically significant change in proportion of visits compared to 2019. Reasons for this lack of change may be due to cultural differences for seeking healthcare and/or the heterogeneous composition of the Asian ethnic grouping. We show minimal change in utilization for Black populations; however, our population size for this group was not sufficient to demonstrate disparities documented elsewhere.
Figure 6. Change in proportion of patients by acuity as measured by Emergency Severity Index (ESI) level for weekly emergency department (ED) visits and percent change by admissions for weekly ED visits in 2020 (top) compared to 2019 (bottom) (March 1-June 30 2020).ED, emergency department.
statistical significance for all but two of the 15 weeks examined (P < .05), with a maximal drop of -4.6 pp (P < .00001) in Week 1 (March 15). Absolute numbers were decreased overall for all conditions when compared to 2019 levels (data available upon request).
DISCUSSIONOur results uniquely demonstrate unreported disparities
in ED utilization by historically vulnerable demographic populations due to COVID-19 and the shelter-in-place order. We found significantly reduced ED utilization patterns by race, ethnicity, payor-status, and household poverty groups during the study period. Similar to others, we also demonstrate changes in the absolute number of ED patients, as well as in the percent change in volume during the different phases

Western Journal of Emergency Medicine 558 Volume 22, no. 3: May 2021
Disparities in ED Access During COVID-19 Lowe et al.
Insurance type also influenced visit rates, with Medicaid patients initially presenting at a lower frequency than those who were commercially insured. While it is difficult to obtain data given that ICD-10 coding for COVID-19 was not uniform in the early stages of the pandemic, we postulate that use of the ED by patients with commercial insurance early in the pandemic could have been for COVID-19 testing as it corresponded to an increase in visits of lower severity and chief complaint. Later during the pandemic, decreased ED use by this same population may have been due to the fact that medical practices that cater to commercial insurance holders were able to adapt more rapidly and deploy solutions, such as telehealth visits, which deflected their patients from the ED. Conversely, we show that those patients using Medicaid presented to the ED less in the early weeks of the pandemic, but later presented more than patients with commercial insurance. This pattern of use raises concern for the underlying drivers to delays in seeking care. Patients who use these public programs have been ranked among the most vulnerable members of the US population,25 and in California 60% of Medicaid enrollees are Hispanic 26,27 highlighting the multiple risk categories many patients straddle. With this concern in mind, efforts to target this population with accurate information and services, in the appropriate language, within their communities should be considered.
Household income level by census tract level also impacted ED visits. It is important to note that our catchment area includes wide disparities in economic status and that the cost-of-living renders FPL incomes untenable to survival here ($25,100 in 2018). Those from ZIP codes with incomes at >400% FPL had increased utilization of the ED, while those in ZIP codes with incomes <300% FPL had decreased utilization. Concerns over the cost of care, occupational demands, childcare needs, and lack of transportation are only some of the challenges that may have interdicted ED presentation at lower income levels. While insurance type, ethnicity/race, and economic status are likely intertwined, we were unable to make more than an observational relationship in our analyses.
Similar to multiple sites nationwide, we experienced a decline in absolute number of ED visits,2,17 evidencing the intended effect of the shelter-in-place order. However, this initial decrease unexpectedly included more acute diagnoses such as myocardial infarction and stroke.2 We also noted a decrease in absolute numbers of patients with high-acuity triage categories (ESI 1) and admissions. The prevalence of these emergent conditions should not be affected by COVID-19 or shelter-in-place orders and delays in their presentation could lead to higher morbidity and mortality as the conditions advance at home. This phenomenon may have occurred because warnings regarding COVID-19 exposure in the ED could have frightened some populations into not heeding serious signs and symptoms.4,18–20 Due to sample size, we were unable to delve more deeply into the effects
of insurance status or race/ethnicity on ESI levels. Further analysis is necessary to understand whether excess deaths that have occurred during the pandemic are due to COVID-19 vs other causes and also to understand which populations experienced these deaths.
While this is a study of one healthcare system with two distinct EDs, we suggest that generalized and standard EHR data assessment should include socioeconomic demographics and should be performed in a timely and regular fashion to ensure equitable utilization of services. Regional hospitals should pool data in order to give statistical power to understand and answer questions we were unable to answer, such as disparities in ED presentations of specific emergent conditions. For example, psychiatric diagnoses, domestic violence, and non-accidental trauma have been postulated to be at risk of increasing within certain populations during this current pandemic.29–32
LIMITATIONSThese results are limited to one hospital system with
two distinct hospital EDs, which may reduce generalizability to other EDs. However, for expediency we used our institutional EHR to obtain real-time data regarding utilization during the pandemic; more representative, curated regional state or national data is more difficult and less timely to obtain, needing the cooperation of segregated systems. Additionally, the California Bay Area is unique in its racial/ethnic population mix2,17 and differs from other states. The cost of living in our catchment area is higher than indicated by the FPL standards. Despite this, many of our clinical data analyses are qualitatively similar to those reported elsewhere.2,3,6,17
CONCLUSIONOur study demonstrates the disparate impact that
a global pandemic and shelter-in-place order has on ED utilization by various demographic groups. As the pandemic continues, disease surges as well as policy changes will further alter these patterns. Using electronic health record data, we can rapidly evaluate the systems in which we operate. Where before a chart review of demographic information would take analysts months to perform, we now have near real-time access. Healthcare systems can cross-reference admissions and operations data with demographic data to appreciate whether emergency care is being accessed and used equitably. With this information, we can target vulnerable populations using appropriate language and cultural awareness to reduce barriers to care in the ED and other medical resources.2,3,28 This should include assurances that access to newer care modalities, such as telemedicine, are made available for all patient populations. Moving forward, this will be crucial to prevent widening disparities during the COVID-19 pandemic and general health outcomes in the future.
Volume 22, no. 3: May 2021 559 Western Journal of Emergency Medicine
Lowe et al. Disparities in ED Access During COVID-19
Address for Correspondence: Jason Lowe, DO, Stanford University School of Medicine, Department of Emergency Medicine, 900 Welch Road, Suite 350, Palo Alto, CA 94304. Email: [email protected].
Conflicts of Interest: By the WestJEM article submission agreement, all authors are required to disclose all affiliations, funding sources and financial or management relationships that could be perceived as potential sources of bias. No author has professional or financial relationships with any companies that are relevant to this study. There are no conflicts of interest or sources of funding to declare.
Copyright: © 2021 Lowe et al. This is an open access article distributed in accordance with the terms of the Creative Commons Attribution (CC BY 4.0) License. See: http://creativecommons.org/licenses/by/4.0/
REFERENCES1. Santa Clara County Public Health. County of Santa Clara Identifies
Three Additional Early COVID-19 Deaths - Novel Coronavirus (COVID-19) - County of Santa Clara. 2020. Available at: https://www.sccgov.org/sites/covid19/Pages/press-release-04-21-20-early.aspx. Accessed July 13, 2020.
2. Hartnett KP. Impact of the COVID-19 pandemic on emergency department visits — United States, January 1, 2019–May 30, 2020. MMWR Morb Mortal Wkly Rep. 2020;69(23):699:704.
3. Lange SJ. Potential indirect effects of the COVID-19 pandemic on use of emergency departments for acute life-threatening conditions — United States, January–May 2020. MMWR Morb Mortal Wkly Rep. 2020;69(25):795-800.
4. Patel S, Lorenzi N, Smith T, et al. Critical insights from patients during the Covid-19 pandemic. NEJM Catal Innov Care Deliv. 2020. In Press.
5. Centers for Disease Control and Prevention. Coronavirus Disease 2019 (COVID-19). Centers for Disease Control and Prevention. 2020. Available at: https://www.cdc.gov/coronavirus/2019-ncov/prevent-getting-sick/cloth-face-cover.html. Accessed June 2, 2020.
6. California Department of Public Health. Race Ethnicity. Available at: https://www.cdph.ca.gov/Programs/CID/DCDC/Pages/COVID-19/Race-Ethnicity.aspx. Accessed July 12, 2020.
7. Castner J, Yin Y, Loomis D, et al. Medical Mondays: ED utilization for Medicaid recipients depends on the day of the week, season, and holidays. J Emerg Nurs. 2016;42(4):317-24.
8. Holleman DR, Bowling RL, Gathy C. Predicting daily visits to a waik-in clinic and emergency department using calendar and weather data. J Gen Intern Med. 1996;11(4):237-9.
9. Faryar K. The effects of weekday, season, federal holidays, and severe weather conditions on emergency department volume in Montgomery County, Ohio. Master Public Health Program Stud Publ. 2013. Available at: https://corescholar.libraries.wright.edu/mph/94. Accessed July 31, 2020.
10. Malik S, Lee DC, Doran KM, et al. Vulnerability of older adults in disasters: emergency department utilization by geriatric patients after Hurricane Sandy | Disaster Medicine and Public Health Preparedness
| Cambridge Core. 2017. Available at: https://www-cambridge-org.laneproxy.stanford.edu/core/journals/disaster-medicine-and-public-health-preparedness/article/vulnerability-of-older-adults-in-disasters-emergency-department-utilization-by-geriatric-patients-after-hurricane-sandy/17AAB203F6729CC7BE19681B3FBD2829. Accessed July 12, 2020.
11. Appavoo SD, Khemlin A, Appavoo DM, Flynn CJ. Community emergency department utilization following a natural disaster (the Goderich tornado). Rural Remote Health. 2016;16(3):3802.
12. California All. California S of. Stay home Q&A. 2020. Available at: https://covid19.ca.gov/stay-home-except-for-essential-needs/.Accessed June 7, 2020.
13. U.S. Census Bureau. QuickFacts: Pleasanton city, California; San Mateo County, California; Santa Clara County, California. 2020. Available at: https://www.census.gov/quickfacts/fact/table/alamedaco-untycalifornia,sanmateocountycalifornia,santaclaracountycalifornia/PST045219. Accessed July 12, 2020.
14. U.S. Census Bureau. Data Profiles. 2020. Available at: https://www.census.gov/acs/www/data/data-tables-and-tools/data-profiles/. Accessed July 18, 2020.
15. ASPE. 2018 Poverty Guidelines. 2019. Available at: https://aspe.hhs.gov/2018-poverty-guidelines. Accessed July 24, 2020.
16. Agency for Healthcare Research and Quality. Clinical Classifications Software Refined (CCSR) for ICD-10-CM Diagnoses. 2020. Available at: https://www.hcup-us.ahrq.gov/toolssoftware/ccsr/ccs_refined.jsp. Accessed July 24, 2020.
17. Wu Z, McGoogan JM. Characteristics of and important lessons from the coronavirus disease 2019 (COVID-19) outbreak in China: summary of a report of 72 314 cases from the Chinese Center for Disease Control and Prevention. JAMA. 2020;323(13):1239-42.
18. Reuters. At-home COVID-19 deaths may be significantly undercounted in New York City. 2020. Available at: https://www.reuters.com/article/us-health-coronavirus-fdny-idUSKBN21P3KF. Accessed July 18, 2020.
19. Ornstein C, ProPublica, Hixenbaugh M, et al. A spike in people dying at home suggests coronavirus deaths in Houston may be higher than reported. 2020. Available at: https://www.propublica.org/article/a-spike-in-people-dying-at-home-suggests-coronavirus-deaths-in-houston-may-be-higher-than-reported. Accessed July 18, 2020.
20. Griffin S. Covid-19: “Huge rise” in deaths at home is not fully explained by virus, say experts. BMJ. 2020;369:m2115.
21. Health Disparities by Race and Ethnicity, 2019: The California Landscape. Available at: https://www.chcf.org/publication/2019-edition-health-disparities-by-race/. Accessed September 21, 2020.
22. Zhang X, Carabello M, Hill T, et al. Racial and ethnic disparities in emergency department care and health outcomes among children in the United States. Front Pediatr. 2019;7:525.
23. Wright K. Disparities and predictors of emergency department use among California’s African American, Latino, and White children, aged 1-11 years, with asthma. Ethn Dis. 2009;19(1):71-7.
24. Jordan M. ‘We’re Petrified’: Immigrants afraid to seek medical care for coronavirus. The New York Times. 2020. Available at: https://

Western Journal of Emergency Medicine 560 Volume 22, no. 3: May 2021
Disparities in ED Access During COVID-19 Lowe et al.
www.nytimes.com/2020/03/18/us/coronavirus-immigrants.html. Accessed July 13, 2020.
25. Lee A and Jaroxz B. Majority of people covered by Medicaid are children, older adults, or disabled. 2017. Available at: https://www.prb.org/majority-of-people-covered-by-medicaid-and-similar-programs/. Accessed July 12, 2020.
26. KFF. Distribution of the nonelderly with Medicaid by race/ethnicity. KFF. 2019. Available at: https://www.kff.org/medicaid/state-indicator/distribution-by-raceethnicity-4/. Accessed July 12, 2020.
27. Finocchio L, Newman M, Roh E, et al. 2019 Edition — Medi-Cal Facts and Figures. California Health Care Foundation. 2019. Available at: https://www.chcf.org/publication/2019-medi-cal-facts-figures-crucial-coverage/.Accessed July 12, 2020.
28. Wong LE, Hawkins JE, Langness S, et al. Where are all the patients? Addressing Covid-19 fear to encourage sick patients to seek emergency care. NEJM Catal Innov Care Deliv. 2020. In Press.
29. Bosmann J. Domestic violence calls mount as restrictions linger: ‘No one can leave.’ The New York Times. 2020. Available at: https://www.nytimes.com/2020/05/15/us/domestic-violence-coronavirus.html.
Accessed July 13, 2020. 30. Taub A. How domestic abuse has risen worldwide since coronavirus.
The New York Times. 2020. Available at: https://www.nytimes.com/2020/04/06/world/coronavirus-domestic-violence.html. Accessed July 13, 2020.
31. BBC News. Coronavirus: domestic violence increases globally during lockdown. 2020. Available at: https://www.bbc.com/news/av/world-53014211/coronavirus-domestic-violence-increases-globally-during-lockdown. Accessed July 13, 2020.
32. Stanley M. Why the increase in domestic violence during COVID-19? Psychology Today. 2020. Available at: https://www.psychologytoday.com/blog/making-sense-chaos/202005/why-the-increase-in-domestic-violence-during-covid-19. Accessed July 13, 2020.
33. Veinot TC, Mitchell H, Ancker JS. Good intentions are not enough: how informatics interventions can worsen inequality. J Am Med Inform Assoc. 2018;25(8):1080-8.
34. Weber E, Miller SJ, Astha V, et al. Characteristics of telehealth users in NYC for COVID-related care during the coronavirus pandemic. J Am Med Inform Assoc. 2020;227(12):1949-54.

Volume 22, no. 3: May 2021 561 Western Journal of Emergency Medicine
Original Research
Impact of the COVID-19 Pandemic on Emergency Department Transfers to a Higher Level of Care
Stephen Lee, OMS-IV*Anthony Santarelli, PhD†
Heesun Choi, DO‡
John Ashurst, DO‡
Section Editor: Mark I. Langdorf, MD, MHPE Submission history: Submitted November 18, 2020; Revision received March 2, 2021; Accepted March 2, 2021 Electronically published May 17, 2021 Full text available through open access at http://escholarship.org/uc/uciem_westjem DOI: 10.5811/westjem.2021.3.50907
INTRODUCTIONEmergency physicians determine a patient’s disposition
following an initial workup that may include laboratory tests, imaging, and consultation. Once a patient’s disposition has been decided it is crucial to determine whether the patient can be cared for at the current facility or requires transfer to a higher level of care. The need to transfer a patient to a higher level of care is dependent upon numerous factors including
Rocky Vista University College of Osteopathic Medicine, Parker, Colorado Kingman Regional Medical Center, Departments of Graduate Medical Education, Kingman, ArizonaKingman Regional Medical Center Emergency Medicine, Kingman, Arizona
*†
‡
Introduction: During the coronavirus disease 2019 (COVID-19) pandemic, a reduction in emergency department (ED) visits was seen nationally according to the US Centers for Disease Control and Prevention. However, no data currently exists for the impact of ED transfers to a higher level of care during this same time period. The primary objective of the study was to determine whether the COVID-19 pandemic affected the rate of non-COVID-19 transfers from a rural community ED.
Methods: We completed a retrospective chart review of all ED patients who presented to Kingman Regional Medical Center in Kingman, Arizona, from March 1–June 31, 2019 and March 1–June 31, 2020. To ensure changes were not due to seasonal trends, we examined transfer rates from the same four-month period in 2019 and 2020. Patients were included in the study if they were transferred to an outside facility for a higher level of care not related to COVID-19.
Results: Between the time periods studied there was a 25.33% (P = 0.001) reduction in total ED volume and a 21.44% (P = 0.009) reduction in ED transfers to a higher level of care. No statistical difference was noted in ED transfer volume following adjustment for decreased ED volumes. Transfers for gastroenterology (45%; P = 0.021), neurosurgery (29.2%; P = 0.029), neurology (76.3%; P < 0.001), trauma (37.5%; P = 0.039), urology (41.8%; P = 0.012), and surgery (56.3%; P = 0.028) all experienced a decrease in transfer rates during the time period studied. When gender was considered, males exhibited an increased rate of transfers to psychiatric facilities (P = 0.018).
Conclusion: Significant reductions in both ED volume and transfers have coincided with the emergence of the COVID-19 pandemic. Further research is needed to determine how the current pandemic has affected patient care. [West J Emerg Med. 2021;22(3)561–564.]
availability of specialists, hospital policies, and specialized treatment algorithms.
As cases of the novel coronavirus disease 2019 (COVID-19) increased across the globe, a sharp decrease in emergency department (ED) volumes was noted for various chief complaints while an increase was seen in out-of-hospital cardiac arrests.1-5 As cases of COVID-19 began to climb in the United States, a 42% reduction in ED volume was reported
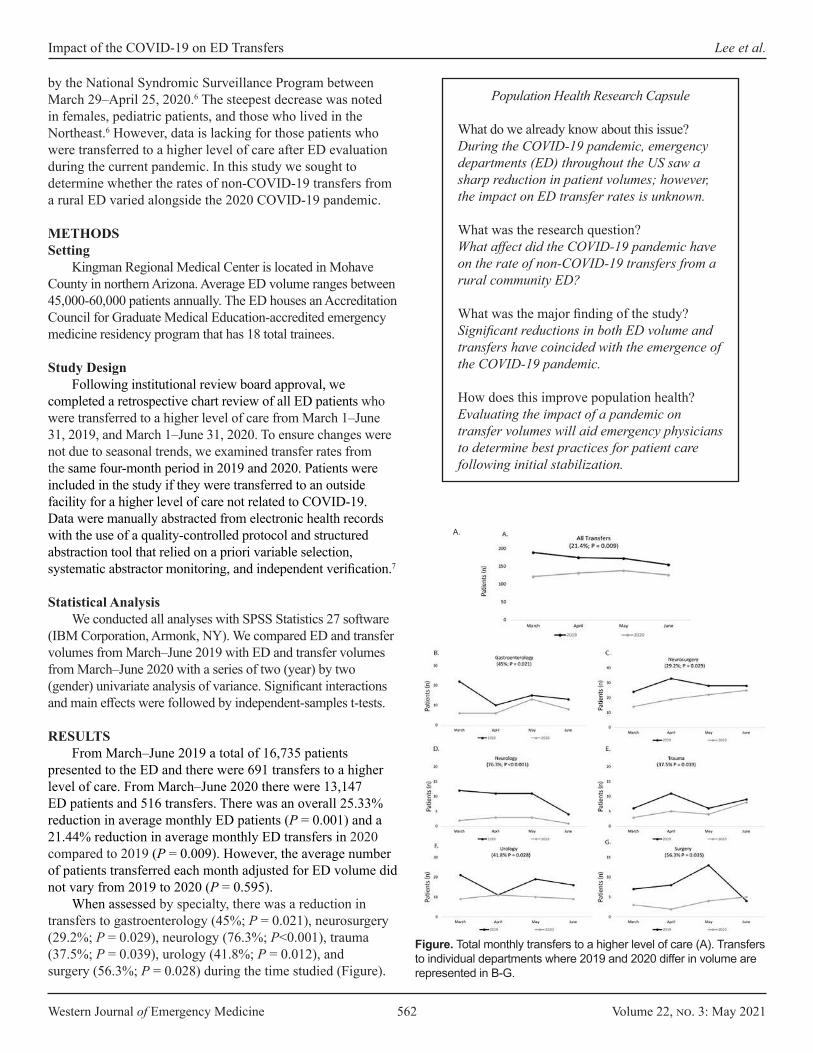
Western Journal of Emergency Medicine 562 Volume 22, no. 3: May 2021
Impact of the COVID-19 on ED Transfers Lee et al.
Population Health Research Capsule
What do we already know about this issue?During the COVID-19 pandemic, emergency departments (ED) throughout the US saw a sharp reduction in patient volumes; however, the impact on ED transfer rates is unknown.
What was the research question?What affect did the COVID-19 pandemic have on the rate of non-COVID-19 transfers from a rural community ED?
What was the major finding of the study?Significant reductions in both ED volume and transfers have coincided with the emergence of the COVID-19 pandemic.
How does this improve population health?Evaluating the impact of a pandemic on transfer volumes will aid emergency physicians to determine best practices for patient care following initial stabilization.
by the National Syndromic Surveillance Program between March 29–April 25, 2020.6 The steepest decrease was noted in females, pediatric patients, and those who lived in the Northeast.6 However, data is lacking for those patients who were transferred to a higher level of care after ED evaluation during the current pandemic. In this study we sought to determine whether the rates of non-COVID-19 transfers from a rural ED varied alongside the 2020 COVID-19 pandemic.
METHODSSetting
Kingman Regional Medical Center is located in Mohave County in northern Arizona. Average ED volume ranges between 45,000-60,000 patients annually. The ED houses an Accreditation Council for Graduate Medical Education-accredited emergency medicine residency program that has 18 total trainees.
Study DesignFollowing institutional review board approval, we
completed a retrospective chart review of all ED patients who were transferred to a higher level of care from March 1–June 31, 2019, and March 1–June 31, 2020. To ensure changes were not due to seasonal trends, we examined transfer rates from the same four-month period in 2019 and 2020. Patients were included in the study if they were transferred to an outside facility for a higher level of care not related to COVID-19. Data were manually abstracted from electronic health records with the use of a quality-controlled protocol and structured abstraction tool that relied on a priori variable selection, systematic abstractor monitoring, and independent verification.7
Statistical AnalysisWe conducted all analyses with SPSS Statistics 27 software
(IBM Corporation, Armonk, NY). We compared ED and transfer volumes from March–June 2019 with ED and transfer volumes from March–June 2020 with a series of two (year) by two (gender) univariate analysis of variance. Significant interactions and main effects were followed by independent-samples t-tests.
RESULTSFrom March–June 2019 a total of 16,735 patients
presented to the ED and there were 691 transfers to a higher level of care. From March–June 2020 there were 13,147 ED patients and 516 transfers. There was an overall 25.33% reduction in average monthly ED patients (P = 0.001) and a 21.44% reduction in average monthly ED transfers in 2020 compared to 2019 (P = 0.009). However, the average number of patients transferred each month adjusted for ED volume did not vary from 2019 to 2020 (P = 0.595).
When assessed by specialty, there was a reduction in transfers to gastroenterology (45%; P = 0.021), neurosurgery (29.2%; P = 0.029), neurology (76.3%; P<0.001), trauma (37.5%; P = 0.039), urology (41.8%; P = 0.012), and surgery (56.3%; P = 0.028) during the time studied (Figure).
Figure. Total monthly transfers to a higher level of care (A). Transfers to individual departments where 2019 and 2020 differ in volume are represented in B-G.
A.
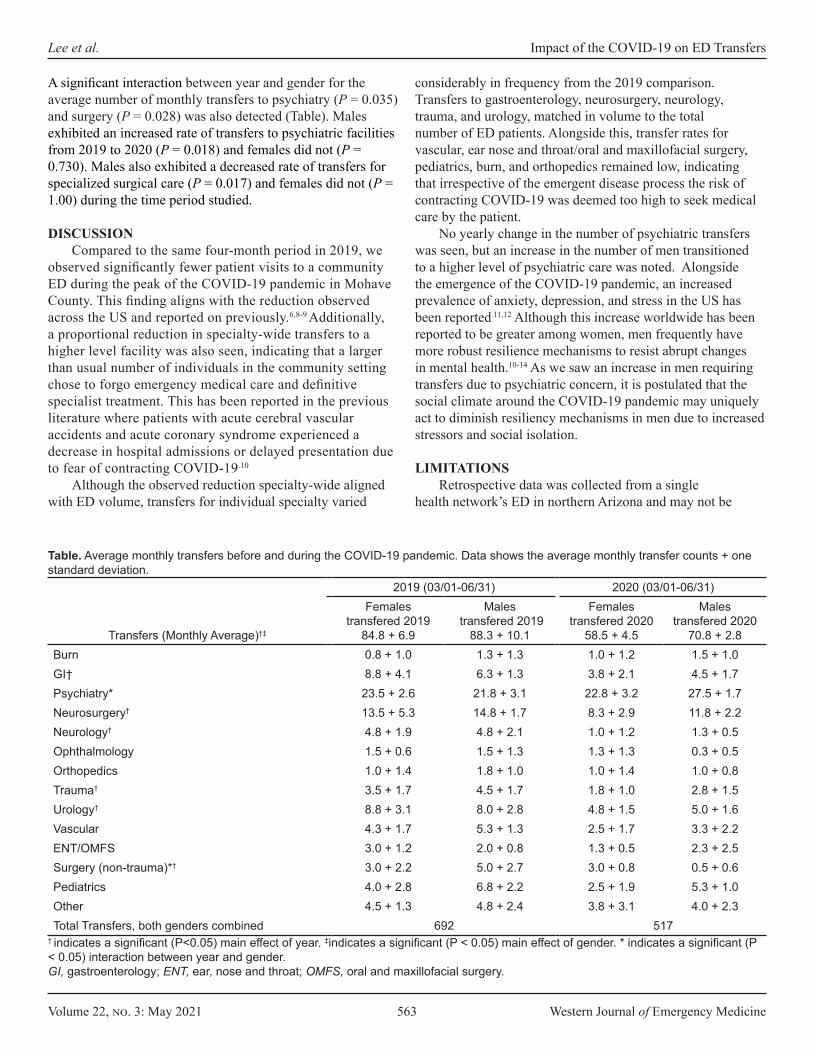
Volume 22, no. 3: May 2021 563 Western Journal of Emergency Medicine
Lee et al. Impact of the COVID-19 on ED Transfers
2019 (03/01-06/31) 2020 (03/01-06/31)
Transfers (Monthly Average)†‡
Females transfered 2019
84.8 + 6.9
Males transfered 2019
88.3 + 10.1
Females transfered 2020
58.5 + 4.5
Males transfered 2020
70.8 + 2.8Burn 0.8 + 1.0 1.3 + 1.3 1.0 + 1.2 1.5 + 1.0GI† 8.8 + 4.1 6.3 + 1.3 3.8 + 2.1 4.5 + 1.7Psychiatry* 23.5 + 2.6 21.8 + 3.1 22.8 + 3.2 27.5 + 1.7Neurosurgery† 13.5 + 5.3 14.8 + 1.7 8.3 + 2.9 11.8 + 2.2Neurology† 4.8 + 1.9 4.8 + 2.1 1.0 + 1.2 1.3 + 0.5Ophthalmology 1.5 + 0.6 1.5 + 1.3 1.3 + 1.3 0.3 + 0.5Orthopedics 1.0 + 1.4 1.8 + 1.0 1.0 + 1.4 1.0 + 0.8Trauma† 3.5 + 1.7 4.5 + 1.7 1.8 + 1.0 2.8 + 1.5Urology† 8.8 + 3.1 8.0 + 2.8 4.8 + 1.5 5.0 + 1.6Vascular 4.3 + 1.7 5.3 + 1.3 2.5 + 1.7 3.3 + 2.2ENT/OMFS 3.0 + 1.2 2.0 + 0.8 1.3 + 0.5 2.3 + 2.5Surgery (non-trauma)*† 3.0 + 2.2 5.0 + 2.7 3.0 + 0.8 0.5 + 0.6Pediatrics 4.0 + 2.8 6.8 + 2.2 2.5 + 1.9 5.3 + 1.0Other 4.5 + 1.3 4.8 + 2.4 3.8 + 3.1 4.0 + 2.3Total Transfers, both genders combined 692 517
† indicates a significant (P<0.05) main effect of year. ‡indicates a significant (P < 0.05) main effect of gender. * indicates a significant (P < 0.05) interaction between year and gender.GI, gastroenterology; ENT, ear, nose and throat; OMFS, oral and maxillofacial surgery.
Table. Average monthly transfers before and during the COVID-19 pandemic. Data shows the average monthly transfer counts + one standard deviation.
A significant interaction between year and gender for the average number of monthly transfers to psychiatry (P = 0.035) and surgery (P = 0.028) was also detected (Table). Males exhibited an increased rate of transfers to psychiatric facilities from 2019 to 2020 (P = 0.018) and females did not (P = 0.730). Males also exhibited a decreased rate of transfers for specialized surgical care (P = 0.017) and females did not (P = 1.00) during the time period studied.
DISCUSSIONCompared to the same four-month period in 2019, we
observed significantly fewer patient visits to a community ED during the peak of the COVID-19 pandemic in Mohave County. This finding aligns with the reduction observed across the US and reported on previously.6,8-9 Additionally, a proportional reduction in specialty-wide transfers to a higher level facility was also seen, indicating that a larger than usual number of individuals in the community setting chose to forgo emergency medical care and definitive specialist treatment. This has been reported in the previous literature where patients with acute cerebral vascular accidents and acute coronary syndrome experienced a decrease in hospital admissions or delayed presentation due to fear of contracting COVID-19.10
Although the observed reduction specialty-wide aligned with ED volume, transfers for individual specialty varied
considerably in frequency from the 2019 comparison. Transfers to gastroenterology, neurosurgery, neurology, trauma, and urology, matched in volume to the total number of ED patients. Alongside this, transfer rates for vascular, ear nose and throat/oral and maxillofacial surgery, pediatrics, burn, and orthopedics remained low, indicating that irrespective of the emergent disease process the risk of contracting COVID-19 was deemed too high to seek medical care by the patient.
No yearly change in the number of psychiatric transfers was seen, but an increase in the number of men transitioned to a higher level of psychiatric care was noted. Alongside the emergence of the COVID-19 pandemic, an increased prevalence of anxiety, depression, and stress in the US has been reported.11,12 Although this increase worldwide has been reported to be greater among women, men frequently have more robust resilience mechanisms to resist abrupt changes in mental health.10-14 As we saw an increase in men requiring transfers due to psychiatric concern, it is postulated that the social climate around the COVID-19 pandemic may uniquely act to diminish resiliency mechanisms in men due to increased stressors and social isolation.
LIMITATIONSRetrospective data was collected from a single
health network’s ED in northern Arizona and may not be
Western Journal of Emergency Medicine 564 Volume 22, no. 3: May 2021
Impact of the COVID-19 on ED Transfers Lee et al.
generalizable to all community hospitals across the nation. Although attempts were made to minimize confounding variables by examining a similar time period from the previous year, the rate of ED transfers could have been impacted by specialist coverage and any changes in institutional policies during the time studied. Transfer rates may have also been affected by receiving-facility protocols during the early stages of the pandemic and patient willingness to be transferred to an outside facility.
CONCLUSIONSignificant reductions in both ED visits and transfers have
coincided with the emergence of the COVID-19 pandemic in a rural setting. Unlike the rest of ED transfers, males requiring psychiatric care appeared uniquely affected. Further research into how the pandemic affected this patient population is needed.
Address for Correspondence: Anthony Santarelli, PhD, Kingman Regional Medical Center, 3269 Stockton Hill Road, Kingman, Arizona, 86409-3619. Email: [email protected].
Conflicts of Interest: By the WestJEM article submission agreement, all authors are required to disclose all affiliations, funding sources and financial or management relationships that could be perceived as potential sources of bias. No author has professional or financial relationships with any companies that are relevant to this study. There are no conflicts of interest or sources of funding to declare.
Copyright: © 2021 Lee et al. This is an open access article distributed in accordance with the terms of the Creative Commons Attribution (CC BY 4.0) License. See: http://creativecommons.org/licenses/by/4.0/
3. Lazzerini M, Barbi E, Apicella A, et al. Delayed access or provision of care in Italy resulting from fear of COVID-19. Lancet Child Adolesc Health. 2020;4(5):e10-1.
4. Wong LE, Hawkins JE, Langness S, et al. Where are all the patients? Addressing Covid-19 fear to encourage sick patients to seek emergency care. NEJM Catalyst Innovations in Care Delivery. 2020. In press.
5. Baldi E, Sechi GM, Mare C, et al. Out-of-hospital cardiac arrest during the COVID-19 outbreak in Italy. N Engl J Med, 2020,383(5):496-8.
6. Hartnett KP, Kite-Powell A, DeVies J, et al. Impact of the COVID-19 pandemic on emergency department visits: United States, January 1, 2019 – May 30, 2020. MMWR Morb Mortal Wkly Rep. 2020;69(23):699-704.
7. Kaji AH, Schriger D, Green S. Looking through the retrospectoscope: reducing bias in emergency medicine chart review studies. Ann Emerg Med. 2014;64(3):292-8.
8. Heppner Z, Shreffler J, Polites A, et al. COVID-19 and emergency department volume: The patients return but have different characteristics. Am J Emerg Med. 2020;S0735-6757(20)30803-2.
9. Butt AA, Azad AM, Kartha AB, et al. Volume and acuity of emergency department visits prior to and after COVID-19. J Emerg Med. 2020;S0736-4679(20)30855-6.
10. Mafham MM, Spata E, Goldacre R, et al. COVID-19 pandemic and admission rates for and management of acute coronary syndromes in England. Lancet. 2020;396(10248):381-9.
11. Moghanibashi-Mansourieh A. Assessing the anxiety level of Iranian general population during COVID-19 outbreak. Asian J Psychiatr. 2020;51:102076.
12. Salari N, Hosseinian-Far A, Jalali R, et al. Prevalence of stress, anxiety, depression among the general population during the COVID-19 pandemic: a systematic review and meta-analysis. Global Health. 2020;16(1):57.
13. Wang Y, Di Y, Ye J, et al. Study on the public psychological states and its related factors during the outbreak of coronavirus disease 2019 (COVID-19) in some regions of China. Psychol Health Med. 2021;26(1):13-22.
14. Liu D, Ren Y, Yan F, et al. Psychological impact and predisposing factors of the coronavirus disease 2019 (COVID-19) pandemic on general public in China. 2020. Available at: https://papers.ssrn.com/sol3/papers.cfm?abstract_id=3551415. Accessed November 2, 2020.
15. Bale TL, Epperson CN. Sex differences and stress across the lifespan. Nat Neurosci. 2015;18(10):141320.
REFERENCES1. Metzler B, Siostrzonek P, Binder RK, et al. Decline of acute coronary
syndrome admissions in Austria since the outbreak of COVID-19: the pandemic response causes cardiac collateral damage. Eur Heart J. 2020;41(19):1852-3.
2. Tam CF, Cheung KS, Lam S, et al. Impact of coronavirus disease 2019 (COVID-19) outbreak on ST-segment–elevation myocardial infarction care in Hong Kong, China. Circ Cardiovasc Qual Outcomes. 2020;13(4):e006631.

Volume 22, no. 3: May 2021 565 Western Journal of Emergency Medicine
Original Research
Provider Antibody Serology Study of Virus in the Emergency Room (PASSOVER) Study: Special
Population COVID-19 Seroprevalence Theodore W. Heyming, MD*‡
Terence Sanger, MD, PhD†§
Aprille Tongol, BA§
John Schomberg, PhD¶
Kellie Bacon§
Bryan Lara§
Section Editor: Ioannis Koutroulis, MD Submission history: Submitted September 28, 2020; Revision received January 15, 2021; Accepted January 23, 2021Electronically published April 9, 2021 Full text available through open access at http://escholarship.org/uc/uciem_westjem DOI: 10.5811/westjem.2021.1.50058
INTRODUCTIONThe healthcare system plays a pivotal role in minimizing
disease transmission, protecting healthcare personnel, and preserving health services during the current pandemic. By
Children’s Hospital of Orange County, Department of Emergency Medicine, Orange, CaliforniaUniversity of California, Irvine, Department of Electrical Engineering and Computer Science, Irvine, CaliforniaUniversity of California, Irvine, Department of Emergency Medicine, Irvine, CaliforniaChildren’s Hospital of Orange County, Research Institute, Orange, CaliforniaChildren’s Hospital of Orange County, Department of Nursing, Orange, California
*
†
‡
§
¶
Introduction: Limited data on the seroprevalence of severe acute respiratory syndrome coronavirus 2 (SARS-CoV-2) among healthcare workers (HCW) are publicly available. In this study we sought to determine the seroprevalence of SARS-CoV-2 in a population of HCWs in a pediatric emergency department (ED).
Methods: We conducted this observational cohort study from April 14–May 13, 2020 in a pediatric ED in Orange County, CA. Asymptomatic HCW ≥18 years of age were included in the study. Blood samples were obtained by fingerstick at the start of each shift. The inter-sampling interval was ≤96 hours. The primary outcome was positive seroprevalence of SARS-CoV-2 as determined with an antibody fast detection kit (Colloidal Gold, Superbio, Timisoara, Romania) for the SARS-CoV-2 immunoglobulin M/immunoglobulin G (IgM/IgG) antibody.
Results: A total of 143 HCWs participated in the study. Overall SARS-CoV-2 seroprevalence was 10.5% (n = 15). Positive seroprevalence was classified as IgG only (4.9%), IgM+IgG (3.5%), or IgM only (2.1%). SARS-CoV-2 was detected by reverse transcription polymerase chain reaction RT-PCR in 0.7% of the overall study population (n = 1). Samples obtained on Day 1 indicated seropositivity in 4.2% of the study population (n = 6). Subsequent seroconversion occurred in 6.3% of participants (n = 9). The rate of seroconversion was linear with a rate of approximately one new case every two days, starting at Day 9 of the study.
Conclusion: We observed a linear rate of seroconversion to SARS-CoV-2–positive status among asymptomatic HCWs who underwent daily symptom surveys and temperature screens in an environment with universal source control. Rapid antibody testing may be useful for screening for SARS-CoV-2 seropositivity in high-risk populations, such as HCWs in the ED. [West J Emerg Med. 2021;22(3)565–571.]
February 11, 2020, 3019 healthcare workers (HCW) in China had contracted coronavirus disease 2019 (COVID-19). By April 24, 2020, 19,942 HCWs in Italy had contracted the disease.1,2 Guidelines for infection control released by the US

Western Journal of Emergency Medicine 566 Volume 22, no. 3: May 2021
Seroprevalence of COVID-19 in Pediatric Emergency Workers Heyming et al.
Population Health Research Capsule
What do we already know about this issue?During the current pandemic, publicly available data on the seroprevalence and seroconversion of SARS-CoV-2 among healthcare workers has been limited.
What was the research question?This study measured the seroprevalence of SARS-CoV-2 in a population of pediatric emergency department health-care workers.
What was the major finding of the study?We observed a linear rate of seroconversion to SARS-CoV-2–positive status in asymptomatic healthcare workers.
How does this improve population health?Rapid antibody testing may be useful for screening for SARS-CoV-2 seropositivity in high-risk populations, such as healthcare workers in the emergency department.
Centers for Disease Control and Prevention (CDC) include universal source control for everyone entering a healthcare facility, regardless of symptoms, through mandatory mask usage, and active screening of all personnel, patients, and visitors for fever and symptoms of COVID-19 before entry.3 Similar recommendations have been made outside the US4
Although data on the infection rates of HCWs in the US are limited, preliminary data from California suggest that HCWs represent an alarming 7.7% of all known COVID-19 cases.5 In a survey of 13 academic medical centers that included 3248 HCWs, 6% were seropositive for severe acute respiratory syndrome coronavirus 2 (SARS-CoV-2). Among those who tested positive, 29% were asymptomatic, and 69% had not previously known that they were infected with SARS-CoV-2.6 An earlier detailed analysis demonstrated that only 18% of HCW who tested positive were known to have been infected in a healthcare setting, suggesting that HCWs may be more likely to contract the disease outside of the healthcare setting.7 As of 3/26/2021, there were 452,706 cases of COVID-19 among healthcare personnel, and 1,505 deaths from COVID-19.8
The current practice for diagnosing COVID-19 is based on the use of reverse transcriptase polymerase chain reaction (RT-PCR) to test for the presence of SARS-CoV-2 in pharyngeal or respiratory specimens. Current epidemiologic data are based on samples from symptomatic patients at high epidemiologic risk and are likely to underestimate the true prevalence of infection. Because many infections are subclinical, serologic methods can play an important role in determining the true prevalence of COVID-19.9 Early serologic studies have reported high sensitivity in detecting SARS-CoV-2 infection, with antibodies to virus detected 6–15 days after disease onset.10 Unlike RT-PCR positivity, SARS-CoV-2 antibodies persist for at least six weeks and remain detectable throughout the course of disease.11,12 Multiple serologic tests for COVID-19 have been developed, including a recently approved lateral flow assay. However, there is concern over the limitations of these tests, such as cross-reactivity with antibodies to other human coronaviruses. Such tests typically detect antibodies against only one or two antigens. Nonetheless, serology testing may help to characterize the rate of spread of COVID-19 within healthcare settings.
In this study we sought to determine the seroprevalence of SARS-CoV-2 antibodies and to calculate the rate of seroconversion in a population of HCWs within a pediatric emergency department (ED) in Orange County, CA.
METHODSStudy design
Staff members in the Julia and George Argyros Emergency Department at CHOC Children’s Hospital participated in the study during each shift from April 14–May 13, 2020. The study was approved by the CHOC Children’s Institutional Review Board. Signed informed consent was obtained from all study participants. The final enrollment
number represents those participants who voluntarily consented; there were no exclusions. All study participants were ≥18 years of age and active employees in the CHOC Children’s ED with direct patient contact, or clerical staff present in the same area as patients. This included physicians, physician assistants, nurse practitioners, nurses, medical technicians, secretaries, monitor technicians, and additional administrative staff. All subjects were asymptomatic and afebrile, as all employees underwent daily pre-shift active verbal screening for symptoms and/or household exposure, as well as daily temperature measurements with a Masimo TIR-1 noncontact clinical-grade infrared thermometer (Masimo Corporation, Irvine, CA) prior to entering the hospital. Personnel with positive screening results were barred from entering the hospital. Any exposure of HCWs to patients or other HCWs infected with SARS-CoV-2 was traced according to CDC guidelines. The associated rate of infection was 0.28% (1 out of 362 exposures).13 Funding for this study was provided by CHOC Children’s Hospital.
Serologic testingBlood samples were obtained every 96 hours or upon
arrival to the HCW’s shift after the 96 hours, until the end of the 30-day study period. All samples were tested with the COVID-19 Rapid Test Kit IgG + IgM (Colloidal Gold) (Superbio Biomedical Company, Rancho Cordova, CA). At the time of the study, the Superbio test was approved by the US Food &
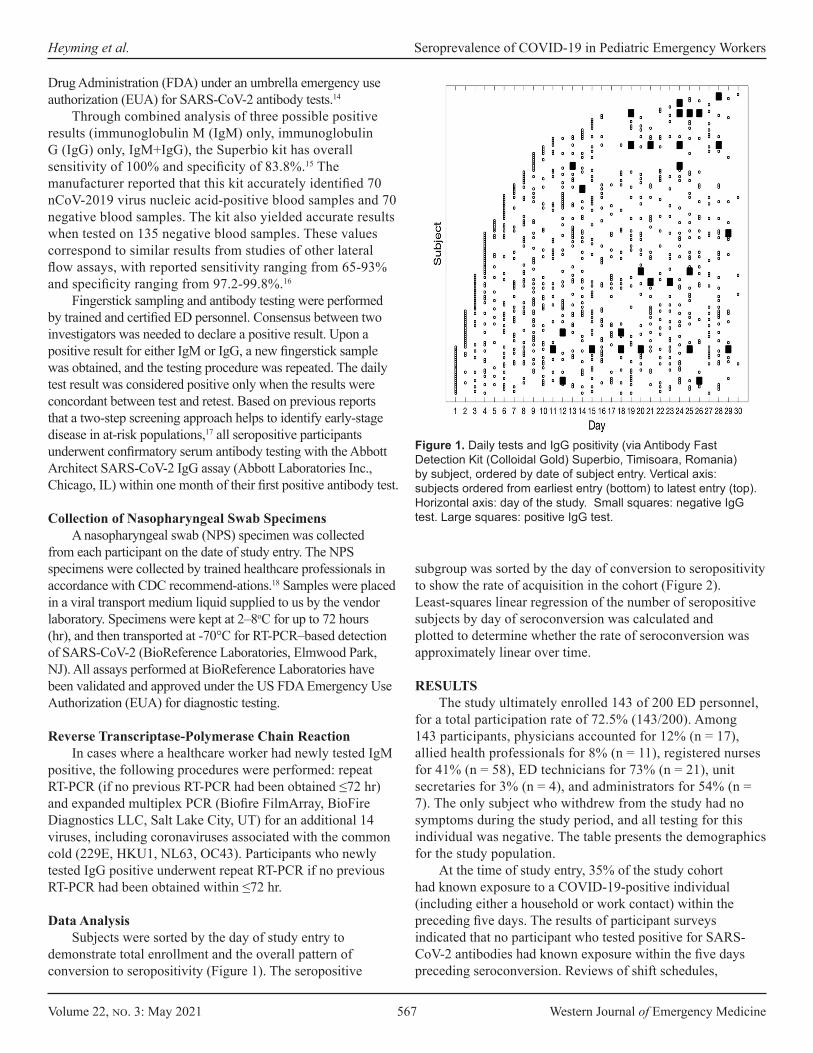
Volume 22, no. 3: May 2021 567 Western Journal of Emergency Medicine
Heyming et al. Seroprevalence of COVID-19 in Pediatric Emergency Workers
Drug Administration (FDA) under an umbrella emergency use authorization (EUA) for SARS-CoV-2 antibody tests.14
Through combined analysis of three possible positive results (immunoglobulin M (IgM) only, immunoglobulin G (IgG) only, IgM+IgG), the Superbio kit has overall sensitivity of 100% and specificity of 83.8%.15 The manufacturer reported that this kit accurately identified 70 nCoV-2019 virus nucleic acid-positive blood samples and 70 negative blood samples. The kit also yielded accurate results when tested on 135 negative blood samples. These values correspond to similar results from studies of other lateral flow assays, with reported sensitivity ranging from 65-93% and specificity ranging from 97.2-99.8%.16
Fingerstick sampling and antibody testing were performed by trained and certified ED personnel. Consensus between two investigators was needed to declare a positive result. Upon a positive result for either IgM or IgG, a new fingerstick sample was obtained, and the testing procedure was repeated. The daily test result was considered positive only when the results were concordant between test and retest. Based on previous reports that a two-step screening approach helps to identify early-stage disease in at-risk populations,17 all seropositive participants underwent confirmatory serum antibody testing with the Abbott Architect SARS-CoV-2 IgG assay (Abbott Laboratories Inc., Chicago, IL) within one month of their first positive antibody test.
Collection of Nasopharyngeal Swab SpecimensA nasopharyngeal swab (NPS) specimen was collected
from each participant on the date of study entry. The NPS specimens were collected by trained healthcare professionals in accordance with CDC recommend-ations.18 Samples were placed in a viral transport medium liquid supplied to us by the vendor laboratory. Specimens were kept at 2–8oC for up to 72 hours (hr), and then transported at -70°C for RT-PCR–based detection of SARS-CoV-2 (BioReference Laboratories, Elmwood Park, NJ). All assays performed at BioReference Laboratories have been validated and approved under the US FDA Emergency Use Authorization (EUA) for diagnostic testing.
Reverse Transcriptase-Polymerase Chain ReactionIn cases where a healthcare worker had newly tested IgM
positive, the following procedures were performed: repeat RT-PCR (if no previous RT-PCR had been obtained ≤72 hr) and expanded multiplex PCR (Biofire FilmArray, BioFire Diagnostics LLC, Salt Lake City, UT) for an additional 14 viruses, including coronaviruses associated with the common cold (229E, HKU1, NL63, OC43). Participants who newly tested IgG positive underwent repeat RT-PCR if no previous RT-PCR had been obtained within ≤72 hr.
Data AnalysisSubjects were sorted by the day of study entry to
demonstrate total enrollment and the overall pattern of conversion to seropositivity (Figure 1). The seropositive
subgroup was sorted by the day of conversion to seropositivity to show the rate of acquisition in the cohort (Figure 2). Least-squares linear regression of the number of seropositive subjects by day of seroconversion was calculated and plotted to determine whether the rate of seroconversion was approximately linear over time.
RESULTSThe study ultimately enrolled 143 of 200 ED personnel,
for a total participation rate of 72.5% (143/200). Among 143 participants, physicians accounted for 12% (n = 17), allied health professionals for 8% (n = 11), registered nurses for 41% (n = 58), ED technicians for 73% (n = 21), unit secretaries for 3% (n = 4), and administrators for 54% (n = 7). The only subject who withdrew from the study had no symptoms during the study period, and all testing for this individual was negative. The table presents the demographics for the study population.
At the time of study entry, 35% of the study cohort had known exposure to a COVID-19-positive individual (including either a household or work contact) within the preceding five days. The results of participant surveys indicated that no participant who tested positive for SARS-CoV-2 antibodies had known exposure within the five days preceding seroconversion. Reviews of shift schedules,
Figure 1. Daily tests and IgG positivity (via Antibody Fast Detection Kit (Colloidal Gold) Superbio, Timisoara, Romania) by subject, ordered by date of subject entry. Vertical axis: subjects ordered from earliest entry (bottom) to latest entry (top). Horizontal axis: day of the study. Small squares: negative IgG test. Large squares: positive IgG test.
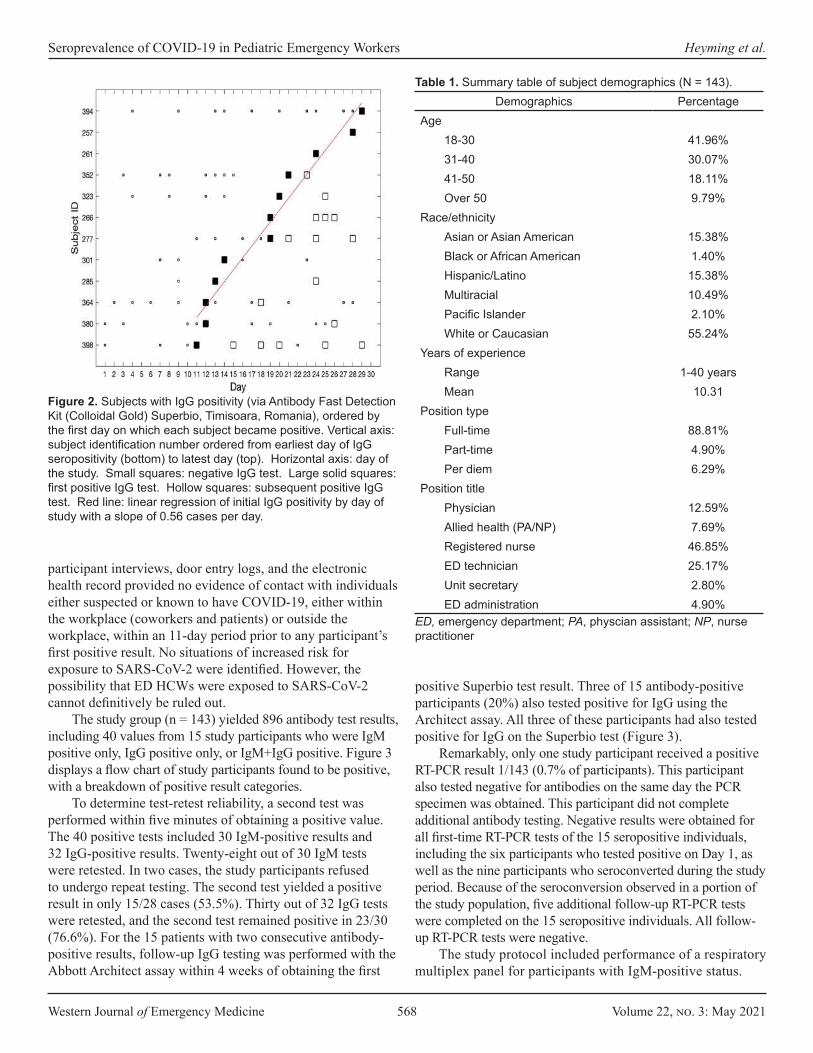
Western Journal of Emergency Medicine 568 Volume 22, no. 3: May 2021
Seroprevalence of COVID-19 in Pediatric Emergency Workers Heyming et al.
Figure 2. Subjects with IgG positivity (via Antibody Fast Detection Kit (Colloidal Gold) Superbio, Timisoara, Romania), ordered by the first day on which each subject became positive. Vertical axis: subject identification number ordered from earliest day of IgG seropositivity (bottom) to latest day (top). Horizontal axis: day of the study. Small squares: negative IgG test. Large solid squares: first positive IgG test. Hollow squares: subsequent positive IgG test. Red line: linear regression of initial IgG positivity by day of study with a slope of 0.56 cases per day.
Demographics PercentageAge
18-30 41.96%31-40 30.07%41-50 18.11%Over 50 9.79%
Race/ethnicityAsian or Asian American 15.38%Black or African American 1.40%Hispanic/Latino 15.38%Multiracial 10.49%Pacific Islander 2.10%White or Caucasian 55.24%
Years of experienceRange 1-40 yearsMean 10.31
Position typeFull-time 88.81%Part-time 4.90%Per diem 6.29%
Position titlePhysician 12.59%Allied health (PA/NP) 7.69%Registered nurse 46.85%ED technician 25.17%Unit secretary 2.80%ED administration 4.90%
Table 1. Summary table of subject demographics (N = 143).
ED, emergency department; PA, physcian assistant; NP, nurse practitioner
participant interviews, door entry logs, and the electronic health record provided no evidence of contact with individuals either suspected or known to have COVID-19, either within the workplace (coworkers and patients) or outside the workplace, within an 11-day period prior to any participant’s first positive result. No situations of increased risk for exposure to SARS-CoV-2 were identified. However, the possibility that ED HCWs were exposed to SARS-CoV-2 cannot definitively be ruled out.
The study group (n = 143) yielded 896 antibody test results, including 40 values from 15 study participants who were IgM positive only, IgG positive only, or IgM+IgG positive. Figure 3 displays a flow chart of study participants found to be positive, with a breakdown of positive result categories.
To determine test-retest reliability, a second test was performed within five minutes of obtaining a positive value. The 40 positive tests included 30 IgM-positive results and 32 IgG-positive results. Twenty-eight out of 30 IgM tests were retested. In two cases, the study participants refused to undergo repeat testing. The second test yielded a positive result in only 15/28 cases (53.5%). Thirty out of 32 IgG tests were retested, and the second test remained positive in 23/30 (76.6%). For the 15 patients with two consecutive antibody-positive results, follow-up IgG testing was performed with the Abbott Architect assay within 4 weeks of obtaining the first
positive Superbio test result. Three of 15 antibody-positive participants (20%) also tested positive for IgG using the Architect assay. All three of these participants had also tested positive for IgG on the Superbio test (Figure 3).
Remarkably, only one study participant received a positive RT-PCR result 1/143 (0.7% of participants). This participant also tested negative for antibodies on the same day the PCR specimen was obtained. This participant did not complete additional antibody testing. Negative results were obtained for all first-time RT-PCR tests of the 15 seropositive individuals, including the six participants who tested positive on Day 1, as well as the nine participants who seroconverted during the study period. Because of the seroconversion observed in a portion of the study population, five additional follow-up RT-PCR tests were completed on the 15 seropositive individuals. All follow-up RT-PCR tests were negative.
The study protocol included performance of a respiratory multiplex panel for participants with IgM-positive status.
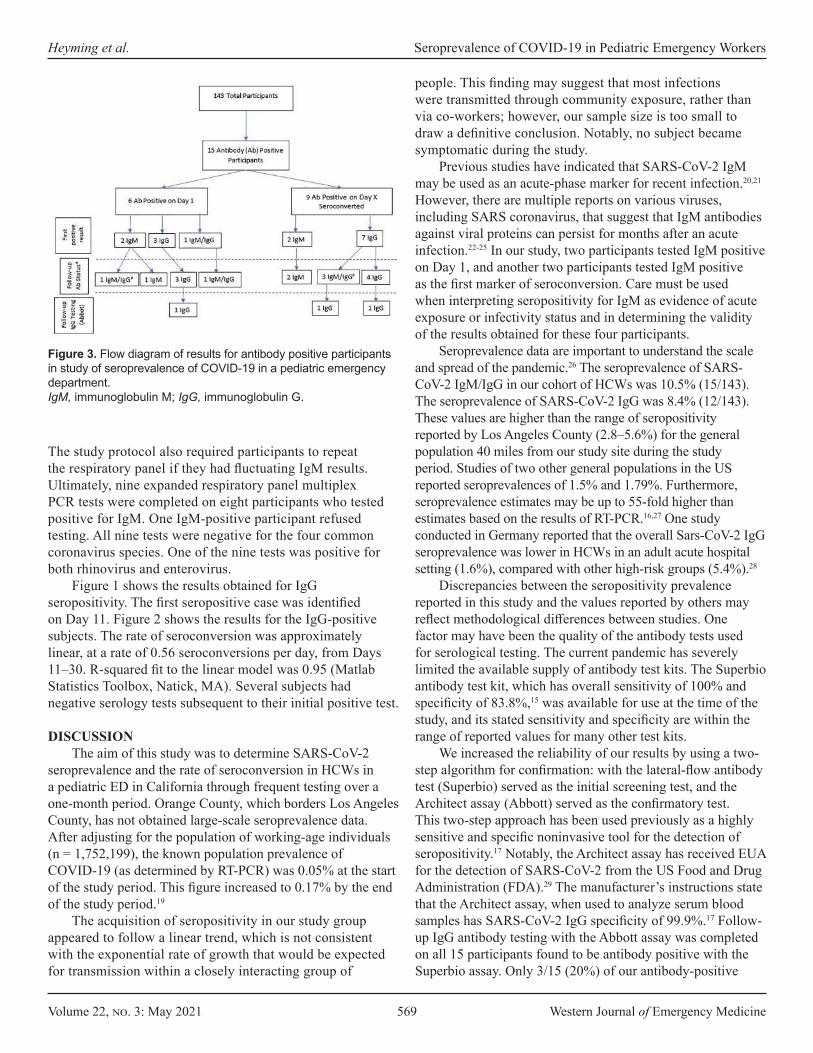
Volume 22, no. 3: May 2021 569 Western Journal of Emergency Medicine
Heyming et al. Seroprevalence of COVID-19 in Pediatric Emergency Workers
Figure 3. Flow diagram of results for antibody positive participants in study of seroprevalence of COVID-19 in a pediatric emergency department.IgM, immunoglobulin M; IgG, immunoglobulin G.
The study protocol also required participants to repeat the respiratory panel if they had fluctuating IgM results. Ultimately, nine expanded respiratory panel multiplex PCR tests were completed on eight participants who tested positive for IgM. One IgM-positive participant refused testing. All nine tests were negative for the four common coronavirus species. One of the nine tests was positive for both rhinovirus and enterovirus.
Figure 1 shows the results obtained for IgG seropositivity. The first seropositive case was identified on Day 11. Figure 2 shows the results for the IgG-positive subjects. The rate of seroconversion was approximately linear, at a rate of 0.56 seroconversions per day, from Days 11–30. R-squared fit to the linear model was 0.95 (Matlab Statistics Toolbox, Natick, MA). Several subjects had negative serology tests subsequent to their initial positive test.
DISCUSSIONThe aim of this study was to determine SARS-CoV-2
seroprevalence and the rate of seroconversion in HCWs in a pediatric ED in California through frequent testing over a one-month period. Orange County, which borders Los Angeles County, has not obtained large-scale seroprevalence data. After adjusting for the population of working-age individuals (n = 1,752,199), the known population prevalence of COVID-19 (as determined by RT-PCR) was 0.05% at the start of the study period. This figure increased to 0.17% by the end of the study period.19
The acquisition of seropositivity in our study group appeared to follow a linear trend, which is not consistent with the exponential rate of growth that would be expected for transmission within a closely interacting group of
people. This finding may suggest that most infections were transmitted through community exposure, rather than via co-workers; however, our sample size is too small to draw a definitive conclusion. Notably, no subject became symptomatic during the study.
Previous studies have indicated that SARS-CoV-2 IgM may be used as an acute-phase marker for recent infection.20,21 However, there are multiple reports on various viruses, including SARS coronavirus, that suggest that IgM antibodies against viral proteins can persist for months after an acute infection.22-25 In our study, two participants tested IgM positive on Day 1, and another two participants tested IgM positive as the first marker of seroconversion. Care must be used when interpreting seropositivity for IgM as evidence of acute exposure or infectivity status and in determining the validity of the results obtained for these four participants.
Seroprevalence data are important to understand the scale and spread of the pandemic.26 The seroprevalence of SARS-CoV-2 IgM/IgG in our cohort of HCWs was 10.5% (15/143). The seroprevalence of SARS-CoV-2 IgG was 8.4% (12/143). These values are higher than the range of seropositivity reported by Los Angeles County (2.8–5.6%) for the general population 40 miles from our study site during the study period. Studies of two other general populations in the US reported seroprevalences of 1.5% and 1.79%. Furthermore, seroprevalence estimates may be up to 55-fold higher than estimates based on the results of RT-PCR.16,27 One study conducted in Germany reported that the overall Sars-CoV-2 IgG seroprevalence was lower in HCWs in an adult acute hospital setting (1.6%), compared with other high-risk groups (5.4%).28
Discrepancies between the seropositivity prevalence reported in this study and the values reported by others may reflect methodological differences between studies. One factor may have been the quality of the antibody tests used for serological testing. The current pandemic has severely limited the available supply of antibody test kits. The Superbio antibody test kit, which has overall sensitivity of 100% and specificity of 83.8%,15 was available for use at the time of the study, and its stated sensitivity and specificity are within the range of reported values for many other test kits.
We increased the reliability of our results by using a two-step algorithm for confirmation: with the lateral-flow antibody test (Superbio) served as the initial screening test, and the Architect assay (Abbott) served as the confirmatory test. This two-step approach has been used previously as a highly sensitive and specific noninvasive tool for the detection of seropositivity.17 Notably, the Architect assay has received EUA for the detection of SARS-CoV-2 from the US Food and Drug Administration (FDA).29 The manufacturer’s instructions state that the Architect assay, when used to analyze serum blood samples has SARS-CoV-2 IgG specificity of 99.9%.17 Follow-up IgG antibody testing with the Abbott assay was completed on all 15 participants found to be antibody positive with the Superbio assay. Only 3/15 (20%) of our antibody-positive
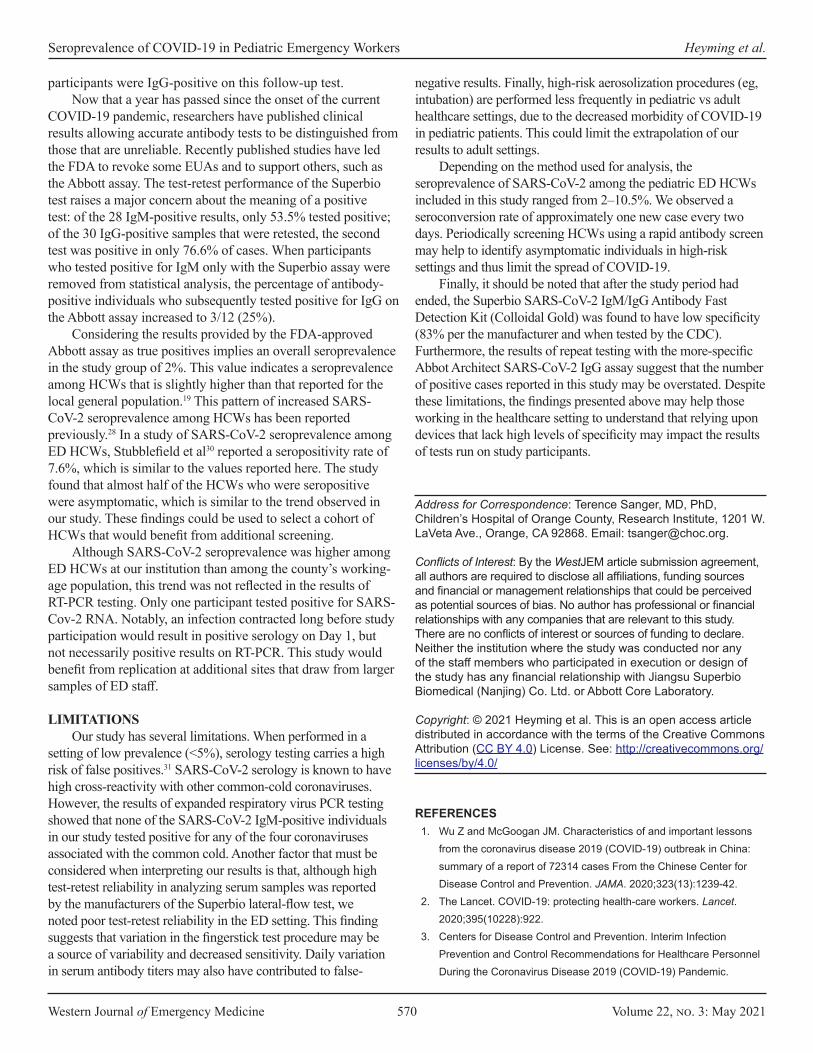
Western Journal of Emergency Medicine 570 Volume 22, no. 3: May 2021
Seroprevalence of COVID-19 in Pediatric Emergency Workers Heyming et al.
participants were IgG-positive on this follow-up test. Now that a year has passed since the onset of the current
COVID-19 pandemic, researchers have published clinical results allowing accurate antibody tests to be distinguished from those that are unreliable. Recently published studies have led the FDA to revoke some EUAs and to support others, such as the Abbott assay. The test-retest performance of the Superbio test raises a major concern about the meaning of a positive test: of the 28 IgM-positive results, only 53.5% tested positive; of the 30 IgG-positive samples that were retested, the second test was positive in only 76.6% of cases. When participants who tested positive for IgM only with the Superbio assay were removed from statistical analysis, the percentage of antibody-positive individuals who subsequently tested positive for IgG on the Abbott assay increased to 3/12 (25%).
Considering the results provided by the FDA-approved Abbott assay as true positives implies an overall seroprevalence in the study group of 2%. This value indicates a seroprevalence among HCWs that is slightly higher than that reported for the local general population.19 This pattern of increased SARS-CoV-2 seroprevalence among HCWs has been reported previously.28 In a study of SARS-CoV-2 seroprevalence among ED HCWs, Stubblefield et al30 reported a seropositivity rate of 7.6%, which is similar to the values reported here. The study found that almost half of the HCWs who were seropositive were asymptomatic, which is similar to the trend observed in our study. These findings could be used to select a cohort of HCWs that would benefit from additional screening.
Although SARS-CoV-2 seroprevalence was higher among ED HCWs at our institution than among the county’s working-age population, this trend was not reflected in the results of RT-PCR testing. Only one participant tested positive for SARS-Cov-2 RNA. Notably, an infection contracted long before study participation would result in positive serology on Day 1, but not necessarily positive results on RT-PCR. This study would benefit from replication at additional sites that draw from larger samples of ED staff.
LIMITATIONSOur study has several limitations. When performed in a
setting of low prevalence (<5%), serology testing carries a high risk of false positives.31 SARS-CoV-2 serology is known to have high cross-reactivity with other common-cold coronaviruses. However, the results of expanded respiratory virus PCR testing showed that none of the SARS-CoV-2 IgM-positive individuals in our study tested positive for any of the four coronaviruses associated with the common cold. Another factor that must be considered when interpreting our results is that, although high test-retest reliability in analyzing serum samples was reported by the manufacturers of the Superbio lateral-flow test, we noted poor test-retest reliability in the ED setting. This finding suggests that variation in the fingerstick test procedure may be a source of variability and decreased sensitivity. Daily variation in serum antibody titers may also have contributed to false-
negative results. Finally, high-risk aerosolization procedures (eg, intubation) are performed less frequently in pediatric vs adult healthcare settings, due to the decreased morbidity of COVID-19 in pediatric patients. This could limit the extrapolation of our results to adult settings.
Depending on the method used for analysis, the seroprevalence of SARS-CoV-2 among the pediatric ED HCWs included in this study ranged from 2–10.5%. We observed a seroconversion rate of approximately one new case every two days. Periodically screening HCWs using a rapid antibody screen may help to identify asymptomatic individuals in high-risk settings and thus limit the spread of COVID-19.
Finally, it should be noted that after the study period had ended, the Superbio SARS-CoV-2 IgM/IgG Antibody Fast Detection Kit (Colloidal Gold) was found to have low specificity (83% per the manufacturer and when tested by the CDC). Furthermore, the results of repeat testing with the more-specific Abbot Architect SARS-CoV-2 IgG assay suggest that the number of positive cases reported in this study may be overstated. Despite these limitations, the findings presented above may help those working in the healthcare setting to understand that relying upon devices that lack high levels of specificity may impact the results of tests run on study participants.
Address for Correspondence: Terence Sanger, MD, PhD, Children’s Hospital of Orange County, Research Institute, 1201 W. LaVeta Ave., Orange, CA 92868. Email: [email protected].
Conflicts of Interest: By the WestJEM article submission agreement, all authors are required to disclose all affiliations, funding sources and financial or management relationships that could be perceived as potential sources of bias. No author has professional or financial relationships with any companies that are relevant to this study. There are no conflicts of interest or sources of funding to declare. Neither the institution where the study was conducted nor any of the staff members who participated in execution or design of the study has any financial relationship with Jiangsu Superbio Biomedical (Nanjing) Co. Ltd. or Abbott Core Laboratory.
Copyright: © 2021 Heyming et al. This is an open access article distributed in accordance with the terms of the Creative Commons Attribution (CC BY 4.0) License. See: http://creativecommons.org/licenses/by/4.0/
REFERENCES 1. Wu Z and McGoogan JM. Characteristics of and important lessons
from the coronavirus disease 2019 (COVID-19) outbreak in China: summary of a report of 72314 cases From the Chinese Center for Disease Control and Prevention. JAMA. 2020;323(13):1239-42.
2. The Lancet. COVID-19: protecting health-care workers. Lancet. 2020;395(10228):922.
3. Centers for Disease Control and Prevention. Interim Infection Prevention and Control Recommendations for Healthcare Personnel During the Coronavirus Disease 2019 (COVID-19) Pandemic.

Volume 22, no. 3: May 2021 571 Western Journal of Emergency Medicine
Heyming et al. Seroprevalence of COVID-19 in Pediatric Emergency Workers
2020. Available at: https://www.cdc.gov/coronavirus/2019-ncov/hcp/infection-control-recommendations.html. Accessed July 20, 2020.
4. Feng S, Shen C, Xia N, et al. Rational use of face masks in the COVID-19 pandemic. Lancet Respir Med. 2020;8(5):434-6.
5. California Department of Public Health. State Officials Announce Latest COVID-19 Facts Including New Data on Racial Demographics and Expanded Health Care Worker Data. 2020. Available at: https://www.cdph.ca.gov/Programs/OPA/Pages/NR20-047.aspx. Accessed July 20, 2020.
6. Self WH, Tenforde MW, Stubblefield WB, et al. Seroprevalence of SARS-CoV-2 among frontline health care personnel in a multistate hospital network - 13 academic medical Centers, April-June 2020. MMWR Morb Mortal Wkly Rep. 2020;69(35):1221-6.
7. California Department of Public Health. Office of Public Affairs - State Officials Announce Latest COVID-19 Facts. 2020. Available at: https://www.cdph.ca.gov/Programs/OPA/Pages/NR20-163.aspx. Accessed July 20, 2020.
8. Centers for Disease Control and Prevention. COVID Data Tracker: Cases in the United States. 2020. Available at: https://www.cdc.gov/coronavirus/2019-ncov/cases-updates/cases-in-us.htm. Accessed March 26, 2021.
9. Tang YW, Schmitz JE, Persing DH, et al. Laboratory diagnosis of COVID-19: current issues and challenges. J Clin Microbiol. 2020;58(6):1-9.
10. Zhao J, Yuan Q, Wang H, et al. Antibody responses to SARS-CoV-2 in patients of novel coronavirus disease 2019. Clin Infect Dis. 2020;71(16):2027-34.
11. Long QX, Liu BZ, Deng HJ, et al. Antibody responses to SARS-CoV-2 in patients with COVID-19. Nat Med. 2020;26(6):845-8.
12. Xiao AT, Gao C, Zhang S. Profile of specific antibodies to SARS-CoV-2: the first report. J Infect. 2020;81(1):147-78.
13. Long QX, Liu BZ, Deng HJ, et al. Antibody responses to SARS-CoV-2 in patients with COVID-19. Nat Med. 2020;26(6):845-8.
14. Food and Drug Administration. Coronavirus Disease 2019 (COVID-19) Emergency Use Authorizations for Medical Devices. 2020. Available at: https://www.fda.gov/medical-devices/emergency-use-authorizations-medical-devices/coronavirus-disease-2019-covid-19-emergency-use-authorizations-medical-devices. Accessed July 20, 2020.
15. Jiangsu Superbio Biomedical (Nanjing) Co Ltd. Serology Test Evaluation Report for “SARS-CoV-2 (COVID-19) IgM/IgG Antibody Fast Detection Kit (Colloidal Gold).” 2020. Available at: http://www.superbioglobal.com. Accessed July 20, 2020.
16. Bryan A, Pepper G, Wener MH, et al. Performance characteristics of the Abbott Architect SARS-CoV-2 IgG assay and seroprevalence in Boise, Idaho. J Clin Microbiol. 2020;58(8):e00941-20.
17. Paramita DK, Fachiroh J, Haryana SM, et al. Two-step Epstein-Barr virus immunoglobulin A enzyme-linked immunosorbent assay system for serological screening and confirmation of nasopharyngeal carcinoma. Clin Vaccine Immunol. 2009;16(5):706-11.
18. Centers for Disease Control and Prevention. Specimen Collection. 2020. Available at: https://www.cdc.gov/coronavirus/2019-ncov/lab/guidelines-clinical-specimens.html. Accessed July 20, 2020.
19. Orange County Health Care Agency. COVID-19 Case Counts and Testing Figures. 2020. Avalable at: https://occovid19.ochealthinfo.com/coronavirus-in-oc. Accessed July 20, 2020.
20. Guo L, Ren L, Yang S, et al. Profiling early humoral response to diagnose novel coronavirus disease (COVID-19). Clin Infect Dis. 2020;71(15):778-85.
21. Li Z, Yi Y, Luo X, et al. Development and clinical application of a rapid IgM-IgG combined antibody test for SARS-CoV-2 infection diagnosis. J Med Virol. 2020;92(9):1518-24.
22. Woo PC, Lau SK, Wong BH, et al. Longitudinal profile of immunoglobulin G (IgG), IgM, and IgA antibodies against the severe acute respiratory syndrome (SARS) coronavirus nucleocapsid protein in patients with pneumonia due to the SARS coronavirus. Clin Diagn Lab Immunol. 2004;11(4):665-8.
23. Griffin I, Martin SW, Fischer M, et al. Zika Virus IgM Detection and neutralizing antibody profiles 12-19 months after illness onset. Emerg Infect Dis. 2019;25(2):299-303.
24. Murray KO, Garcia MN, Yan C, et al. Persistence of detectable immunoglobulin M antibodies up to 8 years after infection with West Nile virus. Am J Trop Med Hyg. 2013;89(5):996-1000.
25. Chien YW, Liu ZH, Tseng FC, et al. Prolonged persistence of IgM against dengue virus detected by commonly used commercial assays. BMC Infect Dis. 2018;18(1):156.
26. Infectious Disease Society of America. IDSA COVID-19 Antibody Testing Primer. 2020. Available at: https://www.idsociety.org/globalassets/idsa/public-health/covid-19/idsa-covid-19-antibody-testing-primer.pdf. Accessed July 20, 2020.
27. Sood N, Simon P, Ebner P, et al. Seroprevalence of SARS-CoV-2-specific antibodies among adults in Los Angeles County, California, on April 10-11, 2020. JAMA. 2020;323(23):2425-7.
28. Korth J, Wilde B, Dolff S, et al. SARS-CoV-2-specific antibody detection in healthcare workers in Germany with direct contact to COVID-19 patients. J Clin Virol. 2020;128:104437.
29. Food and Drug Administration. EUA Authorized Serology Test Performance. 2020. Available at: https://www.fda.gov/medical-devices/coronavirus-disease-2019-covid-19-emergency-use-authorizations-medical-devices/eua-authorized-serology-test-performance. Accessed January 12, 2021.
30. Stubblefield WB, Talbot HK, Feldstein L, et al. Seroprevalence of SARS-CoV-2 among frontline healthcare personnel during the first month of caring for COVID-19 Patients - Nashville, Tennessee. Clin Infect Dis. 2020;ciaa96.
31. Carpenter CR, Mudd PA, West CP, et al. Diagnosing COVID-19 in the emergency department: a scoping review of clinical examinations, laboratory tests, imaging accuracy, and biases. Acad Emerg Med. 2020;27(8):653-70.

Western Journal of Emergency Medicine 572 Volume 22, no. 3: May 2021
Original Research
The Impact of COVID-19 on a Large, Canadian Community Emergency Department
Daniel Dongjoo Lee, BSc*† Hyejung Jung, MSc† Wendy Lou, PhD† David Rauchwerger, MD‡ Lucas B. Chartier, MDCM, MPH§¶ Sameer Masood, MD, MPH§¶ Seyon Sathiaseelan, MD‡§|| Ahmed Khaled Taher, MD, MPH‡§¶
Section Editor: Shada Rouhani, MD Submission history: Submitted October 4, 2020; Revision received January 24, 2021; Accepted January 26, 2021 Electronically published May 5, 2021 Full text available through open access at http://escholarship.org/uc/uciem_westjem DOI: 10.5811/westjem.2021.1.50123
Temerty Faculty of Medicine, University of Toronto, Toronto, Ontario, CanadaDalla Lana School of Public Health, University of Toronto, Toronto, Ontario CanadaMackenzie Health, Department of Emergency Medicine, Richmond Hill, Ontario, Canada University of Toronto, Department of Medicine, Division of Emergency Medicine, Toronto, Ontario, CanadaUniversity Health Network, Department of Emergency Medicine, Toronto, Ontario, Canada McMaster University, Department of Family Medicine, Hamilton, Ontario, Canada
*†
‡
§
¶
||
Introduction: As the COVID-19 pandemic unfolded, emergency departments (EDs) across the world braced for surges in volume and demand. However, many EDs experienced decreased demand even for higher acuity illnesses. In this study we sought to examine the change in utilization at a large Canadian community ED, including changes in patient demographics and presentations, as well as structural and administrative changes made in response to the pandemic.
Methods: This retrospective observational study took place in Ontario, Canada, from March 17– June 30, 2020, during province-wide lockdowns in response to COVID-19. We used a control period of March 17–June 30 in 2018–2019. Differences between observed and expected values were calculated for total visits, Canadian Triage and Acuity Scale (CTAS) groups, and age groups using Fisher’s exact test. Length of stay (LOS), physician initial assessment time (PIA), and top primary and admission diagnoses were also examined.
Results: Patient visits fell to 66.3% of expected volume in the exposure period (20,901 vs 31,525, P<0.0001). CTAS-1 (highest acuity) patient volumes dropped to 86.8% of expected (P = 0.1964) while CTAS-5 (lowest acuity) patient volumes dropped to 32.4% of expected (P <0.0001). Youth (0-17), adult (18-64), and senior (65+) visits all decreased to 37.4%, 71.7%, and 72.9% of expected volumes, respectively (P <0.0001). Median PIA and median ED LOS both decreased (1.1 to 0.6 hours and 3.3 to 3.0 hours, respectively). The most common primary diagnosis in both periods was “other chest pain.” Viral syndromes were more prevalent in the exposure period. The top admission diagnoses were congestive heart failure in the control period (4.8%) and COVID-19 in the study period (3.5%).
Conclusion: ED utilization changed drastically during COVID-19. Our ED responded with wide stakeholder engagement, spatial reorganization, and human resources changes informed by real-time data. Our experiences can help prepare for potential subsequent “waves” of COVID-19 and future pandemics. [West J Emerg Med. 2021;22(3)572–579.]

Volume 22, no. 3: May 2021 573 Western Journal of Emergency Medicine
Lee et al. Impact of COVID-19 on a Canadian Community ED
Population Health Research Capsule
What do we already know about this issue?Emerging evidence shows that COVID-19 significantly disrupted demand for healthcare internationally.
What was the research question?How has COVID-19 changed the demand for emergency care in large community hospitals?
What was the major finding of the study?We found decreased volumes, increased acuity, older demographics, and higher proportions of infectious presentations.
How does this improve population health?By understanding the impact of pandemics on population-level demand for emergency care, we can better prepare for future outbreaks.
INTRODUCTIONThe first case of COVID-19 in Canada was identified in
Toronto, Ontario, on January 25, 2020. Over the next few months, every province and territory in Canada declared a state of emergency and instituted lockdowns in response to increasing infection spread, which reached a total of 1,155,834 cases as of April 23, 2021.1 Provincial and local health systems prepared for worst-case scenarios as they observed dire situations in areas that were hit hard early including Italy, Spain, and areas in the United States. 2,3
Based on challenging international experiences, many Canadian emergency departments (ED) sought to prepare for a high flux of patients with infectious symptoms.4-6 However, as the pandemic unfolded, many EDs did not appear to experience surges, but rather decreases in volumes. In the prehospital realm, emergency medical system (EMS) activations for potential life-threatening presentations decreased in the US and Europe.7,8 Substantial decreases in ED volumes have been noted worldwide, even in countries with high COVID-19 burden.9,10 Moreover, early studies from Canada and worldwide found decreased visits for heart failure, stroke, and acute myocardial infarctions.11-14
Given the large role of EDs in the response to the COVID-19 pandemic, it is important to investigate the landscape of ED utilization during the initial period. The objective of this study was to characterize the utilization of a large community hospital in Ontario, the most populous province, after the declaration of province-wide lockdowns, as well as to explore observed local changes in response to these effects. This included changes in incoming patient demographics, common presentations, and internal indicators of operations such as length of stay (LOS) and physician initial assessment (PIA) times.
These insights can help inform stakeholders in the provision of emergency care by examining how populations respond to pandemics in their decisions to visit EDs. The findings have implications for human resource planning, hospital resource management, supply chain manufacturing and procurement, and local continuing education initiatives.
METHODSStudy Design and Time Period
This was a retrospective, population-based cohort study conducted in the Mackenzie Health (MH) Hospital ED. The study period was from March 17–June 30 in the years 2018–2020. The exposure time period starts March 17, 2020, during which the provincial government of Ontario declared a state of emergency response to COVID-19 and instituted lockdowns of non-essential services. Data collection ended on June 30, 2020. We used a control period of March 17–June 30 in the years 2018–2019 to obtain baseline characteristics for examined variables. This study was approved by the Southlake Regional Health Centre Research Ethics Board.
Study SettingMackenzie Health is a large 506-bed community hospital
in Richmond Hill, Ontario. The ED received 111,384 visits in 2019. Richmond Hill is a city of 195,022 in Ontario, a province with a population of 13,448,494.15 The pre-COVID-19 ED was organized into three main zones. The non-ambulatory zone included a five-bed resuscitation room, five mental health beds, 14 acute care rooms (one isolation), and 20 designated hallway stretchers for overflow. It also included a subacute zone with 15 beds, four of which were isolation beds. The ambulatory zone, for patients who did not need a bed but needed thorough evaluation, included 10 assessment rooms and 30 treatment chairs for patients awaiting treatment or for results. Finally, the minor-treatment zone included six assessment rooms, an eye examination room, and a procedure room, the latter mostly for musculoskeletal injuries.
Data CollectionWe retrieved data from the hospital electronic database (Epic
Systems Corporation, Verona, WI). We examined total daily visits and acuity level via the Canadian Emergency Department Triage and Acuity Scale (CTAS).16 We also examined patient age (youth 0-17; adult 18-64; senior 65+), physician initial assessment (PIA) time, length of stay (LOS) duration, primary (most responsible) diagnosis for the visit, and admission diagnoses.
Primary diagnoses were defined as the most responsible diagnosis coded in the hospital electronic database according to the International Classification of Diseases,

Western Journal of Emergency Medicine 574 Volume 22, no. 3: May 2021
Impact of COVID-19 on a Canadian Community ED Lee et al.
10th rev (ICD-10) format. We compared the volume and proportion of the top five primary diagnoses to the 2018–2019 control period. This was also done for the top five admission diagnoses. Finally, the volume and proportion of acute myocardial infarction (AMI) and acute stroke were examined for the purpose of comparison to emerging literature on the impact of COVID-19 on those conditions in other jurisdictions.11-14 We abstracted AMI visits as visits with the most responsible diagnosis field coded as either ICD-10 I21 or ICD-10 I22,17 while acute stroke was abstracted with most responsible diagnosis fields coded as ICD-10 I60, ICD-10 I61, ICD-10 I62, ICD-10 I63, and ICD-10 I64 (Table 1).18
Data AnalysisWe compared observed numbers of visits to expected
numbers as projected by the method in Johnston et al (2002) (Box A1).19 The expected numbers were calculated using the dates March 17–June 30, 2018–2019, and pre-COVID-19 2020 data to account for seasonality as well as year-to-year variation. We conducted the comparisons between observed and expected numbers using Fisher’s two-tailed exact test. The Bonferroni correction (0.05/8 = 0.00625) was used to adjust for multiple testing in subgroup analyses for CTAS and age (Table 2). We summarized LOS and PIA data by interquartile range (IQR), and 90th percentiles. Categorical variables of primary diagnoses and admission diagnoses were summarized
Diagnosis ICD-10 code ICD-10 descriptionAMI I21 Acute myocardial infarction
I22 Subsequent myocardial infarction*Acute Stroke I60 Subarachnoid haemorrhage
I61 Intracerebral haemorrhageI62 Other nontraumatic intracranial haemorrhageI63 Cerebral infarctionI64 Stroke, not specified as haemorrhage or infarction
Table 1. International Classification of Diseases codes used to abstract most responsible diagnoses.
*Includes infarction of any myocardial site, occurring within 4 weeks (28 days) from onset of a previous infarction.ICD-10, International Classification of Diseases, Tenth Revision, Clinical Modification; AMI, acute myocardial infarction.
Number of visits (n,%)* % Ratio of observed to expected in 2020
Groups 2018 2019 2020 (observed) 2020 (expected)**Observed/expected
% (95% CI) P-value***Total visits 30,540 32667 20,901 31,525 66.3 (64.7–68.1) <0.0001
CTAS
1-Resuscitation 221 (0.7) 526 (1.6) 310 (1.5) 357 86.8 (69.8–107.8) 0.1964
2-Emergent 10,142 (33.2) 11,562 (35.4) 6,846 (32.8) 9,352 73.2 (70.1–76.5) <0.0001
3-Urgent 13,713 (44.9) 16,009 (49.0) 10,664 (51.0) 16,663 64.0 (61.7–66.4) <0.0001
4-Semi-urgent 4,832 (15.8) 3,300 (10.1) 2,303 (11.0) 3,382 68.1 (63.1–73.5) <0.0001
5-Non-urgent 1,612 (5.3) 1,244 (3.8) 742 (3.6) 2,290 32.4 (27.9–37.5) <0.0001
Age group
Youth (0-17) 5,057 (16.6) 5,460 (16.7) 1,916 (9.2) 5,123 37.4 (34.8–40.1) <0.0001
Adult (18-64) 17,452 (57.1) 18,637 (57.1) 13,282 (63.5) 18,524 71.7 (69.3–74.1) <0.0001
Senior (65+) 8,031 (26.3) 8,570 (26.2) 5,703 (27.3) 7,823 72.9 (69.3–76.7) <0.0001
Table 2. Number of emergency department visits during study period March 17–June 30, 2018 to 2020.
* Observed number of visits during study period (3/17–6/30).**Expected volumes calculated by method of Johnson et al (2002) (Box A1).*** Null hypothesis being that observed visits:expected visits = 1.CTAS, Canadian Emergency Department Triage and Acuity Scale.

Volume 22, no. 3: May 2021 575 Western Journal of Emergency Medicine
Lee et al. Impact of COVID-19 on a Canadian Community ED
by percentages. We performed statistical analysis using SAS version 9.4 software (SAS Institute Inc., Cary, NC).
RESULTSVolumes
The number of ED visits during 2020 fell starting in mid-March, close to Ontario’s declaration of a province-wide state of emergency on March 17 (Figure 1). The total volume during the exposure period was 66.3% of expected volumes (20,901 vs 31,525, P<0.0001) (Table 2).
Canadian Triage and Acuity ScaleDuring the exposure period the volume of all CTAS
categories fell compared to expected values (32.4%–86.8%) (Table 2). The volume of CTAS-1 (highest acuity) patients experienced the smallest reduction (86.8% of expected, 95% confidence interval [CI], 69.8–107.8) while the volume of CTAS-5 (lowest acuity) patients experienced the greatest reduction (32.4% of expected, 95% CI, 27.9–
37.5). Decreases in CTAS 2-4 patients were statistically significant (P<0.0001 for all groups).
AgeAll three age groups’ (youth, adult, senior) volumes
during the exposure period were below expected (37.4%, 71.7%, and 72.9% of expected, respectively; all P-values <0.0001) (Table 2). Youth visits dropped more than adults and seniors compared to expected values. Additionally, the proportion of youth visits fell from 16.6% in 2018–2019 to 9.2% in 2020.
Length of Stay and Physician Initial Assessment TimesThe median ED LOS decreased from 3.3 hours (Q1–Q3:
1.9–5.6) across 2018–2019 to 3.0 hours (Q1–Q3: 1.7–5.1) during the exposure period (Table 3). The 90th percentile LOS fell from 10.7 to 8.8 across the same timeframe. The median time to PIA decreased from 1.1 hours (Q1–Q3: 0.6–1.7) in 2018–2019 to 0.6 hours (Q1–Q3: 0.3–1.0) during the exposure
Figure 1. Daily visits to the emergency department from January 1–June 30 for the years 2018 to 2020.*March 17th: closure of large public gatherings, schools, libraries, and theatres, closely followed by closure of all non-essential businesses*Stage 1: opening of selected non-essential retail, outdoor recreation, and household services*Stage 2: opening of personal care services, restaurants and bars (outdoor seating), malls, and recreational facilities
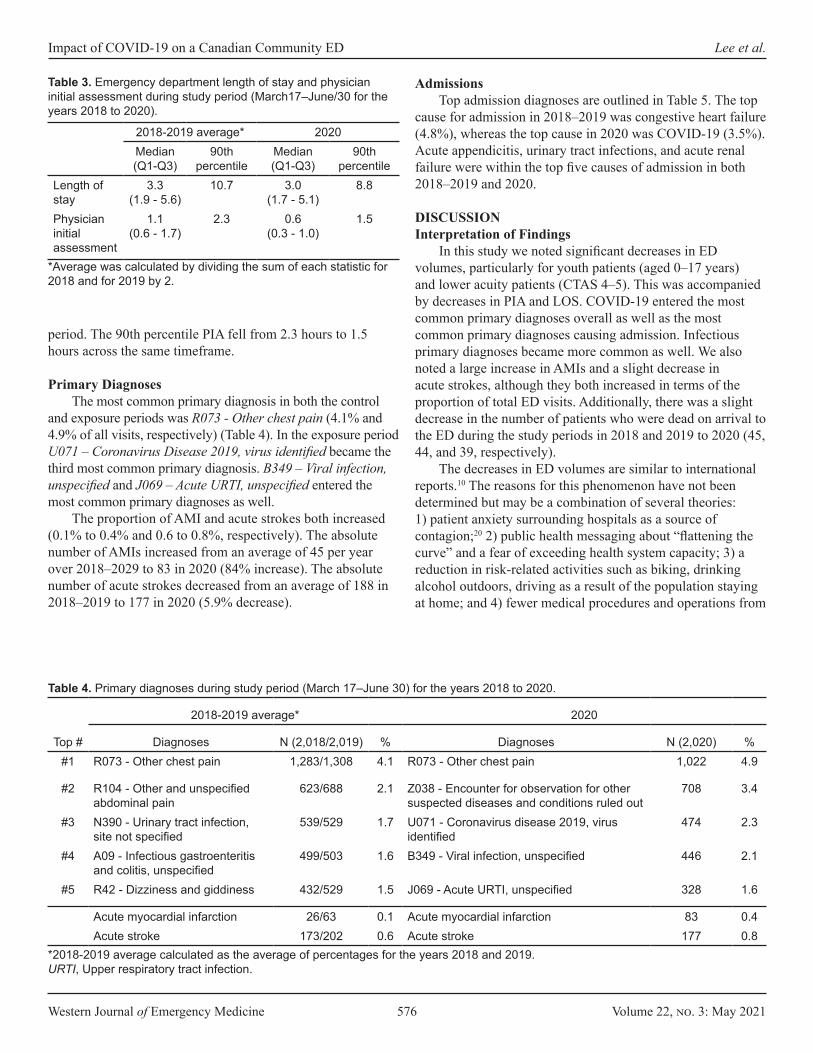
Western Journal of Emergency Medicine 576 Volume 22, no. 3: May 2021
Impact of COVID-19 on a Canadian Community ED Lee et al.
period. The 90th percentile PIA fell from 2.3 hours to 1.5 hours across the same timeframe.
Primary DiagnosesThe most common primary diagnosis in both the control
and exposure periods was R073 - Other chest pain (4.1% and 4.9% of all visits, respectively) (Table 4). In the exposure period U071 – Coronavirus Disease 2019, virus identified became the third most common primary diagnosis. B349 – Viral infection, unspecified and J069 – Acute URTI, unspecified entered the most common primary diagnoses as well.
The proportion of AMI and acute strokes both increased (0.1% to 0.4% and 0.6 to 0.8%, respectively). The absolute number of AMIs increased from an average of 45 per year over 2018–2029 to 83 in 2020 (84% increase). The absolute number of acute strokes decreased from an average of 188 in 2018–2019 to 177 in 2020 (5.9% decrease).
AdmissionsTop admission diagnoses are outlined in Table 5. The top
cause for admission in 2018–2019 was congestive heart failure (4.8%), whereas the top cause in 2020 was COVID-19 (3.5%). Acute appendicitis, urinary tract infections, and acute renal failure were within the top five causes of admission in both 2018–2019 and 2020.
DISCUSSIONInterpretation of Findings
In this study we noted significant decreases in ED volumes, particularly for youth patients (aged 0–17 years) and lower acuity patients (CTAS 4–5). This was accompanied by decreases in PIA and LOS. COVID-19 entered the most common primary diagnoses overall as well as the most common primary diagnoses causing admission. Infectious primary diagnoses became more common as well. We also noted a large increase in AMIs and a slight decrease in acute strokes, although they both increased in terms of the proportion of total ED visits. Additionally, there was a slight decrease in the number of patients who were dead on arrival to the ED during the study periods in 2018 and 2019 to 2020 (45, 44, and 39, respectively).
The decreases in ED volumes are similar to international reports.10 The reasons for this phenomenon have not been determined but may be a combination of several theories: 1) patient anxiety surrounding hospitals as a source of contagion;20 2) public health messaging about “flattening the curve” and a fear of exceeding health system capacity; 3) a reduction in risk-related activities such as biking, drinking alcohol outdoors, driving as a result of the population staying at home; and 4) fewer medical procedures and operations from
2018-2019 average* 2020Median (Q1-Q3)
90th percentile
Median (Q1-Q3)
90th percentile
Length of stay
3.3 (1.9 - 5.6)
10.7 3.0 (1.7 - 5.1)
8.8
Physician initial assessment
1.1 (0.6 - 1.7)
2.3 0.6 (0.3 - 1.0)
1.5
Table 3. Emergency department length of stay and physician initial assessment during study period (March17–June/30 for the years 2018 to 2020).
*Average was calculated by dividing the sum of each statistic for 2018 and for 2019 by 2.
2018-2019 average* 2020
Top # Diagnoses N (2,018/2,019) % Diagnoses N (2,020) %#1 R073 - Other chest pain 1,283/1,308 4.1 R073 - Other chest pain 1,022 4.9
#2 R104 - Other and unspecified abdominal pain
623/688 2.1 Z038 - Encounter for observation for other suspected diseases and conditions ruled out
708 3.4
#3 N390 - Urinary tract infection, site not specified
539/529 1.7 U071 - Coronavirus disease 2019, virus identified
474 2.3
#4 A09 - Infectious gastroenteritis and colitis, unspecified
499/503 1.6 B349 - Viral infection, unspecified 446 2.1
#5 R42 - Dizziness and giddiness 432/529 1.5 J069 - Acute URTI, unspecified 328 1.6
Acute myocardial infarction 26/63 0.1 Acute myocardial infarction 83 0.4Acute stroke 173/202 0.6 Acute stroke 177 0.8
Table 4. Primary diagnoses during study period (March 17–June 30) for the years 2018 to 2020.
*2018-2019 average calculated as the average of percentages for the years 2018 and 2019.URTI, Upper respiratory tract infection.
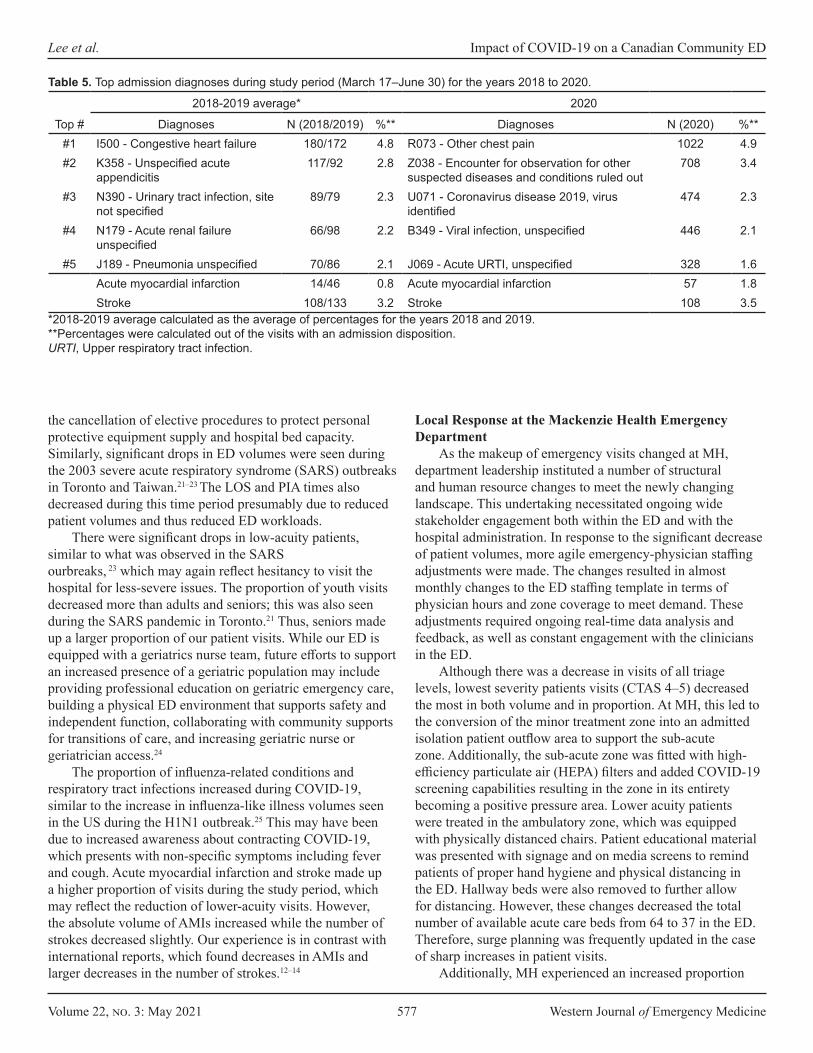
Volume 22, no. 3: May 2021 577 Western Journal of Emergency Medicine
Lee et al. Impact of COVID-19 on a Canadian Community ED
the cancellation of elective procedures to protect personal protective equipment supply and hospital bed capacity. Similarly, significant drops in ED volumes were seen during the 2003 severe acute respiratory syndrome (SARS) outbreaks in Toronto and Taiwan.21–23 The LOS and PIA times also decreased during this time period presumably due to reduced patient volumes and thus reduced ED workloads.
There were significant drops in low-acuity patients, similar to what was observed in the SARS ourbreaks, 23 which may again reflect hesitancy to visit the hospital for less-severe issues. The proportion of youth visits decreased more than adults and seniors; this was also seen during the SARS pandemic in Toronto.21 Thus, seniors made up a larger proportion of our patient visits. While our ED is equipped with a geriatrics nurse team, future efforts to support an increased presence of a geriatric population may include providing professional education on geriatric emergency care, building a physical ED environment that supports safety and independent function, collaborating with community supports for transitions of care, and increasing geriatric nurse or geriatrician access.24
The proportion of influenza-related conditions and respiratory tract infections increased during COVID-19, similar to the increase in influenza-like illness volumes seen in the US during the H1N1 outbreak.25 This may have been due to increased awareness about contracting COVID-19, which presents with non-specific symptoms including fever and cough. Acute myocardial infarction and stroke made up a higher proportion of visits during the study period, which may reflect the reduction of lower-acuity visits. However, the absolute volume of AMIs increased while the number of strokes decreased slightly. Our experience is in contrast with international reports, which found decreases in AMIs and larger decreases in the number of strokes.12–14
Local Response at the Mackenzie Health Emergency Department
As the makeup of emergency visits changed at MH, department leadership instituted a number of structural and human resource changes to meet the newly changing landscape. This undertaking necessitated ongoing wide stakeholder engagement both within the ED and with the hospital administration. In response to the significant decrease of patient volumes, more agile emergency-physician staffing adjustments were made. The changes resulted in almost monthly changes to the ED staffing template in terms of physician hours and zone coverage to meet demand. These adjustments required ongoing real-time data analysis and feedback, as well as constant engagement with the clinicians in the ED.
Although there was a decrease in visits of all triage levels, lowest severity patients visits (CTAS 4–5) decreased the most in both volume and in proportion. At MH, this led to the conversion of the minor treatment zone into an admitted isolation patient outflow area to support the sub-acute zone. Additionally, the sub-acute zone was fitted with high-efficiency particulate air (HEPA) filters and added COVID-19 screening capabilities resulting in the zone in its entirety becoming a positive pressure area. Lower acuity patients were treated in the ambulatory zone, which was equipped with physically distanced chairs. Patient educational material was presented with signage and on media screens to remind patients of proper hand hygiene and physical distancing in the ED. Hallway beds were also removed to further allow for distancing. However, these changes decreased the total number of available acute care beds from 64 to 37 in the ED. Therefore, surge planning was frequently updated in the case of sharp increases in patient visits.
Additionally, MH experienced an increased proportion
2018-2019 average* 2020
Top # Diagnoses N (2018/2019) %** Diagnoses N (2020) %**#1 I500 - Congestive heart failure 180/172 4.8 R073 - Other chest pain 1022 4.9#2 K358 - Unspecified acute
appendicitis117/92 2.8 Z038 - Encounter for observation for other
suspected diseases and conditions ruled out708 3.4
#3 N390 - Urinary tract infection, site not specified
89/79 2.3 U071 - Coronavirus disease 2019, virus identified
474 2.3
#4 N179 - Acute renal failure unspecified
66/98 2.2 B349 - Viral infection, unspecified 446 2.1
#5 J189 - Pneumonia unspecified 70/86 2.1 J069 - Acute URTI, unspecified 328 1.6Acute myocardial infarction 14/46 0.8 Acute myocardial infarction 57 1.8Stroke 108/133 3.2 Stroke 108 3.5
Table 5. Top admission diagnoses during study period (March 17–June 30) for the years 2018 to 2020.
*2018-2019 average calculated as the average of percentages for the years 2018 and 2019.**Percentages were calculated out of the visits with an admission disposition.URTI, Upper respiratory tract infection.
Western Journal of Emergency Medicine 578 Volume 22, no. 3: May 2021
Impact of COVID-19 on a Canadian Community ED Lee et al.
of patients presenting with respiratory symptoms. To meet this demand, the resuscitation area was converted into an ambulatory isolation area with eight chairs, two beds, and a new HEPA filtration system. Moreover, a dedicated and physically separate COVID-19 assessment centre was opened at MH, which experienced drastic increases in volumes during the study period (Figure A1). This assessment centre was set up for performing COVID-19 reverse transcription polymerase chain reaction tests for ambulatory low-acuity or asymptomatic patients. The centre was set up with eight assessment rooms overseen by a team of two emergency physicians and dedicated nurses. This allowed for rapid turnaround for low-acuity patients, tailored care for the intended visit, minimized transmission between asymptomatic and symptomatic patients, and facilitated ED medical resources to be used towards higher acuity patients in the ED.
An ongoing focus on infection control was maintained throughout this time period and a multitude of infection control changes were undertaken in response to the pandemic. These included updating triage screening questions; installation of HEPA ventilation in COVID-19 areas; increases in cleaning frequency and use of full-spectrum UV disinfection machines; reserving negative pressure rooms for aerosol-generating medical procedures; and the use of a dedicated multidisciplinary intubating team for high-risk intubations.
Research ImplicationsDelayed presentations of critical illnesses mean that
clinicians and administrators will need to prepare with downstream exacerbations of time-sensitive conditions that would have otherwise been managed earlier. Therefore, continued proactive advocacy and messaging informing the public of the safety of EDs ahead of subsequent “waves” is crucial.
Additionally, emergency care resources can be distributed to meet new demands. Changes in patient demographics, i.e., a shift towards older patients, can be met with increased geriatric support, such as extended geriatric nurse practitioner hours. Likewise, emergency care resources can be shifted to accommodate for increases in influenza-like or infectious presentations, such as increasing patient isolation capacity.
STRENGTHS AND LIMITATIONThe data collection method ensured a complete sample
of all patient visits during the exposure period. Additionally, the method for calculating expected values accounted for both seasonal variation and year-to-year variation.
However, the exposure period was subjectively chosen by expert opinion to be based on Provincial Government actions and may not precisely capture the period in which shifts in public sentiment and emergency care demand occurred. Additionally, the determination of presenting diagnoses was abstracted from a hospital database using ICD codes and were not confirmed via chart review. Some of these common
primary diagnoses are subject to interpretation, such as Z038 – Encounter for observation for other suspected diseases and conditions ruled out, which limits inferences about most common presentations. Finally, the observed trends may have been influenced by changes in local care provision. Anecdotally, some local family physician offices closed, which may have redirected some low-acuity complaints to the ED. However, no local hospitals closed or were designated as “COVID-19 hospitals”.
CONCLUSIONEmergency department utilization changed significantly
during COVID-19. This large Canadian ED experienced lower volumes, decreased proportions of lower-acuity and younger patients, and an increase in viral illness presentations. The experiences of this local ED can help equip ED administrators with structural and process-based changes for potential subsequent “waves” of COVID-19 and future pandemics.
ACKNOWLEDGEMENTS We would like to acknowledge Anita Wang and Peggy
Richards from Mackenzie Health for their assistance with data collection.
Address for Correspondence: Daniel Dongjoo Lee, BSc, University of Toronto, Department of Medicine, 1 King’s College, Toronto, ON M5S 1A8. Email: [email protected]
Conflicts of Interest: By the WestJEM article submission agreement, all authors are required to disclose all affiliations, funding sources and financial or management relationships that could be perceived as potential sources of bias. No author has professional or financial relationships with any companies that are relevant to this study. There are no conflicts of interest or sources of funding to declare.
Copyright: © 2021 Lee et al. This is an open access article distributed in accordance with the terms of the Creative Commons Attribution (CC BY 4.0) License. See: http://creativecommons.org/licenses/by/4.0/
REFERENCES1. Government of Canada. Coronavirus disease (COVID-19): Outbreak
update. 2020. Available at: https://www.canada.ca/en/public-health/services/diseases/2019-novel-coronavirus-infection.html. Accessed April 23, 2021.
2. Shoukat A, Wells CR, Langley JM, Singer BH, Galvani AP, Moghadas SM. Projecting demand for critical care beds during COVID-19 outbreaks in Canada. CMAJ. 2020;192(19):E489-96.
3. Arya A, Buchman S, Gagnon B, et al. Pandemic palliative care: beyond ventilators and saving lives. CMAJ. 2020;192(15):E400-4.
4. Canadian Association of Emergency Physicians. Surge capacity and the Canadian emergency department. Available at: https://caep.ca/wp-content/uploads/2020/03/Surge-Capacity-and-the-Canadian-
Volume 22, no. 3: May 2021 579 Western Journal of Emergency Medicine
Lee et al. Impact of COVID-19 on a Canadian Community ED
Emergency-Department-CLEAN-March23PP.pdf. Accessed September 20, 2020.
5. Patey C, Asghari S, Norman P, et al. Redesign of a rural emergency department to prepare for the COVID-19 pandemic. CMAJ. 2020;192(19):E518-20.
6. Mohindra R, Atlin C, Moran C, et al. Coronavirus disease - 2019 assessment zone: a community hospital’s rapid response to a novel infectious pandemic. CJEM. 2020;22(6):e19.
7. Jaffe E, Sonkin R, Strugo R. [Ahead of Print] Evolution of emergency medical calls during a pandemic: an emergency medical service during the COVID-19 outbreak. Am J Emerg Med. June 26, 2020.
8. Ikenberg B, Hemmer B, Dommasch M, et al. Code stroke patient referral by emergency medical services during the public COVID-19 pandemic lockdown. J Stroke Cerebrovasc Dis. 2020;29(11):105175.
9. Giamello JD, Abram S, Bernardi S, et al. The emergency department in the COVID-19 era. Who are we missing? Eur J Emerg Med. 2020;27(4):305-6.
10. Boserup B, McKenney M, Elkbuli A. The impact of the COVID-19 pandemic on emergency department visits and patient safety in the United States. Am J Emerg Med. 2020;38(9):1732-6.
11. Frankfurter C, Buchan TA, Kobulnik J, et al. Reduced rate of hospital presentations for heart failure during the COVID-19 pandemic in Toronto, Canada. Can J Cardiol. 2020;36(10):1680-4.
12. Bres Bullrich M, Fridman S, Mandzia JL, et al. COVID-19: stroke admissions, emergency department visits, and prevention clinic referrals. Can J Neurol Sci. 2020;47(5):693-6.
13. Garcia S, Albaghdadi MS, Meraj PM, et al. Reduction in ST-segment elevation cardiac catheterization laboratory activations in the United States during COVID-19 pandemic. J Am Coll Cardiol. 2020;75(22):2871-2.
14. Zhao J, Li H, Kung D, et al. Impact of the COVID-19 epidemic on stroke care and potential solutions. Stroke. 2020;51(7):1996-2001.
15. Statistics Canada. Census Profile, 2016 Census - Richmond Hill,
Town [Census subdivision], Ontario and York, Regional municipality [Census division], Ontario. 2017. Available at: https://www12.statcan.gc.ca/census-recensement/2016/dp-pd/prof/details/page.cfm?Lang=E&Geo1=CSD&Code1=3519038&Geo2=CD&Code2=3519&SearchText=richmond hill&SearchType=Begins&SearchPR=01&B1=All&TABID=1&type=0. Accessed September 30, 2021.
16. Bullard MJ, Musgrave E, Warren D, et al. Revisions to the Canadian Emergency Department Triage and Acuity Scale (CTAS) Guidelines 2016. CJEM. 2017;19(S2):S18-27.
17. So L, Evans D, Quan H. ICD-10 coding algorithms for defining comorbidities of acute myocardial infarction. BMC Health Serv Res. 2006;6:161.
18. McCormick N, Bhole V, Lacaille D, et al. Validity of diagnostic codes for acute stroke in administrative databases: a systematic review. PLoS One. 2015;10(8):e0135834.
19. Johnston SC, Sorel ME, Sidney S. Effects of the September 11th attacks on urgent and emergent medical evaluations in a Northern California managed care plan. Am J Med. 2002;113(7):556-62
20. Asmundson GJG, Taylor S. How health anxiety influences responses to viral outbreaks like COVID-19: What all decision-makers, health authorities, and health care professionals need to know. J Anxiety Disord. 2020;71:102211.
21. Heiber M, Lou WY. Effect of the SARS outbreak on visits to a community hospital emergency department. CJEM. 2006;8(5):323-8.
22. Boutis K, Stephens D, Lam K, et al. The impact of SARS on a tertiary care pediatric emergency department. CMAJ. 2004;171(11):1353-8.
23. Chen TA, Lai KH, Chang HT. Impact of a severe acute respiratory syndrome outbreak in the emergency department: an experience in Taiwan. Emerg Med J. 2004;21(6):660-2.
24. Parke B, McCusker J. Consensus-based policy recommendations for geriatric emergency care. Int J Health Care Qual Assur. 2008;21(4):385-95.
25. Costello BE, Simon HK, Massey R, et al. Pandemic H1N1 influenza in the pediatric emergency department: a comparison with previous seasonal influenza outbreaks. Ann Emerg Med. 2010;56(6):643-8.
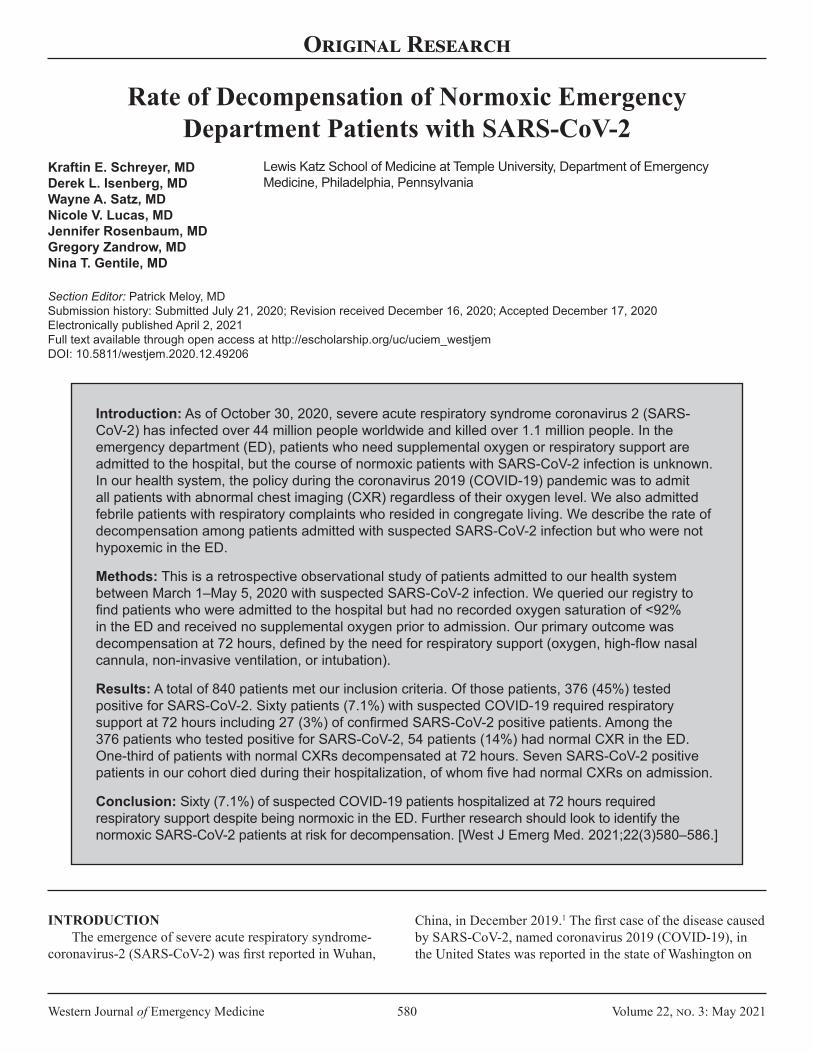
Western Journal of Emergency Medicine 580 Volume 22, no. 3: May 2021
Original Research
Rate of Decompensation of Normoxic Emergency Department Patients with SARS-CoV-2
Kraftin E. Schreyer, MDDerek L. Isenberg, MDWayne A. Satz, MDNicole V. Lucas, MDJennifer Rosenbaum, MDGregory Zandrow, MDNina T. Gentile, MD
Section Editor: Patrick Meloy, MD Submission history: Submitted July 21, 2020; Revision received December 16, 2020; Accepted December 17, 2020 Electronically published April 2, 2021Full text available through open access at http://escholarship.org/uc/uciem_westjem DOI: 10.5811/westjem.2020.12.49206
INTRODUCTIONThe emergence of severe acute respiratory syndrome-
coronavirus-2 (SARS-CoV-2) was first reported in Wuhan,
Lewis Katz School of Medicine at Temple University, Department of Emergency Medicine, Philadelphia, Pennsylvania
Introduction: As of October 30, 2020, severe acute respiratory syndrome coronavirus 2 (SARS-CoV-2) has infected over 44 million people worldwide and killed over 1.1 million people. In the emergency department (ED), patients who need supplemental oxygen or respiratory support are admitted to the hospital, but the course of normoxic patients with SARS-CoV-2 infection is unknown. In our health system, the policy during the coronavirus 2019 (COVID-19) pandemic was to admit all patients with abnormal chest imaging (CXR) regardless of their oxygen level. We also admitted febrile patients with respiratory complaints who resided in congregate living. We describe the rate of decompensation among patients admitted with suspected SARS-CoV-2 infection but who were not hypoxemic in the ED.
Methods: This is a retrospective observational study of patients admitted to our health system between March 1–May 5, 2020 with suspected SARS-CoV-2 infection. We queried our registry to find patients who were admitted to the hospital but had no recorded oxygen saturation of <92% in the ED and received no supplemental oxygen prior to admission. Our primary outcome was decompensation at 72 hours, defined by the need for respiratory support (oxygen, high-flow nasal cannula, non-invasive ventilation, or intubation).
Results: A total of 840 patients met our inclusion criteria. Of those patients, 376 (45%) tested positive for SARS-CoV-2. Sixty patients (7.1%) with suspected COVID-19 required respiratory support at 72 hours including 27 (3%) of confirmed SARS-CoV-2 positive patients. Among the 376 patients who tested positive for SARS-CoV-2, 54 patients (14%) had normal CXR in the ED. One-third of patients with normal CXRs decompensated at 72 hours. Seven SARS-CoV-2 positive patients in our cohort died during their hospitalization, of whom five had normal CXRs on admission.
Conclusion: Sixty (7.1%) of suspected COVID-19 patients hospitalized at 72 hours required respiratory support despite being normoxic in the ED. Further research should look to identify the normoxic SARS-CoV-2 patients at risk for decompensation. [West J Emerg Med. 2021;22(3)580–586.]
China, in December 2019.1 The first case of the disease caused by SARS-CoV-2, named coronavirus 2019 (COVID-19), in the United States was reported in the state of Washington on
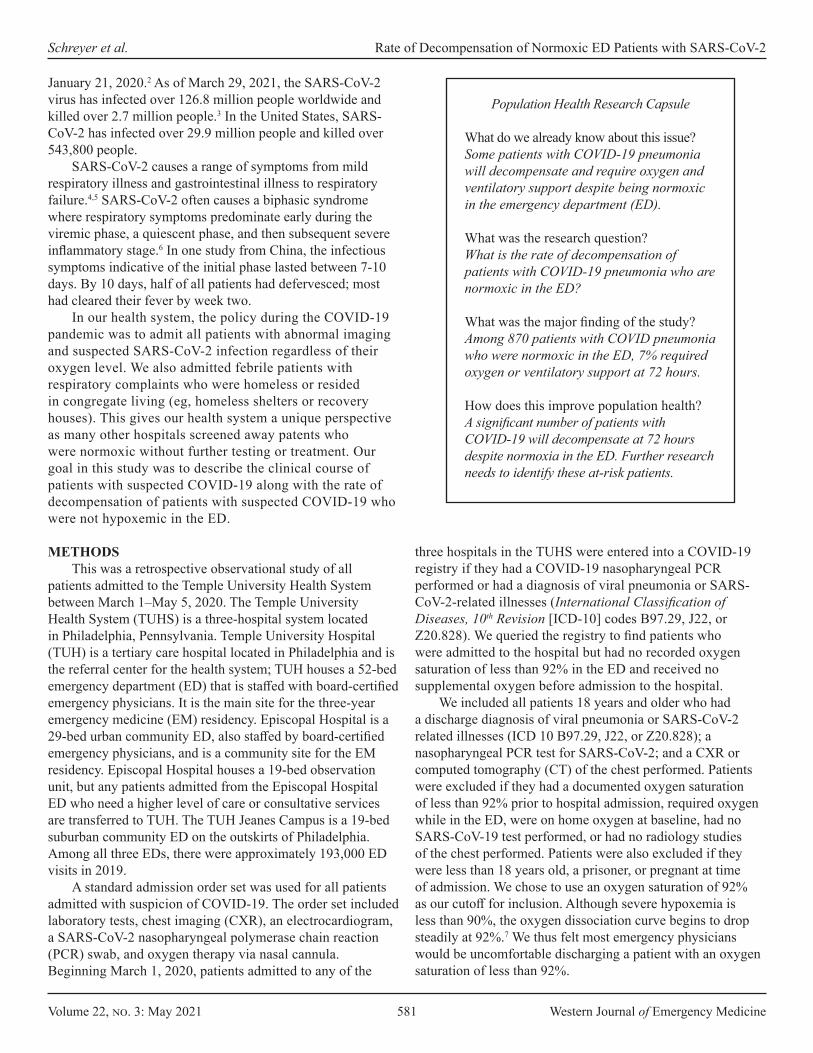
Volume 22, no. 3: May 2021 581 Western Journal of Emergency Medicine
Schreyer et al. Rate of Decompensation of Normoxic ED Patients with SARS-CoV-2
Population Health Research Capsule
What do we already know about this issue?Some patients with COVID-19 pneumonia will decompensate and require oxygen and ventilatory support despite being normoxic in the emergency department (ED).
What was the research question?What is the rate of decompensation of patients with COVID-19 pneumonia who are normoxic in the ED?
What was the major finding of the study?Among 870 patients with COVID pneumonia who were normoxic in the ED, 7% required oxygen or ventilatory support at 72 hours.
How does this improve population health?A significant number of patients with COVID-19 will decompensate at 72 hours despite normoxia in the ED. Further research needs to identify these at-risk patients.
January 21, 2020.2 As of March 29, 2021, the SARS-CoV-2 virus has infected over 126.8 million people worldwide and killed over 2.7 million people.3 In the United States, SARS-CoV-2 has infected over 29.9 million people and killed over 543,800 people.
SARS-CoV-2 causes a range of symptoms from mild respiratory illness and gastrointestinal illness to respiratory failure.4,5 SARS-CoV-2 often causes a biphasic syndrome where respiratory symptoms predominate early during the viremic phase, a quiescent phase, and then subsequent severe inflammatory stage.6 In one study from China, the infectious symptoms indicative of the initial phase lasted between 7-10 days. By 10 days, half of all patients had defervesced; most had cleared their fever by week two.
In our health system, the policy during the COVID-19 pandemic was to admit all patients with abnormal imaging and suspected SARS-CoV-2 infection regardless of their oxygen level. We also admitted febrile patients with respiratory complaints who were homeless or resided in congregate living (eg, homeless shelters or recovery houses). This gives our health system a unique perspective as many other hospitals screened away patents who were normoxic without further testing or treatment. Our goal in this study was to describe the clinical course of patients with suspected COVID-19 along with the rate of decompensation of patients with suspected COVID-19 who were not hypoxemic in the ED.
METHODSThis was a retrospective observational study of all
patients admitted to the Temple University Health System between March 1–May 5, 2020. The Temple University Health System (TUHS) is a three-hospital system located in Philadelphia, Pennsylvania. Temple University Hospital (TUH) is a tertiary care hospital located in Philadelphia and is the referral center for the health system; TUH houses a 52-bed emergency department (ED) that is staffed with board-certified emergency physicians. It is the main site for the three-year emergency medicine (EM) residency. Episcopal Hospital is a 29-bed urban community ED, also staffed by board-certified emergency physicians, and is a community site for the EM residency. Episcopal Hospital houses a 19-bed observation unit, but any patients admitted from the Episcopal Hospital ED who need a higher level of care or consultative services are transferred to TUH. The TUH Jeanes Campus is a 19-bed suburban community ED on the outskirts of Philadelphia. Among all three EDs, there were approximately 193,000 ED visits in 2019.
A standard admission order set was used for all patients admitted with suspicion of COVID-19. The order set included laboratory tests, chest imaging (CXR), an electrocardiogram, a SARS-CoV-2 nasopharyngeal polymerase chain reaction (PCR) swab, and oxygen therapy via nasal cannula. Beginning March 1, 2020, patients admitted to any of the
three hospitals in the TUHS were entered into a COVID-19 registry if they had a COVID-19 nasopharyngeal PCR performed or had a diagnosis of viral pneumonia or SARS-CoV-2-related illnesses (International Classification of Diseases, 10th Revision [ICD-10] codes B97.29, J22, or Z20.828). We queried the registry to find patients who were admitted to the hospital but had no recorded oxygen saturation of less than 92% in the ED and received no supplemental oxygen before admission to the hospital.
We included all patients 18 years and older who had a discharge diagnosis of viral pneumonia or SARS-CoV-2 related illnesses (ICD 10 B97.29, J22, or Z20.828); a nasopharyngeal PCR test for SARS-CoV-2; and a CXR or computed tomography (CT) of the chest performed. Patients were excluded if they had a documented oxygen saturation of less than 92% prior to hospital admission, required oxygen while in the ED, were on home oxygen at baseline, had no SARS-CoV-19 test performed, or had no radiology studies of the chest performed. Patients were also excluded if they were less than 18 years old, a prisoner, or pregnant at time of admission. We chose to use an oxygen saturation of 92% as our cutoff for inclusion. Although severe hypoxemia is less than 90%, the oxygen dissociation curve begins to drop steadily at 92%.7 We thus felt most emergency physicians would be uncomfortable discharging a patient with an oxygen saturation of less than 92%.

Western Journal of Emergency Medicine 582 Volume 22, no. 3: May 2021
Rate of Decompensation of Normoxic ED Patients with SARS-CoV-2 Schreyer et al.
Along with SARS-CoV-2 testing, standard workup for patients admitted for suspected COVID-19 consisted of a CT of the chest. These scans were either CT angiograms to evaluate for pulmonary embolism, spiral CTs of the chest with intravenous contrast, or a viral chest CT. The viral CTs were low-dose, non-contrast chest CTs with 5-millimeter slices. Based on findings such as multifocal pneumonia, patchy infiltrates, and ground-glass opacities, attending radiologists would classify the viral CTs as category 1 (multifocal pneumonia consistent with SARS-CoV-2), category 2 (indeterminant), or category 3 (not consistent with SARS-CoV-2).
A priori we defined CXR and CT findings that were known to be associated with SARS-CoV-2 (Figure 1).8,9 We reviewed the official radiology read for each CXR and CT and categorized the reads by phrases or findings (eg, “ground- glass opacities” or “multifocal pneumonia”). Radiology reads could be classified into more than one group if multiple relevant findings were present. Both CXR and CT were readily available for evaluation of patients with suspected COVID-19 at all EDs in the health system.
Our primary outcome was respiratory decompensation at 72 hours. Respiratory decompensation was defined as the need for supplemental oxygen of any type, high-flow nasal cannula, noninvasive ventilation (bilevel positive pressure or continuous positive pressure), or endotracheal intubation within 72 hours of admission. Only patients who were still in the hospital at 72 hours were included in the primary outcome. Patients could flow across groups during the data analysis. For example, if a patient was on nasal cannula on day one and high-flow nasal cannula on day two, the subject would be listed in their respective group during that time. The same was true of de-escalation of respiratory support.
We performed subgroup analyses for rates of decompensation at 24 and 48 hours as well as for those patients who had a positive SARS-CoV-2 nasopharyngeal PCR test. We also reviewed patients who had a CXR without acute cardiopulmonary findings but an abnormal chest CT consistent with COVID-19 (e.g., ground-glass opacities, multifocal pneumonia, patchy opacities).
Chest radiograph findings-Pneumonia-Infiltrate or consolidation-Opacities-Multifocal, bilateral, or diffuse, opacities-Atypical pneumonia-Patchy or hazy opacities
Computed tomography chest findings-Ground-glass opacities-Consistent with “atypical pneumonia” or “viral pneumonia”-Bilateral/multifocal pneumonia or opacities
Figure 1. Radiology findings suggestive of SARS-CoV-2 infection.
RESULTSBetween March 1–May 5, 2020, 2232 patients were
admitted to TUHS with suspected COVID-19. Of those patients, 840 met our inclusion criteria (Figure 2); 392 (46%) were female and 247 (29%) were over 65 years of age (Table 1). Of these patients, 376 (45%) tested positive for SARS-CoV-2. Of the 840 admitted patients with suspected COVID-19 who were not hypoxemic in the ED, 410 were still admitted to the hospital at 72 hours. Sixty (7%) patients met our outcome for decompensation (Table 3). In the confirmed SARS-CoV-2-positive group, 3% of patients required respiratory support at 72 hours. Table 4 lists the various respiratory inventions in the SARS-CoV-2 positive and negative groups at each time point. At 48 hours, 98 (11.2%) of admitted patients with suspected COVID-19 required oxygen therapy with 57% given nasal cannula and the other 43% on a higher level of respiratory support. At 24 hours, 43 patients (5.1%) needed respiratory support with high-flow nasal cannula, non-rebreather oxygen mask, noninvasive ventilation, or mechanical ventilation. At the time of data analysis, 97 patients were still in the hospital, 49 patients in the SARS-CoV-2 positive group and 48 in the SARS-CoV-2 negative group.
Nine patients (0.8%) in our cohort died during their hospital admission. Seven patients were SARS-Cov-2 positive. The characteristics of these seven patients are listed in Table 6. Six of the seven patients had significant comorbidities including severe congestive heart failure, diabetes, and end-stage renal disease. Only one patient had no apparent comorbidities that would have contributed to death from COVID-19. Of the seven patients who were SARS-CoV-2 PCR positive, four had initial CXRs that were read as no acute cardiopulmonary disease by the attending
Figure 2. Enrollment diagram.
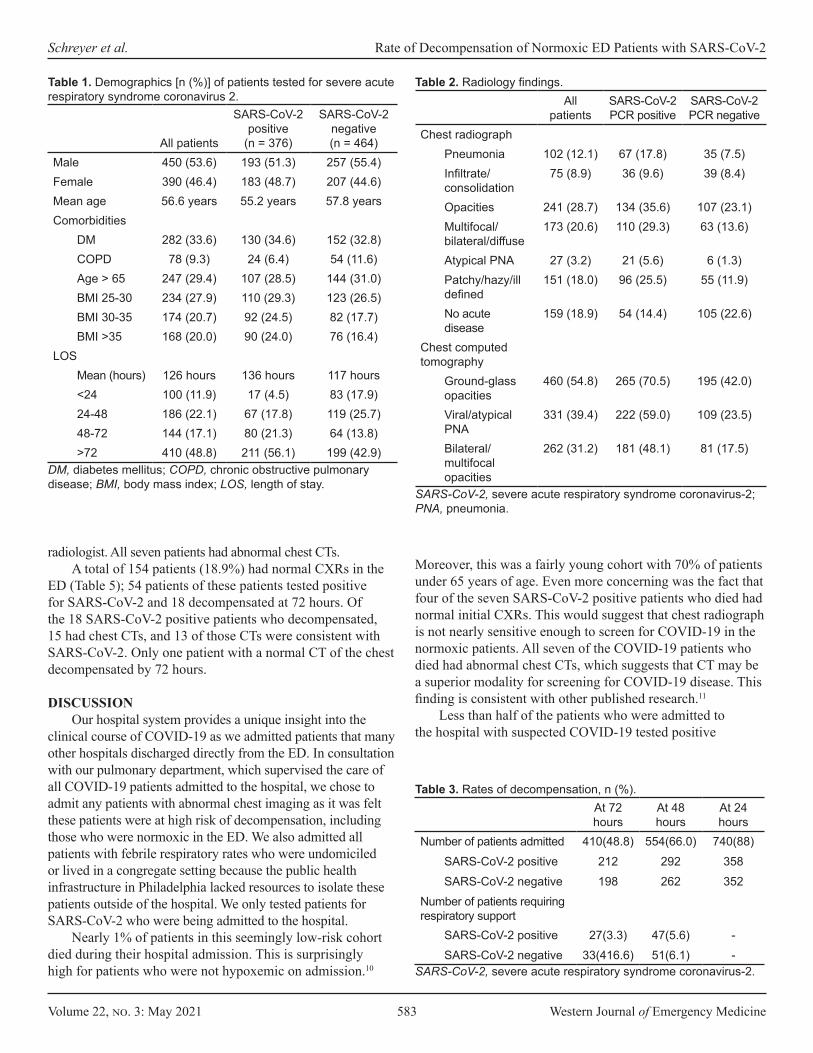
Volume 22, no. 3: May 2021 583 Western Journal of Emergency Medicine
Schreyer et al. Rate of Decompensation of Normoxic ED Patients with SARS-CoV-2
All patients
SARS-CoV-2 positive
(n = 376)
SARS-CoV-2 negative(n = 464)
Male 450 (53.6) 193 (51.3) 257 (55.4)Female 390 (46.4) 183 (48.7) 207 (44.6)Mean age 56.6 years 55.2 years 57.8 yearsComorbidities
DM 282 (33.6) 130 (34.6) 152 (32.8)COPD 78 (9.3) 24 (6.4) 54 (11.6)Age > 65 247 (29.4) 107 (28.5) 144 (31.0)BMI 25-30 234 (27.9) 110 (29.3) 123 (26.5)BMI 30-35 174 (20.7) 92 (24.5) 82 (17.7)BMI >35 168 (20.0) 90 (24.0) 76 (16.4)
LOS Mean (hours) 126 hours 136 hours 117 hours<24 100 (11.9) 17 (4.5) 83 (17.9)24-48 186 (22.1) 67 (17.8) 119 (25.7)48-72 144 (17.1) 80 (21.3) 64 (13.8)>72 410 (48.8) 211 (56.1) 199 (42.9)
Table 1. Demographics [n (%)] of patients tested for severe acute respiratory syndrome coronavirus 2.
DM, diabetes mellitus; COPD, chronic obstructive pulmonary disease; BMI, body mass index; LOS, length of stay.
Allpatients
SARS-CoV-2 PCR positive
SARS-CoV-2 PCR negative
Chest radiographPneumonia 102 (12.1) 67 (17.8) 35 (7.5)Infiltrate/consolidation
75 (8.9) 36 (9.6) 39 (8.4)
Opacities 241 (28.7) 134 (35.6) 107 (23.1)Multifocal/bilateral/diffuse
173 (20.6) 110 (29.3) 63 (13.6)
Atypical PNA 27 (3.2) 21 (5.6) 6 (1.3)Patchy/hazy/ill defined
151 (18.0) 96 (25.5) 55 (11.9)
No acute disease
159 (18.9) 54 (14.4) 105 (22.6)
Chest computed tomography
Ground-glass opacities
460 (54.8) 265 (70.5) 195 (42.0)
Viral/atypical PNA
331 (39.4) 222 (59.0) 109 (23.5)
Bilateral/multifocal opacities
262 (31.2) 181 (48.1) 81 (17.5)
Table 2. Radiology findings.
SARS-CoV-2, severe acute respiratory syndrome coronavirus-2; PNA, pneumonia.
At 72 hours
At 48 hours
At 24 hours
Number of patients admitted 410(48.8) 554(66.0) 740(88)SARS-CoV-2 positive 212 292 358SARS-CoV-2 negative 198 262 352
Number of patients requiring respiratory support
SARS-CoV-2 positive 27(3.3) 47(5.6) -SARS-CoV-2 negative 33(416.6) 51(6.1) -
Table 3. Rates of decompensation, n (%).
SARS-CoV-2, severe acute respiratory syndrome coronavirus-2.
radiologist. All seven patients had abnormal chest CTs.A total of 154 patients (18.9%) had normal CXRs in the
ED (Table 5); 54 patients of these patients tested positive for SARS-CoV-2 and 18 decompensated at 72 hours. Of the 18 SARS-CoV-2 positive patients who decompensated, 15 had chest CTs, and 13 of those CTs were consistent with SARS-CoV-2. Only one patient with a normal CT of the chest decompensated by 72 hours.
DISCUSSIONOur hospital system provides a unique insight into the
clinical course of COVID-19 as we admitted patients that many other hospitals discharged directly from the ED. In consultation with our pulmonary department, which supervised the care of all COVID-19 patients admitted to the hospital, we chose to admit any patients with abnormal chest imaging as it was felt these patients were at high risk of decompensation, including those who were normoxic in the ED. We also admitted all patients with febrile respiratory rates who were undomiciled or lived in a congregate setting because the public health infrastructure in Philadelphia lacked resources to isolate these patients outside of the hospital. We only tested patients for SARS-CoV-2 who were being admitted to the hospital.
Nearly 1% of patients in this seemingly low-risk cohort died during their hospital admission. This is surprisingly high for patients who were not hypoxemic on admission.10
Moreover, this was a fairly young cohort with 70% of patients under 65 years of age. Even more concerning was the fact that four of the seven SARS-CoV-2 positive patients who died had normal initial CXRs. This would suggest that chest radiograph is not nearly sensitive enough to screen for COVID-19 in the normoxic patients. All seven of the COVID-19 patients who died had abnormal chest CTs, which suggests that CT may be a superior modality for screening for COVID-19 disease. This finding is consistent with other published research.11
Less than half of the patients who were admitted to the hospital with suspected COVID-19 tested positive
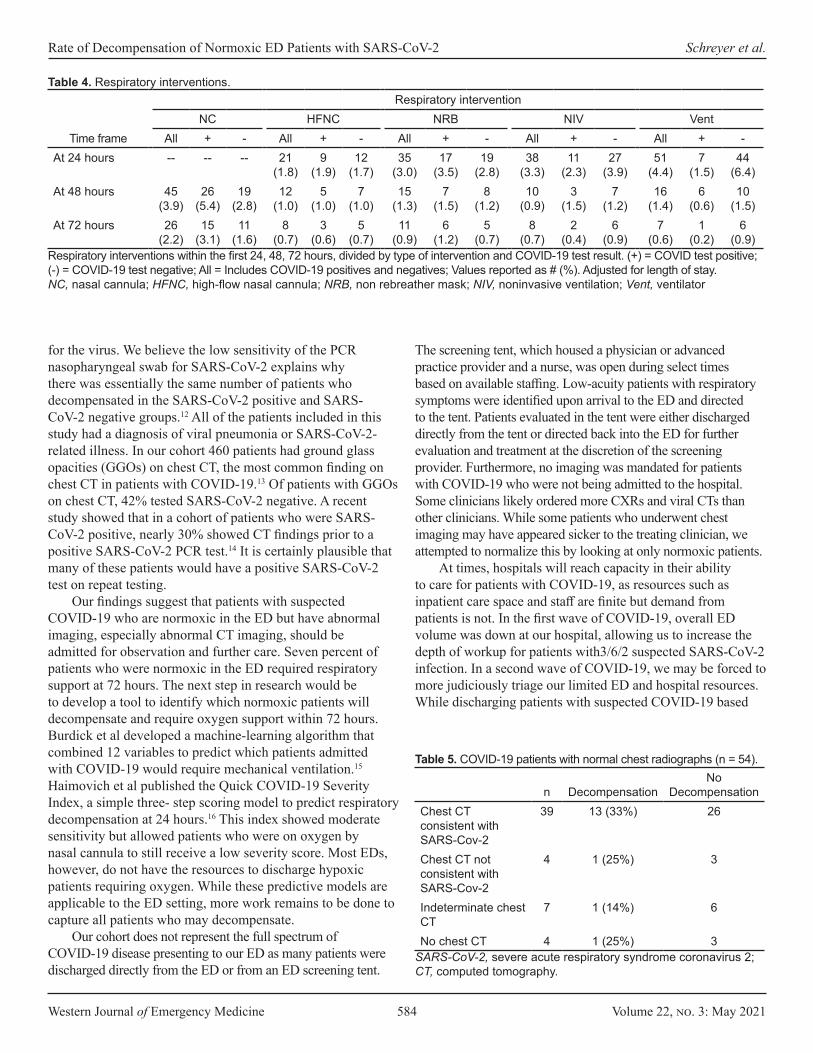
Western Journal of Emergency Medicine 584 Volume 22, no. 3: May 2021
Rate of Decompensation of Normoxic ED Patients with SARS-CoV-2 Schreyer et al.
for the virus. We believe the low sensitivity of the PCR nasopharyngeal swab for SARS-CoV-2 explains why there was essentially the same number of patients who decompensated in the SARS-CoV-2 positive and SARS-CoV-2 negative groups.12 All of the patients included in this study had a diagnosis of viral pneumonia or SARS-CoV-2-related illness. In our cohort 460 patients had ground glass opacities (GGOs) on chest CT, the most common finding on chest CT in patients with COVID-19.13 Of patients with GGOs on chest CT, 42% tested SARS-CoV-2 negative. A recent study showed that in a cohort of patients who were SARS-CoV-2 positive, nearly 30% showed CT findings prior to a positive SARS-CoV-2 PCR test.14 It is certainly plausible that many of these patients would have a positive SARS-CoV-2 test on repeat testing.
Our findings suggest that patients with suspected COVID-19 who are normoxic in the ED but have abnormal imaging, especially abnormal CT imaging, should be admitted for observation and further care. Seven percent of patients who were normoxic in the ED required respiratory support at 72 hours. The next step in research would be to develop a tool to identify which normoxic patients will decompensate and require oxygen support within 72 hours. Burdick et al developed a machine-learning algorithm that combined 12 variables to predict which patients admitted with COVID-19 would require mechanical ventilation.15 Haimovich et al published the Quick COVID-19 Severity Index, a simple three- step scoring model to predict respiratory decompensation at 24 hours.16 This index showed moderate sensitivity but allowed patients who were on oxygen by nasal cannula to still receive a low severity score. Most EDs, however, do not have the resources to discharge hypoxic patients requiring oxygen. While these predictive models are applicable to the ED setting, more work remains to be done to capture all patients who may decompensate.
Our cohort does not represent the full spectrum of COVID-19 disease presenting to our ED as many patients were discharged directly from the ED or from an ED screening tent.
The screening tent, which housed a physician or advanced practice provider and a nurse, was open during select times based on available staffing. Low-acuity patients with respiratory symptoms were identified upon arrival to the ED and directed to the tent. Patients evaluated in the tent were either discharged directly from the tent or directed back into the ED for further evaluation and treatment at the discretion of the screening provider. Furthermore, no imaging was mandated for patients with COVID-19 who were not being admitted to the hospital. Some clinicians likely ordered more CXRs and viral CTs than other clinicians. While some patients who underwent chest imaging may have appeared sicker to the treating clinician, we attempted to normalize this by looking at only normoxic patients.
At times, hospitals will reach capacity in their ability to care for patients with COVID-19, as resources such as inpatient care space and staff are finite but demand from patients is not. In the first wave of COVID-19, overall ED volume was down at our hospital, allowing us to increase the depth of workup for patients with3/6/2 suspected SARS-CoV-2 infection. In a second wave of COVID-19, we may be forced to more judiciously triage our limited ED and hospital resources. While discharging patients with suspected COVID-19 based
Respiratory interventionNC HFNC NRB NIV Vent
Time frame All + - All + - All + - All + - All + -At 24 hours -- -- -- 21
(1.8)9
(1.9)12
(1.7)35
(3.0)17
(3.5)19
(2.8)38
(3.3)11
(2.3)27
(3.9)51
(4.4)7
(1.5)44
(6.4)At 48 hours 45
(3.9)26
(5.4)19
(2.8)12
(1.0)5
(1.0)7
(1.0)15
(1.3)7
(1.5)8
(1.2)10
(0.9)3
(1.5)7
(1.2)16
(1.4)6
(0.6)10
(1.5)At 72 hours 26
(2.2)15
(3.1)11
(1.6)8
(0.7)3
(0.6)5
(0.7)11
(0.9)6
(1.2)5
(0.7)8
(0.7)2
(0.4)6
(0.9)7
(0.6)1
(0.2)6
(0.9)Respiratory interventions within the first 24, 48, 72 hours, divided by type of intervention and COVID-19 test result. (+) = COVID test positive; (-) = COVID-19 test negative; All = Includes COVID-19 positives and negatives; Values reported as # (%). Adjusted for length of stay.NC, nasal cannula; HFNC, high-flow nasal cannula; NRB, non rebreather mask; NIV, noninvasive ventilation; Vent, ventilator
Table 4. Respiratory interventions.
n DecompensationNo
DecompensationChest CT consistent with SARS-Cov-2
39 13 (33%) 26
Chest CT not consistent with SARS-Cov-2
4 1 (25%) 3
Indeterminate chest CT
7 1 (14%) 6
No chest CT 4 1 (25%) 3
Table 5. COVID-19 patients with normal chest radiographs (n = 54).
SARS-CoV-2, severe acute respiratory syndrome coronavirus 2; CT, computed tomography.
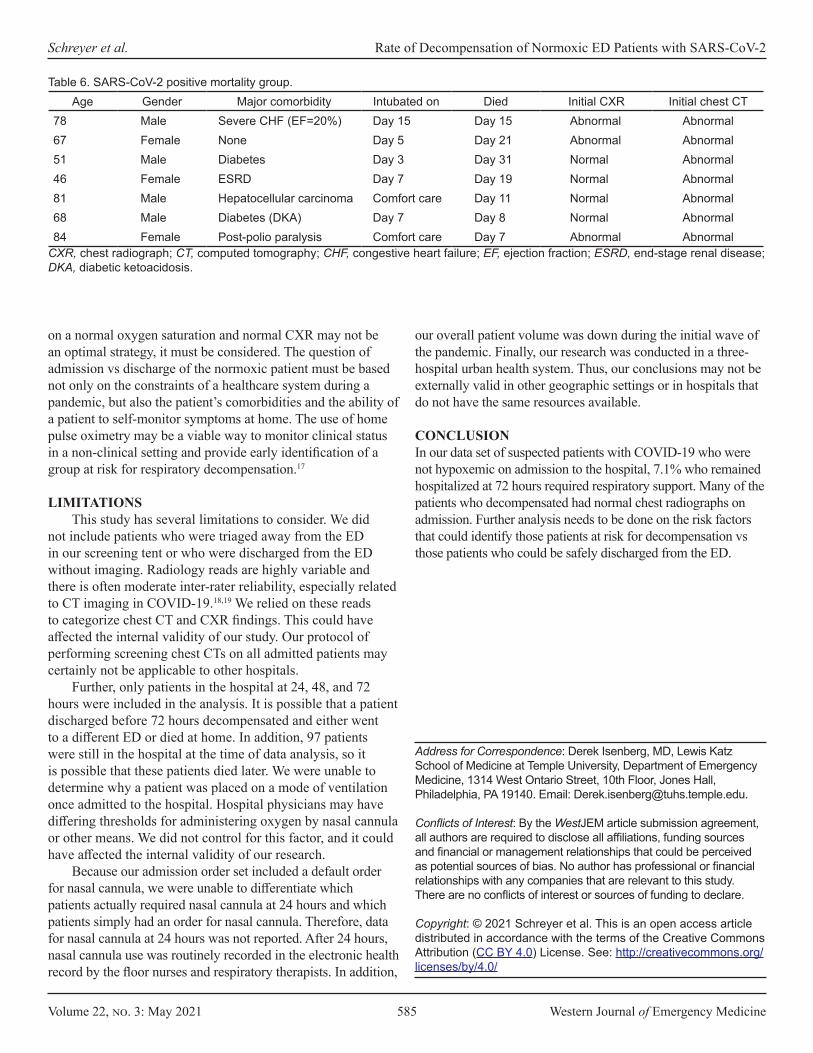
Volume 22, no. 3: May 2021 585 Western Journal of Emergency Medicine
Schreyer et al. Rate of Decompensation of Normoxic ED Patients with SARS-CoV-2
on a normal oxygen saturation and normal CXR may not be an optimal strategy, it must be considered. The question of admission vs discharge of the normoxic patient must be based not only on the constraints of a healthcare system during a pandemic, but also the patient’s comorbidities and the ability of a patient to self-monitor symptoms at home. The use of home pulse oximetry may be a viable way to monitor clinical status in a non-clinical setting and provide early identification of a group at risk for respiratory decompensation.17
LIMITATIONSThis study has several limitations to consider. We did
not include patients who were triaged away from the ED in our screening tent or who were discharged from the ED without imaging. Radiology reads are highly variable and there is often moderate inter-rater reliability, especially related to CT imaging in COVID-19.18,19 We relied on these reads to categorize chest CT and CXR findings. This could have affected the internal validity of our study. Our protocol of performing screening chest CTs on all admitted patients may certainly not be applicable to other hospitals.
Further, only patients in the hospital at 24, 48, and 72 hours were included in the analysis. It is possible that a patient discharged before 72 hours decompensated and either went to a different ED or died at home. In addition, 97 patients were still in the hospital at the time of data analysis, so it is possible that these patients died later. We were unable to determine why a patient was placed on a mode of ventilation once admitted to the hospital. Hospital physicians may have differing thresholds for administering oxygen by nasal cannula or other means. We did not control for this factor, and it could have affected the internal validity of our research.
Because our admission order set included a default order for nasal cannula, we were unable to differentiate which patients actually required nasal cannula at 24 hours and which patients simply had an order for nasal cannula. Therefore, data for nasal cannula at 24 hours was not reported. After 24 hours, nasal cannula use was routinely recorded in the electronic health record by the floor nurses and respiratory therapists. In addition,
Age Gender Major comorbidity Intubated on Died Initial CXR Initial chest CT78 Male Severe CHF (EF=20%) Day 15 Day 15 Abnormal Abnormal67 Female None Day 5 Day 21 Abnormal Abnormal51 Male Diabetes Day 3 Day 31 Normal Abnormal46 Female ESRD Day 7 Day 19 Normal Abnormal81 Male Hepatocellular carcinoma Comfort care Day 11 Normal Abnormal68 Male Diabetes (DKA) Day 7 Day 8 Normal Abnormal84 Female Post-polio paralysis Comfort care Day 7 Abnormal Abnormal
Table 6. SARS-CoV-2 positive mortality group.
CXR, chest radiograph; CT, computed tomography; CHF, congestive heart failure; EF, ejection fraction; ESRD, end-stage renal disease; DKA, diabetic ketoacidosis.
our overall patient volume was down during the initial wave of the pandemic. Finally, our research was conducted in a three-hospital urban health system. Thus, our conclusions may not be externally valid in other geographic settings or in hospitals that do not have the same resources available.
CONCLUSIONIn our data set of suspected patients with COVID-19 who were not hypoxemic on admission to the hospital, 7.1% who remained hospitalized at 72 hours required respiratory support. Many of the patients who decompensated had normal chest radiographs on admission. Further analysis needs to be done on the risk factors that could identify those patients at risk for decompensation vs those patients who could be safely discharged from the ED.
Address for Correspondence: Derek Isenberg, MD, Lewis Katz School of Medicine at Temple University, Department of Emergency Medicine, 1314 West Ontario Street, 10th Floor, Jones Hall, Philadelphia, PA 19140. Email: [email protected].
Conflicts of Interest: By the WestJEM article submission agreement, all authors are required to disclose all affiliations, funding sources and financial or management relationships that could be perceived as potential sources of bias. No author has professional or financial relationships with any companies that are relevant to this study. There are no conflicts of interest or sources of funding to declare.
Copyright: © 2021 Schreyer et al. This is an open access article distributed in accordance with the terms of the Creative Commons Attribution (CC BY 4.0) License. See: http://creativecommons.org/licenses/by/4.0/
Western Journal of Emergency Medicine 586 Volume 22, no. 3: May 2021
Rate of Decompensation of Normoxic ED Patients with SARS-CoV-2 Schreyer et al.
REFERENCES1. World Health Organization. (2020). Novel coronavirus (2019-nCoV)
- Situation Report 1. In World Health Organization (Eds.), Novel Coronavirus (2019-nCoV) (1-5). Switzerland: World Health Organization.
2. Patel A, Jernigan DB, Team -nCR. Initial public health response and interim clinical guidance for the 2019 novel coronavirus outbreak - United States, December 31, 2019-February 4, 2020. Morb Mortal Wkly Rep. 2020;69(5):140-6.
3. World Health Organization. WHO Coronavirus Disease (COVID-19) Dashboard. 2020. Available at: https://covid19.who.int/. Accessed June 28, 2020.
4. Yang W, Sirajuddin A, Zhang X, et al. The role of imaging in 2019 novel coronavirus pneumonia (COVID-19). Eur Radiol. 2020;30(9):4874-82.
5. Huang D, Lian X, Song F, et al. Clinical features of severe patients infected with 2019 novel coronavirus: a systematic review and meta-analysis. Ann Transl Med. 2020;8(9):576.
6. Chen J, Qi T, Liu L, et al. Clinical progression of patients with COVID-19 in Shanghai, China. J Infect. 2020;80(5):e1-6.
7. Roberts JR, Custalow CB, Thomsen TW. (2019). Devices for Assessing Oxygenation and Ventilation. In: Roberts JR, Custalow CB, & Thomsen TW (Eds.), Roberts and Hedges’ Clinical Procedures in Emergency Medicine and Acute Care (p. 26-29). Philadelphia, PA: Elsevier.
8. Ye Z, Zhang Y, Wang Y, et al. Chest CT manifestations of new coronavirus disease 2019 (COVID-19): a pictorial review. Eur Radiol. 2020;30(8):4381-9.
9. Zhao W, Zhong Z, Xie X, et al. Relation between chest CT findings and clinical conditions of coronavirus disease (COVID-19) pneumonia: a multicenter study. Am J Roentgenol.
2020;214(5):1072-7. 10. Johns Hopkins University & Medicine. Coronavirus Resource Center-
Mortality Analysis. 2020. Available at: https://coronavirus.jhu.edu/data/mortality. Accessed June 29, 2020.
11. Wong HYF, Lam HYS, Fong AH, et al. Frequency and distribution of chest radiographic findings in patients positive for COVID-19. Radiology. 2020;296(2):E72-8.
12. Watson J, Whiting PF, Brush JE. Interpreting a Covid-19 test result. BMJ. 2020;369:m1808.
13. Bao C, Liu X, Zhang H, et al. Coronavirus disease 2019 (COVID-19) CT findings: a systematic review and meta-analysis. J Am Coll Radiol. 2020;17(6):701-9.
14. Fang Y, Zhang H, Xie J, et al. Sensitivity of chest CT for COVID-19: comparison to RT-PCR. Radiology. 2020;296(2):E115-7.
15. Burdick H, Lam C, Mataraso S, et al. Prediction of respiratory decompensation in Covid-19 patients using machine learning: the READY trial. Comput Biol Med. 2020;124:103949.
16. Haimovich AD, Ravindra NG, Stoytchev S, et al. Development and validation of the Quick COVID-19 Severity Index: a prognostic tool for early clinical decompensation. Ann Emerg Med. 2020;76(4):442-53.
17. Shah S, Majmudar K, Stein A, et al. Novel use of home pulse oximetry monitoring in COVID-19 patients discharged from the emergency department identifies need for hospitalization. Acad Emerg Med. 2020;27(8):681-92.
18. Prokop M, van Everdingen W, van Rees Vellinga T, et al. CO-RADS - A categorical CT assessment scheme for patients with suspected COVID-19: definition and evaluation. Radiology. 2020;296:E97-104.
19. Ojha V, Mani A, Pandey NN, et al. CT in coronavirus disease 2019 (COVID-19): a systematic review of chest CT findings in 4410 adult patients. Eur Radiol. 2020;30(11):6129-38.
Volume 22, no. 3: May 2021 587 Western Journal of Emergency Medicine
Original Research
Utility Of An Emergency Department Clinical Protocol For Early Identification of Coronavirus Infection
William Bonadio, MDKaedrea Jackson, MDLindsey Gottlieb, MD Eric Legome, MD
Section Editor: Stephen Liang, MD Submission history: Submitted August 8th, 2020; Revision received December 6, 2020; Accepted December 24, 2020 Electronically published April 5, 2021 Full text available through open access at http://escholarship.org/uc/uciem_westjem DOI: 10.5811/westjem.2020.12.49470
INTRODUCTIONDuring the 2020 coronavirus 2019 (COVID-19) pandemic,
urban hospitals experienced excessively high patient volumes and significant spatial constraints.1 Emergency departments (ED) struggled to manage the acute patient influx, particularly given the continued circulation of influenza and other respiratory viruses early in the pandemic. Basic epidemiologic care principles support cohorting patients with like infectious status to reduce risk of nosocomial transmission.2,3 Specifically, it is important to avoid cohorting a COVID-19 person under investigation (PUI) who is not infected with confirmed
Mount Sinai Medical Center, Department of Emergency Medicine, New York City, New York
Introduction: We assessed the utility of an emergency department (ED) protocol using clinical parameters to rapidly distinguish likelihood of novel coronavirus 2019 (COVID-19) infection; the applicability aimed to stratify infectious-risk pre-polymerase chain reaction (PCR) test results and accurately guide early patient cohorting decisions.
Methods: We performed this prospective study over a two-month period during the initial surge of the 2020 COVID-19 pandemic in a busy urban ED of patients presenting with respiratory symptoms who were admitted for in-patient care. Per protocol, each patient received assessment consisting of five clinical parameters: presence of fever; hypoxia; cough; shortness of breath/dyspnea; and performance of a chest radiograph to assess for bilateral pulmonary infiltrates. All patients received nasopharyngeal COVID-19 PCR testing.
Results: Of 283 patients studied, 221 (78%) were PCR+ and 62 (22%) PCR-. Chest radiograph revealed bilateral pulmonary infiltrates in 85%, which was significantly more common in PCR+ (94%) vs PCR- (52%) patients (P < 0.0001). The rate of manifesting all five positive clinical parameters was significantly greater in PCR+ (63%) vs PCR- (6.5%) patients (P < 0.0001). For PCR+ outcome, the presence of all five positive clinical parameters had a specificity of 94%, positive predictive value of 98%, and positive likelihood ratio of 10.
Conclusions: Using an ED protocol to rapidly assess five clinical parameters accurately distinguishes likelihood of COVID-19 infection prior to PCR test results, and can be used to augment early patient cohorting decisions. [West J Emerg Med. 2021;22(3)587-591.]
COVID-19 cases. Routine processing polymerase chain reaction (PCR) tests can take up to 24 hours; thus, waiting for test results to make cohorting decisions poses an unacceptable burden on the capacity to care for PUIs. While more rapid testing platforms are being developed, it is not clear when, and how widely, they will be made available; or how accurate they will be.
In the meantime, implementing a clinical protocol that accurately allows cohorting presumptively positive PUIs with known COVID-19 positive patients while awaiting inpatient bed assignment would optimize utilization of

Western Journal of Emergency Medicine 588 Volume 22, no. 3: May 2021
ED Protocol for Early Identification of COVID-19 Bonadio et al.
Population Health Research Capsule
What do we already know about this issue? There is little published literature defining an emergency department (ED) clinical scoring system to define risk for COVID-19 infection in patients who present with respiratory symptoms during a pandemic.
What was the research question? Can a clinical protocol accurately identify ED patients with COVID-19 infection to facilitate cohorting with known infected patients while awaiting polymerase chain reaction (PCR) test results?
What was the major finding of the study? An ED protocol assessing 5 clinical parameters accurately distinguishes COVID-19 infection risk prior to PCR test results to augment early patient cohorting decisions.
How does this improve population health? Utilizing this clinical protocol facilitates early and accurate identification of risk for COVID-19 infection.
nursing, physical space, and physician oversight. Such a protocol would also ensure that PUIs with lower pre-PCR test probability of COVID-19 infection remain isolated apart from confirmed COVID-19 cases, thus decreasing the risk of nosocomial transmission.
We developed a simple COVID-19 ED screening protocol consisting of five discriminatory, commonly assessed clinical parameters (including performance of a chest radiograph [CXR]). The objective of this study was to prospectively evaluate this screening protocol to predict the likelihood of PCR+ for COVID-19 infection prior to PCR test resulting. We hypothesized that during times of high COVID-19 community prevalence, this clinical protocol would facilitate early and accurate identification of PUIs at risk for COVID-19 infection, allowing them to cohort with known infected patients while awaiting results of the PCR test.
METHODSDuring the initial surge of the 2020 COVID-19
pandemic, from March 1–April 28, we performed a prospective study of patients presenting to our urban ED, which treats >100,000 patients per year. In late February 2020, in conjunction with our infection control department, an ED protocol was devised and implemented anticipating that spatial constraints would eventually amaze the ability to provide appropriate isolation distancing between PUIs and known COVID-19 infected patients. This protocol was applied as standard practice during the study period to inform active clinical decision-making regarding cohorting of admitted/boarded ED patients.
All patients aged 30-70 years presenting with acute respiratory symptoms consistent with possible COVID-19 infection as judged by an attending-level emergency physician were screened by initial providers using parameters given in Table 1. Since the protocol was devised prior to the release of the US Centers for Disease Control and Prevention (CDC) demographic risk information, we arbitrarily set an upper age limit at 70 years. Our electronic health record (EHR) (Epic Systems Corporation, Verona, WI) used an extensive standardized template, including querying whether patients experienced fever, shortness of breath, and cough. Standard triage protocol mandated performance of pulse oximeter 02 saturation measurement and measurement of body temperature
in all patients. The EHR was reviewed in its entirety, noting all entries made by all providers.
We used a clinical decision tool composed of five variables: 1) hypoxia (O2 saturation ≤92% on room air while in the ED or required supplemental oxygen to maintain adequate O2 saturation); 2) fever, either by history (>100.4o
Fahrenheit) or measured in the ED (>38o Celsius); 3) cough; 4) dyspnea/shortness of breath (SOB); and 5) CXR with bilateral pulmonary infiltrates. Every effort was made by study investigators to follow the EHR census in real time to screen/enroll consecutively presenting patients appropriate for study. In addition, the EHR was reviewed every 24 hours to compile a list of consecutive admissions. Initial clinical parameters were tabulated up to 24 hours prior to PCR test results, and included symptomatology (presence of fever, cough, dyspnea/SOB), and vital signs measurements (body temperature and pulse oximeter O2 %-saturation). All received a COVID-19 nasopharyngeal qualitative PCR test (“SARS-CoV-2 PCR” (Roche Laboratories Inc, Rotkreuz, Switzerland) and expedited ED CXR. PCR test results were reviewed and recorded when completed on the next calendar day after presentation.
Consistent with the intended use of the guidelines, we initially surveyed a sample of all patients admitted/boarded in the ED who were awaiting PCR test results, whose medical records were reviewed to determine protocol utility and efficacy. This
• Cough• Dyspnea/shortness of breath• Fever• Hypoxia• Chest radiograph with bilateral pulmonary infiltrates
Table 1. Emergency department protocol: five clinical parameters used to determine likelihood of COVID-19 positive polymerase chain reaction rest.
COVID-19, coronavirus disease 2019.
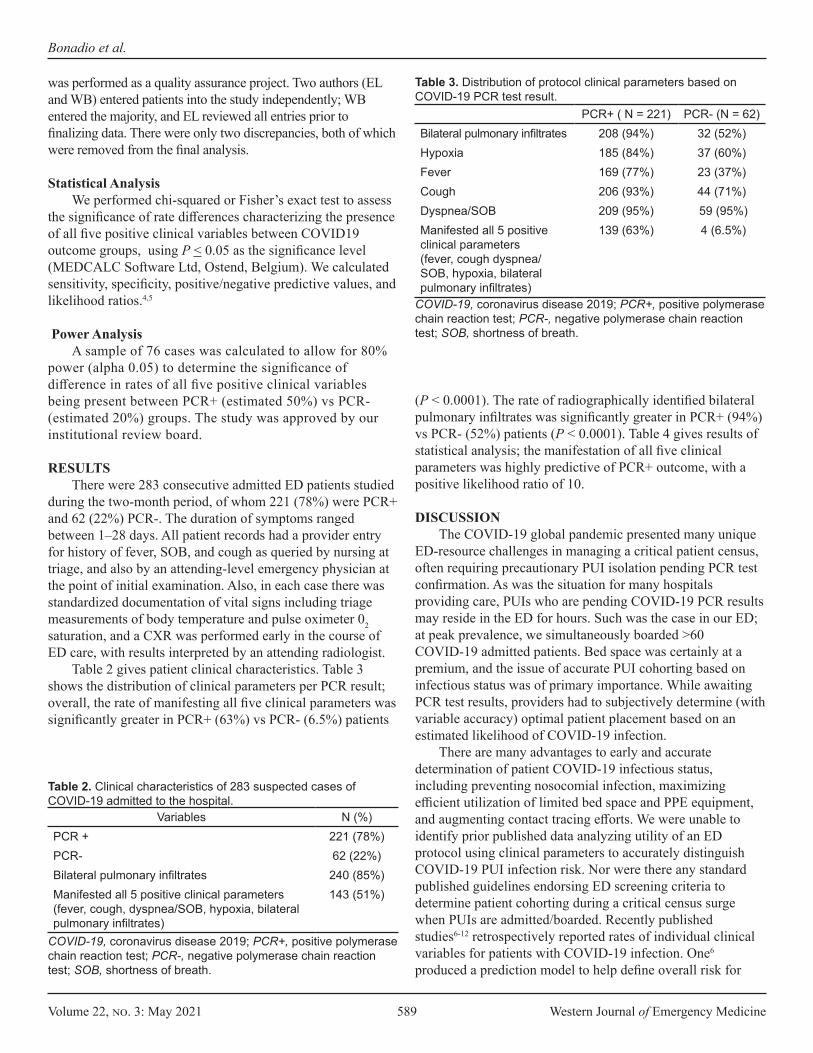
Volume 22, no. 3: May 2021 589 Western Journal of Emergency Medicine
Bonadio et al.
was performed as a quality assurance project. Two authors (EL and WB) entered patients into the study independently; WB entered the majority, and EL reviewed all entries prior to finalizing data. There were only two discrepancies, both of which were removed from the final analysis.
Statistical AnalysisWe performed chi-squared or Fisher’s exact test to assess
the significance of rate differences characterizing the presence of all five positive clinical variables between COVID19 outcome groups, using P < 0.05 as the significance level (MEDCALC Software Ltd, Ostend, Belgium). We calculated sensitivity, specificity, positive/negative predictive values, and likelihood ratios.4,5
Power Analysis A sample of 76 cases was calculated to allow for 80%
power (alpha 0.05) to determine the significance of difference in rates of all five positive clinical variables being present between PCR+ (estimated 50%) vs PCR- (estimated 20%) groups. The study was approved by our institutional review board.
RESULTSThere were 283 consecutive admitted ED patients studied
during the two-month period, of whom 221 (78%) were PCR+ and 62 (22%) PCR-. The duration of symptoms ranged between 1–28 days. All patient records had a provider entry for history of fever, SOB, and cough as queried by nursing at triage, and also by an attending-level emergency physician at the point of initial examination. Also, in each case there was standardized documentation of vital signs including triage measurements of body temperature and pulse oximeter 02 saturation, and a CXR was performed early in the course of ED care, with results interpreted by an attending radiologist.
Table 2 gives patient clinical characteristics. Table 3 shows the distribution of clinical parameters per PCR result; overall, the rate of manifesting all five clinical parameters was significantly greater in PCR+ (63%) vs PCR- (6.5%) patients
(P < 0.0001). The rate of radiographically identified bilateral pulmonary infiltrates was significantly greater in PCR+ (94%) vs PCR- (52%) patients (P < 0.0001). Table 4 gives results of statistical analysis; the manifestation of all five clinical parameters was highly predictive of PCR+ outcome, with a positive likelihood ratio of 10.
DISCUSSIONThe COVID-19 global pandemic presented many unique
ED-resource challenges in managing a critical patient census, often requiring precautionary PUI isolation pending PCR test confirmation. As was the situation for many hospitals providing care, PUIs who are pending COVID-19 PCR results may reside in the ED for hours. Such was the case in our ED; at peak prevalence, we simultaneously boarded >60 COVID-19 admitted patients. Bed space was certainly at a premium, and the issue of accurate PUI cohorting based on infectious status was of primary importance. While awaiting PCR test results, providers had to subjectively determine (with variable accuracy) optimal patient placement based on an estimated likelihood of COVID-19 infection.
There are many advantages to early and accurate determination of patient COVID-19 infectious status, including preventing nosocomial infection, maximizing efficient utilization of limited bed space and PPE equipment, and augmenting contact tracing efforts. We were unable to identify prior published data analyzing utility of an ED protocol using clinical parameters to accurately distinguish COVID-19 PUI infection risk. Nor were there any standard published guidelines endorsing ED screening criteria to determine patient cohorting during a critical census surge when PUIs are admitted/boarded. Recently published studies6-12 retrospectively reported rates of individual clinical variables for patients with COVID-19 infection. One6 produced a prediction model to help define overall risk for
Variables N (%)PCR + 221 (78%)PCR- 62 (22%)Bilateral pulmonary infiltrates 240 (85%)Manifested all 5 positive clinical parameters (fever, cough, dyspnea/SOB, hypoxia, bilateral pulmonary infiltrates)
143 (51%)
Table 2. Clinical characteristics of 283 suspected cases of COVID-19 admitted to the hospital.
COVID-19, coronavirus disease 2019; PCR+, positive polymerase chain reaction test; PCR-, negative polymerase chain reaction test; SOB, shortness of breath.
PCR+ ( N = 221) PCR- (N = 62)Bilateral pulmonary infiltrates 208 (94%) 32 (52%)Hypoxia 185 (84%) 37 (60%)Fever 169 (77%) 23 (37%)Cough 206 (93%) 44 (71%)Dyspnea/SOB 209 (95%) 59 (95%)Manifested all 5 positive clinical parameters (fever, cough dyspnea/SOB, hypoxia, bilateral pulmonary infiltrates)
139 (63%) 4 (6.5%)
COVID-19, coronavirus disease 2019; PCR+, positive polymerase chain reaction test; PCR-, negative polymerase chain reaction test; SOB, shortness of breath.
Table 3. Distribution of protocol clinical parameters based on COVID-19 PCR test result.
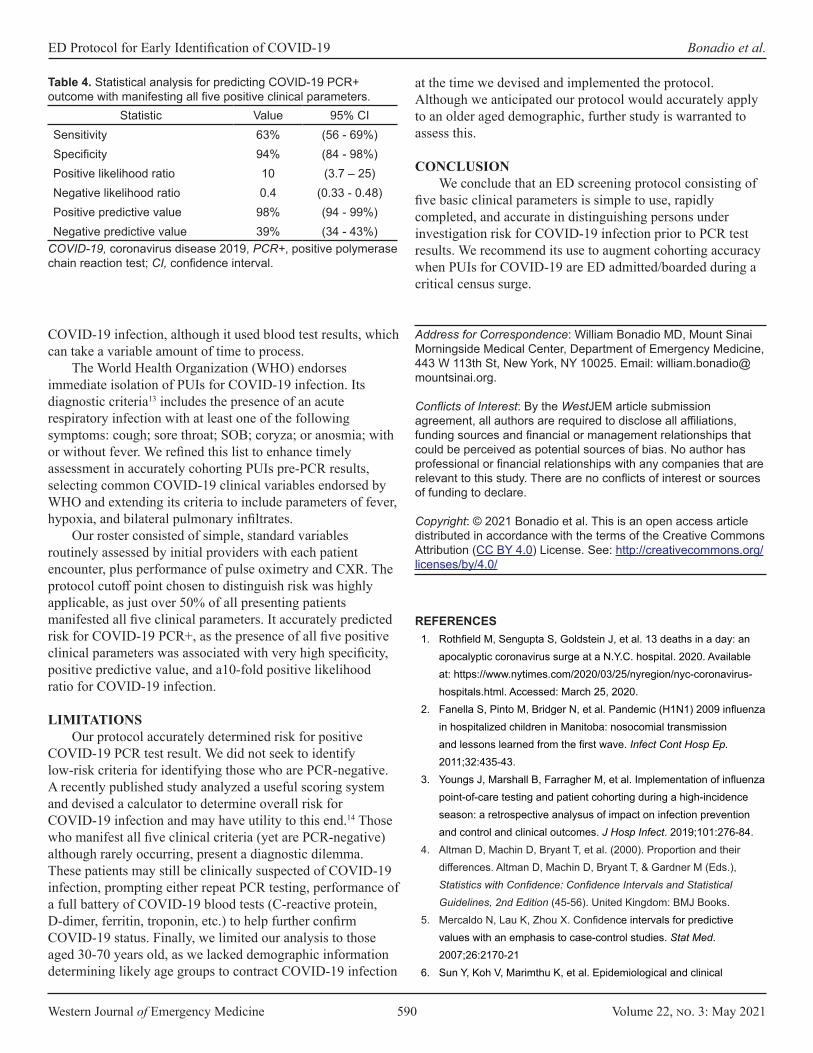
Western Journal of Emergency Medicine 590 Volume 22, no. 3: May 2021
ED Protocol for Early Identification of COVID-19 Bonadio et al.
COVID-19 infection, although it used blood test results, which can take a variable amount of time to process.
The World Health Organization (WHO) endorses immediate isolation of PUIs for COVID-19 infection. Its diagnostic criteria13 includes the presence of an acute respiratory infection with at least one of the following symptoms: cough; sore throat; SOB; coryza; or anosmia; with or without fever. We refined this list to enhance timely assessment in accurately cohorting PUIs pre-PCR results, selecting common COVID-19 clinical variables endorsed by WHO and extending its criteria to include parameters of fever, hypoxia, and bilateral pulmonary infiltrates.
Our roster consisted of simple, standard variables routinely assessed by initial providers with each patient encounter, plus performance of pulse oximetry and CXR. The protocol cutoff point chosen to distinguish risk was highly applicable, as just over 50% of all presenting patients manifested all five clinical parameters. It accurately predicted risk for COVID-19 PCR+, as the presence of all five positive clinical parameters was associated with very high specificity, positive predictive value, and a10-fold positive likelihood ratio for COVID-19 infection.
LIMITATIONSOur protocol accurately determined risk for positive
COVID-19 PCR test result. We did not seek to identify low-risk criteria for identifying those who are PCR-negative. A recently published study analyzed a useful scoring system and devised a calculator to determine overall risk for COVID-19 infection and may have utility to this end.14 Those who manifest all five clinical criteria (yet are PCR-negative) although rarely occurring, present a diagnostic dilemma. These patients may still be clinically suspected of COVID-19 infection, prompting either repeat PCR testing, performance of a full battery of COVID-19 blood tests (C-reactive protein, D-dimer, ferritin, troponin, etc.) to help further confirm COVID-19 status. Finally, we limited our analysis to those aged 30-70 years old, as we lacked demographic information determining likely age groups to contract COVID-19 infection
Statistic Value 95% CISensitivity 63% (56 - 69%)Specificity 94% (84 - 98%)Positive likelihood ratio 10 (3.7 – 25)Negative likelihood ratio 0.4 (0.33 - 0.48)Positive predictive value 98% (94 - 99%)Negative predictive value 39% (34 - 43%)
COVID-19, coronavirus disease 2019, PCR+, positive polymerase chain reaction test; CI, confidence interval.
Table 4. Statistical analysis for predicting COVID-19 PCR+ outcome with manifesting all five positive clinical parameters.
at the time we devised and implemented the protocol. Although we anticipated our protocol would accurately apply to an older aged demographic, further study is warranted to assess this.
CONCLUSIONWe conclude that an ED screening protocol consisting of
five basic clinical parameters is simple to use, rapidly completed, and accurate in distinguishing persons under investigation risk for COVID-19 infection prior to PCR test results. We recommend its use to augment cohorting accuracy when PUIs for COVID-19 are ED admitted/boarded during a critical census surge.
Address for Correspondence: William Bonadio MD, Mount Sinai Morningside Medical Center, Department of Emergency Medicine, 443 W 113th St, New York, NY 10025. Email: [email protected].
Conflicts of Interest: By the WestJEM article submission agreement, all authors are required to disclose all affiliations, funding sources and financial or management relationships that could be perceived as potential sources of bias. No author has professional or financial relationships with any companies that are relevant to this study. There are no conflicts of interest or sources of funding to declare.
Copyright: © 2021 Bonadio et al. This is an open access article distributed in accordance with the terms of the Creative Commons Attribution (CC BY 4.0) License. See: http://creativecommons.org/licenses/by/4.0/
REFERENCES1. Rothfield M, Sengupta S, Goldstein J, et al. 13 deaths in a day: an
apocalyptic coronavirus surge at a N.Y.C. hospital. 2020. Available at: https://www.nytimes.com/2020/03/25/nyregion/nyc-coronavirus-hospitals.html. Accessed: March 25, 2020.
2. Fanella S, Pinto M, Bridger N, et al. Pandemic (H1N1) 2009 influenza in hospitalized children in Manitoba: nosocomial transmission and lessons learned from the first wave. Infect Cont Hosp Ep. 2011;32:435-43.
3. Youngs J, Marshall B, Farragher M, et al. Implementation of influenza point-of-care testing and patient cohorting during a high-incidence season: a retrospective analysus of impact on infection prevention and control and clinical outcomes. J Hosp Infect. 2019;101:276-84.
4. Altman D, Machin D, Bryant T, et al. (2000). Proportion and their differences. Altman D, Machin D, Bryant T, & Gardner M (Eds.), Statistics with Confidence: Confidence Intervals and Statistical Guidelines, 2nd Edition (45-56). United Kingdom: BMJ Books.
5. Mercaldo N, Lau K, Zhou X. Confidence intervals for predictive values with an emphasis to case-control studies. Stat Med. 2007;26:2170-21
6. Sun Y, Koh V, Marimthu K, et al. Epidemiological and clinical

Volume 22, no. 3: May 2021 591 Western Journal of Emergency Medicine
Bonadio et al.
predictors of COVID19. Clin Infect Dis. 2020;71(15):786-92.7. Guan W, Ni Z, Hu y, et al. Clinical characteristics of coronavirus
disease in 2019 in China. N Engl J Med. 2020;382:1708-20.8. Wang D, Hu B, Hu C, et al. Clinical characteristics of 138 hospitalized
patients with 2019 novel coronavirus–infected pneumonia in Wuhan, China. JAMA. 2020;323:1061-69.
9. Jin X, Lian J, Hu J, et al. Epidemiological, clinical and virological characteristics of 74 cases of coronavirus-infected disease 2019 (COVID-19) with gastrointestinal symptoms. Gut. 2020;69(6):1002-9.
10. Yang X, Yu Y, Xu J, et al. Clinical course and outcomes of critically ill patients with SARS-CoV-2 pneumonia in Wuhan, China: a single-centered, retrospective, observational study. Lancet Respir Med. 2020;8(5):475-81.
11. Huang C, Wang Y, Li X, et al. Clinical features of patients infected with 2019 novel coronavirus in Wuhan, China. Lancet. 2020;395(10223):497-506.
12. Zhou F, Yu T, Du R, et al. Clinical course and risk factors for mortality of adult inpatients with COVID-19 in Wuhan, China: a retrospective study. Lancet. 2020;395(10229):1054-62.
13. World Health Organization. Operational considerations for case management of COVID-19 in health facility and community: Interim Guidance, 13 March 2020. 2020. Available at: . https://apps.who.int/iris/handle/10665/331492. Accessed March 19, 2020.
14. Jehi L, Ji X, Milinovich A, et al. Individualizing risk prediction for positive COVID-19 testing: results from 11,672 patients. Chest. 2020; 158(4):1364-75.

Western Journal of Emergency Medicine 592 Volume 22, no. 3: May 2021
Original Research
Clinical Prediction Tool to Assess the Likelihood of a Positive SARS-Cov-2 (COVID-19) Polymerase Chain Reaction Test in
Patients with Flu-like SymptomsBarbara A. Lara, MD, MPH*Francisco Torres, MD*Patricia Holger, MD*Claudia Perales, MD*Sofia Basauri, MD, MMEd*Hans Clausdorff, MD*Ernesto Escobedo, MD* Fernando Saldias, MD†
Stuart Swadron, MD‡
Pablo Aguilera, MD*
Section Editor: Stephen Liang, MD Submission history: Submitted July 25, 2020; Revision received January 2, 2021; Accepted December 15, 2020 Electronically published March 24, 2021 Full text available through open access at http://escholarship.org/uc/uciem_westjem DOI: 10.5811/westjem.2020.12.49200
INTRODUCTIONThe novel coronavirus disease 2019 (COVID-19)
pandemic poses a major threat to global health.1 Despite
Pontificia Universidad Católica de Chile, Section of Emergency Medicine, Santiago, ChilePontificia Universidad Católica de Chile, Department of Respiratory Diseases, Santiago, ChileKeck School of Medicine, Department of Emergency Medicine, University of Southern California, Los Angeles, California
*†
‡
Introduction: The clinical presentation of coronavirus disease 2019 (COVID-19) overlaps with many other common cold and influenza viruses. Identifying patients with a higher probability of infection becomes crucial in settings with limited access to testing. We developed a prediction instrument to assess the likelihood of a positive polymerase chain reaction (PCR) test, based solely on clinical variables that can be determined within the time frame of an emergency department (ED) patient encounter.
Methods: We derived and prospectively validated a model to predict SARS-CoV-2 PCR positivity in patients visiting the ED with symptoms consistent with the disease.
Results: Our model was based on 617 ED visits. In the derivation cohort, the median age was 36 years, 43% were men, and 9% had a positive result. The median time to testing from the onset of initial symptoms was four days (interquartile range [IQR]: 2-5 days, range 0-23 days), and 91% of all patients were discharged home. The final model based on a multivariable logistic regression included a history of close contact (adjusted odds ratio [AOR] 2.47, 95% confidence interval [CI], 1.29-4.7); fever (AOR 3.63, 95% CI, 1.931-6.85); anosmia or dysgeusia (AOR 9.7, 95% CI, 2.72-34.5); headache (AOR 1.95, 95% CI, 1.06-3.58), myalgia (AOR 2.6, 95% CI, 1.39-4.89); and dry cough (AOR 1.93, 95% CI, 1.02-3.64). The area under the curve (AUC) from the derivation cohort was 0.79 (95% CI, 0.73-0.85) and AUC 0.7 (95% CI, 0.61-0.75) in the validation cohort (N = 379).
Conclusion: We developed and validated a clinical tool to predict SARS-CoV-2 PCR positivity in patients presenting to the ED to assist with patient disposition in environments where COVID-19 tests or timely results are not readily available. [West J Emerg Med. 2021;22(3)592–598.]
public health efforts to contain its rapid spread, outbreaks have led to emergency department (ED) crowding, a strain on hospital resources, and a shortage in testing capacity. In
Volume 22, no. 3: May 2021 593 Western Journal of Emergency Medicine
Lara et al. Prediction Tool to Assess Positive COVID-19 Test
Population Health Research Capsule
What do we already know about this issue?The clinical presentation of coronavirus disease 2019 (COVID-19) overlaps with many other common cold and influenza viruses.
What was the research question?Can we predict COVID-19 test positivity based on clinical variables?
What was the major finding of the study?Anosmia, dysgeusia, fever, headache, myalgia, dry cough, and history of close contact are good predictors of COVID-19 diagnosis.
How does this improve population health?This group of symptoms could be used to assist with patient disposition in environments where COVID-19 tests or timely results are not readily available.
the absence of effective prophylaxis or a vaccine, the most efficient containment strategy is interrupting transmission through rapid identification and isolation of infected patients.2
Given that the clinical presentation of COVID-19 overlaps with many other common cold and influenza viruses, identifying patients with a higher probability of infection becomes crucial in settings with limited access to testing.3,4 The most commonly reported symptoms are fever, myalgia, fatigue, headache, dry cough, and dyspnea, whereas less frequent symptoms include rhinorrhea, sore throat, diarrhea, chest tightness, anosmia, dysgeusia, and hemoptysis.4-6 Reported laboratory findings include leukopenia, leukocytosis, lymphopenia, high lactate dehydrogenase, and a host of elevated inflammatory markers.7due to the novel severe acute respiratory syndrome coronavirus 2 (SARS-CoV-2 Imaging findings include patchy, ground-glass infiltrates on chest radiograph (CXR) and computed tomography.4,8
The turnaround time for the SARS-CoV-2 polymerase chain reaction (PCR) test in our ED and in the vast majority of Chilean centers is at least 48 hours and up to 10 days. Moreover, shortages of tests and reagents limit the number of tests that we can perform. To facilitate the disposition of our patients without the benefit of PCR testing results, we developed a prediction instrument to assess the likelihood of a positive PCR test, based solely on clinical variables that can be determined within the time frame of an ED patient encounter.
METHODSWe conducted a two-phase observational study involving
patients visiting the ED with symptoms consistent with COVID-19 who were tested with a SARS-CoV-2 PCR test over two consecutive months (March and April 2020) during the beginning of the pandemic in Chile. Data were collected in an urban, academic hospital with 380 beds and 32 adult intensive care unit beds, expanded to 75 critical care beds during the pandemic. The ED receives an average of 40,000 adult patient visits per year.
In the first phase, during March 2020, data were collected retrospectively from the national COVID-19 notification form required for all patients tested for COVID-19 in our ED. This was complemented with vital signs, and laboratory and imaging results from the patient health record. We used the information collected to derive a prediction instrument for COVID-19 diagnosis. In the second phase, conducted over the subsequent four weeks, we prospectively applied a new data collection form to validate our instrument. In this phase, all patients who were tested for COVID 19 were included. The decision to order the test was at physician discretion. Clinicians were blinded to the study results of the first phase and completed an extended form including all variables tested in the first phase.
Cases were individuals who had a positive SARS-CoV-2 PCR result, and controls were those with a negative
test. We excluded patients younger than 18 years old, pregnant women, patients who returned for a second visit to the ED in the following month, those who had already been tested for COVID-19 prior to the ED visit, those with an indeterminate test result, and those for whom less than 30% of the data required for the derivation set was available. We collected and managed study data using Research Electronic Data Capture tools hosted at Pontificia Universidad Católica de Chile (REDCap Consortium, Vanderbilt University, Nashville, TN). This study was approved under a waiver of informed consent by our institutional review board.
VariablesWe included in the analysis demographic information;
general symptoms (including myalgias, fatigue, quantified fever at home, headache); respiratory symptoms (including rhinorrhea, sore throat, dry, and productive cough, dyspnea); gastrointestinal symptoms (including anorexia, vomiting, diarrhea, nausea, and abdominal pain); and anosmia or dysgeusia. Comorbidities, tobacco and drug use, vaping, medications, influenza vaccination history, and other epidemiologically relevant data such as travel to countries with outbreaks and close contacts with confirmed cases of COVID-19 were also collected and analyzed. We used the Chilean national health definition of “close contact” (high-risk exposure), which includes patients who were exposed to another person with a positive test starting two days before
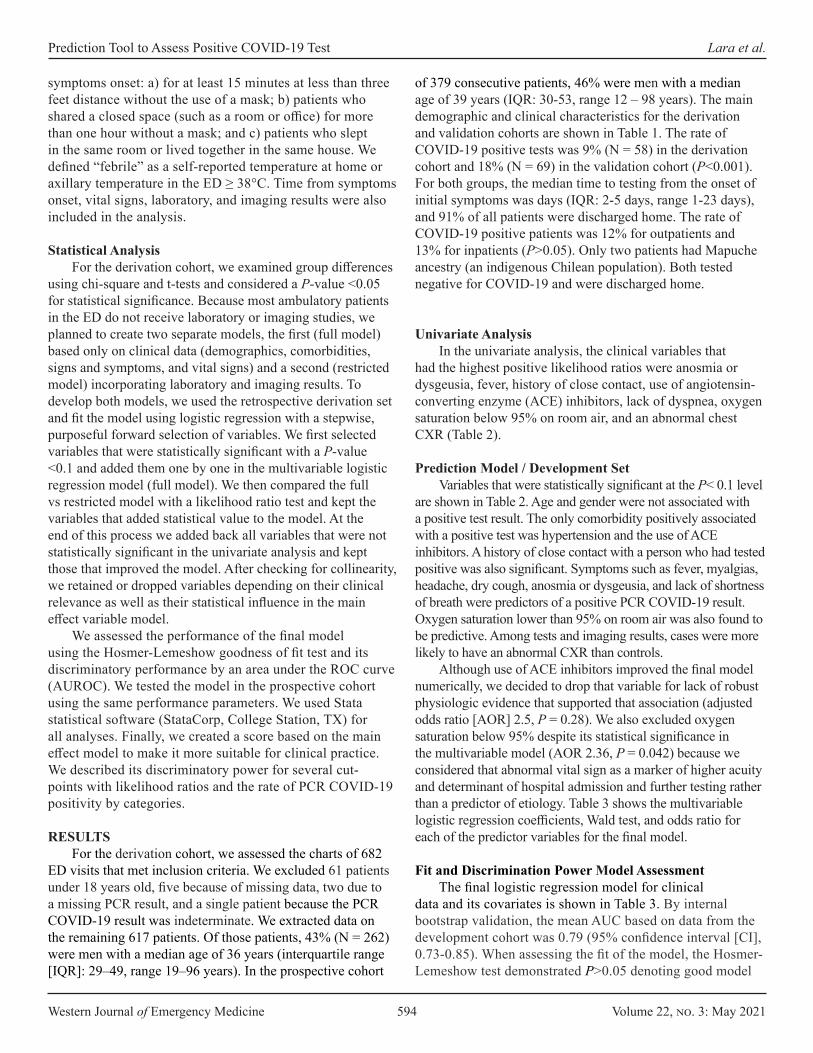
Western Journal of Emergency Medicine 594 Volume 22, no. 3: May 2021
Prediction Tool to Assess Positive COVID-19 Test Lara et al.
symptoms onset: a) for at least 15 minutes at less than three feet distance without the use of a mask; b) patients who shared a closed space (such as a room or office) for more than one hour without a mask; and c) patients who slept in the same room or lived together in the same house. We defined “febrile” as a self-reported temperature at home or axillary temperature in the ED ≥ 38°C. Time from symptoms onset, vital signs, laboratory, and imaging results were also included in the analysis.
Statistical AnalysisFor the derivation cohort, we examined group differences
using chi-square and t-tests and considered a P-value <0.05 for statistical significance. Because most ambulatory patients in the ED do not receive laboratory or imaging studies, we planned to create two separate models, the first (full model) based only on clinical data (demographics, comorbidities, signs and symptoms, and vital signs) and a second (restricted model) incorporating laboratory and imaging results. To develop both models, we used the retrospective derivation set and fit the model using logistic regression with a stepwise, purposeful forward selection of variables. We first selected variables that were statistically significant with a P-value <0.1 and added them one by one in the multivariable logistic regression model (full model). We then compared the full vs restricted model with a likelihood ratio test and kept the variables that added statistical value to the model. At the end of this process we added back all variables that were not statistically significant in the univariate analysis and kept those that improved the model. After checking for collinearity, we retained or dropped variables depending on their clinical relevance as well as their statistical influence in the main effect variable model.
We assessed the performance of the final model using the Hosmer-Lemeshow goodness of fit test and its discriminatory performance by an area under the ROC curve (AUROC). We tested the model in the prospective cohort using the same performance parameters. We used Stata statistical software (StataCorp, College Station, TX) for all analyses. Finally, we created a score based on the main effect model to make it more suitable for clinical practice. We described its discriminatory power for several cut-points with likelihood ratios and the rate of PCR COVID-19 positivity by categories.
RESULTSFor the derivation cohort, we assessed the charts of 682
ED visits that met inclusion criteria. We excluded 61 patients under 18 years old, five because of missing data, two due to a missing PCR result, and a single patient because the PCR COVID-19 result was indeterminate. We extracted data on the remaining 617 patients. Of those patients, 43% (N = 262) were men with a median age of 36 years (interquartile range [IQR]: 29–49, range 19–96 years). In the prospective cohort
of 379 consecutive patients, 46% were men with a median age of 39 years (IQR: 30-53, range 12 – 98 years). The main demographic and clinical characteristics for the derivation and validation cohorts are shown in Table 1. The rate of COVID-19 positive tests was 9% (N = 58) in the derivation cohort and 18% (N = 69) in the validation cohort (P<0.001). For both groups, the median time to testing from the onset of initial symptoms was days (IQR: 2-5 days, range 1-23 days), and 91% of all patients were discharged home. The rate of COVID-19 positive patients was 12% for outpatients and 13% for inpatients (P>0.05). Only two patients had Mapuche ancestry (an indigenous Chilean population). Both tested negative for COVID-19 and were discharged home.
Univariate AnalysisIn the univariate analysis, the clinical variables that
had the highest positive likelihood ratios were anosmia or dysgeusia, fever, history of close contact, use of angiotensin-converting enzyme (ACE) inhibitors, lack of dyspnea, oxygen saturation below 95% on room air, and an abnormal chest CXR (Table 2).
Prediction Model / Development SetVariables that were statistically significant at the P< 0.1 level
are shown in Table 2. Age and gender were not associated with a positive test result. The only comorbidity positively associated with a positive test was hypertension and the use of ACE inhibitors. A history of close contact with a person who had tested positive was also significant. Symptoms such as fever, myalgias, headache, dry cough, anosmia or dysgeusia, and lack of shortness of breath were predictors of a positive PCR COVID-19 result. Oxygen saturation lower than 95% on room air was also found to be predictive. Among tests and imaging results, cases were more likely to have an abnormal CXR than controls.
Although use of ACE inhibitors improved the final model numerically, we decided to drop that variable for lack of robust physiologic evidence that supported that association (adjusted odds ratio [AOR] 2.5, P = 0.28). We also excluded oxygen saturation below 95% despite its statistical significance in the multivariable model (AOR 2.36, P = 0.042) because we considered that abnormal vital sign as a marker of higher acuity and determinant of hospital admission and further testing rather than a predictor of etiology. Table 3 shows the multivariable logistic regression coefficients, Wald test, and odds ratio for each of the predictor variables for the final model.
Fit and Discrimination Power Model AssessmentThe final logistic regression model for clinical
data and its covariates is shown in Table 3. By internal bootstrap validation, the mean AUC based on data from the development cohort was 0.79 (95% confidence interval [CI], 0.73-0.85). When assessing the fit of the model, the Hosmer-Lemeshow test demonstrated P>0.05 denoting good model
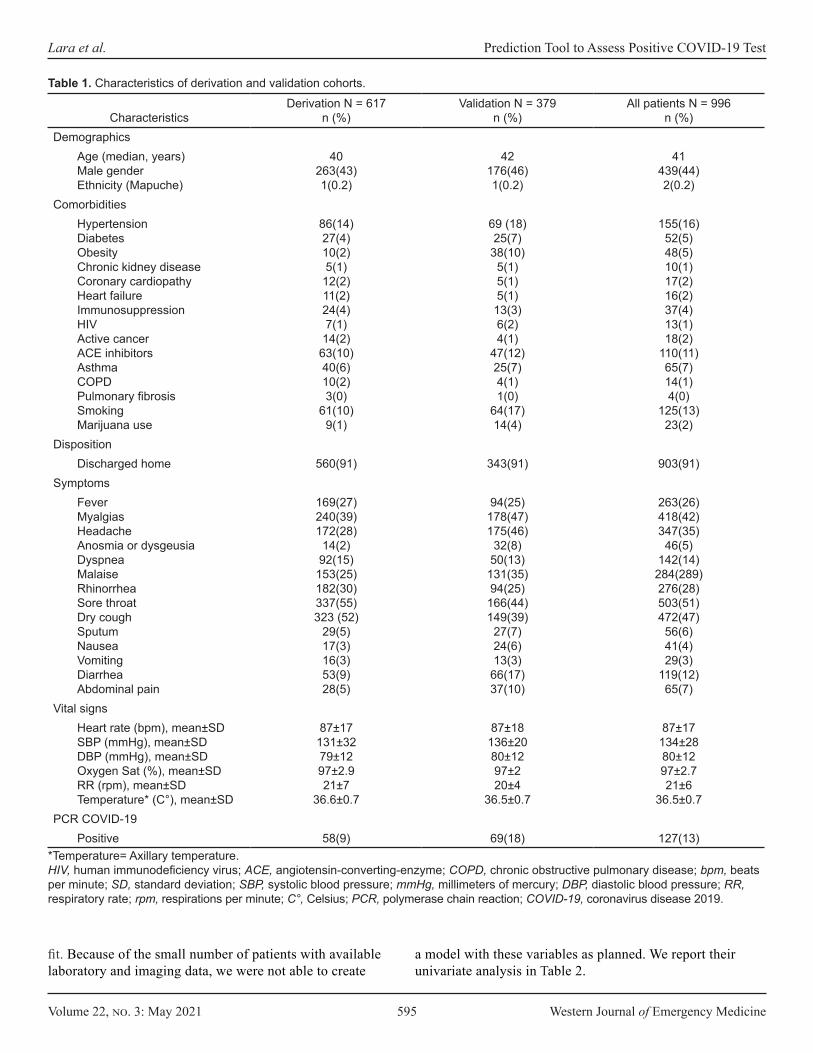
Volume 22, no. 3: May 2021 595 Western Journal of Emergency Medicine
Lara et al. Prediction Tool to Assess Positive COVID-19 Test
CharacteristicsDerivation N = 617
n (%)Validation N = 379
n (%)All patients N = 996
n (%)Demographics
Age (median, years)Male genderEthnicity (Mapuche)
40263(43)1(0.2)
42176(46)1(0.2)
41439(44)2(0.2)
ComorbiditiesHypertensionDiabetesObesityChronic kidney diseaseCoronary cardiopathyHeart failureImmunosuppressionHIVActive cancerACE inhibitorsAsthmaCOPDPulmonary fibrosisSmokingMarijuana use
86(14)27(4)10(2)5(1)
12(2)11(2)24(4)7(1)
14(2)63(10)40(6)10(2)3(0)
61(10)9(1)
69 (18)25(7)
38(10)5(1)5(1)5(1)
13(3)6(2)4(1)
47(12)25(7)4(1)1(0)
64(17)14(4)
155(16)52(5)48(5)10(1)17(2)16(2)37(4)13(1)18(2)
110(11)65(7)14(1)4(0)
125(13)23(2)
DispositionDischarged home 560(91) 343(91) 903(91)
Symptoms Fever MyalgiasHeadacheAnosmia or dysgeusiaDyspneaMalaiseRhinorrheaSore throatDry coughSputumNauseaVomitingDiarrheaAbdominal pain
169(27)240(39)172(28)
14(2)92(15)
153(25)182(30)337(55)323 (52)
29(5)17(3)16(3)53(9)28(5)
94(25)178(47)175(46)
32(8)50(13)
131(35)94(25)
166(44)149(39)
27(7)24(6)13(3)
66(17)37(10)
263(26)418(42)347(35)
46(5)142(14)
284(289)276(28)503(51)472(47)
56(6)41(4)29(3)
119(12)65(7)
Vital signsHeart rate (bpm), mean±SDSBP (mmHg), mean±SDDBP (mmHg), mean±SDOxygen Sat (%), mean±SDRR (rpm), mean±SDTemperature* (C°), mean±SD
87±17131±3279±1297±2.921±7
36.6±0.7
87±18136±2080±1297±220±4
36.5±0.7
87±17134±2880±1297±2.721±6
36.5±0.7PCR COVID-19
Positive 58(9) 69(18) 127(13)
Table 1. Characteristics of derivation and validation cohorts.
*Temperature= Axillary temperature. HIV, human immunodeficiency virus; ACE, angiotensin-converting-enzyme; COPD, chronic obstructive pulmonary disease; bpm, beats per minute; SD, standard deviation; SBP, systolic blood pressure; mmHg, millimeters of mercury; DBP, diastolic blood pressure; RR, respiratory rate; rpm, respirations per minute; C°, Celsius; PCR, polymerase chain reaction; COVID-19, coronavirus disease 2019.
fit. Because of the small number of patients with available laboratory and imaging data, we were not able to create
a model with these variables as planned. We report their univariate analysis in Table 2.
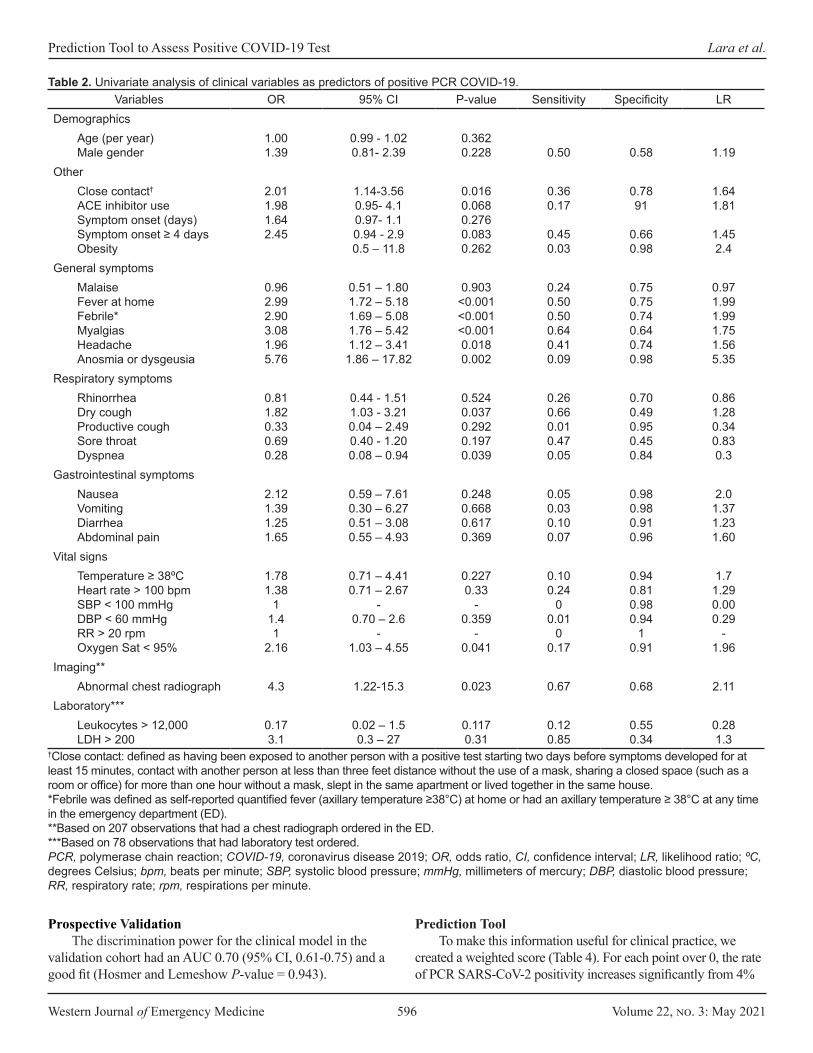
Western Journal of Emergency Medicine 596 Volume 22, no. 3: May 2021
Prediction Tool to Assess Positive COVID-19 Test Lara et al.
Variables OR 95% CI P-value Sensitivity Specificity LRDemographics
Age (per year)Male gender
1.00 1.39
0.99 - 1.02 0.81- 2.39
0.362 0.228 0.50 0.58 1.19
OtherClose contact† ACE inhibitor use Symptom onset (days) Symptom onset ≥ 4 days Obesity
2.01 1.98 1.64 2.45
1.14-3.56 0.95- 4.1 0.97- 1.10.94 - 2.9 0.5 – 11.8
0.016 0.068 0.276 0.083 0.262
0.360.17
0.45 0.03
0.7891
0.660.98
1.641.81
1.452.4
General symptomsMalaiseFever at homeFebrile*MyalgiasHeadacheAnosmia or dysgeusia
0.962.992.903.081.965.76
0.51 – 1.801.72 – 5.181.69 – 5.081.76 – 5.421.12 – 3.411.86 – 17.82
0.903<0.001<0.001<0.0010.0180.002
0.240.500.500.640.410.09
0.750.750.740.640.740.98
0.971.991.991.751.565.35
Respiratory symptomsRhinorrheaDry coughProductive coughSore throatDyspnea
0.811.820.330.69 0.28
0.44 - 1.511.03 - 3.210.04 – 2.490.40 - 1.200.08 – 0.94
0.5240.0370.2920.1970.039
0.260.660.010.470.05
0.700.490.950.450.84
0.861.280.340.830.3
Gastrointestinal symptomsNauseaVomitingDiarrheaAbdominal pain
2.121.391.251.65
0.59 – 7.610.30 – 6.270.51 – 3.080.55 – 4.93
0.2480.6680.6170.369
0.050.030.100.07
0.980.980.910.96
2.01.371.231.60
Vital signsTemperature ≥ 38ºCHeart rate > 100 bpmSBP < 100 mmHgDBP < 60 mmHgRR > 20 rpmOxygen Sat < 95%
1.781.38
11.41
2.16
0.71 – 4.410.71 – 2.67
-0.70 – 2.6
-1.03 – 4.55
0.2270.33
-0.359
-0.041
0.100.24
00.01
00.17
0.940.810.980.94
10.91
1.71.290.00 0.29
-1.96
Imaging**Abnormal chest radiograph 4.3 1.22-15.3 0.023 0.67 0.68 2.11
Laboratory***Leukocytes > 12,000LDH > 200
0.173.1
0.02 – 1.50.3 – 27
0.1170.31
0.120.85
0.550.34
0.28 1.3
Table 2. Univariate analysis of clinical variables as predictors of positive PCR COVID-19.
†Close contact: defined as having been exposed to another person with a positive test starting two days before symptoms developed for at least 15 minutes, contact with another person at less than three feet distance without the use of a mask, sharing a closed space (such as a room or office) for more than one hour without a mask, slept in the same apartment or lived together in the same house.*Febrile was defined as self-reported quantified fever (axillary temperature ≥38°C) at home or had an axillary temperature ≥ 38°C at any time in the emergency department (ED).**Based on 207 observations that had a chest radiograph ordered in the ED.***Based on 78 observations that had laboratory test ordered.PCR, polymerase chain reaction; COVID-19, coronavirus disease 2019; OR, odds ratio, CI, confidence interval; LR, likelihood ratio; ºC, degrees Celsius; bpm, beats per minute; SBP, systolic blood pressure; mmHg, millimeters of mercury; DBP, diastolic blood pressure; RR, respiratory rate; rpm, respirations per minute.
Prospective ValidationThe discrimination power for the clinical model in the
validation cohort had an AUC 0.70 (95% CI, 0.61-0.75) and a good fit (Hosmer and Lemeshow P-value = 0.943).
Prediction ToolTo make this information useful for clinical practice, we
created a weighted score (Table 4). For each point over 0, the rate of PCR SARS-CoV-2 positivity increases significantly from 4%
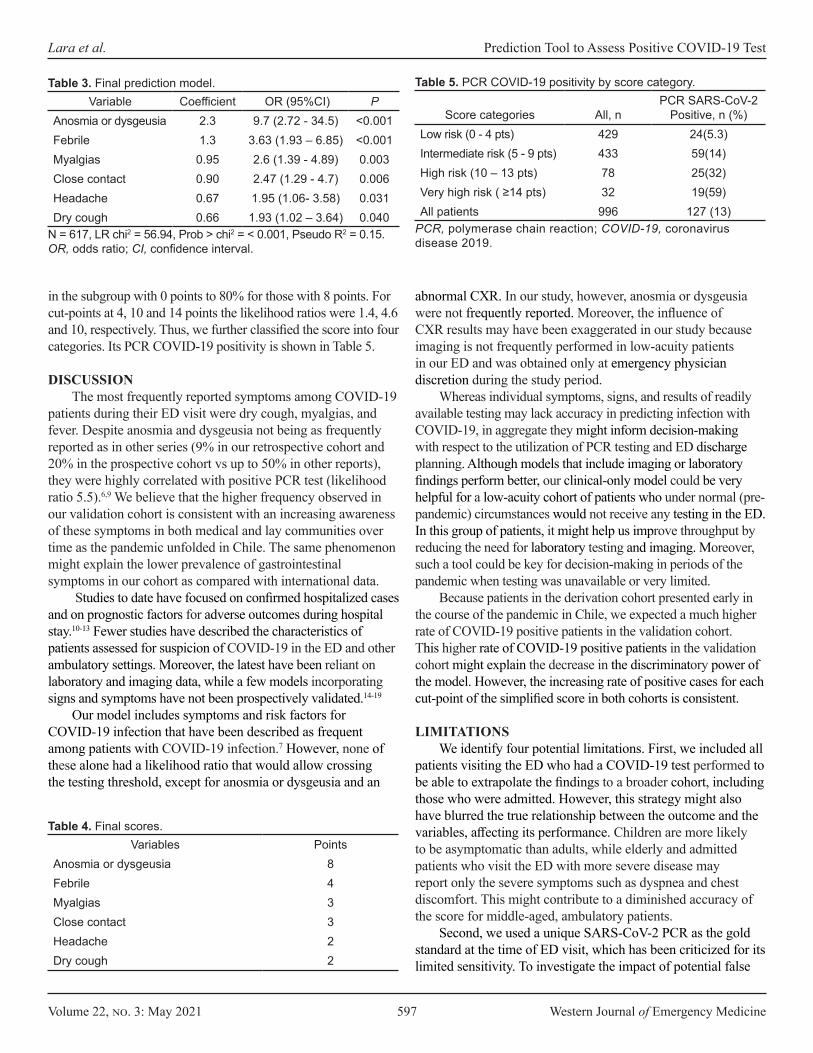
Volume 22, no. 3: May 2021 597 Western Journal of Emergency Medicine
Lara et al. Prediction Tool to Assess Positive COVID-19 Test
Variable Coefficient OR (95%CI) PAnosmia or dysgeusia 2.3 9.7 (2.72 - 34.5) <0.001Febrile 1.3 3.63 (1.93 – 6.85) <0.001Myalgias 0.95 2.6 (1.39 - 4.89) 0.003Close contact 0.90 2.47 (1.29 - 4.7) 0.006Headache 0.67 1.95 (1.06- 3.58) 0.031Dry cough 0.66 1.93 (1.02 – 3.64) 0.040
Table 3. Final prediction model.
N = 617, LR chi2 = 56.94, Prob > chi2 = < 0.001, Pseudo R2 = 0.15.OR, odds ratio; CI, confidence interval.
Variables PointsAnosmia or dysgeusia 8Febrile 4Myalgias 3Close contact 3Headache 2Dry cough 2
Table 4. Final scores.
Score categories All, nPCR SARS-CoV-2
Positive, n (%)Low risk (0 - 4 pts) 429 24(5.3)Intermediate risk (5 - 9 pts) 433 59(14)High risk (10 – 13 pts) 78 25(32)Very high risk ( ≥14 pts) 32 19(59)All patients 996 127 (13)
Table 5. PCR COVID-19 positivity by score category.
PCR, polymerase chain reaction; COVID-19, coronavirus disease 2019.
abnormal CXR. In our study, however, anosmia or dysgeusia were not frequently reported. Moreover, the influence of CXR results may have been exaggerated in our study because imaging is not frequently performed in low-acuity patients in our ED and was obtained only at emergency physician discretion during the study period.
Whereas individual symptoms, signs, and results of readily available testing may lack accuracy in predicting infection with COVID-19, in aggregate they might inform decision-making with respect to the utilization of PCR testing and ED discharge planning. Although models that include imaging or laboratory findings perform better, our clinical-only model could be very helpful for a low-acuity cohort of patients who under normal (pre-pandemic) circumstances would not receive any testing in the ED. In this group of patients, it might help us improve throughput by reducing the need for laboratory testing and imaging. Moreover, such a tool could be key for decision-making in periods of the pandemic when testing was unavailable or very limited.
Because patients in the derivation cohort presented early in the course of the pandemic in Chile, we expected a much higher rate of COVID-19 positive patients in the validation cohort. This higher rate of COVID-19 positive patients in the validation cohort might explain the decrease in the discriminatory power of the model. However, the increasing rate of positive cases for each cut-point of the simplified score in both cohorts is consistent.
LIMITATIONSWe identify four potential limitations. First, we included all
patients visiting the ED who had a COVID-19 test performed to be able to extrapolate the findings to a broader cohort, including those who were admitted. However, this strategy might also have blurred the true relationship between the outcome and the variables, affecting its performance. Children are more likely to be asymptomatic than adults, while elderly and admitted patients who visit the ED with more severe disease may report only the severe symptoms such as dyspnea and chest discomfort. This might contribute to a diminished accuracy of the score for middle-aged, ambulatory patients.
Second, we used a unique SARS-CoV-2 PCR as the gold standard at the time of ED visit, which has been criticized for its limited sensitivity. To investigate the impact of potential false
in the subgroup with 0 points to 80% for those with 8 points. For cut-points at 4, 10 and 14 points the likelihood ratios were 1.4, 4.6 and 10, respectively. Thus, we further classified the score into four categories. Its PCR COVID-19 positivity is shown in Table 5.
DISCUSSIONThe most frequently reported symptoms among COVID-19
patients during their ED visit were dry cough, myalgias, and fever. Despite anosmia and dysgeusia not being as frequently reported as in other series (9% in our retrospective cohort and 20% in the prospective cohort vs up to 50% in other reports), they were highly correlated with positive PCR test (likelihood ratio 5.5).6,9 We believe that the higher frequency observed in our validation cohort is consistent with an increasing awareness of these symptoms in both medical and lay communities over time as the pandemic unfolded in Chile. The same phenomenon might explain the lower prevalence of gastrointestinal symptoms in our cohort as compared with international data.
Studies to date have focused on confirmed hospitalized cases and on prognostic factors for adverse outcomes during hospital stay.10-13 Fewer studies have described the characteristics of patients assessed for suspicion of COVID-19 in the ED and other ambulatory settings. Moreover, the latest have been reliant on laboratory and imaging data, while a few models incorporating signs and symptoms have not been prospectively validated.14-19
Our model includes symptoms and risk factors for COVID-19 infection that have been described as frequent among patients with COVID-19 infection.7 However, none of these alone had a likelihood ratio that would allow crossing the testing threshold, except for anosmia or dysgeusia and an

Western Journal of Emergency Medicine 598 Volume 22, no. 3: May 2021
Prediction Tool to Assess Positive COVID-19 Test Lara et al.
negative tests on our results, we calculated the rate of negative to positive conversion in the proportion of patients who were tested again during the following month. About 1% of admitted and ambulatory patients converted at follow-up. Although the minority of all ambulatory COVID-19 negative patients had a repeated test, we believe that because all our patients had symptoms at the time of testing, we probably tested them at the peak of the sensitivity curve and thus the rate of false negative tests was not significant. Moreover, more than 50% of patients with repeated testing in the ambulatory setting that turned positive were tested more than 14 days after the initial encounter, and presented with new symptoms, suggesting a new infection rather than reflecting an initial false positive.
Third, although we aimed to include imaging and laboratory results as part of a second model, we failed to include these variables because of the small sample size and did not externally validate the model in other clinical settings outside our institution. Lastly, our study was performed during a period of time where SARS-CoV-2 was the predominant circulating virus in our community. Thus, a validation during influenza season would be required to extrapolate these results to a time period when other seasonal viruses start to circulate.
CONCLUSIONOur clinical prediction instrument demonstrated the ability to predict a positive SARS-CoV-2 PCR in patients presenting to the ED with flu-like or cold symptoms with moderate accuracy. Such a tool could be used to assist with patient disposition in environments where COVID-19 tests or timely results are not readily available.
Address for Correspondence: Barbara Lara, MD, MPH, Pontificia Universidad Católica de Chile, Section of Emergency Medicine, Marcoleta 361, oficina 11, Santiago, Region Metropolitana, Chile. Email: [email protected].
Conflicts of Interest: By the WestJEM article submission agreement, all authors are required to disclose all affiliations, funding sources and financial or management relationships that could be perceived as potential sources of bias. No author has professional or financial relationships with any companies that are relevant to this study. There are no conflicts of interest or sources of funding to declare.
Copyright: © 2021 Lara et al. This is an open access article distributed in accordance with the terms of the Creative Commons Attribution (CC BY 4.0) License. See: http://creativecommons.org/licenses/by/4.0/
2. Prem K, Liu Y, Russell TW, et al. The effect of control strategies to reduce social mixing on outcomes of the COVID-19 epidemic in Wuhan, China: a modelling study. Lancet Public Health. 2020;5(5):e261-70.
3. Huang C, Wang Y, Li X, et al. Clinical features of patients infected with 2019 novel coronavirus in Wuhan, China. Lancet. 2020;395(10223):497-506.
4. Rodriguez-Morales AJ, Cardona-Ospina JA, Gutiérrez-Ocampo E, et al. Clinical, laboratory and imaging features of COVID-19: a systematic review and meta-analysis. Travel Med Infect Dis. 2020;34:101623.
5. Cheung KS, Hung IFN, Chan PPY, et al. Gastrointestinal manifestations of SARS-CoV-2 infection and virus load in fecal samples from a Hong Kong cohort: systematic review and meta-analysis. Gastroenterology. 2020;159(1):89-95.
6. Lechien JR, Chiesa-Estomba CM, De Siati DR, et al. Olfactory and gustatory dysfunctions as a clinical presentation of mild-to-moderate forms of the coronavirus disease (COVID-19): a multicenter European study. Eur Arch Otorhinolaryngol. 2020;277(8):2251-61.
7. Wiersinga WJ, Rhodes A, Cheng AC, et al. Pathophysiology, transmission, diagnosis, and treatment of coronavirus disease 2019 (COVID-19): a review. JAMA. 2020;324(8):782-93.
8. Guan W, Ni Z, Hu Y, et al. Clinical characteristics of coronavirus disease 2019 in China. N Engl J Med. 2020;382(18):1708-20.
9. Roland LT, Gurrola JG 2nd, Loftus PA, et al. Smell and Taste symptom-based predictive model for CO VID-19 Diagnosis. Int Forum Allergy Rhinol. 2020;10(7):832-8.
10. Zhang L, Yan X, Fan Q, et al. D-dimer levels on admission to predict in-hospital mortality in patients with Covid-19. J Thromb Haemost. 2020;18(6):1324-9.
11. Ruan Q, Yang K, Wang W, et al. Clinical predictors of mortality due to COVID-19 based on an analysis of data of 150 patients from Wuhan, China. Intensive Care Med. 2020;46(5):846-8.
12. Du RH, Liang LR, Yang CQ, et al. Predictors of mortality for patients with COVID-19 pneumonia caused by SARS-CoV-2: a prospective cohort study. Eur Respir J. 2020;55(5):2000524.
13. Henry BM, De Oliveira MHS, Benoit S,et al. Hematologic, biochemical and immune biomarker abnormalities associated with severe illness and mortality in coronavirus disease 2019 (COVID-19): a meta-analysis. Clin Chem Lab Med. 2020;58(7):1021-8.
14. Wynants L, Van Calster B, Bonten MMJ, et al. Prediction models for diagnosis and prognosis of COVID-19 infection: systematic review and critical appraisal. BMJ. 2020;369:m1328.
15. Tostmann A, Bradley J, Bousema T, et al. Strong associations and moderate predictive value of early symptoms for SARS-CoV-2 test positivity among healthcare workers, the Netherlands, March 2020. Euro Surveill. 2020;25(16):2000508.
16. Jehi L, Ji X, Milinovich A, et al. Individualizing risk prediction for positive COVID-19 testing: results from 11,672 patients. Chest. 2020;158(4):1364-75.
17. Peyrony O, Marbeuf-Gueye C, Truong V, et al. Accuracy of emergency department clinical findings for diagnostic of coronavirus disease 2019. Ann Emerg Med. 2020;76(4):405-12.
18. Zayet S, Klopfenstein T, Mercier J, et al. Contribution of anosmia and dysgeusia for diagnostic of COVID-19 in outpatients. Infection. 2020. In press.
19. Sun Y, Koh V, Marimuthu K, et al. Epidemiological and clinical predictors of COVID-19. Clin Infect Dis. 2020;71(15):786-92.
REFERENCES1. Wang C, Horby PW, Hayden FG, et alo. A novel coronavirus outbreak of
global health concern. Lancet. 2020;395(10223):470-3.
Volume 22, no. 3: May 2021 599 Western Journal of Emergency Medicine
Brief Research Report
SARS-CoV-2 Infection and Associated Rates of Diabetic Ketoacidosis in a New York City Emergency Department
Jared Ditkowsky, MD*Adam C. Lieber, BA†
Evan S. Leibner, MD, PhD*‡
Nicholas Genes, MD, PhD*
Section Editor: Ioannis Koutroulis, MD Submission history: Submitted Auguest 28, 2020; Revision received January 23, 2021; Accepted February 6, 2021 Electronically published May 25, 2021 Full text available through open access at http://escholarship.org/uc/uciem_westjem DOI: 10.5811/westjem.2021.2.49634
Icahn School of Medicine at Mount Sinai, Department of Emergency Medicine, New York City Icahn School of Medicine at Mount Sinai, Department of Emergency Medicine, New York City Icahn School of Medicine at Mount Sinai, Institute for Critical Care Medicine, New York City
Introduction: In early March 2020, coronavirus 2019 (COVID-19) spread rapidly in New York City. Shortly thereafter, in response to the shelter-in-place orders and concern for infection, emergency department (ED) volumes decreased. While a connection between severe acute respiratory syndrome coronavirus 2 (SARS-CoV-2) infection and hyperglycemia/insulin deficiency is well described, its direct relation to diabetic ketoacidosis (DKA) is not. In this study we describe trends in ED volume and admitted patient diagnoses of DKA among five of our health system’s EDs, as they relate to peak SARS-CoV-2 activity in New York City.
Methods: For the five EDs in our hospital system, deidentified visit data extracted for routine quality review was made available for analysis. We looked at total visits and select visit diagnoses related to DKA, across the months of March, April and May 2019, and compared those counts to the same period in 2020.
Results: A total of 93,218 visits were recorded across our five EDs from March 1–May 31, 2019. During that period there were 106 diagnoses of DKA made in the EDs (0.114% of visits). Across the same period in 2020 there were 59,009 visits, and 214 diagnoses of DKA (0.363% of visits)
Conclusion: Despite a decrease in ED volume of 26.9% across our system during this time period, net cases of DKA diagnoses rose drastically by 70.1% compared to the prior year. [West J Emerg Med. 2021;22(3)599-602.]
*
†
‡
INTRODUCTION The coronavirus 2019 (COVID-19) pandemic began
to impact visits to our system’s New York City emergency departments (ED) in March 2020. The city’s first case was detected at our New York City ED on March 1. Case rates rapidly rose across the city; on March 12 mass gatherings in NYC were restricted, and on March 20 a “shelter-in-place” model was ordered by the governor.1 By April 6, COVID-19 cases peaked, and they have steadily decreased since.2 As public health measures went into effect, ED visits at our system’s EDs dropped significantly, and they have only recently started rising again.
COVID-19 has many pathologic manifestations. One difficult-to-manage aspect of severe COVID-19 infections is uncontrolled hyperglycemia and diabetic ketoacidosis (DKA).3
Patients with a history of diabetes mellitus (DM) are also at increased risk for mortality;4 DM was shown to be the leading risk factor among chronic medical conditions along with cerebrovascular disease for COVID-19 mortality.5 In several retrospective studies, uncontrolled hyperglycemia has been associated with worsening mortality,3 and recent consensus guidelines support the importance of glycemic control.6, 7 An exact pathophysiology for this phenomenon has not been
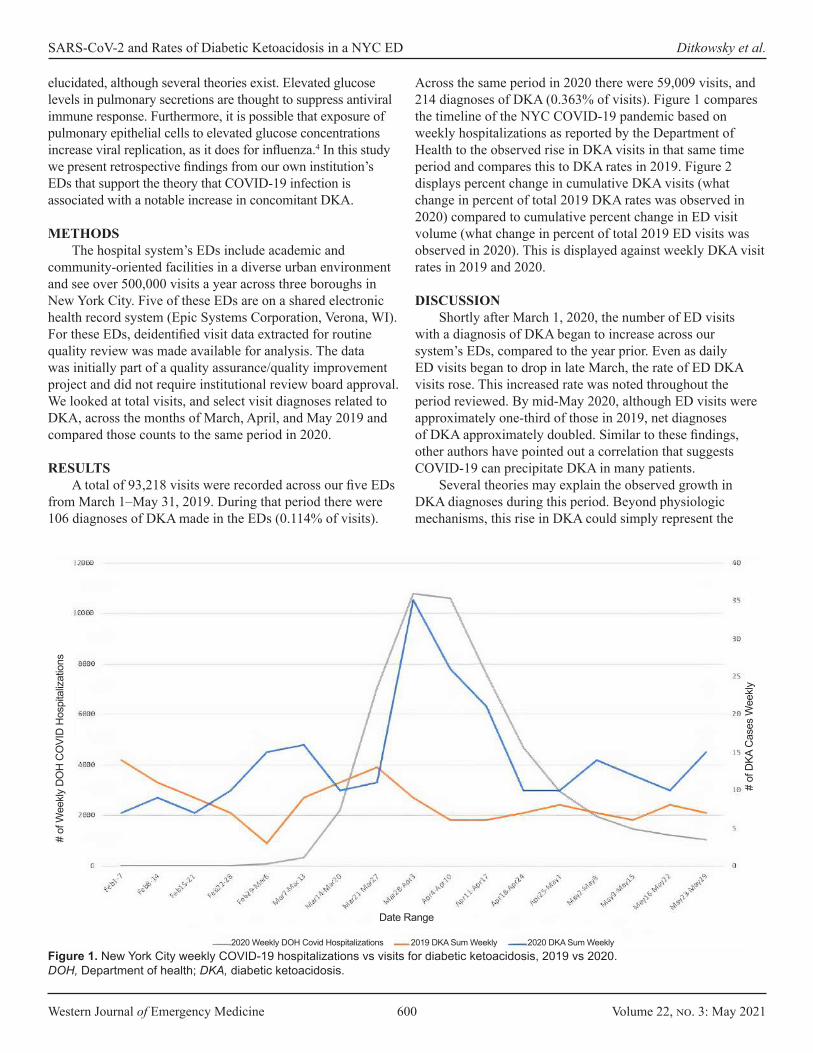
Western Journal of Emergency Medicine 600 Volume 22, no. 3: May 2021
SARS-CoV-2 and Rates of Diabetic Ketoacidosis in a NYC ED Ditkowsky et al.
elucidated, although several theories exist. Elevated glucose levels in pulmonary secretions are thought to suppress antiviral immune response. Furthermore, it is possible that exposure of pulmonary epithelial cells to elevated glucose concentrations increase viral replication, as it does for influenza.4 In this study we present retrospective findings from our own institution’s EDs that support the theory that COVID-19 infection is associated with a notable increase in concomitant DKA.
METHODS
The hospital system’s EDs include academic and community-oriented facilities in a diverse urban environment and see over 500,000 visits a year across three boroughs in New York City. Five of these EDs are on a shared electronic health record system (Epic Systems Corporation, Verona, WI). For these EDs, deidentified visit data extracted for routine quality review was made available for analysis. The data was initially part of a quality assurance/quality improvement project and did not require institutional review board approval. We looked at total visits, and select visit diagnoses related to DKA, across the months of March, April, and May 2019 and compared those counts to the same period in 2020.
RESULTS
A total of 93,218 visits were recorded across our five EDs from March 1–May 31, 2019. During that period there were 106 diagnoses of DKA made in the EDs (0.114% of visits).
Across the same period in 2020 there were 59,009 visits, and 214 diagnoses of DKA (0.363% of visits). Figure 1 compares the timeline of the NYC COVID-19 pandemic based on weekly hospitalizations as reported by the Department of Health to the observed rise in DKA visits in that same time period and compares this to DKA rates in 2019. Figure 2 displays percent change in cumulative DKA visits (what change in percent of total 2019 DKA rates was observed in 2020) compared to cumulative percent change in ED visit volume (what change in percent of total 2019 ED visits was observed in 2020). This is displayed against weekly DKA visit rates in 2019 and 2020.
DISCUSSION
Shortly after March 1, 2020, the number of ED visits with a diagnosis of DKA began to increase across our system’s EDs, compared to the year prior. Even as daily ED visits began to drop in late March, the rate of ED DKA visits rose. This increased rate was noted throughout the period reviewed. By mid-May 2020, although ED visits were approximately one-third of those in 2019, net diagnoses of DKA approximately doubled. Similar to these findings, other authors have pointed out a correlation that suggests COVID-19 can precipitate DKA in many patients.
Several theories may explain the observed growth in DKA diagnoses during this period. Beyond physiologic mechanisms, this rise in DKA could simply represent the
Figure 1. New York City weekly COVID-19 hospitalizations vs visits for diabetic ketoacidosis, 2019 vs 2020. DOH, Department of health; DKA, diabetic ketoacidosis.
2020 Weekly DOH Covid Hospitalizations 2019 DKA Sum Weekly 2020 DKA Sum Weekly
# of
Wee
kly D
OH
CO
VID
Hos
pita
lizat
ions
Date Range
# of
DKA
Cas
es W
eekly
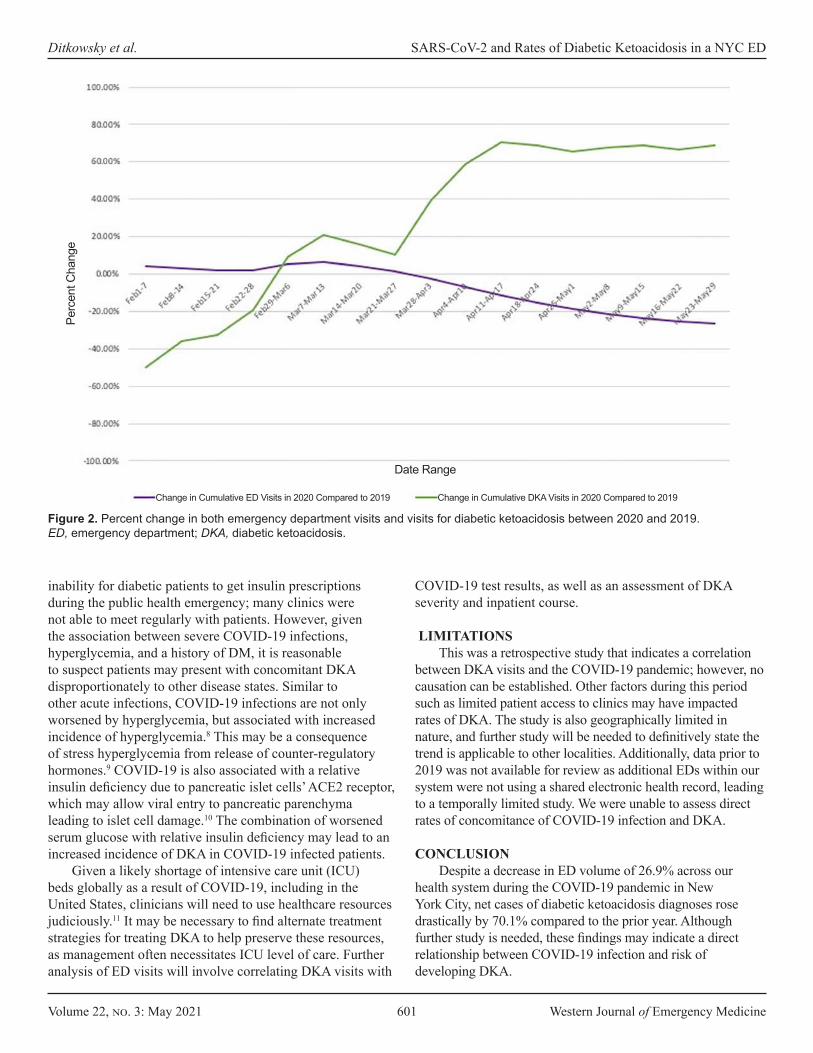
Volume 22, no. 3: May 2021 601 Western Journal of Emergency Medicine
Ditkowsky et al. SARS-CoV-2 and Rates of Diabetic Ketoacidosis in a NYC ED
inability for diabetic patients to get insulin prescriptions during the public health emergency; many clinics were not able to meet regularly with patients. However, given the association between severe COVID-19 infections, hyperglycemia, and a history of DM, it is reasonable to suspect patients may present with concomitant DKA disproportionately to other disease states. Similar to other acute infections, COVID-19 infections are not only worsened by hyperglycemia, but associated with increased incidence of hyperglycemia.8 This may be a consequence of stress hyperglycemia from release of counter-regulatory hormones.9 COVID-19 is also associated with a relative insulin deficiency due to pancreatic islet cells’ ACE2 receptor, which may allow viral entry to pancreatic parenchyma leading to islet cell damage.10 The combination of worsened serum glucose with relative insulin deficiency may lead to an increased incidence of DKA in COVID-19 infected patients.
Given a likely shortage of intensive care unit (ICU) beds globally as a result of COVID-19, including in the United States, clinicians will need to use healthcare resources judiciously.11 It may be necessary to find alternate treatment strategies for treating DKA to help preserve these resources, as management often necessitates ICU level of care. Further analysis of ED visits will involve correlating DKA visits with
COVID-19 test results, as well as an assessment of DKA severity and inpatient course.
LIMITATIONSThis was a retrospective study that indicates a correlation
between DKA visits and the COVID-19 pandemic; however, no causation can be established. Other factors during this period such as limited patient access to clinics may have impacted rates of DKA. The study is also geographically limited in nature, and further study will be needed to definitively state the trend is applicable to other localities. Additionally, data prior to 2019 was not available for review as additional EDs within our system were not using a shared electronic health record, leading to a temporally limited study. We were unable to assess direct rates of concomitance of COVID-19 infection and DKA.
CONCLUSIONDespite a decrease in ED volume of 26.9% across our
health system during the COVID-19 pandemic in New York City, net cases of diabetic ketoacidosis diagnoses rose drastically by 70.1% compared to the prior year. Although further study is needed, these findings may indicate a direct relationship between COVID-19 infection and risk of developing DKA.
Figure 2. Percent change in both emergency department visits and visits for diabetic ketoacidosis between 2020 and 2019.ED, emergency department; DKA, diabetic ketoacidosis.
Change in Cumulative ED Visits in 2020 Compared to 2019 Change in Cumulative DKA Visits in 2020 Compared to 2019
Date Range
Perc
ent C
hang
e
Western Journal of Emergency Medicine 602 Volume 22, no. 3: May 2021
SARS-CoV-2 and Rates of Diabetic Ketoacidosis in a NYC ED Ditkowsky et al.
REFERENCES
1. Lee JC, Mervosh S, Avila Y, et al. See how all 50 states are reopening (and closing again). 2020. Available at: https://www.nytimes.com/interactive/2020/us/states-reopen-map-coronavirus.html. Accessed July 22, 2020.
2. NYC Health, COVID-19: Data Summary - NYC Health 2020. 2020. Available at: https://www1.nyc.gov/site/doh/covid/covid-19-data.page. Accessed July 10, 2020.
Address for Correspondence: Jared Ditkowsky, MD, Icahn School of Medicine at Mount Sinai, Department of Emergency Medicine, 1 Gustave-Levy Place, Manhattan, New York, 10029. Email: [email protected].
Conflicts of Interest: By the WestJEM article submission agreement, all authors are required to disclose all affiliations, funding sources and financial or management relationships that could be perceived as potential sources of bias. No author has professional or financial relationships with any companies that are relevant to this study. There are no conflicts of interest or sources of funding to declare.
Copyright: © 2021 Ditkowsky et al. This is an open access article distributed in accordance with the terms of the Creative Commons Attribution (CC BY 4.0) License. See: http://creativecommons.org/licenses/by/4.0/
3. Zhu L, She ZG, Cheng X, et al. Association of blood glucose control and outcomes in patients with COVID-19 and pre-existing type 2 diabetes. Cell Metab. 2020;31(6):1068-1077.e3.
4. Hill MA, Mantzoros C, Sowers JR. Commentary: COVID-19 in patients with diabetes. Metabolism. 2020;107:154217.
5. Yang X, Yu Y, Xu J, et al. Clinical course and outcomes of critically ill patients with SARS-CoV-2 pneumonia in Wuhan, China: a single-centered, retrospective, observational study. Lancet Respir Med. 2020;8(5):475-81.
6. Bornstein SR, Rubino F, Khunti K, et al. Practical recommendations for the management of diabetes in patients with COVID-19. Lancet Diabetes Endocrinol. 2020;8(6):546-50.
7. Reddy PK, Kuchay MS, Mehta Y, Mishra SK. Diabetic ketoacidosis precipitated by COVID-19: a report of two cases and review of literature. Diabetes Metab Syndr. 2020;14(5):1459-62.
8. Li J, Wang X, Chen J, et al. COVID-19 infection may cause ketosis and ketoacidosis. Diabetes Obes Metab. 2020;22(10):1935-41.
9. Montori VM, Bistrian BR, McMahon MM. Hyperglycemia in acutely ill patients. JAMA. 2002;288(17):2167-9.
10. Yang JK, Lin SS, Ji XJ, et al. Binding of SARS coronavirus to its receptor damages islets and causes acute diabetes. Acta Diabetol. 2010;47(3):193-9.
11. Moghadas SM, Shoukat A, Fitzpatrick MC, et al. Projecting hospital utilization during the COVID-19 outbreaks in the United States. Proc Natl Acad Sci USA. 2020;117(16):9122-26.

Volume 22, no. 3: May 2021 603 Western Journal of Emergency Medicine
Brief Researh Report
Changes in Emergency Department Activity and the First COVID-19 Lockdown: A Cross-sectional Study
Kate Honeyford, MSc, PhD*#
Charles Coughlan, BA, BM, BCh*† Ruud G. Nijman, MD, PhD, MSc‡§
Paul Expert, MSc, PhD*#
Gabriel Burcea, MSc*Ian Maconochie, PhD, MB, BS, LMSSA‡
Anne Kinderlerer, MB, BCh¶ Graham S. Cooke, DPhil, MB, BChir||#
Ceire E. Costelloe, MSc, PhD*#
Section Editor: Patrick Meloy, MD Submission history: Submitted August 25, 2020; Revision received February 1, 2021; Accepted February 13, 2021Electronically published May 7, 2021 Full text available through open access at http://escholarship.org/uc/uciem_westjem DOI: 10.5811/westjem.2021.2.49614
INTRODUCTION The emergence of COVID-19 and subsequent ‘lockdown’
introduced by the British Government on 23rd March 20201 had
Imperial College London, Department of Primary Care and Public Health, Global Digital Health Unit, London, United KingdomImperial College Healthcare NHS Trust, Department of Paediatrics, London, United KingdomSt. Mary’s Hospital, Imperial College Healthcare NHS Trust, Department of Paediatric Emergency Medicine, London, United KingdomImperial College London, Section of Paediatric Infectious Diseases, London, United KingdomSt. Mary’s Hospital, Imperial College Healthcare NHS Trust, London, United KingdomImperial College London, Department of Infectious Disease, London, United KingdomImperial Biomedical Research Centre, London, United Kingdom
Introduction: Emergency department (ED) attendances fell across the UK after the ‘lockdown’ introduced on 23rd March 2020 to limit the spread of coronavirus disease 2019 (COVID-19). We hypothesised that reductions would vary by patient age and disease type. We examined pre- and in-lockdown ED attendances for two COVID-19 unrelated diagnoses: one likely to be affected by lockdown measures (gastroenteritis), and one likely to be unaffected (appendicitis).
Methods: We conducted a retrospective cross-sectional study across two EDs in one London hospital Trust. We compared all adult and paediatric ED attendances, before (January 2020) and during lockdown (March/April 2020). Key patient demographics, method of arrival, and discharge location were compared. We used Systemised Nomenclature of Medicine codes to define attendances for gastroenteritis and appendicitis.
Results: ED attendances fell from 1129 per day before lockdown to 584 in lockdown, 51.7% of pre-lockdown rates. In-lockdown attendances were lowest for under-18s (16.0% of pre-lockdown). The proportion of patients admitted to hospital increased from 17.3% to 24.0%, and the proportion admitted to intensive care increased fourfold. Attendances for gastroenteritis fell from 511 to 103, 20.2% of pre-lockdown rates. Attendances for appendicitis also decreased, from 144 to 41, 28.5% of pre-lockdown rates.
Conclusion: ED attendances fell substantially following lockdown implementation. The biggest reduction was for under-18s. We observed reductions in attendances for gastroenteritis and appendicitis. This may reflect lower rates of infectious disease transmission, although the fall in appendicitis-related attendances suggests that behavioural factors were also important. Larger studies are urgently needed to understand changing patterns of ED use and access to emergency care during the coronavirus 2019 pandemic. [West J Emerg Med. 2021;22(3)603–607.]
*
†
‡
§
¶
||
#
a substantial impact on emergency department (ED) attendances. Total ED attendances in England in March 2020 fell by 29.4% year-on-year.2 The reasons for this change in ED activity are
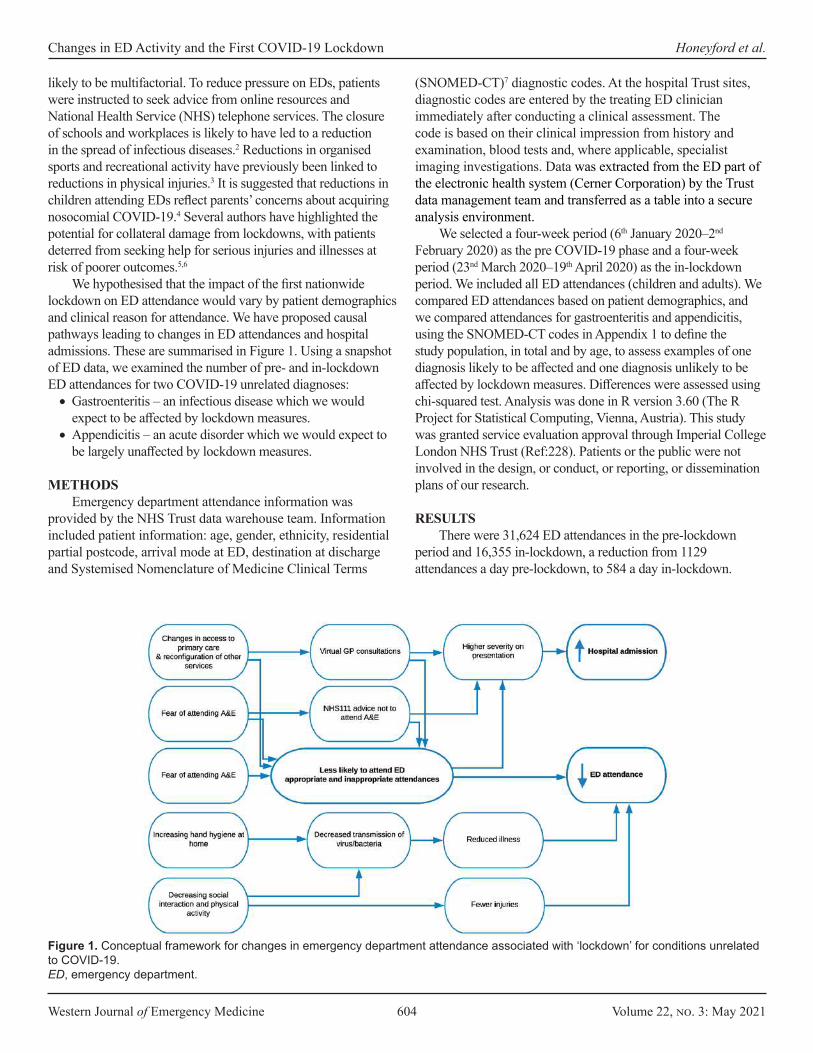
Western Journal of Emergency Medicine 604 Volume 22, no. 3: May 2021
Changes in ED Activity and the First COVID-19 Lockdown Honeyford et al.
likely to be multifactorial. To reduce pressure on EDs, patients were instructed to seek advice from online resources and National Health Service (NHS) telephone services. The closure of schools and workplaces is likely to have led to a reduction in the spread of infectious diseases.2 Reductions in organised sports and recreational activity have previously been linked to reductions in physical injuries.3 It is suggested that reductions in children attending EDs reflect parents’ concerns about acquiring nosocomial COVID-19.4 Several authors have highlighted the potential for collateral damage from lockdowns, with patients deterred from seeking help for serious injuries and illnesses at risk of poorer outcomes.5,6
We hypothesised that the impact of the first nationwide lockdown on ED attendance would vary by patient demographics and clinical reason for attendance. We have proposed causal pathways leading to changes in ED attendances and hospital admissions. These are summarised in Figure 1. Using a snapshot of ED data, we examined the number of pre- and in-lockdown ED attendances for two COVID-19 unrelated diagnoses:•Gastroenteritis – an infectious disease which we would
expect to be affected by lockdown measures. •Appendicitis – an acute disorder which we would expect to
be largely unaffected by lockdown measures.
METHODS Emergency department attendance information was
provided by the NHS Trust data warehouse team. Information included patient information: age, gender, ethnicity, residential partial postcode, arrival mode at ED, destination at discharge and Systemised Nomenclature of Medicine Clinical Terms
(SNOMED-CT)7 diagnostic codes. At the hospital Trust sites, diagnostic codes are entered by the treating ED clinician immediately after conducting a clinical assessment. The code is based on their clinical impression from history and examination, blood tests and, where applicable, specialist imaging investigations. Data was extracted from the ED part of the electronic health system (Cerner Corporation) by the Trust data management team and transferred as a table into a secure analysis environment.
We selected a four-week period (6th January 2020–2nd February 2020) as the pre COVID-19 phase and a four-week period (23nd March 2020–19th April 2020) as the in-lockdown period. We included all ED attendances (children and adults). We compared ED attendances based on patient demographics, and we compared attendances for gastroenteritis and appendicitis, using the SNOMED-CT codes in Appendix 1 to define the study population, in total and by age, to assess examples of one diagnosis likely to be affected and one diagnosis unlikely to be affected by lockdown measures. Differences were assessed using chi-squared test. Analysis was done in R version 3.60 (The R Project for Statistical Computing, Vienna, Austria). This study was granted service evaluation approval through Imperial College London NHS Trust (Ref:228). Patients or the public were not involved in the design, or conduct, or reporting, or dissemination plans of our research.
RESULTS There were 31,624 ED attendances in the pre-lockdown
period and 16,355 in-lockdown, a reduction from 1129 attendances a day pre-lockdown, to 584 a day in-lockdown.
Figure 1. Conceptual framework for changes in emergency department attendance associated with ‘lockdown’ for conditions unrelated to COVID-19.ED, emergency department.
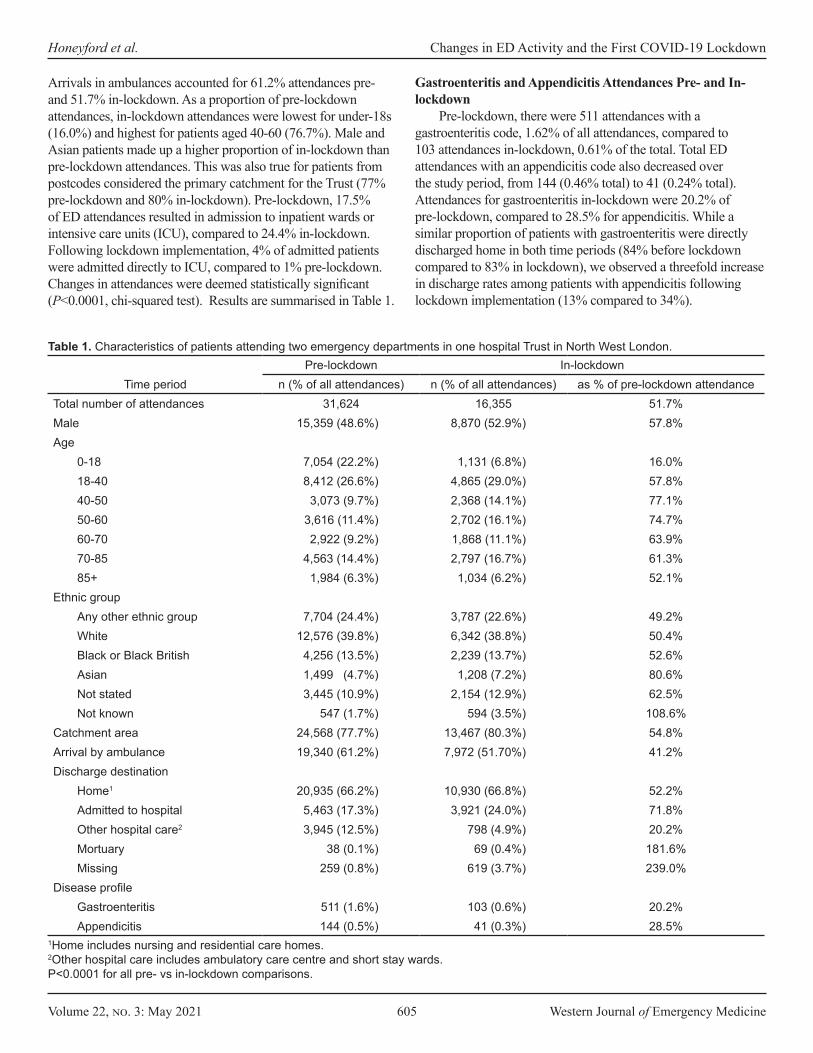
Volume 22, no. 3: May 2021 605 Western Journal of Emergency Medicine
Honeyford et al. Changes in ED Activity and the First COVID-19 Lockdown
Arrivals in ambulances accounted for 61.2% attendances pre- and 51.7% in-lockdown. As a proportion of pre-lockdown attendances, in-lockdown attendances were lowest for under-18s (16.0%) and highest for patients aged 40-60 (76.7%). Male and Asian patients made up a higher proportion of in-lockdown than pre-lockdown attendances. This was also true for patients from postcodes considered the primary catchment for the Trust (77% pre-lockdown and 80% in-lockdown). Pre-lockdown, 17.5% of ED attendances resulted in admission to inpatient wards or intensive care units (ICU), compared to 24.4% in-lockdown. Following lockdown implementation, 4% of admitted patients were admitted directly to ICU, compared to 1% pre-lockdown. Changes in attendances were deemed statistically significant (P<0.0001, chi-squared test). Results are summarised in Table 1.
Gastroenteritis and Appendicitis Attendances Pre- and In-lockdown
Pre-lockdown, there were 511 attendances with a gastroenteritis code, 1.62% of all attendances, compared to 103 attendances in-lockdown, 0.61% of the total. Total ED attendances with an appendicitis code also decreased over the study period, from 144 (0.46% total) to 41 (0.24% total). Attendances for gastroenteritis in-lockdown were 20.2% of pre-lockdown, compared to 28.5% for appendicitis. While a similar proportion of patients with gastroenteritis were directly discharged home in both time periods (84% before lockdown compared to 83% in lockdown), we observed a threefold increase in discharge rates among patients with appendicitis following lockdown implementation (13% compared to 34%).
Time periodPre-lockdown In-lockdown
n (% of all attendances) n (% of all attendances) as % of pre-lockdown attendanceTotal number of attendances 31,624 16,355 51.7%Male 15,359 (48.6%) 8,870 (52.9%) 57.8%Age
0-18 7,054 (22.2%) 1,131 (6.8%) 16.0%18-40 8,412 (26.6%) 4,865 (29.0%) 57.8%40-50 3,073 (9.7%) 2,368 (14.1%) 77.1%50-60 3,616 (11.4%) 2,702 (16.1%) 74.7%60-70 2,922 (9.2%) 1,868 (11.1%) 63.9%70-85 4,563 (14.4%) 2,797 (16.7%) 61.3%85+ 1,984 (6.3%) 1,034 (6.2%) 52.1%
Ethnic groupAny other ethnic group 7,704 (24.4%) 3,787 (22.6%) 49.2%White 12,576 (39.8%) 6,342 (38.8%) 50.4%Black or Black British 4,256 (13.5%) 2,239 (13.7%) 52.6%Asian 1,499 (4.7%) 1,208 (7.2%) 80.6%Not stated 3,445 (10.9%) 2,154 (12.9%) 62.5%Not known 547 (1.7%) 594 (3.5%) 108.6%
Catchment area 24,568 (77.7%) 13,467 (80.3%) 54.8%Arrival by ambulance 19,340 (61.2%) 7,972 (51.70%) 41.2%Discharge destination
Home1 20,935 (66.2%) 10,930 (66.8%) 52.2%Admitted to hospital 5,463 (17.3%) 3,921 (24.0%) 71.8%Other hospital care2 3,945 (12.5%) 798 (4.9%) 20.2%Mortuary 38 (0.1%) 69 (0.4%) 181.6%Missing 259 (0.8%) 619 (3.7%) 239.0%
Disease profileGastroenteritis 511 (1.6%) 103 (0.6%) 20.2%Appendicitis 144 (0.5%) 41 (0.3%) 28.5%
1Home includes nursing and residential care homes.2Other hospital care includes ambulatory care centre and short stay wards.P<0.0001 for all pre- vs in-lockdown comparisons.
Table 1. Characteristics of patients attending two emergency departments in one hospital Trust in North West London.

Western Journal of Emergency Medicine 606 Volume 22, no. 3: May 2021
Changes in ED Activity and the First COVID-19 Lockdown Honeyford et al.
Changes in attendances for both diseases varied with age. We observed the most significant reduction in attendances with gastroenteritis amongst children and young people and patients aged over 60.
DISCUSSION In line with national data,2 we found that overall ED
attendances almost halved since the introduction of lockdown. Similar to other reports,6,8 the impact of the lockdown on ED attendance rate was greatest in the under-18’s, suggesting changes in parental health-seeking behaviour. Following lockdown implementation, a higher proportion of ED patients required hospital admission, and there was a fourfold increase in the proportion admitted directly to ICU. These changes may reflect patients attending with more serious conditions, severe COVID-19 and/or the increase in ICU capacity. In contrast, for patients with appendicitis there was a reduction in admissions, which was likely due to a change in clinical management to antibiotics during this time.9
We hypothesised a reduction in gastroenteritis-related attendances following lockdown implementation due to reduced interpersonal contact and spread of infectious diseases. The results show that attendances in-lockdown fell to one-fifth of pre-lockdown rates. A reduction in ED attendances for specific infectious diseases has been described in England2 and Italy.10 However, the decrease in attendances for appendicitis suggests that reduced transmission alone cannot explain the reduction in ED attendances seen after lockdown.
LIMITATIONSNot all of the differences we have reported are attributable
to lockdown. Seasonal variations are seen in a range of infectious diseases, including gastroenteritis. However, seasonal variations alone are unlikely to account for our findings as nationally published data for this hospital Trust suggest April attendances in 2019 were only 5% lower than January 2019.11 Gastrointestinal (GI) symptoms are seen in around 15% of children and adults with confirmed SARS-CoV-2 infection.12 As such, patients with COVID-19 presenting with fever and prominent GI symptoms may be wrongly diagnosed with gastroenteritis, confounding our in-lockdown results. We did not exclude these presentations as we did not know patients’ motivations for attending ED, and testing policy evolved over the study period. Nonetheless, we feel this confounding effect is unlikely to have had a substantial bearing on our results as we observed a fourfold reduction in gastroenteritis attendances during the in-lockdown period. Indeed, if large numbers of patients with GI symptoms secondary to COVID-19 were wrongly labelled as having infectious gastroenteritis, we may have underestimated the extent of the fall in ED attendances for gastroenteritis across the study period.
Treatment pathways have changed during the pandemic as hospitals have sought to minimize non-emergency surgery. This includes an increase in the management of uncomplicated appendicitis with oral antibiotics possibly explaining the fall in
appendicitis-related admissions.8 However, this cannot explain the reduction in ED attendances with appendicitis to less than one-third of pre-lockdown levels, as there was no concurrent change in advice to primary care practitioners and patients regarding appendicitis during this time.
CONCLUSIONWe have developed a conceptual causal framework
proposing various factors which may lead to lower ED attendances during the COVID-19 pandemic. These factors include deterred care seeking due to fears of acquiring infection in hospital settings and patients seeking health advice from other services. Future studies, using larger, more generalisable data from across whole healthcare systems must aim to untangle the relative contributions of these different factors and ensure that sick patients have timely and equitable access to emergency care.
ACKNOWLEDGMENTSThis research was funded by the NIHR Imperial Biomedical
Research Centre (BRC). The research was conducted using National Institute of Health Research Health Informatics Collaborative data resources. Data management was provided by the Big Data and Analytical Unit (BDAU) at the Institute of Global Health Innovation (IGHI).
Imperial College London is grateful for support from the NW London NIHR Applied Research Collaboration. The views expressed in this publication are those of the authors and not necessarily those of the NIHR or the Department of Health and Social Care.
Address for Correspondence: Kate Honeyford, MSc, PhD, Imperial College London, Department of Primary Care and Public Health, Charing Cross Campus, The Reynolds Building, St Dunstan’s Road, London, W6 8RP. Email: [email protected].
Conflicts of Interest: By the WestJEM article submission agreement, all authors are required to disclose all affiliations, funding sources and financial or management relationships that could be perceived as potential sources of bias. No author has professional or financial relationships with any companies that are relevant to this study. This report is independent research funded by the UK National Institute for Health Research (NIHR) Biomedical Research Centre NIHR-BRC-P68711. KH and PE are supported by the NIHR Imperial Biomedical Research Centre (BRC). CC is supported by a personal NIHR Career Development Fellowship (NIHR-2016-090-015). GSC is supported by NIHR Research Professorship. RGN is supported by NIHR academic clinical lecturer award (ACL-2018-21-007). ChC’s work as a Clinical Research Fellow in Integrated Care is supported by a grant from the Imperial Health Charity. Ethics for this study was granted service evaluation approval through Imperial College London NHS Trust (Ref:228).
Copyright: © 2021 Honeyford et al. This is an open access article distributed in accordance with the terms of the Creative Commons Attribution (CC BY 4.0) License. See: http://creativecommons.org/licenses/by/4.0/

Volume 22, no. 3: May 2021 607 Western Journal of Emergency Medicine
Honeyford et al. Changes in ED Activity and the First COVID-19 Lockdown
REFERENCES1. UK Parliament. UK Parliament Health Secretary gives update on new
‘lockdown’ measures announced to tackle coronavirus. 2020. Available at: https://www.parliament.uk/business/news/2020/march/update-on-coronavirus-24-march-2020. Accessed February 16, 2021.
2. Kelly E, Firth Z. How is COVID-19 changing the use of emergency care? The Health Foundation. 2020. Available at: www.health.org.uk/news-and-comment/charts-and-infographics/how-is-covid-19-changing-the-use-of-emergency-care. Accessed June 5, 2020.
3. Buddhdev P, Gille H, and Ibrahin Y The paediatric burden of UK lockdown – early results in the COVID-19 era. 2020. Available at: https://www.boa.ac.uk/policy-engagement/journal-of-trauma-orthopaedics/journal-of-trauma-orthopaedics-and-coronavirus/the-paediatric-trauma-burden-of-uk-lockdown-early.html. Accessed June 9, 2020.
4. Wong LE, Hawkins JE, Langness S, et al. Where are all the patients? Addressing Covid-19 fear to encourage sick patients to seek emergency care | Catalyst non-issue content. 2020. Available at: https://catalyst.nejm.org/doi/full/10.1056/CAT.20.0193. Accessed June 9, 2020.
5. Crawley E, Loades M, Feder G, et al. Wider collateral damage to children in the UK because of the social distancing measures designed to reduce the impact of COVID-19 in adults. BMJ Paediatr Open. 2020;4(1):e000701.
6. Bavli I, Sutton B, Galea S. Harms of public health interventions
against Covid-19 must not be ignored. BMJ. 2020;371:m4074.7. United Kingdom National Health Service. NHS Digital SNOMED CT
2020. 2020. Available at: https://digital.nhs.uk/services/terminology-and-classifications/snomed-ct. Accessed June 9, 2020.
8. Isba R, Edge R, Jenner R, et al. Where have all the children gone? Decreases in paediatric emergency department attendances at the start of the COVID-19 pandemic of 2020. Arch Dis Child. 2020;105(7):704.
9. Collard M, Lakkis Z, Loriau J, et al. Antibiotics alone as an alternative to appendectomy for uncomplicated acute appendicitis in adults: Changes in treatment modalities related to the COVID-19 health crisis. J Visc Surg. 2020;157(3S1):S33-S42.
10. Angoulvant F, Ouldali N, Dawei Yang D, et al. COVID-19 pandemic: impact caused by school closure and national lockdown on pediatric visits and admissions for viral and non-viral infections, a time series analysis. Clin Infect Dis. 2021;72(2):319-22.
11. NHS England. A&E Attendances. 2020. Available at: www.england.nhs.uk/statistics/statistical-work-areas/ae-waiting-times-and-activity/. Accessed June 5, 2020.
12. Mao R, Qiu Y, He JS, et al. Manifestations and prognosis of gastrointestinal and liver involvement in patients with COVID-19: a systematic review and meta-analysis. Lancet Gastroenterol Hepatol. 2020;5(7):667-78. Erratum in: Lancet Gastroenterol Hepatol. 2020;5(7):e6.

Western Journal of Emergency Medicine 608 Volume 22, no. 3: May 2021
Systems of Medicine
Establishment of an Alternate Care Site (ACS) in Imperial County During COVID-19
Amelia M. Breyre, MD*Bryan Sloane, MD†
Christopher Herring‡
Howard Backer, MD, MPH§
Thomas McGinnis MHA, EMT-P§
Katherine Staats, MD†
Section Editor: Mark I. Langdorf, MD, MHPE Submission history: Submitted August 14, 2020; Revision received December 23, 2020; Accepted December 26, 2020 Electronically published March 25, 2021 Full text available through open access at http://escholarship.org/uc/uciem_westjem DOI: 10.5811/westjem.2020.12.49237
INTRODUCTIONCoronavirus disease 2019 (COVID-19) has created an
unprecedented set of medical challenges across the United States that has strained the resources of communities differently. Imperial County is a county in southern California, bordering Mexico. As of early May 2020, there was a significant increase in COVID-19 cases in Mexico and Imperial County. At the time, 25% of COVID-19 tests were positive, representing 834 per 100,000 residents. This was the largest population-adjusted surge in the state of California.1 In response to this overwhelming surge in the healthcare system a request from the county was sent to the State of California for additional resources. An Alternate Care Site (ACS) was created as part of a collaboration between the California state Emergency Medical Service Authority (EMSA) and Imperial County. The Imperial
University of California San Francisco, Department of Emergency Medicine, San Francisco, California Stanford University, Department of Emergency Medicine, Stanford, California;Emergency Medical Services/Bioterrorism Preparedness Manager, Imperial County Public Health Department, Imperial, CaliforniaCalifornia Emergency Medical Services Authority, Rancho Cordova, California
*
†
‡
§
Imperial County is in southern California, one of the state’s two counties at the international United States-Mexico border. The county is one of the most resource-limited in the state, with only two hospitals serving its 180,000 citizens, and no tertiary care centers. A significant portion of the population cared for at the local hospitals commutes from Mexicali, a large city of 1.2 million persons, just south of Imperial County’s ports of entry. Since May 2020, following an outbreak in Mexicali, Imperial County has seen a significant increase in the number of COVID-19 patients, quickly outpacing its local resources. In response to this surge an alternate care site (ACS) was created as part of a collaboration between the California State Emergency Medical Service Authority (EMSA) and the county. In the first month of operations (May 26–June 26, 2020) the ACS received 106 patients with an average length of stay of 3.6 days. The average patient age was 55.5 years old with a range of 19-95 years. Disposition of patients included 25.5% sent to the emergency department for acute care needs, 1.8% who left against medical advice, and 72.7% who were discharged home or to a skilled nursing facility. There were no deaths on site. This study shares early experiences, challenges, and innovations created with the implementation of this ACS. Improving communication with local partners was the single most significant step in overcoming initial barriers. [West J Emerg Med. 2021;22(3)608–613.]
County ACS opened on May 25, 2020. This article shares the early experiences with the development of this ACS. About Imperial County
Imperial County is bordered in the US by San Diego, Riverside, and Yuma Counties. It is the poorest county in California, and has approximately 180,000 citizens per the 2010 US census. In 2018 the median household income in Imperial County was $45,834, significantly lower than California’s median income ($71,228).2 Mexicali is the capital of the state of Baja California in Mexico; it is a city of approximately 1.2 million people along the southern border of Imperial County (Figure).
This border with Mexico represents the fourth busiest pedestrian crossing in the US, with approximately 50,000

Volume 22, no. 3: May 2021 609 Western Journal of Emergency Medicine
Breyre et al. Establishment of an Alternative Care Site During COVID-19
individuals passing back and forth daily through three land ports of entry, outside of the COVID-19 pandemic limitations.3 A significant number of workers live in Mexico and commute to the US regularly. It is estimated that 10-20% of the population of Mexicali can legally cross the border under the essential worker limitation, approximately 120,000-360,000 persons. Those crossing under these circumstances must be US citizens or lawful permanent residents. At the time of publication, there was no screening or evaluation of COVID-19 at the port of entry. At the time this article was written, Imperial County was a priority in California regarding COVID-19 due to the rapidly increasing numbers of cases, proximity to the outbreak in Baja California, and its resource limitations.
There are two hospitals in Imperial County: El Centro Regional Medical Center (licensed for 161 beds), and Pioneers Memorial Healthcare District (licensed for 107 beds). There are no tertiary care centers within the county – no trauma center, no cardiac catheterization lab, and no stroke center. There is one private EMS 911 transporting agency, and several first-responder public fire departments, most do not transport 911 call patients. There are two air ambulance providers, which are heavily used due to the resource limitations of the county and the number of high-acuity patients. The county routinely collaborates with many state and federal partners including US Customs and Border Protection, US Border Patrol, and land management agencies.
Alternate Care Sites (ACS)Alternate care sites is a broad term for temporary sites that
are intended to decompress existing healthcare infrastructure by caring for low-acuity patients. These sites are important options to manage medical surge after acute care hospitals
have maximized their capacity and capabilities. There are both federal and state guidelines for ACS creation, but the important underlying theme is that an ACS is adaptive to the disaster scenario and the available resources.4,5 Many different models of ACS have been described.4-8 In the case of influenza pandemics, ACS can be useful in providing hospital overflow, patient isolation, expanded ambulatory care, care for recovering non-infectious patients, limited supportive care for non-critical patients, primary triage, and rapid patient screening or quarantine.6,7 Several paradigms advocate for ACS to function as an extension of a supporting hospital, once the hospital exceeds its capacity. In this situation, facilities should not serve as the initial destination for disaster patients as these facilities may lack the appropriate emergency resources. The components of ACS include structure (facilities), stuff (supplies and equipment), staff (personnel), and systems (integrated management policies and processes).8
ObjectiveThe authors of this workgroup represent a variety of
stakeholders who were involved in the operations, logistics, planning, and clinical care of patients at the Imperial County ACS. The objective of this study was to shares early experiences, challenges, and innovations created with the implementation of this ACS. METHODSSite Selection
In Imperial County, the site selected for an ACS was a gymnasium at a local community college, the Imperial Valley College. The site was selected after an assessment conducted by the US Army Corps of Engineers including medical planners,
Figure. Map of Imperial County in southern California and surrounding geography.
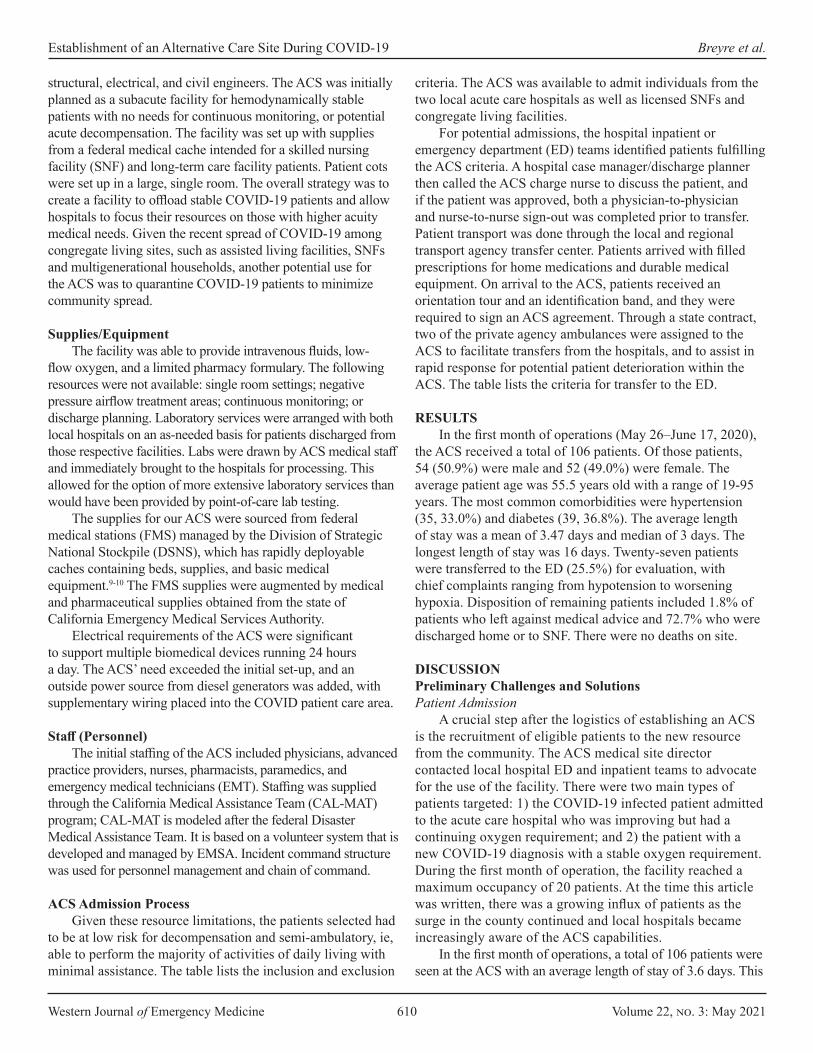
Western Journal of Emergency Medicine 610 Volume 22, no. 3: May 2021
Establishment of an Alternative Care Site During COVID-19 Breyre et al.
structural, electrical, and civil engineers. The ACS was initially planned as a subacute facility for hemodynamically stable patients with no needs for continuous monitoring, or potential acute decompensation. The facility was set up with supplies from a federal medical cache intended for a skilled nursing facility (SNF) and long-term care facility patients. Patient cots were set up in a large, single room. The overall strategy was to create a facility to offload stable COVID-19 patients and allow hospitals to focus their resources on those with higher acuity medical needs. Given the recent spread of COVID-19 among congregate living sites, such as assisted living facilities, SNFs and multigenerational households, another potential use for the ACS was to quarantine COVID-19 patients to minimize community spread. Supplies/Equipment
The facility was able to provide intravenous fluids, low-flow oxygen, and a limited pharmacy formulary. The following resources were not available: single room settings; negative pressure airflow treatment areas; continuous monitoring; or discharge planning. Laboratory services were arranged with both local hospitals on an as-needed basis for patients discharged from those respective facilities. Labs were drawn by ACS medical staff and immediately brought to the hospitals for processing. This allowed for the option of more extensive laboratory services than would have been provided by point-of-care lab testing.
The supplies for our ACS were sourced from federal medical stations (FMS) managed by the Division of Strategic National Stockpile (DSNS), which has rapidly deployable caches containing beds, supplies, and basic medical equipment.9-10 The FMS supplies were augmented by medical and pharmaceutical supplies obtained from the state of California Emergency Medical Services Authority.
Electrical requirements of the ACS were significant to support multiple biomedical devices running 24 hours a day. The ACS’ need exceeded the initial set-up, and an outside power source from diesel generators was added, with supplementary wiring placed into the COVID patient care area.
Staff (Personnel)The initial staffing of the ACS included physicians, advanced
practice providers, nurses, pharmacists, paramedics, and emergency medical technicians (EMT). Staffing was supplied through the California Medical Assistance Team (CAL-MAT) program; CAL-MAT is modeled after the federal Disaster Medical Assistance Team. It is based on a volunteer system that is developed and managed by EMSA. Incident command structure was used for personnel management and chain of command.
ACS Admission ProcessGiven these resource limitations, the patients selected had
to be at low risk for decompensation and semi-ambulatory, ie, able to perform the majority of activities of daily living with minimal assistance. The table lists the inclusion and exclusion
criteria. The ACS was available to admit individuals from the two local acute care hospitals as well as licensed SNFs and congregate living facilities.
For potential admissions, the hospital inpatient or emergency department (ED) teams identified patients fulfilling the ACS criteria. A hospital case manager/discharge planner then called the ACS charge nurse to discuss the patient, and if the patient was approved, both a physician-to-physician and nurse-to-nurse sign-out was completed prior to transfer. Patient transport was done through the local and regional transport agency transfer center. Patients arrived with filled prescriptions for home medications and durable medical equipment. On arrival to the ACS, patients received an orientation tour and an identification band, and they were required to sign an ACS agreement. Through a state contract, two of the private agency ambulances were assigned to the ACS to facilitate transfers from the hospitals, and to assist in rapid response for potential patient deterioration within the ACS. The table lists the criteria for transfer to the ED. RESULTS
In the first month of operations (May 26–June 17, 2020), the ACS received a total of 106 patients. Of those patients, 54 (50.9%) were male and 52 (49.0%) were female. The average patient age was 55.5 years old with a range of 19-95 years. The most common comorbidities were hypertension (35, 33.0%) and diabetes (39, 36.8%). The average length of stay was a mean of 3.47 days and median of 3 days. The longest length of stay was 16 days. Twenty-seven patients were transferred to the ED (25.5%) for evaluation, with chief complaints ranging from hypotension to worsening hypoxia. Disposition of remaining patients included 1.8% of patients who left against medical advice and 72.7% who were discharged home or to SNF. There were no deaths on site. DISCUSSIONPreliminary Challenges and SolutionsPatient Admission
A crucial step after the logistics of establishing an ACS is the recruitment of eligible patients to the new resource from the community. The ACS medical site director contacted local hospital ED and inpatient teams to advocate for the use of the facility. There were two main types of patients targeted: 1) the COVID-19 infected patient admitted to the acute care hospital who was improving but had a continuing oxygen requirement; and 2) the patient with a new COVID-19 diagnosis with a stable oxygen requirement. During the first month of operation, the facility reached a maximum occupancy of 20 patients. At the time this article was written, there was a growing influx of patients as the surge in the county continued and local hospitals became increasingly aware of the ACS capabilities.
In the first month of operations, a total of 106 patients were seen at the ACS with an average length of stay of 3.6 days. This
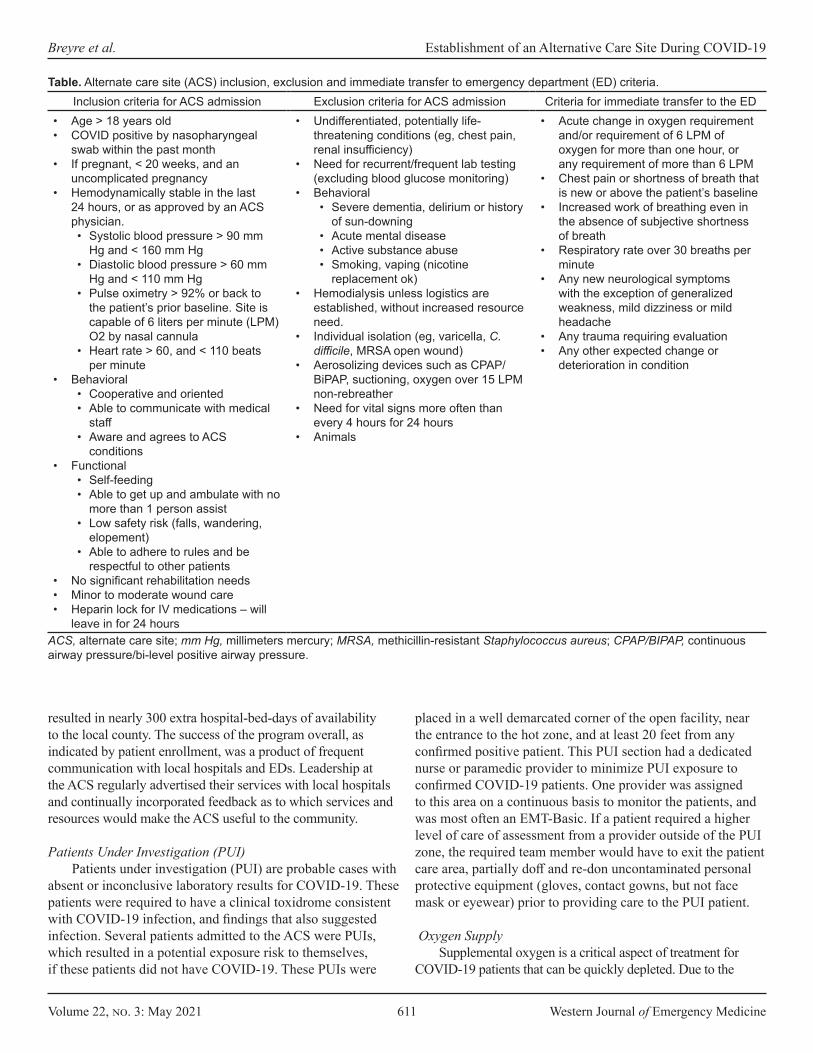
Volume 22, no. 3: May 2021 611 Western Journal of Emergency Medicine
Breyre et al. Establishment of an Alternative Care Site During COVID-19
resulted in nearly 300 extra hospital-bed-days of availability to the local county. The success of the program overall, as indicated by patient enrollment, was a product of frequent communication with local hospitals and EDs. Leadership at the ACS regularly advertised their services with local hospitals and continually incorporated feedback as to which services and resources would make the ACS useful to the community. Patients Under Investigation (PUI)
Patients under investigation (PUI) are probable cases with absent or inconclusive laboratory results for COVID-19. These patients were required to have a clinical toxidrome consistent with COVID-19 infection, and findings that also suggested infection. Several patients admitted to the ACS were PUIs, which resulted in a potential exposure risk to themselves, if these patients did not have COVID-19. These PUIs were
placed in a well demarcated corner of the open facility, near the entrance to the hot zone, and at least 20 feet from any confirmed positive patient. This PUI section had a dedicated nurse or paramedic provider to minimize PUI exposure to confirmed COVID-19 patients. One provider was assigned to this area on a continuous basis to monitor the patients, and was most often an EMT-Basic. If a patient required a higher level of care of assessment from a provider outside of the PUI zone, the required team member would have to exit the patient care area, partially doff and re-don uncontaminated personal protective equipment (gloves, contact gowns, but not face mask or eyewear) prior to providing care to the PUI patient.
Oxygen SupplySupplemental oxygen is a critical aspect of treatment for
COVID-19 patients that can be quickly depleted. Due to the
Inclusion criteria for ACS admission Exclusion criteria for ACS admission Criteria for immediate transfer to the ED• Age > 18 years old• COVID positive by nasopharyngeal
swab within the past month• If pregnant, < 20 weeks, and an
uncomplicated pregnancy• Hemodynamically stable in the last
24 hours, or as approved by an ACS physician. • Systolic blood pressure > 90 mm
Hg and < 160 mm Hg• Diastolic blood pressure > 60 mm
Hg and < 110 mm Hg• Pulse oximetry > 92% or back to
the patient’s prior baseline. Site is capable of 6 liters per minute (LPM) O2 by nasal cannula
• Heart rate > 60, and < 110 beats per minute
• Behavioral• Cooperative and oriented• Able to communicate with medical
staff• Aware and agrees to ACS
conditions• Functional
• Self-feeding• Able to get up and ambulate with no
more than 1 person assist• Low safety risk (falls, wandering,
elopement)• Able to adhere to rules and be
respectful to other patients• No significant rehabilitation needs• Minor to moderate wound care• Heparin lock for IV medications – will
leave in for 24 hours
• Undifferentiated, potentially life-threatening conditions (eg, chest pain, renal insufficiency)
• Need for recurrent/frequent lab testing (excluding blood glucose monitoring)
• Behavioral• Severe dementia, delirium or history
of sun-downing• Acute mental disease• Active substance abuse• Smoking, vaping (nicotine
replacement ok)• Hemodialysis unless logistics are
established, without increased resource need.
• Individual isolation (eg, varicella, C. difficile, MRSA open wound)
• Aerosolizing devices such as CPAP/BiPAP, suctioning, oxygen over 15 LPM non-rebreather
• Need for vital signs more often than every 4 hours for 24 hours
• Animals
• Acute change in oxygen requirement and/or requirement of 6 LPM of oxygen for more than one hour, or any requirement of more than 6 LPM
• Chest pain or shortness of breath that is new or above the patient’s baseline
• Increased work of breathing even in the absence of subjective shortness of breath
• Respiratory rate over 30 breaths per minute
• Any new neurological symptoms with the exception of generalized weakness, mild dizziness or mild headache
• Any trauma requiring evaluation• Any other expected change or
deterioration in condition
ACS, alternate care site; mm Hg, millimeters mercury; MRSA, methicillin-resistant Staphylococcus aureus; CPAP/BIPAP, continuous airway pressure/bi-level positive airway pressure.
Table. Alternate care site (ACS) inclusion, exclusion and immediate transfer to emergency department (ED) criteria.

Western Journal of Emergency Medicine 612 Volume 22, no. 3: May 2021
Establishment of an Alternative Care Site During COVID-19 Breyre et al.
logistical challenges in acquiring and providing a continuous oxygen supply, patient admission criteria to the ACS was limited to an oxygen requirement of ≤ 6 liters per minute. Collaborating with local authorities, we were able to establish a local and renewable source for oxygen tank refills. This became a crucial part of facility sustainability that was initially underestimated.
Oxygen delivery modalities remained a challenge for the ACS. Oxygen concentrators remain the most effective means of sustainable oxygen delivery; however, they were in short supply and their use was limited by electrical requirements. The concentrators also placed a significant strain on the building electrical system, which had not been designed for the uninterrupted demand of a biomedical center. Oxygen regulators were also a scarce resource and required a constant turnover of oxygen tanks. Large, H-cylinder oxygen tanks ( > 7000-liter capacity) were also considered. However, due to delivery requiring a hose-based splitting system and a potential tripping hazard limiting patient mobility, the large-cylinder option was deemed too logistically challenging. Home Medications
Given the limits of the onsite pharmacy, patients transferring to the ACS were expected to have their discharge medications in hand when sent from the hospital. However, this proved challenging for patients who did not have health insurance or had financially burdensome copays. We worked with hospital case managers, patient families, and pharmacists to troubleshoot alternative solutions for specific scenarios. For example, patients who were provided albuterol metered-dose inhalers and spacers at the hospital were encouraged to bring those to the ACS. In hindsight, early discussion about the logistics with the home supply of medication would have facilitated smoother transitions of care. Language Barriers
The vast majority of patients admitted to the ACS has been primarily Spanish speaking, which is representative of Imperial County’s population where 85% of the population self-identifies as Hispanic or Latino.2 Translating discharge documents, signage for patients and families, and having sufficient numbers of Spanish-speaking staff were necessary adaptations.
Patient Care Resources The majority of patients were discharged from the ACS
after being weaned off oxygen and were stable on room air. One patient had to be discharged with a prescription for home oxygen due to a persistent oxygen requirement with exertion. Approximately 30% of patients required transfer back to the local hospitals for escalation of care. The benefit of stat, urgent, and routine laboratory diagnostics may have been beneficial to minimize the number of transfers back to the ED and was further investigated after this preliminary phase. Additionally, in response to requests from local facilities about how we could improve patient care and expand eligible
patients, the ACS contracted a physical therapist. Physical therapy provided daily ambulation and leg exercise, assisted in monitoring fitness levels, and provided a presumed decreased risk of venous thromboembolism. Staffing
CAL-MAT and EMSA collaborated to provide staffing to the ACS. Due to the burden of COVID-19 throughout the state of California, finding available clinical providers with acute care or disaster experience was limited. Many of the roles typically filled by a certified nurse assistant or licensed vocational nurse were performed by EMT-Basics based on their ready availability through the CAL-MAT system. Some commonalities among those recruited for the ACS included retired physicians, nurses who were new graduates, or providers who practiced primarily in outpatient settings. The initial staffing structure used a blend of the nurse, paramedic, and EMT role to care for patients that was adjusted for the austere conditions, and generally a different environment than either primarily inpatient or outpatient providers would typically work in. Creating a successful team with the variety of backgrounds and experiences, in the resource-limited setting, was crucial to the success of the mission. Initially it was difficult to anticipate patient volumes, and in the early stages of development, deliberate attempts were made to overstaff the facility. This approach helped tremendously in trying to improve team dynamics, maximize clinical knowledge, and provide flexibility in scheduling.
LIMITATIONS There are two noteworthy limitations of this study. Firstly,
there is limited outcome data on those patients transferred back to the ED. Unless the patient was returned to the ACS after ED evaluation, it was unknown whether the patient’s condition worsened or improved or there was any additional diagnosis. Secondly, the challenge faced in many disaster medicine scenarios is the limited ability to provide a cost analysis of such interventions. Particularly in a scenario such as the one we report on where there is a collaboration of federal, state, and local resources it can be difficult to calculate the cost benefit of such interventions in a community. Moreover, this ACS was implemented concomitantly with several other health system interventions such as increasing critical care capacity at local hospitals and the development of a regional patient transfer system.
CONCLUSIONAlternate care sites, by their very nature, are
tremendously variable and can be a valuable disaster resource when implemented well. In our recent experience, listening, communicating, and collaborating to meet local community needs is a crucial step in establishing a successful ACS. If there is a mismatch between the requirements of the community and resources provided, then
Volume 22, no. 3: May 2021 613 Western Journal of Emergency Medicine
Breyre et al. Establishment of an Alternative Care Site During COVID-19
the effort can be expensive, redundant, and ineffective. Once begun, our priority was to adapt to the evolving COVID-19 pandemic in Imperial County. Through our adaptations to the logistical challenges of oxygen distribution, staffing issues, and patient care, we were able to significantly increase the capacity of our ACS, and in turn, serve its local community. We hope this summary of the early stages of development of one ACS, in an area highly impacted by the COVID-19 pandemic, will benefit others in their preparation and response to similar disasters. ACKNOWLEDGMENTS
We thank Imperial Valley College, Imperial County Public Health Department, El Centro Regional Medical Center, Pioneers Memorial Healthcare District, California EMSA, CAL-MAT, Global Medical Response, National Guard, Disaster Medical Assistance Teams, the US Centers for Disease Control and Prevention, and ACS Operations staff as well as all our local, regional, state and federal partners who contributed to Imperial County’s COVID-19 response.
Address for Correspondence: Amelia Breyre, MD, University of San Francisco, Department of Emergency Medicine, 505 Parnassus Ave, San Francisco, CA 94143. Email: [email protected].
Conflicts of Interest: By the WestJEM article submission agreement, all authors are required to disclose all affiliations, funding sources and financial or management relationships that could be perceived as potential sources of bias. No author has professional or financial relationships with any companies that are relevant to this study. There are no conflicts of interest or sources of funding to declare.
Copyright: © 2021 Breyre et al. This is an open access article distributed in accordance with the terms of the Creative Commons Attribution (CC BY 4.0) License. See: http://creativecommons.org/licenses/by/4.0/
REFERENCES1. California State 2020. County Variance Info. Covid19.ca.gov.
Available at: https://covid19.ca.gov/roadmap-counties/. Accessed June 2, 2020.
2. Census Bureau QuickFacts 2020. U.S. Census Bureau QuickFacts: Imperial County, California. Available at: https://www.census.gov/quickfacts/imperialcountycalifornia. Accessed June 2, 2020.
3. Bureau of Transportation Statistics. Border Crossing/Entry Data. Border Crossing/Entry Data. 2020. Available at: https://www.bts.gov/content/border-crossingentry-data. Accessed July 24, 2020.
4. Center of Infectious Disease Research and Policy. Standards and Guidelines for Healthcare Surge during Emergencies. Available at: www.cidrap.umn.edu/practice/standards-and-guidelines-healthcare-surge-during-emergencies. Accessed June 3, 2020.
5. Health and Human Services Office of the Assistant Secretary for Preparedness and Response (ASPR) Federal Healthcare Resilience Task Force Alternate Care Site (ACS) Toolkit. 2020. Available at: https://files.asprtracie.hhs.gov/documents/acs-toolkit-ed1-20200330-1022.pdf. Accessed June 2, 2020.
6. Cinti SK, Wilkerson W, Holmes JG, et al. Pandemic influenza and acute care centers: taking care of sick patients in a nonhospital setting. Biosecur Bioterror. 2008;6(4):335-48.
7. Kim CS, Pile JC, Lozon MM, et al. Role of hospitalists in an offsite alternate care center (ACC) for pandemic flu. J Hosp Med. 2009;4(9):546-9.
8. Mohr JA, Allen GW, Guerry JL. (2010). Healthcare facility disaster planning: using GIS to identify alternate care sites. In: Skinner R, eds. GIS in Hospital and Healthcare Emergency Management, (p. 88-97). Boca Raton, FL: CRC Press.
9. CDC Center for Disease Control. Office of Public Health Preparedness and Response Division of Strategic National Stockpile Federal Medical Stations. Available at: https://ftp.cdc.gov/pub/MCMTraining/FMS/FMS%20Fact%20Sheet.pdf. Accessed June 15, 2020.
10. United States Department of Health and Human Services. Medical Assistance. 2019. Available: https://www.phe.gov/Preparedness/support/medicalassistance/Pages/default.aspx. Accessed 15 June, 2020.
Western Journal of Emergency Medicine 614 Volume 22, no. 3: May 2021
Original Research
Acute Kidney Injury After CT in Emergency Patients with Chronic Kidney Disease: A Propensity Score-matched Analysis
Mamata Kene, MD, MPH*†
Vignesh A. Arasu, MD, PhD*‡§
Ajit K. Mahapatra, MD*¶
Jie Huang, PhD§
Mary E. Reed, DrPH§
Section Editor: Brian Yun, MD Submission history: Submitted October 13, 2020; Revision received January 5, 2021; Accepted January 8, 2021 Electronically published April 2, 2021 Full text available through open access at http://escholarship.org/uc/uciem_westjem DOI: 10.5811/westjem.2021.1.50246
INTRODUCTIONIncreasing use of computed tomography (CT) in United
States emergency departments (ED) brings controversy over contrast-associated acute kidney injury (CA-AKI) in focus for ED patients, where a subset may be vulnerable even if overall risk is low.1-8 The recent American College of Radiology and National Kidney Foundation joint consensus statement suggests for patients with “severe kidney disease,” risks of
The Permanente Medical Group, Oakland, CaliforniaKaiser Foundation Hospital, Department of Emergency Medicine, Fremont, CaliforniaKaiser Foundation Hospital, Department of Radiology, Vallejo, CaliforniaKaiser Permanente Division of Research, Oakland, CaliforniaKaiser Foundation Hospital, Department of Nephrology, Santa Clara, California
*†
‡
§
¶
Introduction: Acute kidney injury (AKI) after intravenous contrast administration for computed tomography (CT) occurs infrequently, but certain patients may be susceptible. This study evaluated AKI incidence among emergency department (ED) patients with pre-existing chronic kidney disease (CKD) undergoing CT exams.
Methods: This retrospective cohort study in an integrated healthcare system included ED patients previously diagnosed with CKD stages 3-5 (estimated glomerular filtration rate <60 milliliters per minute per 1.73 meters squared over at least three months), undergoing CT exams with or without intravenous contrast, from January 1, 2013–December 31, 2017. We excluded patients with CT prior to (30 days) or following (14 days) index CT and missing serum creatinine (sCr) measurements. We applied propensity score matching, and then multivariable regression adjustment for post-CT ED disposition and ED diagnosis, to calculate adjusted risk of AKI. Secondary patient-centered outcomes included 30-day mortality, end-stage renal disease (ESRD) diagnosis, and dialysis initiation.
Results: Among 103,573 eligible ED patients undergoing CT, propensity score matching yielded 5,589 pairs. Adjusted risk ratio (ARR) for AKI was higher overall for contrast-enhanced CT (1.60; 95% confidence interval [CI], 1.43-1.79). However, secondary outcomes were infrequent: 19/5,589 non-contrast vs 40/5,589 contrast patients with new dialysis initiation at 30 days (adjusted risk 0.3% vs 0.7%; adjusted risk reduction 0.4%; 95% CI, 0.1%-0.7%).
Conclusion: In ED patients with chronic kidney disease undergoing CT, intravenous contrast was associated with higher overall adjusted risk of AKI, but patient-centered secondary outcomes were rare. The clinical significance of transient kidney injury after CT is unclear, although patients with advanced chronic kidney disease appear to have elevated risk. [West J Emerg Med. 2021;22(3)614–622.]
contrast media are uncertain, and existing evidence may be underpowered to estimate risk of injury.9
Early studies overestimated CA-AKI incidence, while recent work casts doubt on the phenomenon of CA-AKI altogether.8,10-12 Meta-analyses concluding that intravenous (IV) contrast is not associated with AKI were not focused on ED patients or chronic kidney disease (CKD), and where CKD patients were included, definitions were inconsistent.13-15
Volume 22, no. 3: May 2021 615 Western Journal of Emergency Medicine
Kene et al. CT and AKI in ED patients with CKD
Population Health Research Capsule
What do we already know about this issue?Contrast computed tomography (CT) may not pose large risk for acute kidney injury (AKI), yet patients with underlying renal dysfunction may be vulnerable to AKI after contrast exposure.
What was the research question?Among patients with chronic kidney disease (CKD), is contrast CT associated with higher incidence of AKI?
What was the major finding of the study?Despite elevated AKI risk in CKD patients undergoing contrast CT, short-term dialysis starts and mortality were uncommon.
How does this improve population health?While contrast CT was associated with elevated AKI risk for CKD patients, the significance of transient AKI after CT is unclear, warranting further study.
One meta-analysis included six studies that defined CKD differently, using baseline serum creatinine [sCr] within 24 hours of CT (potentially reflecting AKI rather than CKD), or prior kidney disease diagnoses from the medical record.7,14,16 Chronic kidney disease requires presence of objective laboratory markers of decreased renal function persistent over three months or more; so equating abnormal baseline sCr with CKD may cause misidentification.17
Why might CA-AKI go undetected? Studies may be underpowered to detect CA-AKI; substantial confounding may persist despite mitigation attempts, with non-contrast control groups at higher risk for AKI; retrospective cohorts with complete sCr measurements may be sicker overall; undiagnosed AKI could coincide with CT; and propensity score matching may not completely adjust for differences between contrast and non-contrast groups.18 Still, propensity score matching may be the most feasible means to evaluate CA-AKI, absent prospective trials.19 Finally, the significance of short-term AKI is unclear with respect to patient-centered clinical outcomes such as progression to dialysis and of kidney disease severity.
Among patients with moderate-to-severe CKD (stage 3-5), limited data are reported, yet these patients may be most vulnerable to CA-AKI even if overall risk is low.7,8,16 Two of the largest retrospective CA-AKI studies included small numbers of CKD patients spread over long study periods.7,8 A study focused on patients with pre-existent CKD might be able to clarify the association of IV contrast with AKI in this potentially at-risk population. We compared the incidence of AKI in a large cohort of ED patients with pre-existing CKD 3-5, undergoing non-contrast or contrast-enhanced CT, by applying propensity scores to match the groups for likelihood of receiving contrast based on presence of previously described AKI risk factors.
METHODSStudy Design and Setting
We conducted a retrospective cohort study within Kaiser Permanente Northern California, a large, not-for-profit integrated healthcare system caring for four million patients, with over 1.2 million ED visits annually in 21 community EDs. Patients are similar to the regional population and are socioeconomically, racially and ethnically diverse.20 The health system employs a single electronic health record (EHR). The Kaiser Permanente Northern California Institutional Review Board granted a waiver of informed consent for this data-only Health Insurance Portability and Accountability Act-compliant study.
Data SourcesAll data was electronically extracted from the EHR
(Epic Systems Corporation, Verona, WI) and its databases by an experienced programmer (JH). Structured electronic extraction used current procedural terminology, internal and
International Classification of Diseases, Ninth Revision and Tenth Revision (ICD-9 and ICD-10) codes.
Participant SelectionAll ED visits by adult patients (>17 years) with EHR
diagnosis of CKD stage 3-5 who underwent a CT head, neck, chest, abdomen, or pelvis in the ED from January 1, 2013–December 31, 2017 were included.16,17,21 Chronic kidney disease stages 3, 4 and 5 are defined as estimated glomerular filtration rate (eGFR) between 30-59 milliliters per minute per 1.73 meters squared (mL/min/1.73m2), 15-29 mL/min/1.73m2 and <15 mL/min/1.73m2, respectively, persisting over three months or longer. Patients with end-stage renal disease (ESRD) or dialysis were excluded since sCr fluctuations can be inaccurate; we did include patients with CKD stage 5 who were not on dialysis. Patients missing initial and follow-up (24-72 hour) sCr were excluded.7,8,10 We also excluded exams 30 days prior to and 14 days after the index ED visit to avoid confounding due to repeat contrast administration or residual contrast effects. Only the first study-eligible ED CT was included to avoid sampling bias due to clustering by patient; thus, no patients crossed over.
Exposure VariableWe electronically extracted IV contrast administration
based on CT order and procedure code. Omnipaque 300 and 350 and Isovue 370 (non-ionic low-osmolar contrast media)
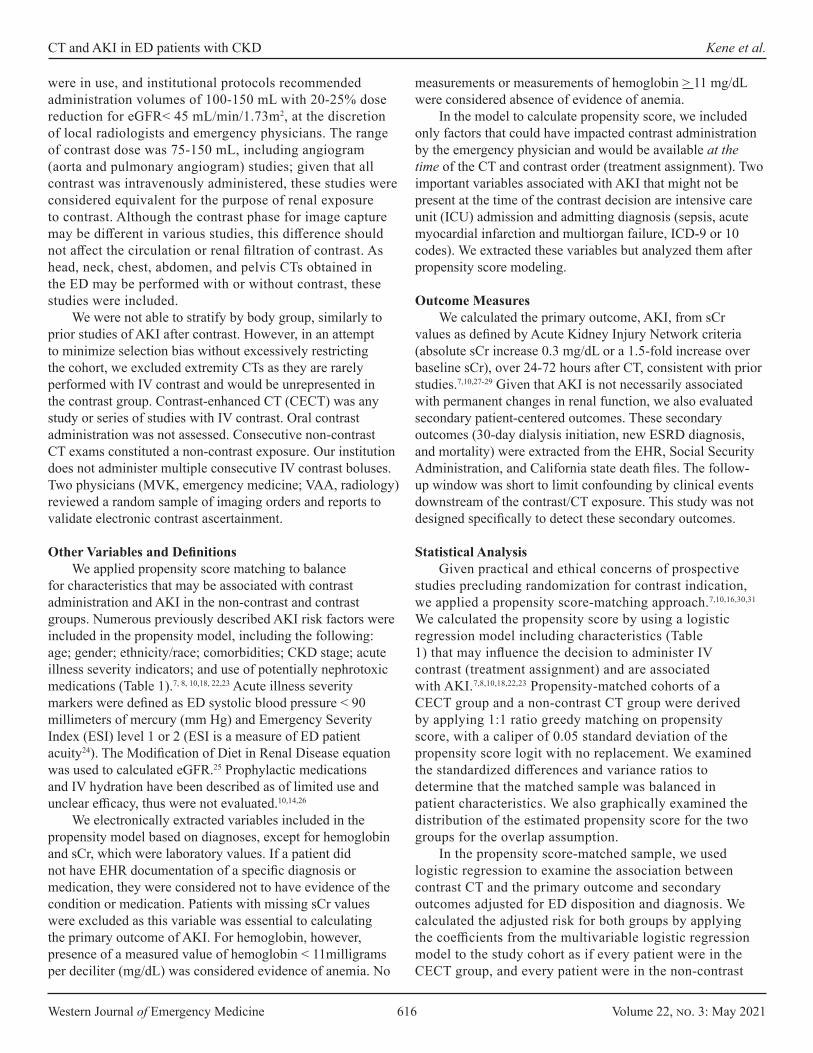
Western Journal of Emergency Medicine 616 Volume 22, no. 3: May 2021
CT and AKI in ED patients with CKD Kene et al.
were in use, and institutional protocols recommended administration volumes of 100-150 mL with 20-25% dose reduction for eGFR< 45 mL/min/1.73m2, at the discretion of local radiologists and emergency physicians. The range of contrast dose was 75-150 mL, including angiogram (aorta and pulmonary angiogram) studies; given that all contrast was intravenously administered, these studies were considered equivalent for the purpose of renal exposure to contrast. Although the contrast phase for image capture may be different in various studies, this difference should not affect the circulation or renal filtration of contrast. As head, neck, chest, abdomen, and pelvis CTs obtained in the ED may be performed with or without contrast, these studies were included.
We were not able to stratify by body group, similarly to prior studies of AKI after contrast. However, in an attempt to minimize selection bias without excessively restricting the cohort, we excluded extremity CTs as they are rarely performed with IV contrast and would be unrepresented in the contrast group. Contrast-enhanced CT (CECT) was any study or series of studies with IV contrast. Oral contrast administration was not assessed. Consecutive non-contrast CT exams constituted a non-contrast exposure. Our institution does not administer multiple consecutive IV contrast boluses. Two physicians (MVK, emergency medicine; VAA, radiology) reviewed a random sample of imaging orders and reports to validate electronic contrast ascertainment.
Other Variables and DefinitionsWe applied propensity score matching to balance
for characteristics that may be associated with contrast administration and AKI in the non-contrast and contrast groups. Numerous previously described AKI risk factors were included in the propensity model, including the following: age; gender; ethnicity/race; comorbidities; CKD stage; acute illness severity indicators; and use of potentially nephrotoxic medications (Table 1).7, 8, 10,18, 22,23 Acute illness severity markers were defined as ED systolic blood pressure < 90 millimeters of mercury (mm Hg) and Emergency Severity Index (ESI) level 1 or 2 (ESI is a measure of ED patient acuity24). The Modification of Diet in Renal Disease equation was used to calculated eGFR.25 Prophylactic medications and IV hydration have been described as of limited use and unclear efficacy, thus were not evaluated.10,14,26
We electronically extracted variables included in the propensity model based on diagnoses, except for hemoglobin and sCr, which were laboratory values. If a patient did not have EHR documentation of a specific diagnosis or medication, they were considered not to have evidence of the condition or medication. Patients with missing sCr values were excluded as this variable was essential to calculating the primary outcome of AKI. For hemoglobin, however, presence of a measured value of hemoglobin < 11milligrams per deciliter (mg/dL) was considered evidence of anemia. No
measurements or measurements of hemoglobin > 11 mg/dL were considered absence of evidence of anemia.
In the model to calculate propensity score, we included only factors that could have impacted contrast administration by the emergency physician and would be available at the time of the CT and contrast order (treatment assignment). Two important variables associated with AKI that might not be present at the time of the contrast decision are intensive care unit (ICU) admission and admitting diagnosis (sepsis, acute myocardial infarction and multiorgan failure, ICD-9 or 10 codes). We extracted these variables but analyzed them after propensity score modeling.
Outcome MeasuresWe calculated the primary outcome, AKI, from sCr
values as defined by Acute Kidney Injury Network criteria (absolute sCr increase 0.3 mg/dL or a 1.5-fold increase over baseline sCr), over 24-72 hours after CT, consistent with prior studies.7,10,27-29 Given that AKI is not necessarily associated with permanent changes in renal function, we also evaluated secondary patient-centered outcomes. These secondary outcomes (30-day dialysis initiation, new ESRD diagnosis, and mortality) were extracted from the EHR, Social Security Administration, and California state death files. The follow-up window was short to limit confounding by clinical events downstream of the contrast/CT exposure. This study was not designed specifically to detect these secondary outcomes.
Statistical AnalysisGiven practical and ethical concerns of prospective
studies precluding randomization for contrast indication, we applied a propensity score-matching approach.7,10,16,30,31 We calculated the propensity score by using a logistic regression model including characteristics (Table 1) that may influence the decision to administer IV contrast (treatment assignment) and are associated with AKI.7,8,10,18,22,23 Propensity-matched cohorts of a CECT group and a non-contrast CT group were derived by applying 1:1 ratio greedy matching on propensity score, with a caliper of 0.05 standard deviation of the propensity score logit with no replacement. We examined the standardized differences and variance ratios to determine that the matched sample was balanced in patient characteristics. We also graphically examined the distribution of the estimated propensity score for the two groups for the overlap assumption.
In the propensity score-matched sample, we used logistic regression to examine the association between contrast CT and the primary outcome and secondary outcomes adjusted for ED disposition and diagnosis. We calculated the adjusted risk for both groups by applying the coefficients from the multivariable logistic regression model to the study cohort as if every patient were in the CECT group, and every patient were in the non-contrast
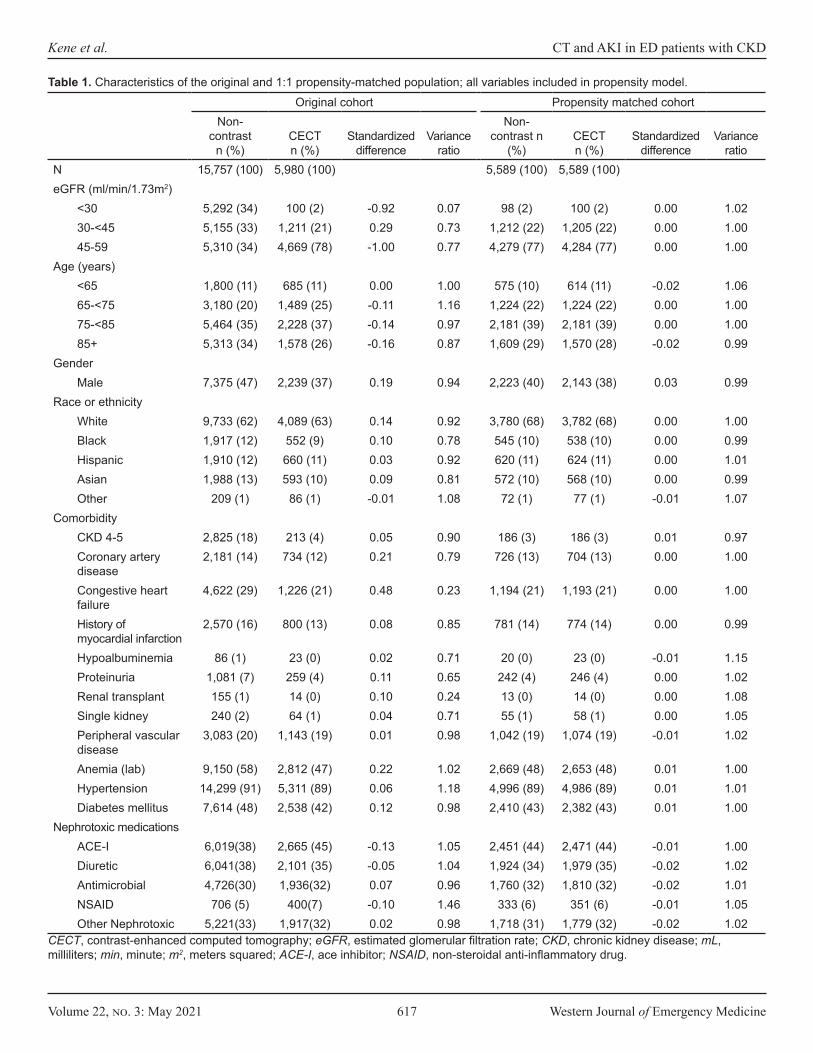
Volume 22, no. 3: May 2021 617 Western Journal of Emergency Medicine
Kene et al. CT and AKI in ED patients with CKD
Original cohort Propensity matched cohortNon-
contrast n (%)
CECT n (%)
Standardized difference
Variance ratio
Non-contrast n
(%)CECT n (%)
Standardized difference
Variance ratio
N 15,757 (100) 5,980 (100) 5,589 (100) 5,589 (100)eGFR (ml/min/1.73m2)
<30 5,292 (34) 100 (2) -0.92 0.07 98 (2) 100 (2) 0.00 1.0230-<45 5,155 (33) 1,211 (21) 0.29 0.73 1,212 (22) 1,205 (22) 0.00 1.0045-59 5,310 (34) 4,669 (78) -1.00 0.77 4,279 (77) 4,284 (77) 0.00 1.00
Age (years)<65 1,800 (11) 685 (11) 0.00 1.00 575 (10) 614 (11) -0.02 1.0665-<75 3,180 (20) 1,489 (25) -0.11 1.16 1,224 (22) 1,224 (22) 0.00 1.0075-<85 5,464 (35) 2,228 (37) -0.14 0.97 2,181 (39) 2,181 (39) 0.00 1.0085+ 5,313 (34) 1,578 (26) -0.16 0.87 1,609 (29) 1,570 (28) -0.02 0.99
GenderMale 7,375 (47) 2,239 (37) 0.19 0.94 2,223 (40) 2,143 (38) 0.03 0.99
Race or ethnicityWhite 9,733 (62) 4,089 (63) 0.14 0.92 3,780 (68) 3,782 (68) 0.00 1.00Black 1,917 (12) 552 (9) 0.10 0.78 545 (10) 538 (10) 0.00 0.99Hispanic 1,910 (12) 660 (11) 0.03 0.92 620 (11) 624 (11) 0.00 1.01Asian 1,988 (13) 593 (10) 0.09 0.81 572 (10) 568 (10) 0.00 0.99Other 209 (1) 86 (1) -0.01 1.08 72 (1) 77 (1) -0.01 1.07
ComorbidityCKD 4-5 2,825 (18) 213 (4) 0.05 0.90 186 (3) 186 (3) 0.01 0.97Coronary artery disease
2,181 (14) 734 (12) 0.21 0.79 726 (13) 704 (13) 0.00 1.00
Congestive heart failure
4,622 (29) 1,226 (21) 0.48 0.23 1,194 (21) 1,193 (21) 0.00 1.00
History of myocardial infarction
2,570 (16) 800 (13) 0.08 0.85 781 (14) 774 (14) 0.00 0.99
Hypoalbuminemia 86 (1) 23 (0) 0.02 0.71 20 (0) 23 (0) -0.01 1.15Proteinuria 1,081 (7) 259 (4) 0.11 0.65 242 (4) 246 (4) 0.00 1.02Renal transplant 155 (1) 14 (0) 0.10 0.24 13 (0) 14 (0) 0.00 1.08Single kidney 240 (2) 64 (1) 0.04 0.71 55 (1) 58 (1) 0.00 1.05Peripheral vascular disease
3,083 (20) 1,143 (19) 0.01 0.98 1,042 (19) 1,074 (19) -0.01 1.02
Anemia (lab) 9,150 (58) 2,812 (47) 0.22 1.02 2,669 (48) 2,653 (48) 0.01 1.00Hypertension 14,299 (91) 5,311 (89) 0.06 1.18 4,996 (89) 4,986 (89) 0.01 1.01Diabetes mellitus 7,614 (48) 2,538 (42) 0.12 0.98 2,410 (43) 2,382 (43) 0.01 1.00
Nephrotoxic medicationsACE-I 6,019(38) 2,665 (45) -0.13 1.05 2,451 (44) 2,471 (44) -0.01 1.00Diuretic 6,041(38) 2,101 (35) -0.05 1.04 1,924 (34) 1,979 (35) -0.02 1.02Antimicrobial 4,726(30) 1,936(32) 0.07 0.96 1,760 (32) 1,810 (32) -0.02 1.01NSAID 706 (5) 400(7) -0.10 1.46 333 (6) 351 (6) -0.01 1.05Other Nephrotoxic 5,221(33) 1,917(32) 0.02 0.98 1,718 (31) 1,779 (32) -0.02 1.02
Table 1. Characteristics of the original and 1:1 propensity-matched population; all variables included in propensity model.
CECT, contrast-enhanced computed tomography; eGFR, estimated glomerular filtration rate; CKD, chronic kidney disease; mL, milliliters; min, minute; m2, meters squared; ACE-I, ace inhibitor; NSAID, non-steroidal anti-inflammatory drug.
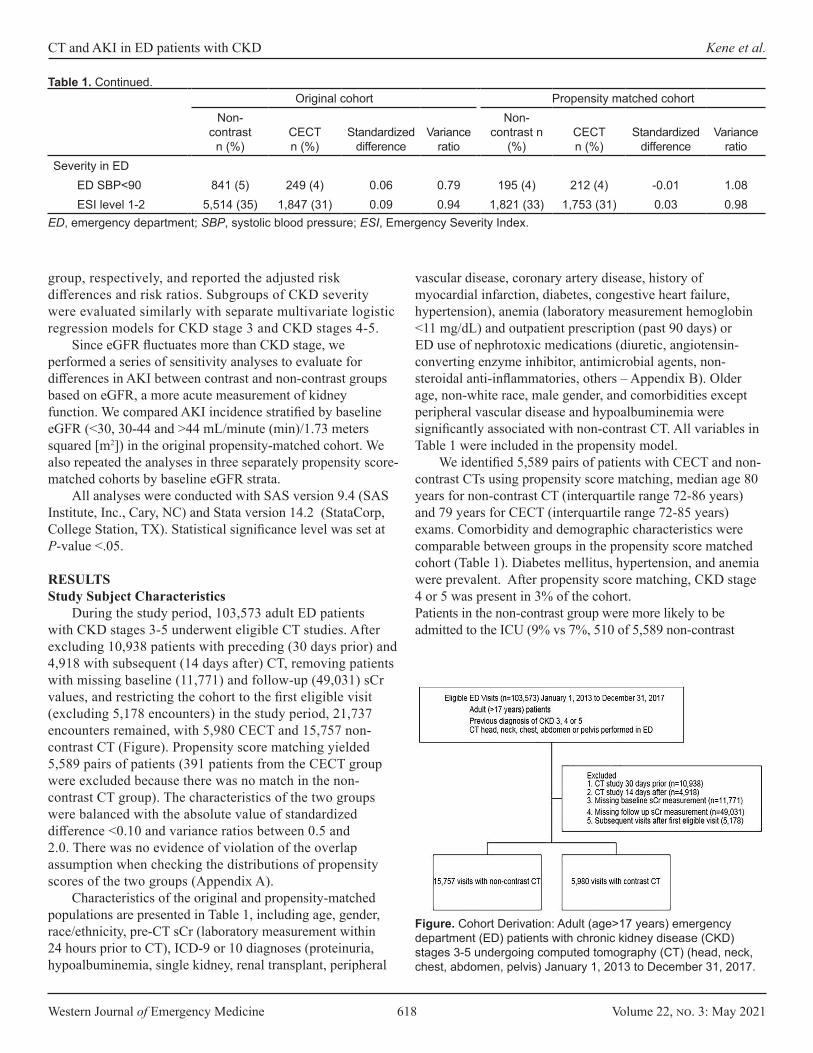
Western Journal of Emergency Medicine 618 Volume 22, no. 3: May 2021
CT and AKI in ED patients with CKD Kene et al.
Original cohort Propensity matched cohortNon-
contrast n (%)
CECT n (%)
Standardized difference
Variance ratio
Non-contrast n
(%)CECT n (%)
Standardized difference
Variance ratio
Severity in EDED SBP<90 841 (5) 249 (4) 0.06 0.79 195 (4) 212 (4) -0.01 1.08ESI level 1-2 5,514 (35) 1,847 (31) 0.09 0.94 1,821 (33) 1,753 (31) 0.03 0.98
Table 1. Continued.
ED, emergency department; SBP, systolic blood pressure; ESI, Emergency Severity Index.
group, respectively, and reported the adjusted risk differences and risk ratios. Subgroups of CKD severity were evaluated similarly with separate multivariate logistic regression models for CKD stage 3 and CKD stages 4-5.
Since eGFR fluctuates more than CKD stage, we performed a series of sensitivity analyses to evaluate for differences in AKI between contrast and non-contrast groups based on eGFR, a more acute measurement of kidney function. We compared AKI incidence stratified by baseline eGFR (<30, 30-44 and >44 mL/minute (min)/1.73 meters squared [m2]) in the original propensity-matched cohort. We also repeated the analyses in three separately propensity score-matched cohorts by baseline eGFR strata.
All analyses were conducted with SAS version 9.4 (SAS Institute, Inc., Cary, NC) and Stata version 14.2 (StataCorp, College Station, TX). Statistical significance level was set at P-value <.05.
RESULTSStudy Subject Characteristics
During the study period, 103,573 adult ED patients with CKD stages 3-5 underwent eligible CT studies. After excluding 10,938 patients with preceding (30 days prior) and 4,918 with subsequent (14 days after) CT, removing patients with missing baseline (11,771) and follow-up (49,031) sCr values, and restricting the cohort to the first eligible visit (excluding 5,178 encounters) in the study period, 21,737 encounters remained, with 5,980 CECT and 15,757 non-contrast CT (Figure). Propensity score matching yielded 5,589 pairs of patients (391 patients from the CECT group were excluded because there was no match in the non-contrast CT group). The characteristics of the two groups were balanced with the absolute value of standardized difference <0.10 and variance ratios between 0.5 and 2.0. There was no evidence of violation of the overlap assumption when checking the distributions of propensity scores of the two groups (Appendix A).
Characteristics of the original and propensity-matched populations are presented in Table 1, including age, gender, race/ethnicity, pre-CT sCr (laboratory measurement within 24 hours prior to CT), ICD-9 or 10 diagnoses (proteinuria, hypoalbuminemia, single kidney, renal transplant, peripheral
vascular disease, coronary artery disease, history of myocardial infarction, diabetes, congestive heart failure, hypertension), anemia (laboratory measurement hemoglobin <11 mg/dL) and outpatient prescription (past 90 days) or ED use of nephrotoxic medications (diuretic, angiotensin-converting enzyme inhibitor, antimicrobial agents, non-steroidal anti-inflammatories, others – Appendix B). Older age, non-white race, male gender, and comorbidities except peripheral vascular disease and hypoalbuminemia were significantly associated with non-contrast CT. All variables in Table 1 were included in the propensity model.
We identified 5,589 pairs of patients with CECT and non-contrast CTs using propensity score matching, median age 80 years for non-contrast CT (interquartile range 72-86 years) and 79 years for CECT (interquartile range 72-85 years) exams. Comorbidity and demographic characteristics were comparable between groups in the propensity score matched cohort (Table 1). Diabetes mellitus, hypertension, and anemia were prevalent. After propensity score matching, CKD stage 4 or 5 was present in 3% of the cohort. Patients in the non-contrast group were more likely to be admitted to the ICU (9% vs 7%, 510 of 5,589 non-contrast
Figure. Cohort Derivation: Adult (age>17 years) emergency department (ED) patients with chronic kidney disease (CKD) stages 3-5 undergoing computed tomography (CT) (head, neck, chest, abdomen, pelvis) January 1, 2013 to December 31, 2017.

Volume 22, no. 3: May 2021 619 Western Journal of Emergency Medicine
Kene et al. CT and AKI in ED patients with CKD
Propensity matched cohortNo contrast
n (%)CECT n(%) P-value
ED dispositionTotal 5,589 (100) 5,589(100) ICU admission 510 (9) 383 (7) <0.0001Hospital admission 4,179 (75) 4,309 (77) Discharged 900 (16) 897 (16)
ED diagnosisAcute heart failure 217 (4) 326 (6) <0.0001AMI 83 (2) 90 (2) 0.59Sepsis 332 (6) 315 (6) 0.49Multiorgan failure 65 (1) 39 (1) 0.01
Table 2. Post-computed tomography and post-contrast characteristics of acuity.
*Based on ICD-9 and 10 diagnosis codes for index visitCECT, contrast-enhanced computed tomography; ED, emergency department; ICU, intensive care unit; AMI, acute myocardial infarction.
Total (n)
Adjusted risk**
Adjusted risk difference
(95% CI)** for CECT - non-contrast CT
Adjusted risk ratio (95% CI) for CECT/
non-contrast CT
OverallNon-contrast 5,589 8.3%CECT 5,589 13.2% 5.0%
(3.8%-6.1%)1.60
(1.43-1.79)CKD stage 3
Non-contrast 5,403 7.9%CECT 5,403 12.8% 4.8%
(3.7%-6%)1.61
(1.43-1.80)CKD stage 4-5
Non-contrast 186 18.9%CECT 186 26.8% 7.8%
(0.7%-16.4%)1.41
(0.96-2.08)
Table 3. Adjusted* risk of acute kidney injury in propensity matched cohort, overall and stratified by chronic kidney disease stage.
*Adjusted for post-computed tomography and post-contrast acuity characteristics (emergency department disposition to intensive care unit and ED diagnosis of acute myocardial infarction, sepsis or multi-organ failure)**Rounded to single decimal pointCI, confidence interval; CECT, contrast-enhanced computed tomography; AKI, acute kidney injury; CKD, chronic kidney disease.
patients and 383 of 5,589 CECT patients, respectively, P<0.001) and had a higher frequency of acute organ failure (65 of 5,589 vs 39 of 5,589, P = 0.01), whereas the CECT group had a higher frequency of acute heart failure diagnosis (6% or 326 of 5,589 CECT patients vs 4% or 217 of 5,589 non-contrast patients, P<0.001) (Table 2). The frequency of acute myocardial infarction (2%, 83 of 5,589 non-contrast patients and 2% or 90 of 5,589 CECT patients, P = 0.59) and sepsis (6% or 332 of 5,589 non-contrast patients and 6% of 315 of 5,589 CECT patients, P = 0.49) were not different between groups.
Primary Outcome AKI IncidenceAfter propensity score matching, the adjusted risk of AKI
was 8.3% in the non-contrast group compared to 13.2% for CECT for 5,589 pairs (adjusted risk ratio [ARR] for AKI 1.60, 95% confidence interval [CI], 1.43-1.79) (Table 3). The AKI absolute risk difference was 5% higher for CECT (95% CI, 3.8%-6.1%). The higher risk of AKI in the CECT remained significant in the stratum of patients with CKD stage 3 (7.9% non-contrast vs 12.8% CECT for 5403 pairs, ARR 1.61, 95% CI ,1.43-1.80) but not for the smaller stratum of CKD 4-5 patients (18.9% non-contrast vs 26.8% CECT for 186 pairs, ARR 1.41, 95% CI, 0.96-2.08). Unadjusted incidence of AKI is available in Appendix C, Table C1.
Secondary Patient-centered OutcomesAdjusted risks for secondary patient-centered outcomes
at 30 days (new diagnosis of ESRD, initiation of dialysis, and mortality) are reported in Table 4. New initiation of renal dialysis and new diagnosis of ESRD were rare (Appendix C,
Table C2). Both non-contrast and CECT groups had notable 30-day mortality (8.5% and 7.1%, respectively).
Sensitivity AnalysisThe results from sensitivity analyses separately
analyzing AKI incidence stratified by baseline pre-CT eGFR in the propensity-matched cohort as well as in a separately propensity-matched cohort based on eGFR strata (45-59, 30-44 and <30 ml/min/1.73m2) were consistent with the results based on CKD stage (3 vs 4-5) (Appendix C, Tables C3 and C4).
DISCUSSIONIn a study of contrast CT and acute kidney injury among
ED patients with chronic kidney disease in an integrated healthcare system, we found that IV contrast-enhanced CT was associated with increased overall risk of AKI compared to non-contrast CT (adjusted risk difference 5%, 95% CI, 3.8%-6.1%; ARR 1.60, 95% CI, 1.43-1.79). Secondary patient-centered outcomes (mortality, new dialysis initiation) were rare, limiting conclusions about the difference between groups; however, the overall low observed frequency at 30 days suggests need for further study of any relationship between AKI in the setting of IV-contrast administration and clinically meaningful outcomes.

Western Journal of Emergency Medicine 620 Volume 22, no. 3: May 2021
CT and AKI in ED patients with CKD Kene et al.
Adjusted risk
Adjusted risk difference for CECT/Non-
contrast (95% CI)
Adjusted risk ratio
for CECT/Non-contrast
(95% CI)30-day new initiation of dialysis
Non-contrast 0.3%CECT 0.7% 0.4%
(0.1%-0.7%)2.14
(1.24-3.70)30-day ESRD diagnosis
Non-contrast 0.6%CECT 0.9% 0.2% (0%-0.5%) 1.39
(0.89-2.17)30-day mortality
Non-contrast 8.5%CECT 7.1% -1.4%
(-2.0- -0.4%)0.84
(0.74-0.95)
Table 4. Adjusted* risk of secondary patient-centered outcomes.
*Adjusted for post-computed tomography and post-contrast acuity characteristics (Emergency department (ED) disposition to intensive care unit and ED diagnosis of acute myocardial infarction, sepsis or multi-organ failure).CECT, contrast-enhanced computed tomography; CI, confidence interval; ESRD, end-stage renal disease.
Most prior contrast-associated AKI studies were not focused on CKD patients or emergency patients, but recent literature calls for further knowledge in patients with “severe kidney disease” in whom prior studies have reached differing conclusions.3,7,9,16 Meta-analyses conclude no association between contrast and AKI, but one study points out a major risk factor for AKI after contrast is pre-existent chronic kidney dysfunction, which is not uniformly treated across studies.14,21,27 Accurate risk characterization is important in these patients, to consider whether to employ dose reduction, to avoid contrast, or to consider alternatives to CT. We focused on CKD patients evaluated in the ED, where urgent diagnostic evaluation requires contrast administration in many cases; we applied propensity score matching to mitigate selection bias in contrast administration and adjusted for post-CT acute illness factors.
The small number of propensity matched pairs with severe CKD in our study and others points to CECT avoidance despite literature suggesting negligible overall CA-AKI incidence. Few studies have focused specifically on CKD patients, and varying results are reported in subsets of larger studies, with inconsistent definitions of renal dysfunction that do not distinguish between abnormal “baseline” pre-CT eGFR etiologies – whether due to incipient AKI, chronically abnormal eGFR without ongoing AKI, or concurrent AKI and
CKD at the time of the study.7,8,10,32 Including patients with incipient AKI or undiagnosed renal dysfunction may obscure AKI ascertainment.
Comparing results across studies with different definitions of abnormal renal function is also difficult. Hinson et al reported 1557 patients (12%) with CKD diagnosis in a larger study yet almost double – 3021 (23%) – the number of CKD patients had eGFR <60 ml/min/1.73m2 at the time of CT, suggesting a notable degree of unexplained renal dysfunction in the cohort, while Davenport et al included 3685 patients (20%) with eGFR<60 ml/min/1.73m2 and excluded patients with undefined “unstable renal function.”7,10 McDonald et al studied 1220 propensity matched pairs with eGFR<60 ml/min/1.73m2, requiring two available sCr values 24 hours prior to CT, potentially selecting for sicker patients.16 Of these studies, only Davenport et al identified increased AKI odds for CECT among patients with eGFR<30 ml/min/1.73m2 (2.96; 95% CI, 1.22-7.17).7 In our study, CKD stage aligned closely but not perfectly with baseline eGFR, and sensitivity analyses of separately derived eGFR cohorts were consistent with CKD stage-based findings. The small subgroup of severe CKD or very low eGFR suggests that patients with very abnormal renal function may be unlikely to receive IV contrast, and statistical power was limited in this subgroup in our study.
Patient-centered outcomes of new dialysis, ESRD, and mortality are difficult to evaluate because confounding increases with time after contrast exposure yet are clinically important. Measured changes in renal function may lag behind physiological injury,33 yet the definition of AKI relies on serial sCr measurements; this difficulty applies to all investigations of AKI and highlights the importance of evaluating clinical and patient-centered outcomes alongside laboratory values. We observed infrequent new dialysis initiation and new ESRD diagnosis, possibly related to a small event rate limiting statistical power, coding lags, and imbalance in unmeasured confounders. In a meta-analysis of AKI and secondary outcomes, mortality odds were similar (0.998, 95% CI, 0.730-1.362) among all patients, yet CKD patients may have elevated mortality risk regardless of CT.14
Mortality in our cohort was notable for both non-contrast and CECT, likely due to selecting for availability of serial sCr measurements. A recent review underscores this difficulty in retrospectively understanding transient sCr changes, secondary patient-centered outcomes, and the relationship between the two, suggesting that measuring renal injury related to contrast is limited both by the questionable significance of transient post-CT sCr changes and by possible confounding in reported longer term outcomes.34 The observations in the current study of the low secondary-outcome frequencies despite the noted incidence of AKI ranging from 8.3% (non-contrast) to 13.2% (CECT) suggests that AKI may not translate into clinically important renal injury after IV contrast. Study of alternate outcomes such as 30-day renal function recovery or strategies to predict AKI
Volume 22, no. 3: May 2021 621 Western Journal of Emergency Medicine
Kene et al. CT and AKI in ED patients with CKD
risk and need for post-CT renal function monitoring may be more clinically relevant. A prospective study or a much larger sample would be necessary to accurately evaluate these patient-centered outcomes.
LIMITATIONSOur study had several limitations. Inclusion and eligibility
criteria limited our study cohort. Although we could not adjust for CT indication, propensity score matching may be the most feasible retrospective approach to balance for treatment assignment (contrast); IV contrast is filtered by the kidneys similarly regardless of indication for IV contrast. However, a retrospective approach cannot discriminate between the potential effect of contrast and the disease process identified by the CT exam. Intra-arterial contrast was not studied in this investigation. We took care to select CT studies that are performed with and without IV contrast in the absence of a prospective study that would allow some form of randomization to contrast, and excluded extremity CTs, which are typically non-contrast studies. Completeness of sCr values was limited, similar to previous studies, and might be differentially measured after CT in sicker patients.7,8,10,28 We addressed the potential for undiagnosed renal dysfunction by measuring pre-CT sCr and matching for renal function at the time of CT. The CKD 4-5 subgroup illustrates difficulties in retrospectively balancing contrast: CKD 4-5 prevalence was 3% (186 CECT and 186 non-contrast) in the propensity-matched cohort, and the study lacked power to separately assess this group.
The small number of patients in the most severe kidney disease (CKD 4-5) subgroup resulted in inadequate discriminatory power to ascertain AKI risk, yet these findings suggest that clinicians avoid IV- contrast exposure in patients with severe kidney disease even if prior literature suggests negligible risk of AKI, and that post-contrast outcomes in patients with baseline renal dysfunction warrant further study. We may not have captured all relevant covariables in this retrospective electronic extraction, but we included many described AKI risk factors; therefore, we do not expect that our study was more subject to these biases than previous similar investigations.7,8,10,11,18,21
CONCLUSIONIn summary, we observed increased overall risk of acute
kidney injury after contrast CT in this cohort of patients with known chronic kidney disease. The substantial attrition in our and other studies, combined with our findings of higher acute kidney injury risk among contrast-exposed patients with chronic kidney disease, suggest that prospective studies in this specific subpopulation are needed. While randomization is unlikely, prospectively recruiting patients undergoing CT would facilitate serial serum creatinine measurements and evaluation of meaningful outcomes like 30-day renal function recovery.
Address for Correspondence: Mamata Kene, MD MPH, The Permanente Medical Group, Fremont, California, 39400 Paseo Padre Parkway, Fremont, California 94538. Email: [email protected].
Conflicts of Interest: By the WestJEM article submission agreement, all authors are required to disclose all affiliations, funding sources and financial or management relationships that could be perceived as potential sources of bias. No author has professional or financial relationships with any companies that are relevant to this study. This work was supported by the Kaiser Permanente Northern California Community Benefit Program.
Copyright: © 2021 Kene et al. This is an open access article distributed in accordance with the terms of the Creative Commons Attribution (CC BY 4.0) License. See: http://creativecommons.org/licenses/by/4.0/
REFERENCES1. Davenport MS, Cohan RH, Khalatbari S, et al. The challenges in
assessing contrast-induced nephropathy: Where are we now? AJR Am Roentgenol. 2014;202(4):784-9.
2. Doyle JF, Forni LG. Acute kidney injury: short-term and long-term effects. Crit Care. 2016;20(1):188.
3. Hinson JS, Ehmann MR, Klein EY. Evidence and patient safety prevail over myth and dogma: consensus guidelines on the use of intravenous contrast media. Ann Emerg Med. 2020;76(2):149-52.
4. McDonald RJ, McDonald JS, Bida JP, et al. Intravenous contrast material-induced nephropathy: causal or coincident phenomenon? Radiology. 2013;267(1):106-18.
5. McDonald RJ, McDonald JS, Newhouse JH, et al. Controversies in contrast material-induced acute kidney injury: closing in on the truth? Radiology. 2015;277(3):627-32.
6. Kocher KE, Meurer WJ, Fazel R, et al. National trends in use of computed tomography in the emergency department. Ann Emerg Med. 2011;58(5):452-62.e3.
7. Davenport MS, Khalatbari S, Cohan RH, et al. Contrast material-induced nephrotoxicity and intravenous low-osmolality iodinated contrast material: risk stratification by using estimated glomerular filtration rate. Radiology. 2013;268(3):719-28.
8. McDonald JS, McDonald RJ, Carter RE, et al. Risk of intravenous contrast material-mediated acute kidney injury: a propensity score-matched study stratified by baseline-estimated glomerular filtration rate. Radiology. 2014;271(1):65-73.
9. Davenport MS, Perazella MA, Yee J, et al. Use of intravenous iodinated contrast media in patients with kidney disease: consensus statements from the American College of Radiology and the National Kidney Foundation. Radiology. 2020; 294(3):660-8.
10. Hinson JS, Ehmann MR, Fine DM, et al. Risk of acute kidney injury after intravenous contrast media administration. Ann Emerg Med. 2017;69(5):577-86.
11. Mitchell AM, Jones AE, Tumlin JA, et al. Incidence of contrast-induced nephropathy after contrast-enhanced computed tomography
Western Journal of Emergency Medicine 622 Volume 22, no. 3: May 2021
CT and AKI in ED patients with CKD Kene et al.
in the outpatient setting. Clin J Am Soc Nephrol. 2010;5(1):4-9.12. Weisbord SD, Mor MK, Resnick AL, et al. Incidence and outcomes of
contrast-induced AKI following computed tomography. Clin J Am Soc Nephrol. 2008;3(5):1274-81.
13. Brinjikji W, Demchuk AM, Murad MH, et al. Neurons over nephrons: systematic review and meta-analysis of contrast-induced nephropathy in patients with acute stroke. Stroke. 2017;48(7):1862-8.
14. Aycock RD, Westafer LM, Boxen JL, et al. Acute kidney injury after computed tomography: a meta-analysis. Ann Emerg Med. 2018;71(1):44-53.e4.
15. Ehrmann S, Quartin A, Hobbs BP, et al. Contrast-associated acute kidney injury in the critically ill: systematic review and Bayesian meta-analysis. Intensive Care Med. 2017;43(6):785-94.
16. McDonald JS, McDonald RJ, Lieske JC, et al. Risk of acute kidney injury, dialysis, and mortality in patients with chronic kidney disease after intravenous contrast material exposure. Mayo Clinic Proc. 2015;90(8):1046-53.
17. Fraser SD, Blakeman T. Chronic kidney disease: identification and management in primary care. Pragmat Obs Res. 2016;7:21-32.
18. Meinel FG, De Cecco CN, Schoepf UJ, et al. Contrast-induced acute kidney injury: definition, epidemiology, and outcome. Biomed Res Int. 2014;2014:859328.
19. Dekkers IA, van der Molen AJ. Propensity score matching as a substitute for randomized controlled trials on acute kidney injury after contrast media administration: a systematic review. AJR Am Roentgenol. 2018;211(4):822-6.
20. Gordon N, Lin T. The Kaiser Permanente Northern California Adult Member Health Survey. Perm J. 2016;20(4):34-42.
21. Lee YC, Hsieh CC, Chang TT, et al. Contrast-induced acute kidney injury among patients with chronic kidney disease undergoing imaging studies: a meta-analysis. AJR Am J Roentgenol. 2019;213(4):728-35.
22. Naughton CA. Drug-induced nephrotoxicity. Am Fam Physician. 2008;78(6):743-50.
23. Perazella MA. Pharmacology behind common drug nephrotoxicities. Clin J Amer Soc Nephrology. 2018;13(12):1897-1908.
24. Agency for Healthcare Research and Quality. Emergency Severity
Index (ESI): a triage tool for emergency departments. 2012. Available at: https://www.ahrq.gov/professionals/systems/hospital/esi/index.html. Accessed August 13, 2020.
25. Levey AS, Coresh J, Greene T, et al. Using standardized serum creatinine values in the modification of diet in renal disease study equation for estimating glomerular filtration rate. Ann Intern Med. 2006;145(4):247-54.
26. Nijssen EC, Rennenberg RJ, Nelemans PJ, et al. Prophylactic hydration to protect renal function from intravascular iodinated contrast material in patients at high risk of contrast-induced nephropathy (AMACING): a prospective, randomised, phase 3, controlled, open-label, non-inferiority trial. Lancet. 2017;389(10076):1312-22.
27. McDonald JS, McDonald RJ, Comin J, et al. Frequency of acute kidney injury following intravenous contrast medium administration: a systematic review and meta-analysis. Radiology. 2013;267(1):119-28.
28. Ehrmann S, Badin J, Savath L, et al. Acute kidney injury in the critically ill: Is iodinated contrast medium really harmful? Crit Care Med. 2013;41(4):1017-26.
29. Makris K, Spanou L. Acute kidney injury: definition, pathophysiology and clinical phenotypes. Clin Biochem Rev. 2016;37(2):85-98.
30. McDonald RJ, McDonald JS, Carter RE, et al. Intravenous contrast material exposure is not an independent risk factor for dialysis or mortality. Radiology. 2014;273(3):71425.
31. Davenport MS, Khalatbari S, Dillman JR, et al. Contrast material-induced nephrotoxicity and intravenous low-osmolality iodinated contrast material. Radiology. 2013;267(1):94-105.
32. Stevens PE, Levin A. Evaluation and management of chronic kidney disease: synopsis of the kidney disease: Improving Global Outcomes 2012 clinical practice guideline. Ann Intern Med. 2013;158(11):825-30.
33. Nyman U, Aspelin P, Jakobsen J, et al. Controversies in contrast material-induced acute kidney injury: propensity score matching of patients with different dose/absolute glomerular filtration rate ratios. Radiology. 2015;277(3):633-7.
34. Mehran R, Dangas GD, Weisbord SD. Contrast-associated acute kidney injury. N Engl J Med. 2019;380(22):2146-55.
Volume 22, no. 3: May 2021 623 Western Journal of Emergency Medicine
Original Research
Study of Haloperidol for Abdominal Pain in the Emergency Department (SHAPE)
Katherine Knudsen-Lachendro, PharmD, BCPS*Kyle Stith, PharmD, BCPS†
Laine A. Vicarel, PharmD, BCPS†
Brittany Harbert, PharmD, BCPS‡
Baruch S. Fertel, MD, MPA§
INTRODUCTION Pain accounts for 45.4% of all emergency department
(ED) visits in the United States. Abdominal pain accounts for up to 8% of those visits.1,2 In 2016, Cervellin and colleagues
Cleveland Clinic Lutheran Hospital, Department of Pharmacy, Cleveland, OhioCleveland Clinic Medina Hospital, Department of Pharmacy, Medina, OhioAultman Hospital, Department of Pharmacy, Canton, OhioCleveland Clinic Enterprise Services Institute, Enterprise Quality and Safety, Cleveland, Ohio
*
†
‡
§
Introduction: Intravenous haloperidol has been shown to decrease milligram morphine equivalents (MME) of analgesia and reduce hospital admissions for diabetic gastroparesis. The objective of this study was to evaluate whether haloperidol decreases MME for the treatment of non-specific abdominal pain diagnoses in the emergency department (ED), including gastroparesis, cyclic vomiting, cannabinoid hyperemesis syndrome, and unspecified abdominal pain. The primary outcome compared the difference in MME between encounters. Secondary outcomes included admission rate, pain scores, length of stay, rescue therapy administration, and adverse effects.
Methods: This retrospective chart review included patients ≥ 18 years old who presented to the ED. Patients must have had ≥ 2 ED encounters for abdominal pain, one in which they received conventional therapy with opioids (C-encounter), and the other in which they received haloperidol (H-encounter). Agitated patients were excluded. Seventy-five patients were needed to detect a 3 MME difference with 80% power and two-sided alpha of 0.05.
Results: We analyzed 107 patients with self-matched encounters. The median dose of haloperidol administered was 5.0 milligrams (mg) (interquartile range [IQR] 2.0 - 5.0). C-encounters had significantly more MME administered than H-encounters (median 5.7 mg [IQR 4.0 - 8.0] vs 0.0 mg [IQR 0.0 - 2.5], P < 0.001). These results remained significant despite route of haloperidol administration. C-encounters had higher rates of rescue therapy administration than H-encounters, (56% vs 33.6%, P < 0.001). There were higher rates of ketorolac administration in the H-encounter (P = 0.02).
Conclusion: Encounters in which patients received haloperidol and ketorolac for abdominal pain had a statistically significant reduction in MME administered and lower rates of rescue therapy administration than encounters in which patients were treated with opioids. [West J Emerg Med. 2021;22(3)623-627.]
Section Editor: Patrick Meloy, MD Submission history: Submitted October 21, 2020; Revision received February 9, 202; Accepted February 9, 2021 Electronically published May 5, 2021 Full text available through open access at http://escholarship.org/uc/uciem_westjem DOI: 10.5811/westjem.2021.2.50390
reported that ED encounters for adults with acute abdominal pain had an admission rate of 17% and a readmission rate just above 6% within 30 days.3 Not only is abdominal pain prevalent and costly, it is becoming more difficult to treat due
Western Journal of Emergency Medicine 624 Volume 22, no. 3: May 2021
Haloperidol for Abdominal Pain in the ED Knudsen-Lachendro et al.
to limited availability of conventional therapy.4,5 Analgesics, including opioids and non-steroidal anti-inflammatory drugs (NSAID), are the mainstay of therapy for abdominal pain. Opioids may be preferred because they, unlike NSAIDs, do not have the potential to mask peritoneal inflammation.6
Other therapies are supportive in nature and directed toward management of concurrent nausea and vomiting.
Haloperidol, a first-generation antipsychotic, antagonizes a variety of neurotransmitters in the central nervous system.7
The antiemetic effect of haloperidol is due mainly to its antagonism of dopamine at the D2 receptor, histamine at the H1 receptor, and acetylcholine at the muscarinic type-1 receptor in the chemoreceptor trigger zone. This antagonism attenuates nausea and vomiting.8 Haloperidol also has anti-emetic effects peripherally, as it non-specifically targets D1-D5 receptors in the gut, affecting blood flow and gastric motility.9 Lastly, haloperidol is a structural derivative of meperidine and has been linked to analgesic effects through sigma-1 receptor antagonism.10,11
Several recent studies have examined the analgesic effect of haloperidol. In 2017, Roldan and colleagues conducted a randomized, double-blind, placebo-controlled trial comparing haloperidol 5 milligrams (mg) intravenously (IV) plus conventional therapy vs placebo plus conventional therapy for the treatment of gastroparesis. They found a significant difference in their primary outcome, mean reduction in pain scores, 5.37 vs 1.11 (P ≤ 0.001), and nausea scores, 2.70 vs 0.72 (P = 0.05), at one hour.12 Another study, by Ramirez and colleagues, examined the opioid-sparing effect of haloperidol. They retrospectively analyzed the effect of intramuscular (IM) haloperidol plus conventional therapy vs conventional therapy alone for the treatment of diabetic gastroparesis. This trial demonstrated that the administration of haloperidol, in addition to conventional therapy, had an opioid sparing effect, with 6.75 vs 10.75 (P = 0.009) morphine equivalents used, and a decreased admission rate of 10% vs 27% (P = 0.002) when compared to conventional therapy alone.13
The combined antiemetic and analgesic effects of haloperidol make it an appealing alternative for the treatment of abdominal pain with concurrent nausea and vomiting, given the limited availability of medications used as conventional treatment for abdominal pain due to drug shortages.5,6 These include but are not limited to the following: ketorolac; morphine; fentanyl; hydromorphone; diphenhydramine; ondansetron; and metoclopramide. This, in addition to decreased opioid prescribing in the setting of the opioid epidemic, was the basis for the health-system implementation of “haloperidol for analgesia” emergency services protocol. The intent of this protocol was to aid in the management of patients with gastroparesis, cannabinoid hyperemesis syndrome, cyclic vomiting, and other non-specific abdominal pain diagnoses.
This protocol provided clinical decision support and monitoring parameters for providers who sought to use
Population Health Research Capsule
What do we already know about this issue?Non-specific abdominal pain is a common emergency department presentation, and its treatment has been complicated by drug shortages and the opioid epidemic.
What was the research question?Does haloperidol administration for the treatment of unspecified abdominal pain spare morphine equivalents?
What was the major finding of the study?Haloperidol, in conjunction with ketorolac, spares approximately 6 milligram morphine equivalents.
How does this improve population health?Haloperidol can reduce opioid exposure and is a safe and effective means of managing unspecified abdominal pain in a population with high healthcare utilization.
haloperidol for analgesia. With the implementation of this protocol came the new medical record, “haloperidol injection 5 mg/mL (HALDOL) – ANALGESIA.” Indications for therapy were included in the order instructions and the dose of 5 milligrams intravenously (mg IV) was auto-selected, with the option of changing dose and route based on provider preference. A reference link to the full protocol was included in the medication record. In this study we sought to examine the opioid-sparing effect of haloperidol when used for abdominal pain and to determine whether the effect was dependent on route of haloperidol administration.
METHODSThis was a retrospective cross-over chart-review of an
electronic health record within an integrated health system. The health system is composed of large academic medical centers, regional hospitals, and freestanding EDs, accounting for approximately 700,000 patient encounters annually. This study, number 19-122, was reviewed and exempted by the institutional review board. Included patients were 18 years of age and older admitted to an ED between July 1–December 1, 2018, and administered haloperidol 2 mg-5 mg intramuscular (IM) or IV for abdominal pain (H-encounter).
Encounters with International Classification of Diseases, revision 10 (ICD-10) codes associated with abdominal pain were analyzed, including, but not limited to the following:
Volume 22, no. 3: May 2021 625 Western Journal of Emergency Medicine
Knudsen-Lachendro et al. Haloperidol for Abdominal Pain in the ED
non-specific abdominal pain; peptic ulcer disease; cyclic vomiting; cannabinoid hyperemesis syndrome; and reflux disease. Abdominal pain was confirmed within the ED provider note with a positive reference in “review of systems.” Patient charts were then audited for qualifying comparison encounters in which the patient received opioids as conventional therapy (C-encounter) for abdominal pain. Encounters did not qualify as a comparator if the patient was administered antipsychotics. All comparison encounters must have been separated by a minimum of three days from other hospital encounters requiring analgesia to allow for treatment washout, and a maximum of 365 days of the haloperidol encounter to minimize variability in patient presentation between encounters. We excluded the following patients from the study: allergy or sensitivity to haloperidol; chronic use of haloperidol as a prior-to-admission medication; urgent abdominal surgery; and administration of haloperidol for acute agitation secondary to delirium, psychosis, or for sedation.
MeasurementsBaseline demographic data included age, gender, time and
date of ED encounter, resulting inpatient stay if applicable, ED location, repeat ED encounter within 30 days, and death. We classified EDs according to number of annual encounters. Dose, route, and resultant pain scores were also collected. Pain was documented as a 0-10 visual analogue scale and was included if the patient had a score before and at least 15 minutes after analgesic administration. If patients had more than two qualifying comparison encounters, the most recent qualifying encounter to the haloperidol encounter was used.
The primary outcome was to analyze the difference in milligram morphine equivalent (MME) administration between the self-matched H- and C-encounters. Any opioids, NSAIDs, acetaminophen, ketamine, lidocaine, and haloperidol administered during the encounters were documented and considered to be concurrent analgesia. Secondary outcomes included disposition, adverse events, difference in pain scores, ED length of stay, repeat ED encounters within 30 days, and use of rescue medications.
The “interventions” of this review were haloperidol and opioid use for the treatment of abdominal pain. We defined rescue therapy as any analgesic or antiemetic administered 30 minutes after initial haloperidol or opioid administration. Any acetaminophen, ketorolac, or antiemetic use prior to administration of the intervention was not analyzed as rescue therapy. We selected 30 minutes to allow for initial onset of medications administered and to provide a realistic time frame for symptom reassessment in ED patients. The following antiemetics were considered rescue therapy: diphenhydramine; metoclopramide; ondansetron; promethazine; and prochlorperazine. All routes of rescue therapy administration were included for analysis. Additional agents were not included due to formulary restrictions. We calculated MMEs based on an equianalgesic dosing chart.14 Adverse events,
including arrhythmia, mental status change from start of ED encounter, seizure, dystonic reaction, and respiratory depression were recorded per nursing documentation and the medication administration record. We defined respiratory depression as respiratory rate less than 12 breaths per minute within one hour after opioid administration.
Seventy-five patients with self-matched encounters were needed to detect a difference of three MMEs with 80% power and a two-sided alpha of 0.05.13 Ordinal variables were compared using the Wilcoxon signed-rank test or paired t-test and categorical variables were compared using McNemar’s test. Data was expressed as medians with interquartile ranges (IQR) if data was nonparametric, as means with confidence intervals (CI) if data was parametric, or numbers and percentages of patients, as appropriate. We performed all data analysis using open-source statistical software R Commander (developed by J. Fox), R package version 3.5-3 (R Foundation for Statistical Computing, Zurich).
RESULTSA total of 504 patients qualified for chart review based on
diagnosis audit and haloperidol administration. Breakdown of excluded patients was as follows: 218 patients lacked a qualifying comparison encounter; 160 patients had documented agitation or altered mental status; 15 patients lacked documentation of abdominal pain in their review of systems; and four patients were admitted for urgent abdominal surgery. The remaining 107 patients were included for review. Patients were administered haloperidol for the following diagnoses: cyclic vomiting; colitis/diverticulitis; gastroparesis; pancreatitis; gastroesophageal reflux disease (GERD); and unspecified abdominal pain. The diagnoses attached to the encounters were not mutually exclusive and no diagnosis predominated significantly, although many patients had concurrent diagnoses of GERD and unspecified abdominal pain.
Seventy percent of patients were women and mean age was 41 years old. The median haloperidol dose administered in the H-encounter was 5.0 mg (IQR 2.0 - 5.0). More patients were administered haloperidol IV than IM, 81.3% vs 18.7%, respectively. Seventy-nine patients, or 73.8%, had their H-encounter chronologically after their C-encounter. Encounters at ED locations with greater than 50,000 annual visits accounted for 46% and 45% of the H-encounters and C-encounters, respectively. Encounters at locations with 20,000-50,000 annual visits accounted for 40% and 39%, respectively. Encounters at locations with less than 20,000 annual visits accounted for 14% and 16%, respectively.
H-encounters had a statistically significant reduction in MME administered when compared to C-encounters, (median 0.0 [IQR 0.0 - 2.5] vs 5.7 [IQR 4.0 - 8.0]; P < 0.001). This opioid-sparing effect remained significant despite route of haloperidol administration. The median MME given with IV haloperidol was 0.00 mg (IQR 0.0-4.0) vs 5.8 mg (IQR 4.0-8.0); P < 0.001 in the comparison C-encounter. The median
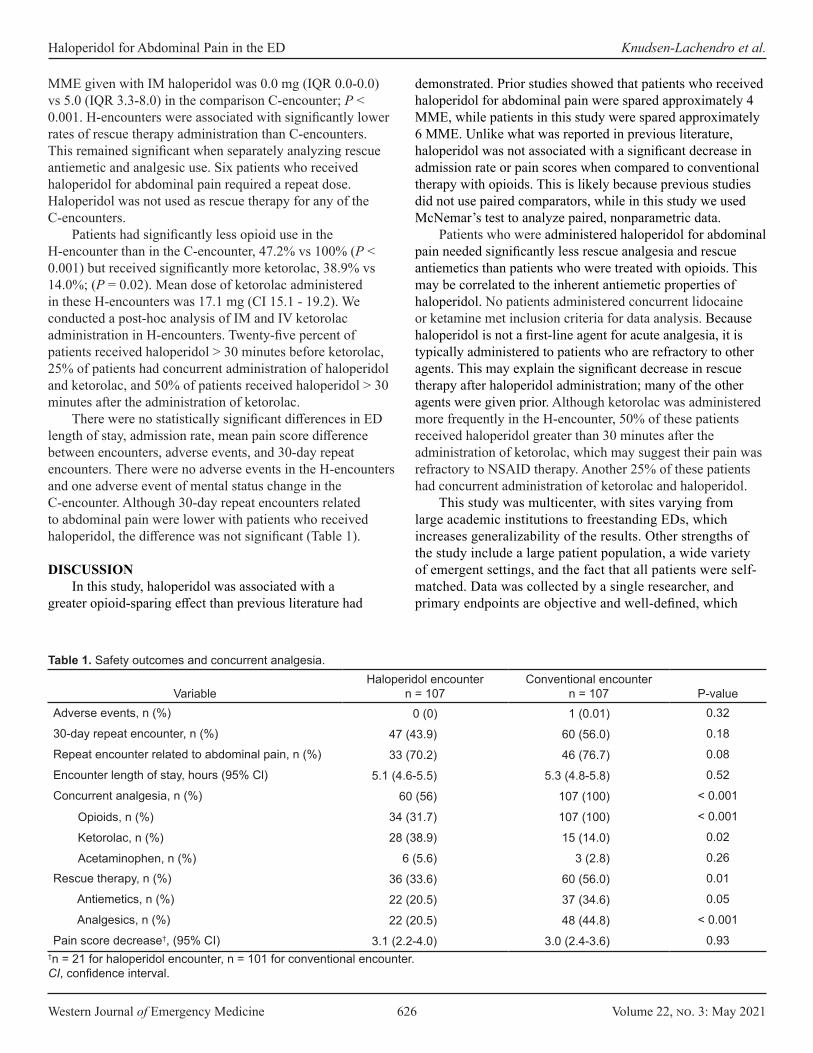
Western Journal of Emergency Medicine 626 Volume 22, no. 3: May 2021
Haloperidol for Abdominal Pain in the ED Knudsen-Lachendro et al.
MME given with IM haloperidol was 0.0 mg (IQR 0.0-0.0) vs 5.0 (IQR 3.3-8.0) in the comparison C-encounter; P < 0.001. H-encounters were associated with significantly lower rates of rescue therapy administration than C-encounters. This remained significant when separately analyzing rescue antiemetic and analgesic use. Six patients who received haloperidol for abdominal pain required a repeat dose. Haloperidol was not used as rescue therapy for any of the C-encounters.
Patients had significantly less opioid use in the H-encounter than in the C-encounter, 47.2% vs 100% (P < 0.001) but received significantly more ketorolac, 38.9% vs 14.0%; (P = 0.02). Mean dose of ketorolac administered in these H-encounters was 17.1 mg (CI 15.1 - 19.2). We conducted a post-hoc analysis of IM and IV ketorolac administration in H-encounters. Twenty-five percent of patients received haloperidol > 30 minutes before ketorolac, 25% of patients had concurrent administration of haloperidol and ketorolac, and 50% of patients received haloperidol > 30 minutes after the administration of ketorolac.
There were no statistically significant differences in ED length of stay, admission rate, mean pain score difference between encounters, adverse events, and 30-day repeat encounters. There were no adverse events in the H-encounters and one adverse event of mental status change in the C-encounter. Although 30-day repeat encounters related to abdominal pain were lower with patients who received haloperidol, the difference was not significant (Table 1).
DISCUSSIONIn this study, haloperidol was associated with a
greater opioid-sparing effect than previous literature had
demonstrated. Prior studies showed that patients who received haloperidol for abdominal pain were spared approximately 4 MME, while patients in this study were spared approximately 6 MME. Unlike what was reported in previous literature, haloperidol was not associated with a significant decrease in admission rate or pain scores when compared to conventional therapy with opioids. This is likely because previous studies did not use paired comparators, while in this study we used McNemar’s test to analyze paired, nonparametric data.
Patients who were administered haloperidol for abdominal pain needed significantly less rescue analgesia and rescue antiemetics than patients who were treated with opioids. This may be correlated to the inherent antiemetic properties of haloperidol. No patients administered concurrent lidocaine or ketamine met inclusion criteria for data analysis. Because haloperidol is not a first-line agent for acute analgesia, it is typically administered to patients who are refractory to other agents. This may explain the significant decrease in rescue therapy after haloperidol administration; many of the other agents were given prior. Although ketorolac was administered more frequently in the H-encounter, 50% of these patients received haloperidol greater than 30 minutes after the administration of ketorolac, which may suggest their pain was refractory to NSAID therapy. Another 25% of these patients had concurrent administration of ketorolac and haloperidol.
This study was multicenter, with sites varying from large academic institutions to freestanding EDs, which increases generalizability of the results. Other strengths of the study include a large patient population, a wide variety of emergent settings, and the fact that all patients were self-matched. Data was collected by a single researcher, and primary endpoints are objective and well-defined, which
VariableHaloperidol encounter
n = 107Conventional encounter
n = 107 P-valueAdverse events, n (%) 0 (0) 1 (0.01) 0.32
30-day repeat encounter, n (%) 47 (43.9) 60 (56.0) 0.18
Repeat encounter related to abdominal pain, n (%) 33 (70.2) 46 (76.7) 0.08
Encounter length of stay, hours (95% Cl) 5.1 (4.6-5.5) 5.3 (4.8-5.8) 0.52
Concurrent analgesia, n (%) 60 (56) 107 (100) < 0.001
Opioids, n (%) 34 (31.7) 107 (100) < 0.001
Ketorolac, n (%) 28 (38.9) 15 (14.0) 0.02
Acetaminophen, n (%) 6 (5.6) 3 (2.8) 0.26
Rescue therapy, n (%) 36 (33.6) 60 (56.0) 0.01
Antiemetics, n (%) 22 (20.5) 37 (34.6) 0.05
Analgesics, n (%) 22 (20.5) 48 (44.8) < 0.001
Pain score decrease†, (95% CI) 3.1 (2.2-4.0) 3.0 (2.4-3.6) 0.93†n = 21 for haloperidol encounter, n = 101 for conventional encounter.CI, confidence interval.
Table 1. Safety outcomes and concurrent analgesia.

Volume 22, no. 3: May 2021 627 Western Journal of Emergency Medicine
Knudsen-Lachendro et al. Haloperidol for Abdominal Pain in the ED
minimizes variability in documentation. Self-matching patients decreases variability in comorbid conditions, prior to admission medications, and perception of pain. Lastly, the time frame selected for patient presentation allowed complete treatment washout between encounters. LIMITATIONS
Although the time frame for qualifying comparison encounters was selected to minimize variability in presentation, diagnosis, and prior to admission medications, patients may have had differences between encounters. Several secondary outcomes relied on nursing documentation in the electronic health record, including pain score changes and adverse effects. Documentation of pain scores was sporadic. Only 21 out of 107 patients in the H-encounter had pre- and post-analgesic pain scores recorded, compared to 101 out of 107 in the C-encounter. This disparity is likely due to lack of a best practice alert prompting nursing staff to document pain scores after haloperidol administration, unlike when they administer opioids. Because adverse drug events were identified with nursing notes, their occurrence may be under-reported in this study. Repeat encounters within 30 days may have been underestimated, as only repeat encounters within the health system are visible. Higher rates of administration of ketorolac in the H-encounter may have confounded the opioid-sparing effect and need for rescue analgesia.
CONCLUSIONThis is the largest study to date analyzing haloperidol for
the treatment of abdominal pain. It demonstrates that both IM and IV haloperidol, in conjunction with ketorolac, significantly reduces the amount of MMEs used for the treatment of abdominal pain and significantly decreases the need for rescue therapy when compared to conventional opioid therapy. These findings allows us to reduce opioid exposure, treat acute pain despite drug shortages, and demonstrate the safety and efficacy of managing chronic abdominal pain in a population with baseline high healthcare utilization.
Address for Correspondence: Katherine Knudsen-Lachendro, PharmD, BCPS, Cleveland Clinic Lutheran Hospital, Department of Pharmacy, 1730 W 25th St, Cleveland, OH, 44113. Email: [email protected].
Conflicts of Interest: By the WestJEM article submission agreement, all authors are required to disclose all affiliations, funding sources and financial or management relationships that could be perceived as potential sources of bias. No author has professional or financial relationships with any companies that are relevant to this study. There are no conflicts of interest or sources of funding to declare.
Copyright: © 2021 Knudsen-Lachendro et al. This is an open access article distributed in accordance with the terms of the Creative Commons Attribution (CC BY 4.0) License. See: http://creativecommons.org/licenses/by/4.0/
REFERENCES 1. Chang HY, Daubresse M, Kruszewski SP, et al. Prevalence and
treatment of pain in EDs in the United States, 2000 to 2010. Am J Emerg Med. 2014;32(5):421-31.
2. Hastings RS and Powers RD. Abdominal pain in the ED: a 35 year retrospective. Am J Emerg Med. 2011 Sep;29(7):711-6.
3. Cervellin G, Mora R, Ticinesi A, et al. Epidemiology and outcomes of acute abdominal pain in a large urban emergency department: retrospective analysis of 5,340 cases. Ann Transl Med. 2016;4(19):362.
4. US Food and Drug Administration. Current and resolved drug shortages and discontinuations reported to FDA. Available at: https://www.accessdata.fda.gov/scripts/drugshortages/. Accessed September 17, 2018.
5. Hawley KL, Mazer-amirshahi M, Zocchi MS, et al. Longitudinal trends in U.S. drug shortages for medications used in emergency departments (2001-2014). Acad Emerg Med. 2016;23(1):63-9.
6. Baskin BE. (2018). Acute abdominal pain. In: Cydulka RK, Fitch MT, Joing SA, Wang VJ, Cline DM, Ma O (Eds.), Tintinalli’s Emergency Medicine Manual, 8e China: McGraw-Hill.
7. Kroeze WK and Hufeisen SJ. H1-histamine receptor affinity predicts short-term weight gain for typical and atypical antipsychotic drugs. Neuropsychopharmacology. 2003;28:519-26.
8. Singh P, Yoon SS, Kuo B. Nausea: a review of pathophysiology and therapeutics. Therap Adv Gastro. 2016;9(1):98-112.
9. Mittal R, Debs LH, Patel AP, et al. Neurotransmitters: the critical modulators regulating gut-brain axis. J Cell Physiol. 2017;232(9):2359-2372.
10. Edmonds-seal J and Prys-roberts C. Pharmacology of drugs used in neuroleptanalgesia. Br J Anaesth. 1970;42(3):207-16.
11. Cobos EJ, Entrena JM, Nieto FR, et al. Pharmacology and therapeutic potential of sigma(1) receptor ligands. Curr Neuropharmacol. 2008;6(4):344–66.
12. Roldan CJ, Chambers KA, Paniagua L, et al. Randomized controlled double-blind trial comparing haloperidol combined with conventional therapy to conventional therapy alone in patients with symptomatic gastroparesis. Acad Emerg Med. 2017;24(11):1307-14.
13. Ramirez R, Stalcup P, Croft B, et al. Haloperidol undermining gastroparesis symptoms (HUGS) in the emergency department. Am J Emerg Med. 2017;35(8):1118-20.
14. University of Florida Health. Pain assessment and management initiative: opioid prescribing and equianalgesic chart. 2017. Available at: https://pami.emergency.med.jax.ufl.edu/resources/dosing-guide/. Accessed October 2, 2018.
Western Journal of Emergency Medicine 628 Volume 22, no. 3: May 2021
Original Research
Code Status Documentation Availability and Accuracy Among Emergency Patients with End-stage Disease
Evan Russell, MD, MSc*Andrew K. Hall, MD, MMEd*Conor McKaigney, MD†
Craig Goldie, MD‡
Ingrid Harle, MD‡
Marco L.A. Sivilotti, MSc, MD*§
Section Editor: Christopher Mills, MD Submission history: Submitted July 29, 2020; Revision received December 8, 2020; Accepted December 24, 2020 Electronically published April 27, 2021Full text available through open access at http://escholarship.org/uc/uciem_westjem DOI: 10.5811/westjem.2020.12.46801
INTRODUCTIONDecisions surrounding the resuscitation of a dying patient
are complex and time pressured, yet are often made by emergency healthcare providers with incomplete or inaccurate information. Attempts to resuscitate patients with end-stage
Queen’s University, Department of Emergency Medicine, Kingston, Ontario, CanadaUniversity of Calgary, Department of Emergency Medicine, Calgary, Alberta, CanadaQueen’s University, Department of Medicine, Division of Palliative Care, Kingston, Ontario, CanadaQueen’s University, Department of Biomedical & Molecular Sciences, Kingston, Ontario, Canada
*†
‡
§
Introduction: Some patients with end-stage disease who may neither want nor benefit from aggressive resuscitation receive such treatment if they cannot communicate in an emergency. Timely access to patients’ current resuscitation wishes, or “code status,” should be a key metric of electronic health records (EHR). We sought to determine what percentage of a cohort of patients with end-stage disease who present to the emergency department (ED) have accessible, code status documents, and for those who do, how quickly can this documentation be retrieved.
Methods: In this cross-sectional study of ED patients with end-stage disease (eg, palliative care, metastatic malignancy, home oxygen, dialysis) conducted during purposefully sampled random accrual times we performed a standardized, timed review of available health records, including accompanying transfer documents. We also interviewed consenting patients and substitute decision makers to compare available code status documents to their current wishes.
Results: Code status documentation was unavailable within 15 minutes of ED arrival in most cases (54/85, or 63%). Retrieval time was under five minutes in the rest, especially when “one click deep” in the EHR. When interviewed, 20/32 (63%) expressed “do not resuscitate” wishes, 10 of whom had no supporting documentation. Patients from assisted-living (odds ratio [OR] 6.7; 95% confidence interval [CI], 1.7-26) and long-term care facilities (OR 13; 95% CI, 2.5-65) were more likely to have a documented code status available compared to those living in the community.
Conclusion: The majority of patients with end-stage disease, including half of those who would not wish resuscitation from cardiorespiratory arrest, did not have code status documents readily available upon arrival to our tertiary care ED. Patients living in the community with advanced disease may be at higher risk for unwanted resuscitative efforts should they present to hospital in extremis. While easily retrievable code status documentation within the EHR shows promise, its accuracy and validity remain important considerations. [West J Emerg Med. 2021;22(3)628-635.]
disease are often futile, unnecessarily traumatic to the dying patient and family, and disturbing to healthcare providers.1-3 Despite this, many patients with end-stage disease receive invasive resuscitative interventions at the end of life despite their expressed or implied goals of care.4-6 Many of these

Volume 22, no. 3: May 2021 629 Western Journal of Emergency Medicine
Russell et al. Code Status Availability and Accuracy for ED Patients with End-stage Disease
Population Health Research Capsule
What do we already know about this issue?Patients with end-stage disease frequently present to the emergency department (ED) at the end of life, sometimes receiving unwanted resuscitation.
What was the research question?What proportion of patients with end-stage disease presenting to the ED have accessible code status documents?
What was the major finding of the study?Of 85 enrolled patients, 54 (63%) did not have any available code status documentation, either in paper or electronic form.
How does this improve population health?This underscores the need to increase code status document rates and availability in the ED for patients in the community with end-stage disease.
patients who present to the emergency department (ED) at the end of life are often so ill that they are unable to communicate their goals of care, including their code status,7 or they lack the ability to make decisions about their care at the end of life.8 In the absence of a readily available substitute decision maker (SDM), patients’ wishes for resuscitation are best obtained through code status documentation. The complexity and time pressure surrounding the high-stakes decision whether to withhold resuscitative efforts has increased with the COVID-19 pandemic.9
While electronic health records (EHR) hold the promise of rapid information retrieval, in many settings this remains to be realized, especially for the more nuanced considerations surrounding a patient’s code status. We wondered how often patients with end-stage disease had code status documentation available at the time of ED arrival. We also sought to measure the delay to retrieval and the accuracy of this documentation compared to current resuscitation wishes.
METHODSDesign
This cross-sectional study occurred from mid-June to mid-August 2016 at a tertiary, academic acute-care hospital, functioning as the referral center for a catchment population of approximately 500,000, and with an ED census of 55,000 visits per year. Ethics approval was granted by the institutional research ethics board.
Participant RecruitmentInclusion criteria were developed by consensus among
study authors. We enrolled consecutive patients who met at least one of five inclusion criteria: 1) palliative care consultation within the prior three months; 2) metastatic malignancy; 3) home oxygen use for chronic obstructive pulmonary disease or heart failure; 4) dialysis for chronic kidney disease; or 5) progressive neurodegenerative disease, including a documented diagnosis of dementia, regardless of severity. These criteria were meant to outline a patient cohort for whom, if possible, most emergency physicians would want to confirm their code statuses prior to proceeding with invasive resuscitation efforts. Subjects were not required to be critically ill to be enrolled in the study.
One author (ER) identified and recruited every eligible patient present in the ED during random convenience sampling, recruiting for 15-20 hours per week. This author (ER) was separate from the patient’s care team. Sampling times included dates from each day of the week, from 6 am – 2 am the following day. Over the course of the enrolment period, efforts were made to evenly distribute sampling times across days of the week and time of day. We identified eligible patients by scanning through the ED’s EHR to see whether they met the inclusion criteria. All patients who met inclusion criteria at the times when the recruiting author (ER) was present in the ED were enrolled using a
standardized and structured protocol to try to retrieve code status documentation. The same author then approached the patient (or, if incapable, the SDM) to obtain consent for the interview portion of the study, after excluding those who were critically ill from the interview portion of the study. Outcome measurements which did not require patient interview were collected for every eligible patient, including those patients who were not interviewed.
Outcome MeasuresThe primary outcome measure was the retrieval of
previously established code status documentation, either from accompanying documents or from the hospital EHR (QuadraMed CPR, Plano, TX). Secondary outcome measures included the time required to obtain the code status, the retrieval of our hospital’s “Patient’s Goals of Care Discussion Form,” and concordance between the documented code status as retrieved vs current wishes as expressed by the patient or SDM at the time of the interview.For the purposes of this study, code status was classified as either “full code” (ie, full resuscitative measures in case of cardiorespiratory arrest) or “DNR” (do not attempt resuscitation in that event). DNR was explicitly defined as direction to not perform chest compressions, defibrillation, and invasive ventilation. Code status falls under the broader umbrella of goals of care, which includes acceptability of other life-sustaining measures interventions, as well as medical and symptom management.10
Western Journal of Emergency Medicine 630 Volume 22, no. 3: May 2021
Code Status Availability and Accuracy for ED Patients with End-stage Disease Russell et al.
Data CollectionAll enrolled patients had demographic information
collected, as well as presenting complaint, and Canadian Triage Acuity Scale (CTAS) scores were recorded. The CTAS is a validated tool used in all Canadian EDs. When triaging patients, emergency nurses assign CTAS scores to patients, ranging from 1 – resuscitation, to 5 – non-urgent. The process of how a score is assigned is determined by patient complaint, specific modifiers (eg, patient age, vital signs), and nursing assessment.11
For the primary outcome measure, we performed a timed searched for existing documentation in the available medical records. We developed a search algorithm by consensus to mimic the steps an experienced emergency physician would use for a patient unable to communicate and in extremis. First, any accompanying paper documentation that had been brought with a patient was reviewed (termed “accompanying documentation”), such as transfer forms from a long-term care facility. Second, the patient’s EHR was searched in the following order: 1) selecting the single-click “Life Care Plans” icon on the patient’s homepage; 2) discharge summaries within the previous two years, 3) clinic reports within the previous two years, or 4) all Ministry of Health and long-term care forms (including past ambulance records with any prehospital advance directive form). The “Life Care Plans” icon was introduced into the EHR approximately two years prior to the study. It allows “one-click” access to scanned copies of both “Do Not Resuscitate Confirmation” ministry forms (Appendix A), as well as copies of the “Patient’s Goals of Care Discussion Form” (Appendix B). The latter, a standardized paper form at our hospital to capture goals of care discussions, was introduced approximately one year prior to the study with the expectation that it be completed routinely during the admission process. In addition to recording patients’ preferences on the scope of treatment they were willing to receive, the form also recorded a discussion of the patients’ understanding of their medical condition(s), their values, priorities, and expectations of treatment.
The two time intervals spent searching either through patients’ accompanying documentation or the EHR were each recorded separately. The timer was stopped as soon as the first documentation of code status had been located and read in sufficient detail to classify with confidence as “full code” or “DNR.” The search was terminated when all eligible records had been reviewed, or the elapsed time had surpassed 15 minutes of dedicated searching. This curfew was determined a priori as beyond the clinically relevant upper time limit during active resuscitation.
One author (ER) interviewed all patients who consented for interview. The partially scripted interview (Appendix C) included a question about the patient’s current code status. Patients (or their surrogate) were given the explicit options of “full code” or “DNR,” and each option was explained in lay language to the patient. If patients were uncertain of
their present goals of care, their responses were deemed “full code.” Patients were also asked about their knowledge of laws governing resuscitation, attitudes about the importance of code status documentation availability in the ED, and about any past invasive resuscitation or intensive care unit (ICU) admission. We defined invasive resuscitative measures as any one of the following: chest compressions; non-elective intubation with mechanical ventilation; or defibrillation.
AnalysisWe selected a priori six variables to test for association
with the primary outcome: place of residence; gender; age; number of hospitals admission in the past year; prior ICU admission; and prior invasive resuscitation. For all tests of statistical significance, P < 0.05 was considered significant.
RESULTSA total of 85 patients were enrolled in the study, of whom
32 (patient or SDM) were also interviewed (Table 1).Only 31 (36%) enrolled patients had documented code status
that could be retrieved at the time of ED presentation (Table 2). When code status documentation was found, it was
almost always available through the EHR (28 of 31 patients), and most commonly found using the single-click “Life Care Plans” icon on the EHR homepage. Of the 31 patients with code status documentation, 13 had accompanying documentation of the goals of care discussion. Not surprisingly, when available either via accompanying paper documentation or the “Life Care Plans” icon on the EHR, code status could be determined within one minute (Figure 1).
When code status documentation was retrieved via other means (eg, reviewing past discharge summaries or clinic reports), the mean (± standard deviation) time to retrieval was 4.33 ±2.57 minutes. In the remaining 54 cases (63%), no code status documentation could be located, despite searching for up to 15 minutes. If found, documented code status agreed well but not perfectly with the current wishes of the patient (or SDM) (Table 3).
Of the 12 patients who self-identified as “full code” on interview, only three had documentation to support this. Of the 20 patients who self-identified as “DNR” on interview, only 10 had supporting documentation. There was one instance in which a SDM for a patient indicated that the patient would be full code despite code status documentation to the contrary, and another in which the accompanying paper documents indicated a patient’s code status as being “full code,” while both the EHR and patient interview identified the patient as DNR.
Of the variables studied (Table 4), only patient residence was associated with having available code status documents. Patients from assisted-living (odds ratio [OR] 6.7; 95% confidence interval [CI], 1.7-26) and long-term care facilities (OR 13; 95% CI, 2.5-65) were more likely to have a documented code status available compared to those living in the community.
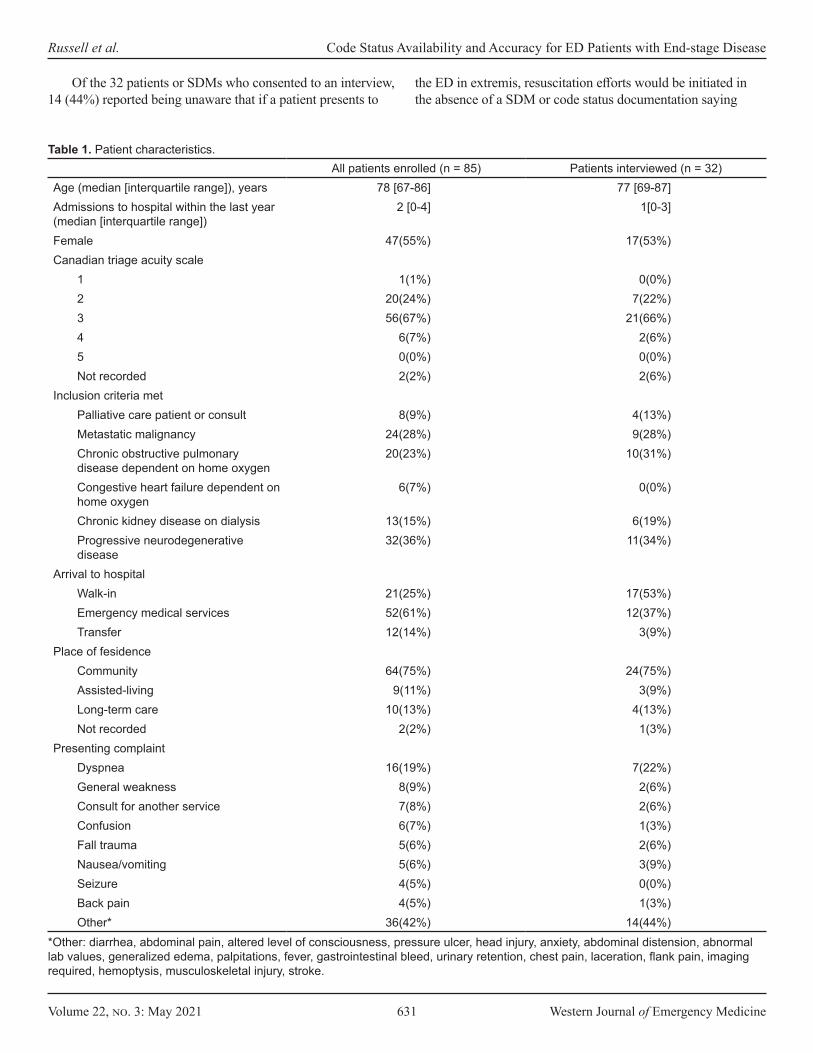
Volume 22, no. 3: May 2021 631 Western Journal of Emergency Medicine
Russell et al. Code Status Availability and Accuracy for ED Patients with End-stage Disease
Of the 32 patients or SDMs who consented to an interview, 14 (44%) reported being unaware that if a patient presents to
the ED in extremis, resuscitation efforts would be initiated in the absence of a SDM or code status documentation saying
All patients enrolled (n = 85) Patients interviewed (n = 32)Age (median [interquartile range]), years 78 [67-86] 77 [69-87]Admissions to hospital within the last year (median [interquartile range])
2 [0-4] 1[0-3]
Female 47(55%) 17(53%)Canadian triage acuity scale
1 1(1%) 0(0%)2 20(24%) 7(22%)3 56(67%) 21(66%)4 6(7%) 2(6%)5 0(0%) 0(0%)Not recorded 2(2%) 2(6%)
Inclusion criteria metPalliative care patient or consult 8(9%) 4(13%)Metastatic malignancy 24(28%) 9(28%)Chronic obstructive pulmonary disease dependent on home oxygen
20(23%) 10(31%)
Congestive heart failure dependent on home oxygen
6(7%) 0(0%)
Chronic kidney disease on dialysis 13(15%) 6(19%)Progressive neurodegenerative disease
32(36%) 11(34%)
Arrival to hospitalWalk-in 21(25%) 17(53%)Emergency medical services 52(61%) 12(37%)Transfer 12(14%) 3(9%)
Place of fesidenceCommunity 64(75%) 24(75%)Assisted-living 9(11%) 3(9%)Long-term care 10(13%) 4(13%)Not recorded 2(2%) 1(3%)
Presenting complaintDyspnea 16(19%) 7(22%)General weakness 8(9%) 2(6%)Consult for another service 7(8%) 2(6%)Confusion 6(7%) 1(3%)Fall trauma 5(6%) 2(6%)Nausea/vomiting 5(6%) 3(9%)Seizure 4(5%) 0(0%)Back pain 4(5%) 1(3%)Other* 36(42%) 14(44%)
Table 1. Patient characteristics.
*Other: diarrhea, abdominal pain, altered level of consciousness, pressure ulcer, head injury, anxiety, abdominal distension, abnormal lab values, generalized edema, palpitations, fever, gastrointestinal bleed, urinary retention, chest pain, laceration, flank pain, imaging required, hemoptysis, musculoskeletal injury, stroke.
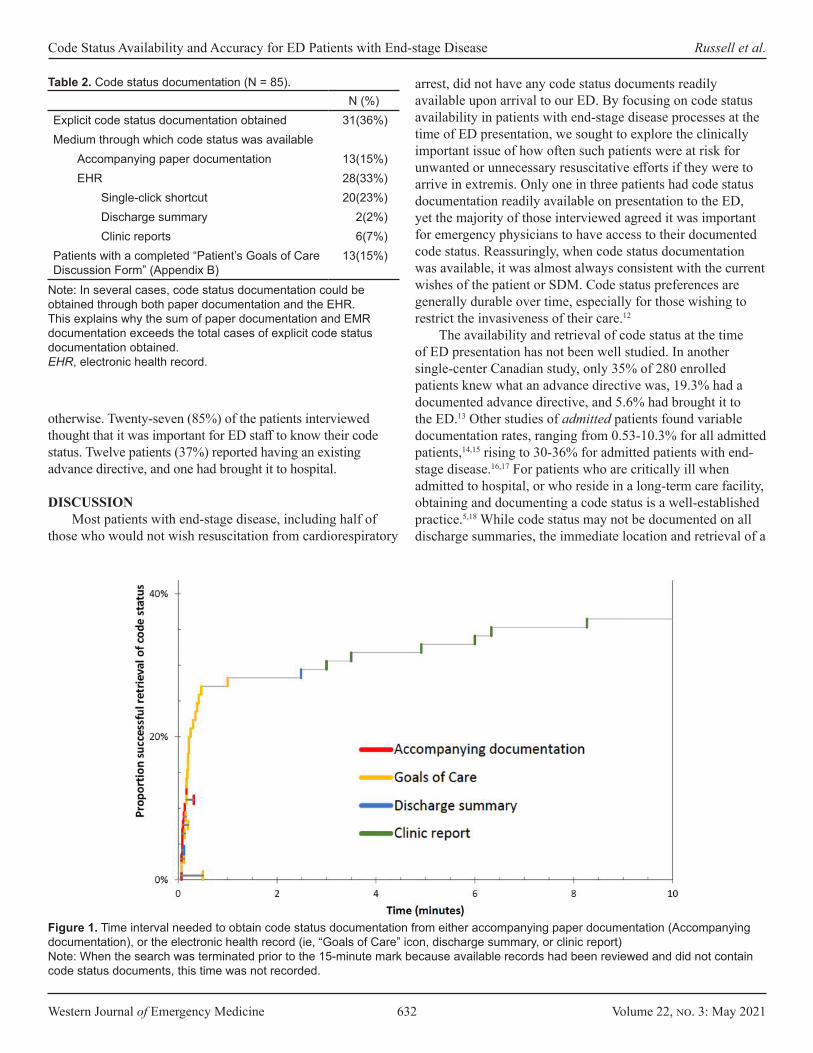
Western Journal of Emergency Medicine 632 Volume 22, no. 3: May 2021
Code Status Availability and Accuracy for ED Patients with End-stage Disease Russell et al.
otherwise. Twenty-seven (85%) of the patients interviewed thought that it was important for ED staff to know their code status. Twelve patients (37%) reported having an existing advance directive, and one had brought it to hospital.
DISCUSSIONMost patients with end-stage disease, including half of
those who would not wish resuscitation from cardiorespiratory
N (%)Explicit code status documentation obtained 31(36%)Medium through which code status was available
Accompanying paper documentation 13(15%)EHR 28(33%)
Single-click shortcut 20(23%)Discharge summary 2(2%)Clinic reports 6(7%)
Patients with a completed “Patient’s Goals of Care Discussion Form” (Appendix B)
13(15%)
Table 2. Code status documentation (N = 85).
Note: In several cases, code status documentation could be obtained through both paper documentation and the EHR. This explains why the sum of paper documentation and EMR documentation exceeds the total cases of explicit code status documentation obtained.EHR, electronic health record.
arrest, did not have any code status documents readily available upon arrival to our ED. By focusing on code status availability in patients with end-stage disease processes at the time of ED presentation, we sought to explore the clinically important issue of how often such patients were at risk for unwanted or unnecessary resuscitative efforts if they were to arrive in extremis. Only one in three patients had code status documentation readily available on presentation to the ED, yet the majority of those interviewed agreed it was important for emergency physicians to have access to their documented code status. Reassuringly, when code status documentation was available, it was almost always consistent with the current wishes of the patient or SDM. Code status preferences are generally durable over time, especially for those wishing to restrict the invasiveness of their care.12
The availability and retrieval of code status at the time of ED presentation has not been well studied. In another single-center Canadian study, only 35% of 280 enrolled patients knew what an advance directive was, 19.3% had a documented advance directive, and 5.6% had brought it to the ED.13 Other studies of admitted patients found variable documentation rates, ranging from 0.53-10.3% for all admitted patients,14,15 rising to 30-36% for admitted patients with end-stage disease.16,17 For patients who are critically ill when admitted to hospital, or who reside in a long-term care facility, obtaining and documenting a code status is a well-established practice.5,18 While code status may not be documented on all discharge summaries, the immediate location and retrieval of a
Figure 1. Time interval needed to obtain code status documentation from either accompanying paper documentation (Accompanying documentation), or the electronic health record (ie, “Goals of Care” icon, discharge summary, or clinic report)Note: When the search was terminated prior to the 15-minute mark because available records had been reviewed and did not contain code status documents, this time was not recorded.

Volume 22, no. 3: May 2021 633 Western Journal of Emergency Medicine
Russell et al. Code Status Availability and Accuracy for ED Patients with End-stage Disease
patient’s prior goals of care should be a priority for any health informatics system, comparable in many ways to allergy or prior violence alerts. While EHR systems continue to mature, our findings highlight the utility of designing an EHR with immediate access to a patient’s documented code status.
For those patients with code status documents, we demonstrated near immediate retrieval using either review of paper forms accompanying a transfer, or with a quick-access icon in the EHR. Retrieval times were much longer when reading through recent discharge summaries or clinic reports. Importantly, most of these latter sources failed to produce any information regarding code status even after a prolonged and concerted effort, leaving the residual uncertainty of whether the issue had ever been discussed. Limited access to palliative care patients’ full medical record is a major barrier to providing quality, patient-centered palliative care in the ED.19 Moving forward, healthcare systems should require greater information integration across clinical environments (ie, ED, family physician offices, outpatient clinics, inpatient services).13,20 There are several examples of rapid access, centralized code-status systems for frontline emergency healthcare providers in other jurisdictions that warrant exploration.21-24
Of all patients interviewed, the majority self-identified as “DNR,” despite many lacking documentation to support this assertion. These patients could have received unwanted resuscitations had they presented to hospital in extremis, absent a knowledgeable SDM. This unacceptably high number may be partially driven by only half of interviewed patients being aware that full resuscitative efforts could be initiated in the absence of documentation or an SDM to say otherwise.
More than one-third of recruited patients interviewed self-identified as “full code,” indicating that advanced disease does not reliably predict desired resuscitative interventions, despite the poor outcomes.23 It has long been known that patients and their families grossly overestimate the benefit of cardiopulmonary resuscitation.16,25 Engaging patients with end-stage disease and their families on the realities of resuscitation is an important conversation, and one they are more likely to participate in if they perceive it to be personally relevant.16 Further, patients with end-stage disease who participate in end-of-life care discussions with their caregivers and healthcare providers experience much
lower rates of mechanical ventilation, ICU admission, and invasive resuscitation.26,27
Consistent with previous studies, place of residence was strongly associated with patients’ likelihood of having accessible code status documentation.18,28 Three in four of our recruited patients lived at home, emphasizing the need to target these patients regarding code status discussions.
LIMITATIONSThis cross-sectional, single-center study was performed
at a time when EHRs are rapidly evolving. Despite the small sample size reducing the precision of our estimates, we believe that the broader issue of difficulties in retrieving or demonstrating the absence of code status documentation apply to many healthcare systems and information networks. With respect to the recruitment process, due to staffing restraints our recruitment times for this study omitted the hours 2 am - 6 am , a time when EDs typically have the lowest amount of coverage. While it would have been preferable to recruit during all times of day, because the recruiter was separate from the patients’ care team this four-hour gap in recruitment time should not have significantly impacted our study’s results.
Unfortunately, less than half of patients who were enrolled in the study consented for an interview. The reasons for this are multifactorial: patients declined to an interview because this was their preference; patients lacked the capacity to consent for an interview and an SDM was not available; or they were so critically ill that it was inappropriate to consent a patient (or SDM) for an interview. We acknowledge that this limits the robustness of data gleaned from the patient interviews and introduces some element of selection bias. Additionally, the use of dementia as an inclusion criterion was not meant to imply that all such patients are near the end of life. Rather, such patients were included given their exclusion from most prior studies, the challenges of quickly determining capacity, and the progressive and common nature of this disease.
This study took place in an academic, tertiary-care center where typically a member of the care team could be tasked with reviewing a patient’s prior code status documentation. We recognize that not all ED settings have enough physician
Patient (or SDM) stated code statusFull code DNR
Code status on record Full code 3(9%) 1(3%)**DNR 1(3%)* 10(30%)Undocumented 9(27%) 10(30%)
Table 3. Concordance of code status documentation with patient or substitute decision maker report (N = 34).
Note: There was one instance where the substitute decision maker (SDM) expressed goals of care that were not consistent with the recorded goals of care,* and one instance of two different recorded goals of care.** This accounts for why the total responses in Table 3 is 34 for 32 patients interviewed.SDM, substitute decision maker; DNR, do not resuscitate.
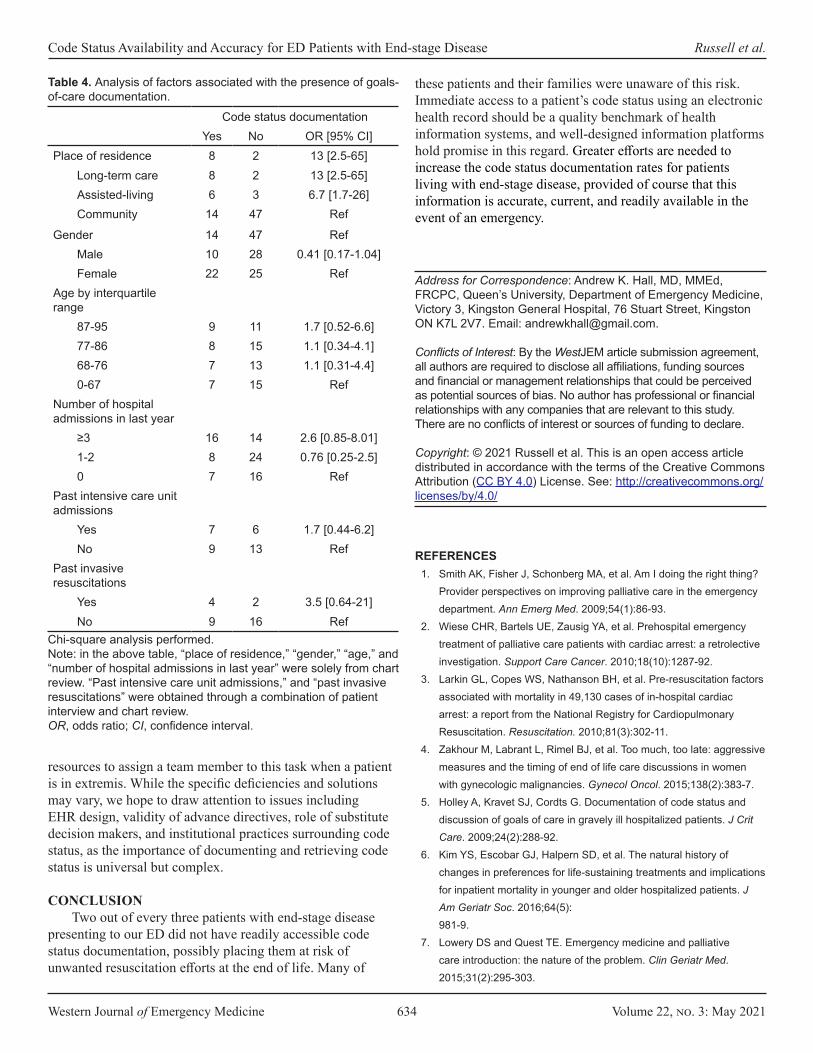
Western Journal of Emergency Medicine 634 Volume 22, no. 3: May 2021
Code Status Availability and Accuracy for ED Patients with End-stage Disease Russell et al.
resources to assign a team member to this task when a patient is in extremis. While the specific deficiencies and solutions may vary, we hope to draw attention to issues including EHR design, validity of advance directives, role of substitute decision makers, and institutional practices surrounding code status, as the importance of documenting and retrieving code status is universal but complex.
CONCLUSIONTwo out of every three patients with end-stage disease
presenting to our ED did not have readily accessible code status documentation, possibly placing them at risk of unwanted resuscitation efforts at the end of life. Many of
these patients and their families were unaware of this risk. Immediate access to a patient’s code status using an electronic health record should be a quality benchmark of health information systems, and well-designed information platforms hold promise in this regard. Greater efforts are needed to increase the code status documentation rates for patients living with end-stage disease, provided of course that this information is accurate, current, and readily available in the event of an emergency.
Address for Correspondence: Andrew K. Hall, MD, MMEd, FRCPC, Queen’s University, Department of Emergency Medicine, Victory 3, Kingston General Hospital, 76 Stuart Street, Kingston ON K7L 2V7. Email: [email protected].
Conflicts of Interest: By the WestJEM article submission agreement, all authors are required to disclose all affiliations, funding sources and financial or management relationships that could be perceived as potential sources of bias. No author has professional or financial relationships with any companies that are relevant to this study. There are no conflicts of interest or sources of funding to declare.
Copyright: © 2021 Russell et al. This is an open access article distributed in accordance with the terms of the Creative Commons Attribution (CC BY 4.0) License. See: http://creativecommons.org/licenses/by/4.0/
Code status documentationYes No OR [95% CI]
Place of residence 8 2 13 [2.5-65]Long-term care 8 2 13 [2.5-65]Assisted-living 6 3 6.7 [1.7-26]Community 14 47 Ref
Gender 14 47 RefMale 10 28 0.41 [0.17-1.04]Female 22 25 Ref
Age by interquartile range
87-95 9 11 1.7 [0.52-6.6]77-86 8 15 1.1 [0.34-4.1]68-76 7 13 1.1 [0.31-4.4]0-67 7 15 Ref
Number of hospital admissions in last year
≥3 16 14 2.6 [0.85-8.01]1-2 8 24 0.76 [0.25-2.5]0 7 16 Ref
Past intensive care unit admissions
Yes 7 6 1.7 [0.44-6.2]No 9 13 Ref
Past invasive resuscitations
Yes 4 2 3.5 [0.64-21]No 9 16 Ref
Table 4. Analysis of factors associated with the presence of goals-of-care documentation.
Chi-square analysis performed.Note: in the above table, “place of residence,” “gender,” “age,” and “number of hospital admissions in last year” were solely from chart review. “Past intensive care unit admissions,” and “past invasive resuscitations” were obtained through a combination of patient interview and chart review.OR, odds ratio; CI, confidence interval.
REFERENCES1. Smith AK, Fisher J, Schonberg MA, et al. Am I doing the right thing?
Provider perspectives on improving palliative care in the emergency department. Ann Emerg Med. 2009;54(1):86-93.
2. Wiese CHR, Bartels UE, Zausig YA, et al. Prehospital emergency treatment of palliative care patients with cardiac arrest: a retrolective investigation. Support Care Cancer. 2010;18(10):1287-92.
3. Larkin GL, Copes WS, Nathanson BH, et al. Pre-resuscitation factors associated with mortality in 49,130 cases of in-hospital cardiac arrest: a report from the National Registry for Cardiopulmonary Resuscitation. Resuscitation. 2010;81(3):302-11.
4. Zakhour M, Labrant L, Rimel BJ, et al. Too much, too late: aggressive measures and the timing of end of life care discussions in women with gynecologic malignancies. Gynecol Oncol. 2015;138(2):383-7.
5. Holley A, Kravet SJ, Cordts G. Documentation of code status and discussion of goals of care in gravely ill hospitalized patients. J Crit Care. 2009;24(2):288-92.
6. Kim YS, Escobar GJ, Halpern SD, et al. The natural history of changes in preferences for life-sustaining treatments and implications for inpatient mortality in younger and older hospitalized patients. J Am Geriatr Soc. 2016;64(5): 981-9.
7. Lowery DS and Quest TE. Emergency medicine and palliative care introduction: the nature of the problem. Clin Geriatr Med. 2015;31(2):295-303.

Volume 22, no. 3: May 2021 635 Western Journal of Emergency Medicine
Russell et al. Code Status Availability and Accuracy for ED Patients with End-stage Disease
8. Silveira MJ, Kim SYH, Langa KM. Advance directives and outcomes of surrogate decision making before death. N Engl J Med. 2010;362(13):1211-8.
9. Kutscher E and Kladney M. Primary care providers: discuss COVID-19-related goals of care with your vulnerable patients now. J Gen Intern Med. 2020;35(7):2195-6.
10. Temel JS, Greer JA, Admane S, et al. Code status documentation in the outpatient electronic medical records of patients with metastatic cancer. J Gen Intern Med. 2010;25(2):150-3.
11. Bullard MJ, Musgrave E, Warren D, et al. Revisions to the Canadian Emergency Department Triage and Acuity Scale (CTAS) Guidelines 2016. Can J Emerg Med. 2017;19(S2):S18-S27.
12. Auriemma CL, Nguyen CA, Bronheim R, et al. Stability of end-of-life preferences: a systematic review of the evidence. JAMA Intern Med. 2014;174(7):1085-92.
13. Gill GGK, Fukushima E, Abu-Laban RB, et al. Prevalence of advance directives among elderly patients attending an urban Canadian emergency department. Can J Emerg Med. 2012;14(2):90-6.
14. Auerbach AD, Katz R, Pantilat SZ, et al. Factors associated with discussion of care plans and code status at the time of hospital admission: results from the multicenter hospitalist study. J Hosp Med. 2008;3(6):437-45.
15. Bhatia HL, Patel NR, Choma NN, et al. Code status and resuscitation options in the electronic health record. Resuscitation. 2015;87:14-20.
16. Heyland DK, Frank C, Groll D, et al. Understanding cardiopulmonary resuscitation decision making: perspectives of seriously III hospitalized patients and family members. Chest. 2006;130(2):419-28.
17. Heyland DK, Barwich D, Pichora D, et al. Failure to engage hospitalized elderly patients and their families in advance care planning. JAMA Intern Med. 2013;173(9):778-87.
18. Wheatley E and Huntington MK. Advanced directives and code status documentation in an academic practice. Fam Med. 2012;44(8):574-8.
19. Lamba S, Nagurka R, Zielinski A, et al. Palliative care provision in the emergency department: barriers reported by emergency physicians. J Palliat Med. 2013;16(2):143-7.
20. Robinson C, Kolesar S, Boyko M, et al. Awareness of do-not-resuscitate orders. Can Fam Physician. 2012;58(4):e229 LP-e233.
21. Jesus JE, Geiderman JM, Venkat A, et al. Physician orders for life-sustaining treatment and emergency medicine: ethical considerations, legal issues, and emerging trends. Ann Emerg Med. 2014;64(2):140-4.
22. Alberta Health Services. Advance Care Planning and Goals of care designation. Available at: https://extranet.ahsnet.ca/teams/policydocuments/1/clp-advance-care-planning-hcs-38-policy.pdf. Accessed July 22, 2018.
23. Régie de l’assurance maladie du Québec. Advance medical directives. Available at: http://www.ramq.gouv.qc.ca/en/citizens/health-insurance/advance-directives/Pagesadvance-medical-directives.aspx. Accessed November 26, 2018.
24. Lee RY, Brumback LC, Sathitratanacheewin S, et al. Association of physician orders for life-sustaining treatment with ICU admission among patients hospitalized near the end of life. JAMA. 2020;323(10):950-60.
25. Frank C, Heyland DK, Chen B, et al. Frank et al. Determining resuscitation preferences of elderly inpatients: a review of the literature. Can Med Assoc J. 2003;169(8):795-9.
26. Wright AA, Zhang B, Ray A, et al. Associations between end-of-life discussions, patient mental health, medical care near death, and caregiver bereavement adjustment. JAMA. 2010;300(14):1665-73.
27. Hanning J, Walker KJ, Horrigan D, et al. Review article: goals-of-care discussions for adult patients nearing end of life in emergency departments: a systematic review. Emerg Med Australas. 2019;31(4):525-32.
28. Teno JM, Gruneir A, Schwartz Z, et al. Association between advance directives and quality of end-of-life care: a national study. J Am Geriatr Soc. 2007;55(2):189-1994.
Western Journal of Emergency Medicine 636 Volume 22, no. 3: May 2021
Original Research
Diabetes Patient Surveillance in the Emergency Department: Proof of Concept and Opportunities
M. Gabriela Sava, PhD*Ronald G. Pirrallo, MD† Brian C. Helsel, PhD‡ Jingyuan Tian, MS*Patricia Carbajales-Dale, MS§
Kuang-Ching Wang, PhD#
John Bruch, MD¶
Ronald W. Gimbel, PhD||
Section Editor: Jacob Manteuffel, MD Submission history: Submitted August 3, 2020; Revision received December 8, 2020; Accepted December 23, 2020 Electronically published April 2, 2021 Full text available through open access at http://escholarship.org/uc/uciem_westjem DOI: 10.5811/westjem.2020.12.49171
INTRODUCTIONEvidence continues to support preventive services as
one solution to reducing patient morbidity and mortality
Clemson University, Department of Management, Clemson, South CarolinaUniversity of South Carolina School of Medicine Greenville, Department of Emergency Medicine, Greenville, South CarolinaUniversity of Kansas Medical Center, Department of Internal Medicine, Kansas City, KansasClemson University, Center for Geospatial Technologies, Clemson, South CarolinaUniversity of South Carolina School of Medicine Greenville, Department of Internal Medicine, Greenville, South CarolinaClemson University, Department of Public Health Sciences, Clemson, South CarolinaClemson University, Department of Electrical and Computer Engineering, Clemson, South Carolina
*†
‡
§
¶
||
#
Introduction: The purpose of this study was to characterize the at-risk diabetes and prediabetes patient population visiting emergency department (ED) and urgent care (UC) centers in upstate South Carolina.
Methods: We conducted this retrospective study at the largest non-profit healthcare system in South Carolina, using electronic health record (EHR) data of patients who had an ED or UC visit between February 2, 2016–July 31, 2018. Key variables including International Classification of Diseases, 10th Revision codes, laboratory test results, family history, medication, and demographic characteristics were used to classify the patients as healthy, having prediabetes, having diabetes, being at-risk for prediabetes, or being at-risk for diabetes. Patients who were known to have diabetes were classified further as having controlled diabetes, management challenged, or uncontrolled diabetes. Population analysis was stratified by the patient’s annual number of ED/UC visits.
Results: The risk stratification revealed 4.58% unique patients with unrecognized diabetes and 10.34% of the known patients with diabetes considered to be suboptimally controlled. Patients identified as diabetes management challenged had more ED/UC visits. Of note, 33.95% of the patients had unrecognized prediabetes/diabetes risk factors identified during their ED/UC with 87.95% having some form of healthcare insurance.
Conclusion: This study supports the idea that a single ED/UC unscheduled visit can identify individuals with unrecognized diabetes and an at-risk prediabetes population using EHR data. A patient’s ED/UC visit, regardless of their primary reason for seeking care, may be an opportunity to provide early identification and diabetes disease management enrollment to augment the medical care of our community. [West J Emerg Med. 2021;22(3)636-643.]
and decreasing healthcare system demands and costs.1,2
Appropriately, healthcare system decision-makers have shifted their focus toward preventive screening, early detection, and
Volume 22, no. 3: May 2021 637 Western Journal of Emergency Medicine
Sava et al. Diabetes Patient Surveillance in the ED
Population Health Research Capsule
What do we already know about this issue?Prior research demonstrates that emergency department (ED) diabetes surveillance protocols using random blood glucose measurements have been successful.
What was the research question?Our goal was to characterize the at-risk diabetes and prediabetes patient population visiting ED and urgent care (UC) centers in upstate South Carolina.
What was the major finding of the study?A single ED/UC unscheduled visit can identify individuals with unrecognized diabetes and an at-risk prediabetes using electronic health records data.
How does this improve population health?A patient’s ED/UC visit, independent of the reason, may be an opportunity to provide early identification and diabetes disease management enrollment.
management of chronic diseases such as diabetes. The US Centers for Disease Control and Prevention (CDC) reports 30.3 million Americans (9.4%) have diabetes and another 84.1 million (33.9%) have prediabetes.3 South Carolina ranks
seventh highest in the nation for an adult population with diabetes, and approximately 1 in 6 African-Americans living in South Carolina have diabetes.4 In addition, the emergency department (ED) and urgent care (UC) patient population is known to have a high prevalence of diabetes risk factors and undiagnosed diabetes.5 As an episodic and unscheduled access point into the US healthcare system, an ED or UC visit is an ideal location for acute disease management and public health surveillance of a community’s burden with diabetes.
Prior research demonstrates that ED diabetes surveillance protocols using only random, blood glucose measurements have been successful.6-10 Patient characteristics, such as demographics,11 body mass index (BMI), family history, comorbidities, and laboratory measures of impaired glucose tolerance, hemoglobin A1c (HbA1c), cholesterol, and triglycerides, can be used to refine a screening decision for diabetes. Confirmatory testing such as fasting plasma glucose, oral glucose tolerance testing, or HbA1C should be considered for definitive diabetes diagnosis.
The adoption of a healthcare systemwide, patient electronic health record (EHR) makes it possible to use dynamic and continuous patient data inquiry for real-time clinical decision-making. Decision-making heuristics and algorithms are being advanced to help notify and advise clinicians of an at-risk patient. In addition, as ED clinicians continue to expand their scope of practice toward early detection and morbidity reduction, exampled by successful human immunodeficiency virus12 and opioid-misuse screening,13 understanding the characteristics of an at-risk population is paramount.
In a proof-of-concept data exploration and risk classification study, we sought to describe the at-risk population for prediabetes and diabetes and those with suboptimally controlled diabetes in the general ED and UC population in upstate South Carolina. Using clinical classification rules based on variables commonly collected in a patient’s EHR and the American Diabetes Association (ADA) Standards of Medical Care in Diabetes,14 we described the characteristics of the broad at-risk diabetes patient population that may not otherwise interact with the healthcare system. Additionally, we geographically mapped the at-risk population to reveal where resources such as primary care clinics or chronic disease management programs access should be focused and allocated.
METHODSThis was a retrospective descriptive study of a single
healthcare system’s EHR containing data on patients who presented to the ED or UC centers of the study location, a health system in South Carolina between February 2, 2016–
July 31, 2018. The health system provides comprehensive healthcare for the 11 counties in upstate South Carolina serving a population of 1.4 million and is the region’s largest health system. The study location’s department of emergency medicine includes seven hospital-based EDs and six UC centers. The hospital-based EDs range from rural access hospitals to an academic American College of Surgeons-verified Level I trauma center that, in total, serve more than 360,000 emergent patients annually. The six UC centers are open 16 hours each weekday with 14 hours of weekend hourly coverage seeing approximately 100,000 patients annually. The health system’s institutional review board determined this study not to constitute human subjects research.
Study PopulationFor all patients 18 years of age and older, their ED and
UC visits were considered a sentinel event to query diabetes-specific screening variables included in the EHR. For patients with multiple visits, only the most recent visit was considered for their risk classification and labeling. Data were extracted from the EHR based on a predetermined set of variables selected by the researchers. These variables contained a preset data code that healthcare system report writers aggregated
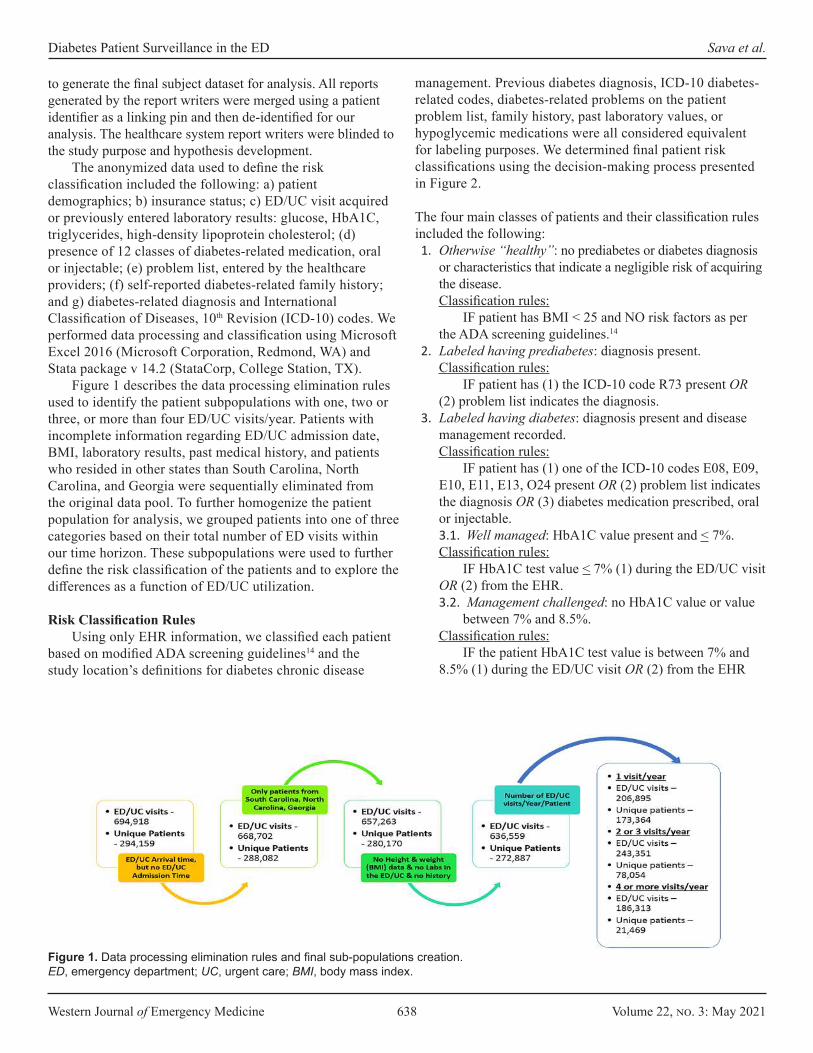
Western Journal of Emergency Medicine 638 Volume 22, no. 3: May 2021
Diabetes Patient Surveillance in the ED Sava et al.
to generate the final subject dataset for analysis. All reports generated by the report writers were merged using a patient identifier as a linking pin and then de-identified for our analysis. The healthcare system report writers were blinded to the study purpose and hypothesis development.
The anonymized data used to define the risk classification included the following: a) patient demographics; b) insurance status; c) ED/UC visit acquired or previously entered laboratory results: glucose, HbA1C, triglycerides, high-density lipoprotein cholesterol; (d) presence of 12 classes of diabetes-related medication, oral or injectable; (e) problem list, entered by the healthcare providers; (f) self-reported diabetes-related family history; and g) diabetes-related diagnosis and International Classification of Diseases, 10th Revision (ICD-10) codes. We performed data processing and classification using Microsoft Excel 2016 (Microsoft Corporation, Redmond, WA) and Stata package v 14.2 (StataCorp, College Station, TX).
Figure 1 describes the data processing elimination rules used to identify the patient subpopulations with one, two or three, or more than four ED/UC visits/year. Patients with incomplete information regarding ED/UC admission date, BMI, laboratory results, past medical history, and patients who resided in other states than South Carolina, North Carolina, and Georgia were sequentially eliminated from the original data pool. To further homogenize the patient population for analysis, we grouped patients into one of three categories based on their total number of ED visits within our time horizon. These subpopulations were used to further define the risk classification of the patients and to explore the differences as a function of ED/UC utilization.
Risk Classification RulesUsing only EHR information, we classified each patient
based on modified ADA screening guidelines14 and the study location’s definitions for diabetes chronic disease
management. Previous diabetes diagnosis, ICD-10 diabetes-related codes, diabetes-related problems on the patient problem list, family history, past laboratory values, or hypoglycemic medications were all considered equivalent for labeling purposes. We determined final patient risk classifications using the decision-making process presented in Figure 2.
The four main classes of patients and their classification rules included the following: 1. Otherwise “healthy”: no prediabetes or diabetes diagnosis
or characteristics that indicate a negligible risk of acquiring the disease.Classification rules:
IF patient has BMI < 25 and NO risk factors as per the ADA screening guidelines.14
2. Labeled having prediabetes: diagnosis present.Classification rules:
IF patient has (1) the ICD-10 code R73 present OR (2) problem list indicates the diagnosis.
3. Labeled having diabetes: diagnosis present and disease management recorded.Classification rules:
IF patient has (1) one of the ICD-10 codes E08, E09, E10, E11, E13, O24 present OR (2) problem list indicates the diagnosis OR (3) diabetes medication prescribed, oral or injectable. 3.1. Well managed: HbA1C value present and < 7%.Classification rules:
IF HbA1C test value < 7% (1) during the ED/UC visit OR (2) from the EHR.3.2. Management challenged: no HbA1C value or value
between 7% and 8.5%.Classification rules:
IF the patient HbA1C test value is between 7% and 8.5% (1) during the ED/UC visit OR (2) from the EHR
Figure 1. Data processing elimination rules and final sub-populations creation.ED, emergency department; UC, urgent care; BMI, body mass index.
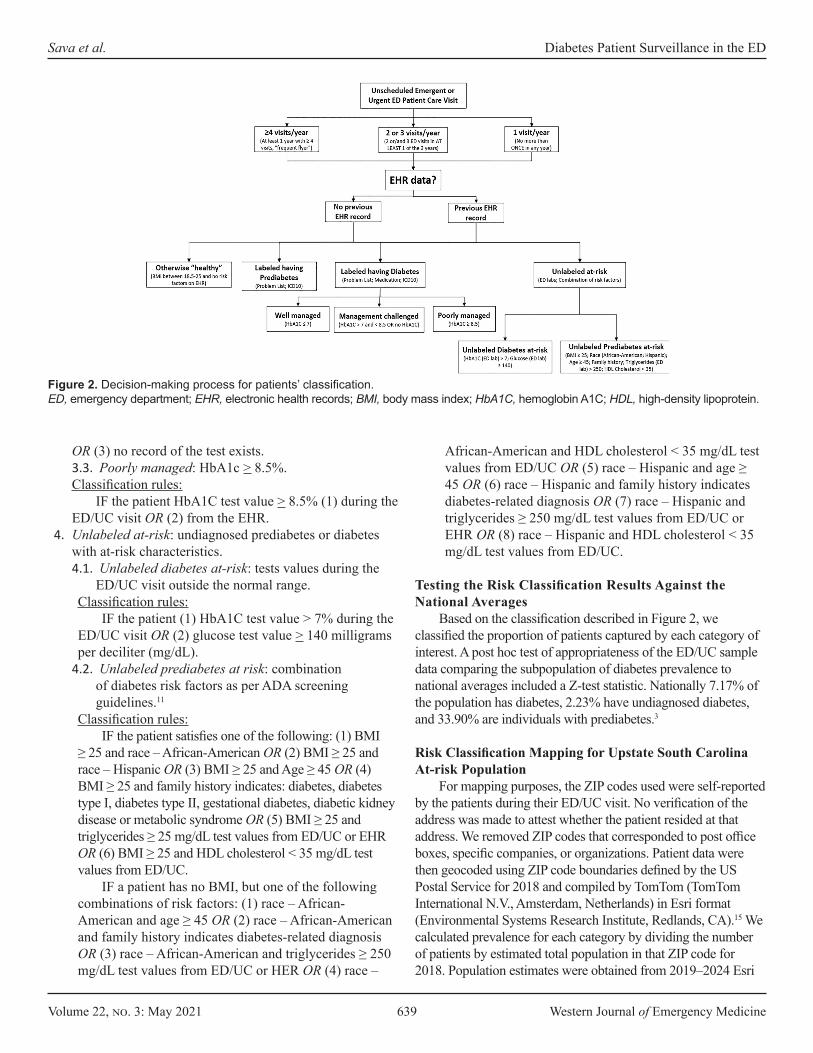
Volume 22, no. 3: May 2021 639 Western Journal of Emergency Medicine
Sava et al. Diabetes Patient Surveillance in the ED
OR (3) no record of the test exists.3.3. Poorly managed: HbA1c > 8.5%.Classification rules:
IF the patient HbA1C test value > 8.5% (1) during the ED/UC visit OR (2) from the EHR.
4. Unlabeled at-risk: undiagnosed prediabetes or diabetes with at-risk characteristics.4.1. Unlabeled diabetes at-risk: tests values during the
ED/UC visit outside the normal range.Classification rules:
IF the patient (1) HbA1C test value > 7% during the ED/UC visit OR (2) glucose test value > 140 milligrams per deciliter (mg/dL).
4.2. Unlabeled prediabetes at risk: combination of diabetes risk factors as per ADA screening guidelines.11
Classification rules: IF the patient satisfies one of the following: (1) BMI
≥ 25 and race – African-American OR (2) BMI ≥ 25 and race – Hispanic OR (3) BMI ≥ 25 and Age ≥ 45 OR (4) BMI ≥ 25 and family history indicates: diabetes, diabetes type I, diabetes type II, gestational diabetes, diabetic kidney disease or metabolic syndrome OR (5) BMI ≥ 25 and triglycerides ≥ 25 mg/dL test values from ED/UC or EHR OR (6) BMI ≥ 25 and HDL cholesterol < 35 mg/dL test values from ED/UC.
IF a patient has no BMI, but one of the following combinations of risk factors: (1) race – African-American and age ≥ 45 OR (2) race – African-American and family history indicates diabetes-related diagnosis OR (3) race – African-American and triglycerides ≥ 250 mg/dL test values from ED/UC or HER OR (4) race –
African-American and HDL cholesterol < 35 mg/dL test values from ED/UC OR (5) race – Hispanic and age ≥ 45 OR (6) race – Hispanic and family history indicates diabetes-related diagnosis OR (7) race – Hispanic and triglycerides ≥ 250 mg/dL test values from ED/UC or EHR OR (8) race – Hispanic and HDL cholesterol < 35 mg/dL test values from ED/UC.
Testing the Risk Classification Results Against the National Averages
Based on the classification described in Figure 2, we classified the proportion of patients captured by each category of interest. A post hoc test of appropriateness of the ED/UC sample data comparing the subpopulation of diabetes prevalence to national averages included a Z-test statistic. Nationally 7.17% of the population has diabetes, 2.23% have undiagnosed diabetes, and 33.90% are individuals with prediabetes.3
Risk Classification Mapping for Upstate South Carolina At-risk Population
For mapping purposes, the ZIP codes used were self-reported by the patients during their ED/UC visit. No verification of the address was made to attest whether the patient resided at that address. We removed ZIP codes that corresponded to post office boxes, specific companies, or organizations. Patient data were then geocoded using ZIP code boundaries defined by the US Postal Service for 2018 and compiled by TomTom (TomTom International N.V., Amsterdam, Netherlands) in Esri format (Environmental Systems Research Institute, Redlands, CA).15 We calculated prevalence for each category by dividing the number of patients by estimated total population in that ZIP code for 2018. Population estimates were obtained from 2019–2024 Esri
Figure 2. Decision-making process for patients’ classification. ED, emergency department; EHR, electronic health records; BMI, body mass index; HbA1C, hemoglobin A1C; HDL, high-density lipoprotein.

Western Journal of Emergency Medicine 640 Volume 22, no. 3: May 2021
Diabetes Patient Surveillance in the ED Sava et al.
updated demographics.16 Once calculated, prevalence rates for each ZIP code in upstate South Carolina were represented using equal interval or natural breaks classification function of the distribution of the data. All maps presented were obtained using
Esri’s ArcGIS software. Further, we analyzed the prevalence of labeled and unlabeled patients with diabetes as a function of race/ethnic background, which is known to be an important discriminating factor.11
Variable 1 ED/UC visit/year 2 or 3 ED/UC visits/year ≥ 4 ED/UC visits/year TotalNumber of unique patients 173,364 (63.53) 78,054 (28.60) 21,469 (7.87) 272,887 (100)Gender
Male 80,457 (46.41)† 33,420 (42.82) 8,342 (38.86) 122,219 (44.79)‡ Female 92,873 (53.57) 44,629 (57.18) 13,126 (61.14) 150,628 (55.20)Other 34 (0.02) 5 (<0.01) 1 (<0.01) 40 (0.01)
Race/EthnicityWhite 129,557 (74.73) 58,517 (74.97) 15,715 (73.20) 203,789 (74.68)African-American 29,948 (17.27) 15,098 (19.34) 4,918 (22.91) 49,964 (18.31)Hispanic 8,900 (5.13) 2,894 (3.71) 517 (2.41) 12,311 (4.51)Other§ 4,959 (2.86) 1,545 (1.98) 319 (1.49) 6,823 (2.50)
Age (years)< 20 7,427 (4.28) 2,310 (2.96) 389 (1.81) 10,126 (3.71)20-39 64,304 (37.09) 28,266 (36.21) 7,692 (35.83) 100,262 (36.74)40-59 56,348 (32.50) 24,604 (31.52) 6,806 (31.70) 87,758 (32.16)60-79 36,796 (21.22) 17,174 (22.00) 4,744 (22.10) 58,714 (21.52)> 80 8,489 (4.90) 5,700 (7.30) 1,838 (8.56) 16,027 (5.87)
InsuranceMedicare** 38,143 (22.00) 21,225 (27.19) 7,385 (34.40) 66,753 (24.46)Medicaid†† 13,038 (7.52) 8,288 (10.62) 3,963 (18.46) 25,289 (9.27)Self-pay 441 (0.25) 230 (0.29) 90 (0.42) 761 (0.28)Commercial‡‡ 98,709 (56.94) 40,871 (52.36) 8,379 (39.03) 147,959 (54.22)Unknown 23,033 (13.29) 7,440 (9.53) 1,652 (7.69) 32,125 (11.77)
Risk Classification(1) Otherwise “healthy” 92,744 (53.50) 36,432 (46.68) 8,014 (37.33) 137,190 (50.27)(2) Labeled having prediabetes 529 (0.31) 597 (0.76) 304 (1.42) 1,430 (0.52)(3) Labeled having diabetes 14,682 (8.47) 10,143 (12.99) 4,480 (20.87) 29,305 (10.74)
(3.1) Well managed 667 (0.38) 529 (0.68) 244 (1.14) 1,440 (0.53)(3.2) Management challenged
13,442 (7.75) 9,183 (11.76) 4,027 (18.76) 26,652 (9.77)
(3.3) Poorly managed 705 (0.41) 580 (0.74) 274 (1.28) 1,559 (0.57)(4) Unlabeled at-risk 65,452 (37.75) 30,963 (39.67) 8,732 (40.67) 105,147 (38.53)
(4.1) Unlabeled diabetes at-risk
8,349 (4.82) 3,303 (4.23) 853 (3.97) 12,505 (4.58)
(4.2) Unlabeled prediabetes at-risk
57,103 (32.94) 27,660 (35.44) 7,879 (36.70) 92,642 (33.95)
Table1. Demographic and classification characteristics of the emergency department (ED) / urgent care (UC) patients.
*Data are reported as n (%).†% in columns 2, 3 and 4 are a calculated function of the total number of unique patients identified for each of the three subpopulations.‡% in column 5 are a calculated function of the total number of unique patients identified in the data set.§“Other” category includes American Indian or Alaska Native, Asian, biracial or multiracial, unknown, Native Hawaiian or other Pacific Islander, Patient refused, Other.**Medicare and Medicare Advanced.††Medicaid, Medicaid managed care organization, and pending Medicaid.‡‡Commercial, Blue Cross, Liability, Managed Care, Tricare, Worker’s Comp, Other.

Volume 22, no. 3: May 2021 641 Western Journal of Emergency Medicine
Sava et al. Diabetes Patient Surveillance in the ED
Total% Per race category§§
(3) % Labeled having diabetes***
(4.1) % Unlabeled diabetes at-risk
Total diabetes patients
Number of unique patients 272,887 29,305 12,505 41,810White 203,789 74.68% 10.39% 4.75% 15.13%African-American 49,964 18.31% 13.05% 5.20% 18.25%Hispanic 12,311 4.51% 8.37% 5.15% 13.52%Others 6,823 2.50%
Table 2. Prevalence of labeled and unlabeled patients with diabetes as a function of race/ethnicity.
RESULTSUsing the classification process described in Figure 2
and the risk classification rules, the following summary risk classification was obtained for each of the three subpopulations of interest (Table 1) and race/ethnic backgrounds. (Table 2).
The Z-test statistic that compared the sample proportions to the national averages for all three subpopulations were significant (P-values < 0.05): labeled having diabetes, 95% confidence interval [CI], 10.62%-10.85%; unlabeled diabetes at-risk, 95% CI, 4.50%-4.66%; labeled having prediabetes, 95% CI, 34.29%-34.65%. Thus, the proportion of disease identified in the sample, for each category, is greater in upstate South Carolina than the reported national levels.
The mapping further identified the areas of highest prevalence of our at-risk population of interest, Figures 3 and 4.
DISCUSSIONThis proof-of-concept study supports the idea that an ED/
UC unscheduled visit can identify individuals with diabetes and at risk for diabetes in the population using EHR data. Our risk stratification revealed 4.58% unique patients with unrecognized
diabetes, with 10.34% of the known individuals with diabetes considered to be suboptimally controlled. As expected, the patients posing diabetes management challenges had more ED/UC visits. Yet the percentage of unrecognized individuals with diabetes was similar across the patients with 1-3 or more ED/UC visits per year, around 4%. In addition, 33.95% of the patients had prediabetes risk factors identified during their ED/UC visit.
The prevalence of diabetes is known to be related to race/ethinicity11 of the population. Our data sample from upstate South Carolina demonstrates a disproportionate prevalence in the race categories, with 74.68% of our patients being White.11 And while our data are from an undifferentiated population that includes healthy and at-risk diabetes patients, our prevalence results of the disease identify similar race/ethnicity disparities compared to the national level. For example, our sample included 4.51% Hispanic, of whom 8.37% were labeled having diabetes and 5.15% were unlabeled patients at risk for diabetes. Our results may reflect other geographic and cultural characteristic present in South Carolina.
A patient’s ED or UC visit, regardless of their primary reason for seeking care, may be an opportunity to provide early
§§% are calculated as a function of the total number of unique patients. ***% calculated as a function of the race/ethnic categories of interest.
Figure 3. Labeled prediabetes or diabetes diagnosis: (3a) labeled having prediabetes; (3b) labeled having diabetes – management challenged; (3c) labeled having diabetes – poorly managed.

Western Journal of Emergency Medicine 642 Volume 22, no. 3: May 2021
Diabetes Patient Surveillance in the ED Sava et al.
identification and disease management enrollment to augment the healthcare safety net of the community. Collaboration with and referral to chronic disease management programs may be facilitated with the recognition that most of the patients in this community have some form of insurance, 87.95%.
When comparing the proportions obtained in the ED/UC sample data vs the national averages, we observed that indeed the sample proportions are higher. Even though the national averages tend to underestimate the disease prevalence for the areas with increased number of cases, the clinical definitions used to label our patients are more conservative than the ones used to generate the national averages.3 Thus, our estimate is conservative.
Not surprising, the mapping suggests that social determinants of health may influence where the at-risk prediabetes and diabetes population resides. Linkages with our dataset to other public health surveillance, economic, educational, and demographic data sources may further inform decision-makers on the best interventions to pursue.17 Our data suggest no single demographic-, geographic- or socioeconomic-focused intervention will likely be successful to reduce diabetes prevalence in upstate South Carolina.
The automated identification by the EHR system of an at-risk patient, based on his/her characteristics, could inform the healthcare provider to start an early detection or diseases management improvement process for that individual patient. The future ED/UC role may include identification of the at-risk patients who could benefit from an unscheduled preventive screening for diabetes, ordering a screening HbA1c test, and then referring these patients to a diabetes prevention program or self-management program. This initial ED/UC visit integrated with a referral and follow-up procedure may improve patient care access with minimal ED resource utilization. This study did not evaluate whether
integrating such a screening program into the ED/UC system would potentially adversely affect patient flow or assess clinician adoption even with an EHR warning.
LIMITATIONSAs a retrospective, risk-stratification study, several
limitations should be noted. First, the data were collected from the EHR of a single healthcare system in a region of the country with a known high prevalence of the target disease, diabetes. Patients may have been members of another healthcare system that did not share data with the study location. The results obtained may not be generalizable to other geographic regions of the United States. Second, our classification and labeling of the patients was based on limited clinical, demographic, pharmaceutical, and laboratory information, with no confirmatory or fasting tests performed in a non-acute setting. Race and ethnicity were gleaned from the EHR that is generated upon patient registration and are self-reported. We did not use the current ADA standard glycemic values for diabetes; rather, we set the threshold higher due to the unscheduled acute setting. Additionally, it is recognized that hypoglycemic medications are used to treat diseases other than diabetes.
Finally, and as with any large dataset, missing and misaligned data points recorded in the EHR from multiple databases were not tested for bias. We focused our analysis only on the last known ED/UC visit, augmented with historical medical data, with 0.067% of the patients categorized in multiple classes and kept in the dataset.
CONCLUSIONThis proof-of-concept model shows the potential of
incorporating clinical decision-making rules via advanced data analytics algorithms into the ED/UC EHR to identify an at-risk population for diabetes. The geographic information system
Figure 4. Unlabeled prediabetes or diabetes: (4a) unlabeled diabetes at risk; (4b) unlabeled prediabetes at risk.
Volume 22, no. 3: May 2021 643 Western Journal of Emergency Medicine
Sava et al. Diabetes Patient Surveillance in the ED
mapping of EHR clinical data with other public datasets may further inform decision-makers of where and how interventions should be crafted to address this complex disease. The proposed preventive screening program may be most beneficial in areas where limited healthcare access exists, but where community healthcare agents are well established. This will ensure that the proposed follow-up mechanism of the referral from the ED/UC to a community-based diabetes program will be successful. Future work will need to address the development of a clinician-adoptable, real-time predictive model and evaluate patient post-visit resources required to improve the health of individuals and our community in a region of the country with a high prevalence of diabetes.
Address for Correspondence: M Gabriela SAVA, PhD, Clemson University, Wilbur O. and Ann Powers College of Business, 420D Powers Hall, 225 Walter T Cox Blvd, Clemson, SC, 29634. Email: [email protected].
Conflicts of Interest: By the WestJEM article submission agreement, all authors are required to disclose all affiliations, funding sources and financial or management relationships that could be perceived as potential sources of bias. M. Gabriela Sava, Ronald G. Pirrallo, Kuang-Ching Wang and John Burch have been awarded the 2018 Greenville Health System Health Sciences Center Seed Grant. No other author has professional or financial relationships with any companies that are relevant to this study. There are no other conflicts of interest or sources of funding to declare.
Copyright: © 2021 Sava et al. This is an open access article distributed in accordance with the terms of the Creative Commons Attribution (CC BY 4.0) License. See: http://creativecommons.org/licenses/by/4.0/
REFERENCES1. Fries JF, Koop CE, Beadle CE, et al. Reducing health care costs by
reducing the need and demand for medical services. N Engl J Med. 1993;329(5):321-5.
2. Maciosek MV, Coffield AB, Flottermesch TJ, et al. Greater use of preventive services in U.S. health care could save lives at little or not cost. Health Aff. 2010;29(9):1656-60.
3. Centers for Disease Control and Prevention. (2017). National Diabetes Statistics Report. Atlanta, GA: Centers for Disease Control and Prevention, U.S. Department of Health and Human Services.
4. Department of Health and Environmental Control, Diabetes Initiative of South Carolina. Diabetes in South Carolina, Fact Sheet. 2016.
Available at: https://www.scdhec.gov/sites/default/files/Library/ML-025328.pdf. Accessed April 15, 2019.
5. Ginde AA, Cagliero E, Nathan DM, et al. Point-of-care glucose and hemoglobin A1c in emergency department patients without known diabetes: implications for opportunistic screening. Acad Emerg Med. 2008;15(12):1241-7.
6. Hng TM, Hor A, Ravi S, et al. Diabetes case finding in the emergency department, using HbA1c: an opportunity to improve diabetes detection, prevention, and care. BMJ Open Diabetes Res Care. 2016;4(1):1-4.
7. BarDayan Y, Zilberman I, Boaz M, et al. Prevalence of undiagnosed hyperglycaemia in patients presenting to the department of emergency medicine with no known history of diabetes. Int J Clin Pract. 2016;70(9):771-4.
8. Charfen MA, Ipp E, Kaji AH, et al. Detection of undiagnosed diabetes and prediabetic states in high-risk emergency department patients. Acad Emerg Med. 2009;16(5):394-402.
9. Gomez-Peralta F, Abreu C, Andreu-Urioste L, et al. Point-of-care capillary HbA1c measurement in the emergency department: a useful tool to detect unrecognized and uncontrolled diabetes. Int J Emerg Med. 2016;9(1):7.
10. Silverman RA, Schleicher MG, Valente CJ, et al. Prevalence of undiagnosed dysglycemia in an emergency department observation unit. Diabetes Metab Res Rev. 2016;32(1):2-86.
11. Cheng YJ, Kanaya AM, Araneta MRG, et al. Prevalence of diabetes by race and ethnicity in the United States, 2011-2016. JAMA. 2019;322(24):2389-98.
12. Haukoos JS, Hopkins E, Byyny RL. Patient acceptance of rapid HIV testing practices in an urban emergency department: assessment of the 2006 CDC recommendations for HIV screening in health care settings. Ann Emerg Med. 2008;51(3):303-9.
13. D’Onofrio G, O’Connor PG, Pantalon MV, et al. Emergency department-initiated buprenorphine/naloxone treatment for opioid dependence: a randomized clinical trial. JAMA. 2015;313(16):1636-44.
14. American Diabetes Association. Classification and diagnosis of diabetes: standards of medical care in diabetes. Diabetes Care. 2018;41(Suppl.1):S13-S27.
15. ArcGIS, Esri, TomTom. United States ZIP Code Boundaries. 2018.Available at https://www.arcgis.com/home/item.html?id=0a2fde8aa7404187917488bafcbc77e6. Accessed April 19, 2020.
16. ArcGIS, Esri. Demographics. 2020. Available at https://doc.arcgis.com/en/esri-demographics/data/updated-demographics.htm. Accessed April 19, 2020.
17. Young K. Black barbershops could ID undiagnosed diabetes. 2020. Available at https://www.jwatch.org/fw116286/2020/01/28/black-barbershops-could-id-undiagnosed-diabetes. Accessed April 19, 2020.
Western Journal of Emergency Medicine 644 Volume 22, no. 3: May 2021
Original Research
Utilization of Educational Videos to Improve Communication and Discharge Instructions
Alisa Wray, MD, MAEdRonald Goubert, MDRishi Gadepally, BSMegan Boysen-Osborn, MD, MHPEWarren Wiechmann, MDShannon Toohey, MD, MA Section Editor: Jeffrey Druck, MD Submission history: Submitted July 4, 2020; Revision received September 9, 2020; Accepted January 4, 2021Electronically published April 27, 2021 Full text available through open access at http://escholarship.org/uc/uciem_westjem DOI: 10.5811/westjem.2021.1.48968
INTRODUCTIONDischarge of patients from the emergency department
(ED) generally includes physician discussion with the patient regarding results, treatment, and discharge plan, followed by the patient receiving paper discharge instructions, which are
University of California Irvine, Department of Emergency Medicine, Irvine, California
Introduction: When discharging a patient from the emergency department (ED), it is crucial to make sure that they understand their disposition and aftercare instructions. However, numerous factors make it difficult to ensure that patients understand their next steps. Our objective was to determine whether patient understanding of ED discharge and aftercare instructions could be improved through instructional videos in addition to standard written discharge instructions.
Methods: This was a prospective pre- and post-intervention study conducted at a single-center, academic tertiary care ED. Patients presenting with the five selective chief complaints (closed head injury, vaginal bleeding, laceration care, splint care, and upper respiratory infection) were given questionnaires after their discharge instructions to test comprehension. Once video discharge instructions were implemented, patients received standard discharge instructions in addition to video discharge instructions and were given the same questionnaire. A total of 120 patients were enrolled in each group.
Results: There were significantly better survey scores after video discharge instructions (VDI) vs standard discharge instructions (SDI) for the closed head injury (27% SDI vs 46% VDI, P = 0.003); upper respiratory infection (28% SDI vs 64% VDI; P < 0.0001); and vaginal bleeding in early pregnancy groups (20% SDI vs 60% VDI, P < 0.0001). There were no significant differences in survey scores between the splint care (53% SDI vs 66% VDI; P = 0.08) and suture care groups (29% SDI vs 31% VDI; P = 0.40).
Conclusion: Video discharge instructions supplementing standard written instructions can help improve patient comprehension and information retention. This better understanding of aftercare instructions is essential to patient follow-up and has been shown to improve patient outcomes. [West J Emerg Med. 2021;22(3)644–647.]
reviewed with the patient by the nurse at the time of discharge. Although this process is standard in many EDs across the United States, it is severely flawed. Many factors including time constraints and the unpredictability of the ED contribute to this flaw.1 Due to time constraints on both physicians and
Volume 22, no. 3: May 2021 645 Western Journal of Emergency Medicine
Wray et al. Educational Videos Improve Communication and Discharge Instructions
Population Health Research Capsule
What do we already know about this issue?Previous research has shown that only about 45-50% of patients or caregivers are able to understand their discharge instructions (SDI).
What was the research question?To determine whether patient understanding of ED discharge and aftercare instructions could be improved through instructional videos in addition to standard written discharge instructions.
What was the major finding of the study?Video discharge instructions supplementing standard written instructions can help improve patient comprehension and information retention.
How does this improve population health?This better understanding of aftercare instructions is essential to patient follow-up and has been shown to improve patient outcomes.
nurses, the amount of time to answer questions and ensure patient understanding during discharge is limited. Previous research has shown that only about 45-50% of patients or caregivers are able to understand their standard discharge instructions (SDI).2 This is confirmed by several studies showing poor patient understanding using questionnaires at or after discharge.3-5 Decreased understanding of discharge instructions then leads to decreased compliance, inadequate follow-up, increased readmission rates, and decreased patient satisfaction.1 It is also known that low health literacy is associated with higher utilization of the ED and with higher rates of return within 14 days.6 This issue is complicated by the fact that approximately 14.5% of individuals aged 16 years or older are illiterate (National Assessment of Adult Literacy).7
Many recommendations have been made on how to improve patient understanding at discharge. One way that has been proposed is the use of video discharge instructions (VDI).4 This provides patients with a multimodal way of receiving their diagnosis, management, and treatment plan. In addition, it provides a standardization of information regardless of patients’ literacy, provider’s time to answer questions, and time constraints of nurses. Video discharge instructions have been previously shown to be effective at improving patient and caregiver understanding of their diagnosis in pediatric EDs with common complaints such as fever or closed head injury.8,9
METHODSThis was a prospective pre- and post-intervention study
with convenience sampling done at a single-center, academic tertiary care ED. The study included any adult patients discharged from the ED with any of the five selected discharge diagnoses: vaginal bleeding in early pregnancy; concussion; splint care; laceration care; or upper respiratory tract infection. Topics were selected based on the most common diagnoses seen in the ED. Five diagnoses from the top 10 most common diagnoses were selected by an expert panel of emergency physicians based on available resources and topics that were more complex and would best benefit from VDIs.
We calculated a power analysis assuming the standard deviation (SD) of correct responses to be 25%, and 100 patients in each of the two groups would provide an 80% power to detect a difference of 10% of correct responses on the questionnaires. We aimed to recruit 240 patients to allow for up to 20% incomplete data.
Questionnaires (Supplement A) were developed based on existing standard written discharge instructions in our electronic health record (EHR) system (Epic Systems Corporation, Verona, WI). These questionnaires covered common management of the diagnoses, aftercare, and return precautions. They were developed by a panel of experts (emergency physicians), and then refined by review with patients of various education levels to ensure adequate understanding.
From July 2017–November 2017 120 patients were enrolled and completed the questionnaires before
implementation of VDIs. During this time, VDIs were created based on the same content in the standard written discharge instructions in the EHR system (Supplement B). Scripts and storyboards were created, edited by the same expert panel that created the questionnaire, and then reviewed by patients of various education levels to ensure appropriate level of language and understanding. Videos were then created by whiteboard video animator wizMotions (Whiteboard Studios LLC, Toronto, ON, Canada). Before videos were finalized, they were again presented to patients of various education levels to confirm appropriate level of language and understanding.
Once VDIs were implemented, patients received SDIs in addition to the VDIs. From February 2018–April 2018 we enrolled 120 patients in the post-intervention study. Participants were then given the same questionnaire. Questionnaires were scored and entered into an Excel spreadsheet (Microsoft Corp, Redmond, WA) to calculate the mean. We calculated statistical significance between the SDI group vs those who received VDIs using unpaired t-tests.
RESULTSA total of 120 patients received the SDIs and 120 patients
received the VDIs. Of those patients, 42 received the splint care instructions (18 SDI, 24 VDI); 59 received suture care instructions (31 SDI, 28 VDI); 63 received closed head injury instructions (31 SDI, 32 VDI); 45 received upper respiratory infection instructions (18 SDI, 27 VDI); and 31 received vaginal

Western Journal of Emergency Medicine 646 Volume 22, no. 3: May 2021
Educational Videos Improve Communication and Discharge Instructions Wray et al.
bleeding in early pregnancy instructions (22 SDI, 9 VDI). We used t-test to compare the survey scores between the SDI and the VDI groups (Figure). We compared the scores separately in each of the five selected discharge diagnoses and set the statistical significance level to 0.01 to adjust for the multiple testing. The mean survey score was 30.1% (SD = 28.2) in the SDI group and 52.3% (SD = 31.7) in the VDI group (P < .001).
There were significantly better survey scores after VDIs vs SDIs for the closed head injury (27% SDI vs 46% VDI, P = 0.003); upper respiratory infection (28% SDI vs 64% VDI;
upper respiratory infection, and vaginal bleeding in early pregnancy. Several studies have found similar utility in using VDIs as an adjunct to SDIs in the pediatric ED.8-10 These findings, along with ours, suggest that a multimedia format such as video provides patients with a multidimensional way of learning that does not bias them based on literacy, educational level, or learning style and that they could improve patient understanding.
Of note, no significant difference in knowledge was found in patients who were given splint care or suture care video compared to SDIs. It is unclear why these two groups showed no difference in understanding. It could be related to these topics being more straightforward, and therefore understanding based on SDI and VDI was similar. For splint care, which had high understanding even with the SDI it is possible that there is a baseline knowledge of how to care for a splint in the community, suggesting that patients required less instruction. For suture care, which consistently scored low in both groups it is possible that our screening and piloting with patients failed and our video was still too complicated to improve patient understanding.
Patients also were satisfied with the videos and found them to be useful. Given the importance placed on patient satisfaction, this suggests that VDIs could have other benefits in addition to improved understanding, which could be evaluated in future research.
LIMITATIONSThere were some limitations to this study that need to be
addressed. First, this study used convenience sampling, which can introduce selection or spectrum bias. In addition, this was a single-center study, which may limit its external validity in EDs with different populations or discharge processes. Furthermore, although the VDIs were created based on the SDIs, it is possible that slight content differences may have been present. These minor changes could potentially have contributed to better retention or understanding of the material presented. Lastly, we did not mandate a specific amount of time for nursing to review paper discharge instructions with the patient; we compared the VDIs to the current standard of care, which likely varies between nurses. Without dedicated time and structure for nursing review of paper discharge instructions with patients it is possible the time spent on the instructions was significantly less than that for the VDI. Arguably, this is one of the benefits of VDI: they are novel, standardized, and the patient is more likely to pay attention. It would be beneficial to determine whether these findings could be duplicated in other EDs with a broad range of chief complaints and more specific guidelines for review of paper discharge instructions.
CONCLUSIONEducating patients on their diagnosis, treatment plan,
and management is an extremely important job of providers that is sometimes overlooked in the treatment process. Lack of attention to this step could put patients at higher risk of preventable complications and overall worse outcomes. Video
Figure. Comparison of scores on patient questionnaires before and after implementation of video discharge instructions. *Denotes significance between standard discharge instruction survey scores and video discharge instruction survey scores (p-value<0.05).SDI, standard discharge instructions; VDI, video discharge instructions; URI, upper respiratory infection.
P < 0.0001); and vaginal bleeding in early pregnancy groups (19% SDI vs 69% VDI, P < 0.0001). There were no significant differences in survey scores between the splint care (53% SDI vs 66% VDI; P = 0.08) and suture care groups (29% SDI vs 31% VDI; P = 0.40).
We also collected data regarding patient satisfaction in the pilot phase of the study. The satisfaction questions were used to gauge how engaging and easily understandable the instructions in the video were. The videos were rated on a scale on 1-5 with “1” being not engaging or understandable and “5” being very engaging and understandable. For the three chief complaints used in the pilot study, the average ratings were 4.53 (splint care), 4.26 (suture care), and 4.38 (upper respiratory infection).
DISCUSSIONThe outcomes of this study suggest that VDI, when
compared to SDI, significantly improved immediate patient understanding of discharge instructions for closed head injury,
Volume 22, no. 3: May 2021 647 Western Journal of Emergency Medicine
Wray et al. Educational Videos Improve Communication and Discharge Instructions
discharge instructions could improve patient understanding of aftercare instructions and improve patient outcomes. With widespread availability of Internet and smartphone use, implementation of VDIs could be easy to implement more broadly. In fact, some companies create such content and have already partnered with electronic health record systems to allow physicians to “prescribe” educational videos to patients through the EHR, emailing the video to the patient. This study shows the efficacy of such discharge instructions and could encourage further development and utilization of VDIs. Future research should evaluate more widespread implementation and long-term patient outcomes. Implementing video discharge instructions can be way to improve patients’ experience in the ED, while simultaneously ensuring a safe discharge process.
Address for Correspondence: Alisa Wray, MD, University of California Irvine, Department of Emergency Medicine, 333 City Blvd W, Suite 640, Orange, CA 92868. Email: [email protected].
Conflicts of Interest: By the WestJEM article submission agreement, all authors are required to disclose all affiliations, funding sources and financial or management relationships that could be perceived as potential sources of bias. No author has professional or financial relationships with any companies that are relevant to this study. There are no conflicts of interest or sources of funding to declare.
Copyright: © 2021 Wray et al. This is an open access article distributed in accordance with the terms of the Creative Commons Attribution (CC BY 4.0) License. See: http://creativecommons.org/licenses/by/4.0/
REFERENCES1. Saidinejad M, Zorc J. Mobile and web-based education: delivering
emergency department discharge and aftercare instructions. Pediatr Emerg Care. 2014;30(3):211-6.
2. Logan PD, Schwab RA, Salomone JA III, et al. Patient understanding of emergency department discharge instructions, South. Med. J. 1996;89(8):770-4.
3. Engel KG, Heisler M, Smith DM, et al. Patient comprehension of emergency department care and instructions: Are patients aware of when they do not understand? Ann Emerg Med. 2009;53(4):454–61.
4. Houts PS, Witmer JT, Egeth HE, et al. Using pictographs to enhance recall of spoken medical instructions II. Patient Educ Couns. 2001;43(3):231-42.
5. Delp C, Jones J. Communicating information to patients: the use of cartoon illustrations to improve comprehension of instructions. Acad Emerg Med. 1996;3(3):264-70.
6. Griffey RT, Kennedy SK, D’Agostino McGowan L, et al. Is low health literacy associated with increased emergency department utilization and recidivism? Acad Emerg Med. 2010;21(10):1109-15.
7. National Center for Education Statistics. National Assessment of Adult Literacy (NAAL). Available at: https://nces.ed.gov/naal/kf_demographics.asp. Accessed April 9 2021.
8. Wood EB, Harrison G, Trickey A, et al. Evidence-based practice: video-discharge instructions in the pediatric emergency department. J Emerg Nurs. 2017;43(4):316-21.
9. Ismail S, McIntosh M, Kalynych C, et al. Impact of video discharge instructions from the emergency department in regard to caregiver understanding of their child’s fever and closed head injury. J Emerg Med. 2016;50(3):177-83.
10. Bloch SA, Bloch AJ. Using video discharge instructions as an adjunct to standard written instructions improved caregivers’ understanding of their child’s emergency department visit, plan, and follow-up. Pediatr Emerg Care. 2013;29(6):699-704.
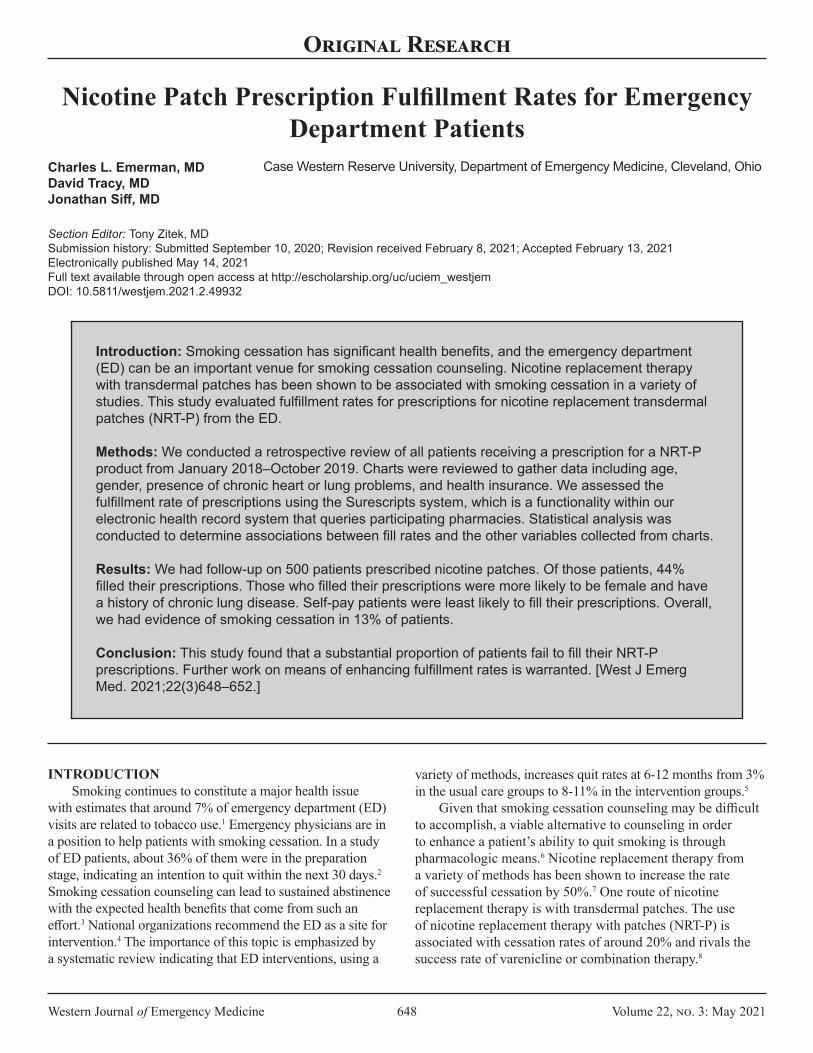
Western Journal of Emergency Medicine 648 Volume 22, no. 3: May 2021
Original Research
Nicotine Patch Prescription Fulfillment Rates for Emergency Department Patients
Charles L. Emerman, MDDavid Tracy, MDJonathan Siff, MD
Section Editor: Tony Zitek, MD Submission history: Submitted September 10, 2020; Revision received February 8, 2021; Accepted February 13, 2021Electronically published May 14, 2021 Full text available through open access at http://escholarship.org/uc/uciem_westjem DOI: 10.5811/westjem.2021.2.49932
INTRODUCTIONSmoking continues to constitute a major health issue
with estimates that around 7% of emergency department (ED) visits are related to tobacco use.1 Emergency physicians are in a position to help patients with smoking cessation. In a study of ED patients, about 36% of them were in the preparation stage, indicating an intention to quit within the next 30 days.2 Smoking cessation counseling can lead to sustained abstinence with the expected health benefits that come from such an effort.3 National organizations recommend the ED as a site for intervention.4 The importance of this topic is emphasized by a systematic review indicating that ED interventions, using a
Case Western Reserve University, Department of Emergency Medicine, Cleveland, Ohio
Introduction: Smoking cessation has significant health benefits, and the emergency department (ED) can be an important venue for smoking cessation counseling. Nicotine replacement therapy with transdermal patches has been shown to be associated with smoking cessation in a variety of studies. This study evaluated fulfillment rates for prescriptions for nicotine replacement transdermal patches (NRT-P) from the ED.
Methods: We conducted a retrospective review of all patients receiving a prescription for a NRT-P product from January 2018–October 2019. Charts were reviewed to gather data including age, gender, presence of chronic heart or lung problems, and health insurance. We assessed the fulfillment rate of prescriptions using the Surescripts system, which is a functionality within our electronic health record system that queries participating pharmacies. Statistical analysis was conducted to determine associations between fill rates and the other variables collected from charts.
Results: We had follow-up on 500 patients prescribed nicotine patches. Of those patients, 44% filled their prescriptions. Those who filled their prescriptions were more likely to be female and have a history of chronic lung disease. Self-pay patients were least likely to fill their prescriptions. Overall, we had evidence of smoking cessation in 13% of patients.
Conclusion: This study found that a substantial proportion of patients fail to fill their NRT-P prescriptions. Further work on means of enhancing fulfillment rates is warranted. [West J Emerg Med. 2021;22(3)648–652.]
variety of methods, increases quit rates at 6-12 months from 3% in the usual care groups to 8-11% in the intervention groups.5
Given that smoking cessation counseling may be difficult to accomplish, a viable alternative to counseling in order to enhance a patient’s ability to quit smoking is through pharmacologic means.6 Nicotine replacement therapy from a variety of methods has been shown to increase the rate of successful cessation by 50%.7 One route of nicotine replacement therapy is with transdermal patches. The use of nicotine replacement therapy with patches (NRT-P) is associated with cessation rates of around 20% and rivals the success rate of varenicline or combination therapy.8
Volume 22, no. 3: May 2021 649 Western Journal of Emergency Medicine
Emerman et al. Nicotine Patch Prescription Fulfillment Rates for ED Patients
Population Health Research Capsule
What do we already know about this issue?Nicotine replacement therapy is effective and recommended for implementation in the emergency department.
What was the research question?Do patients fill their prescriptions for nicotine patch prescriptions?
What was the major finding of the study?A total of 44% filled their prescriptions, with higher rates among women and those with chronic lung disease.
How does this improve population health?Further research should focus on ways to improve the prescription fill rates and compliance with therapy to reduce smoking.
There is little data on the prescription fill rate for NRT-P for ED patients outside of a study environment. Not specific to NRT-P, authors have found 26% of ED patients failed to fill antibiotic prescriptions. Even when patients are prescribed opioid analgesics, more than 20% fail to fill their prescriptions.10 This finding highlights the rationale for the current study, as interventions with NRT-P prescriptions can only be successful if the patients actually obtain the medication. The purpose of this study was to evaluate ED prescription fill rates for NRT-P. We sought to determine factors associated with that fill rate. This information may help to guide further efforts to improve ED-initiated smoking cessation.
METHODSWe conducted this study at an academic urban medical
center ED and its three associated, freestanding community EDs in Northeast Ohio. The combined annual volume of these departments is approximately 150,000 patients. This was a retrospective chart review project conducted with institutional board review approval. Patients were identified through a search of our electronic health record (EHR) system (Epic Systems Corporation, Verona, WI). We identified all patients receiving an electronic prescription for NRT-P from January 2018–October 2019.
To evaluate fill rates, we leveraged the Surescripts functionality within the EHR, which allows evaluation of pharmacy benefit data from sources external to our health system. Surescripts collects and sends data from pharmacy benefits manager (PBM) transactions back into the EHR when queried. In addition, data from the health systems RX-30 ambulatory pharmacy system were imported back into the EHR through the Surescripts payer database to capture fill data from our internal pharmacies, regardless of patient payor status. Each time a patient has an encounter in the health system, including all subsequent ED encounters, outpatient clinic visits, refill encounters, and hospitalizations, the Surescripts system is queried, updating PBM data, including medication fills. Our EHR then stores the results of these queries in its Clarity database.
We compared NRT-P prescriptions from our EHR with the returned PBM and fill data. For the purposes of this analysis, we defined a “successful fill” as NRT-P dispensed from a pharmacy within one week of a NRT-P prescription from a provider in our system, a methodology that has been used by others to evaluate fill rates of other substance use disorder-related prescriptions.11
Since subsequent dispense queries are dependent on subsequent patient encounters, patients receiving a prescription for NRT-P who did not have a follow-up visit in our system as of the date of the query would not have data available. These patients were included in the initial dataset and then removed from subsequent analyses. Patients who received a paper prescription were not included in this database.
All charts were reviewed by one of the two study authors (CE and DT), both of whom are faculty members in the ED.
A standardized data collection sheet was used to record the data. The review results of about 20 of the charts were done together between the two reviewers. Charts were reviewed to gather data on medical insurance, age, gender, purpose of ED visit, presence of chronic heart or lung problems, and evidence of other substance abuse. Chronic lung disease was evidenced by a history of asthma or chronic obstructive lung disease (COPD). Chronic heart disease was evidenced by a history of coronary artery disease, arrhythmias, or heart failure. Evidence of another substance use disorder was noted by a prior diagnosis in the chart of alcohol, cocaine, stimulant, opioid, or THC abuse. We reviewed subsequent clinic notes to determine whether patients had reported smoking cessation. If there was not specific evidence of smoking cessation then that patient was coded as continued smoking. No patients were excluded for any other reason aside from being a duplicate patient. We conducted statistical analyses to determine associations between fill rates and the factors noted above by chi-square analysis and Student’s t-test, as appropriate, using a P value of <0.05 to indicate statistical significance. The data is presented as the mean or percent with the 95% confidence interval (CI) in brackets.
RESULTSOur database search returned 598 unique patients
prescribed NRT-P during the study period. We were able to determine NRT-P fulfillment rates on 500 of these patients with data from 68 unique pharmacies. The patients for whom we had follow-up data were similar to the patients without follow-up, with respect to gender, reason for ED visit (cardiac
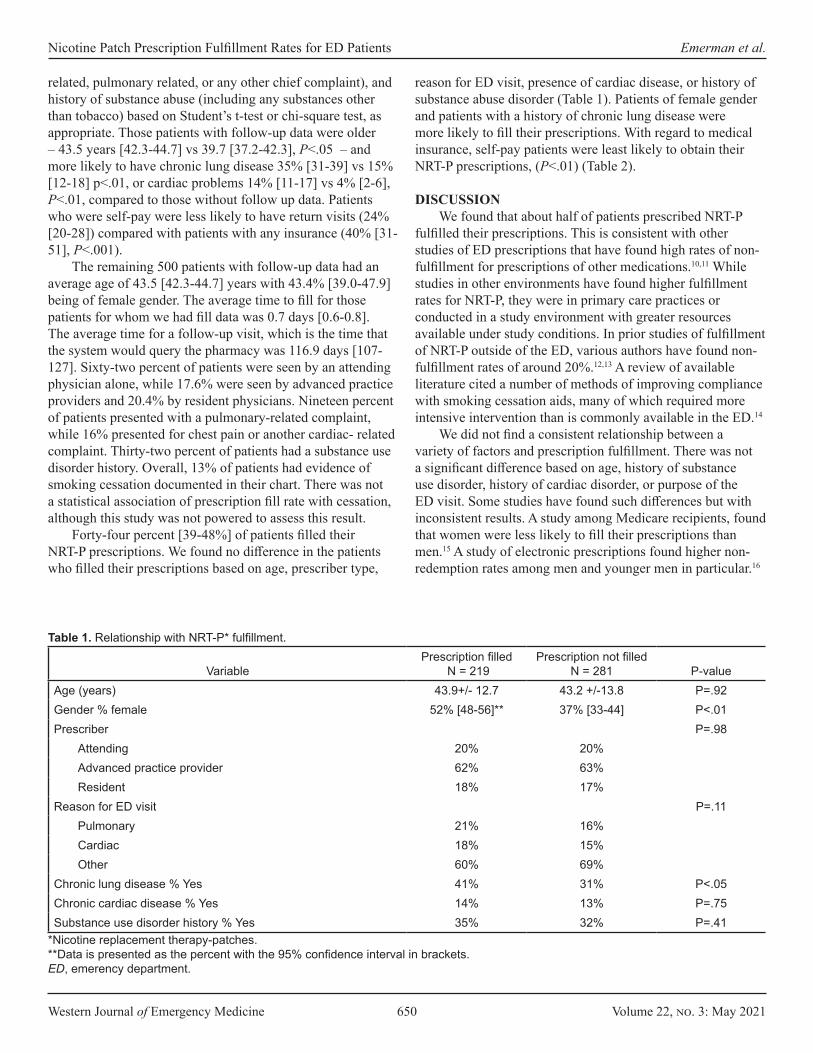
Western Journal of Emergency Medicine 650 Volume 22, no. 3: May 2021
Nicotine Patch Prescription Fulfillment Rates for ED Patients Emerman et al.
related, pulmonary related, or any other chief complaint), and history of substance abuse (including any substances other than tobacco) based on Student’s t-test or chi-square test, as appropriate. Those patients with follow-up data were older – 43.5 years [42.3-44.7] vs 39.7 [37.2-42.3], P<.05 – and more likely to have chronic lung disease 35% [31-39] vs 15% [12-18] p<.01, or cardiac problems 14% [11-17] vs 4% [2-6], P<.01, compared to those without follow up data. Patients who were self-pay were less likely to have return visits (24% [20-28]) compared with patients with any insurance (40% [31-51], P<.001).
The remaining 500 patients with follow-up data had an average age of 43.5 [42.3-44.7] years with 43.4% [39.0-47.9] being of female gender. The average time to fill for those patients for whom we had fill data was 0.7 days [0.6-0.8]. The average time for a follow-up visit, which is the time that the system would query the pharmacy was 116.9 days [107-127]. Sixty-two percent of patients were seen by an attending physician alone, while 17.6% were seen by advanced practice providers and 20.4% by resident physicians. Nineteen percent of patients presented with a pulmonary-related complaint, while 16% presented for chest pain or another cardiac- related complaint. Thirty-two percent of patients had a substance use disorder history. Overall, 13% of patients had evidence of smoking cessation documented in their chart. There was not a statistical association of prescription fill rate with cessation, although this study was not powered to assess this result.
Forty-four percent [39-48%] of patients filled their NRT-P prescriptions. We found no difference in the patients who filled their prescriptions based on age, prescriber type,
reason for ED visit, presence of cardiac disease, or history of substance abuse disorder (Table 1). Patients of female gender and patients with a history of chronic lung disease were more likely to fill their prescriptions. With regard to medical insurance, self-pay patients were least likely to obtain their NRT-P prescriptions, (P<.01) (Table 2). DISCUSSION
We found that about half of patients prescribed NRT-P fulfilled their prescriptions. This is consistent with other studies of ED prescriptions that have found high rates of non-fulfillment for prescriptions of other medications.10,11 While studies in other environments have found higher fulfillment rates for NRT-P, they were in primary care practices or conducted in a study environment with greater resources available under study conditions. In prior studies of fulfillment of NRT-P outside of the ED, various authors have found non-fulfillment rates of around 20%.12,13 A review of available literature cited a number of methods of improving compliance with smoking cessation aids, many of which required more intensive intervention than is commonly available in the ED.14
We did not find a consistent relationship between a variety of factors and prescription fulfillment. There was not a significant difference based on age, history of substance use disorder, history of cardiac disorder, or purpose of the ED visit. Some studies have found such differences but with inconsistent results. A study among Medicare recipients, found that women were less likely to fill their prescriptions than men.15 A study of electronic prescriptions found higher non-redemption rates among men and younger men in particular.16
VariablePrescription filled
N = 219Prescription not filled
N = 281 P-valueAge (years) 43.9+/- 12.7 43.2 +/-13.8 P=.92Gender % female 52% [48-56]** 37% [33-44] P<.01Prescriber P=.98
Attending 20% 20%Advanced practice provider 62% 63%Resident 18% 17%
Reason for ED visit P=.11Pulmonary 21% 16%Cardiac 18% 15%Other 60% 69%
Chronic lung disease % Yes 41% 31% P<.05Chronic cardiac disease % Yes 14% 13% P=.75Substance use disorder history % Yes 35% 32% P=.41
*Nicotine replacement therapy-patches.**Data is presented as the percent with the 95% confidence interval in brackets.ED, emerency department.
Table 1. Relationship with NRT-P* fulfillment.
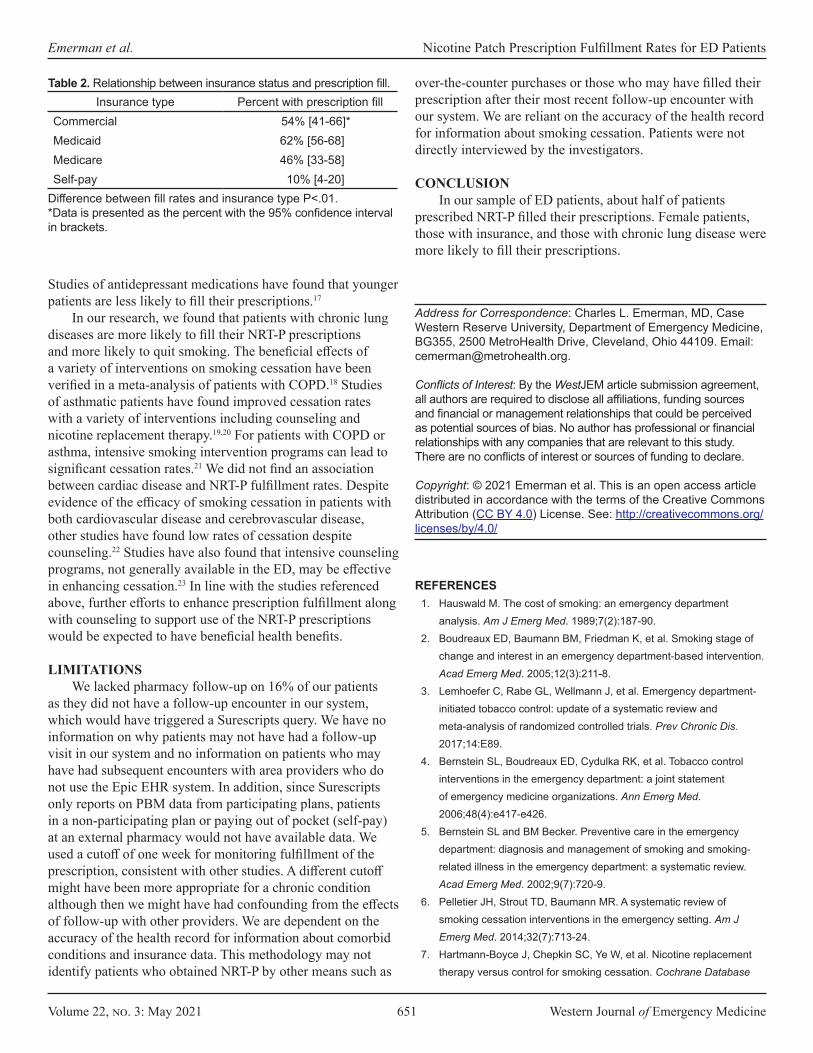
Volume 22, no. 3: May 2021 651 Western Journal of Emergency Medicine
Emerman et al. Nicotine Patch Prescription Fulfillment Rates for ED Patients
Studies of antidepressant medications have found that younger patients are less likely to fill their prescriptions.17
In our research, we found that patients with chronic lung diseases are more likely to fill their NRT-P prescriptions and more likely to quit smoking. The beneficial effects of a variety of interventions on smoking cessation have been verified in a meta-analysis of patients with COPD.18 Studies of asthmatic patients have found improved cessation rates with a variety of interventions including counseling and nicotine replacement therapy.19,20 For patients with COPD or asthma, intensive smoking intervention programs can lead to significant cessation rates.21 We did not find an association between cardiac disease and NRT-P fulfillment rates. Despite evidence of the efficacy of smoking cessation in patients with both cardiovascular disease and cerebrovascular disease, other studies have found low rates of cessation despite counseling.22 Studies have also found that intensive counseling programs, not generally available in the ED, may be effective in enhancing cessation.23 In line with the studies referenced above, further efforts to enhance prescription fulfillment along with counseling to support use of the NRT-P prescriptions would be expected to have beneficial health benefits. LIMITATIONS
We lacked pharmacy follow-up on 16% of our patients as they did not have a follow-up encounter in our system, which would have triggered a Surescripts query. We have no information on why patients may not have had a follow-up visit in our system and no information on patients who may have had subsequent encounters with area providers who do not use the Epic EHR system. In addition, since Surescripts only reports on PBM data from participating plans, patients in a non-participating plan or paying out of pocket (self-pay) at an external pharmacy would not have available data. We used a cutoff of one week for monitoring fulfillment of the prescription, consistent with other studies. A different cutoff might have been more appropriate for a chronic condition although then we might have had confounding from the effects of follow-up with other providers. We are dependent on the accuracy of the health record for information about comorbid conditions and insurance data. This methodology may not identify patients who obtained NRT-P by other means such as
Insurance type Percent with prescription fillCommercial 54% [41-66]*Medicaid 62% [56-68]Medicare 46% [33-58]Self-pay 10% [4-20]
Table 2. Relationship between insurance status and prescription fill.
Difference between fill rates and insurance type P<.01.*Data is presented as the percent with the 95% confidence interval in brackets.
over-the-counter purchases or those who may have filled their prescription after their most recent follow-up encounter with our system. We are reliant on the accuracy of the health record for information about smoking cessation. Patients were not directly interviewed by the investigators.
CONCLUSION In our sample of ED patients, about half of patients
prescribed NRT-P filled their prescriptions. Female patients, those with insurance, and those with chronic lung disease were more likely to fill their prescriptions.
Address for Correspondence: Charles L. Emerman, MD, Case Western Reserve University, Department of Emergency Medicine, BG355, 2500 MetroHealth Drive, Cleveland, Ohio 44109. Email: [email protected].
Conflicts of Interest: By the WestJEM article submission agreement, all authors are required to disclose all affiliations, funding sources and financial or management relationships that could be perceived as potential sources of bias. No author has professional or financial relationships with any companies that are relevant to this study. There are no conflicts of interest or sources of funding to declare.
Copyright: © 2021 Emerman et al. This is an open access article distributed in accordance with the terms of the Creative Commons Attribution (CC BY 4.0) License. See: http://creativecommons.org/licenses/by/4.0/
REFERENCES1. Hauswald M. The cost of smoking: an emergency department
analysis. Am J Emerg Med. 1989;7(2):187-90.2. Boudreaux ED, Baumann BM, Friedman K, et al. Smoking stage of
change and interest in an emergency department-based intervention. Acad Emerg Med. 2005;12(3):211-8.
3. Lemhoefer C, Rabe GL, Wellmann J, et al. Emergency department-initiated tobacco control: update of a systematic review and meta-analysis of randomized controlled trials. Prev Chronic Dis. 2017;14:E89.
4. Bernstein SL, Boudreaux ED, Cydulka RK, et al. Tobacco control interventions in the emergency department: a joint statement of emergency medicine organizations. Ann Emerg Med. 2006;48(4):e417-e426.
5. Bernstein SL and BM Becker. Preventive care in the emergency department: diagnosis and management of smoking and smoking-related illness in the emergency department: a systematic review. Acad Emerg Med. 2002;9(7):720-9.
6. Pelletier JH, Strout TD, Baumann MR. A systematic review of smoking cessation interventions in the emergency setting. Am J Emerg Med. 2014;32(7):713-24.
7. Hartmann-Boyce J, Chepkin SC, Ye W, et al. Nicotine replacement therapy versus control for smoking cessation. Cochrane Database
Western Journal of Emergency Medicine 652 Volume 22, no. 3: May 2021
Nicotine Patch Prescription Fulfillment Rates for ED Patients Emerman et al.
Syst Rev. 2018;5(5):CD000146.8. Baker TB, Piper ME, Stein JH, et al. Effects of nicotine patch
vs varenicline vs combination nicotine replacement therapy on smoking cessation at 26 weeks: a randomized clinical trial. JAMA. 2016;315(4):371-9.
9. Suffoletto B, Calabria J, Ross A, et al. A mobile phone text message program to measure oral antibiotic use and provide feedback on adherence to patients discharged from the emergency department. Acad Emerg Med. 2012;19(8):949-58.
10. Kim HS, Heard KJ, Heard S, et al. Opioid prescription fill rates after emergency department discharge. Am J Health Syst Pharm. 2016;73(12):902-7.
11. Hohl CM, Abu-Laban RB, Brubacher JR, et al. Adherence to emergency department discharge prescriptions. CJEM. 2009;11(2):131-8.
12. Zeng F, Chen CI, Mastey V, et al. Effects of copayment on initiation of smoking cessation pharmacotherapy: an analysis of varenicline reversed claims. Clin Ther. 2011;33(2):225-34.
13. Solberg LI, Parker ED, Foldes SS, et al. Disparities in tobacco cessation medication orders and fills among special populations. Nicotine Tob Res. 2010;12(2):144-51.
14. Pacek LR, McClernon FJ, Bosworth HB. Adherence to pharmacological smoking cessation interventions: a literature review and synthesis of correlates and barriers. Nicotine Tob Res. 2018;20(10):1163-72.
15. Kennedy J, Tuleu I, Mackay K. Unfilled prescriptions of Medicare beneficiaries: prevalence, reasons, and types of medicines
prescribed. J Manag Care Pharm. 2008;14(6):553-60.16. Ekedahl A, Månsson N. Unclaimed prescriptions after automated
prescription transmittals to pharmacies. Pharm World Sci. 2004;26(1):26-31.
17. Xing S, Dipaula BA, Lee HY, et al. Failure to fill electronically prescribed antidepressant medications: a retrospective study. Prim Care Companion CNS Disord. 2011;13(1):PCC.10m00998.
18. van Eerd EA, van der Meer RM, van Schayck OC, et al. Smoking cessation for people with chronic obstructive pulmonary disease. Cochrane Database Syst Rev. 2016;2016(8):CD010744.
19. Perret JL, Bonevski B, McDonald CF, et al. Smoking cessation strategies for patients with asthma: improving patient outcomes. J Asthma Allergy. 2016;9:117-28.
20. Jiménez-Ruiz CA, Andreas S, Lewis KE, et al. Statement on smoking cessation in COPD and other pulmonary diseases and in smokers with comorbidities who find it difficult to quit. Eur Respir J. 2015;46(1):61-79.
21. Gratziou Ch, Florou A, Ischaki E, et al. Smoking cessation effectiveness in smokers with COPD and asthma under real life conditions. Respir Med. 2014;108(4):577-83.
22. Abbasi MA, Malik S, Ali K. Smoking cessation after counselling in patients presenting with acute coronary syndrome. J Ayub Med Coll Abbottabad. 2018;30(2):229-3.
23. Luo JG, et al, Effect of intensive personalized “5As+5Rs” intervention on Smoking cessation in hospitalized acute coronary syndrome patients not ready to quit immediately: a randomized controlled trial. Nicotine Tob Res. 2018;20(5):596-605.
Volume 22, no. 3: May 2021 653 Western Journal of Emergency Medicine
Original Research
Importance of Mentoring on Workplace Engagement of Emergency Medicine Faculty: A Multi-institutional Study
Raymond H. Lucas, MD*Valerie Dandar, MA†
Section Editor: Donna Mendez, MD Submission history: Submitted June 1, 2020; Revision received November 30, 2020; Accepted November 24, 2020Electronically published March 31, 2021 Full text available through open access at http://escholarship.org/uc/uciem_westjem DOI: 10.5811/westjem.2020.11.48510
INTRODUCTIONA large body of literature on the importance of mentorship
in academic medicine1 has demonstrated positive effects on general career satisfaction,1-6 retention,1-3,5,6 and scholarly output.1,2,4,7,8 Participant (mentee and mentor) satisfaction is the most commonly measured outcome, however. Mentorship is especially important for emergency medicine (EM), given the growth of this newer academic specialty. Prior work by us has shown that compared to other clinical specialties, EM faculty are more likely to be younger and of junior academic ranks, and half of EM faculty have been in their current position five years or less.9 There is a much smaller body of literature focused on mentorship in EM10,11 with few meaningful outcome measures reported. Welch10 reported the results of a survey of
George Washington University, School of Medicine and Health Sciences, Department of Emergency Medicine, Washington, District of ColumbiaAssociation of American Medical Colleges, Washington, District of Columbia
*
†
Introduction: Mentoring in emergency medicine (EM) has not been well studied despite a larger body of literature that has described the value of mentoring in academic medicine on career satisfaction and scholarly output. Over half of all EM faculty nationally are of junior faculty ranks. The aim of this study was to identify the frequency and types of mentoring in EM, how types of mentoring in EM differ by gender, and how mentoring correlates with workplace satisfaction for EM faculty.
Methods: Using descriptive statistics and chi-squared analysis, we analyzed data from a cohort of medical schools participating in the Association of American Medical Colleges StandPoint Faculty Engagement Survey.
Results: A total of 514 EM faculty from 26 medical schools replied to the survey. Nearly 80% of EM faculty reported receiving some sort of mentoring; 43.4% reported receiving formal mentoring; 35.4% reported receiving only informal mentoring; and 21.2% received no mentoring at all. Women EM faculty received formal mentoring at lower rates than men (36.2% vs 47.5%) even though they were more likely to report that formal mentoring is important to them. Workplace satisfaction was highest for faculty receiving formal mentoring; informally or formally mentored faculty reported higher workplace satisfaction than faculty who are not mentored at all. Unmentored faculty are less likely to stay at their medical school than those formally mentored (69.8 % vs 80.4%).
Conclusion: Institutions and department chairs should focus on mentoring EM faculty, particularly women, to increase engagement and reduce attrition. [West J Emerg Med. 2021;22(3)653–659.]
EM mentoring practices in 2017, but with a low response rate (29%) and responses captured from department chairs only. In our study we sought to expand on previous research to identify the frequency of formal and informal mentorship as reported by EM faculty, how types of mentorship differ by gender, and how the presence of formal mentorship correlates with EM faculty workplace engagement. Our findings may be used by department chairs and other academic leaders to improve the state of mentoring in academic EM.
METHODSWe used data from the Association of American Medical
Colleges (AAMC) StandPoint Faculty Engagement Survey (SFES) from 26 US Liaison Committee on Medical Education
Western Journal of Emergency Medicine 654 Volume 22, no. 3: May 2021
Importance of Mentoring on the Workplace Engagement Lucas et al.
Population Health Research Capsule
What do we already know about this issue?Mentoring improves career satisfaction, retention, and scholarly output. The importance of mentoring specifically in emergency medicine (EM) has not been well studied.
What was the research question?What are the frequency and types of mentoring reported by EM faculty? How does mentoring correlate with workplace engagement?
What was the major finding of the study?Mentorship improves workplace engagement and retention for all EM faculty; women receive less formal mentoring than men.
How does this improve population health?Engaged faculty are important to the population health and advocacy missions of EM. Mentoring is an effective way to improve faculty engagement and retention.
(LCME)-accredited medical schools who completed the survey from January 2017–November 2019. The SFES is an optional service offered by the AAMC to help medical schools assess and improve faculty engagement and retention. This validated, web-based assessment was first developed in 2008 by experts in survey design, organizational psychology, and academic medicine,12 and since then has been administered to faculty in over 70 US medical schools. Participating institutions have convened annually since 2014 as the StandPoint Faculty Learning Community. This group consists of faculty affairs professionals and representatives from the AAMC who review aggregated survey data and trends and disseminate best practices to improve faculty engagement. We are members of this learning community and thus were granted access to aggregated survey responses for this study.
Most survey questions use five-point Likert scales to assess satisfaction and agreement across 15 dimensions of workplace engagement, including mentoring and feedback. Additionally, the survey measures overall workplace satisfaction and intention to leave one’s job. The StandPoint Survey assessed whether respondents received formal or informal mentoring and whether they received mentoring from within or outside of their institutions. Results from these questions were used to re-code respondents into three distinct groups of individuals for comparison: those who received formal mentoring with or without informal mentoring; those who received only informal mentoring; and those who did not receive either formal or informal mentoring.
We used descriptive statistics and chi-squared analyses to analyze differences between these subgroups of survey respondents using IBM SPSS version 25 (IBM Corporation, Armonk, NY). While chi-square analyses were conducted across the five-point Likert scale responses, percentages presented here reflect the aggregation of the top two response categories for ease of reader interpretation, eg, “very satisfied” and “satisfied,” presented as the percentage of faculty satisfied, across a Likert scale of “very satisfied,” “satisfied,” “neither satisfied nor dissatisfied,” “dissatisfied,” and “very dissatisfied.” We intentionally focused on presenting data as “percent satisfaction,” recognizing that practical workplace interventions are aimed at moving faculty perceptions toward a sense of satisfaction both from those reporting neutral and dissatisfied responses. The American Institutes of Research, the institutional review board of record for the AAMC, approved the StandPoint Surveys data collection and research efforts.
RESULTSFor the study period, 560 of 860 EM full- and part-time
faculty at 26 medical schools responded (65.1%), and 12,251 of 19,938 non-EM clinical faculty responded (61.4%) to the SFES. Of those respondents, 514 EM faculty answered the question about what types of mentoring they received and were included in the analysis. Emergency medicine faculty were more likely to be men (61.8%), identify as White or Asian (90.6%), and
hold an assistant professor rank (54.4%). Table 1 summarizes demographic data on the EM survey respondents. To assess generalizability of the SFES sample, this respondent group was compared with the AAMC’s Faculty Roster,13 which is a database of all full-time faculty at US LCME-accredited medical schools. Our sample is comparable by gender (61.8% vs 62.4% men) to 2019 reports of full-time faculty in the AAMC Faculty Roster; however, our sample consists of a slightly lower percentage of EM assistant professors (54.4 % vs 58.8%) and racial and ethnicity minority faculty (9.4% vs 12.9%) than nationally reported in the AAMC Faculty Roster. In our study, significantly more EM faculty were assistant professors (54.4% vs 47.5%, P = <.001), on non-tenure tracks (80/1% vs 73.8%, P =.003), and age 45 or younger (52.5% vs 33.4%, P =<.001), compared to faculty in other clinical departments.
Table 2 describes the type and frequency of mentoring reported by EM survey respondents and faculty from other clinical departments. Emergency medicine faculty reported receiving more mentoring overall, both formal and informal, than faculty in other clinical departments (78.8% vs 71.3%, P = <.001), particularly more formal mentoring (43.4% vs 36.2%, P = < .001). For EM faculty, most formal mentoring occurred through their department or medical school, yet 28.6% (n = 64/223) of faculty with formal mentoring reported receiving it through a society or professional organization. Thirty-five percent of EM faculty reported only receiving informal mentoring, and 21.2% reported receiving no mentoring at all.
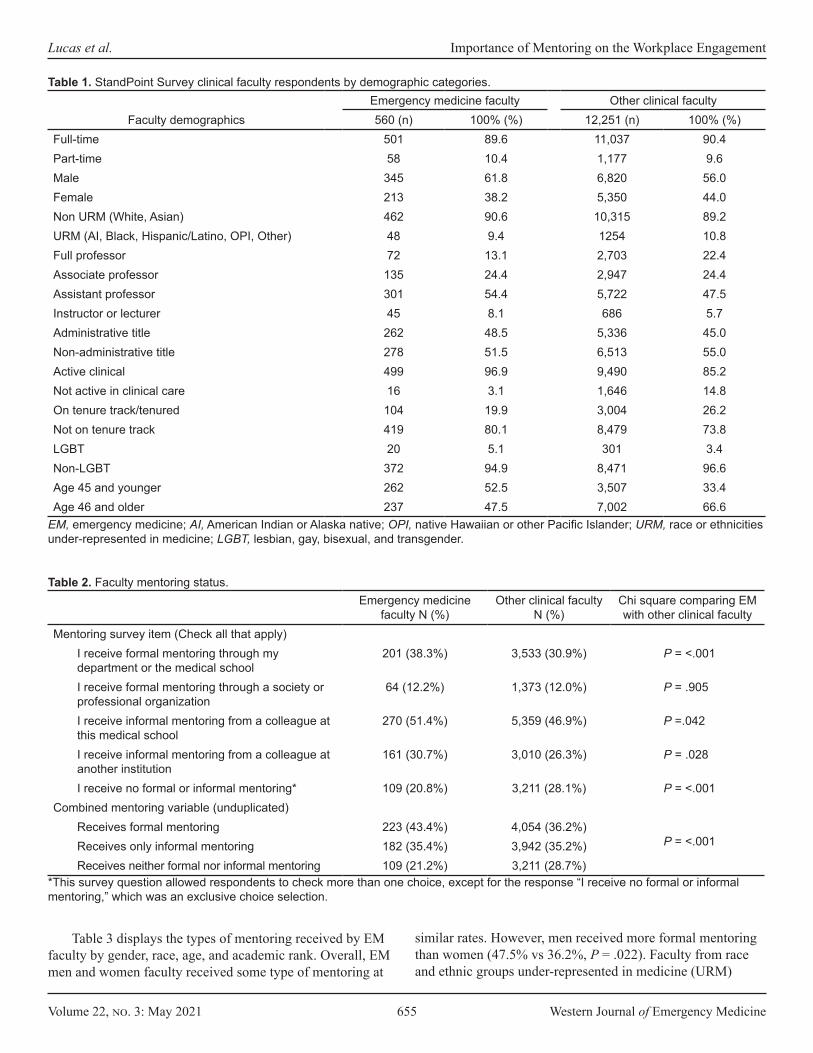
Volume 22, no. 3: May 2021 655 Western Journal of Emergency Medicine
Lucas et al. Importance of Mentoring on the Workplace Engagement
Emergency medicine faculty Other clinical facultyFaculty demographics 560 (n) 100% (%) 12,251 (n) 100% (%)
Full-time 501 89.6 11,037 90.4Part-time 58 10.4 1,177 9.6Male 345 61.8 6,820 56.0Female 213 38.2 5,350 44.0Non URM (White, Asian) 462 90.6 10,315 89.2URM (AI, Black, Hispanic/Latino, OPI, Other) 48 9.4 1254 10.8Full professor 72 13.1 2,703 22.4Associate professor 135 24.4 2,947 24.4Assistant professor 301 54.4 5,722 47.5Instructor or lecturer 45 8.1 686 5.7Administrative title 262 48.5 5,336 45.0Non-administrative title 278 51.5 6,513 55.0Active clinical 499 96.9 9,490 85.2Not active in clinical care 16 3.1 1,646 14.8On tenure track/tenured 104 19.9 3,004 26.2Not on tenure track 419 80.1 8,479 73.8LGBT 20 5.1 301 3.4Non-LGBT 372 94.9 8,471 96.6Age 45 and younger 262 52.5 3,507 33.4Age 46 and older 237 47.5 7,002 66.6
Table 1. StandPoint Survey clinical faculty respondents by demographic categories.
EM, emergency medicine; AI, American Indian or Alaska native; OPI, native Hawaiian or other Pacific Islander; URM, race or ethnicities under-represented in medicine; LGBT, lesbian, gay, bisexual, and transgender.
Emergency medicine faculty N (%)
Other clinical facultyN (%)
Chi square comparing EM with other clinical faculty
Mentoring survey item (Check all that apply)I receive formal mentoring through my department or the medical school
201 (38.3%) 3,533 (30.9%) P = <.001
I receive formal mentoring through a society or professional organization
64 (12.2%) 1,373 (12.0%) P = .905
I receive informal mentoring from a colleague at this medical school
270 (51.4%) 5,359 (46.9%) P =.042
I receive informal mentoring from a colleague at another institution
161 (30.7%) 3,010 (26.3%) P = .028
I receive no formal or informal mentoring* 109 (20.8%) 3,211 (28.1%) P = <.001Combined mentoring variable (unduplicated)
Receives formal mentoring 223 (43.4%) 4,054 (36.2%)P = <.001Receives only informal mentoring 182 (35.4%) 3,942 (35.2%)
Receives neither formal nor informal mentoring 109 (21.2%) 3,211 (28.7%)*This survey question allowed respondents to check more than one choice, except for the response “I receive no formal or informal mentoring,” which was an exclusive choice selection.
Table 2. Faculty mentoring status.
Table 3 displays the types of mentoring received by EM faculty by gender, race, age, and academic rank. Overall, EM men and women faculty received some type of mentoring at
similar rates. However, men received more formal mentoring than women (47.5% vs 36.2%, P = .022). Faculty from race and ethnic groups under-represented in medicine (URM)

Western Journal of Emergency Medicine 656 Volume 22, no. 3: May 2021
Importance of Mentoring on the Workplace Engagement Lucas et al.
reported higher rates of mentoring than non-URM faculty; however, this was not statistically significant given the low percentage (<10%) of URM faculty in the survey sample (P = .268). The percentage of faculty reporting only informal mentoring was similar, approximately 35% across all academic ranks; however, junior faculty were more likely to report formal mentoring and full professors were more likely to report no mentoring. Results by age are similar to those by rank.
Table 4 lists responses regarding perceptions of the importance of mentoring, satisfaction with professional development and advancement, and several components of workplace engagement segregated by mentoring status. Across all survey items, EM faculty with formal mentoring reported higher levels of satisfaction and engagement than EM faculty who received only informal mentoring or no mentoring at all. For faculty who reported no mentoring, over half also reported that mentoring was important to them. The perceptions of the importance of mentoring differed by gender and rank. For example, of those without a formal mentor, more EM women than men agreed that having a formal mentor was important to them (74.8% vs 50.3%, P = <.001) (data not shown). With the exception of full professors without mentors, over half of faculty at all other ranks without mentoring reported that formal mentorship was important to them (Table 4).
When examining satisfaction with advancement and opportunities for development, assistant professors with formal mentors were more satisfied with opportunities for professional development than unmentored assistant professors (78.2% vs 29.6%), and were more satisfied with the pace of professional advancement (68.9% vs 27.8%). Similar trends of gaps in satisfaction were observed among associate professors and instructors who did not receive any mentorship.
In looking at measures of overall satisfaction and
engagement in the workplace, we found that 86.0% of all EM faculty respondents with a formal mentor, 70.6% of those with only an informal mentor, and 56.2% of those with no mentor were satisfied with their department as a place to work. Across EM faculty of all ranks, those without mentoring reported that they were less likely to stay at their current medical school in the next 1-2 years compared to faculty who received formal mentoring (69.8% vs 80.4%, respectively). For associate and assistant professors, those without formal mentoring reported they were approximately 10% less likely to remain at their institutions. Lastly, those EM faculty without a mentor who agreed formal mentoring was important reported even lower overall satisfaction across survey items and even lower intent to remain at their institution (59.6%) (data not shown) (Table 4).
DISCUSSIONIn our study, nearly 80% of EM faculty received either
formal or informal mentoring, which is encouraging given the larger proportion of younger and more junior faculty in EM compared to other clinical disciplines. Also encouraging is the increasing rate of formal mentoring in EM (43%) compared to 33% reported by Mylona14 from a prior cohort of SFES responders from 2011-2016. The rate of formal mentoring for all faculty ranks in our study is consistent with a recent report10 that 43.6% of academic EM departments sponsored formal mentoring programs. Nevertheless, there appears to remain room for improvement in the amount of formal mentorship provided, particularly to junior faculty who made up over 60% of our study respondents yet reported a rate of formal mentoring of approximately 45%.
Gender disparity in mentorship is well documented in the academic literature,2,10,15
and our study suggests it continues to exist in academic EM. We found that although women EM faculty valued formal mentoring more than men, they received
Emergency medicine faculty Other clnical facultyFormal
mentoring N (%)Informal mentoring
only N (%)No mentoring
N (%)Formal
mentoring N (%)Informal mentoring
only N (%)No mentoring
N (%)All faculty 223 (43.4) 182 (35.4) 109 (21.2) 4,054 (36.2) 3,942 (35.2) 3,211 (28.7)Male 150 (47.5) 99 (31.3) 67 (21.2) 2,335 (36.7) 1,989 (31.3) 2,031 (32.0)Female 71 (36.2) 83 (42.3) 42 (21.4) 1,704 (35.6) 1,930 (40.3) 1,158 (24.2)Non-URM 189 (44.0) 151 (35.1) 90 (20.9) 3,442 (35.9) 3,383 (35.3) 2,752 (28.7)URM 23 (50.0) 18 (39.1) 5 (10.9) 468 (40.2) 408 (35.1) 288 (24.7)Full professor 24 (34.8) 24 (34.8) 21 (30.4) 693 (27.1) 791 (31.0) 1,071 (41.9)Associate professor 54 (42.9) 48 (38.1) 24 (19.0) 892 (32.4) 1,065 (38.7) 792 (28.8)Assistant professor 123 (44.9) 95 (34.7) 56 (20.4) 2,183 (42.2) 1,854 (35.8) 1,141 (22.0)Instructor or lecturer 18 (46.2) 14 (35.9) 7 (17.9) 230 (40.4) 179 (31.5) 160 (28.1)45 and younger 123 (49.4) 88 (35.3) 38 (15.3) 1,688 (49.3) 1,251 (36.5) 486 (14.2)46 and older 87 (37.8) 78 (33.9) 65 (28.3) 2,088 (30.7) 2,317 (34.1) 2,399 (35.3)
Table 3. Faculty mentoring status by demographics.
EM, emergency medicine; URM, race/ethnicity is under-represented in medicine.
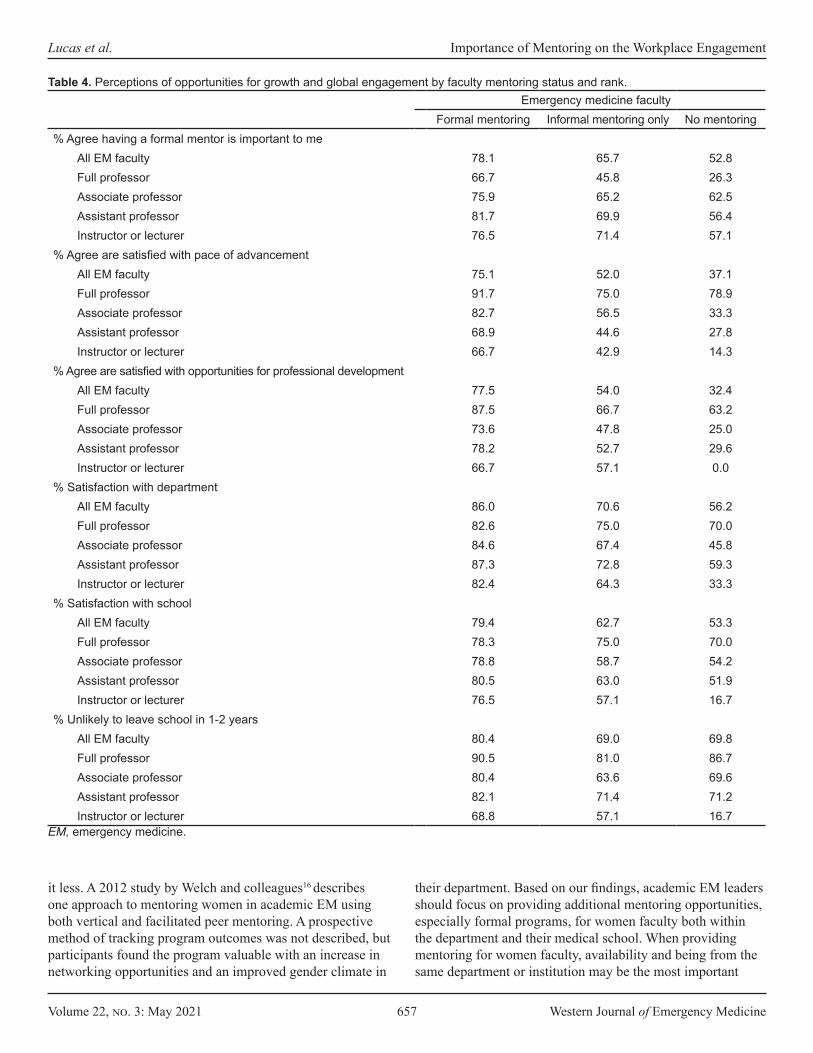
Volume 22, no. 3: May 2021 657 Western Journal of Emergency Medicine
Lucas et al. Importance of Mentoring on the Workplace Engagement
Emergency medicine facultyFormal mentoring Informal mentoring only No mentoring
% Agree having a formal mentor is important to meAll EM faculty 78.1 65.7 52.8Full professor 66.7 45.8 26.3Associate professor 75.9 65.2 62.5Assistant professor 81.7 69.9 56.4Instructor or lecturer 76.5 71.4 57.1
% Agree are satisfied with pace of advancementAll EM faculty 75.1 52.0 37.1Full professor 91.7 75.0 78.9Associate professor 82.7 56.5 33.3Assistant professor 68.9 44.6 27.8Instructor or lecturer 66.7 42.9 14.3
% Agree are satisfied with opportunities for professional developmentAll EM faculty 77.5 54.0 32.4Full professor 87.5 66.7 63.2Associate professor 73.6 47.8 25.0Assistant professor 78.2 52.7 29.6Instructor or lecturer 66.7 57.1 0.0
% Satisfaction with departmentAll EM faculty 86.0 70.6 56.2Full professor 82.6 75.0 70.0Associate professor 84.6 67.4 45.8Assistant professor 87.3 72.8 59.3Instructor or lecturer 82.4 64.3 33.3
% Satisfaction with schoolAll EM faculty 79.4 62.7 53.3Full professor 78.3 75.0 70.0Associate professor 78.8 58.7 54.2Assistant professor 80.5 63.0 51.9Instructor or lecturer 76.5 57.1 16.7
% Unlikely to leave school in 1-2 yearsAll EM faculty 80.4 69.0 69.8Full professor 90.5 81.0 86.7Associate professor 80.4 63.6 69.6Assistant professor 82.1 71.4 71.2Instructor or lecturer 68.8 57.1 16.7
EM, emergency medicine.
Table 4. Perceptions of opportunities for growth and global engagement by faculty mentoring status and rank.
it less. A 2012 study by Welch and colleagues16 describes one approach to mentoring women in academic EM using both vertical and facilitated peer mentoring. A prospective method of tracking program outcomes was not described, but participants found the program valuable with an increase in networking opportunities and an improved gender climate in
their department. Based on our findings, academic EM leaders should focus on providing additional mentoring opportunities, especially formal programs, for women faculty both within the department and their medical school. When providing mentoring for women faculty, availability and being from the same department or institution may be the most important
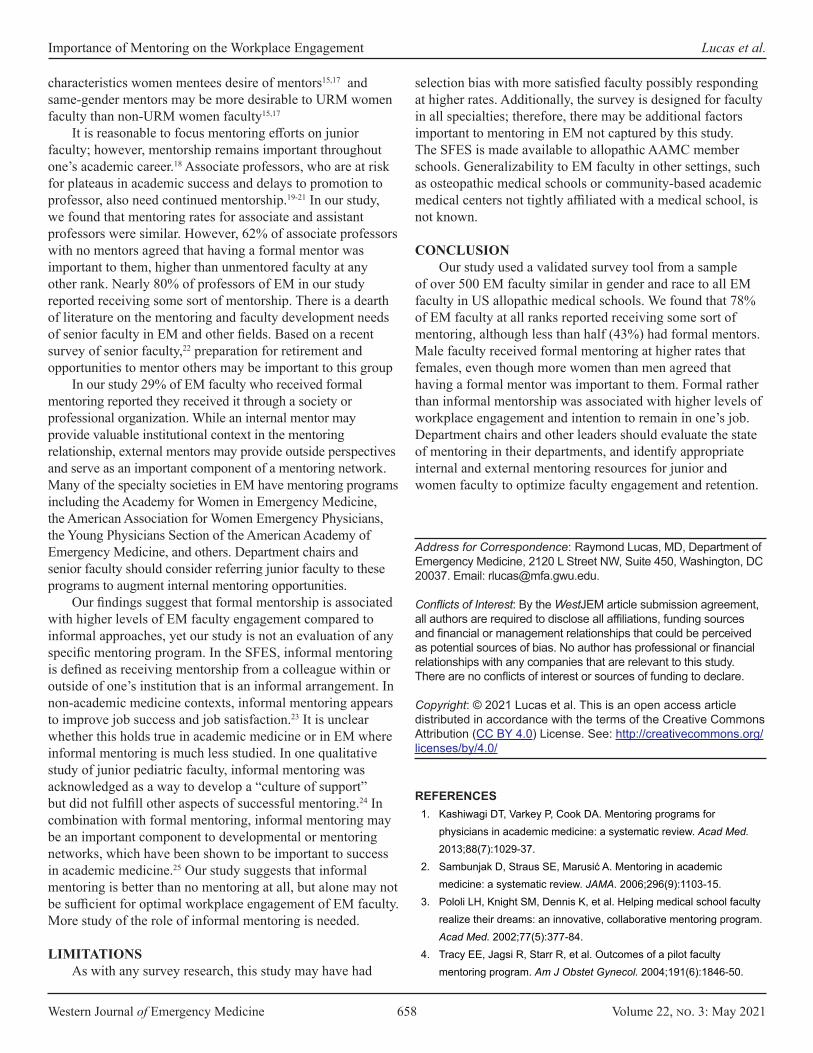
Western Journal of Emergency Medicine 658 Volume 22, no. 3: May 2021
Importance of Mentoring on the Workplace Engagement Lucas et al.
characteristics women mentees desire of mentors15,17 and same-gender mentors may be more desirable to URM women faculty than non-URM women faculty15,17
It is reasonable to focus mentoring efforts on junior faculty; however, mentorship remains important throughout one’s academic career.18 Associate professors, who are at risk for plateaus in academic success and delays to promotion to professor, also need continued mentorship.19-21 In our study, we found that mentoring rates for associate and assistant professors were similar. However, 62% of associate professors with no mentors agreed that having a formal mentor was important to them, higher than unmentored faculty at any other rank. Nearly 80% of professors of EM in our study reported receiving some sort of mentorship. There is a dearth of literature on the mentoring and faculty development needs of senior faculty in EM and other fields. Based on a recent survey of senior faculty,22 preparation for retirement and opportunities to mentor others may be important to this group
In our study 29% of EM faculty who received formal mentoring reported they received it through a society or professional organization. While an internal mentor may provide valuable institutional context in the mentoring relationship, external mentors may provide outside perspectives and serve as an important component of a mentoring network. Many of the specialty societies in EM have mentoring programs including the Academy for Women in Emergency Medicine, the American Association for Women Emergency Physicians, the Young Physicians Section of the American Academy of Emergency Medicine, and others. Department chairs and senior faculty should consider referring junior faculty to these programs to augment internal mentoring opportunities.
Our findings suggest that formal mentorship is associated with higher levels of EM faculty engagement compared to informal approaches, yet our study is not an evaluation of any specific mentoring program. In the SFES, informal mentoring is defined as receiving mentorship from a colleague within or outside of one’s institution that is an informal arrangement. In non-academic medicine contexts, informal mentoring appears to improve job success and job satisfaction.23 It is unclear whether this holds true in academic medicine or in EM where informal mentoring is much less studied. In one qualitative study of junior pediatric faculty, informal mentoring was acknowledged as a way to develop a “culture of support” but did not fulfill other aspects of successful mentoring.24 In combination with formal mentoring, informal mentoring may be an important component to developmental or mentoring networks, which have been shown to be important to success in academic medicine.25 Our study suggests that informal mentoring is better than no mentoring at all, but alone may not be sufficient for optimal workplace engagement of EM faculty. More study of the role of informal mentoring is needed.
LIMITATIONSAs with any survey research, this study may have had
selection bias with more satisfied faculty possibly responding at higher rates. Additionally, the survey is designed for faculty in all specialties; therefore, there may be additional factors important to mentoring in EM not captured by this study. The SFES is made available to allopathic AAMC member schools. Generalizability to EM faculty in other settings, such as osteopathic medical schools or community-based academic medical centers not tightly affiliated with a medical school, is not known.
CONCLUSION Our study used a validated survey tool from a sample
of over 500 EM faculty similar in gender and race to all EM faculty in US allopathic medical schools. We found that 78% of EM faculty at all ranks reported receiving some sort of mentoring, although less than half (43%) had formal mentors. Male faculty received formal mentoring at higher rates that females, even though more women than men agreed that having a formal mentor was important to them. Formal rather than informal mentorship was associated with higher levels of workplace engagement and intention to remain in one’s job. Department chairs and other leaders should evaluate the state of mentoring in their departments, and identify appropriate internal and external mentoring resources for junior and women faculty to optimize faculty engagement and retention.
Address for Correspondence: Raymond Lucas, MD, Department of Emergency Medicine, 2120 L Street NW, Suite 450, Washington, DC 20037. Email: [email protected].
Conflicts of Interest: By the WestJEM article submission agreement, all authors are required to disclose all affiliations, funding sources and financial or management relationships that could be perceived as potential sources of bias. No author has professional or financial relationships with any companies that are relevant to this study. There are no conflicts of interest or sources of funding to declare.
Copyright: © 2021 Lucas et al. This is an open access article distributed in accordance with the terms of the Creative Commons Attribution (CC BY 4.0) License. See: http://creativecommons.org/licenses/by/4.0/
REFERENCES1. Kashiwagi DT, Varkey P, Cook DA. Mentoring programs for
physicians in academic medicine: a systematic review. Acad Med. 2013;88(7):1029-37.
2. Sambunjak D, Straus SE, Marusić A. Mentoring in academic medicine: a systematic review. JAMA. 2006;296(9):1103-15.
3. Pololi LH, Knight SM, Dennis K, et al. Helping medical school faculty realize their dreams: an innovative, collaborative mentoring program. Acad Med. 2002;77(5):377-84.
4. Tracy EE, Jagsi R, Starr R, et al. Outcomes of a pilot faculty mentoring program. Am J Obstet Gynecol. 2004;191(6):1846-50.
Volume 22, no. 3: May 2021 659 Western Journal of Emergency Medicine
Lucas et al. Importance of Mentoring on the Workplace Engagement
5. Wingard DL, Garman KA, Reznik V. Facilitating faculty success: outcomes and cost benefit of the UCSD National Center of Leadership in Academic Medicine. Acad Med. 2004;79(10 Suppl):S9-11.
6. Kosoko-Lasaki O, Sonnino RE, Voytko ML. Mentoring for women and underrepresented minority faculty and students: experience at two institutions of higher education. J Natl Med Assoc. 2006;98(9):1449-59.
7. Illes J, Glover GH, Wexler L, et al. A model for faculty mentoring in academic radiology. Acad Radiol. 2000;7(9):717-24; discussion 725-6. Erratum in: Acad Radiol. 2000;7(11):959.
8. Steiner JF, Curtis P, Lanphear BP, et al. Assessing the role of influential mentors in the research development of primary care fellows. Acad Med. 2004;79(9):865-72.
9. Lucas R, Dandar V, Scott J. [Ahead of Print]. Engagement and workplace satisfaction of emergency medicine faculty in the United States. AEM Educ Train. May 14, 2020.
10. Welch J, Sawtelle S, Cheng D, et al. Faculty mentoring practices in academic emergency medicine. Acad Emerg Med. 2017;24(3):362-70.
11. Yeung M, Nuth J, Stiell IG. Mentoring in emergency medicine: the art and the evidence. CJEM. 2010;12(2):143-9.
12. Bunton SA, Corrice AM, Pollart SM, et al. Predictors of workplace satisfaction for U.S. medical school faculty in an era of change and challenge. Acad Med. 2012;87(5):574-81.
13. American Association of Medical Colleges (AAMC). US Medical School Faculty Tables 2019: Tables 4, 16. https://www.aamc.org/data-reports/faculty-institutions/interactive-data/2019-us-medical-school-faculty. Accessed September 2, 2020.
14. Mylona E, Brubaker L, Williams VN, et al. Does formal mentoring for faculty members matter? A survey of clinical faculty members. Med Educ. 2016;50(6):670-81.
15. Blood EA, Ullrich NJ, Hirshfeld-Becker DR, et al. Academic women faculty: Are they finding the mentoring they need? J Women’s Health.
2012;21(11):1201-8.16. Welch JL, Jimenez HL, Walthall J, et al. The women in emergency
medicine mentoring program: an innovative approach to mentoring. J Grad Med Educ. 2012;4(3):362-6.
17. Carapinha R, Ortiz-Walters R, McCracken CM, et al. Variability in women faculty’s preferences regarding mentor similarity: a multi-institution study in academic medicine. Acad Med. 2016;91(8):1108-18.
18. Golper TA, Feldman HI. New challenges and paradigms for mid-career faculty in academic medical centers: key strategies for success for mid-career medical school faculty. Clin J Am Soc Nephrol. 2008;3(6):1870-4.
19. Bush K, Huet Y, Rorrer A, et al. Removing barriers to full professor: a mentoring program for associate professors. Change. 2011;43(6):38-45.
20. Baldwin R, DeZure K, Shaw A, et al. Mapping the terrain of mid-career faculty at a research university: implications for faculty and academic leaders. Change. 2008;40(5):46-55.
21. Canale A, Herdklotz C, Wild L. Mid-career faculty support: the middle years of the academic profession. 2013. Available at: https://www.rit.edu/provost/sites/rit.edu.provost/files/images/FCD%20Report%20Mid-Career%20Faculty%20Support,%202013.pdf. Accessed on August 25, 2020.
22. Skarupski KA, Welch C, Dandar V, et al. Late-career expectations: a survey of full-time faculty members who are 55 or older at 14 U.S. medical schools. Acad Med. 2020;95(2):226-33.
23. Mohtady J, Konings K, van Merrienboer J. What makes informal mentorship in the medical realm really effective? Mentor Tutoring. 2016;24(4):306-17.
24. Leslie K, Lingard L, Whyte S. Junior faculty experiences with informal mentoring. Med Teach. 2005;27(8):693-8.
25. DeCastro R, Sambuco D, Ubel PA, et al. Mentor networks in academic medicine: moving beyond a dyadic conception of mentoring for junior faculty researchers. Acad Med. 2013;88(4):488-96.
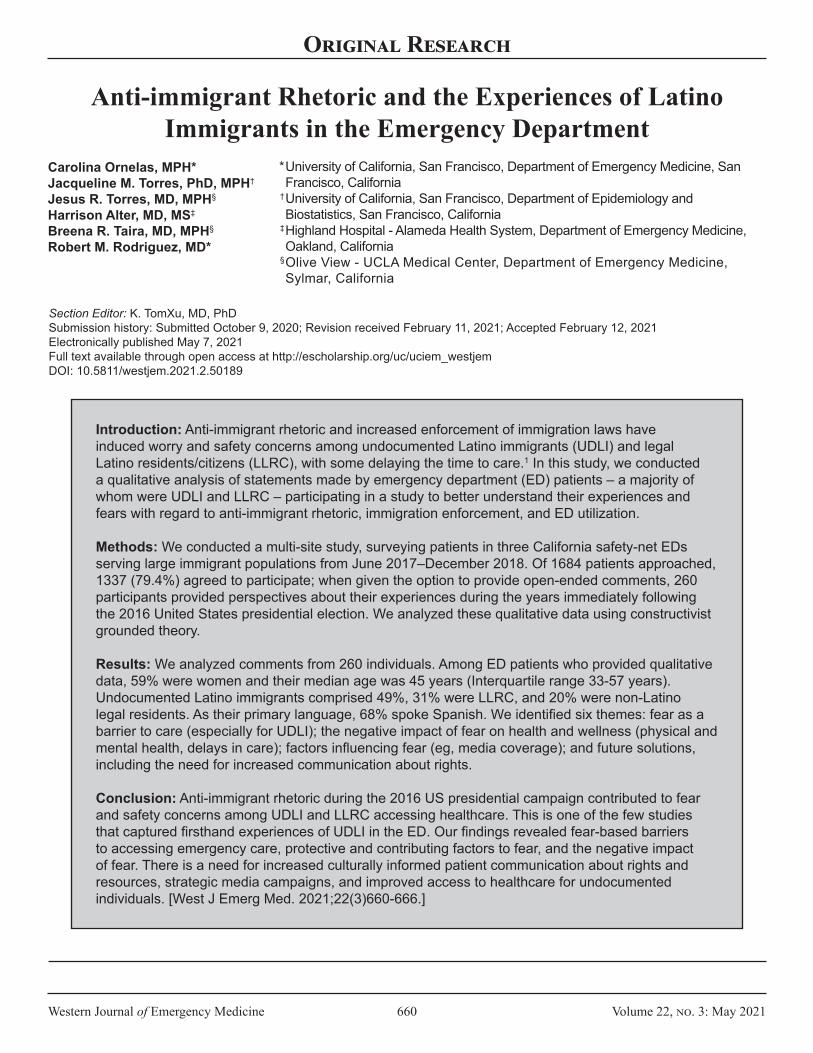
Western Journal of Emergency Medicine 660 Volume 22, no. 3: May 2021
Original Research
Anti-immigrant Rhetoric and the Experiences of Latino Immigrants in the Emergency Department
Carolina Ornelas, MPH*Jacqueline M. Torres, PhD, MPH†
Jesus R. Torres, MD, MPH§
Harrison Alter, MD, MS‡
Breena R. Taira, MD, MPH§
Robert M. Rodriguez, MD*
University of California, San Francisco, Department of Emergency Medicine, San Francisco, CaliforniaUniversity of California, San Francisco, Department of Epidemiology and Biostatistics, San Francisco, CaliforniaHighland Hospital - Alameda Health System, Department of Emergency Medicine, Oakland, CaliforniaOlive View - UCLA Medical Center, Department of Emergency Medicine, Sylmar, California
*
†
‡
§
Introduction: Anti-immigrant rhetoric and increased enforcement of immigration laws have induced worry and safety concerns among undocumented Latino immigrants (UDLI) and legal Latino residents/citizens (LLRC), with some delaying the time to care.1 In this study, we conducted a qualitative analysis of statements made by emergency department (ED) patients – a majority of whom were UDLI and LLRC – participating in a study to better understand their experiences and fears with regard to anti-immigrant rhetoric, immigration enforcement, and ED utilization.
Methods: We conducted a multi-site study, surveying patients in three California safety-net EDs serving large immigrant populations from June 2017–December 2018. Of 1684 patients approached, 1337 (79.4%) agreed to participate; when given the option to provide open-ended comments, 260 participants provided perspectives about their experiences during the years immediately following the 2016 United States presidential election. We analyzed these qualitative data using constructivist grounded theory.
Results: We analyzed comments from 260 individuals. Among ED patients who provided qualitative data, 59% were women and their median age was 45 years (Interquartile range 33-57 years). Undocumented Latino immigrants comprised 49%, 31% were LLRC, and 20% were non-Latino legal residents. As their primary language, 68% spoke Spanish. We identified six themes: fear as a barrier to care (especially for UDLI); the negative impact of fear on health and wellness (physical and mental health, delays in care); factors influencing fear (eg, media coverage); and future solutions, including the need for increased communication about rights.
Conclusion: Anti-immigrant rhetoric during the 2016 US presidential campaign contributed to fear and safety concerns among UDLI and LLRC accessing healthcare. This is one of the few studies that captured firsthand experiences of UDLI in the ED. Our findings revealed fear-based barriers to accessing emergency care, protective and contributing factors to fear, and the negative impact of fear. There is a need for increased culturally informed patient communication about rights and resources, strategic media campaigns, and improved access to healthcare for undocumented individuals. [West J Emerg Med. 2021;22(3)660-666.]
Section Editor: K. TomXu, MD, PhD Submission history: Submitted October 9, 2020; Revision received February 11, 2021; Accepted February 12, 2021 Electronically published May 7, 2021 Full text available through open access at http://escholarship.org/uc/uciem_westjem DOI: 10.5811/westjem.2021.2.50189
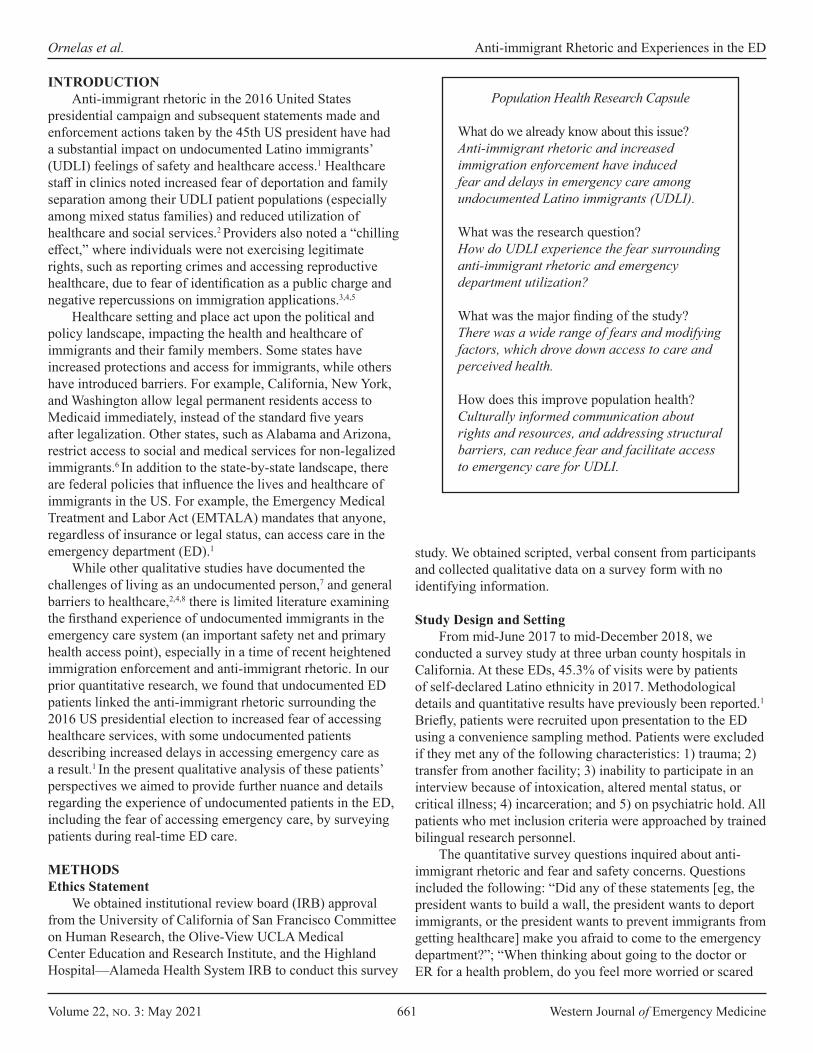
Volume 22, no. 3: May 2021 661 Western Journal of Emergency Medicine
Ornelas et al. Anti-immigrant Rhetoric and Experiences in the ED
Population Health Research Capsule
What do we already know about this issue?Anti-immigrant rhetoric and increased immigration enforcement have induced fear and delays in emergency care among undocumented Latino immigrants (UDLI).
What was the research question?How do UDLI experience the fear surrounding anti-immigrant rhetoric and emergency department utilization?
What was the major finding of the study?There was a wide range of fears and modifying factors, which drove down access to care and perceived health.
How does this improve population health?Culturally informed communication about rights and resources, and addressing structural barriers, can reduce fear and facilitate access to emergency care for UDLI.
INTRODUCTIONAnti-immigrant rhetoric in the 2016 United States
presidential campaign and subsequent statements made and enforcement actions taken by the 45th US president have had a substantial impact on undocumented Latino immigrants’ (UDLI) feelings of safety and healthcare access.1 Healthcare staff in clinics noted increased fear of deportation and family separation among their UDLI patient populations (especially among mixed status families) and reduced utilization of healthcare and social services.2 Providers also noted a “chilling effect,” where individuals were not exercising legitimate rights, such as reporting crimes and accessing reproductive healthcare, due to fear of identification as a public charge and negative repercussions on immigration applications.3,4,5
Healthcare setting and place act upon the political and policy landscape, impacting the health and healthcare of immigrants and their family members. Some states have increased protections and access for immigrants, while others have introduced barriers. For example, California, New York, and Washington allow legal permanent residents access to Medicaid immediately, instead of the standard five years after legalization. Other states, such as Alabama and Arizona, restrict access to social and medical services for non-legalized immigrants.6 In addition to the state-by-state landscape, there are federal policies that influence the lives and healthcare of immigrants in the US. For example, the Emergency Medical Treatment and Labor Act (EMTALA) mandates that anyone, regardless of insurance or legal status, can access care in the emergency department (ED).1
While other qualitative studies have documented the challenges of living as an undocumented person,7 and general barriers to healthcare,2,4,8 there is limited literature examining the firsthand experience of undocumented immigrants in the emergency care system (an important safety net and primary health access point), especially in a time of recent heightened immigration enforcement and anti-immigrant rhetoric. In our prior quantitative research, we found that undocumented ED patients linked the anti-immigrant rhetoric surrounding the 2016 US presidential election to increased fear of accessing healthcare services, with some undocumented patients describing increased delays in accessing emergency care as a result.1 In the present qualitative analysis of these patients’ perspectives we aimed to provide further nuance and details regarding the experience of undocumented patients in the ED, including the fear of accessing emergency care, by surveying patients during real-time ED care.
METHODSEthics Statement
We obtained institutional review board (IRB) approval from the University of California of San Francisco Committee on Human Research, the Olive-View UCLA Medical Center Education and Research Institute, and the Highland Hospital—Alameda Health System IRB to conduct this survey
study. We obtained scripted, verbal consent from participants and collected qualitative data on a survey form with no identifying information.
Study Design and SettingFrom mid-June 2017 to mid-December 2018, we
conducted a survey study at three urban county hospitals in California. At these EDs, 45.3% of visits were by patients of self-declared Latino ethnicity in 2017. Methodological details and quantitative results have previously been reported.1 Briefly, patients were recruited upon presentation to the ED using a convenience sampling method. Patients were excluded if they met any of the following characteristics: 1) trauma; 2) transfer from another facility; 3) inability to participate in an interview because of intoxication, altered mental status, or critical illness; 4) incarceration; and 5) on psychiatric hold. All patients who met inclusion criteria were approached by trained bilingual research personnel.
The quantitative survey questions inquired about anti-immigrant rhetoric and fear and safety concerns. Questions included the following: “Did any of these statements [eg, the president wants to build a wall, the president wants to deport immigrants, or the president wants to prevent immigrants from getting healthcare] make you afraid to come to the emergency department?”; “When thinking about going to the doctor or ER for a health problem, do you feel more worried or scared
Western Journal of Emergency Medicine 662 Volume 22, no. 3: May 2021
Anti-immigrant Rhetoric and Experiences in the ED Ornelas et al.
about getting identified as an undocumented immigrant NOW compared to how you felt ONE YEAR AGO?”; and “Have these statements made you feel worried or unsafe living in the US?”. To more deeply understand patient experiences and perspectives, we provided participants with the option to provide open-ended comments after completing the survey, asking, “Do you have additional comments, including about the study or survey questions?”. The present study is based on responses to this final open-ended question. Study personnel documented patient comments through a combination of direct quotes and their own summarization. We did not collect audio recordings to protect patient privacy and confidentiality.
Data Management Across the three sites, researchers documented a total of
574 open-ended patient commentary entries among the 1318 total surveys collected in the study. We excluded a total of 314 comments because the text consisted of researcher notes about the interview itself, clarifications about the quantitative survey responses, and patient stories irrelevant to immigrant health or the ED experience. We included a total of 281 open-ended responses in our analysis. We consolidated 21 responses that had overlapping participant identifications (i.e., were for the same person surveyed more than once in the ED). These data were consolidated into a total of 260 entries from 260 individual survey respondents (Figure).
Data AnalysisWe analyzed the qualitative data using constructivist
grounded theory, which combines deductive and inductive
thematic analysis.9 The analysis was driven by the research question: What are patients’ experiences and fears with regard to anti-immigrant rhetoric, immigration enforcement, and ED utilization? We used predetermined survey domains, such as fear of accessing care, and added thematic categories to capture the dimensions of fear, including protective and contributive factors. One investigator (CO) coded all comments. A second investigator (JMT) coded a random subsample of 87 (one third) comments to ensure consistency and replicability of coding. Among the 260 comments, there were 213 distinct codes, grouped into six broad themes.
RESULTSDemographics
Of the 260 individuals included in the qualitative study, 41% were men and 59% were women. Their median age was 45 years (interquartile range, 33-57). Undocumented Latino immigrants (UDLI) comprised 49%, 31% were legal Latino residents (LLRC), and 20% were non-Latino legal residents (NLRC). Spanish language was the primary language for 68%, and 32% spoke English as their primary language (Table 1). Compared to our quantitative results, which were previously reported,1 respondents to our qualitative study had a similar median age and primary language distribution, but greater proportions of UDLI and women.
Grounded Theory AnalysisOf the following themes, factors modifying fear, fear as
a barrier to care, and impact of fear on health and healthcare were most frequently mentioned.
UDLIn (%)
LLRCn (%)
NLRCn (%)
Total number 129 (49%) 80 (31%) 51 (20%)Gender
Men 47 (36%) 41 (51%) 20 (39%)Women 82 (64%) 39 (49%) 31 (61%)
Median age in years (IQR)
42 (32 to 54) 48 (38 to 59) 45 (30 to 57)
Primary language
English 7 (5%) 27 (34%) 45 (88%)Spanish 122 (95%) 53 (66%) 0 (0%)Other 0 (0%) 0 (0%) 6 (12%)
Table 1. Demographic information of multi-site emergency department survey participants with open-ended commentary.
UDLI, undocumented Latino immigrants; LLRC, legal Latino residents/citizens; NLRC, non-Latino legal residents; IQR, interquartile range.
Figure. Process of excluding and consolidating open-ended pa-tient commentary for multi-site emergency department study.
Volume 22, no. 3: May 2021 663 Western Journal of Emergency Medicine
Ornelas et al. Anti-immigrant Rhetoric and Experiences in the ED
Theme 1: Fear as a barrier to care (frequency: 32%). Although all ED patients in the study eventually sought care, some UDLI and a few LLRC noted feeling afraid before visiting the hospital. Others, especially LLRC, shared that undocumented family and friends were afraid to visit the ED. Fears ranged from family separation, negative consequences on future legalization (ie, public charge5), the potential for discrimination and denial of services, and encountering law enforcement in the hospital. Other barriers included healthcare expenses, long wait times, and language barriers. Nevertheless, not all expressed fear of visiting the hospital.
Theme 2: Factors modifying fear (frequency: 38%). Factors that increased fear, especially among UDLI, included exposure to media coverage of immigration enforcement, seeing deportations within the community, and the political climate. Factors that decreased fear included knowledge of one’s rights, less media coverage of immigration issues, positive healthcare experiences, and having health insurance. Fear also varied by place and time. Many mentioned feeling safe in a sanctuary city, in California, and in their respective hospitals, while highlighting negative experiences for loved ones in states outside of California.
The presence and perception of law enforcement was a commonly cited reason that influenced fear. A couple of individuals believed that hospitals collaborate with immigration enforcement and that providers report patients. This suspicion was confirmed by seeing law enforcement outside or in the hospital. For some, fear of interacting with law enforcement was a barrier to reporting incidences of domestic violence in the context of ED care. Individuals who did not believe hospitals comply with immigration enforcement cited this as a reason to not have fear.
Theme 3: Impact of fear on health and healthcare (frequency: 16%). Fear had a negative impact on some participants’ health. The stress and worry of immigration enforcement were all consuming, and they felt worried or “on edge” all the time. Some endorsed worsening headaches, increased feelings of anxiety, and elevated/uncontrolled blood pressure. The majority of respondents, however, were not directly impacted and instead recounted how the fear impacted their friends, family, and neighbors.
Sometimes this fear led to a delay in seeking care. Reasons for delaying care were mistrust and misinformation around reporting, deportations, and discrimination within hospitals. For individuals who did not delay, they cited reasons including medical necessity (pain, “felt like I was going to die”). A group of patients shared stories of themselves or individuals they knew who experienced morbidity and mortality from delaying care for emergent and serious conditions including appendicitis, end stage renal disease requiring dialysis, infections, and a retinal detachment.
Theme 4: Effect on the broader community (frequency: 4%). Although the majority of comments were from UDLI, LLRC and NLRC commented on how they were also
impacted by anti-immigrant rhetoric. Legal Latino residents/citizens expressed fear of losing their rights and being persecuted for their race/ethnicity. One mother noted her child crying over having to move back to Mexico after the election, despite being legal residents. On three separate occasions, participants highlighted that “anything can happen.” Others noted an increase in explicit racism during the time period following the 2016 presidential election targeting people of color who were perceived as foreign.
Theme 5: Coping strategies and protective factors (frequency: 7%). Although fearful, worried, and anxious, individuals developed coping strategies and found sources of strength and resilience within themselves and their communities. Coping strategies included avoidance (eg, not looking at the news), acceptance (eg, the possibility of deportation), and problem solving (eg, taking legal rights courses, leaving the US). The main protective factor was having knowledge and information about one’s rights. Individuals learned about their rights through local churches, community clinics, hospital staff, and media sources.
Theme 6: Potential future interventions in the ED (frequency: 3%). Several individuals shared suggestions for future ED changes and interventions that could help mitigate fear, including having more staff who spoke Spanish and identified as part of the Latino community, increasing communication about one’s rights, and clarifying the role of law enforcement in the hospital through television, advertisement, and billboard messages. Exemplar quotes for the six themes are presented in Table 2.
DISCUSSION Anti-immigrant rhetoric and heightened immigration
enforcement surrounding the campaign and results of the 2016 US presidential election has been linked to increased worry and safety concerns among undocumented individuals. Providers have noted delays in care, reduced utilization of healthcare and social services, and fewer individuals accessing legal rights and resources; these impacts have also been documented in a growing number of studies.1-4 For example, there is an expanded definition of a “public charge,” wherein certain individuals applying for a green card (permanent resident card) or visa could be denied for using government resources such as Medicaid and housing assistance; although it does not apply to all immigrants, this has instilled trepidation about accessing resources even among immigrants who are not affected by public charge.5
Given the ED’s role as a primary source of care for many patients and that delays in care for conditions requiring the ED can be life-threatening, we further examined the perspectives of UDLI in a multi-site study at three safety-net EDs with large immigrant populations, collected with respect to the 2016 US presidential nomination.
We found that fear related to immigration status can serve as a barrier to ED care for patients, especially for
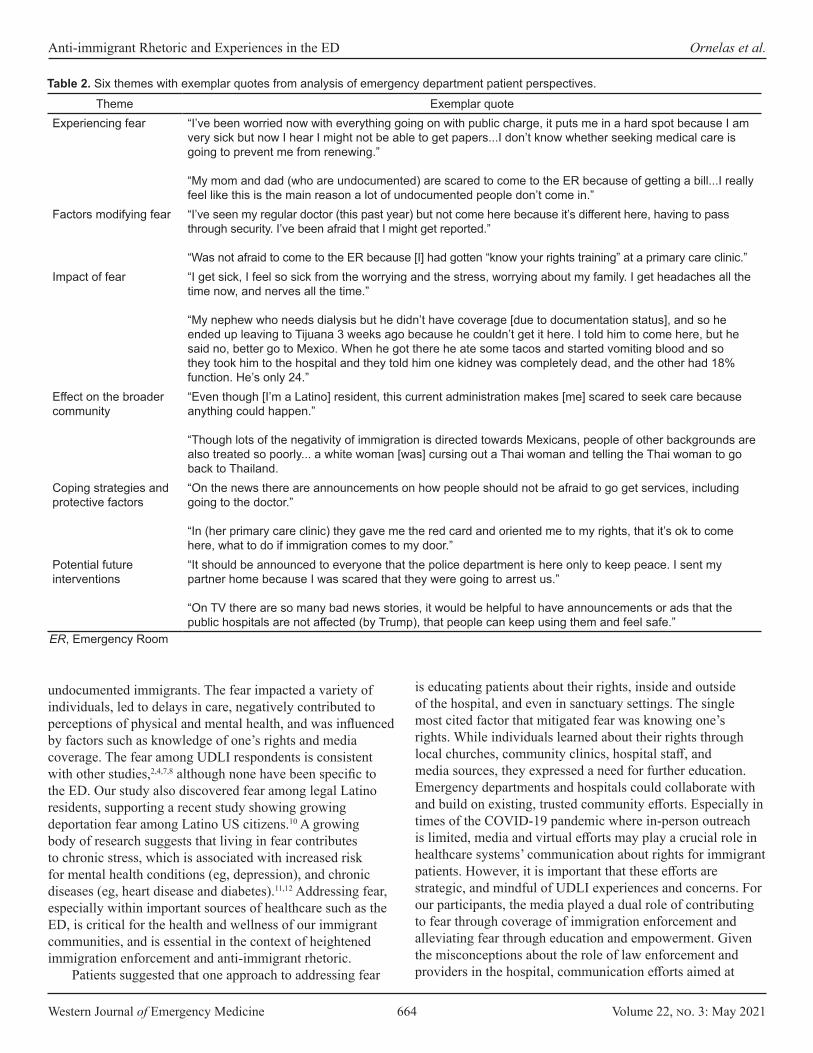
Western Journal of Emergency Medicine 664 Volume 22, no. 3: May 2021
Anti-immigrant Rhetoric and Experiences in the ED Ornelas et al.
undocumented immigrants. The fear impacted a variety of individuals, led to delays in care, negatively contributed to perceptions of physical and mental health, and was influenced by factors such as knowledge of one’s rights and media coverage. The fear among UDLI respondents is consistent with other studies,2,4,7,8 although none have been specific to the ED. Our study also discovered fear among legal Latino residents, supporting a recent study showing growing deportation fear among Latino US citizens.10 A growing body of research suggests that living in fear contributes to chronic stress, which is associated with increased risk for mental health conditions (eg, depression), and chronic diseases (eg, heart disease and diabetes).11,12 Addressing fear, especially within important sources of healthcare such as the ED, is critical for the health and wellness of our immigrant communities, and is essential in the context of heightened immigration enforcement and anti-immigrant rhetoric.
Patients suggested that one approach to addressing fear
is educating patients about their rights, inside and outside of the hospital, and even in sanctuary settings. The single most cited factor that mitigated fear was knowing one’s rights. While individuals learned about their rights through local churches, community clinics, hospital staff, and media sources, they expressed a need for further education. Emergency departments and hospitals could collaborate with and build on existing, trusted community efforts. Especially in times of the COVID-19 pandemic where in-person outreach is limited, media and virtual efforts may play a crucial role in healthcare systems’ communication about rights for immigrant patients. However, it is important that these efforts are strategic, and mindful of UDLI experiences and concerns. For our participants, the media played a dual role of contributing to fear through coverage of immigration enforcement and alleviating fear through education and empowerment. Given the misconceptions about the role of law enforcement and providers in the hospital, communication efforts aimed at
Theme Exemplar quoteExperiencing fear “I’ve been worried now with everything going on with public charge, it puts me in a hard spot because I am
very sick but now I hear I might not be able to get papers...I don’t know whether seeking medical care is going to prevent me from renewing.”
“My mom and dad (who are undocumented) are scared to come to the ER because of getting a bill...I really feel like this is the main reason a lot of undocumented people don’t come in.”
Factors modifying fear “I’ve seen my regular doctor (this past year) but not come here because it’s different here, having to pass through security. I’ve been afraid that I might get reported.”
“Was not afraid to come to the ER because [I] had gotten “know your rights training” at a primary care clinic.”Impact of fear “I get sick, I feel so sick from the worrying and the stress, worrying about my family. I get headaches all the
time now, and nerves all the time.”
“My nephew who needs dialysis but he didn’t have coverage [due to documentation status], and so he ended up leaving to Tijuana 3 weeks ago because he couldn’t get it here. I told him to come here, but he said no, better go to Mexico. When he got there he ate some tacos and started vomiting blood and so they took him to the hospital and they told him one kidney was completely dead, and the other had 18% function. He’s only 24.”
Effect on the broader community
“Even though [I’m a Latino] resident, this current administration makes [me] scared to seek care because anything could happen.”
“Though lots of the negativity of immigration is directed towards Mexicans, people of other backgrounds are also treated so poorly... a white woman [was] cursing out a Thai woman and telling the Thai woman to go back to Thailand.
Coping strategies and protective factors
“On the news there are announcements on how people should not be afraid to go get services, including going to the doctor.”
“In (her primary care clinic) they gave me the red card and oriented me to my rights, that it’s ok to come here, what to do if immigration comes to my door.”
Potential future interventions
“It should be announced to everyone that the police department is here only to keep peace. I sent my partner home because I was scared that they were going to arrest us.”
“On TV there are so many bad news stories, it would be helpful to have announcements or ads that the public hospitals are not affected (by Trump), that people can keep using them and feel safe.”
Table 2. Six themes with exemplar quotes from analysis of emergency department patient perspectives.
ER, Emergency Room
Volume 22, no. 3: May 2021 665 Western Journal of Emergency Medicine
Ornelas et al. Anti-immigrant Rhetoric and Experiences in the ED
reducing fear among immigrant patients should address these roles, as well as clarify existing protections against discrimination and denial of services (eg, EMTALA).
Finally, there is a need to confront structural barriers in our healthcare system for UDLI. Beyond fear of discovery, UDLI mentioned other barriers to care, mainly healthcare expenses. There are large gaps in health insurance eligibility and enrollment for UDLI in the US, with eligibility largely limited to select private, state, and county-specific options13; lack of insurance is a substantial barrier to care. Finally, some individuals only felt safe at specific hospital sites or clinics. It is important to understand and build structural interventions and formulate policies that contribute to these feelings of safety and trust more broadly.
LIMITATIONS We note several limitations, including the convenience
sample of the overall study and the fact that a relatively small percentage of participants provided qualitative data. As compared to the larger quantitative study, the demographic characteristics of qualitative study participants were substantially different. Comments represented largely middle-aged, Spanish-speaking individuals, of whom half were ULDI and a third were LLRC. Although skewed with respect to the larger quantitative study, this analysis highlights the experiences of the two communities impacted the most by anti-immigrant rhetoric.1
In addition, our study captured the experiences of individuals who ultimately sought emergency care. To directly represent the experiences of UDLI who completely avoid the ED due to fear and other barriers, future study sites may include other locations such as community-based organizations and clinics. Also, our study occurred in sanctuary cities within a sanctuary state and does not reflect the experiences of all patients in different settings but may reflect perspectives of hospitals with large immigrant populations.
Other limitations included the lack of recordings or follow-up to elicit further information, a decision we made to maintain confidentiality and security. However, given the opening for unstructured commentary, participants shared a wide range of experiences and perspectives that were not captured in our quantitative data, and to mediate recording error, research assistants documented notes right after the interview.
CONCLUSIONIn a qualitative analysis of ED patients’ perceptions of safety and emergency care in the years following the 2016 US presidential election, we found that fear played a substantial role in experiences with accessing emergency care.1 Some patients described decremental impacts on their mental and physical health and delays in care due to fear of discovery. This fear was not limited to undocumented Latino immigrants, affecting also legal Latino residents. Patients coped through avoidance, acceptance, and problem solving, including
learning about their rights, and identified communication about rights as a key future intervention. Our study supports the need for the following: 1) increased culturally and linguistically appropriate patient communication, including media campaigns, about rights/resources and the role of law enforcement and healthcare providers; and 2) efforts within and outside the ED to address structural barriers to emergency care for UDLI.
Address for Correspondence: Carolina Ornelas, MPH, University of California, San Francisco, Department of Emergency Medicine, 505 Parnassus Ave, San Francisco, CA 94143. Email: [email protected]
Conflicts of Interest: By the WestJEM article submission agreement, all authors are required to disclose all affiliations, funding sources and financial or management relationships that could be perceived as potential sources of bias. No author has professional or financial relationships with any companies that are relevant to this study. There are no conflicts of interest or sources of funding to declare.
Copyright: © 2021 Ornelas et al. This is an open access article distributed in accordance with the terms of the Creative Commons Attribution (CC BY 4.0) License. See: http://creativecommons.org/licenses/by/4.0/
REFERENCES1. Rodriguez RM, Torres JR, Sun J, et al. Declared impact of the
US president’s statements and campaign statements on Latino populations’ perceptions of safety and emergency care access. PLoS One. 2019;14(10):e0222837.
2. Fleming PJ, Lopez WD, Mesa H, et al. A qualitative study on the impact of the 2016 US election on the health of immigrant families in Southeast Michigan. BMC Public Health. 2019 Jul 15;19(1):947.
3. Page KR, Polk S. Chilling effect? Post-election health care use by undocumented and mixed-status families. N Engl J Med. 2017;376(12):e20.
4. Hacker K, Chu J, Arsenault L, Marlin RP. Provider’s perspectives on the impact of Immigration and Customs Enforcement (ICE) activity on immigrant health. J Health Care Poor Underserved. 2012;23(2):651-65.
5. U.S Citizenship and Immigration Services. Public Charge. 2020. Available at: https://www.uscis.gov/green-card/green-card-processes-and-procedures/public-charge. Accessed May 10, 2020.
6. Philbin MM, Flake M, Hatzenbuehler ML, Hirsch JS. State-level immigration and immigrant-focused policies as drivers of Latino health disparities in the United States. Soc Sci Med. 2018;199:29-38.
7. Mendez-Shannon EC. “We will always be in the shadows”- a qualitative descriptive study of undocumented Latino immigrants surviving in the United States. 2010. Available at: https://iro.uiowa.edu/discovery/fulldisplay/alma9983776868602771/01IOWA_INST:ResearchRepository. Accessed November 10, 2019.
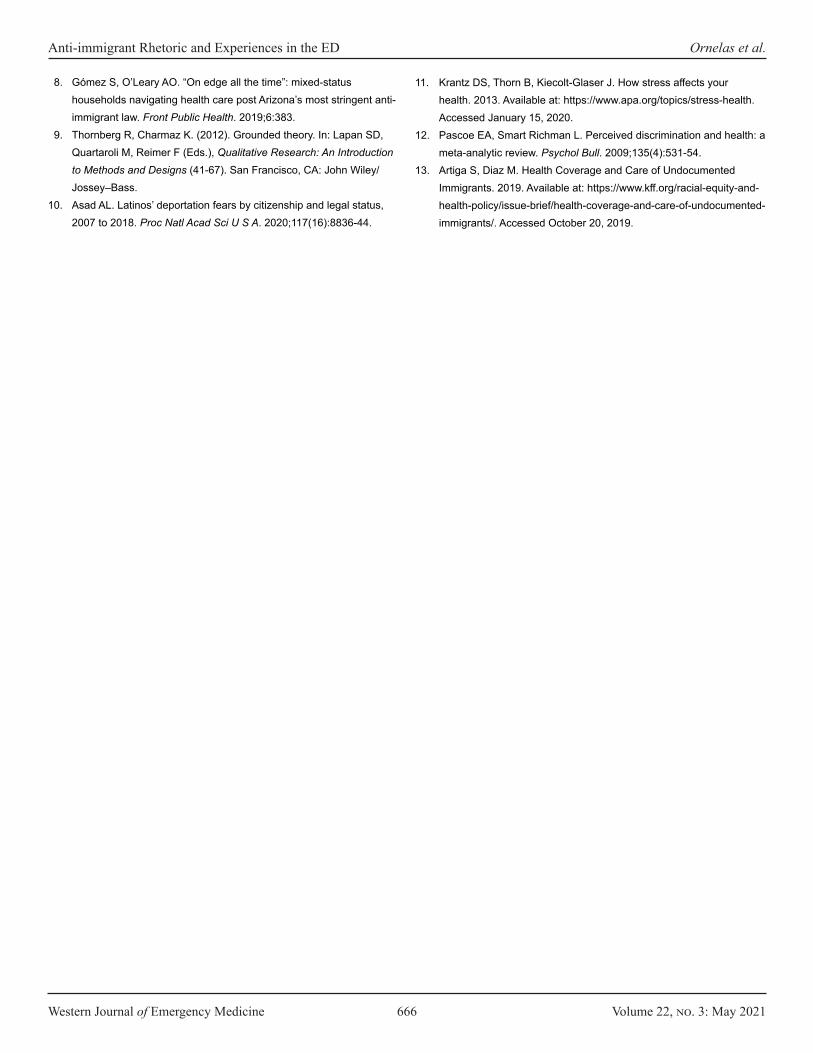
Western Journal of Emergency Medicine 666 Volume 22, no. 3: May 2021
Anti-immigrant Rhetoric and Experiences in the ED Ornelas et al.
8. Gómez S, O’Leary AO. “On edge all the time”: mixed-status households navigating health care post Arizona’s most stringent anti-immigrant law. Front Public Health. 2019;6:383.
9. Thornberg R, Charmaz K. (2012). Grounded theory. In: Lapan SD, Quartaroli M, Reimer F (Eds.), Qualitative Research: An Introduction to Methods and Designs (41-67). San Francisco, CA: John Wiley/Jossey–Bass.
10. Asad AL. Latinos’ deportation fears by citizenship and legal status, 2007 to 2018. Proc Natl Acad Sci U S A. 2020;117(16):8836-44.
11. Krantz DS, Thorn B, Kiecolt-Glaser J. How stress affects your health. 2013. Available at: https://www.apa.org/topics/stress-health. Accessed January 15, 2020.
12. Pascoe EA, Smart Richman L. Perceived discrimination and health: a meta-analytic review. Psychol Bull. 2009;135(4):531-54.
13. Artiga S, Diaz M. Health Coverage and Care of Undocumented Immigrants. 2019. Available at: https://www.kff.org/racial-equity-and-health-policy/issue-brief/health-coverage-and-care-of-undocumented-immigrants/. Accessed October 20, 2019.
Volume 22, no. 3: May 2021 667 Western Journal of Emergency Medicine
Brief Research Report
Impact of Social Determinants of Health, Health Literacy, Self-perceived Risk, and Trust in the Emergency Physician
on Compliance with Follow-up James Sutton, MD*Leon Gu*Deborah B. Diercks, MD, MSc†
Section Editor: Tony Zitek, MD Submission history: Submitted July 6, 2020; Revision received December 13, 2020; Accepted December 17, 2020Electronically published May 5, 2021Full text available through open access at http://escholarship.org/uc/uciem_westjem DOI: 10.5811/westjem.2020.12.48981
INTRODUCTIONChest pain is a most commonly presenting symptom in
the emergency department (ED).1 One of the greatest concerns for chest pain patients is acute coronary syndrome (ACS), which includes high-mortality issues such as myocardial infarction. ED discharge is appropriate if a patient’s history, electrocardiogram, troponin levels, and other risk factors are considered low risk.2,3 However, follow-up is recommended even if appropriately discharged.4 Follow-up compliance in these discharged patients is low, with only 70% attending primary care follow-up within 30 days.2-5 The American Heart Association /American College of Cardiology recommend follow-up within 72 hours of discharge, a guideline that has compliance as low as 6%.4 Previous research has shown that social and demographic factors such as health insurance and socioeconomic status may impact outcomes and follow-up.2,3
University of Texas Southwestern School of Medicine, Dallas, TexasUniversity of Texas Southwestern, Department of Emergency Medicine, Dallas, Texas
*†
Introduction: Patients presenting to the emergency department (ED) with “low-risk” acute coronary syndrome (ACS) symptoms can be discharged with outpatient follow-up. However, follow-up compliance is low for unknown nonclinical reasons. We hypothesized that a patient’s social factors, health literacy, self-perceived risk, and trust in the emergency physician may impact follow-up compliance.
Methods: This was a prospective study of a convenience sample of discharged ED patients presenting with chest pain and given a follow-up appointment prior to departing the ED. Patients were asked about social and demographic factors and to estimate their own risk for heart disease; they also completed the Short Assessment of Health Literacy-English (SAHL-E) and the Trust in Physician Scale (TiPS).
Results: We enrolled146 patients with a follow-up rate of 36.3%. Patients who had a low self-perceived heart disease risk (10% or less) were significantly less likely to attend follow-up than those with a higher perceived risk (23% vs 44%, P = 0.01). Other factors did not significantly predict follow-up rates.
Conclusion: In an urban county ED, in patients who were deemed low risk for ACS and discharged, only self-perception of risk was associated with compliance with a follow-up appointment. [West J Emerg Med. 2021;22(3)667–671.]
In addition, previous research has indicated that an appointment scheduling system and health insurance are high-yield targets to improve patient follow-up.3,6 Little is known about subjective variables such as self-perceived risk for heart disease, trust in the emergency physician, comfort with diagnosis, and health literacy. The objective of this study was to determine whether these factors have an impact on follow-up.
METHODSThis was a prospective study of a convenience sample of
patients discharged with follow-up after a visit for chest pain. This study was reviewed and approved by our institutional review board. The population included those given acute response clinic (ARC) appointments following ED discharge from an urban hospital in Dallas between November 2017–March 2019. Eligible patients were English-speaking, older than 18 years,
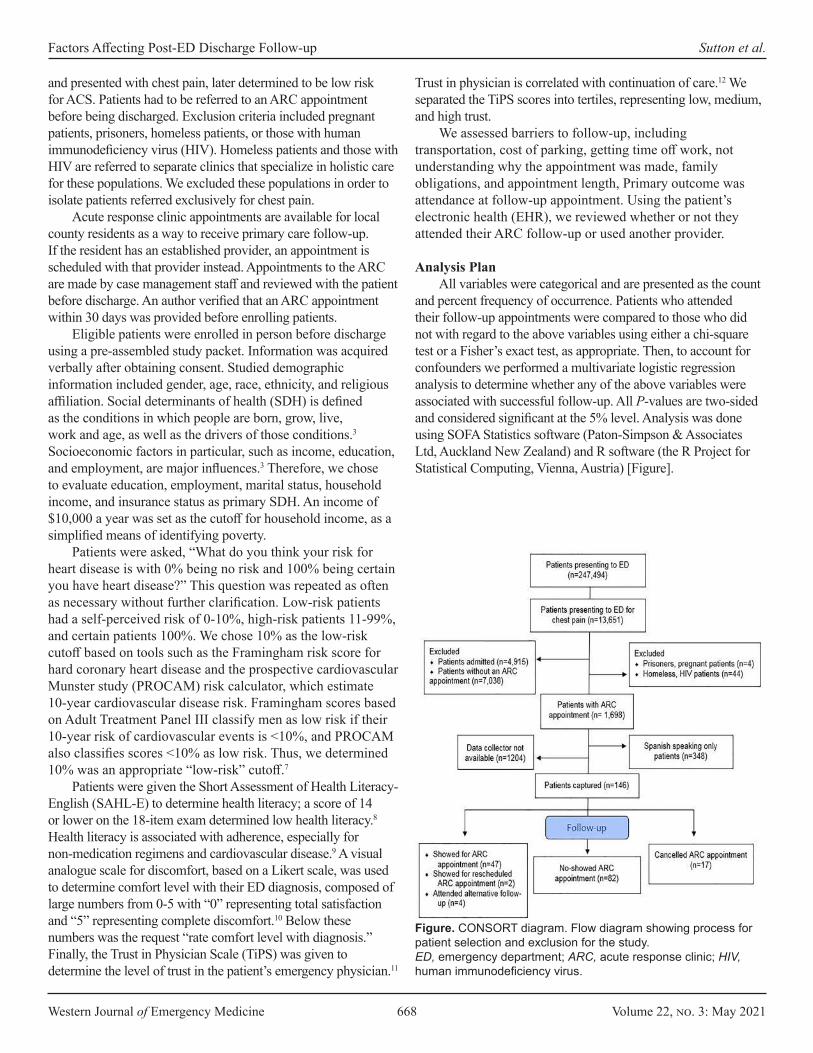
Western Journal of Emergency Medicine 668 Volume 22, no. 3: May 2021
Factors Affecting Post-ED Discharge Follow-up Sutton et al.
and presented with chest pain, later determined to be low risk for ACS. Patients had to be referred to an ARC appointment before being discharged. Exclusion criteria included pregnant patients, prisoners, homeless patients, or those with human immunodeficiency virus (HIV). Homeless patients and those with HIV are referred to separate clinics that specialize in holistic care for these populations. We excluded these populations in order to isolate patients referred exclusively for chest pain.
Acute response clinic appointments are available for local county residents as a way to receive primary care follow-up. If the resident has an established provider, an appointment is scheduled with that provider instead. Appointments to the ARC are made by case management staff and reviewed with the patient before discharge. An author verified that an ARC appointment within 30 days was provided before enrolling patients.
Eligible patients were enrolled in person before discharge using a pre-assembled study packet. Information was acquired verbally after obtaining consent. Studied demographic information included gender, age, race, ethnicity, and religious affiliation. Social determinants of health (SDH) is defined as the conditions in which people are born, grow, live, work and age, as well as the drivers of those conditions.3 Socioeconomic factors in particular, such as income, education, and employment, are major influences.3 Therefore, we chose to evaluate education, employment, marital status, household income, and insurance status as primary SDH. An income of $10,000 a year was set as the cutoff for household income, as a simplified means of identifying poverty.
Patients were asked, “What do you think your risk for heart disease is with 0% being no risk and 100% being certain you have heart disease?” This question was repeated as often as necessary without further clarification. Low-risk patients had a self-perceived risk of 0-10%, high-risk patients 11-99%, and certain patients 100%. We chose 10% as the low-risk cutoff based on tools such as the Framingham risk score for hard coronary heart disease and the prospective cardiovascular Munster study (PROCAM) risk calculator, which estimate 10-year cardiovascular disease risk. Framingham scores based on Adult Treatment Panel III classify men as low risk if their 10-year risk of cardiovascular events is <10%, and PROCAM also classifies scores <10% as low risk. Thus, we determined 10% was an appropriate “low-risk” cutoff.7
Patients were given the Short Assessment of Health Literacy-English (SAHL-E) to determine health literacy; a score of 14 or lower on the 18-item exam determined low health literacy.8 Health literacy is associated with adherence, especially for non-medication regimens and cardiovascular disease.9 A visual analogue scale for discomfort, based on a Likert scale, was used to determine comfort level with their ED diagnosis, composed of large numbers from 0-5 with “0” representing total satisfaction and “5” representing complete discomfort.10 Below these numbers was the request “rate comfort level with diagnosis.” Finally, the Trust in Physician Scale (TiPS) was given to determine the level of trust in the patient’s emergency physician.11
Trust in physician is correlated with continuation of care.12 We separated the TiPS scores into tertiles, representing low, medium, and high trust.
We assessed barriers to follow-up, including transportation, cost of parking, getting time off work, not understanding why the appointment was made, family obligations, and appointment length, Primary outcome was attendance at follow-up appointment. Using the patient’s electronic health (EHR), we reviewed whether or not they attended their ARC follow-up or used another provider.
Analysis Plan
All variables were categorical and are presented as the count and percent frequency of occurrence. Patients who attended their follow-up appointments were compared to those who did not with regard to the above variables using either a chi-square test or a Fisher’s exact test, as appropriate. Then, to account for confounders we performed a multivariate logistic regression analysis to determine whether any of the above variables were associated with successful follow-up. All P-values are two-sided and considered significant at the 5% level. Analysis was done using SOFA Statistics software (Paton-Simpson & Associates Ltd, Auckland New Zealand) and R software (the R Project for Statistical Computing, Vienna, Austria) [Figure].
Figure. CONSORT diagram. Flow diagram showing process for patient selection and exclusion for the study. ED, emergency department; ARC, acute response clinic; HIV, human immunodeficiency virus.
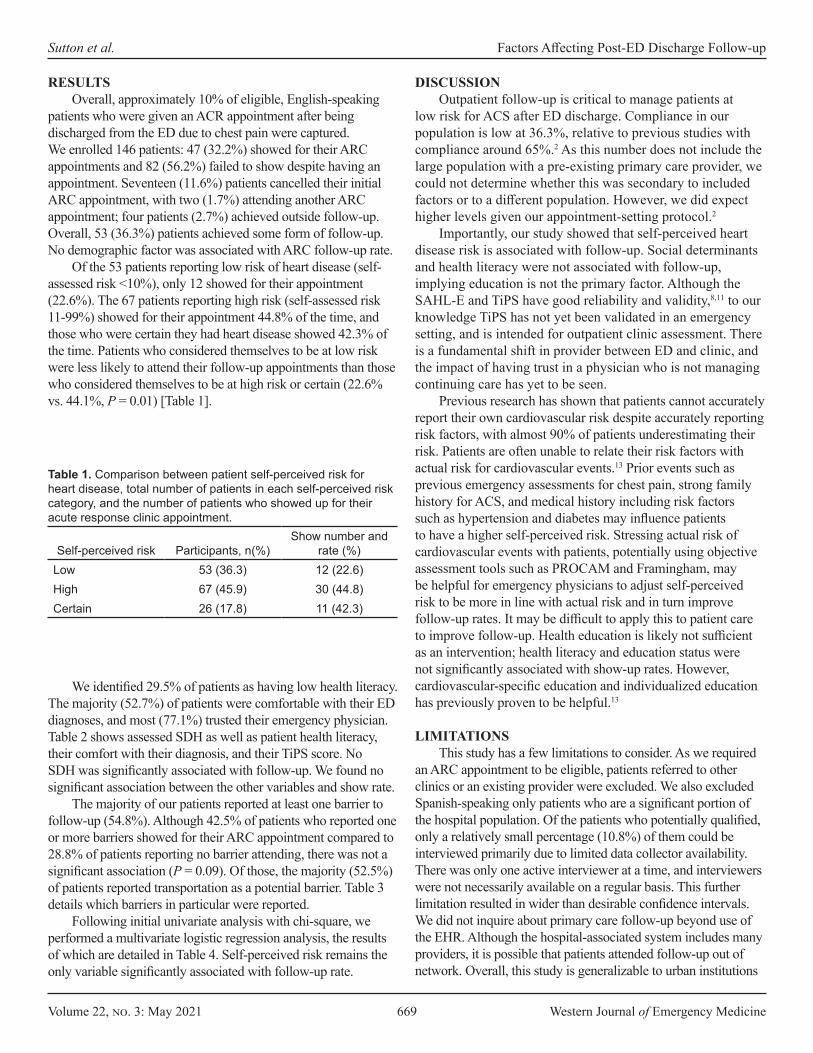
Volume 22, no. 3: May 2021 669 Western Journal of Emergency Medicine
Sutton et al. Factors Affecting Post-ED Discharge Follow-up
Self-perceived risk Participants, n(%)Show number and
rate (%)Low 53 (36.3) 12 (22.6)High 67 (45.9) 30 (44.8)Certain 26 (17.8) 11 (42.3)
Table 1. Comparison between patient self-perceived risk for heart disease, total number of patients in each self-perceived risk category, and the number of patients who showed up for their acute response clinic appointment.
RESULTSOverall, approximately 10% of eligible, English-speaking
patients who were given an ACR appointment after being discharged from the ED due to chest pain were captured. We enrolled 146 patients: 47 (32.2%) showed for their ARC appointments and 82 (56.2%) failed to show despite having an appointment. Seventeen (11.6%) patients cancelled their initial ARC appointment, with two (1.7%) attending another ARC appointment; four patients (2.7%) achieved outside follow-up. Overall, 53 (36.3%) patients achieved some form of follow-up. No demographic factor was associated with ARC follow-up rate.
Of the 53 patients reporting low risk of heart disease (self-assessed risk <10%), only 12 showed for their appointment (22.6%). The 67 patients reporting high risk (self-assessed risk 11-99%) showed for their appointment 44.8% of the time, and those who were certain they had heart disease showed 42.3% of the time. Patients who considered themselves to be at low risk were less likely to attend their follow-up appointments than those who considered themselves to be at high risk or certain (22.6% vs. 44.1%, P = 0.01) [Table 1].
We identified 29.5% of patients as having low health literacy. The majority (52.7%) of patients were comfortable with their ED diagnoses, and most (77.1%) trusted their emergency physician. Table 2 shows assessed SDH as well as patient health literacy, their comfort with their diagnosis, and their TiPS score. No SDH was significantly associated with follow-up. We found no significant association between the other variables and show rate.
The majority of our patients reported at least one barrier to follow-up (54.8%). Although 42.5% of patients who reported one or more barriers showed for their ARC appointment compared to 28.8% of patients reporting no barrier attending, there was not a significant association (P = 0.09). Of those, the majority (52.5%) of patients reported transportation as a potential barrier. Table 3 details which barriers in particular were reported.
Following initial univariate analysis with chi-square, we performed a multivariate logistic regression analysis, the results of which are detailed in Table 4. Self-perceived risk remains the only variable significantly associated with follow-up rate.
DISCUSSIONOutpatient follow-up is critical to manage patients at
low risk for ACS after ED discharge. Compliance in our population is low at 36.3%, relative to previous studies with compliance around 65%.2 As this number does not include the large population with a pre-existing primary care provider, we could not determine whether this was secondary to included factors or to a different population. However, we did expect higher levels given our appointment-setting protocol.2
Importantly, our study showed that self-perceived heart disease risk is associated with follow-up. Social determinants and health literacy were not associated with follow-up, implying education is not the primary factor. Although the SAHL-E and TiPS have good reliability and validity,8,11 to our knowledge TiPS has not yet been validated in an emergency setting, and is intended for outpatient clinic assessment. There is a fundamental shift in provider between ED and clinic, and the impact of having trust in a physician who is not managing continuing care has yet to be seen.
Previous research has shown that patients cannot accurately report their own cardiovascular risk despite accurately reporting risk factors, with almost 90% of patients underestimating their risk. Patients are often unable to relate their risk factors with actual risk for cardiovascular events.13 Prior events such as previous emergency assessments for chest pain, strong family history for ACS, and medical history including risk factors such as hypertension and diabetes may influence patients to have a higher self-perceived risk. Stressing actual risk of cardiovascular events with patients, potentially using objective assessment tools such as PROCAM and Framingham, may be helpful for emergency physicians to adjust self-perceived risk to be more in line with actual risk and in turn improve follow-up rates. It may be difficult to apply this to patient care to improve follow-up. Health education is likely not sufficient as an intervention; health literacy and education status were not significantly associated with show-up rates. However, cardiovascular-specific education and individualized education has previously proven to be helpful.13
LIMITATIONSThis study has a few limitations to consider. As we required
an ARC appointment to be eligible, patients referred to other clinics or an existing provider were excluded. We also excluded Spanish-speaking only patients who are a significant portion of the hospital population. Of the patients who potentially qualified, only a relatively small percentage (10.8%) of them could be interviewed primarily due to limited data collector availability. There was only one active interviewer at a time, and interviewers were not necessarily available on a regular basis. This further limitation resulted in wider than desirable confidence intervals. We did not inquire about primary care follow-up beyond use of the EHR. Although the hospital-associated system includes many providers, it is possible that patients attended follow-up out of network. Overall, this study is generalizable to urban institutions
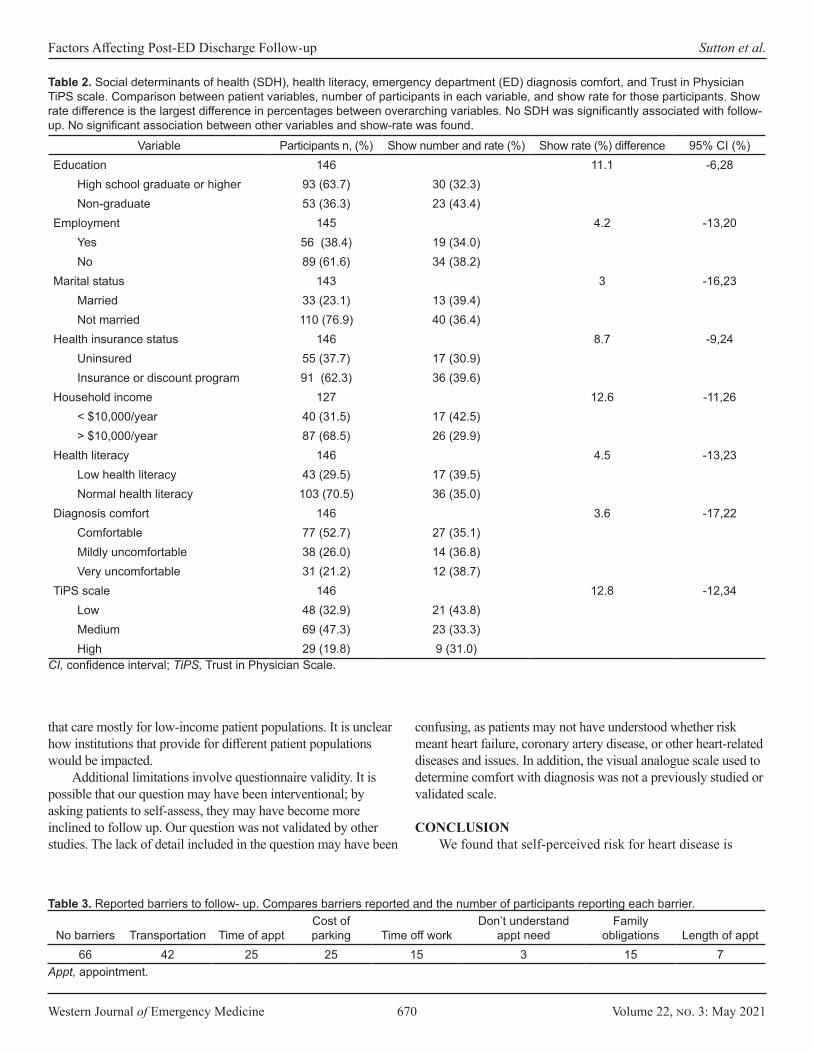
Western Journal of Emergency Medicine 670 Volume 22, no. 3: May 2021
Factors Affecting Post-ED Discharge Follow-up Sutton et al.
Variable Participants n, (%) Show number and rate (%) Show rate (%) difference 95% CI (%)Education 146 11.1 -6,28
High school graduate or higher 93 (63.7) 30 (32.3)Non-graduate 53 (36.3) 23 (43.4)
Employment 145 4.2 -13,20Yes 56 (38.4) 19 (34.0)No 89 (61.6) 34 (38.2)
Marital status 143 3 -16,23Married 33 (23.1) 13 (39.4)Not married 110 (76.9) 40 (36.4)
Health insurance status 146 8.7 -9,24Uninsured 55 (37.7) 17 (30.9)Insurance or discount program 91 (62.3) 36 (39.6)
Household income 127 12.6 -11,26< $10,000/year 40 (31.5) 17 (42.5)> $10,000/year 87 (68.5) 26 (29.9)
Health literacy 146 4.5 -13,23Low health literacy 43 (29.5) 17 (39.5)Normal health literacy 103 (70.5) 36 (35.0)
Diagnosis comfort 146 3.6 -17,22Comfortable 77 (52.7) 27 (35.1)Mildly uncomfortable 38 (26.0) 14 (36.8)Very uncomfortable 31 (21.2) 12 (38.7)
TiPS scale 146 12.8 -12,34Low 48 (32.9) 21 (43.8)Medium 69 (47.3) 23 (33.3)High 29 (19.8) 9 (31.0)
Table 2. Social determinants of health (SDH), health literacy, emergency department (ED) diagnosis comfort, and Trust in Physician TiPS scale. Comparison between patient variables, number of participants in each variable, and show rate for those participants. Show rate difference is the largest difference in percentages between overarching variables. No SDH was significantly associated with follow-up. No significant association between other variables and show-rate was found.
CI, confidence interval; TiPS, Trust in Physician Scale.
No barriers Transportation Time of apptCost of parking Time off work
Don’t understand appt need
Family obligations Length of appt
66 42 25 25 15 3 15 7Appt, appointment.
Table 3. Reported barriers to follow- up. Compares barriers reported and the number of participants reporting each barrier.
that care mostly for low-income patient populations. It is unclear how institutions that provide for different patient populations would be impacted.
Additional limitations involve questionnaire validity. It is possible that our question may have been interventional; by asking patients to self-assess, they may have become more inclined to follow up. Our question was not validated by other studies. The lack of detail included in the question may have been
confusing, as patients may not have understood whether risk meant heart failure, coronary artery disease, or other heart-related diseases and issues. In addition, the visual analogue scale used to determine comfort with diagnosis was not a previously studied or validated scale.
CONCLUSIONWe found that self-perceived risk for heart disease is

Volume 22, no. 3: May 2021 671 Western Journal of Emergency Medicine
Sutton et al. Factors Affecting Post-ED Discharge Follow-up
Variable P-value Odds ratio95% confidence
intervalSelf-perceived risk 0.01 2.84 (1.25,6.42)Gender 0.62 0.82 (0.39,1.74)Race 0.68 0.95 (0.75,1.20)Ethnicity 0.19 1.66 (0.77,3.54)Religion 0.47 1.00 (0.99,1.00)Education level 0.67 1.00 (0.98,1.02)Employment 0.86 0.93 (0.42,2.03)Marital status 0.64 0.99 (0.96,1.02)Income 0.66 0.99 (0.99,1.00)Insurance 0.26 1.07 (0.94,1.22)Health literacy 0.20 1.72 (0.74,4.01)TiPS 0.32 0.76 (0.44,1.30)Barriers 0.21 1.63 (0.74,3.57)VAS 0.91 0.97 (0.61,1.55)Constant 0.01
Table 4. Low vs high/certain self-perceived risk was significantly (P = 0.01) associated with follow-up rates when using multivariable logistic regression to account for confounding. No other variable was found to be significantly associated.
TIPS, Trust in Physician Scale; VAS, visual analogue scale.
associated with follow-up rates in patients who present to the ED with chest pain. We failed to find an association between social determinants of health, health literacy, trust in physician or barriers to access, and follow-up rates in these patients. Conversations with patients about their actual risk of ACS, such as with objective cardiovascular risk assessments such as the PROCAM and Framingham tools, may improve patient compliance with follow-up. Future studies should investigate how to improve follow-up compliance.
Address for Correspondence: Deborah B. Diercks, MD, MSc, University of Texas Southwestern, Department of Emergency Medicine, 5323 Harry Hines Blvd, Dallas, TX 75320. Email: [email protected].
Conflicts of Interest: By the WestJEM article submission agreement, all authors are required to disclose all affiliations, funding sources and financial or management relationships that could be perceived as potential sources of bias. No author has professional or financial relationships with any companies that are relevant to this study. There are no conflicts of interest or sources of funding to declare.
Copyright: © 2021 Sutton et al. This is an open access article distributed in accordance with the terms of the Creative Commons Attribution (CC BY 4.0) License. See: http://creativecommons.org/licenses/by/4.0/
REFERENCES1. Montalescot G, Sechtem U, Achenbach S, et al. 2013 ESC guidelines
on the management of stable coronary artery disease: the Task Force on the Management of Stable Coronary Artery Disease of the European Society of Cardiology. Eur Heart J. 2013;34(38):2949-3003.
2. Wong MK, Wang JT, Czarnecki A, et al. Factors associated with physician follow-up among patients with chest pain discharged from the emergency department. CMAJ. 2015;187(5):E160-8.
3. Braveman P, Gottlieb L. The social determinants of health: It’s time to consider the causes of the causes. Public Health Rep. 2014;129 Suppl 2(Suppl 2):19-31.
4. Milano P, Carden DL, Jackman KM, et al. Compliance with outpatient stress testing in low-risk patients presenting to the emergency department with chest pain. Crit Pathw Cardiol. 2011;10(1):35-40.
5. Story M, Reynolds B, Bowser M, et al. Barriers to outpatient stress testing follow-up for low-risk chest pain patients presenting to an ED chest pain unit. Am J Emerg Med. 2016;34(5):790-3.
6. Atzema CL, Maclagan LC. The transition of care between emergency department and primary care: a scoping study. Acad Emerg Med. 2017;24(2):201-15.
7. Versteylen MO, Joosen IA, Shaw LJ, et al. Comparison of Framingham, PROCAM, SCORE, and Diamond Forrester to predict coronary atherosclerosis and cardiovascular events. J Nucl Cardiol. 2011;18(5):904-11.
8. Lee SY, Stucky BD, Lee JY, et al. Short Assessment of Health Literacy-Spanish and English: a comparable test of health literacy for Spanish and English speakers. Health Serv Res. 2010;45(4):1105-20.
9. Miller TA. Health literacy and adherence to medical treatment in chronic and acute illness: a meta-analysis. Patient Educ Couns. 2016;99(7):1079-86.
10. Likert R. A technique for the development of attitude scales. Educ Psychol Meas. 1952;12:313-15.
11. Anderson LA, Dedrick RF. Development of the Trust in Physician scale: a measure to assess interpersonal trust in patient-physician relationships. Psychol Rep. 1990;67(3 Pt 2):1091-100.
12. Graham JL, Shahani L, Grimes RM, et al. The influence of trust in physicians and trust in the healthcare system on linkage, retention, and adherence to HIV care. AIDS Patient Care STDS. 2015;29(12):661-7.
13. Hussein HM, Harris-Lane P, Abdelmoula MM, et al. Accuracy of self-perception of cardiovascular risk in the community. J Vasc Interv Neurol. 2008;1(4):106-12.
Western Journal of Emergency Medicine 672 Volume 22, no. 3: May 2021
Original Research
Performance of Emergency Heart Failure Mortality Risk Grade in the Emergency Department
Nidhi Garg, MD* Renee Pekmezaris, PhD† Gerin Stevens, MD, PhD‡
Adan Z. Becerra, PhD§
Andrzej Kozikowski, PhD¶
Vidhi Patel, PhD†
Ghania Haddad, MD||
Phillip Levy, MD, MPH# Pridha Kumar, BS**Lance Becker, MD**
Section Editor: Sam Torbati, MD Submission history: Submitted July 6, 2020; Accepted January 11, 2021 Electronically published April 8, 2021 Full text available through open access at http://escholarship.org/uc/uciem_westjem DOI: 10.5811/westjem.2021.1.48978
INTRODUCTIONBackground
Nearly 700,000 emergency department (ED) visits were due to acute heart failure (AHF) in 2009.1-4 Most visits result in
Northwell Health, Southside Hospital, Department of Emergency Medicine, Bayshore, New YorkNorthwell Health, Department of Internal Medicine, Manhasset, New YorkNorthwell Health, Department of Cardiology, Manhasset, New YorkRush University Medical Center, Department of Surgery, Chicago, IllinoisNational Commission on Certification of Physicians Assistants, John’s Creek, GeorgiaNorthwell Health, Department of Emergency Medicine, Manhasset, New YorkWayne State University School of Medicine, Department of Emergency Medicine, Detroit, MichiganNorthwell Health, Long Island Jewish Medical Center, Department of Emergency Medicine, New Hyde Park, New York
*
†
‡
§
¶
||
#
**
Introduction: The purpose of this study was to validate and assess the performance of the Emergency Heart Failure Mortality Risk Grade (EHMRG) to predict seven-day mortality in US patients presenting to the emergency department (ED) with acute congestive heart failure (CHF) exacerbation.
Methods: We performed a retrospective chart review on patients presenting to the ED with acute CHF exacerbation between January 2014–January 2016 across eight EDs in New York. We identified patients using codes from the International Classification of Diseases, 9th and 10 Revisions, or who were diagnosed with CHF in the ED. Inclusion criteria were patients ≥ 18 years of age who presented to the ED for acute CHF. Exclusion criteria included the following: end-stage renal disease related heart failure; < 18 years of age; pregnancy; palliative care; renal failure; and “do not resuscitate” directive. The primary outcome was seven-day mortality. We used mixed-effects logistic regression models to estimate C-statistics and continuous net reclassification index for events and nonevents.
Results: We identified 3,320 ED visits associated with suspected CHF among 2,495 unique patients. Of the 3,320 ED visits, 94.7% patients were admitted to the hospital and 3.4% were discharged. The median age was 78.6 (interquartile range 68.01 - 86.76). There was an overall seven-day mortality of 2%, an inpatient mortality rate of 2.4%, and no mortality among the discharge group. Adding EHMRG to the risk prediction model improved the C-statistic (from 0.748 to 0.772) and led to a higher degree of reclassification for both events and nonevents.
Conclusion: The EHMRG can be used as a valuable and effective screening tool in the US while considering disposition decision for patients with acute CHF exacerbation. Emergency medical services transport and metolazone use is much higher in the US population as compared to the Canadian population. We observed minimal to no short-term mortality among discharged CHF patients from the ED. [West J Emerg Med. 2021;22(3)672–677.]
a hospital admission and account for the largest proportion of the projected $70 billion that will be spent on heart failure care by 2030.4,5 There are few prognostic algorithms to guide in the decision to either admit or discharge a patient appropriately. Thus,
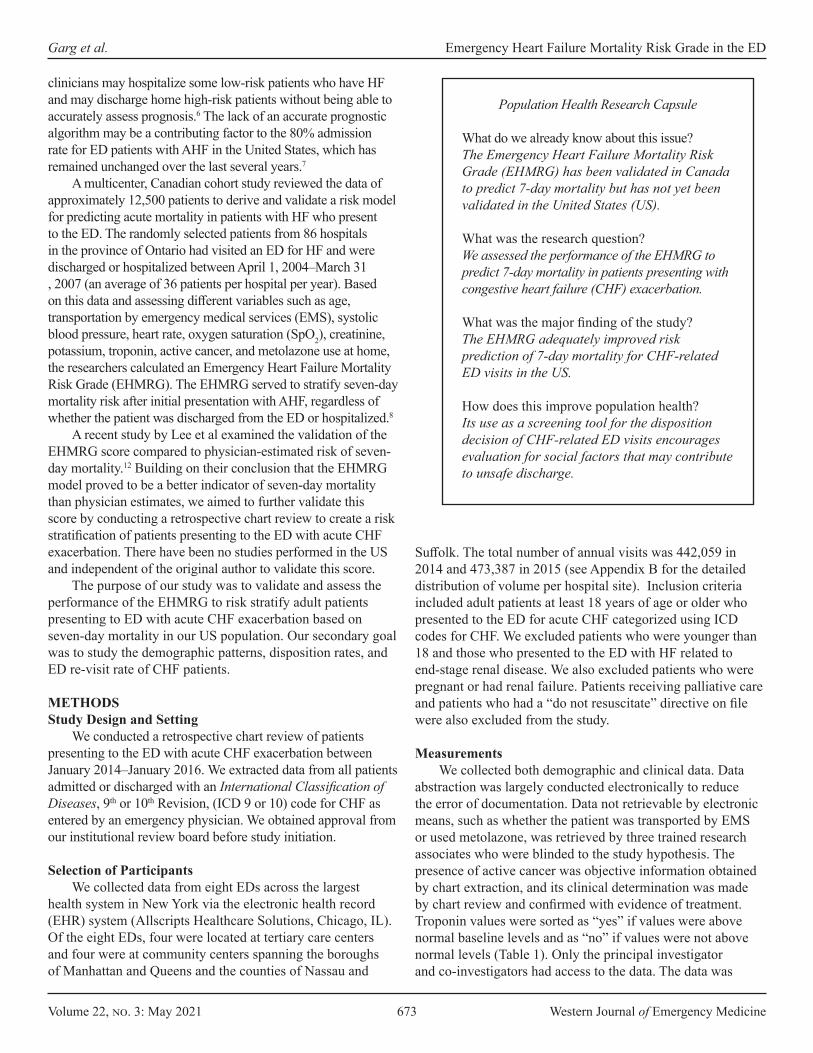
Volume 22, no. 3: May 2021 673 Western Journal of Emergency Medicine
Garg et al. Emergency Heart Failure Mortality Risk Grade in the ED
Population Health Research Capsule
What do we already know about this issue?The Emergency Heart Failure Mortality Risk Grade (EHMRG) has been validated in Canada to predict 7-day mortality but has not yet been validated in the United States (US).
What was the research question?We assessed the performance of the EHMRG to predict 7-day mortality in patients presenting with congestive heart failure (CHF) exacerbation.
What was the major finding of the study?The EHMRG adequately improved risk prediction of 7-day mortality for CHF-related ED visits in the US.
How does this improve population health?Its use as a screening tool for the disposition decision of CHF-related ED visits encourages evaluation for social factors that may contribute to unsafe discharge.
clinicians may hospitalize some low-risk patients who have HF and may discharge home high-risk patients without being able to accurately assess prognosis.6 The lack of an accurate prognostic algorithm may be a contributing factor to the 80% admission rate for ED patients with AHF in the United States, which has remained unchanged over the last several years.7
A multicenter, Canadian cohort study reviewed the data of approximately 12,500 patients to derive and validate a risk model for predicting acute mortality in patients with HF who present to the ED. The randomly selected patients from 86 hospitals in the province of Ontario had visited an ED for HF and were discharged or hospitalized between April 1, 2004–March 31
, 2007 (an average of 36 patients per hospital per year). Based on this data and assessing different variables such as age, transportation by emergency medical services (EMS), systolic blood pressure, heart rate, oxygen saturation (SpO2), creatinine, potassium, troponin, active cancer, and metolazone use at home, the researchers calculated an Emergency Heart Failure Mortality Risk Grade (EHMRG). The EHMRG served to stratify seven-day mortality risk after initial presentation with AHF, regardless of whether the patient was discharged from the ED or hospitalized.8
A recent study by Lee et al examined the validation of the EHMRG score compared to physician-estimated risk of seven-day mortality.12 Building on their conclusion that the EHMRG model proved to be a better indicator of seven-day mortality than physician estimates, we aimed to further validate this score by conducting a retrospective chart review to create a risk stratification of patients presenting to the ED with acute CHF exacerbation. There have been no studies performed in the US and independent of the original author to validate this score.
The purpose of our study was to validate and assess the performance of the EHMRG to risk stratify adult patients presenting to ED with acute CHF exacerbation based on seven-day mortality in our US population. Our secondary goal was to study the demographic patterns, disposition rates, and ED re-visit rate of CHF patients.
METHODSStudy Design and Setting
We conducted a retrospective chart review of patients presenting to the ED with acute CHF exacerbation between January 2014–January 2016. We extracted data from all patients admitted or discharged with an International Classification of Diseases, 9th or 10th Revision, (ICD 9 or 10) code for CHF as entered by an emergency physician. We obtained approval from our institutional review board before study initiation.
Selection of ParticipantsWe collected data from eight EDs across the largest
health system in New York via the electronic health record (EHR) system (Allscripts Healthcare Solutions, Chicago, IL). Of the eight EDs, four were located at tertiary care centers and four were at community centers spanning the boroughs of Manhattan and Queens and the counties of Nassau and
Suffolk. The total number of annual visits was 442,059 in 2014 and 473,387 in 2015 (see Appendix B for the detailed distribution of volume per hospital site). Inclusion criteria included adult patients at least 18 years of age or older who presented to the ED for acute CHF categorized using ICD codes for CHF. We excluded patients who were younger than 18 and those who presented to the ED with HF related to end-stage renal disease. We also excluded patients who were pregnant or had renal failure. Patients receiving palliative care and patients who had a “do not resuscitate” directive on file were also excluded from the study.
MeasurementsWe collected both demographic and clinical data. Data
abstraction was largely conducted electronically to reduce the error of documentation. Data not retrievable by electronic means, such as whether the patient was transported by EMS or used metolazone, was retrieved by three trained research associates who were blinded to the study hypothesis. The presence of active cancer was objective information obtained by chart extraction, and its clinical determination was made by chart review and confirmed with evidence of treatment. Troponin values were sorted as “yes” if values were above normal baseline levels and as “no” if values were not above normal levels (Table 1). Only the principal investigator and co-investigators had access to the data. The data was
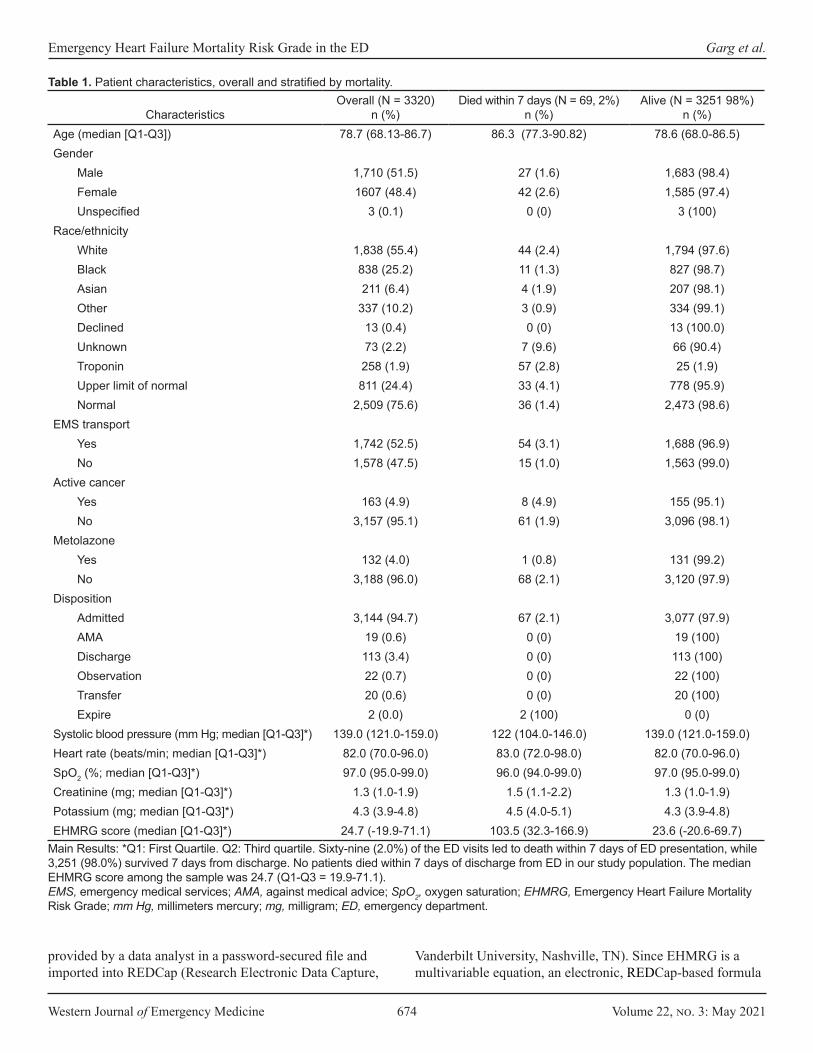
Western Journal of Emergency Medicine 674 Volume 22, no. 3: May 2021
Emergency Heart Failure Mortality Risk Grade in the ED Garg et al.
CharacteristicsOverall (N = 3320)
n (%)Died within 7 days (N = 69, 2%)
n (%)Alive (N = 3251 98%)
n (%)Age (median [Q1-Q3]) 78.7 (68.13-86.7) 86.3 (77.3-90.82) 78.6 (68.0-86.5)Gender
Male 1,710 (51.5) 27 (1.6) 1,683 (98.4)Female 1607 (48.4) 42 (2.6) 1,585 (97.4)Unspecified 3 (0.1) 0 (0) 3 (100)
Race/ethnicityWhite 1,838 (55.4) 44 (2.4) 1,794 (97.6)Black 838 (25.2) 11 (1.3) 827 (98.7)Asian 211 (6.4) 4 (1.9) 207 (98.1)Other 337 (10.2) 3 (0.9) 334 (99.1)Declined 13 (0.4) 0 (0) 13 (100.0)Unknown 73 (2.2) 7 (9.6) 66 (90.4)Troponin 258 (1.9) 57 (2.8) 25 (1.9)Upper limit of normal 811 (24.4) 33 (4.1) 778 (95.9)Normal 2,509 (75.6) 36 (1.4) 2,473 (98.6)
EMS transportYes 1,742 (52.5) 54 (3.1) 1,688 (96.9)No 1,578 (47.5) 15 (1.0) 1,563 (99.0)
Active cancerYes 163 (4.9) 8 (4.9) 155 (95.1)No 3,157 (95.1) 61 (1.9) 3,096 (98.1)
MetolazoneYes 132 (4.0) 1 (0.8) 131 (99.2)No 3,188 (96.0) 68 (2.1) 3,120 (97.9)
DispositionAdmitted 3,144 (94.7) 67 (2.1) 3,077 (97.9)AMA 19 (0.6) 0 (0) 19 (100)Discharge 113 (3.4) 0 (0) 113 (100)Observation 22 (0.7) 0 (0) 22 (100)Transfer 20 (0.6) 0 (0) 20 (100)Expire 2 (0.0) 2 (100) 0 (0)
Systolic blood pressure (mm Hg; median [Q1-Q3]*) 139.0 (121.0-159.0) 122 (104.0-146.0) 139.0 (121.0-159.0)Heart rate (beats/min; median [Q1-Q3]*) 82.0 (70.0-96.0) 83.0 (72.0-98.0) 82.0 (70.0-96.0)SpO2 (%; median [Q1-Q3]*) 97.0 (95.0-99.0) 96.0 (94.0-99.0) 97.0 (95.0-99.0)Creatinine (mg; median [Q1-Q3]*) 1.3 (1.0-1.9) 1.5 (1.1-2.2) 1.3 (1.0-1.9)Potassium (mg; median [Q1-Q3]*) 4.3 (3.9-4.8) 4.5 (4.0-5.1) 4.3 (3.9-4.8)EHMRG score (median [Q1-Q3]*) 24.7 (-19.9-71.1) 103.5 (32.3-166.9) 23.6 (-20.6-69.7)
Table 1. Patient characteristics, overall and stratified by mortality.
Main Results: *Q1: First Quartile. Q2: Third quartile. Sixty-nine (2.0%) of the ED visits led to death within 7 days of ED presentation, while 3,251 (98.0%) survived 7 days from discharge. No patients died within 7 days of discharge from ED in our study population. The median EHMRG score among the sample was 24.7 (Q1-Q3 = 19.9-71.1). EMS, emergency medical services; AMA, against medical advice; SpO2, oxygen saturation; EHMRG, Emergency Heart Failure Mortality Risk Grade; mm Hg, millimeters mercury; mg, milligram; ED, emergency department.
provided by a data analyst in a password-secured file and imported into REDCap (Research Electronic Data Capture,
Vanderbilt University, Nashville, TN). Since EHMRG is a multivariable equation, an electronic, REDCap-based formula

Volume 22, no. 3: May 2021 675 Western Journal of Emergency Medicine
Garg et al. Emergency Heart Failure Mortality Risk Grade in the ED
Admitted AMA Discharged Observation Transferred Expired in EDEHMRG score 26.5 15.4 -16.1 -35.5 44.7 43.3
EHMRG, Emergency Heart Failure Mortality Risk Grade; AMA, against medical advice; ED, emergency department.
Table 2. Mean Emergency Heart Failure Mortality Risk Grade scores by disposition type.
was developed to calculate the score and reduce the error of calculation. The data sheet was set to record the individual factors of EHMRG and then calculate the score. A pilot test was successfully conducted prior to the chart review.
Outcomes Our primary outcome was seven-day mortality in these
patients. The mortality data was collected by a proxy system. For patients who were discharged before seven days from the ED visit, we reviewed their EHR for subsequent clinic visit or revisit to any point of contact in our health system. The patients were flagged as deceased by the insurance provider, and dates of death were recorded to calculate mortality.
AnalysisWe conducted descriptive analyses for all variables to
assess their distribution. Categorical variables are presented as percentages and continuous variables as medians with interquartile ranges (IQR). All ED visits (including multiple ED visits for some patients) were used in multivariable analysis. We used two separate mixed-effects logistic regression models to allow for multiple ED visits per patient. We clustered by patient health record number in order to validate the assumption of correlated outcomes in the same patient. The first model used the individual metrics to derive the EHMRG score as individual-level predictors. The second model added the EHMRG score to the first model to predict seven-day mortality.
To determine appropriate sample size, we used events per variable ratio criteria. With 10 variables, an adequate number of events would be 100. We also estimated odds ratios and 95% confidence intervals (CI) for the EHMRG score quantiles from the second model. The apparent area under the receiver-operating characteristic (ROC) curve was estimated and plotted in a graph for the second model. We also estimated the C-statistic of each model and estimated the difference in C-statistic and P value for difference in C-statistic. The C-statistic is a unitless index denoting the probability that a randomly selected subject who experienced the outcome will have a higher predicted probability of having the outcome occur compared to a randomly selected subject who did not experience the event. It can also be interpreted as the rank correlation between predicted probabilities of the event occurring and the observed response. Finally, we estimated the continuous net reclassification index for events and nonevents separately. All analyses were conducted using R Statistical software (R Foundation for Statistical Computing, Vienna, Austria).
RESULTS Characteristics of Study Subjects
Over the study period we used ICD codes to identify 3,782 ED visits that met the inclusion criteria. Of these, 462 were excluded because they did not meet the inclusion criteria or had incomplete data, leaving a final sample size of 3320 ED visits among 2,495 unique patients. Disposition data was missing from 189 visits; 123 visits were excluded because of renal failure; 34 had missing data on EMS transport; six were missing cancer information; three were missing metolazone information; one was missing initial SpO2; 22 were missing creatinine levels; 83 were missing potassium serum data; and one was missing heart rate data. We found no evidence that visits with missing data were different than visits with data (P = 0.51); thus, we analyzed only those with complete data. Of the 3,320 ED visits included in the analysis, 3,144 patients (94.7%) were admitted to the hospital and 113 (3.4%) were discharged from the ED. Nineteen patients (0.6%) left against medical advice; 22 (0.7%) were observed; 20 (0.6%) cases were transferred; and two (0.0%) passed away in the ED.
The median age among all ED visits was 78.9 years old with 1,607 (48.4%) females, and the median length of stay for those admitted to the hospital was seven days. The predominant racial category was White, constituting 55.4% of the ED visits. Table 1 presents the overall distribution of demographics and disposition of all ED visits. Table 2 presents median EHMRG scores by disposition type.
We fit two separate mixed-effects logistic regression models. The first logistic regression input all of the variables used to calculate EHMRG scores individually into the model. The second logistic regression model added the quantiles of the EHMRG scores. The C-statistic of the multivariable model using the individual variables was 0.748 (95% CI, 0.683 to 0.813) and the C-statistic of the model with EHMRG quantiles was 0.772 (95% CI, 0.729 to 0.815), suggesting that the model using EHMRG was superior for risk stratification (see Figures 1 and 2 for ROC curve). The C-statistic of the model with EHMRG was 0.024 (3.2% higher) than the C-statistic of the model with individual covariates, a significant improvement (P = 0.04). The net reclassification index for events was 0.25 and 0.13 for non-events. As shown in Table 3, patients who were in risk quantiles 5b had 6.16 times the odds of dying within seven days as compared to those in risk quantiles 1.
DISCUSSIONIn this study of CHF-related ED visits in a large US health
system, we found that the EHMRG score adequately improved risk prediction of seven-day mortality, validating previous

Western Journal of Emergency Medicine 676 Volume 22, no. 3: May 2021
Emergency Heart Failure Mortality Risk Grade in the ED Garg et al.
Figure 1. Receiver operating characteristic curve for seven-day mortality with the Emergency Heart Failure Mortality Risk Grade.
Figure 2. Receiver operating characteristic curve for seven-day mortality with individual covariates.
studies in other countries. Specifically, the C-statistic was higher when using EHMR quantile and this model led to 25% and 13% of events and non-events to be classified into a better risk category, respectively. Given that both the C-statistic and the net reclassification improvement both have limitations, we used both to produce consistent and robust results.
Our median age was 79, which is comparable to the median age of 75 in the original EHMRG study and supports the fact that CHF is an advanced and chronic illness, mostly affecting the elderly. In our study we found that more than half of ED visits (53%) used EMS as a transport to the ED, which was much higher than the original study that recorded 38.5-43.4%.8 We also found that metolazone was used twice as often in the Canadian data set; however, we had a lower percentage of patients with active cancer who were suffering from CHF exacerbation in our data set. Our mortality rate overall was very similar to the Canadian study. Despite having the same seven-day mortality rate in our population as compared to the Canadian study, we identified that hospitalization mortality rates were higher among patients who were admitted to the hospital, as one may expect. We had a much higher percentage of non-normal troponin levels, 24% as compared to 10.5-14.6% in the original data set. The creatinine levels, systolic blood pressure, heart rate, and mean potassium levels were similar in our data set as compared to the Canadian data set. We found a similar mean SpO2 level in our data set of 91.5% vs 92.9-93.9% in the original study.8
The Canadian study enrolled 12,500 patients from 86 hospitals over a three-year period, which amounts to an average of 36 patients per year per hospital. Patients were randomly selected. This was different from our selection of patients. However, the number of hospitals covered was greater and it adjusts for more variation and practice patterns.8 We had an admission rate of 94.7%, which was higher than the national average admission rate of 80-85%; we had 0 outpatient discharge
seven-day mortality. Additionally, the ED revisit rate was 24.8%, which is the national US average for CHF patients.9
The US and Canadian healthcare systems are different and hence the risk involved in discharging a patient in the US is higher medically and legally, which would explain no mortality in the discharge group. However, in our system we still had a 24.8% ED revisit for CHF, which is similar to the national average. Therefore, it is unclear whether prior admission to the hospital prevents further revisits to the ED and hence readmissions for the same complaint. It is questionable whether the presence of a prior admission is helpful in decreasing the chance of a revisit to ED.10
The percentage of health costs paid by the government in Canada is 71.3% vs 49.1% in the US.11 There was no difference in the mortality rate of our data set as compared to the Canadian study. This leads us to explore the role of hospitalization on short-term mortality. It has been well established that hospitalization is an independent predictor of long-term mortality in CHF patients.
LIMITATIONSThis was a retrospective study of a single (albeit large) health
system. This hospital system is in the Northeast US, and the population is more diverse as compared to the rest of the country. All the patients were not unique in our study; however, we considered each CHF visit to be unique when a patient presented to the ED.
The predictive ability of the EHMRG score in our data set was less than the Canadian study. This may be due to the low power of the study (only 69 events). All patients in our data set who had a seven-day mortality were hospitalized, which leads us to question the impact of hospitalization on mortality. A lack of cohort of discharged patients with seven-day mortality is a significant limitation of our study, as it depicts that the US population and culture of medicine are quite different than those of Canada. Another limitation was the use of ICD codes to identify patients with CHF (as opposed to Framingham heart
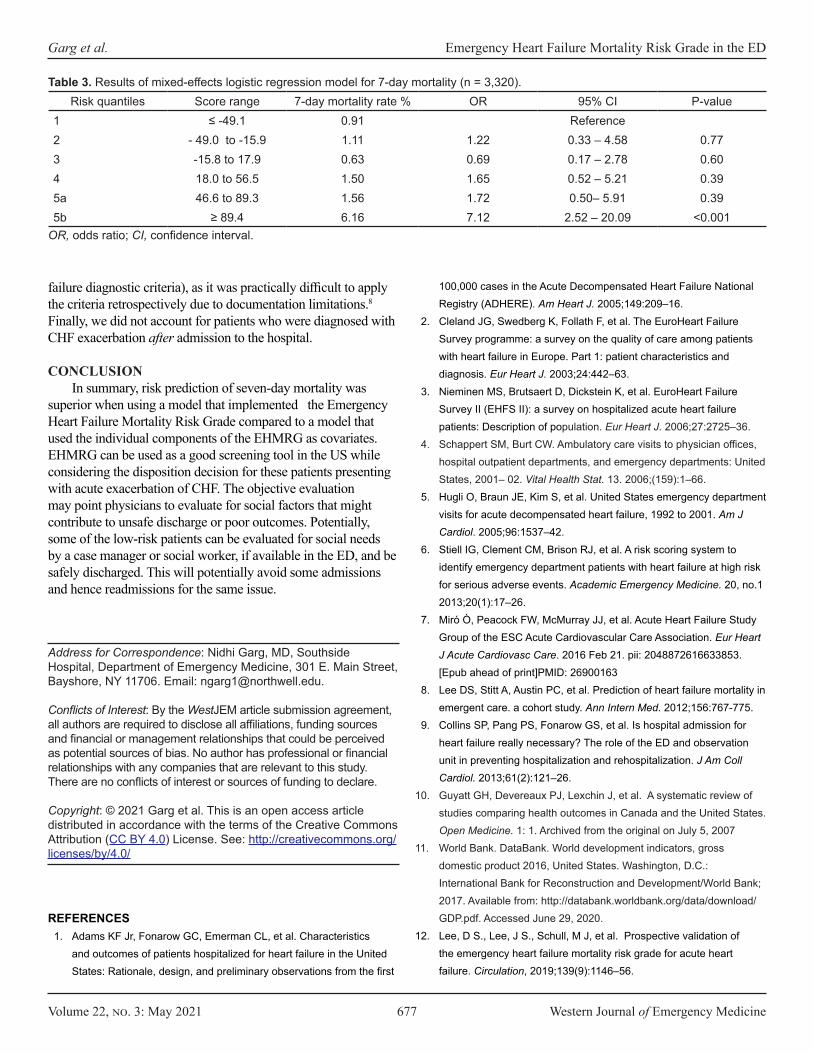
Volume 22, no. 3: May 2021 677 Western Journal of Emergency Medicine
Garg et al. Emergency Heart Failure Mortality Risk Grade in the ED
Risk quantiles Score range 7-day mortality rate % OR 95% CI P-value1 ≤ -49.1 0.91 Reference2 - 49.0 to -15.9 1.11 1.22 0.33 – 4.58 0.773 -15.8 to 17.9 0.63 0.69 0.17 – 2.78 0.604 18.0 to 56.5 1.50 1.65 0.52 – 5.21 0.395a 46.6 to 89.3 1.56 1.72 0.50– 5.91 0.395b ≥ 89.4 6.16 7.12 2.52 – 20.09 <0.001
Table 3. Results of mixed-effects logistic regression model for 7-day mortality (n = 3,320).
OR, odds ratio; CI, confidence interval.
failure diagnostic criteria), as it was practically difficult to apply the criteria retrospectively due to documentation limitations.8 Finally, we did not account for patients who were diagnosed with CHF exacerbation after admission to the hospital.
CONCLUSIONIn summary, risk prediction of seven-day mortality was
superior when using a model that implemented the Emergency Heart Failure Mortality Risk Grade compared to a model that used the individual components of the EHMRG as covariates. EHMRG can be used as a good screening tool in the US while considering the disposition decision for these patients presenting with acute exacerbation of CHF. The objective evaluation may point physicians to evaluate for social factors that might contribute to unsafe discharge or poor outcomes. Potentially, some of the low-risk patients can be evaluated for social needs by a case manager or social worker, if available in the ED, and be safely discharged. This will potentially avoid some admissions and hence readmissions for the same issue.
Address for Correspondence: Nidhi Garg, MD, Southside Hospital, Department of Emergency Medicine, 301 E. Main Street, Bayshore, NY 11706. Email: [email protected].
Conflicts of Interest: By the WestJEM article submission agreement, all authors are required to disclose all affiliations, funding sources and financial or management relationships that could be perceived as potential sources of bias. No author has professional or financial relationships with any companies that are relevant to this study. There are no conflicts of interest or sources of funding to declare.
Copyright: © 2021 Garg et al. This is an open access article distributed in accordance with the terms of the Creative Commons Attribution (CC BY 4.0) License. See: http://creativecommons.org/licenses/by/4.0/
100,000 cases in the Acute Decompensated Heart Failure National Registry (ADHERE). Am Heart J. 2005;149:209–16.
2. Cleland JG, Swedberg K, Follath F, et al. The EuroHeart Failure Survey programme: a survey on the quality of care among patients with heart failure in Europe. Part 1: patient characteristics and diagnosis. Eur Heart J. 2003;24:442–63.
3. Nieminen MS, Brutsaert D, Dickstein K, et al. EuroHeart Failure Survey II (EHFS II): a survey on hospitalized acute heart failure patients: Description of population. Eur Heart J. 2006;27:2725–36.
4. Schappert SM, Burt CW. Ambulatory care visits to physician offices, hospital outpatient departments, and emergency departments: United States, 2001– 02. Vital Health Stat. 13. 2006;(159):1–66.
5. Hugli O, Braun JE, Kim S, et al. United States emergency department visits for acute decompensated heart failure, 1992 to 2001. Am J Cardiol. 2005;96:1537–42.
6. Stiell IG, Clement CM, Brison RJ, et al. A risk scoring system to identify emergency department patients with heart failure at high risk for serious adverse events. Academic Emergency Medicine. 20, no.1 2013;20(1):17–26.
7. Miró O, Peacock FW, McMurray JJ, et al. Acute Heart Failure Study Group of the ESC Acute Cardiovascular Care Association. Eur Heart J Acute Cardiovasc Care. 2016 Feb 21. pii: 2048872616633853. [Epub ahead of print]PMID: 26900163
8. Lee DS, Stitt A, Austin PC, et al. Prediction of heart failure mortality in emergent care. a cohort study. Ann Intern Med. 2012;156:767-775.
9. Collins SP, Pang PS, Fonarow GS, et al. Is hospital admission for heart failure really necessary? The role of the ED and observation unit in preventing hospitalization and rehospitalization. J Am Coll Cardiol. 2013;61(2):121–26.
10. Guyatt GH, Devereaux PJ, Lexchin J, et al. A systematic review of studies comparing health outcomes in Canada and the United States. Open Medicine. 1: 1. Archived from the original on July 5, 2007
11. World Bank. DataBank. World development indicators, gross domestic product 2016, United States. Washington, D.C.: International Bank for Reconstruction and Development/World Bank; 2017. Available from: http://databank.worldbank.org/data/download/GDP.pdf. Accessed June 29, 2020.
12. Lee, D S., Lee, J S., Schull, M J, et al. Prospective validation of the emergency heart failure mortality risk grade for acute heart failure. Circulation, 2019;139(9):1146–56.
REFERENCES1. Adams KF Jr, Fonarow GC, Emerman CL, et al. Characteristics
and outcomes of patients hospitalized for heart failure in the United States: Rationale, design, and preliminary observations from the first
Western Journal of Emergency Medicine 678 Volume 22, no. 3: May 2021
Original Research
Emergency Tracheal Intubation in Patients with COVID-19: A Single-center, Retrospective Cohort Study
Andrew Hawkins, MD*Stephanie Stapleton, MD*Gerardo Rodriguez, MD†
R. Mauricio Gonzalez, MD†
William E. Baker, MD* Section Editor: Joseph Shiber, MD Submission history: Submitted September 1, 2020; Revision received January 13, 2021; Accepted February 5, 2021Electronically published May 17, 2021 Full text available through open access at http://escholarship.org/uc/uciem_westjem DOI: 10.5811/westjem.2020.2.49665
INTRODUCTIONA critical complication of coronavirus 2019 (COVID-19) is
acute respiratory insufficiency requiring supplemental oxygen and mechanical ventilation. A recent report from Wuhan, China, found that 14% of patients with novel coronavirus infections developed acute hypoxemic respiratory failure and 2.3% of patients required endotracheal intubation (ETI).1 During the
Boston University Medical Center, Department of Emergency Medicine, Boston, MassachusettsBoston University, Department of Anesthesiology, Boston, Massachusetts
*
†
Introduction: The objective of this study was to compare airway management technique, performance, and peri-intubation complications during the novel coronavirus pandemic (COVID-19) using a single-center cohort of patients requiring emergent intubation.
Methods: We retrospectively collected data on non-operating room (OR) intubations from February 1–April 23, 2020. All patients undergoing emergency intubation outside the OR were eligible for inclusion. Data were entered using an airway procedure note integrated within the electronic health record. Variables included level of training and specialty of the laryngoscopist, the patient’s indication for intubation, methods of intubation, induction and paralytic agents, grade of view, use of video laryngoscopy, number of attempts, and adverse events. We performed a descriptive analysis comparing intubations with an available positive COVID-19 test result with cases that had either a negative or unavailable test result.
Results: We obtained 406 independent procedure notes filed between February 1–April 23, 2020, and of these, 123 cases had a positive COVID-19 test result. Residents performed fewer tracheal intubations in COVID-19 cases when compared to nurse anesthetists (26.0% vs 37.4%). Video laryngoscopy was used significantly more in COVID-19 cases (91.1% vs 56.8%). No difference in first-pass success was observed between COVID-19 positive cases and controls (89.4% vs. 89.0%, p = 1.0). An increased rate of oxygen desaturation was observed in COVID-19 cases (20.3% vs. 9.9%) while there was no difference in the rate of other recorded complications and first-pass success.
Discussion: An average twofold increase in the rate of tracheal intubation was observed after March 24, 2020, corresponding with an influx of COVID-19 positive cases. We observed adherence to society guidelines regarding performance of tracheal intubation by an expert laryngoscopist and the use of video laryngoscopy. [West J Emerg Med. 2021;22(3)678–686.]
previous severe acute respiratory syndrome coronavirus-1 (SARS-CoV-1) epidemic in 2003, a group in Singapore analyzed airway registry data and noted a decrease in the proportion of intubations performed by trainees and anesthesiologists compared to emergency physicians (EP).2 A recent observational study of emergent tracheal intubation in patients with COVID-19 in two hospitals in Wuhan reported a first-pass success (FPS)

Volume 22, no. 3: May 2021 679 Western Journal of Emergency Medicine
Hawkins et al. Emergency Tracheal Intubation in Patients with COVID-19
Population Health Research Capsule
What do we already know about this issue?Coronavirus disease (COVID-19) prompted changes to intubation processes, primarily aimed at infection prevention. First-pass success rate is an accepted intubation performance indicator.
What was the research question?We sought to compare first-pass success intubation rates prior to the COVID-19 pandemic surge to those of COVID-positive cases during the surge.
What was the major finding of the study?There was a significant increase in intubations in response to COVID-19 with no difference in first-pass success rate.
How does this improve population health?COVID patient intubations can be performed effectively as measured by first-pass success, even with additional infection control and process changes.
rate of 89% in patients who were intubated using rapid sequence induction (RSI) and found that hypoxia and hypotension were common peri-intubation complications.3 To our knowledge, there has not been an analysis in the United States of airway registry data with attention to outcomes including FPS rate and complications, guideline adherence, or change in practice patterns due to resource scarcity.
Endotracheal intubation (ETI) in suspected COVID-19 cases presents challenges related to rapid patient decline, infection control, and resource scarcity. Several groups in China and Italy have described precipitous decline in oxygen saturation after loss of spontaneous breathing, particularly in patients with decreased respiratory reserve.4-6 Non-elective intubations performed in the emergency department (ED) and intensive care unit (ICU) settings have been associated with increased incidence of complications.7 During airway management in suspected COVID-19 patients, enhanced personal protective equipment (PPE) is ideally provided to all operators, but the use of PPE has been associated with decreased intubation success rate in simulation studies.4,8-10
Recent expert consensus guidelines from the Safe Airway Society recommend that the airway operator be the most experienced clinician available and, in anticipated difficult cases, the intervention should be performed by an anesthesiologist.11 In the 2003 SARS epidemic, an increased proportion of intubations were performed by anesthesiologists compared to EPs and fewer interventions were performed by trainees.2 The authors did not note a difference in intubation success or complication rates. The COVID-19 epidemic, however, is greater in scale and has led to considerable strain on healthcare systems.6,12,13 It is feasible that the incidence of multiple airway attempts and complications may be impacted by the current crisis, although this has not been directly studied.
METHODSOutcomes
First-pass success is an important measure of patient prognosis following ETI.14 We have collected all emergent intubations performed at our institution as a part of an ongoing quality and patient safety initiative. The goal of this study was to understand the effect of the increased number of COVID-19 cases and its effect on FPS and risk of adverse events at our institution. We hypothesized that the complexity, volume, and environmental constraints during the COVID-19 epidemic would result in reduced FPS and increased complication rates. The secondary goals of this study were to report on the proportion of intubations performed by specialty and training level, and adherence to recently proposed guidelines for airway management in COVID-19 patients.5,8,11
Study DesignThis is an unmatched retrospective cohort analysis
of all ETIs prospectively recorded in a continuous quality improvement database from February 1–April 23, 2020. All
patients who underwent out-of-operating room (OR) ETI were included, as the note is specifically used for emergent procedures. This project was granted exemption by our institutional review board as it is an analysis of a quality improvement database. All patient name and health record numbers were made anonymous to the researchers.
Study Setting and PopulationWe conducted this study in a 514-bed academic medical
center and safety-net hospital in Boston, Massachusetts. The majority of intubations are typically performed by residents in both the emergency medicine (EM) and anesthesiology residency programs using either a direct or video laryngoscope. All intubations performed in the ED and ICU are supervised by attending physicians. The department of anesthesiology transitioned the airway response team to be comprised of expert laryngoscopists including nurse anesthetists (CRNA), anesthesiologists, and select senior residents. Prior to February 1, 2020, CRNAs did not regularly perform emergent intubations. No changes were made to the constitution of the airway response team in the ED.
Airway Management Policy Multidisciplinary meetings were held on best practice in
airway management of COVID-19 patients at our institution in

Western Journal of Emergency Medicine 680 Volume 22, no. 3: May 2021
Emergency Tracheal Intubation in Patients with COVID-19 Hawkins et al.
late February 2020. A consensus was reached to include routine use of rocuronium with propofol for longer paralysis to minimize disconnection of the breathing circuit and video laryngoscopy to maximize FPS in suspected COVID-19 patients (Appendix A). All patients requiring emergent intubation after February 1 were treated as possible COVID-19 patients, given the extended turnaround period for testing early in the pandemic. This involved standard use of negative pressure rooms, PPE involving an N95 mask or approved respirators, face shield, gown, and gloves. Recommendations for laryngoscopy technique and pharmacologic agents for RSI was communicated in an email and lecture format to all faculty and residents.
Study ProtocolAn airway procedure note user interface and reporting
system was designed with structured and free-text fields integrated within our hospital’s electronic health record, Epic (Epic Systems Corporation, Verona, WI). Specific variables are auto-populated including patient identifier, date-time, author, and specialty. Provider type is collected as anesthesiologist, attending EP, CRNA, or resident. The primary airway operator then must document the following: technique; pre-oxygenation; induction and paralytic agent; C-spine immobilization; laryngoscopist; laryngoscope size; grade of view obtained; external laryngeal manipulation; and common post-procedure complications (dysrhythmias, hypotension, cardiac arrest, aspiration, desaturation, esophageal intubation, laryngospasm, bronchial intubation, airway trauma, dental trauma, medication error, equipment failure) (Figure 1).
The adverse events in the procedure note coincide with those identified in the NEAR study and were defined according to the intubating clinician’s discretion.15 Each intubation attempt is documented individually. The notes included in this study were subject to routine professional billing procedures and manual chart review by an external contractor, which prompts staff to complete documentation. For notes filed between February 1–April 23, 2020, data on EPIC intubation reports was run, which includes both internal and external lab results corresponding to COVID-19 status. The collected data was anonymized and exported into a database compliant with the Health Insurance Portability and Accountability Act of 1996. Duplicate entries were removed according to health record number and date. Two authors checked manually for errors in specialty assignment in respect to corresponding faculty and resident directory listings.
We reconciled missing data within the complication reporting section by assigning “no complication” in the absence of documentation to ensure even distribution of under-reporting bias. For this analysis, controls were designated as those with a negative test result and those who did not have a test sent to ascertain disease-specific variation in FPS and complication rates. Given limited testing capabilities early in the pandemic, patients were not universally tested and we assume this group was most similar to test-negative subjects due to low clinical suspicion.
Statistical AnalysisWe analyzed variables using JMP Pro, version 15 (SAS
Institute, Cary, NC). Data were analyzed by intubation date
Figure 1. Screenshots of electronic health record airway procedure note that is created for each endotracheal intubation. The patient name, time and author are auto-populated fields. The clinician is prompted to document each attempt individually and select multiple post-procedure complications.
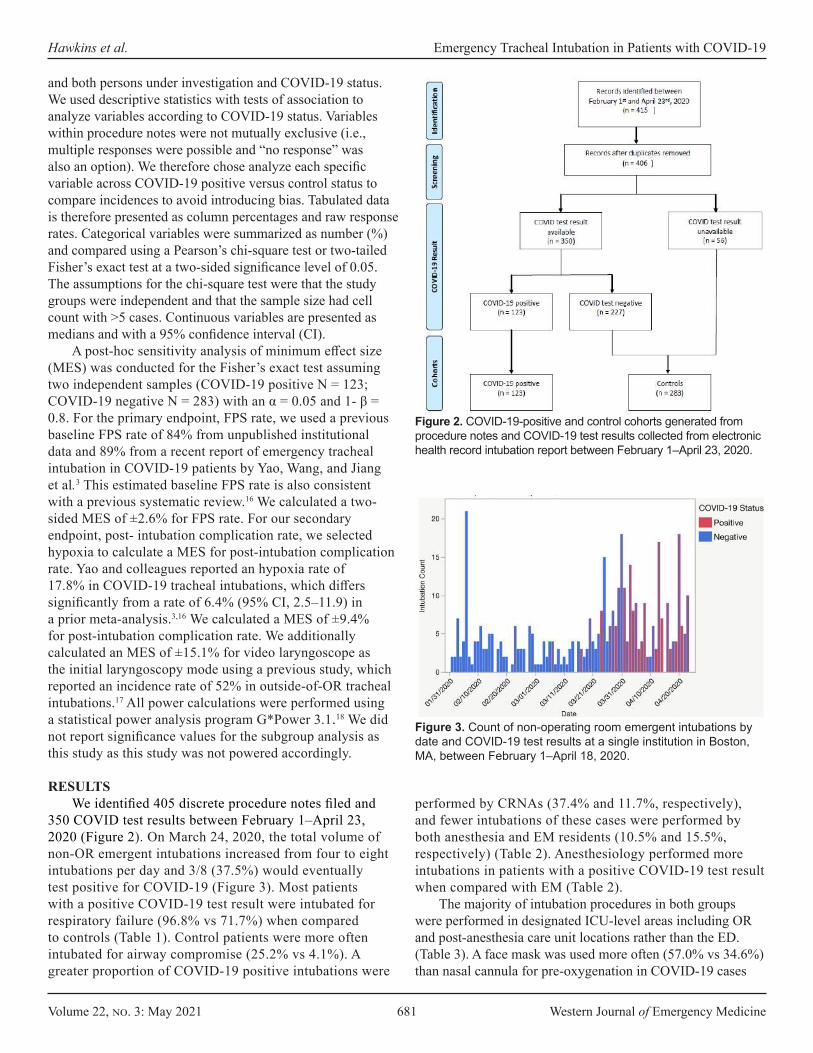
Volume 22, no. 3: May 2021 681 Western Journal of Emergency Medicine
Hawkins et al. Emergency Tracheal Intubation in Patients with COVID-19
and both persons under investigation and COVID-19 status. We used descriptive statistics with tests of association to analyze variables according to COVID-19 status. Variables within procedure notes were not mutually exclusive (i.e., multiple responses were possible and “no response” was also an option). We therefore chose analyze each specific variable across COVID-19 positive versus control status to compare incidences to avoid introducing bias. Tabulated data is therefore presented as column percentages and raw response rates. Categorical variables were summarized as number (%) and compared using a Pearson’s chi-square test or two-tailed Fisher’s exact test at a two-sided significance level of 0.05. The assumptions for the chi-square test were that the study groups were independent and that the sample size had cell count with >5 cases. Continuous variables are presented as medians and with a 95% confidence interval (CI).
A post-hoc sensitivity analysis of minimum effect size (MES) was conducted for the Fisher’s exact test assuming two independent samples (COVID-19 positive N = 123; COVID-19 negative N = 283) with an α = 0.05 and 1- β = 0.8. For the primary endpoint, FPS rate, we used a previous baseline FPS rate of 84% from unpublished institutional data and 89% from a recent report of emergency tracheal intubation in COVID-19 patients by Yao, Wang, and Jiang et al.3 This estimated baseline FPS rate is also consistent with a previous systematic review.16 We calculated a two-sided MES of ±2.6% for FPS rate. For our secondary endpoint, post- intubation complication rate, we selected hypoxia to calculate a MES for post-intubation complication rate. Yao and colleagues reported an hypoxia rate of 17.8% in COVID-19 tracheal intubations, which differs significantly from a rate of 6.4% (95% CI, 2.5–11.9) in a prior meta-analysis.3,16 We calculated a MES of ±9.4% for post-intubation complication rate. We additionally calculated an MES of ±15.1% for video laryngoscope as the initial laryngoscopy mode using a previous study, which reported an incidence rate of 52% in outside-of-OR tracheal intubations.17 All power calculations were performed using a statistical power analysis program G*Power 3.1.18 We did not report significance values for the subgroup analysis as this study as this study was not powered accordingly.
RESULTSWe identified 405 discrete procedure notes filed and
350 COVID test results between February 1–April 23, 2020 (Figure 2). On March 24, 2020, the total volume of non-OR emergent intubations increased from four to eight intubations per day and 3/8 (37.5%) would eventually test positive for COVID-19 (Figure 3). Most patients with a positive COVID-19 test result were intubated for respiratory failure (96.8% vs 71.7%) when compared to controls (Table 1). Control patients were more often intubated for airway compromise (25.2% vs 4.1%). A greater proportion of COVID-19 positive intubations were
Figure 2. COVID-19-positive and control cohorts generated from procedure notes and COVID-19 test results collected from electronic health record intubation report between February 1–April 23, 2020.
performed by CRNAs (37.4% and 11.7%, respectively), and fewer intubations of these cases were performed by both anesthesia and EM residents (10.5% and 15.5%, respectively) (Table 2). Anesthesiology performed more intubations in patients with a positive COVID-19 test result when compared with EM (Table 2).
The majority of intubation procedures in both groups were performed in designated ICU-level areas including OR and post-anesthesia care unit locations rather than the ED. (Table 3). A face mask was used more often (57.0% vs 34.6%) than nasal cannula for pre-oxygenation in COVID-19 cases
Figure 3. Count of non-operating room emergent intubations by date and COVID-19 test results at a single institution in Boston, MA, between February 1–April 18, 2020.
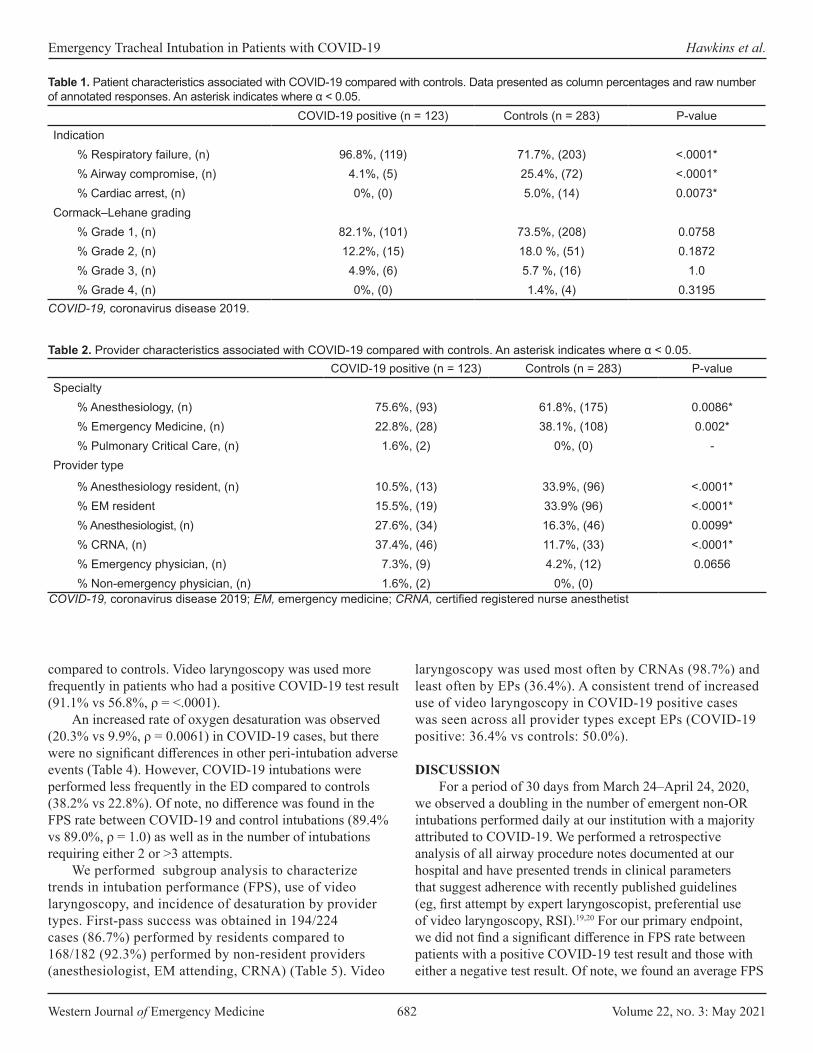
Western Journal of Emergency Medicine 682 Volume 22, no. 3: May 2021
Emergency Tracheal Intubation in Patients with COVID-19 Hawkins et al.
COVID-19 positive (n = 123) Controls (n = 283) P-valueIndication
% Respiratory failure, (n) 96.8%, (119) 71.7%, (203) <.0001*% Airway compromise, (n) 4.1%, (5) 25.4%, (72) <.0001*% Cardiac arrest, (n) 0%, (0) 5.0%, (14) 0.0073*
Cormack–Lehane grading% Grade 1, (n) 82.1%, (101) 73.5%, (208) 0.0758% Grade 2, (n) 12.2%, (15) 18.0 %, (51) 0.1872% Grade 3, (n) 4.9%, (6) 5.7 %, (16) 1.0% Grade 4, (n) 0%, (0) 1.4%, (4) 0.3195
Table 1. Patient characteristics associated with COVID-19 compared with controls. Data presented as column percentages and raw number of annotated responses. An asterisk indicates where α < 0.05.
COVID-19, coronavirus disease 2019.
COVID-19 positive (n = 123) Controls (n = 283) P-valueSpecialty
% Anesthesiology, (n) 75.6%, (93) 61.8%, (175) 0.0086*% Emergency Medicine, (n) 22.8%, (28) 38.1%, (108) 0.002*% Pulmonary Critical Care, (n) 1.6%, (2) 0%, (0) -
Provider type
% Anesthesiology resident, (n) 10.5%, (13) 33.9%, (96) <.0001*% EM resident 15.5%, (19) 33.9% (96) <.0001*% Anesthesiologist, (n) 27.6%, (34) 16.3%, (46) 0.0099*% CRNA, (n) 37.4%, (46) 11.7%, (33) <.0001*% Emergency physician, (n) 7.3%, (9) 4.2%, (12) 0.0656% Non-emergency physician, (n) 1.6%, (2) 0%, (0)
Table 2. Provider characteristics associated with COVID-19 compared with controls. An asterisk indicates where α < 0.05.
COVID-19, coronavirus disease 2019; EM, emergency medicine; CRNA, certified registered nurse anesthetist
compared to controls. Video laryngoscopy was used more frequently in patients who had a positive COVID-19 test result (91.1% vs 56.8%, ρ = <.0001).
An increased rate of oxygen desaturation was observed (20.3% vs 9.9%, ρ = 0.0061) in COVID-19 cases, but there were no significant differences in other peri-intubation adverse events (Table 4). However, COVID-19 intubations were performed less frequently in the ED compared to controls (38.2% vs 22.8%). Of note, no difference was found in the FPS rate between COVID-19 and control intubations (89.4% vs 89.0%, ρ = 1.0) as well as in the number of intubations requiring either 2 or >3 attempts.
We performed subgroup analysis to characterize trends in intubation performance (FPS), use of video laryngoscopy, and incidence of desaturation by provider types. First-pass success was obtained in 194/224 cases (86.7%) performed by residents compared to 168/182 (92.3%) performed by non-resident providers (anesthesiologist, EM attending, CRNA) (Table 5). Video
laryngoscopy was used most often by CRNAs (98.7%) and least often by EPs (36.4%). A consistent trend of increased use of video laryngoscopy in COVID-19 positive cases was seen across all provider types except EPs (COVID-19 positive: 36.4% vs controls: 50.0%).
DISCUSSIONFor a period of 30 days from March 24–April 24, 2020,
we observed a doubling in the number of emergent non-OR intubations performed daily at our institution with a majority attributed to COVID-19. We performed a retrospective analysis of all airway procedure notes documented at our hospital and have presented trends in clinical parameters that suggest adherence with recently published guidelines (eg, first attempt by expert laryngoscopist, preferential use of video laryngoscopy, RSI).19,20 For our primary endpoint, we did not find a significant difference in FPS rate between patients with a positive COVID-19 test result and those with either a negative test result. Of note, we found an average FPS
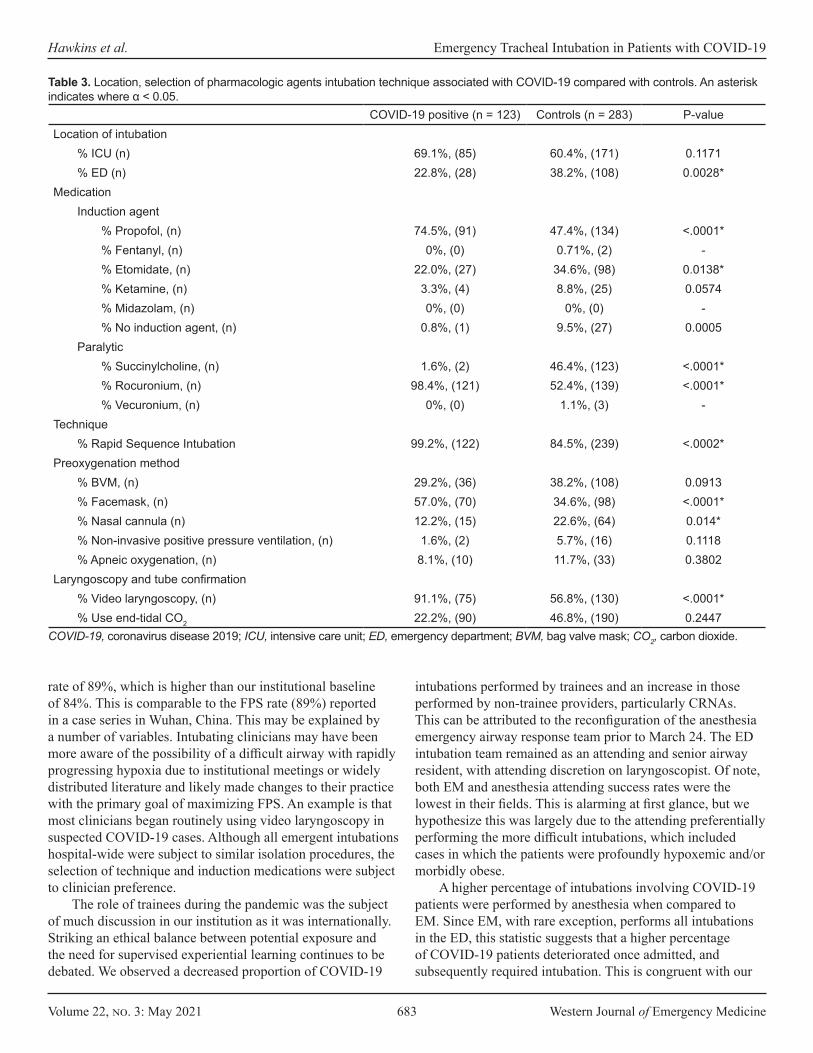
Volume 22, no. 3: May 2021 683 Western Journal of Emergency Medicine
Hawkins et al. Emergency Tracheal Intubation in Patients with COVID-19
COVID-19 positive (n = 123) Controls (n = 283) P-valueLocation of intubation
% ICU (n) 69.1%, (85) 60.4%, (171) 0.1171% ED (n) 22.8%, (28) 38.2%, (108) 0.0028*
Medication Induction agent
% Propofol, (n) 74.5%, (91) 47.4%, (134) <.0001*% Fentanyl, (n) 0%, (0) 0.71%, (2) -% Etomidate, (n) 22.0%, (27) 34.6%, (98) 0.0138*% Ketamine, (n) 3.3%, (4) 8.8%, (25) 0.0574% Midazolam, (n) 0%, (0) 0%, (0) -% No induction agent, (n) 0.8%, (1) 9.5%, (27) 0.0005
Paralytic% Succinylcholine, (n) 1.6%, (2) 46.4%, (123) <.0001*% Rocuronium, (n) 98.4%, (121) 52.4%, (139) <.0001*% Vecuronium, (n) 0%, (0) 1.1%, (3) -
Technique% Rapid Sequence Intubation 99.2%, (122) 84.5%, (239) <.0002*
Preoxygenation method% BVM, (n) 29.2%, (36) 38.2%, (108) 0.0913% Facemask, (n) 57.0%, (70) 34.6%, (98) <.0001*% Nasal cannula (n) 12.2%, (15) 22.6%, (64) 0.014*% Non-invasive positive pressure ventilation, (n) 1.6%, (2) 5.7%, (16) 0.1118% Apneic oxygenation, (n) 8.1%, (10) 11.7%, (33) 0.3802
Laryngoscopy and tube confirmation% Video laryngoscopy, (n) 91.1%, (75) 56.8%, (130) <.0001*% Use end-tidal CO2 22.2%, (90) 46.8%, (190) 0.2447
COVID-19, coronavirus disease 2019; ICU, intensive care unit; ED, emergency department; BVM, bag valve mask; CO2, carbon dioxide.
Table 3. Location, selection of pharmacologic agents intubation technique associated with COVID-19 compared with controls. An asterisk indicates where α < 0.05.
rate of 89%, which is higher than our institutional baseline of 84%. This is comparable to the FPS rate (89%) reported in a case series in Wuhan, China. This may be explained by a number of variables. Intubating clinicians may have been more aware of the possibility of a difficult airway with rapidly progressing hypoxia due to institutional meetings or widely distributed literature and likely made changes to their practice with the primary goal of maximizing FPS. An example is that most clinicians began routinely using video laryngoscopy in suspected COVID-19 cases. Although all emergent intubations hospital-wide were subject to similar isolation procedures, the selection of technique and induction medications were subject to clinician preference.
The role of trainees during the pandemic was the subject of much discussion in our institution as it was internationally. Striking an ethical balance between potential exposure and the need for supervised experiential learning continues to be debated. We observed a decreased proportion of COVID-19
intubations performed by trainees and an increase in those performed by non-trainee providers, particularly CRNAs. This can be attributed to the reconfiguration of the anesthesia emergency airway response team prior to March 24. The ED intubation team remained as an attending and senior airway resident, with attending discretion on laryngoscopist. Of note, both EM and anesthesia attending success rates were the lowest in their fields. This is alarming at first glance, but we hypothesize this was largely due to the attending preferentially performing the more difficult intubations, which included cases in which the patients were profoundly hypoxemic and/or morbidly obese.
A higher percentage of intubations involving COVID-19 patients were performed by anesthesia when compared to EM. Since EM, with rare exception, performs all intubations in the ED, this statistic suggests that a higher percentage of COVID-19 patients deteriorated once admitted, and subsequently required intubation. This is congruent with our
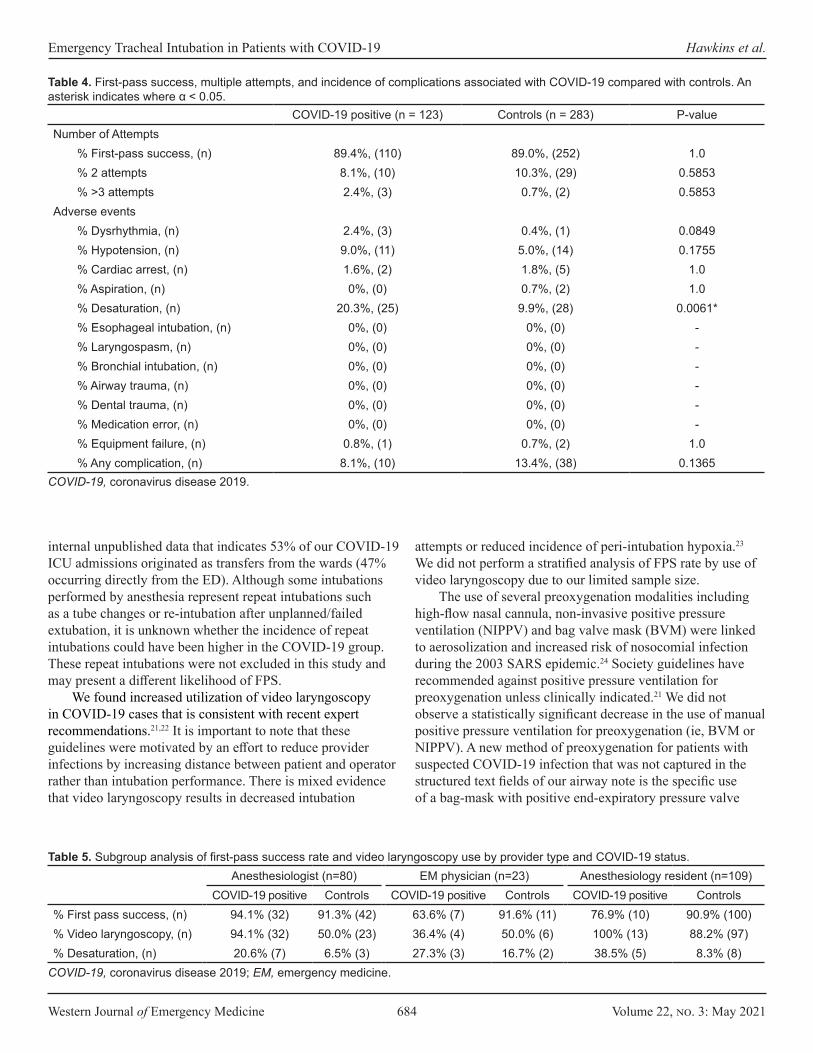
Western Journal of Emergency Medicine 684 Volume 22, no. 3: May 2021
Emergency Tracheal Intubation in Patients with COVID-19 Hawkins et al.
COVID-19 positive (n = 123) Controls (n = 283) P-valueNumber of Attempts
% First-pass success, (n) 89.4%, (110) 89.0%, (252) 1.0% 2 attempts 8.1%, (10) 10.3%, (29) 0.5853% >3 attempts 2.4%, (3) 0.7%, (2) 0.5853
Adverse events% Dysrhythmia, (n) 2.4%, (3) 0.4%, (1) 0.0849% Hypotension, (n) 9.0%, (11) 5.0%, (14) 0.1755% Cardiac arrest, (n) 1.6%, (2) 1.8%, (5) 1.0% Aspiration, (n) 0%, (0) 0.7%, (2) 1.0% Desaturation, (n) 20.3%, (25) 9.9%, (28) 0.0061*% Esophageal intubation, (n) 0%, (0) 0%, (0) -% Laryngospasm, (n) 0%, (0) 0%, (0) -% Bronchial intubation, (n) 0%, (0) 0%, (0) -% Airway trauma, (n) 0%, (0) 0%, (0) -% Dental trauma, (n) 0%, (0) 0%, (0) -% Medication error, (n) 0%, (0) 0%, (0) -% Equipment failure, (n) 0.8%, (1) 0.7%, (2) 1.0% Any complication, (n) 8.1%, (10) 13.4%, (38) 0.1365
COVID-19, coronavirus disease 2019.
Table 4. First-pass success, multiple attempts, and incidence of complications associated with COVID-19 compared with controls. An asterisk indicates where α < 0.05.
Anesthesiologist (n=80) EM physician (n=23) Anesthesiology resident (n=109)COVID-19 positive Controls COVID-19 positive Controls COVID-19 positive Controls
% First pass success, (n) 94.1% (32) 91.3% (42) 63.6% (7) 91.6% (11) 76.9% (10) 90.9% (100)% Video laryngoscopy, (n) 94.1% (32) 50.0% (23) 36.4% (4) 50.0% (6) 100% (13) 88.2% (97)% Desaturation, (n) 20.6% (7) 6.5% (3) 27.3% (3) 16.7% (2) 38.5% (5) 8.3% (8)
Table 5. Subgroup analysis of first-pass success rate and video laryngoscopy use by provider type and COVID-19 status.
COVID-19, coronavirus disease 2019; EM, emergency medicine.
internal unpublished data that indicates 53% of our COVID-19 ICU admissions originated as transfers from the wards (47% occurring directly from the ED). Although some intubations performed by anesthesia represent repeat intubations such as a tube changes or re-intubation after unplanned/failed extubation, it is unknown whether the incidence of repeat intubations could have been higher in the COVID-19 group. These repeat intubations were not excluded in this study and may present a different likelihood of FPS.
We found increased utilization of video laryngoscopy in COVID-19 cases that is consistent with recent expert recommendations.21,22 It is important to note that these guidelines were motivated by an effort to reduce provider infections by increasing distance between patient and operator rather than intubation performance. There is mixed evidence that video laryngoscopy results in decreased intubation
attempts or reduced incidence of peri-intubation hypoxia.23 We did not perform a stratified analysis of FPS rate by use of video laryngoscopy due to our limited sample size.
The use of several preoxygenation modalities including high-flow nasal cannula, non-invasive positive pressure ventilation (NIPPV) and bag valve mask (BVM) were linked to aerosolization and increased risk of nosocomial infection during the 2003 SARS epidemic.24 Society guidelines have recommended against positive pressure ventilation for preoxygenation unless clinically indicated.21 We did not observe a statistically significant decrease in the use of manual positive pressure ventilation for preoxygenation (ie, BVM or NIPPV). A new method of preoxygenation for patients with suspected COVID-19 infection that was not captured in the structured text fields of our airway note is the specific use of a bag-mask with positive end-expiratory pressure valve

Volume 22, no. 3: May 2021 685 Western Journal of Emergency Medicine
Hawkins et al. Emergency Tracheal Intubation in Patients with COVID-19
and viral filter to administer 100% oxygen via continuous positive airway pressure (without “bagging” or administering ventilation). This technique has been described by Weingart.23 Review of the free-text fields of airway notes (as well as the authors’ experience) indicate that this preoxygenation method was widely employed by both anesthesia and emergency clinicians. We additionally did find a measurable decrease in the overall use of NIPPV of 4.6%, which is considerably lower than 70.8% reported in Wuhan, China.
LIMITATIONSWe attempted to compare unmatched cases by selecting
a temporal cohort during which a standardized intubation protocol had been implemented. However, we acknowledge the limitation of retrospective analysis as our methodology.25 Selected agents for both sedation and paralysis were also not standardized and were subject to provider preference. This study does not confirm whether patients with COVID-19 present specific physiologic barriers to ETI or alternative intubation methods are more or less successful. Our study had a limited sample size and was not adequately powered to detect a difference in FPS less than 12.6%. Another limitation was related to reporting of COVID-19 test results within our electronic health record and the lag time for results. We cannot exclude whether these patients were intubated according to institution COVID-19 protocols (negative pressure room, video laryngoscopy, expert laryngoscopist).
We acknowledge that this study did not involve chart review and that no additional quality analysis was performed to ensure complete capture of emergent intubations or complications during the study period. The authors served as data abstractors in our study and were not blinded to the study hypothesis. A potential under-reporting bias was introduced when missing complication data was assigned to the null. However, we anticipate that this would be evenly distributed among both COVID-positive and negative cases. Additionally, the authors were not blinded during data appraisal. Our study was secondarily limited in that the definition of intubation attempt was not determined a priori, and variation among providers is likely present. For our post-intubation complication rates, reporting bias is possible with complication documentation, as under-reporting in health records is a known phenomenon. The assumption that this bias is equally distributed between COVID-positive and controls was not determined.26 A selection bias is likely also present as trainees may be given the opportunity to perform laryngoscopy more often in patients with less difficult airways. Additionally, tube exchanges were not excluded from this analysis and may have biased FPS rates.
CONCLUSIONWe observed a significant increase in the total volume of
emergent intubations performed at a single center in Boston, Massachusetts, during the 30-day period March 24–April
24th, 2020. We found that first-pass success and complications other than oxygen desaturation were not significantly different between COVID-19 positive cases and controls. Future prospective trials should investigate factors surrounding emergency airway management including team composition and video laryngoscopy on intubation performance.
Address for Correspondence: Andrew Hawkins, MD, Boston Medical Center Department of Emergency Medicine, One Boston Medical Center Place, Dowling 1 South Room 1322, Boston, MA 02118. Email: [email protected].
Conflicts of Interest: By the WestJEM article submission agreement, all authors are required to disclose all affiliations, funding sources and financial or management relationships that could be perceived as potential sources of bias. No author has professional or financial relationships with any companies that are relevant to this study. There are no conflicts of interest or sources of funding to declare.
Copyright: © 2021 Hawkins et al. This is an open access article distributed in accordance with the terms of the Creative Commons Attribution (CC BY 4.0) License. See: http://creativecommons.org/licenses/by/4.0/
REFERENCES1. Wang D, Hu B, Hu C, et al. Clinical characteristics of 138 hospitalized
patients with 2019 novel coronavirus–infected pneumonia in Wuhan, China. JAMA. 2020;323(11):1061-9.
2. Wong E and Ho K. The effect of severe acute respiratory syndrome on emergency airway management. Ann Emerg Med. 2004;44(4):S118.
3. Yao W, Wang T, Jiang B, et al. Emergency tracheal intubation in 202 patients with COVID-19 in Wuhan, China: lessons learnt and international expert recommendations. Br J Anaesth. 2020;125(1):e28-e37.
4. Meng L, Qiu H, Wan L, et al. Intubation and ventilation amid the COVID-19 outbreak: Wuhan’s experience. Anesthesiology. 2020;132(6):1317-32.
5. Sorbello M, El-Boghdadly K, Di Giacinto I, et al. The Italian coronavirus disease 2019 outbreak: recommendations from clinical practice. Anaesthesia. 2020;75(6):724-32.
6. Xie J, Tong Z, Guan X, Du B, Qiu H, Slutsky AS. Critical care crisis and some recommendations during the COVID-19 epidemic in China. Intensive Care Med. 2020;46(5):837-40.
7. Taboada M, Doldan P, Calvo A, et al. Comparison of tracheal intubation conditions in operating room and intensive care unit: a prospective, observational study. Anesthesiology. 2018;129(2):321-8.
8. Zuo MZ, Huang YG, Ma WH, et al. Expert recommendations for tracheal intubation in critically ill patients with noval coronavirus disease 2019. Chin Med Sci J. 2020;35(2):105-9.
9. Yousif S, Machan JT, Suner S. Airway Management in disaster
Western Journal of Emergency Medicine 686 Volume 22, no. 3: May 2021
Emergency Tracheal Intubation in Patients with COVID-19 Hawkins et al.
response: a manikin study comparing direct and video laryngoscopy for endotracheal intubation by pre-hospital providers in level C personal protective equipment. J Emerg Med. 2014;46(2):300.
10. Koo A, Walsh R, Knutson T, et al. Comparison of Intubation using personal protective equipment and standard uniform in simulated cadaveric models. Mil Med. 2018;183(suppl_1):216-218.
11. Brewster DJ, Chrimes N, Do TB, et al. Consensus statement: Safe Airway Society principles of airway management and tracheal intubation specific to the COVID-19 adult patient group. Med J Aust. 2020;212(10):472-81.
12. Qiu H, Tong Z, Ma P, et al. Intensive care during the coronavirus epidemic. Intensive Care Med. 2020;46(4):576-8.
13. Phua J, Weng L, Ling L, et al. Intensive care management of coronavirus disease 2019 (COVID-19): challenges and recommendations. Lancet Respir Med. 2020;8(5):506-17.
14. Sakles JC, Chiu S, Mosier J, et al. The importance of first pass success when performing orotracheal intubation in the emergency department. Acad Emerg Med. 2013;20(1):71-8.
15. Brown CA 3rd, Bair AE, Pallin DJ, Walls RM; NEAR III Investigators. Techniques, success, and adverse events of emergency department adult intubations. Ann Emerg Med. 2015;65(4):363-70.e1.
16. Park L, Zeng I, Brainard A. Systematic review and meta-analysis of first-pass success rates in emergency department intubation: creating a benchmark for emergency airway care. Emerg Med Australas. 2017;29(1):40-7.
17. Baek MS, Han M, Huh JW, Lim CM, Koh Y, Hong SB. Video laryngoscopy versus direct laryngoscopy for first-attempt tracheal intubation in the general ward. Ann Intensive Care. 2018;8(1):83.
18. Faul F, Erdfelder E, Lang AG, et al. G*Power 3: a flexible statistical
power analysis program for the social, behavioral, and biomedical sciences. Behav Res Methods. 2007;39(2):175-91.
19. American Society of Anesthesiologists. COVID-19. 2020. Available at: https://www.asahq.org/about-asa/governance-and-committees/asa-committees/committee-on-occupational-health/coronavirus Accessed April 23, 2020.
20. Chavez S, Long B, Koyfman A, et al. Coronavirus disease (COVID-19): a primer for emergency physicians. Am J Emerg Med. March 24, 2020. 2021. In Press.
21. Lockhart SL, Duggan LV, Wax RS, Saad S, Grocott HP. Personal protective equipment (PPE) for both anesthesiologists and other airway managers: principles and practice during the COVID-19 pandemic. Can J Anaesth. 2020;67(8):1005-15.
22. Trembley LL, Tobias AZ, Schillo G, et al. A Multidisciplinary Intubation Algorithm for Suspected COVID-19 Patients in the Emergency Department. West J Emerg Med. 2020; 21(4):764–70
23. Lewis SR, Butler AR, Parker J, Cook TM, Smith AF. Videolaryngoscopy versus direct laryngoscopy for adult patients requiring tracheal intubation. Cochrane Database Syst Rev. 2016;11(11):CD011136.
24. Fowler RA, Guest CB, Lapinsky SE, et al. Transmission of severe acute respiratory syndrome during intubation and mechanical ventilation. Am J Respir Crit Care Med. 2004;169(11):1198-202.
25. Gilbert EH, Lowenstein SR, Koziol-McLain J, Barta DC, Steiner J. Chart reviews in emergency medicine research: Where are the methods? Ann Emerg Med. 1996;27(3):305-8.
26. Sanborn KV, Castro J, Kuroda M, et al. Detection of intraoperative incidents by electronic scanning of computerized anesthesia records. Comparison with voluntary reporting. Anesthesiology. 1996;85(5):977-87.

Volume 22, no. 3: May 2021 687 Western Journal of Emergency Medicine
Expert Commentary
Alteplase for Acute Ischemic Stroke Beyond 3 hours: Enthusiasm Outpaces Evidence
Ravi Garg, MD
Section Editor: Richard Lucarelli, MD Submission history: Submitted November 6, 2020; Revision received January 19, 2021; Accepted January 19, 2021Electronically published April 2, 2021 Full text available through open access at http://escholarship.org/uc/uciem_westjem DOI: 10.5811/westjem.2021.1.50764[West J Emerg Med. 2021;22(3)687–689.]
2019 national guidelines currently make a “strong” recommendation for alteplase treatment for acute ischemic stroke (AIS) in the 3 to 4.5-hour window and a “moderate” recommendation for alteplase treatment guided by magnetic resonance imaging (MRI) in patients with unknown time of symptom onset.1 The 3 to 4.5-hour treatment window recommendation is based on a single, randomized clinical trial (RCT): the European Cooperative Acute Stroke Study (ECASS) III.1 The recommendation for MRI-based treatment with an unknown time of symptom onset is also based on a single RCT: MRI-Guided Thrombolysis for Stroke with Unknown Time of Onset (WAKE-UP).1 Recently, a meta-analysis of RCTs for patients with an unknown time of symptom onset using advanced neuroimaging including the WAKE-UP RCT was published.2 This meta-analysis was composed of four incomplete RCTs and concluded alteplase treatment results in better functional outcome at 90 days. Careful consideration of the methodology of these studies should be considered prior to adapting alteplase use beyond the three-hour time window.
Methodological Limitations of “ECASS III”In a 2014 editorial, Shy pointed out a statistical error in
ECASS III.3 The trial’s reported adjusted primary analysis did not account for the baseline imbalance in prior stroke status. The ECASS III authors have not addressed this statistical error in the literature. In a recent publication, Alper et al used the raw data to reanalyze the ECASS III data with appropriate adjustments. In a multivariate model adjusted for both baseline National Institutes of Health Stroke Scale (NIHSS) scores (P = .03 between groups) and prior stroke status (P = .003 between groups) there was a non-significant difference between alteplase and placebo for all efficacy outcomes.4
An unplanned post-hoc reanalysis risks analytical bias by nature. Limitations not considered in the original trial publication, however, support Alper et al’s findings. In the original trial, the authors reported benefit of alteplase treatment for the primary efficacy endpoint: a modified Rankin
Stritch School of Medicine at Loyola University, Department of Neurology, Division of Neurocritical Care, Maywood, Illinois
scale (mRS) score of 0-1. This dichotomization of the mRS includes functional independence with slight disability (mRS = 2) and death (mRS = 6) in the same category. There was no benefit with alteplase treatment, however, for an mRS score of 0-2. There was also no difference in the secondary efficacy endpoint, a “global outcome,” which was the primary endpoint in the NINDS rt-PA RCT.5 These results may be explained by the inter-rater reliability of the mRS, which is not uniformly distributed across the scale and is lowest at an mRS of 1.6,7 Additionally, the fragility index (1) of the primary endpoint is far less than the number of patients lost to follow-up (23).7,8 The fragility index is relevant given that the method used to handle missing outcome data, worst case imputation, is the method that is most prone to bias in stroke trials.9
Finally, ECASS III did not report enrollment of stroke subtypes, which may be an overlooked source of baseline imbalances. For example, in the NINDS rt-PA RCT, 51 patients with small-vessel occlusive disease were randomized into the alteplase arm compared to 30 patients in the placebo arm.5 Small-vessel occlusive disease has a significantly better natural history than large-vessel occlusive or cardioembolic stroke subtypes.5 Although the authors reported a similar positive effect in favor of alteplase regardless of stroke subtype, the study was not powered to detect these subgroup effects. As shown by Alper et al, small imbalances in a covariate that has a strong relationship with the primary outcome can significantly change the unadjusted effect size. Similar to the NINDS rt-PA RCT, the effect that stroke subtype had on the analysis of ECASS III remains unknown. These limitations of ECASS III make the conclusions from the re-analysis by Alper et al more reliable.
Methodological Limitations of “Intravenous Alteplase for Stroke with Unknown Time of Onset Guided by Advance Imaging: Systematic Review and Meta-Analysis of Individual Patient Data”
A recent meta-analysis of four incomplete RCTs has been published suggesting that the therapeutic time window for
Western Journal of Emergency Medicine 688 Volume 22, no. 3: May 2021
Alteplase for AIS Garg
alteplase may be extended further with the use of advanced neuroimaging.2 The authors of this meta-analysis concluded that alteplase “resulted in better functional outcome at 90 days than placebo or standard care.” Several considerations should be made prior to accepting the authors’ conclusion. All four individual RCTs included in the meta-analysis were prematurely terminated. Trials that end prematurely risk both type 1 and type 2 errors, and often have efficacy estimates that tend to be biased toward extremes in theory and in practice.10-12 Meta-analysis composed of underpowered RCTs are unreliable and may be prone to additional bias if clinical heterogeneity is not considered.13-16 In addition to threats to internal validity, the four incomplete RCTs and meta-analysis have substantially limited external validity due to their inclusion and exclusion criteria.
The four incomplete RCTs enrolled patients with large vessel occlusions (LVO) prior to the publication of multiple RCTs that showed efficacy of mechanical thrombectomy (MT) in patients with LVOs.17 Approximately 25% of patients in each arm would be treated differently in current clinical practice by virtue of MT. The authors erroneously conclude that “results of our pooled analysis support treatment with alteplase in patients with large vessel occlusion” without considering that alteplase may not modify the treatment effect of MT. In a meta-analysis of the five pivotal RCTs of MT, there was nearly an identical stratum-specific odds ratio (OR) for both levels of the alteplase stratum compared to the overall treatment effect suggesting alteplase does not modify the effect of MT.17 This subgroup-derived hypothesis was confirmed in a recent RCT that found that primary MT is non-inferior to a bridging strategy with alteplase.18 Additionally, patients enrolled in late MT-window RCTs were recanalized without bridging alteplase and had comparable outcomes to earlier window trials with a bridging strategy.19-21
In addition to exclusion of the actual procedure, the more prevalent neuroimaging modality used prior to MT, computed tomography perfusion, was used in only one of four incomplete RCTs included in the meta-analysis. Computed tomography was the favored imaging modality in MT efficacy trials.22,23 Computed tomography has advantages over MRI in routine clinical practice including increased availability and faster groin puncture times; and MRI may be precluded in patients with cardiac devices or severe agitation.24
The meta-analysis also enrolled patients with minor stroke. Trial enrollment in all four incomplete RCTs began prior to the PRISMS RCT, which at the time it was stopped found no signal to benefit with alteplase treatment in 12 efficacy outcomes and strong signal to excess harm.25 Considering the natural history of minor stroke, regardless of the designation as disabling or non-disabling, there is hardly a justification for treatment with alteplase without more convincing data.26
Finally, one study included in the meta-analysis used a lower dose of alteplase not routinely used in the United
States or Europe, and which was not shown to be non-inferior to standard dosing in an RCT enrolling primarily Asian patients.27,28 Therefore, exclusion of MT, inclusion of minor strokes, and inclusion of a trial that used low-dose alteplase substantially limits the external validity of the results of the pooled analysis.
Understanding Malpractice Risk and ConclusionsPhysicians caring for patients with AIS may be concerned
that interpretations of evidence that differ from national guidelines may lead to excess malpractice risk. This is augmented by malpractice data that suggest emergency physicians take a greater malpractice burden compared to neurologists, and withholding alteplase is riskier from a malpractice perspective.29 Some misconceptions regarding malpractice risk, however, should be elaborated on. A recent systematic review of acute stroke malpractice found that failure-to-treat cases are frequently merged with failure-to-diagnose cases.29 The direct risk of malpractice related to failure to treat alone without failure to diagnose may be further confounded by physicians unilaterally withholding alteplase without informed consent or not documenting conversations regarding informed consent in the medical record.30 Although AIS is not considered high risk for litigation occurrence compared to other emergency department diagnoses, mitigation steps such as constructive communication and intelligent documentation are paramount.31 Ultimately, stakeholders in acute stroke care should align such that more multi-faceted views can be represented in national guidelines.
Enthusiasm to prevent stroke-related disability may drive more favorable interpretations of the alteplase for AIS literature. Accepting favorable conclusions that are not strongly supported by their respective data should be done so cautiously given the significant risk of intracranial hemorrhage. Methodological pitfalls of the literature should be carefully considered such that enthusiasm does not outpace the evidence.
Address for Correspondence: Ravi Garg, MD, Stritch School of Medicine at Loyola University, Department of Neurology, Division of Neurocritical Care, 2160 S First Ave., Maywood, Illinois, 60153 Email: [email protected].
Conflicts of Interest: By the WestJEM article submission agreement, all authors are required to disclose all affiliations, funding sources and financial or management relationships that could be perceived as potential sources of bias. No author has professional or financial relationships with any companies that are relevant to this study. There are no conflicts of interest or sources of funding to declare.
Copyright: © 2021 Garg. This is an open access article distributed in accordance with the terms of the Creative Commons Attribution (CC BY 4.0) License. See: http://creativecommons.org/licenses/by/4.0/
Volume 22, no. 3: May 2021 689 Western Journal of Emergency Medicine
Garg Alteplase for AIS
REFERENCES1. Powers WJ, Rabinstein AA, Ackerson T, et al. Guidelines for the
Early Management of Patients with Acute Ischemic Stroke: 2019 update to the 2018 guidelines for the early management of acute ischemic stroke: a guideline for healthcare professionals from the American Heart Association/American Stroke Association. Stroke. 2019;50(12):e344-418.
2. Thomalla G, Boutitie F, Ma H, et al. Intravenous alteplase for stroke with unknown time of onset guided by advanced imaging: systematic review and meta-analysis of individual patient data. Lancet. 2020;396(10262):1574-84.
3. Shy BD. Implications of ECASS III error on emergency department treatment of ischemic stroke. J Emerg Med. 2014;46(3):385-6.
4. Alper BS, Foster G, Thabane L, et al. Thrombolysis with alteplase 3-4.5 hours after acute ischaemic stroke: trial reanalysis adjusted for baseline imbalances. BMJ Evid Based Med. 2020;25(5):168-71.
5. National Institute of Neurological Disorders and Stroke rt-PA Stroke Study Group. Tissue plasminogen activator for acute ischemic stroke. N Engl J Med. 1995;333(24):1581-8.
6. Quinn TJ, Dawson J, Walters MR, et al. Exploring the reliability of the modified Rankin scale. Stroke. 2009;40(3):762-6.
7. Fatovich DM. The fragility of stroke thrombolysis. Tasman Med J. 2020;2(1):6-10.
8. Hacke W, Kaste M, Bluhmki E, et al. Thrombolysis with alteplase 3 to 4.5 hours after acute ischemic stroke. N Engl J Med. 2008;359(13):1317-29.
9. Young-Saver DF, Gornbein J, Starkman S, et al. Handling of missing outcome data in acute stroke trials: advantages of multiple imputation using baseline and postbaseline variables. J Stroke Cerebrovasc Dis. 2018;27(12):3662-9.
10. Montori VM, Devereaux P, Adhikari NK, et al. Randomized trials stopped early for benefit: a systematic review. JAMA. 2005;294(17):2203-9.
11. Pocock SJ and Hughes MD. Practical problems in interim analyses, with particular regard to estimation. Control Clin Trials. 1989;10(4 Suppl):209-21.
12. Christley R. Power and error: increased risk of false positive results in underpowered studies. Open J Epidemiol. 2010;3(1):16-9.
13. Pogue J and Yusuf S. Overcoming the limitations of current meta-analysis of randomised controlled trials. Lancet. 1998;351(9095):47-52.
14. Rerkasem K and Rothwell P. Meta-analysis of small randomized controlled trials in surgery may be unreliable. Br J Surg. 2010;97(4):466-9.
15. LeLorier J, Gregoire G, Benhaddad A, et al. Discrepancies between meta-analyses and subsequent large randomized, controlled trials. N Engl J Med. 1997;337(8):536-42.
16. Borzak S and Ridker PM. Discordance between meta-analyses and large-scale randomized, controlled trials: examples from the
management of acute myocardial infarction. Ann Intern Med. 1995;123:873-7.
17. Goyal M, Menon BK, van Zwam WH, et al. Endovascular thrombectomy after large-vessel ischaemic stroke: a meta-analysis of individual patient data from five randomised trials. Lancet. 2016;387(10029):1723-31.
18. Yang P, Zhang Y, Zhang L, et al. Endovascular thrombectomy with or without intravenous alteplase in acute stroke. N Engl J Med. 2020;382(21):1981-93.
19. Nogueira RG, Jadhav AP, Haussen DC, et al. Thrombectomy 6 to 24 hours after stroke with a mismatch between deficit and infarct. N Engl J Med. 2018;378(1):11-21.
20. Albers GW, Marks MP, Kemp S, et al. Thrombectomy for stroke at 6 to 16 hours with selection by perfusion imaging. N Engl J Med. 2018;378(8):708-18.
21. Albers GW. Late window paradox. Stroke. 2018;49(3):768-71.22. Campbell BC, Majoie CB, Albers GW, et al. Penumbral imaging and
functional outcome in patients with anterior circulation ischaemic stroke treated with endovascular thrombectomy versus medical therapy: a meta-analysis of individual patient-level data. Lancet Neurol. 2019;18(1):46-55.
23. Albers GW. Use of imaging to select patients for late window endovascular therapy. Stroke. 2018;49(9):2256-60.
24. Macha K, Hoelter P, Siedler G, et al. Multimodal CT or MRI for IV thrombolysis in ischemic stroke with unknown time of onset. Neurology. 2020;95(22):e2954-64.
25. Khatri P, Kleindorfer DO, Devlin T, et al. Effect of alteplase vs aspirin on functional outcome for patients with acute ischemic stroke and minor nondisabling neurologic deficits: the prisms randomized clinical trial. JAMA. 2018;320(2):156-66.
26. Garg R. Alteplase for Minor Stroke: The AAEM Clinical Practice Advisory is more accurate than other national guidelines. J Emerg Med. 2020;59(5):717-8.
27. Anderson CS, Robinson T, Lindley RI, et al. Low-dose versus standard-dose intravenous alteplase in acute ischemic stroke. N Engl J Med. 2016;374(24):2313-23.
28. Koga M, Yamamoto H, Inoue M, et al. Thrombolysis with alteplase at 0.6 mg/kg for stroke with unknown time of onset: a randomized controlled trial. Stroke. 2020;51(5):1530-8.
29. Haslett JJ, Genadry L, Zhang X, et al. Systematic review of malpractice litigation in the diagnosis and treatment of acute stroke. Stroke. 2019;50(10):2858-64.
30. Moore MJ, Stuart J, Humphreys A, et al. To tPA or not to tPA: two medical-legal misadventures of diagnosing a cerebrovascular accident as a stroke mimic. CPC-EM. 2019;3(3):194.
31. Ferguson B, Geralds J, Petrey J, et al. Malpractice in emergency medicine: a review of risk and mitigation practices for the emergency medicine provider. J Emerg Med. 2018;55(5):659-65.
Western Journal of Emergency Medicine 690 Volume 22, no. 3: May 2021
Review
Sternal Intraosseous Devices: Review of the Literature Jared A. Laney, MSN, RN, FNP-BC*Jonathan Friedman, BSN, RN, FP-C†
Andrew D. Fisher, MD, LP‡§
Section Editor: Pierre Borczuk, MD Submission history: Submitted July 1, 2020; Revision received November 7, 2020; Accepted December 6, 2020 Electronically published March 24, 2021 Full text available through open access at http://escholarship.org/uc/uciem_westjem DOI: 10.5811/westjem.2020.12.48939
INTRODUCTIONEarly vascular access is a key step in providing care for
the severely sick and injured.1 When intravenous (IV) access is difficult, the use of intraosseous (IO) needles offers the ability for rapid vascular access.2 Success of peripheral IV (PIV) access varies from 34-75%, and success is less likely with additional attempts.3 Any fluids or medications that can be administered through an IV can also be given IO, including blood products and IV contrast agents.2,4-6 Intraosseous access is now supported for use in Pediatric Advanced Life Support, Advanced Cardiac Life Support, and Advanced Trauma Life Support.1,4 As this access is vital in emergent cases, a review of the literature is warranted to keep apace of current trends and supports.
Building on preliminary work by Drinker et al. in 1916 and Arnold Josefson in 1934, the IO route for vascular access came to
Texas A&M University College of Medicine, Bryan, TexasWashington County Ambulance District, Mineral Point, MissouriMedical Command, Texas Army National Guard, Austin, TexasUniversity of New Mexico School of Medicine, Department of Surgery, Albuquerque, New Mexico
*†
‡
§
Introduction: The intraosseous (IO) route is one of the primary means of vascular access in critically ill and injured patients. The most common sites used are the proximal humerus, proximal tibia, and sternum. Sternal IO placement remains an often-overlooked option in emergency and prehospital medicine. Due to the conflicts in Afghanistan and Iraq the use of sternal IOs have increased.
Methods: The authors conducted a limited review, searching PubMed and Google Scholar databases for “sternal IO,” “sternal intraosseous,” and “intraosseous” without specific date limitations. A total of 47 articles were included in this review.
Results: Sternal IOs are currently FDA approved for ages 12 and older. Sternal IO access offers several anatomical, pharmacokinetic, hemodynamic, and logistical advantages over peripheral intravenous and other IO points of access. Sternal IO use carries many of the same risks and limitations as the humeral and tibial sites. Sternal IO gravity flow rates are sufficient for transfusing blood and resuscitation. In addition, studies demonstrated they are safe during active CPR.
Conclusion: The sternal IO route remains underutilized in civilian settings. When considering IO vascular access in adults or older children, medical providers should consider the sternum as the recommended IO access, particularly if the user is a novice with IO devices, increased flow rates are required, the patient has extremity trauma, or administration of a lipid soluble drug is anticipated. [West J Emerg Med. 2021;22(3)690–695.]
the forefront based on the studies by Tocantins and O’Neill.3,7-11 They refined the procedure over the years with studies on human patients, most often using the sternum, the distal femur, and the proximal tibia.8 The military used the sternal IO route during World War II due to the ease of use and the large volumes that could be infused.3,8,12 However, as disposable polyvinyl chloride IV catheters were introduced in the 1950s, IO use became less frequent.3,13-14 Prior to the development of the disposable polyvinyl chloride IV catheters, metal trocars were used, which often became dislodged and caused thrombophlebitis and skin infections.3 There were also concerns pertaining to IOs causing osteomyelitis and marrow embolization.3 After several decades, there was renewed interest in pediatric IO, which led to regular use by the 1980s and later inclusion in pediatric resuscitation guidelines in 1985.2,13,15-16
Volume 22, no. 3: May 2021 691 Western Journal of Emergency Medicine
Laney et al. Sternal Intraosseous Devices: A Review
Treatment protocols suggest IO as a primary access option in select situations.17-18 However, it is more traditionally used as an option for vascular access, after failed PIV attempts.8,19 There are several reasons for the device-selection priority recommendations listed in the guideline literature. While a PIV can be left in place for several days, IO devices are not recommended to be left in place for more than 24 hours.8,20-21 Additionally, IO is significantly more expensive than PIV, approximately $80-$120 per use vs $1-$2 per use for PIV.22-23 This is in contrast to US military personnel who may use IO or PIV as first-line vascular access in combat.15
There are three primary IO sites in use today: the proximal tibia; the proximal humerus; and the sternum.8 However, other sites, which include the distal radius and ulna, iliac crest, and medial malleolus, may be used.24 There are multiple IO devices on the market today, but the most popular in the literature are the EZ-IO for the proximal tibia and proximal humerus (Teleflex, Inc, Wayne, PA) and the First Access for Shock and Trauma (FAST1) devices for the sternum (Teleflex, Inc, Wayne, PA).2,4,8,25 In the early 2000s with the development of the FAST1 and conflicts in Afghanistan and Iraq, the sternum became a popular location for military IO device placement.15,22,26-27 It has since become more widespread in the civilian setting as well.28-29 METHODS
We searched PubMed and Google Scholar for articles using a combination of the keywords “sternal IO,” “sternal intraosseous,” and “intraosseous” without specific date limitations. We evaluated case reports and series, retrospective and prospective studies, systematic reviews and meta-analyses, and other narrative reviews. We also reviewed guidelines and supporting citations of included articles. The literature search was restricted to studies published in English. When available, systematic reviews and meta-analyses were preferentially selected. These were followed sequentially by randomized controlled trials, prospective studies, retrospective studies, case reports, and other narrative reviews when alternate data were not available. A total of 47 articles were selected for inclusion in this narrative review.
DISCUSSIONAs with other IO devices in civilian settings, the sternal
IO is indicated when vascular access is necessary, but PIV has failed or is not readily accessible.19 Historically, the use of sternal IO in young children has been associated with higher rates of anatomy-related complications such as increased risk of damage to retrosternal structures and low flow due to small marrow reservoir.3,30 Currently, sternal IOs are only US Food and Drug Administration-approved for patients aged 12 years and older.32
AnatomyIntraosseous access makes use of several characteristics
of mammalian bones. First, their medullary cavities are non-collapsible as a result of both bone hardness as well as spicule formation. Therefore, they are readily accessible, even in profound hemorrhagic or hypovolemic shock. Furthermore, the
bone marrow of the medullary spaces is directly connected to the central venous system via the medullary venous channels.2 In the manubrium, blood flows from the marrow space into the internal thoracic vein, which drains to the subclavian vein and central vasculature. This stands in contrast to the humeral and tibial routes, which are farther from the central venous system and less direct.9 The most common access point for sternal IO devices is the manubrium.3 An additional advantage of the sternum, since the marrow cavities of the sternal body and the manubrium seldom communicate, is that both can be cannulated simultaneously.3
PharmacokineticsThe pharmacokinetics of sternal IO devices have been
shown to be equivalent or superior to extremity IOs and PIVs. Using a swine model of traumatic cardiac arrest, Burgert et al. concluded that the pharmacokinetics of epinephrine for humeral IOs and sternal IOs were statistically equivalent to PIV.19 In the same study, maximum epinephrine concentration – C(max) – and time to maximum epinephrine concentration – T(max) – were significantly longer in the tibial IO group as compared to the sternal IO, humeral IO, and PIV groups. Hoskins et al. had similar findings in a cardiac arrest with ongoing cardiopulmonary resuscitation (CPR) swine model.33 Using dye tracers, co-administered with and used as a surrogate for, epinephrine, C(max) was reached faster in sternal IO vs. tibial IO.33 Additionally, they found that the total dose delivered for tibial IO was only 65% of that delivered via sternal IO. When comparing sternal IO vs the central venous (CV) route, sternal IO delivered 85% of the CV-delivered dose. Overall pharmacokinetics were equivalent when comparing sternal IO vs. central venous administration. Vasopressin has also been found to be equivalent when comparing sternal to PIV administration in terms of C(max), T(max), and mean concentration over time.34 Burger et al. found that for amiodarone, a lipid soluble medication, C(max) was slowest for tibial IO and equivalent for both sternal IO and PIV.35 The authors hypothesized that the lipid-rich marrow in the tibial site resulted in an amiodarone depot, delaying release to the peripheral circulation.
HemodynamicsTwo similar studies evaluated hemodynamics after
hemorrhage and administration of Hextend through a sternal IO compared to an PIV and/or a humeral IO.36-37 The models were bled 30% of their total blood volume36 and 30% total blood volume based on 70 kilograms human,37 and then administered 500 milliliters (mL) of Hextend under pressure. The common hemodynamics measured included heart rate, systolic blood pressure, diastolic blood pressure, mean arterial pressure, stroke volume, and cardiac output. Between the devices being evaluated, there were no significant differences among the hemodynamic variables measured. Additionally, the time required to administer the Hextend was not significantly different between the groups.
Western Journal of Emergency Medicine 692 Volume 22, no. 3: May 2021
Sternal Intraosseous Devices: A Review Laney et al.
Flow RatesUsing fixed and unfixed cadavers, Hammer et al. found
higher flow rates and larger flow volumes in sternal IO compared to humeral IO and tibial IO infusions, both under pressure and unpressurized.38 Interestingly, flow rates decreased at both the sternal and tibial IO sites after five minutes while flow rates increased at the humeral sites. In a different cadaver study that measured rates and volumes infused during a five-minute 0.9% sodium chloride bolus, there were again greater flow rates and flow volumes with sternal IO vs humeral IO or tibial IO devices.39 Additionally, flow was good (fast drip without pressure bag) or very good (continuous flow without pressure bag) in nearly 90% of the sternal IOs. In a 2019 human field study, 31.5% of EZ-IOs demonstrated poor flow (requiring pressurized infusion), whereas none of the FASTResponder lines had poor flow.28 Using human volunteers, unpressurized infusion, and two different sternal IO devices, Bjerkvig et al. were able to deliver 450 mL of whole blood in approximately 11 minutes.4
Ease of UseMany medical providers find IOs easy to use. In a small
study, 10 experienced paramedics evaluating a new sternal IO system (FAST1) found sternal IO placement to be easier than PIV.27 Time from package opening to fluid flowing through the device averaged just over 90 seconds, and device placement by these novel users was reported as excellent. Another study reported a 95% (18/19) first-time success rate for sternal IO placement among novice sternal IO device users (second- and fourth-year medical students); this was better than their rate for tibial IO and humeral IO devices, which they also had never used before: 91% (20/22) and 77% (17/22), respectively.38 Elsewhere, a study found sternal IO placement was achieved with 100% success by the second attempt with a median insertion time for the FASTResponder of 20 seconds.28
In cardiac arrest patients, FAST1 deployment by paramedics had a 73% success rate and an average time to placement of 67 seconds.29 Another study that compared time to fluid administration among different IO sites found no statistically significant differences between humeral IO, sternal IO, or IV groups.36 Similarly, Hammer et al. found no difference in insertion time between the humeral IO, sternal IO, and tibial IO groups in their study.38
When comparing two long bone IO devices, the Bone Injection Gun (PerSys Medical, Houston, TX) and the Jamshidi (Cardinal Health, Dublin, OH) to the FAST1, the long bone devices were equivalent to the FAST1 with respect to success rate, user satisfaction, and complication rates. However, the Jamshadi had a faster mean insertion time than the FAST1 (38 vs 62 seconds, P = 0.002).40 In contrast to the studies above reporting excellent success rates for novice sternal IO device users, a study evaluating 29 emergency medical technician-basic students noted a first-attempt successful placement of only 55.2%; this was despite high rates of correct site identification (96.6%) and a median time
to needle deployment of under 30 seconds.41
PainThe literature comparing pain associated with sternal IO
compared to PIV or peripheral IO is sparse. Preliminary work has been done by Montez et al. evaluating the use of lidocaine to mitigate the discomfort during sternal IO and proximal humerus IO infusions.42 The primary endpoints of the study were pain scores at five minutes using 300 millimeters mercury (mm Hg) to pressure infuse, then again after 15 and 30 minutes of infusion at 125 mL/hour. The published data do not evaluate the sternal IO and humeral IO groups against each other. However, useful analysis can be made by the reader: the difference between the pain scores recorded for the 40-milligram (mg) lidocaine dose, 3.4/10 at the sternal IO site and 3.5/10 at the humeral IO site, are clearly not clinically significant. In the 60 mg lidocaine dose groups, the pain scores were 1.5/10 (sternal) and 2.2/10 (humeral), similarly displaying no clinical significance in the difference noted. Additional work is needed to more fully characterize the pain experienced during placement of and infusion with sternal IO compared to peripheral IO and PIV.
Return of Spontaneous Circulation (ROSC)With regard to ROSC, sternal IO-administered fluids/
medications appear to be at least as effective as PIV and other IO routes. In a 2019 swine model of traumatic (hemorrhagic) cardiac arrest, in which epinephrine followed by 500 mL of 5% albumin was administered, no difference in ROSC was noted between tibial IO, humeral IO, sternal IO, and PIV groups.19 An earlier hemorrhagic cardiac arrest model similarly found that ROSC timelines, results, and outcomes were equivalent when comparing sternal IO and PIV groups.43 However, an additional cardiac arrest model (ventricular fibrillation, no hemorrhage/exsanguination) found that ROSC occurred faster with sternal IO and PIV-administered medications (vasopressin, amiodarone, and epinephrine) as compared to tibial IO-administered medications.44
Advantages of the Sternal Intraosseous RouteAs noted above, flow rates have been shown to be greater
in sternal IO vs other IO routes. While this may seem counter to Poiseuille’s Law (Q=(πPr4)/8ηl) due to the dimensions of the FAST1 and EZ-IO catheters, bone characteristics play a role as well. The sternum is a large, flat bone with a high amount of red marrow.26 It also has a cortex that is thinner and more uniform and is less likely to be fractured as compared to the bones of the arms or legs.26 Furthermore, because the sternum is a non weight-bearing bone, its density is predicted to be 25% less than the proximal humerus.5 Therefore, lower infusion pressures are required and flow rates are higher with a sternal as compared to a humeral route. As an additional anatomic advantage, the sternum can be identified in every shape and size person, to include the morbidly obese.3
There are advantages to the sternal IO route when compared to PIV routes. Findlay et al. noted that its central location as
Volume 22, no. 3: May 2021 693 Western Journal of Emergency Medicine
Laney et al. Sternal Intraosseous Devices: A Review
well as its readily identifiable placement site serve to reduce clutter as well as the chance of line entanglement and accidental dislodgement—a concern for both PIV and humeral IO/tibial IO sites.27 Additionally, the insertion site has minimal overlaying tissue except for in extreme obesity, again making identification straightforward.35 Sternal IO devices also have more direct access to central circulation via the venous drainage of the manubrium, as Burgert et al. noted, and may actually benefit from “the hydraulic action of chest compressions” in cases of cardiac arrest.33,35 Finally, FAST1 IO devices do not require selection of different needle sizes and rely on deployment of a single needle size to the correct depth.32 This reduces the possibility for error and increases cognitive offloading of needle selection based on patient size during stressful patient care scenarios.
Risks and LimitationsContraindications
Contraindications for sternal IO use are similar to other IO sites and include fracture at the insertion site, IO attempt at the same location in the previous 48 hours, hardware in the vicinity of the anticipated IO placement site, compartment syndrome, significant bone disease at the insertion site, and local infection/osteomyelitis history.2,8 The only added contraindication for sternal IO is a history of sternotomy, due to the potential for decreased blood flow and impaired structural integrity in the area after this procedure.8
RisksRisks of IO use in general are few, and serious complications
are rarely experienced.22 These include infection (including osteomyelitis and mediastinitis), compartment syndrome, fractures, drug/fluid extravasation, skin necrosis, arterial thrombosis, air/fat embolism, perforation of the opposing cortex, and retained foreign body.8,22 Epiphyseal plate damage can occur from humeral IO and tibial IO, but not sternal IO.8 Potential minor complications include pain, difficulty aspirating marrow, device displacement, and slow or stopped infusion.9,20 As the manubrium bone is fairly thick at approximately 13.30 mm, the risk of excessive penetration is less than 0.0001%.31
Myths ExplainedThere are myths and falsehoods associated with sternal
IOs and IOs in general. Some believe that IO flow rates are insufficient for mass transfusion in hemorrhaging patients. However, Bjerkvig et al. found gravity flow rates in two different sternal IO devices to be sufficient for resuscitation in human volunteers.4 In their retrospective study of over 1000 IO device deployments, Lewis and Wright noted packed red blood cells transfused successfully nearly 2000 times with no clinical or lab evidence of hemolysis.22
Another concern is that sternal IO will interfere with ongoing CPR.28 Multiple successful swine studies have been conducted with active CPR and concurrent sternal IO fluid administration without issue.19,33-35,44 Based on the findings of their swine
study, Hoskins et al. recommended that sternal IO be used preferentially for drug delivery over other IO sites when PIV has not been established.33 Several recent human field studies have been conducted looking at the use of sternal IO.15,26,28-29,40 While only Hartholt et al. specifically mention ongoing CPR, it may be reasonably assumed that CPR was ongoing in at least some of the other patients studied as well. There is no note in any of these papers regarding the sternal IO device interfering with the ability to appropriately perform chest compressions for CPR. Additionally, there are no reports in the literature of sternal IO devices interfering with chest compressions. Further study looking specifically at chest compressions with concurrent sternal IO in place is needed to more conclusively comment on the relationship between the two, but the lack of negative reports in the literature thus far is promising.
LimitationsAs noted above, the FAST devices are only approved for
use in patients aged 12 years and older.31 There is also some question of device and operator failure rates. Byars noted that 7/41 attempted FAST1 insertions failed because the needle did not deploy as intended. Additionally, two other attempts were abandoned due to extravasation after placement.29 However, this was several years ago and it is unclear whether failure was due to operator error or design flaw or whether the manufacturer has since addressed the problem. Another study noted that stylets in 3 of 22 FASTResponder devices failed to completely withdraw into the protective cover, creating a needlestick risk.45 Additionally, the FAST devices are designed only for sternal use, while the EZ-IO devices can be used in either the humerus or tibia.
Obesity and its associated comorbidities and care complications are ubiquitous in nearly every setting served by medical providers. These challenges become particularly apparent when this population is critically ill and can make vascular access extremely difficult. While there tends to be less tissue overlying the sternum than other potential IO access sites, in the extremely obese, sternal IO access may be compromised as well.26,46 This issue can be mitigated to some degree with peripheral IO devices having multiple needle sizes available, but still presents a challenge. Unfortunately, this feature is not available for the FAST devices, a shortcoming that may preclude their use in patients with excessive parasternal tissue.
Although any drug or fluid that can be given via PIV can also be given IO, there is a paucity of data regarding IV contrast given by the IO route. The existing studies report successful IO contrast administration by hand as well as power injection, resulting in high-quality images; however, these studies either exclusively looked at peripheral IO sites/devices or did not specify the type of device used.47-52 Further investigation into sternal IO administration of contrast agents is warranted. Finally, a 2015 cadaver study by Hammer et al. demonstrated a wide variation in flow rates, a finding that has not been replicated/verified in human field studies or live human model studies.38
Western Journal of Emergency Medicine 694 Volume 22, no. 3: May 2021
Sternal Intraosseous Devices: A Review Laney et al.
CONCLUSIONThe sternum offers an easily accessible route for IO delivery
of fluids and medications with high rates of successful placement, even among novices, according to most studies.27,38 Once the needle has been deployed and the device secured, sternal IO may provide reduced risk for line entanglement as compared to PIV and other IO sites, and there is mounting evidence for superior flow rates with sternal IO.27-28,38-39 When considering IO vascular access in adults or older children, medical providers should consider the sternum as the recommended IO access, particularly if the user is a novice with IO devices, increased flow rates are required, the patient has extremity trauma, or administration of a lipid soluble drug is anticipated.
ACKNOWLEDGMENTSThe authors would like to thank Brandon M. Carius, DSc,
MPAS, PA-C for his valuable comments on the manuscript.
Address for Correspondence: Andrew D. Fisher, MD, LP, University of New Mexico School of Medicine, Department of Surgery, 1 University of New Mexico, Albuquerque, NM 87131-0001. Email: [email protected].
Conflicts of Interest: By the WestJEM article submission agreement, all authors are required to disclose all affiliations, funding sources and financial or management relationships that could be perceived as potential sources of bias. No author has professional or financial relationships with any companies that are relevant to this study. There are no conflicts of interest or sources of funding to declare.
Copyright: © 2021 Laney et al. This is an open access article distributed in accordance with the terms of the Creative Commons Attribution (CC BY 4.0) License. See: http://creativecommons.org/licenses/by/4.0/
2018;84(6S Suppl 1):S120-4.5. Auten JD, McEvoy CS, Roszko PJ, et al. Safety of pressurized
intraosseous blood infusion strategies in a swine model of hemorrhagic shock. J Surg Res. 2020;246:190-9.
6. Baadh AS, Singh A, Choi A, et al. Intraosseous vascular access in radiology: review of clinical status. Am J Roentgenol. 2016;207(2):241-7.
7. Drinker CK, Drinker KR, Lund CC. The circulation in the mammalian bone-marrow. Am J Physiol. 1922;1(62):1-92.
8. Burgert JM. A primer on intraosseous access: history, clinical considerations, and current devices. Am J Disaster Med. 2016;11(3):167-73.
9. Josefson A. A new method of treatment — intraossal injections. Acta Medica Scandinavica. 1934;81(5-6):550-64.
10. Foëx BA. Discovery of the intraosseous route for fluid administration. J Accid. 2000;17(2):136-7.
11. Tocantins LM, O’Neill JF, Price AH. Infusions of blood and other fluids via the bone marrow in traumatic shock and other forms of peripheral circulatory failure. Ann Surg. 1941;114(6):1085-92.
12. Doud EA and Tysell JE. Massive intramedullary infusions. JAMA. 1942;120(15):1212-3.
13. Engels PT, Erdogan M, Widder SL, et al. Use of intraosseous devices in trauma: a survey of trauma practitioners in Canada, Australia and New Zealand. Can J Surg. 2016;59(6):374-82.
14. Millam D. The history of intravenous therapy. J Intraven Nurs. 1996;19(1):5-14.
15. Schauer SG, Naylor JF, April MD, et al. The Prehospital Trauma Registry experience with intraosseous access. J Spec Oper Med. 2019;19(1):52-5.
16. Dubick MA and Holcomb JB. A review of intraosseous vascular access: current status and military application. Mil Med. 2000;165(7):552-9.
17. O’Connor RE. Intraosseous vascular access in the out-of-hospital setting position statement of the National Association of EMS Physicians. Prehosp Emerg Care. 2009;11(1):62-2.
18. Fowler R, Gallagher JV, Isaacs SM, et al. The role of intraosseous vascular access in the out-of-hospital environment (resource document to NAEMSP position statement). Prehosp Emerg Care. 2007;11(1):63-6.
19. Burgert JM, Johnson AD, O’Sullivan JC, et al. Pharmacokinetic effects of endotracheal, intraosseous, and intravenous epinephrine in a swine model of traumatic cardiac arrest. Am J Emerg Med. 2019;37(11):2043-50.
20. Webster J, Osborne S, Rickard CM, et al. Clinically indicated replacement versus routine replacement of peripheral venous catheters. Cochrane Database Syst Rev. 2019;1:CD007798.
21. Patel SA, Alebich MM, Feldman LS. Routine replacement of peripheral intravenous catheters. J Hosp Med. 2017;12(1):42-45.
22. Lewis P and Wright C. Saving the critically injured trauma patient: a retrospective analysis of 1000 uses of intraosseous access. Emerg Med J. 2015;32(6):463-7.
23. Fowler RL and Lippmann MJ. Benefits vs. risks of intraosseous vascular
REFERENCES1. Panchal AR, Berg KM, Hirsch KG, et al. 2019 American Heart
Association Focused Update on Advanced Cardiovascular Life Support: Use of Advanced Airways, Vasopressors, and Extracorporeal Cardiopulmonary Resuscitation During Cardiac Arrest: An Update to the American Heart Association Guidelines for Cardiopulmonary Resuscitation and Emergency Cardiovascular Care. Circulation. 2019;140(24):e881-94.
2. Petitpas F, Guenezan J, Vendeuvre T, et al. Use of intra-osseous access in adults: a systematic review. Crit Care. 2016;20:102.
3. Paxton JH. Intraosseous vascular access: A review. Trauma. 2012;14(3):195-232.
4. Bjerkvig CK, Fosse TK, Apelseth TO, et al. Emergency sternal intraosseous access for warm fresh whole blood transfusion in damage control resuscitation. J Trauma Acute Care Surg.
Volume 22, no. 3: May 2021 695 Western Journal of Emergency Medicine
Laney et al. Sternal Intraosseous Devices: A Review
access. 2014. Available at: https://psnet.ahrq.gov/web-mm/benefits-vs-risks-intraosseous-vascular-access. Accessed April 2, 2020
24. Luck RP, Haines C, Mull CC. Intraosseous access. J Emerg Med. 2010;39(4):468-75.
25. Czyż R, Leśkiewicz M, Górniak I, et al. Current advances in intraosseous access - a review of presently available devices. J Educ Health Sport. 2018;8(8):939-50.
26. Macnab A, Christenson J, Findlay J, et al. A new system for sternal intraosseous infusion in adults. Prehosp Emerg Care. 2000;4(2):173-7.
27. Findlay J, Johnson DL, Macnab AJ, et al. Paramedic evaluation of adult intraosseous infusion system. Prehosp Disaster Med. 2006;21(5):329-34.
28. Sorgjerd R, Sunde GA, Heltne JK. Comparison of two different intraosseous access methods in a physician-staffed helicopter emergency medical service - a quality assurance study. Scand J Trauma Resusc Emerg Med. 2019;27(1):15.
29. Byars DV, Tsuchitani SN, Erwin E, et al. Evaluation of success rate and access time for an adult sternal intraosseous device deployed in the prehospital setting. Prehosp Disaster Med. 2011;26(2):127-9.
30. Day M. Intraosseous devices for intravascular access in adult trauma patients. Crit Care Nurse. 2001;31(2):76-88.
31. Johnson DL, Findlay J, Macnab AJ, Susak L. Cadaver testing to validate design criteria of an adult intraosseous infusion system. Mil Med. 2005;170(3):251-7.
32. Teleflex. FAST1™ Intraosseous Infusion System https://teleflex.com/usa/en/product-areas/military-federal/intraosseous-access/fast1-io-infusion-system/. Accessed February 20, 2021.
33. Hoskins SL, do Nascimento P, Jr., Lima RM, et al. Pharmacokinetics of intraosseous and central venous drug delivery during cardiopulmonary resuscitation. Resuscitation. 2012;83(1):107-12.
34. Vallier DJ, Torrence AD, Stevens R, et al. The effects of sternal and intravenous vasopressin administration on pharmacokinetics. Am J Disaster Med. 2016;11(3):203-9.
35. Burgert JM, Martinez A, O’Sullivan M, et al. Sternal route more effective than tibial route for intraosseous amiodarone administration in a swine model of ventricular fibrillation. Prehosp Emerg Care. 2018;22(2):266-75.
36. Blouin B, Dawn, Gegel D, et al. Effects of intravenous, sternal, and humerus intraosseous administration of Hextend on time of administration and hemodynamics in a hypovolemic swine model.
37. Johnson D, Penaranda C, Phillips K, et al. Effects of sternal intraosseous and intravenous administration of Hextend on time of administration and hemodynamics in a swine model of hemorrhagic shock. Am J Disaster Med. 2015;10(1):61-7.
38. Hammer N, Mobius R, Gries A, et al. Comparison of the fluid resuscitation rate with and without external pressure using two
intraosseous infusion systems for adult emergencies, the CITRIN (Comparison of InTRaosseous infusion systems in emergency medicINe)-Study. PLoS One. 2015;10(12):e0143726.
39. Pasley J M, Catriona HT, DuBose JJ, et al. Intraosseous infusion rates under high pressure: a cadaveric comparison of anatomic sites. J Trauma Acute Care Surg. 2015;78(2):295-9.
40. Hartholt KA, van Lieshout EM, Thies WC, et al. Intraosseous devices: a randomized controlled trial comparing three intraosseous devices. Prehosp Emerg Care. 2010;14(1):6-13.
41. Miller DD, Guimond G, Hostler DP, et al. Feasibility of sternal intraosseous access by emergency medical technician students. Prehosp Emerg Care. 2005;9(1):73-8.
42. Montez D, Puga T, Davlantes C, et al. 310: IO infusion pain mitigation in the sternum and proximal humerus: establishing a regimen. Crit Care Med. 2016;44(12):154.
43. Smith S, Borgkvist B, Kist T, et al. The effects of sternal intraosseous and intravenous administration of amiodarone in a hypovolemic swine cardiac arrest model. Am J Disaster Med. 2016;11(4):271-7.
44. O’Sullivan M, Martinez A, Long A, et al. Comparison of the effects of sternal and tibial intraosseous administered resuscitative drugs on return of spontaneous circulation in a swine model of cardiac arrest. Am J Disaster Med. 2016;11(3):175-82.
45. Hammer N and Bernhard M. Safety concerns for rescue providers using sternal intraosseous infusion systems. J Trauma Acute Care Surg. 2015;79(3):517-8.
46. Frascone RJ, Jensen JP, Kaye K, et al. Consecutive field trials using two different intraosseous devices. Prehosp Emerg Care. 2007;11(2):164-71.
47. Winkler M, Talley C, Woodward C, et al. The use of intraosseous needles for injection of contrast media for computed tomographic angiography of the thoracic aorta. J Cardiovasc Comput Tomogr. 2017;11(3):203-7.
48. Schindler P, Helfen A, Wildgruber M, et al. Intraosseous contrast administration for emergency computed tomography: A case-control study. PLoS One. 2019;14(5):e0217629.
49. Winkler M, Issa M, Lowry C, et al. Intraarticular extravasation, an unusual complication of computed tomographic angiography performed with intraosseous needle intravenous access. Cardiovasc Diagn Ther. 2018;8(4):516-9.
50. Geller E and Crisci KL. Intraosseous infusion of iodinated contrast in an abused child. Pediatr Emerg Care. 1999;15(5):328-9.
51. Cambray EJ, Donaldson JS, Shore RM. Intraosseous contrast infusion: efficacy and associated findings. Pediatr Radiol. 1997;27(11):892-3.
52. Knuth TE, Paxton JH, Myers D. Intraosseous injection of iodinated computed tomography contrast agent in an adult blunt trauma patient. Ann Emerg Med. 2011;57(4):382-6.
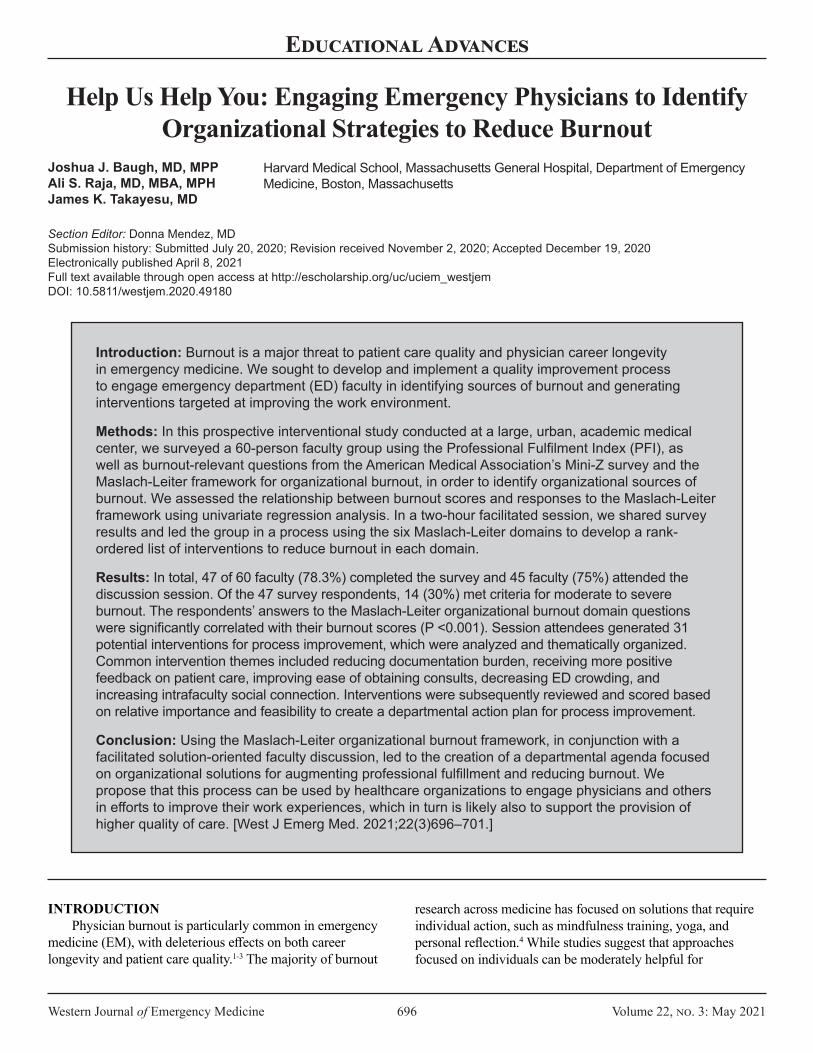
Western Journal of Emergency Medicine 696 Volume 22, no. 3: May 2021
Educational Advances
Help Us Help You: Engaging Emergency Physicians to Identify Organizational Strategies to Reduce Burnout
Joshua J. Baugh, MD, MPPAli S. Raja, MD, MBA, MPHJames K. Takayesu, MD Section Editor: Donna Mendez, MD Submission history: Submitted July 20, 2020; Revision received November 2, 2020; Accepted December 19, 2020 Electronically published April 8, 2021 Full text available through open access at http://escholarship.org/uc/uciem_westjem DOI: 10.5811/westjem.2020.49180
INTRODUCTIONPhysician burnout is particularly common in emergency
medicine (EM), with deleterious effects on both career longevity and patient care quality.1-3 The majority of burnout
Harvard Medical School, Massachusetts General Hospital, Department of Emergency Medicine, Boston, Massachusetts
Introduction: Burnout is a major threat to patient care quality and physician career longevity in emergency medicine. We sought to develop and implement a quality improvement process to engage emergency department (ED) faculty in identifying sources of burnout and generating interventions targeted at improving the work environment.
Methods: In this prospective interventional study conducted at a large, urban, academic medical center, we surveyed a 60-person faculty group using the Professional Fulfilment Index (PFI), as well as burnout-relevant questions from the American Medical Association’s Mini-Z survey and the Maslach-Leiter framework for organizational burnout, in order to identify organizational sources of burnout. We assessed the relationship between burnout scores and responses to the Maslach-Leiter framework using univariate regression analysis. In a two-hour facilitated session, we shared survey results and led the group in a process using the six Maslach-Leiter domains to develop a rank-ordered list of interventions to reduce burnout in each domain.
Results: In total, 47 of 60 faculty (78.3%) completed the survey and 45 faculty (75%) attended the discussion session. Of the 47 survey respondents, 14 (30%) met criteria for moderate to severe burnout. The respondents’ answers to the Maslach-Leiter organizational burnout domain questions were significantly correlated with their burnout scores (P <0.001). Session attendees generated 31 potential interventions for process improvement, which were analyzed and thematically organized. Common intervention themes included reducing documentation burden, receiving more positive feedback on patient care, improving ease of obtaining consults, decreasing ED crowding, and increasing intrafaculty social connection. Interventions were subsequently reviewed and scored based on relative importance and feasibility to create a departmental action plan for process improvement.
Conclusion: Using the Maslach-Leiter organizational burnout framework, in conjunction with a facilitated solution-oriented faculty discussion, led to the creation of a departmental agenda focused on organizational solutions for augmenting professional fulfillment and reducing burnout. We propose that this process can be used by healthcare organizations to engage physicians and others in efforts to improve their work experiences, which in turn is likely also to support the provision of higher quality of care. [West J Emerg Med. 2021;22(3)696–701.]
research across medicine has focused on solutions that require individual action, such as mindfulness training, yoga, and personal reflection.4 While studies suggest that approaches focused on individuals can be moderately helpful for
Volume 22, no. 3: May 2021 697 Western Journal of Emergency Medicine
Baugh et al. Help Us Help You
Maslach-Leiter domain statements (rated 1-5 from strongly disagree to strongly agree)
1. My workload in this job is manageable. 2. The rewards I derive from my work are commensurate with
my effort. 3. I have sufficient autonomy and control in my work. 4. Our workplace is fair and transparent. 5. We have a strong sense of community in our department. 6. Our workplace allows us to fulfill the values endorsed by
our department.
Table 1. The assessment statements developed for each of the six Maslach-Leiter domains. Faculty were asked to rate each of these statements on a 5-point Likert scale, from 1 = strongly disagree to 5 = strongly agree.
alleviating burnout,5,6 other work, both in medicine and across industries, has found that the majority of burnout is potentiated by organizational factors rather than individual ones.7,8 Multiple studies in medicine have now demonstrated that an organizational approach to mitigating burnout can be effective.9 However, an optimal process for diagnosing and addressing organizational causes of burnout has not yet been established.
In decades-long work across many industries, Christina Maslach and Michael Leiter identified six organizational domains intimately related to workforce burnout.7 These six domains are as follows: workload; reward; control; fairness; community; and value congruence. They also found that these same domains – when optimized – could foster engagement, the antithesis of burnout. This six-domain framework has recently been applied specifically to EM, producing an array of potential interventions for promoting engagement over burnout in emergency physicians (EP).10 Maslach and Leiter’s work also suggests that engaging workers in the organizational improvement process can itself help to alleviate burnout by 1) identifying the right target issues affecting staff most frequently, and 2) empowering individuals to change their work environment in ways that improve the experience of work.
We sought to create an approach for engaging our own EM faculty in such a process to identify areas for departmental improvement. We employed the Maslach-Leiter framework to organize a facilitated, solution-oriented discussion incorporating departmental measures of burnout and professional fulfillment to elicit ideas from the group on how to improve the department across the six organizational domains. We describe a process using survey data combined with a two-hour faculty discussion session to frame burnout from an organizational perspective with the goal of developing interventions to address sources of burnout by creating a comprehensive departmental process-improvement plan. METHODSStudy Design and Setting
We conducted this prospective interventional study at a large, urban, academic medical center with a Level I trauma center and STEMI center designations. We surveyed a 60-person faculty group of board-certified/board-eligible EPs. This project was deemed quality improvement by our organization and exempted from formal review by our institutional review board.
Survey Creation and DistributionWe used the full, validated 16-item Professional
Fulfillment Index (PFI) to measure individuals’ burnout and sense of fulfillment from their clinical work.11 Response options consisted of a five-point Likert scale, and questions were grouped to form three PFI scales: professional fulfillment; work exhaustion; and interpersonal disengagement. In addition, we added specific questions from the American Medical Association Mini-Z survey12 to
measure the influence of specific workplace issues known or suspected to be related to negative experiences at work (eg, documentation burden) not explicitly assessed by the PFI. Last, we asked respondents to rate how the department was performing in each of the six Maslach-Leiter domains of organizational burnout (Table 1), using questions that we developed. The survey also contained an open-response section in which participants could identify issues they found to be the most frustrating aspects of their work experience.
The survey was distributed through Qualtrics (Qualtrics XM, Provo, UT) to each faculty member two weeks prior to the discussion session. To encourage participation, we informed participants that the data from the survey would inform the discussion session. Three reminder emails were sent after the initial survey distribution. Survey Analysis
We calculated an overall burnout score, as well as individual PFI scores for depersonalization, emotional exhaustion, and professional fulfillment, for each participant based on the criteria developed and validated for the PFI.11 The relationship of burnout scores to responses to each of the six Maslach-Leiter domain questions was calculated using univariate regression analysis for each individual question, using an alpha error threshold of 0.05 for statistical significance. We analyzed the open responses for recurring themes.
The Discussion SessionPrior to the beginning of the discussion session, we
distributed one-page sheets with the six Maslach-Leiter domains listed, along with pens, to be used for note-taking later in the session. (See below.) The session was divided into five phases (Table 2).
In phase 1, we reviewed the previous departmental initiatives undertaken since the last retreat session two years

Western Journal of Emergency Medicine 698 Volume 22, no. 3: May 2021
Help Us Help You Baugh et al.
Phase 1: Review of prior departmental efforts and presentation of overall burnout data.Phase 2: Introduction of Maslach-Leiter framework and presentation of data regarding departmental performance in each domain, with examples and illustrative quotes.Phase 3: Individual idea generation for solutions in each of the six domains.Phase 4: Small group discussion of most important clinical and non-clinical interventions.Phase 5: Small group report-out of intervention ideas, with generation of a final list of improvements, followed by group discussion regarding prioritization.
Table 2. Phases of the two-hour facilitated discussion session on burnout, organized by activity.
prior addressing burnout, including creation of a mini-sabbatical for long-tenured faculty, sharing of positive clinical feedback, additional ED coverage for surge times of day, addition of a lactation room, and individualizing schedule preferences. We presented overall rates of burnout, as well as de-identified scores in the three PFI subcategories. In phase 2, we introduced the Maslach-Leiter framework and then presented the departmental ratings in each of the six Maslach-Leiter domains. For each domain, we presented the overall score, highlighted prior efforts for improvement in the domain, and reviewed select de-identified comments from the survey relating to each domain. The goal of this phase was to create a foundation for solution-oriented discussion.
For phase 3, we asked individuals to use the note-taking sheets to write down ideas for process improvement in each of the six domains that could build upon previous improvements or address new unmet needs. Phases 1, 2, and 3 took approximately 45 minutes in total.
In phase 4, individuals shared their ideas with a small group (randomly selected groups of 5-6 faculty based on seating location) with the goal of generating 1-2 departmental interventions that would be most desirable to improve clinical work and academic productivity. Groups were asked to come to a consensus on their most important improvements for both clinical and non-clinical work. During phase 5, each group reported out on their choices of most important clinical and non-clinical improvements to the general audience. A master list was generated from this report-out, prioritized by number of mentions across the groups followed by consensus agreement. At the conclusion of the session, the one-page sheets with individual ideas for improvements in each domain were also collected for further review to ensure that all ideas were captured.
After the SessionWe analyzed the individual worksheets for content and
overlapping ideas and themes. The worksheets provided a
very rich data set for identifying opportunities for promoting engagement and fulfillment not included in the consensus-generated list from the report-out. The first author (JB) then reviewed the free-text comments and generated a collection of themes using modified grounded theory. The senior author (JKT) then used the theme structure identified by the first author to review the free-text comments, and no new themes were identified. Agreement on themes, as well as frequency counts of themes, was reached by both authors. The intervention themes were then rank-ordered in priority based on these frequency counts.
The prioritized list of interventions from both the report-out consensus and the individual worksheet dataset was presented to departmental leadership to assess the feasibility of implementation. A feasibility-importance chart was created, with feasibility based on cost and current operational constraints on one axis, and importance as determined by frequency of mention by faculty on the other axis. Items that were below average in both feasibility and importance were removed from the list. All other ideas remained in consideration, with highest priority given to items that ranked above average in both importance and feasibility. The items were then organized into a wellness agenda for the coming year.
RESULTSFaculty Participation
Of the 60 faculty members, 47 (78%) completed the survey and 45 attended the retreat session.
Overall and Scale-specific BurnoutAmong 47 faculty survey respondents, 14 (30%) met
criteria for burnout, 22 (46%) met criteria for emotional exhaustion, and 14 (30%) met criteria for depersonalization. A total of 27 (57%) met criteria for low professional fulfillment.
Relationship of Burnout Scores to Maslach-Leiter DomainsParticipants’ ratings of our department in the six Maslach-
Leiter domains were highly associated with their burnout scores. Ratings of the department in five of the six individual domains were significantly associated with burnout score (Table 3). Individuals’ aggregate ratings of the six domains were also significantly associated with their burnout scores.
Burnout Intervention Ideas A total of 31 distinct ideas for interventions to mitigate
burnout and improve faculty engagement were generated by participants during the group session. These were qualitatively analyzed (JB and JKT) by domain and organized into the 15 most commonly cited interventions (Table 4).
DISCUSSIONBurnout is a commonly recognized issue in clinical
practice across all medical specialties but is particularly
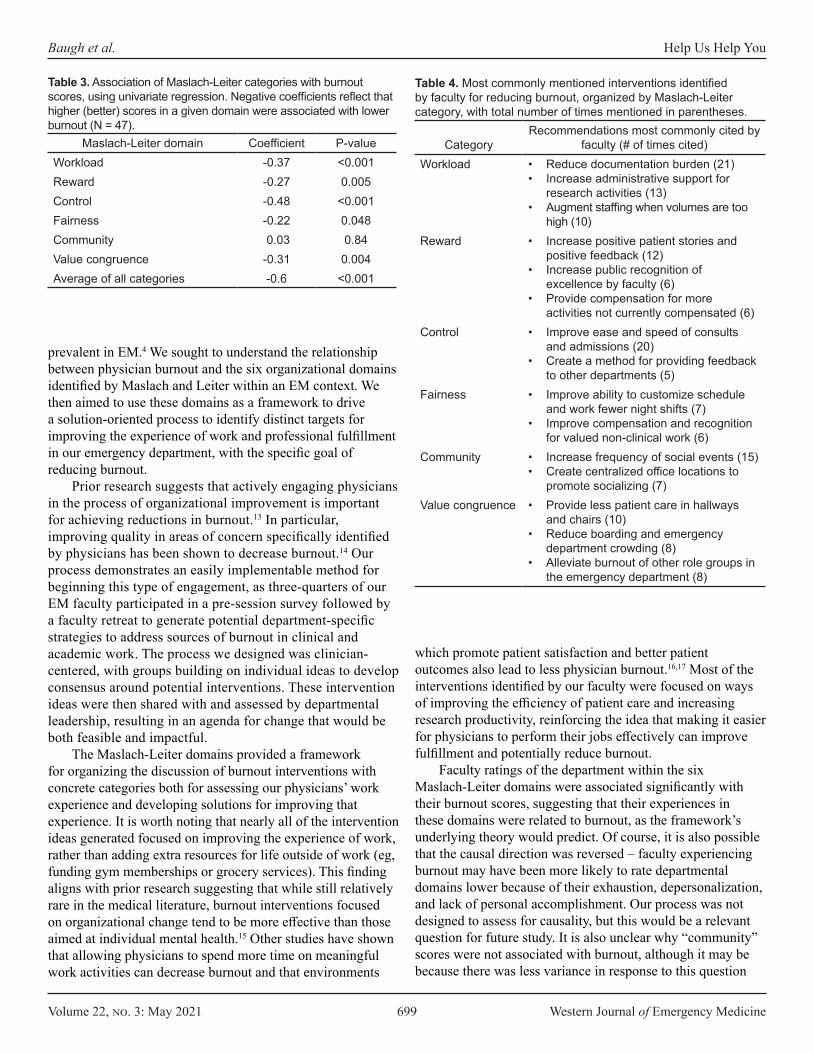
Volume 22, no. 3: May 2021 699 Western Journal of Emergency Medicine
Baugh et al. Help Us Help You
CategoryRecommendations most commonly cited by
faculty (# of times cited)Workload • Reduce documentation burden (21)
• Increase administrative support for research activities (13)
• Augment staffing when volumes are too high (10)
Reward • Increase positive patient stories and positive feedback (12)
• Increase public recognition of excellence by faculty (6)
• Provide compensation for more activities not currently compensated (6)
Control • Improve ease and speed of consults and admissions (20)
• Create a method for providing feedback to other departments (5)
Fairness • Improve ability to customize schedule and work fewer night shifts (7)
• Improve compensation and recognition for valued non-clinical work (6)
Community • Increase frequency of social events (15)• Create centralized office locations to
promote socializing (7)Value congruence • Provide less patient care in hallways
and chairs (10)• Reduce boarding and emergency
department crowding (8)• Alleviate burnout of other role groups in
the emergency department (8)
Table 4. Most commonly mentioned interventions identified by faculty for reducing burnout, organized by Maslach-Leiter category, with total number of times mentioned in parentheses.
prevalent in EM.4 We sought to understand the relationship between physician burnout and the six organizational domains identified by Maslach and Leiter within an EM context. We then aimed to use these domains as a framework to drive a solution-oriented process to identify distinct targets for improving the experience of work and professional fulfillment in our emergency department, with the specific goal of reducing burnout.
Prior research suggests that actively engaging physicians in the process of organizational improvement is important for achieving reductions in burnout.13 In particular, improving quality in areas of concern specifically identified by physicians has been shown to decrease burnout.14 Our process demonstrates an easily implementable method for beginning this type of engagement, as three-quarters of our EM faculty participated in a pre-session survey followed by a faculty retreat to generate potential department-specific strategies to address sources of burnout in clinical and academic work. The process we designed was clinician-centered, with groups building on individual ideas to develop consensus around potential interventions. These intervention ideas were then shared with and assessed by departmental leadership, resulting in an agenda for change that would be both feasible and impactful.
The Maslach-Leiter domains provided a framework for organizing the discussion of burnout interventions with concrete categories both for assessing our physicians’ work experience and developing solutions for improving that experience. It is worth noting that nearly all of the intervention ideas generated focused on improving the experience of work, rather than adding extra resources for life outside of work (eg, funding gym memberships or grocery services). This finding aligns with prior research suggesting that while still relatively rare in the medical literature, burnout interventions focused on organizational change tend to be more effective than those aimed at individual mental health.15 Other studies have shown that allowing physicians to spend more time on meaningful work activities can decrease burnout and that environments
which promote patient satisfaction and better patient outcomes also lead to less physician burnout.16,17 Most of the interventions identified by our faculty were focused on ways of improving the efficiency of patient care and increasing research productivity, reinforcing the idea that making it easier for physicians to perform their jobs effectively can improve fulfillment and potentially reduce burnout.
Faculty ratings of the department within the six Maslach-Leiter domains were associated significantly with their burnout scores, suggesting that their experiences in these domains were related to burnout, as the framework’s underlying theory would predict. Of course, it is also possible that the causal direction was reversed – faculty experiencing burnout may have been more likely to rate departmental domains lower because of their exhaustion, depersonalization, and lack of personal accomplishment. Our process was not designed to assess for causality, but this would be a relevant question for future study. It is also unclear why “community” scores were not associated with burnout, although it may be because there was less variance in response to this question
Maslach-Leiter domain Coefficient P-valueWorkload -0.37 <0.001Reward -0.27 0.005Control -0.48 <0.001Fairness -0.22 0.048Community 0.03 0.84Value congruence -0.31 0.004Average of all categories -0.6 <0.001
Table 3. Association of Maslach-Leiter categories with burnout scores, using univariate regression. Negative coefficients reflect that higher (better) scores in a given domain were associated with lower burnout (N = 47).

Western Journal of Emergency Medicine 700 Volume 22, no. 3: May 2021
Help Us Help You Baugh et al.
than any of the others; scores on this measure were uniformly high, potentially creating a ceiling effect.
Previous studies have suggested that effective organizational leadership decreases burnout and that practice environments identified as both “patient-friendly” and “physician-friendly” have lower burnout rates.18,19 Our process provided a way for department leaders to engage staff in identifying areas of focus for promoting better experiences and outcomes for patients. Importantly, the resulting interventions derived from the process were often “win-win,” ie, solutions were not only relevant to addressing faculty burnout but were also tightly linked to improvements in operational efficiency and care quality. We suspect other departments too will find that areas identified by staff as important for preventing burnout may also highlight opportunities for process improvement.
LIMITATIONSThis article describes our experience with a process
executed once with a single faculty group of physicians. While we believe the process is generalizable, there may be challenges in other settings that we did not encounter. Our sample for assessing the relationship between the Maslach-Leiter domains and burnout scores was small, and this study cannot be used as a validation of the questions we developed. Further work in this area is warranted. We were also unable to assess whether the process we designed, and the resulting solutions, will truly alleviate burnout and promote engagement; this will only be apparent over time. CONCLUSION
We developed an approach to engaging emergency physicians in developing solutions for burnout using the Maslach-Leiter organizational framework. We believe this approach can help other departments engage with physicians to improve their experience of work, with potential positive effects on both career longevity and quality of care.
Address for Correspondence: Joshua J. Baugh, MD, MPP, Massachusetts General Hospital, Department of Emergency Medicine, 55 Fruit St., Boston, MA 02114. Email: [email protected].
Conflicts of Interest: By the WestJEM article submission agreement, all authors are required to disclose all affiliations, funding sources and financial or management relationships that could be perceived as potential sources of bias. No author has professional or financial relationships with any companies that are relevant to this study. There are no conflicts of interest or sources of funding to declare.
Copyright: © 2021 Baugh et al. This is an open access article distributed in accordance with the terms of the Creative Commons Attribution (CC BY 4.0) License. See: http://creativecommons.org/licenses/by/4.0/
REFERENCES1. Arora M, Asha S, Chinnappa J, et al. Burnout in emergency medicine
physicians. Emerg Med Australas. 2013;25(6):491-5.2. Shanafelt TD, Boone S, Tan L, et al. Burnout and satisfaction with
work-life balance among US physicians relative to the general US population. Arch Intern Med. 2012;172(18):1377-85.
3. Lu DW, Dresden S, McCloskey C, et al. Impact of burnout on self-reported patient care among emergency physicians. West J Emerg Med. 2015;16(7):996-1001.
4. Shanafelt TD, Boone S, Tan L, et al. Burnout and satisfaction with work-life balance among US physicians relative to the general US population. Arch Intern Med. 2012;172(18):1377-85.
5. Bragard I, Etienne AM, Merckaert I, et al. Efficacy of a communication and stress management training on medical residents’ self-efficacy, stress to communicate and burnout: a randomized controlled study. J Health Psychol. 2010;15(7):1075-81.
6. Moody K, Kramer D, Santizo RO, et al. Helping the helpers: mindfulness training for burnout in pediatric oncology—a pilot program. J Pediatr Oncol Nurs. 2013;30(5):275-84.
7. Maslach C, Leiter MP. (2008). The Truth about Burnout: How Organizations Cause Personal Stress and What to Do About It. Hoboken, NJ: John Wiley & Sons.
8. Shanafelt TD, Noseworthy JH. Executive leadership and physician well-being: nine organizational strategies to promote engagement and reduce burnout. Mayo Clin Proc. 2017;92(1):129-46.
9. West CP, Dyrbye LN, Erwin PJ, et al. Interventions to prevent and reduce physician burnout: a systematic review and meta-analysis. Lancet. 2016;388(10057):2272-81.
10. Baugh JJ, Takayesu JK, White BA, Raja AS. Beyond the Maslach burnout inventory: addressing emergency medicine burnout with Maslach’s full theory. J Am Coll Emerg Physicians Open. 2020;1(5):1044-9.
11. Trockel M, Bohman B, Lesure E, et al. A brief instrument to assess both burnout and professional fulfillment in physicians: reliability and validity, including correlation with self-reported medical errors, in a sample of resident and practicing physicians. Acad Psychiatry. 2018;42(1):11-24.
12. Olson K, Sinsky C, Rinne ST, et al. Cross-sectional survey of workplace stressors associated with physician burnout measured by the Mini-Z and the Maslach Burnout Inventory. Stress Health. 2019;35(2):157-75.
13. Swensen S, Kabcenell A, Shanafelt T. Physician-organization collaboration reduces physician burnout and promotes engagement: the Mayo Clinic experience. J Healthc Manag. 2016;61(2):105-27.
14. Linzer M, Poplau S, Grossman E, et al. A cluster randomized trial of interventions to improve work conditions and clinician burnout in primary care: results from the Healthy Work Place (HWP) study. J Gen Intern Med. 2015;30(8):1105-11.
15. Panagioti M, Panagopoulou E, Bower P, et al. Controlled interventions to reduce burnout in physicians: a systematic review and meta-analysis. JAMA Intern Med. 2017;177(2):195-205.
16. Shanafelt TD, West CP, Sloan JA, et al. Career fit and burnout among academic faculty. Arch Intern Med. 2009;169(10):990-5.
Volume 22, no. 3: May 2021 701 Western Journal of Emergency Medicine
Baugh et al. Help Us Help You
17. Linn LS, Brook RH, Clark VA, et al. Physician and patient satisfaction as factors related to the organization of internal medicine group practices. Medical Care. 1985;23(10):1171-8.
18. Shanafelt TD, Gorringe G, Menaker R, et al. Impact of organizational leadership on physician burnout and satisfaction. Mayo Clin Proc.
2015;90(4):432-40.19. Williams ES, Konrad TR, Linzer M, et al. Physician, practice, and
patient characteristics related to primary care physician physical and mental health: results from the Physician Worklife Study. Health Serv Res. 2002;37(1):119-41.
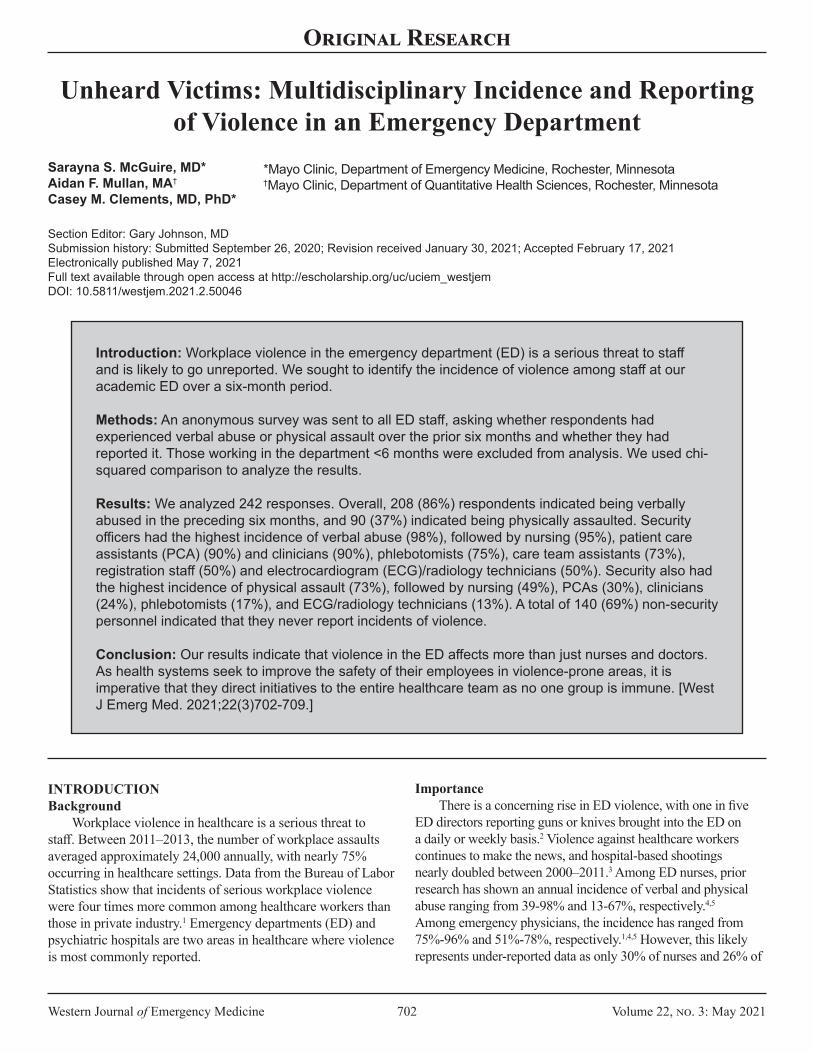
Western Journal of Emergency Medicine 702 Volume 22, no. 3: May 2021
Original Research
Unheard Victims: Multidisciplinary Incidence and Reporting of Violence in an Emergency Department
Sarayna S. McGuire, MD*Aidan F. Mullan, MA†
Casey M. Clements, MD, PhD*
INTRODUCTIONBackground
Workplace violence in healthcare is a serious threat to staff. Between 2011–2013, the number of workplace assaults averaged approximately 24,000 annually, with nearly 75% occurring in healthcare settings. Data from the Bureau of Labor Statistics show that incidents of serious workplace violence were four times more common among healthcare workers than those in private industry.1 Emergency departments (ED) and psychiatric hospitals are two areas in healthcare where violence is most commonly reported.
*Mayo Clinic, Department of Emergency Medicine, Rochester, Minnesota†Mayo Clinic, Department of Quantitative Health Sciences, Rochester, Minnesota
Introduction: Workplace violence in the emergency department (ED) is a serious threat to staff and is likely to go unreported. We sought to identify the incidence of violence among staff at our academic ED over a six-month period.
Methods: An anonymous survey was sent to all ED staff, asking whether respondents had experienced verbal abuse or physical assault over the prior six months and whether they had reported it. Those working in the department <6 months were excluded from analysis. We used chi-squared comparison to analyze the results.
Results: We analyzed 242 responses. Overall, 208 (86%) respondents indicated being verbally abused in the preceding six months, and 90 (37%) indicated being physically assaulted. Security officers had the highest incidence of verbal abuse (98%), followed by nursing (95%), patient care assistants (PCA) (90%) and clinicians (90%), phlebotomists (75%), care team assistants (73%), registration staff (50%) and electrocardiogram (ECG)/radiology technicians (50%). Security also had the highest incidence of physical assault (73%), followed by nursing (49%), PCAs (30%), clinicians (24%), phlebotomists (17%), and ECG/radiology technicians (13%). A total of 140 (69%) non-security personnel indicated that they never report incidents of violence.
Conclusion: Our results indicate that violence in the ED affects more than just nurses and doctors. As health systems seek to improve the safety of their employees in violence-prone areas, it is imperative that they direct initiatives to the entire healthcare team as no one group is immune. [West J Emerg Med. 2021;22(3)702-709.]
Section Editor: Gary Johnson, MD Submission history: Submitted September 26, 2020; Revision received January 30, 2021; Accepted February 17, 2021Electronically published May 7, 2021 Full text available through open access at http://escholarship.org/uc/uciem_westjem DOI: 10.5811/westjem.2021.2.50046
ImportanceThere is a concerning rise in ED violence, with one in five
ED directors reporting guns or knives brought into the ED on a daily or weekly basis.2 Violence against healthcare workers continues to make the news, and hospital-based shootings nearly doubled between 2000–2011.3 Among ED nurses, prior research has shown an annual incidence of verbal and physical abuse ranging from 39-98% and 13-67%, respectively.4,5 Among emergency physicians, the incidence has ranged from 75%-96% and 51%-78%, respectively.1,4,5 However, this likely represents under-reported data as only 30% of nurses and 26% of

Volume 22, no. 3: May 2021 703 Western Journal of Emergency Medicine
McGuire et al. Multidisciplinary Incidence and Reporting of Violence in an ED
Population Health Research Capsule
What do we already know about this issue?Serious workplace violence incidents are five times more common in healthcare than other industries, and events are often not reported.
What was the research question?What is the incidence of workplace violence in the emergency department, risk factors, and why is it under-reported?
What was the major finding of the study?Most staff, including support disciplines, experienced violence and most incidents went unreported.
How does this improve population health?As health systems seek to improve the safety of their employees, they must direct initiatives to the entire healthcare team since no group is immune.
physicians go on to report incidents of violence.6 According to a 2018 poll from the American College of Emergency Physicians, nearly 70% of respondents believed that violence in the ED has increased during the previous five years and nearly 80% felt that patient care was affected as a result.7
Goals of This InterventionExposure to workplace violence impacts the entire team;
however, there is a paucity of research evaluating the incidence of violence experienced by the ED multidisciplinary care team and how it compares to institutional reporting. We sought to survey all staff at our academic ED to identify the incidence of verbal abuse and physical assault over a six-month period and compare responses to documented incident reports from the same time period to evaluate for under-reporting of violence. We also sought to obtain baseline characteristics of respondents to evaluate for risk factors for violence or under-reporting. We hypothesized that nearly all members of the ED multidisciplinary care team have been exposed to verbal abuse over a six-month time period, with many of these incidents going under-reported, and that a significant percentage of staff have also experienced physical assault during the same time frame.
METHODSStudy Design and Setting
This descriptive prospective study took place between April–May 2020 within the ED of a large, academic, Level 1 trauma center in a small urban city in the Midwest. The ED sees an average of 78,000 patients annually and has 24/7 security presence available. Selection of Participants
The target population consisted of all ED staff, including clinicians (attending and resident physicians, and advanced practice providers [APP]), nursing, care team assistants (CTA) who provide clerical support and limited patient interaction, patient care assistants (PCA), electrocardiogram (ECG) and radiology technicians, phlebotomists, registration staff, and security officers who worked in the ED at least six months prior to taking the survey. After review by the institutional review board (IRB), the survey (described below) was emailed to all distribution lists for the abovementioned target population with a cover letter describing the study purpose, directions for participation, and information regarding informed consent. The questionnaire included a statement of informed consent at the beginning, and completion indicated participant consent for inclusion in the study. Two reminder notices were sent two weeks apart through the same method. The IRB reviewed this study and materials and deemed it exempt from approval requirement. Measurements
We developed an anonymous REDCap survey (Research Electronic Data Capture, Vanderbilt University, Nashville, TN)8 that included both multiple-choice and Likert-scale response
questions. This survey was distributed broadly by department and job type to anyone who might work in the ED, even occasionally. Respondents were asked to self-select for if they had done any work in an ED in the preceding six months. Participants were asked to indicate whether they had experienced any of the following forms of verbal abuse in the prior six months (October/November 2019–April/May 2020) while working in the ED: threatening tone of voice; abusive language/statement; harassment (eg, racial, gender, sexual); or personal verbal threats (eg, threat of physical or sexual violence, threat of physical assault to occur outside the workplace). Participants were asked to indicate whether they had experienced any of the following forms of physical assault in the prior six months while working in the ED: physical assault with weapons (including hospital equipment); physical assault with bodily fluids (eg, saliva, urine, feces, wound exudate, blood, or spit); or physical assault in the form of punching, biting, rough handling, scratching, kicking, shoving/pushing, or hitting. If answering affirmatively to any of these choices, respondents were asked to indicate whether they had formally reported the incident.
We used Likert scales to measure participants’ perceptions of safety and estimated frequency of verbal abuse, physical assault, and reporting of incidents of workplace violence in the prior six months. Standard demographic measures were collected, including gender, profession, primary shift worked, and years of experience, and whether the employee had worked in the ED for at least six months. We asked the institution’s
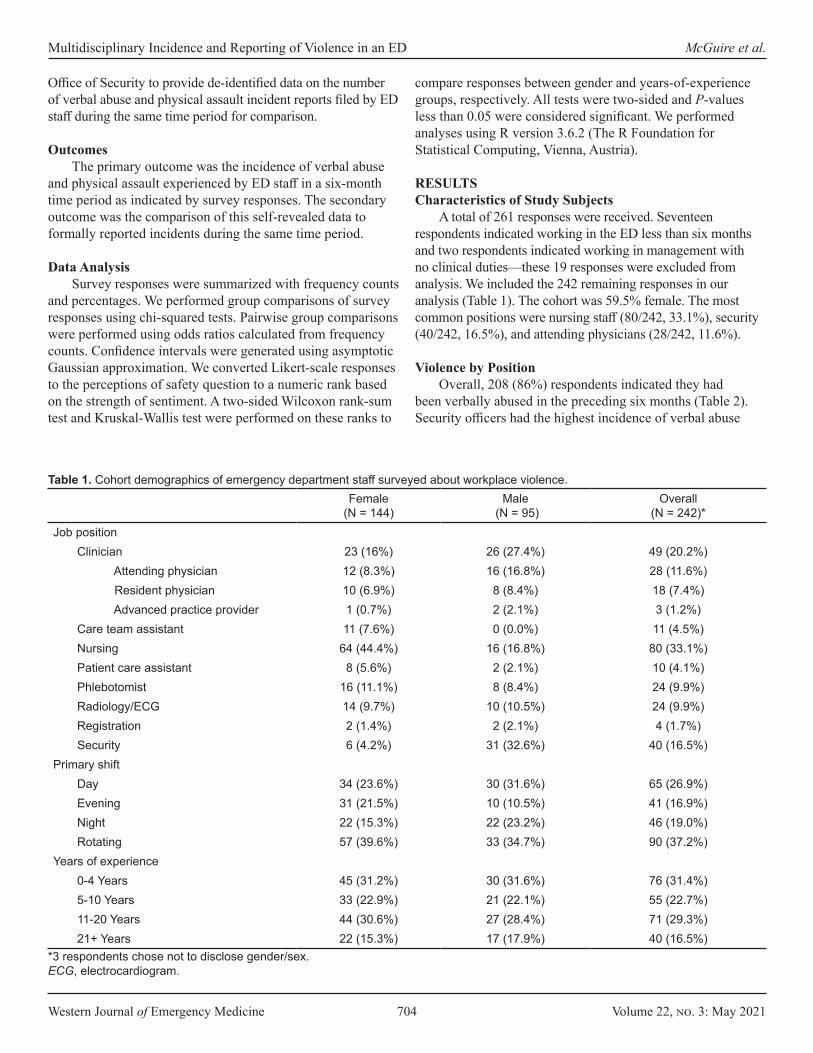
Western Journal of Emergency Medicine 704 Volume 22, no. 3: May 2021
Multidisciplinary Incidence and Reporting of Violence in an ED McGuire et al.
Office of Security to provide de-identified data on the number of verbal abuse and physical assault incident reports filed by ED staff during the same time period for comparison.
OutcomesThe primary outcome was the incidence of verbal abuse
and physical assault experienced by ED staff in a six-month time period as indicated by survey responses. The secondary outcome was the comparison of this self-revealed data to formally reported incidents during the same time period.
Data AnalysisSurvey responses were summarized with frequency counts
and percentages. We performed group comparisons of survey responses using chi-squared tests. Pairwise group comparisons were performed using odds ratios calculated from frequency counts. Confidence intervals were generated using asymptotic Gaussian approximation. We converted Likert-scale responses to the perceptions of safety question to a numeric rank based on the strength of sentiment. A two-sided Wilcoxon rank-sum test and Kruskal-Wallis test were performed on these ranks to
compare responses between gender and years-of-experience groups, respectively. All tests were two-sided and P-values less than 0.05 were considered significant. We performed analyses using R version 3.6.2 (The R Foundation for Statistical Computing, Vienna, Austria).
RESULTSCharacteristics of Study Subjects
A total of 261 responses were received. Seventeen respondents indicated working in the ED less than six months and two respondents indicated working in management with no clinical duties—these 19 responses were excluded from analysis. We included the 242 remaining responses in our analysis (Table 1). The cohort was 59.5% female. The most common positions were nursing staff (80/242, 33.1%), security (40/242, 16.5%), and attending physicians (28/242, 11.6%).
Violence by PositionOverall, 208 (86%) respondents indicated they had
been verbally abused in the preceding six months (Table 2). Security officers had the highest incidence of verbal abuse
Female (N = 144)
Male (N = 95)
Overall (N = 242)*
Job positionClinician 23 (16%) 26 (27.4%) 49 (20.2%)
Attending physician 12 (8.3%) 16 (16.8%) 28 (11.6%) Resident physician 10 (6.9%) 8 (8.4%) 18 (7.4%) Advanced practice provider 1 (0.7%) 2 (2.1%) 3 (1.2%)
Care team assistant 11 (7.6%) 0 (0.0%) 11 (4.5%)Nursing 64 (44.4%) 16 (16.8%) 80 (33.1%)Patient care assistant 8 (5.6%) 2 (2.1%) 10 (4.1%)Phlebotomist 16 (11.1%) 8 (8.4%) 24 (9.9%)Radiology/ECG 14 (9.7%) 10 (10.5%) 24 (9.9%)Registration 2 (1.4%) 2 (2.1%) 4 (1.7%)Security 6 (4.2%) 31 (32.6%) 40 (16.5%)
Primary shiftDay 34 (23.6%) 30 (31.6%) 65 (26.9%)Evening 31 (21.5%) 10 (10.5%) 41 (16.9%)Night 22 (15.3%) 22 (23.2%) 46 (19.0%)Rotating 57 (39.6%) 33 (34.7%) 90 (37.2%)
Years of experience0-4 Years 45 (31.2%) 30 (31.6%) 76 (31.4%)5-10 Years 33 (22.9%) 21 (22.1%) 55 (22.7%)11-20 Years 44 (30.6%) 27 (28.4%) 71 (29.3%)21+ Years 22 (15.3%) 17 (17.9%) 40 (16.5%)
Table 1. Cohort demographics of emergency department staff surveyed about workplace violence.
*3 respondents chose not to disclose gender/sex.ECG, electrocardiogram.

Volume 22, no. 3: May 2021 705 Western Journal of Emergency Medicine
McGuire et al. Multidisciplinary Incidence and Reporting of Violence in an ED
PositionAny
abuseThreatening
toneAbusive
language HarassmentVerbal threats
Reported abuse
Clinician 44 (90%) 42 (86%) 38 (78%) 19 (39%) 17 (44%) 1 (2%) Attending physician 25 (89%) 23 (82%) 23 (82%) 9 (32%) 10 (4%) 1 (4%) Resident physician 16 (89%) 16 (89%) 12 (67%) 10 (6%) 6 (33%) 0 (0%) Advanced practice provider 3 (100%) 3 (100%) 3 (100%) 0 (0%) 1 (33%) 0 (0%)Care team assistant 8 (73%) 7 (64%) 7 (64%) 2 (18%) 1 (9%) 1 (13%)Nursing 76 (95%) 74 (93%) 72 (90%) 41 (51%) 44 (55%) 8 (11%)Patient care assistant 9 (90%) 8 (80%) 9 (90%) 3 (30%) 3 (30%) 0 (0%)Phlebotomist 18 (75%) 12 (50%) 17 (71%) 6 (25%) 2 (8%) 4 (22%)Radiology/ECG 12 (50%) 10 (42%) 10 (42%) 3 (13%) 1 (4%) 0 (0%)Registration 2 (50%) 2 (50%) 1 (25%) 0 (0%) 0 (0%) 0 (0%)Security 39 (98%) 38 (95%) 38 (95%) 27 (68%) 27 (68%) 22 (56%)
Table 2. Incidence of verbal abuse in the prior six months by position.
Note: Reported abuse is given as the percent of respondents who indicated any abuse that reported the incident.ECG, electrocardiogram.
(98%), followed by nursing (95%), PCAs (90%) and clinicians (90%), phlebotomists (75%), CTAs (73%), registration staff (50%), and ECG/radiology technicians (50%). Non-security and non-nursing personnel indicated an incidence of verbal abuse of 78%, which was significantly lower than either security (odds ratio [OR] = 0.08, 95% confidence interval [CI], 0.01 – 0.62, P <.001) or nursing staff (OR = 0.17, 95% CI, 0.06 – 0.50, P < .001).
Staff indicated how often they were verbally abused by patients or family members in the prior six months (Table 3). Security personnel had the highest proportion of responses indicating incidents of verbal abuse at least every week (16/40, 40%), followed by nurses (30/80, 38%). For non-security and non-nurse employees, only 11% of respondents indicated verbal abuse occurring at least every week, which was significantly lower than either security (OR = 0.19, 95% CI, 0.08 - 0.45,P < .001) or nursing staff (OR = 0.22, 95% CI, 0.11 - 0.44, P < .001).
Overall, 90 (37.2%) respondents indicated that they had been physically assaulted in the preceding six months (Table 4). Security officers had the highest incidence of physical assault (73%), followed by nursing (49%), PCAs (30%), clinicians (24%), phlebotomists (17%), and ECG/radiology technicians (13%). Neither CTAs nor registration staff revealed any physical assault. Again, security had the highest frequency of assault, with 29 of 40 (73%) respondents indicating being physically assaulted at least once. Nurses had the next highest frequency of assault (39/80, 49%). For non-security and non-nurse staff, 22 (18%) respondents indicated at least one incident of physical assault. This frequency was significantly lower than security (OR = 0.08, 95% CI, 0.04 - 0.19, P < .001) and nursing staff (OR = 0.23, 95% CI, 0.12 - 0.44, P < .001).
Table 5 describes the frequency of reporting events of workplace violence, grouped by position. Security personnel had the lowest proportion of respondents indicating they never
report incidents, with seven (18%) responding in this way. Comparatively, 140 (69%) non-security personnel responded that they never report incidents. The odds that a non-security staff member responded “Never” were 11 times higher than for security personnel (OR = 10.65, 95% CI, 4.47 - 25.38, P < .001).
Violence by GenderTable 6 provides the number of respondents experiencing
verbal abuse, grouped by gender. Overall, there was no difference in the incidence of verbal abuse between genders (female: 85%; male: 87%, P = 0.70). Males were more likely to report incidents of verbal abuse compared to females (OR = 3.87, 95% CI, 1.77 - 8.47, P < .001). However, once we account for employee position, there was no difference in reporting between males and females. For security personnel, 16/29 (55%) males and 4/6 (67%) females indicated reporting verbal abuse experienced (OR = 1.63, P = 0.61). For non-security personnel, 7/53 (13%) males and 7/116 (6%) females indicated reporting the abuse (OR = 2.37, P = 0.12).
Table 7 summarizes the incidence of physical assault. There was no significant difference in the overall incidence of physical assault between genders (female: 33%; male: 43%, P = 0.16). However, males experienced 2.8 times more occurrences of assault with bodily fluids compared to females (OR = 2.82, 95% CI, 1.43 - 5.55, P = .002). Males who experienced physical assault were more likely to report the incident compared to females (OR = 3.79, 95% CI, 1.57 - 9.18, P = .003). Again, there was no difference in reporting between males and females after accounting for employee position. Among security personnel, 19/21 (90%) males and 5/6 (83%) females indicated reporting physical assault experienced (OR = 1.9, P = 0.63). For non-security personnel, only 6/20 (30%) males and 9/41 (22%) females indicated reporting physical assault experienced (OR = 1.52, P = 0.5).
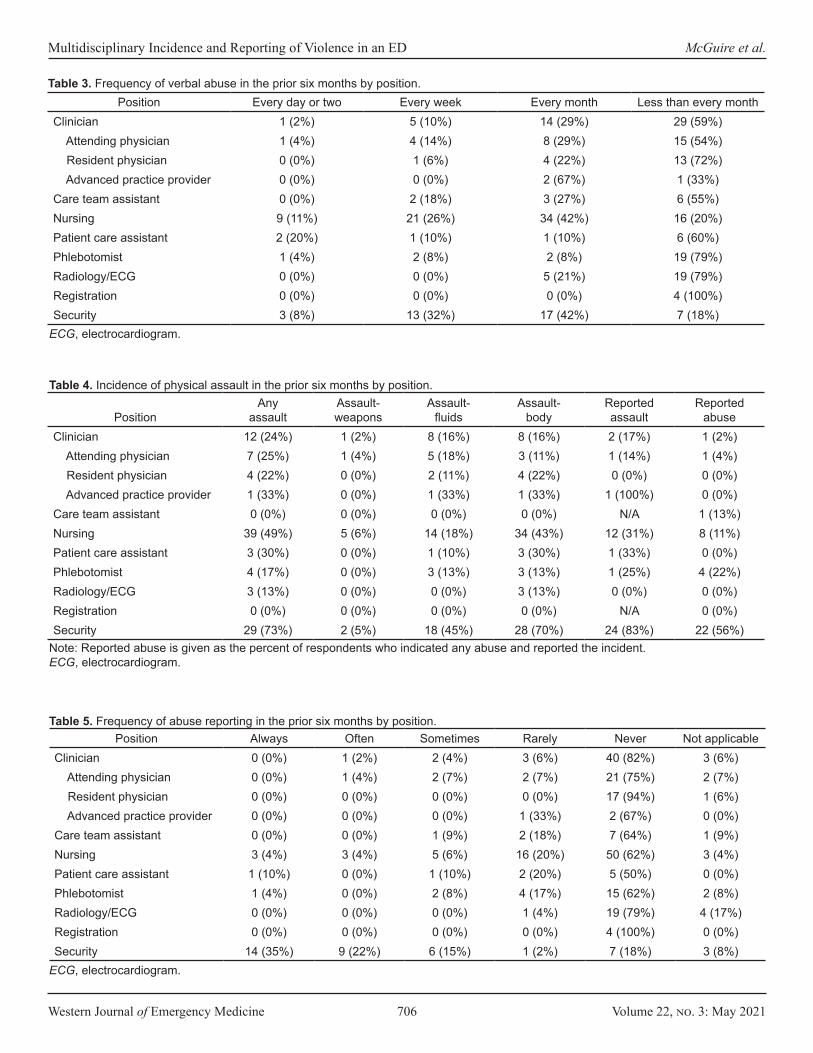
Western Journal of Emergency Medicine 706 Volume 22, no. 3: May 2021
Multidisciplinary Incidence and Reporting of Violence in an ED McGuire et al.
Position Every day or two Every week Every month Less than every monthClinician 1 (2%) 5 (10%) 14 (29%) 29 (59%) Attending physician 1 (4%) 4 (14%) 8 (29%) 15 (54%) Resident physician 0 (0%) 1 (6%) 4 (22%) 13 (72%) Advanced practice provider 0 (0%) 0 (0%) 2 (67%) 1 (33%)Care team assistant 0 (0%) 2 (18%) 3 (27%) 6 (55%)Nursing 9 (11%) 21 (26%) 34 (42%) 16 (20%)Patient care assistant 2 (20%) 1 (10%) 1 (10%) 6 (60%)Phlebotomist 1 (4%) 2 (8%) 2 (8%) 19 (79%)Radiology/ECG 0 (0%) 0 (0%) 5 (21%) 19 (79%)Registration 0 (0%) 0 (0%) 0 (0%) 4 (100%)Security 3 (8%) 13 (32%) 17 (42%) 7 (18%)
Table 3. Frequency of verbal abuse in the prior six months by position.
ECG, electrocardiogram.
PositionAny
assaultAssault- weapons
Assault-fluids
Assault- body
Reported assault
Reported abuse
Clinician 12 (24%) 1 (2%) 8 (16%) 8 (16%) 2 (17%) 1 (2%) Attending physician 7 (25%) 1 (4%) 5 (18%) 3 (11%) 1 (14%) 1 (4%) Resident physician 4 (22%) 0 (0%) 2 (11%) 4 (22%) 0 (0%) 0 (0%) Advanced practice provider 1 (33%) 0 (0%) 1 (33%) 1 (33%) 1 (100%) 0 (0%)Care team assistant 0 (0%) 0 (0%) 0 (0%) 0 (0%) N/A 1 (13%)Nursing 39 (49%) 5 (6%) 14 (18%) 34 (43%) 12 (31%) 8 (11%)Patient care assistant 3 (30%) 0 (0%) 1 (10%) 3 (30%) 1 (33%) 0 (0%)Phlebotomist 4 (17%) 0 (0%) 3 (13%) 3 (13%) 1 (25%) 4 (22%)Radiology/ECG 3 (13%) 0 (0%) 0 (0%) 3 (13%) 0 (0%) 0 (0%)Registration 0 (0%) 0 (0%) 0 (0%) 0 (0%) N/A 0 (0%)Security 29 (73%) 2 (5%) 18 (45%) 28 (70%) 24 (83%) 22 (56%)
Table 4. Incidence of physical assault in the prior six months by position.
Note: Reported abuse is given as the percent of respondents who indicated any abuse and reported the incident.ECG, electrocardiogram.
Position Always Often Sometimes Rarely Never Not applicableClinician 0 (0%) 1 (2%) 2 (4%) 3 (6%) 40 (82%) 3 (6%) Attending physician 0 (0%) 1 (4%) 2 (7%) 2 (7%) 21 (75%) 2 (7%) Resident physician 0 (0%) 0 (0%) 0 (0%) 0 (0%) 17 (94%) 1 (6%) Advanced practice provider 0 (0%) 0 (0%) 0 (0%) 1 (33%) 2 (67%) 0 (0%)Care team assistant 0 (0%) 0 (0%) 1 (9%) 2 (18%) 7 (64%) 1 (9%)Nursing 3 (4%) 3 (4%) 5 (6%) 16 (20%) 50 (62%) 3 (4%)Patient care assistant 1 (10%) 0 (0%) 1 (10%) 2 (20%) 5 (50%) 0 (0%)Phlebotomist 1 (4%) 0 (0%) 2 (8%) 4 (17%) 15 (62%) 2 (8%)Radiology/ECG 0 (0%) 0 (0%) 0 (0%) 1 (4%) 19 (79%) 4 (17%)Registration 0 (0%) 0 (0%) 0 (0%) 0 (0%) 4 (100%) 0 (0%)Security 14 (35%) 9 (22%) 6 (15%) 1 (2%) 7 (18%) 3 (8%)
Table 5. Frequency of abuse reporting in the prior six months by position.
ECG, electrocardiogram.
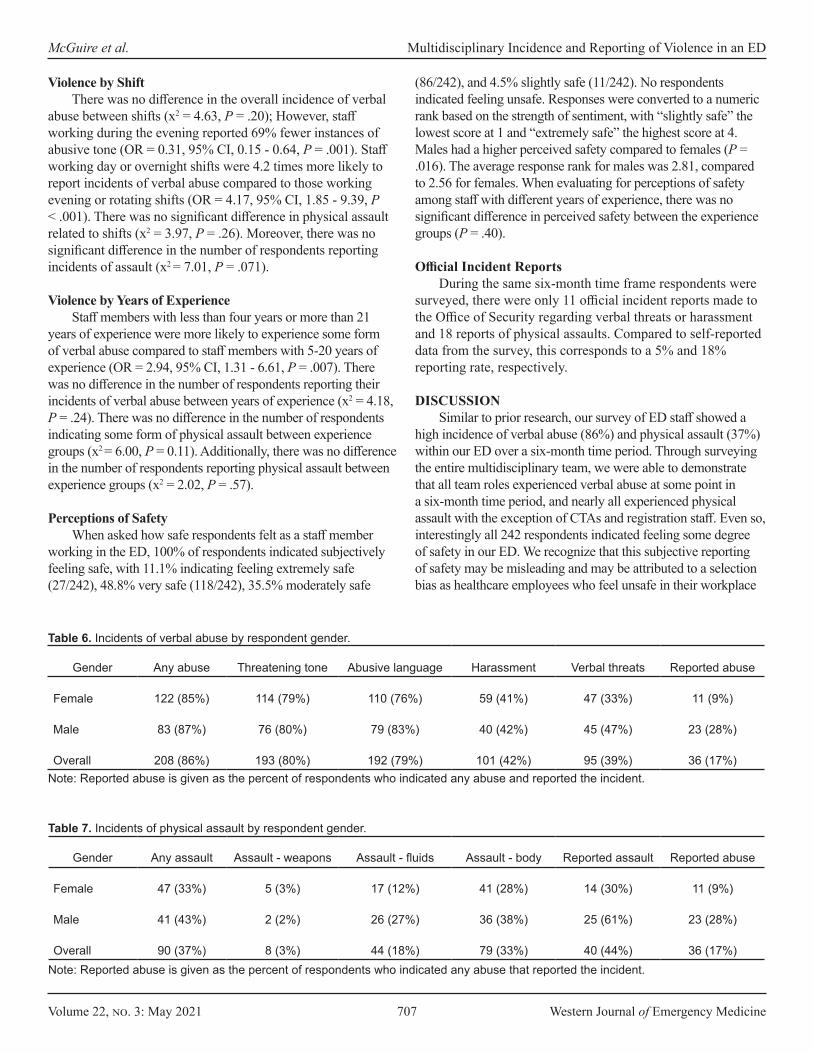
Volume 22, no. 3: May 2021 707 Western Journal of Emergency Medicine
McGuire et al. Multidisciplinary Incidence and Reporting of Violence in an ED
Gender Any abuse Threatening tone Abusive language Harassment Verbal threats Reported abuse
Female 122 (85%) 114 (79%) 110 (76%) 59 (41%) 47 (33%) 11 (9%)
Male 83 (87%) 76 (80%) 79 (83%) 40 (42%) 45 (47%) 23 (28%)
Overall 208 (86%) 193 (80%) 192 (79%) 101 (42%) 95 (39%) 36 (17%)
Table 6. Incidents of verbal abuse by respondent gender.
Note: Reported abuse is given as the percent of respondents who indicated any abuse and reported the incident.
Gender Any assault Assault - weapons Assault - fluids Assault - body Reported assault Reported abuse
Female 47 (33%) 5 (3%) 17 (12%) 41 (28%) 14 (30%) 11 (9%)
Male 41 (43%) 2 (2%) 26 (27%) 36 (38%) 25 (61%) 23 (28%)
Overall 90 (37%) 8 (3%) 44 (18%) 79 (33%) 40 (44%) 36 (17%)
Table 7. Incidents of physical assault by respondent gender.
Note: Reported abuse is given as the percent of respondents who indicated any abuse that reported the incident.
Violence by Shift There was no difference in the overall incidence of verbal
abuse between shifts (x2 = 4.63, P = .20); However, staff working during the evening reported 69% fewer instances of abusive tone (OR = 0.31, 95% CI, 0.15 - 0.64, P = .001). Staff working day or overnight shifts were 4.2 times more likely to report incidents of verbal abuse compared to those working evening or rotating shifts (OR = 4.17, 95% CI, 1.85 - 9.39, P < .001). There was no significant difference in physical assault related to shifts (x2 = 3.97, P = .26). Moreover, there was no significant difference in the number of respondents reporting incidents of assault (x2 = 7.01, P = .071).
Violence by Years of ExperienceStaff members with less than four years or more than 21
years of experience were more likely to experience some form of verbal abuse compared to staff members with 5-20 years of experience (OR = 2.94, 95% CI, 1.31 - 6.61, P = .007). There was no difference in the number of respondents reporting their incidents of verbal abuse between years of experience (x2 = 4.18, P = .24). There was no difference in the number of respondents indicating some form of physical assault between experience groups (x2 = 6.00, P = 0.11). Additionally, there was no difference in the number of respondents reporting physical assault between experience groups (x2 = 2.02, P = .57).
Perceptions of SafetyWhen asked how safe respondents felt as a staff member
working in the ED, 100% of respondents indicated subjectively feeling safe, with 11.1% indicating feeling extremely safe (27/242), 48.8% very safe (118/242), 35.5% moderately safe
(86/242), and 4.5% slightly safe (11/242). No respondents indicated feeling unsafe. Responses were converted to a numeric rank based on the strength of sentiment, with “slightly safe” the lowest score at 1 and “extremely safe” the highest score at 4. Males had a higher perceived safety compared to females (P = .016). The average response rank for males was 2.81, compared to 2.56 for females. When evaluating for perceptions of safety among staff with different years of experience, there was no significant difference in perceived safety between the experience groups (P = .40).
Official Incident ReportsDuring the same six-month time frame respondents were
surveyed, there were only 11 official incident reports made to the Office of Security regarding verbal threats or harassment and 18 reports of physical assaults. Compared to self-reported data from the survey, this corresponds to a 5% and 18% reporting rate, respectively.
DISCUSSIONSimilar to prior research, our survey of ED staff showed a
high incidence of verbal abuse (86%) and physical assault (37%) within our ED over a six-month time period. Through surveying the entire multidisciplinary team, we were able to demonstrate that all team roles experienced verbal abuse at some point in a six-month time period, and nearly all experienced physical assault with the exception of CTAs and registration staff. Even so, interestingly all 242 respondents indicated feeling some degree of safety in our ED. We recognize that this subjective reporting of safety may be misleading and may be attributed to a selection bias as healthcare employees who feel unsafe in their workplace
Western Journal of Emergency Medicine 708 Volume 22, no. 3: May 2021
Multidisciplinary Incidence and Reporting of Violence in an ED McGuire et al.
are more likely to transfer out of the department and may have been missed by our survey. This finding may also mirror prior literature that healthcare employees are resistant to the belief that they are at risk for patient-initiated violence and experience a complacency in thinking that violence is simply “part of the job.”1
Security personnel were more likely to formally report incidents compared to non-security personnel victims. This may be due in part to the nature of their job and the frequency with which they experience violence, as well as familiarity with the reporting process as departmental incident reports are submitted to their office. Concerningly, 69% of non-security personnel indicated that they never report incidents of violence. This was corroborated with a review of official incident reports received during the same time period. Barriers to reporting are multifactorial and include, as described above, the belief that violence is “part of the job,” confusion over what constitutes violence, unfamiliarity with reporting processes, lack of available time at work for reporting incidents, fear of retribution from supervisors, and perceived lack of institutional support.1,9 Our study findings indicate that future efforts to increase incident reporting within the ED should focus on the entire multidisciplinary team, including visiting staff assigned to non-ED departments such as phlebotomy, cardiac monitoring (ECG), and radiology.
In terms of isolating specific risk factors, we found no difference in the overall incidence of violence between genders; however, males were significantly more likely to report incidents of both verbal and physical abuse compared to females. To our knowledge, this has not been previously described in the literature. Although we found a difference in the reporting of violence between genders, this difference was not significant once we accounted for employee position. This is likely due to a greater proportion of males in our study working in security (35% males, 5% females), and security personnel indicating a higher rate of violence reporting regardless of gender. Future studies with larger cohort sizes should seek to identify whether there is a difference in reporting between genders. Coincidentally, females had a significantly lower perceived perception of safety in our ED compared to their male counterparts. Thus, additional research should seek to more clearly establish the reasons why more females choose not to report incidents of violence.
There was no significant difference in the overall incidence of violence between shifts; however, staff working daytime or overnight shifts were more likely to report incidents of verbal abuse. This may be explained by the higher frequency of incident reporting by security staff and the fact that security officers in our institution work 12-hour shifts, considered either day shift or overnight shifts, with only non-security personnel working evening or rotating shifts. Future research should continue to distinguish what additional demographic factors may be contributing to the lack of violence reporting.
The unique environment of the ED contributes to its propensity for violence: stress among patients, families, and visitors; long wait times and delays; crowding; unrestricted
24-hour access; low socioeconomic status; substance abuse; patients with behavioral health issues; gang activity; and frequent delivery of “bad news” have all been suggested to contribute to the elevated incidence of violence.1,10 A multidisciplinary study of healthcare workers found exposure to workplace violence significantly correlated with burnout, and a separate survey of ED nurses found that 94% of those experiencing violence in the workplace exhibited symptoms of post-traumatic stress.11 In addition to its impact on patient care and detriment to employee wellbeing, violence has a substantial financial impact for employers and the economy. Financial costs of workplace violence include lost time/wages; medical costs of employee injury, disability, and/or death; and attrition.12 According to a 2017 report commissioned by the American Hospital Association, hospitals spent an estimated $1.1 billion in security and training costs to prevent violence, and an additional $429 million to cover costs such as medical care, staffing, and insurance resulting from violence against staff.13,14 Future research should attempt to characterize the mental and physical toll on the multidisciplinary ED care team to help direct efforts for employee wellbeing.
This study’s findings have important clinical implications. The incidence of verbal abuse among our multidisciplinary ED care team was nearly 6 of every 7 staff members, and yet these incidents were almost never reported to the institution. The incidence of physical assault was more than 2 of every 5 staff members and, again, the majority went unreported. Nearly 7 out of every 10 non-security staff members declined to officially report the violence they experienced. Findings from this study suggest that the pervasive nature of violence in healthcare is still underappreciated and that increased efforts are needed to protect ED staff members and support and encourage or incentivize accurate and reliable reporting.
LIMITATIONSThis study has several important limitations. To preserve
anonymity of employees, the study was sent to email distribution lists (DL) and included some DLs with employees working in other departments other than the ED (eg, phlebotomy, and ECG and radiology technicians), or who also worked at additional sites elsewhere in our health system (eg, clinicians). Thus, it is not possible to know the actual number of employees from different disciplines who work in the ED to estimate a response rate for our survey. Additionally, to further preserve anonymity, we did not ask in-depth demographic questions. Without knowing full-time vs part-time status of respondents, it is possible that some responses came from employees working part time and this may have skewed our incidence of violence. The definition of “verbal abuse” is highly subjective to individual respondents and survey inclusion of “threatening tone of voice’” may have contributed to over-reporting of verbal abuse in general by respondents.
The study was also subject to recall and reporting bias in terms of violence experienced over a six-month time period, as well as the reporting of incidents. We acknowledge that because this was a single-center study some aspects may not be
Volume 22, no. 3: May 2021 709 Western Journal of Emergency Medicine
McGuire et al. Multidisciplinary Incidence and Reporting of Violence in an ED
generalizable to all institutions or geographic regions. However, the finding of under-reporting is not dissimilar to other published studies,15,16 and the fact that abuse and violence affect previously unstudied populations including ancillary services and clerical assistant staff is important and not likely related to local factors.
Address for Correspondence: Sarayna S. McGuire, MD, Mayo Clinic, Department of Emergency Medicine, 200 First St SW, Rochester, MN 55905. Email: [email protected].
Conflicts of Interest: By the WestJEM article submission agreement, all authors are required to disclose all affiliations, funding sources and financial or management relationships that could be perceived as potential sources of bias. No author has professional or financial relationships with any companies that are relevant to this study. There are no conflicts of interest or sources of funding to declare.
Copyright: © 2021 McGuire et al. This is an open access article distributed in accordance with the terms of the Creative Commons Attribution (CC BY 4.0) License. See: http://creativecommons.org/licenses/by/4.0/
REFERENCES1. Philips JP. Workplace violence against health care workers in the
United States. N Engl J Med. 2016;374:1661-9.2. Kansagra SM, Rao SR, Sullivan AF, et al. A survey of workplace
violence across 65 U.S. emergency departments. SAEM. 2008; 15:1268-74.
3. Weyand JS, Junck E, Kang CS, et al. Security, violent events, and anticipated surge capabilities of emergency departments in Washington state. West J Emerg Med. 2017;18(3)466-73.
4. Gerberich SG, Church TR, McGovern PM, et al. An epidemiological study of the magnitude and consequences of work related violence: the Minnesota Nurses’ Study. Occup Environ Med. 2004;61:495-503.
5. Gates DM, Ross CS, McQueen L. Violence against emergency department workers. J Emerg Med. 2006;31:331-7.
6. Behnam M, Tillotson RD, Davis SM, et al. Violence in the emergency department: a national survey of emergency medicine residents and attending physicians. J Emerg Med. 2011;40(5):565-79.
7. Kelly M. Violent attacks against emergency physicians remain a problem. Ann Emerg Med. 2020(75):11A-4A.
8. Paul A. Harris, Robert Taylor, Robert Thielke, et al. Research electronic data capture (REDCap) – A metadata-driven methodology and workflow process for providing translational research informatics support. J Biomed Inform. 2009; 42(2):377-81.
9. Stene J, Larson E, Levy M, Dohlman M. Workplace violence in the emergency department: giving staff the tools and support to report. Perm J. 2015;19(2):e113-7.
10. Lenaghan PA, Cirrincione NM, Henrich S. Preventing emergency department violence through design. J Emerg Nurs. 2018;44:7-12.
11. Copeland D and Henry M. The relationship between workplace violence, perceptions of safety, and professional quality of life among emergency department staff members in a Level 1 trauma centre. Int Emerg Nurs. 2018;39:26-32.
12. Larson LA, Finley JL, Gross TL, et al. Using a potentially aggressive/violent patient huddle to improve health care safety. Jt Comm J Qual Saf. 2019;45:74-80.
13. Taylor JL and Rew L. A systematic review of the literature: workplace violence in the emergency department. J Clin Nurs. 2010;20:1072-85.
14. Durkin M. Hospital fight back against violence. 2017. Available at: https://acphospitalist.org/archives/2017/12/hospitals-fight-back-against-violence.htm. Accessed May 25, 2020.
15. Pompeii LA, Schoenfisch AL, Lipscomb HJ, et al. Physical assault, physical threat, and verbal abuse perpetrated against hospital workers by patients or visitors in six U.S. hospitals. Am J Ind Med. 2015;58(11):1194-204.
16. Speroni KG, Fitch T, Dawson E, et al. Incidence and cost of nurse workplace violence perpetrated by hospital patients or patient visitors. J Emerg Nurs. 2014;40(3):218-28.

Western Journal of Emergency Medicine 710 Volume 22, no. 3: May 2021
Original Research
Emergency Medicine Influencers’ Twitter Use During the COVID-19 Pandemic: A Mixed-methods Analysis
Maren K. Leibowitz, MD*Michael R. Scudder, BS†
Meghan McCabe, BS‡
Jennifer L. Chan, MD, MPH*Matthew R. Klein, MD, MPH, MEd*N. Seth Trueger, MD, MPH*Danielle M. McCarthy, MD, MS§
Section Editor: Mark I. Langdorf, MD, MHPE Submission history: Submitted July 23, 2020; Revision received January 2, 2021; Accepted December 22, 2020 Electronically published March 22, 2021 Full text available through open access at http://escholarship.org/uc/uciem_westjem DOI: 10.5811/westjem.2020.12.49213
INTRODUCTION The newly discovered coronavirus disease 2019
(COVID-19) global pandemic has had an unprecedented impact on the healthcare community. As of this writing, there have been more than 73.7 million cases worldwide with the United States (US) accounting for approximately one quarter of all cases. The US also accounts for about one fifth of all deaths from COVID-19, with over 300,000 lives lost.1
Since first being described in Wuhan, China, in December
Northwestern University, Department of Emergency Medicine, Chicago, IllinoisVanderbilt University, Nashville, TennesseeSaint Louis University, St. Louis, MissouriNorthwestern University, Center for Health Services & Outcomes Research, Department of Emergency Medicine, Chicago, Illinois
*†
‡
§
Introduction: The objective of this study was to analyze the messages of influential emergency medicine (EM) Twitter users in the United States (US) during the early stages of the coronavirus disease 2019 (COVID-19) global pandemic by characterizing the themes, emotional tones, temporal viewpoints, and depth of engagement with the tweets.
Methods: We performed a retrospective mixed-methods analysis of publicly available Twitter data derived from the publicly available “Coronavirus Tweet IDs” dataset, March 3, 2020–May 1, 2020. Original tweets and modified retweets in the dataset by 50 influential EM Twitter users in the US were analyzed using linguistic software to report the emotional tone and temporal viewpoint. We qualitatively analyzed a 25% random subsample and report themes.
Results: There were 1315 tweets available in the dataset from 36/50 influential EM Twitter users in the US. The majority of tweets were either positive (455/1315, 34.6%) or neutral (407/1315, 31%) in tone and focused on the present (1009/1315, 76.7%). Qualitative analysis identified six distinct themes, with users most often sharing news or clinical information.
Conclusions: During the early weeks of the COVID-19 pandemic, influential EM Twitter users in the US delivered mainly positive or neutral messages, most often pertaining to news stories or information directly relating to patient care. The majority of these messages led to engagement by other users. This study underscores how EM influencers can leverage social media in public health outbreaks to bring attention to topics of importance. [West J Emerg Med. 2021;22(3)710–718.]
2019,2 clinical information, guidelines, and practices have rapidly evolved.3-5 As cases emerged within the US, lack of a coordinated national response overwhelmed certain regions of the country and continue to threaten to overwhelm the country’s health system.6,7 In this way, clinicians have faced unique challenges in discovering and implementing best clinical practices, confronting issues with personal well-being and engaging in the discourse surrounding the country’s response efforts.

Volume 22, no. 3: May 2021 711 Western Journal of Emergency Medicine
Leibowitz et al. EM Influencers Twitter Use During COVID-19
Population Health Research Capsule
What do we already know about this issue?The use of Twitter by influential emergency medicine (EM) users during the coronavirus disease 2019 (COVID-19) pandemic had not previously been studied.
What was the research question?What were influential EM Twitter users talking about during the early stages of the COVID-19 pandemic?
What was the major finding of the study?Influential EM Twitter users mainly shared news or clinical information in positive or neutral messages.
How does this improve population health?This study shows how EM influencers used Twitter in a rapidly evolving situation, and may suggest how it could be leveraged in future public health crises.
Within the field of emergency medicine (EM), social media — in particular Twitter — has risen as a popular platform for the quick and widespread dissemination of information and opinions.8 Opinion leaders within the EM community on Twitter have previously been identified as those with the most followers and most connections within the Twitter community..9 These EM influencers have a disproportionate impact on discourse due to their large audiences that view them as credible sources of information.10,11 Prior to the COVID-19 pandemic, EM influencers used Twitter primarily to discuss medical topics and to share resources and opinions, with a significant social and humor component.12
Since COVID arrived, doctors across many specialties have increasingly turned to Twitter to both gather information and to combat misinformation.13-15 The goal of this study was to analyze the messages of influential EM Twitter users in the US during the early stages of the COVID-19 pandemic. We aimed to evaluate the thematic landscape of messages over time to help describe how social media was being used by the EM community in a novel and evolving setting. We also sought to analyze the emotional tone and temporal viewpoint of the language used and depth of engagement with these messages. These data provide insight into ways EM users can leverage social media in future health crises for the benefit of clinicians and patients alike.
METHODS Study Design
This was a retrospective analysis of publicly available Twitter data analyzed via a mixed-methods analysis using a combined content analysis approach. Due to the qualitative and quantitative nature of Twitter data, combined content analysis has been suggested to address these types of datasets.16,17
SampleWe analyzed a sample of English-language tweets from
50 influential, US-based EM influencers on Twitter during the early stages of the COVID-19 pandemic. We adapted the list of EM influencers from two previously published network analyses9,18 using an iterative consensus-driven process; criteria included presence on either prior list, recognition within the EM Twitter community, and based in the US (Appendix 1). We excluded one potential EM influencer (NST), who is a coauthor on this study, to avoid coding bias since tweets cannot be fully blinded. We chose to analyze influencers from the US to narrow our study to one area of the world where the disaster dynamics were occurring under one governance structure and country environment, enabling a more nuanced analysis of themes related to the US healthcare system, regional logistics, and clinical practices. Previous studies have shown that analyzing tweets from Twitter influencers provides a narrative of Twitter activity without needing to analyze all users;12 thus, we felt that limiting
our sample to influencers would still reflect the general conversation among all EM users on Twitter.
Given the evolving nature of the pandemic over time, we decided to analyze a sample of tweets from each week during the time period of March 3, 2020–May 1, 2020. These dates range from the week before the World Health Organization declared COVID-19 a pandemic to the most current dates available at the time of data retrieval.19
Data Collection We used the George Washington University Libraries
Tweetsets data platform to access and filter the “Coronavirus Tweet IDs” dataset (version 5). The dataset consists of Tweet IDs “collected using the POST statuses/filter method of the Twitter Stream API, using the track parameter with the following keywords: #Coronavirus, #Coronaoutbreak, #COVID19.”20 Version 5 of the dataset contains tweet IDs from March 3, 2020–May 1, 2020. The Tweetsets search functionality allowed us to generate a dataset from the Coronavirus Tweet IDs dataset (which contained 188,026,475 tweets). To generate the dataset for this investigation, we included only original tweets and quote tweets authored by the pre-specified list of EM influencers. Unmodified retweets and replies were excluded.
The Twitter developer policy21 states that tweet IDs may be publicly shared for academic purposes; however, tweets may not. The dataset above contains only tweet IDs, not the
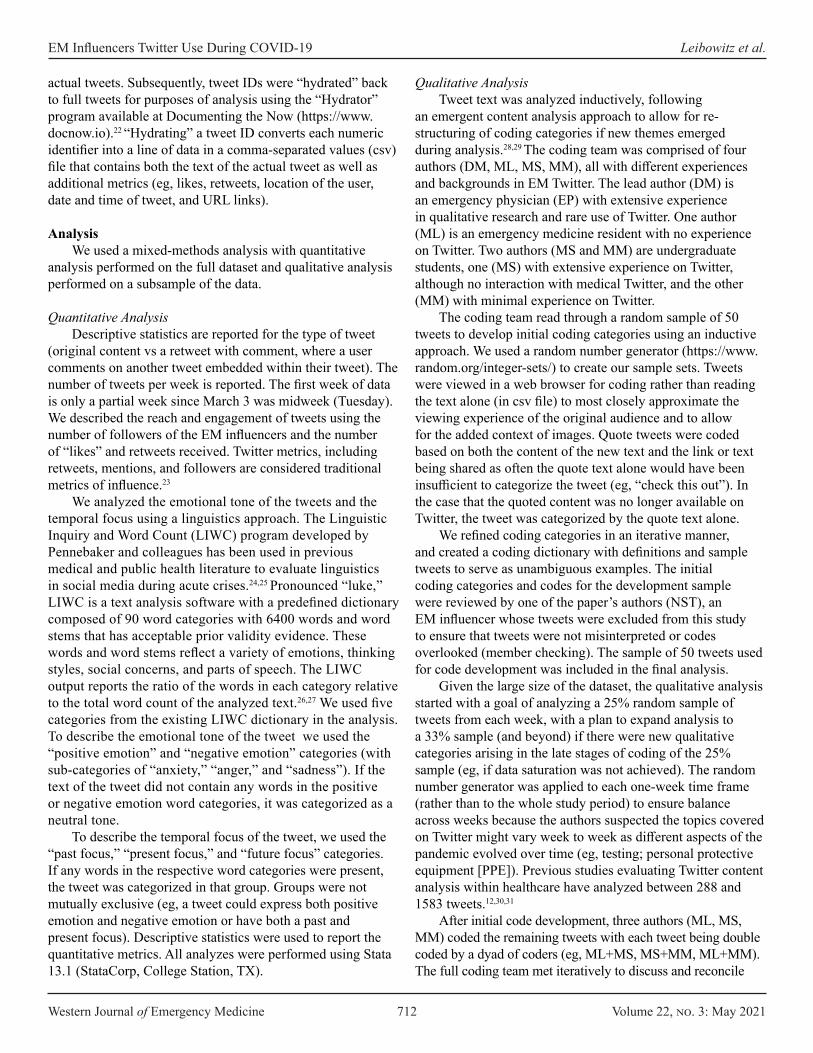
Western Journal of Emergency Medicine 712 Volume 22, no. 3: May 2021
EM Influencers Twitter Use During COVID-19 Leibowitz et al.
actual tweets. Subsequently, tweet IDs were “hydrated” back to full tweets for purposes of analysis using the “Hydrator” program available at Documenting the Now (https://www.docnow.io).22 “Hydrating” a tweet ID converts each numeric identifier into a line of data in a comma-separated values (csv) file that contains both the text of the actual tweet as well as additional metrics (eg, likes, retweets, location of the user, date and time of tweet, and URL links).
Analysis We used a mixed-methods analysis with quantitative
analysis performed on the full dataset and qualitative analysis performed on a subsample of the data.
Quantitative Analysis Descriptive statistics are reported for the type of tweet
(original content vs a retweet with comment, where a user comments on another tweet embedded within their tweet). The number of tweets per week is reported. The first week of data is only a partial week since March 3 was midweek (Tuesday). We described the reach and engagement of tweets using the number of followers of the EM influencers and the number of “likes” and retweets received. Twitter metrics, including retweets, mentions, and followers are considered traditional metrics of influence.23
We analyzed the emotional tone of the tweets and the temporal focus using a linguistics approach. The Linguistic Inquiry and Word Count (LIWC) program developed by Pennebaker and colleagues has been used in previous medical and public health literature to evaluate linguistics in social media during acute crises.24,25 Pronounced “luke,” LIWC is a text analysis software with a predefined dictionary composed of 90 word categories with 6400 words and word stems that has acceptable prior validity evidence. These words and word stems reflect a variety of emotions, thinking styles, social concerns, and parts of speech. The LIWC output reports the ratio of the words in each category relative to the total word count of the analyzed text.26,27 We used five categories from the existing LIWC dictionary in the analysis. To describe the emotional tone of the tweet we used the “positive emotion” and “negative emotion” categories (with sub-categories of “anxiety,” “anger,” and “sadness”). If the text of the tweet did not contain any words in the positive or negative emotion word categories, it was categorized as a neutral tone.
To describe the temporal focus of the tweet, we used the “past focus,” “present focus,” and “future focus” categories. If any words in the respective word categories were present, the tweet was categorized in that group. Groups were not mutually exclusive (eg, a tweet could express both positive emotion and negative emotion or have both a past and present focus). Descriptive statistics were used to report the quantitative metrics. All analyzes were performed using Stata 13.1 (StataCorp, College Station, TX).
Qualitative AnalysisTweet text was analyzed inductively, following
an emergent content analysis approach to allow for re-structuring of coding categories if new themes emerged during analysis.28,29 The coding team was comprised of four authors (DM, ML, MS, MM), all with different experiences and backgrounds in EM Twitter. The lead author (DM) is an emergency physician (EP) with extensive experience in qualitative research and rare use of Twitter. One author (ML) is an emergency medicine resident with no experience on Twitter. Two authors (MS and MM) are undergraduate students, one (MS) with extensive experience on Twitter, although no interaction with medical Twitter, and the other (MM) with minimal experience on Twitter.
The coding team read through a random sample of 50 tweets to develop initial coding categories using an inductive approach. We used a random number generator (https://www.random.org/integer-sets/) to create our sample sets. Tweets were viewed in a web browser for coding rather than reading the text alone (in csv file) to most closely approximate the viewing experience of the original audience and to allow for the added context of images. Quote tweets were coded based on both the content of the new text and the link or text being shared as often the quote text alone would have been insufficient to categorize the tweet (eg, “check this out”). In the case that the quoted content was no longer available on Twitter, the tweet was categorized by the quote text alone.
We refined coding categories in an iterative manner, and created a coding dictionary with definitions and sample tweets to serve as unambiguous examples. The initial coding categories and codes for the development sample were reviewed by one of the paper’s authors (NST), an EM influencer whose tweets were excluded from this study to ensure that tweets were not misinterpreted or codes overlooked (member checking). The sample of 50 tweets used for code development was included in the final analysis.
Given the large size of the dataset, the qualitative analysis started with a goal of analyzing a 25% random sample of tweets from each week, with a plan to expand analysis to a 33% sample (and beyond) if there were new qualitative categories arising in the late stages of coding of the 25% sample (eg, if data saturation was not achieved). The random number generator was applied to each one-week time frame (rather than to the whole study period) to ensure balance across weeks because the authors suspected the topics covered on Twitter might vary week to week as different aspects of the pandemic evolved over time (eg, testing; personal protective equipment [PPE]). Previous studies evaluating Twitter content analysis within healthcare have analyzed between 288 and 1583 tweets.12,30,31
After initial code development, three authors (ML, MS, MM) coded the remaining tweets with each tweet being double coded by a dyad of coders (eg, ML+MS, MS+MM, ML+MM). The full coding team met iteratively to discuss and reconcile
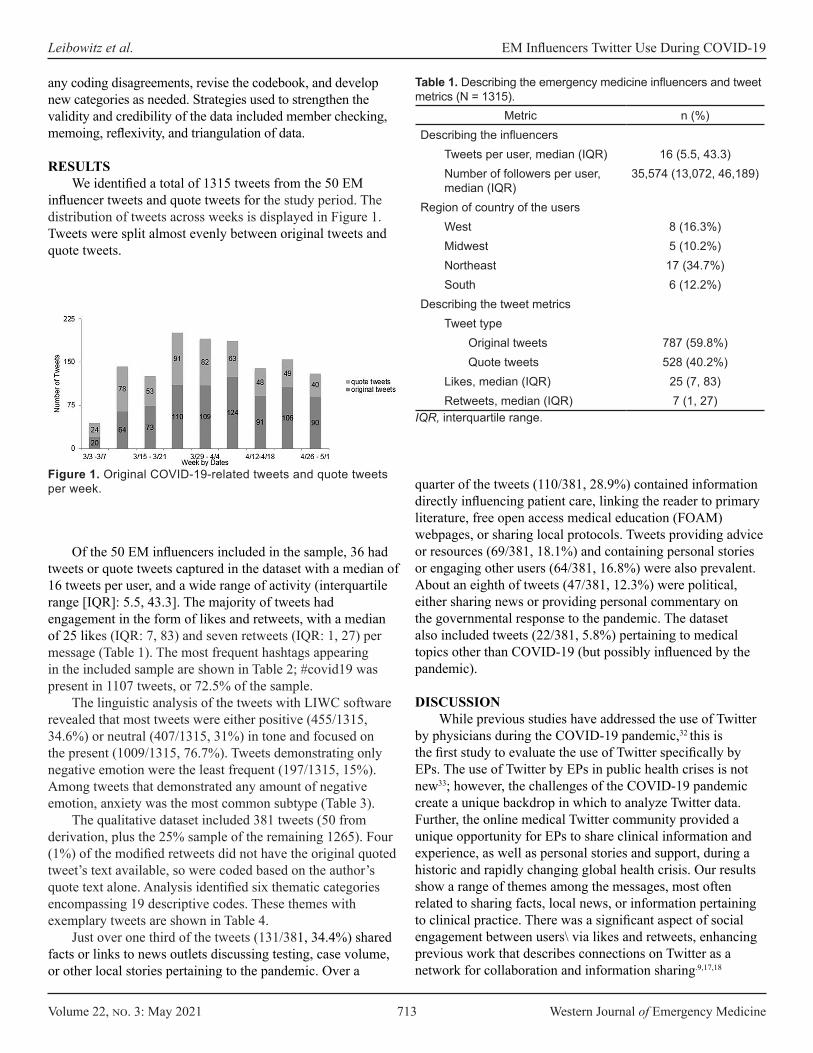
Volume 22, no. 3: May 2021 713 Western Journal of Emergency Medicine
Leibowitz et al. EM Influencers Twitter Use During COVID-19
any coding disagreements, revise the codebook, and develop new categories as needed. Strategies used to strengthen the validity and credibility of the data included member checking, memoing, reflexivity, and triangulation of data.
RESULTS We identified a total of 1315 tweets from the 50 EM
influencer tweets and quote tweets for the study period. The distribution of tweets across weeks is displayed in Figure 1. Tweets were split almost evenly between original tweets and quote tweets.
quarter of the tweets (110/381, 28.9%) contained information directly influencing patient care, linking the reader to primary literature, free open access medical education (FOAM) webpages, or sharing local protocols. Tweets providing advice or resources (69/381, 18.1%) and containing personal stories or engaging other users (64/381, 16.8%) were also prevalent. About an eighth of tweets (47/381, 12.3%) were political, either sharing news or providing personal commentary on the governmental response to the pandemic. The dataset also included tweets (22/381, 5.8%) pertaining to medical topics other than COVID-19 (but possibly influenced by the pandemic).
DISCUSSION While previous studies have addressed the use of Twitter
by physicians during the COVID-19 pandemic,32 this is the first study to evaluate the use of Twitter specifically by EPs. The use of Twitter by EPs in public health crises is not new33; however, the challenges of the COVID-19 pandemic create a unique backdrop in which to analyze Twitter data. Further, the online medical Twitter community provided a unique opportunity for EPs to share clinical information and experience, as well as personal stories and support, during a historic and rapidly changing global health crisis. Our results show a range of themes among the messages, most often related to sharing facts, local news, or information pertaining to clinical practice. There was a significant aspect of social engagement between users\ via likes and retweets, enhancing previous work that describes connections on Twitter as a network for collaboration and information sharing.9,17,18
Figure 1. Original COVID-19-related tweets and quote tweets per week.
Of the 50 EM influencers included in the sample, 36 had tweets or quote tweets captured in the dataset with a median of 16 tweets per user, and a wide range of activity (interquartile range [IQR]: 5.5, 43.3]. The majority of tweets had engagement in the form of likes and retweets, with a median of 25 likes (IQR: 7, 83) and seven retweets (IQR: 1, 27) per message (Table 1). The most frequent hashtags appearing in the included sample are shown in Table 2; #covid19 was present in 1107 tweets, or 72.5% of the sample.
The linguistic analysis of the tweets with LIWC software revealed that most tweets were either positive (455/1315, 34.6%) or neutral (407/1315, 31%) in tone and focused on the present (1009/1315, 76.7%). Tweets demonstrating only negative emotion were the least frequent (197/1315, 15%). Among tweets that demonstrated any amount of negative emotion, anxiety was the most common subtype (Table 3).
The qualitative dataset included 381 tweets (50 from derivation, plus the 25% sample of the remaining 1265). Four (1%) of the modified retweets did not have the original quoted tweet’s text available, so were coded based on the author’s quote text alone. Analysis identified six thematic categories encompassing 19 descriptive codes. These themes with exemplary tweets are shown in Table 4.
Just over one third of the tweets (131/381, 34.4%) shared facts or links to news outlets discussing testing, case volume, or other local stories pertaining to the pandemic. Over a
Metric n (%)Describing the influencers
Tweets per user, median (IQR) 16 (5.5, 43.3)Number of followers per user, median (IQR)
35,574 (13,072, 46,189)
Region of country of the usersWest 8 (16.3%)Midwest 5 (10.2%)Northeast 17 (34.7%)South 6 (12.2%)
Describing the tweet metricsTweet type
Original tweets 787 (59.8%)Quote tweets 528 (40.2%)
Likes, median (IQR) 25 (7, 83)Retweets, median (IQR) 7 (1, 27)
Table 1. Describing the emergency medicine influencers and tweet metrics (N = 1315).
IQR, interquartile range.
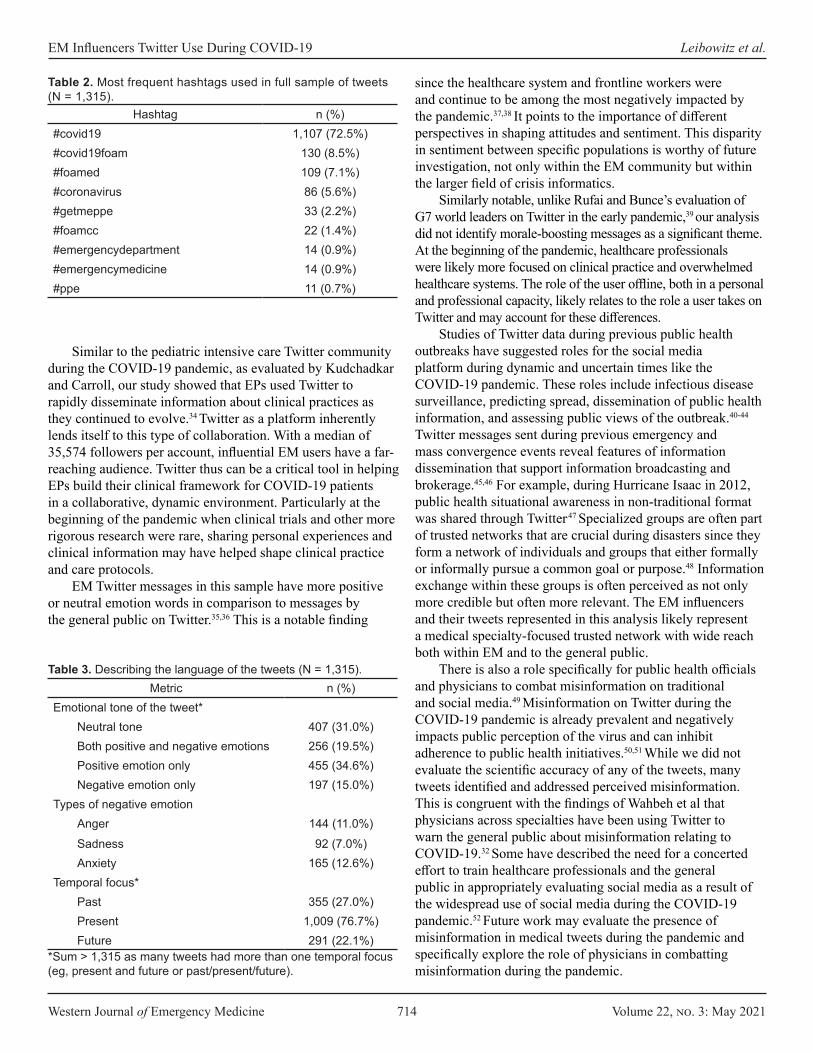
Western Journal of Emergency Medicine 714 Volume 22, no. 3: May 2021
EM Influencers Twitter Use During COVID-19 Leibowitz et al.
Similar to the pediatric intensive care Twitter community during the COVID-19 pandemic, as evaluated by Kudchadkar and Carroll, our study showed that EPs used Twitter to rapidly disseminate information about clinical practices as they continued to evolve.34 Twitter as a platform inherently lends itself to this type of collaboration. With a median of 35,574 followers per account, influential EM users have a far-reaching audience. Twitter thus can be a critical tool in helping EPs build their clinical framework for COVID-19 patients in a collaborative, dynamic environment. Particularly at the beginning of the pandemic when clinical trials and other more rigorous research were rare, sharing personal experiences and clinical information may have helped shape clinical practice and care protocols.
EM Twitter messages in this sample have more positive or neutral emotion words in comparison to messages by the general public on Twitter.35,36 This is a notable finding
since the healthcare system and frontline workers were and continue to be among the most negatively impacted by the pandemic.37,38 It points to the importance of different perspectives in shaping attitudes and sentiment. This disparity in sentiment between specific populations is worthy of future investigation, not only within the EM community but within the larger field of crisis informatics.
Similarly notable, unlike Rufai and Bunce’s evaluation of G7 world leaders on Twitter in the early pandemic,39 our analysis did not identify morale-boosting messages as a significant theme. At the beginning of the pandemic, healthcare professionals were likely more focused on clinical practice and overwhelmed healthcare systems. The role of the user offline, both in a personal and professional capacity, likely relates to the role a user takes on Twitter and may account for these differences.
Studies of Twitter data during previous public health outbreaks have suggested roles for the social media platform during dynamic and uncertain times like the COVID-19 pandemic. These roles include infectious disease surveillance, predicting spread, dissemination of public health information, and assessing public views of the outbreak.40-44
Twitter messages sent during previous emergency and mass convergence events reveal features of information dissemination that support information broadcasting and brokerage.45,46 For example, during Hurricane Isaac in 2012, public health situational awareness in non-traditional format was shared through Twitter.47 Specialized groups are often part of trusted networks that are crucial during disasters since they form a network of individuals and groups that either formally or informally pursue a common goal or purpose.48 Information exchange within these groups is often perceived as not only more credible but often more relevant. The EM influencers and their tweets represented in this analysis likely represent a medical specialty-focused trusted network with wide reach both within EM and to the general public.
There is also a role specifically for public health officials and physicians to combat misinformation on traditional and social media.49 Misinformation on Twitter during the COVID-19 pandemic is already prevalent and negatively impacts public perception of the virus and can inhibit adherence to public health initiatives.50,51 While we did not evaluate the scientific accuracy of any of the tweets, many tweets identified and addressed perceived misinformation. This is congruent with the findings of Wahbeh et al that physicians across specialties have been using Twitter to warn the general public about misinformation relating to COVID-19.32 Some have described the need for a concerted effort to train healthcare professionals and the general public in appropriately evaluating social media as a result of the widespread use of social media during the COVID-19 pandemic.52 Future work may evaluate the presence of misinformation in medical tweets during the pandemic and specifically explore the role of physicians in combatting misinformation during the pandemic.
Hashtag n (%)#covid19 1,107 (72.5%)#covid19foam 130 (8.5%)#foamed 109 (7.1%)#coronavirus 86 (5.6%)#getmeppe 33 (2.2%)#foamcc 22 (1.4%)#emergencydepartment 14 (0.9%)#emergencymedicine 14 (0.9%)#ppe 11 (0.7%)
Table 2. Most frequent hashtags used in full sample of tweets (N = 1,315).
Metric n (%)Emotional tone of the tweet*
Neutral tone 407 (31.0%)Both positive and negative emotions 256 (19.5%)Positive emotion only 455 (34.6%)Negative emotion only 197 (15.0%)
Types of negative emotionAnger 144 (11.0%)Sadness 92 (7.0%)Anxiety 165 (12.6%)
Temporal focus*Past 355 (27.0%)Present 1,009 (76.7%)Future 291 (22.1%)
Table 3. Describing the language of the tweets (N = 1,315).
*Sum > 1,315 as many tweets had more than one temporal focus (eg, present and future or past/present/future).
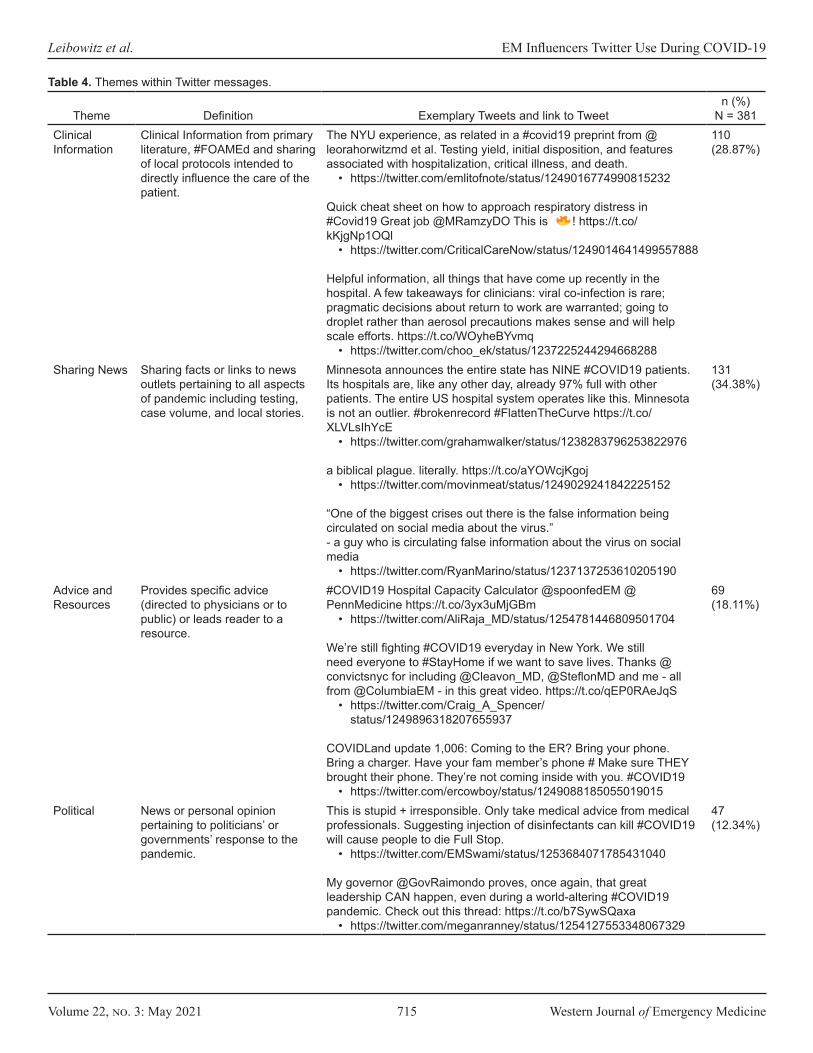
Volume 22, no. 3: May 2021 715 Western Journal of Emergency Medicine
Leibowitz et al. EM Influencers Twitter Use During COVID-19
Theme Definition Exemplary Tweets and link to Tweetn (%)
N = 381Clinical Information
Clinical Information from primary literature, #FOAMEd and sharing of local protocols intended to directly influence the care of the patient.
The NYU experience, as related in a #covid19 preprint from @leorahorwitzmd et al. Testing yield, initial disposition, and features associated with hospitalization, critical illness, and death.
• https://twitter.com/emlitofnote/status/1249016774990815232
Quick cheat sheet on how to approach respiratory distress in #Covid19 Great job @MRamzyDO This is ! https://t.co/kKjgNp1OQl
• https://twitter.com/CriticalCareNow/status/1249014641499557888
Helpful information, all things that have come up recently in the hospital. A few takeaways for clinicians: viral co-infection is rare; pragmatic decisions about return to work are warranted; going to droplet rather than aerosol precautions makes sense and will help scale efforts. https://t.co/WOyheBYvmq
• https://twitter.com/choo_ek/status/1237225244294668288
110 (28.87%)
Sharing News Sharing facts or links to news outlets pertaining to all aspects of pandemic including testing, case volume, and local stories.
Minnesota announces the entire state has NINE #COVID19 patients. Its hospitals are, like any other day, already 97% full with other patients. The entire US hospital system operates like this. Minnesota is not an outlier. #brokenrecord #FlattenTheCurve https://t.co/XLVLsIhYcE
• https://twitter.com/grahamwalker/status/1238283796253822976
a biblical plague. literally. https://t.co/aYOWcjKgoj• https://twitter.com/movinmeat/status/1249029241842225152
“One of the biggest crises out there is the false information being circulated on social media about the virus.” - a guy who is circulating false information about the virus on social media
• https://twitter.com/RyanMarino/status/1237137253610205190
131 (34.38%)
Advice and Resources
Provides specific advice (directed to physicians or to public) or leads reader to a resource.
#COVID19 Hospital Capacity Calculator @spoonfedEM @PennMedicine https://t.co/3yx3uMjGBm
• https://twitter.com/AliRaja_MD/status/1254781446809501704
We’re still fighting #COVID19 everyday in New York. We still need everyone to #StayHome if we want to save lives. Thanks @convictsnyc for including @Cleavon_MD, @SteflonMD and me - all from @ColumbiaEM - in this great video. https://t.co/qEP0RAeJqS
• https://twitter.com/Craig_A_Spencer/status/1249896318207655937
COVIDLand update 1,006: Coming to the ER? Bring your phone. Bring a charger. Have your fam member’s phone # Make sure THEY brought their phone. They’re not coming inside with you. #COVID19
• https://twitter.com/ercowboy/status/1249088185055019015
69 (18.11%)
Political News or personal opinion pertaining to politicians’ or governments’ response to the pandemic.
This is stupid + irresponsible. Only take medical advice from medical professionals. Suggesting injection of disinfectants can kill #COVID19 will cause people to die Full Stop.
• https://twitter.com/EMSwami/status/1253684071785431040
My governor @GovRaimondo proves, once again, that great leadership CAN happen, even during a world-altering #COVID19 pandemic. Check out this thread: https://t.co/b7SywSQaxa
• https://twitter.com/meganranney/status/1254127553348067329
47 (12.34%)
Table 4. Themes within Twitter messages.
Western Journal of Emergency Medicine 716 Volume 22, no. 3: May 2021
EM Influencers Twitter Use During COVID-19 Leibowitz et al.
Theme Definition Exemplary Tweets and link to Tweetn (%)
N = 381Non-COVID Medical
Medical content not related to COVID-19.
I know we’re all full-on #COVID19 but let’s remember there’s also an epidemic of #gunviolence in our country that kills far more people (& more indiscriminately) than this nasty virus. https://t.co/vKfzmqgvit HT @aalkermd
• https://twitter.com/meganranney/status/1235653372558159873
Ryan, ITS ALWAYS TIME TO TALK ABOUT PE!!! https://t.co/1p11hOZxpe
• https://twitter.com/LWestafer/status/1238767153450549249
22 (5.77%)
Personal and Social Messages
Personal stories of COVID-19 experiences and social engagement between users.
My kids told me tonight that #covid19 is making them anxious and lonely. Hopeful that distance learning with their classmates will help this week. But also scared about what next week will look like - for me, in healthcare, and for them, just trying to be kids.
• https://twitter.com/meganranney/status/1241921191494942720
Okay, gotta shave the beard after all. What style should I keep for #COVID19
• https://twitter.com/j mugele/status/1238535319529668610
Dear @Cleanly, I used your app for the 1st time last week for my family’s laundry. I was exhausted from 12-hour shifts seeing #COVID19 patients so I figured I’d treat myself. I was emailed once that our laundry is missing. I have no underwear. No one is returning my calls/emails.
• https://twitter.com/uche_blackstock/status/1247144930579021824
64 (16.80%)
Table 4. Continued.
Our results demonstrate that influential EPs on Twitter are participating in conversations surrounding the COVID-19 pandemic to further clinical practice, spread information, and relay personal experiences and opinions. They are using mostly positive or neutral language, although not in a way that is seen as morale-boosting. These results may provide guidelines and help enable and encourage EM Twitter users, particularly those who are influential, to use Twitter to advance clinical care, increase public awareness, and promote health initiatives.
LIMITATIONS We analyzed content from US users only. Similarly,
we limited our sample to English-language tweets. The EM Twitter community is international and multicultural, and findings may not be generalizable to this global network.9,18
We chose to focus solely on EPs instead of including other specialties. This choice may have led to missing significant themes and messages among the larger medical community on Twitter. Further, although we updated the list of EM influencers, it was originally formulated in 2015 and may be out of date or may not accurately represent current drivers of discourse in the EM Twitter community. This reflects a lack of a standardized method of identifying these influencers in the literature and may warrant the development of a systematic approach of identification of users for future
research. We were also using Twitter as a surrogate for social media platforms as a whole. This focus on Twitter may have excluded discussions and themes unique to other platforms such as Facebook or Instagram.
Our coding team did not include any avid EM Twitter users. While this choice lent a more neutral lens to the data analysis, it may mean that nuances of the EM Twitter community were not captured in the analysis. As with all qualitative studies, there is possible inherent bias due to coding by individuals. To combat this potential bias, we used a large coding team comprised of individuals with multiple backgrounds.
The main dataset itself is also a limitation of this study. As inclusion in the dataset was based on a narrow set of hashtags, certain themes may have been missed if those exact tags were not included and tweets with hashtags may not be representative of tweets in general. For example, the #getmePPE movement made many headlines in traditional and social media but was present in only 2.2% of our data set.53,54 This low rate of #getmePPE may be because tweet authors didn’t routinely include #COVID19 or the other inclusion criteria in their #getmePPE messages. A small number of tweets no longer had the quoted content available, which may have led the coders to mis-categorize the tweet. This lack of quote content, however, was a rare occurrence and likely did not significantly affect overall percentages of tweets in each theme. Lastly, the pandemic is ongoing, and conversations are
Volume 22, no. 3: May 2021 717 Western Journal of Emergency Medicine
Leibowitz et al. EM Influencers Twitter Use During COVID-19
ever evolving; themes and emotional content we identified may no longer be as prevalent.
CONCLUSIONDuring the early weeks of the novel coronavirus
pandemic, influential emergency medicine Twitter users in the United States delivered mainly positive or neutral messages, most often pertaining to news stories or information directly impacting patient care. The majority of these messages led to engagement by other users in the form of likes and retweets. This study underscores how EM Twitter influencers can leverage social media in public health outbreaks to bring attention to topics of importance.
Address for Correspondence: Maren Leibowitz, MD, Northwestern University, Department of Emergency Medicine, 211 East Ontario, Suite #200, Chicago, Illinois 60611. Email: [email protected].
Conflicts of Interest: By the WestJEM article submission agreement, all authors are required to disclose all affiliations, funding sources and financial or management relationships that could be perceived as potential sources of bias. No author has professional or financial relationships with any companies that are relevant to this study. There are no conflicts of interest or sources of funding to declare.
Copyright: © 2021 Leibowitz et al. This is an open access article distributed in accordance with the terms of the Creative Commons Attribution (CC BY 4.0) License. See: http://creativecommons.org/licenses/by/4.0/
7. Bendix A. The US’s failed coronavirus response continues to snowball - even as federal officials insist they’re ‘winning the fight.’ 2020. Available at https://www.businessinsider.com/us-failed-coronavirus-response-reopening-exacerbated-first-wave-2020-6. Accessed June 21, 2020.
8. Nickson CJ, Cadogan MD. Free open access medical education (FOAM) for the emergency physician. Emerg Med Australas. 2014;26(1):76-83.
9. Riddell J, Brown A, Kovic I, et al. Who are the most influential emergency physicians on Twitter? West J Emerg Med. 2017;18(2):281-7.
10. Rogers EM. (2003). Diffusion Networks. Diffusion of Innovations, 5th edition (p. 300-365). London:Free Press.
11. Flodgren G, Parmelli E, Doumit G, et al. Local opinion leaders: effects on professional practice and health care outcomes. Cochrane Database Syst Rev. 2011;6(6):CD000125.
12. Riddell J, Brown A, Robins L, et al. What’s all the chatter? A mixed-methods analysis of emergency physicians’ tweets. West J Emerg Med. 2020;21(1):26-32.
13. Yurief K. Doctors turn to Twitter and TikTok to share coronavirus news. 2020. Available at https://www.cnn.com/2020/03/31/tech/social-media-doctors-coronavirus/index.html. Accessed June 21, 2020.
14. Ouyang H. At the front lines of coronavirus, turning to social media. 2020. Available at https://www.nytimes.com/2020/03/18/well/live/coronavirus-doctors-facebook-Twitter-social-media-covid.html. Accessed on June 21, 2020.
15. Wells G. Doctors are tweeting about coronavirus to make facts go viral. 2020. Available at https://www.wsj.com/articles/doctors-are-tweeting-about-coronavirus-to-make-facts-go-viral-11589558880?mod=e2fb&fbclid=IwAR0ySzBu0jG4OATt5nKXISNZiH2MYt255DeRNVk8FS4RIY5QgyO5Es8Y9I4. Accessed on June 25, 2020.
16. Hamad E, Savundranayagam M, Holmes J, et al. Toward a mixed-methods research approach to content analysis in the digital age: the combined content-analysis model and its applications to health care Twitter feeds. J Med Internet Res. 2016;18(3):e60.
17. Ekenga CC, McElwain C, Sprague N. Examining public perceptions about lead in school drinking water: a mixed-methods analysis of Twitter response to an environmental health hazard. Int J Environ Res Public Health 2018;15(1):162.
18. Park J, Probst M, Kea B, et al. A neighborhood analysis of Twitter communication in emergency medicine. Am J Emerg Med. 2020;38(9):1947-9.
19. World Health Organization. WHO director-general’s opening remarks at the media briefing on COVID-19 - 11 March 2020. 2020. Available at https://www.who.int/dg/speeches/detail/who-director-general-s-opening-remarks-at-the-media-briefing-on-covid-19---11-march-2020. Accessed June 19, 2020.
20. Kerchner D, Wrubel L. “Coronavirus Tweet IDs.” 2020. Available at https://doi.org/10.7910/DVN/LW0BTB. Accessed May 27, 2020.
21. Twitter. Developer Policy - Twitter Developers. Available at https://developer.twitter.com/en/developer-terms/policy. Accessed May 27, 2020.
REFERENCES 1. Johns Hopkins Coronavirus Resource Center: Johns Hopkins
COVID-19 Dashboard. Available at https://coronavirus.jhu.edu/map. Accessed December 16, 2020.
2. Zhu N, Zhang D, Wang W, et al. China novel coronavirus investigating and research team: a novel coronavirus from patients with pneumonia in China, 2019. N Engl J Med. 2020;\382(8): 727-33.
3. Skorton DJ, McKinney R. Criticism of Dr. Fauci is misguided. Our understanding of COVID-19 is rapidly evolving. 2020. Available at https://www.usatoday.com/story/opinion/2020/07/15/why-criticism-dr-anthony-fauci-over-covid-19-misguided-column/5441749002. Accessed December 16, 2020.
4. Del Rio C, Malani PN. COVID-19: new insights on a rapidly changing epidemic. JAMA. 2020;323(14):1339-40.
5. Else H. How a torrent of COVID science changed research publishing - in seven charts. Nature. 2020;588:553.
6. Sheth S. ‘We have it totally under control’: An inside look at how the Trump administration botched America’s response to the coronavirus pandemic. 2020. Available at https://www.businessinsider.com/how-trump-us-botched-coronavirus-pandemic-response-2020-3. Accessed June 21, 2020.
Western Journal of Emergency Medicine 718 Volume 22, no. 3: May 2021
EM Influencers Twitter Use During COVID-19 Leibowitz et al.
22. Documenting the Now. Hydrator [Computer Software]. 2020. Available at: https://github.com/docnow/hydrator. Accessed May 27, 2020.
23. Riquelme F, González-Cantergiani P. Measuring user influence on Twitter: a survey. J Info Process Manag. 2016;52(5):949-75.
24. Andrei A, Elson SB, Zarrella G. (2015). Language and emotion in Philippine Twitter use during Typhoon Haiyan. McLean, VA: MITRE Technical Report.
25. Lee CH, Yu H. The impact of language on retweeting during acute crises: uncertainty reduction and language expectancy perspectives. 2019. Available at https://ssrn.com/abstract=3446718. Accessed July 8, 2020.
26. Pennebaker JW, Boyd RL, Jordan L, et al. (2015). The development and psychometric properties of LIWC2015. Austin, TX: University of Texas at Austin.
27. Pennebaker JW, Booth RJ, Boyd R, et al. (2015). Linguistic Inquiry and Word Count: LIWC2015. Austin, TX: Pennebaker Conglomerates.
28. Cho JY, Lee EH. Reducing confusion about grounded theory and qualitative content analysis: similarities and differences. Qualitative Report. 2014;19(32):1-20.
29. Hsieh HF, SE Shannon. Three approaches to qualitative content analysis. Qual Health Res. 2005;15(9):1277-88.
30. Park H, Reber BH, Chon MG. Tweeting as health communication: health organizations’ use of Twitter for health promotion and public engagement. J Health Commun. 2016;21(2):188-98.
31. Sullivan SG, Schneiders AG, Cheang CW, et al. “What’s happening?” A content analysis of concussion-related traffic on Twitter. Br J Sports Med. 2012;46(4):258-63.
32. Wahbeh A, Nasralah T, Al-Ramahi M, et al. Mining physicians’ opinions on social media to obtain insights into COVID-19: mixed methods analysis. JMIR Public Health Surveill. 2020;6(2):e19276.
33. Ranney ML, Betz ME, Dark C. #ThisIsOurLane - firearm safety as health care’s highway. N Engl J Med. 2019;380(5):405-7.
34. Kudchadkar SR, CL Carroll. Using social media for rapid information dissemination in a pandemic: #PedsICU and coronavirus disease 2019. Ped Crit Care Med. 2020;21(8):e538-46.
35. Lwin MO, Lio J, Sheldenkar, et al. Global sentiments surrounding the COVID-19 pandemic on Twitter: analysis of Twitter trends. JMIR Public Health Surveill. 2020;6(2):e19447.
36. Abd-Alrazaq A, Alhuwail D, Househ M, et al. Top concerns of tweeters during the COVID-19 pandemic: infoveillance study. J Med Internet Res. 2020;22(4):e19016.
37. Rossi R, Socci V, Pacitti F, et al. Mental health outcomes among frontline and second-line health care workers during the coronavirus disease 2019 (COVID-19) pandemic in Italy. JAMA Netw Open. 2020;3(5):e2010185.
38. Lai X, Wang M, Qin C. Coronavirus disease 2019 (COVID-19) infection among health care workers and implications for prevention measures in a tertiary hospital in Wuhan, China. JAMA Netw Open. 2020;3(5):e20966.
39. Rufai SR, Bunce C. World leaders’ usage of Twitter in response
to the COVID-19 pandemic: a content analysis. J Public Health. 2020;42(3):510-6.
40. Liang H, Fung ICH, Ho Tse ZT, et al. How did Ebola information spread on Twitter: broadcasting or viral spreading? BMC Public Health. 2019;19(1):438.
41. Shin SY, Seo DW, An J, et al. High correlation of Middle East respiratory syndrome spread with Google search and Twitter trends in Korea. Sci Rep. 2016;6:32920.
42. Masri S, Jia J, Li C, et al. Use of Twitter data to improve Zika virus surveillance in the United States during the 2016 epidemic. BMC Public Health. 2019;19(1):761.
43. Ahmed W, Bath PA, Sbaffi L, et al. Novel insights into views towards H1N1 during the 2009 pandemic: a thematic analysis of Twitter data. Health Info Libr J. 2019;36(1):60-72.
44. Tang L, Bie B, Park SE, et al. Social media and outbreaks of emerging infectious diseases: a systematic review of literature. Am J Infect Control. 2018;46(9):962-72.
45. Hugh AL, Palen L. Twitter adoption and use in mass convergence and emergency events. International Journal of Emergency Management. 2009;6(3/4).
46. Estes Cohen S. Sandy marked a shift for social media use in disasters. 2013. http://www.emergencymgmt.com/disaster/Sandy-Social-Media-Use-in-Disasters.html. Accessed July 15, 2020.
47. Bennett KJ, Olsen JM, Harris S, et al. The perfect storm of information: combining traditional data sources for public health situational awareness during Hurricane Isaac. PLoS Curr. 2013;5:ecurrents.dis.d2800aa4e536b9d6849e966e91488003.
48. Pandey R, Purohit H, Johri A, et al. AI for trustworthiness! Credible user identification on social web for disaster response agencies. In: AAAI Fall Symposium Series: AI in Government and Public Sector. Association for the Advancement of Artificial Intelligence. 2018:1-8.
49. Chou WS, Oh A, Klein WMP. Addressing health-related misinformation on social media. JAMA. 2018;320(23):2417-8.
50. Kouzy R, Jaoude JA, Kraitem A, et al. Coronavirus goes viral: quantifying the COVID-19 misinformation epidemic on Twitter. Cureus. 2020;12(3):e7255.
51. Ahmed W, Vidal-Alaball J, Downing J, et al. COVID-19 and the 5G conspiracy theory: social network analysis of Twitter data. J Med Internet Res. 2020;22(5):e19458.
52. Gottlieb M, Dyer S. Information and disinformation: social media in the COVID-19 crisis. Am J Emerg Med. 2020;27(7):640-1.
53. Westervelt E. Can the U.S. crowdsource its way out of a mask shortage? No, but it still helps. 2020. Available at https://www.npr.org/2020/03/25/820795727/can-the-u-s-crowdsource-its-way-out-of-a-mask-shortage-no-but-it-still-helps. Accessed June 29, 2020.
54. Chan C. #GetMePPE: why fully equipping health care workers against coronavirus keeps us all safer. 2020. Available at https://www.nbcnews.com/think/opinion/getmeppe-why-fully-equipping-health-care-workers-against-coronavirus-keeps-ncna1167146. Accessed June 29, 2020.

Volume 22, no. 3: May 2021 719 Western Journal of Emergency Medicine
Original Research
Universal Screening for Hepatitis C Virus in the EDUsing a Best Practice Advisory
James S. Ford, MD*Tasleem Chechi, MPH*Kavian Toosi, MD*Bilawal Mahmood*Dillon Meehleis*Michella Otmar, NP, MPH*Nam Tran, PhD†
Larissa May, MD, MSPH, MSHS* Section Editor: Ioannis Koutroulis, MDSubmission history: Submitted September 1, 2020; Revision received January 7, 2021; Accepted January 23, 2021Electronically published May 14, 2021Full text available through open access at http://escholarship.org/uc/uciem_westjemDOI: 10.5811/westjem.2021.1.49667
INTRODUCTIONThere are over two million individuals with chronic
hepatitis C virus (HCV) in the United States (US), making it
UC Davis Health, Department of Emergency Medicine, Sacramento, CaliforniaUC Davis Health, Department of Pathology and Laboratory Medicine,Sacramento, California
*†
Introduction: In 2019 the United States Preventive Services Task Force (USPSTF) released draftguidelines recommending universal hepatitis C virus (HCV) screening for individuals aged 18-79. Weaimed to assess the efficacy of an emergency department-based HCV screening program, by comparingscreening practices before and after its implementation.
Methods: We performed a retrospective cohort analysis of two temporally matched, 11-month studyperiods, corresponding to before and after the implementation of a best practice advisory (BPA). Patientswere screened for anti-HCV antibody (Ab), and positive results were followed by HCV viral load (VL)testing. The primary implementation outcome was ED testing volume (number of tests performed/month).The primary screening outcomes were the seroprevalence of anti-HCV Ab and HCV VL. We describedata with simple descriptive statistics.
Results: The median age of patients was similar between periods (pre: 50 years [interquartile range[IQR] 34-62], post: 47 years [IQR 33-59]). Patients screened were more likely to be males in the pre-BPAperiod (Male, pre: 60%, post: 49%). During the pre-BPA study period, a total of 69,604 patients wereseen in the ED, and 218 unique patients were screened for HCV (mean 19.8 tests/month). During thepost-BPA study period, a total of 68,225 patients were seen in the ED, and 14,981 unique patients werescreened for HCV (mean 1361.9 tests/month). Anti-HCV Ab seroprevalence was 23% (51/218) and 9%(1340/14,981) in the pre-BPA and post-BPA periods, respectively. In the pre-BPA period, six patientswith a positive anti-HCV Ab level had follow-up VL testing (detectable in three). In the post-BPA period,reflex VL testing was performed in most patients (91%, 1225/1,340), and there were 563 patients withdetectable VLs, indicating active infection.
Conclusion: Our study shows that using a universal BPA-driven screening protocol can dramaticallyincrease the number of patients screened for HCV and increase the number of new HCV diagnoses. [West J Emerg Med. 2021;22(3)719–725.]
the most common bloodborne infection in the country.1 Due to downstream consequences of infection, such as cirrhosis and hepatocellular carcinoma, HCV is responsible for more
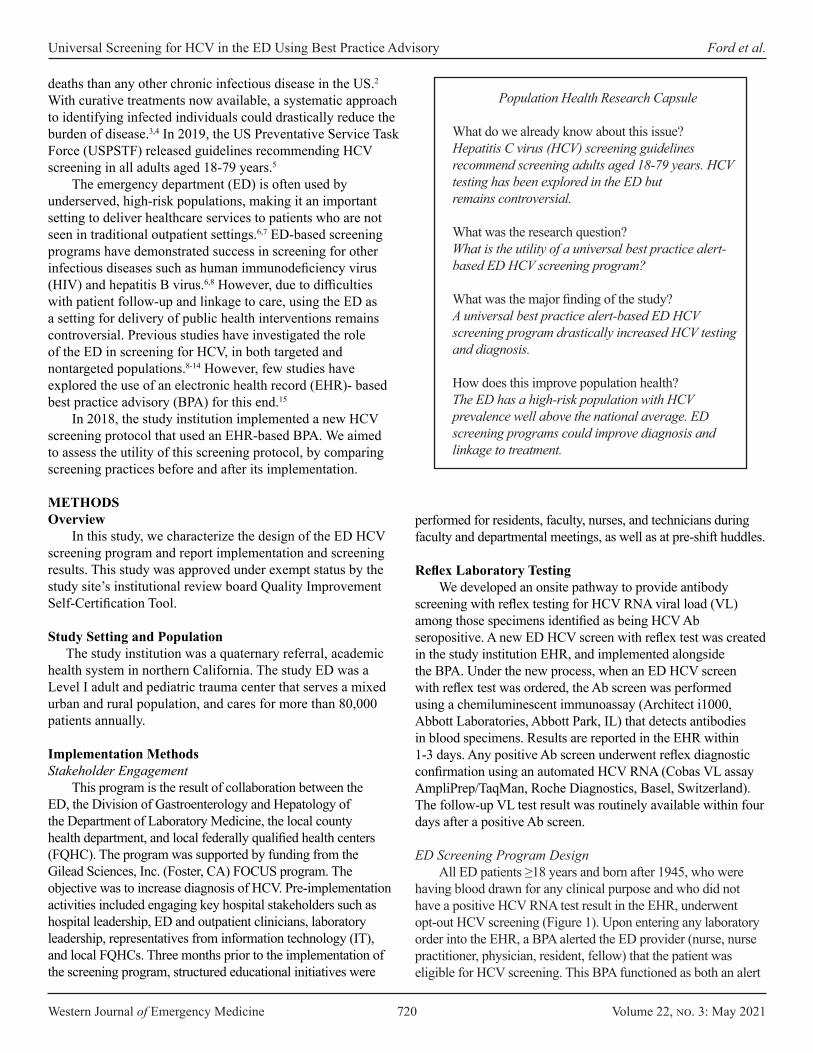
Western Journal of Emergency Medicine 720 Volume 22, no. 3: May 2021
Universal Screening for HCV in the ED Using Best Practice Advisory Ford et al.
Population Health Research Capsule
What do we already know about this issue?Hepatitis C virus (HCV) screening guidelinesrecommend screening adults aged 18-79 years. HCV testing has been explored in the ED butremains controversial.
What was the research question?What is the utility of a universal best practice alert-based ED HCV screening program?
What was the major finding of the study?A universal best practice alert-based ED HCVscreening program drastically increased HCV testing and diagnosis.
How does this improve population health?The ED has a high-risk population with HCVprevalence well above the national average. ED screening programs could improve diagnosis and linkage to treatment.
deaths than any other chronic infectious disease in the US.2
With curative treatments now available, a systematic approachto identifying infected individuals could drastically reduce theburden of disease.3,4 In 2019, the US Preventative Service Task Force (USPSTF) released guidelines recommending HCV screening in all adults aged 18-79 years.5
The emergency department (ED) is often used byunderserved, high-risk populations, making it an importantsetting to deliver healthcare services to patients who are notseen in traditional outpatient settings.6,7 ED-based screeningprograms have demonstrated success in screening for otherinfectious diseases such as human immunodeficiency virus(HIV) and hepatitis B virus.6,8 However, due to difficultieswith patient follow-up and linkage to care, using the ED asa setting for delivery of public health interventions remainscontroversial. Previous studies have investigated the roleof the ED in screening for HCV, in both targeted and nontargeted populations.8-14 However, few studies have explored the use of an electronic health record (EHR)- based best practice advisory (BPA) for this end.15
In 2018, the study institution implemented a new HCVscreening protocol that used an EHR-based BPA. We aimedto assess the utility of this screening protocol, by comparingscreening practices before and after its implementation.
METHODSOverview
In this study, we characterize the design of the ED HCVscreening program and report implementation and screeningresults. This study was approved under exempt status by thestudy site’s institutional review board Quality ImprovementSelf-Certification Tool.
Study Setting and PopulationThe study institution was a quaternary referral, academic
health system in northern California. The study ED was aLevel I adult and pediatric trauma center that serves a mixedurban and rural population, and cares for more than 80,000patients annually.
Implementation MethodsStakeholder Engagement
This program is the result of collaboration between theED, the Division of Gastroenterology and Hepatology ofthe Department of Laboratory Medicine, the local countyhealth department, and local federally qualified health centers(FQHC). The program was supported by funding from theGilead Sciences, Inc. (Foster, CA) FOCUS program. Theobjective was to increase diagnosis of HCV. Pre-implementation activities included engaging key hospital stakeholders such as hospital leadership, ED and outpatient clinicians, laboratory leadership, representatives from information technology (IT), and local FQHCs. Three months prior to the implementation of the screening program, structured educational initiatives were
performed for residents, faculty, nurses, and technicians during faculty and departmental meetings, as well as at pre-shift huddles.
Reflex Laboratory TestingWe developed an onsite pathway to provide antibody
screening with reflex testing for HCV RNA viral load (VL) among those specimens identified as being HCV Abseropositive. A new ED HCV screen with reflex test was created in the study institution EHR, and implemented alongside the BPA. Under the new process, when an ED HCV screen with reflex test was ordered, the Ab screen was performed using a chemiluminescent immunoassay (Architect i1000, Abbott Laboratories, Abbott Park, IL) that detects antibodies in blood specimens. Results are reported in the EHR within 1-3 days. Any positive Ab screen underwent reflex diagnostic confirmation using an automated HCV RNA (Cobas VL assay AmpliPrep/TaqMan, Roche Diagnostics, Basel, Switzerland). The follow-up VL test result was routinely available within four days after a positive Ab screen.
ED Screening Program DesignAll ED patients ≥18 years and born after 1945, who were
having blood drawn for any clinical purpose and who did nothave a positive HCV RNA test result in the EHR, underwentopt-out HCV screening (Figure 1). Upon entering any laboratory order into the EHR, a BPA alerted the ED provider (nurse, nurse practitioner, physician, resident, fellow) that the patient was eligible for HCV screening. This BPA functioned as both an alert

Volume 22, no. 3: May 2021 721 Western Journal of Emergency Medicine
Ford et al. Universal Screening for HCV in the ED Using Best Practice Advisory
and a hard stop for which providers were required to respond to continue with the order entry. The ED provider could, on behalf of the patient, accept, or defer testing. If deferred by the nurse, the BPA would appear again on subsequent phlebotomy orders and if deferred by the physician, it would not appear for the duration of the current encounter but would reappear on subsequent ED visits. On the other hand, if accepted, the BPA generated HCV screening discharge documentation documenting patient verbalauthorization for testing, and triggered an order in the EHR forHCV testing and printed labels for specimen collection.
To standardize screening and to comply with ethicalregulations, ED providers followed a script provided onthe BPA advisory. Patients were allowed to refuse testingafter they were informed about the program. Informationabout the cost of the test was given upon patient request;otherwise, a statement about test charges was included in thepatient’s discharge documents and on brochures and postersthroughout the ED. Funding for the laboratory tests wasobtained by charging the patient’s insurance, a billing strategyemployed by similar screening programs and studies.15 Therewas not a way to prospectively identify which insuranceswould cover the test, so this information was not availableto the provider or the patient to aid in the decision to offer/accept testing. If a patient requested that their insurance not
be charged, or they did not have insurance, testing was paidfor by the program grant. Funding for the development ofthe laboratory reflex pathway, IT changes to the EHR, andsupport for patient care navigators came from the programgrant. Program staff, including two patient navigators,contacted the patients with results via telephone or in persondepending on a patient’s disposition.
Study MethodsStudy Design
We performed a retrospective analysis of two timematched, 11-month study periods, corresponding to before and after BPA implementation. We consecutively includedall patients who underwent HCV testing in the ED, in boththe pre- and post-BPA study periods. The pre-BPA studyperiod was January–November 2018. HCV screening duringthe pre-BPA period was clinician-initiated. The BPA wasimplemented on November 27, 2018, and was followedby a one-month transitional period that allowed cliniciansto adjust to using the BPA, as well as to study temporallymatched cohorts. The post-BPA period was January2019–November 2019. Data were abstracted directly fromthe EHR using computer-generated reports. Personnelresponsible for procuring these reports were blinded to the
Figure 1. Operational model of the hepatitis C screening program in the emergency department.HCV, hepatitis C; HIV, human immunodeficiency virus; Ab, antibody; BPA, best practice advisory.
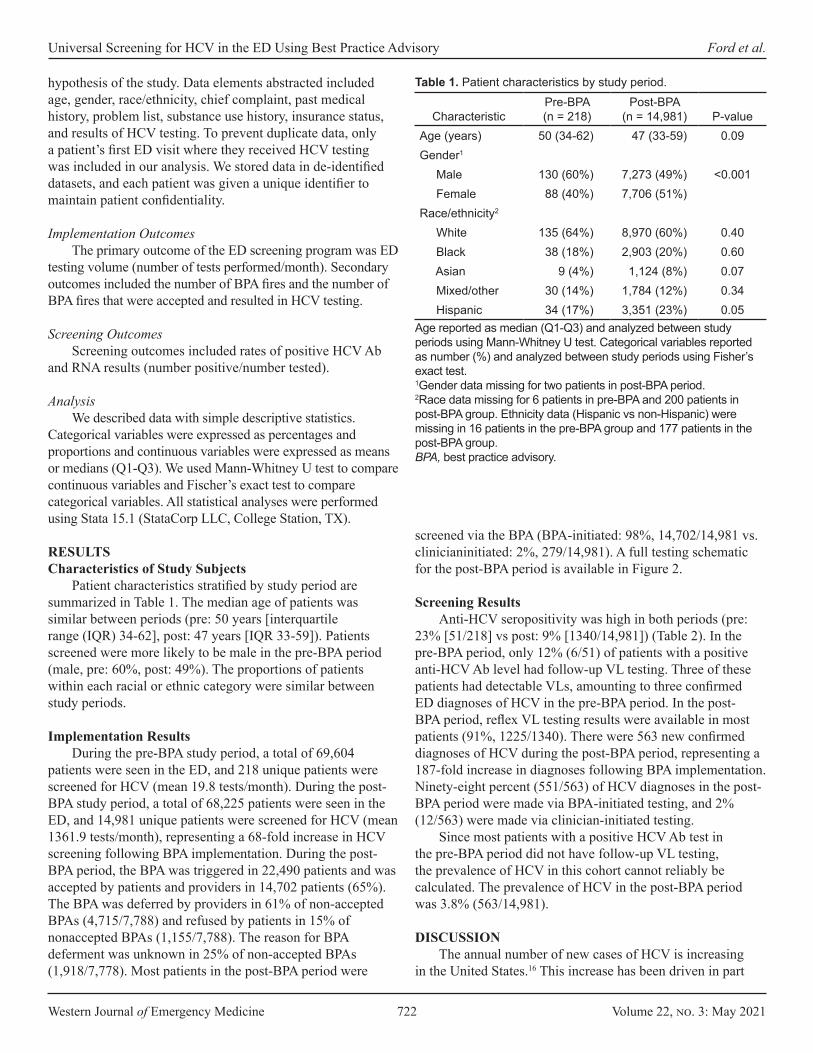
Western Journal of Emergency Medicine 722 Volume 22, no. 3: May 2021
Universal Screening for HCV in the ED Using Best Practice Advisory Ford et al.
hypothesis of the study. Data elements abstracted includedage, gender, race/ethnicity, chief complaint, past medicalhistory, problem list, substance use history, insurance status,and results of HCV testing. To prevent duplicate data, onlya patient’s first ED visit where they received HCV testingwas included in our analysis. We stored data in de-identifieddatasets, and each patient was given a unique identifier tomaintain patient confidentiality.
Implementation OutcomesThe primary outcome of the ED screening program was ED
testing volume (number of tests performed/month). Secondary outcomes included the number of BPA fires and the number of BPA fires that were accepted and resulted in HCV testing.
Screening OutcomesScreening outcomes included rates of positive HCV Ab
and RNA results (number positive/number tested).
AnalysisWe described data with simple descriptive statistics.
Categorical variables were expressed as percentages andproportions and continuous variables were expressed as meansor medians (Q1-Q3). We used Mann-Whitney U test to compare continuous variables and Fischer’s exact test to compare categorical variables. All statistical analyses were performed using Stata 15.1 (StataCorp LLC, College Station, TX).
RESULTSCharacteristics of Study Subjects
Patient characteristics stratified by study period aresummarized in Table 1. The median age of patients wassimilar between periods (pre: 50 years [interquartilerange (IQR) 34-62], post: 47 years [IQR 33-59]). Patientsscreened were more likely to be male in the pre-BPA period(male, pre: 60%, post: 49%). The proportions of patientswithin each racial or ethnic category were similar betweenstudy periods.
Implementation ResultsDuring the pre-BPA study period, a total of 69,604
patients were seen in the ED, and 218 unique patients werescreened for HCV (mean 19.8 tests/month). During the post-BPA study period, a total of 68,225 patients were seen in theED, and 14,981 unique patients were screened for HCV (mean1361.9 tests/month), representing a 68-fold increase in HCVscreening following BPA implementation. During the post-BPA period, the BPA was triggered in 22,490 patients and wasaccepted by patients and providers in 14,702 patients (65%).The BPA was deferred by providers in 61% of non-acceptedBPAs (4,715/7,788) and refused by patients in 15% of nonaccepted BPAs (1,155/7,788). The reason for BPA deferment was unknown in 25% of non-accepted BPAs (1,918/7,778). Most patients in the post-BPA period were
screened via the BPA (BPA-initiated: 98%, 14,702/14,981 vs. clinicianinitiated: 2%, 279/14,981). A full testing schematic for the post-BPA period is available in Figure 2.
Screening ResultsAnti-HCV seropositivity was high in both periods (pre:
23% [51/218] vs post: 9% [1340/14,981]) (Table 2). In thepre-BPA period, only 12% (6/51) of patients with a positiveanti-HCV Ab level had follow-up VL testing. Three of thesepatients had detectable VLs, amounting to three confirmedED diagnoses of HCV in the pre-BPA period. In the post-BPA period, reflex VL testing results were available in mostpatients (91%, 1225/1340). There were 563 new confirmeddiagnoses of HCV during the post-BPA period, representing a 187-fold increase in diagnoses following BPA implementation.Ninety-eight percent (551/563) of HCV diagnoses in the post-BPA period were made via BPA-initiated testing, and 2%(12/563) were made via clinician-initiated testing.
Since most patients with a positive HCV Ab test inthe pre-BPA period did not have follow-up VL testing,the prevalence of HCV in this cohort cannot reliably becalculated. The prevalence of HCV in the post-BPA periodwas 3.8% (563/14,981).
DISCUSSIONThe annual number of new cases of HCV is increasing
in the United States.16 This increase has been driven in part
CharacteristicPre-BPA(n = 218)
Post-BPA(n = 14,981) P-value
Age (years) 50 (34-62) 47 (33-59) 0.09Gender1
Male 130 (60%) 7,273 (49%) <0.001 Female 88 (40%) 7,706 (51%)Race/ethnicity2
White 135 (64%) 8,970 (60%) 0.40 Black 38 (18%) 2,903 (20%) 0.60 Asian 9 (4%) 1,124 (8%) 0.07 Mixed/other 30 (14%) 1,784 (12%) 0.34 Hispanic 34 (17%) 3,351 (23%) 0.05
Table 1. Patient characteristics by study period.
Age reported as median (Q1-Q3) and analyzed between study periods using Mann-Whitney U test. Categorical variables reported as number (%) and analyzed between study periods using Fisher’s exact test. 1Gender data missing for two patients in post-BPA period.2Race data missing for 6 patients in pre-BPA and 200 patients in post-BPA group. Ethnicity data (Hispanic vs non-Hispanic) were missing in 16 patients in the pre-BPA group and 177 patients in the post-BPA group.BPA, best practice advisory.

Volume 22, no. 3: May 2021 723 Western Journal of Emergency Medicine
Ford et al. Universal Screening for HCV in the ED Using Best Practice Advisory
by the national opioid crisis, which has led to a concomitantrise in injection drug use, resulting in more chronic HCVinfections in young individuals.17 These individuals comprisea high-risk population, and are less likely to access primarycare services and are more likely to seek care in acute caresettings.18 As such, the ED could be an important setting totest individuals for HCV. In this study, we demonstrate thatthe implementation of a BPA-based screening protocol in theED can increase HCV screening and diagnosis.
Our study population had an unexpectedly high rateof HCV RNA positivity (post-BPA: 3.8%), representinga value nearly four-fold higher than the national average(~1%).19 This suggests that the ED may be a high-yieldsetting to screen individuals for HCV. An additional 1342.1patients/month (pre: 19.8, post: 1361.9) were screened forHCV after BPA implementation, an increase similar to theoutcome in another study that explored the use of a BPA forED-based HCV screening.15 Since the number of patients who underwent clinician-initiated testing did not drasticallyincrease between study periods (pre: 218, post: 279), thissuggests that the increase in testing was directly attributableto the implementation of the BPA. The BPA was acceptedin 65% of patients in which it fired, a much higher rate thananother BPA-based ED screening study that reported a BPAacceptance rate of 40%.15 This difference in BPA acceptancerate between studies may possibly be explained by differencesin demographics between study institutions (ie, higher rates ofgovernment-payer insurance [72% vs 61%]), which may have
Figure 2. Hepatitis C virus testing schematic for the post-best practice advisory period.*Data for unique patients 18 years of age and born after 1945.**Testing was initiated by physician on the basis of perceived Hepatitis C risk behaviors or clinical manifestations of infection.EHR, electronic health record; BPA, best practice advisory; ABHCV, antibody-hepatitis C virus.
influenced providers’ perceptions of a patient’s likelihood tofollow up, and therefore likelihood to accept the BPA.
Unfortunately, as a VL reflex order was not in placeduring the pre-BPA period, the prevalence of HCV could notbe calculated for this cohort. However, the seroprevalenceof anti-HCV antibody was 23%, over two-fold higherthan the post-BPA group (9%), and over three-fold higherthan the aggregated prevalence of 19 ED-based studies
Pre-BPA Post-BPA P-valueAnti-HCV Ab N = 218 N = 14,9812
Reactive 51 (23%) 1,340 (9%) <0.001 Nonreactive 166 (76%) 13,598 (91%) Indeterminate 1 (<1%) 43 (<1%)HCV VL1 N = 6 N = 1,225 Detected 3 (50%) 563 (46%) 1.0 Not detected 3 (50%) 662 (54%)
Table 2. Hepatitis C virus test results by screening period.
Values expressed as percentage (number). Comparisons between study periods made via Fisher’s exact test.1Reflex viral load testing was not performed during the pre-BPA period. Reflex VL testing was not available for 106 patients in the post-BPA group who underwent anti-HCV Ab testing.2Includes 14,702 patients tested via BPA-initiated testing and 279 patients tested via clinician-initiated testing.Ab, antibody; BPA, best practice advisory; HCV, hepatitis C virus; VL, viral load.
Western Journal of Emergency Medicine 724 Volume 22, no. 3: May 2021
Universal Screening for HCV in the ED Using Best Practice Advisory Ford et al.
(7.5%).20 This demonstrates that the study institutionservices an exceptionally high-risk population. It alsosuggests, unsurprisingly, that universal screening may be lessdiscriminate in screening for HCV, compared to providerswho test patients based on their clinical presentation and riskfactors for infection.
While universal screening may be less selective thanclinician judgment, the increased testing following BPAimplementation led to the identification of 550 more casesof HCV in a temporally matched 11-month period. This iscommensurate with previous studies that demonstrate thattechnology-based infectious disease screening strategiesare more effective than provider-driven protocols, in an EDsetting.10 With HCV testing becoming more affordable andcurative therapy now available, the benefit of early detectionwith linkage-to-treatment in individuals with chronic infectionlikely outweighs the cost of increased testing.21
To assess the impact of provider bias on screeningpractices we compared demographic proportions of screenedindividuals before and after the implementation of the BPA.In the pre-BPA period, individuals tested were more likely tobe male (60%). However, after implementation of the BPA,patient gender was evenly distributed between males andfemales (males: 49%). This suggests that in the absence of aBPA-driven screening protocol, females may not be offeredHCV screening as often as males.
LIMITATIONSOur study must be interpreted in light of its limitations.
This study was retrospective; thus, we were limited bythe data in the EHR. This was a single-institution studyat a large, academic center with a mixed urban and ruralpopulation; hence, our findings may not be generalizableto all settings. The BPA was introduced alongside a newEHR order that automatically ordered VL reflex testingfor reactive HCV Ab testing; so it is difficult to separatethe effect of the BPA from the new reflex order. Linkageto-care data was not available at the time of this study,so we cannot evaluate the full impact of screening inthis study. Future studies will coordinate with primarycare and hepatology clinics to obtain linkage-to-caredata. Additionally, future studies will examine clinicianperceptions related to BPA-implementation.
CONCLUSIONOur study shows that using a universal BPA-driven
screening protocol can dramatically increase the number ofpatients screened for HCV and increase the number of newHCV diagnoses. We also demonstrate that a BPA-drivenscreening protocol may help reduce provider and genderbasedbiases, and increase screening in females. Using thisED-based approach for HCV screening could help combat therise in HCV, particularly in individuals without access to otherforms of healthcare.
REFERENCES1. Centers for Disease Control and Prevention. Hepatitis C Questions
and Answers for Health Professionals. 2020. Available at: https://www.cdc.gov/hepatitis/hcv/hcvfaq.htm. Accessed August 1, 2019.
2. Ly KN, Hughes EM, Jiles RB, et al. Rising mortality associated with hepatitis C virus in the United States, 2003-2013. Clin Infect Dis. 2016;62(10):1287-8.
3. European Association for the Study of the Liver. EASL recommendations on treatment of hepatitis C 2016. J Hepatol. 2017;66(1):153-94.
4. Kohli A, Shaffer A, Sherman A, et al. Treatment of hepatitis C: a systematic review. JAMA. 2014;312(6):631-40.
5. Owens DK, Davidson KW, Krist AH, et al. Screening for HIV Infection: US Preventive Services Task Force Recommendation Statement. JAMA. 2019;321(23):2326-36.
6. Ford JS, Marianelli LG, Frassone N, et al. Hepatitis B screening in an Argentine ED: increasing vaccination in a resource-limited setting. Am J Emerg Med. 2020;38(2):296-9.
7. Stanford KA, Hazra A, Schneider J. Routine opt-out syphilis screening in the emergency department: a public health imperative. Acad Emerg Med. 2020;27(5):437-8.
8. Cowan E, Herman HS, Rahman S, Zahn J, Leider J, Calderon Y. Bundled HIV and hepatitis C testing in the emergency department: a randomized controlled trial. West J Emerg Med. 2018;19(6):1049-1056. doi:10.5811/westjem.2018.8.37827
9. Bielen R, Kremer C, Koc Ö M, et al. Screening for hepatitis C at the emergency department: Should babyboomers also be screened in Belgium? Liver Int. 2018;39(4):667-75.
10. White DAE, Todorovic T, Petti ML, et al. A comparative effectiveness study of two nontargeted HIV and hepatitis C virus screening algorithms in an urban emergency department. Ann Emerg Med. 2018;72(4):438-48.
11. Cornett JK, Bodiwala V, Razuk V, Shukla D, Narayanan N. Results of a hepatitis C virus screening program of the 1945-1965 birth cohort in a large emergency department in New Jersey. Open Forum Infect
Address for Correspondence: Larissa May, MD, MSPH, MSHS, UC Davis Health, Department of Emergency Medicine, 4150 V. St., PSSB 2100, Sacramento, CA 95817. Email: [email protected].
Conflicts of Interest: By the WestJEM article submission agreement, all authors are required to disclose all affiliations, funding sources and financial or management relationships that could be perceived as potential sources of bias. No author has professional or financial relationships with any companies that are relevant to this study. There are no conflicts of interest or sources of funding to declare.
Copyright: © 2021 Ford et al. This is an open access article distributed in accordance with the terms of the Creative Commons Attribution (CC BY 4.0) License. See: http://creativecommons.org/licenses/by/4.0/
Volume 22, no. 3: May 2021 725 Western Journal of Emergency Medicine
Ford et al. Universal Screening for HCV in the ED Using Best Practice Advisory
Dis. 2018;5(4):ofy065. 12. White DA, Anderson ES, Pfeil SK, et al. Results of a rapid hepatitis
C virus screening and diagnostic testing program in an urban emergency department. Ann Emerg Med. 2016;67(1):119-28.
13. Ragan K, Pandya A, Holotnak T, Koger K, Collins N, Swain MG. Hepatitis C virus screening of high-risk patients in a Canadian emergency department. Can J Gastroenterol Hepatol. 2020;2020:5258289. Published 2020 Feb 17. doi:10.1155/2020/5258289
14. Bibbins-Domingo K, Grossman DC, Curry SJ, et al. Screening for syphilis infection in nonpregnant adults and adolescents: US Preventive Services Task Force Recommendation Statement. JAMA. 2016;315(21):2321-7.
15. Schechter-Perkins EM, Miller NS, Hall J, et al. Implementation and preliminary results of an emergency department nontargeted, opt-out hepatitis C virus screening program. Acad Emerg Med. 2018;25(11):1216-26.
16. Centers for Disease Control and Prevention. Surveillance for Viral Hepatitis -- United States, 2017. 2017. Available at: https://www.cdc.
gov/hepatitis/statistics/2017surveillance/index.htm. Accessed August 1, 2019.
17. Suryaprasad AG, White JZ, Xu F, et al. Emerging epidemic of hepatitis C virus infections among young nonurban persons who inject drugs in the United States, 2006-2012. Clin Infect Dis. 2014;59(10):1411-9.
18. Ganguli I, Shi Z, Orav EJ, et al. Declining use of primary care among commercially insured adults in the United States, 2008-2016. Ann Intern Med. 2020;172(4):240-7.
19. Hofmeister MG, Rosenthal EM, Barker LK, et al. Estimating prevalence of hepatitis C virus infection in the United States, 2013-2016. Hepatology. 2019;69(3):1020-31.
20. Schillie S, Wester C, Osborne M, et al. CDC recommendations for hepatitis C screening among adults - United States, 2020. MMWR Recomm Rep. 2020;69(2):1-17.
21. Mendlowitz AB, Naimark D, Wong WWL, et al. The emergency department as a setting-specific opportunity for population-based hepatitis C screening: an economic evaluation. Liver Int. 2020;40(6):1282-91.
Western Journal of Emergency Medicine 726 Volume 22, no. 3: May 2021
Original Research
Increased Emergency Department Hallway Length of Stay is Associated with Development of Delirium
Kate van Loveren, BS*°Arnav Singla, BS*°Liron Sinvani, MD†§
Christopher Calandrella, DO*‡
Thomas Perera, MD*‡
Martina Brave, BA*Lance Becker, MD*‡
Timmy Li, PhD‡
Section Editor: Mark I. Langdorf, MD, MHPE Submission history: Submitted July 30, 2020; Revision received January 4, 2021; Accepted January 14, 2021Electronically published April 9, 2021 Full text available through open access at http://escholarship.org/uc/uciem_westjem DOI: 10.5811/westjem.2021.1.49320
INTRODUCTIONDelirium is a common, costly, and devastating condition
affecting up to 50% of hospitalized, older patients1 and incurs a multibillion dollar financial burden on annual healthcare expenditures.1,2,3 Delirium is a proponent of iatrogenic complications, such as falls, infections, and pressure ulcers, that
North Shore University Hospital, Department of Emergency Medicine, Manhasset, New York Center for Health Innovations and Outcomes Research, Feinstein Institutes of Medical Research, Northwell Health, Manhasset, New YorkDonald and Barbara Zucker School of Medicine at Hofstra/Northwell, Department of Emergency Medicine, Manhasset, New York Donald and Barbara Zucker School of Medicine at Hofstra/Northwell, Department of Medicine, Division of Hospital Medicine, Manhasset, New YorkCo-first authors
*†
‡
§
°
Introduction: Our study aimed to determine 1) the association between time spent in the emergency department (ED) hallway and the development of delirium and 2) the hospital location of delirium development.
Methods: This single-center, retrospective chart review included patients 18+ years old admitted to the hospital after presenting, without baseline cognitive impairment, to the ED in 2018. We identified the Delirium group by the following: key words describing delirium; orders for psychotropics, special observation, and restraints; or documented positive Confusion Assessment Method (CAM) screen. The Control group included patients not meeting delirium criteria. We used a multivariable logistic regression model, while adjusting for confounders, to assess the odds of delirium development associated with percentage of ED LOS spent in the hallway.
Results: A total of 25,156 patients met inclusion criteria with 1920 (7.6%) meeting delirium criteria. Delirium group vs. Control group patients spent a greater percentage of time in the ED hallway (median 50.5% vs 10.8%, P<0.001); had longer ED LOS (median 11.94 vs 8.12 hours, P<0.001); had more ED room transfers (median 5 vs 4, P<0.001); and had longer hospital LOS (median 5.0 vs 4.6 days, P<0.001). Patients more frequently developed delirium in the ED (77.5%) than on inpatient units (22.5%). The relative odds of a patient developing delirium increased by 3.31 times for each percent increase in ED hallway time (95% confidence interval, 2.85, 3.83).
Conclusion: Patients with delirium had more ED hallway exposure, longer ED LOS, and more ED room transfers. Understanding delirium in the ED has substantial implications for improving patient safety. [West J Emerg Med. 2021;22(3)726–735.]
lead to longer hospital lengths of stay (LOS) and higher rates of hospital discharge to a skilled nursing facility and long-term placement.4-9 In addition, its development has been shown to increase the risk of mortality by 70% in the first six months after an emergency department (ED) visit.10 Because of these known deleterious outcomes, delirium prevention, recognition,
Volume 22, no. 3: May 2021 727 Western Journal of Emergency Medicine
van Loveren et al. Increased ED LOS in Hallway is Associated with Delirium
Population Health Research Capsule
What do we already know about this issue?The emergency department (ED) hallway has potential for amplification of known environmental risk factors for the development of delirium.
What was the research question?What is the association between time spent in the ED hallway and the development of delirium?
What was the major finding of the study?Patients are 3.31 times more likely to develop delirium with each percent increase of time spent in the ED hallway.
How does this improve population health?The findings emphasize the need to expand delirium prevention and management in the ED.
and management have been identified as a national priority with regard to patient safety and quality of care.
The rates of delirium development can vary depending on the hospital unit ranging from 6-56% in the general medicine surgery unit,2 upwards of 81% in the intensive care unit (ICU),8 and 5-17% in the ED.11-14 Prior literature on environmental risk factors for delirium development has focused on inpatient settings. Environmental factors such as sensory impairment,15 sleep interruptions,11 and inadequate social interactions with familiar persons16 have been identified as risk factors on inpatient floors. However, the environment of the ED has not been adequately investigated with regard to its effect on delirium development.
The environmental risk factors identified on inpatient floors are not only present in the ED but likely amplified. The ED is particularly associated with an uncomfortable, unfamiliar, and disorienting environment. In particular to the ED environment, EDs across the nation often face overcrowding, which necessitates the treatment of patients in non-treatment areas such as the hallway.17 Due to inpatient crowding, the boarding of admitted patients in the ED, typically in the hallway, is another source of exhaustion of ED resources.17 This trend will appreciate over time as an increasing number of older adults present to the ED.18 Persons over the age of 65 are at higher risk of developing delirium,19-21 which requires an assessment of the impact of the ED’s environment on the development of delirium.
The ED hallway is a unique hospital setting where patients are placed while they are under ED care or while they are admitted and waiting for transfer to a hospital unit. The chaotic setting of the ED hallway may provide constant, uninterrupted exposure to the known environmental risk factors that contribute to the development of delirium. The identification of the ED hallway is a novel site of research to understand its role in the development of delirium. The objectives of this study were to 1) assess the association between time spent in the ED hallway and delirium development; and 2) determine the hospital location of delirium development.
METHODSStudy Design and Setting
This was a single-center, retrospective cohort study. The hospital is a 756-bed, academic, quaternary care center, verified as a Level I trauma center, with a yearly ED volume of approximately 90,000 patients. Our health system’s institutional review board determined that this study qualified as a quality improvement project, with a waiver of informed consent.
Selection of Participants
We identified all patients 18 years or older presenting to the ED between January 1–December 31, 2018, who were subsequently admitted to the hospital. In the hospital studied, there is no standardized delirium screening, which required us to use surrogate markers for identifying delirium development. A preliminary review of the literature as well as of the electronic
health record (EHR) was conducted of patients with and without an ED discharge diagnosis of delirium (n = 27 and n = 27, respectively), in order to better understand local EHR delirium documentation and to determine what criteria could best identify delirium development. We used previous studies identifying delirium through retrospective chart reviews as models for the electronic data query,22-25 and the 54-patient pilot abstraction sought to validate these methods.
The 54 patients selected for this pilot abstraction were randomly chosen based off of all patients presenting to the ED within approximately the previous two years (January 1, 2017–October 30, 2018) at the time the pilot was conducted. Patients who presented to the ED with an ED diagnosis of delirium (n = 180) were considered part of the Delirium group for the pilot; patients with all other ED diagnoses were part of the Control group. Twenty-seven patients (15%) of this Delirium group were randomly chosen, and 27 Control patients were randomly selected. After reviewing the EHR records of 54 patients, including all nursing and physician documentation and provider orders, we determined delirium development based on any provider order for delirium management, including pharmacologic agents, observation orders, and Confusion Assessment Method (CAM) documentation, which was corroborated by provider documentation of frequently used key words identified from prior literature22-25 to describe delirium symptoms (Table 1).
We omitted from the Delirium group those patients with orders for delirium management and documentation of delirium symptoms who also had dementia (indicated by orders for
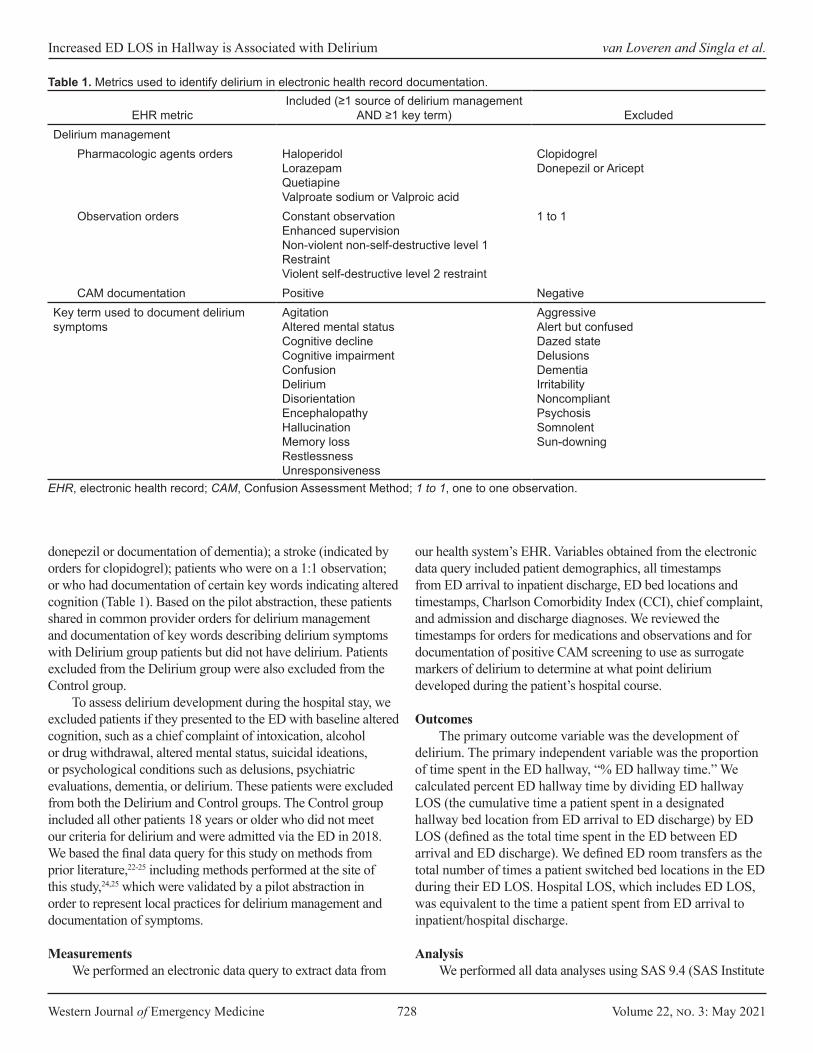
Western Journal of Emergency Medicine 728 Volume 22, no. 3: May 2021
Increased ED LOS in Hallway is Associated with Delirium van Loveren and Singla et al.
donepezil or documentation of dementia); a stroke (indicated by orders for clopidogrel); patients who were on a 1:1 observation; or who had documentation of certain key words indicating altered cognition (Table 1). Based on the pilot abstraction, these patients shared in common provider orders for delirium management and documentation of key words describing delirium symptoms with Delirium group patients but did not have delirium. Patients excluded from the Delirium group were also excluded from the Control group.
To assess delirium development during the hospital stay, we excluded patients if they presented to the ED with baseline altered cognition, such as a chief complaint of intoxication, alcohol or drug withdrawal, altered mental status, suicidal ideations, or psychological conditions such as delusions, psychiatric evaluations, dementia, or delirium. These patients were excluded from both the Delirium and Control groups. The Control group included all other patients 18 years or older who did not meet our criteria for delirium and were admitted via the ED in 2018. We based the final data query for this study on methods from prior literature,22-25 including methods performed at the site of this study,24,25 which were validated by a pilot abstraction in order to represent local practices for delirium management and documentation of symptoms.
MeasurementsWe performed an electronic data query to extract data from
our health system’s EHR. Variables obtained from the electronic data query included patient demographics, all timestamps from ED arrival to inpatient discharge, ED bed locations and timestamps, Charlson Comorbidity Index (CCI), chief complaint, and admission and discharge diagnoses. We reviewed the timestamps for orders for medications and observations and for documentation of positive CAM screening to use as surrogate markers of delirium to determine at what point delirium developed during the patient’s hospital course.
OutcomesThe primary outcome variable was the development of
delirium. The primary independent variable was the proportion of time spent in the ED hallway, “% ED hallway time.” We calculated percent ED hallway time by dividing ED hallway LOS (the cumulative time a patient spent in a designated hallway bed location from ED arrival to ED discharge) by ED LOS (defined as the total time spent in the ED between ED arrival and ED discharge). We defined ED room transfers as the total number of times a patient switched bed locations in the ED during their ED LOS. Hospital LOS, which includes ED LOS, was equivalent to the time a patient spent from ED arrival to inpatient/hospital discharge.
AnalysisWe performed all data analyses using SAS 9.4 (SAS Institute
EHR metricIncluded (≥1 source of delirium management
AND ≥1 key term) ExcludedDelirium management
Pharmacologic agents orders HaloperidolLorazepamQuetiapineValproate sodium or Valproic acid
ClopidogrelDonepezil or Aricept
Observation orders Constant observationEnhanced supervisionNon-violent non-self-destructive level 1 RestraintViolent self-destructive level 2 restraint
1 to 1
CAM documentation Positive NegativeKey term used to document delirium symptoms
AgitationAltered mental statusCognitive declineCognitive impairmentConfusionDeliriumDisorientationEncephalopathyHallucinationMemory lossRestlessnessUnresponsiveness
AggressiveAlert but confusedDazed stateDelusionsDementiaIrritabilityNoncompliantPsychosisSomnolentSun-downing
Table 1. Metrics used to identify delirium in electronic health record documentation.
EHR, electronic health record; CAM, Confusion Assessment Method; 1 to 1, one to one observation.
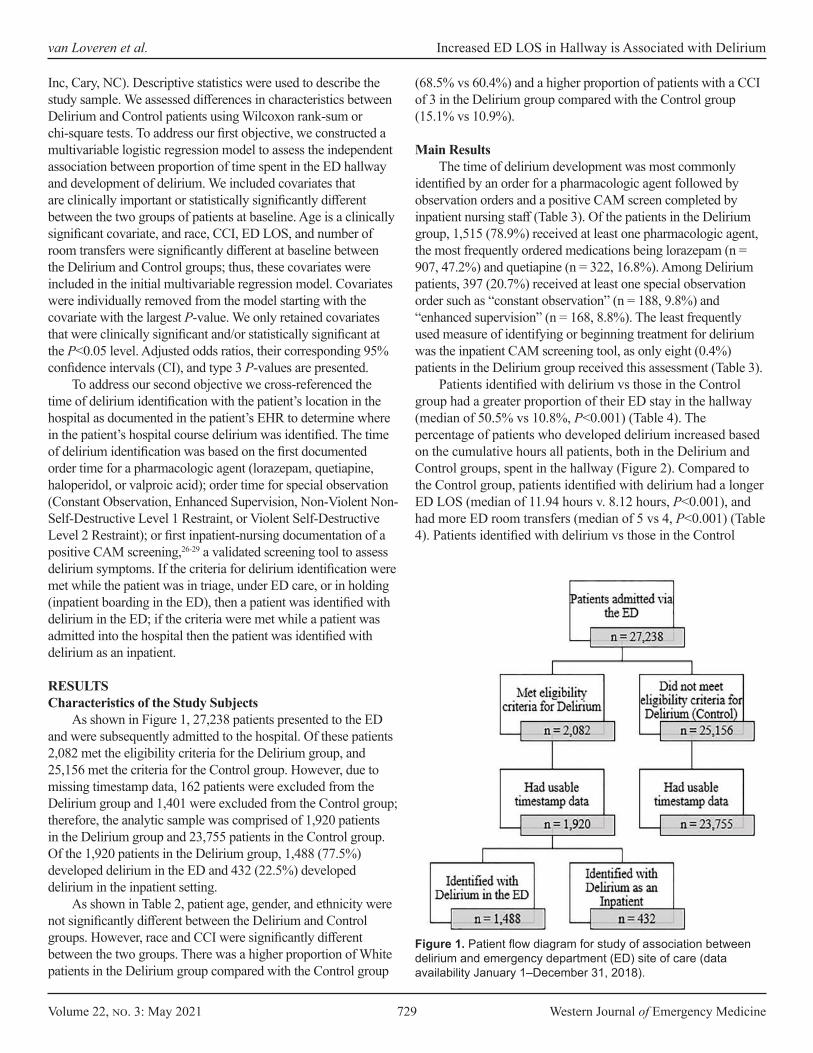
Volume 22, no. 3: May 2021 729 Western Journal of Emergency Medicine
van Loveren et al. Increased ED LOS in Hallway is Associated with Delirium
Inc, Cary, NC). Descriptive statistics were used to describe the study sample. We assessed differences in characteristics between Delirium and Control patients using Wilcoxon rank-sum or chi-square tests. To address our first objective, we constructed a multivariable logistic regression model to assess the independent association between proportion of time spent in the ED hallway and development of delirium. We included covariates that are clinically important or statistically significantly different between the two groups of patients at baseline. Age is a clinically significant covariate, and race, CCI, ED LOS, and number of room transfers were significantly different at baseline between the Delirium and Control groups; thus, these covariates were included in the initial multivariable regression model. Covariates were individually removed from the model starting with the covariate with the largest P-value. We only retained covariates that were clinically significant and/or statistically significant at the P<0.05 level. Adjusted odds ratios, their corresponding 95% confidence intervals (CI), and type 3 P-values are presented.
To address our second objective we cross-referenced the time of delirium identification with the patient’s location in the hospital as documented in the patient’s EHR to determine where in the patient’s hospital course delirium was identified. The time of delirium identification was based on the first documented order time for a pharmacologic agent (lorazepam, quetiapine, haloperidol, or valproic acid); order time for special observation (Constant Observation, Enhanced Supervision, Non-Violent Non-Self-Destructive Level 1 Restraint, or Violent Self-Destructive Level 2 Restraint); or first inpatient-nursing documentation of a positive CAM screening,26-29 a validated screening tool to assess delirium symptoms. If the criteria for delirium identification were met while the patient was in triage, under ED care, or in holding (inpatient boarding in the ED), then a patient was identified with delirium in the ED; if the criteria were met while a patient was admitted into the hospital then the patient was identified with delirium as an inpatient.
RESULTSCharacteristics of the Study Subjects
As shown in Figure 1, 27,238 patients presented to the ED and were subsequently admitted to the hospital. Of these patients 2,082 met the eligibility criteria for the Delirium group, and 25,156 met the criteria for the Control group. However, due to missing timestamp data, 162 patients were excluded from the Delirium group and 1,401 were excluded from the Control group; therefore, the analytic sample was comprised of 1,920 patients in the Delirium group and 23,755 patients in the Control group. Of the 1,920 patients in the Delirium group, 1,488 (77.5%) developed delirium in the ED and 432 (22.5%) developed delirium in the inpatient setting.
As shown in Table 2, patient age, gender, and ethnicity were not significantly different between the Delirium and Control groups. However, race and CCI were significantly different between the two groups. There was a higher proportion of White patients in the Delirium group compared with the Control group
(68.5% vs 60.4%) and a higher proportion of patients with a CCI of 3 in the Delirium group compared with the Control group (15.1% vs 10.9%).
Main ResultsThe time of delirium development was most commonly
identified by an order for a pharmacologic agent followed by observation orders and a positive CAM screen completed by inpatient nursing staff (Table 3). Of the patients in the Delirium group, 1,515 (78.9%) received at least one pharmacologic agent, the most frequently ordered medications being lorazepam (n = 907, 47.2%) and quetiapine (n = 322, 16.8%). Among Delirium patients, 397 (20.7%) received at least one special observation order such as “constant observation” (n = 188, 9.8%) and “enhanced supervision” (n = 168, 8.8%). The least frequently used measure of identifying or beginning treatment for delirium was the inpatient CAM screening tool, as only eight (0.4%) patients in the Delirium group received this assessment (Table 3).
Patients identified with delirium vs those in the Control group had a greater proportion of their ED stay in the hallway (median of 50.5% vs 10.8%, P<0.001) (Table 4). The percentage of patients who developed delirium increased based on the cumulative hours all patients, both in the Delirium and Control groups, spent in the hallway (Figure 2). Compared to the Control group, patients identified with delirium had a longer ED LOS (median of 11.94 hours v. 8.12 hours, P<0.001), and had more ED room transfers (median of 5 vs 4, P<0.001) (Table 4). Patients identified with delirium vs those in the Control
Figure 1. Patient flow diagram for study of association between delirium and emergency department (ED) site of care (data availability January 1–December 31, 2018).

Western Journal of Emergency Medicine 730 Volume 22, no. 3: May 2021
Increased ED LOS in Hallway is Associated with Delirium van Loveren and Singla et al.
group had a significantly longer median hospital LOS (5.0 days vs 4.6 days, P<0.001). Patients identified with delirium had significantly higher CCI scores (P<0.001) (Table 2). In a multivariable logistic regression model controlling for age, race,
CCI, number of room transfers, and ED LOS, the relative odds of a patient being identified with delirium increased by 3.31 times for each percent increase in hallway time (95% CI, 2.85, 3.83) (Table 5).
CharacteristicAll patients (n = 25,675)
Control (n = 23,755)
Delirium (n = 1,920) P-value
Age, years [median (IQR)] 71 (57, 83) 71 (57, 83) 70 (54, 85) 0.118Gender 0.983
Female, n (%) 13,512 (52.6%) 12,502 (52.6%) 1,010 (52.6%)Male, n (%) 12,163 (47.4%) 11,253 (47.4%) 910 (47.4%)
Race <0.001White, n (%) 15,672 (61.0%) 14,356 (60.4%) 1,316 (68.5%)Black, n (%) 3,850 (15.0%) 3,608 (15.2%) 242 (12.6%)Other/Multiracial, n (%) 3,635 (14.2%) 3,404 (14.3%) 231 (12.0%)Asian, n (%) 1,885 (7.3%) 1,798 (7.6%) 87 (4.5%)Native American/Alaska Native, n (%) 107 (0.4%) 104 (0.4%) 3 (0.2%)Unknown, n (%) 526 (2.1%) 485 (2.0%) 41 (2.2%)
Ethnicity 0.891Not Hispanic or Latino, n (%) 22,741 (88.6%) 21,036 (88.6%) 1,705 (88.8%)Hispanic or Latino, n (%) 2,837 (11.1%) 2,630 (11.1%) 207 (10.8%)Unknown, n (%) 97 (0.4%) 89 (0.4%) 8 (0.4%)
Charlson Comorbidity Index <0.0010, n (%) 7,423 (28.9%) 6,891 (29.0%) 532 (27.7%)1, n (%) 3,844 (15.0%) 3,623 (15.3%) 221 (11.5%)2, n (%) 5,643 (22.0%) 5,201 (21.9%) 442 (23.0%)3, n (%) 2,887 (11.2%) 2,597 (10.9%) 290 (15.1%)4, n (%) 0 (0.0%) 0 (0.0%) 0 (0.0%)5, n (%) 5,878 (22.9%) 5,443 (22.9%) 435 (22.7%)
Table 2. Sample characteristics.
*P-values derived from Wilcoxon rank-sum test for age and chi-square test for all other variables.
Orders for delirium management n (% of Delirium group) n = 1,920Medications 1515 (78.9%)
Lorazepam 907 (47.2%)Quetiapine 322 (16.8%)Haloperidol 167 (8.7%)Valproic acid 119 (6.2%)
Bed Orders 397 (20.7%)Constant observation 188 (9.8%)Enhanced supervision 168 (8.8%)Non-violent non-self-destructive level 1 restraint 38 (2.0%)Violent self-destructive level 2 restraint 3 (0.2%)
Inpatient positive CAM screening 8 (0.4%)
Table 3. Medications and orders used for delirium identification.
CAM, confusion assessment method.
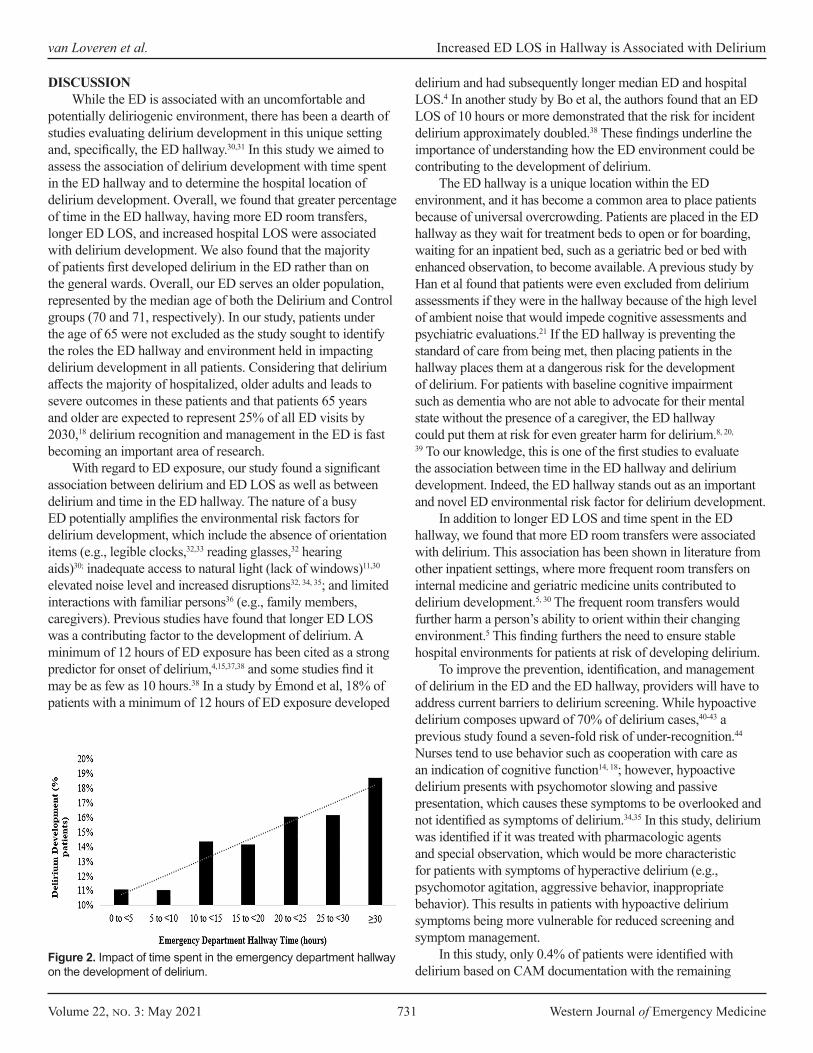
Volume 22, no. 3: May 2021 731 Western Journal of Emergency Medicine
van Loveren et al. Increased ED LOS in Hallway is Associated with Delirium
DISCUSSIONWhile the ED is associated with an uncomfortable and
potentially deliriogenic environment, there has been a dearth of studies evaluating delirium development in this unique setting and, specifically, the ED hallway.30,31 In this study we aimed to assess the association of delirium development with time spent in the ED hallway and to determine the hospital location of delirium development. Overall, we found that greater percentage of time in the ED hallway, having more ED room transfers, longer ED LOS, and increased hospital LOS were associated with delirium development. We also found that the majority of patients first developed delirium in the ED rather than on the general wards. Overall, our ED serves an older population, represented by the median age of both the Delirium and Control groups (70 and 71, respectively). In our study, patients under the age of 65 were not excluded as the study sought to identify the roles the ED hallway and environment held in impacting delirium development in all patients. Considering that delirium affects the majority of hospitalized, older adults and leads to severe outcomes in these patients and that patients 65 years and older are expected to represent 25% of all ED visits by 2030,18 delirium recognition and management in the ED is fast becoming an important area of research.
With regard to ED exposure, our study found a significant association between delirium and ED LOS as well as between delirium and time in the ED hallway. The nature of a busy ED potentially amplifies the environmental risk factors for delirium development, which include the absence of orientation items (e.g., legible clocks,32,33 reading glasses,32 hearing aids)30; inadequate access to natural light (lack of windows)11,30 elevated noise level and increased disruptions32, 34, 35; and limited interactions with familiar persons36 (e.g., family members, caregivers). Previous studies have found that longer ED LOS was a contributing factor to the development of delirium. A minimum of 12 hours of ED exposure has been cited as a strong predictor for onset of delirium,4,15,37,38 and some studies find it may be as few as 10 hours.38 In a study by Émond et al, 18% of patients with a minimum of 12 hours of ED exposure developed
delirium and had subsequently longer median ED and hospital LOS.4 In another study by Bo et al, the authors found that an ED LOS of 10 hours or more demonstrated that the risk for incident delirium approximately doubled.38 These findings underline the importance of understanding how the ED environment could be contributing to the development of delirium.
The ED hallway is a unique location within the ED environment, and it has become a common area to place patients because of universal overcrowding. Patients are placed in the ED hallway as they wait for treatment beds to open or for boarding, waiting for an inpatient bed, such as a geriatric bed or bed with enhanced observation, to become available. A previous study by Han et al found that patients were even excluded from delirium assessments if they were in the hallway because of the high level of ambient noise that would impede cognitive assessments and psychiatric evaluations.21 If the ED hallway is preventing the standard of care from being met, then placing patients in the hallway places them at a dangerous risk for the development of delirium. For patients with baseline cognitive impairment such as dementia who are not able to advocate for their mental state without the presence of a caregiver, the ED hallway could put them at risk for even greater harm for delirium.8, 20,
39 To our knowledge, this is one of the first studies to evaluate the association between time in the ED hallway and delirium development. Indeed, the ED hallway stands out as an important and novel ED environmental risk factor for delirium development.
In addition to longer ED LOS and time spent in the ED hallway, we found that more ED room transfers were associated with delirium. This association has been shown in literature from other inpatient settings, where more frequent room transfers on internal medicine and geriatric medicine units contributed to delirium development.5, 30 The frequent room transfers would further harm a person’s ability to orient within their changing environment.5 This finding furthers the need to ensure stable hospital environments for patients at risk of developing delirium.
To improve the prevention, identification, and management of delirium in the ED and the ED hallway, providers will have to address current barriers to delirium screening. While hypoactive delirium composes upward of 70% of delirium cases,40-43 a previous study found a seven-fold risk of under-recognition.44 Nurses tend to use behavior such as cooperation with care as an indication of cognitive function14, 18; however, hypoactive delirium presents with psychomotor slowing and passive presentation, which causes these symptoms to be overlooked and not identified as symptoms of delirium.34,35 In this study, delirium was identified if it was treated with pharmacologic agents and special observation, which would be more characteristic for patients with symptoms of hyperactive delirium (e.g., psychomotor agitation, aggressive behavior, inappropriate behavior). This results in patients with hypoactive delirium symptoms being more vulnerable for reduced screening and symptom management.
In this study, only 0.4% of patients were identified with delirium based on CAM documentation with the remaining
Figure 2. Impact of time spent in the emergency department hallway on the development of delirium.

Western Journal of Emergency Medicine 732 Volume 22, no. 3: May 2021
Increased ED LOS in Hallway is Associated with Delirium van Loveren and Singla et al.
99.6% of delirious patients identified through provider orders for delirium management including pharmacologic agents and special observation. Prior research has shown that compared to researchers, bedside clinicians miss delirium cases in up to 75%20,45 of patients, and compared to psychiatrists, emergency physicians miss 28% of delirium cases.21 The low usage of CAM, shown through this study, identifies an area of opportunity to use other efficient and effective screening tools for delirium. CAM is the most widely used delirium detection instrument, and it has been adapted for the ED39 and for family corroboration46 (FAM-CAM). Considering that the ED is universally overcrowded and nursing shortages can limit time committed to delirium screening, shorter validated screening tools may be preferred. Other screening tools such as the 4 A’s Test4,35,47 and Nursing Delirium
Outcome measureDelirium
(n = 1,920)Control
(n = 23,755) P-valuePercent hallway time [median (IQR)] 50.5% (20.6%, 77.8%) 10.8% (0.0%, 59.6%) <0.001ED hallway LOS, hours [median (IQR)] 5.85 (1.94, 11.53) 0.80 (0.00, 6.15) <0.001ED LOS, hours [median (IQR)] 11.94 (7.48, 22.04) 8.12 (5.57, 13.37) <0.001Number of ED room transfers [median (IQR)] 5 (4, 5) 4 (3, 5) <0.001Hospital LOS, days [median (IQR)] 5.0 (3.0, 8.4) 4.6 (2.8, 7.9) <0.001
Table 4. Length of stay comparisons between the delirium and control groups.
P-values derived from Wilcoxon rank-sum tests. ED, emergency department; LOS, length of stay; IQR, interquartile range.
Variable Odds ratio (95% CI) P-valueHallway time, per unit of percent change 3.31 (2.85, 3.83) <0.001Age, per year 0.99 (0.99, 1.00) <0.001Race <0.001
White 1.00 (Reference)Black 0.63 (0.54, 0.73)Asian 0.51 (0.41, 0.65)Native American/Alaska Native 0.24 (0.08, 0.77)Other/Multiracial 0.67 (0.58, 0.78)Unknown 0.97 (0.70, 1.35)
Charlson Comorbidity Index <0.0010 1.00 (Reference)1 0.91 (0.77, 1.08)2 1.19 (1.04, 1.36)3 1.62 1.38, 1.90)5 1.20 (1.05, 1.38)
Total of number of room transfers, per number 1.22 (1.18, 1.26) <0.001ED length of stay, per hours 1.02 (1.02, 1.03) <0.001
Table 5. Multivariable logistic regression model of the independent association between percent hallway time and development of delirium (n = 25,675).
CI, confidence interval; ED, emergency department.
Screening Scale34,48 have been identified as quick delirium screening tools that can be used routinely in the ED to improve screening compliance.
LIMITATIONSThis study is not without limitations. First, because the
time of delirium development was based on the order times for pharmacologic agents and special observation or time of an initial positive CAM screening, this provided only an approximate time of development and patients could have been experiencing delirium that did not require clinician management. Indeed, our study likely identified mostly hyperactive delirium and may have missed hypoactive delirium. As shown in other retrospective cohort studies, hypoactive delirium is difficult to detect through

Volume 22, no. 3: May 2021 733 Western Journal of Emergency Medicine
van Loveren et al. Increased ED LOS in Hallway is Associated with Delirium
EHR documentation.22 The retrospective nature of this study presents its second
limitation. We excluded patients with chief complaints indicating baseline-altered cognition in order to exclude patients with delirium at the time of ED arrival. This method reduced the number of patients with extant delirium, yet some patients with extant delirium could have been included considering that clinicians are known to miss delirium symptoms in patients.20,21,45 The methodology from this study, however, allowed for a larger sample size. Although there is no standard or validated way of retrospectively identifying delirium in the ED, we used a methodology based on those used in four previously published papers,22-25 including studies performed using our study site’s EHR,24,25 and we conducted a pilot abstraction to validate the method used to conduct the electronic data query.
Third, because this was a single-center study it could limit the generalizability of our results. Other EDs may have unique factors that contribute to the development of delirium that may not be reflected in our results. The methodology used for this study, therefore, would have to be validated to be applicable to other institutions.
Fourth, because the reason for placement in a hallway bed is not standardized in the ED, it is possible that patients with delirium symptoms were placed in the hallway beds to facilitate observation. Analysis of this relationship, however, indicates that the majority of the patients in the Delirium group were placed in the hallway before being identified with delirium, and delirium was identified in these patients 7.82 hours, on average, after being placed in the hallway (Supplement 1). For patients who developed delirium before being placed in the hallway, on average they developed delirium 5.06 hours before being moved to a hallway bed (Supplement 1). We interpret this to mean that hallway exposure precedes the development of delirium, playing more of a causal role in delirium development than a role in managing delirium symptoms.
The lack of standardization for bed placement and room transfers in the ED presents an underdeveloped understanding for the reason patients are placed in the hallway and transferred to different rooms. Due to ED overcrowding, this can impact the placement of patients as the volume and acuities of patients will continuously fluctuate, impacting placement of patients in a room compared to a bed in the hallway. This presents a topic to be assessed in further studies.
Additionally, to assess time spent in the ED hallway, this study depended on timestamps for room changes, including hallway bed placements. The documentation of the time of bed placement is dependent on ED staff entering these times into the patient’s EHR, which allows for variability due to potentially delayed documentation. And lastly, inconsistent and limited identification of delirium in hallway patients could be due to ED crowding or due to a direct effect of being in a hallway bed. Because we used a retrospective chart review as our method of analysis, this discrepancy is difficult to determine and would require a prospective study to understand the clinical nuances that
impede the identification of delirium in the hallway. Overall, this method of identifying delirium requires further investigation.
CONCLUSIONWe found a strong association between percentage of
time spent in the ED hallway and delirium development after controlling for confounding factors in a multivariable logistic regression model. Greater time spent in the ED, especially the ED hallway, increases vulnerable patients’ exposure to deleterious environmental factors identified in prior literature. Given the high rate of delirium in the ED, education and standardization of delirium prevention, screening, and management should be urgently investigated.
Address for Correspondence: Timmy Li, PhD, North Shore University Hospital, Department of Emergency Medicine, 300 Community Drive Manhasset, NY 11030. Email: [email protected].
Conflicts of Interest: By the WestJEM article submission agreement, all authors are required to disclose all affiliations, funding sources and financial or management relationships that could be perceived as potential sources of bias. No author has professional or financial relationships with any companies that are relevant to this study. There are no conflicts of interest or sources of funding to declare.
Copyright: © 2021 van Loveren and Singla et al. This is an open access article distributed in accordance with the terms of the Creative Commons Attribution (CC BY 4.0) License. See: http://creativecommons.org/licenses/by/4.0/
REFERENCES1. Leslie DL, Marcantonio ER, Zhang Y, et al. One-year health care costs
associated with delirium in the elderly population. Arch Intern Med. 2008;168(1):27-32.
2. Inouye SK. Delirium in older persons. N Engl J Med. 2006;354(11):1157-65.
3. Sinvani L, Kozikowski A, Pekmezaris R, et al. Delirium: a survey of healthcare professionals’ knowledge, beliefs, and practices. J Am Geriatr Soc. 2016;64(12):e297-e303.
4. Émond M, Grenier D, Morin J, et al. Emergency department stay associated delirium in older patients. Can Geriatr J. 2017;20(1):10-4.
5. Goldberg A, Straus SE, Hamid JS, et al. Room transfers and the risk of delirium incidence amongst hospitalized elderly medical patients: a case-control study. BMC Geriatr. 2015;15:69.
6. Kishi Y, Iwasaki Y, Takezawa K, et al. Delirium in critical care unit patients admitted through an emergency room. Gen Hosp Psychiatry.1995;17(5):371-9.
7. Émond M, Boucher V, Carmichael PH, et al. Incidence of delirium in the Canadian emergency department and its consequences on hospital length of stay: a prospective observational multicentre cohort study. BMJ Open. 2018;8(3):e018190.
8. Ely EW, Gautam S, Margolin R, et al. The impact of delirium in the intensive care unit on hospital length of stay. Intensive Care Med. 2001;27(12):1892-900.

Western Journal of Emergency Medicine 734 Volume 22, no. 3: May 2021
9. Ahmed S, Leurent B, Sampson EL. Risk factors for incident delirium among older people in acute hospital medical units: a systematic review and meta-analysis. Age Ageing. 2014;43(3):326-33.
10. Han JH, Shintani A, Eden S. Delirium in the emergency department: an independent predictor of death within 6 months. Ann Emerg Med. 2010;56(3):244-52.
11. Inouye SK, Westendorp RG, Saczynski JS. Delirium in elderly people. Lancet. 2014;383(9920):911-22.
12. Elie M, Rousseau F, Cole M, et al. Prevalence and detection of delirium in elderly emergency department patients. CMAJ. 2000;163(8):977-81.
13. Naughton BJ, Moran MB, Kadah H, et al. Delirium and other cognitive impairment in older adults in an emergency department. Ann Emerg Med. 1995;25(6):751-5.
14. Lewis LM, Miller DK, Morley JE, et al. Unrecognized delirium in ED geriatric patients. Am J Emerg Med.1995;13(2):142-5.
15. Inouye SK, Viscoli CM, Horwitz RI, et al. A predictive model for delirium in hospitalized elderly medical patients based on admission characteristics. Ann Intern Med. 1993;119(6):474-81.
16. Van Rompaey B, Elseviers MM, Schuurmans MJ, et al. Risk factors for delirium in intensive care patients: a prospective cohort study. Crit Care. 2009;13(3):R77.
17. Asplin BR, Magid DJ, Rhodes KV, et al. A conceptual model of emergency department crowding. Ann Emerg Med. 2003;42(2):173-80.
18. Wilber ST, Gerson LW, Terrell KM, et al. Geriatric emergency medicine and the 2006 Institute of Medicine reports from the Committee on the Future of Emergency Care in the U.S. health system. Acad Emerg Med. 2006;13(12):1345-51.
19. Delaney M, Pepin J, Somes J. Emergency department delirium screening improves care and reduces revisits for the older adult patient. J Emerg Nurs. 2015;41(6):521-4.
20. Rice KL, Bennett M, Gomez M, et al. Nurses’ recognition of delirium in the hospitalized older adult. Clin Nurse Spec. 2011;25(6):299-311.
21. Han JH, Wilson A, Graves AJ, et al. Validation of the Confusion Assessment Method for the intensive care unit in older emergency department patients. Acad Emerg Med. 2014;21(2):180-7.
22. Puelle MR, Kosar CM, Xu G, et al. The language of delirium: keywords for identifying delirium from medical records. J Gerontol Nurs. 2015;41(8):34-42.
23. Inouye SK, Leo-Summers L, Zhang Y, et al. A chart-based method for identification of delirium: validation compared with interviewer ratings using the confusion assessment method. J Am Geriatr Soc. 2005;53(2):312-8.
24. Sinvani L, Kozikowski A, Smilios C, et al. Implementing ACOVE quality indicators as an intervention checklist to improve care for hospitalized older adults. J Hosp Med. 2017;12(7):517-22.
25. Sinvani L, Warner-Cohen J, Strunk A, et al. A multicomponent model to improve hospital care of older adults with cognitive impairment: a propensity score-matched analysis. J Am Geriatr Soc. 2018;66(9):1700-7.
26. O’Mahony R, Murthy L, Akunne A, et al. Synopsis of the National Institute for Health and Clinical Excellence guideline for prevention of delirium. Ann Intern Med 2011;154(11):746-51.
27. Inouye SK, van Dyck CH, Alessi CA, et al. Clarifying confusion: the confusion assessment method. A new method for detection of delirium. Ann Intern Med. 1990;113(12): 941-8.
28. Wong CL, Holroyd-Leduc J, Simel DL, et al. Does this patient have delirium? Value of bedside instruments. JAMA 2010;304(7):779–86.
29. Wei LA, Fearing MA, Sternberg EJ, et al. The confusion assessment method: a systematic review of current usage. J Am Geriatr Soc. 2008;56(5):823-30.
30. Shenvi C, Wilson MP, Aldai A, et al. A research agenda for the assessment and management of acute behavioral changes in elderly emergency department patients. West J Emerg Med. 2019;20(2):393-402.
31. Shenvi C, Kennedy M, Austin CA, et al. Managing delirium and agitation in the older emergency department patient: the ADEPT tool. Ann Emerg Med. 2020;75(2):136-45.
32. McCusker J, Cole M, Abrahamowicz M, et al. Environmental risk factors for delirium in hospitalized older people. J Am Geriatr Soc. 2001;49(10):1327-34.
33. Kostas TR, Zimmerman KM, Rudoph JL. Improving delirium care: prevention, monitoring, and assessment. Neurohospitalist. 2013;3(4):194-202.
34. Cole MG. Delirium in elderly patients. Am J Geriatr Psychiatry. 2004;12(1):7-21.
35. Hosker C, Ward D. Hypoactive delirium. BMJ. 2017;357:j2047.36. Vasilevskis EE, Han JH, Hughes CG, et al. Epidemiology and risk
factors for delirium across hospital settings. Best Pract Res Clin Anaesthesiol. 2012;26(3):277-87.
37. Inouye SK, Charpentier PA. Precipitating factors for delirium in hospitalized elderly persons. Predictive model and interrelationship with baseline vulnerability. JAMA. 1996;275(11):852-7.
38. Bo M, Bonetto M, Bottignole G, et al. Length of stay in the emergency department and occurrence of delirium in older medical patients. J Am Geriatr Soc. 2016;64(5):1114-9.
39. Han JH, Zimmerman EE, Cutler N, et al. Delirium in older emergency department patients: recognition, risk factors, and psychomotor subtypes. Acad Emerg Med. 2009;16(3):193-200.
40. O’Keeffe S, Lavan J. The prognostic significance of delirium in older hospital patients. J Am Geriatr Soc. 1997;45(2):174-8.
41. McCusker J, Cole MG, Dendukuri N, et al. Does delirium increase hospital stay? J Am Geriatr Soc. 2003;51(11):1539-46.
42. Liptzin B, Levkoff SE. An empirical study of delirium subtypes. Br J Psychiatry. 1992;161:843-5.
43. Marcantonio E, Ta T, Duthie E, et al. Delirium severity and psychomotor types: their relationship with outcomes after hip fracture repair. J Am Geriatr Soc. 2002;50(5):850-7.
44. Inouye SK, Foreman MD, Miron LC, et al. Nurses’ recognition of delirium and its symptoms: comparison of nurse and researcher ratings. Arch Intern Med. 2001;161(20):2467-73.
45. Han JH, Wilson A, Vasilevskis EE, et al. Diagnosing delirium in older emergency department patients: validity and reliability of the delirium triage screen and the brief Confusion Assessment Method. Ann Emerg Med. 2013;62(5):457-65.
Volume 22, no. 3: May 2021 735 Western Journal of Emergency Medicine
46. Steis MR, Evans L, Hirschman KB, et al. Screening for delirium using family caregivers: convergent validity of the family confusion assessment method and interviewer-rated confusion assessment method. J Am Geriatr Soc. 2012;60(11):2121-6.
47. Bellelli G, Morandi A, David DH, et al. Validation of the 4AT, a new
instrument for rapid delirium screening: a study in 234 hospitalised older people. Age Ageing. 2014;43(4):496-502.
48. Gaudreau JD, Gagnon P, Harel F, et al. Fast, systematic, and continuous delirium assessment in hospitalized patients: the nursing delirium screening scale. J Pain Symptom Manage. 2005;29(4):368-75.
Western Journal of Emergency Medicine 736 Volume 22, no. 3: May 2021
Expert Commentary
Financial Implications of Boarding: A Call for Research Maureen M. Canellas, MD*Kevin A. Kotkowski, MD, MBA*Sean S. Michael, MD, MBA†
Martin A. Reznek, MD, MBA*
Section Editor: Mark I. Langdorf, MD, MHPE Submission history: Submitted August 25, 2020; Revision received January 16, 2021; Accepted January 23, 2021Electronically published April 9, 2021Full text available through open access at http://escholarship.org/uc/uciem_westjem DOI: 10.5811/westjem.2021.1.49527[West J Emerg Med. 2021;22(3)736–738.]
Boarding, the practice of holding patients in emergency departments (ED) after a decision has been made to admit them to the hospital,1 is well known to adversely affect patient care. Multiple investigations have shown that boarding negatively impacts quality and patient safety outcomes including mortality,2-7 readmission rate,8 hospital length of stay,2,5,8,9 and patient satisfaction.10-12 In addition, boarding is known to be a major contributor to overall ED crowding,13 which also has been demonstrated to have significant negative impact on quality and safety.13,14 Multiple operational tactics are known to reduce boarding but, concerningly, adoption of them has been inconsistent.13,15 Also concerning, ED boarding appears to be worsening over time, based upon our unpublished year-over-year review of two large national ED operations benchmarking databases, the Emergency Department Benchmarking Alliance and the Academy of Administrators in Academic Emergency Medicine/Association of Academic Chairs of Emergency Medicine.16,17
The constellation of boarding having been known to adversely affect patient care outcomes for over two decades, inconsistent implementation of tactics known to reduce boarding, and evidence that boarding may be worsening over time naturally raises questions of the barriers to improvement. Chief among these questions is why implementation of boarding-reduction tactics has not consistently occurred, despite their clear benefits. In that regard, some experts have postulated that financial drivers may be at play.18,19
To investigate the potential for financial drivers contributing to boarding, we performed a systematic review, pre-registered with PROSPERO (#CRD42016037794). We reviewed 1185 manuscripts from the past five years, and while we identified a number of articles that considered downstream financial implications of ED crowding, only two investigations studied the financial drivers specific to boarding. In 2015, Dyas et al created a cost model formula to estimate the opportunity costs of boarders and the revenue gained from process improvement changes. Using this model,
University of Massachusetts Medical School, Department of Emergency Medicine, Worcester, MassachusettsUniversity of Colorado School of Medicine, Department of Emergency Medicine, Aurora, Colorado
*
†
they estimated a $4,000,000 financial benefit by reducing their average boarding time to below 60 minutes. However, the model was highly simplified and only considered the costs associated with a single diagnosis per patient, regardless of their overall condition and other diagnoses.20 In 2017, Schreyer and Martin showed that maintaining an admitted patient in an ED bed cost the hospital twice as much as an inpatient bed and five times as much as an admissions holding-unit bed. Notably, this single-center publication assumed that the admissions holding unit could be added to their center’s ED without renovation or building costs.21
Drawing valid, generalizable conclusions from just these two studies is not possible; however, we believe that the paucity of research in this area is—in and of itself—meaningful. The bottom line is that there is very little scientific inquiry into the financial effects of boarding; thus, there remain three mutually exclusive possibilities, in our view:
1) Boarding is financially advantageous for hospitals This has been postulated by some experts, citing the fact that fee-for-service Medicare reimbursements are on average $700 more per elective admission than emergent admissions.22 If this scenario is demonstrably true, it may prompt consideration of reimbursement reform to incentivize boarding reduction.
2) Boarding is financially disadvantageous for hospitals While it may appear that there are revenue incentives for hospitals to continue to board patients admitted from EDs based on the $700 difference cited above, we hypothesize that there are likely significant and disproportionate cost disadvantages to boarding, potentially masked by limitations in historical cost accounting practices and investigational methodologies.23 Recalculating total costs of boarding care would require modifying these structural accounting factors. However, uncovering that boarding is financially disadvantageous would add additional
Volume 22, no. 3: May 2021 737 Western Journal of Emergency Medicine
Canellas et al. Financial Implications of Boarding: A Call for Research
incentive beyond the known quality and safety benefits for hospitals to implement boarding reduction tactics.
3) Boarding is financially neutral for hospitals. It is possible that there are financial advantages and disadvantages of boarding that balance each other. If a financially neutral scenario is demonstrated to be true, the quality and safety evidence alone should then prompt broader adoption of boarding-reduction tactics.
Determining which of the above scenarios holds true will be critical if our society is to address the growing issue of boarding in a socially and financially responsible manner. Historically, financial investigations in healthcare have been challenging due to traditional healthcare cost accounting methods being highly complex, poorly designed,24 and fraught with outdated assumptions about the details of care delivery models. We suspect that this phenomenon is likely the root cause of the paucity of research uncovered by our investigation. Nonetheless, promising alternative costing methodologies exist that may overcome these barriers. For example, some have proposed an alternative approach to traditional cost accounting methods known as time-driven activity-based costing (TDABC).25 This structured methodology, used rarely in healthcare settings but often in other industries,26 could be employed to calculate resources consumed by a patient as they progress through care. This technique holds tremendous potential in boarding-related financial investigations. Conducting a randomized trial of boarding has obvious ethical constraints, but leveraging the fact that boarding naturally varies across patients over time and within any given institution (even within common diagnoses) may allow for prospective investigations using TDABC methodology. Once actual costs are known, computer simulations could enable further research in this important area.
Although accurately determining costs of care is likely the most important component to understanding the financial implications of boarding, there are some additional financial factors that also must be considered. Primarily, boarding patients creates opportunity costs, including ED patients leaving before being seen and reductions in accepted ED transfers and ambulance diversion (where still allowed). This lost revenue also likely extends beyond the ED, as a portion of these patients would require hospital admission and undergo surgical procedures. Likewise, there may be opportunity costs to certain boarding mitigation strategies, such as reducing elective surgeries and elective medical admissions. Negative quality outcomes and excess mortality also have financial costs, and boarding-attributable losses in this realm are often overlooked. The most effective simulation models must account for these additional cost dimensions to fully understand the financial impact of ED boarding.
In conclusion, our recently conducted systematic review
demonstrated a paucity of published investigations of the financial impacts of boarding. We believe that this research void is a significant contributing factor in the persistence, and possibly worsening, of the practice of boarding in EDs. Therefore, we suggest an increased focus in this area of research, using methodologically sound techniques such as time-driven activity-based costing and computer simulation.
Address for Correspondence: Maureen M. Canellas, MD, University of Massachusetts Medical School, Department of Emergency Medicine, Worcester, Massachusetts, 55 N. Lake Ave. Worcester, MA 01604. Email: [email protected].
Conflicts of Interest: By the WestJEM article submission agreement, all authors are required to disclose all affiliations, funding sources and financial or management relationships that could be perceived as potential sources of bias. No author has professional or financial relationships with any companies that are relevant to this study. There are no conflicts of interest or sources of funding to declare.
Copyright: © 2021 Canellas et al. This is an open access article distributed in accordance with the terms of the Creative Commons Attribution (CC BY 4.0) License. See: http://creativecommons.org/licenses/by/4.0/
REFERENCES1. American College of Emergency Physicians. Definition of Boarded
Patient. Policy statement website. 2018. Available at: https://www.acep.org/patient-care/policy-statements/definition-of-boarded-patient/. Accessed May 1, 2020.
2. Singer AJ, Thode HC Jr, Viccellio P, et al. The association between length of emergency department boarding and mortality. Acad Emerg Med. 2011;18(12):1324-29.
3. Reznek MA, Upatising B, Kennedy SJ, et al. Mortality associated with emergency department boarding exposure: Are there differences between patients admitted to ICU and non-ICU settings? Med Care. 2018;56(5):436-40.
4. Cha WC, Cho JS, Shin SD, et al. The impact of prolonged boarding of successfully resuscitated out-of-hospital cardiac arrest patients on survival-to-discharge rates. Resuscitation. 2015;90:25-9.
5. Chalfin DB, Trzeciak S, Likourezos A, et al. Impact of delayed transfer of critically ill patients from the emergency department to the intensive care unit. Crit Care Med. 2007;35(6):1477-83.
6. Intas G, Stergiannis P, Chalari E, et al. The impact of ED boarding time, severity of illness, and discharge destination on outcomes of critically ill ED patients. Adv Emerg Nurs J. 2012;34(2):164-69.
7. Cardoso LT, Grion CM, Matsuo T, et al. Impact of delayed admission to intensive care units on mortality of critically ill patients: a cohort study. Crit Care. 2011;15(1):R28.
8. Bekmezian A, Chung PJ. Boarding admitted children in the
Western Journal of Emergency Medicine 738 Volume 22, no. 3: May 2021
Financial Implications of Boarding: A Call for Research Canellas et al.
emergency department impacts inpatient outcomes. Pediatr Emerg Care. 2012;28(3):236-42.
9. Derose SF, Gabayan GZ, Chiu VY, et al. Emergency department crowding predicts admission length-of-stay but not mortality in a large health system. Med Care. 2014;52(7):602-11.
10. Liu SW, Thomas SH, Gordon JA, et al. A pilot study examining undesirable events among emergency department-boarded patients awaiting inpatient beds. Ann Emerg Med. 2009;54(3):381-85.
11. Pines JM, Hilton JA, Weber EJ, et al. International perspectives on emergency department crowding. Acad Emerg Med. 2011;18(12):1358-70.
12. Viccellio P, Zito JA, Sayage V, et al. Patients overwhelmingly prefer inpatient boarding to emergency department boarding. J Emerg Med. 2013;45(6):942-46.
13. Morley C, Unwin M, Peterson GM, et al. Emergency department crowding: a systematic review of causes, consequences and solutions. PLoS One. 2018;13(8):e0203316.
14. Hoot NR, Aronsky D. Systematic review of emergency department crowding: causes, effects, and solutions. Ann Emerg Med. 2008;52(2):126-36.
15. Schuur JD, Hsia RY, Burstin H, et al. Quality measurement in the emergency department: past and future. Health Aff (Millwood). 2013;32(12):2129-38.
16. Emergency Department Benchmarking Alliance. Emergency department performance measures report 2018. EDBA. 2019. Available at: https://edbenchmarking.org. Accessed May 1, 2020.
17. Reznek MA, Scheulen JJ, Harbertson CA, et al. Contributions of academic emergency medicine programs to U.S. health care: Summary of the AAAEM-AACEM benchmarking data. Acad Emerg
Med. 2018;25(4):444-52.18. Handel DA, Hilton JA, Ward MJ, et al. Emergency department
throughput, crowding, and financial outcomes for hospitals. Acad Emerg Med. 2010;17(8):840-47.
19. Klasco R WR. Sorry, ER patients. People with elective procedures get the hospital beds first. The Washington Post. Health & Science website. 2019. Available at: https://www.washingtonpost.com/national/health-science/sorry-er-patients-people-with-elective-procedures-get-the-hospital-beds-first/2019/02/22/643d1460-2a25-11e9-984d-9b8fba003e81_story.html. Accessed May 1, 2020.
20. Dyas SR, Greenfield E, Messimer S, et al. Process-improvement cost model for the emergency department. J Healthc Manag. 2015;60(6):442-57.
21. Schreyer KE, Martin R. The economics of an admissions holding unit. West J Emerg Med. 2017;18(4):553-58.
22. McHugh M, Regenstein M, Siegel B. The profitability of Medicare admissions based on source of admission. Acad Emerg Med. 2008;15(10):900-7.
23. Yun BJ, Prabhakar AM, Warsh J, et al. Time-driven activity-based costing in emergency medicine. Ann Emerg Med. 2016;67(6):765-72.
24. Mogyorosy Z and Smith P. (2005). Costing methodology. In: Economics CfH (Eds.), The main methodological issues in costing health care services. (p. 32-90). York, UK: University of York.
25. Cidav Z, Mandell D, Pyne J, et al. A pragmatic method for costing implementation strategies using time-driven activity-based costing. Implementation Science. 2020;15(28).
26. Keel G, Savage C, Rafiq M, et al. Time-driven activity-based costing in health care: a systematic review of the literature. Health Policy. 2017;121(7):755-63.

Volume 22, no. 3: May 2021 739 Western Journal of Emergency Medicine
Original Research
Climate Change Adaptation: Prehospital Data Facilitate the Detection of Acute Heat Illness in India
Nikhil Ranadive, MD, MS*†
Jayraj Desai, MD‡
Sathish LM, MS§
Kim Knowlton, DrPH¶
Priya Dutta, PhD§
Parthasarathi Ganguly, MD§
Abhiyant Tiwari, MS§
Anjali Jaiswal, JD¶
Tejas Shah, MD||
Bhavin Solanki, MD||
Dileep Mavalankar, MD, PhD§ Jeremy J. Hess, MD, MPH#**††
Section Editor: Shada Rouhani, MD Submission history: Submitted May 14, 2020; Revision received October 6, 2020; Accepted November 23, 2020Electronically published March 24, 2021 Full text available through open access at http://escholarship.org/uc/uciem_westjem DOI: 10.5811/westjem.2020.11.48209
University of California, San Francisco-Fresno, Department of Emergency Medicine, Fresno, CaliforniaUniversity of Washington, Center for Health and the Global Environment, Seattle, Washington GVK-Emergency Management and Research Institute, Department of Emergency Medicine Learning & Care (Gujarat), Gujurat, IndiaIndian Institute of Public Health, Gandhinagar, Gujarat, IndiaNatural Resources Defense Council, New York City, New YorkAhmedabad Municipal Corporation, Gujarat, IndiaUniversity of Washington, Department of Emergency Medicine, Seattle, WashingtonUniversity of Washington, Department of Environmental and Occupational Health Sciences, Seattle, WashingtonUniversity of Washington, Department of Global Health, Seattle, Washington
*
†
‡
§
¶
||
#
**
††
Introduction: Extreme heat is a significant cause of morbidity and mortality, and the incidence of acute heat illness (AHI) will likely increase secondary to anthropogenic climate change. Prompt diagnosis and treatment of AHI are critical; however, relevant diagnostic and surveillance tools have received little attention. In this exploratory cross-sectional and diagnostic accuracy study, we evaluated three tools for use in the prehospital setting: 1) case definitions; 2) portable loggers to measure on-scene heat exposure; and 3) prevalence data for potential AHI risk factors.
Methods: We enrolled 480 patients who presented to emergency medical services with chief complaints consistent with AHI in Ahmedabad, India, from April–June 2016 in a cross-sectional study. We evaluated AHI case definition test characteristics in reference to trained prehospital provider impressions, compared on-scene heat index measured by portable loggers to weather station measurements, and identified AHI behavioral and environmental risk factors using logistic regression.
Results: The case definition for heat exhaustion was 23.8% (12.1-39.5%) sensitive and 93.6% (90.9-95.7%) specific. The positive and negative predictive values were 33.5% (20.8-49.0%) and 90.1% (88.5-91.5%), respectively. Mean scene heat index was 6.7°C higher than the mean station heat index (P < 0.001), and station data systematically underestimated heat exposure, particularly for AHI cases. Heat exhaustion cases were associated with on-scene heat index ≥ 49°C (odds ratio [OR] 2.66 [1.13–6.25], P = 0.025) and a history of recent exertion (OR 3.66 [1.30–10.29], P = 0.014), while on-scene air conditioning was protective (OR 0.29 [0.10–0.85], P = 0.024).
Conclusion: Systematic collection of prehospital data including recent activity history and presence of air conditioning can facilitate early AHI detection, timely intervention, and surveillance. Scene temperature data can be reliably collected and improve heat exposure and AHI risk assessment. Such data may be important elements of surveillance, clinical practice, and climate change adaptation. [West J Emerg Med. 2021;22(3)739–749.]
Western Journal of Emergency Medicine 740 Volume 22, no. 3: May 2021
Acute Heat Illness in India Ranadive et al.
Population Health Research Capsule
What do we already know about this issue?Climate change is increasing acute heat illness (AHI) prevalence. Prompt diagnosis is key. Exposure history is important, but diagnostic tools are limited.
What was the research question?Can prehospital data elements facilitate the early identification of AHI?
What was the major finding of the study?Prehospital data such as activity history and scene temperature measurement can improve rapid AHI diagnosis.
How does this improve population health?Such data may be important elements for timely surveillance and treatment as the disease burden attributable to extreme heat rises in the setting of climate change.
INTRODUCTION Extreme heat is a significant cause of morbidity and
mortality globally.1–8 Heat poses a threat to human health both directly, causing acute heat illness (AHI) such as heat exhaustion and heat stroke, and indirectly, by exerting stress on physiological systems and exacerbating chronic diseases.9–11 Acute heat illness results from both exogenous and endogenous heat exposure. Exogenous exposure to extreme ambient temperature will likely continue to increase due to the increasing frequency of extreme heat events and anthropogenic climate change.12,13 However, endogenous exposure from exertion is also a significant and increasingly prevalent risk factor.14
Regardless of the exposure pathway, prompt AHI diagnosis and treatment significantly improve clinical outcomes.15 Acute heat illness is a clinical diagnosis facilitated by a high index of suspicion as well as historical and other data that can help determine exposure to endogenous and exogenous heat sources. This is particularly important in the prehospital setting, where diagnostic uncertainty is high, access to adjunct laboratory and other tests is limited, and critically important historical data can be gathered. There is an unmet need to design, test, and evaluate tools to facilitate the early recognition and treatment of AHI in the prehospital setting and to facilitate public health surveillance. This deficit is particularly relevant in India, China, and other low- and middle-income countries (LMIC), which are disproportionately impacted by climate change and where extreme heat poses substantial risk.16–19
In this study we evaluated prehospital AHI diagnostic tools in Ahmedabad, Gujarat, India, a city experiencing significant warming including a heat wave in 2010 that led to more than 1344 deaths – a 43.1% increase over the baseline mortality rate.9 We conducted an exploratory evaluation of three tools with the potential to facilitate early recognition of AHI and more accurate public health surveillance: 1) heat exhaustion and heat stroke case definitions for identifying likely AHI cases; 2) portable digital temperature and humidity data loggers that can be used to measure real-time on-scene temperature at the time of first responder arrival; and 3) prevalence data for AHI risk factors contained in prehospital provider history and physicals (H&P) that can be used to facilitate early diagnosis. We evaluated the potential utility of these tools individually and in combination for improving diagnostic accuracy for AHI in the prehospital setting.
METHODSStudy Overview
This study, which includes a retrospective and exploratory diagnostic accuracy evaluation and a cross-sectional analysis, was conducted between April–June 2016 in Ahmedabad, India.
Study Setting and Collaboration Ahmedabad is the sixth largest city in India. It has a
population of 7.2 million people and is among the fastest growing
cities in the country. It is also one of India’s hottest cities, with summer maximum daily temperatures (Tmax) averaging 45°C from March–May.9,20–22 Like other industrializing cities in LMICs, several populations in Ahmedabad have a high risk for heat illness, including residents of slums and densely populated areas, individuals with limited access to water and air conditioning, and laborers in a range of settings.23–26
This study was conducted in partnership with the Ahmedabad Heat and Climate Study Group and the GVK-Emergency Management and Research Institute (EMRI). GVK-EMRI is the largest emergency medical services (EMS) provider in India and has an active research program. The Ahmedabad Heat and Climate Study Group is comprised of the Ahmedabad Municipal Corporation, the Public Health Foundation of India, the Indian Institute of Public Health-Gandhinagar, the Natural Resources Defense Council, and an international coalition of academic partners including researchers from the University of Washington and the Icahn School of Medicine at Mount Sinai, New York.27,28 Since 2009 the group has developed evidence-based heat preparedness through a heat action plan that combines forecasting of extreme heat, threshold-based early warnings, and capacity building of local health professionals, including training of GVK-EMRI emergency medical technicians (EMT) and their online medical support.27
Study Sample and Data CollectionA flow chart of study enrollment and data collection
is shown in Figure 1. We used a convenience sample of
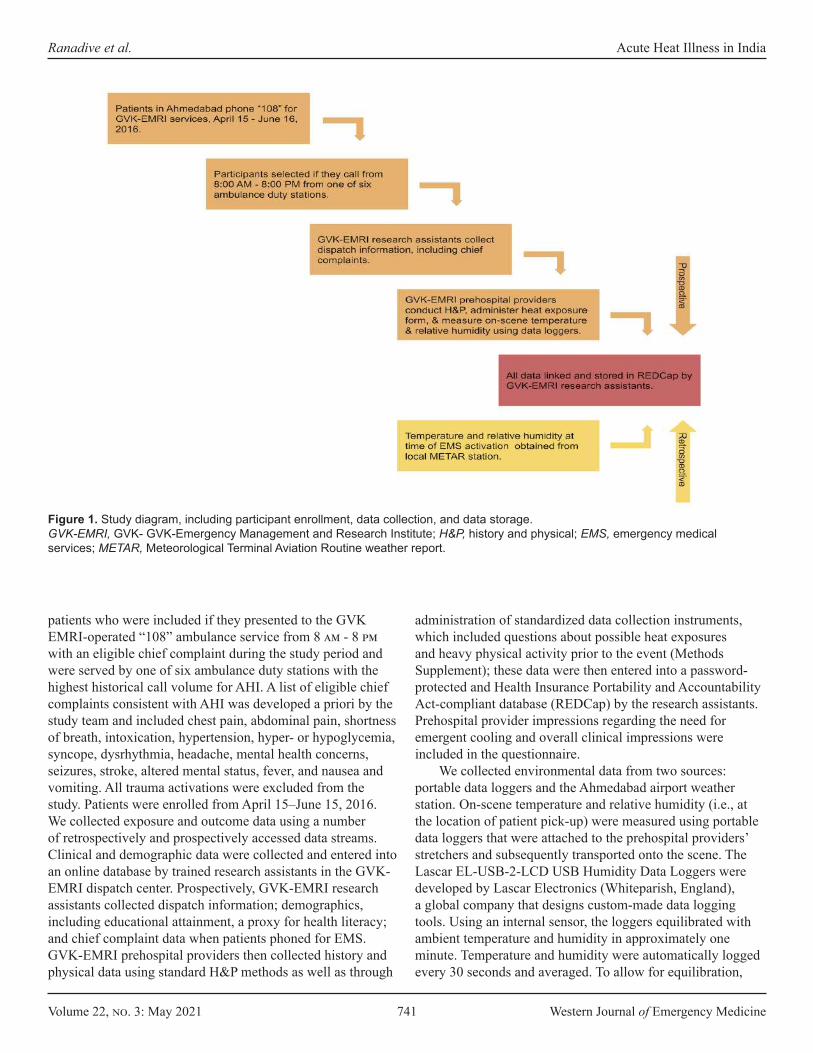
Volume 22, no. 3: May 2021 741 Western Journal of Emergency Medicine
Ranadive et al. Acute Heat Illness in India
patients who were included if they presented to the GVK EMRI-operated “108” ambulance service from 8 am - 8 pm with an eligible chief complaint during the study period and were served by one of six ambulance duty stations with the highest historical call volume for AHI. A list of eligible chief complaints consistent with AHI was developed a priori by the study team and included chest pain, abdominal pain, shortness of breath, intoxication, hypertension, hyper- or hypoglycemia, syncope, dysrhythmia, headache, mental health concerns, seizures, stroke, altered mental status, fever, and nausea and vomiting. All trauma activations were excluded from the study. Patients were enrolled from April 15–June 15, 2016. We collected exposure and outcome data using a number of retrospectively and prospectively accessed data streams. Clinical and demographic data were collected and entered into an online database by trained research assistants in the GVK-EMRI dispatch center. Prospectively, GVK-EMRI research assistants collected dispatch information; demographics, including educational attainment, a proxy for health literacy; and chief complaint data when patients phoned for EMS. GVK-EMRI prehospital providers then collected history and physical data using standard H&P methods as well as through
administration of standardized data collection instruments, which included questions about possible heat exposures and heavy physical activity prior to the event (Methods Supplement); these data were then entered into a password-protected and Health Insurance Portability and Accountability Act-compliant database (REDCap) by the research assistants. Prehospital provider impressions regarding the need for emergent cooling and overall clinical impressions were included in the questionnaire.
We collected environmental data from two sources: portable data loggers and the Ahmedabad airport weather station. On-scene temperature and relative humidity (i.e., at the location of patient pick-up) were measured using portable data loggers that were attached to the prehospital providers’ stretchers and subsequently transported onto the scene. The Lascar EL-USB-2-LCD USB Humidity Data Loggers were developed by Lascar Electronics (Whiteparish, England), a global company that designs custom-made data logging tools. Using an internal sensor, the loggers equilibrated with ambient temperature and humidity in approximately one minute. Temperature and humidity were automatically logged every 30 seconds and averaged. To allow for equilibration,
Figure 1. Study diagram, including participant enrollment, data collection, and data storage. GVK-EMRI, GVK- GVK-Emergency Management and Research Institute; H&P, history and physical; EMS, emergency medical services; METAR, Meteorological Terminal Aviation Routine weather report.
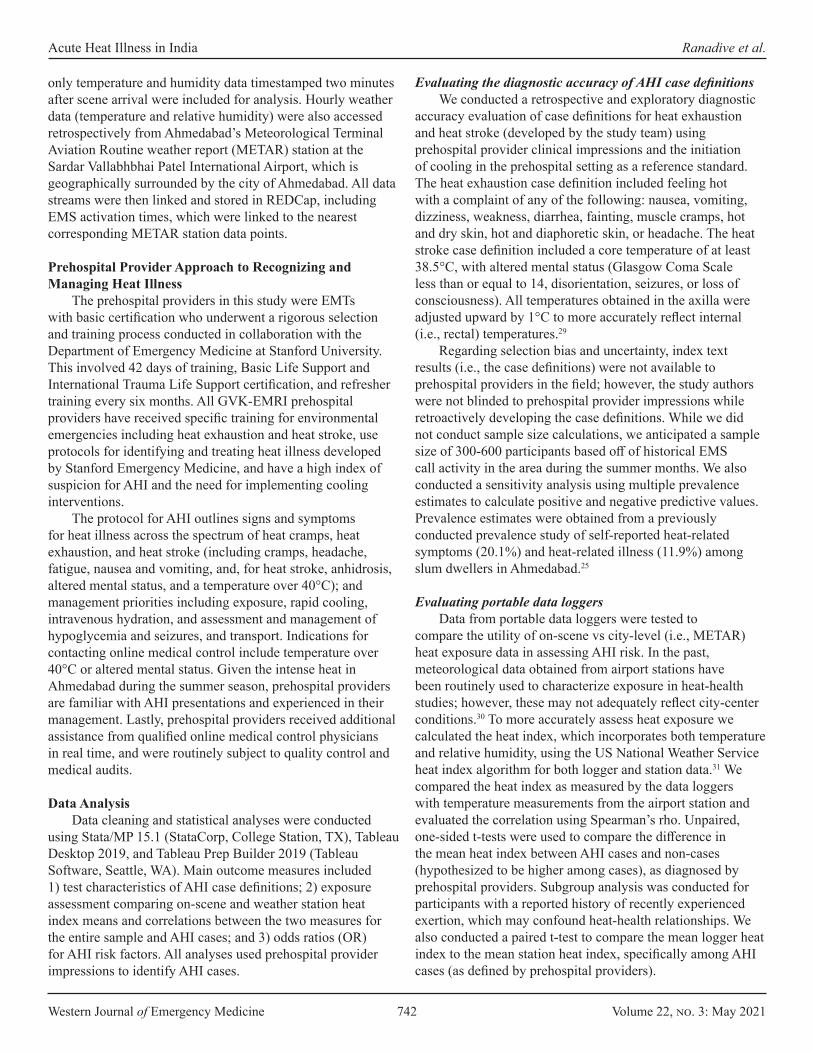
Western Journal of Emergency Medicine 742 Volume 22, no. 3: May 2021
Acute Heat Illness in India Ranadive et al.
only temperature and humidity data timestamped two minutes after scene arrival were included for analysis. Hourly weather data (temperature and relative humidity) were also accessed retrospectively from Ahmedabad’s Meteorological Terminal Aviation Routine weather report (METAR) station at the Sardar Vallabhbhai Patel International Airport, which is geographically surrounded by the city of Ahmedabad. All data streams were then linked and stored in REDCap, including EMS activation times, which were linked to the nearest corresponding METAR station data points.
Prehospital Provider Approach to Recognizing and Managing Heat Illness
The prehospital providers in this study were EMTs with basic certification who underwent a rigorous selection and training process conducted in collaboration with the Department of Emergency Medicine at Stanford University. This involved 42 days of training, Basic Life Support and International Trauma Life Support certification, and refresher training every six months. All GVK-EMRI prehospital providers have received specific training for environmental emergencies including heat exhaustion and heat stroke, use protocols for identifying and treating heat illness developed by Stanford Emergency Medicine, and have a high index of suspicion for AHI and the need for implementing cooling interventions.
The protocol for AHI outlines signs and symptoms for heat illness across the spectrum of heat cramps, heat exhaustion, and heat stroke (including cramps, headache, fatigue, nausea and vomiting, and, for heat stroke, anhidrosis, altered mental status, and a temperature over 40°C); and management priorities including exposure, rapid cooling, intravenous hydration, and assessment and management of hypoglycemia and seizures, and transport. Indications for contacting online medical control include temperature over 40°C or altered mental status. Given the intense heat in Ahmedabad during the summer season, prehospital providers are familiar with AHI presentations and experienced in their management. Lastly, prehospital providers received additional assistance from qualified online medical control physicians in real time, and were routinely subject to quality control and medical audits.
Data AnalysisData cleaning and statistical analyses were conducted
using Stata/MP 15.1 (StataCorp, College Station, TX), Tableau Desktop 2019, and Tableau Prep Builder 2019 (Tableau Software, Seattle, WA). Main outcome measures included 1) test characteristics of AHI case definitions; 2) exposure assessment comparing on-scene and weather station heat index means and correlations between the two measures for the entire sample and AHI cases; and 3) odds ratios (OR) for AHI risk factors. All analyses used prehospital provider impressions to identify AHI cases.
Evaluating the diagnostic accuracy of AHI case definitions We conducted a retrospective and exploratory diagnostic
accuracy evaluation of case definitions for heat exhaustion and heat stroke (developed by the study team) using prehospital provider clinical impressions and the initiation of cooling in the prehospital setting as a reference standard. The heat exhaustion case definition included feeling hot with a complaint of any of the following: nausea, vomiting, dizziness, weakness, diarrhea, fainting, muscle cramps, hot and dry skin, hot and diaphoretic skin, or headache. The heat stroke case definition included a core temperature of at least 38.5°C, with altered mental status (Glasgow Coma Scale less than or equal to 14, disorientation, seizures, or loss of consciousness). All temperatures obtained in the axilla were adjusted upward by 1°C to more accurately reflect internal (i.e., rectal) temperatures.29
Regarding selection bias and uncertainty, index text results (i.e., the case definitions) were not available to prehospital providers in the field; however, the study authors were not blinded to prehospital provider impressions while retroactively developing the case definitions. While we did not conduct sample size calculations, we anticipated a sample size of 300-600 participants based off of historical EMS call activity in the area during the summer months. We also conducted a sensitivity analysis using multiple prevalence estimates to calculate positive and negative predictive values. Prevalence estimates were obtained from a previously conducted prevalence study of self-reported heat-related symptoms (20.1%) and heat-related illness (11.9%) among slum dwellers in Ahmedabad.25
Evaluating portable data loggersData from portable data loggers were tested to
compare the utility of on-scene vs city-level (i.e., METAR) heat exposure data in assessing AHI risk. In the past, meteorological data obtained from airport stations have been routinely used to characterize exposure in heat-health studies; however, these may not adequately reflect city-center conditions.30 To more accurately assess heat exposure we calculated the heat index, which incorporates both temperature and relative humidity, using the US National Weather Service heat index algorithm for both logger and station data.31 We compared the heat index as measured by the data loggers with temperature measurements from the airport station and evaluated the correlation using Spearman’s rho. Unpaired, one-sided t-tests were used to compare the difference in the mean heat index between AHI cases and non-cases (hypothesized to be higher among cases), as diagnosed by prehospital providers. Subgroup analysis was conducted for participants with a reported history of recently experienced exertion, which may confound heat-health relationships. We also conducted a paired t-test to compare the mean logger heat index to the mean station heat index, specifically among AHI cases (as defined by prehospital providers).
Volume 22, no. 3: May 2021 743 Western Journal of Emergency Medicine
Ranadive et al. Acute Heat Illness in India
Assessing risk factors and heat-health relationships We conducted a number of logistic regression models
using each case definition as a dichotomous outcome variable (i.e., heat exhaustion and heat stroke cases and non-cases) to better characterize heat-health relationships, ccount for confounding variables, and identify risk factors for possible use in a clinical decision-making tool. Models were evaluated and selected using the chi-square goodness-of-fit test and Stata’s linktest function, which assesses specification error. Independent variables in each model included heat exposure data such as logger and station heat indices, station visibility (a surrogate for air quality, as air quality data such as daily particulate matter and ozone levels was not available), and station wind speed, and variables to distinguish between exertional and non-exertional heat illness (i.e., a report of recently experienced heavy labor).32 Given the clinical utility of thresholds, logger and station heat indices were included as dichotomous covariates with temperature thresholds ≥ or < 49°C (consistent with previously described heat-wave temperature thresholds in South Asia), rather than as a continuous variable.33
EthicsEthics approval was obtained from the Indian Council of
Medical Research (TRC/IEC No. 14/2015), the University of Washington (#51167), and the Indian Institute of Public Health, Gandhinagar. A waiver of informed consent was obtained to access medical records, and all patient information was de-identified prior to analysis.
DisclosuresAll authors completed the ICMJE uniform disclosure form
at http://www.icmje.org/coi_disclosure.pdf and declare the following: no support from any organization for the submitted work; no financial relationships with any organizations that might have an interest in the submitted work in the previous three years; and no other relationships or activities that could appear to have influenced the submitted work.
Funding This work was funded by the National Institutes of Health
(grant number 5R21TW009535-02). The funding source had no involvement in study design, data collection or analysis, manuscript writing, or the decision to submit this manuscript for publication.
RESULTS Demographic, Environmental, and Clinical Characteristics
Study sample characteristics and environmental exposure data are described in Table 1 (see Figures S1 and S2 for participant flow diagrams). A total of 480 participants were enrolled into the study, with 49.8% males and 50.2% females. The median age was 41.5 years with an age range of 1-95 years. At total of 349 participants (72.71%) reported an
n (%)Demographic characteristics
GenderMale 239 (49.8)Female 241 (50.2)
Age (years)< 1 4 (0.8)1 – 5 15 (3.1)6 - 17 30 (6.3)18 - 44 202 (42.1)45 - 64 123 (25.6)≥ 65 106 (22.1)
Highest level of educationNone/less than grade 5 237 (49.4)Primary (up to grade 5) 112 (23.3)Secondary (up to grade 10) 66 (13.8)High (up to grade 12) 34 (7.1)Bachelor’s degree or above 18 (3.8)Missing 13 (2.7)
Prior medical historyAlcoholism 2 (0.4)Cardiovascular disease 8 (1.7)Diabetes 38 (7.9)Hypertension 66 (13.8)Liver disease 1 (0.2)Renal disease 9 (1.9)
Patient pickup locationResidence 439 (91.5)Indoor public space 4 (0.8)Outdoor public space 14 (2.9)Worksite 17 (3.5)School or college 3 (0.6)Other 3 (0.6)
Clinical characteristicsDermatological signs
Skin hot, diaphoretic 21 (4.3)Skin hot, dry 59 (12.3)
Neurological signsGCS ≤ 14 48 (10.0)GCS ≤ 13 37 (7.7)
Body temperature≥ 38.5°C 112 (23.3)≥ 40.0°C 47 (9.8)
Table 1. Study sample (n = 480) demographic, environmental, and clinical characteristics.
GCS, Glosgow Coma Scale; C, Celsius.
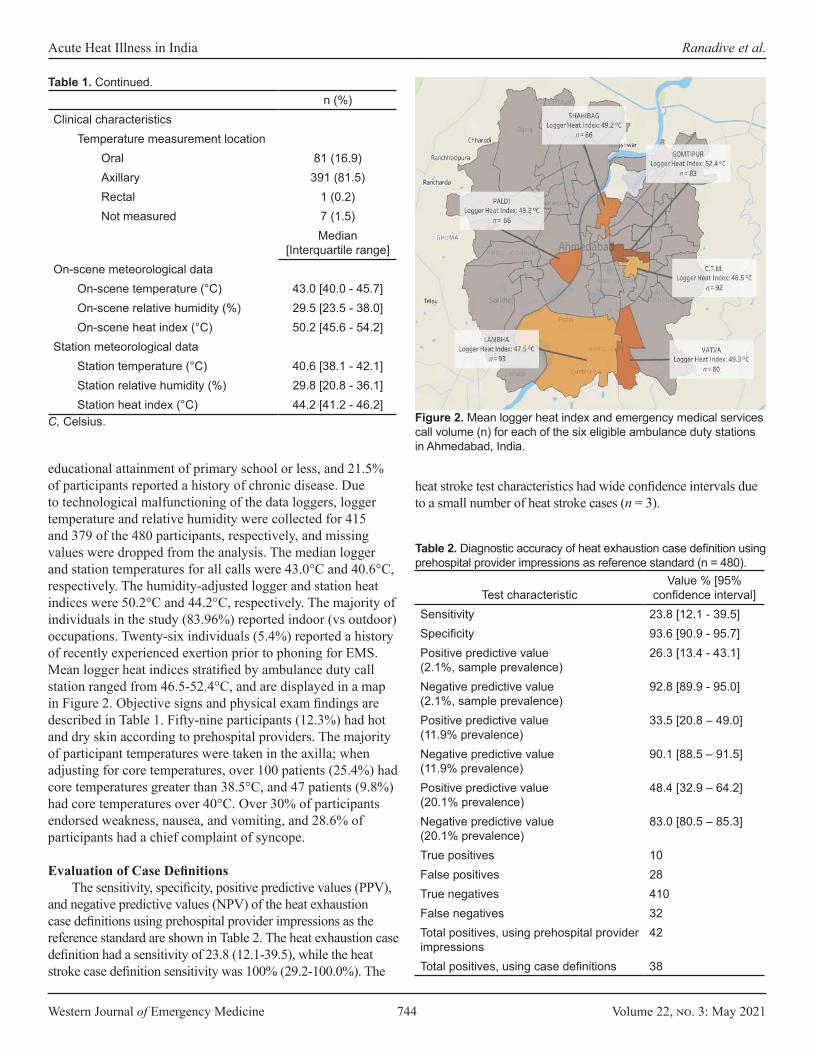
Western Journal of Emergency Medicine 744 Volume 22, no. 3: May 2021
Acute Heat Illness in India Ranadive et al.
educational attainment of primary school or less, and 21.5% of participants reported a history of chronic disease. Due to technological malfunctioning of the data loggers, logger temperature and relative humidity were collected for 415 and 379 of the 480 participants, respectively, and missing values were dropped from the analysis. The median logger and station temperatures for all calls were 43.0°C and 40.6°C, respectively. The humidity-adjusted logger and station heat indices were 50.2°C and 44.2°C, respectively. The majority of individuals in the study (83.96%) reported indoor (vs outdoor) occupations. Twenty-six individuals (5.4%) reported a history of recently experienced exertion prior to phoning for EMS. Mean logger heat indices stratified by ambulance duty call station ranged from 46.5-52.4°C, and are displayed in a map in Figure 2. Objective signs and physical exam findings are described in Table 1. Fifty-nine participants (12.3%) had hot and dry skin according to prehospital providers. The majority of participant temperatures were taken in the axilla; when adjusting for core temperatures, over 100 patients (25.4%) had core temperatures greater than 38.5°C, and 47 patients (9.8%) had core temperatures over 40°C. Over 30% of participants endorsed weakness, nausea, and vomiting, and 28.6% of participants had a chief complaint of syncope.
Evaluation of Case Definitions The sensitivity, specificity, positive predictive values (PPV),
and negative predictive values (NPV) of the heat exhaustion case definitions using prehospital provider impressions as the reference standard are shown in Table 2. The heat exhaustion case definition had a sensitivity of 23.8 (12.1-39.5), while the heat stroke case definition sensitivity was 100% (29.2-100.0%). The
heat stroke test characteristics had wide confidence intervals due to a small number of heat stroke cases (n = 3).
n (%)Clinical characteristics
Temperature measurement locationOral 81 (16.9)Axillary 391 (81.5)Rectal 1 (0.2)Not measured 7 (1.5)
Median [Interquartile range]
On-scene meteorological dataOn-scene temperature (°C) 43.0 [40.0 - 45.7]On-scene relative humidity (%) 29.5 [23.5 - 38.0]On-scene heat index (°C) 50.2 [45.6 - 54.2]
Station meteorological dataStation temperature (°C) 40.6 [38.1 - 42.1]Station relative humidity (%) 29.8 [20.8 - 36.1]Station heat index (°C) 44.2 [41.2 - 46.2]
Table 1. Continued.
C, Celsius. Figure 2. Mean logger heat index and emergency medical services call volume (n) for each of the six eligible ambulance duty stations in Ahmedabad, India.
Test characteristicValue % [95%
confidence interval]Sensitivity 23.8 [12.1 - 39.5]Specificity 93.6 [90.9 - 95.7]Positive predictive value (2.1%, sample prevalence)
26.3 [13.4 - 43.1]
Negative predictive value (2.1%, sample prevalence)
92.8 [89.9 - 95.0]
Positive predictive value (11.9% prevalence)
33.5 [20.8 – 49.0]
Negative predictive value (11.9% prevalence)
90.1 [88.5 – 91.5]
Positive predictive value (20.1% prevalence)
48.4 [32.9 – 64.2]
Negative predictive value (20.1% prevalence)
83.0 [80.5 – 85.3]
True positives 10False positives 28True negatives 410False negatives 32Total positives, using prehospital provider impressions
42
Total positives, using case definitions 38
Table 2. Diagnostic accuracy of heat exhaustion case definition using prehospital provider impressions as reference standard (n = 480).
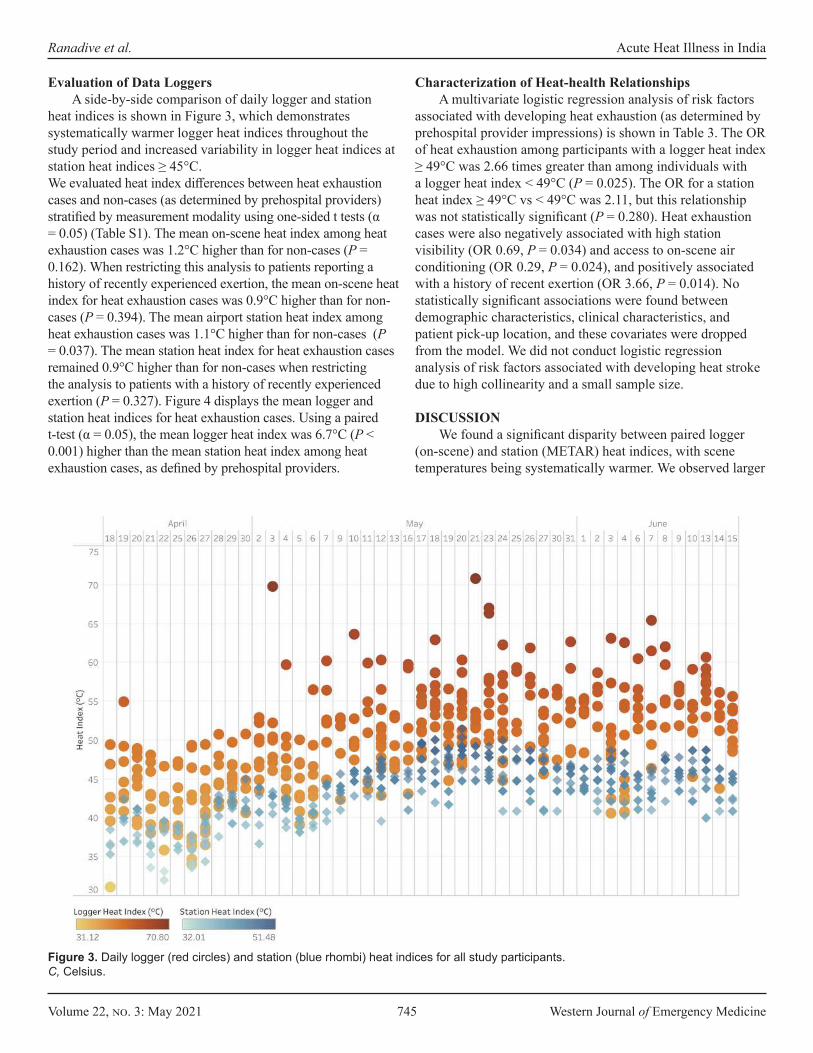
Volume 22, no. 3: May 2021 745 Western Journal of Emergency Medicine
Ranadive et al. Acute Heat Illness in India
Figure 3. Daily logger (red circles) and station (blue rhombi) heat indices for all study participants.C, Celsius.
Evaluation of Data LoggersA side-by-side comparison of daily logger and station
heat indices is shown in Figure 3, which demonstrates systematically warmer logger heat indices throughout the study period and increased variability in logger heat indices at station heat indices ≥ 45°C. We evaluated heat index differences between heat exhaustion cases and non-cases (as determined by prehospital providers) stratified by measurement modality using one-sided t tests (α = 0.05) (Table S1). The mean on-scene heat index among heat exhaustion cases was 1.2°C higher than for non-cases (P = 0.162). When restricting this analysis to patients reporting a history of recently experienced exertion, the mean on-scene heat index for heat exhaustion cases was 0.9°C higher than for non-cases (P = 0.394). The mean airport station heat index among heat exhaustion cases was 1.1°C higher than for non-cases (P = 0.037). The mean station heat index for heat exhaustion cases remained 0.9°C higher than for non-cases when restricting the analysis to patients with a history of recently experienced exertion (P = 0.327). Figure 4 displays the mean logger and station heat indices for heat exhaustion cases. Using a paired t-test (α = 0.05), the mean logger heat index was 6.7°C (P < 0.001) higher than the mean station heat index among heat exhaustion cases, as defined by prehospital providers.
Characterization of Heat-health Relationships A multivariate logistic regression analysis of risk factors
associated with developing heat exhaustion (as determined by prehospital provider impressions) is shown in Table 3. The OR of heat exhaustion among participants with a logger heat index ≥ 49°C was 2.66 times greater than among individuals with a logger heat index < 49°C (P = 0.025). The OR for a station heat index ≥ 49°C vs < 49°C was 2.11, but this relationship was not statistically significant (P = 0.280). Heat exhaustion cases were also negatively associated with high station visibility (OR 0.69, P = 0.034) and access to on-scene air conditioning (OR 0.29, P = 0.024), and positively associated with a history of recent exertion (OR 3.66, P = 0.014). No statistically significant associations were found between demographic characteristics, clinical characteristics, and patient pick-up location, and these covariates were dropped from the model. We did not conduct logistic regression analysis of risk factors associated with developing heat stroke due to high collinearity and a small sample size.
DISCUSSION We found a significant disparity between paired logger
(on-scene) and station (METAR) heat indices, with scene temperatures being systematically warmer. We observed larger

Western Journal of Emergency Medicine 746 Volume 22, no. 3: May 2021
Acute Heat Illness in India Ranadive et al.
Figure 4. Mean heat indices (HI) with 95% confidence intervals as measured by loggers (red circles, upper band) and the METAR* station (blue rhombi, lower band) among individuals with heat exhaustion according to pre-hospital providers. C, Celsious; METAR, Meteorological Terminal Aviation Routine weather report.
differences for heat stroke cases than for heat exhaustion cases and smaller differences among AHI cases with a history of recent heavy exertion. We also observed spatial variability in logger heat indices at the level of ambulance duty stations. Taken together, this suggests that station data may not adequately capture microclimate conditions and on-scene heat exposures, and that data loggers provide useful information for exposure assessment in evaluating possible AHI cases, particularly when there is no history of heavy exertion. Both on-scene and station HI are higher for heat exhaustion cases than non-cases, although this relationship was not always statistically significant.
The observed trend is reinforced by the finding that heat exhaustion cases were significantly and positively associated with a logger heat index ≥ 49°C. Altogether we conclude that scene temperature and relative humidity may have utility as environmental tests for AHI in the prehospital setting. Prior studies have identified significant differences between monitoring station and microclimate data due to on-scene variability in wind speed and direction, solar radiation, and
humidity, among other factors.34,35 A number of tools have been developed to measure on-scene heat risk, including personal temperature loggers and wet bulbs that measure radiant heat, ambient temperature, wind, and humidity.36–39 However, to our knowledge these have only been used to measure workplace risk and have not been evaluated in the context of prehospital medicine.
In the limited case series presented here, a history of exertion seems to have substantially lowered the temperature threshold for developing AHI. We also found that access to air conditioning was negatively associated with a diagnosis of heat exhaustion. Thus, while scene temperature is important, it has to be interpreted as part of total heat load, ie, including both exogenous and endogenous sources: if the patient has a history of heavy exertion or lives or works in an environment without an air conditioner, a lower scene temperature and heat index may be consistent with AHI. Prehospital providers should also specifically assess for these risk factors when obtaining patient histories, both on hot days and in areas with high AHI prevalence.
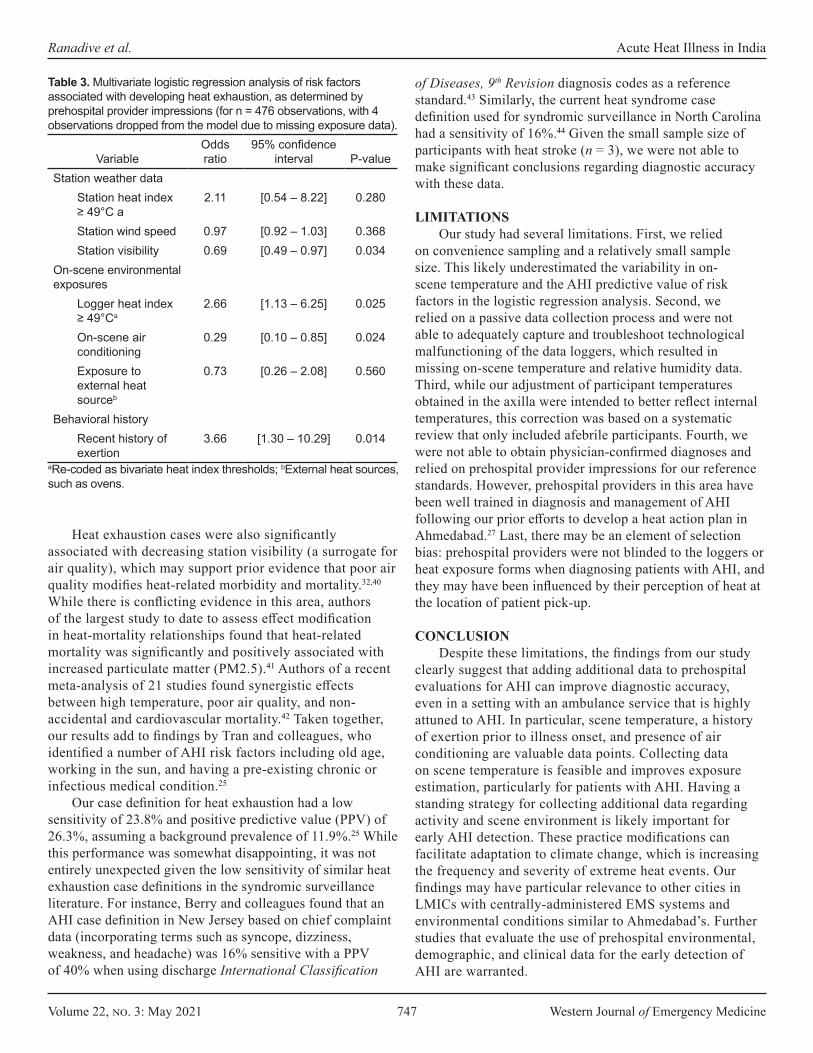
Volume 22, no. 3: May 2021 747 Western Journal of Emergency Medicine
Ranadive et al. Acute Heat Illness in India
VariableOdds ratio
95% confidence interval P-value
Station weather data Station heat index ≥ 49°C a
2.11 [0.54 – 8.22] 0.280
Station wind speed 0.97 [0.92 – 1.03] 0.368Station visibility 0.69 [0.49 – 0.97] 0.034
On-scene environmental exposures
Logger heat index ≥ 49°Ca
2.66 [1.13 – 6.25] 0.025
On-scene air conditioning
0.29 [0.10 – 0.85] 0.024
Exposure to external heat sourceb
0.73 [0.26 – 2.08] 0.560
Behavioral historyRecent history of exertion
3.66 [1.30 – 10.29] 0.014
aRe-coded as bivariate heat index thresholds; bExternal heat sources, such as ovens.
Table 3. Multivariate logistic regression analysis of risk factors associated with developing heat exhaustion, as determined by prehospital provider impressions (for n = 476 observations, with 4 observations dropped from the model due to missing exposure data).
Heat exhaustion cases were also significantly associated with decreasing station visibility (a surrogate for air quality), which may support prior evidence that poor air quality modifies heat-related morbidity and mortality.32,40 While there is conflicting evidence in this area, authors of the largest study to date to assess effect modification in heat-mortality relationships found that heat-related mortality was significantly and positively associated with increased particulate matter (PM2.5).41 Authors of a recent meta-analysis of 21 studies found synergistic effects between high temperature, poor air quality, and non-accidental and cardiovascular mortality.42 Taken together, our results add to findings by Tran and colleagues, who identified a number of AHI risk factors including old age, working in the sun, and having a pre-existing chronic or infectious medical condition.25
Our case definition for heat exhaustion had a low sensitivity of 23.8% and positive predictive value (PPV) of 26.3%, assuming a background prevalence of 11.9%.25 While this performance was somewhat disappointing, it was not entirely unexpected given the low sensitivity of similar heat exhaustion case definitions in the syndromic surveillance literature. For instance, Berry and colleagues found that an AHI case definition in New Jersey based on chief complaint data (incorporating terms such as syncope, dizziness, weakness, and headache) was 16% sensitive with a PPV of 40% when using discharge International Classification
of Diseases, 9th Revision diagnosis codes as a reference standard.43 Similarly, the current heat syndrome case definition used for syndromic surveillance in North Carolina had a sensitivity of 16%.44 Given the small sample size of participants with heat stroke (n = 3), we were not able to make significant conclusions regarding diagnostic accuracy with these data.
LIMITATIONSOur study had several limitations. First, we relied
on convenience sampling and a relatively small sample size. This likely underestimated the variability in on-scene temperature and the AHI predictive value of risk factors in the logistic regression analysis. Second, we relied on a passive data collection process and were not able to adequately capture and troubleshoot technological malfunctioning of the data loggers, which resulted in missing on-scene temperature and relative humidity data. Third, while our adjustment of participant temperatures obtained in the axilla were intended to better reflect internal temperatures, this correction was based on a systematic review that only included afebrile participants. Fourth, we were not able to obtain physician-confirmed diagnoses and relied on prehospital provider impressions for our reference standards. However, prehospital providers in this area have been well trained in diagnosis and management of AHI following our prior efforts to develop a heat action plan in Ahmedabad.27 Last, there may be an element of selection bias: prehospital providers were not blinded to the loggers or heat exposure forms when diagnosing patients with AHI, and they may have been influenced by their perception of heat at the location of patient pick-up.
CONCLUSIONDespite these limitations, the findings from our study
clearly suggest that adding additional data to prehospital evaluations for AHI can improve diagnostic accuracy, even in a setting with an ambulance service that is highly attuned to AHI. In particular, scene temperature, a history of exertion prior to illness onset, and presence of air conditioning are valuable data points. Collecting data on scene temperature is feasible and improves exposure estimation, particularly for patients with AHI. Having a standing strategy for collecting additional data regarding activity and scene environment is likely important for early AHI detection. These practice modifications can facilitate adaptation to climate change, which is increasing the frequency and severity of extreme heat events. Our findings may have particular relevance to other cities in LMICs with centrally-administered EMS systems and environmental conditions similar to Ahmedabad’s. Further studies that evaluate the use of prehospital environmental, demographic, and clinical data for the early detection of AHI are warranted.
Western Journal of Emergency Medicine 748 Volume 22, no. 3: May 2021
Acute Heat Illness in India Ranadive et al.
Address for Correspondence: Jeremy J. Hess, MD, MPH, Department of Emergency Medicine, 325 9th Ave 3EC-22, Box 359702, Seattle, WA 98104. Email: [email protected].
Conflicts of Interest: By the WestJEM article submission agreement, all authors are required to disclose all affiliations, funding sources and financial or management relationships that could be perceived as potential sources of bias. No author has professional or financial relationships with any companies that are relevant to this study. There are no conflicts of interest or sources of funding to declare.
Copyright: © 2021 Ranadive et al. This is an open access article distributed in accordance with the terms of the Creative Commons Attribution (CC BY 4.0) License. See: http://creativecommons.org/licenses/by/4.0/
REFERENCES1. Åström DO, Forsberg B, Rocklöv J. Heat wave impact on morbidity
and mortality in the elderly population: a review of recent studies. Maturitas. 2011;69(2):99-105.
2. Basagaña X, Sartini C, Barrera-Gómez J, et al. Heat waves and cause-specific mortality at all ages. Epidemiology. 2011;22(6):765-72.
3. Basu R. High ambient temperature and mortality: a review of epidemiologic studies from 2001 to 2008. Environ Health. 2009;8:40.
4. Robine JM, Cheung SL, Le Roy S, et al. Death toll exceeded 70,000 in Europe during the summer of 2003. C R Biol. 2008;331(2):171-8.
5. Vandentorren S, Suzan F, Medina S, et al. Mortality in 13 French cities during the August 2003 heat wave. Am J Public Health. 2004;94(9):1518-20.
6. Baccini M, Biggeri A, Accetta G, et al. Heat effects on mortality in 15 European cities. Epidemiology. 2008;19(5):711-9.
7. Knowlton K, Rotkin-Ellman M, King G, et al. The 2006 California heat wave: impacts on hospitalizations and emergency department visits. Environ Health Perspect. 2009;117(1):61-7.
8. Anderson GB, Bell ML. Heat waves in the United States: mortality risk during heat waves and effect modification by heat wave characteristics in 43 U.S. communities. Environ Health Perspect. 2011;119(2):210-8.
9. Azhar GS, Mavalankar D, Nori-Sarma A, et al. Heat-related mortality in India: excess all-cause mortality associated with the 2010 Ahmedabad heat wave. PLoS One. 2014;9(3):e91831. Erratum in: PLoS One. 2014;9(9):e109457.
10. Ellis FP. Heat illness. II. Pathogenesis. Trans R Soc Trop Med Hyg. 1976;70(5-6):412-8.
11. Sandor RP. Heat illness: on-site diagnosis and cooling. Phys Sportsmed. 1997;25(6):35-40.
12. IPCC. Climate Change 2014: Synthesis Report. 2014. Available at: https://www.ipcc.ch/site/assets/uploads/2018/05/SYR_AR5_FINAL_full_wcover.pdf. Accessed on May 14, 2020.
13. Watts N, Amann M, Ayeb-Karlsson S, et al. The Lancet countdown on health and climate change: from 25 years of inaction to a global transformation for public health. Lancet. 2018;391(10120):581-630. Erratum in: Lancet. 2017; Erratum in: Lancet. 2020;395(10239):1762.
14. Kjellstrom T, Holmer I, Lemke B. Workplace heat stress, health and productivity - an increasing challenge for low and middle-income countries during climate change. Glob Health Action. 2009;2:10.3402/gha.v2i0.2047.
15. Bouchama A, Knochel JP. Heat stroke. N Engl J Med. 2002;346(25):1978-88.
16. Kjellstrom T. Climate change, direct heat exposure, health and well-being in low and middle-income countries. Glob Health Action. 2009;2:10.3402/gha.v2i0.1958.
17. Levi M, Kjellstrom T, Baldasseroni A. Impact of climate change on occupational health and productivity: a systematic literature review focusing on workplace heat. Med Lav. 2018;109(3):163-79.
18. Sun X, Sun Q, Yang M, et al. Effects of temperature and heat waves on emergency department visits and emergency ambulance dispatches in Pudong New Area, China: a time series analysis. Environ Health. 2014;13:76.
19. Cheng J, Xu Z, Zhao D, et al. The burden of extreme heat and heatwave on emergency ambulance dispatches: a time-series study in Huainan, China. Sci Total Environ. 2016;571:27-33.
20. Bush KF, Luber G, Kotha SR, et al. Impacts of climate change on public health in India: future research directions. Environ Health Perspect. 2011;119(6):765-70.
21. Kotkin J. The world’s fastest-growing cities. 2010. Available at: https://www.forbes.com/2010/10/07/cities-china-chicago-opinions-columnists-joel-kotkin.html?sh=372b129b54e2. Accessed May 14, 2020.
22. Attri SD, Tyagi A. Climate profile of India. 2010. Available at: http://uchai.net/pdf/knowledge_resources/Publications/Reports/Climate%20Profile%20India_IMD.pdf. Accessed May 14, 2020.
23. Ayyappan R, Sankar S, Rajkumar P, et al. Work-related heat stress concerns in automotive industries: a case study from Chennai, India. Glob Health Action. 2009;2:10.3402/gha.v2i0.2060.
24. Dash SK, Kjellstrom T. Workplace heat stress in the context of rising temperature in India. Curr Sci. 2011;101(4):496-503.
25. Tran KV, Azhar GS, Nair R, et al. A cross-sectional, randomized cluster sample survey of household vulnerability to extreme heat among slum dwellers in Ahmedabad, India. Int J Environ Res Public Health. 2013;10(6):2515-43.
26. Azhar G, Saha S, Ganguly P, et al. Heat wave vulnerability mapping for India. Int J Environ Res Public Health. 2017;14(4):357.
27. Knowlton K, Kulkarni SP, Azhar GS, et al. Development and implementation of South Asia’s first heat-health action plan in Ahmedabad (Gujarat, India). Int J Environ Res Public Health. 2014;11(4):3473-92.
28. Hess JJ, Lm S, Knowlton K, et al. Building resilience to climate change: pilot evaluation of the impact of India’s first heat action plan on all-cause mortality. J Environ Public Health. 2018;2018:7973519.
29. Geneva II, Cuzzo B, Fazili T, Javaid W. Normal body temperature: a systematic review. Open Forum Infect Dis. 2019;6(4):ofz032.
30. de’Donato FK, Stafoggia M, Rognoni M, et al. Airport and city-centre temperatures in the evaluation of the association between heat and mortality. Int J Biometeorol. 2008;52(4):301-10.
31. Anderson GB, Bell ML, Peng RD. Methods to calculate the heat
Volume 22, no. 3: May 2021 749 Western Journal of Emergency Medicine
Ranadive et al. Acute Heat Illness in India
index as an exposure metric in environmental health research. Environ Health Perspect. 2013;121(10):1111-9.
32. Huang W, Tan J, Kan H, et al. Visibility, air quality and daily mortality in Shanghai, China. Sci Total Environ. 2009;407(10):3295-300.
33. Nissan H, Burkart K, Coughlan de Perez E, et al. Defining and predicting heat waves in Bangladesh. J Appl Meteorol Climatol. 2017;56(10):2653-70.
34. Bramer I, Anderson BJ, Bennie J, et al. (2018). Advances in monitoring and modelling climate at ecologically relevant scales. In: Bohan DA, Dumbrell AJ, Woodward G (Eds.), Advances in Ecological Research (101-161). San Diego, CA: Elsevier.
35. Haider N, Kirkeby C, Kristensen B, et al. Microclimatic temperatures increase the potential for vector-borne disease transmission in the Scandinavian climate. Sci Rep. 2017;7(1):8175.
36. Mac VVT, Hertzberg V, McCauley LA. Examining agricultural workplace micro and macroclimate data using decision tree analysis to determine heat illness risk. J Occup Environ Med. 2019;61(2):107-14.
37. Morris CE, Gonzales RG, Hodgson MJ, et al. Actual and simulated weather data to evpluate wet bulb globe temperature and heat index as alerts for occupational heat-related illness. J Occup Environ Hyg.
2019;16(1):54-65.38. Garzon-Villalba XP, Mbah A, Wu Y, et al. Exertional heat illness and
acute injury related to ambient wet bulb globe temperature. Am J Ind Med. 2016;59(12):1169-76.
39. Budd GM. Wet-bulb globe temperature (WBGT)--its history and its limitations. J Sci Med Sport. 2008;11(1):20-32.
40. Scortichini M, De Sario M, de’Donato FK, et al. Short-term effects of heat on mortality and effect modification by air pollution in 25 Italian Cities. Int J Environ Res Public Health. 2018;15(8):1771.
41. Sera F, Armstrong B, Tobias A, et al. How urban characteristics affect vulnerability to heat and cold: a multi-country analysis. Int J Epidemiol. 2019;48(4):1101-12.
42. Li J, Woodward A, Hou XY, et al. Modification of the effects of air pollutants on mortality by temperature: a systematic review and meta-analysis. Sci Total Environ. 2017;575:1556-70.
43. Berry M, Fagliano J, Tsai S, et al. Evaluation of heat-related illness surveillance based on chief complaint data from New Jersey hospital emergency rooms. Online J Public Health Inform. 2013;5(1):e125.
44. Harduar Morano L, Waller AE. Evaluation of the components of the North Carolina Syndromic Surveillance System Heat Syndrome case definition. Public Health Rep. 2017;132(1_suppl):40S-47S.
Western Journal of Emergency Medicine 750 Volume 22, no. 3: May 2021
Original Research
Paramedic-performed Prehospital Point-of-care Ultrasound for Patients with Undifferentiated Dyspnea: A Pilot Study
Jacob H. Schoeneck, MD*†
Ryan F. Coughlin, MD*Cristiana Baloescu, MD* David C. Cone, MD*Rachel B. Liu, MD*Sharmin Kalam, MD* Amanda K. Medoro, MD* Ian Medoro, MD*Daniel Joseph, MD*Kevin Burns, EMT-P, PA-C* Jesse I. Bohrer-Clancy, MD* Christopher L. Moore, MD* Section Editor: Mark I. Langdorf, MD, MHPE Submission history: Submitted July 26, 2020; Accepted December 4, 2020 Electronically published March 24, 2021 Full text available through open access at http://escholarship.org/uc/uciem_westjem DOI: 10.5811/westjem.2020.12.49254
Yale University School of Medicine, Department of Emergency Medicine, New Haven, ConnecticutWake Forest University School of Medicine, Department of Emergency Medicine, Winston-Salem, North Carolina
*
†
Introduction: Thoracic ultrasound is frequently used in the emergency department (ED) to determine the etiology of dyspnea, yet its use is not widespread in the prehospital setting. We sought to investigate the feasibility and diagnostic performance of paramedic acquisition and assessment of thoracic ultrasound images in the prehospital environment, specifically for the detection of B-lines in congestive heart failure (CHF).
Methods: This was a prospective observational study of a convenience sample of adult patients with a chief complaint of dyspnea. Paramedics participated in a didactic and hands-on session instructing them how to use a portable ultrasound device. Paramedics assessed patients for the presence of B-lines. Sensitivity and specificity for the presence of bilateral B-lines and any B-lines were calculated based on discharge diagnosis. Clips archived to the ultrasound units were reviewed and paramedic interpretations were compared to expert sonologist interpretations.
Results: A total of 63 paramedics completed both didactic and hands-on training, and 22 performed ultrasounds in the field. There were 65 patients with B-line findings recorded and a discharge diagnosis for analysis. The presence of bilateral B-lines for diagnosis of CHF yielded a sensitivity of 80.0% (95% confidence interval [CI], 51.4-94.7%) and specificity of 72.0% (95% CI, 57.3-83.3), while presence of any B-lines was 93.3% sensitive (95% CI, 66.0-99.7%), and 50% specific (95% CI, 35.7-64.2%) for CHF. Paramedics archived 117 ultrasound clips of which 63% were determined to be adequate for interpretation. Comparison of paramedic and expert sonologist interpretation of images showed good inter-rater agreement for detection of any B-lines (k = 0.60; 95% CI, 0.36-0.84).
Conclusion: This observational pilot study suggests that prehospital lung ultrasound for B-lines may aid in identifying or excluding CHF as a cause of dyspnea. The presence of bilateral B-lines as determined by paramedics is reasonably sensitive and specific for the diagnosis of CHF and pulmonary edema, while the absence of B lines is likely to exclude significant decompensated heart failure. The study was limited by being a convenience sample and highlighted some of the difficulties related to prehospital research. Larger funded trials will be needed to provide more definitive data. [West J Emerg Med. 2021;22(3)750–755.]
Volume 22, no. 3: May 2021 751 Western Journal of Emergency Medicine
Schoeneck et al. Paramedic-performed Prehospital POCUS for Patients with Dyspnea
Population Health Research Capsule
What do we already know about this issue?Thoracic ultrasound is frequently used in the emergency department (ED) to determine the etiology of dyspnea, yet its use is not widespread in the prehospital setting.
What was the research question?Can paramedics use ultrasound to identify B-lines in patients ultimately diagnosed with decompensated heart failure?
What was the major finding of the study?The presence of bilateral B-lines determined by paramedics is reasonably sensitive and specific for the diagnosis of pulmonary edema.
How does this improve population health?The early diagnosis of pulmonary edema from decompensated heart failure should allow for more rapid initiation of pathology specific treatments.
INTRODUCTIONShortness of breath is responsible for more than 10% of
non-traumatic emergency medical service (EMS) transports.1 Morbidity is high, with half of these patients ultimately admitted to the hospital, and a third of those requiring treatment in intensive care units.1 Distinction between types of acute pulmonary pathology has important implications for acute treatment, particularly when congestive heart failure (CHF) can be more definitively identified. The American College of Cardiology Foundation and the American Heart Association recommend early treatment of fluid overload, and early treatment with diuretics has been associated with lower rates of in-hospital mortality.2,3
Prehospital medications have been associated with improved survival in patients with decompensated CHF, while increased mortality is associated with misdiagnosis.4 Thoracic ultrasound is frequently used in the emergency department (ED) to determine the etiology of dyspnea, yet its use is not widespread in the prehospital setting. Prospective studies of prehospital cardiothoracic ultrasound are limited and have tended to focus on determination of cardiac activity and lung sliding by physician operators.5-9
In this study we sought to investigate the feasibility of training paramedics in acquisition and assessment of thoracic ultrasound images in the prehospital environment. The primary aim was to determine whether assessment of B-lines by paramedics in the prehospital setting could identify patients ultimately diagnosed with pulmonary edema from decompensated heart failure. We also sought to determine accuracy of B-line interpretation based on image capture and/or expert determination of B-lines when this was available.
METHODSThis was a prospective observational study of a
convenience sample of patients being transported by emergency medical services (EMS) with a chief complaint of dyspnea. Patients were enrolled when a trained paramedic was working and had access to one of the shared portable ultrasound units. Paramedics were instructed to enroll as many eligible patients as possible.
Participating paramedics were employed by American Medical Response (AMR) or local fire department-based EMS services and transported patients to two EDs located in New Haven, CT. Each EMS agency or fire department was given two or three portable ultrasound units. Enrolled paramedics participated in a 90-minute didactic training session, which included instruction in the use of a portable, handheld ultrasound device, the Vscan with Dual Probe (GE Healthcare, Chicago, IL), and basic principles of ultrasound, techniques to obtain the necessary thoracic views, as well as review of normal and pathologic video clips. They completed an identical, nine-question multiple-choice pre- and post-test during the didactic session.
Paramedics then completed a 2–3 hour supervised hands-on session using the portable ultrasound device in the ED, imaging patients presenting with shortness of breath. The goal of this training session was to perform and interpret normal and abnormal scans on patients similar to those they could encounter in the field. During the hands-on sessions, paramedics were expected to correctly identify positive or negative findings in at least six patients presenting with undifferentiated pathology, based on previous competency studies with novice sonographers.10 Didactic and hands-on sessions were facilitated and directly supervised by members of the investigatory group, including fellowship-trained ultrasound and EMS attending emergency physicians, ultrasound and EMS fellows, and senior emergency medicine residents.
Patients were eligible for inclusion in the study if they were aged >18 with the chief complaint of shortness of breath, and at least one of the following signs or symptoms of respiratory distress: 1. Respiratory rate > 20 per minute2. Oxygen saturation < 92%3. Rales, rhonchi, or wheezing on pulmonary auscultation4. Increased work of breathing: accessory muscle use,
tripoding, nasal flaring.5. Reported progression of pedal edema or orthopnea.
Permission to perform the ultrasound in the field was obtained by the paramedics using a scripted, brief

Western Journal of Emergency Medicine 752 Volume 22, no. 3: May 2021
Paramedic-performed Prehospital POCUS for Patients with Dyspnea Schoeneck et al.
verbal consent, with full consent obtained by one of the study investigators via telephone during the patient-medic interaction. This study was approved by the investigational review board of Yale University and the Yale-New Haven Hospital Center. Patients were enrolled over a 20-month period at the discretion of the participating paramedics in a convenience sample based on ultrasound device availability and patient volume.
All prehospital ultrasounds were performed by paramedics using a GE Vscan with Dual Probe. In some cases, EMS physicians were present during EMS transport; however, they were specifically instructed not to influence or aid in ultrasound acquisition and interpretation. Paramedics assessed for B-lines with the phased array probe in the second or third intercostal space in the midclavicular line of the right followed by the left anterior chest. Paramedics were provided with standardized data sheets where they noted the presence of any B-lines (1-3) or significant B-lines (>3 in one intercostal space). They were specifically instructed not to alter patient care based on their ultrasound findings, nor to delay standard care to perform the ultrasound. Paramedics were asked to record a clip from each ultrasound view on the device’s removable disk and note the time and date of the ultrasound on the data sheet, so that these images could be matched to the patient for review.
At the conclusion of the study patient charts were reviewed for discharge diagnosis by a single investigator (JS) who was blinded to paramedic ultrasound findings and categorized the discharge diagnosis into CHF/pulmonary edema, chronic obstructive pulmonary disease/asthma, pneumonia, or other. Available images were collected from the ultrasound devices and matched to patient data sheets based on the image timestamps and the times recorded by the paramedic. These video clips were reviewed by an emergency physician (CB) with ultrasound fellowship training (defined as the “expert sonologist”) for adequacy of image acquisition and interpretation. Clips that did not definitively visualize the pleural line were deemed inadequate.
We calculated sensitivity and specificity for the presence of bilateral B-lines and any B-lines with 95% confidence intervals (CI) based on discharge diagnosis. Paramedic interpretations were compared to expert sonologist interpretations using an unweighted Cohen kappa statistic.
RESULTSA total of 71 paramedics were enrolled and completed
the didactic training. Of these participants, 60 reported no prior ultrasound experience and 11 reported prior ultrasound experience with an average of two estimated total hours using ultrasound before attending the training session. The average pretest score was 76.9%, and the average post-test score was 95.8%. After the didactic training, 63 paramedics completed hands-on training and 22 paramedics performed study ultrasounds in the field.
Initially 69 patients were enrolled in the study; three were excluded due to insufficient identifying information. Paramedics recorded their assessments for the presence or absence B-lines in 65 patients. Patient demographics and clinical characteristics are summarized in Table 1.
Pulmonary edema or CHF was diagnosed in 15 of 65 subjects (23.1%), with any B-lines present in 14 and bilateral B-lines present in 12 subjects (Table 2). The presence of bilateral B-lines for diagnosis of CHF yielded a sensitivity of 80.0% (95% CI, 51.4-94.7%) and specificity of 72.0% (95% CI, 57.3-83.3), while presence of any B-lines was 93.3% sensitive (95% CI, .0-99.7%) and 50% specific (95% CI, 35.7-64.2%) for CHF. The positive predictive value of bilateral B-lines for the diagnosis of CHF was 46.1% (95% CI, 41.0- 51.3%), while the presence of any B-lines yielded a positive predictive value of 35.9% (95% CI, 32.4-39.5%).
Paramedics recorded 117 clips from 33 patients on the hand-held ultrasound units; of those images, 63% were adequate for interpretation. Comparison of paramedic and expert sonologist interpretations of archived images showed good inter-rater agreement for detection of any B-lines (k = 0.60, 95% CI, 0.36-0.84).
Characteristic ValueAge
Average 64 +/- 17 yearsRange 19-94 years
Gender Male 37 (57%)Female 28 (43%)
Prehospital vital signs Heart rate 93 +/- 21Respiratory rate 23 +/- 6Room air oxygen saturation 92 +/- 5%
Oxygen device Room air 33 (49%)Nasal cannula 13 (19.5%)Non-rebreather mask 13 (19.5%)CPAP 4 (6%)No oxygen device recorded 4 (6%)
Discharge diagnosis COPD or asthma 21 (32.3%)Congestive heart failure or Pulmonary edema 15 (23.1)Pneumonia 5 (7.7%)Other 24 (36.9%)
Table 1. Demographics and clinical characteristics of patients evaluated by paramedics using a portable device to perform lung ultrasound.
CPAP, continuous positive airway pressure; COPD, chronic obstructive pulmonary disease.
Volume 22, no. 3: May 2021 753 Western Journal of Emergency Medicine
Schoeneck et al. Paramedic-performed Prehospital POCUS for Patients with Dyspnea
DISCUSSIONThis is the first study we are aware of to assess the
feasibility and utility of training paramedics in prehospital ultrasound for the diagnosis of CHF in the United States EMS system and the first to use an ultra-mobile device. These results show that the presence of bilateral B-lines as determined by EMS is reasonably sensitive and specific for the diagnosis of CHF, while the absence of any B-lines makes the diagnosis unlikely. A previous study in Denmark examining assessment for B-lines in CHF using a larger laptop-sized device (SonoSite Edge) enrolled 40 patients and found a sensitivity of 94% for B-lines in the diagnosis of CHF, concluding that ultrasound could be helpful in excluding CHF, which is consistent with these results.11
Another study of prehospital, thoracic ultrasound in medical patients with respiratory distress found that paramedic-performed pulmonary ultrasound with remote physician interpretation did not meet the authors’ predefined standards for feasibility.12 The authors noted that failed transmission of images contributed to non-feasibility. Interpretation of point-of-care ultrasound studies by paramedics would eliminate the need for image transfer and will likely be a necessary step in making prehospital ultrasound use feasible. In this study, there was good inter-rater agreement with the expert sonologist review for the presence of any B-lines, although notably this assessment was limited by poor compliance with image archival for review.
While we believe that this study adds to evidence that motivated prehospital providers can be trained to perform and obtain useful information that can potentially impact treatment and patient outcome, conclusions regarding feasibility need to be tempered by the inconsistent use of ultrasound in this setting. While 63 paramedics completed training, only 22 ultimately enrolled subjects, and our overall enrollment was lower than expected given the duration of the study. Further study is needed to identify the barriers to ultrasound performance in this setting and to understand how EMS providers may be more incentivized to incorporate ultrasound into their practice.
The implementation of ultrasound into an EMS system requires a significant initial monetary investment, instructor and
paramedic time dedicated to training, and ongoing oversight of user performance for patient safety. Additional study is necessary to determine whether paramedic detection of thoracic pathology can lead to meaningful changes in management that would justify these costs. It seems probable that earlier diagnosis and initiation of pathology-specific treatments would positively impact patient care, although this was outside the scope of our study. Many of these challenges and costs of implementing ultrasound usage are likely to decrease in the future as portable units become more affordable and widespread ultrasound proficiency among graduating emergency physicians increases the availability of instructors.
LIMITATIONSThis study was limited by relatively low paramedic
participation, low enrollment of eligible patients, logistic challenges of retrieving and sharing units, and difficulty recording data and ultrasound images. Prehospital patient care research is consistently challenging for clinicians, and this study was no exception.13-14 Generating a steady enrollment of patients and maintaining paramedic interest was difficult. Despite 63 paramedics having completed the didactic and hands-on training, only 22 went on to perform documented ultrasounds in the field, with 42% of the 22 paramedics performing only one ultrasound each. Most patients were enrolled in the first month following the paramedic training, with only seven paramedics participating in the study after that point. This inconsistency may have introduced several biases to the data, including that ultrasound was likely performed by paramedics who were more motivated (and thus perhaps more skilled than average), and that ultrasound may have been performed when there was more time and the situation was less acute (ie, less-ill patients). While recent graduates of emergency medicine residencies are proficient in pulmonary ultrasound and likely capable of teaching these skills to paramedics, the results of this study may not be generalizable to smaller EMS systems without the support of ultrasound fellowship- trained physicians.
We are unable to confidently suggest that paramedics retained thoracic ultrasound skills following their training or routinely used them in their patient evaluations. In discussions with participating EMS providers, most felt that ultrasound was useful but noted that difficulty adhering to study protocols, data collection requiring manual input, and limited ultrasound device availability were significant challenges. User interfaces that facilitate input of patient information, documentation of findings, image archival, and submission for review would almost certainly increase the quantity and quality of data collected in futures studies. Additional research focusing on paramedics’ attitudes regarding the utility of ultrasound would also be advantageous in determining how to implement sustained use in prehospital practice patterns.
Discharge diagnosisAny B-lines
bilateralAny B-lines
presentNo B-lines
presentCHF or pulmonary edema (n = 15)
12 (80%) 14 (93.3%) 1 (6.7%)
COPD or asthma (n = 21)
5 (23.8) 10 (47.6%) 11 (52.4%)
Pneumonia (n = 5) 3 (60%) 5 (100%) 0 (0%)Other ( n= 24) 6 (25%) 10 (41.6%) 14 (58.3%)
Table 2. Paramedic interpretation of B-lines compared with discharge diagnosis.
CHF, congestive heart failure; COPD, chronic obstructive pulmonary disease.
Western Journal of Emergency Medicine 754 Volume 22, no. 3: May 2021
Paramedic-performed Prehospital POCUS for Patients with Dyspnea Schoeneck et al.
Average transport times for most patients in our system are less than 10 minutes, rendering ultrasound study completion and full documentation of findings difficult. These short transport times might have also biased paramedics to enroll less-ill patients requiring fewer interventions affording the paramedics the time necessary to perform the ultrasound. Ultrasound may have greater utility in prehospital systems with longer transport times, where paramedics are engaged in prolonged patient management, and misdiagnosis leading to inappropriate treatments is more detrimental. As enrollment was determined by the paramedics, it is possible that there was bias toward selecting patients with a clear diagnosis of CHF or pulmonary edema. In this study, 23% of patients were discharged with a diagnosis of CHF, which is slightly higher than the rate of 16% previously cited in studies of patients presenting to EMS with shortness of breath.1
Of the clips archived, 37% were inadequate for interpretation. This suggests that obtaining adequate images in the prehospital setting may be difficult for novice, non-physician sonographers. This may be partially ascribed to the paramedics’ training sessions, which focused primarily on scanning technique, normal findings, and pathology, with less emphasis on the adequacy of images and the importance of archiving for review. On several occasions inadequate images were submitted alongside adequate images for the same patient; it is possible that some of the inadequate images were recorded inadvertently by the paramedics. Ideally, ultrasound units used in the prehospital setting would allow for wireless transmission of images to an archiving system with the capability to include ultrasound interpretations for review. Compliance with image archival protocol would also be improved by user interface restrictions that discourage ultrasound use without entering patient identifiers or saving clips.
Among the logistical challenges of prehospital ultrasound are device fragility, need for charging, and the requirement for physical or wireless connectivity. Advances in portable ultrasound units since the start of this study (including the second-generation Vscan Extend) have already resulted in devices that are more amenable to prehospital use. Many of these devices allow for remote video guidance in scanning technique and image acquisition in real time by a more experienced clinician who is not at the bedside. The advent of capacitive micromachined ultrasonic transducer-based probes may also alleviate some of these issues. Production of these probes is cheaper than their piezoelectric counterparts, making them more easily obtainable for research purposes and affordable for EMS agencies.
CONCLUSION This observational pilot study suggests that
prehospital lung ultrasound for B-lines may aid in identifying or excluding CHF as a cause of dyspnea. The presence of
bilateral B-lines as determined by EMS is reasonably sensitive and specific for the diagnosis of CHF and pulmonary edema, while the absence of B-lines is likely to exclude significant decompensated heart failure. The study was limited by being a convenience sample and highlighted some of the difficulties related to prehospital research. Larger funded trials will be needed to provide more definitive data.
Address for Correspondence: Jacob Schoeneck, MD, Wake Forest University School of Medicine, Department of Emergency Medicine, 1 Medical Center Blvd, Winston-Salem, NC 27157. Email: [email protected].
Conflicts of Interest: By the WestJEM article submission agreement, all authors are required to disclose all affiliations, funding sources and financial or management relationships that could be perceived as potential sources of bias. No author has professional or financial relationships with any companies that are relevant to this study. There are no conflicts of interest or sources of funding to declare.
Copyright: © 2021 Schoeneck et al. This is an open access article distributed in accordance with the terms of the Creative Commons Attribution (CC BY 4.0) License. See: http://creativecommons.org/licenses/by/4.0/
REFERENCES1. Prekker ME, Feemster LC, Hough CL, et al. The epidemiology
and outcome of prehospital respiratory distress. Acad Emerg Med. 2014;21(5):543-50.
2. Yancy CW, Jessup M, Bozkurt B, et al. 2013 ACCF/AHA guideline for the management of heart failure: executive summary: a re-port of the American College of Cardiology Foundation/American Heart Association Task Force on practice guidelines. Circulation. 2013;128(16):1810-52.
3. Matsue Y, Damman K, Voors AA, et al. Time-to-furosemide treatment and mortality in patients hospitalized with acute heart failure. J Am Coll Cardiol. 2017;69(25):3042-51.
4. Wuerz RC and Meador SA. Effects of prehospital medications on mortality and length of stay in congestive heart failure. Ann Emerg Med. 1992;21(6):669-74.
5. Aichinger G, Zechner PM, Prause G, et al. Cardiac movement identi-fied on prehospital echocardiography predicts outcome in cardiac arrest patients. Prehosp Emerg Care. 2012;16(2):251-5.
6. Bhat SR, Johnson DA, Pierog JE, et al. Prehospital evaluation of effusion, pneumothorax, and standstill (PEEPS): point-of-care ultrasound in emergency medical services. West J Emerg Med. 2015;16(4):503-9.
7. Booth KL, Reed MJ, Brady S, et al. Training paramedics in focussed echo in life support. Eur J Emerg Med. 2015;22(6):430-5.
8. Chin EJ, Chan CH, Mortazavi R, et al. A pilot study examining the viability of a prehospital assessment with ultrasound for emergencies

Volume 22, no. 3: May 2021 755 Western Journal of Emergency Medicine
Schoeneck et al. Paramedic-performed Prehospital POCUS for Patients with Dyspnea
(PAUSE) protocol. J Emerg Med. 2013;44(1):142-9.9. Rooney KP, Lahham S, Lahham S, et al. Pre-hospital assessment
with ultrasound in emergencies: implementation in the field. World J Emerg Med. 2016;7(2):117-23.
10. Chiem AT, Chan CH, Ander DS, et al. Comparison of expert and novice sonographers’ performance in focused lung ultrasonography in dyspnea (FLUID) to diagnose patients with acute heart failure syndrome. Acad Emerg Med. 2015;22(5):564-73.
11. Laursen CB, Hanselmann A, Posth S, et al. Prehospital lung ultra-sound for the diagnosis of cardiogenic pulmonary oedema: a pilot
study. Scand J Trauma Resusc Emerg Med. 2016;24,1–8.12. Becker TK, Martin-Gill C, Callaway CW, et al. Feasibility of paramedic
performed prehospital lung ultrasound in medical patients with respiratory distress. Prehosp Emerg Care. 2018;22(2):175-9.
13. Leonard JC, Scharff DP, Koors V, et al. A qualitative assessment of factors that influence emergency medical services partnerships in prehospital research. Acad Emerg Med. 2012;19(2),161-73.
14. Lerner EB, Weik T, Edgerton EA. Research in prehospital care: overcoming the barriers to success. Prehosp Emerg Care. 2016;20(4):448-53.

Western Journal of Emergency Medicine 756 Volume 22, no. 3: May 2021
Original Research
Effect of a Prescription Drug Monitoring Program on Emergency Department Opioid Prescribing
Rahul Gupta, BS* Sue Boehmer, MA† David Giampetro, MD‡ Anuj Gupta§
Christopher J. DeFlitch, MD¶
Section Editor: Brandon Wills, DO, MS Submission history: Submitted August 31, 2020; Revision received January 17, 2021; Accepted January 30, 2021Electronically published April 19, 2021Full text available through open access at http://escholarship.org/uc/uciem_westjem DOI: 10.5811/westjem.2021.1.49652
INTRODUCTIONRates of opioid prescription and opioid-related deaths
in the United States have quadrupled over the past three decades.1,2 Particularly among the elderly Medicare population, hospitalizations secondary to opioid overdose have quintupled from 1993 to 2012.1 Although some studies investigating opioid prescriptions in the emergency department (ED) show decreasing trends in recent years, new models expect the opioid crisis to worsen with the annual number of opioid overdose
Penn State College of Medicine, Hershey, PennsylvaniaPenn State Hershey Medical Center, Department of Public Health Services, Division of Biostatistics, Hershey, Pennsylvania Penn State Hershey Medical Center, Department of Anesthesiology and Perioperative Medicine University of Texas at Dallas, Richardson, Texas Penn State Hershey Medical Center, Department of Emergency Medicine, Hershey, Pennsylvania
*†
‡
§
¶
Introduction: Our goal was to determine whether implementation of a prescription drug monitoring program (PDMP) altered emergency department (ED) opioid prescription rates overall and in patients of different pain severities.
Methods: We conducted this single-center, retrospective review at an academic ED. The study examined patients discharged from the ED who received opioid prescriptions, before and after the state’s implementation of a PDMP (August 25, 2016). The monthly rate was a ratio of the patients given ≥ 1 opioid prescription to the ED patients with a numeric pain rating scale (NPRS) > 0. We performed an interrupted time series analysis on each demographic.
Results: The overall ED opioid prescription rate decreased from 51.3% (95% confidence interval [Cl], 50.4%-52.2%) to 47.9% (95% Cl, 47.0%- 48.7%). For males, this decreased from 51.1% to 46.7% (P < 0.0001), while in females it did not significantly change (51.6% to 49.7% [P = 0.0529]). For those with mild pain, the rate increased from 27.5% to 34.3% (P < 0.0001), while for those with moderate pain, it did not significantly change (42.8% to 43.5% [P = 0.5924]). For those with severe pain, the rate decreased from 66.1% to 59.6% (P < 0.0001).
Conclusion: We found that PDMP implementation was associated with an overall decrease in opioid prescription rates, and that patients with mild pain were prescribed opioids more often while severe pain patients were prescribed opioids less often. [West J Emerg Med. 2021;22(3)756–762.]
deaths projected to increase to 81,700 by 2025 from 33,100 in 2015.3-5 Given the number of opioids being prescribed by physicians, evidence also demonstrates that prescription opioid misuse can often result in the downstream use of illicit opioids, such as heroin.6-10 The concern of illicit drug use, as well as the misuse of prescription opioids, has brought the topic of monitoring the distribution of prescription drugs in the healthcare setting into the limelight.
In analyses of the distribution of opioid prescriptions,

Volume 22, no. 3: May 2021 757 Western Journal of Emergency Medicine
Gupta et al. Effect of PDMP on Opioid Prescribing in the ED
Population Health Research Capsule
What do we already know about this issue?Despite the seeming downtrend in opioid prescribing, concern remains for misuse.
What was the research question?Does implementation of a prescription drug monitoring program (PDMP) alter ED opioid prescription rates overall and for patients with different pain severities?
What was the major finding of the study?Post-PDMP, opioid prescribing decreased overall for males and for patients in severe pain, but increased for those with mild pain.
How does this improve population health?Given the prevalence of opioid misuse, implementing a PDMP could potentially decrease opioid prescribing and thereby also reduce misuse.
prescriptions in the ED are often carefully scrutinized.1,11 In a study that examined the rate of opioid prescribing in a single hospital, it was found that the highest rate of opioid prescribing occurred in the ED, with an opioid prescription rate of up to more than three times that of other hospital departments.1,12-15 Another reason that the ED serves as one of the targets for the opioid crisis is that pain is the most common chief complaint and accounts for up to 78% of visits to the ED.16-19 With such a high rate of pain complaints in the ED leading to higher rates of opioid prescribing, prescription drug monitoring programs (PDMP) have become an important tool for emergency physicians to ensure that they are not over-prescribing opioid medications and not prescribing opioid medications to patients seeking to misuse opioids.
With access to the PDMP database, emergency physicians can acquire information regarding a patient’s past controlled substance prescriptions and their frequency. Physicians can then tag individuals who are at high risk for misuse of opioid prescriptions. The primary objective of the implementation of PDMPs is to reduce the mortality and misuse of both prescription opioids and illicit opioids.20 Therefore, it is important to identify and analyze the regulations and legislation enacted by each state PDMP to determine the effectiveness of a PDMP implementation.11,21,22 In Pennsylvania, as of November 19, 2019, the PDMP shares its database with 21 other states and the District of Columbia.23 Access to other states through this dynamic and integrated database allows physicians to ensure that patients who cross interstate borders to fill opioid prescriptions will still be detected.23
Current literature examining opioid prescription rates after PDMP implementation fail to show consistent results, likely due to program variability from state to state.24-29 In addition, no studies have examined the effect of a PDMP on opioid prescription rates within pain scale cohorts using interrupted time series analyses. Therefore, our objective in this study was to determine whether a PDMP implementation alters ED opioid prescription rates overall or alters the prescription rates in patients with different pain severities.
METHODSStudy Design
We conducted this single-center, retrospective review at an academic, suburban, tertiary ED. The overall study examined patients discharged from the ED who received opioid prescriptions that were recorded in the electronic health record (EHR), before and after the state implemented a PDMP system. In Pennsylvania physicians are required to query the PDMP database whenever they are prescribing an opioid or benzodiazepine. They are also required to query the PDMP if they believe that the patient may be a high-risk misuser of prescription drugs. This study was approved by the institutional review board.
Participants/Study SubjectsWe retrospectively extracted data from the EHR
from December 2014–May 2018. Any patient who met the inclusion/exclusion criteria was included in the study. Inclusion criteria were as follows: the patient had to have been triaged and treated by a physician in the ED during the given timeframe; prescribed at least one opioid prescription at the end of their visit; discharged directly from the ED; and to have had a rating greater than zero on the initial numeric pain rating scale (NPRS). We excluded patients if they arrived to the ED outside of the timeframe of the study, were admitted to the hospital for any period of time, had a documented NPRS of zero, did not have one of the study variables documented in the EHR, and were not prescribed an opioid at the end of their visit. A baseline patient total was also extracted from the EHR for each month of the study with the same inclusion/exclusion criteria, with the exception of a required opioid prescription. This data, which served as the denominator in our primary outcome measure, provided the total number of ED patients who presented with any level of pain, but were not necessarily given an opioid prescription at the end of their visit. In addition, if the same patient visited the ED multiple times during the study period and met inclusion criteria, they were considered as separate patients.
Variables/Outcome MeasuresWe extracted the following data from the EHR: age;
gender; date of encounter; and initial NPRS score (ranges 0-10). Pain scores were separated as follows: 1-4 (mild); 5-6
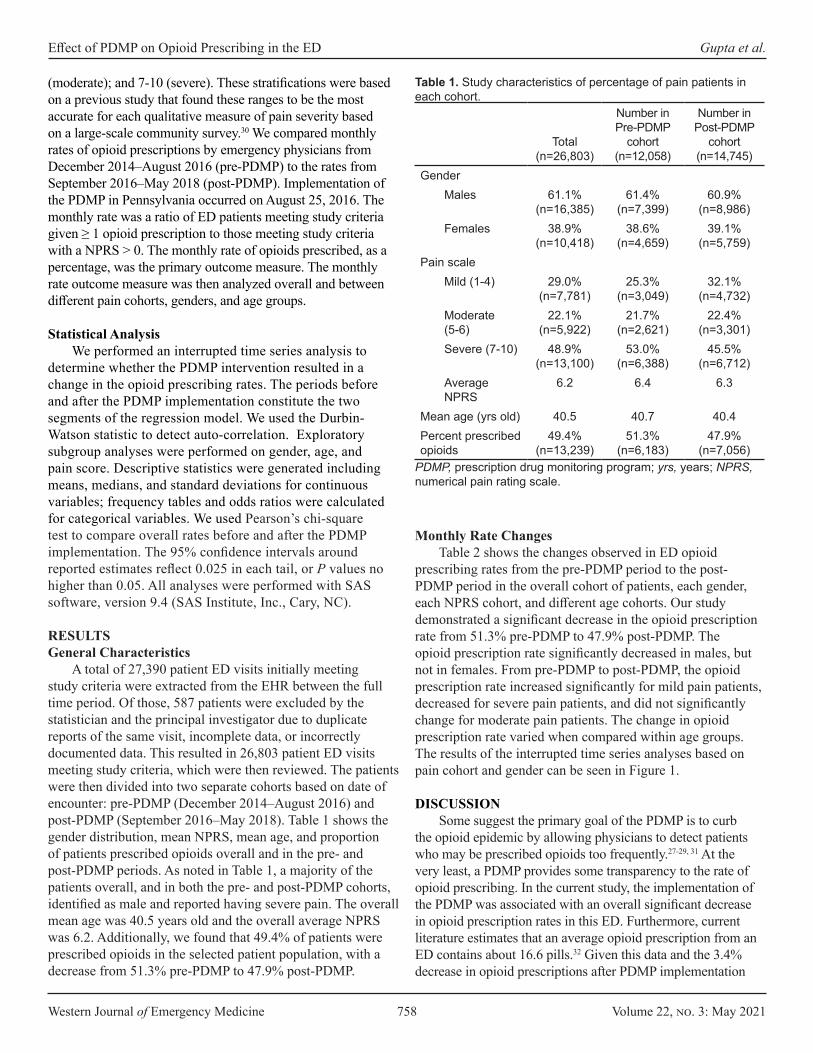
Western Journal of Emergency Medicine 758 Volume 22, no. 3: May 2021
Effect of PDMP on Opioid Prescribing in the ED Gupta et al.
(moderate); and 7-10 (severe). These stratifications were based on a previous study that found these ranges to be the most accurate for each qualitative measure of pain severity based on a large-scale community survey.30 We compared monthly rates of opioid prescriptions by emergency physicians from December 2014–August 2016 (pre-PDMP) to the rates from September 2016–May 2018 (post-PDMP). Implementation of the PDMP in Pennsylvania occurred on August 25, 2016. The monthly rate was a ratio of ED patients meeting study criteria given ≥ 1 opioid prescription to those meeting study criteria with a NPRS > 0. The monthly rate of opioids prescribed, as a percentage, was the primary outcome measure. The monthly rate outcome measure was then analyzed overall and between different pain cohorts, genders, and age groups.
Statistical Analysis We performed an interrupted time series analysis to
determine whether the PDMP intervention resulted in a change in the opioid prescribing rates. The periods before and after the PDMP implementation constitute the two segments of the regression model. We used the Durbin-Watson statistic to detect auto-correlation. Exploratory subgroup analyses were performed on gender, age, and pain score. Descriptive statistics were generated including means, medians, and standard deviations for continuous variables; frequency tables and odds ratios were calculated for categorical variables. We used Pearson’s chi-square test to compare overall rates before and after the PDMP implementation. The 95% confidence intervals around reported estimates reflect 0.025 in each tail, or P values no higher than 0.05. All analyses were performed with SAS software, version 9.4 (SAS Institute, Inc., Cary, NC).
RESULTSGeneral Characteristics
A total of 27,390 patient ED visits initially meeting study criteria were extracted from the EHR between the full time period. Of those, 587 patients were excluded by the statistician and the principal investigator due to duplicate reports of the same visit, incomplete data, or incorrectly documented data. This resulted in 26,803 patient ED visits meeting study criteria, which were then reviewed. The patients were then divided into two separate cohorts based on date of encounter: pre-PDMP (December 2014–August 2016) and post-PDMP (September 2016–May 2018). Table 1 shows the gender distribution, mean NPRS, mean age, and proportion of patients prescribed opioids overall and in the pre- and post-PDMP periods. As noted in Table 1, a majority of the patients overall, and in both the pre- and post-PDMP cohorts, identified as male and reported having severe pain. The overall mean age was 40.5 years old and the overall average NPRS was 6.2. Additionally, we found that 49.4% of patients were prescribed opioids in the selected patient population, with a decrease from 51.3% pre-PDMP to 47.9% post-PDMP.
Total (n=26,803)
Number inPre-PDMP
cohort (n=12,058)
Number in Post-PDMP
cohort (n=14,745)
GenderMales 61.1%
(n=16,385)61.4%
(n=7,399)60.9%
(n=8,986)Females 38.9%
(n=10,418)38.6%
(n=4,659)39.1%
(n=5,759)Pain scale
Mild (1-4) 29.0% (n=7,781)
25.3% (n=3,049)
32.1% (n=4,732)
Moderate (5-6)
22.1% (n=5,922)
21.7% (n=2,621)
22.4% (n=3,301)
Severe (7-10) 48.9% (n=13,100)
53.0% (n=6,388)
45.5% (n=6,712)
Average NPRS
6.2 6.4 6.3
Mean age (yrs old) 40.5 40.7 40.4Percent prescribed opioids
49.4% (n=13,239)
51.3% (n=6,183)
47.9% (n=7,056)
Table 1. Study characteristics of percentage of pain patients in each cohort.
PDMP, prescription drug monitoring program; yrs, years; NPRS, numerical pain rating scale.
Monthly Rate ChangesTable 2 shows the changes observed in ED opioid
prescribing rates from the pre-PDMP period to the post-PDMP period in the overall cohort of patients, each gender, each NPRS cohort, and different age cohorts. Our study demonstrated a significant decrease in the opioid prescription rate from 51.3% pre-PDMP to 47.9% post-PDMP. The opioid prescription rate significantly decreased in males, but not in females. From pre-PDMP to post-PDMP, the opioid prescription rate increased significantly for mild pain patients, decreased for severe pain patients, and did not significantly change for moderate pain patients. The change in opioid prescription rate varied when compared within age groups. The results of the interrupted time series analyses based on pain cohort and gender can be seen in Figure 1.
DISCUSSION Some suggest the primary goal of the PDMP is to curb
the opioid epidemic by allowing physicians to detect patients who may be prescribed opioids too frequently.27-29, 31 At the very least, a PDMP provides some transparency to the rate of opioid prescribing. In the current study, the implementation of the PDMP was associated with an overall significant decrease in opioid prescription rates in this ED. Furthermore, current literature estimates that an average opioid prescription from an ED contains about 16.6 pills.32 Given this data and the 3.4% decrease in opioid prescriptions after PDMP implementation
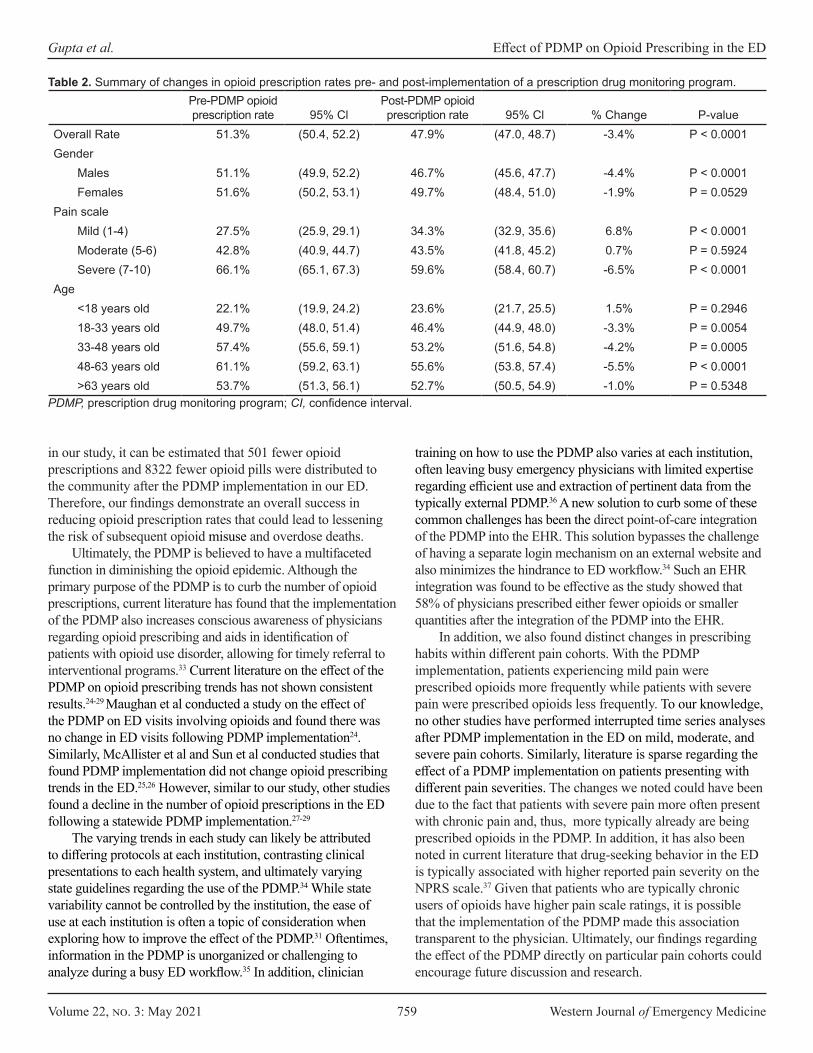
Volume 22, no. 3: May 2021 759 Western Journal of Emergency Medicine
Gupta et al. Effect of PDMP on Opioid Prescribing in the ED
Pre-PDMP opioid prescription rate 95% Cl
Post-PDMP opioid prescription rate 95% Cl % Change P-value
Overall Rate 51.3% (50.4, 52.2) 47.9% (47.0, 48.7) -3.4% P < 0.0001Gender
Males 51.1% (49.9, 52.2) 46.7% (45.6, 47.7) -4.4% P < 0.0001Females 51.6% (50.2, 53.1) 49.7% (48.4, 51.0) -1.9% P = 0.0529
Pain scaleMild (1-4) 27.5% (25.9, 29.1) 34.3% (32.9, 35.6) 6.8% P < 0.0001Moderate (5-6) 42.8% (40.9, 44.7) 43.5% (41.8, 45.2) 0.7% P = 0.5924Severe (7-10) 66.1% (65.1, 67.3) 59.6% (58.4, 60.7) -6.5% P < 0.0001
Age<18 years old 22.1% (19.9, 24.2) 23.6% (21.7, 25.5) 1.5% P = 0.294618-33 years old 49.7% (48.0, 51.4) 46.4% (44.9, 48.0) -3.3% P = 0.005433-48 years old 57.4% (55.6, 59.1) 53.2% (51.6, 54.8) -4.2% P = 0.000548-63 years old 61.1% (59.2, 63.1) 55.6% (53.8, 57.4) -5.5% P < 0.0001>63 years old 53.7% (51.3, 56.1) 52.7% (50.5, 54.9) -1.0% P = 0.5348
Table 2. Summary of changes in opioid prescription rates pre- and post-implementation of a prescription drug monitoring program.
PDMP, prescription drug monitoring program; CI, confidence interval.
in our study, it can be estimated that 501 fewer opioid prescriptions and 8322 fewer opioid pills were distributed to the community after the PDMP implementation in our ED. Therefore, our findings demonstrate an overall success in reducing opioid prescription rates that could lead to lessening the risk of subsequent opioid misuse and overdose deaths.
Ultimately, the PDMP is believed to have a multifaceted function in diminishing the opioid epidemic. Although the primary purpose of the PDMP is to curb the number of opioid prescriptions, current literature has found that the implementation of the PDMP also increases conscious awareness of physicians regarding opioid prescribing and aids in identification of patients with opioid use disorder, allowing for timely referral to interventional programs.33 Current literature on the effect of the PDMP on opioid prescribing trends has not shown consistent results.24-29 Maughan et al conducted a study on the effect of the PDMP on ED visits involving opioids and found there was no change in ED visits following PDMP implementation24. Similarly, McAllister et al and Sun et al conducted studies that found PDMP implementation did not change opioid prescribing trends in the ED.25,26 However, similar to our study, other studies found a decline in the number of opioid prescriptions in the ED following a statewide PDMP implementation.27-29
The varying trends in each study can likely be attributed to differing protocols at each institution, contrasting clinical presentations to each health system, and ultimately varying state guidelines regarding the use of the PDMP.34 While state variability cannot be controlled by the institution, the ease of use at each institution is often a topic of consideration when exploring how to improve the effect of the PDMP.31 Oftentimes, information in the PDMP is unorganized or challenging to analyze during a busy ED workflow.35 In addition, clinician
training on how to use the PDMP also varies at each institution, often leaving busy emergency physicians with limited expertise regarding efficient use and extraction of pertinent data from the typically external PDMP.36 A new solution to curb some of these common challenges has been the direct point-of-care integration of the PDMP into the EHR. This solution bypasses the challenge of having a separate login mechanism on an external website and also minimizes the hindrance to ED workflow.34 Such an EHR integration was found to be effective as the study showed that 58% of physicians prescribed either fewer opioids or smaller quantities after the integration of the PDMP into the EHR.
In addition, we also found distinct changes in prescribing habits within different pain cohorts. With the PDMP implementation, patients experiencing mild pain were prescribed opioids more frequently while patients with severe pain were prescribed opioids less frequently. To our knowledge, no other studies have performed interrupted time series analyses after PDMP implementation in the ED on mild, moderate, and severe pain cohorts. Similarly, literature is sparse regarding the effect of a PDMP implementation on patients presenting with different pain severities. The changes we noted could have been due to the fact that patients with severe pain more often present with chronic pain and, thus, more typically already are being prescribed opioids in the PDMP. In addition, it has also been noted in current literature that drug-seeking behavior in the ED is typically associated with higher reported pain severity on the NPRS scale.37 Given that patients who are typically chronic users of opioids have higher pain scale ratings, it is possible that the implementation of the PDMP made this association transparent to the physician. Ultimately, our findings regarding the effect of the PDMP directly on particular pain cohorts could encourage future discussion and research.
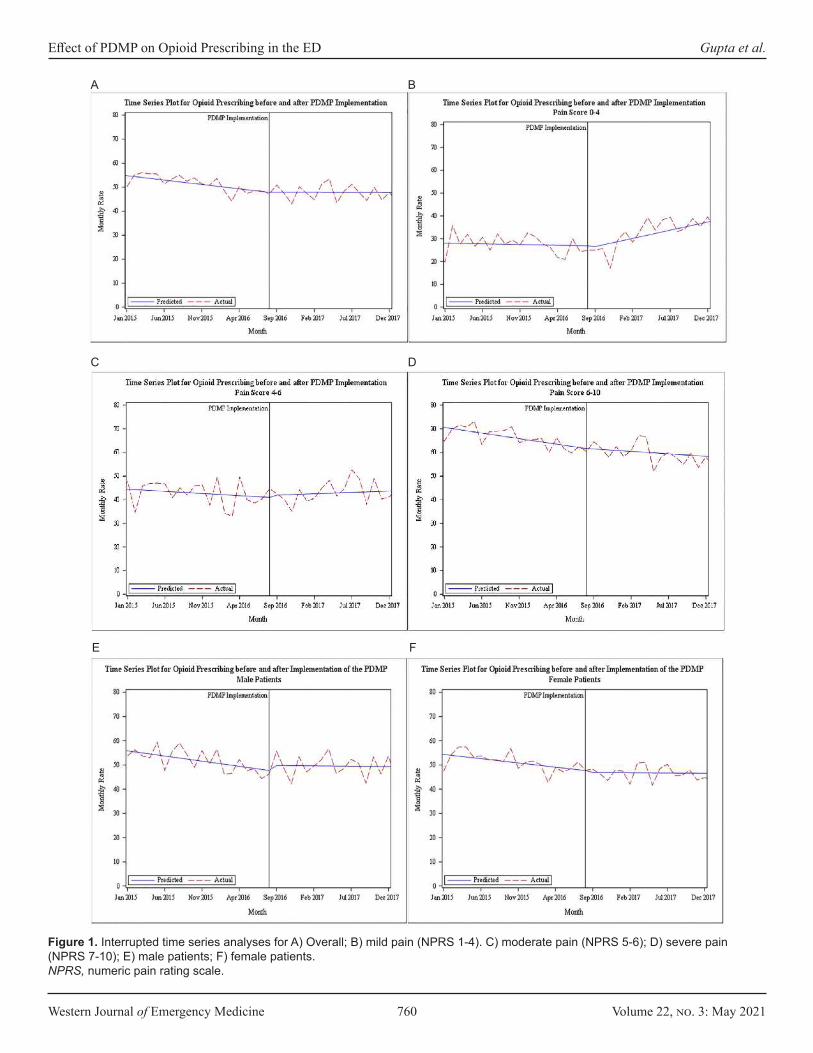
Western Journal of Emergency Medicine 760 Volume 22, no. 3: May 2021
Effect of PDMP on Opioid Prescribing in the ED Gupta et al.
Figure 1. Interrupted time series analyses for A) Overall; B) mild pain (NPRS 1-4). C) moderate pain (NPRS 5-6); D) severe pain (NPRS 7-10); E) male patients; F) female patients.NPRS, numeric pain rating scale.
A B
C D
E F
Volume 22, no. 3: May 2021 761 Western Journal of Emergency Medicine
Gupta et al. Effect of PDMP on Opioid Prescribing in the ED
We also found that males were significantly less likely to be prescribed opioids in the ED after PDMP implementation, while there was no change for prescribing to females. In addition, we found that all three age cohorts (18-33; 33-48; 48-63) between ages 18 and 63 years were significantly less likely to be prescribed opioids in the ED after PDMP implementation. This differs from other studies that found no differences in opioid prescribing with regard to age or gender after the implementation of a PDMP.
LIMITATIONSThere are limitations to our study. It is important to note
that it is not possible to attribute the implementation of the Pennsylvania PDMP as the sole cause for reduction of overall opioid prescribing trends. The data can only show time-dependent correlation, not causation. Given that in the current study, opioid prescription rates were already downtrending prior to the studied intervention, it is possible that other factors may have played a role, including expeditiously increasing awareness regarding the opioid epidemic and guidelines to curb it, the release of the US Centers for Disease Control and Prevention Guidelines for Opioid Prescribing in March 2016, and institutional changes that may have coincided with the implementation of the PDMP. Also, because our data relies on the accuracy of pharmacists and physicians entering data into the EHR and the PDMP, it is possible that errors occurred in the process.
The current study also relies on the fact that all patients with a complaint of pain had a pain score documented in the EHR; moreover, if a patient did not have a pain score documented, they were excluded from the study, thereby altering the accuracy of our opioid prescription rate. Also, although Pennsylvania requires a prescriber to query the PDMP before prescribing an opioid, we were not able to capture compliance rates in this study. It is important to note, however, that at the time of the study, the institution did not have PDMP data automatically imported into the patient chart. In addition, as this study was only conducted at a single hospital in Pennsylvania, it may not be easily generalizable.
While state and institutional guidelines vary, this study does provide new data regarding the effect of the PDMP on specific pain cohorts. It is also important to note that the pain scores collected were the initial pain score in the ED, which often coincided with the triage pain scores. Therefore, some of the ED treatments likely may have improved patients’ pain during their visits. Lastly, we were unable to analyze specific medications, and therefore the dosage (ie, morphine milligram equivalents) and number of pills, that were prescribed to patients in the ED. This data would have provided important information that could have aided in targeting the reduction of certain opioid prescriptions.
CONCLUSIONBased on this analysis of opioid prescriptions pre- and post-
PDMP implementation, we found that the implementation of
the PDMP was associated with an overall significant decrease in opioid prescription rates in this ED. In addition, we also found that after the implementation of the PDMP, patients with mild pain were prescribed opioids more often, while those with severe pain were prescribed opioids less often.
Address for Correspondence: Rahul Gupta, BS, Penn State College of Medicine, 500 University Drive, Hershey, PA 17033. Email: [email protected].
Conflicts of Interest: By the WestJEM article submission agreement, all authors are required to disclose all affiliations, funding sources and financial or management relationships that could be perceived as potential sources of bias. No author has professional or financial relationships with any companies that are relevant to this study. There are no conflicts of interest or sources of funding to declare.
Copyright: © 2021 Gupta et al. This is an open access article distributed in accordance with the terms of the Creative Commons Attribution (CC BY 4.0) License. See: http://creativecommons.org/licenses/by/4.0/
REFERENCES1. Barnett ML, Olenski AR, Jena AB. Opioid-prescribing patterns of
emergency physicians and risk of long-term use. N Engl J Med. 2017;376(7):663-73.
2. Compton WM, Boyle M, Wargo E. Prescription opioid abuse: problems and responses. Prev Med. 2015;80:5-9.
3. Ali MM, Cutler E, Mutter R, et al. Opioid prescribing rates from the emergency department: down but not out. Drug Alcohol Depend. 2019;205:107636
4. Gleber R, Vilke GM, Castillo EM, et al. Trends in emergency physician opioid prescribing practices during the United States opioid crisis. Am J Emerg Med. 2020;38(4):735-40.
5. Chen Q, Larochelle MR, Weaver DT, et al. Prevention of prescription opioid misuse and projected overdose deaths in the United States. JAMA Netw Open. 2019;2(2):e187621.
6. Compton WM, Jones CM, Baldwin GT. Relationship between nonmedical prescription-opioid use and heroin use. N Engl J Med. 2016;374(2):154-63.
7. Lebovits AH, Florence I, Bathina R, et al. Pain knowledge and attitudes of healthcare providers: practice characteristic differences. Clin J Pain. 1997;13(3):237-43.
8. Paice JA, Toy C, Shott S. Barriers to cancer pain relief: fear of tolerance and addiction. J Pain Symptom Manage. 1998;16(1):1-9.
9. Ward SE, Berry PE, Misiewicz H. Concerns about analgesics among patients and family caregivers in a hospice setting. Res Nurs Health. 1996;19(3):205-11.
10. Weissman DE. Doctors, opioids, and the law: the effect of controlled substances regulations on cancer pain management. Semin Oncol.

Western Journal of Emergency Medicine 762 Volume 22, no. 3: May 2021
Effect of PDMP on Opioid Prescribing in the ED Gupta et al.
1993;20(2 suppl 1):53-8.11. Butler MM, Ancona RM, Beauchamp GA, et al. Emergency
department prescription opioids as an initial exposure preceding addiction. Ann Emerg Med. 2016;68(2):202-8.
12. Guarisco J, Salup A. Reducing opioid prescribing rates in emergency medicine. Ochsner J. 2018;18(1):42-5.
13. Joranson DE, Ryan KM, Gilson AM, et al. Trends in medical use and abuse of opioid analgesics. JAMA. 2000;283(13):1710-4.
14. Mazer-Amirshahi M, Dewey K, Mullins PM, et al. Trends in opioid analgesic use for headaches in US emergency departments. Am J Emerg Med. 2014;32(9):1068-73.
15. Pletcher MJ, Kertesz SG, Kohn MA, et al. Trends in opioid prescribing by race/ethnicity for patients seeking care in US emergency departments. JAMA. 2008;299(1):70-8.
16. Johnston CC, Gagnon AJ, Fullerton L, et al. One-week survey of pain intensity on admission to and discharge from the emergency department: a pilot study. J Emerg Med. 1998;16(3):377-82.
17. Cordell WH., Keene KK, Giles BK, et al, The high prevalence of pain in emergency medical care. Am J Emerg Med. 2002;20(3):165-9.
18. Tanabe P, Buschmann M. A prospective study of ED pain management practices and the patient’s perspective. J Emerg Nurs. 1999;25(3):171-7.
19. Todd KH, Ducharme J, Choiniere M, et al. Pain in the emergency department: results of the pain and emergency medicine initiative (PEMI) multicenter study. J Pain. 2007;8(6):460-6.
20. Bohnert AS, Valenstein M, Bair MJ, et al. Association between opioid prescribing patterns and opioid overdose-related deaths. JAMA. 2011;305(13):1315-21.
21. Brady JE, Wunsch H, DiMaggio C, et al. Prescription drug monitoring and dispensing of prescription opioids. Public Health Rep. 2014;129(2):139-47.
22. Rutkow L, Chang HY, Daubresse M, et al. Effect of Florida’s prescription drug monitoring program and pill mill laws on opioid prescribing and use. JAMA Intern Med. 2015;175(10):1642-9.
23. Wolf T, Levine R. About the Department of Health. 2020. Available at: http://www.health.pa.gov/Your-Department-of-Health/Offices and Bureaus/PaPrescriptionDrugMonitoringProgram/Pages/home.aspx#.WttxlojwbD4. Accessed August 5, 2020.
24. Maughan BC, Bachhuber MA, Mitra N, et al. Prescription monitoring programs and emergency department visits involving opioids, 2004-2011. Drug Alcohol Depend. 2015;156:282-8.
25. McAllister MW, Aaronson P, Spillane J, et al. Impact of prescription drug-monitoring program on controlled substance prescribing in the ED. Am J Emerg Med. 2015;33(6):781-5.
26. Sun BC, Charlesworth CJ, Lupulescu-Mann N, et al. Effect of automated prescription drug monitoring program queries on emergency department opioid prescribing. Ann Emerg Med. 2018;71(3):337-47.e6.
27. Wen H, Hockenberry JM, Jeng PJ, et al. Prescription drug monitoring program mandates: impact on opioid prescribing and related hospital use. Health Aff (Millwood). 2019;38(9):1550-6.
28. Weiner SG, Baker O, Poon SJ, et al. The effect of opioid prescribing guidelines on prescriptions by emergency physicians in Ohio. Ann Emerg Med. 2017;70(6):799-808.e1.
29. Suffoletto B, Lynch M, Pacella CB, et al. The effect of a statewide mandatory prescription drug monitoring program on opioid prescribing by emergency medicine providers across 15 hospitals in a single health system. J Pain. 2018;19(4):430-8.
30. Palos GR, Mendoza TR, Mobley GM, et al. Asking the community about cutpoints used to describe mild, moderate, and severe pain. J Pain. 2006;7(1):49-56.
31. Rhodes E, Wilson M, Robinson A, et al. The effectiveness of prescription drug monitoring programs at reducing opioid-related harms and consequences: a systematic review. BMC Health Serv Res. 2019;19(1):784.
32. Hoppe JA, Nelson LS, Perrone J, et al. Opioid prescribing in a cross section of US emergency departments. Ann Emerg Med. 2015;66(3):253-9.e1.
33. Islam MM, McRae IS. An inevitable wave of prescription drug monitoring programs in the context of prescription opioids: pros, cons and tensions. BMC Pharmacol Toxicol. 2014;15:46.
34. Elder JW, DePalma G, Pines JM. Optimal implementation of prescription drug monitoring programs in the emergency department. West J Emerg Med. 2018;19(2):387-391.
35. Marco CA, Venkat A, Baker EF, et al. Prescription drug monitoring programs: ethical issues in the emergency department. Ann Emerg Med. 2016;68(5):589-98.
36. Hildebran C, Cohen DJ, Irvine JM, et al. How clinicians use prescription drug monitoring programs: a qualitative inquiry. Pain Med. 2014;15(7):1179-86.
37. Grover CA, Close RJ, Wiele ED, et al. Quantifying drug-seeking behavior: a case control study. J Emerg Med. 2012;42(1):15-21.
Volume 22, no. 3: May 2021 763 Western Journal of Emergency Medicine
Original Research
Pediatric Emergency Departments and Urgent Care Visits in Houston after Hurricane Harvey
S. Aya Fanny, MD, MPH* Brent D. Kaziny, MD, MA* Andrea T. Cruz, MD, MPH* Elizabeth A. Camp, PhD*Kristy O. Murray, DVM, PhD† Tyler J. Nichols, MD‡
Corrie E. Chumpitazi, MD, MS* Section Editor: Cristina Zeretzke-Bien, MD Submission history: Submitted July 13, 2020; Revision received February 20, 2021; Accepted February 9, 2021 Electronically published May 26, 2021 Full text available through open access at http://escholarship.org/uc/uciem_westjem DOI: 10.5811/westjem.2021.2.49050
INTRODUCTIONFloods are the most common natural disaster around
the world and are becoming increasingly more frequent and devastating.1 Studies have reported increases in illness and
Baylor College of Medicine, Department of Pediatrics, Section of Emergency Medicine, Houston, TexasNational School of Tropical Medicine, Baylor College of Medicine, Houston, Texas Advocate Christ Medical Center, Oak Lawn, Illinois
*
†
‡
Introduction: Natural disasters are increasingly common and devastating. It is essential to understand children’s health needs during disasters as they are a particularly vulnerable population. The objective of this study was to evaluate pediatric disease burden after Hurricane Harvey compared to the preceding month and the same period in the previous year to inform pediatric disaster preparedness.
Methods: This was a retrospective cross-sectional study of patients seen at pediatric emergency departments (ED) and urgent care centers (UCC) 30 days before (late summer) and after (early fall) the hurricane and from the same time period in 2016. We collected demographic information and the first five discharge diagnoses from a network of EDs and UCCs affiliated with a quaternary care children’s hospital in Houston, Texas. We calculated the odds of disease outcomes during various timeframes using binary logistic regression modeling.
Results: There were 20,571 (median age: 3.5 years, 48.1% female) and 18,943 (median age: 3.5 years, 47.3% female) patients in 2016 and 2017, respectively. Inpatient admission rates from the ED a month after Harvey were 20.5%, compared to 25.3% in the same period in 2016 (P<0.001). In both years, asthma and other respiratory illnesses increased from late summer to early fall. After controlling for these seasonal trends, the following diseases were more commonly seen after the hurricane: toxicological emergencies (adjusted odds ratio [aOR]: 2.61, 95% [confidence interval] CI, 1.35-5.05); trauma (aOR: 1.42, 95% CI, 1.32-1.53); and dermatological complaints (aOR: 1.34, 95% CI, 1.23-1.46).
Conclusion: We observed increases in rashes, trauma, and toxicological diagnoses in children after a major flood. These findings highlight the need for more medication resources and public health and education measures focused on pediatric disaster preparedness and management. [West J Emerg Med. 2021;22(3)763-768.]
healthcare needs after hurricanes and major floods. A systematic review and meta-analysis identified drowning, blunt trauma, toxic exposures, water- and vector-borne illnesses, respiratory infections, skin infections, exacerbation of chronic non-
Western Journal of Emergency Medicine 764 Volume 22, no. 3: May 2021
Pediatric EDs and Urgent Care Visits in Houston after Hurricane Harvey Fanny et al.
Population Health Research Capsule
What do we already know about this issue?Natural disasters are increasingly common. Studies report increases in illness and healthcare needs in the aftermath, yet few have focused on pediatric health.
What was the research question?Our goal was to evaluate pediatric visits after Hurricane Harvey in Houston, Texas, to inform disaster preparedness.
What was the major finding of the study?We found increases in rashes, trauma, and toxicological diagnoses in children after a major flooding event.
How does this improve population health?These findings highlight the need for more medication resources, as well as public health and education measures focused on pediatric disaster preparedness.
communicable illnesses, and long-lasting psychological distress after floods.1,2 After Hurricane Katrina in 2005, evacuees at a shelter in Houston, Texas, received medical care for fever, rash, gastrointestinal complaints and respiratory infections.3,4 Similar observations were reported after Hurricane Rita in Louisiana in 2005.4 These studies highlight the importance of improving our understanding of the clinical impact of natural disasters, particularly among vulnerable populations such as children.
Hurricane Harvey made landfall in Southeast Texas on August 25, 2017. Flooding affected about a third of the state population and was linked to 94 deaths.5 There are few studies that solely focus on the health effects of floods on the pediatric population.6 We aimed to fill this gap in the literature and describe the burden of disease in children after Hurricane Harvey in Houston, a major flooding event in one of the largest urban areas in the United States.
MATERIALS AND METHODSPatients and Setting
Houston is the fourth largest city in the US, with a population of 2,325,502 as of July 2018.7 The Greater Houston metropolitan area covers 9,444 square miles.7 We conducted a retrospective cross-sectional study of patients seen at all emergency departments (ED) and urgent care centers (UCC) associated with a large, quaternary-care children’s hospital in the greater Houston area from July 26–September 23, 2016 and July 26–September 23, 2017. In 2016, the hospital network had two EDs and six UCCs and grew to three EDs and eight UCCs in 2017. We extracted demographic information (age, gender, and address), health record number, date and location of the encounter, the first five discharge diagnoses, and disposition from the electronic health record for each patient. We excluded patients who left without being seen by a provider.
Diagnosis Code Groups We converted International Classification of Diseases, 10th
revision (ICD-10) diagnosis codes into ICD-9 diagnosis codes using the publicly available general equivalence mappings developed by the Centers for Medicaid and Medicare Services.8
We then grouped ICD-9 diagnosis codes into 21 major diagnosis groups and 77 subgroups using a published diagnosis grouping system developed specifically for pediatric EDs.9
Data Analysis We compared demographic data using Pearson’s chi-
squared test. For skewed continuous data, we used a non-parametric (Mann-Whitney U test) analysis. We compared the frequency of each major diagnosis group and subgroup during the following timeframes: July 26–August 24, 2016 (late summer 2016); August 25–September 23, 2016 (early fall 2016); July 26–August 24, 2017 (late summer 2017, 30 days before Harvey); and August 25–September 23, 2017 (early fall 2017, 30 days after Harvey). Since Hurricane Harvey occurred at the end of the summer, a period that coincides with seasonal
changes and the back-to-school period when children tend to have more respiratory illnesses, we compared illness rates in the late summer 2016 vs early fall 2016 to obtain baseline seasonal variation in disease frequency in our population. We compared disease frequency in our population 30 days before Hurricane Harvey (late summer 2017) and 30 days after Hurricane Harvey (early fall 2017). To account for seasonal variation from year to year, we compared disease frequency in early fall 2016 vs early fall 2017. ED disposition location was analyzed for all time periods.
We compared overall patient demographics and clinical factors to all study timeframes using Pearson’s chi-squared tests and Kruskal-Wallis test for skewed continuous data (age). Any co-factor with a P-value < 0.20 (age, gender, race, ethnicity, insurance status, and encounter location) was considered for further adjustment in all subsequent models for comparative purposes. We also analyzed binary comparisons of timeframe groups between study factors. Comparisons between disease rates and timeframes were calculated using unadjusted odds ratios (OR) to provide an effect estimate. Any unadjusted OR with a P-value < 0.05 was further adjusted using binary logistic regression and any co-factor with a P-value < 0.20. We defined statistical significance as P-value < 0.05. Statistical analysis was conducted using the Statistical Package for the Social Sciences (SPSS), version 24 (IBM Corp., Armonk, NY). The study protocol was exempted from informed consent and approved by our local institutional review board.
Volume 22, no. 3: May 2021 765 Western Journal of Emergency Medicine
Fanny et al. Pediatric EDs and Urgent Care Visits in Houston after Hurricane Harvey
RESULTS Baseline Seasonal Differences: Late Summer 2016 vs Early Fall 2016
There were more patients seen in the early fall than in the late summer: 11,995 vs 8,576 (n = 20,571 total patient visits). A total of 38,860 individual diagnoses were included in these analyses: 16,072 in late summer and 22,788 in early fall. ED inpatient admission and discharge rates were comparable in the late summer and early fall (Table). In the fall, more children were seen at UCCs (57.1% vs 52.2%) and were older by one median year (3.0 vs 4.0). The following diagnosis groups were more common in early fall as compared to late summer: respiratory diseases ([adjusted odds ratio] aOR: 1.53, 95% [confidence interval] CI, 1.42-1.66); ear nose and throat (ENT) /dental/mouth diseases (aOR: 1.30, 95% CI, 1.22-1.38); neurologic diseases (aOR: 1.14, 95% CI, 1.04-1.25); asthma (aOR: 1.81, 95% CI, 1.52-2.14); infectious respiratory diseases (aOR: 1.70, 95% CI, 1.46-1.99); infectious nose and sinus disorders/upper respiratory infection (URI) (aOR: 1.58, 95% CI, 1.41-1.76); and other respiratory diseases (aOR: 1.34, 95% CI, 1.20-1.50) after adjusting for age, ethnicity, insurance status, and location (Figure, Appendix A, and Supplement)
Seasonal Differences Year of Hurricane: Late Summer 2017 vs Early Fall 2017
There were more patients seen in the late summer of 2017 (30 days pre-hurricane) than in the early fall (30 days post-hurricane) of 2017: 9,843 (52%) vs 9,100 (48%) (n = 18,943 total patient visits). A total of 34,609 individual diagnoses were included in these analyses: 17,957 (51.9%) in late summer and 16,652 (48.1%) in early fall. Although age was statistically significant, with patients seen in early fall older by one median year, there were no significant clinically relevant differences between demographic factors and 30-day time intervals (Table). ED inpatient admission and discharge rates were comparable in the late summer and early fall. The following diagnoses were more common after Hurricane Harvey: respiratory diseases (aOR: 1.32, 95% CI, 1.22-1.44); musculoskeletal and connective tissue diseases (aOR: 1.17, 95% CI, 1.03-1.34); ENT/dental/mouth diseases (aOR: 1.16, 95% CI, 1.10-1.23); asthma (aOR: 1.81, 95% CI, 1.54-2.14), bronchospasm/wheezing (aOR: 1.73, 95% CI, 1.24-2.42); infectious nose and sinus disorders/URI (aOR: 1.53, 95% CI, 1.38-1.69); and infectious respiratory diseases (aOR: 1.22, 95% CI, 1.04-1.43) after adjusting for age, ethnicity, insurance status, and location (Figure, Appendix B, and Supplement)
Differences Between Year of Hurricane and Prior Year: Early Fall 2016 vs Early Fall 2017
There were 21,095 patients seen: 11,995 (56.9%) in the early fall 2016 and 9,100 (43.1%) in the early fall 2017. A total of 39,440 diagnoses were included in these analyses: 22,788 (57.8%) in early fall 2016 and 16,652 (42.2%) in early fall 2017. While the absolute number of patient encounters in
2017 decreased compared to 2016, a larger proportion of those encounters took place at UCCs in 2017 than in 2016 (60.8% vs 57.1%). In the month after Harvey, a higher proportion of ED patients were discharged home than in the same period the prior yea. Conversely, the proportion of ED patients requiring surgical intervention in the month after Harvey doubled compared to the same period in 2016 (Table). The following diagnosis groups were more common after Hurricane Harvey in 2017 than in the same timeframe in 2016: toxicological emergencies (aOR: 2.61, 95% CI, 1.35-5.05); trauma (aOR: 1.42, 95% CI, 1.32-1.53); skin, dermatologic and soft tissue diseases (aOR: 1.34, 95% CI, 1.23-1.46); lacerations and amputations (aOR: 1.78, 95% CI, 1.50-2.11); contusions and abrasions (aOR: 1.93, 95% CI, 1.59-2.35); and infectious skin and dermatologic and soft tissue diseases (aOR: 1.34, 95% CI, 1.19-1.51) after adjusting for age, ethnicity, insurance status, and location (Figure, Appendix C, and Supplement)
DISCUSSIONIn this study we compared data from the 30-day period
immediately following Hurricane Harvey to baseline data from the month and the year before the hurricane. Similar to other studies, we saw an increase in URIs, asthma exacerbations, trauma, toxicological emergencies, and skin rashes in the 30 days that followed the hurricane.1-3,6,10-12 Unlike other studies, we did not detect an increase in water- and vector-borne illnesses and gastroenteritis.1-3, 10,11 As expected, we saw an increase in URIs and asthma exacerbations in the early fall 2016, which coincides with the back-to-school period. In early fall 2016 and 2017, there was a similar increase in the frequency of asthma exacerbations and URIs. The increased odds of visiting the ED or UCC for URI or asthma during the 30-day period after Hurricane Harvey may have been due to exposure to contaminated flood waters and surfaces. Furthermore, this trend may have been compounded by the closure of primary care offices. Another plausible explanation for the nearly fourfold increase in the odds of children presenting to our EDs and UCCs with asthma after Hurricane Harvey may have been that patients were displaced without their asthma medications.
While other studies report increased indoor airborne mold levels and respiratory illnesses after floods, we were unable to specifically evaluate the impact of mold in the context of the current study due to the nature of diagnosis codes.13-16 Due to the flooding of approximately 200,000 homes and apartment buildings during Hurricane Harvey in the Greater Houston area, mold exposure was likely increased in our population.17 Although the Institute of Medicine reported an association between exposure to damp environments and high indoor mold levels and respiratory symptoms in certain populations such as individuals with asthma or allergies, there is no definitive scientific evidence of a causal relationship between mold exposure and respiratory illnesses to date.18
The marked increase in odds of toxicological emergencies (over double) and trauma (almost double the rate of lacerations)
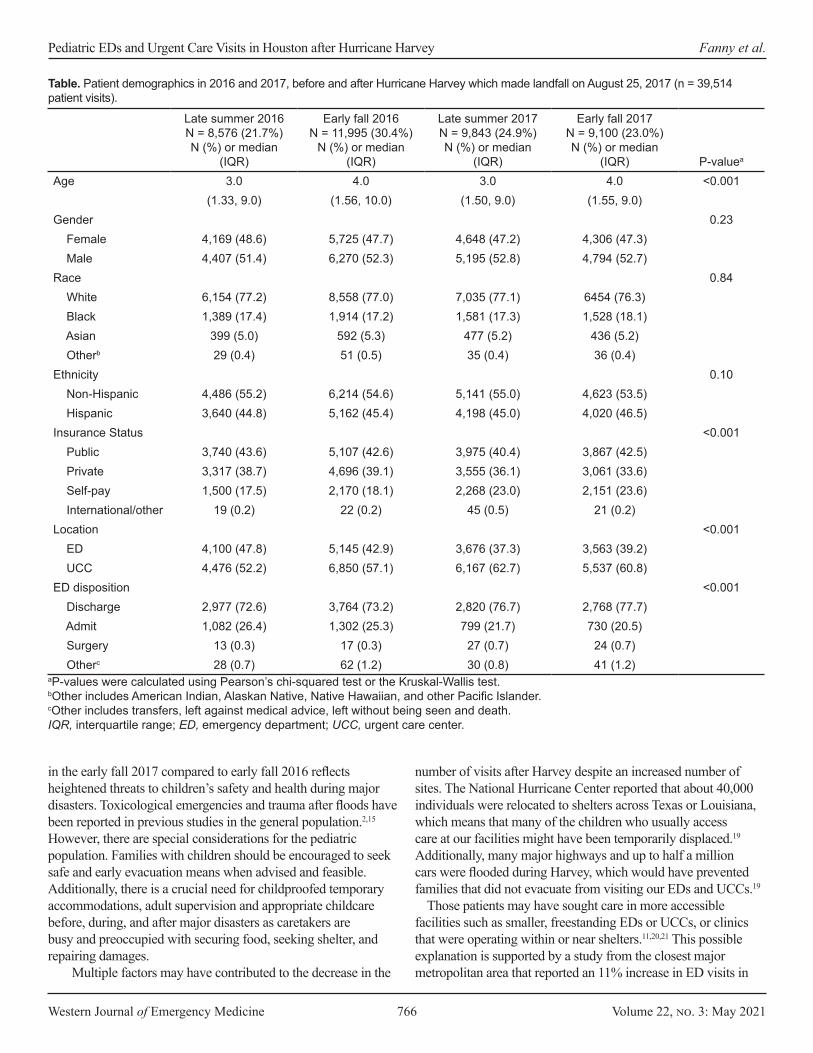
Western Journal of Emergency Medicine 766 Volume 22, no. 3: May 2021
Pediatric EDs and Urgent Care Visits in Houston after Hurricane Harvey Fanny et al.
Late summer 2016N = 8,576 (21.7%)N (%) or median
(IQR)
Early fall 2016N = 11,995 (30.4%)
N (%) or median (IQR)
Late summer 2017N = 9,843 (24.9%)N (%) or median
(IQR)
Early fall 2017 N = 9,100 (23.0%)N (%) or median
(IQR) P-valuea
Age 3.0 4.0 3.0 4.0 <0.001(1.33, 9.0) (1.56, 10.0) (1.50, 9.0) (1.55, 9.0)
Gender 0.23 Female 4,169 (48.6) 5,725 (47.7) 4,648 (47.2) 4,306 (47.3) Male 4,407 (51.4) 6,270 (52.3) 5,195 (52.8) 4,794 (52.7)Race 0.84 White 6,154 (77.2) 8,558 (77.0) 7,035 (77.1) 6454 (76.3) Black 1,389 (17.4) 1,914 (17.2) 1,581 (17.3) 1,528 (18.1) Asian 399 (5.0) 592 (5.3) 477 (5.2) 436 (5.2) Otherb 29 (0.4) 51 (0.5) 35 (0.4) 36 (0.4)Ethnicity 0.10 Non-Hispanic 4,486 (55.2) 6,214 (54.6) 5,141 (55.0) 4,623 (53.5) Hispanic 3,640 (44.8) 5,162 (45.4) 4,198 (45.0) 4,020 (46.5)Insurance Status <0.001 Public 3,740 (43.6) 5,107 (42.6) 3,975 (40.4) 3,867 (42.5) Private 3,317 (38.7) 4,696 (39.1) 3,555 (36.1) 3,061 (33.6) Self-pay 1,500 (17.5) 2,170 (18.1) 2,268 (23.0) 2,151 (23.6) International/other 19 (0.2) 22 (0.2) 45 (0.5) 21 (0.2)Location <0.001 ED 4,100 (47.8) 5,145 (42.9) 3,676 (37.3) 3,563 (39.2) UCC 4,476 (52.2) 6,850 (57.1) 6,167 (62.7) 5,537 (60.8)ED disposition <0.001 Discharge 2,977 (72.6) 3,764 (73.2) 2,820 (76.7) 2,768 (77.7) Admit 1,082 (26.4) 1,302 (25.3) 799 (21.7) 730 (20.5) Surgery 13 (0.3) 17 (0.3) 27 (0.7) 24 (0.7) Otherc 28 (0.7) 62 (1.2) 30 (0.8) 41 (1.2)
Table. Patient demographics in 2016 and 2017, before and after Hurricane Harvey which made landfall on August 25, 2017 (n = 39,514 patient visits).
aP-values were calculated using Pearson’s chi-squared test or the Kruskal-Wallis test.bOther includes American Indian, Alaskan Native, Native Hawaiian, and other Pacific Islander.cOther includes transfers, left against medical advice, left without being seen and death.IQR, interquartile range; ED, emergency department; UCC, urgent care center.
in the early fall 2017 compared to early fall 2016 reflects heightened threats to children’s safety and health during major disasters. Toxicological emergencies and trauma after floods have been reported in previous studies in the general population.2,15 However, there are special considerations for the pediatric population. Families with children should be encouraged to seek safe and early evacuation means when advised and feasible. Additionally, there is a crucial need for childproofed temporary accommodations, adult supervision and appropriate childcare before, during, and after major disasters as caretakers are busy and preoccupied with securing food, seeking shelter, and repairing damages.
Multiple factors may have contributed to the decrease in the
number of visits after Harvey despite an increased number of sites. The National Hurricane Center reported that about 40,000 individuals were relocated to shelters across Texas or Louisiana, which means that many of the children who usually access care at our facilities might have been temporarily displaced.19 Additionally, many major highways and up to half a million cars were flooded during Harvey, which would have prevented families that did not evacuate from visiting our EDs and UCCs.19
Those patients may have sought care in more accessible facilities such as smaller, freestanding EDs or UCCs, or clinics that were operating within or near shelters.11,20,21 This possible explanation is supported by a study from the closest major metropolitan area that reported an 11% increase in ED visits in
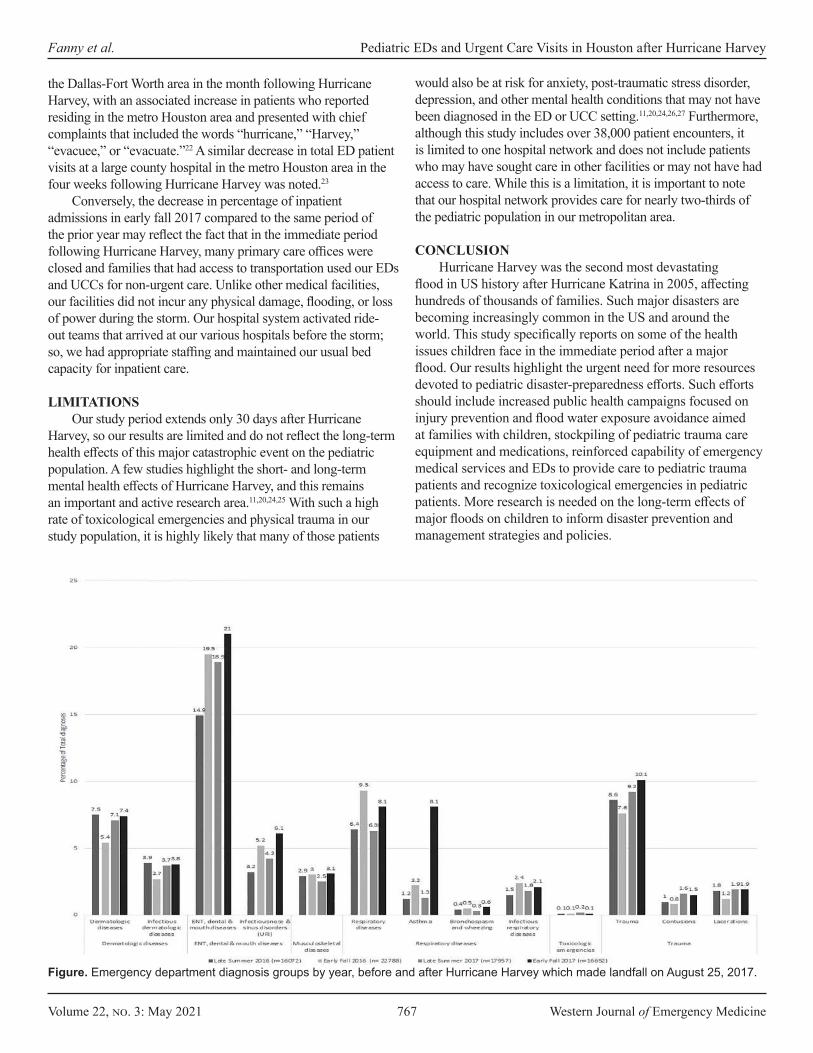
Volume 22, no. 3: May 2021 767 Western Journal of Emergency Medicine
Fanny et al. Pediatric EDs and Urgent Care Visits in Houston after Hurricane Harvey
the Dallas-Fort Worth area in the month following Hurricane Harvey, with an associated increase in patients who reported residing in the metro Houston area and presented with chief complaints that included the words “hurricane,” “Harvey,” “evacuee,” or “evacuate.”22 A similar decrease in total ED patient visits at a large county hospital in the metro Houston area in the four weeks following Hurricane Harvey was noted.23
Conversely, the decrease in percentage of inpatient admissions in early fall 2017 compared to the same period of the prior year may reflect the fact that in the immediate period following Hurricane Harvey, many primary care offices were closed and families that had access to transportation used our EDs and UCCs for non-urgent care. Unlike other medical facilities, our facilities did not incur any physical damage, flooding, or loss of power during the storm. Our hospital system activated ride-out teams that arrived at our various hospitals before the storm; so, we had appropriate staffing and maintained our usual bed capacity for inpatient care.
LIMITATIONSOur study period extends only 30 days after Hurricane
Harvey, so our results are limited and do not reflect the long-term health effects of this major catastrophic event on the pediatric population. A few studies highlight the short- and long-term mental health effects of Hurricane Harvey, and this remains an important and active research area.11,20,24,25 With such a high rate of toxicological emergencies and physical trauma in our study population, it is highly likely that many of those patients
would also be at risk for anxiety, post-traumatic stress disorder, depression, and other mental health conditions that may not have been diagnosed in the ED or UCC setting.11,20,24,26,27 Furthermore, although this study includes over 38,000 patient encounters, it is limited to one hospital network and does not include patients who may have sought care in other facilities or may not have had access to care. While this is a limitation, it is important to note that our hospital network provides care for nearly two-thirds of the pediatric population in our metropolitan area.
CONCLUSIONHurricane Harvey was the second most devastating
flood in US history after Hurricane Katrina in 2005, affecting hundreds of thousands of families. Such major disasters are becoming increasingly common in the US and around the world. This study specifically reports on some of the health issues children face in the immediate period after a major flood. Our results highlight the urgent need for more resources devoted to pediatric disaster-preparedness efforts. Such efforts should include increased public health campaigns focused on injury prevention and flood water exposure avoidance aimed at families with children, stockpiling of pediatric trauma care equipment and medications, reinforced capability of emergency medical services and EDs to provide care to pediatric trauma patients and recognize toxicological emergencies in pediatric patients. More research is needed on the long-term effects of major floods on children to inform disaster prevention and management strategies and policies.
Figure. Emergency department diagnosis groups by year, before and after Hurricane Harvey which made landfall on August 25, 2017.
Western Journal of Emergency Medicine 768 Volume 22, no. 3: May 2021
Pediatric EDs and Urgent Care Visits in Houston after Hurricane Harvey Fanny et al.
Address for Correspondence: Corrie E. Chumpitazi, MD, MS, Baylor College of Medicine, Department of Pediatrics, Section of Emergency Medicine, 6621 Fannin Street, Suite A2210, Houston, TX 77030. Email: [email protected]
Conflicts of Interest: By the WestJEM article submission agreement, all authors are required to disclose all affiliations, funding sources and financial or management relationships that could be perceived as potential sources of bias. No author has professional or financial relationships with any companies that are relevant to this study. There are no conflicts of interest or sources of funding to declare.
Copyright: © 2021 Fanny et al. This is an open access article distributed in accordance with the terms of the Creative Commons Attribution (CC BY 4.0) License. See: http://creativecommons.org/licenses/by/4.0/
REFERENCES1. Kouadio IK, Aljunid S, Kamigaki T, et al. Infectious diseases following
natural disasters: prevention and control measures. Expert Rev Anti Infect Ther. 2012;10(1):95-104.
2. Alderman K, Turner LR, Tong S. Floods and human health: a systematic review. Environ Int. 2012;47:37-47.
3. Murray KO, Kilborn C, DesVignes-Kendrick M, et al. Emerging disease syndromic surveillance for Hurricane Katrina evacuees seeking shelter in Houston’s Astrodome and Reliant Park Complex. Public Health Rep Wash DC 1974. 2009;124(3):364-71.
4. Centers for Disease Control and Prevention. Injury and illness surveil-lance in hospitals and acute-care facilities after Hurricanes Katrina And Rita--New Orleans area, Louisiana, September 25-October 15, 2005. MMWR Morb Mortal Wkly Rep. 2006;55(2):35-8.
5. Texas Department of State Health Services Hurricane Harvey Re-sponse. Hurricane Harvey Response. Texas Department of State Health Services; May 30, 2018. Available at: https://sk75w2kudjd3fv2xs2cvym-rg-wpengine.netdna-ssl.com/wp-content/uploads/2018/08/Texas-DSHS-Hurricane-Harvey-AAR-FINAL.pdf. Accessed February 14, 2021.
6. Rath B, Donato J, Duggan A, et al. Adverse health outcomes after Hur-ricane Katrina among children and adolescents with chronic conditions. J Health Care Poor Underserved. 2007;18(2):405-17.
7. City of Houston. About Houston. Available at: https://www.houstontx.gov/abouthouston/houstonfacts.html. Accessed February 14, 2021.
8. Centers for Medicare and Medicaid Services. 2017 ICD-10-CM and GEMs. Available at: https://www.cms.gov/Medicare/Coding/ICD10/2017-ICD-10-CM-and-GEMs.html. Accessed February 14, 2021.
9. Alessandrini EA, Alpern ER, Chamberlain JM, et al. A new diagnosis grouping system for child emergency department visits. Acad Emerg Med. 2010;17(2):204-13.
10. Yee EL, Palacio H, Atmar RL, et al. Widespread outbreak of norovirus gastroenteritis among evacuees of Hurricane Katrina residing in a large “megashelter” in Houston, Texas: lessons learned for prevention. Clin Infect Dis. 2007;44(8):1032-9.
11. Schnall AH, Hanchey A, Nakata N, et al. Disaster-related shelter surveil-lance during the Hurricane Harvey response – Texas 2017. Disaster Med Public Health Prep. 2020; 14(1):49-55.
12. Crutchfield AS, Harkey KA. A comparison of call volumes before, during,
and after Hurricane Harvey. Am J Emerg Med. 2019;37(10):1904-6.13. Jimenez AM, Collins TW, Grineski SE. Intra-ethnic disparities in respira-
tory health problems among hispanic residents impacted by a flood. J Asthma. 2013;50(5):463-71.
14. Hoppe KA, Metwali N, Perry SS, et al. Assessment of airborne expo-sures and health in flooded homes undergoing renovation: Bioaerosol exposures in flooded homes. Indoor Air. 2012;22(6):446-56.
15. Emerson JB, Keady PB, Brewer TE, et al. Impacts of flood damage on airborne bacteria and fungi in homes after the 2013 Colorado Front Range flood. Environ Sci Technol. 2015;49(5):2675-84.
16. Chow NA, Toda M, Pennington AF, et al. Hurricane-associated mold exposures among patients at risk for invasive mold infections after Hur-ricane Harvey — Houston, Texas, 2017. MMWR Morb Mortal Wkly Rep. 2019;68(21):469-73.
17. Hunn D, Dempsey M, Zaveri M. Harvey’s floods. Houston Chronicle. March 30, 2018. Available at: https://www.houstonchronicle.com/news/article/In-Harvey-s-deluge-most-damaged-homes-were-12794820.php. Accessed February 19, 2021.
18. National Academy of Sciences, Board on Health and Disease Prevention, National Academy of Sciences, Institute of Medicine. Damp Indoor Spaces and Health.; 2004. Available at: https://www.nap.edu/catalog/11011/damp-indoor-spaces-and-health. Accessed April 29, 2021.
19. Blake ES, Zelinsky DA. National Hurricane Center Tropical Cyclone Report Hurricane Harvey. National Hurricane Center; 2018. Available at: https://www.nhc.noaa.gov/data/tcr/AL092017_Harvey.pdf. Accessed February 14, 2021.
20. Storch EA, Shah A, Salloum A, et al. Psychiatric diagnoses and medica-tions for Hurricane Harvey sheltered evacuees. Community Ment Health J. 2019;55(7):1099-1102.
21. Liu EL, Morshedi B, Miller BL, et al. Dallas megashelter medical opera-tions response to Hurricane Harvey. Disaster Med Public Health Prep. 2019;13(1):90-3.
22. Stephens W, Wilt GE, Lehnert EA, et al. A spatial and temporal investi-gation of medical surge in Dallas–Fort Worth During Hurricane Harvey, Texas 2017. Disaster Med Public Health Prep. 2020;14(1):111-8.
23. Chambers K, Husain I, Chathampally Y, et al. Impact of Hurricane Harvey on healthcare utilization and emergency department operations. West J Emerg Med. 2020;21(3):586-94.
24. Schwartz R, Tuminello S, Kerath S, et al. Preliminary assessment of Hurricane Harvey exposures and mental health impact. Int J Environ Res Public Health. 2018;15(5):974.
25. Taioli E, Tuminello S, Lieberman-Cribbin W, et al. Mental health challeng-es and experiences in displaced populations following Hurricane Sandy and Hurricane Harvey: the need for more comprehensive interventions in temporary shelters. J Epidemiol Community Health. 2018;72(10):867-70.
26. Bistricky SL, Long LJ, Lai BS, et al. Surviving the storm: avoidant coping, helping behavior, resilience and affective symptoms around a major hurricane-flood. J Affect Disord. 2019;257:297-306.
27. Grineski SE, Flores AB, Collins TW, Chakraborty J. Hurricane Harvey and Greater Houston households: comparing pre-event preparedness with post-event health effects, event exposures, and recovery. Disasters. 2020;44(2):408-32.

Volume 22, no. 3: May 2021 769 Western Journal of Emergency Medicine
Original Research
Acceptability of Contraceptive Services in the Emergency Department: A Cross-sectional Survey
Andreia B. Alexander, MD, PhD, MPH*Kimberly Chernoby, MD, JD, MA*Nathan VanderVinne, DO*Yancy Doos†
Navneet Kaur†
Caitlin Bernard, MD‡
Jeffrey A. Kline, MD*
Section Editor: Jacob Manteuffel, MD Submission history: Submitted September 1, 2020; Revision received February 22, 2021; Accepted February 16, 2021 Electronically published May 24, 2021 Full text available through open access at http://escholarship.org/uc/uciem_westjem DOI: 10.5811/westjem.2021.2.49675
Indiana University School of Medicine, Department of Emergency Medicine, Indianapolis, IndianaIndiana University-Purdue University, School of Science, Indianapolis, IndianaIndiana University School of Medicine, Department of Obstetrics and Gynecology, Indianapolis, Indiana
*
†
‡
Introduction: Unintended pregnancy disproportionately affects marginalized populations and has significant negative health and financial impacts on women, their families, and society. The emergency department (ED) is a promising alternative setting to increase access to sexual and reproductive health (SRH) services including contraception, especially among marginalized populations. The primary objective of this study was to determine the extent to which adult women of childbearing age who present to the ED would be receptive to receiving contraception and/or information about contraception in the ED. As a secondary objective, we sought to identify the barriers faced in attempting to obtain SRH care in the past.
Methods: We conducted a quantitative, cross-sectional, assisted, in-person survey of women aged 18-50 in the ED setting at two large, urban, academic EDs between June 2018–September 2019. The survey was approved by the institutional review board. Survey items included demographics, interest in contraception initiation and/or receiving information about contraception in the ED, desire to conceive, prior SRH care utilization, and barriers to SRH.
Results: A total of 505 patients participated in the survey. Participants were predominantly single and Black, with a mean age of 31 years, and reporting not wanting to become pregnant in the next year. Of those participants, 55.2% (n = 279) stated they would be interested in receiving information about birth control AND receiving birth control in the ED if it were available. Of those who reported the ability to get pregnant, and not desiring pregnancy in the next year (n = 279, 55.2%), 32.6% were not currently using anything to prevent pregnancy (n = 91). Only 10.5% of participants stated they had experienced barriers to SRH care in the past (n = 53). Participants who experienced barriers to SRH reported higher interest in receiving information and birth control in the ED (74%, n = 39) compared to those who had not experienced barriers (53%, n = 240); (P = 0.004, 95% confidence interval, 1.30-4.66).
Conclusion: The majority of women of childbearing age indicated the desire to access contraception services in the ED setting. This finding suggests favorable patient acceptability for an implementation study of contraception services in emergency care. [West J Emerg Med. 2021;22(3)769–774.]
Western Journal of Emergency Medicine 770 Volume 22, no. 3: May 2021
Acceptability of Contraceptive Services in the ED Alexander et al.
Population Health Research Capsule
What do we already know about this issue?Unintended pregnancy disproportionately affects marginalized populations and has significant negative health and financial impacts.
What was the research question?Our goal was to determine whether women presenting to the emergency department (ED) would be receptive to contraceptive services in the ED.
What was the major finding of the study?Most women were interested in accessing contraception in the ED setting.
How does this improve population health?Increasing access to contraception in the ED for patients at higher risk for unintended pregnancy could help decrease this health inequity.
BACKGROUND Despite the decline in unintended pregnancy rates in the
United States over the past decade, unintended pregnancy remains a significant public health issue.1 According to the US Centers for Disease Control and Prevention (CDC), factors for increased risk of unintended pregnancy include the following: age 18-24 years; non-Hispanic Black; low income (<100% federal poverty level); less than high school education; and cohabitation without marriage.2,3 Additionally, unintended pregnancy has significant negative health and financial impacts on women, their families, and society.4-8
The decrease in unintended pregnancy rates in the US has been attributed to increased access and utilization of contraception.2 This decrease can largely be attributed to the contraception benefit of the Affordable Care Act (ACA), which required insurance companies to cover contraception without a copay.9 After implementation of the ACA we saw significant increases in contraception utilization and decreases in pregnancy rates, particularly in patients at highest risk for unintended pregnancy.10 However, with nearly three million unintended pregnancies per year,11 the US ranks significantly higher than many other developed countries.12 Thus, there is still significant room for improvement.
The emergency department (ED) is a promising alternative setting to increase access to sexual and reproductive health (SRH) services including contraception, especially among marginalized populations.13-18
Emerging evidence has suggested it is feasible to provide SRH services in the ED.19
A mandatory aspect of translating medical services from theory into practice (so-called implementation science, or T2 to T3 translation) requires input from patients. Given the dearth of literature on the role of SRH interventions in the ED setting, we conducted a cross-sectional survey to assess patients’ receptiveness to accepting contraception services in the ED. Survey studies are useful when trying to understand respondents’ opinions,20 such as in acceptability studies. The primary objective of this study was to determine the extent to which adult women of childbearing age who present to the ED would be receptive to receiving contraception and/or information about contraception in the ED. As a secondary objective, we sought to identify the barriers faced in attempting to obtain SRH care in the past.
METHODS Study Design
We conducted a quantitative, cross-sectional, assisted, in-person survey of women aged 18-50 in the ED setting. This study was approved by the institutional review board at our institution. Participant Recruitment and Data Collection
A convenience sample of participants were recruited from two large, urban, academic EDs between June 2018–
September 2019. Each ED has approximately 100,000 annual visits and serves primarily adult patients. (About 85% of visits at each site are by patients at least 18 years of age.) Eligible participants were women aged 18-50 who presented to the ED for any complaint when a research assistant (RA) was present in the ED. The RAs were volunteers and did not have a set schedule. While it was feasible to collect data 24 hours per day/seven days per week, the RAs dictated their own schedules. We excluded participants from the study if they were intoxicated, exhibiting hostile behavior, non-English speaking, or had a chief complaint of sexual assault (due to the potential introduction of psychological risk). Participants were approached and asked to participate in the study by a RA, after the RA confirmed appropriate timing with the treating emergency physician or resident. If they agreed, participants were given a study information sheet, questions were answered, and verbal consent was obtained. The RAs then verbally administered the survey to participants, capturing their responses electronically. The survey took approximately 10 minutes to complete. No compensation was provided for participation. Survey Development
Survey items were developed by an EM resident (NV). To establish face and content validity, a multidisciplinary team of content experts from emergency medicine, obstetrics and gynecology, and pediatric-adolescent medicine, evaluated the initial survey items. Sequential changes were made to the instrument based on their discussions. Once the survey design
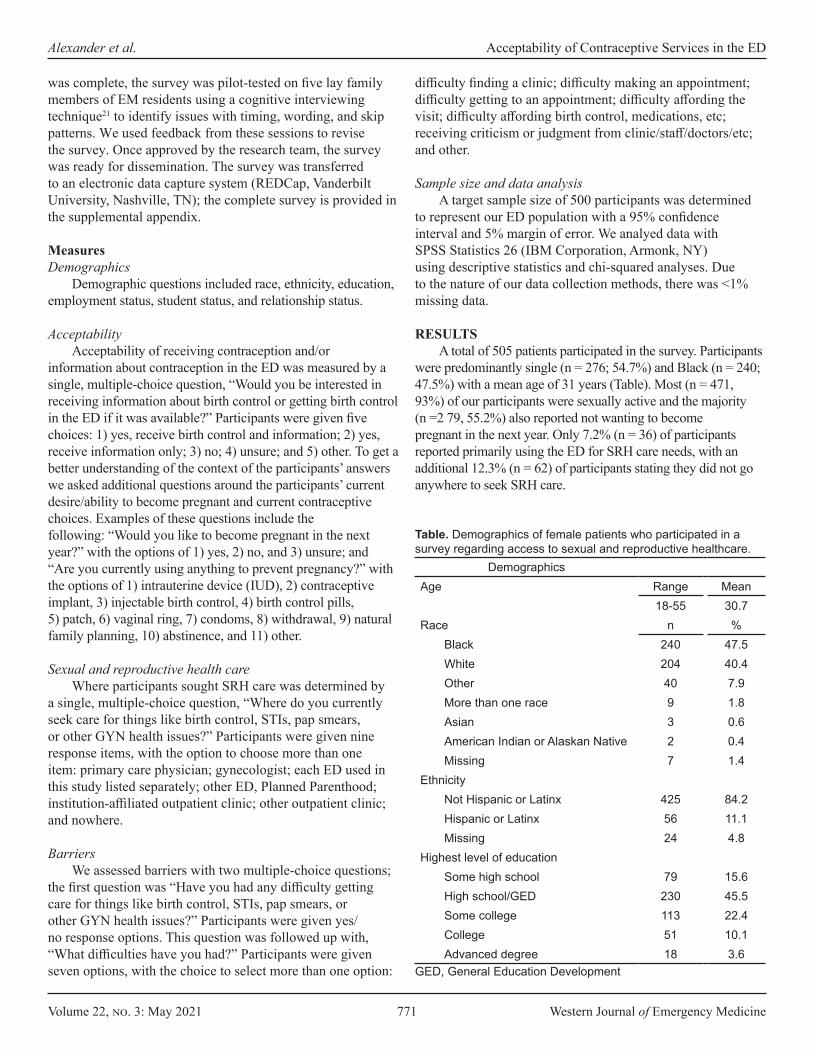
Volume 22, no. 3: May 2021 771 Western Journal of Emergency Medicine
Alexander et al. Acceptability of Contraceptive Services in the ED
DemographicsAge Range Mean
18-55 30.7Race n %
Black 240 47.5 White 204 40.4 Other 40 7.9 More than one race 9 1.8 Asian 3 0.6 American Indian or Alaskan Native 2 0.4 Missing 7 1.4
EthnicityNot Hispanic or Latinx 425 84.2 Hispanic or Latinx 56 11.1 Missing 24 4.8
Highest level of educationSome high school 79 15.6High school/GED 230 45.5 Some college 113 22.4 College 51 10.1 Advanced degree 18 3.6
Table. Demographics of female patients who participated in a survey regarding access to sexual and reproductive healthcare.
was complete, the survey was pilot-tested on five lay family members of EM residents using a cognitive interviewing technique21 to identify issues with timing, wording, and skip patterns. We used feedback from these sessions to revise the survey. Once approved by the research team, the survey was ready for dissemination. The survey was transferred to an electronic data capture system (REDCap, Vanderbilt University, Nashville, TN); the complete survey is provided in the supplemental appendix. Measures Demographics
Demographic questions included race, ethnicity, education, employment status, student status, and relationship status. Acceptability
Acceptability of receiving contraception and/or information about contraception in the ED was measured by a single, multiple-choice question, “Would you be interested in receiving information about birth control or getting birth control in the ED if it was available?” Participants were given five choices: 1) yes, receive birth control and information; 2) yes, receive information only; 3) no; 4) unsure; and 5) other. To get a better understanding of the context of the participants’ answers we asked additional questions around the participants’ current desire/ability to become pregnant and current contraceptive choices. Examples of these questions include the following: “Would you like to become pregnant in the next year?” with the options of 1) yes, 2) no, and 3) unsure; and “Are you currently using anything to prevent pregnancy?” with the options of 1) intrauterine device (IUD), 2) contraceptive implant, 3) injectable birth control, 4) birth control pills, 5) patch, 6) vaginal ring, 7) condoms, 8) withdrawal, 9) natural family planning, 10) abstinence, and 11) other. Sexual and reproductive health care
Where participants sought SRH care was determined by a single, multiple-choice question, “Where do you currently seek care for things like birth control, STIs, pap smears, or other GYN health issues?” Participants were given nine response items, with the option to choose more than one item: primary care physician; gynecologist; each ED used in this study listed separately; other ED, Planned Parenthood; institution-affiliated outpatient clinic; other outpatient clinic; and nowhere. Barriers
We assessed barriers with two multiple-choice questions; the first question was “Have you had any difficulty getting care for things like birth control, STIs, pap smears, or other GYN health issues?” Participants were given yes/no response options. This question was followed up with, “What difficulties have you had?” Participants were given seven options, with the choice to select more than one option:
difficulty finding a clinic; difficulty making an appointment; difficulty getting to an appointment; difficulty affording the visit; difficulty affording birth control, medications, etc; receiving criticism or judgment from clinic/staff/doctors/etc; and other. Sample size and data analysis
A target sample size of 500 participants was determined to represent our ED population with a 95% confidence interval and 5% margin of error. We analyed data with SPSS Statistics 26 (IBM Corporation, Armonk, NY) using descriptive statistics and chi-squared analyses. Due to the nature of our data collection methods, there was <1% missing data. RESULTS
A total of 505 patients participated in the survey. Participants were predominantly single (n = 276; 54.7%) and Black (n = 240; 47.5%) with a mean age of 31 years (Table). Most (n = 471, 93%) of our participants were sexually active and the majority (n =2 79, 55.2%) also reported not wanting to become pregnant in the next year. Only 7.2% (n = 36) of participants reported primarily using the ED for SRH care needs, with an additional 12.3% (n = 62) of participants stating they did not go anywhere to seek SRH care.
GED, General Education Development
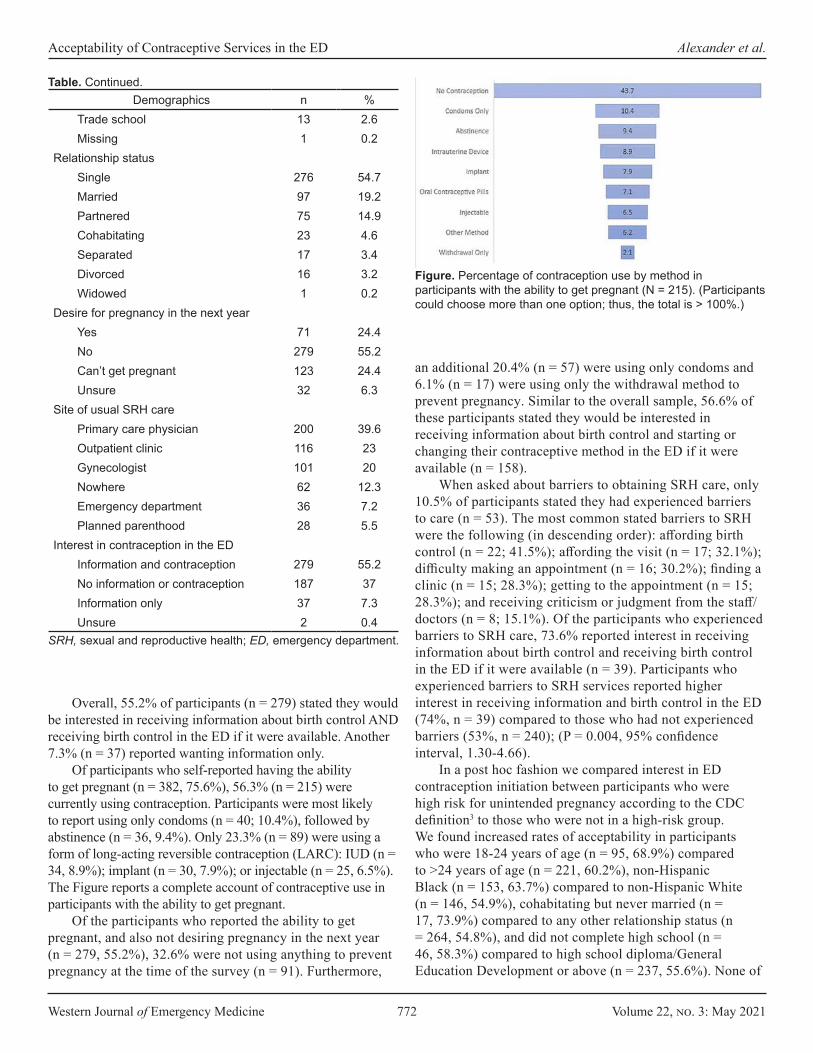
Western Journal of Emergency Medicine 772 Volume 22, no. 3: May 2021
Acceptability of Contraceptive Services in the ED Alexander et al.
Demographics n %Trade school 13 2.6 Missing 1 0.2
Relationship statusSingle 276 54.7 Married 97 19.2 Partnered 75 14.9 Cohabitating 23 4.6 Separated 17 3.4 Divorced 16 3.2 Widowed 1 0.2
Desire for pregnancy in the next yearYes 71 24.4 No 279 55.2 Can’t get pregnant 123 24.4 Unsure 32 6.3
Site of usual SRH carePrimary care physician 200 39.6 Outpatient clinic 116 23 Gynecologist 101 20 Nowhere 62 12.3 Emergency department 36 7.2 Planned parenthood 28 5.5
Interest in contraception in the EDInformation and contraception 279 55.2 No information or contraception 187 37 Information only 37 7.3 Unsure 2 0.4
SRH, sexual and reproductive health; ED, emergency department.
Table. Continued.
Overall, 55.2% of participants (n = 279) stated they would be interested in receiving information about birth control AND receiving birth control in the ED if it were available. Another 7.3% (n = 37) reported wanting information only.
Of participants who self-reported having the ability to get pregnant (n = 382, 75.6%), 56.3% (n = 215) were currently using contraception. Participants were most likely to report using only condoms (n = 40; 10.4%), followed by abstinence (n = 36, 9.4%). Only 23.3% (n = 89) were using a form of long-acting reversible contraception (LARC): IUD (n = 34, 8.9%); implant (n = 30, 7.9%); or injectable (n = 25, 6.5%). The Figure reports a complete account of contraceptive use in participants with the ability to get pregnant.
Of the participants who reported the ability to get pregnant, and also not desiring pregnancy in the next year (n = 279, 55.2%), 32.6% were not using anything to prevent pregnancy at the time of the survey (n = 91). Furthermore,
Figure. Percentage of contraception use by method in participants with the ability to get pregnant (N = 215). (Participants could choose more than one option; thus, the total is > 100%.)
an additional 20.4% (n = 57) were using only condoms and 6.1% (n = 17) were using only the withdrawal method to prevent pregnancy. Similar to the overall sample, 56.6% of these participants stated they would be interested in receiving information about birth control and starting or changing their contraceptive method in the ED if it were available (n = 158).
When asked about barriers to obtaining SRH care, only 10.5% of participants stated they had experienced barriers to care (n = 53). The most common stated barriers to SRH were the following (in descending order): affording birth control (n = 22; 41.5%); affording the visit (n = 17; 32.1%); difficulty making an appointment (n = 16; 30.2%); finding a clinic (n = 15; 28.3%); getting to the appointment (n = 15; 28.3%); and receiving criticism or judgment from the staff/doctors (n = 8; 15.1%). Of the participants who experienced barriers to SRH care, 73.6% reported interest in receiving information about birth control and receiving birth control in the ED if it were available (n = 39). Participants who experienced barriers to SRH services reported higher interest in receiving information and birth control in the ED (74%, n = 39) compared to those who had not experienced barriers (53%, n = 240); (P = 0.004, 95% confidence interval, 1.30-4.66).
In a post hoc fashion we compared interest in ED contraception initiation between participants who were high risk for unintended pregnancy according to the CDC definition3 to those who were not in a high-risk group. We found increased rates of acceptability in participants who were 18-24 years of age (n = 95, 68.9%) compared to >24 years of age (n = 221, 60.2%), non-Hispanic Black (n = 153, 63.7%) compared to non-Hispanic White (n = 146, 54.9%), cohabitating but never married (n = 17, 73.9%) compared to any other relationship status (n = 264, 54.8%), and did not complete high school (n = 46, 58.3%) compared to high school diploma/General Education Development or above (n = 237, 55.6%). None of
Volume 22, no. 3: May 2021 773 Western Journal of Emergency Medicine
Alexander et al. Acceptability of Contraceptive Services in the ED
these factors reached statistical significance at a level of P = 0.05.
DISCUSSION Among the many factors that determine the
feasibility of a study, two important elements are that the intervention is both needed and wanted (acceptable) by the target population.22 In this survey study of women presenting to the ED, most (55.2%) of our participants wanted to receive contraception and information about contraception in the ED and an additional 7.3% wanted information only. To our knowledge, there has only been one study, published in 2005, examining the acceptability of the provision of contraception in the adult ED population.23 In this study, contraception provision in the ED was acceptable to 44% of ED patients. Our rate of acceptability was somewhat higher at 55.2%. This may be secondary to the increase in awareness of and access to contraception over the last decade,24 specifically since the introduction of the ACA contraception benefit.9,10
Todd et al found that acceptability was significantly higher in patients who were uninsured, without a primary care provider, were frequent ED utilizers, and were at increased risk of pregnancy.23 In participants who were at increased risk of pregnancy,3 we found increased rates of acceptability in most categories including those who were 18-24 years of age, non-Hispanic Black, cohabitating but never married, and had not completed high school. We did not collect income information; therefore, we could not compare low to higher income participants. None of these factors reached statistical significance at a level of P = 0.05; however, this study was not powered to answer this question. Additionally, patients who experienced barriers to SRH care reported higher interest in receiving information and birth control in the ED compared to those who did not experience these barriers.
A qualitative study by Caldwell et al found that 81% participants were accepting of contraception counseling in the ED. These participants felt that the ED provided an opportunity to address women’s unmet contraception needs, contraception was within the scope of ED practice, and the ED was a convenient setting with competent providers who could deliver contraception counseling. However, the participants who were not accepting of contraception counseling felt that contraception is a sensitive topic, and the ED is an inappropriate setting to receive contraception counseling.25 While this study further supports the ED as a setting for contraception services, it highlights the need for patient-centered, targeted approaches to ED-based contraception services. Future research should explore these factors further.
Our data suggest that ED-based contraception was both wanted and needed. Of participants who were able to but did not want to get pregnant in the next year, 32.6% of
them were not using any form of contraception, with another 26.5% relying on condoms only or the withdrawal method. To reduce unintended pregnancy in the US we need to increase access to contraception by identifying alternative settings for its provision13,26,27 because the traditional settings are insufficient to meet the needs of the most vulnerable populations. The need identified by this study supports the notion that the ED may be an important setting to reach some of our patients who are at high risk for unintended pregnancy and its complications.
While our study showed that acceptability of contraception was high in the ED patients we sampled, further research needs to be completed. First, a similar multisite study of acceptability should be implemented to increase generalizability of these findings. Additionally, feasibility studies in the areas of insurance coverage, physician knowledge and acceptability, and follow-up structure as well as a pilot study should be conducted to ensure successful implementation of contraception initiation in the ED. LIMITATIONS
Bias may have been introduced into this study as we used a convenience sample rather than a consecutive or random sample. This was because this was an unfunded study. Data was collected by two volunteer RAs, one undergraduate and one medical student. Therefore, data needed to be collected when they were available. While there were no restrictions on when they could collect data, all but two participants were enrolled between 7 am -11 pm. We do not have data on the day of the week data was collected as we did not keep track of dates in order to preserve anonymity and not collect personal health information. Additionally, although we collected data at two large urban EDs, these EDs were located in the same city, limiting generalizability of the results of this study. Another limitation is that we did not keep track of patients who were approached but refused to participate. Therefore, we could not calculate a response rate, and we could not determine whether there was a difference between participants and non-participants. Finally, although insurance status was identified in a prior study as having a significant correlation with acceptability of contraception in the ED,23 this survey was not designed to assess influence of insurance status on decision-making; one of the reasons for this was our concern about confounding from financial literacy,28 because this was coming from the patient not the chart. We did not have IRB approval to look at the electronic health record. This correlation will be explored in future studies.
CONCLUSION The majority of women of childbearing age indicated the
desire to access contraception services in the ED setting. This finding suggests favorable patient acceptability for an implementation study of contraception in emergency care.
Western Journal of Emergency Medicine 774 Volume 22, no. 3: May 2021
Acceptability of Contraceptive Services in the ED Alexander et al.
Address for Correspondence: Andreia B. Alexander, MD, PhD, MPH, Indiana University School of Medicine, Department of Emergency Medicine, Fifth Third Bank Building | Third Floor, 720 Eskenazi Avenue, Indianapolis, IN 46202. Email: [email protected].
Conflicts of Interest: By the WestJEM article submission agreement, all authors are required to disclose all affiliations, funding sources and financial or management relationships that could be perceived as potential sources of bias. No author has professional or financial relationships with any companies that are relevant to this study. There are no conflicts of interest or sources of funding to declare.
Copyright: © 2021 Alexander et al. This is an open access article distributed in accordance with the terms of the Creative Commons Attribution (CC BY 4.0) License. See: http://creativecommons.org/licenses/by/4.0/
REFERENCES1. Healthy People 2020. Reproductive and sexual health. 2020. Available
at: https://www.healthypeople.gov/2020/leading-health-indicators/2020-lhi-topics/Reproductive-and-Sexual-Health. Accessed May 15, 2020.
2. Finer LB, Zolna MR. Declines in unintended pregnancy in the United States, 2008–2011. N Engl J Med. 2016;374(9):843-52.
3. Centers for Disease Control and Prevention. Unintended Pregnancy. September 12, 2019. Available at: https://www.cdc.gov/reproductivehealth/contraception/unintendedpregnancy/index.htm. Accessed July 3, 2020.
4. Cheng D, Schwarz EB, Douglas E, et al. Unintended pregnancy and associated maternal preconception, prenatal and postpartum behaviors. Contraception. 2009;79(3):194-8.
5. Dott M, Rasmussen SA, Hogue CJ, et al. Association between pregnancy intention and reproductive-health related behaviors before and after pregnancy recognition, National Birth Defects Prevention Study, 1997–2002. Matern Child Health J. 2010;14(3):373-81.
6. Guterman K. Unintended pregnancy as a predictor of child maltreatment. Child Abuse Negl. 2015;48:160-169.
7. Orr ST, Miller CA, James SA, et al. Unintended pregnancy and preterm birth. Paediatr Perinat Epidemiol. 2000;14(4):309-13.
8. Sonfield A and Kost K, Public costs from unintended pregnancies and the role of public insurance programs in paying for pregnancy-related care: National and state estimates for 2010, New York: Guttmacher Institute, 2015. Available at: http://citeseerx.ist.psu.edu/viewdoc/download?doi=10.1.1.700.5575&rep=rep1&type=pdf. Accessed May 5, 2020.
9. Kaiser Family Foundation. Preventive services covered by private health plans under the Affordable Care Act. 2015. Available at: https://www.kff.org/health-reform/fact-sheet/preventive-services-covered-by-private-health-plans/. Accessed October 1, 2020.
10. Dalton VK, Moniz MH, Bailey MJ, et al. Trends in birth rates after elimination of cost sharing for contraception by the patient protection and Affordable Care Act. JAMA Netw Open. 2020; 2;3(11):e2024398.
11. Frost JJ, Sonfield A, Zolna MR, et al. Return on investment: a fuller assessment of the benefits and cost savings of the US publicly funded family planning program. Milbank Q. 2014;92(4):696-749.
12. Singh S, Sedgh G, Hussain R. Unintended pregnancy: worldwide levels, trends, and outcomes. Stud Fam Plann. 2010;41(4):241-50.
13. Alexander AB, Ott MA. A social emergency medicine approach to the implementation of sexual and reproductive health interventions in the emergency department. Acad Emerg Med. 2019;26(4):457-9.
14. Morganti KG, Bauhoff S, Blanchard JC, et al. The evolving role of emergency departments in the United States. Rand Health Q. 2013;3(2):3.
15. Coster JE, Turner JK, Bradbury D, et al. Why do people choose emergency and urgent care services? A rapid review utilizing a systematic literature search and narrative synthesis. Acad Emer Med. 2017;24(9):1137-49.
16. Cunningham A, Mautner D, Ku B, et al. Frequent emergency department visitors are frequent primary care visitors and report unmet primary care needs. J Eval Clin Pract. 2017;23(3):567-73.
17. Greenwood-Ericksen MB, Kocher K. Trends in emergency department use by rural and urban populations in the United States. JAMA Netw Open. 2019;2(4):e191919-e191919.
18. Caldwell MT, Choi H, Levy P, et al. Effective contraception use by usual source of care: an opportunity for prevention. Womens Health Issues. 2018;28:306-12.
19. Miller MK, Chernick LS, Goyal MK, et al. A research agenda for emergency medicine–based adolescent sexual and reproductive health. Acad Emer Med. 2019;26(12):1357-68.
20. Mello MJ, Merchant RC, Clark MA. Surveying emergency medicine. Acad Emer Med. 2013;20(4):409-12.
21. Brace I. (2018). How to pilot a questionnaire. Questionnaire Design: How to Plan, Structure and Write Survey Material for Effective Market Research 4th ed, (p. 276-88). New York, NY: Kogan Page Publishers.
22. American Public Health Association. Criteria for the development of health promotion and education programs. Am J Public Health. 1987;77(1):89-92.
23. Todd CS, Plantinga LC, Lichenstein R. Primary care services for an emergency department population: a novel location for contraception. Contraception. 2005;71(1):40-4.
24. Hogben M, Ford J, Becasen JS, et al. A systematic review of sexual health interventions for adults: narrative evidence. J Sex Res. 2015;52(4):444-69.
25. Caldwell MT, Hambrick N, Vallee P, et. al. “They’re doing their job”: women’s acceptance of emergency department contraception counseling. Ann Emerg Med. 2020;76(4):515-26.
26. World Health Organization. Improving access to quality care in family planning: medical eligibility criteria for initiating and continuing using use of contraceptive methods. 1996. Available at: https://apps.who.int/iris/bitstream/handle/10665/61086/WHO_RHR_00.02.pdf. Accessed May 5, 2020.
27. American College of Obstetricians and Gynecologists. Practice bulletin No. 200: Early pregnancy loss. Obstet Gynecol. Nov 2018;132(5):e197-207.
28. Hoerl M, Wuppermann A, Barcellos SH, et. al. Knowledge as a predictor of insurance coverage under the Affordable Care Act. Med Care. 2017;55(4):428-35.
Volume 22, no. 3: May 2021 775 Western Journal of Emergency Medicine
Original Research
Ultrasound Hypotension Protocol Time-motion Study Using the Multifrequency Single Transducer Versus a Multiple
Transducer Ultrasound Device Linda Sabbadini, MD*Rocco Germano, MD*Emily Hopkins, MSPH†
Jason S. Haukoos, MD, MSc†‡ §
John L. Kendall, MD†‡
Section Editor: Shane Summers, MD Submission history: Submitted April 24, 2020; Revision received November 13, 2020; Accepted December 9, 2020Electronically published April 8, 2021 Full text available through open access at http://escholarship.org/uc/uciem_westjem DOI: 10.5811/westjem.2020.12.47862
INTRODUCTIONShock is one of the most challenging diagnostic
presentations for the emergency physician (EP), and it is associated with mortality that has been reported as high as 25%.1 Physical examination alone, in most instances, is
University of Brescia - Medicine and Surgery, Department of Clinical and Experimental Science, Brescia, Italy Denver Health Medical Center, Department of Emergency Medicine, Denver, ColoradoUniversity of Colorado School of Medicine, Aurora, ColoradoColorado School of Public Health, Aurora, Colorado
*
†
‡
§
Introduction: Ultrasound hypotension protocols (UHP) involve imaging multiple body areas, each with different transducers and imaging presets. The time for task switching between presets and transducers to perform an UHP has not been previously studied. A novel hand-carried ultrasound (HCU) has been developed that uses a multifrequency single transducer to image areas of the body (lung, heart, abdomen, superficial) that would typically require three transducers using a traditional cart-based ultrasound (CBU) system. Our primary aim was to compare the time to complete UHPs with a single transducer HCU to a multiple transducer CBU.
Methods: We performed a randomized, crossover feasibility trial in the emergency department of an urban, safety-net hospital. This was a convenience sample of non-hypotensive emergency department patients presenting during a two-month period of time. Ultrasound hypotension protocols were performed by emergency physicians (EP) on patients using the HCU and the CBU. The EPs collected UHP views in sequential order using the most appropriate transducer and preset for the area/organ to be imaged. Time to complete each view, time for task switching, total time to complete the examination, and image diagnostic quality were recorded.
Results: A total of 29 patients were scanned by one of eight EPs. When comparing the HCU to the CBU, the median time to complete the UHP was 4.3 vs 8.5 minutes (P <0.0001), respectively. When the transport and plugin times were excluded, the median times were 4.1 vs 5.8 minutes (P <0.0001), respectively. There was no difference in the diagnostic quality of images obtained by the two devices.
Conclusion: Ultrasound hypotension protocols were performed significantly faster using the single transducer HCU compared to a multiple transducer CBU with no difference in the number of images deemed to be diagnostic quality. [West J Emerg Med. 2021;22(3)775–781.]
insufficient to adequately determine the etiology of shock, due to the complexity of the pathophysiological mechanisms, which can result in delayed diagnosis and appropriate treatment.2 Outcomes of patients in shock are closely related to the duration of hypotension; therefore, it is crucial to reach

Western Journal of Emergency Medicine 776 Volume 22, no. 3: May 2021
Ultrasound Hypotension Protocol Time-motion Study Sabbadini et al.
Population Health Research Capsule
What do we already know about this issue?Task switching by selecting different transducers during the ultrasound evaluation of patients with undifferentiated hypotension (UHP) may lead to diagnostic and therapeutic delays.
What was the research question?The primary aim was to measure the time to perform a UHP with a single- compared to a multiple-transducer ultrasound system.
What was the major finding of the study?The UHP was performed significantly faster with a single transducer hand carried device compared to a cart-based system.
How does this improve population health?In time-critical ultrasound studies, time savings associated with using a single transducer hand carried device may positively impact patient outcomes.
the correct diagnosis as soon as possible in order to institute the most appropriate therapy.3
The rapid ultrasound for shock and hypotension (RUSH) examination is a scanning protocol that involves imaging the chest, heart, peritoneal cavity, abdominal aorta, inferior vena cava (IVC), and leg veins to determine the etiology of different shock states.4 Similar ultrasound hypotension protocols (UHP) have been shown to improve outcomes, enhance diagnostic certainty, and change patient management.2,5-7 For example, Haydar et al found that incorporating an UHP involving multiple views of the heart and IVC altered more than half of physicians’ management decisions, while 90% perceived the ultrasound data to have positive clinical utility.5 Similarly, Shokoohi et al used an UHP involving a focused cardiac assessment, measurement of IVC collapsibility, an assessment of the abdominal cavity for free fluid or abdominal aortic aneurysm, and a thoracic scan to evaluate for pneumothorax, which changed management in 24.6% of hypotensive patients while decreasing diagnostic complexity by 27.4%.6
A unique aspect of an UHP is the need to scan multiple different body regions and structures. While previous studies have recommended using specific transducers to perform different aspects of the UHP, such as a phased array for the cardiac component, curvilinear for the abdominal structures, and a linear for the lung and extremity venous examinations,4 the only study reporting time to complete a multiorgan hypotension protocol employed a single transducer.2 Consequently, it is unclear how much time is needed to complete an UHP using specific transducers and presets for the different components of the examination.
A novel hand-carried ultrasound (HCU) system, the Butterfly iQ, (Butterfly Network, Inc., Guilford, CT) uses a single, multifrequency, capacitive micromachined ultrasonic transducer (CMUT) (1-9 megahertz [MHz]) to image areas of the body (lung, heart, abdomen, superficial) that would typically require three piezoelectric transducers using a traditional cart-based ultrasound (CBU) system. A potential advantage of this design is decreasing the need for task switching to select different presets and transducers, which may result in less time to perform multiorgan ultrasound protocols and improve efficiency for physicians in the emergency department (ED). The primary aim of our study was to measure the time needed to perform an UHP with a single transducer HCU compared to a traditional multiple transducer CBU system. Secondarily, we sought to determine whether diagnostic quality images could be obtained from the two comparison ultrasound systems.
METHODSStudy Design
This was a prospective, randomized, crossover feasibility study. The hospital’s institutional review board approved the research study. The manufacturers of the CBU or the HCU had
no input into the study design, data collection, data analysis, or manuscript preparation.
Study Setting and PopulationThe study was conducted over a two-month period of
time on a convenience sample of ED patients. We conducted the study in an urban, academic ED with an annual census of approximately 60,000 visits. Patients > 18 years of age and with systolic blood pressure readings > 100 millimeters mercury and no signs of inadequate perfusion were evaluated for further eligibility in the study. This approach was taken for this pilot study because performing two sequential UHP on patients who were hypotensive was determined to place patients at unnecessary risk by delaying care. Exclusion criteria were one or more of the following: inability of the patient to tolerate the positioning for the ultrasound examination; traumatic mechanism of injury; or all views of the UHP could not be obtained. After obtaining written informed consent to participate in this study, each patient underwent a brief ultrasound examination of their heart and abdominal organs with a CBU by one of the study investigators to determine the feasibility of acquiring the required views of a complete UHP.
Study ProtocolUltrasound Measurements
Ultrasound studies were performed by a convenience sample of EPs with extensive experience performing an UHP.
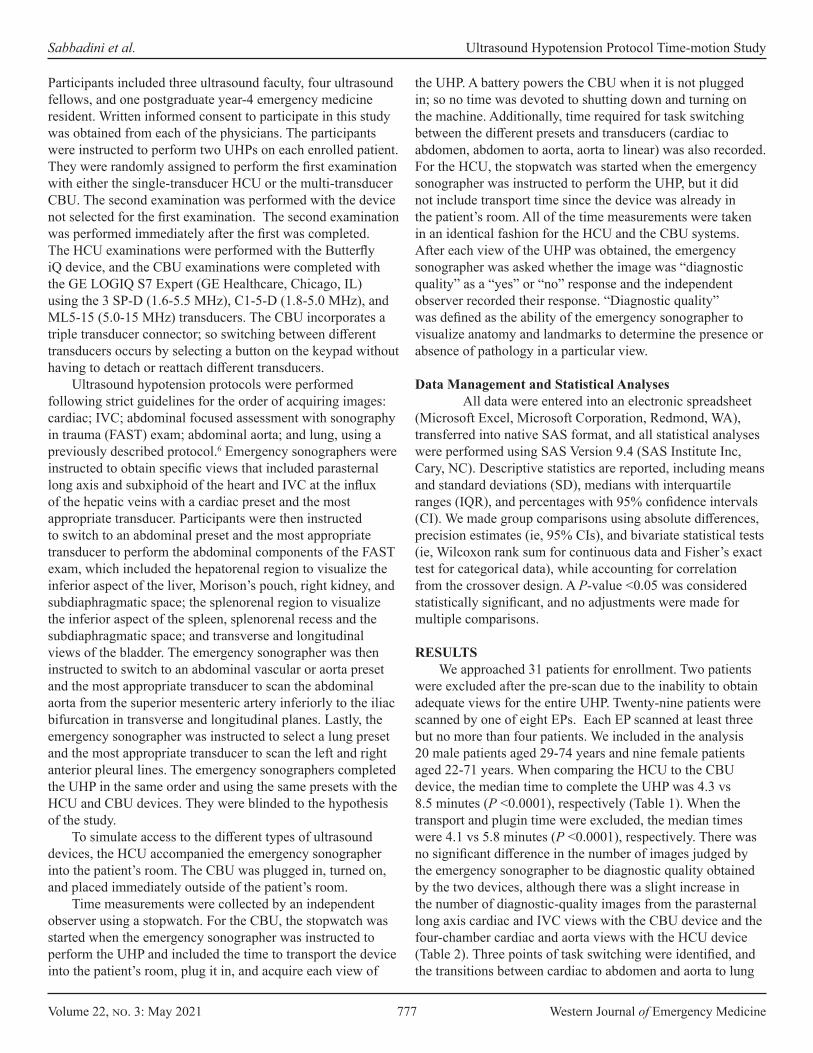
Volume 22, no. 3: May 2021 777 Western Journal of Emergency Medicine
Sabbadini et al. Ultrasound Hypotension Protocol Time-motion Study
Participants included three ultrasound faculty, four ultrasound fellows, and one postgraduate year-4 emergency medicine resident. Written informed consent to participate in this study was obtained from each of the physicians. The participants were instructed to perform two UHPs on each enrolled patient. They were randomly assigned to perform the first examination with either the single-transducer HCU or the multi-transducer CBU. The second examination was performed with the device not selected for the first examination. The second examination was performed immediately after the first was completed. The HCU examinations were performed with the Butterfly iQ device, and the CBU examinations were completed with the GE LOGIQ S7 Expert (GE Healthcare, Chicago, IL) using the 3 SP-D (1.6-5.5 MHz), C1-5-D (1.8-5.0 MHz), and ML5-15 (5.0-15 MHz) transducers. The CBU incorporates a triple transducer connector; so switching between different transducers occurs by selecting a button on the keypad without having to detach or reattach different transducers.
Ultrasound hypotension protocols were performed following strict guidelines for the order of acquiring images: cardiac; IVC; abdominal focused assessment with sonography in trauma (FAST) exam; abdominal aorta; and lung, using a previously described protocol.6 Emergency sonographers were instructed to obtain specific views that included parasternal long axis and subxiphoid of the heart and IVC at the influx of the hepatic veins with a cardiac preset and the most appropriate transducer. Participants were then instructed to switch to an abdominal preset and the most appropriate transducer to perform the abdominal components of the FAST exam, which included the hepatorenal region to visualize the inferior aspect of the liver, Morison’s pouch, right kidney, and subdiaphragmatic space; the splenorenal region to visualize the inferior aspect of the spleen, splenorenal recess and the subdiaphragmatic space; and transverse and longitudinal views of the bladder. The emergency sonographer was then instructed to switch to an abdominal vascular or aorta preset and the most appropriate transducer to scan the abdominal aorta from the superior mesenteric artery inferiorly to the iliac bifurcation in transverse and longitudinal planes. Lastly, the emergency sonographer was instructed to select a lung preset and the most appropriate transducer to scan the left and right anterior pleural lines. The emergency sonographers completed the UHP in the same order and using the same presets with the HCU and CBU devices. They were blinded to the hypothesis of the study.
To simulate access to the different types of ultrasound devices, the HCU accompanied the emergency sonographer into the patient’s room. The CBU was plugged in, turned on, and placed immediately outside of the patient’s room.
Time measurements were collected by an independent observer using a stopwatch. For the CBU, the stopwatch was started when the emergency sonographer was instructed to perform the UHP and included the time to transport the device into the patient’s room, plug it in, and acquire each view of
the UHP. A battery powers the CBU when it is not plugged in; so no time was devoted to shutting down and turning on the machine. Additionally, time required for task switching between the different presets and transducers (cardiac to abdomen, abdomen to aorta, aorta to linear) was also recorded. For the HCU, the stopwatch was started when the emergency sonographer was instructed to perform the UHP, but it did not include transport time since the device was already in the patient’s room. All of the time measurements were taken in an identical fashion for the HCU and the CBU systems. After each view of the UHP was obtained, the emergency sonographer was asked whether the image was “diagnostic quality” as a “yes” or “no” response and the independent observer recorded their response. “Diagnostic quality” was defined as the ability of the emergency sonographer to visualize anatomy and landmarks to determine the presence or absence of pathology in a particular view.
Data Management and Statistical Analyses All data were entered into an electronic spreadsheet
(Microsoft Excel, Microsoft Corporation, Redmond, WA), transferred into native SAS format, and all statistical analyses were performed using SAS Version 9.4 (SAS Institute Inc, Cary, NC). Descriptive statistics are reported, including means and standard deviations (SD), medians with interquartile ranges (IQR), and percentages with 95% confidence intervals (CI). We made group comparisons using absolute differences, precision estimates (ie, 95% CIs), and bivariate statistical tests (ie, Wilcoxon rank sum for continuous data and Fisher’s exact test for categorical data), while accounting for correlation from the crossover design. A P-value <0.05 was considered statistically significant, and no adjustments were made for multiple comparisons.
RESULTSWe approached 31 patients for enrollment. Two patients
were excluded after the pre-scan due to the inability to obtain adequate views for the entire UHP. Twenty-nine patients were scanned by one of eight EPs. Each EP scanned at least three but no more than four patients. We included in the analysis 20 male patients aged 29-74 years and nine female patients aged 22-71 years. When comparing the HCU to the CBU device, the median time to complete the UHP was 4.3 vs 8.5 minutes (P <0.0001), respectively (Table 1). When the transport and plugin time were excluded, the median times were 4.1 vs 5.8 minutes (P <0.0001), respectively. There was no significant difference in the number of images judged by the emergency sonographer to be diagnostic quality obtained by the two devices, although there was a slight increase in the number of diagnostic-quality images from the parasternal long axis cardiac and IVC views with the CBU device and the four-chamber cardiac and aorta views with the HCU device (Table 2). Three points of task switching were identified, and the transitions between cardiac to abdomen and aorta to lung
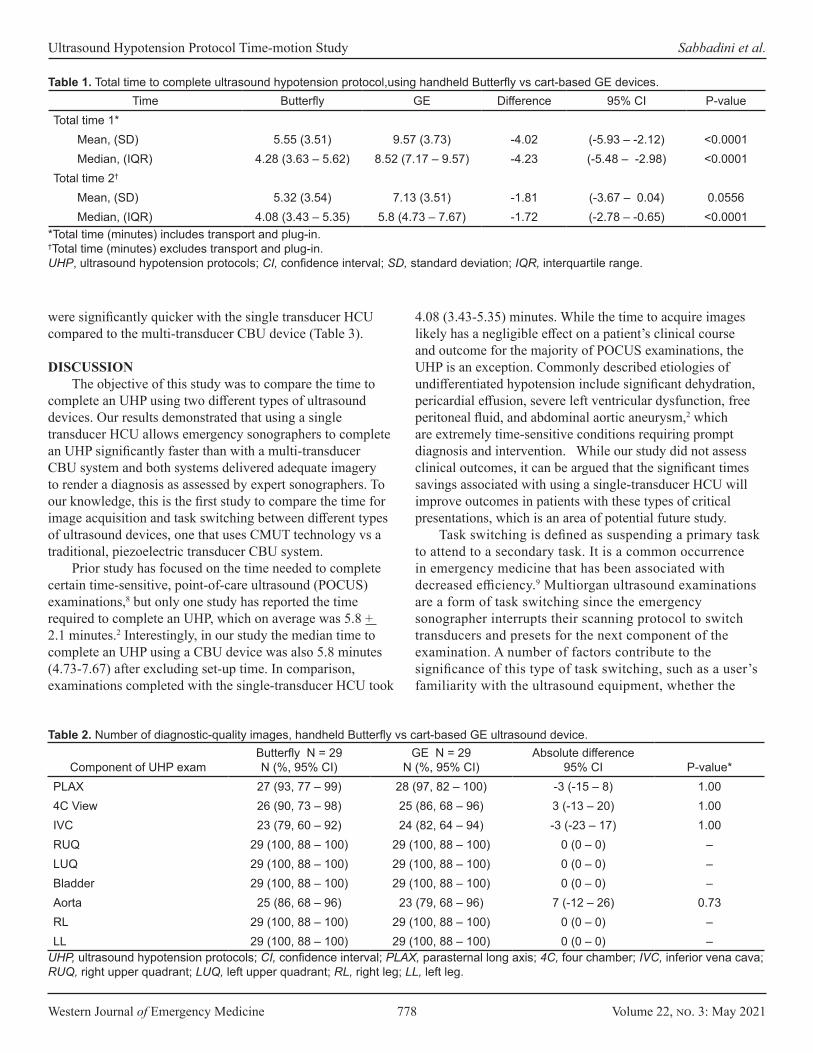
Western Journal of Emergency Medicine 778 Volume 22, no. 3: May 2021
Ultrasound Hypotension Protocol Time-motion Study Sabbadini et al.
were significantly quicker with the single transducer HCU compared to the multi-transducer CBU device (Table 3).
DISCUSSION
The objective of this study was to compare the time to complete an UHP using two different types of ultrasound devices. Our results demonstrated that using a single transducer HCU allows emergency sonographers to complete an UHP significantly faster than with a multi-transducer CBU system and both systems delivered adequate imagery to render a diagnosis as assessed by expert sonographers. To our knowledge, this is the first study to compare the time for image acquisition and task switching between different types of ultrasound devices, one that uses CMUT technology vs a traditional, piezoelectric transducer CBU system.
Prior study has focused on the time needed to complete certain time-sensitive, point-of-care ultrasound (POCUS) examinations,8 but only one study has reported the time required to complete an UHP, which on average was 5.8 + 2.1 minutes.2 Interestingly, in our study the median time to complete an UHP using a CBU device was also 5.8 minutes (4.73-7.67) after excluding set-up time. In comparison, examinations completed with the single-transducer HCU took
4.08 (3.43-5.35) minutes. While the time to acquire images likely has a negligible effect on a patient’s clinical course and outcome for the majority of POCUS examinations, the UHP is an exception. Commonly described etiologies of undifferentiated hypotension include significant dehydration, pericardial effusion, severe left ventricular dysfunction, free peritoneal fluid, and abdominal aortic aneurysm,2 which are extremely time-sensitive conditions requiring prompt diagnosis and intervention. While our study did not assess clinical outcomes, it can be argued that the significant times savings associated with using a single-transducer HCU will improve outcomes in patients with these types of critical presentations, which is an area of potential future study.
Task switching is defined as suspending a primary task to attend to a secondary task. It is a common occurrence in emergency medicine that has been associated with decreased efficiency.9 Multiorgan ultrasound examinations are a form of task switching since the emergency sonographer interrupts their scanning protocol to switch transducers and presets for the next component of the examination. A number of factors contribute to the significance of this type of task switching, such as a user’s familiarity with the ultrasound equipment, whether the
Time Butterfly GE Difference 95% CI P-valueTotal time 1*
Mean, (SD) 5.55 (3.51) 9.57 (3.73) -4.02 (-5.93 – -2.12) <0.0001Median, (IQR) 4.28 (3.63 – 5.62) 8.52 (7.17 – 9.57) -4.23 (-5.48 – -2.98) <0.0001
Total time 2†
Mean, (SD) 5.32 (3.54) 7.13 (3.51) -1.81 (-3.67 – 0.04) 0.0556Median, (IQR) 4.08 (3.43 – 5.35) 5.8 (4.73 – 7.67) -1.72 (-2.78 – -0.65) <0.0001
*Total time (minutes) includes transport and plug-in.†Total time (minutes) excludes transport and plug-in.UHP, ultrasound hypotension protocols; CI, confidence interval; SD, standard deviation; IQR, interquartile range.
Table 1. Total time to complete ultrasound hypotension protocol,using handheld Butterfly vs cart-based GE devices.
Component of UHP examButterfly N = 29N (%, 95% CI)
GE N = 29N (%, 95% CI)
Absolute difference95% CI P-value*
PLAX 27 (93, 77 – 99) 28 (97, 82 – 100) -3 (-15 – 8) 1.004C View 26 (90, 73 – 98) 25 (86, 68 – 96) 3 (-13 – 20) 1.00IVC 23 (79, 60 – 92) 24 (82, 64 – 94) -3 (-23 – 17) 1.00RUQ 29 (100, 88 – 100) 29 (100, 88 – 100) 0 (0 – 0) –LUQ 29 (100, 88 – 100) 29 (100, 88 – 100) 0 (0 – 0) –Bladder 29 (100, 88 – 100) 29 (100, 88 – 100) 0 (0 – 0) –Aorta 25 (86, 68 – 96) 23 (79, 68 – 96) 7 (-12 – 26) 0.73RL 29 (100, 88 – 100) 29 (100, 88 – 100) 0 (0 – 0) –LL 29 (100, 88 – 100) 29 (100, 88 – 100) 0 (0 – 0) –
UHP, ultrasound hypotension protocols; CI, confidence interval; PLAX, parasternal long axis; 4C, four chamber; IVC, inferior vena cava; RUQ, right upper quadrant; LUQ, left upper quadrant; RL, right leg; LL, left leg.
Table 2. Number of diagnostic-quality images, handheld Butterfly vs cart-based GE ultrasound device.
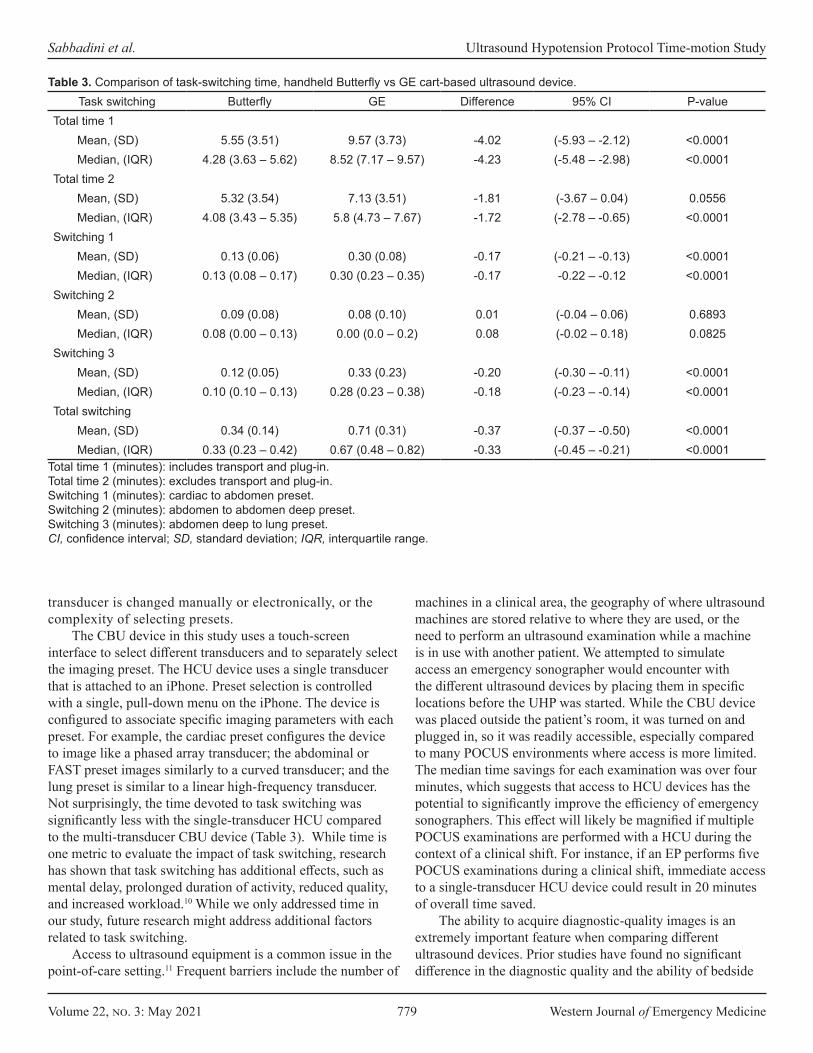
Volume 22, no. 3: May 2021 779 Western Journal of Emergency Medicine
Sabbadini et al. Ultrasound Hypotension Protocol Time-motion Study
Task switching Butterfly GE Difference 95% CI P-valueTotal time 1
Mean, (SD) 5.55 (3.51) 9.57 (3.73) -4.02 (-5.93 – -2.12) <0.0001Median, (IQR) 4.28 (3.63 – 5.62) 8.52 (7.17 – 9.57) -4.23 (-5.48 – -2.98) <0.0001
Total time 2 Mean, (SD) 5.32 (3.54) 7.13 (3.51) -1.81 (-3.67 – 0.04) 0.0556Median, (IQR) 4.08 (3.43 – 5.35) 5.8 (4.73 – 7.67) -1.72 (-2.78 – -0.65) <0.0001
Switching 1 Mean, (SD) 0.13 (0.06) 0.30 (0.08) -0.17 (-0.21 – -0.13) <0.0001Median, (IQR) 0.13 (0.08 – 0.17) 0.30 (0.23 – 0.35) -0.17 -0.22 – -0.12 <0.0001
Switching 2 Mean, (SD) 0.09 (0.08) 0.08 (0.10) 0.01 (-0.04 – 0.06) 0.6893Median, (IQR) 0.08 (0.00 – 0.13) 0.00 (0.0 – 0.2) 0.08 (-0.02 – 0.18) 0.0825
Switching 3 Mean, (SD) 0.12 (0.05) 0.33 (0.23) -0.20 (-0.30 – -0.11) <0.0001Median, (IQR) 0.10 (0.10 – 0.13) 0.28 (0.23 – 0.38) -0.18 (-0.23 – -0.14) <0.0001
Total switching Mean, (SD) 0.34 (0.14) 0.71 (0.31) -0.37 (-0.37 – -0.50) <0.0001Median, (IQR) 0.33 (0.23 – 0.42) 0.67 (0.48 – 0.82) -0.33 (-0.45 – -0.21) <0.0001
Total time 1 (minutes): includes transport and plug-in.Total time 2 (minutes): excludes transport and plug-in.Switching 1 (minutes): cardiac to abdomen preset.Switching 2 (minutes): abdomen to abdomen deep preset.Switching 3 (minutes): abdomen deep to lung preset.CI, confidence interval; SD, standard deviation; IQR, interquartile range.
Table 3. Comparison of task-switching time, handheld Butterfly vs GE cart-based ultrasound device.
transducer is changed manually or electronically, or the complexity of selecting presets.
The CBU device in this study uses a touch-screen interface to select different transducers and to separately select the imaging preset. The HCU device uses a single transducer that is attached to an iPhone. Preset selection is controlled with a single, pull-down menu on the iPhone. The device is configured to associate specific imaging parameters with each preset. For example, the cardiac preset configures the device to image like a phased array transducer; the abdominal or FAST preset images similarly to a curved transducer; and the lung preset is similar to a linear high-frequency transducer. Not surprisingly, the time devoted to task switching was significantly less with the single-transducer HCU compared to the multi-transducer CBU device (Table 3). While time is one metric to evaluate the impact of task switching, research has shown that task switching has additional effects, such as mental delay, prolonged duration of activity, reduced quality, and increased workload.10 While we only addressed time in our study, future research might address additional factors related to task switching.
Access to ultrasound equipment is a common issue in the point-of-care setting.11 Frequent barriers include the number of
machines in a clinical area, the geography of where ultrasound machines are stored relative to where they are used, or the need to perform an ultrasound examination while a machine is in use with another patient. We attempted to simulate access an emergency sonographer would encounter with the different ultrasound devices by placing them in specific locations before the UHP was started. While the CBU device was placed outside the patient’s room, it was turned on and plugged in, so it was readily accessible, especially compared to many POCUS environments where access is more limited. The median time savings for each examination was over four minutes, which suggests that access to HCU devices has the potential to significantly improve the efficiency of emergency sonographers. This effect will likely be magnified if multiple POCUS examinations are performed with a HCU during the context of a clinical shift. For instance, if an EP performs five POCUS examinations during a clinical shift, immediate access to a single-transducer HCU device could result in 20 minutes of overall time saved.
The ability to acquire diagnostic-quality images is an extremely important feature when comparing different ultrasound devices. Prior studies have found no significant difference in the diagnostic quality and the ability of bedside
Western Journal of Emergency Medicine 780 Volume 22, no. 3: May 2021
Ultrasound Hypotension Protocol Time-motion Study Sabbadini et al.
sonographers to interpret images from a HCU device compared to a CBU.12-15 Our findings were similar as no specific view was associated with a significant difference between the HCU and the CBU and the number of images the emergency sonographer deemed to be of diagnostic quality. This data should be interpreted with caution, since only the ability to acquire images of diagnostic quality was assessed and not the presence or absence of pathology. Additionally, we made no direct comparison in image quality between the HCU and the CBU. Future study will need to compare the ability of a single-transducer HCU to detect and exclude pathology compared to standard POCUS systems.
LIMITATIONSWhile we enrolled patients in a clinical setting, this was a
feasibility study; thus, none of the patients were hypotensive. Therefore, it is unclear whether the time-savings between the HCU and CBU systems would be maintained in a clinical situation when the patient is in shock. Additionally, none of the patients had pathology that would typically be assessed with an UHP. We also enrolled patients when the study investigators and emergency sonographers were available; thus, the enrolled patients were a convenience sample that may have introduced selection bias into our study population. We only compared one HCU device (Butterfly iQ) and one CBU system (GE LOGIQ S7 Expert). It is possible that time savings would be different if alternative ultrasound machines were studied.
We also performed a pre-scan on all patients. While this approach screened out patients with difficult anatomy, it was performed with the CBU device to ensure that all views of the UHP could be obtained. And while we mandated specific presets and transducers be used for the different aspects of the UHP, there is a possibility that time savings can occur if all views are obtained without changing a preset and using a single transducer, such as a curvilinear. We also asked emergency sonographers to self-determine the diagnostic quality of the ultrasound images from the two different ultrasound systems; therefore, it is possible that quality differences existed that an independent review would have detected.
Additionally, because no images or clips were saved, independent, retrospective review of the images was not possible. Images were not stored because the Butterfly iQ was not integrated into the ordering and archival process at our institution; therefore, the comparison between the HCU and CBU would not have been equivalent. We also did not require labels or text to be added to the images, which may have affected the time to complete studies on either a CBU or HCU; however, it can be argued that labels are not a necessary component of scans performed on hypotensive patients.
CONCLUSIONWe found that UHP examinations were performed significantly faster using the single-transducer, HCU device compared to a
traditional multiple-transducer CBU system with no difference between the HCU and the CBU and the number of images the emergency sonographer deemed to be of diagnostic quality. In time-critical ultrasound studies, such as the UHP examination, time savings associated with using CMUT transducers may positively impact patient outcomes. For future studies, we recommend comparing ultrasound systems equipped with CMUT technology vs standard CBUs in patients with undifferentiated hypotension and assessing image quality along with time to diagnosis or change in management.
Address for Correspondence: John L. Kendall, MD, Denver Health Medical Center, Department of Emergency Medicine, 7601 Broadway, Denver, CO 80204. Email: [email protected].
Conflicts of Interest: By the WestJEM article submission agreement, all authors are required to disclose all affiliations, funding sources and financial or management relationships that could be perceived as potential sources of bias. JLK is a member of the medical advisory board for Butterfly Network, Inc. The other authors have no financial interest in the Butterfly device manufacture or sale. Butterfly Network, Inc. had no role in the design, execution or publishing of this research.
Copyright: © 2021 Sabbadini et al. This is an open access article distributed in accordance with the terms of the Creative Commons Attribution (CC BY 4.0) License. See: http://creativecommons.org/licenses/by/4.0/
REFERENCES1. Rowan KM, Angus DC, Bailey M, et al. Early, goal-directed therapy
for septic shock: a patient-level meta-analysis. N Engl J Med. 2017;376(23):2223-34.
2. Jones AE, Tayal VS, Sullivan DM, et al. Randomized, controlled trial of immediate versus delayed goal-directed ultrasound to identify the cause of nontraumatic hypotension in emergency department patients. Crit Care Med. 2004;32(8):1703-8.
3. Jones AE, Aborn LS, Kline JA. Severity of emergency department hypotension predicts adverse hospital outcome. Shock. 2004;22(5):410-4.
4. Perera P, Mailhot T, Riley D, et al. The RUSH exam: Rapid Ultrasound in SHock in the evaluation of the critically lll. Emerg Med Clin North Am. 2010;28(1):29-56.
5. Haydar SA, Moore ET, Higgins GL, et al. Effect of bedside ultrasonography on the certainty of physician clinical decisionmaking for septic patients in the emergency department. Ann Emerg Med. 2012;60(3):346-58.
6. Shokoohi H, Boniface KS, Pourmand A, et al. Bedside ultrasound reduces diagnostic uncertainty and guides resuscitation in patients with undifferentiated hypotension. Crit Care Med. 2015;43(12):2562-9.
7. Volpicelli G, Lamorte A, Tullio M, et al. Point-of-care multiorgan ultrasonography for the evaluation of undifferentiated hypotension in the emergency department. Intensive Care Med. 2013;39(7):1290-8.
8. Socransky S WR, Bota G, Furtak T. How long does it take to perform
Volume 22, no. 3: May 2021 781 Western Journal of Emergency Medicine
Sabbadini et al. Ultrasound Hypotension Protocol Time-motion Study
emergency ultrasound for the primary indications? Crit Ultrasound J. 2010;2:59-63.
9. Bailey BP and Konstan JA. On the need for attention-aware systems: measuring effects of interruption on task performance, error rate, and affective state. Comput Hum Behav. 2006;22(4):685-708.
10. Skaugset LM, Farrell S, Carney M, et al. Can you multitask? Evidence and limitations of task switching and multitasking in emergency medicine. Ann Emerg Med. 2016;68(2):189-95.
11. Stowell JR, Kessler R, Lewiss RE, et al. Critical care ultrasound: a national survey across specialties. J Clin Ultrasound. 2018;46(3):167-77.
12. Tsutsui JM, Maciel RR, Costa JM, et al. Hand-carried ultrasound performed at bedside in cardiology inpatient setting: a comparative
study with comprehensive echocardiography. Cardiovasc Ultrasound. 2004;2:24.
13. Parashar SK, Jain V. Pocket carried ultrasound: its usefulness in clinical practice: a pilot study. Indian Heart J. 2011;63(2):185-9.
14. Dalla Pozza R, Loeff M, Kozlik-Feldmann R, et al. Hand-carried ultrasound devices in pediatric cardiology: clinical experience with three different devices in 110 patients. J Am Soc Echocardiogr. 2010;23(12):1231-7.
15. Perez-Avraham G, Kobal SL, Etzion O, et al E. Left ventricular geometric abnormality screening in hypertensive patients using a hand-carried ultrasound device. J Clin Hypertens (Greenwich). 2010;12(3):181-6.
Western Journal of Emergency Medicine 782 Volume 22, no. 3: May 2021
Original Research
Intracranial Traumatic Hematoma Detection in Children Using a Portable Near-infrared Spectroscopy Device
Matthew P. Kirschen, MD PhD*†‡
Sage R. Myers, MD MSCE‡§
Mark I. Neuman, MD MPH¶
Joseph A. Grubenhoff, MD, MSCS||
Rebekah Mannix, MD, MPH¶
Nicholas Stence, MD#
Edward Yang, MD, PhD**Ashley L. Woodford, BS††
Tyson Rogers, MS‡‡
Anna Nordell, MS‡‡
Arastoo Vossough, MD, PhD§§
Mark R. Zonfrillo, MD, MSCE¶¶
Section Editor: Muhammad Waseem, MD Submission history: Submitted March 6, 2020; Revision received September 10, 2020; Accepted November 23, 2020 Electronically published March 24, 2021 Full text available through open access at http://escholarship.org/uc/uciem_westjem DOI: 10.5811/westjem.2020.11.47251
Children’s Hospital of Philadelphia, Department of Anesthesiology and Critical Care Medicine, Philadelphia, PennsylvaniaChildren’s Hospital of Philadelphia, Division of Neurology, Philadelphia, PennsylvaniaChildren’s Hospital of Philadelphia, Department of Pediatrics, Philadelphia, PennsylvaniaChildren’s Hospital of Philadelphia, Division of Emergency Medicine, Philadelphia, PennsylvaniaBoston Children’s Hospital, Division of Emergency Medicine, Department of Pediatrics, Boston, MassachusettsUniversity of Colorado, Department of Pediatrics, Aurora, ColoradoChildren’s Hospital Colorado, Department of Radiology, Aurora, ColoradoBoston Children’s Hospital, Department of Radiology, Boston, MassachusettsCooper Medical School of Rowan University, Camden, New JerseyNorth American Science Associates Inc., Minneapolis, MinnesotaChildren’s Hospital of Philadelphia, Department of Radiology, Philadelphia, PennsylvaniaAlpert Medical School of Brown University, Departments of Emergency Medicine and Pediatrics, Providence, Rhode Island
*
†
‡
§
¶
||
#
**††
‡‡
§§
¶¶
Introduction: We sought to validate a handheld, near-infrared spectroscopy (NIRS) device for detecting intracranial hematomas in children with head injury.
Methods: Eligible patients were those <18 years old who were admitted to the emergency department at three academic children’s hospitals with head trauma and who received a clinically indicated head computed tomography (HCT). Measurements were obtained by a blinded operator in bilateral frontal, temporal, parietal, and occipital regions. Qualifying hematomas were a priori determined to be within the brain scanner’s detection limits of >3.5 milliliters in volume and <2.5 centimeters from the surface of the brain. The device’s measurements were positive if the difference in optical density between hemispheres was >0.2 on three successive scans. We calculated diagnostic performance measures with corresponding exact two-sided 95% Clopper-Pearson confidence intervals (CI). Hypothesis test evaluated whether predictive performance exceeded chance agreement (predictive Youden’s index > 0).
Results: A total of 464 patients were enrolled and 344 met inclusion for primary data analysis: 10.5% (36/344) had evidence of a hematoma on HCT, and 4.7% (16/344) had qualifying hematomas. The handheld brain scanner demonstrated a sensitivity of 58.3% (21/36) and specificity of 67.9% (209/308) for hematomas of any size. For qualifying hematomas the scanner was designed to detect, sensitivity was 81% (13/16) and specificity was 67.4% (221/328). Predictive performance exceeded chance agreement with a predictive Youden’s index of 0.11 (95% CI, 0.10 – 0.15; P < 0.001) for all hematomas, and 0.09 (95% CI, 0.08 – 0.12; P < 0.001) for qualifying hematomas.
Conclusion: The handheld brain scanner can non-invasively detect a subset of intracranial hematomas in children and may serve an adjunctive role to head-injury neuroimaging decision rules that predict the risk of clinically significant intracranial pathology after head trauma. [West J Emerg Med. 2021;22(3)782–791.]
Volume 22, no. 3: May 2021 783 Western Journal of Emergency Medicine
Kirschen et al. Intracranial Traumatic Hematoma Detection Using a NIRS Device
Population Health Research Capsule
What do we already know about this issue?An expanding intracranial hematoma after traumatic brain injury can lead to significant neurological morbidity or death due to brainstem compression or ischemia.
What was the research question?How does Infrascanner compare to head CT for detecting intracranial hematomas in children with head injury?
What was the major finding of the study?The Infrascanner demonstrated a sensitivity of 81% and specificity of 67% for detecting qualifying hematomas.
How does this improve population health?The Infrascanner device may serve an adjunctive role to head injury imaging decision rules that predict risk of intracranial pathology after pediatric head trauma.
INTRODUCTIONNearly 760,000 children and adolescents less than 18
years old with head trauma undergo evaluation in United States (US) emergency departments (ED) annually.1 While there are multiple decision rules that predict the risk of a significant intracranial injury in children with head trauma, a substantial proportion of children classified as “not low” risk may require an extended period of observation or neuroimaging to exclude the presence of an intracranial hematoma that may require neurosurgical intervention.2 An expanding hematoma can lead to significant neurological morbidity or death due to brainstem compression or further ischemic injury. A computed tomography scan of the head (HCT) is the clinical standard for emergent identification and localization of acute intracranial hematomas. However, the ionizing radiation increases the risk of developing malignancies.3 Notably, 26% of children evaluated for mild head injury will undergo a HCT, thus exposing a large population of children each year to ionizing radiation.4
Near-infrared spectroscopy (NIRS) is a non-invasive, radiation-sparing technology that measures the near- infrared light absorption of hemoglobin within the brain and may be useful as an adjunctive modality for early identification of intracranial hematomas in patients with head trauma.5-7 Extravascular hemoglobin absorbs more near-infrared light (usually 10-fold) than intravascular hemoglobin, enabling NIRS devices to detect differential absorption between intracranial hematomas and uninjured brain. A handheld NIRS detection system, the Infrascanner Model 2000 (InfraScan, Inc., Philadelphia, PA) has shown 90% sensitivity and specificity for detecting intracranial hematomas in adult patients suffering from head trauma.8,9
Given the fixed size of the device and the differences between adult and pediatric cranial anatomy (eg, cranial bone thickness and composition, presence of cranial sutures, and brain volume and composition) and head trauma mechanics, it was unknown whether the device would display similar performance characteristics in children. Previous pediatric studies conducted with an earlier model of the device each detected only a few hematomas, and used different patient populations, scanning protocols, and incomplete blinding.8-14 This study is important because we designed it to overcome those limitations by using the newer model scanner in a multicenter approach with blinded operators and independent neuroradiological review of HCTs to more precisely determine the device’s performance characteristics in children with head injury.
We aimed to validate the Infrascanner Model 2000 in children of all ages with known or suspected head injury compared to HCT as the clinical standard. We hypothesized that, compared to HCT, the device would have a sensitivity non-inferior to 90% (the sensitivity found in adult trials) to detect intracranial hematomas that are within the detection limit of the device.
METHODSStudy Design and Setting
We conducted an observational device validation study between June 2014–September 2018 in the EDs of three large, urban, quaternary care academic medical centers: Children’s Hospital of Philadelphia, Boston Children’s Hospital, Children’s Hospital Colorado. Enrollment at the latter two centers began in April and June 2016, respectively. The protocol was approved by the institutional review board at each institution. The study was registered on ClinicalTrials.gov with the identifier NCT02149082. The Infrascanner Model 2000 has 510(k) clearance (K120949) from the US Food and Drug Administration (FDA) as a Class II device for individuals 18 years of age and older.
Selection of ParticipantsEligible participants were individuals less than 18 years
old presenting to the ED with known or suspected head trauma who received a clinically indicated HCT. This was a convenience sample as enrollment occurred only when research team members were available for enrollment. If a research team member was not available for a shift, the census was screened the following shift and eligible patients were recorded as not enrolled due to lack of staff availability. Patients who received an initial HCT after trauma or HCT performed for a clinical change (eg, seizure, headache, emesis, focal neurological deficit) were eligible. The HCTs were
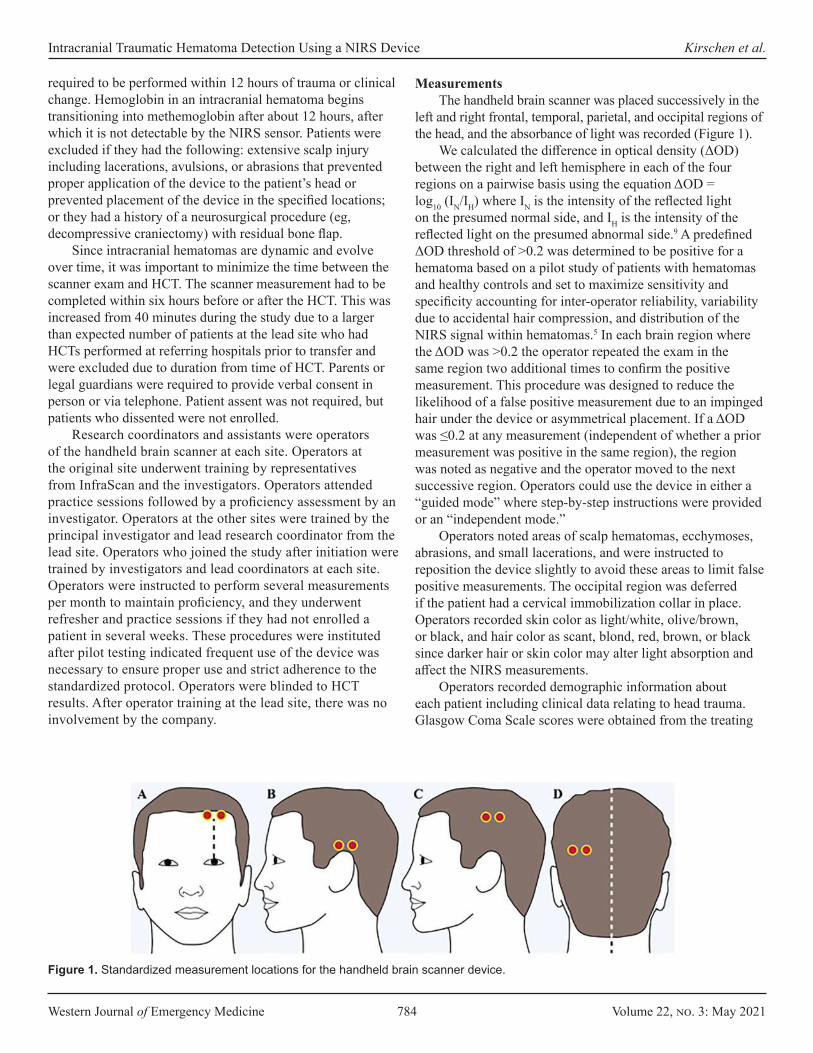
Western Journal of Emergency Medicine 784 Volume 22, no. 3: May 2021
Intracranial Traumatic Hematoma Detection Using a NIRS Device Kirschen et al.
required to be performed within 12 hours of trauma or clinical change. Hemoglobin in an intracranial hematoma begins transitioning into methemoglobin after about 12 hours, after which it is not detectable by the NIRS sensor. Patients were excluded if they had the following: extensive scalp injury including lacerations, avulsions, or abrasions that prevented proper application of the device to the patient’s head or prevented placement of the device in the specified locations; or they had a history of a neurosurgical procedure (eg, decompressive craniectomy) with residual bone flap.
Since intracranial hematomas are dynamic and evolve over time, it was important to minimize the time between the scanner exam and HCT. The scanner measurement had to be completed within six hours before or after the HCT. This was increased from 40 minutes during the study due to a larger than expected number of patients at the lead site who had HCTs performed at referring hospitals prior to transfer and were excluded due to duration from time of HCT. Parents or legal guardians were required to provide verbal consent in person or via telephone. Patient assent was not required, but patients who dissented were not enrolled.
Research coordinators and assistants were operators of the handheld brain scanner at each site. Operators at the original site underwent training by representatives from InfraScan and the investigators. Operators attended practice sessions followed by a proficiency assessment by an investigator. Operators at the other sites were trained by the principal investigator and lead research coordinator from the lead site. Operators who joined the study after initiation were trained by investigators and lead coordinators at each site. Operators were instructed to perform several measurements per month to maintain proficiency, and they underwent refresher and practice sessions if they had not enrolled a patient in several weeks. These procedures were instituted after pilot testing indicated frequent use of the device was necessary to ensure proper use and strict adherence to the standardized protocol. Operators were blinded to HCT results. After operator training at the lead site, there was no involvement by the company.
MeasurementsThe handheld brain scanner was placed successively in the
left and right frontal, temporal, parietal, and occipital regions of the head, and the absorbance of light was recorded (Figure 1).
We calculated the difference in optical density (ΔOD) between the right and left hemisphere in each of the four regions on a pairwise basis using the equation ΔOD = log10 (IN/IH) where IN is the intensity of the reflected light on the presumed normal side, and IH is the intensity of the reflected light on the presumed abnormal side.9 A predefined ΔOD threshold of >0.2 was determined to be positive for a hematoma based on a pilot study of patients with hematomas and healthy controls and set to maximize sensitivity and specificity accounting for inter-operator reliability, variability due to accidental hair compression, and distribution of the NIRS signal within hematomas.5 In each brain region where the ΔOD was >0.2 the operator repeated the exam in the same region two additional times to confirm the positive measurement. This procedure was designed to reduce the likelihood of a false positive measurement due to an impinged hair under the device or asymmetrical placement. If a ΔOD was ≤0.2 at any measurement (independent of whether a prior measurement was positive in the same region), the region was noted as negative and the operator moved to the next successive region. Operators could use the device in either a “guided mode” where step-by-step instructions were provided or an “independent mode.”
Operators noted areas of scalp hematomas, ecchymoses, abrasions, and small lacerations, and were instructed to reposition the device slightly to avoid these areas to limit false positive measurements. The occipital region was deferred if the patient had a cervical immobilization collar in place. Operators recorded skin color as light/white, olive/brown, or black, and hair color as scant, blond, red, brown, or black since darker hair or skin color may alter light absorption and affect the NIRS measurements.
Operators recorded demographic information about each patient including clinical data relating to head trauma. Glasgow Coma Scale scores were obtained from the treating
Figure 1. Standardized measurement locations for the handheld brain scanner device.
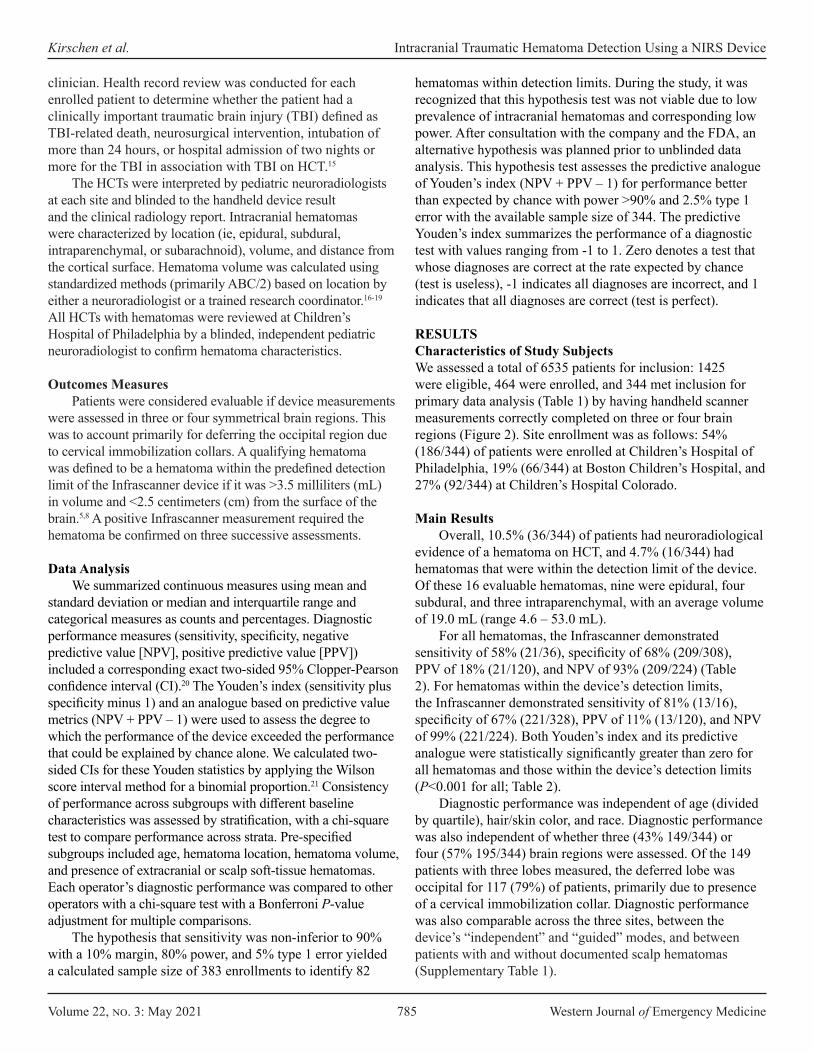
Volume 22, no. 3: May 2021 785 Western Journal of Emergency Medicine
Kirschen et al. Intracranial Traumatic Hematoma Detection Using a NIRS Device
clinician. Health record review was conducted for each enrolled patient to determine whether the patient had a clinically important traumatic brain injury (TBI) defined as TBI-related death, neurosurgical intervention, intubation of more than 24 hours, or hospital admission of two nights or more for the TBI in association with TBI on HCT.15
The HCTs were interpreted by pediatric neuroradiologists at each site and blinded to the handheld device result and the clinical radiology report. Intracranial hematomas were characterized by location (ie, epidural, subdural, intraparenchymal, or subarachnoid), volume, and distance from the cortical surface. Hematoma volume was calculated using standardized methods (primarily ABC/2) based on location by either a neuroradiologist or a trained research coordinator.16-19 All HCTs with hematomas were reviewed at Children’s Hospital of Philadelphia by a blinded, independent pediatric neuroradiologist to confirm hematoma characteristics.
Outcomes MeasuresPatients were considered evaluable if device measurements
were assessed in three or four symmetrical brain regions. This was to account primarily for deferring the occipital region due to cervical immobilization collars. A qualifying hematoma was defined to be a hematoma within the predefined detection limit of the Infrascanner device if it was >3.5 milliliters (mL) in volume and <2.5 centimeters (cm) from the surface of the brain.5,8 A positive Infrascanner measurement required the hematoma be confirmed on three successive assessments.
Data AnalysisWe summarized continuous measures using mean and
standard deviation or median and interquartile range and categorical measures as counts and percentages. Diagnostic performance measures (sensitivity, specificity, negative predictive value [NPV], positive predictive value [PPV]) included a corresponding exact two-sided 95% Clopper-Pearson confidence interval (CI).20 The Youden’s index (sensitivity plus specificity minus 1) and an analogue based on predictive value metrics (NPV + PPV – 1) were used to assess the degree to which the performance of the device exceeded the performance that could be explained by chance alone. We calculated two-sided CIs for these Youden statistics by applying the Wilson score interval method for a binomial proportion.21 Consistency of performance across subgroups with different baseline characteristics was assessed by stratification, with a chi-square test to compare performance across strata. Pre-specified subgroups included age, hematoma location, hematoma volume, and presence of extracranial or scalp soft-tissue hematomas. Each operator’s diagnostic performance was compared to other operators with a chi-square test with a Bonferroni P-value adjustment for multiple comparisons.
The hypothesis that sensitivity was non-inferior to 90% with a 10% margin, 80% power, and 5% type 1 error yielded a calculated sample size of 383 enrollments to identify 82
hematomas within detection limits. During the study, it was recognized that this hypothesis test was not viable due to low prevalence of intracranial hematomas and corresponding low power. After consultation with the company and the FDA, an alternative hypothesis was planned prior to unblinded data analysis. This hypothesis test assesses the predictive analogue of Youden’s index (NPV + PPV – 1) for performance better than expected by chance with power >90% and 2.5% type 1 error with the available sample size of 344. The predictive Youden’s index summarizes the performance of a diagnostic test with values ranging from -1 to 1. Zero denotes a test that whose diagnoses are correct at the rate expected by chance (test is useless), -1 indicates all diagnoses are incorrect, and 1 indicates that all diagnoses are correct (test is perfect).
RESULTSCharacteristics of Study SubjectsWe assessed a total of 6535 patients for inclusion: 1425 were eligible, 464 were enrolled, and 344 met inclusion for primary data analysis (Table 1) by having handheld scanner measurements correctly completed on three or four brain regions (Figure 2). Site enrollment was as follows: 54% (186/344) of patients were enrolled at Children’s Hospital of Philadelphia, 19% (66/344) at Boston Children’s Hospital, and 27% (92/344) at Children’s Hospital Colorado.
Main ResultsOverall, 10.5% (36/344) of patients had neuroradiological
evidence of a hematoma on HCT, and 4.7% (16/344) had hematomas that were within the detection limit of the device. Of these 16 evaluable hematomas, nine were epidural, four subdural, and three intraparenchymal, with an average volume of 19.0 mL (range 4.6 – 53.0 mL).
For all hematomas, the Infrascanner demonstrated sensitivity of 58% (21/36), specificity of 68% (209/308), PPV of 18% (21/120), and NPV of 93% (209/224) (Table 2). For hematomas within the device’s detection limits, the Infrascanner demonstrated sensitivity of 81% (13/16), specificity of 67% (221/328), PPV of 11% (13/120), and NPV of 99% (221/224). Both Youden’s index and its predictive analogue were statistically significantly greater than zero for all hematomas and those within the device’s detection limits (P<0.001 for all; Table 2).
Diagnostic performance was independent of age (divided by quartile), hair/skin color, and race. Diagnostic performance was also independent of whether three (43% 149/344) or four (57% 195/344) brain regions were assessed. Of the 149 patients with three lobes measured, the deferred lobe was occipital for 117 (79%) of patients, primarily due to presence of a cervical immobilization collar. Diagnostic performance was also comparable across the three sites, between the device’s “independent” and “guided” modes, and between patients with and without documented scalp hematomas (Supplementary Table 1).

Western Journal of Emergency Medicine 786 Volume 22, no. 3: May 2021
Intracranial Traumatic Hematoma Detection Using a NIRS Device Kirschen et al.
There were 24 trained operators at Children’s Hospital of Philadelphia, 11 at Boston Children’s Hospital, and 10 at Children’s Hospital Colorado, each completing an average of 10.3 (range 1-61) assessments. One operator was found to be
an outlier with regard to specificity (Supplementary Figure 1), with a specificity of 42.9% (15/35) vs 71.1% (194/273) for the remaining operators (P = 0.0008). The operator was determined to be an outlier using a Bonferroni-adjusted
Evaluable patients(N = 344)
Any hematoma(N = 36)
Hematoma within the detection limit of the infrascanner
(N = 16)Age, mean [IQR] 9.5 [5.0, 13.8] 9.7 [4.3, 12.9] 10.4 [4.1, 12.9]Male gender 225 (65%) 19 (53%) 9 (56%)Race*
Caucasian 168 (50%) 22 (67%) 9 (64%)Black 120 (36%) 5 (15%) 2 (14%)Asian 18 (5%) 1 (3%) 0 (0%)Other 30 (9%) 5 (15%) 3 (21%)
Hispanic ethnicity* 54 (17%) 7 (22%) 5 (39%)Skin color
Light/white 161 (47%) 24 (67%) 10 (63%)Black 106 (31%) 4 (11%) 1 (6%)Olive/brown 77 (22%) 8 (22%) 5 (31%)
Hair colorBlack 143 (42%) 7 (20%) 4 (27%)Brown 99 (29%) 14 (40%) 9 (60%)Blonde 75 (22%) 10 (29%) 2 (13%)Scant 19 (6%) 4 (11%) 0 (0%)Red 7 (2%) 0 (0%) 0 (0%)
Mechanism of injuryFall 179 (52%) 16 (44%) 7 (44%)Sports 39 (11%) 4 (11%) 3 (19%)Bicycle 24 (7%) 6 (17%) 2 (13%)Motor vehicle crash 21 (6%) 2 (6%) 1 (6%)Assault/NAT 18 (5%) 1 (3%) 0 (0%)Pedestrian struck 16 (5%) 2 (6%) 0 (0%)Hit with blunt object 10 (3%) 0 (0%) 0 (0%)Motorcycle 3 (1%) 0 (0%) 0 (0%)Other 34 (10%) 5 (14%) 3 (19%)
Intubated 6 (2%) 3 (8%) 2 (13%)Disposition
Home 251 (73%) 5 (14%) 1 (6%)Floor 74 (22%) 18 (50%) 6 (38%)PICU 19 (6%) 13 (36%) 9 (56%)
Glasgow Coma Scale, Median [IQR] 15.0 [15, 15]Range 7-15
15.0 [15, 15.0]Range 7-15
15.0 [14, 15]Range 9-15
Table 1. Patient and clinical characteristics.
*Number of subjects used for race (336, 33, 14) and ethnicity (322, 32, 13) calculations for evaluable patients, patients with any hematoma and patients with a hematoma within the detection limit of the Infrascanner, respectively due to missing data. SD, standard deviation; NAT, non-accidental trauma; PICU, pediatric intensive care unit; IQR, interquartile range.
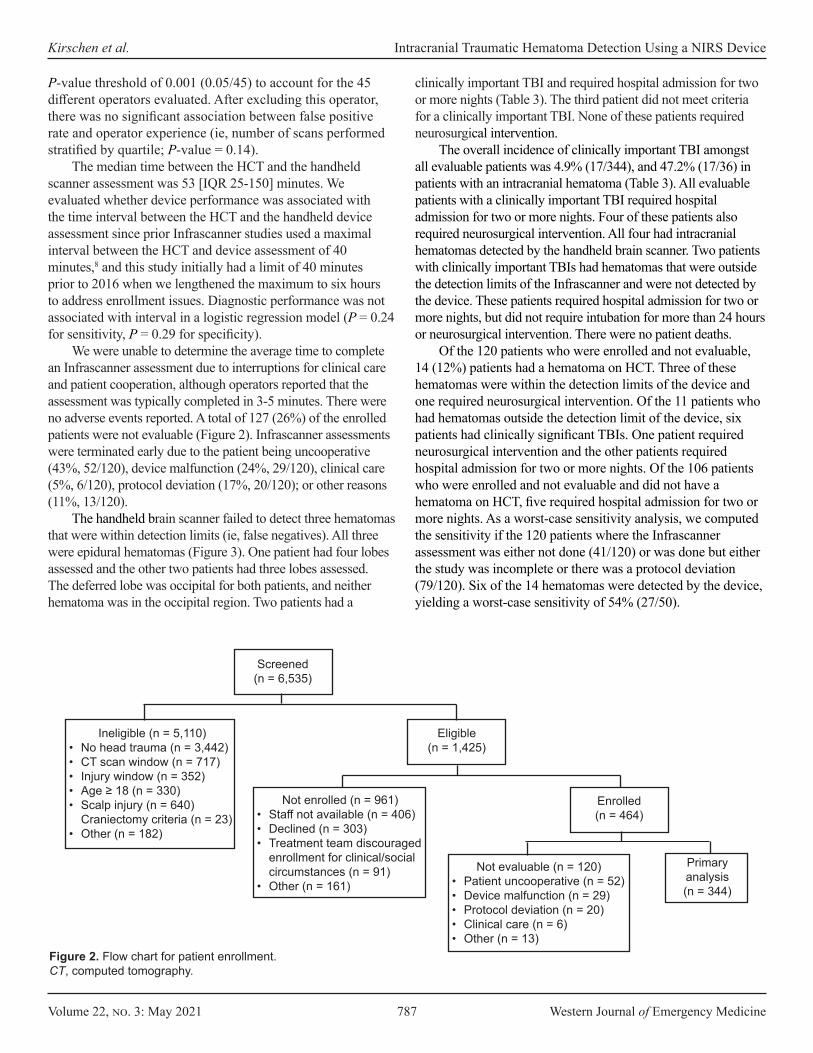
Volume 22, no. 3: May 2021 787 Western Journal of Emergency Medicine
Kirschen et al. Intracranial Traumatic Hematoma Detection Using a NIRS Device
P-value threshold of 0.001 (0.05/45) to account for the 45 different operators evaluated. After excluding this operator, there was no significant association between false positive rate and operator experience (ie, number of scans performed stratified by quartile; P-value = 0.14).
The median time between the HCT and the handheld scanner assessment was 53 [IQR 25-150] minutes. We evaluated whether device performance was associated with the time interval between the HCT and the handheld device assessment since prior Infrascanner studies used a maximal interval between the HCT and device assessment of 40 minutes,8 and this study initially had a limit of 40 minutes prior to 2016 when we lengthened the maximum to six hours to address enrollment issues. Diagnostic performance was not associated with interval in a logistic regression model (P = 0.24 for sensitivity, P = 0.29 for specificity).
We were unable to determine the average time to complete an Infrascanner assessment due to interruptions for clinical care and patient cooperation, although operators reported that the assessment was typically completed in 3-5 minutes. There were no adverse events reported. A total of 127 (26%) of the enrolled patients were not evaluable (Figure 2). Infrascanner assessments were terminated early due to the patient being uncooperative (43%, 52/120), device malfunction (24%, 29/120), clinical care (5%, 6/120), protocol deviation (17%, 20/120); or other reasons (11%, 13/120).
The handheld brain scanner failed to detect three hematomas that were within detection limits (ie, false negatives). All three were epidural hematomas (Figure 3). One patient had four lobes assessed and the other two patients had three lobes assessed. The deferred lobe was occipital for both patients, and neither hematoma was in the occipital region. Two patients had a
clinically important TBI and required hospital admission for two or more nights (Table 3). The third patient did not meet criteria for a clinically important TBI. None of these patients required neurosurgical intervention.
The overall incidence of clinically important TBI amongst all evaluable patients was 4.9% (17/344), and 47.2% (17/36) in patients with an intracranial hematoma (Table 3). All evaluable patients with a clinically important TBI required hospital admission for two or more nights. Four of these patients also required neurosurgical intervention. All four had intracranial hematomas detected by the handheld brain scanner. Two patients with clinically important TBIs had hematomas that were outside the detection limits of the Infrascanner and were not detected by the device. These patients required hospital admission for two or more nights, but did not require intubation for more than 24 hours or neurosurgical intervention. There were no patient deaths.
Of the 120 patients who were enrolled and not evaluable, 14 (12%) patients had a hematoma on HCT. Three of these hematomas were within the detection limits of the device and one required neurosurgical intervention. Of the 11 patients who had hematomas outside the detection limit of the device, six patients had clinically significant TBIs. One patient required neurosurgical intervention and the other patients required hospital admission for two or more nights. Of the 106 patients who were enrolled and not evaluable and did not have a hematoma on HCT, five required hospital admission for two or more nights. As a worst-case sensitivity analysis, we computed the sensitivity if the 120 patients where the Infrascanner assessment was either not done (41/120) or was done but either the study was incomplete or there was a protocol deviation (79/120). Six of the 14 hematomas were detected by the device, yielding a worst-case sensitivity of 54% (27/50).
Screened (n = 6,535)
Eligible(n = 1,425)
Ineligible (n = 5,110)• No head trauma (n = 3,442)• CT scan window (n = 717)• Injury window (n = 352)• Age ≥ 18 (n = 330)• Scalp injury (n = 640)
Craniectomy criteria (n = 23)• Other (n = 182)
Not enrolled (n = 961)• Staff not available (n = 406)• Declined (n = 303)• Treatment team discouraged
enrollment for clinical/social circumstances (n = 91)
• Other (n = 161)
Enrolled(n = 464)
Not evaluable (n = 120)• Patient uncooperative (n = 52)• Device malfunction (n = 29)• Protocol deviation (n = 20)• Clinical care (n = 6)• Other (n = 13)
Primary analysis (n = 344)
Figure 2. Flow chart for patient enrollment.CT, computed tomography.
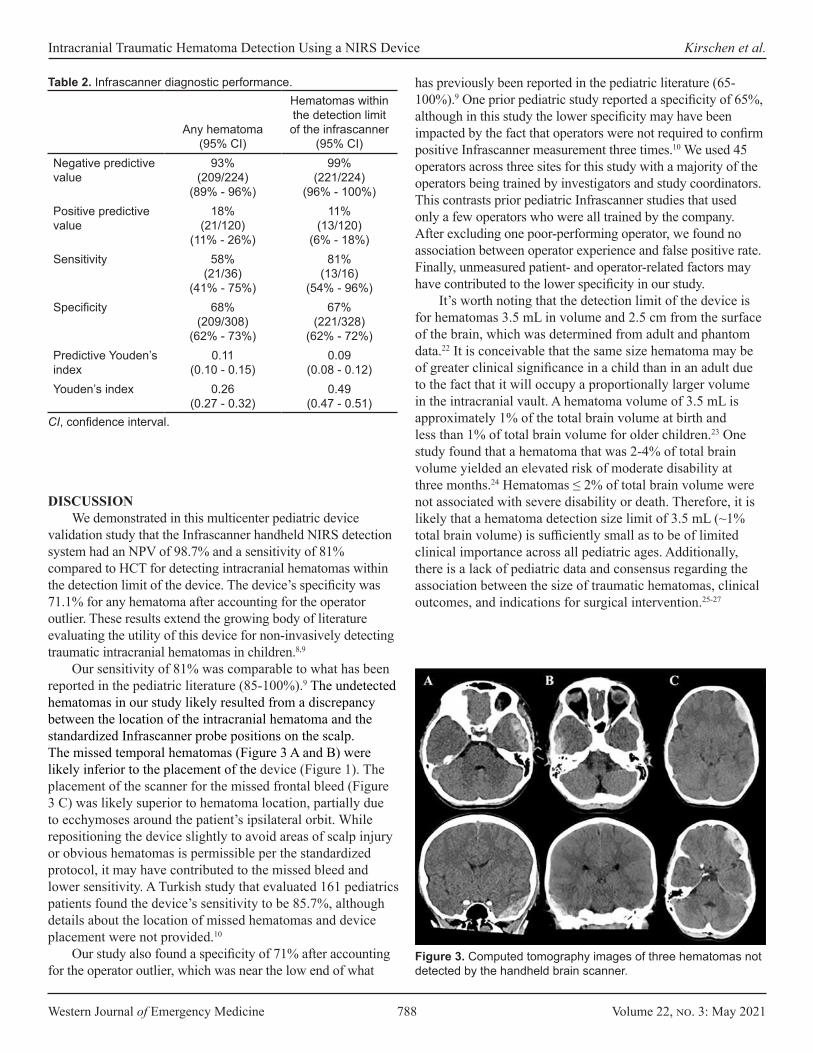
Western Journal of Emergency Medicine 788 Volume 22, no. 3: May 2021
Intracranial Traumatic Hematoma Detection Using a NIRS Device Kirschen et al.
DISCUSSIONWe demonstrated in this multicenter pediatric device
validation study that the Infrascanner handheld NIRS detection system had an NPV of 98.7% and a sensitivity of 81% compared to HCT for detecting intracranial hematomas within the detection limit of the device. The device’s specificity was 71.1% for any hematoma after accounting for the operator outlier. These results extend the growing body of literature evaluating the utility of this device for non-invasively detecting traumatic intracranial hematomas in children.8,9
Our sensitivity of 81% was comparable to what has been reported in the pediatric literature (85-100%).9 The undetected hematomas in our study likely resulted from a discrepancy between the location of the intracranial hematoma and the standardized Infrascanner probe positions on the scalp. The missed temporal hematomas (Figure 3 A and B) were likely inferior to the placement of the device (Figure 1). The placement of the scanner for the missed frontal bleed (Figure 3 C) was likely superior to hematoma location, partially due to ecchymoses around the patient’s ipsilateral orbit. While repositioning the device slightly to avoid areas of scalp injury or obvious hematomas is permissible per the standardized protocol, it may have contributed to the missed bleed and lower sensitivity. A Turkish study that evaluated 161 pediatrics patients found the device’s sensitivity to be 85.7%, although details about the location of missed hematomas and device placement were not provided.10
Our study also found a specificity of 71% after accounting for the operator outlier, which was near the low end of what
has previously been reported in the pediatric literature (65-100%).9 One prior pediatric study reported a specificity of 65%, although in this study the lower specificity may have been impacted by the fact that operators were not required to confirm positive Infrascanner measurement three times.10 We used 45 operators across three sites for this study with a majority of the operators being trained by investigators and study coordinators. This contrasts prior pediatric Infrascanner studies that used only a few operators who were all trained by the company. After excluding one poor-performing operator, we found no association between operator experience and false positive rate. Finally, unmeasured patient- and operator-related factors may have contributed to the lower specificity in our study.
It’s worth noting that the detection limit of the device is for hematomas 3.5 mL in volume and 2.5 cm from the surface of the brain, which was determined from adult and phantom data.22 It is conceivable that the same size hematoma may be of greater clinical significance in a child than in an adult due to the fact that it will occupy a proportionally larger volume in the intracranial vault. A hematoma volume of 3.5 mL is approximately 1% of the total brain volume at birth and less than 1% of total brain volume for older children.23 One study found that a hematoma that was 2-4% of total brain volume yielded an elevated risk of moderate disability at three months.24 Hematomas ≤ 2% of total brain volume were not associated with severe disability or death. Therefore, it is likely that a hematoma detection size limit of 3.5 mL (~1% total brain volume) is sufficiently small as to be of limited clinical importance across all pediatric ages. Additionally, there is a lack of pediatric data and consensus regarding the association between the size of traumatic hematomas, clinical outcomes, and indications for surgical intervention.25-27
Any hematoma(95% CI)
Hematomas within the detection limit of the infrascanner
(95% CI)Negative predictive value
93%(209/224)
(89% - 96%)
99%(221/224)
(96% - 100%)Positive predictive value
18%(21/120)
(11% - 26%)
11%(13/120)
(6% - 18%)Sensitivity 58%
(21/36)(41% - 75%)
81%(13/16)
(54% - 96%)Specificity 68%
(209/308)(62% - 73%)
67%(221/328)
(62% - 72%)Predictive Youden’s index
0.11(0.10 - 0.15)
0.09(0.08 - 0.12)
Youden’s index 0.26(0.27 - 0.32)
0.49(0.47 - 0.51)
Table 2. Infrascanner diagnostic performance.
CI, confidence interval.
Figure 3. Computed tomography images of three hematomas not detected by the handheld brain scanner.
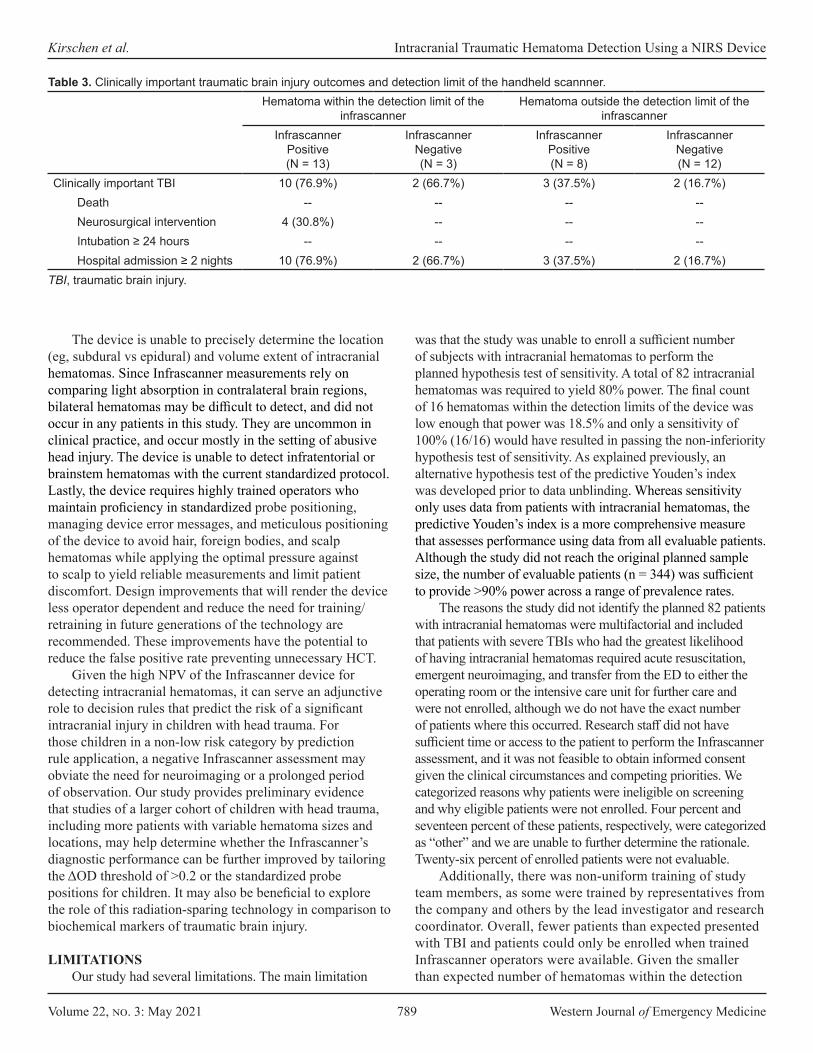
Volume 22, no. 3: May 2021 789 Western Journal of Emergency Medicine
Kirschen et al. Intracranial Traumatic Hematoma Detection Using a NIRS Device
The device is unable to precisely determine the location (eg, subdural vs epidural) and volume extent of intracranial hematomas. Since Infrascanner measurements rely on comparing light absorption in contralateral brain regions, bilateral hematomas may be difficult to detect, and did not occur in any patients in this study. They are uncommon in clinical practice, and occur mostly in the setting of abusive head injury. The device is unable to detect infratentorial or brainstem hematomas with the current standardized protocol. Lastly, the device requires highly trained operators who maintain proficiency in standardized probe positioning, managing device error messages, and meticulous positioning of the device to avoid hair, foreign bodies, and scalp hematomas while applying the optimal pressure against to scalp to yield reliable measurements and limit patient discomfort. Design improvements that will render the device less operator dependent and reduce the need for training/retraining in future generations of the technology are recommended. These improvements have the potential to reduce the false positive rate preventing unnecessary HCT.
Given the high NPV of the Infrascanner device for detecting intracranial hematomas, it can serve an adjunctive role to decision rules that predict the risk of a significant intracranial injury in children with head trauma. For those children in a non-low risk category by prediction rule application, a negative Infrascanner assessment may obviate the need for neuroimaging or a prolonged period of observation. Our study provides preliminary evidence that studies of a larger cohort of children with head trauma, including more patients with variable hematoma sizes and locations, may help determine whether the Infrascanner’s diagnostic performance can be further improved by tailoring the ΔOD threshold of >0.2 or the standardized probe positions for children. It may also be beneficial to explore the role of this radiation-sparing technology in comparison to biochemical markers of traumatic brain injury.
LIMITATIONSOur study had several limitations. The main limitation
was that the study was unable to enroll a sufficient number of subjects with intracranial hematomas to perform the planned hypothesis test of sensitivity. A total of 82 intracranial hematomas was required to yield 80% power. The final count of 16 hematomas within the detection limits of the device was low enough that power was 18.5% and only a sensitivity of 100% (16/16) would have resulted in passing the non-inferiority hypothesis test of sensitivity. As explained previously, an alternative hypothesis test of the predictive Youden’s index was developed prior to data unblinding. Whereas sensitivity only uses data from patients with intracranial hematomas, the predictive Youden’s index is a more comprehensive measure that assesses performance using data from all evaluable patients. Although the study did not reach the original planned sample size, the number of evaluable patients (n = 344) was sufficient to provide >90% power across a range of prevalence rates.
The reasons the study did not identify the planned 82 patients with intracranial hematomas were multifactorial and included that patients with severe TBIs who had the greatest likelihood of having intracranial hematomas required acute resuscitation, emergent neuroimaging, and transfer from the ED to either the operating room or the intensive care unit for further care and were not enrolled, although we do not have the exact number of patients where this occurred. Research staff did not have sufficient time or access to the patient to perform the Infrascanner assessment, and it was not feasible to obtain informed consent given the clinical circumstances and competing priorities. We categorized reasons why patients were ineligible on screening and why eligible patients were not enrolled. Four percent and seventeen percent of these patients, respectively, were categorized as “other” and we are unable to further determine the rationale. Twenty-six percent of enrolled patients were not evaluable.
Additionally, there was non-uniform training of study team members, as some were trained by representatives from the company and others by the lead investigator and research coordinator. Overall, fewer patients than expected presented with TBI and patients could only be enrolled when trained Infrascanner operators were available. Given the smaller than expected number of hematomas within the detection
Hematoma within the detection limit of the infrascanner
Hematoma outside the detection limit of the infrascanner
InfrascannerPositive(N = 13)
InfrascannerNegative(N = 3)
InfrascannerPositive(N = 8)
InfrascannerNegative(N = 12)
Clinically important TBI 10 (76.9%) 2 (66.7%) 3 (37.5%) 2 (16.7%)Death -- -- -- --Neurosurgical intervention 4 (30.8%) -- -- --Intubation ≥ 24 hours -- -- -- --Hospital admission ≥ 2 nights 10 (76.9%) 2 (66.7%) 3 (37.5%) 2 (16.7%)
TBI, traumatic brain injury.
Table 3. Clinically important traumatic brain injury outcomes and detection limit of the handheld scannner.
Western Journal of Emergency Medicine 790 Volume 22, no. 3: May 2021
Intracranial Traumatic Hematoma Detection Using a NIRS Device Kirschen et al.
REFERENCES 1. Gaw CE and Zonfrillo MR. Emergency department visits for head
trauma in the United States. BMC Emerg Med. 2016;16:5.2. Babl FE, Borland ML, Phillips N, et al. Accuracy of PECARN, CATCH,
and CHALICE head injury decision rules in children: a prospective cohort study. Lancet. 2017;389(10087):2393-402.
3. Miglioretti DL, Johnson E, Williams A, et al. The use of computed tomography in pediatrics and the associated radiation exposure and estimated cancer risk. JAMA Pediatr. 2013;167(8):700-7.
4. Ukwuoma OI, Allareddy V, Allareddy V, et al. Trends in head computed tomography utilization in children presenting to emergency departments after traumatic head injury. Pediatr Emerg Care. 2018.Online ahead of print.
5. Robertson CS, Gopinath S, Chance B. Use of near infrared spectroscopy to identify traumatic intracranial hemotomas. J Biomed Opt. 1997;2(1):31-41.
6. Robertson CS, Gopinath SP, Chance B. A new application for near-infrared spectroscopy: detection of delayed intracranial hematomas after head injury. J Neurotrauma. 1995;12(4):591-600.
7. Zhang Q, Ma H, Nioka S, et al. Study of near infrared technology for intracranial hematoma detection. J Biomed Opt. 2000;5(2):206-13.
8. Robertson CS, Zager EL, Narayan RK, et al. Clinical evaluation of a portable near-infrared device for detection of traumatic intracranial hematomas. J Neurotrauma. 2010;27(9):1597-604.
9. Ayaz H, Izzetoglu M, Izzetoglu K, et al. Early diagnosis of traumatic intracranial hematomas. J Biomed Opt. 2019;24(5):1-10.
10. Coskun F, Sezer EA, Karamercan MA, et al. An assessment on the use of Infrascanner for the diagnosis of the brain hemotoma by using support vector machine. Scientific Research and Essays. 2010;5:1911-5.
11. Semenova AH, Marshintev V, Melnikov V, et al. Infrascanner in the diagnosis of intracranial damage in children with traumatic brain injuries. Brain Inj. 2016;30(1):18-22.
12. Salonia R, Bell MJ, Kochanek PM, et al. The utility of near infrared spectroscopy in detecting intracranial hemorrhage in children. J Neurotrauma. 2012;29(6):1047-53.
13. Bressan S, Daverio M, Martinolli F, et al. The use of handheld near-infrared device (Infrascanner) for detecting intracranial haemorrhages in children with minor head injury. Childs Nerv Syst. 2014;30(3):477-84.
14. Lewartowska-Nyga D, Nyga K, Skotnicka-Klonowicz G. [Can Infrascanner be useful in hospital emergency departments for diagnosing minor head injury in children?]. Dev Period Med. 2017;21(1):51-9.
15. Kuppermann N, Holmes JF, Dayan PS, et al. Identification of children at very low risk of clinically-important brain injuries after head trauma: a prospective cohort study. Lancet. 2009;374(9696):1160-70.
16. Kothari RU, Brott T, Broderick JP, et al. The ABCs of measuring intracerebral hemorrhage volumes. Stroke. 1996;27(8):1304-5.
17. Webb AJ, Ullman NL, Morgan TC, et al. Accuracy of the ABC/2 score for intracerebral hemorrhage: systematic review and analysis of MISTIE, CLEAR-IVH, and CLEAR III. Stroke. 2015;46(9):2470-6.
18. Hu TT, Yan L, Yan PF, et al. Assessment of the ABC/2 method of
limit of the device, we did not have enough patients with intracranial hematomas to comprehensively evaluate the device’s performance by hematoma location or size, or the impact of distance from the surface of the brain for intraparenchymal hematomas.
CONCLUSIONIn summary, this non-invasive, radiation-sparing,
NIRS-based technology may serve as an adjunct to current pediatric head injury neuroimaging decision rules for identifying intracranial hematomas in the ED setting. Further investigation to determine optimal training paradigms and the Infrascanner’s clinical impact, including subgroups of patients for whom its application can alter current imaging or observation patterns, is warranted.
ACKNOWLEDGEMENTSThe authors acknowledge the ED research study teams
based at the Children’s Hospital of Philadelphia, Boston Children’s Hospital, and Children’s Hospital Colorado, including the research coordinators and assistants who participated in screening, enrolling, and performing Infrascanner measurements on patients. The authors acknowledge in particular: Ima Samba from Children’s Hospital of Philadelphia, Michelle Smreczak from Boston Children’s Hospital, and Kathleen Grice and Mimi Munroe from Children’s Hospital Colorado.
Address for Correspondence: Matthew Kirschen, MD, PhD, Children’s Hospital of Philadelphia, Department of Critical Care Medicine, 3401 Civic Center Blvd, Wood 6108, Philadelphia, PA 19104. Email: [email protected].
Conflicts of Interest: By the WestJEM article submission agreement, all authors are required to disclose all affiliations, funding sources and financial or management relationships that could be perceived as potential sources of bias. Financial support for the study was provided by Infrascan Inc. Infrascan Inc. did not play any role in study design, data collection, data analysis, data interpretation, or writing of the report.
Copyright: © 2021 Kirschen et al. This is an open access article distributed in accordance with the terms of the Creative Commons Attribution (CC BY 4.0) License. See: http://creativecommons.org/licenses/by/4.0/
Volume 22, no. 3: May 2021 791 Western Journal of Emergency Medicine
Kirschen et al. Intracranial Traumatic Hematoma Detection Using a NIRS Device
epidural hematoma volume measurement as compared to computer-assisted planimetric analysis. Biol Res Nurs. 2016;18(1):5-11.
19. Won SY, Zagorcic A, Dubinski D, et al. Excellent accuracy of ABC/2 volume formula compared to computer-assisted volumetric analysis of subdural hematomas. PLoS One. 2018;13(6):e0199809.
20. Clopper C and Pearson ES. The use of confidence or fiducial limits illustrated in the case of the binomial. Biometrika. 1934;26(4):404–13.
21. Shan G. Improved confidence intervals for the Youden Index. PLoS One. 2015;10(7):e0127272.
22. Wang J, Lin J, Chen Y, et al. Phantom-based evaluation of near-infrared intracranial hematoma detector performance. J Biomed Opt.
2019;24(4):1-10.23. Lindley AA, Benson JE, Grimes C, et al. The relationship in
neonates between clinically measured head circumference and brain volume estimated from head CT-scans. Early Hum Dev. 1999;56(1):17-29.
24. Beslow LA, Ichord RN, Gindville MC, et al. Pediatric intracerebral hemorrhage score: a simple grading scale for intracerebral hemorrhage in children. Stroke. 2014;45(1):66-70.
25. Bullock MR, Chesnut R, Ghajar J, et al. Surgical management of acute subdural hematomas. Neurosurgery. 2006;58(3 Suppl):S16-24; discussion Si-iv.
Western Journal of Emergency Medicine 792 Volume 22, no. 3: May 2021
Educational Advances
Virtual Emergency Medicine Clerkship Curriculum during the COVID-19 Pandemic: Development, Application, and Outcomes
Kathryn E. Redinger, MD*Jeffrey D. Greene, PhD†
Section Editor: Jonathan Fisher, MD, MPH Submission history: Submitted May 26, 2020; Revision received February 8, 2021; Accepted February 2, 2021Electronically published April 28, 2021Full text available through open access at http://escholarship.org/uc/uciem_westjem DOI: 10.5811/westjem.2021.2.48430
BACKGROUNDIn 2006 Cooke and her colleagues observed in a New
England Journal of Medicine review article that “Medical Education seems to be in a perpetual state of unrest.”1 Nationally the need to develop a virtual clerkship model became necessary when the Association of American Medical Colleges (AAMC) issued a statement strongly discouraging students from direct patient care in light of the COVID-19 pandemic, and extended stay-at-home orders were implemented in states across the country. This removed opportunities for bedside teaching in the course of direct patient care but also eliminated the ability for students and
Western Michigan University Homer Stryker M.D. School of Medicine, Department of Emergency Medicine, Kalamazoo, MichiganWestern Michigan University Homer Stryker M.D. School of Medicine, Department of Medical Education, Kalamazoo, Michigan
*
†
The COVID-19 pandemic has been a significant catalyst for change in medical education and clinical care. The traditional model of bedside clinical teaching in required advanced clerkships was upended on March 17, 2020, when the Association of American Medical Colleges recommended removing medical students from direct patient care to prevent further spread of the disease and also to help conserve scarce personal protective equipment (PPE). This created unique challenges for delivering a robust, advanced emergency medicine (EM) clerkship since the emergency department is ground zero for the undifferentiated and potentially infected patient and has high demand for PPE. Here, we describe the development, application, and program evaluation of an online-based, virtual advanced EM curriculum developed rapidly in response to the COVID-19 pandemic.
Starting March 23, 2020, we began rotating fourth-year medical students through a four-week rotation. We completed a total of four virtual clerkship experiences comprised of 56 students through July 27, 2020. Through analysis of the students’ performance on a national standardized EM shelf exam, students participating in this virtual clerkship demonstrated a fund of knowledge that was not significantly different from that of their peers who completed a traditional clerkship in the specialty prior to the pandemic interruptions. Additionally, the critical review of the traditional course created the opportunity to make improvements and enrich the medical student educational experience in a virtual environment and upon resumption of the traditional course when students returned to the in-person environment. The resources provided for those interested in adopting our pedagogical approach include a course syllabus, calendar, and learner summative assessment. [West J Emerg Med. 2021;22(3)792–798.]
faculty to meet in classroom and simulation environments. Although the modern era has seen a large increase in technological innovation and online-based learning modules, up until now those advances have always served to augment traditional bedside training, not supplant it (Figure 1).2
Our institution has a required fourth-year emergency medicine (EM) curriculum for all students. Sixteen of the fourth-year students from the Class of 2020 who were previously enrolled in the March 23 rotation were switched to the virtual learning environment to meet graduation requirements. In the spring, fourth-year students of the Class of 2021 were given the option of completing the virtual

Volume 22, no. 3: May 2021 793 Western Journal of Emergency Medicine
Redinger et al. Virtual EM Clerkship Curriculum During COVID-19
Population Health Research Capsule
What do we already know about this issue?Medical students were removed from the clinical learning environment in response to the COVID-19 pandemic.
What was the research question?How are virtual students’ educational outcomes different from students in clerkships with direct patient contact?
What was the major finding of the study?Virtual students’ exam scores were not significantly different from peers’ scores in the in-person setting.
How does this improve population health?Beyond the COVID-19 pandemic interruptions, this virtual curriculum is useful in situations where students have limited access to direct patient care.
curriculum to fulfill their EM requirement or take their EM clerkship in the fall/winter in the traditional clinical model. Forty students elected to enroll in the virtual EM curriculum from April 27–July 26, 2020, representing 49% of the Class of 2021.
Students were able to return to the clinical environment in late summer; however, we still experienced periodic interruptions in medical education due to the need for quarantine and isolation among our learners. Moreover, in January 2021 the AAMC recommended that medical students not be involved in the direct care of known or suspected COVID-19 patients. For those students able to participate in direct patient care the undifferentiated nature of acute emergency patients, and the wide variability of presenting complaints in active COVID-19 disease, has limited the number of patients the medical students could see and the number of procedures they were allowed to participate in despite their return.
Although emergency departments (ED) provide robust learning opportunities for medical students through the acute, undifferentiated patient, evidence suggests that student exposure to recommended curriculum presentations and procedures was limited even before COVID-19. In a study published in 2014, case logs from 130 students at three institutions were reviewed. Only 15.4% of students saw 10 required conditions during their rotation, although 76.9% saw at least eight.4 This finding provides evidence that even in the traditional bedside model, advanced clerkship curriculums are lacking key educational components since certain conditions are far less likely than others to be encountered.
The lack of clinical exposure available to students was compounded by a general decrease in ED patient volumes nationally. According to the National Syndromic Surveillance Program, ED visits declined 42% during the early COVID-19 pandemic.5 Volumes continued to languish through the summer months, and an analysis from TransUnion Healthcare found ED visits were down 25% through August 2020.6 As students return to patient care in EDs, educators must be prepared for the possibility that volumes will not be
sufficient to ensure a robust educational experience without supplemental material taught in a nonclinical setting.
Having a prepared contingency plan for an online-based curriculum for students who are experiencing interruptions in their education due to quarantine, isolation, or other unforeseen events or absences not related to COVID-19 is a beneficial resource. A bank of chief complaint-based activities and resources can help augment an in-person ED clerkship if there is a specific, patient encounter deficiency identified by the student or educator. This course as it is designed in its entirety also has utility in a post-pandemic world as an elective offering for both EM and non EM-bound students interested in building the medical knowledge base of EM in self-directed study. This study was granted exception status by the Western Michigan University Homer Stryker M.D. School of Medicine institutional review board.
OBJECTIVESAt the outset, the virtual clerkship curriculum was
designed to capture as many of the institutional educational objectives contained within the live clerkship as possible to ensure that our students were minimally disadvantaged by the change in content delivery. The course was to remain academically rigorous, so that COVID-19 did not become an excuse for students to receive a watered-down version of the curriculum or progress without an EM experience altogether. Table 1 summarizes the key changes in curriculum design and
Figure 1. Timeline of the development and implementation of a virtual emergency medicine clerkship during the COVID-19 pandemic.3
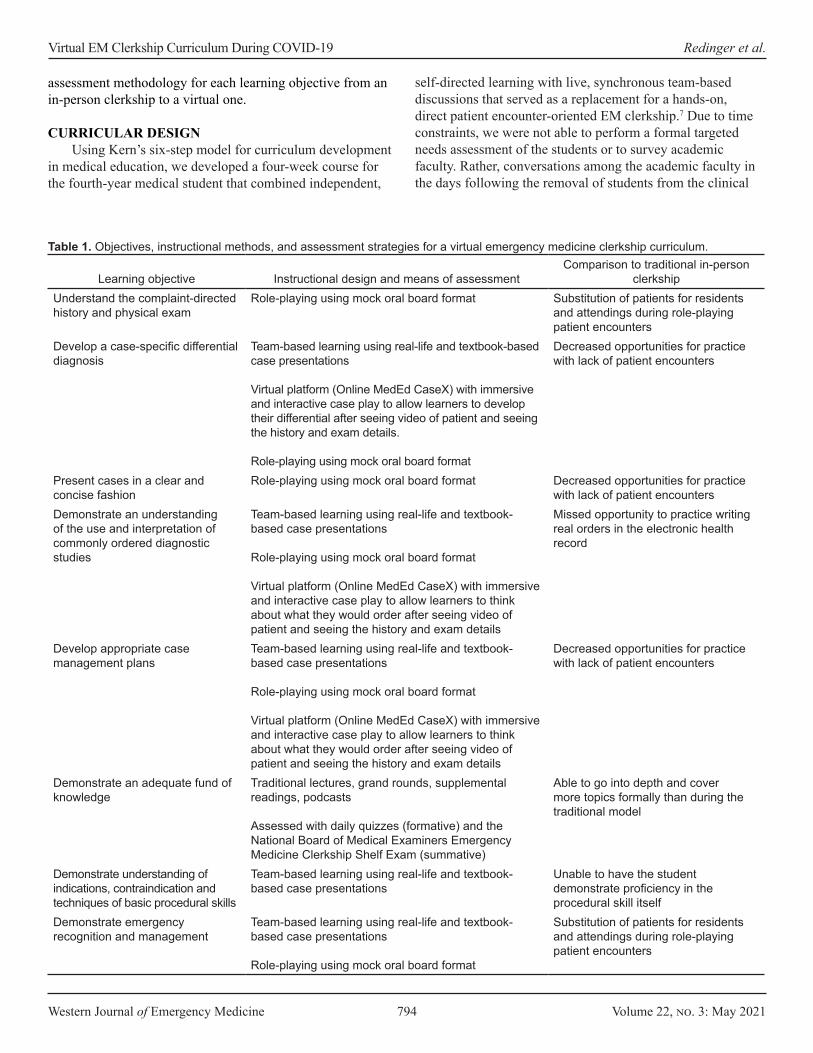
Western Journal of Emergency Medicine 794 Volume 22, no. 3: May 2021
Virtual EM Clerkship Curriculum During COVID-19 Redinger et al.
assessment methodology for each learning objective from an in-person clerkship to a virtual one.
CURRICULAR DESIGNUsing Kern’s six-step model for curriculum development
in medical education, we developed a four-week course for the fourth-year medical student that combined independent,
self-directed learning with live, synchronous team-based discussions that served as a replacement for a hands-on, direct patient encounter-oriented EM clerkship.7 Due to time constraints, we were not able to perform a formal targeted needs assessment of the students or to survey academic faculty. Rather, conversations among the academic faculty in the days following the removal of students from the clinical
Learning objective Instructional design and means of assessmentComparison to traditional in-person
clerkshipUnderstand the complaint-directed history and physical exam
Role-playing using mock oral board format Substitution of patients for residents and attendings during role-playing patient encounters
Develop a case-specific differential diagnosis
Team-based learning using real-life and textbook-based case presentations
Virtual platform (Online MedEd CaseX) with immersive and interactive case play to allow learners to develop their differential after seeing video of patient and seeing the history and exam details.
Role-playing using mock oral board format
Decreased opportunities for practice with lack of patient encounters
Present cases in a clear and concise fashion
Role-playing using mock oral board format Decreased opportunities for practice with lack of patient encounters
Demonstrate an understanding of the use and interpretation of commonly ordered diagnostic studies
Team-based learning using real-life and textbook-based case presentations
Role-playing using mock oral board format
Virtual platform (Online MedEd CaseX) with immersive and interactive case play to allow learners to think about what they would order after seeing video of patient and seeing the history and exam details
Missed opportunity to practice writing real orders in the electronic health record
Develop appropriate case management plans
Team-based learning using real-life and textbook-based case presentations
Role-playing using mock oral board format
Virtual platform (Online MedEd CaseX) with immersive and interactive case play to allow learners to think about what they would order after seeing video of patient and seeing the history and exam details
Decreased opportunities for practice with lack of patient encounters
Demonstrate an adequate fund of knowledge
Traditional lectures, grand rounds, supplemental readings, podcasts
Assessed with daily quizzes (formative) and the National Board of Medical Examiners Emergency Medicine Clerkship Shelf Exam (summative)
Able to go into depth and cover more topics formally than during the traditional model
Demonstrate understanding of indications, contraindication and techniques of basic procedural skills
Team-based learning using real-life and textbook-based case presentations
Unable to have the student demonstrate proficiency in the procedural skill itself
Demonstrate emergency recognition and management
Team-based learning using real-life and textbook-based case presentations
Role-playing using mock oral board format
Substitution of patients for residents and attendings during role-playing patient encounters
Table 1. Objectives, instructional methods, and assessment strategies for a virtual emergency medicine clerkship curriculum.
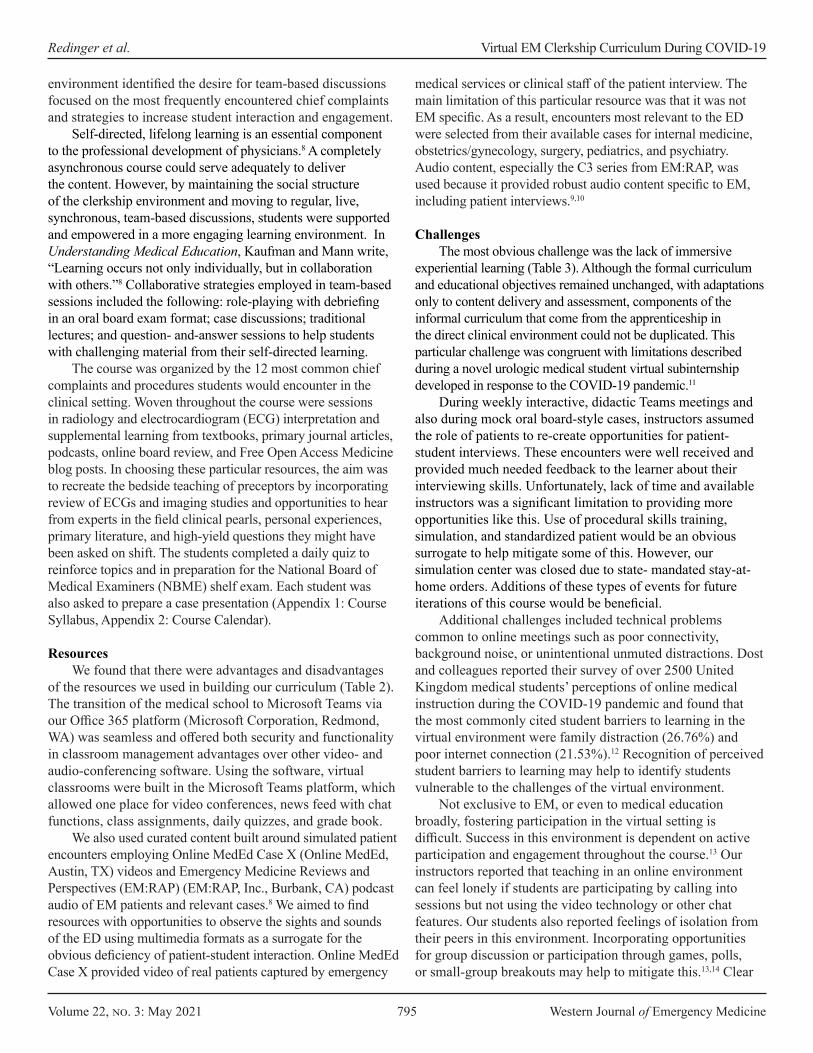
Volume 22, no. 3: May 2021 795 Western Journal of Emergency Medicine
Redinger et al. Virtual EM Clerkship Curriculum During COVID-19
environment identified the desire for team-based discussions focused on the most frequently encountered chief complaints and strategies to increase student interaction and engagement.
Self-directed, lifelong learning is an essential component to the professional development of physicians.8 A completely asynchronous course could serve adequately to deliver the content. However, by maintaining the social structure of the clerkship environment and moving to regular, live, synchronous, team-based discussions, students were supported and empowered in a more engaging learning environment. In Understanding Medical Education, Kaufman and Mann write, “Learning occurs not only individually, but in collaboration with others.”8 Collaborative strategies employed in team-based sessions included the following: role-playing with debriefing in an oral board exam format; case discussions; traditional lectures; and question- and-answer sessions to help students with challenging material from their self-directed learning.
The course was organized by the 12 most common chief complaints and procedures students would encounter in the clinical setting. Woven throughout the course were sessions in radiology and electrocardiogram (ECG) interpretation and supplemental learning from textbooks, primary journal articles, podcasts, online board review, and Free Open Access Medicine blog posts. In choosing these particular resources, the aim was to recreate the bedside teaching of preceptors by incorporating review of ECGs and imaging studies and opportunities to hear from experts in the field clinical pearls, personal experiences, primary literature, and high-yield questions they might have been asked on shift. The students completed a daily quiz to reinforce topics and in preparation for the National Board of Medical Examiners (NBME) shelf exam. Each student was also asked to prepare a case presentation (Appendix 1: Course Syllabus, Appendix 2: Course Calendar).
ResourcesWe found that there were advantages and disadvantages
of the resources we used in building our curriculum (Table 2). The transition of the medical school to Microsoft Teams via our Office 365 platform (Microsoft Corporation, Redmond, WA) was seamless and offered both security and functionality in classroom management advantages over other video- and audio-conferencing software. Using the software, virtual classrooms were built in the Microsoft Teams platform, which allowed one place for video conferences, news feed with chat functions, class assignments, daily quizzes, and grade book.
We also used curated content built around simulated patient encounters employing Online MedEd Case X (Online MedEd, Austin, TX) videos and Emergency Medicine Reviews and Perspectives (EM:RAP) (EM:RAP, Inc., Burbank, CA) podcast audio of EM patients and relevant cases.8 We aimed to find resources with opportunities to observe the sights and sounds of the ED using multimedia formats as a surrogate for the obvious deficiency of patient-student interaction. Online MedEd Case X provided video of real patients captured by emergency
medical services or clinical staff of the patient interview. The main limitation of this particular resource was that it was not EM specific. As a result, encounters most relevant to the ED were selected from their available cases for internal medicine, obstetrics/gynecology, surgery, pediatrics, and psychiatry. Audio content, especially the C3 series from EM:RAP, was used because it provided robust audio content specific to EM, including patient interviews.9,10
ChallengesThe most obvious challenge was the lack of immersive
experiential learning (Table 3). Although the formal curriculum and educational objectives remained unchanged, with adaptations only to content delivery and assessment, components of the informal curriculum that come from the apprenticeship in the direct clinical environment could not be duplicated. This particular challenge was congruent with limitations described during a novel urologic medical student virtual subinternship developed in response to the COVID-19 pandemic.11
During weekly interactive, didactic Teams meetings and also during mock oral board-style cases, instructors assumed the role of patients to re-create opportunities for patient-student interviews. These encounters were well received and provided much needed feedback to the learner about their interviewing skills. Unfortunately, lack of time and available instructors was a significant limitation to providing more opportunities like this. Use of procedural skills training, simulation, and standardized patient would be an obvious surrogate to help mitigate some of this. However, our simulation center was closed due to state- mandated stay-at-home orders. Additions of these types of events for future iterations of this course would be beneficial.
Additional challenges included technical problems common to online meetings such as poor connectivity, background noise, or unintentional unmuted distractions. Dost and colleagues reported their survey of over 2500 United Kingdom medical students’ perceptions of online medical instruction during the COVID-19 pandemic and found that the most commonly cited student barriers to learning in the virtual environment were family distraction (26.76%) and poor internet connection (21.53%).12 Recognition of perceived student barriers to learning may help to identify students vulnerable to the challenges of the virtual environment.
Not exclusive to EM, or even to medical education broadly, fostering participation in the virtual setting is difficult. Success in this environment is dependent on active participation and engagement throughout the course.13 Our instructors reported that teaching in an online environment can feel lonely if students are participating by calling into sessions but not using the video technology or other chat features. Our students also reported feelings of isolation from their peers in this environment. Incorporating opportunities for group discussion or participation through games, polls, or small-group breakouts may help to mitigate this.13,14 Clear
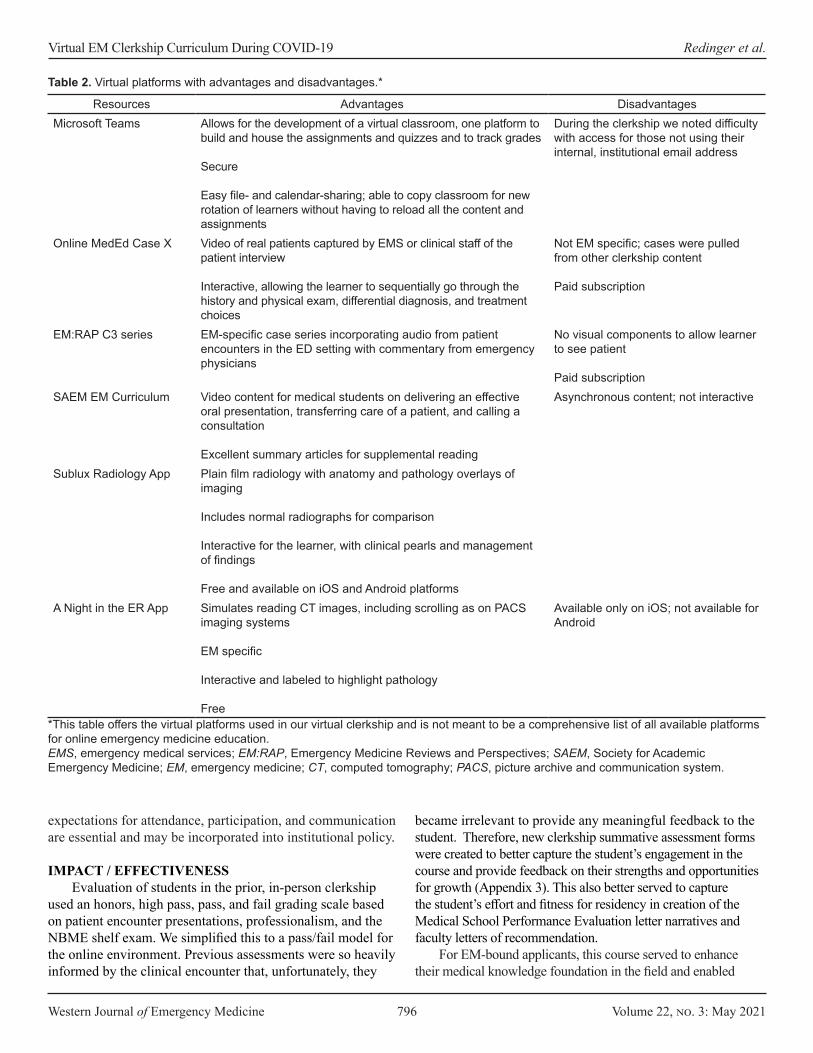
Western Journal of Emergency Medicine 796 Volume 22, no. 3: May 2021
Virtual EM Clerkship Curriculum During COVID-19 Redinger et al.
expectations for attendance, participation, and communication are essential and may be incorporated into institutional policy.
IMPACT / EFFECTIVENESSEvaluation of students in the prior, in-person clerkship
used an honors, high pass, pass, and fail grading scale based on patient encounter presentations, professionalism, and the NBME shelf exam. We simplified this to a pass/fail model for the online environment. Previous assessments were so heavily informed by the clinical encounter that, unfortunately, they
Resources Advantages DisadvantagesMicrosoft Teams Allows for the development of a virtual classroom, one platform to
build and house the assignments and quizzes and to track grades
Secure
Easy file- and calendar-sharing; able to copy classroom for new rotation of learners without having to reload all the content and assignments
During the clerkship we noted difficulty with access for those not using their internal, institutional email address
Online MedEd Case X Video of real patients captured by EMS or clinical staff of the patient interview
Interactive, allowing the learner to sequentially go through the history and physical exam, differential diagnosis, and treatment choices
Not EM specific; cases were pulled from other clerkship content
Paid subscription
EM:RAP C3 series EM-specific case series incorporating audio from patient encounters in the ED setting with commentary from emergency physicians
No visual components to allow learner to see patient
Paid subscriptionSAEM EM Curriculum Video content for medical students on delivering an effective
oral presentation, transferring care of a patient, and calling a consultation
Excellent summary articles for supplemental reading
Asynchronous content; not interactive
Sublux Radiology App Plain film radiology with anatomy and pathology overlays of imaging
Includes normal radiographs for comparison
Interactive for the learner, with clinical pearls and management of findings
Free and available on iOS and Android platformsA Night in the ER App Simulates reading CT images, including scrolling as on PACS
imaging systems
EM specific
Interactive and labeled to highlight pathology
Free
Available only on iOS; not available for Android
Table 2. Virtual platforms with advantages and disadvantages.*
*This table offers the virtual platforms used in our virtual clerkship and is not meant to be a comprehensive list of all available platforms for online emergency medicine education.EMS, emergency medical services; EM:RAP, Emergency Medicine Reviews and Perspectives; SAEM, Society for Academic Emergency Medicine; EM, emergency medicine; CT, computed tomography; PACS, picture archive and communication system.
became irrelevant to provide any meaningful feedback to the student. Therefore, new clerkship summative assessment forms were created to better capture the student’s engagement in the course and provide feedback on their strengths and opportunities for growth (Appendix 3). This also better served to capture the student’s effort and fitness for residency in creation of the Medical School Performance Evaluation letter narratives and faculty letters of recommendation.
For EM-bound applicants, this course served to enhance their medical knowledge foundation in the field and enabled
Volume 22, no. 3: May 2021 797 Western Journal of Emergency Medicine
Redinger et al. Virtual EM Clerkship Curriculum During COVID-19
them to interact with the EM faculty in a virtual setting and avoid interruptions in their education from having a cancelled rotation. At our institution, these students were able to complete a home clinical rotation as soon as possible, allowing time for faculty to write a Standardized Letter of Evaluation and provide clinical feedback to the students. An interesting observation by the instructors who evaluated the group of EM-bound students involved in both the virtual and a subsequent traditional in-person clinical rotation was that those students who excelled in the virtual environment as evidenced by high test scores and good participation during online sessions, although they still did very well, did not necessarily maintain their top spots when evaluated during the clinical experience.
Alternatively, some students who were assessed as having average medical knowledge during the virtual clerkship, excelled in the clinical setting as they were able to showcase professional traits such as tenacity and ability to establish rapport, which are essential to the practice of EM. It is for this reason the virtual clerkship experience is not sufficient as the only method of exposure to the specialty for the EM-bound student. For those interested in EM as a career, we recommend that the student participate in an in-person clinical experience prior to applying to the specialty so that they can make an informed decision about whether EM is the right specialty choice for them.
It was our hope that the virtual clerkship would provide the same level and quality of conventional instructional resources needed to fulfill the learning needs of the fourth-year medical student. To assess the extent to which these aims were achieved, we designed a multimethod evaluation study that included the analysis of student scores on the EM shelf exam and a thematic study of comments elicited from a student focus group.
We performed a t-test for independent means comparing the composite scores of students completing the virtual rotation with the composite scores of students who
completed the traditional rotation prior to the mandated shutdown of clinical education. Scores among the 56 students who completed the virtual rotation (X = 81.18, standard deviation [SD] 6.55, 95% confidence interval [CI], 79.42, 82.93) were not statistically different from the 48 students completing the traditional rotation during that same academic year in the six months prior to the COVID-19 pandemic (X = 79.38, SD 6.85, 95% CI, 77.39, 81.36), t(102) = 1.317, P = .174, 95% CI [-.808, 4.415]. This finding provides evidence that the development of students’ fund of knowledge in EM was not attenuated by their participation in the virtual rotation experience.
Post-course, we assembled a student focus group and asked participants to describe their thoughts about the merit, value, or shortcomings of the virtual clerkship. The following themes emerged from their comments:
The virtual clerkship was well constructed and organized.• “Every week there was a theme, you know, like trauma,
abdominal pain, or chest pain. Solid, worthwhile topics that were laid out for us.”
• “This was my favorite virtual thing that I’ve done. The clerkship director did a great job with providing us with a variety of cases and ways to learn.”
• “The other virtual clerkships I did allowed us to use whatever resources we wanted. That made things scattered and unorganized.”
• “There were daily assignments, reading, and cases we had to do. And there was accountability because you had to turn things in through Teams.”
Quality resources and activities are paramount for authentic learning.• “I thought the podcasts were really great. She [the clerkship
director] should continue to use them even after things go
Challenges identified Proposed solutionsLack of immersive experiential learning from direct patient contact
Include opportunities for interactive live didactic sessions, and employ multi-modal sessions including video, audio, team-based learning, role-playing, and group discussion
Limited opportunities for direct feedback to learners
Incorporate opportunities for mock oral board-style cases with time for debriefing and feedback
Lack of procedural skills training Consider sending supplies, such as suture material, to learners to have them practice at home while watching procedure videos or during live didactic sessions
Low participation from learners during live sessions
Encourage students to have their cameras on when speaking during live interactive sessions
Set expectations for attendance, participation and communication, and consider incorporation of expectations into institutional policy
Incorporate methods such as games, polls, quizzes or breakout rooms, which have been shown to encourage student participation
Table 3. Challenges with virtual learning environments and proposed solutions.
Western Journal of Emergency Medicine 798 Volume 22, no. 3: May 2021
Virtual EM Clerkship Curriculum During COVID-19 Redinger et al.
back to normal.”• “Students got to choose a topic relevant to EM to make a
presentation on. As a non-EM-bound student, getting to choose what to learn about was a very good approach as far as being valuable to me as a learner.”
• “She gave us so many high-quality EM resources. Anyone who does well with self-directed learning would benefit from this format.”
Shortcomings of a virtual clerkship experience and suggestions for improvement.• “I miss the opportunity to interact with peers.”• “Maybe try to have more small group cases and get more
resident involvement. It is amazing to learn from near-peers.”• “It is difficult to get audience interaction in the virtual setting.
Have the instructors call on people randomly to ask questions and generate talk.”
CONCLUSIONStudents participating in this virtual clerkship in emergency
medicine demonstrated a fund of knowledge at the course conclusion that did not differ from that of their peers who completed a traditional rotation in the specialty. Student comments indicate that this particular virtual clerkship was successful in meeting the learning needs of fourth-year medical students as a result of its design, organization, and use of quality learning resources. Opportunities for improvement of this experience are consistent with assessments of other virtual learning activities, namely, limitations in peer interaction and group learning dynamics.
Address for Correspondence: Kathryn E. Redinger, MD, Western Michigan University Homer Stryker M.D. School of Medicine, Department of Emergency Medicine, 1000 Oakland Drive, Kalamazoo, MI 49008. Email: [email protected].
Conflicts of Interest: By the WestJEM article submission agreement, all authors are required to disclose all affiliations, funding sources and financial or management relationships that could be perceived as potential sources of bias. No author has professional or financial relationships with any companies that are relevant to this study. There are no conflicts of interest or sources of funding to declare.
Copyright: © 2021 Redinger et al. This is an open access article distributed in accordance with the terms of the Creative Commons Attribution (CC BY 4.0) License. See: http://creativecommons.org/licenses/by/4.0/
REFERENCES1. Cooke M, Irby DM, Sullivan W, et al. American medical education 100
years after the Flexner report. NEJM. 2006;355(13):1339-44.2. Sandars J. Technology and the delivery of the curriculum of the
future: opportunities and challenges. Med Teach. 2012;34(7):534-8.3. American Journal of Managed Care Staff. A timeline of COVID-19
developments in 2020. 2021. Available at: https://www.ajmc.com/view/a-timeline-of-covid19-developments-in-2020. Accessed January 27, 2021.
4. Avegno J, Leuthauser A, Martinez J, et al. Medical student education in emergency medicine: Do students meet the national standards for clinical encounters of selected core conditions? J Emerg Med. 2014;47(3):328-32.
5. Hartnett KP, Kite-Powell A, DeVies J, et al. Impact of the COVID-19 pandemic on emergency department visits - United States, January 1, 2019-May 30, 2020. MMWR. 2020;69(23):699-704.
6. TransUnion Healthcare. Ongoing COVID-19 challenges stagnate hospital visit recovery. 2015. Available at: https://newsroom.transunion.com/ongoing-covid-19-challenges-stagnate-hospital-visit-recovery/. Accessed January 27, 2021.
7. Kern DE, Thomas PA, Hughes MT. Curriculum development for medical education: a six-step approach. 2009. Available at: https://jhupbooks.press.jhu.edu/title/curriculum-development-medical-education. Accessed February 8, 2021.
8. Kauffman DM, Mann KV. (2013). Teaching and learning in medical education. In: T. Swanwick (Ed.), Understanding Medical Education (7-29). Hoboken, NJ: Wiley-Blackwell.
9. Online MedEd. Case X. Available at: https://onlinemeded.org/spa/cases. Accessed May 26, 2020.
10. EM:RAP. Emergency Medicine Reviews and Perspectives. 2020. Available at: https://www.emrap.org/. Accessed May 26, 2020.
11. Williams C, Familusi OO, Ziemba J, et al. Adapting to the educational challenges of a pandemic: development of a novel virtual urology subinternship during the time of COVID-19. Urology. 2021;148:70-6.
12. Dost S, Hossain A, Shehab M, et al. Perceptions of medical students towards online teaching during the COVID-19 pandemic: a national cross-sectional survey of 2721 UK medical students. BMJ Open. 2020;10(11):e042378.
13. McBrien JL, Cheng R, Jones P. Virtual spaces: employing a synchronous online classroom to facilitate student engagement in online learning. 2009. Available at: http://www.irrodl.org/index.php/irrodl/article/view/605. Accessed February 8, 2021.
14. Morawo A, Sun C, Lowden M. Enhancing engagement during live virtual learning using interactive quizzes. Med Educ. 2020;54(12):1188.
Volume 22, no. 3: May 2021 799 Western Journal of Emergency Medicine
Letter to the Editor
Presentation of Neuro-COVID is Broad and Pathogenesis Diverse
Josef Finsterer, MD, PhD Section Editor: William Whetstone, MD Submission history: Submitted November 17, 2020; Revision received December 6, 2020; Accepted January 14, 2021 Electronically published April 8, 2021 Full textavailable through open access at http://escholarship.org/uc/uciem_westjem DOI: 10.5811/westjem.2021.1.50893[West J Emerg Med. 2021;22(3)799–800.]
To the Editor:With interest we read the review article by Valiuddin
et al. about the neurological implications of coronavirus disease 2019 (COVID-19) (neuro-COVID).1 The authors listed ischemic stroke, transverse myelitis, seizures, acute hemorrhaghic necrotising encephalopathy (AHNE), acute disseminated encephalo-myelitis (ADEM), posterior reversible encephalopathy syndrome (PRES), myasthenia, and sinus venous thrombosis as central nervous system (CNS) manifestations, and hyposmia/hypogeusia, Guillain-Barré syndrome, facial palsy, ophthalmoparesis, and neuropathy, as peripheral nervous system (PNS) manifestations of COVID-19.1 We have the following comments and concerns.
The review is comprehensive but does not include the entire spectrum of neuro-COVID-19. Several neurological manifestations of COVID-19 in the CNS and PNS were not discussed. CNS disorders not included in the review were intracerebral bleeding,2 cerebral vasculitis,3 acute cerebral demyelination,4 headache,5 myoclonus-ataxia syndrome,6 limbic encephalitis,7 cytokine release syndrome,8 delirium,9 and psychosis.10 Peripheral nervous system disorders not included in the review were isolated oculomotor, trochlear, facial, or hypoglossal nerve palsy,11 myositis/ dermatomyositis,12 myopathy,13 and rhabdomyolysis.14
There was no discussion about the putative delineation between neurological disorders due to direct attack of the virus (primary manifestations), secondary CNS/PNS disorders due to the immune response (secondary manifestations), and those occurring as a side effect of the treatment or involvement of other organs than the CNS (tertiary manifestations). Whether such a distinction is truly permissible is under debate. Limited data from animal and basic science research are currently available. Disregarding this debate, there are indications that the virus enters the CNS via the blood brain barrier (BBB) or via retrograde invasion along peripheral nerves, as mentioned in the review.1,15 There are even indications that the virus disrupts the BBB.16 Interestingly, in most of the CNS disorders claimed to have been triggered by direct contact of the virus
Klinik Landstrasse, Messerli Institute, Department of Neurology, Vienna, Austria
with CNS structures, investigations of the cerebro-spinal fluid (CSF) did not confirm the presence of the virus in the CSF. Absence of the virus in the CSF has been explained by rapid entering of the virus intra-cellularly, thus being present in the CSF only temporarily for a short time. Accordingly, virus-RNA has been found inside neurons and glial cells.17
Since the infection triggers an immense immune reaction, it has been speculated that the immune reaction is responsible for many or most of the neurological comorbidities in COVID-19 patients. This is even the case for encephalitis, which is often characterised by a negative polymerase chain reaction test for the virus in the CSF and thus interpreted as immune encephalitis. Other immune-mediated CNS/PNS disorders in COVID-19 include limbic encephalitis, cerebral vasculitis, AHNE, cytokine-release syndrome, myoclonus-ataxia syndrome, ADEM, delirium, psychosis, transverse myelitis, isolated cranial nerve palsy, myositis, or myasthenia.
Side effects of treatment have to be clearly delineated from primary or secondary neurological manifestations of the viral infection. Adverse reactions to treatment particularly manifest in the PNS. CNS/PNS diseases due to adverse reactions include cerebral hypoxia, critical ill neuropathy, critical ill myopathy, myasthenic syndrome, myopathy, and toxic neuropathy. Agents with a neurotoxic potential include hydro-chloroquine, which may trigger toxic myopathy, steroids, which may induce mitochondrial myopathy, tocilizumab, which may trigger myositis, and azithromycin, which may cause rhabdomyolysis.
Though the authors state that myasthenia gravis (MG) can be a complication of COVID-19, they cite the paper by Anand et al. who only described five patients with pre-existing MG (four due to antibodies against the acetyl-choline receptor, and one due to antibodies against tyrosine-kinase) who experienced an infection with severe acute respiratory syndrome coronavirus 2 (SARS-CoV-2). Thus, this article cannot be taken as an example of SARS-CoV-2 triggered MG. More appropriate for documenting MG triggered by SARS-CoV-2 is the study by Restivo et al. who described three previously
Western Journal of Emergency Medicine 800 Volume 22, no. 3: May 2021
Neuro-COVID Diverse Pathogenesis Finsterer
neurologically normal patients who developed confirmed MG after onset of the classical manifestations of COVID-19.18
Finally, we do not agree with the listing of MG among the CNS disorders triggered by SARS-CoV-2 in Table 1.1 Myasthenia gravis is a prototypic PNS disorder and should not be mentioned among the CNS but the PNS disorders.Overall, the interesting review has a number of limitations, which need to be accomplished before drawing final conclusions. The spectrum of neurological disease triggered by SARS-CoV-2 is broader than anticipated. Neurological disease possibly results from a direct virus attack, from the immune response, or from side effects of the treatment of pulmonary manifestations.
Address for Correspondence: Josef Finsterer, Messerli Institute, Department of Neuology, Postfach 20, 1180 Vienna, Austria. Email: [email protected].
Conflicts of Interest: By the WestJEM article submission agreement, all authors are required to disclose all affiliations, funding sources and financial or management relationships that could be perceived as potential sources of bias. No author has professional or financial relationships with any companies that are relevant to this study. There are no conflicts of interest or sources of funding to declare.
Copyright: © 2021 Finsterer. This is an open access article distributed in accordance with the terms of the Creative Commons Attribution (CC BY 4.0) License. See: http://creativecommons.org/licenses/by/4.0/
Neuropsiquiatr. 2020;78(10):666. 5. Peng KP. Association between COVID-19 and headache: What
evidence and history tell us. Cephalalgia. 2020;40(13):1403-5. 6. Schellekens MMI, Bleeker-Rovers CP, Keurlings PAJ, et al.
Reversible myoclonus-ataxia as a postinfectious manifestation of COVID-19. Mov Disord Clin Pract. 2020;7:977-9.
7. Guilmot A, Maldonado Slootjes S, Sellimi A, et al. Immune-mediated neurological syndromes in SARS-CoV-2-infected patients. J Neurol. 2020;1-7. In press.
8. Perrin P, Collongues N, Baloglu S, et al. Cytokine release syndrome-associated encephalopathy in patients with COVID-19. Eur J Neurol. 2021;28(1):248-58.
9. Poloni TE, Carlos AF, Cairati M, et al. Prevalence and prognostic value of delirium as the initial presentation of COVID-19 in the elderly with dementia: an Italian retrospective study. EclinicalMedicine. 2020;26:100490.
10. Parra A, Juanes A, Losada CP, et al. Psychotic symptoms in COVID-19 patients. A retrospective descriptive study. Psychiatry Res. 2020;291:113254.
11. Costa Martins D, Branco Ribeiro S, Jesus Pereira I, et al. Unilateral hypoglossal nerve palsy as a Covid-19 sequel: a case report. Am J Phys Med Rehabil. 2020;99(12):1096-8.
12. Gupta L, Lilleker JB, Agarwal V, et al. COVID-19 and myositis - unique challenges for patients. Rheumatology (Oxford). 2021;60(2):907-10.
13. Cabañes-Martínez L, Villadóniga M, González-Rodríguez L, et al. Neuromuscular involvement in COVID-19 critically ill patients. Clin Neurophysiol. 2020;131(12):2809-16.
14. Singh B, Kaur P, Mechineni A, et al. Rhabdomyolysis in COVID-19: report of four cases. Cureus. 2020;12(9):e10686.
15. Yavarpour-Bali H, Ghasemi-Kasman M. Update on neurological manifestations of COVID-19. Life Sci. 2020;257:118063.
16. Pellegrini L, Albecka A, Mallery DL, et al. SARS-CoV-2 Infects the brain choroid plexus and disrupts the blood-CSF barrier in human brain organoids. Cell Stem Cell. 2020;27(6):951-61.e5.
17. Bulfamante G, Chiumello D, Canevini MP, et al. First ultrastructural autoptic findings of SARS-Cov-2 in olfactory pathways and brainstem. Minerva Anestesiol 2020;86(6):678-9.
18. Restivo DA, Centonze D, Alesina A, et al. Myasthenia gravis associated with SARS-CoV-2 infection. Ann Intern Med. 2020;173(12):1027-8.
REFERENCES1. Valiuddin HM, Kalajdzic A, Rosati J, et al. Update on neurological
manifestations of SARS-CoV-2. West J Emerg Med. 2020;21(6):45-51.2. Pavlov V, Beylerli O, Gareev I, et al. COVID-19-related intracerebral
hemorrhage. Front Aging Neurosci. 2020;12:600172.3. Varatharaj A, Thomas N, Ellul MA, et al. Neurological and
neuropsychiatric complications of COVID-19 in 153 patients: a UK-wide surveillance study. Lancet Psychiatry. 2020;7(10):875-82.
4. Pessoa Neto AD, Alves MDM, Brito PSM, et al. Possible acute multifocal demyelinating lesions in a COVID-19 patient. Arq
Volume 22, no. 3: May 2021 801 Western Journal of Emergency Medicine
Letter to the Editor
Emergency Medicine Residents Experience Acute Stress WhileWorking in the Emergency Department
Matthew L. Wong, MD, MPH*Leon D. Sanchez, MD, MPH†
Gregory A. Peters, MD‡
Section Editor: Mark I. Langdorf, MD, MHPESubmission history: Submitted January 28, 2021; Revision received January 28, 2021; Accepted February 5, 2021Electronically published April 28, 2021Full text available through open access at http://escholarship.org/uc/uciem_westjemDOI: 10.5811/westjem.2021.2.51963[West J Emerg Med. 2021;22(3)801.]
Address for Correspondence: Matthew L. Wong, MD, MPH, BethIsrael Deaconess Medical Center, Department of EmergencyMedicine, 1 Deaconess Road, Rosenberg 2nd Floor, Boston, MA02215. Email: [email protected].
Conflicts of Interest: By the WestJEM article submission agreement, all authors are required to disclose all affiliations, funding sources and financial or management relationships that could be perceived as potential sources of bias. No author has professional or financial relationships with any companies that are relevant to this study. There are no conflicts of interest or sources of funding to declare.
Copyright: © 2021 Wong et al. This is an open access article distributed in accordance with the terms of the Creative Commons Attribution (CC BY 4.0) License. See: http://creativecommons.org/licenses/by/4.0/
Beth Israel Deaconess Medical Center, Department of Emergency Medicine,Boston, MassachusettsBrigham and Women’s Faulkner Hospital, Department of EmergencyMedicine, Boston, MassachusettsMassachusetts General Hospital, Department of Emergency Medicine,Boston, Massachusetts
*
†
‡
We were very interested to read the manuscript by Janicki and colleagues, and we are grateful for their contribution to the literature.1 We agree that stress is a major problem for emergency physicians.2 But we had two concerns with the study design.
We performed a similar study with wearable devices and photoplethysmography but had a problem with motion artifact that precluded using all of the collected data in analysis.3 Did the authors also experience any problems with motion artifact interfering with data analysis? It is hard to imagine that there were no problems.
We do not think that the authors made a fair comparison when they measured the heart rate and heart rate variability of subjects during didactics and compared them to clinical shift work. We have previously found that our residents walk on average 2.6 miles per shift, 588 steps per hour.4 The simple physical activity of clinical shift work should cause some change in heart rate variability, which may account for a lot of the observed difference and not stress.
REFERENCES1. Janicki AJ, Frisch SO, Patterson PD, et al. Emergency medicine
residents experience acute stress while working in the emergency department. West J Emerg Med. 2020;22(1):94-100.
2. Wong ML, Anderson J, Knorr T, et al. Grit, anxiety, and stress in emergency physicians. Am J Emerg Med. 2018;36(6):1036-9.
3. Peters GA, Wong ML, Joseph JW, et al. Pulse rate variability in emergency physicians during shifts: pilot cross-sectional study. JMIR Mhealth Uhealth. 2019;7(10):e13909.
4. Peters GA, Wong ML, Sanchez LD. Pedometer-measured physical activity among emergency physicians during shifts. Am J Emerg Med. 2020;38(1):118-21.
Western Journal of Emergency Medicine 802 Volume 22, no. 3: May 2021
Letter to the Editor
Response to: Emergency Medicine Residents Experience Acute Stress While Working in the Emergency Department
Adam J. Janicki, MD, MS*Stephanie O. Frisch, PhD, MSN, RN†
P. Daniel Patterson, PhD, NRP*Aaron Brown, MD*Adam Frisch, MD, MS*
Section Editor: Mark I. Langdorf, MD, MHPE Submission history: Submitted February 11, 2021; Revision received February 11, 2021; Accepted February 11, 2021Electronically published April 28, 2021Full text available through open access at http://escholarship.org/uc/uciem_westjem DOI: 10.5811/westjem.2021.2.52121[West J Emerg Med. 2021;22(3)802.]
We first want to thank Peters and colleagues for their interest in our work. They bring up two notable points in discussing our study.
We utilized three-lead Nasiff CardioHolter monitors to assess physiologic parameters. The raw data was downloaded directly from Holter monitors using Nasiff software and then reviewed by study authors to ensure quality data was obtained. While there was some motion artifact throughout the shift, the majority of the data was reliable with discernible QRS complexes in one of the three leads. We did not quantify the amount of artifact in each reading. This data was then analyzed using the provided software. When designing the study, we felt that a three-lead Holter, although less convenient and comfortable, would afford us additional data over pulse rate sensors. We do acknowledge as a limitation that we cannot account for all data obscured by artifact as we cannot control how the software decides to analyze and provide specific summary measures.
While prior literature has shown heart rate (HR) and heart rate variability (HRV) change during acute stress, their use as a proxy for stress is imperfect with no true gold standard.1 This is evidenced by how different studies operationalize various measures of HRV using different time points. Physical activity while on shift was normally limited to mild intensity walking, standing, and sitting, as evidenced by our HR data (mean 78 beats per minute, maximum 114 beats per minute during clinical work), but we acknowledge that even mild intensity activity may have affected HR and HRV. Prior work has demonstrated that any exercise will decrease HRV and increase HR, but there appears to be an intensity dose-response with HRV reaching a minimum at moderate-high intensity – sustained heart rates of 120-160 beats per minute for 3-10 minutes.2 Obtaining additional baseline data during mild exertion would certainly clarify our findings, but we also acknowledge that there are numerous variables that affect HR and HRV such as time of day, exertion, hydration status, life stressors, age, gender, etc,
University of Pittsburgh, School of Medicine, Department of Emergency Medicine, Pittsburgh, Pennsylvania University of Pittsburgh, School of Nursing, Department of Acute and Tertiary Care, Pittsburgh, Pennsylvania
*
†
and controlling for all of these was not feasible. Future studies should focus on disentangling the physical
activity component of HRV versus the effects of acute stress via interaction with patients in an emergency setting to confirm our findings. We hope that our qualitative data helps inform future work evaluating the acute stress response and the impact of acute stress on EM resident performance.
Address for Correspondence: Adam J. Janicki, MD, University of Pittsburgh, School of Medicine, Department of Emergency Medicine, 230 McKee Pl, Suite 500, Pittsburgh, PA 15213. Email: [email protected].
Conflicts of Interest: By the WestJEM article submission agreement, all authors are required to disclose all affiliations, funding sources and financial or management relationships that could be perceived as potential sources of bias. No author has professional or financial relationships with any companies that are relevant to this study. There are no conflicts of interest or sources of funding to declare.
Copyright: © 2021 Janicki et al. This is an open access article distributed in accordance with the terms of the Creative Commons Attribution (CC BY 4.0) License. See: http://creativecommons.org/licenses/by/4.0/
REFERENCES1. Pulopulos MM, Vanderhasselt MA, De Raedt R. Association
between changes in heart rate variability during the anticipation of a stressful situation and the stress-induced cortisol response. Psychoneuroendocrinology. 2018;94:63-71.
2. Michael S, Graham KS, Davis GM Oam. Cardiac autonomic responses during exercise and post-exercise recovery using heart rate variability and systolic time intervals: a review. Front Physiol. 2017;8:301.

JETem is an online, open access, peer- reviewed journal- repository for EM educators.
VISIT JETem.org to learn more about submissions or if you’re interested in being a JETem reviewer.
CALL FOR SUBMISSIONS
CALL FOR REVIEWERS
Team Based Learning Podcasts Lectures Small Group Learning and Workshops Oral Boards Simulation Curricula Innovations

ACOEP stands with all emergency physicians and providers on the front line. We thank you for your
tireless work and effort.
www.acoep.org
Championing individual physician rights
and workplace fairness
JOIN
CAL/AAEM!
BENEFITS- Western Journal of Emergency Medicine Subscription- CAL/AAEM News Service email updates- Free and discounted registration to CAL/AAEM events- And more!
CAL/AAEM NEWS SERVICE- Healthcare industry news- Public policy- Government issues- Legal cases and court decisions
In collaboration with our official journal
Join the CAL/AAEM Facebook Group to stay up-to-date: www.facebook.com/groups/calaaem
www.aaem.org/calaaemAAEM-0720-255

Western Journal of Em
ergency Medicine
V
OLU
ME 22, N
UM
BER
3, May 2021
PA
GES 457-802
Friday, September 10, 2021Westin San Diego Gaslamp Quarter
SAVE the DATECALIFORNIA ACEP’S ANNUAL CONFERENCE 2021
Education is targeted to Medical Students and Residents, but all are welcome to attend.
Related Documents