UBS ETF – MSCI World UCITS ETF Semi-Annual report as of 30 June 2019 The accompanying notes form an integral part of these financial statements. 225 Schedule of Investments as at 30 June 2019 (Expressed in USD) (Unaudited) Transferable securities listed on an Official Stock Exchange Quantity Market Value USD % of Net Assets Common Stocks Advertising (0.17%) Dentsu 5,500 191,944 0.02 Hakuhodo DY Holdings 7,100 119,541 0.01 Interpublic Group of Companies 9,675 218,558 0.02 JCDecaux 2,881 87,403 0.01 Omnicom Group 6,014 492,847 0.04 Publicis Groupe 6,532 345,376 0.03 WPP 35,236 444,054 0.04 Aerospace & Defense (2.09%) Airbus 15,693 2,228,181 0.20 Arconic 10,384 268,115 0.02 BAE Systems 86,648 546,312 0.05 Boeing 14,640 5,329,106 0.47 Bombardier - Class B 57,200 96,300 0.01 CAE 8,600 231,725 0.02 Dassault Aviation 112 161,218 0.01 Elbit Systems 315 46,898 0.00 General Dynamics 7,042 1,280,377 0.11 HEICO 532 71,187 0.01 HEICO - Class A 1,016 105,024 0.01 IHI 3,100 74,723 0.01 Kawasaki Heavy Industries 3,600 84,637 0.01 L3 Technologies 1,947 477,346 0.04 L3Harris Technologies 3,400 643,042 0.06 Leonardo 11,795 149,701 0.01 Lockheed Martin 6,926 2,517,878 0.22 Meggitt 24,379 162,582 0.02 MTU Aero Engines 1,413 337,112 0.03 Northrop Grumman 4,676 1,510,862 0.13 Raytheon 8,008 1,392,431 0.12 Rolls-Royce Holdings 47,289 505,792 0.05 Safran 8,785 1,289,062 0.11 Spirit AeroSystems Holdings - Class A 2,956 240,530 0.02 Thales 3,222 398,660 0.04 TransDigm Group 1,431 692,318 0.06 United Technologies 22,052 2,871,170 0.25 Agriculture (0.92%) Altria Group 51,795 2,452,493 0.22 Archer-Daniels-Midland 15,521 633,257 0.06 British American Tobacco 62,112 2,173,083 0.19 Bunge 4,253 236,935 0.02 Golden Agri-Resources 310,000 66,447 0.01 Imperial Brands 27,075 636,377 0.06 Japan Tobacco 30,900 682,444 0.06 Philip Morris International 42,560 3,342,237 0.29 Swedish Match 3,861 163,126 0.01 Airlines (0.10%) American Airlines Group 2,469 80,514 0.01 ANA Holdings 4,200 139,090 0.01 Delta Air Lines 4,700 266,725 0.02 Deutsche Lufthansa - Registered 7,803 133,913 0.01 easyJet 4,650 56,411 0.00 Japan Airlines 3,400 108,652 0.01 Singapore Airlines 10,000 68,517 0.01 Southwest Airlines 3,360 170,621 0.02 United Continental Holdings 1,570 137,454 0.01 Apparel (1.07%) adidas 5,005 1,547,468 0.14 Burberry Group 11,230 266,125 0.02 Gildan Activewear 4,124 159,942 0.01 Hanesbrands 11,400 196,308 0.02 Hermes International 919 663,727 0.06

Welcome message from author
This document is posted to help you gain knowledge. Please leave a comment to let me know what you think about it! Share it to your friends and learn new things together.
Transcript

UBS ETF – MSCI World UCITS ETF
Semi-Annual report as of 30 June 2019
The accompanying notes form an integral part of these financial statements.
225
Schedule of Investments as at 30 June 2019 (Expressed in USD) (Unaudited)
Transferable securities listed on an Official Stock Exchange
Quantity Market
Value USD % of
Net Assets
Common Stocks
Advertising (0.17%) Dentsu 5,500 191,944 0.02Hakuhodo DY Holdings 7,100 119,541 0.01Interpublic Group of Companies 9,675 218,558 0.02JCDecaux 2,881 87,403 0.01Omnicom Group 6,014 492,847 0.04Publicis Groupe 6,532 345,376 0.03WPP 35,236 444,054 0.04
Aerospace & Defense (2.09%) Airbus 15,693 2,228,181 0.20Arconic 10,384 268,115 0.02BAE Systems 86,648 546,312 0.05Boeing 14,640 5,329,106 0.47Bombardier - Class B 57,200 96,300 0.01CAE 8,600 231,725 0.02Dassault Aviation 112 161,218 0.01Elbit Systems 315 46,898 0.00General Dynamics 7,042 1,280,377 0.11HEICO 532 71,187 0.01HEICO - Class A 1,016 105,024 0.01IHI 3,100 74,723 0.01Kawasaki Heavy Industries 3,600 84,637 0.01L3 Technologies 1,947 477,346 0.04L3Harris Technologies 3,400 643,042 0.06Leonardo 11,795 149,701 0.01Lockheed Martin 6,926 2,517,878 0.22Meggitt 24,379 162,582 0.02MTU Aero Engines 1,413 337,112 0.03Northrop Grumman 4,676 1,510,862 0.13Raytheon 8,008 1,392,431 0.12Rolls-Royce Holdings 47,289 505,792 0.05Safran 8,785 1,289,062 0.11Spirit AeroSystems Holdings - Class A 2,956 240,530 0.02Thales 3,222 398,660 0.04TransDigm Group 1,431 692,318 0.06United Technologies 22,052 2,871,170 0.25
Agriculture (0.92%) Altria Group 51,795 2,452,493 0.22Archer-Daniels-Midland 15,521 633,257 0.06British American Tobacco 62,112 2,173,083 0.19Bunge 4,253 236,935 0.02Golden Agri-Resources 310,000 66,447 0.01Imperial Brands 27,075 636,377 0.06Japan Tobacco 30,900 682,444 0.06Philip Morris International 42,560 3,342,237 0.29Swedish Match 3,861 163,126 0.01
Airlines (0.10%) American Airlines Group 2,469 80,514 0.01ANA Holdings 4,200 139,090 0.01Delta Air Lines 4,700 266,725 0.02Deutsche Lufthansa - Registered 7,803 133,913 0.01easyJet 4,650 56,411 0.00Japan Airlines 3,400 108,652 0.01Singapore Airlines 10,000 68,517 0.01Southwest Airlines 3,360 170,621 0.02United Continental Holdings 1,570 137,454 0.01
Apparel (1.07%) adidas 5,005 1,547,468 0.14Burberry Group 11,230 266,125 0.02Gildan Activewear 4,124 159,942 0.01Hanesbrands 11,400 196,308 0.02Hermes International 919 663,727 0.06
UBS ETF – MSCI World UCITS ETF
Semi-Annual report as of 30 June 2019
The accompanying notes form an integral part of these financial statements.
226
Schedule of Investments as at 30 June 2019 (Expressed in USD) (Unaudited)
Transferable securities listed on an Official Stock Exchange
Quantity Market
Value USD % of
Net Assets
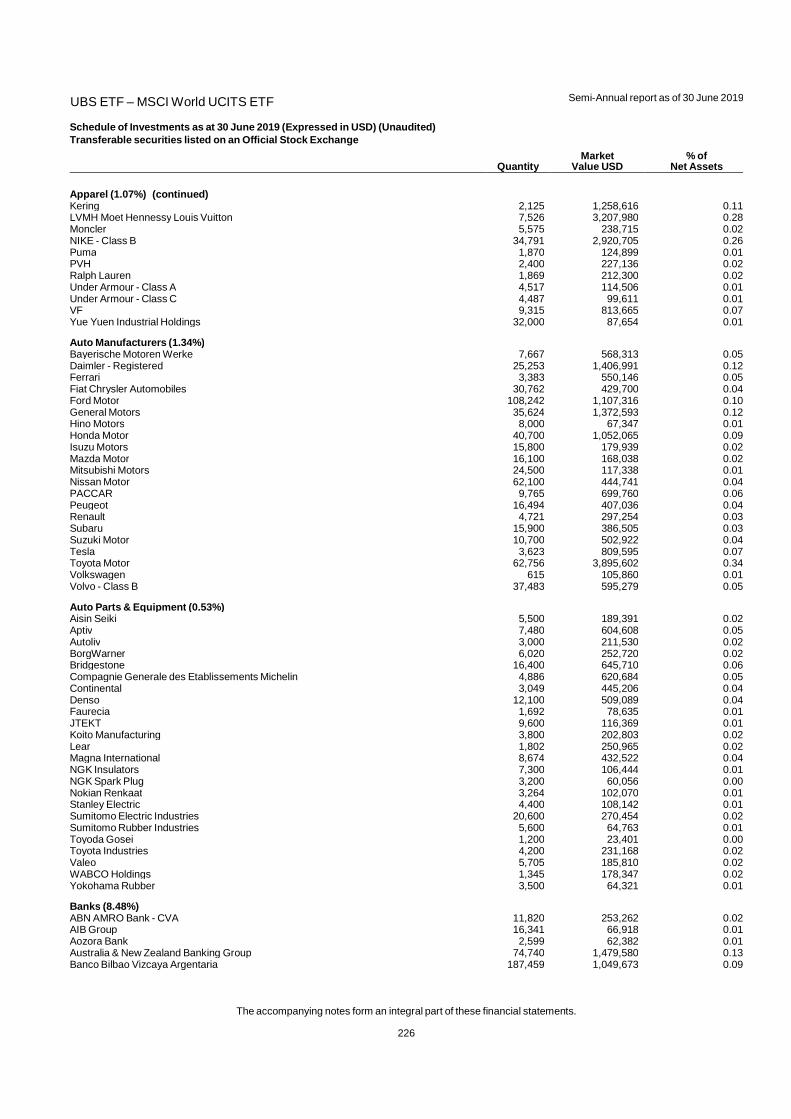
Apparel (1.07%) (continued) Kering 2,125 1,258,616 0.11LVMH Moet Hennessy Louis Vuitton 7,526 3,207,980 0.28Moncler 5,575 238,715 0.02NIKE - Class B 34,791 2,920,705 0.26Puma 1,870 124,899 0.01PVH 2,400 227,136 0.02Ralph Lauren 1,869 212,300 0.02Under Armour - Class A 4,517 114,506 0.01Under Armour - Class C 4,487 99,611 0.01VF 9,315 813,665 0.07Yue Yuen Industrial Holdings 32,000 87,654 0.01
Auto Manufacturers (1.34%) Bayerische Motoren Werke 7,667 568,313 0.05Daimler - Registered 25,253 1,406,991 0.12Ferrari 3,383 550,146 0.05Fiat Chrysler Automobiles 30,762 429,700 0.04Ford Motor 108,242 1,107,316 0.10General Motors 35,624 1,372,593 0.12Hino Motors 8,000 67,347 0.01Honda Motor 40,700 1,052,065 0.09Isuzu Motors 15,800 179,939 0.02Mazda Motor 16,100 168,038 0.02Mitsubishi Motors 24,500 117,338 0.01Nissan Motor 62,100 444,741 0.04PACCAR 9,765 699,760 0.06Peugeot 16,494 407,036 0.04Renault 4,721 297,254 0.03Subaru 15,900 386,505 0.03Suzuki Motor 10,700 502,922 0.04Tesla 3,623 809,595 0.07Toyota Motor 62,756 3,895,602 0.34Volkswagen 615 105,860 0.01Volvo - Class B 37,483 595,279 0.05
Auto Parts & Equipment (0.53%) Aisin Seiki 5,500 189,391 0.02Aptiv 7,480 604,608 0.05Autoliv 3,000 211,530 0.02BorgWarner 6,020 252,720 0.02Bridgestone 16,400 645,710 0.06Compagnie Generale des Etablissements Michelin 4,886 620,684 0.05Continental 3,049 445,206 0.04Denso 12,100 509,089 0.04Faurecia 1,692 78,635 0.01JTEKT 9,600 116,369 0.01Koito Manufacturing 3,800 202,803 0.02Lear 1,802 250,965 0.02Magna International 8,674 432,522 0.04NGK Insulators 7,300 106,444 0.01NGK Spark Plug 3,200 60,056 0.00Nokian Renkaat 3,264 102,070 0.01Stanley Electric 4,400 108,142 0.01Sumitomo Electric Industries 20,600 270,454 0.02Sumitomo Rubber Industries 5,600 64,763 0.01Toyoda Gosei 1,200 23,401 0.00Toyota Industries 4,200 231,168 0.02Valeo 5,705 185,810 0.02WABCO Holdings 1,345 178,347 0.02Yokohama Rubber 3,500 64,321 0.01
Banks (8.48%) ABN AMRO Bank - CVA 11,820 253,262 0.02AIB Group 16,341 66,918 0.01Aozora Bank 2,599 62,382 0.01Australia & New Zealand Banking Group 74,740 1,479,580 0.13Banco Bilbao Vizcaya Argentaria 187,459 1,049,673 0.09
UBS ETF – MSCI World UCITS ETF
Semi-Annual report as of 30 June 2019
The accompanying notes form an integral part of these financial statements.
227
Schedule of Investments as at 30 June 2019 (Expressed in USD) (Unaudited)
Transferable securities listed on an Official Stock Exchange
Quantity Market
Value USD % of
Net Assets
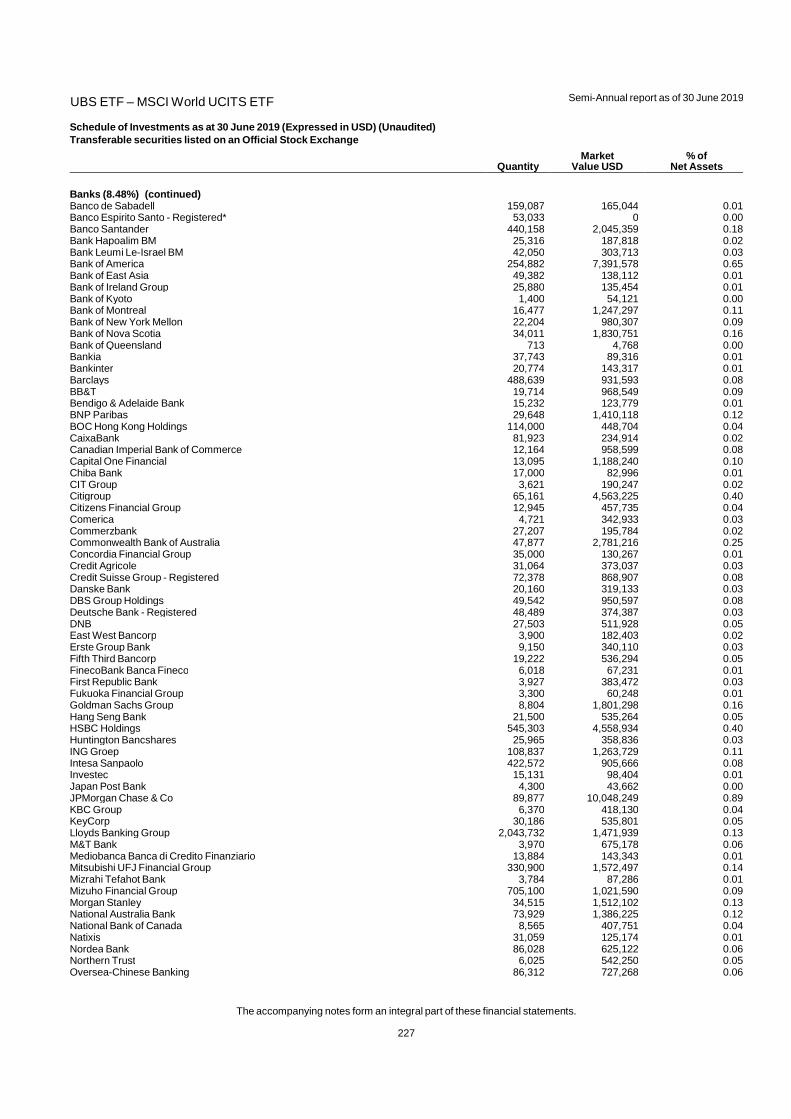
Banks (8.48%) (continued) Banco de Sabadell 159,087 165,044 0.01Banco Espirito Santo - Registered* 53,033 0 0.00Banco Santander 440,158 2,045,359 0.18Bank Hapoalim BM 25,316 187,818 0.02Bank Leumi Le-Israel BM 42,050 303,713 0.03Bank of America 254,882 7,391,578 0.65Bank of East Asia 49,382 138,112 0.01Bank of Ireland Group 25,880 135,454 0.01Bank of Kyoto 1,400 54,121 0.00Bank of Montreal 16,477 1,247,297 0.11Bank of New York Mellon 22,204 980,307 0.09Bank of Nova Scotia 34,011 1,830,751 0.16Bank of Queensland 713 4,768 0.00Bankia 37,743 89,316 0.01Bankinter 20,774 143,317 0.01Barclays 488,639 931,593 0.08BB&T 19,714 968,549 0.09Bendigo & Adelaide Bank 15,232 123,779 0.01BNP Paribas 29,648 1,410,118 0.12BOC Hong Kong Holdings 114,000 448,704 0.04CaixaBank 81,923 234,914 0.02Canadian Imperial Bank of Commerce 12,164 958,599 0.08Capital One Financial 13,095 1,188,240 0.10Chiba Bank 17,000 82,996 0.01CIT Group 3,621 190,247 0.02Citigroup 65,161 4,563,225 0.40Citizens Financial Group 12,945 457,735 0.04Comerica 4,721 342,933 0.03Commerzbank 27,207 195,784 0.02Commonwealth Bank of Australia 47,877 2,781,216 0.25Concordia Financial Group 35,000 130,267 0.01Credit Agricole 31,064 373,037 0.03Credit Suisse Group - Registered 72,378 868,907 0.08Danske Bank 20,160 319,133 0.03DBS Group Holdings 49,542 950,597 0.08Deutsche Bank - Registered 48,489 374,387 0.03DNB 27,503 511,928 0.05East West Bancorp 3,900 182,403 0.02Erste Group Bank 9,150 340,110 0.03Fifth Third Bancorp 19,222 536,294 0.05FinecoBank Banca Fineco 6,018 67,231 0.01First Republic Bank 3,927 383,472 0.03Fukuoka Financial Group 3,300 60,248 0.01Goldman Sachs Group 8,804 1,801,298 0.16Hang Seng Bank 21,500 535,264 0.05HSBC Holdings 545,303 4,558,934 0.40Huntington Bancshares 25,965 358,836 0.03ING Groep 108,837 1,263,729 0.11Intesa Sanpaolo 422,572 905,666 0.08Investec 15,131 98,404 0.01Japan Post Bank 4,300 43,662 0.00JPMorgan Chase & Co 89,877 10,048,249 0.89KBC Group 6,370 418,130 0.04KeyCorp 30,186 535,801 0.05Lloyds Banking Group 2,043,732 1,471,939 0.13M&T Bank 3,970 675,178 0.06Mediobanca Banca di Credito Finanziario 13,884 143,343 0.01Mitsubishi UFJ Financial Group 330,900 1,572,497 0.14Mizrahi Tefahot Bank 3,784 87,286 0.01Mizuho Financial Group 705,100 1,021,590 0.09Morgan Stanley 34,515 1,512,102 0.13National Australia Bank 73,929 1,386,225 0.12National Bank of Canada 8,565 407,751 0.04Natixis 31,059 125,174 0.01Nordea Bank 86,028 625,122 0.06Northern Trust 6,025 542,250 0.05Oversea-Chinese Banking 86,312 727,268 0.06
UBS ETF – MSCI World UCITS ETF
Semi-Annual report as of 30 June 2019
The accompanying notes form an integral part of these financial statements.
228
Schedule of Investments as at 30 June 2019 (Expressed in USD) (Unaudited)
Transferable securities listed on an Official Stock Exchange
Quantity Market
Value USD % of
Net Assets
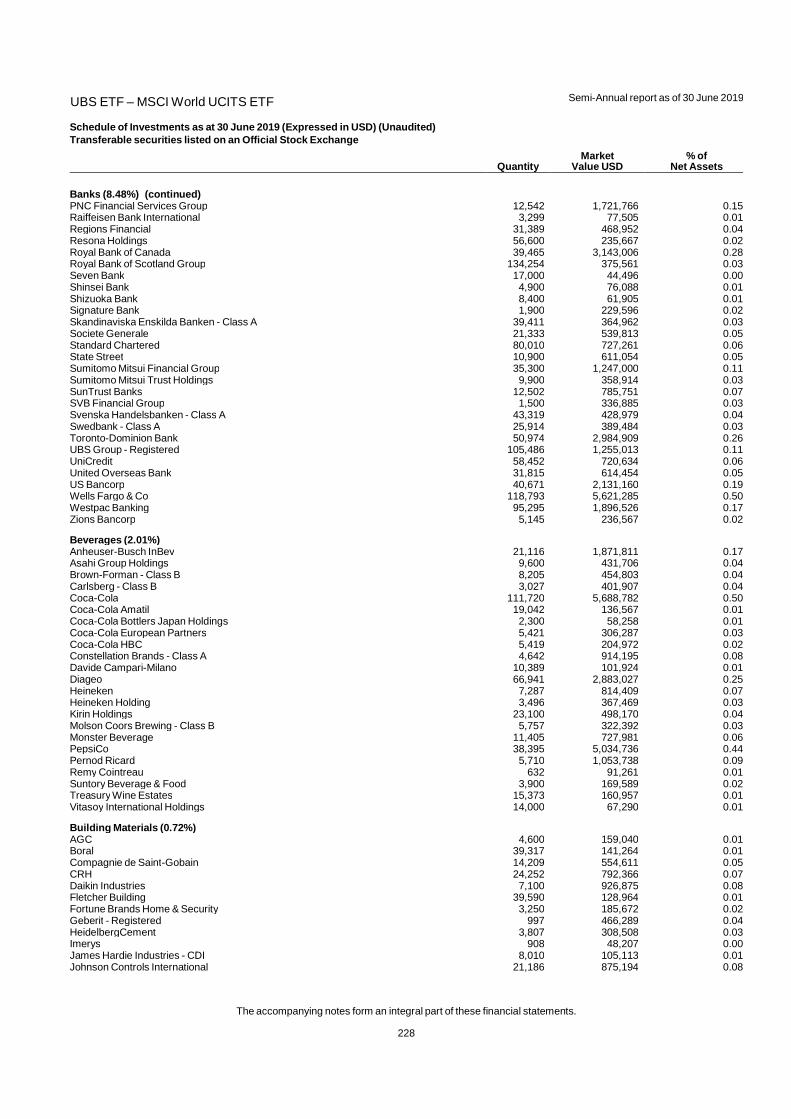
Banks (8.48%) (continued) PNC Financial Services Group 12,542 1,721,766 0.15Raiffeisen Bank International 3,299 77,505 0.01Regions Financial 31,389 468,952 0.04Resona Holdings 56,600 235,667 0.02Royal Bank of Canada 39,465 3,143,006 0.28Royal Bank of Scotland Group 134,254 375,561 0.03Seven Bank 17,000 44,496 0.00Shinsei Bank 4,900 76,088 0.01Shizuoka Bank 8,400 61,905 0.01Signature Bank 1,900 229,596 0.02Skandinaviska Enskilda Banken - Class A 39,411 364,962 0.03Societe Generale 21,333 539,813 0.05Standard Chartered 80,010 727,261 0.06State Street 10,900 611,054 0.05Sumitomo Mitsui Financial Group 35,300 1,247,000 0.11Sumitomo Mitsui Trust Holdings 9,900 358,914 0.03SunTrust Banks 12,502 785,751 0.07SVB Financial Group 1,500 336,885 0.03Svenska Handelsbanken - Class A 43,319 428,979 0.04Swedbank - Class A 25,914 389,484 0.03Toronto-Dominion Bank 50,974 2,984,909 0.26UBS Group - Registered 105,486 1,255,013 0.11UniCredit 58,452 720,634 0.06United Overseas Bank 31,815 614,454 0.05US Bancorp 40,671 2,131,160 0.19Wells Fargo & Co 118,793 5,621,285 0.50Westpac Banking 95,295 1,896,526 0.17Zions Bancorp 5,145 236,567 0.02
Beverages (2.01%) Anheuser-Busch InBev 21,116 1,871,811 0.17Asahi Group Holdings 9,600 431,706 0.04Brown-Forman - Class B 8,205 454,803 0.04Carlsberg - Class B 3,027 401,907 0.04Coca-Cola 111,720 5,688,782 0.50Coca-Cola Amatil 19,042 136,567 0.01Coca-Cola Bottlers Japan Holdings 2,300 58,258 0.01Coca-Cola European Partners 5,421 306,287 0.03Coca-Cola HBC 5,419 204,972 0.02Constellation Brands - Class A 4,642 914,195 0.08Davide Campari-Milano 10,389 101,924 0.01Diageo 66,941 2,883,027 0.25Heineken 7,287 814,409 0.07Heineken Holding 3,496 367,469 0.03Kirin Holdings 23,100 498,170 0.04Molson Coors Brewing - Class B 5,757 322,392 0.03Monster Beverage 11,405 727,981 0.06PepsiCo 38,395 5,034,736 0.44Pernod Ricard 5,710 1,053,738 0.09Remy Cointreau 632 91,261 0.01Suntory Beverage & Food 3,900 169,589 0.02Treasury Wine Estates 15,373 160,957 0.01Vitasoy International Holdings 14,000 67,290 0.01
Building Materials (0.72%) AGC 4,600 159,040 0.01Boral 39,317 141,264 0.01Compagnie de Saint-Gobain 14,209 554,611 0.05CRH 24,252 792,366 0.07Daikin Industries 7,100 926,875 0.08Fletcher Building 39,590 128,964 0.01Fortune Brands Home & Security 3,250 185,672 0.02Geberit - Registered 997 466,289 0.04HeidelbergCement 3,807 308,508 0.03Imerys 908 48,207 0.00James Hardie Industries - CDI 8,010 105,113 0.01Johnson Controls International 21,186 875,194 0.08

UBS ETF – MSCI World UCITS ETF
Semi-Annual report as of 30 June 2019
The accompanying notes form an integral part of these financial statements.
229
Schedule of Investments as at 30 June 2019 (Expressed in USD) (Unaudited)
Transferable securities listed on an Official Stock Exchange
Quantity Market
Value USD % of
Net Assets
Building Materials (0.72%) (continued) Kingspan Group 2,536 137,931 0.01LafargeHolcim - Registered - CH 6,018 294,234 0.03LafargeHolcim - Registered - FR 6,367 311,347 0.03Lennox International 900 247,500 0.02LIXIL Group 4,700 74,335 0.01Martin Marietta Materials 1,718 395,329 0.03Masco 7,962 312,429 0.03Owens Corning 2,291 133,336 0.01Rinnai 1,100 69,937 0.01Sika - Registered 3,780 645,895 0.06Taiheiyo Cement 3,300 99,851 0.01TOTO 4,500 177,720 0.01Vulcan Materials 3,851 528,781 0.05
Chemicals (2.26%) Air Liquide 11,893 1,666,559 0.15Air Products & Chemicals 6,084 1,377,235 0.12Air Water 4,000 68,461 0.01Akzo Nobel 6,629 623,858 0.06Albemarle 2,267 159,619 0.01Arkema 1,993 185,610 0.02Asahi Kasei 33,900 361,371 0.03Axalta Coating Systems 6,800 202,436 0.02Basf 25,291 1,840,986 0.16Brenntag 4,962 244,733 0.02Celanese - Class A 3,222 347,332 0.03CF Industries Holdings 5,981 279,373 0.02Chemours 5,400 129,600 0.01Clariant - Registered 4,397 89,496 0.01Corteva 21,072 623,099 0.05Covestro 5,794 295,006 0.03Croda International 3,702 241,231 0.02Daicel 5,200 46,237 0.00Dow 21,072 1,039,060 0.09DuPont de Nemours 21,072 1,581,875 0.14Eastman Chemical 3,586 279,098 0.02EMS-Chemie Holding - Registered 270 175,431 0.02Evonik Industries 3,202 93,385 0.01FMC 4,200 348,390 0.03Givaudan - Registered 248 701,013 0.06Hitachi Chemical 1,900 51,600 0.00Incitec Pivot 54,648 130,771 0.01International Flavors & Fragrances - IL 241 34,671 0.00International Flavors & Fragrances - US 2,366 343,283 0.03Israel Chemicals 16,505 86,492 0.01Johnson Matthey 5,543 234,847 0.02JSR 5,400 85,255 0.01Kaneka 2,200 82,699 0.01Kansai Paint 2,700 56,611 0.00Koninklijke DSM 4,785 592,324 0.05Kuraray 5,500 65,700 0.01Lanxess 3,017 179,553 0.02Linde - DE 6,531 1,313,835 0.12Linde - US 8,439 1,694,551 0.15LyondellBasell Industries - Class A 7,703 663,459 0.06Methanex 2,000 90,989 0.01Mitsubishi Chemical Holdings 35,600 248,678 0.02Mitsubishi Gas Chemical 2,400 31,988 0.00Mitsui Chemicals 3,500 86,639 0.01Mosaic 9,755 244,168 0.02Nippon Paint Holdings 5,300 205,625 0.02Nissan Chemical 3,500 157,718 0.01Nitto Denko 5,100 251,686 0.02Novozymes - Class B 5,885 274,855 0.02Nutrien 15,451 828,271 0.07PPG Industries 6,044 705,395 0.06Sherwin-Williams 2,468 1,131,060 0.10
UBS ETF – MSCI World UCITS ETF
Semi-Annual report as of 30 June 2019
The accompanying notes form an integral part of these financial statements.
230
Schedule of Investments as at 30 June 2019 (Expressed in USD) (Unaudited)
Transferable securities listed on an Official Stock Exchange
Quantity Market
Value USD % of
Net Assets
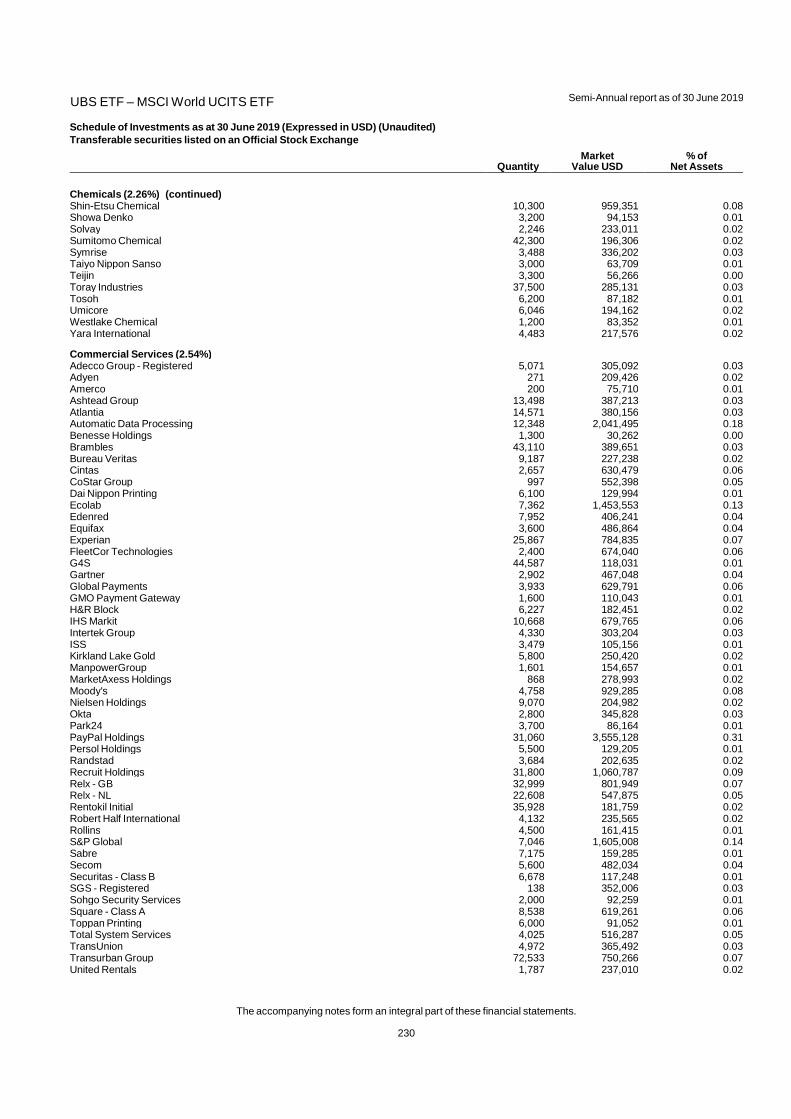
Chemicals (2.26%) (continued) Shin-Etsu Chemical 10,300 959,351 0.08Showa Denko 3,200 94,153 0.01Solvay 2,246 233,011 0.02Sumitomo Chemical 42,300 196,306 0.02Symrise 3,488 336,202 0.03Taiyo Nippon Sanso 3,000 63,709 0.01Teijin 3,300 56,266 0.00Toray Industries 37,500 285,131 0.03Tosoh 6,200 87,182 0.01Umicore 6,046 194,162 0.02Westlake Chemical 1,200 83,352 0.01Yara International 4,483 217,576 0.02
Commercial Services (2.54%) Adecco Group - Registered 5,071 305,092 0.03Adyen 271 209,426 0.02Amerco 200 75,710 0.01Ashtead Group 13,498 387,213 0.03Atlantia 14,571 380,156 0.03Automatic Data Processing 12,348 2,041,495 0.18Benesse Holdings 1,300 30,262 0.00Brambles 43,110 389,651 0.03Bureau Veritas 9,187 227,238 0.02Cintas 2,657 630,479 0.06CoStar Group 997 552,398 0.05Dai Nippon Printing 6,100 129,994 0.01Ecolab 7,362 1,453,553 0.13Edenred 7,952 406,241 0.04Equifax 3,600 486,864 0.04Experian 25,867 784,835 0.07FleetCor Technologies 2,400 674,040 0.06G4S 44,587 118,031 0.01Gartner 2,902 467,048 0.04Global Payments 3,933 629,791 0.06GMO Payment Gateway 1,600 110,043 0.01H&R Block 6,227 182,451 0.02IHS Markit 10,668 679,765 0.06Intertek Group 4,330 303,204 0.03ISS 3,479 105,156 0.01Kirkland Lake Gold 5,800 250,420 0.02ManpowerGroup 1,601 154,657 0.01MarketAxess Holdings 868 278,993 0.02Moody's 4,758 929,285 0.08Nielsen Holdings 9,070 204,982 0.02Okta 2,800 345,828 0.03Park24 3,700 86,164 0.01PayPal Holdings 31,060 3,555,128 0.31Persol Holdings 5,500 129,205 0.01Randstad 3,684 202,635 0.02Recruit Holdings 31,800 1,060,787 0.09Relx - GB 32,999 801,949 0.07Relx - NL 22,608 547,875 0.05Rentokil Initial 35,928 181,759 0.02Robert Half International 4,132 235,565 0.02Rollins 4,500 161,415 0.01S&P Global 7,046 1,605,008 0.14Sabre 7,175 159,285 0.01Secom 5,600 482,034 0.04Securitas - Class B 6,678 117,248 0.01SGS - Registered 138 352,006 0.03Sohgo Security Services 2,000 92,259 0.01Square - Class A 8,538 619,261 0.06Toppan Printing 6,000 91,052 0.01Total System Services 4,025 516,287 0.05TransUnion 4,972 365,492 0.03Transurban Group 72,533 750,266 0.07United Rentals 1,787 237,010 0.02

UBS ETF – MSCI World UCITS ETF
Semi-Annual report as of 30 June 2019
The accompanying notes form an integral part of these financial statements.
231
Schedule of Investments as at 30 June 2019 (Expressed in USD) (Unaudited)
Transferable securities listed on an Official Stock Exchange
Quantity Market
Value USD % of
Net Assets
Commercial Services (2.54%) (continued) Verisk Analytics 4,296 629,192 0.06Western Union 12,967 257,914 0.02Wirecard 3,359 566,325 0.05Worldpay - Class A - GB 2,522 309,071 0.03Worldpay - Class A - US 5,847 716,550 0.06
Computers (3.64%) Accenture - Class A 17,985 3,323,088 0.29Apple 129,225 25,576,212 2.25Atos 2,576 215,675 0.02Capgemini 3,878 482,919 0.04CGI 7,100 547,027 0.05Check Point Software Technologies 3,436 397,236 0.03Cognizant Technology Solutions - Class A 16,218 1,028,059 0.09Computershare 11,018 125,334 0.01CyberArk Software 900 115,056 0.01Dell Technologies - Class C 4,573 232,308 0.02DXC Technology 7,317 403,533 0.04EPAM Systems 1,040 180,024 0.02Fortinet 4,095 314,619 0.03Fujitsu 5,100 355,589 0.03Hewlett Packard Enterprise 34,257 512,142 0.05HP 44,836 932,140 0.08Ingenico Group 1,820 161,208 0.01International Business Machines 24,094 3,322,563 0.29Leidos Holdings 4,200 335,370 0.03NEC 7,500 295,155 0.03NetApp 7,206 444,610 0.04Nomura Research Institute 10,998 176,291 0.02NTT Data 16,100 214,437 0.02Obic 1,800 203,824 0.02Otsuka 2,400 96,566 0.01Seagate Technology 6,530 307,694 0.03TDK 3,600 278,671 0.02Teleperformance 1,541 309,212 0.03Western Digital 7,631 362,854 0.03
Cosmetics & Personal Care (1.78%) Beiersdorf 2,829 340,047 0.03Colgate-Palmolive 22,746 1,630,206 0.14Coty - Class A 10,764 144,238 0.01Essity - Class B 15,495 476,630 0.04Estee Lauder Companies - Class A 5,880 1,076,687 0.10Kao 13,300 1,013,486 0.09Kose 1,000 167,719 0.02Lion 8,200 152,751 0.01L'Oreal 7,085 2,021,134 0.18Pigeon 2,000 80,471 0.01Pola Orbis Holdings 1,200 33,525 0.00Procter & Gamble 69,045 7,570,784 0.67Shiseido 10,600 798,985 0.07Unicharm 10,900 328,194 0.03Unilever 30,099 1,874,936 0.17Unilever - CVA 39,901 2,433,728 0.21
Distribution & Wholesale (0.52%) Bunzl 8,828 233,359 0.02Copart 6,300 470,862 0.04Fastenal 16,114 525,155 0.05Ferguson 6,588 469,535 0.04HD Supply Holdings 4,513 181,784 0.02ITOCHU 35,000 669,366 0.06Jardine Cycle & Carriage 1,876 50,236 0.00LKQ 9,800 260,778 0.02Marubeni 44,100 291,844 0.03Mitsubishi 34,000 896,232 0.08Mitsui & Co 47,700 776,553 0.07

UBS ETF – MSCI World UCITS ETF
Semi-Annual report as of 30 June 2019
The accompanying notes form an integral part of these financial statements.
232
Schedule of Investments as at 30 June 2019 (Expressed in USD) (Unaudited)
Transferable securities listed on an Official Stock Exchange
Quantity Market
Value USD % of
Net Assets
Distribution & Wholesale (0.52%) (continued) Sumitomo 33,700 510,630 0.04Toyota Tsusho 7,700 233,344 0.02WW Grainger 1,387 372,035 0.03
Diversified Financial Services (3.20%) Acom 5,500 19,807 0.00AEON Financial Service 3,500 56,363 0.01Affiliated Managers Group 1,155 106,422 0.01Alliance Data Systems 1,071 150,079 0.01Ally Financial 11,107 344,206 0.03American Express 19,615 2,421,276 0.21Ameriprise Financial 3,637 527,947 0.05Amundi 1,480 103,485 0.01ASX 4,821 278,669 0.02BlackRock 3,353 1,573,563 0.14Cboe Global Markets 3,200 331,616 0.03Charles Schwab 33,888 1,361,959 0.12CI Financial 5,300 86,552 0.01CME Group 10,112 1,962,840 0.17Credit Saison 5,200 60,861 0.01Daiwa Securities Group 38,600 169,139 0.01Deutsche Boerse 5,059 716,692 0.06Discover Financial Services 9,192 713,207 0.06E*TRADE Financial 7,136 318,266 0.03Eaton Vance 3,517 151,688 0.01Franklin Resources 7,707 268,204 0.02Hargreaves Lansdown 7,190 175,602 0.02Hong Kong Exchanges & Clearing 34,814 1,229,018 0.11IGM Financial 4,000 114,452 0.01Intercontinental Exchange 15,806 1,358,368 0.12Invesco 8,679 177,572 0.02Japan Exchange Group 13,600 216,106 0.02Jefferies Financial Group 10,047 193,204 0.02Julius Baer Group 5,740 255,857 0.02London Stock Exchange Group 8,743 610,439 0.05Macquarie Group 8,854 779,085 0.07Mastercard - Class A 25,357 6,707,687 0.59Mebuki Financial Group 25,740 67,133 0.01Mitsubishi UFJ Lease & Finance 10,000 52,998 0.00Nasdaq 3,400 326,978 0.03Nomura Holdings 92,500 325,733 0.03ORIX 38,000 567,143 0.05Partners Group Holding 542 426,373 0.04Raymond James Financial 2,876 243,166 0.02Schroders 3,267 126,816 0.01SEI Investments 4,151 232,871 0.02Singapore Exchange 21,100 123,517 0.01Standard Life Aberdeen 66,930 250,946 0.02Synchrony Financial 16,479 571,327 0.05T Rowe Price Group 6,740 739,445 0.07TD Ameritrade Holding 8,251 411,890 0.04Visa - Class A 47,935 8,319,119 0.73
Electric (2.87%) AES 15,556 260,719 0.02AGL Energy 16,643 233,701 0.02Alliant Energy 6,828 335,118 0.03Ameren 6,389 479,878 0.04American Electric Power 13,951 1,227,827 0.11Atco - Class I 2,600 87,824 0.01AusNet Services 82,000 107,894 0.01CenterPoint Energy 13,242 379,118 0.03Chubu Electric Power 18,200 255,330 0.02Chugoku Electric Power 9,400 118,482 0.01CLP Holdings 46,000 507,546 0.05CMS Energy 7,333 424,654 0.04Consolidated Edison 8,344 731,602 0.07
UBS ETF – MSCI World UCITS ETF
Semi-Annual report as of 30 June 2019
The accompanying notes form an integral part of these financial statements.
233
Schedule of Investments as at 30 June 2019 (Expressed in USD) (Unaudited)
Transferable securities listed on an Official Stock Exchange
Quantity Market
Value USD % of
Net Assets
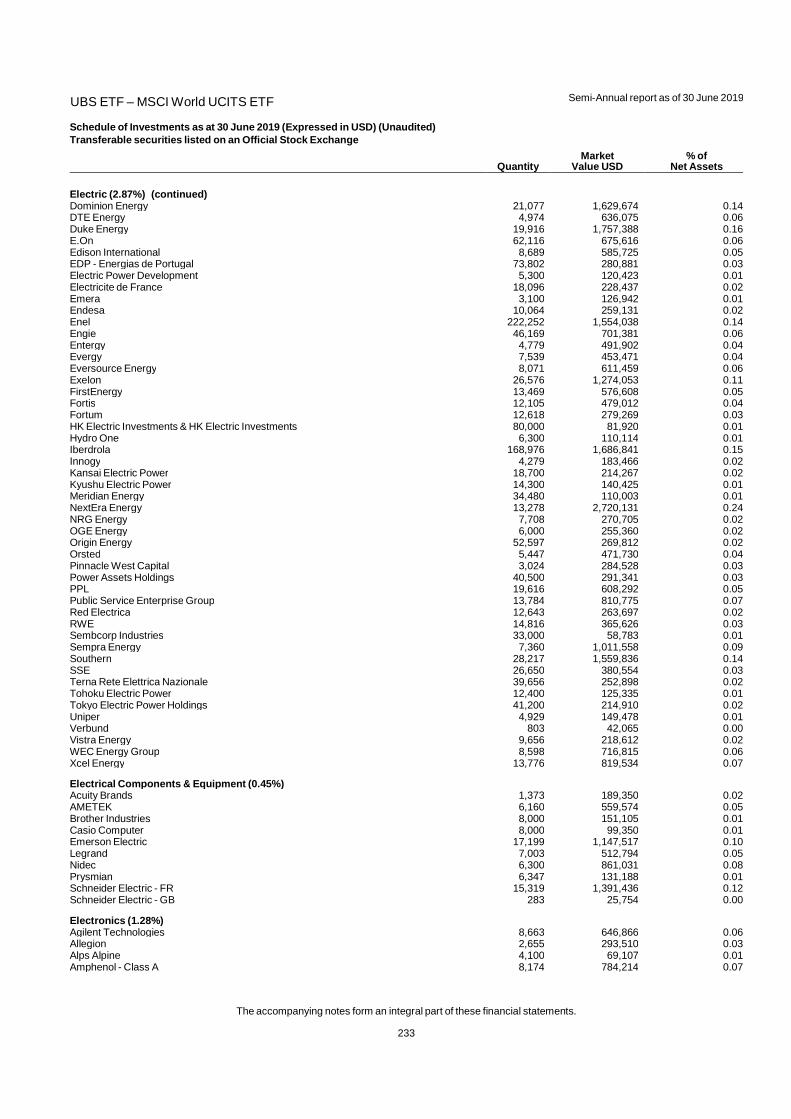
Electric (2.87%) (continued) Dominion Energy 21,077 1,629,674 0.14DTE Energy 4,974 636,075 0.06Duke Energy 19,916 1,757,388 0.16E.On 62,116 675,616 0.06Edison International 8,689 585,725 0.05EDP - Energias de Portugal 73,802 280,881 0.03Electric Power Development 5,300 120,423 0.01Electricite de France 18,096 228,437 0.02Emera 3,100 126,942 0.01Endesa 10,064 259,131 0.02Enel 222,252 1,554,038 0.14Engie 46,169 701,381 0.06Entergy 4,779 491,902 0.04Evergy 7,539 453,471 0.04Eversource Energy 8,071 611,459 0.06Exelon 26,576 1,274,053 0.11FirstEnergy 13,469 576,608 0.05Fortis 12,105 479,012 0.04Fortum 12,618 279,269 0.03HK Electric Investments & HK Electric Investments 80,000 81,920 0.01Hydro One 6,300 110,114 0.01Iberdrola 168,976 1,686,841 0.15Innogy 4,279 183,466 0.02Kansai Electric Power 18,700 214,267 0.02Kyushu Electric Power 14,300 140,425 0.01Meridian Energy 34,480 110,003 0.01NextEra Energy 13,278 2,720,131 0.24NRG Energy 7,708 270,705 0.02OGE Energy 6,000 255,360 0.02Origin Energy 52,597 269,812 0.02Orsted 5,447 471,730 0.04Pinnacle West Capital 3,024 284,528 0.03Power Assets Holdings 40,500 291,341 0.03PPL 19,616 608,292 0.05Public Service Enterprise Group 13,784 810,775 0.07Red Electrica 12,643 263,697 0.02RWE 14,816 365,626 0.03Sembcorp Industries 33,000 58,783 0.01Sempra Energy 7,360 1,011,558 0.09Southern 28,217 1,559,836 0.14SSE 26,650 380,554 0.03Terna Rete Elettrica Nazionale 39,656 252,898 0.02Tohoku Electric Power 12,400 125,335 0.01Tokyo Electric Power Holdings 41,200 214,910 0.02Uniper 4,929 149,478 0.01Verbund 803 42,065 0.00Vistra Energy 9,656 218,612 0.02WEC Energy Group 8,598 716,815 0.06Xcel Energy 13,776 819,534 0.07
Electrical Components & Equipment (0.45%) Acuity Brands 1,373 189,350 0.02AMETEK 6,160 559,574 0.05Brother Industries 8,000 151,105 0.01Casio Computer 8,000 99,350 0.01Emerson Electric 17,199 1,147,517 0.10Legrand 7,003 512,794 0.05Nidec 6,300 861,031 0.08Prysmian 6,347 131,188 0.01Schneider Electric - FR 15,319 1,391,436 0.12Schneider Electric - GB 283 25,754 0.00
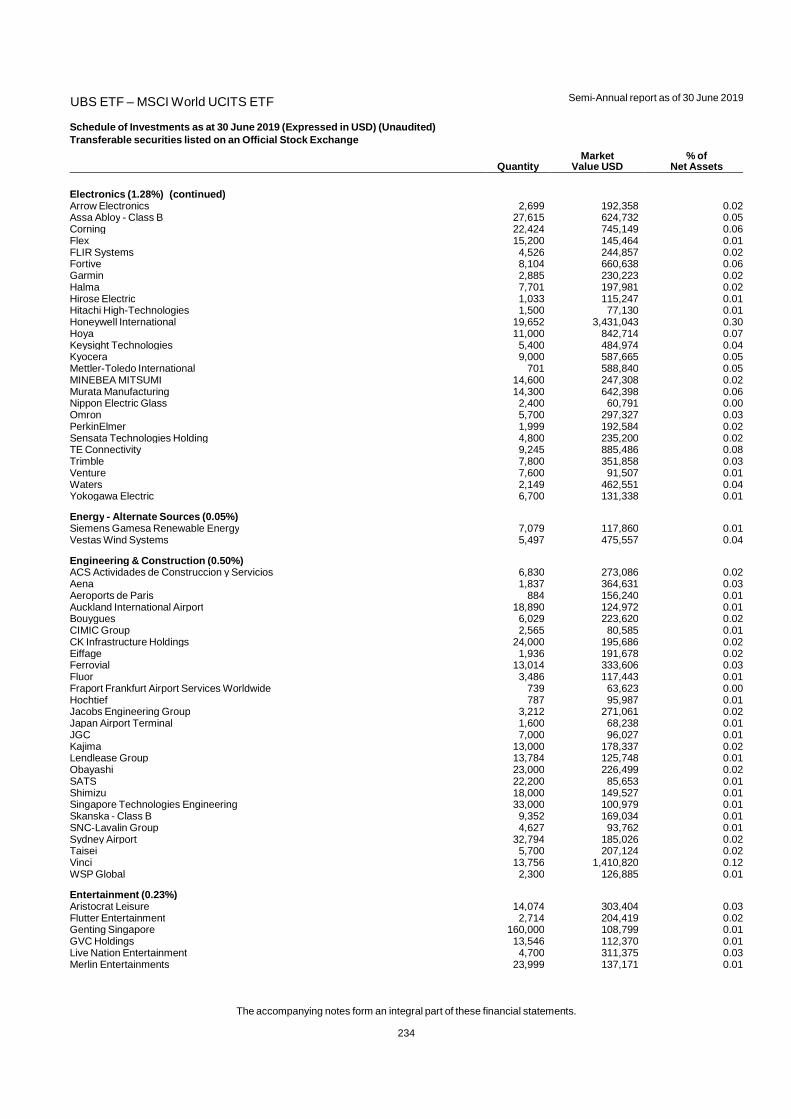
Electronics (1.28%) Agilent Technologies 8,663 646,866 0.06Allegion 2,655 293,510 0.03Alps Alpine 4,100 69,107 0.01Amphenol - Class A 8,174 784,214 0.07
UBS ETF – MSCI World UCITS ETF
Semi-Annual report as of 30 June 2019
The accompanying notes form an integral part of these financial statements.
234
Schedule of Investments as at 30 June 2019 (Expressed in USD) (Unaudited)
Transferable securities listed on an Official Stock Exchange
Quantity Market
Value USD % of
Net Assets
Electronics (1.28%) (continued) Arrow Electronics 2,699 192,358 0.02Assa Abloy - Class B 27,615 624,732 0.05Corning 22,424 745,149 0.06Flex 15,200 145,464 0.01FLIR Systems 4,526 244,857 0.02Fortive 8,104 660,638 0.06Garmin 2,885 230,223 0.02Halma 7,701 197,981 0.02Hirose Electric 1,033 115,247 0.01Hitachi High-Technologies 1,500 77,130 0.01Honeywell International 19,652 3,431,043 0.30Hoya 11,000 842,714 0.07Keysight Technologies 5,400 484,974 0.04Kyocera 9,000 587,665 0.05Mettler-Toledo International 701 588,840 0.05MINEBEA MITSUMI 14,600 247,308 0.02Murata Manufacturing 14,300 642,398 0.06Nippon Electric Glass 2,400 60,791 0.00Omron 5,700 297,327 0.03PerkinElmer 1,999 192,584 0.02Sensata Technologies Holding 4,800 235,200 0.02TE Connectivity 9,245 885,486 0.08Trimble 7,800 351,858 0.03Venture 7,600 91,507 0.01Waters 2,149 462,551 0.04Yokogawa Electric 6,700 131,338 0.01
Energy - Alternate Sources (0.05%) Siemens Gamesa Renewable Energy 7,079 117,860 0.01Vestas Wind Systems 5,497 475,557 0.04
Engineering & Construction (0.50%) ACS Actividades de Construccion y Servicios 6,830 273,086 0.02Aena 1,837 364,631 0.03Aeroports de Paris 884 156,240 0.01Auckland International Airport 18,890 124,972 0.01Bouygues 6,029 223,620 0.02CIMIC Group 2,565 80,585 0.01CK Infrastructure Holdings 24,000 195,686 0.02Eiffage 1,936 191,678 0.02Ferrovial 13,014 333,606 0.03Fluor 3,486 117,443 0.01Fraport Frankfurt Airport Services Worldwide 739 63,623 0.00Hochtief 787 95,987 0.01Jacobs Engineering Group 3,212 271,061 0.02Japan Airport Terminal 1,600 68,238 0.01JGC 7,000 96,027 0.01Kajima 13,000 178,337 0.02Lendlease Group 13,784 125,748 0.01Obayashi 23,000 226,499 0.02SATS 22,200 85,653 0.01Shimizu 18,000 149,527 0.01Singapore Technologies Engineering 33,000 100,979 0.01Skanska - Class B 9,352 169,034 0.01SNC-Lavalin Group 4,627 93,762 0.01Sydney Airport 32,794 185,026 0.02Taisei 5,700 207,124 0.02Vinci 13,756 1,410,820 0.12WSP Global 2,300 126,885 0.01
Entertainment (0.23%) Aristocrat Leisure 14,074 303,404 0.03Flutter Entertainment 2,714 204,419 0.02Genting Singapore 160,000 108,799 0.01GVC Holdings 13,546 112,370 0.01Live Nation Entertainment 4,700 311,375 0.03Merlin Entertainments 23,999 137,171 0.01
UBS ETF – MSCI World UCITS ETF
Semi-Annual report as of 30 June 2019
The accompanying notes form an integral part of these financial statements.
235
Schedule of Investments as at 30 June 2019 (Expressed in USD) (Unaudited)
Transferable securities listed on an Official Stock Exchange
Quantity Market
Value USD % of
Net Assets
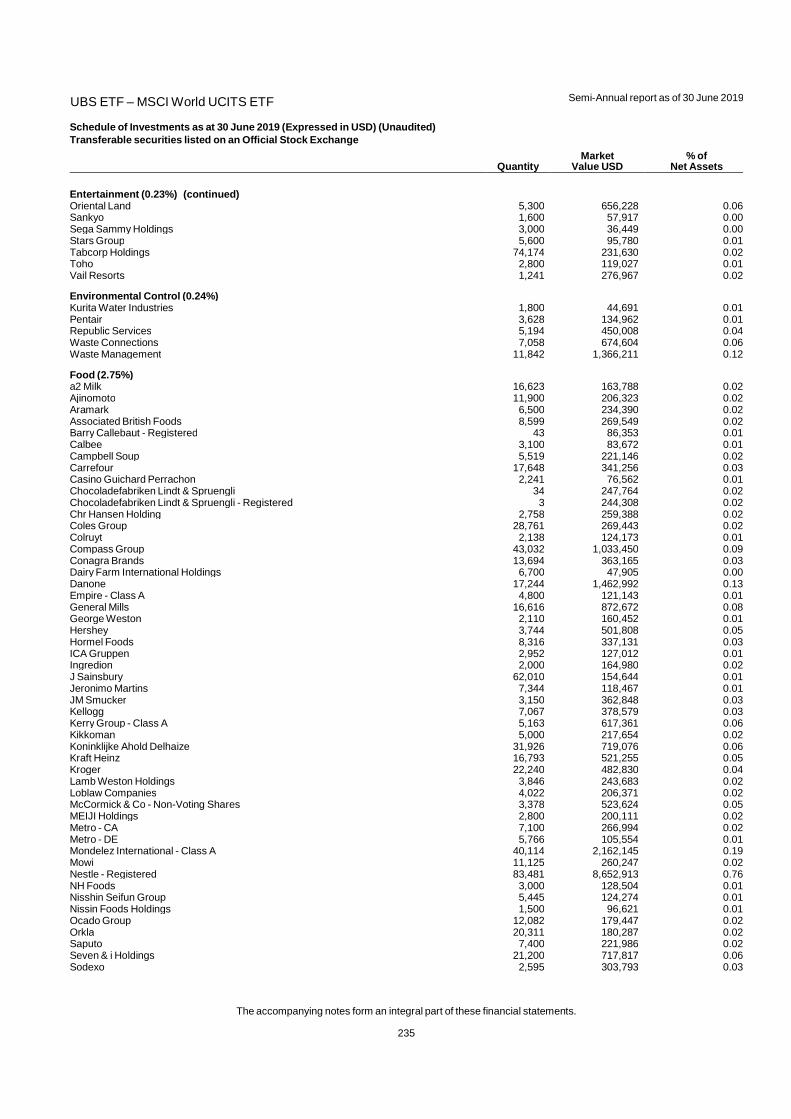
Entertainment (0.23%) (continued) Oriental Land 5,300 656,228 0.06Sankyo 1,600 57,917 0.00Sega Sammy Holdings 3,000 36,449 0.00Stars Group 5,600 95,780 0.01Tabcorp Holdings 74,174 231,630 0.02Toho 2,800 119,027 0.01Vail Resorts 1,241 276,967 0.02
Environmental Control (0.24%) Kurita Water Industries 1,800 44,691 0.01Pentair 3,628 134,962 0.01Republic Services 5,194 450,008 0.04Waste Connections 7,058 674,604 0.06Waste Management 11,842 1,366,211 0.12
Food (2.75%) a2 Milk 16,623 163,788 0.02Ajinomoto 11,900 206,323 0.02Aramark 6,500 234,390 0.02Associated British Foods 8,599 269,549 0.02Barry Callebaut - Registered 43 86,353 0.01Calbee 3,100 83,672 0.01Campbell Soup 5,519 221,146 0.02Carrefour 17,648 341,256 0.03Casino Guichard Perrachon 2,241 76,562 0.01Chocoladefabriken Lindt & Spruengli 34 247,764 0.02Chocoladefabriken Lindt & Spruengli - Registered 3 244,308 0.02Chr Hansen Holding 2,758 259,388 0.02Coles Group 28,761 269,443 0.02Colruyt 2,138 124,173 0.01Compass Group 43,032 1,033,450 0.09Conagra Brands 13,694 363,165 0.03Dairy Farm International Holdings 6,700 47,905 0.00Danone 17,244 1,462,992 0.13Empire - Class A 4,800 121,143 0.01General Mills 16,616 872,672 0.08George Weston 2,110 160,452 0.01Hershey 3,744 501,808 0.05Hormel Foods 8,316 337,131 0.03ICA Gruppen 2,952 127,012 0.01Ingredion 2,000 164,980 0.02J Sainsbury 62,010 154,644 0.01Jeronimo Martins 7,344 118,467 0.01JM Smucker 3,150 362,848 0.03Kellogg 7,067 378,579 0.03Kerry Group - Class A 5,163 617,361 0.06Kikkoman 5,000 217,654 0.02Koninklijke Ahold Delhaize 31,926 719,076 0.06Kraft Heinz 16,793 521,255 0.05Kroger 22,240 482,830 0.04Lamb Weston Holdings 3,846 243,683 0.02Loblaw Companies 4,022 206,371 0.02McCormick & Co - Non-Voting Shares 3,378 523,624 0.05MEIJI Holdings 2,800 200,111 0.02Metro - CA 7,100 266,994 0.02Metro - DE 5,766 105,554 0.01Mondelez International - Class A 40,114 2,162,145 0.19Mowi 11,125 260,247 0.02Nestle - Registered 83,481 8,652,913 0.76NH Foods 3,000 128,504 0.01Nisshin Seifun Group 5,445 124,274 0.01Nissin Foods Holdings 1,500 96,621 0.01Ocado Group 12,082 179,447 0.02Orkla 20,311 180,287 0.02Saputo 7,400 221,986 0.02Seven & i Holdings 21,200 717,817 0.06Sodexo 2,595 303,793 0.03

UBS ETF – MSCI World UCITS ETF
Semi-Annual report as of 30 June 2019
The accompanying notes form an integral part of these financial statements.
236
Schedule of Investments as at 30 June 2019 (Expressed in USD) (Unaudited)
Transferable securities listed on an Official Stock Exchange
Quantity Market
Value USD % of
Net Assets
Food (2.75%) (continued) Sysco 13,928 984,988 0.09Tesco 276,487 797,723 0.07Toyo Suisan Kaisha 3,000 123,631 0.01Tyson Foods - Class A 8,106 654,478 0.06Wesfarmers 31,009 786,862 0.07WH Group 241,000 244,316 0.02Wilmar International 74,500 203,740 0.02Wm Morrison Supermarkets 58,701 150,463 0.01Woolworths Group 34,733 809,944 0.07Yakult Honsha 2,500 147,345 0.01Yamazaki Baking 4,500 68,039 0.01
Forest Products & Paper (0.13%) International Paper 10,915 472,838 0.04Mondi 10,512 239,477 0.02Oji Holdings 20,000 115,463 0.01Smurfit Kappa Group 3,919 118,759 0.01Stora Enso - Class R 16,713 196,704 0.02UPM-Kymmene 13,891 369,692 0.03West Fraser Timber 300 13,706 0.00
Gas (0.35%) Atmos Energy 3,129 330,297 0.03Canadian Utilities - Class A 4,200 118,792 0.01Centrica 153,226 171,180 0.02Enagas 6,332 169,239 0.02Hong Kong & China Gas 311,055 689,597 0.06National Grid 87,115 926,662 0.08Naturgy Energy Group 7,927 218,731 0.02NiSource 9,500 273,600 0.02Osaka Gas 9,300 162,021 0.01Snam 70,507 350,963 0.03Toho Gas 2,000 73,603 0.01Tokyo Gas 9,400 221,390 0.02UGI 4,900 261,709 0.02
Hand & Machine Tools (0.23%) Disco 900 147,689 0.01Fuji Electric 3,400 117,236 0.01Makita 6,700 227,603 0.02Sandvik 32,988 606,557 0.06Schindler Holding 1,091 243,153 0.02Schindler Holding - Registered 593 129,669 0.01Snap-on 1,600 265,024 0.02Stanley Black & Decker 4,601 665,351 0.06Techtronic Industries 30,500 233,459 0.02
Healthcare Products (3.12%) Abbott Laboratories 48,602 4,087,428 0.36ABIOMED 1,063 276,901 0.03Alcon 11,992 741,413 0.07Align Technology 2,211 605,151 0.05Asahi Intecc 5,000 123,167 0.01Baxter International 13,003 1,064,946 0.09Becton Dickinson & Co 7,564 1,906,204 0.17Boston Scientific 39,132 1,681,893 0.15Carl Zeiss Meditec 568 56,113 0.01Cochlear 1,638 237,756 0.02Coloplast - Class B 3,039 343,962 0.03Cooper Companies 1,367 460,529 0.04Danaher 17,429 2,490,953 0.22Demant 3,116 97,036 0.01DENTSPLY SIRONA 5,724 334,053 0.03Edwards Lifesciences 5,931 1,095,693 0.10EssilorLuxottica 7,945 1,038,231 0.09Fisher & Paykel Healthcare 14,182 147,262 0.01Henry Schein 3,979 278,132 0.03Hologic 8,719 418,686 0.04

UBS ETF – MSCI World UCITS ETF
Semi-Annual report as of 30 June 2019
The accompanying notes form an integral part of these financial statements.
237
Schedule of Investments as at 30 June 2019 (Expressed in USD) (Unaudited)
Transferable securities listed on an Official Stock Exchange
Quantity Market
Value USD % of
Net Assets
Healthcare Products (3.12%) (continued) IDEXX Laboratories 2,500 688,325 0.06Intuitive Surgical 3,093 1,622,433 0.14Koninklijke Philips 26,743 1,162,922 0.10Lonza Group - Registered 2,074 700,693 0.06Medtronic 36,894 3,593,107 0.32Olympus 31,200 346,345 0.03Qiagen 6,199 251,951 0.02ResMed 3,800 463,714 0.04Sartorius Stedim Biotech 471 74,395 0.01Shimadzu 7,000 171,654 0.02Siemens Healthineers 3,570 150,871 0.01Smith & Nephew 23,194 503,299 0.04Sonova Holding - Registered 1,435 326,444 0.03Steris 1,700 253,096 0.02Straumann Holding - Registered 279 246,493 0.02Stryker 9,475 1,947,870 0.17Sysmex 3,900 254,365 0.02Teleflex 1,208 400,029 0.04Terumo 15,600 464,786 0.04Thermo Fisher Scientific 10,942 3,213,446 0.28Varian Medical Systems 2,651 360,881 0.03Zimmer Biomet Holdings 5,694 670,412 0.06
Healthcare Services (1.52%) Anthem 7,004 1,976,599 0.17BioMerieux 1,296 107,518 0.01Centene 11,614 609,038 0.05Cigna 10,305 1,623,553 0.14DaVita 3,480 195,785 0.02Eurofins Scientific 322 142,644 0.01Fresenius & Co 11,823 641,965 0.06Fresenius Medical Care & Co 6,347 499,019 0.04HCA Healthcare 7,811 1,055,813 0.09Humana 3,922 1,040,506 0.09IQVIA Holdings 4,524 727,912 0.06Laboratory of America Holdings 2,667 461,124 0.04NMC Health 2,395 73,246 0.01Quest Diagnostics 4,112 418,643 0.04Ramsay Health Care 3,319 168,255 0.02Ryman Healthcare 11,816 93,250 0.01Sonic Healthcare 11,884 226,003 0.02UnitedHealth Group 26,376 6,436,008 0.57Universal Health Services - Class B 2,600 339,014 0.03WellCare Health Plans 1,500 427,605 0.04
Holding Companies - Diversified Operations (0.17%) CK Hutchison Holdings 74,220 731,512 0.06Industrivarden - Class C 4,435 98,373 0.01Jardine Matheson Holdings 5,500 346,610 0.03Jardine Strategic Holdings 6,000 228,780 0.02Keppel 47,500 233,823 0.02NWS Holdings 31,628 65,017 0.01Swire Pacific - Class A 13,000 159,744 0.01Wharf Holdings 39,100 103,599 0.01
Home Builders (0.29%) Barratt Developments 28,685 209,041 0.02Berkeley Group Holdings 3,863 183,432 0.02Daiwa House Industry 15,400 448,964 0.04DR Horton 10,800 465,804 0.04Iida Group Holdings 4,700 75,905 0.01Lennar - Class A 8,300 402,218 0.04NVR 110 370,728 0.03Persimmon 9,443 240,002 0.02PulteGroup 7,900 249,798 0.02Sekisui Chemical 8,600 129,152 0.01

UBS ETF – MSCI World UCITS ETF
Semi-Annual report as of 30 June 2019
The accompanying notes form an integral part of these financial statements.
238
Schedule of Investments as at 30 June 2019 (Expressed in USD) (Unaudited)
Transferable securities listed on an Official Stock Exchange
Quantity Market
Value USD % of
Net Assets
Home Builders (0.29%) (continued) Sekisui House 16,900 278,503 0.02Taylor Wimpey 98,312 197,379 0.02
Home Furnishings (0.28%) Electrolux - Class B 8,373 214,148 0.02Hoshizaki 1,600 119,101 0.01Leggett & Platt 2,501 95,963 0.01Panasonic 61,700 514,033 0.05SEB 893 160,780 0.01Sharp 5,500 60,340 0.00Sony 34,400 1,803,334 0.16Whirlpool 1,391 198,023 0.02
Household Products (0.41%) Avery Dennison 2,145 248,134 0.02Church & Dwight 6,676 487,749 0.04Clorox 3,568 546,296 0.05Henkel & Co 3,337 306,864 0.03Kimberly-Clark 9,688 1,291,217 0.11Newell Brands 13,203 203,590 0.02Reckitt Benckiser Group 18,351 1,451,300 0.13Societe 965 73,684 0.01
Insurance (4.70%) Admiral Group 5,424 152,421 0.01Aegon 51,796 258,238 0.02Aflac 21,026 1,152,435 0.10Ageas 4,517 235,130 0.02AIA Group 329,200 3,550,093 0.31Alleghany 343 233,621 0.02Allianz - Registered 11,726 2,830,958 0.25Allstate 9,379 953,750 0.08Amcor 10,000 114,900 0.01American Financial Group 1,889 193,566 0.02American International Group 24,908 1,327,098 0.12AMP 93,156 138,589 0.01Aon 6,800 1,312,264 0.12Arch Capital Group 9,837 364,756 0.03Arthur J Gallagher & Co 5,084 445,308 0.04Assicurazioni Generali 33,533 632,383 0.06Assurant 1,060 112,763 0.01Athene Holding - Class A 2,740 117,984 0.01Aviva 109,896 582,536 0.05AXA 49,849 1,311,342 0.12AXA Equitable Holdings 6,200 129,580 0.01Baloise Holding - Registered 1,595 282,683 0.02Berkshire Hathaway - Class B 35,818 7,635,323 0.67Brighthouse Financial 2,843 104,310 0.01Challenger 16,509 76,926 0.01Chubb 12,214 1,799,000 0.16Cincinnati Financial 4,252 440,805 0.04CNP Assurances 7,619 173,183 0.02Dai-ichi Life Holdings 32,100 484,152 0.04Direct Line Insurance Group 31,606 133,466 0.01Erie Indemnity 327 83,150 0.01Everest Re Group 1,080 266,954 0.02Fairfax Financial Holdings 879 432,360 0.04Fidelity National Financial 7,130 287,339 0.03Gjensidige Forsikring 6,399 128,940 0.01Great-West Lifeco 7,800 179,966 0.02Hannover Rueck 1,955 316,588 0.03Hartford Financial Services Group 8,959 499,195 0.04iA Financial 3,400 138,784 0.01Insurance Australia Group 69,972 405,590 0.04Intact Financial 3,822 353,961 0.03Japan Post Holdings 45,900 519,751 0.05Legal & General Group 168,567 578,172 0.05
UBS ETF – MSCI World UCITS ETF
Semi-Annual report as of 30 June 2019
The accompanying notes form an integral part of these financial statements.
239
Schedule of Investments as at 30 June 2019 (Expressed in USD) (Unaudited)
Transferable securities listed on an Official Stock Exchange
Quantity Market
Value USD % of
Net Assets
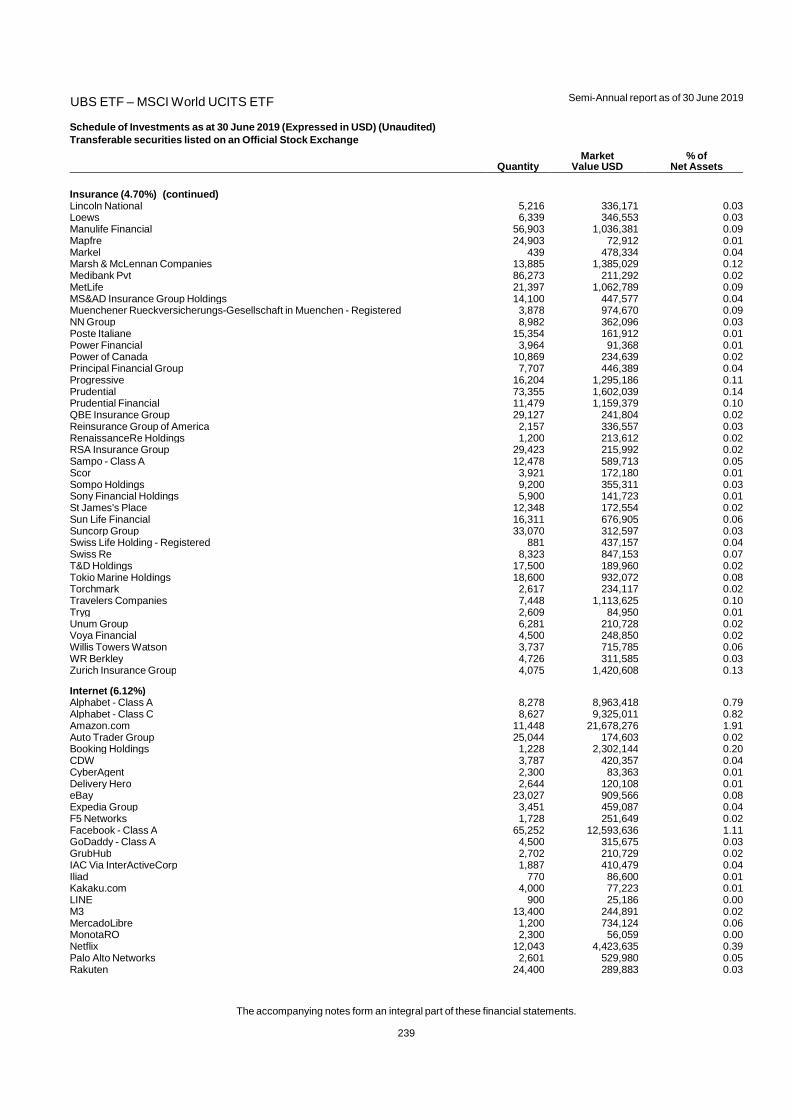
Insurance (4.70%) (continued) Lincoln National 5,216 336,171 0.03Loews 6,339 346,553 0.03Manulife Financial 56,903 1,036,381 0.09Mapfre 24,903 72,912 0.01Markel 439 478,334 0.04Marsh & McLennan Companies 13,885 1,385,029 0.12Medibank Pvt 86,273 211,292 0.02MetLife 21,397 1,062,789 0.09MS&AD Insurance Group Holdings 14,100 447,577 0.04Muenchener Rueckversicherungs-Gesellschaft in Muenchen - Registered 3,878 974,670 0.09NN Group 8,982 362,096 0.03Poste Italiane 15,354 161,912 0.01Power Financial 3,964 91,368 0.01Power of Canada 10,869 234,639 0.02Principal Financial Group 7,707 446,389 0.04Progressive 16,204 1,295,186 0.11Prudential 73,355 1,602,039 0.14Prudential Financial 11,479 1,159,379 0.10QBE Insurance Group 29,127 241,804 0.02Reinsurance Group of America 2,157 336,557 0.03RenaissanceRe Holdings 1,200 213,612 0.02RSA Insurance Group 29,423 215,992 0.02Sampo - Class A 12,478 589,713 0.05Scor 3,921 172,180 0.01Sompo Holdings 9,200 355,311 0.03Sony Financial Holdings 5,900 141,723 0.01St James's Place 12,348 172,554 0.02Sun Life Financial 16,311 676,905 0.06Suncorp Group 33,070 312,597 0.03Swiss Life Holding - Registered 881 437,157 0.04Swiss Re 8,323 847,153 0.07T&D Holdings 17,500 189,960 0.02Tokio Marine Holdings 18,600 932,072 0.08Torchmark 2,617 234,117 0.02Travelers Companies 7,448 1,113,625 0.10Tryg 2,609 84,950 0.01Unum Group 6,281 210,728 0.02Voya Financial 4,500 248,850 0.02Willis Towers Watson 3,737 715,785 0.06WR Berkley 4,726 311,585 0.03Zurich Insurance Group 4,075 1,420,608 0.13
Internet (6.12%) Alphabet - Class A 8,278 8,963,418 0.79Alphabet - Class C 8,627 9,325,011 0.82Amazon.com 11,448 21,678,276 1.91Auto Trader Group 25,044 174,603 0.02Booking Holdings 1,228 2,302,144 0.20CDW 3,787 420,357 0.04CyberAgent 2,300 83,363 0.01Delivery Hero 2,644 120,108 0.01eBay 23,027 909,566 0.08Expedia Group 3,451 459,087 0.04F5 Networks 1,728 251,649 0.02Facebook - Class A 65,252 12,593,636 1.11GoDaddy - Class A 4,500 315,675 0.03GrubHub 2,702 210,729 0.02IAC Via InterActiveCorp 1,887 410,479 0.04Iliad 770 86,600 0.01Kakaku.com 4,000 77,223 0.01LINE 900 25,186 0.00M3 13,400 244,891 0.02MercadoLibre 1,200 734,124 0.06MonotaRO 2,300 56,059 0.00Netflix 12,043 4,423,635 0.39Palo Alto Networks 2,601 529,980 0.05Rakuten 24,400 289,883 0.03
UBS ETF – MSCI World UCITS ETF
Semi-Annual report as of 30 June 2019
The accompanying notes form an integral part of these financial statements.
240
Schedule of Investments as at 30 June 2019 (Expressed in USD) (Unaudited)
Transferable securities listed on an Official Stock Exchange
Quantity Market
Value USD % of
Net Assets
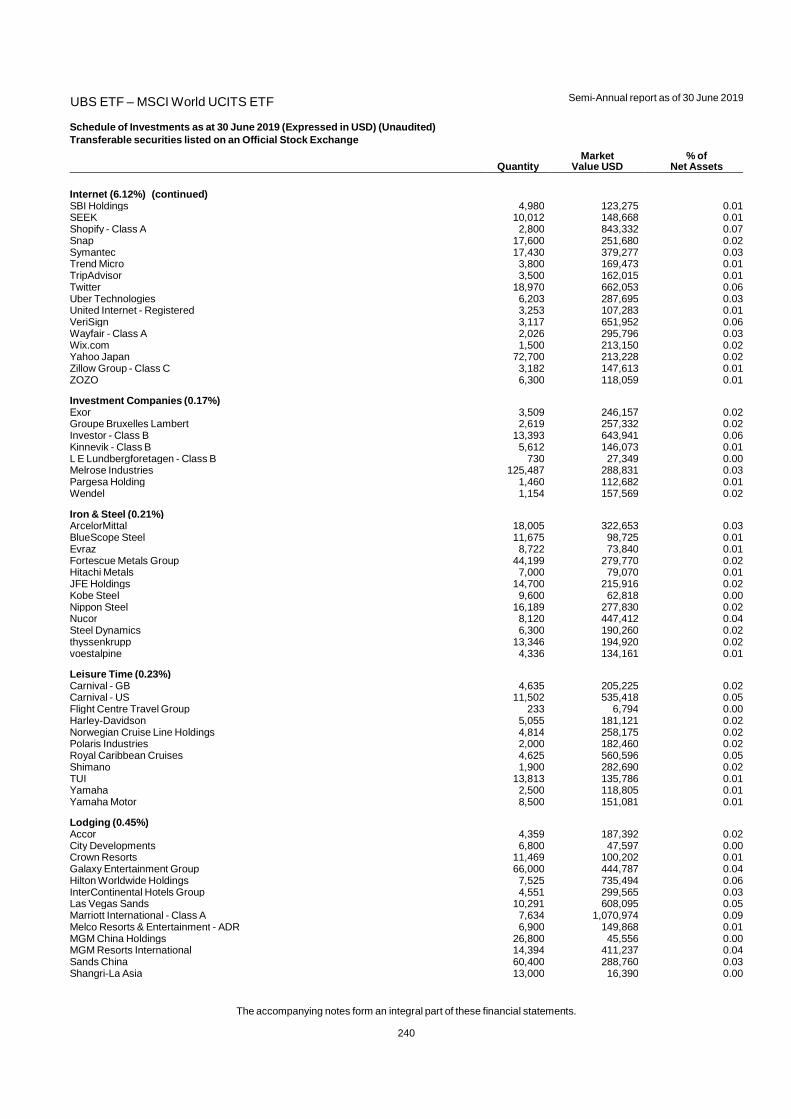
Internet (6.12%) (continued) SBI Holdings 4,980 123,275 0.01SEEK 10,012 148,668 0.01Shopify - Class A 2,800 843,332 0.07Snap 17,600 251,680 0.02Symantec 17,430 379,277 0.03Trend Micro 3,800 169,473 0.01TripAdvisor 3,500 162,015 0.01Twitter 18,970 662,053 0.06Uber Technologies 6,203 287,695 0.03United Internet - Registered 3,253 107,283 0.01VeriSign 3,117 651,952 0.06Wayfair - Class A 2,026 295,796 0.03Wix.com 1,500 213,150 0.02Yahoo Japan 72,700 213,228 0.02Zillow Group - Class C 3,182 147,613 0.01ZOZO 6,300 118,059 0.01
Investment Companies (0.17%) Exor 3,509 246,157 0.02Groupe Bruxelles Lambert 2,619 257,332 0.02Investor - Class B 13,393 643,941 0.06Kinnevik - Class B 5,612 146,073 0.01L E Lundbergforetagen - Class B 730 27,349 0.00Melrose Industries 125,487 288,831 0.03Pargesa Holding 1,460 112,682 0.01Wendel 1,154 157,569 0.02
Iron & Steel (0.21%) ArcelorMittal 18,005 322,653 0.03BlueScope Steel 11,675 98,725 0.01Evraz 8,722 73,840 0.01Fortescue Metals Group 44,199 279,770 0.02Hitachi Metals 7,000 79,070 0.01JFE Holdings 14,700 215,916 0.02Kobe Steel 9,600 62,818 0.00Nippon Steel 16,189 277,830 0.02Nucor 8,120 447,412 0.04Steel Dynamics 6,300 190,260 0.02thyssenkrupp 13,346 194,920 0.02voestalpine 4,336 134,161 0.01
Leisure Time (0.23%) Carnival - GB 4,635 205,225 0.02Carnival - US 11,502 535,418 0.05Flight Centre Travel Group 233 6,794 0.00Harley-Davidson 5,055 181,121 0.02Norwegian Cruise Line Holdings 4,814 258,175 0.02Polaris Industries 2,000 182,460 0.02Royal Caribbean Cruises 4,625 560,596 0.05Shimano 1,900 282,690 0.02TUI 13,813 135,786 0.01Yamaha 2,500 118,805 0.01Yamaha Motor 8,500 151,081 0.01
Lodging (0.45%) Accor 4,359 187,392 0.02City Developments 6,800 47,597 0.00Crown Resorts 11,469 100,202 0.01Galaxy Entertainment Group 66,000 444,787 0.04Hilton Worldwide Holdings 7,525 735,494 0.06InterContinental Hotels Group 4,551 299,565 0.03Las Vegas Sands 10,291 608,095 0.05Marriott International - Class A 7,634 1,070,974 0.09Melco Resorts & Entertainment - ADR 6,900 149,868 0.01MGM China Holdings 26,800 45,556 0.00MGM Resorts International 14,394 411,237 0.04Sands China 60,400 288,760 0.03Shangri-La Asia 13,000 16,390 0.00
UBS ETF – MSCI World UCITS ETF
Semi-Annual report as of 30 June 2019
The accompanying notes form an integral part of these financial statements.
241
Schedule of Investments as at 30 June 2019 (Expressed in USD) (Unaudited)
Transferable securities listed on an Official Stock Exchange
Quantity Market
Value USD % of
Net Assets
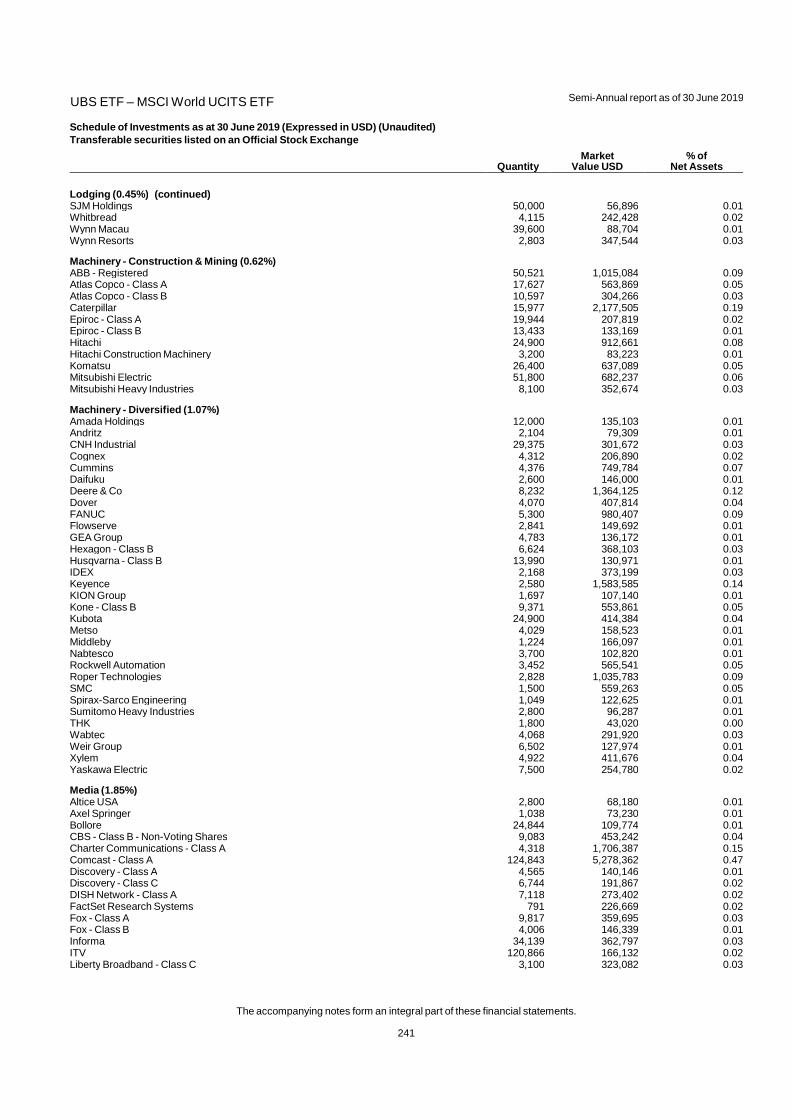
Lodging (0.45%) (continued) SJM Holdings 50,000 56,896 0.01Whitbread 4,115 242,428 0.02Wynn Macau 39,600 88,704 0.01Wynn Resorts 2,803 347,544 0.03
Machinery - Construction & Mining (0.62%) ABB - Registered 50,521 1,015,084 0.09Atlas Copco - Class A 17,627 563,869 0.05Atlas Copco - Class B 10,597 304,266 0.03Caterpillar 15,977 2,177,505 0.19Epiroc - Class A 19,944 207,819 0.02Epiroc - Class B 13,433 133,169 0.01Hitachi 24,900 912,661 0.08Hitachi Construction Machinery 3,200 83,223 0.01Komatsu 26,400 637,089 0.05Mitsubishi Electric 51,800 682,237 0.06Mitsubishi Heavy Industries 8,100 352,674 0.03
Machinery - Diversified (1.07%) Amada Holdings 12,000 135,103 0.01Andritz 2,104 79,309 0.01CNH Industrial 29,375 301,672 0.03Cognex 4,312 206,890 0.02Cummins 4,376 749,784 0.07Daifuku 2,600 146,000 0.01Deere & Co 8,232 1,364,125 0.12Dover 4,070 407,814 0.04FANUC 5,300 980,407 0.09Flowserve 2,841 149,692 0.01GEA Group 4,783 136,172 0.01Hexagon - Class B 6,624 368,103 0.03Husqvarna - Class B 13,990 130,971 0.01IDEX 2,168 373,199 0.03Keyence 2,580 1,583,585 0.14KION Group 1,697 107,140 0.01Kone - Class B 9,371 553,861 0.05Kubota 24,900 414,384 0.04Metso 4,029 158,523 0.01Middleby 1,224 166,097 0.01Nabtesco 3,700 102,820 0.01Rockwell Automation 3,452 565,541 0.05Roper Technologies 2,828 1,035,783 0.09SMC 1,500 559,263 0.05Spirax-Sarco Engineering 1,049 122,625 0.01Sumitomo Heavy Industries 2,800 96,287 0.01THK 1,800 43,020 0.00Wabtec 4,068 291,920 0.03Weir Group 6,502 127,974 0.01Xylem 4,922 411,676 0.04Yaskawa Electric 7,500 254,780 0.02
Media (1.85%) Altice USA 2,800 68,180 0.01Axel Springer 1,038 73,230 0.01Bollore 24,844 109,774 0.01CBS - Class B - Non-Voting Shares 9,083 453,242 0.04Charter Communications - Class A 4,318 1,706,387 0.15Comcast - Class A 124,843 5,278,362 0.47Discovery - Class A 4,565 140,146 0.01Discovery - Class C 6,744 191,867 0.02DISH Network - Class A 7,118 273,402 0.02FactSet Research Systems 791 226,669 0.02Fox - Class A 9,817 359,695 0.03Fox - Class B 4,006 146,339 0.01Informa 34,139 362,797 0.03ITV 120,866 166,132 0.02Liberty Broadband - Class C 3,100 323,082 0.03
UBS ETF – MSCI World UCITS ETF
Semi-Annual report as of 30 June 2019
The accompanying notes form an integral part of these financial statements.
242
Schedule of Investments as at 30 June 2019 (Expressed in USD) (Unaudited)
Transferable securities listed on an Official Stock Exchange
Quantity Market
Value USD % of
Net Assets
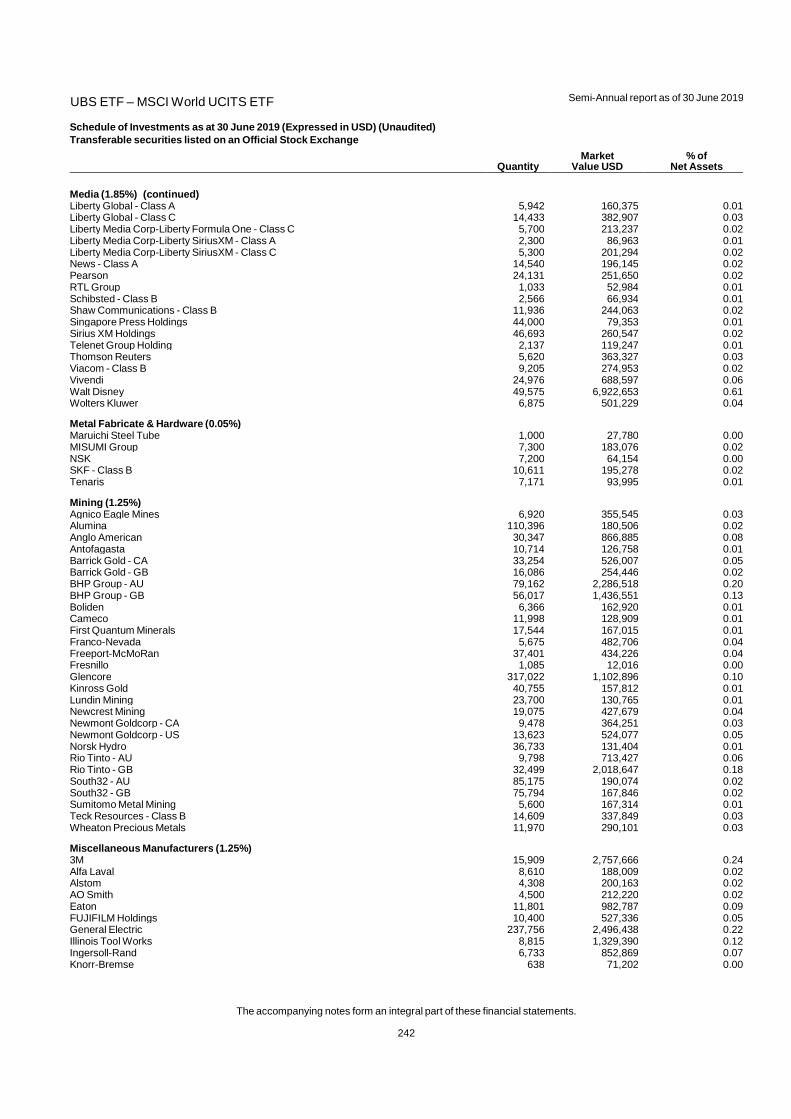
Media (1.85%) (continued) Liberty Global - Class A 5,942 160,375 0.01Liberty Global - Class C 14,433 382,907 0.03Liberty Media Corp-Liberty Formula One - Class C 5,700 213,237 0.02Liberty Media Corp-Liberty SiriusXM - Class A 2,300 86,963 0.01Liberty Media Corp-Liberty SiriusXM - Class C 5,300 201,294 0.02News - Class A 14,540 196,145 0.02Pearson 24,131 251,650 0.02RTL Group 1,033 52,984 0.01Schibsted - Class B 2,566 66,934 0.01Shaw Communications - Class B 11,936 244,063 0.02Singapore Press Holdings 44,000 79,353 0.01Sirius XM Holdings 46,693 260,547 0.02Telenet Group Holding 2,137 119,247 0.01Thomson Reuters 5,620 363,327 0.03Viacom - Class B 9,205 274,953 0.02Vivendi 24,976 688,597 0.06Walt Disney 49,575 6,922,653 0.61Wolters Kluwer 6,875 501,229 0.04
Metal Fabricate & Hardware (0.05%) Maruichi Steel Tube 1,000 27,780 0.00MISUMI Group 7,300 183,076 0.02NSK 7,200 64,154 0.00SKF - Class B 10,611 195,278 0.02Tenaris 7,171 93,995 0.01
Mining (1.25%) Agnico Eagle Mines 6,920 355,545 0.03Alumina 110,396 180,506 0.02Anglo American 30,347 866,885 0.08Antofagasta 10,714 126,758 0.01Barrick Gold - CA 33,254 526,007 0.05Barrick Gold - GB 16,086 254,446 0.02BHP Group - AU 79,162 2,286,518 0.20BHP Group - GB 56,017 1,436,551 0.13Boliden 6,366 162,920 0.01Cameco 11,998 128,909 0.01First Quantum Minerals 17,544 167,015 0.01Franco-Nevada 5,675 482,706 0.04Freeport-McMoRan 37,401 434,226 0.04Fresnillo 1,085 12,016 0.00Glencore 317,022 1,102,896 0.10Kinross Gold 40,755 157,812 0.01Lundin Mining 23,700 130,765 0.01Newcrest Mining 19,075 427,679 0.04Newmont Goldcorp - CA 9,478 364,251 0.03Newmont Goldcorp - US 13,623 524,077 0.05Norsk Hydro 36,733 131,404 0.01Rio Tinto - AU 9,798 713,427 0.06Rio Tinto - GB 32,499 2,018,647 0.18South32 - AU 85,175 190,074 0.02South32 - GB 75,794 167,846 0.02Sumitomo Metal Mining 5,600 167,314 0.01Teck Resources - Class B 14,609 337,849 0.03Wheaton Precious Metals 11,970 290,101 0.03
Miscellaneous Manufacturers (1.25%) 3M 15,909 2,757,666 0.24Alfa Laval 8,610 188,009 0.02Alstom 4,308 200,163 0.02AO Smith 4,500 212,220 0.02Eaton 11,801 982,787 0.09FUJIFILM Holdings 10,400 527,336 0.05General Electric 237,756 2,496,438 0.22Illinois Tool Works 8,815 1,329,390 0.12Ingersoll-Rand 6,733 852,869 0.07Knorr-Bremse 638 71,202 0.00
UBS ETF – MSCI World UCITS ETF
Semi-Annual report as of 30 June 2019
The accompanying notes form an integral part of these financial statements.
243
Schedule of Investments as at 30 June 2019 (Expressed in USD) (Unaudited)
Transferable securities listed on an Official Stock Exchange
Quantity Market
Value USD % of
Net Assets
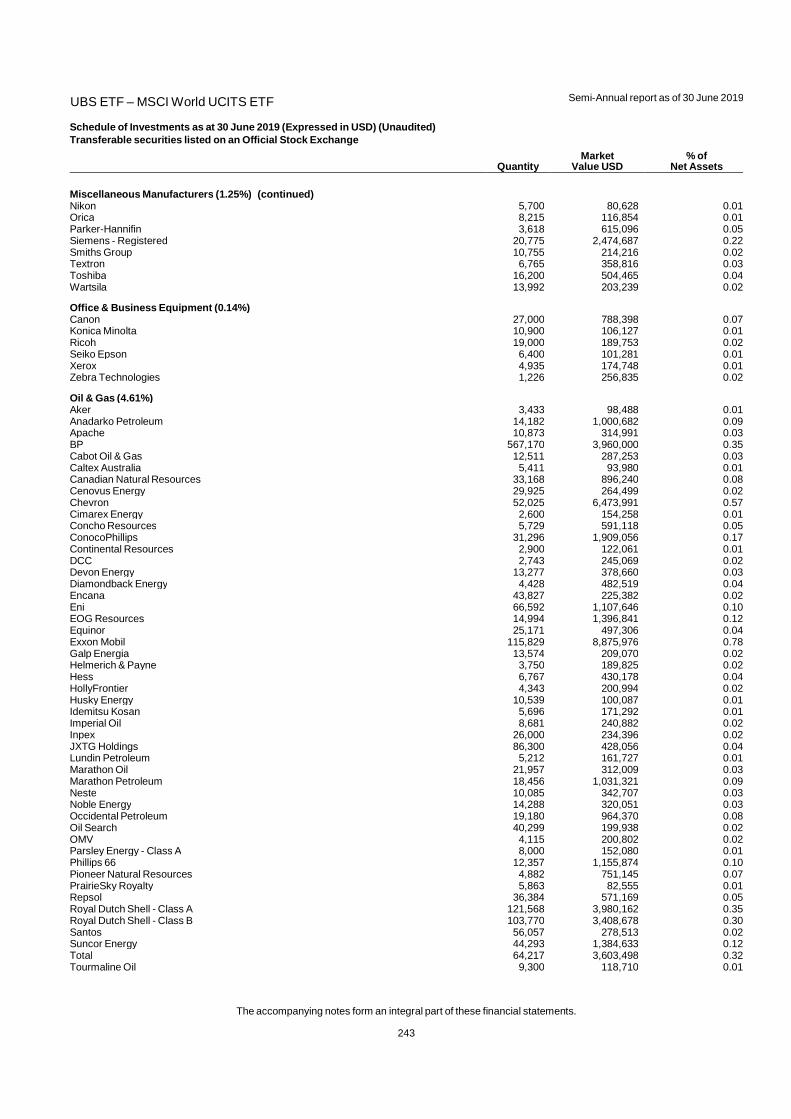
Miscellaneous Manufacturers (1.25%) (continued) Nikon 5,700 80,628 0.01Orica 8,215 116,854 0.01Parker-Hannifin 3,618 615,096 0.05Siemens - Registered 20,775 2,474,687 0.22Smiths Group 10,755 214,216 0.02Textron 6,765 358,816 0.03Toshiba 16,200 504,465 0.04Wartsila 13,992 203,239 0.02
Office & Business Equipment (0.14%) Canon 27,000 788,398 0.07Konica Minolta 10,900 106,127 0.01Ricoh 19,000 189,753 0.02Seiko Epson 6,400 101,281 0.01Xerox 4,935 174,748 0.01Zebra Technologies 1,226 256,835 0.02
Oil & Gas (4.61%) Aker 3,433 98,488 0.01Anadarko Petroleum 14,182 1,000,682 0.09Apache 10,873 314,991 0.03BP 567,170 3,960,000 0.35Cabot Oil & Gas 12,511 287,253 0.03Caltex Australia 5,411 93,980 0.01Canadian Natural Resources 33,168 896,240 0.08Cenovus Energy 29,925 264,499 0.02Chevron 52,025 6,473,991 0.57Cimarex Energy 2,600 154,258 0.01Concho Resources 5,729 591,118 0.05ConocoPhillips 31,296 1,909,056 0.17Continental Resources 2,900 122,061 0.01DCC 2,743 245,069 0.02Devon Energy 13,277 378,660 0.03Diamondback Energy 4,428 482,519 0.04Encana 43,827 225,382 0.02Eni 66,592 1,107,646 0.10EOG Resources 14,994 1,396,841 0.12Equinor 25,171 497,306 0.04Exxon Mobil 115,829 8,875,976 0.78Galp Energia 13,574 209,070 0.02Helmerich & Payne 3,750 189,825 0.02Hess 6,767 430,178 0.04HollyFrontier 4,343 200,994 0.02Husky Energy 10,539 100,087 0.01Idemitsu Kosan 5,696 171,292 0.01Imperial Oil 8,681 240,882 0.02Inpex 26,000 234,396 0.02JXTG Holdings 86,300 428,056 0.04Lundin Petroleum 5,212 161,727 0.01Marathon Oil 21,957 312,009 0.03Marathon Petroleum 18,456 1,031,321 0.09Neste 10,085 342,707 0.03Noble Energy 14,288 320,051 0.03Occidental Petroleum 19,180 964,370 0.08Oil Search 40,299 199,938 0.02OMV 4,115 200,802 0.02Parsley Energy - Class A 8,000 152,080 0.01Phillips 66 12,357 1,155,874 0.10Pioneer Natural Resources 4,882 751,145 0.07PrairieSky Royalty 5,863 82,555 0.01Repsol 36,384 571,169 0.05Royal Dutch Shell - Class A 121,568 3,980,162 0.35Royal Dutch Shell - Class B 103,770 3,408,678 0.30Santos 56,057 278,513 0.02Suncor Energy 44,293 1,384,633 0.12Total 64,217 3,603,498 0.32Tourmaline Oil 9,300 118,710 0.01

UBS ETF – MSCI World UCITS ETF
Semi-Annual report as of 30 June 2019
The accompanying notes form an integral part of these financial statements.
244
Schedule of Investments as at 30 June 2019 (Expressed in USD) (Unaudited)
Transferable securities listed on an Official Stock Exchange
Quantity Market
Value USD % of
Net Assets
Oil & Gas (4.61%) (continued) Valero Energy 12,090 1,035,025 0.09Vermilion Energy 2,732 59,480 0.01Woodside Petroleum 24,983 637,457 0.06
Oil & Gas Services (0.28%) Baker Hughes 14,134 348,120 0.03Halliburton 25,487 579,574 0.05John Wood Group 19,040 109,530 0.01National Oilwell Varco 11,288 250,932 0.02Schlumberger 36,647 1,456,352 0.13TechnipFMC 10,919 283,239 0.03WorleyParsons 10,199 105,282 0.01
Packaging & Containers (0.18%) Amcor 29,934 340,090 0.03Ball 8,822 617,452 0.05CCL Industries - Class B 4,300 211,323 0.02Crown Holdings 3,561 217,577 0.02Packaging of America 2,671 254,600 0.02Sealed Air 4,000 171,120 0.02Toyo Seikan Group Holdings 2,800 55,563 0.00Westrock 6,251 227,974 0.02
Pharmaceuticals & Biotechnology (7.69%) AbbVie 40,087 2,915,127 0.26Alexion Pharmaceuticals 5,934 777,235 0.07Alfresa Holdings 6,000 148,023 0.01Alkermes 4,800 108,192 0.01Allergan 9,123 1,527,464 0.13Alnylam Pharmaceuticals 2,400 174,144 0.01AmerisourceBergen 3,740 318,872 0.03Amgen 17,574 3,238,537 0.29Astellas Pharma 54,400 775,051 0.07AstraZeneca 34,689 2,842,293 0.25Aurora Cannabis 17,600 138,187 0.01Bausch Health Companies 8,595 217,317 0.02Bayer - Registered 25,349 1,759,182 0.15BeiGene - ADR 700 86,765 0.01Biogen 5,540 1,295,640 0.11BioMarin Pharmaceutical 5,295 453,517 0.04Bristol-Myers Squibb 44,700 2,027,145 0.18Canopy Growth 5,100 206,342 0.02Cardinal Health 8,727 411,042 0.04Celgene 18,620 1,721,233 0.15Chugai Pharmaceutical 6,700 437,795 0.04Cronos Group 5,400 86,821 0.01CSL 12,503 1,886,406 0.17CVS Health 35,065 1,910,692 0.17Daiichi Sankyo 16,000 836,829 0.07DexCom 2,713 406,516 0.04Eisai 7,200 407,047 0.04Elanco Animal Health 9,000 304,200 0.03Eli Lilly & Co 24,798 2,747,370 0.24Exact Sciences 3,084 364,035 0.03Genmab 1,734 319,337 0.03Gilead Sciences 34,792 2,350,547 0.21GlaxoSmithKline 134,555 2,699,899 0.24Grifols 8,990 266,183 0.02H Lundbeck 1,862 73,667 0.01Hisamitsu Pharmaceutical 1,800 71,088 0.01Illumina 3,946 1,452,720 0.13Incyte 5,039 428,113 0.04Ionis Pharmaceuticals 3,617 232,465 0.02Ipsen 907 123,947 0.01Jazz Pharmaceuticals 2,000 285,120 0.02Johnson & Johnson 73,046 10,173,847 0.90Kobayashi Pharmaceutical 1,700 121,654 0.01
UBS ETF – MSCI World UCITS ETF
Semi-Annual report as of 30 June 2019
The accompanying notes form an integral part of these financial statements.
245
Schedule of Investments as at 30 June 2019 (Expressed in USD) (Unaudited)
Transferable securities listed on an Official Stock Exchange
Quantity Market
Value USD % of
Net Assets
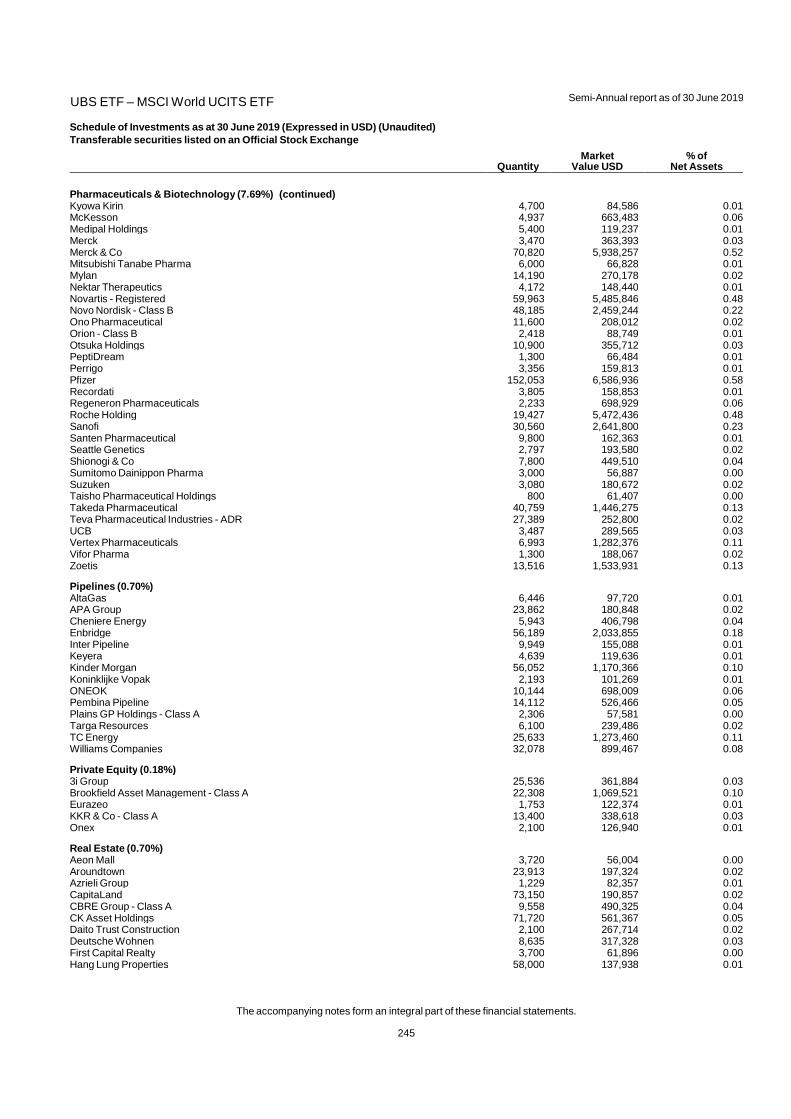
Pharmaceuticals & Biotechnology (7.69%) (continued) Kyowa Kirin 4,700 84,586 0.01McKesson 4,937 663,483 0.06Medipal Holdings 5,400 119,237 0.01Merck 3,470 363,393 0.03Merck & Co 70,820 5,938,257 0.52Mitsubishi Tanabe Pharma 6,000 66,828 0.01Mylan 14,190 270,178 0.02Nektar Therapeutics 4,172 148,440 0.01Novartis - Registered 59,963 5,485,846 0.48Novo Nordisk - Class B 48,185 2,459,244 0.22Ono Pharmaceutical 11,600 208,012 0.02Orion - Class B 2,418 88,749 0.01Otsuka Holdings 10,900 355,712 0.03PeptiDream 1,300 66,484 0.01Perrigo 3,356 159,813 0.01Pfizer 152,053 6,586,936 0.58Recordati 3,805 158,853 0.01Regeneron Pharmaceuticals 2,233 698,929 0.06Roche Holding 19,427 5,472,436 0.48Sanofi 30,560 2,641,800 0.23Santen Pharmaceutical 9,800 162,363 0.01Seattle Genetics 2,797 193,580 0.02Shionogi & Co 7,800 449,510 0.04Sumitomo Dainippon Pharma 3,000 56,887 0.00Suzuken 3,080 180,672 0.02Taisho Pharmaceutical Holdings 800 61,407 0.00Takeda Pharmaceutical 40,759 1,446,275 0.13Teva Pharmaceutical Industries - ADR 27,389 252,800 0.02UCB 3,487 289,565 0.03Vertex Pharmaceuticals 6,993 1,282,376 0.11Vifor Pharma 1,300 188,067 0.02Zoetis 13,516 1,533,931 0.13
Pipelines (0.70%) AltaGas 6,446 97,720 0.01APA Group 23,862 180,848 0.02Cheniere Energy 5,943 406,798 0.04Enbridge 56,189 2,033,855 0.18Inter Pipeline 9,949 155,088 0.01Keyera 4,639 119,636 0.01Kinder Morgan 56,052 1,170,366 0.10Koninklijke Vopak 2,193 101,269 0.01ONEOK 10,144 698,009 0.06Pembina Pipeline 14,112 526,466 0.05Plains GP Holdings - Class A 2,306 57,581 0.00Targa Resources 6,100 239,486 0.02TC Energy 25,633 1,273,460 0.11Williams Companies 32,078 899,467 0.08
Private Equity (0.18%) 3i Group 25,536 361,884 0.03Brookfield Asset Management - Class A 22,308 1,069,521 0.10Eurazeo 1,753 122,374 0.01KKR & Co - Class A 13,400 338,618 0.03Onex 2,100 126,940 0.01
Real Estate (0.70%) Aeon Mall 3,720 56,004 0.00Aroundtown 23,913 197,324 0.02Azrieli Group 1,229 82,357 0.01CapitaLand 73,150 190,857 0.02CBRE Group - Class A 9,558 490,325 0.04CK Asset Holdings 71,720 561,367 0.05Daito Trust Construction 2,100 267,714 0.02Deutsche Wohnen 8,635 317,328 0.03First Capital Realty 3,700 61,896 0.00Hang Lung Properties 58,000 137,938 0.01
UBS ETF – MSCI World UCITS ETF
Semi-Annual report as of 30 June 2019
The accompanying notes form an integral part of these financial statements.
246
Schedule of Investments as at 30 June 2019 (Expressed in USD) (Unaudited)
Transferable securities listed on an Official Stock Exchange
Quantity Market
Value USD % of
Net Assets
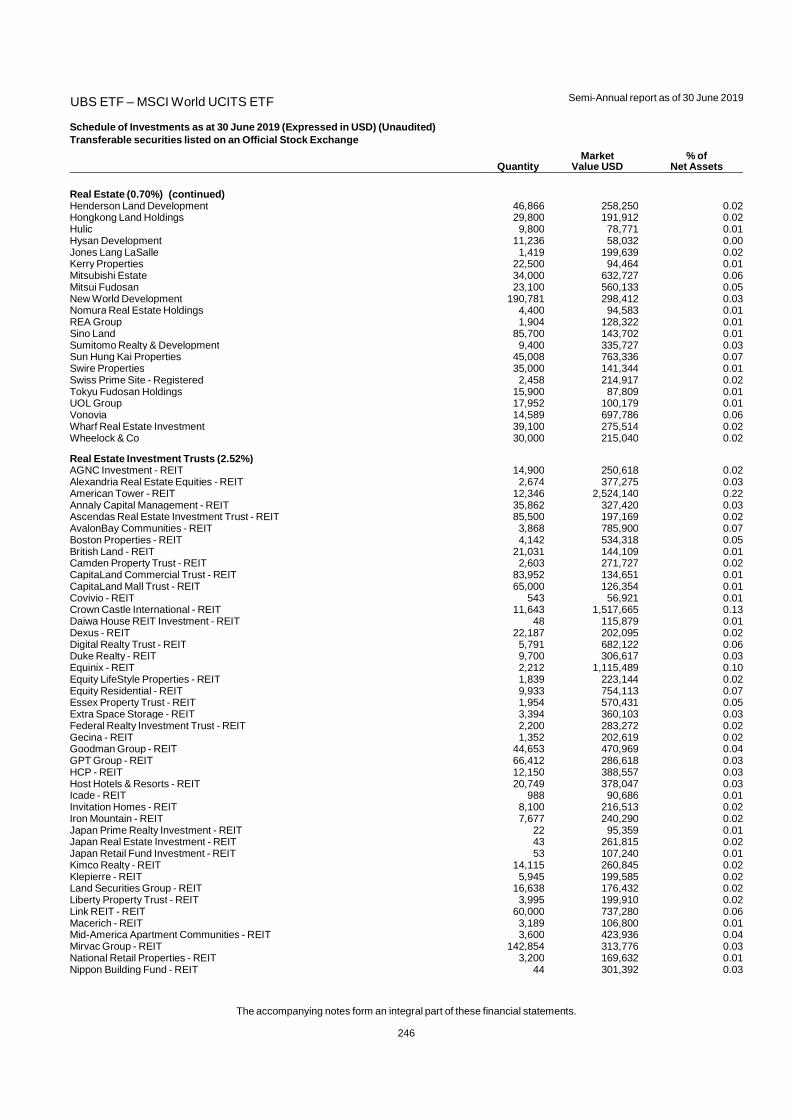
Real Estate (0.70%) (continued) Henderson Land Development 46,866 258,250 0.02Hongkong Land Holdings 29,800 191,912 0.02Hulic 9,800 78,771 0.01Hysan Development 11,236 58,032 0.00Jones Lang LaSalle 1,419 199,639 0.02Kerry Properties 22,500 94,464 0.01Mitsubishi Estate 34,000 632,727 0.06Mitsui Fudosan 23,100 560,133 0.05New World Development 190,781 298,412 0.03Nomura Real Estate Holdings 4,400 94,583 0.01REA Group 1,904 128,322 0.01Sino Land 85,700 143,702 0.01Sumitomo Realty & Development 9,400 335,727 0.03Sun Hung Kai Properties 45,008 763,336 0.07Swire Properties 35,000 141,344 0.01Swiss Prime Site - Registered 2,458 214,917 0.02Tokyu Fudosan Holdings 15,900 87,809 0.01UOL Group 17,952 100,179 0.01Vonovia 14,589 697,786 0.06Wharf Real Estate Investment 39,100 275,514 0.02Wheelock & Co 30,000 215,040 0.02
Real Estate Investment Trusts (2.52%) AGNC Investment - REIT 14,900 250,618 0.02Alexandria Real Estate Equities - REIT 2,674 377,275 0.03American Tower - REIT 12,346 2,524,140 0.22Annaly Capital Management - REIT 35,862 327,420 0.03Ascendas Real Estate Investment Trust - REIT 85,500 197,169 0.02AvalonBay Communities - REIT 3,868 785,900 0.07Boston Properties - REIT 4,142 534,318 0.05British Land - REIT 21,031 144,109 0.01Camden Property Trust - REIT 2,603 271,727 0.02CapitaLand Commercial Trust - REIT 83,952 134,651 0.01CapitaLand Mall Trust - REIT 65,000 126,354 0.01Covivio - REIT 543 56,921 0.01Crown Castle International - REIT 11,643 1,517,665 0.13Daiwa House REIT Investment - REIT 48 115,879 0.01Dexus - REIT 22,187 202,095 0.02Digital Realty Trust - REIT 5,791 682,122 0.06Duke Realty - REIT 9,700 306,617 0.03Equinix - REIT 2,212 1,115,489 0.10Equity LifeStyle Properties - REIT 1,839 223,144 0.02Equity Residential - REIT 9,933 754,113 0.07Essex Property Trust - REIT 1,954 570,431 0.05Extra Space Storage - REIT 3,394 360,103 0.03Federal Realty Investment Trust - REIT 2,200 283,272 0.02Gecina - REIT 1,352 202,619 0.02Goodman Group - REIT 44,653 470,969 0.04GPT Group - REIT 66,412 286,618 0.03HCP - REIT 12,150 388,557 0.03Host Hotels & Resorts - REIT 20,749 378,047 0.03Icade - REIT 988 90,686 0.01Invitation Homes - REIT 8,100 216,513 0.02Iron Mountain - REIT 7,677 240,290 0.02Japan Prime Realty Investment - REIT 22 95,359 0.01Japan Real Estate Investment - REIT 43 261,815 0.02Japan Retail Fund Investment - REIT 53 107,240 0.01Kimco Realty - REIT 14,115 260,845 0.02Klepierre - REIT 5,945 199,585 0.02Land Securities Group - REIT 16,638 176,432 0.02Liberty Property Trust - REIT 3,995 199,910 0.02Link REIT - REIT 60,000 737,280 0.06Macerich - REIT 3,189 106,800 0.01Mid-America Apartment Communities - REIT 3,600 423,936 0.04Mirvac Group - REIT 142,854 313,776 0.03National Retail Properties - REIT 3,200 169,632 0.01Nippon Building Fund - REIT 44 301,392 0.03

UBS ETF – MSCI World UCITS ETF
Semi-Annual report as of 30 June 2019
The accompanying notes form an integral part of these financial statements.
247
Schedule of Investments as at 30 June 2019 (Expressed in USD) (Unaudited)
Transferable securities listed on an Official Stock Exchange
Quantity Market
Value USD % of
Net Assets
Real Estate Investment Trusts (2.52%) (continued) Nippon Prologis REIT - REIT 52 120,130 0.01Nomura Real Estate Master Fund - REIT 65 99,967 0.01Prologis - REIT 17,446 1,397,425 0.12Public Storage - REIT 4,435 1,056,284 0.09Realty Income - REIT 7,451 513,895 0.05Regency Centers - REIT 4,017 268,095 0.02RioCan Real Estate Investment Trust - REIT 4,324 86,000 0.01SBA Communications - REIT 3,302 742,422 0.07Scentre Group - REIT 168,978 455,348 0.04Segro - REIT 28,077 260,927 0.02Simon Property Group - REIT 8,377 1,338,309 0.12SL Green Realty - REIT 2,279 183,163 0.02Stockland - REIT 64,652 189,191 0.02Sun Communities - REIT 1,746 223,820 0.02Suntec Real Estate Investment Trust - REIT 63,000 90,336 0.01UDR - REIT 7,239 324,959 0.03Unibail-Rodamco-Westfield - CDI 20,800 149,905 0.01Unibail-Rodamco-Westfield - REIT 2,392 358,888 0.03United Urban Investment - REIT 88 147,511 0.01Ventas - REIT 9,975 681,791 0.06VEREIT - REIT 27,267 245,676 0.02Vicinity Centres - REIT 99,055 170,304 0.01Vornado Realty Trust - REIT 4,173 267,489 0.02Welltower - REIT 10,441 851,255 0.08Weyerhaeuser - REIT 20,523 540,576 0.05WP Carey - REIT 3,747 304,181 0.03
Retail (4.18%) Advance Auto Parts 2,211 340,804 0.03Aeon 18,200 312,681 0.03Alimentation Couche-Tard - Class B 12,316 776,707 0.07AutoZone 654 719,053 0.06Best Buy 7,409 516,630 0.04Burlington Stores 1,514 257,607 0.02Canadian Tire - Class A 1,814 198,065 0.02CarMax 4,793 416,176 0.04Chipotle Mexican Grill 680 498,358 0.04Compagnie Financiere Richemont - Registered 14,526 1,234,189 0.11Costco Wholesale 12,135 3,206,795 0.28Darden Restaurants 2,928 356,425 0.03Dollar General 7,381 997,616 0.09Dollar Tree 6,262 672,476 0.06Dollarama 8,100 285,569 0.02Domino's Pizza 1,100 306,108 0.03Domino's Pizza Enterprises 2,112 55,786 0.00Dufry - Registered 860 72,928 0.01FamilyMart UNY Holdings 6,400 152,783 0.01Fast Retailing 1,700 1,027,669 0.09Gap 6,473 116,320 0.01Genuine Parts 4,197 434,725 0.04Harvey Norman Holdings 9,442 26,968 0.00Hennes & Mauritz - Class B 24,638 439,109 0.04Home Depot 30,790 6,403,396 0.56Hugo Boss 2,449 163,152 0.01Industria de Diseno Textil 30,948 932,193 0.08Isetan Mitsukoshi Holdings 11,500 93,289 0.01J Front Retailing 8,500 97,434 0.01Kingfisher 63,771 174,416 0.01Kohl's 5,031 239,224 0.02L Brands 6,087 158,871 0.01Lawson 1,400 67,180 0.01Lowe's Companies 22,269 2,247,165 0.20Lululemon Athletica 2,643 476,295 0.04Macy's 8,277 177,624 0.02Marks & Spencer Group 65,839 176,553 0.02Marui Group 5,700 116,074 0.01McDonald's 21,275 4,417,967 0.39
UBS ETF – MSCI World UCITS ETF
Semi-Annual report as of 30 June 2019
The accompanying notes form an integral part of these financial statements.
248
Schedule of Investments as at 30 June 2019 (Expressed in USD) (Unaudited)
Transferable securities listed on an Official Stock Exchange
Quantity Market
Value USD % of
Net Assets
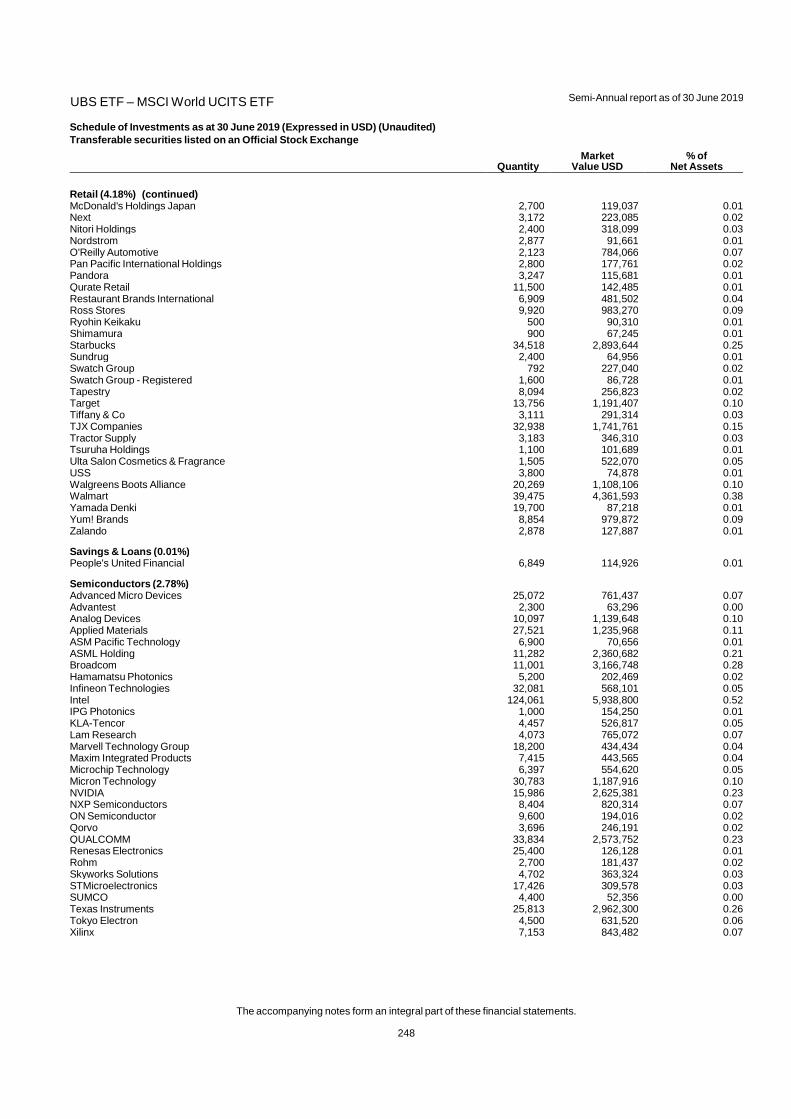
Retail (4.18%) (continued) McDonald's Holdings Japan 2,700 119,037 0.01Next 3,172 223,085 0.02Nitori Holdings 2,400 318,099 0.03Nordstrom 2,877 91,661 0.01O'Reilly Automotive 2,123 784,066 0.07Pan Pacific International Holdings 2,800 177,761 0.02Pandora 3,247 115,681 0.01Qurate Retail 11,500 142,485 0.01Restaurant Brands International 6,909 481,502 0.04Ross Stores 9,920 983,270 0.09Ryohin Keikaku 500 90,310 0.01Shimamura 900 67,245 0.01Starbucks 34,518 2,893,644 0.25Sundrug 2,400 64,956 0.01Swatch Group 792 227,040 0.02Swatch Group - Registered 1,600 86,728 0.01Tapestry 8,094 256,823 0.02Target 13,756 1,191,407 0.10Tiffany & Co 3,111 291,314 0.03TJX Companies 32,938 1,741,761 0.15Tractor Supply 3,183 346,310 0.03Tsuruha Holdings 1,100 101,689 0.01Ulta Salon Cosmetics & Fragrance 1,505 522,070 0.05USS 3,800 74,878 0.01Walgreens Boots Alliance 20,269 1,108,106 0.10Walmart 39,475 4,361,593 0.38Yamada Denki 19,700 87,218 0.01Yum! Brands 8,854 979,872 0.09Zalando 2,878 127,887 0.01
Savings & Loans (0.01%) People's United Financial 6,849 114,926 0.01
Semiconductors (2.78%) Advanced Micro Devices 25,072 761,437 0.07Advantest 2,300 63,296 0.00Analog Devices 10,097 1,139,648 0.10Applied Materials 27,521 1,235,968 0.11ASM Pacific Technology 6,900 70,656 0.01ASML Holding 11,282 2,360,682 0.21Broadcom 11,001 3,166,748 0.28Hamamatsu Photonics 5,200 202,469 0.02Infineon Technologies 32,081 568,101 0.05Intel 124,061 5,938,800 0.52IPG Photonics 1,000 154,250 0.01KLA-Tencor 4,457 526,817 0.05Lam Research 4,073 765,072 0.07Marvell Technology Group 18,200 434,434 0.04Maxim Integrated Products 7,415 443,565 0.04Microchip Technology 6,397 554,620 0.05Micron Technology 30,783 1,187,916 0.10NVIDIA 15,986 2,625,381 0.23NXP Semiconductors 8,404 820,314 0.07ON Semiconductor 9,600 194,016 0.02Qorvo 3,696 246,191 0.02QUALCOMM 33,834 2,573,752 0.23Renesas Electronics 25,400 126,128 0.01Rohm 2,700 181,437 0.02Skyworks Solutions 4,702 363,324 0.03STMicroelectronics 17,426 309,578 0.03SUMCO 4,400 52,356 0.00Texas Instruments 25,813 2,962,300 0.26Tokyo Electron 4,500 631,520 0.06Xilinx 7,153 843,482 0.07
UBS ETF – MSCI World UCITS ETF
Semi-Annual report as of 30 June 2019
The accompanying notes form an integral part of these financial statements.
249
Schedule of Investments as at 30 June 2019 (Expressed in USD) (Unaudited)
Transferable securities listed on an Official Stock Exchange
Quantity Market
Value USD % of
Net Assets
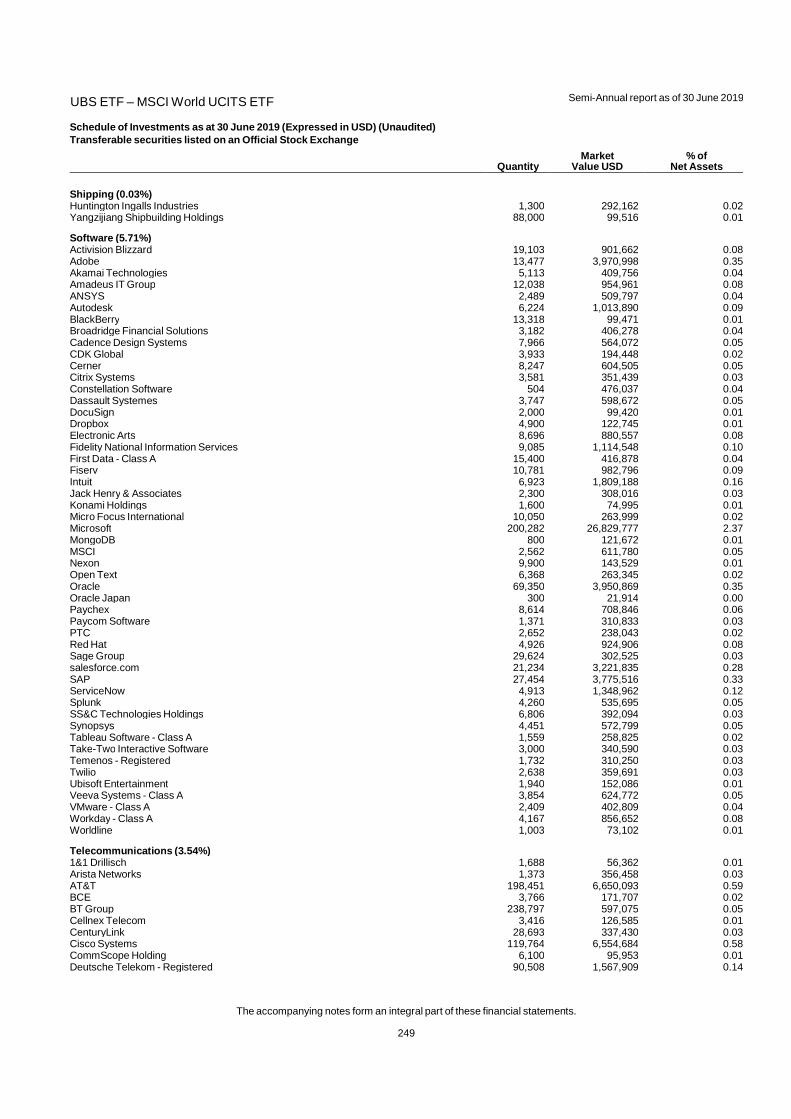
Shipping (0.03%) Huntington Ingalls Industries 1,300 292,162 0.02Yangzijiang Shipbuilding Holdings 88,000 99,516 0.01
Software (5.71%) Activision Blizzard 19,103 901,662 0.08Adobe 13,477 3,970,998 0.35Akamai Technologies 5,113 409,756 0.04Amadeus IT Group 12,038 954,961 0.08ANSYS 2,489 509,797 0.04Autodesk 6,224 1,013,890 0.09BlackBerry 13,318 99,471 0.01Broadridge Financial Solutions 3,182 406,278 0.04Cadence Design Systems 7,966 564,072 0.05CDK Global 3,933 194,448 0.02Cerner 8,247 604,505 0.05Citrix Systems 3,581 351,439 0.03Constellation Software 504 476,037 0.04Dassault Systemes 3,747 598,672 0.05DocuSign 2,000 99,420 0.01Dropbox 4,900 122,745 0.01Electronic Arts 8,696 880,557 0.08Fidelity National Information Services 9,085 1,114,548 0.10First Data - Class A 15,400 416,878 0.04Fiserv 10,781 982,796 0.09Intuit 6,923 1,809,188 0.16Jack Henry & Associates 2,300 308,016 0.03Konami Holdings 1,600 74,995 0.01Micro Focus International 10,050 263,999 0.02Microsoft 200,282 26,829,777 2.37MongoDB 800 121,672 0.01MSCI 2,562 611,780 0.05Nexon 9,900 143,529 0.01Open Text 6,368 263,345 0.02Oracle 69,350 3,950,869 0.35Oracle Japan 300 21,914 0.00Paychex 8,614 708,846 0.06Paycom Software 1,371 310,833 0.03PTC 2,652 238,043 0.02Red Hat 4,926 924,906 0.08Sage Group 29,624 302,525 0.03salesforce.com 21,234 3,221,835 0.28SAP 27,454 3,775,516 0.33ServiceNow 4,913 1,348,962 0.12Splunk 4,260 535,695 0.05SS&C Technologies Holdings 6,806 392,094 0.03Synopsys 4,451 572,799 0.05Tableau Software - Class A 1,559 258,825 0.02Take-Two Interactive Software 3,000 340,590 0.03Temenos - Registered 1,732 310,250 0.03Twilio 2,638 359,691 0.03Ubisoft Entertainment 1,940 152,086 0.01Veeva Systems - Class A 3,854 624,772 0.05VMware - Class A 2,409 402,809 0.04Workday - Class A 4,167 856,652 0.08Worldline 1,003 73,102 0.01
Telecommunications (3.54%) 1&1 Drillisch 1,688 56,362 0.01Arista Networks 1,373 356,458 0.03AT&T 198,451 6,650,093 0.59BCE 3,766 171,707 0.02BT Group 238,797 597,075 0.05Cellnex Telecom 3,416 126,585 0.01CenturyLink 28,693 337,430 0.03Cisco Systems 119,764 6,554,684 0.58CommScope Holding 6,100 95,953 0.01Deutsche Telekom - Registered 90,508 1,567,909 0.14
UBS ETF – MSCI World UCITS ETF
Semi-Annual report as of 30 June 2019
The accompanying notes form an integral part of these financial statements.
250
Schedule of Investments as at 30 June 2019 (Expressed in USD) (Unaudited)
Transferable securities listed on an Official Stock Exchange
Quantity Market
Value USD % of
Net Assets
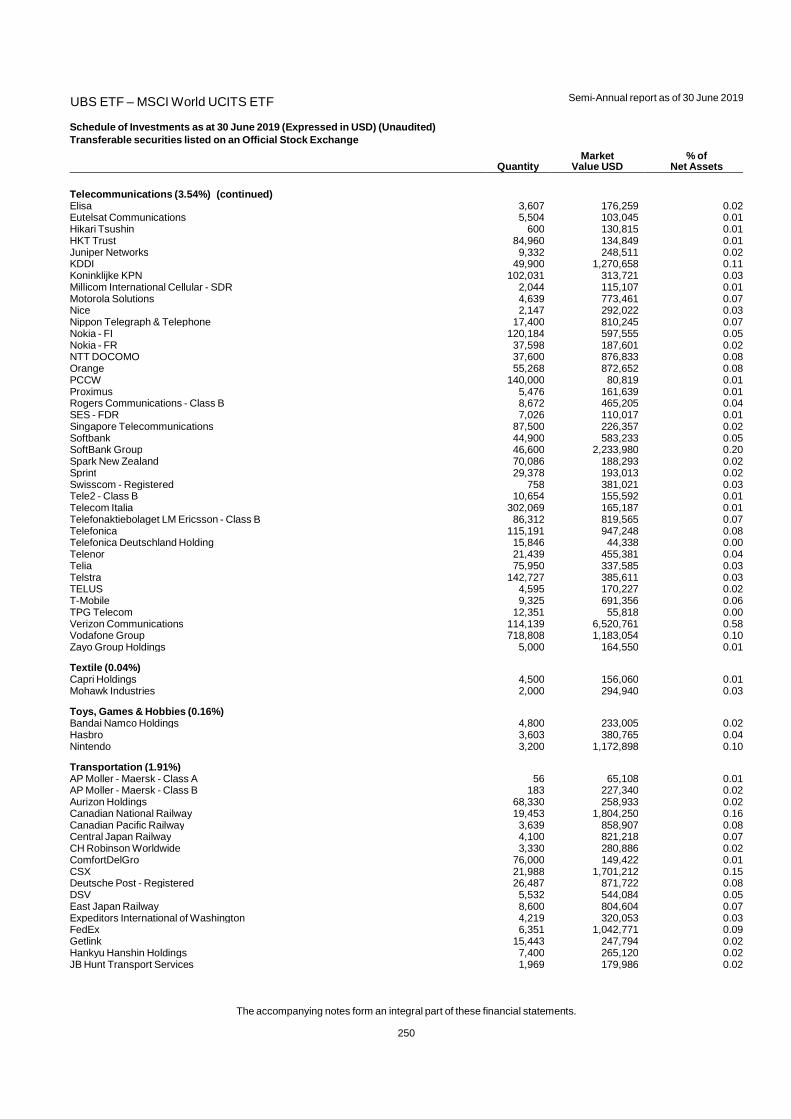
Telecommunications (3.54%) (continued) Elisa 3,607 176,259 0.02Eutelsat Communications 5,504 103,045 0.01Hikari Tsushin 600 130,815 0.01HKT Trust 84,960 134,849 0.01Juniper Networks 9,332 248,511 0.02KDDI 49,900 1,270,658 0.11Koninklijke KPN 102,031 313,721 0.03Millicom International Cellular - SDR 2,044 115,107 0.01Motorola Solutions 4,639 773,461 0.07Nice 2,147 292,022 0.03Nippon Telegraph & Telephone 17,400 810,245 0.07Nokia - FI 120,184 597,555 0.05Nokia - FR 37,598 187,601 0.02NTT DOCOMO 37,600 876,833 0.08Orange 55,268 872,652 0.08PCCW 140,000 80,819 0.01Proximus 5,476 161,639 0.01Rogers Communications - Class B 8,672 465,205 0.04SES - FDR 7,026 110,017 0.01Singapore Telecommunications 87,500 226,357 0.02Softbank 44,900 583,233 0.05SoftBank Group 46,600 2,233,980 0.20Spark New Zealand 70,086 188,293 0.02Sprint 29,378 193,013 0.02Swisscom - Registered 758 381,021 0.03Tele2 - Class B 10,654 155,592 0.01Telecom Italia 302,069 165,187 0.01Telefonaktiebolaget LM Ericsson - Class B 86,312 819,565 0.07Telefonica 115,191 947,248 0.08Telefonica Deutschland Holding 15,846 44,338 0.00Telenor 21,439 455,381 0.04Telia 75,950 337,585 0.03Telstra 142,727 385,611 0.03TELUS 4,595 170,227 0.02T-Mobile 9,325 691,356 0.06TPG Telecom 12,351 55,818 0.00Verizon Communications 114,139 6,520,761 0.58Vodafone Group 718,808 1,183,054 0.10Zayo Group Holdings 5,000 164,550 0.01
Textile (0.04%) Capri Holdings 4,500 156,060 0.01Mohawk Industries 2,000 294,940 0.03
Toys, Games & Hobbies (0.16%) Bandai Namco Holdings 4,800 233,005 0.02Hasbro 3,603 380,765 0.04Nintendo 3,200 1,172,898 0.10
Transportation (1.91%) AP Moller - Maersk - Class A 56 65,108 0.01AP Moller - Maersk - Class B 183 227,340 0.02Aurizon Holdings 68,330 258,933 0.02Canadian National Railway 19,453 1,804,250 0.16Canadian Pacific Railway 3,639 858,907 0.08Central Japan Railway 4,100 821,218 0.07CH Robinson Worldwide 3,330 280,886 0.02ComfortDelGro 76,000 149,422 0.01CSX 21,988 1,701,212 0.15Deutsche Post - Registered 26,487 871,722 0.08DSV 5,532 544,084 0.05East Japan Railway 8,600 804,604 0.07Expeditors International of Washington 4,219 320,053 0.03FedEx 6,351 1,042,771 0.09Getlink 15,443 247,794 0.02Hankyu Hanshin Holdings 7,400 265,120 0.02JB Hunt Transport Services 1,969 179,986 0.02

UBS ETF – MSCI World UCITS ETF
Semi-Annual report as of 30 June 2019
The accompanying notes form an integral part of these financial statements.
251
Schedule of Investments as at 30 June 2019 (Expressed in USD) (Unaudited)
Transferable securities listed on an Official Stock Exchange
Quantity Market
Value USD % of
Net Assets
Transportation (1.91%) (continued) Kamigumi 4,000 94,672 0.01Kansas City Southern 3,083 375,571 0.03Keihan Holdings 3,600 156,878 0.01Keikyu 8,000 137,739 0.01Keio 3,500 230,323 0.02Keisei Electric Railway 3,000 109,291 0.01Kintetsu Group Holdings 4,600 220,308 0.02Knight-Swift Transportation Holdings 3,800 124,792 0.01Kuehne + Nagel International - Registered 1,507 223,963 0.02Kyushu Railway 6,300 183,609 0.02Mitsui OSK Lines 3,600 86,174 0.01MTR 35,082 236,200 0.02Nagoya Railroad 5,399 149,382 0.01Nippon Express 2,700 143,596 0.01Nippon Yusen 4,100 65,796 0.01Norfolk Southern 7,501 1,495,174 0.13Odakyu Electric Railway 7,200 176,224 0.02Old Dominion Freight Line 2,000 298,520 0.03Seibu Holdings 4,500 75,014 0.01SG Holdings 4,000 113,421 0.01Tobu Railway 6,100 177,780 0.02Tokyu 13,400 237,678 0.02Union Pacific 20,127 3,403,677 0.30United Parcel Service - Class B 19,140 1,976,588 0.17West Japan Railway 4,900 396,402 0.03XPO Logistics 3,600 208,116 0.02Yamato Holdings 8,400 170,822 0.01
Trucking & Leasing (0.02%) AerCap Holdings 3,379 175,742 0.02
Water (0.13%) American Water Works 4,810 557,960 0.05Severn Trent 6,454 168,223 0.01Suez 13,871 200,455 0.02United Utilities Group 19,292 192,200 0.02Veolia Environnement 13,820 337,113 0.03
Total Common Stocks 1,130,958,858 99.72
Preferred Stocks
Auto Manufacturers (0.11%) Bayerische Motoren Werke 2,232 138,782 0.01Porsche Automobil Holding 4,065 264,514 0.02Volkswagen 4,954 836,201 0.08
Chemicals (0.01%) Fuchs Petrolub 2,517 99,119 0.01
Electronics (0.01%) Sartorius 850 174,527 0.01
Household Products (0.04%) Henkel & Co 4,963 486,173 0.04
Telecommunications (0.01%) Telecom Italia - Rsp 182,203 94,637 0.01
Total Preferred Stocks 2,093,953 0.18
Rights
MCH Red Categorization (0.00%) ACS Actividades de Construccion y Servicios - Rights 6,830 10,734 0.00
UBS ETF – MSCI World UCITS ETF
Semi-Annual report as of 30 June 2019
The accompanying notes form an integral part of these financial statements.
252
Schedule of Investments as at 30 June 2019 (Expressed in USD) (Unaudited)
Transferable securities listed on an Official Stock Exchange
Quantity Market
Value USD % of
Net Assets
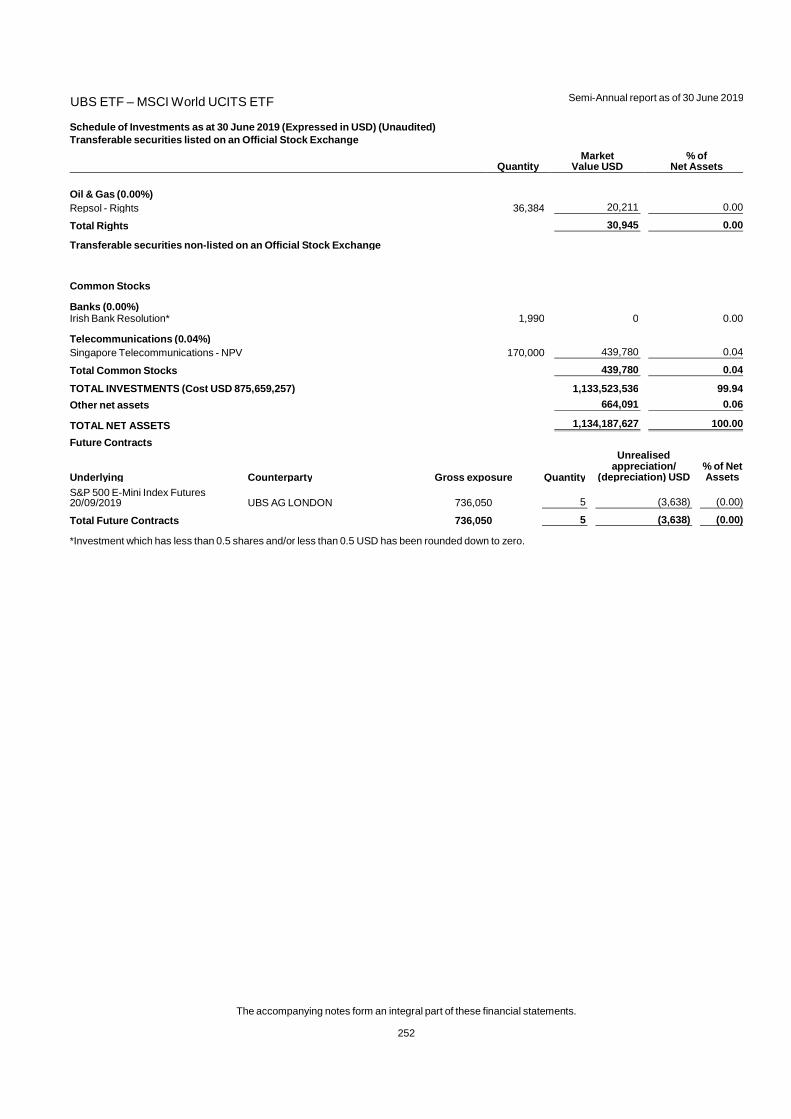
Oil & Gas (0.00%) Repsol - Rights 36,384 20,211 0.00
Total Rights 30,945 0.00
Transferable securities non -listed on an Official Stock Exchange
Common Stocks
Banks (0.00%) Irish Bank Resolution* 1,990 0 0.00
Telecommunications (0.04%) Singapore Telecommunications - NPV 170,000 439,780 0.04
Total Common Stocks 439,780 0.04
TOTAL INVESTMENTS (Cost USD 875,659,257) 1,133,523,536 99.94
Other net assets 664,091 0.06
TOTAL NET ASSETS 1,134,187,627 100.00
Future Contracts
Underlying Counterparty Gross exposure Quantity
Unrealised appreciation/
(depreciation) USD % of Net Assets
S&P 500 E-Mini Index Futures 20/09/2019 UBS AG LONDON 736,050 5 (3,638) (0.00)
Total Future Contracts 736,050 5 (3,638) (0.00)
*Investment which has less than 0.5 shares and/or less than 0.5 USD has been rounded down to zero.
UBS ETF – MSCI Emerging Markets UCITS ETF
Semi-Annual report as of 30 June 2019
The accompanying notes form an integral part of these financial statements.
253
Schedule of Investments as at 30 June 2019 (Expressed in USD) (Unaudited)
Transferable securities listed on an Official Stock Exchange
Quantity Market
Value USD % of
Net Assets
Common Stocks
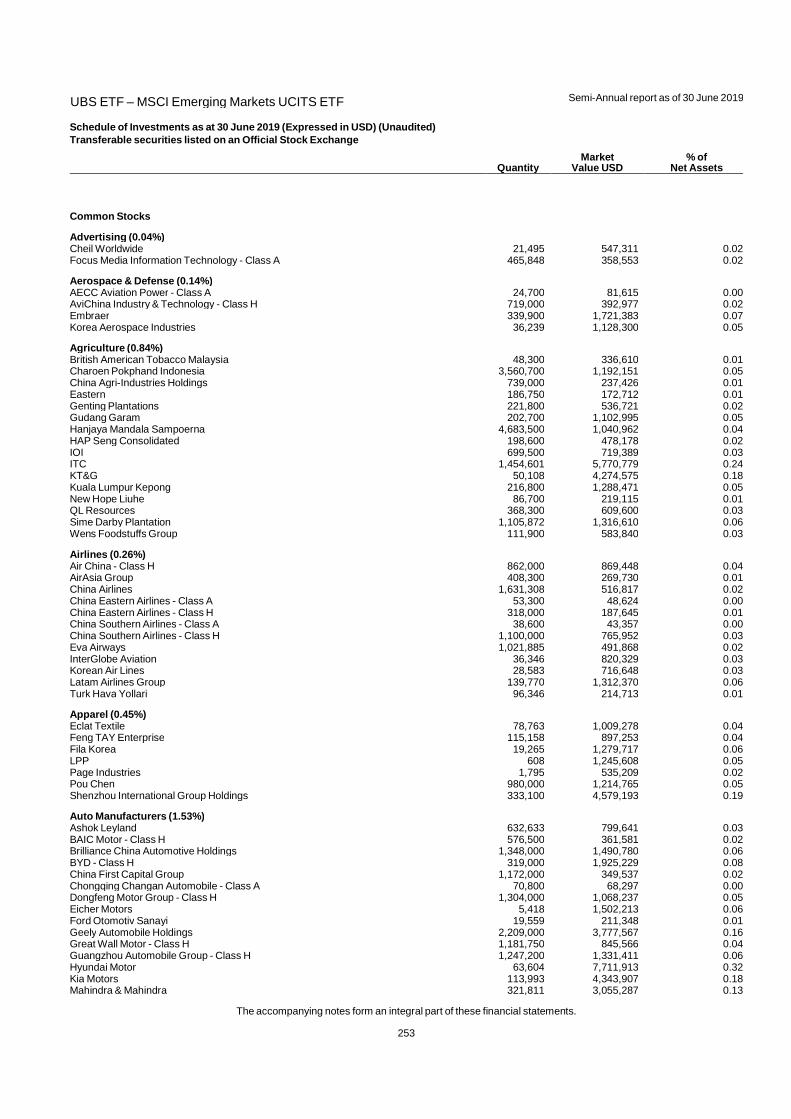
Advertising (0.04%) Cheil Worldwide 21,495 547,311 0.02Focus Media Information Technology - Class A 465,848 358,553 0.02
Aerospace & Defense (0.14%) AECC Aviation Power - Class A 24,700 81,615 0.00AviChina Industry & Technology - Class H 719,000 392,977 0.02Embraer 339,900 1,721,383 0.07Korea Aerospace Industries 36,239 1,128,300 0.05
Agriculture (0.84%) British American Tobacco Malaysia 48,300 336,610 0.01Charoen Pokphand Indonesia 3,560,700 1,192,151 0.05China Agri-Industries Holdings 739,000 237,426 0.01Eastern 186,750 172,712 0.01Genting Plantations 221,800 536,721 0.02Gudang Garam 202,700 1,102,995 0.05Hanjaya Mandala Sampoerna 4,683,500 1,040,962 0.04HAP Seng Consolidated 198,600 478,178 0.02IOI 699,500 719,389 0.03ITC 1,454,601 5,770,779 0.24KT&G 50,108 4,274,575 0.18Kuala Lumpur Kepong 216,800 1,288,471 0.05New Hope Liuhe 86,700 219,115 0.01QL Resources 368,300 609,600 0.03Sime Darby Plantation 1,105,872 1,316,610 0.06Wens Foodstuffs Group 111,900 583,840 0.03
Airlines (0.26%) Air China - Class H 862,000 869,448 0.04AirAsia Group 408,300 269,730 0.01China Airlines 1,631,308 516,817 0.02China Eastern Airlines - Class A 53,300 48,624 0.00China Eastern Airlines - Class H 318,000 187,645 0.01China Southern Airlines - Class A 38,600 43,357 0.00China Southern Airlines - Class H 1,100,000 765,952 0.03Eva Airways 1,021,885 491,868 0.02InterGlobe Aviation 36,346 820,329 0.03Korean Air Lines 28,583 716,648 0.03Latam Airlines Group 139,770 1,312,370 0.06Turk Hava Yollari 96,346 214,713 0.01
Apparel (0.45%) Eclat Textile 78,763 1,009,278 0.04Feng TAY Enterprise 115,158 897,253 0.04Fila Korea 19,265 1,279,717 0.06LPP 608 1,245,608 0.05Page Industries 1,795 535,209 0.02Pou Chen 980,000 1,214,765 0.05Shenzhou International Group Holdings 333,100 4,579,193 0.19
Auto Manufacturers (1.53%) Ashok Leyland 632,633 799,641 0.03BAIC Motor - Class H 576,500 361,581 0.02Brilliance China Automotive Holdings 1,348,000 1,490,780 0.06BYD - Class H 319,000 1,925,229 0.08China First Capital Group 1,172,000 349,537 0.02Chongqing Changan Automobile - Class A 70,800 68,297 0.00Dongfeng Motor Group - Class H 1,304,000 1,068,237 0.05Eicher Motors 5,418 1,502,213 0.06Ford Otomotiv Sanayi 19,559 211,348 0.01Geely Automobile Holdings 2,209,000 3,777,567 0.16Great Wall Motor - Class H 1,181,750 845,566 0.04Guangzhou Automobile Group - Class H 1,247,200 1,331,411 0.06Hyundai Motor 63,604 7,711,913 0.32Kia Motors 113,993 4,343,907 0.18Mahindra & Mahindra 321,811 3,055,287 0.13
UBS ETF – MSCI Emerging Markets UCITS ETF
Semi-Annual report as of 30 June 2019
The accompanying notes form an integral part of these financial statements.
254
Schedule of Investments as at 30 June 2019 (Expressed in USD) (Unaudited)
Transferable securities listed on an Official Stock Exchange
Quantity Market
Value USD % of
Net Assets
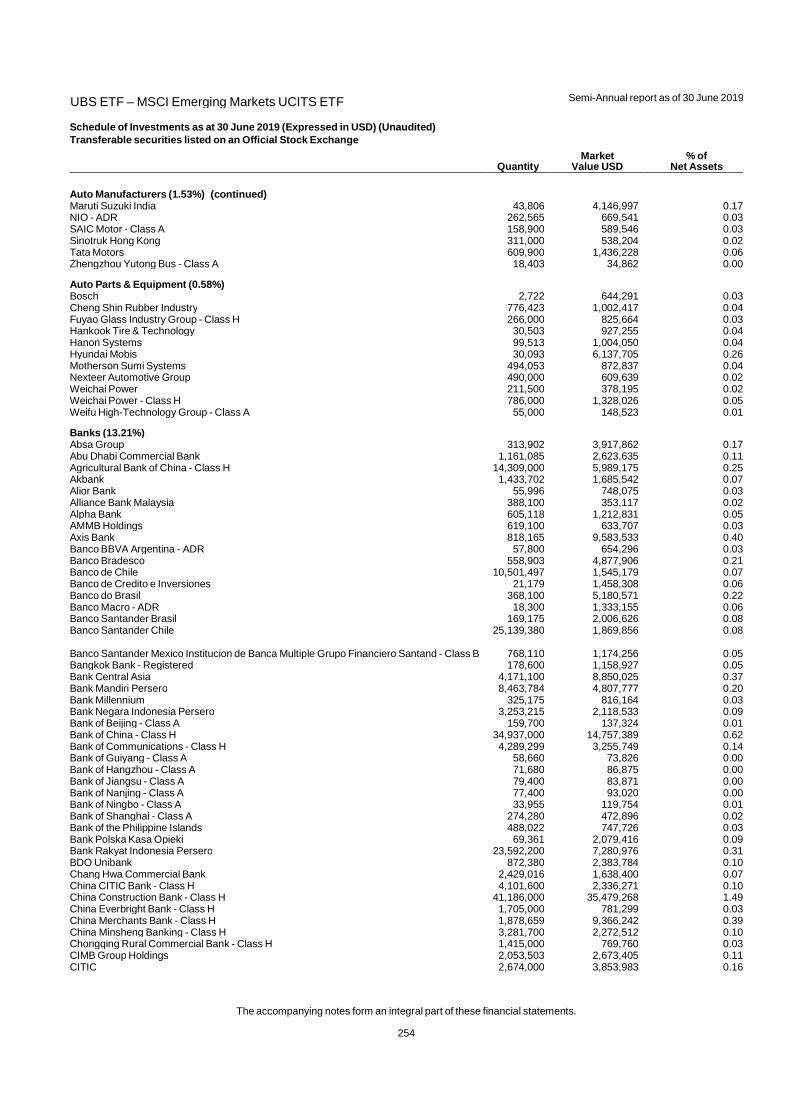
Auto Manufacturers (1.53%) (continued) Maruti Suzuki India 43,806 4,146,997 0.17NIO - ADR 262,565 669,541 0.03SAIC Motor - Class A 158,900 589,546 0.03Sinotruk Hong Kong 311,000 538,204 0.02Tata Motors 609,900 1,436,228 0.06Zhengzhou Yutong Bus - Class A 18,403 34,862 0.00
Auto Parts & Equipment (0.58%) Bosch 2,722 644,291 0.03Cheng Shin Rubber Industry 776,423 1,002,417 0.04Fuyao Glass Industry Group - Class H 266,000 825,664 0.03Hankook Tire & Technology 30,503 927,255 0.04Hanon Systems 99,513 1,004,050 0.04Hyundai Mobis 30,093 6,137,705 0.26Motherson Sumi Systems 494,053 872,837 0.04Nexteer Automotive Group 490,000 609,639 0.02Weichai Power 211,500 378,195 0.02Weichai Power - Class H 786,000 1,328,026 0.05Weifu High-Technology Group - Class A 55,000 148,523 0.01
Banks (13.21%) Absa Group 313,902 3,917,862 0.17Abu Dhabi Commercial Bank 1,161,085 2,623,635 0.11Agricultural Bank of China - Class H 14,309,000 5,989,175 0.25Akbank 1,433,702 1,685,542 0.07Alior Bank 55,996 748,075 0.03Alliance Bank Malaysia 388,100 353,117 0.02Alpha Bank 605,118 1,212,831 0.05AMMB Holdings 619,100 633,707 0.03Axis Bank 818,165 9,583,533 0.40Banco BBVA Argentina - ADR 57,800 654,296 0.03Banco Bradesco 558,903 4,877,906 0.21Banco de Chile 10,501,497 1,545,179 0.07Banco de Credito e Inversiones 21,179 1,458,308 0.06Banco do Brasil 368,100 5,180,571 0.22Banco Macro - ADR 18,300 1,333,155 0.06Banco Santander Brasil 169,175 2,006,626 0.08Banco Santander Chile 25,139,380 1,869,856 0.08
Banco Santander Mexico Institucion de Banca Multiple Grupo Financiero Santand - Class B 768,110 1,174,256 0.05Bangkok Bank - Registered 178,600 1,158,927 0.05Bank Central Asia 4,171,100 8,850,025 0.37Bank Mandiri Persero 8,463,784 4,807,777 0.20Bank Millennium 325,175 816,164 0.03Bank Negara Indonesia Persero 3,253,215 2,118,533 0.09Bank of Beijing - Class A 159,700 137,324 0.01Bank of China - Class H 34,937,000 14,757,389 0.62Bank of Communications - Class H 4,289,299 3,255,749 0.14Bank of Guiyang - Class A 58,660 73,826 0.00Bank of Hangzhou - Class A 71,680 86,875 0.00Bank of Jiangsu - Class A 79,400 83,871 0.00Bank of Nanjing - Class A 77,400 93,020 0.00Bank of Ningbo - Class A 33,955 119,754 0.01Bank of Shanghai - Class A 274,280 472,896 0.02Bank of the Philippine Islands 488,022 747,726 0.03Bank Polska Kasa Opieki 69,361 2,079,416 0.09Bank Rakyat Indonesia Persero 23,592,200 7,280,976 0.31BDO Unibank 872,380 2,383,784 0.10Chang Hwa Commercial Bank 2,429,016 1,638,400 0.07China CITIC Bank - Class H 4,101,600 2,336,271 0.10China Construction Bank - Class H 41,186,000 35,479,268 1.49China Everbright Bank - Class H 1,705,000 781,299 0.03China Merchants Bank - Class H 1,878,659 9,366,242 0.39China Minsheng Banking - Class H 3,281,700 2,272,512 0.10Chongqing Rural Commercial Bank - Class H 1,415,000 769,760 0.03CIMB Group Holdings 2,053,503 2,673,405 0.11CITIC 2,674,000 3,853,983 0.16
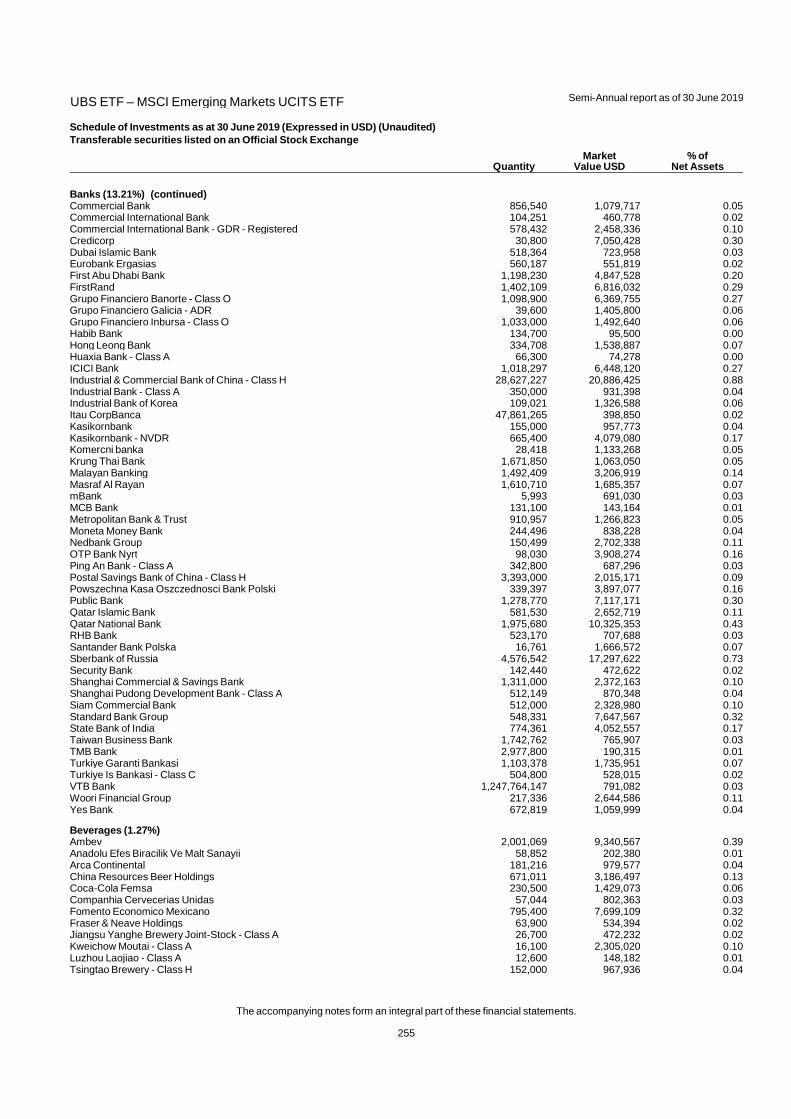
UBS ETF – MSCI Emerging Markets UCITS ETF
Semi-Annual report as of 30 June 2019
The accompanying notes form an integral part of these financial statements.
255
Schedule of Investments as at 30 June 2019 (Expressed in USD) (Unaudited)
Transferable securities listed on an Official Stock Exchange
Quantity Market
Value USD % of
Net Assets
Banks (13.21%) (continued) Commercial Bank 856,540 1,079,717 0.05Commercial International Bank 104,251 460,778 0.02Commercial International Bank - GDR - Registered 578,432 2,458,336 0.10Credicorp 30,800 7,050,428 0.30Dubai Islamic Bank 518,364 723,958 0.03Eurobank Ergasias 560,187 551,819 0.02First Abu Dhabi Bank 1,198,230 4,847,528 0.20FirstRand 1,402,109 6,816,032 0.29Grupo Financiero Banorte - Class O 1,098,900 6,369,755 0.27Grupo Financiero Galicia - ADR 39,600 1,405,800 0.06Grupo Financiero Inbursa - Class O 1,033,000 1,492,640 0.06Habib Bank 134,700 95,500 0.00Hong Leong Bank 334,708 1,538,887 0.07Huaxia Bank - Class A 66,300 74,278 0.00ICICI Bank 1,018,297 6,448,120 0.27Industrial & Commercial Bank of China - Class H 28,627,227 20,886,425 0.88Industrial Bank - Class A 350,000 931,398 0.04Industrial Bank of Korea 109,021 1,326,588 0.06Itau CorpBanca 47,861,265 398,850 0.02Kasikornbank 155,000 957,773 0.04Kasikornbank - NVDR 665,400 4,079,080 0.17Komercni banka 28,418 1,133,268 0.05Krung Thai Bank 1,671,850 1,063,050 0.05Malayan Banking 1,492,409 3,206,919 0.14Masraf Al Rayan 1,610,710 1,685,357 0.07mBank 5,993 691,030 0.03MCB Bank 131,100 143,164 0.01Metropolitan Bank & Trust 910,957 1,266,823 0.05Moneta Money Bank 244,496 838,228 0.04Nedbank Group 150,499 2,702,338 0.11OTP Bank Nyrt 98,030 3,908,274 0.16Ping An Bank - Class A 342,800 687,296 0.03Postal Savings Bank of China - Class H 3,393,000 2,015,171 0.09Powszechna Kasa Oszczednosci Bank Polski 339,397 3,897,077 0.16Public Bank 1,278,770 7,117,171 0.30Qatar Islamic Bank 581,530 2,652,719 0.11Qatar National Bank 1,975,680 10,325,353 0.43RHB Bank 523,170 707,688 0.03Santander Bank Polska 16,761 1,666,572 0.07Sberbank of Russia 4,576,542 17,297,622 0.73Security Bank 142,440 472,622 0.02Shanghai Commercial & Savings Bank 1,311,000 2,372,163 0.10Shanghai Pudong Development Bank - Class A 512,149 870,348 0.04Siam Commercial Bank 512,000 2,328,980 0.10Standard Bank Group 548,331 7,647,567 0.32State Bank of India 774,361 4,052,557 0.17Taiwan Business Bank 1,742,762 765,907 0.03TMB Bank 2,977,800 190,315 0.01Turkiye Garanti Bankasi 1,103,378 1,735,951 0.07Turkiye Is Bankasi - Class C 504,800 528,015 0.02VTB Bank 1,247,764,147 791,082 0.03Woori Financial Group 217,336 2,644,586 0.11Yes Bank 672,819 1,059,999 0.04
Beverages (1.27%) Ambev 2,001,069 9,340,567 0.39Anadolu Efes Biracilik Ve Malt Sanayii 58,852 202,380 0.01Arca Continental 181,216 979,577 0.04China Resources Beer Holdings 671,011 3,186,497 0.13Coca-Cola Femsa 230,500 1,429,073 0.06Companhia Cervecerias Unidas 57,044 802,363 0.03Fomento Economico Mexicano 795,400 7,699,109 0.32Fraser & Neave Holdings 63,900 534,394 0.02Jiangsu Yanghe Brewery Joint-Stock - Class A 26,700 472,232 0.02Kweichow Moutai - Class A 16,100 2,305,020 0.10Luzhou Laojiao - Class A 12,600 148,182 0.01Tsingtao Brewery - Class H 152,000 967,936 0.04
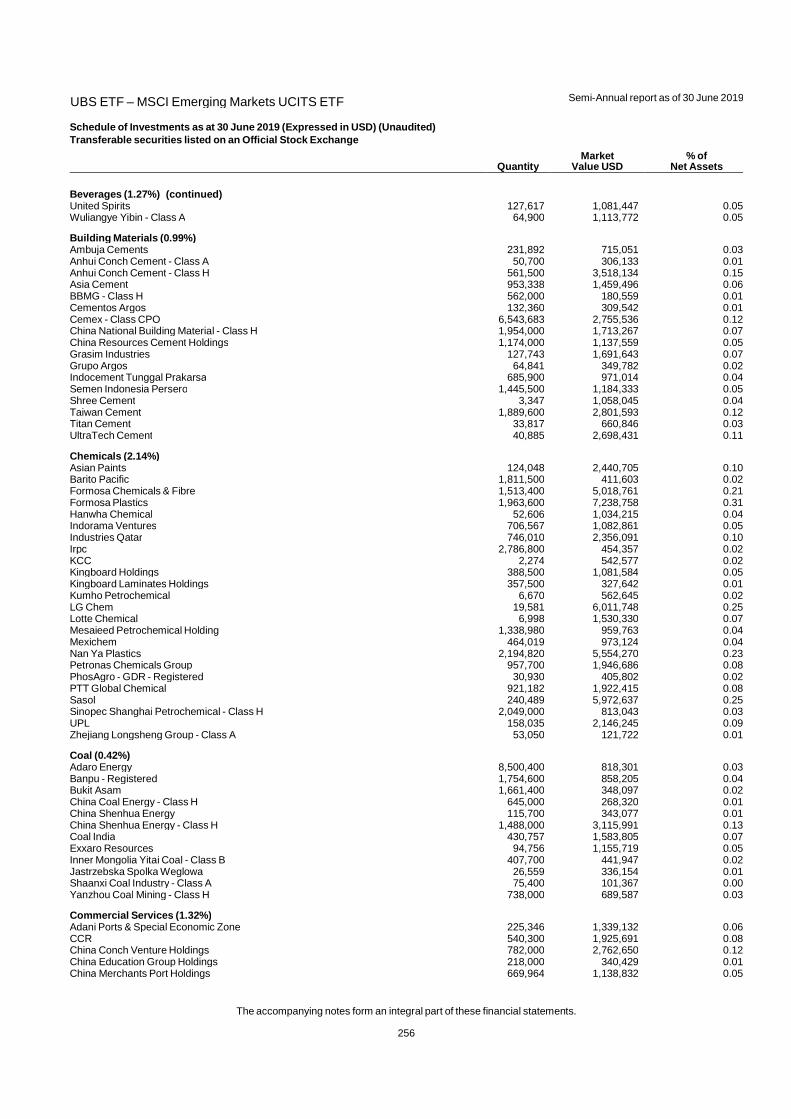
UBS ETF – MSCI Emerging Markets UCITS ETF
Semi-Annual report as of 30 June 2019
The accompanying notes form an integral part of these financial statements.
256
Schedule of Investments as at 30 June 2019 (Expressed in USD) (Unaudited)
Transferable securities listed on an Official Stock Exchange
Quantity Market
Value USD % of
Net Assets
Beverages (1.27%) (continued) United Spirits 127,617 1,081,447 0.05Wuliangye Yibin - Class A 64,900 1,113,772 0.05
Building Materials (0.99%) Ambuja Cements 231,892 715,051 0.03Anhui Conch Cement - Class A 50,700 306,133 0.01Anhui Conch Cement - Class H 561,500 3,518,134 0.15Asia Cement 953,338 1,459,496 0.06BBMG - Class H 562,000 180,559 0.01Cementos Argos 132,360 309,542 0.01Cemex - Class CPO 6,543,683 2,755,536 0.12China National Building Material - Class H 1,954,000 1,713,267 0.07China Resources Cement Holdings 1,174,000 1,137,559 0.05Grasim Industries 127,743 1,691,643 0.07Grupo Argos 64,841 349,782 0.02Indocement Tunggal Prakarsa 685,900 971,014 0.04Semen Indonesia Persero 1,445,500 1,184,333 0.05Shree Cement 3,347 1,058,045 0.04Taiwan Cement 1,889,600 2,801,593 0.12Titan Cement 33,817 660,846 0.03UltraTech Cement 40,885 2,698,431 0.11
Chemicals (2.14%) Asian Paints 124,048 2,440,705 0.10Barito Pacific 1,811,500 411,603 0.02Formosa Chemicals & Fibre 1,513,400 5,018,761 0.21Formosa Plastics 1,963,600 7,238,758 0.31Hanwha Chemical 52,606 1,034,215 0.04Indorama Ventures 706,567 1,082,861 0.05Industries Qatar 746,010 2,356,091 0.10Irpc 2,786,800 454,357 0.02KCC 2,274 542,577 0.02Kingboard Holdings 388,500 1,081,584 0.05Kingboard Laminates Holdings 357,500 327,642 0.01Kumho Petrochemical 6,670 562,645 0.02LG Chem 19,581 6,011,748 0.25Lotte Chemical 6,998 1,530,330 0.07Mesaieed Petrochemical Holding 1,338,980 959,763 0.04Mexichem 464,019 973,124 0.04Nan Ya Plastics 2,194,820 5,554,270 0.23Petronas Chemicals Group 957,700 1,946,686 0.08PhosAgro - GDR - Registered 30,930 405,802 0.02PTT Global Chemical 921,182 1,922,415 0.08Sasol 240,489 5,972,637 0.25Sinopec Shanghai Petrochemical - Class H 2,049,000 813,043 0.03UPL 158,035 2,146,245 0.09Zhejiang Longsheng Group - Class A 53,050 121,722 0.01
Coal (0.42%) Adaro Energy 8,500,400 818,301 0.03Banpu - Registered 1,754,600 858,205 0.04Bukit Asam 1,661,400 348,097 0.02China Coal Energy - Class H 645,000 268,320 0.01China Shenhua Energy 115,700 343,077 0.01China Shenhua Energy - Class H 1,488,000 3,115,991 0.13Coal India 430,757 1,583,805 0.07Exxaro Resources 94,756 1,155,719 0.05Inner Mongolia Yitai Coal - Class B 407,700 441,947 0.02Jastrzebska Spolka Weglowa 26,559 336,154 0.01Shaanxi Coal Industry - Class A 75,400 101,367 0.00Yanzhou Coal Mining - Class H 738,000 689,587 0.03
Commercial Services (1.32%) Adani Ports & Special Economic Zone 225,346 1,339,132 0.06CCR 540,300 1,925,691 0.08China Conch Venture Holdings 782,000 2,762,650 0.12China Education Group Holdings 218,000 340,429 0.01China Merchants Port Holdings 669,964 1,138,832 0.05
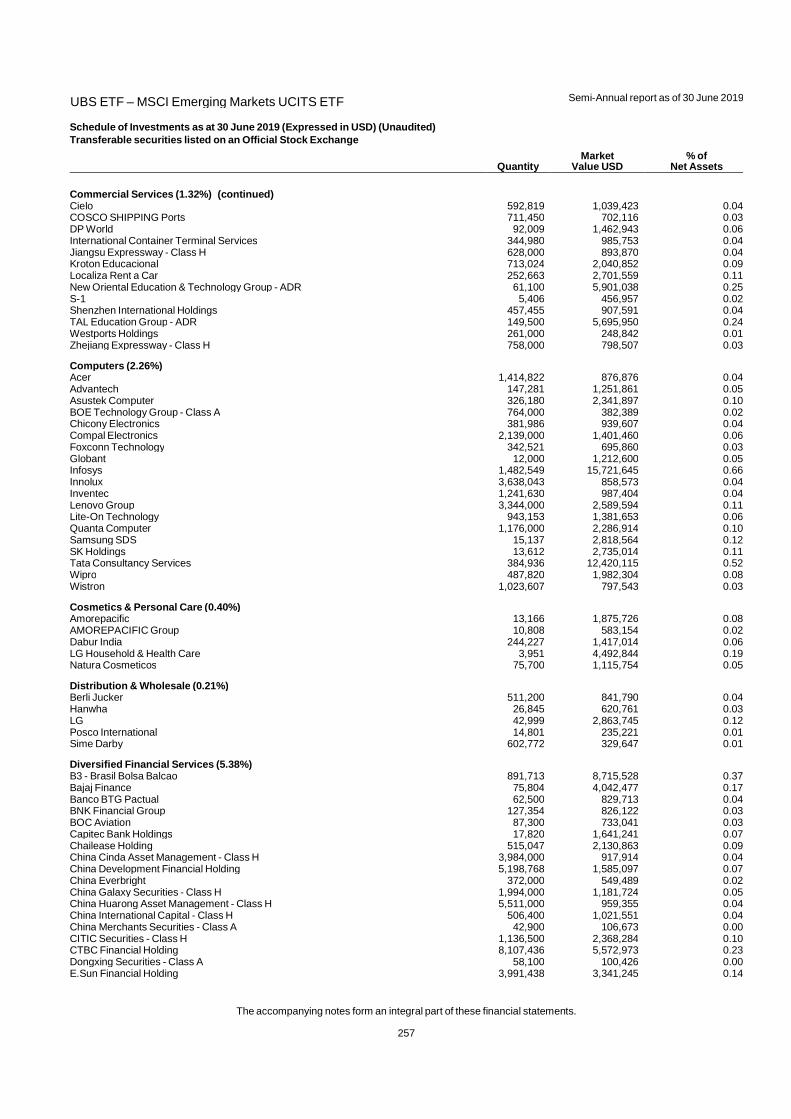
UBS ETF – MSCI Emerging Markets UCITS ETF
Semi-Annual report as of 30 June 2019
The accompanying notes form an integral part of these financial statements.
257
Schedule of Investments as at 30 June 2019 (Expressed in USD) (Unaudited)
Transferable securities listed on an Official Stock Exchange
Quantity Market
Value USD % of
Net Assets
Commercial Services (1.32%) (continued) Cielo 592,819 1,039,423 0.04COSCO SHIPPING Ports 711,450 702,116 0.03DP World 92,009 1,462,943 0.06International Container Terminal Services 344,980 985,753 0.04Jiangsu Expressway - Class H 628,000 893,870 0.04Kroton Educacional 713,024 2,040,852 0.09Localiza Rent a Car 252,663 2,701,559 0.11New Oriental Education & Technology Group - ADR 61,100 5,901,038 0.25S-1 5,406 456,957 0.02Shenzhen International Holdings 457,455 907,591 0.04TAL Education Group - ADR 149,500 5,695,950 0.24Westports Holdings 261,000 248,842 0.01Zhejiang Expressway - Class H 758,000 798,507 0.03
Computers (2.26%) Acer 1,414,822 876,876 0.04Advantech 147,281 1,251,861 0.05Asustek Computer 326,180 2,341,897 0.10BOE Technology Group - Class A 764,000 382,389 0.02Chicony Electronics 381,986 939,607 0.04Compal Electronics 2,139,000 1,401,460 0.06Foxconn Technology 342,521 695,860 0.03Globant 12,000 1,212,600 0.05Infosys 1,482,549 15,721,645 0.66Innolux 3,638,043 858,573 0.04Inventec 1,241,630 987,404 0.04Lenovo Group 3,344,000 2,589,594 0.11Lite-On Technology 943,153 1,381,653 0.06Quanta Computer 1,176,000 2,286,914 0.10Samsung SDS 15,137 2,818,564 0.12SK Holdings 13,612 2,735,014 0.11Tata Consultancy Services 384,936 12,420,115 0.52Wipro 487,820 1,982,304 0.08Wistron 1,023,607 797,543 0.03
Cosmetics & Personal Care (0.40%) Amorepacific 13,166 1,875,726 0.08AMOREPACIFIC Group 10,808 583,154 0.02Dabur India 244,227 1,417,014 0.06LG Household & Health Care 3,951 4,492,844 0.19Natura Cosmeticos 75,700 1,115,754 0.05
Distribution & Wholesale (0.21%) Berli Jucker 511,200 841,790 0.04Hanwha 26,845 620,761 0.03LG 42,999 2,863,745 0.12Posco International 14,801 235,221 0.01Sime Darby 602,772 329,647 0.01
Diversified Financial Services (5.38%) B3 - Brasil Bolsa Balcao 891,713 8,715,528 0.37Bajaj Finance 75,804 4,042,477 0.17Banco BTG Pactual 62,500 829,713 0.04BNK Financial Group 127,354 826,122 0.03BOC Aviation 87,300 733,041 0.03Capitec Bank Holdings 17,820 1,641,241 0.07Chailease Holding 515,047 2,130,863 0.09China Cinda Asset Management - Class H 3,984,000 917,914 0.04China Development Financial Holding 5,198,768 1,585,097 0.07China Everbright 372,000 549,489 0.02China Galaxy Securities - Class H 1,994,000 1,181,724 0.05China Huarong Asset Management - Class H 5,511,000 959,355 0.04China International Capital - Class H 506,400 1,021,551 0.04China Merchants Securities - Class A 42,900 106,673 0.00CITIC Securities - Class H 1,136,500 2,368,284 0.10CTBC Financial Holding 8,107,436 5,572,973 0.23Dongxing Securities - Class A 58,100 100,426 0.00E.Sun Financial Holding 3,991,438 3,341,245 0.14
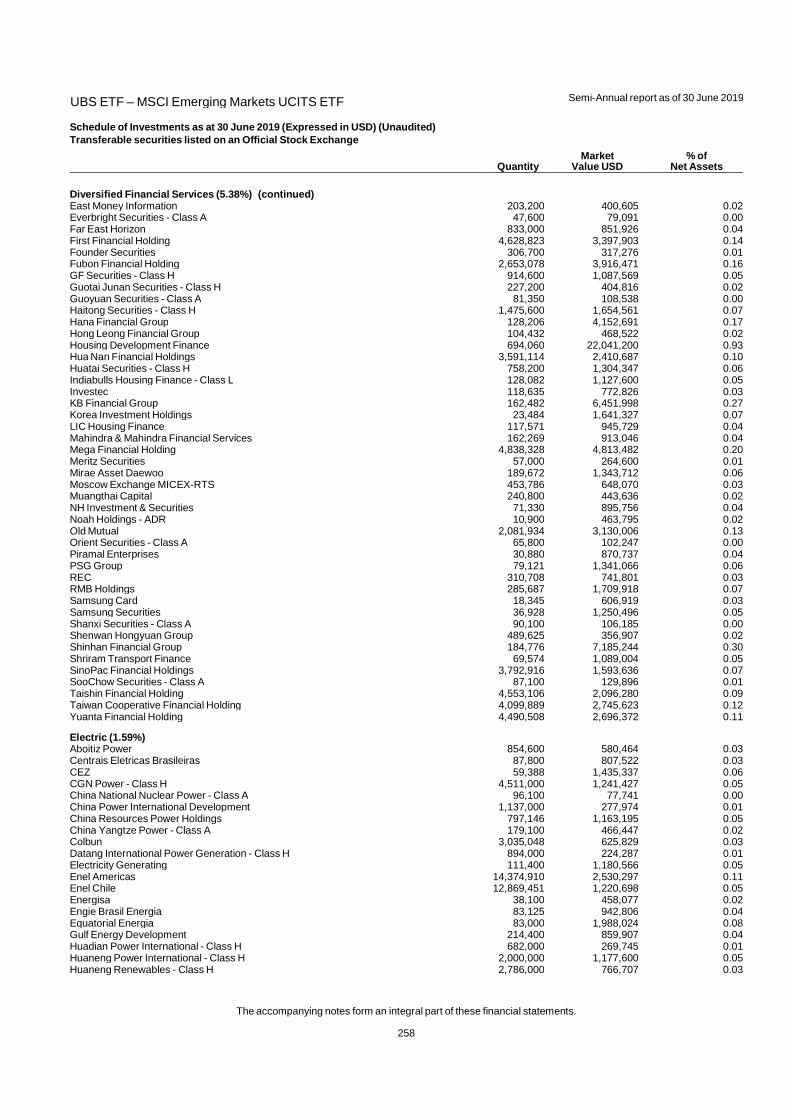
UBS ETF – MSCI Emerging Markets UCITS ETF
Semi-Annual report as of 30 June 2019
The accompanying notes form an integral part of these financial statements.
258
Schedule of Investments as at 30 June 2019 (Expressed in USD) (Unaudited)
Transferable securities listed on an Official Stock Exchange
Quantity Market
Value USD % of
Net Assets
Diversified Financial Services (5.38%) (continued) East Money Information 203,200 400,605 0.02Everbright Securities - Class A 47,600 79,091 0.00Far East Horizon 833,000 851,926 0.04First Financial Holding 4,628,823 3,397,903 0.14Founder Securities 306,700 317,276 0.01Fubon Financial Holding 2,653,078 3,916,471 0.16GF Securities - Class H 914,600 1,087,569 0.05Guotai Junan Securities - Class H 227,200 404,816 0.02Guoyuan Securities - Class A 81,350 108,538 0.00Haitong Securities - Class H 1,475,600 1,654,561 0.07Hana Financial Group 128,206 4,152,691 0.17Hong Leong Financial Group 104,432 468,522 0.02Housing Development Finance 694,060 22,041,200 0.93Hua Nan Financial Holdings 3,591,114 2,410,687 0.10Huatai Securities - Class H 758,200 1,304,347 0.06Indiabulls Housing Finance - Class L 128,082 1,127,600 0.05Investec 118,635 772,826 0.03KB Financial Group 162,482 6,451,998 0.27Korea Investment Holdings 23,484 1,641,327 0.07LIC Housing Finance 117,571 945,729 0.04Mahindra & Mahindra Financial Services 162,269 913,046 0.04Mega Financial Holding 4,838,328 4,813,482 0.20Meritz Securities 57,000 264,600 0.01Mirae Asset Daewoo 189,672 1,343,712 0.06Moscow Exchange MICEX-RTS 453,786 648,070 0.03Muangthai Capital 240,800 443,636 0.02NH Investment & Securities 71,330 895,756 0.04Noah Holdings - ADR 10,900 463,795 0.02Old Mutual 2,081,934 3,130,006 0.13Orient Securities - Class A 65,800 102,247 0.00Piramal Enterprises 30,880 870,737 0.04PSG Group 79,121 1,341,066 0.06REC 310,708 741,801 0.03RMB Holdings 285,687 1,709,918 0.07Samsung Card 18,345 606,919 0.03Samsung Securities 36,928 1,250,496 0.05Shanxi Securities - Class A 90,100 106,185 0.00Shenwan Hongyuan Group 489,625 356,907 0.02Shinhan Financial Group 184,776 7,185,244 0.30Shriram Transport Finance 69,574 1,089,004 0.05SinoPac Financial Holdings 3,792,916 1,593,636 0.07SooChow Securities - Class A 87,100 129,896 0.01Taishin Financial Holding 4,553,106 2,096,280 0.09Taiwan Cooperative Financial Holding 4,099,889 2,745,623 0.12Yuanta Financial Holding 4,490,508 2,696,372 0.11
Electric (1.59%) Aboitiz Power 854,600 580,464 0.03Centrais Eletricas Brasileiras 87,800 807,522 0.03CEZ 59,388 1,435,337 0.06CGN Power - Class H 4,511,000 1,241,427 0.05China National Nuclear Power - Class A 96,100 77,741 0.00China Power International Development 1,137,000 277,974 0.01China Resources Power Holdings 797,146 1,163,195 0.05China Yangtze Power - Class A 179,100 466,447 0.02Colbun 3,035,048 625,829 0.03Datang International Power Generation - Class H 894,000 224,287 0.01Electricity Generating 111,400 1,180,566 0.05Enel Americas 14,374,910 2,530,297 0.11Enel Chile 12,869,451 1,220,698 0.05Energisa 38,100 458,077 0.02Engie Brasil Energia 83,125 942,806 0.04Equatorial Energia 83,000 1,988,024 0.08Gulf Energy Development 214,400 859,907 0.04Huadian Power International - Class H 682,000 269,745 0.01Huaneng Power International - Class H 2,000,000 1,177,600 0.05Huaneng Renewables - Class H 2,786,000 766,707 0.03
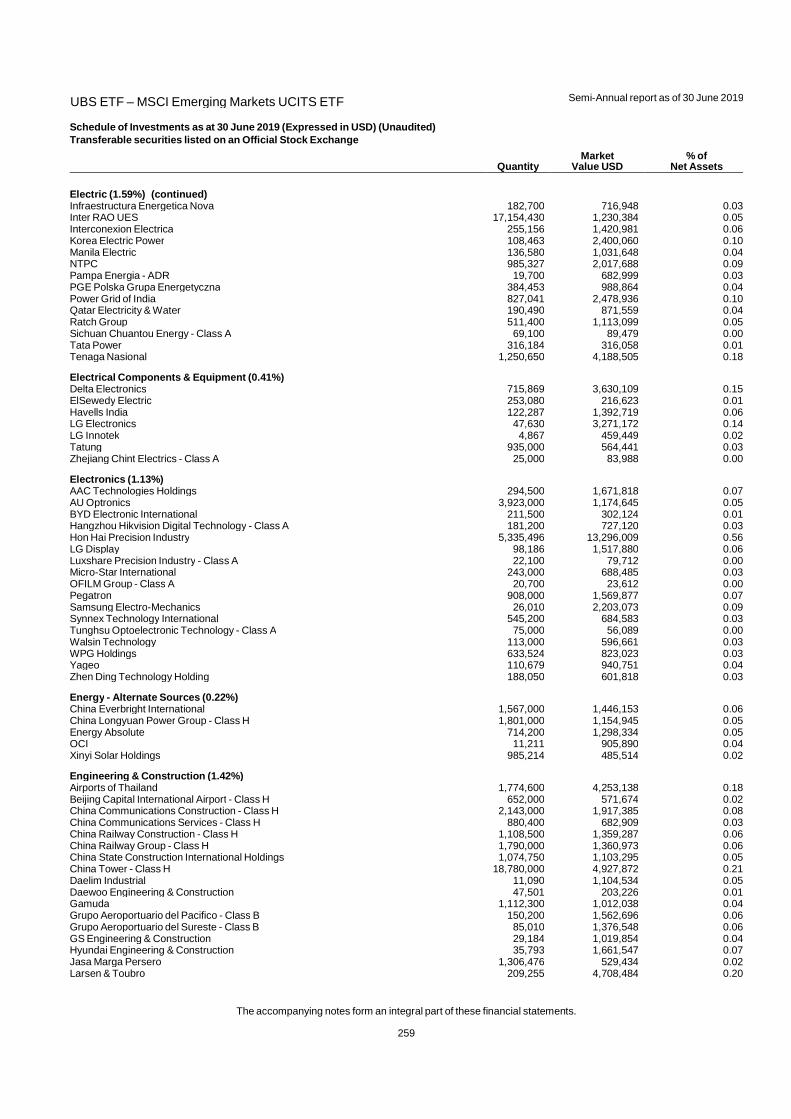
UBS ETF – MSCI Emerging Markets UCITS ETF
Semi-Annual report as of 30 June 2019
The accompanying notes form an integral part of these financial statements.
259
Schedule of Investments as at 30 June 2019 (Expressed in USD) (Unaudited)
Transferable securities listed on an Official Stock Exchange
Quantity Market
Value USD % of
Net Assets
Electric (1.59%) (continued) Infraestructura Energetica Nova 182,700 716,948 0.03Inter RAO UES 17,154,430 1,230,384 0.05Interconexion Electrica 255,156 1,420,981 0.06Korea Electric Power 108,463 2,400,060 0.10Manila Electric 136,580 1,031,648 0.04NTPC 985,327 2,017,688 0.09Pampa Energia - ADR 19,700 682,999 0.03PGE Polska Grupa Energetyczna 384,453 988,864 0.04Power Grid of India 827,041 2,478,936 0.10Qatar Electricity & Water 190,490 871,559 0.04Ratch Group 511,400 1,113,099 0.05Sichuan Chuantou Energy - Class A 69,100 89,479 0.00Tata Power 316,184 316,058 0.01Tenaga Nasional 1,250,650 4,188,505 0.18
Electrical Components & Equipment (0.41%) Delta Electronics 715,869 3,630,109 0.15ElSewedy Electric 253,080 216,623 0.01Havells India 122,287 1,392,719 0.06LG Electronics 47,630 3,271,172 0.14LG Innotek 4,867 459,449 0.02Tatung 935,000 564,441 0.03Zhejiang Chint Electrics - Class A 25,000 83,988 0.00
Electronics (1.13%) AAC Technologies Holdings 294,500 1,671,818 0.07AU Optronics 3,923,000 1,174,645 0.05BYD Electronic International 211,500 302,124 0.01Hangzhou Hikvision Digital Technology - Class A 181,200 727,120 0.03Hon Hai Precision Industry 5,335,496 13,296,009 0.56LG Display 98,186 1,517,880 0.06Luxshare Precision Industry - Class A 22,100 79,712 0.00Micro-Star International 243,000 688,485 0.03OFILM Group - Class A 20,700 23,612 0.00Pegatron 908,000 1,569,877 0.07Samsung Electro-Mechanics 26,010 2,203,073 0.09Synnex Technology International 545,200 684,583 0.03Tunghsu Optoelectronic Technology - Class A 75,000 56,089 0.00Walsin Technology 113,000 596,661 0.03WPG Holdings 633,524 823,023 0.03Yageo 110,679 940,751 0.04Zhen Ding Technology Holding 188,050 601,818 0.03
Energy - Alternate Sources (0.22%) China Everbright International 1,567,000 1,446,153 0.06China Longyuan Power Group - Class H 1,801,000 1,154,945 0.05Energy Absolute 714,200 1,298,334 0.05OCI 11,211 905,890 0.04Xinyi Solar Holdings 985,214 485,514 0.02
Engineering & Construction (1.42%) Airports of Thailand 1,774,600 4,253,138 0.18Beijing Capital International Airport - Class H 652,000 571,674 0.02China Communications Construction - Class H 2,143,000 1,917,385 0.08China Communications Services - Class H 880,400 682,909 0.03China Railway Construction - Class H 1,108,500 1,359,287 0.06China Railway Group - Class H 1,790,000 1,360,973 0.06China State Construction International Holdings 1,074,750 1,103,295 0.05China Tower - Class H 18,780,000 4,927,872 0.21Daelim Industrial 11,090 1,104,534 0.05Daewoo Engineering & Construction 47,501 203,226 0.01Gamuda 1,112,300 1,012,038 0.04Grupo Aeroportuario del Pacifico - Class B 150,200 1,562,696 0.06Grupo Aeroportuario del Sureste - Class B 85,010 1,376,548 0.06GS Engineering & Construction 29,184 1,019,854 0.04Hyundai Engineering & Construction 35,793 1,661,547 0.07Jasa Marga Persero 1,306,476 529,434 0.02Larsen & Toubro 209,255 4,708,484 0.20

UBS ETF – MSCI Emerging Markets UCITS ETF
Semi-Annual report as of 30 June 2019
The accompanying notes form an integral part of these financial statements.
260
Schedule of Investments as at 30 June 2019 (Expressed in USD) (Unaudited)
Transferable securities listed on an Official Stock Exchange
Quantity Market
Value USD % of
Net Assets
Engineering & Construction (1.42%) (continued) Malaysia Airports Holdings 360,844 744,827 0.03Metallurgical of China - Class H 933,000 249,596 0.01Power Construction of China 472,000 363,288 0.01Promotora y Operadora de Infraestructura 132,925 1,319,657 0.05Samsung Engineering 68,049 1,010,731 0.04Shanghai International Airport 32,800 399,823 0.02TAV Havalimanlari Holding 84,253 393,297 0.02
Entertainment (0.10%) Alibaba Pictures Group 4,890,000 1,051,546 0.04Opap 117,967 1,323,257 0.06
Food (2.33%) Avenue Supermarts 64,101 1,298,132 0.05Bid 131,493 2,862,657 0.12BIM Birlesik Magazalar 94,031 1,294,877 0.05BRF 253,000 1,948,667 0.08Britannia Industries 28,555 1,135,002 0.05Cencosud 754,850 1,478,681 0.06Charoen Pokphand Foods 1,186,300 1,092,785 0.05China Huishan Dairy Holdings* 738,000 0 0.00China Mengniu Dairy 1,216,000 4,708,352 0.20CJ CheilJedang 4,180 1,075,183 0.05Dali Foods Group 682,000 453,066 0.02Dino Polska 26,474 929,274 0.04Foshan Haitian Flavouring & Food - Class A 28,729 438,898 0.02Gruma - Class B 55,910 524,246 0.02Grupo Bimbo - Class A 775,000 1,614,814 0.07Henan Shuanghui Investment & Development 91,587 331,675 0.01Indofood CBP Sukses Makmur 1,300,500 934,353 0.04Indofood Sukses Makmur 1,617,500 804,313 0.03Inner Mongolia Yili Industrial Group - Class A 72,900 354,371 0.02JBS 431,400 2,388,506 0.10JG Summit Holdings 1,139,810 1,499,428 0.06Magnit - GDR - Registered 157,050 2,289,004 0.10Nestle India 11,041 1,905,429 0.08Nestle Malaysia 20,200 728,813 0.03Orion 10,489 840,283 0.04Ottogi 695 412,311 0.02PPB Group 277,560 1,255,988 0.05Shoprite Holdings 194,643 2,176,220 0.09SPAR Group 73,063 968,025 0.04Standard Foods 128,303 250,744 0.01Thai Union Group - Class F 1,086,900 648,578 0.03Tiger Brands 75,938 1,204,668 0.05Tingyi Cayman Islands Holding 840,000 1,402,061 0.06Uni-President China Holdings 446,000 496,666 0.02Uni-President Enterprises 2,089,928 5,564,708 0.23Universal Robina 341,910 1,107,779 0.05Want Want China Holdings 2,378,000 1,932,838 0.08Woolworths Holdings 470,160 1,629,744 0.07X5 Retail Group - GDR - Registered 59,405 2,036,997 0.09Yihai International Holding 195,000 1,012,128 0.04Yonghui Superstores 225,100 334,391 0.01
Forest Products & Paper (0.33%) Empresas 439,660 1,204,459 0.05Indah Kiat Pulp & Paper 1,553,400 1,030,835 0.04Mondi 57,239 1,286,586 0.06Nine Dragons Paper Holdings 993,000 880,831 0.04Pabrik Kertas Tjiwi Kimia 533,800 475,140 0.02Sappi 262,247 1,020,813 0.04Suzano 223,086 1,912,091 0.08
Gas (0.51%) Beijing Enterprises Holdings 233,000 1,184,013 0.05China Gas Holdings 766,800 2,851,269 0.12China Resources Gas Group 432,000 2,142,720 0.09
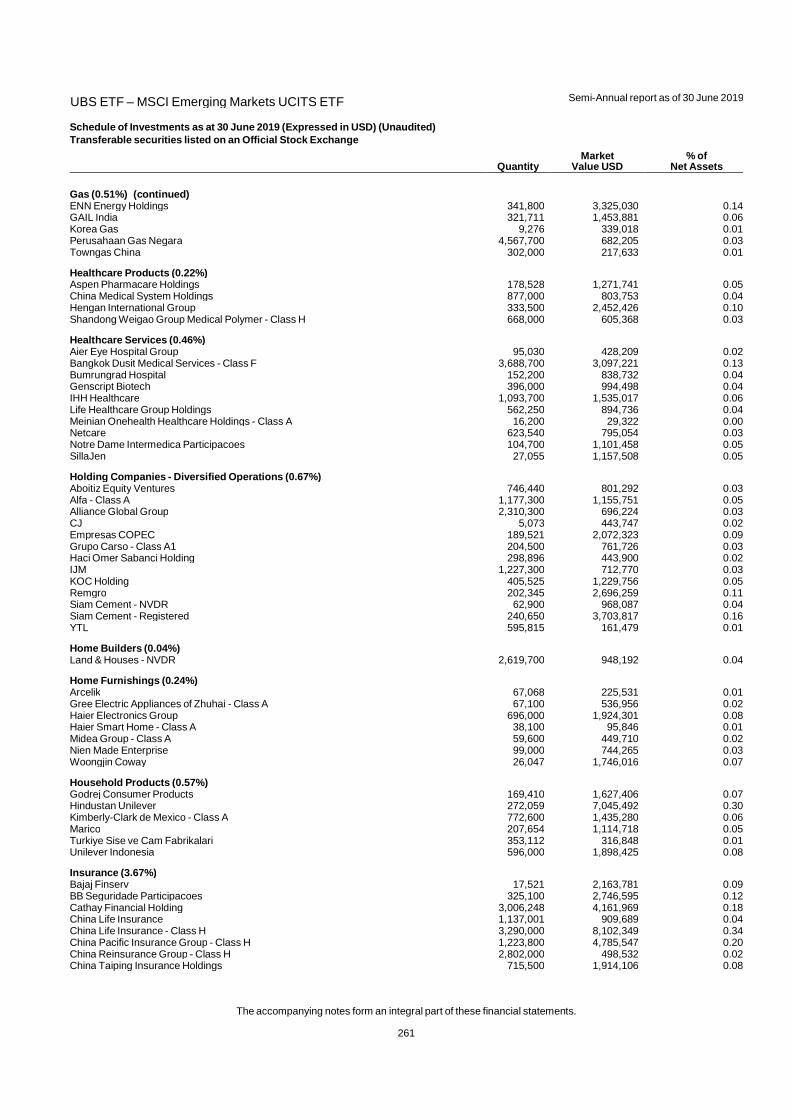
UBS ETF – MSCI Emerging Markets UCITS ETF
Semi-Annual report as of 30 June 2019
The accompanying notes form an integral part of these financial statements.
261
Schedule of Investments as at 30 June 2019 (Expressed in USD) (Unaudited)
Transferable securities listed on an Official Stock Exchange
Quantity Market
Value USD % of
Net Assets
Gas (0.51%) (continued) ENN Energy Holdings 341,800 3,325,030 0.14GAIL India 321,711 1,453,881 0.06Korea Gas 9,276 339,018 0.01Perusahaan Gas Negara 4,567,700 682,205 0.03Towngas China 302,000 217,633 0.01
Healthcare Products (0.22%) Aspen Pharmacare Holdings 178,528 1,271,741 0.05China Medical System Holdings 877,000 803,753 0.04Hengan International Group 333,500 2,452,426 0.10Shandong Weigao Group Medical Polymer - Class H 668,000 605,368 0.03
Healthcare Services (0.46%) Aier Eye Hospital Group 95,030 428,209 0.02Bangkok Dusit Medical Services - Class F 3,688,700 3,097,221 0.13Bumrungrad Hospital 152,200 838,732 0.04Genscript Biotech 396,000 994,498 0.04IHH Healthcare 1,093,700 1,535,017 0.06Life Healthcare Group Holdings 562,250 894,736 0.04Meinian Onehealth Healthcare Holdings - Class A 16,200 29,322 0.00Netcare 623,540 795,054 0.03Notre Dame Intermedica Participacoes 104,700 1,101,458 0.05SillaJen 27,055 1,157,508 0.05
Holding Companies - Diversified Operations (0.67%) Aboitiz Equity Ventures 746,440 801,292 0.03Alfa - Class A 1,177,300 1,155,751 0.05Alliance Global Group 2,310,300 696,224 0.03CJ 5,073 443,747 0.02Empresas COPEC 189,521 2,072,323 0.09Grupo Carso - Class A1 204,500 761,726 0.03Haci Omer Sabanci Holding 298,896 443,900 0.02IJM 1,227,300 712,770 0.03KOC Holding 405,525 1,229,756 0.05Remgro 202,345 2,696,259 0.11Siam Cement - NVDR 62,900 968,087 0.04Siam Cement - Registered 240,650 3,703,817 0.16YTL 595,815 161,479 0.01
Home Builders (0.04%) Land & Houses - NVDR 2,619,700 948,192 0.04
Home Furnishings (0.24%) Arcelik 67,068 225,531 0.01Gree Electric Appliances of Zhuhai - Class A 67,100 536,956 0.02Haier Electronics Group 696,000 1,924,301 0.08Haier Smart Home - Class A 38,100 95,846 0.01Midea Group - Class A 59,600 449,710 0.02Nien Made Enterprise 99,000 744,265 0.03Woongjin Coway 26,047 1,746,016 0.07
Household Products (0.57%) Godrej Consumer Products 169,410 1,627,406 0.07Hindustan Unilever 272,059 7,045,492 0.30Kimberly-Clark de Mexico - Class A 772,600 1,435,280 0.06Marico 207,654 1,114,718 0.05Turkiye Sise ve Cam Fabrikalari 353,112 316,848 0.01Unilever Indonesia 596,000 1,898,425 0.08
Insurance (3.67%) Bajaj Finserv 17,521 2,163,781 0.09BB Seguridade Participacoes 325,100 2,746,595 0.12Cathay Financial Holding 3,006,248 4,161,969 0.18China Life Insurance 1,137,001 909,689 0.04China Life Insurance - Class H 3,290,000 8,102,349 0.34China Pacific Insurance Group - Class H 1,223,800 4,785,547 0.20China Reinsurance Group - Class H 2,802,000 498,532 0.02China Taiping Insurance Holdings 715,500 1,914,106 0.08

UBS ETF – MSCI Emerging Markets UCITS ETF
Semi-Annual report as of 30 June 2019
The accompanying notes form an integral part of these financial statements.
262
Schedule of Investments as at 30 June 2019 (Expressed in USD) (Unaudited)
Transferable securities listed on an Official Stock Exchange
Quantity Market
Value USD % of
Net Assets
Insurance (3.67%) (continued) DB Insurance 23,316 1,197,453 0.05Discovery 174,034 1,840,277 0.08Fosun International 1,163,820 1,546,298 0.07Hubei Biocause Pharmaceutical - Class A 89,600 84,607 0.00Hyundai Marine & Fire Insurance 22,131 545,297 0.02ICICI Lombard General Insurance 32,506 523,915 0.02IRB Brasil Resseguros 60,500 1,554,864 0.07Liberty Holdings 70,286 526,650 0.02MMI Holdings 455,444 612,695 0.03New China Life Insurance - Class H 359,600 1,749,094 0.07Orange Life Insurance 12,304 337,264 0.01People's Insurance Group of China - Class H 3,278,000 1,279,731 0.05PICC Property & Casualty - Class H 3,049,986 3,291,057 0.14Ping An Insurance Group of China - Class A 138,500 1,785,608 0.08Ping An Insurance Group of China - Class H 2,359,000 28,323,098 1.19Porto Seguro 43,800 590,605 0.02Powszechny Zaklad Ubezpieczen 259,333 3,036,168 0.13Qatar Insurance 104,038 1,001,736 0.04Samsung Fire & Marine Insurance 14,112 3,275,465 0.14Samsung Life Insurance 27,371 1,981,740 0.08Sanlam 754,528 4,182,176 0.18Shin Kong Financial Holding 4,494,199 1,364,487 0.06Sul America 87,941 860,905 0.04ZhongAn Online P&C Insurance - Class H 109,100 299,545 0.01
Internet (11.54%) 51job - ADR 7,900 596,450 0.0258.com - ADR 42,600 2,648,442 0.11Alibaba Group Holding - ADR 605,500 102,601,975 4.32Autohome - ADR 27,200 2,328,864 0.10B2W Companhia Digital 96,900 827,252 0.03Baidu - ADR 118,900 13,954,104 0.59Baozun - ADR 13,300 663,138 0.03China Literature 172,200 811,131 0.03Ctrip.com International - ADR 175,400 6,474,014 0.27HengTen Networks Group 7,336,000 174,655 0.01iQIYI - ADR 54,700 1,129,555 0.05JD.com - ADR 319,100 9,665,539 0.41Kakao 22,271 2,536,385 0.11Meituan Dianping 369,200 3,237,146 0.14NAVER 61,187 6,041,067 0.25NCSoft 7,195 2,972,342 0.12Pinduoduo - ADR 86,900 1,792,747 0.07SINA 25,800 1,112,754 0.05Tencent Holdings 2,446,200 110,403,855 4.65Vipshop Holdings - ADR 193,100 1,666,453 0.07Weibo - ADR 26,280 1,144,494 0.05YY - ADR 19,500 1,358,955 0.06
Investment Companies (0.23%) China Ding Yi Feng Holdings 478,000 11,625 0.00Grupo de Inversiones Suramericana 117,763 1,252,173 0.05GT Capital Holdings 40,612 745,102 0.03Hyundai Heavy Industries Holdings 4,424 1,241,394 0.05Legend Holdings - Class H 190,900 449,119 0.02Rand Merchant Investment Holdings 249,897 602,003 0.03Reinet Investments 68,117 1,097,408 0.05
Iron & Steel (1.74%) Angang Steel - Class A 85,540 47,170 0.00Angang Steel - Class H 327,600 149,281 0.01Baoshan Iron & Steel - Class A 465,472 440,211 0.02China Oriental Group 515,000 301,254 0.01China Steel 5,320,334 4,273,808 0.18Companhia Siderurgica Nacional 224,000 976,619 0.04Eregli Demir ve Celik Fabrikalari 678,523 923,232 0.04Hyundai Steel 35,897 1,299,523 0.06
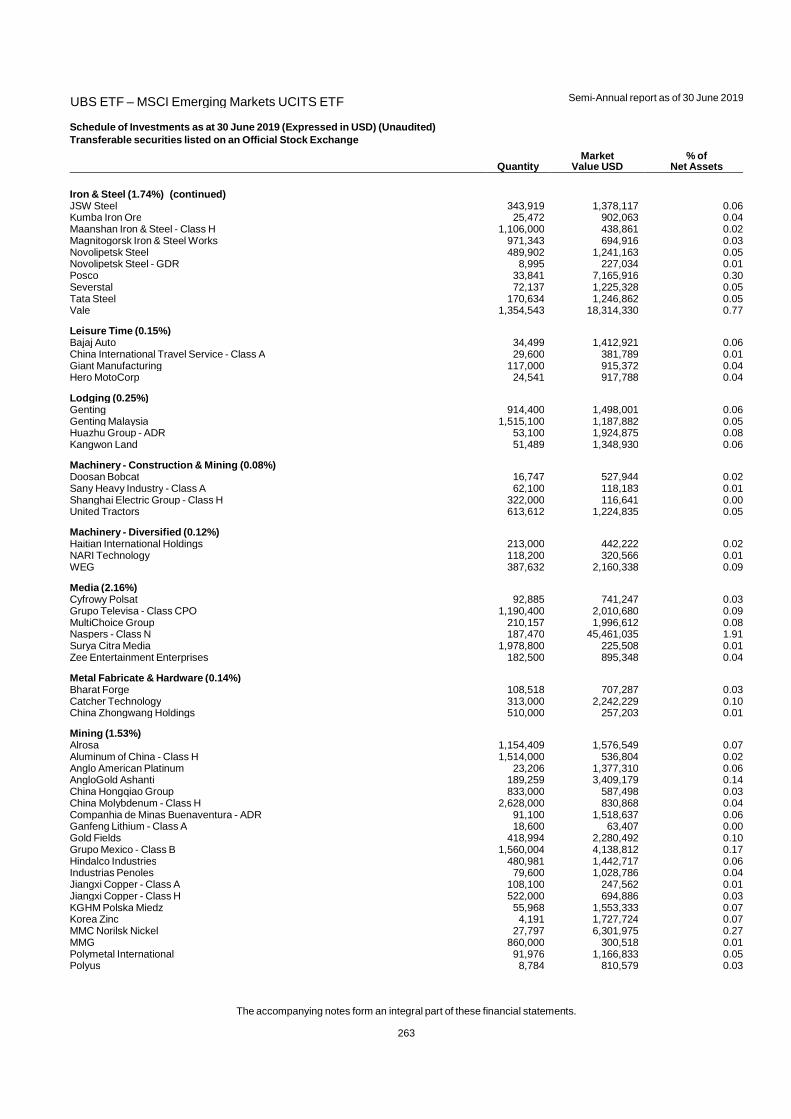
UBS ETF – MSCI Emerging Markets UCITS ETF
Semi-Annual report as of 30 June 2019
The accompanying notes form an integral part of these financial statements.
263
Schedule of Investments as at 30 June 2019 (Expressed in USD) (Unaudited)
Transferable securities listed on an Official Stock Exchange
Quantity Market
Value USD % of
Net Assets
Iron & Steel (1.74%) (continued) JSW Steel 343,919 1,378,117 0.06Kumba Iron Ore 25,472 902,063 0.04Maanshan Iron & Steel - Class H 1,106,000 438,861 0.02Magnitogorsk Iron & Steel Works 971,343 694,916 0.03Novolipetsk Steel 489,902 1,241,163 0.05Novolipetsk Steel - GDR 8,995 227,034 0.01Posco 33,841 7,165,916 0.30Severstal 72,137 1,225,328 0.05Tata Steel 170,634 1,246,862 0.05Vale 1,354,543 18,314,330 0.77
Leisure Time (0.15%) Bajaj Auto 34,499 1,412,921 0.06China International Travel Service - Class A 29,600 381,789 0.01Giant Manufacturing 117,000 915,372 0.04Hero MotoCorp 24,541 917,788 0.04
Lodging (0.25%) Genting 914,400 1,498,001 0.06Genting Malaysia 1,515,100 1,187,882 0.05Huazhu Group - ADR 53,100 1,924,875 0.08Kangwon Land 51,489 1,348,930 0.06
Machinery - Construction & Mining (0.08%) Doosan Bobcat 16,747 527,944 0.02Sany Heavy Industry - Class A 62,100 118,183 0.01Shanghai Electric Group - Class H 322,000 116,641 0.00United Tractors 613,612 1,224,835 0.05
Machinery - Diversified (0.12%) Haitian International Holdings 213,000 442,222 0.02NARI Technology 118,200 320,566 0.01WEG 387,632 2,160,338 0.09
Media (2.16%) Cyfrowy Polsat 92,885 741,247 0.03Grupo Televisa - Class CPO 1,190,400 2,010,680 0.09MultiChoice Group 210,157 1,996,612 0.08Naspers - Class N 187,470 45,461,035 1.91Surya Citra Media 1,978,800 225,508 0.01Zee Entertainment Enterprises 182,500 895,348 0.04
Metal Fabricate & Hardware (0.14%) Bharat Forge 108,518 707,287 0.03Catcher Technology 313,000 2,242,229 0.10China Zhongwang Holdings 510,000 257,203 0.01
Mining (1.53%) Alrosa 1,154,409 1,576,549 0.07Aluminum of China - Class H 1,514,000 536,804 0.02Anglo American Platinum 23,206 1,377,310 0.06AngloGold Ashanti 189,259 3,409,179 0.14China Hongqiao Group 833,000 587,498 0.03China Molybdenum - Class H 2,628,000 830,868 0.04Companhia de Minas Buenaventura - ADR 91,100 1,518,637 0.06Ganfeng Lithium - Class A 18,600 63,407 0.00Gold Fields 418,994 2,280,492 0.10Grupo Mexico - Class B 1,560,004 4,138,812 0.17Hindalco Industries 480,981 1,442,717 0.06Industrias Penoles 79,600 1,028,786 0.04Jiangxi Copper - Class A 108,100 247,562 0.01Jiangxi Copper - Class H 522,000 694,886 0.03KGHM Polska Miedz 55,968 1,553,333 0.07Korea Zinc 4,191 1,727,724 0.07MMC Norilsk Nickel 27,797 6,301,975 0.27MMG 860,000 300,518 0.01Polymetal International 91,976 1,166,833 0.05Polyus 8,784 810,579 0.03
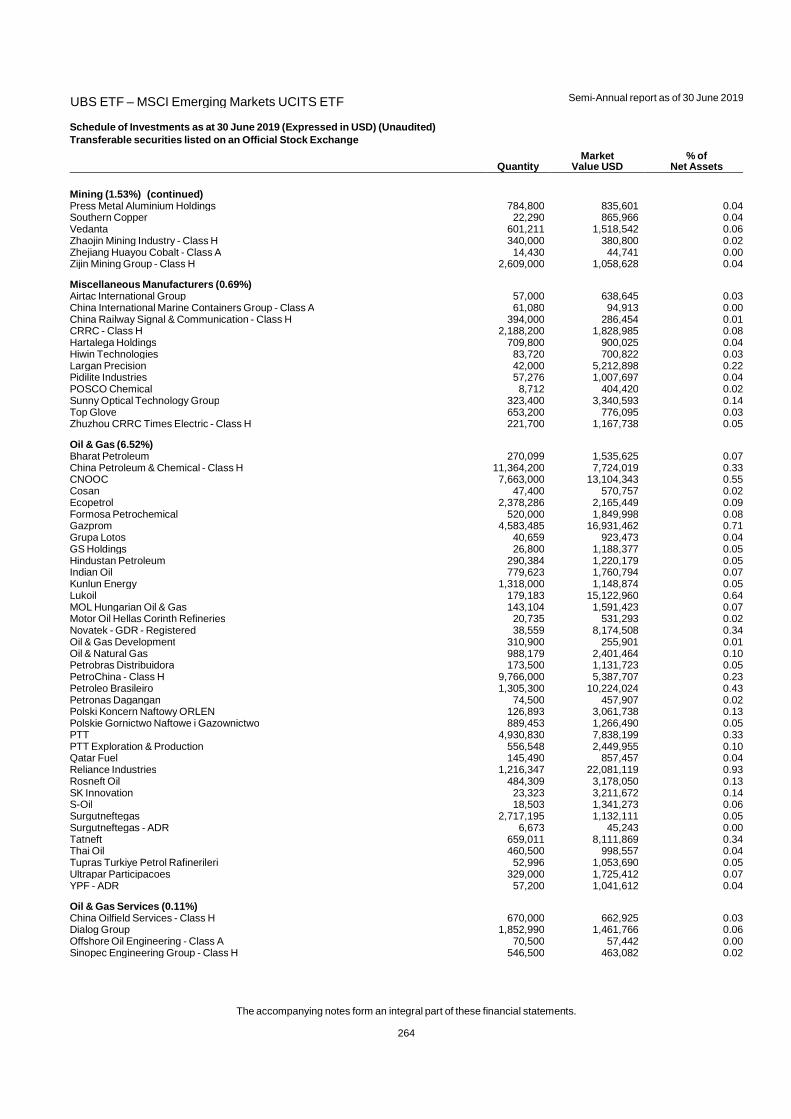
UBS ETF – MSCI Emerging Markets UCITS ETF
Semi-Annual report as of 30 June 2019
The accompanying notes form an integral part of these financial statements.
264
Schedule of Investments as at 30 June 2019 (Expressed in USD) (Unaudited)
Transferable securities listed on an Official Stock Exchange
Quantity Market
Value USD % of
Net Assets
Mining (1.53%) (continued) Press Metal Aluminium Holdings 784,800 835,601 0.04Southern Copper 22,290 865,966 0.04Vedanta 601,211 1,518,542 0.06Zhaojin Mining Industry - Class H 340,000 380,800 0.02Zhejiang Huayou Cobalt - Class A 14,430 44,741 0.00Zijin Mining Group - Class H 2,609,000 1,058,628 0.04
Miscellaneous Manufacturers (0.69%) Airtac International Group 57,000 638,645 0.03China International Marine Containers Group - Class A 61,080 94,913 0.00China Railway Signal & Communication - Class H 394,000 286,454 0.01CRRC - Class H 2,188,200 1,828,985 0.08Hartalega Holdings 709,800 900,025 0.04Hiwin Technologies 83,720 700,822 0.03Largan Precision 42,000 5,212,898 0.22Pidilite Industries 57,276 1,007,697 0.04POSCO Chemical 8,712 404,420 0.02Sunny Optical Technology Group 323,400 3,340,593 0.14Top Glove 653,200 776,095 0.03Zhuzhou CRRC Times Electric - Class H 221,700 1,167,738 0.05
Oil & Gas (6.52%) Bharat Petroleum 270,099 1,535,625 0.07China Petroleum & Chemical - Class H 11,364,200 7,724,019 0.33CNOOC 7,663,000 13,104,343 0.55Cosan 47,400 570,757 0.02Ecopetrol 2,378,286 2,165,449 0.09Formosa Petrochemical 520,000 1,849,998 0.08Gazprom 4,583,485 16,931,462 0.71Grupa Lotos 40,659 923,473 0.04GS Holdings 26,800 1,188,377 0.05Hindustan Petroleum 290,384 1,220,179 0.05Indian Oil 779,623 1,760,794 0.07Kunlun Energy 1,318,000 1,148,874 0.05Lukoil 179,183 15,122,960 0.64MOL Hungarian Oil & Gas 143,104 1,591,423 0.07Motor Oil Hellas Corinth Refineries 20,735 531,293 0.02Novatek - GDR - Registered 38,559 8,174,508 0.34Oil & Gas Development 310,900 255,901 0.01Oil & Natural Gas 988,179 2,401,464 0.10Petrobras Distribuidora 173,500 1,131,723 0.05PetroChina - Class H 9,766,000 5,387,707 0.23Petroleo Brasileiro 1,305,300 10,224,024 0.43Petronas Dagangan 74,500 457,907 0.02Polski Koncern Naftowy ORLEN 126,893 3,061,738 0.13Polskie Gornictwo Naftowe i Gazownictwo 889,453 1,266,490 0.05PTT 4,930,830 7,838,199 0.33PTT Exploration & Production 556,548 2,449,955 0.10Qatar Fuel 145,490 857,457 0.04Reliance Industries 1,216,347 22,081,119 0.93Rosneft Oil 484,309 3,178,050 0.13SK Innovation 23,323 3,211,672 0.14S-Oil 18,503 1,341,273 0.06Surgutneftegas 2,717,195 1,132,111 0.05Surgutneftegas - ADR 6,673 45,243 0.00Tatneft 659,011 8,111,869 0.34Thai Oil 460,500 998,557 0.04Tupras Turkiye Petrol Rafinerileri 52,996 1,053,690 0.05Ultrapar Participacoes 329,000 1,725,412 0.07YPF - ADR 57,200 1,041,612 0.04
Oil & Gas Services (0.11%) China Oilfield Services - Class H 670,000 662,925 0.03Dialog Group 1,852,990 1,461,766 0.06Offshore Oil Engineering - Class A 70,500 57,442 0.00Sinopec Engineering Group - Class H 546,500 463,082 0.02
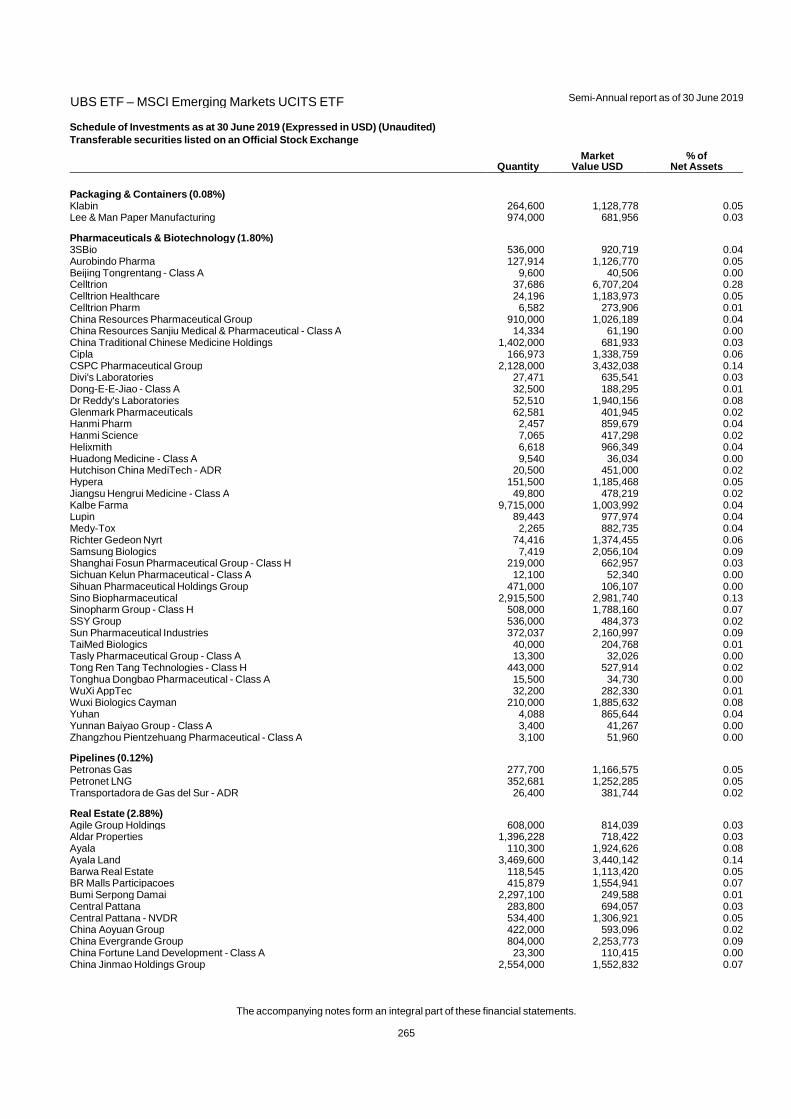
UBS ETF – MSCI Emerging Markets UCITS ETF
Semi-Annual report as of 30 June 2019
The accompanying notes form an integral part of these financial statements.
265
Schedule of Investments as at 30 June 2019 (Expressed in USD) (Unaudited)
Transferable securities listed on an Official Stock Exchange
Quantity Market
Value USD % of
Net Assets
Packaging & Containers (0.08%) Klabin 264,600 1,128,778 0.05Lee & Man Paper Manufacturing 974,000 681,956 0.03
Pharmaceuticals & Biotechnology (1.80%) 3SBio 536,000 920,719 0.04Aurobindo Pharma 127,914 1,126,770 0.05Beijing Tongrentang - Class A 9,600 40,506 0.00Celltrion 37,686 6,707,204 0.28Celltrion Healthcare 24,196 1,183,973 0.05Celltrion Pharm 6,582 273,906 0.01China Resources Pharmaceutical Group 910,000 1,026,189 0.04China Resources Sanjiu Medical & Pharmaceutical - Class A 14,334 61,190 0.00China Traditional Chinese Medicine Holdings 1,402,000 681,933 0.03Cipla 166,973 1,338,759 0.06CSPC Pharmaceutical Group 2,128,000 3,432,038 0.14Divi's Laboratories 27,471 635,541 0.03Dong-E-E-Jiao - Class A 32,500 188,295 0.01Dr Reddy's Laboratories 52,510 1,940,156 0.08Glenmark Pharmaceuticals 62,581 401,945 0.02Hanmi Pharm 2,457 859,679 0.04Hanmi Science 7,065 417,298 0.02Helixmith 6,618 966,349 0.04Huadong Medicine - Class A 9,540 36,034 0.00Hutchison China MediTech - ADR 20,500 451,000 0.02Hypera 151,500 1,185,468 0.05Jiangsu Hengrui Medicine - Class A 49,800 478,219 0.02Kalbe Farma 9,715,000 1,003,992 0.04Lupin 89,443 977,974 0.04Medy-Tox 2,265 882,735 0.04Richter Gedeon Nyrt 74,416 1,374,455 0.06Samsung Biologics 7,419 2,056,104 0.09Shanghai Fosun Pharmaceutical Group - Class H 219,000 662,957 0.03Sichuan Kelun Pharmaceutical - Class A 12,100 52,340 0.00Sihuan Pharmaceutical Holdings Group 471,000 106,107 0.00Sino Biopharmaceutical 2,915,500 2,981,740 0.13Sinopharm Group - Class H 508,000 1,788,160 0.07SSY Group 536,000 484,373 0.02Sun Pharmaceutical Industries 372,037 2,160,997 0.09TaiMed Biologics 40,000 204,768 0.01Tasly Pharmaceutical Group - Class A 13,300 32,026 0.00Tong Ren Tang Technologies - Class H 443,000 527,914 0.02Tonghua Dongbao Pharmaceutical - Class A 15,500 34,730 0.00WuXi AppTec 32,200 282,330 0.01Wuxi Biologics Cayman 210,000 1,885,632 0.08Yuhan 4,088 865,644 0.04Yunnan Baiyao Group - Class A 3,400 41,267 0.00Zhangzhou Pientzehuang Pharmaceutical - Class A 3,100 51,960 0.00
Pipelines (0.12%) Petronas Gas 277,700 1,166,575 0.05Petronet LNG 352,681 1,252,285 0.05Transportadora de Gas del Sur - ADR 26,400 381,744 0.02
Real Estate (2.88%) Agile Group Holdings 608,000 814,039 0.03Aldar Properties 1,396,228 718,422 0.03Ayala 110,300 1,924,626 0.08Ayala Land 3,469,600 3,440,142 0.14Barwa Real Estate 118,545 1,113,420 0.05BR Malls Participacoes 415,879 1,554,941 0.07Bumi Serpong Damai 2,297,100 249,588 0.01Central Pattana 283,800 694,057 0.03Central Pattana - NVDR 534,400 1,306,921 0.05China Aoyuan Group 422,000 593,096 0.02China Evergrande Group 804,000 2,253,773 0.09China Fortune Land Development - Class A 23,300 110,415 0.00China Jinmao Holdings Group 2,554,000 1,552,832 0.07
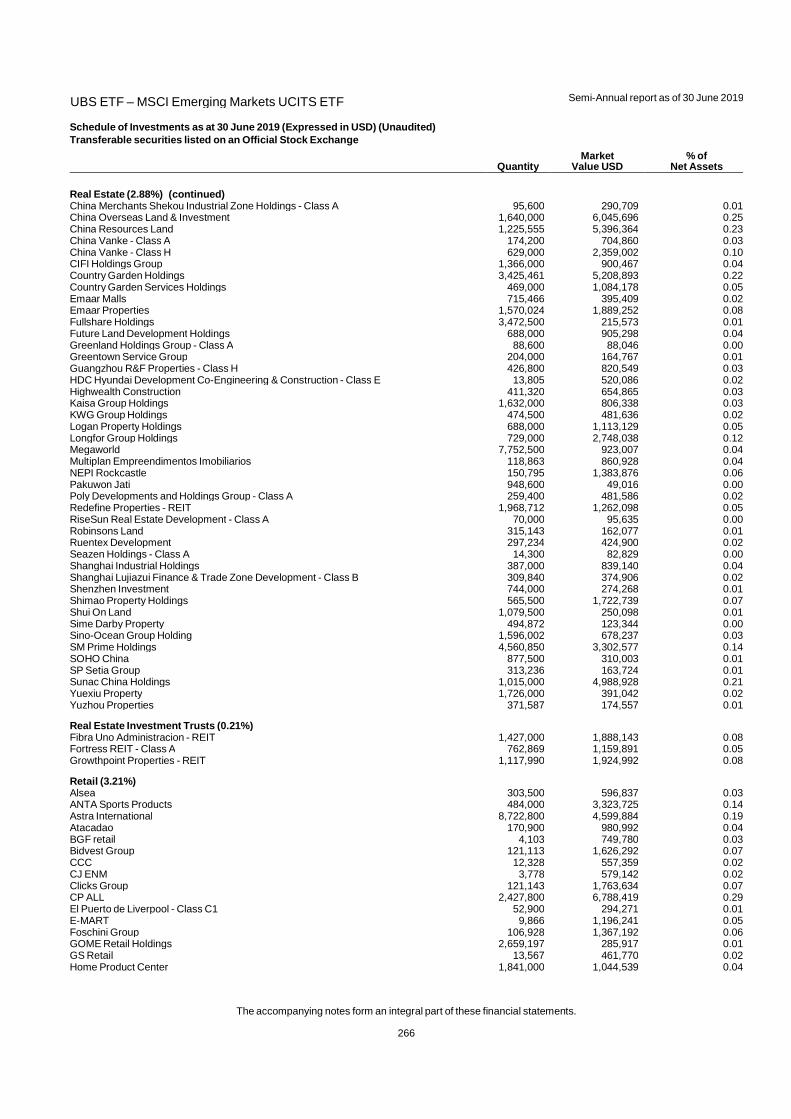
UBS ETF – MSCI Emerging Markets UCITS ETF
Semi-Annual report as of 30 June 2019
The accompanying notes form an integral part of these financial statements.
266
Schedule of Investments as at 30 June 2019 (Expressed in USD) (Unaudited)
Transferable securities listed on an Official Stock Exchange
Quantity Market
Value USD % of
Net Assets
Real Estate (2.88%) (continued) China Merchants Shekou Industrial Zone Holdings - Class A 95,600 290,709 0.01China Overseas Land & Investment 1,640,000 6,045,696 0.25China Resources Land 1,225,555 5,396,364 0.23China Vanke - Class A 174,200 704,860 0.03China Vanke - Class H 629,000 2,359,002 0.10CIFI Holdings Group 1,366,000 900,467 0.04Country Garden Holdings 3,425,461 5,208,893 0.22Country Garden Services Holdings 469,000 1,084,178 0.05Emaar Malls 715,466 395,409 0.02Emaar Properties 1,570,024 1,889,252 0.08Fullshare Holdings 3,472,500 215,573 0.01Future Land Development Holdings 688,000 905,298 0.04Greenland Holdings Group - Class A 88,600 88,046 0.00Greentown Service Group 204,000 164,767 0.01Guangzhou R&F Properties - Class H 426,800 820,549 0.03HDC Hyundai Development Co-Engineering & Construction - Class E 13,805 520,086 0.02Highwealth Construction 411,320 654,865 0.03Kaisa Group Holdings 1,632,000 806,338 0.03KWG Group Holdings 474,500 481,636 0.02Logan Property Holdings 688,000 1,113,129 0.05Longfor Group Holdings 729,000 2,748,038 0.12Megaworld 7,752,500 923,007 0.04Multiplan Empreendimentos Imobiliarios 118,863 860,928 0.04NEPI Rockcastle 150,795 1,383,876 0.06Pakuwon Jati 948,600 49,016 0.00Poly Developments and Holdings Group - Class A 259,400 481,586 0.02Redefine Properties - REIT 1,968,712 1,262,098 0.05RiseSun Real Estate Development - Class A 70,000 95,635 0.00Robinsons Land 315,143 162,077 0.01Ruentex Development 297,234 424,900 0.02Seazen Holdings - Class A 14,300 82,829 0.00Shanghai Industrial Holdings 387,000 839,140 0.04Shanghai Lujiazui Finance & Trade Zone Development - Class B 309,840 374,906 0.02Shenzhen Investment 744,000 274,268 0.01Shimao Property Holdings 565,500 1,722,739 0.07Shui On Land 1,079,500 250,098 0.01Sime Darby Property 494,872 123,344 0.00Sino-Ocean Group Holding 1,596,002 678,237 0.03SM Prime Holdings 4,560,850 3,302,577 0.14SOHO China 877,500 310,003 0.01SP Setia Group 313,236 163,724 0.01Sunac China Holdings 1,015,000 4,988,928 0.21Yuexiu Property 1,726,000 391,042 0.02Yuzhou Properties 371,587 174,557 0.01
Real Estate Investment Trusts (0.21%) Fibra Uno Administracion - REIT 1,427,000 1,888,143 0.08Fortress REIT - Class A 762,869 1,159,891 0.05Growthpoint Properties - REIT 1,117,990 1,924,992 0.08
Retail (3.21%) Alsea 303,500 596,837 0.03ANTA Sports Products 484,000 3,323,725 0.14Astra International 8,722,800 4,599,884 0.19Atacadao 170,900 980,992 0.04BGF retail 4,103 749,780 0.03Bidvest Group 121,113 1,626,292 0.07CCC 12,328 557,359 0.02CJ ENM 3,778 579,142 0.02Clicks Group 121,143 1,763,634 0.07CP ALL 2,427,800 6,788,419 0.29El Puerto de Liverpool - Class C1 52,900 294,271 0.01E-MART 9,866 1,196,241 0.05Foschini Group 106,928 1,367,192 0.06GOME Retail Holdings 2,659,197 285,917 0.01GS Retail 13,567 461,770 0.02Home Product Center 1,841,000 1,044,539 0.04
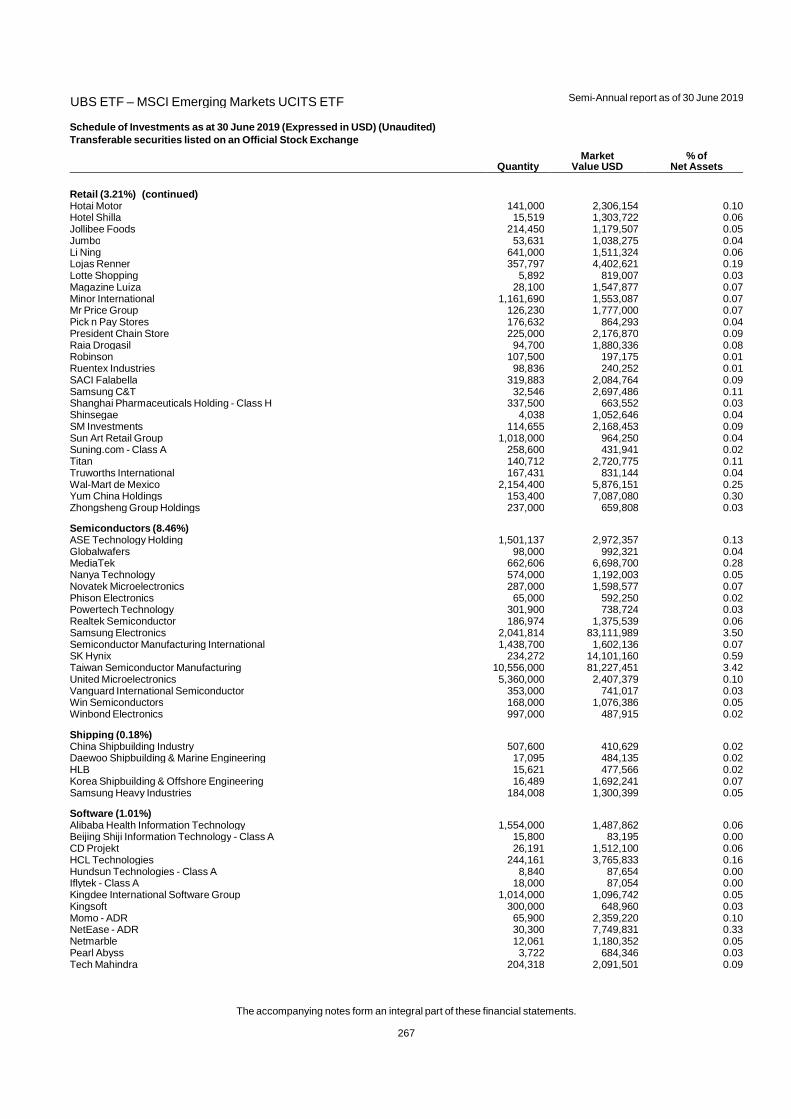
UBS ETF – MSCI Emerging Markets UCITS ETF
Semi-Annual report as of 30 June 2019
The accompanying notes form an integral part of these financial statements.
267
Schedule of Investments as at 30 June 2019 (Expressed in USD) (Unaudited)
Transferable securities listed on an Official Stock Exchange
Quantity Market
Value USD % of
Net Assets
Retail (3.21%) (continued) Hotai Motor 141,000 2,306,154 0.10Hotel Shilla 15,519 1,303,722 0.06Jollibee Foods 214,450 1,179,507 0.05Jumbo 53,631 1,038,275 0.04Li Ning 641,000 1,511,324 0.06Lojas Renner 357,797 4,402,621 0.19Lotte Shopping 5,892 819,007 0.03Magazine Luiza 28,100 1,547,877 0.07Minor International 1,161,690 1,553,087 0.07Mr Price Group 126,230 1,777,000 0.07Pick n Pay Stores 176,632 864,293 0.04President Chain Store 225,000 2,176,870 0.09Raia Drogasil 94,700 1,880,336 0.08Robinson 107,500 197,175 0.01Ruentex Industries 98,836 240,252 0.01SACI Falabella 319,883 2,084,764 0.09Samsung C&T 32,546 2,697,486 0.11Shanghai Pharmaceuticals Holding - Class H 337,500 663,552 0.03Shinsegae 4,038 1,052,646 0.04SM Investments 114,655 2,168,453 0.09Sun Art Retail Group 1,018,000 964,250 0.04Suning.com - Class A 258,600 431,941 0.02Titan 140,712 2,720,775 0.11Truworths International 167,431 831,144 0.04Wal-Mart de Mexico 2,154,400 5,876,151 0.25Yum China Holdings 153,400 7,087,080 0.30Zhongsheng Group Holdings 237,000 659,808 0.03
Semiconductors (8.46%) ASE Technology Holding 1,501,137 2,972,357 0.13Globalwafers 98,000 992,321 0.04MediaTek 662,606 6,698,700 0.28Nanya Technology 574,000 1,192,003 0.05Novatek Microelectronics 287,000 1,598,577 0.07Phison Electronics 65,000 592,250 0.02Powertech Technology 301,900 738,724 0.03Realtek Semiconductor 186,974 1,375,539 0.06Samsung Electronics 2,041,814 83,111,989 3.50Semiconductor Manufacturing International 1,438,700 1,602,136 0.07SK Hynix 234,272 14,101,160 0.59Taiwan Semiconductor Manufacturing 10,556,000 81,227,451 3.42United Microelectronics 5,360,000 2,407,379 0.10Vanguard International Semiconductor 353,000 741,017 0.03Win Semiconductors 168,000 1,076,386 0.05Winbond Electronics 997,000 487,915 0.02
Shipping (0.18%) China Shipbuilding Industry 507,600 410,629 0.02Daewoo Shipbuilding & Marine Engineering 17,095 484,135 0.02HLB 15,621 477,566 0.02Korea Shipbuilding & Offshore Engineering 16,489 1,692,241 0.07Samsung Heavy Industries 184,008 1,300,399 0.05
Software (1.01%) Alibaba Health Information Technology 1,554,000 1,487,862 0.06Beijing Shiji Information Technology - Class A 15,800 83,195 0.00CD Projekt 26,191 1,512,100 0.06HCL Technologies 244,161 3,765,833 0.16Hundsun Technologies - Class A 8,840 87,654 0.00Iflytek - Class A 18,000 87,054 0.00Kingdee International Software Group 1,014,000 1,096,742 0.05Kingsoft 300,000 648,960 0.03Momo - ADR 65,900 2,359,220 0.10NetEase - ADR 30,300 7,749,831 0.33Netmarble 12,061 1,180,352 0.05Pearl Abyss 3,722 684,346 0.03Tech Mahindra 204,318 2,091,501 0.09
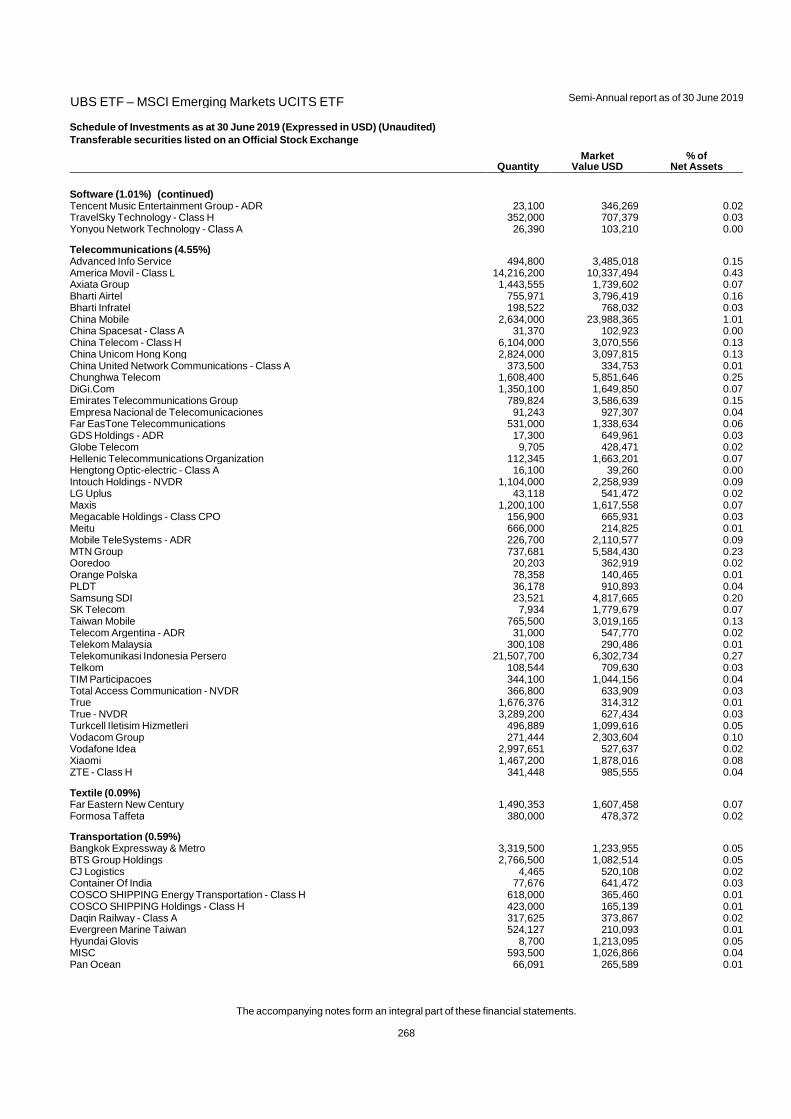
UBS ETF – MSCI Emerging Markets UCITS ETF
Semi-Annual report as of 30 June 2019
The accompanying notes form an integral part of these financial statements.
268
Schedule of Investments as at 30 June 2019 (Expressed in USD) (Unaudited)
Transferable securities listed on an Official Stock Exchange
Quantity Market
Value USD % of
Net Assets
Software (1.01%) (continued) Tencent Music Entertainment Group - ADR 23,100 346,269 0.02TravelSky Technology - Class H 352,000 707,379 0.03Yonyou Network Technology - Class A 26,390 103,210 0.00
Telecommunications (4.55%) Advanced Info Service 494,800 3,485,018 0.15America Movil - Class L 14,216,200 10,337,494 0.43Axiata Group 1,443,555 1,739,602 0.07Bharti Airtel 755,971 3,796,419 0.16Bharti Infratel 198,522 768,032 0.03China Mobile 2,634,000 23,988,365 1.01China Spacesat - Class A 31,370 102,923 0.00China Telecom - Class H 6,104,000 3,070,556 0.13China Unicom Hong Kong 2,824,000 3,097,815 0.13China United Network Communications - Class A 373,500 334,753 0.01Chunghwa Telecom 1,608,400 5,851,646 0.25DiGi.Com 1,350,100 1,649,850 0.07Emirates Telecommunications Group 789,824 3,586,639 0.15Empresa Nacional de Telecomunicaciones 91,243 927,307 0.04Far EasTone Telecommunications 531,000 1,338,634 0.06GDS Holdings - ADR 17,300 649,961 0.03Globe Telecom 9,705 428,471 0.02Hellenic Telecommunications Organization 112,345 1,663,201 0.07Hengtong Optic-electric - Class A 16,100 39,260 0.00Intouch Holdings - NVDR 1,104,000 2,258,939 0.09LG Uplus 43,118 541,472 0.02Maxis 1,200,100 1,617,558 0.07Megacable Holdings - Class CPO 156,900 665,931 0.03Meitu 666,000 214,825 0.01Mobile TeleSystems - ADR 226,700 2,110,577 0.09MTN Group 737,681 5,584,430 0.23Ooredoo 20,203 362,919 0.02Orange Polska 78,358 140,465 0.01PLDT 36,178 910,893 0.04Samsung SDI 23,521 4,817,665 0.20SK Telecom 7,934 1,779,679 0.07Taiwan Mobile 765,500 3,019,165 0.13Telecom Argentina - ADR 31,000 547,770 0.02Telekom Malaysia 300,108 290,486 0.01Telekomunikasi Indonesia Persero 21,507,700 6,302,734 0.27Telkom 108,544 709,630 0.03TIM Participacoes 344,100 1,044,156 0.04Total Access Communication - NVDR 366,800 633,909 0.03True 1,676,376 314,312 0.01True - NVDR 3,289,200 627,434 0.03Turkcell Iletisim Hizmetleri 496,889 1,099,616 0.05Vodacom Group 271,444 2,303,604 0.10Vodafone Idea 2,997,651 527,637 0.02Xiaomi 1,467,200 1,878,016 0.08ZTE - Class H 341,448 985,555 0.04
Textile (0.09%) Far Eastern New Century 1,490,353 1,607,458 0.07Formosa Taffeta 380,000 478,372 0.02
Transportation (0.59%) Bangkok Expressway & Metro 3,319,500 1,233,955 0.05BTS Group Holdings 2,766,500 1,082,514 0.05CJ Logistics 4,465 520,108 0.02Container Of India 77,676 641,472 0.03COSCO SHIPPING Energy Transportation - Class H 618,000 365,460 0.01COSCO SHIPPING Holdings - Class H 423,000 165,139 0.01Daqin Railway - Class A 317,625 373,867 0.02Evergreen Marine Taiwan 524,127 210,093 0.01Hyundai Glovis 8,700 1,213,095 0.05MISC 593,500 1,026,866 0.04Pan Ocean 66,091 265,589 0.01
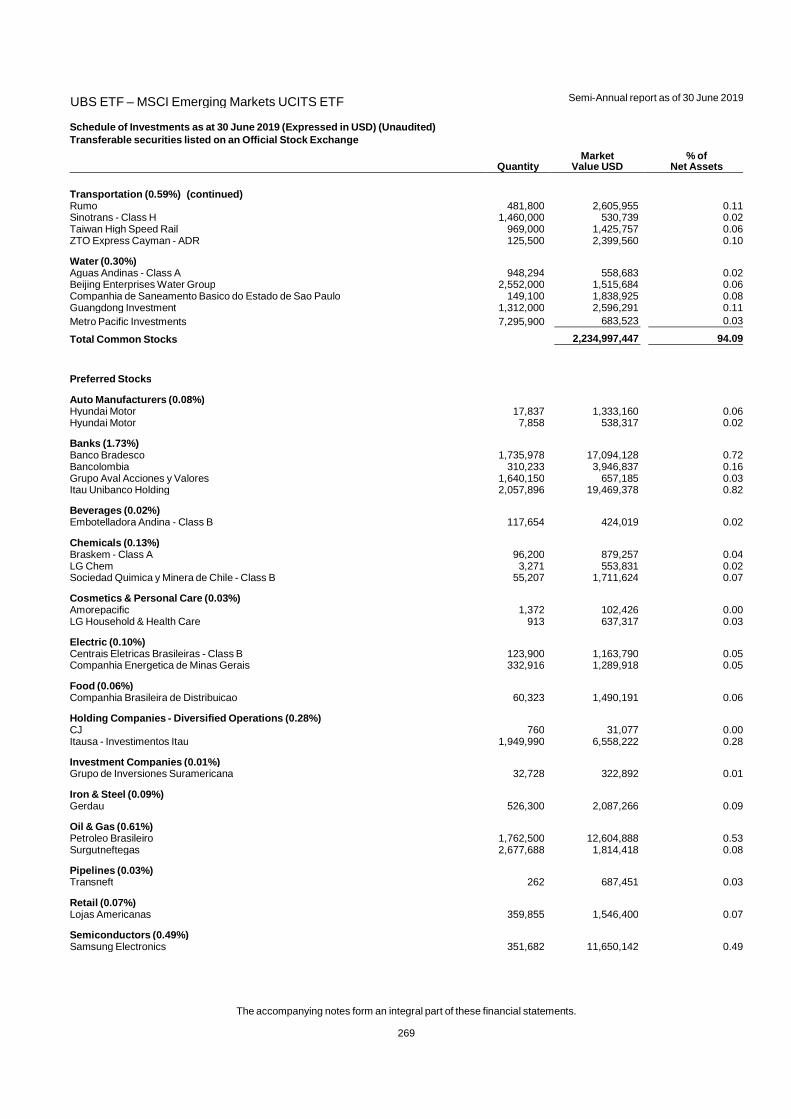
UBS ETF – MSCI Emerging Markets UCITS ETF
Semi-Annual report as of 30 June 2019
The accompanying notes form an integral part of these financial statements.
269
Schedule of Investments as at 30 June 2019 (Expressed in USD) (Unaudited)
Transferable securities listed on an Official Stock Exchange
Quantity Market
Value USD % of
Net Assets
Transportation (0.59%) (continued) Rumo 481,800 2,605,955 0.11Sinotrans - Class H 1,460,000 530,739 0.02Taiwan High Speed Rail 969,000 1,425,757 0.06ZTO Express Cayman - ADR 125,500 2,399,560 0.10
Water (0.30%) Aguas Andinas - Class A 948,294 558,683 0.02Beijing Enterprises Water Group 2,552,000 1,515,684 0.06Companhia de Saneamento Basico do Estado de Sao Paulo 149,100 1,838,925 0.08Guangdong Investment 1,312,000 2,596,291 0.11Metro Pacific Investments 7,295,900 683,523 0.03
Total Common Stocks 2,234,997,447 94.09
Preferred Stocks
Auto Manufacturers (0.08%) Hyundai Motor 17,837 1,333,160 0.06Hyundai Motor 7,858 538,317 0.02
Banks (1.73%) Banco Bradesco 1,735,978 17,094,128 0.72Bancolombia 310,233 3,946,837 0.16Grupo Aval Acciones y Valores 1,640,150 657,185 0.03Itau Unibanco Holding 2,057,896 19,469,378 0.82
Beverages (0.02%) Embotelladora Andina - Class B 117,654 424,019 0.02
Chemicals (0.13%) Braskem - Class A 96,200 879,257 0.04LG Chem 3,271 553,831 0.02Sociedad Quimica y Minera de Chile - Class B 55,207 1,711,624 0.07
Cosmetics & Personal Care (0.03%) Amorepacific 1,372 102,426 0.00LG Household & Health Care 913 637,317 0.03
Electric (0.10%) Centrais Eletricas Brasileiras - Class B 123,900 1,163,790 0.05Companhia Energetica de Minas Gerais 332,916 1,289,918 0.05
Food (0.06%) Companhia Brasileira de Distribuicao 60,323 1,490,191 0.06
Holding Companies - Diversified Operations (0.28%) CJ 760 31,077 0.00Itausa - Investimentos Itau 1,949,990 6,558,222 0.28
Investment Companies (0.01%) Grupo de Inversiones Suramericana 32,728 322,892 0.01
Iron & Steel (0.09%) Gerdau 526,300 2,087,266 0.09
Oil & Gas (0.61%) Petroleo Brasileiro 1,762,500 12,604,888 0.53Surgutneftegas 2,677,688 1,814,418 0.08
Pipelines (0.03%) Transneft 262 687,451 0.03
Retail (0.07%) Lojas Americanas 359,855 1,546,400 0.07
Semiconductors (0.49%) Samsung Electronics 351,682 11,650,142 0.49
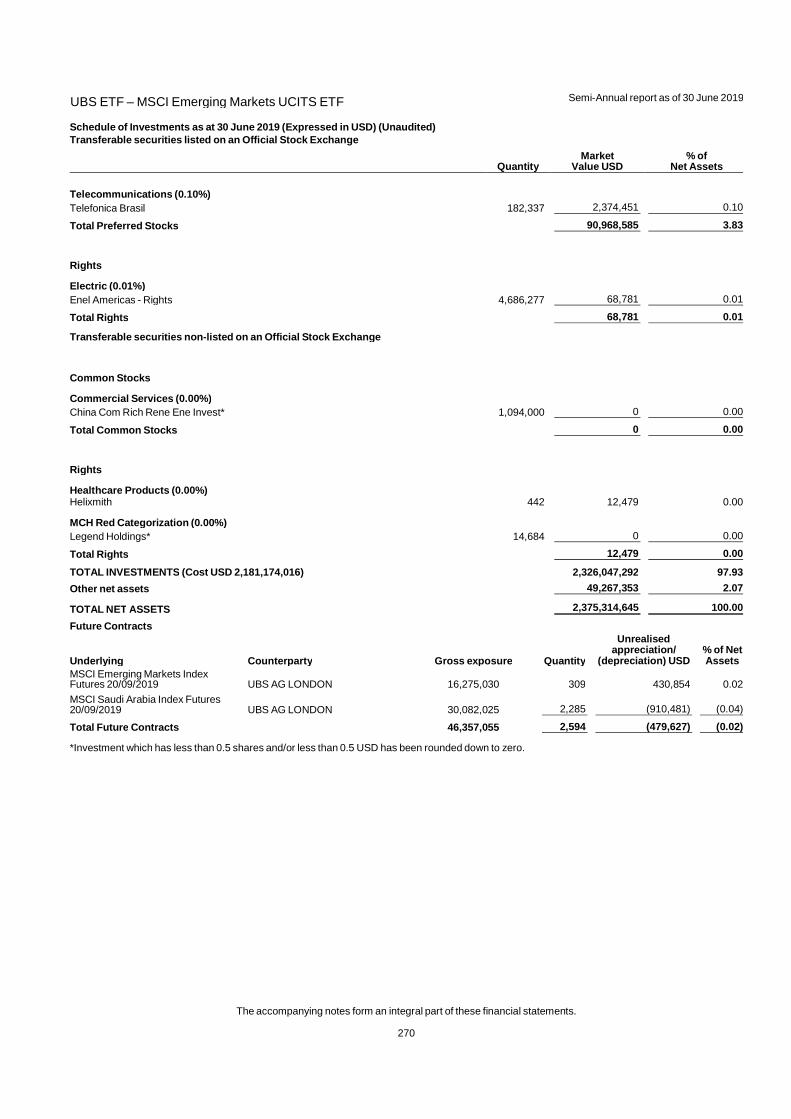
UBS ETF – MSCI Emerging Markets UCITS ETF
Semi-Annual report as of 30 June 2019
The accompanying notes form an integral part of these financial statements.
270
Schedule of Investments as at 30 June 2019 (Expressed in USD) (Unaudited)
Transferable securities listed on an Official Stock Exchange
Quantity Market
Value USD % of
Net Assets
Telecommunications (0.10%) Telefonica Brasil 182,337 2,374,451 0.10
Total Preferred Stocks 90,968,585 3.83
Rights
Electric (0.01%) Enel Americas - Rights 4,686,277 68,781 0.01
Total Rights 68,781 0.01
Transferable securities non -listed on an Official Stock Exchange
Common Stocks
Commercial Services (0.00%) China Com Rich Rene Ene Invest* 1,094,000 0 0.00
Total Common Stocks 0 0.00
Rights
Healthcare Products (0.00%) Helixmith 442 12,479 0.00
MCH Red Categorization (0.00%) Legend Holdings* 14,684 0 0.00
Total Rights 12,479 0.00
TOTAL INVESTMENTS (Cost USD 2,181,174,016) 2,326,047,292 97.93
Other net assets 49,267,353 2.07
TOTAL NET ASSETS 2,375,314,645 100.00
Future Contracts
Underlying Counterparty Gross exposure Quantity
Unrealised appreciation/
(depreciation) USD % of Net Assets
MSCI Emerging Markets Index Futures 20/09/2019 UBS AG LONDON 16,275,030 309 430,854 0.02
MSCI Saudi Arabia Index Futures 20/09/2019 UBS AG LONDON 30,082,025 2,285 (910,481) (0.04)
Total Future Contracts 46,357,055 2,594 (479,627) (0.02)
*Investment which has less than 0.5 shares and/or less than 0.5 USD has been rounded down to zero.
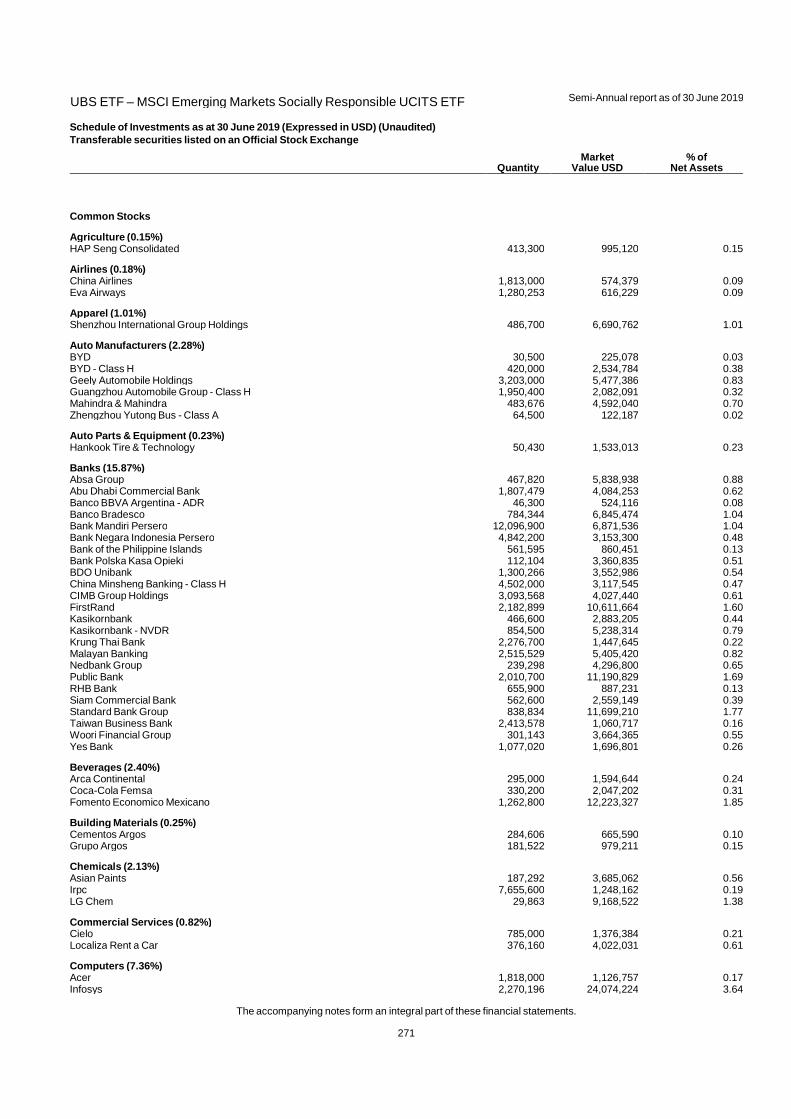
UBS ETF – MSCI Emerging Markets Socially Responsible UCITS ETF
Semi-Annual report as of 30 June 2019
The accompanying notes form an integral part of these financial statements.
271
Schedule of Investments as at 30 June 2019 (Expressed in USD) (Unaudited)
Transferable securities listed on an Official Stock Exchange
Quantity Market
Value USD % of
Net Assets
Common Stocks
Agriculture (0.15%) HAP Seng Consolidated 413,300 995,120 0.15
Airlines (0.18%) China Airlines 1,813,000 574,379 0.09Eva Airways 1,280,253 616,229 0.09
Apparel (1.01%) Shenzhou International Group Holdings 486,700 6,690,762 1.01
Auto Manufacturers (2.28%) BYD 30,500 225,078 0.03BYD - Class H 420,000 2,534,784 0.38Geely Automobile Holdings 3,203,000 5,477,386 0.83Guangzhou Automobile Group - Class H 1,950,400 2,082,091 0.32Mahindra & Mahindra 483,676 4,592,040 0.70Zhengzhou Yutong Bus - Class A 64,500 122,187 0.02
Auto Parts & Equipment (0.23%) Hankook Tire & Technology 50,430 1,533,013 0.23
Banks (15.87%) Absa Group 467,820 5,838,938 0.88Abu Dhabi Commercial Bank 1,807,479 4,084,253 0.62Banco BBVA Argentina - ADR 46,300 524,116 0.08Banco Bradesco 784,344 6,845,474 1.04Bank Mandiri Persero 12,096,900 6,871,536 1.04Bank Negara Indonesia Persero 4,842,200 3,153,300 0.48Bank of the Philippine Islands 561,595 860,451 0.13Bank Polska Kasa Opieki 112,104 3,360,835 0.51BDO Unibank 1,300,266 3,552,986 0.54China Minsheng Banking - Class H 4,502,000 3,117,545 0.47CIMB Group Holdings 3,093,568 4,027,440 0.61FirstRand 2,182,899 10,611,664 1.60Kasikornbank 466,600 2,883,205 0.44Kasikornbank - NVDR 854,500 5,238,314 0.79Krung Thai Bank 2,276,700 1,447,645 0.22Malayan Banking 2,515,529 5,405,420 0.82Nedbank Group 239,298 4,296,800 0.65Public Bank 2,010,700 11,190,829 1.69RHB Bank 655,900 887,231 0.13Siam Commercial Bank 562,600 2,559,149 0.39Standard Bank Group 838,834 11,699,210 1.77Taiwan Business Bank 2,413,578 1,060,717 0.16Woori Financial Group 301,143 3,664,365 0.55Yes Bank 1,077,020 1,696,801 0.26
Beverages (2.40%) Arca Continental 295,000 1,594,644 0.24Coca-Cola Femsa 330,200 2,047,202 0.31Fomento Economico Mexicano 1,262,800 12,223,327 1.85
Building Materials (0.25%) Cementos Argos 284,606 665,590 0.10Grupo Argos 181,522 979,211 0.15
Chemicals (2.13%) Asian Paints 187,292 3,685,062 0.56Irpc 7,655,600 1,248,162 0.19LG Chem 29,863 9,168,522 1.38
Commercial Services (0.82%) Cielo 785,000 1,376,384 0.21Localiza Rent a Car 376,160 4,022,031 0.61
Computers (7.36%) Acer 1,818,000 1,126,757 0.17Infosys 2,270,196 24,074,224 3.64

UBS ETF – MSCI Emerging Markets Socially Responsible UCITS ETF
Semi-Annual report as of 30 June 2019
The accompanying notes form an integral part of these financial statements.
272
Schedule of Investments as at 30 June 2019 (Expressed in USD) (Unaudited)
Transferable securities listed on an Official Stock Exchange
Quantity Market
Value USD % of
Net Assets
Computers (7.36%) (continued) SK Holdings 22,835 4,588,161 0.69Tata Consultancy Services 584,991 18,874,969 2.86
Cosmetics & Personal Care (2.23%) Amorepacific 20,881 2,974,862 0.45AMOREPACIFIC Group 18,504 998,397 0.15Dabur India 347,290 2,014,989 0.31LG Household & Health Care 6,119 6,958,166 1.05Natura Cosmeticos 122,400 1,804,072 0.27
Distribution & Wholesale (0.76%) LG 61,499 4,095,850 0.62Sime Darby 1,720,500 940,915 0.14
Diversified Financial Services (14.33%) B3 - Brasil Bolsa Balcao 1,337,000 13,067,726 1.98BNK Financial Group 180,063 1,168,035 0.18Chailease Holding 746,620 3,088,932 0.47E.Sun Financial Holding 6,384,893 5,344,813 0.81Housing Development Finance 1,059,305 33,640,252 5.09Indiabulls Housing Finance - Class L 188,018 1,655,261 0.25Investec 175,278 1,141,816 0.17KB Financial Group 259,063 10,287,133 1.56Mahindra & Mahindra Financial Services 194,683 1,095,431 0.16Old Mutual 3,194,696 4,802,947 0.73Piramal Enterprises 55,462 1,563,888 0.23RMB Holdings 509,959 3,052,250 0.46Samsung Card 18,539 613,337 0.09Shinhan Financial Group 293,641 11,418,595 1.73Taishin Financial Holding 6,014,000 2,768,886 0.42
Electric (1.09%) Enel Americas 18,428,403 3,243,800 0.49Huaneng Renewables - Class H 3,074,000 845,965 0.13Infraestructura Energetica Nova 339,200 1,331,082 0.20Inter RAO UES 24,403,835 1,750,341 0.27
Electrical Components & Equipment (0.93%) LG Electronics 69,338 4,762,052 0.72Tatung 1,169,000 705,702 0.11Xinjiang Goldwind Science & Technology 80,000 144,682 0.02Xinjiang Goldwind Science & Technology - Class H 462,000 505,022 0.08
Electronics (0.36%) LG Display 153,813 2,377,831 0.36
Energy - Alternate Sources (0.53%) China Everbright International 2,430,444 2,243,008 0.34China Longyuan Power Group - Class H 1,956,000 1,254,344 0.19
Engineering & Construction (0.34%) Grupo Aeroportuario del Sureste - Class B 139,800 2,263,750 0.34
Food (2.89%) CJ CheilJedang 5,242 1,348,352 0.21M Dias Branco 70,000 711,570 0.11Nestle India 15,058 2,598,673 0.39Nestle Malaysia 44,200 1,594,730 0.24SPAR Group 126,331 1,673,782 0.25Standard Foods 274,221 535,914 0.08Uni-President Enterprises 3,151,280 8,390,697 1.27Woolworths Holdings 654,731 2,269,533 0.34
Forest Products & Paper (0.27%) Mondi 78,966 1,774,954 0.27
Healthcare Services (1.36%) Bangkok Dusit Medical Services - Class F 6,012,700 5,048,570 0.76Genscript Biotech 620,000 1,557,043 0.24
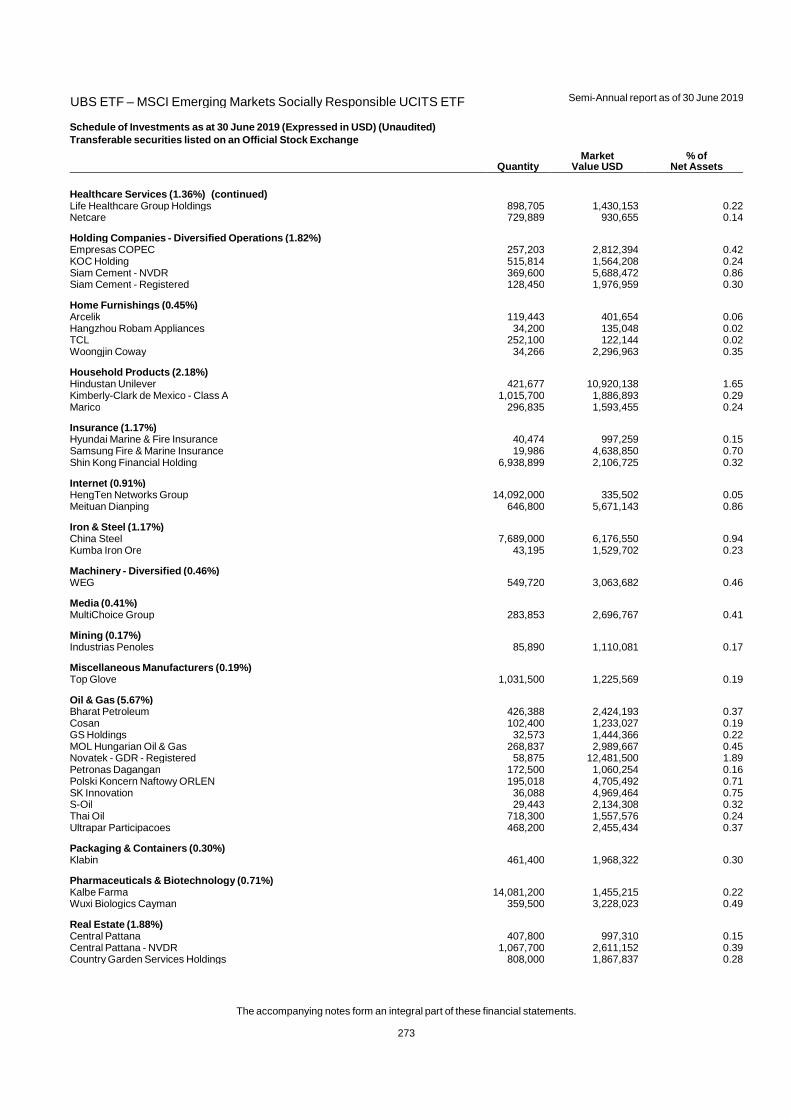
UBS ETF – MSCI Emerging Markets Socially Responsible UCITS ETF
Semi-Annual report as of 30 June 2019
The accompanying notes form an integral part of these financial statements.
273
Schedule of Investments as at 30 June 2019 (Expressed in USD) (Unaudited)
Transferable securities listed on an Official Stock Exchange
Quantity Market
Value USD % of
Net Assets
Healthcare Services (1.36%) (continued) Life Healthcare Group Holdings 898,705 1,430,153 0.22Netcare 729,889 930,655 0.14
Holding Companies - Diversified Operations (1.82%) Empresas COPEC 257,203 2,812,394 0.42KOC Holding 515,814 1,564,208 0.24Siam Cement - NVDR 369,600 5,688,472 0.86Siam Cement - Registered 128,450 1,976,959 0.30
Home Furnishings (0.45%) Arcelik 119,443 401,654 0.06Hangzhou Robam Appliances 34,200 135,048 0.02TCL 252,100 122,144 0.02Woongjin Coway 34,266 2,296,963 0.35
Household Products (2.18%) Hindustan Unilever 421,677 10,920,138 1.65Kimberly-Clark de Mexico - Class A 1,015,700 1,886,893 0.29Marico 296,835 1,593,455 0.24
Insurance (1.17%) Hyundai Marine & Fire Insurance 40,474 997,259 0.15Samsung Fire & Marine Insurance 19,986 4,638,850 0.70Shin Kong Financial Holding 6,938,899 2,106,725 0.32
Internet (0.91%) HengTen Networks Group 14,092,000 335,502 0.05Meituan Dianping 646,800 5,671,143 0.86
Iron & Steel (1.17%) China Steel 7,689,000 6,176,550 0.94Kumba Iron Ore 43,195 1,529,702 0.23
Machinery - Diversified (0.46%) WEG 549,720 3,063,682 0.46
Media (0.41%) MultiChoice Group 283,853 2,696,767 0.41
Mining (0.17%) Industrias Penoles 85,890 1,110,081 0.17
Miscellaneous Manufacturers (0.19%) Top Glove 1,031,500 1,225,569 0.19
Oil & Gas (5.67%) Bharat Petroleum 426,388 2,424,193 0.37Cosan 102,400 1,233,027 0.19GS Holdings 32,573 1,444,366 0.22MOL Hungarian Oil & Gas 268,837 2,989,667 0.45Novatek - GDR - Registered 58,875 12,481,500 1.89Petronas Dagangan 172,500 1,060,254 0.16Polski Koncern Naftowy ORLEN 195,018 4,705,492 0.71SK Innovation 36,088 4,969,464 0.75S-Oil 29,443 2,134,308 0.32Thai Oil 718,300 1,557,576 0.24Ultrapar Participacoes 468,200 2,455,434 0.37
Packaging & Containers (0.30%) Klabin 461,400 1,968,322 0.30
Pharmaceuticals & Biotechnology (0.71%) Kalbe Farma 14,081,200 1,455,215 0.22Wuxi Biologics Cayman 359,500 3,228,023 0.49
Real Estate (1.88%) Central Pattana 407,800 997,310 0.15Central Pattana - NVDR 1,067,700 2,611,152 0.39Country Garden Services Holdings 808,000 1,867,837 0.28
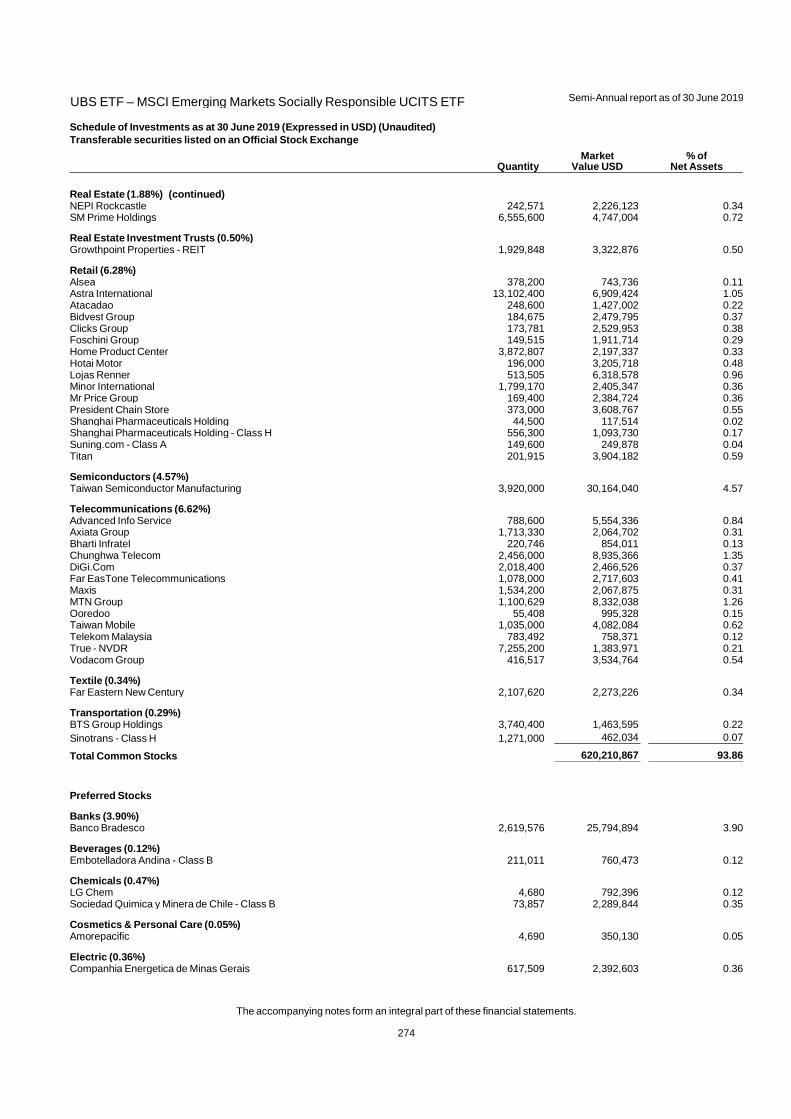
UBS ETF – MSCI Emerging Markets Socially Responsible UCITS ETF
Semi-Annual report as of 30 June 2019
The accompanying notes form an integral part of these financial statements.
274
Schedule of Investments as at 30 June 2019 (Expressed in USD) (Unaudited)
Transferable securities listed on an Official Stock Exchange
Quantity Market
Value USD % of
Net Assets
Real Estate (1.88%) (continued) NEPI Rockcastle 242,571 2,226,123 0.34SM Prime Holdings 6,555,600 4,747,004 0.72
Real Estate Investment Trusts (0.50%) Growthpoint Properties - REIT 1,929,848 3,322,876 0.50
Retail (6.28%) Alsea 378,200 743,736 0.11Astra International 13,102,400 6,909,424 1.05Atacadao 248,600 1,427,002 0.22Bidvest Group 184,675 2,479,795 0.37Clicks Group 173,781 2,529,953 0.38Foschini Group 149,515 1,911,714 0.29Home Product Center 3,872,807 2,197,337 0.33Hotai Motor 196,000 3,205,718 0.48Lojas Renner 513,505 6,318,578 0.96Minor International 1,799,170 2,405,347 0.36Mr Price Group 169,400 2,384,724 0.36President Chain Store 373,000 3,608,767 0.55Shanghai Pharmaceuticals Holding 44,500 117,514 0.02Shanghai Pharmaceuticals Holding - Class H 556,300 1,093,730 0.17Suning.com - Class A 149,600 249,878 0.04Titan 201,915 3,904,182 0.59
Semiconductors (4.57%) Taiwan Semiconductor Manufacturing 3,920,000 30,164,040 4.57
Telecommunications (6.62%) Advanced Info Service 788,600 5,554,336 0.84Axiata Group 1,713,330 2,064,702 0.31Bharti Infratel 220,746 854,011 0.13Chunghwa Telecom 2,456,000 8,935,366 1.35DiGi.Com 2,018,400 2,466,526 0.37Far EasTone Telecommunications 1,078,000 2,717,603 0.41Maxis 1,534,200 2,067,875 0.31MTN Group 1,100,629 8,332,038 1.26Ooredoo 55,408 995,328 0.15Taiwan Mobile 1,035,000 4,082,084 0.62Telekom Malaysia 783,492 758,371 0.12True - NVDR 7,255,200 1,383,971 0.21Vodacom Group 416,517 3,534,764 0.54
Textile (0.34%) Far Eastern New Century 2,107,620 2,273,226 0.34
Transportation (0.29%) BTS Group Holdings 3,740,400 1,463,595 0.22Sinotrans - Class H 1,271,000 462,034 0.07
Total Common Stocks 620,210,867 93.86
Preferred Stocks
Banks (3.90%) Banco Bradesco 2,619,576 25,794,894 3.90
Beverages (0.12%) Embotelladora Andina - Class B 211,011 760,473 0.12
Chemicals (0.47%) LG Chem 4,680 792,396 0.12Sociedad Quimica y Minera de Chile - Class B 73,857 2,289,844 0.35
Cosmetics & Personal Care (0.05%) Amorepacific 4,690 350,130 0.05
Electric (0.36%) Companhia Energetica de Minas Gerais 617,509 2,392,603 0.36

UBS ETF – MSCI Emerging Markets Socially Responsible UCITS ETF
Semi-Annual report as of 30 June 2019
The accompanying notes form an integral part of these financial statements.
275
Schedule of Investments as at 30 June 2019 (Expressed in USD) (Unaudited)
Transferable securities listed on an Official Stock Exchange
Quantity Market
Value USD % of
Net Assets
Food (0.40%) Companhia Brasileira de Distribuicao 106,200 2,623,515 0.40
Telecommunications (0.57%) Telefonica Brasil 291,700 3,798,611 0.57
Total Preferred Stocks 38,802,466 5.87
Rights
Electric (0.01%) Enel Americas - Rights 6,007,732 88,176 0.01
Total Rights 88,176 0.01
TOTAL INVESTMENTS (Cost USD 621,110,178) 659,101,509 99.74
Other net assets 1,690,901 0.26
TOTAL NET ASSETS 660,792,410 100.00
Future Contracts
Underlying Counterparty Gross exposure Quantity
Unrealised appreciation/
(depreciation) USD % of Net Assets
MSCI Emerging Markets Index Futures 21/06/2019 UBS AG LONDON (1,948,457) (37) 1,825,733 0.28
MSCI Emerging Markets Index Futures 20/09/2019 UBS AG LONDON 4,898,310 93 (3,612,321) (0.55)
Total Future Contracts 2,949,853 56 (1,786,588) (0.27)

UBS ETF – MSCI World Socially Responsible UCITS ETF
Semi-Annual report as of 30 June 2019
The accompanying notes form an integral part of these financial statements.
276
Schedule of Investments as at 30 June 2019 (Expressed in USD) (Unaudited)
Transferable securities listed on an Official Stock Exchange
Quantity Market
Value USD % of
Net Assets
Common Stocks
Advertising (0.18%) JCDecaux 8,948 271,461 0.02WPP 154,463 1,946,586 0.16
Agriculture (0.07%) Bunge 16,733 932,195 0.07
Airlines (0.06%) easyJet 21,756 263,930 0.02Singapore Airlines 73,900 506,340 0.04
Apparel (2.21%) adidas 22,672 7,009,827 0.56Burberry Group 51,365 1,217,231 0.10Gildan Activewear 26,410 1,024,265 0.08Hanesbrands 46,743 804,915 0.06NIKE - Class B 156,210 13,113,830 1.05PVH 9,710 918,954 0.07VF 41,787 3,650,094 0.29
Auto Manufacturers (0.70%) Honda Motor 200,200 5,175,023 0.41Tesla 16,358 3,655,359 0.29
Auto Parts & Equipment (0.55%) Compagnie Generale des Etablissements Michelin 20,747 2,635,557 0.21Denso 53,800 2,263,555 0.18NGK Insulators 32,800 478,270 0.04Stanley Electric 18,800 462,061 0.04Valeo 30,922 1,007,120 0.08
Banks (6.52%) Banco Bilbao Vizcaya Argentaria 829,560 4,645,106 0.37Bank Hapoalim BM 131,957 978,980 0.08Bank of Montreal 79,152 5,991,747 0.48Bank of New York Mellon 105,670 4,665,330 0.37Bank of Nova Scotia 151,395 8,149,320 0.65BOC Hong Kong Holdings 440,500 1,733,808 0.14Canadian Imperial Bank of Commerce 55,063 4,339,306 0.35Comerica 19,295 1,401,589 0.11DBS Group Holdings 227,900 4,372,877 0.35Hang Seng Bank 92,500 2,302,880 0.18Intesa Sanpaolo 1,837,592 3,938,368 0.31Investec 81,873 532,461 0.04KBC Group 30,532 2,004,134 0.16KeyCorp 122,516 2,174,659 0.17M&T Bank 16,115 2,740,678 0.22Natixis 115,671 466,179 0.04Northern Trust 25,604 2,304,360 0.18PNC Financial Services Group 57,044 7,831,000 0.63Signature Bank 6,671 806,124 0.06Skandinaviska Enskilda Banken - Class A 206,378 1,911,146 0.15Standard Chartered 342,750 3,115,469 0.25State Street 46,497 2,606,622 0.21Sumitomo Mitsui Trust Holdings 44,000 1,595,174 0.13SVB Financial Group 6,558 1,472,861 0.12Westpac Banking 430,750 8,572,627 0.68Zions Bancorp 23,775 1,093,175 0.09
Beverages (2.14%) Coca-Cola Amatil 68,230 489,338 0.04Coca-Cola European Partners 31,154 1,760,201 0.14Coca-Cola HBC 25,588 967,857 0.08PepsiCo 173,711 22,778,723 1.82Suntory Beverage & Food 17,500 760,976 0.06

UBS ETF – MSCI World Socially Responsible UCITS ETF
Semi-Annual report as of 30 June 2019
The accompanying notes form an integral part of these financial statements.
277
Schedule of Investments as at 30 June 2019 (Expressed in USD) (Unaudited)
Transferable securities listed on an Official Stock Exchange
Quantity Market
Value USD % of
Net Assets
Building Materials (1.14%) Boral 142,087 510,513 0.04CRH 101,058 3,301,785 0.26Daikin Industries 30,700 4,007,755 0.32Fletcher Building 93,712 305,267 0.03Fortune Brands Home & Security 17,814 1,017,714 0.08Imerys 3,246 172,333 0.01Johnson Controls International 98,480 4,068,209 0.33Owens Corning 14,422 839,360 0.07
Chemicals (2.99%) Akzo Nobel 28,626 2,694,006 0.22Asahi Kasei 154,100 1,642,694 0.13Axalta Coating Systems 27,489 818,348 0.07Croda International 15,031 979,454 0.08Givaudan - Registered 1,151 3,253,493 0.26Hitachi Chemical 15,700 426,380 0.03International Flavors & Fragrances 12,432 1,803,759 0.14Johnson Matthey 24,276 1,028,530 0.08Kaneka 4,400 165,398 0.01Kansai Paint 24,200 507,405 0.04Koninklijke DSM 22,724 2,812,950 0.22Linde 68,211 13,696,769 1.09Mosaic 43,590 1,091,058 0.09Nitto Denko 19,100 942,590 0.08Novozymes - Class B 27,206 1,270,637 0.10Solvay 9,515 987,131 0.08Sumitomo Chemical 174,200 808,428 0.06Teijin 22,900 390,452 0.03Toray Industries 175,600 1,335,173 0.11Umicore 25,533 819,971 0.07
Commercial Services (2.23%) Benesse Holdings 7,300 169,931 0.01Brambles 197,910 1,788,817 0.14Ecolab 31,948 6,307,813 0.50IHS Markit 47,268 3,011,917 0.24Intertek Group 18,885 1,322,403 0.11ManpowerGroup 7,473 721,892 0.06Moody's 21,312 4,162,447 0.33Relx - GB 180,672 4,390,729 0.35Relx - NL 59,132 1,432,985 0.12Robert Half International 14,595 832,061 0.07Sohgo Security Services 9,200 424,392 0.03Transurban Group 328,172 3,394,544 0.27
Computers (1.80%) Accenture - Class A 79,110 14,617,155 1.17CGI 30,057 2,315,775 0.18Fujitsu 24,400 1,701,251 0.14Hewlett Packard Enterprise 169,077 2,527,701 0.20Teleperformance 7,138 1,432,287 0.11
Cosmetics & Personal Care (5.35%) Beiersdorf 12,722 1,529,189 0.12Colgate-Palmolive 101,089 7,245,049 0.58Essity - Class B 75,391 2,319,048 0.19Kao 60,300 4,594,979 0.37L'Oreal 30,870 8,806,269 0.70Procter & Gamble 310,366 34,031,632 2.72Unilever 135,734 8,455,185 0.67
Distribution & Wholesale (0.55%) Fastenal 70,948 2,312,195 0.19Ferguson 28,492 2,030,659 0.16LKQ 39,042 1,038,908 0.08WW Grainger 5,800 1,555,734 0.12
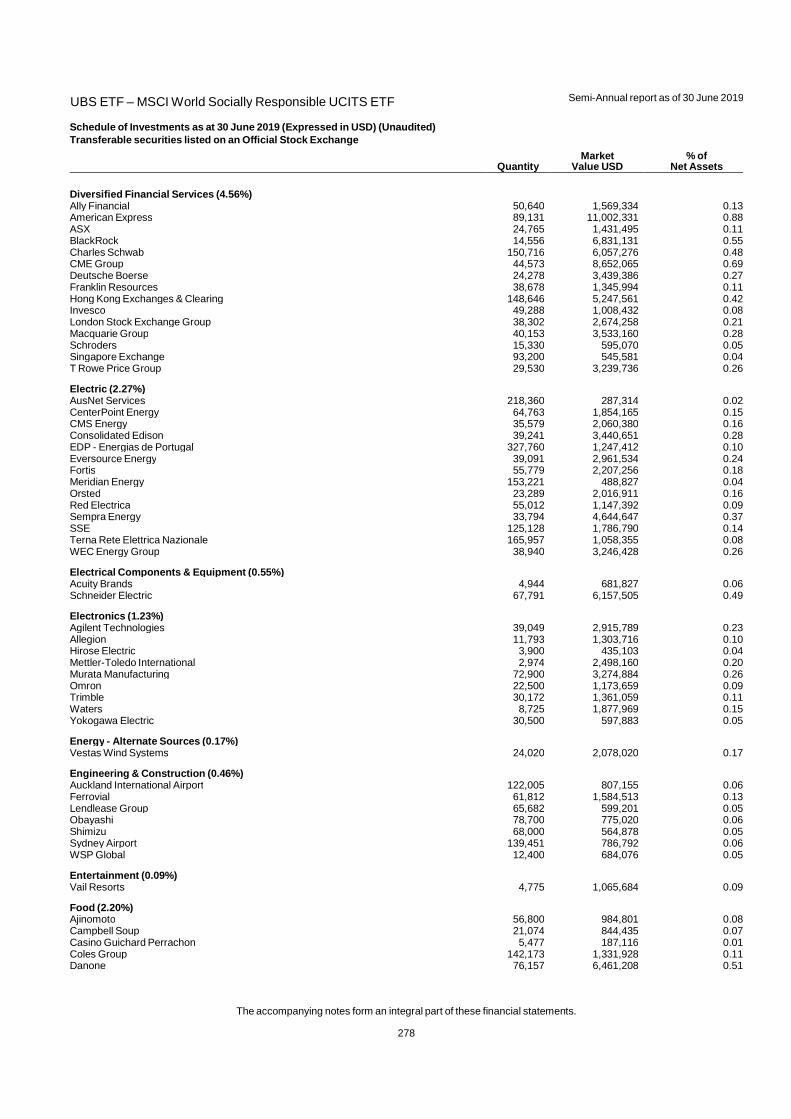
UBS ETF – MSCI World Socially Responsible UCITS ETF
Semi-Annual report as of 30 June 2019
The accompanying notes form an integral part of these financial statements.
278
Schedule of Investments as at 30 June 2019 (Expressed in USD) (Unaudited)
Transferable securities listed on an Official Stock Exchange
Quantity Market
Value USD % of
Net Assets
Diversified Financial Services (4.56%) Ally Financial 50,640 1,569,334 0.13American Express 89,131 11,002,331 0.88ASX 24,765 1,431,495 0.11BlackRock 14,556 6,831,131 0.55Charles Schwab 150,716 6,057,276 0.48CME Group 44,573 8,652,065 0.69Deutsche Boerse 24,278 3,439,386 0.27Franklin Resources 38,678 1,345,994 0.11Hong Kong Exchanges & Clearing 148,646 5,247,561 0.42Invesco 49,288 1,008,432 0.08London Stock Exchange Group 38,302 2,674,258 0.21Macquarie Group 40,153 3,533,160 0.28Schroders 15,330 595,070 0.05Singapore Exchange 93,200 545,581 0.04T Rowe Price Group 29,530 3,239,736 0.26
Electric (2.27%) AusNet Services 218,360 287,314 0.02CenterPoint Energy 64,763 1,854,165 0.15CMS Energy 35,579 2,060,380 0.16Consolidated Edison 39,241 3,440,651 0.28EDP - Energias de Portugal 327,760 1,247,412 0.10Eversource Energy 39,091 2,961,534 0.24Fortis 55,779 2,207,256 0.18Meridian Energy 153,221 488,827 0.04Orsted 23,289 2,016,911 0.16Red Electrica 55,012 1,147,392 0.09Sempra Energy 33,794 4,644,647 0.37SSE 125,128 1,786,790 0.14Terna Rete Elettrica Nazionale 165,957 1,058,355 0.08WEC Energy Group 38,940 3,246,428 0.26
Electrical Components & Equipment (0.55%) Acuity Brands 4,944 681,827 0.06Schneider Electric 67,791 6,157,505 0.49
Electronics (1.23%) Agilent Technologies 39,049 2,915,789 0.23Allegion 11,793 1,303,716 0.10Hirose Electric 3,900 435,103 0.04Mettler-Toledo International 2,974 2,498,160 0.20Murata Manufacturing 72,900 3,274,884 0.26Omron 22,500 1,173,659 0.09Trimble 30,172 1,361,059 0.11Waters 8,725 1,877,969 0.15Yokogawa Electric 30,500 597,883 0.05
Energy - Alternate Sources (0.17%) Vestas Wind Systems 24,020 2,078,020 0.17
Engineering & Construction (0.46%) Auckland International Airport 122,005 807,155 0.06Ferrovial 61,812 1,584,513 0.13Lendlease Group 65,682 599,201 0.05Obayashi 78,700 775,020 0.06Shimizu 68,000 564,878 0.05Sydney Airport 139,451 786,792 0.06WSP Global 12,400 684,076 0.05
Entertainment (0.09%) Vail Resorts 4,775 1,065,684 0.09
Food (2.20%) Ajinomoto 56,800 984,801 0.08Campbell Soup 21,074 844,435 0.07Casino Guichard Perrachon 5,477 187,116 0.01Coles Group 142,173 1,331,928 0.11Danone 76,157 6,461,208 0.51
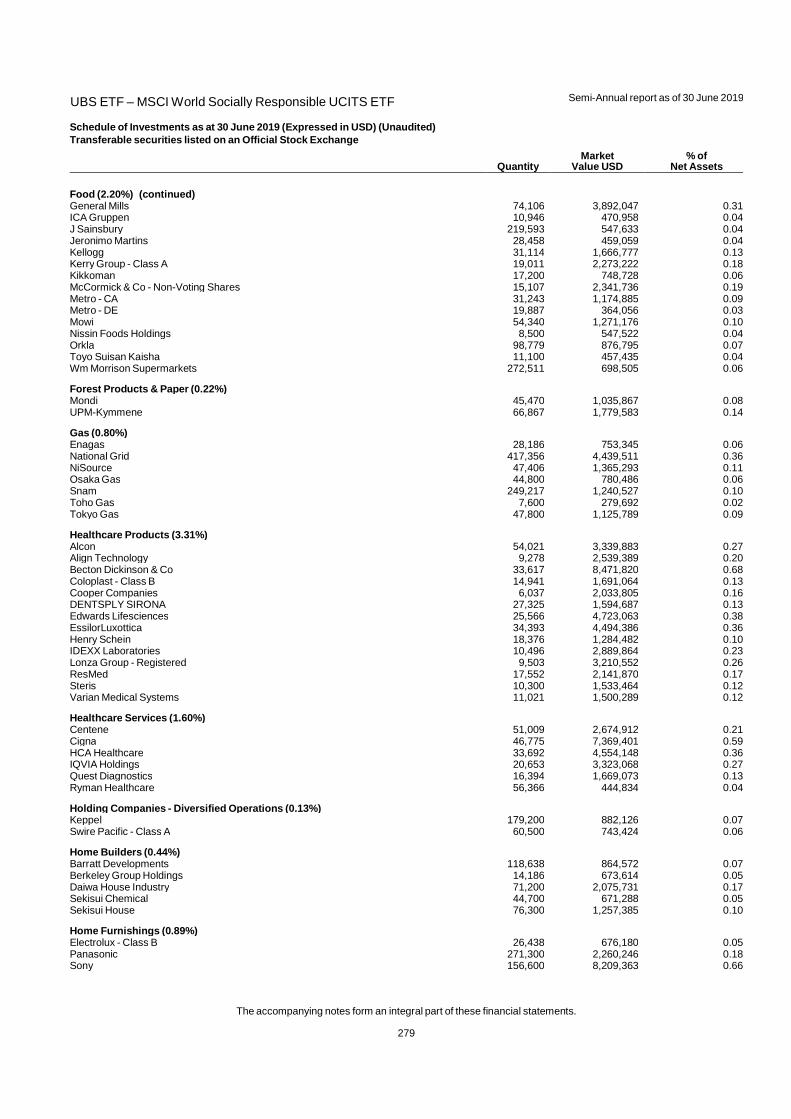
UBS ETF – MSCI World Socially Responsible UCITS ETF
Semi-Annual report as of 30 June 2019
The accompanying notes form an integral part of these financial statements.
279
Schedule of Investments as at 30 June 2019 (Expressed in USD) (Unaudited)
Transferable securities listed on an Official Stock Exchange
Quantity Market
Value USD % of
Net Assets
Food (2.20%) (continued) General Mills 74,106 3,892,047 0.31ICA Gruppen 10,946 470,958 0.04J Sainsbury 219,593 547,633 0.04Jeronimo Martins 28,458 459,059 0.04Kellogg 31,114 1,666,777 0.13Kerry Group - Class A 19,011 2,273,222 0.18Kikkoman 17,200 748,728 0.06McCormick & Co - Non-Voting Shares 15,107 2,341,736 0.19Metro - CA 31,243 1,174,885 0.09Metro - DE 19,887 364,056 0.03Mowi 54,340 1,271,176 0.10Nissin Foods Holdings 8,500 547,522 0.04Orkla 98,779 876,795 0.07Toyo Suisan Kaisha 11,100 457,435 0.04Wm Morrison Supermarkets 272,511 698,505 0.06
Forest Products & Paper (0.22%) Mondi 45,470 1,035,867 0.08UPM-Kymmene 66,867 1,779,583 0.14
Gas (0.80%) Enagas 28,186 753,345 0.06National Grid 417,356 4,439,511 0.36NiSource 47,406 1,365,293 0.11Osaka Gas 44,800 780,486 0.06Snam 249,217 1,240,527 0.10Toho Gas 7,600 279,692 0.02Tokyo Gas 47,800 1,125,789 0.09
Healthcare Products (3.31%) Alcon 54,021 3,339,883 0.27Align Technology 9,278 2,539,389 0.20Becton Dickinson & Co 33,617 8,471,820 0.68Coloplast - Class B 14,941 1,691,064 0.13Cooper Companies 6,037 2,033,805 0.16DENTSPLY SIRONA 27,325 1,594,687 0.13Edwards Lifesciences 25,566 4,723,063 0.38EssilorLuxottica 34,393 4,494,386 0.36Henry Schein 18,376 1,284,482 0.10IDEXX Laboratories 10,496 2,889,864 0.23Lonza Group - Registered 9,503 3,210,552 0.26ResMed 17,552 2,141,870 0.17Steris 10,300 1,533,464 0.12Varian Medical Systems 11,021 1,500,289 0.12
Healthcare Services (1.60%) Centene 51,009 2,674,912 0.21Cigna 46,775 7,369,401 0.59HCA Healthcare 33,692 4,554,148 0.36IQVIA Holdings 20,653 3,323,068 0.27Quest Diagnostics 16,394 1,669,073 0.13Ryman Healthcare 56,366 444,834 0.04
Holding Companies - Diversified Operations (0.13%) Keppel 179,200 882,126 0.07Swire Pacific - Class A 60,500 743,424 0.06
Home Builders (0.44%) Barratt Developments 118,638 864,572 0.07Berkeley Group Holdings 14,186 673,614 0.05Daiwa House Industry 71,200 2,075,731 0.17Sekisui Chemical 44,700 671,288 0.05Sekisui House 76,300 1,257,385 0.10
Home Furnishings (0.89%) Electrolux - Class B 26,438 676,180 0.05Panasonic 271,300 2,260,246 0.18Sony 156,600 8,209,363 0.66
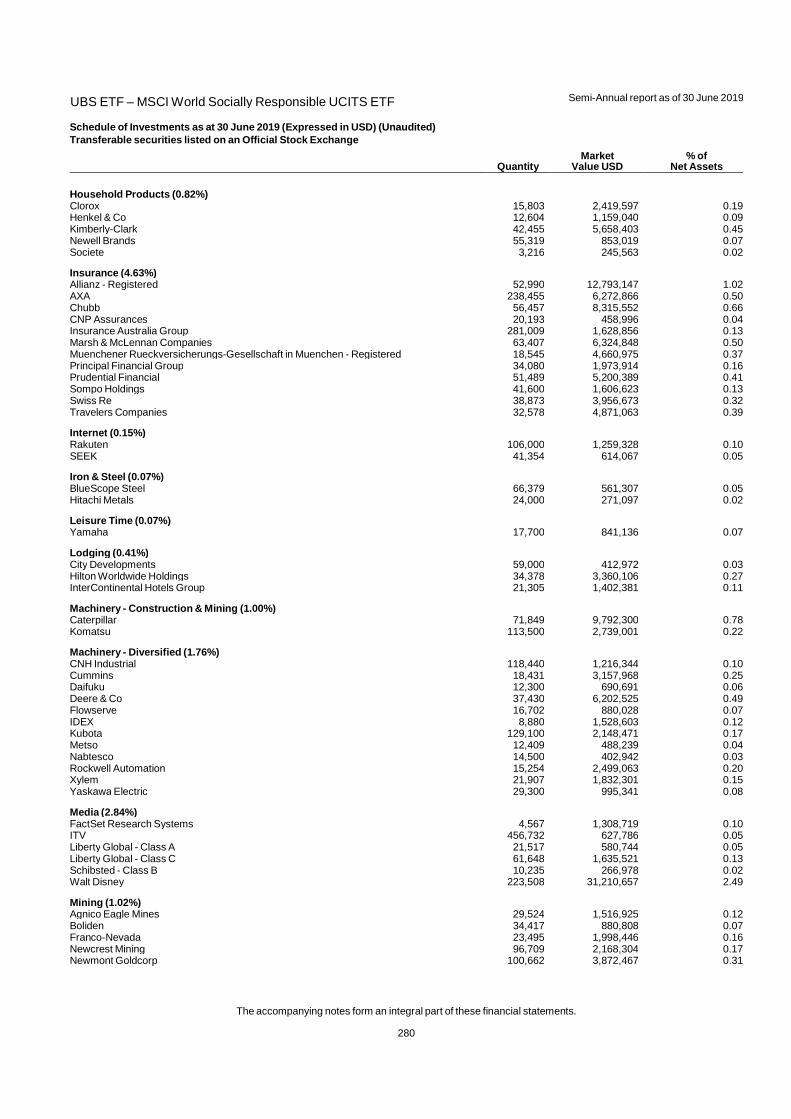
UBS ETF – MSCI World Socially Responsible UCITS ETF
Semi-Annual report as of 30 June 2019
The accompanying notes form an integral part of these financial statements.
280
Schedule of Investments as at 30 June 2019 (Expressed in USD) (Unaudited)
Transferable securities listed on an Official Stock Exchange
Quantity Market
Value USD % of
Net Assets
Household Products (0.82%) Clorox 15,803 2,419,597 0.19Henkel & Co 12,604 1,159,040 0.09Kimberly-Clark 42,455 5,658,403 0.45Newell Brands 55,319 853,019 0.07Societe 3,216 245,563 0.02
Insurance (4.63%) Allianz - Registered 52,990 12,793,147 1.02AXA 238,455 6,272,866 0.50Chubb 56,457 8,315,552 0.66CNP Assurances 20,193 458,996 0.04Insurance Australia Group 281,009 1,628,856 0.13Marsh & McLennan Companies 63,407 6,324,848 0.50Muenchener Rueckversicherungs-Gesellschaft in Muenchen - Registered 18,545 4,660,975 0.37Principal Financial Group 34,080 1,973,914 0.16Prudential Financial 51,489 5,200,389 0.41Sompo Holdings 41,600 1,606,623 0.13Swiss Re 38,873 3,956,673 0.32Travelers Companies 32,578 4,871,063 0.39
Internet (0.15%) Rakuten 106,000 1,259,328 0.10SEEK 41,354 614,067 0.05
Iron & Steel (0.07%) BlueScope Steel 66,379 561,307 0.05Hitachi Metals 24,000 271,097 0.02
Leisure Time (0.07%) Yamaha 17,700 841,136 0.07
Lodging (0.41%) City Developments 59,000 412,972 0.03Hilton Worldwide Holdings 34,378 3,360,106 0.27InterContinental Hotels Group 21,305 1,402,381 0.11
Machinery - Construction & Mining (1.00%) Caterpillar 71,849 9,792,300 0.78Komatsu 113,500 2,739,001 0.22
Machinery - Diversified (1.76%) CNH Industrial 118,440 1,216,344 0.10Cummins 18,431 3,157,968 0.25Daifuku 12,300 690,691 0.06Deere & Co 37,430 6,202,525 0.49Flowserve 16,702 880,028 0.07IDEX 8,880 1,528,603 0.12Kubota 129,100 2,148,471 0.17Metso 12,409 488,239 0.04Nabtesco 14,500 402,942 0.03Rockwell Automation 15,254 2,499,063 0.20Xylem 21,907 1,832,301 0.15Yaskawa Electric 29,300 995,341 0.08
Media (2.84%) FactSet Research Systems 4,567 1,308,719 0.10ITV 456,732 627,786 0.05Liberty Global - Class A 21,517 580,744 0.05Liberty Global - Class C 61,648 1,635,521 0.13Schibsted - Class B 10,235 266,978 0.02Walt Disney 223,508 31,210,657 2.49
Mining (1.02%) Agnico Eagle Mines 29,524 1,516,925 0.12Boliden 34,417 880,808 0.07Franco-Nevada 23,495 1,998,446 0.16Newcrest Mining 96,709 2,168,304 0.17Newmont Goldcorp 100,662 3,872,467 0.31

UBS ETF – MSCI World Socially Responsible UCITS ETF
Semi-Annual report as of 30 June 2019
The accompanying notes form an integral part of these financial statements.
281
Schedule of Investments as at 30 June 2019 (Expressed in USD) (Unaudited)
Transferable securities listed on an Official Stock Exchange
Quantity Market
Value USD % of
Net Assets
Mining (1.02%) (continued) Sumitomo Metal Mining 28,900 863,459 0.07Teck Resources - Class B 62,300 1,440,755 0.12
Miscellaneous Manufacturers (1.86%) Illinois Tool Works 40,442 6,099,058 0.49Ingersoll-Rand 29,746 3,767,926 0.30Nikon 40,600 574,294 0.05Orica 48,229 686,032 0.05Siemens - Registered 95,519 11,378,082 0.91Wartsila 56,155 815,674 0.06
Office & Business Equipment (0.04%) Konica Minolta 56,500 550,107 0.04
Oil & Gas (4.93%) Cenovus Energy 129,021 1,140,381 0.09ConocoPhillips 141,629 8,639,369 0.69DCC 11,541 1,031,114 0.08Devon Energy 53,779 1,533,777 0.12Encana 176,027 905,224 0.07Equinor 123,101 2,432,118 0.19Galp Energia 62,842 967,910 0.08Hess 33,538 2,132,011 0.17Marathon Oil 99,024 1,407,131 0.11Neste 51,958 1,765,626 0.14Noble Energy 59,900 1,341,760 0.11OMV 17,476 852,787 0.07Phillips 66 56,185 5,255,545 0.42Pioneer Natural Resources 20,716 3,187,364 0.25PrairieSky Royalty 26,100 367,507 0.03Repsol 181,205 2,844,622 0.23Suncor Energy 197,996 6,189,506 0.49Total 291,624 16,364,303 1.31Vermilion Energy 19,100 415,837 0.03Woodside Petroleum 120,011 3,062,156 0.25
Oil & Gas Services (0.36%) Baker Hughes 62,523 1,539,942 0.12John Wood Group 84,690 487,188 0.04National Oilwell Varco 47,725 1,060,927 0.09TechnipFMC - FR 3,698 95,175 0.01TechnipFMC - US 50,444 1,308,517 0.10
Packaging & Containers (0.22%) Ball 39,096 2,736,329 0.22
Pharmaceuticals & Biotechnology (7.97%) AmerisourceBergen 19,806 1,688,659 0.13Amgen 77,120 14,211,674 1.13Astellas Pharma 233,800 3,331,010 0.27Biogen 24,201 5,659,888 0.45Cardinal Health 36,731 1,730,030 0.14Cronos Group 19,800 318,345 0.03CSL 55,868 8,429,154 0.67Eisai 31,500 1,780,829 0.14Gilead Sciences 158,645 10,718,056 0.86Jazz Pharmaceuticals 6,822 972,544 0.08Merck 16,101 1,686,162 0.13Novo Nordisk - Class B 214,274 10,936,017 0.87Orion - Class B 13,604 499,315 0.04Roche Holding 87,124 24,542,161 1.96Vertex Pharmaceuticals 31,939 5,856,974 0.47Vifor Pharma 5,773 835,161 0.07Zoetis 59,024 6,698,634 0.53
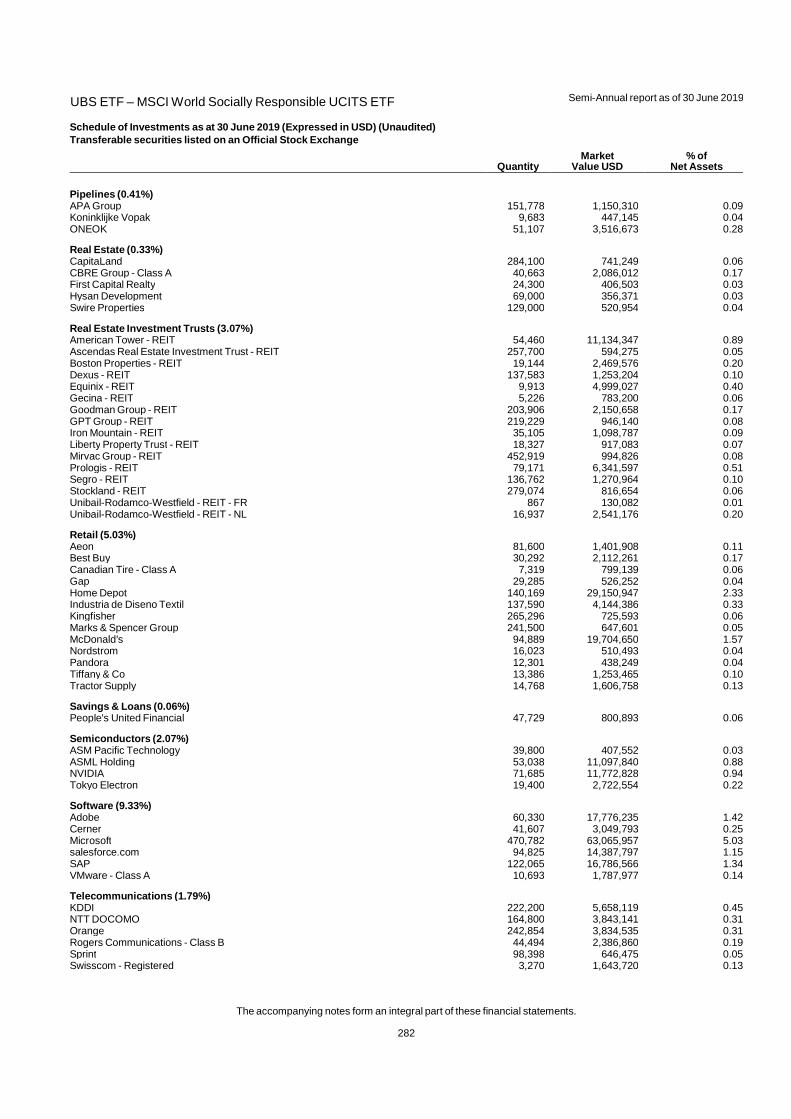
UBS ETF – MSCI World Socially Responsible UCITS ETF
Semi-Annual report as of 30 June 2019
The accompanying notes form an integral part of these financial statements.
282
Schedule of Investments as at 30 June 2019 (Expressed in USD) (Unaudited)
Transferable securities listed on an Official Stock Exchange
Quantity Market
Value USD % of
Net Assets
Pipelines (0.41%) APA Group 151,778 1,150,310 0.09Koninklijke Vopak 9,683 447,145 0.04ONEOK 51,107 3,516,673 0.28
Real Estate (0.33%) CapitaLand 284,100 741,249 0.06CBRE Group - Class A 40,663 2,086,012 0.17First Capital Realty 24,300 406,503 0.03Hysan Development 69,000 356,371 0.03Swire Properties 129,000 520,954 0.04
Real Estate Investment Trusts (3.07%) American Tower - REIT 54,460 11,134,347 0.89Ascendas Real Estate Investment Trust - REIT 257,700 594,275 0.05Boston Properties - REIT 19,144 2,469,576 0.20Dexus - REIT 137,583 1,253,204 0.10Equinix - REIT 9,913 4,999,027 0.40Gecina - REIT 5,226 783,200 0.06Goodman Group - REIT 203,906 2,150,658 0.17GPT Group - REIT 219,229 946,140 0.08Iron Mountain - REIT 35,105 1,098,787 0.09Liberty Property Trust - REIT 18,327 917,083 0.07Mirvac Group - REIT 452,919 994,826 0.08Prologis - REIT 79,171 6,341,597 0.51Segro - REIT 136,762 1,270,964 0.10Stockland - REIT 279,074 816,654 0.06Unibail-Rodamco-Westfield - REIT - FR 867 130,082 0.01Unibail-Rodamco-Westfield - REIT - NL 16,937 2,541,176 0.20
Retail (5.03%) Aeon 81,600 1,401,908 0.11Best Buy 30,292 2,112,261 0.17Canadian Tire - Class A 7,319 799,139 0.06Gap 29,285 526,252 0.04Home Depot 140,169 29,150,947 2.33Industria de Diseno Textil 137,590 4,144,386 0.33Kingfisher 265,296 725,593 0.06Marks & Spencer Group 241,500 647,601 0.05McDonald's 94,889 19,704,650 1.57Nordstrom 16,023 510,493 0.04Pandora 12,301 438,249 0.04Tiffany & Co 13,386 1,253,465 0.10Tractor Supply 14,768 1,606,758 0.13
Savings & Loans (0.06%) People's United Financial 47,729 800,893 0.06
Semiconductors (2.07%) ASM Pacific Technology 39,800 407,552 0.03ASML Holding 53,038 11,097,840 0.88NVIDIA 71,685 11,772,828 0.94Tokyo Electron 19,400 2,722,554 0.22
Software (9.33%) Adobe 60,330 17,776,235 1.42Cerner 41,607 3,049,793 0.25Microsoft 470,782 63,065,957 5.03salesforce.com 94,825 14,387,797 1.15SAP 122,065 16,786,566 1.34VMware - Class A 10,693 1,787,977 0.14
Telecommunications (1.79%) KDDI 222,200 5,658,119 0.45NTT DOCOMO 164,800 3,843,141 0.31Orange 242,854 3,834,535 0.31Rogers Communications - Class B 44,494 2,386,860 0.19Sprint 98,398 646,475 0.05Swisscom - Registered 3,270 1,643,720 0.13

UBS ETF – MSCI World Socially Responsible UCITS ETF
Semi-Annual report as of 30 June 2019
The accompanying notes form an integral part of these financial statements.
283
Schedule of Investments as at 30 June 2019 (Expressed in USD) (Unaudited)
Transferable securities listed on an Official Stock Exchange
Quantity Market
Value USD % of
Net Assets
Telecommunications (1.79%) (continued) Tele2 - Class B 62,068 906,449 0.07Telenor 92,137 1,957,062 0.16Telia 343,334 1,526,060 0.12
Textile (0.09%) Mohawk Industries 7,345 1,083,167 0.09
Toys, Games & Hobbies (0.53%) Hasbro 14,523 1,534,791 0.12Nintendo 14,000 5,131,427 0.41
Transportation (3.44%) Aurizon Holdings 225,532 854,642 0.07Canadian National Railway 90,316 8,376,736 0.67CH Robinson Worldwide 16,275 1,372,796 0.11CSX 96,931 7,499,551 0.60Expeditors International of Washington 20,948 1,589,115 0.13Hankyu Hanshin Holdings 29,800 1,067,644 0.09Kansas City Southern 12,500 1,522,750 0.12Keio 11,700 769,937 0.06Kuehne + Nagel International - Registered 6,709 997,061 0.08Kyushu Railway 18,800 547,912 0.04MTR 182,403 1,228,083 0.10Nippon Express 10,400 553,109 0.04Norfolk Southern 32,914 6,560,748 0.52Tokyu 64,700 1,147,593 0.09United Parcel Service - Class B 87,006 8,985,110 0.72
Total Common Stocks 1,249,518,336 99.71
Preferred Stocks
Electronics (0.07%) Sartorius 4,198 861,958 0.07
Household Products (0.17%) Henkel & Co 22,377 2,192,042 0.17
Total Preferred Stocks 3,054,000 0.24
Rights
Oil & Gas (0.01%) Repsol - Rights 173,345 96,294 0.01
Total Rights 96,294 0.01
TOTAL INVESTMENTS (Cost USD 1,134,954,469) 1,252,668,630 99.96
Other net assets 465,417 0.04
TOTAL NET ASSETS 1,253,134,047 100.00
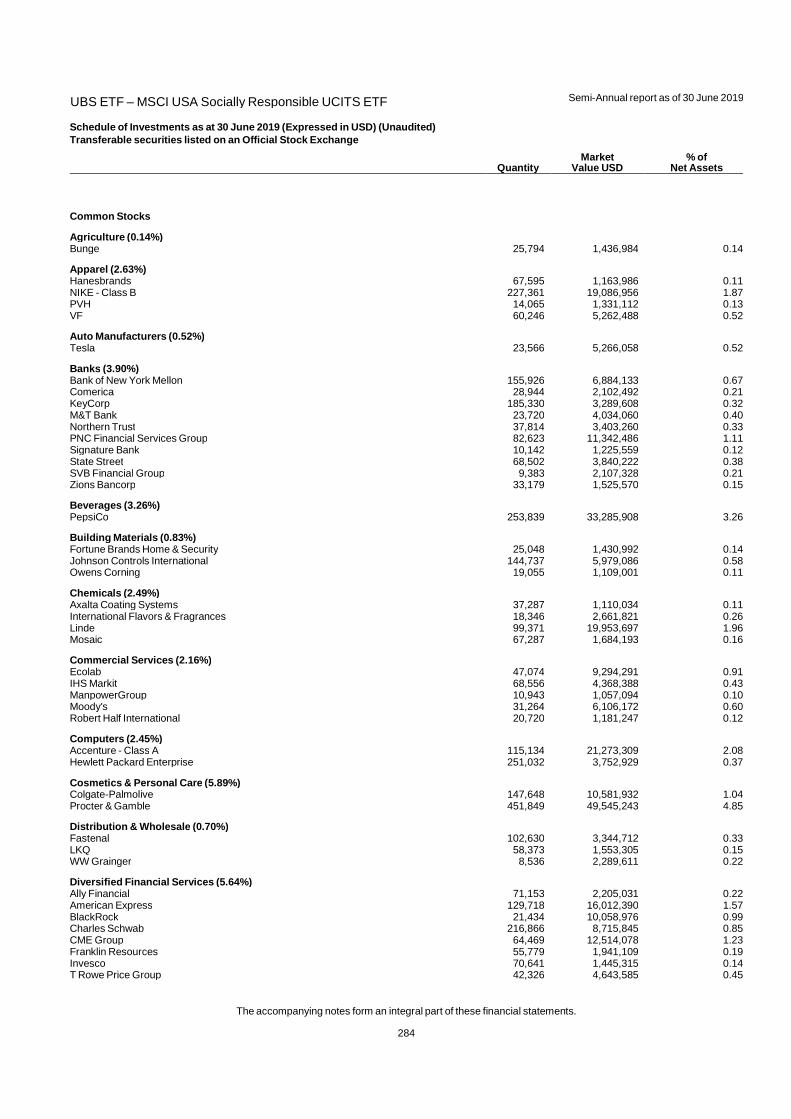
UBS ETF – MSCI USA Socially Responsible UCITS ETF
Semi-Annual report as of 30 June 2019
The accompanying notes form an integral part of these financial statements.
284
Schedule of Investments as at 30 June 2019 (Expressed in USD) (Unaudited)
Transferable securities listed on an Official Stock Exchange
Quantity Market
Value USD % of
Net Assets
Common Stocks
Agriculture (0.14%) Bunge 25,794 1,436,984 0.14
Apparel (2.63%) Hanesbrands 67,595 1,163,986 0.11NIKE - Class B 227,361 19,086,956 1.87PVH 14,065 1,331,112 0.13VF 60,246 5,262,488 0.52
Auto Manufacturers (0.52%) Tesla 23,566 5,266,058 0.52
Banks (3.90%) Bank of New York Mellon 155,926 6,884,133 0.67Comerica 28,944 2,102,492 0.21KeyCorp 185,330 3,289,608 0.32M&T Bank 23,720 4,034,060 0.40Northern Trust 37,814 3,403,260 0.33PNC Financial Services Group 82,623 11,342,486 1.11Signature Bank 10,142 1,225,559 0.12State Street 68,502 3,840,222 0.38SVB Financial Group 9,383 2,107,328 0.21Zions Bancorp 33,179 1,525,570 0.15
Beverages (3.26%) PepsiCo 253,839 33,285,908 3.26
Building Materials (0.83%) Fortune Brands Home & Security 25,048 1,430,992 0.14Johnson Controls International 144,737 5,979,086 0.58Owens Corning 19,055 1,109,001 0.11
Chemicals (2.49%) Axalta Coating Systems 37,287 1,110,034 0.11International Flavors & Fragrances 18,346 2,661,821 0.26Linde 99,371 19,953,697 1.96Mosaic 67,287 1,684,193 0.16
Commercial Services (2.16%) Ecolab 47,074 9,294,291 0.91IHS Markit 68,556 4,368,388 0.43ManpowerGroup 10,943 1,057,094 0.10Moody's 31,264 6,106,172 0.60Robert Half International 20,720 1,181,247 0.12
Computers (2.45%) Accenture - Class A 115,134 21,273,309 2.08Hewlett Packard Enterprise 251,032 3,752,929 0.37
Cosmetics & Personal Care (5.89%) Colgate-Palmolive 147,648 10,581,932 1.04Procter & Gamble 451,849 49,545,243 4.85
Distribution & Wholesale (0.70%) Fastenal 102,630 3,344,712 0.33LKQ 58,373 1,553,305 0.15WW Grainger 8,536 2,289,611 0.22
Diversified Financial Services (5.64%) Ally Financial 71,153 2,205,031 0.22American Express 129,718 16,012,390 1.57BlackRock 21,434 10,058,976 0.99Charles Schwab 216,866 8,715,845 0.85CME Group 64,469 12,514,078 1.23Franklin Resources 55,779 1,941,109 0.19Invesco 70,641 1,445,315 0.14T Rowe Price Group 42,326 4,643,585 0.45
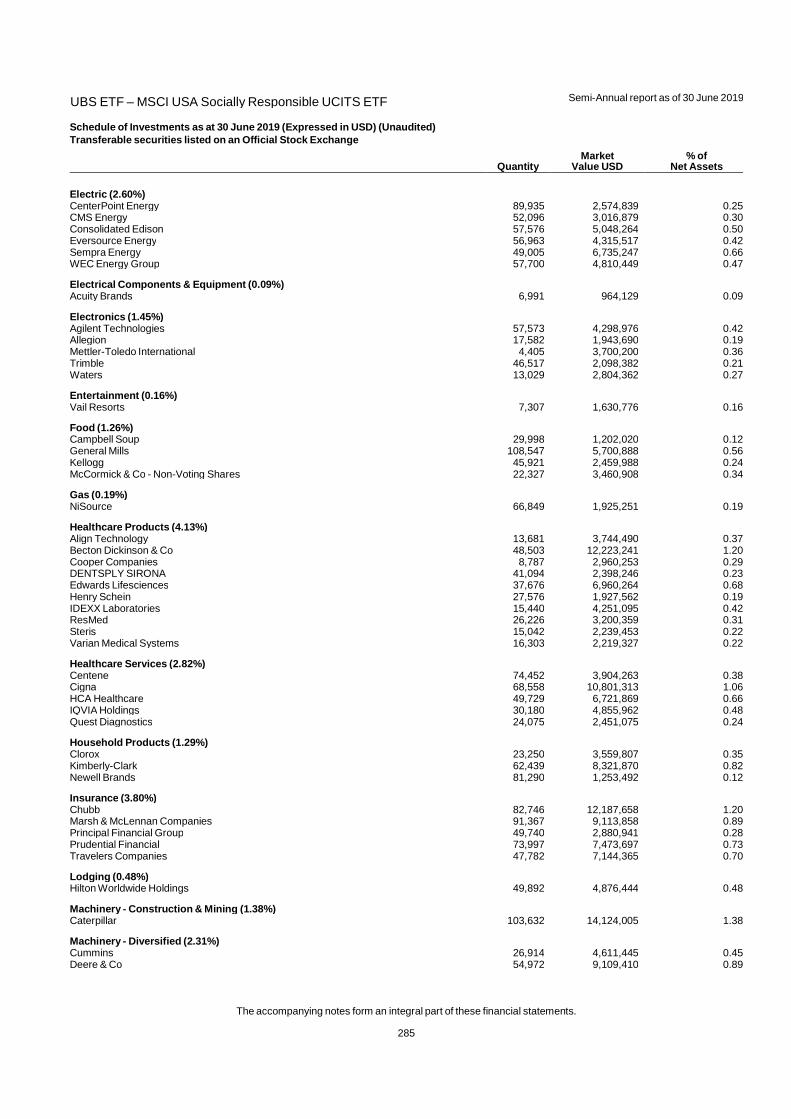
UBS ETF – MSCI USA Socially Responsible UCITS ETF
Semi-Annual report as of 30 June 2019
The accompanying notes form an integral part of these financial statements.
285
Schedule of Investments as at 30 June 2019 (Expressed in USD) (Unaudited)
Transferable securities listed on an Official Stock Exchange
Quantity Market
Value USD % of
Net Assets
Electric (2.60%) CenterPoint Energy 89,935 2,574,839 0.25CMS Energy 52,096 3,016,879 0.30Consolidated Edison 57,576 5,048,264 0.50Eversource Energy 56,963 4,315,517 0.42Sempra Energy 49,005 6,735,247 0.66WEC Energy Group 57,700 4,810,449 0.47
Electrical Components & Equipment (0.09%) Acuity Brands 6,991 964,129 0.09
Electronics (1.45%) Agilent Technologies 57,573 4,298,976 0.42Allegion 17,582 1,943,690 0.19Mettler-Toledo International 4,405 3,700,200 0.36Trimble 46,517 2,098,382 0.21Waters 13,029 2,804,362 0.27
Entertainment (0.16%) Vail Resorts 7,307 1,630,776 0.16
Food (1.26%) Campbell Soup 29,998 1,202,020 0.12General Mills 108,547 5,700,888 0.56Kellogg 45,921 2,459,988 0.24McCormick & Co - Non-Voting Shares 22,327 3,460,908 0.34
Gas (0.19%) NiSource 66,849 1,925,251 0.19
Healthcare Products (4.13%) Align Technology 13,681 3,744,490 0.37Becton Dickinson & Co 48,503 12,223,241 1.20Cooper Companies 8,787 2,960,253 0.29DENTSPLY SIRONA 41,094 2,398,246 0.23Edwards Lifesciences 37,676 6,960,264 0.68Henry Schein 27,576 1,927,562 0.19IDEXX Laboratories 15,440 4,251,095 0.42ResMed 26,226 3,200,359 0.31Steris 15,042 2,239,453 0.22Varian Medical Systems 16,303 2,219,327 0.22
Healthcare Services (2.82%) Centene 74,452 3,904,263 0.38Cigna 68,558 10,801,313 1.06HCA Healthcare 49,729 6,721,869 0.66IQVIA Holdings 30,180 4,855,962 0.48Quest Diagnostics 24,075 2,451,075 0.24
Household Products (1.29%) Clorox 23,250 3,559,807 0.35Kimberly-Clark 62,439 8,321,870 0.82Newell Brands 81,290 1,253,492 0.12
Insurance (3.80%) Chubb 82,746 12,187,658 1.20Marsh & McLennan Companies 91,367 9,113,858 0.89Principal Financial Group 49,740 2,880,941 0.28Prudential Financial 73,997 7,473,697 0.73Travelers Companies 47,782 7,144,365 0.70
Lodging (0.48%) Hilton Worldwide Holdings 49,892 4,876,444 0.48
Machinery - Construction & Mining (1.38%) Caterpillar 103,632 14,124,005 1.38
Machinery - Diversified (2.31%) Cummins 26,914 4,611,445 0.45Deere & Co 54,972 9,109,410 0.89

UBS ETF – MSCI USA Socially Responsible UCITS ETF
Semi-Annual report as of 30 June 2019
The accompanying notes form an integral part of these financial statements.
286
Schedule of Investments as at 30 June 2019 (Expressed in USD) (Unaudited)
Transferable securities listed on an Official Stock Exchange
Quantity Market
Value USD % of
Net Assets
Machinery - Diversified (2.31%) (continued) Flowserve 24,553 1,293,697 0.13IDEX 13,276 2,285,331 0.22Rockwell Automation 21,772 3,566,907 0.35Xylem 32,309 2,702,325 0.27
Media (4.96%) FactSet Research Systems 6,738 1,930,841 0.19Liberty Global - Class A 32,227 869,807 0.09Liberty Global - Class C 89,193 2,366,290 0.23Walt Disney 325,279 45,421,960 4.45
Mining (0.56%) Newmont Goldcorp 148,582 5,715,950 0.56
Miscellaneous Manufacturers (1.43%) Illinois Tool Works 59,379 8,954,947 0.88Ingersoll-Rand 44,319 5,613,888 0.55
Oil & Gas (3.37%) ConocoPhillips 204,441 12,470,901 1.22Devon Energy 79,480 2,266,770 0.22Hess 50,063 3,182,505 0.31Marathon Oil 147,377 2,094,227 0.21Noble Energy 87,792 1,966,541 0.19Phillips 66 82,613 7,727,620 0.76Pioneer Natural Resources 30,148 4,638,571 0.46
Oil & Gas Services (0.57%) Baker Hughes 92,235 2,271,748 0.22National Oilwell Varco 70,508 1,567,393 0.15TechnipFMC 78,074 2,025,239 0.20
Packaging & Containers (0.39%) Ball 57,036 3,991,950 0.39
Pharmaceuticals & Biotechnology (6.79%) AmerisourceBergen 28,169 2,401,689 0.24Amgen 112,257 20,686,720 2.03Biogen 35,565 8,317,587 0.81Cardinal Health 53,244 2,507,792 0.25Gilead Sciences 230,898 15,599,469 1.53Jazz Pharmaceuticals 10,081 1,437,147 0.14Vertex Pharmaceuticals 46,186 8,469,589 0.83Zoetis 86,516 9,818,701 0.96
Pipelines (0.51%) ONEOK 74,942 5,156,759 0.51
Real Estate (0.29%) CBRE Group - Class A 57,510 2,950,263 0.29
Real Estate Investment Trusts (3.85%) American Tower - REIT 79,548 16,263,589 1.59Boston Properties - REIT 27,873 3,595,617 0.35Equinix - REIT 14,414 7,268,836 0.71Iron Mountain - REIT 52,996 1,658,775 0.16Liberty Property Trust - REIT 27,589 1,380,553 0.14Prologis - REIT 114,392 9,162,799 0.90
Retail (7.83%) Best Buy 44,469 3,100,823 0.30Gap 40,113 720,831 0.07Home Depot 204,058 42,437,942 4.16McDonald's 138,484 28,757,588 2.82Nordstrom 20,901 665,906 0.07Tiffany & Co 19,961 1,869,148 0.18Tractor Supply 21,753 2,366,726 0.23

UBS ETF – MSCI USA Socially Responsible UCITS ETF
Semi-Annual report as of 30 June 2019
The accompanying notes form an integral part of these financial statements.
287
Schedule of Investments as at 30 June 2019 (Expressed in USD) (Unaudited)
Transferable securities listed on an Official Stock Exchange
Quantity Market
Value USD % of
Net Assets
Savings & Loans (0.11%) People's United Financial 68,315 1,146,326 0.11
Semiconductors (1.67%) NVIDIA 103,713 17,032,786 1.67
Software (10.30%) Adobe 88,190 25,985,184 2.55Cerner 58,614 4,296,406 0.42Microsoft 383,019 51,309,225 5.03salesforce.com 138,017 20,941,319 2.05VMware - Class A 15,137 2,531,058 0.25
Telecommunications (0.09%) Sprint 139,706 917,868 0.09
Textile (0.16%) Mohawk Industries 11,289 1,664,789 0.16
Toys, Games & Hobbies (0.22%) Hasbro 21,441 2,265,885 0.22
Transportation (3.92%) CH Robinson Worldwide 24,769 2,089,265 0.20CSX 139,904 10,824,373 1.06Expeditors International of Washington 30,965 2,349,005 0.23Kansas City Southern 18,051 2,198,973 0.22Norfolk Southern 48,239 9,615,480 0.94United Parcel Service - Class B 125,420 12,952,123 1.27
Total Common Stocks 1,016,248,447 99.59
TOTAL INVESTMENTS (Cost USD 890,313,701) 1,016,248,447 99.59
Other net assets 4,187,305 0.41
TOTAL NET ASSETS 1,020,435,752 100.00
Forward Foreign Exchange Contracts
Purchases Sales Maturity Date Unrealised appreciation/
(depreciation) USD % of Net Assets
CHF 1,762,468 USD 1,768,000 02 July 2019 39,659 0.00CHF 14,999,655 USD 14,953,300 02 July 2019 430,962 0.04CHF 15,922,407 USD 15,873,200 02 July 2019 457,474 0.05EUR 1,656,753 USD 1,862,000 02 July 2019 24,711 0.00EUR 13,229,529 USD 14,813,500 02 July 2019 252,292 0.02EUR 1,240,318 USD 1,405,000 02 July 2019 7,475 0.00EUR 56,347,510 USD 62,940,000 02 July 2019 1,228,568 0.12USD 4,228,200 CHF 4,174,185 02 July 2019 (53,015) (0.00)USD 2,601,300 CHF 2,562,931 02 July 2019 (27,347) (0.00)
Total Forward Foreign Exchange Contracts 2,360,779 0.23
Future Contracts
Underlying Counterparty Gross exposure Quantity
Unrealised appreciation/
(depreciation) USD % of Net Assets
S&P 500 E-Mini Index Futures 21/06/2019 UBS AG LONDON (1,476,950) (10) (29,750) (0.00)
S&P 500 E-Mini Index Futures 20/09/2019 UBS AG LONDON 3,533,040 24 54,720 0.00
Total Future Contracts 2,056,090 14 24,970 0.00
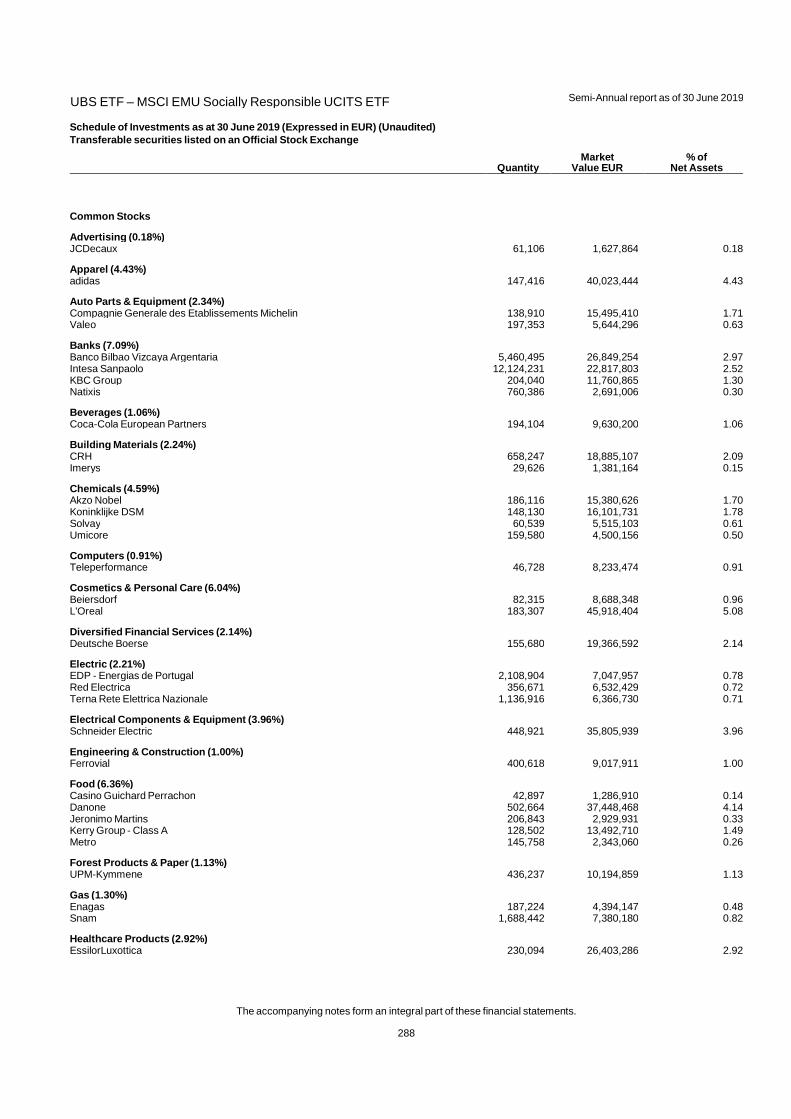
UBS ETF – MSCI EMU Socially Responsible UCITS ETF
Semi-Annual report as of 30 June 2019
The accompanying notes form an integral part of these financial statements.
288
Schedule of Investments as at 30 June 2019 (Expressed in EUR) (Unaudited)
Transferable securities listed on an Official Stock Exchange
Quantity Market
Value EUR % of
Net Assets
Common Stocks
Advertising (0.18%) JCDecaux 61,106 1,627,864 0.18
Apparel (4.43%) adidas 147,416 40,023,444 4.43
Auto Parts & Equipment (2.34%) Compagnie Generale des Etablissements Michelin 138,910 15,495,410 1.71Valeo 197,353 5,644,296 0.63
Banks (7.09%) Banco Bilbao Vizcaya Argentaria 5,460,495 26,849,254 2.97Intesa Sanpaolo 12,124,231 22,817,803 2.52KBC Group 204,040 11,760,865 1.30Natixis 760,386 2,691,006 0.30
Beverages (1.06%) Coca-Cola European Partners 194,104 9,630,200 1.06
Building Materials (2.24%) CRH 658,247 18,885,107 2.09Imerys 29,626 1,381,164 0.15
Chemicals (4.59%) Akzo Nobel 186,116 15,380,626 1.70Koninklijke DSM 148,130 16,101,731 1.78Solvay 60,539 5,515,103 0.61Umicore 159,580 4,500,156 0.50
Computers (0.91%) Teleperformance 46,728 8,233,474 0.91
Cosmetics & Personal Care (6.04%) Beiersdorf 82,315 8,688,348 0.96L'Oreal 183,307 45,918,404 5.08
Diversified Financial Services (2.14%) Deutsche Boerse 155,680 19,366,592 2.14
Electric (2.21%) EDP - Energias de Portugal 2,108,904 7,047,957 0.78Red Electrica 356,671 6,532,429 0.72Terna Rete Elettrica Nazionale 1,136,916 6,366,730 0.71
Electrical Components & Equipment (3.96%) Schneider Electric 448,921 35,805,939 3.96
Engineering & Construction (1.00%) Ferrovial 400,618 9,017,911 1.00
Food (6.36%) Casino Guichard Perrachon 42,897 1,286,910 0.14Danone 502,664 37,448,468 4.14Jeronimo Martins 206,843 2,929,931 0.33Kerry Group - Class A 128,502 13,492,710 1.49Metro 145,758 2,343,060 0.26
Forest Products & Paper (1.13%) UPM-Kymmene 436,237 10,194,859 1.13
Gas (1.30%) Enagas 187,224 4,394,147 0.48Snam 1,688,442 7,380,180 0.82
Healthcare Products (2.92%) EssilorLuxottica 230,094 26,403,286 2.92
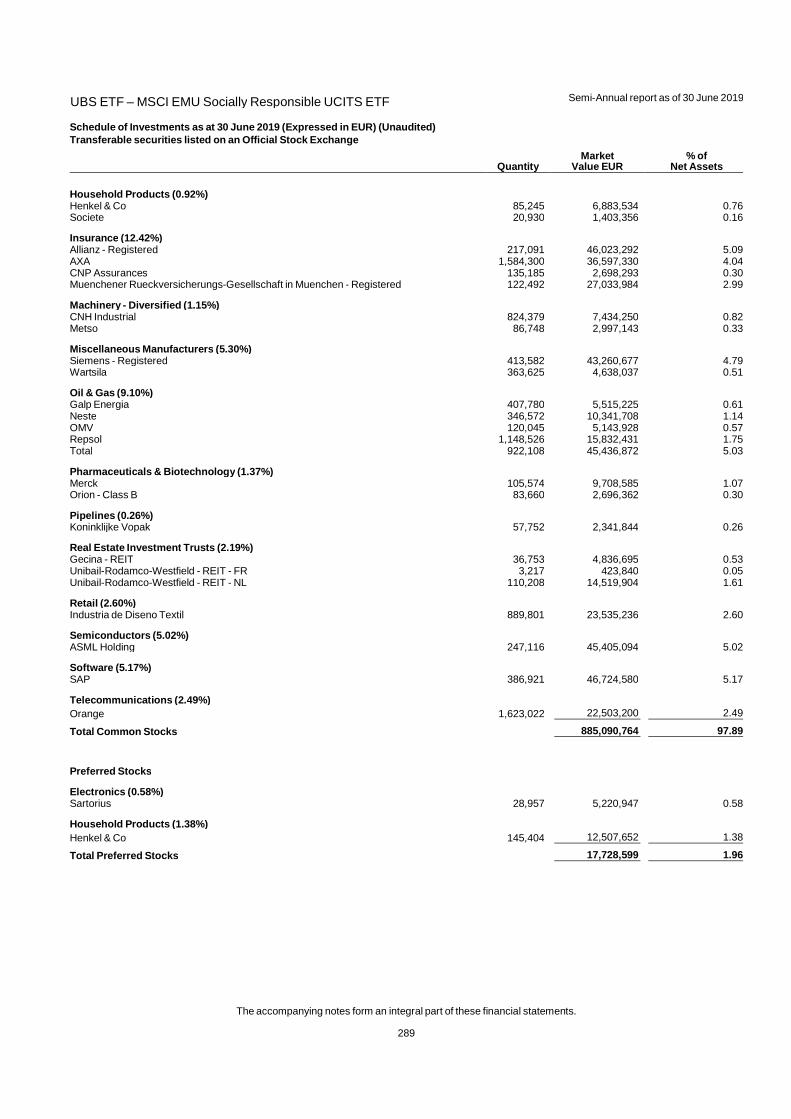
UBS ETF – MSCI EMU Socially Responsible UCITS ETF
Semi-Annual report as of 30 June 2019
The accompanying notes form an integral part of these financial statements.
289
Schedule of Investments as at 30 June 2019 (Expressed in EUR) (Unaudited)
Transferable securities listed on an Official Stock Exchange
Quantity Market
Value EUR % of
Net Assets
Household Products (0.92%) Henkel & Co 85,245 6,883,534 0.76Societe 20,930 1,403,356 0.16
Insurance (12.42%) Allianz - Registered 217,091 46,023,292 5.09AXA 1,584,300 36,597,330 4.04CNP Assurances 135,185 2,698,293 0.30Muenchener Rueckversicherungs-Gesellschaft in Muenchen - Registered 122,492 27,033,984 2.99
Machinery - Diversified (1.15%) CNH Industrial 824,379 7,434,250 0.82Metso 86,748 2,997,143 0.33
Miscellaneous Manufacturers (5.30%) Siemens - Registered 413,582 43,260,677 4.79Wartsila 363,625 4,638,037 0.51
Oil & Gas (9.10%) Galp Energia 407,780 5,515,225 0.61Neste 346,572 10,341,708 1.14OMV 120,045 5,143,928 0.57Repsol 1,148,526 15,832,431 1.75Total 922,108 45,436,872 5.03
Pharmaceuticals & Biotechnology (1.37%) Merck 105,574 9,708,585 1.07Orion - Class B 83,660 2,696,362 0.30
Pipelines (0.26%) Koninklijke Vopak 57,752 2,341,844 0.26
Real Estate Investment Trusts (2.19%) Gecina - REIT 36,753 4,836,695 0.53Unibail-Rodamco-Westfield - REIT - FR 3,217 423,840 0.05Unibail-Rodamco-Westfield - REIT - NL 110,208 14,519,904 1.61
Retail (2.60%) Industria de Diseno Textil 889,801 23,535,236 2.60
Semiconductors (5.02%) ASML Holding 247,116 45,405,094 5.02
Software (5.17%) SAP 386,921 46,724,580 5.17
Telecommunications (2.49%) Orange 1,623,022 22,503,200 2.49
Total Common Stocks 885,090,764 97.89
Preferred Stocks
Electronics (0.58%) Sartorius 28,957 5,220,947 0.58
Household Products (1.38%) Henkel & Co 145,404 12,507,652 1.38
Total Preferred Stocks 17,728,599 1.96
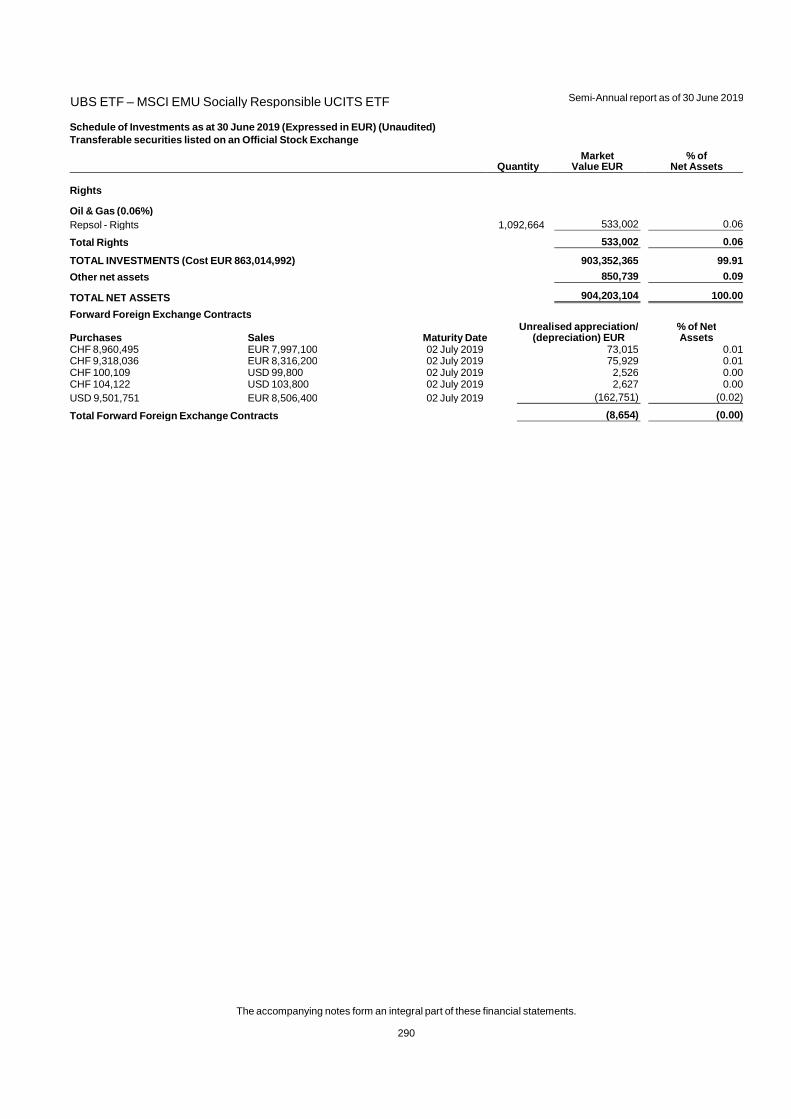
UBS ETF – MSCI EMU Socially Responsible UCITS ETF
Semi-Annual report as of 30 June 2019
The accompanying notes form an integral part of these financial statements.
290
Schedule of Investments as at 30 June 2019 (Expressed in EUR) (Unaudited)
Transferable securities listed on an Official Stock Exchange
Quantity Market
Value EUR % of
Net Assets
Rights
Oil & Gas (0.06%) Repsol - Rights 1,092,664 533,002 0.06
Total Rights 533,002 0.06
TOTAL INVESTMENTS (Cost EUR 863,014,992) 903,352,365 99.91
Other net assets 850,739 0.09
TOTAL NET ASSETS 904,203,104 100.00
Forward Foreign Exchange Contracts
Purchases Sales Maturity Date Unrealised appreciation/
(depreciation) EUR % of Net Assets
CHF 8,960,495 EUR 7,997,100 02 July 2019 73,015 0.01CHF 9,318,036 EUR 8,316,200 02 July 2019 75,929 0.01CHF 100,109 USD 99,800 02 July 2019 2,526 0.00CHF 104,122 USD 103,800 02 July 2019 2,627 0.00USD 9,501,751 EUR 8,506,400 02 July 2019 (162,751) (0.02)
Total Forward Foreign Exchange Contracts (8,654) (0.00)
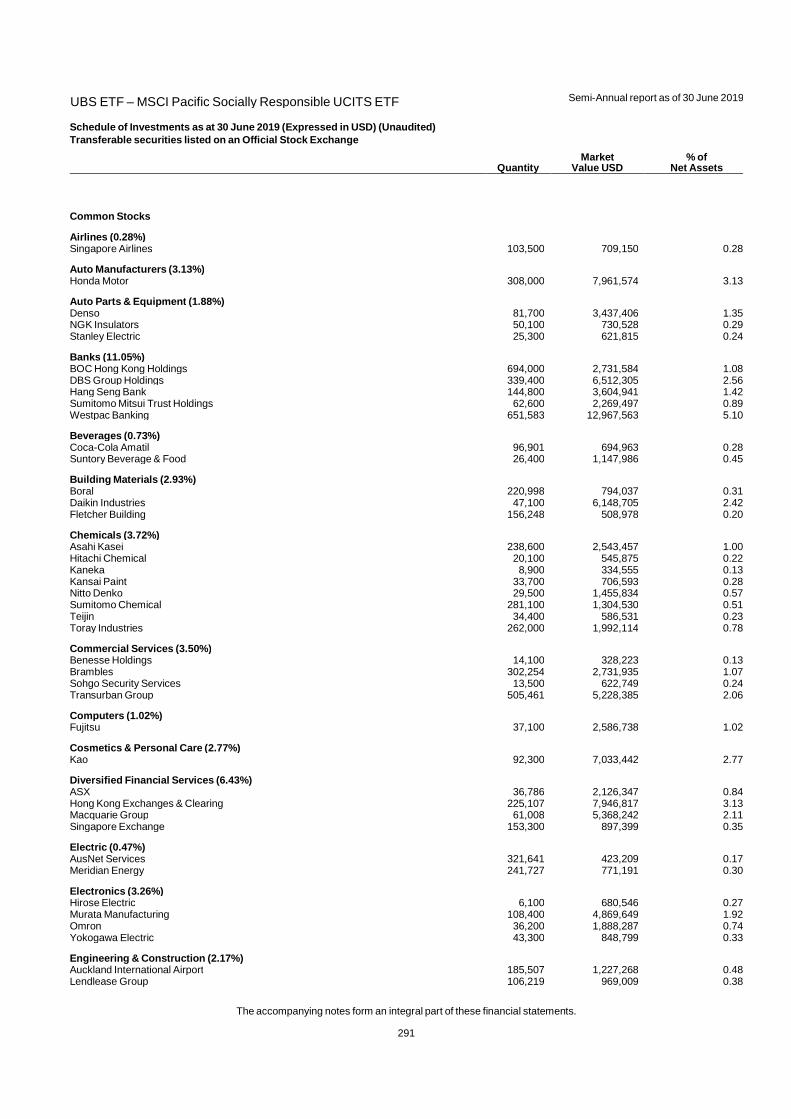
UBS ETF – MSCI Pacific Socially Responsible UCITS ETF
Semi-Annual report as of 30 June 2019
The accompanying notes form an integral part of these financial statements.
291
Schedule of Investments as at 30 June 2019 (Expressed in USD) (Unaudited)
Transferable securities listed on an Official Stock Exchange
Quantity Market
Value USD % of
Net Assets
Common Stocks
Airlines (0.28%) Singapore Airlines 103,500 709,150 0.28
Auto Manufacturers (3.13%) Honda Motor 308,000 7,961,574 3.13
Auto Parts & Equipment (1.88%) Denso 81,700 3,437,406 1.35NGK Insulators 50,100 730,528 0.29Stanley Electric 25,300 621,815 0.24
Banks (11.05%) BOC Hong Kong Holdings 694,000 2,731,584 1.08DBS Group Holdings 339,400 6,512,305 2.56Hang Seng Bank 144,800 3,604,941 1.42Sumitomo Mitsui Trust Holdings 62,600 2,269,497 0.89Westpac Banking 651,583 12,967,563 5.10
Beverages (0.73%) Coca-Cola Amatil 96,901 694,963 0.28Suntory Beverage & Food 26,400 1,147,986 0.45
Building Materials (2.93%) Boral 220,998 794,037 0.31Daikin Industries 47,100 6,148,705 2.42Fletcher Building 156,248 508,978 0.20
Chemicals (3.72%) Asahi Kasei 238,600 2,543,457 1.00Hitachi Chemical 20,100 545,875 0.22Kaneka 8,900 334,555 0.13Kansai Paint 33,700 706,593 0.28Nitto Denko 29,500 1,455,834 0.57Sumitomo Chemical 281,100 1,304,530 0.51Teijin 34,400 586,531 0.23Toray Industries 262,000 1,992,114 0.78
Commercial Services (3.50%) Benesse Holdings 14,100 328,223 0.13Brambles 302,254 2,731,935 1.07Sohgo Security Services 13,500 622,749 0.24Transurban Group 505,461 5,228,385 2.06
Computers (1.02%) Fujitsu 37,100 2,586,738 1.02
Cosmetics & Personal Care (2.77%) Kao 92,300 7,033,442 2.77
Diversified Financial Services (6.43%) ASX 36,786 2,126,347 0.84Hong Kong Exchanges & Clearing 225,107 7,946,817 3.13Macquarie Group 61,008 5,368,242 2.11Singapore Exchange 153,300 897,399 0.35
Electric (0.47%) AusNet Services 321,641 423,209 0.17Meridian Energy 241,727 771,191 0.30
Electronics (3.26%) Hirose Electric 6,100 680,546 0.27Murata Manufacturing 108,400 4,869,649 1.92Omron 36,200 1,888,287 0.74Yokogawa Electric 43,300 848,799 0.33
Engineering & Construction (2.17%) Auckland International Airport 185,507 1,227,268 0.48Lendlease Group 106,219 969,009 0.38
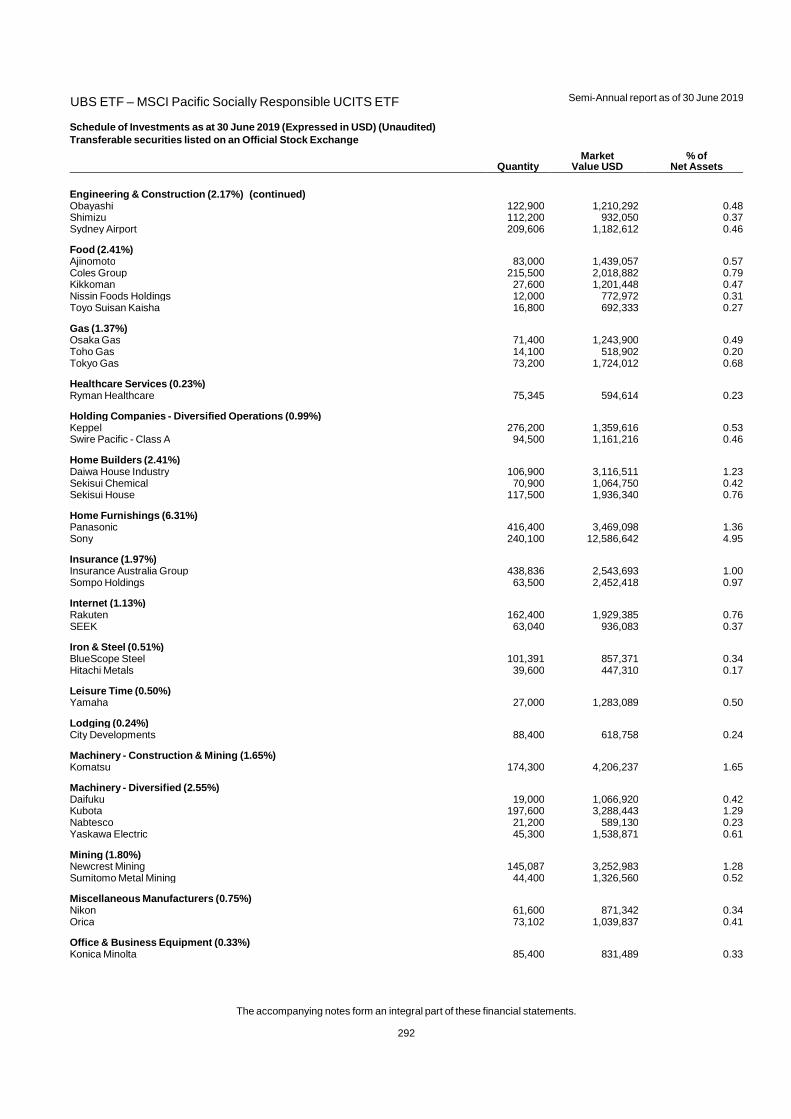
UBS ETF – MSCI Pacific Socially Responsible UCITS ETF
Semi-Annual report as of 30 June 2019
The accompanying notes form an integral part of these financial statements.
292
Schedule of Investments as at 30 June 2019 (Expressed in USD) (Unaudited)
Transferable securities listed on an Official Stock Exchange
Quantity Market
Value USD % of
Net Assets
Engineering & Construction (2.17%) (continued) Obayashi 122,900 1,210,292 0.48Shimizu 112,200 932,050 0.37Sydney Airport 209,606 1,182,612 0.46
Food (2.41%) Ajinomoto 83,000 1,439,057 0.57Coles Group 215,500 2,018,882 0.79Kikkoman 27,600 1,201,448 0.47Nissin Foods Holdings 12,000 772,972 0.31Toyo Suisan Kaisha 16,800 692,333 0.27
Gas (1.37%) Osaka Gas 71,400 1,243,900 0.49Toho Gas 14,100 518,902 0.20Tokyo Gas 73,200 1,724,012 0.68
Healthcare Services (0.23%) Ryman Healthcare 75,345 594,614 0.23
Holding Companies - Diversified Operations (0.99%) Keppel 276,200 1,359,616 0.53Swire Pacific - Class A 94,500 1,161,216 0.46
Home Builders (2.41%) Daiwa House Industry 106,900 3,116,511 1.23Sekisui Chemical 70,900 1,064,750 0.42Sekisui House 117,500 1,936,340 0.76
Home Furnishings (6.31%) Panasonic 416,400 3,469,098 1.36Sony 240,100 12,586,642 4.95
Insurance (1.97%) Insurance Australia Group 438,836 2,543,693 1.00Sompo Holdings 63,500 2,452,418 0.97
Internet (1.13%) Rakuten 162,400 1,929,385 0.76SEEK 63,040 936,083 0.37
Iron & Steel (0.51%) BlueScope Steel 101,391 857,371 0.34Hitachi Metals 39,600 447,310 0.17
Leisure Time (0.50%) Yamaha 27,000 1,283,089 0.50
Lodging (0.24%) City Developments 88,400 618,758 0.24
Machinery - Construction & Mining (1.65%) Komatsu 174,300 4,206,237 1.65
Machinery - Diversified (2.55%) Daifuku 19,000 1,066,920 0.42Kubota 197,600 3,288,443 1.29Nabtesco 21,200 589,130 0.23Yaskawa Electric 45,300 1,538,871 0.61
Mining (1.80%) Newcrest Mining 145,087 3,252,983 1.28Sumitomo Metal Mining 44,400 1,326,560 0.52
Miscellaneous Manufacturers (0.75%) Nikon 61,600 871,342 0.34Orica 73,102 1,039,837 0.41
Office & Business Equipment (0.33%) Konica Minolta 85,400 831,489 0.33

UBS ETF – MSCI Pacific Socially Responsible UCITS ETF
Semi-Annual report as of 30 June 2019
The accompanying notes form an integral part of these financial statements.
293
Schedule of Investments as at 30 June 2019 (Expressed in USD) (Unaudited)
Transferable securities listed on an Official Stock Exchange
Quantity Market
Value USD % of
Net Assets
Oil & Gas (1.77%) Woodside Petroleum 176,608 4,506,264 1.77
Pharmaceuticals & Biotechnology (8.12%) Astellas Pharma 354,800 5,054,929 1.99CSL 85,614 12,917,118 5.08Eisai 47,500 2,685,377 1.05
Pipelines (0.67%) APA Group 223,545 1,694,225 0.67
Real Estate (1.08%) CapitaLand 477,500 1,245,852 0.49Hysan Development 118,000 609,446 0.24Swire Properties 218,800 883,602 0.35
Real Estate Investment Trusts (4.22%) Ascendas Real Estate Investment Trust - REIT 473,500 1,091,925 0.43Dexus - REIT 207,658 1,891,497 0.74Goodman Group - REIT 309,556 3,264,981 1.28GPT Group - REIT 363,972 1,570,817 0.62Mirvac Group - REIT 724,758 1,591,915 0.63Stockland - REIT 450,004 1,316,845 0.52
Retail (0.84%) Aeon 123,800 2,126,915 0.84
Semiconductors (1.87%) ASM Pacific Technology 57,700 590,848 0.23Tokyo Electron 29,600 4,154,000 1.64
Telecommunications (5.66%) KDDI 334,900 8,527,920 3.35NTT DOCOMO 251,700 5,869,652 2.31
Toys, Games & Hobbies (3.08%) Nintendo 21,400 7,843,753 3.08
Transportation (3.75%) Aurizon Holdings 373,541 1,415,515 0.56Hankyu Hanshin Holdings 43,000 1,540,561 0.60Keio 19,600 1,289,809 0.51Kyushu Railway 30,100 877,241 0.34MTR 288,039 1,939,309 0.76Nippon Express 15,200 808,391 0.32Tokyu 94,100 1,669,065 0.66
Total Common Stocks 253,141,694 99.55
TOTAL INVESTMENTS (Cost USD 243,757,084) 253,141,694 99.55
Other net assets 1,151,279 0.45
TOTAL NET ASSETS 254,292,973 100.00
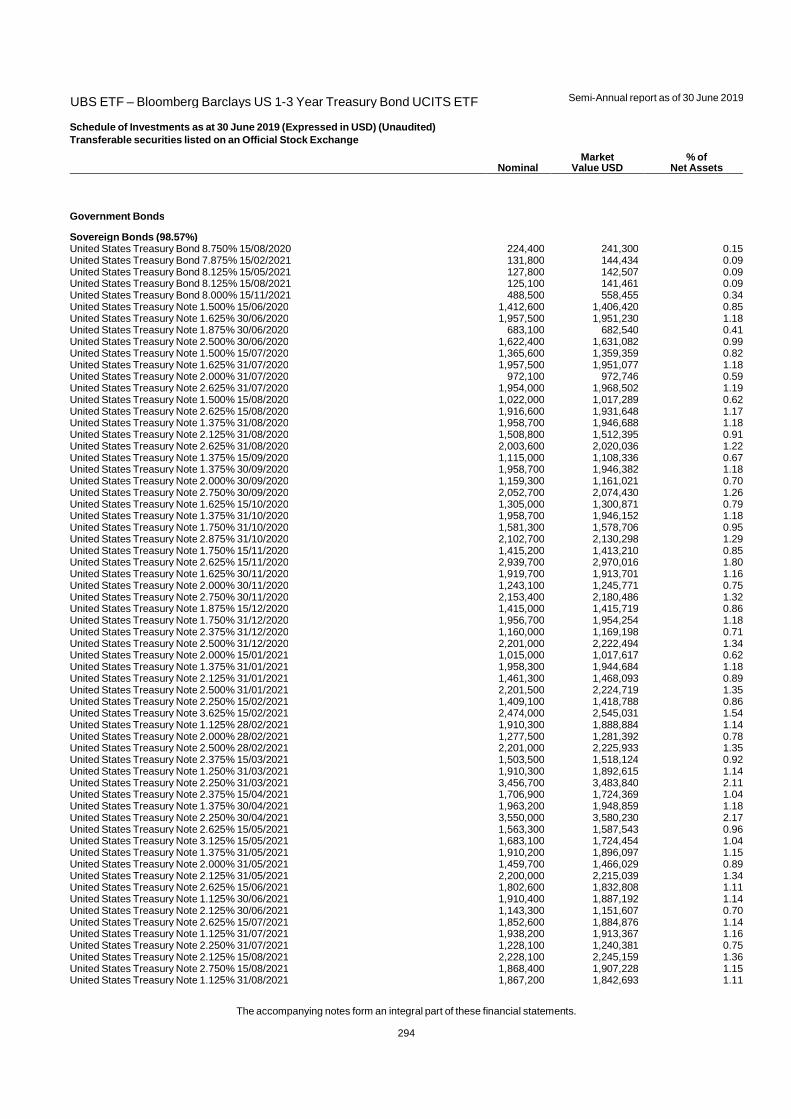
UBS ETF – Bloomberg Barclays US 1-3 Year Treasury Bond UCITS ETF
Semi-Annual report as of 30 June 2019
The accompanying notes form an integral part of these financial statements.
294
Schedule of Investments as at 30 June 2019 (Expressed in USD) (Unaudited)
Transferable securities listed on an Official Stock Exchange
Nominal Market
Value USD % of
Net Assets
Government Bonds
Sovereign Bonds (98.57%) United States Treasury Bond 8.750% 15/08/2020 224,400 241,300 0.15United States Treasury Bond 7.875% 15/02/2021 131,800 144,434 0.09United States Treasury Bond 8.125% 15/05/2021 127,800 142,507 0.09United States Treasury Bond 8.125% 15/08/2021 125,100 141,461 0.09United States Treasury Bond 8.000% 15/11/2021 488,500 558,455 0.34United States Treasury Note 1.500% 15/06/2020 1,412,600 1,406,420 0.85United States Treasury Note 1.625% 30/06/2020 1,957,500 1,951,230 1.18United States Treasury Note 1.875% 30/06/2020 683,100 682,540 0.41United States Treasury Note 2.500% 30/06/2020 1,622,400 1,631,082 0.99United States Treasury Note 1.500% 15/07/2020 1,365,600 1,359,359 0.82United States Treasury Note 1.625% 31/07/2020 1,957,500 1,951,077 1.18United States Treasury Note 2.000% 31/07/2020 972,100 972,746 0.59United States Treasury Note 2.625% 31/07/2020 1,954,000 1,968,502 1.19United States Treasury Note 1.500% 15/08/2020 1,022,000 1,017,289 0.62United States Treasury Note 2.625% 15/08/2020 1,916,600 1,931,648 1.17United States Treasury Note 1.375% 31/08/2020 1,958,700 1,946,688 1.18United States Treasury Note 2.125% 31/08/2020 1,508,800 1,512,395 0.91United States Treasury Note 2.625% 31/08/2020 2,003,600 2,020,036 1.22United States Treasury Note 1.375% 15/09/2020 1,115,000 1,108,336 0.67United States Treasury Note 1.375% 30/09/2020 1,958,700 1,946,382 1.18United States Treasury Note 2.000% 30/09/2020 1,159,300 1,161,021 0.70United States Treasury Note 2.750% 30/09/2020 2,052,700 2,074,430 1.26United States Treasury Note 1.625% 15/10/2020 1,305,000 1,300,871 0.79United States Treasury Note 1.375% 31/10/2020 1,958,700 1,946,152 1.18United States Treasury Note 1.750% 31/10/2020 1,581,300 1,578,706 0.95United States Treasury Note 2.875% 31/10/2020 2,102,700 2,130,298 1.29United States Treasury Note 1.750% 15/11/2020 1,415,200 1,413,210 0.85United States Treasury Note 2.625% 15/11/2020 2,939,700 2,970,016 1.80United States Treasury Note 1.625% 30/11/2020 1,919,700 1,913,701 1.16United States Treasury Note 2.000% 30/11/2020 1,243,100 1,245,771 0.75United States Treasury Note 2.750% 30/11/2020 2,153,400 2,180,486 1.32United States Treasury Note 1.875% 15/12/2020 1,415,000 1,415,719 0.86United States Treasury Note 1.750% 31/12/2020 1,956,700 1,954,254 1.18United States Treasury Note 2.375% 31/12/2020 1,160,000 1,169,198 0.71United States Treasury Note 2.500% 31/12/2020 2,201,000 2,222,494 1.34United States Treasury Note 2.000% 15/01/2021 1,015,000 1,017,617 0.62United States Treasury Note 1.375% 31/01/2021 1,958,300 1,944,684 1.18United States Treasury Note 2.125% 31/01/2021 1,461,300 1,468,093 0.89United States Treasury Note 2.500% 31/01/2021 2,201,500 2,224,719 1.35United States Treasury Note 2.250% 15/02/2021 1,409,100 1,418,788 0.86United States Treasury Note 3.625% 15/02/2021 2,474,000 2,545,031 1.54United States Treasury Note 1.125% 28/02/2021 1,910,300 1,888,884 1.14United States Treasury Note 2.000% 28/02/2021 1,277,500 1,281,392 0.78United States Treasury Note 2.500% 28/02/2021 2,201,000 2,225,933 1.35United States Treasury Note 2.375% 15/03/2021 1,503,500 1,518,124 0.92United States Treasury Note 1.250% 31/03/2021 1,910,300 1,892,615 1.14United States Treasury Note 2.250% 31/03/2021 3,456,700 3,483,840 2.11United States Treasury Note 2.375% 15/04/2021 1,706,900 1,724,369 1.04United States Treasury Note 1.375% 30/04/2021 1,963,200 1,948,859 1.18United States Treasury Note 2.250% 30/04/2021 3,550,000 3,580,230 2.17United States Treasury Note 2.625% 15/05/2021 1,563,300 1,587,543 0.96United States Treasury Note 3.125% 15/05/2021 1,683,100 1,724,454 1.04United States Treasury Note 1.375% 31/05/2021 1,910,200 1,896,097 1.15United States Treasury Note 2.000% 31/05/2021 1,459,700 1,466,029 0.89United States Treasury Note 2.125% 31/05/2021 2,200,000 2,215,039 1.34United States Treasury Note 2.625% 15/06/2021 1,802,600 1,832,808 1.11United States Treasury Note 1.125% 30/06/2021 1,910,400 1,887,192 1.14United States Treasury Note 2.125% 30/06/2021 1,143,300 1,151,607 0.70United States Treasury Note 2.625% 15/07/2021 1,852,600 1,884,876 1.14United States Treasury Note 1.125% 31/07/2021 1,938,200 1,913,367 1.16United States Treasury Note 2.250% 31/07/2021 1,228,100 1,240,381 0.75United States Treasury Note 2.125% 15/08/2021 2,228,100 2,245,159 1.36United States Treasury Note 2.750% 15/08/2021 1,868,400 1,907,228 1.15United States Treasury Note 1.125% 31/08/2021 1,867,200 1,842,693 1.11
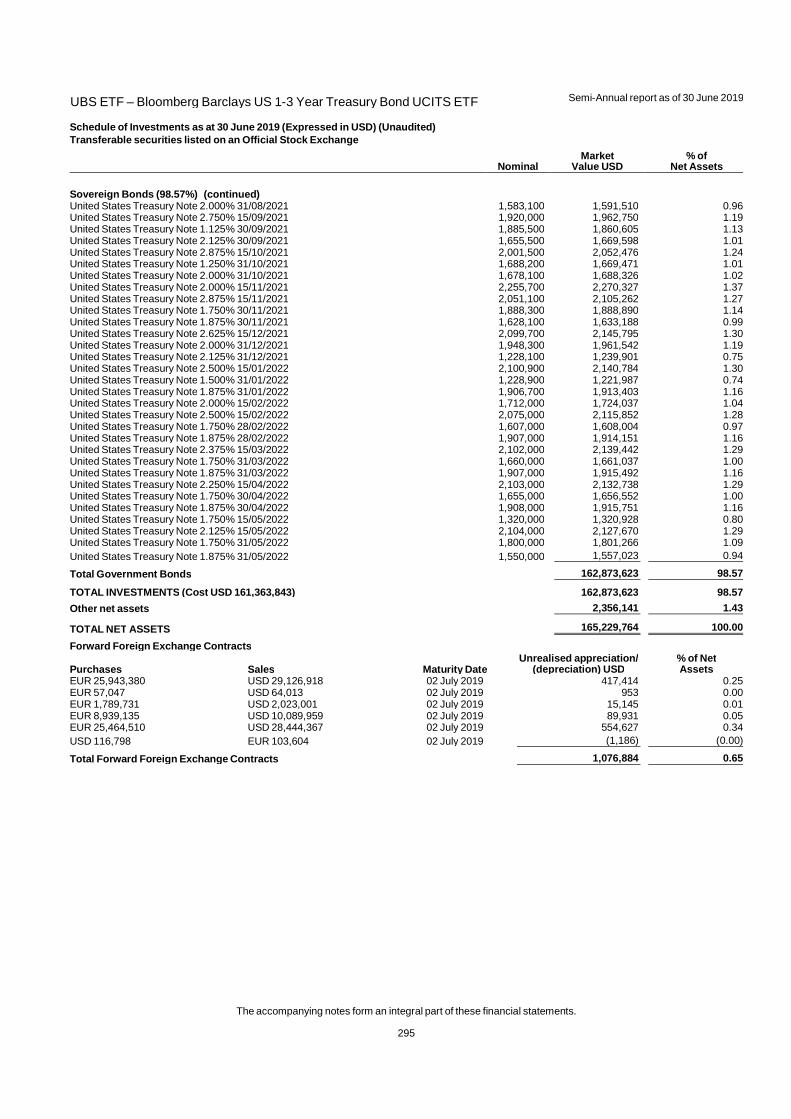
UBS ETF – Bloomberg Barclays US 1-3 Year Treasury Bond UCITS ETF
Semi-Annual report as of 30 June 2019
The accompanying notes form an integral part of these financial statements.
295
Schedule of Investments as at 30 June 2019 (Expressed in USD) (Unaudited)
Transferable securities listed on an Official Stock Exchange
Nominal Market
Value USD % of
Net Assets
Sovereign Bonds (98.57%) (continued) United States Treasury Note 2.000% 31/08/2021 1,583,100 1,591,510 0.96United States Treasury Note 2.750% 15/09/2021 1,920,000 1,962,750 1.19United States Treasury Note 1.125% 30/09/2021 1,885,500 1,860,605 1.13United States Treasury Note 2.125% 30/09/2021 1,655,500 1,669,598 1.01United States Treasury Note 2.875% 15/10/2021 2,001,500 2,052,476 1.24United States Treasury Note 1.250% 31/10/2021 1,688,200 1,669,471 1.01United States Treasury Note 2.000% 31/10/2021 1,678,100 1,688,326 1.02United States Treasury Note 2.000% 15/11/2021 2,255,700 2,270,327 1.37United States Treasury Note 2.875% 15/11/2021 2,051,100 2,105,262 1.27United States Treasury Note 1.750% 30/11/2021 1,888,300 1,888,890 1.14United States Treasury Note 1.875% 30/11/2021 1,628,100 1,633,188 0.99United States Treasury Note 2.625% 15/12/2021 2,099,700 2,145,795 1.30United States Treasury Note 2.000% 31/12/2021 1,948,300 1,961,542 1.19United States Treasury Note 2.125% 31/12/2021 1,228,100 1,239,901 0.75United States Treasury Note 2.500% 15/01/2022 2,100,900 2,140,784 1.30United States Treasury Note 1.500% 31/01/2022 1,228,900 1,221,987 0.74United States Treasury Note 1.875% 31/01/2022 1,906,700 1,913,403 1.16United States Treasury Note 2.000% 15/02/2022 1,712,000 1,724,037 1.04United States Treasury Note 2.500% 15/02/2022 2,075,000 2,115,852 1.28United States Treasury Note 1.750% 28/02/2022 1,607,000 1,608,004 0.97United States Treasury Note 1.875% 28/02/2022 1,907,000 1,914,151 1.16United States Treasury Note 2.375% 15/03/2022 2,102,000 2,139,442 1.29United States Treasury Note 1.750% 31/03/2022 1,660,000 1,661,037 1.00United States Treasury Note 1.875% 31/03/2022 1,907,000 1,915,492 1.16United States Treasury Note 2.250% 15/04/2022 2,103,000 2,132,738 1.29United States Treasury Note 1.750% 30/04/2022 1,655,000 1,656,552 1.00United States Treasury Note 1.875% 30/04/2022 1,908,000 1,915,751 1.16United States Treasury Note 1.750% 15/05/2022 1,320,000 1,320,928 0.80United States Treasury Note 2.125% 15/05/2022 2,104,000 2,127,670 1.29United States Treasury Note 1.750% 31/05/2022 1,800,000 1,801,266 1.09United States Treasury Note 1.875% 31/05/2022 1,550,000 1,557,023 0.94
Total Government Bonds 162,873,623 98.57
TOTAL INVESTMENTS (Cost USD 161,363,843) 162,873,623 98.57
Other net assets 2,356,141 1.43
TOTAL NET ASSETS 165,229,764 100.00
Forward Foreign Exchange Contracts
Purchases Sales Maturity Date Unrealised appreciation/
(depreciation) USD % of Net Assets
EUR 25,943,380 USD 29,126,918 02 July 2019 417,414 0.25EUR 57,047 USD 64,013 02 July 2019 953 0.00EUR 1,789,731 USD 2,023,001 02 July 2019 15,145 0.01EUR 8,939,135 USD 10,089,959 02 July 2019 89,931 0.05EUR 25,464,510 USD 28,444,367 02 July 2019 554,627 0.34USD 116,798 EUR 103,604 02 July 2019 (1,186) (0.00)
Total Forward Foreign Exchange Contracts 1,076,884 0.65
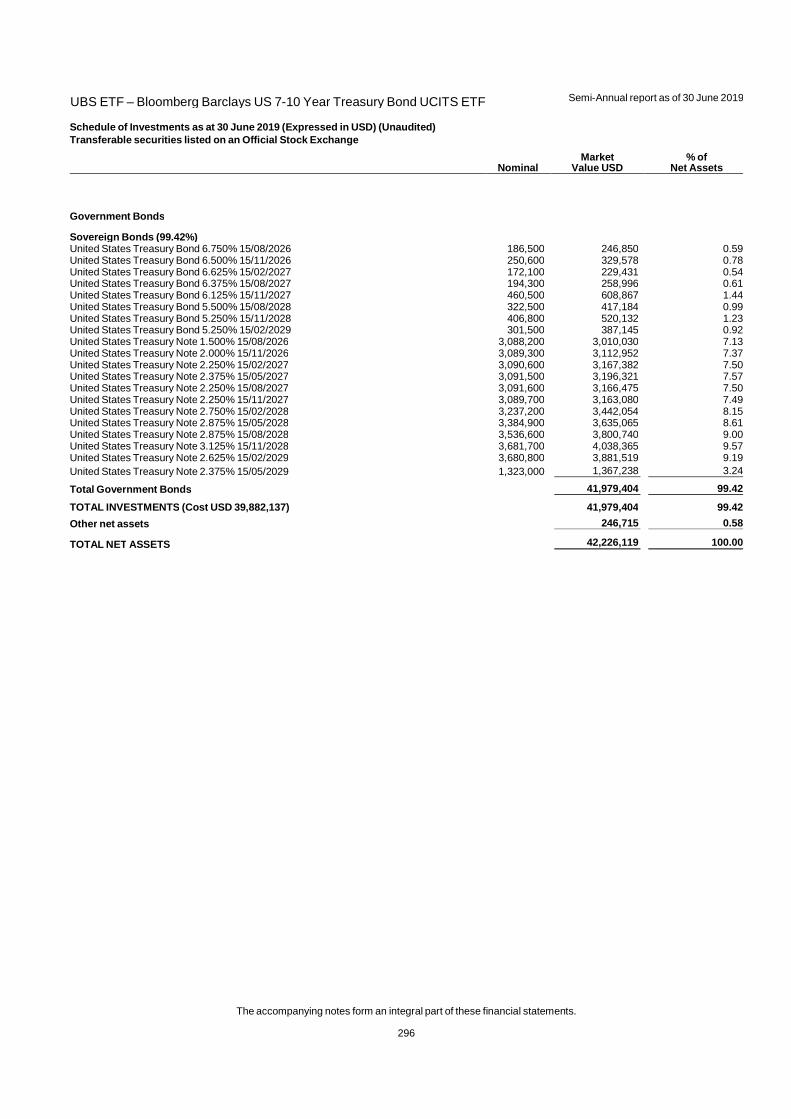
UBS ETF – Bloomberg Barclays US 7-10 Year Treasury Bond UCITS ETF
Semi-Annual report as of 30 June 2019
The accompanying notes form an integral part of these financial statements.
296
Schedule of Investments as at 30 June 2019 (Expressed in USD) (Unaudited)
Transferable securities listed on an Official Stock Exchange
Nominal Market
Value USD % of
Net Assets
Government Bonds
Sovereign Bonds (99.42%) United States Treasury Bond 6.750% 15/08/2026 186,500 246,850 0.59United States Treasury Bond 6.500% 15/11/2026 250,600 329,578 0.78United States Treasury Bond 6.625% 15/02/2027 172,100 229,431 0.54United States Treasury Bond 6.375% 15/08/2027 194,300 258,996 0.61United States Treasury Bond 6.125% 15/11/2027 460,500 608,867 1.44United States Treasury Bond 5.500% 15/08/2028 322,500 417,184 0.99United States Treasury Bond 5.250% 15/11/2028 406,800 520,132 1.23United States Treasury Bond 5.250% 15/02/2029 301,500 387,145 0.92United States Treasury Note 1.500% 15/08/2026 3,088,200 3,010,030 7.13United States Treasury Note 2.000% 15/11/2026 3,089,300 3,112,952 7.37United States Treasury Note 2.250% 15/02/2027 3,090,600 3,167,382 7.50United States Treasury Note 2.375% 15/05/2027 3,091,500 3,196,321 7.57United States Treasury Note 2.250% 15/08/2027 3,091,600 3,166,475 7.50United States Treasury Note 2.250% 15/11/2027 3,089,700 3,163,080 7.49United States Treasury Note 2.750% 15/02/2028 3,237,200 3,442,054 8.15United States Treasury Note 2.875% 15/05/2028 3,384,900 3,635,065 8.61United States Treasury Note 2.875% 15/08/2028 3,536,600 3,800,740 9.00United States Treasury Note 3.125% 15/11/2028 3,681,700 4,038,365 9.57United States Treasury Note 2.625% 15/02/2029 3,680,800 3,881,519 9.19United States Treasury Note 2.375% 15/05/2029 1,323,000 1,367,238 3.24
Total Government Bonds 41,979,404 99.42
TOTAL INVESTMENTS (Cost USD 39,882,137) 41,979,404 99.42
Other net assets 246,715 0.58
TOTAL NET ASSETS 42,226,119 100.00

UBS ETF – Bloomberg Barclays US 10+ Year Treasury Bond UCITS ETF
Semi-Annual report as of 30 June 2019
The accompanying notes form an integral part of these financial statements.
297
Schedule of Investments as at 30 June 2019 (Expressed in USD) (Unaudited)
Transferable securities listed on an Official Stock Exchange
Nominal Market
Value USD % of
Net Assets
Government Bonds
Sovereign Bonds (97.39%) United States Treasury Bond 6.125% 15/08/2029 138,900 191,183 0.35United States Treasury Bond 6.250% 15/05/2030 278,800 393,239 0.72United States Treasury Bond 5.375% 15/02/2031 449,800 603,997 1.10United States Treasury Bond 4.500% 15/02/2036 492,600 649,847 1.18United States Treasury Bond 4.750% 15/02/2037 172,100 235,616 0.43United States Treasury Bond 5.000% 15/05/2037 219,700 309,708 0.56United States Treasury Bond 4.375% 15/02/2038 233,900 309,150 0.56United States Treasury Bond 4.500% 15/05/2038 261,300 350,959 0.64United States Treasury Bond 3.500% 15/02/2039 426,400 506,350 0.92United States Treasury Bond 4.250% 15/05/2039 395,700 517,563 0.94United States Treasury Bond 4.500% 15/08/2039 422,200 570,168 1.04United States Treasury Bond 4.375% 15/11/2039 454,000 603,536 1.10United States Treasury Bond 4.625% 15/02/2040 756,900 1,039,082 1.89United States Treasury Bond 4.375% 15/05/2040 639,100 850,902 1.55United States Treasury Bond 3.875% 15/08/2040 551,400 688,647 1.25United States Treasury Bond 4.250% 15/11/2040 585,800 768,496 1.40United States Treasury Bond 4.750% 15/02/2041 643,400 900,257 1.64United States Treasury Bond 4.375% 15/05/2041 495,800 662,048 1.20United States Treasury Bond 3.750% 15/08/2041 550,200 675,542 1.23United States Treasury Bond 3.125% 15/11/2041 498,100 557,405 1.01United States Treasury Bond 3.125% 15/02/2042 621,600 695,027 1.27United States Treasury Bond 3.000% 15/05/2042 524,100 573,808 1.04United States Treasury Bond 2.750% 15/08/2042 803,300 842,837 1.53United States Treasury Bond 2.750% 15/11/2042 987,100 1,034,604 1.88United States Treasury Bond 3.125% 15/02/2043 1,000,400 1,115,602 2.03United States Treasury Bond 2.875% 15/05/2043 1,410,500 1,508,574 2.75United States Treasury Bond 3.625% 15/08/2043 1,169,700 1,411,864 2.57United States Treasury Bond 3.750% 15/11/2043 1,407,200 1,732,395 3.15United States Treasury Bond 3.625% 15/02/2044 1,417,100 1,712,255 3.12United States Treasury Bond 3.375% 15/05/2044 1,425,400 1,656,582 3.02United States Treasury Bond 3.125% 15/08/2044 1,426,700 1,591,662 2.90United States Treasury Bond 3.000% 15/11/2044 1,427,800 1,559,648 2.84United States Treasury Bond 2.500% 15/02/2045 1,425,900 1,420,553 2.59United States Treasury Bond 3.000% 15/05/2045 1,425,700 1,559,137 2.84United States Treasury Bond 2.875% 15/08/2045 1,425,800 1,523,824 2.77United States Treasury Bond 3.000% 15/11/2045 1,424,600 1,559,047 2.84United States Treasury Bond 2.500% 15/02/2046 1,324,000 1,316,966 2.40United States Treasury Bond 2.500% 15/05/2046 1,324,000 1,316,553 2.40United States Treasury Bond 2.250% 15/08/2046 1,319,400 1,246,421 2.27United States Treasury Bond 2.875% 15/11/2046 1,317,500 1,409,931 2.57United States Treasury Bond 3.000% 15/02/2047 1,318,900 1,446,256 2.63United States Treasury Bond 3.000% 15/05/2047 1,319,000 1,444,717 2.63United States Treasury Bond 2.750% 15/08/2047 1,319,100 1,376,605 2.51United States Treasury Bond 2.750% 15/11/2047 1,319,100 1,376,811 2.51United States Treasury Bond 3.000% 15/02/2048 1,420,700 1,556,110 2.83United States Treasury Bond 3.125% 15/05/2048 1,526,500 1,713,019 3.12United States Treasury Bond 3.000% 15/08/2048 1,627,100 1,784,471 3.25United States Treasury Bond 3.375% 15/11/2048 1,727,800 2,033,945 3.70United States Treasury Bond 3.000% 15/02/2049 1,728,100 1,898,210 3.46United States Treasury Bond 2.875% 15/05/2049 645,000 691,964 1.26
Total Government Bonds 53,493,093 97.39
TOTAL INVESTMENTS (Cost USD 51,292,090) 53,493,093 97.39
Other net assets 1,436,396 2.61
TOTAL NET ASSETS 54,929,489 100.00
Forward Foreign Exchange Contracts
Purchases Sales Maturity Date Unrealised appreciation/
(depreciation) USD % of Net Assets
EUR 3,219,902 USD 3,615,019 02 July 2019 51,806 0.09EUR 406,327 USD 455,940 02 July 2019 6,786 0.01EUR 29,346 USD 33,059 02 July 2019 361 0.00

UBS ETF – Bloomberg Barclays US 10+ Year Treasury Bond UCITS ETF
Semi-Annual report as of 30 June 2019
The accompanying notes form an integral part of these financial statements.
298
Schedule of Investments as at 30 June 2019 (Expressed in USD) (Unaudited) Forward Foreign Exchange Contracts
Purchases Sales Maturity Date Unrealised appreciation/
(depreciation) USD % of Net Assets
EUR 3,574,949 USD 4,060,334 02 July 2019 10,819 0.02EUR 1,753,312 USD 1,986,998 02 July 2019 9,674 0.02EUR 2,192,509 USD 2,474,772 02 July 2019 22,058 0.04EUR 4,937,692 USD 5,619,558 02 July 2019 3,488 0.01EUR 33,239,791 USD 37,129,512 02 July 2019 723,976 1.32USD 25,558 EUR 22,671 02 July 2019 (260) (0.00)USD 2,019,676 EUR 1,787,479 02 July 2019 (15,906) (0.03)
Total Forward Foreign Exchange Contracts 812,802 1.48

UBS ETF – Bloomberg Barclays TIPS 1-10 UCITS ETF
Semi-Annual report as of 30 June 2019
The accompanying notes form an integral part of these financial statements.
299
Schedule of Investments as at 30 June 2019 (Expressed in USD) (Unaudited)
Transferable securities listed on an Official Stock Exchange
Nominal Market
Value USD % of
Net Assets
Government Bonds
Sovereign Bonds (98.91%) United States Treasury Inflation Indexed Bonds 1.250% 15/07/2020 34,236,439 34,466,599 3.09United States Treasury Inflation Indexed Bonds 1.125% 15/01/2021 39,076,024 39,388,842 3.54United States Treasury Inflation Indexed Bonds 0.125% 15/04/2021 50,151,283 49,695,538 4.46United States Treasury Inflation Indexed Bonds 0.625% 15/07/2021 42,129,413 42,410,927 3.81United States Treasury Inflation Indexed Bonds 0.125% 15/01/2022 46,135,449 45,859,159 4.12United States Treasury Inflation Indexed Bonds 0.125% 15/04/2022 49,002,657 48,627,511 4.37United States Treasury Inflation Indexed Bonds 0.125% 15/07/2022 47,952,016 47,819,465 4.29United States Treasury Inflation Indexed Bonds 0.125% 15/01/2023 46,494,270 46,241,740 4.15United States Treasury Inflation Indexed Bonds 0.625% 15/04/2023 47,810,414 48,382,456 4.34United States Treasury Inflation Indexed Bonds 0.375% 15/07/2023 47,067,951 47,466,638 4.26United States Treasury Inflation Indexed Bonds 0.625% 15/01/2024 47,729,182 48,577,897 4.36United States Treasury Inflation Indexed Bonds 0.500% 15/04/2024 18,727,427 18,967,247 1.70United States Treasury Inflation Indexed Bonds 0.125% 15/07/2024 45,266,949 45,205,542 4.06United States Treasury Inflation Indexed Bonds 0.250% 15/01/2025 47,347,948 47,421,319 4.26United States Treasury Inflation Indexed Bonds 2.375% 15/01/2025 30,354,890 33,933,941 3.05United States Treasury Inflation Indexed Bonds 0.375% 15/07/2025 47,060,698 47,592,801 4.27United States Treasury Inflation Indexed Bonds 0.625% 15/01/2026 42,724,357 43,767,880 3.93United States Treasury Inflation Indexed Bonds 2.000% 15/01/2026 22,213,093 24,729,578 2.22United States Treasury Inflation Indexed Bonds 0.125% 15/07/2026 39,471,124 39,220,475 3.52United States Treasury Inflation Indexed Bonds 0.375% 15/01/2027 38,358,110 38,628,088 3.47United States Treasury Inflation Indexed Bonds 2.375% 15/01/2027 18,486,866 21,361,334 1.92United States Treasury Inflation Indexed Bonds 0.375% 15/07/2027 39,041,843 39,414,892 3.54United States Treasury Inflation Indexed Bonds 0.500% 15/01/2028 38,635,423 39,283,023 3.53United States Treasury Inflation Indexed Bonds 1.750% 15/01/2028 17,951,440 20,138,436 1.81United States Treasury Inflation Indexed Bonds 3.625% 15/04/2028 14,799,291 19,010,346 1.71United States Treasury Inflation Indexed Bonds 0.750% 15/07/2028 37,711,066 39,308,870 3.53United States Treasury Inflation Indexed Bonds 0.875% 15/01/2029 37,619,573 39,616,574 3.56United States Treasury Inflation Indexed Bonds 2.500% 15/01/2029 16,947,502 20,397,141 1.83United States Treasury Inflation Indexed Bonds 3.875% 15/04/2029 18,400,411 24,650,780 2.21
Total Government Bonds 1,101,585,039 98.91
TOTAL INVESTMENTS (Cost USD 1,084,592,562) 1,101,585,039 98.91
Other net assets 12,192,592 1.09
TOTAL NET ASSETS 1,113,777,631 100.00
Forward Foreign Exchange Contracts
Purchases Sales Maturity Date Unrealised appreciation/
(depreciation) USD % of Net Assets
CHF 223,111 USD 223,985 02 July 2019 4,846 0.00CHF 48,431,596 USD 48,281,922 02 July 2019 1,391,510 0.12EUR 1,548,398 USD 1,737,424 02 July 2019 25,892 0.00EUR 4,949 USD 5,576 02 July 2019 61 0.00EUR 915 USD 1,029 02 July 2019 13 0.00EUR 316,201,097 USD 353,202,949 02 July 2019 6,886,990 0.62GBP 530,056 USD 670,119 02 July 2019 4,483 0.00GBP 1,573,635 USD 1,985,547 02 July 2019 17,219 0.00GBP 97,884,119 USD 123,555,012 02 July 2019 1,022,125 0.09USD 2,543,620 EUR 2,253,847 02 July 2019 (23,062) (0.00)USD 7,780,320 EUR 6,865,293 02 July 2019 (37,879) (0.00)
Total Forward Foreign Exchange Contracts 9,292,198 0.83
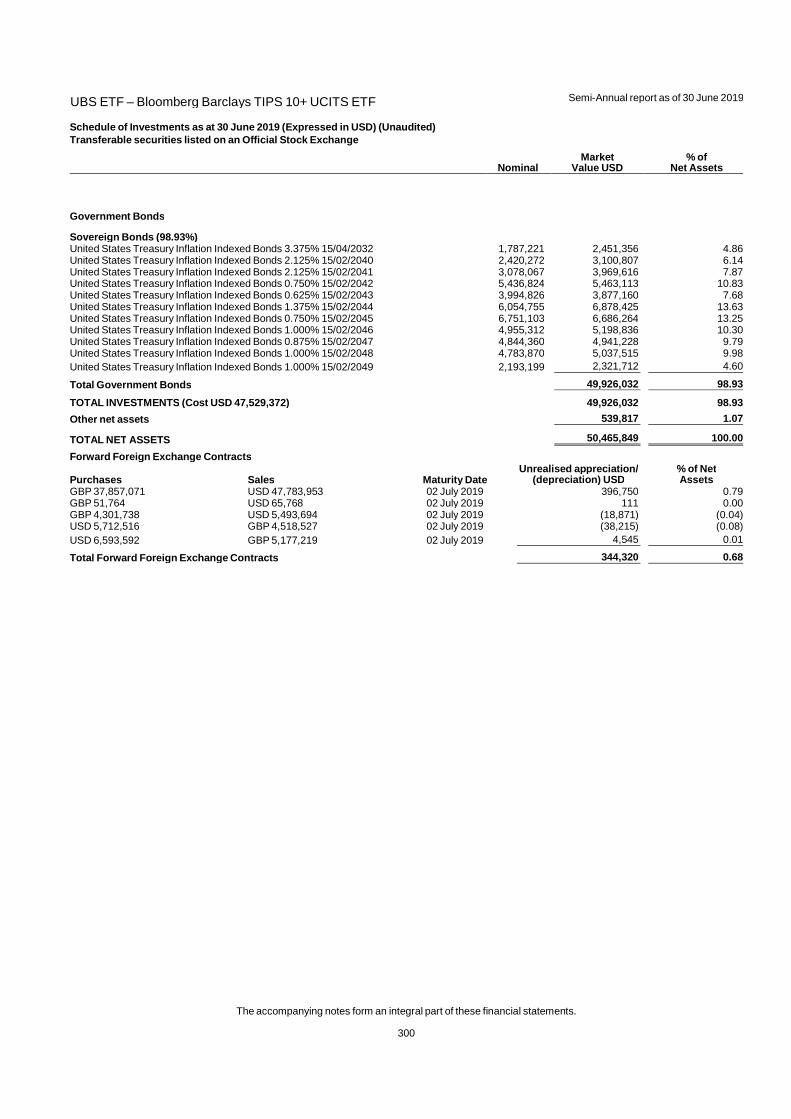
UBS ETF – Bloomberg Barclays TIPS 10+ UCITS ETF
Semi-Annual report as of 30 June 2019
The accompanying notes form an integral part of these financial statements.
300
Schedule of Investments as at 30 June 2019 (Expressed in USD) (Unaudited)
Transferable securities listed on an Official Stock Exchange
Nominal Market
Value USD % of
Net Assets
Government Bonds
Sovereign Bonds (98.93%) United States Treasury Inflation Indexed Bonds 3.375% 15/04/2032 1,787,221 2,451,356 4.86United States Treasury Inflation Indexed Bonds 2.125% 15/02/2040 2,420,272 3,100,807 6.14United States Treasury Inflation Indexed Bonds 2.125% 15/02/2041 3,078,067 3,969,616 7.87United States Treasury Inflation Indexed Bonds 0.750% 15/02/2042 5,436,824 5,463,113 10.83United States Treasury Inflation Indexed Bonds 0.625% 15/02/2043 3,994,826 3,877,160 7.68United States Treasury Inflation Indexed Bonds 1.375% 15/02/2044 6,054,755 6,878,425 13.63United States Treasury Inflation Indexed Bonds 0.750% 15/02/2045 6,751,103 6,686,264 13.25United States Treasury Inflation Indexed Bonds 1.000% 15/02/2046 4,955,312 5,198,836 10.30United States Treasury Inflation Indexed Bonds 0.875% 15/02/2047 4,844,360 4,941,228 9.79United States Treasury Inflation Indexed Bonds 1.000% 15/02/2048 4,783,870 5,037,515 9.98United States Treasury Inflation Indexed Bonds 1.000% 15/02/2049 2,193,199 2,321,712 4.60
Total Government Bonds 49,926,032 98.93
TOTAL INVESTMENTS (Cost USD 47,529,372) 49,926,032 98.93
Other net assets 539,817 1.07
TOTAL NET ASSETS 50,465,849 100.00
Forward Foreign Exchange Contracts
Purchases Sales Maturity Date Unrealised appreciation/
(depreciation) USD % of Net Assets
GBP 37,857,071 USD 47,783,953 02 July 2019 396,750 0.79GBP 51,764 USD 65,768 02 July 2019 111 0.00GBP 4,301,738 USD 5,493,694 02 July 2019 (18,871) (0.04)USD 5,712,516 GBP 4,518,527 02 July 2019 (38,215) (0.08)USD 6,593,592 GBP 5,177,219 02 July 2019 4,545 0.01
Total Forward Foreign Exchange Contracts 344,320 0.68
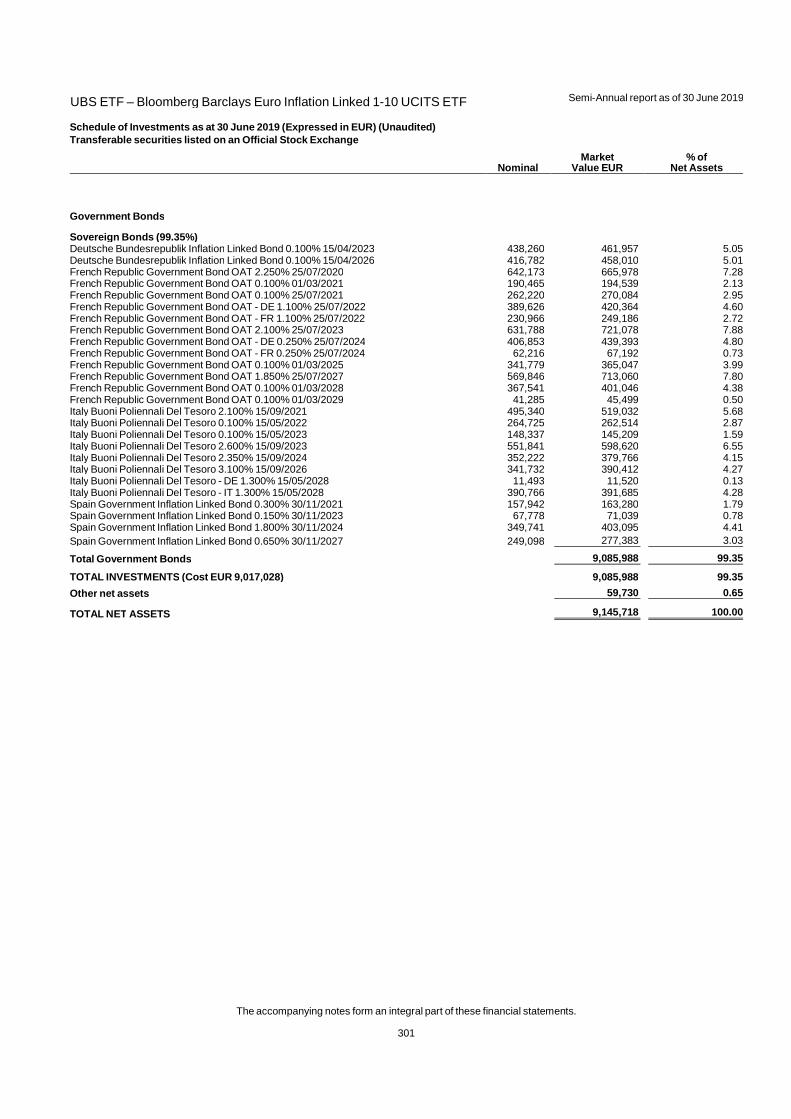
UBS ETF – Bloomberg Barclays Euro Inflation Linked 1-10 UCITS ETF
Semi-Annual report as of 30 June 2019
The accompanying notes form an integral part of these financial statements.
301
Schedule of Investments as at 30 June 2019 (Expressed in EUR) (Unaudited)
Transferable securities listed on an Official Stock Exchange
Nominal Market
Value EUR % of
Net Assets
Government Bonds
Sovereign Bonds (99.35%) Deutsche Bundesrepublik Inflation Linked Bond 0.100% 15/04/2023 438,260 461,957 5.05Deutsche Bundesrepublik Inflation Linked Bond 0.100% 15/04/2026 416,782 458,010 5.01French Republic Government Bond OAT 2.250% 25/07/2020 642,173 665,978 7.28French Republic Government Bond OAT 0.100% 01/03/2021 190,465 194,539 2.13French Republic Government Bond OAT 0.100% 25/07/2021 262,220 270,084 2.95French Republic Government Bond OAT - DE 1.100% 25/07/2022 389,626 420,364 4.60French Republic Government Bond OAT - FR 1.100% 25/07/2022 230,966 249,186 2.72French Republic Government Bond OAT 2.100% 25/07/2023 631,788 721,078 7.88French Republic Government Bond OAT - DE 0.250% 25/07/2024 406,853 439,393 4.80French Republic Government Bond OAT - FR 0.250% 25/07/2024 62,216 67,192 0.73French Republic Government Bond OAT 0.100% 01/03/2025 341,779 365,047 3.99French Republic Government Bond OAT 1.850% 25/07/2027 569,846 713,060 7.80French Republic Government Bond OAT 0.100% 01/03/2028 367,541 401,046 4.38French Republic Government Bond OAT 0.100% 01/03/2029 41,285 45,499 0.50Italy Buoni Poliennali Del Tesoro 2.100% 15/09/2021 495,340 519,032 5.68Italy Buoni Poliennali Del Tesoro 0.100% 15/05/2022 264,725 262,514 2.87Italy Buoni Poliennali Del Tesoro 0.100% 15/05/2023 148,337 145,209 1.59Italy Buoni Poliennali Del Tesoro 2.600% 15/09/2023 551,841 598,620 6.55Italy Buoni Poliennali Del Tesoro 2.350% 15/09/2024 352,222 379,766 4.15Italy Buoni Poliennali Del Tesoro 3.100% 15/09/2026 341,732 390,412 4.27Italy Buoni Poliennali Del Tesoro - DE 1.300% 15/05/2028 11,493 11,520 0.13Italy Buoni Poliennali Del Tesoro - IT 1.300% 15/05/2028 390,766 391,685 4.28Spain Government Inflation Linked Bond 0.300% 30/11/2021 157,942 163,280 1.79Spain Government Inflation Linked Bond 0.150% 30/11/2023 67,778 71,039 0.78Spain Government Inflation Linked Bond 1.800% 30/11/2024 349,741 403,095 4.41Spain Government Inflation Linked Bond 0.650% 30/11/2027 249,098 277,383 3.03
Total Government Bonds 9,085,988 99.35
TOTAL INVESTMENTS (Cost EUR 9,017,028) 9,085,988 99.35
Other net assets 59,730 0.65
TOTAL NET ASSETS 9,145,718 100.00
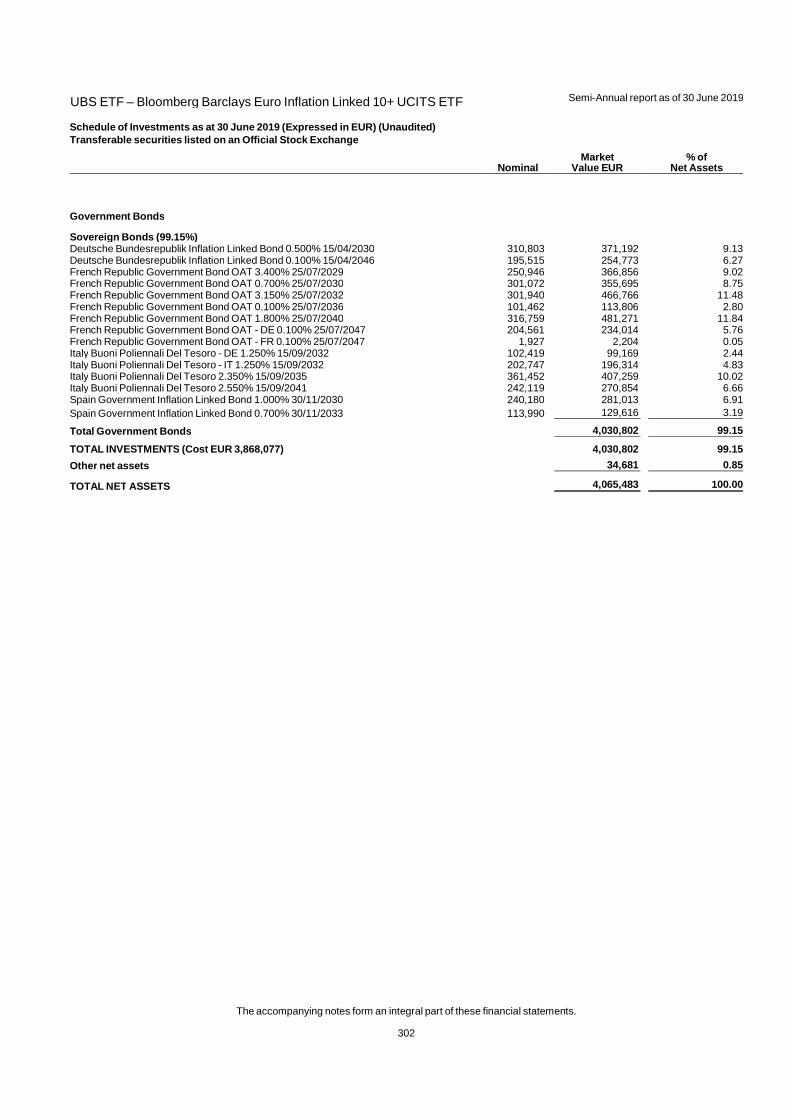
UBS ETF – Bloomberg Barclays Euro Inflation Linked 10+ UCITS ETF
Semi-Annual report as of 30 June 2019
The accompanying notes form an integral part of these financial statements.
302
Schedule of Investments as at 30 June 2019 (Expressed in EUR) (Unaudited)
Transferable securities listed on an Official Stock Exchange
Nominal Market
Value EUR % of
Net Assets
Government Bonds
Sovereign Bonds (99.15%) Deutsche Bundesrepublik Inflation Linked Bond 0.500% 15/04/2030 310,803 371,192 9.13Deutsche Bundesrepublik Inflation Linked Bond 0.100% 15/04/2046 195,515 254,773 6.27French Republic Government Bond OAT 3.400% 25/07/2029 250,946 366,856 9.02French Republic Government Bond OAT 0.700% 25/07/2030 301,072 355,695 8.75French Republic Government Bond OAT 3.150% 25/07/2032 301,940 466,766 11.48French Republic Government Bond OAT 0.100% 25/07/2036 101,462 113,806 2.80French Republic Government Bond OAT 1.800% 25/07/2040 316,759 481,271 11.84French Republic Government Bond OAT - DE 0.100% 25/07/2047 204,561 234,014 5.76French Republic Government Bond OAT - FR 0.100% 25/07/2047 1,927 2,204 0.05Italy Buoni Poliennali Del Tesoro - DE 1.250% 15/09/2032 102,419 99,169 2.44Italy Buoni Poliennali Del Tesoro - IT 1.250% 15/09/2032 202,747 196,314 4.83Italy Buoni Poliennali Del Tesoro 2.350% 15/09/2035 361,452 407,259 10.02Italy Buoni Poliennali Del Tesoro 2.550% 15/09/2041 242,119 270,854 6.66Spain Government Inflation Linked Bond 1.000% 30/11/2030 240,180 281,013 6.91Spain Government Inflation Linked Bond 0.700% 30/11/2033 113,990 129,616 3.19
Total Government Bonds 4,030,802 99.15
TOTAL INVESTMENTS (Cost EUR 3,868,077) 4,030,802 99.15
Other net assets 34,681 0.85
TOTAL NET ASSETS 4,065,483 100.00
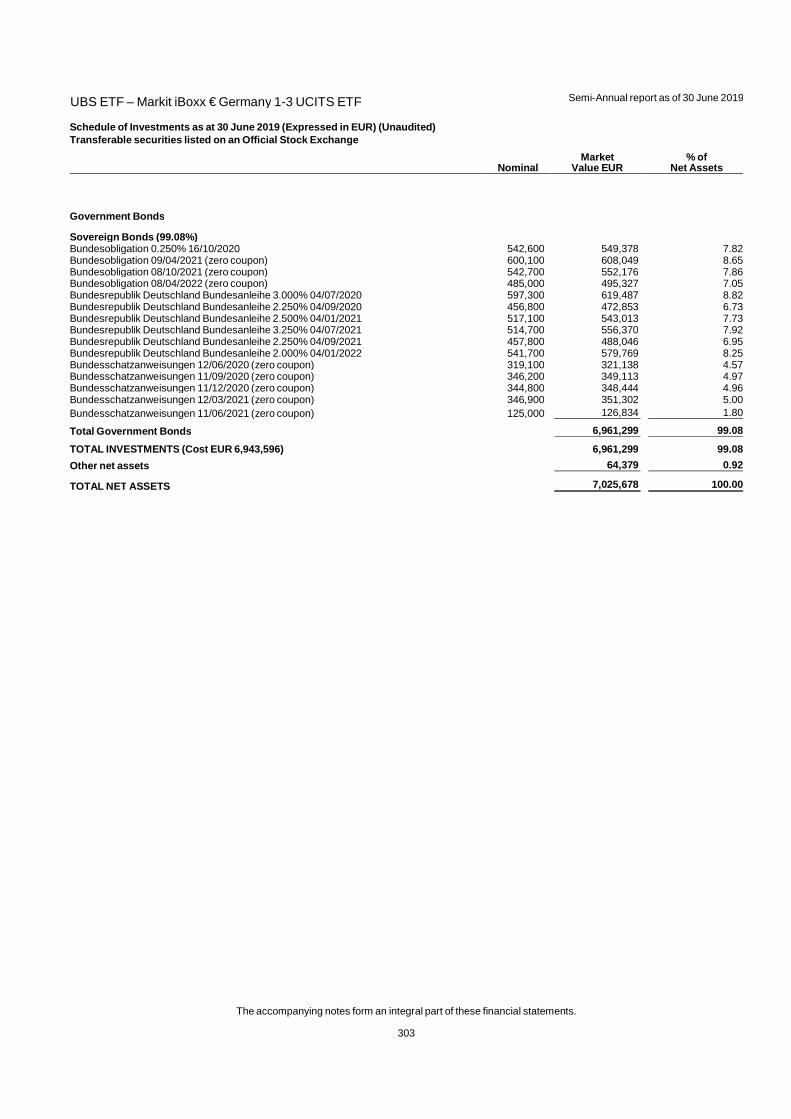
UBS ETF – Markit iBoxx € Germany 1-3 UCITS ETF
Semi-Annual report as of 30 June 2019
The accompanying notes form an integral part of these financial statements.
303
Schedule of Investments as at 30 June 2019 (Expressed in EUR) (Unaudited)
Transferable securities listed on an Official Stock Exchange
Nominal Market
Value EUR % of
Net Assets
Government Bonds
Sovereign Bonds (99.08%) Bundesobligation 0.250% 16/10/2020 542,600 549,378 7.82Bundesobligation 09/04/2021 (zero coupon) 600,100 608,049 8.65Bundesobligation 08/10/2021 (zero coupon) 542,700 552,176 7.86Bundesobligation 08/04/2022 (zero coupon) 485,000 495,327 7.05Bundesrepublik Deutschland Bundesanleihe 3.000% 04/07/2020 597,300 619,487 8.82Bundesrepublik Deutschland Bundesanleihe 2.250% 04/09/2020 456,800 472,853 6.73Bundesrepublik Deutschland Bundesanleihe 2.500% 04/01/2021 517,100 543,013 7.73Bundesrepublik Deutschland Bundesanleihe 3.250% 04/07/2021 514,700 556,370 7.92Bundesrepublik Deutschland Bundesanleihe 2.250% 04/09/2021 457,800 488,046 6.95Bundesrepublik Deutschland Bundesanleihe 2.000% 04/01/2022 541,700 579,769 8.25Bundesschatzanweisungen 12/06/2020 (zero coupon) 319,100 321,138 4.57Bundesschatzanweisungen 11/09/2020 (zero coupon) 346,200 349,113 4.97Bundesschatzanweisungen 11/12/2020 (zero coupon) 344,800 348,444 4.96Bundesschatzanweisungen 12/03/2021 (zero coupon) 346,900 351,302 5.00Bundesschatzanweisungen 11/06/2021 (zero coupon) 125,000 126,834 1.80
Total Government Bonds 6,961,299 99.08
TOTAL INVESTMENTS (Cost EUR 6,943,596) 6,961,299 99.08
Other net assets 64,379 0.92
TOTAL NET ASSETS 7,025,678 100.00
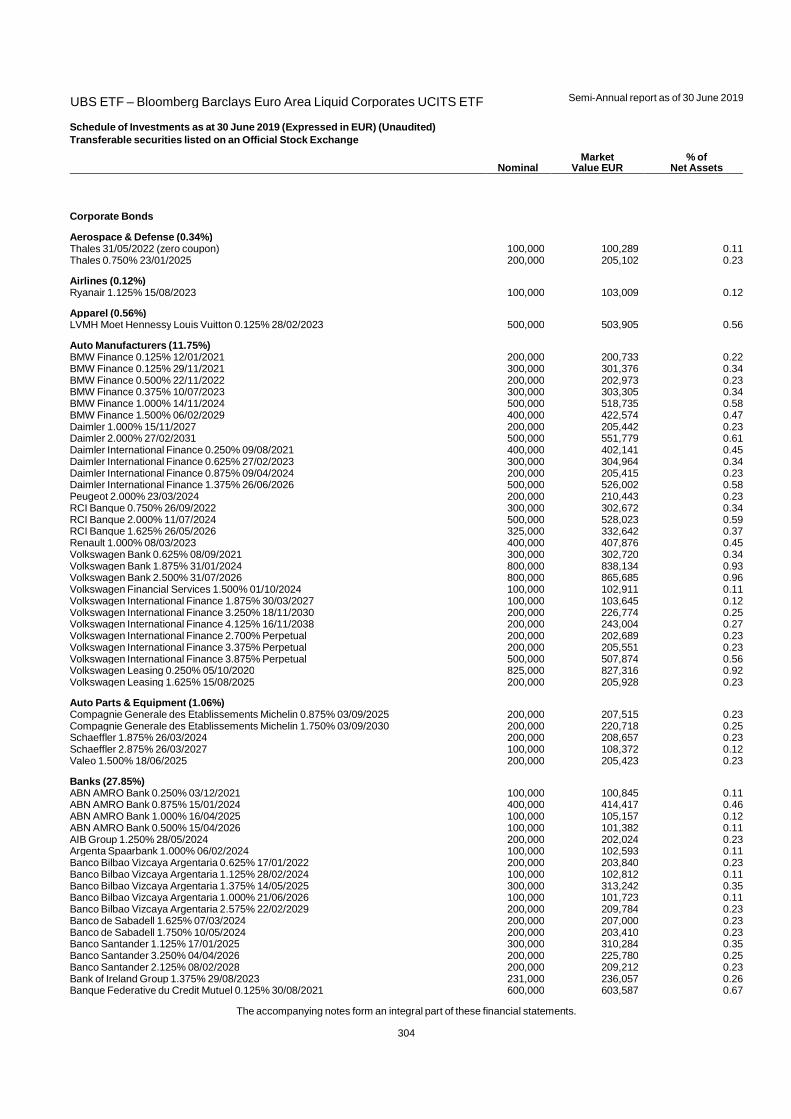
UBS ETF – Bloomberg Barclays Euro Area Liquid Corporates UCITS ETF
Semi-Annual report as of 30 June 2019
The accompanying notes form an integral part of these financial statements.
304
Schedule of Investments as at 30 June 2019 (Expressed in EUR) (Unaudited)
Transferable securities listed on an Official Stock Exchange
Nominal Market
Value EUR % of
Net Assets
Corporate Bonds
Aerospace & Defense (0.34%) Thales 31/05/2022 (zero coupon) 100,000 100,289 0.11Thales 0.750% 23/01/2025 200,000 205,102 0.23
Airlines (0.12%) Ryanair 1.125% 15/08/2023 100,000 103,009 0.12
Apparel (0.56%) LVMH Moet Hennessy Louis Vuitton 0.125% 28/02/2023 500,000 503,905 0.56
Auto Manufacturers (11.75%) BMW Finance 0.125% 12/01/2021 200,000 200,733 0.22BMW Finance 0.125% 29/11/2021 300,000 301,376 0.34BMW Finance 0.500% 22/11/2022 200,000 202,973 0.23BMW Finance 0.375% 10/07/2023 300,000 303,305 0.34BMW Finance 1.000% 14/11/2024 500,000 518,735 0.58BMW Finance 1.500% 06/02/2029 400,000 422,574 0.47Daimler 1.000% 15/11/2027 200,000 205,442 0.23Daimler 2.000% 27/02/2031 500,000 551,779 0.61Daimler International Finance 0.250% 09/08/2021 400,000 402,141 0.45Daimler International Finance 0.625% 27/02/2023 300,000 304,964 0.34Daimler International Finance 0.875% 09/04/2024 200,000 205,415 0.23Daimler International Finance 1.375% 26/06/2026 500,000 526,002 0.58Peugeot 2.000% 23/03/2024 200,000 210,443 0.23RCI Banque 0.750% 26/09/2022 300,000 302,672 0.34RCI Banque 2.000% 11/07/2024 500,000 528,023 0.59RCI Banque 1.625% 26/05/2026 325,000 332,642 0.37Renault 1.000% 08/03/2023 400,000 407,876 0.45Volkswagen Bank 0.625% 08/09/2021 300,000 302,720 0.34Volkswagen Bank 1.875% 31/01/2024 800,000 838,134 0.93Volkswagen Bank 2.500% 31/07/2026 800,000 865,685 0.96Volkswagen Financial Services 1.500% 01/10/2024 100,000 102,911 0.11Volkswagen International Finance 1.875% 30/03/2027 100,000 103,645 0.12Volkswagen International Finance 3.250% 18/11/2030 200,000 226,774 0.25Volkswagen International Finance 4.125% 16/11/2038 200,000 243,004 0.27Volkswagen International Finance 2.700% Perpetual 200,000 202,689 0.23Volkswagen International Finance 3.375% Perpetual 200,000 205,551 0.23Volkswagen International Finance 3.875% Perpetual 500,000 507,874 0.56Volkswagen Leasing 0.250% 05/10/2020 825,000 827,316 0.92Volkswagen Leasing 1.625% 15/08/2025 200,000 205,928 0.23
Auto Parts & Equipment (1.06%) Compagnie Generale des Etablissements Michelin 0.875% 03/09/2025 200,000 207,515 0.23Compagnie Generale des Etablissements Michelin 1.750% 03/09/2030 200,000 220,718 0.25Schaeffler 1.875% 26/03/2024 200,000 208,657 0.23Schaeffler 2.875% 26/03/2027 100,000 108,372 0.12Valeo 1.500% 18/06/2025 200,000 205,423 0.23
Banks (27.85%) ABN AMRO Bank 0.250% 03/12/2021 100,000 100,845 0.11ABN AMRO Bank 0.875% 15/01/2024 400,000 414,417 0.46ABN AMRO Bank 1.000% 16/04/2025 100,000 105,157 0.12ABN AMRO Bank 0.500% 15/04/2026 100,000 101,382 0.11AIB Group 1.250% 28/05/2024 200,000 202,024 0.23Argenta Spaarbank 1.000% 06/02/2024 100,000 102,593 0.11Banco Bilbao Vizcaya Argentaria 0.625% 17/01/2022 200,000 203,840 0.23Banco Bilbao Vizcaya Argentaria 1.125% 28/02/2024 100,000 102,812 0.11Banco Bilbao Vizcaya Argentaria 1.375% 14/05/2025 300,000 313,242 0.35Banco Bilbao Vizcaya Argentaria 1.000% 21/06/2026 100,000 101,723 0.11Banco Bilbao Vizcaya Argentaria 2.575% 22/02/2029 200,000 209,784 0.23Banco de Sabadell 1.625% 07/03/2024 200,000 207,000 0.23Banco de Sabadell 1.750% 10/05/2024 200,000 203,410 0.23Banco Santander 1.125% 17/01/2025 300,000 310,284 0.35Banco Santander 3.250% 04/04/2026 200,000 225,780 0.25Banco Santander 2.125% 08/02/2028 200,000 209,212 0.23Bank of Ireland Group 1.375% 29/08/2023 231,000 236,057 0.26Banque Federative du Credit Mutuel 0.125% 30/08/2021 600,000 603,587 0.67
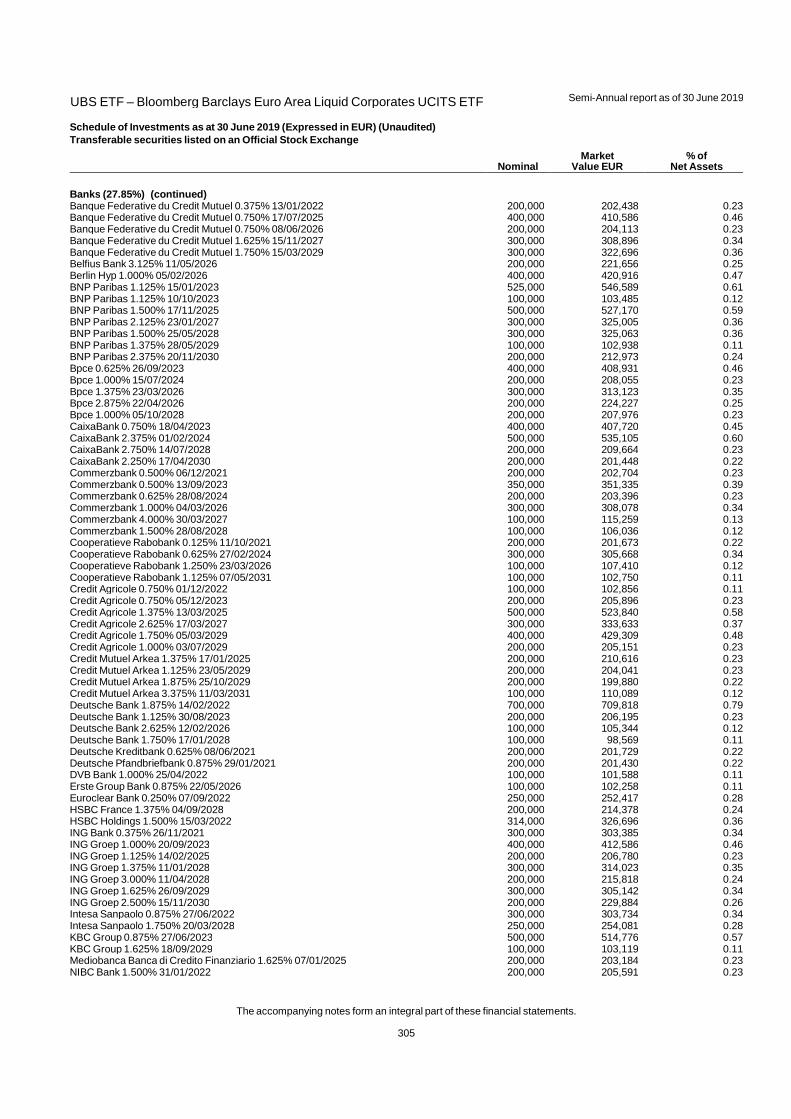
UBS ETF – Bloomberg Barclays Euro Area Liquid Corporates UCITS ETF
Semi-Annual report as of 30 June 2019
The accompanying notes form an integral part of these financial statements.
305
Schedule of Investments as at 30 June 2019 (Expressed in EUR) (Unaudited)
Transferable securities listed on an Official Stock Exchange
Nominal Market
Value EUR % of
Net Assets
Banks (27.85%) (continued) Banque Federative du Credit Mutuel 0.375% 13/01/2022 200,000 202,438 0.23Banque Federative du Credit Mutuel 0.750% 17/07/2025 400,000 410,586 0.46Banque Federative du Credit Mutuel 0.750% 08/06/2026 200,000 204,113 0.23Banque Federative du Credit Mutuel 1.625% 15/11/2027 300,000 308,896 0.34Banque Federative du Credit Mutuel 1.750% 15/03/2029 300,000 322,696 0.36Belfius Bank 3.125% 11/05/2026 200,000 221,656 0.25Berlin Hyp 1.000% 05/02/2026 400,000 420,916 0.47BNP Paribas 1.125% 15/01/2023 525,000 546,589 0.61BNP Paribas 1.125% 10/10/2023 100,000 103,485 0.12BNP Paribas 1.500% 17/11/2025 500,000 527,170 0.59BNP Paribas 2.125% 23/01/2027 300,000 325,005 0.36BNP Paribas 1.500% 25/05/2028 300,000 325,063 0.36BNP Paribas 1.375% 28/05/2029 100,000 102,938 0.11BNP Paribas 2.375% 20/11/2030 200,000 212,973 0.24Bpce 0.625% 26/09/2023 400,000 408,931 0.46Bpce 1.000% 15/07/2024 200,000 208,055 0.23Bpce 1.375% 23/03/2026 300,000 313,123 0.35Bpce 2.875% 22/04/2026 200,000 224,227 0.25Bpce 1.000% 05/10/2028 200,000 207,976 0.23CaixaBank 0.750% 18/04/2023 400,000 407,720 0.45CaixaBank 2.375% 01/02/2024 500,000 535,105 0.60CaixaBank 2.750% 14/07/2028 200,000 209,664 0.23CaixaBank 2.250% 17/04/2030 200,000 201,448 0.22Commerzbank 0.500% 06/12/2021 200,000 202,704 0.23Commerzbank 0.500% 13/09/2023 350,000 351,335 0.39Commerzbank 0.625% 28/08/2024 200,000 203,396 0.23Commerzbank 1.000% 04/03/2026 300,000 308,078 0.34Commerzbank 4.000% 30/03/2027 100,000 115,259 0.13Commerzbank 1.500% 28/08/2028 100,000 106,036 0.12Cooperatieve Rabobank 0.125% 11/10/2021 200,000 201,673 0.22Cooperatieve Rabobank 0.625% 27/02/2024 300,000 305,668 0.34Cooperatieve Rabobank 1.250% 23/03/2026 100,000 107,410 0.12Cooperatieve Rabobank 1.125% 07/05/2031 100,000 102,750 0.11Credit Agricole 0.750% 01/12/2022 100,000 102,856 0.11Credit Agricole 0.750% 05/12/2023 200,000 205,896 0.23Credit Agricole 1.375% 13/03/2025 500,000 523,840 0.58Credit Agricole 2.625% 17/03/2027 300,000 333,633 0.37Credit Agricole 1.750% 05/03/2029 400,000 429,309 0.48Credit Agricole 1.000% 03/07/2029 200,000 205,151 0.23Credit Mutuel Arkea 1.375% 17/01/2025 200,000 210,616 0.23Credit Mutuel Arkea 1.125% 23/05/2029 200,000 204,041 0.23Credit Mutuel Arkea 1.875% 25/10/2029 200,000 199,880 0.22Credit Mutuel Arkea 3.375% 11/03/2031 100,000 110,089 0.12Deutsche Bank 1.875% 14/02/2022 700,000 709,818 0.79Deutsche Bank 1.125% 30/08/2023 200,000 206,195 0.23Deutsche Bank 2.625% 12/02/2026 100,000 105,344 0.12Deutsche Bank 1.750% 17/01/2028 100,000 98,569 0.11Deutsche Kreditbank 0.625% 08/06/2021 200,000 201,729 0.22Deutsche Pfandbriefbank 0.875% 29/01/2021 200,000 201,430 0.22DVB Bank 1.000% 25/04/2022 100,000 101,588 0.11Erste Group Bank 0.875% 22/05/2026 100,000 102,258 0.11Euroclear Bank 0.250% 07/09/2022 250,000 252,417 0.28HSBC France 1.375% 04/09/2028 200,000 214,378 0.24HSBC Holdings 1.500% 15/03/2022 314,000 326,696 0.36ING Bank 0.375% 26/11/2021 300,000 303,385 0.34ING Groep 1.000% 20/09/2023 400,000 412,586 0.46ING Groep 1.125% 14/02/2025 200,000 206,780 0.23ING Groep 1.375% 11/01/2028 300,000 314,023 0.35ING Groep 3.000% 11/04/2028 200,000 215,818 0.24ING Groep 1.625% 26/09/2029 300,000 305,142 0.34ING Groep 2.500% 15/11/2030 200,000 229,884 0.26Intesa Sanpaolo 0.875% 27/06/2022 300,000 303,734 0.34Intesa Sanpaolo 1.750% 20/03/2028 250,000 254,081 0.28KBC Group 0.875% 27/06/2023 500,000 514,776 0.57KBC Group 1.625% 18/09/2029 100,000 103,119 0.11Mediobanca Banca di Credito Finanziario 1.625% 07/01/2025 200,000 203,184 0.23NIBC Bank 1.500% 31/01/2022 200,000 205,591 0.23
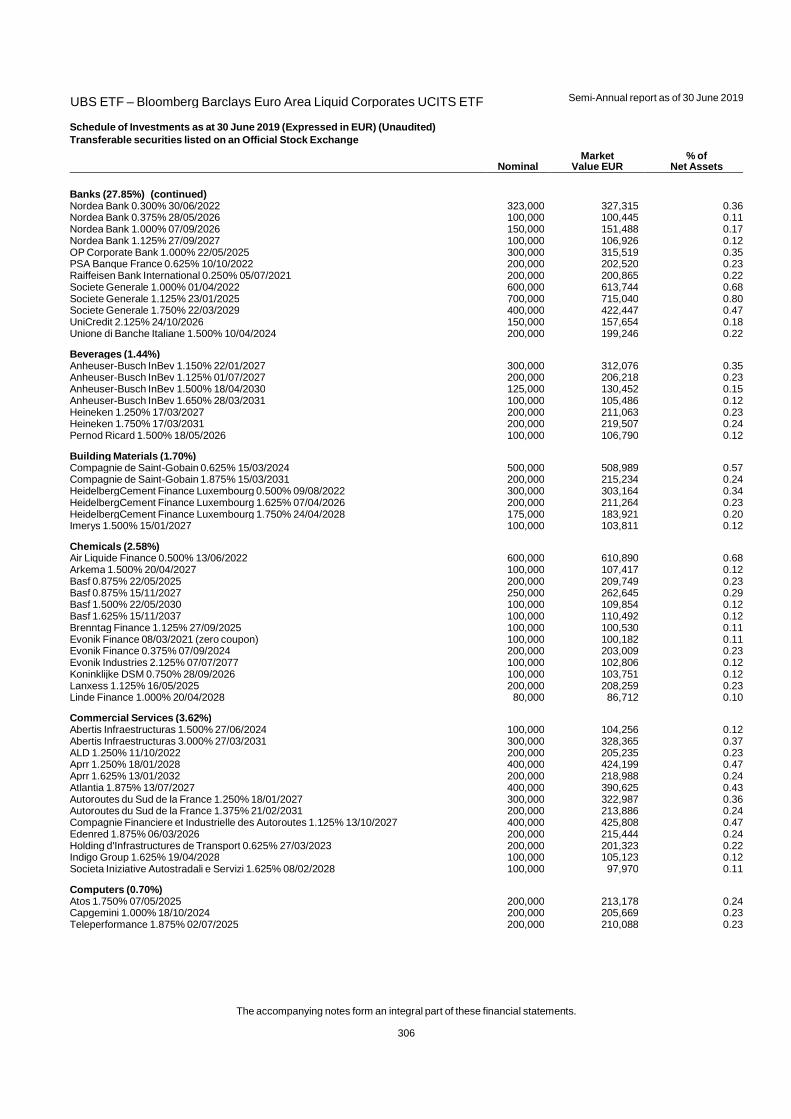
UBS ETF – Bloomberg Barclays Euro Area Liquid Corporates UCITS ETF
Semi-Annual report as of 30 June 2019
The accompanying notes form an integral part of these financial statements.
306
Schedule of Investments as at 30 June 2019 (Expressed in EUR) (Unaudited)
Transferable securities listed on an Official Stock Exchange
Nominal Market
Value EUR % of
Net Assets
Banks (27.85%) (continued) Nordea Bank 0.300% 30/06/2022 323,000 327,315 0.36Nordea Bank 0.375% 28/05/2026 100,000 100,445 0.11Nordea Bank 1.000% 07/09/2026 150,000 151,488 0.17Nordea Bank 1.125% 27/09/2027 100,000 106,926 0.12OP Corporate Bank 1.000% 22/05/2025 300,000 315,519 0.35PSA Banque France 0.625% 10/10/2022 200,000 202,520 0.23Raiffeisen Bank International 0.250% 05/07/2021 200,000 200,865 0.22Societe Generale 1.000% 01/04/2022 600,000 613,744 0.68Societe Generale 1.125% 23/01/2025 700,000 715,040 0.80Societe Generale 1.750% 22/03/2029 400,000 422,447 0.47UniCredit 2.125% 24/10/2026 150,000 157,654 0.18Unione di Banche Italiane 1.500% 10/04/2024 200,000 199,246 0.22
Beverages (1.44%) Anheuser-Busch InBev 1.150% 22/01/2027 300,000 312,076 0.35Anheuser-Busch InBev 1.125% 01/07/2027 200,000 206,218 0.23Anheuser-Busch InBev 1.500% 18/04/2030 125,000 130,452 0.15Anheuser-Busch InBev 1.650% 28/03/2031 100,000 105,486 0.12Heineken 1.250% 17/03/2027 200,000 211,063 0.23Heineken 1.750% 17/03/2031 200,000 219,507 0.24Pernod Ricard 1.500% 18/05/2026 100,000 106,790 0.12
Building Materials (1.70%) Compagnie de Saint-Gobain 0.625% 15/03/2024 500,000 508,989 0.57Compagnie de Saint-Gobain 1.875% 15/03/2031 200,000 215,234 0.24HeidelbergCement Finance Luxembourg 0.500% 09/08/2022 300,000 303,164 0.34HeidelbergCement Finance Luxembourg 1.625% 07/04/2026 200,000 211,264 0.23HeidelbergCement Finance Luxembourg 1.750% 24/04/2028 175,000 183,921 0.20Imerys 1.500% 15/01/2027 100,000 103,811 0.12
Chemicals (2.58%) Air Liquide Finance 0.500% 13/06/2022 600,000 610,890 0.68Arkema 1.500% 20/04/2027 100,000 107,417 0.12Basf 0.875% 22/05/2025 200,000 209,749 0.23Basf 0.875% 15/11/2027 250,000 262,645 0.29Basf 1.500% 22/05/2030 100,000 109,854 0.12Basf 1.625% 15/11/2037 100,000 110,492 0.12Brenntag Finance 1.125% 27/09/2025 100,000 100,530 0.11Evonik Finance 08/03/2021 (zero coupon) 100,000 100,182 0.11Evonik Finance 0.375% 07/09/2024 200,000 203,009 0.23Evonik Industries 2.125% 07/07/2077 100,000 102,806 0.12Koninklijke DSM 0.750% 28/09/2026 100,000 103,751 0.12Lanxess 1.125% 16/05/2025 200,000 208,259 0.23Linde Finance 1.000% 20/04/2028 80,000 86,712 0.10
Commercial Services (3.62%) Abertis Infraestructuras 1.500% 27/06/2024 100,000 104,256 0.12Abertis Infraestructuras 3.000% 27/03/2031 300,000 328,365 0.37ALD 1.250% 11/10/2022 200,000 205,235 0.23Aprr 1.250% 18/01/2028 400,000 424,199 0.47Aprr 1.625% 13/01/2032 200,000 218,988 0.24Atlantia 1.875% 13/07/2027 400,000 390,625 0.43Autoroutes du Sud de la France 1.250% 18/01/2027 300,000 322,987 0.36Autoroutes du Sud de la France 1.375% 21/02/2031 200,000 213,886 0.24Compagnie Financiere et Industrielle des Autoroutes 1.125% 13/10/2027 400,000 425,808 0.47Edenred 1.875% 06/03/2026 200,000 215,444 0.24Holding d'Infrastructures de Transport 0.625% 27/03/2023 200,000 201,323 0.22Indigo Group 1.625% 19/04/2028 100,000 105,123 0.12Societa Iniziative Autostradali e Servizi 1.625% 08/02/2028 100,000 97,970 0.11
Computers (0.70%) Atos 1.750% 07/05/2025 200,000 213,178 0.24Capgemini 1.000% 18/10/2024 200,000 205,669 0.23Teleperformance 1.875% 02/07/2025 200,000 210,088 0.23
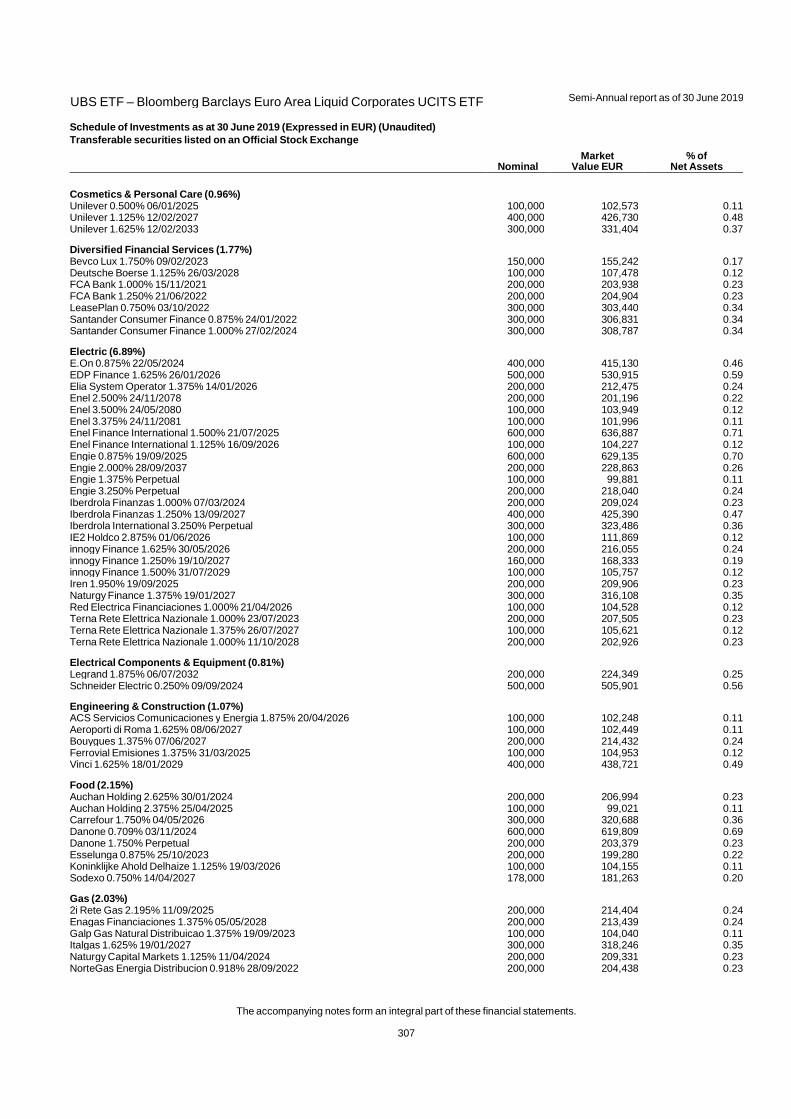
UBS ETF – Bloomberg Barclays Euro Area Liquid Corporates UCITS ETF
Semi-Annual report as of 30 June 2019
The accompanying notes form an integral part of these financial statements.
307
Schedule of Investments as at 30 June 2019 (Expressed in EUR) (Unaudited)
Transferable securities listed on an Official Stock Exchange
Nominal Market
Value EUR % of
Net Assets
Cosmetics & Personal Care (0.96%) Unilever 0.500% 06/01/2025 100,000 102,573 0.11Unilever 1.125% 12/02/2027 400,000 426,730 0.48Unilever 1.625% 12/02/2033 300,000 331,404 0.37
Diversified Financial Services (1.77%) Bevco Lux 1.750% 09/02/2023 150,000 155,242 0.17Deutsche Boerse 1.125% 26/03/2028 100,000 107,478 0.12FCA Bank 1.000% 15/11/2021 200,000 203,938 0.23FCA Bank 1.250% 21/06/2022 200,000 204,904 0.23LeasePlan 0.750% 03/10/2022 300,000 303,440 0.34Santander Consumer Finance 0.875% 24/01/2022 300,000 306,831 0.34Santander Consumer Finance 1.000% 27/02/2024 300,000 308,787 0.34
Electric (6.89%) E.On 0.875% 22/05/2024 400,000 415,130 0.46EDP Finance 1.625% 26/01/2026 500,000 530,915 0.59Elia System Operator 1.375% 14/01/2026 200,000 212,475 0.24Enel 2.500% 24/11/2078 200,000 201,196 0.22Enel 3.500% 24/05/2080 100,000 103,949 0.12Enel 3.375% 24/11/2081 100,000 101,996 0.11Enel Finance International 1.500% 21/07/2025 600,000 636,887 0.71Enel Finance International 1.125% 16/09/2026 100,000 104,227 0.12Engie 0.875% 19/09/2025 600,000 629,135 0.70Engie 2.000% 28/09/2037 200,000 228,863 0.26Engie 1.375% Perpetual 100,000 99,881 0.11Engie 3.250% Perpetual 200,000 218,040 0.24Iberdrola Finanzas 1.000% 07/03/2024 200,000 209,024 0.23Iberdrola Finanzas 1.250% 13/09/2027 400,000 425,390 0.47Iberdrola International 3.250% Perpetual 300,000 323,486 0.36IE2 Holdco 2.875% 01/06/2026 100,000 111,869 0.12innogy Finance 1.625% 30/05/2026 200,000 216,055 0.24innogy Finance 1.250% 19/10/2027 160,000 168,333 0.19innogy Finance 1.500% 31/07/2029 100,000 105,757 0.12Iren 1.950% 19/09/2025 200,000 209,906 0.23Naturgy Finance 1.375% 19/01/2027 300,000 316,108 0.35Red Electrica Financiaciones 1.000% 21/04/2026 100,000 104,528 0.12Terna Rete Elettrica Nazionale 1.000% 23/07/2023 200,000 207,505 0.23Terna Rete Elettrica Nazionale 1.375% 26/07/2027 100,000 105,621 0.12Terna Rete Elettrica Nazionale 1.000% 11/10/2028 200,000 202,926 0.23
Electrical Components & Equipment (0.81%) Legrand 1.875% 06/07/2032 200,000 224,349 0.25Schneider Electric 0.250% 09/09/2024 500,000 505,901 0.56
Engineering & Construction (1.07%) ACS Servicios Comunicaciones y Energia 1.875% 20/04/2026 100,000 102,248 0.11Aeroporti di Roma 1.625% 08/06/2027 100,000 102,449 0.11Bouygues 1.375% 07/06/2027 200,000 214,432 0.24Ferrovial Emisiones 1.375% 31/03/2025 100,000 104,953 0.12Vinci 1.625% 18/01/2029 400,000 438,721 0.49
Food (2.15%) Auchan Holding 2.625% 30/01/2024 200,000 206,994 0.23Auchan Holding 2.375% 25/04/2025 100,000 99,021 0.11Carrefour 1.750% 04/05/2026 300,000 320,688 0.36Danone 0.709% 03/11/2024 600,000 619,809 0.69Danone 1.750% Perpetual 200,000 203,379 0.23Esselunga 0.875% 25/10/2023 200,000 199,280 0.22Koninklijke Ahold Delhaize 1.125% 19/03/2026 100,000 104,155 0.11Sodexo 0.750% 14/04/2027 178,000 181,263 0.20
Gas (2.03%) 2i Rete Gas 2.195% 11/09/2025 200,000 214,404 0.24Enagas Financiaciones 1.375% 05/05/2028 200,000 213,439 0.24Galp Gas Natural Distribuicao 1.375% 19/09/2023 100,000 104,040 0.11Italgas 1.625% 19/01/2027 300,000 318,246 0.35Naturgy Capital Markets 1.125% 11/04/2024 200,000 209,331 0.23NorteGas Energia Distribucion 0.918% 28/09/2022 200,000 204,438 0.23
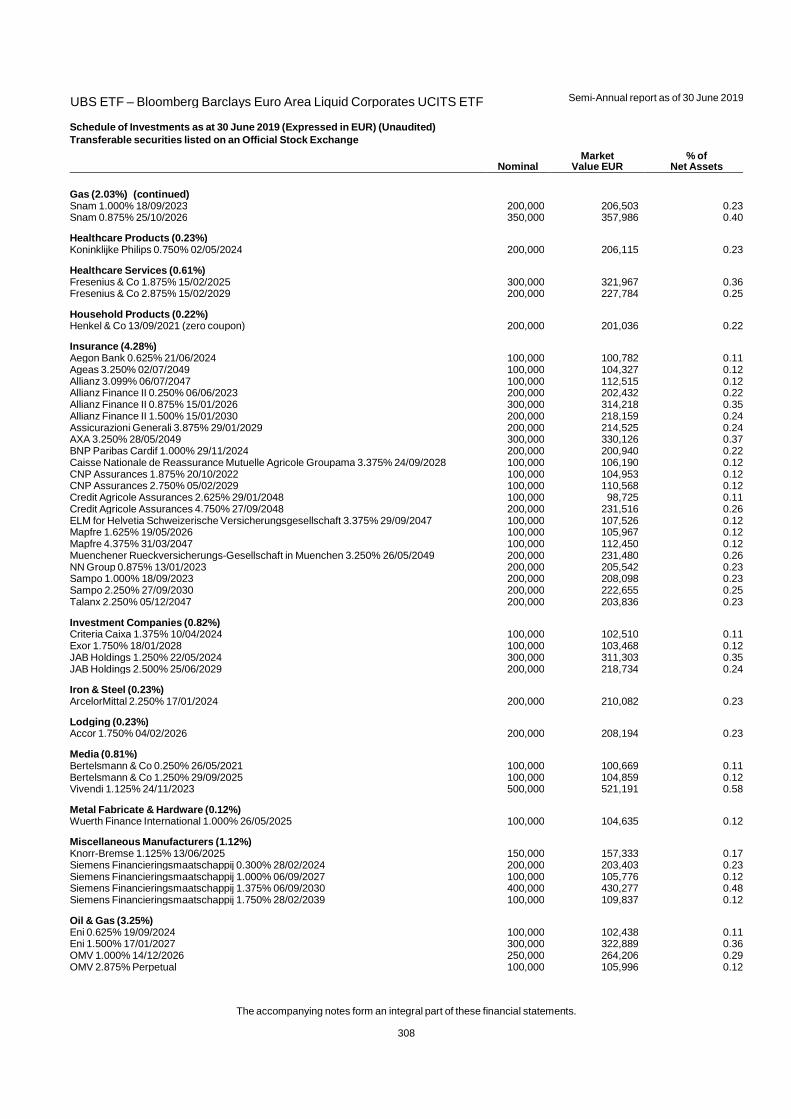
UBS ETF – Bloomberg Barclays Euro Area Liquid Corporates UCITS ETF
Semi-Annual report as of 30 June 2019
The accompanying notes form an integral part of these financial statements.
308
Schedule of Investments as at 30 June 2019 (Expressed in EUR) (Unaudited)
Transferable securities listed on an Official Stock Exchange
Nominal Market
Value EUR % of
Net Assets
Gas (2.03%) (continued) Snam 1.000% 18/09/2023 200,000 206,503 0.23Snam 0.875% 25/10/2026 350,000 357,986 0.40
Healthcare Products (0.23%) Koninklijke Philips 0.750% 02/05/2024 200,000 206,115 0.23
Healthcare Services (0.61%) Fresenius & Co 1.875% 15/02/2025 300,000 321,967 0.36Fresenius & Co 2.875% 15/02/2029 200,000 227,784 0.25
Household Products (0.22%) Henkel & Co 13/09/2021 (zero coupon) 200,000 201,036 0.22
Insurance (4.28%) Aegon Bank 0.625% 21/06/2024 100,000 100,782 0.11Ageas 3.250% 02/07/2049 100,000 104,327 0.12Allianz 3.099% 06/07/2047 100,000 112,515 0.12Allianz Finance II 0.250% 06/06/2023 200,000 202,432 0.22Allianz Finance II 0.875% 15/01/2026 300,000 314,218 0.35Allianz Finance II 1.500% 15/01/2030 200,000 218,159 0.24Assicurazioni Generali 3.875% 29/01/2029 200,000 214,525 0.24AXA 3.250% 28/05/2049 300,000 330,126 0.37BNP Paribas Cardif 1.000% 29/11/2024 200,000 200,940 0.22Caisse Nationale de Reassurance Mutuelle Agricole Groupama 3.375% 24/09/2028 100,000 106,190 0.12CNP Assurances 1.875% 20/10/2022 100,000 104,953 0.12CNP Assurances 2.750% 05/02/2029 100,000 110,568 0.12Credit Agricole Assurances 2.625% 29/01/2048 100,000 98,725 0.11Credit Agricole Assurances 4.750% 27/09/2048 200,000 231,516 0.26ELM for Helvetia Schweizerische Versicherungsgesellschaft 3.375% 29/09/2047 100,000 107,526 0.12Mapfre 1.625% 19/05/2026 100,000 105,967 0.12Mapfre 4.375% 31/03/2047 100,000 112,450 0.12Muenchener Rueckversicherungs-Gesellschaft in Muenchen 3.250% 26/05/2049 200,000 231,480 0.26NN Group 0.875% 13/01/2023 200,000 205,542 0.23Sampo 1.000% 18/09/2023 200,000 208,098 0.23Sampo 2.250% 27/09/2030 200,000 222,655 0.25Talanx 2.250% 05/12/2047 200,000 203,836 0.23
Investment Companies (0.82%) Criteria Caixa 1.375% 10/04/2024 100,000 102,510 0.11Exor 1.750% 18/01/2028 100,000 103,468 0.12JAB Holdings 1.250% 22/05/2024 300,000 311,303 0.35JAB Holdings 2.500% 25/06/2029 200,000 218,734 0.24
Iron & Steel (0.23%) ArcelorMittal 2.250% 17/01/2024 200,000 210,082 0.23
Lodging (0.23%) Accor 1.750% 04/02/2026 200,000 208,194 0.23
Media (0.81%) Bertelsmann & Co 0.250% 26/05/2021 100,000 100,669 0.11Bertelsmann & Co 1.250% 29/09/2025 100,000 104,859 0.12Vivendi 1.125% 24/11/2023 500,000 521,191 0.58
Metal Fabricate & Hardware (0.12%) Wuerth Finance International 1.000% 26/05/2025 100,000 104,635 0.12
Miscellaneous Manufacturers (1.12%) Knorr-Bremse 1.125% 13/06/2025 150,000 157,333 0.17Siemens Financieringsmaatschappij 0.300% 28/02/2024 200,000 203,403 0.23Siemens Financieringsmaatschappij 1.000% 06/09/2027 100,000 105,776 0.12Siemens Financieringsmaatschappij 1.375% 06/09/2030 400,000 430,277 0.48Siemens Financieringsmaatschappij 1.750% 28/02/2039 100,000 109,837 0.12
Oil & Gas (3.25%) Eni 0.625% 19/09/2024 100,000 102,438 0.11Eni 1.500% 17/01/2027 300,000 322,889 0.36OMV 1.000% 14/12/2026 250,000 264,206 0.29OMV 2.875% Perpetual 100,000 105,996 0.12

UBS ETF – Bloomberg Barclays Euro Area Liquid Corporates UCITS ETF
Semi-Annual report as of 30 June 2019
The accompanying notes form an integral part of these financial statements.
309
Schedule of Investments as at 30 June 2019 (Expressed in EUR) (Unaudited)
Transferable securities listed on an Official Stock Exchange
Nominal Market
Value EUR % of
Net Assets
Oil & Gas (3.25%) (continued) Repsol International Finance 0.500% 23/05/2022 100,000 101,720 0.11Shell International Finance 0.375% 15/02/2025 100,000 102,485 0.11Shell International Finance 1.250% 12/05/2028 200,000 216,000 0.24Total 2.708% Perpetual 200,000 213,745 0.24Total 3.369% Perpetual 300,000 333,915 0.37Total 1.750% Perpetual 100,000 102,681 0.12Total Capital International 0.625% 04/10/2024 500,000 516,813 0.58Total Capital International 0.696% 31/05/2028 200,000 206,388 0.23Total Capital International 1.491% 04/09/2030 300,000 330,021 0.37
Pharmaceuticals & Biotechnology (2.34%) Bayer Capital 1.500% 26/06/2026 300,000 310,728 0.35Bayer Capital 2.125% 15/12/2029 300,000 316,451 0.35Sanofi 21/03/2022 (zero coupon) 300,000 301,547 0.34Sanofi 0.625% 05/04/2024 500,000 515,490 0.57Sanofi 0.875% 21/03/2029 300,000 311,689 0.35Sanofi 1.875% 21/03/2038 300,000 345,094 0.38
Pipelines (0.12%) Vier Gas Transport 1.500% 25/09/2028 100,000 108,602 0.12
Private Equity (0.35%) Blackstone Property Partners Europe Holdings 2.200% 24/07/2025 300,000 316,753 0.35
Real Estate (4.41%) Aroundtown 1.000% 07/01/2025 200,000 201,431 0.22Aroundtown 1.875% 19/01/2026 300,000 314,900 0.35Aroundtown 2.000% 02/11/2026 400,000 420,138 0.47CPI Property Group 2.125% 04/10/2024 100,000 102,185 0.11Grand City Properties 1.375% 03/08/2026 200,000 205,644 0.23Immofinanz 2.625% 27/01/2023 100,000 104,347 0.12LEG Immobilien 1.250% 23/01/2024 100,000 103,800 0.12Logicor Financing 0.500% 30/04/2021 100,000 100,801 0.11Logicor Financing 2.250% 13/05/2025 200,000 213,156 0.24Logicor Financing 3.250% 13/11/2028 100,000 110,782 0.12TLG Immobilien 1.500% 28/05/2026 100,000 99,999 0.11Vesteda Finance 1.500% 24/05/2027 200,000 208,799 0.23Vonovia Finance 0.875% 03/07/2023 500,000 512,853 0.57Vonovia Finance 0.750% 15/01/2024 100,000 102,086 0.11Vonovia Finance 1.800% 29/06/2025 300,000 321,209 0.36Vonovia Finance 1.500% 22/03/2026 400,000 421,085 0.47Vonovia Finance 1.750% 25/01/2027 200,000 214,316 0.24Vonovia Finance 1.500% 14/01/2028 200,000 210,867 0.23
Real Estate Investment Trusts (4.04%) Covivio 1.500% 21/06/2027 200,000 207,352 0.23Gecina 1.375% 30/06/2027 300,000 321,193 0.36Gecina 1.625% 29/05/2034 100,000 104,546 0.12Icade 1.500% 13/09/2027 300,000 317,607 0.35Inmobiliaria Colonial Socimi 1.625% 28/11/2025 400,000 419,360 0.47Klepierre 0.625% 01/07/2030 200,000 196,720 0.22Merlin Properties Socimi 2.375% 23/05/2022 200,000 211,786 0.23Merlin Properties Socimi 1.875% 02/11/2026 200,000 210,248 0.23Unibail-Rodamco 0.875% 21/02/2025 350,000 365,141 0.41Unibail-Rodamco 1.000% 27/02/2027 400,000 414,571 0.46Unibail-Rodamco 1.875% 15/01/2031 300,000 329,080 0.36Unibail-Rodamco 2.250% 14/05/2038 200,000 231,094 0.26Unibail-Rodamco 2.125% Perpetual 300,000 303,417 0.34
Semiconductors (0.36%) ASML Holding 1.625% 28/05/2027 300,000 327,448 0.36
Software (1.05%) Amadeus IT Group 0.875% 18/09/2023 200,000 206,039 0.23SAP 0.250% 10/03/2022 300,000 303,227 0.34SAP 1.000% 13/03/2026 100,000 105,716 0.12SAP 1.625% 10/03/2031 300,000 329,482 0.36
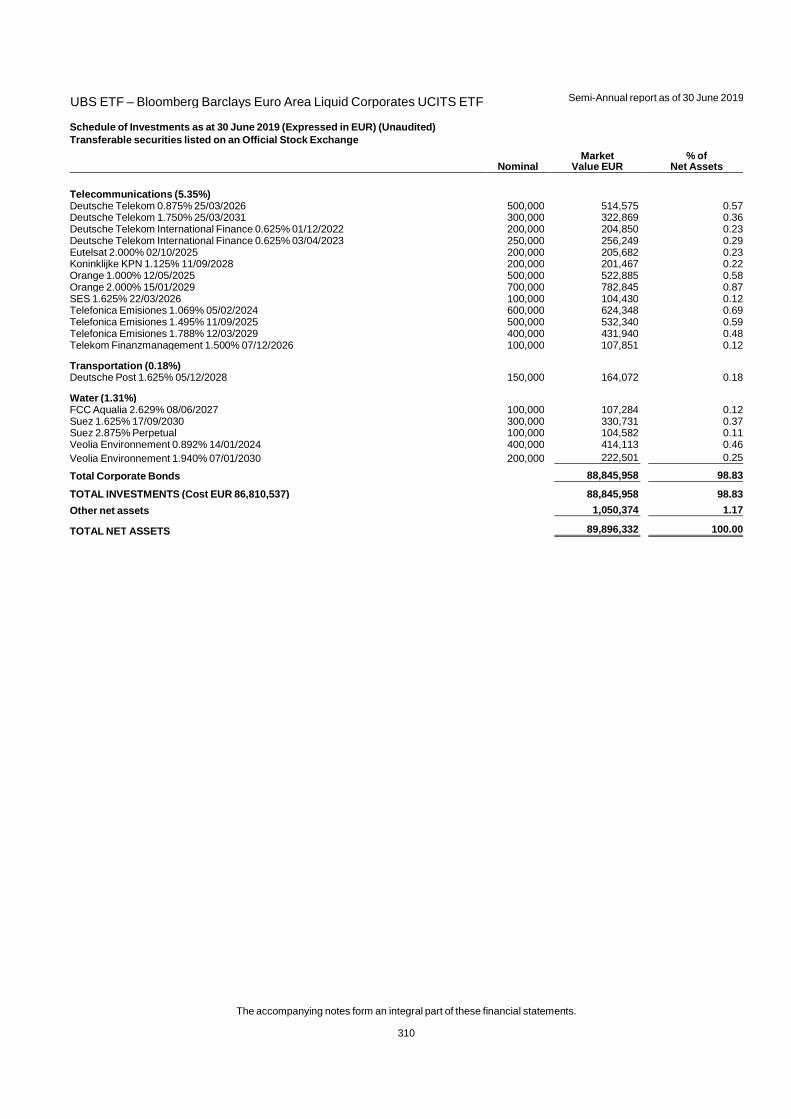
UBS ETF – Bloomberg Barclays Euro Area Liquid Corporates UCITS ETF
Semi-Annual report as of 30 June 2019
The accompanying notes form an integral part of these financial statements.
310
Schedule of Investments as at 30 June 2019 (Expressed in EUR) (Unaudited)
Transferable securities listed on an Official Stock Exchange
Nominal Market
Value EUR % of
Net Assets
Telecommunications (5.35%) Deutsche Telekom 0.875% 25/03/2026 500,000 514,575 0.57Deutsche Telekom 1.750% 25/03/2031 300,000 322,869 0.36Deutsche Telekom International Finance 0.625% 01/12/2022 200,000 204,850 0.23Deutsche Telekom International Finance 0.625% 03/04/2023 250,000 256,249 0.29Eutelsat 2.000% 02/10/2025 200,000 205,682 0.23Koninklijke KPN 1.125% 11/09/2028 200,000 201,467 0.22Orange 1.000% 12/05/2025 500,000 522,885 0.58Orange 2.000% 15/01/2029 700,000 782,845 0.87SES 1.625% 22/03/2026 100,000 104,430 0.12Telefonica Emisiones 1.069% 05/02/2024 600,000 624,348 0.69Telefonica Emisiones 1.495% 11/09/2025 500,000 532,340 0.59Telefonica Emisiones 1.788% 12/03/2029 400,000 431,940 0.48Telekom Finanzmanagement 1.500% 07/12/2026 100,000 107,851 0.12
Transportation (0.18%) Deutsche Post 1.625% 05/12/2028 150,000 164,072 0.18
Water (1.31%) FCC Aqualia 2.629% 08/06/2027 100,000 107,284 0.12Suez 1.625% 17/09/2030 300,000 330,731 0.37Suez 2.875% Perpetual 100,000 104,582 0.11Veolia Environnement 0.892% 14/01/2024 400,000 414,113 0.46Veolia Environnement 1.940% 07/01/2030 200,000 222,501 0.25
Total Corporate Bonds 88,845,958 98.83
TOTAL INVESTMENTS (Cost EUR 86,810,537) 88,845,958 98.83
Other net assets 1,050,374 1.17
TOTAL NET ASSETS 89,896,332 100.00
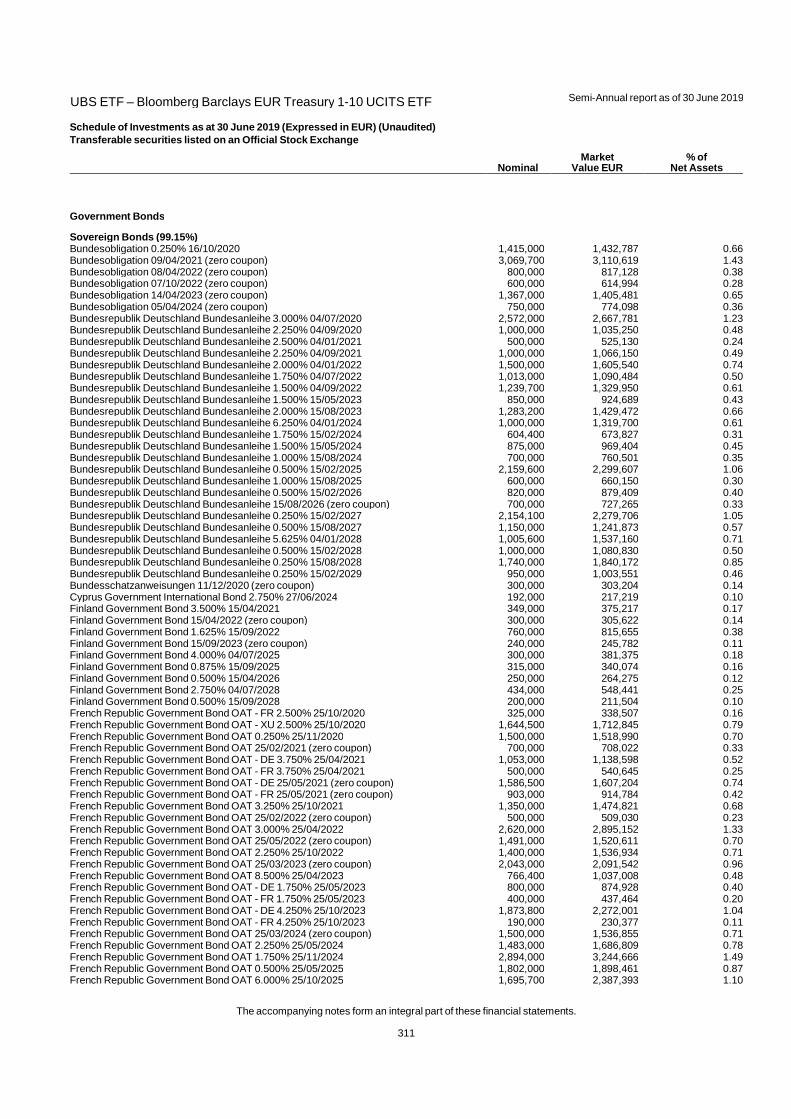
UBS ETF – Bloomberg Barclays EUR Treasury 1-10 UCITS ETF
Semi-Annual report as of 30 June 2019
The accompanying notes form an integral part of these financial statements.
311
Schedule of Investments as at 30 June 2019 (Expressed in EUR) (Unaudited)
Transferable securities listed on an Official Stock Exchange
Nominal Market
Value EUR % of
Net Assets
Government Bonds
Sovereign Bonds (99.15%) Bundesobligation 0.250% 16/10/2020 1,415,000 1,432,787 0.66Bundesobligation 09/04/2021 (zero coupon) 3,069,700 3,110,619 1.43Bundesobligation 08/04/2022 (zero coupon) 800,000 817,128 0.38Bundesobligation 07/10/2022 (zero coupon) 600,000 614,994 0.28Bundesobligation 14/04/2023 (zero coupon) 1,367,000 1,405,481 0.65Bundesobligation 05/04/2024 (zero coupon) 750,000 774,098 0.36Bundesrepublik Deutschland Bundesanleihe 3.000% 04/07/2020 2,572,000 2,667,781 1.23Bundesrepublik Deutschland Bundesanleihe 2.250% 04/09/2020 1,000,000 1,035,250 0.48Bundesrepublik Deutschland Bundesanleihe 2.500% 04/01/2021 500,000 525,130 0.24Bundesrepublik Deutschland Bundesanleihe 2.250% 04/09/2021 1,000,000 1,066,150 0.49Bundesrepublik Deutschland Bundesanleihe 2.000% 04/01/2022 1,500,000 1,605,540 0.74Bundesrepublik Deutschland Bundesanleihe 1.750% 04/07/2022 1,013,000 1,090,484 0.50Bundesrepublik Deutschland Bundesanleihe 1.500% 04/09/2022 1,239,700 1,329,950 0.61Bundesrepublik Deutschland Bundesanleihe 1.500% 15/05/2023 850,000 924,689 0.43Bundesrepublik Deutschland Bundesanleihe 2.000% 15/08/2023 1,283,200 1,429,472 0.66Bundesrepublik Deutschland Bundesanleihe 6.250% 04/01/2024 1,000,000 1,319,700 0.61Bundesrepublik Deutschland Bundesanleihe 1.750% 15/02/2024 604,400 673,827 0.31Bundesrepublik Deutschland Bundesanleihe 1.500% 15/05/2024 875,000 969,404 0.45Bundesrepublik Deutschland Bundesanleihe 1.000% 15/08/2024 700,000 760,501 0.35Bundesrepublik Deutschland Bundesanleihe 0.500% 15/02/2025 2,159,600 2,299,607 1.06Bundesrepublik Deutschland Bundesanleihe 1.000% 15/08/2025 600,000 660,150 0.30Bundesrepublik Deutschland Bundesanleihe 0.500% 15/02/2026 820,000 879,409 0.40Bundesrepublik Deutschland Bundesanleihe 15/08/2026 (zero coupon) 700,000 727,265 0.33Bundesrepublik Deutschland Bundesanleihe 0.250% 15/02/2027 2,154,100 2,279,706 1.05Bundesrepublik Deutschland Bundesanleihe 0.500% 15/08/2027 1,150,000 1,241,873 0.57Bundesrepublik Deutschland Bundesanleihe 5.625% 04/01/2028 1,005,600 1,537,160 0.71Bundesrepublik Deutschland Bundesanleihe 0.500% 15/02/2028 1,000,000 1,080,830 0.50Bundesrepublik Deutschland Bundesanleihe 0.250% 15/08/2028 1,740,000 1,840,172 0.85Bundesrepublik Deutschland Bundesanleihe 0.250% 15/02/2029 950,000 1,003,551 0.46Bundesschatzanweisungen 11/12/2020 (zero coupon) 300,000 303,204 0.14Cyprus Government International Bond 2.750% 27/06/2024 192,000 217,219 0.10Finland Government Bond 3.500% 15/04/2021 349,000 375,217 0.17Finland Government Bond 15/04/2022 (zero coupon) 300,000 305,622 0.14Finland Government Bond 1.625% 15/09/2022 760,000 815,655 0.38Finland Government Bond 15/09/2023 (zero coupon) 240,000 245,782 0.11Finland Government Bond 4.000% 04/07/2025 300,000 381,375 0.18Finland Government Bond 0.875% 15/09/2025 315,000 340,074 0.16Finland Government Bond 0.500% 15/04/2026 250,000 264,275 0.12Finland Government Bond 2.750% 04/07/2028 434,000 548,441 0.25Finland Government Bond 0.500% 15/09/2028 200,000 211,504 0.10French Republic Government Bond OAT - FR 2.500% 25/10/2020 325,000 338,507 0.16French Republic Government Bond OAT - XU 2.500% 25/10/2020 1,644,500 1,712,845 0.79French Republic Government Bond OAT 0.250% 25/11/2020 1,500,000 1,518,990 0.70French Republic Government Bond OAT 25/02/2021 (zero coupon) 700,000 708,022 0.33French Republic Government Bond OAT - DE 3.750% 25/04/2021 1,053,000 1,138,598 0.52French Republic Government Bond OAT - FR 3.750% 25/04/2021 500,000 540,645 0.25French Republic Government Bond OAT - DE 25/05/2021 (zero coupon) 1,586,500 1,607,204 0.74French Republic Government Bond OAT - FR 25/05/2021 (zero coupon) 903,000 914,784 0.42French Republic Government Bond OAT 3.250% 25/10/2021 1,350,000 1,474,821 0.68French Republic Government Bond OAT 25/02/2022 (zero coupon) 500,000 509,030 0.23French Republic Government Bond OAT 3.000% 25/04/2022 2,620,000 2,895,152 1.33French Republic Government Bond OAT 25/05/2022 (zero coupon) 1,491,000 1,520,611 0.70French Republic Government Bond OAT 2.250% 25/10/2022 1,400,000 1,536,934 0.71French Republic Government Bond OAT 25/03/2023 (zero coupon) 2,043,000 2,091,542 0.96French Republic Government Bond OAT 8.500% 25/04/2023 766,400 1,037,008 0.48French Republic Government Bond OAT - DE 1.750% 25/05/2023 800,000 874,928 0.40French Republic Government Bond OAT - FR 1.750% 25/05/2023 400,000 437,464 0.20French Republic Government Bond OAT - DE 4.250% 25/10/2023 1,873,800 2,272,001 1.04French Republic Government Bond OAT - FR 4.250% 25/10/2023 190,000 230,377 0.11French Republic Government Bond OAT 25/03/2024 (zero coupon) 1,500,000 1,536,855 0.71French Republic Government Bond OAT 2.250% 25/05/2024 1,483,000 1,686,809 0.78French Republic Government Bond OAT 1.750% 25/11/2024 2,894,000 3,244,666 1.49French Republic Government Bond OAT 0.500% 25/05/2025 1,802,000 1,898,461 0.87French Republic Government Bond OAT 6.000% 25/10/2025 1,695,700 2,387,393 1.10
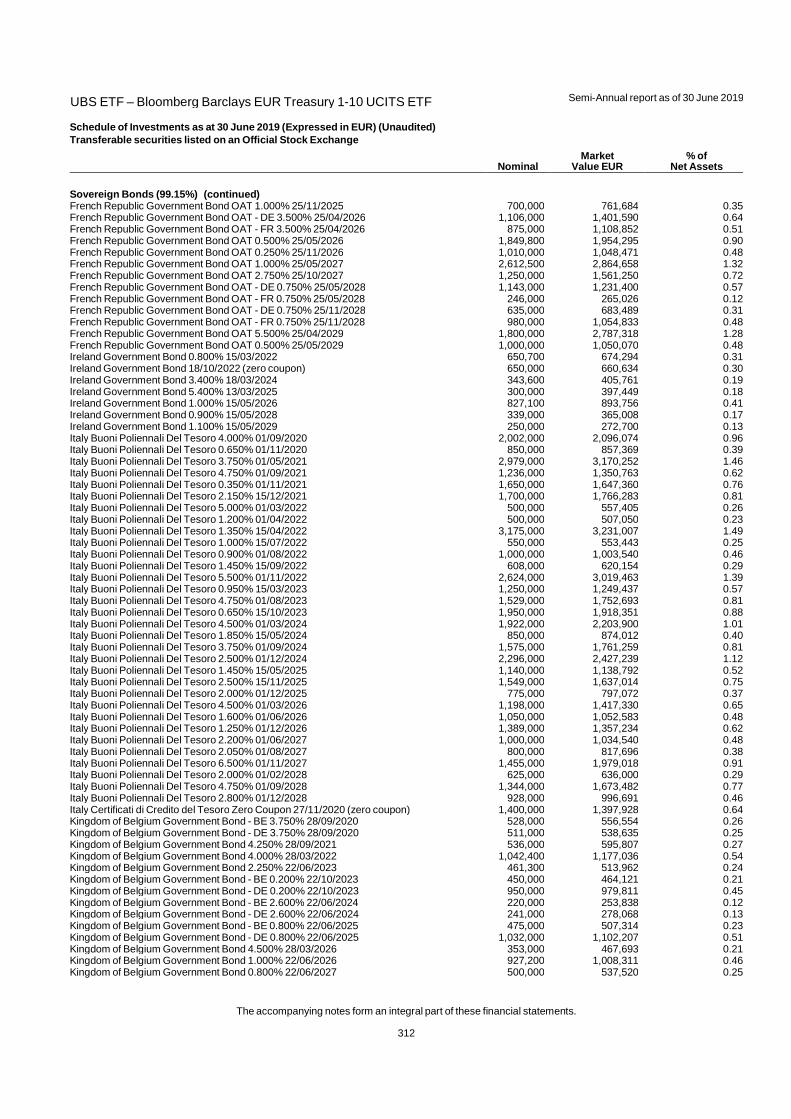
UBS ETF – Bloomberg Barclays EUR Treasury 1-10 UCITS ETF
Semi-Annual report as of 30 June 2019
The accompanying notes form an integral part of these financial statements.
312
Schedule of Investments as at 30 June 2019 (Expressed in EUR) (Unaudited)
Transferable securities listed on an Official Stock Exchange
Nominal Market
Value EUR % of
Net Assets
Sovereign Bonds (99.15%) (continued) French Republic Government Bond OAT 1.000% 25/11/2025 700,000 761,684 0.35French Republic Government Bond OAT - DE 3.500% 25/04/2026 1,106,000 1,401,590 0.64French Republic Government Bond OAT - FR 3.500% 25/04/2026 875,000 1,108,852 0.51French Republic Government Bond OAT 0.500% 25/05/2026 1,849,800 1,954,295 0.90French Republic Government Bond OAT 0.250% 25/11/2026 1,010,000 1,048,471 0.48French Republic Government Bond OAT 1.000% 25/05/2027 2,612,500 2,864,658 1.32French Republic Government Bond OAT 2.750% 25/10/2027 1,250,000 1,561,250 0.72French Republic Government Bond OAT - DE 0.750% 25/05/2028 1,143,000 1,231,400 0.57French Republic Government Bond OAT - FR 0.750% 25/05/2028 246,000 265,026 0.12French Republic Government Bond OAT - DE 0.750% 25/11/2028 635,000 683,489 0.31French Republic Government Bond OAT - FR 0.750% 25/11/2028 980,000 1,054,833 0.48French Republic Government Bond OAT 5.500% 25/04/2029 1,800,000 2,787,318 1.28French Republic Government Bond OAT 0.500% 25/05/2029 1,000,000 1,050,070 0.48Ireland Government Bond 0.800% 15/03/2022 650,700 674,294 0.31Ireland Government Bond 18/10/2022 (zero coupon) 650,000 660,634 0.30Ireland Government Bond 3.400% 18/03/2024 343,600 405,761 0.19Ireland Government Bond 5.400% 13/03/2025 300,000 397,449 0.18Ireland Government Bond 1.000% 15/05/2026 827,100 893,756 0.41Ireland Government Bond 0.900% 15/05/2028 339,000 365,008 0.17Ireland Government Bond 1.100% 15/05/2029 250,000 272,700 0.13Italy Buoni Poliennali Del Tesoro 4.000% 01/09/2020 2,002,000 2,096,074 0.96Italy Buoni Poliennali Del Tesoro 0.650% 01/11/2020 850,000 857,369 0.39Italy Buoni Poliennali Del Tesoro 3.750% 01/05/2021 2,979,000 3,170,252 1.46Italy Buoni Poliennali Del Tesoro 4.750% 01/09/2021 1,236,000 1,350,763 0.62Italy Buoni Poliennali Del Tesoro 0.350% 01/11/2021 1,650,000 1,647,360 0.76Italy Buoni Poliennali Del Tesoro 2.150% 15/12/2021 1,700,000 1,766,283 0.81Italy Buoni Poliennali Del Tesoro 5.000% 01/03/2022 500,000 557,405 0.26Italy Buoni Poliennali Del Tesoro 1.200% 01/04/2022 500,000 507,050 0.23Italy Buoni Poliennali Del Tesoro 1.350% 15/04/2022 3,175,000 3,231,007 1.49Italy Buoni Poliennali Del Tesoro 1.000% 15/07/2022 550,000 553,443 0.25Italy Buoni Poliennali Del Tesoro 0.900% 01/08/2022 1,000,000 1,003,540 0.46Italy Buoni Poliennali Del Tesoro 1.450% 15/09/2022 608,000 620,154 0.29Italy Buoni Poliennali Del Tesoro 5.500% 01/11/2022 2,624,000 3,019,463 1.39Italy Buoni Poliennali Del Tesoro 0.950% 15/03/2023 1,250,000 1,249,437 0.57Italy Buoni Poliennali Del Tesoro 4.750% 01/08/2023 1,529,000 1,752,693 0.81Italy Buoni Poliennali Del Tesoro 0.650% 15/10/2023 1,950,000 1,918,351 0.88Italy Buoni Poliennali Del Tesoro 4.500% 01/03/2024 1,922,000 2,203,900 1.01Italy Buoni Poliennali Del Tesoro 1.850% 15/05/2024 850,000 874,012 0.40Italy Buoni Poliennali Del Tesoro 3.750% 01/09/2024 1,575,000 1,761,259 0.81Italy Buoni Poliennali Del Tesoro 2.500% 01/12/2024 2,296,000 2,427,239 1.12Italy Buoni Poliennali Del Tesoro 1.450% 15/05/2025 1,140,000 1,138,792 0.52Italy Buoni Poliennali Del Tesoro 2.500% 15/11/2025 1,549,000 1,637,014 0.75Italy Buoni Poliennali Del Tesoro 2.000% 01/12/2025 775,000 797,072 0.37Italy Buoni Poliennali Del Tesoro 4.500% 01/03/2026 1,198,000 1,417,330 0.65Italy Buoni Poliennali Del Tesoro 1.600% 01/06/2026 1,050,000 1,052,583 0.48Italy Buoni Poliennali Del Tesoro 1.250% 01/12/2026 1,389,000 1,357,234 0.62Italy Buoni Poliennali Del Tesoro 2.200% 01/06/2027 1,000,000 1,034,540 0.48Italy Buoni Poliennali Del Tesoro 2.050% 01/08/2027 800,000 817,696 0.38Italy Buoni Poliennali Del Tesoro 6.500% 01/11/2027 1,455,000 1,979,018 0.91Italy Buoni Poliennali Del Tesoro 2.000% 01/02/2028 625,000 636,000 0.29Italy Buoni Poliennali Del Tesoro 4.750% 01/09/2028 1,344,000 1,673,482 0.77Italy Buoni Poliennali Del Tesoro 2.800% 01/12/2028 928,000 996,691 0.46Italy Certificati di Credito del Tesoro Zero Coupon 27/11/2020 (zero coupon) 1,400,000 1,397,928 0.64Kingdom of Belgium Government Bond - BE 3.750% 28/09/2020 528,000 556,554 0.26Kingdom of Belgium Government Bond - DE 3.750% 28/09/2020 511,000 538,635 0.25Kingdom of Belgium Government Bond 4.250% 28/09/2021 536,000 595,807 0.27Kingdom of Belgium Government Bond 4.000% 28/03/2022 1,042,400 1,177,036 0.54Kingdom of Belgium Government Bond 2.250% 22/06/2023 461,300 513,962 0.24Kingdom of Belgium Government Bond - BE 0.200% 22/10/2023 450,000 464,121 0.21Kingdom of Belgium Government Bond - DE 0.200% 22/10/2023 950,000 979,811 0.45Kingdom of Belgium Government Bond - BE 2.600% 22/06/2024 220,000 253,838 0.12Kingdom of Belgium Government Bond - DE 2.600% 22/06/2024 241,000 278,068 0.13Kingdom of Belgium Government Bond - BE 0.800% 22/06/2025 475,000 507,314 0.23Kingdom of Belgium Government Bond - DE 0.800% 22/06/2025 1,032,000 1,102,207 0.51Kingdom of Belgium Government Bond 4.500% 28/03/2026 353,000 467,693 0.21Kingdom of Belgium Government Bond 1.000% 22/06/2026 927,200 1,008,311 0.46Kingdom of Belgium Government Bond 0.800% 22/06/2027 500,000 537,520 0.25
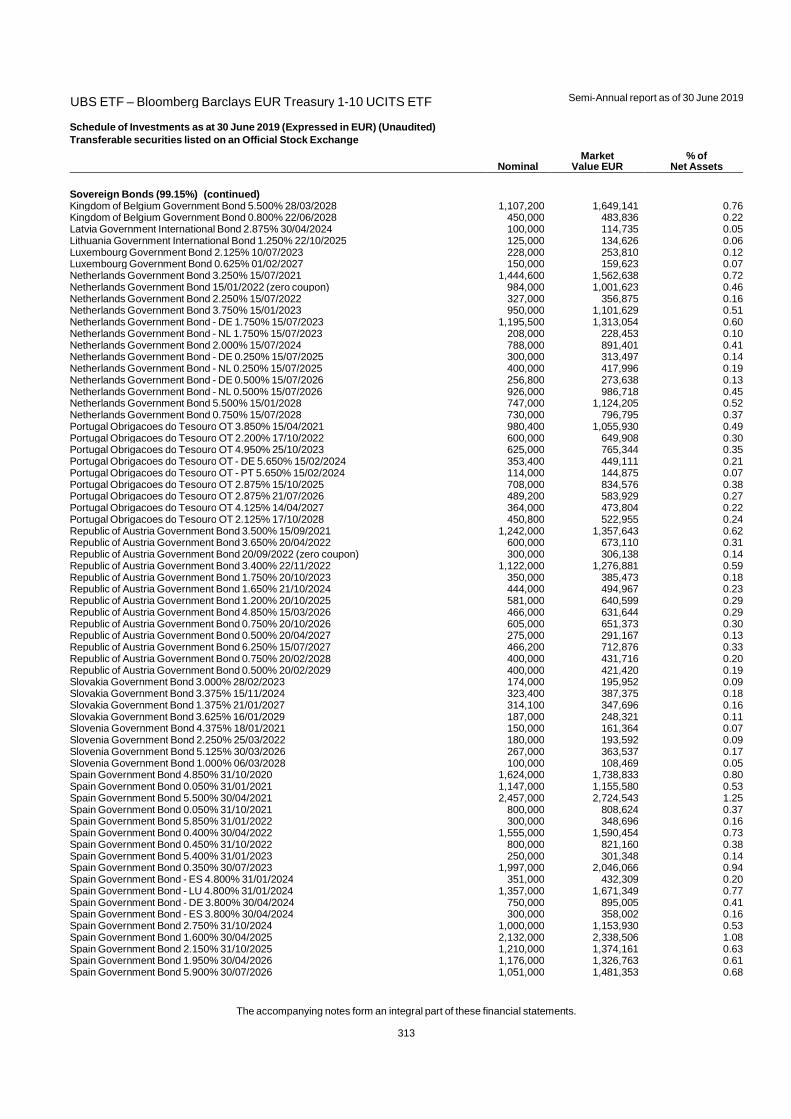
UBS ETF – Bloomberg Barclays EUR Treasury 1-10 UCITS ETF
Semi-Annual report as of 30 June 2019
The accompanying notes form an integral part of these financial statements.
313
Schedule of Investments as at 30 June 2019 (Expressed in EUR) (Unaudited)
Transferable securities listed on an Official Stock Exchange
Nominal Market
Value EUR % of
Net Assets
Sovereign Bonds (99.15%) (continued) Kingdom of Belgium Government Bond 5.500% 28/03/2028 1,107,200 1,649,141 0.76Kingdom of Belgium Government Bond 0.800% 22/06/2028 450,000 483,836 0.22Latvia Government International Bond 2.875% 30/04/2024 100,000 114,735 0.05Lithuania Government International Bond 1.250% 22/10/2025 125,000 134,626 0.06Luxembourg Government Bond 2.125% 10/07/2023 228,000 253,810 0.12Luxembourg Government Bond 0.625% 01/02/2027 150,000 159,623 0.07Netherlands Government Bond 3.250% 15/07/2021 1,444,600 1,562,638 0.72Netherlands Government Bond 15/01/2022 (zero coupon) 984,000 1,001,623 0.46Netherlands Government Bond 2.250% 15/07/2022 327,000 356,875 0.16Netherlands Government Bond 3.750% 15/01/2023 950,000 1,101,629 0.51Netherlands Government Bond - DE 1.750% 15/07/2023 1,195,500 1,313,054 0.60Netherlands Government Bond - NL 1.750% 15/07/2023 208,000 228,453 0.10Netherlands Government Bond 2.000% 15/07/2024 788,000 891,401 0.41Netherlands Government Bond - DE 0.250% 15/07/2025 300,000 313,497 0.14Netherlands Government Bond - NL 0.250% 15/07/2025 400,000 417,996 0.19Netherlands Government Bond - DE 0.500% 15/07/2026 256,800 273,638 0.13Netherlands Government Bond - NL 0.500% 15/07/2026 926,000 986,718 0.45Netherlands Government Bond 5.500% 15/01/2028 747,000 1,124,205 0.52Netherlands Government Bond 0.750% 15/07/2028 730,000 796,795 0.37Portugal Obrigacoes do Tesouro OT 3.850% 15/04/2021 980,400 1,055,930 0.49Portugal Obrigacoes do Tesouro OT 2.200% 17/10/2022 600,000 649,908 0.30Portugal Obrigacoes do Tesouro OT 4.950% 25/10/2023 625,000 765,344 0.35Portugal Obrigacoes do Tesouro OT - DE 5.650% 15/02/2024 353,400 449,111 0.21Portugal Obrigacoes do Tesouro OT - PT 5.650% 15/02/2024 114,000 144,875 0.07Portugal Obrigacoes do Tesouro OT 2.875% 15/10/2025 708,000 834,576 0.38Portugal Obrigacoes do Tesouro OT 2.875% 21/07/2026 489,200 583,929 0.27Portugal Obrigacoes do Tesouro OT 4.125% 14/04/2027 364,000 473,804 0.22Portugal Obrigacoes do Tesouro OT 2.125% 17/10/2028 450,800 522,955 0.24Republic of Austria Government Bond 3.500% 15/09/2021 1,242,000 1,357,643 0.62Republic of Austria Government Bond 3.650% 20/04/2022 600,000 673,110 0.31Republic of Austria Government Bond 20/09/2022 (zero coupon) 300,000 306,138 0.14Republic of Austria Government Bond 3.400% 22/11/2022 1,122,000 1,276,881 0.59Republic of Austria Government Bond 1.750% 20/10/2023 350,000 385,473 0.18Republic of Austria Government Bond 1.650% 21/10/2024 444,000 494,967 0.23Republic of Austria Government Bond 1.200% 20/10/2025 581,000 640,599 0.29Republic of Austria Government Bond 4.850% 15/03/2026 466,000 631,644 0.29Republic of Austria Government Bond 0.750% 20/10/2026 605,000 651,373 0.30Republic of Austria Government Bond 0.500% 20/04/2027 275,000 291,167 0.13Republic of Austria Government Bond 6.250% 15/07/2027 466,200 712,876 0.33Republic of Austria Government Bond 0.750% 20/02/2028 400,000 431,716 0.20Republic of Austria Government Bond 0.500% 20/02/2029 400,000 421,420 0.19Slovakia Government Bond 3.000% 28/02/2023 174,000 195,952 0.09Slovakia Government Bond 3.375% 15/11/2024 323,400 387,375 0.18Slovakia Government Bond 1.375% 21/01/2027 314,100 347,696 0.16Slovakia Government Bond 3.625% 16/01/2029 187,000 248,321 0.11Slovenia Government Bond 4.375% 18/01/2021 150,000 161,364 0.07Slovenia Government Bond 2.250% 25/03/2022 180,000 193,592 0.09Slovenia Government Bond 5.125% 30/03/2026 267,000 363,537 0.17Slovenia Government Bond 1.000% 06/03/2028 100,000 108,469 0.05Spain Government Bond 4.850% 31/10/2020 1,624,000 1,738,833 0.80Spain Government Bond 0.050% 31/01/2021 1,147,000 1,155,580 0.53Spain Government Bond 5.500% 30/04/2021 2,457,000 2,724,543 1.25Spain Government Bond 0.050% 31/10/2021 800,000 808,624 0.37Spain Government Bond 5.850% 31/01/2022 300,000 348,696 0.16Spain Government Bond 0.400% 30/04/2022 1,555,000 1,590,454 0.73Spain Government Bond 0.450% 31/10/2022 800,000 821,160 0.38Spain Government Bond 5.400% 31/01/2023 250,000 301,348 0.14Spain Government Bond 0.350% 30/07/2023 1,997,000 2,046,066 0.94Spain Government Bond - ES 4.800% 31/01/2024 351,000 432,309 0.20Spain Government Bond - LU 4.800% 31/01/2024 1,357,000 1,671,349 0.77Spain Government Bond - DE 3.800% 30/04/2024 750,000 895,005 0.41Spain Government Bond - ES 3.800% 30/04/2024 300,000 358,002 0.16Spain Government Bond 2.750% 31/10/2024 1,000,000 1,153,930 0.53Spain Government Bond 1.600% 30/04/2025 2,132,000 2,338,506 1.08Spain Government Bond 2.150% 31/10/2025 1,210,000 1,374,161 0.63Spain Government Bond 1.950% 30/04/2026 1,176,000 1,326,763 0.61Spain Government Bond 5.900% 30/07/2026 1,051,000 1,481,353 0.68

UBS ETF – Bloomberg Barclays EUR Treasury 1-10 UCITS ETF
Semi-Annual report as of 30 June 2019
The accompanying notes form an integral part of these financial statements.
314
Schedule of Investments as at 30 June 2019 (Expressed in EUR) (Unaudited)
Transferable securities listed on an Official Stock Exchange
Nominal Market
Value EUR % of
Net Assets
Sovereign Bonds (99.15%) (continued) Spain Government Bond 1.500% 30/04/2027 2,916,000 3,213,753 1.48Spain Government Bond 1.400% 30/04/2028 2,115,000 2,323,497 1.07Spain Government Bond 1.400% 30/07/2028 1,250,000 1,371,225 0.63Spain Government Bond 6.000% 31/01/2029 1,550,000 2,378,893 1.09Spain Government Bond 1.450% 30/04/2029 610,000 672,251 0.31
Total Government Bonds 215,602,911 99.15
TOTAL INVESTMENTS (Cost EUR 210,214,221) 215,602,911 99.15
Other net assets 1,840,758 0.85
TOTAL NET ASSETS 217,443,669 100.00
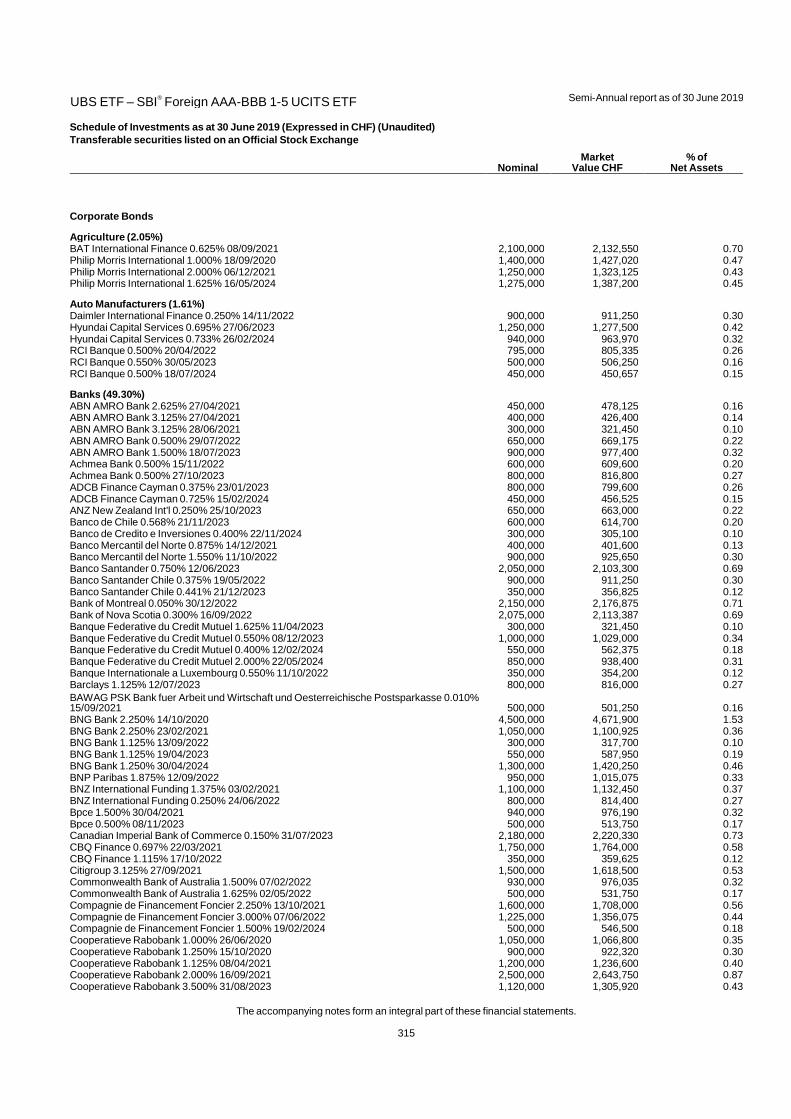
UBS ETF – SBI® Foreign AAA-BBB 1-5 UCITS ETF
Semi-Annual report as of 30 June 2019
The accompanying notes form an integral part of these financial statements.
315
Schedule of Investments as at 30 June 2019 (Expressed in CHF) (Unaudited)
Transferable securities listed on an Official Stock Exchange
Nominal Market
Value CHF % of
Net Assets
Corporate Bonds
Agriculture (2.05%) BAT International Finance 0.625% 08/09/2021 2,100,000 2,132,550 0.70Philip Morris International 1.000% 18/09/2020 1,400,000 1,427,020 0.47Philip Morris International 2.000% 06/12/2021 1,250,000 1,323,125 0.43Philip Morris International 1.625% 16/05/2024 1,275,000 1,387,200 0.45
Auto Manufacturers (1.61%) Daimler International Finance 0.250% 14/11/2022 900,000 911,250 0.30Hyundai Capital Services 0.695% 27/06/2023 1,250,000 1,277,500 0.42Hyundai Capital Services 0.733% 26/02/2024 940,000 963,970 0.32RCI Banque 0.500% 20/04/2022 795,000 805,335 0.26RCI Banque 0.550% 30/05/2023 500,000 506,250 0.16RCI Banque 0.500% 18/07/2024 450,000 450,657 0.15
Banks (49.30%) ABN AMRO Bank 2.625% 27/04/2021 450,000 478,125 0.16ABN AMRO Bank 3.125% 27/04/2021 400,000 426,400 0.14ABN AMRO Bank 3.125% 28/06/2021 300,000 321,450 0.10ABN AMRO Bank 0.500% 29/07/2022 650,000 669,175 0.22ABN AMRO Bank 1.500% 18/07/2023 900,000 977,400 0.32Achmea Bank 0.500% 15/11/2022 600,000 609,600 0.20Achmea Bank 0.500% 27/10/2023 800,000 816,800 0.27ADCB Finance Cayman 0.375% 23/01/2023 800,000 799,600 0.26ADCB Finance Cayman 0.725% 15/02/2024 450,000 456,525 0.15ANZ New Zealand Int'l 0.250% 25/10/2023 650,000 663,000 0.22Banco de Chile 0.568% 21/11/2023 600,000 614,700 0.20Banco de Credito e Inversiones 0.400% 22/11/2024 300,000 305,100 0.10Banco Mercantil del Norte 0.875% 14/12/2021 400,000 401,600 0.13Banco Mercantil del Norte 1.550% 11/10/2022 900,000 925,650 0.30Banco Santander 0.750% 12/06/2023 2,050,000 2,103,300 0.69Banco Santander Chile 0.375% 19/05/2022 900,000 911,250 0.30Banco Santander Chile 0.441% 21/12/2023 350,000 356,825 0.12Bank of Montreal 0.050% 30/12/2022 2,150,000 2,176,875 0.71Bank of Nova Scotia 0.300% 16/09/2022 2,075,000 2,113,387 0.69Banque Federative du Credit Mutuel 1.625% 11/04/2023 300,000 321,450 0.10Banque Federative du Credit Mutuel 0.550% 08/12/2023 1,000,000 1,029,000 0.34Banque Federative du Credit Mutuel 0.400% 12/02/2024 550,000 562,375 0.18Banque Federative du Credit Mutuel 2.000% 22/05/2024 850,000 938,400 0.31Banque Internationale a Luxembourg 0.550% 11/10/2022 350,000 354,200 0.12Barclays 1.125% 12/07/2023 800,000 816,000 0.27BAWAG PSK Bank fuer Arbeit und Wirtschaft und Oesterreichische Postsparkasse 0.010% 15/09/2021 500,000 501,250 0.16BNG Bank 2.250% 14/10/2020 4,500,000 4,671,900 1.53BNG Bank 2.250% 23/02/2021 1,050,000 1,100,925 0.36BNG Bank 1.125% 13/09/2022 300,000 317,700 0.10BNG Bank 1.125% 19/04/2023 550,000 587,950 0.19BNG Bank 1.250% 30/04/2024 1,300,000 1,420,250 0.46BNP Paribas 1.875% 12/09/2022 950,000 1,015,075 0.33BNZ International Funding 1.375% 03/02/2021 1,100,000 1,132,450 0.37BNZ International Funding 0.250% 24/06/2022 800,000 814,400 0.27Bpce 1.500% 30/04/2021 940,000 976,190 0.32Bpce 0.500% 08/11/2023 500,000 513,750 0.17Canadian Imperial Bank of Commerce 0.150% 31/07/2023 2,180,000 2,220,330 0.73CBQ Finance 0.697% 22/03/2021 1,750,000 1,764,000 0.58CBQ Finance 1.115% 17/10/2022 350,000 359,625 0.12Citigroup 3.125% 27/09/2021 1,500,000 1,618,500 0.53Commonwealth Bank of Australia 1.500% 07/02/2022 930,000 976,035 0.32Commonwealth Bank of Australia 1.625% 02/05/2022 500,000 531,750 0.17Compagnie de Financement Foncier 2.250% 13/10/2021 1,600,000 1,708,000 0.56Compagnie de Financement Foncier 3.000% 07/06/2022 1,225,000 1,356,075 0.44Compagnie de Financement Foncier 1.500% 19/02/2024 500,000 546,500 0.18Cooperatieve Rabobank 1.000% 26/06/2020 1,050,000 1,066,800 0.35Cooperatieve Rabobank 1.250% 15/10/2020 900,000 922,320 0.30Cooperatieve Rabobank 1.125% 08/04/2021 1,200,000 1,236,600 0.40Cooperatieve Rabobank 2.000% 16/09/2021 2,500,000 2,643,750 0.87Cooperatieve Rabobank 3.500% 31/08/2023 1,120,000 1,305,920 0.43

UBS ETF – SBI® Foreign AAA-BBB 1-5 UCITS ETF
Semi-Annual report as of 30 June 2019
The accompanying notes form an integral part of these financial statements.
316
Schedule of Investments as at 30 June 2019 (Expressed in CHF) (Unaudited)
Transferable securities listed on an Official Stock Exchange
Nominal Market
Value CHF % of
Net Assets
Banks (49.30%) (continued) Coopeuch 1.050% 15/10/2021 500,000 508,750 0.17Credit Agricole 1.250% 17/07/2020 1,300,000 1,326,520 0.43Credit Agricole 1.000% 08/10/2021 850,000 876,775 0.29Credit Agricole 0.450% 14/03/2022 1,000,000 1,014,500 0.33Credit Agricole 0.550% 01/09/2022 500,000 513,000 0.17Credit Agricole 1.750% 13/03/2023 280,000 299,880 0.10Credit Agricole 0.625% 15/09/2023 400,000 413,400 0.13Credit Agricole 0.200% 30/10/2023 750,000 761,250 0.25Credit Agricole 0.300% 18/04/2024 450,000 458,325 0.15Credit Suisse 1.000% 24/09/2021 1,800,000 1,860,300 0.61Credit Suisse 0.550% 15/04/2024 1,000,000 1,031,500 0.34Credit Suisse Group Funding Guernsey 0.625% 21/08/2020 1,650,000 1,668,810 0.55Credit Suisse Group Funding Guernsey 1.000% 14/04/2023 4,250,000 4,407,250 1.44Danske Bank 0.625% 24/11/2022 1,000,000 1,009,000 0.33Deutsche Bank 0.750% 05/07/2021 600,000 598,500 0.20Deutsche Bank 0.750% 21/03/2022 1,200,000 1,186,800 0.39Deutsche Bank 1.625% 12/09/2022 750,000 759,750 0.25Deutsche Bank 0.625% 08/02/2023 800,000 784,000 0.26Deutsche Bank 0.625% 19/12/2023 1,300,000 1,263,600 0.41Deutsche Pfandbriefbank 0.300% 02/11/2021 400,000 398,800 0.13Deutsche Pfandbriefbank 0.125% 05/06/2023 600,000 599,700 0.20DNB Bank 0.125% 30/11/2023 500,000 509,500 0.17DNB Bank 0.050% 13/03/2024 500,000 507,750 0.17DNB Boligkreditt 2.250% 25/01/2021 600,000 628,500 0.21DVB Bank 0.575% 17/06/2022 500,000 495,000 0.16DZ Bank Deutsche Zentral-Genossenschaftsbank Frankfurt Am Main 3.238% 30/08/2023 500,000 549,500 0.18Eksportfinans 2.250% 11/02/2021 1,250,000 1,296,250 0.42Emirates 0.625% 09/02/2023 1,300,000 1,306,500 0.43First Abu Dhabi Bank 0.323% 27/09/2023 1,000,000 1,005,000 0.33First Abu Dhabi Bank 0.401% 02/10/2024 200,000 204,000 0.07First Gulf Bank 0.625% 27/05/2022 700,000 712,600 0.23Goldman Sachs Group 0.550% 09/09/2021 1,400,000 1,423,100 0.47HYPO NOE Landesbank fuer Niederoesterreich und Wien 30/12/2020 (zero coupon) 500,000 503,500 0.16HYPO NOE Landesbank fuer Niederoesterreich und Wien 0.200% 31/03/2022 500,000 506,500 0.17HYPO NOE Landesbank fuer Niederoesterreich und Wien 0.125% 17/10/2023 450,000 454,950 0.15HYPO NOE Landesbank fuer Niederoesterreich und Wien 0.100% 27/11/2024 150,000 151,050 0.05Hypo Vorarlberg Bank 0.125% 06/10/2021 1,000,000 1,006,000 0.33Hypo Vorarlberg Bank 0.450% 05/03/2024 800,000 819,600 0.27ING Bank 2.625% 23/03/2021 1,350,000 1,424,925 0.47ING Bank 3.000% 17/12/2021 100,000 108,550 0.04JPMorgan Chase & Co 1.125% 06/11/2020 1,000,000 1,019,500 0.33JPMorgan Chase & Co 0.500% 04/12/2023 3,200,000 3,310,400 1.08KEB Hana Bank 0.408% 14/09/2023 900,000 916,200 0.30Kiwibank 1.000% 23/12/2020 450,000 461,250 0.15Kiwibank 0.250% 18/10/2023 1,000,000 1,018,000 0.33Kommunalkredit Austria 2.375% 26/08/2020 300,000 308,610 0.10Kommunalkredit Austria 2.500% 14/02/2022 1,000,000 1,072,500 0.35Kreditanstalt fuer Wiederaufbau 2.250% 12/08/2020 800,000 826,400 0.27Lansforsakringar Hypotek 1.125% 11/04/2023 460,000 488,750 0.16Macquarie Bank 3.000% 29/11/2022 1,000,000 1,110,000 0.36Macquarie Bank 0.625% 04/09/2023 1,350,000 1,389,825 0.46Macquarie Bank 0.750% 05/02/2024 650,000 670,800 0.22mBank 0.565% 07/06/2022 750,000 759,000 0.25Mediobanca International Luxembourg 0.550% 02/03/2023 700,000 706,300 0.23mFinance France 1.005% 28/03/2023 1,000,000 1,022,500 0.33Muenchener Hypothekenbank 0.350% 12/12/2023 500,000 509,500 0.17Muenchener Hypothekenbank 0.001% 19/02/2024 750,000 769,500 0.25National Australia Bank 1.000% 10/12/2021 1,440,000 1,494,720 0.49National Australia Bank 0.350% 05/08/2022 950,000 969,950 0.32National Australia Bank 0.250% 19/01/2023 1,220,000 1,243,790 0.41National Australia Bank 1.625% 05/09/2023 750,000 809,250 0.26National Australia Bank 1.500% 07/02/2024 550,000 603,900 0.20National Australia Bank 0.250% 13/03/2024 1,300,000 1,329,900 0.44Nederlandse Waterschapsbank 2.375% 19/08/2020 1,750,000 1,811,425 0.59Nederlandse Waterschapsbank 2.250% 24/02/2021 950,000 996,075 0.33Nederlandse Waterschapsbank 2.625% 07/02/2022 1,000,000 1,090,000 0.36Nederlandse Waterschapsbank 2.375% 27/01/2023 1,800,000 2,000,700 0.66
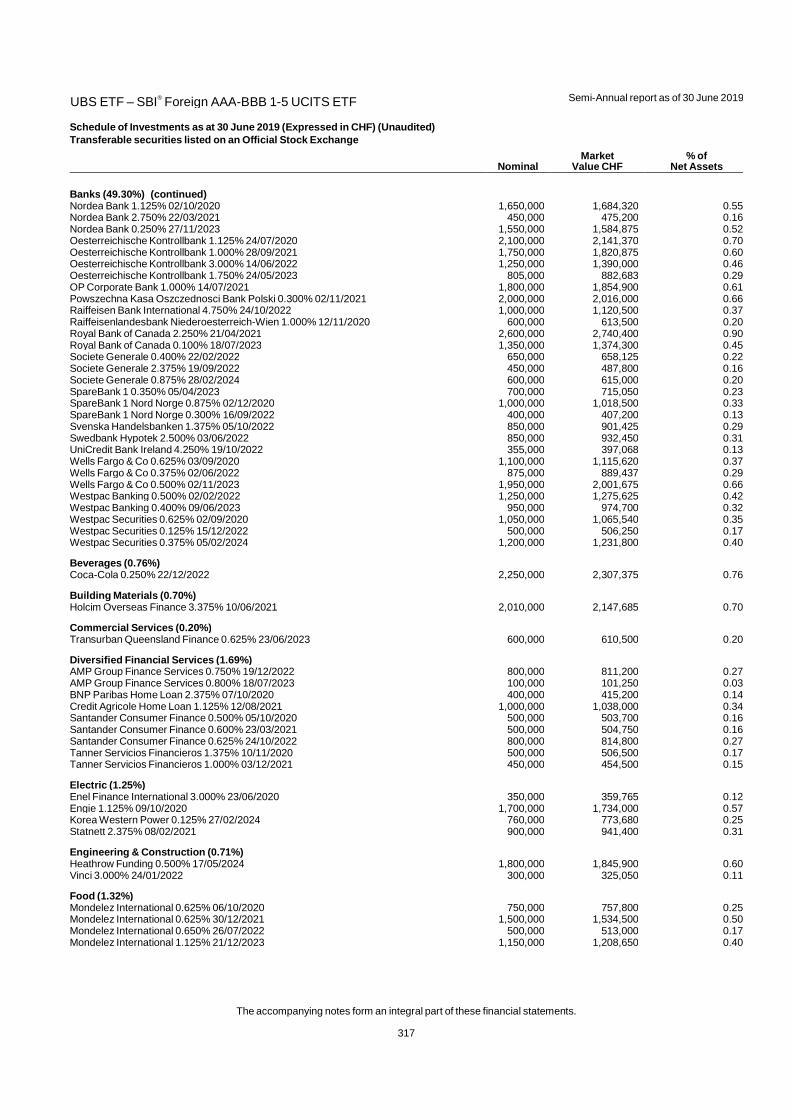
UBS ETF – SBI® Foreign AAA-BBB 1-5 UCITS ETF
Semi-Annual report as of 30 June 2019
The accompanying notes form an integral part of these financial statements.
317
Schedule of Investments as at 30 June 2019 (Expressed in CHF) (Unaudited)
Transferable securities listed on an Official Stock Exchange
Nominal Market
Value CHF % of
Net Assets
Banks (49.30%) (continued) Nordea Bank 1.125% 02/10/2020 1,650,000 1,684,320 0.55Nordea Bank 2.750% 22/03/2021 450,000 475,200 0.16Nordea Bank 0.250% 27/11/2023 1,550,000 1,584,875 0.52Oesterreichische Kontrollbank 1.125% 24/07/2020 2,100,000 2,141,370 0.70Oesterreichische Kontrollbank 1.000% 28/09/2021 1,750,000 1,820,875 0.60Oesterreichische Kontrollbank 3.000% 14/06/2022 1,250,000 1,390,000 0.46Oesterreichische Kontrollbank 1.750% 24/05/2023 805,000 882,683 0.29OP Corporate Bank 1.000% 14/07/2021 1,800,000 1,854,900 0.61Powszechna Kasa Oszczednosci Bank Polski 0.300% 02/11/2021 2,000,000 2,016,000 0.66Raiffeisen Bank International 4.750% 24/10/2022 1,000,000 1,120,500 0.37Raiffeisenlandesbank Niederoesterreich-Wien 1.000% 12/11/2020 600,000 613,500 0.20Royal Bank of Canada 2.250% 21/04/2021 2,600,000 2,740,400 0.90Royal Bank of Canada 0.100% 18/07/2023 1,350,000 1,374,300 0.45Societe Generale 0.400% 22/02/2022 650,000 658,125 0.22Societe Generale 2.375% 19/09/2022 450,000 487,800 0.16Societe Generale 0.875% 28/02/2024 600,000 615,000 0.20SpareBank 1 0.350% 05/04/2023 700,000 715,050 0.23SpareBank 1 Nord Norge 0.875% 02/12/2020 1,000,000 1,018,500 0.33SpareBank 1 Nord Norge 0.300% 16/09/2022 400,000 407,200 0.13Svenska Handelsbanken 1.375% 05/10/2022 850,000 901,425 0.29Swedbank Hypotek 2.500% 03/06/2022 850,000 932,450 0.31UniCredit Bank Ireland 4.250% 19/10/2022 355,000 397,068 0.13Wells Fargo & Co 0.625% 03/09/2020 1,100,000 1,115,620 0.37Wells Fargo & Co 0.375% 02/06/2022 875,000 889,437 0.29Wells Fargo & Co 0.500% 02/11/2023 1,950,000 2,001,675 0.66Westpac Banking 0.500% 02/02/2022 1,250,000 1,275,625 0.42Westpac Banking 0.400% 09/06/2023 950,000 974,700 0.32Westpac Securities 0.625% 02/09/2020 1,050,000 1,065,540 0.35Westpac Securities 0.125% 15/12/2022 500,000 506,250 0.17Westpac Securities 0.375% 05/02/2024 1,200,000 1,231,800 0.40
Beverages (0.76%) Coca-Cola 0.250% 22/12/2022 2,250,000 2,307,375 0.76
Building Materials (0.70%) Holcim Overseas Finance 3.375% 10/06/2021 2,010,000 2,147,685 0.70
Commercial Services (0.20%) Transurban Queensland Finance 0.625% 23/06/2023 600,000 610,500 0.20
Diversified Financial Services (1.69%) AMP Group Finance Services 0.750% 19/12/2022 800,000 811,200 0.27AMP Group Finance Services 0.800% 18/07/2023 100,000 101,250 0.03BNP Paribas Home Loan 2.375% 07/10/2020 400,000 415,200 0.14Credit Agricole Home Loan 1.125% 12/08/2021 1,000,000 1,038,000 0.34Santander Consumer Finance 0.500% 05/10/2020 500,000 503,700 0.16Santander Consumer Finance 0.600% 23/03/2021 500,000 504,750 0.16Santander Consumer Finance 0.625% 24/10/2022 800,000 814,800 0.27Tanner Servicios Financieros 1.375% 10/11/2020 500,000 506,500 0.17Tanner Servicios Financieros 1.000% 03/12/2021 450,000 454,500 0.15
Electric (1.25%) Enel Finance International 3.000% 23/06/2020 350,000 359,765 0.12Engie 1.125% 09/10/2020 1,700,000 1,734,000 0.57Korea Western Power 0.125% 27/02/2024 760,000 773,680 0.25Statnett 2.375% 08/02/2021 900,000 941,400 0.31
Engineering & Construction (0.71%) Heathrow Funding 0.500% 17/05/2024 1,800,000 1,845,900 0.60Vinci 3.000% 24/01/2022 300,000 325,050 0.11
Food (1.32%) Mondelez International 0.625% 06/10/2020 750,000 757,800 0.25Mondelez International 0.625% 30/12/2021 1,500,000 1,534,500 0.50Mondelez International 0.650% 26/07/2022 500,000 513,000 0.17Mondelez International 1.125% 21/12/2023 1,150,000 1,208,650 0.40
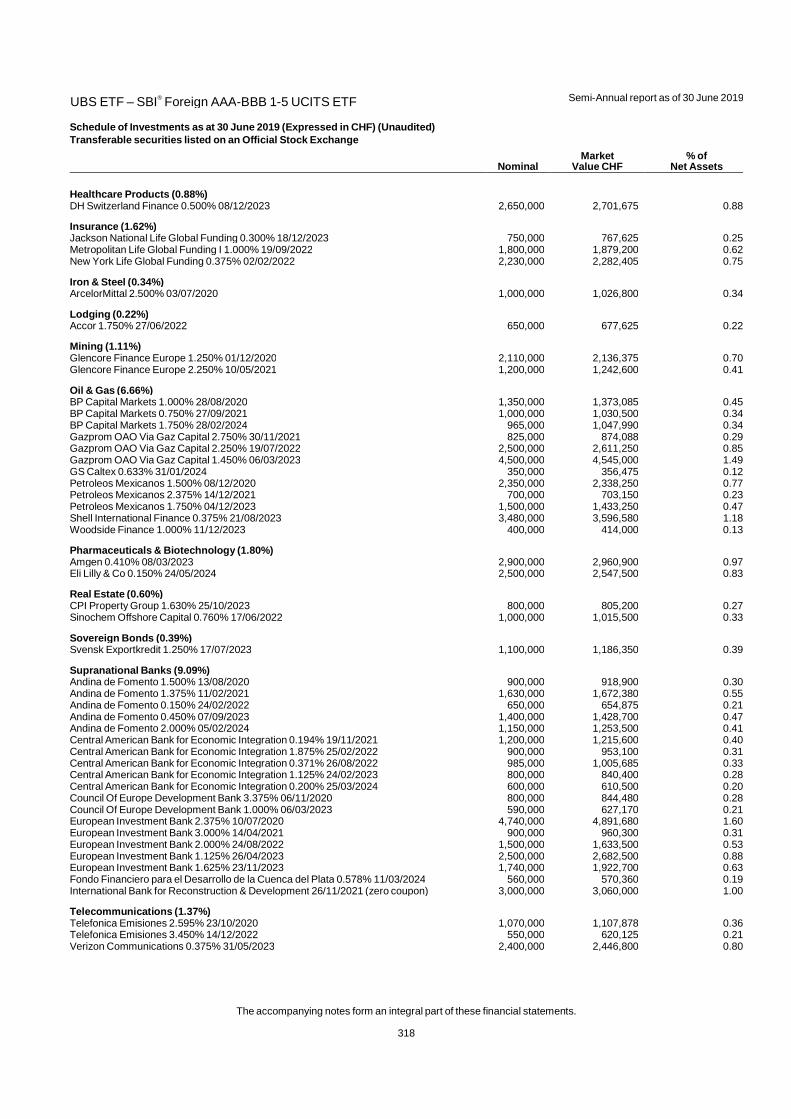
UBS ETF – SBI® Foreign AAA-BBB 1-5 UCITS ETF
Semi-Annual report as of 30 June 2019
The accompanying notes form an integral part of these financial statements.
318
Schedule of Investments as at 30 June 2019 (Expressed in CHF) (Unaudited)
Transferable securities listed on an Official Stock Exchange
Nominal Market
Value CHF % of
Net Assets
Healthcare Products (0.88%) DH Switzerland Finance 0.500% 08/12/2023 2,650,000 2,701,675 0.88
Insurance (1.62%) Jackson National Life Global Funding 0.300% 18/12/2023 750,000 767,625 0.25Metropolitan Life Global Funding I 1.000% 19/09/2022 1,800,000 1,879,200 0.62New York Life Global Funding 0.375% 02/02/2022 2,230,000 2,282,405 0.75
Iron & Steel (0.34%) ArcelorMittal 2.500% 03/07/2020 1,000,000 1,026,800 0.34
Lodging (0.22%) Accor 1.750% 27/06/2022 650,000 677,625 0.22
Mining (1.11%) Glencore Finance Europe 1.250% 01/12/2020 2,110,000 2,136,375 0.70Glencore Finance Europe 2.250% 10/05/2021 1,200,000 1,242,600 0.41
Oil & Gas (6.66%) BP Capital Markets 1.000% 28/08/2020 1,350,000 1,373,085 0.45BP Capital Markets 0.750% 27/09/2021 1,000,000 1,030,500 0.34BP Capital Markets 1.750% 28/02/2024 965,000 1,047,990 0.34Gazprom OAO Via Gaz Capital 2.750% 30/11/2021 825,000 874,088 0.29Gazprom OAO Via Gaz Capital 2.250% 19/07/2022 2,500,000 2,611,250 0.85Gazprom OAO Via Gaz Capital 1.450% 06/03/2023 4,500,000 4,545,000 1.49GS Caltex 0.633% 31/01/2024 350,000 356,475 0.12Petroleos Mexicanos 1.500% 08/12/2020 2,350,000 2,338,250 0.77Petroleos Mexicanos 2.375% 14/12/2021 700,000 703,150 0.23Petroleos Mexicanos 1.750% 04/12/2023 1,500,000 1,433,250 0.47Shell International Finance 0.375% 21/08/2023 3,480,000 3,596,580 1.18Woodside Finance 1.000% 11/12/2023 400,000 414,000 0.13
Pharmaceuticals & Biotechnology (1.80%) Amgen 0.410% 08/03/2023 2,900,000 2,960,900 0.97Eli Lilly & Co 0.150% 24/05/2024 2,500,000 2,547,500 0.83
Real Estate (0.60%) CPI Property Group 1.630% 25/10/2023 800,000 805,200 0.27Sinochem Offshore Capital 0.760% 17/06/2022 1,000,000 1,015,500 0.33
Sovereign Bonds (0.39%) Svensk Exportkredit 1.250% 17/07/2023 1,100,000 1,186,350 0.39
Supranational Banks (9.09%) Andina de Fomento 1.500% 13/08/2020 900,000 918,900 0.30Andina de Fomento 1.375% 11/02/2021 1,630,000 1,672,380 0.55Andina de Fomento 0.150% 24/02/2022 650,000 654,875 0.21Andina de Fomento 0.450% 07/09/2023 1,400,000 1,428,700 0.47Andina de Fomento 2.000% 05/02/2024 1,150,000 1,253,500 0.41Central American Bank for Economic Integration 0.194% 19/11/2021 1,200,000 1,215,600 0.40Central American Bank for Economic Integration 1.875% 25/02/2022 900,000 953,100 0.31Central American Bank for Economic Integration 0.371% 26/08/2022 985,000 1,005,685 0.33Central American Bank for Economic Integration 1.125% 24/02/2023 800,000 840,400 0.28Central American Bank for Economic Integration 0.200% 25/03/2024 600,000 610,500 0.20Council Of Europe Development Bank 3.375% 06/11/2020 800,000 844,480 0.28Council Of Europe Development Bank 1.000% 06/03/2023 590,000 627,170 0.21European Investment Bank 2.375% 10/07/2020 4,740,000 4,891,680 1.60European Investment Bank 3.000% 14/04/2021 900,000 960,300 0.31European Investment Bank 2.000% 24/08/2022 1,500,000 1,633,500 0.53European Investment Bank 1.125% 26/04/2023 2,500,000 2,682,500 0.88European Investment Bank 1.625% 23/11/2023 1,740,000 1,922,700 0.63Fondo Financiero para el Desarrollo de la Cuenca del Plata 0.578% 11/03/2024 560,000 570,360 0.19International Bank for Reconstruction & Development 26/11/2021 (zero coupon) 3,000,000 3,060,000 1.00
Telecommunications (1.37%) Telefonica Emisiones 2.595% 23/10/2020 1,070,000 1,107,878 0.36Telefonica Emisiones 3.450% 14/12/2022 550,000 620,125 0.21Verizon Communications 0.375% 31/05/2023 2,400,000 2,446,800 0.80
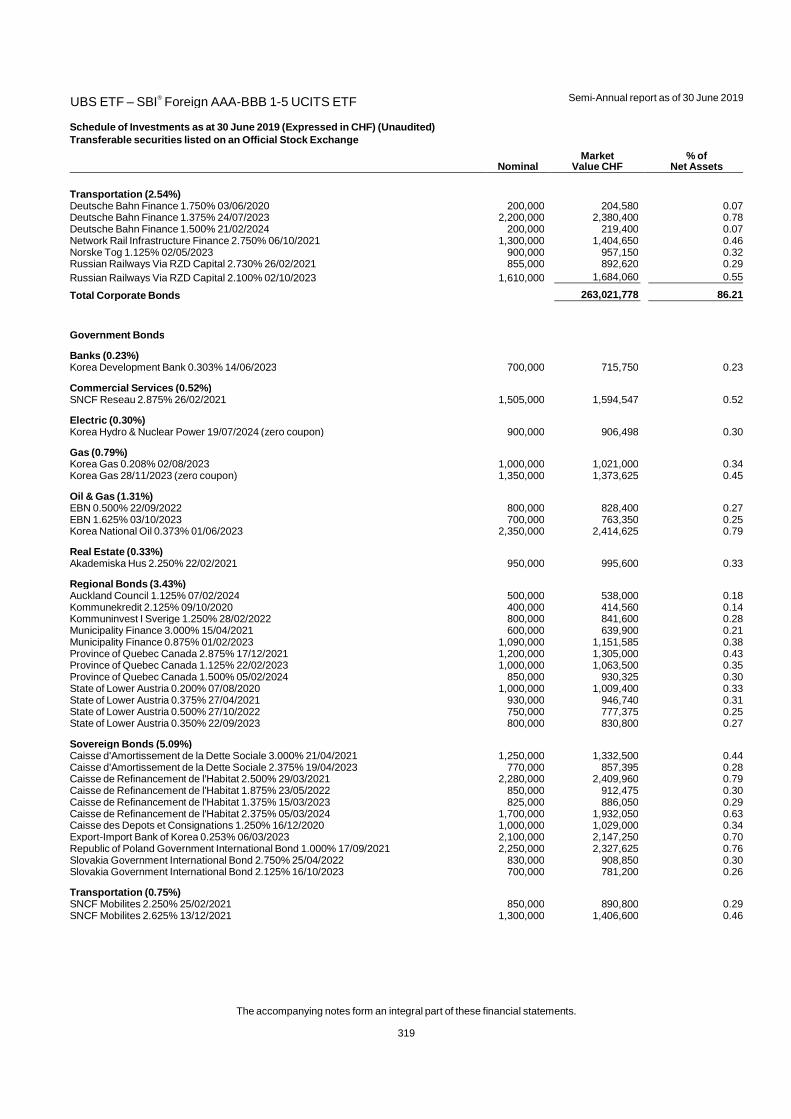
UBS ETF – SBI® Foreign AAA-BBB 1-5 UCITS ETF
Semi-Annual report as of 30 June 2019
The accompanying notes form an integral part of these financial statements.
319
Schedule of Investments as at 30 June 2019 (Expressed in CHF) (Unaudited)
Transferable securities listed on an Official Stock Exchange
Nominal Market
Value CHF % of
Net Assets
Transportation (2.54%) Deutsche Bahn Finance 1.750% 03/06/2020 200,000 204,580 0.07Deutsche Bahn Finance 1.375% 24/07/2023 2,200,000 2,380,400 0.78Deutsche Bahn Finance 1.500% 21/02/2024 200,000 219,400 0.07Network Rail Infrastructure Finance 2.750% 06/10/2021 1,300,000 1,404,650 0.46Norske Tog 1.125% 02/05/2023 900,000 957,150 0.32Russian Railways Via RZD Capital 2.730% 26/02/2021 855,000 892,620 0.29Russian Railways Via RZD Capital 2.100% 02/10/2023 1,610,000 1,684,060 0.55
Total Corporate Bonds 263,021,778 86.21
Government Bonds
Banks (0.23%) Korea Development Bank 0.303% 14/06/2023 700,000 715,750 0.23
Commercial Services (0.52%) SNCF Reseau 2.875% 26/02/2021 1,505,000 1,594,547 0.52
Electric (0.30%) Korea Hydro & Nuclear Power 19/07/2024 (zero coupon) 900,000 906,498 0.30
Gas (0.79%) Korea Gas 0.208% 02/08/2023 1,000,000 1,021,000 0.34Korea Gas 28/11/2023 (zero coupon) 1,350,000 1,373,625 0.45
Oil & Gas (1.31%) EBN 0.500% 22/09/2022 800,000 828,400 0.27EBN 1.625% 03/10/2023 700,000 763,350 0.25Korea National Oil 0.373% 01/06/2023 2,350,000 2,414,625 0.79
Real Estate (0.33%) Akademiska Hus 2.250% 22/02/2021 950,000 995,600 0.33
Regional Bonds (3.43%) Auckland Council 1.125% 07/02/2024 500,000 538,000 0.18Kommunekredit 2.125% 09/10/2020 400,000 414,560 0.14Kommuninvest I Sverige 1.250% 28/02/2022 800,000 841,600 0.28Municipality Finance 3.000% 15/04/2021 600,000 639,900 0.21Municipality Finance 0.875% 01/02/2023 1,090,000 1,151,585 0.38Province of Quebec Canada 2.875% 17/12/2021 1,200,000 1,305,000 0.43Province of Quebec Canada 1.125% 22/02/2023 1,000,000 1,063,500 0.35Province of Quebec Canada 1.500% 05/02/2024 850,000 930,325 0.30State of Lower Austria 0.200% 07/08/2020 1,000,000 1,009,400 0.33State of Lower Austria 0.375% 27/04/2021 930,000 946,740 0.31State of Lower Austria 0.500% 27/10/2022 750,000 777,375 0.25State of Lower Austria 0.350% 22/09/2023 800,000 830,800 0.27
Sovereign Bonds (5.09%) Caisse d'Amortissement de la Dette Sociale 3.000% 21/04/2021 1,250,000 1,332,500 0.44Caisse d'Amortissement de la Dette Sociale 2.375% 19/04/2023 770,000 857,395 0.28Caisse de Refinancement de l'Habitat 2.500% 29/03/2021 2,280,000 2,409,960 0.79Caisse de Refinancement de l'Habitat 1.875% 23/05/2022 850,000 912,475 0.30Caisse de Refinancement de l'Habitat 1.375% 15/03/2023 825,000 886,050 0.29Caisse de Refinancement de l'Habitat 2.375% 05/03/2024 1,700,000 1,932,050 0.63Caisse des Depots et Consignations 1.250% 16/12/2020 1,000,000 1,029,000 0.34Export-Import Bank of Korea 0.253% 06/03/2023 2,100,000 2,147,250 0.70Republic of Poland Government International Bond 1.000% 17/09/2021 2,250,000 2,327,625 0.76Slovakia Government International Bond 2.750% 25/04/2022 830,000 908,850 0.30Slovakia Government International Bond 2.125% 16/10/2023 700,000 781,200 0.26
Transportation (0.75%) SNCF Mobilites 2.250% 25/02/2021 850,000 890,800 0.29SNCF Mobilites 2.625% 13/12/2021 1,300,000 1,406,600 0.46
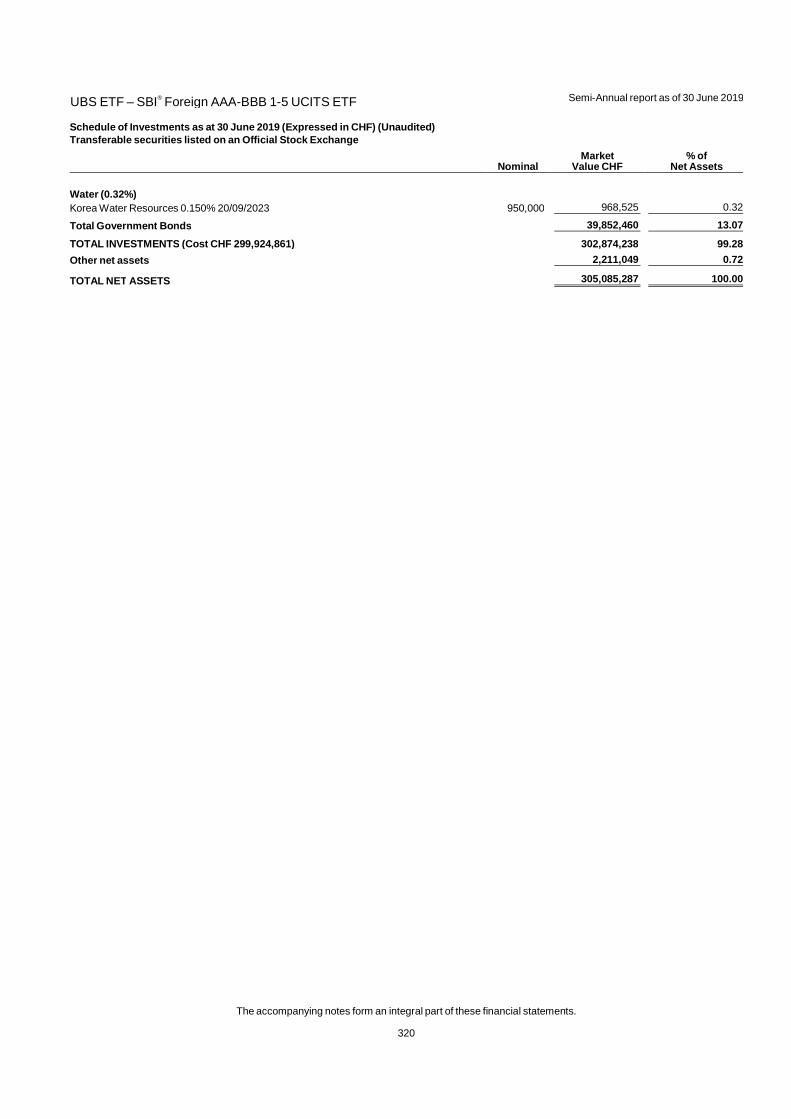
UBS ETF – SBI® Foreign AAA-BBB 1-5 UCITS ETF
Semi-Annual report as of 30 June 2019
The accompanying notes form an integral part of these financial statements.
320
Schedule of Investments as at 30 June 2019 (Expressed in CHF) (Unaudited)
Transferable securities listed on an Official Stock Exchange
Nominal Market
Value CHF % of
Net Assets
Water (0.32%) Korea Water Resources 0.150% 20/09/2023 950,000 968,525 0.32
Total Government Bonds 39,852,460 13.07
TOTAL INVESTMENTS (Cost CHF 299,924,861) 302,874,238 99.28
Other net assets 2,211,049 0.72
TOTAL NET ASSETS 305,085,287 100.00

UBS ETF – SBI® Foreign AAA-BBB 5-10 UCITS ETF
Semi-Annual report as of 30 June 2019
The accompanying notes form an integral part of these financial statements.
321
Schedule of Investments as at 30 June 2019 (Expressed in CHF) (Unaudited)
Transferable securities listed on an Official Stock Exchange
Nominal Market
Value CHF % of
Net Assets
Corporate Bonds
Agriculture (0.75%) BAT International Finance 1.375% 08/09/2026 1,450,000 1,555,850 0.75
Auto Manufacturers (2.13%) BMW International Investment 0.300% 05/09/2024 2,000,000 2,036,000 0.98BMW International Investment 0.750% 03/09/2027 1,300,000 1,351,350 0.65Daimler International Finance 0.850% 14/11/2025 1,000,000 1,043,500 0.50
Banks (40.63%) ABN AMRO Bank 0.300% 18/12/2024 250,000 256,250 0.12Achmea Bank 0.500% 03/10/2025 500,000 505,750 0.24ADCB Finance Cayman 0.500% 29/11/2024 950,000 952,850 0.46ANZ New Zealand Int'l 0.350% 22/10/2024 500,000 512,500 0.25ANZ New Zealand Int'l 0.250% 22/09/2025 1,500,000 1,527,000 0.73ASB Finance 0.200% 02/08/2024 1,200,000 1,220,400 0.59ASB Finance 0.450% 30/01/2025 850,000 875,500 0.42Banco de Chile 0.250% 05/12/2024 500,000 507,500 0.24Banco de Credito e Inversiones 0.400% 22/11/2024 700,000 711,900 0.34Banco del Estado de Chile 0.693% 04/12/2024 900,000 924,300 0.44Banco del Estado de Chile 0.575% 07/04/2027 800,000 816,400 0.39Banco Santander 1.000% 10/12/2024 750,000 784,500 0.38Banco Santander 1.125% 20/07/2027 1,000,000 1,051,000 0.50Banco Santander Chile 0.384% 27/09/2024 1,000,000 1,016,500 0.49Banco Santander Chile 0.350% 30/05/2025 400,000 404,200 0.19Bank of America 0.253% 12/06/2026 1,925,000 1,937,512 0.93Bank of Nova Scotia 0.200% 19/11/2025 2,300,000 2,387,400 1.15Banque Federative du Credit Mutuel 0.366% 10/10/2024 350,000 358,050 0.17Banque Federative du Credit Mutuel 0.320% 10/02/2025 800,000 814,800 0.39Banque Federative du Credit Mutuel 0.250% 10/07/2025 1,000,000 1,015,000 0.49Banque Federative du Credit Mutuel 0.400% 19/12/2025 1,125,000 1,151,437 0.55Banque Federative du Credit Mutuel 0.200% 12/06/2026 600,000 600,300 0.29Banque Federative du Credit Mutuel 1.000% 13/11/2026 900,000 958,500 0.46Banque Federative du Credit Mutuel 0.600% 05/04/2027 1,000,000 1,031,000 0.49BNG Bank 2.500% 21/07/2025 3,440,000 4,088,440 1.96BNP Paribas 1.750% 05/06/2025 355,000 378,608 0.18BNP Paribas 1.000% 06/06/2025 250,000 259,000 0.12Canadian Imperial Bank of Commerce 0.600% 30/01/2025 800,000 833,200 0.40Canadian Imperial Bank of Commerce 0.100% 30/04/2025 1,600,000 1,649,600 0.79Canadian Imperial Bank of Commerce 0.125% 22/12/2025 1,150,000 1,191,400 0.57Citigroup 0.500% 22/11/2024 1,450,000 1,484,800 0.71Citigroup 0.750% 02/04/2026 1,550,000 1,605,025 0.77Commerzbank 1.100% 11/07/2025 800,000 819,200 0.39Commerzbank 3.125% 14/07/2025 1,000,000 1,214,500 0.58Commonwealth Bank of Australia 0.400% 25/09/2026 2,200,000 2,271,500 1.09Cooperatieve Rabobank 3.125% 15/09/2026 2,450,000 3,036,775 1.46Cooperatieve Rabobank 0.250% 25/11/2027 800,000 805,600 0.39Credit Agricole 0.625% 12/07/2024 400,000 409,000 0.20Credit Agricole 2.125% 30/10/2024 950,000 1,061,150 0.51Credit Agricole 1.000% 27/01/2025 975,000 1,030,575 0.49Credit Agricole 2.125% 29/09/2025 400,000 438,200 0.21Credit Agricole 1.000% 07/11/2025 1,000,000 1,030,000 0.49Credit Agricole 0.550% 14/12/2026 700,000 720,300 0.35First Abu Dhabi Bank 0.401% 02/10/2024 1,000,000 1,020,000 0.49First Abu Dhabi Bank 0.205% 04/12/2025 900,000 896,850 0.43Goldman Sachs Group 0.500% 04/12/2024 1,500,000 1,523,250 0.73Goldman Sachs Group 1.000% 24/11/2025 1,600,000 1,667,200 0.80HYPO NOE Landesbank fuer Niederoesterreich und Wien 0.100% 27/11/2024 450,000 453,150 0.22Hypo Vorarlberg Bank 0.250% 12/11/2025 800,000 834,800 0.40JPMorgan Chase & Co 0.450% 11/11/2026 600,000 619,500 0.30Kommunalkredit Austria 3.375% 22/06/2026 1,180,000 1,444,910 0.69Kreditanstalt fuer Wiederaufbau 2.500% 25/08/2025 4,400,000 5,262,400 2.53Lansforsakringar Hypotek 0.875% 16/09/2024 400,000 429,200 0.21Lansforsakringar Hypotek 0.200% 17/04/2026 1,160,000 1,205,820 0.58Lloyds Banking Group 1.000% 04/03/2025 2,100,000 2,164,050 1.04mBank 1.018% 04/10/2024 800,000 809,600 0.39Muenchener Hypothekenbank 0.100% 31/10/2024 500,000 516,000 0.25

UBS ETF – SBI® Foreign AAA-BBB 5-10 UCITS ETF
Semi-Annual report as of 30 June 2019
The accompanying notes form an integral part of these financial statements.
322
Schedule of Investments as at 30 June 2019 (Expressed in CHF) (Unaudited)
Transferable securities listed on an Official Stock Exchange
Nominal Market
Value CHF % of
Net Assets
Banks (40.63%) (continued) Muenchener Hypothekenbank 0.300% 20/12/2024 700,000 709,450 0.34Muenchener Hypothekenbank 0.500% 14/06/2028 1,100,000 1,170,950 0.56Muenchener Hypothekenbank 0.250% 26/02/2029 800,000 829,600 0.40National Australia Bank 0.300% 31/10/2025 1,250,000 1,280,000 0.61National Australia Bank 0.125% 21/06/2027 850,000 845,750 0.41Nederlandse Waterschapsbank 1.250% 09/08/2024 800,000 877,200 0.42Nederlandse Waterschapsbank 1.375% 13/09/2027 500,000 573,250 0.28Nordea Bank 0.550% 23/06/2025 1,250,000 1,301,250 0.62Oesterreichische Kontrollbank 2.625% 22/11/2024 3,350,000 3,939,600 1.89Societe Generale 0.700% 26/02/2025 800,000 809,600 0.39SpareBank 1 Nord Norge 0.125% 11/12/2025 600,000 601,500 0.29Wells Fargo & Co 1.250% 03/09/2024 1,400,000 1,493,800 0.72Westpac Banking 0.400% 06/06/2024 1,200,000 1,236,600 0.59Westpac Banking 0.300% 28/11/2025 1,000,000 1,023,500 0.49Westpac Banking 0.250% 29/01/2027 1,900,000 1,985,500 0.95Westpac Banking 0.500% 16/05/2028 500,000 516,000 0.25
Beverages (1.42%) Coca-Cola 1.000% 02/10/2028 2,705,000 2,966,033 1.42
Commercial Services (1.26%) Korea Expressway 0.250% 07/06/2024 500,000 512,500 0.24Transurban Queensland Finance 1.000% 08/12/2025 1,050,000 1,098,300 0.53Transurban Queensland Finance 0.650% 02/11/2026 1,000,000 1,020,000 0.49
Computers (2.09%) Apple 0.375% 25/11/2024 4,200,000 4,357,500 2.09
Diversified Financial Services (3.73%) Credit Agricole Home Loan 1.125% 05/06/2024 700,000 757,400 0.36Credit Agricole Home Loan 0.250% 08/12/2025 1,450,000 1,508,725 0.72Credit Agricole Home Loan 0.100% 26/01/2026 1,635,000 1,684,050 0.81Credit Agricole Home Loan 0.250% 18/06/2026 500,000 520,500 0.25Credit Agricole Home Loan 0.500% 16/03/2027 600,000 635,700 0.30Credit Agricole Home Loan 0.250% 27/07/2027 900,000 934,200 0.45Credit Agricole Home Loan 0.500% 03/10/2028 650,000 687,375 0.33Credit Agricole Home Loan 0.450% 24/01/2029 1,000,000 1,053,000 0.51
Electric (2.48%) Electricite de France 0.300% 14/10/2024 2,000,000 2,033,000 0.98Electricite de France 0.650% 13/10/2028 900,000 923,850 0.44Enel Finance International 0.550% 03/09/2024 1,400,000 1,434,300 0.69Enel Finance International 4.000% 26/10/2027 300,000 383,100 0.18Engie 1.625% 09/10/2024 355,000 387,838 0.19
Engineering & Construction (0.54%) Heathrow Funding 0.450% 15/10/2026 1,100,000 1,124,200 0.54
Food (2.19%) Auchan Holding 1.500% 03/06/2024 500,000 498,500 0.24Mondelez International 0.617% 30/09/2024 850,000 872,950 0.42Mondelez International 1.125% 30/12/2025 800,000 844,000 0.41Nestle Holdings 0.250% 04/10/2027 2,250,000 2,340,000 1.12
Healthcare Products (0.54%) DH Switzerland Finance 1.125% 08/12/2028 1,050,000 1,123,500 0.54
Insurance (2.94%) Jackson National Life Global Funding 0.375% 18/07/2025 665,000 683,953 0.33Metropolitan Life Global Funding I 0.300% 19/01/2026 1,100,000 1,125,300 0.54Metropolitan Life Global Funding I 0.125% 11/06/2027 1,100,000 1,098,350 0.53New York Life Global Funding 0.250% 18/10/2027 3,135,000 3,221,212 1.54
Mining (0.50%) Glencore Finance Europe 1.250% 09/10/2024 1,000,000 1,035,000 0.50
Oil & Gas (4.35%) Shell International Finance 0.875% 21/08/2028 2,500,000 2,702,500 1.30Total Capital International 1.000% 29/08/2024 3,910,000 4,179,790 2.00
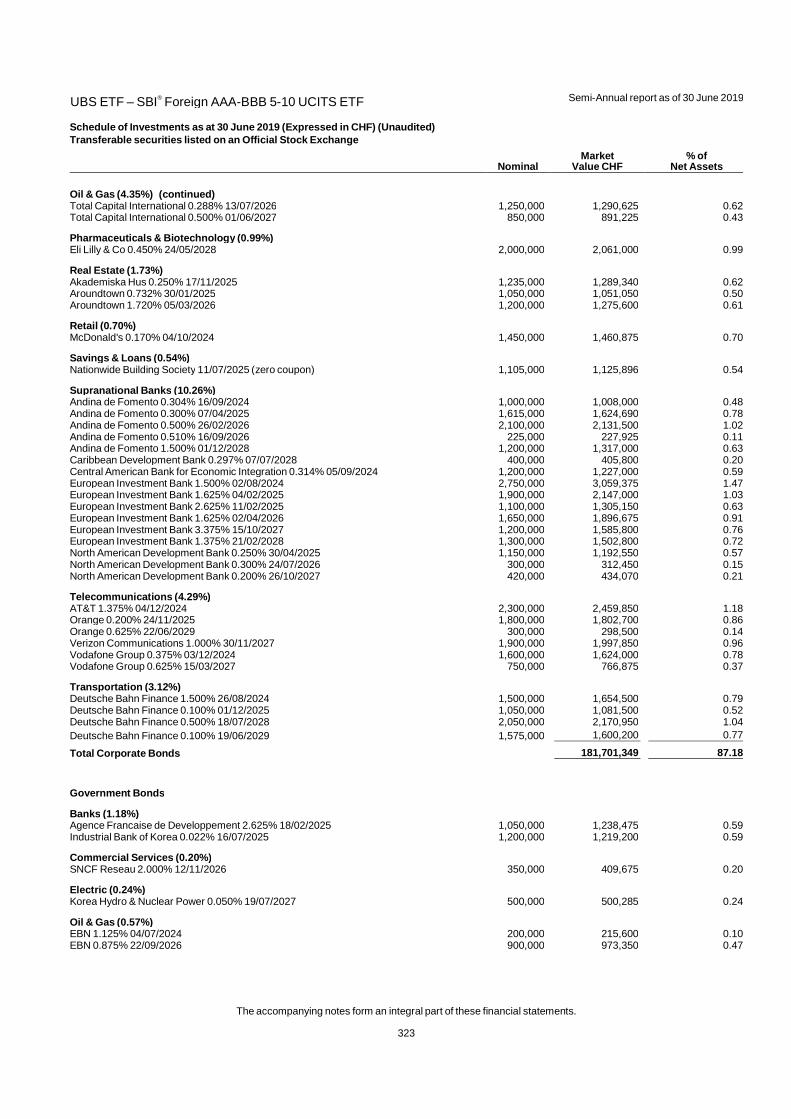
UBS ETF – SBI® Foreign AAA-BBB 5-10 UCITS ETF
Semi-Annual report as of 30 June 2019
The accompanying notes form an integral part of these financial statements.
323
Schedule of Investments as at 30 June 2019 (Expressed in CHF) (Unaudited)
Transferable securities listed on an Official Stock Exchange
Nominal Market
Value CHF % of
Net Assets
Oil & Gas (4.35%) (continued) Total Capital International 0.288% 13/07/2026 1,250,000 1,290,625 0.62Total Capital International 0.500% 01/06/2027 850,000 891,225 0.43
Pharmaceuticals & Biotechnology (0.99%) Eli Lilly & Co 0.450% 24/05/2028 2,000,000 2,061,000 0.99
Real Estate (1.73%) Akademiska Hus 0.250% 17/11/2025 1,235,000 1,289,340 0.62Aroundtown 0.732% 30/01/2025 1,050,000 1,051,050 0.50Aroundtown 1.720% 05/03/2026 1,200,000 1,275,600 0.61
Retail (0.70%) McDonald's 0.170% 04/10/2024 1,450,000 1,460,875 0.70
Savings & Loans (0.54%) Nationwide Building Society 11/07/2025 (zero coupon) 1,105,000 1,125,896 0.54
Supranational Banks (10.26%) Andina de Fomento 0.304% 16/09/2024 1,000,000 1,008,000 0.48Andina de Fomento 0.300% 07/04/2025 1,615,000 1,624,690 0.78Andina de Fomento 0.500% 26/02/2026 2,100,000 2,131,500 1.02Andina de Fomento 0.510% 16/09/2026 225,000 227,925 0.11Andina de Fomento 1.500% 01/12/2028 1,200,000 1,317,000 0.63Caribbean Development Bank 0.297% 07/07/2028 400,000 405,800 0.20Central American Bank for Economic Integration 0.314% 05/09/2024 1,200,000 1,227,000 0.59European Investment Bank 1.500% 02/08/2024 2,750,000 3,059,375 1.47European Investment Bank 1.625% 04/02/2025 1,900,000 2,147,000 1.03European Investment Bank 2.625% 11/02/2025 1,100,000 1,305,150 0.63European Investment Bank 1.625% 02/04/2026 1,650,000 1,896,675 0.91European Investment Bank 3.375% 15/10/2027 1,200,000 1,585,800 0.76European Investment Bank 1.375% 21/02/2028 1,300,000 1,502,800 0.72North American Development Bank 0.250% 30/04/2025 1,150,000 1,192,550 0.57North American Development Bank 0.300% 24/07/2026 300,000 312,450 0.15North American Development Bank 0.200% 26/10/2027 420,000 434,070 0.21
Telecommunications (4.29%) AT&T 1.375% 04/12/2024 2,300,000 2,459,850 1.18Orange 0.200% 24/11/2025 1,800,000 1,802,700 0.86Orange 0.625% 22/06/2029 300,000 298,500 0.14Verizon Communications 1.000% 30/11/2027 1,900,000 1,997,850 0.96Vodafone Group 0.375% 03/12/2024 1,600,000 1,624,000 0.78Vodafone Group 0.625% 15/03/2027 750,000 766,875 0.37
Transportation (3.12%) Deutsche Bahn Finance 1.500% 26/08/2024 1,500,000 1,654,500 0.79Deutsche Bahn Finance 0.100% 01/12/2025 1,050,000 1,081,500 0.52Deutsche Bahn Finance 0.500% 18/07/2028 2,050,000 2,170,950 1.04Deutsche Bahn Finance 0.100% 19/06/2029 1,575,000 1,600,200 0.77
Total Corporate Bonds 181,701,349 87.18
Government Bonds
Banks (1.18%) Agence Francaise de Developpement 2.625% 18/02/2025 1,050,000 1,238,475 0.59Industrial Bank of Korea 0.022% 16/07/2025 1,200,000 1,219,200 0.59
Commercial Services (0.20%) SNCF Reseau 2.000% 12/11/2026 350,000 409,675 0.20
Electric (0.24%) Korea Hydro & Nuclear Power 0.050% 19/07/2027 500,000 500,285 0.24
Oil & Gas (0.57%) EBN 1.125% 04/07/2024 200,000 215,600 0.10EBN 0.875% 22/09/2026 900,000 973,350 0.47

UBS ETF – SBI® Foreign AAA-BBB 5-10 UCITS ETF
Semi-Annual report as of 30 June 2019
The accompanying notes form an integral part of these financial statements.
324
Schedule of Investments as at 30 June 2019 (Expressed in CHF) (Unaudited)
Transferable securities listed on an Official Stock Exchange
Nominal Market
Value CHF % of
Net Assets
Regional Bonds (6.61%) Auckland Council 1.500% 28/11/2025 850,000 950,725 0.46Kommunekredit 0.625% 09/07/2027 1,000,000 1,087,500 0.52Municipality Finance 0.750% 17/09/2024 250,000 268,125 0.13Municipality Finance 2.375% 30/03/2026 1,350,000 1,620,675 0.78Municipality Finance 1.375% 08/06/2027 830,000 952,425 0.46Province of Alberta Canada 0.375% 07/02/2029 1,800,000 1,883,700 0.90Province of Manitoba Canada 0.250% 15/03/2029 1,100,000 1,136,300 0.54Province of New Brunswick Canada 0.250% 19/01/2029 1,530,000 1,582,785 0.76Province of Ontario Canada 0.250% 28/06/2029 1,775,000 1,837,125 0.88Province of Quebec Canada 0.750% 21/11/2024 1,800,000 1,916,999 0.92State of North Rhine-Westphalia Germany 0.875% 29/07/2024 500,000 538,500 0.26
Sovereign Bonds (3.98%) Caisse d'Amortissement de la Dette Sociale 2.500% 09/12/2025 800,000 951,200 0.46Caisse de Refinancement de l'Habitat 1.750% 26/06/2025 1,000,000 1,130,500 0.54Caisse des Depots et Consignations 0.250% 30/05/2025 600,000 625,500 0.30Caisse des Depots et Consignations 0.300% 12/11/2027 1,400,000 1,458,800 0.70Export-Import Bank of Korea 0.383% 11/07/2024 1,100,000 1,134,650 0.54Export-Import Bank of Korea 0.170% 18/07/2025 1,800,000 1,837,800 0.88Instituto de Credito Oficial 3.250% 28/06/2024 1,000,000 1,169,000 0.56
Transportation (0.29%) Korea Railroad 13/06/2025 (zero coupon) 600,000 608,100 0.29
Total Government Bonds 27,246,994 13.07
TOTAL INVESTMENTS (Cost CHF 204,441,805) 208,948,343 100.25
Other net liabilities (517,121) (0.25)
TOTAL NET ASSETS 208,431,222 100.00
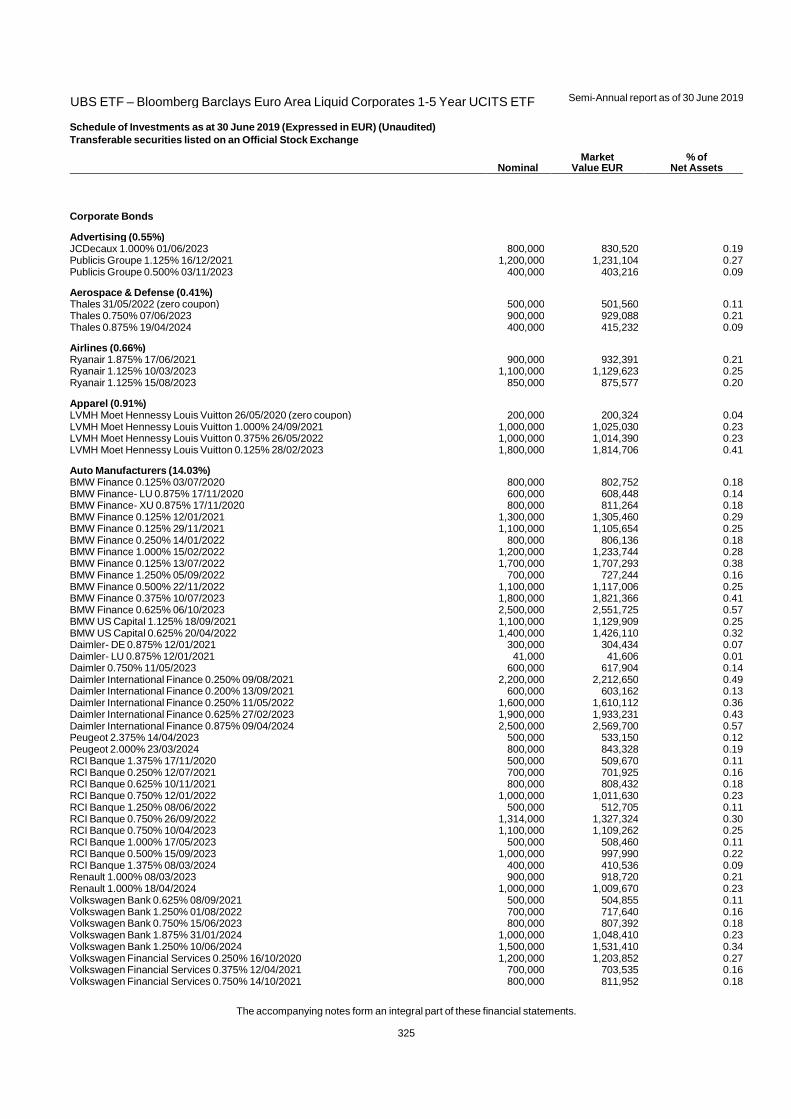
UBS ETF – Bloomberg Barclays Euro Area Liquid Corporates 1-5 Year UCITS ETF
Semi-Annual report as of 30 June 2019
The accompanying notes form an integral part of these financial statements.
325
Schedule of Investments as at 30 June 2019 (Expressed in EUR) (Unaudited)
Transferable securities listed on an Official Stock Exchange
Nominal Market
Value EUR % of
Net Assets
Corporate Bonds
Advertising (0.55%) JCDecaux 1.000% 01/06/2023 800,000 830,520 0.19Publicis Groupe 1.125% 16/12/2021 1,200,000 1,231,104 0.27Publicis Groupe 0.500% 03/11/2023 400,000 403,216 0.09
Aerospace & Defense (0.41%) Thales 31/05/2022 (zero coupon) 500,000 501,560 0.11Thales 0.750% 07/06/2023 900,000 929,088 0.21Thales 0.875% 19/04/2024 400,000 415,232 0.09
Airlines (0.66%) Ryanair 1.875% 17/06/2021 900,000 932,391 0.21Ryanair 1.125% 10/03/2023 1,100,000 1,129,623 0.25Ryanair 1.125% 15/08/2023 850,000 875,577 0.20
Apparel (0.91%) LVMH Moet Hennessy Louis Vuitton 26/05/2020 (zero coupon) 200,000 200,324 0.04LVMH Moet Hennessy Louis Vuitton 1.000% 24/09/2021 1,000,000 1,025,030 0.23LVMH Moet Hennessy Louis Vuitton 0.375% 26/05/2022 1,000,000 1,014,390 0.23LVMH Moet Hennessy Louis Vuitton 0.125% 28/02/2023 1,800,000 1,814,706 0.41
Auto Manufacturers (14.03%) BMW Finance 0.125% 03/07/2020 800,000 802,752 0.18BMW Finance- LU 0.875% 17/11/2020 600,000 608,448 0.14BMW Finance- XU 0.875% 17/11/2020 800,000 811,264 0.18BMW Finance 0.125% 12/01/2021 1,300,000 1,305,460 0.29BMW Finance 0.125% 29/11/2021 1,100,000 1,105,654 0.25BMW Finance 0.250% 14/01/2022 800,000 806,136 0.18BMW Finance 1.000% 15/02/2022 1,200,000 1,233,744 0.28BMW Finance 0.125% 13/07/2022 1,700,000 1,707,293 0.38BMW Finance 1.250% 05/09/2022 700,000 727,244 0.16BMW Finance 0.500% 22/11/2022 1,100,000 1,117,006 0.25BMW Finance 0.375% 10/07/2023 1,800,000 1,821,366 0.41BMW Finance 0.625% 06/10/2023 2,500,000 2,551,725 0.57BMW US Capital 1.125% 18/09/2021 1,100,000 1,129,909 0.25BMW US Capital 0.625% 20/04/2022 1,400,000 1,426,110 0.32Daimler- DE 0.875% 12/01/2021 300,000 304,434 0.07Daimler- LU 0.875% 12/01/2021 41,000 41,606 0.01Daimler 0.750% 11/05/2023 600,000 617,904 0.14Daimler International Finance 0.250% 09/08/2021 2,200,000 2,212,650 0.49Daimler International Finance 0.200% 13/09/2021 600,000 603,162 0.13Daimler International Finance 0.250% 11/05/2022 1,600,000 1,610,112 0.36Daimler International Finance 0.625% 27/02/2023 1,900,000 1,933,231 0.43Daimler International Finance 0.875% 09/04/2024 2,500,000 2,569,700 0.57Peugeot 2.375% 14/04/2023 500,000 533,150 0.12Peugeot 2.000% 23/03/2024 800,000 843,328 0.19RCI Banque 1.375% 17/11/2020 500,000 509,670 0.11RCI Banque 0.250% 12/07/2021 700,000 701,925 0.16RCI Banque 0.625% 10/11/2021 800,000 808,432 0.18RCI Banque 0.750% 12/01/2022 1,000,000 1,011,630 0.23RCI Banque 1.250% 08/06/2022 500,000 512,705 0.11RCI Banque 0.750% 26/09/2022 1,314,000 1,327,324 0.30RCI Banque 0.750% 10/04/2023 1,100,000 1,109,262 0.25RCI Banque 1.000% 17/05/2023 500,000 508,460 0.11RCI Banque 0.500% 15/09/2023 1,000,000 997,990 0.22RCI Banque 1.375% 08/03/2024 400,000 410,536 0.09Renault 1.000% 08/03/2023 900,000 918,720 0.21Renault 1.000% 18/04/2024 1,000,000 1,009,670 0.23Volkswagen Bank 0.625% 08/09/2021 500,000 504,855 0.11Volkswagen Bank 1.250% 01/08/2022 700,000 717,640 0.16Volkswagen Bank 0.750% 15/06/2023 800,000 807,392 0.18Volkswagen Bank 1.875% 31/01/2024 1,000,000 1,048,410 0.23Volkswagen Bank 1.250% 10/06/2024 1,500,000 1,531,410 0.34Volkswagen Financial Services 0.250% 16/10/2020 1,200,000 1,203,852 0.27Volkswagen Financial Services 0.375% 12/04/2021 700,000 703,535 0.16Volkswagen Financial Services 0.750% 14/10/2021 800,000 811,952 0.18
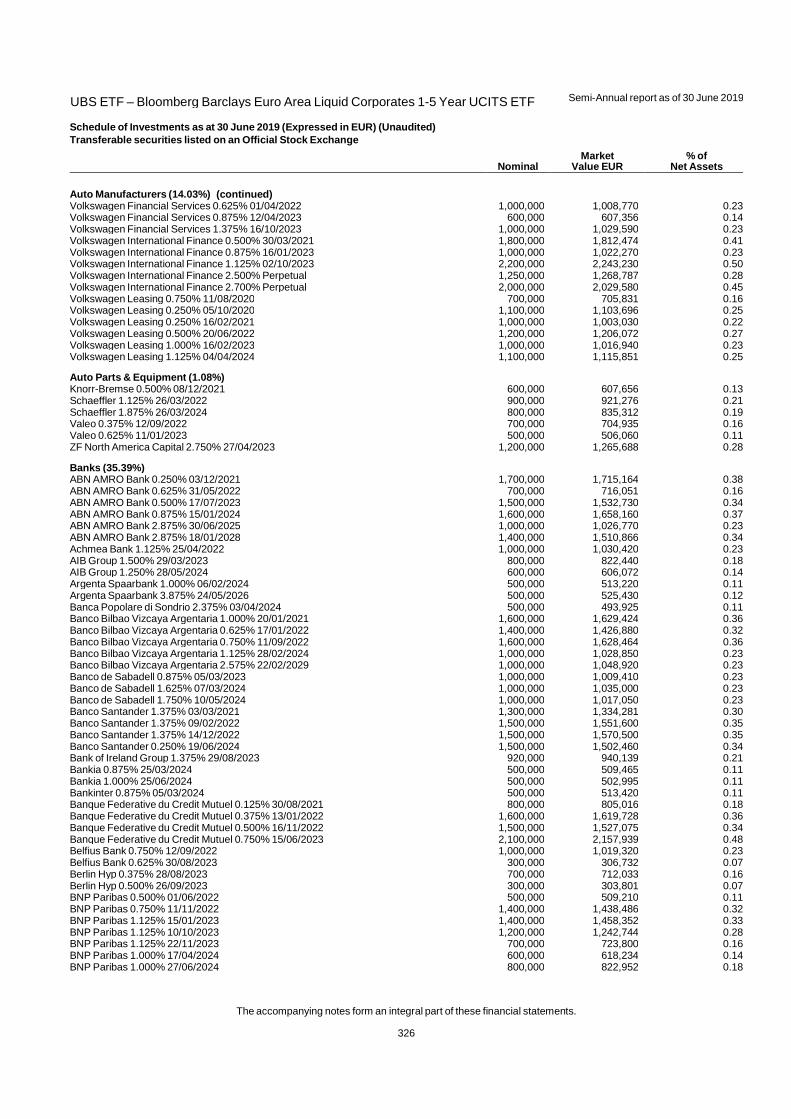
UBS ETF – Bloomberg Barclays Euro Area Liquid Corporates 1-5 Year UCITS ETF
Semi-Annual report as of 30 June 2019
The accompanying notes form an integral part of these financial statements.
326
Schedule of Investments as at 30 June 2019 (Expressed in EUR) (Unaudited)
Transferable securities listed on an Official Stock Exchange
Nominal Market
Value EUR % of
Net Assets
Auto Manufacturers (14.03%) (continued) Volkswagen Financial Services 0.625% 01/04/2022 1,000,000 1,008,770 0.23Volkswagen Financial Services 0.875% 12/04/2023 600,000 607,356 0.14Volkswagen Financial Services 1.375% 16/10/2023 1,000,000 1,029,590 0.23Volkswagen International Finance 0.500% 30/03/2021 1,800,000 1,812,474 0.41Volkswagen International Finance 0.875% 16/01/2023 1,000,000 1,022,270 0.23Volkswagen International Finance 1.125% 02/10/2023 2,200,000 2,243,230 0.50Volkswagen International Finance 2.500% Perpetual 1,250,000 1,268,787 0.28Volkswagen International Finance 2.700% Perpetual 2,000,000 2,029,580 0.45Volkswagen Leasing 0.750% 11/08/2020 700,000 705,831 0.16Volkswagen Leasing 0.250% 05/10/2020 1,100,000 1,103,696 0.25Volkswagen Leasing 0.250% 16/02/2021 1,000,000 1,003,030 0.22Volkswagen Leasing 0.500% 20/06/2022 1,200,000 1,206,072 0.27Volkswagen Leasing 1.000% 16/02/2023 1,000,000 1,016,940 0.23Volkswagen Leasing 1.125% 04/04/2024 1,100,000 1,115,851 0.25
Auto Parts & Equipment (1.08%) Knorr-Bremse 0.500% 08/12/2021 600,000 607,656 0.13Schaeffler 1.125% 26/03/2022 900,000 921,276 0.21Schaeffler 1.875% 26/03/2024 800,000 835,312 0.19Valeo 0.375% 12/09/2022 700,000 704,935 0.16Valeo 0.625% 11/01/2023 500,000 506,060 0.11ZF North America Capital 2.750% 27/04/2023 1,200,000 1,265,688 0.28
Banks (35.39%) ABN AMRO Bank 0.250% 03/12/2021 1,700,000 1,715,164 0.38ABN AMRO Bank 0.625% 31/05/2022 700,000 716,051 0.16ABN AMRO Bank 0.500% 17/07/2023 1,500,000 1,532,730 0.34ABN AMRO Bank 0.875% 15/01/2024 1,600,000 1,658,160 0.37ABN AMRO Bank 2.875% 30/06/2025 1,000,000 1,026,770 0.23ABN AMRO Bank 2.875% 18/01/2028 1,400,000 1,510,866 0.34Achmea Bank 1.125% 25/04/2022 1,000,000 1,030,420 0.23AIB Group 1.500% 29/03/2023 800,000 822,440 0.18AIB Group 1.250% 28/05/2024 600,000 606,072 0.14Argenta Spaarbank 1.000% 06/02/2024 500,000 513,220 0.11Argenta Spaarbank 3.875% 24/05/2026 500,000 525,430 0.12Banca Popolare di Sondrio 2.375% 03/04/2024 500,000 493,925 0.11Banco Bilbao Vizcaya Argentaria 1.000% 20/01/2021 1,600,000 1,629,424 0.36Banco Bilbao Vizcaya Argentaria 0.625% 17/01/2022 1,400,000 1,426,880 0.32Banco Bilbao Vizcaya Argentaria 0.750% 11/09/2022 1,600,000 1,628,464 0.36Banco Bilbao Vizcaya Argentaria 1.125% 28/02/2024 1,000,000 1,028,850 0.23Banco Bilbao Vizcaya Argentaria 2.575% 22/02/2029 1,000,000 1,048,920 0.23Banco de Sabadell 0.875% 05/03/2023 1,000,000 1,009,410 0.23Banco de Sabadell 1.625% 07/03/2024 1,000,000 1,035,000 0.23Banco de Sabadell 1.750% 10/05/2024 1,000,000 1,017,050 0.23Banco Santander 1.375% 03/03/2021 1,300,000 1,334,281 0.30Banco Santander 1.375% 09/02/2022 1,500,000 1,551,600 0.35Banco Santander 1.375% 14/12/2022 1,500,000 1,570,500 0.35Banco Santander 0.250% 19/06/2024 1,500,000 1,502,460 0.34Bank of Ireland Group 1.375% 29/08/2023 920,000 940,139 0.21Bankia 0.875% 25/03/2024 500,000 509,465 0.11Bankia 1.000% 25/06/2024 500,000 502,995 0.11Bankinter 0.875% 05/03/2024 500,000 513,420 0.11Banque Federative du Credit Mutuel 0.125% 30/08/2021 800,000 805,016 0.18Banque Federative du Credit Mutuel 0.375% 13/01/2022 1,600,000 1,619,728 0.36Banque Federative du Credit Mutuel 0.500% 16/11/2022 1,500,000 1,527,075 0.34Banque Federative du Credit Mutuel 0.750% 15/06/2023 2,100,000 2,157,939 0.48Belfius Bank 0.750% 12/09/2022 1,000,000 1,019,320 0.23Belfius Bank 0.625% 30/08/2023 300,000 306,732 0.07Berlin Hyp 0.375% 28/08/2023 700,000 712,033 0.16Berlin Hyp 0.500% 26/09/2023 300,000 303,801 0.07BNP Paribas 0.500% 01/06/2022 500,000 509,210 0.11BNP Paribas 0.750% 11/11/2022 1,400,000 1,438,486 0.32BNP Paribas 1.125% 15/01/2023 1,400,000 1,458,352 0.33BNP Paribas 1.125% 10/10/2023 1,200,000 1,242,744 0.28BNP Paribas 1.125% 22/11/2023 700,000 723,800 0.16BNP Paribas 1.000% 17/04/2024 600,000 618,234 0.14BNP Paribas 1.000% 27/06/2024 800,000 822,952 0.18
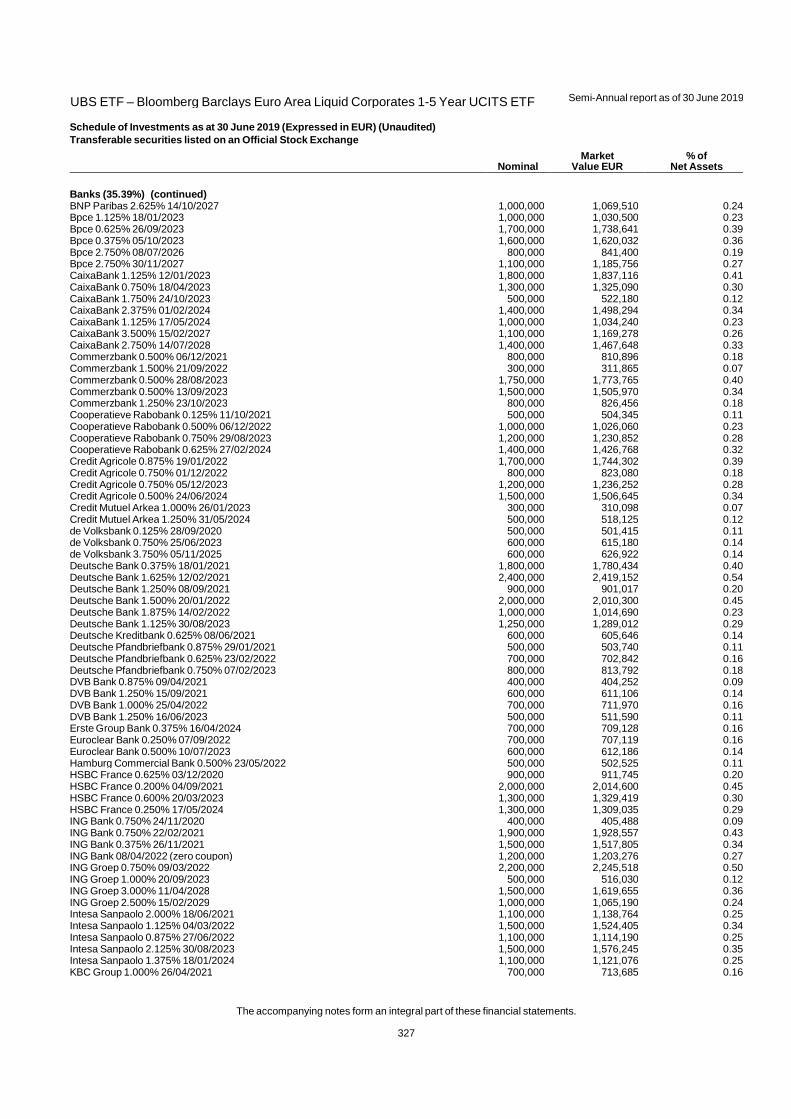
UBS ETF – Bloomberg Barclays Euro Area Liquid Corporates 1-5 Year UCITS ETF
Semi-Annual report as of 30 June 2019
The accompanying notes form an integral part of these financial statements.
327
Schedule of Investments as at 30 June 2019 (Expressed in EUR) (Unaudited)
Transferable securities listed on an Official Stock Exchange
Nominal Market
Value EUR % of
Net Assets
Banks (35.39%) (continued) BNP Paribas 2.625% 14/10/2027 1,000,000 1,069,510 0.24Bpce 1.125% 18/01/2023 1,000,000 1,030,500 0.23Bpce 0.625% 26/09/2023 1,700,000 1,738,641 0.39Bpce 0.375% 05/10/2023 1,600,000 1,620,032 0.36Bpce 2.750% 08/07/2026 800,000 841,400 0.19Bpce 2.750% 30/11/2027 1,100,000 1,185,756 0.27CaixaBank 1.125% 12/01/2023 1,800,000 1,837,116 0.41CaixaBank 0.750% 18/04/2023 1,300,000 1,325,090 0.30CaixaBank 1.750% 24/10/2023 500,000 522,180 0.12CaixaBank 2.375% 01/02/2024 1,400,000 1,498,294 0.34CaixaBank 1.125% 17/05/2024 1,000,000 1,034,240 0.23CaixaBank 3.500% 15/02/2027 1,100,000 1,169,278 0.26CaixaBank 2.750% 14/07/2028 1,400,000 1,467,648 0.33Commerzbank 0.500% 06/12/2021 800,000 810,896 0.18Commerzbank 1.500% 21/09/2022 300,000 311,865 0.07Commerzbank 0.500% 28/08/2023 1,750,000 1,773,765 0.40Commerzbank 0.500% 13/09/2023 1,500,000 1,505,970 0.34Commerzbank 1.250% 23/10/2023 800,000 826,456 0.18Cooperatieve Rabobank 0.125% 11/10/2021 500,000 504,345 0.11Cooperatieve Rabobank 0.500% 06/12/2022 1,000,000 1,026,060 0.23Cooperatieve Rabobank 0.750% 29/08/2023 1,200,000 1,230,852 0.28Cooperatieve Rabobank 0.625% 27/02/2024 1,400,000 1,426,768 0.32Credit Agricole 0.875% 19/01/2022 1,700,000 1,744,302 0.39Credit Agricole 0.750% 01/12/2022 800,000 823,080 0.18Credit Agricole 0.750% 05/12/2023 1,200,000 1,236,252 0.28Credit Agricole 0.500% 24/06/2024 1,500,000 1,506,645 0.34Credit Mutuel Arkea 1.000% 26/01/2023 300,000 310,098 0.07Credit Mutuel Arkea 1.250% 31/05/2024 500,000 518,125 0.12de Volksbank 0.125% 28/09/2020 500,000 501,415 0.11de Volksbank 0.750% 25/06/2023 600,000 615,180 0.14de Volksbank 3.750% 05/11/2025 600,000 626,922 0.14Deutsche Bank 0.375% 18/01/2021 1,800,000 1,780,434 0.40Deutsche Bank 1.625% 12/02/2021 2,400,000 2,419,152 0.54Deutsche Bank 1.250% 08/09/2021 900,000 901,017 0.20Deutsche Bank 1.500% 20/01/2022 2,000,000 2,010,300 0.45Deutsche Bank 1.875% 14/02/2022 1,000,000 1,014,690 0.23Deutsche Bank 1.125% 30/08/2023 1,250,000 1,289,012 0.29Deutsche Kreditbank 0.625% 08/06/2021 600,000 605,646 0.14Deutsche Pfandbriefbank 0.875% 29/01/2021 500,000 503,740 0.11Deutsche Pfandbriefbank 0.625% 23/02/2022 700,000 702,842 0.16Deutsche Pfandbriefbank 0.750% 07/02/2023 800,000 813,792 0.18DVB Bank 0.875% 09/04/2021 400,000 404,252 0.09DVB Bank 1.250% 15/09/2021 600,000 611,106 0.14DVB Bank 1.000% 25/04/2022 700,000 711,970 0.16DVB Bank 1.250% 16/06/2023 500,000 511,590 0.11Erste Group Bank 0.375% 16/04/2024 700,000 709,128 0.16Euroclear Bank 0.250% 07/09/2022 700,000 707,119 0.16Euroclear Bank 0.500% 10/07/2023 600,000 612,186 0.14Hamburg Commercial Bank 0.500% 23/05/2022 500,000 502,525 0.11HSBC France 0.625% 03/12/2020 900,000 911,745 0.20HSBC France 0.200% 04/09/2021 2,000,000 2,014,600 0.45HSBC France 0.600% 20/03/2023 1,300,000 1,329,419 0.30HSBC France 0.250% 17/05/2024 1,300,000 1,309,035 0.29ING Bank 0.750% 24/11/2020 400,000 405,488 0.09ING Bank 0.750% 22/02/2021 1,900,000 1,928,557 0.43ING Bank 0.375% 26/11/2021 1,500,000 1,517,805 0.34ING Bank 08/04/2022 (zero coupon) 1,200,000 1,203,276 0.27ING Groep 0.750% 09/03/2022 2,200,000 2,245,518 0.50ING Groep 1.000% 20/09/2023 500,000 516,030 0.12ING Groep 3.000% 11/04/2028 1,500,000 1,619,655 0.36ING Groep 2.500% 15/02/2029 1,000,000 1,065,190 0.24Intesa Sanpaolo 2.000% 18/06/2021 1,100,000 1,138,764 0.25Intesa Sanpaolo 1.125% 04/03/2022 1,500,000 1,524,405 0.34Intesa Sanpaolo 0.875% 27/06/2022 1,100,000 1,114,190 0.25Intesa Sanpaolo 2.125% 30/08/2023 1,500,000 1,576,245 0.35Intesa Sanpaolo 1.375% 18/01/2024 1,100,000 1,121,076 0.25KBC Group 1.000% 26/04/2021 700,000 713,685 0.16

UBS ETF – Bloomberg Barclays Euro Area Liquid Corporates 1-5 Year UCITS ETF
Semi-Annual report as of 30 June 2019
The accompanying notes form an integral part of these financial statements.
328
Schedule of Investments as at 30 June 2019 (Expressed in EUR) (Unaudited)
Transferable securities listed on an Official Stock Exchange
Nominal Market
Value EUR % of
Net Assets
Banks (35.39%) (continued) KBC Group 0.750% 01/03/2022 1,300,000 1,327,573 0.30KBC Group 0.875% 27/06/2023 500,000 514,835 0.12KBC Group 0.750% 18/10/2023 1,400,000 1,431,556 0.32KBC Group 1.125% 25/01/2024 1,000,000 1,035,650 0.23KBC Group 1.875% 11/03/2027 800,000 829,672 0.19Mediobanca Banca di Credito Finanziario 1.625% 19/01/2021 400,000 409,144 0.09Mediobanca Banca di Credito Finanziario 0.625% 27/09/2022 1,100,000 1,094,280 0.24Nationale-Nederlanden Bank NV/The Netherlands 0.375% 31/05/2023 500,000 503,910 0.11NIBC Bank 1.500% 31/01/2022 600,000 616,950 0.14NIBC Bank 1.125% 19/04/2023 400,000 407,772 0.09Nordea Bank 0.300% 30/06/2022 500,000 506,680 0.11Nordea Bank 1.000% 22/02/2023 1,400,000 1,452,878 0.32Nordea Bank 0.875% 26/06/2023 1,400,000 1,434,902 0.32Nordea Bank 1.875% 10/11/2025 1,000,000 1,021,820 0.23Nordea Bank 1.000% 07/09/2026 1,000,000 1,009,920 0.23OP Corporate Bank 0.750% 03/03/2022 1,200,000 1,228,944 0.27OP Corporate Bank 0.375% 11/10/2022 500,000 508,345 0.11OP Corporate Bank 0.375% 29/08/2023 500,000 508,780 0.11OP Corporate Bank 0.375% 26/02/2024 700,000 712,327 0.16OP Corporate Bank 0.375% 19/06/2024 500,000 501,470 0.11PSA Banque France 0.625% 10/10/2022 1,200,000 1,216,404 0.27PSA Banque France 0.750% 19/04/2023 800,000 811,328 0.18Raiffeisen Bank International 0.250% 05/07/2021 800,000 803,640 0.18Raiffeisen Bank International 1.000% 04/12/2023 400,000 411,444 0.09Raiffeisenlandesbank Oberoesterreich 0.750% 22/05/2023 700,000 710,724 0.16Santander Consumer Bank 0.750% 17/10/2022 600,000 609,162 0.14Societe Generale 0.750% 19/02/2021 1,000,000 1,015,410 0.23Societe Generale 0.125% 05/10/2021 900,000 905,859 0.20Societe Generale 0.250% 18/01/2022 2,400,000 2,420,616 0.54Societe Generale 1.000% 01/04/2022 1,100,000 1,125,465 0.25Societe Generale 27/05/2022 (zero coupon) 1,600,000 1,602,288 0.36Societe Generale 0.500% 13/01/2023 900,000 904,509 0.20Societe Generale 0.750% 26/05/2023 1,500,000 1,540,305 0.34Societe Generale 1.250% 15/02/2024 1,700,000 1,753,346 0.39Societe Generale 2.500% 16/09/2026 600,000 626,640 0.14Societe Generale 1.375% 23/02/2028 1,500,000 1,514,445 0.34UniCredit 2.000% 04/03/2023 1,100,000 1,146,508 0.26UniCredit 1.250% 25/06/2025 1,500,000 1,504,590 0.34Unione di Banche Italiane 0.750% 17/10/2022 750,000 737,603 0.17Unione di Banche Italiane 1.500% 10/04/2024 500,000 498,115 0.11
Beverages (1.13%) Anheuser-Busch InBev 0.875% 17/03/2022 3,000,000 3,079,500 0.69Anheuser-Busch InBev 0.800% 20/04/2023 600,000 618,762 0.14Heineken 1.250% 10/09/2021 700,000 719,579 0.16Pernod Ricard 1.875% 28/09/2023 600,000 647,838 0.14
Building Materials (1.62%) Buzzi Unicem 2.125% 28/04/2023 550,000 571,659 0.13Compagnie de Saint-Gobain 0.875% 21/09/2023 600,000 619,836 0.14Compagnie de Saint-Gobain 0.625% 15/03/2024 800,000 814,872 0.18CRH Funding 1.875% 09/01/2024 1,000,000 1,075,620 0.24HeidelbergCement 2.250% 30/03/2023 1,500,000 1,606,815 0.36HeidelbergCement 2.250% 03/06/2024 300,000 326,262 0.07HeidelbergCement Finance Luxembourg 0.500% 18/01/2021 900,000 907,299 0.20HeidelbergCement Finance Luxembourg 0.500% 09/08/2022 1,300,000 1,315,158 0.30
Chemicals (1.93%) Air Liquide Finance 0.500% 13/06/2022 700,000 713,104 0.16Air Liquide Finance 0.750% 13/06/2024 500,000 520,900 0.12BASF Finance Europe 10/11/2020 (zero coupon) 1,300,000 1,304,446 0.29Covestro 1.000% 07/10/2021 500,000 511,565 0.11Evonik Finance 08/03/2021 (zero coupon) 750,000 751,598 0.17Evonik Industries 1.000% 23/01/2023 800,000 829,928 0.18Evonik Industries 2.125% 07/07/2077 600,000 617,436 0.14Koninklijke DSM 1.375% 26/09/2022 500,000 526,235 0.12Lanxess 0.250% 07/10/2021 550,000 553,647 0.12

UBS ETF – Bloomberg Barclays Euro Area Liquid Corporates 1-5 Year UCITS ETF
Semi-Annual report as of 30 June 2019
The accompanying notes form an integral part of these financial statements.
329
Schedule of Investments as at 30 June 2019 (Expressed in EUR) (Unaudited)
Transferable securities listed on an Official Stock Exchange
Nominal Market
Value EUR % of
Net Assets
Chemicals (1.93%) (continued) Linde Finance 0.250% 18/01/2022 1,150,000 1,166,686 0.26Solvay 1.625% 02/12/2022 1,100,000 1,156,914 0.26
Commercial Services (0.85%) ALD 0.875% 18/07/2022 500,000 507,275 0.11ALD 1.250% 11/10/2022 700,000 718,879 0.16Aprr 1.125% 15/01/2021 500,000 508,455 0.12Aprr 1.500% 15/01/2024 700,000 748,636 0.17Holding d'Infrastructures de Transport 0.625% 27/03/2023 500,000 504,250 0.11Prosegur Companhia de Seguridad 1.000% 08/02/2023 800,000 813,416 0.18
Computers (0.86%) Atos 0.750% 07/05/2022 900,000 917,496 0.21Capgemini 0.500% 09/11/2021 1,100,000 1,110,670 0.25Capgemini 2.500% 01/07/2023 1,000,000 1,088,320 0.24Teleperformance 1.500% 03/04/2024 700,000 724,157 0.16
Cosmetics & Personal Care (0.90%) Unilever 31/07/2021 (zero coupon) 700,000 702,562 0.16Unilever 0.500% 03/02/2022 1,000,000 1,017,570 0.23Unilever 0.375% 14/02/2023 850,000 865,215 0.19Unilever 1.000% 03/06/2023 400,000 417,108 0.09Unilever 0.500% 12/08/2023 500,000 512,400 0.11Unilever 0.500% 29/04/2024 500,000 513,055 0.12
Diversified Financial Services (4.23%) Aareal Bank 0.375% 10/04/2024 500,000 504,625 0.11Bevco Lux 1.750% 09/02/2023 1,000,000 1,035,930 0.23Deutsche Boerse 2.750% 05/02/2041 900,000 933,651 0.21FCA Bank 1.250% 23/09/2020 500,000 507,435 0.11FCA Bank 0.250% 12/10/2020 1,000,000 1,002,940 0.22FCA Bank 1.250% 21/01/2021 400,000 407,452 0.09FCA Bank 1.000% 15/11/2021 1,050,000 1,070,674 0.24FCA Bank 1.000% 21/02/2022 800,000 812,640 0.18FCA Bank 1.250% 21/06/2022 600,000 614,712 0.14FCA Bank 0.625% 24/11/2022 1,000,000 1,004,320 0.23LeasePlan 1.000% 24/05/2021 1,200,000 1,222,068 0.27LeasePlan 0.750% 03/10/2022 1,200,000 1,214,604 0.27LeasePlan 1.000% 02/05/2023 800,000 813,920 0.18LeasePlan 1.375% 07/03/2024 600,000 617,664 0.14Santander Consumer Finance 1.500% 12/11/2020 1,000,000 1,022,770 0.23Santander Consumer Finance 1.000% 26/05/2021 600,000 612,636 0.14Santander Consumer Finance 0.500% 04/10/2021 1,100,000 1,114,971 0.25Santander Consumer Finance 0.875% 24/01/2022 1,700,000 1,738,709 0.39Santander Consumer Finance 0.875% 30/05/2023 500,000 512,175 0.12Santander Consumer Finance 1.125% 09/10/2023 1,000,000 1,035,750 0.23Santander Consumer Finance 1.000% 27/02/2024 1,100,000 1,132,219 0.25
Electric (4.93%) E.On 0.375% 23/08/2021 800,000 808,064 0.18E.On 0.875% 22/05/2024 700,000 726,831 0.16EDP Finance 2.625% 18/01/2022 1,000,000 1,070,120 0.24EDP Finance 2.375% 23/03/2023 800,000 868,200 0.20EDP Finance 1.875% 29/09/2023 500,000 536,710 0.12EDP Finance 1.125% 12/02/2024 1,600,000 1,667,040 0.37Elia System Operator 1.375% 27/05/2024 600,000 638,406 0.14Elia System Operator 2.750% Perpetual 800,000 843,816 0.19Enel 2.500% 24/11/2078 800,000 806,832 0.18Engie 0.500% 13/03/2022 500,000 509,260 0.11Engie 0.375% 28/02/2023 800,000 814,672 0.18Engie 0.875% 27/03/2024 1,000,000 1,044,220 0.23Engie 1.375% Perpetual 1,200,000 1,201,176 0.27Eurogrid 1.625% 03/11/2023 800,000 851,904 0.19Iberdrola Finanzas 1.000% 07/03/2024 1,000,000 1,045,120 0.23Iberdrola International 1.125% 27/01/2023 600,000 626,862 0.14Iberdrola International 1.750% 17/09/2023 500,000 538,660 0.12Iberdrola International 1.875% Perpetual 1,100,000 1,116,401 0.25Iberdrola International 2.625% Perpetual 1,000,000 1,048,750 0.24
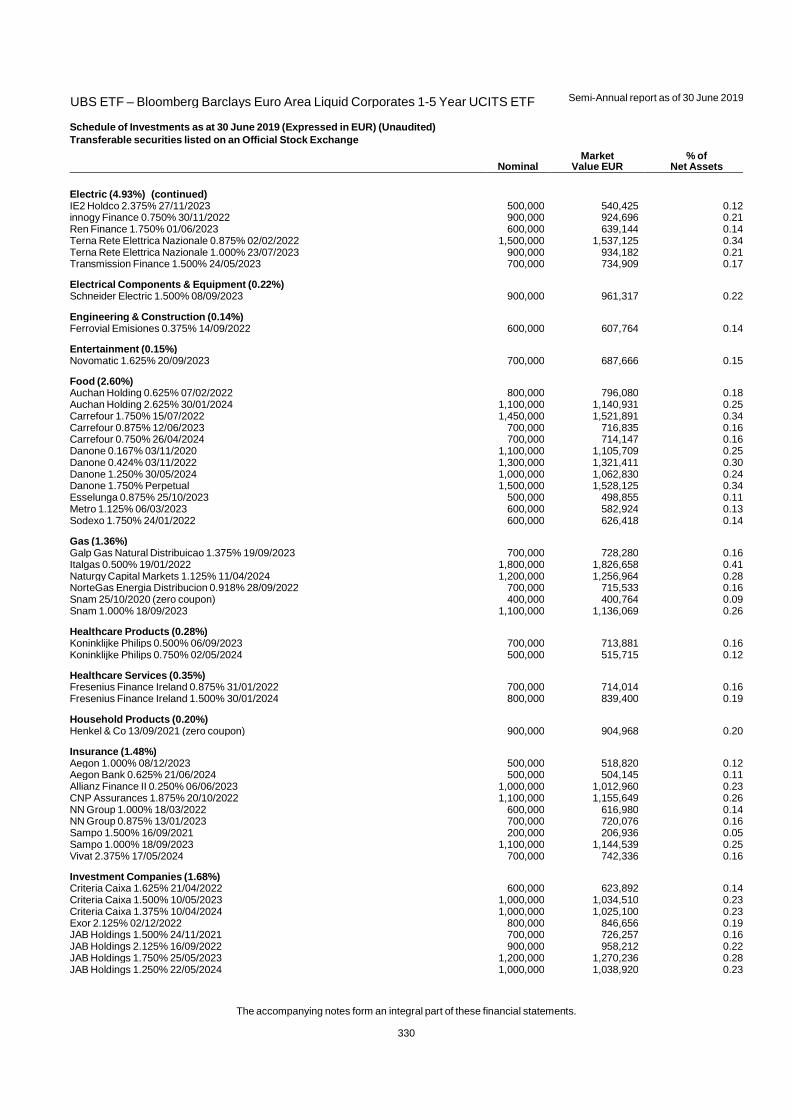
UBS ETF – Bloomberg Barclays Euro Area Liquid Corporates 1-5 Year UCITS ETF
Semi-Annual report as of 30 June 2019
The accompanying notes form an integral part of these financial statements.
330
Schedule of Investments as at 30 June 2019 (Expressed in EUR) (Unaudited)
Transferable securities listed on an Official Stock Exchange
Nominal Market
Value EUR % of
Net Assets
Electric (4.93%) (continued) IE2 Holdco 2.375% 27/11/2023 500,000 540,425 0.12innogy Finance 0.750% 30/11/2022 900,000 924,696 0.21Ren Finance 1.750% 01/06/2023 600,000 639,144 0.14Terna Rete Elettrica Nazionale 0.875% 02/02/2022 1,500,000 1,537,125 0.34Terna Rete Elettrica Nazionale 1.000% 23/07/2023 900,000 934,182 0.21Transmission Finance 1.500% 24/05/2023 700,000 734,909 0.17
Electrical Components & Equipment (0.22%) Schneider Electric 1.500% 08/09/2023 900,000 961,317 0.22
Engineering & Construction (0.14%) Ferrovial Emisiones 0.375% 14/09/2022 600,000 607,764 0.14
Entertainment (0.15%) Novomatic 1.625% 20/09/2023 700,000 687,666 0.15
Food (2.60%) Auchan Holding 0.625% 07/02/2022 800,000 796,080 0.18Auchan Holding 2.625% 30/01/2024 1,100,000 1,140,931 0.25Carrefour 1.750% 15/07/2022 1,450,000 1,521,891 0.34Carrefour 0.875% 12/06/2023 700,000 716,835 0.16Carrefour 0.750% 26/04/2024 700,000 714,147 0.16Danone 0.167% 03/11/2020 1,100,000 1,105,709 0.25Danone 0.424% 03/11/2022 1,300,000 1,321,411 0.30Danone 1.250% 30/05/2024 1,000,000 1,062,830 0.24Danone 1.750% Perpetual 1,500,000 1,528,125 0.34Esselunga 0.875% 25/10/2023 500,000 498,855 0.11Metro 1.125% 06/03/2023 600,000 582,924 0.13Sodexo 1.750% 24/01/2022 600,000 626,418 0.14
Gas (1.36%) Galp Gas Natural Distribuicao 1.375% 19/09/2023 700,000 728,280 0.16Italgas 0.500% 19/01/2022 1,800,000 1,826,658 0.41Naturgy Capital Markets 1.125% 11/04/2024 1,200,000 1,256,964 0.28NorteGas Energia Distribucion 0.918% 28/09/2022 700,000 715,533 0.16Snam 25/10/2020 (zero coupon) 400,000 400,764 0.09Snam 1.000% 18/09/2023 1,100,000 1,136,069 0.26
Healthcare Products (0.28%) Koninklijke Philips 0.500% 06/09/2023 700,000 713,881 0.16Koninklijke Philips 0.750% 02/05/2024 500,000 515,715 0.12
Healthcare Services (0.35%) Fresenius Finance Ireland 0.875% 31/01/2022 700,000 714,014 0.16Fresenius Finance Ireland 1.500% 30/01/2024 800,000 839,400 0.19
Household Products (0.20%) Henkel & Co 13/09/2021 (zero coupon) 900,000 904,968 0.20
Insurance (1.48%) Aegon 1.000% 08/12/2023 500,000 518,820 0.12Aegon Bank 0.625% 21/06/2024 500,000 504,145 0.11Allianz Finance II 0.250% 06/06/2023 1,000,000 1,012,960 0.23CNP Assurances 1.875% 20/10/2022 1,100,000 1,155,649 0.26NN Group 1.000% 18/03/2022 600,000 616,980 0.14NN Group 0.875% 13/01/2023 700,000 720,076 0.16Sampo 1.500% 16/09/2021 200,000 206,936 0.05Sampo 1.000% 18/09/2023 1,100,000 1,144,539 0.25Vivat 2.375% 17/05/2024 700,000 742,336 0.16
Investment Companies (1.68%) Criteria Caixa 1.625% 21/04/2022 600,000 623,892 0.14Criteria Caixa 1.500% 10/05/2023 1,000,000 1,034,510 0.23Criteria Caixa 1.375% 10/04/2024 1,000,000 1,025,100 0.23Exor 2.125% 02/12/2022 800,000 846,656 0.19JAB Holdings 1.500% 24/11/2021 700,000 726,257 0.16JAB Holdings 2.125% 16/09/2022 900,000 958,212 0.22JAB Holdings 1.750% 25/05/2023 1,200,000 1,270,236 0.28JAB Holdings 1.250% 22/05/2024 1,000,000 1,038,920 0.23
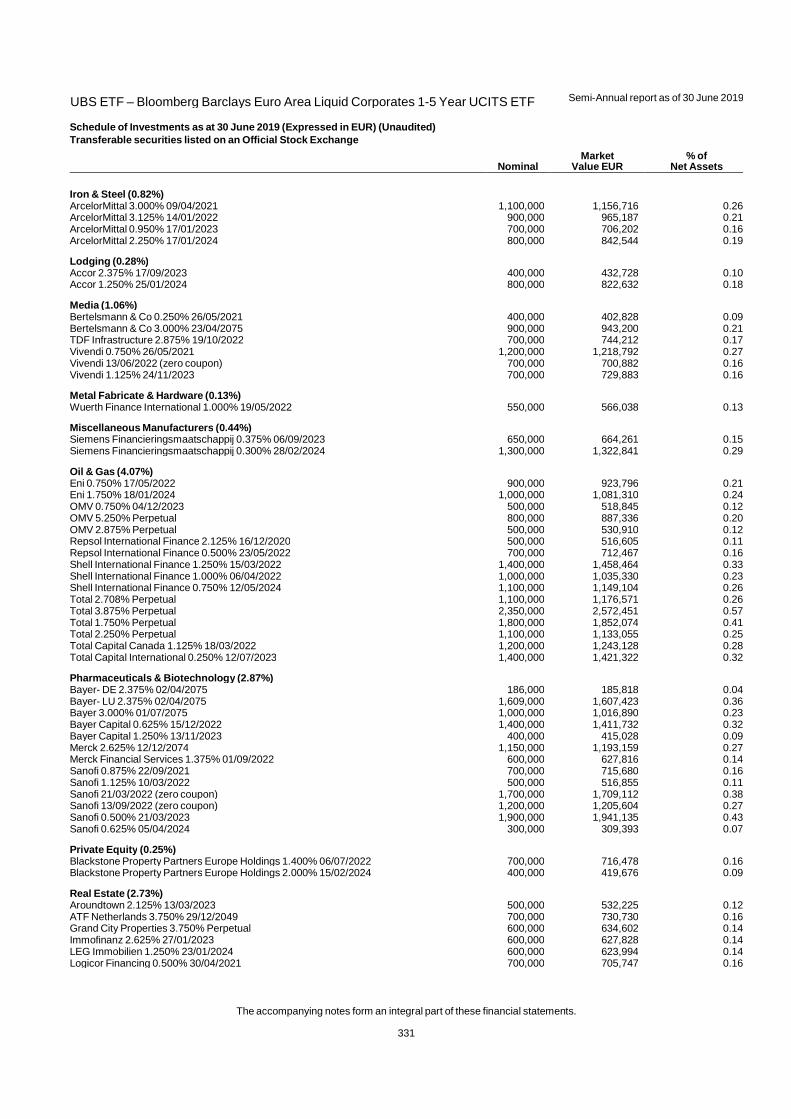
UBS ETF – Bloomberg Barclays Euro Area Liquid Corporates 1-5 Year UCITS ETF
Semi-Annual report as of 30 June 2019
The accompanying notes form an integral part of these financial statements.
331
Schedule of Investments as at 30 June 2019 (Expressed in EUR) (Unaudited)
Transferable securities listed on an Official Stock Exchange
Nominal Market
Value EUR % of
Net Assets
Iron & Steel (0.82%) ArcelorMittal 3.000% 09/04/2021 1,100,000 1,156,716 0.26ArcelorMittal 3.125% 14/01/2022 900,000 965,187 0.21ArcelorMittal 0.950% 17/01/2023 700,000 706,202 0.16ArcelorMittal 2.250% 17/01/2024 800,000 842,544 0.19
Lodging (0.28%) Accor 2.375% 17/09/2023 400,000 432,728 0.10Accor 1.250% 25/01/2024 800,000 822,632 0.18
Media (1.06%) Bertelsmann & Co 0.250% 26/05/2021 400,000 402,828 0.09Bertelsmann & Co 3.000% 23/04/2075 900,000 943,200 0.21TDF Infrastructure 2.875% 19/10/2022 700,000 744,212 0.17Vivendi 0.750% 26/05/2021 1,200,000 1,218,792 0.27Vivendi 13/06/2022 (zero coupon) 700,000 700,882 0.16Vivendi 1.125% 24/11/2023 700,000 729,883 0.16
Metal Fabricate & Hardware (0.13%) Wuerth Finance International 1.000% 19/05/2022 550,000 566,038 0.13
Miscellaneous Manufacturers (0.44%) Siemens Financieringsmaatschappij 0.375% 06/09/2023 650,000 664,261 0.15Siemens Financieringsmaatschappij 0.300% 28/02/2024 1,300,000 1,322,841 0.29
Oil & Gas (4.07%) Eni 0.750% 17/05/2022 900,000 923,796 0.21Eni 1.750% 18/01/2024 1,000,000 1,081,310 0.24OMV 0.750% 04/12/2023 500,000 518,845 0.12OMV 5.250% Perpetual 800,000 887,336 0.20OMV 2.875% Perpetual 500,000 530,910 0.12Repsol International Finance 2.125% 16/12/2020 500,000 516,605 0.11Repsol International Finance 0.500% 23/05/2022 700,000 712,467 0.16Shell International Finance 1.250% 15/03/2022 1,400,000 1,458,464 0.33Shell International Finance 1.000% 06/04/2022 1,000,000 1,035,330 0.23Shell International Finance 0.750% 12/05/2024 1,100,000 1,149,104 0.26Total 2.708% Perpetual 1,100,000 1,176,571 0.26Total 3.875% Perpetual 2,350,000 2,572,451 0.57Total 1.750% Perpetual 1,800,000 1,852,074 0.41Total 2.250% Perpetual 1,100,000 1,133,055 0.25Total Capital Canada 1.125% 18/03/2022 1,200,000 1,243,128 0.28Total Capital International 0.250% 12/07/2023 1,400,000 1,421,322 0.32
Pharmaceuticals & Biotechnology (2.87%) Bayer- DE 2.375% 02/04/2075 186,000 185,818 0.04Bayer- LU 2.375% 02/04/2075 1,609,000 1,607,423 0.36Bayer 3.000% 01/07/2075 1,000,000 1,016,890 0.23Bayer Capital 0.625% 15/12/2022 1,400,000 1,411,732 0.32Bayer Capital 1.250% 13/11/2023 400,000 415,028 0.09Merck 2.625% 12/12/2074 1,150,000 1,193,159 0.27Merck Financial Services 1.375% 01/09/2022 600,000 627,816 0.14Sanofi 0.875% 22/09/2021 700,000 715,680 0.16Sanofi 1.125% 10/03/2022 500,000 516,855 0.11Sanofi 21/03/2022 (zero coupon) 1,700,000 1,709,112 0.38Sanofi 13/09/2022 (zero coupon) 1,200,000 1,205,604 0.27Sanofi 0.500% 21/03/2023 1,900,000 1,941,135 0.43Sanofi 0.625% 05/04/2024 300,000 309,393 0.07
Private Equity (0.25%) Blackstone Property Partners Europe Holdings 1.400% 06/07/2022 700,000 716,478 0.16Blackstone Property Partners Europe Holdings 2.000% 15/02/2024 400,000 419,676 0.09
Real Estate (2.73%) Aroundtown 2.125% 13/03/2023 500,000 532,225 0.12ATF Netherlands 3.750% 29/12/2049 700,000 730,730 0.16Grand City Properties 3.750% Perpetual 600,000 634,602 0.14Immofinanz 2.625% 27/01/2023 600,000 627,828 0.14LEG Immobilien 1.250% 23/01/2024 600,000 623,994 0.14Logicor Financing 0.500% 30/04/2021 700,000 705,747 0.16
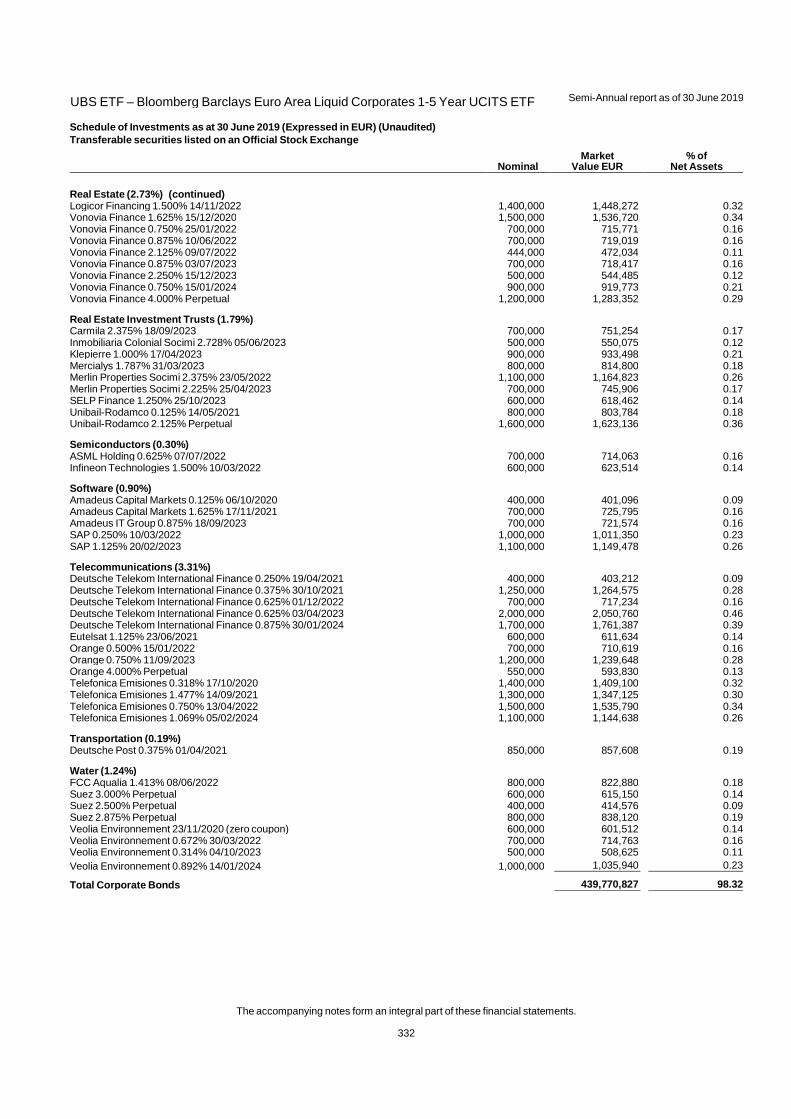
UBS ETF – Bloomberg Barclays Euro Area Liquid Corporates 1-5 Year UCITS ETF
Semi-Annual report as of 30 June 2019
The accompanying notes form an integral part of these financial statements.
332
Schedule of Investments as at 30 June 2019 (Expressed in EUR) (Unaudited)
Transferable securities listed on an Official Stock Exchange
Nominal Market
Value EUR % of
Net Assets
Real Estate (2.73%) (continued) Logicor Financing 1.500% 14/11/2022 1,400,000 1,448,272 0.32Vonovia Finance 1.625% 15/12/2020 1,500,000 1,536,720 0.34Vonovia Finance 0.750% 25/01/2022 700,000 715,771 0.16Vonovia Finance 0.875% 10/06/2022 700,000 719,019 0.16Vonovia Finance 2.125% 09/07/2022 444,000 472,034 0.11Vonovia Finance 0.875% 03/07/2023 700,000 718,417 0.16Vonovia Finance 2.250% 15/12/2023 500,000 544,485 0.12Vonovia Finance 0.750% 15/01/2024 900,000 919,773 0.21Vonovia Finance 4.000% Perpetual 1,200,000 1,283,352 0.29
Real Estate Investment Trusts (1.79%) Carmila 2.375% 18/09/2023 700,000 751,254 0.17Inmobiliaria Colonial Socimi 2.728% 05/06/2023 500,000 550,075 0.12Klepierre 1.000% 17/04/2023 900,000 933,498 0.21Mercialys 1.787% 31/03/2023 800,000 814,800 0.18Merlin Properties Socimi 2.375% 23/05/2022 1,100,000 1,164,823 0.26Merlin Properties Socimi 2.225% 25/04/2023 700,000 745,906 0.17SELP Finance 1.250% 25/10/2023 600,000 618,462 0.14Unibail-Rodamco 0.125% 14/05/2021 800,000 803,784 0.18Unibail-Rodamco 2.125% Perpetual 1,600,000 1,623,136 0.36
Semiconductors (0.30%) ASML Holding 0.625% 07/07/2022 700,000 714,063 0.16Infineon Technologies 1.500% 10/03/2022 600,000 623,514 0.14
Software (0.90%) Amadeus Capital Markets 0.125% 06/10/2020 400,000 401,096 0.09Amadeus Capital Markets 1.625% 17/11/2021 700,000 725,795 0.16Amadeus IT Group 0.875% 18/09/2023 700,000 721,574 0.16SAP 0.250% 10/03/2022 1,000,000 1,011,350 0.23SAP 1.125% 20/02/2023 1,100,000 1,149,478 0.26
Telecommunications (3.31%) Deutsche Telekom International Finance 0.250% 19/04/2021 400,000 403,212 0.09Deutsche Telekom International Finance 0.375% 30/10/2021 1,250,000 1,264,575 0.28Deutsche Telekom International Finance 0.625% 01/12/2022 700,000 717,234 0.16Deutsche Telekom International Finance 0.625% 03/04/2023 2,000,000 2,050,760 0.46Deutsche Telekom International Finance 0.875% 30/01/2024 1,700,000 1,761,387 0.39Eutelsat 1.125% 23/06/2021 600,000 611,634 0.14Orange 0.500% 15/01/2022 700,000 710,619 0.16Orange 0.750% 11/09/2023 1,200,000 1,239,648 0.28Orange 4.000% Perpetual 550,000 593,830 0.13Telefonica Emisiones 0.318% 17/10/2020 1,400,000 1,409,100 0.32Telefonica Emisiones 1.477% 14/09/2021 1,300,000 1,347,125 0.30Telefonica Emisiones 0.750% 13/04/2022 1,500,000 1,535,790 0.34Telefonica Emisiones 1.069% 05/02/2024 1,100,000 1,144,638 0.26
Transportation (0.19%) Deutsche Post 0.375% 01/04/2021 850,000 857,608 0.19
Water (1.24%) FCC Aqualia 1.413% 08/06/2022 800,000 822,880 0.18Suez 3.000% Perpetual 600,000 615,150 0.14Suez 2.500% Perpetual 400,000 414,576 0.09Suez 2.875% Perpetual 800,000 838,120 0.19Veolia Environnement 23/11/2020 (zero coupon) 600,000 601,512 0.14Veolia Environnement 0.672% 30/03/2022 700,000 714,763 0.16Veolia Environnement 0.314% 04/10/2023 500,000 508,625 0.11Veolia Environnement 0.892% 14/01/2024 1,000,000 1,035,940 0.23
Total Corporate Bonds 439,770,827 98.32
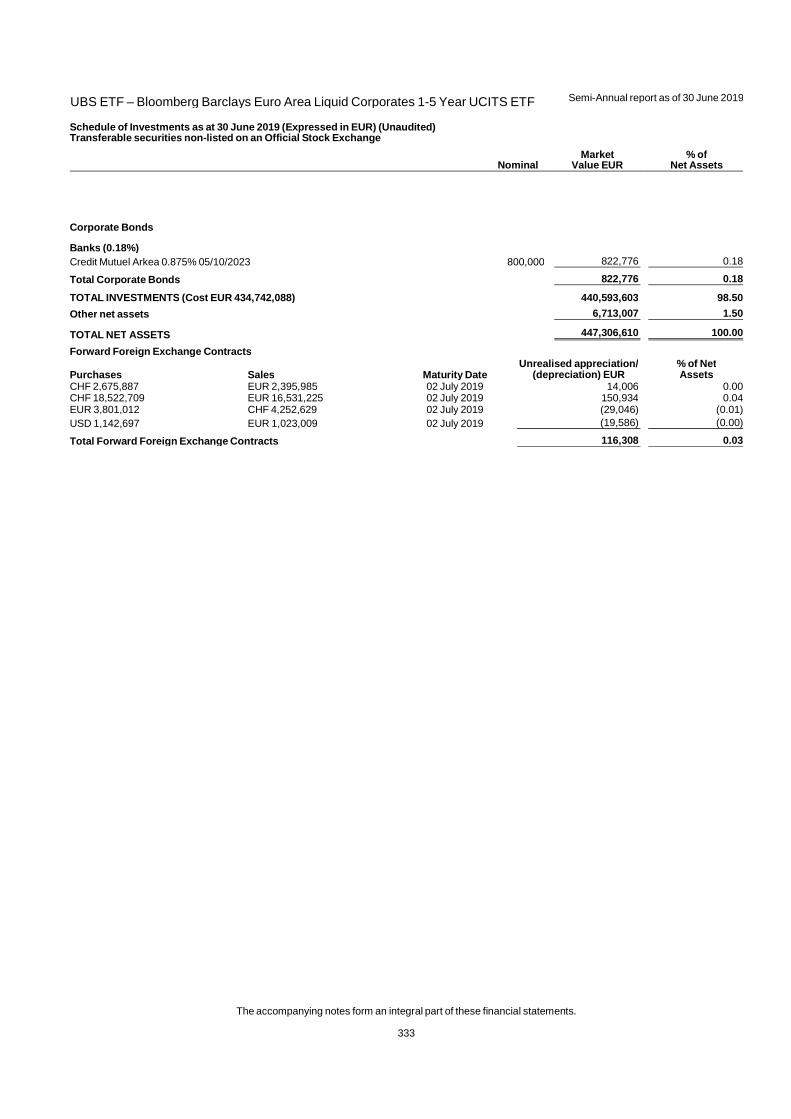
UBS ETF – Bloomberg Barclays Euro Area Liquid Corporates 1-5 Year UCITS ETF
Semi-Annual report as of 30 June 2019
The accompanying notes form an integral part of these financial statements.
333
Schedule of Investments as at 30 June 2019 (Expressed in EUR) (Unaudited) Transferable securities non-listed on an Official Stock Exchange
Nominal Market
Value EUR % of
Net Assets
Corporate Bonds
Banks (0.18%) Credit Mutuel Arkea 0.875% 05/10/2023 800,000 822,776 0.18
Total Corporate Bonds 822,776 0.18
TOTAL INVESTMENTS (Cost EUR 434,742,088) 440,593,603 98.50
Other net assets 6,713,007 1.50
TOTAL NET ASSETS 447,306,610 100.00
Forward Foreign Exchange Contracts
Purchases Sales Maturity Date Unrealised appreciation/
(depreciation) EUR % of Net Assets
CHF 2,675,887 EUR 2,395,985 02 July 2019 14,006 0.00CHF 18,522,709 EUR 16,531,225 02 July 2019 150,934 0.04EUR 3,801,012 CHF 4,252,629 02 July 2019 (29,046) (0.01)USD 1,142,697 EUR 1,023,009 02 July 2019 (19,586) (0.00)
Total Forward Foreign Exchange Contracts 116,308 0.03
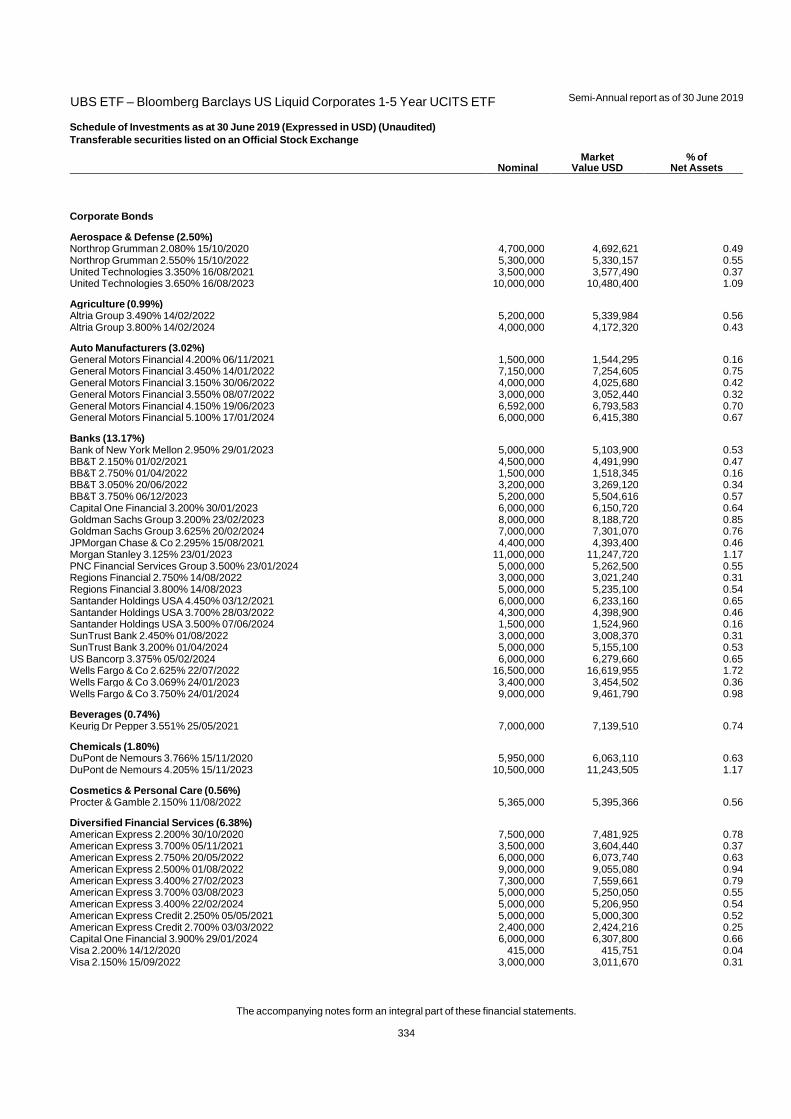
UBS ETF – Bloomberg Barclays US Liquid Corporates 1-5 Year UCITS ETF
Semi-Annual report as of 30 June 2019
The accompanying notes form an integral part of these financial statements.
334
Schedule of Investments as at 30 June 2019 (Expressed in USD) (Unaudited)
Transferable securities listed on an Official Stock Exchange
Nominal Market
Value USD % of
Net Assets
Corporate Bonds
Aerospace & Defense (2.50%) Northrop Grumman 2.080% 15/10/2020 4,700,000 4,692,621 0.49Northrop Grumman 2.550% 15/10/2022 5,300,000 5,330,157 0.55United Technologies 3.350% 16/08/2021 3,500,000 3,577,490 0.37United Technologies 3.650% 16/08/2023 10,000,000 10,480,400 1.09
Agriculture (0.99%) Altria Group 3.490% 14/02/2022 5,200,000 5,339,984 0.56Altria Group 3.800% 14/02/2024 4,000,000 4,172,320 0.43
Auto Manufacturers (3.02%) General Motors Financial 4.200% 06/11/2021 1,500,000 1,544,295 0.16General Motors Financial 3.450% 14/01/2022 7,150,000 7,254,605 0.75General Motors Financial 3.150% 30/06/2022 4,000,000 4,025,680 0.42General Motors Financial 3.550% 08/07/2022 3,000,000 3,052,440 0.32General Motors Financial 4.150% 19/06/2023 6,592,000 6,793,583 0.70General Motors Financial 5.100% 17/01/2024 6,000,000 6,415,380 0.67
Banks (13.17%) Bank of New York Mellon 2.950% 29/01/2023 5,000,000 5,103,900 0.53BB&T 2.150% 01/02/2021 4,500,000 4,491,990 0.47BB&T 2.750% 01/04/2022 1,500,000 1,518,345 0.16BB&T 3.050% 20/06/2022 3,200,000 3,269,120 0.34BB&T 3.750% 06/12/2023 5,200,000 5,504,616 0.57Capital One Financial 3.200% 30/01/2023 6,000,000 6,150,720 0.64Goldman Sachs Group 3.200% 23/02/2023 8,000,000 8,188,720 0.85Goldman Sachs Group 3.625% 20/02/2024 7,000,000 7,301,070 0.76JPMorgan Chase & Co 2.295% 15/08/2021 4,400,000 4,393,400 0.46Morgan Stanley 3.125% 23/01/2023 11,000,000 11,247,720 1.17PNC Financial Services Group 3.500% 23/01/2024 5,000,000 5,262,500 0.55Regions Financial 2.750% 14/08/2022 3,000,000 3,021,240 0.31Regions Financial 3.800% 14/08/2023 5,000,000 5,235,100 0.54Santander Holdings USA 4.450% 03/12/2021 6,000,000 6,233,160 0.65Santander Holdings USA 3.700% 28/03/2022 4,300,000 4,398,900 0.46Santander Holdings USA 3.500% 07/06/2024 1,500,000 1,524,960 0.16SunTrust Bank 2.450% 01/08/2022 3,000,000 3,008,370 0.31SunTrust Bank 3.200% 01/04/2024 5,000,000 5,155,100 0.53US Bancorp 3.375% 05/02/2024 6,000,000 6,279,660 0.65Wells Fargo & Co 2.625% 22/07/2022 16,500,000 16,619,955 1.72Wells Fargo & Co 3.069% 24/01/2023 3,400,000 3,454,502 0.36Wells Fargo & Co 3.750% 24/01/2024 9,000,000 9,461,790 0.98
Beverages (0.74%) Keurig Dr Pepper 3.551% 25/05/2021 7,000,000 7,139,510 0.74
Chemicals (1.80%) DuPont de Nemours 3.766% 15/11/2020 5,950,000 6,063,110 0.63DuPont de Nemours 4.205% 15/11/2023 10,500,000 11,243,505 1.17
Cosmetics & Personal Care (0.56%) Procter & Gamble 2.150% 11/08/2022 5,365,000 5,395,366 0.56
Diversified Financial Services (6.38%) American Express 2.200% 30/10/2020 7,500,000 7,481,925 0.78American Express 3.700% 05/11/2021 3,500,000 3,604,440 0.37American Express 2.750% 20/05/2022 6,000,000 6,073,740 0.63American Express 2.500% 01/08/2022 9,000,000 9,055,080 0.94American Express 3.400% 27/02/2023 7,300,000 7,559,661 0.79American Express 3.700% 03/08/2023 5,000,000 5,250,050 0.55American Express 3.400% 22/02/2024 5,000,000 5,206,950 0.54American Express Credit 2.250% 05/05/2021 5,000,000 5,000,300 0.52American Express Credit 2.700% 03/03/2022 2,400,000 2,424,216 0.25Capital One Financial 3.900% 29/01/2024 6,000,000 6,307,800 0.66Visa 2.200% 14/12/2020 415,000 415,751 0.04Visa 2.150% 15/09/2022 3,000,000 3,011,670 0.31
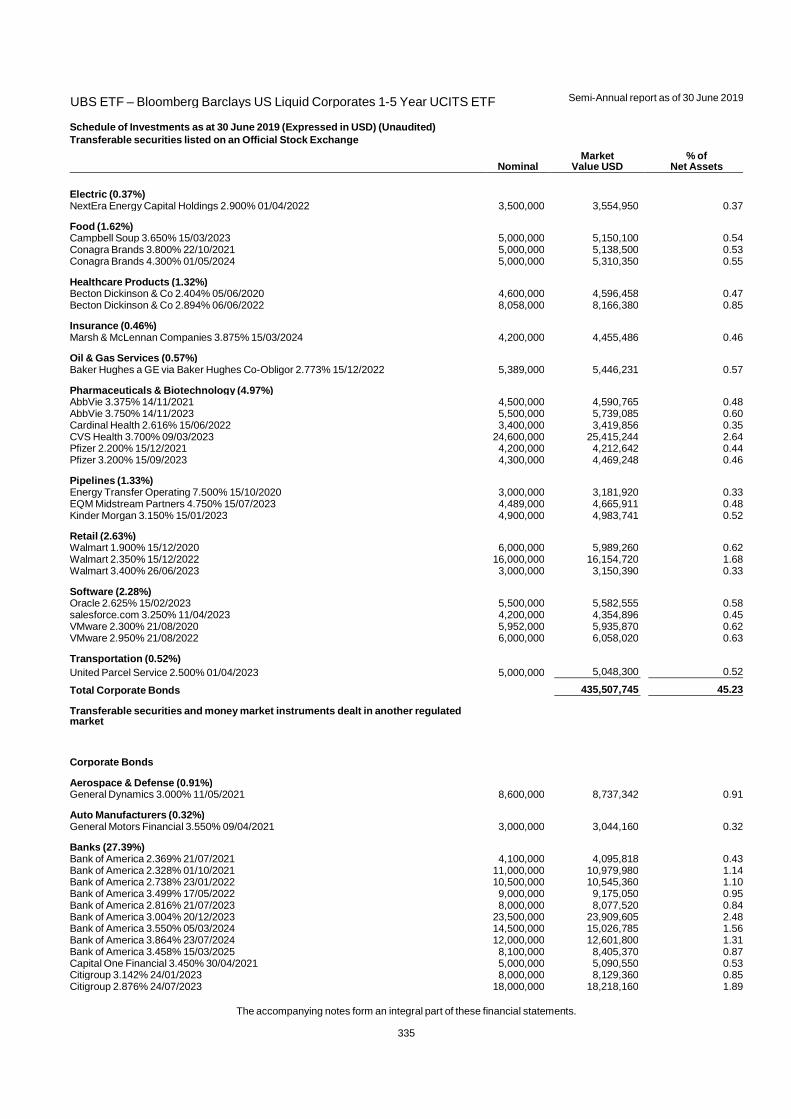
UBS ETF – Bloomberg Barclays US Liquid Corporates 1-5 Year UCITS ETF
Semi-Annual report as of 30 June 2019
The accompanying notes form an integral part of these financial statements.
335
Schedule of Investments as at 30 June 2019 (Expressed in USD) (Unaudited)
Transferable securities listed on an Official Stock Exchange
Nominal Market
Value USD % of
Net Assets
Electric (0.37%) NextEra Energy Capital Holdings 2.900% 01/04/2022 3,500,000 3,554,950 0.37
Food (1.62%) Campbell Soup 3.650% 15/03/2023 5,000,000 5,150,100 0.54Conagra Brands 3.800% 22/10/2021 5,000,000 5,138,500 0.53Conagra Brands 4.300% 01/05/2024 5,000,000 5,310,350 0.55
Healthcare Products (1.32%) Becton Dickinson & Co 2.404% 05/06/2020 4,600,000 4,596,458 0.47Becton Dickinson & Co 2.894% 06/06/2022 8,058,000 8,166,380 0.85
Insurance (0.46%) Marsh & McLennan Companies 3.875% 15/03/2024 4,200,000 4,455,486 0.46
Oil & Gas Services (0.57%) Baker Hughes a GE via Baker Hughes Co-Obligor 2.773% 15/12/2022 5,389,000 5,446,231 0.57
Pharmaceuticals & Biotechnology (4.97%) AbbVie 3.375% 14/11/2021 4,500,000 4,590,765 0.48AbbVie 3.750% 14/11/2023 5,500,000 5,739,085 0.60Cardinal Health 2.616% 15/06/2022 3,400,000 3,419,856 0.35CVS Health 3.700% 09/03/2023 24,600,000 25,415,244 2.64Pfizer 2.200% 15/12/2021 4,200,000 4,212,642 0.44Pfizer 3.200% 15/09/2023 4,300,000 4,469,248 0.46
Pipelines (1.33%) Energy Transfer Operating 7.500% 15/10/2020 3,000,000 3,181,920 0.33EQM Midstream Partners 4.750% 15/07/2023 4,489,000 4,665,911 0.48Kinder Morgan 3.150% 15/01/2023 4,900,000 4,983,741 0.52
Retail (2.63%) Walmart 1.900% 15/12/2020 6,000,000 5,989,260 0.62Walmart 2.350% 15/12/2022 16,000,000 16,154,720 1.68Walmart 3.400% 26/06/2023 3,000,000 3,150,390 0.33
Software (2.28%) Oracle 2.625% 15/02/2023 5,500,000 5,582,555 0.58salesforce.com 3.250% 11/04/2023 4,200,000 4,354,896 0.45VMware 2.300% 21/08/2020 5,952,000 5,935,870 0.62VMware 2.950% 21/08/2022 6,000,000 6,058,020 0.63
Transportation (0.52%) United Parcel Service 2.500% 01/04/2023 5,000,000 5,048,300 0.52
Total Corporate Bonds 435,507,745 45.23
Transferable securities and money market instruments dealt in another regulated market
Corporate Bonds
Aerospace & Defense (0.91%) General Dynamics 3.000% 11/05/2021 8,600,000 8,737,342 0.91
Auto Manufacturers (0.32%) General Motors Financial 3.550% 09/04/2021 3,000,000 3,044,160 0.32
Banks (27.39%) Bank of America 2.369% 21/07/2021 4,100,000 4,095,818 0.43Bank of America 2.328% 01/10/2021 11,000,000 10,979,980 1.14Bank of America 2.738% 23/01/2022 10,500,000 10,545,360 1.10Bank of America 3.499% 17/05/2022 9,000,000 9,175,050 0.95Bank of America 2.816% 21/07/2023 8,000,000 8,077,520 0.84Bank of America 3.004% 20/12/2023 23,500,000 23,909,605 2.48Bank of America 3.550% 05/03/2024 14,500,000 15,026,785 1.56Bank of America 3.864% 23/07/2024 12,000,000 12,601,800 1.31Bank of America 3.458% 15/03/2025 8,100,000 8,405,370 0.87Capital One Financial 3.450% 30/04/2021 5,000,000 5,090,550 0.53Citigroup 3.142% 24/01/2023 8,000,000 8,129,360 0.85Citigroup 2.876% 24/07/2023 18,000,000 18,218,160 1.89
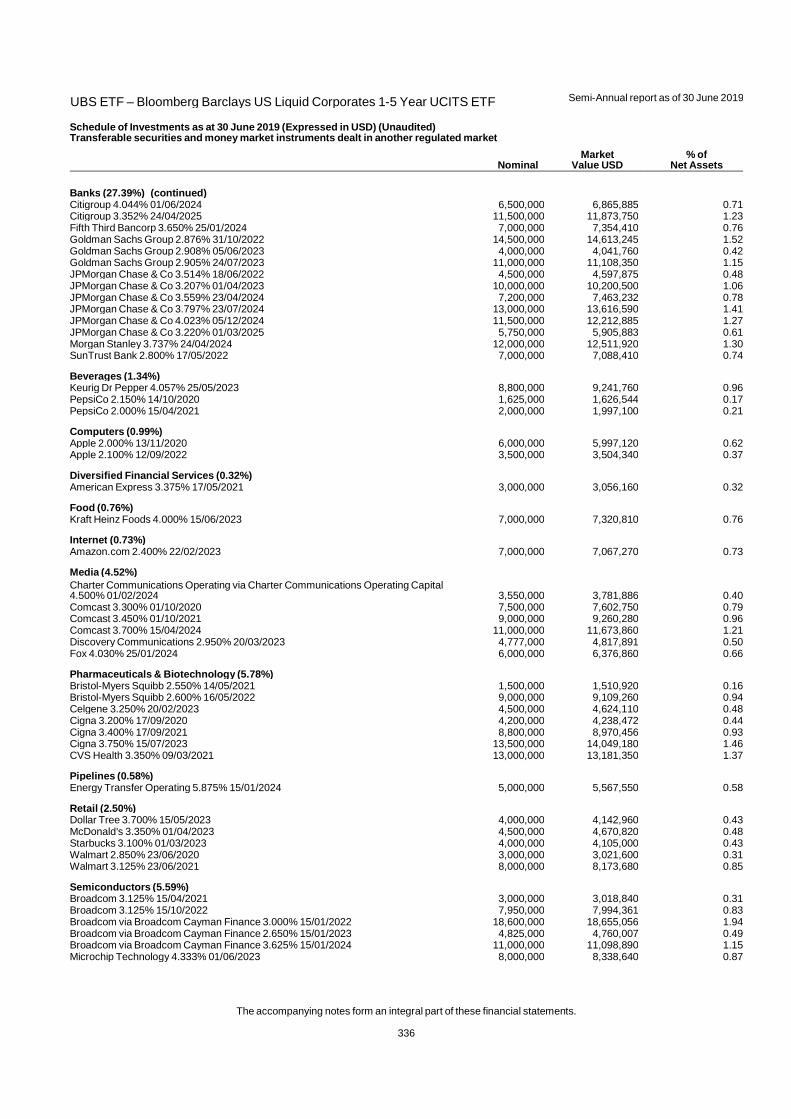
UBS ETF – Bloomberg Barclays US Liquid Corporates 1-5 Year UCITS ETF
Semi-Annual report as of 30 June 2019
The accompanying notes form an integral part of these financial statements.
336
Schedule of Investments as at 30 June 2019 (Expressed in USD) (Unaudited) Transferable securities and money market instruments dealt in another regulated market
Nominal Market
Value USD % of
Net Assets
Banks (27.39%) (continued) Citigroup 4.044% 01/06/2024 6,500,000 6,865,885 0.71Citigroup 3.352% 24/04/2025 11,500,000 11,873,750 1.23Fifth Third Bancorp 3.650% 25/01/2024 7,000,000 7,354,410 0.76Goldman Sachs Group 2.876% 31/10/2022 14,500,000 14,613,245 1.52Goldman Sachs Group 2.908% 05/06/2023 4,000,000 4,041,760 0.42Goldman Sachs Group 2.905% 24/07/2023 11,000,000 11,108,350 1.15JPMorgan Chase & Co 3.514% 18/06/2022 4,500,000 4,597,875 0.48JPMorgan Chase & Co 3.207% 01/04/2023 10,000,000 10,200,500 1.06JPMorgan Chase & Co 3.559% 23/04/2024 7,200,000 7,463,232 0.78JPMorgan Chase & Co 3.797% 23/07/2024 13,000,000 13,616,590 1.41JPMorgan Chase & Co 4.023% 05/12/2024 11,500,000 12,212,885 1.27JPMorgan Chase & Co 3.220% 01/03/2025 5,750,000 5,905,883 0.61Morgan Stanley 3.737% 24/04/2024 12,000,000 12,511,920 1.30SunTrust Bank 2.800% 17/05/2022 7,000,000 7,088,410 0.74
Beverages (1.34%) Keurig Dr Pepper 4.057% 25/05/2023 8,800,000 9,241,760 0.96PepsiCo 2.150% 14/10/2020 1,625,000 1,626,544 0.17PepsiCo 2.000% 15/04/2021 2,000,000 1,997,100 0.21
Computers (0.99%) Apple 2.000% 13/11/2020 6,000,000 5,997,120 0.62Apple 2.100% 12/09/2022 3,500,000 3,504,340 0.37
Diversified Financial Services (0.32%) American Express 3.375% 17/05/2021 3,000,000 3,056,160 0.32
Food (0.76%) Kraft Heinz Foods 4.000% 15/06/2023 7,000,000 7,320,810 0.76
Internet (0.73%) Amazon.com 2.400% 22/02/2023 7,000,000 7,067,270 0.73
Media (4.52%) Charter Communications Operating via Charter Communications Operating Capital 4.500% 01/02/2024 3,550,000 3,781,886 0.40Comcast 3.300% 01/10/2020 7,500,000 7,602,750 0.79Comcast 3.450% 01/10/2021 9,000,000 9,260,280 0.96Comcast 3.700% 15/04/2024 11,000,000 11,673,860 1.21Discovery Communications 2.950% 20/03/2023 4,777,000 4,817,891 0.50Fox 4.030% 25/01/2024 6,000,000 6,376,860 0.66
Pharmaceuticals & Biotechnology (5.78%) Bristol-Myers Squibb 2.550% 14/05/2021 1,500,000 1,510,920 0.16Bristol-Myers Squibb 2.600% 16/05/2022 9,000,000 9,109,260 0.94Celgene 3.250% 20/02/2023 4,500,000 4,624,110 0.48Cigna 3.200% 17/09/2020 4,200,000 4,238,472 0.44Cigna 3.400% 17/09/2021 8,800,000 8,970,456 0.93Cigna 3.750% 15/07/2023 13,500,000 14,049,180 1.46CVS Health 3.350% 09/03/2021 13,000,000 13,181,350 1.37
Pipelines (0.58%) Energy Transfer Operating 5.875% 15/01/2024 5,000,000 5,567,550 0.58
Retail (2.50%) Dollar Tree 3.700% 15/05/2023 4,000,000 4,142,960 0.43McDonald's 3.350% 01/04/2023 4,500,000 4,670,820 0.48Starbucks 3.100% 01/03/2023 4,000,000 4,105,000 0.43Walmart 2.850% 23/06/2020 3,000,000 3,021,600 0.31Walmart 3.125% 23/06/2021 8,000,000 8,173,680 0.85
Semiconductors (5.59%) Broadcom 3.125% 15/04/2021 3,000,000 3,018,840 0.31Broadcom 3.125% 15/10/2022 7,950,000 7,994,361 0.83Broadcom via Broadcom Cayman Finance 3.000% 15/01/2022 18,600,000 18,655,056 1.94Broadcom via Broadcom Cayman Finance 2.650% 15/01/2023 4,825,000 4,760,007 0.49Broadcom via Broadcom Cayman Finance 3.625% 15/01/2024 11,000,000 11,098,890 1.15Microchip Technology 4.333% 01/06/2023 8,000,000 8,338,640 0.87
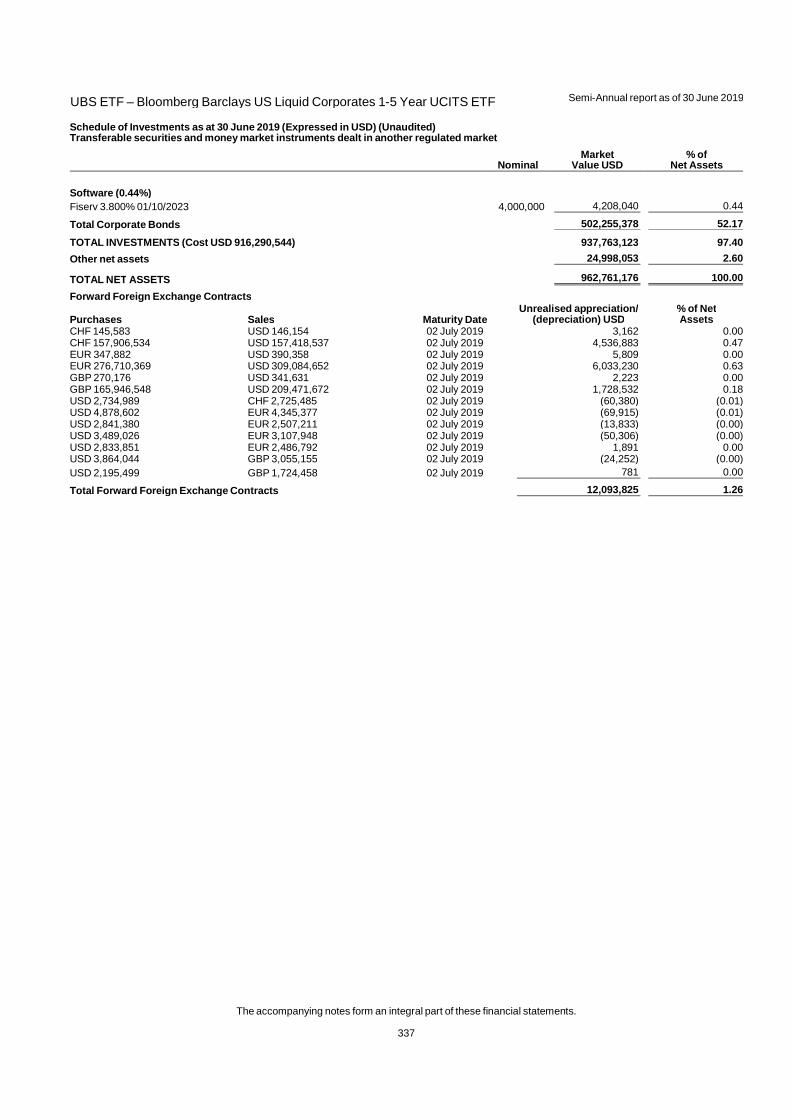
UBS ETF – Bloomberg Barclays US Liquid Corporates 1-5 Year UCITS ETF
Semi-Annual report as of 30 June 2019
The accompanying notes form an integral part of these financial statements.
337
Schedule of Investments as at 30 June 2019 (Expressed in USD) (Unaudited) Transferable securities and money market instruments dealt in another regulated market
Nominal Market
Value USD % of
Net Assets
Software (0.44%) Fiserv 3.800% 01/10/2023 4,000,000 4,208,040 0.44
Total Corporate Bonds 502,255,378 52.17
TOTAL INVESTMENTS (Cost USD 916,290,544) 937,763,123 97.40
Other net assets 24,998,053 2.60
TOTAL NET ASSETS 962,761,176 100.00
Forward Foreign Exchange Contracts
Purchases Sales Maturity Date Unrealised appreciation/
(depreciation) USD % of Net Assets
CHF 145,583 USD 146,154 02 July 2019 3,162 0.00CHF 157,906,534 USD 157,418,537 02 July 2019 4,536,883 0.47EUR 347,882 USD 390,358 02 July 2019 5,809 0.00EUR 276,710,369 USD 309,084,652 02 July 2019 6,033,230 0.63GBP 270,176 USD 341,631 02 July 2019 2,223 0.00GBP 165,946,548 USD 209,471,672 02 July 2019 1,728,532 0.18USD 2,734,989 CHF 2,725,485 02 July 2019 (60,380) (0.01)USD 4,878,602 EUR 4,345,377 02 July 2019 (69,915) (0.01)USD 2,841,380 EUR 2,507,211 02 July 2019 (13,833) (0.00)USD 3,489,026 EUR 3,107,948 02 July 2019 (50,306) (0.00)USD 2,833,851 EUR 2,486,792 02 July 2019 1,891 0.00USD 3,864,044 GBP 3,055,155 02 July 2019 (24,252) (0.00)USD 2,195,499 GBP 1,724,458 02 July 2019 781 0.00
Total Forward Foreign Exchange Contracts 12,093,825 1.26
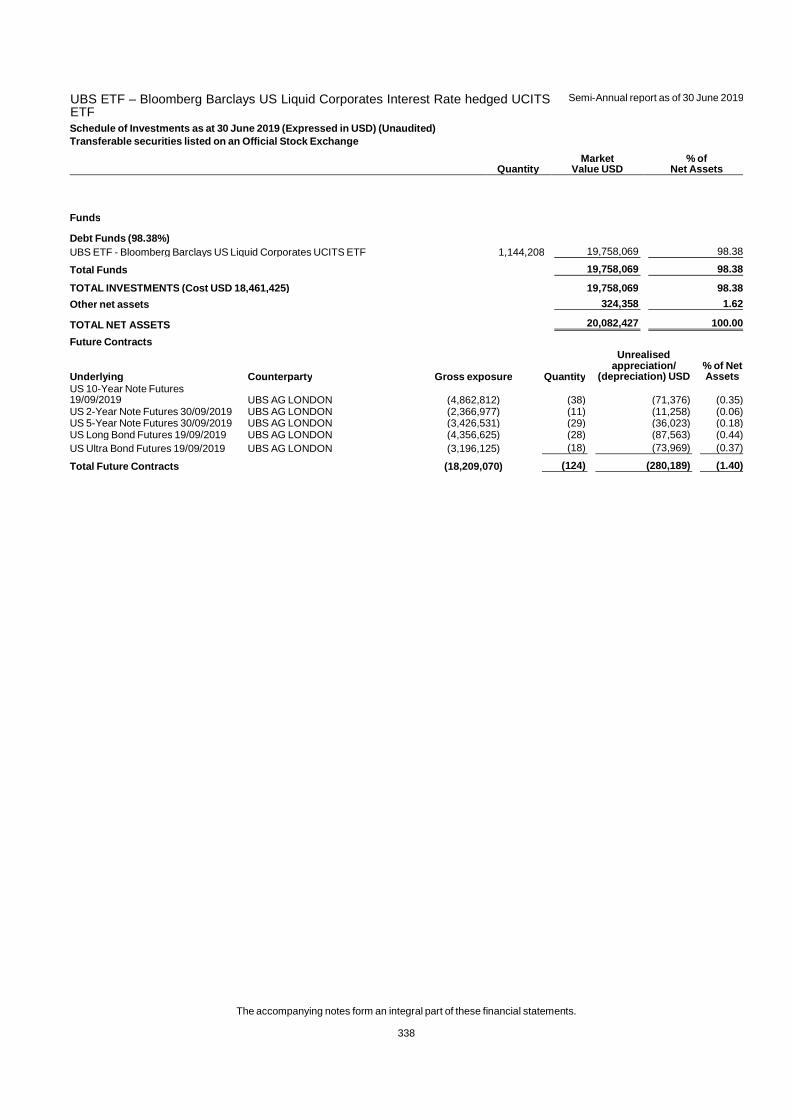
UBS ETF – Bloomberg Barclays US Liquid Corporates Interest Rate hedged UCITSETF
Semi-Annual report as of 30 June 2019
The accompanying notes form an integral part of these financial statements.
338
Schedule of Investments as at 30 June 2019 (Expressed in USD) (Unaudited)
Transferable securities listed on an Official Stock Exchange
Quantity Market
Value USD % of
Net Assets
Funds
Debt Funds (98.38%) UBS ETF - Bloomberg Barclays US Liquid Corporates UCITS ETF 1,144,208 19,758,069 98.38
Total Funds 19,758,069 98.38
TOTAL INVESTMENTS (Cost USD 18,461,425) 19,758,069 98.38
Other net assets 324,358 1.62
TOTAL NET ASSETS 20,082,427 100.00
Future Contracts
Underlying Counterparty Gross exposure Quantity
Unrealised appreciation/
(depreciation) USD % of Net Assets
US 10-Year Note Futures 19/09/2019 UBS AG LONDON (4,862,812) (38) (71,376) (0.35)US 2-Year Note Futures 30/09/2019 UBS AG LONDON (2,366,977) (11) (11,258) (0.06)US 5-Year Note Futures 30/09/2019 UBS AG LONDON (3,426,531) (29) (36,023) (0.18)US Long Bond Futures 19/09/2019 UBS AG LONDON (4,356,625) (28) (87,563) (0.44)US Ultra Bond Futures 19/09/2019 UBS AG LONDON (3,196,125) (18) (73,969) (0.37)
Total Future Contracts (18,209,070) (124) (280,189) (1.40)
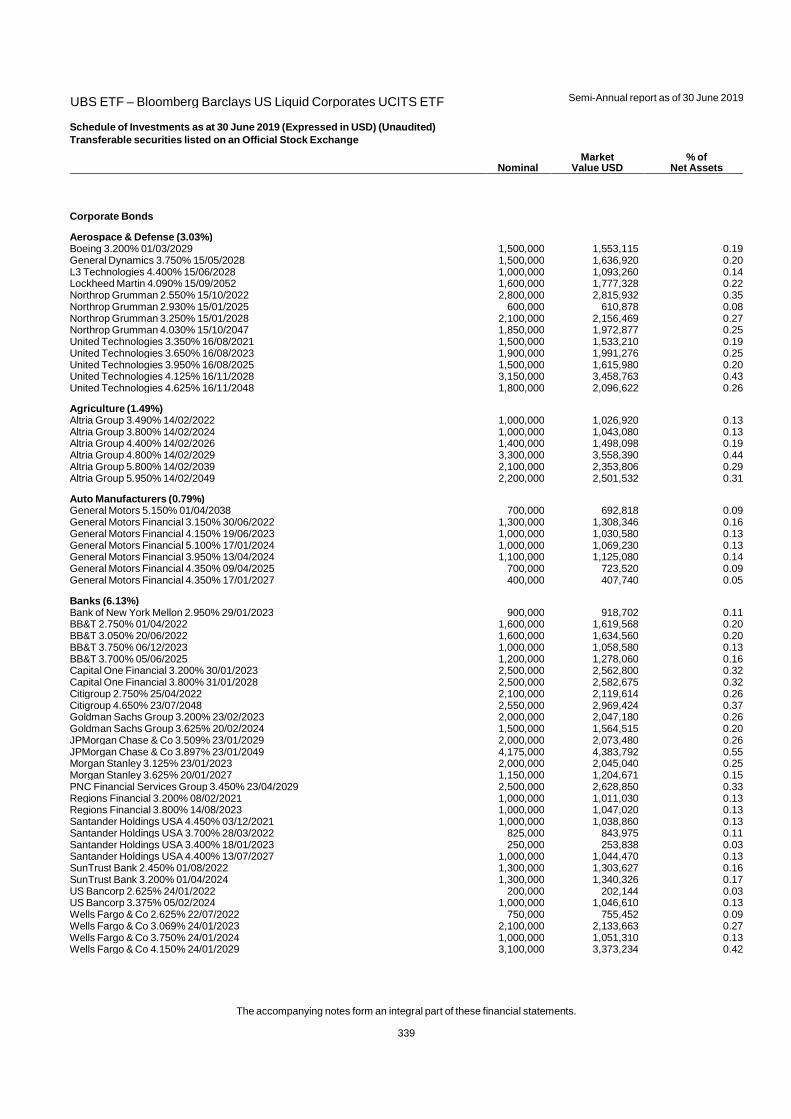
UBS ETF – Bloomberg Barclays US Liquid Corporates UCITS ETF
Semi-Annual report as of 30 June 2019
The accompanying notes form an integral part of these financial statements.
339
Schedule of Investments as at 30 June 2019 (Expressed in USD) (Unaudited)
Transferable securities listed on an Official Stock Exchange
Nominal Market
Value USD % of
Net Assets
Corporate Bonds
Aerospace & Defense (3.03%) Boeing 3.200% 01/03/2029 1,500,000 1,553,115 0.19General Dynamics 3.750% 15/05/2028 1,500,000 1,636,920 0.20L3 Technologies 4.400% 15/06/2028 1,000,000 1,093,260 0.14Lockheed Martin 4.090% 15/09/2052 1,600,000 1,777,328 0.22Northrop Grumman 2.550% 15/10/2022 2,800,000 2,815,932 0.35Northrop Grumman 2.930% 15/01/2025 600,000 610,878 0.08Northrop Grumman 3.250% 15/01/2028 2,100,000 2,156,469 0.27Northrop Grumman 4.030% 15/10/2047 1,850,000 1,972,877 0.25United Technologies 3.350% 16/08/2021 1,500,000 1,533,210 0.19United Technologies 3.650% 16/08/2023 1,900,000 1,991,276 0.25United Technologies 3.950% 16/08/2025 1,500,000 1,615,980 0.20United Technologies 4.125% 16/11/2028 3,150,000 3,458,763 0.43United Technologies 4.625% 16/11/2048 1,800,000 2,096,622 0.26
Agriculture (1.49%) Altria Group 3.490% 14/02/2022 1,000,000 1,026,920 0.13Altria Group 3.800% 14/02/2024 1,000,000 1,043,080 0.13Altria Group 4.400% 14/02/2026 1,400,000 1,498,098 0.19Altria Group 4.800% 14/02/2029 3,300,000 3,558,390 0.44Altria Group 5.800% 14/02/2039 2,100,000 2,353,806 0.29Altria Group 5.950% 14/02/2049 2,200,000 2,501,532 0.31
Auto Manufacturers (0.79%) General Motors 5.150% 01/04/2038 700,000 692,818 0.09General Motors Financial 3.150% 30/06/2022 1,300,000 1,308,346 0.16General Motors Financial 4.150% 19/06/2023 1,000,000 1,030,580 0.13General Motors Financial 5.100% 17/01/2024 1,000,000 1,069,230 0.13General Motors Financial 3.950% 13/04/2024 1,100,000 1,125,080 0.14General Motors Financial 4.350% 09/04/2025 700,000 723,520 0.09General Motors Financial 4.350% 17/01/2027 400,000 407,740 0.05
Banks (6.13%) Bank of New York Mellon 2.950% 29/01/2023 900,000 918,702 0.11BB&T 2.750% 01/04/2022 1,600,000 1,619,568 0.20BB&T 3.050% 20/06/2022 1,600,000 1,634,560 0.20BB&T 3.750% 06/12/2023 1,000,000 1,058,580 0.13BB&T 3.700% 05/06/2025 1,200,000 1,278,060 0.16Capital One Financial 3.200% 30/01/2023 2,500,000 2,562,800 0.32Capital One Financial 3.800% 31/01/2028 2,500,000 2,582,675 0.32Citigroup 2.750% 25/04/2022 2,100,000 2,119,614 0.26Citigroup 4.650% 23/07/2048 2,550,000 2,969,424 0.37Goldman Sachs Group 3.200% 23/02/2023 2,000,000 2,047,180 0.26Goldman Sachs Group 3.625% 20/02/2024 1,500,000 1,564,515 0.20JPMorgan Chase & Co 3.509% 23/01/2029 2,000,000 2,073,480 0.26JPMorgan Chase & Co 3.897% 23/01/2049 4,175,000 4,383,792 0.55Morgan Stanley 3.125% 23/01/2023 2,000,000 2,045,040 0.25Morgan Stanley 3.625% 20/01/2027 1,150,000 1,204,671 0.15PNC Financial Services Group 3.450% 23/04/2029 2,500,000 2,628,850 0.33Regions Financial 3.200% 08/02/2021 1,000,000 1,011,030 0.13Regions Financial 3.800% 14/08/2023 1,000,000 1,047,020 0.13Santander Holdings USA 4.450% 03/12/2021 1,000,000 1,038,860 0.13Santander Holdings USA 3.700% 28/03/2022 825,000 843,975 0.11Santander Holdings USA 3.400% 18/01/2023 250,000 253,838 0.03Santander Holdings USA 4.400% 13/07/2027 1,000,000 1,044,470 0.13SunTrust Bank 2.450% 01/08/2022 1,300,000 1,303,627 0.16SunTrust Bank 3.200% 01/04/2024 1,300,000 1,340,326 0.17US Bancorp 2.625% 24/01/2022 200,000 202,144 0.03US Bancorp 3.375% 05/02/2024 1,000,000 1,046,610 0.13Wells Fargo & Co 2.625% 22/07/2022 750,000 755,452 0.09Wells Fargo & Co 3.069% 24/01/2023 2,100,000 2,133,663 0.27Wells Fargo & Co 3.750% 24/01/2024 1,000,000 1,051,310 0.13Wells Fargo & Co 4.150% 24/01/2029 3,100,000 3,373,234 0.42
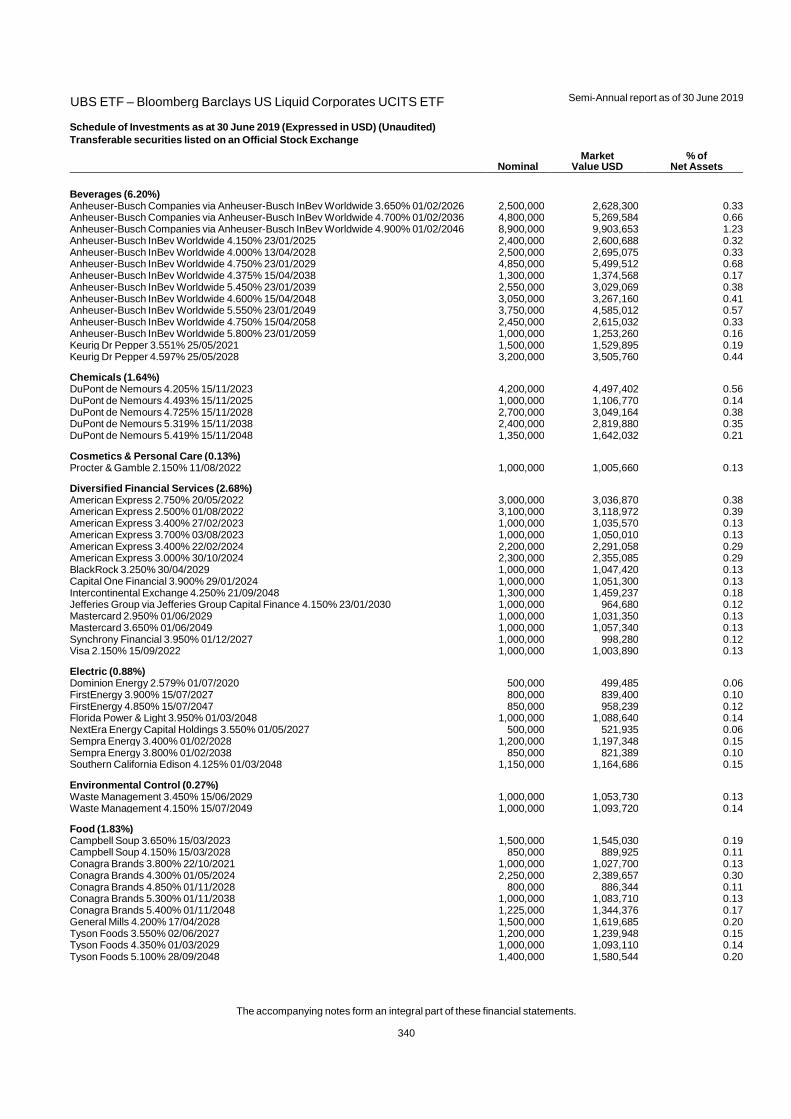
UBS ETF – Bloomberg Barclays US Liquid Corporates UCITS ETF
Semi-Annual report as of 30 June 2019
The accompanying notes form an integral part of these financial statements.
340
Schedule of Investments as at 30 June 2019 (Expressed in USD) (Unaudited)
Transferable securities listed on an Official Stock Exchange
Nominal Market
Value USD % of
Net Assets
Beverages (6.20%) Anheuser-Busch Companies via Anheuser-Busch InBev Worldwide 3.650% 01/02/2026 2,500,000 2,628,300 0.33Anheuser-Busch Companies via Anheuser-Busch InBev Worldwide 4.700% 01/02/2036 4,800,000 5,269,584 0.66Anheuser-Busch Companies via Anheuser-Busch InBev Worldwide 4.900% 01/02/2046 8,900,000 9,903,653 1.23Anheuser-Busch InBev Worldwide 4.150% 23/01/2025 2,400,000 2,600,688 0.32Anheuser-Busch InBev Worldwide 4.000% 13/04/2028 2,500,000 2,695,075 0.33Anheuser-Busch InBev Worldwide 4.750% 23/01/2029 4,850,000 5,499,512 0.68Anheuser-Busch InBev Worldwide 4.375% 15/04/2038 1,300,000 1,374,568 0.17Anheuser-Busch InBev Worldwide 5.450% 23/01/2039 2,550,000 3,029,069 0.38Anheuser-Busch InBev Worldwide 4.600% 15/04/2048 3,050,000 3,267,160 0.41Anheuser-Busch InBev Worldwide 5.550% 23/01/2049 3,750,000 4,585,012 0.57Anheuser-Busch InBev Worldwide 4.750% 15/04/2058 2,450,000 2,615,032 0.33Anheuser-Busch InBev Worldwide 5.800% 23/01/2059 1,000,000 1,253,260 0.16Keurig Dr Pepper 3.551% 25/05/2021 1,500,000 1,529,895 0.19Keurig Dr Pepper 4.597% 25/05/2028 3,200,000 3,505,760 0.44
Chemicals (1.64%) DuPont de Nemours 4.205% 15/11/2023 4,200,000 4,497,402 0.56DuPont de Nemours 4.493% 15/11/2025 1,000,000 1,106,770 0.14DuPont de Nemours 4.725% 15/11/2028 2,700,000 3,049,164 0.38DuPont de Nemours 5.319% 15/11/2038 2,400,000 2,819,880 0.35DuPont de Nemours 5.419% 15/11/2048 1,350,000 1,642,032 0.21
Cosmetics & Personal Care (0.13%) Procter & Gamble 2.150% 11/08/2022 1,000,000 1,005,660 0.13
Diversified Financial Services (2.68%) American Express 2.750% 20/05/2022 3,000,000 3,036,870 0.38American Express 2.500% 01/08/2022 3,100,000 3,118,972 0.39American Express 3.400% 27/02/2023 1,000,000 1,035,570 0.13American Express 3.700% 03/08/2023 1,000,000 1,050,010 0.13American Express 3.400% 22/02/2024 2,200,000 2,291,058 0.29American Express 3.000% 30/10/2024 2,300,000 2,355,085 0.29BlackRock 3.250% 30/04/2029 1,000,000 1,047,420 0.13Capital One Financial 3.900% 29/01/2024 1,000,000 1,051,300 0.13Intercontinental Exchange 4.250% 21/09/2048 1,300,000 1,459,237 0.18Jefferies Group via Jefferies Group Capital Finance 4.150% 23/01/2030 1,000,000 964,680 0.12Mastercard 2.950% 01/06/2029 1,000,000 1,031,350 0.13Mastercard 3.650% 01/06/2049 1,000,000 1,057,340 0.13Synchrony Financial 3.950% 01/12/2027 1,000,000 998,280 0.12Visa 2.150% 15/09/2022 1,000,000 1,003,890 0.13
Electric (0.88%) Dominion Energy 2.579% 01/07/2020 500,000 499,485 0.06FirstEnergy 3.900% 15/07/2027 800,000 839,400 0.10FirstEnergy 4.850% 15/07/2047 850,000 958,239 0.12Florida Power & Light 3.950% 01/03/2048 1,000,000 1,088,640 0.14NextEra Energy Capital Holdings 3.550% 01/05/2027 500,000 521,935 0.06Sempra Energy 3.400% 01/02/2028 1,200,000 1,197,348 0.15Sempra Energy 3.800% 01/02/2038 850,000 821,389 0.10Southern California Edison 4.125% 01/03/2048 1,150,000 1,164,686 0.15
Environmental Control (0.27%) Waste Management 3.450% 15/06/2029 1,000,000 1,053,730 0.13Waste Management 4.150% 15/07/2049 1,000,000 1,093,720 0.14
Food (1.83%) Campbell Soup 3.650% 15/03/2023 1,500,000 1,545,030 0.19Campbell Soup 4.150% 15/03/2028 850,000 889,925 0.11Conagra Brands 3.800% 22/10/2021 1,000,000 1,027,700 0.13Conagra Brands 4.300% 01/05/2024 2,250,000 2,389,657 0.30Conagra Brands 4.850% 01/11/2028 800,000 886,344 0.11Conagra Brands 5.300% 01/11/2038 1,000,000 1,083,710 0.13Conagra Brands 5.400% 01/11/2048 1,225,000 1,344,376 0.17General Mills 4.200% 17/04/2028 1,500,000 1,619,685 0.20Tyson Foods 3.550% 02/06/2027 1,200,000 1,239,948 0.15Tyson Foods 4.350% 01/03/2029 1,000,000 1,093,110 0.14Tyson Foods 5.100% 28/09/2048 1,400,000 1,580,544 0.20
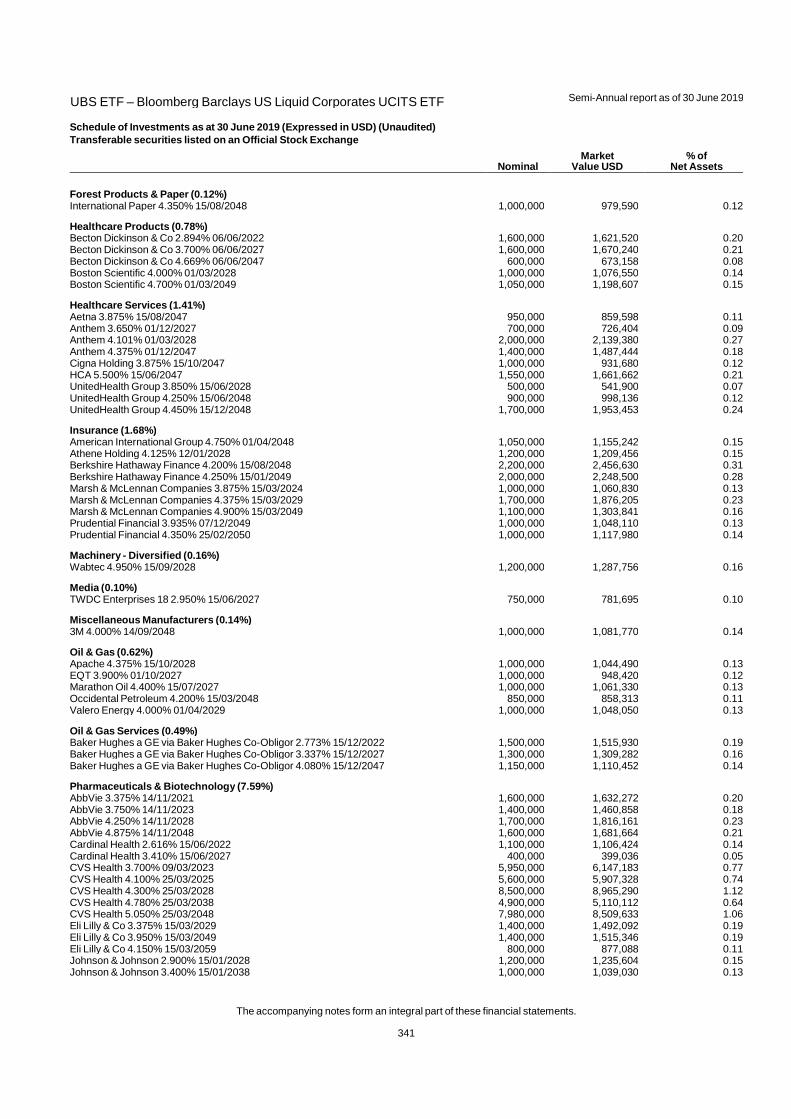
UBS ETF – Bloomberg Barclays US Liquid Corporates UCITS ETF
Semi-Annual report as of 30 June 2019
The accompanying notes form an integral part of these financial statements.
341
Schedule of Investments as at 30 June 2019 (Expressed in USD) (Unaudited)
Transferable securities listed on an Official Stock Exchange
Nominal Market
Value USD % of
Net Assets
Forest Products & Paper (0.12%) International Paper 4.350% 15/08/2048 1,000,000 979,590 0.12
Healthcare Products (0.78%) Becton Dickinson & Co 2.894% 06/06/2022 1,600,000 1,621,520 0.20Becton Dickinson & Co 3.700% 06/06/2027 1,600,000 1,670,240 0.21Becton Dickinson & Co 4.669% 06/06/2047 600,000 673,158 0.08Boston Scientific 4.000% 01/03/2028 1,000,000 1,076,550 0.14Boston Scientific 4.700% 01/03/2049 1,050,000 1,198,607 0.15
Healthcare Services (1.41%) Aetna 3.875% 15/08/2047 950,000 859,598 0.11Anthem 3.650% 01/12/2027 700,000 726,404 0.09Anthem 4.101% 01/03/2028 2,000,000 2,139,380 0.27Anthem 4.375% 01/12/2047 1,400,000 1,487,444 0.18Cigna Holding 3.875% 15/10/2047 1,000,000 931,680 0.12HCA 5.500% 15/06/2047 1,550,000 1,661,662 0.21UnitedHealth Group 3.850% 15/06/2028 500,000 541,900 0.07UnitedHealth Group 4.250% 15/06/2048 900,000 998,136 0.12UnitedHealth Group 4.450% 15/12/2048 1,700,000 1,953,453 0.24
Insurance (1.68%) American International Group 4.750% 01/04/2048 1,050,000 1,155,242 0.15Athene Holding 4.125% 12/01/2028 1,200,000 1,209,456 0.15Berkshire Hathaway Finance 4.200% 15/08/2048 2,200,000 2,456,630 0.31Berkshire Hathaway Finance 4.250% 15/01/2049 2,000,000 2,248,500 0.28Marsh & McLennan Companies 3.875% 15/03/2024 1,000,000 1,060,830 0.13Marsh & McLennan Companies 4.375% 15/03/2029 1,700,000 1,876,205 0.23Marsh & McLennan Companies 4.900% 15/03/2049 1,100,000 1,303,841 0.16Prudential Financial 3.935% 07/12/2049 1,000,000 1,048,110 0.13Prudential Financial 4.350% 25/02/2050 1,000,000 1,117,980 0.14
Machinery - Diversified (0.16%) Wabtec 4.950% 15/09/2028 1,200,000 1,287,756 0.16
Media (0.10%) TWDC Enterprises 18 2.950% 15/06/2027 750,000 781,695 0.10
Miscellaneous Manufacturers (0.14%) 3M 4.000% 14/09/2048 1,000,000 1,081,770 0.14
Oil & Gas (0.62%) Apache 4.375% 15/10/2028 1,000,000 1,044,490 0.13EQT 3.900% 01/10/2027 1,000,000 948,420 0.12Marathon Oil 4.400% 15/07/2027 1,000,000 1,061,330 0.13Occidental Petroleum 4.200% 15/03/2048 850,000 858,313 0.11Valero Energy 4.000% 01/04/2029 1,000,000 1,048,050 0.13
Oil & Gas Services (0.49%) Baker Hughes a GE via Baker Hughes Co-Obligor 2.773% 15/12/2022 1,500,000 1,515,930 0.19Baker Hughes a GE via Baker Hughes Co-Obligor 3.337% 15/12/2027 1,300,000 1,309,282 0.16Baker Hughes a GE via Baker Hughes Co-Obligor 4.080% 15/12/2047 1,150,000 1,110,452 0.14
Pharmaceuticals & Biotechnology (7.59%) AbbVie 3.375% 14/11/2021 1,600,000 1,632,272 0.20AbbVie 3.750% 14/11/2023 1,400,000 1,460,858 0.18AbbVie 4.250% 14/11/2028 1,700,000 1,816,161 0.23AbbVie 4.875% 14/11/2048 1,600,000 1,681,664 0.21Cardinal Health 2.616% 15/06/2022 1,100,000 1,106,424 0.14Cardinal Health 3.410% 15/06/2027 400,000 399,036 0.05CVS Health 3.700% 09/03/2023 5,950,000 6,147,183 0.77CVS Health 4.100% 25/03/2025 5,600,000 5,907,328 0.74CVS Health 4.300% 25/03/2028 8,500,000 8,965,290 1.12CVS Health 4.780% 25/03/2038 4,900,000 5,110,112 0.64CVS Health 5.050% 25/03/2048 7,980,000 8,509,633 1.06Eli Lilly & Co 3.375% 15/03/2029 1,400,000 1,492,092 0.19Eli Lilly & Co 3.950% 15/03/2049 1,400,000 1,515,346 0.19Eli Lilly & Co 4.150% 15/03/2059 800,000 877,088 0.11Johnson & Johnson 2.900% 15/01/2028 1,200,000 1,235,604 0.15Johnson & Johnson 3.400% 15/01/2038 1,000,000 1,039,030 0.13
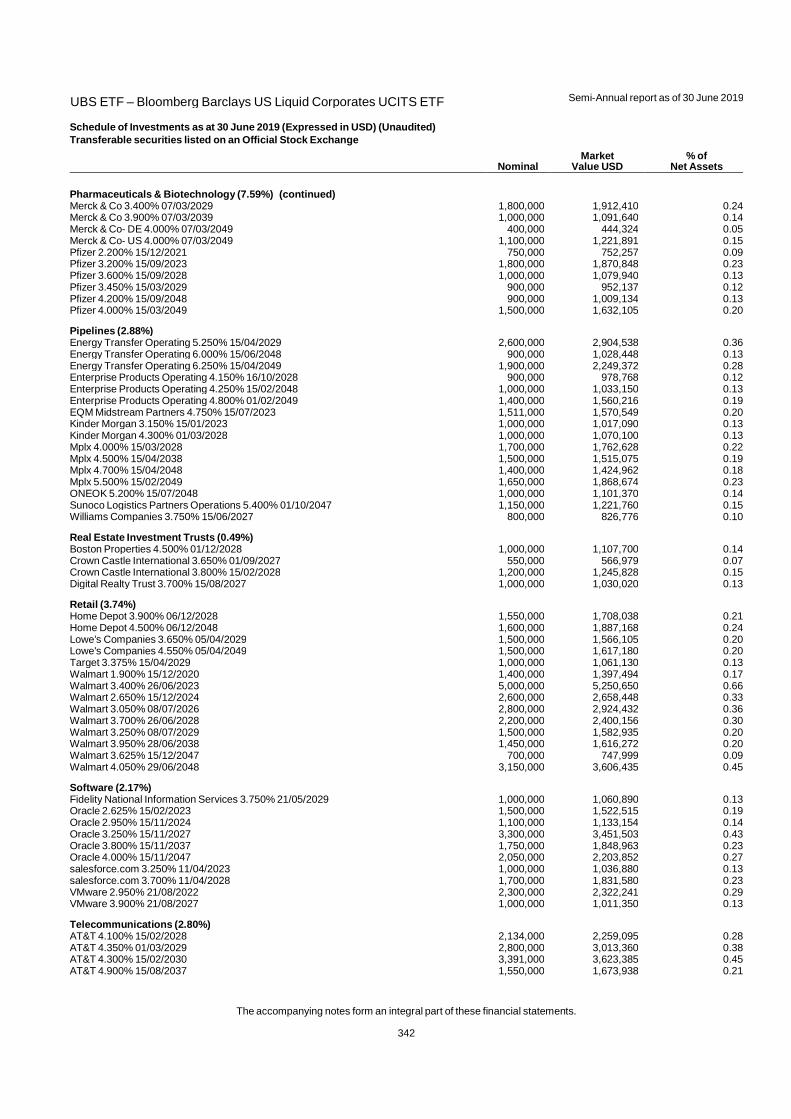
UBS ETF – Bloomberg Barclays US Liquid Corporates UCITS ETF
Semi-Annual report as of 30 June 2019
The accompanying notes form an integral part of these financial statements.
342
Schedule of Investments as at 30 June 2019 (Expressed in USD) (Unaudited)
Transferable securities listed on an Official Stock Exchange
Nominal Market
Value USD % of
Net Assets
Pharmaceuticals & Biotechnology (7.59%) (continued) Merck & Co 3.400% 07/03/2029 1,800,000 1,912,410 0.24Merck & Co 3.900% 07/03/2039 1,000,000 1,091,640 0.14Merck & Co- DE 4.000% 07/03/2049 400,000 444,324 0.05Merck & Co- US 4.000% 07/03/2049 1,100,000 1,221,891 0.15Pfizer 2.200% 15/12/2021 750,000 752,257 0.09Pfizer 3.200% 15/09/2023 1,800,000 1,870,848 0.23Pfizer 3.600% 15/09/2028 1,000,000 1,079,940 0.13Pfizer 3.450% 15/03/2029 900,000 952,137 0.12Pfizer 4.200% 15/09/2048 900,000 1,009,134 0.13Pfizer 4.000% 15/03/2049 1,500,000 1,632,105 0.20
Pipelines (2.88%) Energy Transfer Operating 5.250% 15/04/2029 2,600,000 2,904,538 0.36Energy Transfer Operating 6.000% 15/06/2048 900,000 1,028,448 0.13Energy Transfer Operating 6.250% 15/04/2049 1,900,000 2,249,372 0.28Enterprise Products Operating 4.150% 16/10/2028 900,000 978,768 0.12Enterprise Products Operating 4.250% 15/02/2048 1,000,000 1,033,150 0.13Enterprise Products Operating 4.800% 01/02/2049 1,400,000 1,560,216 0.19EQM Midstream Partners 4.750% 15/07/2023 1,511,000 1,570,549 0.20Kinder Morgan 3.150% 15/01/2023 1,000,000 1,017,090 0.13Kinder Morgan 4.300% 01/03/2028 1,000,000 1,070,100 0.13Mplx 4.000% 15/03/2028 1,700,000 1,762,628 0.22Mplx 4.500% 15/04/2038 1,500,000 1,515,075 0.19Mplx 4.700% 15/04/2048 1,400,000 1,424,962 0.18Mplx 5.500% 15/02/2049 1,650,000 1,868,674 0.23ONEOK 5.200% 15/07/2048 1,000,000 1,101,370 0.14Sunoco Logistics Partners Operations 5.400% 01/10/2047 1,150,000 1,221,760 0.15Williams Companies 3.750% 15/06/2027 800,000 826,776 0.10
Real Estate Investment Trusts (0.49%) Boston Properties 4.500% 01/12/2028 1,000,000 1,107,700 0.14Crown Castle International 3.650% 01/09/2027 550,000 566,979 0.07Crown Castle International 3.800% 15/02/2028 1,200,000 1,245,828 0.15Digital Realty Trust 3.700% 15/08/2027 1,000,000 1,030,020 0.13
Retail (3.74%) Home Depot 3.900% 06/12/2028 1,550,000 1,708,038 0.21Home Depot 4.500% 06/12/2048 1,600,000 1,887,168 0.24Lowe's Companies 3.650% 05/04/2029 1,500,000 1,566,105 0.20Lowe's Companies 4.550% 05/04/2049 1,500,000 1,617,180 0.20Target 3.375% 15/04/2029 1,000,000 1,061,130 0.13Walmart 1.900% 15/12/2020 1,400,000 1,397,494 0.17Walmart 3.400% 26/06/2023 5,000,000 5,250,650 0.66Walmart 2.650% 15/12/2024 2,600,000 2,658,448 0.33Walmart 3.050% 08/07/2026 2,800,000 2,924,432 0.36Walmart 3.700% 26/06/2028 2,200,000 2,400,156 0.30Walmart 3.250% 08/07/2029 1,500,000 1,582,935 0.20Walmart 3.950% 28/06/2038 1,450,000 1,616,272 0.20Walmart 3.625% 15/12/2047 700,000 747,999 0.09Walmart 4.050% 29/06/2048 3,150,000 3,606,435 0.45
Software (2.17%) Fidelity National Information Services 3.750% 21/05/2029 1,000,000 1,060,890 0.13Oracle 2.625% 15/02/2023 1,500,000 1,522,515 0.19Oracle 2.950% 15/11/2024 1,100,000 1,133,154 0.14Oracle 3.250% 15/11/2027 3,300,000 3,451,503 0.43Oracle 3.800% 15/11/2037 1,750,000 1,848,963 0.23Oracle 4.000% 15/11/2047 2,050,000 2,203,852 0.27salesforce.com 3.250% 11/04/2023 1,000,000 1,036,880 0.13salesforce.com 3.700% 11/04/2028 1,700,000 1,831,580 0.23VMware 2.950% 21/08/2022 2,300,000 2,322,241 0.29VMware 3.900% 21/08/2027 1,000,000 1,011,350 0.13
Telecommunications (2.80%) AT&T 4.100% 15/02/2028 2,134,000 2,259,095 0.28AT&T 4.350% 01/03/2029 2,800,000 3,013,360 0.38AT&T 4.300% 15/02/2030 3,391,000 3,623,385 0.45AT&T 4.900% 15/08/2037 1,550,000 1,673,938 0.21
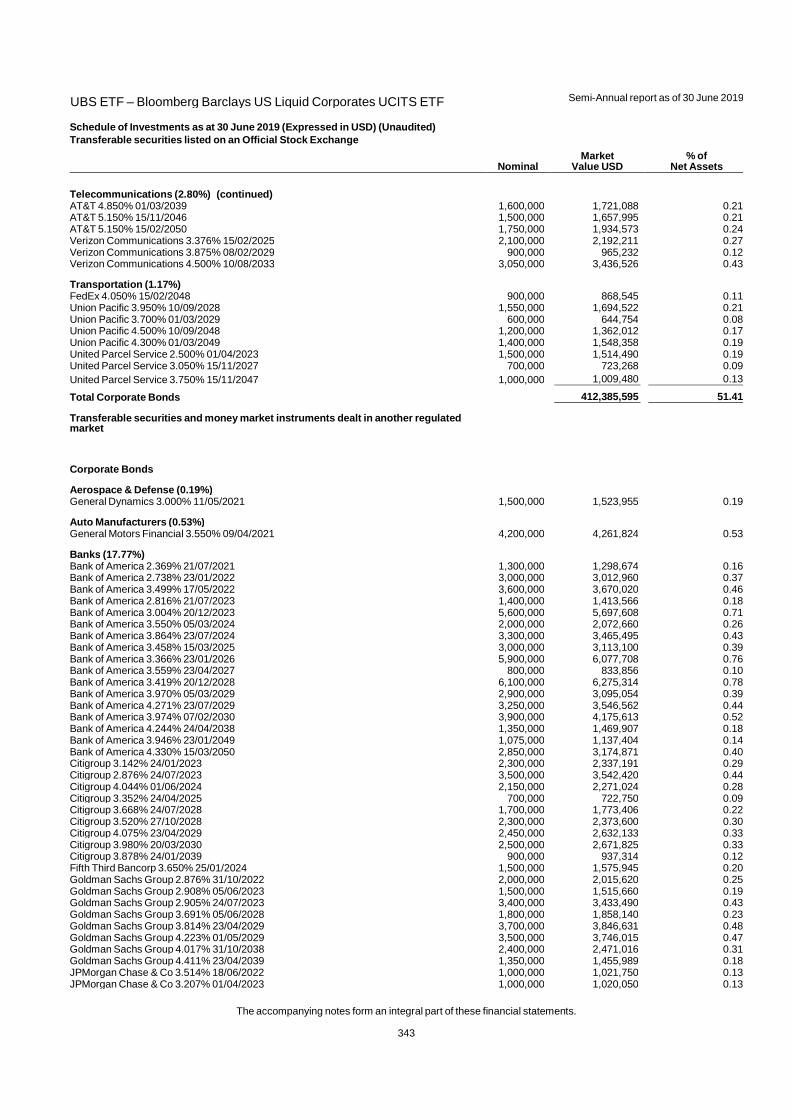
UBS ETF – Bloomberg Barclays US Liquid Corporates UCITS ETF
Semi-Annual report as of 30 June 2019
The accompanying notes form an integral part of these financial statements.
343
Schedule of Investments as at 30 June 2019 (Expressed in USD) (Unaudited)
Transferable securities listed on an Official Stock Exchange
Nominal Market
Value USD % of
Net Assets
Telecommunications (2.80%) (continued) AT&T 4.850% 01/03/2039 1,600,000 1,721,088 0.21AT&T 5.150% 15/11/2046 1,500,000 1,657,995 0.21AT&T 5.150% 15/02/2050 1,750,000 1,934,573 0.24Verizon Communications 3.376% 15/02/2025 2,100,000 2,192,211 0.27Verizon Communications 3.875% 08/02/2029 900,000 965,232 0.12Verizon Communications 4.500% 10/08/2033 3,050,000 3,436,526 0.43
Transportation (1.17%) FedEx 4.050% 15/02/2048 900,000 868,545 0.11Union Pacific 3.950% 10/09/2028 1,550,000 1,694,522 0.21Union Pacific 3.700% 01/03/2029 600,000 644,754 0.08Union Pacific 4.500% 10/09/2048 1,200,000 1,362,012 0.17Union Pacific 4.300% 01/03/2049 1,400,000 1,548,358 0.19United Parcel Service 2.500% 01/04/2023 1,500,000 1,514,490 0.19United Parcel Service 3.050% 15/11/2027 700,000 723,268 0.09United Parcel Service 3.750% 15/11/2047 1,000,000 1,009,480 0.13
Total Corporate Bonds 412,385,595 51.41
Transferable securities and money market instruments dealt in another regulated market
Corporate Bonds
Aerospace & Defense (0.19%) General Dynamics 3.000% 11/05/2021 1,500,000 1,523,955 0.19
Auto Manufacturers (0.53%) General Motors Financial 3.550% 09/04/2021 4,200,000 4,261,824 0.53
Banks (17.77%) Bank of America 2.369% 21/07/2021 1,300,000 1,298,674 0.16Bank of America 2.738% 23/01/2022 3,000,000 3,012,960 0.37Bank of America 3.499% 17/05/2022 3,600,000 3,670,020 0.46Bank of America 2.816% 21/07/2023 1,400,000 1,413,566 0.18Bank of America 3.004% 20/12/2023 5,600,000 5,697,608 0.71Bank of America 3.550% 05/03/2024 2,000,000 2,072,660 0.26Bank of America 3.864% 23/07/2024 3,300,000 3,465,495 0.43Bank of America 3.458% 15/03/2025 3,000,000 3,113,100 0.39Bank of America 3.366% 23/01/2026 5,900,000 6,077,708 0.76Bank of America 3.559% 23/04/2027 800,000 833,856 0.10Bank of America 3.419% 20/12/2028 6,100,000 6,275,314 0.78Bank of America 3.970% 05/03/2029 2,900,000 3,095,054 0.39Bank of America 4.271% 23/07/2029 3,250,000 3,546,562 0.44Bank of America 3.974% 07/02/2030 3,900,000 4,175,613 0.52Bank of America 4.244% 24/04/2038 1,350,000 1,469,907 0.18Bank of America 3.946% 23/01/2049 1,075,000 1,137,404 0.14Bank of America 4.330% 15/03/2050 2,850,000 3,174,871 0.40Citigroup 3.142% 24/01/2023 2,300,000 2,337,191 0.29Citigroup 2.876% 24/07/2023 3,500,000 3,542,420 0.44Citigroup 4.044% 01/06/2024 2,150,000 2,271,024 0.28Citigroup 3.352% 24/04/2025 700,000 722,750 0.09Citigroup 3.668% 24/07/2028 1,700,000 1,773,406 0.22Citigroup 3.520% 27/10/2028 2,300,000 2,373,600 0.30Citigroup 4.075% 23/04/2029 2,450,000 2,632,133 0.33Citigroup 3.980% 20/03/2030 2,500,000 2,671,825 0.33Citigroup 3.878% 24/01/2039 900,000 937,314 0.12Fifth Third Bancorp 3.650% 25/01/2024 1,500,000 1,575,945 0.20Goldman Sachs Group 2.876% 31/10/2022 2,000,000 2,015,620 0.25Goldman Sachs Group 2.908% 05/06/2023 1,500,000 1,515,660 0.19Goldman Sachs Group 2.905% 24/07/2023 3,400,000 3,433,490 0.43Goldman Sachs Group 3.691% 05/06/2028 1,800,000 1,858,140 0.23Goldman Sachs Group 3.814% 23/04/2029 3,700,000 3,846,631 0.48Goldman Sachs Group 4.223% 01/05/2029 3,500,000 3,746,015 0.47Goldman Sachs Group 4.017% 31/10/2038 2,400,000 2,471,016 0.31Goldman Sachs Group 4.411% 23/04/2039 1,350,000 1,455,989 0.18JPMorgan Chase & Co 3.514% 18/06/2022 1,000,000 1,021,750 0.13JPMorgan Chase & Co 3.207% 01/04/2023 1,000,000 1,020,050 0.13
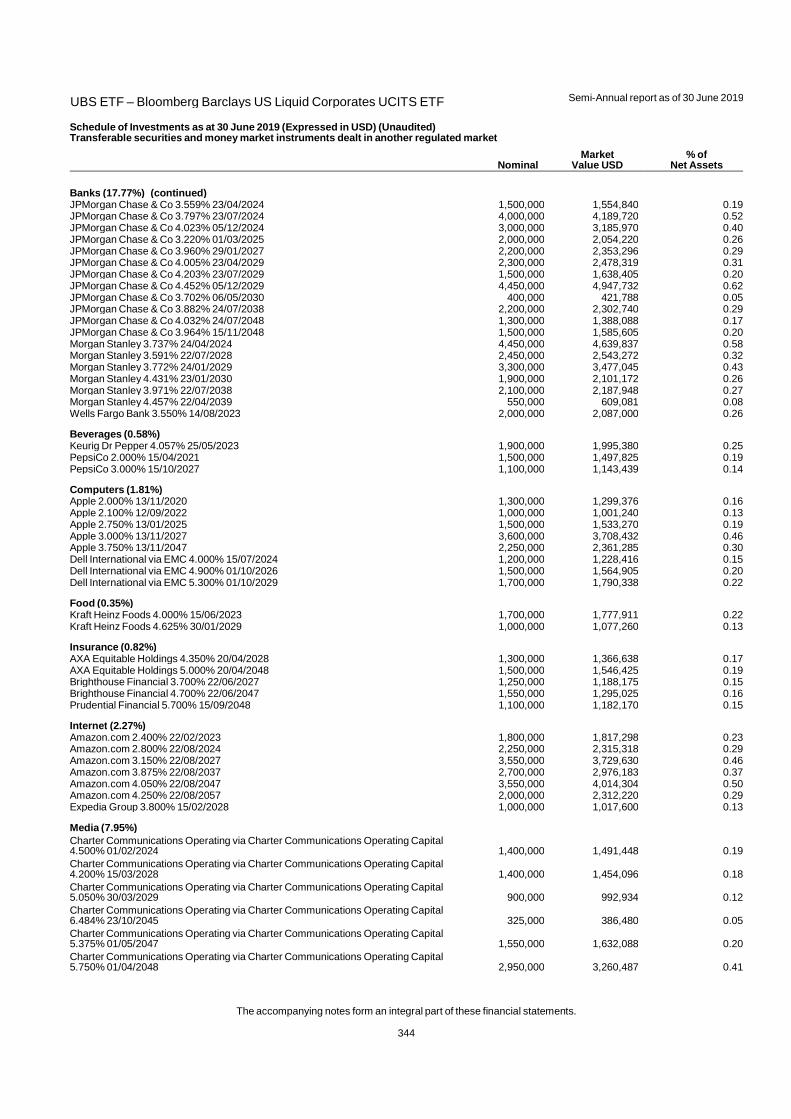
UBS ETF – Bloomberg Barclays US Liquid Corporates UCITS ETF
Semi-Annual report as of 30 June 2019
The accompanying notes form an integral part of these financial statements.
344
Schedule of Investments as at 30 June 2019 (Expressed in USD) (Unaudited) Transferable securities and money market instruments dealt in another regulated market
Nominal Market
Value USD % of
Net Assets
Banks (17.77%) (continued) JPMorgan Chase & Co 3.559% 23/04/2024 1,500,000 1,554,840 0.19JPMorgan Chase & Co 3.797% 23/07/2024 4,000,000 4,189,720 0.52JPMorgan Chase & Co 4.023% 05/12/2024 3,000,000 3,185,970 0.40JPMorgan Chase & Co 3.220% 01/03/2025 2,000,000 2,054,220 0.26JPMorgan Chase & Co 3.960% 29/01/2027 2,200,000 2,353,296 0.29JPMorgan Chase & Co 4.005% 23/04/2029 2,300,000 2,478,319 0.31JPMorgan Chase & Co 4.203% 23/07/2029 1,500,000 1,638,405 0.20JPMorgan Chase & Co 4.452% 05/12/2029 4,450,000 4,947,732 0.62JPMorgan Chase & Co 3.702% 06/05/2030 400,000 421,788 0.05JPMorgan Chase & Co 3.882% 24/07/2038 2,200,000 2,302,740 0.29JPMorgan Chase & Co 4.032% 24/07/2048 1,300,000 1,388,088 0.17JPMorgan Chase & Co 3.964% 15/11/2048 1,500,000 1,585,605 0.20Morgan Stanley 3.737% 24/04/2024 4,450,000 4,639,837 0.58Morgan Stanley 3.591% 22/07/2028 2,450,000 2,543,272 0.32Morgan Stanley 3.772% 24/01/2029 3,300,000 3,477,045 0.43Morgan Stanley 4.431% 23/01/2030 1,900,000 2,101,172 0.26Morgan Stanley 3.971% 22/07/2038 2,100,000 2,187,948 0.27Morgan Stanley 4.457% 22/04/2039 550,000 609,081 0.08Wells Fargo Bank 3.550% 14/08/2023 2,000,000 2,087,000 0.26
Beverages (0.58%) Keurig Dr Pepper 4.057% 25/05/2023 1,900,000 1,995,380 0.25PepsiCo 2.000% 15/04/2021 1,500,000 1,497,825 0.19PepsiCo 3.000% 15/10/2027 1,100,000 1,143,439 0.14
Computers (1.81%) Apple 2.000% 13/11/2020 1,300,000 1,299,376 0.16Apple 2.100% 12/09/2022 1,000,000 1,001,240 0.13Apple 2.750% 13/01/2025 1,500,000 1,533,270 0.19Apple 3.000% 13/11/2027 3,600,000 3,708,432 0.46Apple 3.750% 13/11/2047 2,250,000 2,361,285 0.30Dell International via EMC 4.000% 15/07/2024 1,200,000 1,228,416 0.15Dell International via EMC 4.900% 01/10/2026 1,500,000 1,564,905 0.20Dell International via EMC 5.300% 01/10/2029 1,700,000 1,790,338 0.22
Food (0.35%) Kraft Heinz Foods 4.000% 15/06/2023 1,700,000 1,777,911 0.22Kraft Heinz Foods 4.625% 30/01/2029 1,000,000 1,077,260 0.13
Insurance (0.82%) AXA Equitable Holdings 4.350% 20/04/2028 1,300,000 1,366,638 0.17AXA Equitable Holdings 5.000% 20/04/2048 1,500,000 1,546,425 0.19Brighthouse Financial 3.700% 22/06/2027 1,250,000 1,188,175 0.15Brighthouse Financial 4.700% 22/06/2047 1,550,000 1,295,025 0.16Prudential Financial 5.700% 15/09/2048 1,100,000 1,182,170 0.15
Internet (2.27%) Amazon.com 2.400% 22/02/2023 1,800,000 1,817,298 0.23Amazon.com 2.800% 22/08/2024 2,250,000 2,315,318 0.29Amazon.com 3.150% 22/08/2027 3,550,000 3,729,630 0.46Amazon.com 3.875% 22/08/2037 2,700,000 2,976,183 0.37Amazon.com 4.050% 22/08/2047 3,550,000 4,014,304 0.50Amazon.com 4.250% 22/08/2057 2,000,000 2,312,220 0.29Expedia Group 3.800% 15/02/2028 1,000,000 1,017,600 0.13
Media (7.95%) Charter Communications Operating via Charter Communications Operating Capital 4.500% 01/02/2024 1,400,000 1,491,448 0.19Charter Communications Operating via Charter Communications Operating Capital 4.200% 15/03/2028 1,400,000 1,454,096 0.18Charter Communications Operating via Charter Communications Operating Capital 5.050% 30/03/2029 900,000 992,934 0.12Charter Communications Operating via Charter Communications Operating Capital 6.484% 23/10/2045 325,000 386,480 0.05Charter Communications Operating via Charter Communications Operating Capital 5.375% 01/05/2047 1,550,000 1,632,088 0.20Charter Communications Operating via Charter Communications Operating Capital 5.750% 01/04/2048 2,950,000 3,260,487 0.41
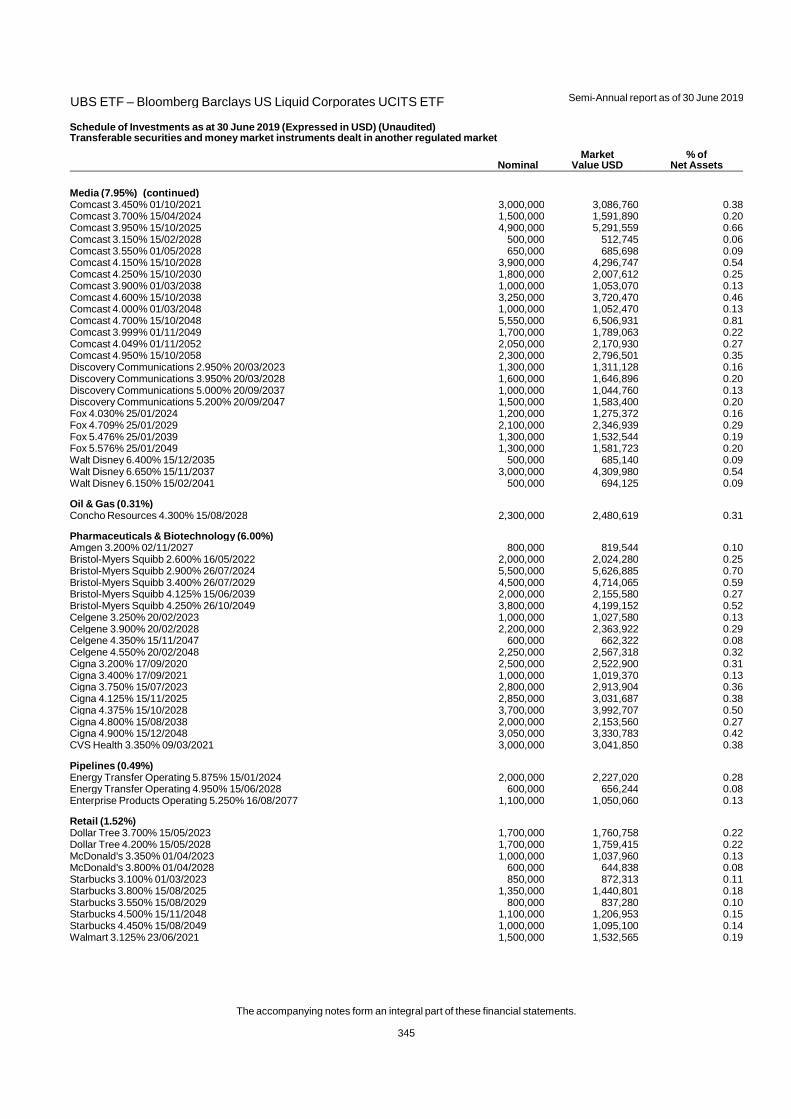
UBS ETF – Bloomberg Barclays US Liquid Corporates UCITS ETF
Semi-Annual report as of 30 June 2019
The accompanying notes form an integral part of these financial statements.
345
Schedule of Investments as at 30 June 2019 (Expressed in USD) (Unaudited) Transferable securities and money market instruments dealt in another regulated market
Nominal Market
Value USD % of
Net Assets
Media (7.95%) (continued) Comcast 3.450% 01/10/2021 3,000,000 3,086,760 0.38Comcast 3.700% 15/04/2024 1,500,000 1,591,890 0.20Comcast 3.950% 15/10/2025 4,900,000 5,291,559 0.66Comcast 3.150% 15/02/2028 500,000 512,745 0.06Comcast 3.550% 01/05/2028 650,000 685,698 0.09Comcast 4.150% 15/10/2028 3,900,000 4,296,747 0.54Comcast 4.250% 15/10/2030 1,800,000 2,007,612 0.25Comcast 3.900% 01/03/2038 1,000,000 1,053,070 0.13Comcast 4.600% 15/10/2038 3,250,000 3,720,470 0.46Comcast 4.000% 01/03/2048 1,000,000 1,052,470 0.13Comcast 4.700% 15/10/2048 5,550,000 6,506,931 0.81Comcast 3.999% 01/11/2049 1,700,000 1,789,063 0.22Comcast 4.049% 01/11/2052 2,050,000 2,170,930 0.27Comcast 4.950% 15/10/2058 2,300,000 2,796,501 0.35Discovery Communications 2.950% 20/03/2023 1,300,000 1,311,128 0.16Discovery Communications 3.950% 20/03/2028 1,600,000 1,646,896 0.20Discovery Communications 5.000% 20/09/2037 1,000,000 1,044,760 0.13Discovery Communications 5.200% 20/09/2047 1,500,000 1,583,400 0.20Fox 4.030% 25/01/2024 1,200,000 1,275,372 0.16Fox 4.709% 25/01/2029 2,100,000 2,346,939 0.29Fox 5.476% 25/01/2039 1,300,000 1,532,544 0.19Fox 5.576% 25/01/2049 1,300,000 1,581,723 0.20Walt Disney 6.400% 15/12/2035 500,000 685,140 0.09Walt Disney 6.650% 15/11/2037 3,000,000 4,309,980 0.54Walt Disney 6.150% 15/02/2041 500,000 694,125 0.09
Oil & Gas (0.31%) Concho Resources 4.300% 15/08/2028 2,300,000 2,480,619 0.31
Pharmaceuticals & Biotechnology (6.00%) Amgen 3.200% 02/11/2027 800,000 819,544 0.10Bristol-Myers Squibb 2.600% 16/05/2022 2,000,000 2,024,280 0.25Bristol-Myers Squibb 2.900% 26/07/2024 5,500,000 5,626,885 0.70Bristol-Myers Squibb 3.400% 26/07/2029 4,500,000 4,714,065 0.59Bristol-Myers Squibb 4.125% 15/06/2039 2,000,000 2,155,580 0.27Bristol-Myers Squibb 4.250% 26/10/2049 3,800,000 4,199,152 0.52Celgene 3.250% 20/02/2023 1,000,000 1,027,580 0.13Celgene 3.900% 20/02/2028 2,200,000 2,363,922 0.29Celgene 4.350% 15/11/2047 600,000 662,322 0.08Celgene 4.550% 20/02/2048 2,250,000 2,567,318 0.32Cigna 3.200% 17/09/2020 2,500,000 2,522,900 0.31Cigna 3.400% 17/09/2021 1,000,000 1,019,370 0.13Cigna 3.750% 15/07/2023 2,800,000 2,913,904 0.36Cigna 4.125% 15/11/2025 2,850,000 3,031,687 0.38Cigna 4.375% 15/10/2028 3,700,000 3,992,707 0.50Cigna 4.800% 15/08/2038 2,000,000 2,153,560 0.27Cigna 4.900% 15/12/2048 3,050,000 3,330,783 0.42CVS Health 3.350% 09/03/2021 3,000,000 3,041,850 0.38
Pipelines (0.49%) Energy Transfer Operating 5.875% 15/01/2024 2,000,000 2,227,020 0.28Energy Transfer Operating 4.950% 15/06/2028 600,000 656,244 0.08Enterprise Products Operating 5.250% 16/08/2077 1,100,000 1,050,060 0.13
Retail (1.52%) Dollar Tree 3.700% 15/05/2023 1,700,000 1,760,758 0.22Dollar Tree 4.200% 15/05/2028 1,700,000 1,759,415 0.22McDonald's 3.350% 01/04/2023 1,000,000 1,037,960 0.13McDonald's 3.800% 01/04/2028 600,000 644,838 0.08Starbucks 3.100% 01/03/2023 850,000 872,313 0.11Starbucks 3.800% 15/08/2025 1,350,000 1,440,801 0.18Starbucks 3.550% 15/08/2029 800,000 837,280 0.10Starbucks 4.500% 15/11/2048 1,100,000 1,206,953 0.15Starbucks 4.450% 15/08/2049 1,000,000 1,095,100 0.14Walmart 3.125% 23/06/2021 1,500,000 1,532,565 0.19

UBS ETF – Bloomberg Barclays US Liquid Corporates UCITS ETF
Semi-Annual report as of 30 June 2019
The accompanying notes form an integral part of these financial statements.
346
Schedule of Investments as at 30 June 2019 (Expressed in USD) (Unaudited) Transferable securities and money market instruments dealt in another regulated market
Nominal Market
Value USD % of
Net Assets
Semiconductors (3.62%) Broadcom 3.125% 15/10/2022 3,000,000 3,016,740 0.38Broadcom 4.250% 15/04/2026 4,000,000 4,059,120 0.51Broadcom 4.750% 15/04/2029 2,700,000 2,769,390 0.34Broadcom via Broadcom Cayman Finance 3.000% 15/01/2022 3,000,000 3,008,880 0.37Broadcom via Broadcom Cayman Finance 2.650% 15/01/2023 600,000 591,918 0.07Broadcom via Broadcom Cayman Finance 3.625% 15/01/2024 3,800,000 3,834,162 0.48Broadcom via Broadcom Cayman Finance 3.875% 15/01/2027 5,700,000 5,584,233 0.70Broadcom via Broadcom Cayman Finance 3.500% 15/01/2028 1,150,000 1,088,808 0.14Intel 3.734% 08/12/2047 2,000,000 2,076,840 0.26Lam Research 4.000% 15/03/2029 1,300,000 1,385,332 0.17Texas Instruments 4.150% 15/05/2048 1,400,000 1,588,678 0.20
Software (0.28%) Fiserv 3.800% 01/10/2023 1,300,000 1,367,613 0.17Fiserv 4.200% 01/10/2028 800,000 865,160 0.11
Telecommunications (1.18%) Verizon Communications 4.329% 21/09/2028 4,150,000 4,596,332 0.57Verizon Communications 4.016% 03/12/2029 4,502,000 4,881,699 0.61
Total Corporate Bonds 366,300,487 45.67
TOTAL INVESTMENTS (Cost USD 735,479,768) 778,686,082 97.08
Other net assets 23,381,301 2.92
TOTAL NET ASSETS 802,067,383 100.00
Forward Foreign Exchange Contracts
Purchases Sales Maturity Date Unrealised appreciation/
(depreciation) USD % of Net Assets
CHF 4,336,876 USD 4,351,999 02 July 2019 96,079 0.01CHF 169,520 USD 170,184 02 July 2019 3,682 0.00CHF 3,425,816 USD 3,470,147 02 July 2019 43,510 0.00CHF 70,902,368 USD 70,683,250 02 July 2019 2,037,128 0.25EUR 3,728,352 USD 4,185,862 02 July 2019 59,987 0.01EUR 3,447,677 USD 3,870,745 02 July 2019 55,471 0.01EUR 4,373,130 USD 4,909,761 02 July 2019 70,361 0.01EUR 872,593 USD 979,118 02 July 2019 14,592 0.00EUR 4,457,707 USD 5,018,361 02 July 2019 58,077 0.01EUR 311,187,310 USD 347,595,292 02 July 2019 6,784,945 0.85GBP 112,940 USD 142,809 02 July 2019 929 0.00GBP 34,342,658 USD 43,350,187 02 July 2019 357,720 0.04USD 4,182,412 CHF 4,167,878 02 July 2019 (92,335) (0.01)USD 3,347,609 CHF 3,320,999 02 July 2019 (58,544) (0.01)USD 4,356,921 EUR 3,880,715 02 July 2019 (62,438) (0.01)USD 3,484,888 EUR 3,087,885 02 July 2019 (31,596) (0.00)USD 7,794,942 EUR 6,863,110 02 July 2019 (20,771) (0.00)USD 3,984,025 EUR 3,500,612 02 July 2019 (2,473) (0.00)
Total Forward Foreign Exchange Contracts 9,314,324 1.16

UBS ETF – Bloomberg Barclays MSCI US Liquid Corporates Sustainable UCITS ETF
Semi-Annual report as of 30 June 2019
The accompanying notes form an integral part of these financial statements.
347
Schedule of Investments as at 30 June 2019 (Expressed in USD) (Unaudited)
Transferable securities listed on an Official Stock Exchange
Nominal Market
Value USD % of
Net Assets
Corporate Bonds
Banks (8.01%) Bank of New York Mellon 2.950% 29/01/2023 1,400,000 1,429,092 0.58BB&T 2.150% 01/02/2021 900,000 898,398 0.37BB&T 3.050% 20/06/2022 1,800,000 1,838,880 0.75BB&T 3.750% 06/12/2023 1,000,000 1,058,580 0.43BB&T 3.700% 05/06/2025 1,275,000 1,357,939 0.56Goldman Sachs Group 3.200% 23/02/2023 800,000 818,872 0.34Goldman Sachs Group 3.625% 20/02/2024 2,150,000 2,242,471 0.92Morgan Stanley 3.125% 23/01/2023 1,100,000 1,124,772 0.46Morgan Stanley 3.625% 20/01/2027 300,000 314,262 0.13Morgan Stanley 4.300% 27/01/2045 45,000 49,260 0.02PNC Financial Services Group 3.500% 23/01/2024 750,000 789,375 0.32PNC Financial Services Group 3.450% 23/04/2029 1,450,000 1,524,733 0.62Regions Financial 2.750% 14/08/2022 1,300,000 1,309,204 0.54Regions Financial 3.800% 14/08/2023 600,000 628,212 0.26Santander Holdings USA 4.450% 03/12/2021 1,800,000 1,869,948 0.76Santander Holdings USA 3.700% 28/03/2022 250,000 255,750 0.10Santander Holdings USA 3.400% 18/01/2023 475,000 482,291 0.20Santander Holdings USA 3.500% 07/06/2024 750,000 762,480 0.31Santander Holdings USA 4.400% 13/07/2027 800,000 835,576 0.34
Beverages (1.32%) Keurig Dr Pepper 3.551% 25/05/2021 1,300,000 1,325,909 0.54Keurig Dr Pepper 4.597% 25/05/2028 1,725,000 1,889,824 0.78
Cosmetics & Personal Care (0.51%) Procter & Gamble 2.150% 11/08/2022 1,250,000 1,257,075 0.51
Diversified Financial Services (6.53%) American Express 2.200% 30/10/2020 1,500,000 1,496,385 0.61American Express 3.700% 05/11/2021 1,400,000 1,441,776 0.59American Express 2.750% 20/05/2022 500,000 506,145 0.21American Express 2.500% 01/08/2022 1,100,000 1,106,732 0.45American Express 3.400% 27/02/2023 2,700,000 2,796,039 1.14American Express 3.700% 03/08/2023 1,200,000 1,260,012 0.51American Express 3.400% 22/02/2024 1,350,000 1,405,876 0.57American Express 3.000% 30/10/2024 925,000 947,154 0.39BlackRock 3.250% 30/04/2029 950,000 995,049 0.41Intercontinental Exchange 4.250% 21/09/2048 1,125,000 1,262,801 0.52Mastercard 2.950% 01/06/2029 900,000 928,215 0.38Mastercard 3.650% 01/06/2049 900,000 951,606 0.39Visa 2.150% 15/09/2022 875,000 878,404 0.36
Electric (0.73%) Sempra Energy 3.400% 01/02/2028 910,000 907,989 0.37Sempra Energy 3.800% 01/02/2038 900,000 869,706 0.36
Environmental Control (0.81%) Waste Management 3.450% 15/06/2029 900,000 948,357 0.39Waste Management 4.150% 15/07/2049 950,000 1,039,034 0.42
Food (4.15%) Campbell Soup 3.650% 15/03/2023 1,250,000 1,287,525 0.53Campbell Soup 4.150% 15/03/2028 850,000 889,925 0.36Conagra Brands 3.800% 22/10/2021 1,675,000 1,721,397 0.70Conagra Brands 4.300% 01/05/2024 850,000 902,760 0.37Conagra Brands 4.600% 01/11/2025 625,000 679,188 0.28Conagra Brands 4.850% 01/11/2028 1,225,000 1,357,214 0.55Conagra Brands 5.300% 01/11/2038 850,000 921,154 0.38Conagra Brands 5.400% 01/11/2048 950,000 1,042,577 0.43General Mills 4.200% 17/04/2028 1,250,000 1,349,737 0.55
Forest Products & Paper (0.36%) International Paper 4.350% 15/08/2048 900,000 881,631 0.36
Gas (0.06%) NiSource 4.375% 15/05/2047 131,000 140,283 0.06
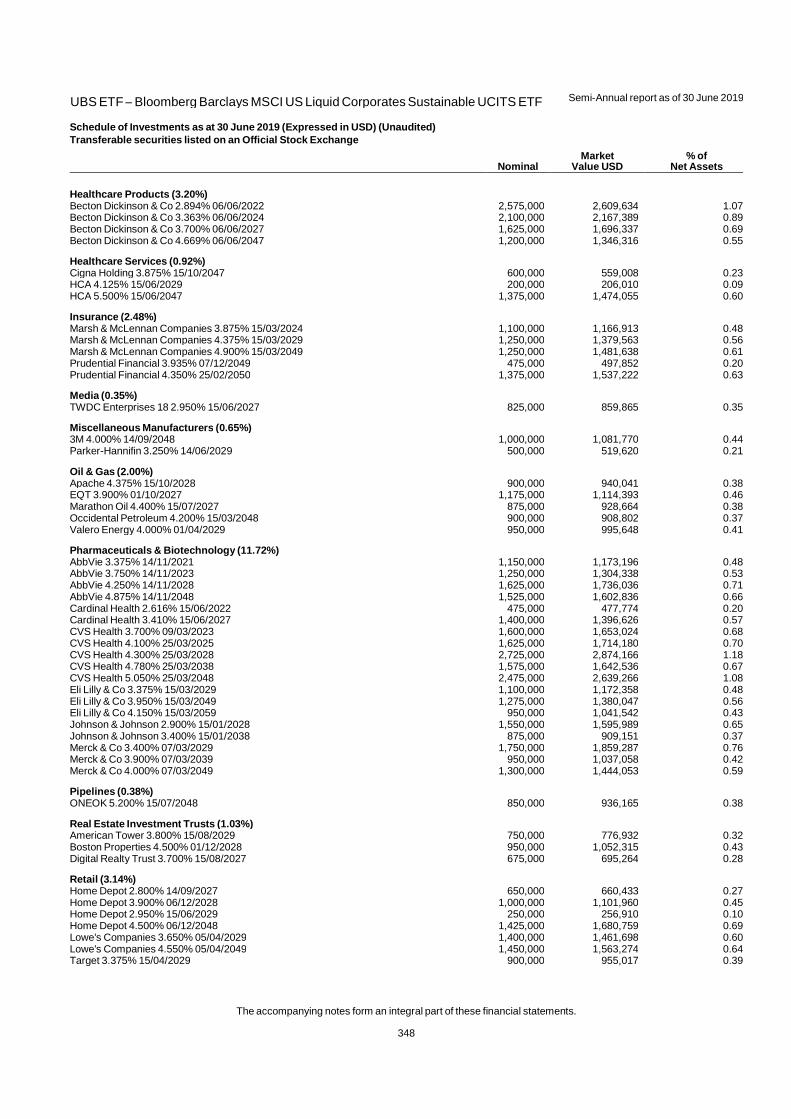
UBS ETF – Bloomberg Barclays MSCI US Liquid Corporates Sustainable UCITS ETF
Semi-Annual report as of 30 June 2019
The accompanying notes form an integral part of these financial statements.
348
Schedule of Investments as at 30 June 2019 (Expressed in USD) (Unaudited)
Transferable securities listed on an Official Stock Exchange
Nominal Market
Value USD % of
Net Assets
Healthcare Products (3.20%) Becton Dickinson & Co 2.894% 06/06/2022 2,575,000 2,609,634 1.07Becton Dickinson & Co 3.363% 06/06/2024 2,100,000 2,167,389 0.89Becton Dickinson & Co 3.700% 06/06/2027 1,625,000 1,696,337 0.69Becton Dickinson & Co 4.669% 06/06/2047 1,200,000 1,346,316 0.55
Healthcare Services (0.92%) Cigna Holding 3.875% 15/10/2047 600,000 559,008 0.23HCA 4.125% 15/06/2029 200,000 206,010 0.09HCA 5.500% 15/06/2047 1,375,000 1,474,055 0.60
Insurance (2.48%) Marsh & McLennan Companies 3.875% 15/03/2024 1,100,000 1,166,913 0.48Marsh & McLennan Companies 4.375% 15/03/2029 1,250,000 1,379,563 0.56Marsh & McLennan Companies 4.900% 15/03/2049 1,250,000 1,481,638 0.61Prudential Financial 3.935% 07/12/2049 475,000 497,852 0.20Prudential Financial 4.350% 25/02/2050 1,375,000 1,537,222 0.63
Media (0.35%) TWDC Enterprises 18 2.950% 15/06/2027 825,000 859,865 0.35
Miscellaneous Manufacturers (0.65%) 3M 4.000% 14/09/2048 1,000,000 1,081,770 0.44Parker-Hannifin 3.250% 14/06/2029 500,000 519,620 0.21
Oil & Gas (2.00%) Apache 4.375% 15/10/2028 900,000 940,041 0.38EQT 3.900% 01/10/2027 1,175,000 1,114,393 0.46Marathon Oil 4.400% 15/07/2027 875,000 928,664 0.38Occidental Petroleum 4.200% 15/03/2048 900,000 908,802 0.37Valero Energy 4.000% 01/04/2029 950,000 995,648 0.41
Pharmaceuticals & Biotechnology (11.72%) AbbVie 3.375% 14/11/2021 1,150,000 1,173,196 0.48AbbVie 3.750% 14/11/2023 1,250,000 1,304,338 0.53AbbVie 4.250% 14/11/2028 1,625,000 1,736,036 0.71AbbVie 4.875% 14/11/2048 1,525,000 1,602,836 0.66Cardinal Health 2.616% 15/06/2022 475,000 477,774 0.20Cardinal Health 3.410% 15/06/2027 1,400,000 1,396,626 0.57CVS Health 3.700% 09/03/2023 1,600,000 1,653,024 0.68CVS Health 4.100% 25/03/2025 1,625,000 1,714,180 0.70CVS Health 4.300% 25/03/2028 2,725,000 2,874,166 1.18CVS Health 4.780% 25/03/2038 1,575,000 1,642,536 0.67CVS Health 5.050% 25/03/2048 2,475,000 2,639,266 1.08Eli Lilly & Co 3.375% 15/03/2029 1,100,000 1,172,358 0.48Eli Lilly & Co 3.950% 15/03/2049 1,275,000 1,380,047 0.56Eli Lilly & Co 4.150% 15/03/2059 950,000 1,041,542 0.43Johnson & Johnson 2.900% 15/01/2028 1,550,000 1,595,989 0.65Johnson & Johnson 3.400% 15/01/2038 875,000 909,151 0.37Merck & Co 3.400% 07/03/2029 1,750,000 1,859,287 0.76Merck & Co 3.900% 07/03/2039 950,000 1,037,058 0.42Merck & Co 4.000% 07/03/2049 1,300,000 1,444,053 0.59
Pipelines (0.38%) ONEOK 5.200% 15/07/2048 850,000 936,165 0.38
Real Estate Investment Trusts (1.03%) American Tower 3.800% 15/08/2029 750,000 776,932 0.32Boston Properties 4.500% 01/12/2028 950,000 1,052,315 0.43Digital Realty Trust 3.700% 15/08/2027 675,000 695,264 0.28
Retail (3.14%) Home Depot 2.800% 14/09/2027 650,000 660,433 0.27Home Depot 3.900% 06/12/2028 1,000,000 1,101,960 0.45Home Depot 2.950% 15/06/2029 250,000 256,910 0.10Home Depot 4.500% 06/12/2048 1,425,000 1,680,759 0.69Lowe's Companies 3.650% 05/04/2029 1,400,000 1,461,698 0.60Lowe's Companies 4.550% 05/04/2049 1,450,000 1,563,274 0.64Target 3.375% 15/04/2029 900,000 955,017 0.39

UBS ETF – Bloomberg Barclays MSCI US Liquid Corporates Sustainable UCITS ETF
Semi-Annual report as of 30 June 2019
The accompanying notes form an integral part of these financial statements.
349
Schedule of Investments as at 30 June 2019 (Expressed in USD) (Unaudited)
Transferable securities listed on an Official Stock Exchange
Nominal Market
Value USD % of
Net Assets
Software (6.44%) Oracle 2.625% 15/02/2023 1,400,000 1,421,014 0.58Oracle 2.950% 15/11/2024 1,500,000 1,545,210 0.63Oracle 2.650% 15/07/2026 100,000 100,394 0.04Oracle 3.250% 15/11/2027 2,750,000 2,876,252 1.18Oracle 3.850% 15/07/2036 300,000 319,269 0.13Oracle 3.800% 15/11/2037 1,125,000 1,188,619 0.49Oracle 4.000% 15/11/2047 2,175,000 2,338,234 0.96salesforce.com 3.250% 11/04/2023 1,050,000 1,088,724 0.44salesforce.com 3.700% 11/04/2028 1,375,000 1,481,425 0.61VMware 2.300% 21/08/2020 550,000 548,509 0.22VMware 2.950% 21/08/2022 1,900,000 1,918,373 0.78VMware 3.900% 21/08/2027 925,000 935,499 0.38
Transportation (3.25%) Union Pacific 3.950% 10/09/2028 1,325,000 1,448,543 0.59Union Pacific 3.700% 01/03/2029 1,050,000 1,128,319 0.46Union Pacific 4.500% 10/09/2048 1,375,000 1,560,639 0.64Union Pacific 4.300% 01/03/2049 925,000 1,023,022 0.42United Parcel Service 2.500% 01/04/2023 675,000 681,521 0.28United Parcel Service 3.050% 15/11/2027 1,050,000 1,084,902 0.44United Parcel Service 3.750% 15/11/2047 1,010,000 1,019,575 0.42
Total Corporate Bonds 141,950,547 58.04
Transferable securities and money market instruments dealt in another regulated market
Corporate Bonds
Banks (7.76%) Goldman Sachs Group 2.876% 31/10/2022 1,000,000 1,007,810 0.41Goldman Sachs Group 2.905% 24/07/2023 875,000 883,619 0.36Goldman Sachs Group 3.272% 29/09/2025 1,150,000 1,174,288 0.48Goldman Sachs Group 3.691% 05/06/2028 425,000 438,728 0.18Goldman Sachs Group 3.814% 23/04/2029 1,350,000 1,403,500 0.57Goldman Sachs Group 4.223% 01/05/2029 1,675,000 1,792,736 0.73Goldman Sachs Group 4.017% 31/10/2038 975,000 1,003,850 0.41Goldman Sachs Group 4.411% 23/04/2039 1,125,000 1,213,324 0.50Morgan Stanley 3.737% 24/04/2024 2,075,000 2,163,519 0.89Morgan Stanley 3.591% 22/07/2028 700,000 726,649 0.30Morgan Stanley 3.772% 24/01/2029 1,740,000 1,833,351 0.75Morgan Stanley 4.431% 23/01/2030 3,125,000 3,455,875 1.41Morgan Stanley 3.971% 22/07/2038 775,000 807,457 0.33Morgan Stanley 4.457% 22/04/2039 975,000 1,079,734 0.44
Beverages (1.36%) Keurig Dr Pepper 4.057% 25/05/2023 1,425,000 1,496,535 0.61PepsiCo 3.000% 15/10/2027 1,750,000 1,819,108 0.75
Computers (5.65%) Apple 2.100% 12/09/2022 1,550,000 1,551,922 0.63Apple 3.000% 09/02/2024 650,000 671,398 0.27Apple 2.750% 13/01/2025 850,000 868,853 0.36Apple 2.450% 04/08/2026 100,000 99,602 0.04Apple 3.350% 09/02/2027 675,000 709,675 0.29Apple 3.000% 20/06/2027 425,000 437,457 0.18Apple 2.900% 12/09/2027 1,255,000 1,283,062 0.53Apple 3.000% 13/11/2027 2,000,000 2,060,240 0.84Apple 3.850% 04/08/2046 125,000 132,920 0.05Apple 4.250% 09/02/2047 275,000 308,467 0.13Apple 3.750% 12/09/2047 900,000 942,246 0.39Apple 3.750% 13/11/2047 590,000 619,181 0.25Dell International via EMC 4.000% 15/07/2024 850,000 870,128 0.36Dell International via EMC 4.900% 01/10/2026 1,675,000 1,747,477 0.71Dell International via EMC 5.300% 01/10/2029 1,450,000 1,527,053 0.62
Diversified Financial Services (0.33%) American Express 3.375% 17/05/2021 800,000 814,976 0.33
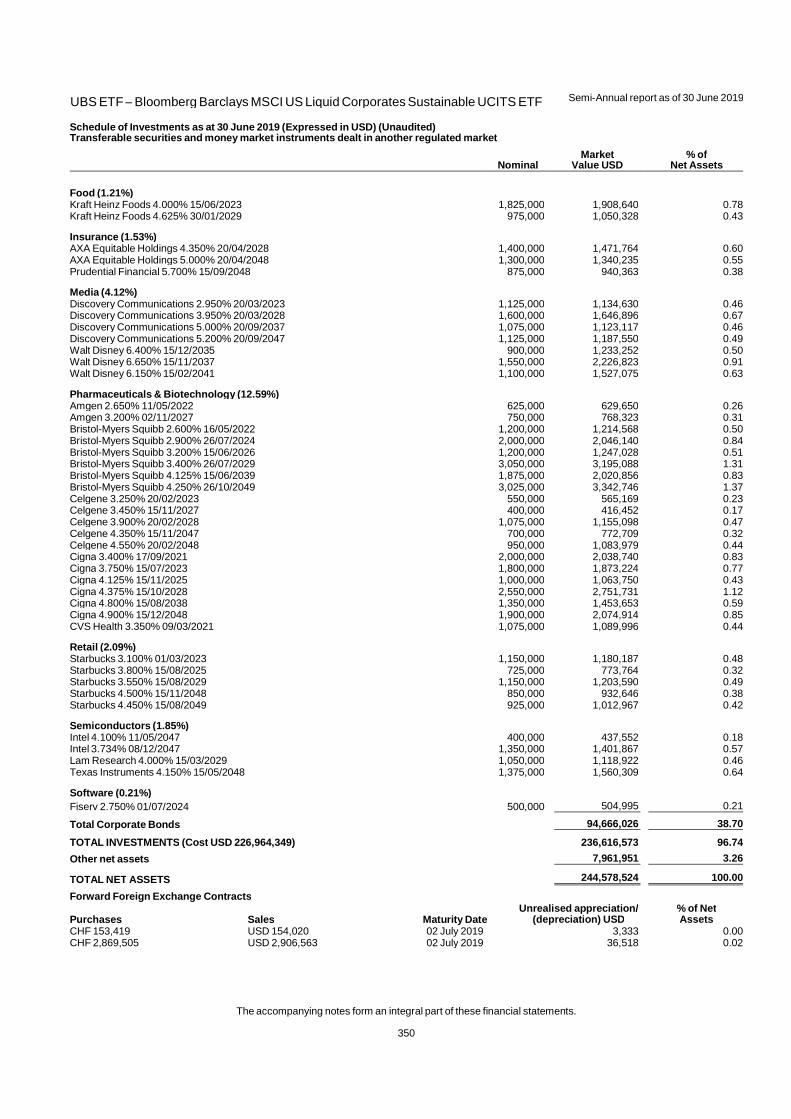
UBS ETF – Bloomberg Barclays MSCI US Liquid Corporates Sustainable UCITS ETF
Semi-Annual report as of 30 June 2019
The accompanying notes form an integral part of these financial statements.
350
Schedule of Investments as at 30 June 2019 (Expressed in USD) (Unaudited) Transferable securities and money market instruments dealt in another regulated market
Nominal Market
Value USD % of
Net Assets
Food (1.21%) Kraft Heinz Foods 4.000% 15/06/2023 1,825,000 1,908,640 0.78Kraft Heinz Foods 4.625% 30/01/2029 975,000 1,050,328 0.43
Insurance (1.53%) AXA Equitable Holdings 4.350% 20/04/2028 1,400,000 1,471,764 0.60AXA Equitable Holdings 5.000% 20/04/2048 1,300,000 1,340,235 0.55Prudential Financial 5.700% 15/09/2048 875,000 940,363 0.38
Media (4.12%) Discovery Communications 2.950% 20/03/2023 1,125,000 1,134,630 0.46Discovery Communications 3.950% 20/03/2028 1,600,000 1,646,896 0.67Discovery Communications 5.000% 20/09/2037 1,075,000 1,123,117 0.46Discovery Communications 5.200% 20/09/2047 1,125,000 1,187,550 0.49Walt Disney 6.400% 15/12/2035 900,000 1,233,252 0.50Walt Disney 6.650% 15/11/2037 1,550,000 2,226,823 0.91Walt Disney 6.150% 15/02/2041 1,100,000 1,527,075 0.63
Pharmaceuticals & Biotechnology (12.59%) Amgen 2.650% 11/05/2022 625,000 629,650 0.26Amgen 3.200% 02/11/2027 750,000 768,323 0.31Bristol-Myers Squibb 2.600% 16/05/2022 1,200,000 1,214,568 0.50Bristol-Myers Squibb 2.900% 26/07/2024 2,000,000 2,046,140 0.84Bristol-Myers Squibb 3.200% 15/06/2026 1,200,000 1,247,028 0.51Bristol-Myers Squibb 3.400% 26/07/2029 3,050,000 3,195,088 1.31Bristol-Myers Squibb 4.125% 15/06/2039 1,875,000 2,020,856 0.83Bristol-Myers Squibb 4.250% 26/10/2049 3,025,000 3,342,746 1.37Celgene 3.250% 20/02/2023 550,000 565,169 0.23Celgene 3.450% 15/11/2027 400,000 416,452 0.17Celgene 3.900% 20/02/2028 1,075,000 1,155,098 0.47Celgene 4.350% 15/11/2047 700,000 772,709 0.32Celgene 4.550% 20/02/2048 950,000 1,083,979 0.44Cigna 3.400% 17/09/2021 2,000,000 2,038,740 0.83Cigna 3.750% 15/07/2023 1,800,000 1,873,224 0.77Cigna 4.125% 15/11/2025 1,000,000 1,063,750 0.43Cigna 4.375% 15/10/2028 2,550,000 2,751,731 1.12Cigna 4.800% 15/08/2038 1,350,000 1,453,653 0.59Cigna 4.900% 15/12/2048 1,900,000 2,074,914 0.85CVS Health 3.350% 09/03/2021 1,075,000 1,089,996 0.44
Retail (2.09%) Starbucks 3.100% 01/03/2023 1,150,000 1,180,187 0.48Starbucks 3.800% 15/08/2025 725,000 773,764 0.32Starbucks 3.550% 15/08/2029 1,150,000 1,203,590 0.49Starbucks 4.500% 15/11/2048 850,000 932,646 0.38Starbucks 4.450% 15/08/2049 925,000 1,012,967 0.42
Semiconductors (1.85%) Intel 4.100% 11/05/2047 400,000 437,552 0.18Intel 3.734% 08/12/2047 1,350,000 1,401,867 0.57Lam Research 4.000% 15/03/2029 1,050,000 1,118,922 0.46Texas Instruments 4.150% 15/05/2048 1,375,000 1,560,309 0.64
Software (0.21%) Fiserv 2.750% 01/07/2024 500,000 504,995 0.21
Total Corporate Bonds 94,666,026 38.70
TOTAL INVESTMENTS (Cost USD 226,964,349) 236,616,573 96.74
Other net assets 7,961,951 3.26
TOTAL NET ASSETS 244,578,524 100.00
Forward Foreign Exchange Contracts
Purchases Sales Maturity Date Unrealised appreciation/
(depreciation) USD % of Net Assets
CHF 153,419 USD 154,020 02 July 2019 3,333 0.00CHF 2,869,505 USD 2,906,563 02 July 2019 36,518 0.02

UBS ETF – Bloomberg Barclays MSCI US Liquid Corporates Sustainable UCITS ETF
Semi-Annual report as of 30 June 2019
The accompanying notes form an integral part of these financial statements.
351
Schedule of Investments as at 30 June 2019 (Expressed in USD) (Unaudited) Forward Foreign Exchange Contracts
Purchases Sales Maturity Date Unrealised appreciation/
(depreciation) USD % of Net Assets
CHF 4,749,355 USD 4,787,053 02 July 2019 84,080 0.03CHF 54,098,020 USD 53,930,834 02 July 2019 1,554,314 0.64EUR 3,189,305 USD 3,580,668 02 July 2019 51,314 0.02EUR 312,908 USD 351,115 02 July 2019 5,226 0.00EUR 94,740,645 USD 105,825,017 02 July 2019 2,065,669 0.85GBP 89,285 USD 112,899 02 July 2019 735 0.00GBP 23,744,849 USD 29,972,742 02 July 2019 247,331 0.10
Total Forward Foreign Exchange Contracts 4,048,520 1.66
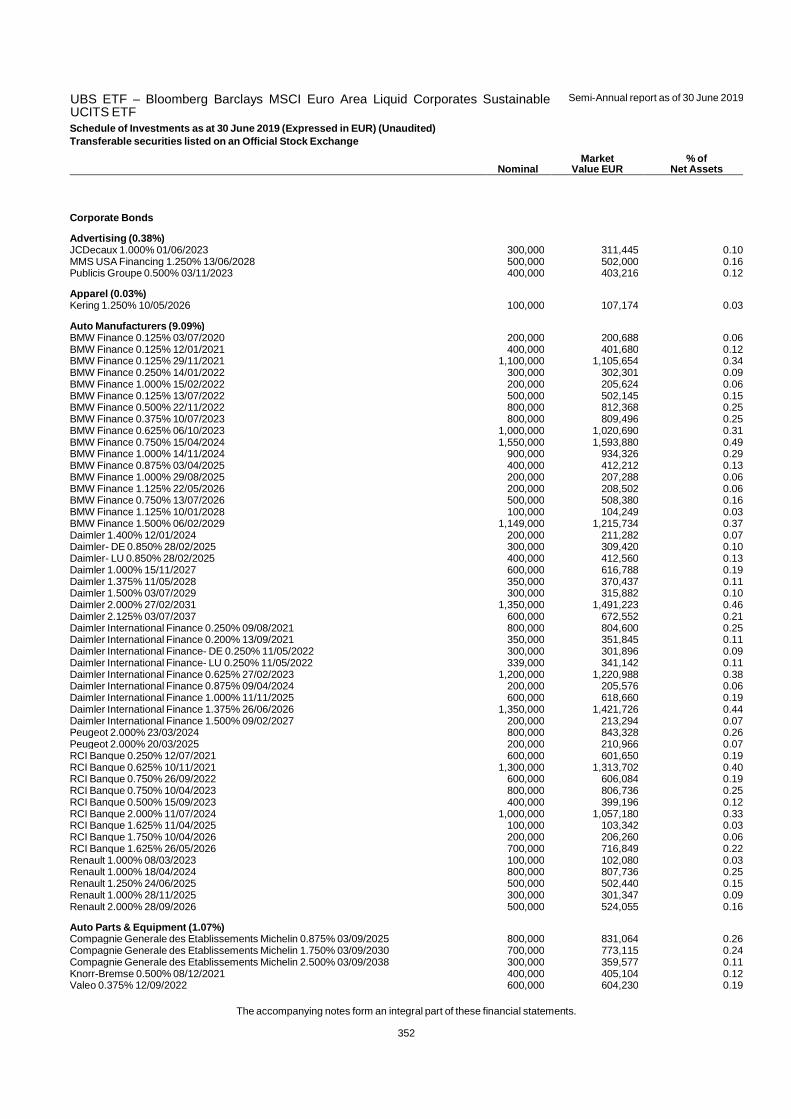
UBS ETF – Bloomberg Barclays MSCI Euro Area Liquid Corporates SustainableUCITS ETF
Semi-Annual report as of 30 June 2019
The accompanying notes form an integral part of these financial statements.
352
Schedule of Investments as at 30 June 2019 (Expressed in EUR) (Unaudited)
Transferable securities listed on an Official Stock Exchange
Nominal Market
Value EUR % of
Net Assets
Corporate Bonds
Advertising (0.38%) JCDecaux 1.000% 01/06/2023 300,000 311,445 0.10MMS USA Financing 1.250% 13/06/2028 500,000 502,000 0.16Publicis Groupe 0.500% 03/11/2023 400,000 403,216 0.12
Apparel (0.03%) Kering 1.250% 10/05/2026 100,000 107,174 0.03
Auto Manufacturers (9.09%) BMW Finance 0.125% 03/07/2020 200,000 200,688 0.06BMW Finance 0.125% 12/01/2021 400,000 401,680 0.12BMW Finance 0.125% 29/11/2021 1,100,000 1,105,654 0.34BMW Finance 0.250% 14/01/2022 300,000 302,301 0.09BMW Finance 1.000% 15/02/2022 200,000 205,624 0.06BMW Finance 0.125% 13/07/2022 500,000 502,145 0.15BMW Finance 0.500% 22/11/2022 800,000 812,368 0.25BMW Finance 0.375% 10/07/2023 800,000 809,496 0.25BMW Finance 0.625% 06/10/2023 1,000,000 1,020,690 0.31BMW Finance 0.750% 15/04/2024 1,550,000 1,593,880 0.49BMW Finance 1.000% 14/11/2024 900,000 934,326 0.29BMW Finance 0.875% 03/04/2025 400,000 412,212 0.13BMW Finance 1.000% 29/08/2025 200,000 207,288 0.06BMW Finance 1.125% 22/05/2026 200,000 208,502 0.06BMW Finance 0.750% 13/07/2026 500,000 508,380 0.16BMW Finance 1.125% 10/01/2028 100,000 104,249 0.03BMW Finance 1.500% 06/02/2029 1,149,000 1,215,734 0.37Daimler 1.400% 12/01/2024 200,000 211,282 0.07Daimler- DE 0.850% 28/02/2025 300,000 309,420 0.10Daimler- LU 0.850% 28/02/2025 400,000 412,560 0.13Daimler 1.000% 15/11/2027 600,000 616,788 0.19Daimler 1.375% 11/05/2028 350,000 370,437 0.11Daimler 1.500% 03/07/2029 300,000 315,882 0.10Daimler 2.000% 27/02/2031 1,350,000 1,491,223 0.46Daimler 2.125% 03/07/2037 600,000 672,552 0.21Daimler International Finance 0.250% 09/08/2021 800,000 804,600 0.25Daimler International Finance 0.200% 13/09/2021 350,000 351,845 0.11Daimler International Finance- DE 0.250% 11/05/2022 300,000 301,896 0.09Daimler International Finance- LU 0.250% 11/05/2022 339,000 341,142 0.11Daimler International Finance 0.625% 27/02/2023 1,200,000 1,220,988 0.38Daimler International Finance 0.875% 09/04/2024 200,000 205,576 0.06Daimler International Finance 1.000% 11/11/2025 600,000 618,660 0.19Daimler International Finance 1.375% 26/06/2026 1,350,000 1,421,726 0.44Daimler International Finance 1.500% 09/02/2027 200,000 213,294 0.07Peugeot 2.000% 23/03/2024 800,000 843,328 0.26Peugeot 2.000% 20/03/2025 200,000 210,966 0.07RCI Banque 0.250% 12/07/2021 600,000 601,650 0.19RCI Banque 0.625% 10/11/2021 1,300,000 1,313,702 0.40RCI Banque 0.750% 26/09/2022 600,000 606,084 0.19RCI Banque 0.750% 10/04/2023 800,000 806,736 0.25RCI Banque 0.500% 15/09/2023 400,000 399,196 0.12RCI Banque 2.000% 11/07/2024 1,000,000 1,057,180 0.33RCI Banque 1.625% 11/04/2025 100,000 103,342 0.03RCI Banque 1.750% 10/04/2026 200,000 206,260 0.06RCI Banque 1.625% 26/05/2026 700,000 716,849 0.22Renault 1.000% 08/03/2023 100,000 102,080 0.03Renault 1.000% 18/04/2024 800,000 807,736 0.25Renault 1.250% 24/06/2025 500,000 502,440 0.15Renault 1.000% 28/11/2025 300,000 301,347 0.09Renault 2.000% 28/09/2026 500,000 524,055 0.16
Auto Parts & Equipment (1.07%) Compagnie Generale des Etablissements Michelin 0.875% 03/09/2025 800,000 831,064 0.26Compagnie Generale des Etablissements Michelin 1.750% 03/09/2030 700,000 773,115 0.24Compagnie Generale des Etablissements Michelin 2.500% 03/09/2038 300,000 359,577 0.11Knorr-Bremse 0.500% 08/12/2021 400,000 405,104 0.12Valeo 0.375% 12/09/2022 600,000 604,230 0.19
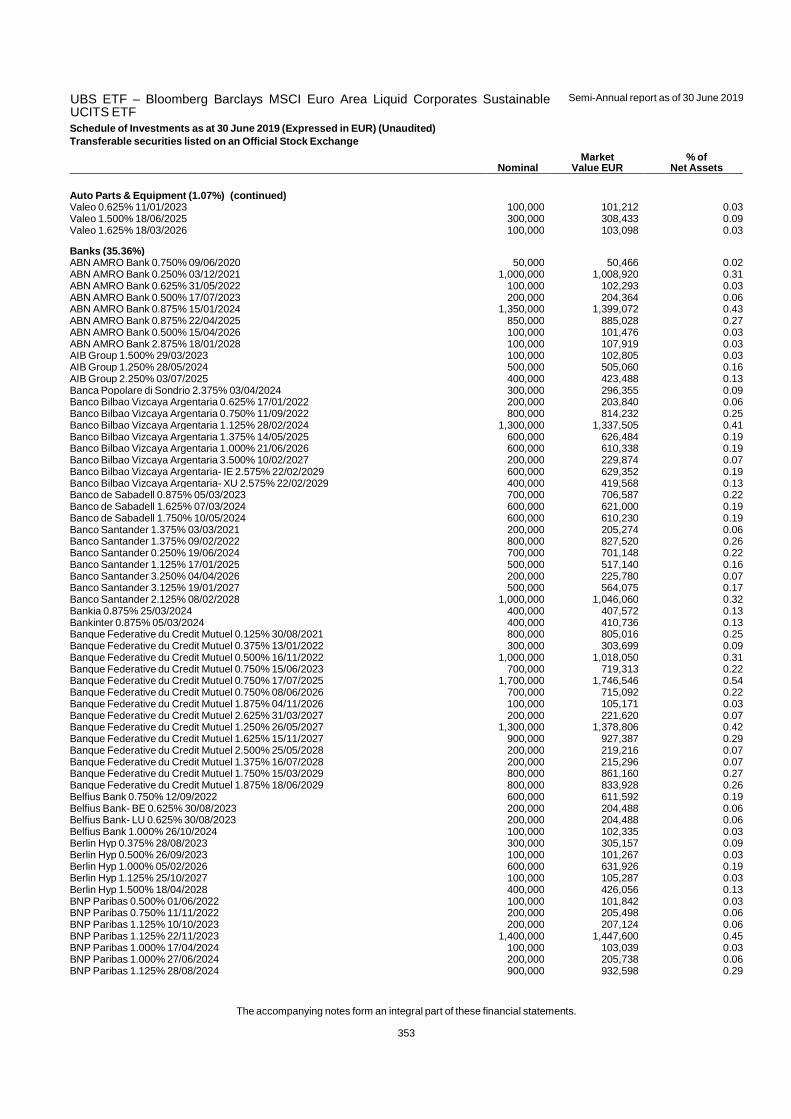
UBS ETF – Bloomberg Barclays MSCI Euro Area Liquid Corporates SustainableUCITS ETF
Semi-Annual report as of 30 June 2019
The accompanying notes form an integral part of these financial statements.
353
Schedule of Investments as at 30 June 2019 (Expressed in EUR) (Unaudited)
Transferable securities listed on an Official Stock Exchange
Nominal Market
Value EUR % of
Net Assets
Auto Parts & Equipment (1.07%) (continued) Valeo 0.625% 11/01/2023 100,000 101,212 0.03Valeo 1.500% 18/06/2025 300,000 308,433 0.09Valeo 1.625% 18/03/2026 100,000 103,098 0.03
Banks (35.36%) ABN AMRO Bank 0.750% 09/06/2020 50,000 50,466 0.02ABN AMRO Bank 0.250% 03/12/2021 1,000,000 1,008,920 0.31ABN AMRO Bank 0.625% 31/05/2022 100,000 102,293 0.03ABN AMRO Bank 0.500% 17/07/2023 200,000 204,364 0.06ABN AMRO Bank 0.875% 15/01/2024 1,350,000 1,399,072 0.43ABN AMRO Bank 0.875% 22/04/2025 850,000 885,028 0.27ABN AMRO Bank 0.500% 15/04/2026 100,000 101,476 0.03ABN AMRO Bank 2.875% 18/01/2028 100,000 107,919 0.03AIB Group 1.500% 29/03/2023 100,000 102,805 0.03AIB Group 1.250% 28/05/2024 500,000 505,060 0.16AIB Group 2.250% 03/07/2025 400,000 423,488 0.13Banca Popolare di Sondrio 2.375% 03/04/2024 300,000 296,355 0.09Banco Bilbao Vizcaya Argentaria 0.625% 17/01/2022 200,000 203,840 0.06Banco Bilbao Vizcaya Argentaria 0.750% 11/09/2022 800,000 814,232 0.25Banco Bilbao Vizcaya Argentaria 1.125% 28/02/2024 1,300,000 1,337,505 0.41Banco Bilbao Vizcaya Argentaria 1.375% 14/05/2025 600,000 626,484 0.19Banco Bilbao Vizcaya Argentaria 1.000% 21/06/2026 600,000 610,338 0.19Banco Bilbao Vizcaya Argentaria 3.500% 10/02/2027 200,000 229,874 0.07Banco Bilbao Vizcaya Argentaria- IE 2.575% 22/02/2029 600,000 629,352 0.19Banco Bilbao Vizcaya Argentaria- XU 2.575% 22/02/2029 400,000 419,568 0.13Banco de Sabadell 0.875% 05/03/2023 700,000 706,587 0.22Banco de Sabadell 1.625% 07/03/2024 600,000 621,000 0.19Banco de Sabadell 1.750% 10/05/2024 600,000 610,230 0.19Banco Santander 1.375% 03/03/2021 200,000 205,274 0.06Banco Santander 1.375% 09/02/2022 800,000 827,520 0.26Banco Santander 0.250% 19/06/2024 700,000 701,148 0.22Banco Santander 1.125% 17/01/2025 500,000 517,140 0.16Banco Santander 3.250% 04/04/2026 200,000 225,780 0.07Banco Santander 3.125% 19/01/2027 500,000 564,075 0.17Banco Santander 2.125% 08/02/2028 1,000,000 1,046,060 0.32Bankia 0.875% 25/03/2024 400,000 407,572 0.13Bankinter 0.875% 05/03/2024 400,000 410,736 0.13Banque Federative du Credit Mutuel 0.125% 30/08/2021 800,000 805,016 0.25Banque Federative du Credit Mutuel 0.375% 13/01/2022 300,000 303,699 0.09Banque Federative du Credit Mutuel 0.500% 16/11/2022 1,000,000 1,018,050 0.31Banque Federative du Credit Mutuel 0.750% 15/06/2023 700,000 719,313 0.22Banque Federative du Credit Mutuel 0.750% 17/07/2025 1,700,000 1,746,546 0.54Banque Federative du Credit Mutuel 0.750% 08/06/2026 700,000 715,092 0.22Banque Federative du Credit Mutuel 1.875% 04/11/2026 100,000 105,171 0.03Banque Federative du Credit Mutuel 2.625% 31/03/2027 200,000 221,620 0.07Banque Federative du Credit Mutuel 1.250% 26/05/2027 1,300,000 1,378,806 0.42Banque Federative du Credit Mutuel 1.625% 15/11/2027 900,000 927,387 0.29Banque Federative du Credit Mutuel 2.500% 25/05/2028 200,000 219,216 0.07Banque Federative du Credit Mutuel 1.375% 16/07/2028 200,000 215,296 0.07Banque Federative du Credit Mutuel 1.750% 15/03/2029 800,000 861,160 0.27Banque Federative du Credit Mutuel 1.875% 18/06/2029 800,000 833,928 0.26Belfius Bank 0.750% 12/09/2022 600,000 611,592 0.19Belfius Bank- BE 0.625% 30/08/2023 200,000 204,488 0.06Belfius Bank- LU 0.625% 30/08/2023 200,000 204,488 0.06Belfius Bank 1.000% 26/10/2024 100,000 102,335 0.03Berlin Hyp 0.375% 28/08/2023 300,000 305,157 0.09Berlin Hyp 0.500% 26/09/2023 100,000 101,267 0.03Berlin Hyp 1.000% 05/02/2026 600,000 631,926 0.19Berlin Hyp 1.125% 25/10/2027 100,000 105,287 0.03Berlin Hyp 1.500% 18/04/2028 400,000 426,056 0.13BNP Paribas 0.500% 01/06/2022 100,000 101,842 0.03BNP Paribas 0.750% 11/11/2022 200,000 205,498 0.06BNP Paribas 1.125% 10/10/2023 200,000 207,124 0.06BNP Paribas 1.125% 22/11/2023 1,400,000 1,447,600 0.45BNP Paribas 1.000% 17/04/2024 100,000 103,039 0.03BNP Paribas 1.000% 27/06/2024 200,000 205,738 0.06BNP Paribas 1.125% 28/08/2024 900,000 932,598 0.29

UBS ETF – Bloomberg Barclays MSCI Euro Area Liquid Corporates SustainableUCITS ETF
Semi-Annual report as of 30 June 2019
The accompanying notes form an integral part of these financial statements.
354
Schedule of Investments as at 30 June 2019 (Expressed in EUR) (Unaudited)
Transferable securities listed on an Official Stock Exchange
Nominal Market
Value EUR % of
Net Assets
Banks (35.36%) (continued) BNP Paribas 1.250% 19/03/2025 300,000 311,661 0.10BNP Paribas 1.500% 17/11/2025 1,100,000 1,160,885 0.36BNP Paribas 1.625% 23/02/2026 100,000 109,387 0.03BNP Paribas 1.125% 11/06/2026 800,000 824,728 0.25BNP Paribas 2.875% 01/10/2026 200,000 225,382 0.07BNP Paribas 2.250% 11/01/2027 900,000 976,077 0.30BNP Paribas 2.125% 23/01/2027 1,500,000 1,626,330 0.50BNP Paribas 1.500% 23/05/2028 200,000 212,544 0.07BNP Paribas 1.500% 25/05/2028 500,000 542,315 0.17BNP Paribas 1.375% 28/05/2029 800,000 824,704 0.25BNP Paribas 2.375% 20/11/2030 100,000 106,584 0.03Bpce 1.125% 18/01/2023 900,000 927,450 0.29Bpce 0.625% 26/09/2023 300,000 306,819 0.09Bpce 0.375% 05/10/2023 200,000 202,504 0.06Bpce 0.875% 31/01/2024 1,300,000 1,327,248 0.41Bpce 1.000% 15/07/2024 400,000 416,408 0.13Bpce 0.625% 26/09/2024 700,000 702,975 0.22Bpce 1.000% 01/04/2025 900,000 919,818 0.28Bpce 1.375% 23/03/2026 100,000 104,455 0.03Bpce 2.875% 22/04/2026 100,000 112,294 0.04Bpce 2.750% 30/11/2027 100,000 107,796 0.03Bpce 1.625% 31/01/2028 300,000 323,076 0.10Bpce 1.000% 05/10/2028 1,100,000 1,146,145 0.35CaixaBank 1.125% 12/01/2023 1,100,000 1,122,682 0.35CaixaBank 0.750% 18/04/2023 600,000 611,580 0.19CaixaBank 1.750% 24/10/2023 1,100,000 1,148,796 0.35CaixaBank 2.375% 01/02/2024 500,000 535,105 0.17CaixaBank 1.125% 17/05/2024 200,000 206,848 0.06CaixaBank 1.125% 27/03/2026 800,000 820,688 0.25CaixaBank 1.375% 19/06/2026 500,000 507,115 0.16CaixaBank 3.500% 15/02/2027 800,000 850,384 0.26CaixaBank 2.750% 14/07/2028 500,000 524,160 0.16CaixaBank 2.250% 17/04/2030 800,000 805,792 0.25Commerzbank 0.500% 06/12/2021 300,000 304,086 0.09Commerzbank 0.500% 28/08/2023 1,200,000 1,216,296 0.37Commerzbank 0.500% 13/09/2023 400,000 401,592 0.12Commerzbank 1.250% 23/10/2023 500,000 516,535 0.16Commerzbank 1.125% 24/05/2024 100,000 103,042 0.03Commerzbank 0.625% 28/08/2024 600,000 610,314 0.19Commerzbank 1.125% 19/09/2025 600,000 612,762 0.19Commerzbank 1.000% 04/03/2026 900,000 925,119 0.29Commerzbank 1.125% 22/06/2026 300,000 302,913 0.09Commerzbank 4.000% 30/03/2027 500,000 576,790 0.18Commerzbank 1.875% 28/02/2028 100,000 105,422 0.03Commerzbank 1.500% 28/08/2028 400,000 424,632 0.13Cooperatieve Rabobank 0.125% 11/10/2021 100,000 100,869 0.03Cooperatieve Rabobank 0.500% 06/12/2022 700,000 718,242 0.22Cooperatieve Rabobank 0.750% 29/08/2023 800,000 820,568 0.25Cooperatieve Rabobank 0.625% 27/02/2024 900,000 917,208 0.28Cooperatieve Rabobank 1.125% 07/05/2031 700,000 720,314 0.22Credit Agricole 0.750% 01/12/2022 200,000 205,770 0.06Credit Agricole 0.750% 05/12/2023 600,000 618,126 0.19Credit Agricole 1.000% 16/09/2024 1,500,000 1,568,955 0.48Credit Agricole 1.375% 13/03/2025 300,000 314,598 0.10Credit Agricole 1.250% 14/04/2026 500,000 530,035 0.16Credit Agricole 1.875% 20/12/2026 600,000 652,086 0.20Credit Agricole 1.375% 03/05/2027 500,000 533,590 0.16Credit Agricole 1.750% 05/03/2029 1,500,000 1,611,810 0.50Credit Agricole 2.000% 25/03/2029 900,000 944,577 0.29Credit Agricole 1.000% 03/07/2029 600,000 616,548 0.19Credit Mutuel Arkea 1.250% 31/05/2024 100,000 103,625 0.03Credit Mutuel Arkea 1.375% 17/01/2025 300,000 316,062 0.10Credit Mutuel Arkea 1.625% 15/04/2026 200,000 209,196 0.06Credit Mutuel Arkea 3.250% 01/06/2026 100,000 110,551 0.03Credit Mutuel Arkea 3.500% 09/02/2029 600,000 674,658 0.21Credit Mutuel Arkea 1.125% 23/05/2029 400,000 408,692 0.13Credit Mutuel Arkea 1.875% 25/10/2029 100,000 100,004 0.03
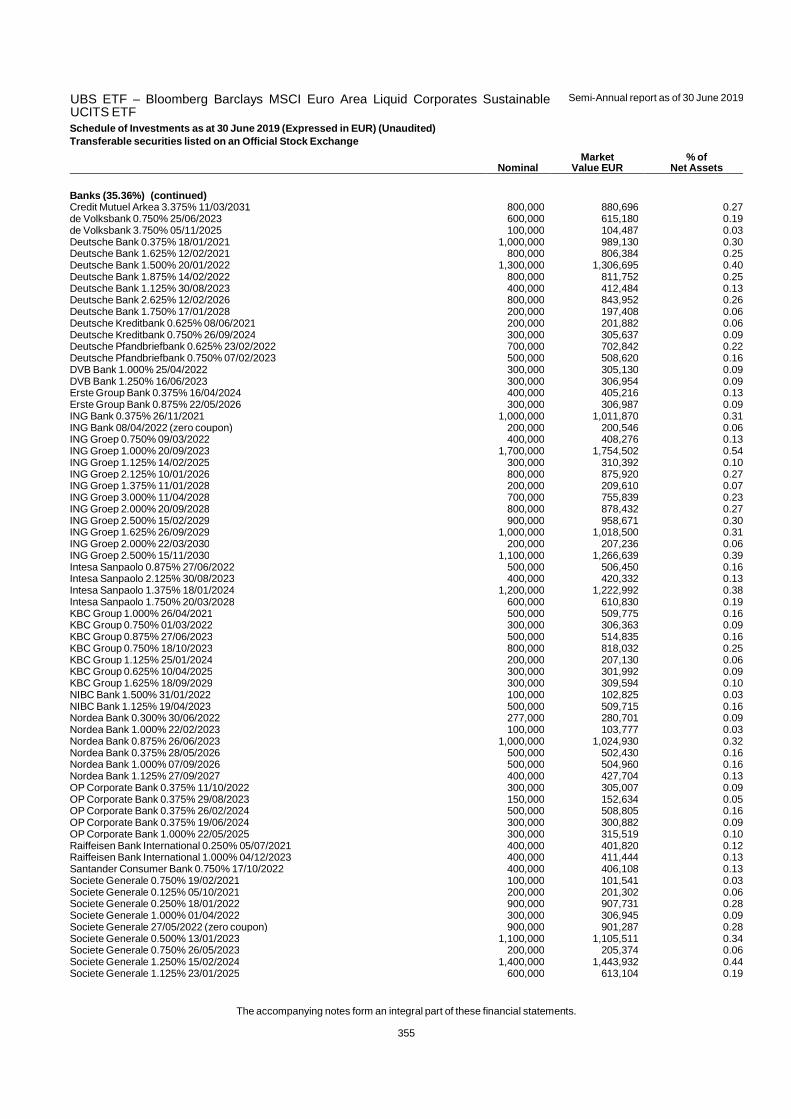
UBS ETF – Bloomberg Barclays MSCI Euro Area Liquid Corporates SustainableUCITS ETF
Semi-Annual report as of 30 June 2019
The accompanying notes form an integral part of these financial statements.
355
Schedule of Investments as at 30 June 2019 (Expressed in EUR) (Unaudited)
Transferable securities listed on an Official Stock Exchange
Nominal Market
Value EUR % of
Net Assets
Banks (35.36%) (continued) Credit Mutuel Arkea 3.375% 11/03/2031 800,000 880,696 0.27de Volksbank 0.750% 25/06/2023 600,000 615,180 0.19de Volksbank 3.750% 05/11/2025 100,000 104,487 0.03Deutsche Bank 0.375% 18/01/2021 1,000,000 989,130 0.30Deutsche Bank 1.625% 12/02/2021 800,000 806,384 0.25Deutsche Bank 1.500% 20/01/2022 1,300,000 1,306,695 0.40Deutsche Bank 1.875% 14/02/2022 800,000 811,752 0.25Deutsche Bank 1.125% 30/08/2023 400,000 412,484 0.13Deutsche Bank 2.625% 12/02/2026 800,000 843,952 0.26Deutsche Bank 1.750% 17/01/2028 200,000 197,408 0.06Deutsche Kreditbank 0.625% 08/06/2021 200,000 201,882 0.06Deutsche Kreditbank 0.750% 26/09/2024 300,000 305,637 0.09Deutsche Pfandbriefbank 0.625% 23/02/2022 700,000 702,842 0.22Deutsche Pfandbriefbank 0.750% 07/02/2023 500,000 508,620 0.16DVB Bank 1.000% 25/04/2022 300,000 305,130 0.09DVB Bank 1.250% 16/06/2023 300,000 306,954 0.09Erste Group Bank 0.375% 16/04/2024 400,000 405,216 0.13Erste Group Bank 0.875% 22/05/2026 300,000 306,987 0.09ING Bank 0.375% 26/11/2021 1,000,000 1,011,870 0.31ING Bank 08/04/2022 (zero coupon) 200,000 200,546 0.06ING Groep 0.750% 09/03/2022 400,000 408,276 0.13ING Groep 1.000% 20/09/2023 1,700,000 1,754,502 0.54ING Groep 1.125% 14/02/2025 300,000 310,392 0.10ING Groep 2.125% 10/01/2026 800,000 875,920 0.27ING Groep 1.375% 11/01/2028 200,000 209,610 0.07ING Groep 3.000% 11/04/2028 700,000 755,839 0.23ING Groep 2.000% 20/09/2028 800,000 878,432 0.27ING Groep 2.500% 15/02/2029 900,000 958,671 0.30ING Groep 1.625% 26/09/2029 1,000,000 1,018,500 0.31ING Groep 2.000% 22/03/2030 200,000 207,236 0.06ING Groep 2.500% 15/11/2030 1,100,000 1,266,639 0.39Intesa Sanpaolo 0.875% 27/06/2022 500,000 506,450 0.16Intesa Sanpaolo 2.125% 30/08/2023 400,000 420,332 0.13Intesa Sanpaolo 1.375% 18/01/2024 1,200,000 1,222,992 0.38Intesa Sanpaolo 1.750% 20/03/2028 600,000 610,830 0.19KBC Group 1.000% 26/04/2021 500,000 509,775 0.16KBC Group 0.750% 01/03/2022 300,000 306,363 0.09KBC Group 0.875% 27/06/2023 500,000 514,835 0.16KBC Group 0.750% 18/10/2023 800,000 818,032 0.25KBC Group 1.125% 25/01/2024 200,000 207,130 0.06KBC Group 0.625% 10/04/2025 300,000 301,992 0.09KBC Group 1.625% 18/09/2029 300,000 309,594 0.10NIBC Bank 1.500% 31/01/2022 100,000 102,825 0.03NIBC Bank 1.125% 19/04/2023 500,000 509,715 0.16Nordea Bank 0.300% 30/06/2022 277,000 280,701 0.09Nordea Bank 1.000% 22/02/2023 100,000 103,777 0.03Nordea Bank 0.875% 26/06/2023 1,000,000 1,024,930 0.32Nordea Bank 0.375% 28/05/2026 500,000 502,430 0.16Nordea Bank 1.000% 07/09/2026 500,000 504,960 0.16Nordea Bank 1.125% 27/09/2027 400,000 427,704 0.13OP Corporate Bank 0.375% 11/10/2022 300,000 305,007 0.09OP Corporate Bank 0.375% 29/08/2023 150,000 152,634 0.05OP Corporate Bank 0.375% 26/02/2024 500,000 508,805 0.16OP Corporate Bank 0.375% 19/06/2024 300,000 300,882 0.09OP Corporate Bank 1.000% 22/05/2025 300,000 315,519 0.10Raiffeisen Bank International 0.250% 05/07/2021 400,000 401,820 0.12Raiffeisen Bank International 1.000% 04/12/2023 400,000 411,444 0.13Santander Consumer Bank 0.750% 17/10/2022 400,000 406,108 0.13Societe Generale 0.750% 19/02/2021 100,000 101,541 0.03Societe Generale 0.125% 05/10/2021 200,000 201,302 0.06Societe Generale 0.250% 18/01/2022 900,000 907,731 0.28Societe Generale 1.000% 01/04/2022 300,000 306,945 0.09Societe Generale 27/05/2022 (zero coupon) 900,000 901,287 0.28Societe Generale 0.500% 13/01/2023 1,100,000 1,105,511 0.34Societe Generale 0.750% 26/05/2023 200,000 205,374 0.06Societe Generale 1.250% 15/02/2024 1,400,000 1,443,932 0.44Societe Generale 1.125% 23/01/2025 600,000 613,104 0.19
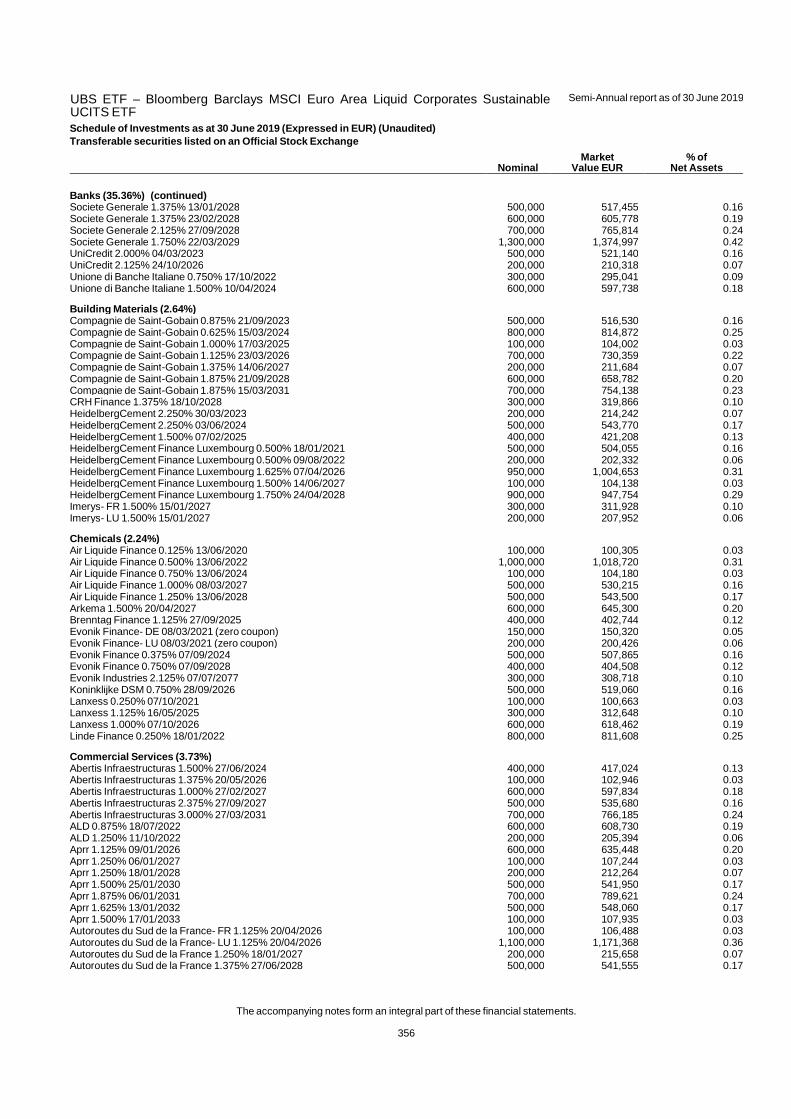
UBS ETF – Bloomberg Barclays MSCI Euro Area Liquid Corporates SustainableUCITS ETF
Semi-Annual report as of 30 June 2019
The accompanying notes form an integral part of these financial statements.
356
Schedule of Investments as at 30 June 2019 (Expressed in EUR) (Unaudited)
Transferable securities listed on an Official Stock Exchange
Nominal Market
Value EUR % of
Net Assets
Banks (35.36%) (continued) Societe Generale 1.375% 13/01/2028 500,000 517,455 0.16Societe Generale 1.375% 23/02/2028 600,000 605,778 0.19Societe Generale 2.125% 27/09/2028 700,000 765,814 0.24Societe Generale 1.750% 22/03/2029 1,300,000 1,374,997 0.42UniCredit 2.000% 04/03/2023 500,000 521,140 0.16UniCredit 2.125% 24/10/2026 200,000 210,318 0.07Unione di Banche Italiane 0.750% 17/10/2022 300,000 295,041 0.09Unione di Banche Italiane 1.500% 10/04/2024 600,000 597,738 0.18
Building Materials (2.64%) Compagnie de Saint-Gobain 0.875% 21/09/2023 500,000 516,530 0.16Compagnie de Saint-Gobain 0.625% 15/03/2024 800,000 814,872 0.25Compagnie de Saint-Gobain 1.000% 17/03/2025 100,000 104,002 0.03Compagnie de Saint-Gobain 1.125% 23/03/2026 700,000 730,359 0.22Compagnie de Saint-Gobain 1.375% 14/06/2027 200,000 211,684 0.07Compagnie de Saint-Gobain 1.875% 21/09/2028 600,000 658,782 0.20Compagnie de Saint-Gobain 1.875% 15/03/2031 700,000 754,138 0.23CRH Finance 1.375% 18/10/2028 300,000 319,866 0.10HeidelbergCement 2.250% 30/03/2023 200,000 214,242 0.07HeidelbergCement 2.250% 03/06/2024 500,000 543,770 0.17HeidelbergCement 1.500% 07/02/2025 400,000 421,208 0.13HeidelbergCement Finance Luxembourg 0.500% 18/01/2021 500,000 504,055 0.16HeidelbergCement Finance Luxembourg 0.500% 09/08/2022 200,000 202,332 0.06HeidelbergCement Finance Luxembourg 1.625% 07/04/2026 950,000 1,004,653 0.31HeidelbergCement Finance Luxembourg 1.500% 14/06/2027 100,000 104,138 0.03HeidelbergCement Finance Luxembourg 1.750% 24/04/2028 900,000 947,754 0.29Imerys- FR 1.500% 15/01/2027 300,000 311,928 0.10Imerys- LU 1.500% 15/01/2027 200,000 207,952 0.06
Chemicals (2.24%) Air Liquide Finance 0.125% 13/06/2020 100,000 100,305 0.03Air Liquide Finance 0.500% 13/06/2022 1,000,000 1,018,720 0.31Air Liquide Finance 0.750% 13/06/2024 100,000 104,180 0.03Air Liquide Finance 1.000% 08/03/2027 500,000 530,215 0.16Air Liquide Finance 1.250% 13/06/2028 500,000 543,500 0.17Arkema 1.500% 20/04/2027 600,000 645,300 0.20Brenntag Finance 1.125% 27/09/2025 400,000 402,744 0.12Evonik Finance- DE 08/03/2021 (zero coupon) 150,000 150,320 0.05Evonik Finance- LU 08/03/2021 (zero coupon) 200,000 200,426 0.06Evonik Finance 0.375% 07/09/2024 500,000 507,865 0.16Evonik Finance 0.750% 07/09/2028 400,000 404,508 0.12Evonik Industries 2.125% 07/07/2077 300,000 308,718 0.10Koninklijke DSM 0.750% 28/09/2026 500,000 519,060 0.16Lanxess 0.250% 07/10/2021 100,000 100,663 0.03Lanxess 1.125% 16/05/2025 300,000 312,648 0.10Lanxess 1.000% 07/10/2026 600,000 618,462 0.19Linde Finance 0.250% 18/01/2022 800,000 811,608 0.25
Commercial Services (3.73%) Abertis Infraestructuras 1.500% 27/06/2024 400,000 417,024 0.13Abertis Infraestructuras 1.375% 20/05/2026 100,000 102,946 0.03Abertis Infraestructuras 1.000% 27/02/2027 600,000 597,834 0.18Abertis Infraestructuras 2.375% 27/09/2027 500,000 535,680 0.16Abertis Infraestructuras 3.000% 27/03/2031 700,000 766,185 0.24ALD 0.875% 18/07/2022 600,000 608,730 0.19ALD 1.250% 11/10/2022 200,000 205,394 0.06Aprr 1.125% 09/01/2026 600,000 635,448 0.20Aprr 1.250% 06/01/2027 100,000 107,244 0.03Aprr 1.250% 18/01/2028 200,000 212,264 0.07Aprr 1.500% 25/01/2030 500,000 541,950 0.17Aprr 1.875% 06/01/2031 700,000 789,621 0.24Aprr 1.625% 13/01/2032 500,000 548,060 0.17Aprr 1.500% 17/01/2033 100,000 107,935 0.03Autoroutes du Sud de la France- FR 1.125% 20/04/2026 100,000 106,488 0.03Autoroutes du Sud de la France- LU 1.125% 20/04/2026 1,100,000 1,171,368 0.36Autoroutes du Sud de la France 1.250% 18/01/2027 200,000 215,658 0.07Autoroutes du Sud de la France 1.375% 27/06/2028 500,000 541,555 0.17

UBS ETF – Bloomberg Barclays MSCI Euro Area Liquid Corporates SustainableUCITS ETF
Semi-Annual report as of 30 June 2019
The accompanying notes form an integral part of these financial statements.
357
Schedule of Investments as at 30 June 2019 (Expressed in EUR) (Unaudited)
Transferable securities listed on an Official Stock Exchange
Nominal Market
Value EUR % of
Net Assets
Commercial Services (3.73%) (continued) Autoroutes du Sud de la France 1.375% 22/01/2030 1,100,000 1,182,489 0.36Autoroutes du Sud de la France 1.375% 21/02/2031 300,000 320,916 0.10Compagnie Financiere et Industrielle des Autoroutes 0.375% 07/02/2025 100,000 101,970 0.03Compagnie Financiere et Industrielle des Autoroutes 1.125% 13/10/2027 800,000 853,016 0.26Compagnie Financiere et Industrielle des Autoroutes 0.750% 09/09/2028 100,000 102,784 0.03Edenred 1.875% 06/03/2026 300,000 323,574 0.10Edenred 1.875% 30/03/2027 300,000 321,915 0.10Holding d'Infrastructures de Transport 0.625% 27/03/2023 400,000 403,400 0.12Holding d'Infrastructures de Transport 1.625% 27/11/2027 300,000 310,425 0.10
Computers (1.02%) Atos 0.750% 07/05/2022 600,000 611,664 0.19Atos- DE 1.750% 07/05/2025 100,000 106,667 0.03Atos- FR 1.750% 07/05/2025 300,000 320,001 0.10Capgemini 0.500% 09/11/2021 700,000 706,790 0.22Capgemini 1.000% 18/10/2024 200,000 205,894 0.06Capgemini 1.750% 18/04/2028 300,000 321,450 0.10Teleperformance 1.500% 03/04/2024 100,000 103,451 0.03Teleperformance 1.875% 02/07/2025 900,000 946,854 0.29
Cosmetics & Personal Care (1.51%) Unilever 0.375% 14/02/2023 650,000 661,635 0.20Unilever 0.500% 12/08/2023 200,000 204,960 0.06Unilever 0.500% 29/04/2024 600,000 615,666 0.19Unilever 0.500% 06/01/2025 100,000 102,649 0.03Unilever 0.875% 31/07/2025 600,000 629,226 0.19Unilever 1.125% 12/02/2027 600,000 640,998 0.20Unilever 1.125% 29/04/2028 200,000 214,260 0.07Unilever 1.375% 31/07/2029 100,000 108,824 0.03Unilever 1.375% 04/09/2030 500,000 540,145 0.17Unilever 1.625% 12/02/2033 800,000 884,744 0.27Unilever 1.500% 11/06/2039 300,000 315,276 0.10
Diversified Financial Services (1.69%) Deutsche Boerse 1.125% 26/03/2028 500,000 538,320 0.17Euronext 1.000% 18/04/2025 300,000 311,241 0.10Euronext 1.125% 12/06/2029 300,000 308,259 0.09LeasePlan 1.000% 08/04/2020 200,000 201,666 0.06LeasePlan 1.000% 24/05/2021 300,000 305,517 0.09LeasePlan 1.000% 25/02/2022 200,000 204,296 0.06LeasePlan 0.750% 03/10/2022 350,000 354,260 0.11LeasePlan 1.000% 02/05/2023 200,000 203,480 0.06LeasePlan 1.375% 07/03/2024 300,000 308,832 0.10Santander Consumer Finance 0.500% 04/10/2021 500,000 506,805 0.16Santander Consumer Finance 0.875% 24/01/2022 700,000 715,939 0.22Santander Consumer Finance 0.875% 30/05/2023 200,000 204,870 0.06Santander Consumer Finance 1.125% 09/10/2023 600,000 621,450 0.19Santander Consumer Finance 1.000% 27/02/2024 700,000 720,503 0.22
Electric (1.59%) Elia System Operator 1.375% 14/01/2026 400,000 425,548 0.13Elia System Operator- BE 2.750% Perpetual 100,000 105,477 0.03Elia System Operator- DE 2.750% Perpetual 300,000 316,431 0.10Iren 0.875% 04/11/2024 100,000 100,050 0.03Iren 1.950% 19/09/2025 400,000 420,172 0.13Iren 1.500% 24/10/2027 500,000 502,515 0.15Red Electrica Financiaciones 1.250% 13/03/2027 400,000 423,932 0.13Ren Finance 1.750% 01/06/2023 500,000 532,620 0.16Terna Rete Elettrica Nazionale 1.000% 23/07/2023 1,100,000 1,141,778 0.35Terna Rete Elettrica Nazionale 1.000% 10/04/2026 300,000 308,967 0.10Terna Rete Elettrica Nazionale 1.375% 26/07/2027 600,000 634,086 0.20Terna Rete Elettrica Nazionale 1.000% 11/10/2028 250,000 253,933 0.08
Electrical Components & Equipment (0.75%) Legrand 0.750% 06/07/2024 100,000 103,508 0.03Legrand 1.875% 06/07/2032 500,000 561,670 0.17Schneider Electric 0.250% 09/09/2024 300,000 303,708 0.09Schneider Electric 0.875% 13/12/2026 900,000 936,234 0.29
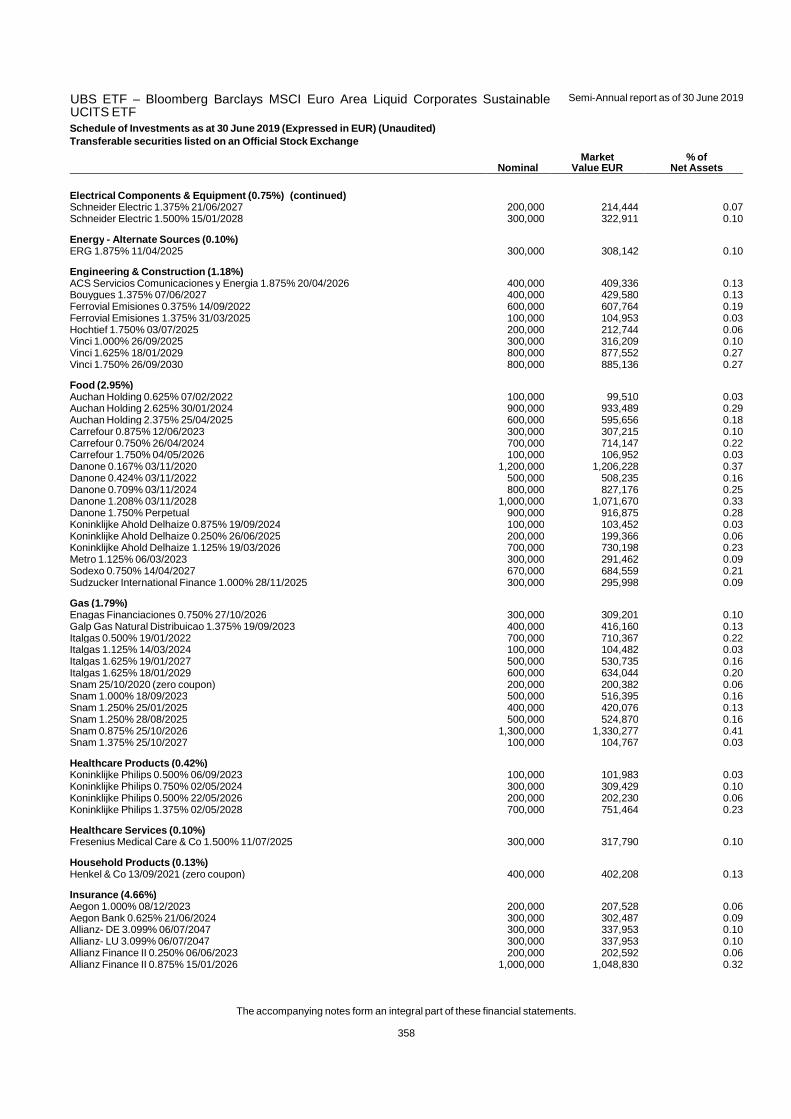
UBS ETF – Bloomberg Barclays MSCI Euro Area Liquid Corporates SustainableUCITS ETF
Semi-Annual report as of 30 June 2019
The accompanying notes form an integral part of these financial statements.
358
Schedule of Investments as at 30 June 2019 (Expressed in EUR) (Unaudited)
Transferable securities listed on an Official Stock Exchange
Nominal Market
Value EUR % of
Net Assets
Electrical Components & Equipment (0.75%) (continued) Schneider Electric 1.375% 21/06/2027 200,000 214,444 0.07Schneider Electric 1.500% 15/01/2028 300,000 322,911 0.10
Energy - Alternate Sources (0.10%) ERG 1.875% 11/04/2025 300,000 308,142 0.10
Engineering & Construction (1.18%) ACS Servicios Comunicaciones y Energia 1.875% 20/04/2026 400,000 409,336 0.13Bouygues 1.375% 07/06/2027 400,000 429,580 0.13Ferrovial Emisiones 0.375% 14/09/2022 600,000 607,764 0.19Ferrovial Emisiones 1.375% 31/03/2025 100,000 104,953 0.03Hochtief 1.750% 03/07/2025 200,000 212,744 0.06Vinci 1.000% 26/09/2025 300,000 316,209 0.10Vinci 1.625% 18/01/2029 800,000 877,552 0.27Vinci 1.750% 26/09/2030 800,000 885,136 0.27
Food (2.95%) Auchan Holding 0.625% 07/02/2022 100,000 99,510 0.03Auchan Holding 2.625% 30/01/2024 900,000 933,489 0.29Auchan Holding 2.375% 25/04/2025 600,000 595,656 0.18Carrefour 0.875% 12/06/2023 300,000 307,215 0.10Carrefour 0.750% 26/04/2024 700,000 714,147 0.22Carrefour 1.750% 04/05/2026 100,000 106,952 0.03Danone 0.167% 03/11/2020 1,200,000 1,206,228 0.37Danone 0.424% 03/11/2022 500,000 508,235 0.16Danone 0.709% 03/11/2024 800,000 827,176 0.25Danone 1.208% 03/11/2028 1,000,000 1,071,670 0.33Danone 1.750% Perpetual 900,000 916,875 0.28Koninklijke Ahold Delhaize 0.875% 19/09/2024 100,000 103,452 0.03Koninklijke Ahold Delhaize 0.250% 26/06/2025 200,000 199,366 0.06Koninklijke Ahold Delhaize 1.125% 19/03/2026 700,000 730,198 0.23Metro 1.125% 06/03/2023 300,000 291,462 0.09Sodexo 0.750% 14/04/2027 670,000 684,559 0.21Sudzucker International Finance 1.000% 28/11/2025 300,000 295,998 0.09
Gas (1.79%) Enagas Financiaciones 0.750% 27/10/2026 300,000 309,201 0.10Galp Gas Natural Distribuicao 1.375% 19/09/2023 400,000 416,160 0.13Italgas 0.500% 19/01/2022 700,000 710,367 0.22Italgas 1.125% 14/03/2024 100,000 104,482 0.03Italgas 1.625% 19/01/2027 500,000 530,735 0.16Italgas 1.625% 18/01/2029 600,000 634,044 0.20Snam 25/10/2020 (zero coupon) 200,000 200,382 0.06Snam 1.000% 18/09/2023 500,000 516,395 0.16Snam 1.250% 25/01/2025 400,000 420,076 0.13Snam 1.250% 28/08/2025 500,000 524,870 0.16Snam 0.875% 25/10/2026 1,300,000 1,330,277 0.41Snam 1.375% 25/10/2027 100,000 104,767 0.03
Healthcare Products (0.42%) Koninklijke Philips 0.500% 06/09/2023 100,000 101,983 0.03Koninklijke Philips 0.750% 02/05/2024 300,000 309,429 0.10Koninklijke Philips 0.500% 22/05/2026 200,000 202,230 0.06Koninklijke Philips 1.375% 02/05/2028 700,000 751,464 0.23
Healthcare Services (0.10%) Fresenius Medical Care & Co 1.500% 11/07/2025 300,000 317,790 0.10
Household Products (0.13%) Henkel & Co 13/09/2021 (zero coupon) 400,000 402,208 0.13
Insurance (4.66%) Aegon 1.000% 08/12/2023 200,000 207,528 0.06Aegon Bank 0.625% 21/06/2024 300,000 302,487 0.09Allianz- DE 3.099% 06/07/2047 300,000 337,953 0.10Allianz- LU 3.099% 06/07/2047 300,000 337,953 0.10Allianz Finance II 0.250% 06/06/2023 200,000 202,592 0.06Allianz Finance II 0.875% 15/01/2026 1,000,000 1,048,830 0.32
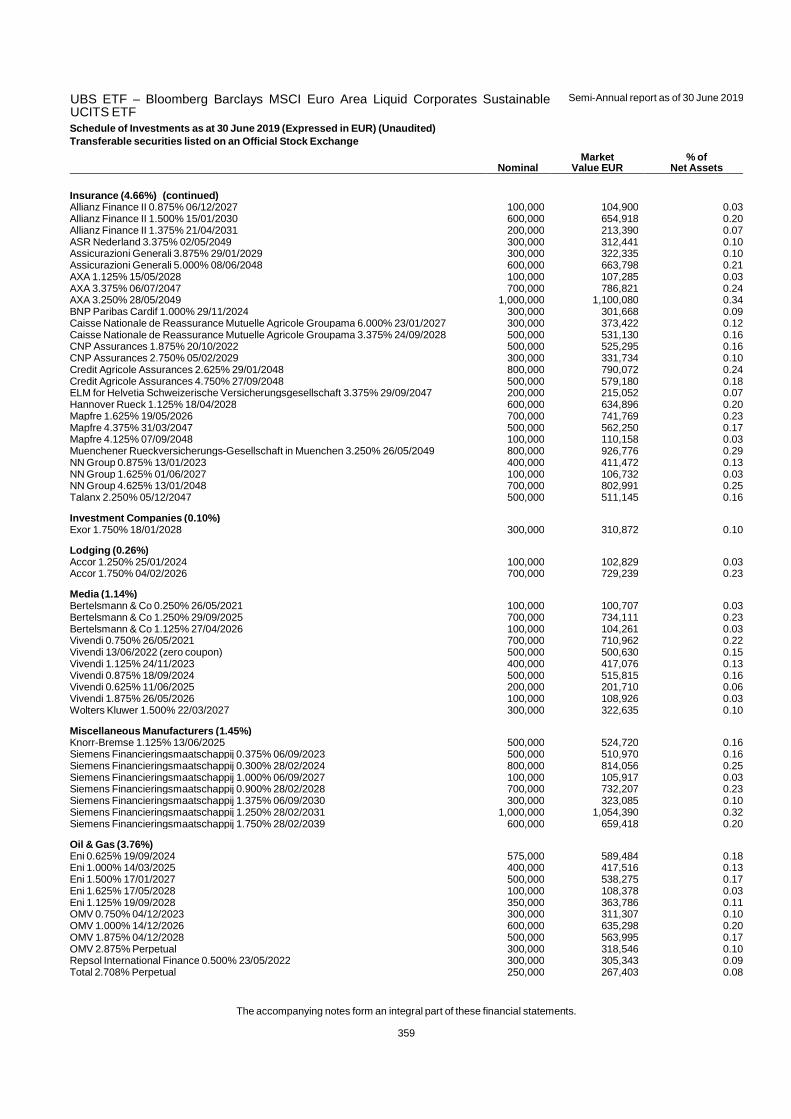
UBS ETF – Bloomberg Barclays MSCI Euro Area Liquid Corporates SustainableUCITS ETF
Semi-Annual report as of 30 June 2019
The accompanying notes form an integral part of these financial statements.
359
Schedule of Investments as at 30 June 2019 (Expressed in EUR) (Unaudited)
Transferable securities listed on an Official Stock Exchange
Nominal Market
Value EUR % of
Net Assets
Insurance (4.66%) (continued) Allianz Finance II 0.875% 06/12/2027 100,000 104,900 0.03Allianz Finance II 1.500% 15/01/2030 600,000 654,918 0.20Allianz Finance II 1.375% 21/04/2031 200,000 213,390 0.07ASR Nederland 3.375% 02/05/2049 300,000 312,441 0.10Assicurazioni Generali 3.875% 29/01/2029 300,000 322,335 0.10Assicurazioni Generali 5.000% 08/06/2048 600,000 663,798 0.21AXA 1.125% 15/05/2028 100,000 107,285 0.03AXA 3.375% 06/07/2047 700,000 786,821 0.24AXA 3.250% 28/05/2049 1,000,000 1,100,080 0.34BNP Paribas Cardif 1.000% 29/11/2024 300,000 301,668 0.09Caisse Nationale de Reassurance Mutuelle Agricole Groupama 6.000% 23/01/2027 300,000 373,422 0.12Caisse Nationale de Reassurance Mutuelle Agricole Groupama 3.375% 24/09/2028 500,000 531,130 0.16CNP Assurances 1.875% 20/10/2022 500,000 525,295 0.16CNP Assurances 2.750% 05/02/2029 300,000 331,734 0.10Credit Agricole Assurances 2.625% 29/01/2048 800,000 790,072 0.24Credit Agricole Assurances 4.750% 27/09/2048 500,000 579,180 0.18ELM for Helvetia Schweizerische Versicherungsgesellschaft 3.375% 29/09/2047 200,000 215,052 0.07Hannover Rueck 1.125% 18/04/2028 600,000 634,896 0.20Mapfre 1.625% 19/05/2026 700,000 741,769 0.23Mapfre 4.375% 31/03/2047 500,000 562,250 0.17Mapfre 4.125% 07/09/2048 100,000 110,158 0.03Muenchener Rueckversicherungs-Gesellschaft in Muenchen 3.250% 26/05/2049 800,000 926,776 0.29NN Group 0.875% 13/01/2023 400,000 411,472 0.13NN Group 1.625% 01/06/2027 100,000 106,732 0.03NN Group 4.625% 13/01/2048 700,000 802,991 0.25Talanx 2.250% 05/12/2047 500,000 511,145 0.16
Investment Companies (0.10%) Exor 1.750% 18/01/2028 300,000 310,872 0.10
Lodging (0.26%) Accor 1.250% 25/01/2024 100,000 102,829 0.03Accor 1.750% 04/02/2026 700,000 729,239 0.23
Media (1.14%) Bertelsmann & Co 0.250% 26/05/2021 100,000 100,707 0.03Bertelsmann & Co 1.250% 29/09/2025 700,000 734,111 0.23Bertelsmann & Co 1.125% 27/04/2026 100,000 104,261 0.03Vivendi 0.750% 26/05/2021 700,000 710,962 0.22Vivendi 13/06/2022 (zero coupon) 500,000 500,630 0.15Vivendi 1.125% 24/11/2023 400,000 417,076 0.13Vivendi 0.875% 18/09/2024 500,000 515,815 0.16Vivendi 0.625% 11/06/2025 200,000 201,710 0.06Vivendi 1.875% 26/05/2026 100,000 108,926 0.03Wolters Kluwer 1.500% 22/03/2027 300,000 322,635 0.10
Miscellaneous Manufacturers (1.45%) Knorr-Bremse 1.125% 13/06/2025 500,000 524,720 0.16Siemens Financieringsmaatschappij 0.375% 06/09/2023 500,000 510,970 0.16Siemens Financieringsmaatschappij 0.300% 28/02/2024 800,000 814,056 0.25Siemens Financieringsmaatschappij 1.000% 06/09/2027 100,000 105,917 0.03Siemens Financieringsmaatschappij 0.900% 28/02/2028 700,000 732,207 0.23Siemens Financieringsmaatschappij 1.375% 06/09/2030 300,000 323,085 0.10Siemens Financieringsmaatschappij 1.250% 28/02/2031 1,000,000 1,054,390 0.32Siemens Financieringsmaatschappij 1.750% 28/02/2039 600,000 659,418 0.20
Oil & Gas (3.76%) Eni 0.625% 19/09/2024 575,000 589,484 0.18Eni 1.000% 14/03/2025 400,000 417,516 0.13Eni 1.500% 17/01/2027 500,000 538,275 0.17Eni 1.625% 17/05/2028 100,000 108,378 0.03Eni 1.125% 19/09/2028 350,000 363,786 0.11OMV 0.750% 04/12/2023 300,000 311,307 0.10OMV 1.000% 14/12/2026 600,000 635,298 0.20OMV 1.875% 04/12/2028 500,000 563,995 0.17OMV 2.875% Perpetual 300,000 318,546 0.10Repsol International Finance 0.500% 23/05/2022 300,000 305,343 0.09Total 2.708% Perpetual 250,000 267,403 0.08

UBS ETF – Bloomberg Barclays MSCI Euro Area Liquid Corporates SustainableUCITS ETF
Semi-Annual report as of 30 June 2019
The accompanying notes form an integral part of these financial statements.
360
Schedule of Investments as at 30 June 2019 (Expressed in EUR) (Unaudited)
Transferable securities listed on an Official Stock Exchange
Nominal Market
Value EUR % of
Net Assets
Oil & Gas (3.76%) (continued) Total 3.369% Perpetual 1,050,000 1,172,850 0.36Total 3.875% Perpetual 500,000 547,330 0.17Total 1.750% Perpetual 1,000,000 1,028,930 0.32Total Capital International 0.250% 12/07/2023 1,000,000 1,015,230 0.31Total Capital International 0.625% 04/10/2024 300,000 310,314 0.10Total Capital International 1.023% 04/03/2027 300,000 319,290 0.10Total Capital International 0.696% 31/05/2028 500,000 516,875 0.16Total Capital International 0.750% 12/07/2028 800,000 829,720 0.25Total Capital International 1.375% 04/10/2029 1,200,000 1,311,432 0.40Total Capital International 1.491% 04/09/2030 200,000 220,354 0.07Total Capital International 1.535% 31/05/2039 500,000 532,540 0.16
Pharmaceuticals & Biotechnology (2.36%) Sanofi 21/03/2022 (zero coupon) 600,000 603,216 0.19Sanofi 13/09/2022 (zero coupon) 100,000 100,467 0.03Sanofi 0.500% 21/03/2023 2,100,000 2,145,465 0.66Sanofi 0.625% 05/04/2024 100,000 103,131 0.03Sanofi 1.000% 21/03/2026 1,000,000 1,054,750 0.32Sanofi 0.500% 13/01/2027 200,000 203,786 0.06Sanofi 1.125% 05/04/2028 200,000 212,954 0.07Sanofi 0.875% 21/03/2029 500,000 519,960 0.16Sanofi 1.375% 21/03/2030 1,400,000 1,521,618 0.47Sanofi 1.250% 21/03/2034 500,000 526,130 0.16Sanofi 1.875% 21/03/2038 600,000 690,810 0.21
Pipelines (0.10%) Vier Gas Transport 1.500% 25/09/2028 300,000 326,082 0.10
Real Estate (2.11%) CPI Property Group 2.125% 04/10/2024 500,000 511,625 0.16Grand City Properties 1.375% 03/08/2026 700,000 719,754 0.22Grand City Properties 1.500% 22/02/2027 100,000 102,660 0.03Immofinanz 2.625% 27/01/2023 300,000 313,914 0.10LEG Immobilien 1.250% 23/01/2024 300,000 311,997 0.10TLG Immobilien 1.500% 28/05/2026 400,000 400,088 0.12Vonovia Finance 0.750% 25/01/2022 100,000 102,253 0.03Vonovia Finance 2.125% 09/07/2022 100,000 106,314 0.03Vonovia Finance 0.875% 03/07/2023 200,000 205,262 0.06Vonovia Finance 0.750% 15/01/2024 600,000 613,182 0.19Vonovia Finance 1.250% 06/12/2024 100,000 104,835 0.03Vonovia Finance- DE 1.800% 29/06/2025 100,000 107,172 0.03Vonovia Finance- LU 1.800% 29/06/2025 200,000 214,344 0.07Vonovia Finance 1.125% 08/09/2025 100,000 103,593 0.03Vonovia Finance 1.500% 22/03/2026 1,000,000 1,054,210 0.33Vonovia Finance 1.750% 25/01/2027 900,000 965,862 0.30Vonovia Finance 1.500% 14/01/2028 100,000 105,539 0.03Vonovia Finance 2.125% 22/03/2030 400,000 444,576 0.14Vonovia Finance 2.750% 22/03/2038 300,000 354,003 0.11
Real Estate Investment Trusts (4.24%) Covivio 1.875% 20/05/2026 100,000 107,488 0.03Covivio 1.500% 21/06/2027 400,000 415,188 0.13Gecina 1.375% 30/06/2027 300,000 321,537 0.10Gecina 1.375% 26/01/2028 500,000 533,690 0.17Gecina 1.000% 30/01/2029 100,000 102,864 0.03Gecina 1.625% 14/03/2030 500,000 539,645 0.17Gecina 2.000% 30/06/2032 300,000 334,218 0.10Gecina 1.625% 29/05/2034 500,000 522,740 0.16Icade 1.125% 17/11/2025 100,000 104,072 0.03Icade 1.750% 10/06/2026 800,000 861,344 0.27Icade 1.500% 13/09/2027 400,000 424,128 0.13Icade 1.625% 28/02/2028 300,000 319,227 0.10Inmobiliaria Colonial Socimi 1.450% 28/10/2024 100,000 104,342 0.03Inmobiliaria Colonial Socimi 1.625% 28/11/2025 500,000 524,200 0.16Inmobiliaria Colonial Socimi- IE 2.000% 17/04/2026 300,000 320,931 0.10Inmobiliaria Colonial Socimi- XU 2.000% 17/04/2026 200,000 213,954 0.07Klepierre 1.875% 19/02/2026 100,000 110,209 0.03Klepierre 1.375% 16/02/2027 600,000 644,046 0.20
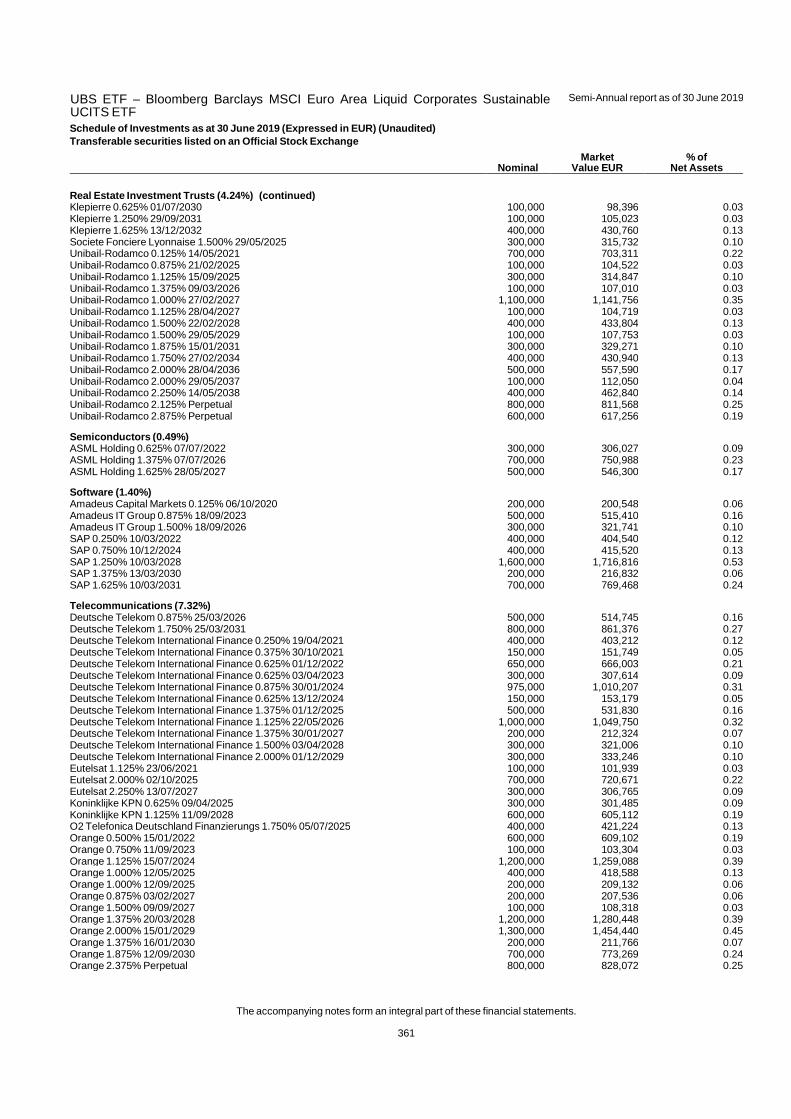
UBS ETF – Bloomberg Barclays MSCI Euro Area Liquid Corporates SustainableUCITS ETF
Semi-Annual report as of 30 June 2019
The accompanying notes form an integral part of these financial statements.
361
Schedule of Investments as at 30 June 2019 (Expressed in EUR) (Unaudited)
Transferable securities listed on an Official Stock Exchange
Nominal Market
Value EUR % of
Net Assets
Real Estate Investment Trusts (4.24%) (continued) Klepierre 0.625% 01/07/2030 100,000 98,396 0.03Klepierre 1.250% 29/09/2031 100,000 105,023 0.03Klepierre 1.625% 13/12/2032 400,000 430,760 0.13Societe Fonciere Lyonnaise 1.500% 29/05/2025 300,000 315,732 0.10Unibail-Rodamco 0.125% 14/05/2021 700,000 703,311 0.22Unibail-Rodamco 0.875% 21/02/2025 100,000 104,522 0.03Unibail-Rodamco 1.125% 15/09/2025 300,000 314,847 0.10Unibail-Rodamco 1.375% 09/03/2026 100,000 107,010 0.03Unibail-Rodamco 1.000% 27/02/2027 1,100,000 1,141,756 0.35Unibail-Rodamco 1.125% 28/04/2027 100,000 104,719 0.03Unibail-Rodamco 1.500% 22/02/2028 400,000 433,804 0.13Unibail-Rodamco 1.500% 29/05/2029 100,000 107,753 0.03Unibail-Rodamco 1.875% 15/01/2031 300,000 329,271 0.10Unibail-Rodamco 1.750% 27/02/2034 400,000 430,940 0.13Unibail-Rodamco 2.000% 28/04/2036 500,000 557,590 0.17Unibail-Rodamco 2.000% 29/05/2037 100,000 112,050 0.04Unibail-Rodamco 2.250% 14/05/2038 400,000 462,840 0.14Unibail-Rodamco 2.125% Perpetual 800,000 811,568 0.25Unibail-Rodamco 2.875% Perpetual 600,000 617,256 0.19
Semiconductors (0.49%) ASML Holding 0.625% 07/07/2022 300,000 306,027 0.09ASML Holding 1.375% 07/07/2026 700,000 750,988 0.23ASML Holding 1.625% 28/05/2027 500,000 546,300 0.17
Software (1.40%) Amadeus Capital Markets 0.125% 06/10/2020 200,000 200,548 0.06Amadeus IT Group 0.875% 18/09/2023 500,000 515,410 0.16Amadeus IT Group 1.500% 18/09/2026 300,000 321,741 0.10SAP 0.250% 10/03/2022 400,000 404,540 0.12SAP 0.750% 10/12/2024 400,000 415,520 0.13SAP 1.250% 10/03/2028 1,600,000 1,716,816 0.53SAP 1.375% 13/03/2030 200,000 216,832 0.06SAP 1.625% 10/03/2031 700,000 769,468 0.24
Telecommunications (7.32%) Deutsche Telekom 0.875% 25/03/2026 500,000 514,745 0.16Deutsche Telekom 1.750% 25/03/2031 800,000 861,376 0.27Deutsche Telekom International Finance 0.250% 19/04/2021 400,000 403,212 0.12Deutsche Telekom International Finance 0.375% 30/10/2021 150,000 151,749 0.05Deutsche Telekom International Finance 0.625% 01/12/2022 650,000 666,003 0.21Deutsche Telekom International Finance 0.625% 03/04/2023 300,000 307,614 0.09Deutsche Telekom International Finance 0.875% 30/01/2024 975,000 1,010,207 0.31Deutsche Telekom International Finance 0.625% 13/12/2024 150,000 153,179 0.05Deutsche Telekom International Finance 1.375% 01/12/2025 500,000 531,830 0.16Deutsche Telekom International Finance 1.125% 22/05/2026 1,000,000 1,049,750 0.32Deutsche Telekom International Finance 1.375% 30/01/2027 200,000 212,324 0.07Deutsche Telekom International Finance 1.500% 03/04/2028 300,000 321,006 0.10Deutsche Telekom International Finance 2.000% 01/12/2029 300,000 333,246 0.10Eutelsat 1.125% 23/06/2021 100,000 101,939 0.03Eutelsat 2.000% 02/10/2025 700,000 720,671 0.22Eutelsat 2.250% 13/07/2027 300,000 306,765 0.09Koninklijke KPN 0.625% 09/04/2025 300,000 301,485 0.09Koninklijke KPN 1.125% 11/09/2028 600,000 605,112 0.19O2 Telefonica Deutschland Finanzierungs 1.750% 05/07/2025 400,000 421,224 0.13Orange 0.500% 15/01/2022 600,000 609,102 0.19Orange 0.750% 11/09/2023 100,000 103,304 0.03Orange 1.125% 15/07/2024 1,200,000 1,259,088 0.39Orange 1.000% 12/05/2025 400,000 418,588 0.13Orange 1.000% 12/09/2025 200,000 209,132 0.06Orange 0.875% 03/02/2027 200,000 207,536 0.06Orange 1.500% 09/09/2027 100,000 108,318 0.03Orange 1.375% 20/03/2028 1,200,000 1,280,448 0.39Orange 2.000% 15/01/2029 1,300,000 1,454,440 0.45Orange 1.375% 16/01/2030 200,000 211,766 0.07Orange 1.875% 12/09/2030 700,000 773,269 0.24Orange 2.375% Perpetual 800,000 828,072 0.25
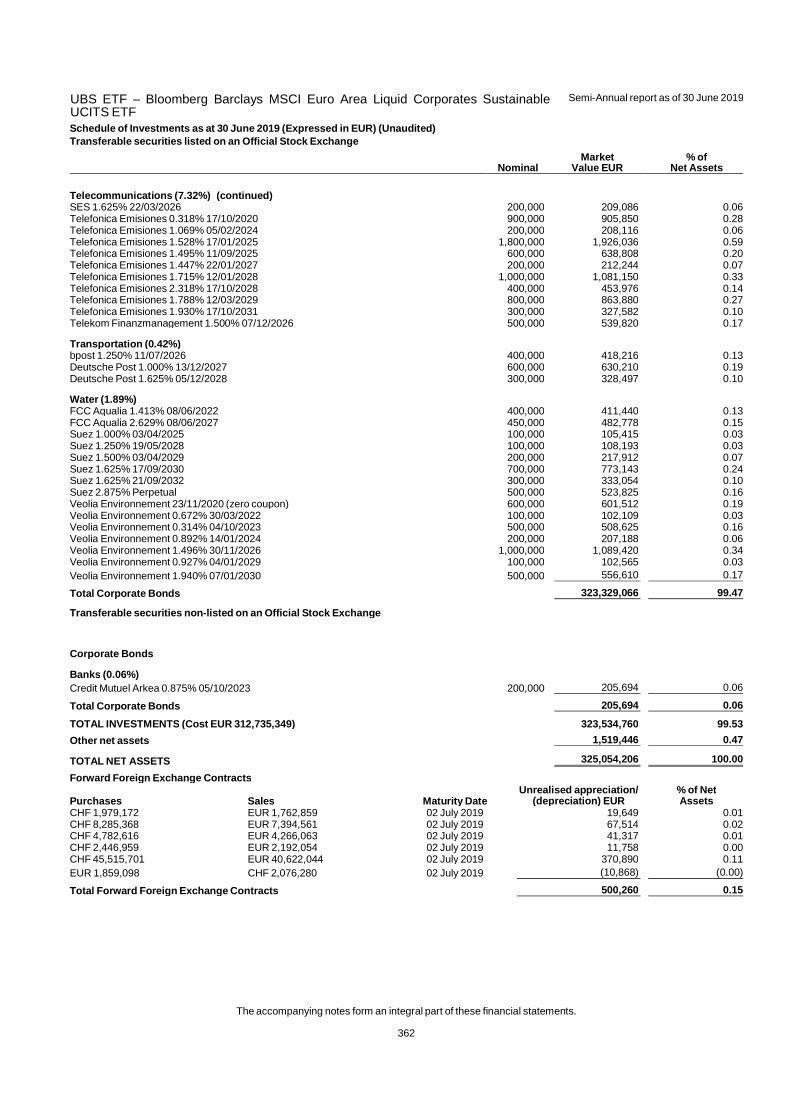
UBS ETF – Bloomberg Barclays MSCI Euro Area Liquid Corporates SustainableUCITS ETF
Semi-Annual report as of 30 June 2019
The accompanying notes form an integral part of these financial statements.
362
Schedule of Investments as at 30 June 2019 (Expressed in EUR) (Unaudited)
Transferable securities listed on an Official Stock Exchange
Nominal Market
Value EUR % of
Net Assets
Telecommunications (7.32%) (continued) SES 1.625% 22/03/2026 200,000 209,086 0.06Telefonica Emisiones 0.318% 17/10/2020 900,000 905,850 0.28Telefonica Emisiones 1.069% 05/02/2024 200,000 208,116 0.06Telefonica Emisiones 1.528% 17/01/2025 1,800,000 1,926,036 0.59Telefonica Emisiones 1.495% 11/09/2025 600,000 638,808 0.20Telefonica Emisiones 1.447% 22/01/2027 200,000 212,244 0.07Telefonica Emisiones 1.715% 12/01/2028 1,000,000 1,081,150 0.33Telefonica Emisiones 2.318% 17/10/2028 400,000 453,976 0.14Telefonica Emisiones 1.788% 12/03/2029 800,000 863,880 0.27Telefonica Emisiones 1.930% 17/10/2031 300,000 327,582 0.10Telekom Finanzmanagement 1.500% 07/12/2026 500,000 539,820 0.17
Transportation (0.42%) bpost 1.250% 11/07/2026 400,000 418,216 0.13Deutsche Post 1.000% 13/12/2027 600,000 630,210 0.19Deutsche Post 1.625% 05/12/2028 300,000 328,497 0.10
Water (1.89%) FCC Aqualia 1.413% 08/06/2022 400,000 411,440 0.13FCC Aqualia 2.629% 08/06/2027 450,000 482,778 0.15Suez 1.000% 03/04/2025 100,000 105,415 0.03Suez 1.250% 19/05/2028 100,000 108,193 0.03Suez 1.500% 03/04/2029 200,000 217,912 0.07Suez 1.625% 17/09/2030 700,000 773,143 0.24Suez 1.625% 21/09/2032 300,000 333,054 0.10Suez 2.875% Perpetual 500,000 523,825 0.16Veolia Environnement 23/11/2020 (zero coupon) 600,000 601,512 0.19Veolia Environnement 0.672% 30/03/2022 100,000 102,109 0.03Veolia Environnement 0.314% 04/10/2023 500,000 508,625 0.16Veolia Environnement 0.892% 14/01/2024 200,000 207,188 0.06Veolia Environnement 1.496% 30/11/2026 1,000,000 1,089,420 0.34Veolia Environnement 0.927% 04/01/2029 100,000 102,565 0.03Veolia Environnement 1.940% 07/01/2030 500,000 556,610 0.17
Total Corporate Bonds 323,329,066 99.47
Transferable securities non -listed on an Official Stock Exchange
Corporate Bonds
Banks (0.06%) Credit Mutuel Arkea 0.875% 05/10/2023 200,000 205,694 0.06
Total Corporate Bonds 205,694 0.06
TOTAL INVESTMENTS (Cost EUR 312,735,349) 323,534,760 99.53
Other net assets 1,519,446 0.47
TOTAL NET ASSETS 325,054,206 100.00
Forward Foreign Exchange Contracts
Purchases Sales Maturity Date Unrealised appreciation/
(depreciation) EUR % of Net Assets
CHF 1,979,172 EUR 1,762,859 02 July 2019 19,649 0.01CHF 8,285,368 EUR 7,394,561 02 July 2019 67,514 0.02CHF 4,782,616 EUR 4,266,063 02 July 2019 41,317 0.01CHF 2,446,959 EUR 2,192,054 02 July 2019 11,758 0.00CHF 45,515,701 EUR 40,622,044 02 July 2019 370,890 0.11EUR 1,859,098 CHF 2,076,280 02 July 2019 (10,868) (0.00)
Total Forward Foreign Exchange Contracts 500,260 0.15
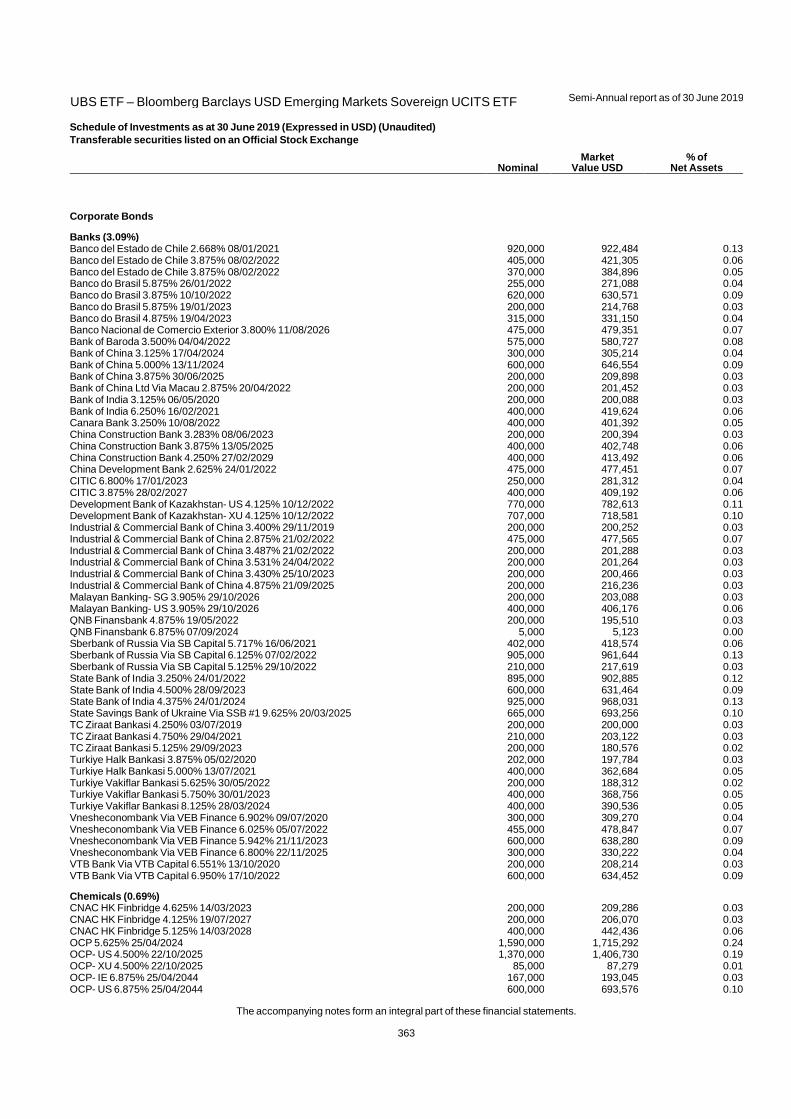
UBS ETF – Bloomberg Barclays USD Emerging Markets Sovereign UCITS ETF
Semi-Annual report as of 30 June 2019
The accompanying notes form an integral part of these financial statements.
363
Schedule of Investments as at 30 June 2019 (Expressed in USD) (Unaudited)
Transferable securities listed on an Official Stock Exchange
Nominal Market
Value USD % of
Net Assets
Corporate Bonds
Banks (3.09%) Banco del Estado de Chile 2.668% 08/01/2021 920,000 922,484 0.13Banco del Estado de Chile 3.875% 08/02/2022 405,000 421,305 0.06Banco del Estado de Chile 3.875% 08/02/2022 370,000 384,896 0.05Banco do Brasil 5.875% 26/01/2022 255,000 271,088 0.04Banco do Brasil 3.875% 10/10/2022 620,000 630,571 0.09Banco do Brasil 5.875% 19/01/2023 200,000 214,768 0.03Banco do Brasil 4.875% 19/04/2023 315,000 331,150 0.04Banco Nacional de Comercio Exterior 3.800% 11/08/2026 475,000 479,351 0.07Bank of Baroda 3.500% 04/04/2022 575,000 580,727 0.08Bank of China 3.125% 17/04/2024 300,000 305,214 0.04Bank of China 5.000% 13/11/2024 600,000 646,554 0.09Bank of China 3.875% 30/06/2025 200,000 209,898 0.03Bank of China Ltd Via Macau 2.875% 20/04/2022 200,000 201,452 0.03Bank of India 3.125% 06/05/2020 200,000 200,088 0.03Bank of India 6.250% 16/02/2021 400,000 419,624 0.06Canara Bank 3.250% 10/08/2022 400,000 401,392 0.05China Construction Bank 3.283% 08/06/2023 200,000 200,394 0.03China Construction Bank 3.875% 13/05/2025 400,000 402,748 0.06China Construction Bank 4.250% 27/02/2029 400,000 413,492 0.06China Development Bank 2.625% 24/01/2022 475,000 477,451 0.07CITIC 6.800% 17/01/2023 250,000 281,312 0.04CITIC 3.875% 28/02/2027 400,000 409,192 0.06Development Bank of Kazakhstan- US 4.125% 10/12/2022 770,000 782,613 0.11Development Bank of Kazakhstan- XU 4.125% 10/12/2022 707,000 718,581 0.10Industrial & Commercial Bank of China 3.400% 29/11/2019 200,000 200,252 0.03Industrial & Commercial Bank of China 2.875% 21/02/2022 475,000 477,565 0.07Industrial & Commercial Bank of China 3.487% 21/02/2022 200,000 201,288 0.03Industrial & Commercial Bank of China 3.531% 24/04/2022 200,000 201,264 0.03Industrial & Commercial Bank of China 3.430% 25/10/2023 200,000 200,466 0.03Industrial & Commercial Bank of China 4.875% 21/09/2025 200,000 216,236 0.03Malayan Banking- SG 3.905% 29/10/2026 200,000 203,088 0.03Malayan Banking- US 3.905% 29/10/2026 400,000 406,176 0.06QNB Finansbank 4.875% 19/05/2022 200,000 195,510 0.03QNB Finansbank 6.875% 07/09/2024 5,000 5,123 0.00Sberbank of Russia Via SB Capital 5.717% 16/06/2021 402,000 418,574 0.06Sberbank of Russia Via SB Capital 6.125% 07/02/2022 905,000 961,644 0.13Sberbank of Russia Via SB Capital 5.125% 29/10/2022 210,000 217,619 0.03State Bank of India 3.250% 24/01/2022 895,000 902,885 0.12State Bank of India 4.500% 28/09/2023 600,000 631,464 0.09State Bank of India 4.375% 24/01/2024 925,000 968,031 0.13State Savings Bank of Ukraine Via SSB #1 9.625% 20/03/2025 665,000 693,256 0.10TC Ziraat Bankasi 4.250% 03/07/2019 200,000 200,000 0.03TC Ziraat Bankasi 4.750% 29/04/2021 210,000 203,122 0.03TC Ziraat Bankasi 5.125% 29/09/2023 200,000 180,576 0.02Turkiye Halk Bankasi 3.875% 05/02/2020 202,000 197,784 0.03Turkiye Halk Bankasi 5.000% 13/07/2021 400,000 362,684 0.05Turkiye Vakiflar Bankasi 5.625% 30/05/2022 200,000 188,312 0.02Turkiye Vakiflar Bankasi 5.750% 30/01/2023 400,000 368,756 0.05Turkiye Vakiflar Bankasi 8.125% 28/03/2024 400,000 390,536 0.05Vnesheconombank Via VEB Finance 6.902% 09/07/2020 300,000 309,270 0.04Vnesheconombank Via VEB Finance 6.025% 05/07/2022 455,000 478,847 0.07Vnesheconombank Via VEB Finance 5.942% 21/11/2023 600,000 638,280 0.09Vnesheconombank Via VEB Finance 6.800% 22/11/2025 300,000 330,222 0.04VTB Bank Via VTB Capital 6.551% 13/10/2020 200,000 208,214 0.03VTB Bank Via VTB Capital 6.950% 17/10/2022 600,000 634,452 0.09
Chemicals (0.69%) CNAC HK Finbridge 4.625% 14/03/2023 200,000 209,286 0.03CNAC HK Finbridge 4.125% 19/07/2027 200,000 206,070 0.03CNAC HK Finbridge 5.125% 14/03/2028 400,000 442,436 0.06OCP 5.625% 25/04/2024 1,590,000 1,715,292 0.24OCP- US 4.500% 22/10/2025 1,370,000 1,406,730 0.19OCP- XU 4.500% 22/10/2025 85,000 87,279 0.01OCP- IE 6.875% 25/04/2044 167,000 193,045 0.03OCP- US 6.875% 25/04/2044 600,000 693,576 0.10

UBS ETF – Bloomberg Barclays USD Emerging Markets Sovereign UCITS ETF
Semi-Annual report as of 30 June 2019
The accompanying notes form an integral part of these financial statements.
364
Schedule of Investments as at 30 June 2019 (Expressed in USD) (Unaudited)
Transferable securities listed on an Official Stock Exchange
Nominal Market
Value USD % of
Net Assets
Diversified Financial Services (1.11%) ABCL Glory Capital 2.500% 21/06/2021 200,000 199,562 0.03BOC Aviation 3.500% 10/10/2024 200,000 203,682 0.03Cagamas Global 2.530% 26/04/2020 200,000 199,894 0.03Charming Light Investments 2.375% 30/08/2021 200,000 197,502 0.03China Cinda Finance 2017 I 3.650% 09/03/2022 400,000 408,288 0.05China Cinda Finance 2017 I 4.750% 08/02/2028 200,000 216,020 0.03China Cinda Finance 2017 I 4.750% 21/02/2029 410,000 443,353 0.06China Great Wall International Holdings III 2.750% 31/08/2020 200,000 199,848 0.03China Great Wall International Holdings III 4.375% 25/05/2023 200,000 209,706 0.03GTLK Europe 5.125% 31/05/2024 200,000 200,504 0.03Gtlk Europe Capital 5.950% 17/04/2025 200,000 204,904 0.03Huarong Finance 2017 3.750% 27/04/2022 240,000 243,379 0.03Huarong Finance 2017 3.657% 03/07/2023 200,000 198,732 0.03Huarong Finance 2017 4.750% 27/04/2027 200,000 208,752 0.03Huarong Finance 2017 4.950% 07/11/2047 200,000 200,108 0.03ICBCIL Finance 3.000% 05/04/2020 200,000 200,434 0.03ICBCIL Finance 3.618% 15/05/2023 200,000 199,592 0.03ICBCIL Finance 3.750% 05/03/2024 200,000 206,286 0.03Power Finance 6.150% 06/12/2028 600,000 691,236 0.09Power Sector Assets & Liabilities Management 7.390% 02/12/2024 584,000 718,221 0.10REC 5.250% 13/11/2023 800,000 853,936 0.12SPARC EM SPC Panama Metro Line 2 05/12/2022 (zero coupon) 683,330 647,080 0.09SSG Resources 4.250% 04/10/2022 847,000 879,008 0.12
Electric (2.29%) China Clean Energy Development 4.000% 05/11/2025 200,000 210,364 0.03Comision Federal de Electricidad 4.875% 15/01/2024 400,000 415,332 0.06Comision Federal de Electricidad 6.125% 16/06/2045 400,000 442,300 0.06Empresa de Transmision Electrica 5.125% 02/05/2049 655,000 715,031 0.10Eskom Holdings- US 5.750% 26/01/2021 400,000 404,492 0.06Eskom Holdings- XU 5.750% 26/01/2021 400,000 404,492 0.06Eskom Holdings 6.750% 06/08/2023 1,578,000 1,654,927 0.23Eskom Holdings 7.125% 11/02/2025 1,480,000 1,556,161 0.22Eskom Holdings 8.450% 10/08/2028 1,085,000 1,225,084 0.17Greenko Investment 4.875% 16/08/2023 400,000 391,268 0.05Hrvatska Elektroprivreda 5.875% 23/10/2022 600,000 647,826 0.09NTPC 4.750% 03/10/2022 400,000 420,684 0.06NTPC 3.750% 03/04/2024 400,000 407,660 0.06NTPC 4.250% 26/02/2026 400,000 415,776 0.06NTPC 4.500% 19/03/2028 400,000 425,524 0.06Perusahaan Listrik Negara 4.125% 15/05/2027 200,000 203,878 0.03Perusahaan Listrik Negara 5.375% 25/01/2029 350,000 386,484 0.05Perusahaan Listrik Negara 6.150% 21/05/2048 690,000 816,553 0.11Perusahaan Listrik Negara 6.250% 25/01/2049 365,000 434,963 0.06Power Grid of India 3.875% 17/01/2023 600,000 616,872 0.09SPIC 2016 US dollar Bond 3.000% 06/12/2021 200,000 201,190 0.03State Grid Overseas Investment 2014 4.125% 07/05/2024 505,000 537,376 0.07State Grid Overseas Investment 2016 3.750% 02/05/2023 400,000 416,144 0.06Three Gorges Finance I Cayman Islands 3.700% 10/06/2025 400,000 418,872 0.06TNB Global Ventures Capital 3.244% 19/10/2026 400,000 397,076 0.05TNB Global Ventures Capital 4.851% 01/11/2028 1,265,000 1,404,087 0.20Trinidad Generation 5.250% 04/11/2027 815,000 825,733 0.11
Electronics (0.03%) Tsinghua Unic 4.750% 31/01/2021 200,000 196,080 0.03
Engineering & Construction (0.40%) Aeropuerto Internacional de Tocumen 5.625% 18/05/2036 800,000 894,000 0.12Aeropuerto Internacional de Tocumen 6.000% 18/11/2048 950,000 1,119,584 0.16Leader Goal International 4.250% Perpetual 200,000 202,134 0.03Mexico City Airport Trust 4.250% 31/10/2026 400,000 399,416 0.06Mexico City Airport Trust 5.500% 31/10/2046 236,000 234,792 0.03
Gas (0.09%) China Resources Gas Group 4.500% 05/04/2022 200,000 209,262 0.03Perusahaan Gas Negara 5.125% 16/05/2024 400,000 430,588 0.06

UBS ETF – Bloomberg Barclays USD Emerging Markets Sovereign UCITS ETF
Semi-Annual report as of 30 June 2019
The accompanying notes form an integral part of these financial statements.
365
Schedule of Investments as at 30 June 2019 (Expressed in USD) (Unaudited)
Transferable securities listed on an Official Stock Exchange
Nominal Market
Value USD % of
Net Assets
Investment Companies (0.23%) Beijing State-Owned Assets Management Hong Kong 4.125% 26/05/2025 375,000 388,444 0.05Huarong Finance 2019 3.750% 29/05/2024 615,000 618,370 0.09Huarong Finance 2019 4.500% 29/05/2029 200,000 203,752 0.03Huarong Finance II 3.250% 03/06/2021 200,000 200,584 0.03Huarong Finance II 3.625% 22/11/2021 200,000 202,226 0.03
Leisure Time (0.03%) King Power Capital 5.625% 03/11/2024 200,000 225,040 0.03
Mining (1.59%) China Minmetals 3.750% Perpetual 200,000 198,598 0.03Chinalco Capital Holdings 4.250% 21/04/2022 200,000 198,884 0.03Indonesia Asahan Aluminium Persero 5.230% 15/11/2021 200,000 210,594 0.03Indonesia Asahan Aluminium Persero 5.710% 15/11/2023 400,000 439,016 0.06Indonesia Asahan Aluminium Persero 6.757% 15/11/2048 300,000 368,325 0.05Nacional del Cobre de Chile 4.500% 16/09/2025 2,060,000 2,236,625 0.31Nacional del Cobre de Chile 3.625% 01/08/2027 1,785,000 1,848,457 0.26Nacional del Cobre de Chile 6.150% 24/10/2036 115,000 149,915 0.02Nacional del Cobre de Chile 4.250% 17/07/2042 1,880,000 1,964,694 0.28Nacional del Cobre de Chile 4.875% 04/11/2044 1,405,000 1,595,630 0.22Nacional del Cobre de Chile 4.500% 01/08/2047 620,000 670,344 0.09Nacional del Cobre de Chile 4.375% 05/02/2049 1,400,000 1,486,198 0.21
Oil & Gas (7.62%) Bharat Petroleum 4.375% 24/01/2022 605,000 626,223 0.09Bharat Petroleum 4.625% 25/10/2022 400,000 421,060 0.06Bharat Petroleum 4.000% 08/05/2025 250,000 257,595 0.04BPRL International Singapore 4.375% 18/01/2027 600,000 626,316 0.09CNOOC Curtis Funding No 1 4.500% 03/10/2023 200,000 214,036 0.03CNOOC Finance 2015 USA 3.500% 05/05/2025 200,000 206,454 0.03CNOOC Finance 2015 USA 4.375% 02/05/2028 210,000 228,810 0.03CNOOC Nexen Finance 2014 4.250% 30/04/2024 200,000 212,546 0.03Ecopetrol 5.875% 18/09/2023 700,000 775,061 0.11Ecopetrol 4.125% 16/01/2025 305,000 315,693 0.04Ecopetrol 5.375% 26/06/2026 1,900,000 2,093,249 0.29Ecopetrol 7.375% 18/09/2043 425,000 545,840 0.08Ecopetrol 5.875% 28/05/2045 1,075,000 1,188,982 0.17Empresa Nacional del Petroleo 5.250% 06/11/2029 1,335,000 1,509,498 0.21Gazprom Neft OAO Via GPN Capital 4.375% 19/09/2022 430,000 437,878 0.06Gazprom Neft OAO Via GPN Capital 6.000% 27/11/2023 600,000 651,828 0.09Gazprom OAO Via Gaz Capital 4.950% 19/07/2022 200,000 209,778 0.03Gazprom OAO Via Gaz Capital 5.150% 11/02/2026 1,200,000 1,280,184 0.18Gazprom OAO Via Gaz Capital 4.950% 23/03/2027 205,000 216,533 0.03Gazprom OAO Via Gaz Capital 4.950% 06/02/2028 240,000 254,218 0.04Gazprom OAO Via Gaz Capital 7.288% 16/08/2037 530,000 669,538 0.09Hindustan Petroleum 4.000% 12/07/2027 400,000 407,532 0.06Indian Oil 5.625% 02/08/2021 200,000 211,004 0.03Indian Oil 5.750% 01/08/2023 650,000 712,289 0.10Indian Oil 4.750% 16/01/2024 800,000 843,496 0.12KazMunayGas National 3.875% 19/04/2022 405,000 413,748 0.06KazMunayGas National- US 4.750% 24/04/2025 1,100,000 1,171,896 0.16KazMunayGas National- XU 4.750% 24/04/2025 275,000 292,974 0.04KazMunayGas National 4.750% 19/04/2027 480,000 514,848 0.07KazMunayGas National 5.375% 24/04/2030 1,620,000 1,792,449 0.25KazMunayGas National 5.750% 19/04/2047 1,677,000 1,899,186 0.27KazMunayGas National- US 6.375% 24/10/2048 1,128,000 1,344,170 0.19KazMunayGas National- XU 6.375% 24/10/2048 540,000 643,486 0.09Oil India 5.375% 17/04/2024 200,000 217,814 0.03Oil India 5.125% 04/02/2029 455,000 499,585 0.07Oil India International 4.000% 21/04/2027 575,000 584,131 0.08ONGC Videsh 4.625% 15/07/2024 930,000 984,647 0.14ONGC Videsh Vankorneft- SG 3.750% 27/07/2026 400,000 404,212 0.06ONGC Videsh Vankorneft- US 3.750% 27/07/2026 200,000 202,106 0.03Pertamina Persero 4.875% 03/05/2022 265,000 279,331 0.04Pertamina Persero 4.300% 20/05/2023 1,000,000 1,047,780 0.15Pertamina Persero 6.500% 27/05/2041 300,000 363,345 0.05Pertamina Persero 6.450% 30/05/2044 400,000 489,264 0.07

UBS ETF – Bloomberg Barclays USD Emerging Markets Sovereign UCITS ETF
Semi-Annual report as of 30 June 2019
The accompanying notes form an integral part of these financial statements.
366
Schedule of Investments as at 30 June 2019 (Expressed in USD) (Unaudited)
Transferable securities listed on an Official Stock Exchange
Nominal Market
Value USD % of
Net Assets
Oil & Gas (7.62%) (continued) Pertamina Persero 6.500% 07/11/2048 200,000 246,140 0.03Petroamazonas EP 4.625% 06/11/2020 211,000 209,331 0.03Petrobras Global Finance 6.250% 17/03/2024 674,000 741,090 0.10Petrobras Global Finance 5.299% 27/01/2025 1,059,000 1,123,472 0.16Petrobras Global Finance 8.750% 23/05/2026 1,055,000 1,302,566 0.18Petrobras Global Finance 7.375% 17/01/2027 1,150,000 1,322,925 0.18Petrobras Global Finance 5.999% 27/01/2028 775,000 823,135 0.11Petrobras Global Finance 5.750% 01/02/2029 1,178,000 1,229,773 0.17Petrobras Global Finance 6.875% 20/01/2040 250,000 270,995 0.04Petrobras Global Finance 6.750% 27/01/2041 5,000 5,371 0.00Petrobras Global Finance 7.250% 17/03/2044 1,000,000 1,118,720 0.16Petrobras Global Finance 6.900% 19/03/2049 658,000 701,342 0.10Petrobras Global Finance 6.850% 05/06/2115 620,000 643,982 0.09Petroleos del Peru 4.750% 19/06/2032 1,190,000 1,302,276 0.18Petroleos del Peru 5.625% 19/06/2047 1,215,000 1,381,990 0.19Petroleos Mexicanos 6.101% 11/03/2022 470,000 470,512 0.07Petroleos Mexicanos 5.375% 13/03/2022 450,000 453,262 0.06Petroleos Mexicanos 3.500% 30/01/2023 630,000 598,456 0.08Petroleos Mexicanos 4.875% 18/01/2024 195,000 190,646 0.03Petroleos Mexicanos 6.500% 13/03/2027 345,000 340,184 0.05Petroleos Mexicanos 6.500% 23/01/2029 550,000 532,218 0.07Petroleos Mexicanos 6.750% 21/09/2047 991,000 877,412 0.12Petroleos Mexicanos 6.350% 12/02/2048 587,000 503,347 0.07Petroliam Nasional 7.625% 15/10/2026 205,000 267,917 0.04Petronas Capital 5.250% 12/08/2019 660,000 662,066 0.09Petronas Capital 7.875% 22/05/2022 595,000 682,257 0.10Petronas Global Sukuk 2.707% 18/03/2020 430,000 430,641 0.06PTT 4.500% 25/10/2042 735,000 778,211 0.11Rosneft Oil Via Rosneft International Finance 4.199% 06/03/2022 670,000 680,010 0.09Saka Energi Indonesia 4.450% 05/05/2024 200,000 201,324 0.03Sinopec Capital 2013 3.125% 24/04/2023 220,000 222,994 0.03Sinopec Group Overseas Development 2015 2.500% 28/04/2020 400,000 400,192 0.06Sinopec Group Overseas Development 2016 2.750% 03/05/2021 440,000 441,276 0.06Sinopec Group Overseas Development 2017 3.250% 13/09/2027 400,000 403,488 0.06Sinopec Group Overseas Development 2018 4.600% 12/09/2048 200,000 229,234 0.03State Oil of the Azerbaijan Republic 4.750% 13/03/2023 1,495,000 1,556,714 0.22State Oil of the Azerbaijan Republic- GB 6.950% 18/03/2030 200,000 237,140 0.03State Oil of the Azerbaijan Republic- US 6.950% 18/03/2030 750,000 889,275 0.12YPF 8.500% 23/03/2021 431,000 439,689 0.06YPF 8.750% 04/04/2024 100,000 101,204 0.01YPF 8.500% 28/07/2025 610,000 610,037 0.09YPF 6.950% 21/07/2027 235,000 213,953 0.03YPF 8.500% 27/06/2029 400,000 393,948 0.05
Pipelines (0.53%) Oleoducto Central 4.000% 07/05/2021 200,000 203,510 0.03Southern Gas Corridor- US 6.875% 24/03/2026 2,866,000 3,328,630 0.47Southern Gas Corridor- XU 6.875% 24/03/2026 200,000 232,284 0.03
Real Estate (0.15%) China Overseas Finance Cayman III 5.375% 29/10/2023 200,000 219,366 0.03China Overseas Finance Cayman V 3.950% 15/11/2022 200,000 206,808 0.03China Overseas Finance Cayman VII 4.250% 26/04/2023 250,000 261,803 0.03Franshion Brilliant 3.600% 03/03/2022 200,000 201,906 0.03Sino-Ocean Land Treasure Finance II 5.950% 04/02/2027 200,000 213,358 0.03
Sovereign Bonds (0.62%) Avi Funding 3.800% 16/09/2025 200,000 209,666 0.03Danga Capital 3.035% 01/03/2021 1,000,000 1,001,040 0.14Hazine Mustesarligi Varlik Kiralama- US 4.251% 08/06/2021 200,000 196,590 0.03Indian Railway Finance 3.917% 26/02/2019 0 0 0.00Indian Railway Finance 3.730% 29/03/2024 470,000 480,683 0.07Instituto Costarricense de Electricidad 6.950% 10/11/2021 770,000 789,712 0.11Instituto Costarricense de Electricidad 6.375% 15/05/2043 715,000 597,340 0.08Malaysia Sukuk Global 3.179% 27/04/2026 355,000 364,748 0.05Ukreximbank Via Biz Finance 9.625% 27/04/2022 185,000 193,016 0.03
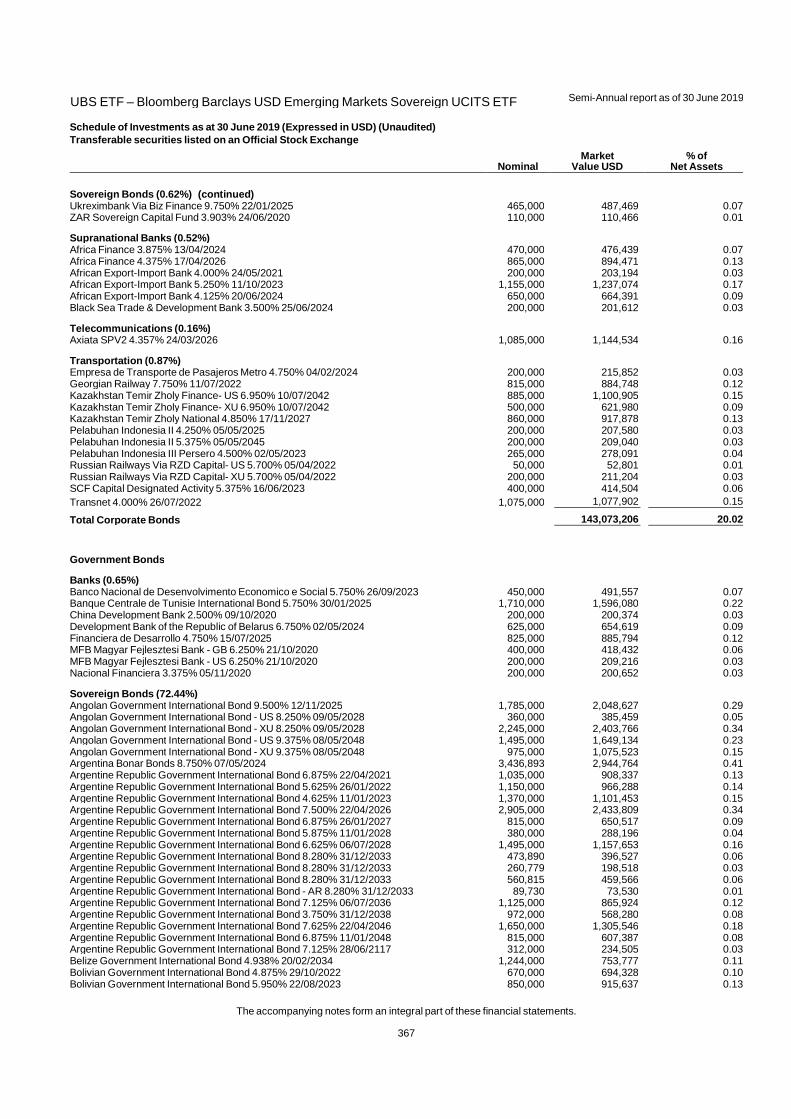
UBS ETF – Bloomberg Barclays USD Emerging Markets Sovereign UCITS ETF
Semi-Annual report as of 30 June 2019
The accompanying notes form an integral part of these financial statements.
367
Schedule of Investments as at 30 June 2019 (Expressed in USD) (Unaudited)
Transferable securities listed on an Official Stock Exchange
Nominal Market
Value USD % of
Net Assets
Sovereign Bonds (0.62%) (continued) Ukreximbank Via Biz Finance 9.750% 22/01/2025 465,000 487,469 0.07ZAR Sovereign Capital Fund 3.903% 24/06/2020 110,000 110,466 0.01
Supranational Banks (0.52%) Africa Finance 3.875% 13/04/2024 470,000 476,439 0.07Africa Finance 4.375% 17/04/2026 865,000 894,471 0.13African Export-Import Bank 4.000% 24/05/2021 200,000 203,194 0.03African Export-Import Bank 5.250% 11/10/2023 1,155,000 1,237,074 0.17African Export-Import Bank 4.125% 20/06/2024 650,000 664,391 0.09Black Sea Trade & Development Bank 3.500% 25/06/2024 200,000 201,612 0.03
Telecommunications (0.16%) Axiata SPV2 4.357% 24/03/2026 1,085,000 1,144,534 0.16
Transportation (0.87%) Empresa de Transporte de Pasajeros Metro 4.750% 04/02/2024 200,000 215,852 0.03Georgian Railway 7.750% 11/07/2022 815,000 884,748 0.12Kazakhstan Temir Zholy Finance- US 6.950% 10/07/2042 885,000 1,100,905 0.15Kazakhstan Temir Zholy Finance- XU 6.950% 10/07/2042 500,000 621,980 0.09Kazakhstan Temir Zholy National 4.850% 17/11/2027 860,000 917,878 0.13Pelabuhan Indonesia II 4.250% 05/05/2025 200,000 207,580 0.03Pelabuhan Indonesia II 5.375% 05/05/2045 200,000 209,040 0.03Pelabuhan Indonesia III Persero 4.500% 02/05/2023 265,000 278,091 0.04Russian Railways Via RZD Capital- US 5.700% 05/04/2022 50,000 52,801 0.01Russian Railways Via RZD Capital- XU 5.700% 05/04/2022 200,000 211,204 0.03SCF Capital Designated Activity 5.375% 16/06/2023 400,000 414,504 0.06Transnet 4.000% 26/07/2022 1,075,000 1,077,902 0.15
Total Corporate Bonds 143,073,206 20.02
Government Bonds
Banks (0.65%) Banco Nacional de Desenvolvimento Economico e Social 5.750% 26/09/2023 450,000 491,557 0.07Banque Centrale de Tunisie International Bond 5.750% 30/01/2025 1,710,000 1,596,080 0.22China Development Bank 2.500% 09/10/2020 200,000 200,374 0.03Development Bank of the Republic of Belarus 6.750% 02/05/2024 625,000 654,619 0.09Financiera de Desarrollo 4.750% 15/07/2025 825,000 885,794 0.12MFB Magyar Fejlesztesi Bank - GB 6.250% 21/10/2020 400,000 418,432 0.06MFB Magyar Fejlesztesi Bank - US 6.250% 21/10/2020 200,000 209,216 0.03Nacional Financiera 3.375% 05/11/2020 200,000 200,652 0.03
Sovereign Bonds (72.44%) Angolan Government International Bond 9.500% 12/11/2025 1,785,000 2,048,627 0.29Angolan Government International Bond - US 8.250% 09/05/2028 360,000 385,459 0.05Angolan Government International Bond - XU 8.250% 09/05/2028 2,245,000 2,403,766 0.34Angolan Government International Bond - US 9.375% 08/05/2048 1,495,000 1,649,134 0.23Angolan Government International Bond - XU 9.375% 08/05/2048 975,000 1,075,523 0.15Argentina Bonar Bonds 8.750% 07/05/2024 3,436,893 2,944,764 0.41Argentine Republic Government International Bond 6.875% 22/04/2021 1,035,000 908,337 0.13Argentine Republic Government International Bond 5.625% 26/01/2022 1,150,000 966,288 0.14Argentine Republic Government International Bond 4.625% 11/01/2023 1,370,000 1,101,453 0.15Argentine Republic Government International Bond 7.500% 22/04/2026 2,905,000 2,433,809 0.34Argentine Republic Government International Bond 6.875% 26/01/2027 815,000 650,517 0.09Argentine Republic Government International Bond 5.875% 11/01/2028 380,000 288,196 0.04Argentine Republic Government International Bond 6.625% 06/07/2028 1,495,000 1,157,653 0.16Argentine Republic Government International Bond 8.280% 31/12/2033 473,890 396,527 0.06Argentine Republic Government International Bond 8.280% 31/12/2033 260,779 198,518 0.03Argentine Republic Government International Bond 8.280% 31/12/2033 560,815 459,566 0.06Argentine Republic Government International Bond - AR 8.280% 31/12/2033 89,730 73,530 0.01Argentine Republic Government International Bond 7.125% 06/07/2036 1,125,000 865,924 0.12Argentine Republic Government International Bond 3.750% 31/12/2038 972,000 568,280 0.08Argentine Republic Government International Bond 7.625% 22/04/2046 1,650,000 1,305,546 0.18Argentine Republic Government International Bond 6.875% 11/01/2048 815,000 607,387 0.08Argentine Republic Government International Bond 7.125% 28/06/2117 312,000 234,505 0.03Belize Government International Bond 4.938% 20/02/2034 1,244,000 753,777 0.11Bolivian Government International Bond 4.875% 29/10/2022 670,000 694,328 0.10Bolivian Government International Bond 5.950% 22/08/2023 850,000 915,637 0.13
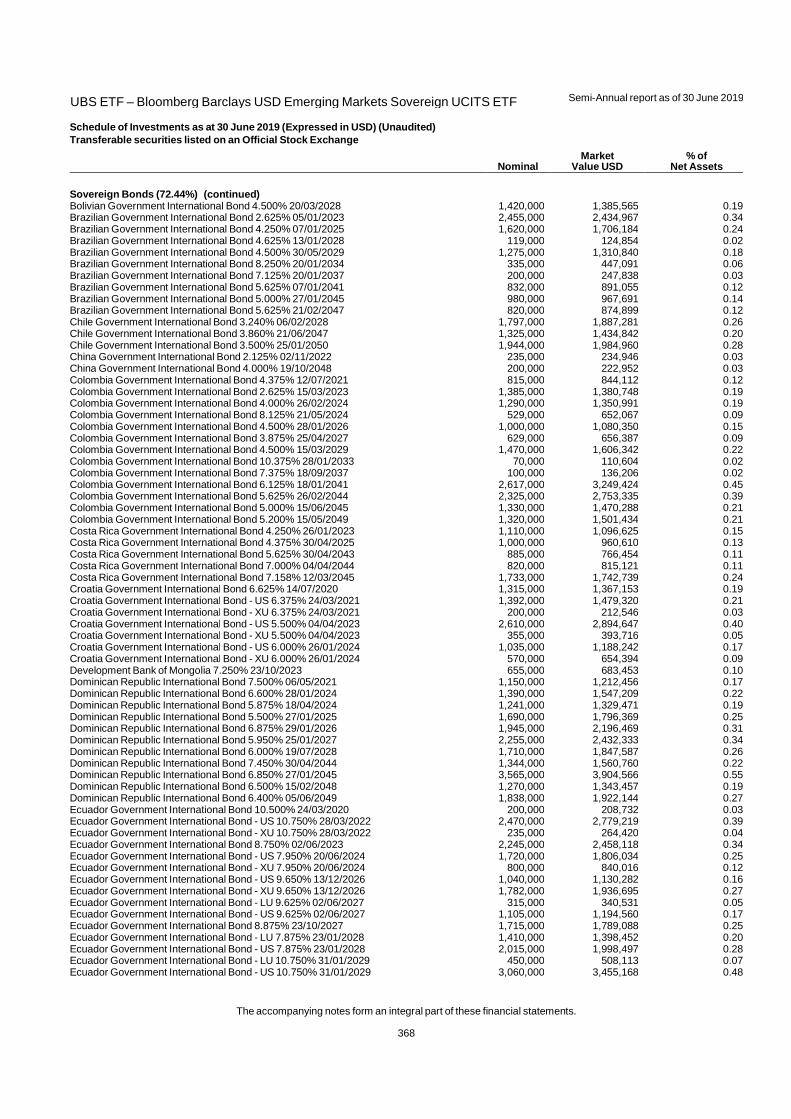
UBS ETF – Bloomberg Barclays USD Emerging Markets Sovereign UCITS ETF
Semi-Annual report as of 30 June 2019
The accompanying notes form an integral part of these financial statements.
368
Schedule of Investments as at 30 June 2019 (Expressed in USD) (Unaudited)
Transferable securities listed on an Official Stock Exchange
Nominal Market
Value USD % of
Net Assets
Sovereign Bonds (72.44%) (continued) Bolivian Government International Bond 4.500% 20/03/2028 1,420,000 1,385,565 0.19Brazilian Government International Bond 2.625% 05/01/2023 2,455,000 2,434,967 0.34Brazilian Government International Bond 4.250% 07/01/2025 1,620,000 1,706,184 0.24Brazilian Government International Bond 4.625% 13/01/2028 119,000 124,854 0.02Brazilian Government International Bond 4.500% 30/05/2029 1,275,000 1,310,840 0.18Brazilian Government International Bond 8.250% 20/01/2034 335,000 447,091 0.06Brazilian Government International Bond 7.125% 20/01/2037 200,000 247,838 0.03Brazilian Government International Bond 5.625% 07/01/2041 832,000 891,055 0.12Brazilian Government International Bond 5.000% 27/01/2045 980,000 967,691 0.14Brazilian Government International Bond 5.625% 21/02/2047 820,000 874,899 0.12Chile Government International Bond 3.240% 06/02/2028 1,797,000 1,887,281 0.26Chile Government International Bond 3.860% 21/06/2047 1,325,000 1,434,842 0.20Chile Government International Bond 3.500% 25/01/2050 1,944,000 1,984,960 0.28China Government International Bond 2.125% 02/11/2022 235,000 234,946 0.03China Government International Bond 4.000% 19/10/2048 200,000 222,952 0.03Colombia Government International Bond 4.375% 12/07/2021 815,000 844,112 0.12Colombia Government International Bond 2.625% 15/03/2023 1,385,000 1,380,748 0.19Colombia Government International Bond 4.000% 26/02/2024 1,290,000 1,350,991 0.19Colombia Government International Bond 8.125% 21/05/2024 529,000 652,067 0.09Colombia Government International Bond 4.500% 28/01/2026 1,000,000 1,080,350 0.15Colombia Government International Bond 3.875% 25/04/2027 629,000 656,387 0.09Colombia Government International Bond 4.500% 15/03/2029 1,470,000 1,606,342 0.22Colombia Government International Bond 10.375% 28/01/2033 70,000 110,604 0.02Colombia Government International Bond 7.375% 18/09/2037 100,000 136,206 0.02Colombia Government International Bond 6.125% 18/01/2041 2,617,000 3,249,424 0.45Colombia Government International Bond 5.625% 26/02/2044 2,325,000 2,753,335 0.39Colombia Government International Bond 5.000% 15/06/2045 1,330,000 1,470,288 0.21Colombia Government International Bond 5.200% 15/05/2049 1,320,000 1,501,434 0.21Costa Rica Government International Bond 4.250% 26/01/2023 1,110,000 1,096,625 0.15Costa Rica Government International Bond 4.375% 30/04/2025 1,000,000 960,610 0.13Costa Rica Government International Bond 5.625% 30/04/2043 885,000 766,454 0.11Costa Rica Government International Bond 7.000% 04/04/2044 820,000 815,121 0.11Costa Rica Government International Bond 7.158% 12/03/2045 1,733,000 1,742,739 0.24Croatia Government International Bond 6.625% 14/07/2020 1,315,000 1,367,153 0.19Croatia Government International Bond - US 6.375% 24/03/2021 1,392,000 1,479,320 0.21Croatia Government International Bond - XU 6.375% 24/03/2021 200,000 212,546 0.03Croatia Government International Bond - US 5.500% 04/04/2023 2,610,000 2,894,647 0.40Croatia Government International Bond - XU 5.500% 04/04/2023 355,000 393,716 0.05Croatia Government International Bond - US 6.000% 26/01/2024 1,035,000 1,188,242 0.17Croatia Government International Bond - XU 6.000% 26/01/2024 570,000 654,394 0.09Development Bank of Mongolia 7.250% 23/10/2023 655,000 683,453 0.10Dominican Republic International Bond 7.500% 06/05/2021 1,150,000 1,212,456 0.17Dominican Republic International Bond 6.600% 28/01/2024 1,390,000 1,547,209 0.22Dominican Republic International Bond 5.875% 18/04/2024 1,241,000 1,329,471 0.19Dominican Republic International Bond 5.500% 27/01/2025 1,690,000 1,796,369 0.25Dominican Republic International Bond 6.875% 29/01/2026 1,945,000 2,196,469 0.31Dominican Republic International Bond 5.950% 25/01/2027 2,255,000 2,432,333 0.34Dominican Republic International Bond 6.000% 19/07/2028 1,710,000 1,847,587 0.26Dominican Republic International Bond 7.450% 30/04/2044 1,344,000 1,560,760 0.22Dominican Republic International Bond 6.850% 27/01/2045 3,565,000 3,904,566 0.55Dominican Republic International Bond 6.500% 15/02/2048 1,270,000 1,343,457 0.19Dominican Republic International Bond 6.400% 05/06/2049 1,838,000 1,922,144 0.27Ecuador Government International Bond 10.500% 24/03/2020 200,000 208,732 0.03Ecuador Government International Bond - US 10.750% 28/03/2022 2,470,000 2,779,219 0.39Ecuador Government International Bond - XU 10.750% 28/03/2022 235,000 264,420 0.04Ecuador Government International Bond 8.750% 02/06/2023 2,245,000 2,458,118 0.34Ecuador Government International Bond - US 7.950% 20/06/2024 1,720,000 1,806,034 0.25Ecuador Government International Bond - XU 7.950% 20/06/2024 800,000 840,016 0.12Ecuador Government International Bond - US 9.650% 13/12/2026 1,040,000 1,130,282 0.16Ecuador Government International Bond - XU 9.650% 13/12/2026 1,782,000 1,936,695 0.27Ecuador Government International Bond - LU 9.625% 02/06/2027 315,000 340,531 0.05Ecuador Government International Bond - US 9.625% 02/06/2027 1,105,000 1,194,560 0.17Ecuador Government International Bond 8.875% 23/10/2027 1,715,000 1,789,088 0.25Ecuador Government International Bond - LU 7.875% 23/01/2028 1,410,000 1,398,452 0.20Ecuador Government International Bond - US 7.875% 23/01/2028 2,015,000 1,998,497 0.28Ecuador Government International Bond - LU 10.750% 31/01/2029 450,000 508,113 0.07Ecuador Government International Bond - US 10.750% 31/01/2029 3,060,000 3,455,168 0.48
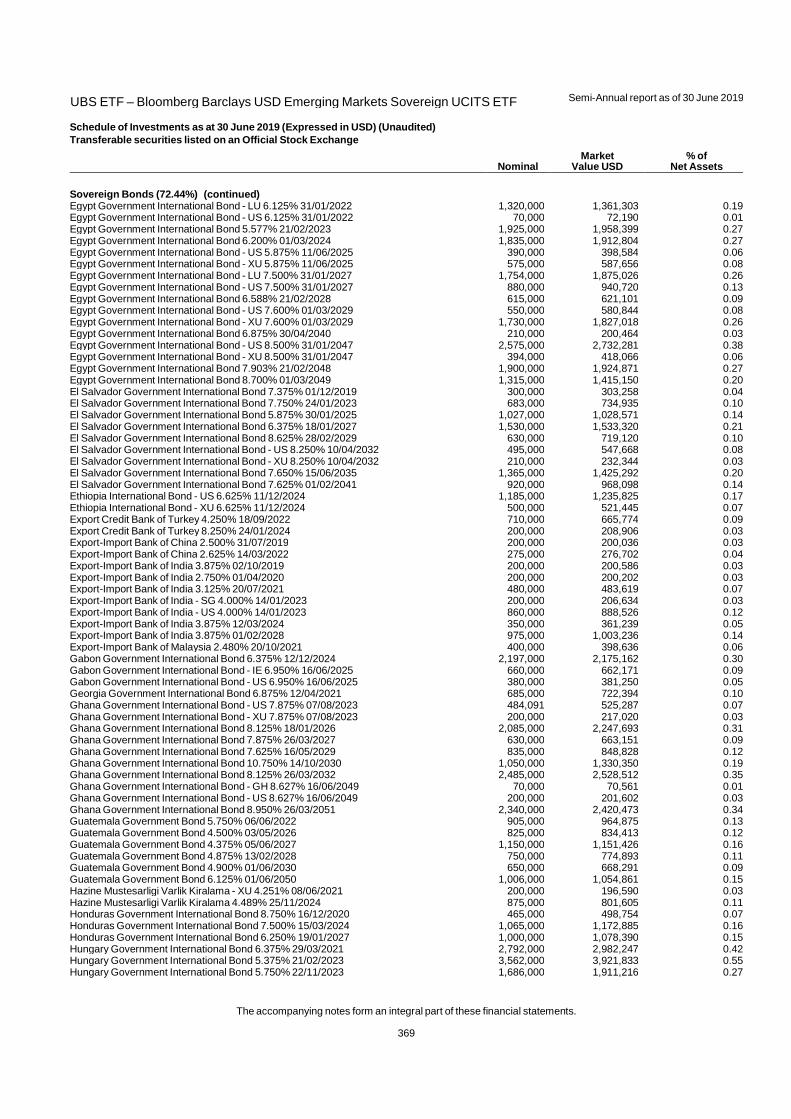
UBS ETF – Bloomberg Barclays USD Emerging Markets Sovereign UCITS ETF
Semi-Annual report as of 30 June 2019
The accompanying notes form an integral part of these financial statements.
369
Schedule of Investments as at 30 June 2019 (Expressed in USD) (Unaudited)
Transferable securities listed on an Official Stock Exchange
Nominal Market
Value USD % of
Net Assets
Sovereign Bonds (72.44%) (continued) Egypt Government International Bond - LU 6.125% 31/01/2022 1,320,000 1,361,303 0.19Egypt Government International Bond - US 6.125% 31/01/2022 70,000 72,190 0.01Egypt Government International Bond 5.577% 21/02/2023 1,925,000 1,958,399 0.27Egypt Government International Bond 6.200% 01/03/2024 1,835,000 1,912,804 0.27Egypt Government International Bond - US 5.875% 11/06/2025 390,000 398,584 0.06Egypt Government International Bond - XU 5.875% 11/06/2025 575,000 587,656 0.08Egypt Government International Bond - LU 7.500% 31/01/2027 1,754,000 1,875,026 0.26Egypt Government International Bond - US 7.500% 31/01/2027 880,000 940,720 0.13Egypt Government International Bond 6.588% 21/02/2028 615,000 621,101 0.09Egypt Government International Bond - US 7.600% 01/03/2029 550,000 580,844 0.08Egypt Government International Bond - XU 7.600% 01/03/2029 1,730,000 1,827,018 0.26Egypt Government International Bond 6.875% 30/04/2040 210,000 200,464 0.03Egypt Government International Bond - US 8.500% 31/01/2047 2,575,000 2,732,281 0.38Egypt Government International Bond - XU 8.500% 31/01/2047 394,000 418,066 0.06Egypt Government International Bond 7.903% 21/02/2048 1,900,000 1,924,871 0.27Egypt Government International Bond 8.700% 01/03/2049 1,315,000 1,415,150 0.20El Salvador Government International Bond 7.375% 01/12/2019 300,000 303,258 0.04El Salvador Government International Bond 7.750% 24/01/2023 683,000 734,935 0.10El Salvador Government International Bond 5.875% 30/01/2025 1,027,000 1,028,571 0.14El Salvador Government International Bond 6.375% 18/01/2027 1,530,000 1,533,320 0.21El Salvador Government International Bond 8.625% 28/02/2029 630,000 719,120 0.10El Salvador Government International Bond - US 8.250% 10/04/2032 495,000 547,668 0.08El Salvador Government International Bond - XU 8.250% 10/04/2032 210,000 232,344 0.03El Salvador Government International Bond 7.650% 15/06/2035 1,365,000 1,425,292 0.20El Salvador Government International Bond 7.625% 01/02/2041 920,000 968,098 0.14Ethiopia International Bond - US 6.625% 11/12/2024 1,185,000 1,235,825 0.17Ethiopia International Bond - XU 6.625% 11/12/2024 500,000 521,445 0.07Export Credit Bank of Turkey 4.250% 18/09/2022 710,000 665,774 0.09Export Credit Bank of Turkey 8.250% 24/01/2024 200,000 208,906 0.03Export-Import Bank of China 2.500% 31/07/2019 200,000 200,036 0.03Export-Import Bank of China 2.625% 14/03/2022 275,000 276,702 0.04Export-Import Bank of India 3.875% 02/10/2019 200,000 200,586 0.03Export-Import Bank of India 2.750% 01/04/2020 200,000 200,202 0.03Export-Import Bank of India 3.125% 20/07/2021 480,000 483,619 0.07Export-Import Bank of India - SG 4.000% 14/01/2023 200,000 206,634 0.03Export-Import Bank of India - US 4.000% 14/01/2023 860,000 888,526 0.12Export-Import Bank of India 3.875% 12/03/2024 350,000 361,239 0.05Export-Import Bank of India 3.875% 01/02/2028 975,000 1,003,236 0.14Export-Import Bank of Malaysia 2.480% 20/10/2021 400,000 398,636 0.06Gabon Government International Bond 6.375% 12/12/2024 2,197,000 2,175,162 0.30Gabon Government International Bond - IE 6.950% 16/06/2025 660,000 662,171 0.09Gabon Government International Bond - US 6.950% 16/06/2025 380,000 381,250 0.05Georgia Government International Bond 6.875% 12/04/2021 685,000 722,394 0.10Ghana Government International Bond - US 7.875% 07/08/2023 484,091 525,287 0.07Ghana Government International Bond - XU 7.875% 07/08/2023 200,000 217,020 0.03Ghana Government International Bond 8.125% 18/01/2026 2,085,000 2,247,693 0.31Ghana Government International Bond 7.875% 26/03/2027 630,000 663,151 0.09Ghana Government International Bond 7.625% 16/05/2029 835,000 848,828 0.12Ghana Government International Bond 10.750% 14/10/2030 1,050,000 1,330,350 0.19Ghana Government International Bond 8.125% 26/03/2032 2,485,000 2,528,512 0.35Ghana Government International Bond - GH 8.627% 16/06/2049 70,000 70,561 0.01Ghana Government International Bond - US 8.627% 16/06/2049 200,000 201,602 0.03Ghana Government International Bond 8.950% 26/03/2051 2,340,000 2,420,473 0.34Guatemala Government Bond 5.750% 06/06/2022 905,000 964,875 0.13Guatemala Government Bond 4.500% 03/05/2026 825,000 834,413 0.12Guatemala Government Bond 4.375% 05/06/2027 1,150,000 1,151,426 0.16Guatemala Government Bond 4.875% 13/02/2028 750,000 774,893 0.11Guatemala Government Bond 4.900% 01/06/2030 650,000 668,291 0.09Guatemala Government Bond 6.125% 01/06/2050 1,006,000 1,054,861 0.15Hazine Mustesarligi Varlik Kiralama - XU 4.251% 08/06/2021 200,000 196,590 0.03Hazine Mustesarligi Varlik Kiralama 4.489% 25/11/2024 875,000 801,605 0.11Honduras Government International Bond 8.750% 16/12/2020 465,000 498,754 0.07Honduras Government International Bond 7.500% 15/03/2024 1,065,000 1,172,885 0.16Honduras Government International Bond 6.250% 19/01/2027 1,000,000 1,078,390 0.15Hungary Government International Bond 6.375% 29/03/2021 2,792,000 2,982,247 0.42Hungary Government International Bond 5.375% 21/02/2023 3,562,000 3,921,833 0.55Hungary Government International Bond 5.750% 22/11/2023 1,686,000 1,911,216 0.27

UBS ETF – Bloomberg Barclays USD Emerging Markets Sovereign UCITS ETF
Semi-Annual report as of 30 June 2019
The accompanying notes form an integral part of these financial statements.
370
Schedule of Investments as at 30 June 2019 (Expressed in USD) (Unaudited)
Transferable securities listed on an Official Stock Exchange
Nominal Market
Value USD % of
Net Assets
Sovereign Bonds (72.44%) (continued) Hungary Government International Bond 5.375% 25/03/2024 2,856,000 3,221,568 0.45Hungary Government International Bond 7.625% 29/03/2041 1,512,000 2,427,758 0.34Indonesia Government International Bond 3.700% 08/01/2022 465,000 475,802 0.07Indonesia Government International Bond 2.950% 11/01/2023 315,000 316,947 0.04Indonesia Government International Bond 3.375% 15/04/2023 600,000 610,908 0.09Indonesia Government International Bond 5.875% 15/01/2024 245,000 274,750 0.04Indonesia Government International Bond 4.125% 15/01/2025 200,000 210,338 0.03Indonesia Government International Bond 4.750% 08/01/2026 350,000 380,779 0.05Indonesia Government International Bond 4.350% 08/01/2027 400,000 427,628 0.06Indonesia Government International Bond 4.750% 11/02/2029 700,000 777,518 0.11Indonesia Government International Bond 8.500% 12/10/2035 330,000 496,888 0.07Indonesia Government International Bond 6.625% 17/02/2037 315,000 410,177 0.06Indonesia Government International Bond 7.750% 17/01/2038 485,000 701,174 0.10Indonesia Government International Bond 5.250% 17/01/2042 590,000 673,922 0.09Indonesia Government International Bond 4.625% 15/04/2043 745,000 789,670 0.11Indonesia Government International Bond 6.750% 15/01/2044 930,000 1,272,007 0.18Indonesia Government International Bond 5.950% 08/01/2046 400,000 501,368 0.07Indonesia Government International Bond 5.250% 08/01/2047 610,000 703,910 0.10Indonesia Government International Bond 5.350% 11/02/2049 220,000 263,424 0.04Iraq International Bond - DE 6.752% 09/03/2023 380,000 391,069 0.05Iraq International Bond - US 6.752% 09/03/2023 1,340,000 1,379,034 0.19Iraq International Bond - US 5.800% 15/01/2028 2,760,000 2,718,904 0.38Iraq International Bond - XU 5.800% 15/01/2028 578,000 569,394 0.08Ivory Coast Government International Bond 5.375% 23/07/2024 615,000 621,316 0.09Ivory Coast Government International Bond 6.375% 03/03/2028 1,322,000 1,311,199 0.18Ivory Coast Government International Bond - DE 5.750% 31/12/2032 853,415 829,263 0.12Ivory Coast Government International Bond - US 5.750% 31/12/2032 1,745,745 1,696,340 0.24Ivory Coast Government International Bond - LU 6.125% 15/06/2033 470,000 438,247 0.06Ivory Coast Government International Bond - US 6.125% 15/06/2033 1,394,000 1,299,821 0.18Jamaica Government International Bond 7.625% 09/07/2025 1,165,000 1,349,711 0.19Jamaica Government International Bond 6.750% 28/04/2028 2,817,000 3,200,309 0.45Jamaica Government International Bond 8.000% 15/03/2039 1,432,000 1,777,742 0.25Jamaica Government International Bond 7.875% 28/07/2045 1,310,000 1,622,016 0.23Jordan Government International Bond - IE 6.125% 29/01/2026 500,000 518,555 0.07Jordan Government International Bond - US 6.125% 29/01/2026 800,000 829,688 0.12Jordan Government International Bond - IE 5.750% 31/01/2027 300,000 303,780 0.04Jordan Government International Bond - US 5.750% 31/01/2027 1,020,000 1,032,852 0.14Jordan Government International Bond - US 7.375% 10/10/2047 370,000 381,533 0.05Jordan Government International Bond - XU 7.375% 10/10/2047 1,145,000 1,180,690 0.17Kazakhstan Government International Bond - GB 5.125% 21/07/2025 673,000 761,695 0.11Kazakhstan Government International Bond - US 5.125% 21/07/2025 3,990,000 4,515,842 0.63Kazakhstan Government International Bond - US 4.875% 14/10/2044 405,000 466,507 0.07Kazakhstan Government International Bond - XU 4.875% 14/10/2044 200,000 230,374 0.03Kazakhstan Government International Bond 6.500% 21/07/2045 2,300,000 3,187,455 0.45Kenya Government International Bond - US 6.875% 24/06/2024 960,000 1,021,872 0.14Kenya Government International Bond - XU 6.875% 24/06/2024 1,795,000 1,910,688 0.27Kenya Government International Bond 7.000% 22/05/2027 1,525,000 1,592,710 0.22Kenya Government International Bond - CH 7.250% 28/02/2028 605,000 629,006 0.09Kenya Government International Bond - US 7.250% 28/02/2028 395,000 410,674 0.06Kenya Government International Bond 8.000% 22/05/2032 1,700,000 1,797,274 0.25Kenya Government International Bond - CH 8.250% 28/02/2048 1,108,000 1,154,669 0.16Kenya Government International Bond - US 8.250% 28/02/2048 260,000 270,951 0.04Lebanon Government International Bond - LU 5.450% 28/11/2019 101,000 99,993 0.01Lebanon Government International Bond - US 5.450% 28/11/2019 0 0 0.00Lebanon Government International Bond - DE 5.800% 14/04/2020 290,000 281,294 0.04Lebanon Government International Bond - US 5.800% 14/04/2020 89,000 86,328 0.01Lebanon Government International Bond - US 8.250% 12/04/2021 450,000 423,621 0.06Lebanon Government International Bond - XU 8.250% 12/04/2021 381,000 358,666 0.05Lebanon Government International Bond - US 6.250% 27/05/2022 385,000 333,641 0.05Lebanon Government International Bond - XU 6.250% 27/05/2022 455,000 394,303 0.06Lebanon Government International Bond - DE 6.100% 04/10/2022 82,000 69,953 0.01Lebanon Government International Bond - US 6.100% 04/10/2022 1,936,000 1,651,582 0.23Lebanon Government International Bond - LU 6.000% 27/01/2023 55,000 46,197 0.01Lebanon Government International Bond - US 6.000% 27/01/2023 1,138,000 955,863 0.13Lebanon Government International Bond - US 6.400% 26/05/2023 1,620,000 1,366,389 0.19Lebanon Government International Bond - XU 6.400% 26/05/2023 100,000 84,345 0.01Lebanon Government International Bond - DE 6.650% 22/04/2024 375,000 308,419 0.04
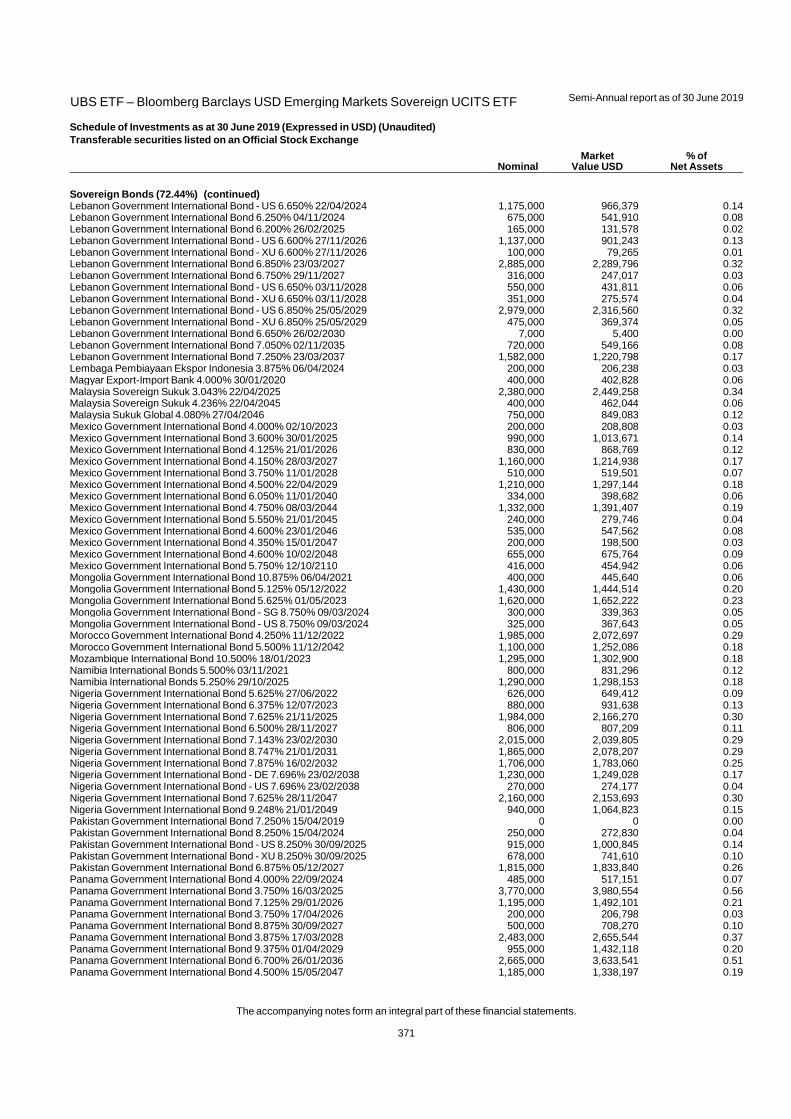
UBS ETF – Bloomberg Barclays USD Emerging Markets Sovereign UCITS ETF
Semi-Annual report as of 30 June 2019
The accompanying notes form an integral part of these financial statements.
371
Schedule of Investments as at 30 June 2019 (Expressed in USD) (Unaudited)
Transferable securities listed on an Official Stock Exchange
Nominal Market
Value USD % of
Net Assets
Sovereign Bonds (72.44%) (continued) Lebanon Government International Bond - US 6.650% 22/04/2024 1,175,000 966,379 0.14Lebanon Government International Bond 6.250% 04/11/2024 675,000 541,910 0.08Lebanon Government International Bond 6.200% 26/02/2025 165,000 131,578 0.02Lebanon Government International Bond - US 6.600% 27/11/2026 1,137,000 901,243 0.13Lebanon Government International Bond - XU 6.600% 27/11/2026 100,000 79,265 0.01Lebanon Government International Bond 6.850% 23/03/2027 2,885,000 2,289,796 0.32Lebanon Government International Bond 6.750% 29/11/2027 316,000 247,017 0.03Lebanon Government International Bond - US 6.650% 03/11/2028 550,000 431,811 0.06Lebanon Government International Bond - XU 6.650% 03/11/2028 351,000 275,574 0.04Lebanon Government International Bond - US 6.850% 25/05/2029 2,979,000 2,316,560 0.32Lebanon Government International Bond - XU 6.850% 25/05/2029 475,000 369,374 0.05Lebanon Government International Bond 6.650% 26/02/2030 7,000 5,400 0.00Lebanon Government International Bond 7.050% 02/11/2035 720,000 549,166 0.08Lebanon Government International Bond 7.250% 23/03/2037 1,582,000 1,220,798 0.17Lembaga Pembiayaan Ekspor Indonesia 3.875% 06/04/2024 200,000 206,238 0.03Magyar Export-Import Bank 4.000% 30/01/2020 400,000 402,828 0.06Malaysia Sovereign Sukuk 3.043% 22/04/2025 2,380,000 2,449,258 0.34Malaysia Sovereign Sukuk 4.236% 22/04/2045 400,000 462,044 0.06Malaysia Sukuk Global 4.080% 27/04/2046 750,000 849,083 0.12Mexico Government International Bond 4.000% 02/10/2023 200,000 208,808 0.03Mexico Government International Bond 3.600% 30/01/2025 990,000 1,013,671 0.14Mexico Government International Bond 4.125% 21/01/2026 830,000 868,769 0.12Mexico Government International Bond 4.150% 28/03/2027 1,160,000 1,214,938 0.17Mexico Government International Bond 3.750% 11/01/2028 510,000 519,501 0.07Mexico Government International Bond 4.500% 22/04/2029 1,210,000 1,297,144 0.18Mexico Government International Bond 6.050% 11/01/2040 334,000 398,682 0.06Mexico Government International Bond 4.750% 08/03/2044 1,332,000 1,391,407 0.19Mexico Government International Bond 5.550% 21/01/2045 240,000 279,746 0.04Mexico Government International Bond 4.600% 23/01/2046 535,000 547,562 0.08Mexico Government International Bond 4.350% 15/01/2047 200,000 198,500 0.03Mexico Government International Bond 4.600% 10/02/2048 655,000 675,764 0.09Mexico Government International Bond 5.750% 12/10/2110 416,000 454,942 0.06Mongolia Government International Bond 10.875% 06/04/2021 400,000 445,640 0.06Mongolia Government International Bond 5.125% 05/12/2022 1,430,000 1,444,514 0.20Mongolia Government International Bond 5.625% 01/05/2023 1,620,000 1,652,222 0.23Mongolia Government International Bond - SG 8.750% 09/03/2024 300,000 339,363 0.05Mongolia Government International Bond - US 8.750% 09/03/2024 325,000 367,643 0.05Morocco Government International Bond 4.250% 11/12/2022 1,985,000 2,072,697 0.29Morocco Government International Bond 5.500% 11/12/2042 1,100,000 1,252,086 0.18Mozambique International Bond 10.500% 18/01/2023 1,295,000 1,302,900 0.18Namibia International Bonds 5.500% 03/11/2021 800,000 831,296 0.12Namibia International Bonds 5.250% 29/10/2025 1,290,000 1,298,153 0.18Nigeria Government International Bond 5.625% 27/06/2022 626,000 649,412 0.09Nigeria Government International Bond 6.375% 12/07/2023 880,000 931,638 0.13Nigeria Government International Bond 7.625% 21/11/2025 1,984,000 2,166,270 0.30Nigeria Government International Bond 6.500% 28/11/2027 806,000 807,209 0.11Nigeria Government International Bond 7.143% 23/02/2030 2,015,000 2,039,805 0.29Nigeria Government International Bond 8.747% 21/01/2031 1,865,000 2,078,207 0.29Nigeria Government International Bond 7.875% 16/02/2032 1,706,000 1,783,060 0.25Nigeria Government International Bond - DE 7.696% 23/02/2038 1,230,000 1,249,028 0.17Nigeria Government International Bond - US 7.696% 23/02/2038 270,000 274,177 0.04Nigeria Government International Bond 7.625% 28/11/2047 2,160,000 2,153,693 0.30Nigeria Government International Bond 9.248% 21/01/2049 940,000 1,064,823 0.15Pakistan Government International Bond 7.250% 15/04/2019 0 0 0.00Pakistan Government International Bond 8.250% 15/04/2024 250,000 272,830 0.04Pakistan Government International Bond - US 8.250% 30/09/2025 915,000 1,000,845 0.14Pakistan Government International Bond - XU 8.250% 30/09/2025 678,000 741,610 0.10Pakistan Government International Bond 6.875% 05/12/2027 1,815,000 1,833,840 0.26Panama Government International Bond 4.000% 22/09/2024 485,000 517,151 0.07Panama Government International Bond 3.750% 16/03/2025 3,770,000 3,980,554 0.56Panama Government International Bond 7.125% 29/01/2026 1,195,000 1,492,101 0.21Panama Government International Bond 3.750% 17/04/2026 200,000 206,798 0.03Panama Government International Bond 8.875% 30/09/2027 500,000 708,270 0.10Panama Government International Bond 3.875% 17/03/2028 2,483,000 2,655,544 0.37Panama Government International Bond 9.375% 01/04/2029 955,000 1,432,118 0.20Panama Government International Bond 6.700% 26/01/2036 2,665,000 3,633,541 0.51Panama Government International Bond 4.500% 15/05/2047 1,185,000 1,338,197 0.19
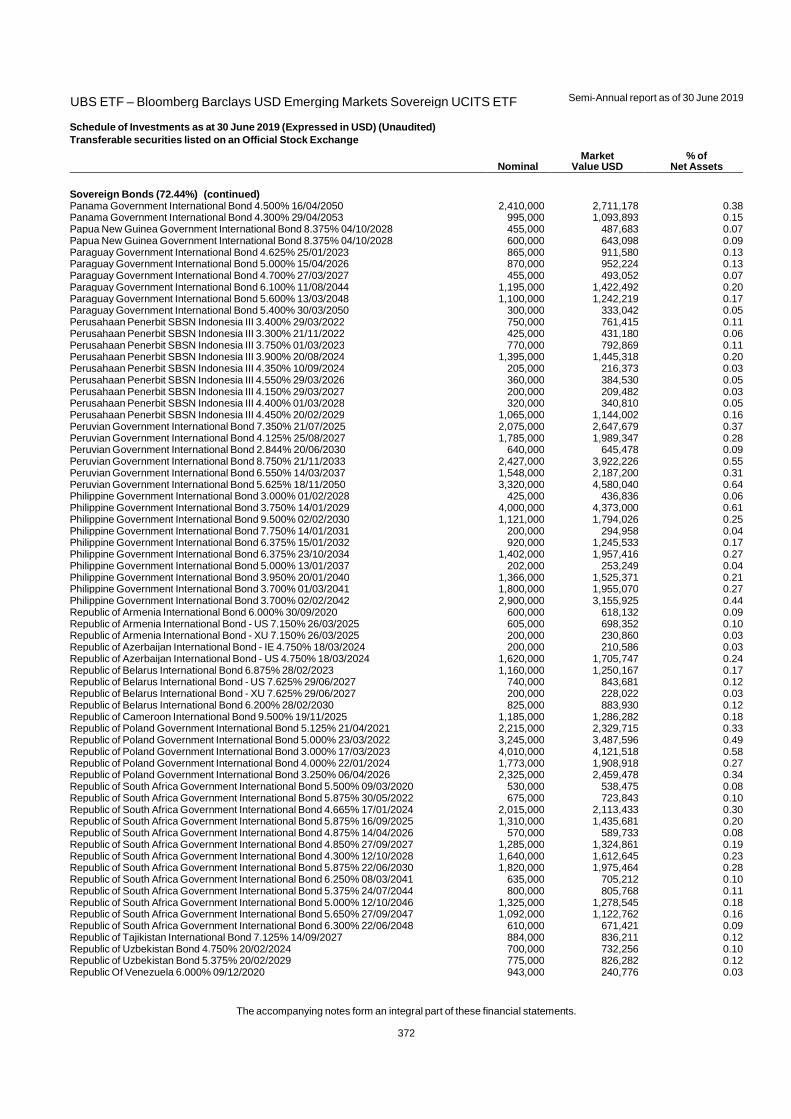
UBS ETF – Bloomberg Barclays USD Emerging Markets Sovereign UCITS ETF
Semi-Annual report as of 30 June 2019
The accompanying notes form an integral part of these financial statements.
372
Schedule of Investments as at 30 June 2019 (Expressed in USD) (Unaudited)
Transferable securities listed on an Official Stock Exchange
Nominal Market
Value USD % of
Net Assets
Sovereign Bonds (72.44%) (continued) Panama Government International Bond 4.500% 16/04/2050 2,410,000 2,711,178 0.38Panama Government International Bond 4.300% 29/04/2053 995,000 1,093,893 0.15Papua New Guinea Government International Bond 8.375% 04/10/2028 455,000 487,683 0.07Papua New Guinea Government International Bond 8.375% 04/10/2028 600,000 643,098 0.09Paraguay Government International Bond 4.625% 25/01/2023 865,000 911,580 0.13Paraguay Government International Bond 5.000% 15/04/2026 870,000 952,224 0.13Paraguay Government International Bond 4.700% 27/03/2027 455,000 493,052 0.07Paraguay Government International Bond 6.100% 11/08/2044 1,195,000 1,422,492 0.20Paraguay Government International Bond 5.600% 13/03/2048 1,100,000 1,242,219 0.17Paraguay Government International Bond 5.400% 30/03/2050 300,000 333,042 0.05Perusahaan Penerbit SBSN Indonesia III 3.400% 29/03/2022 750,000 761,415 0.11Perusahaan Penerbit SBSN Indonesia III 3.300% 21/11/2022 425,000 431,180 0.06Perusahaan Penerbit SBSN Indonesia III 3.750% 01/03/2023 770,000 792,869 0.11Perusahaan Penerbit SBSN Indonesia III 3.900% 20/08/2024 1,395,000 1,445,318 0.20Perusahaan Penerbit SBSN Indonesia III 4.350% 10/09/2024 205,000 216,373 0.03Perusahaan Penerbit SBSN Indonesia III 4.550% 29/03/2026 360,000 384,530 0.05Perusahaan Penerbit SBSN Indonesia III 4.150% 29/03/2027 200,000 209,482 0.03Perusahaan Penerbit SBSN Indonesia III 4.400% 01/03/2028 320,000 340,810 0.05Perusahaan Penerbit SBSN Indonesia III 4.450% 20/02/2029 1,065,000 1,144,002 0.16Peruvian Government International Bond 7.350% 21/07/2025 2,075,000 2,647,679 0.37Peruvian Government International Bond 4.125% 25/08/2027 1,785,000 1,989,347 0.28Peruvian Government International Bond 2.844% 20/06/2030 640,000 645,478 0.09Peruvian Government International Bond 8.750% 21/11/2033 2,427,000 3,922,226 0.55Peruvian Government International Bond 6.550% 14/03/2037 1,548,000 2,187,200 0.31Peruvian Government International Bond 5.625% 18/11/2050 3,320,000 4,580,040 0.64Philippine Government International Bond 3.000% 01/02/2028 425,000 436,836 0.06Philippine Government International Bond 3.750% 14/01/2029 4,000,000 4,373,000 0.61Philippine Government International Bond 9.500% 02/02/2030 1,121,000 1,794,026 0.25Philippine Government International Bond 7.750% 14/01/2031 200,000 294,958 0.04Philippine Government International Bond 6.375% 15/01/2032 920,000 1,245,533 0.17Philippine Government International Bond 6.375% 23/10/2034 1,402,000 1,957,416 0.27Philippine Government International Bond 5.000% 13/01/2037 202,000 253,249 0.04Philippine Government International Bond 3.950% 20/01/2040 1,366,000 1,525,371 0.21Philippine Government International Bond 3.700% 01/03/2041 1,800,000 1,955,070 0.27Philippine Government International Bond 3.700% 02/02/2042 2,900,000 3,155,925 0.44Republic of Armenia International Bond 6.000% 30/09/2020 600,000 618,132 0.09Republic of Armenia International Bond - US 7.150% 26/03/2025 605,000 698,352 0.10Republic of Armenia International Bond - XU 7.150% 26/03/2025 200,000 230,860 0.03Republic of Azerbaijan International Bond - IE 4.750% 18/03/2024 200,000 210,586 0.03Republic of Azerbaijan International Bond - US 4.750% 18/03/2024 1,620,000 1,705,747 0.24Republic of Belarus International Bond 6.875% 28/02/2023 1,160,000 1,250,167 0.17Republic of Belarus International Bond - US 7.625% 29/06/2027 740,000 843,681 0.12Republic of Belarus International Bond - XU 7.625% 29/06/2027 200,000 228,022 0.03Republic of Belarus International Bond 6.200% 28/02/2030 825,000 883,930 0.12Republic of Cameroon International Bond 9.500% 19/11/2025 1,185,000 1,286,282 0.18Republic of Poland Government International Bond 5.125% 21/04/2021 2,215,000 2,329,715 0.33Republic of Poland Government International Bond 5.000% 23/03/2022 3,245,000 3,487,596 0.49Republic of Poland Government International Bond 3.000% 17/03/2023 4,010,000 4,121,518 0.58Republic of Poland Government International Bond 4.000% 22/01/2024 1,773,000 1,908,918 0.27Republic of Poland Government International Bond 3.250% 06/04/2026 2,325,000 2,459,478 0.34Republic of South Africa Government International Bond 5.500% 09/03/2020 530,000 538,475 0.08Republic of South Africa Government International Bond 5.875% 30/05/2022 675,000 723,843 0.10Republic of South Africa Government International Bond 4.665% 17/01/2024 2,015,000 2,113,433 0.30Republic of South Africa Government International Bond 5.875% 16/09/2025 1,310,000 1,435,681 0.20Republic of South Africa Government International Bond 4.875% 14/04/2026 570,000 589,733 0.08Republic of South Africa Government International Bond 4.850% 27/09/2027 1,285,000 1,324,861 0.19Republic of South Africa Government International Bond 4.300% 12/10/2028 1,640,000 1,612,645 0.23Republic of South Africa Government International Bond 5.875% 22/06/2030 1,820,000 1,975,464 0.28Republic of South Africa Government International Bond 6.250% 08/03/2041 635,000 705,212 0.10Republic of South Africa Government International Bond 5.375% 24/07/2044 800,000 805,768 0.11Republic of South Africa Government International Bond 5.000% 12/10/2046 1,325,000 1,278,545 0.18Republic of South Africa Government International Bond 5.650% 27/09/2047 1,092,000 1,122,762 0.16Republic of South Africa Government International Bond 6.300% 22/06/2048 610,000 671,421 0.09Republic of Tajikistan International Bond 7.125% 14/09/2027 884,000 836,211 0.12Republic of Uzbekistan Bond 4.750% 20/02/2024 700,000 732,256 0.10Republic of Uzbekistan Bond 5.375% 20/02/2029 775,000 826,282 0.12Republic Of Venezuela 6.000% 09/12/2020 943,000 240,776 0.03

UBS ETF – Bloomberg Barclays USD Emerging Markets Sovereign UCITS ETF
Semi-Annual report as of 30 June 2019
The accompanying notes form an integral part of these financial statements.
373
Schedule of Investments as at 30 June 2019 (Expressed in USD) (Unaudited)
Transferable securities listed on an Official Stock Exchange
Nominal Market
Value USD % of
Net Assets
Sovereign Bonds (72.44%) (continued) Republic Of Venezuela 12.750% 23/08/2022 220,000 57,048 0.01Republic Of Venezuela 9.000% 07/05/2023 1,335,000 354,830 0.05Republic Of Venezuela 8.250% 13/10/2024 1,995,000 532,106 0.07Republic Of Venezuela - US 7.650% 21/04/2025 200,000 53,860 0.01Republic Of Venezuela - XU 7.650% 21/04/2025 233,000 62,747 0.01Republic Of Venezuela 11.750% 21/10/2026 1,401,000 376,827 0.05Republic Of Venezuela 9.250% 15/09/2027 2,645,000 698,280 0.10Republic Of Venezuela 9.250% 07/05/2028 1,400,000 368,760 0.05Republic Of Venezuela 11.950% 05/08/2031 2,370,000 640,682 0.09Republic Of Venezuela 7.000% 31/03/2038 626,000 161,433 0.02Romanian Government International Bond 6.750% 07/02/2022 2,322,000 2,550,972 0.36Romanian Government International Bond 4.375% 22/08/2023 2,528,000 2,681,854 0.38Romanian Government International Bond 4.875% 22/01/2024 840,000 909,023 0.13Romanian Government International Bond 6.125% 22/01/2044 1,414,000 1,793,659 0.25Romanian Government International Bond 5.125% 15/06/2048 1,444,000 1,613,453 0.23Russian Foreign Bond - Eurobond - GB 5.000% 29/04/2020 400,000 407,360 0.06Russian Foreign Bond - Eurobond - US 5.000% 29/04/2020 300,000 305,520 0.04Russian Foreign Bond - Eurobond - US 4.500% 04/04/2022 1,200,000 1,251,000 0.17Russian Foreign Bond - Eurobond - XU 4.500% 04/04/2022 200,000 208,500 0.03Russian Foreign Bond - Eurobond 4.875% 16/09/2023 1,200,000 1,284,060 0.18Russian Foreign Bond - Eurobond 4.750% 27/05/2026 1,000,000 1,064,670 0.15Russian Foreign Bond - Eurobond 12.750% 24/06/2028 340,000 562,153 0.08Russian Foreign Bond - Eurobond - RU 4.375% 21/03/2029 1,200,000 1,246,236 0.17Russian Foreign Bond - Eurobond - US 4.375% 21/03/2029 600,000 623,118 0.09Russian Foreign Bond - Eurobond 7.500% 31/03/2030 238,125 269,162 0.04Russian Foreign Bond - Eurobond - RU 5.100% 28/03/2035 1,200,000 1,304,460 0.18Russian Foreign Bond - Eurobond - US 5.100% 28/03/2035 400,000 434,820 0.06Russian Foreign Bond - Eurobond - GB 5.625% 04/04/2042 400,000 469,332 0.07Russian Foreign Bond - Eurobond - US 5.625% 04/04/2042 600,000 703,998 0.10Russian Foreign Bond - Eurobond 5.875% 16/09/2043 400,000 486,024 0.07Russian Foreign Bond - Eurobond - RU 5.250% 23/06/2047 600,000 662,868 0.09Russian Foreign Bond - Eurobond - US 5.250% 23/06/2047 1,800,000 1,988,604 0.28Senegal Government International Bond 6.250% 30/07/2024 785,000 843,404 0.12Senegal Government International Bond 6.250% 23/05/2033 1,515,000 1,467,277 0.21Senegal Government International Bond - DE 6.750% 13/03/2048 500,000 469,810 0.07Senegal Government International Bond - US 6.750% 13/03/2048 860,000 808,073 0.11Serbia International Bond 4.875% 25/02/2020 200,000 202,494 0.03Serbia International Bond - US 7.250% 28/09/2021 946,000 1,036,948 0.14Serbia International Bond - XU 7.250% 28/09/2021 362,000 396,803 0.06Sri Lanka Government International Bond 6.250% 04/10/2020 903,000 913,213 0.13Sri Lanka Government International Bond 6.250% 27/07/2021 650,000 658,216 0.09Sri Lanka Government International Bond 5.750% 18/01/2022 1,650,000 1,654,257 0.23Sri Lanka Government International Bond 5.875% 25/07/2022 880,000 882,869 0.12Sri Lanka Government International Bond 5.750% 18/04/2023 1,750,000 1,734,932 0.24Sri Lanka Government International Bond 6.850% 14/03/2024 2,265,000 2,312,791 0.32Sri Lanka Government International Bond 6.125% 03/06/2025 1,390,000 1,355,361 0.19Sri Lanka Government International Bond 6.850% 03/11/2025 1,445,000 1,449,566 0.20Sri Lanka Government International Bond 6.825% 18/07/2026 1,250,000 1,246,263 0.17Sri Lanka Government International Bond 6.200% 11/05/2027 1,351,000 1,283,720 0.18Sri Lanka Government International Bond 7.850% 14/03/2029 2,495,000 2,581,152 0.36Sri Lanka Government International Bond 7.550% 28/03/2030 1,260,000 1,267,749 0.18Suriname Government International Bond 9.250% 26/10/2026 1,155,000 1,075,524 0.15Third Pakistan International Sukuk 5.500% 13/10/2021 740,000 746,786 0.10Third Pakistan International Sukuk 5.625% 05/12/2022 2,360,000 2,379,139 0.33Trinidad & Tobago Government International Bond 4.375% 16/01/2024 600,000 610,512 0.09Trinidad & Tobago Government International Bond 4.500% 04/08/2026 1,700,000 1,704,182 0.24Turkey Government International Bond 7.000% 05/06/2020 615,000 629,016 0.09Turkey Government International Bond 5.625% 30/03/2021 1,015,000 1,030,215 0.14Turkey Government International Bond 5.125% 25/03/2022 420,000 414,296 0.06Turkey Government International Bond 6.250% 26/09/2022 485,000 489,355 0.07Turkey Government International Bond 3.250% 23/03/2023 875,000 796,329 0.11Turkey Government International Bond 7.250% 23/12/2023 800,000 826,640 0.12Turkey Government International Bond 5.750% 22/03/2024 640,000 624,813 0.09Turkey Government International Bond 7.375% 05/02/2025 600,000 620,028 0.09Turkey Government International Bond 4.250% 14/04/2026 280,000 245,020 0.03Turkey Government International Bond 4.875% 09/10/2026 1,365,000 1,223,313 0.17Turkey Government International Bond 6.000% 25/03/2027 1,035,000 984,564 0.14
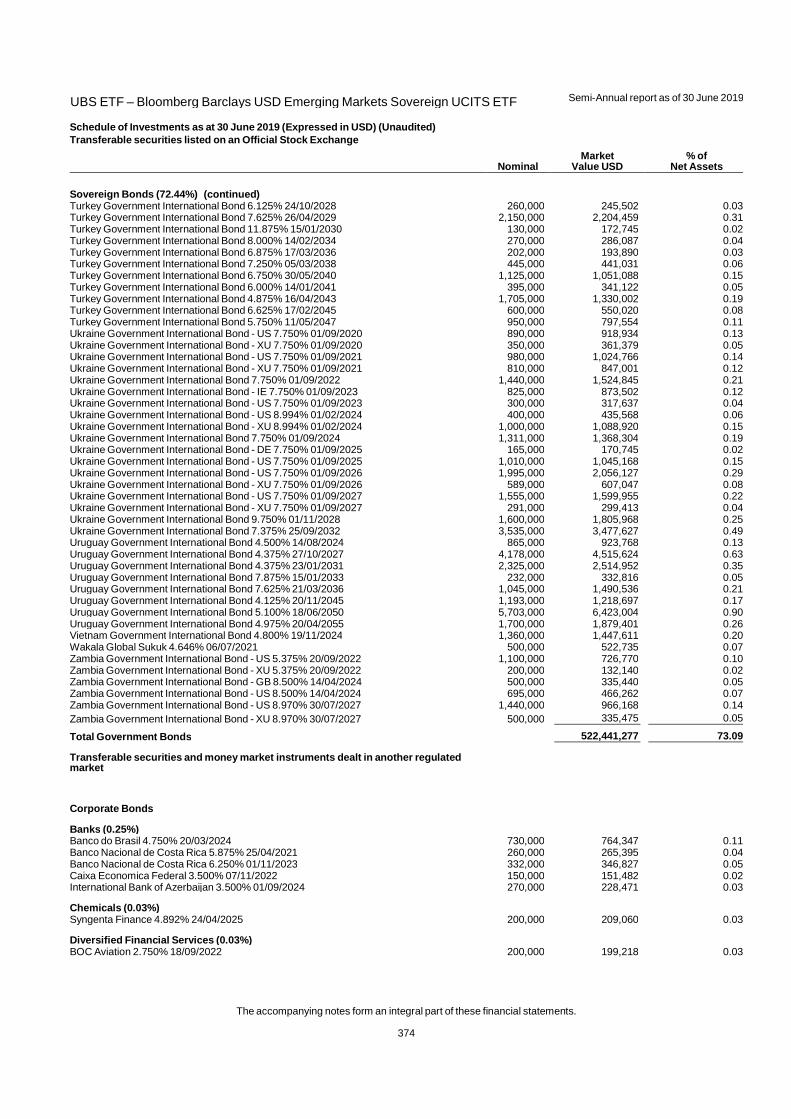
UBS ETF – Bloomberg Barclays USD Emerging Markets Sovereign UCITS ETF
Semi-Annual report as of 30 June 2019
The accompanying notes form an integral part of these financial statements.
374
Schedule of Investments as at 30 June 2019 (Expressed in USD) (Unaudited)
Transferable securities listed on an Official Stock Exchange
Nominal Market
Value USD % of
Net Assets
Sovereign Bonds (72.44%) (continued) Turkey Government International Bond 6.125% 24/10/2028 260,000 245,502 0.03Turkey Government International Bond 7.625% 26/04/2029 2,150,000 2,204,459 0.31Turkey Government International Bond 11.875% 15/01/2030 130,000 172,745 0.02Turkey Government International Bond 8.000% 14/02/2034 270,000 286,087 0.04Turkey Government International Bond 6.875% 17/03/2036 202,000 193,890 0.03Turkey Government International Bond 7.250% 05/03/2038 445,000 441,031 0.06Turkey Government International Bond 6.750% 30/05/2040 1,125,000 1,051,088 0.15Turkey Government International Bond 6.000% 14/01/2041 395,000 341,122 0.05Turkey Government International Bond 4.875% 16/04/2043 1,705,000 1,330,002 0.19Turkey Government International Bond 6.625% 17/02/2045 600,000 550,020 0.08Turkey Government International Bond 5.750% 11/05/2047 950,000 797,554 0.11Ukraine Government International Bond - US 7.750% 01/09/2020 890,000 918,934 0.13Ukraine Government International Bond - XU 7.750% 01/09/2020 350,000 361,379 0.05Ukraine Government International Bond - US 7.750% 01/09/2021 980,000 1,024,766 0.14Ukraine Government International Bond - XU 7.750% 01/09/2021 810,000 847,001 0.12Ukraine Government International Bond 7.750% 01/09/2022 1,440,000 1,524,845 0.21Ukraine Government International Bond - IE 7.750% 01/09/2023 825,000 873,502 0.12Ukraine Government International Bond - US 7.750% 01/09/2023 300,000 317,637 0.04Ukraine Government International Bond - US 8.994% 01/02/2024 400,000 435,568 0.06Ukraine Government International Bond - XU 8.994% 01/02/2024 1,000,000 1,088,920 0.15Ukraine Government International Bond 7.750% 01/09/2024 1,311,000 1,368,304 0.19Ukraine Government International Bond - DE 7.750% 01/09/2025 165,000 170,745 0.02Ukraine Government International Bond - US 7.750% 01/09/2025 1,010,000 1,045,168 0.15Ukraine Government International Bond - US 7.750% 01/09/2026 1,995,000 2,056,127 0.29Ukraine Government International Bond - XU 7.750% 01/09/2026 589,000 607,047 0.08Ukraine Government International Bond - US 7.750% 01/09/2027 1,555,000 1,599,955 0.22Ukraine Government International Bond - XU 7.750% 01/09/2027 291,000 299,413 0.04Ukraine Government International Bond 9.750% 01/11/2028 1,600,000 1,805,968 0.25Ukraine Government International Bond 7.375% 25/09/2032 3,535,000 3,477,627 0.49Uruguay Government International Bond 4.500% 14/08/2024 865,000 923,768 0.13Uruguay Government International Bond 4.375% 27/10/2027 4,178,000 4,515,624 0.63Uruguay Government International Bond 4.375% 23/01/2031 2,325,000 2,514,952 0.35Uruguay Government International Bond 7.875% 15/01/2033 232,000 332,816 0.05Uruguay Government International Bond 7.625% 21/03/2036 1,045,000 1,490,536 0.21Uruguay Government International Bond 4.125% 20/11/2045 1,193,000 1,218,697 0.17Uruguay Government International Bond 5.100% 18/06/2050 5,703,000 6,423,004 0.90Uruguay Government International Bond 4.975% 20/04/2055 1,700,000 1,879,401 0.26Vietnam Government International Bond 4.800% 19/11/2024 1,360,000 1,447,611 0.20Wakala Global Sukuk 4.646% 06/07/2021 500,000 522,735 0.07Zambia Government International Bond - US 5.375% 20/09/2022 1,100,000 726,770 0.10Zambia Government International Bond - XU 5.375% 20/09/2022 200,000 132,140 0.02Zambia Government International Bond - GB 8.500% 14/04/2024 500,000 335,440 0.05Zambia Government International Bond - US 8.500% 14/04/2024 695,000 466,262 0.07Zambia Government International Bond - US 8.970% 30/07/2027 1,440,000 966,168 0.14Zambia Government International Bond - XU 8.970% 30/07/2027 500,000 335,475 0.05
Total Government Bonds 522,441,277 73.09
Transferable securities and money market instruments dealt in another regulated market
Corporate Bonds
Banks (0.25%) Banco do Brasil 4.750% 20/03/2024 730,000 764,347 0.11Banco Nacional de Costa Rica 5.875% 25/04/2021 260,000 265,395 0.04Banco Nacional de Costa Rica 6.250% 01/11/2023 332,000 346,827 0.05Caixa Economica Federal 3.500% 07/11/2022 150,000 151,482 0.02International Bank of Azerbaijan 3.500% 01/09/2024 270,000 228,471 0.03
Chemicals (0.03%) Syngenta Finance 4.892% 24/04/2025 200,000 209,060 0.03
Diversified Financial Services (0.03%) BOC Aviation 2.750% 18/09/2022 200,000 199,218 0.03
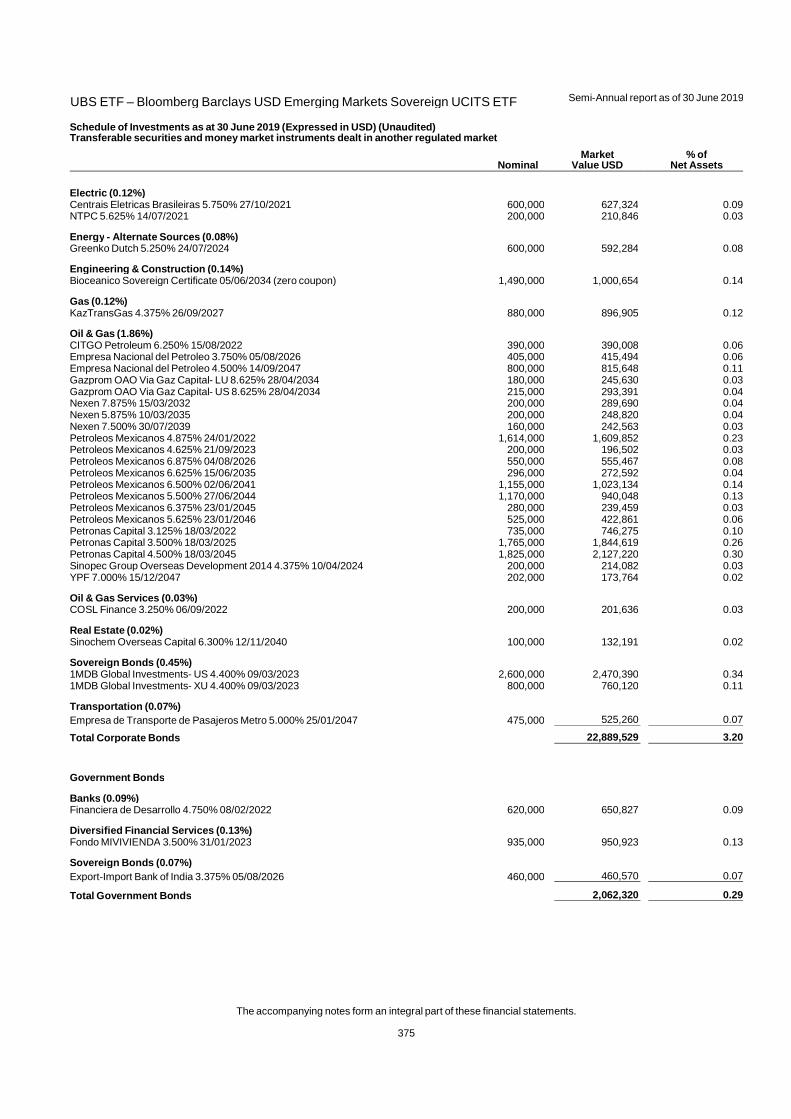
UBS ETF – Bloomberg Barclays USD Emerging Markets Sovereign UCITS ETF
Semi-Annual report as of 30 June 2019
The accompanying notes form an integral part of these financial statements.
375
Schedule of Investments as at 30 June 2019 (Expressed in USD) (Unaudited) Transferable securities and money market instruments dealt in another regulated market
Nominal Market
Value USD % of
Net Assets
Electric (0.12%) Centrais Eletricas Brasileiras 5.750% 27/10/2021 600,000 627,324 0.09NTPC 5.625% 14/07/2021 200,000 210,846 0.03
Energy - Alternate Sources (0.08%) Greenko Dutch 5.250% 24/07/2024 600,000 592,284 0.08
Engineering & Construction (0.14%) Bioceanico Sovereign Certificate 05/06/2034 (zero coupon) 1,490,000 1,000,654 0.14
Gas (0.12%) KazTransGas 4.375% 26/09/2027 880,000 896,905 0.12
Oil & Gas (1.86%) CITGO Petroleum 6.250% 15/08/2022 390,000 390,008 0.06Empresa Nacional del Petroleo 3.750% 05/08/2026 405,000 415,494 0.06Empresa Nacional del Petroleo 4.500% 14/09/2047 800,000 815,648 0.11Gazprom OAO Via Gaz Capital- LU 8.625% 28/04/2034 180,000 245,630 0.03Gazprom OAO Via Gaz Capital- US 8.625% 28/04/2034 215,000 293,391 0.04Nexen 7.875% 15/03/2032 200,000 289,690 0.04Nexen 5.875% 10/03/2035 200,000 248,820 0.04Nexen 7.500% 30/07/2039 160,000 242,563 0.03Petroleos Mexicanos 4.875% 24/01/2022 1,614,000 1,609,852 0.23Petroleos Mexicanos 4.625% 21/09/2023 200,000 196,502 0.03Petroleos Mexicanos 6.875% 04/08/2026 550,000 555,467 0.08Petroleos Mexicanos 6.625% 15/06/2035 296,000 272,592 0.04Petroleos Mexicanos 6.500% 02/06/2041 1,155,000 1,023,134 0.14Petroleos Mexicanos 5.500% 27/06/2044 1,170,000 940,048 0.13Petroleos Mexicanos 6.375% 23/01/2045 280,000 239,459 0.03Petroleos Mexicanos 5.625% 23/01/2046 525,000 422,861 0.06Petronas Capital 3.125% 18/03/2022 735,000 746,275 0.10Petronas Capital 3.500% 18/03/2025 1,765,000 1,844,619 0.26Petronas Capital 4.500% 18/03/2045 1,825,000 2,127,220 0.30Sinopec Group Overseas Development 2014 4.375% 10/04/2024 200,000 214,082 0.03YPF 7.000% 15/12/2047 202,000 173,764 0.02
Oil & Gas Services (0.03%) COSL Finance 3.250% 06/09/2022 200,000 201,636 0.03
Real Estate (0.02%) Sinochem Overseas Capital 6.300% 12/11/2040 100,000 132,191 0.02
Sovereign Bonds (0.45%) 1MDB Global Investments- US 4.400% 09/03/2023 2,600,000 2,470,390 0.341MDB Global Investments- XU 4.400% 09/03/2023 800,000 760,120 0.11
Transportation (0.07%) Empresa de Transporte de Pasajeros Metro 5.000% 25/01/2047 475,000 525,260 0.07
Total Corporate Bonds 22,889,529 3.20
Government Bonds
Banks (0.09%) Financiera de Desarrollo 4.750% 08/02/2022 620,000 650,827 0.09
Diversified Financial Services (0.13%) Fondo MIVIVIENDA 3.500% 31/01/2023 935,000 950,923 0.13
Sovereign Bonds (0.07%) Export-Import Bank of India 3.375% 05/08/2026 460,000 460,570 0.07
Total Government Bonds 2,062,320 0.29
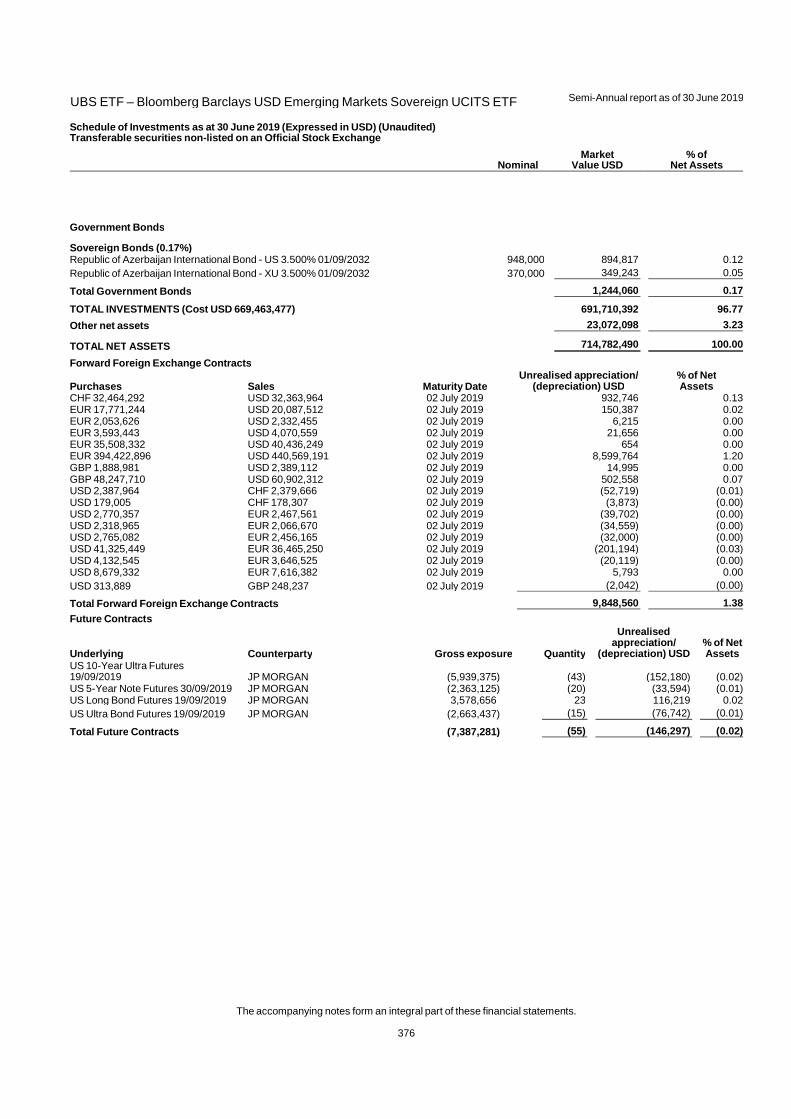
UBS ETF – Bloomberg Barclays USD Emerging Markets Sovereign UCITS ETF
Semi-Annual report as of 30 June 2019
The accompanying notes form an integral part of these financial statements.
376
Schedule of Investments as at 30 June 2019 (Expressed in USD) (Unaudited) Transferable securities non-listed on an Official Stock Exchange
Nominal Market
Value USD % of
Net Assets
Government Bonds
Sovereign Bonds (0.17%) Republic of Azerbaijan International Bond - US 3.500% 01/09/2032 948,000 894,817 0.12Republic of Azerbaijan International Bond - XU 3.500% 01/09/2032 370,000 349,243 0.05
Total Government Bonds 1,244,060 0.17
TOTAL INVESTMENTS (Cost USD 669,463,477) 691,710,392 96.77
Other net assets 23,072,098 3.23
TOTAL NET ASSETS 714,782,490 100.00
Forward Foreign Exchange Contracts
Purchases Sales Maturity Date Unrealised appreciation/
(depreciation) USD % of Net Assets
CHF 32,464,292 USD 32,363,964 02 July 2019 932,746 0.13EUR 17,771,244 USD 20,087,512 02 July 2019 150,387 0.02EUR 2,053,626 USD 2,332,455 02 July 2019 6,215 0.00EUR 3,593,443 USD 4,070,559 02 July 2019 21,656 0.00EUR 35,508,332 USD 40,436,249 02 July 2019 654 0.00EUR 394,422,896 USD 440,569,191 02 July 2019 8,599,764 1.20GBP 1,888,981 USD 2,389,112 02 July 2019 14,995 0.00GBP 48,247,710 USD 60,902,312 02 July 2019 502,558 0.07USD 2,387,964 CHF 2,379,666 02 July 2019 (52,719) (0.01)USD 179,005 CHF 178,307 02 July 2019 (3,873) (0.00)USD 2,770,357 EUR 2,467,561 02 July 2019 (39,702) (0.00)USD 2,318,965 EUR 2,066,670 02 July 2019 (34,559) (0.00)USD 2,765,082 EUR 2,456,165 02 July 2019 (32,000) (0.00)USD 41,325,449 EUR 36,465,250 02 July 2019 (201,194) (0.03)USD 4,132,545 EUR 3,646,525 02 July 2019 (20,119) (0.00)USD 8,679,332 EUR 7,616,382 02 July 2019 5,793 0.00USD 313,889 GBP 248,237 02 July 2019 (2,042) (0.00)
Total Forward Foreign Exchange Contracts 9,848,560 1.38
Future Contracts
Underlying Counterparty Gross exposure Quantity
Unrealised appreciation/
(depreciation) USD % of Net Assets
US 10-Year Ultra Futures 19/09/2019 JP MORGAN (5,939,375) (43) (152,180) (0.02)US 5-Year Note Futures 30/09/2019 JP MORGAN (2,363,125) (20) (33,594) (0.01)US Long Bond Futures 19/09/2019 JP MORGAN 3,578,656 23 116,219 0.02US Ultra Bond Futures 19/09/2019 JP MORGAN (2,663,437) (15) (76,742) (0.01)
Total Future Contracts (7,387,281) (55) (146,297) (0.02)
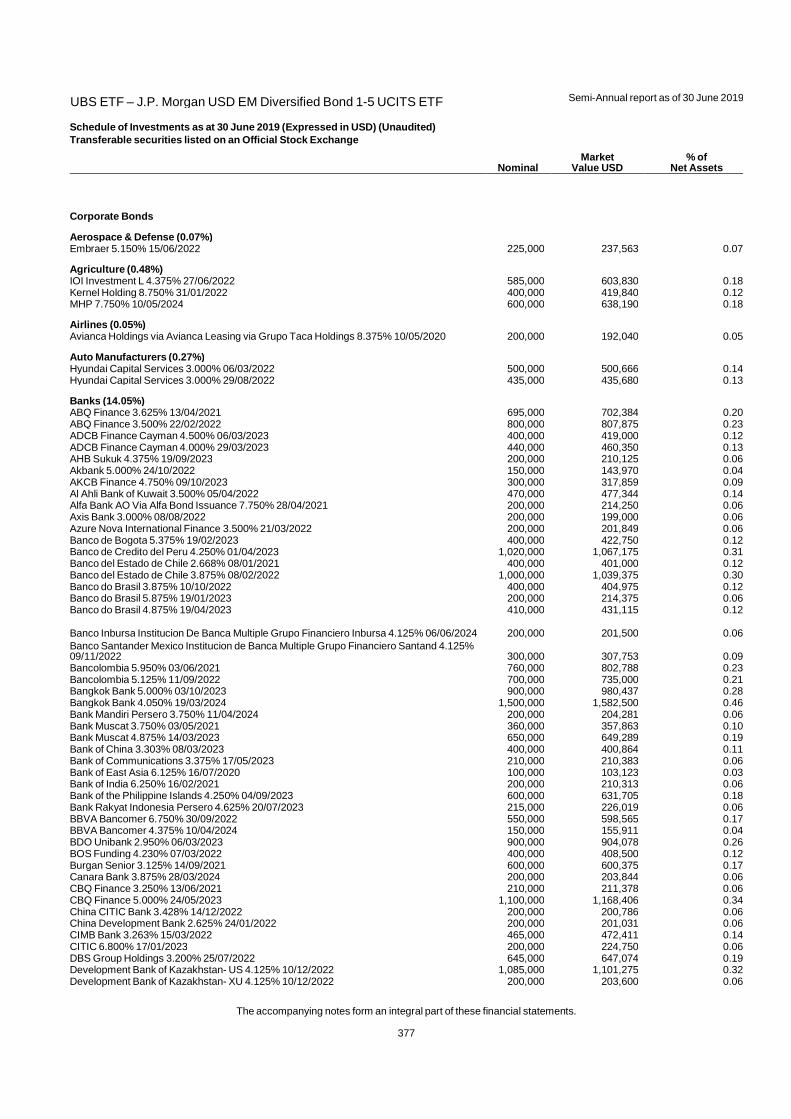
UBS ETF – J.P. Morgan USD EM Diversified Bond 1-5 UCITS ETF
Semi-Annual report as of 30 June 2019
The accompanying notes form an integral part of these financial statements.
377
Schedule of Investments as at 30 June 2019 (Expressed in USD) (Unaudited)
Transferable securities listed on an Official Stock Exchange
Nominal Market
Value USD % of
Net Assets
Corporate Bonds
Aerospace & Defense (0.07%) Embraer 5.150% 15/06/2022 225,000 237,563 0.07
Agriculture (0.48%) IOI Investment L 4.375% 27/06/2022 585,000 603,830 0.18Kernel Holding 8.750% 31/01/2022 400,000 419,840 0.12MHP 7.750% 10/05/2024 600,000 638,190 0.18
Airlines (0.05%) Avianca Holdings via Avianca Leasing via Grupo Taca Holdings 8.375% 10/05/2020 200,000 192,040 0.05
Auto Manufacturers (0.27%) Hyundai Capital Services 3.000% 06/03/2022 500,000 500,666 0.14Hyundai Capital Services 3.000% 29/08/2022 435,000 435,680 0.13
Banks (14.05%) ABQ Finance 3.625% 13/04/2021 695,000 702,384 0.20ABQ Finance 3.500% 22/02/2022 800,000 807,875 0.23ADCB Finance Cayman 4.500% 06/03/2023 400,000 419,000 0.12ADCB Finance Cayman 4.000% 29/03/2023 440,000 460,350 0.13AHB Sukuk 4.375% 19/09/2023 200,000 210,125 0.06Akbank 5.000% 24/10/2022 150,000 143,970 0.04AKCB Finance 4.750% 09/10/2023 300,000 317,859 0.09Al Ahli Bank of Kuwait 3.500% 05/04/2022 470,000 477,344 0.14Alfa Bank AO Via Alfa Bond Issuance 7.750% 28/04/2021 200,000 214,250 0.06Axis Bank 3.000% 08/08/2022 200,000 199,000 0.06Azure Nova International Finance 3.500% 21/03/2022 200,000 201,849 0.06Banco de Bogota 5.375% 19/02/2023 400,000 422,750 0.12Banco de Credito del Peru 4.250% 01/04/2023 1,020,000 1,067,175 0.31Banco del Estado de Chile 2.668% 08/01/2021 400,000 401,000 0.12Banco del Estado de Chile 3.875% 08/02/2022 1,000,000 1,039,375 0.30Banco do Brasil 3.875% 10/10/2022 400,000 404,975 0.12Banco do Brasil 5.875% 19/01/2023 200,000 214,375 0.06Banco do Brasil 4.875% 19/04/2023 410,000 431,115 0.12
Banco Inbursa Institucion De Banca Multiple Grupo Financiero Inbursa 4.125% 06/06/2024 200,000 201,500 0.06Banco Santander Mexico Institucion de Banca Multiple Grupo Financiero Santand 4.125% 09/11/2022 300,000 307,753 0.09Bancolombia 5.950% 03/06/2021 760,000 802,788 0.23Bancolombia 5.125% 11/09/2022 700,000 735,000 0.21Bangkok Bank 5.000% 03/10/2023 900,000 980,437 0.28Bangkok Bank 4.050% 19/03/2024 1,500,000 1,582,500 0.46Bank Mandiri Persero 3.750% 11/04/2024 200,000 204,281 0.06Bank Muscat 3.750% 03/05/2021 360,000 357,863 0.10Bank Muscat 4.875% 14/03/2023 650,000 649,289 0.19Bank of China 3.303% 08/03/2023 400,000 400,864 0.11Bank of Communications 3.375% 17/05/2023 210,000 210,383 0.06Bank of East Asia 6.125% 16/07/2020 100,000 103,123 0.03Bank of India 6.250% 16/02/2021 200,000 210,313 0.06Bank of the Philippine Islands 4.250% 04/09/2023 600,000 631,705 0.18Bank Rakyat Indonesia Persero 4.625% 20/07/2023 215,000 226,019 0.06BBVA Bancomer 6.750% 30/09/2022 550,000 598,565 0.17BBVA Bancomer 4.375% 10/04/2024 150,000 155,911 0.04BDO Unibank 2.950% 06/03/2023 900,000 904,078 0.26BOS Funding 4.230% 07/03/2022 400,000 408,500 0.12Burgan Senior 3.125% 14/09/2021 600,000 600,375 0.17Canara Bank 3.875% 28/03/2024 200,000 203,844 0.06CBQ Finance 3.250% 13/06/2021 210,000 211,378 0.06CBQ Finance 5.000% 24/05/2023 1,100,000 1,168,406 0.34China CITIC Bank 3.428% 14/12/2022 200,000 200,786 0.06China Development Bank 2.625% 24/01/2022 200,000 201,031 0.06CIMB Bank 3.263% 15/03/2022 465,000 472,411 0.14CITIC 6.800% 17/01/2023 200,000 224,750 0.06DBS Group Holdings 3.200% 25/07/2022 645,000 647,074 0.19Development Bank of Kazakhstan- US 4.125% 10/12/2022 1,085,000 1,101,275 0.32Development Bank of Kazakhstan- XU 4.125% 10/12/2022 200,000 203,600 0.06
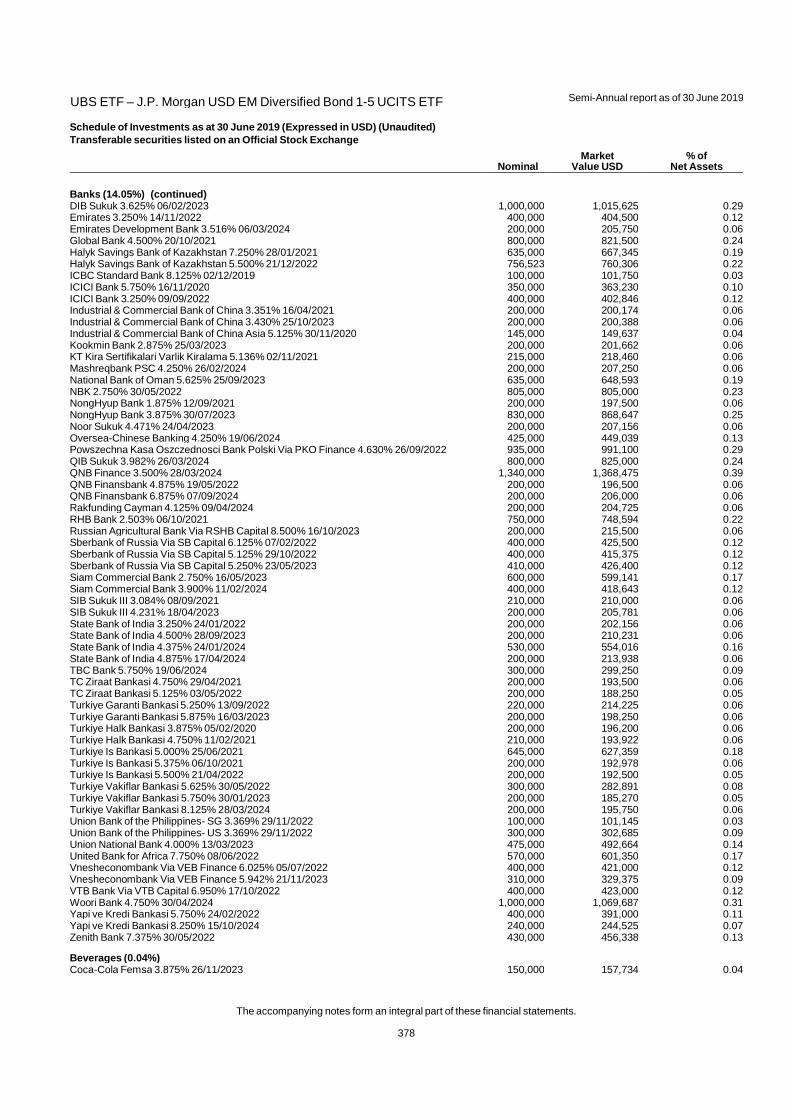
UBS ETF – J.P. Morgan USD EM Diversified Bond 1-5 UCITS ETF
Semi-Annual report as of 30 June 2019
The accompanying notes form an integral part of these financial statements.
378
Schedule of Investments as at 30 June 2019 (Expressed in USD) (Unaudited)
Transferable securities listed on an Official Stock Exchange
Nominal Market
Value USD % of
Net Assets
Banks (14.05%) (continued) DIB Sukuk 3.625% 06/02/2023 1,000,000 1,015,625 0.29Emirates 3.250% 14/11/2022 400,000 404,500 0.12Emirates Development Bank 3.516% 06/03/2024 200,000 205,750 0.06Global Bank 4.500% 20/10/2021 800,000 821,500 0.24Halyk Savings Bank of Kazakhstan 7.250% 28/01/2021 635,000 667,345 0.19Halyk Savings Bank of Kazakhstan 5.500% 21/12/2022 756,523 760,306 0.22ICBC Standard Bank 8.125% 02/12/2019 100,000 101,750 0.03ICICI Bank 5.750% 16/11/2020 350,000 363,230 0.10ICICI Bank 3.250% 09/09/2022 400,000 402,846 0.12Industrial & Commercial Bank of China 3.351% 16/04/2021 200,000 200,174 0.06Industrial & Commercial Bank of China 3.430% 25/10/2023 200,000 200,388 0.06Industrial & Commercial Bank of China Asia 5.125% 30/11/2020 145,000 149,637 0.04Kookmin Bank 2.875% 25/03/2023 200,000 201,662 0.06KT Kira Sertifikalari Varlik Kiralama 5.136% 02/11/2021 215,000 218,460 0.06Mashreqbank PSC 4.250% 26/02/2024 200,000 207,250 0.06National Bank of Oman 5.625% 25/09/2023 635,000 648,593 0.19NBK 2.750% 30/05/2022 805,000 805,000 0.23NongHyup Bank 1.875% 12/09/2021 200,000 197,500 0.06NongHyup Bank 3.875% 30/07/2023 830,000 868,647 0.25Noor Sukuk 4.471% 24/04/2023 200,000 207,156 0.06Oversea-Chinese Banking 4.250% 19/06/2024 425,000 449,039 0.13Powszechna Kasa Oszczednosci Bank Polski Via PKO Finance 4.630% 26/09/2022 935,000 991,100 0.29QIB Sukuk 3.982% 26/03/2024 800,000 825,000 0.24QNB Finance 3.500% 28/03/2024 1,340,000 1,368,475 0.39QNB Finansbank 4.875% 19/05/2022 200,000 196,500 0.06QNB Finansbank 6.875% 07/09/2024 200,000 206,000 0.06Rakfunding Cayman 4.125% 09/04/2024 200,000 204,725 0.06RHB Bank 2.503% 06/10/2021 750,000 748,594 0.22Russian Agricultural Bank Via RSHB Capital 8.500% 16/10/2023 200,000 215,500 0.06Sberbank of Russia Via SB Capital 6.125% 07/02/2022 400,000 425,500 0.12Sberbank of Russia Via SB Capital 5.125% 29/10/2022 400,000 415,375 0.12Sberbank of Russia Via SB Capital 5.250% 23/05/2023 410,000 426,400 0.12Siam Commercial Bank 2.750% 16/05/2023 600,000 599,141 0.17Siam Commercial Bank 3.900% 11/02/2024 400,000 418,643 0.12SIB Sukuk III 3.084% 08/09/2021 210,000 210,000 0.06SIB Sukuk III 4.231% 18/04/2023 200,000 205,781 0.06State Bank of India 3.250% 24/01/2022 200,000 202,156 0.06State Bank of India 4.500% 28/09/2023 200,000 210,231 0.06State Bank of India 4.375% 24/01/2024 530,000 554,016 0.16State Bank of India 4.875% 17/04/2024 200,000 213,938 0.06TBC Bank 5.750% 19/06/2024 300,000 299,250 0.09TC Ziraat Bankasi 4.750% 29/04/2021 200,000 193,500 0.06TC Ziraat Bankasi 5.125% 03/05/2022 200,000 188,250 0.05Turkiye Garanti Bankasi 5.250% 13/09/2022 220,000 214,225 0.06Turkiye Garanti Bankasi 5.875% 16/03/2023 200,000 198,250 0.06Turkiye Halk Bankasi 3.875% 05/02/2020 200,000 196,200 0.06Turkiye Halk Bankasi 4.750% 11/02/2021 210,000 193,922 0.06Turkiye Is Bankasi 5.000% 25/06/2021 645,000 627,359 0.18Turkiye Is Bankasi 5.375% 06/10/2021 200,000 192,978 0.06Turkiye Is Bankasi 5.500% 21/04/2022 200,000 192,500 0.05Turkiye Vakiflar Bankasi 5.625% 30/05/2022 300,000 282,891 0.08Turkiye Vakiflar Bankasi 5.750% 30/01/2023 200,000 185,270 0.05Turkiye Vakiflar Bankasi 8.125% 28/03/2024 200,000 195,750 0.06Union Bank of the Philippines- SG 3.369% 29/11/2022 100,000 101,145 0.03Union Bank of the Philippines- US 3.369% 29/11/2022 300,000 302,685 0.09Union National Bank 4.000% 13/03/2023 475,000 492,664 0.14United Bank for Africa 7.750% 08/06/2022 570,000 601,350 0.17Vnesheconombank Via VEB Finance 6.025% 05/07/2022 400,000 421,000 0.12Vnesheconombank Via VEB Finance 5.942% 21/11/2023 310,000 329,375 0.09VTB Bank Via VTB Capital 6.950% 17/10/2022 400,000 423,000 0.12Woori Bank 4.750% 30/04/2024 1,000,000 1,069,687 0.31Yapi ve Kredi Bankasi 5.750% 24/02/2022 400,000 391,000 0.11Yapi ve Kredi Bankasi 8.250% 15/10/2024 240,000 244,525 0.07Zenith Bank 7.375% 30/05/2022 430,000 456,338 0.13
Beverages (0.04%) Coca-Cola Femsa 3.875% 26/11/2023 150,000 157,734 0.04
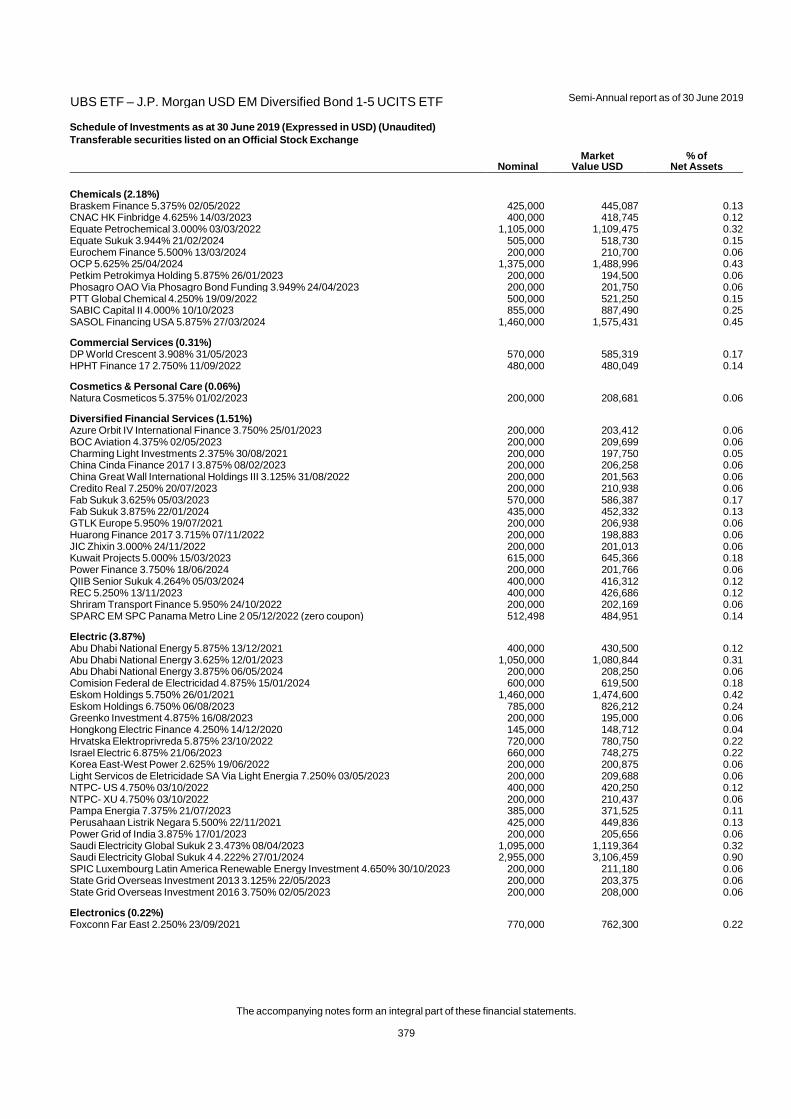
UBS ETF – J.P. Morgan USD EM Diversified Bond 1-5 UCITS ETF
Semi-Annual report as of 30 June 2019
The accompanying notes form an integral part of these financial statements.
379
Schedule of Investments as at 30 June 2019 (Expressed in USD) (Unaudited)
Transferable securities listed on an Official Stock Exchange
Nominal Market
Value USD % of
Net Assets
Chemicals (2.18%) Braskem Finance 5.375% 02/05/2022 425,000 445,087 0.13CNAC HK Finbridge 4.625% 14/03/2023 400,000 418,745 0.12Equate Petrochemical 3.000% 03/03/2022 1,105,000 1,109,475 0.32Equate Sukuk 3.944% 21/02/2024 505,000 518,730 0.15Eurochem Finance 5.500% 13/03/2024 200,000 210,700 0.06OCP 5.625% 25/04/2024 1,375,000 1,488,996 0.43Petkim Petrokimya Holding 5.875% 26/01/2023 200,000 194,500 0.06Phosagro OAO Via Phosagro Bond Funding 3.949% 24/04/2023 200,000 201,750 0.06PTT Global Chemical 4.250% 19/09/2022 500,000 521,250 0.15SABIC Capital II 4.000% 10/10/2023 855,000 887,490 0.25SASOL Financing USA 5.875% 27/03/2024 1,460,000 1,575,431 0.45
Commercial Services (0.31%) DP World Crescent 3.908% 31/05/2023 570,000 585,319 0.17HPHT Finance 17 2.750% 11/09/2022 480,000 480,049 0.14
Cosmetics & Personal Care (0.06%) Natura Cosmeticos 5.375% 01/02/2023 200,000 208,681 0.06
Diversified Financial Services (1.51%) Azure Orbit IV International Finance 3.750% 25/01/2023 200,000 203,412 0.06BOC Aviation 4.375% 02/05/2023 200,000 209,699 0.06Charming Light Investments 2.375% 30/08/2021 200,000 197,750 0.05China Cinda Finance 2017 I 3.875% 08/02/2023 200,000 206,258 0.06China Great Wall International Holdings III 3.125% 31/08/2022 200,000 201,563 0.06Credito Real 7.250% 20/07/2023 200,000 210,938 0.06Fab Sukuk 3.625% 05/03/2023 570,000 586,387 0.17Fab Sukuk 3.875% 22/01/2024 435,000 452,332 0.13GTLK Europe 5.950% 19/07/2021 200,000 206,938 0.06Huarong Finance 2017 3.715% 07/11/2022 200,000 198,883 0.06JIC Zhixin 3.000% 24/11/2022 200,000 201,013 0.06Kuwait Projects 5.000% 15/03/2023 615,000 645,366 0.18Power Finance 3.750% 18/06/2024 200,000 201,766 0.06QIIB Senior Sukuk 4.264% 05/03/2024 400,000 416,312 0.12REC 5.250% 13/11/2023 400,000 426,686 0.12Shriram Transport Finance 5.950% 24/10/2022 200,000 202,169 0.06SPARC EM SPC Panama Metro Line 2 05/12/2022 (zero coupon) 512,498 484,951 0.14
Electric (3.87%) Abu Dhabi National Energy 5.875% 13/12/2021 400,000 430,500 0.12Abu Dhabi National Energy 3.625% 12/01/2023 1,050,000 1,080,844 0.31Abu Dhabi National Energy 3.875% 06/05/2024 200,000 208,250 0.06Comision Federal de Electricidad 4.875% 15/01/2024 600,000 619,500 0.18Eskom Holdings 5.750% 26/01/2021 1,460,000 1,474,600 0.42Eskom Holdings 6.750% 06/08/2023 785,000 826,212 0.24Greenko Investment 4.875% 16/08/2023 200,000 195,000 0.06Hongkong Electric Finance 4.250% 14/12/2020 145,000 148,712 0.04Hrvatska Elektroprivreda 5.875% 23/10/2022 720,000 780,750 0.22Israel Electric 6.875% 21/06/2023 660,000 748,275 0.22Korea East-West Power 2.625% 19/06/2022 200,000 200,875 0.06Light Servicos de Eletricidade SA Via Light Energia 7.250% 03/05/2023 200,000 209,688 0.06NTPC- US 4.750% 03/10/2022 400,000 420,250 0.12NTPC- XU 4.750% 03/10/2022 200,000 210,437 0.06Pampa Energia 7.375% 21/07/2023 385,000 371,525 0.11Perusahaan Listrik Negara 5.500% 22/11/2021 425,000 449,836 0.13Power Grid of India 3.875% 17/01/2023 200,000 205,656 0.06Saudi Electricity Global Sukuk 2 3.473% 08/04/2023 1,095,000 1,119,364 0.32Saudi Electricity Global Sukuk 4 4.222% 27/01/2024 2,955,000 3,106,459 0.90SPIC Luxembourg Latin America Renewable Energy Investment 4.650% 30/10/2023 200,000 211,180 0.06State Grid Overseas Investment 2013 3.125% 22/05/2023 200,000 203,375 0.06State Grid Overseas Investment 2016 3.750% 02/05/2023 200,000 208,000 0.06
Electronics (0.22%) Foxconn Far East 2.250% 23/09/2021 770,000 762,300 0.22

UBS ETF – J.P. Morgan USD EM Diversified Bond 1-5 UCITS ETF
Semi-Annual report as of 30 June 2019
The accompanying notes form an integral part of these financial statements.
380
Schedule of Investments as at 30 June 2019 (Expressed in USD) (Unaudited)
Transferable securities listed on an Official Stock Exchange
Nominal Market
Value USD % of
Net Assets
Energy - Alternate Sources (0.12%) Adani Green Energy UP via Prayatna Developers Pvt via Parampujya Solar Energ 6.250% 10/12/2024 200,000 204,750 0.06Azure Power Energy 5.500% 03/11/2022 200,000 201,588 0.06
Engineering & Construction (0.06%) China Railway Xunjie 2.875% 25/07/2022 200,000 200,875 0.06
Food (0.78%) Almarai Sukuk 4.311% 05/03/2024 200,000 209,313 0.06Arcor 6.000% 06/07/2023 380,000 378,138 0.11BRF 3.950% 22/05/2023 200,000 196,620 0.06Cencosud 4.875% 20/01/2023 1,000,000 1,045,000 0.30Grupo Bimbo 4.500% 25/01/2022 250,000 259,219 0.07JBS Investments 7.250% 03/04/2024 200,000 207,406 0.06MARB BondCo 7.000% 15/03/2024 400,000 415,034 0.12
Forest Products & Paper (0.06%) Fibria Overseas Finance 5.250% 12/05/2024 185,000 196,447 0.06
Gas (0.19%) Perusahaan Gas Negara 5.125% 16/05/2024 600,000 645,750 0.19
Holding Companies - Diversified Operations (1.02%) CK Hutchison International 17 2.875% 05/04/2022 485,000 489,244 0.14Hutchison Whampoa International 11 4.625% 13/01/2022 1,330,000 1,394,422 0.40Hutchison Whampoa International 12 II 3.250% 08/11/2022 200,000 204,375 0.06KOC Holding 6.500% 11/03/2025 200,000 200,000 0.06State Elite Global 2.750% 13/06/2022 200,000 200,630 0.06Swire Pacific MTN Financing 4.500% 28/02/2022 200,000 209,562 0.06Swire Pacific MTN Financing 4.500% 09/10/2023 400,000 430,000 0.12Swire Pacific MTN Financing 3.000% 05/07/2024 400,000 404,500 0.12
Home Furnishings (0.06%) Arcelik 5.000% 03/04/2023 200,000 193,979 0.06
Insurance (0.17%) AIA Group 3.125% 13/03/2023 400,000 408,625 0.12Fortune Star 5.250% 23/03/2022 200,000 198,906 0.05
Internet (0.23%) Alibaba Group Holding 3.125% 28/11/2021 200,000 202,764 0.06Baidu 3.875% 29/09/2023 200,000 207,897 0.06Tencent Holdings 2.985% 19/01/2023 200,000 201,447 0.06Weibo 3.500% 05/07/2024 200,000 201,112 0.05
Investment Companies (0.06%) Mumtalakat Sukuk Holding 5.625% 27/02/2024 200,000 204,438 0.06
Iron & Steel (1.11%) Evraz 5.250% 02/04/2024 600,000 625,500 0.18Gerdau Trade 4.750% 15/04/2023 200,000 209,000 0.06GTL Trade Finance via Gerdau Holdings 5.893% 29/04/2024 200,000 218,688 0.06JSW Steel 5.950% 18/04/2024 200,000 206,188 0.06Metinvest- IE 7.750% 23/04/2023 697,000 722,789 0.21Metinvest- US 7.750% 23/04/2023 235,000 242,520 0.07Novolipetsk Steel Via Steel Funding 4.500% 15/06/2023 200,000 206,000 0.06Posco 4.250% 28/10/2020 135,000 138,055 0.04Posco 4.000% 01/08/2023 1,000,000 1,044,955 0.30Vale Overseas 4.375% 11/01/2022 220,000 226,806 0.07
Lodging (1.01%) Sands China 4.600% 08/08/2023 1,885,000 1,985,730 0.57Studio City 7.250% 30/11/2021 860,000 890,906 0.26Studio City Finance 7.250% 11/02/2024 610,000 632,875 0.18
Media (1.15%) Altice Financing 6.625% 15/02/2023 1,585,000 1,624,625 0.47Altice Financing 6.625% 15/02/2023 495,000 507,375 0.14
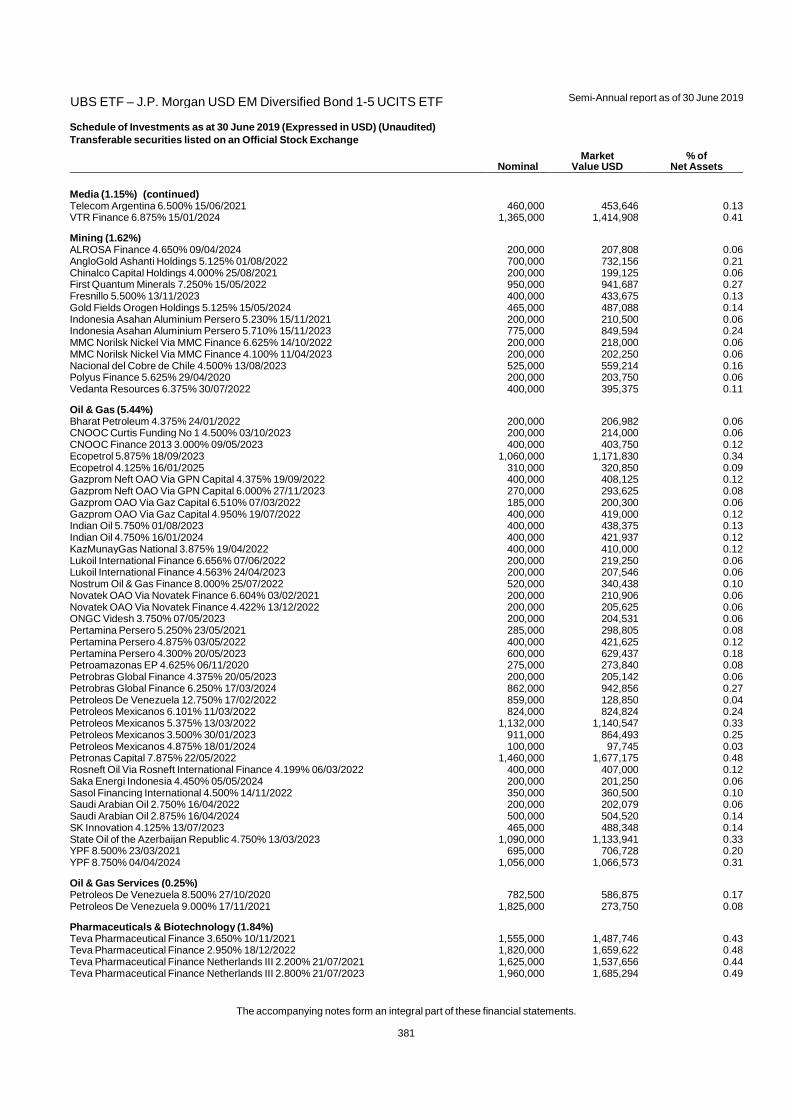
UBS ETF – J.P. Morgan USD EM Diversified Bond 1-5 UCITS ETF
Semi-Annual report as of 30 June 2019
The accompanying notes form an integral part of these financial statements.
381
Schedule of Investments as at 30 June 2019 (Expressed in USD) (Unaudited)
Transferable securities listed on an Official Stock Exchange
Nominal Market
Value USD % of
Net Assets
Media (1.15%) (continued) Telecom Argentina 6.500% 15/06/2021 460,000 453,646 0.13VTR Finance 6.875% 15/01/2024 1,365,000 1,414,908 0.41
Mining (1.62%) ALROSA Finance 4.650% 09/04/2024 200,000 207,808 0.06AngloGold Ashanti Holdings 5.125% 01/08/2022 700,000 732,156 0.21Chinalco Capital Holdings 4.000% 25/08/2021 200,000 199,125 0.06First Quantum Minerals 7.250% 15/05/2022 950,000 941,687 0.27Fresnillo 5.500% 13/11/2023 400,000 433,675 0.13Gold Fields Orogen Holdings 5.125% 15/05/2024 465,000 487,088 0.14Indonesia Asahan Aluminium Persero 5.230% 15/11/2021 200,000 210,500 0.06Indonesia Asahan Aluminium Persero 5.710% 15/11/2023 775,000 849,594 0.24MMC Norilsk Nickel Via MMC Finance 6.625% 14/10/2022 200,000 218,000 0.06MMC Norilsk Nickel Via MMC Finance 4.100% 11/04/2023 200,000 202,250 0.06Nacional del Cobre de Chile 4.500% 13/08/2023 525,000 559,214 0.16Polyus Finance 5.625% 29/04/2020 200,000 203,750 0.06Vedanta Resources 6.375% 30/07/2022 400,000 395,375 0.11
Oil & Gas (5.44%) Bharat Petroleum 4.375% 24/01/2022 200,000 206,982 0.06CNOOC Curtis Funding No 1 4.500% 03/10/2023 200,000 214,000 0.06CNOOC Finance 2013 3.000% 09/05/2023 400,000 403,750 0.12Ecopetrol 5.875% 18/09/2023 1,060,000 1,171,830 0.34Ecopetrol 4.125% 16/01/2025 310,000 320,850 0.09Gazprom Neft OAO Via GPN Capital 4.375% 19/09/2022 400,000 408,125 0.12Gazprom Neft OAO Via GPN Capital 6.000% 27/11/2023 270,000 293,625 0.08Gazprom OAO Via Gaz Capital 6.510% 07/03/2022 185,000 200,300 0.06Gazprom OAO Via Gaz Capital 4.950% 19/07/2022 400,000 419,000 0.12Indian Oil 5.750% 01/08/2023 400,000 438,375 0.13Indian Oil 4.750% 16/01/2024 400,000 421,937 0.12KazMunayGas National 3.875% 19/04/2022 400,000 410,000 0.12Lukoil International Finance 6.656% 07/06/2022 200,000 219,250 0.06Lukoil International Finance 4.563% 24/04/2023 200,000 207,546 0.06Nostrum Oil & Gas Finance 8.000% 25/07/2022 520,000 340,438 0.10Novatek OAO Via Novatek Finance 6.604% 03/02/2021 200,000 210,906 0.06Novatek OAO Via Novatek Finance 4.422% 13/12/2022 200,000 205,625 0.06ONGC Videsh 3.750% 07/05/2023 200,000 204,531 0.06Pertamina Persero 5.250% 23/05/2021 285,000 298,805 0.08Pertamina Persero 4.875% 03/05/2022 400,000 421,625 0.12Pertamina Persero 4.300% 20/05/2023 600,000 629,437 0.18Petroamazonas EP 4.625% 06/11/2020 275,000 273,840 0.08Petrobras Global Finance 4.375% 20/05/2023 200,000 205,142 0.06Petrobras Global Finance 6.250% 17/03/2024 862,000 942,856 0.27Petroleos De Venezuela 12.750% 17/02/2022 859,000 128,850 0.04Petroleos Mexicanos 6.101% 11/03/2022 824,000 824,824 0.24Petroleos Mexicanos 5.375% 13/03/2022 1,132,000 1,140,547 0.33Petroleos Mexicanos 3.500% 30/01/2023 911,000 864,493 0.25Petroleos Mexicanos 4.875% 18/01/2024 100,000 97,745 0.03Petronas Capital 7.875% 22/05/2022 1,460,000 1,677,175 0.48Rosneft Oil Via Rosneft International Finance 4.199% 06/03/2022 400,000 407,000 0.12Saka Energi Indonesia 4.450% 05/05/2024 200,000 201,250 0.06Sasol Financing International 4.500% 14/11/2022 350,000 360,500 0.10Saudi Arabian Oil 2.750% 16/04/2022 200,000 202,079 0.06Saudi Arabian Oil 2.875% 16/04/2024 500,000 504,520 0.14SK Innovation 4.125% 13/07/2023 465,000 488,348 0.14State Oil of the Azerbaijan Republic 4.750% 13/03/2023 1,090,000 1,133,941 0.33YPF 8.500% 23/03/2021 695,000 706,728 0.20YPF 8.750% 04/04/2024 1,056,000 1,066,573 0.31
Oil & Gas Services (0.25%) Petroleos De Venezuela 8.500% 27/10/2020 782,500 586,875 0.17Petroleos De Venezuela 9.000% 17/11/2021 1,825,000 273,750 0.08
Pharmaceuticals & Biotechnology (1.84%) Teva Pharmaceutical Finance 3.650% 10/11/2021 1,555,000 1,487,746 0.43Teva Pharmaceutical Finance 2.950% 18/12/2022 1,820,000 1,659,622 0.48Teva Pharmaceutical Finance Netherlands III 2.200% 21/07/2021 1,625,000 1,537,656 0.44Teva Pharmaceutical Finance Netherlands III 2.800% 21/07/2023 1,960,000 1,685,294 0.49
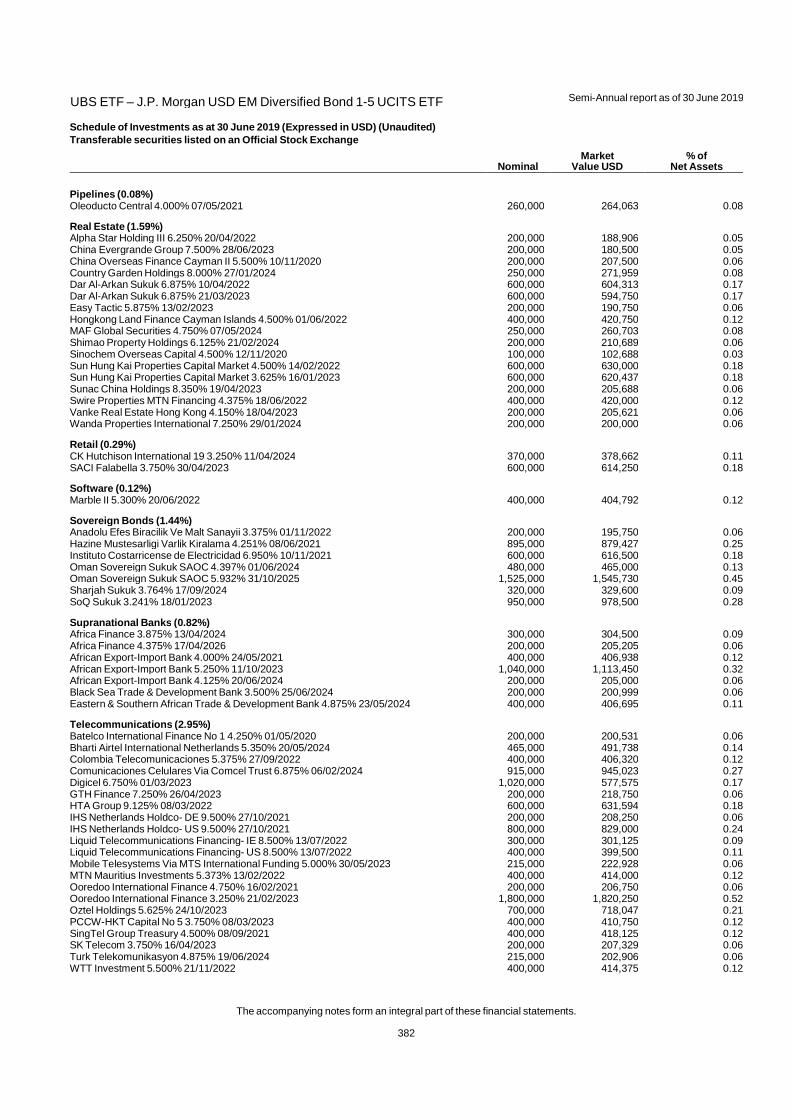
UBS ETF – J.P. Morgan USD EM Diversified Bond 1-5 UCITS ETF
Semi-Annual report as of 30 June 2019
The accompanying notes form an integral part of these financial statements.
382
Schedule of Investments as at 30 June 2019 (Expressed in USD) (Unaudited)
Transferable securities listed on an Official Stock Exchange
Nominal Market
Value USD % of
Net Assets
Pipelines (0.08%) Oleoducto Central 4.000% 07/05/2021 260,000 264,063 0.08
Real Estate (1.59%) Alpha Star Holding III 6.250% 20/04/2022 200,000 188,906 0.05China Evergrande Group 7.500% 28/06/2023 200,000 180,500 0.05China Overseas Finance Cayman II 5.500% 10/11/2020 200,000 207,500 0.06Country Garden Holdings 8.000% 27/01/2024 250,000 271,959 0.08Dar Al-Arkan Sukuk 6.875% 10/04/2022 600,000 604,313 0.17Dar Al-Arkan Sukuk 6.875% 21/03/2023 600,000 594,750 0.17Easy Tactic 5.875% 13/02/2023 200,000 190,750 0.06Hongkong Land Finance Cayman Islands 4.500% 01/06/2022 400,000 420,750 0.12MAF Global Securities 4.750% 07/05/2024 250,000 260,703 0.08Shimao Property Holdings 6.125% 21/02/2024 200,000 210,689 0.06Sinochem Overseas Capital 4.500% 12/11/2020 100,000 102,688 0.03Sun Hung Kai Properties Capital Market 4.500% 14/02/2022 600,000 630,000 0.18Sun Hung Kai Properties Capital Market 3.625% 16/01/2023 600,000 620,437 0.18Sunac China Holdings 8.350% 19/04/2023 200,000 205,688 0.06Swire Properties MTN Financing 4.375% 18/06/2022 400,000 420,000 0.12Vanke Real Estate Hong Kong 4.150% 18/04/2023 200,000 205,621 0.06Wanda Properties International 7.250% 29/01/2024 200,000 200,000 0.06
Retail (0.29%) CK Hutchison International 19 3.250% 11/04/2024 370,000 378,662 0.11SACI Falabella 3.750% 30/04/2023 600,000 614,250 0.18
Software (0.12%) Marble II 5.300% 20/06/2022 400,000 404,792 0.12
Sovereign Bonds (1.44%) Anadolu Efes Biracilik Ve Malt Sanayii 3.375% 01/11/2022 200,000 195,750 0.06Hazine Mustesarligi Varlik Kiralama 4.251% 08/06/2021 895,000 879,427 0.25Instituto Costarricense de Electricidad 6.950% 10/11/2021 600,000 616,500 0.18Oman Sovereign Sukuk SAOC 4.397% 01/06/2024 480,000 465,000 0.13Oman Sovereign Sukuk SAOC 5.932% 31/10/2025 1,525,000 1,545,730 0.45Sharjah Sukuk 3.764% 17/09/2024 320,000 329,600 0.09SoQ Sukuk 3.241% 18/01/2023 950,000 978,500 0.28
Supranational Banks (0.82%) Africa Finance 3.875% 13/04/2024 300,000 304,500 0.09Africa Finance 4.375% 17/04/2026 200,000 205,205 0.06African Export-Import Bank 4.000% 24/05/2021 400,000 406,938 0.12African Export-Import Bank 5.250% 11/10/2023 1,040,000 1,113,450 0.32African Export-Import Bank 4.125% 20/06/2024 200,000 205,000 0.06Black Sea Trade & Development Bank 3.500% 25/06/2024 200,000 200,999 0.06Eastern & Southern African Trade & Development Bank 4.875% 23/05/2024 400,000 406,695 0.11
Telecommunications (2.95%) Batelco International Finance No 1 4.250% 01/05/2020 200,000 200,531 0.06Bharti Airtel International Netherlands 5.350% 20/05/2024 465,000 491,738 0.14Colombia Telecomunicaciones 5.375% 27/09/2022 400,000 406,320 0.12Comunicaciones Celulares Via Comcel Trust 6.875% 06/02/2024 915,000 945,023 0.27Digicel 6.750% 01/03/2023 1,020,000 577,575 0.17GTH Finance 7.250% 26/04/2023 200,000 218,750 0.06HTA Group 9.125% 08/03/2022 600,000 631,594 0.18IHS Netherlands Holdco- DE 9.500% 27/10/2021 200,000 208,250 0.06IHS Netherlands Holdco- US 9.500% 27/10/2021 800,000 829,000 0.24Liquid Telecommunications Financing- IE 8.500% 13/07/2022 300,000 301,125 0.09Liquid Telecommunications Financing- US 8.500% 13/07/2022 400,000 399,500 0.11Mobile Telesystems Via MTS International Funding 5.000% 30/05/2023 215,000 222,928 0.06MTN Mauritius Investments 5.373% 13/02/2022 400,000 414,000 0.12Ooredoo International Finance 4.750% 16/02/2021 200,000 206,750 0.06Ooredoo International Finance 3.250% 21/02/2023 1,800,000 1,820,250 0.52Oztel Holdings 5.625% 24/10/2023 700,000 718,047 0.21PCCW-HKT Capital No 5 3.750% 08/03/2023 400,000 410,750 0.12SingTel Group Treasury 4.500% 08/09/2021 400,000 418,125 0.12SK Telecom 3.750% 16/04/2023 200,000 207,329 0.06Turk Telekomunikasyon 4.875% 19/06/2024 215,000 202,906 0.06WTT Investment 5.500% 21/11/2022 400,000 414,375 0.12
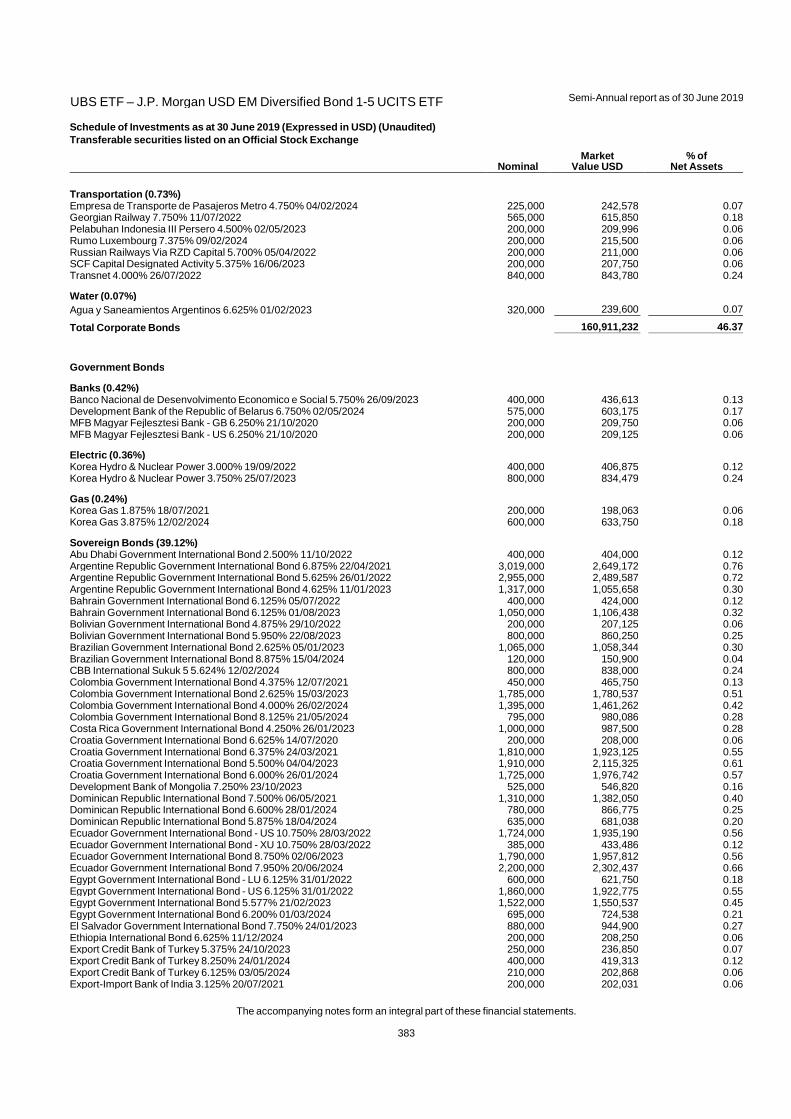
UBS ETF – J.P. Morgan USD EM Diversified Bond 1-5 UCITS ETF
Semi-Annual report as of 30 June 2019
The accompanying notes form an integral part of these financial statements.
383
Schedule of Investments as at 30 June 2019 (Expressed in USD) (Unaudited)
Transferable securities listed on an Official Stock Exchange
Nominal Market
Value USD % of
Net Assets
Transportation (0.73%) Empresa de Transporte de Pasajeros Metro 4.750% 04/02/2024 225,000 242,578 0.07Georgian Railway 7.750% 11/07/2022 565,000 615,850 0.18Pelabuhan Indonesia III Persero 4.500% 02/05/2023 200,000 209,996 0.06Rumo Luxembourg 7.375% 09/02/2024 200,000 215,500 0.06Russian Railways Via RZD Capital 5.700% 05/04/2022 200,000 211,000 0.06SCF Capital Designated Activity 5.375% 16/06/2023 200,000 207,750 0.06Transnet 4.000% 26/07/2022 840,000 843,780 0.24
Water (0.07%) Agua y Saneamientos Argentinos 6.625% 01/02/2023 320,000 239,600 0.07
Total Corporate Bonds 160,911,232 46.37
Government Bonds
Banks (0.42%) Banco Nacional de Desenvolvimento Economico e Social 5.750% 26/09/2023 400,000 436,613 0.13Development Bank of the Republic of Belarus 6.750% 02/05/2024 575,000 603,175 0.17MFB Magyar Fejlesztesi Bank - GB 6.250% 21/10/2020 200,000 209,750 0.06MFB Magyar Fejlesztesi Bank - US 6.250% 21/10/2020 200,000 209,125 0.06
Electric (0.36%) Korea Hydro & Nuclear Power 3.000% 19/09/2022 400,000 406,875 0.12Korea Hydro & Nuclear Power 3.750% 25/07/2023 800,000 834,479 0.24
Gas (0.24%) Korea Gas 1.875% 18/07/2021 200,000 198,063 0.06Korea Gas 3.875% 12/02/2024 600,000 633,750 0.18
Sovereign Bonds (39.12%) Abu Dhabi Government International Bond 2.500% 11/10/2022 400,000 404,000 0.12Argentine Republic Government International Bond 6.875% 22/04/2021 3,019,000 2,649,172 0.76Argentine Republic Government International Bond 5.625% 26/01/2022 2,955,000 2,489,587 0.72Argentine Republic Government International Bond 4.625% 11/01/2023 1,317,000 1,055,658 0.30Bahrain Government International Bond 6.125% 05/07/2022 400,000 424,000 0.12Bahrain Government International Bond 6.125% 01/08/2023 1,050,000 1,106,438 0.32Bolivian Government International Bond 4.875% 29/10/2022 200,000 207,125 0.06Bolivian Government International Bond 5.950% 22/08/2023 800,000 860,250 0.25Brazilian Government International Bond 2.625% 05/01/2023 1,065,000 1,058,344 0.30Brazilian Government International Bond 8.875% 15/04/2024 120,000 150,900 0.04CBB International Sukuk 5 5.624% 12/02/2024 800,000 838,000 0.24Colombia Government International Bond 4.375% 12/07/2021 450,000 465,750 0.13Colombia Government International Bond 2.625% 15/03/2023 1,785,000 1,780,537 0.51Colombia Government International Bond 4.000% 26/02/2024 1,395,000 1,461,262 0.42Colombia Government International Bond 8.125% 21/05/2024 795,000 980,086 0.28Costa Rica Government International Bond 4.250% 26/01/2023 1,000,000 987,500 0.28Croatia Government International Bond 6.625% 14/07/2020 200,000 208,000 0.06Croatia Government International Bond 6.375% 24/03/2021 1,810,000 1,923,125 0.55Croatia Government International Bond 5.500% 04/04/2023 1,910,000 2,115,325 0.61Croatia Government International Bond 6.000% 26/01/2024 1,725,000 1,976,742 0.57Development Bank of Mongolia 7.250% 23/10/2023 525,000 546,820 0.16Dominican Republic International Bond 7.500% 06/05/2021 1,310,000 1,382,050 0.40Dominican Republic International Bond 6.600% 28/01/2024 780,000 866,775 0.25Dominican Republic International Bond 5.875% 18/04/2024 635,000 681,038 0.20Ecuador Government International Bond - US 10.750% 28/03/2022 1,724,000 1,935,190 0.56Ecuador Government International Bond - XU 10.750% 28/03/2022 385,000 433,486 0.12Ecuador Government International Bond 8.750% 02/06/2023 1,790,000 1,957,812 0.56Ecuador Government International Bond 7.950% 20/06/2024 2,200,000 2,302,437 0.66Egypt Government International Bond - LU 6.125% 31/01/2022 600,000 621,750 0.18Egypt Government International Bond - US 6.125% 31/01/2022 1,860,000 1,922,775 0.55Egypt Government International Bond 5.577% 21/02/2023 1,522,000 1,550,537 0.45Egypt Government International Bond 6.200% 01/03/2024 695,000 724,538 0.21El Salvador Government International Bond 7.750% 24/01/2023 880,000 944,900 0.27Ethiopia International Bond 6.625% 11/12/2024 200,000 208,250 0.06Export Credit Bank of Turkey 5.375% 24/10/2023 250,000 236,850 0.07Export Credit Bank of Turkey 8.250% 24/01/2024 400,000 419,313 0.12Export Credit Bank of Turkey 6.125% 03/05/2024 210,000 202,868 0.06Export-Import Bank of India 3.125% 20/07/2021 200,000 202,031 0.06
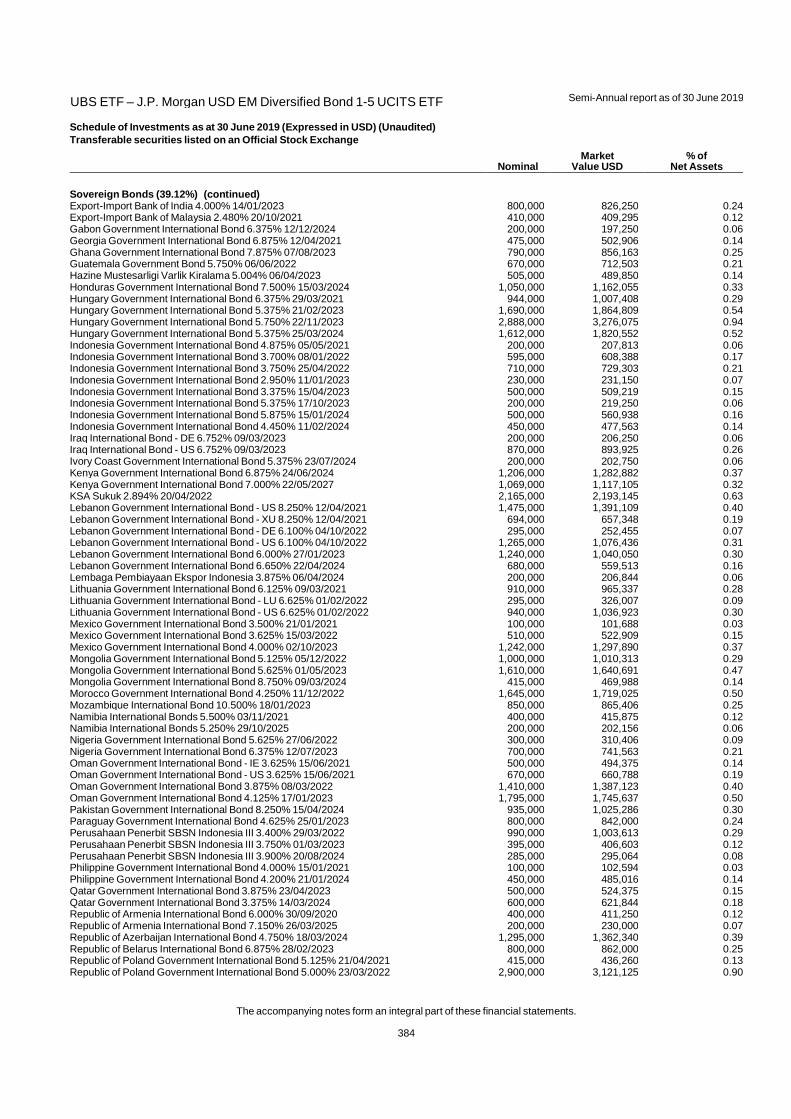
UBS ETF – J.P. Morgan USD EM Diversified Bond 1-5 UCITS ETF
Semi-Annual report as of 30 June 2019
The accompanying notes form an integral part of these financial statements.
384
Schedule of Investments as at 30 June 2019 (Expressed in USD) (Unaudited)
Transferable securities listed on an Official Stock Exchange
Nominal Market
Value USD % of
Net Assets
Sovereign Bonds (39.12%) (continued) Export-Import Bank of India 4.000% 14/01/2023 800,000 826,250 0.24Export-Import Bank of Malaysia 2.480% 20/10/2021 410,000 409,295 0.12Gabon Government International Bond 6.375% 12/12/2024 200,000 197,250 0.06Georgia Government International Bond 6.875% 12/04/2021 475,000 502,906 0.14Ghana Government International Bond 7.875% 07/08/2023 790,000 856,163 0.25Guatemala Government Bond 5.750% 06/06/2022 670,000 712,503 0.21Hazine Mustesarligi Varlik Kiralama 5.004% 06/04/2023 505,000 489,850 0.14Honduras Government International Bond 7.500% 15/03/2024 1,050,000 1,162,055 0.33Hungary Government International Bond 6.375% 29/03/2021 944,000 1,007,408 0.29Hungary Government International Bond 5.375% 21/02/2023 1,690,000 1,864,809 0.54Hungary Government International Bond 5.750% 22/11/2023 2,888,000 3,276,075 0.94Hungary Government International Bond 5.375% 25/03/2024 1,612,000 1,820,552 0.52Indonesia Government International Bond 4.875% 05/05/2021 200,000 207,813 0.06Indonesia Government International Bond 3.700% 08/01/2022 595,000 608,388 0.17Indonesia Government International Bond 3.750% 25/04/2022 710,000 729,303 0.21Indonesia Government International Bond 2.950% 11/01/2023 230,000 231,150 0.07Indonesia Government International Bond 3.375% 15/04/2023 500,000 509,219 0.15Indonesia Government International Bond 5.375% 17/10/2023 200,000 219,250 0.06Indonesia Government International Bond 5.875% 15/01/2024 500,000 560,938 0.16Indonesia Government International Bond 4.450% 11/02/2024 450,000 477,563 0.14Iraq International Bond - DE 6.752% 09/03/2023 200,000 206,250 0.06Iraq International Bond - US 6.752% 09/03/2023 870,000 893,925 0.26Ivory Coast Government International Bond 5.375% 23/07/2024 200,000 202,750 0.06Kenya Government International Bond 6.875% 24/06/2024 1,206,000 1,282,882 0.37Kenya Government International Bond 7.000% 22/05/2027 1,069,000 1,117,105 0.32KSA Sukuk 2.894% 20/04/2022 2,165,000 2,193,145 0.63Lebanon Government International Bond - US 8.250% 12/04/2021 1,475,000 1,391,109 0.40Lebanon Government International Bond - XU 8.250% 12/04/2021 694,000 657,348 0.19Lebanon Government International Bond - DE 6.100% 04/10/2022 295,000 252,455 0.07Lebanon Government International Bond - US 6.100% 04/10/2022 1,265,000 1,076,436 0.31Lebanon Government International Bond 6.000% 27/01/2023 1,240,000 1,040,050 0.30Lebanon Government International Bond 6.650% 22/04/2024 680,000 559,513 0.16Lembaga Pembiayaan Ekspor Indonesia 3.875% 06/04/2024 200,000 206,844 0.06Lithuania Government International Bond 6.125% 09/03/2021 910,000 965,337 0.28Lithuania Government International Bond - LU 6.625% 01/02/2022 295,000 326,007 0.09Lithuania Government International Bond - US 6.625% 01/02/2022 940,000 1,036,923 0.30Mexico Government International Bond 3.500% 21/01/2021 100,000 101,688 0.03Mexico Government International Bond 3.625% 15/03/2022 510,000 522,909 0.15Mexico Government International Bond 4.000% 02/10/2023 1,242,000 1,297,890 0.37Mongolia Government International Bond 5.125% 05/12/2022 1,000,000 1,010,313 0.29Mongolia Government International Bond 5.625% 01/05/2023 1,610,000 1,640,691 0.47Mongolia Government International Bond 8.750% 09/03/2024 415,000 469,988 0.14Morocco Government International Bond 4.250% 11/12/2022 1,645,000 1,719,025 0.50Mozambique International Bond 10.500% 18/01/2023 850,000 865,406 0.25Namibia International Bonds 5.500% 03/11/2021 400,000 415,875 0.12Namibia International Bonds 5.250% 29/10/2025 200,000 202,156 0.06Nigeria Government International Bond 5.625% 27/06/2022 300,000 310,406 0.09Nigeria Government International Bond 6.375% 12/07/2023 700,000 741,563 0.21Oman Government International Bond - IE 3.625% 15/06/2021 500,000 494,375 0.14Oman Government International Bond - US 3.625% 15/06/2021 670,000 660,788 0.19Oman Government International Bond 3.875% 08/03/2022 1,410,000 1,387,123 0.40Oman Government International Bond 4.125% 17/01/2023 1,795,000 1,745,637 0.50Pakistan Government International Bond 8.250% 15/04/2024 935,000 1,025,286 0.30Paraguay Government International Bond 4.625% 25/01/2023 800,000 842,000 0.24Perusahaan Penerbit SBSN Indonesia III 3.400% 29/03/2022 990,000 1,003,613 0.29Perusahaan Penerbit SBSN Indonesia III 3.750% 01/03/2023 395,000 406,603 0.12Perusahaan Penerbit SBSN Indonesia III 3.900% 20/08/2024 285,000 295,064 0.08Philippine Government International Bond 4.000% 15/01/2021 100,000 102,594 0.03Philippine Government International Bond 4.200% 21/01/2024 450,000 485,016 0.14Qatar Government International Bond 3.875% 23/04/2023 500,000 524,375 0.15Qatar Government International Bond 3.375% 14/03/2024 600,000 621,844 0.18Republic of Armenia International Bond 6.000% 30/09/2020 400,000 411,250 0.12Republic of Armenia International Bond 7.150% 26/03/2025 200,000 230,000 0.07Republic of Azerbaijan International Bond 4.750% 18/03/2024 1,295,000 1,362,340 0.39Republic of Belarus International Bond 6.875% 28/02/2023 800,000 862,000 0.25Republic of Poland Government International Bond 5.125% 21/04/2021 415,000 436,260 0.13Republic of Poland Government International Bond 5.000% 23/03/2022 2,900,000 3,121,125 0.90
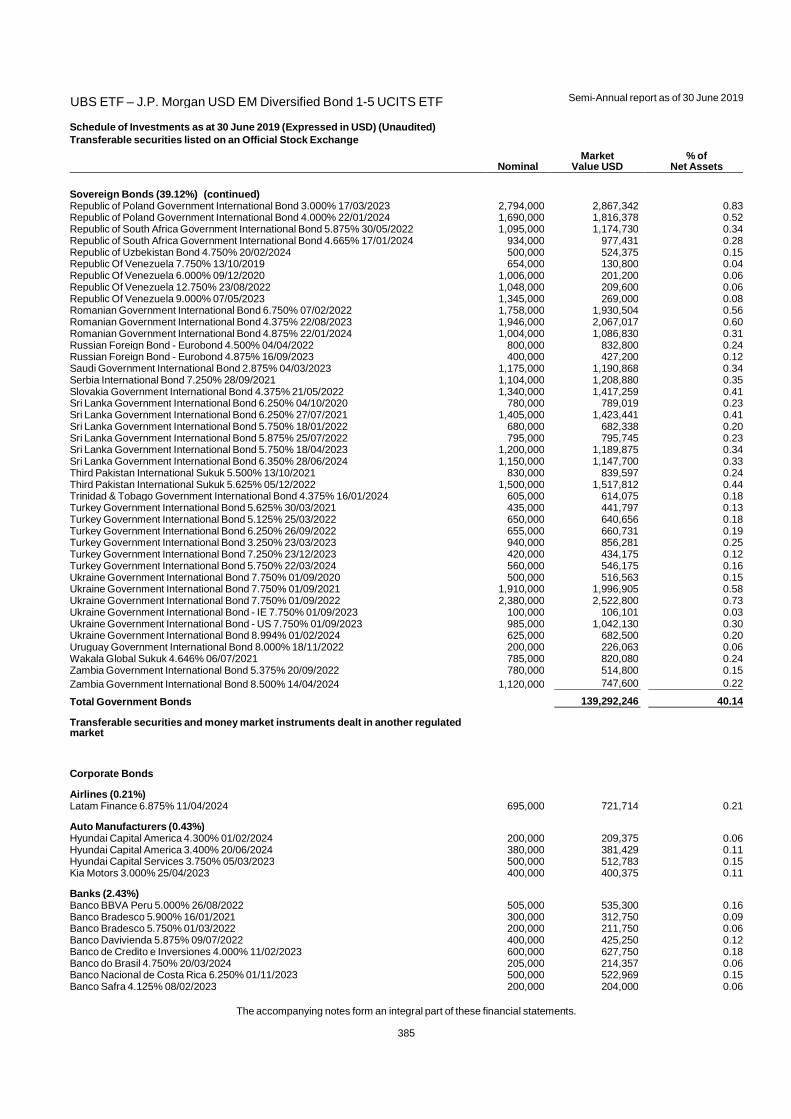
UBS ETF – J.P. Morgan USD EM Diversified Bond 1-5 UCITS ETF
Semi-Annual report as of 30 June 2019
The accompanying notes form an integral part of these financial statements.
385
Schedule of Investments as at 30 June 2019 (Expressed in USD) (Unaudited)
Transferable securities listed on an Official Stock Exchange
Nominal Market
Value USD % of
Net Assets
Sovereign Bonds (39.12%) (continued) Republic of Poland Government International Bond 3.000% 17/03/2023 2,794,000 2,867,342 0.83Republic of Poland Government International Bond 4.000% 22/01/2024 1,690,000 1,816,378 0.52Republic of South Africa Government International Bond 5.875% 30/05/2022 1,095,000 1,174,730 0.34Republic of South Africa Government International Bond 4.665% 17/01/2024 934,000 977,431 0.28Republic of Uzbekistan Bond 4.750% 20/02/2024 500,000 524,375 0.15Republic Of Venezuela 7.750% 13/10/2019 654,000 130,800 0.04Republic Of Venezuela 6.000% 09/12/2020 1,006,000 201,200 0.06Republic Of Venezuela 12.750% 23/08/2022 1,048,000 209,600 0.06Republic Of Venezuela 9.000% 07/05/2023 1,345,000 269,000 0.08Romanian Government International Bond 6.750% 07/02/2022 1,758,000 1,930,504 0.56Romanian Government International Bond 4.375% 22/08/2023 1,946,000 2,067,017 0.60Romanian Government International Bond 4.875% 22/01/2024 1,004,000 1,086,830 0.31Russian Foreign Bond - Eurobond 4.500% 04/04/2022 800,000 832,800 0.24Russian Foreign Bond - Eurobond 4.875% 16/09/2023 400,000 427,200 0.12Saudi Government International Bond 2.875% 04/03/2023 1,175,000 1,190,868 0.34Serbia International Bond 7.250% 28/09/2021 1,104,000 1,208,880 0.35Slovakia Government International Bond 4.375% 21/05/2022 1,340,000 1,417,259 0.41Sri Lanka Government International Bond 6.250% 04/10/2020 780,000 789,019 0.23Sri Lanka Government International Bond 6.250% 27/07/2021 1,405,000 1,423,441 0.41Sri Lanka Government International Bond 5.750% 18/01/2022 680,000 682,338 0.20Sri Lanka Government International Bond 5.875% 25/07/2022 795,000 795,745 0.23Sri Lanka Government International Bond 5.750% 18/04/2023 1,200,000 1,189,875 0.34Sri Lanka Government International Bond 6.350% 28/06/2024 1,150,000 1,147,700 0.33Third Pakistan International Sukuk 5.500% 13/10/2021 830,000 839,597 0.24Third Pakistan International Sukuk 5.625% 05/12/2022 1,500,000 1,517,812 0.44Trinidad & Tobago Government International Bond 4.375% 16/01/2024 605,000 614,075 0.18Turkey Government International Bond 5.625% 30/03/2021 435,000 441,797 0.13Turkey Government International Bond 5.125% 25/03/2022 650,000 640,656 0.18Turkey Government International Bond 6.250% 26/09/2022 655,000 660,731 0.19Turkey Government International Bond 3.250% 23/03/2023 940,000 856,281 0.25Turkey Government International Bond 7.250% 23/12/2023 420,000 434,175 0.12Turkey Government International Bond 5.750% 22/03/2024 560,000 546,175 0.16Ukraine Government International Bond 7.750% 01/09/2020 500,000 516,563 0.15Ukraine Government International Bond 7.750% 01/09/2021 1,910,000 1,996,905 0.58Ukraine Government International Bond 7.750% 01/09/2022 2,380,000 2,522,800 0.73Ukraine Government International Bond - IE 7.750% 01/09/2023 100,000 106,101 0.03Ukraine Government International Bond - US 7.750% 01/09/2023 985,000 1,042,130 0.30Ukraine Government International Bond 8.994% 01/02/2024 625,000 682,500 0.20Uruguay Government International Bond 8.000% 18/11/2022 200,000 226,063 0.06Wakala Global Sukuk 4.646% 06/07/2021 785,000 820,080 0.24Zambia Government International Bond 5.375% 20/09/2022 780,000 514,800 0.15Zambia Government International Bond 8.500% 14/04/2024 1,120,000 747,600 0.22
Total Government Bonds 139,292,246 40.14
Transferable securities and money market instruments dealt in another regulated market
Corporate Bonds
Airlines (0.21%) Latam Finance 6.875% 11/04/2024 695,000 721,714 0.21
Auto Manufacturers (0.43%) Hyundai Capital America 4.300% 01/02/2024 200,000 209,375 0.06Hyundai Capital America 3.400% 20/06/2024 380,000 381,429 0.11Hyundai Capital Services 3.750% 05/03/2023 500,000 512,783 0.15Kia Motors 3.000% 25/04/2023 400,000 400,375 0.11
Banks (2.43%) Banco BBVA Peru 5.000% 26/08/2022 505,000 535,300 0.16Banco Bradesco 5.900% 16/01/2021 300,000 312,750 0.09Banco Bradesco 5.750% 01/03/2022 200,000 211,750 0.06Banco Davivienda 5.875% 09/07/2022 400,000 425,250 0.12Banco de Credito e Inversiones 4.000% 11/02/2023 600,000 627,750 0.18Banco do Brasil 4.750% 20/03/2024 205,000 214,357 0.06Banco Nacional de Costa Rica 6.250% 01/11/2023 500,000 522,969 0.15Banco Safra 4.125% 08/02/2023 200,000 204,000 0.06

UBS ETF – J.P. Morgan USD EM Diversified Bond 1-5 UCITS ETF
Semi-Annual report as of 30 June 2019
The accompanying notes form an integral part of these financial statements.
386
Schedule of Investments as at 30 June 2019 (Expressed in USD) (Unaudited) Transferable securities and money market instruments dealt in another regulated market
Nominal Market
Value USD % of
Net Assets
Banks (2.43%) (continued) Bangkok Bank 3.875% 27/09/2022 229,000 237,373 0.07Banistmo 3.650% 19/09/2022 565,000 567,649 0.16BBVA Bancomer 6.500% 10/03/2021 500,000 524,875 0.15Caixa Economica Federal 3.500% 07/11/2022 165,000 166,650 0.05Grupo Aval 4.750% 26/09/2022 800,000 827,200 0.24Industrial & Commercial Bank of China 2.905% 13/11/2020 250,000 250,687 0.07Industrial Senior Trust 5.500% 01/11/2022 510,000 519,881 0.15Itau Unibanco Holding 5.750% 22/01/2021 910,000 943,556 0.27Itau Unibanco Holding 6.200% 21/12/2021 235,000 249,614 0.07Itau Unibanco Holding 5.500% 06/08/2022 200,000 210,820 0.06Shinhan Bank 3.875% 05/11/2023 650,000 681,765 0.20Turkiye Garanti Bankasi 4.750% 17/10/2019 200,000 199,750 0.06
Building Materials (0.12%) CEMEX Finance 6.000% 01/04/2024 400,000 412,000 0.12
Chemicals (0.27%) Alpek 4.500% 20/11/2022 300,000 308,062 0.09Braskem Finance 6.450% 03/02/2024 200,000 220,750 0.06Mexichem 4.875% 19/09/2022 200,000 210,188 0.06Yingde Gases Investment 6.250% 19/01/2023 200,000 202,250 0.06
Commercial Services (0.17%) Adani Ports & Special Economic Zone 3.950% 19/01/2022 400,000 408,250 0.12Cielo via Cielo USA 3.750% 16/11/2022 200,000 198,000 0.05
Diversified Financial Services (0.16%) BOC Aviation 2.750% 18/09/2022 200,000 199,250 0.06SURA Asset Management 4.875% 17/04/2024 345,000 367,425 0.10
Electric (0.32%) Centrais Eletricas Brasileiras 5.750% 27/10/2021 400,000 419,200 0.12Genneia 8.750% 20/01/2022 310,000 282,972 0.08Korea East-West Power 3.875% 19/07/2023 400,000 419,082 0.12
Electronics (0.31%) Flex 5.000% 15/02/2023 1,015,000 1,061,944 0.31
Engineering & Construction (0.06%) Indo Energy Finance II 6.375% 24/01/2023 200,000 204,125 0.06
Forest Products & Paper (0.33%) Inversiones 4.500% 25/04/2022 310,000 320,753 0.09Inversiones 4.375% 15/05/2023 800,000 831,000 0.24
Holding Companies - Diversified Operations (0.53%) Alfa 5.250% 25/03/2024 200,000 214,000 0.06CK Hutchison International 17 II 2.750% 29/03/2023 1,600,000 1,607,000 0.47
Iron & Steel (0.12%) CSN Resources 7.625% 13/02/2023 200,000 211,000 0.06Severstal OAO Via Steel Capital 5.900% 17/10/2022 200,000 214,500 0.06
Media (0.06%) Prosus 6.000% 18/07/2020 200,000 205,750 0.06
Mining (0.99%) First Quantum Minerals 7.250% 01/04/2023 1,145,000 1,113,512 0.32First Quantum Minerals 6.500% 01/03/2024 785,000 733,975 0.21Petra Diamonds US Treasury 7.250% 01/05/2022 600,000 591,000 0.17Vedanta Resources 8.250% 07/06/2021 405,000 422,719 0.12Volcan Companhia Minera 5.375% 02/02/2022 544,000 564,400 0.17
Oil & Gas (1.49%) CNPC General Capital 3.400% 16/04/2023 200,000 204,375 0.06Dolphin Energy 5.500% 15/12/2021 430,000 455,666 0.13Petroleos Mexicanos 6.375% 04/02/2021 444,000 456,099 0.13Petroleos Mexicanos 4.875% 24/01/2022 215,000 214,462 0.06Petroleos Mexicanos 4.625% 21/09/2023 435,000 427,392 0.12Petronas Capital 3.125% 18/03/2022 335,000 340,653 0.10
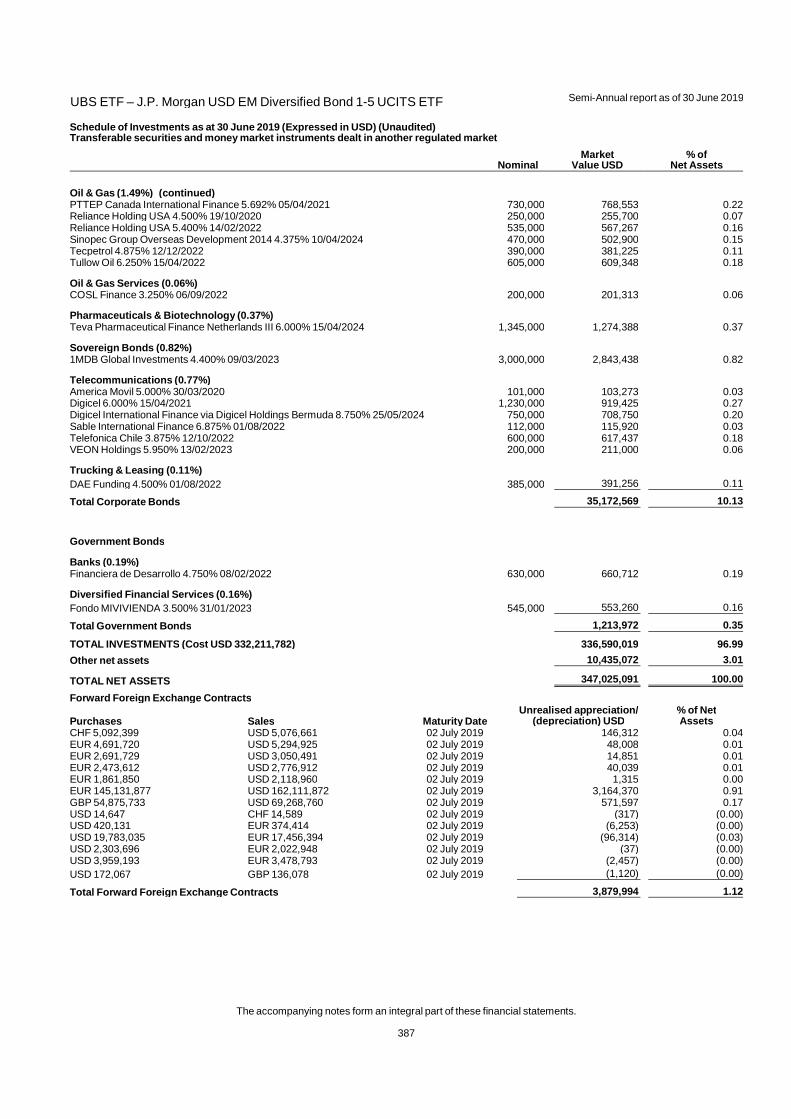
UBS ETF – J.P. Morgan USD EM Diversified Bond 1-5 UCITS ETF
Semi-Annual report as of 30 June 2019
The accompanying notes form an integral part of these financial statements.
387
Schedule of Investments as at 30 June 2019 (Expressed in USD) (Unaudited) Transferable securities and money market instruments dealt in another regulated market
Nominal Market
Value USD % of
Net Assets
Oil & Gas (1.49%) (continued) PTTEP Canada International Finance 5.692% 05/04/2021 730,000 768,553 0.22Reliance Holding USA 4.500% 19/10/2020 250,000 255,700 0.07Reliance Holding USA 5.400% 14/02/2022 535,000 567,267 0.16Sinopec Group Overseas Development 2014 4.375% 10/04/2024 470,000 502,900 0.15Tecpetrol 4.875% 12/12/2022 390,000 381,225 0.11Tullow Oil 6.250% 15/04/2022 605,000 609,348 0.18
Oil & Gas Services (0.06%) COSL Finance 3.250% 06/09/2022 200,000 201,313 0.06
Pharmaceuticals & Biotechnology (0.37%) Teva Pharmaceutical Finance Netherlands III 6.000% 15/04/2024 1,345,000 1,274,388 0.37
Sovereign Bonds (0.82%) 1MDB Global Investments 4.400% 09/03/2023 3,000,000 2,843,438 0.82
Telecommunications (0.77%) America Movil 5.000% 30/03/2020 101,000 103,273 0.03Digicel 6.000% 15/04/2021 1,230,000 919,425 0.27Digicel International Finance via Digicel Holdings Bermuda 8.750% 25/05/2024 750,000 708,750 0.20Sable International Finance 6.875% 01/08/2022 112,000 115,920 0.03Telefonica Chile 3.875% 12/10/2022 600,000 617,437 0.18VEON Holdings 5.950% 13/02/2023 200,000 211,000 0.06
Trucking & Leasing (0.11%) DAE Funding 4.500% 01/08/2022 385,000 391,256 0.11
Total Corporate Bonds 35,172,569 10.13
Government Bonds
Banks (0.19%) Financiera de Desarrollo 4.750% 08/02/2022 630,000 660,712 0.19
Diversified Financial Services (0.16%) Fondo MIVIVIENDA 3.500% 31/01/2023 545,000 553,260 0.16
Total Government Bonds 1,213,972 0.35
TOTAL INVESTMENTS (Cost USD 332,211,782) 336,590,019 96.99
Other net assets 10,435,072 3.01
TOTAL NET ASSETS 347,025,091 100.00
Forward Foreign Exchange Contracts
Purchases Sales Maturity Date Unrealised appreciation/
(depreciation) USD % of Net Assets
CHF 5,092,399 USD 5,076,661 02 July 2019 146,312 0.04EUR 4,691,720 USD 5,294,925 02 July 2019 48,008 0.01EUR 2,691,729 USD 3,050,491 02 July 2019 14,851 0.01EUR 2,473,612 USD 2,776,912 02 July 2019 40,039 0.01EUR 1,861,850 USD 2,118,960 02 July 2019 1,315 0.00EUR 145,131,877 USD 162,111,872 02 July 2019 3,164,370 0.91GBP 54,875,733 USD 69,268,760 02 July 2019 571,597 0.17USD 14,647 CHF 14,589 02 July 2019 (317) (0.00)USD 420,131 EUR 374,414 02 July 2019 (6,253) (0.00)USD 19,783,035 EUR 17,456,394 02 July 2019 (96,314) (0.03)USD 2,303,696 EUR 2,022,948 02 July 2019 (37) (0.00)USD 3,959,193 EUR 3,478,793 02 July 2019 (2,457) (0.00)USD 172,067 GBP 136,078 02 July 2019 (1,120) (0.00)
Total Forward Foreign Exchange Contracts 3,879,994 1.12
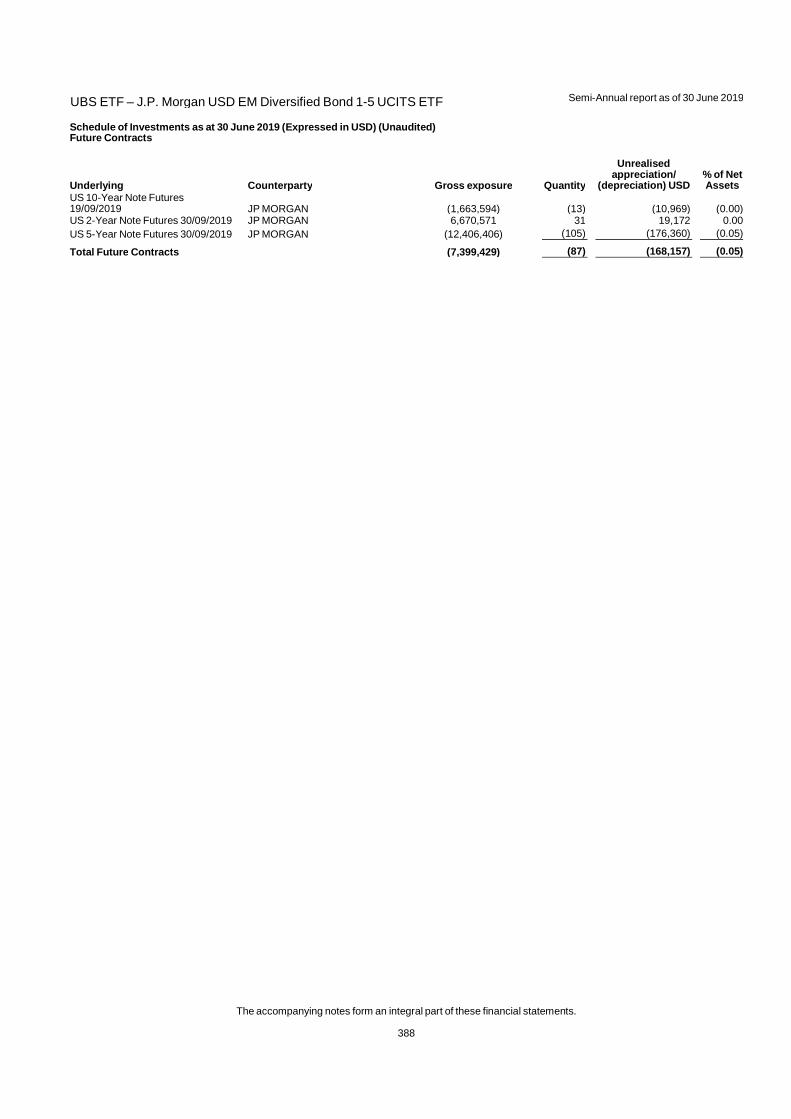
UBS ETF – J.P. Morgan USD EM Diversified Bond 1-5 UCITS ETF
Semi-Annual report as of 30 June 2019
The accompanying notes form an integral part of these financial statements.
388
Schedule of Investments as at 30 June 2019 (Expressed in USD) (Unaudited) Future Contracts
Underlying Counterparty Gross exposure Quantity
Unrealised appreciation/
(depreciation) USD % of Net Assets
US 10-Year Note Futures 19/09/2019 JP MORGAN (1,663,594) (13) (10,969) (0.00)US 2-Year Note Futures 30/09/2019 JP MORGAN 6,670,571 31 19,172 0.00US 5-Year Note Futures 30/09/2019 JP MORGAN (12,406,406) (105) (176,360) (0.05)
Total Future Contracts (7,399,429) (87) (168,157) (0.05)
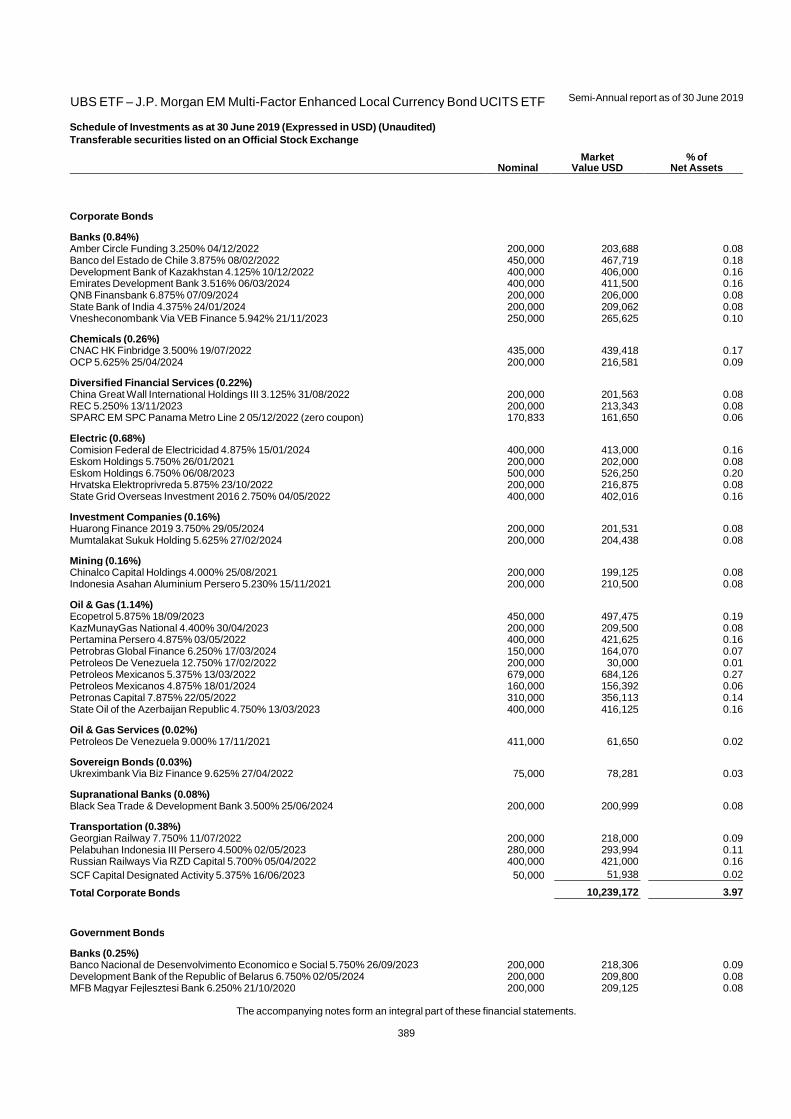
UBS ETF – J.P. Morgan EM Multi-Factor Enhanced Local Currency Bond UCITS ETF
Semi-Annual report as of 30 June 2019
The accompanying notes form an integral part of these financial statements.
389
Schedule of Investments as at 30 June 2019 (Expressed in USD) (Unaudited)
Transferable securities listed on an Official Stock Exchange
Nominal Market
Value USD % of
Net Assets
Corporate Bonds
Banks (0.84%) Amber Circle Funding 3.250% 04/12/2022 200,000 203,688 0.08Banco del Estado de Chile 3.875% 08/02/2022 450,000 467,719 0.18Development Bank of Kazakhstan 4.125% 10/12/2022 400,000 406,000 0.16Emirates Development Bank 3.516% 06/03/2024 400,000 411,500 0.16QNB Finansbank 6.875% 07/09/2024 200,000 206,000 0.08State Bank of India 4.375% 24/01/2024 200,000 209,062 0.08Vnesheconombank Via VEB Finance 5.942% 21/11/2023 250,000 265,625 0.10
Chemicals (0.26%) CNAC HK Finbridge 3.500% 19/07/2022 435,000 439,418 0.17OCP 5.625% 25/04/2024 200,000 216,581 0.09
Diversified Financial Services (0.22%) China Great Wall International Holdings III 3.125% 31/08/2022 200,000 201,563 0.08REC 5.250% 13/11/2023 200,000 213,343 0.08SPARC EM SPC Panama Metro Line 2 05/12/2022 (zero coupon) 170,833 161,650 0.06
Electric (0.68%) Comision Federal de Electricidad 4.875% 15/01/2024 400,000 413,000 0.16Eskom Holdings 5.750% 26/01/2021 200,000 202,000 0.08Eskom Holdings 6.750% 06/08/2023 500,000 526,250 0.20Hrvatska Elektroprivreda 5.875% 23/10/2022 200,000 216,875 0.08State Grid Overseas Investment 2016 2.750% 04/05/2022 400,000 402,016 0.16
Investment Companies (0.16%) Huarong Finance 2019 3.750% 29/05/2024 200,000 201,531 0.08Mumtalakat Sukuk Holding 5.625% 27/02/2024 200,000 204,438 0.08
Mining (0.16%) Chinalco Capital Holdings 4.000% 25/08/2021 200,000 199,125 0.08Indonesia Asahan Aluminium Persero 5.230% 15/11/2021 200,000 210,500 0.08
Oil & Gas (1.14%) Ecopetrol 5.875% 18/09/2023 450,000 497,475 0.19KazMunayGas National 4.400% 30/04/2023 200,000 209,500 0.08Pertamina Persero 4.875% 03/05/2022 400,000 421,625 0.16Petrobras Global Finance 6.250% 17/03/2024 150,000 164,070 0.07Petroleos De Venezuela 12.750% 17/02/2022 200,000 30,000 0.01Petroleos Mexicanos 5.375% 13/03/2022 679,000 684,126 0.27Petroleos Mexicanos 4.875% 18/01/2024 160,000 156,392 0.06Petronas Capital 7.875% 22/05/2022 310,000 356,113 0.14State Oil of the Azerbaijan Republic 4.750% 13/03/2023 400,000 416,125 0.16
Oil & Gas Services (0.02%) Petroleos De Venezuela 9.000% 17/11/2021 411,000 61,650 0.02
Sovereign Bonds (0.03%) Ukreximbank Via Biz Finance 9.625% 27/04/2022 75,000 78,281 0.03
Supranational Banks (0.08%) Black Sea Trade & Development Bank 3.500% 25/06/2024 200,000 200,999 0.08
Transportation (0.38%) Georgian Railway 7.750% 11/07/2022 200,000 218,000 0.09Pelabuhan Indonesia III Persero 4.500% 02/05/2023 280,000 293,994 0.11Russian Railways Via RZD Capital 5.700% 05/04/2022 400,000 421,000 0.16SCF Capital Designated Activity 5.375% 16/06/2023 50,000 51,938 0.02
Total Corporate Bonds 10,239,172 3.97
Government Bonds
Banks (0.25%) Banco Nacional de Desenvolvimento Economico e Social 5.750% 26/09/2023 200,000 218,306 0.09Development Bank of the Republic of Belarus 6.750% 02/05/2024 200,000 209,800 0.08MFB Magyar Fejlesztesi Bank 6.250% 21/10/2020 200,000 209,125 0.08
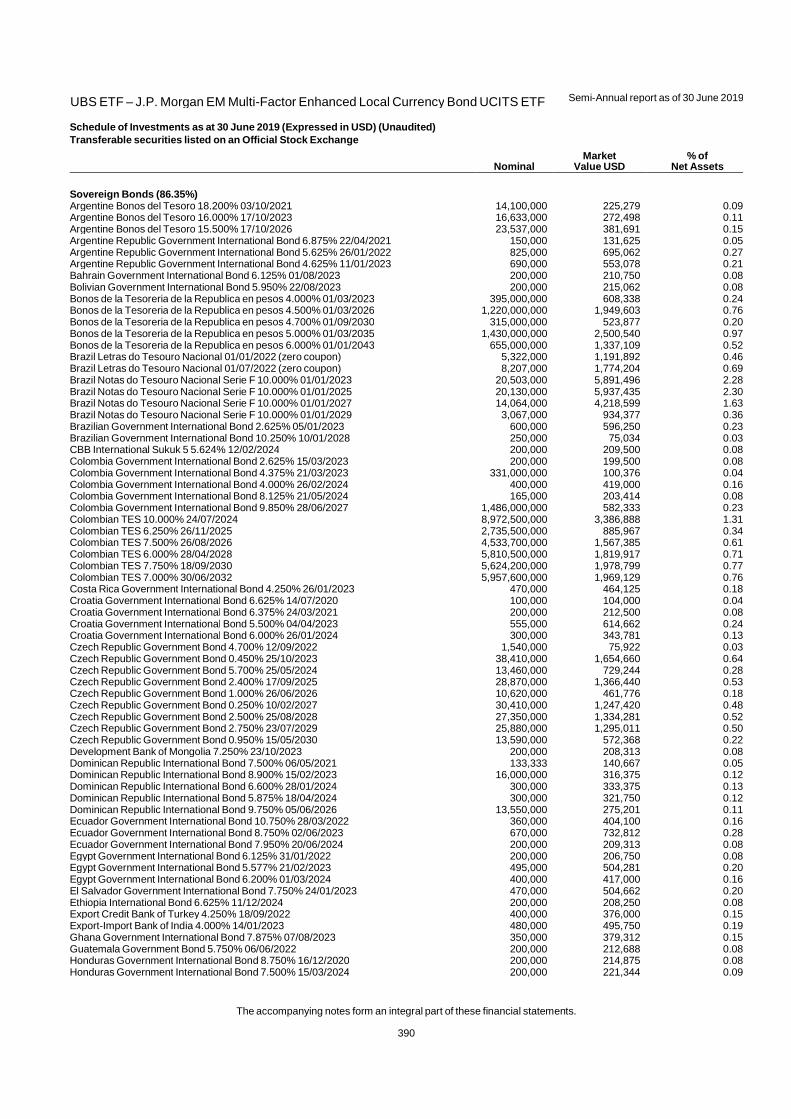
UBS ETF – J.P. Morgan EM Multi-Factor Enhanced Local Currency Bond UCITS ETF
Semi-Annual report as of 30 June 2019
The accompanying notes form an integral part of these financial statements.
390
Schedule of Investments as at 30 June 2019 (Expressed in USD) (Unaudited)
Transferable securities listed on an Official Stock Exchange
Nominal Market
Value USD % of
Net Assets
Sovereign Bonds (86.35%) Argentine Bonos del Tesoro 18.200% 03/10/2021 14,100,000 225,279 0.09Argentine Bonos del Tesoro 16.000% 17/10/2023 16,633,000 272,498 0.11Argentine Bonos del Tesoro 15.500% 17/10/2026 23,537,000 381,691 0.15Argentine Republic Government International Bond 6.875% 22/04/2021 150,000 131,625 0.05Argentine Republic Government International Bond 5.625% 26/01/2022 825,000 695,062 0.27Argentine Republic Government International Bond 4.625% 11/01/2023 690,000 553,078 0.21Bahrain Government International Bond 6.125% 01/08/2023 200,000 210,750 0.08Bolivian Government International Bond 5.950% 22/08/2023 200,000 215,062 0.08Bonos de la Tesoreria de la Republica en pesos 4.000% 01/03/2023 395,000,000 608,338 0.24Bonos de la Tesoreria de la Republica en pesos 4.500% 01/03/2026 1,220,000,000 1,949,603 0.76Bonos de la Tesoreria de la Republica en pesos 4.700% 01/09/2030 315,000,000 523,877 0.20Bonos de la Tesoreria de la Republica en pesos 5.000% 01/03/2035 1,430,000,000 2,500,540 0.97Bonos de la Tesoreria de la Republica en pesos 6.000% 01/01/2043 655,000,000 1,337,109 0.52Brazil Letras do Tesouro Nacional 01/01/2022 (zero coupon) 5,322,000 1,191,892 0.46Brazil Letras do Tesouro Nacional 01/07/2022 (zero coupon) 8,207,000 1,774,204 0.69Brazil Notas do Tesouro Nacional Serie F 10.000% 01/01/2023 20,503,000 5,891,496 2.28Brazil Notas do Tesouro Nacional Serie F 10.000% 01/01/2025 20,130,000 5,937,435 2.30Brazil Notas do Tesouro Nacional Serie F 10.000% 01/01/2027 14,064,000 4,218,599 1.63Brazil Notas do Tesouro Nacional Serie F 10.000% 01/01/2029 3,067,000 934,377 0.36Brazilian Government International Bond 2.625% 05/01/2023 600,000 596,250 0.23Brazilian Government International Bond 10.250% 10/01/2028 250,000 75,034 0.03CBB International Sukuk 5 5.624% 12/02/2024 200,000 209,500 0.08Colombia Government International Bond 2.625% 15/03/2023 200,000 199,500 0.08Colombia Government International Bond 4.375% 21/03/2023 331,000,000 100,376 0.04Colombia Government International Bond 4.000% 26/02/2024 400,000 419,000 0.16Colombia Government International Bond 8.125% 21/05/2024 165,000 203,414 0.08Colombia Government International Bond 9.850% 28/06/2027 1,486,000,000 582,333 0.23Colombian TES 10.000% 24/07/2024 8,972,500,000 3,386,888 1.31Colombian TES 6.250% 26/11/2025 2,735,500,000 885,967 0.34Colombian TES 7.500% 26/08/2026 4,533,700,000 1,567,385 0.61Colombian TES 6.000% 28/04/2028 5,810,500,000 1,819,917 0.71Colombian TES 7.750% 18/09/2030 5,624,200,000 1,978,799 0.77Colombian TES 7.000% 30/06/2032 5,957,600,000 1,969,129 0.76Costa Rica Government International Bond 4.250% 26/01/2023 470,000 464,125 0.18Croatia Government International Bond 6.625% 14/07/2020 100,000 104,000 0.04Croatia Government International Bond 6.375% 24/03/2021 200,000 212,500 0.08Croatia Government International Bond 5.500% 04/04/2023 555,000 614,662 0.24Croatia Government International Bond 6.000% 26/01/2024 300,000 343,781 0.13Czech Republic Government Bond 4.700% 12/09/2022 1,540,000 75,922 0.03Czech Republic Government Bond 0.450% 25/10/2023 38,410,000 1,654,660 0.64Czech Republic Government Bond 5.700% 25/05/2024 13,460,000 729,244 0.28Czech Republic Government Bond 2.400% 17/09/2025 28,870,000 1,366,440 0.53Czech Republic Government Bond 1.000% 26/06/2026 10,620,000 461,776 0.18Czech Republic Government Bond 0.250% 10/02/2027 30,410,000 1,247,420 0.48Czech Republic Government Bond 2.500% 25/08/2028 27,350,000 1,334,281 0.52Czech Republic Government Bond 2.750% 23/07/2029 25,880,000 1,295,011 0.50Czech Republic Government Bond 0.950% 15/05/2030 13,590,000 572,368 0.22Development Bank of Mongolia 7.250% 23/10/2023 200,000 208,313 0.08Dominican Republic International Bond 7.500% 06/05/2021 133,333 140,667 0.05Dominican Republic International Bond 8.900% 15/02/2023 16,000,000 316,375 0.12Dominican Republic International Bond 6.600% 28/01/2024 300,000 333,375 0.13Dominican Republic International Bond 5.875% 18/04/2024 300,000 321,750 0.12Dominican Republic International Bond 9.750% 05/06/2026 13,550,000 275,201 0.11Ecuador Government International Bond 10.750% 28/03/2022 360,000 404,100 0.16Ecuador Government International Bond 8.750% 02/06/2023 670,000 732,812 0.28Ecuador Government International Bond 7.950% 20/06/2024 200,000 209,313 0.08Egypt Government International Bond 6.125% 31/01/2022 200,000 206,750 0.08Egypt Government International Bond 5.577% 21/02/2023 495,000 504,281 0.20Egypt Government International Bond 6.200% 01/03/2024 400,000 417,000 0.16El Salvador Government International Bond 7.750% 24/01/2023 470,000 504,662 0.20Ethiopia International Bond 6.625% 11/12/2024 200,000 208,250 0.08Export Credit Bank of Turkey 4.250% 18/09/2022 400,000 376,000 0.15Export-Import Bank of India 4.000% 14/01/2023 480,000 495,750 0.19Ghana Government International Bond 7.875% 07/08/2023 350,000 379,312 0.15Guatemala Government Bond 5.750% 06/06/2022 200,000 212,688 0.08Honduras Government International Bond 8.750% 16/12/2020 200,000 214,875 0.08Honduras Government International Bond 7.500% 15/03/2024 200,000 221,344 0.09
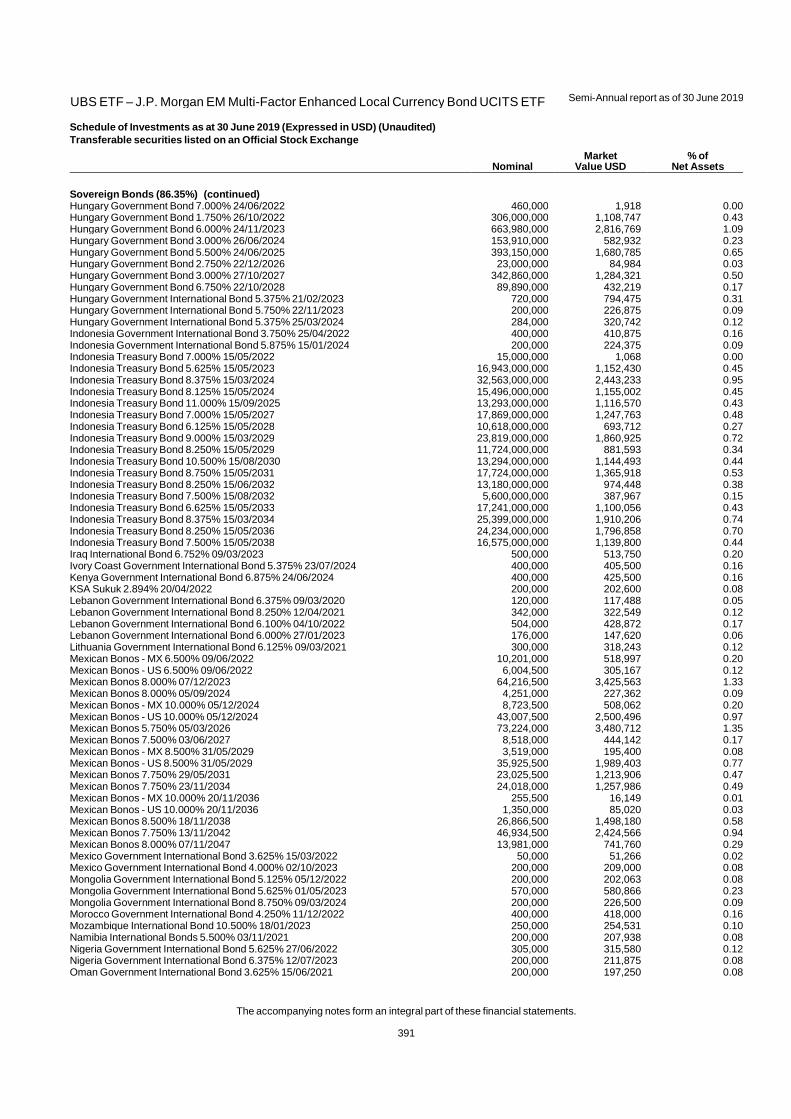
UBS ETF – J.P. Morgan EM Multi-Factor Enhanced Local Currency Bond UCITS ETF
Semi-Annual report as of 30 June 2019
The accompanying notes form an integral part of these financial statements.
391
Schedule of Investments as at 30 June 2019 (Expressed in USD) (Unaudited)
Transferable securities listed on an Official Stock Exchange
Nominal Market
Value USD % of
Net Assets
Sovereign Bonds (86.35%) (continued) Hungary Government Bond 7.000% 24/06/2022 460,000 1,918 0.00Hungary Government Bond 1.750% 26/10/2022 306,000,000 1,108,747 0.43Hungary Government Bond 6.000% 24/11/2023 663,980,000 2,816,769 1.09Hungary Government Bond 3.000% 26/06/2024 153,910,000 582,932 0.23Hungary Government Bond 5.500% 24/06/2025 393,150,000 1,680,785 0.65Hungary Government Bond 2.750% 22/12/2026 23,000,000 84,984 0.03Hungary Government Bond 3.000% 27/10/2027 342,860,000 1,284,321 0.50Hungary Government Bond 6.750% 22/10/2028 89,890,000 432,219 0.17Hungary Government International Bond 5.375% 21/02/2023 720,000 794,475 0.31Hungary Government International Bond 5.750% 22/11/2023 200,000 226,875 0.09Hungary Government International Bond 5.375% 25/03/2024 284,000 320,742 0.12Indonesia Government International Bond 3.750% 25/04/2022 400,000 410,875 0.16Indonesia Government International Bond 5.875% 15/01/2024 200,000 224,375 0.09Indonesia Treasury Bond 7.000% 15/05/2022 15,000,000 1,068 0.00Indonesia Treasury Bond 5.625% 15/05/2023 16,943,000,000 1,152,430 0.45Indonesia Treasury Bond 8.375% 15/03/2024 32,563,000,000 2,443,233 0.95Indonesia Treasury Bond 8.125% 15/05/2024 15,496,000,000 1,155,002 0.45Indonesia Treasury Bond 11.000% 15/09/2025 13,293,000,000 1,116,570 0.43Indonesia Treasury Bond 7.000% 15/05/2027 17,869,000,000 1,247,763 0.48Indonesia Treasury Bond 6.125% 15/05/2028 10,618,000,000 693,712 0.27Indonesia Treasury Bond 9.000% 15/03/2029 23,819,000,000 1,860,925 0.72Indonesia Treasury Bond 8.250% 15/05/2029 11,724,000,000 881,593 0.34Indonesia Treasury Bond 10.500% 15/08/2030 13,294,000,000 1,144,493 0.44Indonesia Treasury Bond 8.750% 15/05/2031 17,724,000,000 1,365,918 0.53Indonesia Treasury Bond 8.250% 15/06/2032 13,180,000,000 974,448 0.38Indonesia Treasury Bond 7.500% 15/08/2032 5,600,000,000 387,967 0.15Indonesia Treasury Bond 6.625% 15/05/2033 17,241,000,000 1,100,056 0.43Indonesia Treasury Bond 8.375% 15/03/2034 25,399,000,000 1,910,206 0.74Indonesia Treasury Bond 8.250% 15/05/2036 24,234,000,000 1,796,858 0.70Indonesia Treasury Bond 7.500% 15/05/2038 16,575,000,000 1,139,800 0.44Iraq International Bond 6.752% 09/03/2023 500,000 513,750 0.20Ivory Coast Government International Bond 5.375% 23/07/2024 400,000 405,500 0.16Kenya Government International Bond 6.875% 24/06/2024 400,000 425,500 0.16KSA Sukuk 2.894% 20/04/2022 200,000 202,600 0.08Lebanon Government International Bond 6.375% 09/03/2020 120,000 117,488 0.05Lebanon Government International Bond 8.250% 12/04/2021 342,000 322,549 0.12Lebanon Government International Bond 6.100% 04/10/2022 504,000 428,872 0.17Lebanon Government International Bond 6.000% 27/01/2023 176,000 147,620 0.06Lithuania Government International Bond 6.125% 09/03/2021 300,000 318,243 0.12Mexican Bonos - MX 6.500% 09/06/2022 10,201,000 518,997 0.20Mexican Bonos - US 6.500% 09/06/2022 6,004,500 305,167 0.12Mexican Bonos 8.000% 07/12/2023 64,216,500 3,425,563 1.33Mexican Bonos 8.000% 05/09/2024 4,251,000 227,362 0.09Mexican Bonos - MX 10.000% 05/12/2024 8,723,500 508,062 0.20Mexican Bonos - US 10.000% 05/12/2024 43,007,500 2,500,496 0.97Mexican Bonos 5.750% 05/03/2026 73,224,000 3,480,712 1.35Mexican Bonos 7.500% 03/06/2027 8,518,000 444,142 0.17Mexican Bonos - MX 8.500% 31/05/2029 3,519,000 195,400 0.08Mexican Bonos - US 8.500% 31/05/2029 35,925,500 1,989,403 0.77Mexican Bonos 7.750% 29/05/2031 23,025,500 1,213,906 0.47Mexican Bonos 7.750% 23/11/2034 24,018,000 1,257,986 0.49Mexican Bonos - MX 10.000% 20/11/2036 255,500 16,149 0.01Mexican Bonos - US 10.000% 20/11/2036 1,350,000 85,020 0.03Mexican Bonos 8.500% 18/11/2038 26,866,500 1,498,180 0.58Mexican Bonos 7.750% 13/11/2042 46,934,500 2,424,566 0.94Mexican Bonos 8.000% 07/11/2047 13,981,000 741,760 0.29Mexico Government International Bond 3.625% 15/03/2022 50,000 51,266 0.02Mexico Government International Bond 4.000% 02/10/2023 200,000 209,000 0.08Mongolia Government International Bond 5.125% 05/12/2022 200,000 202,063 0.08Mongolia Government International Bond 5.625% 01/05/2023 570,000 580,866 0.23Mongolia Government International Bond 8.750% 09/03/2024 200,000 226,500 0.09Morocco Government International Bond 4.250% 11/12/2022 400,000 418,000 0.16Mozambique International Bond 10.500% 18/01/2023 250,000 254,531 0.10Namibia International Bonds 5.500% 03/11/2021 200,000 207,938 0.08Nigeria Government International Bond 5.625% 27/06/2022 305,000 315,580 0.12Nigeria Government International Bond 6.375% 12/07/2023 200,000 211,875 0.08Oman Government International Bond 3.625% 15/06/2021 200,000 197,250 0.08

UBS ETF – J.P. Morgan EM Multi-Factor Enhanced Local Currency Bond UCITS ETF
Semi-Annual report as of 30 June 2019
The accompanying notes form an integral part of these financial statements.
392
Schedule of Investments as at 30 June 2019 (Expressed in USD) (Unaudited)
Transferable securities listed on an Official Stock Exchange
Nominal Market
Value USD % of
Net Assets
Sovereign Bonds (86.35%) (continued) Oman Government International Bond 3.875% 08/03/2022 720,000 708,318 0.27Oman Government International Bond 4.125% 17/01/2023 200,000 194,500 0.08Paraguay Government International Bond 4.625% 25/01/2023 200,000 210,500 0.08Peru Government Bond 5.940% 12/02/2029 6,547,000 2,176,767 0.84Peru Government Bond 6.150% 12/08/2032 5,044,000 1,686,346 0.65Peru Government Bond 5.400% 12/08/2034 900,000 278,150 0.11Peru Government Bond 6.900% 12/08/2037 405,000 144,372 0.06Perusahaan Penerbit SBSN Indonesia III 3.750% 01/03/2023 200,000 205,875 0.08Philippine Government International Bond 4.950% 15/01/2021 5,000,000 98,229 0.04Philippine Government International Bond 3.900% 26/11/2022 10,000,000 189,313 0.07Philippine Government International Bond 6.250% 14/01/2036 10,000,000 222,231 0.09Qatar Government International Bond 3.875% 23/04/2023 200,000 209,750 0.08Qatar Government International Bond 3.375% 14/03/2024 200,000 207,281 0.08Republic of Azerbaijan International Bond 4.750% 18/03/2024 400,000 420,800 0.16Republic of Belarus International Bond 6.875% 28/02/2023 350,000 377,125 0.15Republic of Poland Government Bond 2.250% 25/04/2022 152,000 41,363 0.02Republic of Poland Government Bond 5.750% 23/09/2022 2,018,000 608,238 0.24Republic of Poland Government Bond 2.500% 25/01/2023 7,780,000 2,134,430 0.83Republic of Poland Government Bond 4.000% 25/10/2023 9,780,000 2,846,512 1.10Republic of Poland Government Bond 2.500% 25/04/2024 8,830,000 2,424,864 0.94Republic of Poland Government Bond 3.250% 25/07/2025 4,980,000 1,419,805 0.55Republic of Poland Government Bond 2.500% 25/07/2026 10,530,000 2,870,535 1.11Republic of Poland Government Bond 2.500% 25/07/2027 7,262,000 1,973,234 0.76Republic of Poland Government Bond 2.750% 25/04/2028 8,810,000 2,436,145 0.94Republic of Poland Government International Bond 5.125% 21/04/2021 50,000 52,562 0.02Republic of Poland Government International Bond 5.000% 23/03/2022 195,000 209,869 0.08Republic of Poland Government International Bond 3.000% 17/03/2023 200,000 205,250 0.08Republic of Poland Government International Bond 4.000% 22/01/2024 160,000 171,965 0.07Republic of South Africa Government Bond 7.750% 28/02/2023 26,916,000 1,939,801 0.75Republic of South Africa Government Bond 10.500% 21/12/2026 28,914,000 2,323,895 0.90Republic of South Africa Government Bond 8.000% 31/01/2030 34,170,000 2,289,512 0.89Republic of South Africa Government Bond - US 7.000% 28/02/2031 7,689,000 466,821 0.18Republic of South Africa Government Bond - ZA 7.000% 28/02/2031 2,571,000 156,198 0.06Republic of South Africa Government Bond 8.250% 31/03/2032 42,081,000 2,779,454 1.08Republic of South Africa Government Bond 8.875% 28/02/2035 9,780,000 661,509 0.26Republic of South Africa Government Bond 6.250% 31/03/2036 8,672,000 452,205 0.18Republic of South Africa Government Bond 8.500% 31/01/2037 32,550,000 2,105,954 0.82Republic of South Africa Government Bond 9.000% 31/01/2040 17,066,000 1,139,637 0.44Republic of South Africa Government Bond 6.500% 28/02/2041 14,998,000 759,351 0.29Republic of South Africa Government Bond 8.750% 31/01/2044 38,503,000 2,489,581 0.96Republic of South Africa Government Bond 8.750% 28/02/2048 39,482,000 2,549,984 0.99Republic of South Africa Government International Bond 4.665% 17/01/2024 725,000 758,712 0.29Republic of Uzbekistan Bond 4.750% 20/02/2024 400,000 419,500 0.16Republic Of Venezuela 6.000% 09/12/2020 163,000 32,600 0.01Republic Of Venezuela 9.000% 07/05/2023 40,000 8,000 0.00Romania Government Bond 3.500% 19/12/2022 1,355,000 321,999 0.12Romania Government Bond 5.850% 26/04/2023 4,570,000 1,170,362 0.45Romania Government Bond 4.250% 28/06/2023 1,945,000 471,460 0.18Romania Government Bond 3.250% 29/04/2024 4,875,000 1,129,161 0.44Romania Government Bond 4.750% 24/02/2025 1,685,000 414,760 0.16Romania Government Bond 5.800% 26/07/2027 580,000 151,682 0.06Romanian Government International Bond 6.750% 07/02/2022 50,000 54,906 0.02Romanian Government International Bond 4.375% 22/08/2023 640,000 679,800 0.26Romanian Government International Bond 4.875% 22/01/2024 440,000 476,300 0.18Russian Federal Bond - OFZ 7.600% 20/07/2022 13,440,000 215,956 0.08Russian Federal Bond - OFZ 7.400% 07/12/2022 66,569,000 1,064,365 0.41Russian Federal Bond - OFZ 7.000% 25/01/2023 135,831,000 2,142,717 0.83Russian Federal Bond - OFZ 7.000% 16/08/2023 93,985,000 1,478,876 0.57Russian Federal Bond - OFZ 6.500% 28/02/2024 143,185,000 2,209,918 0.86Russian Federal Bond - OFZ 7.100% 16/10/2024 62,590,000 988,341 0.38Russian Federal Bond - OFZ 7.750% 16/09/2026 86,423,000 1,407,164 0.55Russian Federal Bond - OFZ 8.150% 03/02/2027 34,905,000 582,981 0.23Russian Federal Bond - OFZ 7.050% 19/01/2028 132,174,000 2,070,370 0.80Russian Federal Bond - OFZ 6.900% 23/05/2029 46,925,000 724,274 0.28Russian Federal Bond - OFZ 8.500% 17/09/2031 96,940,000 1,679,025 0.65Russian Federal Bond - OFZ 7.700% 23/03/2033 164,983,000 2,683,684 1.04Russian Federal Bond - OFZ 7.250% 10/05/2034 10,224,000 159,819 0.06
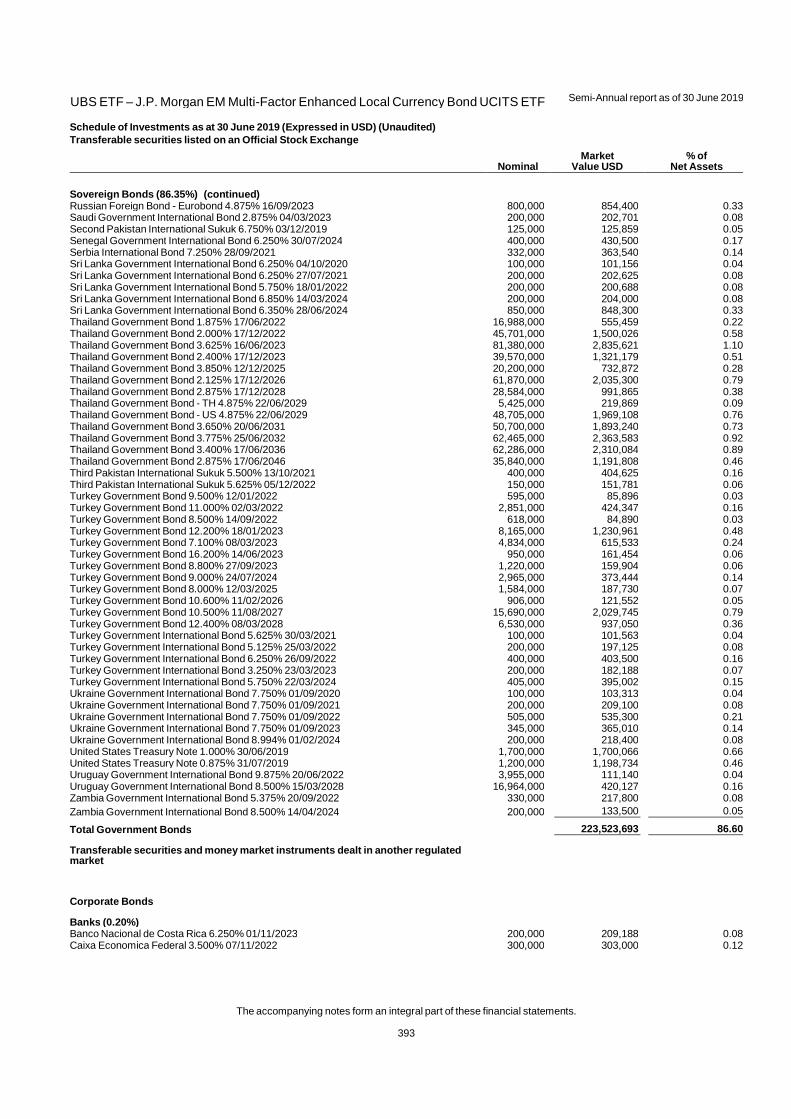
UBS ETF – J.P. Morgan EM Multi-Factor Enhanced Local Currency Bond UCITS ETF
Semi-Annual report as of 30 June 2019
The accompanying notes form an integral part of these financial statements.
393
Schedule of Investments as at 30 June 2019 (Expressed in USD) (Unaudited)
Transferable securities listed on an Official Stock Exchange
Nominal Market
Value USD % of
Net Assets
Sovereign Bonds (86.35%) (continued) Russian Foreign Bond - Eurobond 4.875% 16/09/2023 800,000 854,400 0.33Saudi Government International Bond 2.875% 04/03/2023 200,000 202,701 0.08Second Pakistan International Sukuk 6.750% 03/12/2019 125,000 125,859 0.05Senegal Government International Bond 6.250% 30/07/2024 400,000 430,500 0.17Serbia International Bond 7.250% 28/09/2021 332,000 363,540 0.14Sri Lanka Government International Bond 6.250% 04/10/2020 100,000 101,156 0.04Sri Lanka Government International Bond 6.250% 27/07/2021 200,000 202,625 0.08Sri Lanka Government International Bond 5.750% 18/01/2022 200,000 200,688 0.08Sri Lanka Government International Bond 6.850% 14/03/2024 200,000 204,000 0.08Sri Lanka Government International Bond 6.350% 28/06/2024 850,000 848,300 0.33Thailand Government Bond 1.875% 17/06/2022 16,988,000 555,459 0.22Thailand Government Bond 2.000% 17/12/2022 45,701,000 1,500,026 0.58Thailand Government Bond 3.625% 16/06/2023 81,380,000 2,835,621 1.10Thailand Government Bond 2.400% 17/12/2023 39,570,000 1,321,179 0.51Thailand Government Bond 3.850% 12/12/2025 20,200,000 732,872 0.28Thailand Government Bond 2.125% 17/12/2026 61,870,000 2,035,300 0.79Thailand Government Bond 2.875% 17/12/2028 28,584,000 991,865 0.38Thailand Government Bond - TH 4.875% 22/06/2029 5,425,000 219,869 0.09Thailand Government Bond - US 4.875% 22/06/2029 48,705,000 1,969,108 0.76Thailand Government Bond 3.650% 20/06/2031 50,700,000 1,893,240 0.73Thailand Government Bond 3.775% 25/06/2032 62,465,000 2,363,583 0.92Thailand Government Bond 3.400% 17/06/2036 62,286,000 2,310,084 0.89Thailand Government Bond 2.875% 17/06/2046 35,840,000 1,191,808 0.46Third Pakistan International Sukuk 5.500% 13/10/2021 400,000 404,625 0.16Third Pakistan International Sukuk 5.625% 05/12/2022 150,000 151,781 0.06Turkey Government Bond 9.500% 12/01/2022 595,000 85,896 0.03Turkey Government Bond 11.000% 02/03/2022 2,851,000 424,347 0.16Turkey Government Bond 8.500% 14/09/2022 618,000 84,890 0.03Turkey Government Bond 12.200% 18/01/2023 8,165,000 1,230,961 0.48Turkey Government Bond 7.100% 08/03/2023 4,834,000 615,533 0.24Turkey Government Bond 16.200% 14/06/2023 950,000 161,454 0.06Turkey Government Bond 8.800% 27/09/2023 1,220,000 159,904 0.06Turkey Government Bond 9.000% 24/07/2024 2,965,000 373,444 0.14Turkey Government Bond 8.000% 12/03/2025 1,584,000 187,730 0.07Turkey Government Bond 10.600% 11/02/2026 906,000 121,552 0.05Turkey Government Bond 10.500% 11/08/2027 15,690,000 2,029,745 0.79Turkey Government Bond 12.400% 08/03/2028 6,530,000 937,050 0.36Turkey Government International Bond 5.625% 30/03/2021 100,000 101,563 0.04Turkey Government International Bond 5.125% 25/03/2022 200,000 197,125 0.08Turkey Government International Bond 6.250% 26/09/2022 400,000 403,500 0.16Turkey Government International Bond 3.250% 23/03/2023 200,000 182,188 0.07Turkey Government International Bond 5.750% 22/03/2024 405,000 395,002 0.15Ukraine Government International Bond 7.750% 01/09/2020 100,000 103,313 0.04Ukraine Government International Bond 7.750% 01/09/2021 200,000 209,100 0.08Ukraine Government International Bond 7.750% 01/09/2022 505,000 535,300 0.21Ukraine Government International Bond 7.750% 01/09/2023 345,000 365,010 0.14Ukraine Government International Bond 8.994% 01/02/2024 200,000 218,400 0.08United States Treasury Note 1.000% 30/06/2019 1,700,000 1,700,066 0.66United States Treasury Note 0.875% 31/07/2019 1,200,000 1,198,734 0.46Uruguay Government International Bond 9.875% 20/06/2022 3,955,000 111,140 0.04Uruguay Government International Bond 8.500% 15/03/2028 16,964,000 420,127 0.16Zambia Government International Bond 5.375% 20/09/2022 330,000 217,800 0.08Zambia Government International Bond 8.500% 14/04/2024 200,000 133,500 0.05
Total Government Bonds 223,523,693 86.60
Transferable securities and money market instruments dealt in another regulated market
Corporate Bonds
Banks (0.20%) Banco Nacional de Costa Rica 6.250% 01/11/2023 200,000 209,188 0.08Caixa Economica Federal 3.500% 07/11/2022 300,000 303,000 0.12

UBS ETF – J.P. Morgan EM Multi-Factor Enhanced Local Currency Bond UCITS ETF
Semi-Annual report as of 30 June 2019
The accompanying notes form an integral part of these financial statements.
394
Schedule of Investments as at 30 June 2019 (Expressed in USD) (Unaudited) Transferable securities and money market instruments dealt in another regulated market
Nominal Market
Value USD % of
Net Assets
Oil & Gas (0.30%) Petroleos Mexicanos 5.500% 21/01/2021 150,000 151,837 0.06Petroleos Mexicanos 4.875% 24/01/2022 100,000 99,750 0.04Petroleos Mexicanos 4.625% 21/09/2023 115,000 112,989 0.04Sinopec Group Overseas Development 2014 4.375% 10/04/2024 200,000 214,000 0.08Sinopec Group Overseas Development 2018 3.750% 12/09/2023 200,000 208,375 0.08
Total Corporate Bonds 1,299,139 0.50
Government Bonds
Banks (0.08%) Banco Nacional de Desenvolvimento Economico e Social 4.750% 09/05/2024 200,000 208,812 0.08
Diversified Financial Services (0.12%) Fondo MIVIVIENDA 3.500% 31/01/2023 300,000 304,547 0.12
Total Government Bonds 513,359 0.20
Transferable securities non -listed on an Official Stock Exchange
Government Bonds
Sovereign Bonds (5.96%) Malaysia Government Bond 3.620% 30/11/2021 620,000 151,148 0.06Malaysia Government Bond 3.757% 20/04/2023 7,207,000 1,765,693 0.68Malaysia Government Bond 3.800% 17/08/2023 5,085,000 1,247,901 0.48Malaysia Government Bond 4.181% 15/07/2024 2,090,000 521,906 0.20Malaysia Government Bond 3.955% 15/09/2025 5,100,000 1,261,887 0.49Malaysia Government Bond 3.900% 30/11/2026 2,465,000 607,228 0.24Malaysia Government Bond 3.899% 16/11/2027 13,540,000 3,332,167 1.29Malaysia Government Bond 3.733% 15/06/2028 1,887,000 459,478 0.18Malaysia Government Bond 3.885% 15/08/2029 1,505,000 371,743 0.14Malaysia Government Bond 4.762% 07/04/2037 5,190,000 1,364,534 0.53Peruvian Government International Bond 5.700% 12/08/2024 1,508,000 497,516 0.19Peruvian Government International Bond 8.200% 12/08/2026 4,222,000 1,594,374 0.62Peruvian Government International Bond 6.350% 12/08/2028 2,978,000 1,018,905 0.40Peruvian Government International Bond 6.900% 12/08/2037 3,356,000 1,196,326 0.46
Total Government Bonds 15,390,806 5.96
TOTAL INVESTMENTS (Cost USD 240,175,438) 250,966,169 97.23
Other net assets 7,152,012 2.77
TOTAL NET ASSETS 258,118,181 100.00
Forward Foreign Exchange Contracts
Purchases Sales Maturity Date Unrealised appreciation/
(depreciation) USD % of Net Assets
USD 269,744 PEN 900,000 02 July 2019 (3,983) (0.00)ARS 253,337,000 USD 4,888,316 17 September 2019 488,066 0.19ARS 36,335,000 USD 724,526 17 September 2019 46,584 0.02BRL 4,790,000 USD 1,232,979 17 September 2019 7,984 0.00CNY 547,000 USD 78,921 17 September 2019 715 0.00CZK 52,170,000 USD 2,292,996 17 September 2019 46,002 0.02HUF 23,371,000 USD 82,304 17 September 2019 549 0.00IDR 93,347,100,000 USD 6,454,647 17 September 2019 93,476 0.04INR 292,850,000 USD 4,178,497 17 September 2019 23,322 0.01KRW 202,592,000 USD 171,735 17 September 2019 3,724 0.00MXN 203,940,000 USD 10,497,424 17 September 2019 (13,774) (0.01)PEN 7,290,300 USD 2,184,229 17 September 2019 25,804 0.01PHP 8,250,000 USD 158,401 17 September 2019 2,172 0.00PLN 16,900,000 USD 4,461,287 17 September 2019 78,484 0.03RON 26,384,250 USD 6,254,083 17 September 2019 90,704 0.04RUB 549,897,500 USD 8,407,447 17 September 2019 217,773 0.08RUB 15,479,000 USD 236,129 17 September 2019 6,661 0.00SGD 55,000 USD 40,300 17 September 2019 402 0.00THB 236,180,000 USD 7,565,677 17 September 2019 149,943 0.06
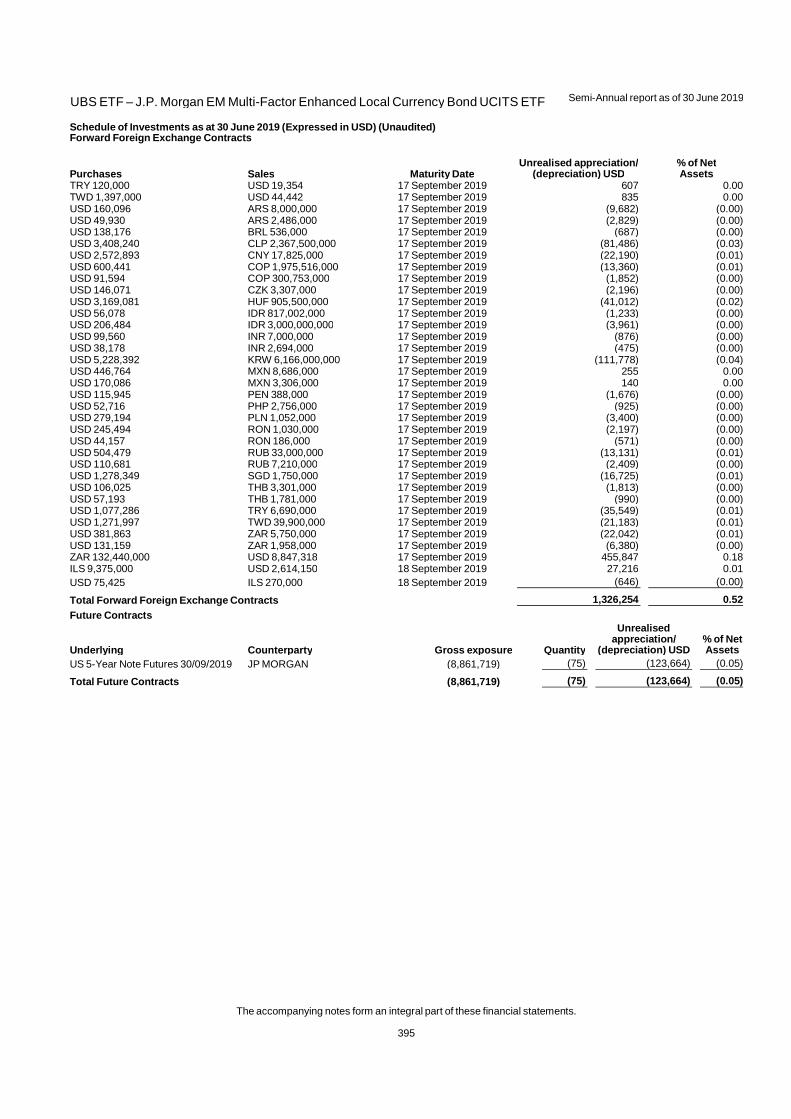
UBS ETF – J.P. Morgan EM Multi-Factor Enhanced Local Currency Bond UCITS ETF
Semi-Annual report as of 30 June 2019
The accompanying notes form an integral part of these financial statements.
395
Schedule of Investments as at 30 June 2019 (Expressed in USD) (Unaudited) Forward Foreign Exchange Contracts
Purchases Sales Maturity Date Unrealised appreciation/
(depreciation) USD % of Net Assets
TRY 120,000 USD 19,354 17 September 2019 607 0.00TWD 1,397,000 USD 44,442 17 September 2019 835 0.00USD 160,096 ARS 8,000,000 17 September 2019 (9,682) (0.00)USD 49,930 ARS 2,486,000 17 September 2019 (2,829) (0.00)USD 138,176 BRL 536,000 17 September 2019 (687) (0.00)USD 3,408,240 CLP 2,367,500,000 17 September 2019 (81,486) (0.03)USD 2,572,893 CNY 17,825,000 17 September 2019 (22,190) (0.01)USD 600,441 COP 1,975,516,000 17 September 2019 (13,360) (0.01)USD 91,594 COP 300,753,000 17 September 2019 (1,852) (0.00)USD 146,071 CZK 3,307,000 17 September 2019 (2,196) (0.00)USD 3,169,081 HUF 905,500,000 17 September 2019 (41,012) (0.02)USD 56,078 IDR 817,002,000 17 September 2019 (1,233) (0.00)USD 206,484 IDR 3,000,000,000 17 September 2019 (3,961) (0.00)USD 99,560 INR 7,000,000 17 September 2019 (876) (0.00)USD 38,178 INR 2,694,000 17 September 2019 (475) (0.00)USD 5,228,392 KRW 6,166,000,000 17 September 2019 (111,778) (0.04)USD 446,764 MXN 8,686,000 17 September 2019 255 0.00USD 170,086 MXN 3,306,000 17 September 2019 140 0.00USD 115,945 PEN 388,000 17 September 2019 (1,676) (0.00)USD 52,716 PHP 2,756,000 17 September 2019 (925) (0.00)USD 279,194 PLN 1,052,000 17 September 2019 (3,400) (0.00)USD 245,494 RON 1,030,000 17 September 2019 (2,197) (0.00)USD 44,157 RON 186,000 17 September 2019 (571) (0.00)USD 504,479 RUB 33,000,000 17 September 2019 (13,131) (0.01)USD 110,681 RUB 7,210,000 17 September 2019 (2,409) (0.00)USD 1,278,349 SGD 1,750,000 17 September 2019 (16,725) (0.01)USD 106,025 THB 3,301,000 17 September 2019 (1,813) (0.00)USD 57,193 THB 1,781,000 17 September 2019 (990) (0.00)USD 1,077,286 TRY 6,690,000 17 September 2019 (35,549) (0.01)USD 1,271,997 TWD 39,900,000 17 September 2019 (21,183) (0.01)USD 381,863 ZAR 5,750,000 17 September 2019 (22,042) (0.01)USD 131,159 ZAR 1,958,000 17 September 2019 (6,380) (0.00)ZAR 132,440,000 USD 8,847,318 17 September 2019 455,847 0.18ILS 9,375,000 USD 2,614,150 18 September 2019 27,216 0.01USD 75,425 ILS 270,000 18 September 2019 (646) (0.00)
Total Forward Foreign Exchange Contracts 1,326,254 0.52
Future Contracts
Underlying Counterparty Gross exposure Quantity
Unrealised appreciation/
(depreciation) USD % of Net Assets
US 5-Year Note Futures 30/09/2019 JP MORGAN (8,861,719) (75) (123,664) (0.05)
Total Future Contracts (8,861,719) (75) (123,664) (0.05)

UBS ETF – Bloomberg Barclays EUR High Quality Liquid Assets 1-5 Bond UCITS ETF
Semi-Annual report as of 30 June 2019
The accompanying notes form an integral part of these financial statements.
396
Schedule of Investments as at 30 June 2019 (Expressed in EUR) (Unaudited)
Transferable securities listed on an Official Stock Exchange
Nominal Market
Value EUR % of
Net Assets
Corporate Bonds
Advertising (0.18%) Publicis Groupe 1.125% 16/12/2021 100,000 102,592 0.18
Aerospace & Defense (0.18%) Thales 0.750% 07/06/2023 100,000 103,232 0.18
Airlines (0.35%) Ryanair 1.875% 17/06/2021 100,000 103,599 0.18Ryanair 1.125% 10/03/2023 100,000 102,693 0.17
Apparel (0.43%) LVMH Moet Hennessy Louis Vuitton 26/05/2020 (zero coupon) 50,000 50,081 0.09LVMH Moet Hennessy Louis Vuitton 0.375% 26/05/2022 100,000 101,439 0.17LVMH Moet Hennessy Louis Vuitton 0.125% 28/02/2023 100,000 100,817 0.17
Auto Manufacturers (1.75%) BMW Finance 0.125% 12/01/2021 100,000 100,420 0.17BMW Finance 0.500% 22/11/2022 200,000 203,092 0.35BMW Finance 0.625% 06/10/2023 100,000 102,069 0.18BMW US Capital 0.625% 20/04/2022 100,000 101,865 0.17Daimler 0.875% 12/01/2021 200,000 202,956 0.35Daimler International Finance 0.250% 11/05/2022 100,000 100,632 0.17Daimler International Finance 0.875% 09/04/2024 100,000 102,788 0.18Peugeot 2.375% 14/04/2023 100,000 106,630 0.18
Auto Parts & Equipment (0.35%) Valeo 0.375% 12/09/2022 100,000 100,705 0.17ZF North America Capital 2.750% 27/04/2023 100,000 105,474 0.18
Banks (18.90%) AIB Mortgage Bank 0.875% 04/02/2023 100,000 104,457 0.18Banca Popolare di Milano Scarl 0.875% 14/09/2022 100,000 101,773 0.17Banco Bilbao Vizcaya Argentaria 0.625% 17/05/2021 300,000 305,907 0.52Banco Bilbao Vizcaya Argentaria 0.625% 18/03/2023 100,000 103,443 0.18Banco BPM 0.750% 31/03/2022 100,000 101,310 0.17Banco de Sabadell 0.625% 03/11/2020 100,000 101,352 0.17Banco de Sabadell 0.875% 12/11/2021 200,000 205,964 0.35Banco de Sabadell 0.125% 20/10/2023 100,000 101,561 0.17Banco de Sabadell 0.625% 10/06/2024 100,000 103,908 0.18Banco Santander 1.000% 03/03/2022 200,000 207,494 0.36Banco Santander 0.750% 09/09/2022 100,000 103,632 0.18Bankia 1.125% 05/08/2022 100,000 104,388 0.18Bankinter 0.875% 03/08/2022 100,000 103,648 0.18Belfius Bank 0.625% 14/10/2021 100,000 102,412 0.18BNG Bank 1.875% 14/01/2021 100,000 103,735 0.18BNG Bank 3.000% 25/10/2021 550,000 595,298 1.02BNG Bank 0.500% 26/08/2022 175,000 180,434 0.31BNG Bank 3.875% 26/05/2023 100,000 117,015 0.20BNG Bank 0.050% 11/07/2023 150,000 152,883 0.26Caisse Centrale du Credit Immobilier de France 0.375% 31/07/2020 100,000 100,793 0.17CaixaBank 0.625% 12/11/2020 100,000 101,381 0.17CaixaBank 1.000% 08/02/2023 100,000 104,640 0.18Commerzbank 0.250% 26/01/2022 300,000 305,199 0.52Commerzbank 0.125% 23/02/2023 150,000 152,755 0.26Compagnie de Financement Foncier 0.625% 12/11/2021 100,000 102,501 0.18Compagnie de Financement Foncier 0.200% 16/09/2022 100,000 101,915 0.17Compagnie de Financement Foncier 0.625% 10/02/2023 100,000 103,516 0.18Compagnie de Financement Foncier 0.250% 11/04/2023 100,000 102,215 0.17Cooperatieve Rabobank 0.250% 31/05/2024 100,000 102,689 0.18Credit Agricole Italia 0.875% 31/01/2022 100,000 102,690 0.18Credit Agricole Italia 0.875% 16/06/2023 100,000 103,459 0.18Danske Kiinnitysluottopankki 0.250% 26/11/2020 100,000 100,964 0.17Deutsche Bank Espanola 0.625% 25/11/2020 100,000 101,394 0.17Deutsche Bank Espanola 0.625% 15/12/2021 100,000 102,483 0.18Dexia Credit Local 0.200% 16/03/2021 100,000 101,052 0.17Dexia Credit Local 0.250% 02/06/2022 150,000 152,652 0.26Dexia Credit Local 0.250% 01/06/2023 200,000 204,194 0.35
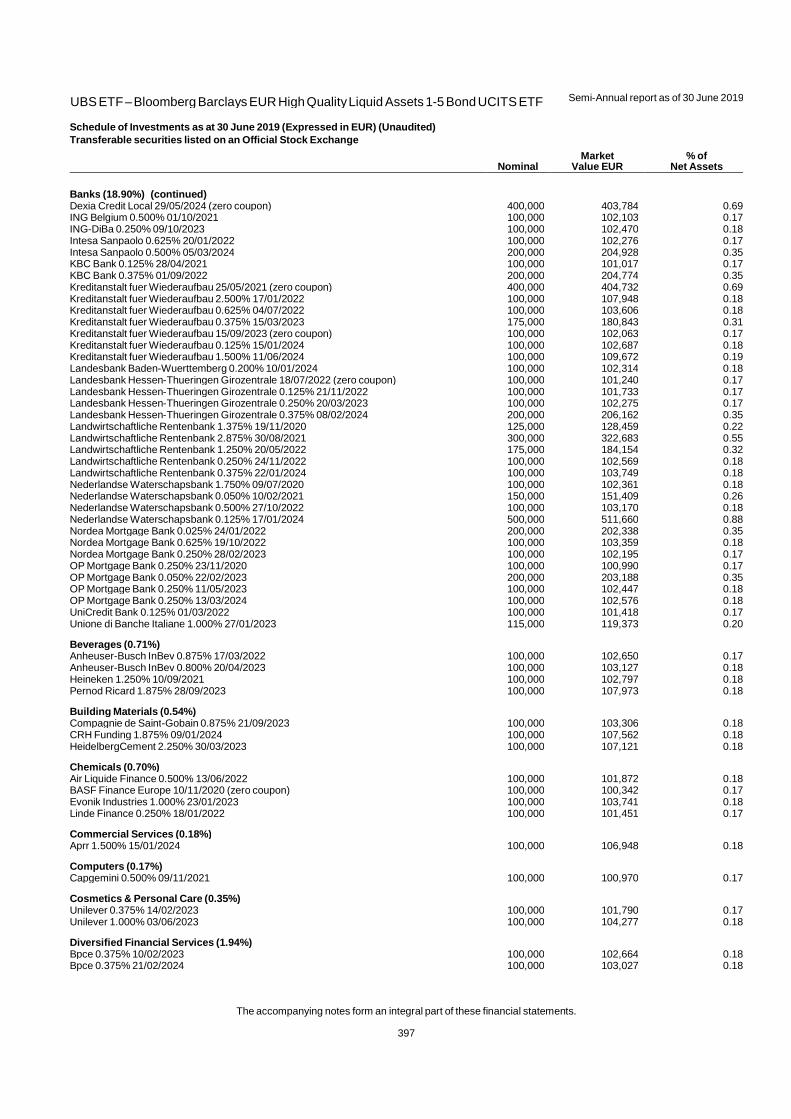
UBS ETF – Bloomberg Barclays EUR High Quality Liquid Assets 1-5 Bond UCITS ETF
Semi-Annual report as of 30 June 2019
The accompanying notes form an integral part of these financial statements.
397
Schedule of Investments as at 30 June 2019 (Expressed in EUR) (Unaudited)
Transferable securities listed on an Official Stock Exchange
Nominal Market
Value EUR % of
Net Assets
Banks (18.90%) (continued) Dexia Credit Local 29/05/2024 (zero coupon) 400,000 403,784 0.69ING Belgium 0.500% 01/10/2021 100,000 102,103 0.17ING-DiBa 0.250% 09/10/2023 100,000 102,470 0.18Intesa Sanpaolo 0.625% 20/01/2022 100,000 102,276 0.17Intesa Sanpaolo 0.500% 05/03/2024 200,000 204,928 0.35KBC Bank 0.125% 28/04/2021 100,000 101,017 0.17KBC Bank 0.375% 01/09/2022 200,000 204,774 0.35Kreditanstalt fuer Wiederaufbau 25/05/2021 (zero coupon) 400,000 404,732 0.69Kreditanstalt fuer Wiederaufbau 2.500% 17/01/2022 100,000 107,948 0.18Kreditanstalt fuer Wiederaufbau 0.625% 04/07/2022 100,000 103,606 0.18Kreditanstalt fuer Wiederaufbau 0.375% 15/03/2023 175,000 180,843 0.31Kreditanstalt fuer Wiederaufbau 15/09/2023 (zero coupon) 100,000 102,063 0.17Kreditanstalt fuer Wiederaufbau 0.125% 15/01/2024 100,000 102,687 0.18Kreditanstalt fuer Wiederaufbau 1.500% 11/06/2024 100,000 109,672 0.19Landesbank Baden-Wuerttemberg 0.200% 10/01/2024 100,000 102,314 0.18Landesbank Hessen-Thueringen Girozentrale 18/07/2022 (zero coupon) 100,000 101,240 0.17Landesbank Hessen-Thueringen Girozentrale 0.125% 21/11/2022 100,000 101,733 0.17Landesbank Hessen-Thueringen Girozentrale 0.250% 20/03/2023 100,000 102,275 0.17Landesbank Hessen-Thueringen Girozentrale 0.375% 08/02/2024 200,000 206,162 0.35Landwirtschaftliche Rentenbank 1.375% 19/11/2020 125,000 128,459 0.22Landwirtschaftliche Rentenbank 2.875% 30/08/2021 300,000 322,683 0.55Landwirtschaftliche Rentenbank 1.250% 20/05/2022 175,000 184,154 0.32Landwirtschaftliche Rentenbank 0.250% 24/11/2022 100,000 102,569 0.18Landwirtschaftliche Rentenbank 0.375% 22/01/2024 100,000 103,749 0.18Nederlandse Waterschapsbank 1.750% 09/07/2020 100,000 102,361 0.18Nederlandse Waterschapsbank 0.050% 10/02/2021 150,000 151,409 0.26Nederlandse Waterschapsbank 0.500% 27/10/2022 100,000 103,170 0.18Nederlandse Waterschapsbank 0.125% 17/01/2024 500,000 511,660 0.88Nordea Mortgage Bank 0.025% 24/01/2022 200,000 202,338 0.35Nordea Mortgage Bank 0.625% 19/10/2022 100,000 103,359 0.18Nordea Mortgage Bank 0.250% 28/02/2023 100,000 102,195 0.17OP Mortgage Bank 0.250% 23/11/2020 100,000 100,990 0.17OP Mortgage Bank 0.050% 22/02/2023 200,000 203,188 0.35OP Mortgage Bank 0.250% 11/05/2023 100,000 102,447 0.18OP Mortgage Bank 0.250% 13/03/2024 100,000 102,576 0.18UniCredit Bank 0.125% 01/03/2022 100,000 101,418 0.17Unione di Banche Italiane 1.000% 27/01/2023 115,000 119,373 0.20
Beverages (0.71%) Anheuser-Busch InBev 0.875% 17/03/2022 100,000 102,650 0.17Anheuser-Busch InBev 0.800% 20/04/2023 100,000 103,127 0.18Heineken 1.250% 10/09/2021 100,000 102,797 0.18Pernod Ricard 1.875% 28/09/2023 100,000 107,973 0.18
Building Materials (0.54%) Compagnie de Saint-Gobain 0.875% 21/09/2023 100,000 103,306 0.18CRH Funding 1.875% 09/01/2024 100,000 107,562 0.18HeidelbergCement 2.250% 30/03/2023 100,000 107,121 0.18
Chemicals (0.70%) Air Liquide Finance 0.500% 13/06/2022 100,000 101,872 0.18BASF Finance Europe 10/11/2020 (zero coupon) 100,000 100,342 0.17Evonik Industries 1.000% 23/01/2023 100,000 103,741 0.18Linde Finance 0.250% 18/01/2022 100,000 101,451 0.17
Commercial Services (0.18%) Aprr 1.500% 15/01/2024 100,000 106,948 0.18
Computers (0.17%) Capgemini 0.500% 09/11/2021 100,000 100,970 0.17
Cosmetics & Personal Care (0.35%) Unilever 0.375% 14/02/2023 100,000 101,790 0.17Unilever 1.000% 03/06/2023 100,000 104,277 0.18
Diversified Financial Services (1.94%) Bpce 0.375% 10/02/2023 100,000 102,664 0.18Bpce 0.375% 21/02/2024 100,000 103,027 0.18
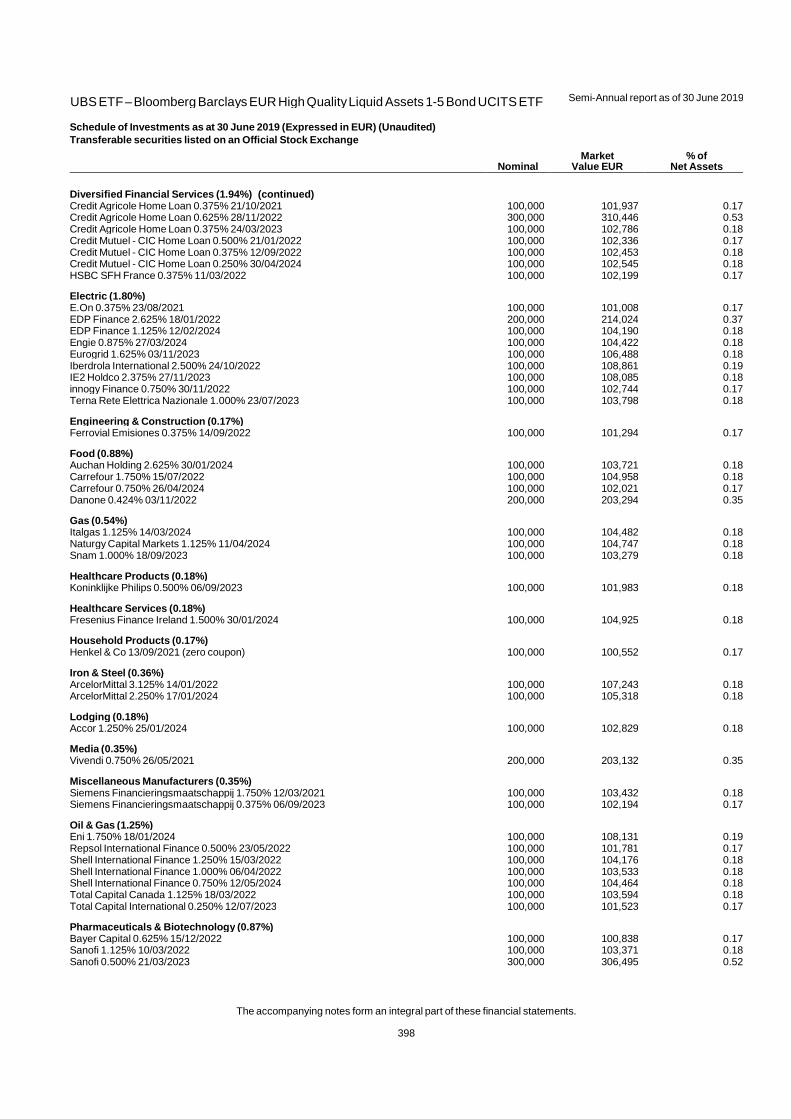
UBS ETF – Bloomberg Barclays EUR High Quality Liquid Assets 1-5 Bond UCITS ETF
Semi-Annual report as of 30 June 2019
The accompanying notes form an integral part of these financial statements.
398
Schedule of Investments as at 30 June 2019 (Expressed in EUR) (Unaudited)
Transferable securities listed on an Official Stock Exchange
Nominal Market
Value EUR % of
Net Assets
Diversified Financial Services (1.94%) (continued) Credit Agricole Home Loan 0.375% 21/10/2021 100,000 101,937 0.17Credit Agricole Home Loan 0.625% 28/11/2022 300,000 310,446 0.53Credit Agricole Home Loan 0.375% 24/03/2023 100,000 102,786 0.18Credit Mutuel - CIC Home Loan 0.500% 21/01/2022 100,000 102,336 0.17Credit Mutuel - CIC Home Loan 0.375% 12/09/2022 100,000 102,453 0.18Credit Mutuel - CIC Home Loan 0.250% 30/04/2024 100,000 102,545 0.18HSBC SFH France 0.375% 11/03/2022 100,000 102,199 0.17
Electric (1.80%) E.On 0.375% 23/08/2021 100,000 101,008 0.17EDP Finance 2.625% 18/01/2022 200,000 214,024 0.37EDP Finance 1.125% 12/02/2024 100,000 104,190 0.18Engie 0.875% 27/03/2024 100,000 104,422 0.18Eurogrid 1.625% 03/11/2023 100,000 106,488 0.18Iberdrola International 2.500% 24/10/2022 100,000 108,861 0.19IE2 Holdco 2.375% 27/11/2023 100,000 108,085 0.18innogy Finance 0.750% 30/11/2022 100,000 102,744 0.17Terna Rete Elettrica Nazionale 1.000% 23/07/2023 100,000 103,798 0.18
Engineering & Construction (0.17%) Ferrovial Emisiones 0.375% 14/09/2022 100,000 101,294 0.17
Food (0.88%) Auchan Holding 2.625% 30/01/2024 100,000 103,721 0.18Carrefour 1.750% 15/07/2022 100,000 104,958 0.18Carrefour 0.750% 26/04/2024 100,000 102,021 0.17Danone 0.424% 03/11/2022 200,000 203,294 0.35
Gas (0.54%) Italgas 1.125% 14/03/2024 100,000 104,482 0.18Naturgy Capital Markets 1.125% 11/04/2024 100,000 104,747 0.18Snam 1.000% 18/09/2023 100,000 103,279 0.18
Healthcare Products (0.18%) Koninklijke Philips 0.500% 06/09/2023 100,000 101,983 0.18
Healthcare Services (0.18%) Fresenius Finance Ireland 1.500% 30/01/2024 100,000 104,925 0.18
Household Products (0.17%) Henkel & Co 13/09/2021 (zero coupon) 100,000 100,552 0.17
Iron & Steel (0.36%) ArcelorMittal 3.125% 14/01/2022 100,000 107,243 0.18ArcelorMittal 2.250% 17/01/2024 100,000 105,318 0.18
Lodging (0.18%) Accor 1.250% 25/01/2024 100,000 102,829 0.18
Media (0.35%) Vivendi 0.750% 26/05/2021 200,000 203,132 0.35
Miscellaneous Manufacturers (0.35%) Siemens Financieringsmaatschappij 1.750% 12/03/2021 100,000 103,432 0.18Siemens Financieringsmaatschappij 0.375% 06/09/2023 100,000 102,194 0.17
Oil & Gas (1.25%) Eni 1.750% 18/01/2024 100,000 108,131 0.19Repsol International Finance 0.500% 23/05/2022 100,000 101,781 0.17Shell International Finance 1.250% 15/03/2022 100,000 104,176 0.18Shell International Finance 1.000% 06/04/2022 100,000 103,533 0.18Shell International Finance 0.750% 12/05/2024 100,000 104,464 0.18Total Capital Canada 1.125% 18/03/2022 100,000 103,594 0.18Total Capital International 0.250% 12/07/2023 100,000 101,523 0.17
Pharmaceuticals & Biotechnology (0.87%) Bayer Capital 0.625% 15/12/2022 100,000 100,838 0.17Sanofi 1.125% 10/03/2022 100,000 103,371 0.18Sanofi 0.500% 21/03/2023 300,000 306,495 0.52

UBS ETF – Bloomberg Barclays EUR High Quality Liquid Assets 1-5 Bond UCITS ETF
Semi-Annual report as of 30 June 2019
The accompanying notes form an integral part of these financial statements.
399
Schedule of Investments as at 30 June 2019 (Expressed in EUR) (Unaudited)
Transferable securities listed on an Official Stock Exchange
Nominal Market
Value EUR % of
Net Assets
Real Estate (0.88%) Aroundtown 2.125% 13/03/2023 100,000 106,445 0.18Vonovia Finance 0.750% 25/01/2022 100,000 102,253 0.18Vonovia Finance 0.875% 10/06/2022 200,000 205,434 0.35Vonovia Finance 0.750% 15/01/2024 100,000 102,197 0.17
Semiconductors (0.18%) ASML Holding 0.625% 07/07/2022 100,000 102,009 0.18
Software (0.53%) Amadeus IT Group 0.875% 18/09/2023 100,000 103,082 0.17SAP 1.125% 20/02/2023 200,000 208,996 0.36
Sovereign Bonds (0.53%) FMS Wertmanagement 3.375% 17/06/2021 100,000 107,809 0.18FMS Wertmanagement 0.050% 06/07/2021 200,000 202,514 0.35
Supranational Banks (0.87%) FMS Wertmanagement 18/09/2020 (zero coupon) 300,000 302,025 0.52FMS Wertmanagement 3.000% 08/09/2021 100,000 107,899 0.18KA Finanz 0.375% 11/08/2020 100,000 100,867 0.17
Telecommunications (1.23%) Deutsche Telekom International Finance 0.375% 30/10/2021 100,000 101,166 0.17Deutsche Telekom International Finance 0.625% 03/04/2023 200,000 205,076 0.35Orange 0.750% 11/09/2023 100,000 103,304 0.18Telefonica Emisiones 1.477% 14/09/2021 100,000 103,625 0.18Telefonica Emisiones 0.750% 13/04/2022 100,000 102,386 0.17Telefonica Emisiones 1.069% 05/02/2024 100,000 104,058 0.18
Transportation (0.67%) OeBB-Infrastruktur 3.500% 19/10/2020 100,000 105,290 0.18OeBB-Infrastruktur 4.875% 27/06/2022 150,000 174,429 0.30OeBB-Infrastruktur 2.250% 04/07/2023 100,000 110,890 0.19
Water (0.35%) Veolia Environnement 0.314% 04/10/2023 200,000 203,450 0.35
Total Corporate Bonds 22,935,369 39.25
Government Bonds
Banks (0.17%) Nederlandse Financierings-Maatschappij voor Ontwikkelingslanden 0.125% 20/04/2022 100,000 101,937 0.17
Commercial Services (1.41%) Autobahnen- und Schnell- strassen-Finanzierungs 1.750% 21/10/2020 100,000 103,090 0.18Autobahnen- und Schnell- strassen-Finanzierungs 0.625% 15/09/2022 150,000 155,538 0.26SNCF Reseau 6.000% 12/10/2020 200,000 216,444 0.37SNCF Reseau 4.375% 02/06/2022 200,000 228,278 0.39SNCF Reseau 4.500% 30/01/2024 100,000 122,095 0.21
Pipelines (0.55%) de Gestion de Stocks de Securite 3.125% 21/10/2022 100,000 111,709 0.19de Gestion de Stocks de Securite 0.625% 25/05/2023 200,000 208,178 0.36
Sovereign Bonds (56.27%) Bpifrance Financement 0.100% 19/02/2021 300,000 302,793 0.52Bpifrance Financement 2.375% 25/04/2022 200,000 216,174 0.37Bpifrance Financement 0.250% 14/02/2023 100,000 102,301 0.18Bpifrance Financement 0.125% 25/11/2023 200,000 203,604 0.35Bpifrance Financement 2.500% 25/05/2024 200,000 227,000 0.39Bundesobligation 0.250% 16/10/2020 250,000 253,142 0.43Bundesobligation 09/04/2021 (zero coupon) 200,000 202,666 0.35Bundesobligation 08/10/2021 (zero coupon) 79,000 80,382 0.14Bundesobligation 08/04/2022 (zero coupon) 150,000 153,212 0.26Bundesobligation 07/10/2022 (zero coupon) 125,000 128,124 0.22Bundesobligation 14/04/2023 (zero coupon) 150,000 154,222 0.26Bundesobligation 13/10/2023 (zero coupon) 200,000 206,162 0.35Bundesobligation 05/04/2024 (zero coupon) 150,000 154,819 0.27
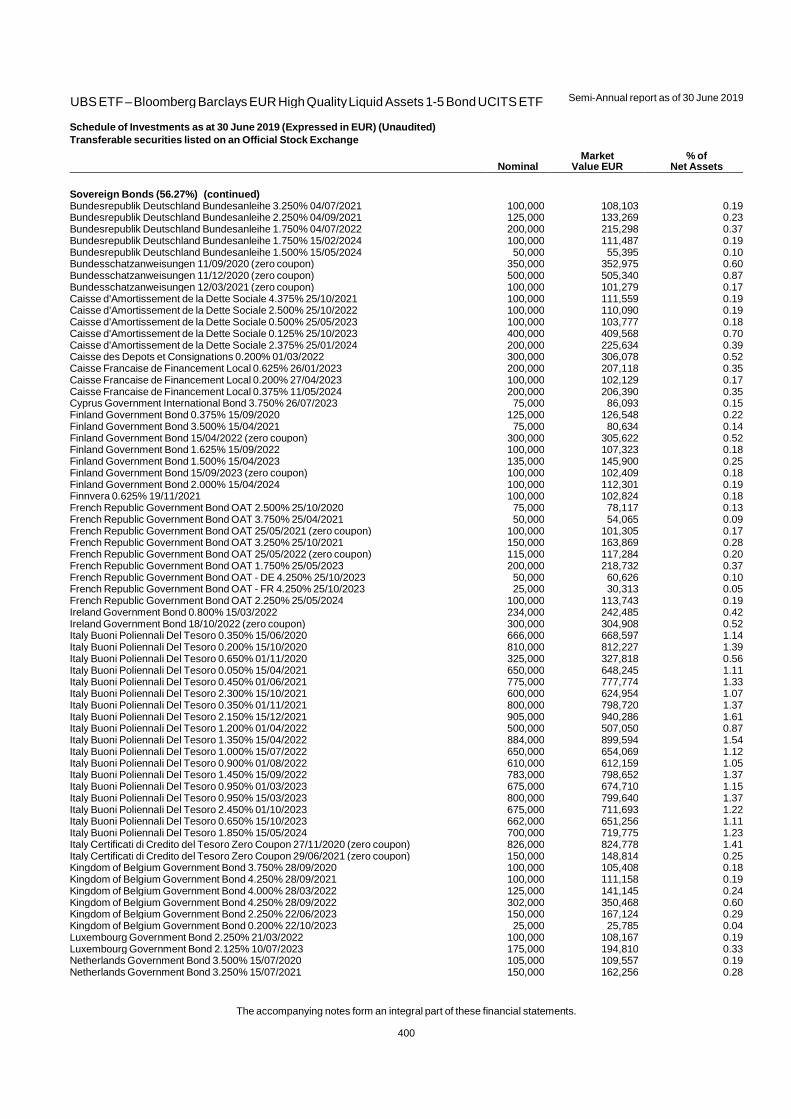
UBS ETF – Bloomberg Barclays EUR High Quality Liquid Assets 1-5 Bond UCITS ETF
Semi-Annual report as of 30 June 2019
The accompanying notes form an integral part of these financial statements.
400
Schedule of Investments as at 30 June 2019 (Expressed in EUR) (Unaudited)
Transferable securities listed on an Official Stock Exchange
Nominal Market
Value EUR % of
Net Assets
Sovereign Bonds (56.27%) (continued) Bundesrepublik Deutschland Bundesanleihe 3.250% 04/07/2021 100,000 108,103 0.19Bundesrepublik Deutschland Bundesanleihe 2.250% 04/09/2021 125,000 133,269 0.23Bundesrepublik Deutschland Bundesanleihe 1.750% 04/07/2022 200,000 215,298 0.37Bundesrepublik Deutschland Bundesanleihe 1.750% 15/02/2024 100,000 111,487 0.19Bundesrepublik Deutschland Bundesanleihe 1.500% 15/05/2024 50,000 55,395 0.10Bundesschatzanweisungen 11/09/2020 (zero coupon) 350,000 352,975 0.60Bundesschatzanweisungen 11/12/2020 (zero coupon) 500,000 505,340 0.87Bundesschatzanweisungen 12/03/2021 (zero coupon) 100,000 101,279 0.17Caisse d'Amortissement de la Dette Sociale 4.375% 25/10/2021 100,000 111,559 0.19Caisse d'Amortissement de la Dette Sociale 2.500% 25/10/2022 100,000 110,090 0.19Caisse d'Amortissement de la Dette Sociale 0.500% 25/05/2023 100,000 103,777 0.18Caisse d'Amortissement de la Dette Sociale 0.125% 25/10/2023 400,000 409,568 0.70Caisse d'Amortissement de la Dette Sociale 2.375% 25/01/2024 200,000 225,634 0.39Caisse des Depots et Consignations 0.200% 01/03/2022 300,000 306,078 0.52Caisse Francaise de Financement Local 0.625% 26/01/2023 200,000 207,118 0.35Caisse Francaise de Financement Local 0.200% 27/04/2023 100,000 102,129 0.17Caisse Francaise de Financement Local 0.375% 11/05/2024 200,000 206,390 0.35Cyprus Government International Bond 3.750% 26/07/2023 75,000 86,093 0.15Finland Government Bond 0.375% 15/09/2020 125,000 126,548 0.22Finland Government Bond 3.500% 15/04/2021 75,000 80,634 0.14Finland Government Bond 15/04/2022 (zero coupon) 300,000 305,622 0.52Finland Government Bond 1.625% 15/09/2022 100,000 107,323 0.18Finland Government Bond 1.500% 15/04/2023 135,000 145,900 0.25Finland Government Bond 15/09/2023 (zero coupon) 100,000 102,409 0.18Finland Government Bond 2.000% 15/04/2024 100,000 112,301 0.19Finnvera 0.625% 19/11/2021 100,000 102,824 0.18French Republic Government Bond OAT 2.500% 25/10/2020 75,000 78,117 0.13French Republic Government Bond OAT 3.750% 25/04/2021 50,000 54,065 0.09French Republic Government Bond OAT 25/05/2021 (zero coupon) 100,000 101,305 0.17French Republic Government Bond OAT 3.250% 25/10/2021 150,000 163,869 0.28French Republic Government Bond OAT 25/05/2022 (zero coupon) 115,000 117,284 0.20French Republic Government Bond OAT 1.750% 25/05/2023 200,000 218,732 0.37French Republic Government Bond OAT - DE 4.250% 25/10/2023 50,000 60,626 0.10French Republic Government Bond OAT - FR 4.250% 25/10/2023 25,000 30,313 0.05French Republic Government Bond OAT 2.250% 25/05/2024 100,000 113,743 0.19Ireland Government Bond 0.800% 15/03/2022 234,000 242,485 0.42Ireland Government Bond 18/10/2022 (zero coupon) 300,000 304,908 0.52Italy Buoni Poliennali Del Tesoro 0.350% 15/06/2020 666,000 668,597 1.14Italy Buoni Poliennali Del Tesoro 0.200% 15/10/2020 810,000 812,227 1.39Italy Buoni Poliennali Del Tesoro 0.650% 01/11/2020 325,000 327,818 0.56Italy Buoni Poliennali Del Tesoro 0.050% 15/04/2021 650,000 648,245 1.11Italy Buoni Poliennali Del Tesoro 0.450% 01/06/2021 775,000 777,774 1.33Italy Buoni Poliennali Del Tesoro 2.300% 15/10/2021 600,000 624,954 1.07Italy Buoni Poliennali Del Tesoro 0.350% 01/11/2021 800,000 798,720 1.37Italy Buoni Poliennali Del Tesoro 2.150% 15/12/2021 905,000 940,286 1.61Italy Buoni Poliennali Del Tesoro 1.200% 01/04/2022 500,000 507,050 0.87Italy Buoni Poliennali Del Tesoro 1.350% 15/04/2022 884,000 899,594 1.54Italy Buoni Poliennali Del Tesoro 1.000% 15/07/2022 650,000 654,069 1.12Italy Buoni Poliennali Del Tesoro 0.900% 01/08/2022 610,000 612,159 1.05Italy Buoni Poliennali Del Tesoro 1.450% 15/09/2022 783,000 798,652 1.37Italy Buoni Poliennali Del Tesoro 0.950% 01/03/2023 675,000 674,710 1.15Italy Buoni Poliennali Del Tesoro 0.950% 15/03/2023 800,000 799,640 1.37Italy Buoni Poliennali Del Tesoro 2.450% 01/10/2023 675,000 711,693 1.22Italy Buoni Poliennali Del Tesoro 0.650% 15/10/2023 662,000 651,256 1.11Italy Buoni Poliennali Del Tesoro 1.850% 15/05/2024 700,000 719,775 1.23Italy Certificati di Credito del Tesoro Zero Coupon 27/11/2020 (zero coupon) 826,000 824,778 1.41Italy Certificati di Credito del Tesoro Zero Coupon 29/06/2021 (zero coupon) 150,000 148,814 0.25Kingdom of Belgium Government Bond 3.750% 28/09/2020 100,000 105,408 0.18Kingdom of Belgium Government Bond 4.250% 28/09/2021 100,000 111,158 0.19Kingdom of Belgium Government Bond 4.000% 28/03/2022 125,000 141,145 0.24Kingdom of Belgium Government Bond 4.250% 28/09/2022 302,000 350,468 0.60Kingdom of Belgium Government Bond 2.250% 22/06/2023 150,000 167,124 0.29Kingdom of Belgium Government Bond 0.200% 22/10/2023 25,000 25,785 0.04Luxembourg Government Bond 2.250% 21/03/2022 100,000 108,167 0.19Luxembourg Government Bond 2.125% 10/07/2023 175,000 194,810 0.33Netherlands Government Bond 3.500% 15/07/2020 105,000 109,557 0.19Netherlands Government Bond 3.250% 15/07/2021 150,000 162,256 0.28

UBS ETF – Bloomberg Barclays EUR High Quality Liquid Assets 1-5 Bond UCITS ETF
Semi-Annual report as of 30 June 2019
The accompanying notes form an integral part of these financial statements.
401
Schedule of Investments as at 30 June 2019 (Expressed in EUR) (Unaudited)
Transferable securities listed on an Official Stock Exchange
Nominal Market
Value EUR % of
Net Assets
Sovereign Bonds (56.27%) (continued) Netherlands Government Bond 15/01/2022 (zero coupon) 215,000 218,851 0.37Netherlands Government Bond 3.750% 15/01/2023 150,000 173,941 0.30Netherlands Government Bond 1.750% 15/07/2023 200,000 219,666 0.38Netherlands Government Bond 15/01/2024 (zero coupon) 100,000 102,706 0.18Portugal Obrigacoes do Tesouro OT 2.200% 17/10/2022 440,000 476,599 0.82Republic of Austria Government Bond 3.900% 15/07/2020 50,000 52,351 0.09Republic of Austria Government Bond 3.500% 15/09/2021 260,000 284,209 0.49Republic of Austria Government Bond 3.650% 20/04/2022 100,000 112,185 0.19Republic of Austria Government Bond 20/09/2022 (zero coupon) 100,000 102,046 0.17Republic of Austria Government Bond 3.400% 22/11/2022 100,000 113,804 0.19Republic of Austria Government Bond 15/07/2023 (zero coupon) 100,000 102,332 0.18Republic of Austria Government Bond 1.750% 20/10/2023 150,000 165,202 0.28Sfil 0.100% 18/10/2022 200,000 203,074 0.35Sfil 24/05/2024 (zero coupon) 100,000 101,062 0.17Slovakia Government Bond 13/11/2023 (zero coupon) 100,000 101,704 0.17Spain Government Bond 1.150% 30/07/2020 805,000 819,055 1.40Spain Government Bond 0.050% 31/01/2021 786,000 791,879 1.36Spain Government Bond 0.750% 30/07/2021 988,000 1,012,364 1.73Spain Government Bond 0.050% 31/10/2021 675,000 682,276 1.17Spain Government Bond 0.400% 30/04/2022 725,000 741,530 1.27Spain Government Bond 0.450% 31/10/2022 948,000 973,075 1.67Spain Government Bond 0.350% 30/07/2023 792,000 811,459 1.39Unedic Asseo 1.500% 16/04/2021 300,000 310,707 0.53Unedic Asseo 0.300% 04/11/2021 300,000 305,505 0.52Unedic Asseo 0.875% 25/10/2022 100,000 104,389 0.18Unedic Asseo 2.250% 05/04/2023 100,000 110,126 0.19Unedic Asseo 0.250% 24/11/2023 200,000 205,394 0.35
Transportation (0.94%) Regie Autonome des Transports Parisiens 4.000% 23/09/2021 100,000 109,907 0.19Regie Autonome des Transports Parisiens 2.875% 09/09/2022 100,000 110,722 0.19SNCF Mobilites 3.625% 03/06/2020 200,000 207,406 0.35SNCF Mobilites 4.875% 12/06/2023 100,000 120,839 0.21
Total Government Bonds 34,675,514 59.34
TOTAL INVESTMENTS (Cost EUR 57,103,945) 57,610,883 98.59
Other net assets 824,719 1.41
TOTAL NET ASSETS 58,435,602 100.00
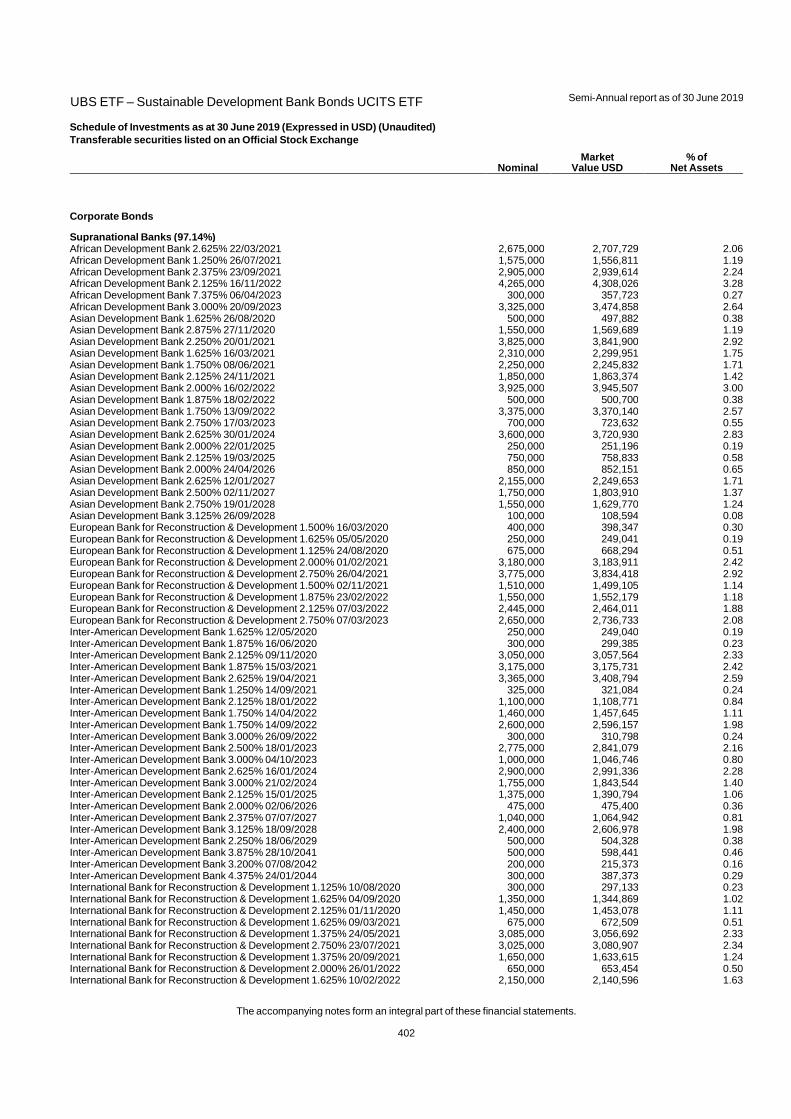
UBS ETF – Sustainable Development Bank Bonds UCITS ETF
Semi-Annual report as of 30 June 2019
The accompanying notes form an integral part of these financial statements.
402
Schedule of Investments as at 30 June 2019 (Expressed in USD) (Unaudited)
Transferable securities listed on an Official Stock Exchange
Nominal Market
Value USD % of
Net Assets
Corporate Bonds
Supranational Banks (97.14%) African Development Bank 2.625% 22/03/2021 2,675,000 2,707,729 2.06African Development Bank 1.250% 26/07/2021 1,575,000 1,556,811 1.19African Development Bank 2.375% 23/09/2021 2,905,000 2,939,614 2.24African Development Bank 2.125% 16/11/2022 4,265,000 4,308,026 3.28African Development Bank 7.375% 06/04/2023 300,000 357,723 0.27African Development Bank 3.000% 20/09/2023 3,325,000 3,474,858 2.64Asian Development Bank 1.625% 26/08/2020 500,000 497,882 0.38Asian Development Bank 2.875% 27/11/2020 1,550,000 1,569,689 1.19Asian Development Bank 2.250% 20/01/2021 3,825,000 3,841,900 2.92Asian Development Bank 1.625% 16/03/2021 2,310,000 2,299,951 1.75Asian Development Bank 1.750% 08/06/2021 2,250,000 2,245,832 1.71Asian Development Bank 2.125% 24/11/2021 1,850,000 1,863,374 1.42Asian Development Bank 2.000% 16/02/2022 3,925,000 3,945,507 3.00Asian Development Bank 1.875% 18/02/2022 500,000 500,700 0.38Asian Development Bank 1.750% 13/09/2022 3,375,000 3,370,140 2.57Asian Development Bank 2.750% 17/03/2023 700,000 723,632 0.55Asian Development Bank 2.625% 30/01/2024 3,600,000 3,720,930 2.83Asian Development Bank 2.000% 22/01/2025 250,000 251,196 0.19Asian Development Bank 2.125% 19/03/2025 750,000 758,833 0.58Asian Development Bank 2.000% 24/04/2026 850,000 852,151 0.65Asian Development Bank 2.625% 12/01/2027 2,155,000 2,249,653 1.71Asian Development Bank 2.500% 02/11/2027 1,750,000 1,803,910 1.37Asian Development Bank 2.750% 19/01/2028 1,550,000 1,629,770 1.24Asian Development Bank 3.125% 26/09/2028 100,000 108,594 0.08European Bank for Reconstruction & Development 1.500% 16/03/2020 400,000 398,347 0.30European Bank for Reconstruction & Development 1.625% 05/05/2020 250,000 249,041 0.19European Bank for Reconstruction & Development 1.125% 24/08/2020 675,000 668,294 0.51European Bank for Reconstruction & Development 2.000% 01/02/2021 3,180,000 3,183,911 2.42European Bank for Reconstruction & Development 2.750% 26/04/2021 3,775,000 3,834,418 2.92European Bank for Reconstruction & Development 1.500% 02/11/2021 1,510,000 1,499,105 1.14European Bank for Reconstruction & Development 1.875% 23/02/2022 1,550,000 1,552,179 1.18European Bank for Reconstruction & Development 2.125% 07/03/2022 2,445,000 2,464,011 1.88European Bank for Reconstruction & Development 2.750% 07/03/2023 2,650,000 2,736,733 2.08Inter-American Development Bank 1.625% 12/05/2020 250,000 249,040 0.19Inter-American Development Bank 1.875% 16/06/2020 300,000 299,385 0.23Inter-American Development Bank 2.125% 09/11/2020 3,050,000 3,057,564 2.33Inter-American Development Bank 1.875% 15/03/2021 3,175,000 3,175,731 2.42Inter-American Development Bank 2.625% 19/04/2021 3,365,000 3,408,794 2.59Inter-American Development Bank 1.250% 14/09/2021 325,000 321,084 0.24Inter-American Development Bank 2.125% 18/01/2022 1,100,000 1,108,771 0.84Inter-American Development Bank 1.750% 14/04/2022 1,460,000 1,457,645 1.11Inter-American Development Bank 1.750% 14/09/2022 2,600,000 2,596,157 1.98Inter-American Development Bank 3.000% 26/09/2022 300,000 310,798 0.24Inter-American Development Bank 2.500% 18/01/2023 2,775,000 2,841,079 2.16Inter-American Development Bank 3.000% 04/10/2023 1,000,000 1,046,746 0.80Inter-American Development Bank 2.625% 16/01/2024 2,900,000 2,991,336 2.28Inter-American Development Bank 3.000% 21/02/2024 1,755,000 1,843,544 1.40Inter-American Development Bank 2.125% 15/01/2025 1,375,000 1,390,794 1.06Inter-American Development Bank 2.000% 02/06/2026 475,000 475,400 0.36Inter-American Development Bank 2.375% 07/07/2027 1,040,000 1,064,942 0.81Inter-American Development Bank 3.125% 18/09/2028 2,400,000 2,606,978 1.98Inter-American Development Bank 2.250% 18/06/2029 500,000 504,328 0.38Inter-American Development Bank 3.875% 28/10/2041 500,000 598,441 0.46Inter-American Development Bank 3.200% 07/08/2042 200,000 215,373 0.16Inter-American Development Bank 4.375% 24/01/2044 300,000 387,373 0.29International Bank for Reconstruction & Development 1.125% 10/08/2020 300,000 297,133 0.23International Bank for Reconstruction & Development 1.625% 04/09/2020 1,350,000 1,344,869 1.02International Bank for Reconstruction & Development 2.125% 01/11/2020 1,450,000 1,453,078 1.11International Bank for Reconstruction & Development 1.625% 09/03/2021 675,000 672,509 0.51International Bank for Reconstruction & Development 1.375% 24/05/2021 3,085,000 3,056,692 2.33International Bank for Reconstruction & Development 2.750% 23/07/2021 3,025,000 3,080,907 2.34International Bank for Reconstruction & Development 1.375% 20/09/2021 1,650,000 1,633,615 1.24International Bank for Reconstruction & Development 2.000% 26/01/2022 650,000 653,454 0.50International Bank for Reconstruction & Development 1.625% 10/02/2022 2,150,000 2,140,596 1.63

UBS ETF – Sustainable Development Bank Bonds UCITS ETF
Semi-Annual report as of 30 June 2019
The accompanying notes form an integral part of these financial statements.
403
Schedule of Investments as at 30 June 2019 (Expressed in USD) (Unaudited)
Transferable securities listed on an Official Stock Exchange
Nominal Market
Value USD % of
Net Assets
Supranational Banks (97.14%) (continued) International Bank for Reconstruction & Development 2.125% 01/07/2022 1,850,000 1,875,017 1.43International Bank for Reconstruction & Development 7.625% 19/01/2023 500,000 598,835 0.46International Bank for Reconstruction & Development 2.125% 13/02/2023 300,000 303,586 0.23International Bank for Reconstruction & Development 3.000% 27/09/2023 1,925,000 2,017,670 1.54International Bank for Reconstruction & Development 2.500% 19/03/2024 2,050,000 2,108,643 1.61International Bank for Reconstruction & Development 2.500% 25/11/2024 2,475,000 2,554,512 1.94International Bank for Reconstruction & Development 2.500% 29/07/2025 1,150,000 1,186,435 0.90International Bank for Reconstruction & Development 1.875% 27/10/2026 900,000 893,875 0.68International Bank for Reconstruction & Development 2.500% 22/11/2027 850,000 879,374 0.67International Development Association 2.750% 24/04/2023 750,000 774,982 0.59International Finance 1.625% 16/07/2020 275,000 273,916 0.21International Finance 2.250% 25/01/2021 1,000,000 1,005,290 0.77International Finance 1.125% 20/07/2021 1,400,000 1,379,865 1.05International Finance 2.000% 24/10/2022 150,000 150,974 0.12International Finance 2.875% 31/07/2023 700,000 728,156 0.55International Finance 2.125% 07/04/2026 450,000 454,603 0.35
Total Corporate Bonds 127,634,333 97.14
TOTAL INVESTMENTS (Cost USD 125,472,707) 127,634,333 97.14
Other net assets 3,757,618 2.86
TOTAL NET ASSETS 131,391,951 100.00
Forward Foreign Exchange Contracts
Purchases Sales Maturity Date Unrealised appreciation/
(depreciation) USD % of Net Assets
CHF 40,443,059 USD 40,318,073 02 July 2019 1,161,988 0.88CHF 3,201,522 USD 3,295,781 02 July 2019 (12,169) (0.01)EUR 26,276,186 USD 29,350,421 02 July 2019 572,910 0.44EUR 2,378,411 USD 2,670,269 02 July 2019 38,267 0.03EUR 1,769,732 USD 1,981,622 02 July 2019 33,750 0.03USD 2,466,963 CHF 2,405,017 02 July 2019 278 0.00
Total Forward Foreign Exchange Contracts 1,795,024 1.37

Notes to Financial Statements Semi-Annual report as of 30 June 2019
404
Note 1 Description of the Fund
UBS ETF (the "Company") was incorporated in the Grand Duchy of Luxembourg as an open-ended investment company (a "Société d'Investissement à Capital Variable") on 7 September 2001 for an unlimited period under the original name of "Fresco". The Company is governed by the Luxembourg Law of 10 August 1915 on commercial companies, as amended, and by Part I of the Luxembourg Law of 17 December 2010 on undertakings for collective investments, as amended. Accordingly, each Sub-Fund has been established for an unlimited period. The registered office of the company is established at 49, Avenue J.F. Kennedy, L-1855 Luxembourg.
The Company has appointed UBS Fund Management (Luxembourg) S.A. to act as its management company (the “Management Company”) with effect as of 1 July 2012.
The Company's Articles of Incorporation (the "Articles") have been published in their original version in the Mémorial, Recueil des Sociétés et Associations (the "Mémorial") dated 11 October 2001. The notarial deed containing the minutes of the extraordinary general meeting held on 29 November 2004 deciding the change of the denomination of the company into UBS ETF has been published in the Mémorial dated 23 December 2004. Additionally, the notarial deed containing the minutes of the extraordinary general meeting held on 27 December 2005, amending the Articles related to the compliance by the Company with the rules of the amended directive 2009/65/EC, has been published in the Mémorial dated 30 January 2006. Finally, the notarial deed containing the minutes of the extraordinary general meeting held on 18 January 2016, amending the Articles as to allow for the issuance of registered shares only has been published in the Mémorial dated 7 April 2016. All bearer shares were converted to registered shares as of 8 February 2016. Moreover, the consolidated version of the Articles has been deposited with the Luxembourg company register.
The Company has been established to provide investors with an opportunity to purchase Shares in its Sub-Funds, the investment objective of each of which is to aim to track a specific Index. Each Sub-Fund aims to replicate or track, before expenses, the price and income performance of its Index by holding a portfolio of transferable securities that comprises all or substantially all of the component securities of its Index.
Each Sub-Fund will have Shares listed on one or more Listing Stock Exchanges to be an Exchange Traded Fund (“ETF”). With the exceptions detailed in the prospectus, only institutions qualifying as Authorised Participants are able to subscribe or redeem Shares by delivery of in kind stocks, which mostly are stocks composing the relevant index or versus cash. Those subscriptions and redemptions minimise fund turnover and lower trading expenses. A secondary market is created through such Authorised Participants. Persons who are not Authorised Participants are able to buy or sell Shares in a Sub-Fund on a Listing Stock Exchange at prices which should approximate to the Indicative Intra-Day NAV per Share from other investors in Shares who are acting as market makers or broker/dealers. In order to allow participants in the secondary market to have access to a real-time estimate of the Daily NAV per Share, an Indicative Intra-Day NAV per Share is calculated by a calculation agent.
In order to allow participants in the secondary market to have access to a real-time estimate of the Daily NAV per Share, an Indicative Intra-Day NAV per Share is calculated by a calculation agent.
As of 30 June 2019, the following ETF share classes of the following Sub-Funds are available:
For the Year Ended: ETF Share Classes Initial Dealing Day
UBS ETF – EURO STOXX 50 UCITS ETF (EUR) A-dis 29 October 2001
UBS ETF – MSCI Europe UCITS ETF (EUR) A-dis 5 October 2009
UBS ETF – MSCI Europe UCITS ETF (hedged to CHF) A-acc 21 June 2017
UBS ETF – MSCI Europe UCITS ETF (hedged to EUR) A-acc 21 June 2017
UBS ETF – MSCI Europe UCITS ETF (hedged to GBP) A-acc 21 June 2017
UBS ETF – MSCI Europe UCITS ETF (hedged to USD) A-acc 21 June 2017
UBS ETF – MSCI EMU UCITS ETF (EUR) A-dis 19 September 2002
UBS ETF – MSCI EMU UCITS ETF (EUR) A-acc 12 August 2016
UBS ETF – MSCI EMU UCITS ETF (EUR) A-UK dis 5 November 2014
UBS ETF – MSCI EMU UCITS ETF (hedged to GBP) A-dis 21 October 2013
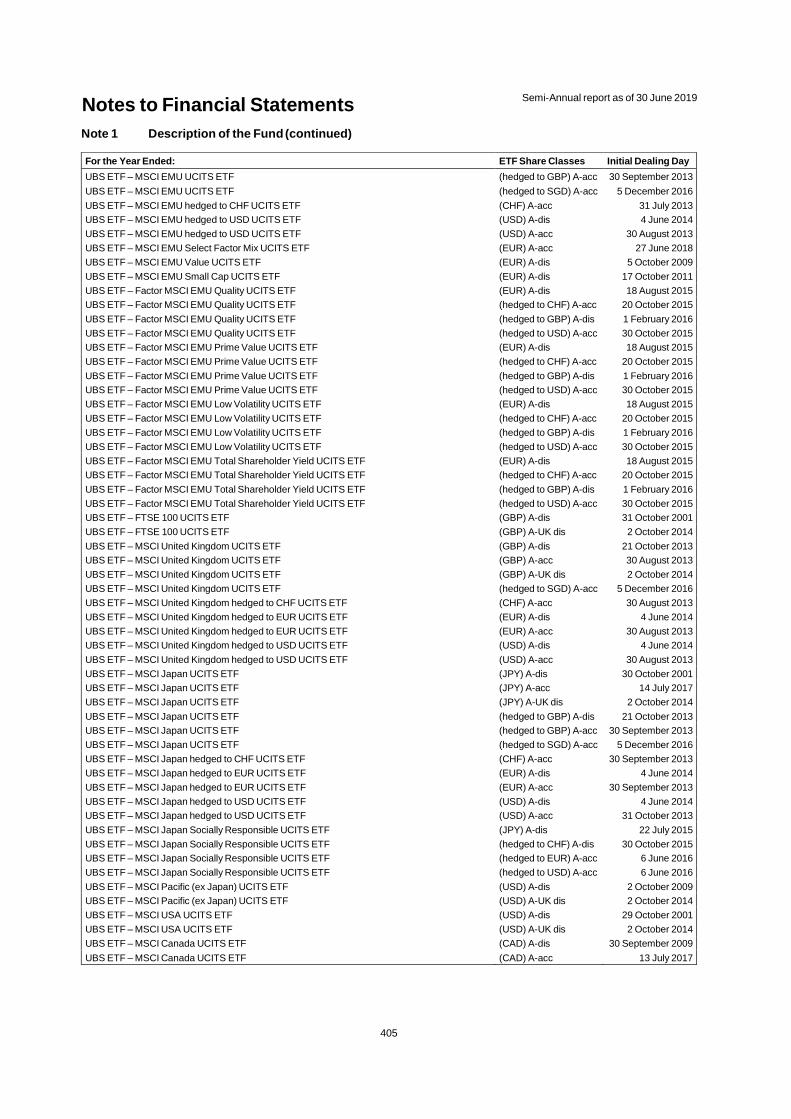
Notes to Financial Statements Semi-Annual report as of 30 June 2019
405
Note 1 Description of the Fund (continued)
For the Year Ended: ETF Share Classes Initial Dealing Day
UBS ETF – MSCI EMU UCITS ETF (hedged to GBP) A-acc 30 September 2013
UBS ETF – MSCI EMU UCITS ETF (hedged to SGD) A-acc 5 December 2016
UBS ETF – MSCI EMU hedged to CHF UCITS ETF (CHF) A-acc 31 July 2013
UBS ETF – MSCI EMU hedged to USD UCITS ETF (USD) A-dis 4 June 2014
UBS ETF – MSCI EMU hedged to USD UCITS ETF (USD) A-acc 30 August 2013
UBS ETF – MSCI EMU Select Factor Mix UCITS ETF (EUR) A-acc 27 June 2018
UBS ETF – MSCI EMU Value UCITS ETF (EUR) A-dis 5 October 2009
UBS ETF – MSCI EMU Small Cap UCITS ETF (EUR) A-dis 17 October 2011
UBS ETF – Factor MSCI EMU Quality UCITS ETF (EUR) A-dis 18 August 2015
UBS ETF – Factor MSCI EMU Quality UCITS ETF (hedged to CHF) A-acc 20 October 2015
UBS ETF – Factor MSCI EMU Quality UCITS ETF (hedged to GBP) A-dis 1 February 2016
UBS ETF – Factor MSCI EMU Quality UCITS ETF (hedged to USD) A-acc 30 October 2015
UBS ETF – Factor MSCI EMU Prime Value UCITS ETF (EUR) A-dis 18 August 2015
UBS ETF – Factor MSCI EMU Prime Value UCITS ETF (hedged to CHF) A-acc 20 October 2015
UBS ETF – Factor MSCI EMU Prime Value UCITS ETF (hedged to GBP) A-dis 1 February 2016
UBS ETF – Factor MSCI EMU Prime Value UCITS ETF (hedged to USD) A-acc 30 October 2015
UBS ETF – Factor MSCI EMU Low Volatility UCITS ETF (EUR) A-dis 18 August 2015
UBS ETF – Factor MSCI EMU Low Volatility UCITS ETF (hedged to CHF) A-acc 20 October 2015
UBS ETF – Factor MSCI EMU Low Volatility UCITS ETF (hedged to GBP) A-dis 1 February 2016
UBS ETF – Factor MSCI EMU Low Volatility UCITS ETF (hedged to USD) A-acc 30 October 2015
UBS ETF – Factor MSCI EMU Total Shareholder Yield UCITS ETF (EUR) A-dis 18 August 2015
UBS ETF – Factor MSCI EMU Total Shareholder Yield UCITS ETF (hedged to CHF) A-acc 20 October 2015
UBS ETF – Factor MSCI EMU Total Shareholder Yield UCITS ETF (hedged to GBP) A-dis 1 February 2016
UBS ETF – Factor MSCI EMU Total Shareholder Yield UCITS ETF (hedged to USD) A-acc 30 October 2015
UBS ETF – FTSE 100 UCITS ETF (GBP) A-dis 31 October 2001
UBS ETF – FTSE 100 UCITS ETF (GBP) A-UK dis 2 October 2014
UBS ETF – MSCI United Kingdom UCITS ETF (GBP) A-dis 21 October 2013
UBS ETF – MSCI United Kingdom UCITS ETF (GBP) A-acc 30 August 2013
UBS ETF – MSCI United Kingdom UCITS ETF (GBP) A-UK dis 2 October 2014
UBS ETF – MSCI United Kingdom UCITS ETF (hedged to SGD) A-acc 5 December 2016
UBS ETF – MSCI United Kingdom hedged to CHF UCITS ETF (CHF) A-acc 30 August 2013
UBS ETF – MSCI United Kingdom hedged to EUR UCITS ETF (EUR) A-dis 4 June 2014
UBS ETF – MSCI United Kingdom hedged to EUR UCITS ETF (EUR) A-acc 30 August 2013
UBS ETF – MSCI United Kingdom hedged to USD UCITS ETF (USD) A-dis 4 June 2014
UBS ETF – MSCI United Kingdom hedged to USD UCITS ETF (USD) A-acc 30 August 2013
UBS ETF – MSCI Japan UCITS ETF (JPY) A-dis 30 October 2001
UBS ETF – MSCI Japan UCITS ETF (JPY) A-acc 14 July 2017
UBS ETF – MSCI Japan UCITS ETF (JPY) A-UK dis 2 October 2014
UBS ETF – MSCI Japan UCITS ETF (hedged to GBP) A-dis 21 October 2013
UBS ETF – MSCI Japan UCITS ETF (hedged to GBP) A-acc 30 September 2013
UBS ETF – MSCI Japan UCITS ETF (hedged to SGD) A-acc 5 December 2016
UBS ETF – MSCI Japan hedged to CHF UCITS ETF (CHF) A-acc 30 September 2013
UBS ETF – MSCI Japan hedged to EUR UCITS ETF (EUR) A-dis 4 June 2014
UBS ETF – MSCI Japan hedged to EUR UCITS ETF (EUR) A-acc 30 September 2013
UBS ETF – MSCI Japan hedged to USD UCITS ETF (USD) A-dis 4 June 2014
UBS ETF – MSCI Japan hedged to USD UCITS ETF (USD) A-acc 31 October 2013
UBS ETF – MSCI Japan Socially Responsible UCITS ETF (JPY) A-dis 22 July 2015
UBS ETF – MSCI Japan Socially Responsible UCITS ETF (hedged to CHF) A-dis 30 October 2015
UBS ETF – MSCI Japan Socially Responsible UCITS ETF (hedged to EUR) A-acc 6 June 2016
UBS ETF – MSCI Japan Socially Responsible UCITS ETF (hedged to USD) A-acc 6 June 2016
UBS ETF – MSCI Pacific (ex Japan) UCITS ETF (USD) A-dis 2 October 2009
UBS ETF – MSCI Pacific (ex Japan) UCITS ETF (USD) A-UK dis 2 October 2014
UBS ETF – MSCI USA UCITS ETF (USD) A-dis 29 October 2001
UBS ETF – MSCI USA UCITS ETF (USD) A-UK dis 2 October 2014
UBS ETF – MSCI Canada UCITS ETF (CAD) A-dis 30 September 2009
UBS ETF – MSCI Canada UCITS ETF (CAD) A-acc 13 July 2017
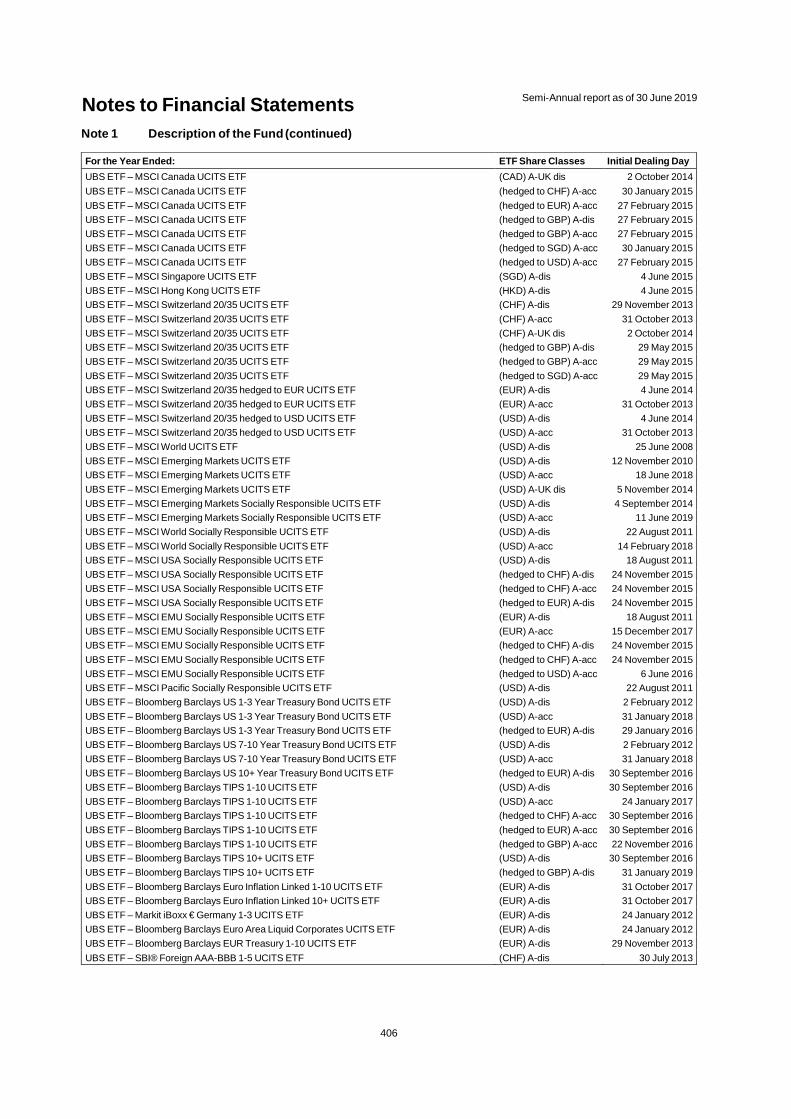
Notes to Financial Statements Semi-Annual report as of 30 June 2019
406
Note 1 Description of the Fund (continued)
For the Year Ended: ETF Share Classes Initial Dealing Day
UBS ETF – MSCI Canada UCITS ETF (CAD) A-UK dis 2 October 2014
UBS ETF – MSCI Canada UCITS ETF (hedged to CHF) A-acc 30 January 2015
UBS ETF – MSCI Canada UCITS ETF (hedged to EUR) A-acc 27 February 2015
UBS ETF – MSCI Canada UCITS ETF (hedged to GBP) A-dis 27 February 2015
UBS ETF – MSCI Canada UCITS ETF (hedged to GBP) A-acc 27 February 2015
UBS ETF – MSCI Canada UCITS ETF (hedged to SGD) A-acc 30 January 2015
UBS ETF – MSCI Canada UCITS ETF (hedged to USD) A-acc 27 February 2015
UBS ETF – MSCI Singapore UCITS ETF (SGD) A-dis 4 June 2015
UBS ETF – MSCI Hong Kong UCITS ETF (HKD) A-dis 4 June 2015
UBS ETF – MSCI Switzerland 20/35 UCITS ETF (CHF) A-dis 29 November 2013
UBS ETF – MSCI Switzerland 20/35 UCITS ETF (CHF) A-acc 31 October 2013
UBS ETF – MSCI Switzerland 20/35 UCITS ETF (CHF) A-UK dis 2 October 2014
UBS ETF – MSCI Switzerland 20/35 UCITS ETF (hedged to GBP) A-dis 29 May 2015
UBS ETF – MSCI Switzerland 20/35 UCITS ETF (hedged to GBP) A-acc 29 May 2015
UBS ETF – MSCI Switzerland 20/35 UCITS ETF (hedged to SGD) A-acc 29 May 2015
UBS ETF – MSCI Switzerland 20/35 hedged to EUR UCITS ETF (EUR) A-dis 4 June 2014
UBS ETF – MSCI Switzerland 20/35 hedged to EUR UCITS ETF (EUR) A-acc 31 October 2013
UBS ETF – MSCI Switzerland 20/35 hedged to USD UCITS ETF (USD) A-dis 4 June 2014
UBS ETF – MSCI Switzerland 20/35 hedged to USD UCITS ETF (USD) A-acc 31 October 2013
UBS ETF – MSCI World UCITS ETF (USD) A-dis 25 June 2008
UBS ETF – MSCI Emerging Markets UCITS ETF (USD) A-dis 12 November 2010
UBS ETF – MSCI Emerging Markets UCITS ETF (USD) A-acc 18 June 2018
UBS ETF – MSCI Emerging Markets UCITS ETF (USD) A-UK dis 5 November 2014
UBS ETF – MSCI Emerging Markets Socially Responsible UCITS ETF (USD) A-dis 4 September 2014
UBS ETF – MSCI Emerging Markets Socially Responsible UCITS ETF (USD) A-acc 11 June 2019
UBS ETF – MSCI World Socially Responsible UCITS ETF (USD) A-dis 22 August 2011
UBS ETF – MSCI World Socially Responsible UCITS ETF (USD) A-acc 14 February 2018
UBS ETF – MSCI USA Socially Responsible UCITS ETF (USD) A-dis 18 August 2011
UBS ETF – MSCI USA Socially Responsible UCITS ETF (hedged to CHF) A-dis 24 November 2015
UBS ETF – MSCI USA Socially Responsible UCITS ETF (hedged to CHF) A-acc 24 November 2015
UBS ETF – MSCI USA Socially Responsible UCITS ETF (hedged to EUR) A-dis 24 November 2015
UBS ETF – MSCI EMU Socially Responsible UCITS ETF (EUR) A-dis 18 August 2011
UBS ETF – MSCI EMU Socially Responsible UCITS ETF (EUR) A-acc 15 December 2017
UBS ETF – MSCI EMU Socially Responsible UCITS ETF (hedged to CHF) A-dis 24 November 2015
UBS ETF – MSCI EMU Socially Responsible UCITS ETF (hedged to CHF) A-acc 24 November 2015
UBS ETF – MSCI EMU Socially Responsible UCITS ETF (hedged to USD) A-acc 6 June 2016
UBS ETF – MSCI Pacific Socially Responsible UCITS ETF (USD) A-dis 22 August 2011
UBS ETF – Bloomberg Barclays US 1-3 Year Treasury Bond UCITS ETF (USD) A-dis 2 February 2012
UBS ETF – Bloomberg Barclays US 1-3 Year Treasury Bond UCITS ETF (USD) A-acc 31 January 2018
UBS ETF – Bloomberg Barclays US 1-3 Year Treasury Bond UCITS ETF (hedged to EUR) A-dis 29 January 2016
UBS ETF – Bloomberg Barclays US 7-10 Year Treasury Bond UCITS ETF (USD) A-dis 2 February 2012
UBS ETF – Bloomberg Barclays US 7-10 Year Treasury Bond UCITS ETF (USD) A-acc 31 January 2018
UBS ETF – Bloomberg Barclays US 10+ Year Treasury Bond UCITS ETF (hedged to EUR) A-dis 30 September 2016
UBS ETF – Bloomberg Barclays TIPS 1-10 UCITS ETF (USD) A-dis 30 September 2016
UBS ETF – Bloomberg Barclays TIPS 1-10 UCITS ETF (USD) A-acc 24 January 2017
UBS ETF – Bloomberg Barclays TIPS 1-10 UCITS ETF (hedged to CHF) A-acc 30 September 2016
UBS ETF – Bloomberg Barclays TIPS 1-10 UCITS ETF (hedged to EUR) A-acc 30 September 2016
UBS ETF – Bloomberg Barclays TIPS 1-10 UCITS ETF (hedged to GBP) A-acc 22 November 2016
UBS ETF – Bloomberg Barclays TIPS 10+ UCITS ETF (USD) A-dis 30 September 2016
UBS ETF – Bloomberg Barclays TIPS 10+ UCITS ETF (hedged to GBP) A-dis 31 January 2019
UBS ETF – Bloomberg Barclays Euro Inflation Linked 1-10 UCITS ETF (EUR) A-dis 31 October 2017
UBS ETF – Bloomberg Barclays Euro Inflation Linked 10+ UCITS ETF (EUR) A-dis 31 October 2017
UBS ETF – Markit iBoxx € Germany 1-3 UCITS ETF (EUR) A-dis 24 January 2012
UBS ETF – Bloomberg Barclays Euro Area Liquid Corporates UCITS ETF (EUR) A-dis 24 January 2012
UBS ETF – Bloomberg Barclays EUR Treasury 1-10 UCITS ETF (EUR) A-dis 29 November 2013
UBS ETF – SBI® Foreign AAA-BBB 1-5 UCITS ETF (CHF) A-dis 30 July 2013
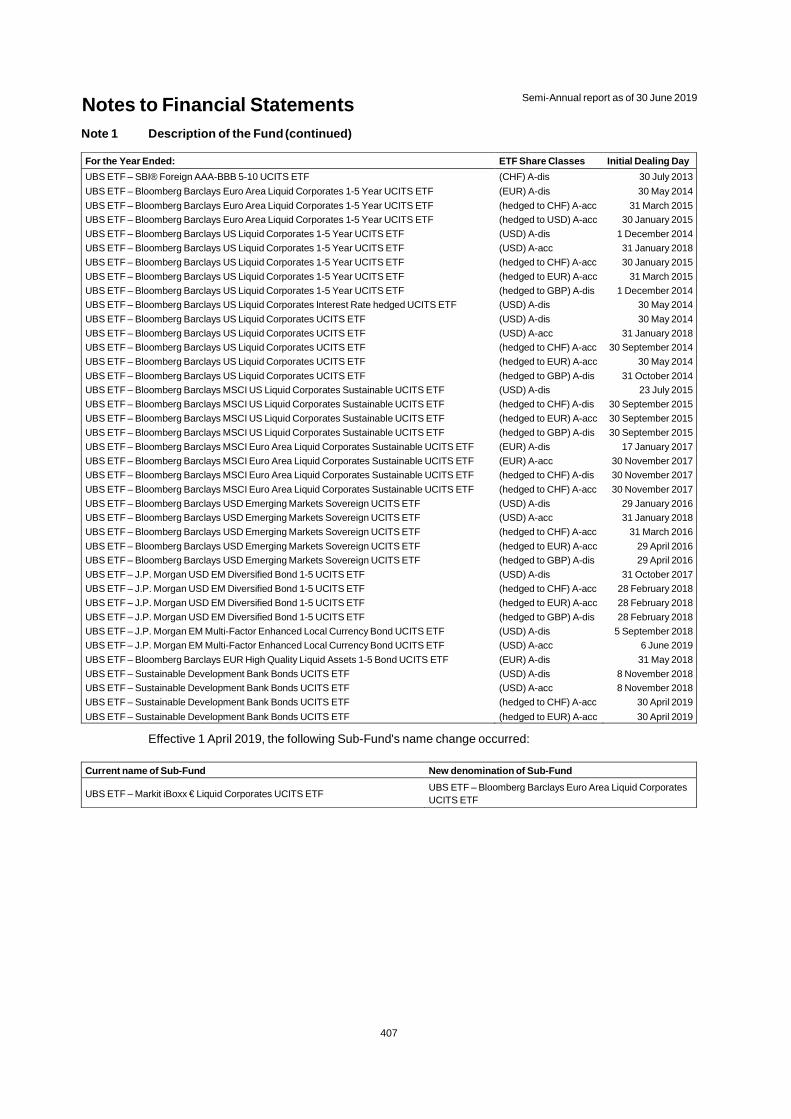
Notes to Financial Statements Semi-Annual report as of 30 June 2019
407
Note 1 Description of the Fund (continued)
For the Year Ended: ETF Share Classes Initial Dealing Day
UBS ETF – SBI® Foreign AAA-BBB 5-10 UCITS ETF (CHF) A-dis 30 July 2013
UBS ETF – Bloomberg Barclays Euro Area Liquid Corporates 1-5 Year UCITS ETF (EUR) A-dis 30 May 2014
UBS ETF – Bloomberg Barclays Euro Area Liquid Corporates 1-5 Year UCITS ETF (hedged to CHF) A-acc 31 March 2015
UBS ETF – Bloomberg Barclays Euro Area Liquid Corporates 1-5 Year UCITS ETF (hedged to USD) A-acc 30 January 2015
UBS ETF – Bloomberg Barclays US Liquid Corporates 1-5 Year UCITS ETF (USD) A-dis 1 December 2014
UBS ETF – Bloomberg Barclays US Liquid Corporates 1-5 Year UCITS ETF (USD) A-acc 31 January 2018
UBS ETF – Bloomberg Barclays US Liquid Corporates 1-5 Year UCITS ETF (hedged to CHF) A-acc 30 January 2015
UBS ETF – Bloomberg Barclays US Liquid Corporates 1-5 Year UCITS ETF (hedged to EUR) A-acc 31 March 2015
UBS ETF – Bloomberg Barclays US Liquid Corporates 1-5 Year UCITS ETF (hedged to GBP) A-dis 1 December 2014
UBS ETF – Bloomberg Barclays US Liquid Corporates Interest Rate hedged UCITS ETF (USD) A-dis 30 May 2014
UBS ETF – Bloomberg Barclays US Liquid Corporates UCITS ETF (USD) A-dis 30 May 2014
UBS ETF – Bloomberg Barclays US Liquid Corporates UCITS ETF (USD) A-acc 31 January 2018
UBS ETF – Bloomberg Barclays US Liquid Corporates UCITS ETF (hedged to CHF) A-acc 30 September 2014
UBS ETF – Bloomberg Barclays US Liquid Corporates UCITS ETF (hedged to EUR) A-acc 30 May 2014
UBS ETF – Bloomberg Barclays US Liquid Corporates UCITS ETF (hedged to GBP) A-dis 31 October 2014
UBS ETF – Bloomberg Barclays MSCI US Liquid Corporates Sustainable UCITS ETF (USD) A-dis 23 July 2015
UBS ETF – Bloomberg Barclays MSCI US Liquid Corporates Sustainable UCITS ETF (hedged to CHF) A-dis 30 September 2015
UBS ETF – Bloomberg Barclays MSCI US Liquid Corporates Sustainable UCITS ETF (hedged to EUR) A-acc 30 September 2015
UBS ETF – Bloomberg Barclays MSCI US Liquid Corporates Sustainable UCITS ETF (hedged to GBP) A-dis 30 September 2015
UBS ETF – Bloomberg Barclays MSCI Euro Area Liquid Corporates Sustainable UCITS ETF (EUR) A-dis 17 January 2017
UBS ETF – Bloomberg Barclays MSCI Euro Area Liquid Corporates Sustainable UCITS ETF (EUR) A-acc 30 November 2017
UBS ETF – Bloomberg Barclays MSCI Euro Area Liquid Corporates Sustainable UCITS ETF (hedged to CHF) A-dis 30 November 2017
UBS ETF – Bloomberg Barclays MSCI Euro Area Liquid Corporates Sustainable UCITS ETF (hedged to CHF) A-acc 30 November 2017
UBS ETF – Bloomberg Barclays USD Emerging Markets Sovereign UCITS ETF (USD) A-dis 29 January 2016
UBS ETF – Bloomberg Barclays USD Emerging Markets Sovereign UCITS ETF (USD) A-acc 31 January 2018
UBS ETF – Bloomberg Barclays USD Emerging Markets Sovereign UCITS ETF (hedged to CHF) A-acc 31 March 2016
UBS ETF – Bloomberg Barclays USD Emerging Markets Sovereign UCITS ETF (hedged to EUR) A-acc 29 April 2016
UBS ETF – Bloomberg Barclays USD Emerging Markets Sovereign UCITS ETF (hedged to GBP) A-dis 29 April 2016
UBS ETF – J.P. Morgan USD EM Diversified Bond 1-5 UCITS ETF (USD) A-dis 31 October 2017
UBS ETF – J.P. Morgan USD EM Diversified Bond 1-5 UCITS ETF (hedged to CHF) A-acc 28 February 2018
UBS ETF – J.P. Morgan USD EM Diversified Bond 1-5 UCITS ETF (hedged to EUR) A-acc 28 February 2018
UBS ETF – J.P. Morgan USD EM Diversified Bond 1-5 UCITS ETF (hedged to GBP) A-dis 28 February 2018
UBS ETF – J.P. Morgan EM Multi-Factor Enhanced Local Currency Bond UCITS ETF (USD) A-dis 5 September 2018
UBS ETF – J.P. Morgan EM Multi-Factor Enhanced Local Currency Bond UCITS ETF (USD) A-acc 6 June 2019
UBS ETF – Bloomberg Barclays EUR High Quality Liquid Assets 1-5 Bond UCITS ETF (EUR) A-dis 31 May 2018
UBS ETF – Sustainable Development Bank Bonds UCITS ETF (USD) A-dis 8 November 2018
UBS ETF – Sustainable Development Bank Bonds UCITS ETF (USD) A-acc 8 November 2018
UBS ETF – Sustainable Development Bank Bonds UCITS ETF (hedged to CHF) A-acc 30 April 2019
UBS ETF – Sustainable Development Bank Bonds UCITS ETF (hedged to EUR) A-acc 30 April 2019
Effective 1 April 2019, the following Sub-Fund's name change occurred:
Current name of Sub-Fund New denomination of Sub-Fund
UBS ETF – Markit iBoxx € Liquid Corporates UCITS ETF UBS ETF – Bloomberg Barclays Euro Area Liquid Corporates UCITS ETF

Notes to Financial Statements Semi-Annual report as of 30 June 2019
408
Note 1 Description of the Fund (continued)
Registration
The Sub-Funds of the Company are registered for distribution in the following countries at 30 June 2019:
Aus
tria
Bel
gium
Chi
le
Den
mar
k
Fin
land
Fra
nce
Ger
man
y
Italy
Liec
hten
stei
n
Luxe
mbo
urg
Mex
ico
Net
herla
nds
Nor
way
Por
tuga
l
Sin
gapo
re
Spa
in
Sw
eden
Sw
itzer
land
Uni
ted
Kin
gdom
UBS ETF – EURO STOXX50 UCITS ETF
Yes - Yes* Yes** Yes Yes Yes Yes Yes Yes - Yes Yes Yes Yes**** Yes Yes Yes Yes
UBS ETF – MSCI Europe UCITS ETF
Yes - - Yes** Yes Yes Yes Yes Yes Yes - Yes Yes Yes Yes**** Yes Yes Yes Yes
UBS ETF – MSCI EMU UCITS ETF
Yes Yes Yes* Yes** Yes Yes Yes Yes Yes Yes Yes*** Yes Yes Yes Yes**** Yes Yes Yes Yes
UBS ETF – MSCI EMU hedged to CHF UCITS ETF
Yes - - Yes** Yes Yes Yes Yes Yes Yes - Yes Yes Yes - Yes Yes Yes Yes
UBS ETF – MSCI EMU hedged to USD UCITS ETF
Yes - Yes* Yes** Yes Yes Yes Yes Yes Yes Yes*** Yes Yes Yes - Yes Yes Yes Yes
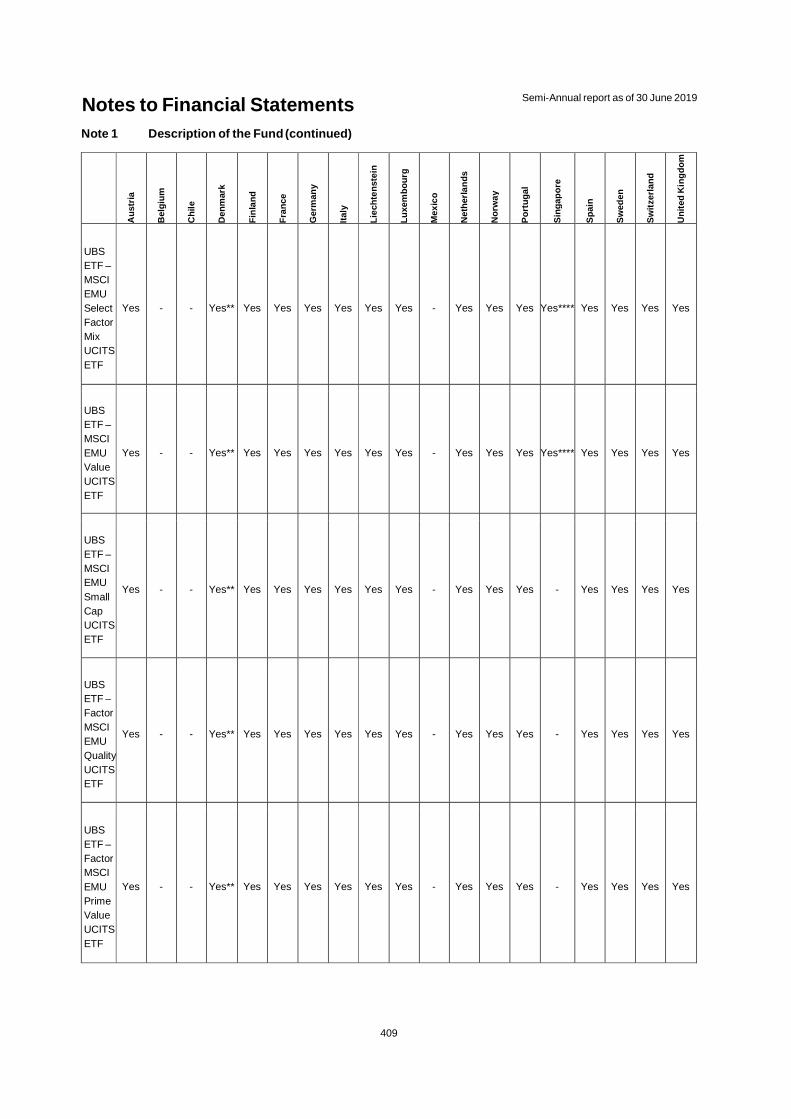
Notes to Financial Statements Semi-Annual report as of 30 June 2019
409
Note 1 Description of the Fund (continued)
Aus
tria
Bel
gium
Chi
le
Den
mar
k
Fin
land
Fra
nce
Ger
man
y
Italy
Liec
hten
stei
n
Luxe
mbo
urg
Mex
ico
Net
herla
nds
Nor
way
Por
tuga
l
Sin
gapo
re
Spa
in
Sw
eden
Sw
itzer
land
Uni
ted
Kin
gdom
UBS ETF – MSCI EMU Select Factor Mix UCITS ETF
Yes - - Yes** Yes Yes Yes Yes Yes Yes - Yes Yes Yes Yes**** Yes Yes Yes Yes
UBS ETF – MSCI EMU Value UCITS ETF
Yes - - Yes** Yes Yes Yes Yes Yes Yes - Yes Yes Yes Yes**** Yes Yes Yes Yes
UBS ETF – MSCI EMU Small Cap UCITS ETF
Yes - - Yes** Yes Yes Yes Yes Yes Yes - Yes Yes Yes - Yes Yes Yes Yes
UBS ETF – Factor MSCI EMU Quality UCITS ETF
Yes - - Yes** Yes Yes Yes Yes Yes Yes - Yes Yes Yes - Yes Yes Yes Yes
UBS ETF – Factor MSCI EMU Prime Value UCITS ETF
Yes - - Yes** Yes Yes Yes Yes Yes Yes - Yes Yes Yes - Yes Yes Yes Yes
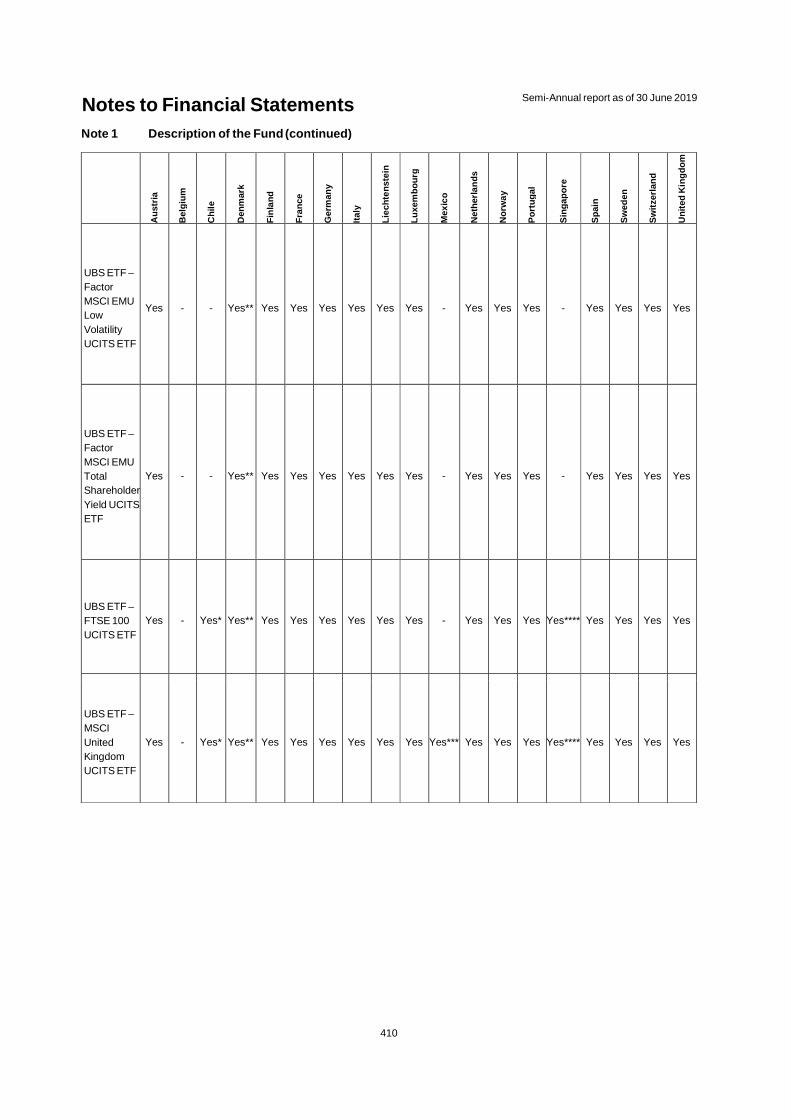
Notes to Financial Statements Semi-Annual report as of 30 June 2019
410
Note 1 Description of the Fund (continued)
Aus
tria
Bel
gium
Chi
le
Den
mar
k
Fin
land
Fra
nce
Ger
man
y
Italy
Liec
hten
stei
n
Luxe
mbo
urg
Mex
ico
Net
herla
nds
Nor
way
Por
tuga
l
Sin
gapo
re
Spa
in
Sw
eden
Sw
itzer
land
Uni
ted
Kin
gdom
UBS ETF – Factor MSCI EMU Low Volatility UCITS ETF
Yes - - Yes** Yes Yes Yes Yes Yes Yes - Yes Yes Yes - Yes Yes Yes Yes
UBS ETF – Factor MSCI EMU Total ShareholderYield UCITS ETF
Yes - - Yes** Yes Yes Yes Yes Yes Yes - Yes Yes Yes - Yes Yes Yes Yes
UBS ETF – FTSE 100 UCITS ETF
Yes - Yes* Yes** Yes Yes Yes Yes Yes Yes - Yes Yes Yes Yes**** Yes Yes Yes Yes
UBS ETF – MSCI United Kingdom UCITS ETF
Yes - Yes* Yes** Yes Yes Yes Yes Yes Yes Yes*** Yes Yes Yes Yes**** Yes Yes Yes Yes

Notes to Financial Statements Semi-Annual report as of 30 June 2019
411
Note 1 Description of the Fund (continued)
Aus
tria
Bel
gium
Chi
le
Den
mar
k
Fin
land
Fra
nce
Ger
man
y
Italy
Liec
hten
stei
n
Luxe
mbo
urg
Mex
ico
Net
herla
nds
Nor
way
Por
tuga
l
Sin
gapo
re
Spa
in
Sw
eden
Sw
itzer
land
Uni
ted
Kin
gdom
UBS ETF – MSCI United Kingdomhedged to CHF UCITS ETF
Yes - - Yes** Yes Yes Yes Yes Yes Yes - Yes Yes Yes - Yes Yes Yes Yes
UBS ETF – MSCI United Kingdomhedged to EUR UCITS ETF
Yes - - Yes** Yes Yes Yes Yes Yes Yes - Yes Yes Yes - Yes Yes Yes Yes
UBS ETF – MSCI United Kingdomhedged to USD UCITS ETF
Yes - Yes* Yes** Yes Yes Yes Yes Yes Yes Yes*** Yes Yes Yes - Yes Yes Yes Yes
UBS ETF – MSCI Japan UCITS ETF
Yes - Yes* Yes** Yes Yes Yes Yes Yes Yes Yes*** Yes Yes Yes Yes**** Yes Yes Yes Yes
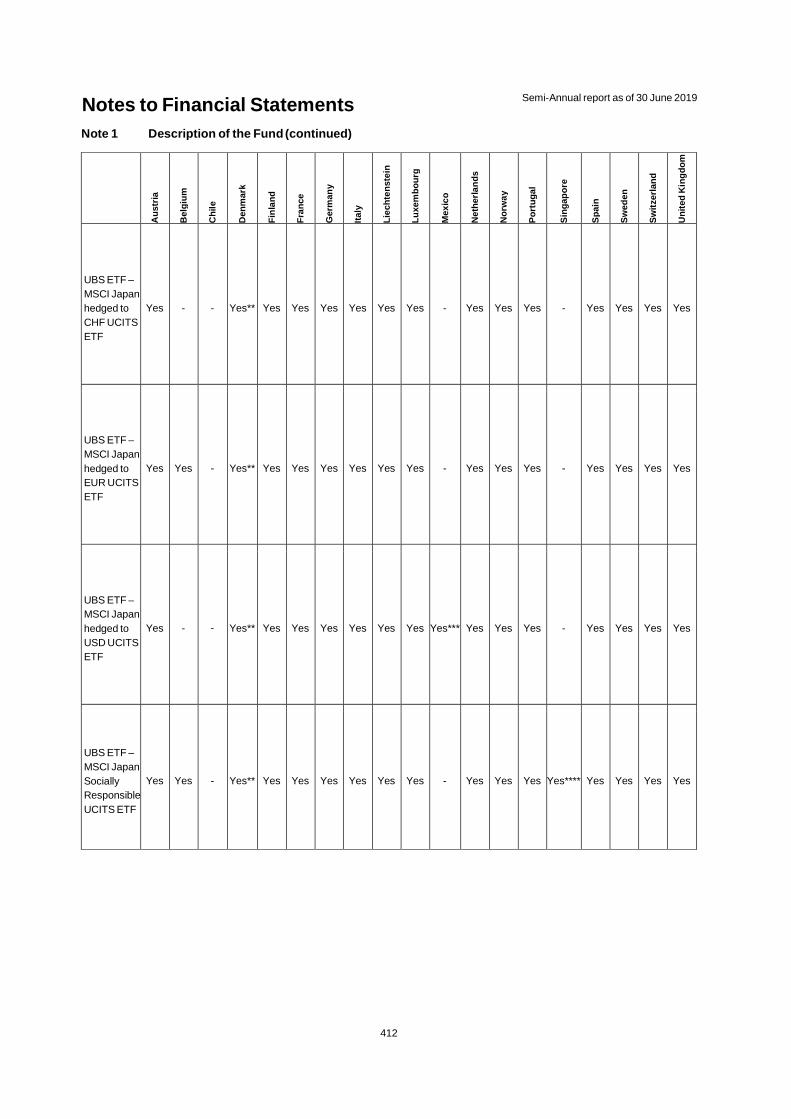
Notes to Financial Statements Semi-Annual report as of 30 June 2019
412
Note 1 Description of the Fund (continued)
Aus
tria
Bel
gium
Chi
le
Den
mar
k
Fin
land
Fra
nce
Ger
man
y
Italy
Liec
hten
stei
n
Luxe
mbo
urg
Mex
ico
Net
herla
nds
Nor
way
Por
tuga
l
Sin
gapo
re
Spa
in
Sw
eden
Sw
itzer
land
Uni
ted
Kin
gdom
UBS ETF – MSCI Japan hedged to CHF UCITS ETF
Yes - - Yes** Yes Yes Yes Yes Yes Yes - Yes Yes Yes - Yes Yes Yes Yes
UBS ETF – MSCI Japan hedged to EUR UCITS ETF
Yes Yes - Yes** Yes Yes Yes Yes Yes Yes - Yes Yes Yes - Yes Yes Yes Yes
UBS ETF – MSCI Japan hedged to USD UCITS ETF
Yes - Yes** Yes Yes Yes Yes Yes Yes Yes*** Yes Yes Yes - Yes Yes Yes Yes
UBS ETF – MSCI Japan Socially Responsible UCITS ETF
Yes Yes - Yes** Yes Yes Yes Yes Yes Yes - Yes Yes Yes Yes**** Yes Yes Yes Yes
-
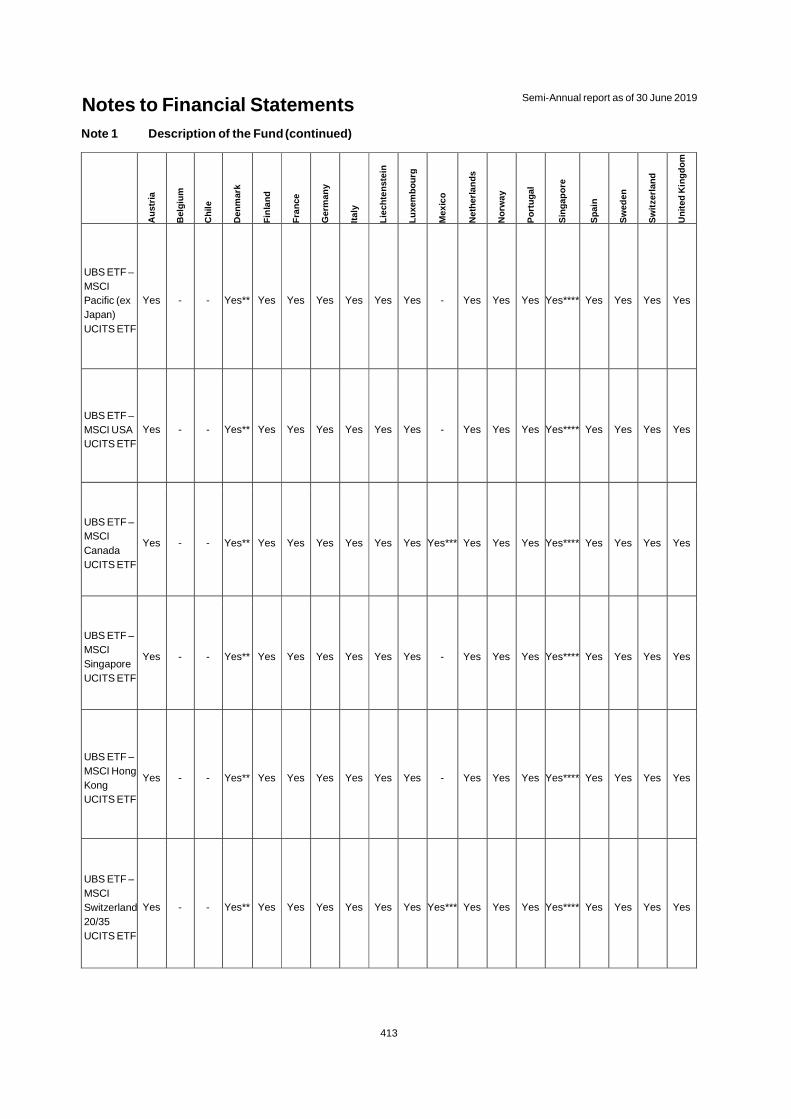
Notes to Financial Statements Semi-Annual report as of 30 June 2019
413
Note 1 Description of the Fund (continued)
Aus
tria
Bel
gium
Chi
le
Den
mar
k
Fin
land
Fra
nce
Ger
man
y
Italy
Liec
hten
stei
n
Luxe
mbo
urg
Mex
ico
Net
herla
nds
Nor
way
Por
tuga
l
Sin
gapo
re
Spa
in
Sw
eden
Sw
itzer
land
Uni
ted
Kin
gdom
UBS ETF – MSCI Pacific (ex Japan) UCITS ETF
Yes - - Yes** Yes Yes Yes Yes Yes Yes - Yes Yes Yes Yes**** Yes Yes Yes Yes
UBS ETF – MSCI USA UCITS ETF
Yes - - Yes** Yes Yes Yes Yes Yes Yes - Yes Yes Yes Yes**** Yes Yes Yes Yes
UBS ETF – MSCI Canada UCITS ETF
Yes - - Yes** Yes Yes Yes Yes Yes Yes Yes*** Yes Yes Yes Yes**** Yes Yes Yes Yes
UBS ETF – MSCI Singapore UCITS ETF
Yes - - Yes** Yes Yes Yes Yes Yes Yes - Yes Yes Yes Yes**** Yes Yes Yes Yes
UBS ETF – MSCI Hong Kong UCITS ETF
Yes - - Yes** Yes Yes Yes Yes Yes Yes - Yes Yes Yes Yes**** Yes Yes Yes Yes
UBS ETF – MSCI Switzerland 20/35 UCITS ETF
Yes - - Yes** Yes Yes Yes Yes Yes Yes Yes*** Yes Yes Yes Yes**** Yes Yes Yes Yes
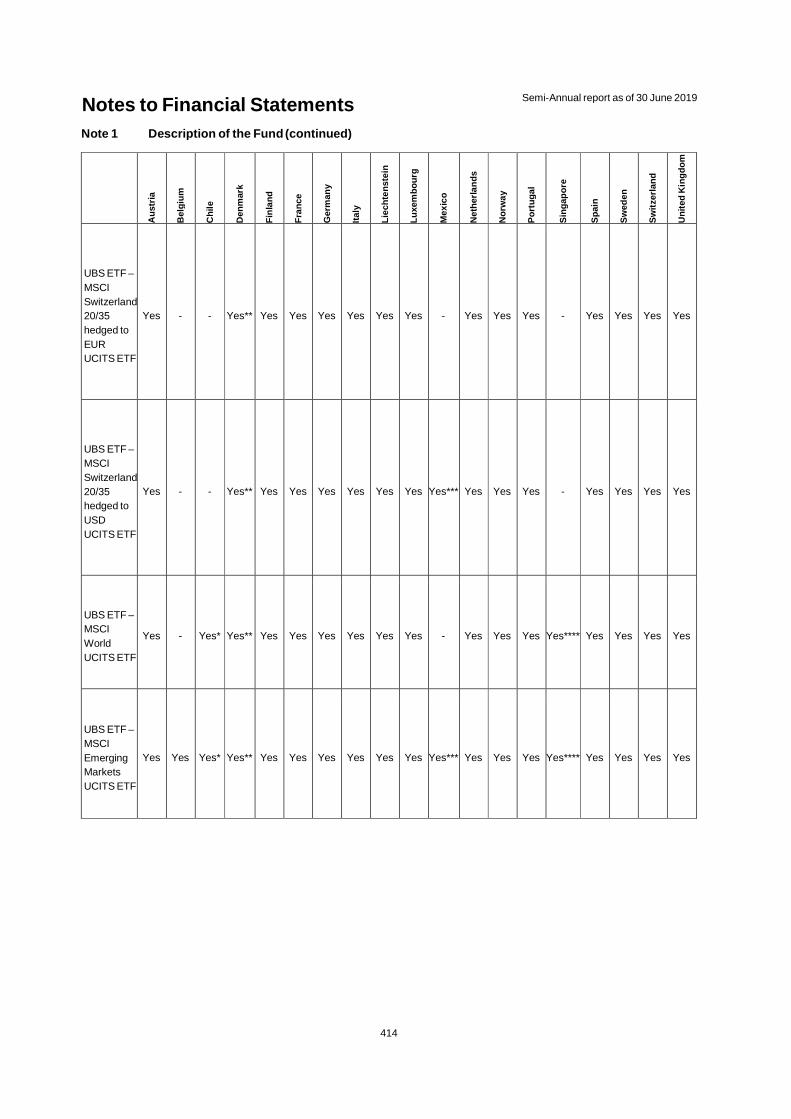
Notes to Financial Statements Semi-Annual report as of 30 June 2019
414
Note 1 Description of the Fund (continued)
Aus
tria
Bel
gium
Chi
le
Den
mar
k
Fin
land
Fra
nce
Ger
man
y
Italy
Liec
hten
stei
n
Luxe
mbo
urg
Mex
ico
Net
herla
nds
Nor
way
Por
tuga
l
Sin
gapo
re
Spa
in
Sw
eden
Sw
itzer
land
Uni
ted
Kin
gdom
UBS ETF – MSCI Switzerland 20/35 hedged to EUR UCITS ETF
Yes - - Yes** Yes Yes Yes Yes Yes Yes - Yes Yes Yes - Yes Yes Yes Yes
UBS ETF – MSCI Switzerland 20/35 hedged to USD UCITS ETF
Yes - - Yes** Yes Yes Yes Yes Yes Yes Yes*** Yes Yes Yes - Yes Yes Yes Yes
UBS ETF – MSCI World UCITS ETF
Yes - Yes* Yes** Yes Yes Yes Yes Yes Yes - Yes Yes Yes Yes**** Yes Yes Yes Yes
UBS ETF – MSCI Emerging Markets UCITS ETF
Yes Yes Yes* Yes** Yes Yes Yes Yes Yes Yes Yes*** Yes Yes Yes Yes**** Yes Yes Yes Yes
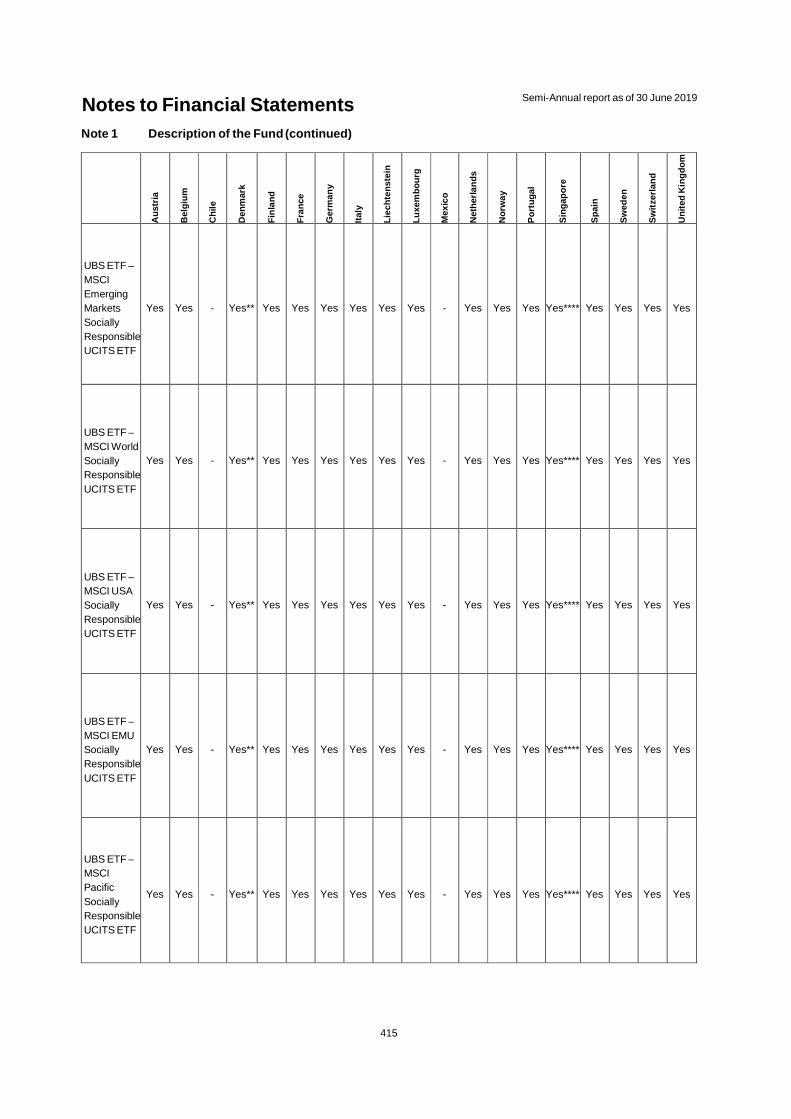
Notes to Financial Statements Semi-Annual report as of 30 June 2019
415
Note 1 Description of the Fund (continued)
Aus
tria
Bel
gium
Chi
le
Den
mar
k
Fin
land
Fra
nce
Ger
man
y
Italy
Liec
hten
stei
n
Luxe
mbo
urg
Mex
ico
Net
herla
nds
Nor
way
Por
tuga
l
Sin
gapo
re
Spa
in
Sw
eden
Sw
itzer
land
Uni
ted
Kin
gdom
UBS ETF – MSCI Emerging Markets Socially Responsible UCITS ETF
Yes Yes - Yes** Yes Yes Yes Yes Yes Yes - Yes Yes Yes Yes**** Yes Yes Yes Yes
UBS ETF – MSCI World Socially Responsible UCITS ETF
Yes Yes - Yes** Yes Yes Yes Yes Yes Yes - Yes Yes Yes Yes**** Yes Yes Yes Yes
UBS ETF – MSCI USA Socially Responsible UCITS ETF
Yes Yes - Yes** Yes Yes Yes Yes Yes Yes - Yes Yes Yes Yes**** Yes Yes Yes Yes
UBS ETF – MSCI EMU Socially Responsible UCITS ETF
Yes Yes - Yes** Yes Yes Yes Yes Yes Yes - Yes Yes Yes Yes**** Yes Yes Yes Yes
UBS ETF – MSCI Pacific Socially Responsible UCITS ETF
Yes Yes - Yes** Yes Yes Yes Yes Yes Yes - Yes Yes Yes Yes**** Yes Yes Yes Yes
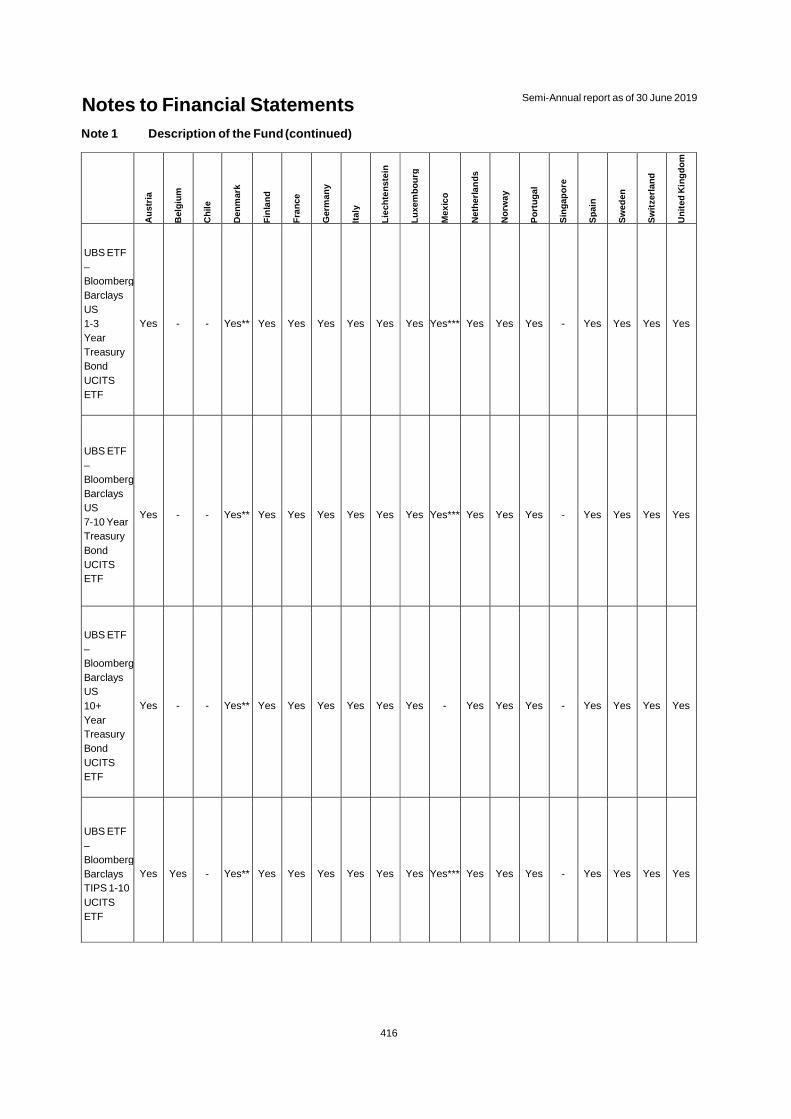
Notes to Financial Statements Semi-Annual report as of 30 June 2019
416
Note 1 Description of the Fund (continued)
Aus
tria
Bel
gium
Chi
le
Den
mar
k
Fin
land
Fra
nce
Ger
man
y
Italy
Liec
hten
stei
n
Luxe
mbo
urg
Mex
ico
Net
herla
nds
Nor
way
Por
tuga
l
Sin
gapo
re
Spa
in
Sw
eden
Sw
itzer
land
Uni
ted
Kin
gdom
UBS ETF – BloombergBarclays US 1-3 Year Treasury Bond UCITS ETF
Yes - - Yes** Yes Yes Yes Yes Yes Yes Yes*** Yes Yes Yes - Yes Yes Yes Yes
UBS ETF – BloombergBarclays US 7-10 Year Treasury Bond UCITS ETF
Yes - - Yes** Yes Yes Yes Yes Yes Yes Yes*** Yes Yes Yes - Yes Yes Yes Yes
UBS ETF – BloombergBarclays US 10+ Year Treasury Bond UCITS ETF
Yes - - Yes** Yes Yes Yes Yes Yes Yes - Yes Yes Yes - Yes Yes Yes Yes
UBS ETF – BloombergBarclays TIPS 1-10 UCITS ETF
Yes Yes - Yes** Yes Yes Yes Yes Yes Yes Yes*** Yes Yes Yes - Yes Yes Yes Yes
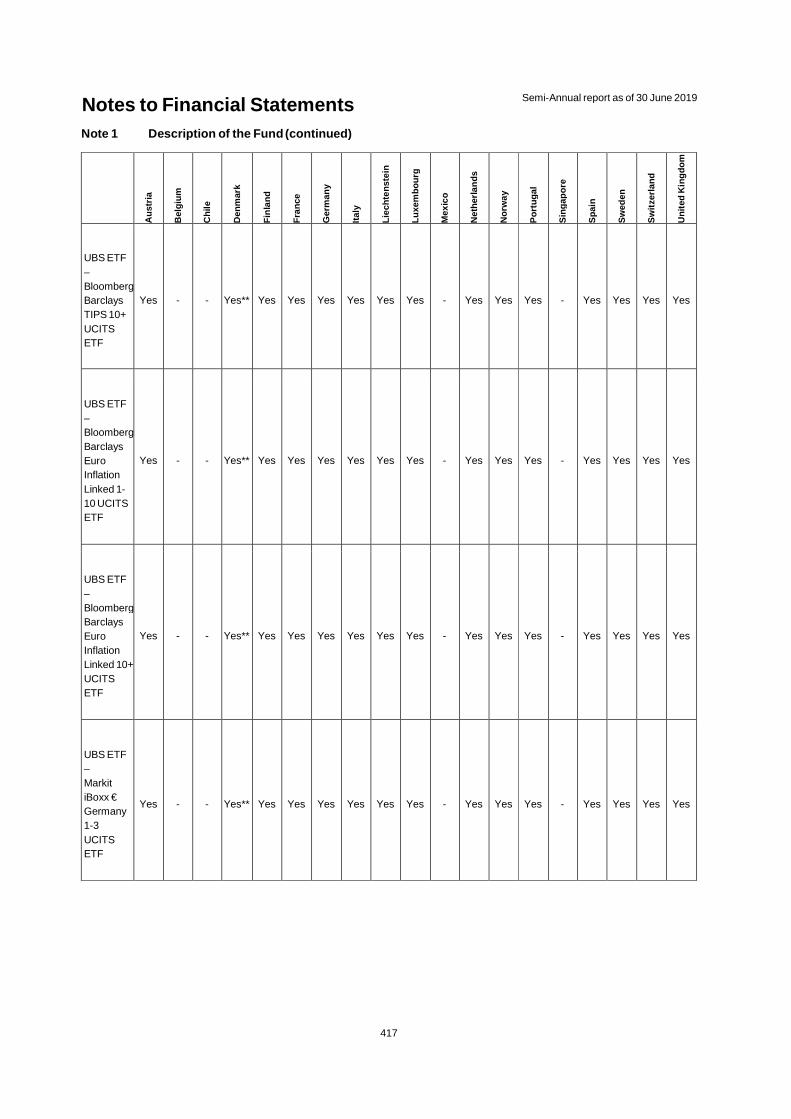
Notes to Financial Statements Semi-Annual report as of 30 June 2019
417
Note 1 Description of the Fund (continued)
Aus
tria
Bel
gium
Chi
le
Den
mar
k
Fin
land
Fra
nce
Ger
man
y
Italy
Liec
hten
stei
n
Luxe
mbo
urg
Mex
ico
Net
herla
nds
Nor
way
Por
tuga
l
Sin
gapo
re
Spa
in
Sw
eden
Sw
itzer
land
Uni
ted
Kin
gdom
UBS ETF – BloombergBarclays TIPS 10+ UCITS ETF
Yes - - Yes** Yes Yes Yes Yes Yes Yes - Yes Yes Yes - Yes Yes Yes Yes
UBS ETF – BloombergBarclays Euro Inflation Linked 1-10 UCITS ETF
Yes - - Yes** Yes Yes Yes Yes Yes Yes - Yes Yes Yes - Yes Yes Yes Yes
UBS ETF – BloombergBarclays Euro Inflation Linked 10+ UCITS ETF
Yes - - Yes** Yes Yes Yes Yes Yes Yes - Yes Yes Yes - Yes Yes Yes Yes
UBS ETF – Markit iBoxx € Germany 1-3 UCITS ETF
Yes - - Yes** Yes Yes Yes Yes Yes Yes - Yes Yes Yes - Yes Yes Yes Yes
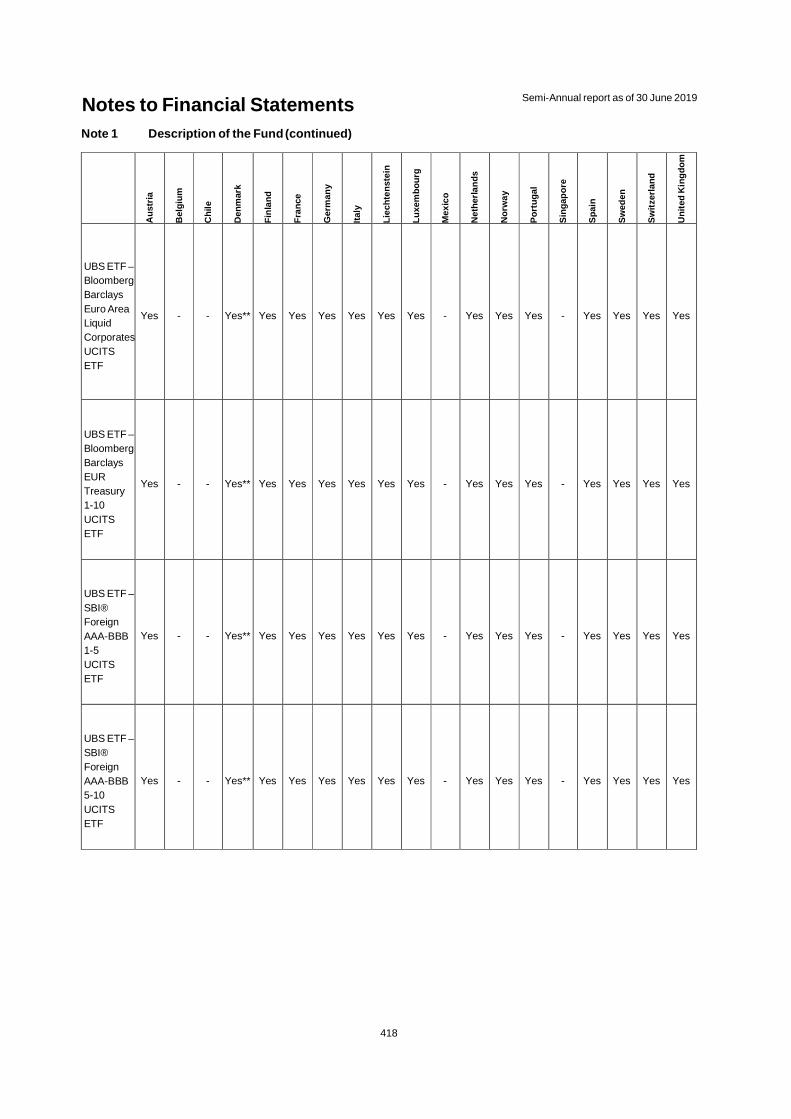
Notes to Financial Statements Semi-Annual report as of 30 June 2019
418
Note 1 Description of the Fund (continued)
Aus
tria
Bel
gium
Chi
le
Den
mar
k
Fin
land
Fra
nce
Ger
man
y
Italy
Liec
hten
stei
n
Luxe
mbo
urg
Mex
ico
Net
herla
nds
Nor
way
Por
tuga
l
Sin
gapo
re
Spa
in
Sw
eden
Sw
itzer
land
Uni
ted
Kin
gdom
UBS ETF – Bloomberg Barclays Euro Area Liquid CorporatesUCITS ETF
Yes - - Yes** Yes Yes Yes Yes Yes Yes - Yes Yes Yes - Yes Yes Yes Yes
UBS ETF – Bloomberg Barclays EUR Treasury 1-10 UCITS ETF
Yes - - Yes** Yes Yes Yes Yes Yes Yes - Yes Yes Yes - Yes Yes Yes Yes
UBS ETF – SBI® Foreign AAA-BBB 1-5 UCITS ETF
Yes - - Yes** Yes Yes Yes Yes Yes Yes - Yes Yes Yes - Yes Yes Yes Yes
UBS ETF – SBI® Foreign AAA-BBB 5-10 UCITS ETF
Yes - - Yes** Yes Yes Yes Yes Yes Yes - Yes Yes Yes - Yes Yes Yes Yes
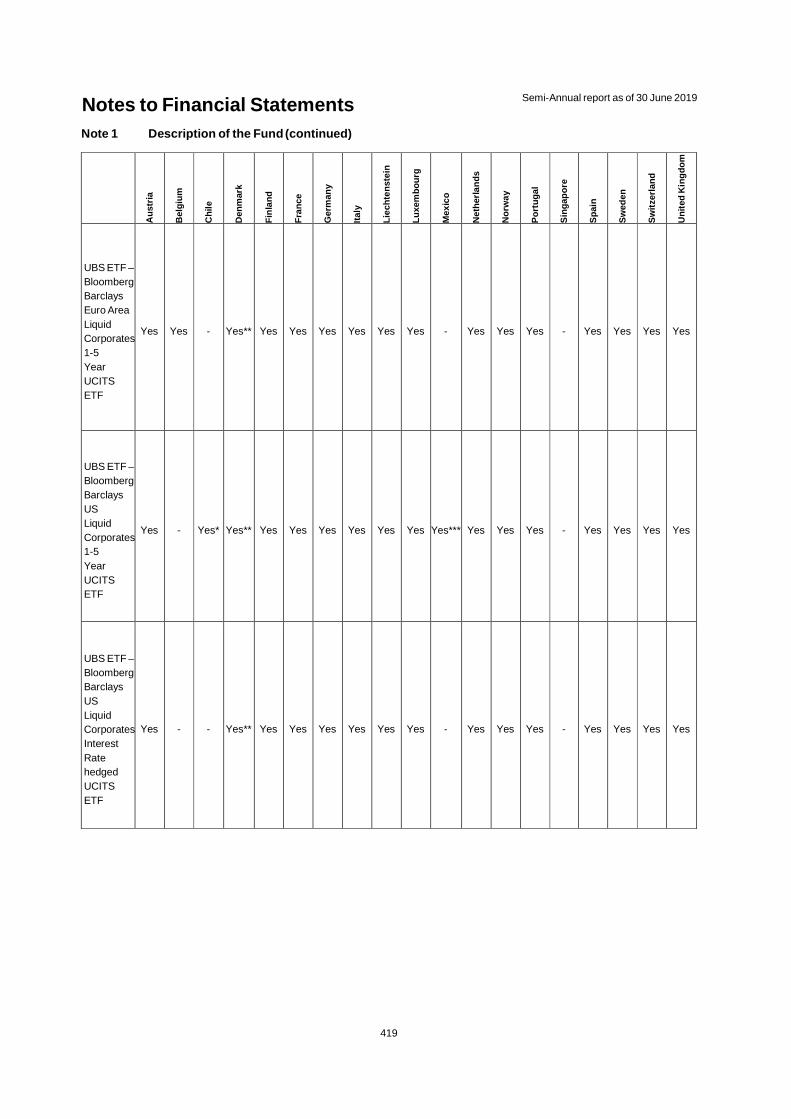
Notes to Financial Statements Semi-Annual report as of 30 June 2019
419
Note 1 Description of the Fund (continued)
Aus
tria
Bel
gium
Chi
le
Den
mar
k
Fin
land
Fra
nce
Ger
man
y
Italy
Liec
hten
stei
n
Luxe
mbo
urg
Mex
ico
Net
herla
nds
Nor
way
Por
tuga
l
Sin
gapo
re
Spa
in
Sw
eden
Sw
itzer
land
Uni
ted
Kin
gdom
UBS ETF – Bloomberg Barclays Euro Area Liquid Corporates1-5 Year UCITS ETF
Yes Yes - Yes** Yes Yes Yes Yes Yes Yes - Yes Yes Yes - Yes Yes Yes Yes
UBS ETF – Bloomberg Barclays US Liquid Corporates1-5 Year UCITS ETF
Yes - Yes* Yes** Yes Yes Yes Yes Yes Yes Yes*** Yes Yes Yes - Yes Yes Yes Yes
UBS ETF – Bloomberg Barclays US Liquid CorporatesInterest Rate hedged UCITS ETF
Yes - - Yes** Yes Yes Yes Yes Yes Yes - Yes Yes Yes - Yes Yes Yes Yes
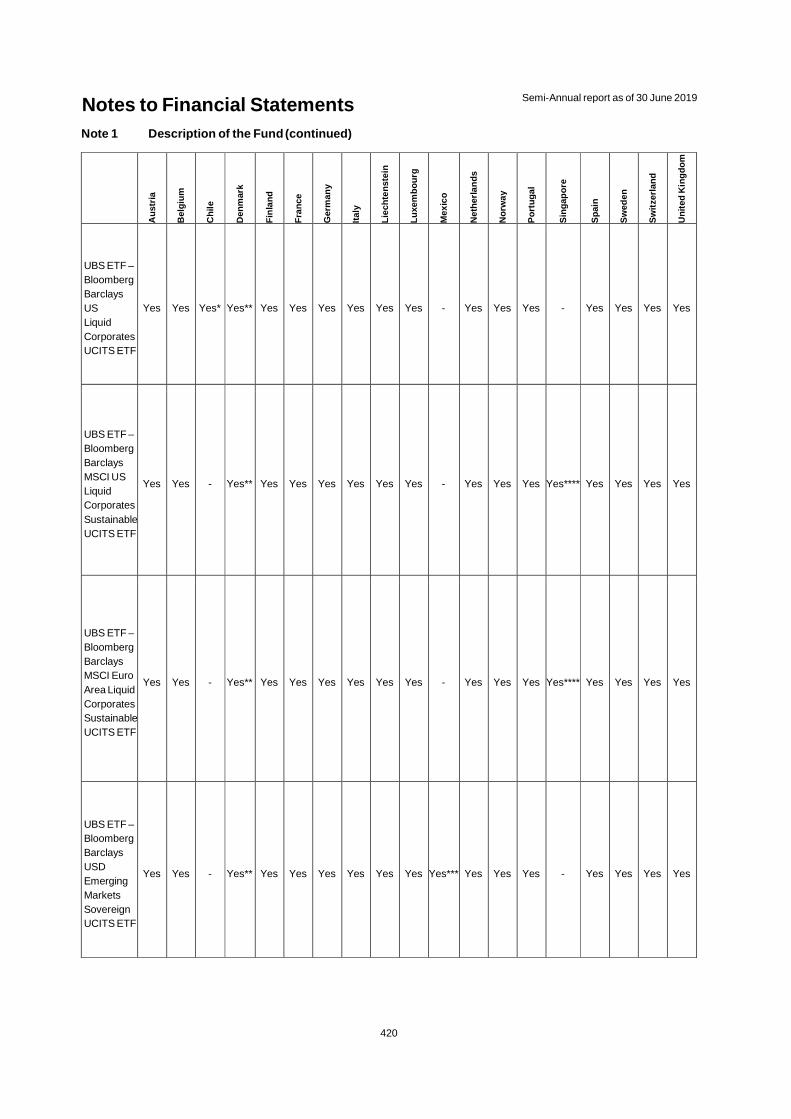
Notes to Financial Statements Semi-Annual report as of 30 June 2019
420
Note 1 Description of the Fund (continued)
Aus
tria
Bel
gium
Chi
le
Den
mar
k
Fin
land
Fra
nce
Ger
man
y
Italy
Liec
hten
stei
n
Luxe
mbo
urg
Mex
ico
Net
herla
nds
Nor
way
Por
tuga
l
Sin
gapo
re
Spa
in
Sw
eden
Sw
itzer
land
Uni
ted
Kin
gdom
UBS ETF – Bloomberg Barclays US Liquid Corporates UCITS ETF
Yes Yes Yes* Yes** Yes Yes Yes Yes Yes Yes - Yes Yes Yes - Yes Yes Yes Yes
UBS ETF – Bloomberg Barclays MSCI US Liquid Corporates SustainableUCITS ETF
Yes Yes - Yes** Yes Yes Yes Yes Yes Yes - Yes Yes Yes Yes**** Yes Yes Yes Yes
UBS ETF – Bloomberg Barclays MSCI Euro Area Liquid Corporates SustainableUCITS ETF
Yes Yes - Yes** Yes Yes Yes Yes Yes Yes - Yes Yes Yes Yes**** Yes Yes Yes Yes
UBS ETF – Bloomberg Barclays USD Emerging Markets Sovereign UCITS ETF
Yes Yes - Yes** Yes Yes Yes Yes Yes Yes Yes*** Yes Yes Yes - Yes Yes Yes Yes
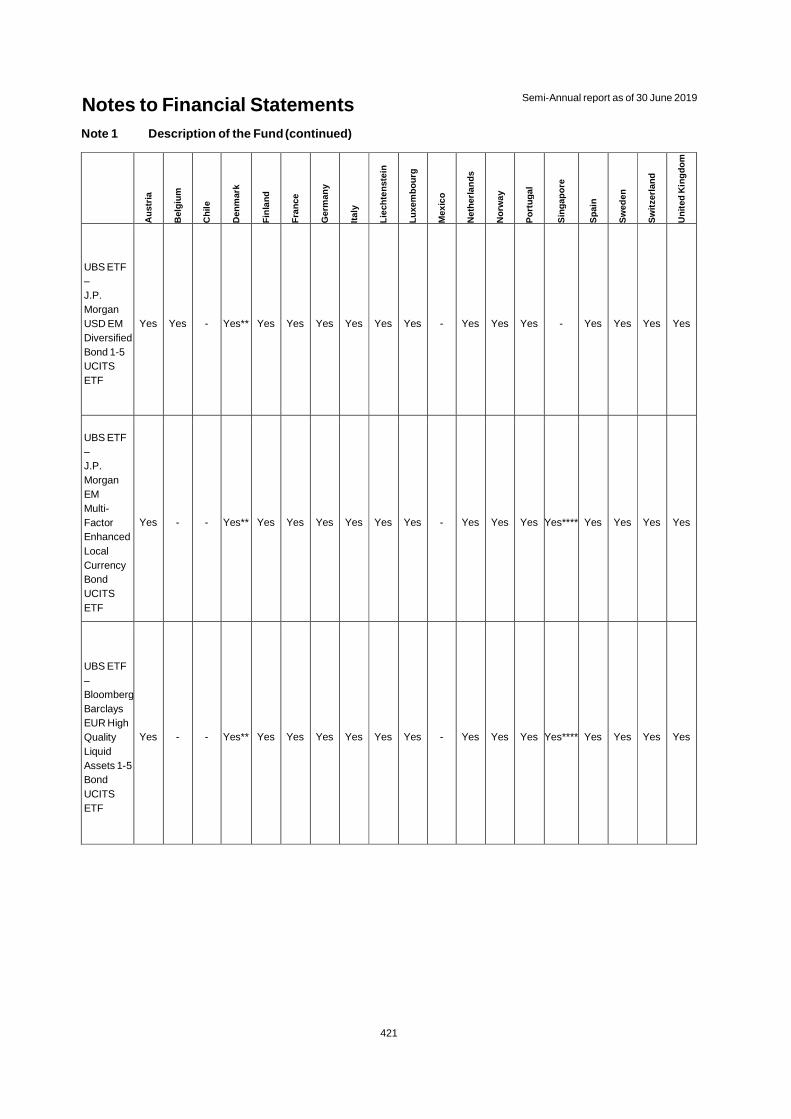
Notes to Financial Statements Semi-Annual report as of 30 June 2019
421
Note 1 Description of the Fund (continued)
Aus
tria
Bel
gium
Chi
le
Den
mar
k
Fin
land
Fra
nce
Ger
man
y
Italy
Liec
hten
stei
n
Luxe
mbo
urg
Mex
ico
Net
herla
nds
Nor
way
Por
tuga
l
Sin
gapo
re
Spa
in
Sw
eden
Sw
itzer
land
Uni
ted
Kin
gdom
UBS ETF – J.P. Morgan USD EM Diversified Bond 1-5 UCITS ETF
Yes Yes - Yes** Yes Yes Yes Yes Yes Yes - Yes Yes Yes - Yes Yes Yes Yes
UBS ETF – J.P. Morgan EM Multi-Factor Enhanced Local Currency Bond UCITS ETF
Yes - - Yes** Yes Yes Yes Yes Yes Yes - Yes Yes Yes Yes**** Yes Yes Yes Yes
UBS ETF – BloombergBarclays EUR High Quality Liquid Assets 1-5 Bond UCITS ETF
Yes - - Yes** Yes Yes Yes Yes Yes Yes - Yes Yes Yes Yes**** Yes Yes Yes Yes
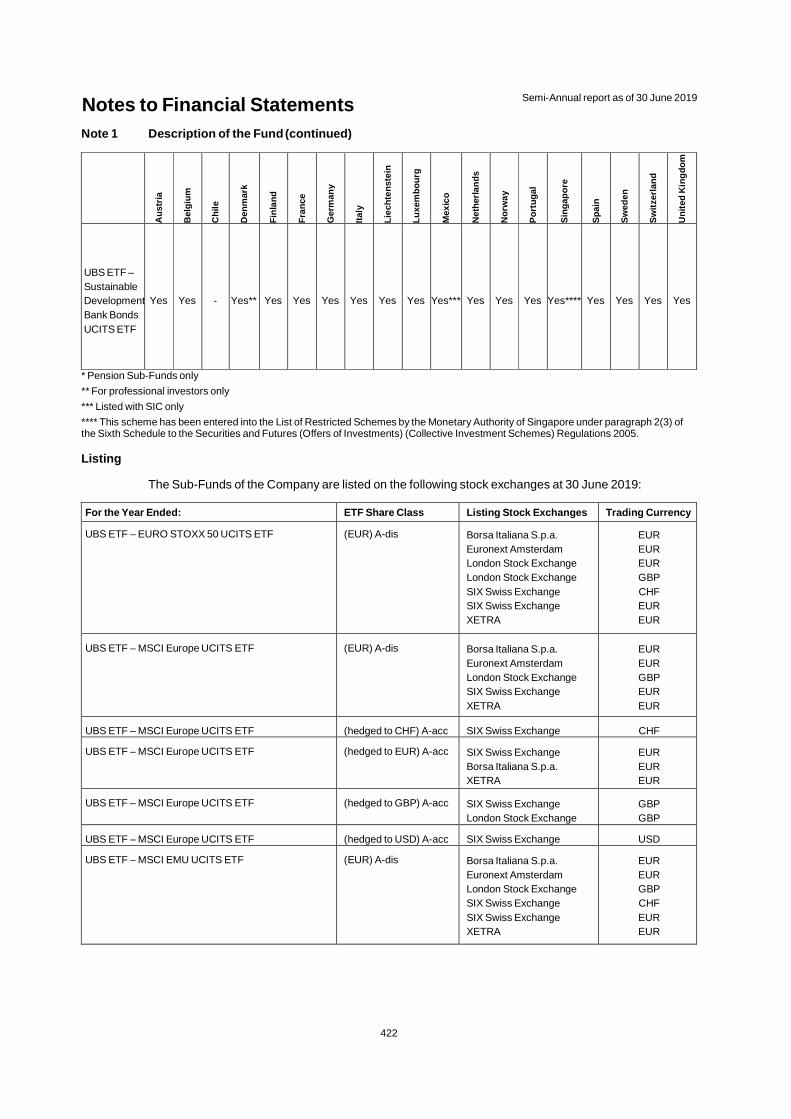
Notes to Financial Statements Semi-Annual report as of 30 June 2019
422
Note 1 Description of the Fund (continued)
Aus
tria
Bel
gium
Chi
le
Den
mar
k
Fin
land
Fra
nce
Ger
man
y
Italy
Liec
hten
stei
n
Luxe
mbo
urg
Mex
ico
Net
herla
nds
Nor
way
Por
tuga
l
Sin
gapo
re
Spa
in
Sw
eden
Sw
itzer
land
Uni
ted
Kin
gdom
UBS ETF – Sustainable DevelopmentBank Bonds UCITS ETF
Yes Yes - Yes** Yes Yes Yes Yes Yes Yes Yes*** Yes Yes Yes Yes**** Yes Yes Yes Yes
* Pension Sub-Funds only ** For professional investors only *** Listed with SIC only **** This scheme has been entered into the List of Restricted Schemes by the Monetary Authority of Singapore under paragraph 2(3) of the Sixth Schedule to the Securities and Futures (Offers of Investments) (Collective Investment Schemes) Regulations 2005.
Listing
The Sub-Funds of the Company are listed on the following stock exchanges at 30 June 2019:
For the Year Ended: ETF Share Class Listing Stock Exchanges Trading Currency
UBS ETF – EURO STOXX 50 UCITS ETF (EUR) A-dis Borsa Italiana S.p.a. Euronext Amsterdam London Stock Exchange London Stock Exchange SIX Swiss Exchange SIX Swiss Exchange XETRA
EUR EUR EUR GBP CHF EUR EUR
UBS ETF – MSCI Europe UCITS ETF (EUR) A-dis Borsa Italiana S.p.a. Euronext Amsterdam London Stock Exchange SIX Swiss Exchange XETRA
EUR EUR GBP EUR EUR
UBS ETF – MSCI Europe UCITS ETF (hedged to CHF) A-acc SIX Swiss Exchange CHF
UBS ETF – MSCI Europe UCITS ETF (hedged to EUR) A-acc SIX Swiss Exchange Borsa Italiana S.p.a. XETRA
EUR EUR EUR
UBS ETF – MSCI Europe UCITS ETF (hedged to GBP) A-acc SIX Swiss Exchange London Stock Exchange
GBP GBP
UBS ETF – MSCI Europe UCITS ETF (hedged to USD) A-acc SIX Swiss Exchange USD
UBS ETF – MSCI EMU UCITS ETF (EUR) A-dis Borsa Italiana S.p.a. Euronext Amsterdam London Stock Exchange SIX Swiss Exchange SIX Swiss Exchange XETRA
EUR EUR GBP CHF EUR EUR
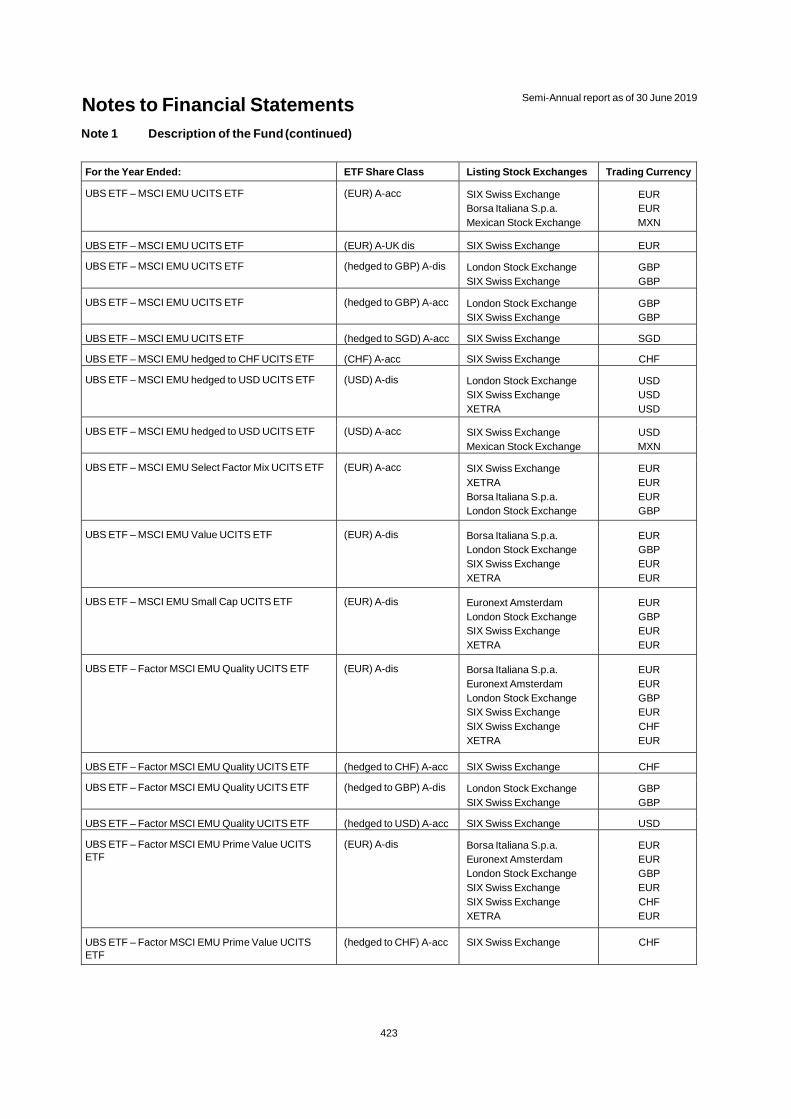
Notes to Financial Statements Semi-Annual report as of 30 June 2019
423
Note 1 Description of the Fund (continued)
For the Year Ended: ETF Share Class Listing Stock Exchanges Trading Currency
UBS ETF – MSCI EMU UCITS ETF (EUR) A-acc SIX Swiss Exchange Borsa Italiana S.p.a. Mexican Stock Exchange
EUR EUR MXN
UBS ETF – MSCI EMU UCITS ETF (EUR) A-UK dis SIX Swiss Exchange EUR
UBS ETF – MSCI EMU UCITS ETF (hedged to GBP) A-dis London Stock Exchange SIX Swiss Exchange
GBP GBP
UBS ETF – MSCI EMU UCITS ETF (hedged to GBP) A-acc London Stock Exchange SIX Swiss Exchange
GBP GBP
UBS ETF – MSCI EMU UCITS ETF (hedged to SGD) A-acc SIX Swiss Exchange SGD
UBS ETF – MSCI EMU hedged to CHF UCITS ETF (CHF) A-acc SIX Swiss Exchange CHF
UBS ETF – MSCI EMU hedged to USD UCITS ETF (USD) A-dis London Stock Exchange SIX Swiss Exchange XETRA
USD USD USD
UBS ETF – MSCI EMU hedged to USD UCITS ETF (USD) A-acc SIX Swiss Exchange Mexican Stock Exchange
USD MXN
UBS ETF – MSCI EMU Select Factor Mix UCITS ETF (EUR) A-acc SIX Swiss Exchange XETRA Borsa Italiana S.p.a. London Stock Exchange
EUR EUR EUR GBP
UBS ETF – MSCI EMU Value UCITS ETF (EUR) A-dis Borsa Italiana S.p.a. London Stock Exchange SIX Swiss Exchange XETRA
EUR GBP EUR EUR
UBS ETF – MSCI EMU Small Cap UCITS ETF (EUR) A-dis Euronext Amsterdam London Stock Exchange SIX Swiss Exchange XETRA
EUR GBP EUR EUR
UBS ETF – Factor MSCI EMU Quality UCITS ETF (EUR) A-dis Borsa Italiana S.p.a. Euronext Amsterdam London Stock Exchange SIX Swiss Exchange SIX Swiss Exchange XETRA
EUR EUR GBP EUR CHF EUR
UBS ETF – Factor MSCI EMU Quality UCITS ETF (hedged to CHF) A-acc SIX Swiss Exchange CHF
UBS ETF – Factor MSCI EMU Quality UCITS ETF (hedged to GBP) A-dis London Stock Exchange SIX Swiss Exchange
GBP GBP
UBS ETF – Factor MSCI EMU Quality UCITS ETF (hedged to USD) A-acc SIX Swiss Exchange USD
UBS ETF – Factor MSCI EMU Prime Value UCITS ETF
(EUR) A-dis Borsa Italiana S.p.a. Euronext Amsterdam London Stock Exchange SIX Swiss Exchange SIX Swiss Exchange XETRA
EUR EUR GBP EUR CHF EUR
UBS ETF – Factor MSCI EMU Prime Value UCITS ETF
(hedged to CHF) A-acc SIX Swiss Exchange CHF
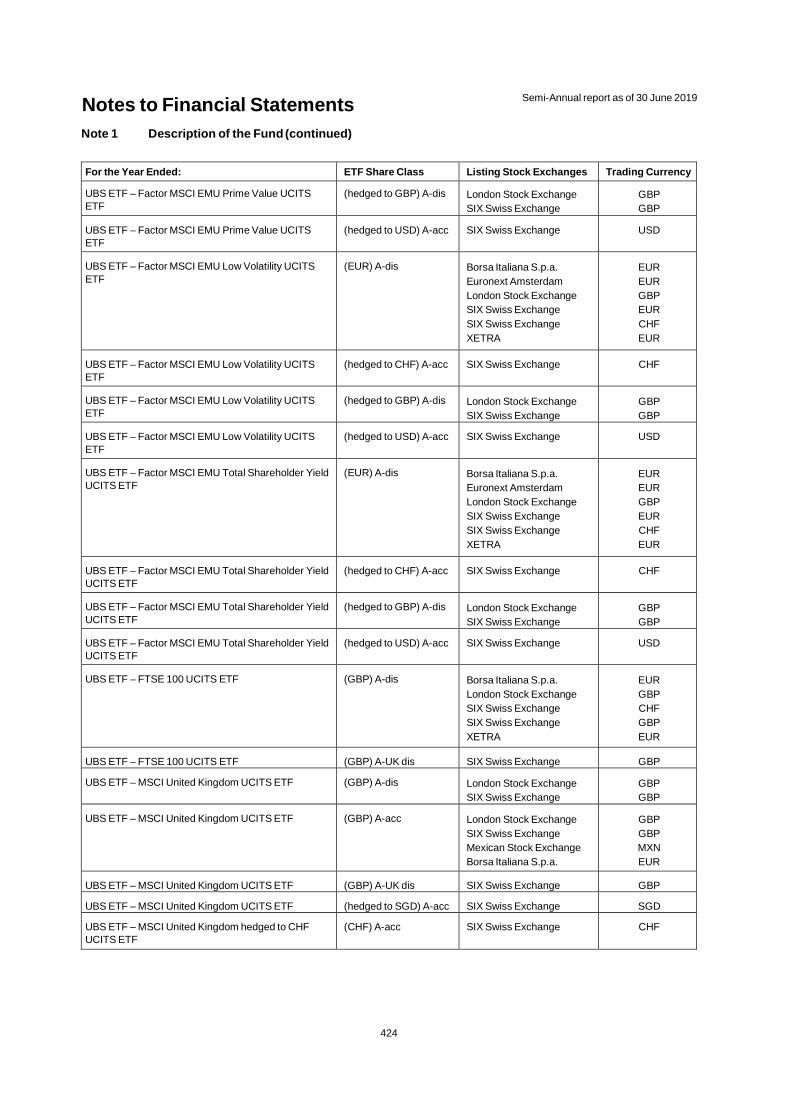
Notes to Financial Statements Semi-Annual report as of 30 June 2019
424
Note 1 Description of the Fund (continued)
For the Year Ended: ETF Share Class Listing Stock Exchanges Trading Currency
UBS ETF – Factor MSCI EMU Prime Value UCITS ETF
(hedged to GBP) A-dis London Stock Exchange SIX Swiss Exchange
GBP GBP
UBS ETF – Factor MSCI EMU Prime Value UCITS ETF
(hedged to USD) A-acc SIX Swiss Exchange USD
UBS ETF – Factor MSCI EMU Low Volatility UCITS ETF
(EUR) A-dis Borsa Italiana S.p.a. Euronext Amsterdam London Stock Exchange SIX Swiss Exchange SIX Swiss Exchange XETRA
EUR EUR GBP EUR CHF EUR
UBS ETF – Factor MSCI EMU Low Volatility UCITS ETF
(hedged to CHF) A-acc SIX Swiss Exchange CHF
UBS ETF – Factor MSCI EMU Low Volatility UCITS ETF
(hedged to GBP) A-dis London Stock Exchange SIX Swiss Exchange
GBP GBP
UBS ETF – Factor MSCI EMU Low Volatility UCITS ETF
(hedged to USD) A-acc SIX Swiss Exchange USD
UBS ETF – Factor MSCI EMU Total Shareholder Yield UCITS ETF
(EUR) A-dis Borsa Italiana S.p.a. Euronext Amsterdam London Stock Exchange SIX Swiss Exchange SIX Swiss Exchange XETRA
EUR EUR GBP EUR CHF EUR
UBS ETF – Factor MSCI EMU Total Shareholder Yield UCITS ETF
(hedged to CHF) A-acc SIX Swiss Exchange CHF
UBS ETF – Factor MSCI EMU Total Shareholder Yield UCITS ETF
(hedged to GBP) A-dis London Stock Exchange SIX Swiss Exchange
GBP GBP
UBS ETF – Factor MSCI EMU Total Shareholder Yield UCITS ETF
(hedged to USD) A-acc SIX Swiss Exchange USD
UBS ETF – FTSE 100 UCITS ETF (GBP) A-dis Borsa Italiana S.p.a. London Stock Exchange SIX Swiss Exchange SIX Swiss Exchange XETRA
EUR GBP CHF GBP EUR
UBS ETF – FTSE 100 UCITS ETF (GBP) A-UK dis SIX Swiss Exchange GBP
UBS ETF – MSCI United Kingdom UCITS ETF (GBP) A-dis London Stock Exchange SIX Swiss Exchange
GBP GBP
UBS ETF – MSCI United Kingdom UCITS ETF (GBP) A-acc London Stock Exchange SIX Swiss Exchange Mexican Stock Exchange Borsa Italiana S.p.a.
GBP GBP MXN EUR
UBS ETF – MSCI United Kingdom UCITS ETF (GBP) A-UK dis SIX Swiss Exchange GBP
UBS ETF – MSCI United Kingdom UCITS ETF (hedged to SGD) A-acc SIX Swiss Exchange SGD
UBS ETF – MSCI United Kingdom hedged to CHF UCITS ETF
(CHF) A-acc SIX Swiss Exchange CHF
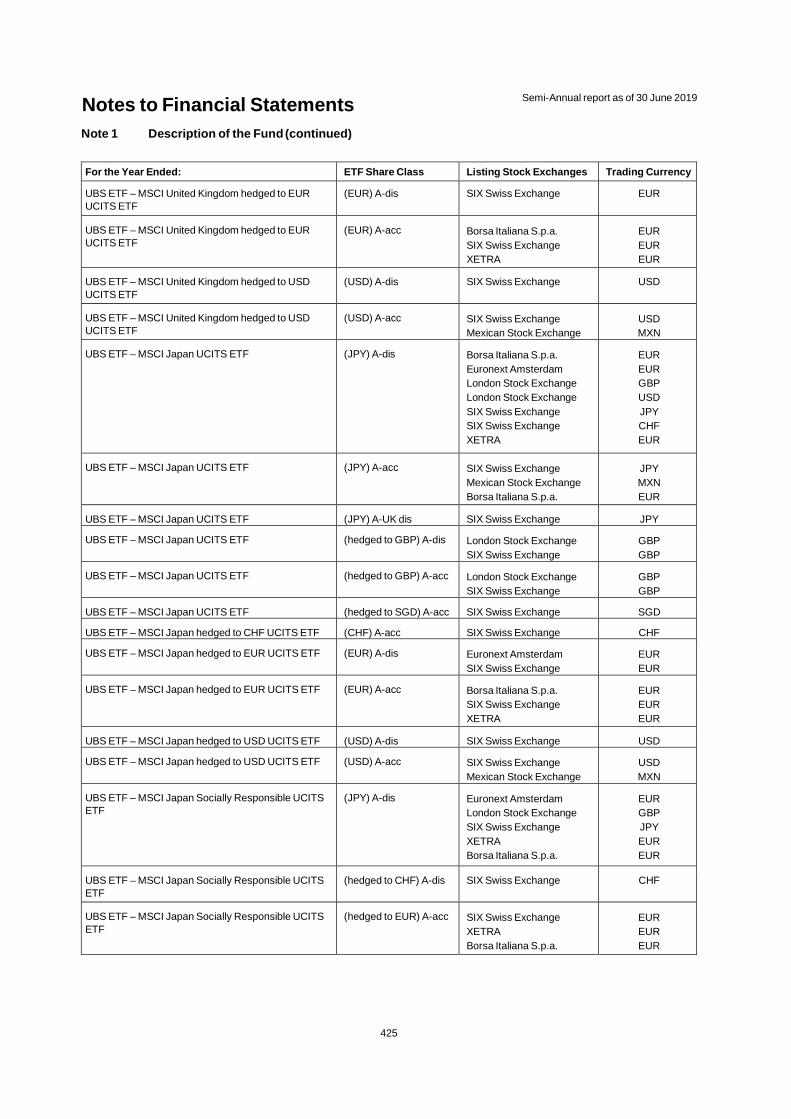
Notes to Financial Statements Semi-Annual report as of 30 June 2019
425
Note 1 Description of the Fund (continued)
For the Year Ended: ETF Share Class Listing Stock Exchanges Trading Currency
UBS ETF – MSCI United Kingdom hedged to EUR UCITS ETF
(EUR) A-dis SIX Swiss Exchange EUR
UBS ETF – MSCI United Kingdom hedged to EUR UCITS ETF
(EUR) A-acc Borsa Italiana S.p.a. SIX Swiss Exchange XETRA
EUR EUR EUR
UBS ETF – MSCI United Kingdom hedged to USD UCITS ETF
(USD) A-dis SIX Swiss Exchange USD
UBS ETF – MSCI United Kingdom hedged to USD UCITS ETF
(USD) A-acc SIX Swiss Exchange Mexican Stock Exchange
USD MXN
UBS ETF – MSCI Japan UCITS ETF (JPY) A-dis Borsa Italiana S.p.a. Euronext Amsterdam London Stock Exchange London Stock Exchange SIX Swiss Exchange SIX Swiss Exchange XETRA
EUR EUR GBP USD JPY CHF EUR
UBS ETF – MSCI Japan UCITS ETF (JPY) A-acc SIX Swiss Exchange Mexican Stock Exchange Borsa Italiana S.p.a.
JPY MXN EUR
UBS ETF – MSCI Japan UCITS ETF (JPY) A-UK dis SIX Swiss Exchange JPY
UBS ETF – MSCI Japan UCITS ETF (hedged to GBP) A-dis London Stock Exchange SIX Swiss Exchange
GBP GBP
UBS ETF – MSCI Japan UCITS ETF (hedged to GBP) A-acc London Stock Exchange SIX Swiss Exchange
GBP GBP
UBS ETF – MSCI Japan UCITS ETF (hedged to SGD) A-acc SIX Swiss Exchange SGD
UBS ETF – MSCI Japan hedged to CHF UCITS ETF (CHF) A-acc SIX Swiss Exchange CHF
UBS ETF – MSCI Japan hedged to EUR UCITS ETF (EUR) A-dis Euronext Amsterdam SIX Swiss Exchange
EUR EUR
UBS ETF – MSCI Japan hedged to EUR UCITS ETF (EUR) A-acc Borsa Italiana S.p.a. SIX Swiss Exchange XETRA
EUR EUR EUR
UBS ETF – MSCI Japan hedged to USD UCITS ETF (USD) A-dis SIX Swiss Exchange USD
UBS ETF – MSCI Japan hedged to USD UCITS ETF (USD) A-acc SIX Swiss Exchange Mexican Stock Exchange
USD MXN
UBS ETF – MSCI Japan Socially Responsible UCITS ETF
(JPY) A-dis Euronext Amsterdam London Stock Exchange SIX Swiss Exchange XETRA Borsa Italiana S.p.a.
EUR GBP JPY EUR EUR
UBS ETF – MSCI Japan Socially Responsible UCITS ETF
(hedged to CHF) A-dis SIX Swiss Exchange CHF
UBS ETF – MSCI Japan Socially Responsible UCITS ETF
(hedged to EUR) A-acc SIX Swiss Exchange XETRA Borsa Italiana S.p.a.
EUR EUR EUR

Notes to Financial Statements Semi-Annual report as of 30 June 2019
426
Note 1 Description of the Fund (continued)
For the Year Ended: ETF Share Class Listing Stock Exchanges Trading Currency
UBS ETF – MSCI Japan Socially Responsible UCITS ETF
(hedged to USD) A-acc SIX Swiss Exchange USD
UBS ETF – MSCI Pacific (ex Japan) UCITS ETF (USD) A-dis Borsa Italiana S.p.a. Euronext Amsterdam London Stock Exchange SIX Swiss Exchange XETRA
EUR EUR GBP USD EUR
UBS ETF – MSCI Pacific (ex Japan) UCITS ETF (USD) A-UK dis SIX Swiss Exchange USD
UBS ETF – MSCI USA UCITS ETF (USD) A-dis Borsa Italiana S.p.a. London Stock Exchange SIX Swiss Exchange SIX Swiss Exchange XETRA
EUR USD CHF USD EUR
UBS ETF – MSCI USA UCITS ETF (USD) A-UK dis SIX Swiss Exchange USD
UBS ETF – MSCI Canada UCITS ETF (CAD) A-dis Borsa Italiana S.p.a. Euronext Amsterdam London Stock Exchange SIX Swiss Exchange XETRA
EUR EUR GBP CAD EUR
UBS ETF – MSCI Canada UCITS ETF (CAD) A-acc SIX Swiss Exchange Mexican Stock Exchange Borsa Italiana S.p.a.
CAD MXN EUR
UBS ETF – MSCI Canada UCITS ETF (CAD) A-UK dis SIX Swiss Exchange CAD
UBS ETF – MSCI Canada UCITS ETF (hedged to CHF) A-acc SIX Swiss Exchange CHF
UBS ETF – MSCI Canada UCITS ETF (hedged to EUR) A-acc Borsa Italiana S.p.a. Euronext Amsterdam SIX Swiss Exchange
EUR EUR EUR
UBS ETF – MSCI Canada UCITS ETF (hedged to GBP) A-dis SIX Swiss Exchange GBP
UBS ETF – MSCI Canada UCITS ETF (hedged to GBP) A-acc London Stock Exchange SIX Swiss Exchange
GBP GBP
UBS ETF – MSCI Canada UCITS ETF (hedged to SGD) A-acc SIX Swiss Exchange SGD
UBS ETF – MSCI Canada UCITS ETF (hedged to USD) A-acc SIX Swiss Exchange Mexican Stock Exchange
USD MXN
UBS ETF – MSCI Singapore UCITS ETF (SGD) A-dis Euronext Amsterdam SIX Swiss Exchange
EUR USD
UBS ETF – MSCI Hong Kong UCITS ETF (HKD) A-dis Euronext Amsterdam SIX Swiss Exchange
EUR USD
UBS ETF – MSCI Switzerland 20/35 UCITS ETF (CHF) A-dis SIX Swiss Exchange CHF
UBS ETF – MSCI Switzerland 20/35 UCITS ETF (CHF) A-acc Borsa Italiana S.p.a. SIX Swiss Exchange Mexican Stock Exchange
EUR CHF MXN
UBS ETF – MSCI Switzerland 20/35 UCITS ETF (CHF) A-UK dis SIX Swiss Exchange CHF
UBS ETF – MSCI Switzerland 20/35 UCITS ETF (hedged to GBP) A-dis London Stock Exchange SIX Swiss Exchange
GBP GBP
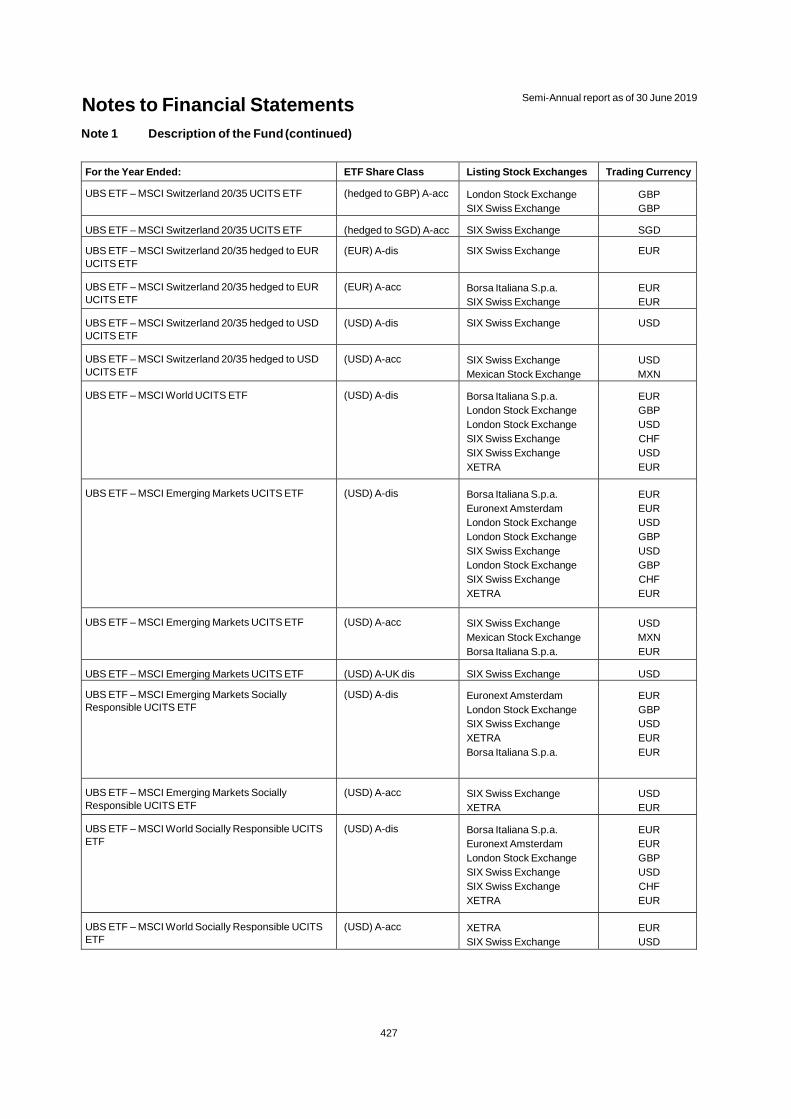
Notes to Financial Statements Semi-Annual report as of 30 June 2019
427
Note 1 Description of the Fund (continued)
For the Year Ended: ETF Share Class Listing Stock Exchanges Trading Currency
UBS ETF – MSCI Switzerland 20/35 UCITS ETF (hedged to GBP) A-acc London Stock Exchange SIX Swiss Exchange
GBP GBP
UBS ETF – MSCI Switzerland 20/35 UCITS ETF (hedged to SGD) A-acc SIX Swiss Exchange SGD
UBS ETF – MSCI Switzerland 20/35 hedged to EUR UCITS ETF
(EUR) A-dis SIX Swiss Exchange EUR
UBS ETF – MSCI Switzerland 20/35 hedged to EUR UCITS ETF
(EUR) A-acc Borsa Italiana S.p.a. SIX Swiss Exchange
EUR EUR
UBS ETF – MSCI Switzerland 20/35 hedged to USD UCITS ETF
(USD) A-dis SIX Swiss Exchange USD
UBS ETF – MSCI Switzerland 20/35 hedged to USD UCITS ETF
(USD) A-acc SIX Swiss Exchange Mexican Stock Exchange
USD MXN
UBS ETF – MSCI World UCITS ETF (USD) A-dis Borsa Italiana S.p.a. London Stock Exchange London Stock Exchange SIX Swiss Exchange SIX Swiss Exchange XETRA
EUR GBP USD CHF USD EUR
UBS ETF – MSCI Emerging Markets UCITS ETF (USD) A-dis Borsa Italiana S.p.a. Euronext Amsterdam London Stock Exchange London Stock Exchange SIX Swiss Exchange London Stock Exchange SIX Swiss Exchange XETRA
EUR EUR USD GBP USD GBP CHF EUR
UBS ETF – MSCI Emerging Markets UCITS ETF (USD) A-acc SIX Swiss Exchange Mexican Stock Exchange Borsa Italiana S.p.a.
USD MXN EUR
UBS ETF – MSCI Emerging Markets UCITS ETF (USD) A-UK dis SIX Swiss Exchange USD
UBS ETF – MSCI Emerging Markets Socially Responsible UCITS ETF
(USD) A-dis Euronext Amsterdam London Stock Exchange SIX Swiss Exchange XETRA Borsa Italiana S.p.a.
EUR GBP USD EUR EUR
UBS ETF – MSCI Emerging Markets Socially Responsible UCITS ETF
(USD) A-acc SIX Swiss Exchange XETRA
USD EUR
UBS ETF – MSCI World Socially Responsible UCITS ETF
(USD) A-dis Borsa Italiana S.p.a. Euronext Amsterdam London Stock Exchange SIX Swiss Exchange SIX Swiss Exchange XETRA
EUR EUR GBP USD CHF EUR
UBS ETF – MSCI World Socially Responsible UCITS ETF
(USD) A-acc XETRA SIX Swiss Exchange
EUR USD

Notes to Financial Statements Semi-Annual report as of 30 June 2019
428
Note 1 Description of the Fund (continued)
For the Year Ended: ETF Share Class Listing Stock Exchanges Trading Currency
UBS ETF – MSCI USA Socially Responsible UCITS ETF
(USD) A-dis Borsa Italiana S.p.a. Euronext Amsterdam London Stock Exchange SIX Swiss Exchange XETRA
EUR EUR GBP USD EUR
UBS ETF – MSCI USA Socially Responsible UCITS ETF
(hedged to CHF) A-dis SIX Swiss Exchange CHF
UBS ETF – MSCI USA Socially Responsible UCITS ETF
(hedged to CHF) A-acc SIX Swiss Exchange CHF
UBS ETF – MSCI USA Socially Responsible UCITS ETF
(hedged to EUR) A-dis Euronext Amsterdam Borsa Italiana S.p.a. XETRA SIX Swiss Exchange
EUR EUR EUR EUR
UBS ETF – MSCI EMU Socially Responsible UCITS ETF
(EUR) A-dis Borsa Italiana S.p.a. Euronext Amsterdam London Stock Exchange SIX Swiss Exchange SIX Swiss Exchange XETRA
EUR EUR GBP EUR CHF EUR
UBS ETF – MSCI EMU Socially Responsible UCITS ETF
(EUR) A-acc SIX Swiss Exchange EUR
UBS ETF – MSCI EMU Socially Responsible UCITS ETF
(hedged to CHF) A-dis SIX Swiss Exchange CHF
UBS ETF – MSCI EMU Socially Responsible UCITS ETF
(hedged to CHF) A-acc SIX Swiss Exchange CHF
UBS ETF – MSCI EMU Socially Responsible UCITS ETF
(hedged to USD) A-acc SIX Swiss Exchange USD
UBS ETF – MSCI Pacific Socially Responsible UCITS ETF
(USD) A-dis Borsa Italiana S.p.a. Euronext Amsterdam London Stock Exchange SIX Swiss Exchange SIX Swiss Exchange XETRA
EUR EUR GBP USD CHF EUR
UBS ETF – Bloomberg Barclays US 1-3 Year Treasury Bond UCITS ETF
(USD) A-dis Borsa Italiana S.p.a. Euronext Amsterdam London Stock Exchange SIX Swiss Exchange XETRA
EUR EUR GBP USD EUR
UBS ETF – Bloomberg Barclays US 1-3 Year Treasury Bond UCITS ETF
(USD) A-acc SIX Swiss Exchange Mexican Stock Exchange
USD MXN
UBS ETF – Bloomberg Barclays US 1-3 Year Treasury Bond UCITS ETF
(hedged to EUR) A-dis SIX Swiss Exchange Borsa Italiana S.p.a.
EUR EUR
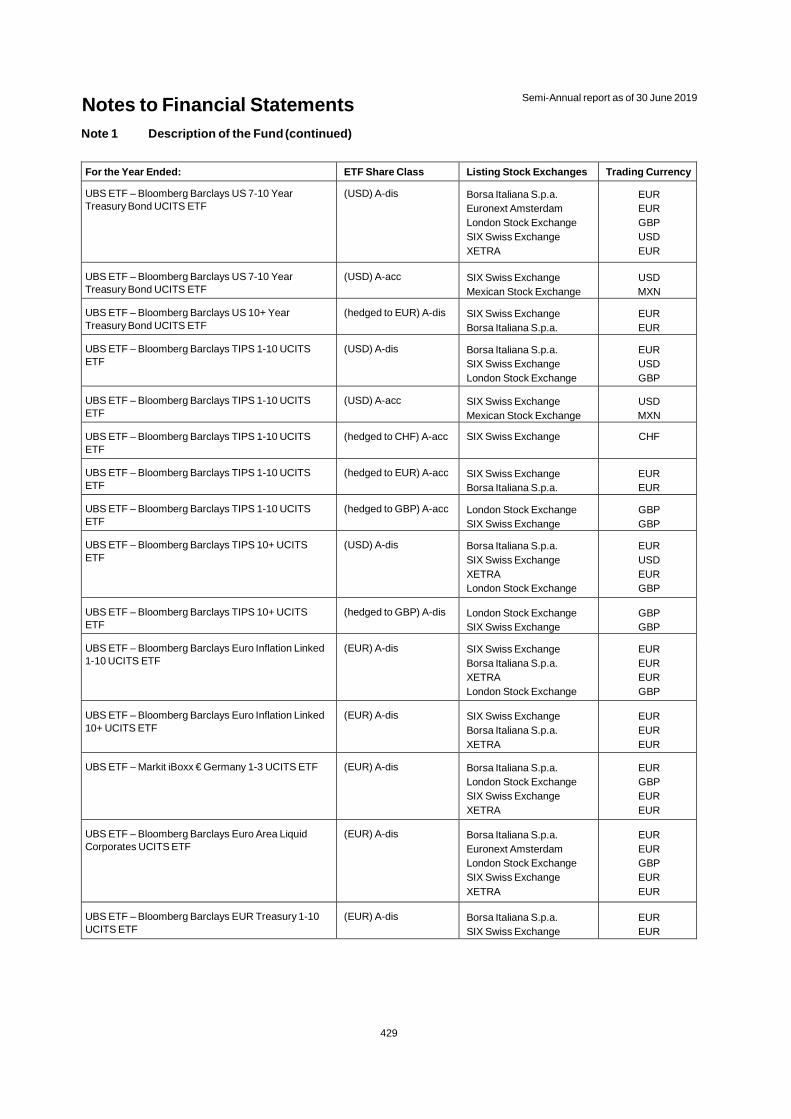
Notes to Financial Statements Semi-Annual report as of 30 June 2019
429
Note 1 Description of the Fund (continued)
For the Year Ended: ETF Share Class Listing Stock Exchanges Trading Currency
UBS ETF – Bloomberg Barclays US 7-10 Year Treasury Bond UCITS ETF
(USD) A-dis Borsa Italiana S.p.a. Euronext Amsterdam London Stock Exchange SIX Swiss Exchange XETRA
EUR EUR GBP USD EUR
UBS ETF – Bloomberg Barclays US 7-10 Year Treasury Bond UCITS ETF
(USD) A-acc SIX Swiss Exchange Mexican Stock Exchange
USD MXN
UBS ETF – Bloomberg Barclays US 10+ Year Treasury Bond UCITS ETF
(hedged to EUR) A-dis SIX Swiss Exchange Borsa Italiana S.p.a.
EUR EUR
UBS ETF – Bloomberg Barclays TIPS 1-10 UCITS ETF
(USD) A-dis Borsa Italiana S.p.a. SIX Swiss Exchange London Stock Exchange
EUR USD GBP
UBS ETF – Bloomberg Barclays TIPS 1-10 UCITS ETF
(USD) A-acc SIX Swiss Exchange Mexican Stock Exchange
USD MXN
UBS ETF – Bloomberg Barclays TIPS 1-10 UCITS ETF
(hedged to CHF) A-acc SIX Swiss Exchange CHF
UBS ETF – Bloomberg Barclays TIPS 1-10 UCITS ETF
(hedged to EUR) A-acc SIX Swiss Exchange Borsa Italiana S.p.a.
EUR EUR
UBS ETF – Bloomberg Barclays TIPS 1-10 UCITS ETF
(hedged to GBP) A-acc London Stock Exchange SIX Swiss Exchange
GBP GBP
UBS ETF – Bloomberg Barclays TIPS 10+ UCITS ETF
(USD) A-dis Borsa Italiana S.p.a. SIX Swiss Exchange XETRA London Stock Exchange
EUR USD EUR GBP
UBS ETF – Bloomberg Barclays TIPS 10+ UCITS ETF
(hedged to GBP) A-dis London Stock Exchange SIX Swiss Exchange
GBP GBP
UBS ETF – Bloomberg Barclays Euro Inflation Linked 1-10 UCITS ETF
(EUR) A-dis SIX Swiss Exchange Borsa Italiana S.p.a. XETRA London Stock Exchange
EUR EUR EUR GBP
UBS ETF – Bloomberg Barclays Euro Inflation Linked 10+ UCITS ETF
(EUR) A-dis SIX Swiss Exchange Borsa Italiana S.p.a. XETRA
EUR EUR EUR
UBS ETF – Markit iBoxx € Germany 1-3 UCITS ETF (EUR) A-dis Borsa Italiana S.p.a. London Stock Exchange SIX Swiss Exchange XETRA
EUR GBP EUR EUR
UBS ETF – Bloomberg Barclays Euro Area Liquid Corporates UCITS ETF
(EUR) A-dis Borsa Italiana S.p.a. Euronext Amsterdam London Stock Exchange SIX Swiss Exchange XETRA
EUR EUR GBP EUR EUR
UBS ETF – Bloomberg Barclays EUR Treasury 1-10 UCITS ETF
(EUR) A-dis Borsa Italiana S.p.a. SIX Swiss Exchange
EUR EUR
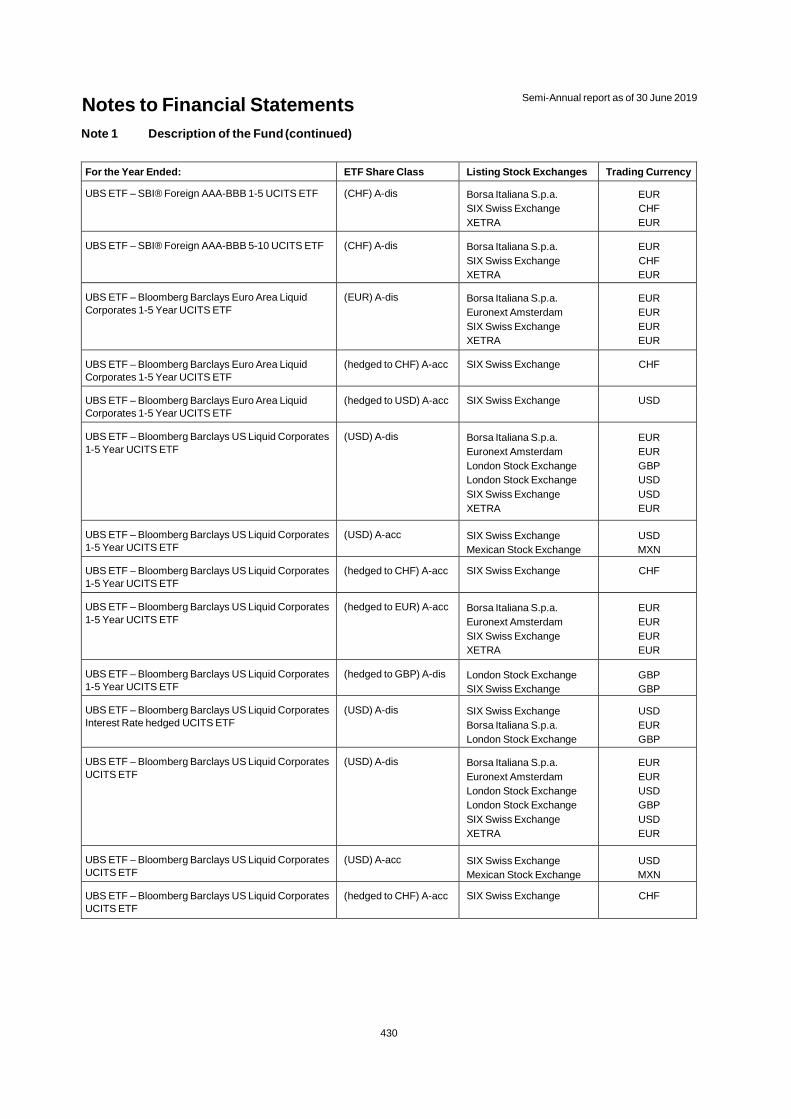
Notes to Financial Statements Semi-Annual report as of 30 June 2019
430
Note 1 Description of the Fund (continued)
For the Year Ended: ETF Share Class Listing Stock Exchanges Trading Currency
UBS ETF – SBI® Foreign AAA-BBB 1-5 UCITS ETF (CHF) A-dis Borsa Italiana S.p.a. SIX Swiss Exchange XETRA
EUR CHF EUR
UBS ETF – SBI® Foreign AAA-BBB 5-10 UCITS ETF (CHF) A-dis Borsa Italiana S.p.a. SIX Swiss Exchange XETRA
EUR CHF EUR
UBS ETF – Bloomberg Barclays Euro Area Liquid Corporates 1-5 Year UCITS ETF
(EUR) A-dis Borsa Italiana S.p.a. Euronext Amsterdam SIX Swiss Exchange XETRA
EUR EUR EUR EUR
UBS ETF – Bloomberg Barclays Euro Area Liquid Corporates 1-5 Year UCITS ETF
(hedged to CHF) A-acc SIX Swiss Exchange CHF
UBS ETF – Bloomberg Barclays Euro Area Liquid Corporates 1-5 Year UCITS ETF
(hedged to USD) A-acc SIX Swiss Exchange USD
UBS ETF – Bloomberg Barclays US Liquid Corporates 1-5 Year UCITS ETF
(USD) A-dis Borsa Italiana S.p.a. Euronext Amsterdam London Stock Exchange London Stock Exchange SIX Swiss Exchange XETRA
EUR EUR GBP USD USD EUR
UBS ETF – Bloomberg Barclays US Liquid Corporates 1-5 Year UCITS ETF
(USD) A-acc SIX Swiss Exchange Mexican Stock Exchange
USD MXN
UBS ETF – Bloomberg Barclays US Liquid Corporates 1-5 Year UCITS ETF
(hedged to CHF) A-acc SIX Swiss Exchange CHF
UBS ETF – Bloomberg Barclays US Liquid Corporates 1-5 Year UCITS ETF
(hedged to EUR) A-acc Borsa Italiana S.p.a. Euronext Amsterdam SIX Swiss Exchange XETRA
EUR EUR EUR EUR
UBS ETF – Bloomberg Barclays US Liquid Corporates 1-5 Year UCITS ETF
(hedged to GBP) A-dis London Stock Exchange SIX Swiss Exchange
GBP GBP
UBS ETF – Bloomberg Barclays US Liquid Corporates Interest Rate hedged UCITS ETF
(USD) A-dis SIX Swiss Exchange Borsa Italiana S.p.a. London Stock Exchange
USD EUR GBP
UBS ETF – Bloomberg Barclays US Liquid Corporates UCITS ETF
(USD) A-dis Borsa Italiana S.p.a. Euronext Amsterdam London Stock Exchange London Stock Exchange SIX Swiss Exchange XETRA
EUR EUR USD GBP USD EUR
UBS ETF – Bloomberg Barclays US Liquid Corporates UCITS ETF
(USD) A-acc SIX Swiss Exchange Mexican Stock Exchange
USD MXN
UBS ETF – Bloomberg Barclays US Liquid Corporates UCITS ETF
(hedged to CHF) A-acc SIX Swiss Exchange CHF
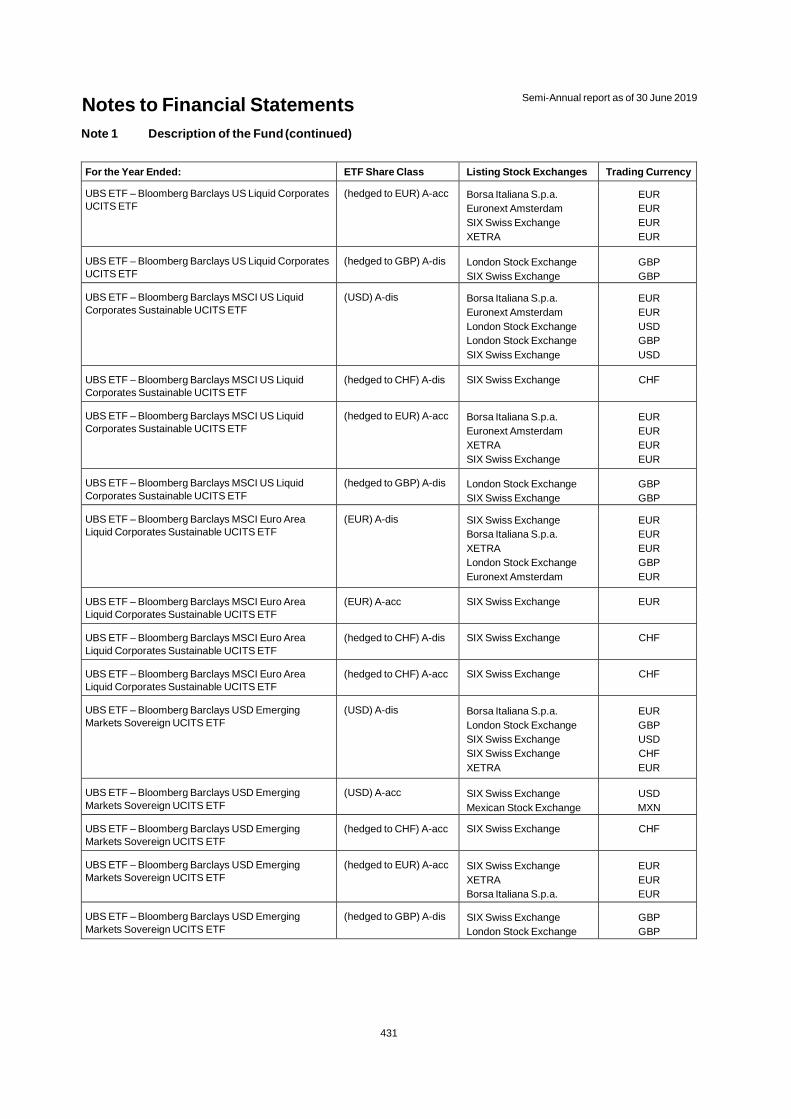
Notes to Financial Statements Semi-Annual report as of 30 June 2019
431
Note 1 Description of the Fund (continued)
For the Year Ended: ETF Share Class Listing Stock Exchanges Trading Currency
UBS ETF – Bloomberg Barclays US Liquid Corporates UCITS ETF
(hedged to EUR) A-acc Borsa Italiana S.p.a. Euronext Amsterdam SIX Swiss Exchange XETRA
EUR EUR EUR EUR
UBS ETF – Bloomberg Barclays US Liquid Corporates UCITS ETF
(hedged to GBP) A-dis London Stock Exchange SIX Swiss Exchange
GBP GBP
UBS ETF – Bloomberg Barclays MSCI US Liquid Corporates Sustainable UCITS ETF
(USD) A-dis Borsa Italiana S.p.a. Euronext Amsterdam London Stock Exchange London Stock Exchange SIX Swiss Exchange
EUR EUR USD GBP USD
UBS ETF – Bloomberg Barclays MSCI US Liquid Corporates Sustainable UCITS ETF
(hedged to CHF) A-dis SIX Swiss Exchange CHF
UBS ETF – Bloomberg Barclays MSCI US Liquid Corporates Sustainable UCITS ETF
(hedged to EUR) A-acc Borsa Italiana S.p.a. Euronext Amsterdam XETRA SIX Swiss Exchange
EUR EUR EUR EUR
UBS ETF – Bloomberg Barclays MSCI US Liquid Corporates Sustainable UCITS ETF
(hedged to GBP) A-dis London Stock Exchange SIX Swiss Exchange
GBP GBP
UBS ETF – Bloomberg Barclays MSCI Euro Area Liquid Corporates Sustainable UCITS ETF
(EUR) A-dis SIX Swiss Exchange Borsa Italiana S.p.a. XETRA London Stock Exchange Euronext Amsterdam
EUR EUR EUR GBP EUR
UBS ETF – Bloomberg Barclays MSCI Euro Area Liquid Corporates Sustainable UCITS ETF
(EUR) A-acc SIX Swiss Exchange EUR
UBS ETF – Bloomberg Barclays MSCI Euro Area Liquid Corporates Sustainable UCITS ETF
(hedged to CHF) A-dis SIX Swiss Exchange CHF
UBS ETF – Bloomberg Barclays MSCI Euro Area Liquid Corporates Sustainable UCITS ETF
(hedged to CHF) A-acc SIX Swiss Exchange CHF
UBS ETF – Bloomberg Barclays USD Emerging Markets Sovereign UCITS ETF
(USD) A-dis Borsa Italiana S.p.a. London Stock Exchange SIX Swiss Exchange SIX Swiss Exchange XETRA
EUR GBP USD CHF EUR
UBS ETF – Bloomberg Barclays USD Emerging Markets Sovereign UCITS ETF
(USD) A-acc SIX Swiss Exchange Mexican Stock Exchange
USD MXN
UBS ETF – Bloomberg Barclays USD Emerging Markets Sovereign UCITS ETF
(hedged to CHF) A-acc SIX Swiss Exchange CHF
UBS ETF – Bloomberg Barclays USD Emerging Markets Sovereign UCITS ETF
(hedged to EUR) A-acc SIX Swiss Exchange XETRA Borsa Italiana S.p.a.
EUR EUR EUR
UBS ETF – Bloomberg Barclays USD Emerging Markets Sovereign UCITS ETF
(hedged to GBP) A-dis SIX Swiss Exchange London Stock Exchange
GBP GBP
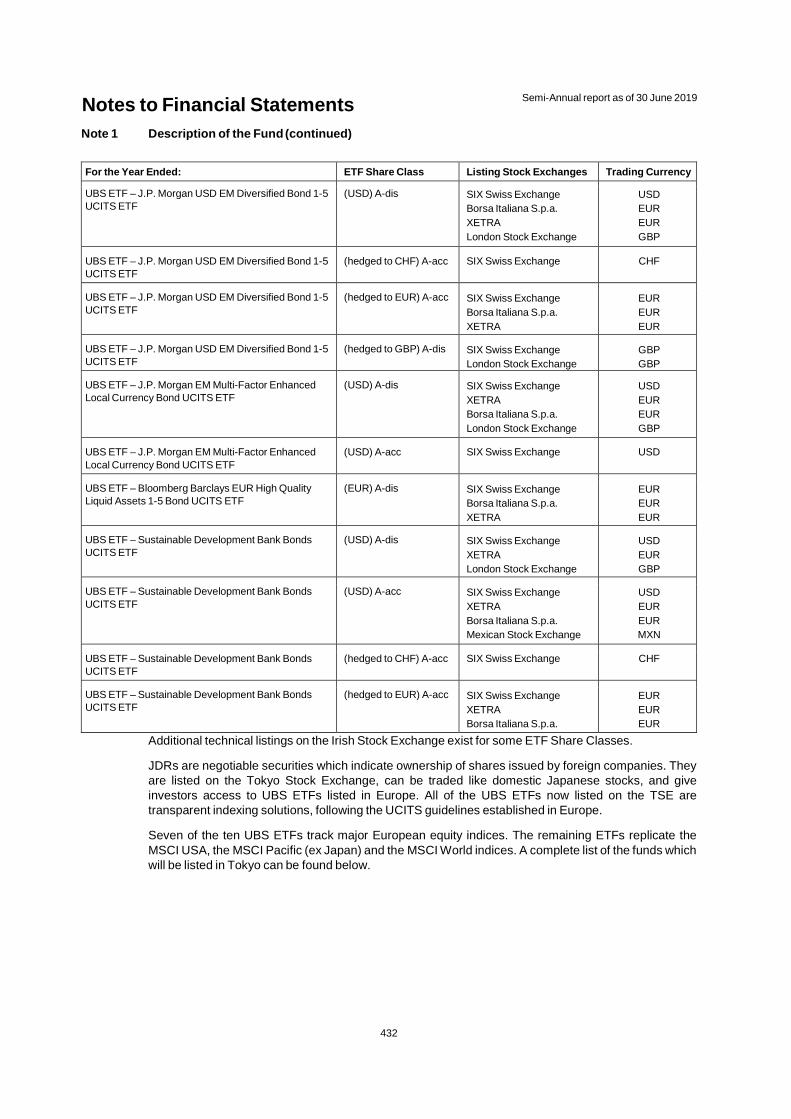
Notes to Financial Statements Semi-Annual report as of 30 June 2019
432
Note 1 Description of the Fund (continued)
For the Year Ended: ETF Share Class Listing Stock Exchanges Trading Currency
UBS ETF – J.P. Morgan USD EM Diversified Bond 1-5 UCITS ETF
(USD) A-dis SIX Swiss Exchange Borsa Italiana S.p.a. XETRA London Stock Exchange
USD EUR EUR GBP
UBS ETF – J.P. Morgan USD EM Diversified Bond 1-5 UCITS ETF
(hedged to CHF) A-acc SIX Swiss Exchange CHF
UBS ETF – J.P. Morgan USD EM Diversified Bond 1-5 UCITS ETF
(hedged to EUR) A-acc SIX Swiss Exchange Borsa Italiana S.p.a. XETRA
EUR EUR EUR
UBS ETF – J.P. Morgan USD EM Diversified Bond 1-5 UCITS ETF
(hedged to GBP) A-dis SIX Swiss Exchange London Stock Exchange
GBP GBP
UBS ETF – J.P. Morgan EM Multi-Factor Enhanced Local Currency Bond UCITS ETF
(USD) A-dis SIX Swiss Exchange XETRA Borsa Italiana S.p.a. London Stock Exchange
USD EUR EUR GBP
UBS ETF – J.P. Morgan EM Multi-Factor Enhanced Local Currency Bond UCITS ETF
(USD) A-acc SIX Swiss Exchange USD
UBS ETF – Bloomberg Barclays EUR High Quality Liquid Assets 1-5 Bond UCITS ETF
(EUR) A-dis SIX Swiss Exchange Borsa Italiana S.p.a. XETRA
EUR EUR EUR
UBS ETF – Sustainable Development Bank Bonds UCITS ETF
(USD) A-dis SIX Swiss Exchange XETRA London Stock Exchange
USD EUR GBP
UBS ETF – Sustainable Development Bank Bonds UCITS ETF
(USD) A-acc SIX Swiss Exchange XETRA Borsa Italiana S.p.a. Mexican Stock Exchange
USD EUR EUR MXN
UBS ETF – Sustainable Development Bank Bonds UCITS ETF
(hedged to CHF) A-acc SIX Swiss Exchange CHF
UBS ETF – Sustainable Development Bank Bonds UCITS ETF
(hedged to EUR) A-acc SIX Swiss Exchange XETRA Borsa Italiana S.p.a.
EUR EUR EUR
Additional technical listings on the Irish Stock Exchange exist for some ETF Share Classes.
JDRs are negotiable securities which indicate ownership of shares issued by foreign companies. They are listed on the Tokyo Stock Exchange, can be traded like domestic Japanese stocks, and give investors access to UBS ETFs listed in Europe. All of the UBS ETFs now listed on the TSE are transparent indexing solutions, following the UCITS guidelines established in Europe.
Seven of the ten UBS ETFs track major European equity indices. The remaining ETFs replicate the MSCI USA, the MSCI Pacific (ex Japan) and the MSCI World indices. A complete list of the funds which will be listed in Tokyo can be found below.
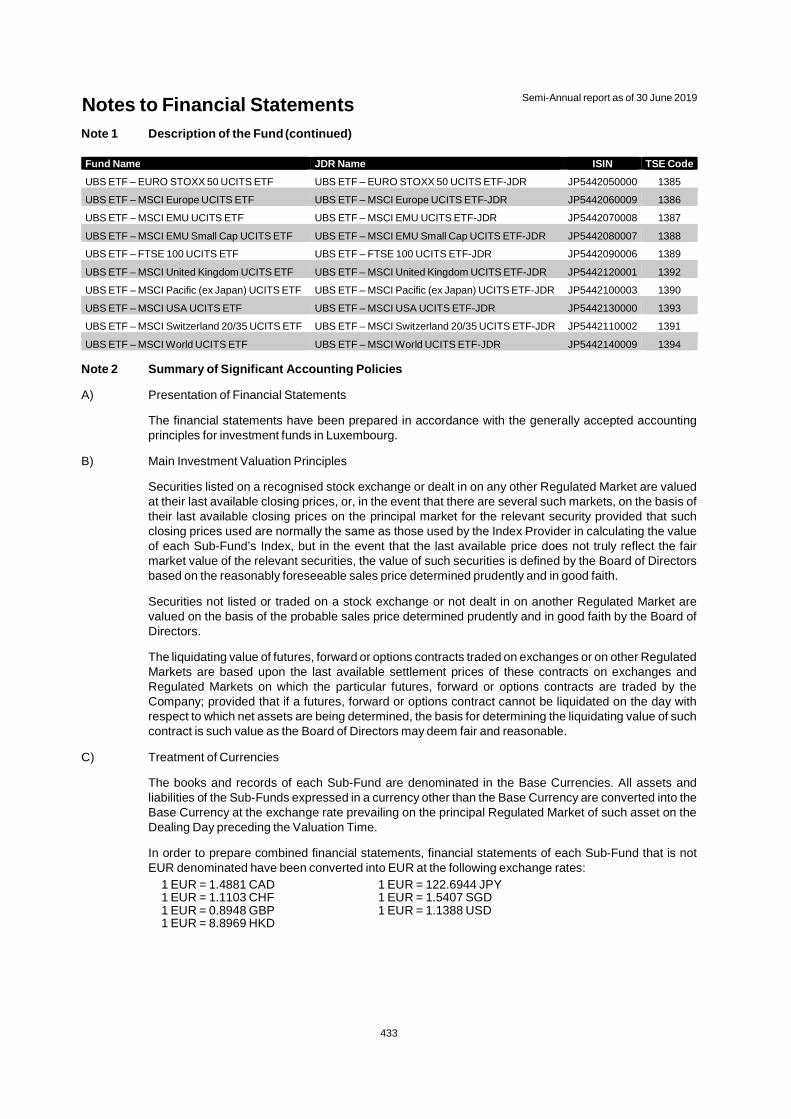
Notes to Financial Statements Semi-Annual report as of 30 June 2019
433
Note 1 Description of the Fund (continued)
Fund Name JDR Name ISIN TSE Code
UBS ETF – EURO STOXX 50 UCITS ETF UBS ETF – EURO STOXX 50 UCITS ETF-JDR JP5442050000 1385
UBS ETF – MSCI Europe UCITS ETF UBS ETF – MSCI Europe UCITS ETF-JDR JP5442060009 1386
UBS ETF – MSCI EMU UCITS ETF UBS ETF – MSCI EMU UCITS ETF-JDR JP5442070008 1387
UBS ETF – MSCI EMU Small Cap UCITS ETF UBS ETF – MSCI EMU Small Cap UCITS ETF-JDR JP5442080007 1388
UBS ETF – FTSE 100 UCITS ETF UBS ETF – FTSE 100 UCITS ETF-JDR JP5442090006 1389
UBS ETF – MSCI United Kingdom UCITS ETF UBS ETF – MSCI United Kingdom UCITS ETF-JDR JP5442120001 1392
UBS ETF – MSCI Pacific (ex Japan) UCITS ETF UBS ETF – MSCI Pacific (ex Japan) UCITS ETF-JDR JP5442100003 1390
UBS ETF – MSCI USA UCITS ETF UBS ETF – MSCI USA UCITS ETF-JDR JP5442130000 1393
UBS ETF – MSCI Switzerland 20/35 UCITS ETF UBS ETF – MSCI Switzerland 20/35 UCITS ETF-JDR JP5442110002 1391
UBS ETF – MSCI World UCITS ETF UBS ETF – MSCI World UCITS ETF-JDR JP5442140009 1394
Note 2 Summary of Significant Accounting Policies
A) Presentation of Financial Statements
The financial statements have been prepared in accordance with the generally accepted accounting principles for investment funds in Luxembourg.
B) Main Investment Valuation Principles
Securities listed on a recognised stock exchange or dealt in on any other Regulated Market are valued at their last available closing prices, or, in the event that there are several such markets, on the basis of their last available closing prices on the principal market for the relevant security provided that such closing prices used are normally the same as those used by the Index Provider in calculating the value of each Sub-Fund’s Index, but in the event that the last available price does not truly reflect the fair market value of the relevant securities, the value of such securities is defined by the Board of Directors based on the reasonably foreseeable sales price determined prudently and in good faith.
Securities not listed or traded on a stock exchange or not dealt in on another Regulated Market are valued on the basis of the probable sales price determined prudently and in good faith by the Board of Directors.
The liquidating value of futures, forward or options contracts traded on exchanges or on other Regulated Markets are based upon the last available settlement prices of these contracts on exchanges and Regulated Markets on which the particular futures, forward or options contracts are traded by the Company; provided that if a futures, forward or options contract cannot be liquidated on the day with respect to which net assets are being determined, the basis for determining the liquidating value of such contract is such value as the Board of Directors may deem fair and reasonable.
C) Treatment of Currencies
The books and records of each Sub-Fund are denominated in the Base Currencies. All assets and liabilities of the Sub-Funds expressed in a currency other than the Base Currency are converted into the Base Currency at the exchange rate prevailing on the principal Regulated Market of such asset on the Dealing Day preceding the Valuation Time.
In order to prepare combined financial statements, financial statements of each Sub-Fund that is not EUR denominated have been converted into EUR at the following exchange rates:
1 EUR = 1.4881 CAD 1 EUR = 122.6944 JPY
1 EUR = 1.1103 CHF 1 EUR = 1.5407 SGD
1 EUR = 0.8948 GBP 1 EUR = 1.1388 USD
1 EUR = 8.8969 HKD
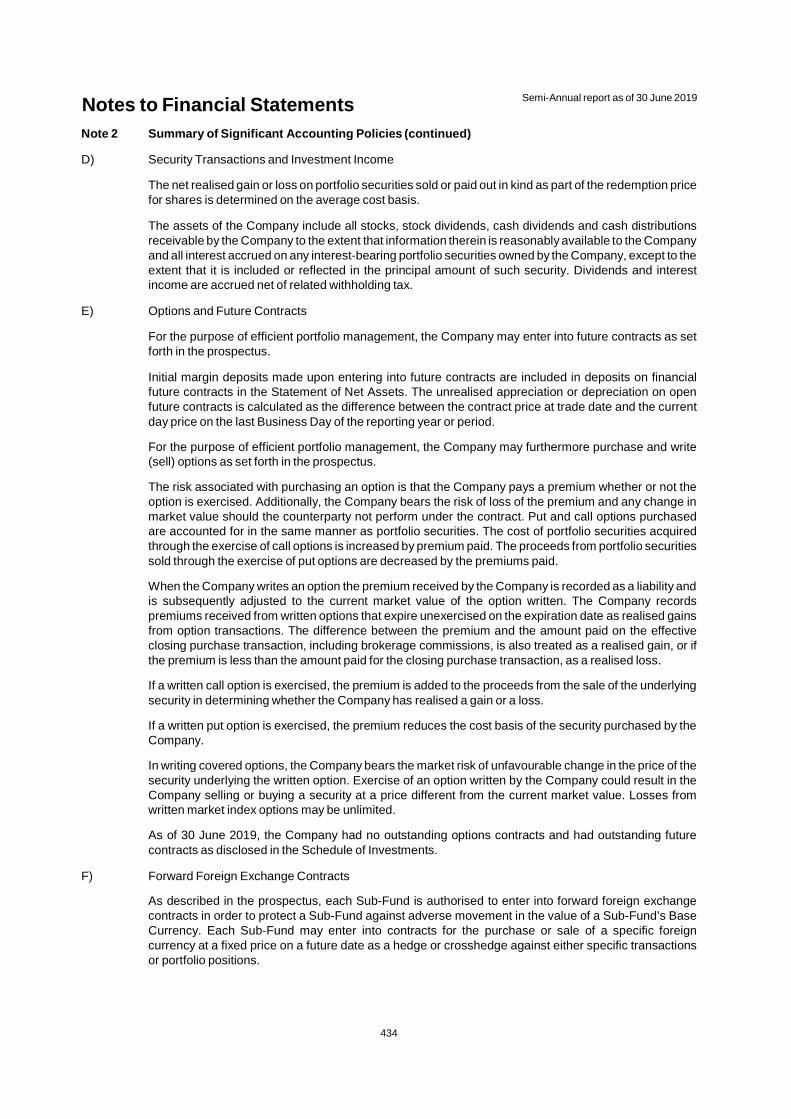
Notes to Financial Statements Semi-Annual report as of 30 June 2019
434
Note 2 Summary of Significant Accounting Policies (continued)
D) Security Transactions and Investment Income
The net realised gain or loss on portfolio securities sold or paid out in kind as part of the redemption price for shares is determined on the average cost basis.
The assets of the Company include all stocks, stock dividends, cash dividends and cash distributions receivable by the Company to the extent that information therein is reasonably available to the Company and all interest accrued on any interest-bearing portfolio securities owned by the Company, except to the extent that it is included or reflected in the principal amount of such security. Dividends and interest income are accrued net of related withholding tax.
E) Options and Future Contracts
For the purpose of efficient portfolio management, the Company may enter into future contracts as set forth in the prospectus.
Initial margin deposits made upon entering into future contracts are included in deposits on financial future contracts in the Statement of Net Assets. The unrealised appreciation or depreciation on open future contracts is calculated as the difference between the contract price at trade date and the current day price on the last Business Day of the reporting year or period.
For the purpose of efficient portfolio management, the Company may furthermore purchase and write (sell) options as set forth in the prospectus.
The risk associated with purchasing an option is that the Company pays a premium whether or not the option is exercised. Additionally, the Company bears the risk of loss of the premium and any change in market value should the counterparty not perform under the contract. Put and call options purchased are accounted for in the same manner as portfolio securities. The cost of portfolio securities acquired through the exercise of call options is increased by premium paid. The proceeds from portfolio securities sold through the exercise of put options are decreased by the premiums paid.
When the Company writes an option the premium received by the Company is recorded as a liability and is subsequently adjusted to the current market value of the option written. The Company records premiums received from written options that expire unexercised on the expiration date as realised gains from option transactions. The difference between the premium and the amount paid on the effective closing purchase transaction, including brokerage commissions, is also treated as a realised gain, or if the premium is less than the amount paid for the closing purchase transaction, as a realised loss.
If a written call option is exercised, the premium is added to the proceeds from the sale of the underlying security in determining whether the Company has realised a gain or a loss.
If a written put option is exercised, the premium reduces the cost basis of the security purchased by the Company.
In writing covered options, the Company bears the market risk of unfavourable change in the price of the security underlying the written option. Exercise of an option written by the Company could result in the Company selling or buying a security at a price different from the current market value. Losses from written market index options may be unlimited.
As of 30 June 2019, the Company had no outstanding options contracts and had outstanding future contracts as disclosed in the Schedule of Investments.
F) Forward Foreign Exchange Contracts
As described in the prospectus, each Sub-Fund is authorised to enter into forward foreign exchange contracts in order to protect a Sub-Fund against adverse movement in the value of a Sub-Fund’s Base Currency. Each Sub-Fund may enter into contracts for the purchase or sale of a specific foreign currency at a fixed price on a future date as a hedge or crosshedge against either specific transactions or portfolio positions.

Notes to Financial Statements Semi-Annual report as of 30 June 2019
435
Note 2 Summary of Significant Accounting Policies (continued)
F) Forward Foreign Exchange Contracts (continued)
The aggregate principal amounts are reflected net in the accompanying Statement of Net Assets if a Sub-Fund intends to settle the contract prior to delivery. All commitments are marked-to-market at the applicable translation rates and any resulting unrealised gains or losses are recorded in each Sub-Fund’s financial statements.
Each Sub-Fund/share class records realised gains or losses at the time the forward foreign exchange contract is offset by entry into a closing transaction or extinguished by delivery of the currency. Risks may arise upon entering these contracts from the potential inability of counterparties to meet the terms of their contracts and from unanticipated movements in the value of a foreign currency relative to the Base Currency.
As of 30 June 2019, the Company had outstanding forward foreign exchange contracts as disclosed in the Schedules of Investments.
G) Swap Contracts
The Company may enter into swap contracts in which the Company and the counterparty agree to exchange the returns generated by a security, instrument, basket or index thereof for the return generated by another security, instrument, basket or index thereof. The payments made by the Company to the counterparty and vice versa are calculated by reference to a specific security, index, or instrument and an agreed upon notional amount. The relevant indices include, but are not limited to, currencies, fixed interest rates, prices and total return on interest rate indices, fixed income indices and stock indices. The commitment arising on a swap transaction is equal to the value of the net position under the contract marked to market daily.
As of 30 June 2019, the Company had no outstanding swap contracts.
H) Cross sub-fund investments
The sub-fund UBS ETF - Bloomberg Barclays US Liquid Corporates Interest Rate hedged UCITS ETF is a feeder UCITS. It invests at least 85% of its assets in the (USD) A-dis share class of UBS ETF - Bloomberg Barclays US Liquid Corporates UCITS ETF, a sub-fund of the Company. At 30 June 2019, the total cross sub-fund investment amounted to USD 19,758,069. The total combined net assets of UBS ETF at year-end, excluding the cross investment amounts to EUR 27,069,205,093.
Note 3 Agreements
For all ETF share classes, each Sub-Fund pays a Management Fee. The Management Fee is allocated by the Company among the Sub-Funds and paid directly by the Company to the Depositary and to the Management Company. The Management Company will pay out of its fees the company administrator, the portfolio manager and the distributor, each of which is a service provider.
The Management Fee also includes the costs for the Sub-Funds' administration (comprising the costs of the Company administrator and depositary bank), asset management and distribution, as well as other costs and expenses incurred in the Sub-Fund's course of business, as detailed in the Prospectus.
The Management Fee is a flat fee calculated on the average daily NAV of the Sub-Fund attributable to the relevant class of shares and is payable monthly in arrears.
Sub-Funds ETF Share Classes Management Fee
UBS ETF – EURO STOXX 50 UCITS ETF (EUR) A-dis 15 bps per annum
UBS ETF – MSCI Europe UCITS ETF (EUR) A-dis 20 bps per annum
UBS ETF – MSCI Europe UCITS ETF (hedged to CHF) A-acc 30 bps per annum
UBS ETF – MSCI Europe UCITS ETF (hedged to EUR) A-acc 30 bps per annum
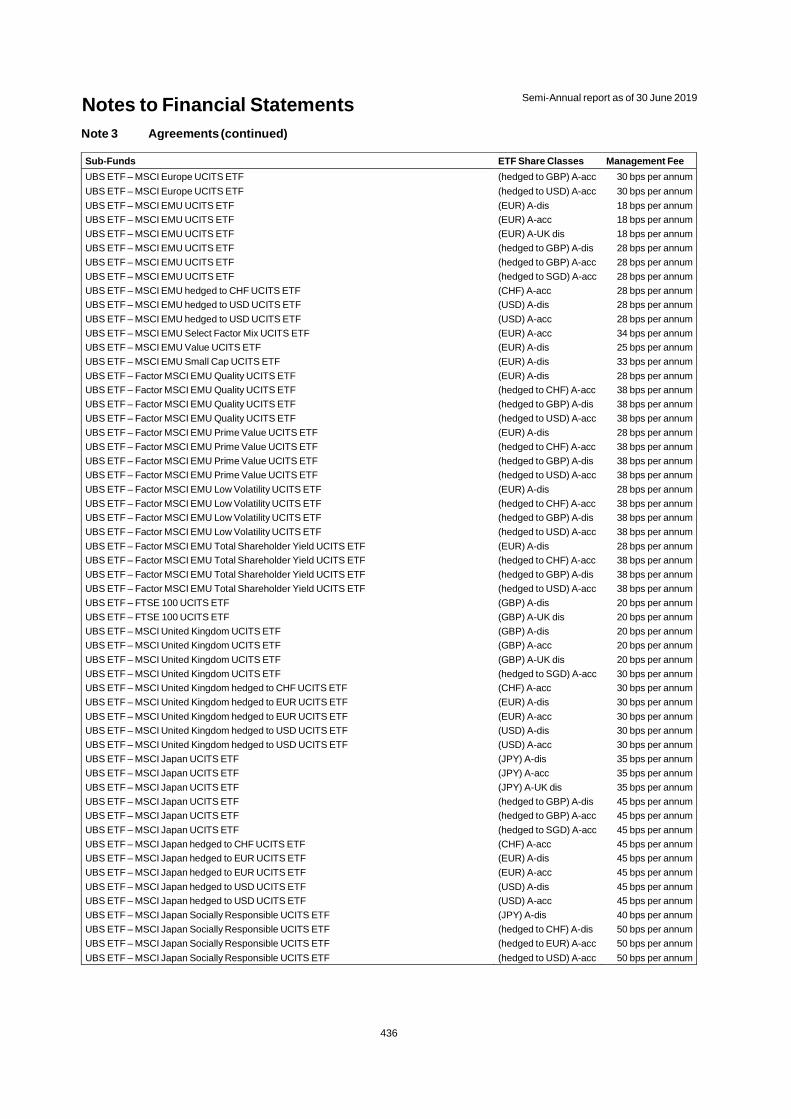
Notes to Financial Statements Semi-Annual report as of 30 June 2019
436
Note 3 Agreements (continued)
Sub-Funds ETF Share Classes Management Fee
UBS ETF – MSCI Europe UCITS ETF (hedged to GBP) A-acc 30 bps per annum
UBS ETF – MSCI Europe UCITS ETF (hedged to USD) A-acc 30 bps per annum
UBS ETF – MSCI EMU UCITS ETF (EUR) A-dis 18 bps per annum
UBS ETF – MSCI EMU UCITS ETF (EUR) A-acc 18 bps per annum
UBS ETF – MSCI EMU UCITS ETF (EUR) A-UK dis 18 bps per annum
UBS ETF – MSCI EMU UCITS ETF (hedged to GBP) A-dis 28 bps per annum
UBS ETF – MSCI EMU UCITS ETF (hedged to GBP) A-acc 28 bps per annum
UBS ETF – MSCI EMU UCITS ETF (hedged to SGD) A-acc 28 bps per annum
UBS ETF – MSCI EMU hedged to CHF UCITS ETF (CHF) A-acc 28 bps per annum
UBS ETF – MSCI EMU hedged to USD UCITS ETF (USD) A-dis 28 bps per annum
UBS ETF – MSCI EMU hedged to USD UCITS ETF (USD) A-acc 28 bps per annum
UBS ETF – MSCI EMU Select Factor Mix UCITS ETF (EUR) A-acc 34 bps per annum
UBS ETF – MSCI EMU Value UCITS ETF (EUR) A-dis 25 bps per annum
UBS ETF – MSCI EMU Small Cap UCITS ETF (EUR) A-dis 33 bps per annum
UBS ETF – Factor MSCI EMU Quality UCITS ETF (EUR) A-dis 28 bps per annum
UBS ETF – Factor MSCI EMU Quality UCITS ETF (hedged to CHF) A-acc 38 bps per annum
UBS ETF – Factor MSCI EMU Quality UCITS ETF (hedged to GBP) A-dis 38 bps per annum
UBS ETF – Factor MSCI EMU Quality UCITS ETF (hedged to USD) A-acc 38 bps per annum
UBS ETF – Factor MSCI EMU Prime Value UCITS ETF (EUR) A-dis 28 bps per annum
UBS ETF – Factor MSCI EMU Prime Value UCITS ETF (hedged to CHF) A-acc 38 bps per annum
UBS ETF – Factor MSCI EMU Prime Value UCITS ETF (hedged to GBP) A-dis 38 bps per annum
UBS ETF – Factor MSCI EMU Prime Value UCITS ETF (hedged to USD) A-acc 38 bps per annum
UBS ETF – Factor MSCI EMU Low Volatility UCITS ETF (EUR) A-dis 28 bps per annum
UBS ETF – Factor MSCI EMU Low Volatility UCITS ETF (hedged to CHF) A-acc 38 bps per annum
UBS ETF – Factor MSCI EMU Low Volatility UCITS ETF (hedged to GBP) A-dis 38 bps per annum
UBS ETF – Factor MSCI EMU Low Volatility UCITS ETF (hedged to USD) A-acc 38 bps per annum
UBS ETF – Factor MSCI EMU Total Shareholder Yield UCITS ETF (EUR) A-dis 28 bps per annum
UBS ETF – Factor MSCI EMU Total Shareholder Yield UCITS ETF (hedged to CHF) A-acc 38 bps per annum
UBS ETF – Factor MSCI EMU Total Shareholder Yield UCITS ETF (hedged to GBP) A-dis 38 bps per annum
UBS ETF – Factor MSCI EMU Total Shareholder Yield UCITS ETF (hedged to USD) A-acc 38 bps per annum
UBS ETF – FTSE 100 UCITS ETF (GBP) A-dis 20 bps per annum
UBS ETF – FTSE 100 UCITS ETF (GBP) A-UK dis 20 bps per annum
UBS ETF – MSCI United Kingdom UCITS ETF (GBP) A-dis 20 bps per annum
UBS ETF – MSCI United Kingdom UCITS ETF (GBP) A-acc 20 bps per annum
UBS ETF – MSCI United Kingdom UCITS ETF (GBP) A-UK dis 20 bps per annum
UBS ETF – MSCI United Kingdom UCITS ETF (hedged to SGD) A-acc 30 bps per annum
UBS ETF – MSCI United Kingdom hedged to CHF UCITS ETF (CHF) A-acc 30 bps per annum
UBS ETF – MSCI United Kingdom hedged to EUR UCITS ETF (EUR) A-dis 30 bps per annum
UBS ETF – MSCI United Kingdom hedged to EUR UCITS ETF (EUR) A-acc 30 bps per annum
UBS ETF – MSCI United Kingdom hedged to USD UCITS ETF (USD) A-dis 30 bps per annum
UBS ETF – MSCI United Kingdom hedged to USD UCITS ETF (USD) A-acc 30 bps per annum
UBS ETF – MSCI Japan UCITS ETF (JPY) A-dis 35 bps per annum
UBS ETF – MSCI Japan UCITS ETF (JPY) A-acc 35 bps per annum
UBS ETF – MSCI Japan UCITS ETF (JPY) A-UK dis 35 bps per annum
UBS ETF – MSCI Japan UCITS ETF (hedged to GBP) A-dis 45 bps per annum
UBS ETF – MSCI Japan UCITS ETF (hedged to GBP) A-acc 45 bps per annum
UBS ETF – MSCI Japan UCITS ETF (hedged to SGD) A-acc 45 bps per annum
UBS ETF – MSCI Japan hedged to CHF UCITS ETF (CHF) A-acc 45 bps per annum
UBS ETF – MSCI Japan hedged to EUR UCITS ETF (EUR) A-dis 45 bps per annum
UBS ETF – MSCI Japan hedged to EUR UCITS ETF (EUR) A-acc 45 bps per annum
UBS ETF – MSCI Japan hedged to USD UCITS ETF (USD) A-dis 45 bps per annum
UBS ETF – MSCI Japan hedged to USD UCITS ETF (USD) A-acc 45 bps per annum
UBS ETF – MSCI Japan Socially Responsible UCITS ETF (JPY) A-dis 40 bps per annum
UBS ETF – MSCI Japan Socially Responsible UCITS ETF (hedged to CHF) A-dis 50 bps per annum
UBS ETF – MSCI Japan Socially Responsible UCITS ETF (hedged to EUR) A-acc 50 bps per annum
UBS ETF – MSCI Japan Socially Responsible UCITS ETF (hedged to USD) A-acc 50 bps per annum

Notes to Financial Statements Semi-Annual report as of 30 June 2019
437
Note 3 Agreements (continued)
Sub-Funds ETF Share Classes Management Fee
UBS ETF – MSCI Pacific (ex Japan) UCITS ETF (USD) A-dis 30 bps per annum
UBS ETF – MSCI Pacific (ex Japan) UCITS ETF (USD) A-UK dis 30 bps per annum
UBS ETF – MSCI USA UCITS ETF (USD) A-dis 14 bps per annum
UBS ETF – MSCI USA UCITS ETF (USD) A-UK dis 14 bps per annum
UBS ETF – MSCI Canada UCITS ETF (CAD) A-dis 33 bps per annum
UBS ETF – MSCI Canada UCITS ETF (CAD) A-acc 33 bps per annum
UBS ETF – MSCI Canada UCITS ETF (CAD) A-UK dis 33 bps per annum
UBS ETF – MSCI Canada UCITS ETF (hedged to CHF) A-acc 43 bps per annum
UBS ETF – MSCI Canada UCITS ETF (hedged to EUR) A-acc 43 bps per annum
UBS ETF – MSCI Canada UCITS ETF (hedged to GBP) A-dis 43 bps per annum
UBS ETF – MSCI Canada UCITS ETF (hedged to GBP) A-acc 43 bps per annum
UBS ETF – MSCI Canada UCITS ETF (hedged to SGD) A-acc 43 bps per annum
UBS ETF – MSCI Canada UCITS ETF (hedged to USD) A-acc 43 bps per annum
UBS ETF – MSCI Singapore UCITS ETF (SGD) A-dis 45 bps per annum
UBS ETF – MSCI Hong Kong UCITS ETF (HKD) A-dis 45 bps per annum
UBS ETF – MSCI Switzerland 20/35 UCITS ETF (CHF) A-dis 20 bps per annum
UBS ETF – MSCI Switzerland 20/35 UCITS ETF (CHF) A-acc 20 bps per annum
UBS ETF – MSCI Switzerland 20/35 UCITS ETF (CHF) A-UK dis 20 bps per annum
UBS ETF – MSCI Switzerland 20/35 UCITS ETF (hedged to GBP) A-dis 30 bps per annum
UBS ETF – MSCI Switzerland 20/35 UCITS ETF (hedged to GBP) A-acc 30 bps per annum
UBS ETF – MSCI Switzerland 20/35 UCITS ETF (hedged to SGD) A-acc 30 bps per annum
UBS ETF – MSCI Switzerland 20/35 hedged to EUR UCITS ETF (EUR) A-dis 30 bps per annum
UBS ETF – MSCI Switzerland 20/35 hedged to EUR UCITS ETF (EUR) A-acc 30 bps per annum
UBS ETF – MSCI Switzerland 20/35 hedged to USD UCITS ETF (USD) A-dis 30 bps per annum
UBS ETF – MSCI Switzerland 20/35 hedged to USD UCITS ETF (USD) A-acc 30 bps per annum
UBS ETF – MSCI World UCITS ETF (USD) A-dis 30 bps per annum
UBS ETF – MSCI Emerging Markets UCITS ETF (USD) A-dis 22.5 bps per annum
UBS ETF – MSCI Emerging Markets UCITS ETF (USD) A-acc 22.5 bps per annum
UBS ETF – MSCI Emerging Markets UCITS ETF (USD) A-UK dis 22.5 bps per annum
UBS ETF – MSCI Emerging Markets Socially Responsible UCITS ETF (USD) A-dis 35 bps per annum
UBS ETF – MSCI Emerging Markets Socially Responsible UCITS ETF (USD) A-acc 35 bps per annum
UBS ETF – MSCI World Socially Responsible UCITS ETF (USD) A-dis 25 bps per annum
UBS ETF – MSCI World Socially Responsible UCITS ETF (USD) A-acc 25 bps per annum
UBS ETF – MSCI USA Socially Responsible UCITS ETF (USD) A-dis 33 bps per annum
UBS ETF – MSCI USA Socially Responsible UCITS ETF (hedged to CHF) A-dis 43 bps per annum
UBS ETF – MSCI USA Socially Responsible UCITS ETF (hedged to CHF) A-acc 43 bps per annum
UBS ETF – MSCI USA Socially Responsible UCITS ETF (hedged to EUR) A-dis 43 bps per annum
UBS ETF – MSCI EMU Socially Responsible UCITS ETF (EUR) A-dis 28 bps per annum
UBS ETF – MSCI EMU Socially Responsible UCITS ETF (EUR) A-acc 28 bps per annum
UBS ETF – MSCI EMU Socially Responsible UCITS ETF (hedged to CHF) A-dis 38 bps per annum
UBS ETF – MSCI EMU Socially Responsible UCITS ETF (hedged to CHF) A-acc 38 bps per annum
UBS ETF – MSCI EMU Socially Responsible UCITS ETF (hedged to USD) A-acc 38 bps per annum
UBS ETF – MSCI Pacific Socially Responsible UCITS ETF (USD) A-dis 40 bps per annum
UBS ETF – Bloomberg Barclays US 1-3 Year Treasury Bond UCITS ETF (USD) A-dis 12 bps per annum
UBS ETF – Bloomberg Barclays US 1-3 Year Treasury Bond UCITS ETF (USD) A-acc 12 bps per annum
UBS ETF – Bloomberg Barclays US 1-3 Year Treasury Bond UCITS ETF (hedged to EUR) A-dis 17 bps per annum
UBS ETF – Bloomberg Barclays US 7-10 Year Treasury Bond UCITS ETF (USD) A-dis 12 bps per annum
UBS ETF – Bloomberg Barclays US 7-10 Year Treasury Bond UCITS ETF (USD) A-acc 12 bps per annum
UBS ETF – Bloomberg Barclays US 10+ Year Treasury Bond UCITS ETF (hedged to EUR) A-dis 25 bps per annum
UBS ETF – Bloomberg Barclays TIPS 1-10 UCITS ETF (USD) A-dis 15 bps per annum
UBS ETF – Bloomberg Barclays TIPS 1-10 UCITS ETF (USD) A-acc 15 bps per annum
UBS ETF – Bloomberg Barclays TIPS 1-10 UCITS ETF (hedged to CHF) A-acc 20 bps per annum
UBS ETF – Bloomberg Barclays TIPS 1-10 UCITS ETF (hedged to EUR) A-acc 20 bps per annum
UBS ETF – Bloomberg Barclays TIPS 1-10 UCITS ETF (hedged to GBP) A-acc 20 bps per annum
UBS ETF – Bloomberg Barclays TIPS 10+ UCITS ETF (USD) A-dis 20 bps per annum
UBS ETF – Bloomberg Barclays TIPS 10+ UCITS ETF (hedged to GBP) A-dis 25 bps per annum

Notes to Financial Statements Semi-Annual report as of 30 June 2019
438
Note 3 Agreements (continued)
Sub-Funds ETF Share Classes Management Fee
UBS ETF – Bloomberg Barclays Euro Inflation Linked 1-10 UCITS ETF (EUR) A-dis 20 bps per annum
UBS ETF – Bloomberg Barclays Euro Inflation Linked 10+ UCITS ETF (EUR) A-dis 20 bps per annum
UBS ETF – Markit iBoxx € Germany 1-3 UCITS ETF (EUR) A-dis 17 bps per annum
UBS ETF – Bloomberg Barclays Euro Area Liquid Corporates UCITS ETF (EUR) A-dis 18 bps per annum1
UBS ETF – Bloomberg Barclays EUR Treasury 1-10 UCITS ETF (EUR) A-dis 17 bps per annum
UBS ETF – SBI® Foreign AAA-BBB 1-5 UCITS ETF (CHF) A-dis 20 bps per annum
UBS ETF – SBI® Foreign AAA-BBB 5-10 UCITS ETF (CHF) A-dis 20 bps per annum
UBS ETF – Bloomberg Barclays Euro Area Liquid Corporates 1-5 Year UCITS ETF (EUR) A-dis 18 bps per annum
UBS ETF – Bloomberg Barclays Euro Area Liquid Corporates 1-5 Year UCITS ETF (hedged to CHF) A-acc 23 bps per annum
UBS ETF – Bloomberg Barclays Euro Area Liquid Corporates 1-5 Year UCITS ETF (hedged to USD) A-acc 23 bps per annum
UBS ETF – Bloomberg Barclays US Liquid Corporates 1-5 Year UCITS ETF (USD) A-dis 18 bps per annum
UBS ETF – Bloomberg Barclays US Liquid Corporates 1-5 Year UCITS ETF (USD) A-acc 18 bps per annum
UBS ETF – Bloomberg Barclays US Liquid Corporates 1-5 Year UCITS ETF (hedged to CHF) A-acc 23 bps per annum
UBS ETF – Bloomberg Barclays US Liquid Corporates 1-5 Year UCITS ETF (hedged to EUR) A-acc 23 bps per annum
UBS ETF – Bloomberg Barclays US Liquid Corporates 1-5 Year UCITS ETF (hedged to GBP) A-dis 23 bps per annum
UBS ETF – Bloomberg Barclays US Liquid Corporates Interest Rate hedged UCITS ETF (USD) A-dis 5 bps per annum
UBS ETF – Bloomberg Barclays US Liquid Corporates UCITS ETF (USD) A-dis 18 bps per annum
UBS ETF – Bloomberg Barclays US Liquid Corporates UCITS ETF (USD) A-acc 18 bps per annum
UBS ETF – Bloomberg Barclays US Liquid Corporates UCITS ETF (hedged to CHF) A-acc 23 bps per annum
UBS ETF – Bloomberg Barclays US Liquid Corporates UCITS ETF (hedged to EUR) A-acc 23 bps per annum
UBS ETF – Bloomberg Barclays US Liquid Corporates UCITS ETF (hedged to GBP) A-dis 23 bps per annum
UBS ETF – Bloomberg Barclays MSCI US Liquid Corporates Sustainable UCITS ETF (USD) A-dis 20 bps per annum
UBS ETF – Bloomberg Barclays MSCI US Liquid Corporates Sustainable UCITS ETF (hedged to CHF) A-dis 25 bps per annum
UBS ETF – Bloomberg Barclays MSCI US Liquid Corporates Sustainable UCITS ETF (hedged to EUR) A-acc 25 bps per annum
UBS ETF – Bloomberg Barclays MSCI US Liquid Corporates Sustainable UCITS ETF (hedged to GBP) A-dis 25 bps per annum
UBS ETF – Bloomberg Barclays MSCI Euro Area Liquid Corporates Sustainable UCITS ETF (EUR) A-dis 20 bps per annum
UBS ETF – Bloomberg Barclays MSCI Euro Area Liquid Corporates Sustainable UCITS ETF (EUR) A-acc 20 bps per annum
UBS ETF – Bloomberg Barclays MSCI Euro Area Liquid Corporates Sustainable UCITS ETF (hedged to CHF) A-dis 25 bps per annum
UBS ETF – Bloomberg Barclays MSCI Euro Area Liquid Corporates Sustainable UCITS ETF (hedged to CHF) A-acc 25 bps per annum
UBS ETF – Bloomberg Barclays USD Emerging Markets Sovereign UCITS ETF (USD) A-dis 42 bps per annum
UBS ETF – Bloomberg Barclays USD Emerging Markets Sovereign UCITS ETF (USD) A-acc 42 bps per annum
UBS ETF – Bloomberg Barclays USD Emerging Markets Sovereign UCITS ETF (hedged to CHF) A-acc 47 bps per annum
UBS ETF – Bloomberg Barclays USD Emerging Markets Sovereign UCITS ETF (hedged to EUR) A-acc 47 bps per annum
UBS ETF – Bloomberg Barclays USD Emerging Markets Sovereign UCITS ETF (hedged to GBP) A-dis 47 bps per annum
UBS ETF – J.P. Morgan USD EM Diversified Bond 1-5 UCITS ETF (USD) A-dis 42 bps per annum
UBS ETF – J.P. Morgan USD EM Diversified Bond 1-5 UCITS ETF (hedged to CHF) A-acc 47 bps per annum
UBS ETF – J.P. Morgan USD EM Diversified Bond 1-5 UCITS ETF (hedged to EUR) A-acc 47 bps per annum
UBS ETF – J.P. Morgan USD EM Diversified Bond 1-5 UCITS ETF (hedged to GBP) A-dis 47 bps per annum
UBS ETF – J.P. Morgan EM Multi-Factor Enhanced Local Currency Bond UCITS ETF (USD) A-dis 47 bps per annum
UBS ETF – J.P. Morgan EM Multi-Factor Enhanced Local Currency Bond UCITS ETF (USD) A-acc 47 bps per annum
UBS ETF – Bloomberg Barclays EUR High Quality Liquid Assets 1-5 Bond UCITS ETF (EUR) A-dis 18 bps per annum
UBS ETF – Sustainable Development Bank Bonds UCITS ETF (USD) A-dis 18 bps per annum
UBS ETF – Sustainable Development Bank Bonds UCITS ETF (USD) A-acc 18 bps per annum
UBS ETF – Sustainable Development Bank Bonds UCITS ETF (hedged to CHF) A-acc 23 bps per annum
UBS ETF – Sustainable Development Bank Bonds UCITS ETF (hedged to EUR) A-acc 23 bps per annum 1 Effective 1 April 2019, the rate changed from 20 bps per annum to 18 bps per annum The fees of the service providers and any other costs or expenses in respect of each Sub- Fund and/or ETF share class do together not exceed the Management Fee payable by the assets attributable to the relevant ETF share class in that Sub-Fund. Any additional fees, costs or expenses, not met out of the Management Fee is paid by the distributor.
The Management Company appointed:
a) UBS Asset Management (UK) Ltd, 5 Broadgate, EC2M 2QS London (the “Portfolio Manager”) or
b) UBS Asset Management Switzerland AG, Bahnhofstrasse 45, CH-8098 Zurich
Notes to Financial Statements Semi-Annual report as of 30 June 2019
439
Note 3 Agreements (continued)
c) UBS Asset Management (Americas) Inc., UBS Tower, One North Wacker Drive, IL 60606, Chicago.
to act as Portfolio Manager of all the current equity based or fixed income based listed Sub-Funds.
The portfolio Manager is commissioned to manage the securities portfolio, to meet decisions regarding foreign exchange spot and forward transactions and will instruct all relevant equity transactions in conformity with the specified investment restrictions.
UBS Asset Management Switzerland AG (the “Distributor”) is acting as distributor and is responsible for the marketing of the Shares and promoting the establishment and operation of a secondary market in Shares as well as other general marketing activities.
A Novation Agreement, dated 17 June 2019, to the Distribution Agreement, dated 22 August 2014, was signed between UBS Fund Management (Luxembourg) S.A., UBS AG and UBS Asset Management Switzerland AG. On 17 June 2019 assets and liabilities were transferred from UBS AG to UBS Asset Management Switzerland AG pursuant to the Swiss Merger Act.
Directors Andreas Haberzeth, Clemens Reuter and Frank Müsel are employees of UBS Asset Management Switzerland AG which acts as the distributor and as the portfolio manager.Director Ian Ashment is an employee of UBS Asset Management (UK) Ltd which acts as portfolio manager. Director Jörgen Jessen is an Independent Board Member, appointed on 18 April 2017.
At the annual general meeting held 15 April 2019 PricewaterhouseCoopers Société Coopérative as Independent Auditor of the Company was re-elected until the next annual general meeting of shareholders to the held in 2020. Mr. Andreas Haberzeth was re-elected at the 15 April annual general meeting until the annual general meeting of shareholders to be held in 2023.
State Street Bank Luxembourg S.C.A., 49, Avenue J.F. Kennedy, L-1855 Luxembourg, acts as the Company's administrator, domiciliary, corporate and paying agent in Luxembourg, registrar and transfer agent and is responsible for the general administrative duties involved in administering the Company as prescribed by Luxembourg laws and acting as the transfer agent. These duties include domiciliation, calculation of the Daily NAV per Share and the keeping of the Company's accounts, as well as reporting. Moreover, the administrative agent will be responsible for the issue and redemption of shares in the Company, and all related operations, including processing all subscriptions, redemptions and conversions to or from Authorized Participants.
Note 4 Taxation
Investors should be aware that tax regulations and their application or interpretation by the relevant taxation authorities can change periodically. The following should not be taken as constituting legal or tax advice. Investors should obtain information and, if necessary, should consult their professional advisers on the possible tax or other consequences of buying, holding, transferring or selling the Shares under the laws of their countries of origin citizenship, residence or domicile.
Under current laws and practice, the Company is not liable to any Luxembourg income tax, nor are dividends paid by the Company liable to any Luxembourg withholding tax. ETFs (whether UCITS or not) are exempt from the Taxe d’Abonnement if their securities are listed or traded on at least one stock exchange or another regulated market operating regularly, recognized and open to the public.
No stamp duty or other tax is payable in Luxembourg on the issue of shares by the Company.
Notes to Financial Statements Semi-Annual report as of 30 June 2019
440
Note 4 Taxation (continued)
The Directors intend that all share classes in each Sub-Fund will be certified by HM Revenue & Customs in the UK as reporting funds. The reporting fund status will remain in place permanently provided that the annual reporting requirements are satisfied. In broad terms, a "reporting fund" is an offshore fund that meets certain annual reporting requirements to HM Revenue & Customs and its investors. The Directors intend to manage the affairs of the Company so that these annual duties are met and will continue to be met on an ongoing basis.
Each Sub-Fund of the Company is subject to taxation on capital gains, interest and dividends in certain jurisdictions in which each Sub-Fund invests. It is the policy of each Sub-Fund to accrue for such taxes when the dividend is declared or interest is earned. At each valuation date, taxation on unrealised appreciation of securities is accrued for at applicable rates.
The Common Reporting Standard (“CRS”) has been developed by the OECD to address the issue of offshore tax evasion on a global basis. Prospective investors will be required to provide to the Fund information about themselves and their tax status prior to investment in order to enable the Fund to satisfy its obligations under CRS, and to update that information on a continuing basis. Prospective investors should note the Fund’s obligation to disclose such information to the Luxembourg tax authority. The Luxembourg tax authorities will exchange the information with other tax authorities in participating CRS jurisdictions on an annual basis. Each investor acknowledges that the Fund may take such action as it considers necessary in relation to such investor’s holding in the Fund to ensure that any withholding tax suffered by the Fund and any other related costs, interest, penalties and other losses and liabilities arising from such investor’s failure to provide the requested information to the Fund is economically borne by such investor.
German equity ratios are calculated and distributed daily.
FATCA is the Foreign Account Tax Compliance Act which aims to gather information on overseas accounts held by US Persons and ultimately ensure that the correct amount of tax is paid by US taxpayers.
FATCA enforces reporting obligations on foreign Financial Institutions (“FIs”) where these accounts are held.
The Directors intend that UBS ETFs will continue to be compliant with FATCA and the relevant Intergovernmental Agreement (IGA) regulations. UBS ETF has been classified as a Sponsored Investment Entity. The sponsoring entity is UBS Fund Management (Luxembourg) S.A. with the GIIN: 9D0VT6.00000.SP.442
Section 871(m) of the US Tax Code requires withholding (up to 30%, depending on whether a treaty applies) on certain financial instruments to the extent that the payments or deemed payments on the financial instruments are contingent upon or determined by reference to U.S.-source dividends. Under U.S. Treasury Department regulations, certain payments or deemed payments to the Company with respect to certain equity-linked instruments that reference U.S. stocks may be treated as dividend equivalents that are subject to U.S. withholding tax at a rate of 30% (or lower treaty rate). Under these regulations, withholding may be required even in the absence of any actual dividend-related payment or adjustment made pursuant to the terms of the instrument. If the Company becomes subject to a withholding tax as a result of 871(m), the value of the Shares held by the Shareholders may be materially affected. All prospective investors/Shareholders should consult with their own tax advisors regarding the possible implications of 871(m) on an investment in the Company.
Note 5 Distribution
Within the limits provided by Luxembourg law, the Board of Directors determines how the income of each Sub-Fund shall be dealt with, and may from time to time declare distributions. The Board of Directors may decide to pay interim dividends in compliance with the conditions set forth by Luxembourg law.

Notes to Financial Statements Semi-Annual report as of 30 June 2019
441
Note 5 Distribution (continued)
The Company intends for each Sub-Fund to distribute its net income in order to achieve the maximum tracking accuracy of the relevant Index. An income equalization amount will be calculated by reference to the amount of the Daily NAV Per Share representing the accrued net income (or deficit) at the time when a subscription or a redemption in kind is made so that the dividend representing the net investment income corresponds to the net income return of the Index.
For UK dis share classes, as defined in the sales prospectus, Net Investment Income used for determination of distributions may be different that Net Investment Income as per accounting records due to UK tax reporting requirements.
During the period 1 January 2019 to 30 June 2019, the Company resolved to pay to all shareholders of the Sub-Funds mentioned below dividends which are mainly composed of the income net of all costs and expenses incurred by the respective Sub-Fund as detailed in the following table.
Sub-Funds (ETF Share Classes)
Ex- Dividend
Date
Payment Date
Currency Number of
Shares
Dividend Per
Share
Total Amount of
Dividends Paid
Net Investment
Income/Loss
UBS ETF – EURO STOXX 50 UCITS ETF (EUR) A-dis
31 Jan 2019 5 Feb 2019 EUR 15,341,085 0.1856 2,847,305
2,847,305 11,350,990
UBS ETF – MSCI Europe UCITS ETF (EUR) A-dis
31 Jan 2019 5 Feb 2019 EUR 4,214,341 0.4410 1,858,525
1,858,525 7,844,893
UBS ETF – MSCI EMU UCITS ETF (EUR) A-dis
31 Jan 2019 5 Feb 2019 EUR 16,479,757 0.4686 7,722,414
UBS ETF – MSCI EMU UCITS ETF (hedged to GBP) A-dis
31 Jan 2019 5 Feb 2019 EUR 2,672,901 0.2972 794,386
8,516,800 74,655,100
UBS ETF – MSCI EMU hedged to USD UCITS ETF (USD) A-dis
31 Jan 2019 5 Feb 2019 USD 1,290,344 0.0864 111,486
111,486 27,420,432
UBS ETF – MSCI EMU Value UCITS ETF (EUR) A-dis
31 Jan 2019 5 Feb 2019 EUR 3,939,868 0.2331 918,383
918,383 3,796,826
UBS ETF – MSCI EMU Small Cap UCITS ETF (EUR) A-dis
31 Jan 2019 5 Feb 2019 EUR 1,348,478 0.2439 328,894
328,894 1,979,475
UBS ETF – Factor MSCI EMU Quality UCITS ETF (EUR) A-dis
31 Jan 2019 5 Feb 2019 EUR 2,972,694 0.0353 104,936
UBS ETF – Factor MSCI EMU Quality UCITS ETF (hedged to GBP) A-dis
31 Jan 2019 5 Feb 2019 EUR 40,000 0.2283 9,132
114,068 2,397,477
UBS ETF – Factor MSCI EMU Prime Value UCITS ETF (EUR) A-dis
31 Jan 2019 5 Feb 2019 EUR 2,647,934 0.0400 105,917
UBS ETF – Factor MSCI EMU Prime Value UCITS ETF (hedged to GBP)
A-dis 31 Jan 2019 5 Feb 2019 EUR 160,000 0.4028 64,448
170,365 1,721,647
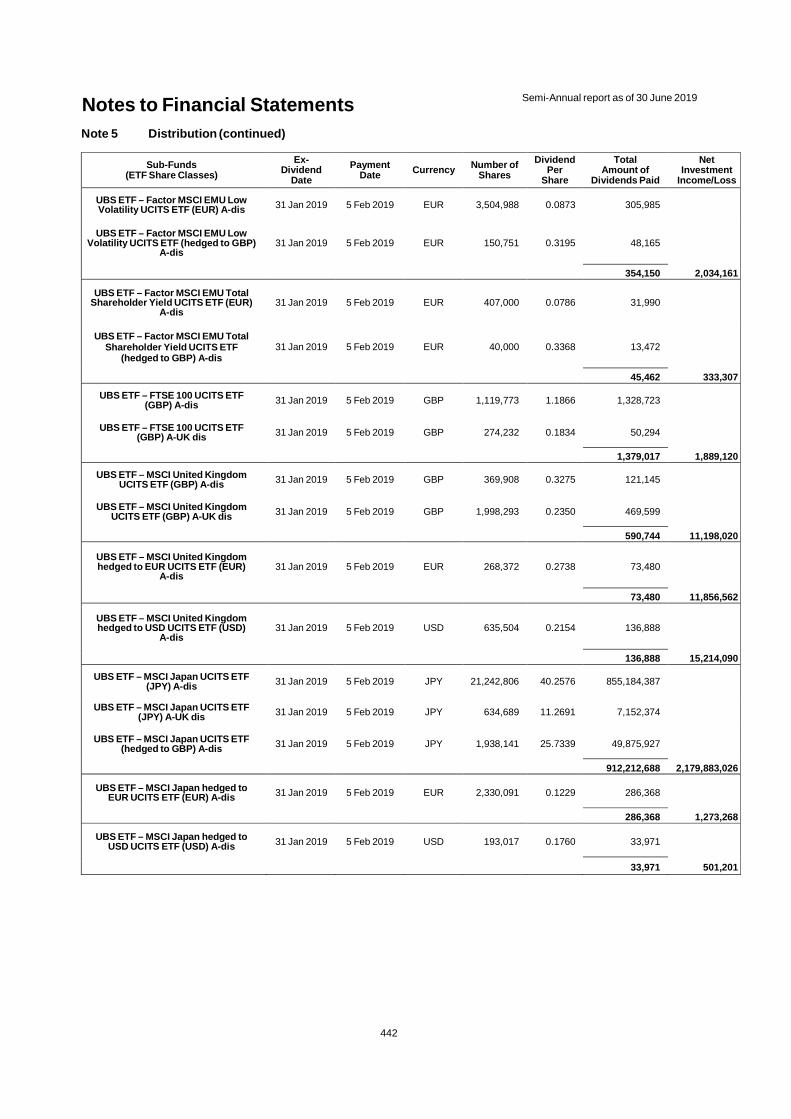
Notes to Financial Statements Semi-Annual report as of 30 June 2019
442
Note 5 Distribution (continued)
Sub-Funds (ETF Share Classes)
Ex- Dividend
Date
Payment Date
Currency Number of
Shares
Dividend Per
Share
Total Amount of
Dividends Paid
Net Investment
Income/Loss
UBS ETF – Factor MSCI EMU Low Volatility UCITS ETF (EUR) A-dis
31 Jan 2019 5 Feb 2019 EUR 3,504,988 0.0873 305,985
UBS ETF – Factor MSCI EMU Low Volatility UCITS ETF (hedged to GBP)
A-dis 31 Jan 2019 5 Feb 2019 EUR 150,751 0.3195 48,165
354,150 2,034,161
UBS ETF – Factor MSCI EMU Total Shareholder Yield UCITS ETF (EUR)
A-dis 31 Jan 2019 5 Feb 2019 EUR 407,000 0.0786 31,990
UBS ETF – Factor MSCI EMU Total Shareholder Yield UCITS ETF
(hedged to GBP) A-dis 31 Jan 2019 5 Feb 2019 EUR 40,000 0.3368 13,472
45,462 333,307
UBS ETF – FTSE 100 UCITS ETF (GBP) A-dis
31 Jan 2019 5 Feb 2019 GBP 1,119,773 1.1866 1,328,723
UBS ETF – FTSE 100 UCITS ETF (GBP) A-UK dis
31 Jan 2019 5 Feb 2019 GBP 274,232 0.1834 50,294
1,379,017 1,889,120
UBS ETF – MSCI United Kingdom UCITS ETF (GBP) A-dis
31 Jan 2019 5 Feb 2019 GBP 369,908 0.3275 121,145
UBS ETF – MSCI United Kingdom UCITS ETF (GBP) A-UK dis
31 Jan 2019 5 Feb 2019 GBP 1,998,293 0.2350 469,599
590,744 11,198,020
UBS ETF – MSCI United Kingdom hedged to EUR UCITS ETF (EUR)
A-dis 31 Jan 2019 5 Feb 2019 EUR 268,372 0.2738 73,480
73,480 11,856,562
UBS ETF – MSCI United Kingdom hedged to USD UCITS ETF (USD)
A-dis 31 Jan 2019 5 Feb 2019 USD 635,504 0.2154 136,888
136,888 15,214,090
UBS ETF – MSCI Japan UCITS ETF (JPY) A-dis
31 Jan 2019 5 Feb 2019 JPY 21,242,806 40.2576 855,184,387
UBS ETF – MSCI Japan UCITS ETF (JPY) A-UK dis
31 Jan 2019 5 Feb 2019 JPY 634,689 11.2691 7,152,374
UBS ETF – MSCI Japan UCITS ETF (hedged to GBP) A-dis
31 Jan 2019 5 Feb 2019 JPY 1,938,141 25.7339 49,875,927
912,212,688 2,179,883,026
UBS ETF – MSCI Japan hedged to EUR UCITS ETF (EUR) A-dis
31 Jan 2019 5 Feb 2019 EUR 2,330,091 0.1229 286,368
286,368 1,273,268
UBS ETF – MSCI Japan hedged to USD UCITS ETF (USD) A-dis
31 Jan 2019 5 Feb 2019 USD 193,017 0.1760 33,971
33,971 501,201
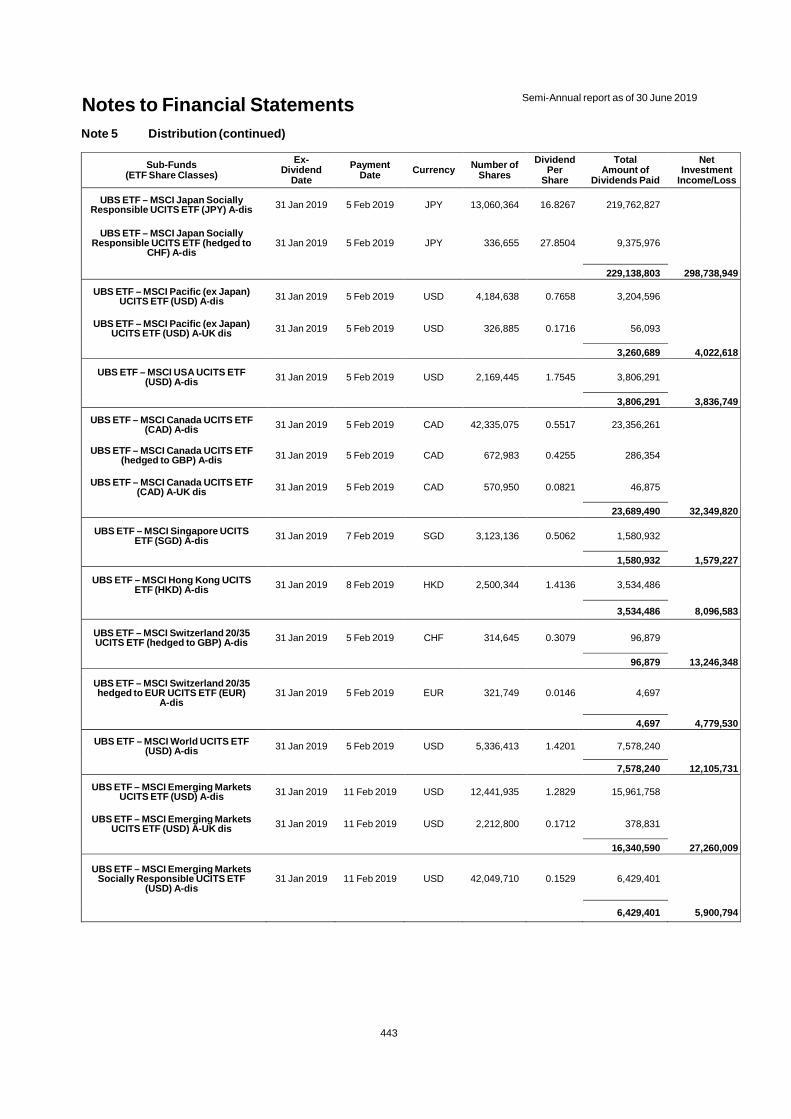
Notes to Financial Statements Semi-Annual report as of 30 June 2019
443
Note 5 Distribution (continued)
Sub-Funds (ETF Share Classes)
Ex- Dividend
Date
Payment Date
Currency Number of
Shares
Dividend Per
Share
Total Amount of
Dividends Paid
Net Investment
Income/Loss
UBS ETF – MSCI Japan Socially Responsible UCITS ETF (JPY) A-dis
31 Jan 2019 5 Feb 2019 JPY 13,060,364 16.8267 219,762,827
UBS ETF – MSCI Japan Socially Responsible UCITS ETF (hedged to
CHF) A-dis 31 Jan 2019 5 Feb 2019 JPY 336,655 27.8504 9,375,976
229,138,803 298,738,949
UBS ETF – MSCI Pacific (ex Japan) UCITS ETF (USD) A-dis
31 Jan 2019 5 Feb 2019 USD 4,184,638 0.7658 3,204,596
UBS ETF – MSCI Pacific (ex Japan) UCITS ETF (USD) A-UK dis
31 Jan 2019 5 Feb 2019 USD 326,885 0.1716 56,093
3,260,689 4,022,618
UBS ETF – MSCI USA UCITS ETF (USD) A-dis
31 Jan 2019 5 Feb 2019 USD 2,169,445 1.7545 3,806,291
3,806,291 3,836,749
UBS ETF – MSCI Canada UCITS ETF (CAD) A-dis
31 Jan 2019 5 Feb 2019 CAD 42,335,075 0.5517 23,356,261
UBS ETF – MSCI Canada UCITS ETF (hedged to GBP) A-dis
31 Jan 2019 5 Feb 2019 CAD 672,983 0.4255 286,354
UBS ETF – MSCI Canada UCITS ETF (CAD) A-UK dis
31 Jan 2019 5 Feb 2019 CAD 570,950 0.0821 46,875
23,689,490 32,349,820
UBS ETF – MSCI Singapore UCITS ETF (SGD) A-dis
31 Jan 2019 7 Feb 2019 SGD 3,123,136 0.5062 1,580,932
1,580,932 1,579,227
UBS ETF – MSCI Hong Kong UCITS ETF (HKD) A-dis
31 Jan 2019 8 Feb 2019 HKD 2,500,344 1.4136 3,534,486
3,534,486 8,096,583
UBS ETF – MSCI Switzerland 20/35 UCITS ETF (hedged to GBP) A-dis
31 Jan 2019 5 Feb 2019 CHF 314,645 0.3079 96,879
96,879 13,246,348
UBS ETF – MSCI Switzerland 20/35 hedged to EUR UCITS ETF (EUR)
A-dis 31 Jan 2019 5 Feb 2019 EUR 321,749 0.0146 4,697
4,697 4,779,530
UBS ETF – MSCI World UCITS ETF (USD) A-dis
31 Jan 2019 5 Feb 2019 USD 5,336,413 1.4201 7,578,240
7,578,240 12,105,731
UBS ETF – MSCI Emerging Markets UCITS ETF (USD) A-dis
31 Jan 2019 11 Feb 2019 USD 12,441,935 1.2829 15,961,758
UBS ETF – MSCI Emerging Markets UCITS ETF (USD) A-UK dis
31 Jan 2019 11 Feb 2019 USD 2,212,800 0.1712 378,831
16,340,590 27,260,009
UBS ETF – MSCI Emerging Markets Socially Responsible UCITS ETF
(USD) A-dis 31 Jan 2019 11 Feb 2019 USD 42,049,710 0.1529 6,429,401
6,429,401 5,900,794

Notes to Financial Statements Semi-Annual report as of 30 June 2019
444
Note 5 Distribution (continued)
Sub-Funds (ETF Share Classes)
Ex- Dividend
Date
Payment Date
Currency Number of
Shares
Dividend Per
Share
Total Amount of
Dividends Paid
Net Investment
Income/Loss
UBS ETF – MSCI World Socially Responsible UCITS ETF (USD) A-dis
31 Jan 2019 5 Feb 2019 USD 9,433,663 0.6283 5,927,170
5,927,170 12,510,187
UBS ETF – MSCI USA Socially Responsible UCITS ETF (USD) A-dis
31 Jan 2019 5 Feb 2019 USD 6,513,325 0.6301 4,104,046
UBS ETF – MSCI USA Socially Responsible UCITS ETF (hedged to
CHF) A-dis
31 Jan 2019 5 Feb 2019 USD 1,116,016 0.1461 163,050
UBS ETF – MSCI USA Socially Responsible UCITS ETF (hedged to
EUR) A-dis 31 Jan 2019 5 Feb 2019 USD 3,662,125 0.1721 630,252
4,897,348 4,983,078
UBS ETF – MSCI EMU Socially Responsible UCITS ETF (EUR) A-dis
31 Jan 2019 5 Feb 2019 EUR 7,501,465 0.2641 1,981,137
UBS ETF – MSCI EMU Socially Responsible UCITS ETF (hedged to
CHF) A-dis
31 Jan 2019 5 Feb 2019 EUR 547,538 0.3334 182,549
2,163,686 21,479,493
UBS ETF – MSCI Pacific Socially Responsible UCITS ETF (USD) A-dis
31 Jan 2019 5 Feb 2019 USD 1,716,140 0.7805 1,339,447
1,339,447 2,458,845
UBS ETF – Bloomberg Barclays US 1-3 Year Treasury Bond UCITS ETF
(USD) A-dis 31 Jan 2019 5 Feb 2019 USD 2,277,145 0.2596 591,147
UBS ETF – Bloomberg Barclays US 1-3 Year Treasury Bond UCITS ETF
(hedged to EUR) A-dis 31 Jan 2019 5 Feb 2019 USD 5,700,291 0.2372 1,352,109
1,943,256 1,396,641
UBS ETF – Bloomberg Barclays US 7-10 Year Treasury Bond UCITS ETF
(USD) A-dis 31 Jan 2019 5 Feb 2019 USD 318,079 0.2847 90,557
90,557 453,702
UBS ETF – Bloomberg Barclays US 10+ Year Treasury Bond UCITS ETF
(hedged to EUR) A-dis 31 Jan 2019 5 Feb 2019 USD 1,000,000 0.3023 302,300
302,300 221,393
UBS ETF – Bloomberg Barclays TIPS 1-10 UCITS ETF (USD) A-dis
31 Jan 2019 5 Feb 2019 USD 15,744,483 0.1304 2,053,081
2,053,081 12,647,956
UBS ETF – Bloomberg Barclays TIPS 10+ UCITS ETF (USD) A-dis
31 Jan 2019 5 Feb 2019 USD 638,000 0.1740 111,012
111,012 781,110
UBS ETF – Bloomberg Barclays Euro Inflation Linked 10+ UCITS ETF (EUR)
A-dis 31 Jan 2019 5 Feb 2019 EUR 480,000 0.0814 39,072
39,072 -28,434

Notes to Financial Statements Semi-Annual report as of 30 June 2019
445
Note 5 Distribution (continued)
Sub-Funds (ETF Share Classes)
Ex- Dividend
Date
Payment Date
Currency Number of
Shares
Dividend Per
Share
Total Amount of
Dividends Paid
Net Investment
Income/Loss
UBS ETF – Bloomberg Barclays Euro Area Liquid Corporates UCITS ETF
(EUR) A-dis 31 Jan 2019 5 Feb 2019 EUR 633,000 0.4819 305,043
305,043 359,242
UBS ETF – Bloomberg Barclays EUR Treasury 1-10 UCITS ETF (EUR) A-dis
31 Jan 2019 5 Feb 2019 EUR 11,500,000 0.0107 123,050
123,050 198,914
UBS ETF – SBI® Foreign AAA-BBB 5-10 UCITS ETF (CHF) A-dis
31 Jan 2019 5 Feb 2019 CHF 8,330,000 0.0084 69,972
69,972 53,224
UBS ETF – Bloomberg Barclays Euro Area Liquid Corporates 1-5 Year
UCITS ETF (EUR) A-dis 31 Jan 2019 5 Feb 2019 EUR 34,882,255 0.0402 1,402,267
1,402,267 1,529,379
UBS ETF – Bloomberg Barclays US Liquid Corporates 1-5 Year UCITS
ETF (USD) A-dis 31 Jan 2019 5 Feb 2019 USD 15,847,351 0.2012 3,188,487
UBS ETF – Bloomberg Barclays US Liquid Corporates 1-5 Year UCITS
ETF (hedged to GBP) A-dis 31 Jan 2019 5 Feb 2019 USD 11,557,723 0.4697 5,428,662
8,617,150 13,917,769
UBS ETF – Bloomberg Barclays US Liquid Corporates Interest Rate hedged UCITS ETF (USD) A-dis
31 Jan 2019 5 Feb 2019 USD 1,412,978 0.0599 84,637
84,637 344,974
UBS ETF – Bloomberg Barclays US Liquid Corporates UCITS ETF (USD)
A-dis 31 Jan 2019 5 Feb 2019 USD 10,956,791 0.2992 3,278,272
UBS ETF – Bloomberg Barclays US Liquid Corporates UCITS ETF
(hedged to GBP) A-dis 31 Jan 2019 5 Feb 2019 USD 2,134,816 0.7283 1,554,786
4,833,058 13,168,219
UBS ETF – Bloomberg Barclays MSCI US Liquid Corporates Sustainable
UCITS ETF (USD) A-dis 31 Jan 2019 5 Feb 2019 USD 1,367,534 0.2798 382,636
UBS ETF – Bloomberg Barclays MSCI US Liquid Corporates Sustainable UCITS ETF (hedged to CHF) A-dis
31 Jan 2019 5 Feb 2019 USD 1,945,280 0.4857 944,823
UBS ETF – Bloomberg Barclays MSCI US Liquid Corporates Sustainable UCITS ETF (hedged to GBP) A-dis
31 Jan 2019 5 Feb 2019 USD 2,265,549 0.4549 1,030,598
2,358,057 2,514,596
UBS ETF – Bloomberg Barclays MSCI Euro Area Liquid Corporates
Sustainable UCITS ETF (EUR) A-dis 31 Jan 2019 5 Feb 2019 EUR 3,297,825 0.0749 247,007
UBS ETF – Bloomberg Barclays MSCI Euro Area Liquid Corporates
Sustainable UCITS ETF (hedged to CHF) A-dis
31 Jan 2019 5 Feb 2019 EUR 468,851 0.1193 55,934
302,941 967,770
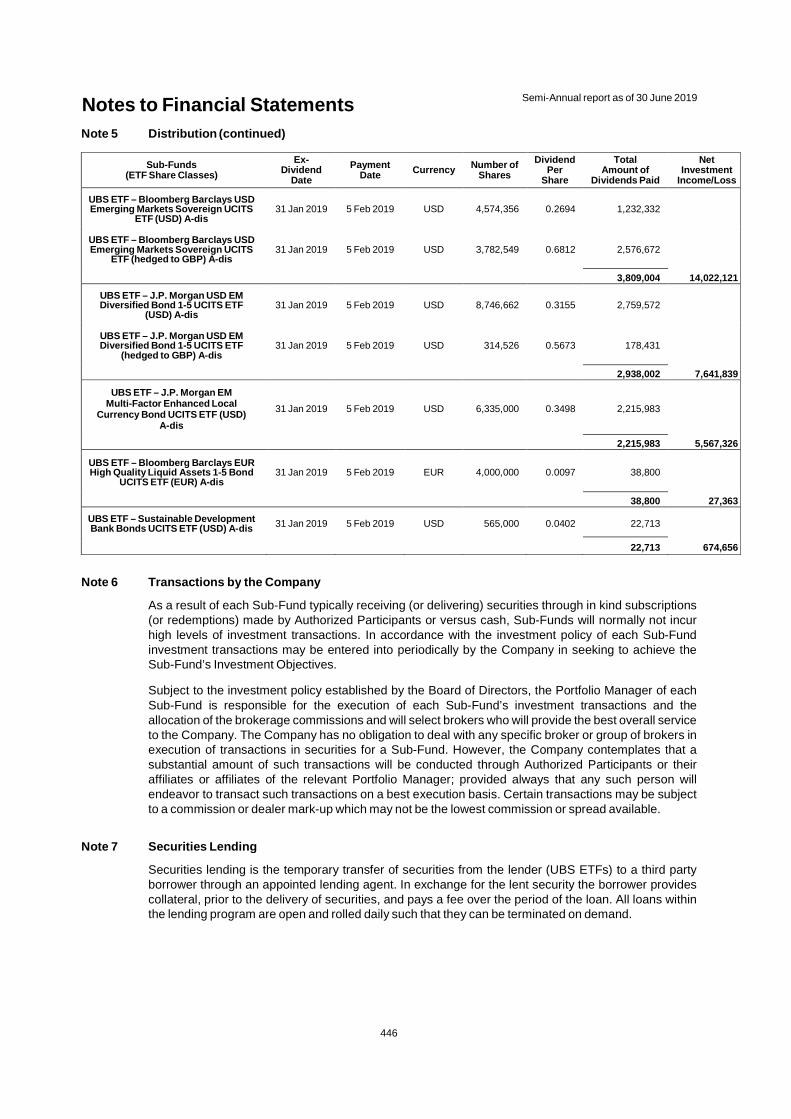
Notes to Financial Statements Semi-Annual report as of 30 June 2019
446
Note 5 Distribution (continued)
Sub-Funds(ETF Share Classes)
Ex-Dividend
Date
PaymentDate Currency
Number ofShares
DividendPer
Share
TotalAmount of
Dividends Paid
NetInvestment
Income/Loss
UBS ETF – Bloomberg Barclays USD Emerging Markets Sovereign UCITS
ETF (USD) A-dis31 Jan 2019 5 Feb 2019 USD 4,574,356 0.2694 1,232,332
UBS ETF – Bloomberg Barclays USD Emerging Markets Sovereign UCITS
ETF (hedged to GBP) A-dis31 Jan 2019 5 Feb 2019 USD 3,782,549 0.6812 2,576,672
3,809,004 14,022,121
UBS ETF – J.P. Morgan USD EM Diversified Bond 1-5 UCITS ETF
(USD) A-dis31 Jan 2019 5 Feb 2019 USD 8,746,662 0.3155 2,759,572
UBS ETF – J.P. Morgan USD EM Diversified Bond 1-5 UCITS ETF
(hedged to GBP) A-dis31 Jan 2019 5 Feb 2019 USD 314,526 0.5673 178,431
2,938,002 7,641,839
UBS ETF – J.P. Morgan EM Multi-Factor Enhanced Local
Currency Bond UCITS ETF (USD) A-dis
31 Jan 2019 5 Feb 2019 USD 6,335,000 0.3498 2,215,983
2,215,983 5,567,326
UBS ETF – Bloomberg Barclays EUR High Quality Liquid Assets 1-5 Bond
UCITS ETF (EUR) A-dis31 Jan 2019 5 Feb 2019 EUR 4,000,000 0.0097 38,800
38,800 27,363
UBS ETF – Sustainable Development Bank Bonds UCITS ETF (USD) A-dis 31 Jan 2019 5 Feb 2019 USD 565,000 0.0402 22,713
22,713 674,656
Note 6 Transactions by the Company
As a result of each Sub-Fund typically receiving (or delivering) securities through in kind subscriptions (or redemptions) made by Authorized Participants or versus cash, Sub-Funds will normally not incur high levels of investment transactions. In accordance with the investment policy of each Sub-Fund investment transactions may be entered into periodically by the Company in seeking to achieve the Sub-Fund’s Investment Objectives.
Subject to the investment policy established by the Board of Directors, the Portfolio Manager of each Sub-Fund is responsible for the execution of each Sub-Fund’s investment transactions and the allocation of the brokerage commissions and will select brokers who will provide the best overall service to the Company. The Company has no obligation to deal with any specific broker or group of brokers in execution of transactions in securities for a Sub-Fund. However, the Company contemplates that a substantial amount of such transactions will be conducted through Authorized Participants or their affiliates or affiliates of the relevant Portfolio Manager; provided always that any such person will endeavor to transact such transactions on a best execution basis. Certain transactions may be subject to a commission or dealer mark-up which may not be the lowest commission or spread available.
Note 7 Securities Lending
Securities lending is the temporary transfer of securities from the lender (UBS ETFs) to a third party borrower through an appointed lending agent. In exchange for the lent security the borrower provides collateral, prior to the delivery of securities, and pays a fee over the period of the loan. All loans within the lending program are open and rolled daily such that they can be terminated on demand.
Notes to Financial Statements Semi-Annual report as of 30 June 2019
447
Note 7 Securities Lending (continued)
UBS ETFs engage in securities lending for selected, physically replicated Funds with the aim of reducing the investor's net costs. Securities lending with UBS ETFs is always overcollateralised with at least 105% margin across all asset classes. An additional safeguard, introduced 1 April 2014, is that on loan balances are capped at 50% of each Sub-Fund’s AUM except for UBS ETF – EURO STOXX 50 UCITS ETF. For this Sub-Fund on-loan balance is capped at 25% of the sub-fund’s AUM.
Effective 4 May 2017, Sub-Funds tracking fixed Income Indices and "ESG" and "Socially Responsible" indexes were not in the security lending program anymore.
In general, lending may only be effected via the Securities Lending Agent (State Street Bank International GmbH, Frankfurt Branch) with the protection of an indemnity against borrower default provided for by State Street Bank and Trust Company. Collateral is held in a depositary account that is ring-fenced from the lending agents balance sheet. Mark to markets take place on a daily basis to ensure that the required margin levels are consistently maintained. Whilst State Street Bank and Trust Company provides a borrower indemnity and carefully selects its underlying list of borrowers an additional level of oversight is provided for by UBS Credit & Risk to structure a bespoke approved borrower list.
Non-cash collateral received by way of title transfer collateral arrangement in relation to securities lending transactions cannot be sold, re-invested or pledged.
It should be noted that securities lending is subject to a certain risk where the borrower does not return the borrowed securities according to their obligation, and where the value of the collateral provided does not cover the costs of repurchase of the securities. In such cases, State Street Bank and Trust Company, under the terms of the borrower default indemnity, shall cover the cost of purchasing the replacement securities, subject to certain conditions.
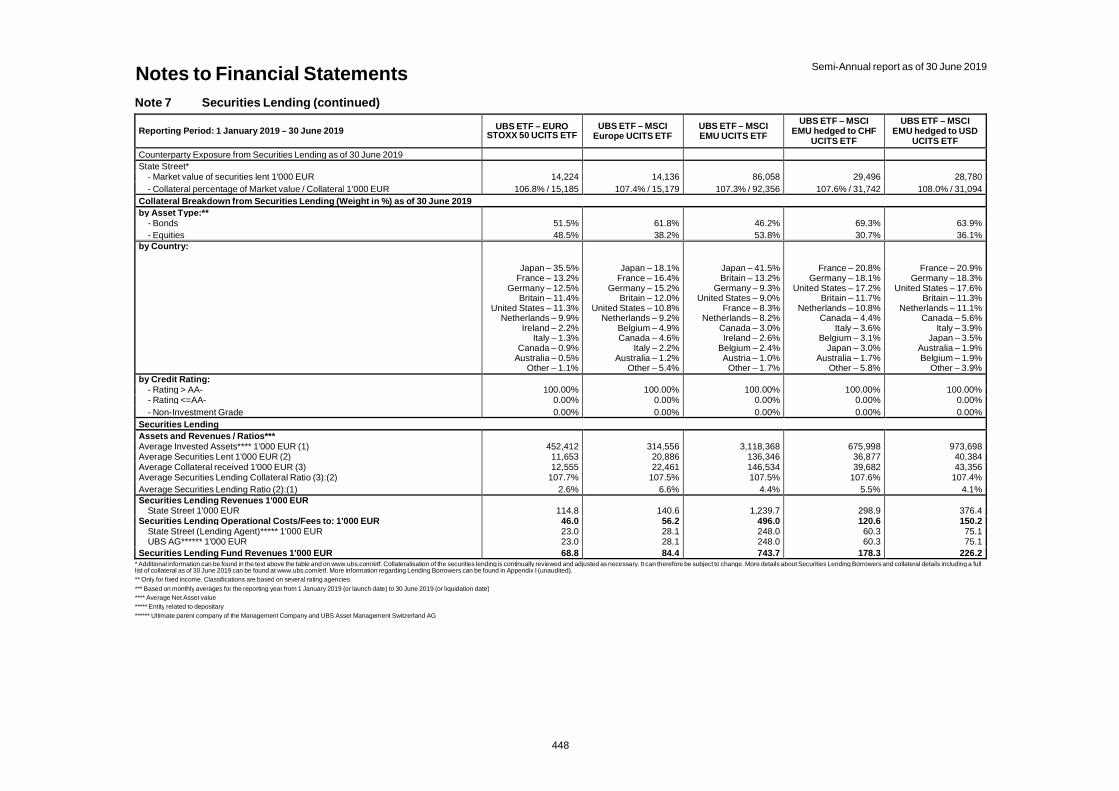
Notes to Financial Statements Semi-Annual report as of 30 June 2019
448
Note 7 Securities Lending (continued)
Reporting Period: 1 January 2019 – 30 June 2019 UBS ETF – EURO STOXX 50 UCITS ETF
UBS ETF – MSCI Europe UCITS ETF
UBS ETF – MSCI EMU UCITS ETF
UBS ETF – MSCI EMU hedged to CHF
UCITS ETF
UBS ETF – MSCI EMU hedged to USD
UCITS ETF
Counterparty Exposure from Securities Lending as of 30 June 2019 State Street*
- Market value of securities lent 1'000 EUR 14,224 14,136 86,058 29,496 28,780
- Collateral percentage of Market value / Collateral 1'000 EUR 106.8% / 15,185 107.4% / 15,179 107.3% / 92,356 107.6% / 31,742 108.0% / 31,094
Collateral Breakdown from Securities Lending (Weight in %) as of 30 June 2019
by Asset Type:** - Bonds 51.5% 61.8% 46.2% 69.3% 63.9%
- Equities 48.5% 38.2% 53.8% 30.7% 36.1% by Country:
Japan – 35.5% France – 13.2%
Germany – 12.5% Britain – 11.4%
United States – 11.3% Netherlands – 9.9%
Ireland – 2.2% Italy – 1.3%
Canada – 0.9% Australia – 0.5%
Other – 1.1%
Japan – 18.1% France – 16.4%
Germany – 15.2% Britain – 12.0%
United States – 10.8% Netherlands – 9.2%
Belgium – 4.9% Canada – 4.6%
Italy – 2.2% Australia – 1.2%
Other – 5.4%
Japan – 41.5% Britain – 13.2%
Germany – 9.3% United States – 9.0%
France – 8.3% Netherlands – 8.2%
Canada – 3.0% Ireland – 2.6%
Belgium – 2.4% Austria – 1.0%
Other – 1.7%
France – 20.8% Germany – 18.1%
United States – 17.2% Britain – 11.7%
Netherlands – 10.8% Canada – 4.4%
Italy – 3.6% Belgium – 3.1%
Japan – 3.0% Australia – 1.7%
Other – 5.8%
France – 20.9% Germany – 18.3%
United States – 17.6% Britain – 11.3%
Netherlands – 11.1% Canada – 5.6%
Italy – 3.9% Japan – 3.5%
Australia – 1.9% Belgium – 1.9%
Other – 3.9%
by Credit Rating: - Rating > AA- 100.00% 100.00% 100.00% 100.00% 100.00% - Rating <=AA- 0.00% 0.00% 0.00% 0.00% 0.00%
- Non-Investment Grade 0.00% 0.00% 0.00% 0.00% 0.00%
Securities Lending
Assets and Revenues / Ratios*** Average Invested Assets**** 1'000 EUR (1) 452,412 314,556 3,118,368 675,998 973,698 Average Securities Lent 1'000 EUR (2) 11,653 20,886 136,346 36,877 40,384 Average Collateral received 1'000 EUR (3) 12,555 22,461 146,534 39,682 43,356 Average Securities Lending Collateral Ratio (3):(2) 107.7% 107.5% 107.5% 107.6% 107.4%
Average Securities Lending Ratio (2):(1) 2.6% 6.6% 4.4% 5.5% 4.1% Securities Lending Revenues 1'000 EUR
State Street 1'000 EUR 114.8 140.6 1,239.7 298.9 376.4 Securities Lending Operational Costs/Fees to: 1'000 EUR 46.0 56.2 496.0 120.6 150.2
State Street (Lending Agent)***** 1'000 EUR 23.0 28.1 248.0 60.3 75.1 UBS AG****** 1'000 EUR 23.0 28.1 248.0 60.3 75.1
Securities Lending Fund Revenues 1'000 EUR 68.8 84.4 743.7 178.3 226.2 * Additional information can be found in the text above the table and on www.ubs.com/etf. Collateralisation of the securities lending is continually reviewed and adjusted as necessary. It can therefore be subject to change. More details about Securities Lending Borrowers and collateral details including a fulllist of collateral as of 30 June 2019 can be found at www.ubs.com/etf. More information regarding Lending Borrowers can be found in Appendix I (unaudited). ** Only for fixed income. Classifications are based on several rating agencies. *** Based on monthly averages for the reporting year from 1 January 2019 (or launch date) to 30 June 2019 (or liquidation date) **** Average Net Asset value ***** Entity related to depositary ****** Ultimate parent company of the Management Company and UBS Asset Management Switzerland AG
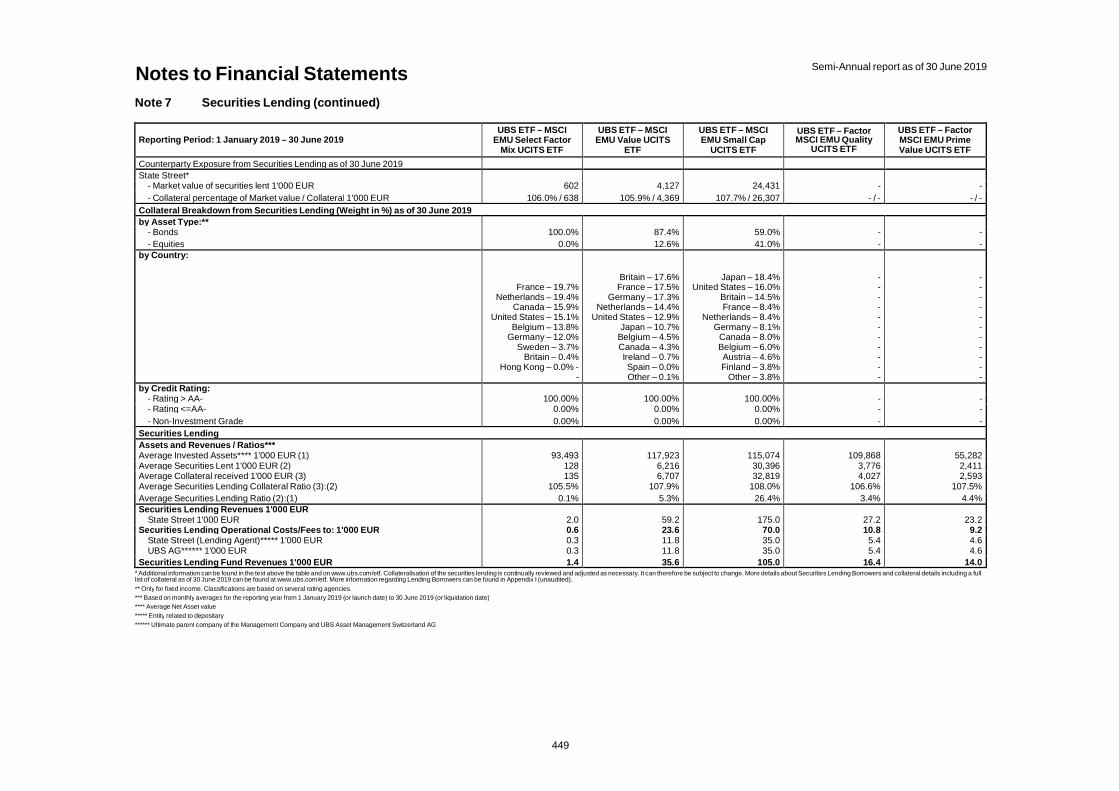
Notes to Financial Statements Semi-Annual report as of 30 June 2019
449
Note 7 Securities Lending (continued)
Reporting Period: 1 January 2019 – 30 June 2019 UBS ETF – MSCI
EMU Select Factor Mix UCITS ETF
UBS ETF – MSCI EMU Value UCITS
ETF
UBS ETF – MSCI EMU Small Cap
UCITS ETF
UBS ETF – Factor MSCI EMU Quality
UCITS ETF
UBS ETF – Factor MSCI EMU Prime Value UCITS ETF
Counterparty Exposure from Securities Lending as of 30 June 2019 State Street*
- Market value of securities lent 1'000 EUR 602 4,127 24,431 - - - Collateral percentage of Market value / Collateral 1'000 EUR 106.0% / 638 105.9% / 4,369 107.7% / 26,307 - / - - / -
Collateral Breakdown from Securities Lending (Weight in %) as of 30 June 2019
by Asset Type:** - Bonds 100.0% 87.4% 59.0% - - - Equities 0.0% 12.6% 41.0% - -
by Country:
France – 19.7% Netherlands – 19.4%
Canada – 15.9% United States – 15.1%
Belgium – 13.8% Germany – 12.0%
Sweden – 3.7% Britain – 0.4%
Hong Kong – 0.0% - -
Britain – 17.6% France – 17.5%
Germany – 17.3% Netherlands – 14.4%
United States – 12.9% Japan – 10.7%
Belgium – 4.5% Canada – 4.3% Ireland – 0.7% Spain – 0.0% Other – 0.1%
Japan – 18.4% United States – 16.0%
Britain – 14.5% France – 8.4%
Netherlands – 8.4% Germany – 8.1%
Canada – 8.0% Belgium – 6.0% Austria – 4.6% Finland – 3.8%
Other – 3.8%
- - - - - - - - - - -
- - - - - - - - - - -
by Credit Rating: - Rating > AA- 100.00% 100.00% 100.00% - - - Rating <=AA- 0.00% 0.00% 0.00% - - - Non-Investment Grade 0.00% 0.00% 0.00% - -
Securities Lending
Assets and Revenues / Ratios*** Average Invested Assets**** 1'000 EUR (1) 93,493 117,923 115,074 109,868 55,282 Average Securities Lent 1'000 EUR (2) 128 6,216 30,396 3,776 2,411 Average Collateral received 1'000 EUR (3) 135 6,707 32,819 4,027 2,593 Average Securities Lending Collateral Ratio (3):(2) 105.5% 107.9% 108.0% 106.6% 107.5%
Average Securities Lending Ratio (2):(1) 0.1% 5.3% 26.4% 3.4% 4.4% Securities Lending Revenues 1'000 EUR
State Street 1'000 EUR 2.0 59.2 175.0 27.2 23.2 Securities Lending Operational Costs/Fees to: 1'000 EUR 0.6 23.6 70.0 10.8 9.2
State Street (Lending Agent)***** 1'000 EUR 0.3 11.8 35.0 5.4 4.6 UBS AG****** 1'000 EUR 0.3 11.8 35.0 5.4 4.6
Securities Lending Fund Revenues 1'000 EUR 1.4 35.6 105.0 16.4 14.0 * Additional information can be found in the text above the table and on www.ubs.com/etf. Collateralisation of the securities lending is continually reviewed and adjusted as necessary. It can therefore be subject to change. More details about Securities Lending Borrowers and collateral details including a fulllist of collateral as of 30 June 2019 can be found at www.ubs.com/etf. More information regarding Lending Borrowers can be found in Appendix I (unaudited). ** Only for fixed income. Classifications are based on several rating agencies. *** Based on monthly averages for the reporting year from 1 January 2019 (or launch date) to 30 June 2019 (or liquidation date) **** Average Net Asset value ***** Entity related to depositary ****** Ultimate parent company of the Management Company and UBS Asset Management Switzerland AG
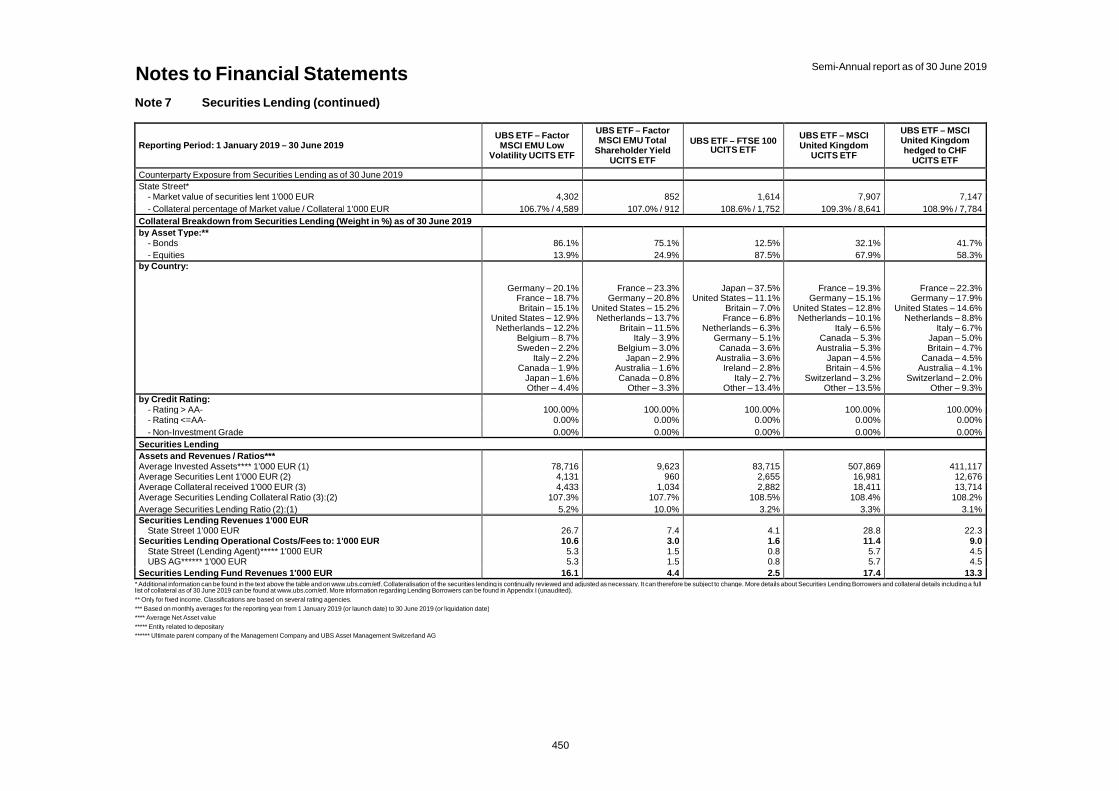
Notes to Financial Statements Semi-Annual report as of 30 June 2019
450
Note 7 Securities Lending (continued)
Reporting Period: 1 January 2019 – 30 June 2019 UBS ETF – Factor MSCI EMU Low
Volatility UCITS ETF
UBS ETF – Factor MSCI EMU Total
Shareholder Yield UCITS ETF
UBS ETF – FTSE 100 UCITS ETF
UBS ETF – MSCI United Kingdom
UCITS ETF
UBS ETF – MSCI United Kingdom hedged to CHF
UCITS ETF
Counterparty Exposure from Securities Lending as of 30 June 2019 State Street*
- Market value of securities lent 1'000 EUR 4,302 852 1,614 7,907 7,147
- Collateral percentage of Market value / Collateral 1'000 EUR 106.7% / 4,589 107.0% / 912 108.6% / 1,752 109.3% / 8,641 108.9% / 7,784
Collateral Breakdown from Securities Lending (Weight in %) as of 30 June 2019
by Asset Type:** - Bonds 86.1% 75.1% 12.5% 32.1% 41.7%
- Equities 13.9% 24.9% 87.5% 67.9% 58.3% by Country:
Germany – 20.1% France – 18.7% Britain – 15.1%
United States – 12.9% Netherlands – 12.2%
Belgium – 8.7% Sweden – 2.2%
Italy – 2.2% Canada – 1.9%
Japan – 1.6% Other – 4.4%
France – 23.3% Germany – 20.8%
United States – 15.2% Netherlands – 13.7%
Britain – 11.5% Italy – 3.9%
Belgium – 3.0% Japan – 2.9%
Australia – 1.6% Canada – 0.8%
Other – 3.3%
Japan – 37.5% United States – 11.1%
Britain – 7.0% France – 6.8%
Netherlands – 6.3% Germany – 5.1%
Canada – 3.6% Australia – 3.6%
Ireland – 2.8% Italy – 2.7%
Other – 13.4%
France – 19.3% Germany – 15.1%
United States – 12.8% Netherlands – 10.1%
Italy – 6.5% Canada – 5.3%
Australia – 5.3% Japan – 4.5% Britain – 4.5%
Switzerland – 3.2% Other – 13.5%
France – 22.3% Germany – 17.9%
United States – 14.6% Netherlands – 8.8%
Italy – 6.7% Japan – 5.0% Britain – 4.7%
Canada – 4.5% Australia – 4.1%
Switzerland – 2.0% Other – 9.3%
by Credit Rating: - Rating > AA- 100.00% 100.00% 100.00% 100.00% 100.00% - Rating <=AA- 0.00% 0.00% 0.00% 0.00% 0.00%
- Non-Investment Grade 0.00% 0.00% 0.00% 0.00% 0.00%
Securities Lending
Assets and Revenues / Ratios*** Average Invested Assets**** 1'000 EUR (1) 78,716 9,623 83,715 507,869 411,117 Average Securities Lent 1'000 EUR (2) 4,131 960 2,655 16,981 12,676 Average Collateral received 1'000 EUR (3) 4,433 1,034 2,882 18,411 13,714 Average Securities Lending Collateral Ratio (3):(2) 107.3% 107.7% 108.5% 108.4% 108.2%
Average Securities Lending Ratio (2):(1) 5.2% 10.0% 3.2% 3.3% 3.1% Securities Lending Revenues 1'000 EUR
State Street 1'000 EUR 26.7 7.4 4.1 28.8 22.3 Securities Lending Operational Costs/Fees to: 1'000 EUR 10.6 3.0 1.6 11.4 9.0
State Street (Lending Agent)***** 1'000 EUR 5.3 1.5 0.8 5.7 4.5 UBS AG****** 1'000 EUR 5.3 1.5 0.8 5.7 4.5
Securities Lending Fund Revenues 1'000 EUR 16.1 4.4 2.5 17.4 13.3 * Additional information can be found in the text above the table and on www.ubs.com/etf. Collateralisation of the securities lending is continually reviewed and adjusted as necessary. It can therefore be subject to change. More details about Securities Lending Borrowers and collateral details including a fulllist of collateral as of 30 June 2019 can be found at www.ubs.com/etf. More information regarding Lending Borrowers can be found in Appendix I (unaudited). ** Only for fixed income. Classifications are based on several rating agencies. *** Based on monthly averages for the reporting year from 1 January 2019 (or launch date) to 30 June 2019 (or liquidation date) **** Average Net Asset value ***** Entity related to depositary ****** Ultimate parent company of the Management Company and UBS Asset Management Switzerland AG
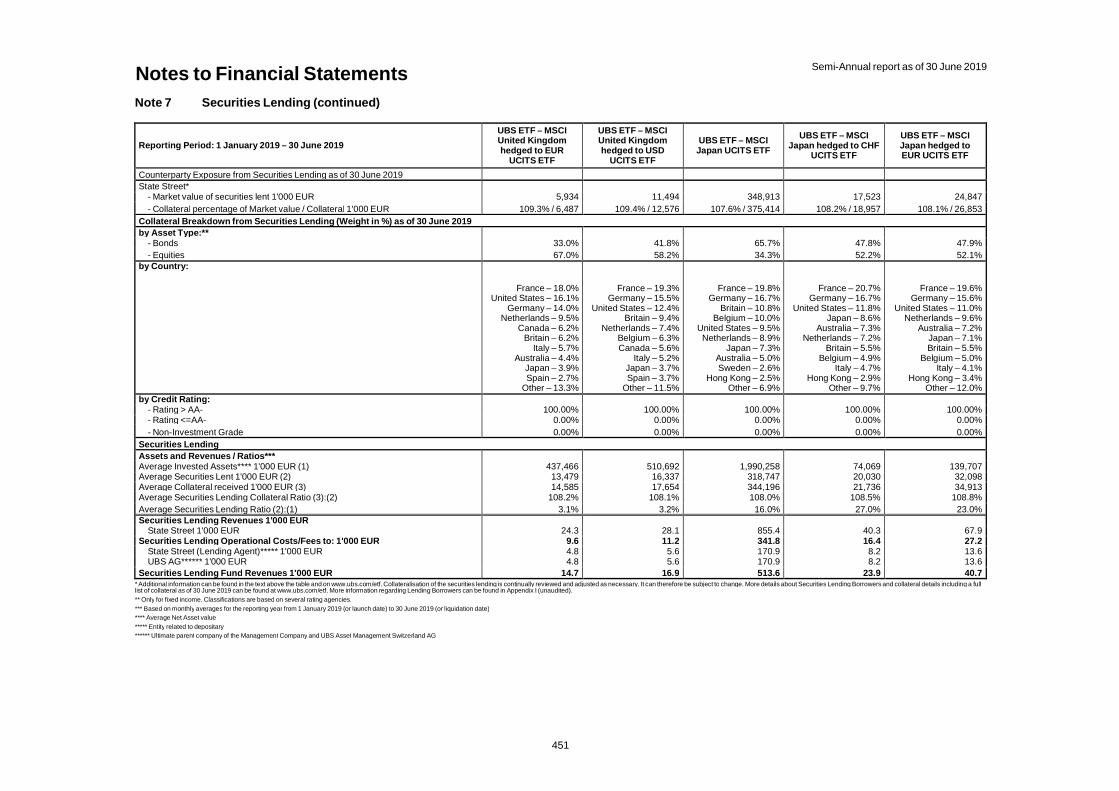
Notes to Financial Statements Semi-Annual report as of 30 June 2019
451
Note 7 Securities Lending (continued)
Reporting Period: 1 January 2019 – 30 June 2019
UBS ETF – MSCI United Kingdom hedged to EUR
UCITS ETF
UBS ETF – MSCI United Kingdom hedged to USD
UCITS ETF
UBS ETF – MSCI Japan UCITS ETF
UBS ETF – MSCI Japan hedged to CHF
UCITS ETF
UBS ETF – MSCI Japan hedged to EUR UCITS ETF
Counterparty Exposure from Securities Lending as of 30 June 2019 State Street*
- Market value of securities lent 1'000 EUR 5,934 11,494 348,913 17,523 24,847
- Collateral percentage of Market value / Collateral 1'000 EUR 109.3% / 6,487 109.4% / 12,576 107.6% / 375,414 108.2% / 18,957 108.1% / 26,853
Collateral Breakdown from Securities Lending (Weight in %) as of 30 June 2019
by Asset Type:** - Bonds 33.0% 41.8% 65.7% 47.8% 47.9%
- Equities 67.0% 58.2% 34.3% 52.2% 52.1% by Country:
France – 18.0% United States – 16.1%
Germany – 14.0% Netherlands – 9.5%
Canada – 6.2% Britain – 6.2%
Italy – 5.7% Australia – 4.4%
Japan – 3.9% Spain – 2.7%
Other – 13.3%
France – 19.3% Germany – 15.5%
United States – 12.4% Britain – 9.4%
Netherlands – 7.4% Belgium – 6.3% Canada – 5.6%
Italy – 5.2% Japan – 3.7% Spain – 3.7%
Other – 11.5%
France – 19.8% Germany – 16.7%
Britain – 10.8% Belgium – 10.0%
United States – 9.5% Netherlands – 8.9%
Japan – 7.3% Australia – 5.0% Sweden – 2.6%
Hong Kong – 2.5% Other – 6.9%
France – 20.7% Germany – 16.7%
United States – 11.8% Japan – 8.6%
Australia – 7.3% Netherlands – 7.2%
Britain – 5.5% Belgium – 4.9%
Italy – 4.7% Hong Kong – 2.9%
Other – 9.7%
France – 19.6% Germany – 15.6%
United States – 11.0% Netherlands – 9.6%
Australia – 7.2% Japan – 7.1% Britain – 5.5%
Belgium – 5.0% Italy – 4.1%
Hong Kong – 3.4% Other – 12.0%
by Credit Rating: - Rating > AA- 100.00% 100.00% 100.00% 100.00% 100.00% - Rating <=AA- 0.00% 0.00% 0.00% 0.00% 0.00%
- Non-Investment Grade 0.00% 0.00% 0.00% 0.00% 0.00%
Securities Lending
Assets and Revenues / Ratios*** Average Invested Assets**** 1'000 EUR (1) 437,466 510,692 1,990,258 74,069 139,707 Average Securities Lent 1'000 EUR (2) 13,479 16,337 318,747 20,030 32,098 Average Collateral received 1'000 EUR (3) 14,585 17,654 344,196 21,736 34,913 Average Securities Lending Collateral Ratio (3):(2) 108.2% 108.1% 108.0% 108.5% 108.8%
Average Securities Lending Ratio (2):(1) 3.1% 3.2% 16.0% 27.0% 23.0% Securities Lending Revenues 1'000 EUR
State Street 1'000 EUR 24.3 28.1 855.4 40.3 67.9 Securities Lending Operational Costs/Fees to: 1'000 EUR 9.6 11.2 341.8 16.4 27.2
State Street (Lending Agent)***** 1'000 EUR 4.8 5.6 170.9 8.2 13.6 UBS AG****** 1'000 EUR 4.8 5.6 170.9 8.2 13.6
Securities Lending Fund Revenues 1'000 EUR 14.7 16.9 513.6 23.9 40.7 * Additional information can be found in the text above the table and on www.ubs.com/etf. Collateralisation of the securities lending is continually reviewed and adjusted as necessary. It can therefore be subject to change. More details about Securities Lending Borrowers and collateral details including a fulllist of collateral as of 30 June 2019 can be found at www.ubs.com/etf. More information regarding Lending Borrowers can be found in Appendix I (unaudited). ** Only for fixed income. Classifications are based on several rating agencies. *** Based on monthly averages for the reporting year from 1 January 2019 (or launch date) to 30 June 2019 (or liquidation date) **** Average Net Asset value ***** Entity related to depositary ****** Ultimate parent company of the Management Company and UBS Asset Management Switzerland AG
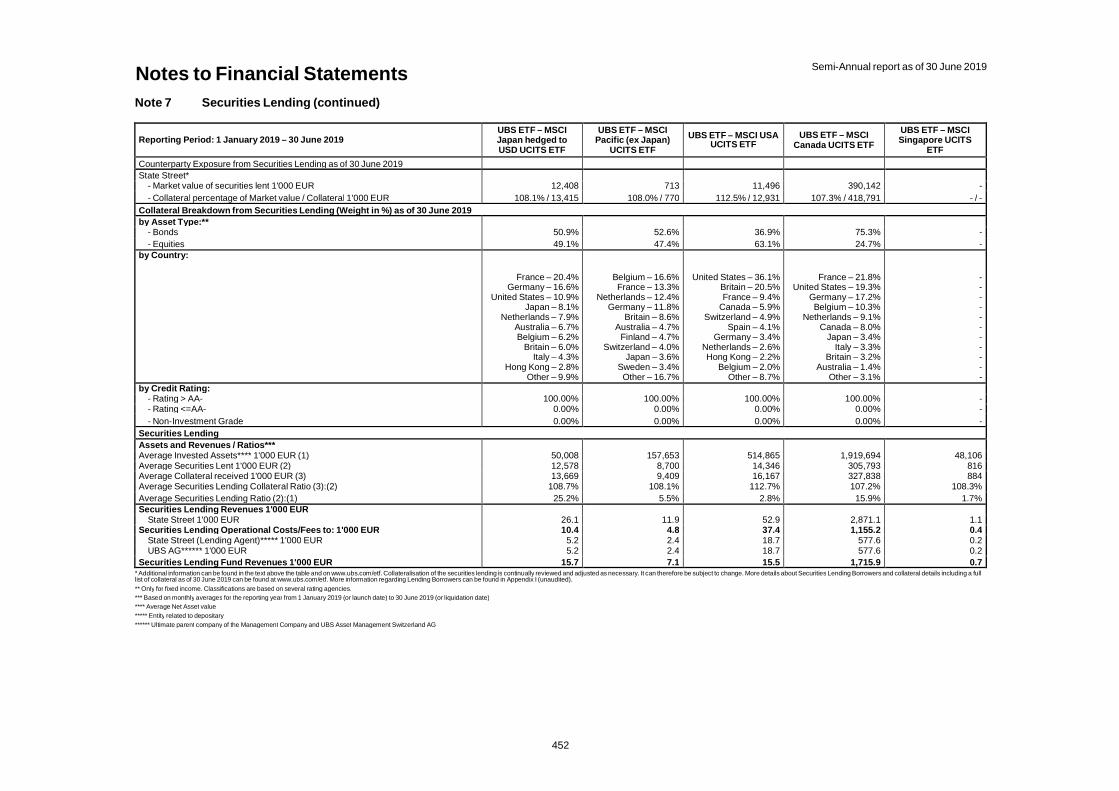
Notes to Financial Statements Semi-Annual report as of 30 June 2019
452
Note 7 Securities Lending (continued)
Reporting Period: 1 January 2019 – 30 June 2019 UBS ETF – MSCI Japan hedged to USD UCITS ETF
UBS ETF – MSCI Pacific (ex Japan)
UCITS ETF
UBS ETF – MSCI USA UCITS ETF
UBS ETF – MSCI Canada UCITS ETF
UBS ETF – MSCI Singapore UCITS
ETF
Counterparty Exposure from Securities Lending as of 30 June 2019 State Street*
- Market value of securities lent 1'000 EUR 12,408 713 11,496 390,142 - - Collateral percentage of Market value / Collateral 1'000 EUR 108.1% / 13,415 108.0% / 770 112.5% / 12,931 107.3% / 418,791 - / -
Collateral Breakdown from Securities Lending (Weight in %) as of 30 June 2019
by Asset Type:** - Bonds 50.9% 52.6% 36.9% 75.3% - - Equities 49.1% 47.4% 63.1% 24.7% -
by Country:
France – 20.4% Germany – 16.6%
United States – 10.9% Japan – 8.1%
Netherlands – 7.9% Australia – 6.7% Belgium – 6.2%
Britain – 6.0% Italy – 4.3%
Hong Kong – 2.8% Other – 9.9%
Belgium – 16.6% France – 13.3%
Netherlands – 12.4% Germany – 11.8%
Britain – 8.6% Australia – 4.7%
Finland – 4.7% Switzerland – 4.0%
Japan – 3.6% Sweden – 3.4% Other – 16.7%
United States – 36.1% Britain – 20.5% France – 9.4%
Canada – 5.9% Switzerland – 4.9%
Spain – 4.1% Germany – 3.4%
Netherlands – 2.6% Hong Kong – 2.2%
Belgium – 2.0% Other – 8.7%
France – 21.8% United States – 19.3%
Germany – 17.2% Belgium – 10.3%
Netherlands – 9.1% Canada – 8.0%
Japan – 3.4% Italy – 3.3%
Britain – 3.2% Australia – 1.4%
Other – 3.1%
- - - - - - - - - - -
by Credit Rating: - Rating > AA- 100.00% 100.00% 100.00% 100.00% - - Rating <=AA- 0.00% 0.00% 0.00% 0.00% - - Non-Investment Grade 0.00% 0.00% 0.00% 0.00% -
Securities Lending
Assets and Revenues / Ratios*** Average Invested Assets**** 1'000 EUR (1) 50,008 157,653 514,865 1,919,694 48,106 Average Securities Lent 1'000 EUR (2) 12,578 8,700 14,346 305,793 816 Average Collateral received 1'000 EUR (3) 13,669 9,409 16,167 327,838 884 Average Securities Lending Collateral Ratio (3):(2) 108.7% 108.1% 112.7% 107.2% 108.3%
Average Securities Lending Ratio (2):(1) 25.2% 5.5% 2.8% 15.9% 1.7% Securities Lending Revenues 1'000 EUR
State Street 1'000 EUR 26.1 11.9 52.9 2,871.1 1.1 Securities Lending Operational Costs/Fees to: 1'000 EUR 10.4 4.8 37.4 1,155.2 0.4
State Street (Lending Agent)***** 1'000 EUR 5.2 2.4 18.7 577.6 0.2 UBS AG****** 1'000 EUR 5.2 2.4 18.7 577.6 0.2
Securities Lending Fund Revenues 1'000 EUR 15.7 7.1 15.5 1,715.9 0.7 * Additional information can be found in the text above the table and on www.ubs.com/etf. Collateralisation of the securities lending is continually reviewed and adjusted as necessary. It can therefore be subject to change. More details about Securities Lending Borrowers and collateral details including a fulllist of collateral as of 30 June 2019 can be found at www.ubs.com/etf. More information regarding Lending Borrowers can be found in Appendix I (unaudited). ** Only for fixed income. Classifications are based on several rating agencies. *** Based on monthly averages for the reporting year from 1 January 2019 (or launch date) to 30 June 2019 (or liquidation date) **** Average Net Asset value ***** Entity related to depositary ****** Ultimate parent company of the Management Company and UBS Asset Management Switzerland AG
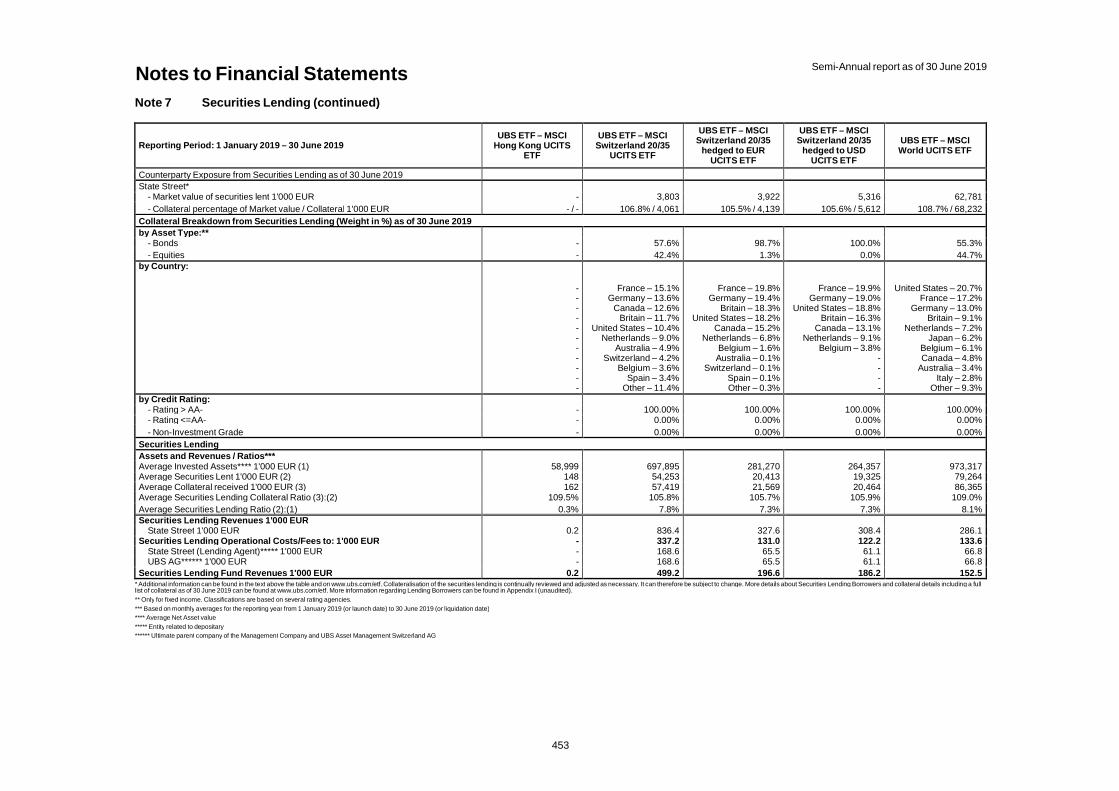
Notes to Financial Statements Semi-Annual report as of 30 June 2019
453
Note 7 Securities Lending (continued)
Reporting Period: 1 January 2019 – 30 June 2019 UBS ETF – MSCI
Hong Kong UCITS ETF
UBS ETF – MSCI Switzerland 20/35
UCITS ETF
UBS ETF – MSCI Switzerland 20/35
hedged to EUR UCITS ETF
UBS ETF – MSCI Switzerland 20/35
hedged to USD UCITS ETF
UBS ETF – MSCI World UCITS ETF
Counterparty Exposure from Securities Lending as of 30 June 2019 State Street*
- Market value of securities lent 1'000 EUR - 3,803 3,922 5,316 62,781
- Collateral percentage of Market value / Collateral 1'000 EUR - / - 106.8% / 4,061 105.5% / 4,139 105.6% / 5,612 108.7% / 68,232
Collateral Breakdown from Securities Lending (Weight in %) as of 30 June 2019
by Asset Type:** - Bonds - 57.6% 98.7% 100.0% 55.3%
- Equities - 42.4% 1.3% 0.0% 44.7% by Country:
- - - - - - - - - - -
France – 15.1% Germany – 13.6%
Canada – 12.6% Britain – 11.7%
United States – 10.4% Netherlands – 9.0%
Australia – 4.9% Switzerland – 4.2%
Belgium – 3.6% Spain – 3.4%
Other – 11.4%
France – 19.8% Germany – 19.4%
Britain – 18.3% United States – 18.2%
Canada – 15.2% Netherlands – 6.8%
Belgium – 1.6% Australia – 0.1%
Switzerland – 0.1% Spain – 0.1% Other – 0.3%
France – 19.9% Germany – 19.0%
United States – 18.8% Britain – 16.3%
Canada – 13.1% Netherlands – 9.1%
Belgium – 3.8% - - - -
United States – 20.7% France – 17.2%
Germany – 13.0% Britain – 9.1%
Netherlands – 7.2% Japan – 6.2%
Belgium – 6.1% Canada – 4.8%
Australia – 3.4% Italy – 2.8%
Other – 9.3%
by Credit Rating: - Rating > AA- - 100.00% 100.00% 100.00% 100.00% - Rating <=AA- - 0.00% 0.00% 0.00% 0.00%
- Non-Investment Grade - 0.00% 0.00% 0.00% 0.00%
Securities Lending
Assets and Revenues / Ratios*** Average Invested Assets**** 1'000 EUR (1) 58,999 697,895 281,270 264,357 973,317 Average Securities Lent 1'000 EUR (2) 148 54,253 20,413 19,325 79,264 Average Collateral received 1'000 EUR (3) 162 57,419 21,569 20,464 86,365 Average Securities Lending Collateral Ratio (3):(2) 109.5% 105.8% 105.7% 105.9% 109.0%
Average Securities Lending Ratio (2):(1) 0.3% 7.8% 7.3% 7.3% 8.1% Securities Lending Revenues 1'000 EUR
State Street 1'000 EUR 0.2 836.4 327.6 308.4 286.1 Securities Lending Operational Costs/Fees to: 1'000 EUR - 337.2 131.0 122.2 133.6
State Street (Lending Agent)***** 1'000 EUR - 168.6 65.5 61.1 66.8 UBS AG****** 1'000 EUR - 168.6 65.5 61.1 66.8
Securities Lending Fund Revenues 1'000 EUR 0.2 499.2 196.6 186.2 152.5 * Additional information can be found in the text above the table and on www.ubs.com/etf. Collateralisation of the securities lending is continually reviewed and adjusted as necessary. It can therefore be subject to change. More details about Securities Lending Borrowers and collateral details including a fulllist of collateral as of 30 June 2019 can be found at www.ubs.com/etf. More information regarding Lending Borrowers can be found in Appendix I (unaudited). ** Only for fixed income. Classifications are based on several rating agencies. *** Based on monthly averages for the reporting year from 1 January 2019 (or launch date) to 30 June 2019 (or liquidation date) **** Average Net Asset value ***** Entity related to depositary ****** Ultimate parent company of the Management Company and UBS Asset Management Switzerland AG
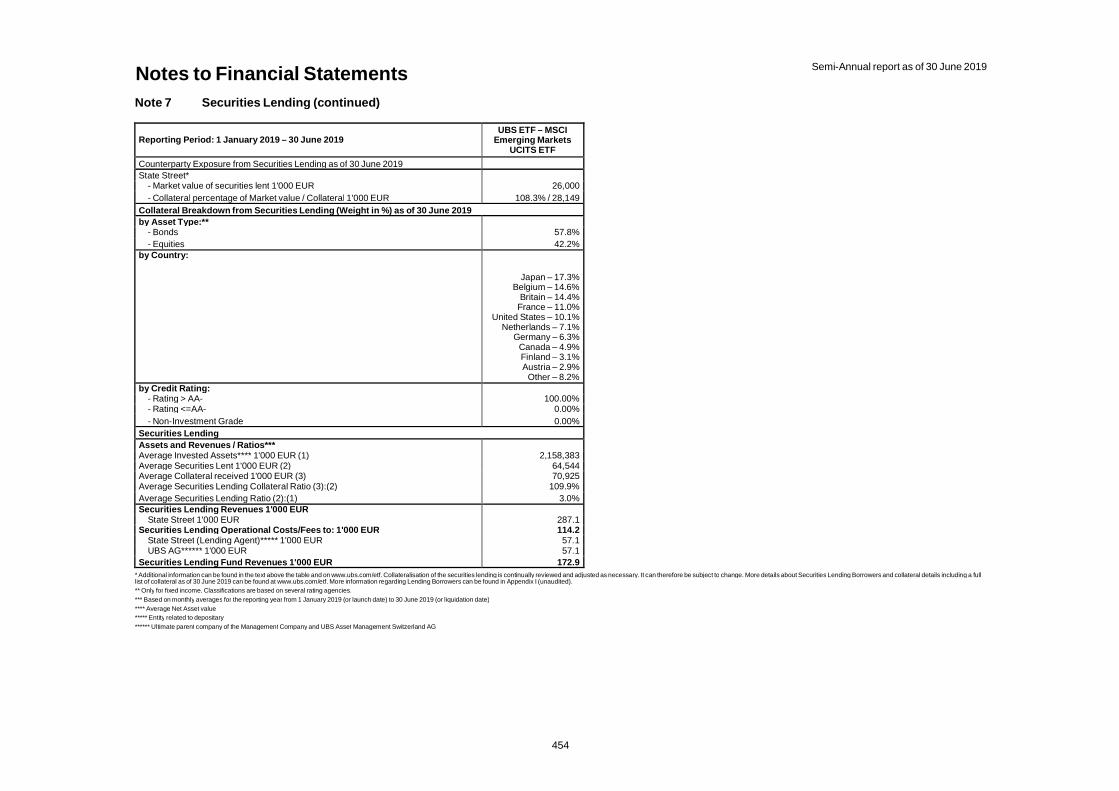
Notes to Financial Statements Semi-Annual report as of 30 June 2019
454
Note 7 Securities Lending (continued)
Reporting Period: 1 January 2019 – 30 June 2019 UBS ETF – MSCI
Emerging Markets UCITS ETF
Counterparty Exposure from Securities Lending as of 30 June 2019 State Street*
- Market value of securities lent 1'000 EUR 26,000
- Collateral percentage of Market value / Collateral 1'000 EUR 108.3% / 28,149
Collateral Breakdown from Securities Lending (Weight in %) as of 30 June 2019
by Asset Type:** - Bonds 57.8%
- Equities 42.2% by Country:
Japan – 17.3% Belgium – 14.6%
Britain – 14.4% France – 11.0%
United States – 10.1% Netherlands – 7.1%
Germany – 6.3% Canada – 4.9% Finland – 3.1% Austria – 2.9%
Other – 8.2%
by Credit Rating: - Rating > AA- 100.00% - Rating <=AA- 0.00%
- Non-Investment Grade 0.00%
Securities Lending
Assets and Revenues / Ratios*** Average Invested Assets**** 1'000 EUR (1) 2,158,383 Average Securities Lent 1'000 EUR (2) 64,544 Average Collateral received 1'000 EUR (3) 70,925 Average Securities Lending Collateral Ratio (3):(2) 109.9%
Average Securities Lending Ratio (2):(1) 3.0% Securities Lending Revenues 1'000 EUR
State Street 1'000 EUR 287.1 Securities Lending Operational Costs/Fees to: 1'000 EUR 114.2
State Street (Lending Agent)***** 1'000 EUR 57.1 UBS AG****** 1'000 EUR 57.1
Securities Lending Fund Revenues 1'000 EUR 172.9 * Additional information can be found in the text above the table and on www.ubs.com/etf. Collateralisation of the securities lending is continually reviewed and adjusted as necessary. It can therefore be subject to change. More details about Securities Lending Borrowers and collateral details including a fulllist of collateral as of 30 June 2019 can be found at www.ubs.com/etf. More information regarding Lending Borrowers can be found in Appendix I (unaudited). ** Only for fixed income. Classifications are based on several rating agencies. *** Based on monthly averages for the reporting year from 1 January 2019 (or launch date) to 30 June 2019 (or liquidation date) **** Average Net Asset value ***** Entity related to depositary ****** Ultimate parent company of the Management Company and UBS Asset Management Switzerland AG
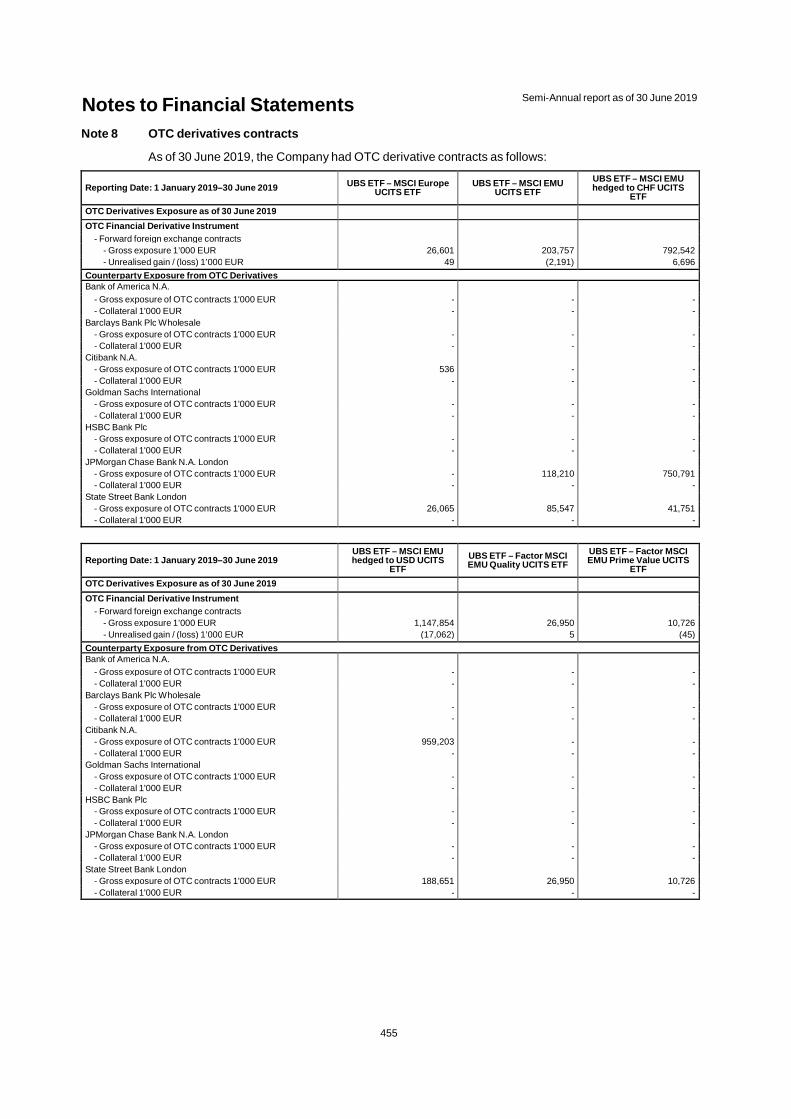
Notes to Financial Statements Semi-Annual report as of 30 June 2019
455
Note 8 OTC derivatives contracts
As of 30 June 2019, the Company had OTC derivative contracts as follows:
Reporting Date: 1 January 2019–30 June 2019 UBS ETF – MSCI Europe UCITS ETF
UBS ETF – MSCI EMU UCITS ETF
UBS ETF – MSCI EMU hedged to CHF UCITS
ETF
OTC Derivatives Exposure as of 30 June 2019
OTC Financial Derivative Instrument
- Forward foreign exchange contracts
- Gross exposure 1’000 EUR 26,601 203,757 792,542
- Unrealised gain / (loss) 1’000 EUR 49 (2,191) 6,696
Counterparty Exposure from OTC Derivatives Bank of America N.A.
- Gross exposure of OTC contracts 1'000 EUR - - - - Collateral 1'000 EUR - - -
Barclays Bank Plc Wholesale
- Gross exposure of OTC contracts 1'000 EUR - - - - Collateral 1'000 EUR - - -
Citibank N.A.
- Gross exposure of OTC contracts 1'000 EUR 536 - - - Collateral 1'000 EUR - - -
Goldman Sachs International
- Gross exposure of OTC contracts 1'000 EUR - - - - Collateral 1'000 EUR - - -
HSBC Bank Plc
- Gross exposure of OTC contracts 1'000 EUR - - - - Collateral 1'000 EUR - - -
JPMorgan Chase Bank N.A. London
- Gross exposure of OTC contracts 1'000 EUR - 118,210 750,791
- Collateral 1'000 EUR - - - State Street Bank London
- Gross exposure of OTC contracts 1'000 EUR 26,065 85,547 41,751
- Collateral 1'000 EUR - - -
Reporting Date: 1 January 2019–30 June 2019 UBS ETF – MSCI EMU hedged to USD UCITS
ETF
UBS ETF – Factor MSCI EMU Quality UCITS ETF
UBS ETF – Factor MSCI EMU Prime Value UCITS
ETF
OTC Derivatives Exposure as of 30 June 2019
OTC Financial Derivative Instrument
- Forward foreign exchange contracts
- Gross exposure 1’000 EUR 1,147,854 26,950 10,726
- Unrealised gain / (loss) 1’000 EUR (17,062) 5 (45)
Counterparty Exposure from OTC Derivatives Bank of America N.A.
- Gross exposure of OTC contracts 1'000 EUR - - - - Collateral 1'000 EUR - - -
Barclays Bank Plc Wholesale
- Gross exposure of OTC contracts 1'000 EUR - - - - Collateral 1'000 EUR - - -
Citibank N.A.
- Gross exposure of OTC contracts 1'000 EUR 959,203 - - - Collateral 1'000 EUR - - -
Goldman Sachs International
- Gross exposure of OTC contracts 1'000 EUR - - - - Collateral 1'000 EUR - - -
HSBC Bank Plc
- Gross exposure of OTC contracts 1'000 EUR - - - - Collateral 1'000 EUR - - -
JPMorgan Chase Bank N.A. London
- Gross exposure of OTC contracts 1'000 EUR - - - - Collateral 1'000 EUR - - -
State Street Bank London
- Gross exposure of OTC contracts 1'000 EUR 188,651 26,950 10,726
- Collateral 1'000 EUR - - -

Notes to Financial Statements Semi-Annual report as of 30 June 2019
456
Note 8 OTC derivatives contracts (continued)
Reporting Date: 1 January 2019–30 June 2019 UBS ETF – Factor MSCI
EMU Low Volatility UCITS ETF
UBS ETF – Factor MSCI EMU Total Shareholder
Yield UCITS ETF
UBS ETF – MSCI United Kingdom UCITS ETF
OTC Derivatives Exposure as of 30 June 2019
OTC Financial Derivative Instrument
- Forward foreign exchange contracts
- Gross exposure 1’000 EUR 38,429 3,218 1,257
- Unrealised gain / (loss) 1’000 EUR 236 (20) 11
Counterparty Exposure from OTC Derivatives Bank of America N.A.
- Gross exposure of OTC contracts 1'000 EUR - - - - Collateral 1'000 EUR - - -
Barclays Bank Plc Wholesale
- Gross exposure of OTC contracts 1'000 EUR - - - - Collateral 1'000 EUR - - -
Citibank N.A.
- Gross exposure of OTC contracts 1'000 EUR - - - - Collateral 1'000 EUR - - -
Goldman Sachs International
- Gross exposure of OTC contracts 1'000 EUR - - - - Collateral 1'000 EUR - - -
HSBC Bank Plc
- Gross exposure of OTC contracts 1'000 EUR - - - - Collateral 1'000 EUR - - -
JPMorgan Chase Bank N.A. London
- Gross exposure of OTC contracts 1'000 EUR - - - - Collateral 1'000 EUR - - -
State Street Bank London
- Gross exposure of OTC contracts 1'000 EUR 38,429 3,218 1,257
- Collateral 1'000 EUR - - -
Reporting Date: 1 January 2019–30 June 2019 UBS ETF – MSCI United Kingdom hedged to CHF
UCITS ETF
UBS ETF – MSCI United Kingdom hedged to EUR
UCITS ETF
UBS ETF – MSCI United Kingdom hedged to USD
UCITS ETF
OTC Derivatives Exposure as of 30 June 2019
OTC Financial Derivative Instrument
- Forward foreign exchange contracts
- Gross exposure 1’000 EUR 422,529 461,435 529,840
- Unrealised gain / (loss) 1’000 EUR 8,605 5,105 (4,356)
Counterparty Exposure from OTC Derivatives Bank of America N.A.
- Gross exposure of OTC contracts 1'000 EUR - - - - Collateral 1'000 EUR - - -
Barclays Bank Plc Wholesale
- Gross exposure of OTC contracts 1'000 EUR - - - - Collateral 1'000 EUR - - -
Citibank N.A.
- Gross exposure of OTC contracts 1'000 EUR 422,529 461,435 529,840
- Collateral 1'000 EUR - - - Goldman Sachs International
- Gross exposure of OTC contracts 1'000 EUR - - - - Collateral 1'000 EUR - - -
HSBC Bank Plc
- Gross exposure of OTC contracts 1'000 EUR - - - - Collateral 1'000 EUR - - -
JPMorgan Chase Bank N.A. London
- Gross exposure of OTC contracts 1'000 EUR - - - - Collateral 1'000 EUR - - -
State Street Bank London
- Gross exposure of OTC contracts 1'000 EUR - - - - Collateral 1'000 EUR - - -

Notes to Financial Statements Semi-Annual report as of 30 June 2019
457
Note 8 OTC derivatives contracts (continued)
Reporting Date: 1 January 2019–30 June 2019 UBS ETF – MSCI Japan UCITS ETF
UBS ETF – MSCI Japan hedged to CHF UCITS
ETF
UBS ETF – MSCI Japan hedged to EUR UCITS
ETF
OTC Derivatives Exposure as of 30 June 2019
OTC Financial Derivative Instrument
- Forward foreign exchange contracts
- Gross exposure 1’000 EUR 60,231 69,388 139,697
- Unrealised gain / (loss) 1’000 EUR 164 1,613 1,898
Counterparty Exposure from OTC Derivatives Bank of America N.A.
- Gross exposure of OTC contracts 1'000 EUR - - - - Collateral 1'000 EUR - - -
Barclays Bank Plc Wholesale
- Gross exposure of OTC contracts 1'000 EUR - - - - Collateral 1'000 EUR - - -
Citibank N.A.
- Gross exposure of OTC contracts 1'000 EUR - - - - Collateral 1'000 EUR - - -
Goldman Sachs International
- Gross exposure of OTC contracts 1'000 EUR - - - - Collateral 1'000 EUR - - -
HSBC Bank Plc
- Gross exposure of OTC contracts 1'000 EUR - - - - Collateral 1'000 EUR - - -
JPMorgan Chase Bank N.A. London
- Gross exposure of OTC contracts 1'000 EUR - - 137,229
- Collateral 1'000 EUR - - - State Street Bank London
- Gross exposure of OTC contracts 1'000 EUR 60,231 69,388 2,468
- Collateral 1'000 EUR - - -
Reporting Date: 1 January 2019–30 June 2019 UBS ETF – MSCI Japan hedged to USD UCITS
ETF
UBS ETF – MSCI Japan Socially Responsible
UCITS ETF
UBS ETF – MSCI Canada UCITS ETF
OTC Derivatives Exposure as of 30 June 2019
OTC Financial Derivative Instrument
- Forward foreign exchange contracts
- Gross exposure 1’000 EUR 54,347 27,649 1,126,750
- Unrealised gain / (loss) 1’000 EUR (294) 311 (10,429)
Counterparty Exposure from OTC Derivatives Bank of America N.A.
- Gross exposure of OTC contracts 1'000 EUR - - - - Collateral 1'000 EUR - - -
Barclays Bank Plc Wholesale
- Gross exposure of OTC contracts 1'000 EUR - - - - Collateral 1'000 EUR - - -
Citibank N.A.
- Gross exposure of OTC contracts 1'000 EUR - - - - Collateral 1'000 EUR - - -
Goldman Sachs International
- Gross exposure of OTC contracts 1'000 EUR - - - - Collateral 1'000 EUR - - -
HSBC Bank Plc
- Gross exposure of OTC contracts 1'000 EUR - - - - Collateral 1'000 EUR - - -
JPMorgan Chase Bank N.A. London
- Gross exposure of OTC contracts 1'000 EUR - - 763,168
- Collateral 1'000 EUR - - - State Street Bank London
- Gross exposure of OTC contracts 1'000 EUR 54,347 27,649 363,582
- Collateral 1'000 EUR - - -
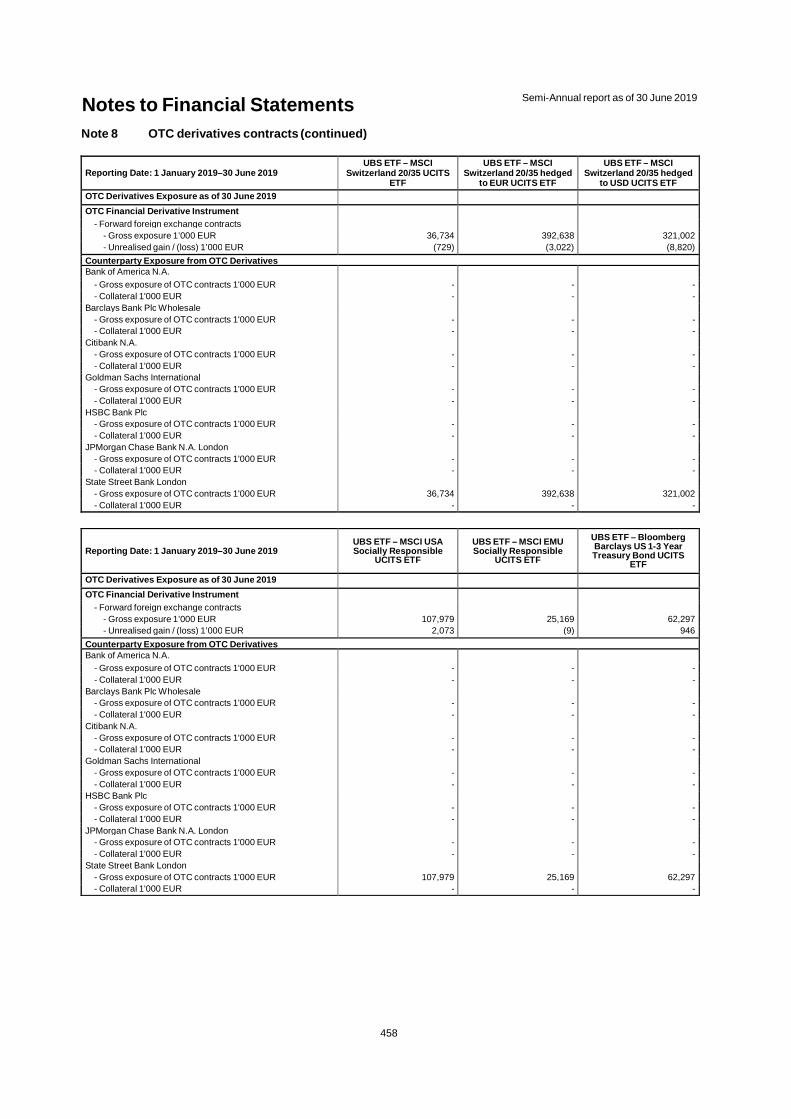
Notes to Financial Statements Semi-Annual report as of 30 June 2019
458
Note 8 OTC derivatives contracts (continued)
Reporting Date: 1 January 2019–30 June 2019 UBS ETF – MSCI
Switzerland 20/35 UCITS ETF
UBS ETF – MSCI Switzerland 20/35 hedged
to EUR UCITS ETF
UBS ETF – MSCI Switzerland 20/35 hedged
to USD UCITS ETF
OTC Derivatives Exposure as of 30 June 2019
OTC Financial Derivative Instrument
- Forward foreign exchange contracts
- Gross exposure 1’000 EUR 36,734 392,638 321,002
- Unrealised gain / (loss) 1’000 EUR (729) (3,022) (8,820)
Counterparty Exposure from OTC Derivatives Bank of America N.A.
- Gross exposure of OTC contracts 1'000 EUR - - - - Collateral 1'000 EUR - - -
Barclays Bank Plc Wholesale
- Gross exposure of OTC contracts 1'000 EUR - - - - Collateral 1'000 EUR - - -
Citibank N.A.
- Gross exposure of OTC contracts 1'000 EUR - - - - Collateral 1'000 EUR - - -
Goldman Sachs International
- Gross exposure of OTC contracts 1'000 EUR - - - - Collateral 1'000 EUR - - -
HSBC Bank Plc
- Gross exposure of OTC contracts 1'000 EUR - - - - Collateral 1'000 EUR - - -
JPMorgan Chase Bank N.A. London
- Gross exposure of OTC contracts 1'000 EUR - - - - Collateral 1'000 EUR - - -
State Street Bank London
- Gross exposure of OTC contracts 1'000 EUR 36,734 392,638 321,002
- Collateral 1'000 EUR - - -
Reporting Date: 1 January 2019–30 June 2019 UBS ETF – MSCI USA Socially Responsible
UCITS ETF
UBS ETF – MSCI EMU Socially Responsible
UCITS ETF
UBS ETF – Bloomberg Barclays US 1-3 Year Treasury Bond UCITS
ETF
OTC Derivatives Exposure as of 30 June 2019
OTC Financial Derivative Instrument
- Forward foreign exchange contracts
- Gross exposure 1’000 EUR 107,979 25,169 62,297
- Unrealised gain / (loss) 1’000 EUR 2,073 (9) 946
Counterparty Exposure from OTC Derivatives Bank of America N.A.
- Gross exposure of OTC contracts 1'000 EUR - - - - Collateral 1'000 EUR - - -
Barclays Bank Plc Wholesale
- Gross exposure of OTC contracts 1'000 EUR - - - - Collateral 1'000 EUR - - -
Citibank N.A.
- Gross exposure of OTC contracts 1'000 EUR - - - - Collateral 1'000 EUR - - -
Goldman Sachs International
- Gross exposure of OTC contracts 1'000 EUR - - - - Collateral 1'000 EUR - - -
HSBC Bank Plc
- Gross exposure of OTC contracts 1'000 EUR - - - - Collateral 1'000 EUR - - -
JPMorgan Chase Bank N.A. London
- Gross exposure of OTC contracts 1'000 EUR - - - - Collateral 1'000 EUR - - -
State Street Bank London
- Gross exposure of OTC contracts 1'000 EUR 107,979 25,169 62,297
- Collateral 1'000 EUR - - -
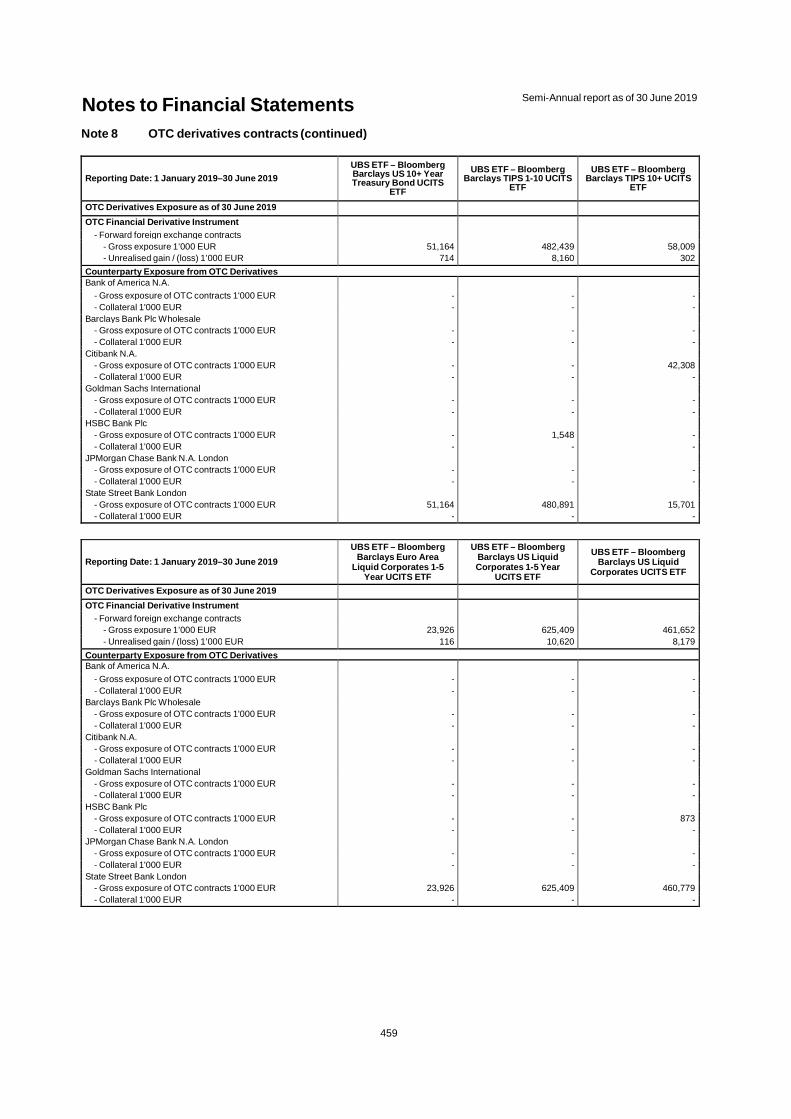
Notes to Financial Statements Semi-Annual report as of 30 June 2019
459
Note 8 OTC derivatives contracts (continued)
Reporting Date: 1 January 2019–30 June 2019
UBS ETF – Bloomberg Barclays US 10+ Year Treasury Bond UCITS
ETF
UBS ETF – Bloomberg Barclays TIPS 1-10 UCITS
ETF
UBS ETF – Bloomberg Barclays TIPS 10+ UCITS
ETF
OTC Derivatives Exposure as of 30 June 2019
OTC Financial Derivative Instrument
- Forward foreign exchange contracts
- Gross exposure 1’000 EUR 51,164 482,439 58,009
- Unrealised gain / (loss) 1’000 EUR 714 8,160 302
Counterparty Exposure from OTC Derivatives Bank of America N.A.
- Gross exposure of OTC contracts 1'000 EUR - - - - Collateral 1'000 EUR - - -
Barclays Bank Plc Wholesale
- Gross exposure of OTC contracts 1'000 EUR - - - - Collateral 1'000 EUR - - -
Citibank N.A.
- Gross exposure of OTC contracts 1'000 EUR - - 42,308
- Collateral 1'000 EUR - - - Goldman Sachs International
- Gross exposure of OTC contracts 1'000 EUR - - - - Collateral 1'000 EUR - - -
HSBC Bank Plc
- Gross exposure of OTC contracts 1'000 EUR - 1,548 - - Collateral 1'000 EUR - - -
JPMorgan Chase Bank N.A. London
- Gross exposure of OTC contracts 1'000 EUR - - - - Collateral 1'000 EUR - - -
State Street Bank London
- Gross exposure of OTC contracts 1'000 EUR 51,164 480,891 15,701
- Collateral 1'000 EUR - - -
Reporting Date: 1 January 2019–30 June 2019
UBS ETF – Bloomberg Barclays Euro Area
Liquid Corporates 1-5 Year UCITS ETF
UBS ETF – Bloomberg Barclays US Liquid Corporates 1-5 Year
UCITS ETF
UBS ETF – Bloomberg Barclays US Liquid
Corporates UCITS ETF
OTC Derivatives Exposure as of 30 June 2019
OTC Financial Derivative Instrument
- Forward foreign exchange contracts
- Gross exposure 1’000 EUR 23,926 625,409 461,652
- Unrealised gain / (loss) 1’000 EUR 116 10,620 8,179
Counterparty Exposure from OTC Derivatives Bank of America N.A.
- Gross exposure of OTC contracts 1'000 EUR - - - - Collateral 1'000 EUR - - -
Barclays Bank Plc Wholesale
- Gross exposure of OTC contracts 1'000 EUR - - - - Collateral 1'000 EUR - - -
Citibank N.A.
- Gross exposure of OTC contracts 1'000 EUR - - - - Collateral 1'000 EUR - - -
Goldman Sachs International
- Gross exposure of OTC contracts 1'000 EUR - - - - Collateral 1'000 EUR - - -
HSBC Bank Plc
- Gross exposure of OTC contracts 1'000 EUR - - 873
- Collateral 1'000 EUR - - - JPMorgan Chase Bank N.A. London
- Gross exposure of OTC contracts 1'000 EUR - - - - Collateral 1'000 EUR - - -
State Street Bank London
- Gross exposure of OTC contracts 1'000 EUR 23,926 625,409 460,779
- Collateral 1'000 EUR - - -
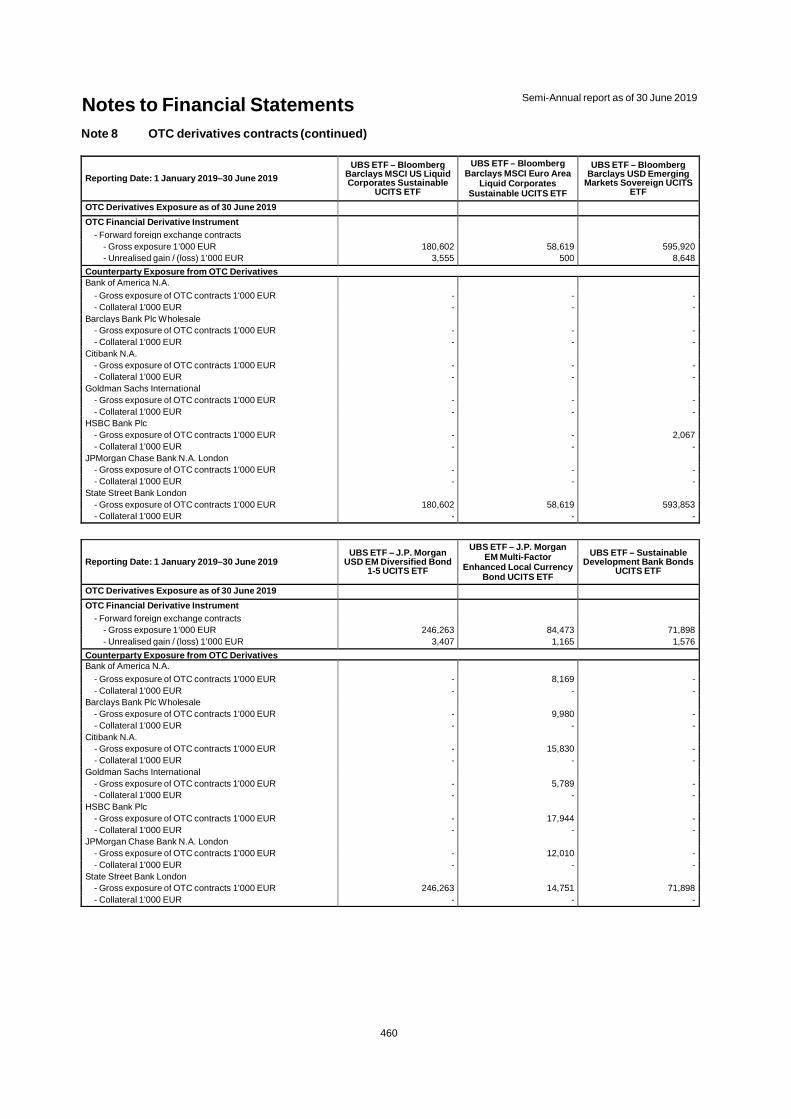
Notes to Financial Statements Semi-Annual report as of 30 June 2019
460
Note 8 OTC derivatives contracts (continued)
Reporting Date: 1 January 2019–30 June 2019
UBS ETF – Bloomberg Barclays MSCI US Liquid Corporates Sustainable
UCITS ETF
UBS ETF – Bloomberg Barclays MSCI Euro Area
Liquid Corporates Sustainable UCITS ETF
UBS ETF – Bloomberg Barclays USD Emerging
Markets Sovereign UCITS ETF
OTC Derivatives Exposure as of 30 June 2019
OTC Financial Derivative Instrument
- Forward foreign exchange contracts
- Gross exposure 1’000 EUR 180,602 58,619 595,920
- Unrealised gain / (loss) 1’000 EUR 3,555 500 8,648
Counterparty Exposure from OTC Derivatives Bank of America N.A.
- Gross exposure of OTC contracts 1'000 EUR - - - - Collateral 1'000 EUR - - -
Barclays Bank Plc Wholesale
- Gross exposure of OTC contracts 1'000 EUR - - - - Collateral 1'000 EUR - - -
Citibank N.A.
- Gross exposure of OTC contracts 1'000 EUR - - - - Collateral 1'000 EUR - - -
Goldman Sachs International
- Gross exposure of OTC contracts 1'000 EUR - - - - Collateral 1'000 EUR - - -
HSBC Bank Plc
- Gross exposure of OTC contracts 1'000 EUR - - 2,067
- Collateral 1'000 EUR - - - JPMorgan Chase Bank N.A. London
- Gross exposure of OTC contracts 1'000 EUR - - - - Collateral 1'000 EUR - - -
State Street Bank London
- Gross exposure of OTC contracts 1'000 EUR 180,602 58,619 593,853
- Collateral 1'000 EUR - - -
Reporting Date: 1 January 2019–30 June 2019 UBS ETF – J.P. Morgan
USD EM Diversified Bond 1-5 UCITS ETF
UBS ETF – J.P. Morgan EM Multi-Factor
Enhanced Local Currency Bond UCITS ETF
UBS ETF – Sustainable Development Bank Bonds
UCITS ETF
OTC Derivatives Exposure as of 30 June 2019
OTC Financial Derivative Instrument
- Forward foreign exchange contracts
- Gross exposure 1’000 EUR 246,263 84,473 71,898
- Unrealised gain / (loss) 1’000 EUR 3,407 1,165 1,576
Counterparty Exposure from OTC Derivatives Bank of America N.A.
- Gross exposure of OTC contracts 1'000 EUR - 8,169 - - Collateral 1'000 EUR - - -
Barclays Bank Plc Wholesale
- Gross exposure of OTC contracts 1'000 EUR - 9,980 - - Collateral 1'000 EUR - - -
Citibank N.A.
- Gross exposure of OTC contracts 1'000 EUR - 15,830 - - Collateral 1'000 EUR - - -
Goldman Sachs International
- Gross exposure of OTC contracts 1'000 EUR - 5,789 - - Collateral 1'000 EUR - - -
HSBC Bank Plc
- Gross exposure of OTC contracts 1'000 EUR - 17,944 - - Collateral 1'000 EUR - - -
JPMorgan Chase Bank N.A. London
- Gross exposure of OTC contracts 1'000 EUR - 12,010 - - Collateral 1'000 EUR - - -
State Street Bank London
- Gross exposure of OTC contracts 1'000 EUR 246,263 14,751 71,898
- Collateral 1'000 EUR - - -
Notes to Financial Statements Semi-Annual report as of 30 June 2019
461
Note 9 Changes in Investment Portfolio
A copy of the list of changes in the portfolio during the reference period may be obtained free of charge at the depositary, at the paying agents and information agent in Germany, at the Swiss representation office in Switzerland as well as at the Austrian representative and French centralizing and financial agent.
Note 10 Fund documentation
Information about UBS ETF and available ETF share classes, the full prospectus as well as the key investor information documents, the latest annual and semi-annual reports, can be obtained free of charge, in English from the Fund Management Company, the Central Administrator, the Depositary, the Funds distributors or online at www.ubs.com/etf or from the German information/paying agent, the Swiss representative or paying agent, the Austrian information/paying agent, or from the French centralizing and financial agent.
Note 11 For German residents only
The Company has appointed UBS Europe SE, Bockenheimer Landstrasse 2-4, D-60306 Frankfurt am Main as paying and information agent in Germany.
Note 12 For Swiss residents only
The Company has appointed UBS Fund Management (Switzerland) AG, Aeschenplatz 6, CH-4052 Basel as representation agent of the Company in Switzerland.
The Company has appointed UBS Switzerland AG, Bahnhofstrasse 45, CH-8098 Zurich and its branches in Switzerland as paying agent of the Company in Switzerland.
The sales prospectus, the KIID, management regulations, annual and semi-annual reports as well as the portfolio movements of the investment fund mentioned in this publication are available free of charge from UBS AG, CH-8001 Zurich and from UBS Fund Management (Switzerland) AG, CH-4052 Basel.
Note 13 For French residents only
The Company has appointed Société Générale S.A., 29, Boulevard Haussmann, F-75009 Paris as centralizing and financial agent in France.
Note 14 For Austrian residents only
The Company has appointed Erste Bank der oesterreichischen Sparkassen AG, Am Belvedere 1, A-1100 Vienna as paying and representation agent in Austria.
Note 15 For Liechtenstein residents only
The Company has appointed Liechtensteinische Landesbank AG, Städte 44, FL-9490 Vaduz as paying agent in Liechtenstein.
Note 16 For Spanish residents only
The Company has appointed UBS Europe SE, 4, Calle Maria de Molina, 3a planta, 28006 Madrid as Spanish information, representation and paying agent.
Note 17 For Portuguese residents only
The Company has appointed Best – Banco Electrónico de Serviço Total, S.A., Praça Marquês de Pombal, 3A - 3º, 1250-161 Lisboa as Representation Agent in Portugal.
Notes to Financial Statements Semi-Annual report as of 30 June 2019
462
Note 18 For UK residents only
The Company has appointed UBS Asset Management (UK) Ltd, 5 Broadgate, EC2M 2QS London as paying agent in the United Kingdom.
Note 19 For Belgian residents only
The Company has appointed BNP Paribas Securities Services S.C.A., Brussels branch, Rue de Loxum, 25, 1000 Brussels as paying agent in Belgium.
Note 20 Commission arrangements
During the period ended 30 June 2019, no commission sharing arrangements (CSAs) were entered into on behalf of UBS ETF.
Note 21 Transaction Fees
Transaction Fees are the brokerage costs and commissions and correspondence fees for transferring securities or investments or other interests.
Note 22 Risk Management
In terms of risk management the Board of Directors of the Management Company decided to adopt the commitment approach as a method of determining the global exposure.
Note 23 Applicable law, place of performance and authoritative language
The Luxembourg District Court is the place of performance for all legal disputes between the shareholders, the Company, the Management Company and the Depositary. Luxembourg law applies. However, in matters concerning the claims of investors from other countries, the Company, Management Company and/or depositary can elect to make themselves subject to the jurisdictions of the countries in which the shares were bought and sold. The English version of the prospectus is the authoritative version. This prospectus may also be translated into other languages. To the extent that there is any inconsistency between the English language prospectus and a version in another language, the English language prospectus will prevail, except, to the extent required by the law of any jurisdiction where the shares are sold.
Note 24 Replication Strategy
Our approach to passive equity investment is to use full replication where possible depending on the characteristics of the benchmark index, the size of portfolio and the client's desired tracking accuracy. In some situations, the portfolio manager may utilize stratified sampling where the portfolio manager deems this to be more efficient.
We typically utilize “stratified sampling” approach for our passive fixed income funds. “Stratified Sampling” is a quantitative based process, bolstered with qualitative input from our portfolio managers, that aims to construct an optimal portfolio that efficiently replicates benchmark risk characteristics with fewer securities that are sufficiently liquid and diversified. However, for certain cases, the optimal portfolio may be achieved by full replication.
In practice, the majority of our Equity ETFs are typically full replication (holding all or virtually all the underlying constituents at weights at or close to the index) and Fixed Income ETFs utilize stratified sampling.
As at 30 June 2019 the following Fixed Income sub-funds utilize full replication:
UBS ETF – Bloomberg Barclays US 1-3 Year Treasury Bond UCITS ETF UBS ETF – Bloomberg Barclays US 7-10 Year Treasury Bond UCITS ETF UBS ETF – Bloomberg Barclays US 10+ UCITS ETF
Notes to Financial Statements Semi-Annual report as of 30 June 2019
463
Note 24 Replication Strategy (continued)
UBS ETF – Bloomberg Barclays TIPS 1-10 UCITS ETF UBS ETF – Bloomberg Barclays TIPS 10+ UCITS ETF UBS ETF – Markit iBoxx € Germany 1-3 UCITS ETF UBS ETF – Bloomberg Barclays Euro Area Liquid Corporates UCITS ETF UBS ETF – Bloomberg Barclays Euro Inflation Linked 10+ UCITS ETF UBS ETF – Bloomberg Barclays Euro Inflation Linked 1-10 UCITS ETF
In emerging markets we may make use of stock substitutions such as Depository Receipts or foreign listings where we deem this to be more efficient.
Note 25 Significant events during the reporting period
Fund Name Change
UBS ETF – Markit iBoxx € Liquid Corporates UCITS Sub-Fund changed its name on 1 April 2019 to UBS ETF – Bloomberg Barclays Euro Area Liquid Corporates UCITS ETF.
Replacement of the Underlying Index
The underlying index of the UBS ETF – Markit iBoxx € Liquid Corporates UCITS ETF Sub-Fund is replaced with the Bloomberg Barclays Euro Area Liquid Corporates index in order to adapt to past and current investor demand. The investment objective of the Sub-Fund is amended accordingly so as to read as follows: "The UBS ETF – Bloomberg Barclays Euro Area Liquid Corporates UCITS ETF sub-fund aims to track, before expenses, the price and income performance of the Bloomberg Barclays Euro Area Liquid Corporates™ Index (Total Return) (this sub-fund's "Index")." Shareholders can find a short comparison of the two indices below.
Current Index (until 1 April 2019)
The Markit iBoxx € Liquid Corporates™ Index is a market capitalization weighted index. The Index represents liquid corporate bonds issued by investment grade companies that are available to investors worldwide. Bonds are screened by age, type and size. Debt issued by financial and non-financial companies is eligible for the Index, which comprises bonds from issuers of different sectors, including such from the financial industry. The issuer domicile is not relevant. The bonds are valued daily based on Bid prices, however on rebalancing new bonds enter the index at the Ask price and they are removed based on the Bid Price. The index is rebalanced on a quarterly basis and may also be rebalanced at other times in order to comply with applicable investment restrictions or to reflect corporate activity such as mergers and acquisitions.
New Index (since 1 April 2019)
The Bloomberg Barclays Euro Area Liquid Corporates™ Index is a market capitalization weighted index. The Index represents liquid corporate bonds, issued by investment grade companies that are available to investors worldwide. Bonds are screened by age, type and size. Debt issued by financial and non-financial companies is eligible for the Index, which comprises bonds from issuers of different sectors, including such from the financial industry. The issuer domicile is relevant and only an issuer from a Euro Zone country, as defined by Bloomberg Indices, issuing in EUR is included. The bonds are valued daily based on Bid prices, however on rebalancing new bonds enter the index at the Ask price and they are removed based on the Bid Price. The index is rebalanced on a monthly basis.
Management Fee Changes
The management fee for UBS ETF – Bloomberg Barclays Euro Area Liquid Corporates UCITS ETF was lowered from 20 bps to 18 bps effective Date 1 April 2019 for the following share class:
LU0721553864: (EUR) A-dis.
Notes to Financial Statements Semi-Annual report as of 30 June 2019
464
Note 25 Significant events during the reporting period (continued)
Legal Name Changes
Effective 17 June 2019 Portfolio Manager of Sub-Funds and Distributor changed their names from UBS AG to UBS Asset Management Switzerland AG.
Note 26 Subsequent events
Potential Implication of Brexit’
Pursuant to the European Referendum Act 2015, a referendum on the United Kingdom’s membership of the EU was held on 23 June 2016 with the majority voting to leave the EU. On 29 March 2017, the UK Government exercised its right under Article 50 of the Treaty of the European Union (“Article 50”) to leave the EU. Unless the UK and EU agree a different date (or the Article 50 notice is withdrawn), the UK is set to formally leave the EU on 29 March 2019. As at the date of this semi-annual report, negotiations between the UK Government and the Governments of the other EU Member States to determine the manner of the UK’s departure from the EU remain ongoing. The EU has published a working draft of the Article 50 withdrawal agreement which provides for a transition period lasting until December 2020 during which EU law would continue to apply to the UK as if it were a member state. However, the Article 50 withdrawal agreement has not yet been fully agreed and there is a risk that the UK will leave the EU without any transitional arrangements in place.
Whilst the medium to long-term consequences of the decision to leave the EU remain uncertain, there could be short-term volatility which could have a negative impact on general economic conditions in the UK and business and consumer confidence in the UK, which may in turn have a negative impact elsewhere in the EU and more widely. The longer-term consequences may be affected by the terms of any future arrangements the UK has with the remaining member states of the EU. Among other things, the UK’s decision to leave the EU could lead to instability in the foreign exchange markets, including volatility in the value of the pound sterling or the euro.
Deteriorating business, consumer or investor confidence could lead to (i) reduced levels of business activity; (ii) higher levels of default rates and impairment; and (iii) mark to market losses in trading portfolios resulting from changes in credit ratings, share prices and solvency of counterparties.
No assurance can be given that such matters would not adversely affect the market value and/or the liquidity of the securities of the Funds in the secondary market and/or the ability of the Funds to satisfy its obligations.
Information of the upcoming State Street merger
As part of an internal restructuring with the aim to streamline State Street’s banking entity structure across Europe, State Street Bank Luxembourg S.C.A. will merge into State Street Bank International GmbH. The date when the merger takes legal effect will be the date on which the local court of Munich registers the merger in the commercial register (the “Merger Date”), which is expected to be on or around 4 November 2019.
As from the Merger Date, State Street Bank International GmbH will continue to carry out the depositary and central administration agent functions through State Street Bank International GmbH, Luxembourg Branch.
As legal successor of State Street Bank Luxembourg S.C.A., State Street Bank International GmbH, Luxembourg Branch will assume the same duties and responsibilities, and have the same rights under the existing agreements with the Fund. Any agreements in place with State Street Bank Luxembourg S.C.A. will be transferred to State Street Bank International GmbH, Luxembourg Branch by operation of law.

Notes to Financial Statements Semi-Annual report as of 30 June 2019
465
Note 26 Subsequent events (continued)
State Street Bank International GmbH, Luxembourg Branch, is supervised by the European Central Bank (ECB), the German Federal Financial Services Supervisory Authority (BaFin) and the German Central Bank and has been authorised to act as depositary and central administration agent by the Commission de Surveillance du Secteur Financier (“CSSF”) in Luxembourg. State Street Bank International GmbH, Luxembourg Branch is registered in the Luxembourg Commercial and Companies’ Register (RCS) under number B 148 186.
Share classes to be launched:
Sub-Funds Share Class Initial Dealing Day
UBS ETF – Bloomberg Barclays Capital US 10-20 Year Treasury Bond
Class (USD) A-dis Not determined
UBS ETF – Bloomberg Barclays Capital US 20+ Year Treasury Bond
Class (EUR) A-dis Not determined
UBS ETF – Markit iBoxx € Germany 10+ Class (EUR) A-dis Not determined
UBS ETF – Markit iBoxx TIPS Inflation-Linked Index 5-10 Class (USD) A-dis Not determined
UBS ETF – Markit iBoxx TIPS Inflation-Linked Index 10+ Class (USD) A-dis Not determined
UBS ETF – Markit iBoxx Sterling Inflation-Linked Index 10+ Class (USD) A-dis Not determined

Appendix I - Supplementary Information
466
Securities Financing Transactions Regulation (Regulation (EU) 2015/2365) (“SFTR”) came into force on 12 January 2016 and, amongst other requirements, introduces new disclosure requirements in the UBS ETF annual and half-yearly reports published after 13 January 2017 detailing the UBS ETF use of securities financing transactions. As a result, additional disclosures have been included in this appendix.
The following table details the value of securities on loan in EUR as a proportion of the Fund’s Net Assets Value, as at 30 June 2019.
Fund Securities on loan % of Net Assets
Securities on loan % of Total Lendable
Securities UBS ETF – EURO STOXX 50 UCITS ETF 3.33 3.33 UBS ETF – MSCI Europe UCITS ETF 4.15 4.15
UBS ETF – MSCI EMU UCITS ETF 3.34 3.38
UBS ETF – MSCI EMU hedged to CHF UCITS ETF 3.87 3.93
UBS ETF – MSCI EMU hedged to USD UCITS ETF 3.62 3.59
UBS ETF – MSCI EMU Select Factor Mix UCITS ETF 0.71 0.71
UBS ETF – MSCI EMU Value UCITS ETF 5.13 5.14
UBS ETF – MSCI EMU Small Cap UCITS ETF 24.37 24.42
UBS ETF – Factor MSCI EMU Low Volatility UCITS ETF 4.12 4.13
UBS ETF – Factor MSCI EMU Total Shareholder Yield UCITS ETF 8.61 8.63
UBS ETF – FTSE 100 UCITS ETF 1.99 2.00
UBS ETF – MSCI United Kingdom UCITS ETF 1.69 1.70
UBS ETF – MSCI United Kingdom hedged to CHF UCITS ETF 1.61 1.65
UBS ETF – MSCI United Kingdom hedged to EUR UCITS ETF 1.23 1.25
UBS ETF – MSCI United Kingdom hedged to USD UCITS ETF 2.12 2.12
UBS ETF – MSCI Japan UCITS ETF 13.12 13.24
UBS ETF – MSCI Japan hedged to CHF UCITS ETF 24.55 25.51
UBS ETF – MSCI Japan hedged to EUR UCITS ETF 18.11 18.60
UBS ETF – MSCI Japan hedged to USD UCITS ETF 22.90 23.06
UBS ETF – MSCI Pacific (ex Japan) UCITS ETF 0.47 0.47
UBS ETF – MSCI USA UCITS ETF 2.34 2.35
UBS ETF – MSCI Canada UCITS ETF 27.25 27.18
UBS ETF – MSCI Switzerland 20/35 UCITS ETF 0.45 0.45
UBS ETF – MSCI Switzerland 20/35 hedged to EUR UCITS ETF 0.98 0.97
UBS ETF – MSCI Switzerland 20/35 hedged to USD UCITS ETF 1.65 1.60
UBS ETF – MSCI World UCITS ETF 6.30 6.31
UBS ETF – MSCI Emerging Markets UCITS ETF 1.25 1.27
For all sub-funds, the maturity tenor of securities on loan is open as there are all equities.
The following table details the value of securities on loan and associated non cash collateral received, analysed by Lending Borrowers, as at 30 June 2019. Please refer to Note 7 for further information on reuse of non-cash collateral received.
No cash is received as collateral in relation to securities lending activities.
The figures are disclosed in EUR which is the base currency of the Company but the currency in which the non-cash collateral is received is always USD.
Counterparty Counterparty's country of incorporation
Securities on loan EUR '000
Non-cash collateral received EUR '000
UBS ETF – EURO STOXX 50 UCITS ETF
BARCLAYS CAPITAL SECURITIES LIMITED United Kingdom 5,617 6,069
JP MORGAN SECURITIES PLC United Kingdom 2,345 2,538
SOCIETE GENERALE SA France 6,262 6,578
Total 14,224 15,185

Appendix I - Supplementary Information (continued)
467
Counterparty Counterparty's country of incorporation
Securities on loan EUR '000
Non-cash collateral received EUR '000
UBS ETF – MSCI Europe UCITS ETF
BANK OF NOVA SCOTIA Canada 360 424
BARCLAYS CAPITAL SECURITIES LIMITED United Kingdom 4,288 4,598
CITIGROUP GLOBAL MARKETS LIMITED United Kingdom 39 41
CREDIT SUISSE SECURITIES (EUROPE) LIMITED United Kingdom 235 236
GOLDMAN SACHS INTERNATIONAL United Kingdom 582 641
JP MORGAN SECURITIES PLC United Kingdom 5,517 5,933
MERRILL LYNCH INTERNATIONAL United Kingdom 203 216
MORGAN STANLEY & CO INTERNATIONAL PLC United Kingdom 949 1,017
SOCIETE GENERALE SA France 1,963 2,073
Total 14,136 15,179
Counterparty Counterparty's country of incorporation
Securities on loan EUR '000
Non-cash collateral received EUR '000
UBS ETF – MSCI EMU UCITS ETF
BANK OF NOVA SCOTIA Canada 3,247 3,818
BARCLAYS CAPITAL SECURITIES LIMITED United Kingdom 46,360 50,026
CREDIT SUISSE SECURITIES (EUROPE) LIMITED United Kingdom 4,548 4,860
GOLDMAN SACHS INTERNATIONAL United Kingdom 1,285 1,427
HSBC BANK PLC United Kingdom 2,706 2,846
MERRILL LYNCH INTERNATIONAL United Kingdom 198 212
MORGAN STANLEY & CO INTERNATIONAL PLC United Kingdom 4,325 4,605
SOCIETE GENERALE SA France 23,389 24,562
Total 86,058 92,356
Counterparty Counterparty's country of incorporation
Securities on loan EUR '000
Non-cash collateral received EUR '000
UBS ETF – MSCI EMU hedged to CHF UCITS ETF
BANK OF NOVA SCOTIA Canada 1,544 1,814
CITIGROUP GLOBAL MARKETS LIMITED United Kingdom 70 74
CREDIT SUISSE SECURITIES (EUROPE) LIMITED United Kingdom 774 849
GOLDMAN SACHS INTERNATIONAL United Kingdom 940 1,051
HSBC BANK PLC United Kingdom 607 638
JP MORGAN SECURITIES PLC United Kingdom 16,094 17,351
MERRILL LYNCH INTERNATIONAL United Kingdom 903 948
MORGAN STANLEY & CO INTERNATIONAL PLC United Kingdom 1,666 1,772
SOCIETE GENERALE SA France 6,898 7,245
Total 29,496 31,742
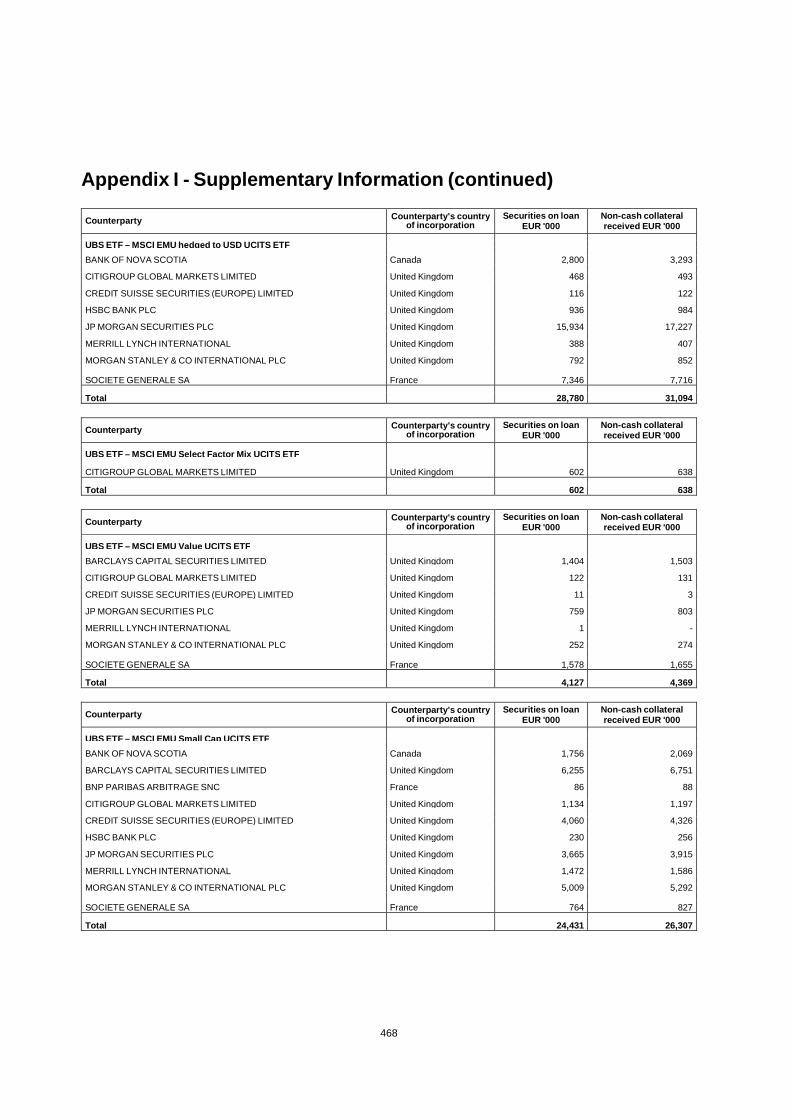
Appendix I - Supplementary Information (continued)
468
Counterparty Counterparty's country of incorporation
Securities on loan EUR '000
Non-cash collateral received EUR '000
UBS ETF – MSCI EMU hedged to USD UCITS ETF
BANK OF NOVA SCOTIA Canada 2,800 3,293
CITIGROUP GLOBAL MARKETS LIMITED United Kingdom 468 493
CREDIT SUISSE SECURITIES (EUROPE) LIMITED United Kingdom 116 122
HSBC BANK PLC United Kingdom 936 984
JP MORGAN SECURITIES PLC United Kingdom 15,934 17,227
MERRILL LYNCH INTERNATIONAL United Kingdom 388 407
MORGAN STANLEY & CO INTERNATIONAL PLC United Kingdom 792 852
SOCIETE GENERALE SA France 7,346 7,716
Total 28,780 31,094
Counterparty Counterparty's country of incorporation
Securities on loan EUR '000
Non-cash collateral received EUR '000
UBS ETF – MSCI EMU Select Factor Mix UCITS ETF
CITIGROUP GLOBAL MARKETS LIMITED United Kingdom 602 638
Total 602 638
Counterparty Counterparty's country of incorporation
Securities on loan EUR '000
Non-cash collateral received EUR '000
UBS ETF – MSCI EMU Value UCITS ETF
BARCLAYS CAPITAL SECURITIES LIMITED United Kingdom 1,404 1,503
CITIGROUP GLOBAL MARKETS LIMITED United Kingdom 122 131
CREDIT SUISSE SECURITIES (EUROPE) LIMITED United Kingdom 11 3
JP MORGAN SECURITIES PLC United Kingdom 759 803
MERRILL LYNCH INTERNATIONAL United Kingdom 1 -
MORGAN STANLEY & CO INTERNATIONAL PLC United Kingdom 252 274
SOCIETE GENERALE SA France 1,578 1,655
Total 4,127 4,369
Counterparty Counterparty's country of incorporation
Securities on loan EUR '000
Non-cash collateral received EUR '000
UBS ETF – MSCI EMU Small Cap UCITS ETF
BANK OF NOVA SCOTIA Canada 1,756 2,069
BARCLAYS CAPITAL SECURITIES LIMITED United Kingdom 6,255 6,751
BNP PARIBAS ARBITRAGE SNC France 86 88
CITIGROUP GLOBAL MARKETS LIMITED United Kingdom 1,134 1,197
CREDIT SUISSE SECURITIES (EUROPE) LIMITED United Kingdom 4,060 4,326
HSBC BANK PLC United Kingdom 230 256
JP MORGAN SECURITIES PLC United Kingdom 3,665 3,915
MERRILL LYNCH INTERNATIONAL United Kingdom 1,472 1,586
MORGAN STANLEY & CO INTERNATIONAL PLC United Kingdom 5,009 5,292
SOCIETE GENERALE SA France 764 827
Total 24,431 26,307
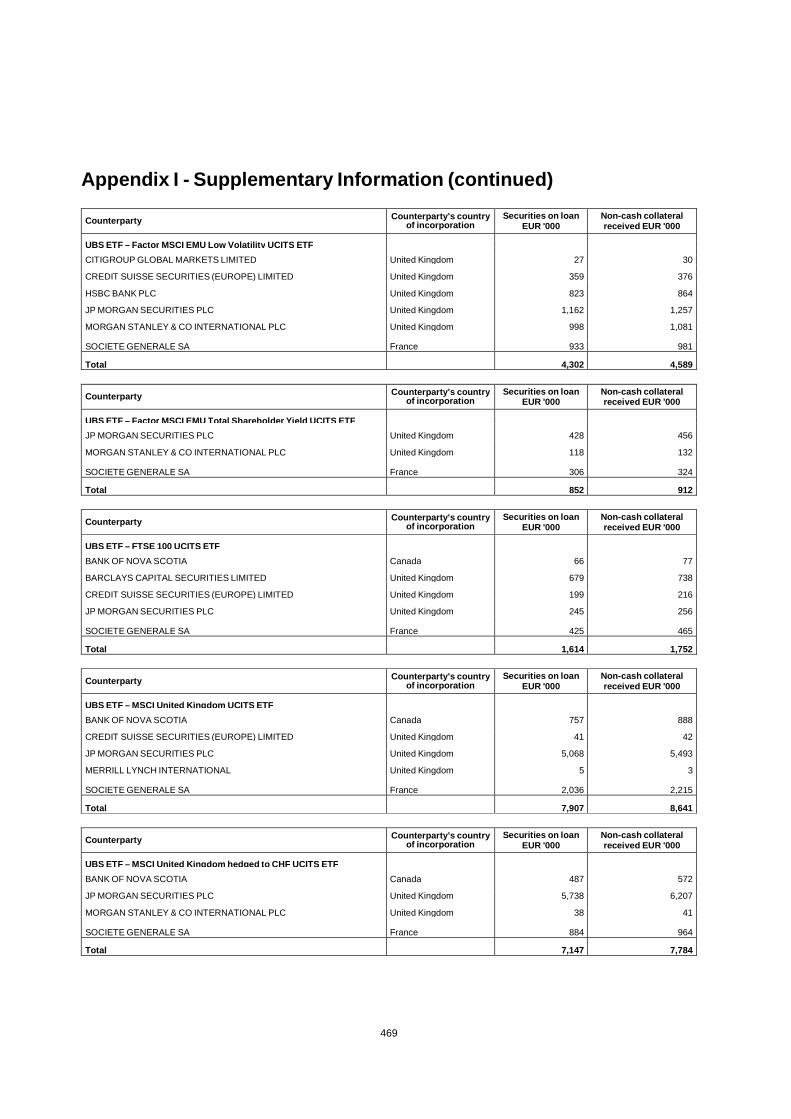
Appendix I - Supplementary Information (continued)
469
Counterparty Counterparty's country of incorporation
Securities on loan EUR '000
Non-cash collateral received EUR '000
UBS ETF – Factor MSCI EMU Low Volatility UCITS ETF
CITIGROUP GLOBAL MARKETS LIMITED United Kingdom 27 30
CREDIT SUISSE SECURITIES (EUROPE) LIMITED United Kingdom 359 376
HSBC BANK PLC United Kingdom 823 864
JP MORGAN SECURITIES PLC United Kingdom 1,162 1,257
MORGAN STANLEY & CO INTERNATIONAL PLC United Kingdom 998 1,081
SOCIETE GENERALE SA France 933 981
Total 4,302 4,589
Counterparty Counterparty's country of incorporation
Securities on loan EUR '000
Non-cash collateral received EUR '000
UBS ETF – Factor MSCI EMU Total Shareholder Yield UCITS ETF
JP MORGAN SECURITIES PLC United Kingdom 428 456
MORGAN STANLEY & CO INTERNATIONAL PLC United Kingdom 118 132
SOCIETE GENERALE SA France 306 324
Total 852 912
Counterparty Counterparty's country of incorporation
Securities on loan EUR '000
Non-cash collateral received EUR '000
UBS ETF – FTSE 100 UCITS ETF
BANK OF NOVA SCOTIA Canada 66 77
BARCLAYS CAPITAL SECURITIES LIMITED United Kingdom 679 738
CREDIT SUISSE SECURITIES (EUROPE) LIMITED United Kingdom 199 216
JP MORGAN SECURITIES PLC United Kingdom 245 256
SOCIETE GENERALE SA France 425 465
Total 1,614 1,752
Counterparty Counterparty's country
of incorporation Securities on loan
EUR '000 Non-cash collateral received EUR '000
UBS ETF – MSCI United Kingdom UCITS ETF
BANK OF NOVA SCOTIA Canada 757 888
CREDIT SUISSE SECURITIES (EUROPE) LIMITED United Kingdom 41 42
JP MORGAN SECURITIES PLC United Kingdom 5,068 5,493
MERRILL LYNCH INTERNATIONAL United Kingdom 5 3
SOCIETE GENERALE SA France 2,036 2,215
Total 7,907 8,641
Counterparty Counterparty's country of incorporation
Securities on loan EUR '000
Non-cash collateral received EUR '000
UBS ETF – MSCI United Kingdom hedged to CHF UCITS ETF
BANK OF NOVA SCOTIA Canada 487 572
JP MORGAN SECURITIES PLC United Kingdom 5,738 6,207
MORGAN STANLEY & CO INTERNATIONAL PLC United Kingdom 38 41
SOCIETE GENERALE SA France 884 964
Total 7,147 7,784
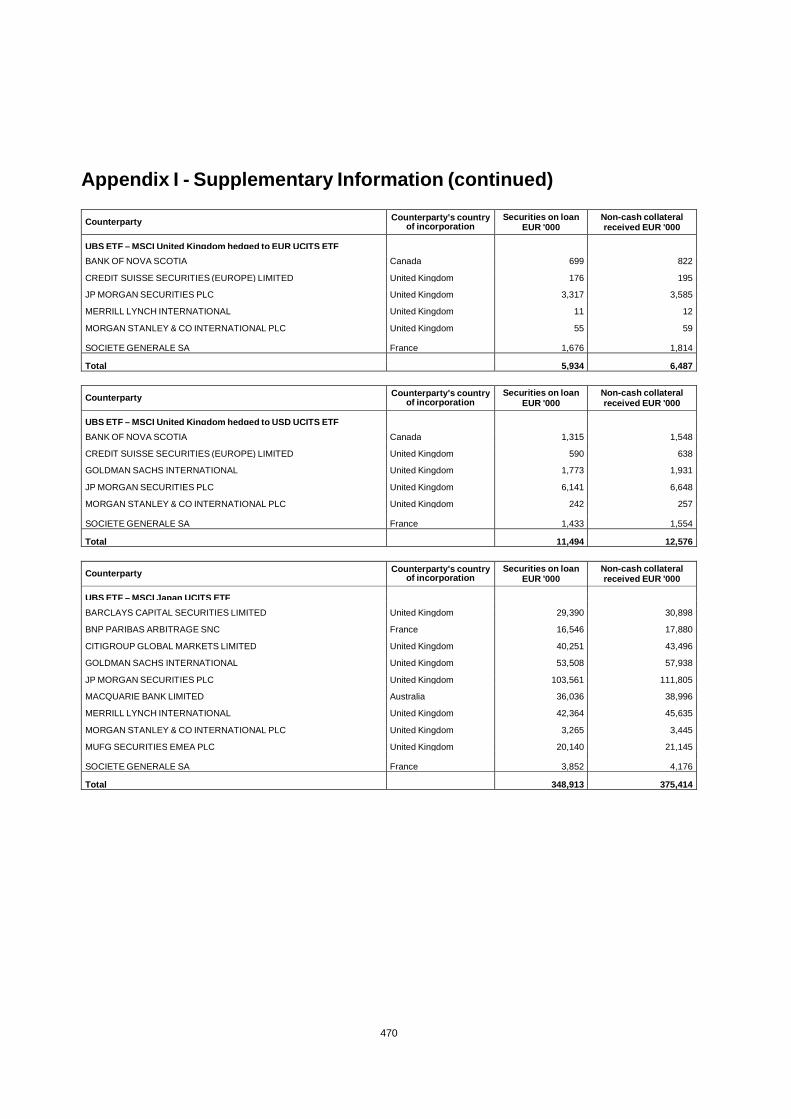
Appendix I - Supplementary Information (continued)
470
Counterparty Counterparty's country of incorporation
Securities on loan EUR '000
Non-cash collateral received EUR '000
UBS ETF – MSCI United Kingdom hedged to EUR UCITS ETF
BANK OF NOVA SCOTIA Canada 699 822
CREDIT SUISSE SECURITIES (EUROPE) LIMITED United Kingdom 176 195
JP MORGAN SECURITIES PLC United Kingdom 3,317 3,585
MERRILL LYNCH INTERNATIONAL United Kingdom 11 12
MORGAN STANLEY & CO INTERNATIONAL PLC United Kingdom 55 59
SOCIETE GENERALE SA France 1,676 1,814
Total 5,934 6,487
Counterparty Counterparty's country
of incorporation Securities on loan
EUR '000 Non-cash collateral received EUR '000
UBS ETF – MSCI United Kingdom hedged to USD UCITS ETF
BANK OF NOVA SCOTIA Canada 1,315 1,548
CREDIT SUISSE SECURITIES (EUROPE) LIMITED United Kingdom 590 638
GOLDMAN SACHS INTERNATIONAL United Kingdom 1,773 1,931
JP MORGAN SECURITIES PLC United Kingdom 6,141 6,648
MORGAN STANLEY & CO INTERNATIONAL PLC United Kingdom 242 257
SOCIETE GENERALE SA France 1,433 1,554
Total 11,494 12,576
Counterparty Counterparty's country of incorporation
Securities on loan EUR '000
Non-cash collateral received EUR '000
UBS ETF – MSCI Japan UCITS ETF
BARCLAYS CAPITAL SECURITIES LIMITED United Kingdom 29,390 30,898
BNP PARIBAS ARBITRAGE SNC France 16,546 17,880
CITIGROUP GLOBAL MARKETS LIMITED United Kingdom 40,251 43,496
GOLDMAN SACHS INTERNATIONAL United Kingdom 53,508 57,938
JP MORGAN SECURITIES PLC United Kingdom 103,561 111,805
MACQUARIE BANK LIMITED Australia 36,036 38,996
MERRILL LYNCH INTERNATIONAL United Kingdom 42,364 45,635
MORGAN STANLEY & CO INTERNATIONAL PLC United Kingdom 3,265 3,445
MUFG SECURITIES EMEA PLC United Kingdom 20,140 21,145
SOCIETE GENERALE SA France 3,852 4,176
Total 348,913 375,414
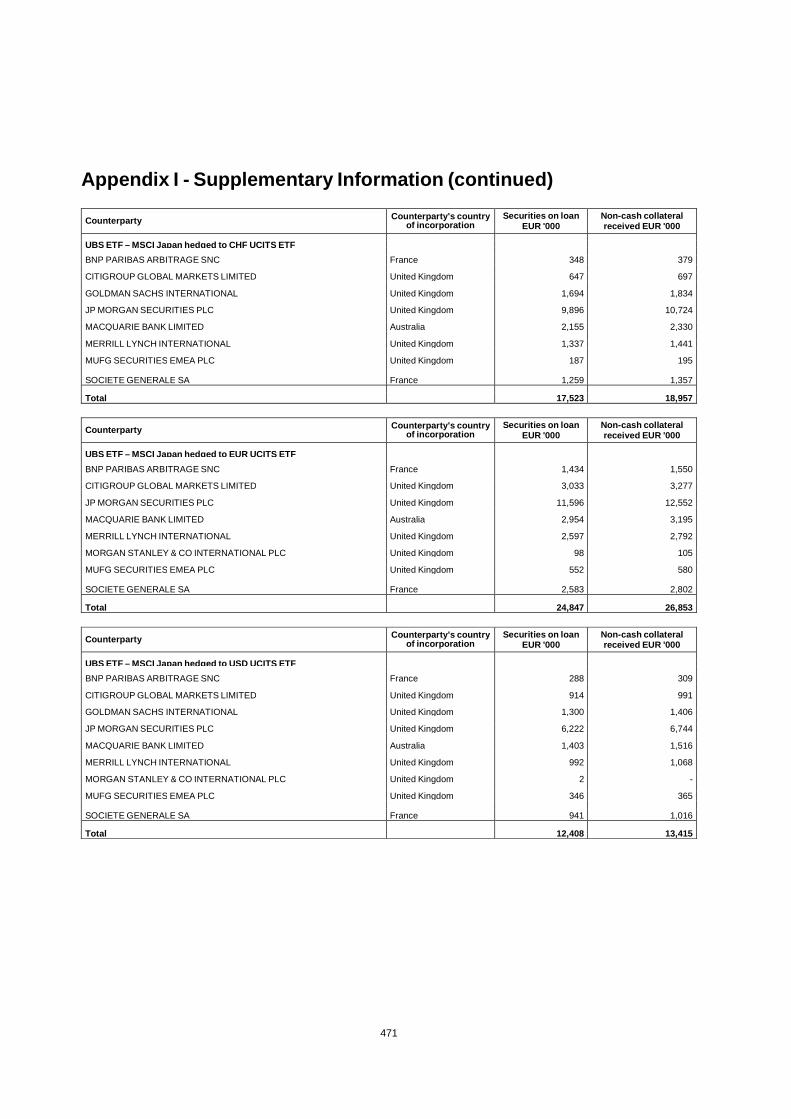
Appendix I - Supplementary Information (continued)
471
Counterparty Counterparty's country of incorporation
Securities on loan EUR '000
Non-cash collateral received EUR '000
UBS ETF – MSCI Japan hedged to CHF UCITS ETF
BNP PARIBAS ARBITRAGE SNC France 348 379
CITIGROUP GLOBAL MARKETS LIMITED United Kingdom 647 697
GOLDMAN SACHS INTERNATIONAL United Kingdom 1,694 1,834
JP MORGAN SECURITIES PLC United Kingdom 9,896 10,724
MACQUARIE BANK LIMITED Australia 2,155 2,330
MERRILL LYNCH INTERNATIONAL United Kingdom 1,337 1,441
MUFG SECURITIES EMEA PLC United Kingdom 187 195
SOCIETE GENERALE SA France 1,259 1,357
Total 17,523 18,957
Counterparty Counterparty's country of incorporation
Securities on loan EUR '000
Non-cash collateral received EUR '000
UBS ETF – MSCI Japan hedged to EUR UCITS ETF
BNP PARIBAS ARBITRAGE SNC France 1,434 1,550
CITIGROUP GLOBAL MARKETS LIMITED United Kingdom 3,033 3,277
JP MORGAN SECURITIES PLC United Kingdom 11,596 12,552
MACQUARIE BANK LIMITED Australia 2,954 3,195
MERRILL LYNCH INTERNATIONAL United Kingdom 2,597 2,792
MORGAN STANLEY & CO INTERNATIONAL PLC United Kingdom 98 105
MUFG SECURITIES EMEA PLC United Kingdom 552 580
SOCIETE GENERALE SA France 2,583 2,802
Total 24,847 26,853
Counterparty Counterparty's country
of incorporation Securities on loan
EUR '000 Non-cash collateral received EUR '000
UBS ETF – MSCI Japan hedged to USD UCITS ETF
BNP PARIBAS ARBITRAGE SNC France 288 309
CITIGROUP GLOBAL MARKETS LIMITED United Kingdom 914 991
GOLDMAN SACHS INTERNATIONAL United Kingdom 1,300 1,406
JP MORGAN SECURITIES PLC United Kingdom 6,222 6,744
MACQUARIE BANK LIMITED Australia 1,403 1,516
MERRILL LYNCH INTERNATIONAL United Kingdom 992 1,068
MORGAN STANLEY & CO INTERNATIONAL PLC United Kingdom 2 -
MUFG SECURITIES EMEA PLC United Kingdom 346 365
SOCIETE GENERALE SA France 941 1,016
Total 12,408 13,415

Appendix I - Supplementary Information (continued)
472
Counterparty Counterparty's country of incorporation
Securities on loan EUR '000
Non-cash collateral received EUR '000
UBS ETF – MSCI Pacific (ex Japan) UCITS ETF
CITIGROUP GLOBAL MARKETS LIMITED United Kingdom 130 141
GOLDMAN SACHS INTERNATIONAL United Kingdom 219 239
MORGAN STANLEY & CO INTERNATIONAL PLC United Kingdom 70 75
SOCIETE GENERALE SA France 294 315
Total 713 770
Counterparty Counterparty's country
of incorporation Securities on loan
EUR '000 Non-cash collateral received EUR '000
UBS ETF – MSCI USA UCITS ETF
BARCLAYS BANK PLC United Kingdom 177 200
CREDIT SUISSE SECURITIES (EUROPE) LIMITED United Kingdom 8,929 10,058
HSBC BANK PLC United Kingdom 420 469
SOCIETE GENERALE SA France 1,970 2,204
Total 11,496 12,931
Counterparty Counterparty's country
of incorporation Securities on loan
EUR '000 Non-cash collateral received EUR '000
UBS ETF – MSCI Canada UCITS ETF
BARCLAYS CAPITAL SECURITIES LIMITED United Kingdom 8,609 9,170
CREDIT SUISSE SECURITIES (EUROPE) LIMITED United Kingdom 16,201 17,463
GOLDMAN SACHS INTERNATIONAL United Kingdom 3,778 4,217
JP MORGAN SECURITIES PLC United Kingdom 172,881 187,082
MERRILL LYNCH INTERNATIONAL United Kingdom 186,084 198,117
MORGAN STANLEY & CO INTERNATIONAL PLC United Kingdom 1,849 1,966
SOCIETE GENERALE SA France 740 776
Total 390,142 418,791
Counterparty Counterparty's country of incorporation
Securities on loan EUR '000
Non-cash collateral received EUR '000
UBS ETF – MSCI Switzerland 20/35 UCITS ETF
JP MORGAN SECURITIES PLC United Kingdom 2,219 2,345
SOCIETE GENERALE SA France 1,584 1,716
Total 3,803 4,061
Counterparty Counterparty's country of incorporation
Securities on loan EUR '000
Non-cash collateral received EUR '000
UBS ETF – MSCI Switzerland 20/35 hedged to EUR UCITS ETF
JP MORGAN SECURITIES PLC United Kingdom 2,935 3,103
MERRILL LYNCH INTERNATIONAL United Kingdom 283 304
SOCIETE GENERALE SA France 704 732
Total 3,922 4,139
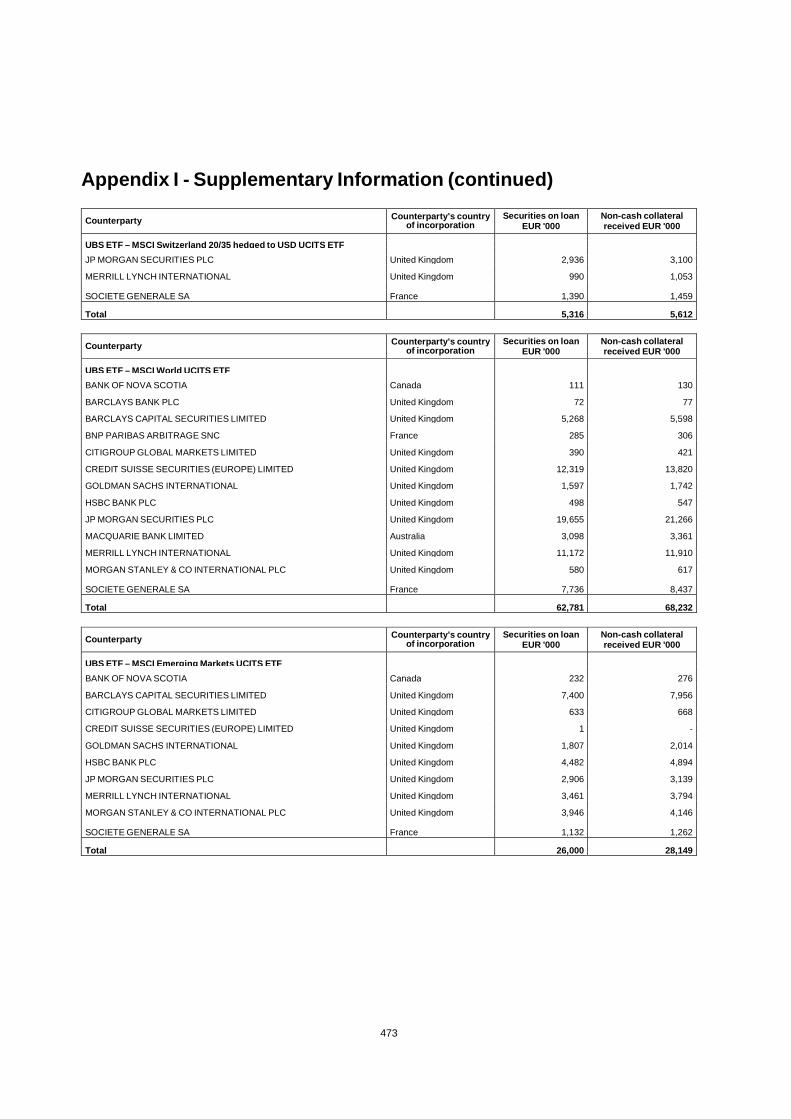
Appendix I - Supplementary Information (continued)
473
Counterparty Counterparty's country of incorporation
Securities on loan EUR '000
Non-cash collateral received EUR '000
UBS ETF – MSCI Switzerland 20/35 hedged to USD UCITS ETF
JP MORGAN SECURITIES PLC United Kingdom 2,936 3,100
MERRILL LYNCH INTERNATIONAL United Kingdom 990 1,053
SOCIETE GENERALE SA France 1,390 1,459
Total 5,316 5,612
Counterparty Counterparty's country of incorporation
Securities on loan EUR '000
Non-cash collateral received EUR '000
UBS ETF – MSCI World UCITS ETF
BANK OF NOVA SCOTIA Canada 111 130
BARCLAYS BANK PLC United Kingdom 72 77
BARCLAYS CAPITAL SECURITIES LIMITED United Kingdom 5,268 5,598
BNP PARIBAS ARBITRAGE SNC France 285 306
CITIGROUP GLOBAL MARKETS LIMITED United Kingdom 390 421
CREDIT SUISSE SECURITIES (EUROPE) LIMITED United Kingdom 12,319 13,820
GOLDMAN SACHS INTERNATIONAL United Kingdom 1,597 1,742
HSBC BANK PLC United Kingdom 498 547
JP MORGAN SECURITIES PLC United Kingdom 19,655 21,266
MACQUARIE BANK LIMITED Australia 3,098 3,361
MERRILL LYNCH INTERNATIONAL United Kingdom 11,172 11,910
MORGAN STANLEY & CO INTERNATIONAL PLC United Kingdom 580 617
SOCIETE GENERALE SA France 7,736 8,437
Total 62,781 68,232
Counterparty Counterparty's country
of incorporation Securities on loan
EUR '000 Non-cash collateral received EUR '000
UBS ETF – MSCI Emerging Markets UCITS ETF
BANK OF NOVA SCOTIA Canada 232 276
BARCLAYS CAPITAL SECURITIES LIMITED United Kingdom 7,400 7,956
CITIGROUP GLOBAL MARKETS LIMITED United Kingdom 633 668
CREDIT SUISSE SECURITIES (EUROPE) LIMITED United Kingdom 1 -
GOLDMAN SACHS INTERNATIONAL United Kingdom 1,807 2,014
HSBC BANK PLC United Kingdom 4,482 4,894
JP MORGAN SECURITIES PLC United Kingdom 2,906 3,139
MERRILL LYNCH INTERNATIONAL United Kingdom 3,461 3,794
MORGAN STANLEY & CO INTERNATIONAL PLC United Kingdom 3,946 4,146
SOCIETE GENERALE SA France 1,132 1,262
Total 26,000 28,149
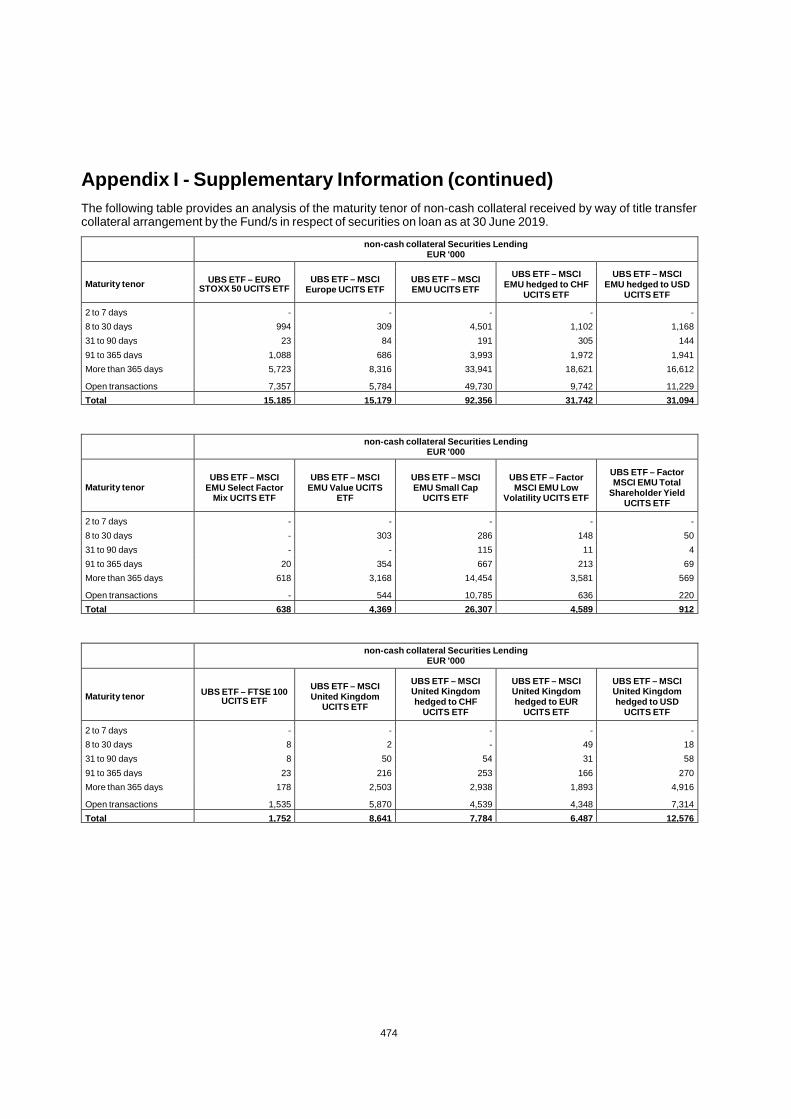
Appendix I - Supplementary Information (continued)
474
The following table provides an analysis of the maturity tenor of non-cash collateral received by way of title transfer collateral arrangement by the Fund/s in respect of securities on loan as at 30 June 2019.
non-cash collateral Securities Lending EUR '000
Maturity tenor UBS ETF – EURO STOXX 50 UCITS ETF
UBS ETF – MSCI Europe UCITS ETF
UBS ETF – MSCI EMU UCITS ETF
UBS ETF – MSCI EMU hedged to CHF
UCITS ETF
UBS ETF – MSCI EMU hedged to USD
UCITS ETF
2 to 7 days - - - - -
8 to 30 days 994 309 4,501 1,102 1,168
31 to 90 days 23 84 191 305 144
91 to 365 days 1,088 686 3,993 1,972 1,941
More than 365 days 5,723 8,316 33,941 18,621 16,612
Open transactions 7,357 5,784 49,730 9,742 11,229
Total 15,185 15,179 92,356 31,742 31,094
non-cash collateral Securities Lending EUR '000
Maturity tenor UBS ETF – MSCI
EMU Select Factor Mix UCITS ETF
UBS ETF – MSCI EMU Value UCITS
ETF
UBS ETF – MSCI EMU Small Cap
UCITS ETF
UBS ETF – Factor MSCI EMU Low
Volatility UCITS ETF
UBS ETF – Factor MSCI EMU Total
Shareholder Yield UCITS ETF
2 to 7 days - - - - -
8 to 30 days - 303 286 148 50
31 to 90 days - - 115 11 4
91 to 365 days 20 354 667 213 69
More than 365 days 618 3,168 14,454 3,581 569
Open transactions - 544 10,785 636 220
Total 638 4,369 26,307 4,589 912
non-cash collateral Securities Lending EUR '000
Maturity tenor UBS ETF – FTSE 100
UCITS ETF
UBS ETF – MSCI United Kingdom
UCITS ETF
UBS ETF – MSCI United Kingdom hedged to CHF
UCITS ETF
UBS ETF – MSCI United Kingdom hedged to EUR
UCITS ETF
UBS ETF – MSCI United Kingdom hedged to USD
UCITS ETF
2 to 7 days - - - - -
8 to 30 days 8 2 - 49 18
31 to 90 days 8 50 54 31 58
91 to 365 days 23 216 253 166 270
More than 365 days 178 2,503 2,938 1,893 4,916
Open transactions 1,535 5,870 4,539 4,348 7,314
Total 1,752 8,641 7,784 6,487 12,576
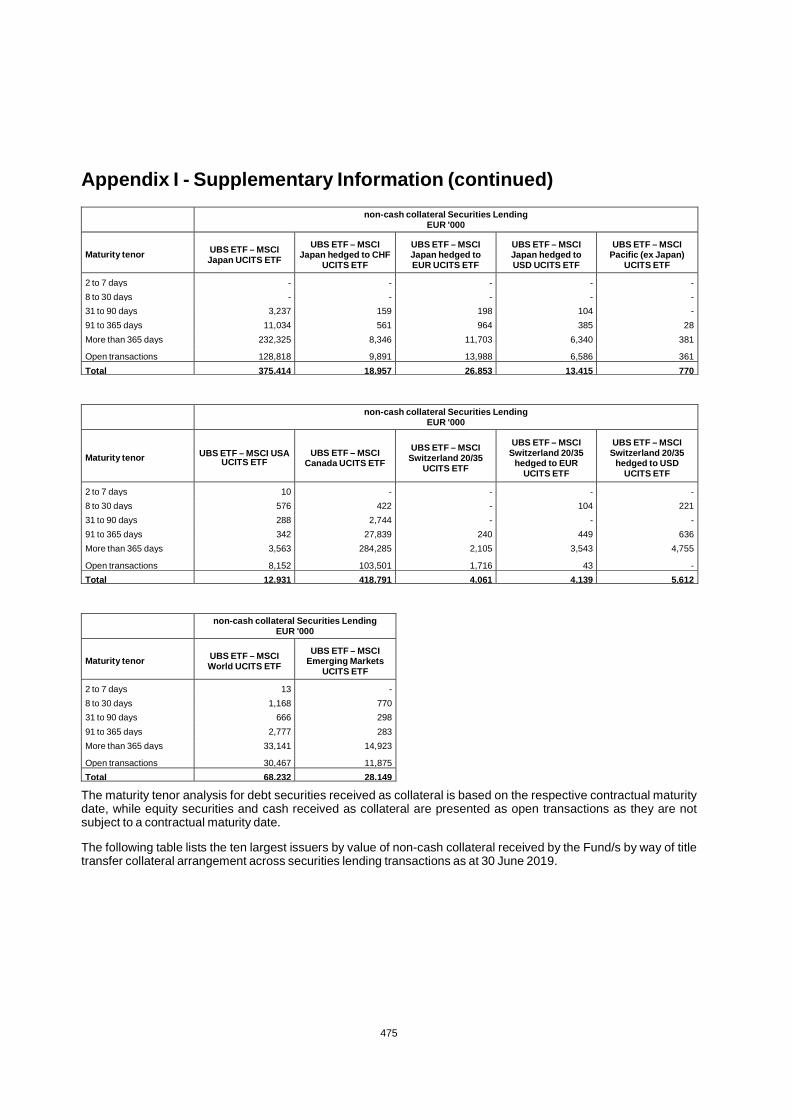
Appendix I - Supplementary Information (continued)
475
non-cash collateral Securities Lending EUR '000
Maturity tenor UBS ETF – MSCI Japan UCITS ETF
UBS ETF – MSCI Japan hedged to CHF
UCITS ETF
UBS ETF – MSCI Japan hedged to EUR UCITS ETF
UBS ETF – MSCI Japan hedged to USD UCITS ETF
UBS ETF – MSCI Pacific (ex Japan)
UCITS ETF
2 to 7 days - - - - -
8 to 30 days - - - - -
31 to 90 days 3,237 159 198 104 -
91 to 365 days 11,034 561 964 385 28
More than 365 days 232,325 8,346 11,703 6,340 381
Open transactions 128,818 9,891 13,988 6,586 361
Total 375,414 18,957 26,853 13,415 770
non-cash collateral Securities Lending EUR '000
Maturity tenor UBS ETF – MSCI USA UCITS ETF
UBS ETF – MSCI Canada UCITS ETF
UBS ETF – MSCI Switzerland 20/35
UCITS ETF
UBS ETF – MSCI Switzerland 20/35
hedged to EUR UCITS ETF
UBS ETF – MSCI Switzerland 20/35
hedged to USD UCITS ETF
2 to 7 days 10 - - - -
8 to 30 days 576 422 - 104 221
31 to 90 days 288 2,744 - - -
91 to 365 days 342 27,839 240 449 636
More than 365 days 3,563 284,285 2,105 3,543 4,755
Open transactions 8,152 103,501 1,716 43 -
Total 12,931 418,791 4,061 4,139 5,612
non-cash collateral Securities Lending EUR '000
Maturity tenor UBS ETF – MSCI World UCITS ETF
UBS ETF – MSCI Emerging Markets
UCITS ETF
2 to 7 days 13 -
8 to 30 days 1,168 770
31 to 90 days 666 298
91 to 365 days 2,777 283
More than 365 days 33,141 14,923
Open transactions 30,467 11,875
Total 68,232 28,149
The maturity tenor analysis for debt securities received as collateral is based on the respective contractual maturity date, while equity securities and cash received as collateral are presented as open transactions as they are not subject to a contractual maturity date.
The following table lists the ten largest issuers by value of non-cash collateral received by the Fund/s by way of title transfer collateral arrangement across securities lending transactions as at 30 June 2019.
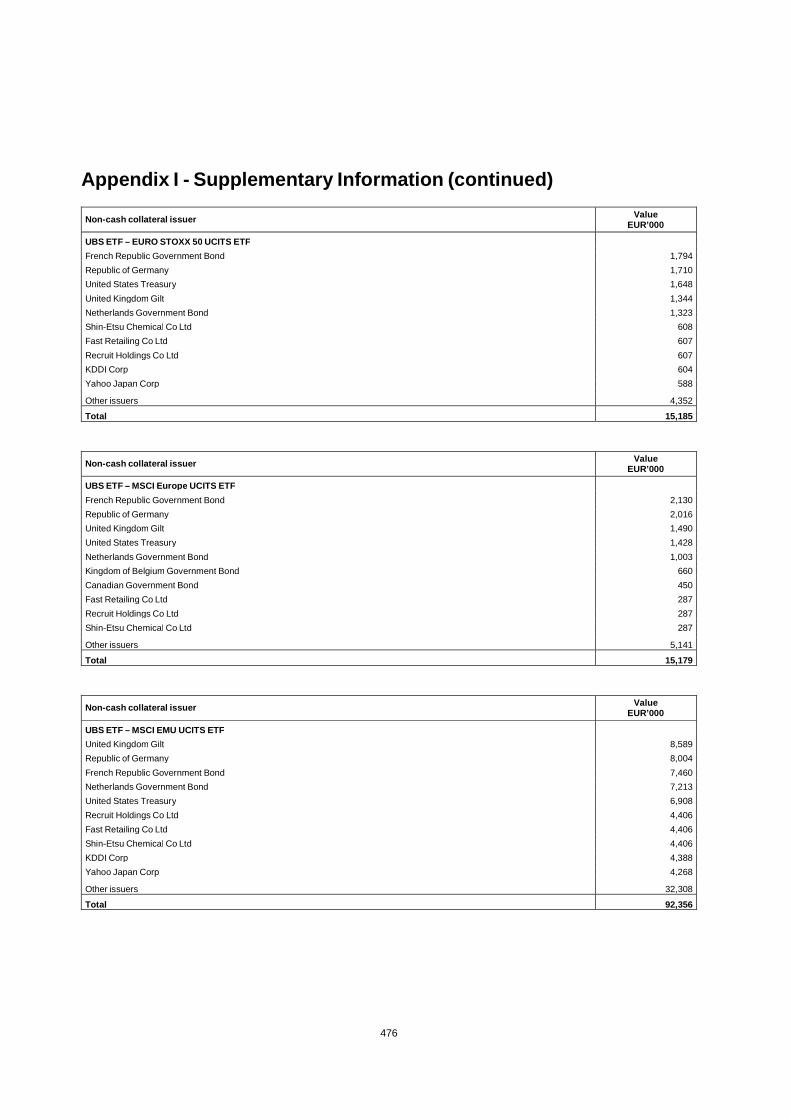
Appendix I - Supplementary Information (continued)
476
Non-cash collateral issuer Value
EUR’000
UBS ETF – EURO STOXX 50 UCITS ETF French Republic Government Bond 1,794
Republic of Germany 1,710
United States Treasury 1,648
United Kingdom Gilt 1,344
Netherlands Government Bond 1,323
Shin-Etsu Chemical Co Ltd 608
Fast Retailing Co Ltd 607
Recruit Holdings Co Ltd 607
KDDI Corp 604
Yahoo Japan Corp 588
Other issuers 4,352
Total 15,185
Non-cash collateral issuer Value
EUR’000
UBS ETF – MSCI Europe UCITS ETF French Republic Government Bond 2,130
Republic of Germany 2,016
United Kingdom Gilt 1,490
United States Treasury 1,428
Netherlands Government Bond 1,003
Kingdom of Belgium Government Bond 660
Canadian Government Bond 450
Fast Retailing Co Ltd 287
Recruit Holdings Co Ltd 287
Shin-Etsu Chemical Co Ltd 287
Other issuers 5,141
Total 15,179
Non-cash collateral issuer Value
EUR’000
UBS ETF – MSCI EMU UCITS ETF United Kingdom Gilt 8,589
Republic of Germany 8,004
French Republic Government Bond 7,460
Netherlands Government Bond 7,213
United States Treasury 6,908
Recruit Holdings Co Ltd 4,406
Fast Retailing Co Ltd 4,406
Shin-Etsu Chemical Co Ltd 4,406
KDDI Corp 4,388
Yahoo Japan Corp 4,268
Other issuers 32,308
Total 92,356
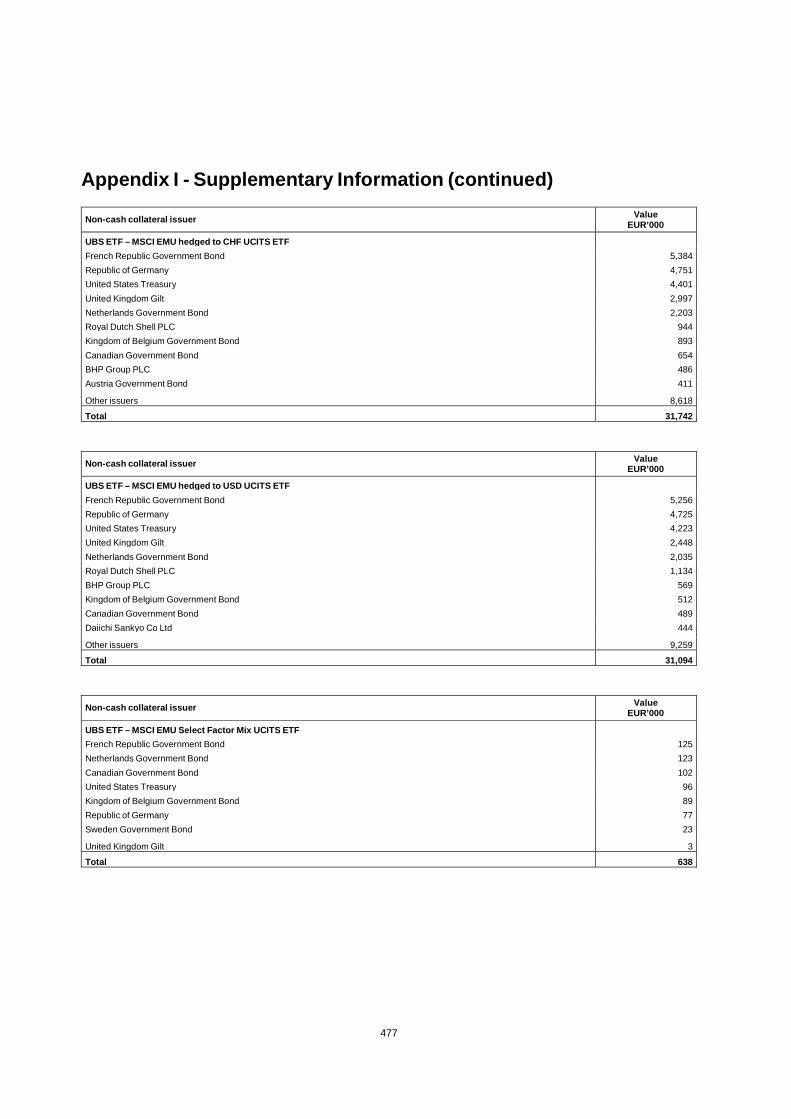
Appendix I - Supplementary Information (continued)
477
Non-cash collateral issuer Value
EUR’000
UBS ETF – MSCI EMU hedged to CHF UCITS ETF French Republic Government Bond 5,384
Republic of Germany 4,751
United States Treasury 4,401
United Kingdom Gilt 2,997
Netherlands Government Bond 2,203
Royal Dutch Shell PLC 944
Kingdom of Belgium Government Bond 893
Canadian Government Bond 654
BHP Group PLC 486
Austria Government Bond 411
Other issuers 8,618
Total 31,742
Non-cash collateral issuer Value
EUR’000
UBS ETF – MSCI EMU hedged to USD UCITS ETF French Republic Government Bond 5,256
Republic of Germany 4,725
United States Treasury 4,223
United Kingdom Gilt 2,448
Netherlands Government Bond 2,035
Royal Dutch Shell PLC 1,134
BHP Group PLC 569
Kingdom of Belgium Government Bond 512
Canadian Government Bond 489
Daiichi Sankyo Co Ltd 444
Other issuers 9,259
Total 31,094
Non-cash collateral issuer Value
EUR’000
UBS ETF – MSCI EMU Select Factor Mix UCITS ETF French Republic Government Bond 125
Netherlands Government Bond 123
Canadian Government Bond 102
United States Treasury 96
Kingdom of Belgium Government Bond 89
Republic of Germany 77
Sweden Government Bond 23
United Kingdom Gilt 3
Total 638
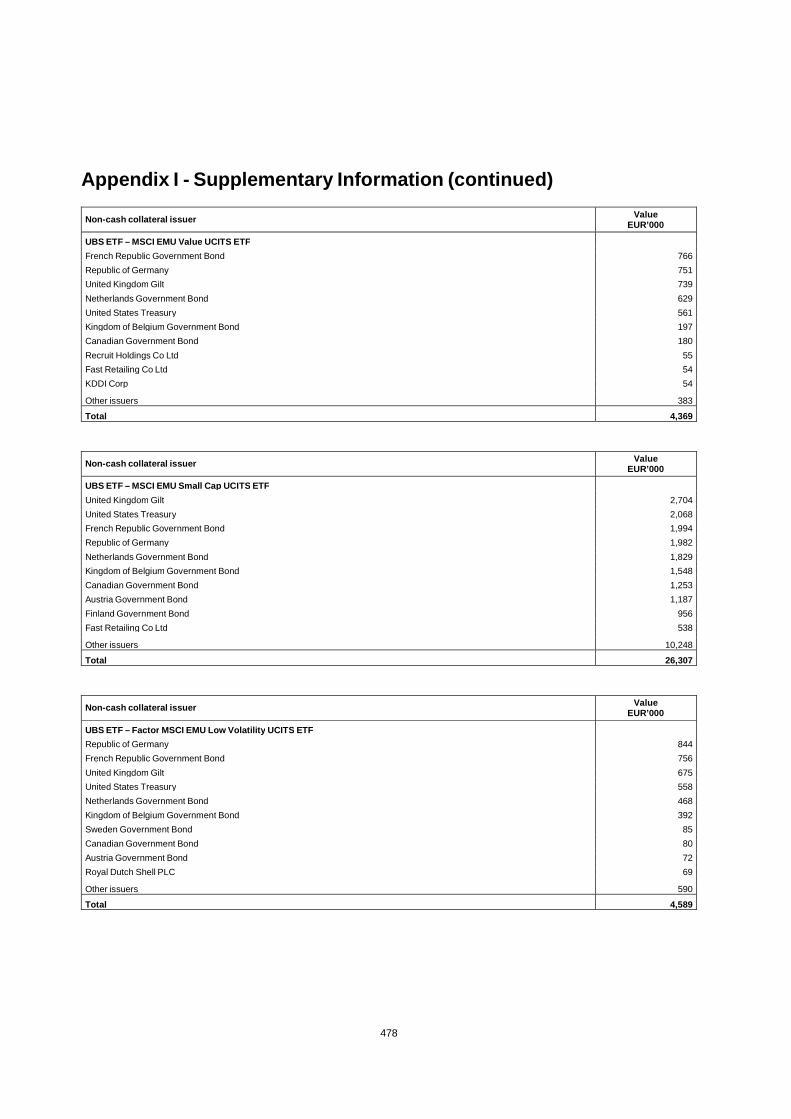
Appendix I - Supplementary Information (continued)
478
Non-cash collateral issuer Value
EUR’000
UBS ETF – MSCI EMU Value UCITS ETF French Republic Government Bond 766
Republic of Germany 751
United Kingdom Gilt 739
Netherlands Government Bond 629
United States Treasury 561
Kingdom of Belgium Government Bond 197
Canadian Government Bond 180
Recruit Holdings Co Ltd 55
Fast Retailing Co Ltd 54
KDDI Corp 54
Other issuers 383
Total 4,369
Non-cash collateral issuer Value
EUR’000
UBS ETF – MSCI EMU Small Cap UCITS ETF United Kingdom Gilt 2,704
United States Treasury 2,068
French Republic Government Bond 1,994
Republic of Germany 1,982
Netherlands Government Bond 1,829
Kingdom of Belgium Government Bond 1,548
Canadian Government Bond 1,253
Austria Government Bond 1,187
Finland Government Bond 956
Fast Retailing Co Ltd 538
Other issuers 10,248
Total 26,307
Non-cash collateral issuer Value
EUR’000
UBS ETF – Factor MSCI EMU Low Volatility UCITS ETF Republic of Germany 844
French Republic Government Bond 756
United Kingdom Gilt 675
United States Treasury 558
Netherlands Government Bond 468
Kingdom of Belgium Government Bond 392
Sweden Government Bond 85
Canadian Government Bond 80
Austria Government Bond 72
Royal Dutch Shell PLC 69
Other issuers 590
Total 4,589
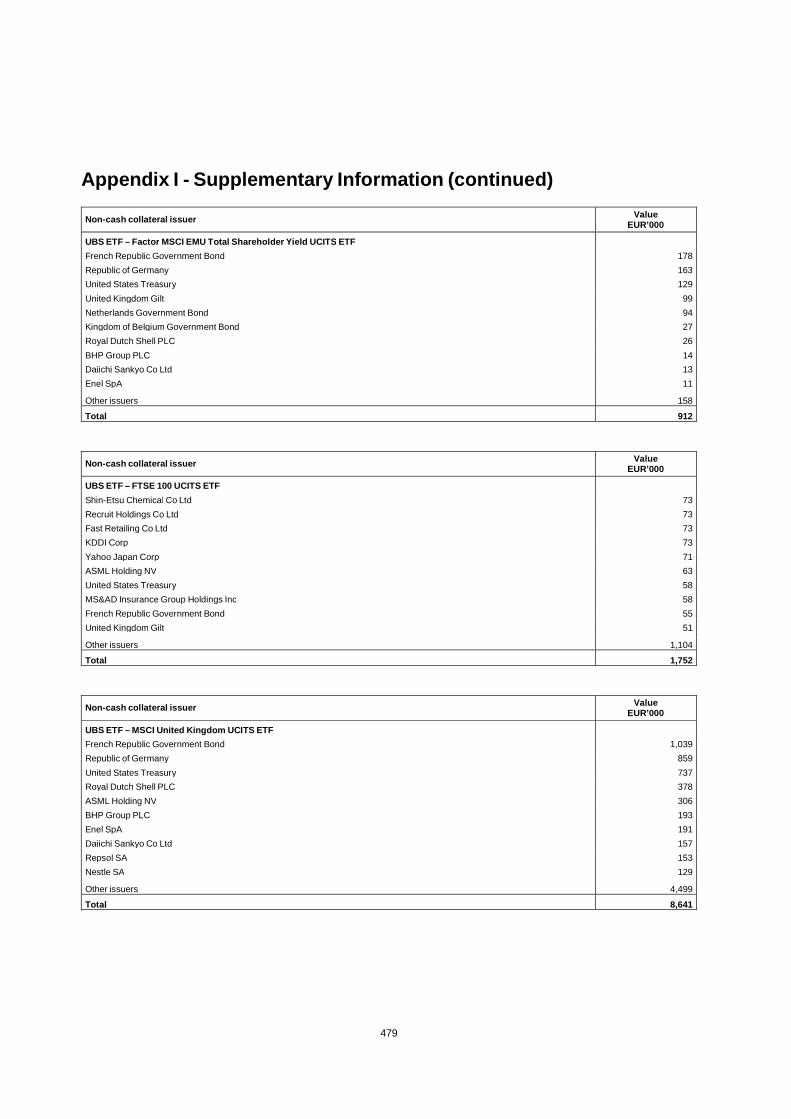
Appendix I - Supplementary Information (continued)
479
Non-cash collateral issuer Value
EUR’000
UBS ETF – Factor MSCI EMU Total Shareholder Yield UCITS ETF French Republic Government Bond 178
Republic of Germany 163
United States Treasury 129
United Kingdom Gilt 99
Netherlands Government Bond 94
Kingdom of Belgium Government Bond 27
Royal Dutch Shell PLC 26
BHP Group PLC 14
Daiichi Sankyo Co Ltd 13
Enel SpA 11
Other issuers 158
Total 912
Non-cash collateral issuer Value
EUR’000
UBS ETF – FTSE 100 UCITS ETF Shin-Etsu Chemical Co Ltd 73
Recruit Holdings Co Ltd 73
Fast Retailing Co Ltd 73
KDDI Corp 73
Yahoo Japan Corp 71
ASML Holding NV 63
United States Treasury 58
MS&AD Insurance Group Holdings Inc 58
French Republic Government Bond 55
United Kingdom Gilt 51
Other issuers 1,104
Total 1,752
Non-cash collateral issuer Value
EUR’000
UBS ETF – MSCI United Kingdom UCITS ETF French Republic Government Bond 1,039
Republic of Germany 859
United States Treasury 737
Royal Dutch Shell PLC 378
ASML Holding NV 306
BHP Group PLC 193
Enel SpA 191
Daiichi Sankyo Co Ltd 157
Repsol SA 153
Nestle SA 129
Other issuers 4,499
Total 8,641
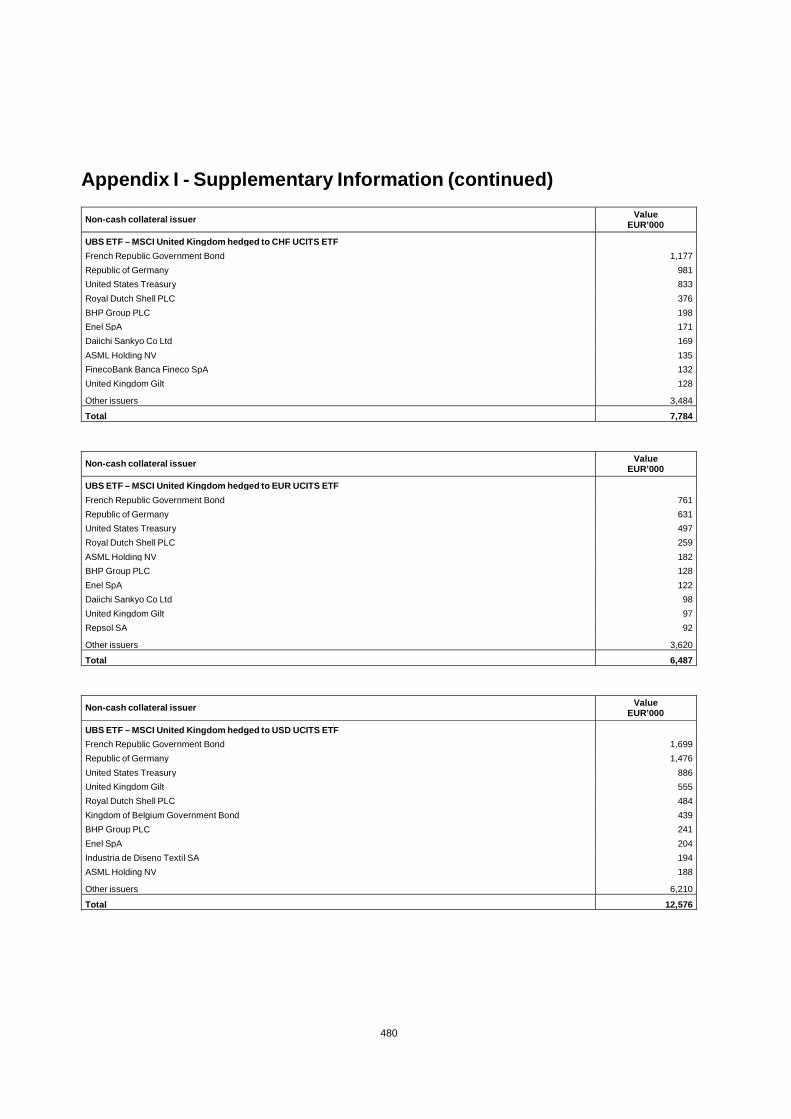
Appendix I - Supplementary Information (continued)
480
Non-cash collateral issuer Value
EUR’000
UBS ETF – MSCI United Kingdom hedged to CHF UCITS ETF French Republic Government Bond 1,177
Republic of Germany 981
United States Treasury 833
Royal Dutch Shell PLC 376
BHP Group PLC 198
Enel SpA 171
Daiichi Sankyo Co Ltd 169
ASML Holding NV 135
FinecoBank Banca Fineco SpA 132
United Kingdom Gilt 128
Other issuers 3,484
Total 7,784
Non-cash collateral issuer Value
EUR’000
UBS ETF – MSCI United Kingdom hedged to EUR UCITS ETF French Republic Government Bond 761
Republic of Germany 631
United States Treasury 497
Royal Dutch Shell PLC 259
ASML Holding NV 182
BHP Group PLC 128
Enel SpA 122
Daiichi Sankyo Co Ltd 98
United Kingdom Gilt 97
Repsol SA 92
Other issuers 3,620
Total 6,487
Non-cash collateral issuer Value
EUR’000
UBS ETF – MSCI United Kingdom hedged to USD UCITS ETF French Republic Government Bond 1,699
Republic of Germany 1,476
United States Treasury 886
United Kingdom Gilt 555
Royal Dutch Shell PLC 484
Kingdom of Belgium Government Bond 439
BHP Group PLC 241
Enel SpA 204
Industria de Diseno Textil SA 194
ASML Holding NV 188
Other issuers 6,210
Total 12,576

Appendix I - Supplementary Information (continued)
481
Non-cash collateral issuer Value
EUR’000
UBS ETF – MSCI Japan UCITS ETF French Republic Government Bond 63,615
Republic of Germany 54,030
Kingdom of Belgium Government Bond 33,556
United States Treasury 28,410
United Kingdom Gilt 27,840
Netherlands Government Bond 23,943
Sweden Government Bond 7,884
Royal Dutch Shell PLC 7,033
Toyota Motor Corp 6,441
CK Hutchison Holdings Ltd 6,154
Other issuers 116,508
Total 375,414
Non-cash collateral issuer Value
EUR’000
UBS ETF – MSCI Japan hedged to CHF UCITS ETF French Republic Government Bond 2,913
Republic of Germany 2,391
United States Treasury 1,805
Kingdom of Belgium Government Bond 675
Royal Dutch Shell PLC 611
United Kingdom Gilt 603
Toyota Motor Corp 386
CK Hutchison Holdings Ltd 368
Netherlands Government Bond 338
BHP Group PLC 313
Other issuers 8,554
Total 18,957
Non-cash collateral issuer Value
EUR’000
UBS ETF – MSCI Japan hedged to EUR UCITS ETF French Republic Government Bond 3,837
Republic of Germany 3,099
United States Treasury 2,374
Netherlands Government Bond 1,072
Kingdom of Belgium Government Bond 1,035
Royal Dutch Shell PLC 807
Sweden Government Bond 589
Toyota Motor Corp 528
CK Hutchison Holdings Ltd 504
United Kingdom Gilt 472
Other issuers 12,536
Total 26,853
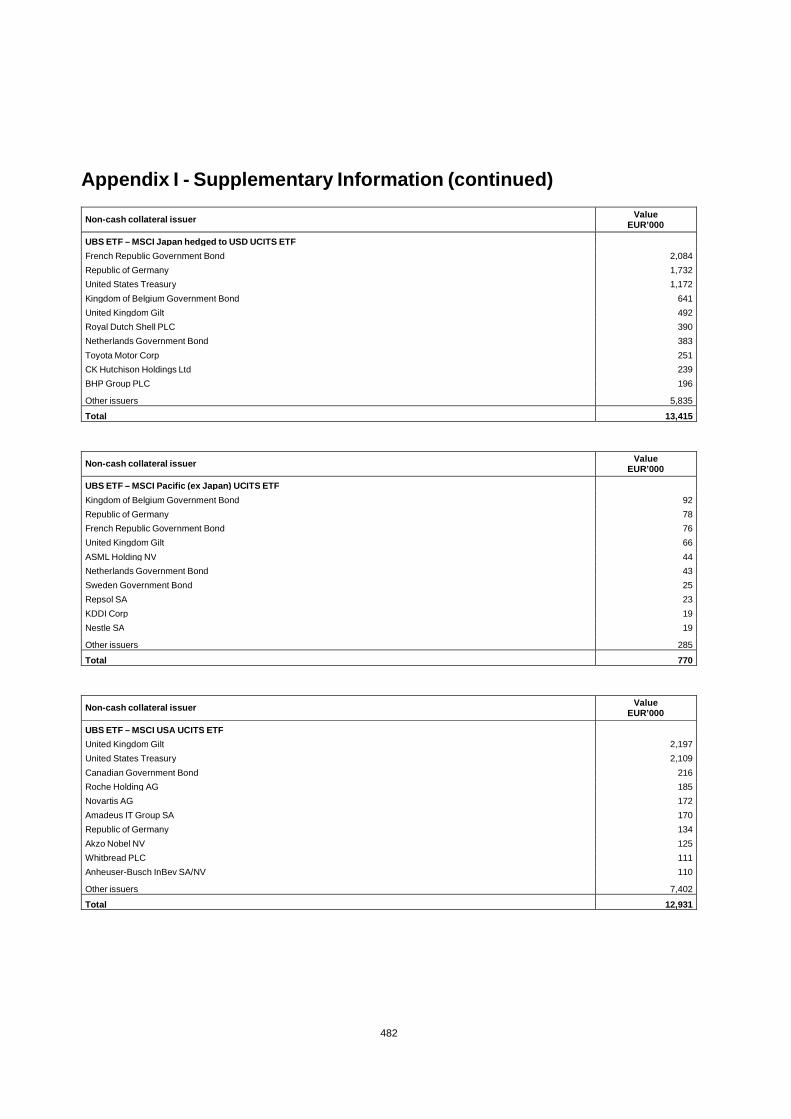
Appendix I - Supplementary Information (continued)
482
Non-cash collateral issuer Value
EUR’000
UBS ETF – MSCI Japan hedged to USD UCITS ETF French Republic Government Bond 2,084
Republic of Germany 1,732
United States Treasury 1,172
Kingdom of Belgium Government Bond 641
United Kingdom Gilt 492
Royal Dutch Shell PLC 390
Netherlands Government Bond 383
Toyota Motor Corp 251
CK Hutchison Holdings Ltd 239
BHP Group PLC 196
Other issuers 5,835
Total 13,415
Non-cash collateral issuer Value
EUR’000
UBS ETF – MSCI Pacific (ex Japan) UCITS ETF Kingdom of Belgium Government Bond 92
Republic of Germany 78
French Republic Government Bond 76
United Kingdom Gilt 66
ASML Holding NV 44
Netherlands Government Bond 43
Sweden Government Bond 25
Repsol SA 23
KDDI Corp 19
Nestle SA 19
Other issuers 285
Total 770
Non-cash collateral issuer Value
EUR’000
UBS ETF – MSCI USA UCITS ETF United Kingdom Gilt 2,197
United States Treasury 2,109
Canadian Government Bond 216
Roche Holding AG 185
Novartis AG 172
Amadeus IT Group SA 170
Republic of Germany 134
Akzo Nobel NV 125
Whitbread PLC 111
Anheuser-Busch InBev SA/NV 110
Other issuers 7,402
Total 12,931
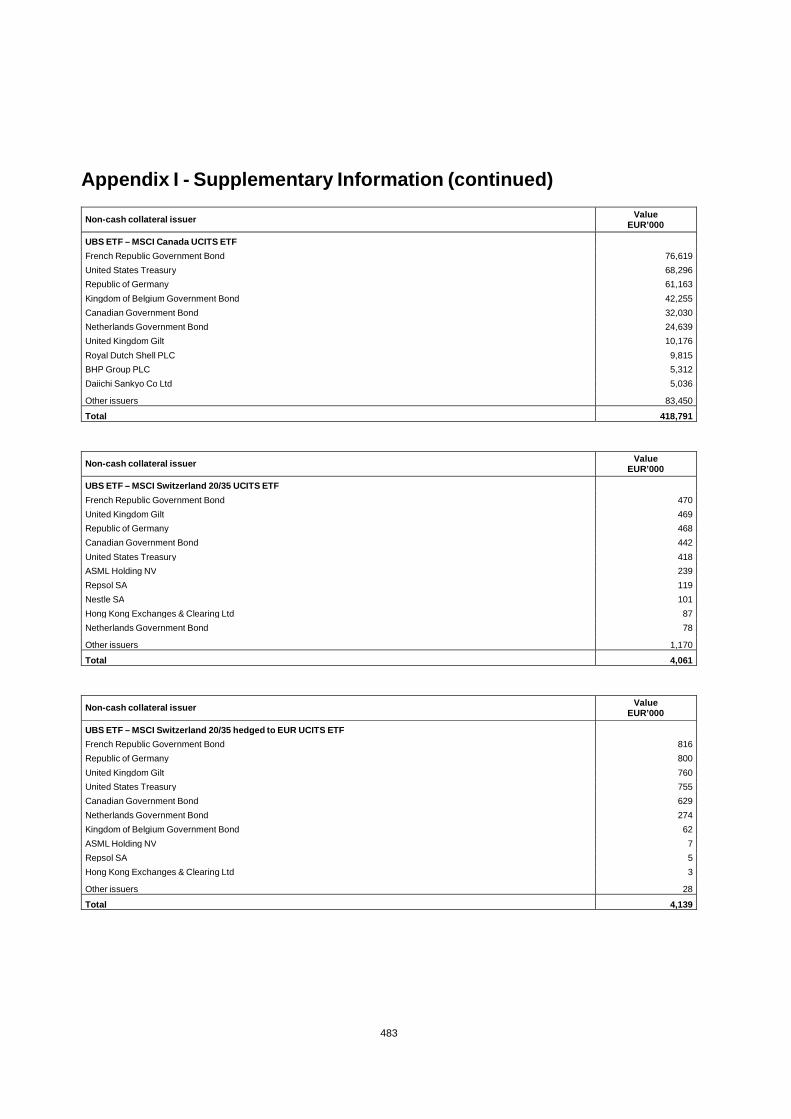
Appendix I - Supplementary Information (continued)
483
Non-cash collateral issuer Value
EUR’000
UBS ETF – MSCI Canada UCITS ETF French Republic Government Bond 76,619
United States Treasury 68,296
Republic of Germany 61,163
Kingdom of Belgium Government Bond 42,255
Canadian Government Bond 32,030
Netherlands Government Bond 24,639
United Kingdom Gilt 10,176
Royal Dutch Shell PLC 9,815
BHP Group PLC 5,312
Daiichi Sankyo Co Ltd 5,036
Other issuers 83,450
Total 418,791
Non-cash collateral issuer Value
EUR’000
UBS ETF – MSCI Switzerland 20/35 UCITS ETF French Republic Government Bond 470
United Kingdom Gilt 469
Republic of Germany 468
Canadian Government Bond 442
United States Treasury 418
ASML Holding NV 239
Repsol SA 119
Nestle SA 101
Hong Kong Exchanges & Clearing Ltd 87
Netherlands Government Bond 78
Other issuers 1,170
Total 4,061
Non-cash collateral issuer Value
EUR’000
UBS ETF – MSCI Switzerland 20/35 hedged to EUR UCITS ETF French Republic Government Bond 816
Republic of Germany 800
United Kingdom Gilt 760
United States Treasury 755
Canadian Government Bond 629
Netherlands Government Bond 274
Kingdom of Belgium Government Bond 62
ASML Holding NV 7
Repsol SA 5
Hong Kong Exchanges & Clearing Ltd 3
Other issuers 28
Total 4,139
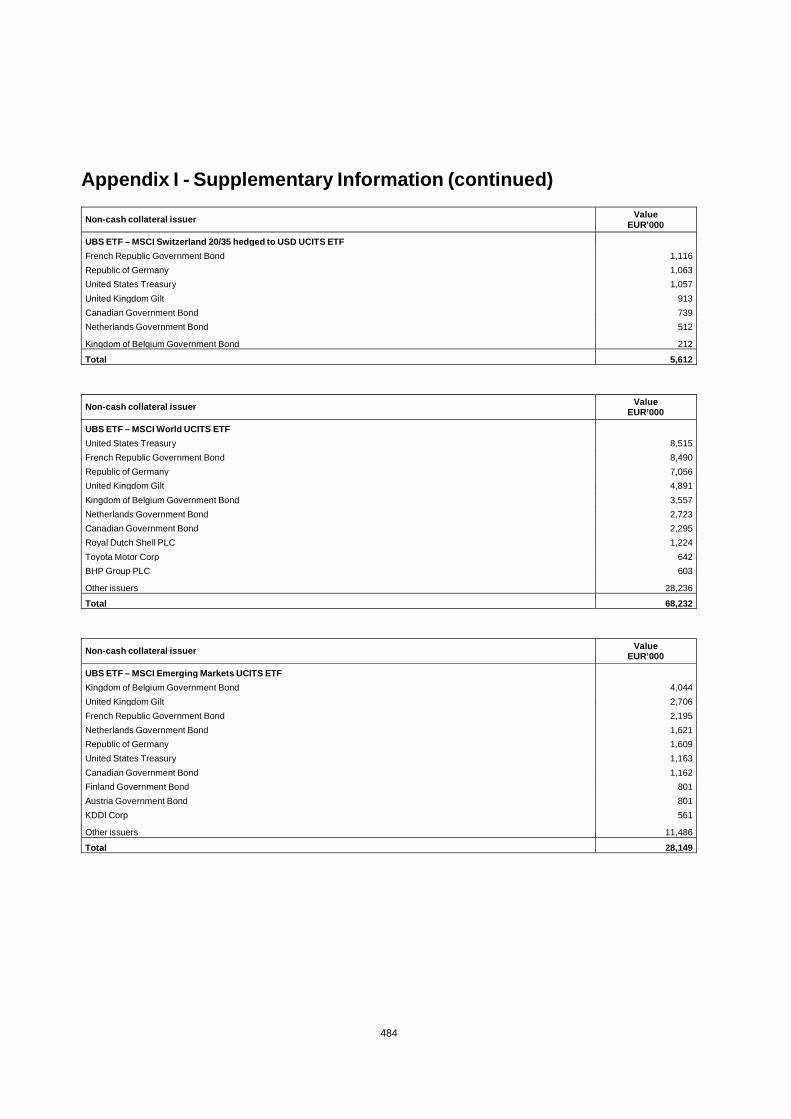
Appendix I - Supplementary Information (continued)
484
Non-cash collateral issuer Value
EUR’000
UBS ETF – MSCI Switzerland 20/35 hedged to USD UCITS ETF French Republic Government Bond 1,116
Republic of Germany 1,063
United States Treasury 1,057
United Kingdom Gilt 913
Canadian Government Bond 739
Netherlands Government Bond 512
Kingdom of Belgium Government Bond 212
Total 5,612
Non-cash collateral issuer Value
EUR’000
UBS ETF – MSCI World UCITS ETF United States Treasury 8,515
French Republic Government Bond 8,490
Republic of Germany 7,056
United Kingdom Gilt 4,891
Kingdom of Belgium Government Bond 3,557
Netherlands Government Bond 2,723
Canadian Government Bond 2,295
Royal Dutch Shell PLC 1,224
Toyota Motor Corp 642
BHP Group PLC 603
Other issuers 28,236
Total 68,232
Non-cash collateral issuer Value
EUR’000
UBS ETF – MSCI Emerging Markets UCITS ETF Kingdom of Belgium Government Bond 4,044
United Kingdom Gilt 2,706
French Republic Government Bond 2,195
Netherlands Government Bond 1,621
Republic of Germany 1,609
United States Treasury 1,163
Canadian Government Bond 1,162
Finland Government Bond 801
Austria Government Bond 801
KDDI Corp 561
Other issuers 11,486
Total 28,149
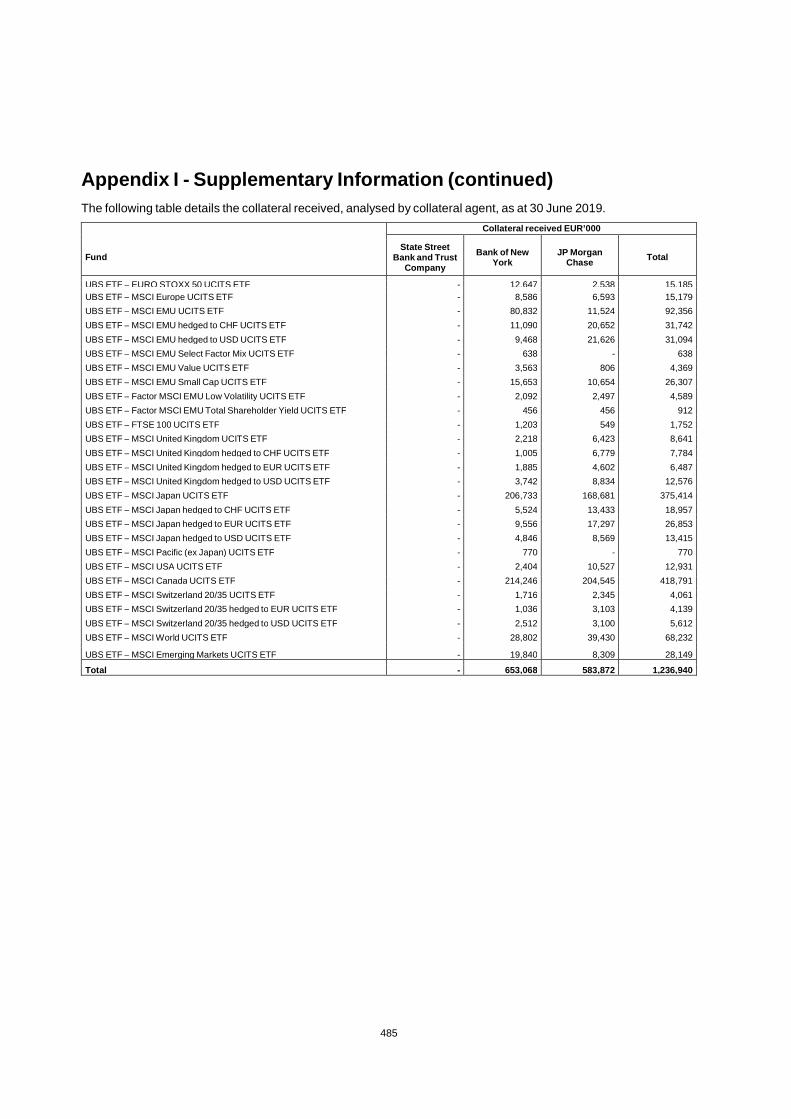
Appendix I - Supplementary Information (continued)
485
The following table details the collateral received, analysed by collateral agent, as at 30 June 2019. Collateral received EUR’000
Fund State Street
Bank and Trust Company
Bank of New York
JP Morgan Chase
Total
UBS ETF – EURO STOXX 50 UCITS ETF - 12,647 2,538 15,185
UBS ETF – MSCI Europe UCITS ETF - 8,586 6,593 15,179
UBS ETF – MSCI EMU UCITS ETF - 80,832 11,524 92,356
UBS ETF – MSCI EMU hedged to CHF UCITS ETF - 11,090 20,652 31,742
UBS ETF – MSCI EMU hedged to USD UCITS ETF - 9,468 21,626 31,094
UBS ETF – MSCI EMU Select Factor Mix UCITS ETF - 638 - 638
UBS ETF – MSCI EMU Value UCITS ETF - 3,563 806 4,369
UBS ETF – MSCI EMU Small Cap UCITS ETF - 15,653 10,654 26,307
UBS ETF – Factor MSCI EMU Low Volatility UCITS ETF - 2,092 2,497 4,589
UBS ETF – Factor MSCI EMU Total Shareholder Yield UCITS ETF - 456 456 912
UBS ETF – FTSE 100 UCITS ETF - 1,203 549 1,752
UBS ETF – MSCI United Kingdom UCITS ETF - 2,218 6,423 8,641
UBS ETF – MSCI United Kingdom hedged to CHF UCITS ETF - 1,005 6,779 7,784
UBS ETF – MSCI United Kingdom hedged to EUR UCITS ETF - 1,885 4,602 6,487
UBS ETF – MSCI United Kingdom hedged to USD UCITS ETF - 3,742 8,834 12,576
UBS ETF – MSCI Japan UCITS ETF - 206,733 168,681 375,414
UBS ETF – MSCI Japan hedged to CHF UCITS ETF - 5,524 13,433 18,957
UBS ETF – MSCI Japan hedged to EUR UCITS ETF - 9,556 17,297 26,853
UBS ETF – MSCI Japan hedged to USD UCITS ETF - 4,846 8,569 13,415
UBS ETF – MSCI Pacific (ex Japan) UCITS ETF - 770 - 770
UBS ETF – MSCI USA UCITS ETF - 2,404 10,527 12,931
UBS ETF – MSCI Canada UCITS ETF - 214,246 204,545 418,791
UBS ETF – MSCI Switzerland 20/35 UCITS ETF - 1,716 2,345 4,061
UBS ETF – MSCI Switzerland 20/35 hedged to EUR UCITS ETF - 1,036 3,103 4,139
UBS ETF – MSCI Switzerland 20/35 hedged to USD UCITS ETF - 2,512 3,100 5,612
UBS ETF – MSCI World UCITS ETF - 28,802 39,430 68,232
UBS ETF – MSCI Emerging Markets UCITS ETF - 19,840 8,309 28,149
Total - 653,068 583,872 1,236,940

Appendix I - Supplementary Information (continued)
486
The Company has collateral both bilaterally (State Street Bank and Trust) and via tri-party agents (Bank of New York and JP Morgan Chase). In the case of Bank of New York and JP Morgan Chase agents, State Street Bank and Trust delegates some collateral management duties to these tri-party agents. In all cases the depository has delegated collateral management duties to State Street Bank and Trust. State Street Bank and Trust are then permitted to further delegate responsibilities to tri-party agents if they see fit.
Related Documents