CHAPTER – 1 INTRODUCTION 1.1 BACKGROUND OF STUDY United Bank of Pakistan is one of the leading and first government recognized bank in Pakistan. Aimed to be the pre-eminent financial institution in Pakistan and achieve market recognition both in the quality and delivery of service as well as the range of product offering. The reason of its development was that the UBL in addition to being a commercial bank in the public sector at a time when all other commercial banks were in the private sector, also came to acquire certain characteristics which to this day set it part from other commercial banks of the country. The establishment of UBL thus signaled the achievement of another milestone in the development of the banking industry in Pakistan. 1.2 OBJECTIVE OF THE STUDY For getting the Master degree of Business Administration, each student is required to spend at least two months as an internee in a recognized organization. The students are required to work in Internship Report on UBL, Main Branch, Bannu 1

Welcome message from author
This document is posted to help you gain knowledge. Please leave a comment to let me know what you think about it! Share it to your friends and learn new things together.
Transcript

CHAPTER – 1
INTRODUCTION
1.1 BACKGROUND OF STUDY
United Bank of Pakistan is one of the leading and first government
recognized bank in Pakistan. Aimed to be the pre-eminent financial institution in
Pakistan and achieve market recognition both in the quality and delivery of service as
well as the range of product offering.
The reason of its development was that the UBL in addition to being a
commercial bank in the public sector at a time when all other commercial
banks were in the private sector, also came to acquire certain characteristics
which to this day set it part from other commercial banks of the country.
The establishment of UBL thus signaled the achievement of another
milestone in the development of the banking industry in Pakistan.
1.2 OBJECTIVE OF THE STUDY
For getting the Master degree of Business Administration, each student
is required to spend at least two months as an internee in a recognized
organization. The students are required to work in their own field in which they
have done their specialization.
Main purpose of this program is to make students familiar with the
practical work, as there is great difference between what they have learnt
during their M.B.A. and how the job is practically done.
Another important aspect of the internship program is that internee is placed in most
of the departments of the organization through job rotation. It provides a glance of
each department, as the period is too short for learning in detail.
Internship Report on UBL, Main Branch, Bannu 1

1.3 SCOPE OF THE STUDY
1. It is a compulsory requirement for the award of Master’s Degree of Business
Administration.
2. It will help the present and prospective students of the department in making
assignments and writing reports on the UBL, evolution of banking, importance
of banking and different operations.
3. It can also provide help to UBL’s management in identifying their Strengths,
Weaknesses, Opportunities and Threats.
4. It can also provide assistance to students seeking financial data for analysis.
1.4 IMPORTANCE OF STUDY
Banks play a central and very important role in the economic life of a
country, that’s why they are considered as the lifeblood of modern economy.
Today no one can deny the importance of banking in the economy. They
facilitate and expedite trade and commerce and provide a variety of services
that one can’t imagine with out banks.
I have chosen the United Bank Limited Pine View Road branch for my
internship because it has all the departments a bank could have.
Besides this, UBL plays an important role in the economic development
of Pakistan.
1.5 RESEARCH METHODOLOGY
The methodology that I adopted for this research project is based on
both the primary as well as secondary data.
The sources of primary data were:
1. Formally arranged interview/ discussions with Management, Director
and Joint Directors.
2. Personal observations.
The sources of secondary data were:
Internship Report on UBL, Main Branch, Bannu 2

1. Annual reports
2. Over view of the UBL
3. Relevant books.
4. The web sit of UBL
During the research project, I observed that enough written material
regarding the Bank is not available, so I had count on my personal observation
and interviews with manager. I spent eight weeks in the local branch and
collected information about different departments of the bank from discussion
and interview with manager, so most of the data of this report is primary .I also
availed assistance from few relevant books.
1.6 LIMITATION OF THE REPORT
There were however some limitations and that is the two months
durations of internship are nothing to gain entire knowledge of banking.
Moreover the bank does not want to provide data particularly about the
rightsizing of employees and stuck-up loans due to various reasons, so the
reader must also keep this in mind.
1.7 SCHEME OF THE REPORT
The report has been divided into ten chapters.
Chapter 1 is about the introduction of the report. In this chapter it is
discussed that how the internship is important and what a student can learn
from it. Light is also thrown on the way in which the research has been
conducted.
Chapter 2 of the report is about evolution of banking. This chapter
contains detailed information that what role the banks play in the economic
development of a country. In this chapter the bank is defined. Growth of the
banking globally as well as in Pakistan is pointed here. As well as it is about
the historical background of UBL. The circumstances in which UBL was
established and its growth is discussed here.
Internship Report on UBL, Main Branch, Bannu 3

Chapter 3: This chapter also gives the information about various
services offered by the UBL.
Chapter 4 of the report is about the organizational structure of UBL.
Hierarchy of staff and various positions of seniority are shown and discussed
through a Chart.
Chapter 5 covers various departments of UBL. Each department is
separately given due consideration. Various functions performed by different
departments are highlighted.
Chapter 6 this chapter is about different banking efforts like commercial,
consumer and corporate banking, throws light on various financial products
UBL offers to its customers.
Chapter 7 of the report consists of SWOT analysis.
Chapter 8 is about Financial statement analysis; analyzed horizontally
and vertically. Also the performance of the bank has been shown through ratio
analysis and trend analysis.
Chapter 9 is consists of Findings and Recommendation of UBL.
Internship Report on UBL, Main Branch, Bannu 4

CHAPTER – 2
EVOLUTION OF BANKING
2.1 INTRODUCTION
The word bank is derived from Latin word “Bancs” or “Banque”, which
means a bench. The explanation of this origin is attributed to the fact that the
Jews in Lombardy transected the business of money exchange on benches in
the market place. When the business failed, the people destroy the bench.
Incidentally the word bankrupt is said to have been evolved from this practice.
The opponents of this opinion argue that if it was so, then how is it that
the Italian money changers were never called Banchierei in the middle ages
Other authorities hold the opinion that Bank is derived from German
word back which mean joint stock fund. Later on, when the German occupied
major part of Italy, the Back was italicized into Bank.
2.2 DEVELOPMENT OF MODERN BANKING
Despite the classical origin, banking in its modern form and structure
started in Britain when many of the Lambordary merchants came to England in
the fourteen century and settled in the part of the London now called Lombard
street.
They were so resourceful that even the kings had to depend on them for
loans despite the fact that the church was firmly against usury. They dealt with
not only keeping the money in safe custody but also changed money for the
travelers or merchants engaged in foreign trade.
The business of changing money was so lucrative that King Edward III
established the office of Royal Exchanger for changing foreign money at a
profit for the benefit of the crown.
The discovery of America brought riches to England and gave a
tremendous boost to foreign trade. The merchants now began to hold part of
Internship Report on UBL, Main Branch, Bannu 5
their riches in cash. These transactions, however, received a big setback in
1640, when King Charles I seized 130,000 Pounds and bullion left for safe
custody with the city merchants at the Royal Mint.
This shook the confidence of the merchants in the Royal Exchanger and
Royal Mint. Consequently this business was taken over by the gold smiths,
who, up to that time, were dealing only in gold and silver. Since these gold
smiths required strong safes for the purpose of their own business, they
introduce necessary facilities of safe keeping of the valuables and the cash of
their customers. These goldsmiths issued receipts or note to their depositors in
respect of the cash or articles left with them. These were called gold smith
notes, and carried an undertaking to return the money and articles to depositors
or bearers on demand. There were a considerable number of such notes on
circulation among various classes of merchants and thus they can be aptly
called Bank Notes in their earliest form.
Over a period of time, these goldsmiths discovered that large sums of
money were left in their custody for long periods. Therefore, they started the
use of this cash to advance loans to other persons for a fixed period of time and
at considerably at a higher rate of interest. Moreover they further encourage
cash deposits by their customers by offering them a part of their profit earned
on the money. Thus began the issue and deposit banking of modern times.
Some of the enterprise goldsmiths issued checkbooks for the attraction of their
customers; and thus another important step in the evolution of banking was
taken.
In 1672, however, English banking faced a great crisis when Charles II
borrowed huge sum of money from the goldsmith bankers formed themselves
into a Corporation in 1695, known as the Bank of England. This bank lent
1,200,000 pounds at 8% interest to William III, who in return, allowed a
number of privileges to the bank, specially the right to issue Notes payable to
bearer on demand unto the amount of this loan. This was known as fiduciary
Internship Report on UBL, Main Branch, Bannu 6

issue, not covered by gold. This new bank became a very serious competitor to
the comparatively smaller private banks run by the London goldsmiths.
By the year 1700, the Bank of England was not only issuing Notes but
also conducting accounts for customers. Being a joint stock bank by charter, its
directors were conducting the business like that of limited companies. The
Bank of England was the only joint stock company which was given the
monopoly of issuing the Bank Notes.
In 1708 the privilege to issue Notes in England was withdrawn from
joint stock banks and confined to the private banks with not more then 6
partners.
Up to 1813 or there about in England, the main profit of banks was
derived from the circulation of notes and for many years after that, deposits
were treated as very minor matters
2.3 GROWTHS AND HISTORY OF UBL
Commercial banks play a role of vital importance in the economic
growth of a country. Banks mobilize idle savings of public and provide finance
to various sectors of economy. In spite of vital importance, there was shortage
of branches of commercial banks in the areas of sub-continents, which now
constitute Pakistan. When Pakistan got independence, there were only 487
branches of commercial banks, which were further reduced to 195 as at
30/09/47 due to shifting of a number of branches to India or U.K. The Reserve
Bank of India, which was made responsible to exercise control over banking
sector in both the dominions, did not perform its duties properly in Pakistan.
The State Bank of Pakistan was established on 01/07/1948. After the
establishment of State Bank of Pakistan, banking expansion got momentum but
real progress was not achieved until 1959, when a dynamic banker Mr. Agha
Hassan Abedi conceived the idea of opening a bank different from others. His
dream was translated into reality on November 07/1959 when first branch of
Internship Report on UBL, Main Branch, Bannu 7
UBL was opened at McLeod Road Karachi (now known as I.I. Chundrigar
Road).
This achievement was secured after passing through many problems and
after completion of a lot of legal formalities. UBL was established on 24-07-59
as a public limited company with registered office at I.I. Chandrigar road
Karachi. The authorized capital was RS. 20,000,000 issued, subscribed and
paid up capital was. RS. 10,000,000 divided into 1,000,000 shares of RS.
10each.
I. LOCATION
WITH an integrated network of over 1000 branches in Pakistan as well
as 15 Overseas branches, UBL gives you direct access to a comprehensive
range of better banking facilities to help you monitor your business locally as
well as internationally.
II. TREASURY
The UBL Treasury & Capital Markets (TCM) has developed a
reputation as a proven market leader in converting innovative ideas into
profitable ventures for the bank and for its customers. Today the UBL TCM is
a frontrunner in providing:
The narrowest bid/ask spreads and the fastest quotes
Dynamic risk-reducing hedging strategies for its customers
The best relationships with institutional, corporate and retail clients Year
2003 was a highly lucrative year for the bank with net profits in excess of PKR
4 billion. Treasury and Capital Markets contributed to over 65% of UBL’s total
returns. This was due to Government Bond Trading, Equity Trading, Structured
Products/Financial Engineering, Corporate Debt trading, and double-Count of
revenues.
Under the new management, the TCM expedited the launch of
Pakistan’s first derivative money market product-the FRA (forward rate
Internship Report on UBL, Main Branch, Bannu 8
agreement) with Quetta Textile Mills Ltd. in August 2003, and has further
closed several similar transactions thereafter.
UBL TCM is a market maker in both the domestic money market as
well as the foreign exchange market. Being one of 11 primary dealers (PD),
UBL has one of the largest balance sheets amongst banks in Pakistan, and
hence our Foreign Exchange Exposure Limit (FEEL), as imposed by the State
Bank of Pakistan, is the highest in the industry.
UBL was the first local bank to establish a Corporate Treasury team in
the Treasury dealing room. The Global Corporate Treasury Business is globally
responsible for sales of all structured and derivative products for UBL. The
bank’s trade volumes and revenues have grown significantly since the
introduction of the corporate treasury business.
Equities are responsible for managing the bank’s trading and badla
portfolio, and to eventually develop a global equity trading activity for UBL.
Structured Products is responsible for developing and packaging plain vanilla
derivatives as well as more exotic customer specific products, and pipeline
products.
The Strategic Planning and Balance Sheet Management responsibilities
include:
Liquidity Management for the domestic balance sheet - This unit is the
focal point for all branch-related liquidity issues and will also be responsible
for day-to-day management of liquidity for UBL.
Overseas Branches Treasury and Capital Markets - we plan to integrate
the treasury activities for all overseas branches, to develop synergies
amongst our various treasuries. As our core business in these markets
continues to develop, we expect significant opportunities to arise in the
trading, funding and gapping areas.
Research - providing market research for internal and external clients in
order to support the sales and trading effort.
Internship Report on UBL, Main Branch, Bannu 9

2.4 THE FIRST BOARD OF GOVERNORS OF UBL CONSISTED OF THE FOLLOWING MEMBERS
TABLE – 1
1 Mr. Ismail Ibrahim Chandrighar Chairman
2 Mr. Muhammad Shafiq Saigol Managing Director
3 Mr. Muhammad Rafiq Saigol Director
4 Mr. M.Bashir saigol Director
5 Mr. A. Razaq Dada Director
6 Mr. Mian M.Yahya Director
7 Mr. M. Saeed Saigol Director
8 Mr. Agha Hassan Abidi Director and General ManagerSource: Hassan Raza, Internship Report on UBL, 2002.
Presently UBL is managed by a board of directors including one
president, 4 directors from UBL, 1 from Pakistan Banking Council and one
from ministry of finance.
The names and designations of present top management include;
TABLE – 2
1 Mr. Shaikh Nahayan Mubarak Al Nahayan Chairman
2 Mr. Afzal H.Mufti Director
3 Mr. Iltaf M. Saleem Director
4 Mr. Iftikhar Allahwala Director
5 Mr. Munnawar Hameed Director
6 Mr. Syed Shamsul Haq Director
7 Mr. Afaq Tiwana Director
8 Mr. Abdul Ghafoor Corporate Secretary
Source: www.ubl.com.pk
Since inception, UBL provides personalized, efficient and courteous
services to its customers and has achieved dynamic progress in a short span of
time. UBL has achieved the distinction of earning profit in very first year of its
operation. UBL also introduced many remunerative schemes for its depositors
and introduced computer services for the first time in the banking history of
Internship Report on UBL, Main Branch, Bannu 10

Pakistan. UBL gives advance finances to small, medium and large industries,
commercial establishments, agriculturists, construction companies and other
needy persons. UBL offers computerized services to intending Hajis free of
cost. UBL collects Electricity, Gas and Telephone bills from public and issues
TV licenses on behalf of Pakistan Television Corporation. It also offers
evening banking and lockers facilities at its selected branches. Over 100
branches deal in foreign exchange where facilities to importers, exporters,
travelers and other persons are being given.
UBL arranges prompt payment of inward remittances. Similarly for
issues of outward remittances minimum time is taken. Other auxiliary services
such as unicorn, inland travelers checks, school banking and collection of
checks and other documentary bills drawn on its station drawees are offered.
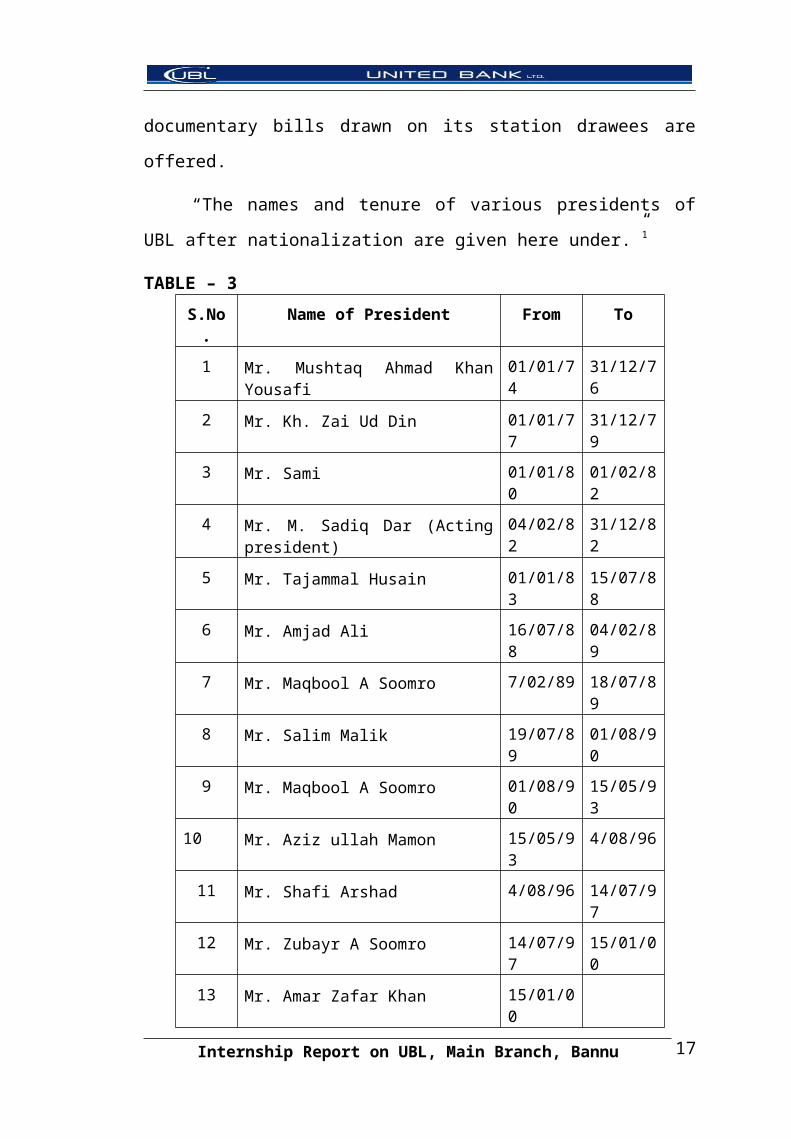
“The names and tenure of various presidents of UBL after
nationalization are given here under.”1
TABLE – 3
S.No. Name of President From To
1 Mr. Mushtaq Ahmad Khan Yousafi 01/01/74 31/12/76
2 Mr. Kh. Zai Ud Din 01/01/77 31/12/79
3 Mr. Sami 01/01/80 01/02/82
4 Mr. M. Sadiq Dar (Acting president) 04/02/82 31/12/82
5 Mr. Tajammal Husain 01/01/83 15/07/88
6 Mr. Amjad Ali 16/07/88 04/02/89
7 Mr. Maqbool A Soomro 7/02/89 18/07/89
8 Mr. Salim Malik 19/07/89 01/08/90
9 Mr. Maqbool A Soomro 01/08/90 15/05/93
10 Mr. Aziz ullah Mamon 15/05/93 4/08/96
11 Mr. Shafi Arshad 4/08/96 14/07/97
12 Mr. Zubayr A Soomro 14/07/97 15/01/00
13 Mr. Amar Zafar Khan 15/01/00
Internship Report on UBL, Main Branch, Bannu 11

2.4 NUMBER OF BRANCHES
UBL has a large network of branches, which extends to the remotest
areas of the country. In December 1983, there were 1417 branches whereas in
1974 it had only 1238 branches and in December 1999 there were 1623
branches and in December 2003 there were 1821 branches. Presently there are
1056 domestic branches and 15 overseas branches.
I. OVERSEAS BRANCHES
UBL, with an integrated network of over 1000 branches globally, with
15 overseas locations, gives their customers direct access to a
comprehensive range of better banking facilities to help them monitor
their business internationally.
They have branches in:
United States of America
Qatar
UAE
United Kingdom
Bahrain
Republic of Yemen
Zurich
Off Shore banking Unit
II. SUBSIDIARIES
UBL has two subsidiaries, namely,
United Bank of Lebanon & Pakistan
United bank A. G. Zurich.
United bank of Lebanon and Pakistan was established in 1968, 1st had a
paid up capital of dollars 379,000, deposits of dollars 125,978, advances
of dollars 1983,313 and six branches as on December 31, 1983.
Internship Report on UBL, Main Branch, Bannu 12

United Bank A.G. Zurich also was established in 1968 and had a paid –
up capital of dollars 2722 thousand, deposits of dollars 5827 thousand
and advances of dollars 5538 thousand as on December 31, 1962.
2.5 JOINT VENTURE
UBL has two ventures, Commercial Bank of Oman limited, established
in 1975. It had a paid up capital of dollars 8,700 million, deposits of dollars
7,333 million, advances of dollars 73.993 million and 11 branches as on
December 31, 1962. And United Saudi Commercial Bank Limited (Saudi
Arabia), established in 1982.
2.6 ROLE OF UBL IN N.W.F.P.
The role of UBL has developed largely; through out the country in very
short period of forty seven years. The bank is operating in the entire country
and has branches all over the country and overseas. In N.W.F.P, UBL is
operating successfully. The number of branches of UBL in Peshawar region is
156 up to dec.2001 i.e. there are total 14 Hub Branches in Peshawar region and
under these Hub branches, there are 142 spokes branches. These 156 branches
come under the Peshawar Region , for which there is a Regional head Quarter
(RHQ) in Peshawar.
The list of hub branches come under the Peshawar Region is as under.
1. Peshawar 6. Haripur 11. Mardan2. Bannu 7. D.I. Khan 12. Swabi3. Mansehra 8. Mingora 13. Kohat4. Timergara 9. Nowshera 14. Abbotabad5. Hangu 10. Bathela
2.7 MISSION STATEMENT OF UBL
“We shall dominate Pakistan’s financial markets and be the leading
bank of Pakistan in term of quality of customer services, assets, profits and
reserves. we shall consistently try to be among banks in the Pakistan.
Comparing over selves to international standards. We shall be a modern
universal bank. Our employees will be efficient, motivated and have corporate
pride”
Internship Report on UBL, Main Branch, Bannu 13
2.8 OBJECTIVES OF UBL
Objectives mean the end towards which an activity is aimed. An
organization without objective is like a person who is wandering with no
purpose. All the activities of an organization are due to its objectives and goals.
And for the attainment of those objectives, various types of financial products
and plans are developed. UBL has also some objectives, which are as under.
To ensure growth and development of the bank.
To use resources of the bank efficiently.
To get more deposits.
To participate in development of the country.
Paying special attention to the areas, which are under developed.
To develop SME’S.
To increase industrialization in the country.
To provide financial help to the farmers.
To provide employment opportunities.
To make people more of mind to have saving habits.
Internship Report on UBL, Main Branch, Bannu 14

REFERENCES
www.ubl.com
Hassan Raza, Internship Report on UBL, 2002.
UBL Annual Report, 2005.
Internship Report on UBL, Main Branch, Bannu 15

CHAPTER – 3
SERVICES OFFERED BY UNITED BANK LIMITED
3.1 CONSUMER BANKING
United Bank limited aspires to be the leading provider of consumer
baking services in the country besides the fact that UBL was the Last entrant in
the consumer products of the new age but Not The Least. The bank’s operating
strategy in this regard has been aligned with the core customer needs of highest
value and expert services. The bankers in general are facing challenging time
today as bankers; as they should be more than just custodians of client’s funds.
Rather they should devise safe and prudent methods of maximizing the returns
on hard earned savings and investments of their customers. These corporate
values are evident in United Bank’s diversified product portfolio which
includes Current a/c, Pls saving, Business Partner a/c, Term Finance
Certificate, UBL Profit certificate of deposit, Monthly income, Foreign
currency a/c, Rupee travelers’ check, Money gram, Safe deposits, Car finance,
Credit card, Personal loans, Housing finance, Business Loans and Running
Finance.
In the arena of consumer banking the bank has carved a niche in the
market place, with products like car finance, rupee travelers’ checks homes and
car loans for U.A.E based non-resident Pakistanis. It has set up strong internal
control mechanisms to monitor and measure risks arising out of consumer
banking products. The bank is developing electronic, automated and
computerized environment to give impetus to their efforts in consumer banking
area.
3.2 CORPORATE BANKING
Systems and operations have to be aligned so that they support the
performance of the Organization’s product offering. Consequently, business
process re-engineering and quality control are on the main maxims of corporate
Internship Report on UBL, Main Branch, Bannu 16
philosophy. United Bank Limited has the Corporate Banking Group (CBG)
which enhanced the image of UBL in the corporate world and also increased
the advances, revenues and profit of the bank to the new heights.
United Bank’s product line-up fulfills and satisfies the banking
requirements of not just the conventional consumer, but the demanding
financial needs of the corporate sector as well. Corporate product includes
current deposits, foreign deposits, over draft, term loans, project financing etc.
The bank is continuously setting new standards of services in the industry and
is becoming reliable financial ally of all the customers.
3.3 INVESTMENT BANKING
Investment Banking Group of UBL (IBG) continues its leadership
position in providing innovative and unique financial solution to its clients by
anticipating their changing requirements and developing new products &
services.
IBG concludes more transactions, both number and volume than any
other local and foreign financial institution, including banks, investment banks,
and brokerage houses.
More specifically, while IBG maintained its leading status in the
traditional business of loan syndication and debt capital markets, major strides
were achieved in the newer value-added business areas of projects and
structured finance, equity & advisory services and private equity solutions.
Nowadays IBG is focusing on the fast emerging Technology, Media and
Telecom sector where it concluded several unique high-profile transactions.
Most significantly UBL is the only major financial institution based in Pakistan
to be engaged by a reputable local group to act as financial advisor for the
cellular license auction bidding in April 2004.
3.4 AUTOMATED BANKING
Technology and automation play a pivotal role in the progressive
development of any organization. It has become impossible to control the
Internship Report on UBL, Main Branch, Bannu 17

operations of a bank effectively in real time situation without the latest
technology. The bank continues to invest heavily into the progressive
automation and computerization of all banking activities. Its aim is to achieve
total connectivity between branches. The objectives are to achieve efficiency in
services and to control costs. UBL has recently installed the New-state-of-the-
art ATM machines in UAE.
United Bank Ltd provides:
ATM/ UBL Wallet Debit Card
Online Banking/ Uni Remote
Telephone banking
UBL Business Partner ( In 500 branches and 250 cities)
3.5 ISLAMIC BANKING
UBL has played an important role in Islamic banking and successful
operation of Non- interest based system of banking.
The interest free banking system was introduced on January I, 1981.
Since then, UBL has played an important role in the successful operation of
this system. For this purpose, it has established a special division, “The Islamic
Banking Cell”.
The sincere efforts of UBL as making Islamic Banking successful is
proved by the fact that it declared the highest rates of profit for PLS deposits
for the first half year of 1983. This has been due to a sound planning of all its
Islamic Banking efforts.
The bank has provided capital to businessmen and industrialists on the
basis of “Mudaraba and Musharika”. Additionally the bank has started interest-
free hire purchase and lease schemes for financing purchase of buses, trucks
and industrial machinery on installments. The bank also provides “Qarz-e-
Hasna” to needy and deserving students.
Internship Report on UBL, Main Branch, Bannu 18

3.6 AGRICULTURE
UBL has contributed in full measures to the development of agriculture.
It has always exceeded, by a considerable margin, the targets given by the State
Bank of Pakistan. UBL has also provided loans for a variety of agricultural
activities including tractors, tube-wells, fertilizers, insecticides, poultry
farming, bio-gas plants etc. The bank officers who are qualified agricultural
graduates not only provide loans at the doorsteps of the farmers, but also render
technical assistance to them. To maintain constant liaison with the farmers, the
bank officers have been provided with motorcycles.
Financing of Small Business to meet the goals of social justice, the bank
has zealously participated in the small loans scheme. It has always tried to
exceed the targets fixed by the state Bank. A full- fledged department catering
to the needs of small businessmen is functioning. To improve its operations, the
bank has made arrangements for overseas training of its staff.
The bank is also participating in the dollars 30 million IDA credit,
which will be provided to small industrialists.
For training its staff, a staff collage was established at Karachi in 1994.
Now there are three such colleges at Karachi, Lahore and Rawalpindi, where
the officers and staff are provided extensive training. Furthermore for training
senior officers, a UBL school of Banking has been set up at Karachi. Senior
bankers and management experts provide training to the executives and senior
officers of the bank.
3.7 RESEARCH DEPARTMENT
UBL was the first commercial bank in the private sector to establish a
full- fledged Research Department. Prominent economists of the country have
been acclaimed both at home and abroad. Not only does this research provides
useful and cogent studies of economic development in Pakistan and abroad, it
also assists in the managerial decision making process.
Internship Report on UBL, Main Branch, Bannu 19
The Research Department is publishing “Economic Matters” every
month since 1967. It was recently upgraded to “UBL Economic Journal”. In
addition, the department also brings out the “UBL Home Journal”.
3.8 COMPUTER SERVICES
UBL was the first bank to introduce computers. The Computer Division
was established in 1968. Presently, UBL has Computer Department at Karachi,
Lahore and Rawalpindi. Many branches have been fully equipped with
computers. The Computer Division prepares weekly, monthly, quarterly, bi-
annual and annual reports for top services to many Government, Semi
Government and private institutions.
3.9 SERVICE TO HAJJIS
For providing prompt and efficient services to the intending Hajis who
come to UBL every year, the bank has introduced the most modern system of
electronic banking which permits all formalities to be completed within a short
time. This year 2005, UBL received the greatest number of applications from
customers for Hajj, which shows the customers faith in UBL.
3.10 AUXILIARY BANKING SERVICE
Bank provides a number of auxiliary services such as credit cards,
travelers checks and school banking.
3.11 COLLECTION OF UTILITY BILLS
UBL also collects electricity, gas, and telephone bills from the public on
behalf of the respective organizations. The bank also introduced the bills
collection facilities in selected branches in the evening hours for the
convenience of general public. And now selected UBL branches are collecting
the utility bills through online banking.
3.12 ISSUANCE OF TV LICENSE
UBL also collects TV License fee on behalf of Pakistan Television
Corporation and issues TV Licenses to the general public.
Internship Report on UBL, Main Branch, Bannu 20

Sports
UBL was one of the first banks to patronize sports. Senior executives at
the highest level supervise the sports activities.
The bank has established a special department to organize its various
sports activities. It has provided patronage to leading sportsmen. Many
outstanding players and national players have been included in its teams.
The bank has won United States of America trophies in hockey, cricket,
badminton, table tennis, rifle shooting, etc.
Development of Data Base Management System (DBMS)
United bank is the only bank in Pakistan, which is making use of its own
data base management system (DBMS) since 1971. The VIS was used
in the three main branches of Karachi. After years of deducted efforts on
its work, it succeeded in loping UNI Bank Plus.
Internship Report on UBL, Main Branch, Bannu 21
CHAPTER – 4
ORGANIZATIONAL STRUCTURE
Organizational structure of a firm provides boundaries for authority of
persons and clarifies individual responsibility and authority. It shows who is
responsible to whom, and who has the authority to give orders to someone. An
organization having dual authority or vague structure would not have clear
direction and will face hurdles in getting its goals and objectives. Therefore, it
is very important for any organization to have a well-established structure of
responsibility and authority. An organization structure should be so designated
to clarify the environment so that everyone knows his duty and who is
responsible for what. It results to remove obstacle to performance caused by
confusion and uncertainty of tasks and to furnish a decision making
communication network reflecting and supporting enterprise objectives.
4.1 UBL ORGANIZATIONAL STRUCTURE:
UBL also has a well defined formal organizational structure. UBL is a
very vast organization. In the organization set up of UBL, the highest authority
rests with Board of Directors which consists of Chairman, Deputy Chairman,
President & CEO and the directors. In which four directors are from UBL, one
from Pakistan Banking Council, one from Ministry of Finance and one who is
also the secretary of the board. So the Board of Directors is an eight member
team, and is responsible for policy formulation and making important strategic
decisions.
THE NAMES OF THE BOARD OF DIRECTORS ARE AS FOLLOWS:
Chairman
H.H Sheikh Nahayan Mabarak Al Nahayan
Deputy Chairman
Sir Muhammad Anwar Pervez, OBE, HPK
Internship Report on UBL, Main Branch, Bannu 22
President & CEO
Atif R. Bokhari
Director
Zameer M. Choudrey
Director
Omar Z. Al Askari
Director
Muhammad Tehsin Khan Iqbal
Director
Ahmad Waqar
Director
Javed Sadiq Malik
The authority, which is second highest, lies with executive committee. It
consists of seven members, including the president and secretaries are in charge
of divisions. The members are Senior Executive Vice President (SEVP) of
UBL. There are twenty divisions, which have their own Senior Executive Vice
President (SEVT). Executive Vice President (EVP), or Senior Vice President
(SVP), the
SEVP to international divisions manages the operations of foreign
countries branches. The rest of the divisions work along their functional lines
as shown in the organizational chart.
At the National level, UBL has a network of branches spread allover the
country and its field operations are one of the most extensive among the
leading banks in Pakistan. At provincial level the bank is managed by SEVP,
who is assisted by General Manager (OM), who is EVP or SEVP. The OM is
responsible for either a number of regional areas or in charge of various
provincial departments such as Administration, General Recovery, Loans,
Inspection, etc. The complexity and extensiveness of the operations in a given
Internship Report on UBL, Main Branch, Bannu 23

province determine the number of OMs. OMs are assisted by circles executives
who are of the rank of SEVP or VP.
The entire country is divided into Circles which are further divided into
Zones.
The circles are administered by circle executive. Each zone is comprised
of a number of branches, which are managed by branch managers who are
mostly Grade I or Grade II officers. Some large sized branches are also
managed by AVPs.
4.2 CONCEPT OF HUB AND SPOKES BRANCHES:
The concept of HUB and Spoke branches was introduced by ANZ Grind
lays Bank (now renamed Standard Chattered Bank). The bank couldn’t get the
desired benefits and withdrew form it. Another bank which adopted the concept
was National Bank of Pakistan (NBP), which also couldn’t get the desired
results so both the banks disbanded it. Recently UBL has implemented this
scheme with high hopes. Under the concept big branches of a zone are given
the status of Hub branches. The Hub branches monitor the activities of spokes
branches. The number of branches under a Hub branch depends upon the
resources of Hub branch and the location of the spokes branches e.g. in
Peshawar there are two hub branches one is Peshawar Cantt branch and the
other one is Khyber Bazaar branch. All the spoke and Hub branches work
under the concerned area manager. He is responsible for the performance of
these branches. He sits in the Hub branch and is assisted by a Vice President. In
UBL this new concept of banking has shown tremendous results and is quite
successful here. Unlike ANZ and NBP, UBL is getting benefits from it, and has
improved its performance quite well.
Internship Report on UBL, Main Branch, Bannu 24

4.3 DIVISION OF UBL’S OFFICE
Basically there are two types of offices in UBL
1. Head Office
2. Regional Head quarters
1. Head Office
Head office of UBL is in Karachi. It exercises overall control over the
bank. The head office (HQ) has various functions.
It formulates polices and ensures its implementation.
To supervise and control the operations of the regional offices.
To formulate policies and ensure its implementation by the field offices.
To deal/liaison with foreign donors like IBRD (World Bank), Asian
Development Bank, Islamic Development Bank, KFW (German Bank),
FMO Netherlands etc.
To deal with Ministry of Finance.
To supervise RHQs.
To sanction loan applications received from the branches.
To deal with ministry of finance.
2. Regional Head Quarters
There are Eleven Regional Offices of UBL which fully cooperate with
the Head Office. UBL Regional Offices performance with reference to
sanctions, disbursement, recoveries, and deposit mobilization is of vital
importance to the bank operations. The functions are as follows:
To implement the policies formulated by the Head Office.
To extend the credit facilities by keeping in view all the prescribed
conditions.
Internship Report on UBL, Main Branch, Bannu 25

To recover/collect the existing long-term credits extended by the bank as
per schedule.
To assist customers in the process of development by advancing loans
for viable financial projects.
All the 1056 UBL branches are the representatives of the bank. These
branches provide commercial as well as non-commercial banking facilities.
Various structures involved in the organization of UBL are given below.
4.4 CONCEPT OF CONSUMER ASSETS CENTERS:
As the UBL was privatized the management started thinking about the
consumer products as well the commercial products. For this purpose the
management started hiring from all over the world in order to collect the cream,
and make a world class team without any doubt.
The management took the consumer head from the bank which is
consider as the pioneer in the consumer sector “Citi Bank”, and then he joined
hands management and made all the possible ways to make UBL a World
Class Bank on the Consumer Side as well in the Commercial Sector. They
made collectively the plans to make Consumer Assets Centers in all over the
country which was introduced first time in Pakistan.
The UBL’s Consumer Assets Centers are the state-of-the-art in the main
cities like Karachi, Lahore, Islamabad and Peshawar. The Consumer Assets
Centers are divided in main Head Office, Regional Centers and New Cities. At
the time of launch the regions were 10 in the country but now it has been
increased to 14.
In Consumer Assets centers the products are divided in to two types:
The Secured, and Un-secured Products. The Secured include UBL Autos, UBL
Address, and Credit Card while the UBL Money and UBL Cashline comes
under the canopy of Un-secured Products.
Internship Report on UBL, Main Branch, Bannu 26

There is a Group Executive, a Global Sales Head, Head Secured
Financing, Head Un-secured Financing, National Sales Managers, Regional
Sales Managers, Relationship Managers and the Relationship Officers.
4.5 TOP MANAGEMENT AT THE HEAD OFFICE:
I. Board of Directors
The executive authority for the general direction and supervision of the
Bank operations or the conduct of business of UBL vests in Board of
Directors. The board consists of a Chairman and seven other Directors.
The chairman of the Board of Directors is the “Managing Director”. All
the members of the Board of Directors, as well as the Managing
Directors are appointed by the government of Pakistan.
II. Executive Committee
Executive committee of UBL consists of seven members. With the
expectation of the president, and secretary all other members serves as
Incharge of many divisions. These members are Senior Executive Vice
President (SEVP), or consultants hired on contract basis. The Division
Heads that work under SEVP or consultants are either Senior Vice
President (SVP), Executive Vice President (EVP) or Vice President
(VP). The members of the executive committee other than the M.D.
shall hold office for such period as may be determined by the Board.
The decisions of the executive committee, other than those, which relate
to matters specified by the board in this behalf, shall be laid before the
board
Functions of Executive Committee
The members of the executive committee other than the M.D. shall hold
office for such period as may be determined by the Board of Directors.
Internship Report on UBL, Main Branch, Bannu 27

The decisions of the executive committee, other than those, which relate
to matters specified by the board in this behalf, shall be laid before the
board for approval.
Subject to the general or special direction of the board, The Executive
Committee may deal with any matter within the competence of the
board.
Managing Director
The Managing Director is responsible for the efficient working of the
organization. He performs his duty according to the policies formulated
by the Board of Directors and is directly answerable to it.
The Federal Government on such salary and on terms and conditions,
shall appoint the MD as it might deem fit.
The MD shall hold office for term of three years, which the government
may extend from time to time.
The MD shall be the Chief Executive of the organization and shall
perform such functions as required by the Ordinance and the rules and
regulations made for the past.
Internship Report on UBL, Main Branch, Bannu 28

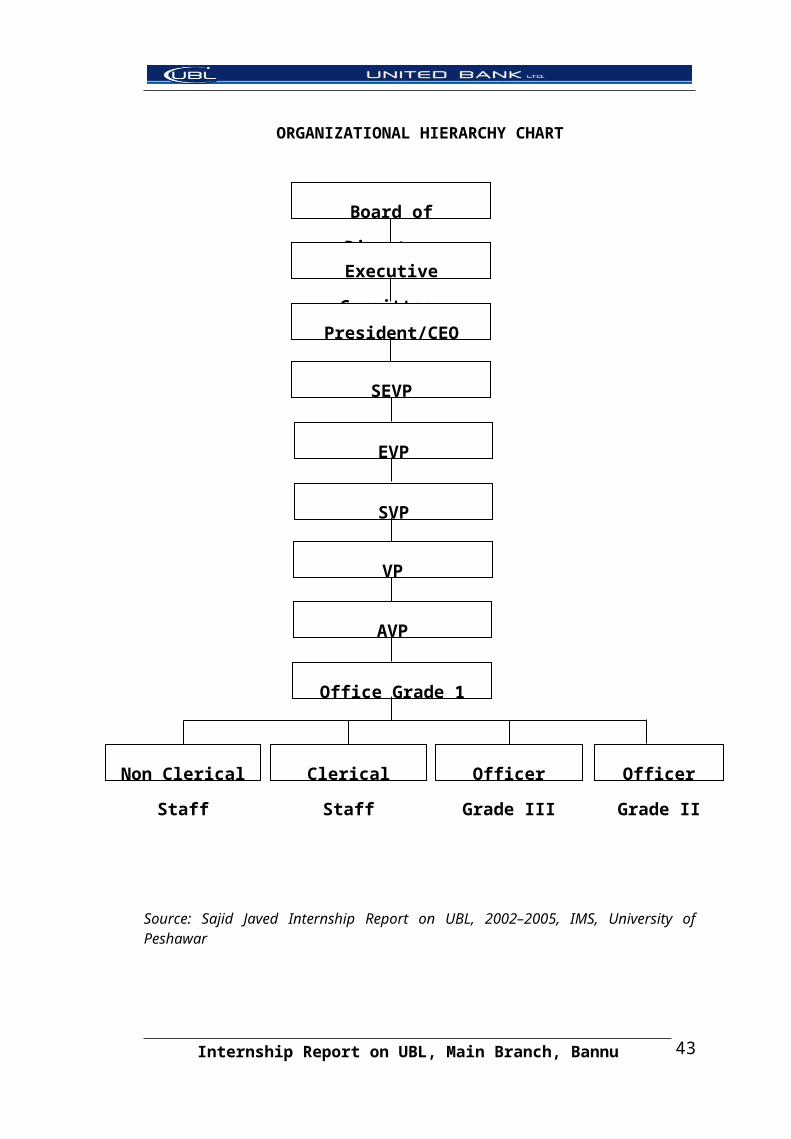
ORGANIZATIONAL HIERARCHY CHART
Source: Sajid Javed Internship Report on UBL, 2002–2005, IMS, University of Peshawar
Internship Report on UBL, Main Branch, Bannu 29
Board of Directors
Executive Committee
President/CEO
SEVP
EVP
SVP
VP
AVP
Office Grade 1
Non Clerical Staff Clerical Staff Officer Grade
III
Officer Grade
II

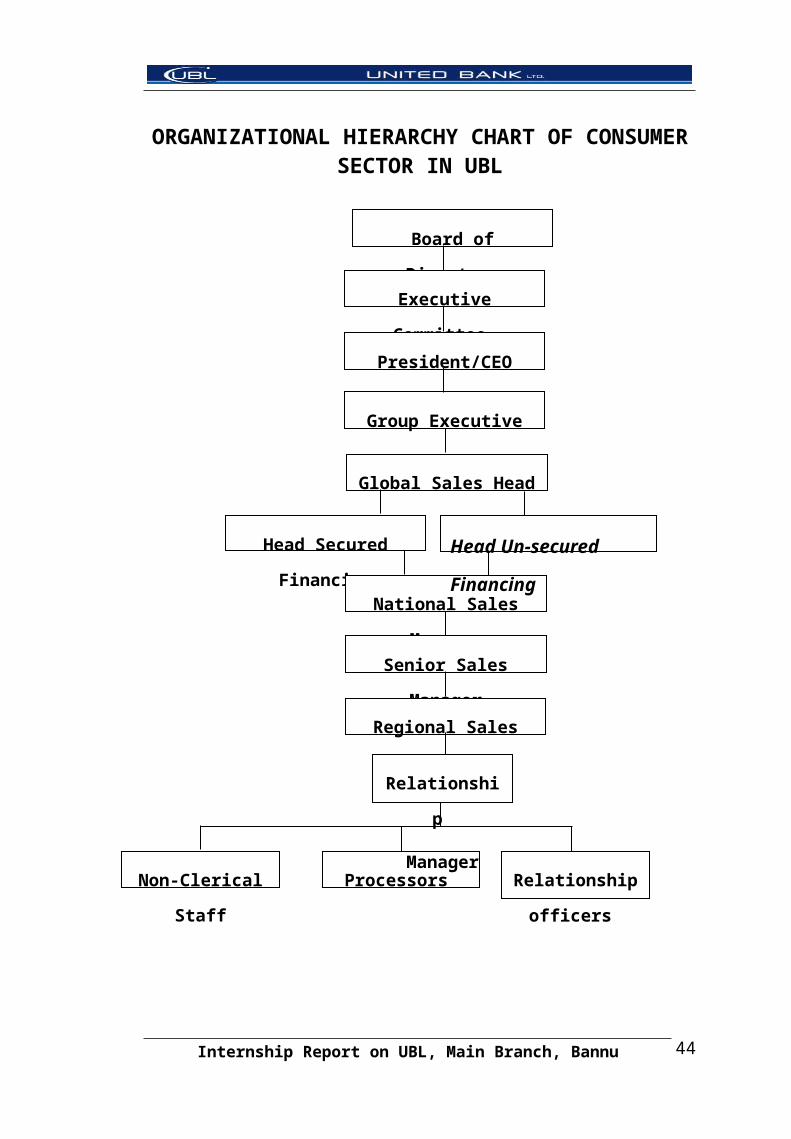
ORGANIZATIONAL HIERARCHY CHART OF CONSUMER SECTOR IN UBL
Internship Report on UBL, Main Branch, Bannu 30
Board of Directors
Executive Committee
President/CEO
Group Executive
Global Sales Head
Head Secured Financing
National Sales Manager
Senior Sales Manager
Regional Sales Manager
Non-Clerical Staff Processors Relationship
officers
Relationship
Manager
Head Un-secured
Financing
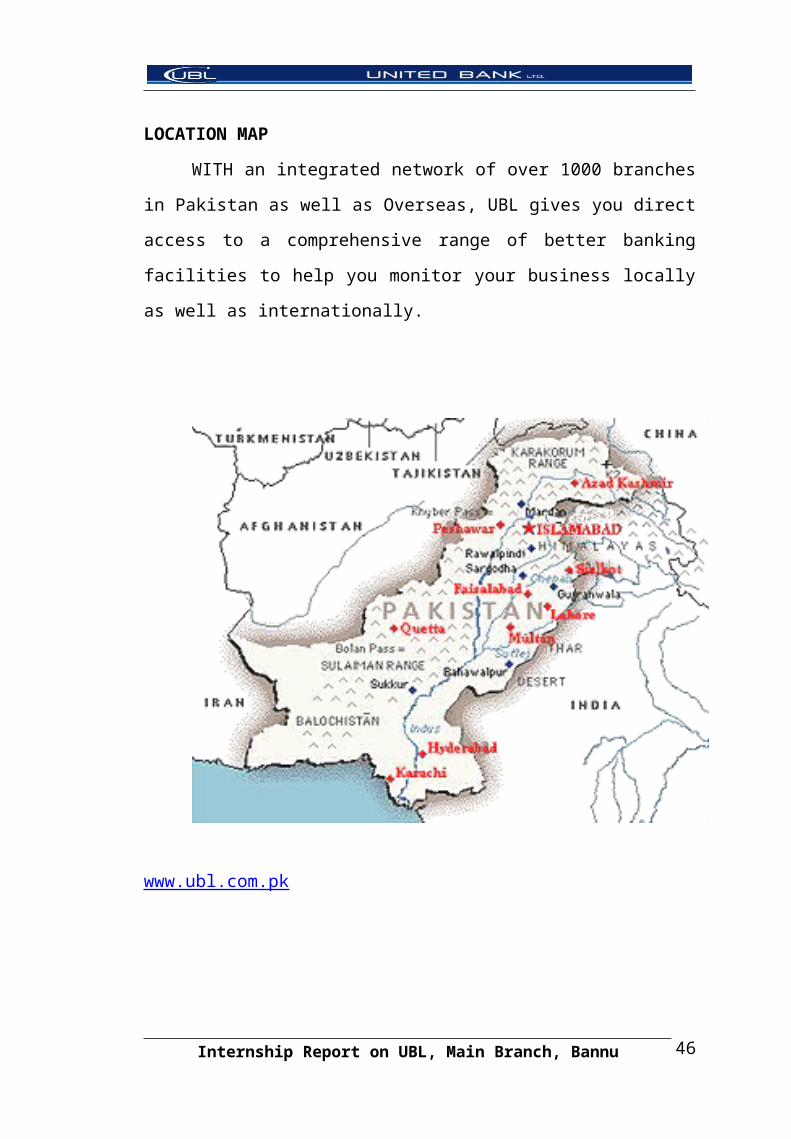
LOCATION MAP
WITH an integrated network of over 1000 branches in Pakistan as well
as Overseas, UBL gives you direct access to a comprehensive range of better
banking facilities to help you monitor your business locally as well as
internationally.
www.ubl.com.pk
Internship Report on UBL, Main Branch, Bannu 31
CHAPTER – 5
DEPARTMENTATION
5.1 ACCOUNTS DEPARTMENT
This department deals with the internal accounts of the bank. The only
Book maintained here is the cashbook. The summary book and main ledger are
maintained.
The function of cashbook is to balance the daily transactions. At the end
of the day this department receives cash position from the cashier. This
position shows opening and closing balance.
TYPES OF ACCOUNTS
There are three types of accounts:
Current Accounts
Saving Accounts
Fixed Accounts
5.2 REMITTANCES DEPARTMENT
This dept is concerned with transfer of money from one place to another
place. Remittance can take place in three different ways.
a. Mail Transfer
When a customer requests the bank to transfer his money from this bank
to any other bank or the branch of the same bank in the city/ outside the
city or outside the country, the first thing he has to do is to fill an
application form in which he states that I want to transfer the money
from this bank to another bank. If the customer is the account bolder of
bank, then the bank will debit his account. The concerned office will fill
the different forms to make the mail transfer complete. Three forms used
for this purpose are listed below;
Internship Report on UBL, Main Branch, Bannu 32

Debit voucher
Credit voucher
Mail transfer register
If the customer is not the account holder of bank, then firstly he has to
deposit the money and then the above said procedure will be adopted to
transfer his money.
b. Telegraphic Transfer
This type of transfer is simple. After filling the application form, the
concerned officer fills the telegraphic form. This telegram is sent to the
required bank. Which on receiving it immediately makes the payment to
the customer and afterwards the vouchers are sent to the bank by
ordinary mail.
c. Demand Draft
DD is just a check and is issued when the customer wants to take the
draft personally. The idea behind it is that as the cash is not safe to be
kept along and a check in the shape of a draft is safer and one can easily
get cash by presenting it in the bank, on whose favor it has been made.
Draft is only issued when the customer is known to the bank and the
bank has the confidence that the customer will not do anything wrong
with the draft. For the preparation of a draft, first of all customer has to
fill an application form, then the concerned officer fills the following
before delivering the draft to the customer. The forms filled for this
purpose are as follows;
Demand draft register
Credit vouchers
Internship Report on UBL, Main Branch, Bannu 33

5.3 DEPOSITS DEPARTMENT
The main economic function of the commercial bank is to receive
surplus balances of individuals, firms, public institutions and to honor check
drawn up to it. The funds deposited with the commercial banks are classified
under four main heads.
a. Current or Demand Deposits
In this type of deposits, the depositor at any time by presenting a check
can draw his money from the bank. People keep some of their deposits
in current account in order to have ready command over money. No
interest is given on current deposits, because it is subject to transfer or
cashing by check at sight. The bank charges commission on the account,
which is called bank charges.
b. Saving Deposits
This deposit refers to the deposits, which are kept to meet the customer
and unexpected outlay or to safeguard financial respectability. The bank
undertakes to repay the money on demand up to a certain limit fixed by
the rules of the bank. The bank pays interest to the customers on saving
deposits. The customer has to give a notice to the bank about two weeks
in advance for withdrawal of large amounts.
c. Fixed Deposits
Fixed deposits are those, which are repayable only after the expiry of the
stipulated period i.e. from three months up to sixty months. The rate of
interest depends upon the length of the period. The rate of interest on
fixed deposits is higher than saving account, because the bank can safely
utilize these deposits for a certain period. Customer is allowed to borrow
the required amount, which should not exceed his fixed deposit. The
bank charges one or two percent higher rate of interest than the profit
allowed to him at his fixed deposit. The bank issues a receipt against the
fixed disposition stating the amount and the time of expiry to the
Internship Report on UBL, Main Branch, Bannu 34

customer. There is no paying book or passbook or checkbook issued to
the depositor.
Call Deposits
It is a type of bank guarantee on behalf of the depositor given at call. In
this case, Security Deposit Receipt (SDR) is issued by the bank at the
instructions of the depositor, confirming that amount of the SDR is held
by the bank, to be paid whenever called upon to do so by the beneficiary
named in the SDR.
5.4 ADVANCES DEPARTMENT
It is the loan function, which produces the major portion of banks’
income, and as such it is one of the major areas of professional bankers’
concerns and attention.
A bank generally deals in following areas;
Agricultural finance
Commercial finance
Industrial finance
Export finance
Import finance
In addition to the above-mentioned broad areas, there are loans available
to small size businessmen, construction companies etc.
In UBL, advances department is responsible to deal with following
cases;
1. Handle all the cases of short and long term loans.
2. To process all the cases concerned.
3. To forward the cases for approval and consideration to the higher authorities.
4. To deal with the borrower directly.
5. To implement the disbursement of the loan.
6. To give feed back to higher authorities in advance.
Internship Report on UBL, Main Branch, Bannu 35
UBL advances loans in the following manners:
a. By Cash Credit
In this form of lending, the bank lends money to the borrower against a
tangible security. The total amount of the loan, which is given, is not
paid in one installment. The borrower has to pay interest on the amount
borrowed. Cash credit is the favorite loan for large commercial and
industrial concerns, on account that the customers need not to borrow at
once the whole amount he is likely to require, but can draw such amount
as and when required.
b. By Discounting Bills of Exchange
It is another method of advancing loans to borrowers. The holder of bills
is paid an amount equal to the face value of the bill after deducting
interest at the market rate for the period the bill has to mature. Interest in
this type of loan can be charged as running finance and demand finance.
c. By Over Drafting
This facility is given to regular, reliable and well- established customers.
The bank charges interest on the extra money, which the borrower takes.
When a customer requires temporary accommodation, he may be
allowed to overdraw his current account usually against collateral
security. From the customers point of view this agreement like cash
credit is advantageous, as he is required to pay interest on the amount
actually used by him.
5.5 FOREIGN EXCHANGE DEPARTMENT
In modern banking system, foreign exchange department plays very
crucial and important role from every aspect. It is parallel banking with general
banking with an additional function of import and export business controlled
by State Bank of Pakistan. Rules and regulations are framed by state Bank of
Pakistan in the form of manuals. Foreign exchange department under SBP
Internship Report on UBL, Main Branch, Bannu 36

regulations also carries out international banking of UBL. Foreign exchange is
being controlled by SBP. No transaction can be affected without permission of
SBP, under foreign exchange regulations Act 1947 and notification issued there
under. Exchange control department of State Bank of Pakistan is responsible
for day-to-day administration of exchange control.
All the transactions shall be done at rate authorized by SBP. For this
purpose, US dollar has been fixed by SBP and the rates of other currencies are
calculated in accordance with the formula approved by SBP and as published
daily by the Foreign Exchange Rate Committee in Karachi. Head office ensures
that the branches receive the rates published by Foreign Exchange Rate
Committee on the same day.
The foreign exchange department provides the following services;
1. Foreign Currency Accounts
Foreign currency in UBL can be opened in 4 major currencies of the
world i.e. US dollar $, Japanese Yen, German Mark, DM and Pound
Sterling. Only authorized branches of UBL can deal in foreign currency
account.
Pakistani citizens and foreigners both can open foreign currency account
by introduction and following the procedure required for general
accounts with one exception for foreigners that they will have to submit
a copy of their passport. The account may be personal or joint.
Amount deposited in foreign currency account must be in four
currencies, which were mentioned earlier. When the customer will
withdraw the money he will receive the amount in the same foreign
currency. Profit will also be in the same currency. There are two types
of foreign currency account;
a. Current account
b. Saving account
Internship Report on UBL, Main Branch, Bannu 37
a. Current Account
On current account, no profit is given to the account holder. This
account is exempted from zakat, income tax and wealth tax. Worldwide
remittances (inside and outside) facility is given to customer. Cash travel
checks, foreign exchange bearer certificate, and coming for customer
can be deposited in his account.
Similarly account holder can shift the amount or any part thereof to
foreign countries through exchange remittances service.
b. Saving Account
On saving account, a handsome profit is paid to the account holder. On
saving account, profit is paid to the customer in the same currency in
which he had opened the account. This account is also exempted from
zakat, income tax and wealth tax etc.
Saving account can be opened with an amount of $ 100 equivalent in
other three currencies. The facility of inward and outward remittance is
also granted to the customer. Profit is paid on monthly product basis.
2. Sale and Purchase of Foreign Currency
UBL is an authorized dealer of State Bank of Pakistan. It can sell and
purchase foreign currency. UBL usually involves sale and purchase of
US dollars, Japanese yen, Pound Sterling, German Mark, Saudi Riyal,
and UAE Durham.
Daily exchange rate by SBP from ANZ Grind lays Bank Karachi is sent
to all the branches authorized in foreign exchange. Daily sale and
purchase of foreign currencies is done according to that rate sheet issued
by SBP on daily basis. Sale and purchase rates of foreign currency are
different.
The purchase of coins is avoided, only notes are purchased. Only those
foreign currencies are purchased for which resale to customer is
possible. And only those persons, who have passport, can sell and
Internship Report on UBL, Main Branch, Bannu 38

purchase foreign currency to or from UBL. Foreigners can also sell
foreign currencies by showing their passport.
There are 5 rates of foreign currencies:
1. For import
2. Cash purchase
3. Cash sale
4. Travel check purchases
5. Foreign currency
It is the policy of UBL to involve only in the sale of hard currencies i.e.
those, which are easily accepted. Head office of UBL has given certain
limits to each authorized branch about the custody of foreign currency.
If the amount exceeds this limit, the branch must transfer the cash to
feeding branch or SBP.
All the authorized branches of UBL must submit following reports about
foreign exchange business;
1. Report to general manager office
2. Monthly business report to SBP
3. Monthly report to head office
3. Remittances in Foreign Exchange
As we know that the money of one country is not legal tender in other
countries. The monetary device, which has been evolved, for all international
payments is the foreign exchange from the exporter and others who have it for
sale and sell foreign currency to importers and others who need it in their own
countries. A transfer from a bank account in the debtor’s country to the
creditor’s country affects the international payments.
Two branches of the same bank or of different banks involve in foreign
remittance. One is called remitting branch or bank and the other is called
receiving branch or bank. In foreign currency, SBP has given general
permission to authorized dealers in foreign exchange including UBL to affect
Internship Report on UBL, Main Branch, Bannu 39

remittances for specific purposes without referring it to (SBP) for approval i.e.
remittance on account of education subscription, books and periodical of
technical nature. Remittance can be done in following ways;
1. Telegraphic Transfer (TT)
2. Mail Transfer (MT)
3. Foreign Demand Draft (FDD)
Internship Report on UBL, Main Branch, Bannu 40

REFERENCES
1. S.A.HAQ (1980), practice and Law of Banking in Pakistan 6 th Edition,
Royal Book Company Karachikpp1-19.
2. UBL Annual Report (2003-2005).
3. Sajid Javed (2002-2005) Internship Report on UBL, IMS P (36-38)
4. UBL annual report (2003-2005)
5. Ibid.
Internship Report on UBL, Main Branch, Bannu 41

CHAPTER – 6
BANKING EFFORTS
6.1 COMMERCIAL BANKING
If you have a small or medium-sized business, UBL can assist you with
the right mix of banking services that will help you manage and grow your
business. Our experts will facilitate you in the varied financial situations that
you come across. We will respond to your needs promptly because we
understand how many your customers, your employees and you depend on us.
6.2 CONSUMER BANKING
You as an individual can gain and benefit the most through UBL
Consumer Banking. In UBL you get friendly, efficient and attentive
personalized banking services - a unique banking relationship experienced by
each UBL client. You can utilize the following services
UBL Cash line
UBL Address
UBL Drive
PLS Term Deposits
PLS Savings Accounts
Uni-Saver
Remittances
6.3 CORPORATE BANKING
Our mission is to serve all your corporate needs and ensure your full
satisfaction through product innovation, personalized banking, and top notch
service.
The CBG department of UBL defines corporate banking in Pakistan.
Amongst the local banks UBL CBG is the pioneer in providing innovative
Internship Report on UBL, Main Branch, Bannu 42
solutions to its diversified and satisfied customer base. UBL CBG is considered
to be a major player in the financial market of Pakistan.
The Corporate Banking Group focuses on attracting and servicing large
portfolio customers. Our effort is providing exemplary customer service using
the "Single Window" concept and product superiority. The Relationship
Management team managed by highly qualified individuals from the industry
has steadily expanded our customer base and continues to enhance our cordial
relations with our esteemed clients.
Despite the sluggish economic growth in recent years, UBL
outperformed all the other local banks in the corporate banking sector primarily
due to CBG's emphasis on establishing and enhancing relationships with
foreign/local blue chip and middle market customers thereby capturing
significant market share.
UBL's appetite for large exposures coupled with dedicated Structured
Finance Unit, and an innovative team of professionals having extensive
experience of Corporate Banking gives it the right platform to succeed in
todays competitive and a demanding environment.
The success of CBG has been established from the fact that UBL
received the 'No.1Euromoney 2000' Best Local Bank award and recognized it
to have out performed all other banks. In year 2000, UBL was also voted as the
best Corporate Bank by the customers of a major foreign bank in a survey.
Aggressive marketing combined with professionalism has led to an increase in
UBL's market share with top corporate customers and in some cases replacing
Foreign Banks.
Internship Report on UBL, Main Branch, Bannu 43
FINANCIAL PRODUCTS
6.4 UNI CASH
Nowadays carrying cash while going out of your home is very risky.
Every body wants maximum security while keeping his money in his pocket.
People make use of TC and various credit cards for this purpose. UBL provides
such facility through UNI CASH. The management of UNI CASH is carried
out in the following way.
I. Personal Identification Number
When a Uni-Cash card is issued to a customer, a unique number known
as Personal Identification Number (PIN) is also allotted to him/her. This
is 4 digits confidential number which when used in conjunction with the
Uni-Cash card enables the customer to avail the cash point service. To
keep it secret even from the bank staff, the PIN is generated and printed
in a special manner by the computer on pre-sealed, tamper proof PIN
millers. These PIN millers are designed in such a way that the PIN is
only visible after the envelope is opened by the customer.
II. Card serial number
The customer will notice that some numbers and alphabets are embossed
on his Uni-Cash card. The first line obtains UNICASH CARD SERIAL
NUMBER while the other line has customer’s name, account number
and card expiry Month/ Year.
III. Weekly withdrawal limits
The Uni-Cash card issued to customer carries a weekly withdrawal limit,
which applies to cash withdrawal, made from any of the cash point. This
limit is equal to initial amount deposited by him at the time of applying
for his card.
IV. Cash points
For customer’s convenience, a number of cash points are available in the
country. These machines are at customer’s service round the clock on all
Internship Report on UBL, Main Branch, Bannu 44

days of the year. Uni-Cash card can be used in these machines. Besides
cash withdrawal, cash points would provide the following facilities;
Balance Inquiry Mini Statement
Pin Change
V. Card Captures
Cash points will automatically capture card that have been duly reported
as lost or have been cancelled or have expired. Similarly if one fails to
key-in his correct PIN, in three repeated attempts, the card will be
captured.
VI. Loss of Card
In case, customer loses his UNI CASH card or the card is stolen, the
matter should invariably be brought to the notice of the bank personnel.
6.2 UNI SONA
This product has been designed to attract more and more savings. As
inflation in Pakistan is at a very high rate, due to which money has very limited
value.
The features of Uni-Sona are the following;
The amount deposited in the bank becomes triple after seven years.
If person withdraws his money after five years he will get double
amount as compared to its initial deposits.
There is also a facility for partial withdrawal from principle amount. For
example, if a person has deposited Rs.50, 000,000 in January 1993 and he
withdraws Rs.20, 000,000 in January 1995. In 1996 the person has Rs.
30,000,000. This amount will receive the same interest rate and would be
doubled (Rs. 60,000,000) in January 98 and triple (RS. 90,000,000) in January
2000.
Internship Report on UBL, Main Branch, Bannu 45
6.3 UNIZAR
It is a special type of foreign currency account and can be opened in two
currencies i.e. US $ and Pound Sterling. Minimum amount required for
opening of this account is 750 pounds or $ 1000. Profit is paid in the currency
in which the account is opened. Rate of return of 2.25% is paid to the depositor.
A special feature of this account is that withdrawal from the deposits can
be made anywhere in the world in the UBL branch.
6.4 UISAVER
It is a special type of account designed for corporate savers. This
account can be opened with Rs.1 m up to Rs. 10 m. The minimum profit rate is
4% while maximum limit is 8%. Profit is paid on daily product basis. Any one
can open this account.
Internship Report on UBL, Main Branch, Bannu 46

REFERENCES
Thaiman Theo, Scott G. William, Connor E.Partick, Management, “5th
Edition”, Boston USA, Houghton Miffin Company 1985, p. 303.
Ewin B. Flipp, principles of personnel Management, Tokyo McGraw
Hill 1984, p. 275.
www.ubl.com.pk
Internship Report on UBL, Main Branch, Bannu 47

CHAPTER – 7
SWOT ANALYSIS
SWOT analysis helps to find out about the strengths and weaknesses of
an organization, the opportunities that the organization can avail and the threats
that could be harmful. This analysis gives a clear picture about the organization
management and giving a review of the organization’s environments. The
following are the strengths, weaknesses, opportunities and threats of United
Bank Limited:
7.1 STRENGTHS
Product Line
Bank offers a prestigious product line-up that continues to fulfill and
satisfy the banking requirements of not just the conventional consumers but the
demanding financial needs of the corporate sector as well. The product
portfolio has been expanded in response to the customers’ needs, and now
covers a host of services in the areas of corporate banking, consumer banking,
and investment banking. The line-up includes:
Business Line Account
Car financing
Credit cards
Home loans
ATMs and etc.
Running Finances
Rupee traveler’s checks & Money gram
Online banking
Personal Loans
Internship Report on UBL, Main Branch, Bannu 48

QUALITY OF MANAGEMENT
Any banking organization is successful if it has an efficient and effective
management structure. The management of United Bank limited is providing
the best possible services and is trying to push the organization to heights of
success. The management is free from any politics after the privatization. The
structure is designed in such a way that everyone is clear about the assigned
role and responsibilities; the hierarchy is efficient in problem solving and
making decisions. An organization’s success dependent on the efficiency of its
management, and weak management can destroy its image. Planning, staffing,
organizing and leading are the basic functions of any management, the
structure is affiliated with Abu Dhabi consortium, the management style is also
successfully implemented in Pakistan.
RESOURCEFULNESS OF THE SPONSORS
United Bank Limited has been taken over by Abu Dhabi Consortium and
BestWay Group. These sponsors are resourceful, as in the span of three and half years
the bank has launched the consumer loans segments and expanded the regional sales
centers from 10 to 14 from the launch till date and is further expanding. The bank is
planning to add 10 more regions in the years to come.
COMPETITIVENESS AND AGILITY
The bank is one of the top banks of Pakistan. It has a tendency of being
agile in any kind of market condition and can compete with any bank. The
Banks like PICIC, ASKARI, HBL, NBP, Bank Alfalah and UNION
commercial banks are also having a lead in providing better services and
products but United Bank limited still has a cutting edge by providing branded
products. The market of Pakistan is fragile but UBL has the talent to act
accordingly to any situation and take control. The basic philosophy is customer
satisfaction and in order to act on this they are providing new and better
products. The services of UBL as compared with other banks are customer
friendly.
Internship Report on UBL, Main Branch, Bannu 49

FLEXIBILITY IN APPROACH
The bank has a flexible approach towards different kinds of customers
located in different regions of Pakistan. The bank knows where to invest and
lend funds and from where to generate deposits. The branches are located in the
main areas where resources and clientele are readily available. The bank is not
taking any kind of the risk by investing into areas where profit is unpredictable.
EFFICIENT HUMAN RESOURCE MANAGEMENT
UBL has a qualified staff and the bank’s human resource policy is quite
satisfactory. The bank provides formal and on- the job training to its staff
members. Every year the bank is adding young and energetic personnel to its
team. The increments of UBL are merit based. The bank has a separate
department, human resource department that deals with hiring, developing and
retaining staff. The bank places advertisements in the newspapers, giving the
job description specifying the types of personnel required. Performance based
evaluation is done at the year-end.
OFFER INNOVATIVE PRODUCTS
UBL is keeping pace not only with the local market but also with the
global market. New products like credit card and money gram remittance
service have been introduced. Being a big bank by network it has established
reputation in providing all the possible products with attractive package e.g.,
low rates or low entrance fee, no annual and renewal charges etc.
PROMOTING SPORTS
The bank arranges championships and tournaments of Golf and Cricket
in all the provinces of Pakistan.
CREDIT RATINGS
PACRA (Pakistan Credit Rating Agency) an affiliate of IBCA rated
UBL as A1+ for both long term and short-term periods. Both ratings are
investment grade and deficits expectation of credit quality and very low
expectation of credit risk. It is a statutory requirement that every bank will go
Internship Report on UBL, Main Branch, Bannu 50
through an exercise with this rating agency. United Bank limited credit
portfolio was rated on the basis of bad debts, lending to different sectors and
overall credit management.
7.2 WEAKNESSES
Even if an organization is profitable and is having best possible policies
and management, it might be having certain shortcomings, which should be
pinpointed in order to overcome them or minimize their adverse effects.
OVER AMBITIOUSNESS
The bank is over ambitious. In the last three and half years post-
privatization era the bank has not consolidated. Within this short span of time,
the bank has opened 14 regions for granting consumer loans and is planning to
open more which can become very unwieldy. The bank is attempting to
achieve too many things too soon. In doing so it is ignoring the myriad
problems faced by the branches, which can’t keep pace with the high speed.
STAFF OVER WORKED
The bank’s staff is over worked and over loaded with responsibilities.
The bank needs more staff as the existing staff is trying it hard but cannot cope
with both the paper work and customer handling at the same time. Though the
working hours of the bank are from 9 am to 5 pm but the staff has some much
work to handle that they have sit late hours. This frequent late sitting is likely
to erode the employee efficiency/morale.
OVER COMPETITIVENESS
The bank is too concerned about competition. This is affecting the
bank’s profitability. Rates charged on home loans and car finance is too low,
lower than what is being charged by others in the market. In attracting
customers and taking over a large portion of the market share, the bank is
putting its profitability as stake.
Internship Report on UBL, Main Branch, Bannu 51

CONTRACTUAL STAFF
The UBL has hired the Consumer Loans personnel through the
recruiting agencies, who are not treated at par with its regular employees. The
contractual workers work on commission or commission +salary basis. These
employees leave UBL when they get permanent or relatively better job in the
market. Continued use of contract staff creates problems for the UBL
management in the form of employees’ shortage.
TOO CAUTIOUS
The bank is cautious in relation to investment and exploring new
markets. It has invested in all those companies which are already on-going
concerns it is good for the profitability of the bank but it is not beneficial to the
market. The bank also follows a strict lending policy that is ignoring project
financing. The bank is also not taking initiative in introducing new products in
the markets e.g., debit card is a new product and other banks are trying to
concentrate on it, but UBL is not availing it. Leasing and micro finance for the
consumer durables have already been started by other banks, but United Bank
Limited is still waiting for the response from the market, and is delaying the
launch of these products.
SHORTAGE OF CAPITAL ADEQUACY
The bank is suffering from capital inadequacy. The deposit base has
overgrown the equity. As per statutory requirement the bank has to keep 51.6
billion deposits against Rs. 4.13 billion equity, but its deposit of Rs. 51.6
billion are far above the statutory level.
7.3 OPPORTUNITIES
Financial market of Pakistan is a dynamic one and offers a number of
opportunities to the organizations. Due to lack of know-how and initiation on
the part of financial institutions, certain products, which are offered in other
countries, are still unavailable in our market. United Bank Limited is a well-
established bank and can avail these opportunities:
Internship Report on UBL, Main Branch, Bannu 52

SEARCH FOR NEW MARKETS AND AVENUES
The bank should reach to those markets that are totally ignored by other
banks / financial institutions. For example, to finance projects in developing
tourist and facilities like hotels and motels in Swat, Galyat, Kaghan valley and
the Northern region to attract tourists etc. The bank can boost earnings from
tourist and increase employment opportunities in the said areas.
7.4 THREATS
Pakistan economy is largely based on foreign financial aid. Though the
country is trying to cut down the debt but all the financial institution inside
Pakistan are adversely affected by the political instability and foreign aid.
United Bank Limited also faces the same threats, which are:
POLITICAL ENVIRONMENT
Pakistan has unstable political condition. The policies implemented by
one government are soon abolished after the change of government this is
causing a mayhem in the banking sector. United Bank Limited is also
influenced by the political conditions of the country, as it has to follow the
same policies and rules passed by the Government like rest of the banking
institutions. It is slowing the growth process of the bank.
CHANGE IN THE FOREIGN POLICIES
UBL can be greatly affected by the Middle East crisis. The trade finance
of the bank is negatively affected. If there is any change in the foreign policy
that could make it difficult for the bank to stabilize its trade finance.
OVER EXPANSION
Over expansion is a very big threat to any organization. United Bank is
expanding and is ignoring the problems related to the branches already been
established. These branches should be monitored and properly staffed. The
bank should consolidate for some time and then plan ahead. Management of
larger organization is very difficult.
Internship Report on UBL, Main Branch, Bannu 53

OVER EXPOSURE
The bank is overexposing the products and lending by aggressive
marketing strategies.
COMPETITION FACED FROM THE OTHER BANKS
UBL is facing strong competition from the other banks like the Bank
Alfalah, Askari Commercial Bank, Union Bank; Standard chartered Bank and
Allied Bank. Because the Bank Alfalah is offering the Credit Cards without
joining charges and annual fee. Similarly the MCB has launched auto financing
with lowest mark-up and the other banks are also trying to follow suit.
Internship Report on UBL, Main Branch, Bannu 54
CHAPTER – 8
FINANCIAL ANALYSIS
Financial analysis is performed in order to determine whether the
business organization is performing satisfactorily or not in respect to other
competitive organizations.
Financial analysis is the process of identifying the financial strengths
and weaknesses of the firm by properly establishing relationships between the
items of balance sheet and profit and loss account. Financial analysis can be
undertaken by management of the firm or by parties’ outsides the firm viz.
owners, creditors, investors and others. The nature of the analysis depends on
the purpose of the analyst.
Trade creditors are interest in firm’s ability to meet their claims over a
very short period of time. Their analysis will, therefore, confine to the
evaluation of the firm’s liquidity position.
Suppliers of long term debt on the other hand are concerned with the
firm’s long term solvency and survival. They analyze the firm’s profitability
over time, its ability to generate cash to be able to pay interest and repay
principal and the relationship between various sources of funds (capital
structure relationship). Long term creditors do analyze the historical financial
statements but they place more emphasis on the firm’s projected financial
statements to make analysis about its future solvency and profitability.
Investors, who have invested their money in the firm’s share, are most
concerned about the firm’s steady growth in earnings. As such, they
concentrate on the analysis of the firm’s present and future profitability. They
are also interested in the firm’s financial structure to the extent it influences the
firm’s earnings ability and risk.
Management of the firm is interested in every aspect of the financial
analysis. It is their overall responsibility to see that the resources of the firm are
used most effectively and efficiently and that the firm’s financial condition is
sound.
Internship Report on UBL, Main Branch, Bannu 55

UNITED BANK LIMITEDRECASTED BALANCE SHEET
AS AT DEC, 31,2005
(Rupees in 000)
Assets 2005 2004 2003
Cash and balances with treasury banks 34,062,679 23,844,435 17,274,461
Balances with other banks 12,729,207 17,699,334 11,366,434
Lending to financial institutions 17,867,552 18,360,633 23,096,028
Investments 63,026,944 54,953,728 56,516,760
Advances
Performing 201,152,095 139,699,440 92,513,736
Non-performing 3,658,375 4,481,615 3,611,442
Other assets 7,829,770 4,439,580 3,001,793
Total current Assets 340,326,622 263,448,765 96,125,178
Fixed assets 4,449,324 3,969,006 3,754,236
Deferred tax asset-net 2,273,005 5,194,892 5,486,357
Total Assets 347,048,951 272,612,663 216,621,247
Liabilities
Bills payables 4,159,964 3,811,284 2,975,910
Borrowing from financial institutions 21,790,480 11,975,684 7,710,375
Deposits and other accounts 289,226,299 230,256,627 185,071,502
Subordinated loans 3,999,192 3,500,000 ---
Liabilities against assets subject to finance lease
--- 288 39,995
Other liabilities 6,204,746 5,704,749 4,541,704
Total liabilities 325,380,681 225,248,632 200,339,486
Net Assets 21,668,270 17,364,031 16,281,761
Owner’s Equity
Share capital 5,180,000 5,180,000 5,180,000
Reserves 6,225,461 5,915,928 4,678,317
Inappropriate profit 7,250,813 3,274,439 1,384,490
18,756,274 14,370,367 11,242,807
Surplus on revaluation of assets 2,911,996 2,993,664 5 ,038,954
Total owner’s equity 21,668,270 17,364,031 16,281,761
Total liabilities and owner’s equity 347,048951 272,612,663 216,621,247
Source: UBL Annual Report 2003, 2004, 2005
Internship Report on UBL, Main Branch, Bannu 56
UNITED BANK LIMITEDRECASTED INCOME STATEMENT
FOR THE YEAR ENDED DEC, 31,2005(Rupees in 000)
2005 2004 2003
Markup/return/interest earned 20,158,860 9,233,881 8,944,260
Markup/return/interest expensed 6,045,848 1,732,760 1,888,349
Net markup/interest income 14,112,912 7,501,121 7,055,911
Provision against loans and advances-net 1,277,002 435,414 444,871
Provision (reversal) for diminution in value of investment-net
112,666 (100,381) 104,285
Bed debts written off-directly 38,140 3,841 12,897
1,427,808 338,874562,053
Net markup/return/interest income after provision
12,685,104 7,162,247 6,493,858
Net markup/interest income
Fee, commission and brokerage income 2,543,739 1,654,475 1,442,642
Dividend income/ gain on sale of investments 583,982 1,102,510 2,057,314
Income from dealing in foreign currencies 675,109 668,085 436,656
Other income 1,210,202 1,072,750 607,500
Total non-markup/return/interest income 5,013,032 4,497,826 4,544,112
EBIT 17,698,138 11,660,073 11,037,970
Non markup /interest Expense
Administrative expenses 7,874,013 6,794,311 6,153,913
Other provision /write offs/(reversals) 335,409 (34,422) 551,840
Other charges 7,066 10,456 5,501
Total non markup/interest expenses 8,216,488 6,770,345 6,711,254
Extraordinary items ---- --- ---
Profit before Taxation 4,889,728 4,326,716 4,889,728
Taxes 498,748 283,083 193,050
Net Profit 4,606,645 4,043,633 3,614,750
Source: UBL Annual Report 2003, 2004, 2005
Internship Report on UBL, Main Branch, Bannu 57
RATIO ANALYSISRatio analysis is a powerful tool of financial analysis. A ratio is defined
as “the quotient of two mathematical expression” and as “the relationship
between two or more things”. In financial ratio analysis a ratio is used as
benchmark for evaluation the financial position and performance of a firm.
STANDARD OF COMPARISONThe ratio analysis involves comparison for a useful interpretation of
financial statements. A single ratio is itself does not indicate favorable or
unfavorable condition. It should be compared with some standard. Standard of
comparison may consist of:
Past Ratios
Ratio calculated from the past financial statements of the same firm.
Competitors Ratios
Ratios of some selected firms, especially the most progressive and
successful competitors at the same point in time.
Industry Ratios
Ratios of the industry to which the firm belongs.
Projected Ratios
Ratios developed using he projected, or Performa, financial stat3ements
of the same firm.
Table No. 8.1 Financial Ratio’s at a glance 2001, 2002, and 2003 Years 2003 2004 2005Gross profit margin 78.8% 81.23% 70%Net Profit Margin 40.41% 43.79% 22.85%Return on Assets 1.67% 1.47% 1.33%Return on Equity 22.20% 23.29% 21.26%Current ratio 0.48 1.17 1.05Cash ratio 0.14 0.18 0.14Debt to Equity Ratio 12.30 12.97 15.02Total Debt to total Assets 0.92 0.83 0.94Current Asset Turn Over Ratio 3.76 1.53 1.35Taxation to Total Income 5.34 7.00 10.83Assets Turnover Ratio 0.023 0.023 0.013Fixed Asset Turnover Ratio 0.96 1.02 1.03Interest Coverage Ratio 1.64 1.72 2.15 Interest Expense to Deposit 3.63 2.94 2.84
Internship Report on UBL, Main Branch, Bannu 58

8.2 RATIO ANALYSIS DETAILED
8.2.1 Profitability Ratios
The objective of any firm is to increase the wealth of shareholders. So
profitability ratio is calculated in order to determine how much increase
or decrease has occurred in the wealth of shareholders of a business.
8.2.2 Gross Profit Margin
This ratio tells us the profit of the firm related to sales after deducting
the cost of producing the goods or in other words an indication of the
total margin available to cover operating expense and yield a profit.
Formula: {Gross Profit / Net Sales} x 100
Gross Profit Margin (2003) = {7,055,911 / 8,944,260} x 100
Gross Profit Margin (2004) = {7,501,121 / 9,233,881} x 100
Gross Profit Margin (2005) = {14,112,912 / 20,158,860} x 100
Year 2003 2004 2005
Gross Profit Margin 78.8% 81.23% 70%
Graph 8.1 Gross Profit Margin
Years
The Gross Profit of the bank in 2001 was 78.8%, which increased to 81.23%
and then decreased to 70%. The gross profit decreased in 2005 because of
increase in cost of goods sold.
Internship Report on UBL, Main Branch, Bannu 59

8.2.3 Net Profit Margin
The net profit margin is a measure through which the fir’s profitability is
measured. It tells about the firm’s net income per dollar of sales.
Formula: {Net Income / Net Sales} x 100
Net Profit margin (2003) = {3,614,750 / 8,944,260} x 100
Net Profit margin (2004} = {4,043,633 / 9,233,881} x 100
Net Profit margin (2005} = {4,606,645 / 20,158,860} x 100
Year 2003 2004 2005
Net Profit Margin 40.41% 43.79% 22.85%
Graph 8.2 Net Profit Margin
Years
The net profit ratio shows that net profit increased from 2003 to 2004.But
decreased in 2005, which is partially because of increase in expenses and cost
of goods sold.
Internship Report on UBL, Main Branch, Bannu 60
8.2.4 Return on Assets
It is the ratio that explains that how efficiently the assets are being
utilized. The high return on assets means efficient utilization of the assets.
Formula: {Net Income / Total Assets} x 100
Return on Assets (2003) = {3,614,750 / 216,621,247} x 100
Return on Assets (2004) = {4,043,633 / 272,612,663} x 100
Return on Assets (2005) = {4,606,645 / 347,048,951} x 100
P11 2003 2004 2005
Return on Assets 1.67% 1.47% 1.33%
Graph 8.3 Return on Assets
Years
The return on assets decreases gradually as can be seen from the above
table. It shows that the assets are not utilized efficiently. This should be
controlled in order to improve the bank financial position and attract
more deposits.
Internship Report on UBL, Main Branch, Bannu 61
8.2.5 Return on Equity
This ratio tells us the earning power on shareholders’ book value
investment and is frequently used in comparing two or more firms in an
industry. A high return on equity often reflects the firms’ acceptance of strong
investment opportunities and effective expense management.
Formula: {Net Income / Equity} x 100
Return on Equity (2003) = {3,614,750 / 16,281,761} x 100
Return on Equity (2004) = {4,043,633 / 17,364,031} x 100
Return on Equity (2005) = {4,606,645 / 21,668,270} x 100
Year 2003 2004 2005
Return on Equity 22.20% 23.29% 21.26%
Graph 8.4: Return on Equity
Years
The return on equity has increased from 2003 to 2004 by 1.09%. But has
decreased from 2004 to 2005 by -2.03% which shows rise in liabilities,
inefficient management. This situation should be improved so as to
bring something to equity holders.
Internship Report on UBL, Main Branch, Bannu 62

8.2.6 Liquidity Ratios
Liquidity ratios show that how efficient management is to meet its
current liabilities from it current assets.
8.2.6.1Current Ratio
Current ratio indicates the extent to which the claims of the short term
creditors are covered by assets that are expected to be converted into
cash a period roughly corresponding to the maturity of the liabilities.
Formula: Current Assets / Current Liabilities
Current Ratio (2003) = {96,125,178 / 200,339,486}
Current Ratio (2004) = {263,448,765 / 225,248,632}
Current Ratio (2005) = {340,326,622 / 325,380,681}
Years 2003 2004 2005
Current Ratio 0.48 1.17 1.05
Graph 8.5: Current Ratio
Years
The current ratio shows increase from 2003 to 2004, which is
encouraging. But decreased in 2005. This is because of increase in
liabilities. But still it shows that current assets are more than current
liabilities, which is sufficient to meet current liabilities.
Internship Report on UBL, Main Branch, Bannu 63
8.2.6.2 Cash Ratio
This is a relationship between cash in hand and current liabilities. It
indicates the extent to which cash covers the claims of short-term
creditors in hand.
Formula: {Cash / Current Liabilities}
Cash Ratio (2003) = {28640895 / 200,339,486}
Cash Ratio (2004) = {41543769 / 225,248,632}
Cash Ratio (2005) = {46791886 / 325,380,681}
Year 2003 2004 2005
Cash Ratio 0.14 0.18 0.14
Graph 8.6: Cash Ratio
Years
From the cash ratio we see that this ratio has increased from 2003 to
2004. But decreased in 2005 by –0.04, which came to the 2003 position
which is not too big decrease. Overall cash position is satisfactory.
Internship Report on UBL, Main Branch, Bannu 64

8.2.3 Leverage Ratios
Leverage means using borrowed money to earn a return greater than the
cost of borrowing, increasing net income and the return on common
stockholders’ equity.
8.2.3.1 Debt to Equity Ratio
This is a ratio that shows the share of owners and outsiders in the
business. It explains the extent to which the bank is financed by the
owners and debtors.
Formula: {Total Debt / Owner’s Equity}
Debt to Equity Ratio (2003) = {200,339,486 / 16,281,761}
Debt to Equity Ratio (2004) = {225,248,632 / 17,364,031}
Debt to Equity Ratio (2005 = {325,380,681 / 21,668,270}
Year 2003 2004 2005
Debt to Equity Ratio 12.30 12.97 15.02
Graph 8.7: Debt to Equity Ratio
Years
The debt to equity ratio has increased continuously from 2003 and
onward. But increase in 2005 is more than increase in 2004. This shows
that business has financed by debtors more than the owners. And this
ratio has risen in 2005. But anyhow the trend is improving.
Internship Report on UBL, Main Branch, Bannu 65

8.2.3.2 Total Debt to Total Assets Ratio
This ratio highlights the relative importance of debt financing to the firm
by showing the percentage of the firm’s assets that is supported by debt
financing. The greater this ratio the greater will be the protection for
creditor.
Formula: {Total Debt / Total Assets}
Total Debt to Total Assets Ratio (2003 = {200,339,486 / 216,621,247}
Total Debt to Total Assets Ratio (2004 = {225,248,632 / 272,612,663}
Total Debt to Total Assets Ratio (2005) = {325,380,681 / 347,048,951}
Year 2003 2004 2005
Debt to Total Assets 0.92 0.83 0.94
Graph 8.8: Debt to Total Assets Ratio
Years
The above ratio shows a satisfactory picture of the bank. Although the
ratio decreased in 2004 but it then increased in 2005. This means that
the bank is becoming safer for the investors. Which will further lead to
the increase in the per value share of the bank.
Internship Report on UBL, Main Branch, Bannu 66
8.3 ACTIVITY RATIOS
Activity ratios also known as Efficiency or turnover ratios, measure how
effectively the firm is using its assets.
8.3.1 Current Asset Turnover Ratio
It shows the relationship between revenue and current assets, a measure
of the revenue productivity and utilization of current assets.
Formula: {Net Revenue / Current Asset} x 100
Current Asset Turnover Ratio (2003) = {3,614,750 / 96,125,178} x 100
Current Asset Turnover Ratio (2004) = {4,043,633 / 263,448,765} x 100
Current Asset Turnover Ratio (2005) = {4,606,645 / 340,326,622} x 100
Year 2003 2004 2005
Current Asset Turnover Ratio 3.76 1.53 1.35
Graph 8.9: Current Asset Turnover Ratio
Years
The current asset turnover ratio is decreasing from 2003 to 2005. This
tells us that the current assets are not utilized efficiently because of
management ineffectiveness.
Internship Report on UBL, Main Branch, Bannu 67
8.3.2 Taxation to Total Income
This ratio shows the percentage of tax that is applied to total net income.
Formula: {Tax / Total Income} x 100
Taxation to Total Income ratio (2003) = {193,050 / 3,614,750} x 100
Taxation to Total Income ratio (2004) = {283,083 / 4,043,633} x 100
Taxation to Total Income ratio (2005) = {498,748 / 4,606,645} x 100
Year 2003 2004 2005
Taxation to Total Income Ratio 5.34 7.00 10.83
Graph 8.10: Taxation to Total Income Ratio
Years
This ratio shows continuous increase. Because the profit of the bank is
also increasing.
Internship Report on UBL, Main Branch, Bannu 68
8.3.3 Assets Turnover Ratio
The asset turnover ratio is the ratio that explains the relationship
between the Net sales and the total Assets. That how much efficiently
the assets are being turnover into sales.
Formula: {Net Revenue / total Assets}
Assets Turnover Ratio (2003) = {3,614,750 / 216,621,247}
Assets Turnover Ratio (2004) = {3,614,750 / 216,621,247}
Assets Turnover Ratio (2005) = {4,606,645 / 347,048,951}
Year 2003 2004 2005
Assets Turnover Ratio 0.023 0.023 0.013
Graph 8.11: Assets Turnover Ratio
Years
The ratio indicates that the asset turnover remained the same in both
2003 and 2004. But decreased in the year 2005. This means that the
bank does not efficiently utilize the assets in the year 2005.
Internship Report on UBL, Main Branch, Bannu 69

8.3.4 Fixed Assets Turnover Ratio
This ratio explains the relationship between the fixed assets and Net
Revenues. That how efficiently the fixed Assets contribute to the Net
Revenues.
Formula: {Net Revenue / Total Fixed Assets}
Fixed Assets Turnover Ratio (2003) = {3,614,750 / 3754236}
Fixed Assets Turnover Ratio (2004) = {4043633 / 3969006}
Fixed Assets Turnover Ratio (2005) = {4,606,645 / 4449324}
Year 2003 2004 2005
Fixed Assets Turnover Ratio 0.96 1.02 1.03
Graph 8.12: Fixed Assets Turnover Ratio
Years
The contribution of fixed asset to generating Revenue is shown in the
above graph. In the year 2003 the ratio is low. But increased in the years
2004 and 2005, which is encouraging. Also this ratio tells us that these
fixed assets are utilized efficiently.
Internship Report on UBL, Main Branch, Bannu 70

8.4 COVERAGE RATIOS
Coverage ratios are designed to relate the financial charges of a firm to
its ability to service, or cover, them. In other words this ratio help us to
determine that how much of the interest expenses are covered out of the
revenue generated.
4.4.1 Interest Coverage Ratio
This ratio serves as one measure o the firm’s ability to meet its interest
payments and thus avoids bankruptcy. In general the higher the ratio, the
greater the likelihood that the company could cover its interest payments
without difficulty.
Formula: {Earning Before Interest and Taxes/Interest Expenses}
Interest Coverage Ratio (2003) = {11,037,970 / 6711254}
Interest Coverage Ratio (2004) = {11660073 / 6770345}
Interest Coverage Ratio (2005) = {17698138 / 8216488}
Years 2003 2004 2005
Interest Coverage Ratio 1.64 1.72 2.15
Graph 8.13: Interest Coverage Ratio
Years
The increase in the Ratio indicates that the bank has enough profit to pay
its interest expenses.
Internship Report on UBL, Main Branch, Bannu 71
8.4.2 Interest Expense to Deposit
The ratio reflects the rate at which the bank has honored the depositors.
Formula: {Interest Expense / Deposit} x 100
Interest Expense to Deposit (2003) = {6711254 / 185071502} x 100
Interest Expense to Deposit (2004) = {6770345 / 230256627} x 100
Interest Expense to Deposit (2005) = {8216488 / 289226299} x 100
Year 2003 2004 2005
Interest Expense to Deposit 3.63 2.94 2.84
Graph 8.14: Interest Expense to Deposit Ratio
Years
The interest rats offered to the public are getting decreased. This is not
beneficial for the bank. But as the policy of the government, the bank
has to keep the interest rates as lower as possible in order to encourage
the investment.
8.9 CROSS SECTIONAL ANALYSIS
The cross-sectional approach involves the comparison of different firms’
financial data at the same point in time, as they are interested in knowing how
they are performing financially in relation to the competitors in the industry.
Internship Report on UBL, Main Branch, Bannu 72

Due to certain constraints the analysis will not be in much detail rather a mere
glance at the financial performance of the banks similar in status to UBL in
order to judge its standing in the banking sector.
The following graphs and tables will help better analyse UBL’s position
relative to its competitors in the financial market.
8.9.1 MARKET SHARE IN ADVANCES
Total Advances in millions (Rs)
Years 2005 2006 %
HBL 167225 167523 37%
NBP 170319 140547 30%
MCB 76586 78924 17%
UBL 88383 75795 16%
Total 502513 462789 100%
Although UBL suffered huge losses in the last years, yet its share in
advances out of the total market reveal the customer’s confidence and its
capability to regain its position.
8.9.2 MARKET SHARE IN DEPOSITS
Rs. In millions
Years 2005 2006 %
HBL 273012 306316 33%
NBP 262022 295768 31%
MCB 153751 180777 19%
UBL 140736 161669 17%
Total 829521 944530 100%
Deposits from financial institutions have been excluded to analyze the
customer deposit base separately. The above two tables clearly show that UBL
has better Advances to Deposit Ratio as compared to the other banks and the
borrowed funds are closely matched by the lent funds.
Internship Report on UBL, Main Branch, Bannu 73

8.9.3 INVESTMENT IN GOVERNMENT SECURITIES
Ratio
Years 2005 2006
UBL 57.4% 51.7%
HBL 58.1% 51.5%
MCB 53.9% 44.6%
NBP 45.0% 43.1%
UBL has given equal weight age to investment in government securities
as compared to the advances. This figure is neither too high nor low; as a high
amount of investments in these would mean foregoing a possibly large
opportunity cost as government securities although reliable offer a far lower
rate as compared to the other securities.
8.9.4 Average Advances to Average Deposits Ratio
UBL had the second highest average advances to average deposits ratio
in 2005 and in 2006 it stands at the top.
NON-PERFORMING ADVANCES TO GROSS ADVANCES RATIO
Ratio
Years 2005 2006
MCB 16.2% 14.2%
NBP 22.5% 26.3%
HBL 28.2% 26.4%
UBL 34.6% 31.0%
This ratio in comparison shows that UBL has the highest average of
non-performing advances to the total advances, implying that it has more debts
gone badly as compared to the other banks. Although this ratio has come down
from the previous year’s figure yet it is the highest in 2006.
Internship Report on UBL, Main Branch, Bannu 74

8.4 ABSOLUTE AND PERCENTAGE CHANGES IN BALANCE SHEET
TABLE 8.4 ABSOLUTE AND PERCENTAGE CHANGES IN
BALANCE SHEET
Absolute Changes Percentages Changes
2004 2005 2004 2005
ASSETS
CURRENT ASSETS
Cash and balances with treasury banks
6569974 102182244
38.03 428.54
Balances with other banks (5396694) (4970127) (47.47) (28.08)
Lending to financial institutions (4735395) (493081) (20.50) (2.69)
Investments (1563032) 8073216 (2.77) 14.69
Advances
Performing 47155704 61482655 50.97 44.02
Non Performing 870173 (823240) 24.09 (18.36)
Other Assets 1437787 3390190 47.90 76036
Fixed assets 214770 480318 5.72 12.10
Deferred tax asset-net (291465) (2921887) (5.31) (56.24)
Liabilities
Bills payable 835374 348680 28.07 9.14
Borrowing from financial institutions
4265309 9814796 53.32 81.96
Deposits and other accounts 45185125 58969672 24.41 25.61
Sub-ordinate loans 3500000 499192 14.26
Liabilities against assets subject to finance lease
(39707) (99.28)
Other liabilities 1163045 499997 25.60 8.76
Total liabilities 54909146 70132049 27.41 27.47
Net assets 1082270 4304239 6.65 24.79
Owner’s equity
Share capital --- --- -- ---
Reserves 1237611 309533 26.45 5.23
Inappropriate profit 1889949 4076374 136.51 124.50
Surplus on revaluation of assets (2045290) (81668) (40.58) (2.73)
Total Owner’s Equity 1082270 4304239 6.65 24.79
Total liabilities and owner Equity
55991416 74436288 25.85 27.30
Internship Report on UBL, Main Branch, Bannu 75

8.5 TREND PERCENTAGES AND COMMON SIZE ANALYSIS OF BALANCE SHEET
TABLE 8.5 TREND PERCENTAGES AND COMMON SIZE ANALYSIS
OF BALANCE SHEET
Trend Percentages Common Size Analysis
2004 2005 2003 2004 2005
ASSETS
CURRENT ASSETS
Cash and balances with treasury banks
138.03 142.85 7.97 8.75 9.81
Balances with other banks 155.72 71.92 5.25 6.49 3.67
Lending to financial institutions 79.50 97.31 10.66 6.74 5.15
Investments 97.23 114.70 26.09 20.16 15.83
Advances
Performing 247.13 144.02 42.71 51.23 57.96
Non Performing 124.09 81.63 1.67 1.64 1.05
Other assets 147.90 176.36 1.39 1.63 2.26
Fixed assets 105.72 112.10 1.73 1.46 1.28
Deferred tax asset-net 94.69 43.75 2.53 1.91 0.65
Total assets 125.85 127.30 100% 100% 100%
Liabilities
Bills payable 128.07 109.15 1.37 1.40 1.20
Borrowing from financial institution
155.32 181.96 3.56 4.39 6.28
Deposits and other accounts 124.41 125.61 85.44 84.46 83.33
Sub-ordinate loans --- 114.26 --- 1.29 1.12
Liabilities against assets subject to finance lease
0.72 --- 0.02 ---- ---
Other liabilities 125.61 108.76 2.10 2.09 1.79
Total liabilities 127.41 127.48 92.48 93.63 93.76
Net assets 127.41 127.76 92.48 6.37 6.24
Owner’s Equity
Share capital 100 100 2.39 1.90 1.49
Reserves 126.45 105.23 2.16 2.17 1.79
Inappropriate profit 236.51 224.49 0.64 1.20 2.11
Surplus on revaluation of assets 59.41 97.27 2.33 1.10 0.84
Total Owner’s Equity 106.65 124.79 7.52 6.37 6.24
Total liabilities and owner’s equity
125.85 127.30 100% 100% 100%
Internship Report on UBL, Main Branch, Bannu 76
Internship Report on UBL, Main Branch, Bannu 77

8.6 INDEX ANALYSIS OF BALANCE SHEET
TABLE 8.6: INDEX ANALYSIS OF BALANCE SHEET
Index Analysis
2003 2004 2005
ASSETS
CURRENT ASSETS
Cash and balances with treasury banks 100% 138.03 197.19
Balances with other banks 100% 155.72 111.99
Lending to financial institutions 100% 79.50 77.36
Investments 100% 97.23 111.52
Advances
Performing 100% 150.97 217.43
Non Performing 100% 124.10 101.30
Other assets 100% 147.90 260.84
Fixed assets 100% 105.72 118.51
Deferred tax asset-net 100% 94.69 41.43
Total assets 100% 125.85 160.21
Liabilities
Bills payable 100% 128.07 139.79
Borrowing from financial institutions 100% 155.32 282.61
Deposits and other accounts 100% 124.41 156.28
Sub-ordinate loans --- --- ---
Liabilities against assets subject to finance lease
100% 0.72 ---
Other liabilities 100% 125.61 136.62
Total liabilities 100% 127.41 162.41
Net assets 100% 106.65 133.08
Owner’s Equity
Share capital 100% 100 100
Reserves 100% 126.45 133.07
Inappropriate profit 100% 236.51 530.94
Surplus on revaluation of assets 100% 59.41 57.79
Total owner’s Equity 100% 59.41 57.79
Total liabilities and Owner’s equity 100% 125.85 160.21
Internship Report on UBL, Main Branch, Bannu 78

8.9 ABSOLUTE AND PERCENTAGE CHANGES IN INCOME STATEMENT
TABLE 8.9 ABSOLUTE AND PERCENTAGES IN INCOME
STATEMENT
Absolute Changes Percentage Changes
2004 2005 2004 2005
Mark-up/return/interest earned 289621 10924979 3.24 118.31
Mark-up/return/interest expense (15589) 4313088 (8.24) 248.91
Net mark-up/interest income 445210 (6088209) 6.31 (81.16)
Provision against loans and advances-net
(9457) 841588 (2.13) 193.28
Provision/(reversals) for diminution in value of investment-net
--- --- --- ---
Bed debts written off-directly (9056) 34299 (70.22) 892.97
Net mark0up/return/interest income after provisions
668389 5522857 10.29 77.11
Net mark-up/interest income
Fee, commission and brokerage income 211833 889264 14.68 53.75
Dividend income/gain on sale of investments
(954804) (518528) (46.41) (47.03)
Income from dealing in foreign currencies
231429 7024 53.00 1.05
Other income 465250 137452 76.58 12.81
Total non-markup/return/interest income (46286) 515206 (1.02) 11.45
Non-markup/Interest Expenses
Administrative expenses 640398 1079702 10.41 15.89
Other provisions/write offs/(reversal) --- --- --- ---
Other charges 4955 (3390) 90.07 (32.42)
Total non mark-up/interest expenses 59091 1446143 0.88 21.36
Extraordinary items -- --- --- ---
Profit before taxation (563012) 563012 (11.51) 13.01
Taxation 90033 215665 46.64 76.18
Net Profit 428883 563012 11.86 13.92
Internship Report on UBL, Main Branch, Bannu 79

8.10 TREND PERCENTAGES AND COMMON SIZE ANALYSIS OF INCOME STATEMENT
Table 8.10 Trend percentages and Common Size Analysis of Income Statement
Trend Percentages Common Size Analysis
2004 2005 2003 2004 2005
Mark-up/return/interest earned 103.24 218.31 100% 100% 100%
Mark-up/return/interest expense 91.76 348.91 21.11 18.77 29.99
Net mark-up/interest income 106.30 188.14 78.89 81.23 70.00
Provision against loans and advances-net 97.87 293.28 4.97 4.72 6.33
Provision/(reversals) for diminution in value of investment-net
--- ---- 1.17 1.08 0.55
Bed debts written off-directly 29.78 992.97 0.14 0.04 0.19
Net mark0up/return/interest income after provisions
60.29 421.34 6.28 3.66 7.08
Net mark-up/interest income 72.60 77.56
Fee, commission and brokerage income 114.68 153.75 16.13 17.92 12.62
Dividend income/gain on sale of investments
53.59 52.97 23.00 11.94 2.90
Income from dealing in foreign currencies
153.00 101.05 4.88 7.24 4.84
Other income 176.58 112.81 6.79 11.62 6.00
Total non-markup/return/interest income 98.98 111.45 50.80 48.71 24.87
Non-markup/Interest Expenses
Administrative expenses 110.41 115.89 68.80 73.58 39.06
Other provisions/write offs/(reversal) --- --- 6.17 0.37 1.66
Other charges 190.07 67.58 0.06 0.11 0.04
Total non mark-up/interest expenses 100.88 121.36 75.03 73.32 40.76
Extraordinary items --- --- 54.67 46.86 24.26
Profit before taxation 88.49 113.01 2.16 3.07 2.47
Taxation 146.64 176.18 14.25 6.71 14.66
Net Profit 111.86 113.92 40.41 43.79 22.85
Internship Report on UBL, Main Branch, Bannu 80
INDEX ANALYSIS OF INCOME STATEMENT
TABLE 4.11 INDEX ANALYSIS OF INCOME STATEMENT
Index Analysis
2003 2004 2005
Mark-up/return/interest earned 100% 103.23 225.38
Mark-up/return/interest expense 100% 91.76 320.16
Net mark-up/interest income 100% 106.31 200.02
Provision against loans and advances-net 100% 97.87 287.04
Provision/(reversals) for diminution in value of investment-net
100% 96.26 108.04
Bed debts written off-directly 100% 29.78 295.73
Net markup/return/interest income after provisions
100% 60.29 254.03
Net mark-up/interest income
Fee, commission and brokerage income 100% 114.68 176.33
Dividend income/gain on sale of investments 100% 9.14 4.84
Income from dealing in foreign currencies 100% 153.00 154.61
Other income 100% 176.58 199.21
Total non-markup/return/interest income 100% 98.98 110.32
Non-markup/Interest Expenses
Administrative expenses 100% 110.41 127.95
Other provisions/write offs/(reversal) 100% 6.24 60.78
Other charges 100% 190.07 128.45
Total non mark-up/interest expenses 100% 100.88 122.43
Extraordinary items 100% --- ---
Profit before taxation 100% 88.46 100
Taxation 100% 146.64 258.35
Net Profit 100% 111.86 127.44
Internship Report on UBL, Main Branch, Bannu 81

CHAPTER – 9
FINDINGS AND RECOMMENDATIONS
Recommendations are based on the previous sections of a report and are
suggestions that the analyst feels are required to be implemented in order to
improve further the standing and position of the firm in the financial world.
These are thus based on the findings and shortcomings noted in an organization
while working with it and then writing on it. Opinions of various capable
individuals are sought who through their real life experiences and deep insight
are better able to judge whether the course of action adopted by the
organization is going to prove fruitful or does it require further improvement in
the form of changes in its strategies.
Following are the findings and recommendations for various
Departments that were felt are required while consulting the staff members of
UBL, Main Branch Bannu.
9.1 DEPOSITS DEPARTMENT
The comparative analyses reveal that UBL has the lowest share of
Deposits out of the total in the market. Since deposits are the lifeblood of a
bank, it should attract more customers and expand its deposit base in the
following manner
9.1.1 Simplification of Procedures
The procedure of opening an account should be simplified. The account
opening form should be self-explanatory and include translations in
Urdu for those customers who are not well read, since the fact cannot be
ignored that many people do not have a good understanding of English.
9.1.2 No Duplication of Activities
Once the account opening form is filled there should be no reason to
submit a written application for opening an account, since it not only is a
Internship Report on UBL, Main Branch, Bannu 82

wasteful and time consuming exercise on the part of the customer but
also makes filing lengthy.
9.1.3 Incentives for Depositors
Those who deposit large amounts of money or are old customers of the
bank should be given free credit lines up to a certain limit. Besides,
financial advice should be provided to customers in case there is a
change in the market trend before they seek for it.
9.1.4 Integrated Marketing Approach
All the officers in Deposits Department should be involved in marketing
and not just opening accounts and maintaining their records. This can be
done through improving their personnel relations’ skills and applying
the Uni-Service concept of visiting the potential customers at their
offices and homes.
9.1.5 Performance Appraisal
UBL should follow the performance evaluation policy strictly and award
those who bring in deposits and help it increase its market share.
Unfortunately, this has been stated in the bank’s policy but is not being
implemented.
9.2 REMITTANCES DEPARTMENT
The Remittances Department at the Branch is divided into Inland
Remittances and Foreign Remittances.
Both these are dealt by separate officers and involve using specific
stationary and procedures. The following recommendations are made for this
very important Department of the bank
9.2.1 Organizing the Department
The Department is spread over the entire bank with no specific person or
desk for the purpose. Usually drafts and telegraphic transfers are made
in the cash counter that results in hassle for the other customers. A
senior officer detached from the other officers performing inland
Internship Report on UBL, Main Branch, Bannu 83
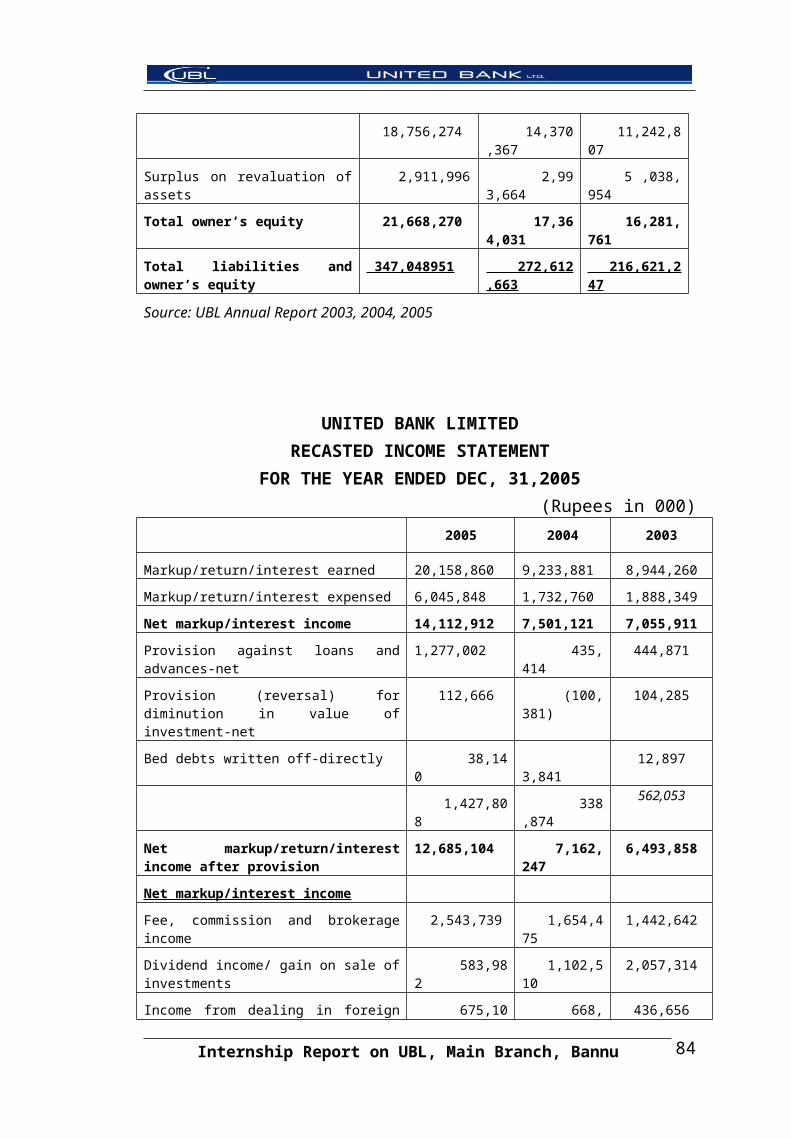
remittance transactions handles the foreign remittances. It would be
better for them to sit together so that they can benefit from his
experience and know how.
9.2.2 Centralized Money gram Services
The customers receiving funds from abroad have to wait quite long in
order to get their money as the branch sends the application form
through fax to the City Branch from where it is confirmed whether the
amount has been credited to the Swabi. Branch or not. This confirmation
takes long at times and there is always a fear of the bank losing its
goodwill in case of lengthy delays. The service should thus be
decentralized and the Hub Branch having the authority of directly
confirming the amount.
9.3 CASH DEPARTMENT
The following recommendations are made for the Cash Department.
9.3.1 Expansion of the Cash Counter
The Cash Department at the Branch needs special attention in the sense
that the cash counter is small and becomes crowded when there are more
than five to six customers to attend. Customers purchase drafts and other
instruments from the very same counter where utility bills are collected
and cash is deposited and withdrawn. Hence, if a new counter cannot be
built due to certain limitations the utility bills should be collected
through a window so that the regular customers do not face any
problems.
9.3.2 Extended timings for Cash
In order for the bank to progress and compete with the others in the
market, it should extend the time for accepting and withdrawing cash.
The customers face great hardship especially when they come from far
off places and find that the cash counter is closed for the daily
transactions.
Internship Report on UBL, Main Branch, Bannu 84

9.4 BILLS AND CLEARING DEPARTMENT
The following suggestions are made for this Department keeping in
view the problems noted in it.
9.4.1 Career Development
It has been noted that the officers taking bills for clearing do not involve
themselves much with the other operations of the bank and thus remain
on the very same post and seat throughout their banking career. This is
against the modern day policies of organizations giving their employees
conducive, rewarding and equal opportunities of prospering and
growing with it. Thus, the Human Resource Department at the Head
Office should prepare a plan that shows the future growth potential of
the employees based on their job performance and evaluation and make
it known to all.
9.4.2 Job Rotation
There should be job rotation of employees especially in this department
as it was felt that the employees here know quite less as compared to the
others. This will enhance their capabilities and help them break the
monotony making them find their work more interesting.
9.5 ADVANCES DEPARTMENT
There were certain drawbacks in the application and processing for the
loan requests that were observed at the branch. The findings and the
recommendations are as under
9.5.1 Proper Documentation
If valid documents are not obtained before sanctioning the loan limit, it
becomes irrecoverable in case of default by the borrower. It has been
noted that at times the related officers oblige the customer by letting him
submit the documents later and approving the limit by getting the
Disbursement Authorization Certificate from the Credit Committee. It
proves to be very time and resource consuming afterwards tracing the
Internship Report on UBL, Main Branch, Bannu 85
borrower to bring in the documents. Therefore, correct and complete
documents should be attained before the amount is sanctioned and no
leniency shown in any case.
9.5.2 Computerised Record
All the sanctioned cases should have record on the computer as it is easy
to access and does not involve the hassles of maintaining and retrieving
large and old files. For this purpose, training programs should be
organized for the Relationship Managers to enable them to have a basic
computer know how. Through this, they would also be able to assess the
financial position of the prospective borrower in minutes by using
related financial software.
9.5.3 Verification of Security
Physical verification of the security tendered is a must rather than to
merely rely on the documents. It had been noted that where the property
to be hypothecated/ mortgaged lay in remote areas such as the Gadoon
Industrial Estate regular physical visits are avoided by the officers. This
and the above factors result in an increase in the non-performing loans
of the bank and as result UBL had more debts turned bad as compared to
the other banks. For this purpose, regular physical verification must be
conducted of securities pledged and hypothecated.
9.6 OTHER FINDINGS AND RECOMMENDATIONS
The following recommendations are for the bank as a whole
9.6.1 Development of Managerial Leadership
Good managerial skills make positive contribution towards higher
effective results. UBL should focus on the effective utilization of its
human resource by applying the modern style of management. This can
only be possible if political interferences are discouraged especially
when hiring and placing personnel and the recruitment policies are
changed to give preference to M.B.A. and M. Com. students.
Internship Report on UBL, Main Branch, Bannu 86

9.6.2 Tests for Promotions
A sizeable portion of the officers at UBL is promoted without
conducting any tests and interviews. This results in undeserving people
sitting on the managerial posts and steering the organization away from
its goals and objectives in the long run.
9.6.3 Training for Credit Management
Special trainings on credit management should be imparted to the staff
dealing in financing activities of the bank. This is very important in light
of current loan default scenario in the economy.
9.6.4 Delegation of Powers
Delegating powers to the Department in-charges up to the greater
possible extent will most certainly reduce the workload on the managers
and they would be able to perform well by taking quick remedial actions
where necessary. Besides, the spare time will be spent dealing with
matters of more important nature.
9.6.5 Research and Development Department
A Research and Development Department in UBL will help it to adopt
new procedures and modern techniques that will help the bank to
compete with the others. An R&DD should be maintained at all the Hub
Branches that would define the target market for the bank in that
particular area and through its findings suggest measures to improve the
performance of branches there.
Internship Report on UBL, Main Branch, Bannu 87
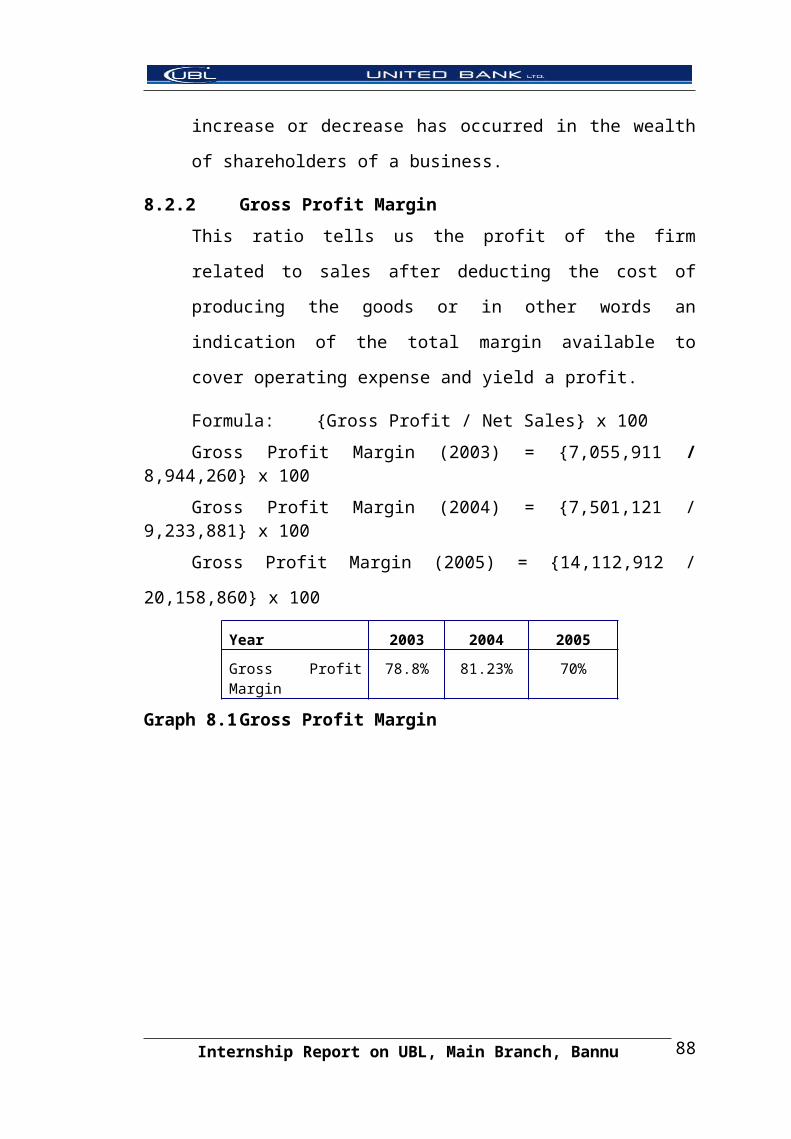
REFERENCES
Van Horne Tames C. Wachowich, J.R. Fundamentals of Financial
Management, eleventh Edition, Prentice Hall International Inc., p. 125-
136.
Muhammad Musa Khan. Internship Report on UBL (2006-2007).
Internship Report on UBL, Main Branch, Bannu 88

BIBLIOGRAPHY
Block Stanley B & Hirt Geoffrey A. (1998) Fundamentals of Financial
Management.
Earl, K Bowen. (1999). Basic Statistics for Business and Economics.
International Edition, (Pvt.) Ltd.
Edwin B Fillip (1998) Principles of Personnel Management, McGraw
Hill Inc.
Koontz, Harold. (1993). Management. Tenth Edition. Singapore
McGraw Hill.
Management. Seventh Edition, Richard. O Erwin Inc.
Memorial C.B. (1987). Personnel Management. New Delhi,
Himalayand
Nasir, M Saeed. (1993). Banking Currency and Finance. Lahore: Ilmi
Kutab Khana.
Philip Kotler. (1991). Marketing Management. New Jersey, Ninth
Edition, Prentice Hall International Inc., Publishing House.
Reece, Barry L. (1987). Business. Houghton Mifflin Company.
Siddiqui Asrar H. (1993). Practice and Law of Banking in Pakistan.
Karachi, Royal Book Company.
Simons, Harry. (1964). Intermediate Accounting. Forth editions USA:
Southwestern publishing company.
Van Horane, James C. (1998). Fundamentals of Financial Management.
Tenth Editions. New Jersey: Prentice Hall.
Internship Report on UBL, Main Branch, Bannu 89
Related Documents