Ubiquitous Memory Introspection Qin Zhao 1,2 Rodric Rabbah 3 Saman Amarasinghe 1,4 Larry Rudolph 1,4 Weng-Fai Wong 1,2 1 Singapore-MIT Alliance 2 National University of Singapore 3 IBM T.J. Watson Research Center 4 Massachusetts Institute of Technology Abstract Modern memory systems play a critical role in the per- formance of applications, but a detailed understanding of the application behavior in the memory system is not trivial to attain. It requires time consuming simulations and de- tailed modeling of the memory hierarchy, often using long address traces. It is increasingly possible to access hard- ware performance counters to count relevant events in the memory system, but the measurements are coarse-grained and better suited for performance summaries than provid- ing instruction level feedback. The availability of a low cost, online, and accurate methodology for deriving fine- grained memory behavior profiles can prove extremely use- ful for runtime analysis and optimization of programs. This paper presents a new methodology for Ubiqui- tous Memory Introspection (UMI). It is an online and lightweight methodology that uses fast mini-simulations to analyze short memory access traces recorded from fre- quently executed code regions. The simulations provide pro- filing results at varying granularities, down to that of a sin- gle instruction or address. UMI naturally complements run- time optimizations and enables new opportunities for online memory specific optimizations. We present a prototype runtime system implementing UMI. The prototype has an average runtime overhead of 14%. This overhead is only 1% more than a state of the art binary instrumentation tool. We used 32 benchmarks, including the full suite of SPEC CPU2000 benchmarks, for evaluation. We show that the mini-simulations accurately reflect the cache performance of two existing memory sys- tems, an Intel Pentium 4 and an AMD Athlon MP (K7). We also demonstrate that UMI predicts delinquent load instruc- tions with an 88% rate of accuracy for applications with a relatively high number of cache misses, and 61% overall. The online profiling results are used at runtime to imple- ment a simple software prefetching strategy that achieves an overall speedup of 64% in the best case. 1. Introduction The migration from offline to runtime optimizations pro- vides the unique ability to perform workload-specific opti- mizations that are tailored to end-user scenarios. This pa- per presents a practical simulation-based profiling method- ology for use in an online setting. The methodology calls for i) identifying frequently executed program regions dur- ing execution, ii) selectively instrumenting some of their operations and profiling their execution, and iii) period- ically triggering a fast online mini-simulator to analyze the recorded profiles and derive detailed performance sum- maries, all while the application is running. It is not un- common for offline simulators to use similar techniques to reduce simulation time with sampling and functional fast forwarding [4]. A key observation inspiring this work is that similar ideas and even simpler heuristics are possible at runtime. The paper is focused on delivering detailed profiles of the application behavior in the memory hierarchy, at the level of individual instructions and addresses. Virtually all op- timizations that attempt to mitigate the memory bottleneck rely on accurate application-specific profiles of the mem- ory hierarchy performance. For example, data prefetching techniques are up to 60% more effective when they are tar- geted at high miss rate memory references. Similarly, local- ity enhancing optimizations can significantly benefit from accurate measurements of the working sets size and char- acterization of their predominant reference patterns. Ubiq- uitous Memory Introspection (UMI) provides online and application-specific profiling information that is necessary for runtime memory-centric optimizations. As a result and for the first time, UMI makes it possible for traditionally offline simulation-based optimizations to run online. 1.1. Common Practice It is not uncommon to use simulators to model the mem- ory system behavior of benchmarks and application codes.

Welcome message from author
This document is posted to help you gain knowledge. Please leave a comment to let me know what you think about it! Share it to your friends and learn new things together.
Transcript
Ubiquitous Memory Introspection
Qin Zhao1,2 Rodric Rabbah3
Saman Amarasinghe1,4 Larry Rudolph1,4 Weng-Fai Wong1,2
1 Singapore-MIT Alliance2 National University of Singapore
3 IBM T.J. Watson Research Center4 Massachusetts Institute of Technology
Abstract
Modern memory systems play a critical role in the per-formance of applications, but a detailed understanding ofthe application behavior in the memory system is not trivialto attain. It requires time consuming simulations and de-tailed modeling of the memory hierarchy, often using longaddress traces. It is increasingly possible to access hard-ware performance counters to count relevant events in thememory system, but the measurements are coarse-grainedand better suited for performance summaries than provid-ing instruction level feedback. The availability of a lowcost, online, and accurate methodology for deriving fine-grained memory behavior profiles can prove extremely use-ful for runtime analysis and optimization of programs.
This paper presents a new methodology for Ubiqui-tous Memory Introspection (UMI). It is an online andlightweight methodology that uses fast mini-simulations toanalyze short memory access traces recorded from fre-quently executed code regions. The simulations provide pro-filing results at varying granularities, down to that of a sin-gle instruction or address. UMI naturally complements run-time optimizations and enables new opportunities for onlinememory specific optimizations.
We present a prototype runtime system implementingUMI. The prototype has an average runtime overhead of14%. This overhead is only 1% more than a state of theart binary instrumentation tool. We used 32 benchmarks,including the full suite of SPEC CPU2000 benchmarks, forevaluation. We show that the mini-simulations accuratelyreflect the cache performance of two existing memory sys-tems, an Intel Pentium 4 and an AMD Athlon MP (K7). Wealso demonstrate that UMI predicts delinquent load instruc-tions with an 88% rate of accuracy for applications with arelatively high number of cache misses, and 61% overall.The online profiling results are used at runtime to imple-ment a simple software prefetching strategy that achievesan overall speedup of 64% in the best case.
1. Introduction
The migration from offline to runtime optimizations pro-vides the unique ability to perform workload-specific opti-mizations that are tailored to end-user scenarios. This pa-per presents a practical simulation-based profiling method-ology for use in an online setting. The methodology callsfor i) identifying frequently executed program regions dur-ing execution, ii) selectively instrumenting some of theiroperations and profiling their execution, and iii) period-ically triggering a fast online mini-simulator to analyzethe recorded profiles and derive detailed performance sum-maries, all while the application is running. It is not un-common for offline simulators to use similar techniques toreduce simulation time with sampling and functional fastforwarding [4]. A key observation inspiring this work isthat similar ideas and even simpler heuristics are possible atruntime.
The paper is focused on delivering detailed profiles of theapplication behavior in the memory hierarchy, at the levelof individual instructions and addresses. Virtually all op-timizations that attempt to mitigate the memory bottleneckrely on accurate application-specific profiles of the mem-ory hierarchy performance. For example, data prefetchingtechniques are up to 60% more effective when they are tar-geted at high miss rate memory references. Similarly, local-ity enhancing optimizations can significantly benefit fromaccurate measurements of the working sets size and char-acterization of their predominant reference patterns. Ubiq-uitous Memory Introspection (UMI) provides online andapplication-specific profiling information that is necessaryfor runtime memory-centric optimizations. As a result andfor the first time, UMI makes it possible for traditionallyoffline simulation-based optimizations to run online.
1.1. Common Practice
It is not uncommon to use simulators to model the mem-ory system behavior of benchmarks and application codes.
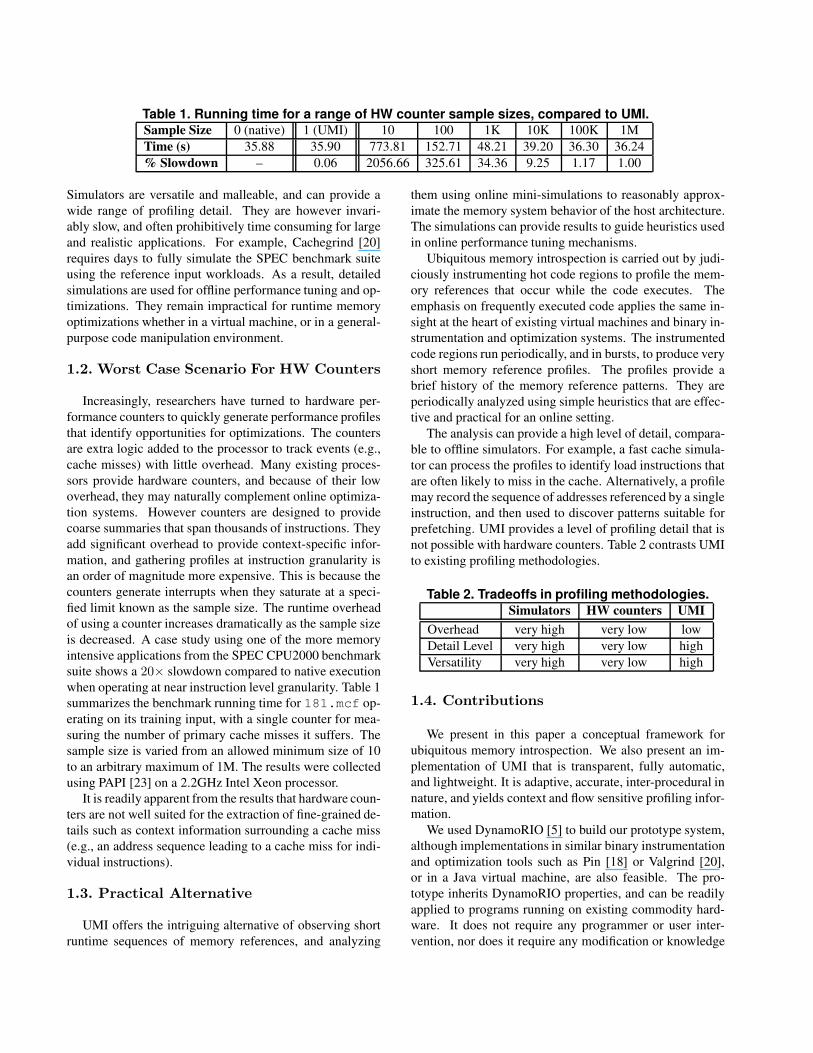
Table 1. Running time for a range of HW counter sample sizes, compared to UMI.Sample Size 0 (native) 1 (UMI) 10 100 1K 10K 100K 1MTime (s) 35.88 35.90 773.81 152.71 48.21 39.20 36.30 36.24% Slowdown – 0.06 2056.66 325.61 34.36 9.25 1.17 1.00
Simulators are versatile and malleable, and can provide awide range of profiling detail. They are however invari-ably slow, and often prohibitively time consuming for largeand realistic applications. For example, Cachegrind [20]requires days to fully simulate the SPEC benchmark suiteusing the reference input workloads. As a result, detailedsimulations are used for offline performance tuning and op-timizations. They remain impractical for runtime memoryoptimizations whether in a virtual machine, or in a general-purpose code manipulation environment.
1.2. Worst Case Scenario For HW Counters
Increasingly, researchers have turned to hardware per-formance counters to quickly generate performance profilesthat identify opportunities for optimizations. The countersare extra logic added to the processor to track events (e.g.,cache misses) with little overhead. Many existing proces-sors provide hardware counters, and because of their lowoverhead, they may naturally complement online optimiza-tion systems. However counters are designed to providecoarse summaries that span thousands of instructions. Theyadd significant overhead to provide context-specific infor-mation, and gathering profiles at instruction granularity isan order of magnitude more expensive. This is because thecounters generate interrupts when they saturate at a speci-fied limit known as the sample size. The runtime overheadof using a counter increases dramatically as the sample sizeis decreased. A case study using one of the more memoryintensive applications from the SPEC CPU2000 benchmarksuite shows a 20× slowdown compared to native executionwhen operating at near instruction level granularity. Table 1summarizes the benchmark running time for 181.mcf op-erating on its training input, with a single counter for mea-suring the number of primary cache misses it suffers. Thesample size is varied from an allowed minimum size of 10to an arbitrary maximum of 1M. The results were collectedusing PAPI [23] on a 2.2GHz Intel Xeon processor.
It is readily apparent from the results that hardware coun-ters are not well suited for the extraction of fine-grained de-tails such as context information surrounding a cache miss(e.g., an address sequence leading to a cache miss for indi-vidual instructions).
1.3. Practical Alternative
UMI offers the intriguing alternative of observing shortruntime sequences of memory references, and analyzing
them using online mini-simulations to reasonably approx-imate the memory system behavior of the host architecture.The simulations can provide results to guide heuristics usedin online performance tuning mechanisms.
Ubiquitous memory introspection is carried out by judi-ciously instrumenting hot code regions to profile the mem-ory references that occur while the code executes. Theemphasis on frequently executed code applies the same in-sight at the heart of existing virtual machines and binary in-strumentation and optimization systems. The instrumentedcode regions run periodically, and in bursts, to produce veryshort memory reference profiles. The profiles provide abrief history of the memory reference patterns. They areperiodically analyzed using simple heuristics that are effec-tive and practical for an online setting.
The analysis can provide a high level of detail, compara-ble to offline simulators. For example, a fast cache simula-tor can process the profiles to identify load instructions thatare often likely to miss in the cache. Alternatively, a profilemay record the sequence of addresses referenced by a singleinstruction, and then used to discover patterns suitable forprefetching. UMI provides a level of profiling detail that isnot possible with hardware counters. Table 2 contrasts UMIto existing profiling methodologies.
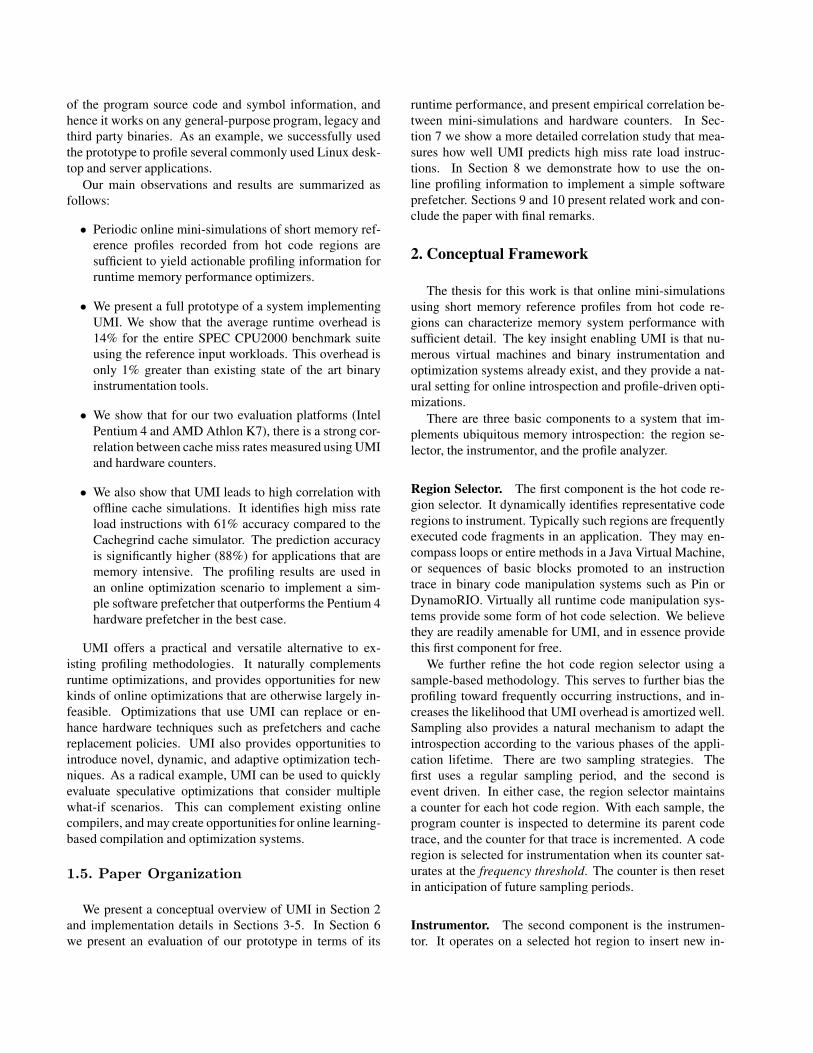
Table 2. Tradeoffs in profiling methodologies.Simulators HW counters UMI
Overhead very high very low lowDetail Level very high very low highVersatility very high very low high
1.4. Contributions
We present in this paper a conceptual framework forubiquitous memory introspection. We also present an im-plementation of UMI that is transparent, fully automatic,and lightweight. It is adaptive, accurate, inter-procedural innature, and yields context and flow sensitive profiling infor-mation.
We used DynamoRIO [5] to build our prototype system,although implementations in similar binary instrumentationand optimization tools such as Pin [18] or Valgrind [20],or in a Java virtual machine, are also feasible. The pro-totype inherits DynamoRIO properties, and can be readilyapplied to programs running on existing commodity hard-ware. It does not require any programmer or user inter-vention, nor does it require any modification or knowledge
of the program source code and symbol information, andhence it works on any general-purpose program, legacy andthird party binaries. As an example, we successfully usedthe prototype to profile several commonly used Linux desk-top and server applications.
Our main observations and results are summarized asfollows:
• Periodic online mini-simulations of short memory ref-erence profiles recorded from hot code regions aresufficient to yield actionable profiling information forruntime memory performance optimizers.
• We present a full prototype of a system implementingUMI. We show that the average runtime overhead is14% for the entire SPEC CPU2000 benchmark suiteusing the reference input workloads. This overhead isonly 1% greater than existing state of the art binaryinstrumentation tools.
• We show that for our two evaluation platforms (IntelPentium 4 and AMD Athlon K7), there is a strong cor-relation between cache miss rates measured using UMIand hardware counters.
• We also show that UMI leads to high correlation withoffline cache simulations. It identifies high miss rateload instructions with 61% accuracy compared to theCachegrind cache simulator. The prediction accuracyis significantly higher (88%) for applications that arememory intensive. The profiling results are used inan online optimization scenario to implement a sim-ple software prefetcher that outperforms the Pentium 4hardware prefetcher in the best case.
UMI offers a practical and versatile alternative to ex-isting profiling methodologies. It naturally complementsruntime optimizations, and provides opportunities for newkinds of online optimizations that are otherwise largely in-feasible. Optimizations that use UMI can replace or en-hance hardware techniques such as prefetchers and cachereplacement policies. UMI also provides opportunities tointroduce novel, dynamic, and adaptive optimization tech-niques. As a radical example, UMI can be used to quicklyevaluate speculative optimizations that consider multiplewhat-if scenarios. This can complement existing onlinecompilers, and may create opportunities for online learning-based compilation and optimization systems.
1.5. Paper Organization
We present a conceptual overview of UMI in Section 2and implementation details in Sections 3-5. In Section 6we present an evaluation of our prototype in terms of its
runtime performance, and present empirical correlation be-tween mini-simulations and hardware counters. In Sec-tion 7 we show a more detailed correlation study that mea-sures how well UMI predicts high miss rate load instruc-tions. In Section 8 we demonstrate how to use the on-line profiling information to implement a simple softwareprefetcher. Sections 9 and 10 present related work and con-clude the paper with final remarks.
2. Conceptual Framework
The thesis for this work is that online mini-simulationsusing short memory reference profiles from hot code re-gions can characterize memory system performance withsufficient detail. The key insight enabling UMI is that nu-merous virtual machines and binary instrumentation andoptimization systems already exist, and they provide a nat-ural setting for online introspection and profile-driven opti-mizations.
There are three basic components to a system that im-plements ubiquitous memory introspection: the region se-lector, the instrumentor, and the profile analyzer.
Region Selector. The first component is the hot code re-gion selector. It dynamically identifies representative coderegions to instrument. Typically such regions are frequentlyexecuted code fragments in an application. They may en-compass loops or entire methods in a Java Virtual Machine,or sequences of basic blocks promoted to an instructiontrace in binary code manipulation systems such as Pin orDynamoRIO. Virtually all runtime code manipulation sys-tems provide some form of hot code selection. We believethey are readily amenable for UMI, and in essence providethis first component for free.
We further refine the hot code region selector using asample-based methodology. This serves to further bias theprofiling toward frequently occurring instructions, and in-creases the likelihood that UMI overhead is amortized well.Sampling also provides a natural mechanism to adapt theintrospection according to the various phases of the appli-cation lifetime. There are two sampling strategies. Thefirst uses a regular sampling period, and the second isevent driven. In either case, the region selector maintainsa counter for each hot code region. With each sample, theprogram counter is inspected to determine its parent codetrace, and the counter for that trace is incremented. A coderegion is selected for instrumentation when its counter sat-urates at the frequency threshold. The counter is then resetin anticipation of future sampling periods.
Instrumentor. The second component is the instrumen-tor. It operates on a selected hot region to insert new in-
structions that instrument and profile the code. The appli-cation alternates between instrumented and native code re-gions. When the instrumented code is run, it generates shortprofiles that record instruction addresses and the memorylocations they reference. The instrumentor is commissionedwith filtering the instructions in a code region such that onlyinformative operations are instrumented. The instrumentoralso determines the frequency with which to trigger the pro-file analyzer.
Profile Analyzer. The profile analyzer or mini-simulatoris the third and final component in a system implementingUMI. It analyzes the recorded memory reference profiles toprovide various forms of information relevant to an onlineoptimizer. It is customizable and in this paper we presentan example use of the analyzer as a fast cache simulator. Itcan perform simple hit and miss accounting as a hardwarecounter does. It may also simulate the hit and miss behaviorfor individual instructions to identity those that are morelikely to miss. Such information is useful for optimizationsthat dynamically perform data prefetching.
3. Prototype System
We extended DynamoRIO to perform UMI. Dy-namoRIO is a dynamic binary rewriting framework for run-time instrumentation and optimization [5]. The prototypeperforms bursty profiling on running applications to collectshort memory reference sequences for frequently executedcode regions, and then uses a fast cache simulator to col-lect cache statistics dynamically. While our prototype wasimplemented in DynamoRIO, UMI can be realized in othersimilar systems or Java virtual machines.
DynamoRIO is a general-purpose runtime code manip-ulation system designed for transparency and efficiency. Itcan run large real world applications on off-the-shelf IA-32 hardware. DynamoRIO executes the input applicationby copying the user code, one basic block at a time, intoa code cache before executing the code there. All run-time control flow is directed through the cache to pro-vide a programmable mechanism for instrumentation, pro-filing, and optimizations. DynamoRIO reduces its over-head by directly linking blocks that are joined with di-rect branches, and using a fast lookup to transition be-tween blocks that are linked with indirect branches. Thesystem performs other optimizations that remove uncondi-tional branches, and stitches together frequently executedsequences of blocks into traces, also called code fragments.The traces are kept in the trace cache with fast lookups forindirect branches.
DynamoRIO initially executes all user code from thebasic block cache, until some set of blocks is consideredhot. At that point, the blocks are inlined into a single-entry,
Start basic block builder trace builder
dispatch
context switch
indirect branch lookup
BASIC BLOCK CACHE
TRACE CACHE
non-control-flowinstructions
non-control-flowinstructions
Instrumentor
indirect branch stays on trace?
ProfileAnalyzer
select
Figure 1. DynamoRIO and extensions for UMI.
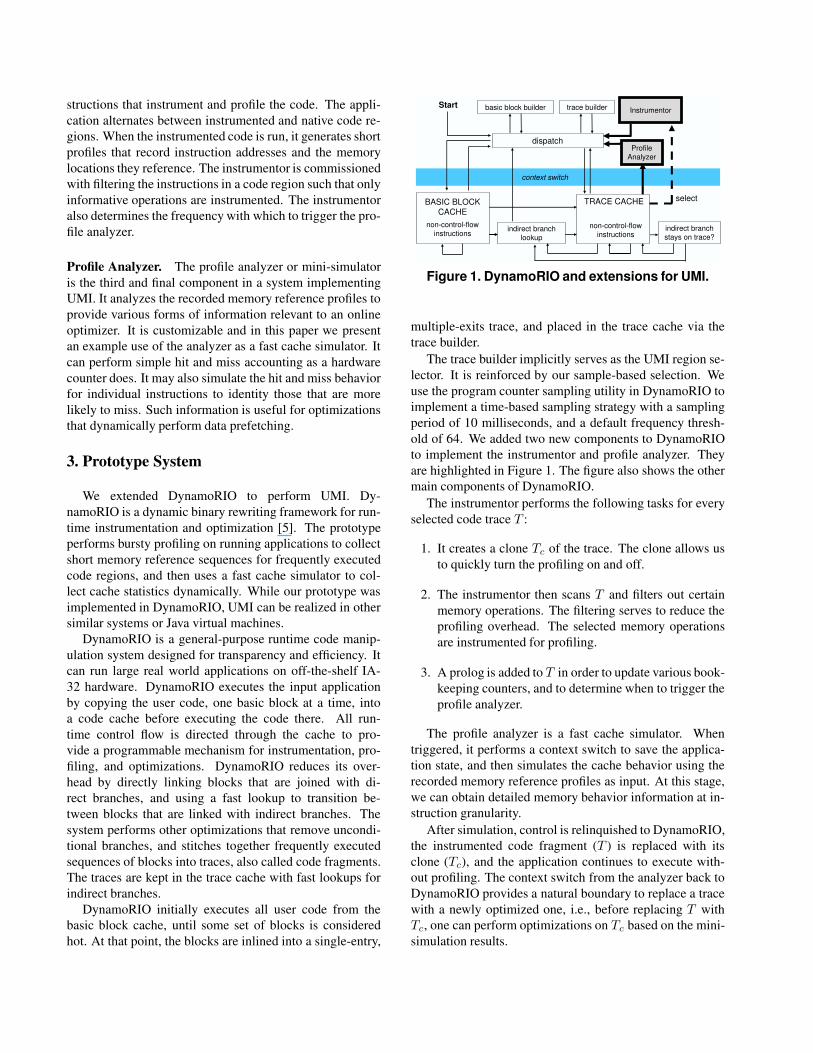
multiple-exits trace, and placed in the trace cache via thetrace builder.
The trace builder implicitly serves as the UMI region se-lector. It is reinforced by our sample-based selection. Weuse the program counter sampling utility in DynamoRIO toimplement a time-based sampling strategy with a samplingperiod of 10 milliseconds, and a default frequency thresh-old of 64. We added two new components to DynamoRIOto implement the instrumentor and profile analyzer. Theyare highlighted in Figure 1. The figure also shows the othermain components of DynamoRIO.
The instrumentor performs the following tasks for everyselected code trace T :
1. It creates a clone Tc of the trace. The clone allows usto quickly turn the profiling on and off.
2. The instrumentor then scans T and filters out certainmemory operations. The filtering serves to reduce theprofiling overhead. The selected memory operationsare instrumented for profiling.
3. A prolog is added to T in order to update various book-keeping counters, and to determine when to trigger theprofile analyzer.
The profile analyzer is a fast cache simulator. Whentriggered, it performs a context switch to save the applica-tion state, and then simulates the cache behavior using therecorded memory reference profiles as input. At this stage,we can obtain detailed memory behavior information at in-struction granularity.
After simulation, control is relinquished to DynamoRIO,the instrumented code fragment (T ) is replaced with itsclone (Tc), and the application continues to execute with-out profiling. The context switch from the analyzer back toDynamoRIO provides a natural boundary to replace a tracewith a newly optimized one, i.e., before replacing T withTc, one can perform optimizations on Tc based on the mini-simulation results.
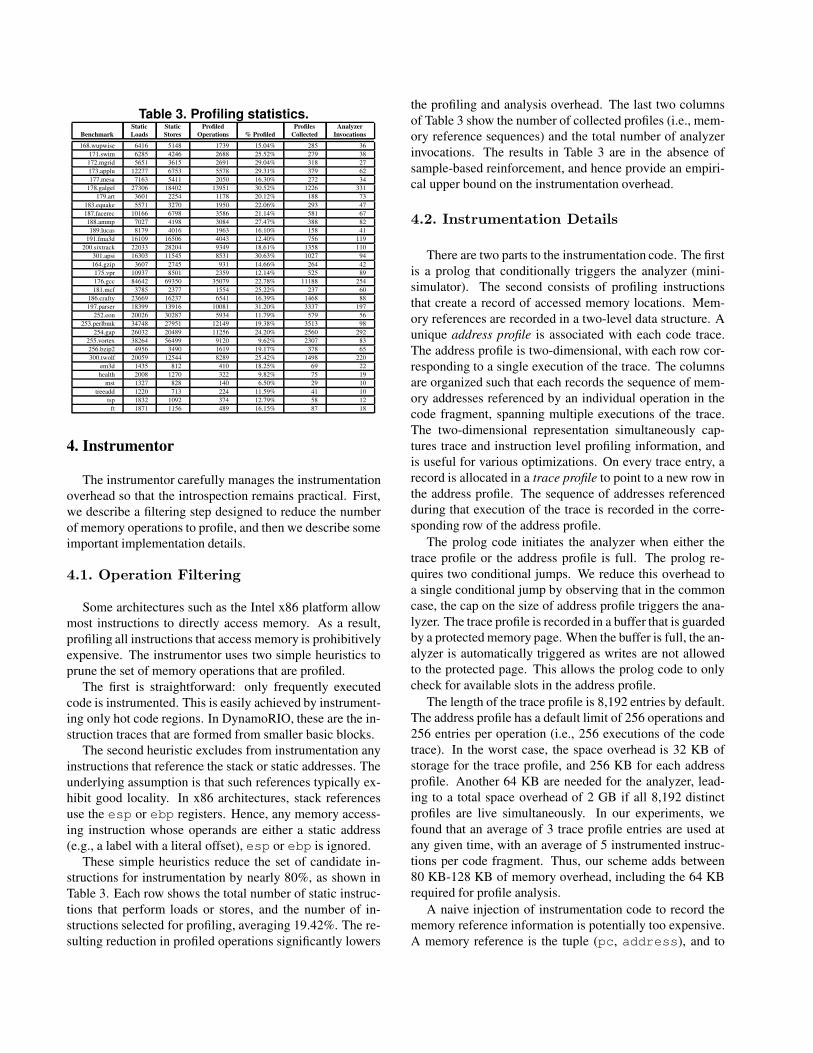
Table 3. Profiling statistics.Static Static Profiled Profiles Analyzer
Benchmark Loads Stores Operations % Profiled Collected Invocations
168.wupwise 6416 5148 1739 15.04% 285 36171.swim 6285 4246 2688 25.52% 279 38172.mgrid 5651 3615 2691 29.04% 318 27173.applu 12277 6753 5578 29.31% 379 62177.mesa 7163 5411 2050 16.30% 272 34
178.galgel 27306 18402 13951 30.52% 1226 331179.art 3601 2254 1178 20.12% 188 73
183.equake 5571 3270 1950 22.06% 293 47187.facerec 10166 6798 3586 21.14% 581 67188.ammp 7027 4198 3084 27.47% 388 82189.lucas 8179 4016 1963 16.10% 158 41
191.fma3d 16109 16506 4043 12.40% 756 119200.sixtrack 22033 28204 9349 18.61% 1358 110
301.apsi 16303 11545 8531 30.63% 1027 94164.gzip 3607 2745 931 14.66% 264 42175.vpr 10937 8501 2359 12.14% 525 89176.gcc 84642 69350 35079 22.78% 11188 254181.mcf 3785 2377 1554 25.22% 237 60
186.crafty 23669 16237 6541 16.39% 1468 88197.parser 18399 13916 10081 31.20% 3337 197
252.eon 20026 30287 5934 11.79% 579 56253.perlbmk 34748 27951 12149 19.38% 3513 98
254.gap 26032 20489 11256 24.20% 2560 292255.vortex 38264 56499 9120 9.62% 2307 83256.bzip2 4956 3490 1619 19.17% 378 65300.twolf 20059 12544 8289 25.42% 1498 220
em3d 1435 812 410 18.25% 69 22health 2008 1270 322 9.82% 75 19
mst 1327 828 140 6.50% 29 10treeadd 1220 713 224 11.59% 41 10
tsp 1832 1092 374 12.79% 58 12ft 1871 1156 489 16.15% 87 18
4. Instrumentor
The instrumentor carefully manages the instrumentationoverhead so that the introspection remains practical. First,we describe a filtering step designed to reduce the numberof memory operations to profile, and then we describe someimportant implementation details.
4.1. Operation Filtering
Some architectures such as the Intel x86 platform allowmost instructions to directly access memory. As a result,profiling all instructions that access memory is prohibitivelyexpensive. The instrumentor uses two simple heuristics toprune the set of memory operations that are profiled.
The first is straightforward: only frequently executedcode is instrumented. This is easily achieved by instrument-ing only hot code regions. In DynamoRIO, these are the in-struction traces that are formed from smaller basic blocks.
The second heuristic excludes from instrumentation anyinstructions that reference the stack or static addresses. Theunderlying assumption is that such references typically ex-hibit good locality. In x86 architectures, stack referencesuse the esp or ebp registers. Hence, any memory access-ing instruction whose operands are either a static address(e.g., a label with a literal offset), esp or ebp is ignored.
These simple heuristics reduce the set of candidate in-structions for instrumentation by nearly 80%, as shown inTable 3. Each row shows the total number of static instruc-tions that perform loads or stores, and the number of in-structions selected for profiling, averaging 19.42%. The re-sulting reduction in profiled operations significantly lowers
the profiling and analysis overhead. The last two columnsof Table 3 show the number of collected profiles (i.e., mem-ory reference sequences) and the total number of analyzerinvocations. The results in Table 3 are in the absence ofsample-based reinforcement, and hence provide an empiri-cal upper bound on the instrumentation overhead.
4.2. Instrumentation Details
There are two parts to the instrumentation code. The firstis a prolog that conditionally triggers the analyzer (mini-simulator). The second consists of profiling instructionsthat create a record of accessed memory locations. Mem-ory references are recorded in a two-level data structure. Aunique address profile is associated with each code trace.The address profile is two-dimensional, with each row cor-responding to a single execution of the trace. The columnsare organized such that each records the sequence of mem-ory addresses referenced by an individual operation in thecode fragment, spanning multiple executions of the trace.The two-dimensional representation simultaneously cap-tures trace and instruction level profiling information, andis useful for various optimizations. On every trace entry, arecord is allocated in a trace profile to point to a new row inthe address profile. The sequence of addresses referencedduring that execution of the trace is recorded in the corre-sponding row of the address profile.
The prolog code initiates the analyzer when either thetrace profile or the address profile is full. The prolog re-quires two conditional jumps. We reduce this overhead toa single conditional jump by observing that in the commoncase, the cap on the size of address profile triggers the ana-lyzer. The trace profile is recorded in a buffer that is guardedby a protected memory page. When the buffer is full, the an-alyzer is automatically triggered as writes are not allowedto the protected page. This allows the prolog code to onlycheck for available slots in the address profile.
The length of the trace profile is 8,192 entries by default.The address profile has a default limit of 256 operations and256 entries per operation (i.e., 256 executions of the codetrace). In the worst case, the space overhead is 32 KB ofstorage for the trace profile, and 256 KB for each addressprofile. Another 64 KB are needed for the analyzer, lead-ing to a total space overhead of 2 GB if all 8,192 distinctprofiles are live simultaneously. In our experiments, wefound that an average of 3 trace profile entries are used atany given time, with an average of 5 instrumented instruc-tions per code fragment. Thus, our scheme adds between80 KB-128 KB of memory overhead, including the 64 KBrequired for profile analysis.
A naive injection of instrumentation code to record thememory reference information is potentially too expensive.A memory reference is the tuple (pc, address), and to
record this information requires nine operations in a straightforward approach. We implemented a number of optimiza-tions to reduce the overhead to between four to six opera-tions. These details are omitted here.
5. Profile Analyzer
The analyzer for this paper is a fast cache simulator. It isconfigured to match the number of sets, the line size, and theassociativity of the secondary cache on the host machine.The simulator implements an LRU replacement policy al-though other schemes are possible. The mini-simulation re-sults were observed to be far more dependent on the lengthof the address profiles, than on the actual configuration ofthe simulated cache. We observed statistically insignificantvariations in our results when simulating caches that aremuch smaller than that of the host machine. This is not sur-prising since mini-simulations span much shorter addressspaces compared to longer or full simulations.
The simulator is similar to the one used inCachegrind [20]. It tracks the miss ratios for individualoperations, and also maintains coarser level performancedetails. During simulation, each reference is mapped to itscorresponding set. The tag is compared to all tags in theset. If there is a match, the recorded time of the matchingline is updated. Otherwise, an empty line, or the oldestline, is selected to store the current tag. We use a counter tosimulate time.
Since not all memory references are profiled, the simu-lated results are approximations of the application behavior.Furthermore, because only a small fraction of the memoryreferences is simulated, the simulator must be tuned to ac-count for the high number of compulsory misses, and thelow number of conflict and capacity misses that would oth-erwise arise. Thus, in order to improve the simulated re-sults, cache miss accounting only starts after the first fewaccesses in the address profile, typically two executions ofthe trace. This has the effect of warming up the cache,and is akin to functional warming in offline cache simu-lations that use fast forwarding. We also use a single logi-cal cache to analyze all of the recorded address profiles. Inother words, the state of the cache is carried over from theanalysis of one profile to the next. We periodically flushthe cache state to avoid long term contamination. In ourexperiments, the flush occurs whenever the analyzer is trig-gered and more than 1M processor cycles (obtained usingrdtsc) have elapsed since it last ran.
6. Experimental Methodology and Analysis
We ran the experiments on a 3.06 GHz Intel Pentium 4with 1 GB of RAM. The operating system is Linux Fedora
Core 1. The memory hierarchy consists of an 8-way asso-ciative L1 instruction cache, with a capacity to hold 12 Kmicro instructions. The L1 data cache is an 8 KB 4-way as-sociative cache with 64-byte cache lines. The L2 cache is a512 KB, 8-way associative unified cache with 64-byte cachelines. The benchmarks are x86 binaries compiled with gccversion 3.3 using the -O3 flag. We used all of the bench-marks from SPEC CPU2000 and their reference input work-loads.
We also selected em3d, health, mst, treeadd, andtsp from Olden [21], and ft from the Ptrdist [3] bench-mark suite. Olden and Ptrdist are commonly used in theliterature when evaluating dynamic memory optimizations.The other benchmarks from these suites have too short arunning time (less than 5 seconds) for meaningful measure-ments, and were therefore omitted.
We repeated many of the experiments on an older AMDAthlon MP 1400+ (1.2 GHz K7 architecture). It has a64 KB, 2-way associative L1 data cache, a 64 KB L1 in-struction cache, and a 256 KB L2 unified cache that is16-way associative. Both cache levels have 64-byte cachelines.
6.1. UMI Runtime Overhead
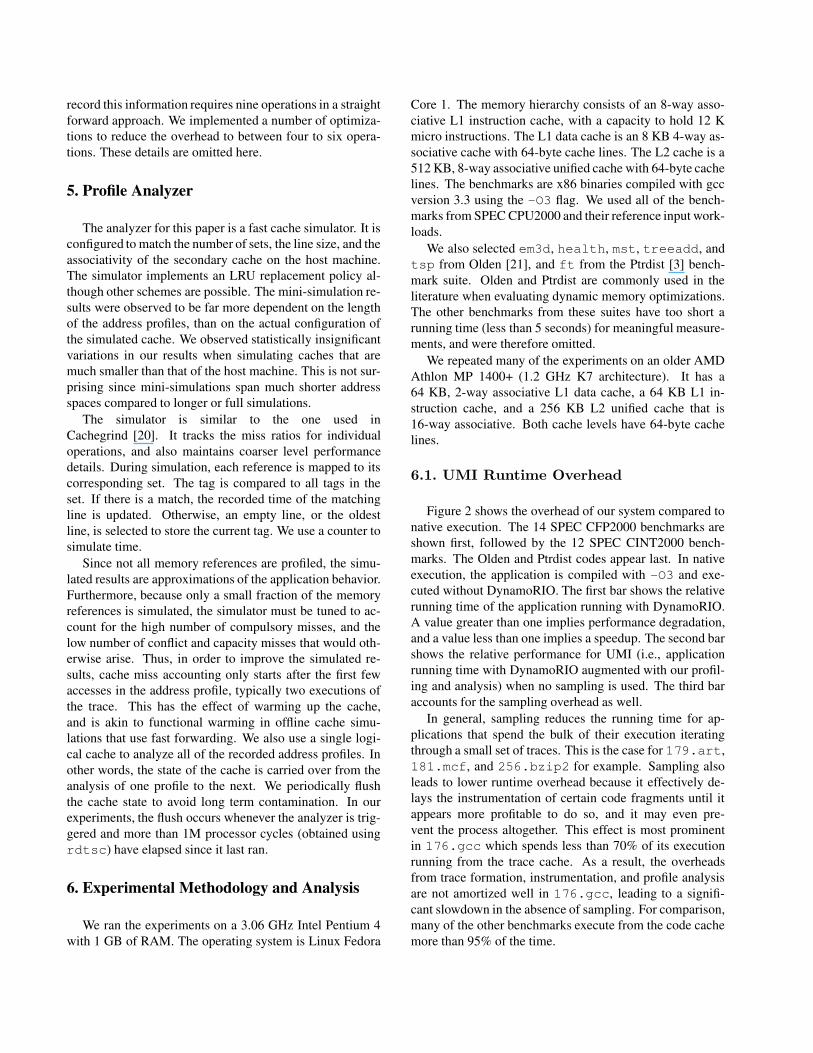
Figure 2 shows the overhead of our system compared tonative execution. The 14 SPEC CFP2000 benchmarks areshown first, followed by the 12 SPEC CINT2000 bench-marks. The Olden and Ptrdist codes appear last. In nativeexecution, the application is compiled with -O3 and exe-cuted without DynamoRIO. The first bar shows the relativerunning time of the application running with DynamoRIO.A value greater than one implies performance degradation,and a value less than one implies a speedup. The second barshows the relative performance for UMI (i.e., applicationrunning time with DynamoRIO augmented with our profil-ing and analysis) when no sampling is used. The third baraccounts for the sampling overhead as well.
In general, sampling reduces the running time for ap-plications that spend the bulk of their execution iteratingthrough a small set of traces. This is the case for 179.art,181.mcf, and 256.bzip2 for example. Sampling alsoleads to lower runtime overhead because it effectively de-lays the instrumentation of certain code fragments until itappears more profitable to do so, and it may even pre-vent the process altogether. This effect is most prominentin 176.gcc which spends less than 70% of its executionrunning from the trace cache. As a result, the overheadsfrom trace formation, instrumentation, and profile analysisare not amortized well in 176.gcc, leading to a signifi-cant slowdown in the absence of sampling. For comparison,many of the other benchmarks execute from the code cachemore than 95% of the time.
0.80
1.00
1.20
1.40
1.60
1.80
2.00
168.w
upwise
171.s
wim
172.m
grid
173.a
pplu
177.m
esa
178.g
algel
179.a
rt
183.e
quak
e
187.f
acer
ec
188.a
mmp
189.l
ucas
191.f
ma3d
200.s
ixtra
ck
301.a
psi
164.g
zip
175.v
pr
176.g
cc
181.m
cf
186.c
rafty
197.p
arse
r
252.e
on
253.p
erlbm
k
254.g
ap
255.v
ortex
256.b
zip2
300.t
wolf
em3d
healt
hmst
treea
dd tsp ft
Avera
ge
DynamoRIO
UMI no sampling
UMI with sampling
runn
ing
time
rela
tive
to n
ativ
e ex
ecut
ion
Figure 2. Runtime overhead on Pentium 4 with hardware prefetching enabled.
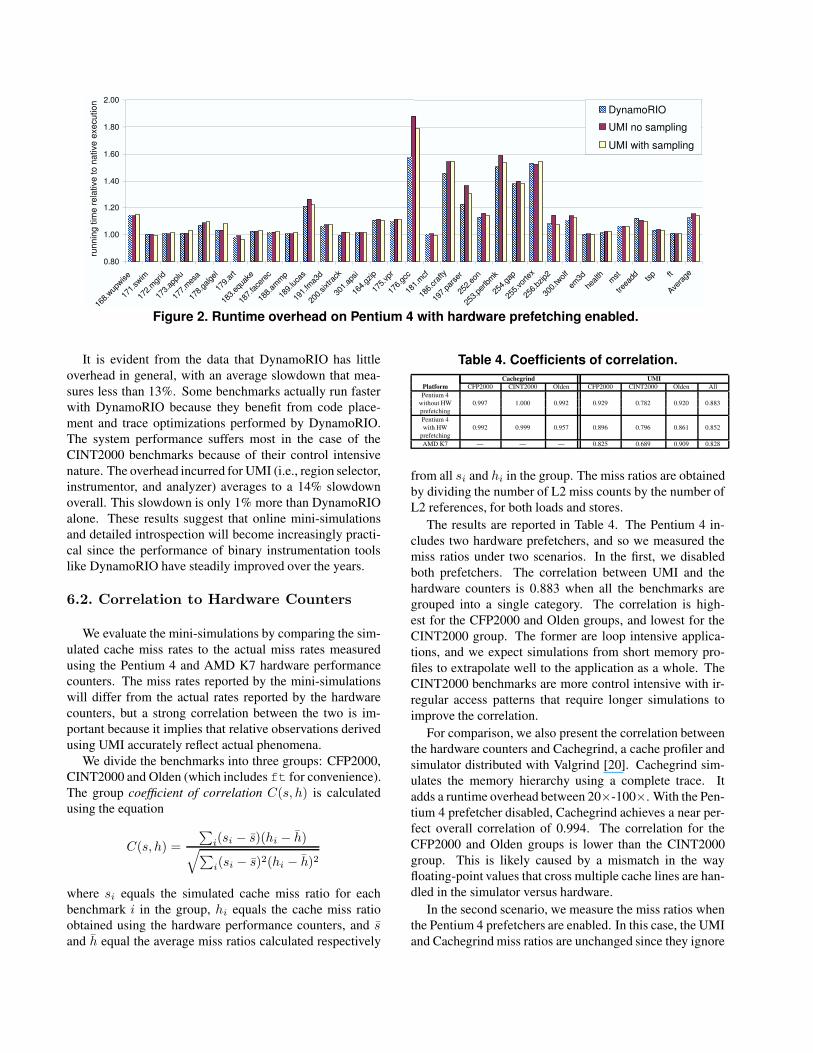
It is evident from the data that DynamoRIO has littleoverhead in general, with an average slowdown that mea-sures less than 13%. Some benchmarks actually run fasterwith DynamoRIO because they benefit from code place-ment and trace optimizations performed by DynamoRIO.The system performance suffers most in the case of theCINT2000 benchmarks because of their control intensivenature. The overhead incurred for UMI (i.e., region selector,instrumentor, and analyzer) averages to a 14% slowdownoverall. This slowdown is only 1% more than DynamoRIOalone. These results suggest that online mini-simulationsand detailed introspection will become increasingly practi-cal since the performance of binary instrumentation toolslike DynamoRIO have steadily improved over the years.
6.2. Correlation to Hardware Counters
We evaluate the mini-simulations by comparing the sim-ulated cache miss rates to the actual miss rates measuredusing the Pentium 4 and AMD K7 hardware performancecounters. The miss rates reported by the mini-simulationswill differ from the actual rates reported by the hardwarecounters, but a strong correlation between the two is im-portant because it implies that relative observations derivedusing UMI accurately reflect actual phenomena.
We divide the benchmarks into three groups: CFP2000,CINT2000 and Olden (which includes ft for convenience).The group coefficient of correlation C(s, h) is calculatedusing the equation
C(s, h) =
∑
i(si − s)(hi − h)
√
∑
i(si − s)2(hi − h)2
where si equals the simulated cache miss ratio for eachbenchmark i in the group, hi equals the cache miss ratioobtained using the hardware performance counters, and s
and h equal the average miss ratios calculated respectively
Table 4. Coefficients of correlation.Cachegrind UMI
Platform CFP2000 CINT2000 Olden CFP2000 CINT2000 Olden AllPentium 4
without HW 0.997 1.000 0.992 0.929 0.782 0.920 0.883prefetchingPentium 4with HW 0.992 0.999 0.957 0.896 0.796 0.861 0.852
prefetchingAMD K7 — — — 0.825 0.689 0.909 0.828
from all si and hi in the group. The miss ratios are obtainedby dividing the number of L2 miss counts by the number ofL2 references, for both loads and stores.
The results are reported in Table 4. The Pentium 4 in-cludes two hardware prefetchers, and so we measured themiss ratios under two scenarios. In the first, we disabledboth prefetchers. The correlation between UMI and thehardware counters is 0.883 when all the benchmarks aregrouped into a single category. The correlation is high-est for the CFP2000 and Olden groups, and lowest for theCINT2000 group. The former are loop intensive applica-tions, and we expect simulations from short memory pro-files to extrapolate well to the application as a whole. TheCINT2000 benchmarks are more control intensive with ir-regular access patterns that require longer simulations toimprove the correlation.
For comparison, we also present the correlation betweenthe hardware counters and Cachegrind, a cache profiler andsimulator distributed with Valgrind [20]. Cachegrind sim-ulates the memory hierarchy using a complete trace. Itadds a runtime overhead between 20×-100×. With the Pen-tium 4 prefetcher disabled, Cachegrind achieves a near per-fect overall correlation of 0.994. The correlation for theCFP2000 and Olden groups is lower than the CINT2000group. This is likely caused by a mismatch in the wayfloating-point values that cross multiple cache lines are han-dled in the simulator versus hardware.
In the second scenario, we measure the miss ratios whenthe Pentium 4 prefetchers are enabled. In this case, the UMIand Cachegrind miss ratios are unchanged since they ignore
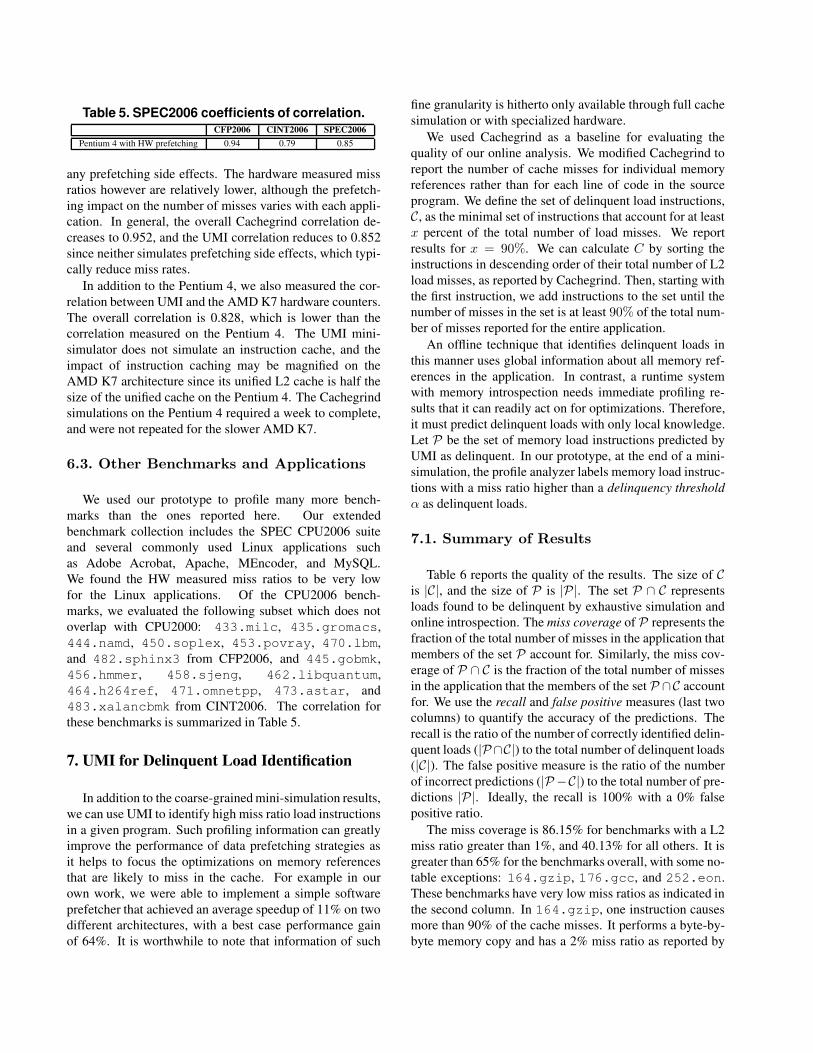
Table 5. SPEC2006 coefficients of correlation.CFP2006 CINT2006 SPEC2006
Pentium 4 with HW prefetching 0.94 0.79 0.85
any prefetching side effects. The hardware measured missratios however are relatively lower, although the prefetch-ing impact on the number of misses varies with each appli-cation. In general, the overall Cachegrind correlation de-creases to 0.952, and the UMI correlation reduces to 0.852since neither simulates prefetching side effects, which typi-cally reduce miss rates.
In addition to the Pentium 4, we also measured the cor-relation between UMI and the AMD K7 hardware counters.The overall correlation is 0.828, which is lower than thecorrelation measured on the Pentium 4. The UMI mini-simulator does not simulate an instruction cache, and theimpact of instruction caching may be magnified on theAMD K7 architecture since its unified L2 cache is half thesize of the unified cache on the Pentium 4. The Cachegrindsimulations on the Pentium 4 required a week to complete,and were not repeated for the slower AMD K7.
6.3. Other Benchmarks and Applications
We used our prototype to profile many more bench-marks than the ones reported here. Our extendedbenchmark collection includes the SPEC CPU2006 suiteand several commonly used Linux applications suchas Adobe Acrobat, Apache, MEncoder, and MySQL.We found the HW measured miss ratios to be very lowfor the Linux applications. Of the CPU2006 bench-marks, we evaluated the following subset which does notoverlap with CPU2000: 433.milc, 435.gromacs,444.namd, 450.soplex, 453.povray, 470.lbm,and 482.sphinx3 from CFP2006, and 445.gobmk,456.hmmer, 458.sjeng, 462.libquantum,464.h264ref, 471.omnetpp, 473.astar, and483.xalancbmk from CINT2006. The correlation forthese benchmarks is summarized in Table 5.
7. UMI for Delinquent Load Identification
In addition to the coarse-grained mini-simulation results,we can use UMI to identify high miss ratio load instructionsin a given program. Such profiling information can greatlyimprove the performance of data prefetching strategies asit helps to focus the optimizations on memory referencesthat are likely to miss in the cache. For example in ourown work, we were able to implement a simple softwareprefetcher that achieved an average speedup of 11% on twodifferent architectures, with a best case performance gainof 64%. It is worthwhile to note that information of such
fine granularity is hitherto only available through full cachesimulation or with specialized hardware.
We used Cachegrind as a baseline for evaluating thequality of our online analysis. We modified Cachegrind toreport the number of cache misses for individual memoryreferences rather than for each line of code in the sourceprogram. We define the set of delinquent load instructions,C, as the minimal set of instructions that account for at leastx percent of the total number of load misses. We reportresults for x = 90%. We can calculate C by sorting theinstructions in descending order of their total number of L2load misses, as reported by Cachegrind. Then, starting withthe first instruction, we add instructions to the set until thenumber of misses in the set is at least 90% of the total num-ber of misses reported for the entire application.
An offline technique that identifies delinquent loads inthis manner uses global information about all memory ref-erences in the application. In contrast, a runtime systemwith memory introspection needs immediate profiling re-sults that it can readily act on for optimizations. Therefore,it must predict delinquent loads with only local knowledge.Let P be the set of memory load instructions predicted byUMI as delinquent. In our prototype, at the end of a mini-simulation, the profile analyzer labels memory load instruc-tions with a miss ratio higher than a delinquency thresholdα as delinquent loads.
7.1. Summary of Results
Table 6 reports the quality of the results. The size of Cis |C|, and the size of P is |P|. The set P ∩ C representsloads found to be delinquent by exhaustive simulation andonline introspection. The miss coverage of P represents thefraction of the total number of misses in the application thatmembers of the set P account for. Similarly, the miss cov-erage of P ∩ C is the fraction of the total number of missesin the application that the members of the set P ∩C accountfor. We use the recall and false positive measures (last twocolumns) to quantify the accuracy of the predictions. Therecall is the ratio of the number of correctly identified delin-quent loads (|P ∩C|) to the total number of delinquent loads(|C|). The false positive measure is the ratio of the numberof incorrect predictions (|P −C|) to the total number of pre-dictions |P|. Ideally, the recall is 100% with a 0% falsepositive ratio.
The miss coverage is 86.15% for benchmarks with a L2miss ratio greater than 1%, and 40.13% for all others. It isgreater than 65% for the benchmarks overall, with some no-table exceptions: 164.gzip, 176.gcc, and 252.eon.These benchmarks have very low miss ratios as indicated inthe second column. In 164.gzip, one instruction causesmore than 90% of the cache misses. It performs a byte-by-byte memory copy and has a 2% miss ratio as reported by
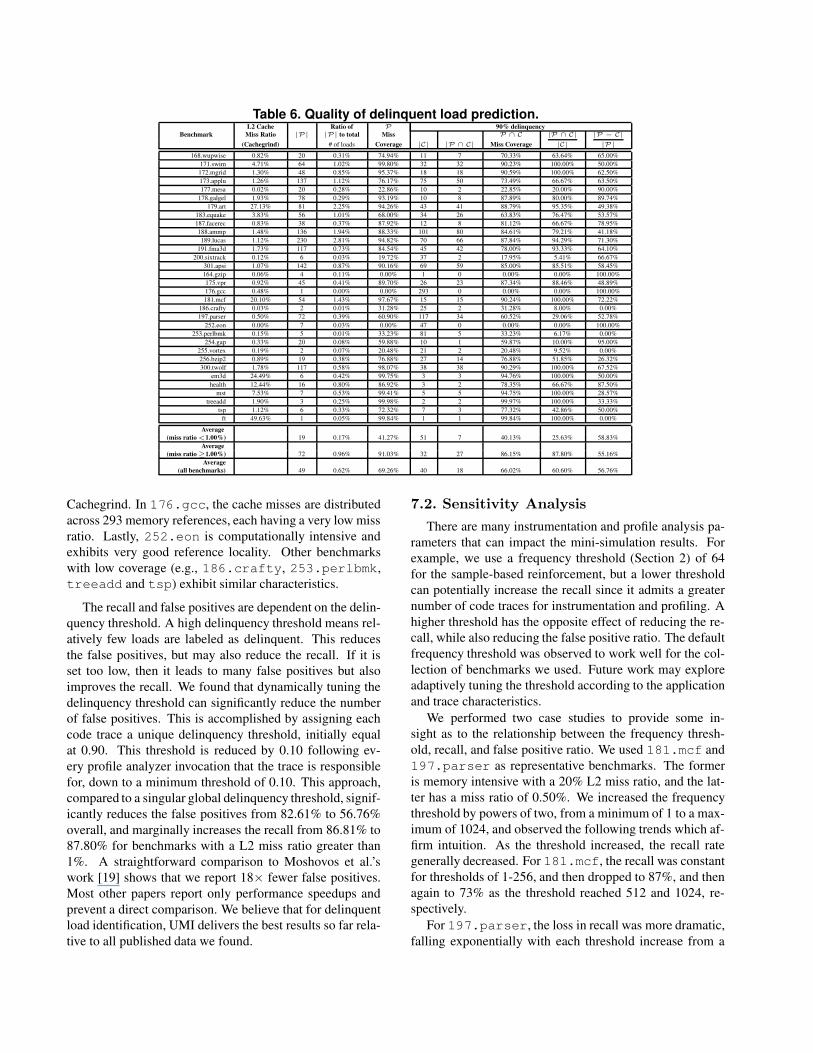
Table 6. Quality of delinquent load prediction.L2 Cache Ratio of P 90% delinquency
Benchmark Miss Ratio |P| |P| to total Miss P ∩ C |P ∩ C| |P − C|
(Cachegrind) # of loads Coverage |C| |P ∩ C| Miss Coverage |C| |P|
168.wupwise 0.82% 20 0.31% 74.94% 11 7 70.33% 63.64% 65.00%171.swim 4.71% 64 1.02% 99.80% 32 32 90.23% 100.00% 50.00%172.mgrid 1.30% 48 0.85% 95.37% 18 18 90.59% 100.00% 62.50%173.applu 1.26% 137 1.12% 76.17% 75 50 73.49% 66.67% 63.50%177.mesa 0.02% 20 0.28% 22.86% 10 2 22.85% 20.00% 90.00%
178.galgel 1.93% 78 0.29% 93.19% 10 8 87.89% 80.00% 89.74%179.art 27.13% 81 2.25% 94.26% 43 41 88.79% 95.35% 49.38%
183.equake 3.83% 56 1.01% 68.00% 34 26 63.83% 76.47% 53.57%187.facerec 0.83% 38 0.37% 87.92% 12 8 81.12% 66.67% 78.95%188.ammp 1.48% 136 1.94% 88.33% 101 80 84.61% 79.21% 41.18%189.lucas 1.12% 230 2.81% 94.82% 70 66 87.84% 94.29% 71.30%
191.fma3d 1.73% 117 0.73% 84.54% 45 42 78.00% 93.33% 64.10%200.sixtrack 0.12% 6 0.03% 19.72% 37 2 17.95% 5.41% 66.67%
301.apsi 1.07% 142 0.87% 90.16% 69 59 85.00% 85.51% 58.45%164.gzip 0.06% 4 0.11% 0.00% 1 0 0.00% 0.00% 100.00%175.vpr 0.92% 45 0.41% 89.70% 26 23 87.34% 88.46% 48.89%176.gcc 0.48% 1 0.00% 0.00% 293 0 0.00% 0.00% 100.00%181.mcf 20.10% 54 1.43% 97.67% 15 15 90.24% 100.00% 72.22%
186.crafty 0.03% 2 0.01% 31.28% 25 2 31.28% 8.00% 0.00%197.parser 0.50% 72 0.39% 60.90% 117 34 60.52% 29.06% 52.78%
252.eon 0.00% 7 0.03% 0.00% 47 0 0.00% 0.00% 100.00%253.perlbmk 0.15% 5 0.01% 33.23% 81 5 33.23% 6.17% 0.00%
254.gap 0.33% 20 0.08% 59.88% 10 1 59.87% 10.00% 95.00%255.vortex 0.19% 2 0.07% 20.48% 21 2 20.48% 9.52% 0.00%256.bzip2 0.89% 19 0.38% 76.88% 27 14 76.88% 51.85% 26.32%300.twolf 1.78% 117 0.58% 98.07% 38 38 90.29% 100.00% 67.52%
em3d 24.49% 6 0.42% 99.75% 3 3 94.76% 100.00% 50.00%health 12.44% 16 0.80% 86.92% 3 2 78.35% 66.67% 87.50%
mst 7.53% 7 0.53% 99.41% 5 5 94.75% 100.00% 28.57%treeadd 1.90% 3 0.25% 99.98% 2 2 99.97% 100.00% 33.33%
tsp 1.12% 6 0.33% 72.32% 7 3 77.32% 42.86% 50.00%ft 49.63% 1 0.05% 99.84% 1 1 99.84% 100.00% 0.00%
Average(miss ratio <1.00%) 19 0.17% 41.27% 51 7 40.13% 25.63% 58.83%
Average(miss ratio ≥1.00%) 72 0.96% 91.03% 32 27 86.15% 87.80% 55.16%
Average(all benchmarks) 49 0.62% 69.26% 40 18 66.02% 60.60% 56.76%
Cachegrind. In 176.gcc, the cache misses are distributedacross 293 memory references, each having a very low missratio. Lastly, 252.eon is computationally intensive andexhibits very good reference locality. Other benchmarkswith low coverage (e.g., 186.crafty, 253.perlbmk,treeadd and tsp) exhibit similar characteristics.
The recall and false positives are dependent on the delin-quency threshold. A high delinquency threshold means rel-atively few loads are labeled as delinquent. This reducesthe false positives, but may also reduce the recall. If it isset too low, then it leads to many false positives but alsoimproves the recall. We found that dynamically tuning thedelinquency threshold can significantly reduce the numberof false positives. This is accomplished by assigning eachcode trace a unique delinquency threshold, initially equalat 0.90. This threshold is reduced by 0.10 following ev-ery profile analyzer invocation that the trace is responsiblefor, down to a minimum threshold of 0.10. This approach,compared to a singular global delinquency threshold, signif-icantly reduces the false positives from 82.61% to 56.76%overall, and marginally increases the recall from 86.81% to87.80% for benchmarks with a L2 miss ratio greater than1%. A straightforward comparison to Moshovos et al.’swork [19] shows that we report 18× fewer false positives.Most other papers report only performance speedups andprevent a direct comparison. We believe that for delinquentload identification, UMI delivers the best results so far rela-tive to all published data we found.
7.2. Sensitivity Analysis
There are many instrumentation and profile analysis pa-rameters that can impact the mini-simulation results. Forexample, we use a frequency threshold (Section 2) of 64for the sample-based reinforcement, but a lower thresholdcan potentially increase the recall since it admits a greaternumber of code traces for instrumentation and profiling. Ahigher threshold has the opposite effect of reducing the re-call, while also reducing the false positive ratio. The defaultfrequency threshold was observed to work well for the col-lection of benchmarks we used. Future work may exploreadaptively tuning the threshold according to the applicationand trace characteristics.
We performed two case studies to provide some in-sight as to the relationship between the frequency thresh-old, recall, and false positive ratio. We used 181.mcf and197.parser as representative benchmarks. The formeris memory intensive with a 20% L2 miss ratio, and the lat-ter has a miss ratio of 0.50%. We increased the frequencythreshold by powers of two, from a minimum of 1 to a max-imum of 1024, and observed the following trends which af-firm intuition. As the threshold increased, the recall rategenerally decreased. For 181.mcf, the recall was constantfor thresholds of 1-256, and then dropped to 87%, and thenagain to 73% as the threshold reached 512 and 1024, re-spectively.
For 197.parser, the loss in recall was more dramatic,falling exponentially with each threshold increase from a
maximum of 100% for a threshold of 1, down to 0% for athreshold of 512 and 1024. The contrast between the twobenchmarks is largely due to their execution patterns. In181.mcf, execution spans a few memory intensive andlong running loops, and is mostly insensitive to variationsin the sampling frequency. In contrast 197.parser has amuch more dynamic control flow, and many loops run foronly a few iterations. As a result, recall is best when thefrequency threshold is at its lowest value. The low thresh-old admits virtually all code traces for instrumentation andprofiling, but has the undesirable side effect of an 88% falsepositive ratio. The runtime overhead for both benchmarkswas constant for a frequency threshold greater than 32.
In general, the recall is inversely related to the frequencythreshold. However the relationship between the recall andthe length of the simulated address profile is less obvious.In 181.mcf, varying the length of the address profile hasno effect on the recall, and only marginally improves thefalse positive rate. We varied the length of the addressprofile from a minimum of 64 trace executions to a max-imum of 32K executions (in powers of two). The actuallength of the recorded address sequence is proportional tothe number of trace executions and the number of memoryreferences in each trace iteration. Hence increasing the sizeof the address profile increases the length of the recordedmemory reference sequence. In 197.parser, the sameexperiment reduced the recall significantly from 34% at theminimum address profile size, to less than 17% for addressprofiles of 4K iterations or more. In 197.parser, as inother benchmarks with a low overall miss ratio, the longersimulations have the effect of rapidly lowering the miss ra-tio of individual instructions, and at a faster rate than wetune the delinquency threshold. As a result fewer instruc-tions are identified as delinquent, thus reducing the recall.The false positive ratio however is affected more favorably,with a ratio of 36% at 8K iterations, and 23% at 16K iter-ations. The overall runtime overhead is largely unchangedfor the two benchmarks, ranging up to 3% for 181.mcf,and 27-30% for 197.parser.
In order to systematically reduce the false positive ratio,it may prove necessary to eventually weigh in the collec-tive effects of multiple memory operations, rather than la-bel each operation independent of any other, as we do in thecurrent runtime system.
8. Example Runtime Optimization Using UMI
We illustrate an example use scenario for UMI by im-plementing a simple stride prefetching optimization in soft-ware. The optimization issues L2 prefetch requests forloads labeled as delinquent by the introspection phase. Wemodified the profile analyzer to also calculate the stride dis-tance between successive memory references for individual
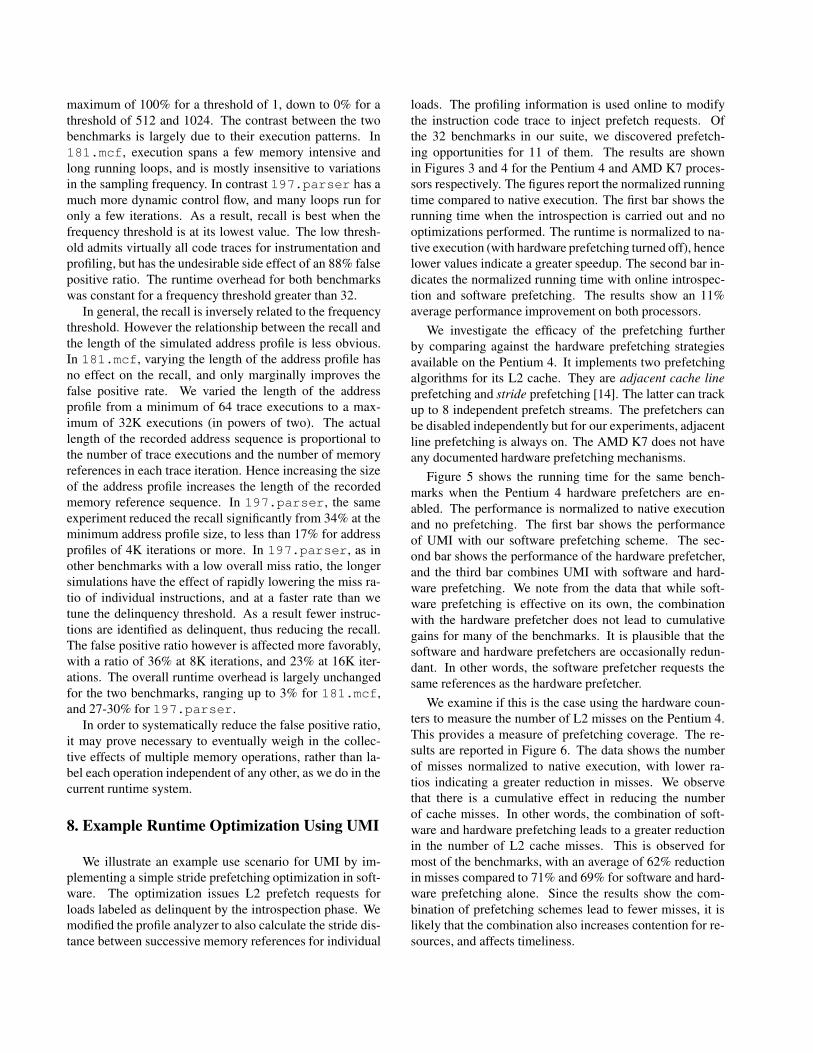
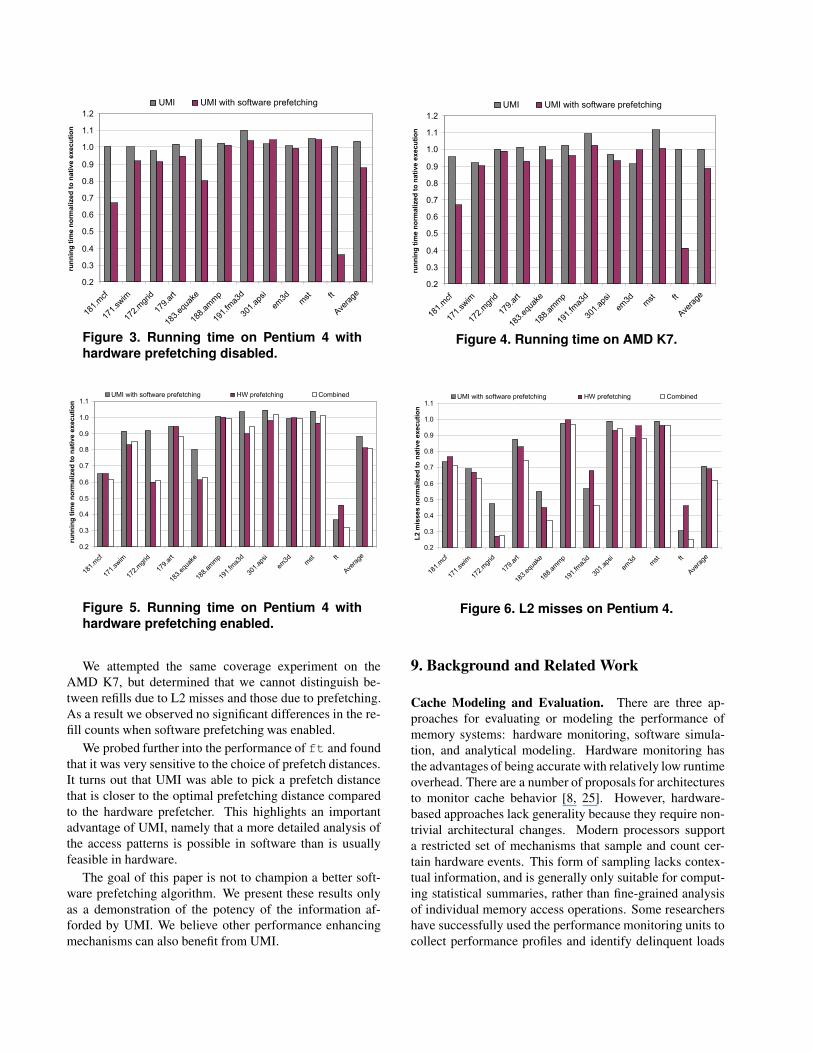
loads. The profiling information is used online to modifythe instruction code trace to inject prefetch requests. Ofthe 32 benchmarks in our suite, we discovered prefetch-ing opportunities for 11 of them. The results are shownin Figures 3 and 4 for the Pentium 4 and AMD K7 proces-sors respectively. The figures report the normalized runningtime compared to native execution. The first bar shows therunning time when the introspection is carried out and nooptimizations performed. The runtime is normalized to na-tive execution (with hardware prefetching turned off), hencelower values indicate a greater speedup. The second bar in-dicates the normalized running time with online introspec-tion and software prefetching. The results show an 11%average performance improvement on both processors.
We investigate the efficacy of the prefetching furtherby comparing against the hardware prefetching strategiesavailable on the Pentium 4. It implements two prefetchingalgorithms for its L2 cache. They are adjacent cache lineprefetching and stride prefetching [14]. The latter can trackup to 8 independent prefetch streams. The prefetchers canbe disabled independently but for our experiments, adjacentline prefetching is always on. The AMD K7 does not haveany documented hardware prefetching mechanisms.
Figure 5 shows the running time for the same bench-marks when the Pentium 4 hardware prefetchers are en-abled. The performance is normalized to native executionand no prefetching. The first bar shows the performanceof UMI with our software prefetching scheme. The sec-ond bar shows the performance of the hardware prefetcher,and the third bar combines UMI with software and hard-ware prefetching. We note from the data that while soft-ware prefetching is effective on its own, the combinationwith the hardware prefetcher does not lead to cumulativegains for many of the benchmarks. It is plausible that thesoftware and hardware prefetchers are occasionally redun-dant. In other words, the software prefetcher requests thesame references as the hardware prefetcher.
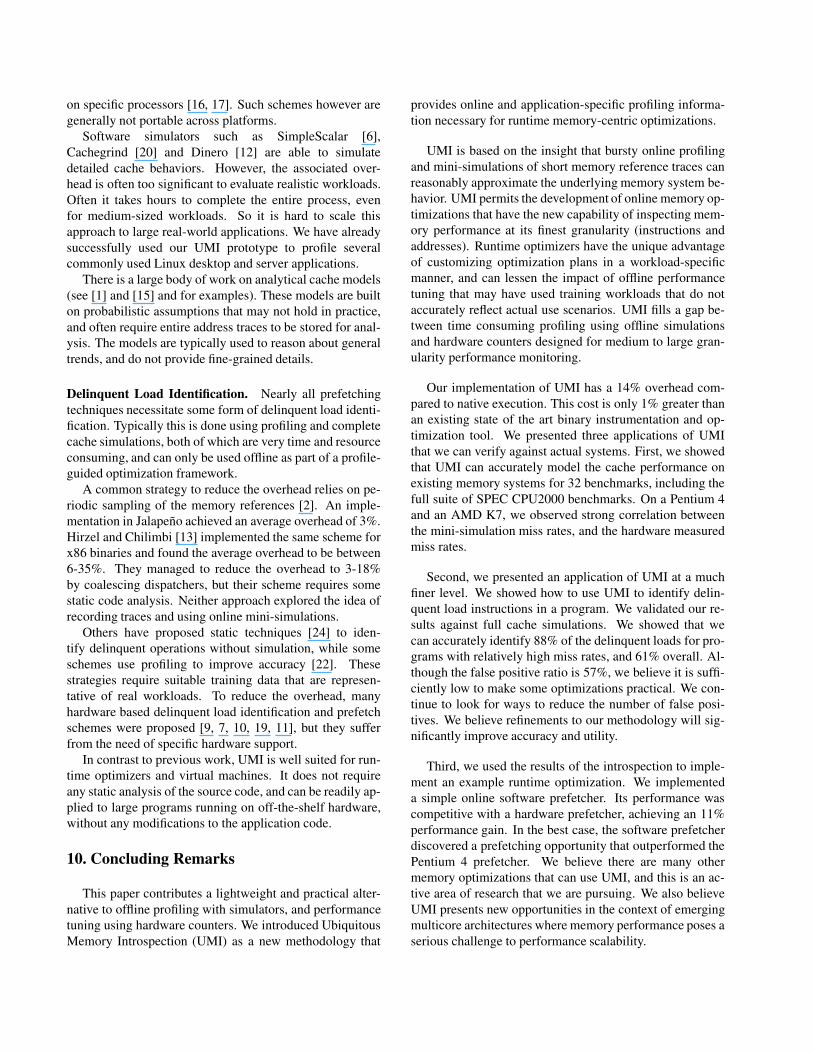
We examine if this is the case using the hardware coun-ters to measure the number of L2 misses on the Pentium 4.This provides a measure of prefetching coverage. The re-sults are reported in Figure 6. The data shows the numberof misses normalized to native execution, with lower ra-tios indicating a greater reduction in misses. We observethat there is a cumulative effect in reducing the numberof cache misses. In other words, the combination of soft-ware and hardware prefetching leads to a greater reductionin the number of L2 cache misses. This is observed formost of the benchmarks, with an average of 62% reductionin misses compared to 71% and 69% for software and hard-ware prefetching alone. Since the results show the com-bination of prefetching schemes lead to fewer misses, it islikely that the combination also increases contention for re-sources, and affects timeliness.
UMI UMI with software prefetching
0.2
0.3
0.4
0.5
0.6
0.7
0.8
0.9
1.0
1.1
1.2
181.
mcf
171.
swim
172.
mgr
id
179.
art
183.
equa
ke
188.
amm
p
191.
fma3
d
301.
apsi
em3d m
st ft
Ave
rage
run
nin
g t
ime n
orm
alized
to n
ati
ve e
xecu
tio
n
Figure 3. Running time on Pentium 4 withhardware prefetching disabled.
UMI UMI with software prefetching
0.2
0.3
0.4
0.5
0.6
0.7
0.8
0.9
1.0
1.1
1.2
181.
mcf
171.
swim
172.
mgr
id
179.
art
183.
equa
ke
188.
amm
p
191.
fma3
d
301.
apsi
em3d m
st ft
Ave
rage
run
nin
g t
ime n
orm
alized
to
nati
ve e
xecu
tio
n
Figure 4. Running time on AMD K7.
0.2
0.3
0.4
0.5
0.6
0.7
0.8
0.9
1.0
1.1
181.
mcf
171.
swim
172.
mgr
id
179.
art
183.
equa
ke
188.
amm
p
191.
fma3
d
301.
apsi
em3d m
st ft
Ave
rage
run
nin
g t
ime n
orm
alized
to
nati
ve e
xecu
tio
n
UMI with software prefetching HW prefetching Combined
Figure 5. Running time on Pentium 4 withhardware prefetching enabled.
UMI with software prefetching HW prefetching Combined
0.2
0.3
0.4
0.5
0.6
0.7
0.8
0.9
1.0
1.1
181.
mcf
171.
swim
172.
mgr
id
179.
art
183.
equa
ke
188.
amm
p
191.
fma3
d
301.
apsi
em3d m
st ft
Ave
rage
L2 m
isses n
orm
alized
to
nati
ve e
xecu
tio
n
Figure 6. L2 misses on Pentium 4.
We attempted the same coverage experiment on theAMD K7, but determined that we cannot distinguish be-tween refills due to L2 misses and those due to prefetching.As a result we observed no significant differences in the re-fill counts when software prefetching was enabled.
We probed further into the performance of ft and foundthat it was very sensitive to the choice of prefetch distances.It turns out that UMI was able to pick a prefetch distancethat is closer to the optimal prefetching distance comparedto the hardware prefetcher. This highlights an importantadvantage of UMI, namely that a more detailed analysis ofthe access patterns is possible in software than is usuallyfeasible in hardware.
The goal of this paper is not to champion a better soft-ware prefetching algorithm. We present these results onlyas a demonstration of the potency of the information af-forded by UMI. We believe other performance enhancingmechanisms can also benefit from UMI.
9. Background and Related Work
Cache Modeling and Evaluation. There are three ap-proaches for evaluating or modeling the performance ofmemory systems: hardware monitoring, software simula-tion, and analytical modeling. Hardware monitoring hasthe advantages of being accurate with relatively low runtimeoverhead. There are a number of proposals for architecturesto monitor cache behavior [8, 25]. However, hardware-based approaches lack generality because they require non-trivial architectural changes. Modern processors supporta restricted set of mechanisms that sample and count cer-tain hardware events. This form of sampling lacks contex-tual information, and is generally only suitable for comput-ing statistical summaries, rather than fine-grained analysisof individual memory access operations. Some researchershave successfully used the performance monitoring units tocollect performance profiles and identify delinquent loads
on specific processors [16, 17]. Such schemes however aregenerally not portable across platforms.
Software simulators such as SimpleScalar [6],Cachegrind [20] and Dinero [12] are able to simulatedetailed cache behaviors. However, the associated over-head is often too significant to evaluate realistic workloads.Often it takes hours to complete the entire process, evenfor medium-sized workloads. So it is hard to scale thisapproach to large real-world applications. We have alreadysuccessfully used our UMI prototype to profile severalcommonly used Linux desktop and server applications.
There is a large body of work on analytical cache models(see [1] and [15] and for examples). These models are builton probabilistic assumptions that may not hold in practice,and often require entire address traces to be stored for anal-ysis. The models are typically used to reason about generaltrends, and do not provide fine-grained details.
Delinquent Load Identification. Nearly all prefetchingtechniques necessitate some form of delinquent load identi-fication. Typically this is done using profiling and completecache simulations, both of which are very time and resourceconsuming, and can only be used offline as part of a profile-guided optimization framework.
A common strategy to reduce the overhead relies on pe-riodic sampling of the memory references [2]. An imple-mentation in Jalapeno achieved an average overhead of 3%.Hirzel and Chilimbi [13] implemented the same scheme forx86 binaries and found the average overhead to be between6-35%. They managed to reduce the overhead to 3-18%by coalescing dispatchers, but their scheme requires somestatic code analysis. Neither approach explored the idea ofrecording traces and using online mini-simulations.
Others have proposed static techniques [24] to iden-tify delinquent operations without simulation, while someschemes use profiling to improve accuracy [22]. Thesestrategies require suitable training data that are represen-tative of real workloads. To reduce the overhead, manyhardware based delinquent load identification and prefetchschemes were proposed [9, 7, 10, 19, 11], but they sufferfrom the need of specific hardware support.
In contrast to previous work, UMI is well suited for run-time optimizers and virtual machines. It does not requireany static analysis of the source code, and can be readily ap-plied to large programs running on off-the-shelf hardware,without any modifications to the application code.
10. Concluding Remarks
This paper contributes a lightweight and practical alter-native to offline profiling with simulators, and performancetuning using hardware counters. We introduced UbiquitousMemory Introspection (UMI) as a new methodology that
provides online and application-specific profiling informa-tion necessary for runtime memory-centric optimizations.
UMI is based on the insight that bursty online profilingand mini-simulations of short memory reference traces canreasonably approximate the underlying memory system be-havior. UMI permits the development of online memory op-timizations that have the new capability of inspecting mem-ory performance at its finest granularity (instructions andaddresses). Runtime optimizers have the unique advantageof customizing optimization plans in a workload-specificmanner, and can lessen the impact of offline performancetuning that may have used training workloads that do notaccurately reflect actual use scenarios. UMI fills a gap be-tween time consuming profiling using offline simulationsand hardware counters designed for medium to large gran-ularity performance monitoring.
Our implementation of UMI has a 14% overhead com-pared to native execution. This cost is only 1% greater thanan existing state of the art binary instrumentation and op-timization tool. We presented three applications of UMIthat we can verify against actual systems. First, we showedthat UMI can accurately model the cache performance onexisting memory systems for 32 benchmarks, including thefull suite of SPEC CPU2000 benchmarks. On a Pentium 4and an AMD K7, we observed strong correlation betweenthe mini-simulation miss rates, and the hardware measuredmiss rates.
Second, we presented an application of UMI at a muchfiner level. We showed how to use UMI to identify delin-quent load instructions in a program. We validated our re-sults against full cache simulations. We showed that wecan accurately identify 88% of the delinquent loads for pro-grams with relatively high miss rates, and 61% overall. Al-though the false positive ratio is 57%, we believe it is suffi-ciently low to make some optimizations practical. We con-tinue to look for ways to reduce the number of false posi-tives. We believe refinements to our methodology will sig-nificantly improve accuracy and utility.
Third, we used the results of the introspection to imple-ment an example runtime optimization. We implementeda simple online software prefetcher. Its performance wascompetitive with a hardware prefetcher, achieving an 11%performance gain. In the best case, the software prefetcherdiscovered a prefetching opportunity that outperformed thePentium 4 prefetcher. We believe there are many othermemory optimizations that can use UMI, and this is an ac-tive area of research that we are pursuing. We also believeUMI presents new opportunities in the context of emergingmulticore architectures where memory performance poses aserious challenge to performance scalability.
Acknowledgements
This research was sponsored in part by the Singapore-MIT Alliance, NUS Research Grant R-252-000-248-112,and DARPA through the Department of the Interior Na-tional Business Center under grant numbers NBCH104009,PCA-F29601-03-2-0065 and HPCA/PERCS-W0133890.We thank Martin Hirzel and the anonymous reviewers fortheir valuable comments on earlier drafts of this paper.
References
[1] A. Agarwal, J. Hennessy, and M. Horowitz. An analyti-cal cache model. ACM Trans. Comput. Syst., 7(2):184–215,1989.
[2] M. Arnold and B. G. Ryder. A framework for reducing thecost of instrumented code. In PLDI ’01: Proceedings of theACM SIGPLAN 2001 conference on Programming languagedesign and implementation, pages 168–179, New York, NY,USA, 2001. ACM Press.
[3] T. Austin. Pointer-intensive benchmark suite.http://www.cs.wisc.edu/˜austin/ptr-dist.html.
[4] K. Barr. Summarizing Multiprocessor Program Executionwith Versatile, Microarchitecture-Independent Snapshots.PhD thesis, Massachusetts Institute of Technology, Septem-ber 2006.
[5] D. Bruening. Efficient, Transparent, and Comprehen-sive Runtime Code Manipulation. PhD thesis, Mas-sachusetts Institute of Technology, September 2004.http://www.cag.csail.mit.edu/rio/.
[6] D. Burger and T. Austin. The SimpleScalar Tool Set, Ver-sion 2.0. Technical report, University of Wisconsin-MadisonComputer Science Department, 1997.
[7] J. D. Collins, S. Sair, B. Calder, and D. M. Tullsen. Pointercache assisted prefetching. In MICRO 35: Proceedingsof the 35th annual ACM/IEEE international symposium onMicroarchitecture, pages 62–73, Los Alamitos, CA, USA,2002. IEEE Computer Society Press.
[8] J. D. Collins and D. M. Tullsen. Runtime identification ofcache conflict misses: The adaptive miss buffer. ACM Trans.Comput. Syst., 19(4):413–439, 2001.
[9] J. D. Collins, D. M. Tullsen, H. Wang, and J. P. Shen. Dy-namic speculative precomputation. In MICRO 34: Pro-ceedings of the 34th annual ACM/IEEE international sym-posium on Microarchitecture, pages 306–317, Washington,DC, USA, 2001. IEEE Computer Society.
[10] J. D. Collins, H. Wang, D. M. Tullsen, C. Hughes, Y.-F. Lee,D. Lavery, and J. P. Shen. Speculative precomputation: long-range prefetching of delinquent loads. SIGARCH Comput.Archit. News, 29(2):14–25, 2001.
[11] R. Cooksey, S. Jourdan, and D. Grunwald. A stateless,content-directed data prefetching mechanism. In ASPLOS-X: Proceedings of the 10th international conference on Ar-chitectural support for programming languages and oper-ating systems, pages 279–290, New York, NY, USA, 2002.ACM Press.
[12] J. Edler and M. Hill. Dinero IV Trace-Driven UniprocessorCache Simulator.http://www.cs.wisc.edu/˜markhill/DineroIV.
[13] M. Hirzel and T. M. Chilimbi. Bursty tracing: A frameworkfor low-overhead temporal profiling. In ACM Workshop onFeedback-Directed and Dynamic Optimization, 2001.
[14] Intel Corporation. IA-32 Intel Architecture OptimizationReference Manual.
[15] S. Laha, J. H. Patel, and R. K. IYER. Accurate low-costmethods for performance evaluation of cachememory sys-tems. IEEE Transactions on Computers, 37(11):1325–1336,Nov 1988.
[16] J. Lu, H. Chen, R. Fu, W.-C. Hsu, B. Othmer, P.-C. Yew,and D.-Y. Chen. The performance of runtime data cacheprefetching in a dynamic optimization system. In MICRO36: Proceedings of the 36th annual IEEE/ACM Interna-tional Symposium on Microarchitecture, page 180, Wash-ington, DC, USA, 2003. IEEE Computer Society.
[17] J. Lu, A. Das, W.-C. Hsu, K. Nguyen, and S. G. Abraham.Dynamic helper threaded prefetching on the sun ultrasparccmp processor. In MICRO 38: Proceedings of the 38th an-nual IEEE/ACM International Symposium on Microarchi-tecture, pages 93–104, Washington, DC, USA, 2005. IEEEComputer Society.
[18] C.-K. Luk, R. Cohn, R. Muth, H. Patil, A. Klauser,G. Lowney, S. Wallace, V. J. Reddi, and K. Hazelwood. Pin:Building customized program analysis tools with dynamicinstrumentation. In Programming Language Design and Im-plementation, pages 190–200, Chicago, IL, June 2005.
[19] A. Moshovos, D. N. Pnevmatikatos, and A. Baniasadi. Slice-processors: an implementation of operation-based predic-tion. In ICS ’01: Proceedings of the 15th international con-ference on Supercomputing, pages 321–334, New York, NY,USA, 2001. ACM Press.
[20] N. Nethercote. Dynamic Binary Analysis and Instrumenta-tion. PhD thesis, University of Cambridge, November 2004.http://valgrind.org/.
[21] OLDEN benchmark suite.http://www.cs.princeton.edu/˜mcc/olden.html.
[22] V.-M. Panait, A. Sasturkar, and W.-F. Wong. Static identi-fication of delinquent loads. In CGO ’04: Proceedings ofthe international symposium on Code generation and op-timization, page 303, Washington, DC, USA, 2004. IEEEComputer Society.
[23] PAPI: Performance application programmer interface.http://icl.cs.utk.edu/papi/.
[24] Y. K. Toshihiro Ozawa and S. Nishizaki. Cache missheuristics and preloading techniques for general-purposeprograms. In Micro28: Proceedings of the 28th Interna-tional Symposium on Microarchitecture, pages 243 – 248,1995.
[25] C. Zilles and G. Sohi. A programmable co-processor forprofiling. In HPCA ’01: Proceedings of International Sym-posium on High Performance Computer Architecture, 2001.
Related Documents