UBC Social Ecological Economic Development Studies (SEEDS) Student Report An Investigation into Reusable Coffee Mugs Albert Chang Daniel Craig Josh Leclerc Tianyu Fang Niv Nikaein University of British Columbia APSC 261 November 23, 2011 Disclaimer: “UBC SEEDS provides students with the opportunity to share the findings of their studies, as well as their opinions, conclusions and recommendations with the UBC community. The reader should bear in mind that this is a student project/report and is not an official document of UBC. Furthermore readers should bear in mind that these reports may not reflect the current status of activities at UBC. We urge you to contact the research persons mentioned in a report or the SEEDS Coordinator about the current status of the subject matter of a project/report”.

Welcome message from author
This document is posted to help you gain knowledge. Please leave a comment to let me know what you think about it! Share it to your friends and learn new things together.
Transcript
UBC Social Ecological Economic Development Studies (SEEDS) Student Report
An Investigation into Reusable Coffee Mugs
Albert Chang
Daniel Craig
Josh Leclerc
Tianyu Fang
Niv Nikaein
University of British Columbia
APSC 261
November 23, 2011
Disclaimer: “UBC SEEDS provides students with the opportunity to share the findings of their studies, as well as their opinions,
conclusions and recommendations with the UBC community. The reader should bear in mind that this is a student project/report and
is not an official document of UBC. Furthermore readers should bear in mind that these reports may not reflect the current status of
activities at UBC. We urge you to contact the research persons mentioned in a report or the SEEDS Coordinator about the current
status of the subject matter of a project/report”.

AN INVESTIGATION INTO REUSABLE COFFEE MUGS
- Formal Report for Sustainability Project
Submitted to Dr. Christina Gyenge
Prepared by Albert Chang, Daniel Craig, Josh Leclerc,
Tianyu Fang, and Niv Nikaein
Applied Science 261
University of British Columbia
November 23, 2011
ii
ABSTRACT
“An Investigation into Reusable Coffee Mug”
By Albert Chang, Daniel Craig, Josh Leclerc,
Tianyu Fang, and Niv Nikaein
In order to stock the green vending machine, reusable and disposable coffee cups
should be evaluated based on a triple bottom line assessment which contains
environmental, social and economic factors. The scope of the report incorporates
evaluating paper, ceramic, plastic and stainless steel as potential materials for the
transportable coffee mug as well as the vending machine energy consumption. In this
evaluation, energy consumption over the life-cycle of each material is assumed to be the
main player. The methods utilized in this analysis are gathered from academic articles
and trusted web resources.
Each of the materials mentioned above is examined throughout the report. Paper
cups create a lot of waste since they are only capable of one use. With proper initiatives,
their consumption can be reduced, however these initiatives will be difficult to implement.
The ceramic mug‟s life-cycle is found to be energy taking and have low durability which
makes it an unpopular option for the vending machine. Plastic mugs have various user
benefits in terms of insulation and ergonomics but were found to be potentially harmful
due the release of Bisphenol A which can negatively impact reproductive health. Stainless
steel mugs have long-term durability and do not pose any potential health hazards;
however, they have high energy consumption and CO2 emissions.
If reusable mugs are to be sold from vending machines in the new Student Union
Building, they should be made of stainless steel. However, in order to ensure the
feasibility of selling reusable mugs, further research should be conducted regarding
public perception of reusable mugs, the reasons why individuals choose not to use them
and potential ways to make them more attractive to customers.
iii
TABLE OF CONTENT
ABSTRACT ....................................................................................................................... ii
LIST OF ILLUSTRATIONS .......................................................................................... iv
GLOSSARY....................................................................................................................... v
LIST OF ABBREVIATIONS ......................................................................................... vi
1.0 INTRODUCTION....................................................................................................... 1
2.0 ENVIRONMENTAL CONSIDERATIONS ............................................................. 2
2.1 DISPOSABLE PAPER CUP .................................................................................. 2
2.2 REUSABLE CERAMIC COFFEE MUG ............................................................. 2
2.4 REUSABLE STAINLESS STEEL COFFEE MUG ............................................ 6
3.0 SOCIAL CONSIDERATIONS ................................................................................ 10
3.1 DISPOSABLE PAPER CUP ................................................................................ 10
3.2 REUSABLE CERAMIC COFFEE MUG ........................................................... 10
3.3 REUSABLE PLASTIC COFFEE MUG ............................................................. 11
3.4 REUSABLE STAINLESS STEEL COFFEE MUG .......................................... 13
4.0 ECONOMIC CONSIDERATIONS .......................................................................... 1
4.1 DISPOSABLE PAPER CUP .................................................................................. 1
4.2 REUSABLE CERAMIC COFFEE MUG ............................................................. 1
4.3 REUSABLE PLASTIC COFFEE MUG ............................................................... 3
4.4 REUSABLE STAINLESS STEEL COFFEE MUG ............................................ 4
5.0 VENDING MACHINE ENERGY CONSUMPTION ............................................. 6
6.0 CONCLUSION & RECOMMENDATIONS ......................................................... 10
REFERENCES ................................................................................................................ 12
iv
LIST OF ILLUSTRATIONS
TABLES
Table 2.1 Raw Material Consumption, Energy Consumption and Emissions
during Casting, Moulding and Pressing of Ceramic Dough ........................................2
Table 2.2 Raw Material Consumption, Energy Consumption and Emissions
during Firing ....................................................................................................................2
Table 2.3 Inputs into the Packaging and Transportation .....................................2
Table 2.4 CO2 Emissions from Raw Materials Needed to Produce Stainless
Steel ....................................................................................................................................6
Table 2.5 CO2 Emissions by Type of Electricity Generation Plant ......................6
Table 2.6 Electricity CO2 Emissions by Country ...................................................7
Table 2.7 Steel Compositions ....................................................................................7
Table 2.8 Production Method ...................................................................................7
Table 2.9 Emissions ...................................................................................................8
Table 3.1 BPA Migration Experiment ...................................................................11
Table 4.1 Foreign Trade Flow Stainless Steel Products in 2010 ..........................16
Table 5.1 the "Energy Star” Specification of Vending Machine .........................19
FIGURES
Figure 2.1 Cradles to Gate Energy of Plastic Production .......................................4
Figure 2.2 Distributions of CO2 Emission ................................................................7
Figure 4.1 Energy Consumption per Use vs. Number of Servings ......................14
Figure 4.2 Energy Cost of Ceramic Production ....................................................15
v
GLOSSARY
Ferro/Ferri A combining form with the meanings “iron,” “ferric,” used in the
formation of compound words: ferriferous; ferricyanide.
Bisphenol A An organic compound used to make polycarbonate plastics
Kaolinite A mineral used in ceramic manufacturing, medicine toothpaste
production and has chemical composition Al2Si2O5(OH)4.
Polyethylene A thermoplastic polymer, and is the most common plastic
produced.
Coin Mechs A component of vending machine which validate currency and
detect counterfeit
vi
LIST OF ABBREVIATIONS
BPA Bisphenol A
SUB Student Union Building
ISSF International Stainless Steel Forum
NREL National Renewable Energy Laboratory
DOE Department of Energy
EPA United States Environmental Protection Agency
LED Light Emitting Diode
1
1.0 INTRODUCTION
The University of British Columbia is one of the leading universities in the
campus sustainability initiative; as part of this initiative, some students of the Applied
Science 261 course participate in providing sustainable solutions for Waste-Reducing
Vending Products. These waste reducing vending products will be a part of the
implementation of green vending machines which will be placed in the current Student
Union Building(SUB) as well as the new SUB. The overall objective of this project is to
reduce the amount of waste generated by students use of disposable products.
As requested by the stakeholder of the project, Justin Ritchie, our team
investigates the applicability of adding transportable coffee mugs into the sustainable
products provided by the green vending machine. In order to analyze the products and
make appropriate recommendations, a triple bottom line assessment is conducted which
includes environmental, social and economic aspects. This report will investigate into the
energy consumption of the vending machine and different materials including stainless
steel, ceramic, plastic and paper.
For each material, multiple factors are examined to evaluate their feasibility such
as manufacturing energy consumption, life cycle cost, potential health issues, and waste
management. By considering all these factors into the assessment, a conclusion in terms
of recommendation of a respective product is made to the stakeholder of the project and
will potentially be offered by the green vending machine.
2
2.0 ENVIRONMENTAL CONSIDERATIONS
The following sections discuss the environmental impacts of all four candidate
coffee containers with a strong focus on life cycle energy consumption, associated
emissions and waste management.
2.1 DISPOSABLE PAPER CUP
The largest negative impact of paper cups is its environmental footprint. These
single use items can all be seen scattered around, with minimal decomposition. This is
due to the inside coating of polyethylene plastic. The only way to return these cups to
their base elements is to bury them in landfills for many years. Mostly because of
structural issues, paper cups are regulated to contain no more than 10 percent recycled
paper, increasing demand of trees for the new card stock. In the US, 23 billion coffee
cups are consumed a year; and the production cost mirrors this. 9.4million trees are
consumed, 5.7 billion gallons of water, and 7 trillion BTUs of heat are consumed for the
production of the 23 billion coffee cups. For a 16oz paper cup, the CO2 production cost
is 110g per cup. The end result is 363 million pounds of waste created annually(The
Basic Problem with Coffee Cups, 2009).
2.2 REUSABLE CERAMIC COFFEE MUG
Ceramic mugs consume much energy over their lifetime and therefore cause
damage to the environment. Ceramic mugs also damage the environment through their
dependency on detergents which is an ongoing need throughout their lifetime. On the
other hand, using ceramic mugs promote waste reduction and energy saving which could
potentially compensate for the environmental damages.
The entire life-cycle of ceramic mugs include preparation of ceramic dough,
casting, moulding, pressing the dough, firing of mugs, packaging and transportation of
the finished products, and utilization of ceramic mugs and their disposal. The primary
input materials are Kaolinite 0.28Kg/cup, Silicon 0.14Kg/cup, Feldspar 0.14kg/cup and
water 1.1 liter/cup.
(FROM :http://sustainability.yale.edu/sites/default/files/mita_broca_report.pdf) )
3
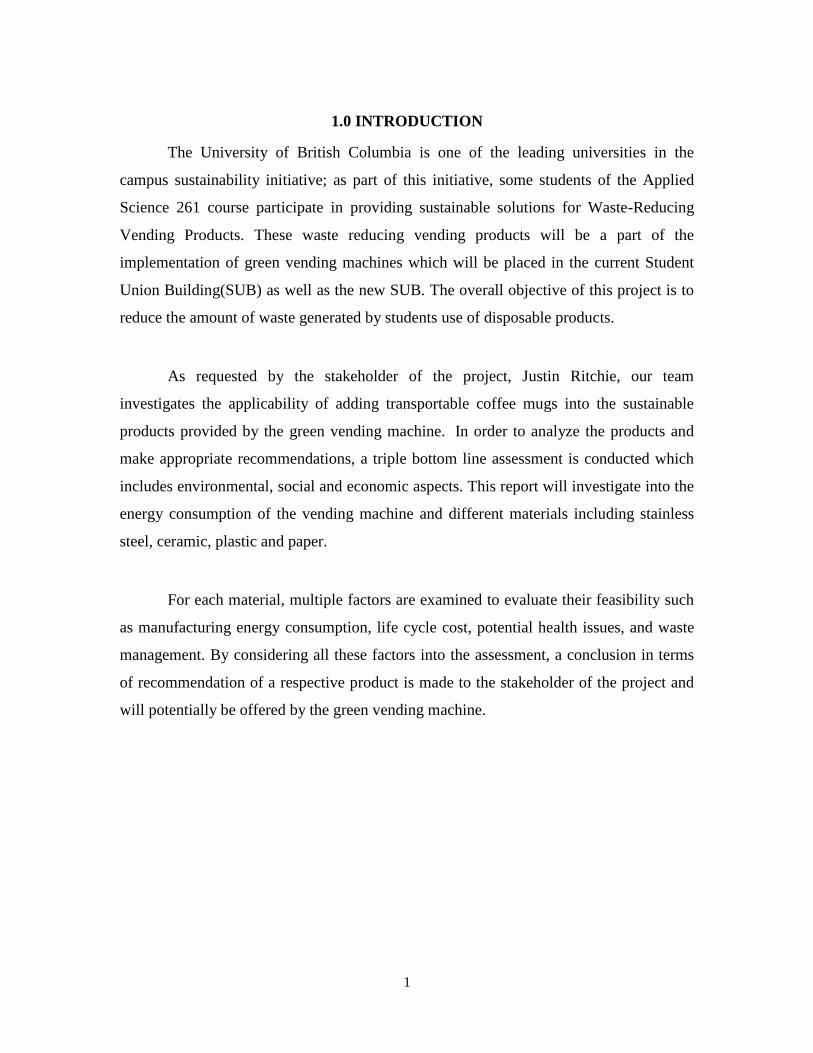
Much of the environmental footprint of the ceramic manufacturing process takes
place in the molding, pressing, and firing stages. The amounts of pollutants emitted in
these two steps are illustrated in the tables 2.1 and 2.2 below. In table 2.3, the amounts of
energy and detergent needed to wash the cups are also determined. Note that in tables
below, each plate is assumed to contain the same amount of material as a mug and emit
the same amount of pollution.
Table 2.1 Raw Material Consumption, Energy Consumption and Emissions during
Casting, Moulding and Pressing of Ceramic Dough
4
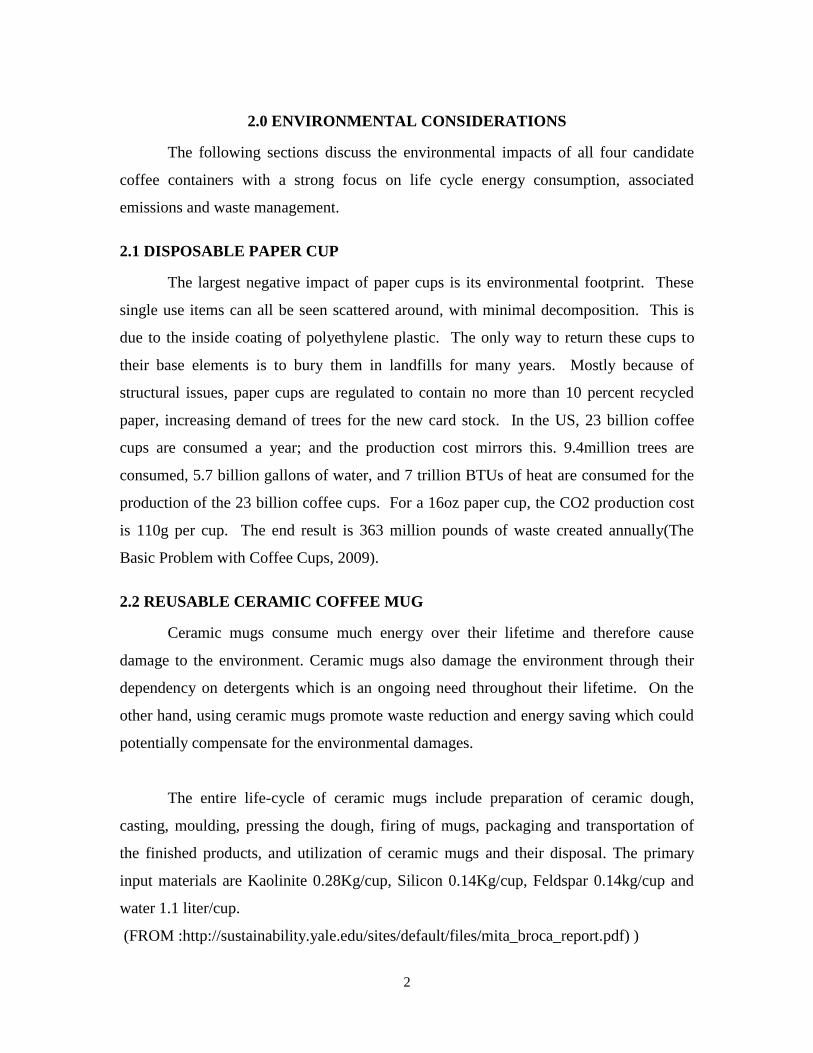
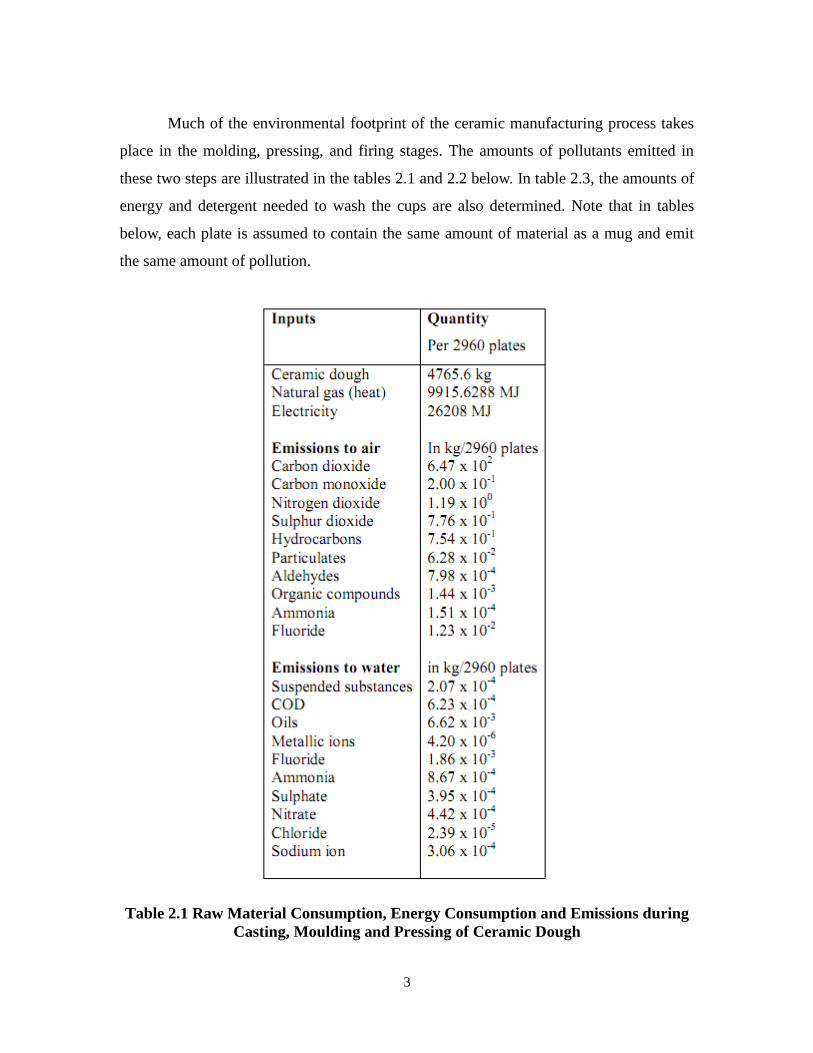
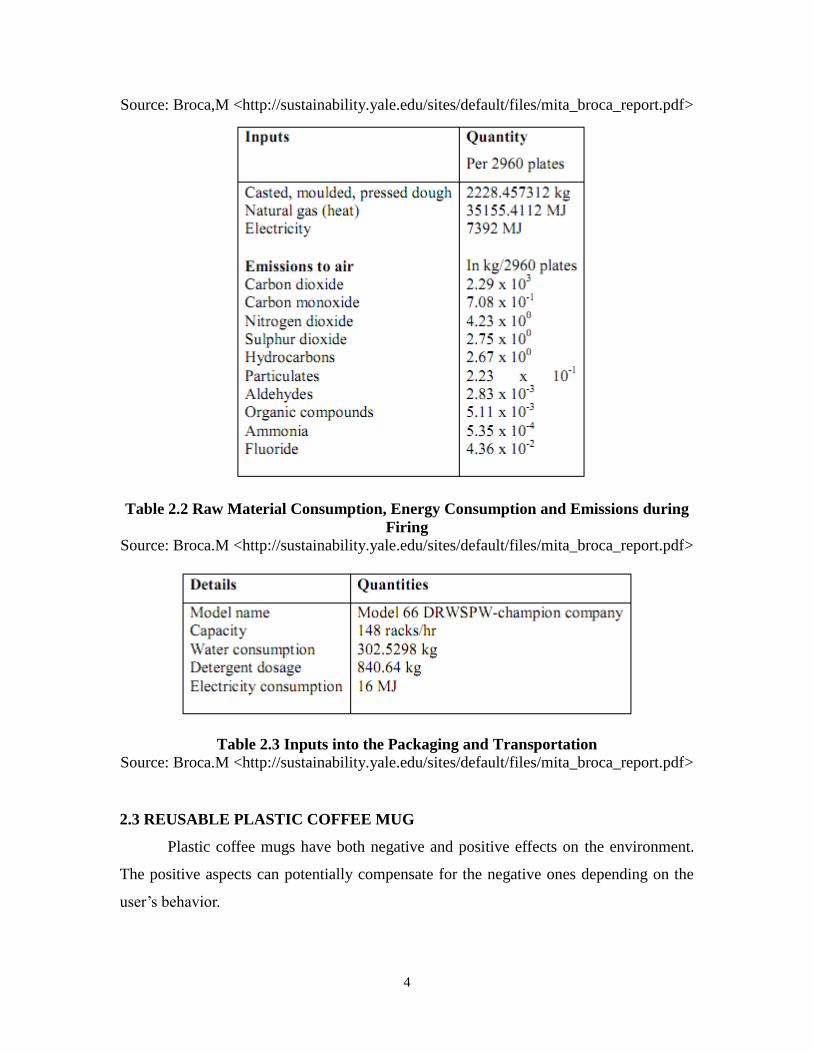
Source: Broca,M <http://sustainability.yale.edu/sites/default/files/mita_broca_report.pdf>
Table 2.2 Raw Material Consumption, Energy Consumption and Emissions during
Firing
Source: Broca.M <http://sustainability.yale.edu/sites/default/files/mita_broca_report.pdf>
Table 2.3 Inputs into the Packaging and Transportation Source: Broca.M <http://sustainability.yale.edu/sites/default/files/mita_broca_report.pdf>
2.3 REUSABLE PLASTIC COFFEE MUG
Plastic coffee mugs have both negative and positive effects on the environment.
The positive aspects can potentially compensate for the negative ones depending on the
user‟s behavior.
5
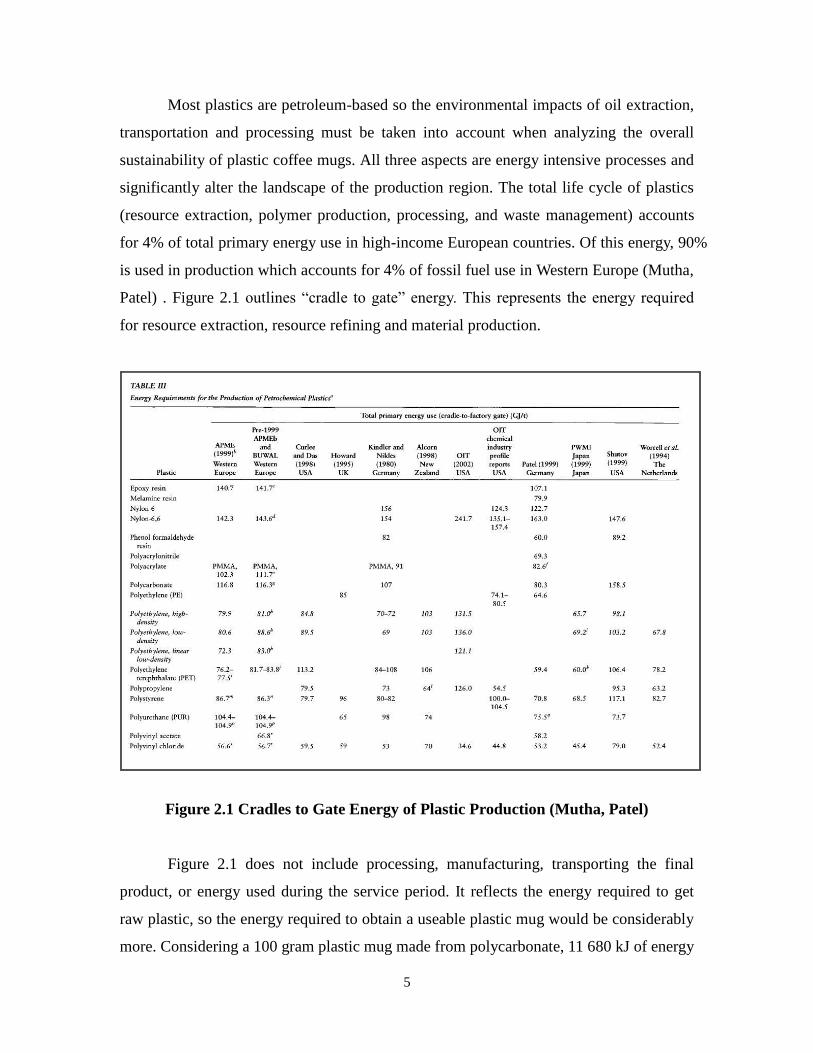
Most plastics are petroleum-based so the environmental impacts of oil extraction,
transportation and processing must be taken into account when analyzing the overall
sustainability of plastic coffee mugs. All three aspects are energy intensive processes and
significantly alter the landscape of the production region. The total life cycle of plastics
(resource extraction, polymer production, processing, and waste management) accounts
for 4% of total primary energy use in high-income European countries. Of this energy, 90%
is used in production which accounts for 4% of fossil fuel use in Western Europe (Mutha,
Patel) . Figure 2.1 outlines “cradle to gate” energy. This represents the energy required
for resource extraction, resource refining and material production.
Figure 2.1 Cradles to Gate Energy of Plastic Production (Mutha, Patel)
Figure 2.1 does not include processing, manufacturing, transporting the final
product, or energy used during the service period. It reflects the energy required to get
raw plastic, so the energy required to obtain a useable plastic mug would be considerably
more. Considering a 100 gram plastic mug made from polycarbonate, 11 680 kJ of energy
6
is required to form the necessary raw materials into plastic. This amount of energy is
equivalent to the amount of energy contained in 320ML of crude oil. For the sake of
visualization, if a plastic coffee mug was filled with crude oil it would contain enough
energy to produce another mug of equal size.
One of the benefits of plastic is that it is recyclable. After the useful life of the
beverage container has ended the material can be recycled and used for other
manufacturing purposes. However, this benefit would not be realized if the user chose to
throw the beverage container into the trash at the end of its life. Plastic is not
biodegradable and will likely sit in a landfill for centuries, contributing to the ever-
growing problem of waste management.
2.4 REUSABLE STAINLESS STEEL COFFEE MUG
The production of stainless steel coffee mugs is divided into three main stages:
The extraction and preparation of ores and production of ferro-alloys, the electricity
needed for these processes, the electricity production needed to produce stainless steel,
and the production processes at stainless steel sites (International Stainless Steel Forum,
June 2010). Then, with the gathered information, the approximate calculation of
emissions from a single stainless steel mug is provided.
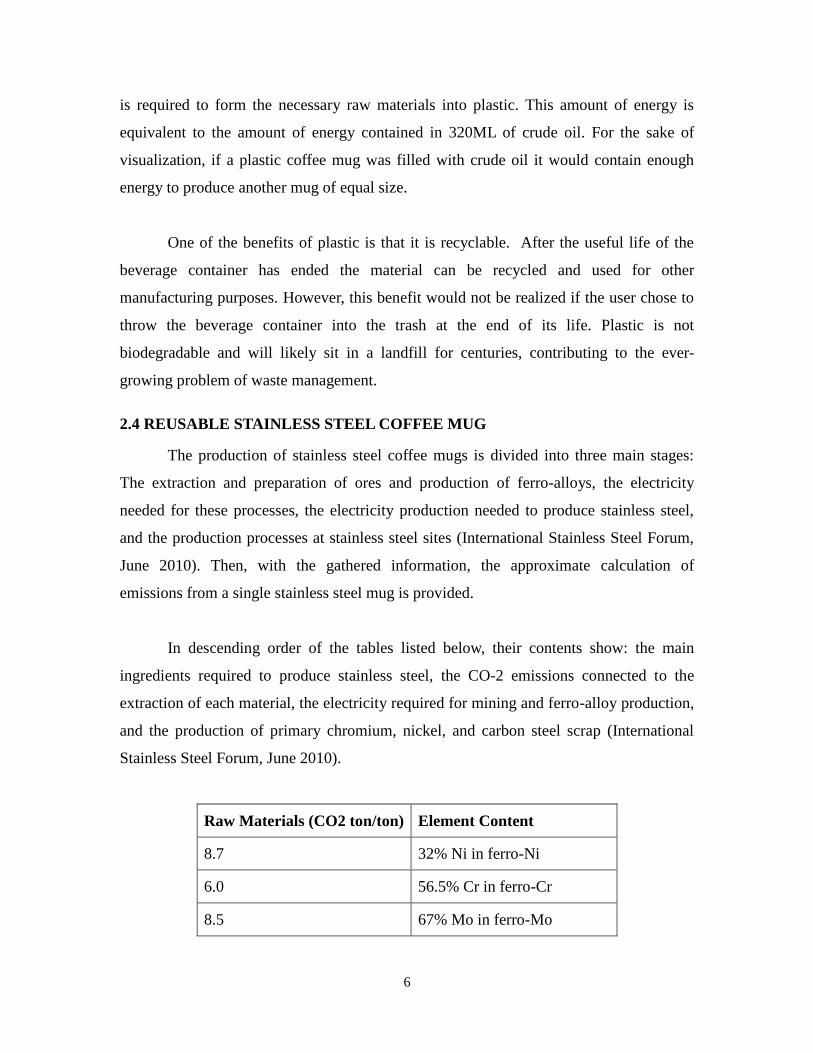
In descending order of the tables listed below, their contents show: the main
ingredients required to produce stainless steel, the CO2 emissions connected to the
extraction of each material, the electricity required for mining and ferro-alloy production,
and the production of primary chromium, nickel, and carbon steel scrap (International
Stainless Steel Forum, June 2010).
Raw Materials (CO2 ton/ton) Element Content
8.7 32% Ni in ferro-Ni
6.0 56.5% Cr in ferro-Cr
8.5 67% Mo in ferro-Mo
7
1.4 100% Fe in carbon steel scrap
Table 2.4 CO2 Emissions from Raw Materials Needed to Produce Stainless Steel
(International Stainless Steel Forum, 2010)
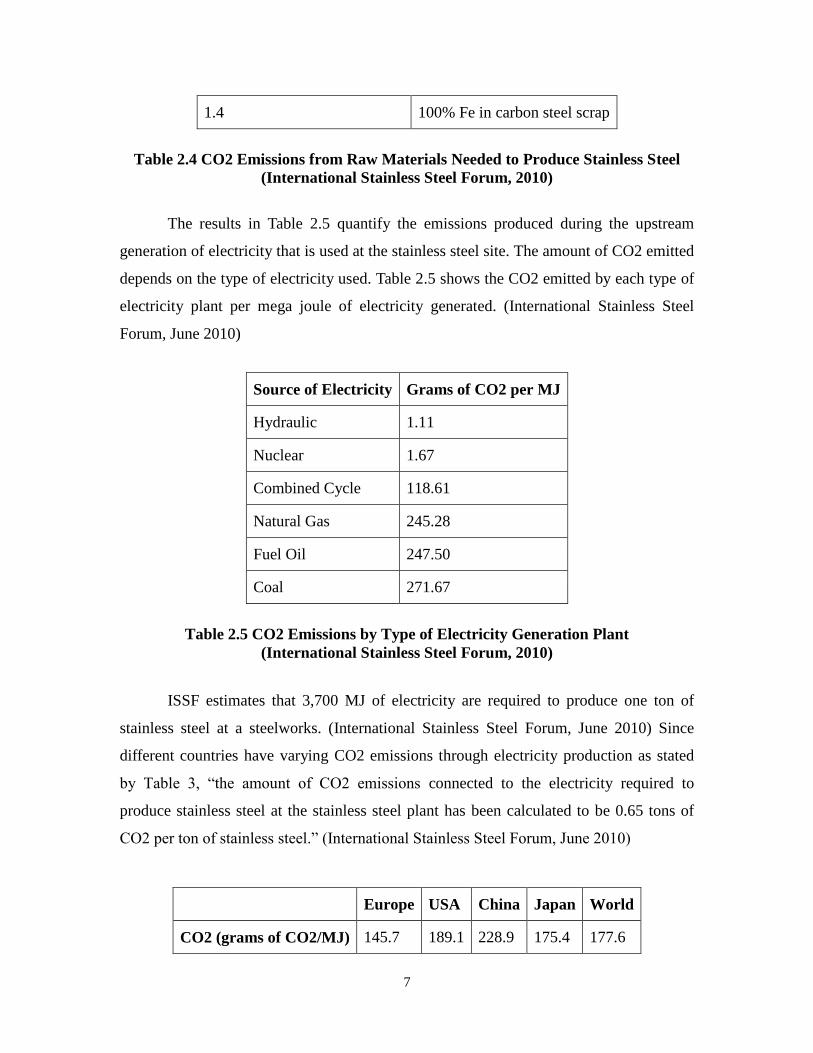
The results in Table 2.5 quantify the emissions produced during the upstream
generation of electricity that is used at the stainless steel site. The amount of CO2 emitted
depends on the type of electricity used. Table 2.5 shows the CO2 emitted by each type of
electricity plant per mega joule of electricity generated. (International Stainless Steel
Forum, June 2010)
Source of Electricity Grams of CO2 per MJ
Hydraulic 1.11
Nuclear 1.67
Combined Cycle 118.61
Natural Gas 245.28
Fuel Oil 247.50
Coal 271.67
Table 2.5 CO2 Emissions by Type of Electricity Generation Plant
(International Stainless Steel Forum, 2010)
ISSF estimates that 3,700 MJ of electricity are required to produce one ton of
stainless steel at a steelworks. (International Stainless Steel Forum, June 2010) Since
different countries have varying CO2 emissions through electricity production as stated
by Table 3, “the amount of CO2 emissions connected to the electricity required to
produce stainless steel at the stainless steel plant has been calculated to be 0.65 tons of
CO2 per ton of stainless steel.” (International Stainless Steel Forum, June 2010)
Europe USA China Japan World
CO2 (grams of CO2/MJ) 145.7 189.1 228.9 175.4 177.6
8
Table 2.6 Electricity CO2 Emissions by Country
(International Stainless Steel Forum, 2010)
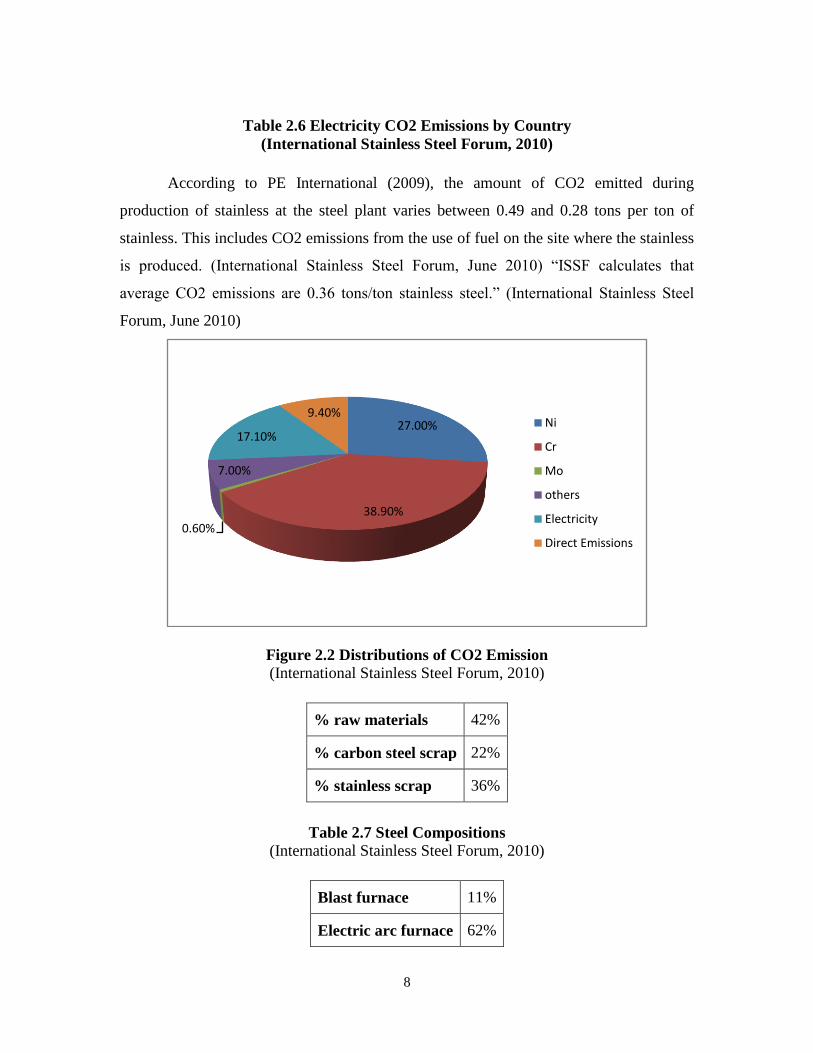
According to PE International (2009), the amount of CO2 emitted during
production of stainless at the steel plant varies between 0.49 and 0.28 tons per ton of
stainless. This includes CO2 emissions from the use of fuel on the site where the stainless
is produced. (International Stainless Steel Forum, June 2010) “ISSF calculates that
average CO2 emissions are 0.36 tons/ton stainless steel.” (International Stainless Steel
Forum, June 2010)
Figure 2.2 Distributions of CO2 Emission (International Stainless Steel Forum, 2010)
% raw materials 42%
% carbon steel scrap 22%
% stainless scrap 36%
Table 2.7 Steel Compositions
(International Stainless Steel Forum, 2010)
Blast furnace 11%
Electric arc furnace 62%
27.00%
38.90%
0.60%
7.00%
17.10%
9.40%Ni
Cr
Mo
others
Electricity
Direct Emissions
9
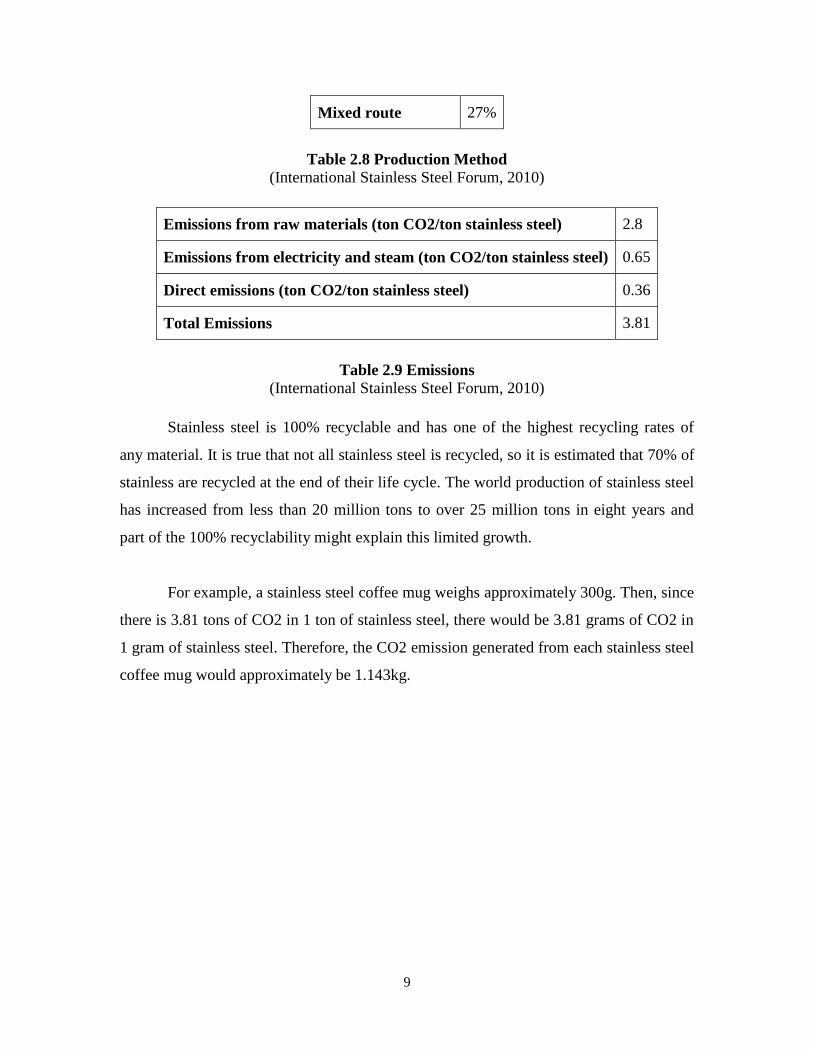
Mixed route 27%
Table 2.8 Production Method
(International Stainless Steel Forum, 2010)
Emissions from raw materials (ton CO2/ton stainless steel) 2.8
Emissions from electricity and steam (ton CO2/ton stainless steel) 0.65
Direct emissions (ton CO2/ton stainless steel) 0.36
Total Emissions 3.81
Table 2.9 Emissions
(International Stainless Steel Forum, 2010)
Stainless steel is 100% recyclable and has one of the highest recycling rates of
any material. It is true that not all stainless steel is recycled, so it is estimated that 70% of
stainless are recycled at the end of their life cycle. The world production of stainless steel
has increased from less than 20 million tons to over 25 million tons in eight years and
part of the 100% recyclability might explain this limited growth.
For example, a stainless steel coffee mug weighs approximately 300g. Then, since
there is 3.81 tons of CO2 in 1 ton of stainless steel, there would be 3.81 grams of CO2 in
1 gram of stainless steel. Therefore, the CO2 emission generated from each stainless steel
coffee mug would approximately be 1.143kg.
10
3.0 SOCIAL CONSIDERATIONS
The following sections discuss the social considerations of all four potential
coffee containers with a focus on user benefits, user drawbacks and potential health
issues.
3.1 DISPOSABLE PAPER CUP
Part of the convenience of using paper cups is that they are a one use item that is
thrown away without having to be cleaned. This saves the consumer time and the effort
to carry the used cup with them. Many beverage consumers may want to consume more
than one beverage in a day, and there is no compounding problem with disposable cups,
since each one starts off clean. With reusable cups, the prospect of filling a dirty cup
may seem off putting; while washing may also seem tedious. Other social aspects of
paper cups is that it carries brand power, allowing the consumer to be associated with the
beverage provider; and can even be a display of disposable income.
Safety considerations are minimal with paper cups, as the potentially dangerous
plastic coating that could cause leaching is never used twice. This situation minimizes
the absorption of plastic.
3.2 REUSABLE CERAMIC COFFEE MUG
Ceramic coffee mugs are convenient alternatives for disposable cups as they come
in variety of designs appealing to many consumers. These mugs are easily washed and
won‟t get stained. Ceramic is considered to be the premium material for hot drinks as it
insulates heat and will not absorb the odor of the coffee. Mugs can be manufactured to
have insulating properties allowing the user‟s beverage to remain at a desirable
temperature over a long time period. Of course, the performance of the mug depends on
the manufacturer, cost, type of ceramic and overall design. Ceramic mugs are generally
sealable making them suitable for the user to carry with them throughout the day. Many
are designed with spill-proof lids as added convenience and safety measures. Ergonomic
features can be easily implemented which greatly add to the user‟s comfort since ceramic
is such a versatile material
11
3.3 REUSABLE PLASTIC COFFEE MUG
The social impacts of employing a reusable, plastic coffee mug in place of other
alternatives are difficult to quantify. There are many potential benefits and drawbacks to
using a plastic coffee mug, however, each are subjective and are valued differently
depending on the individual. The user benefits of plastic coffee mugs are quite similar to
those mentioned in the previous section regarding ceramic mugs, mainly insulation,
safety and ergonomics.
Despite the advantages of plastic coffee mugs, there are drawbacks that cannot be
overlooked. Some individuals may feel burdened by having to carry a mug with them all
at all times and would never consider using one due to this inconvenience. The initial
purchase cost may also turn away potential users. However, the most compelling
disadvantage, and the one that is not at all based on user preference, is the potential
toxicity of plastic beverage containers.
Bisphenol A (BPA) is commonly used in the production of polycarbonate plastics,
food cans, plastic packaging and other everyday items. Animal studies on BPA have
identified it as an endocrine disrupting chemical that can have negative effects on
reproductive function in high enough doses. Analysis of BPA in urine samples has shown
that BPA is present in 93% of the United States‟ population (Belcher, Cooper, Kendig,
2011).
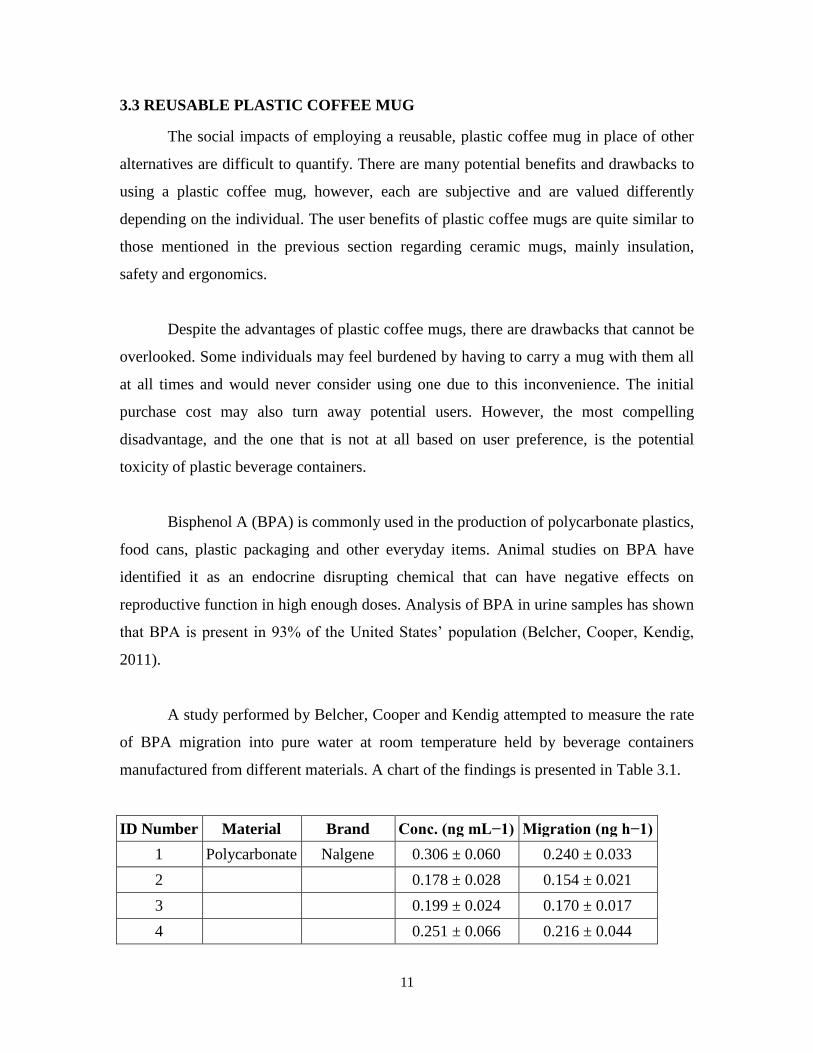
A study performed by Belcher, Cooper and Kendig attempted to measure the rate
of BPA migration into pure water at room temperature held by beverage containers
manufactured from different materials. A chart of the findings is presented in Table 3.1.
ID Number Material Brand Conc. (ng mL−1) Migration (ng h−1)
1 Polycarbonate Nalgene 0.306 ± 0.060 0.240 ± 0.033
2 0.178 ± 0.028 0.154 ± 0.021
3 0.199 ± 0.024 0.170 ± 0.017
4 0.251 ± 0.066 0.216 ± 0.044
12
1 Tritan™ Nalgene 0.007 ± 0.005 0.007 ± 0.003
2 0.008 ± 0.002 0.005 ± 0.001
3 0.008 ± 0.003 0.006 ± 0.002
1 Stainless steel Steel Works 0.026 ± 0.023 0.014 ± 0.007
2 Sigg 0.056 ± 0.018 0.043 ± 0.012
3 0.010 ± 0.004 0.009 ± 0.003
1 Al EcoCare™ Sigg 0.006 ± 0.003 0.005 ± 0.001
2 0.028 ± 0.008 0.021 ± 0.002
3 0.016 ± 0.001 0.014 ± 0.005
4 0.016 ± 0.001 0.013 ± 0.004
1A Al/epoxy Sigg 0.140 ± 0.014 0.120 ± 0.005
2A 0.131 ± 0.019 0.151 ± 0.005
3A 0.091 ± 0.004 0.075 ± 0.001
4A 0.081 ± 0.015 0.065 ± 0.011
5A 0.104 ± 0.022 0.094 ± 0.006
6A 0.059 ± 0.019 0.044 ± 0.009
1B Al/epoxy New Balance 1.902 ± 0.522 1.710 ± 0.311
2B 0.767 ± 0.058 0.658 ± 0.016
3B 0.931 ± 0.211 0.840 ± 0.080
4B 1.305 ± 0.979 1.072 ± 0.072
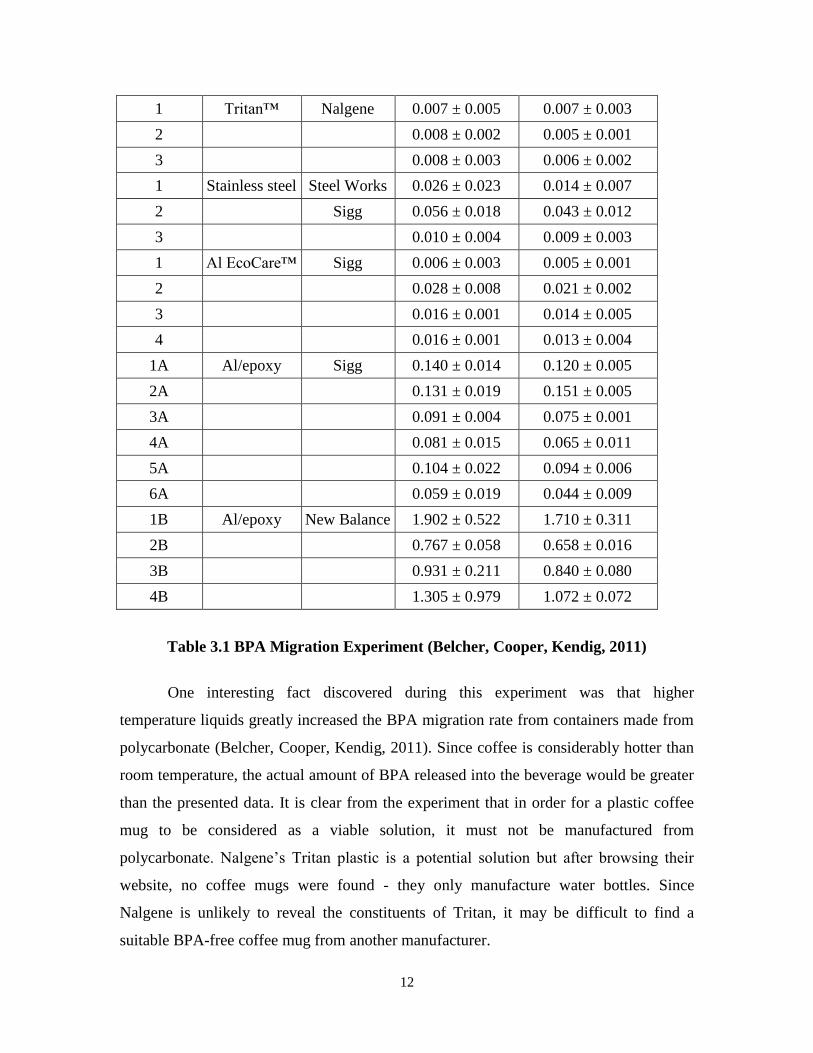
Table 3.1 BPA Migration Experiment (Belcher, Cooper, Kendig, 2011)
One interesting fact discovered during this experiment was that higher
temperature liquids greatly increased the BPA migration rate from containers made from
polycarbonate (Belcher, Cooper, Kendig, 2011). Since coffee is considerably hotter than
room temperature, the actual amount of BPA released into the beverage would be greater
than the presented data. It is clear from the experiment that in order for a plastic coffee
mug to be considered as a viable solution, it must not be manufactured from
polycarbonate. Nalgene‟s Tritan plastic is a potential solution but after browsing their
website, no coffee mugs were found - they only manufacture water bottles. Since
Nalgene is unlikely to reveal the constituents of Tritan, it may be difficult to find a
suitable BPA-free coffee mug from another manufacturer.
13
3.4 REUSABLE STAINLESS STEEL COFFEE MUG
The ease of cleaning stainless steel surgical instruments and appliances is an
obvious illustration of the way the material helps safeguard peoples‟ health as this can be
applied to cleansing stainless steel coffee mugs. Also, stainless steel is an exceptionally
neutral and corrosion resistant material and for this specific reason, it is a normal choice
in the food industry, pharmaceutical production, or for medical devices. “Stainless steel []
largely prevents the formation of any nutritive medium upon which bacteria can grow.”
(Euro Inox, July 2006)
Although stainless steel is pricier than its competitors, its other qualities, such as
being highly resistant to breaking, large dent resistance, light weight, and long term
durability overshadows the extra financial cost of the vendor and the buyer. Also, pure
stainless steel products are BPA - free with the absence of plastic. Stainless steel has a 10%
chromium coating and does not need a „lining‟, this chromium coating assists with
protecting the stainless steel from corrosion, ensuring a long lifespan. Further research
would have to be done regarding a specific stainless steel mug and its potential health
issues.
1
4.0 ECONOMIC CONSIDERATIONS
The following sections discusses the economic considerations of all four potential
coffee containers with a focus on the financial benefit of re-usability and the associated
costs of environmental impacts outlined in Section 2.
4.1 DISPOSABLE PAPER CUP
Since paper cups are well established in many different restaurants, we can
assume that they are the lowest cost alternative. A somewhat new idea is to encourage
the customer to bring their own cup. This would reduce cost through having less storage,
fewer cups that need to be bought, and reducing store garbage. This idea is easy to
market, as is can be presented as an eco-sensitive alternative, and have a price incentive.
This is seen in many stores that serve coffee, but not seen as frequently in restaurants. A
standard metal coffee cup is estimated to last 3000 cycles, and if the store offers a mild
10 cents per use, this system can potentially save the customer $300 per metal coffee cup.
As we can see, reusing a cup financially benefits both the store and customer.
4.2 REUSABLE CERAMIC COFFEE MUG
To simply practice sustainability by using a reusable coffee mug, one should
theoretically use the same cup several times. Therefore the question boils down to how
many times a consumer should use the same reusable cup so that its economic impacts
( mainly energy consumption) become less than that of a disposable cup?
Firstly, the amount of manufacturing energy, transportation energy and
maintenance energy per use (mainly washing and sanitizing) must be figured out in order
to decide if the ceramic cup is the more economic product to be placed in the vending
machine. For the purpose of calculations, the two equations below have been derived. In
the equations below, A represents the energy required to manufacture one single reusable
cup. B is the energy requirement of one time washing and sanitizing the mug, while E
expresses the number of times the cup is used before washing. For example the consumer
might drink two cups of coffee in the same cup consecutively and skip washing the cup.
F represents the number of refills before and after using the cup. In the second equation,
2
an additional parameter G is added which stands for the energy recovered from recycling
the material.
Total Energy Consumption per use of a reusable cup = (A+EB)/(E+F)
Break Even Number of Uses = (A-G)/((C/D)-(B/(E+F)))
(http://www.springerlink.com/content/c275588280002wp8/fulltext.pdf Hocking,
M.B)
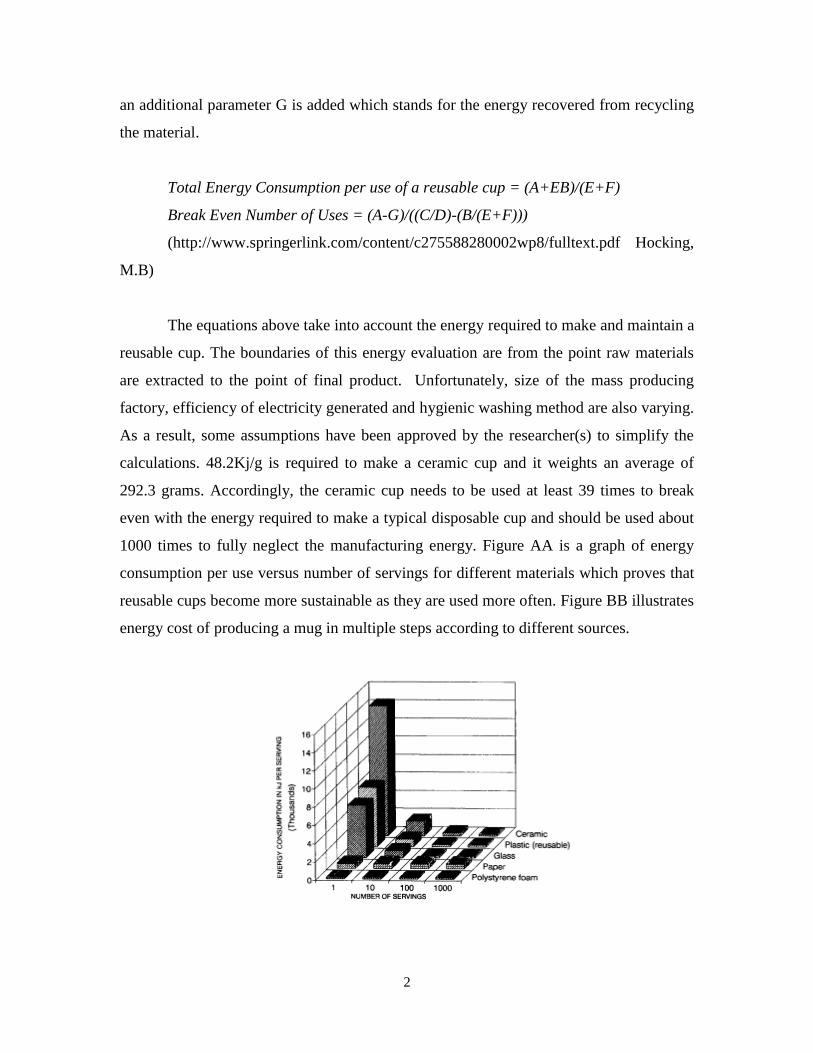
The equations above take into account the energy required to make and maintain a
reusable cup. The boundaries of this energy evaluation are from the point raw materials
are extracted to the point of final product. Unfortunately, size of the mass producing
factory, efficiency of electricity generated and hygienic washing method are also varying.
As a result, some assumptions have been approved by the researcher(s) to simplify the
calculations. 48.2Kj/g is required to make a ceramic cup and it weights an average of
292.3 grams. Accordingly, the ceramic cup needs to be used at least 39 times to break
even with the energy required to make a typical disposable cup and should be used about
1000 times to fully neglect the manufacturing energy. Figure AA is a graph of energy
consumption per use versus number of servings for different materials which proves that
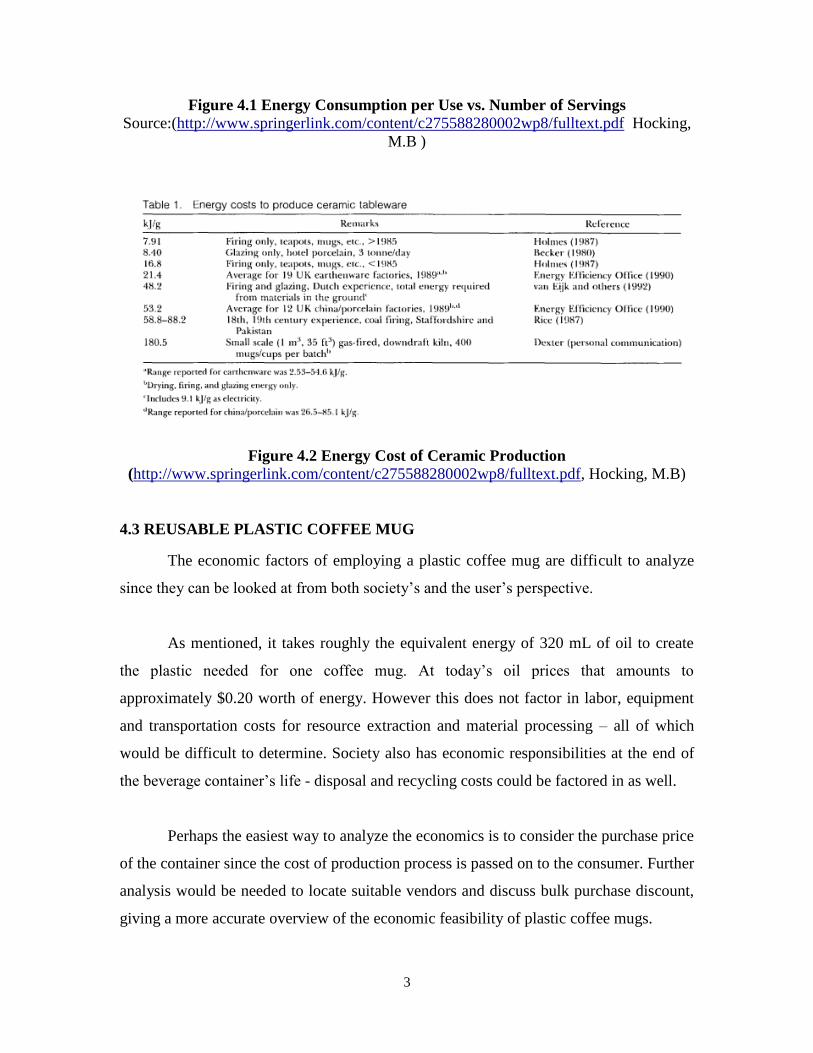
reusable cups become more sustainable as they are used more often. Figure BB illustrates
energy cost of producing a mug in multiple steps according to different sources.
3
Figure 4.1 Energy Consumption per Use vs. Number of Servings Source:(http://www.springerlink.com/content/c275588280002wp8/fulltext.pdf Hocking,
M.B )
Figure 4.2 Energy Cost of Ceramic Production
(http://www.springerlink.com/content/c275588280002wp8/fulltext.pdf, Hocking, M.B)
4.3 REUSABLE PLASTIC COFFEE MUG
The economic factors of employing a plastic coffee mug are difficult to analyze
since they can be looked at from both society‟s and the user‟s perspective.
As mentioned, it takes roughly the equivalent energy of 320 mL of oil to create
the plastic needed for one coffee mug. At today‟s oil prices that amounts to
approximately $0.20 worth of energy. However this does not factor in labor, equipment
and transportation costs for resource extraction and material processing – all of which
would be difficult to determine. Society also has economic responsibilities at the end of
the beverage container‟s life - disposal and recycling costs could be factored in as well.
Perhaps the easiest way to analyze the economics is to consider the purchase price
of the container since the cost of production process is passed on to the consumer. Further
analysis would be needed to locate suitable vendors and discuss bulk purchase discount,
giving a more accurate overview of the economic feasibility of plastic coffee mugs.
4
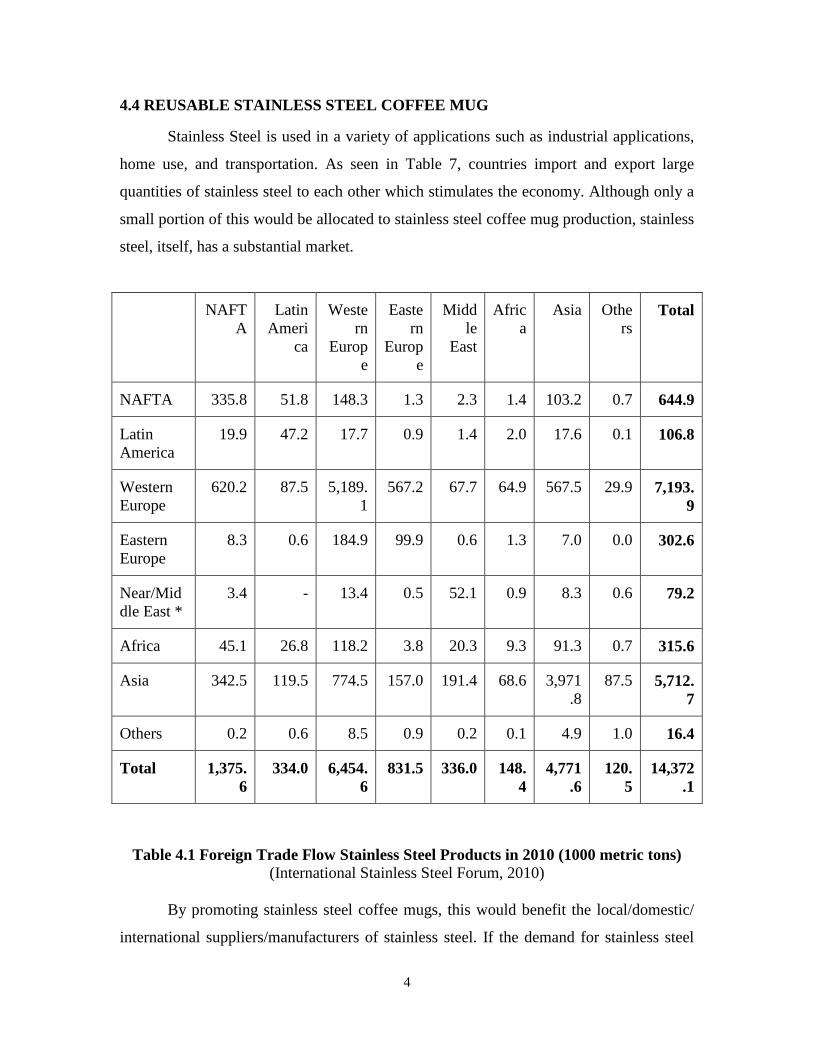
4.4 REUSABLE STAINLESS STEEL COFFEE MUG
Stainless Steel is used in a variety of applications such as industrial applications,
home use, and transportation. As seen in Table 7, countries import and export large
quantities of stainless steel to each other which stimulates the economy. Although only a
small portion of this would be allocated to stainless steel coffee mug production, stainless
steel, itself, has a substantial market.
NAFT
A
Latin
Ameri
ca
Weste
rn
Europ
e
Easte
rn
Europ
e
Midd
le
East
Afric
a
Asia Othe
rs Total
NAFTA 335.8 51.8 148.3 1.3 2.3 1.4 103.2 0.7 644.9
Latin
America
19.9 47.2 17.7 0.9 1.4 2.0 17.6 0.1 106.8
Western
Europe
620.2 87.5 5,189.
1
567.2 67.7 64.9 567.5 29.9 7,193.
9
Eastern
Europe
8.3 0.6 184.9 99.9 0.6 1.3 7.0 0.0 302.6
Near/Mid
dle East *
3.4 - 13.4 0.5 52.1 0.9 8.3 0.6 79.2
Africa 45.1 26.8 118.2 3.8 20.3 9.3 91.3 0.7 315.6
Asia 342.5 119.5 774.5 157.0 191.4 68.6 3,971
.8
87.5 5,712.
7
Others 0.2 0.6 8.5 0.9 0.2 0.1 4.9 1.0 16.4
Total 1,375.
6
334.0 6,454.
6
831.5 336.0 148.
4
4,771
.6
120.
5
14,372
.1
Table 4.1 Foreign Trade Flow Stainless Steel Products in 2010 (1000 metric tons)
(International Stainless Steel Forum, 2010)
By promoting stainless steel coffee mugs, this would benefit the local/domestic/
international suppliers/manufacturers of stainless steel. If the demand for stainless steel
5
coffee mugs were to increase the supply and constant recyclable nature would also
increase; thereby, resulting in a good economic life cycle.
The life cycle of a stainless steel coffee mug would include the production,
maintenance, and recycle cost. Further analysis into local/domestic/international suppliers
would provide an accurate cost approximation for manufacturing a stainless steel coffee
mug.
6
5.0 VENDING MACHINE ENERGY CONSUMPTION
As mentioned in previous sections, our product the transportable coffee mug will
be held and sold in the "Green Vending Machines" at various locations on campus. While
concentrating on conducting the triple bottom line assessments of the products, we should
not overlook the energy consumption of the vending machines themselves. The "green
vending machine" that will be implemented, should not only be used to sell "green
products", but also be reasonably sustainable to fit the objective of the project. This
section will provide an in-depth look on the power consumption of green vending
machines, and investigate into possible solutions for reducing the energy used.
It is an undoubted that vending machines are significant sources of energy
consumption in public places, as they generally operate 24 hours per day, and 7 days a
week. In addition to the electricity they consume, they also increase the cooling loads of
the positions they locate. Measurements at the National Renewable Energy Laboratory
(NREL) have shown that a typical vending machine that dispenses 500 cans of soft drink
with an illuminated front panel consumes between 7 and 11 kWh/day in a public
environment, which can be converted into a range of 2500 to 5000 kWh of electricity
consumed per year. (M. Deru, 2003)
The number of vending machines has also greatly incremented over recent years.
A recent research conducted by the Department of Energy (DOE) of the United States has
shown that there are more than three million vending machines in US or one machine for
every 100 Americans. With the considerable number of vending machines in service, the
problem of their power consumption has been escalated as well. Thus, it is important for
us to realize a solution to harness vending machines' powerful automated functionalities
without breaking our goal of improving sustainability.
In order to regulate the energy efficiency of vending machines, and encourage
more sustainable designs of new generation vending machines, the Department of Energy
(DOE) and United States Environmental Protection Agency (EPA) have co-authored the
"Energy Star" standards for vending machines. Those vending machines which meet the
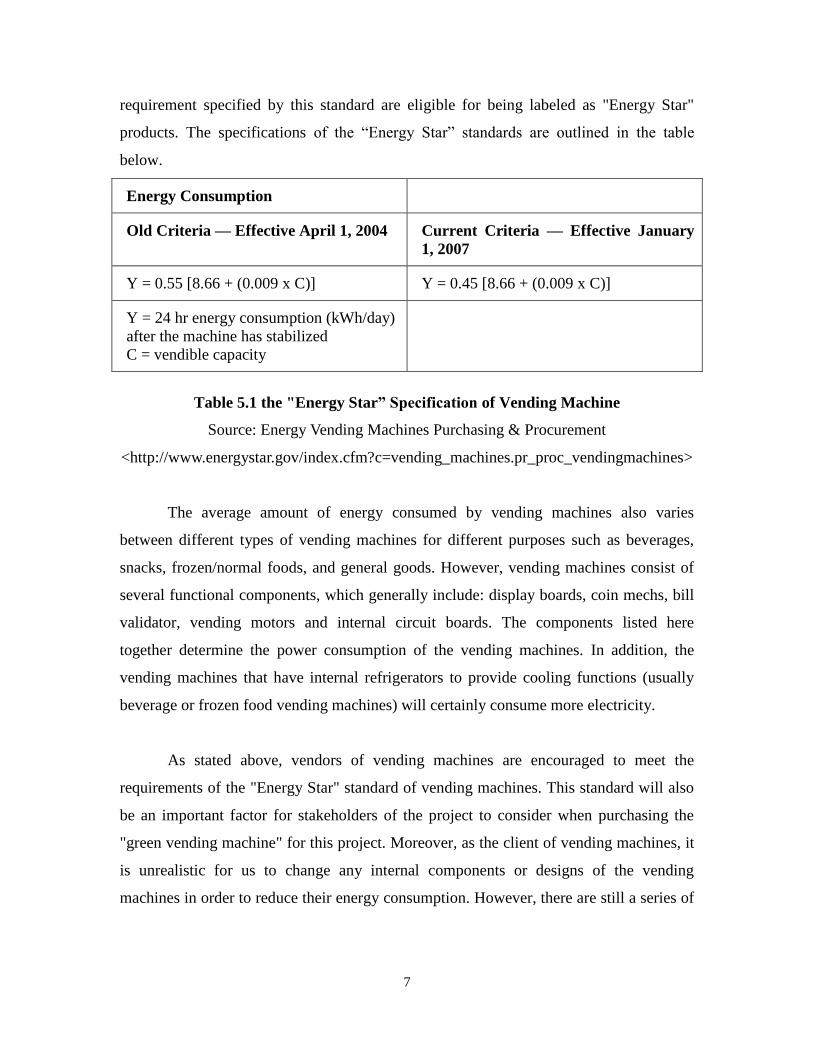
7
requirement specified by this standard are eligible for being labeled as "Energy Star"
products. The specifications of the “Energy Star” standards are outlined in the table
below.
Energy Consumption
Old Criteria — Effective April 1, 2004 Current Criteria — Effective January
1, 2007
Y = 0.55 [8.66 + (0.009 x C)] Y = 0.45 [8.66 + (0.009 x C)]
Y = 24 hr energy consumption (kWh/day)
after the machine has stabilized
C = vendible capacity
Table 5.1 the "Energy Star” Specification of Vending Machine
Source: Energy Vending Machines Purchasing & Procurement
<http://www.energystar.gov/index.cfm?c=vending_machines.pr_proc_vendingmachines>
The average amount of energy consumed by vending machines also varies
between different types of vending machines for different purposes such as beverages,
snacks, frozen/normal foods, and general goods. However, vending machines consist of
several functional components, which generally include: display boards, coin mechs, bill
validator, vending motors and internal circuit boards. The components listed here
together determine the power consumption of the vending machines. In addition, the
vending machines that have internal refrigerators to provide cooling functions (usually
beverage or frozen food vending machines) will certainly consume more electricity.
As stated above, vendors of vending machines are encouraged to meet the
requirements of the "Energy Star" standard of vending machines. This standard will also
be an important factor for stakeholders of the project to consider when purchasing the
"green vending machine" for this project. Moreover, as the client of vending machines, it
is unrealistic for us to change any internal components or designs of the vending
machines in order to reduce their energy consumption. However, there are still a series of
8
improvements can be implemented to significantly reduce the power consumption of
vending machines, which are introduced in the following details:
Low Power Mode
A lot of vending machines are designed with low power mode and can be
configured to switch to low power mode automatically during periods of extended
inactivity. (E Source Companies, 2009) During running in low power mode, the vending
machines will switch off the lights to facilitate the saving of additional energy where
appropriate. In addition, the vending machine will be able to resume to its normal
operating conditions at the conclusion of the inactivity period. Also, there are some
vending machines are equipped with LED lights instead of traditional gas-discharge
lamps with ballast will contribute to a further reduction of energy consumption.
De-lamp Vending Machines
Another way of reducing the energy consumed by the vending machine is to
completely de-lamp the lights used in vending machine and fully utilize illuminations
from the environment. In fact, the lights and ballasts used in vending machine (without
refrigerators) are the most significant source of power consumption, which consume on
average 180 Watts according to the research done by NREL. (M. Deru, 2003) At a rate of
$0.06 per kWh for electricity, de-lamped vending machine can produce savings of
approximately $100 per year. In addition, we could potentially increase the social
acknowledgement of the project objective by implementing a special decoration for de-
lamped "green vending machine", such as a sign that says "This machine is operating
without lights to save power."
Energy Saving Sensors
In addition to the above methods, the use of energy saving sensors, also referred
to as occupancy sensors, will reduce the vending machines' power requirements during
long periods of inactivity, such as nights and weekends. The occupancy sensor and
controller, typically in the form of an infrared sensor, is used to monitor the active
movements around the location of the vending machine, and power down the vending
9
machine or switch it to the low power mode when there is no activity detected for a
period of time, and reactivate the vending machine when motion is detected. According
to the data provided by Bayview Technology - a energy saving solution provider, energy
saving sensors save between 30~50% of the annual electricity costs of a vending machine,
depending on the application and occupancy of the location. (E Source Companies, 2009)
This occupancy sensor option could be considered as an add-on or replacement to the de-
lamping when it's not advisable.
To conclude, following the importance of energy consumption, the model chosen
for "green vending machine" implemented in this project should be assessed carefully in
terms of their power efficiency; and "Energy Star" branded products are more
recommended. Moreover, there are certain procedures and methodologies of improving
the sustainability of the "green vending machine" that are highly recommended.
10
6.0 CONCLUSION & RECOMMENDATIONS
It is not a common occurrence for a practice to benefit the merchandiser,
consumer, and environment at the same time, yet it is a possibility with reusable cups.
The consumer can save money, the merchandiser does not have to purchase as many cups,
and the produced waste declines. The only obstacle in the way is a perceived stigma
regarding reusable cups. The difficulty would be to encourage the majority to continually
use reusable cups.
Energy consumption regarding the life-cycle of ceramic mugs is quite high. As a
result, they require several number of usages to compensate the environmental and
economic damages caused during their life-cycle, thus the ceramic mug is not a
applicable product to be placed in the vending machine. We do not recommend
employing reusable plastic coffee mugs because of the potential health risks of plastic
coffee mugs due to BPA migration and our inability to locate a suitable product. Plastic
toxicity is a fairly recent issue and we currently do not have enough information to make
a confident decision concerning product safety. We do, however, recommend stainless
steel coffee mugs due to its 100% recyclable nature and durability. Also, since we use
stainless steel in so many other areas, such as pipelines, household appliances, and
medical devices, we have found no potential health risks associated with stainless steel
products. The only downside of stainless steel products is the high energy consumption
and its high CO2 emissions.
If reusable coffee mugs are to be sold from vending machines in the new SUB, we
recommend they be made of stainless steel. However we feel further research is
necessary regarding public perception of reusable mugs. Individuals that are concerned
about the environment or consider a travel mug to be convenient most likely already own
one and will not need to purchase them from the vending machines in the SUB. Those
that do not use a travel mug likely have reasoning behind their decision. For example,
some individuals may consider them an inconvenience or some may not want to pay the
initial purchase price. More research should be done into the reasons why reusable mugs
are being neglected. This research may support implementing incentives for using a

11
travel mug, conducting information sessions to educate individuals on the effects of using
disposal cups or forgoing the concept of a vending machine selling reusable coffee mugs
altogether.
12
REFERENCES
Belcher, S.M., Cooper, J.E., Kendig, E.L.,. (2011). Assessment of bisphenol A released
from reusable plastic, aluminium and stainless steel water bottles. Chemosphere
Broca,M.(2008). A comparative analysis of the environmental impacts of
ceramic plates and biodegradable plates (made of corn starch)
using the Life Cycle Assessment tool.
http://sustainability.yale.edu/sites/default/files/mita_broca_report.pdf
E Source Companies LLC. (2009) Vending Machine Energy Saving, Retrieved November
17, 2011, from http://www.mge.com/business/saving/madison/pa_50.html
Energy Vending Machines Purchasing & Procurement (n.d.) November 16, 2011, from:
http://www.energystar.gov/index.cfm?c=vending_machines.pr_proc_vendingmachines
Euro Inox. (July 2006). Stainless steel in technical building services : Sanitary equipment.
Retrieved from http://www.euro-
inox.org/pdf/build/technicalbuildingservices/Sanitary_DrinkWaterSys_EN.pdf
Feldman, H. (2008, May 28). About My Planet. Retrieved November 15, 2011, from
Paper Cups = Unsustainable Consumption:
http://www.aboutmyplanet.com/environment/paper-unsustainable/
Finn,A.(2008). Green Worker
http://www.guardian.co.uk/money/2008/mar/03/ethicalliving.carbonfootprints
Hocking, M.B (1994). Reusable and Disposable Cup: an Energy-Based Evaluation.
http://www.springerlink.com/content/c275588280002wp8/fulltext.pdf
International Stainless Steel Forum. (2010, June 03). Stainless steel and co2: Facts and
scientific observations. Retrieved from
http://www.worldstainless.org/ISSF/Files/Stainless steel and co2.pdf
ISSF. (2011, July 20). Foreign trade flow stainless steel products in 2010. Retrieved from
http://www.worldstainless.org/Statistics/Foreign trade/
Patel, M., Mutha, N. "Plastics Production and Energy." Encyclopedia of Energy. Ed.
Cutler J. Cleveland. Vol. 5. Amsterdam
M. Deru, P.Torcellini, K. Bottom, and R. Ault (2003) Analysis of NREL Cold-Drink

13
Vending Machines for Energy Savings, Retrieved from
http://www.nrel.gov/docs/fy03osti/34008.pdf
The Basic Problem with Coffee Cups. (2009). Retrieved November 16, 2011, from
Sustainability is Sexy: http://www.sustainabilityissexy.com/facts.html
Related Documents