Annual Report 2012 United Bank for Africa Plc RC: 2457 Partnering with Africa for development AFRICA LONDON NEW YORK PARIS Africa’s global bank Nigeria Ghana Cameroon Cote d’lvoire Burkina Faso Rep.Benin Senegal Chad Guinea Sierra Leone Liberia Uganda Kenya Tanzania Gabon Zambia Mozambique Congo DR Congo Brazzaville USA France England

Uba annual report 2012
Jun 12, 2015
Welcome message from author
This document is posted to help you gain knowledge. Please leave a comment to let me know what you think about it! Share it to your friends and learn new things together.
Transcript

Annual Report 2012
United Bank for Africa PlcRC: 2457
Partnering with Africa for development
AFRICA LONDON NEW YORK PARIS Africa’s global bank
Nigeria Ghana Cameroon Cote d’lvoire Burkina Faso Rep.Benin Senegal Chad GuineaSierra LeoneLiberiaUganda Kenya Tanzania Gabon Zambia Mozambique Congo DR Congo Brazzaville
USA FranceEngland

Table of contents
About UBA1 Group Profile2 Our Footprint3 Highlights of 2012 Performance 4 Our People
Strategy and Business Review11 Chairman’s Statement15 Chief Executive Officer’s Report19 Review of Group Strategy23 Group Financial Performance Review27 Review of E-Banking Resources
Responsibility and Sustainability30 Sustainability and Corporate Social Responsibility Report
Governance34 Directors’ Report41 Customers Complaints Report44 Corporate Governance Report51 Audit Committee Report52 Board Evaluation Report53 Statement on Directors’ Responsibility
Financial Statements54 Report of the Independent Auditors 56 Statement of Comprehensive Income 57 Statement of Financial Position58 Statement of Comprehensive Changes in Equity62 Statement of Cash flows63 Notes to the Accounts183 Value Added Statement 185 Group Five-Year Financial Summary 187 Bank Five-Year Financial Summary
Investor Information189 Investor Information194 Ratios and Formula196 Notice of AGMShareholder Forms
Corporate InformationCorporate InformationSubsidiaries with Contact Details
Partnering with Africa for development

1
Annual report 2012
United Bank for Africa (UBA) Plc is one of the leading financial services institutions in Africa. UBA provides banking and other financial services to more than 7.2 million customers through its channels strategically located in 19 African countries, United States of America, United Kingdom and France. It is a publicly quoted company listed on the Nigerian Stock Exchange (NSE) and has a well-diversified shareholder base.
The origin of UBA dates back to 1949, when it was first referred to as the British and French Bank Limited (BFB). It took over the assets and liabilities of BFB and was incorporated as a limited liability company on 23 February 1961 under the Compliance Ordinance (Cap 37) 1922. UBA was the first Nigerian bank to make an Initial Public Offering (IPO), following its listing on the NSE in 1970. It was also the first bank to issue Global Depository Receipts (GDRs).
In 2005, it completed one of the biggest mergers in the history of Nigeria’s capital markets with the business combination with Standard Trust Bank (STB) Plc. From then, it commenced its pan African expansion strategy, which has led to its presence in Ghana, Benin Republic, Cote d’Ivoire, Burkina Faso, Guinea, Chad, Cameroon, Kenya, Gabon, Tanzania, Zambia, Uganda, Liberia, Sierra Leone, Mozambique, Senegal, Congo DR and Congo Brazzaville.
VisionTo be the undisputed leading and dominant financial services institution in Africa.
MissionTo be a role model for African businesses by creating superior value for all our stakeholders, abiding by the utmost professional and ethical standards, and by building an enduring institution.
Who we areUBA Plc is a leading financial service group in Sub-Saharan Africa with presence in 19 Africa countries as well as United Kingdom, United States of America and France. With the Bank’s migration from universal banking to the monoline commercial banking in line with regulatory requirement, UBA now provides commercial banking and pension custody services to its corporate, commercial and retail customers.
What we doProducts
UBA is a financial institution offering a range of banking and pension fund custody services.
Market
UBA has over 7.2 million customers in retail, commercial and corporate market segments. The bank’s operation is spread across 22 countries, consisting of Nigeria, 18 African countries, United States of America, United Kingdom and France.
Channels
UBA has one of the largest distribution network in Nigeria. As at 31 December 2012, there were 603 branches and retail outlets, 1,500 ATMs and 5,303 POS machines fully deployed.
Staff
As at 31 December 2012, the Group had 11,529 members of staff.

Annual Report 2012
2
Global footprint

3
Highlights of 2012 Performance
Gross earnings Operating income Profit for the year
N220.1 billion N153.1 billion N54.8 billionUp 34.4% year-on-year Up 28.7% year-on-year Up 905.3% year-on-year
Total Assets Total Deposits Owners’ equity
N2.27 trillion N1.78 trillion N192.5 billionUp 17.6% year-on-year Up 21.4% year-on-year Up 17.5% year-on-year
Return on equity Return on assets Capital adequacy ratio
31.9% 2.6% 23.5%Versus (4.5%) in prior year Versus (0.4%) in prior year Versus 21.7% in prior year
100
80
60
40
20
2010 2011 20120
2010 2011 2012
75.8%
89.2%
67.0%
6
5
4
3
2
1
2010 2011 20120
2010 2011 2012
5.7%
3.0%
1.9%
200
150
100
50
-50
0
2010 2011 2012
-8-21
166
Cost-to-income ratio Non-performing loan ratio
Earnings per share (kobo)

Annual Report 2012
4
Our people
Israel Ogbue, Chairman
Appointed Non-Executive Director in 2005 and Chairman of the Board in 2011.
Qualified as a Chartered Secretary upon graduation from South-West London College of Commerce, England. Holds the fellowship of the Chartered Institute of Secretaries. Has work experience spanning over four decades, two of which were at a senior management level. He retired as General Manager of National Insurance Corporation of Nigeria (NICON). Has served as a Director on the boards of many companies, including Transcorp Hilton Hotel and NAL Bank (now Sterling Bank Plc).
Joseph Keshi, Oon, Vice-Chairman
Appointed a Non-Executive Director in 2010 and Vice-Chairman of the Board in 2011.
A graduate of political science from the University of Ibadan, Nigeria, he holds a post graduate diploma in International Relations and Diplomacy from the Nigerian Institute of International Affairs and a Masters in Administration and Development from the Institute of Social Studies, the Hague. He is both a Fellow of the John Kennedy School of Government, Harvard University and the Harvard Business School.
He joined the Nigerian Public Service in 1975 and has over 35 years working experience, some which were at the highest level of Government. Apart from serving in a number of Nigeria’s diplomatic missions and heading a few, he was at various times, Permanent Secretary, Cabinet Secretariat, the Presidency and Permanent Secretary, Ministry of Foreign Affairs.
He is a Director of South Strategy and Chairman of Afrigrowth Foundation.
Phillips Oduoza, Group Managing Director/CEO
Appointed Executive Director in 2005 and GMD/CEO in 2010.
Holds an MBA (Finance) and first class honours (Civil Engineering) degrees from the University of Lagos. An alumnus of the Harvard Business School’s Advance Management Program. Banking career spans over two decades with experience in several areas, including credit and marketing, treasury, relationship management, information technology, business development, strategic planning, financial control, human resources, internal control and international operations. He held several senior level appointments before joining Standard Trust Bank in 2004. He has attended numerous banking, management and leadership programs. He is also known for strong execution and talent management.
Kennedy Uzoka, Deputy Managing Director
Appointed Executive Director in 2010 and Deputy Managing Director in 2011.
Until his appointment as the Deputy Managing Director, Kennedy Uzoka was the Executive Director, Resources, a position he held from May 2010, in which role he oversaw, Human Capital, Corporate Communication, Company Secretariat, Corporate Services, Legal Services, UBA Academy, UBA Foundation, and UBA Properties.
Kennedy has a BSc degree in Mechanical Engineering from the University of Benin and an MBA degree from the University of Lagos. His experience spans over two decades in marketing, business strategy, finance, and resources management. Before the merger of STB with UBA Plc in 2005, Kennedy was the General Manager, North Bank covering all the states in the Northern part of Nigeria including the Federal Capital Territory. He is an alumnus of international institutions such as the Harvard Business School in Boston, USA; International Institute of Management Development (IMD) in Lausanne, Switzerland, and the London Business School, UK.

5
Emmanuel N. Nnorom, Executive Director and CEO – Uba africa
Appointed Executive Director in 2008.
An alumnus of the Oxford University Templeton College and trained with the accounting firm of Peat Marwick Caselleton Elliot & Co, where he qualified as a professional accountant. He holds the fellowship of the Institute of Chartered Accountants of Nigeria (ICAN) and an honorary membership of the Chartered Institute of Bankers of Nigeria (CIBN). He has had extensive work experience in accounting and finance (including at executive levels) in both the real and banking sectors of the Nigerian economy spanning over two decades. He previously worked with ANZ Merchant Bank (now part of Stanbic IBTC Bank Plc), Diamond Bank Plc, Standard Trust Bank Plc and since joining UBA Plc, has been involved in several functions including financial control, operations, regulatory affairs, executive office and supervision of non-bank subsidiaries. He is currently the Managing Director/CEO of UBA Africa.
abdulqadir bello, Executive Director (Uba Nigeria, Far North)
Appointed Executive Director in 2009.
Holds a BSc (Accounting) degree from Bayero University, Kano and an Associate Membership of the Institute of Chartered Accountants of Nigeria (ICAN). He has over 22 years’ experience in the banking sector, during which period he held several senior management positions in various banks. Until his appointment as Executive Director, Risk Management, he was the Group Chief Credit Officer.
Femi Olaloku, Executive Director/Group Chief Operating Officer
Appointed Executive Director in 2010.
He holds a BSc (Civil Engineering) and MBA degrees from the University of Lagos. He has over 21 years of work experience in the banking sector, holding several management positions in operations and information technology.
Dan Okeke, Executive Director (Uba Nigeria, East and abuja)
Appointed Executive Director in 2011.
He holds a BSc degree in Geography and Planning from the University of Nigeria Nsukka and an MBA (Finance) degree from the ESUT Business School Lagos. He is an associate of the Nigerian Institute of Management (NIM) and has attended various local and international courses, including the Competition and Strategy programme at the Harvard Business School. He acquired varied work experience in the manufacturing industry before moving to the financial services sector. He has over 17 years banking experience, garnering capabilities in domestic and international operations, credit and marketing.
He is currently responsible for the bank’s retail, commercial and public sector business in Abuja and Eastern Nigeria.

Annual Report 2012
6
Our people continued…
Kola Jamodu, OFr Non-Executive Director
Appointed Non-Executive Director in 2007.
He is a qualified Chartered Management Accountant in the UK. He is also a fellow of the Institute of Chartered Accountants of Nigeria (ICAN) and Chartered Secretaries and Administrators. His work experience spans the multinational sector in Nigeria, having worked in UAC, Unilever and PZ Industries where he was appointed Chairman/Chief Executive of PZ Group. An alumnus of the Harvard Business School, Boston, USA, and a former Minister of Industry of the Federal Republic of Nigeria, Chief Jamodu was the President, Manufacturers Association of Nigeria (MAN) and currently, the Chairman of the Board of Nigerian Breweries Plc. He is a recipient of National Merit Awards including Member of the Order of the Federal Republic of Nigeria (MFR) and Officer of the Order of the Federal Republic of Nigeria (OFR). He is also a recipient of the National Productivity Merit Award (NPMA).
adekunle Olumide, OON Non-Executive Director
Appointed Non-Executive Director in 2007.
He is a quintessential diplomat, a distinguished career public servant and an accomplished technocrat of the organised private sector who holds a second class upper honours degree in History from the University College, Ibadan. He is a former Federal Permanent Secretary and Chairman of the Nigerian Social Insurance Trust Fund (NSITF). He has represented Nigeria in many global fora, including as Minister-Counselor at the Permanent Mission of Nigeria to the United Nations Office in Geneva, member of the Board of the International Atomic Energy Agency (IAEA), Chairman of the Employment Committee of the International Labour Organisation (ILO) and Charge d’Affaires of the Nigerian Embassy in Gabon, which he opened after the Nigerian Civil War. He retired as the first Director-General/CEO of the Lagos Chamber of Commerce & Industry in 2005.
Foluke K. abdulrazaq, Non-Executive Director Appointed Non-Executive Director in 2007.
She holds MSc Degree in Banking and Finance from the University of Ibadan. She is an Alumnus of the Harvard Business School, Boston, USA.She has over 15 years of practical banking experience. She was appointed by the Central Bank of Nigeria (CBN) and Nigeria Deposit Insurance Corporation (NDIC) in September 1995 as the Executive Chairman, Interim Management Board of Credite Bank Nigeria Limited. She also has vast public service experience, having served as Commissioner for Finance and Women Affairs in Lagos State. She was the Chairman of the State’s Tenders’ Board, a member of the Federal Accounts Allocation Committee (FAAC) and the State’s Executive Council. Mrs Abdulrazaq has held several major Board positions, including Julius Berger Plc. She is a Council Member of the Bank Directors Association of Nigeria (BDAN), a member of the Institute of Directors (IOD), and a recipient of the ‘Lagos State Woman of Excellence’ Award in 1999 and a Justice of Peace (JP).She is the founder and presently the Executive Director of Bridge House College, Ikoyi – Lagos.
Ja’afaru Paki, Non-Executive Director Appointed Non-Executive Director in 2008. He obtained a DSc degree in Business Administration from Bradley University, USA. He had a distinguished career working for Mobil Oil Nigeria, the Nigerian National Petroleum Corporation (NNPC) and Unipetrol Nigeria where he served as Managing Director/CEO between 1999 and 2001. He has held directorships in several organisations, including Kaduna State Housing and Property Development Authority, Kaduna State Industrialization Board, African Petroleum, and Stallion Property and Development Company. He was Special Assistant on Petroleum Matters to Nigeria’s President Olusegun Obasanjo (2003 – 2007). He is a currently a member of the National Stakeholders Working Group of Nigerian Extractive Industries Transparency Initiative as well as the Chairman of Nymex Investment Limited, Chairman Oxygen Manufacturing Company Limited and a Director on the Board of Advance Link Petroleum Limited.

7
angela aneke, Non-Executive Director
Appointed Non-Executive Director in 2010.
She holds a BSc from The American University, Washington DC, USA and qualified as an International Associate of the American Institute of Certified Public Accountants in 1985. Her working career spans over 27 years with experience in key financial services institutions across West Africa, where she held executive management positions. She holds board positions in UBA subsidiaries in Liberia, Tanzania, Zambia, Chad and Guinea Conakry. She is Chairman of UBA Metropolitan Life Insurance, UBA Capital Plc and was until December 2010, the Chairman of Credit Reference Company, a credit bureau. She retired as an Executive Director of UBA in March 2010 and was appointed a Non-Executive Director in July 2010.
Yahaya Zekeri, Non-Executive Director
Appointed Non-Executive Director in 2010.
He is a Chartered Accountant and seasoned banker with over 35 years banking experience across leading Financial Institutions. He is an Associate Member, Chartered Institute of Bankers, London (ACIB) and an Associate member, Institute of Chartered Accountants of Nigeria (ICAN). He is also a Fellow, Association of Chartered Certified Accountants, London (FCCA).
rose Okwechime, Non-Executive Director
Appointed Non-Executive Director in 2005, resigned from the Board in 2010 and was reappointed Non-Executive Director in July 2012.
She holds a Masters in Business Administration in Banking and Finance. Currently the Managing Director of Abbey Building Society Plc. Fellow of the Chartered Institute of Bankers of Nigeria and Fellow of the Institute of Bankers (London). She is a recipient of many awards, including the Woman of Excellence Award.
Owanari Duke, Non-Executive Director
Appointed Non-Executive Director in July 2012.
She holds an LLB degree from Ahmadu Bello University, Zaria (1983). She is a former First Lady of Cross River State of Nigeria and a Legal Practitioner, an Entrepreneur, a certified Mediation/Dispute Resolution Consultant and Philanthropist. She is the Managing Partner of a Law Firm, Duke and Bobmanuel and serves as the Executive Chairman of Allied Merchants & Brokers Limited. Mrs Duke also serves as Country Director of EMPRETEC Nigeria Foundation; a United Nations Centre for Trade & Development (UNCTAD) Private Sector Support Initiative to help Nigerians achieve higher levels of productivity and competitiveness among Small and Medium-Scale Enterprises SMEs.

Annual Report 2012
8
Emeke E. Iweriebor, Group Director, Corporate banking and Uba Nigeria (Lagos & West Directorate)
Appointed Executive Director in 2013 (subject to CBN approval).
He holds BSc and MSc degrees in Political Science (International Relations) as well as an MBA degree from the University of Lagos, Nigeria. He is an alumnus of the Wharton Business School’s Executive Development Program.
He has about two decades experience in banking and financial services and in his current role as Head of Corporate Banking as well as UBA Nigeria (Lagos and West) Directorates. He was previously Deputy CEO, UBA Africa, where he was responsible for building the Bank’s business and governance in UBA subsidiaries across Africa. He was also the CEO UBA Central East and Southern (CES) Africa, where he oversaw the Bank’s subsidiaries in the sub-region and before then, the pioneer MD/CEO of UBA Cameroun.
Our people continued…
ben Odukwe, Group Human resource Director
Holds a first degree in Business Administration from the University of Benin and MSc in Banking and Finance from the University of Ibadan. He is a fellow of the Nigerian Institute of Cost Management (NICM), an Associate of the Chartered Institute of Bankers of Nigeria (CIBN), Nigerian Institute of Management (NIM), American Institute of Management and a member of the Oxford Club, Geneva Switzerland. He is also an Alumnus of the IMD International, Lausanne Switzerland.
He has held senior level and top management positions in the manufacturing and financial services sectors garnering capabilities in cash/treasury management, operations, audit, corporate banking, financial control, corporate finance and investment banking.
He is responsible for human capital policies and practices across the Group.
Ugo a. Nwaghodoh, Group Chief Finance Officer
He holds a BSc degree from the University of Ibadan, Nigeria and MSc degree in Finance and Management from Cranfield University, England. He is a fellow of the Institute of Chartered Accountants of Nigeria (ICAN) and a member of the Cranfield Management Association.
He is a seasoned financial analyst and accountant with about two decades experience spanning assurance, advisory, financial control, strategy and business transformation, investor relations, mergers and acquisitions, business integration and project management. Prior to his current role, he was, at different times, Group Financial Controller, Group Chief Compliance Officer and Head – Performance Management in UBA. Before joining UBA in 2004, he had almost one decade experience with Deloitte and PricewaterhouseCoopers.
Uche Ike, Group Chief risk Officer
Holds a BSc degree in Accountancy and a Master of Business Administration degree from the University of Benin. He is an Associate member of the Institute of Chartered Accountants of Nigeria (ICAN).
Uche has over two decades of banking experience spanning operations, internal audit, operational risk management, fraud management and regulatory compliance. In his current role as Group Chief Risk Officer, he has responsibility for coordinating the risk management activities of the Bank. Prior to this role, he was the General Manager of UBA New York Branch and had also previously supervised Operations in the East and South Banks of UBA Nigeria.

9
Samuel adikamkwu, Group General Counsel
Holds an LLB from the then Bendel State University (now Ambrose Alli University) and an LLM degree from both his alma mater and the University of Lagos. He is a Member, Chartered Institute of Arbitrators, United Kingdom.
Before joining the banking industry in 1997, Mr Adikamkwu lectured at the Ambrose Alli University where he was the Acting Head of Department for Commercial Law Department of the Faculty of Laws.
He was appointed Company Secretary/Legal Adviser of Standard Trust Bank (STB) Plc in 1997. Following the merger of STB Plc with UBA Plc, he became the Deputy Legal Adviser. In 2007 he was appointed the Group General Counsel. Mr. Adikamkwu has attended several courses within and outside Nigeria.
Puri Ibrahim, Head Uba Nigeria (North Central)
Holds a BSc in Accountancy and MSc in Banking and Finance from Bayero University Kano.
He has over 26 years banking experience spanning Operations, Trade and Structured Finance, Retail banking, Commercial and Corporate Banking. He is responsible for the Retail, Commercial and Corporate Banking business in UBA’s North (Central) region. Prior to this role, he was Head Wholesale Banking (North), Regional Director (Abuja) and Regional Bank Head (North West). Before joining UBA, he was Regional Controller (Northern Nigeria), responsible for consumer, commercial and corporate banking at Universal Trust Bank Plc. (Now part of Union Bank Plc). He has attended several local and international courses.
Emmanuel Onokpasa, Group Treasurer
He holds a BSc (Honours) degree in Accounting from the University of Benin and is a Fellow of the Institute of Chartered Accountants of Nigeria (ICAN) and Associate of the Chartered Institute of Taxation of Nigeria (CITN). He is an Alumnus of the Harvard Business School, Boston and the Lagos Business School.
His experience spans key areas of banking most especially in Financial Markets, Operations, International Trade, Business Strategy and Structured Finance.
Mr Onokpasa has had a distinguished career serving at different times as Group Treasurer with Diamond Bank and First Inland Bank (now part of FCMB) after having a stint in Consulting, Auditing and Taxation.
Emem Etuk, regional bank Head (Cra bank)
Holds Bsc (Biochemistry) and MBA from the Obafemi Awolowo University, Ile Ife. An alumnus of the Lagos Business School and Harvard Business School.
She has over 14 years banking experience and has garnered capabilities in relationship management, marketing and commercial banking. Prior to joining UBA in 2011, she was a regional executive in Bank PHB Plc, now Keystone Bank, where she was responsible for developing the commercial businesses in bank’s Victoria Island region.
Emem is currently the head of UBA’s Cross River and Akwa Ibom Region (CRA) and is responsible for supervising and coordinating activities in the branches located in the region, whilst planning and implementing strategies to grow the bank’s business in the region.

Annual Report 2012
10
bili Odum, Group Company Secretary
He holds an LLB (Hons) degree from Edo State University, Ekpoma, Nigeria and was enrolled as a Solicitor and Advocate of the Supreme Court of Nigeria in 1990. He is a member of the Chartered Institute of Arbitrators (United Kingdom), the Nigerian Bar Association and the International Bar Association.
He has held high-level strategic positions in top financial services institutions in Nigeria, with responsibilities that encompassed asset management, structured finance, legal advisory, corporate governance, human resource management, administration, knowledge management and business communication.
Our people continued…

11
Chairman’s Statement
Fellow shareholders, it is with great delight that I present to you the financial performance of our Bank for the year 2012.
Indeed, the year has proven to be a year of stabilisation for our Bank on all fronts, with a remarkable return to high performance, and our pan-African businesses increasingly becoming more justified, giving the region’s growing contribution to the Group’s performance, due to Africa’s rising profile in the global economy.
The return to high performance was within the context of a challenging global and local operating environment, which makes our recovery even more remarkable.
UBA financial performanceI am delighted with the progress our Bank has made in delivering strong financial performance and superior shareholder value enhancement. The 2012 financial year ushered in a new era for UBA, with the major phase of our pan-African expansion ceasing in 2011 and the consolidation of these businesses taking firm route.
Profit before income tax was also strong, growing by almost 300% to N52.0 billion from a loss of N26.6 billion in 2011. Meanwhile, the Group’s profit for the year was even stronger at N54.8 billion after incorporating a profit of N3.3 billion, earned from discontinued operations.
In view of these sterling results, the Board of Directors has proposed that a proportion of our profits be distributed as dividends to shareholders. A cash dividend of 50 kobo on every share outstanding in the Bank is thereby proposed for your approval. The aggregate sum of this dividend is N16.49 billion.
It is our belief that your Bank is better positioned to do well in future for the benefit of every stakeholder, especially you shareholders, through sustained wealth enhancement.
Now, let me highlight the major events that pervaded our local and global operating environment in 2012.
“We achieved gross earnings of N220.1 billion, representing a 34.5% growth over the N163.7 billion recorded in 2011. This topline performance was driven by quality asset creation, improving non-interest incomes and growth in revenues from other African countries”
Annual Report 2012
12
Chairman’s Statement continued …
Lag in global economic growth persisted through most of 2012The global economy in 2012 continued to maintain a slow growth pace as a result of the uncertainty surrounding the US economic growth prospect and the lingering Eurozone crisis that has defied several intervention mechanisms.
The Eurozone Sovereign Debt Crisis worsened during the year as the contagion effect of the worst affected countries continues to impinge on the growth of the region as a whole. Austerity measures taken in response so far has led to further weakening of growth and employment prospects within the region, making fiscal adjustment and the repair of financial sector balance sheets all the more challenging.
On the whole, GDP for the zone fell by 0.1% in the third quarter, after shrinking by 0.2% in the second quarter, plunging the region into a recession that has dragged into the new year.
The US economy, which remains the largest importer of crude oil from Nigeria, struggled to expand only by a mere 2% as at Q3 in the face of stubbornly high unemployment rate and unresolved issues around the fiscal cliff. Asia Pacific economies, the major source of heavy machinery and general imports to Africa, were also impacted, as exports to key developed markets including the Eurozone came under pressure. China’s real GDP growth slowed to 7.6 per cent in Q2 due to decline in net exports, while growth moderated in Japan, especially in Q3, as a result of softening manufacturing activities. India’s real GDP, year-on-year, moderated to 5.5 per cent in Q2 of 2012 from 6.1 per cent in Q4 of 2011, mainly as a result of deceleration in private consumption.
Global oil prices have however remained relatively stable throughout the year, hovering around the $100/barrel mark despite heightened fear regarding demands and imminent drop in prices. The effect of the weak oil demand from the Eurozone, coupled with new crude discoveries in East Africa and increased oil production in Iraq, was countered by the reduction in global supply arising from the EU sanction imposed on Syria and Iran during the year. Recent oil discoveries in the US also had no impact on the market, as the energy demand in the wake of Hurricane Sandy reconstruction phase resulted in very limited decrease in oil demand from the US.
African growth remains positive throughout the yearWhile the developed economies are groaning under the weight of stunted growth, Africa on the other hand has been experiencing consistent economic development due largely to strong commodity prices, accommodative policy environment, relative political stability and effective domestic demand, though the region, particularly South Africa, experienced a reduction in export to the largest developing economies, especially in the last three quarters of the year.
In Nigeria, oil revenues accounted for about 90% of total export income and the stable oil price has significantly overshadowed the economic impact of the global slow down on the country’s export market, helping to shore up foreign reserves.
Private capital flows into Africa during the year fell to about $36.6 billion after reaching an estimated $42.4 billion in 2011, while foreign direct investment flows remained resilient at about $31billion (compared to $32.5 billion in 2011) on the back of relative strong domestic demand and robust export growth in countries with new mineral development, resulting in the estimated 5.1% growth for the region in 2012.
Africa’s consistent growth has attracted significant financial inflows into the region from discerning investors from developed economies, mostly through investments in government-issued financial instruments, prompting financial regulators in the different economies within the region to adopt different monetary policies to manage their economy.
In Nigeria, the CBN adopted monetary tightening policies, focusing on maintaining relative economic stability and foreign reserve build up to curtail inflation and protect the country from economic shocks. GDP growth has been on an upward swing, growing from 6.17% as at Q1 to about 6.41 percent in Q3, and estimated to close at about 6.46 percent for the 2012FY. Total foreign reserve also increased from about $34.2 billion in January 2012 to about $44.5 billion as at November 2012.
Some other African countries including Uganda, Tanzania, Kenya and Zambia, having initially adopted monetary tightening measures to successfully curb growing inflation, reverted to expansionary policy of monetary easing; reducing benchmark interest rates to increase money flow within their economies; stimulate aggregate demand and increase productivity.
13
SustainabilityIn conducting our business as a responsible bank, the social impact of our operation within our operating environment has continued to receive priority attention. We sustained our interactions with our social environment through UBA Foundation, our dedicated CSR arm. During the year, we executed the ‘Read Africa’ initiative, our annual essay competition to promote academic excellence within the community, and also worked in collaboration with the Lagos State Government to promote a greener environment through the Greener Lagos initiatives. The Bank is also still actively involved in several beautification projects which provide gainful employments opportunities while also enhancing environmental ambience.
Adoption of a monoline banking structureOn 13 December 2012, the shareholders of UBA Plc unanimously voted for the bank to restructure into a Monoline Commercial Banking Model in order for it to fully comply with the new CBN guidelines for commercial banks in Nigeria, which repealed the erstwhile universal banking regime. With the restructuring, the Group’s non-commercial banking subsidiaries with the exception of Africa Prudential Registrars Plc and Afriland Properties Plc were consolidated under UBA Capital Plc and spun-off to shareholders of the Bank. The Bank’s excess real estate assets were used to capitalise Afriland Properties Plc, which was then spun-off, along with Africa Prudential Registrars Plc, to be held directly by the Bank’s shareholders. Along with UBA Plc, the result of the restructuring is three stand-alone entities held directly by the Bank’s shareholders – UBA Capital Plc and Africa Prudential Registrars Plc, which are already listed on the Nigerian Stock Exchange, as well as Afriland Properties Plc, which will be listed on a future date. In order words, the shareholders of UBA Plc received four shares of UBA Capital Plc, one share of Africa Prudential Plc and one share of Afriland Properties for every 33 shares they own in UBA Plc.
Board appointmentsIn line with the Bank’s desire to continue to reinforce its corporate governance structure and embrace diversity even at the highest level, the membership of its Board of Directors was strengthened with the appointment of two highly accomplished and deeply experienced female Non-Executive Directors:
– Mrs Rose Okwechime has over 20 years experience as a company director, including as Non-Executive Director on the Boards of erstwhile Standard Trust Bank Plc (two years) and United Bank for Africa Plc (five years). She has cognate experience in strategic planning and systems development, gained with top-notch institutions including the Bank of England
– Mrs Owanari Duke is a legal practitioner and the Managing Partner of the Law Firm of Duke & Bobmanuel. Mrs Duke sits on the board of Allied Merchants & Brokers Limited as the Executive Chairman and also as Country Director of EMPRETEC Nigeria Foundation; a United Nations Centre for Trade & Development (UNCTAD) private sector initiative, driving higher levels of productivity and competitiveness among Small and Medium-Scale Enterprises (SMEs) in Nigeria
We are confident that, the Bank will significantly benefit from the wealth of experience of the new Non-Executive Directors, to achieve our strategic intent of becoming Africa’s Global Bank.
OutlookDespite the high downside risks of further weakening of global economic conditions, global growth is expected to improve in 2013, albeit still at a slow pace. This will be largely driven by improvements in the management of the Eurozone crisis through the adoption of the new regulatory framework for European financial institutions and effective resolution of the fiscal cliff issue in the US, leading to increase in aggregate demand and productivity in the Asian Pacific economies, with trickle-down effect on African trade.
In the same vein, oil prices are estimated to remain around the $100 mark in 2013, buoyed by protracted political impasse in the Middle East as well as growth recovery in the US and the Asia Pacific. This will sustain banking opportunities in Nigeria and other commodity-rich African economies.

Annual Report 2012
14
In Sub-Saharan Africa, domestic demand is expected to see an uptick to about 5.2% in 2013 (6.2% excluding South Africa) on the back of stable political environment, increasing pace of reforms within the region, strong demand driven by the rising middle class and new mineral exports creating viable opportunities for expansion of banking services to facilitate the expected growth.
In Nigeria, the pace of reforms in the power, agriculture, oil and gas and aviation sectors is expected to significantly improve economic growth through inflows into the economy and increase in aggregate demand. Continuous management of inflation and improvements in the state of security within the country is also expected to contribute to economic expansion in 2013.
With these factors in place, the CBN is expected to shift from a monetary tightening stance to an expansionary policy, which should include a reduction in the benchmark interest rates and encourage increased domestic participation in the credit market.
AppreciationI would want to use this opportunity to appreciate our shareholders for the confidence reposed in us, especially as we successfully weathered through the difficult time of the past few years, as well as my fellow Board members for your relentless effort in providing strong leadership in steering the Bank to regain its industry position. Above all, I want to specially commend the management and staff of UBA for the passion and dedication that resulted in the laudable turnaround performance we are celebrating today.
We of course couldn’t have achieved anything without the loyalty of our esteemed customers who provided us the opportunity to deliver unique value-added services to them. For this, we are most grateful.
Thank you
Chief Israel OgbueChairman
Chairman’s Statement continued …

15
Chief Executive Officer’s Report
Distinguished Shareholders,It is my pleasure to present your Bank’s stellar performance during the 2012 financial year. Indeed, adopting the option to improve the quality of our balance sheet and reposition our Bank for industry leadership, though painful, have proven to be a key factor in the creation of the Bank’s performance recovery platform, setting the stage for the attainment of our long-term strategic intent of being ‘Africa’s Global Bank’.
With an improved balance sheet, buoyed by quality earning assets and diversified earnings stream.
2012 Strategic imperativesAt the beginning of the year, following a deliberate and thorough clean-up of our balance sheet in the preceding year, we defined a set of strategic imperatives for the year designed to fuel the propulsion of our bank along its Three-Tier Strategic Intent – dominance in Nigeria; leading bank in Africa; and maintaining a global presence. These key imperatives include:
– improving the bank’s cost-to-income ratio by increasingly leveraging scale economies and executing high impact cost saving measures;
– leveraging the bank’s large branch network to build on momentum in low-cost deposit growth;
– improving the bank’s balance sheet yield by optimising opportunities in the high interest rate regime;
– leverage emerging growth sectors to create high quality earning assets in partnership with both the private and public sectors;
– optimising e-banking capability through aggressive deployment of e-banking channels and products in line with the cash-lite initiatives; and
– strengthening governance, business oversight and the Bank’s risk management framework for sustainable profitability.
Over the course of the year, the Bank defined and methodically implemented execution steps for each of these initiatives with high impact results. The Bank’s cost-to-income ratio was significantly improved to 67% from 89.8 as at year-end 2011. The low cost deposit ratio improved to 80% from 78% in 2011. Overall, net interest margin also improved from 4.9% in 2011 to 5.9%. The Bank also recorded marked improvement in the contribution of its African subsidiaries to Group performance, deepened penetration in the e-banking market, along with significant wins in the critical sectors of the economy.
“Our Bank ended the year with N54.8 billion as profits and emerged a stronger financial institution with progressively productive footprints in growing African economies”

Annual Report 2012
16
Chief Executive Officer’s Report continued…
In addition, the Bank aimed to improve executive oversight for its businesses. The number of Executive Directors supervising businesses was therefore increased from three (3) to five (5), enabling improved market penetration across our businesses during the year.
The impact of these initiatives, with the unmatched passion and dedication of its workforce, propelled us to deliver the performance we are reporting today.
Key transactionsAs earlier mentioned, one of the key thrusts of our Bank in 2011 was partnership with the private and public sectors in the transformation of critical sectors of the economy across Africa. To this end, the Bank during the course of the year participated in key landmark transactions including the following:
– appointment as lead financier in the US$100 million Government of Ghana syndicated bond, of which UBA Ghana financed US$50 million;
– joint participant in the syndicated US$58 million finance line to IHS Limited, Cameroun, a member of Africa’s largest independent mobile infrastructure provider;
– corporate bond guarantee to China Civil Engineering Construction Limited (CCECC), to the tune of about US$40 million in Tanzania;
– financier of the US$40 million structured commodity finance line to Olam International Limited, Uganda;
– sole financier of the US$25 million term loan to the Government of Tanzania;
– bid sponsor for the Transcorp Consortium, preferred bidder for the Ughelli Power plant in line with the ongoing Federal Government of Nigeria power sector reform;
– financial adviser/lead arranger to North South Power Limited, which emerged as the preferred bidder in the $111milion Shiroro power project in Nigeria;
– partnership with European Investment Bank (EIB), Europe’s long-term lending institution on the Euro 50 million regional funding initiative to strengthen small and medium businesses across 16 countries in Africa; and
– partnership with Standard Chartered Bank on the $100 million medium-term facility for onward lending to finance risk assets in Nigeria.
Major awardsIn 2012, our Bank was severally recognised for its leadership role in the financial services industry, both locally and internationally. Specifically, the Bank received the following major awards, among others:
– the ‘Best Bank of the Year 2012 for Africa’, courtesy the Financial Times Bankers Magazine;
– the ‘Best Bank of the Year 2012 in Cameroun’ for the second year running, courtesy the Financial Times Bankers Magazine;
– the ‘Best Bank of the Year 2012 in Senegal’, courtesy the Financial Times Bankers Magazine;
– the ‘Best bank in Short-term Financing in Ghana’, courtesy the Bank of Ghana; and
– Forbes Africa Top 25 companies, courtesy Forbes Africa.
Overview of 2012 financial performanceIn the financial year ended 2012, the UBA Group delivered a strong set of results across key financial metrics. The income statement reflected our ability to diversify our earnings base, manage costs and deliver value to shareholders, while our statement of financial position demonstrated our capacity to handle big ticket transactions and alter our asset mix to stay competitive.
Review of income and profits
Our gross earnings growth was strong in 2012, riding on the back of contributions from operations outside Nigeria and higher business volumes. The rest of Africa contributed 19% to total revenues this year compared to 22% in the previous year. Of the N41.5 billion revenue generated by our bank subsidiaries, 45% were from non-interest sources, attesting to the successes recorded by the ancillary products and services we have developed to channel global funds and trade to Africa and allow them flow seamlessly within the continent, especially in the 19 countries we have operations.

17
Net interest income grew by 34.3% from N68.2 billion to N91.6 billion in2012, having extracted value from our earnings assets, as reflected by the impressive run on our interest and similar incomes. We believe there is more value to be seen in that respect, as we continue to price our assets better.
In light of the forgoing, operating income was N153.1 billion, achieving a growth of 28.7% year-on-year. We were able to put our operating expenses in check by reducing total operating expenses by 3.3% from N106.1 billion in 2011 to N102.6 billion in 2012. This was in spite of an average inflation rate of 11 – 12% in 2012.
Review of financial position
UBA’s capacity to do more business was enhanced in 2012 with an 18.4% growth in total assets from N1.92 trillion in 2011 to N2.27 trillion in 2012. Riding on the strength of deposit growth, asset base was driven by growth in loans (up 8.8%); and cash and bank balances, (especially money market placements, which rose by 68% year-on-year). These assets returned 2.6% in 2012 and a sizeable portion of them are near-cash items.
Our loan book grew modestly and is largely made up of top quality assets. As expected, Upstream oil and gas, manufacturing, Telecoms sectors and consumer finance accounted for the bulk of our loan book with 61.2%. In the end, we achieved an improved return on our earning assets with a net interest margin of 5.9%.
We ramped up deposit during the year, posting a 21.3% growth from N1.47 trillion in 2011 to N1.78 trillion in 2012. These deposits cost us an average of 2.9% during the year, in spite of the upward pressure on interest rates in the last quarter of 2012. We were able to achieve this due to the good mix of our deposits, consisting about 80% cheap funds.
The year came to a close with an equity base of N192.5 billion, 27.5% higher than the position at the end of 2011. We are gratified by the efficiency of our owners’ equity, which returned 31.9% in 2012, the highest in the industry. Also, with a capital adequacy ratio of 23.5%, there is sufficient buffer to meet our future growth needs in 2013.
How the rest of Africa (excluding Nigeria) fared
The major phase of our expansion in Africa ended in 2011, to enable us consolidate those businesses and extract value from them. I am pleased to inform you that our subsidiaries in Africa are truly beginning to bear fruits. Total revenue of the 18 bank subsidiaries grew by 13% from N36.8 billion in 2011 to N41.5 billion in 2012. They made N5.4 billion as profits, which represent about 10% of Group profits, for the first time. This profit level was 88% higher than the N2.9 billion recorded in 2011.
On the balance sheet side, there has been considerable growth from the rest of Africa. Total assets stood at N387.3 billion compared to N344.6 billion in 2011. We also recorded impressive growth in loans from N98.7 billion in 2011 to N119 billion, representing an increase of N20.3 billion or 20.6%. Customer deposits were 16.6% higher reaching N273.8 billion in 2012.
Also, the equity base attributable to the rest of Africa remained strong at N45.3 billion, from N41.9 billion in 2011.
We expect to present even better results from the rest of Africa in the coming year. Please join me in congratulating the staff and management of our subsidiaries in Africa for a job well done.
Looking ahead
With the successful stabilisation achieved in our business in 2012, the Bank has set the stage for rapid growth going forward with the aim of regaining our industry leadership. To this end, the Bank has defined a set of strategic imperatives that will underpin an aggressive transformation agenda tagged “PROJECT ALPHA” for the medium term (2013 – 2015):
– re-engineering the customer experience though a Customer Service Transformation Programme;
– aggressive accounts acquisition and reactivation drive;
– aggressive deposit mobilization drive through the reinvigoration of the SBU structure at branches;
– positioning for leadership in e-banking space through the deployment of e-channels and products;
– build the platform to drive increased synergy among the Bank’s African subsidiaries;

Annual Report 2012
18
– initiate organisational realignment for improved market penetration;
– position to be the partner for reforms, for rapid growth in Africa; and
– focus on improving employee motivation with the objectives of driving improved productivity and positioning the Bank as ‘the employer of choice in the industry’.
We are convinced that the disciplined execution of these initiatives guarantees our reclaiming industry leadership.
Conclusion
As we commence on the ‘industry leadership’ phase in our growth trajectory, our immediate priorities are clear. Adoption of an enhanced customer centric approach to market and service delivery will be the key driver of our strategic thrust, with focus on low cost deposits mobilisation and quality asset creation. We will also continue to drive regional synergies across our various jurisdictions and leverage our unique technology platform to offer value-added services to our customers across Africa.
On behalf of the Board, I want to specially appreciate our employees for their devotion to the achievement of our modest success, our revered customers who stood by us and provided us the opportunity to continue to deliver value to them and above all our shareholders for their support and unwavering belief in our shared aspirations.
Thank you
Phillips OduozaGMD/CEO
Chief Executive Officer’s Report continued…

19
Review of Group Strategy
Driven by visionUBA Plc’s strategic aspirations and priorities are derived from its three–tier strategic intents, aimed at continuously unlocking growth potential within the Group and creating values for the Bank’s stakeholders
Our Three-tierStrategic Intent Strategic Imperatives
Dominant and Clear Leadership in Nigeria
– Market share dominance
– Balance sheet optimisation
– Leveraging cash-lite initiatives
– Improved cost efficiency
Leading African Bank– Migration to consolidation phase
– Development of partnership for profitability
Maintain Global Presence – Improved access to multilateral trade
Our Vision:“To be the undisputed leading and dominant financial services institution in Africa”
The Bank has strategically positioned its operations to serve customers across different segments and along different industry sectors with tailored products and services designed in line with the Bank’s risk acceptance criteria for each segment/sector.
✓ Oil and Gas: Upstream; Midstream; Downstream (majors only); Oil trading and oil services
✓ Power: Generation; Transmission and Distribution
✓ Agriculture
✓ Manufacturing
✓ General commerce
✓ Financial institutions
✓ Public sector
✓ Infrastructure
✓ Aviation
✓ Hospitality and Tourism
✓ Telecoms
✓ Mining, etc
Middle Markets– Commercial
SME– Enterprise
Consumer– HNI
– Mass Affluent
– Mass Market
Wholesale– Multinational Corporates
– Local Corporates
– Public sector

Annual Report 2012
20
Review of Group Strategy continued …
GUIDED BY MISSIONThe essence of the Bank’s legacy is also fully demonstrated in our mission statement that guides our interactions with our stakeholders.
Entrench corporate social responsibility
Become an industry enabler in Africa
Reinforce institutional framework
Our MissionTo be a role model for African businesses by
creating superior value for all our stakeholders, abiding by the utmost professional and
ethical standards and building an enduring institution
Project Alpha: UBA’s 2013 – 2015 Medium Term Plan
Looking ahead, our thrust for 2013 – 2015 is designed to deliver strong growth by adopting an aggressive approach to market, tagged Project Alpha, with focus on driving deposit growth, improved cross selling and value chain banking through enhanced synergies across the Group.
In line with Project Alpha, the Bank intends to attain the following milestones:
– attain market leadership across all parameters by 2015;
– improve deposit growth and profitability to attain Top 3 industry position in 2013; and
– achieve 100% customer account growth in 2013.
To deliver on these aggressive corporate objectives, the Bank has earmarked a selection of strategic initiatives to be fully implemented over the plan period.
Business Model Review
UBA has adopted a monoline commercial banking business model having divested its interests in the non-commercial banking businesses in line with CBNs’ new guidelines for commercial banks in Nigeria.
This monoline commercial banking business model involves UBA Plc remaining the parent company for all its commercial banking activities in Nigeria, Africa and the rest of the world. It will also be the parent company for UBA Pension Custodian Limited, UBA Capital (UK) and UBA FX Mart Limited.

21
SHAREHOLDERS
ENTITIES DIVESTED TO SHAREHOLDERS
AFRICAN BANKING SUBSIDIARIES
– UBA GHANA– UBA CAMEROON SA– UBA UGANDA– UBA TANZANIA– UBA SIERRA LEONE– UBA CHAD SA– UBA KENYA– UBA GABON– UBA COTE D’IVOIRE– UBA LEBERIA– UBA SENEGAL SA– UBA ZAMBIA– UBA GUINEA CONAKRY– CCB, BENIN– BIB, BURKINA FASO– UBA MOZAMBIQUE– UBA CONGO DRC– UBA CONGO BRAZZAVILLE
UBA PENSIONS
CUSTODIAN LIMITED
UBA NEW YORK
BRANCH
UBA FX MART LIMITED
UBA CAPITAL EUROPE
UBA POST-RESTRUCTURE
SHAREHOLDERS
UBA PLC

Annual Report 2012
22
Organisational Arrangement
The changes in our business model accord us the opportunity to improve our organisational arrangement for better market coverage. The new organisational arrangement is built with the aim of positioning the Bank’s service delivery model for optimal relationship management and product alignment for our target customer segments.
ALIGNMENT OF PRODUCT GROUPS TO CUSTOMER SEGMENTS
CONSUMER BANKING DIVISION CREDIT RISK MGT DIVISION
GROUP TREASURY DIVISION
E-BANKING DIVISION
INT’L FINANCIAL ORGs & TRANSACTION BANKING DIVISION
LIABILITY PRODUCTS
CREDIT PRODUCTS
TRADE, CASH MGT & CORRESPONDENT
BANKING PRODUCTS
TREASURY PRODUCTS
E-BANKING PRODUCTS
ALIGNMENT OF SALE
UNITS TO CUSTOMER SEGMENTS
UBA AFRICA (18 COUNTRY SUBSIDIARIES)
REGIONAL BANKS IN NIGERIACORPORATE
BANKING DIRECTORATE
AFRICA
NIGERIA
CUSTOMER SEGMENTS RETAIL COMMERCIAL/PSG CORPORATE
In Nigeria, our sales architecture is structured to serve our customers in the retail, commercial and public sector customer segments through our Regional Banks. These sectors are covered by our banking subsidiaries in the 18 countries where we have presence in Africa. To serve the corporate segment that typically has cross-border businesses in multi-jurisdictions, our Corporate Banking Directorate extends to cover corporate clients in Nigeria as well as our African operations where the directorate teams up with the local wholesale banking teams to provide a unique global relationship management proposition
The Bank has also deployed product groups to provide tailored products and services that match the need of the different customer segments. These product groups, which include Group Treasury, E-banking and the International Financial Organisation and transaction banking divisions, provide treasury, e-banking and trade and cash management products respectively. In addition, the consumer banking division manages the Bank’s liability and credit products for the retail customer segment, while credit products and services for the commercial, public sector and corporate customer segments are housed in the credit risk management division.
Review of Group Strategy continued …

23
Group Financial Performance Review
Gross Earnings (N’billion)
Our total revenue was strong in 2012 at N220.1 billion, growing by 33.6%, compared to N164.8 billion in the prior year. This performance was driven by increase in volumes, and contribution from the rest of Africa.
revenue Mix (%)
The split of our gross earnings between interest and non-interest related earnings is balanced, with interest revenues representing more than two-thirds of total revenue. Notwithstanding, we expect this mix to be altered slightly over the medium term, when non-interest income should constitute up to 40% of total revenue.
Operating Income (N’billion)
Driven by strong interest and non-interest incomes, as well as low cost of risks, we recorded 28.7% growth in operating income. This attests to the strength of our underlying business.
Profit/(Loss) before Tax (N’billion)
We posted a profit of N52.0 billion before income tax, compared to a N26.6 billion loss in the corresponding period of 2011. This PBT level was helped by an efficient cost base.
32%
68%
■ Interest Income ■ Non-Interest Income
240
160
80
2010 2011 20120
160
80
2010 2011 20120
60
30
-302010 2011 2012
0

Annual Report 2012
24
Group Financial Performance Review continued …
Profit for the Year (N’billion)
A total of N54.8 billion was achieved as profit for the year with discontinued operations contibuting N3.3 billion. Minimum tax was applicable during the year, due to significant tax exempt incomes claimed by the bank.
Earnings Per Share (kobo)
The Group earned 166 kobo on every share in issue; a strong recovery from a loss per share of 21 kobo in the previous year. Potential for further EPS growth exists over the medium term.
return on average Equity (%)
With a ROaE of 31.9%, UBA has delivered one of the best returns to shareholders in the local and regional banking industry. It is instructive to note however that impact of IFRS on prior year equity base helped strengthen the ratio.
return on average assets (%)
The efficiency of our asset base was reflected in the delivery of a ROaA of 2.6%. The robustness of our liquid assets, helped by significant growth in fee-based incomes contributed to the quality our assets’ returns.
60
45
30
15
-152010 2011 2012
0
200
100
-1002010 2011 2012
0
3.0%
2.0%
1.0%
-1.0%2010 2011 2012
0.0%
30.0%
20.0%
10.0%
-10.0%2010 2011 2012
0.0%

25
Non-Performing Loan ratio (%)
Our NPL ratio has continued to improve over the last few years, dropping from 5.7% in 2010 to 1.9% in 2012. This attests to the improving quality of our risk asset portfolio, thereby positioning us for better financial performance going forward.
NPL Coverage ratio (%)
In view of our adherence to conservative reporting and robust risk management framework, the Group coverage ratio been more than 100% over the last few years. Indeed, we are gratified that our NPL coverage ratio for 2012 was 119%.
Capital adequacy ratio (%)
Group Capital Adequacy Ratio stood at 23.5% by the end of 2012; an improvement by 18 basis points from 21.7% in 2011. This capital adequacy level is sufficient to cushion against shocks in the medium term.
Liquidity ratio (%)
Liquidity Ratio remained strong reaching 69.8% in 2012, compared to 69% in 2011. This solid liquidity position allows some flexibility with our balance sheet management and gives headroom to alter our asset mix in reaction to events in the operating environment.
6.0%
4.0%
2.0%
2010 2011 20120.0%
140%
70%
2010 2011 20120%
24.0
16.0
8.0
2010 2011 20120.0
75%
50%
25.0%
2010 2011 20120.0%

Annual Report 2012
26
Total assets (N’trillion)
Total asset growth of 17.6% was recorded in 2012 from N1.93 trillion in 2011 to N2.27 trillion. We are determined to ensure that value is extracted from these assets to the benefit of shareholders.
Loans (N’billion)
As a reflection of our conservative lending posture, we grew loans by 6.2% in 2012 to N687 billion. The bulk of our loans are made to selected customer segments with a view to ensuring good asset quality.
Deposits (N’trillion)
Our deposit grew by 21.4% year-on-year from N1.47 trillion to N1.78 trillion. They consist of largely of low cost deposits ( about 80%). Our deposit book enhances our capacity to create good quality assets for top end customer segments.
Shareholders’ Funds (N’billion)
Owners’ equity firmed up in 2012, growing by 27.5% over the N151 billion position in 2011. With a capital adequacy ratio of 23.5%, we are positioned to grow our business going forward.
750
500
250
2010 2011 20120
210
140
70
2010 2011 20120
2.4
1.6
0.8
2010 2011 20120.0
2.0
1.0
2010 2011 20120.0
Group Financial Performance Review continued …

27
To transform the features of retail, commercial and corporate banking products, UBA has enhanced its e-Banking capabilities by developing a suit of products. The e-Banking model is designed to increase customer capacity in our branches by moving quick and regular businesses to self-service platforms, while the branches become high-value customer consulting shops. With our spread across 19 countries in Africa, e-Banking enables us leverage the opportunities presented by the cashless policy in Nigeria to deepen banking penetration and engender seamless customer transactions.
Retail/Individual Corporate
Debit Card
VerveU-Pay
U-Pay ConnectDebit MasterCard (including All About U) U-Pay HRGold MasterCard (NGN, USD, GBP, EUR) TTUMPaltinum MasterCard (NGN, USD, GBP, EUR) PayManager PayManagerWorld MasterCard (NGN, USD, GBP, EUR) U-Swift NIPVisa Classic
U-Collect
BankCollect (UBA Branch Only)Visa Dual Currency PayDirect
PrepaidVisa Prepaid – Local Country Currency e-TransactVisa Prepaid – USD (Nigeria, Liberia, Congo, DRC only) SchoolOnline
U-Mobile Mobile Banking EduPortalU-Direct Internet Banking Web PaymentATM ATM
PoSPayment PoSCustomised PoS
Alerts SMSe-Maile-Statement
Retail e-Banking Channels and Products
UBA has 17 e-Banking products to complement and drive sales of retails products and service channels. The products, channels and services are presented on the left hand side of Table 1 above.
The details of the products are presented below.
Debit Cards
In 2012, UBA introduced new Visa, MasterCard and Verve Cards to facilitate access to funds in accounts locally and internationally.
Previously, Visa cards were issued as EMV chip and PIN cards with the ultimate security; but by segmenting our customer base, we have introduced debit cards for mass market, mass affluent and high net-worth individuals.
Verve Debit Card
In Nigeria, Verve Debit Card has been introduced as ‘Pay-As-U-Go’ to eliminate card maintenance charges, when the customer does not use the card to withdraw cash within the month. Verve, therefore, serves as a low-cost debit card for mass-market customers.
Visa Debit Card
The Visa standard debit cards are still issued, across the branches in Nigeria and the other 18 countries of operations, as single currency cards that enable customers to use them for payment in any currency within and outside the countries.
Visa Dual Currency Debit Card (Visa DCDC)
Visa Dual Currency Debit Card (Visa DCDC) has also increased in the number issued. Visa DCDC allows customers that have domiciliary and local currency accounts to link both accounts to a single debit card. The card only allows customers to access the local currency account when within the local country of issuance and allows spending from the domiciliary account from anywhere in the world outside the local country.
Review of UBA’s e-Banking Resources

Annual Report 2012
28
Review of UBA’s e-Banking Resources continued …
MasterCard Debit Cards: Standard, Gold, Platinum and World
We also introduced MasterCard as debit cards. It serves as a standard MasterCard debit card for the mass-market, Gold MasterCard for the mass-affluent, Platinum MasterCard for the high net-worth and World MasterCard on special requests. These cards are introduced as single currency cards as they are issued on local currency, while customers can spend in any currency at ATMs, PoS or on the internet. This eliminates the need to change currencies before spending. The MasterCard Debit Cards are currently issued in Nigeria only, with the plan to issue them across Africa, when the acceptance of MasterCards grows across the other 18 countries we operate.
MasterCard: USD, EURO and GBP
In Nigeria, we have also introduced MasterCard for domiciliary accounts in USD, GBP and Euro. The introduction of these foreign currency MasterCard debit cards has elevated the value propositions of our domiciliary accounts. These cards will be introduced in other African countries very soon.
PrePaid Cards
UBA introduced prepaid cards in Visa brand. UBA prepaid card has been launched in all 19 countries in their respective local currencies. As market demands, UBA is poised to introduce prepaid cards in MasterCard card and other card schemes.
Visa Prepaid card has also been introduced in US Dollar denomination in Nigeria, Liberia and Congo DRC only.
Channels
Mobile Banking (U-Mobile), Internet Banking (U-Direct), ATMs, PoS and Web Payment are provided and enabled by UBA for account holders to access and manage accounts with U-Mobile and U-Direct; withdraw cash with the ATM; and make payments using PoS and Web Payment channels.
ATM Channel
ATMs are deployed across 19 countries. The ATMs have been developed to accept payment request from all card schemes, including those issued outside Nigeria.
The landscape of charges that apply to ATMs withdrawal services has changed dramatically in Nigeria since December, 2012. Banks have discontinued the charge of N100 for non-bank customers. However, the banks that issue the cards now pay the charges, whenever their customers make withdrawals through other banks’ ATMs.
This has changed the customers’ behavior dramatically. Customers now randomly use any nearest and reliable ATMs which have resulted in a dramatic increase in ATM transaction counts and costs at the same time. Total number of transactions has been at a minimum of 10% on a monthly basis.
Mobile Banking (U-Mobile)
UBA has invested in Mobile Banking capability and beyond. The Mobile Banking has been running in Nigeria and Ghana. Work is in progress to deploy to all other 17 countries of operations by middle of June, 2013. The Mobile Banking channel enables customer to access basic banking service such as viewing balances, confirming cheques, transferring money, buying airtime, paying bills and sending complaints to customer fulfillment center.
Internet Banking (U-Direct)
UBA has deployed internet banking (U-Direct) to all the 19 countries of operations.
The internet banking channel enables customer to access basic banking service such as viewing balances, confirming cheques, transferring money, buying airtime, paying bills and sending complaints to customer fulfilment centre.

29
Services (SMS, e-Mail Notification, Periodic e-Statement)
UBA provides other notification services which include SMS, e-Mail notification and frequent statement. SMS and e-Mail notification services are designed to present notification to customers when debit or credit is passed to the customers’ accounts. SMS and e-Mail notifications are sent to mobile number and e-mail address provided by the customers and in the bank’s records.
Corporate and Commercial e-Banking Products
PayManager: Bulk Vendor PaymentPayManager payment platform designed for use by corporate, commercial and institutions, SME and government to manage payment from their operations account. UBA PayManager is a secure web-based application that allows companies, corporate, and small businesses make electronic payments to any beneficiary, in any bank (local and foreign currency), from any location over the internet. It supports electronic payments with a unique rules-based logic that increases straight-through-processing (STP).
It gives the corporate control of its accounts for various types of payments (eg staff salary, vendor payment, dividends, pensions etc). These services are offered through a single window, along with quick client on-boarding, simple and flexible configuration, authorisation rules and multiple level approvals. Pay Manager supports both one-to-one payments, and one-to-many payments, predefined workflows and multiple file formats. It also supports direct credit and direct debit payments
The solution can be used to make individual payments to vendors and for employee petty cash and benefits. Payment can be made in both local. The PayManager solution is available across all 19 countries of operations.
U-Pay: Bulk Salary PaymentU-Pay payment platform designed to manage employees’ record, benefits, taxes and salary calculations and payments. U-Pay is designed for use by corporate, institutions, SME and government to manage employees’ database, payment of salaries and benefits for employees and remittance of taxes to the government authorities, right from their operations account.
UBA U-Pay is a secure web-based application that allows electronic payment with a business approval process to do straight-through-processing (STP) from the comfort of their offices. These services are offered through a single window, along with quick client on-boarding, simple and flexible configuration, authorisation rules and multiple level approvals. U-Pay also supports direct credit and direct debit payments. The web enabled and client based version of U-Pay solution are available across all 19 countries of operations.
U-Collect Branch (BankCollect): Inbound CollectionsUBA BankCollect is offered to businesses to be able to collect payments from their customers across all UBA branches. This proprietary product is deployed and used by tellers of UBA branches to collect business and financial information from those paying into the account. Examples of such collections are for government taxes, business sales, utility bills, etc.
BankCollect enables the business that collects to view payments real time so they can give values to the payers. The system is flexible and can be integrated with the billing system of the collecting company. Even though BankCollect can only be used for collection that is through UBA branches only, we also accept white-labeled interbank collection platforms that enable collections from all selected bank branches.
BankCollect is used to drive deposit collections through our network of branches for merchants that have one or multiple outlets. It is available across the 19 countries of operations in Africa.
U-Collect Web: Web CollectionsU-Collect Web is a UBA proprietary web collection portal that enables payment at merchant sites online. The collection portal enable merchants to collect payments using any card scheme including MasterCard, Visa and any local cards. UBA currently offers U-Collect web-to-web developers and merchants at no cost in order to drive the growth of web commerce.
A version of U-Collect Web when deployed for collections of school fees at secondary level are referred to as SchoolsOnline and when deployed to tertiary institutions is called EduPortal. For EduPortal and SchoolOnline, UBA also provides the online contents of education programs and activities besides just fee collections.

Annual Report 2012
30
SustainabilityIn UBA, we are committed to running our business in a socially responsible and environmentally friendly manner. UBA is appreciative of the fact that Sustainable Banking is critical to the success of any Bank and embodies two main concepts:
• CorporateSocialResponsibility(CSR)
• EnvironmentalRiskManagement(ERM)
Building sustainability thinking into our DNA is our long-term mission, and will involve understanding the linkages between our operations, the communities where we have presence and the changes in the global environment.
We believe we can make positive impact on people’s lives through creating access to affordable financial services irrespective of status, race or gender. We will continue to assist in creating job opportunities in communities where we operate and will undertake varied social projects that promote education, health and safety, Corporate Social Responsibility and Environment Management System and to work in conjunction with our various stakeholders towards attaining internationally accepted practices and standards.
Corporate Social ResponsibilityOur CSR is all encompassing, beginning with our staff and extending externally to other stakeholders. UBA Foundation therefore is the social extension of the Group’s core values of Humility, Empathy, Integrity and Resilience.
UBA Foundation (UBAF) has from inception been driving the Group’s deliberate corporate strategy of sustainable development that combines our banking excellence with social interventions in our chosen need areas of education, health, human capital development and special projects.
By investing in the social, economic and environmental needs of the countries and communities where we conduct our businesses, the Group aims to deepen goodwill while ensuring sustainable operations, by contributing to the improvement of the quality of life.
Partnering with Stakeholders
Our CSR activities are executed across Africa. In doing this, we strive to develop unique programs and development actions that impact on individual and community lives thereby bridging social and economic gaps that are inherent in the various environments we operate in. At every point in the execution of these programmes, internal and external stakeholders are actively engaged to ensure the maximisation of resources for strongest impact in identified critical need areas. All these are done using global frameworks and metrics for best practice and impact measurement.
UBA Foundation, the Bank’s corporate social responsibility arm, as part of its wider contribution to the Bank’s community and social engagement programme, provides an annual grant of USD2 million to the Tony Elumelu Foundation, one of Africa’s leading philanthropies, with a specific focus on the promotion of entrepreneurship and business leadership across Africa. In this way, the Bank believes it achieves a focused and effective way of implementing its commitment to improving the opportunities for entrepreneurship and the business environment across Africa.
Sustainability and Corporate Social Responsibility Report

31
Education
2012 Projects include READ AFRICA and Annual projects like the READ AFRICA initiative, UBA Foundation National Essay Competition (Nigeria). The 2012 READ AFRICA project was centered on the book “Weep not Child” written by Ngugi wa Thiong’O, the renowned Kenyan author who visited Nigeria in July, 2012 to kick start the year’s programme. The initiative saw the Management staff of UBA pay visits to schools, with role models to drive mentorship and career emulation by pupils and students across Africa. Thousands of books were donated to students in addition to reading and mentoring sessions held aimed at rekindling what is largely seen as the dwindling reading culture amongst African youths.
Pic 1: Professor Ngugi Wa Thiong’O at the launch of the ‘READ AFRICA’ 2012 with senior management of UBA Plc, students of Kings College Lagos and Holy Child College.
Pic 2: A student of Baptist Academy Obanikoro, asking Professor Ngugi Wa Thiong’O a question.
Pic 3: Mrs Mary Udu-Ejembi, Assistant Director, Budget Office, Federal Ministry of Finance and UBA Foundation Trustee (2nd right) and Ms Ijeoma Aso, MD/CEO UBA Foundation, leading the reading session.
The increased number of entries in the 2012 UBA Foundation’s National Essay Competition was a clear indication of how much Nigerians have bought into the initiative and of the impact the project made the previous year. In the 2012 competition, a total of 2,847 entries were sent in from various schools across Nigeria, representing more than a 100% increase from the 1,217 entries received in 2011. This is a strong indication that the UBA Group’s objective of instilling the spirits of competitiveness, aspiring for excellence and awakening the consciousness for the quest for knowledge is manifesting and yielding fruits in the lives of school children. As a demonstration of our commitment to educational development, the UBA Foundation gave educational grants to the three finalists to help with their tuition in any African university where they are admitted.
Pic 1 Pic 2
Pic 3

Annual Report 2012
32
Sustainability and Corporate Social Responsibility Report continued …
Pic 4: L-R; Deputy Managing Director, UBA Plc, Mr. Kennedy Uzoka; Winner, UBA Foundation National Essay Competition for Secondary Schools in Nigeria 2012, Master Ugwuegbulam Ogbonna; Managing Director, UBA Foundation, Ms Ijeoma Aso; and Managing Director, Financial Derivates Company Ltd, Mr. Bismark Rewane, at the Prize Giving Ceremony of the Competition.
WELLNESSAnother part of the Foundation’s annualized programme’s is the Walk, Jog and Cycle for Prostate Cancer programme aimed at creating awareness on the debilitating effect of prostate cancer. The day culminates with free prostate cancer screening for men held at the venue of the event. In 2012, there was a remarkable 200% increase in the number of men who were screened. We are happy to report the Foundation’s avowed commitment to further deepening this awareness about this dreaded disease, especially knowing that it is one that can easily be treated if detected early. As usual, novelty matches were played and staff took to the streets across Africa to raise awareness.
Pic 5: L-R; Permanent Secretary, Lagos State Ministry of Health, Dr Femi Olugbile; DMD, UBA Plc, Mr Kennedy Uzoka; Nigerian ex-international player, Mr Henry Nwosu; MD/CEO, UBA Foundation, Ms Ijeoma Aso..
Pic 4
Pic 5

33
PROJECTSBesides these projects, The UBA Foundation also made several donations to various projects and institutions during the year. It also created several other social and economic partnerships with different organisations all in the drive to impact the lives of the people in the countries and communities where we operate.
Pic 6: L-R; RBH, Mainland bank, Ilesanmi Owoeye; Chairman, Medical Advisory Committee LUTH, Prof Olugbenga Ogunlewe; MD/CEO, UBA Foundation, Ms Ijeoma Aso.
UBA FIRE SERVICES UNITAs part of our social responsibilities, UBA has put its fire-fighting resources to community use when required, which has included putting out a fire outbreak at the Head Office of one of the Banks in Lagos and a 5 storey Euro-Asia Plaza on Breadfruit Street, Lagos, Nigeria.
We remain committed to ensuring that we impact lives in the communities we operate.
Pic 6

Annual Report 2012
34
The Directors present their report together with the audited financial statements of the Group for the year ended 31 December 2012.
1. RESULTSGROUP BANK
2012 N’million
2011 N’million
2012 N’million
2011 N’million
Profit before income tax 52,010 (26,600) 46,180 (26,468)Taxation (charge)/credit (533) 17,935 1,195 18,502
Profit from continuing operations 51,477 (8,665) 47,375 (7,966)Profit from discontinued operations 3,289 1,864 – –Other comprehensive income 764 5,680 3,534 4,212
Total comprehensive income 55,530 (1,121) 50,909 (3,754)
Total comprehensive income attributable to equity holders of the Bank 55,306 (1,971) 50,909 (3,754)Non-controlling interest 224 850 – –
Profit/(loss) for the year 55,530 (1,121) 50,909 (3,754)
2. DIVIDEND
In respect of the current year, the Directors propose that a dividend of 50 kobo per ordinary share of 50 kobo each, amounting to N16.49 billion, be paid to shareholders upon approval at the Annual General Meeting. The proposed dividend is subject to withholding tax at the appropriate tax rate and is payable to shareholders whose names appear on the Register of Members at the close of business on May 21, 2013.
3. LEGAL FORM
United Bank for Africa Plc was incorporated in Nigeria as a limited liability company on 23 February 1961 under the companies Ordinance [Cap 37] 1922. It took over the assets and liabilities of the British and French Bank Limited which had carried on banking business in Nigeria since 1949. UBA is the first Nigerian Bank to offer an Initial Public Offering (IPO) following its listing on the floor of the Nigerian Stock Exchange in 1970. The Bank is also the first Nigerian company with a GDR programme. Following the consolidation reforms introduced and driven by the Central Bank of Nigeria in 2004, the Bank merged with Standard Trust Bank Plc on 1 August 2005 and subsequently acquired Continental Trust Bank Limited on 31 December 2005.
4. MAJOR ACTIVITIES
UBA Plc is engaged in the business of banking and provides corporate, commercial, consumer and international banking, trade services, cash management, treasury and electronic banking services. Pensions Custody and Bureau de Change services are provided through subsidiaries.
5. BUSINESS REVIEW AND FUTURE DEVELOPMENT
UBA Plc carries out banking activities in accordance with its Memorandum and Articles of Association. A comprehensive review of the business for the year and the prospects for the ensuing year is contained in the Group CEO’s report.
Directors’ Report

35
6. DIRECTORS
The names of the Directors during the year ended December 31, 2012 are as shown on pages 35 and 36. Rose Okwechime was reappointed to the Board and Owanari Duke was newly appointed to the Board on July 13, 2012 and in accordance with Article 75 of the Articles of Association of the Bank. They will retire at the Annual General Meeting and offer themselves for election.
In accordance with Articles 97 of the Articles of Association of the Bank, the following Directors will retire by rotation and being eligible would offer themselves for re-election:
1. Angela Aneke
2. Jaafaru Paki
During the course of the year, Victor Osadolor, Paolo Di Martino and Runa Alan retired from the Board.
7. DIRECTORS’ RESPONSIBILITIES
The Directors are responsible for the preparation of the financial statements which give a true and fair view of the state of affairs of the Bank and Group and of the profit or loss for that period and comply with the provisions of the Companies and Allied Matters Act. In so doing, they ensure that:
– proper accounting records are maintained;
– applicable accounting standards are followed;
– suitable accounting policies are adopted and consistently applied;
– judgments and estimates made are reasonable and prudent;
– the going concern basis is used, unless it is inappropriate to presume that the Bank will continue in business, and
– internal control procedures are instituted which as far as reasonably possible, safeguard the assets of the Bank and prevent and detect fraud and other irregularities.
8. DIRECTORS’ INTERESTS
The interests of the Directors in the issued share capital of the Bank are recorded in the register of Directors’ Shareholding as at 31 December 2012 as follows:
31 December 2012 31 December 2011
S/N NAMES OF DIRECTORS DIRECT INDIRECT DIRECT INDIRECT
1 Israel Ogbue 1,277,936 66,812,728 810,000 1,584,690,453
2 Joseph Keshi, OON 127,500 Nil 125,000 Nil
3 Phillips Oduoza 97,306,259 17,254,234 27,049,552 16,915,916
4 Kennedy Uzoka 32,295,910 NIL 22,042,035 Nil
5 Emmanuel Nnorom 10,482,360 1,031,855 1,660,760 694,062
6 Rasheed Olaoluwa 8,502,267 Nil 5,106,926 Nil
7 Abdulqadir Bello 3,576,573 Nil 500,000 Nil
8 Femi Olaloku 4,376,578 Nil 683,030 Nil
9 Ifeatu Onejeme 6,908,943 Nil 2,564,451 Nil
10 Dan Okeke 6,344,873 Nil 6,220,465 Nil

Annual Report 2012
36
Directors’ Report continued …
31 December 2012 31 December 2011
S/N NAMES OF DIRECTORS DIRECT INDIRECT DIRECT INDIRECT
11 Victor Osadolor [Resigned 9 January 2012] 13,295,663 Nil
12 Rose Okwechime [Appointed 13 July 2012] Nil 40,133,851
13 Paolo Di Martino [Retired May 2012] Nil 247,860,000
14 Adekunle Olumide, OON 2,635,014 Nil 2,583,348 Nil
15 Angela Aneke 5,923,971 Nil 1,611,263 Nil
16 Kolawole Jamodu, OFR 484,015 52,756 474,525 52,756
17 Runa Alan [Retired April 2012] Nil Nil
18 Ja’afaru Paki Nil 22,950,000 Nil 22,500,000
19 Foluke Abdulrazaq 3,000,000 6,120,000 Nil 9,000,000
20 Yahaya Zekeri 11,704 Nil 11,475 Nil
21 Owanari Duke [Appointed 13 July 2012] Nil Nil
9. ANALYSIS OF SHAREHOLDING
ShareholdingNumber of
shares held% of total
shareholdingNumber of
shareholders% of total
shareholders
1 – 1,000 11,334,642 0.03% 23,110 8.19%
1,001 – 5,000 313,293,402 0.95% 122,974 43.47%
5,001 – 10,000 337,456,711 1.02% 46,689 17.26%
10,001 – 50,000 1,321,120,644 4.01% 62,145 22.03%
50,001 – 100,000 843,793,334 2.56% 12,497 4.43%
100,001 – 500,000 2,034,724,924 6.17% 10,168 3.60%
500,001 – 1,000,000 58,717,987 2.91% 1,413 0.50%
1,000,001 and above 27,160,945,924 82.35% 1,436 0.51%
Total 32,981,387,565 100.00% 282,432 100.00%
10% AND ABOVE HOLDINGS
Shareholder Shareholding % holding
Stanbic Nominees Nigeria Limited (SNNL) 3,637,413,911 11.03%
(SNNL holds these shares on behalf of several investors under a nominee arrangement)

37
10. SUMMARY OF DEALING IN UBA SHARES AS AT 31 DECEMBER 2012
Quarter TotalMonthly average
First Quarter 3,070,040,525 1,023,346,841
Second Quarter 1,468,323,316 489,441,105
Third Quarter 1,112,802,849 370,934,283
Fourth Quarter 1,016,590,183 338,863,394
11. DONATIONS
In order to identify with the aspirations of the community and the environment within which the Group operates a total sum of N87.5 million was given out as donations and charitable contributions during the period. These comprise contributions to charitable organisations and to other non-charitable organisations. Details of such donations and charitable contributions are as follows:
Schedule of donations for the period 1 January 2012 to 31 December 2012
S/N Beneficiary Amount
(Naira)
1 African University of Science and Technology (AUST) 50,000,000
2 Nasarawa State Government 10,000,000
3 Federal Ministry of Agriculture 10,000,000
4 The Nigerian Police Force 5,449,500
5 Kogi State Flood Disaster Relief 5,000,000
6 Central Bank of Nigeria 3,500,000
7 Lagos University Teaching Hospital (LUTH) 1,500,000
8 Financial Reporting Council (FRC) 1,000,000
9 Lagos University Teaching Hospital (LUTH) 540,750
10 Nigerian Defense Academy 500,000
Total 87,490,250
12. FIXED ASSETS
Movements in property and equipment during the period are shown on pages 154 and 155. In the opinion of the Directors, the market value of the Bank’s properties is not less than the value shown in the financial statement.
13. EMPLOYMENT AND EMPLOYEES
i. Employment of Physically Challenged Persons
The Bank operates a non-discriminatory policy in the consideration of applications for employment including those received from physically challenged persons. The Bank’s policy is that the most qualified persons are recruited for appropriate job levels irrespective of an applicant’s state of origin, ethnicity, religion or physical condition.

Annual Report 2012
38
Directors’ Report continued …
DEMOGRAPHICS OF OUR WORKFORCE
During the 2012 financial year, the Group employed 11 529 staff across the different businesses and geographies we operate.
Group Staff Distribution by Nationality and Location during the 2012 financial year
Nationality Location Head count% of total
Nigerians
Nigeria 9,116 79.07
Other 18 Africa Countries 30 0.26
USA 7 0.06
Europe (London) 3 0.03
Francophone (Africa)Nigeria 3 0.03
Other 18 African Countries 1,288 11.16
Anglophone (Africa)
Nigeria 2 0.02
Other 18 African Countries 1,046 9.07
Europe (London) 2 0.02
South Africans Nigeria 1 0.01
Indians Nigeria 5 0.04
Americans/US New York 18 0.16
Canadians Nigeria 1 0.01
Europeans Europe (London) 7 0.06
Total 11,529 100
The Group staff consist of nationals from over 23 African Countries, USA, UK, France, India, Canada, West Indies, New Zealand and Pakistan. UBA recruitment policy is non-discriminatory and seeks to attract the most qualified skills from any part of the world.
Physically challenged persons account for 0.10% of our total staff strength, indicating our compliance with the Group’s policy not to discriminate against employing such individuals.
Staff Distribution by Gender during 2012 financial year
Description Gender Head count% of total
Group
Male 6,456 56
Female 5,073 44
Total 11,529 100
Bank
Male 5,060 56
Female 3,975 44
Total 9,035 100

39
As a reflection of our diverse workforce, 44% of staff are females, both at the Group and bank level.
Average Gender Analysis of the Bank’s Board of Directors and Top Management during 2012 Financial Year
Description Gender Head count% oftotal
Board of Directors
Male 14 78
Female 4 22
Total 18 100
Top Management
Male 76 77
Female 23 23
Total 99 100
Detailed Average Gender Analysis for Board of Directors and Top Management Staff during the 2012 Financial Year
Classification
Male Female Total
Count % Count %
Non-Executive Directors 6 60.00 4 40.00 10
Executive Directors 8 100.00 – – 8
General Managers 23 76.67 7 23.33 30
Deputy General Managers 25 89.29 3 10.71 28
Assistant General Managers 28 68.29 13 31.71 41
Total 90 78.00 27 22.00 117
ii. Health, Safety at Work and Welfare of Employees
The Bank maintains business premises designed with a view to guaranteeing the safety and healthy living conditions of its employees and customers alike. Employees are adequately insured against occupational and other hazards. In addition, the Bank provides medical facilities to its employees and their immediate families at its expense.
iii. Employee Involvement and Training
The Bank encourages participation of its employees in arriving at decisions in respect of matters affecting their well being. Towards this end, the Bank provides opportunities where employees deliberate on issues affecting the Bank and employees interest, with a view to making inputs to decisions thereon. The Bank places a high premium on the development of its manpower. Consequently, the Bank achieved over 78% of its training plan (local and international) in 2012. The total amount spent on training was N355 062 000.00.
iv. Research and Development
The Bank also carries out research into new banking products and services, on a continuous basis.
14. POST-BALANCE SHEET EVENTS
There are no post-balance sheet events which could have had a material effect on the financial state of affairs as at 31 December 2012.

Annual Report 2012
40
15. AUDIT COMMITTEE
Pursuant to section 359(3) of the Companies and Allied Matters Act, the Bank has an Audit Committee comprising three Non-Executive Directors and three shareholders as follows:
Matthew Esonanjor – Chairman/Shareholder
Wale Ariyibi – Shareholder
Umar Al-Kassim – Shareholder
Foluke Abdulrazaq – Non-Executive Director
Angela Aneke – Non-Executive Director
Amb Joe C Keshi – Non-Executive Director
The functions of the Audit Committee are as laid down in section 359(6) of the Companies and Allied Matters Act Cap 20 Laws of the Federation of Nigeria, 2004.
16. AUDITORS
Messrs PricewaterhouseCoopers have indicated their willingness to continue in office in accordance with section 357(2) of the Companies and Allied Matters Act. A resolution will be proposed at the Annual General Meeting to authorise the Directors to determine their remuneration.
BY THE ORDER OF THE BOARD
Bili A OdumCompany Secretary
57 Marina, Lagos
Directors’ Report continued …

41
Customer Complaints Report
Introduction
United Bank for Africa Plc considers her customers as critical stakeholders in her business. As a result, the Bank strives to deliver excellent customer service and provide high quality financial services of international standard that meet or surpass customers’ expectations. We therefore consider customer feedback as a necessary and important factor in our drive to delight our customers at every interaction they have with the Bank.
Consistent with the Bank’s policy of excellent service delivery to all customers in all locations, the Bank’s products, processes and operational frameworks are regularly reviewed with a view to ensuring continuous improvement and increasing customer satisfaction.
UBA staff worldwide have been trained to imbibe quality service and place consistent focus on customers in every aspect of the Bank’s operations thereby keeping to the Bank’s promise to customers as contained in our charter as follows:
– be respectful – we know ‘The Customer is King’ and is the purpose of our business;
– be courteous and friendly in all our interactions with the customer;
– process transactions without delay and attend to enquiries promptly;
– investigate and resolve complaints promptly;
– listen attentively;
– communicate honestly and proactively;
– leverage on technical knowledge to fully support the customer’s financial needs; and
– show appreciation at all times.
Complaints Channels:
In recognition of this, the Bank has provided the following channels for feedback on its products and services either as enquires, requests or complaints. These platforms include:
– Customer Fulfillment Center (CFC) – Our 24/7 customer contact centre where customers can call in to lodge complaints, make requests or enquire about our products and services.
– Dedicated Email address – A dedicated email address [email protected] is available to customers 24/7 to send in their complaints. This email channel is manned by skilled and effective agents to accurately deliver high quality service to UBA customers and prospects alike.
– Hot lines in the branches: Branded phones called UBA hotline have been placed in designated business offices to enable customers call the Customers Fulfilment Centre to relay their complaints, requests and enquiries. Calls received through this channel are handled by designated inbound call agents. This is also to reduce customers’ wait time at the branches.
– Suggestion/Complaint Box: Customers’ complaint boxes are maintained in all UBA business offices to facilitate the tracking, resolution, reporting and dissemination of learning points.
– Web: On the UBA website www.ubagroup.com, customers also log in and register their Complaints through the link that asks ‘Do You Have Feedback?’ Such complaints are automatically routed to the CFC for resolution.
– Post: A dedicated Post Office Box (P.O. Box 5551, Marina, Lagos) is also available exclusively for receiving customer complaints by post.
– Fax: A fax line number 01-2808 448 is available, directly to the Supervisor Customer Complaints.
– A notice is displayed in all banking halls directing customers to forward their complaints through any of the various channels listed above.

Annual Report 2012
42
Customer Complaints Report continued …
Resolution Structure
In order to ensure that customers’ complaints, enquiries and requests are promptly resolved, the Bank has put in place a dedicated complaints management unit headed by a very senior officer of the Bank, responsible for prompt investigation and resolution of customers’ complaints within the approved timeline. The complaints unit is manned by skilled personnel with diverse banking experience to resolve complaints from customers promptly without referring to other areas of the Bank. The Bank maintains a robust customer complaints management system, which is managed by well trained staff of the Customer Fulfilment Centre and reports generated are periodically reviewed by Executive Management.
The complaints management system ensures that customers’ requests, enquiries and complaints are timely and promptly treated as specified within the framework and established turnaround time.
The process flow of customer complaint and resolution is as follows:
– The receiving point of a customer’s complaint acknowledges the complaint.
– The complaint is reviewed and it is determined if the complaint could be resolved at first level.
– Where the complaint can be resolved at the first level, a resolution is provided to the customer.
– If such complaint cannot be resolved at the first level, the receiving point forwards the complaint to operations specialist at the Customer Fulfilment Centre to handle.
– Upon resolution, the customer is contacted and the necessary feedback provided to the customer.
– The complaint is closed and marked as resolved.
Feedback on customers’ complaints to the Bank
Feedback on customers’ complaints is provided to management and relevant departments within the Bank to ensure that complaints and issues raised by customers do not recur. The feedback gathered ensures that:
– the Bank retains her customers as customers feel appreciated and respected;
– the quality of the Bank’s service delivery is maintained and made uniform across board; and
– it serves as a reliable source of identifying improvement opportunities.

43
Reports of the complaints received and resolved by the bank from January to December 2012, is stated hereunder:
Month
Number of complaints
received during the period
Number resolved
Number not resolved but
reported to CBN
Total Disputed Amount
(N’ million)
January 3,551 3,079 Nil 8.78
February 4,873 4,618 Nil 280.97
March 12,842 10,697 Nil 22.54
April 7,109 6,628 Nil 121.66
May 5,271 4,904 Nil 83.81
June 6,115 5,923 Nil 23.74
July 6,636 6,229 Nil 29.63
August 5,797 5,287 Nil 10.11
September 5,811 5,460 Nil 13.70
October 7,536 6,973 Nil 20.59
November 6,432 5,753 Nil 67.61
December 8,946 7,692 Nil 12.19
TOTAL 695.33
In addition to the above, the Bank renders a monthly report to the Central Bank of Nigeria in line with the guidelines on resolution of customer complaints.

Annual Report 2012
44
United Bank for Africa Plc holds good governance as one of its core values and confirms its commitment to the implementation of effective corporate governance principles in its business operations. The Directors endorse the principles of best practice corporate governance as stated in the ‘Code of Corporate Governance For Banks in Nigeria Post Consolidation’ issued by the Central Bank of Nigeria (CBN) and the Securities and Exchange Commission’s (SEC) ‘Code of Corporate Governance’.
The Board is of the opinion that UBA Plc has in all material respects, complied with the requirements of the CBN Code, the SEC Code and its own Governance Charters, during the 2012 financial year.
During the 2012 financial year, shareholders approved the restructuring plan of the Bank to operate as a monoline business and divest from all non-commercial banking subsidiaries, pursuant to CBN’s approval of the Bank’s compliance plan.
Under the new restructuring arrangement, UBA Plc will remain the parent bank holding company of all its commercial banking activities in Nigeria, Africa and the rest of the world and will also be the parent company for UBA Pension Custodian Limited and UBA FX Mart Limited. Furthermore, UBA Plc will divest from the following non-commercial banking subsidiaries: UBA Capital, UBA Asset Management Limited (which currently owns UBA Trustees Limited and UBA Nominees Limited), UBA Insurance Brokers Limited and UBA Metropolitan Life Insurance Limited. These entities with the exception of UBA Insurance Brokers Limited (which is being wound up), would be consolidated under UBA Capital Plc and spun off to all eligible Shareholders of UBA Plc, along with Africa Prudential Registrars Plc and Afriland Properties Plc.
The Board of Directors of UBA Plc has the overall responsibility for ensuring that the highest standards of corporate governance are maintained and adhered to by the Bank. In order to promote effective governance of the UBA Group, the following structures have been put in place for the execution of UBA Plc’s Corporate Governance strategy:
1. Board of Directors
2. Board Committees
3. Executive Management Committee
As at December 31, 2012, the Board comprised a Non-Executive Chairman, a Non-Executive Vice Chairman, eight Non-Executive Directors, two independent Non-Executive Directors and eight Executive Directors, all of whom bring a wide range of skills and experience to the Board.
The Board of Directors carries out its responsibility through its standing Committees discussed in section E of this report. In addition to these Committees, there are a number of Management Committees which ensure effective and good Corporate Governance at the Managerial level.
A. THE BOARD
The Board presently consists of 18 members, eight of whom, inclusive of the GMD/CEO are Executive Directors and 10 Non-Executive Directors. The Non-Executive Directors have the requisite integrity, skills and experience to bring independent judgment to bear on Board deliberations and discussions.
Responsibility
The roles of Chairman and Chief Executive Officer are separated and clearly defined. The Chairman is primarily responsible for the working of the Board whilst the Chief Executive Officer is responsible for the running of the business and implementation of Board strategy and policy. The Chief Executive Officer is assisted in managing the business of the Bank on a day-to-day basis by the Executive Management Committee, which he chairs and which meets every other week and comprises all Executive Directors. The Board’s primary responsibility is to increase shareholder wealth. The Board is accountable to shareholders and is responsible for the management of the relationships with its various stakeholders.
Executive Management is accountable to the Board for the development and implementation of strategy and policies. The Board regularly reviews Group performance, matters of strategic concern and any other matters it regards as material.
The Board meets quarterly and additional meetings are convened as the need arises. In 2012 the Board met four times.
The Board is also responsible for the Bank’s structure and areas of operation, financial reporting, ensuring there is an effective system of internal control and risk management and appointments to the Board. The Board has the authority to delegate matters to Directors, Board Committees and the Executive Management Committee.
Corporate Governance Report
45
Appointments and retirements
During the course of the year, Mr Victor Osadolor, Mr Paolo Di Martino and Ms Runa Alan retired from the Board. Mrs Rose Okwechime was reappointed to the Board and Mrs Owanari Duke was newly appointed to the Board.
Professional Independent Advice
All Directors are aware that they may take independent professional advice at the expense of the Bank, in the furtherance of their duties. They all have access to the advice and services of the Company Secretary, who is responsible to the Board for ensuring that all governance matters are complied with and assists with professional development as required.
B. ACCOUNTABILITY AND AUDIT
Financial Reporting
The Board has presented a balanced assessment of the Company’s position and prospects. The Board is mindful of its responsibilities and is satisfied that in the preparation of its financial report it has met with its obligations under the Group’s Code of Corporate Governance.
The Directors make themselves accountable to the shareholders through regular publication of the Group’s financial performance and Annual Reports. The Board has ensured that the Group’s reporting procedure is conveyed on the most up to date infrastructure to ensure accuracy. This procedure involves the monitoring of performance throughout the financial year in addition to monthly reporting of key performance indicators.
PricewaterhouseCoopers acted as external auditors to the Group during the 2012 financial year. Their report is contained on pages 54 and 55 of this Annual Report.
Internal Controls
The Group has consistently improved its internal control system to ensure effective management of risks. The Directors review the effectiveness of the system of internal controls through regular reports and reviews at Board and Risk Management Committee meetings.
C. CONTROL ENVIRONMENT
The Board has continued to place emphasis on risk management as an essential tool for achieving the Group’s objectives. Towards this end, it has ensured that the Group has in place robust risk management policies and mechanisms to ensure identification of risk and effective control.
The Board approves the annual budget for the Group and ensures that a robust budgetary process is operated with adequate authorisation levels put in place to regulate capital expenditure.
D. SHAREHOLDER RIGHTS
The Board of UBA Plc has always placed considerable importance on effective communication with its shareholders. It ensures that the rights of shareholders are protected at all times. Notice of meetings and all other statutory notices and information are communicated to the shareholders regularly.
Shareholders are encouraged to communicate their opinions and recommendations whenever they see the need to do so, to either the Director, Investor Relations or the Company Secretary. Their contact details are available on the Bank’s website and are reproduced at the back cover of this Annual Report.

Annual Report 2012
46
Corporate Governance Report continued …
E. BOARD COMMITTEES
The Board of UBA Plc has the following committees, namely, the Board Audit Committee, the Board Risk Management Committee, the Finance and General Purpose Committee, the Nominations and Governance Committee, the Board Credit Committee and the Statutory Audit Committee.
Board Audit Committee
The Board Audit committee is comprised as follows:
1. Mr Adekunle Olumide, OON – Chairman
2. Mrs Foluke Abdulrazaq – Member
3. Chief Kola Jamodu, OFR – Member
4. Mr Rasheed Olaoluwa – Member
5. Mr Kennedy Uzoka – Member
6. Mrs Rose Okwechime – Member
7. Mrs Owanari Duke – Member
The Board Audit Committee was set up to further strengthen internal controls in the Group. It assists the Board of Directors in fulfilling its audit responsibilities by ensuring that effective systems of financial and internal controls are in place within the Group.
Meetings are held at least once a quarter, with the Chief Inspector of the Bank in attendance.
S/N MembersNumber of
meetings held
Number of meetings attended
1 Mr Adekunle Olumide, OON 5 5
2 Mrs Foluke Abdulrazaq 5 5
3 Mr Rasheed Olaoluwa 5 1
4 Chief Kola Jamodu 5 1
5 Mr Kennedy Uzoka 5 5
6 Mrs Rose Okwechime (Appointed July 2012) 5 1
7 Mrs Owanari Duke (Appointed July 2012) 5 1
Board Risk Management Committee
The Board Risk Management Committee comprises of the following Directors:
1. Chief Kola Jamodu, OFR – Chairman
2. Mr Phillips Oduoza – Member
3. Mr Femi Olaloku – Member
4. Mr Emmanuel Nnorom – Member
5. Alhaji Ja’afaru Paki – Member
6. Mr Yahaya Zekeri – Member
7. Mrs Rose Okwechime – Member

47
Meetings are held at least once a quarter and the responsibilities of the Committee include to review and recommend risk management strategies, policies and risk tolerance for the Board’s approval; to review management’s periodic reports on risk exposure, risk portfolio composition and risk management activities; and to consider and examine such other matters as the Board requires, the Committee considers appropriate, or which are brought to its attention, and make recommendations or reports to the Board accordingly.
S/N MembersNumber of
meetings held
Number of meetings attended
1 Chief Kola Jamodu, OFR 4 4
2 Phillips Oduoza 4 3
3 Alhaji Ja’afaru Paki 4 4
4 Emmanuel Nnorom 4 4
5 Femi Olaloku 4 4
6 Yahaya Zekeri 4 4
7 Rose Okwechime (Appointed July 2012) 4 1
Board Credit Committee
The Board Credit Committee is made up of six Non-Executive Directors and is responsible for approval of credit facilities in the Company. It reviews all credits granted by the Company and meetings are held at least once a quarter. Members of the Board Credit Committee are:
1. Mrs Foluke Abdulrazaq – Chairman
2. Alhaji Ja’afaru Paki – Member
3. Amb Joe C Keshi OON – Member
4. Ms Angela Aneke – Member
5. Mr Yahaya Zekeri – Member
6. Mrs Owanari Duke – Member
The Board Credit Committee was set up to assist the Board of Directors in discharging its responsibility of exercising due care, diligence and skill to oversee, direct and review the management of the credit portfolio of the Group. Its terms of reference include determining and setting the parameters for credit risk and asset concentration and reviewing compliance within such limits; determining and setting the lending limits, reviewing and approving the Group’s credit strategy and the credit risk tolerance. The Committee also reviews the loan portfolio of the Bank. It also reviews and approves country risks exposure limits. The Chief Credit Officer and the Group Chief Risk and Compliance Officer are in attendance at every meeting of the Committee.
S/N MembersNumber of
meetings held
Number of meetings attended
1 Mrs Foluke Abdulrazaq 12 12
2 Alh Ja’afaru A Paki 12 10
3 Ms Angela Aneke 12 12
4 Mr Yahaya Zekeri 12 12
5 Amb Joe C Keshi, OON 12 8
6 Owanari Duke (Appointed July 2012) 12 1

Annual Report 2012
48
Corporate Governance Report continued …
Nominations and Governance Committee
The Nominations and Governance Committee is comprised of six Non-Executive Directors namely:
1. Amb Joe C Keshi, OON – Chairman
2. Mrs Foluke Abdulrazaq – Member
3. Ms Angela Aneke – Member
4. Mr Yahaya Zekeri – Member
5. Mrs Rose Okwechime – Member
6. Mrs Owanari Duke – Member
Meetings are held at least once annually and the responsibilities of the Committee include reviewing, considering and determining the appropriate remuneration payable to the Bank’s Executive Directors.
S/N MembersNumber of
meetings held
Number of meetings attended
1 Amb Joe C Keshi, OON 5 5
2 Ms Angela Aneke 5 5
3 Mr Yahaya Zekeri 5 5
4 Mrs Foluke Abdulrazaq 5 3
5 Mrs Rose Okwechime (Appointed July 2012) 5 1
6 Mrs Owanari Duke (Appointed July 2012) 5 1
Finance and General Purpose Committee
The purpose of Finance and General Purpose Committee is to, amongst other things, discharge the Board’s responsibilities with regard to strategic direction and budgeting and to provide oversight on financial matters and the performance of the Group.
Members of this Committee are:
1. Ms Angela Aneke – Chairman
2. Mr Adekunle Olumide, OON – Member
3. Mr Phillips Oduoza – Member
4. Mr Emmanuel Nnorom – Member
5. Mr Kennedy Uzoka – Member
6. Alhaji Ja’afaru Paki – Member
7. Amb Joe C Keshi OON – Member

49
S/N MembersNumber of
meetings held
Number of meetings attended
1 Angela Aneke 6 6
2 Phillips Oduoza 6 5
3 Emmanuel Nnorom 6 5
4 Mr Adekunle Olumide, OON 6 6
5 Alhaji Ja’afaru Paki 6 6
6 Kennedy Uzoka 6 6
7 Joe C Keshi, OON 6 4
Attendance at Board Meetings
Membership and attendance at Board Meetings are set out below:
S/N MembersNumber of
meetings held
Number of meetings attended
1 Chief Israel C. Ogbue 4 4
2 Phillips Oduoza 4 4
3 Kennedy Uzoka 4 4
4 Emmanuel Nnorom 4 4
5 Rasheed Olaoluwa 4 4
6 Abdulqadir J. Bello 4 4
7 Femi Olaloku 4 4
8 Ifeatu Onejeme 4 4
9 Chief Kola Jamodu, OFR 4 4
10 Alhaji Ja’afaru Paki 4 4
11 Mr Adekunle Olumide, OON 4 4
12 Angela Aneke 4 4
13 Yahaya Zekeri 4 4
14 Joe C Keshi, OON 4 4
15 Foluke Abdulrazaq 4 4
16 Dan Okeke 4 4
17 Rose Okwechime (Appointed July, 2012) 4 1
18 Owanari Duke (Appointed July, 2012) 4 1
19 Paolo Di Martino (Resigned May, 2012) 4 1
20 Runa Alan (Resigned April, 2012) 4 0

Annual Report 2012
50
Executive Management Committee
These are Committees comprising of senior management of the Bank. The Committees are also risk driven as they are basically set up to identify, analyse, synthesise and make recommendations on risks arising from day-to-day activities of the Bank. They also ensure that risk limits as contained in the Board and Regulatory policies are complied with at all times. They provide inputs for the respective Board Committees and also ensure that recommendations of the Board Committees are effectively and efficiently implemented. They meet as frequently as risk issues occur to immediately take actions and decisions within the confines of their powers. Some of these Executive Management Committees include the Group Asset and Liability Committee (GALCO), the Executive Credit Committee (ECC) and the Executive Management Committee (EMC).
Statutory Audit Committee
The Statutory Audit Committee was set up in accordance with the provisions of the Companies and Allied Matters Act, CAP20, 2004. It comprises of a mixture of Non-Executive Directors and ordinary shareholders elected at the Annual General Meeting. Its terms of reference include the monitoring of processes designed to ensure compliance by the Group in all respects with legal and regulatory requirements, including disclosure, controls and procedures and the impact (or potential impact) of developments related thereto. It evaluates annually, the independence and performance of the external auditors. The Committee also reviews with Management and the External Auditors the annual audited financial statement before its submission to the Board.
The Members of the Statutory Audit Committee in 2012 are as follows:
1. Mr Matthew Esonanjor – Chairman/Shareholder
2. Mr Oyewale Ariyibi – Shareholder
3. Alhaji Umar Al-Kassim – Shareholder
4. Mrs Foluke Abdulrazaq – Non-Executive Director
5. Ms Angela Aneke – Non-Executive Director
6. Amb Joe C Keshi – Non-Executive Director
Corporate Governance Report continued …

51
TO MEMBERS OF UNITED BANK FOR AFRICA PLC
In accordance with the provision of section 359[6] of the Companies and Allied Matters Act, we the members of the Audit Committee hereby report as follows:
– we confirm that we have seen the audit plan and scope and the management letter on the audit of the accounts of the Bank and the responses to the said letter;
– in our opinion, the plan and scope for the period ended 31 December 2012 were adequate. We have reviewed the auditors’ findings and we are satisfied with the Management responses thereon;
– we also confirm that the accounting and reporting policies of the Bank are in accordance with legal requirements and ethical practices; and
– as required by the provisions of the Central Bank of Nigeria circular 85D/1//2004 dated 18 February 2004 on ‘Disclosure of Insider-Related Credits in Financial Statements’, we reviewed the insider-related credits of the Bank and found them to be as analysed in the financial statements as at 31 December 2012.
MEMBERS OF THE AUDIT COMMITTEE ARE:
1. Mr Matthew Esonanjor – Chairman/shareholder
2. Mr Wale Ariyibi – Shareholder
3. Alhaji Umar Al-Kassim – Shareholder
4. Mrs Foluke Abdulrazaq – Non-Executive Director
5. Ms Angela Aneke – Non-Executive Director
6. Amb Joe Keshi – Non-Executive Director
Audit Committee Report

Annual Report 2012
52
Board Evaluation Report
Akintola Williams Deloitte235 Ikorodu Road, IlupejuPO Box 965, MarinaLagosNigeriaTel: +234 (1) 271 7800Fax: +234 (1) 271 7801www.deloitte.com/ng
30 April 2013
Board of DirectorsUnited Bank for Africa Plc UBA House57 MarinaLagos
Dear Sirs,
REPORT TO THE DIRECTORS OF UBA PLC ON THE OUTCOME OF THE BOARD EVALUATION
Akintola Williams Deloitte was engaged to conduct an evaluation of the Board of Directors of United Bank for Africa Plc (‘UBA or the Bank’) for the FY 2012, in compliance with the requirements of the Central Bank of Nigeria (CBN) Code of Corporate Governance for Banks in Nigeria (‘the Code’) and best practices. The code requires that there should be an annual Board and Directors’ appraisal covering all aspects of the Board’s structure and composition, responsibilities, processes and relationships, as well as individual members’ competencies and respective roles in the Board’s performance.
Our evaluation was undertaken based on information provided by the Bank. Our responsibility is to determine the level of performance of the Board with respect to the Code based on the work carried out within the scope of our engagement as well as identify areas of improvement for the Board to address in its commitment to continuous improvements in corporate governance.
On the basis of our work, we conclude that the Board’s performance complied materially with the standards contained in the Code. The Bank is committed to continuous in its corporate governance practices, ensuring that despite the major changes in the structure of the Bank and the Board composition during the year, the bank remained stable.
Yours faithfully
Joseph OlofinsolaPartner, Consulting

53
Statement of Directors’ Responsibilities in Relation to the Financial Statements for the Year Ended December 31, 2012
In accordance with the provisions of the Companies and Allied Matters Act and the Banks and Other Financial Institutions Act, the Directors accept responsibility for the preparation of these financial statements. The Directors are of the opinion that the 2012 financial statements give a true and fair view of the state of the financial affairs and profits of the Bank and its subsidiaries for the year ended December 31, 2012. The preparation of the financial statements ensured that:
– proper accounting records were maintained;
– applicable accounting standards were followed;
– suitable accounting policies were adopted and applied;
– reasonable and prudent judgments and estimates were made;
– the going concern accounting basis was used; and
– internal control procedures were instituted to safeguard the assets of the Bank, prevent and detect fraud and other irregularities.
As of the date of this statement, nothing has come to the attention of the Directors to indicate that the Group will not remain a going concern for at least 12 months.
Signed on behalf of the Directors
Phillips OduozaGMD/CEO

Annual Report 2012
54
Report on the financial statements
We have audited the accompanying separate and consolidated financial statements of United Bank for Africa Plc (“the Bank”) and its subsidiaries (together “the Group”). These financial statements comprise the statements of financial position as at 31 December 2012 and the statements of comprehensive income, changes in equity and cash flows for the year then ended and a summary of significant accounting policies and other explanatory notes.
DIRECTORS’ RESPONSIBILITY FOR THE FINANCIAL STATEMENTSThe Directors are responsible for the preparation and fair presentation of these financial statements in accordance with International Financial Reporting Standards, with the requirements of the Companies and Allied Matters Act and the Banks and Other Financial Institutions Act and for such internal control, as the Directors determine is necessary to enable the preparation of financial statements that are free from material misstatement, whether due to fraud or error.
AUDITORS’ RESPONSIBILITYOur responsibility is to express an opinion on the financial statements based on our audit. We conducted our audit in accordance with International Standards on Auditing. Those standards require that we comply with ethical requirements and plan and perform our audit to obtain reasonable assurance about whether the financial statements are free from material misstatements.
An audit involves performing procedures to obtain audit evidence about the amounts and disclosures in the financial statements. The procedures selected depend on the auditor’s judgement, including the assessment of the risks of material misstatement of the financial statements, whether due to fraud or error. In making those risk assessments, the auditor considers internal control relevant to the entity’s preparation and fair presentation of the financial statements in order to design audit procedures that are appropriate in the circumstances, but not for the purpose of expressing an opinion on the effectiveness of the entity’s internal control. An audit also includes evaluating the appropriateness of accounting policies used and the reasonableness of accounting estimates made by the Directors, as well as evaluating the overall presentation of the financial statements.
We believe that the audit evidence we have obtained is sufficient and appropriate to provide a basis for our opinion.
OPINIONIn our opinion, the accompanying financial statements give a true and fair view of the state of the financial affairs of the Bank and the Group as at 31 December 2012 and of the financial performance and cash flows of the Group for year then ended in accordance with International Financial Reporting Standards, the requirements of the Companies and Allied Matters Act, the Banks and Other Financial Institutions Act and the Financial Reporting Council Act.
Report of the Independent Auditor to the members of United Bank for Africa Plc

55
Report on other legal requirements
The Companies and Allied Matters Act and the Banks and Other Financial Institutions Act require that in carrying out our audit we consider and report to you on the following matters. We confirm that:
(i) we have obtained all the information and explanations which to the best of our knowledge and belief were necessary for the purposes of our audit;
(ii) the Bank has kept proper books of account, so far as appears from our examination of those books and returns adequate for our audit have been received from branches not visited by us;
(iii) the Bank’s statement of financial position and statement of comprehensive income are in agreement with the books of account;
(iv) related party transactions and balances are disclosed in Note 40 to the financial statements in accordance with the Central Bank of Nigeria Circular BSD/1/2004; and
(v) except for the contraventions disclosed in Note 43 to the financial statements, the Bank has complied with the requirements of the relevant circulars issued by the Central Bank of Nigeria.

Annual Report 2012
56
Consolidated and Separate Statement of Comprehensive IncomeFor the year ended December 31
In millions of Nigerian Naira Notes
Group Bank
2012 2011 2012 2011
Gross earnings 220,129 163,732 177,429 126,098Interest and similar income 8 150,003 113,590 126,147 97,427Interest and similar expense 8 (58,386) (45,423) (51,302) (41,203)Net interest income 91,617 68,167 74,845 56,224Net fee and commission income 9 45,108 38,660 34,212 28,726Net trading income/(loss) 10 9,695 3,546 9,254 (2,563)Other operating income 12 6,673 8,596 6,045 2,763Operating income 153,093 118,969 124,356 85,150Net impairment loss on loans and receivables 13 (4,560) (17,738) (2,654) (8,180)Net gains/(losses) on investment securities 11 6,123 (1,865) (129) (1,460)Loss on loans sold to Asset Management Corporation of Nigeria – AMCON – (19,894) – (19,894)Net operating income 154,656 79,472 121,573 55,616Personnel expenses 14 (43,452) (47,874) (32,999) (38,103)Depreciation and amortisation 15 (10,888) (10,500) (6,903) (8,239)Other operating expenses 16 (48,252) (47,730) (35,491) (35,742)Total operating expenses (102,592) (106,104) (75,393) (82,084)Share of (loss)/profit of equity accounted investee 26 (54) 32 – –Profit/(loss) before income tax 52,010 (26,600) 46,180 (26,468)Taxation (charge)/credit 17 (533) 17,935 1,195 18,502Profit/(loss) for the year from continuing operations 51,477 (8,665) 47,375 (7,966)Profit for the year from discontinued operations 18(c) 3,289 1,864 – –Profit/(loss) for the year 54,766 (6,801) 47,375 (7,966)Other comprehensive incomeForeign currency translation differences (2,999) 1,607 – –Fair value gains on available-for-sale investments 3,763 4,073 3,534 4,212Other comprehensive income 764 5,680 3,534 4,212Total comprehensive income/(loss) for the year 55,530 (1,121) 50,909 (3,754)Profit attributable to:Owners of Bank 54,664 (7,651) 47,375 (7,966)Non-controlling interest 102 850 – –Profit/(loss) for the year 54,766 (6,801) 47,375 (7,966)Total comprehensive income attributable to:Owners of Bank 55,306 (1,971) 50,909 (3,754)Non-controlling interest 224 850 – –Total comprehensive income for the year 55,530 (1,121) 50,909 (3,754)Earnings per share from continuing and discontinued operations attributable to owners of the Bank during the yearBasic earnings/(loss) per share (Naira)From continuing operations 19 1.66 (0.29) 1.44 (0.24)From discontinued operations 19 0.11 0.06 – –From profit for the year 1.77 (0.23) 1.44 (0.24)Diluted earnings/(loss) per share (Naira)From continuing operations 19 1.66 (0.29) 1.44 (0.24)From discontinued operations 19 0.11 0.06 – –From profit for the year 1.77 (0.23) 1.44 (0.24)
The accompanying notes to the financial statements are an integral part of these consolidated and separate financial statements.

57
Consolidated and Separate Statement of Financial Position
As atIn millions of Nigerian Naira Notes
Group Bank
31 December2012
31 December 2011
1 January 2011
31 December 2012
31 December 2011
1 January 2011
ASSETSCash and bank balances 20 714,115 434,218 385,397 629,481 352,500 330,701Financial assets held for trading 21 457 1,303 2,594 456 237 1,267Loans and advances to banks 22 28,513 41,564 11,226 27,878 41,564 11,226Loans and advances to customers 23 658,922 605,627 590,797 570,714 552,526 557,224Investment securities 24 680,817 722,308 493,079 527,994 560,028 391,461Other assets 25 18,598 16,513 30,290 11,159 16,891 24,877Investments in equity accounted investee 26 – 10,356 10,118 – 10,843 10,843Investments in subsidiaries 27 – – – 66,727 56,695 50,355Property and equipment 28 70,746 55,618 62,009 63,118 47,066 53,263Intangible assets 29 7,568 5,930 6,626 1,578 2,099 2,952Deferred tax assets 30 29,624 26,998 7,049 28,152 25,604 6,555
2,209,360 1,920,435 1,599,185 1,927,257 1,666,053 1,440,724Non-current assets held for distribution 18(a) 63,563 – – 5,808 – –TOTAL ASSETS 2,272,923 1,920,435 1,599,185 1,933,065 1,666,053 1,440,724LIABILITIESDerivative liabilities 31 124 817 9,310 124 817 9,310Deposits from banks 32 57,780 19,510 7,456 22,875 23,408 51Deposits from customers 33 1,720,008 1,445,822 1,270,409 1,461,131 1,216,511 1,120,566Managed funds – 51,943 32,753 – – –Other liabilities 34 81,438 58,210 41,671 57,299 49,924 38,782Current tax liabilities 17 1,274 2,627 2,869 1,325 784 1,185Subordinated liabilities 35 53,719 53,500 18,335 55,474 55,254 20,147Borrowings 36 114,520 137,040 63,327 114,520 137,040 63,327Deferred tax liabilities 30 59 26 30 – – –
2,028,922 1,769,495 1,446,160 1,712,748 1,483,738 1,253,368Liabilities held for distribution 18(b) 51,534 – – – – –TOTAL LIABILITIES 2,080,456 1,769,495 1,446,160 1,712,748 1,483,738 1,253,368EQUITYShare capital 37 16,491 16,168 12,934 16,491 16,168 12,934Share premium 37 107,932 108,255 111,489 107,932 108,255 111,489Retained earnings 37 49,572 16,034 25,695 47,723 21,474 30,727Other reserves 37 15,111 6,888 10 48,171 36,418 32,206EQUITY ATTRIBUTABLE TO OWNERS OF THE BANK 189,106 147,345 150,128 220,317 182,315 187,356Non-controlling interests 3,361 3,595 2,897 – – –TOTAL EQUITY 192,467 150,940 153,025 220,317 182,315 187,356TOTAL LIABILITIES AND EQUITY 2,272,923 1,920,435 1,599,185 1,933,065 1,666,053 1,440,724
The accompanying notes to the financial statements are an integral part of these consolidated and separate financial statements.
The consolidated and separate financial statements were approved by the Directors on 12 April 2013.
Ugochukwu NwaghodohGroup Chief Finance Officer
FRC/2012/ICAN/00000000272
Israel OgbueChairman, Board of Directors
FRC/2013/ICSAN/00000001948
Phillips OduozaGroup Managing Director/CEO
FRC/2013/CIBN/00000001955

Annual Report 2012
58
(a)31 December 2012
(i) Group
In millions of Nigerian Naira
Sharecapital
Sharepremium
Translationreserve
Regulatoryrisk
reserve
Fairvalue
reserveTreasury
sharesStatutory
reserveRetainedearnings Total
Non-controlling
interestTotal
equity
Balance at 1 January 2012 16,168 108,255 1,607 – 11,460 (32,193) 26,014 16,034 147,345 3,595 150,940
Profit for the year – – – – – – – 54,664 54,664 102 54,766
Other comprehensive income
Foreign currency translation difference – – (3,121) – – – – – (3,121) 124 (2,999)
Fair value change in (available-for-sale) financial assets – – – – 3,763 – – – 3,763 – 3,763
Other comprehensive income for the year – – (3,121) – 3,763 – – – 642 122 764
Total comprehensive income for the year – – (3,121) – 3,763 – – 54,664 55,306 224 55,530
Transactions with owners, recorded directly in equity
Contributions by and distributions to owners
Bonus shares issued 323 (323) – – – – – – – – –
Increase in treasury shares – – – – – (638) – – (638) – (638)
Dividend in specie (note 34) – – – – – – – (12,907) (12,907) –
Transfer to statutory reserves – – – – – – 7,106 (7,106) – – –
Transfer to other regulatory reserve – – – 1,113 – – – (1,113) –
Dividends to equity/non-controlling holders – – – – – – – – – (458) (458)
Total contribution and distributions to owners 323 (323) – 1,113 – (638) 7,106 (21,126) (13,545) (458) (14,003)
Balance at 31 December 2012 16,491 107,932 (1,514) 1,113 15,223 (32,831) 33,120 49,572 189,106 3,361 192,467
Consolidated and Separate Statement of Changes in Equity For the year ended

59
(ii) Bank
In millions of Nigerian NairaShare
capitalShare
premium
Regulatoryrisk
reserve
Fairvalue
reserveStatutory
reserveRetainedearnings Total
Balance at 1 January 2012 16,168 108,255 – 12,300 24,118 21,474 182,315
Profit for the year – – – – – 47,375 47,375
Other comprehensive income
Fair value change in (available-for-sale) financial assets – – – 3,534 – – 3,534
Other regulatory reserve – – 1,113 – – (1,113) –
Other comprehensive income for the year – – 1,113 3,534 – (1,113) 3,534
Total comprehensive income for the year – – 1,113 3,534 – 46,262 50,909
Transactions with owners, recorded directly in equity
Contributions by and distributions to owners
Bonus shares issued 323 (323) – – – – –
Transfer for the year – – – – 7,106 (7,106) –
Dividends to equity holders – – – – – (12,907) (12,907)
Total contribution and distributions to owners 323 (323) – – 7,106 (20,013) (12,907)
Balance at 31 December 2012 16,491 107,932 1,113 15,834 31,224 47,723 220,317

Annual Report 2012
60
Consolidated and Separate Statement of Changes in Equitycontinued …
(b) 31 December 2011(ii) Group
In millions of Nigerian Naira
ShareCapital
Sharepremium
Translationreserve
Fairvalue
reserveTreasury
sharesStatutory
reserveRetainedearnings Total
Non-controlling
interestTotal
equity
Balance at 1 January 2011 12,934 111,489 – 7,387 (32,591) 25,214 25,695 150,128 2,897 153,025
Profit or (loss) for the year – – – – – – (7,651) (7,651) 850 (6,801)
Other comprehensive income
Foreign currency translation difference – – 1,607 – – – – 1,607 – 1,607
Fair value change in (available-for-sale) financial assets – – – 4,073 – – – 4,073 – 4,073
Other comprehensive income for the year – – 1,607 4,073 – – – 5,680 – 5,680
Total comprehensive income for the year – – 1,607 4,073 – – (7,651) (1,971) 850 (1,121)
Transactions with owners, recorded directly in equity
Contributions by and distributions to owners
Bonus shares issued during the year 3,234 (3,234) – – – – – – – –
Decrease in non-controlling interest – – – – – – – – (152) (152)
Reduction in treasury shares – – – – 398 – – 398 – 398
Transfers for the year – – – – – 800 (800) – – –
Dividends to equity holders – – – – – – (1,210) (1,210) – (1,210)
Total contribution and distributions to owners 3,234 (3,234) – – 398 800 (2,010) (812) (152) (964)
Balance at 31 December 2011 16,168 108,255 1,607 11,460 (32,193) 26,014 16,034 147,345 3,595 150,940

61
(ii) Bank
In millions of Nigerian NairaShare
capitalShare
premium
Fairvalue
reserveStatutory
reserveRetainedearnings Total
Balance at 1 January 2011 12,934 111,489 8,088 24,118 30,727 187,356
Loss for the year – – – – (7,966) (7,966)
Other comprehensive income
Fair value change in (available-for-sale) financial assets – – 4,212 – – 4,212
Other comprehensive income for the year – – 4,212 – – 4,212
Total comprehesive income for the year – – 4,212 – (7,966) (3,754)
Transactions with owners, recorded directly in equity
Contributions by and distributions to owners
Bonus shares issued during the year 3,234 (3,234) – – – –
Dividends to equity holders – – – – (1,287) (1,287)
Total contribution and distributions to owners 3,234 (3,234) – – (1,287) (1,287)
Balance at 31 December 2011 16,168 108,255 12,300 24,118 21,474 182,315

Annual Report 2012
62
In millions of Nigerian Naira Notes
Group Bank
2012 2011 2012 2011
Cash flows from operating activitiesProfit/(loss) before income tax, including discontinued operations 55,874 (24,383) 46,180 (26,468)Adjustments for:Depreciation of property and equipment 15 9,775 9,348 6,043 7,128Amortisation of intangible assets 15 1,113 1,152 860 1,111Net impairment loss on investment securities 11 673 1,723 725 1,318Net impairment loss on loans and advances 13 5,093 25,246 1,527 7,312Write-off of loans and advances 13 7,859 9,499 2,910 9,499Net impairment charge on other assets 13 1,055 719 281 672Foreign exchange (gains)/losses (5,979) (182) 247 (24)Fair value (gain)/loss on derivative financial instruments 10 (693) 8,464 (693) 8,464Fair value gain on previously held interest in equity-accounted investee (31) – (31) –Dividend income (3,104) (576) (4,772) (407)Gain on disposal of property and equipment (34) – (34) –Net interest income 8 (91,617) (68,167) (74,845) (56,224)Share of profit of equity accounted investee (196) (238) – –Operating profit before changes in operating assets and liabilities (20,212) (37,395) (21,602) (47,619)Change in financial assets held for trading 600 1,297 (219) 1,030Cash reserve balance (37,908) (69,327) (42,666) (65,987)Change in loans and advances to banks 5,992 (30,513) (6,851) (30,675)Change in loans and advances to customers (71,435) (178,833) (54,876) (141,924)Change in other assets (20,228) 12,833 5,451 7,314Change in derivative liabilities 31 – (16,957) – (16,957)Change in deposits from banks 40,792 12,089 (533) 23,357Change in deposits from customers 235,178 178,655 246,325 98,794Change in managed fund (3,243) 19,190 – –Interest received 150,427 119,427 126,041 103,327Interest paid (49,295) (47,943) (42,057) (44,052)Change in other liabilities and provisions 9,040 16,200 (5,579) 11,142Income tax paid 17(c) (4,479) (2,260) (812) (948)Net cash from operating activities 235,229 (23,537) 202,622 (103,198)Cash flows from investing activitiesProceeds/(acquisition) of investment securities 14,075 (102,773) 35,744 (40,495)Acquisition of property and equipment (8,979) (6,058) (5,087) (3,109)Acquisition of investment in subsidiaries (652) – (3,133) (7,412)Dividend received 3,104 576 4,772 407Proceeds from the sale of property and equipment 2,513 3,352 1,409 2,178Acquisition of intangible assets 29 (558) (456) (339) (258)Net cash used in investing activities 9,503 (105,359) 33,366 (48,689)Cash flows from financing activitiesProceeds from borrowings 28,436 116,958 28,436 116,900Repayments of borrowings (18,736) (5,480) (18,736) (5,480)Interest paid on long-term borrowings (10,950) (2,600) (10,950) (2,600)Dividend paid to owners of the Bank 38 – (1,210) – (1,287)Dividend paid to non-controlling interests (458) – – –(Increase)/reduction in treasury shares (638) 398 – –Net cash from financing activities (2,346) 108,066 (1,250) 107,533Net increase/(decrease) in cash and cash equivalents 242,386 (20,830) 234,738 (44,354)Effects of exchange rate changes on cash and cash equivalents (397) 324 (423) 166Cash and cash equivalents at beginning of year 20 352,429 372,935 278,254 322,442Cash and cash equivalents at end of year 20 594,418 352,429 512,569 278,254
The accompanying notes to the financial statements are an integral part of these consolidated and separate financial statements.
Consolidated and Separate Statement of Cash FlowsFor the year ended 31 December

63
1. REPORTING ENTITY
United Bank for Africa Plc (the “Bank”) is a Nigerian registered company with address at 57 Marina, Lagos, Nigeria. The consolidated financial statements of the Bank for the year ended December 31, 2012 comprise the Bank (Bank) and its subsidiaries (together referred to as the “Group” and individually referred to as Group entities”). The Bank and its other banking subsidiaries are primarily involved in corporate, commercial and retail banking, trade services, cash management and treasury services. Through its other subsidiaries, it carries out the following businesses: capital raising, issuing house services, financial advisory services, mergers and acquisitions advisory, security trading, asset management, stockbroking, trusteeship, registrarship, as well as custodial services.
2. BASIS OF PREPARATION
(a) Statement of complianceThe consolidated and separate financial statements have been prepared in accordance with the International Financial Reporting Standards (IFRS). These are the Bank and Group’s first financial statements prepared in accordance with IFRS and therefore, IFRS 1-First-time Adoption of International Financial Reporting Standards has been applied.
An explanation of how the transition to IFRS has affected the reported financial position, financial performance and cash flows of the Group and the Bank is provided in note 42. This note includes reconciliations of equity and profit or loss for comparative periods reported under the Statement of Accounting Standards issued by the Financial Reporting Council of Nigeria (formerly Nigerian Accounting Standards Board) to those reported for this period under IFRS.
(b) Basis of measurementThese financial statements are prepared on the historical cost basis except for the assets and liabilities carried at fair value.
(c) Functional and presentation currencyThese consolidated and separate financial statements are presented in Nigerian Naira, which is the Bank’s functional currency. Except otherwise indicated, financial information presented in Naira have been rounded to the nearest million.
(d) Use of estimates and judgementsThe preparation of financial statements requires the directors to make judgements, estimates and assumptions that affect the application of policies and reported amounts of assets and liabilities, incomes and expenses. The estimates and associated assumptions are based on historical experience and various other factors that are believed to be reasonable under the circumstances, the results of which form the basis of making the judgements about carrying values of assets and liabilities that are not readily apparent from other sources. Actual results may differ from these estimates.
The estimates and underlying assumptions are reviewed on an ongoing basis. Revisions to accounting estimates are recognised in the period in which the estimate is revised, if the revision affects only that period, or in the period of the revision and future periods, if the revision affects both current and future periods. The areas involving a higher degree of judgement or complexity, or areas where assumptions and estimates are significant to the consolidated financial statements are disclosed in note 5.
3. SIGNIFICANT ACCOUNTING POLICIES
(a) Basis of consolidation(i) Subsidiaries
Subsidiaries are entities controlled by the Group. Control exists when the Group has the power to govern the financial and operating policies of an entity so as to obtain benefits from its activities. In assessing control, potential voting rights that presently are exercisable are taken into account. The financial statements of subsidiaries are included in the consolidated financial statements from the date that control commences until the date that control ceases.
The accounting policies of subsidiaries have been changed, where necessary, to align with the policies adopted by the Group. Losses applicable to the non-controlling interests in a subsidiary are allocated to the non-controlling interests, even if doing so causes the non-controlling interests to have a deficit balance.
In the separate financial statements, investments in subsidiaries are carried at cost less impairment.
Notes to the consolidated and separate financial statements

Annual Report 2012
64
(ii) Business combinations Acquisitions prior to 1 January 2011
As part of its transition to IFRSs, the Group elected not to restate those business combinations that occurred before 1 January 2011, its date of transition to IFRSs. Under Nigeria GAAP, goodwill was measured as the excess of the aggregate of the consideration transferred and the fair value of non-controlling interest over the net identifiable assets acquired and liabilities assumed.
Acquisitions subsequent to 1 January 2011
Business combinations are accounted for using the acquisition method as at the acquisition date, which is the date on which control is transferred to the Group.
The Group measures goodwill at the acquisition date as the total of:
– the fair value of the consideration transferred; plus
– the recognised amount of any non-controlling interest in the acquiree; plus if the business combination is achieved in stages, the fair value of the existing equity interest in the acquiree;
– less the net recognised amount (generally fair value) of the identifiable assets acquired and liabilities assumed.
When this total is negative, a bargain purchase is recognised immediately in profit or loss.
The Group recognises any non-controlling interest in the acquiree on an acquisition-by-acquisition basis either at fair value or at the non-controlling interests’ proportionate share of the recognised amounts of the identifiable net assets for components that are present ownership interests and entitle their holders to proportionate share of the net assets in the event of liquidation. All other components of non-controlling interests are measured at fair value.
The consideration transferred does not include amounts related to the settlement of pre-existing relationships. Such amounts are generally recognsied in profit or loss. Costs related to the acquisition, other than those associated with the issue of debt or equity securities that the Group incurs in connection with a business combination are expensed as incurred.
Any contingent consideration payable is recognised at fair value at the acquisition date. If the contingent consideration is classified as equity, it is not remeasured and settlement is accounted for within equity. Otherwise, subsequent changes to the fair value of the contingent consideration are recognised in profit or loss.
(iii) Loss of control Upon the loss of control, the Group derecognises the assets and liabilities of the subsidiary, any non-controlling interests and the other components of equity related to the subsidiary. Any surplus or deficit arising on the loss of control is recognised in profit or loss. If the Group retains any interest in the previous subsidiary, then such interest is measured at fair value at the date that control is lost. Subsequently, it is accounted for as an equity accounted investee or in accordance with the Group’s accounting policy for financial instruments depending on the level of influence retained.
(iv) Acquisitions under common control Business combinations between entities that are under common control are accounted for at book values. The assets and liabilities acquired or transferred are recognised or derecognised at the carrying amounts previously recognised in the Group controlling shareholder’s consolidated financial statements. The components of equity of the acquired entities are added to the same components within the Group equity and any gain/loss arising is recognised directly in equity.
(v) Associates Associates are those entities in which the Group has significant influence, but not control, over the financial and operating policies. The consolidated financial statements include the Group’s share of the total recognised gains and losses of associates on an equity accounted basis from the date that significant influence commences until the date that significant influence ceases. When the Group’s share of losses exceeds its interest in an associate, the Group’s carrying amount is reduced to nil and
Notes to the consolidated and separate financial statementscontinued …

65
recognition of further losses is discontinued except, to the extent that the Group has incurred legal or constructive obligations or made payments on behalf of an associate.
In the separate financial statements, investments in associates are carried at cost less impairment.
(vi) Joint ventures Interests in jointly controlled entities are recognised using the equity accounting method in the Group financial statements but are recognised at cost less impairment in the separate financial statements.
(vii) Funds managementThe Group manages and administers assets held in unit trusts and other investment vehicles on behalf of investors. The financial statements of these entities are not included in the consolidated financial statements, except when the Group controls the entity.
(viii) Transactions eliminated on consolidationIntra-group balances and any unrealised gains or losses or incomes and expenses arising from intra-group transactions, are eliminated in preparing the consolidated financial statements. Unrealised gains arising from transactions with associates are eliminated to the extent of the Group’s interest in the entity. Unrealised losses are eliminated in the same way as unrealised gains, but only to the extent that there is no evidence of impairment.
(b) Foreign currency(i) Foreign currency transactions
Foreign currency transactions are recorded at the rate of exchange on the date of the transaction. At the reporting date, monetary assets and liabilities denominated in foreign currencies are reported using the closing exchange rate. Exchange differences arising on the settlement of transactions at rates different from those at the date of the transaction, as well as unrealised foreign exchange differences on unsettled foreign currency monetary assets and liabilities, are recognised in profit or loss.
Unrealised exchange differences on non-monetary financial assets are a component of the change in their entire fair value. For a non-monetary financial asset held for trading and for non-monetary financial assets designated at fair value through profit or loss, unrealised exchange differences are recognised in profit or loss. For non-monetary financial investments available-for-sale, unrealised exchange differences are recorded in other comprehensive income until the asset is sold or becomes impaired.
(ii) Foreign operationsThe assets and liabilities of foreign operations, including goodwill and fair value adjustments arising on acquisition, are translated to Nigerian Naira at exchange rates at each reporting date. The incomes and expenses of foreign operations are translated to Nigerian Naira at exchange rates at average rates.
Foreign currency differences are recognised in other comprehensive income, and presented in the foreign currency translation reserve in equity. However, if the operation is a non-wholly owned subsidiary, then the relevant proportionate share of the translation difference is allocated to the non-controlling interest. When a foreign operation is disposed of such that control, significant influence or joint control is lost, the cumulative amount in the translation reserve related to that foreign operation is reclassifeid to profit or loss as part of the gain or loss on disposal.
(c) InterestInterest income and expense for all interest-bearing financial instruments, except for those classified at fair value through profit or loss, are recognised within ‘interest income’ and ‘interest expense’ in the statement of comprehensive income using the effective interest method. The effective interest rate is the rate that exactly discounts the estimated future cash payments and receipts through the expected life of the financial asset or liability (or, where appropriate, a shorter period) to the net carrying amount of the financial asset or liability.
The calculation of the effective interest rate includes all transaction costs and fees paid or received that are an integral part of the effective interest rate. Transaction costs include incremental costs that are directly attributable to the acquisition or issue of a financial asset or liability.
Interest income and expense on all trading assets and liabilities are considered to be incidental to the Group’s trading operations and are presented together with all other changes in the fair value of trading assets and liabilities in net trading income.
Annual Report 2012
66
(d) Fees and commissionsFees and commission income and expenses that are integral to the effective interest rate on a financial asset or liability are included in the measurement of the effective interest rate. Other fees and commission income, including account servicing fees, investment management and other fiduciary activity fees, sales commission, placement fees and syndication fees, are recognised as the related services are performed.
When a loan commitment is not expected to result in the draw-down of a loan, loan commitment fees are recognised on a straight-line basis over the commitment period.
Other fees and commission expenses relates mainly to transaction and service fees, which are expensed as the services are received.
(e) Net trading incomeNet trading income comprises gains less losses related to trading assets and liabilities, and includes all realised and unrealised fair value changes, interest, dividends and foreign exchange differences.
(f) DividendsDividend income is recognised when the right to receive income is established. Dividends are reflected as a component of other income.
(g) LeasesPayments made under operating leases are recognised in profit or loss on a straight-line basis over the term of the lease. Lease incentives received are recognised as an integral part of the total lease expense, over the term of the lease.
Minimum lease payments made under finance leases are apportioned between the finance expense and the reduction of the outstanding liability. The finance expense is allocated to each period during the lease term, so as to produce a constant periodic rate of interest on the remaining balance of the liability. Contingent lease payments are accounted for by revising the minimum lease payments over the remaining term of the lease when the lease adjustment is confirmed.
Leases in terms of which the Group assumes substantially all the risks and rewards incidental to ownership are classified as finance leases. Upon initial recognition the leased asset is measured at an amount equal to the lower of its fair value and the present value of the minimum lease payments. Subsequent to initial recognition, the asset is accounted for in accordance with the accounting policy applicable to that asset.
Other leases are operating leases and are not recognised on the Group’s statement of financial position.
(h) Income tax Income tax expense comprises current and deferred tax. Income tax expense is recognised in profit or loss except to the extent that it relates to items recognised directly in equity, in which case it is recognised in equity.
Current tax is the expected tax payable on taxable income for the year, using tax rates enacted or substantively enacted at the reporting date, and any adjustment to tax payable in respect of previous years.
Deferred tax is recognised in respect of temporary differences between the carrying amounts of assets and liabilities for financial reporting purposes and the amounts used for taxation purposes. Deferred tax is not recognised for the following temporary differences: the initial recognition of goodwill, the initial recognition of assets or liabilities in a transaction that is not a business combination and that affects neither accounting nor taxable profit, and differences relating to investments in subsidiaries to the extent that they probably will not reverse in the foreseeable future. Deferred tax is measured at the tax rates that are expected to be applied to the temporary differences when they reverse, based on laws that have been enacted or substantively enacted by the reporting date.
A deferred tax asset is recognised only to the extent that it is probable that future taxable profits will be available against which the asset can be utilised. Deferred tax assets are reviewed at each reporting date and are reduced to the extent that it is no longer probable that the related tax benefit will be realised.
Notes to the consolidated and separate financial statementscontinued …

67
Deferred tax assets and liabilities are offset if there is a legally enforceable right to offset current tax liabilities against current tax assets, and they relate to taxes levied by the same tax authority on the same taxable entity, or on different tax entities, but they intend to settle current tax liabilities and assets on a net basis or their tax assets and liabilities will be realised simultaneously.
(i) Financial instrumentsRecognition and initial measurementThe Group initially recognises loans and advances, deposits, debt securities issued and subordinated liabilities on the date that they are originated. All other financial assets and liabilities are initially recognised on the trade date at which the Group becomes a party to the contractual provisions of the instrument.
A financial asset or financial liability is measured initially at fair value plus, for an item not at fair value through profit or loss, direct and incremental transaction costs that are directly attributable to its acquisition or issue.
Subsequent measurementSubsequent to initial measurement, financial instruments are measured either at fair value or amortised cost, depending on their classification:
(i) Held-to-maturityHeld-to-maturity investments are non-derivative financial assets with fixed determinable payments and fixed maturities that management has both the positive intent and ability to hold to maturity, and which are not designated as fair value through profit or loss or as available for sale or as loans and receivables. Were the Group to sell more than an insignificant amount of held-to-maturity assets, the entire category would be tainted and reclassified as available-for-sale assets and the difference between amortised cost and fair value will be accounted for in other comprehensive income.
Held-to-maturity investments are carried at amortised cost, using the effective interest method, less any provisions for impairment.
Interest on held-to-maturity investments is included in the consolidated income statement and reported as ‘Interest and similar income’. In the case of an impairment, the impairment loss is reported as a deduction from the carrying value of the investment and recognised in the consolidated income statement as ‘Net gains/(losses) on investment securities’.
(ii) Financial assets at fair value through profit or lossThis category has two sub-categories: financial assets held for trading, and those designated at fair value through profit or loss upon initial recognition. A financial asset is classified as held-for-trading if acquired or incurred principally for the purpose of selling in the short term or it is part of a portfolio of identified financial instruments that are managed together and for which there is evidence of a recent pattern of short-term profit-making. Derivatives are also categorised as held-for-trading unless they are designated as hedges and effective as hedging instruments. All derivatives are carried as assets when fair value is positive and as liabilities when fair value is negative.
Financial assets may be designated at fair value through profit or loss when:
– the designation eliminates or significantly reduces measurement or recognition inconsistency that would otherwise arise from measuring assets or liabilities on different basis; or
– a group of financial assets is managed and its performance evaluated on a fair value basis; and
– the financial assets consist of debt host and an embedded derivatives that must be separated.
Subsequent to initial recognition, the fair values are remeasured at each reporting date. All gains and losses arising from changes therein are recognised in profit or loss in ‘net trading income’ for trading assets.
(iii) Available-for-saleFinancial assets classified by the Group as available-for-sale financial assets are generally those that are not designated as another category of financial assets, or investments held for an indefinite period of time, which may be sold in response to needs for liquidity or changes in interest rates, exchange rates or equity prices.
Available-for-sale financial assets are subsequently carried at fair value. Unrealised gains and losses arising from changes in the fair value of available-for-sale financial assets are recognised directly in fair value reserve in other comprehensive income until the financial asset is derecognised or impaired. When available-for-sale financial assets are disposed of, the fair value adjustments accumulated in other comprehensive income are recognised in profit or loss.

Annual Report 2012
68
Interest income, calculated using the effective interest method, foreign currency gains and losses on monetary assets classified as available-for-sale is recognised in profit or loss. Dividends received on available-for-sale instruments are recognised in profit or loss when the Group’s right to receive payment has been established.
(iv) Loans and receivablesLoans and receivables are non-derivative financial assets with fixed or determinable payments that are not quoted in an active market, other than those classified by the Group as fair value through profit or loss or available-for-sale or those for which the holder may not recover substantially all of its initial investment, other than because of credit deterioration.
Loans and receivables are measured at amortised cost using the effective interest method, less any impairment losses. Transaction costs that are integral to the effective rate are capitalised to the value of the loan and amortised through interest income as part of the effective interest rate. All of the Group’s advances are included in the loans and receivables category.
(v) Financial liabilitiesThe Group classifies its financial liabilities as measured at amortised cost or fair value through profit or loss. The financial liabilities at fair value through profit or loss are in two sub-categories: financial liabilities classified as held for trading and financial liabilities designated at fair value through profit or loss.
A financial liability is classified as held for trading if it is acquired or incurred principally for the purpose of selling or repurchasing it in the near term or if it is part of a portfolio of identified financial instruments that are managed together and for which there is evidence of a recent actual pattern of short-term profit-taking. Financial liabilities held for trading also include obligations to deliver financial assets borrowed by a short seller. Those financial instruments are recognised in the statement of financial position as ‘Financial liabilities held for trading’.
Where an equity instrument does not have an active market and its fair value cannot be measured reliably using valuation techniques, it is carried at cost less impairment.
Fair value measurementSubsequent to initial recognition, the fair values of financial instruments are based on quoted market prices or dealer price quotations for financial instruments traded in active markets. If the market for a financial asset is not active or the instrument is unlisted, the fair value is determined by using applicable valuation techniques. These include the use of recent arm’s length transactions, discounted cash flow analyses, pricing models and valuation techniques commonly used by market participants.
Where discounted cash flow analyses are used, estimated cash flows are based on management’s best estimates and the discount rate is a market-related rate at the reporting date from a financial asset with similar terms and conditions. Where pricing models are used, inputs are based on observable market indicators at the reporting date and profits or losses are only recognised to the extent that they relate to changes in factors that market participants will consider in setting a price.
Impairment of financial assets(i) Assets carried at amortised cost
The Group assesses at each reporting date whether there is objective evidence that a financial asset or group of financial assets is impaired. A financial asset or a group of financial assets is impaired and impairment losses are incurred if, and only if, there is objective evidence of impairment as a result of one or more events that occurred after the initial recognition of the assets (a ‘loss event’), and that loss event (or events) has an impact on the estimated future cash flows of the financial asset or group of financial assets that can be reliably estimated.
The following factors are considered in assessing objective evidence of impairment:
– whether a loan or other financial assets or any obligation is more than 90 days past due;
– the Group consents to a restructuring of the obligation, resulting in a diminished financial obligation, demonstrated by a material forgiveness of debt or postponement of scheduled payments; or
Notes to the consolidated and separate financial statementscontinued …

69
– there is an observable data indicating that there is a measurable decrease in the estimated future cash flows of a group of financial assets, although the decrease cannot yet be identified with specific individual financial assets.
The Group first assesses whether objective evidence of impairment exists individually for financial assets that are individually significant, and individually or collectively for financial assets that are not individually significant.
If the Group determines that no objective evidence of impairment exists for an individually assessed financial asset, whether significant or not, it includes the asset in a group of financial assets with similar credit risk characteristics and collectively assesses them for impairment. Assets that are individually assessed for impairment and for which an impairment loss is or continues to be recognised, are not included in a collective assessment of impairment.
For the purposes of a collective evaluation of impairment, financial assets are grouped on the basis of similar credit risk characteristics (that is, on the basis of the Bank’s grading process that considers asset type, industry, geographical location, collateral type, past-due status and other relevant factors). Those characteristics are relevant to the estimation of future cash flows for groups of such assets by being indicative of the debtors’ ability to pay all amounts due according to the contractual terms of the assets being evaluated.
Future cash flows in a group of financial assets that are collectively evaluated for impairment are estimated on the basis of the contractual cash flows of the assets in the Group and historical loss experience for assets with credit risk characteristics similar to those in the Group. Historical loss experience is adjusted on the basis of current observable data to reflect the effects of current conditions that did not affect the period on which the historical loss experience is based and to remove the effects of conditions in the historical period that do not currently exist.
Estimates of changes in future cash flows for groups of assets reflect changes in related observable data from period to period (for example, changes in unemployment rates, property prices, payment status, or other factors indicative of changes in the probability of losses in the Bank and their magnitude). The methodology and assumptions used for estimating future cash flows are reviewed regularly by the Bank to reduce any differences between loss estimates and actual loss experience.
When a loan is uncollectible, it is written off against the related allowance for loan impairment. Such loans are written off after all the necessary procedures have been completed and the amount of the loss has been determined. Impairment charges relating to loans and advances to banks and customers are classified in loan impairment charges whilst impairment charges relating to investment securities (held-to-maturity and loans and receivables categories) are classified in ‘Net gains/(losses) on investment securities’.
If, in a subsequent period, the amount of the impairment loss decreases and the decrease can be related objectively to an event occurring after the impairment was recognised (such as an improvement in the debtor’s credit rating), the previously recognised impairment loss is reversed by adjusting the allowance account. The amount of the reversal is recognised in profit or loss.
If there is objective evidence that an impairment loss on a loan and receivable or a held-to-maturity asset has been incurred, the amount of the loss is measured as the difference between the asset’s carrying amount and the present value of estimated future cash flows (excluding future credit losses that have not been incurred), discounted at the asset’s original effective interest rate. The carrying amount of the asset is reduced through the use of an allowance account and the amount of the loss is recognised in profit or loss.
The calculation of the present value of the estimated future cash flows of a collateralised financial asset reflects the cash flows that may result from foreclosure, less costs for obtaining and selling the collateral, whether or not foreclosure is probable. For the purposes of a collective evaluation of impairment, financial assets are grouped on the basis of similar credit risk characteristics (i.e. on the basis of the Group’s grading process which considers asset type, industry, geographic location, collateral type, past-due status and other relevant factors). These characteristics are relevant to the estimation of future cash flows for groups of such assets being indicative of the debtors’ ability to pay all amounts due according to the contractual terms of the assets being evaluated.
If a loan or held-to-maturity investment has a variable interest rate, the discount rate for measuring any impairment loss is the current effective interest rate determined under the contract. As a practical expedient, the Bank may measure impairment on the basis of an instrument’s fair value using an observable market price.

Annual Report 2012
70
Future cash flows in a group of financial assets that are collectively evaluated for impairment are estimated on the basis of the historical loss experience for assets with credit risk characteristics similar to those in the Group. Historical loss experience is adjusted on the basis of current observable data to reflect the effects of current conditions that did not affect the period on which the historical loss experience is based, and to remove the effects of conditions in the historical period that do not exist currently.
To the extent that a loan is irrecoverable, it is written off against the related allowance for loan impairment. Such loans are written off after all the necessary procedures have been completed and the amount of the loss has been determined. Subsequent recoveries of amounts previously written off decrease the amount of the allowance for loan impairment in profit or loss. If, in a subsequent period, the amount of the impairment loss decreases and the decrease can be related objectively to an event occurring after the impairment was recognised (such as an improvement in the debtor’s credit rating), the previously recognised impairment loss is reversed by adjusting the allowance account. The amount of the reversal is recognised in profit or loss.
(ii) Available-for-sale financial assetsAvailable-for-sale financial assets are impaired if there is objective evidence of impairment, resulting from one or more loss events that occurred after initial recognition but before the reporting date, that have an impact on the future cash flows of the asset. In addition, an available-for-sale equity instrument is generally considered impaired if a significant or prolonged decline in the fair value of the instrument below its cost has occurred. Where an available-for-sale asset, which has been remeasured to fair value directly through equity, is impaired, the impairment loss is recognised in profit or loss. If any loss on the financial asset was previously recognised directly in equity as a reduction in fair value, the cumulative net loss that had been recognised in equity is transferred to profit or loss and is recognised as part of the impairment loss. The amount of the loss recognised in profit or loss is the difference between the acquisition cost and the current fair value, less any previously recognised impairment loss.
If, in a subsequent period, the amount relating to an impairment loss decreases and the decrease can be linked objectively to an event occurring after the impairment loss was recognised, where the instrument is a debt instrument, the impairment loss is reversed through profit or loss. An impairment loss in respect of an equity instrument classified as available-for-sale is not reversed through profit or loss but accounted for directly in equity.
Offsetting financial instrumentsFinancial assets and liabilities are set off and the net amount presented in the statement of financial position when, and only when, the Group has a legal right to set off the amounts and intends either to settle on a net basis or to realise the asset and settle the liability simultaneously.
Incomes and expenses are presented on a net basis only when permitted under IFRSs, or for gains and losses arising from a group of similar transactions such as in the Group’s trading activity.
Sale and repurchase agreements and lending of securitiesSecurities sold subject to linked repurchase agreements are disclosed in the financial statements as pledged assets when the transferee has the right by contract or custom to sell or repledge the collateral. The liability to the counterparty is included in deposit from banks, or other deposits, as appropriate.
Securities purchased under agreements to resell are recorded as loans granted under resale agreements and included under loans and advances to other banks or customers as appropriate. The difference between the sale and repurchase price is treated as interest and amortised over the life of the repurchase agreement using the effective interest method.
Derecognition of financial instrumentsThe Group derecognises a financial asset when the contractual rights to the cash flows from the asset expire, or it transfers the rights to receive the contractual cash flows on the financial asset in a transaction in which substantially all the risks and rewards of ownership of the financial asset are transferred, or has assumed an obligation to pay those cash flows to one or more recipients, subject to certain criteria.
Notes to the consolidated and separate financial statementscontinued …

71
Any interest in transferred financial assets that is created or retained by the Group is recognised as a separate asset or liability.
The Group may enter into transactions whereby it transfers assets recognised on its statement of financial position, but retains either all risks and rewards of the transferred assets or a portion of them. If all or substantially all risks and rewards are retained, then the transferred assets are not derecognised from the statement of financial position. In transactions where the Group neither retains nor transfers substantially all the risks and rewards of ownership of a financial asset, it derecognises the asset if control over the asset is lost.
The rights and obligations retained in the transfer are recognised separately as assets and liabilities as appropriate. In transfers where control over the asset is retained, the Group continues to recognise the asset to the extent of its continuing involvement, determined by the extent to which it is exposed to changes in the value of the transferred asset.
The Group derecognises a financial liability when its contractual obligations are discharged or cancelled or expire.
Reclassification of financial assetsThe Group may choose to reclassify a non-derivative financial asset held for trading out of the held-for-trading category if the financial asset is no longer held for the purpose of selling it in the near-term. Financial assets other than loans and receivables are permitted to be reclassified out of the held-for-trading category only in rare circumstances arising from a single event that is unusual and highly unlikely to recur in the near-term. In addition, the Bank may choose to reclassify financial assets that would meet the definition of loans and receivables out of the held-for-trading or available-for-sale categories if the Bank has the intention and ability to hold these financial assets for the foreseeable future or until maturity at the date of reclassification.
Reclassifications are made at fair value as of the reclassification date. Fair value becomes the new cost or amortised cost as applicable, and no reversals of fair value gains or losses recorded before reclassification date are subsequently made. Effective interest rates for financial assets reclassified to loans and receivables and held-to-maturity categories are determined at the reclassification date. Further increases in estimates of cash flows adjust effective interest rates prospectively.
On reclassification of a financial asset out of the ‘at fair value through profit or loss’ category, all embedded derivatives are re-assessed and, if necessary, separately accounted for.
(j) Cash and cash equivalentsCash and cash equivalents include notes and coins in hand, unrestricted balances held with central banks and highly liquid financial assets with original maturities of less than three months, which are subject to insignificant risk of changes in their fair value, and are used by the Group in the management of its short-term commitments.
Cash and cash equivalents are carried at amortised cost in the statement of financial position.
(k) Trading assetsTrading assets are those assets that the Group acquires principally for the purpose of selling in the near term, or holds as part of a portfolio that is managed together for short-term profit or position taking.
Trading assets are measured at fair value with changes in fair value recognised as part of net trading income in profit or loss.
(l) Derivative financial instrumentsDerivatives are initially recognised at fair value on the date on which a derivative contract is entered into and are subsequently remeasured at their fair value. Fair values are obtained from quoted market prices in active markets, including recent market transactions, and valuation techniques. All derivatives are carried as assets when fair value is positive and as liabilities when fair value is negative.
Certain derivatives embedded in other financial instruments are treated as separate derivatives when their economic characteristics and risks are not closely related to those of the host contract and the host contract is not carried at fair value through profit or loss. These embedded derivatives are separately accounted for at fair value with changes in fair value recognised in the income statement unless the Group chooses to designate the hybrid contracts at fair value through profit or loss.

Annual Report 2012
72
(m) Property and equipment(i) Recognition and measurement
Items of property and equipment are carried at cost less accumulated depreciation and impairment losses. Cost includes expenditures that are directly attributable to the acquisition of the asset. When parts of an item of property and equipment have different useful lives, they are accounted for as separate items (major components) of property and equipment.
(ii) Subsequent costsThe cost of replacing part of an item of property and equipment is recognised in the carrying amount of the item if it is probable that the future economic benefits embodied within the part will flow to the Group and its cost can be measured reliably. The costs of the day-to-day servicing of property and equipment are recognised in profit or loss as incurred.
(iii) DepreciationDepreciation is recognised in profit or loss on a straight-line basis over the estimated useful lives of each part of an item of property and equipment since this most closely reflects the expected pattern of consumption of the future economic benefits embodied in the asset. Leased assets are depreciated over the shorter of the lease term and their useful lives. Depreciation begins when an asset is available for use and ceases at the earlier of the date that the asset is derecognised or classified as held for sale in accordance with IFRS 5: Non-current Assets Held for Sale and Discontinued Operations.
The estimated useful lives for the current and comparative period are as follows:
Leasehold improvements Over the shorter of the useful life of item or lease period
Buildings 40 years
Computer hardware 5 years
Furniture and fittings 5 years
Equipment 5 years
Motor vehicles 5 years
Other transportation equipment* Over the useful life of the specific asset
Capital work in progress Not depreciated
Land Not depreciated
* Other transportation equipment include major components with different useful lives. They are accounted for as separate major components and are depreciated over the respective useful lives of between ten (10) and twenty (20) years respectively.
Work in progress represents construction cost incurred on assets that are not available for use. On completion of construction, the related amounts are transferred to the appropriate category of property and equipment.
Depreciation methods, useful lives and residual values are reassessed at each reporting date and adjusted if appropriate.
(iv) De-recognitionAn item of property and equipment is derecognised on disposal or when no future economic benefits are expected from its use or disposal. Any gain or loss arising on derecognition of the asset (calculated as the difference between the net disposal proceeds and the carrying amount of the asset) is included in profit or loss in the year the asset is derecognised.
Notes to the consolidated and separate financial statementscontinued …

73
(n) Intangible assets(i) Goodwill
Goodwill represents the excess of consideration over the Group’s interest in net fair value of net identifiable assets, liabilities and contingent liabilities of the acquired subsidiaries at the date of acquisition. When the excess is negative, it is recognised immediately in profit or loss. Goodwill is measured at cost less accumulated impairment losses.
Subsequent measurementGoodwill is allocated to cash-generating units or groups of cash-generating units for the purpose of impairment testing. The allocation is made to those cash-generating units or groups of cash-generating units that are expected to benefit from the business combination in which the goodwill arose. Goodwill is tested annually as well as whenever a trigger event has been observed for impairment by comparing the present value of the expected future cash flows from a cash-generating unit with the carrying value of its net assets, including attributable goodwill. Impairment losses on goodwill are not reversed.
(ii) SoftwareSoftware acquired by the Group is stated at cost less accumulated amortisation and accumulated impairment losses.
Expenditure on internally developed software is recognised as an asset when the Group is able to demonstrate its intention and ability to complete the development and use the software in a manner that will generate future economic benefits, and can reliably measure the costs to complete the development. The capitalised costs of internally developed software include all costs directly attributable to developing the software, and are amortised over its useful life. Internally developed software is stated at capitalised cost less accumulated amortisation and impairment.
Subsequent expenditure on software assets is capitalised only when it increases the future economic benefits embodied in the specific asset to which it relates. All other expenditure is expensed as incurred.
Amortisation is recognised in profit or loss on a straight-line basis over the estimated useful life, from the date that it is available for use. The amortisation method and useful life of software are reassessed at each financial year-end and adjusted if appropriate.
(o) Repossessed collateralRepossessed collateral represents financial and non-financial assets acquired by the Group in settlement of overdue loans. The assets are initially recognised at fair value when acquired and included in the relevant assets depending on the nature and the Group’s intention in respect of recovery of these assets, and are subsequently remeasured and acounted for in accordance with the accounting policies for these categories of assets. Where repossessed collateral results in acquiring control over a business, the business combination is accounted for using the purchase method of accounting with fair value of the settled loan representing the cost of acquisition (refer to the accounting policy for consolidation). Accounting policy for associates is applied to repossessed shares where the Group obtains significant influence, but not control. The cost of the associate is the fair value of the loan settled by repossessing the pledged shares.
(p) Deposits and debt securities issuedWhen the Group sells a financial asset and simultaneously enters into a “repo” or “stock lending” agreement to repurchase the asset (or a similar asset) at a fixed price on a future date, the arrangement is accounted for as a deposit, and the underlying asset continues to be recognised in the Group’s financial statements.
The Group classifies capital instruments as financial liabilities or equity instruments in accordance with the substance of the contractual terms of the instrument.
Deposits are initially measured at fair value plus transaction costs, and subsequently measured at their amortised cost using the effective interest method, except where the Group chooses to carry the liabilities at fair value through profit or loss.

Annual Report 2012
74
(q) ProvisionsA provision is recognised if, as a result of a past event, the Group has a present legal or constructive obligation that can be estimated reliably, and it is probable that an outflow of economic benefits will be required to settle the obligation. Provisions are determined by discounting the expected future cash flows at a pre-tax rate that reflects current market assessments of the time value of money and, where appropriate, the risks specific to the liability.
A provision for restructuring is recognised when the Group has approved a detailed and formal restructuring plan, and the restructuring either has commenced or has been announced publicly. Future operating costs are not provided for.
A provision for onerous contracts is recognised when the expected benefits to be derived by the Group from a contract are lower than the unavoidable cost of meeting its obligations under the contract. The provision is measured at the present value of the lower of the expected cost of terminating the contract and the expected net cost of continuing with the contract. Before a provision is established, the Group recognises any impairment loss on the assets associated with that contract.
(r) Financial guarantee contractsFinancial guarantee contracts are contracts that require the Group (issuer) to make specified payments to reimburse the holder for a loss it incurs because a specified debtor fails to make payment when due in accordance with the original or modified terms of a debt instrument.
Financial guarantee liabilities are initially recognised at their fair value, which is the premium received, and then amortised over the life of the financial guarantee. Subsequent to initial recognition, the financial guarantee liability is measured at the higher of the present value of any expected payment, when a payment under the guarantee has become probable, and the unamortised premium. Financial guarantees are included within other liabilities.
(s) Employee benefitsPost-employment benefits
Defined contribution plans
Obligations for contributions to defined contribution plans are recognised as an expense in profit or loss when they are due.
(t) Share capital and reserves(i) Share issue costs
Incremental costs directly attributable to the issue of an equity instrument are deducted from the initial measurement of the equity instruments.
(ii) Dividend on ordinary sharesDividends on the Bank’s ordinary shares are recognised in equity in the period in which they are paid or, if earlier, approved by the Bank’s shareholders.
(iii) Treasury sharesWhere the Bank or any member of the Group purchases the Bank’s shares, the consideration paid is deducted from the shareholders’ equity as treasury shares until they are cancelled. Where such shares are subsequently sold or reissued, any consideration received is included in shareholders’ equity.
(u) Earnings per shareThe Group presents basic earnings per share (EPS) data for its ordinary shares. Basic EPS is calculated by dividing the profit or loss attributable to ordinary shareholders of the Bank by the weighted average number of ordinary shares outstanding during the period.
Diluted EPS is determined by adjusting the profit or loss attributable to ordinary shareholders and the weighted average number of ordinary shares outstanding for the effects of all dilutive potential ordinary shares.
Notes to the consolidated and separate financial statementscontinued …

75
(v) Fiduciary activitiesThe Group commonly acts as trustees in other fiduciary capacities that result in the holding or placing of assets on behalf of individuals, trusts, retirement benefit plans and other institutions. These assets and incomes arising thereon are excluded from these financial statements, as they are not assets of the Group.
(w) Segment reportingAn operating segment is a component of the Group that engages in business activities from which it may earn revenues and incur expenses, including revenues and expenses that relate to transactions with any of the Group’s other components, whose operating results are reviewed regularly by the Chief Executive Officer of the Group, being the chief operating decision-maker, to make decisions about resources allocated to each segment and assess its performance, and for which discrete financial information is available. All costs that are directly traceable to the operating segments are allocated to the segment concerned, while indirect costs are allocated based on the benfits derived from such cost.
(x) New standards and interpretations not yet adoptedA number of new standards, amendments to standards and interpretations are effective for annual periods beginning after 1 January 2012, and have not been applied in preparing these financial statements.
The Group plans to adopt the standards below on their respective effective dates. Management is in the process of assessing the impact of the standards on the Group:
(i) IAS 27: (Separate Financial Statements (effective on or after 1 January 2013)
IAS 27: (revised 2011) includes the requirements relating to separate financial statements.
(ii) IAS 28: Investments in Associates and Joint Ventures (effective on or after 1 January 2013)
IAS 28: (revised 2011) includes the requirements for associates and joint ventures that have to be equity accounted following the issue of IFRS 11.
(iii) IFRS 9: Financial Instruments (effective on or after 1 January 2015)
IFRS 9 is the first standard issued as part of a wider project to replace IAS 39. IFRS 9 retains but simplifies the mixed measurement model and establishes two primary measurement categories for financial assets: amortised cost and fair value. The basis of classification depends on the entity’s business model and the contractual cash flow characteristics of the financial asset. The guidance in IAS 39 on impairment of financial assets and hedge accounting continues to apply.
(iv) IFRS 10: Consolidated Financial Statements (effective on or after 1 January 2013)
The objective of IFRS 10 is to establish principles for the presentation and preparation of consolidated financial statements when an entity controls one or more other entity. It defines the principle of control, and establishes controls as the basis for consolidation. It sets out how to apply the principle of control to identify whether an investor controls an investee and therefore must consolidate the investee. It also sets out the accounting requirements for the preparation of consolidated financial statements.
(v) IFRS 11: Joint Arrangements (effective on or after 1 January 2013)
IFRS 11 is a more realistic reflection of joint arrangements by focusing on the rights and obligations of the parties to the arrangement rather than its legal form. There are two types of joint arrangement: joint operations and joint ventures. Joint operations arise where a joint operator has rights to the assets and obligations relating to the arrangement and therefore accounts for its share of assets, liabilities, revenue and expenses. Joint ventures arise where the joint venture has rights to the net assets of the arrangement and therefore equity accounts for its interest. Proportional consolidation of joint ventures is no longer allowed.
(vi) IFRS 12: Disclosure of Interests in other Entities (effective on or after 1 January 2013)
IFRS 12 includes the disclosure requirements for all forms of interests in other entities, including joint arrangements, associates, special purpose vehicles and other off balance sheet vehicles.

Annual Report 2012
76
(vii) IFRS 13: Fair Value Measurement (effective on or after 1 January 2013)
IFRS 13 aims to improve consistency and reduce complexity by providing a precise definition of fair value and a single source of fair value measurement and disclosure requirements for use across IFRSs. The requirements, which are largely aligned between IFRS and US GAAP, do not extend the use of fair value accounting but provide guidance on how it should be applied where its use is already required or permitted by other standards within IFRS or US GAAP.
(y) Special purpose entitiesSpecial purpose entities (SPEs) are entities that are created to accomplish a narrow and well defined objective such as the securitisation of particular assets, or the execution of a specific borrowing or lending transaction. An SPE is consolidated if, based on an evaluation of the substance of its relationship with the Group and the SPE’s risks and rewards, the Group concludes that it controls the SPE. The following circumstances may indicate a relationship in which, in substance, the Group controls and consequently consolidates an SPE:
– the activities of the SPE are being conducted on behalf of the Group according to its specific needs so that the Group obtains from the SPE’s operation;
– the Group has the decision-making powers to obtain the majority of the benefits of the activities of the SPE or, by setting up an ‘autopilot’ mechanism, the Group has delegated these decision-making powers;
– the Group has rights to obtain the majority of the benfits of the SPE and therefore may be exposed to risks incident to the activities of the SPE; and
– the Group retains the majority of the residual or ownership risks related to the SPE or its assets in order to obtain benefits from its activities.
The assessment of whether the Group has control over an SPE is carried out at inception and normally no further reassessment of control is carried out in the absence of changes in the structure or terms of the SPE, or additional transactions between the Group and the SPE. Day-to-day changes in market conditions normally do not lead to a reassessment of control. However, sometimes changes in market conditions may alter the substance of the relationship between the Group and the SPE and in such instances the Group determines whether the change warrants a reassessment of control based on the specific facts and circumstances. Where the Group’s voluntary actions, such as lending amounts in excess of existing liquidity facilities or extending terms beyond those established originally, change the relationship between the Group and an SPE, the Group performs a reassessment of control over the SPE.
(z) Non-current assets held for distribution and discontinued operationsNon-current assets, or disposal groups comprising assets and liabilities, that are expected to be recovered primarily through sale or distribution rather than through continuing use, are classified as held for sale or distribution. Before being classified as held for sale or distribution, the assets, or components of a disposal group, are re-measured in accordance with the Group’s accounting policies.
Conditions to be met before assets qualify as being held for sale/distribution include the following:
• managementiscommittedtoaplantosell
• theassetisavailableforimmediatesale
• anactiveprogrammetolocateabuyerisinitiated
• thesaleishighlyprobable,within12monthsofclassificationasheldforsale(subjecttolimitedexceptions)
• theassetisbeingactivelymarketedforsaleatasalespricereasonableinrelationtoitsfairvalue
• actionsrequiredtocompletetheplanindicatethatitisunlikelythatplanwillbesignificantlychangedorwithdrawn
Thereafter, the assets or disposal group, are measured at the lower of their carrying amount and fair value less costs to sell. Any impairment loss on a disposal group is allocated first to goodwill, and then to remaining assets and liabilities on a pro rata basis, except that no loss is allocated to financial assets and deferred tax assets, which continue to be measured in accordance with the Group’s accounting policies.
Notes to the consolidated and separate financial statementscontinued …

77
Impairment losses on initial classification as held for sale or distribution and subsequent gains and losses on re-measurement are recognised in profit or loss:
Intangible assets and property and equipment once classified as held for sale or distribution are not amortized or depreciated. In addition, equity accounting of equity-accounted investees ceases once classified as held for sale or distribution. In line with IFRIC 17, the subsidiaries being spun off will be distributed as dividend to the shareholders of the parent. The dividend payable will be at the fair value of the net assets to be distributed.
For discontinued operations, the Group presents discontinued operations in a separate line in the Income statement if an entity or a component of an entity has been disposed of or is classified as held for sale and:
(a) represents a separate major line of business or geographical area of operations;
(b) is part of a single co-ordinated plan to dispose of a separate major line of business or geographical area of operations; or
(c) is a subsidiary acquired exclusively with a view to resale
Net profit from discontinued operations includes the net total of operating profit and loss before tax from operations, including net gain or loss on sale before tax or measurement to fair value less costs to sell and discontinued operations tax expense. A component of an entity comprises operations and cash flows that can be clearly distinguished, operationally and for financial reporting purposes, from the rest of the Group’s operations and cash flows. If an entity or a component of an entity is classified as a discontinued operation, the Group restates prior periods in the Income statement. Non-current assets classified as held for sale are measured at the lower of carrying amount and fair value less costs to sell.

Annual Report 2012
78
4. FINANCIAL RISK MANAGEMENT
Introduction and OverviewGiven the scale and scope of its operations as well as the diversity of the geographies within which it operates, United Bank for Africa Plc (UBA) has adopted an enterprise wide, integrated approach to risk management. The key objectives are as follows:
1. meet and exceed best practice global standards as defined by local and international regulatory bodies. We intend to achieve this by adhering to the principles of the Basel II (and now III) Accords and COSO (Commission of Sponsoring Organisations) in the implementation of an Enterprise Risk Management (ERM) framework as adopted by the Central Bank of Nigeria (CBN);
2. ensure sustainable profitability and enterprise value protection by maintaining growth within appropriate risk-control boundaries; and
3. enhance corporate governance by involving the Board and Senior Management in setting the tone for the risk management agenda.
The key elements of the ERM framework are intended to enhance risk identification, measurement, control and reporting. These are diagrammatically represented as follows:
Key Activities Outputs
Optimised Risk ProfileRisk Governance
– Risk committee structures
– Policies and framework
– Set risk appetite
– Corporate governance
– Compliance rule book
Risk Assessment
– Credit default measurement
– Operational risk assessment
– Policy compliance self assessment
– Trading loss elimination
– Recovery risk
Risk Monitoring
– Effective reporting
– Early Warning
– Event Tracking
– Compliance dashboard
– Key risk indicator tracking
– BCP testing and scenario planning
Risk Mitigation
– Effective controls
– Debt restructuring
– Maximised recoveries
– Limit concentration
– Risk appetite management
– Hedging
– Data recovery management and alternate site arrangement
Market RiskCredit Risk
Operational Risk
– Effective Compliance Process
– Reduced non-compliance cost
– Reduced Reputational Risk
Minimised Compliance Cost
Risk Governance StructuresThe Board of Directors has overall responsibility for risk management of the institution. They have delegated specific functional roles to key sub-committees of the Board including the Board Risk Management Committee (BRMC), the Board Credit Committee (BCC) and the Board Audit Committee (BAC).
Notes to the consolidated and separate financial statementscontinued …

79
These Board committees are supported by various management committees in identifying and providing appropriate responses to risks arising from the Group’s ongoing business activities. This is illustrated in the diagram below.
Setting and approval of:– Risk philosophy– Risk management principles– Risk appetite and tolerance
UBA Board
Board CommitteesCredit, Risk Management, Fin and Gen Purpose,
Nomination and Governance, Audit and Statutory Audit
RiskManagement
Dimension
Risk controlDepartments
Enterprise Wide Risk Management
Business units/Subsidiaries
Approval of:– Risk policies– Risk limits
Oversight of:– Risk profile of the group– Risk limits per business unit/
subsidiaries and risk type– Control and compliance enviroment
Management of:– All risk exposures in the business
unit/subsidiary
Implementation:– Risk management principles
– Stakeholders– Regulators– The community
– Stakeholders– Group Risk Committee– GMD/CEO
– GCRO
– Board of Directors– Regulators– Stakeholders
Management CommitteesGALCO, EMC, ECC
GMD/CEO, EMC
Role and responsibilities
The key players in the risk management framework are as indicated in the above governance structure and their responsibilities are as follows:
Board of Directors
The ultimate responsibility for risk management in UBA lies with the Board of Directors. The roles and responsibilities of the Board with respect to risk management include, but are not limited to:
– ensuring an appropriate corporate governance framework is developed and operated;
– providing guidelines regarding the management of risk elements in the Group;
– approving Group risk management policies;
– determination of the Group’s risk appetite;
– ensuring that management controls and reporting procedures are satisfactory and reliable;
– approving large credit exposures beyond the limit of the Board Credit Committee;
– approving loan write-offs above set threshold; and
– approving capital demand plans based on risk budgets.
The Board of Directors has established various Board-level risk committees, to support its risk oversight roles and responsibilities. These committees review and advise on numerous risk matters requiring Board approvals.

Annual Report 2012
80
The Board Risk Management Committee has direct oversight for the Bank’s overall risk management framework. The Board Credit Committee considers and approves large exposure underwriting decisions within its authority and recommends those above its limit to the Board for consideration. The Board Audit Committee assists the Board with regard to internal controls, audit assessments and compliance matters.
A list of various Board committees and their assigned responsibilities is contained in the corporate governance report.
Management Committees
Key Management Committees include:
Executive Management Committee (EMC)
The EMC is responsible for the following, among others, and shall be accountable to the Board:
– formulating and executing strategy once approved by the Board;
– overall performance of the Group;
– managing the Group’s risks; and
– day-to-day oversight for the Group.
All non-credit product approvals must go to the EMC who shall review and approve or recommend for approval to the appropriate Board Committees in line with the Bank’s advised approval limits. Above the EMC approval limits, non-credit products are approved by the Board’s Finance and General Purpose Committee (F&GPC).
All new business activity irrespective of capital commitment must be approved by the F & GPC through the EMC.
Executive Credit Committee (ECC)
The Committee’s main objective is to develop and maintain a sound credit risk portfolio for the Group and to oversee the development and deployment of credit risk practices across the Group.
Its principal activities and functions are:
– set frameworks and guidelines for credit risk management for the Group;
– review and recommend all credit-related policies for the Group to the BCC for approval;
– monitor implementation and compliance with credit policy paying particular attention to the following:
– credit concentration;
– credit portfolio quality;
– review credit requests and recommend those above its limit to BCC for approval;
– ensure the Group’s non-performing Loans portfolio is within the approved ratio; and
– review all major credit audit issues with a view to adopting learning points for enhancement to the credit process.
Group Asset and Liability Committee
The Group Asset and Liability Committee (GALCO), is a sub-committee of the EMC that has responsibility for managing UBA Group’s balance sheet. This committee manages traded and non-traded market risks as well as steering the implementation of Basel II requirements for market risk.
Notes to the consolidated and separate financial statementscontinued …

81
In playing this role, GALCO does the following:
– recommend balance sheet management policies, frameworks and procedures to the Board Risk Management Committee through EMC for approval;
– recommend Treasury policies, frameworks and procedures to the F & GPC through EMC for approval;
– manage the Group’s balance sheet and ensure compliance with regulatory and statutory ratios and requirements;
– develop an optimal structure of the Group’s balance sheet to optimise risk-reward through a review of:
– liquidity gap analysis,
– maximum cumulative outflow (MCO),
– stress test,
– wholesale borrowing guidelines,
– contingency liquidity plan,
– review liquidity, interest rate and currency risks and approve risk mitigation proposals subject to ratification by EMC; and
– set pricing strategies for the Group on assets and liabilities (pool rate, asset and/or liability composition) subject to ratification by EMC.
Criticised Assets Committee
The Criticised Assets Committee reviews Past Due Obligations (PDOs) and:
– develops the framework to reduce the Group’s portfolio of credits on watch-list as well as delinquent accounts;
– monitor implementation of strategies developed for recoveries and reduction of loan delinquencies;
– ratifies proposed classification of accounts and provisioning levels; and
– recommends write-offs for approval through the EMC to the Board.
Group Chief Risk Officer
The Group Chief Risk Officer has oversight for the effective and efficient governance of all risk functions in the Group. He is responsible for development and implementation of Group’s risk management frameworks, policies and processes across the entire risk spectrum.
Central Risk Management Functions
Each risk function including credit, market, operational and IT risk has direct responsibility for the development and management of risk management frameworks. The responsibilities of divisional functions with respect to risk include:
– develop and maintain policies, frameworks and risk management methodologies;
– provide guidance on the management of risks and ensure implementation of risk policies and strategies;
– provide recommendations for improvement of risk management;
– provide consolidated risk reports to the various Board and management committees such as EMC, ECC and/or Board of Directors; and
– provide assurance that risk management policies and strategies are operating effectively to achieve the Group’s business objectives.

Annual Report 2012
82
At a strategic level, our risk management objectives are as follows:
– to identify the Group’s material risks and optimize risk/return decisions;
– to ensure business growth plans are properly supported by effective risk infrastructure; and
– to manage the risk profile to ensure that specific financial deliverables remain possible under a range of adverse business conditions.
In pursuit of its risk management objectives, policies and standards are set for each risk type, adopting a standard methodology consisting of five risk steps as illustrated below.
Identify Assess Control ReportManage and
Challenge
• Identifytherisk inherent in achieving the bank’s goals and objectives
• Establishriskappetite across the entire risk spectrum
• Establishandcommunicate risk management frameworks
• Buildaccurateandconsistent risk assessment
• Establishandimplement measurement reporting standards and methodologies
• Buildasolidriskprofile for the Bank
• Establishkeycontrolprocesses, practices and reporting requirements
• Monitortheeffectiveness of control
• EnsurealltheBank’s exposures are adequately identified, measured and managed in accordance with Board approved frameworks
• Provideearlywarning signals
• Ensureriskmanagement practices are adequate and appropriate for managing the Bank’s risks
• Reportingareasof stress where crystallization of risk is imminent
• Presentremedialactions to reduce and/or mitigate such risks
• Reportonsensitiveand key risk indicators
• Communicatewithrelevant parties
• Reviewandchallenge all aspects of the Bank’s risk profile
• Adviseonoptimizing and improving the Bank’s risk profile
• Reviewandchallenge risk management practices
Notes to the consolidated and separate financial statementscontinued …

83
Risk Management StructureIn response to the dynamic risk environment, the risk management structure has been flattened to ensure increased oversight and improved responsiveness.
Lagos and West Bank
Abuja and East Bank
CEO
Risk Measurement
Chief Credit Officer (Nigeria)
Market Risk
Credit Policy & Strategy
Individually Assess Credit
Group Recoveries Nigeria
Risk Identification, Assessment &
Control Standard
ITSecurity
Credit Risk Management
Credit Monitoring
Credit Recoveries
Operational Risk
IT Risk
Portfolio Analytics
Corporate & Energy
Traded Market Risk
Credit ProductPrograms
Product Programs
GroupRecoveries Africa
OpRisk Monitoring
E-Business Security
Risk Modelling
Far North Bank
Non-Traded Market Risk
Credit Control
Collateral Management
Remedial Mgt & Retail Collections
Policy & Framework Compliance Monitoring
IT/E-channel Security
UBA Africa/Beyond
Capital Measurement
North Central Bank
CreditAdministration
Subsidiary Monitoring
Fraud & Forgeries
Continuity of Business
Management
System SecurityMonitoring
Subsidiary Compliance UBA
Africa
Compliance & Fin. Crime
Transaction Monitoring
Research & Training
Customer Due Diligence &
Policies
Regulatory Liaison & Product Risk Assessment
Chief Credit Officer (Africa)
Subsidiaries Credit-WAMZ
& CESA
Subsidiaries Credit-UEMOA
& CEMAC
Group Chief Risk Officer

Annual Report 2012
84
RISK MANAGEMENT POLICIESThe principal risk policies cover the Group’s main risk types, assigning responsibility for the management of specific risks and setting out requirements for control frameworks for all risk types. Fundamental to the delivery of the Group’s risk management objectives are a series of methodologies that allow it to measure, model, price, stress-test, mitigate and report the risks that arise from its activities.
Risk appetite
A key responsibility of the Board is the determination of the organisation’s risk appetite. This is codified in a Risk Appetite framework which considers the level of risk that the Group is willing to take in pursuit of its business objectives. This is expressed as the Group’s appetite for earnings volatility across all businesses from a credit, marketing and operational risk perspective.
Risk appetite is institutionalised by establishing scale of activities through clearly defined target market criteria, product risk acceptance criteria, portfolio limits as well as risk-return requirements.
Approval authority
The Board of Directors also set internal approval limits which are reviewed from time to time as the circumstances of the Group demands. These are at all times guided by maximum regulatory limit which is the Legal Lending limit.
Limit concentration
The Group applies a concentration risk management framework that sets exposure limits as a function of capital across all dimensions of its asset portfolio including geography, sector, obligor, product etc. This is closely monitored to ensure diversification of risk.
Risk assessment
The Bank considers the following risk types among others which are assessed, monitored and managed in terms of the Group’s risk management framework.
Credit risk
This relates to the probability that the group may suffer financial loss where any of its corporate borrowers or other counterparties fails to perform on their payment, guarantee and/or other obligations as contracted.
Market risk
This relates to risk of losses on balance sheet positions that may arise from movements or volatility in market prices that could adversely affect business objectives.
Liquidity risk
This is the risk of loss in earnings and capital that arise from the Group’s inability to fund increases in assets or to meet its payment obligations to its customers as they fall due or to replace funds when they are withdrawn.
Operational risk (OpRisk)
The risk of direct and/or indirect losses may arise from inadequacy or failure of internal processes, people, systems, or external events, including legal risk but not strategic risk. Major sources of operational risk include: operational processes, Information and communication technology, outsourcing activities, service providers, strategy implementation, mergers and acquisitions, fraud, error, regulatory compliance, staff, social and environmental factors.
Notes to the consolidated and separate financial statementscontinued …

85
Financial crime risk
This is the risk of failure to monitor, report and act on financial crimes, thereby exposing UBA to losses and penalties. Financial crimes include offences involving money laundering, fraud or dishonesty, and market abuse.
Capital adequacy risk
This is the risk that the Group has insufficient capital resources to meet minimum regulatory capital requirements in Nigeria and in other jurisdictions such as in the UK, USA, and other African countries, where regulated activities are undertaken. Alternatively, it is the risk that capital resources may be inadequate to absorb unexpected losses under severely stressed conditions or may arise due to inefficient utilisation of available capital resources or attributed to reduced returns through sub-optimal capital structures.
Legal risk
Legal risk is the risk arising from the type and nature of the Group’s contractual agreements. It also involves the risk that contracts may render the Group or any part therefore, particularly vulnerable to litigation. These risks, if not addressed, may result in unspecified erosion of value.
Regulatory risk
This is the risk of non-compliance with applicable financial services regulatory rules that could expose the Group to penalties. It may also include the risk that a change in laws and regulation or increased complexity in local and international regulatory environment may materially impact the Group.
Technology risk
Technology risk is that which impacts on the integrity of the Group’s information systems and technology infrastructure. It is also the risk associated with missing the benefit of adopting a technology that could have enhanced operational efficiency.
Brand reputational risk
This is the risk of brand erosion, reputation loss to the Group. It includes failure to understand, identify or manage developments that could negatively impact on the brand and its value, especially its image, as perceived by its various stakeholders.
Risk Monitoring
Key Risk Indicators (KRIs)
Key risk indicators (KRIs) are central to our risk monitoring and reporting processes. They constitute a systematic means of managing our risk measurement framework and approach, by employing various qualitative and quantitative risk assessment methods, to generate risk exposures.
The KRIs also provide a basis for our assessment of all inherent risk types and supports our decision on materiality, rating and direction of overall risk.

Annual Report 2012
86
Risk mitigation
Controls
Risk controls and mitigants, identified and approved for the Group, are documented for existing and new products, processes and systems.
The adequacy of these mitigants is tested on a periodic basis through administration of control self-assessment questionnaires, using OpRisk Manager – (an operational risk management tool) which requires risk owners to confirm the effectiveness of established controls. These are subsequently audited as part of the review process.
Remedial management process
This process is managed by the Group Remedial & Recovery Division (GRRD). Depending on the severity of classification, the Group undertakes remedial corrective action geared towards ensuring performance of weak credits. Early attention, including substantive discussions with borrowers, is required to correct deficiencies.
Remedial process covers the evaluation, analysis and restructuring of credit facilities for existing PDOs. It may include new extensions of credit, and/or restructuring of terms. Some of the possible actions are summarised as follows:
– Rate/Payment modification or long-term payment relief – adjusting interest rates or payment frequency;
– Ageing/Extension: Modifying the length of the loan;
– Cash Out: Refinancing a loan at a higher principal amount in order to get additional funds for other uses;
– Loan and Collateral Consolidation: Combining several loans into a single payment which is lower than if the payments were separate;
– Short Sale – Loan is discounted to prevent imminent foreclosure; and
– Deed in lieu – Voluntary conveyance of interest in property to the Bank.
The process calls for full information gathering, together with financial and risk analysis leading up to the approval decision. Analysis and standards vary according to business product, market, transaction characteristics and environmental issues. In all cases, we strive to achieve good judgement, in ensuring that all relevant issues have been addressed in each situation.
Maximising recoveries
GRRD has established a framework in order to ensure maximised recoveries that is intended to:
– ensure clear definition of recovery accounts and functions within the Group;
– streamline decision-making at each recovery operating unit; and
– achieve uniformity in recovery process methodology and consolidate similar functions in all locations where the Group operates.
Notes to the consolidated and separate financial statementscontinued …

87
The universal market risk factors in UBA Group are foreign exchange rates, interest rates and equity/stock prices. The associated market risks are:
– foreign currency risk; the risk that foreign exchange rate (e.g. USD/NGN EUR/USD, EUR/GBP, etc.) and/or their implied volatility will change;
– interest rate risk; the risk that interest rate (e.g. Nibor, inflation, etc.) and/or their implied volatility will change; and
– equity risk; the risk that stock or stock index prices and/or their implied volatility will change.
The key market risk initiatives in the past 12 months include the ongoing implementation and enhancement of advanced market risk measurement and reporting tools, and focus on the African subsidiaries with a revised reporting structure. The scenario planning process continues to receive strong management oversight, as part of the medium term business development strategy.
Operational Risk
Operational Risk Division manages operational risk which is defined as the risk of loss resulting from inadequate or failed internal processes, people, systems or external events.
The Group has a comprehensive Operational Risk management framework in place which defines the set of activities designed to reduce, transfer, transform, avoid and accept operational losses.
The Group monitors measurable metrics to track exposures or losses. The exposures are measured against the established tolerance limit thereby enabling implementation of proactive corrective actions.
Operational Risk policies include:
– Group Operational Risk Management Policy;
– Group Safety and Physical Security Policy;
– Group Risk and Control Self Assessment Framework;
– Group Framework for the Management of Principal Risk; and
– Group Continuity of Business Policy.
Risk and Control Self Assessment (RCSA)
Operational Risks that arise from Business or Function strategy, objectives, products and activities are identified, and the effectiveness of the controls over those risks are evaluated, tested and monitored applying RCSA process. This process is targeted at achieving the following objectives:
– Focus on the root causes of risk;
– Allocate ownership/accountability of the key risks and controls to risk owner, best placed to manage them;
– Draw common risk language and categorization;
– Draw input from both management and staff across all businesses and service units;
– Be undertaken at any level – product, process, project, business units, functions or entire business;
– Facilitate appropriate reporting of operational risks to senior management and Board of Directors;
– Promote the use of key risk indicators; and
– Establish a consistent standard for the measurement and reporting of operational risk loss data.

Annual Report 2012
88
Key risk indicators and key risk scenario (KRIs/KRS)
Key Risk Indicator (KRI) tracking – Key risk indicators (KRIs) are central to our operational risk monitoring and reporting processes. Various qualitative and quantitative risk assessment methods are employed in order to generate risk exposures and potential loss estimates at business unit and enterprise-wide levels. Comprehensive MIS platforms support the tracking process.
Policy compliance self assessment (PCSA)
Policy and Framework Compliance Monitoring
This function ensures that principles, guidelines and standards aimed at achieving the strategic objectives of the organisation in an effective and efficient manner are complied with.
We aim to achieve this via the following:
– provide a platform to ensure all divergences from the policy provisions are authorised and documented;
– ensure policy awareness and consciousness by all staff through various modes of awareness creation, assessment and certification; and
– monitor key officers’ compliance with laid down policies and reporting on the level of policy compliance.
Losses and loss events data collection and reporting
The Bank maintains a comprehensive losses and loss event database to deliver on the following objectives:
– carry out root cause analysis for each loss event to prevent recurrence;
– identify trends and lessons to be learned over time;
– justify the cost of new or improved controls and compare the effectiveness of controls;
– build a comprehensive loss events database for planning purposes; and
– use loss data as a potential input for capital calculation.
In line with Basel II s, we categorise our loss events as follows:
UBA Group Loss Categories Definition
Internal Fraud These are losses due to acts of a type intended to defraud, misappropriate property or circumvent regulations which involves at least one internal party.
External Fraud These are losses due to acts of a type intended to defraud, misappropriate property or circumvent the law by a third party.
Clients Products and Business Practices These are losses arising from an unintentional or negligent failure to meet a professional obligation to specific clients or from the nature or design of a product.
Employment Practices and Workplace Safety These are losses arising from acts inconsistent with employment, health or safety laws or agreement.
Damage to Physical Assets These are losses arising from loss or damage to physical assets from natural disaster or other events.
Business Disruption and System Failures These are losses arising from disruption of business or systems failure.
Execution, Delivery and Process Management These are losses from failed transaction processing or process management from relations with trade counterparties and vendor.
Notes to the consolidated and separate financial statementscontinued …

89
Business continuity management
Business Continuity Programme is implemented across the Group – Head Office, Branches in Nigeria, subsidiaries in African countries and offices in London and New York – aimed at:
(a) identifying potential impacts that threaten our business processes;
(b) providing framework for building resilience and capability for effective response to business disruption; and
(c) striving to safeguard the interest of our key stakeholders, reputation, brand and value creating activities.
We have developed and implemented Business Continuity Plans for critical processes in the Group, made up of:
(a) Business Impact Analysis – identification of impact on our critical processes, if disrupted, and proactive plans to minimise losses.
(b) Continuity of Business Risk Assessment – analysis of threats and vulnerability we are exposed to and corrective action plans to minimise risk of losses.
(c) Crisis Management Plan – Framework of crisis management in the event of business disruption. All Directorates have Crisis Management Teams.
Crisis managers are responsible for escalation, control and coordination of crisis when it occurs and putting machinery in place to handle emergency/and incident responses
(a) Business Recovery Plan – recovery of critical process at alternate sites to ensure continuity of the Bank’s operations.
(b) Test Plan – carry out at least annual tests of all processes to ensure the Business Continuity Plans are functional. Our wide network of branches in Nigeria and Africa provides alternate sites where we conduct BCP Test for our businesses in the event of premise failure.
(c) Plan Maintenance – continuous update of our Business Continuity Plans when there are changes.
(d) Monitoring and Reporting – continuous feedback to senior management on Business Continuity implementation and level of compliance with Business Continuity Policy. Deployment of Business Continuity scenario planning tool to monitor and track threats in our business environment.
(e) Training and awareness – development of business continuity skills in the coordination and dissemination of business continuity information to all staff.
Disaster recovery programme
In view of the technicality and special role of Information Technology, we have developed Disaster Recovery Plans for all departments in our Information Technology Division in addition to the Business Continuity Plans. This document specifies how each Information Technology components can be recovered, which includes infrastructure, people, systems and third party support, tracking and reporting of IT and E-banking risk status using IT/e-banking risk dashboards.
IT risk
The need to effectively manage information technology and electronic banking risk is crucial to the Bank. The IT Risk Management Division has the responsibility for the Group Information Security and E-Banking Risk Management Strategy. The Group ensures that all key risks facing the Bank’s information assets and electronic banking services are proactively managed in line with best practices and international standards.
The Group manages the information security and e-business risks through the following measures:
– development and implementation of IT Risk Management framework and information security policy in line with ISO 27001;
– development and implementation of appropriate E-banking risk management framework and policy in line with international standard;
– proactive and continuous risk assessment of information technology infrastructure and electronic banking products/services;
– formulation and implementation of appropriate risk treatment plans to address identified IT/e-banking risks;

Annual Report 2012
90
The key functional areas and their responsibilities are highlighted below:
Credit Office
The Credit Office has responsibility for credit underwriting and makes recommendations to the appropriate authority level for approval of assessed Corporate, Commercial, Public Sector and Retail Credits as spelt out in the Credit Empowerment/Approval Framework.
Credit Risk Management
The Credit Risk Management division acts as the custodian of Group credit policies and recommends reviews based on regulatory changes and other developments in the operating environment. It develops and implements the Group credit risk management framework, as well as a portfolio management strategy towards achieving a diversified, high quality asset mix to minimise delinquencies.
In addition, CRM ensures appropriate control measures are taken in the documentation and administration of approved loans.
Credit Monitoring
Credit monitoring runs as a separate group of risk management to improve oversight of loan performance. Its primary function is to continuously monitor the Bank’s loan portfolio to ensure ongoing portfolio performance and achievement of portfolio quality targets. Credit Monitoring ensures all loans are booked in line with the Bank’s policy and highlights income leakages. They also identify exceptions which may prevent the loan from being paid in a timely manner. Observed Credit exceptions are escalated for possible resolution, sanction implementation and management attention. The Group takes proactive steps to ensure follow up on accounts showing signs of delinquency.
Market Risk
This is the risk that the value of our portfolio, either an investment portfolio or a trading portfolio, will decrease due to the change in value of the market risk factors and affect the Group’s income or the value of its holdings of financial instruments. The main objective of market risk management is not only to manage, measure and control market risk exposures but also to ensure that the Group carries out its affairs within acceptable parameters and in line with the market risk appetite.
Market risk achieves the above stated objective, through a mix of quantitative and statistical controls which covers the underlisted activities:
– Market data collection and statistical analysis
– VaR limit determination based on market volatility
– VaR/Stop loss limit utilisation monitoring
– Position monitoring
– New trading products risk assessment
– P&L attribution analysis
– Pricing model validation and sign off
– Trading portfolio stress testing
– Regulatory limit monitoring
– Position data extraction and internal limit monitoring
– Contingency funding plan maintenance and testing
– Risk profile reporting to GALCO.
Notes to the consolidated and separate financial statementscontinued …

91
– periodic vulnerability assessment and penetration testing of UBA’s network and systems;
– conducting information security awareness training for staff and educating staff/customer on current e-banking threats; and
– continuous security monitoring of bank’s network and e-banking infrastructure.
Recovery and remedial management
The Group Remedial and Recovery Division (GRRD) manages the repayment of all past due obligations (PDOs) that are classified as substandard, doubtful or lost. It also intervenes in those accounts that appear on Watch list that may be past due but are yet to be impaired. Any accounts remaining on the bank’s memorandum database are also managed for potential write-off recoveries.
The aim of GRRD is to manage and track those accounts that show early warning signs of distress and to assist to pro-actively identify loans for immediate recovery action.
Compliance
The compliance function identifies, assesses and documents the compliance risk associated with the Bank’s business activities. It develops compliance procedures and guidelines and monitors to ensure exceptions are minimised and addressed promptly.
The Bank uses risk indicators to monitor the compliance risk exposure of the business units and assess the effectiveness of controls for the key risk areas.
The Compliance team aims to ensure effective management of compliance risk via the following:
(a) Track changes to relevant laws and regulations and disseminate relevant information across the Bank.
(b) Take prompt and appropriate action to correct compliance problems that are identified through self-assessments, internal or external compliance audits.
(c) Develop worktools, forms and checklists to assist the Bank staff, as they perform their jobs, in complying with laws, regulations and rules.
(d) Analyse the impact of new or amended legal and regulatory requirements and implement such requirements in the Rule book.
The compliance polices include:
– Anti-Money Laundering/Counter Terrorist Financing Policy
– Know Your Customer [KYC] Policy
– Whistle Blowing Policy
– Anti-Bribery & Corruption Policy
– Environmental Risk Management Policy
Sustainability
Sustainable practices are those practices that meet the needs of the present without compromising the ability of future generations to meet their own needs. It embodies the following key concepts:
i. Corporate Social Responsibility (CSR) C327
ii. Environmental Risk Management (ERM)
iii. Economic consideration/Sustainable lending
UBA is committed to the highest level of sustainable business practices across all activities and operations. As Africa’s Global Bank, we are dedicated to being in the forefront of environmental responsibility and social relevance in Nigeria and Africa as a whole. UBA has appointed and ensured the development of the necessary capacity needed to identify, manage and assess the economic and social risks and opportunities associated with the Bank’s business activities and operations.

Annual Report 2012
92
Credit risk
There was increased focus on our African subsidiaries, with the appointment of dedicated credited officers at the Group Office. This enhances responsiveness and gives more attention to their diverse requirements. The credit policy and strategy documents have been revised for all Group operations in line with their distinct circumstances.
Credit risk measurement
In measuring credit risk of loans and advances to various counterparties, the Group considers the character and capacity of the obligor to pay or meet contractual obligations, current exposures to the counter party/obligor and its likely future developments, credit history of the counterparty/obligor; and the likely recovery ratio in case of default obligations-value of collateral and other ways out. Our credit exposure comprises wholesale and retail loans and advances which are developed to reflect the needs of our customers. The Group’s policy is to lend principally on the basis of our customer’s repayment capacity through quantitative and qualitative evaluation. However we ensure that our loans are backed by collateral to reflect the risk of the obligors and the nature of the facility.
In the estimation of credit risk, the Group estimate the following parameters:
i. Probability of Default
ii. Loss Given Default
iii. Exposure at Default
i. Probability of default
This is the probability that an obligor or counterparty will default over a given period, usually one year.
ii. Loss given default
LGD is defined as the portion of the loan determined to be irrecoverable at the time of loan default (1 – recovery rate). Our methods for estimating LGD includes both quantitative and qualitative factors.
iii. Exposure at default
This represents the amount that is outstanding at the point of default. Its estimation includes the drawn amount and expected utilisation of the undrawn commitment at default.
Impairment assessment under IFRS
The Group assesses its impairment for the purpose of IFRS reporting using a two-way approach which are Individual assessment and portfolio assessment.
i. Individual assessment
The Group reviewed and revised existing impairment triggers for each loan asset portfolio to ensure that a trigger identifies a loss event as early as possible, which would result in the earliest possible recognition of losses within the IFRS framework. The Group then estimated the impairment based on the shortfall between the present value of estimated future cash flows and the asset carrying amount.
ii. Portfolio assessment
Loans and advances that are not specifically impaired are assessed under collective impairment. For the purpose of collective impairment, financial assets are grouped on the basis of similar credit risk characteristics that are indicative of the debtors’ ability to pay all amounts due according to contractual terms.
Notes to the consolidated and separate financial statementscontinued …

93
General risk rating process
United Bank for Africa adopts a two-dimensional approach to the assessment of credit risk in the Risk Rating Process for all Businesses. The core tenets of the two-dimensional approach are shown below:
Facility Risk Rating
Obligor Rating
AAA
Low High
C
Low Risk: Fast Decision Track
High Risk: Rejection, Exit
Focus is on Collateral Value and Enforceability
Focus is on Accurate Obligor Rating and Covenants
All Obligors and Facilities are assigned a risk rating. Obligors are assigned an Obligor Risk Rating (ORR) while a Facility Risk Rating (FRRs) is assigned to facilities.
Credit rating of counterparty/obligor
In measuring credit risk of loans and advances to various counterparties, Credit Officers/Risk Measurement ensure that the following components are considered:
i. character and capacity of the obligor to pay or meet contractual obligations;
ii. current exposures to the counterparty/obligor and its likely future developments;
iii. credit history of the counterparty/obligor; and
iv. the likely recovery ratio in case of default obligations-value of collateral and other ways out.
All risk rating processes are reviewed and validated periodically to ensure relevance to business realities. At a minimum, the risk rating process must be re-approved at least once every three years, unless more frequent review is specified as a condition of the approvals above. The Risk Rating buckets and definitions are as highlighted below:
UBA risk buckets and definition
Description Rating Bucket Range of Scores Risk RangeRisk Range (Description)
Extremely Low Risk AAA 1.00 – 1.99 90% – 100%Low Risk
RangeVery Low Risk AA 2.00 – 2.99 80% – 89%
Low Risk A 3.00 – 3.99 70% – 79%
Acceptable Risk BBB 4.00 – 4.99 60% – 69% Acceptable Risk RangeModerately High Risk BB 5.00 – 5.99 50% – 59%
High Risk B 6.00 – 6.99 40% – 49% High Risk RangeVery High Risk CCC 7.00 – 7.99 30% – 39%
Extremly High Risk CC 8.00 – 8.99 0% – 29%Unacceptable
Risk RangeHigh likelihood of default C 9.00 – 9.99 Below 0%
Default D Above 9.99 Below 0%

Annual Report 2012
94
Exposure to credit risk
Maximum exposure to credit risk before collateral held or other credit enhancements
Credit risk exposure relating to on-balance sheet
Gross credit risk exposures relating to on-balance sheet assets are as follows:
Maximum exposure Maximum exposure
Group Bank
In millions of Nigerian Naira 2012 2011 2010 2012 2011 2010
Cash and cash equivalent 714,115 434,218 385,397 629,481 352,500 330,701
Loans and advances to banks 28,513 41,564 11,226 27,878 41,564 11,226
Loans and advances to customers 658,922 605,627 590,797 570,714 552,526 557,224
Trading assets 457 1,303 2,594 456 237 1,267
Debt securities 645,243 656,224 447,793 492,865 527,075 363,002
Other assets 13,710 8,956 21,252 8,497 12,228 20,054
Total 2,060,960 1,747,892 1,459,059 1,729,891 1,486,130 1,283,474
Loans exposure to total exposure 33% 37% 41% 35% 40% 44%
Debt securities exposure to total exposure 31% 38% 31% 28% 35% 28%
Other exposures to total exposure 1% 1% 2% 1% 1% 2%
Credit risk exposure relating to off-balance sheet
Group Bank
In millions of Nigerian NairaDecember
2012December
2011January
2011December
2012December
2011January
2011
Performance bonds and guarantees 305,492 239,014 139,653 284,359 228,852 124,602
Letters of credits 95,820 121,874 73,524 78,543 84,465 62,468
Bankers acceptances – 11,159 9,227 – 11,159 9,227
401,312 372,047 222,404 362,902 324,476 196,297
Bonds and guarantee exposure to total exposure 76% 64% 63% 78% 71% 63%
Letters of credit exposure to total exposure 24% 33% 33% 22% 26% 32%
Bankers acceptance exposure to total exposure 0% 3% 4% 0% 3% 5%
Credit collateral
The Group holds collateral against loans and advances to customers in the form of mortgage interests over property, other registered securities over assets, and guarantees. Estimates of fair value are based on the value of collateral assessed at the time of borrowing, and generally are not updated except when a loan is individually assessed as impaired. Collateral generally is not held over loans and advances to banks, except when securities are held as part of reverse repurchase and securities borrowing activity. Collateral usually is not held against investment securities, and no such collateral was held at 1 January 2011.
Notes to the consolidated and separate financial statementscontinued …

95
An estimate of the fair value of collateral and other security enhancements held against financial assets is shown below:
GroupIn millions of Nigerian Naira
Loans and advancesto customers
For the year ended 31 DecemberDecember
2012December
2011January
2011
Against individually impaired
Property 1,525 1,844 1,641
Equities 664 – 6,623
Others 11,433 16,911 12,345
GroupIn millions of Nigerian Naira
Loans and advancesto customers
For the year ended 31 DecemberDecember
2012December
2011January
2011
Against neither past due nor impaired
Property 272,737 150,910 226,364
Equities 35,784 9,822 12,230
Others 421,150 500,027 393,948
Total 743,293 679,514 653,151
Bank
Against individually impaired
Property 1,700 1,844 1,641
Equities 5,600 – 6,623
Others 2,100 2,542 9,324
Against neither past due nor impaired
Property 271,021 150,910 211,712
Equities 30,184 9,822 12,230
Others 305,431 401,521 372,370
Total 616,036 566,639 613,900

Annual Report 2012
96
Credit concentration
The Group monitors concentrations of credit risk by sector, geographic location and industry. Concentration by location for loans and advances is measured based on the location of the Group entity holding the asset, which has a high correlation with the location of the borrower. Concentration by location for investment securities is measured based on the location of the issuer of the security.
UBA has a domestic bias with over 92% of exposures in Nigeria, of which approximately 80% is local currency denominated. The risks attributable to foreign subsidiaries are covered by the appropriate capital investments in different jurisdictions.
An analysis of concentrations of credit risk at the reporting date is shown below:
Loans and advancesto customers
Loans and advancesto banks
Group December December January December December JanuaryFor the year ended 31 December 2012 2011 2011 2012 2011 2011
Carrying amount (net) 658,922 605,627 590,797 28,513 41,564 11,226
Concentration by sector (net)
Corporate 468,437 424,897 413,736 28,513 41,564 11,226
Commercial 49,589 58,574 35,799 – – –
Retail 79,046 89,511 82,199 – – –
Public sector 61,850 32,645 59,063 – – –
658,922 605,627 590,797 28,513 41,564 11,226
Concentration by location (net)
Nigeria 554,586 506,124 525,705 28,513 41,564 11,226
Rest of Africa 104,336 98,960 65,092 – – –
658,922 605,084 590,797 28,513 41,564 11,226
Bank
Carrying amount (net) 570,714 552,526 557,224 27,878 41,564 11,226
Concentration by sector (net)
Corporate 398,220 415,772 382,714 27,878 41,564 11,226
Commercial 31,008 38,107 21,407 – – –
Retail 79,190 66,027 98,456 – – –
Public sector 62,296 32,620 54,647 – – –
570,714 552,526 557,224 27,878 41,564 11,226
Concentration by location (net)
Nigeria 570,714 552,526 557,224 27,878 41,564 11,226
Rest of Africa – – – – – –
Rest of the World – – – – – –
570,714 552,526 557,224 27,878 41,564 11,226
Notes to the consolidated and separate financial statementscontinued …

97
Concentration by location (net) Off-balance sheet
Group Bank
Nigeria 362,902 313,317 187,070 – – –
Rest of Africa 38,410 47,571 26,107 – – –
Rest of the World – – – – – –
401,312 360,888 213,177 – – –
Credit concentration – sector
Investment securities
Group Bank
For the year ended 31 December 2012 2011 2010 2012 2011 2010
Carrying amount (net) 645,243 656,224 447,793 492,865 527,075 363,002
Concentration by location (net)
Nigeria 476,192 550,119 382,173 476,192 509,339 345,005
Rest of Africa 164,397 60,645 23,992 12,019 13,056 13,537
Rest of the World 4,654 4,680 4,460 4,654 4,680 4,460
645,243 656,224 447,793 492,865 527,075 363,002
Financial assets held for trading
Group Bank
For the year ended 31 December 2012 2011 2010 2012 2011 2010
Carrying amount (net) 457 237 1,267 456 237 1,267
Concentration by location (net)
Nigeria 457 237 1,267 456 237 1,267
Rest of Africa – – – – – –
Rest of the World – – – – – –
457 237 1,267 456 237 1,267
Cash and cash equivalent
Group Bank
For the year ended 31 December 2012 2011 2010 2012 2011 2010
Carrying amount (net) 714,115 434,218 385,397 629,481 352,500 330,701
Concentration by location (net)
Nigeria 629,481 352,500 330,701 629,481 352,500 330,701
Rest of Africa 84,634 81,718 54,696 – – –
Rest of the World – – – – – –
714,115 434,218 385,397 629,481 352,500 330,701

Annual Report 2012
98
Other assets
Group Bank
For the year ended 31 December 2012 2011 2010 2012 2011 2010
Carrying amount (net) 13,710 8,956 21,252 8,497 12,228 20,054
Concentration by location (net)
Nigeria 8,497 8,956 20,054 8,497 12,228 20,054
Rest of Africa 5,213 – 1,198 – – –
Rest of the World – – – – – –
13,710 8,956 21,252 8,497 12,228 20,054
Credit concentration – industryThe following table analyses the Group’s credit exposure at carrying amounts (without taking into account any collateral held or other credit support), as categorised by the industry sectors of the Group’s counterparties. Investment securities and financial assets held-for-trading analysed below excludes investments in equty instruments.
GroupIn millions of Nigerian Naira
Loans andadvances to
banks
Loans andadvances to
customers
Financialassets held-for-trading
Investment securities
Otherassets Total
Administrative and support service activities – 826 – – – 826
Agriculture, forestry and fishing – 44,718 – – – 44,718
Construction – 45,312 – – – 45,312
Education – 4,248 – – – 4,248
Finance and insurance 28,513 – – 137,586 13,710 179,809
General – 135,373 – – – 135,373
General commerce – 55,662 – – – 55,662
Governments – 64,114 457 498,976 – 563,547
Human health and social work activities – 2,118 – – – 2,118
Information and communication – 69,967 – 154 – 70,121
Manufacturing – 83,759 – 8,527 – 92,286
Oil and gas – 131,491 – – – 131,491
Power and energy – 15,357 – – – 15,357
Professional, scientific and technical activities – 3,261 – – – 3,261
Real estate activities – 698 – – – 698
Transportation and storage – 2,007 – – – 2,007
Water supply sewage, waste management and remediation activities – 11 – – – 11
31 December 2012 28,513 658,922 457 645,243 13,710 1,346,845
Notes to the consolidated and separate financial statementscontinued …

99
BankIn millions of Nigerian Naira
Loans andadvances to
banks
Loans andadvances to
customers
Financialassets held-for-trading
Investment securities
Otherassets Total
Administrative and support service activities – – – – – –
Agriculture, forestry and fishing – 37,995 – – – 37,995
Construction – 43,736 – – – 43,736
Education – 3,875 – – – 3,875
Finance and insurance 27,878 – – 25,166 8,497 61,541
General – 129,404 – – – 129,404
General commerce – 43,015 – – – 43,015
Governments – 64,003 456 459,555 – 524,014
Human health and social work activities – 2,106 – – – 2,106
Information and communication – 62,040 – – – 62,040
Manufacturing – 79,125 – 8,144 – 87,269
Oil and gas – 100,381 – – – 100,381
Power and energy – 32 – – – 32
Professional, scientific and technical activities – 2,877 – – – 2,877
Real estate activities – 698 – – – 698
Transportation and storage – 1,427 – – – 1,427
Water supply sewage, waste management and remediation activities – – – – – –
31 December 2012 27,878 570,714 456 492,865 8,497 1,100,410
GroupIn millions of Nigerian Naira
Loans andadvances to
banks
Loans andadvances to
customers
Financialassets held- for-trading
Investment securities
Otherassets Total
Administrative and support service activities – 953 – – – 953
Agriculture, forestry and fishing – 41,523 – – – 41,523
Construction – 10,168 – – – 10,168
Education – 4,078 – – – 4,078
Finance and insurance 41,564 – – 26,241 8,956 76,761
General – 93,290 – – – 93,290
General commerce – 57,991 – – – 57,991
Governments – 33,707 237 620,416 – 654,360
Human health and social work activities – 1,957 – – – 1,957
Information and communication – 69,228 – 316 – 69,544
Manufacturing – 82,595 – 9,251 – 91,846
Oil and gas – 150,033 – – – 150,033
Power and energy – 18,677 – – – 18,677
Professional, scientific and technical activities – 1,293 – – – 1,293
Real estate activities – 2,745 – – – 2,745
Transportation and storage – 37,386 – – – 37,386
Water supply sewage, waste management and remediation activities – 3 – – – 3
31 December 2011 41,564 605,627 237 656,224 8,956 1,312,608

Annual Report 2012
100
BankIn millions of Nigerian Naira
Loans andadvances to
banks
Loans andadvances to
customers
Financialassets held- for-trading
Investment securities
Otherassets Total
Administrative and support service activities – – – – – –
Agriculture, forestry and fishing – 35,616 – – – 35,616
Construction – 10,603 – – – 10,603
Education – 3,708 – – – 3,708
Finance and insurance 41,564 – – 25,997 12,228 79,789
General – 116,381 – – – 116,381
General commerce – 46,417 – – – 46,417
Governments – 34,052 237 492,430 – 526,719
Human health and social work activities – 1,957 – – – 1,957
Information and communication – 62,443 – – – 62,443
Manufacturing – 74,274 – 8,649 – 82,923
Oil and gas – 129,446 – – – 129,446
Power and energy – 25 – – – 25
Professional, scientific and technical activities – 856 – – – 856
Real estate activities – – – – – –
Transportation and storage – 36,748 – – – 36,748
Water supply sewage, waste management and remediation activities – – – – – –
31 December 2011 41,564 552,526 237 527,075 12,228 1,133,631
GroupIn millions of Nigerian Naira
Loans andadvances to
banks
Loans andadvances to
customers
Financialassets held-for-trading
Investment securities
Otherassets Total
Administrative and support service activities – 5,016 – – – 5,016
Agriculture, forestry and fishing – 39,903 – – – 39,903
Construction – 4,892 – – – 4,892
Education – 2,864 – – – 2,864
Finance and insurance 11,226 – – 18,819 21,252 51,297
General – 113,670 – – – 113,670
General commerce – 45,242 – – – 45,242
Governments – 65,477 1,267 421,253 – 487,997
Human health and social work activities – 784 – – – 784
Information and communication – 54,037 – 876 – 54,913
Manufacturing – 61,926 – 6,847 – 68,773
Oil and gas – 110,721 – – – 110,721
Power and energy – 5,048 – – – 5,048
Professional, scientific and technical activities – 1,012 – – – 1,012
Real estate activities – 42,043 – – – 42,043
Transportation and storage – 38,162 – – – 38,162
Water supply sewage, waste management and remediation activities – – – – – –
1 January 2011 11,226 590,797 1,267 447,793 21,252 1,072,337
Notes to the consolidated and separate financial statementscontinued …

101
BankFor the year ended 31 DecemberIn millions of Nigerian Naira
Loans andadvances to
banks
Loans andadvances to
customers
Financialassets held-for-trading
Investment securities
Otherassets Total
Administrative and support service activities – 3,710 – – – 3,710
Agriculture, forestry and fishing – 36,974 – – – 36,974
Construction – 4,892 – – – 4,892
Education – 3,003 – – – 3,003
Finance and insurance 11,226 – – 18,403 20,054 49,683
General – 100,581 – – – 100,581
General commerce – 59,954 – – – 59,954
Governments – 56,873 1,267 338,520 – 396,660
Human health and social work activities – 784 – – – 784
Information and communication – 53,184 – – – 53,184
Manufacturing – 53,725 – 6,077 – 59,802
Oil and gas – 110,730 – – – 110,730
Power and energy – 83 – – – 83
Professional, scientific and technical activities – 1,037 – – – 1,037
Real estate activities – 35,900 – – – 35,900
Transportation and storage – 35,794 – – – 35,794
Water supply sewage, waste management and remediation activities – – – – – –
1 January 2011 11,226 557,224 1,267 363,002 20,054 952,771
Credit QualityCredit quality of Loans and advances is summarised as follows:
31 December 2012 31 December 2011 1 January 2011
GROUPLoans to
customersLoans to
banksLoans to
customersLoans to
banksLoans to
customersLoans to
banks
Neither past due nor impaired 640,348 28,699 594,543 42,107 553,919 11,432
Past due but not impaired 20,940 – 18,601 – 40,921 –
Individually impaired 13,439 – 16,936 – 36,527 –
Gross 674,727 28,699 630,080 42,107 631,367 11,432
Less: allowance for impairment (15,805) (186) (24,453) (543) (40,570) (206)
Net 658,922 28,513 605,627 41,564 590,797 11,226
Allowance for impairment is broken down as follows:
Specific allowance (5,447) – (13,131) – (25,487) –
Portfolio allowance (10,358) (186) (11,322) (543) (15,083) (206)
Total (15,805) (186) (24,453) (543) (40,570) (206)

Annual Report 2012
102
31 December 2012 31 December 2011 1 January 2011
BankLoans to
customersLoans to
banksLoans to
customersLoans to
banksLoans to
customersLoans to
banks
Neither past due nor impaired 570,417 28,064 543,808 42,107 529,952 11,432
Past due but not impaired 6,180 – 18,601 – 40,921 –
Individually impaired 2,700 – 2,567 – 18,709 –
Gross 579,297 28,064 564,976 42,107 589,582 11,432
Less: allowance for impairment (8,583) (186) (12,450) (543) (32,358) (206)
Net 570,714 27,878 552,526 41,564 557,224 11,226
Allowance for impairment is broken down as follows:
Specific allowance (1,394) – (2,567) – (18,709) –
Portfolio allowance (7,189) (186) (9,883) (543) (13,649) (206)
Total (8,583) (186) (12,450) (543) (32,358) (206)
Loans and advances to customers – neither past due nor impaired
The credit quality of the portfolio of loans and advances to customers that were neither past due nor impaired can be assessed by reference to the internal rating system adopted by the Group.
Group Bank31 Dec 12 31 Dec 11 1 Jan 11 31 Dec 12 31 Dec 11 1 Jan 11
Grades:Extremely Low Risk 23,439 2,074 57,099 21,702 2,074 56,590
Very Low Risk 58,474 22,097 57,821 44,342 18,637 52,222
Low Risk 49,744 34,498 77,431 49,744 12,650 67,408
Acceptable Risk 482,787 356,040 303,416 428,828 330,614 295,581
Moderately High Risk 25,904 179,834 58,151 25,904 179,834 58,151
Total 640,348 594,543 553,918 570,520 543,809 529,952
Portfolio allowance (9,754) (10,738) (15,083) (7,029) (9,299) (13,649)
Loans and advances (net) 630,594 583,805 538,835 563,491 534,510 516,303
Credit qualityLoans and advances past due but not impaired
Group Bank31 Dec 12 31 Dec 11 1 Jan 11 31 Dec 12 31 Dec 11 1 Jan 11
Past due up to 30 days 9,791 9,184 20,203 3,670 9,184 20,203
Past due by 30 – 60 days 9,597 3,917 8,617 1,166 3,917 8,617
Past due 60 – 90 days 1,552 5,500 12,101 1,344 5,500 12,101
20,940 18,601 40,921 6,180 18,601 40,921
Portfolio allowance (604) (584) – (160) (584) –
Loans and advances (net) 20,336 18,017 40,921 6,020 18,017 40,921
Notes to the consolidated and separate financial statementscontinued …

103
Loans and advances individually impaired
Group Bank31 Dec 12 31 Dec 11 1 Jan 11 31 Dec 12 31 Dec 11 1 Jan 11
Gross amount 13,439 16,936 36,527 2,700 2,567 18,709
Specific impairment (5,447) (13,131) (25,487) (1,394) (2,567) (18,709)
Net amount 7,992 3,805 11,040 1,306 – –
Loans and advances to Banks
Group Bank
In millions of Nigerian Naira 31 Dec 12 31 Dec 11 1 Jan 11 31 Dec 12 31 Dec 11 1 Jan 11
Carrying amount 28,513 41,564 11,226 27,878 41,564 11,226
Assets at amortised cost
Individually impaired
Moderately high risk – – – – – –
High risk – – – – – –
Very high risk – – – – – –
Gross amount – – – – – –
Allowance for impairment – – – – – –
Carrying amount – – – – – –
Neither past due nor impaired
Low risk 28,699 42,107 11,432 28,064 42,107 11,432
Acceptable risk – – – – – –
Gross amount 28,699 42,107 11,432 28,064 42,107 11,432
Allowance for impairment (186) (543) (206) (186) (543) (206)
Carrying amount 28,513 41,564 11,226 27,878 41,564 11,226
Credit quality
GroupFor the year ended 31 DecemberIn millions of Nigerian Naira
Investment securities
Notes 31 Dec 12 31 Dec 11 1 Jan 11
Carrying amount 24 645,243 656,224 447,793
Held to maturity (HTM)
Neither past due nor impaired
Low risk 552,152 625,564 368,935
Carrying amount – amortised cost 552,152 625,564 368,935
Available-for-sale assets (AFS)
Neither past due nor impaired
Low risk 93,091 30,660 78,858
Carrying amount – fair value 93,091 30,660 78,858
Total carrying amount 645,243 656,224 447,793
Assets at fair value through profit or loss (Trading assets)
Carrying amount 21 457 1,303 2,594
Low risk 457 1,303 2,594
Total carrying amount 457 1,303 2,594

Annual Report 2012
104
BankFor the year ended 31 DecemberIn millions of Nigerian Naira
Investment securities
Notes 31 Dec 12 31 Dec 11 1 Jan 11
Carrying amount 24 492,865 527,075 363,002
Held to maturity (HTM)
Neither past due nor impaired
Low risk 401,348 496,600 284,144
Carrying amount – amortised cost 401,348 496,600 284,144
Available-for-sale assets (AFS)
Neither past due nor impaired
Low risk 91,517 30,475 78,858
Carrying amount – fair value 91,517 30,475 78,858
Total carrying amount 492,865 527,075 363,002
Assets at fair value through profit or loss (Trading assets)
Carrying amount 21 456 237 1,267
Low risk 456 237 1,267
Total carrying amount 456 237 1,267
Cash and bank balances
GroupFor the year ended 31 DecemberIn millions of Nigerian Naira Note 31 Dec 12 31 Dec 11 1 Jan 11
Carrying amount 20 714,115 434,218 385,397
Low risk 714,115 434,218 385,397
Total carrying amount 714,115 434,218 385,397
BankFor the year ended 31 DecemberIn millions of Nigerian Naira Note 31 Dec 12 31 Dec 11 1 Jan 11
Carrying amount 20 629,481 352,500 330,701
Low risk 629,481 352,500 330,701
Total carrying amount 629,481 352,500 330,701
Other assets
GroupFor the year ended 31 DecemberIn millions of Nigerian Naira Note 31 Dec 12 31 Dec 11 1 Jan 11
Carrying amount 25 13,710 8,956 21,252
Low risk 13,710 8,956 21,252
Total carrying amount 13,710 8,956 21,252
BankFor the year ended 31 DecemberIn millions of Nigerian Naira Note 31 Dec 12 31 Dec 11 1 Jan 11
Carrying amount 25 8,497 12,228 20,054
Low risk 8,497 12,228 20,054
Total carrying amount 8,497 12,228 20,054
Notes to the consolidated and separate financial statementscontinued …

105
Statement of Prudential adjustments
Provisions under prudential guidelines are determined using the time based provisioning prescribed by the Revised Central Bank of Nigeria (CBN) Prudential Guidelines. This is at variance with the incurred loss model required by IFRS under IAS 39. As a result of the differences in the methodology/provision, there will be variances in the impairments allowances required under the two methodologies.
Paragraph 12.4 of the revised Prudential Guidelines for Deposit Money Banks in Nigeria stipulates that Banks would be required to make provisions for loans as prescribed in the relevant IFRS Standards when IFRS is adopted.
However, Banks would be required to comply with the following:
(a) Provisions for loans recognized in the profit and loss account should be determined based on the requirements of IFRS. However, the IFRS provision should be compared with provisions determined under prudential guidelines and the expected impact/changes in general reserves should be treated as follows:
• PrudentialProvisionsisgreaterthanIFRSprovisions;theexcessprovisionresultingshouldbetransferredfromthegeneralreserveaccount to a “”regulatory risk reserve””.
• PrudentialProvisionsislessthanIFRSprovisions;IFRSdeterminedprovisionischargedtothestatementofcomprehensiveincome.The cumulative balance in the regulatory risk reserve is thereafter reversed to the general reserve account
(b) The non-distributable reserve should be classified under Tier 1 as part of the core capital.
During the year ended 31 December 2012, the Bank transferred an amount of N1,113 million to the Credit risk reserve. This amount represents the difference between the provisions for credit and other known losses as determined under the prudential guideline issued by the Central Bank of Nigeria (CBN), and the impairment reserve as determined in line with IAS 39 as at year end.
In line with the same directive of the CBN, the Bank compared the provision based on the prudential guidelines with impairment under IFRS for comparative periods and no transfers were made as the impairment balance under IFRS was higher for the years.”
Bank 31 Dec 12 31 Dec 11 1 Jan 11
Total impairment based on IFRS 8,769 12,993 32,564
Total impairment based on the Central Bank of Nigeria’s Prudential Guidelines 9,882 12,430 31,463
(Write-back)/charge (1,113) 563 1,101
Impaired loans and securities
Impaired loans and securities are loans and securities for which the Group determines that it is probable that it will be unable to collect all principal and interest due according to the contractual terms of the loan/securities agreement(s). These are loans and securities specifically impaired and graded 6 in the Group’s internal credit risk grading system.
Past due but not impaired loans
Loans and securities where contractual interest or principal payments are past due but the Group believes that impairment is not appropriate on the basis of the level of security/collateral available and/or the stage of collection of amounts owed to the Group.
Allowances for impairment
The Group establishes an allowance for impairment losses that represents its estimate of incurred losses in its loan portfolio. The main components of this allowance are a specific loss component that relates to individually significant exposures, and a collective loan loss allowance, established for groups of homogeneous assets in respect of losses that have been incurred but have not been identified on loans subject to individual assessment for impairment.

Annual Report 2012
106
Write-off policy
The Group writes off a loan/security balance (and any related allowances for impairment losses) when Group credit determines that the loans/securities are uncollectible. This determination is reached after considering information such as the occurrence of significant changes in the borrower/issuer’s financial position such that the borrower/issuer can no longer pay the obligation, or that proceeds from collateral will not be sufficient to pay back the entire exposure. For smaller balance standardised loans, charge off decisions are generally based on a product specific past due status.
Set out below is an analysis of the gross and net (of allowances for impairment) amounts of individually impaired assets.
GroupIn millions of Nigerian Naira
Loans and advances to customers
Loans and advances to banks
Gross Net Gross Net
31 December 2012
Moderately high risk 1,122 574 – –
High risk 1,842 1,245 – –
Very high risk 10,475 6,173 – –
Total 13,439 7,992 – –
31 December 2011
Moderately high risk 2,293 438 – –
High risk 3,045 589 – –
Very high risk 11,598 2,778 – –
Total 16,936 3,805 – –
Notes to the consolidated and separate financial statementscontinued …

107
GroupIn millions of Nigerian Naira
Loans and advances to customers
Loans and advances to banks
Gross Net Gross Net
1 January 2011
Moderately high risk 4,954 403 – –
High risk 6,566 605 – –
Very high risk 25,007 10,032 – –
Total 36,527 11,040 – –
BankIn millions of Nigerian Naira
Loans and advances to customers
Loans and advances to banks
Gross Net Gross Net
31 December 2012
Moderately high risk 334 162 – –
High risk 108 52 – –
Very high risk 2,258 1,092 – –
Total 2,700 1,306 – –
31 December 2011
Moderately high risk – – – –
High risk 565 – – –
Very high risk 2,002 – – –
Total 2,567 – – –
1 January 2011
Moderately high risk – – – –
High risk 4,115 – – –
Very high risk 14,594 – – –
Total 18,709 – – –
Account receivables (other asset) and cash and bank balances are neither past due nor impaired.
Work out and recovery
The Remedial Management & Credit Recovery Division (“RMCRD”) is the collections arm of Credit Risk Management that evaluates, monitors and supervises the restructuring, repayments and collections of all past due obligations that have been prudential classified and show early warning signs of default. The division has a three level governance structure:
Level 1 is an oversight and supervisory function performed by the Divisional Head through the Regional Heads;
Level 2 is a supervisory and management function performed by the Regional Heads through the Zonal Heads; and
Level 3 is an operational function performed by the Zonal Head in conjunction with the Recovery/Remedial officers from the regional bank offices.
RMCRD maintains effective governance and control over its entire process and adopts a standard methodology consisting of five steps.

Annual Report 2012
108
Risk management and credit recovery division methodology
Steps Description
1. Identification – Identification of past due obligations due for recovery, collections and remedial action
– Identification of strategies to be adopted
– Identification of the least cost alternative of achieving timely collections within resource constraints
2. Assessment & Implementation – accurate review and professional assessment of credit records
– Implementation of identified strategies
– update the database
3. Management & Monitoring – proffer professional work-out situations to aid prompt settlement
– risk Management and Credit Recovery Division methodology
– review identified strategies for adequacy in managing past due obligations
– proffer solutions that will aid the credit decision making process
4. Controlling – establish key control processes, practices and reporting requirements on a case-by-case basis.
– ensure work-out situations align with UBA’s strategic framework
– proffer solutions that will aid the credit decision making process
5. Reporting – communicate learning points from case profiles on past due obligations in order to improve the quality of lending practices
– report cases of imminent crystallisation of default
– present remedial actions to reduce and/or mitigate default
Credit collateral
The Group holds collateral against loans and advances to customers in the form of mortgage interests over property, other registered securities over assets, and guarantees. Estimates of fair value are based on the value of collateral assessed at the time of borrowing, and generally are not updated except when a loan is individually assessed as impaired. Collateral generally is not held over loans and advances to banks, except when securities are held as part of reverse repurchase and securities borrowing activity. Collateral usually is not held against investment securities.
As at reporting date – 31 December 2012, the Bank took possession of property amounting to N21 billion (2011 – Nil) held as collateral against certain loans. Management evaluates such property from time to time to determine the most appropriate use to which they can be put.
Liquidity risk sometimes arises from shallow markets or from the lack of marketability of an investment that cannot be bought or sold quickly enough to prevent or minimize a loss. Prudent management of liquidity contributes positively to earnings, with sound liquidity risk management being pivotal to the viability of UBA and the maintenance of overall banking stability. Accordingly all Nigerian banks are required by regulation to provide daily updates to the Central Bank of Nigeria (“CBN”) evidencing compliance with the liquidity and cash reserve ratios.
Notes to the consolidated and separate financial statementscontinued …

109
Liquidity risk management focuses on a number of key areas including:
– the continuous management of net anticipated cumulative cash flows;
– the active participation in local money and capital markets required to support day-to-day funding needed to refinance maturities, meet customer withdrawals and growth in advances;
– the maintenance of a portfolio of highly liquid assets that can easily be liquidated as protection against any unforeseen interruption to cash flow;
– the monitoring and managing of liquidity costs;
– running of a liquidity strategy in each of the jurisdictions where each of the foreign offices are opened; and
– the ongoing assessment and evaluation of various funding sources designated to grow and diversify the Group’s funding base in order to achieve an optimal funding profile and sound liquidity risk management.
Liquidity risk policy framework
In order to effectively manage liquidity risk, UBA measures, monitors and manages on-and off-balance-sheet liquidity mismatch risk, taking cognisance of business-as-usual liquidity conditions, stress liquidity scenarios, guidelines and limit as set by the regulatory requirements and requirements in terms of best practice liquidity contingency planning.
Liquidity risk management process
The Group has sufficient liquidity to meet obligations as they fall due in all the jurisdictions in which we operate. Liquidity risk is minimised to ensure that financial liabilities are duly settled regardless of currency or market conditions. Liquidity risk sometimes arises from shallow markets or from the lack of marketability of an investment that cannot be bought or sold quickly enough to prevent or minimize a loss.
Due to the negative consequence on the Group’s reputation in the event of failure to fulfil its financial obligations as and when due; maximum attention is given to analysing the liquidity profile. UBA Group stress testing simulates the impact of changes in customer behaviour, market prices, default by important borrowers, and in particular, a deterioration of ratings via scenario-based analyses. In view of this, it evaluates the possibilities of forecasting future liquidity situations and rectifying liquidity squeezes at an early stage, thereby ensuring optimised liquidity management.
In recognition of the prevailing market conditions, UBA comprehensively reviewed its Contingency Funding Planning process to incorporate more severe stress scenarios as well as systemic liquidity freezes and has implemented contingency plans for extreme liquidity stress events, should they occur. A separate capital committee plans for strategic longer-term funding requirement over a 3 – 5 year time-frame.
Liquidity risk management process
Our long-term liquidity needs are managed strategically in three broad categories:
– 6 – 12 months for continuity and business as usual;
– 1 – 3 years for growth and capital expenditure; and
– 3 – 10 years for strategic positioning.
Group Treasury receives information from other business divisions/directorate regarding the liquidity profile of their financial assets and liability as well as details of other forecasted cash flows arising from projected future business. Group Treasury then maintains a portfolio of short-term liquid assets, such as short-term investment securities, placements/inter-bank facilities to other financial institutions to ensure that sufficient liquidity within the Group. When a subsidiary is subject to a liquidity limit imposed by its local regulator, the subsidiary is responsible for managing its overall liquidity within the regulatory limit in coordination with the Central Treasury for Africa. Market Risk together with the Group Treasury monitors compliance of all operating subsidiaries and foreign branches with local regulatory limit on a daily basis. The daily liquidity position is monitored and periodic liquidity stress testing is conducted under a variety of scenarios covering both normal and harsh market conditions.

Annual Report 2012
110
All liquidity policies and procedures are subject to review by Market Risk Policy Committee subject to the approval by GALCO. Daily reports are prepared to cover not only the liquidity position of the Group but also to highlight any exceptions and remedial action taken is submitted daily to Group Executive Management.
Funding sources for the Group includes deposits from customers, medium-term borrowings from other financial institutions, issued debt securities and subordinated liabilities as its primary sources of funding. Although over 80% of deposits are available on demand, the behavioural pattern of these funding sources over time reveals that there is a core component that we have profiled and can rely upon as stable funding in a business as usual scenario. Our debt securities and subordinated liabilities have maturities of over one year, with the Tier 2 capital issued under the bank’s medium-term note program falling due in 2017 and 2018.
The short-term nature of fixed term deposits means that the Group faces a frequent repricing and maturity profile, though liquidity risk is actively managed through maintaining competitive pricing, drive to enhance the customer base and constant monitoring of market trends.
Exposure to liquidity risk
There are two measures used across the Group for managing liquidity risk namely by positively gapping the maturity profile of assets and liabilities and through the liquidity ratio mechanism which is a statutory requirement from most Central Banks in order to protect third party deposits.
I. The table 1 below shows the ratio of net liquid assets to current liabilities at the reporting date and during the period under review.
II Table 2 below highlights maturity analysis for current liabilities.
The key measure used by the Group for managing liquidity risk is the ratio of net liquid assets to deposits from customers. For this purpose net liquid assets are considered as including cash and cash equivalents and investment grade debt securities for which there is an active and liquid market less any deposits from banks, debt securities issued, other borrowings and commitment maturing within the next month. A similar calculation is used to measure the Group’s compliance with the liquidity limit established by the Group’s lead regulators (The Cental Bank of Nigeria).
Details for the Group ratio of net liquid assets to deposits and customers at the reporting date and during the reporting period were as follows:
2012 2011
At 31 December 63.4% 60.0%
Average for the period 59.7% 46.4%
Maximum for the period 63.4% 60.0%
Minimum for the period 57.3% 41.3%
Maturity analysis for financial liabilities
Over 80% of deposits are available on demand, and the disclosed liquidity gap is based on the contractual maturities of both the assets and the liabilities. However, the behavioural pattern of our funding sources over time reveals that there is a core component that we have profiled and can rely upon as stable funding in a business-as-usual scenario. Our Tier 2 capital issued under the Bank’s medium-term note program falls due in 2017 and 2018 and has provided support for risk asset growth in Nigeria.
The Group has sufficient liquidity to meet obligations as they fall due in all the jurisdictions in which we operate, and maturing assets available to fund maturing liabilities comprise cash, balances with Central Banks and other banks, interbank placements, short dated treasury bills and other risk assets as they are paid down.
Derivative contracts may be entered into as a part of our sales activities, if so, equal and opposite contracts are executed to fully eliminate market risk. UBA may invest in structured investment products, with embedded derivative components from time to time to optimally utilise surplus cash. Only principal guaranteed investment products are considered for this purpose. There were no nominal value of positions held in these products at year end.
Notes to the consolidated and separate financial statementscontinued …

111
The tables below show the undiscounted cash flow on the Group’s financial liabilities and on the basis of their earliest possible contractual maturity. The Gross nominal inflow/(outflow) disclosed in the table is the contractual, undiscounted cash flows on the financial liabilities or commitments. Whilst the table below have been prepared based on the contractual maturities, the maturity profile based on the behavioral pattern of the assets and liabilities observed over a very long period (five years) presents management with a reliable basis to manage the inherent liquidity risks.
31 December 2012In millions of Nigerian Naira
Grossnominal
inflow/(outflow)
Lessthan
1 month
1 – 3
months3 – 6
months6 – 12
months
Morethan
1 year
Group
Assets used to manage liquidity 2,247,793 987,061 231,771 103,820 200,071 725,070
Non-derivative liabilities
Deposits from banks 60,004 57,966 262 361 1,415 –
Deposits from customers 1,764,055 1,483,479 134,539 37,660 41,043 67,334
Other liabilities 68,385 12,437 – – 55,948 –
Subordinated liabilities 61,157 – 3,719 – 3,719 53,719
Borrowings 118,035 4,560 4,762 33,380 10,798 64,535
2,071,636 1,558,442 143,282 71,401 112,923 185,588
Derivative liabilities
Cross currency swap 124 62 – – 62 –
GAP 176,034 (571,443) 88,489 32,419 87,086 539,482
Bank
Non-derivative assets
Assets used to manage liquidity 1,729,031 840,901 190,662 64,515 94,452 538,501
Non-derivative liabilities
Deposits from banks 23,962 22,967 22 148 825 –
Deposits from customers 1,499,711 1,322,391 121,314 29,257 26,749 –
Other liabilities 44,246 12,438 – – 31,808 –
Subordinated liabilities 62,912 – 3,719 – 3,719 55,474
Borrowings 118,035 4,560 4,762 33,380 10,798 64,535
1,748,866 1,362,356 129,817 62,785 73,899 120,009
Derivative liabilities
Cross currency swap 124 62 – – 62 –
GAP (19,959) (521,517) 60,845 1,730 20,491 418,492

Annual Report 2012
112
31 December 2011In millions of Nigerian Naira
Grossnominal
inflow/(outflow)
Lessthan
1 month
1 – 3
months3 – 6
months6 – 12
months
Morethan
1 year
Group
Assets used to manage liquidity 1,925,645 724,420 203,900 111,852 162,452 723,021
Non-derivative liabilities
Deposits from banks 20,402 19,548 127 153 574 –
Deposits from customers 1,484,102 1,134,878 244,736 65,324 39,164 –
Managed funds 56,098 43,931 9,306 2,861 – –
Other liabilities 58,146 21,175 – – 36,971 –
Subordinated liabilities 60,938 – 3,719 – 3,719 53,500
Borrowings 137,254 3,868 349 505 9,227 123,305
1,816,940 1,223,400 258,237 68,843 89,655 176,805
Derivative liabilities
Cross currency swap 817 409 – – 408 –
GAPS 107,888 (499,389) (54,337) 43,009 72,389 546,216
Bank
Assets used to manage liquidity 1,590,576 593,095 134,888 132,321 110,520 619,752
Non-derivative liabilities
Deposits from banks 23,842 23,408 45 87 302 –
Deposits from customers 1,249,896 1,094,743 98,551 31,039 25,563 –
Other liabilities 49,860 18,661 – – 31,199 –
Subordinated liabilities 62,692 – 3,719 – 3,719 55,254
Borrowings 139,318 3,868 349 2,569 9,227 123,305
1,525,608 1,140,680 102,664 33,695 70,010 178,559
Derivative liabilities
Cross currency swap 817 409 – – 408 –
GAPS 64,151 (547,994) 32,224 98,626 40,102 441,193
Notes to the consolidated and separate financial statementscontinued …

113
1 January 2011In millions of Nigerian Naira
Grossnominal
inflow/(outflow)
Lessthan
1 month
1 – 3
months3 – 6
months6 – 12
months
Morethan
1 year
Group
Assets used to manage liquidity 1,612,481 659,968 137,143 140,254 120,991 554,124
Non-derivative liabilities
Deposits from banks 7,984 7,475 146 115 248 –
Deposits from customers 1,311,815 985,630 225,144 47,870 28,368 24,803
Other liabilities 41,558 34,078 5,586 1,895 – –
Managed funds 41,316 15,756 – – – 25,560
Subordinated liabilities 20,913 – 1,289 – 1,289 18,335
Borrowings 64,192 7,923 809 1,268 858 53,334
1,487,778 1,050,862 232,974 51,148 30,763 122,032
Derivative liabilities
Commodities 9,310 – 1,472 7,838 – –
GAPS 115,393 (390,894) (97,303) 81,268 90,228 432,092
Bank
Assets used to manage liquidity 1,404,002 570,239 128,678 113,731 112,586 478,767
Non-derivative liabilities
Deposits from banks 751 63 146 171 371 –
Deposits from customers 1,158,083 982,163 115,076 27,786 20,972 12,086
Other liabilities 38,669 15,040 – – – 23,629
Subordinated liabilities 22,725 – 1,289 – 1,289 20,147
Borrowings 64,192 7,923 809 1,268 858 53,334
1,284,420 1,005,189 117,320 29,225 23,490 109,196
Derivative liabilities
Commodities 9,310 – 1,472 7,838 – –
GAPS 110,272 (434,950) 9,886 76,668 89,096 369,571
Contingent liabilities
The tables that follow highlight those financial commitments not presented on the consolidated statement of financial position but are treated as off-balance sheets items.
These transactions represent third party obligations that can crystallise in future and are generally not directly dependent on the customers’ credit worthiness.
These transactions include performance bonds and guarantees, letters of credit, and banker’s acceptances. As stated earlier, these instruments are contingent in nature and carry the same credit risk as loans and advances. The Group ensures that off-balance sheet exposures are subjected to detailed credit analysis.

Annual Report 2012
114
31 December 2012In millions of Nigerian Naira
Grossnominal
inflow/(outflow)
Lessthan
1 month
1 – 3
Months3 – 6
Months6 – 12
Months
Morethan
1 year
Group
Performance bonds and guarantees 312,181 3,697 415 8,857 130,724 168,488
Letters of credits 97,329 3,235 35,342 56,476 2,264 12
409,510 6,932 35,757 65,333 132,988 168,500
31 December 2011
Performance bonds and guarantees 241,729 4,237 381 3,679 80,579 152,853
Letters of credits 128,032 5,148 55,821 60,854 6,183 26
Bankers acceptances 12,184 906 11,278 – – –
381,945 10,291 67,480 64,533 86,762 152,879
1 January 2011
Performance bonds and guarantees 145,147 506 1,154 11,350 25,084 107,053
Letters of credits 77,560 2,572 42,321 16,954 11,308 4,405
Bankers acceptances 10,319 4,310 6,009 – – –
233,026 7,388 49,484 28,304 36,392 111,458
Bank
31 December 2012
Performance bonds and guarantees 288,302 3,344 375 8,009 118,212 158,362
Letters of credits 86,648 2,835 31,352 50,403 2,047 11
374,950 6,179 31,727 58,412 120,259 158,373
31 December 2011
Performance bonds and guarantees 231,822 3,696 332 4,209 78,276 145,309
Letters of credits 92,595 4,870 43,314 38,796 5,592 23
Bankers acceptances 12,416 929 11,487 – – –
336,833 9,495 55,133 43,005 83,868 145,332
1 January 2011
Performance bonds and guarantees 128,111 447 1,019 10,018 22,140 94,487
Letters of credits 64,894 2,270 33,958 14,798 9,980 3,888
Bankers acceptances 11,665 3,893 7,772 – – –
204,670 6,610 42,749 24,816 32,120 98,375
Notes to the consolidated and separate financial statementscontinued …

115
Market risk profile
The Group’s risk profile changes as the Group expands across geographies, taking into consideration the worldwide market turbulence, additional foreign exchange risks alongside interest rate risks open up in different countries where UBA operates. Other areas within market risk exposures include UBA subsidiaries within Nigeria that take-on equity positions as well as UBA Treasury which has the responsibility for managing the Group’s risk taking positions and harmonising the operations of various countries. The main objective of market risk management is not only to manage measure and control market risk exposures but also to ensure that the Group carries out its affairs within acceptable parameters and in line with the market risk appetite. Market risk achieves the above stated objective, through a mix of quantitative and statistical controls.
Market risk governance
The Board through (Board Risk Management Committee, BRMC) is responsible for the overall governance of market risk as well as defining the terms of reference and delegating responsibilities to both the GRMC and GALCO. GALCO has Group oversight and is charged with ensuring that market risks are managed homogeneously in all areas of operation. Further to the above, oversight of market risk is vested in BRMC, GALCO (Group Asset and Liability Committee) and the Finance & General Purpose Committee (F& GPC) while the day to day management rests with the Executive Director, Risks and Non-Bank Subsidiaries. The Group Market Risk is not only responsible for the development of detailed risk management policies but is also involved in the day-to-day review of their implementation. These risk management policies are usually validated/approved by BRMC, GALCO or the full Board in accordance with the approval guidelines.
Market risk measurement
Market risk management in UBA relies on quantitative measures of risks, all of which aim to capture the variation of given target variable generated by uncertainty in market conditions. Measures used are a mix of “Volume methods”, which base risk exposures on absolute positions such as portfolio size, and newer methods of risk measurement which measures value. The “value measures” are used for standardising results across products and countries as well as measuring financial risks in day-to-day business.
Market risk limits
UBA takes propriety trading positions in foreign exchange, money market and bonds, primarily in the Nigerian financial market. Market risk limits are based on recommendations by GALCO and approved by the Board, as may be required. Transaction size and portfolio volume limits are in place for each trading portfolios from the first quarter of 2009. UBA Group uses VaR limits for total market risk and specific foreign exchange, interest rate, equity and other price risks. The overall structure of VaR limits is subject to review and approval by GALCO. VaR limits are allocated to trading portfolios, and is measured daily for the actively traded portfolios. These reports are consolidated for review by GALCO. We believe that market risk is most effectively managed through a combination of VaR, Gap Analysis and volume limits (open position limit) and not VaR limits only due to some of the limitation of VaR. These limitations include:
– A 10-day holding period assumes that it is possible to hedge or dispose of positions within that period. This may not be the case for certain highly illiquid assets or in situations in which there are severe general market illiquidity.

Annual Report 2012
116
– A 99% confidence level does not reflect losses that may occur beyond this level. Even within the model used there is a one percent chance that losses could exceed the VaR.
– VaR is calculated at the end of the business day and does not reflect exposures that may arise on positions during the trading day.
– The use of historical data as a basis for determining the possible range of future outcomes may not always cover all possible scenarios, particularly those of an exceptional nature.
– The VaR measure is dependent upon the Group’s position and the volatility of market prices. The VaR of an unchanged position reduces if market price volatility declines and vice versa.
Market risk measurement
VaR on trading portfolio is measured at 99% confidence limit over a 10-day holding period. No diversification deductions to stand-alone VaR numbers are made for prudence sake, given that we operate in inefficient markets.
Exposure to interest rate risk – non-trading portfolio
The principal risk to which non-trading portfolio are exposed is the risk of loss from flunctuations in the future cashflows or fair values of financial instruments because of a change in market interest rates. Interest rate risk is managed principally through monitoring interest rate gaps and having preapproved limits for repricing bands. There will always be a mismatch between maturing assets and maturing liabilities, and changes in interest rates means that the Net Interest Margin (NIM) is affected on a daily basis by maturing and repricing activities. This change is measured through calculation of Earnings at Risk or EaR on a portfolio over the life of its assets and liabilities.
EaR is usually calculated at various levels of change to simulate the likely change in the course of normal business or the expected risk where there is an unusual market event such as the occurrence in July and August 2012 when the Cash Reserve Ratio was increased by the Monetary Policy Committee (MPC) at very short notice from 8% to 12%.
GALCO has oversight for compliance with these limits and execution of gapping strategy is carried out by Group Treasury in its day-to-day activities, depending on their outlook for which direction rates will move.
The management of interest rate risk against interest rate gap limits is supplemented by monitoring the sensitivity of the Group’s financial assets and liabilities to various standard and non-standard interest rate scenarios.
Notes to the consolidated and separate financial statementscontinued …

117
Analysis of the Group’s sensitivity to an increase or decrease in market interest rates, asssuming no asymmetrical movement in yield curves and a constant financial position is as follows:
GROUP DECEMBER 2012 REPRICING GAP Total< 1
month1 – 3
months3 – 6
months6 – 12
monthsMore than
1 year
EAR @ 200 bps rate rise (3,276) (18,651) 4,687 56 451 10,181
EAR @ 200 bps rate decline 3,276 18,651 (4,687) (56) (451) (10,181)
BANK DECEMBER 2012 REPRICING GAP
EAR @ 200 bps rate rise (3,141) (15,996) 3,018 32 379 9,425
EAR @ 200 bps rate decline 3,141 15,996 (3,018) (32) (379) (9,425)
GROUP DECEMBER 2011 REPRICING GAP
EAR @ 200 bps rate rise (1,894) (12,400) 170 257 348 9,731
EAR @ 200 bps rate decline 1,894 12,400 (170) (257) (348) (9,731)
BANK DECEMBER 2011 REPRICING GAP
EAR @ 200 bps rate rise (2,909) (13,124) 854 850 280 8,230
EAR @ 200 bps rate decline 2,909 13,124 (854) (850) (280) (8,230)
GROUP JANUARY 2011 REPRICING GAP
EAR @ 200 bps rate rise (385) (8,361) (1,334) 710 273 8,327
EAR @ 200 bps rate decline 385 8,361 1,334 (710) (273) (8,327)
BANK JANUARY 2011 REPRICING GAP
EAR @ 200 bps rate rise (996) (9,329) 171 666 291 7,205
EAR @ 200 bps rate decline 996 9,329 (171) (666) (291) (7,205)

Annual Report 2012
118
Exposure to interest rate risk
See table below for a summary of the Group’s interest rate gap position as at 31 December 2012, 30 December 2011 and 1 January 2011 respectively using 200bps as the assumed linear change in the yield curve.
Group31 December 2012In millions of Nigerian Naira
Repricing period
Carryingamount
< 1month
1 – 3months
3 – 6months
6 – 12months
More than1 year
Non-interest bearing
Cash and cash equivalents 714,115 349,670 216,694 – – – 147,751
Financial assets held-for-trading 457 457 – – – – –
Loans and advances to banks 28,513 8,491 5,082 14,940 – – –
Loans and advances to customers 658,922 215,064 98,835 39,452 21,329 284,242 –
Investment securities 680,817 35,895 96,989 11,620 97,770 402,969 35,574
Other assets 15,021 – – – – – 15,021
2,097,845 609,577 417,600 66,012 119,099 687,211 198,346
Derivative liability 124 – – – – – 124
Deposits from banks 57,780 57,780 – – – – –
Deposits from customers 1,720,008 1,480,060 128,359 27,930 16,325 67,334 –
Other liabilities 81,438 – – – – – 81,438
Subordinated liabilities 53,719 – 3,719 – 3,719 46,281 –
Borrowings 114,520 4,275 4,320 32,451 8,939 64,535 –
2,027,589 1,542,115 136,398 60,381 28,983 178,150 81,562
GAPS 70,256 (932,538) 281,202 5,631 90,116 509,061 116,784
31 December 2011
Cash and cash equivalents 434,218 254,404 69,877 – – – 109,937
Financial assets held-for-trading 1,303 237 – – – – 1,066
Loans and advances to banks 41,564 12,051 8,501 4,609 5,566 10,837 –
Loans and advances to customers 605,627 247,904 133,686 16,126 47,968 159,943 –
Investment securities 722,308 20,897 41,691 61,912 46,612 485,112 66,084
Other assets 10,608 – – – – – 10,608
1,815,628 535,493 253,755 82,647 100,146 655,892 187,695
Derivative liability 817 – – – – – 817
Deposits from banks 19,510 19,510 – – – – –
Deposits from customers 1,445,822 1,132,226 239,850 54,843 18,903 – –
Other liabilities 58,210 – – – – – 58,210
Subordinated liabilities 53,500 – 3,719 – 3,719 46,062 –
Borrowings 137,040 3,770 – 2,064 7,901 123,305 –
1,714,899 1,155,506 243,569 56,907 30,523 169,367 59,027
GAPS 100,729 (620,013) 10,186 25,740 69,623 486,525 128,668
1 January 2011
Cash and cash equivalents 385,397 317,131 31,050 – – – 37,216
Financial assets held-for-trading 2,594 1,267 – – – – 1,327
Loans and advances to banks 11,226 4,123 2,467 4,636 – – –
Loans and advances to customers 590,797 253,381 92,695 65,837 37,970 140,914 –
Investment securities 493,079 2,587 11,750 35,034 29,115 369,307 45,286
Other assets 26,370 – – – – – 26,370
1,509,463 578,489 137,962 105,507 67,085 510,221 110,199
Notes to the consolidated and separate financial statementscontinued …

119
Group31 December 2012In millions of Nigerian Naira
Repricing period
Carryingamount
< 1month
1 – 3months
3 – 6months
6 – 12months
More than1 year
Non-interest bearing
Derivative liability 9,310 – – – – – 9,310
Deposits from banks 7,456 7,456 – – – – –
Deposits from customers 1,270,409 981,094 216,034 37,701 10,777 24,803 –
Other liabilities 41,671 – – – – – 41,671
Subordinated liabilities 18,335 – 1,289 – 1,289 15,756 1
Borrowings 63,327 7,837 700 1,074 382 53,334 –
1,410,508 996,387 218,023 38,775 12,448 93,893 50,982
GAPS 98,955 (417,898) (80,061) 66,732 54,637 416,328 59,217
Bank
31 December 2012
Cash and cash equivalents 629,481 336,067 157,627 – – – 135,787
Financial assets held-for-trading 456 456 – – – – –
Loans and advances to banks 27,878 8,295 4,965 14,618 – – –
Loans and advances to customers 570,714 179,776 84,042 36,687 17,275 252,933 1
Investment securities 527,994 22,142 58,361 5,238 76,223 330,901 35,129
Other assets 9,296 – – – – – 9,296
1,765,819 546,736 304,995 56,543 93,498 583,834 180,213
Derivative liability 124 – – – – – 124
Deposits from banks 22,875 22,875 – – – – –
Deposits from customers 1,461,131 1,319,365 115,875 20,852 5,039 – –
Other liabilities 57,299 – – – – – 57,299
Subordinated liabilities 55,474 – 3,719 – 3,719 48,036 –
Borrowings 114,520 4,275 4,320 32,451 8,939 64,535 –
1,711,423 1,346,515 123,914 53,303 17,697 112,571 57,423
GAPS 54,396 (799,779) 181,081 3,240 75,801 471,263 122,790
31 December 2011
Cash and cash equivalents 352,500 227,674 30,883 – – – 93,943
Financial assets held-for-trading 237 237 – – – – –
Loans and advances to banks 41,564 12,451 8,901 5,009 5,966 9,237 –
Loans and advances to customers 552,526 208,101 75,392 52,620 28,993 187,420 –
Investment securities 560,028 14,994 34,155 51,085 40,887 385,954 32,953
Other assets 13,695 – – – – – 13,695
1,520,550 463,457 149,331 108,714 75,846 582,611 140,591
Derivative liability 817 – – – – – 817
Deposits from banks 23,408 23,408 – – – – –
Deposits from customers 1,216,511 1,092,466 94,342 21,636 8,067 – –
Other liabilities 49,924 – – – – – 49,924
Subordinated liabilities 55,254 – 3,719 – 3,719 47,816 –
Borrowings 137,040 3,770 – 2,064 7,901 123,305 –
1,482,954 1,119,644 98,061 23,700 19,687 171,121 50,741
GAPS 37,596 (656,187) 51,270 85,014 56,159 411,490 89,850

Annual Report 2012
120
Group1 January 2011In millions of Nigerian Naira
Repricing period
Carryingamount
< 1month
1 – 3months
3 – 6months
6 – 12months
More than1 year
Non-interest bearing
Cash and cash equivalents 330,701 290,881 13,725 – – – 26,095
Financial assets held-for-trading 1,267 1,267 – – – – –
Loans and advances to banks 11,226 4,122 2,467 4,637 – – –
Loans and advances to customers 557,224 220,383 91,017 42,293 35,995 167,536 –
Investment securities 391,461 2,587 11,750 43,825 29,115 275,725 28,459
Other assets 24,001 24,001
1,315,880 519,240 118,959 90,755 65,110 443,261 78,555
Derivative liability 9,310 – – – – – 9,310
Deposits from banks 51 51 – – – – –
Deposits from customers 1,120,566 977,801 106,728 18,625 5,326 12,086 –
Other liabilities 38,782 38,782
Subordinated liabilities 20,147 – 1,289 – 1,289 17,568 1
Borrowings 63,327 7,837 700 1,074 382 53,334 –
1,252,183 985,689 108,717 19,699 6,997 82,988 48,093
GAPS 63,697 (466,449) 10,242 71,056 58,113 360,273 30,462
Interest rate movements affect reported equity in the following ways:
– Retained earnings arising from increases or decreases in net interest income and the fair value changes reported in profit and loss.
– Fair value reserves arising from increases or decreases in fair values of available-for-sale financial instruments reported directly in equity.
Overall non-trading interest rate risk positions are managed by Group Treasury, which uses investment securities, advances to other financial institutions (banks and discount houses) to manage the overall position arising from the Group’s non-trading activities.
Liabilities typically reprice much faster than assets due to the nature of most markets where the Group operates therefore most regions are susceptible to falling interest rates.
Exchange rate exposure limits
Exchange rate limits are volume based. UBA operates within the exchange controls defined by the CBN.
Equity risk
The Group did not undertake significant equity trading activity in 2012, though our legacy equity portfolio and the embedded price risk is still subject to regular monitoring by the Group Market Risk.
The legacy portfolio value as at 31 December 2012 had reduced to N131million, (down from N1.381million in 2011) which is not a significant risk to the Group, though it contains investments that are still quoted on the Nigerian Stock Exchange (NSE) and therefore exposed to price risk. In 2013 the investment bank and other areas of the business that undertake proprietary equity trading would have been spun off into a separate legal entity.
The NSE was the third most rewarding stock market globally in 2012 behind only Egypt and Kenya, as investors harvested 35.45% return on investment during the year. However, for the purpose of sensitivity analysis we have made a conservative assumption that the stocks could appreciate a further 5% or lose 10% in value. The Group has significant investments in AFC which is a non-quoted investment with a fair value of N32.251billion as at 31 December 2012. Full details are disclosed in Note 5 (c).
Notes to the consolidated and separate financial statementscontinued …

121
Group Bank Group Bank Group Bank
Level 1 Equity Sensitivities 2012 2012 2011 2011 2010 2010
Impact on profit or loss:
Favourable change @ 5% increase in indicative value – – 53 – 66 –
Unfavourable change @ 10% reduction in indicative value – – (107) – (133) –
Impact on Other comprehensive income:
Favourable change @ 5% increase in indicative value 7 7 69 69 168 168
Unfavourable change @ 10% reduction in indicative value (13) (13) (138) (138) (337) (337)
Level 1 Equity Positions
In million of Nigerian Naira
Financial assets held-for-trading: – – 1,066 – 1,327 –
Available-for-sale investment securities: 131 131 1,381 1,381 3,369 3,369
Total 131 131 2,447 1,381 4,696 3,369
Level 2 Equity Sensitivities
Impact on other comprehensive income:
Favourable change @ 5% increase in indicative value 81 81 76 76 123 123
Unfavourable change @ 10% reduction in indicative value (162) (162) (152) (152) (246) (246)
Level 2 Equity Positions
In million of Nigerian Naira
Financial assets held-for-trading: – – – – – –
Available-for-sale investment securities: 1,623 1,623 1,516 1,516 2,461 2,461
Total 1,623 1,623 1,516 1,516 2,461 2,461
FCY Sensitivity Analysis on Foreign Exchange Rate
The Naira has fluctuated within a range of 5% over the past three years, depreciating in 2011 but closing 2012 with about 2% appreciation during the year. The Naira has been supported by strong earnings from crude oil sales and robust foreign direct investments, leading to a sustained increase in the level of foreign exchange reserves which currently stand close to $50 billion. UBA remains a top player in the foreign exchange market and accounts for 15% – 20% of total interbank volumes (excluding the CBN). UBA is also very active in third currency trading, with “enforcement of stop loss limits on position taking” acting as a primary risk mitigant.
The tables below shows the sensitivity of the net foreign currency (FCY) exposure to changes in the value of the Naira. Based on the past years behaviour, it is expected that the Naira will appreciate by a smaller quantum than it would depreciate.

Annual Report 2012
122
Group
In millions of Nigerian Naira US Dollar Euro Pound Others Total
31 December 2012
Cash and cash equivalents 435,439 13,009 4,707 77,081 530,237
Non-pledged trading assets – – – – –
Loans and advances to banks 21,545 18 – 6,950 28,513
Loans and advances to customers 156,855 4,563 97 94,122 255,638
Investment securities 39,812 – – 154,595 194,407
Total financial assets 653,652 17,590 4,804 332,749 1,008,795
Derivative liability 124 – – – 124
Deposits from banks 10,653 2,131 – 39,976 52,760
Deposits from customers 556,219 9,759 3,471 242,093 811,542
Subordinated liabilities – – – – –
Other borrowed funds 62,100 – – – 62,100
Total financial liabilities 629,096 11,890 3,471 282,069 926,526
Net FCY Exposure 24,556 5,700 1,333 50,680 82,269
Sensitivity at 200 bps Naira appreciation (491) (114) (27) (1,014) (1,645)
Sensitivity at 400 bps Naira depreciation 982 228 53 2,027 3,291
31 December 2011
Cash and cash equivalents 167,084 30,114 6,830 60,592 264,620
Non-pledged trading assets – – – – –
Loans and advances to banks 41,564 – – – 41,564
Loans and advances to customers 151,563 885 63 33,643 186,154
Investment securities 48,505 – – 65,041 113,546
Total financial assets 408,716 30,999 6,893 159,276 605,884
Derivative liability 817 – – – 817
Deposits from banks 16,604 – – – 16,604
Deposits from customers 282,980 6,779 2,854 213,548 506,161
Managed funds – – – – –
Subordinated liabilities – – – – –
Other borrowed funds 56,276 – – – 56,276
Total financial liabilities 356,677 6,779 2,854 213,548 579,858
Net FCY Exposure 52,039 24,220 4,039 (54,272) 26,026
Sensitivity at 200 bps Naira appreciation (1,041) (484) (81) 1,085 (521)
Sensitivity at 400 bps Naira depreciation 2,082 969 162 2,171 1,041
Notes to the consolidated and separate financial statementscontinued …

123
Group
In millions of Nigerian Naira US Dollar Euro Pound Others Total
1 January 2011
Cash and cash equivalents 4,244 1,956 902 24,138 31,240
Non-pledged trading assets – – – 44,752 44,752
Loans and advances to banks 100,069 23,795 4,039 4,236 132,139
Loans and advances to customers 146,780 291 93 56,643 203,807
Investment securities 26,612 – – 45,576 72,188
Total financial assets 277,705 26,042 5,034 175,345 484,126
Derivative liability 9,310 – – – 9,310
Deposits from banks – – – 5,173 5,173
Deposits from customers 342,967 4,987 2,184 154,613 504,751
Subordinated liabilities 22,301 – – – 22,301
Other borrowed funds 22,574 – – – 22,574
Total financial liabilities 397,152 4,987 2,184 159,786 564,109
Net FCY Exposure (119,447) 21,055 2,850 15,559 (79,983)
Sensitivity at 200 bps Naira appreciation 2,389 (421) (57) (311) 1,600
Sensitivity at 400 bps Naira depreciation (4,778) 842 114 622 3,199
Bank
31 December 2012
Cash and cash equivalents 414,852 6,181 4,489 2,875 428,397
Non-pledged trading assets – – – – –
Loans and advances to banks 27,860 18 – – 27,878
Loans and advances to customers 126,385 4,462 97 – 130,944
Investment securities 36,336 – – 4,832 41,168
Total financial assets 605,434 10,661 4,586 7,707 628,387
Derivative liability 124 – – – 124
Deposits from banks – – – – –
Deposits from customers 525,334 5,180 3,310 – 533,824
Subordinated liabilities – – – – –
Other borrowed funds 63,969 – – – 63,969
Total financial liabilities 589,427 5,180 3,310 – 597,916
Net FCY Exposure 16,006 5,481 1,277 7,707 30,471
Sensitivity at 200bps Naira appreciation (320) (110) (26) (154) (609)
Sensitivity at 400bps Naira depreciation 640 219 51 308 1,219

Annual Report 2012
124
Bank
In millions of Nigerian Naira US Dollar Euro Pound Others Total
31 December 2011
Cash and cash equivalents 163,836 25,378 6,472 33,496 229,182
Non-pledged trading assets – – – – –
Loans and advances to banks 41,564 – – – 41,564
Loans and advances to customers 122,409 880 62 – 123,351
Investment securities 48,504 – – 5,835 54,339
Total financial assets 376,313 26,258 6,534 39,331 448,436
Derivative liability 817 – – – 817
Deposits from banks 21,158 – – – 21,158
Deposits from customers 245,894 5,414 2,721 770 254,799
Subordinated liabilities – – – – –
Other borrowed funds 56,276 – – – 56,276
Total financial liabilities 324,145 5,414 2,721 770 333,050
Net FCY Exposure 52,168 20,844 3,813 38,561 115,386
Sensitivity at 200 bps Naira appreciation (1,043) (417) (76) (771) (2,308)
Sensitivity at 400 bps Naira depreciation 2,087 834 153 1,542 4,615
1 January 2011
Cash and cash equivalents 4,244 1,956 902 24,138 31,240
Non-pledged trading assets – – – 44,752 44,752
Loans and advances to banks 100,069 23,795 4,039 4,236 132,139
Loans and advances to customers 146,780 291 93 56,643 203,807
Investment securities 26,612 – – 45,576 72,188
Total financial assets 277,705 26,042 5,034 175,345 484,126
Derivative liability 9,310 – – – 9,310
Deposits from banks – – – 5,173 5,173
Deposits from customers 342,967 4,987 2,184 154,613 504,751
Subordinated liabilities 22,301 – – – 22,301
Other borrowed funds 22,573 – – – 22,573
Total financial liabilities 397,151 4,987 2,184 159,786 564,108
Net FCY Exposure (119,446) 21,055 2,850 15,559 (79,982)
Sensitivity at 200 bps Naira appreciation 2,389 (421) (57) (311) 1,600
Sensitivity at 400 bps Naira depreciation (4,778) 842 114 622 3,199
Notes to the consolidated and separate financial statementscontinued …

125
Fixed income re-pricing gap
Price sensitivity analysis of fixed income securities
The sensitivity analysis of our fixed income securities highlights the likely impact of yield volatility on the portion of the Bonds and Bills portfolio that is exposed to price risk in 2013.
The price sensitivity analysis reflects the actual risks which the Bank faced in 2012 when yields in Nigeria were between 14 – 16.8% in January, yet closed the year in the range of 12 – 12.5% depending on the tenor involved. In some of the other markets where the Group operates, the differential in rates was even greater. For example Ghana fixed income securities returned 14.5% in January 2012 and 23% by December, thus guiding our decision to conduct the sensitivity analysis using a delta of 400 bps in a business as usual scenario.
GROUP DECEMBER 2012 REPRICING PROFILE Total< 1
month1 – 3
months3 – 6
months6 – 12
monthsMore than
1 year
1 Year Sensitivity @ 400 bps rate rise (5,897) (1,454) (3,233) (232) (978) –
1 Year Sensitivity @ 400 bps rate decline 5,897 1,454 3,233 232 978 –
GROUP DECEMBER 2011 REPRICING PROFILE
1 Year Sensitivity @ 400 bps rate rise (3,939) (845) (1,390) (1,238) (466) –
1 Year Sensitivity @ 400 bps rate decline 3,939 845 1,390 1,238 466 –
GROUP JANUARY 2011 REPRICING PROFILE
1 Year Sensitivity @ 400 bps rate rise (1,624) (154) (392) (787) (291) –
1 Year Sensitivity @ 400 bps rate decline 1,624 154 392 787 291 –
BANK DECEMBER 2012 REPRICING PROFILE
1 Year Sensitivity @ 400 bps rate rise (3,716) (904) (1,945) (105) (762) –
1 Year Sensitivity @ 400 bps rate decline 3,716 904 1,945 105 762 –
BANK DECEMBER 2011 REPRICING PROFILE
1 Year Sensitivity @ 400 bps rate rise (3,177) (609) (1,139) (1,022) (408) –
1 Year Sensitivity @ 400 bps rate decline 3,177 609 1,139 1,022 408 –
BANK JANUARY 2011 REPRICING PROFILE
1 Year Sensitivity @ 400 bps rate rise (1,624) (154) (392) (787) (291) –
1 Year Sensitivity @ 400 bps rate decline 1,624 154 392 787 291 –

Annual Report 2012
126
REPRICING PERIOD ANALYSIS
GROUPIn millions of Nigerian Naira
Repricing period
Grossamount
< 1month
1 – 3months
3 – 6months
6 – 12months
More than1 year
Non-sensitive
31 December 2012
Financial assets held-for-trading 457 457 – – – – –
Investment securities 680,817 35,895 96,989 11,620 97,770 402,969 35,574
681,274 36,352 96,989 11,620 97,770 402,969 35,574
31 December 2011
Financial assets held-for-trading 1,303 237 – – – – 1,066
Investment securities 722,308 20,897 41,691 61,912 46,612 485,112 66,084
723,611 21,134 41,691 61,912 46,612 485,112 67,150
1 January 2011
Financial assets held-for-trading 2,594 1,267 – – – – 1,327
Investment securities 493,079 2,587 11,750 39,350 29,115 369,307 40,970
495,673 3,854 11,750 39,350 29,115 369,307 42,297
BANK
31 December 2012
Financial assets held-for-trading 456 456 – – – –
Investment securities 527,994 22,142 58,361 5,238 76,223 330,901 35,129
528,450 22,598 58,361 5,238 76,223 330,901 35,129
31 December 2011
Financial assets held-for-trading 237 237 – – – – –
Investment securities 560,028 14,994 34,155 51,085 40,767 385,954 33,073
560,265 15,231 34,155 51,085 40,767 385,954 33,073
1 January 2011
Financial assets held-for-trading 1,267 1,267 – – – –
Investment securities 391,461 2,587 11,750 39,350 29,115 275,725 32,934
392,728 3,854 11,750 39,350 29,115 275,725 32,934
The Group also uses a wide range of stress tests to model the financial impact of a variety of exceptional market scenarios, such as periods of prolonged market liquidity, on individual trading portfolios and the Group’s overall position.
Capital management
Regulatory capital
The Group’s lead regulator, the Central Bank of Nigeria sets and monitors capital requirements for the Bank. The Bank company and individual banking operations are directly supervised by the Central Bank of Nigeria and the respective regulatory authorities in the countries in which the subsidiary banking operations are domiciled.
The Central Bank of Nigeria requires the Bank to maintain a prescribed ratio of total capital to total risk-weighted assets.
The Group’s regulatory capital is analysed into two tiers:
Tier 1 capital, which includes ordinary share capital, share premium, retained earnings, translation reserve and minority interests after deductions for goodwill and intangible assets, and other regulatory adjustments relating to items that are included in equity but are treated differently for capital adequacy purposes.
Notes to the consolidated and separate financial statementscontinued …

127
Tier 2 capital, which includes qualifying subordinated liabilities, collective impairment allowances and the element of the fair value reserve relating to unrealised gains on financial instruments classified as available-for-sale.
Various limits are applied to elements of the capital base. The qualifying tier 2 capital cannot exceed tier 1 capital. There are also restrictions on the amount of collective impairment allowances that may be included as part of tier 2 capital.
Banking operations are categorised mainly as trading book or banking book, and risk-weighted assets are determined according to specified requirements that seek to reflect the varying levels of risk attached to assets and off-balance sheet exposures.
The Group’s policy is to maintain a strong capital base so as to maintain investor, creditor and market confidence and to sustain future development of the business. The impact of the level of capital on shareholders’ return is also recognised and the Group recognises the need to maintain a balance between the higher returns that might be possible with greater gearing and the advantages and security afforded by a sound capital position.
The capital adequacy ratio is the quotient of the capital base of the Bank and the Bank’s risk-weighted asset base. UBA Plc operates under an international banking authorisation with a minimum regulatory capital of N50 billion and a minimum capital adequacy ratio of 15%.
Capital management
Group Bank
In millions of Nigeria naira Notes31 December
201231 December
201131 December
201231 December
2011
Tier 1 capital
Ordinary share capital 37 16,491 16,168 16,491 16,168
Share premium 37 107,932 108,255 107,932 108,255
Retained earnings 37 49,572 16,034 47,723 21,474
Translation reserve (1,514) 1,607 – –
Other reserves 37 16,625 5,281 48,171 36,418
Non-controlling interests 3,361 3,595 – –
Shareholders’ fund 192,467 150,940 220,317 182,315
Less:
Fair value reserve for available-for-sale securities 37 (15,223) (11,460) (15,834) (12,300)
Non-controlling interests 37 (3,361) (3,595) – –
Investment in subsidiaries and equity-accounted investee 26, 27 – (10,356) (66,727) (67,538)
Total 173,883 125,529 137,756 102,477
Tier 2 capital
Fair value reserve for available-for-sale securities 37 15,223 11,460 15,834 12,300
Debenture stock 35 53,719 53,500 55,474 55,254
Collective allowances for impairment 22 10,358 11,322 7,189 9,883
Non-controlling interests 3,361 3,595 – –
Total 82,661 79,877 78,497 77,437
Total regulatory capital 256,544 205,406 216,253 179,914
Risk-weighted assets 1,091,824 945,279 907,514 828,321
Capital ratios
Total regulatory capital expressed as a percentage of total risk-weighted assets 23.5% 21.7% 23.8% 21.7%
Total tier 1 capital expressed as a percentage of risk-weighted assets 15.9% 13.3% 15.2% 12.4%

Annual Report 2012
128
Capital allocation
The allocation of capital between specific operations and activities is, to a large extent, driven by optimisation of the return achieved on the capital allocated. The amount of capital allocated to each operation or activity is based primarily upon the regulatory capital, but in some cases the regulatory requirements do not reflect fully the varying degree of risk associated with different activities. In such cases the capital requirements may be flexed to reflect differing risk profiles, subject to the overall level of capital to support a particular operation or activity not falling below the minimum required for regulatory purposes.
Although maximisation of the return on risk-adjusted capital is the principal basis used in determining how capital is allocated within the Group to particular operations or activities, it is not the sole basis used for decision-making. Account also is taken of synergies with other operations and activities, the availability of management and other resources, and the fit of the activity with the Group’s longer term strategic objectives.
Notes to the consolidated and separate financial statementscontinued …

129
5. USE OF ESTIMATES AND JUDGEMENTS
Management discusses with the Audit Committee the development, selection and disclosure of the Group’s critical accounting policies and estimates, and the application of these policies and estimates.
These disclosures supplement the commentary on financial risk management (see note 4).
(i) Key sources of estimation uncertaintyAllowances for credit lossesAssets accounted for at amortised cost are evaluated for impairment on a basis described in accounting policy 3(j).
The specific counterparty component of the total allowances for impairment applies to claims evaluated individually for impairment and is based upon management’s best estimate of the present value of the cash flows that are expected to be received. In estimating these cash flows, management makes judgements about a counterparty’s financial situation and the net realisable value of any underlying collateral. Each impaired asset is assessed on its merits, and the workout strategy and estimate of cash flows considered recoverable are independently approved by the Credit Risk function.
Collectively assessed impairment allowances cover credit losses inherent in portfolios of claims with similar economic characteristics when there is objective evidence to suggest that they contain impaired claims, but the individual impaired items cannot yet be identified. In assessing the need for collective loan loss allowances, management considers factors such as credit quality, portfolio size, concentrations, and economic factors. In order to estimate the required allowance, assumptions are made to define the way interest losses are modelled and to determine the required input parameters, based on historical experience and current economic conditions. The accuracy of the allowances depends on how well future cash flows for specific counterparty allowances and the model assumptions and parameters used in determining collective allowances are estimated.
Determining fair valuesThe determination of fair value for financial assets and liabilities for which there is no observable market price requires the use of techniques as described in accounting policy 3(i)(v). For financial instruments that trade infrequently and have little price transparency, fair value is less objective, and requires varying degrees of judgement depending on liquidity, concentration, uncertainty of market factors, pricing assumptions and other risks affecting the specific instrument.
Critical accounting judgements in applying the Group’s accounting policiesCritical accounting judgements made in applying the Group’s accounting policies include:
Valuation of financial instrumentsThe Group’s accounting policy on valuation of financial instruments is discussed under note 3(i).
In measuring credit risk of loans and advances to various counterparties, the Group considers the character and capacity of the obligor, the probability that an obligor or counterparty will default over a given period (probability of default – PD) , the portion of the loan expected to be irrecoverable at the time of loan default (loss given default – LGD) and expected amount that is outstanding at the point of default. The table below shows the sensitivities of the impairment loss provision for 1% increase or decrease in the LGD and PD.
Probability of Default – PD Loss Given Default – LGDIncrease/decrease Impact (N’000) Impact (N’000)
1% increase 73,742 73,745
1% decrease (73,742) (73,745)
The Group measures fair values using the following fair value hierarchy that reflects the significance of the inputs used in making the measurments:
Level 1: Quoted market price (unadjusted) in an active market for an identical instrument.
Level 2: Valuation techniques based on observable inputs, either directly (i.e., as prices) or indirectly (i.e., derived from prices). This category includes instruments valued using: quoted market prices in active markets for similar instruments; quoted prices for identical or similar instruments in markets that are considered less than active; or other valuation techniques where all significant inputs are directly or indirectly observable from market data.

Annual Report 2012
130
Notes to the consolidated and separate financial statementscontinued …
Level 3: Valuation techniques using significant unobservable inputs. This category includes all instruments where the valuation technique includes inputs not based on observable data and the unobservable inputs could have a significant effect on the instrument’s valuation. This category includes instruments that are valued based on quoted prices for similar instruments where significant unobservable adjustments or assumptions are required to reflect differences between the instruments.
The table below analyses financial instruments measured at fair value at the end of the reporting period, by the level in the fair value hierarchy into which the fair value measurement is categorised:
(a) Group:December 2012In millions of Nigerian Naira Notes Level 1 Level 2 Level 3 Total
Financial assets held for trading: 21
Government bonds 284 – – 284
Treasury bills 173 – – 173
Equities – – – –
457 – – 457
Available-for-sale investment securities: 24
Treasury bills 93,091 – – 93,091
Bonds – – – –
Equity investments at fair value 131 1,623 32,251 34,005
93,222 1,623 32,251 127,096
Derivative liability 31 – 124 – 124
93,679 1,747 32,251 127,677
Bank:December 2012In millions of Nigerian Naira Notes Level 1 Level 2 Level 3 Total
Financial assets held for trading: 21
Government bonds 284 – – 284
Treasury bills 172 – – 172
Equities – – – –
456 – – 456
Available-for-sale investment securities: 24
Treasury bills 91,517 – – 91,517
Bonds – – – –
Equity investments at fair value 131 1,623 32,251 34,005
91,648 1,623 32,251 125,522
Derivative liability 31 – 124 – 124
92,104 1,747 32,251 126,102

131
(b)(i)
Group:December 2011In millions of Nigerian Naira Notes Level 1 Level 2 Level 3 TotalFinancial assets held for trading: 21Government bonds 237 – – 237 Equities 1,066 – – 1,066
1,303 – – 1,303Available-for-sale investment securities: 24Treasury bills 30,660 – – 30,660 Bonds – – – – Equity investments at fair value 8,732 1,516 29,718 39,966
39,392 1,516 29,718 70,626 Derivative liability 31 – 817 – 817
40,695 2,333 29,718 72,746 (ii) Bank:
December 2011In millions of Nigerian Naira Notes Level 1 Level 2 Level 3 TotalFinancial assets held for trading: 21Government bonds 237 – – 237
237 – – 237 Available-for-sale investment securities: 24Treasury bills 30,475 – – 30,475 Equity investments at fair value 641 1,516 29,718 31,875
31,116 1,516 29,718 62,350 Derivative liability 31 – 817 – 817
31,353 2,333 29,718 63,404(iii) Group:
January 2011In millions of Nigerian Naira Notes Level 1 Level 2 Level 3 TotalFinancial assets held for trading: 25Government bonds 1,267 – – 1,267 Equities 1,327 – – 1,327
2,594 – – 2,594 Available-for-sale investment securities: 25Treasury bills 78,858 – – 78,858 Equity investments at fair value 3,369 2,461 23,947 29,777
82,227 2,461 23,947 108,635 Derivative liability 33 – 9,310 – 9,310
84,821 11,771 23,947 120,539 (iv) Bank:
January 2011In millions of Nigerian Naira Notes Level 1 Level 2 Level 3 TotalFinancial assets held for trading: 25Government bonds 1,267 – – 1,267 Equities – – – –
1,267 – – 1,267Available-for-sale investment securities: 25Treasury bills 78,858 – – 78,858 Equity investments at fair value 3,369 2,461 23,947 29,777
82,227 2,461 23,947 108,635 Derivative liability 33 – 9,310 – 9,310
83,494 11,771 23,947 119,212

Annual Report 2012
132
Notes to the consolidated and separate financial statementscontinued …
(c) Included in AFS equity investment at fair value is an investment in Africa Finance Corporation (AFC). The Group holds 116.72 million shares of AFC, whose fair value management has estimated using discounted cash flow valuation model. The cost of equity was determined by relevering the unlevered beta of similar companies using the forecasted debt to equity ratios of AFC. The cost of equity is assessed to be a significant input in the model. An analysis of the impact of changes in cost of equity to the fair value of AFC investment is as follows:
Change in cost of equity% change in AFC value
2012 2011 2010
5% increase 4.3% decrease 6.2% decrease 6.2% decrease5% decrease 4.7% increase 6.2% increase 6.2% increase
Group Bank
In millions of Nigerian NairaDecember
2012 December
2011 December
2012 December
2011
Balance, beginning of period 29,718 23,947 29,718 23,947 Gain/(loss) recognised in other comprehensive income 2,533 5,771 2,533 5,771 Balance, end of period 32,251 29,718 32,251 29,718
(d) Financial asset and liability classificationThe Group’s accounting policies provide scope for assets and liabilities to be designated on inception into different accounting categories in certain circumstances.
Details of the Group’s classification of financial assets and liabilities are given in note 7.
(e) Depreciation and carrying value of property and equipmentThe estimation of the useful lives of assets is based on management’s judgement. Any material adjustment to the estimated useful lives of items of property and equipment will have an impact on the carrying value of these items.
(f) Determination of impairment of property and equipment, and intangible assets, excluding goodwillManagement is required to make judgements concerning the cause, timing and amount of impairment. In the identification of impairment indicators, management considers the impact of changes in current competitive conditions, cost of capital, availability of funding, technological obsolescence, discontinuance of services and other circumstances that could indicate that impairment exists. The Group applies the impairment assessment to its separate cash-generating units. This requires management to make significant judgements and estimates concerning the existence of impairment indicators, separate cash generating units, remaining useful lives of assets, projected cash flows and net realisable values. Management’s judgement is also required when assessing whether a previously recognised impairment loss should be reversed.
6. OPERATING SEGMENTS
Segment information is presented in respect of the Group’s geographic segments which represents the primary segment reporting format and is based on the Group’s management and reporting structure. The Group Managing Director of the Group who is also the Chief Operating Decision Maker (CODM) review the Group’s performance along these business segments and resources are allocated accordingly.
Geographical segmentsThe Group operates in the following geographical regions:
• Nigeria
• RestofAfrica
• Restoftheworld

133
Business segmentsThe Group operates the following main business segments:
Corporate Banking This business segment provides a broad range of financial solutions to multinationals, regional companies, state-owned companies, non-governmental organisations, international and multinational organisations and financial institutions.
Retail/Commercial bankingThis business segment has presence in all major cities in Nigeria and in 18 other countries across Africa where the Group has operations . It provides commercial banking products and services to the middle and retail segments of the market.
Treasury and Financial MarketsThis segment provides innovative financing and risk management solutions and advisory services to the Group’s corporate and institutional customers. The Group is also responsible for formulation and implementation of financial market products for the Group’s customers.
No single external customer or group amounts to 10% or more of the Group’s revenues.
(a) Geographical segments
(i) 31 December 2012
In millions of Nigerian Naira Nigeria Rest of AfricaRest of the
World Elimination Total
External revenues 177,629 41,480 3,016 (1,996) 220,129
Total revenue 177,629 41,480 3,016 (1,996) 220,129
Profit before tax 47,323 5,429 1,254 (1,996) 52,010
Interest income 124,960 22,726 2,317 – 150,003
Interest expenses (51,171) (7,078) (137) – (58,386)
Share of profit/(loss) in equity accounted investee – – (54) – (54)
Impairment loss recognised in profit or loss (2,652) (1,907) (1) – (4,560)
Income tax expenses 1,195 (1,728) – – (533)
Profit/(loss) for the year from continuing operations 48,518 3,701 1,254 (1,996) 51,477
Profit for the year from discontinued operations 3,289 – – – 3,289
Profit/(loss) for the year 51,807 3,701 1,254 (1,996) 54,766
Total segment assets 1 1,927,101 386,147 51,977 (92,302) 2,272,923
Total segment liabilities 1,725,643 340,410 42,944 (28,541) 2,080,4561 Includes:
Investments in associate and joint venture accounted for by using the equity method 1,395 – 9,188 – 10,583
Expenditure for reportable segment:
Non-current assets 5,087 3,892 – – 8,979
Depreciation 7,832 1,919 24 – 9,775
Amortisation 1,037 76 – – 1,113

Annual Report 2012
134
Notes to the consolidated and separate financial statementscontinued …
(ii) 31 December 2011
Nigeria Rest of AfricaRest of the
World Elimination Total
External revenues 126,225 36,216 2,695 (1,404) 163,732
Total revenue 126,225 36,216 2,695 (1,404) 163,732
Profit before tax (30,533) 2,871 1,037 25 (26,600)
Interest income 95,901 17,087 1,979 (1,377) 113,590
Interest expenses (41,389) (5,265) (146) 1,377 (45,423)
Share of profit/(loss) in equity accounted investee – – 32 – 32
Impairment loss recognised in profit or loss (34,855) (4,628) (14) – (39,497)
Income tax expenses 18,880 (40) (905) – 17,935
Profit/(loss) for the year from continuing operations (11,653) 2,831 132 25 (8,665)
Profit for the year from discontinued operations 1,864 – – – 1,864
Profit/(loss) for the year (9,789) 2,831 132 25 (6,801)
Total segment assets 1 1,668,161 344,582 40,344 (132,652) 1,920,435
Total segment liabilities 1,504,446 304,013 39,258 (78,222) 1,769,4951 Includes:
Investments in associate and joint venture accounted for by using the equity method 900 – 9,943 – 10,843
Expenditure for reportable segment:
Non-current assets 3,109 2,949 – – 6,058
Depreciation 7,331 1,969 48 – 9,348
Amortisation 1,089 31 32 – 1,152
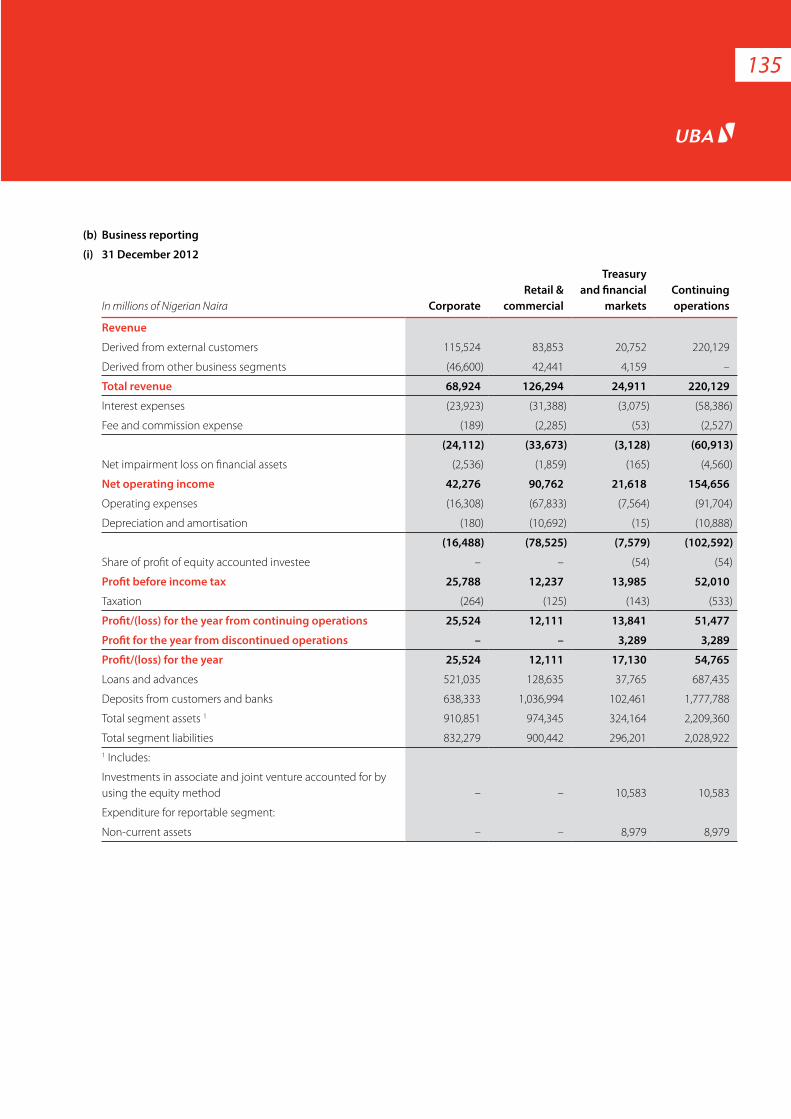
135
(b) Business reporting
(i) 31 December 2012
In millions of Nigerian Naira CorporateRetail &
commercial
Treasuryand financial
marketsContinuingoperations
Revenue
Derived from external customers 115,524 83,853 20,752 220,129
Derived from other business segments (46,600) 42,441 4,159 –
Total revenue 68,924 126,294 24,911 220,129
Interest expenses (23,923) (31,388) (3,075) (58,386)
Fee and commission expense (189) (2,285) (53) (2,527)
(24,112) (33,673) (3,128) (60,913)
Net impairment loss on financial assets (2,536) (1,859) (165) (4,560)
Net operating income 42,276 90,762 21,618 154,656
Operating expenses (16,308) (67,833) (7,564) (91,704)
Depreciation and amortisation (180) (10,692) (15) (10,888)
(16,488) (78,525) (7,579) (102,592)
Share of profit of equity accounted investee – – (54) (54)
Profit before income tax 25,788 12,237 13,985 52,010
Taxation (264) (125) (143) (533)
Profit/(loss) for the year from continuing operations 25,524 12,111 13,841 51,477
Profit for the year from discontinued operations – – 3,289 3,289
Profit/(loss) for the year 25,524 12,111 17,130 54,765
Loans and advances 521,035 128,635 37,765 687,435
Deposits from customers and banks 638,333 1,036,994 102,461 1,777,788
Total segment assets 1 910,851 974,345 324,164 2,209,360
Total segment liabilities 832,279 900,442 296,201 2,028,9221 Includes:
Investments in associate and joint venture accounted for by using the equity method – – 10,583 10,583
Expenditure for reportable segment:
Non-current assets – – 8,979 8,979

Annual Report 2012
136
Notes to the consolidated and separate financial statementscontinued …
(ii) 31 December 2011
In millions of Nigerian Naira CorporateRetail &
commercial
Treasury andfinancial markets Total
Revenue
Derived from external customers 91,064 56,310 16,358 163,732
Derived from other business segments (46,601) 42,441 4,159 –
Total revenue 44,463 98,752 20,517 163,732
Interest expenses (18,592) (24,442) (2,389) (45,423)
Fee and commission expense (723) (456) (26) (1,205)
Net impairment loss on financial assets (24,175) (13,098) (359) (37,632)
Net operating income 973 60,756 17,743 79,472
Operating expenses (17,965) (65,909) (11,730) (95,604)
Depreciation and amortisation (224) (10,257) (19) (10,500)
(18,188) (76,167) (11,749) (106,104)
Share of profit of equity accounted investee – – 32 32
Profit before income tax (17,215) (15,411) 6,026 (26,600)
Taxation 7,174 12,555 (1,794) 17,935
Profit/(loss) for the year from continuing operations (10,041) (2,856) 4,232 (8,665)
Profit for the year from discontinued operations – – 1,864 1,864
Profit/(loss) for the year (10,041) (2,856) 6,096 (6,801)
Loans and advances 457,542 148,085 41,564 647,191
Deposits from customers and banks 525,737 855,447 84,148 1,465,332
Total segment assets 1 765,906 881,950 272,579 1,920,435
Total segment liabilities 704,920 813,700 250,875 1,769,4951 Includes:
Investments in associate and joint venture accounted for by using the equity method – – 10,843 10,843
Expenditure for reportable segment:
Non-current assets – – 6,058 6,058

137
7. Financial assets and liabilities
Accounting classification, measurement basis and fair values
The table below sets out the Group’s classification of each class of financial assets and liabilities, and their fair values (excluding accrued interest).
GroupIn millions of Nigerian Naira
Held-for-trading
Derivativesat fair value
Held-to-maturity
Loans andreceivables
Available-for-sale
Otherfinancial
liabilitiesamortised
cost
Totalcarryingamount Fair value
(a) 31 December 2012
Cash and cash equivalents – – – 714,115 – – 714,115 714,115
Financial assets held-for-trading 457 – – – – – 457 457
Loans and advances to banks – – – 28,513 – – 28,513 21,350
Loans and advances to customers – – – 658,922 – – 658,922 704,497
Investment securities – – 552,152 – 128,665 – 680,817 651,547
Other assets – – – 15,021 – – 18,598 15,021
Derivative liabilities – 124 – – – – 124 124
Deposits from banks – – – – – 57,780 57,780 57,780
Deposits from customers – – – – – 1,720,008 1,720,008 1,720,008
Other liabilities – – – – – 68,385 81,438 68,385
Subordinated liabilities – – – – – 53,719 53,719 53,719
Borrowings – – – – – 114,520 114,520 114,520
(b) 31 December 2011
Cash and cash equivalents – – – 434,218 – – 434,218 434,218
Financial assets held-for- trading 1,303 – – – – – 1,303 1,303
Loans and advances to banks – – – 41,564 – – 41,564 41,564
Loans and advances to customers – – – 605,627 – – 605,627 654,699
Investment securities – – 625,564 – 96,744 – 722,308 604,300
Other assets – – – 10,608 – 16,513 16,513
Derivative liabilities – 817 – – – – 817 817
Deposits from banks – – – – – 19,510 19,510 19,510
Deposits from customers – – – – – 1,445,822 1,445,822 1,445,822
Managed funds – – – – – 51,943 51,943 51,943
Other liabilities – – – – – 58,146 58,210 58,146
Subordinated liabilities – – – – – 53,500 53,500 53,500
Borrowings – – – – – 137,040 137,040 137,040

Annual Report 2012
138
Notes to the consolidated and separate financial statementscontinued …
GroupIn millions of Nigerian Naira
Held-for-trading
Derivativesat fair value
Held-to-maturity
Loans andreceivables
Available-for-sale
Otherfinancial
liabilitiesamortised
cost
Totalcarryingamount Fair value
(b) 1 January 2010
Cash and cash equivalents – – – 385,397 – – 385,397 385,397
Financial assets held-for- trading 2,594 – – – – – 2,594 2,594
Loans and advances to banks – – – 11,226 – – 11,226 11,226
Loans and advances to customers – – – 590,797 – – 590,797 676,365
Investment securities – – 368,935 – 124,144 – 493,079 473,640
Other assets – – – 26,370 – – 30,290 30,290
Derivative liabilities – 9,310 – – – – 9,310 9,310
Deposits from banks – – – – – 7,456 7,456 7,456
Deposits from customers – – – – – 1,270,409 1,270,409 1,270,409
Managed funds – – – – – 32,753 32,753 32,753
Other liabilities – – – – – 41,558 41,671 41,558
Subordinated liabilities – – – – – 18,335 18,335 18,335
Borrowings – – – – – 63,327 63,327 63,327

139
The table below sets out the Bank’s classification of each class of financial assets and liabilities, and their fair values (excluding accrued interest).
BankIn millions of Nigerian Naira
Held-for-trading
Derivativeat fair value
Held-to-maturity
Loans andreceivables
Available-for-sale
Otheramortised
cost
Totalcarryingamount Fair value
31 December 2012
Cash and cash equivalents – – – 629,481 – – 629,481 629,481
Financial assets held-for-trading 456 – – – – – 456 456
Loans and advances to banks – – – 27,878 – – 27,878 27,878
Loans and advances to customers – – – 570,714 – – 570,714 603,011
Investment securities – – 401,348 – 126,646 – 527,994 498,724
Other assets – – – 9,296 – – 11,159 9,296
Derivative liabilities – 124 – – – – 124 124
Deposits from banks – – – – – 22,875 22,875 22,875
Deposits from customers – – – – – 1,461,131 1,461,131 1,461,131
Other liabilities – – – – – 44,246 57,299 44,246
Subordinated liabilities – – – – – 55,474 55,474 55,474
Borrowings – – – – – 114,520 114,520 114,520
31 December 2011
Cash and cash equivalents – – – 352,500 – – 352,500 352,500
Financial assets held-for-trading 237 – – – – – 237 237
Loans and advances to banks – – – 41,564 – – 41,564 23,413
Loans and advances to customers – – – 552,526 – – 552,526 586,826
Investment securities – – 496,600 – 63,428 – 560,028 442,021
Other assets – – – 13,695 – – 16,891 13,695
Derivative liabilities – 817 – – – – 817 817
Deposits from banks – – – – – 23,408 23,408 23,408
Deposits from customers – – – – – 1,216,511 1,216,511 1,216,511
Other liabilities – – – – – 49,860 49,924 49,860
Subordinated liabilities – – – – – 55,254 55,254 55,254
Borrowings – – – – – 137,040 137,040 137,040

Annual Report 2012
140
Notes to the consolidated and separate financial statementscontinued …
BankIn millions of Nigerian Naira
Held-for-trading
Derivativeat fair value
Held-to-maturity
Loans andreceivables
Available-for-sale
Otheramortised
cost
Totalcarryingamount Fair value
1 January 2010
Cash and cash equivalents – – – 330,701 – 237 330,938 330,938
Financial assets held-for-trading 1,267 – – – – – 1,267 1,267
Loans and advances to banks – – – 11,226 – – 11,226 11,226
Loans and advances to customers – – – 557,224 – – 557,224 603,037
Investment securities – – 284,144 – 107,317 – 391,461 372,022
Other assets – – – 24,001 – – 24,877 24,001
Derivative liabilities – 9,310 – – – – 9,310 9,310
Deposits from banks – – – – – 51 51 51
Deposits from customers – – – – – 1,120,566 1,120,566 1,120,566
Other liabilities – – – – – 38,669 38,782 38,669
Subordinated liabilities – – – – – 20,147 20,147 20,147
Borrowings – – – – – 63,327 63,327 63,327
8. Net interest income
In millions of Nigerian Naira
Group Bank
December 2012
December 2011
December 2012
December 2011
Interest and similar income
Cash and cash equivalents 8,281 6,555 7,238 7,576
Loans and advances to banks and customers 83,291 55,872 71,983 47,134
Investments securities 58,431 51,163 46,926 42,717
Total interest income 150,003 113,590 126,147 97,427
Interest and similar expense
Deposits from banks (2,225) (1,039) (1,056) (434)
Deposits from customers (44,876) (37,449) (38,966) (33,834)
Borrowings (11,285) (6,935) (11,280) (6,935)
Total interest expense (58,386) (45,423) (51,302) (41,203)
Interest income includes accrued interest on impaired loans of N800.53 million (Bank: N210.95 million) and N2.2 billion (Bank: N1.3 billion) for the years ended 31 December 2012 and 31 December 2011, respectively.

141
9. Net fees and commission income
In millions of Nigerian Naira
Group Bank
December 2012
December 2011
December 2012
December 2011
Net fee and commission income 45,108 38,660 34,212 28,726
Fees and commsion income comprise:
Credit-related fees and commissions 9,515 8,199 6,045 7,000
Commission on turnover 15,631 12,148 15,062 11,576
Other fees and charges 22,489 19,518 15,005 11,355
Total fee and commission income 47,635 39,865 36,112 29,931
Fees and commission expense comprise:
Card services (2,088) (941) (1,889) (941)
Other expenses (439) (264) (11) (264)
Total fee and commission expense (2,527) (1,205) (1,900) (1,205)
Credit-related fees and commissions exclude any other fees used in calculating the effective interest rate on the financial instruments.
10. Net trading income/(loss)
In millions of Nigerian Naira
Group Bank
December 2012
December 2011
December 2012
December 2011
Fixed income securities 775 461 618 317
Foreign exchange gain 8,227 11,549 7,943 5,584
Loss on treasury trading (note (ii)) 693 (8,464) 693 (8,464)
9,695 3,546 9,254 (2,563)
(i) Net trading income includes the gains and losses arising from the purchase and sale of trading instruments.(ii) Loss on treasury trading represents exceptional losses arising from the close out of trading positions in prior year.
11. Net gains/losses on investment securities
In millions of Nigerian Naira
Group Bank
December 2012
December 2011
December 2012
December 2011
Financial assets classified as available-for-sale
– Exchange differences on monetary items 48 28 47 28
– Allowance for impairment (673) (1,723) (725) (1,318)
Financial assets classified as held-to-maturity
– Exchange differences on monetary items 6,328 (170) 129 (170)
Net fair value gains/(losses) 5,703 (1,865) (549) (1,460)
Financial assets classified as available-for-sale
Gain on disposal 420 – 420 –
6,123 (1,865) (129) (1,460)

Annual Report 2012
142
Notes to the consolidated and separate financial statementscontinued …
12. Other operating income
In millions of Nigerian Naira
Group Bank
December 2012
December 2011
December 2012
December 2011
Dividend income 2,887 427 4,772 407
Rental income 490 444 448 440
Others 3,296 7,725 825 1,916
6,673 8,596 6,045 2,763
Included in dividend income is a sum of N1.58 billion (2011: Nil) being dividend received from some African subsidiaries.
13. Impairment loss on loans and receivables
In millions of Nigerian Naira
Group Bank
December 2012
December 2011
December 2012
December 2011
Impairment (losses)/gains on loans and advances to customers:
– specific impairment (6,414) (28,670) (4,578) (10,741)
– portfolio impairment 964 3,761 2,694 3,766
Impairment gains/(losses) on loans and advances to banks:
– portfolio impairment 357 (337) 357 (337)
Recoveries on loans and advances 8,513 16,195 1,130 8,045
Write-offs on loans and advances (7,859) (9,499) (2,910) (9,499)
Recoveries on other assets 934 1,531 934 1,258
Impairment loss on other assets (1,055) (719) (281) (672)
(4,560) (17,738) (2,654) (8,180)
14. Personnel expenses
In millions of Nigerian Naira
Group Bank
December 2012
December 2011
December 2012
December 2011
Wages and salaries (39,331) (42,524) (28,895) (35,240)
Retirement benefit costs (1,317) (1,345) (850) (861)
Other staff costs (2,804) (4,005) (3,254) (2,002)
(43,452) (47,874) (32,999) (38,103)
15. Depreciation and amortisation
In millions of Nigerian Naira
Group Bank
December 2012
December 2011
December 2012
December 2011
Depreciation of property and equipment (note 28) (9,775) (9,348) (6,043) (7,128)
Amortisation of intangible assets (note 29) (1,113) (1,152) (860) (1,111)
(10,888) (10,500) (6,903) (8,239)

143
16. Other operating expenses
In millions of Nigerian Naira
Group Bank
December 2012
December 2011
December 2012
December 2011
Auditors remuneration (309) (308) (179) (100)
Directors fees (37) (67) (37) (67)
Asset Management Corporation of Nigeria (AMCON) levy (4,966) (4,298) (4,966) (4,298)
Nigerian Deposit Insurance Corporation (NDIC) premium (5,685) (4,936) (5,685) (4,936)
Others (37,255) (38,121) (24,624) (26,341)
(48,252) (47,730) (35,491) (35,742)
17. Taxation
Recognised in the profit or lossIn millions of Nigerian Naira
Group Bank
December 2012
December 2011
December 2012
December 2011
(a) Current tax expense
Current year (3,126) (2,185) (1,353) (784)
Prior year over provision – 167 – 237
(3,126) (2,018) (1,353) (547)
(b) Deferred tax expense
Origination and reversal of temporary differences (note 30) 2,593 19,953 2,548 19,049
Total income tax (expense)/credit (533) 17,935 1,195 18,502
(c) Current tax liabilities
Balance, beginning of year 2,627 2,869 784 1,185
Tax paid (4,479) (2,427) (812) (1,185)
Income tax charge 3,126 2,185 1,353 784
Balance, end of year 1,274 2,627 1,325 784
(d) Reconciliation of effective tax rate
(i) 31 December 2012
Profit before income tax 52,010 46,180
Income tax using the domestic corporation tax rate 15,603 13,854
Income tax payable for Bank is based on the minimum tax provisions in the Nigerian tax law, which is applicable to companies that do not have taxable profits
Companies Income Tax 1,173 –
Minimum tax 894 894
Effect of tax rates in foreign jurisdictions (352) –
Information Technology Levy 459 459
Disallowed permanent differences 403 350
Exempted permanent differences (17,647) (16,752)
Total income tax expense in comprehensive income 533 (1,195)

Annual Report 2012
144
Notes to the consolidated and separate financial statementscontinued …
(ii) 31 December 2011
Loss before income tax (26,600) (26,468)
Group Bank
Recognised in the profit or lossIn millions of Nigerian Naira
December 2011
December 2011
Income tax payable for Bank is based on the minimum tax provisions in the Nigerian tax law, which is applicable to companies that do not have taxable profits
Companies Income Tax 1,352 –
Minimum tax 784 784
Effect of tax rates in foreign jurisdictions (40) –
Education tax levy 33 –
Information Technology Levy 16 –
Prior year over provision (167) (237)
Disallowed permanent differences 151 97
Exempted permanent differences (12,084) (11,206)
Total income tax expense in comprehensive income (17,935) (18,502)
18. Non-current assets held for distribution and discontinued operations
(a) Assets of disposal group held for distribution to owners are analysed below:
Group Bank
December 2012
December 2012
Cash and cash equivalents 18,406 –
Financial assets held for trading 427 –
Loans and advances to customers 11 –
Investments in equity accounted investee 1,398 900
Investments in subsidiaries – 2,408
Investment securities 39,796 –
Property and equipment 2,773 2,500
Intangible assets 16 –
Deferred tax assets 225 –
Other assets 511 –
Total 63,563 5,808
(b) Liabilities of disposal group held for distribution to owners are analysed below:
Managed funds 48,700 –
Current tax liabilities 513 –
Other liabilities 2,321 –
Total 51,534 –
Non-current asset held for distribution and discontinued operations relate to investment banking businesses of the Group.

145
(c) Analysis of the result of discontinued operations is as follows:
Group Group
December 2012
December 2011
Revenue 5,208 4,974
Expenses (1,598) (2,963)
Share of profit of equity accounted investee 254 206
Profit before tax of discontinued operations 3,864 2,217
Tax (575) (353)
Profit for the year from discontinued operations 3,289 1,864
(d) Summarised cash flow of disposal group is presented below:
Operating cash flows (14) 4,923
Investing cash flows 3,307 3,698
Financing cash flows (1,335) (746)
Total cash flows 1,958 7,875
Non-current assets held for distribution represent assets and liabilities relating to certain subsidiaries of the Group namely: UBA Assets Management Limited; UBA Capital Plc; and UBA Insurance Brokers Limited; as well as the Group’s joint venture, UBA Metropolitan Life Insurance Limited, spun off by United Bank for Africa Plc to eligible shareholders effective January 1, 2013. This was pursuant to Central Bank of Nigeria’s circular (Regulation on Scope of Banking Activities and Ancillary Matters No. 3, 2010) repealing universal banking regime under which Nigerian banks operated . These assets have therefore been presented as assets held for distribution to shareholders.
The scheme of arrangement for the spin off was approved by the shareholders of UBA Plc at a court ordered meeting held on 13 December, 2012. Under this plan, the Bank transferred its 499,999,998 ordinary shares of N1.00 each in UBA Asset Management Limited, 4,500,000 shares of N1.00 each in UBA Insurance Brokers Limited and 500,000,000 ordinary shares of N1.00 each in UBA Metropolitan Life Insurance Limited (an associated company) to UBA Capital Limited which also acquired another indirect subsidiary namely UBA Trustees Limited.
The Bank also transferred its excess realties with book value of N2.5 billion to Afriland Properties Plc under the scheme of arrangement. Subsequent to year end, UBA Capital Limited was listed on the Nigerian Stock Exchange and changed its name to UBA Capital Plc.
In consideration for the above transfers, 3,999,999,998 ordinary shares representing 100% of the share capital of UBA Capital Plc and 1,000,000,000 ordinary shares representing 100% of the share capital of Africa Prudential Registrars Plc (formerly owned by UBA Capital Plc) were allotted to eligible shareholders of UBA Plc. In addition, 1,000,000,000 ordinary shares representing 100% of the share capital of Afriland Properties Plc were alloted to the eligible Shareholders of UBA Plc.
For every 33 ordinary shares held in UBA Plc, eligible shareholders received 4 ordinary shares in UBA Capital Plc and 1 ordinary share each in Africa Prudential Registrars Plc, respectively.
Arising from the spin off, the Bank’s Accumulated Reserves were reduced by an amount equal to N11.9 billion being the aggregate value of (a) the Bank’s investment in UBA Capital Africa Limited, UBA Insurance Brokers Limited, UBA Asset Management Limited and UBA Metropolitan Life Insurance Limited; and (b) the excess realty transferred to Afriland Properties Plc.
The fair value of the dividend payable in respect of assets and liabilities held for distribution has been disclosed in note 34.

Annual Report 2012
146
Notes to the consolidated and separate financial statementscontinued …
19. Earnings per share
Basic earnings per share
The calculation of basic earnings per share at 31 December 2012 was based on the profit attributable to ordinary shareholders of N51,477 million (Bank: N47,375 million) and weighted average number of ordinary shares outstanding of 30,973,642,991 (Bank: 32,981,387,565), excluding treasury shares held by the Bank’s Staff Share Investment Trust. There was a net addition of 592 million units to the Bank’s shares held by Staff Share Investment Trust during the year.
Group Bank
December2012
December 2011
December 2012
December 2011
In millions of Nigerian Naira
Profit/(loss) from continuing operations attributable to owners of the Bank 51,477 (8,665) 47,375 (7,966)
Profit from discontinued operations attributable to owners of the Bank 3,289 1,864 – –
Total 54,766 (6,801) 47,375 (7,966)
Weighted average number of ordinary shares outstanding 30,974 30,382 32,982 32,982
Basic earnings/(loss) per share (Naira)
From continuing operations 1.66 (0.29) 1.44 (0.24)
From discontinued operations 0.11 0.06 – –
From profit for the year 1.77 (0.23) 1.44 (0.24)
Diluted earnings/(loss) per share (Naira)
From continuing operations 1.66 (0.29) 1.44 (0.24)
From discontinued operations 0.11 0.06 – –
From profit for the year 1.77 (0.23) 1.44 (0.24)
20. Cash and bank balances
Group Bank
In millions of Nigerian NairaDecember
2012December
2011January
2011December
2012December
2011January
2011
Cash and balances with banks 162,353 173,221 172,238 140,673 135,130 149,218
Unrestricted balances with central bank 82,395 52,249 25,352 35,829 17,746 10,216
Money market placements 349,670 126,959 175,345 336,067 125,378 163,008
Cash and cash equivalents 594,418 352,429 372,935 512,569 278,254 322,442
Mandatory reserve deposits with the Central Bank (note (i) below) 119,697 81,789 12,462 116,912 74,246 8,259
714,115 434,218 385,397 629,481 352,500 330,701
(i) This represents cash reserve requirement with central banks of the countries in which the Group operates and is not available-for-use in the Group’s day-to-day operations.
(ii) Cash and bank balances include N12.69 billion (2011: N21.37 billion) Group and N12.69 billion (2011: N18.85 billion) Bank, which represent the Naira value of foreign currency bank balances held on behalf of customers in respect of letters of credit transactions. The corresponding liability is included in other liabilities (see note (34)).

147
21. Financial assets held-for-tradingGroup Bank
In millions of Nigerian NairaDecember
2012December
2011January
2011December
2012December
2011January
2011
Government bonds 284 237 1,267 284 237 1,267
Treasury bills 173 – – 172 – –
Equities – 1,066 1,327 – – –
457 1,303 2,594 456 237 1,267
Current 457 237 2,594 456 237 1,267
Non-current – 1,066 – – – –
457 1,303 2,594 456 237 1,267
22. Loans and advances to banksGroup Bank
In millions of Nigerian NairaDecember
2012December
2011January
2011December
2012December
2011January
2011
Gross amount 28,699 42,107 11,432 28,064 42,107 11,432
Portfolio impairment (186) (543) (206) (186) (543) (206)
28,513 41,564 11,226 27,878 41,564 11,226
Current 28,513 30,727 11,226 27,878 32,327 11,226
Non-current – 10,837 – – 9,237 –
28,513 41,564 11,226 27,878 41,564 11,226
22b. Impairment allowance on loans and advances to banksGroup Bank
In millions of Nigerian NairaDecember
2012December
2011December
2012December
2011
Portfolio impairment
Balance, beginning of year 543 206 543 206
Impairment charge for the year (357) 337 (357) 337
Balance, end of year 186 543 186 543
23. Loans and advances to customers
(a) 31 December 2012
(i) Group
In millions of Nigerian NairaGross
amountSpecific
impairmentPortfolio
impairmentTotal
impairmentCarryingamount
Loans to individuals 111,372 (1,556) (1,130) (2,686) 108,686
Loans to corporate entities and other organisations 563,355 (3,891) (9,228) (13,119) 550,236
674,727 (5,447) (10,358) (15,805) 658,922
(ii) bankLoans to individuals 82,353 (1,049) (447) (1,496) 80,857
Loans to corporate entities and other organisations 496,944 (345) (6,742) (7,087) 489,857
579,297 (1,394) (7,189) (8,583) 570,714

Annual Report 2012
148
Notes to the consolidated and separate financial statementscontinued …
(b) 31 December 2011
In millions of Nigerian NairaGross
amountSpecific
impairmentPortfolio
impairmentTotal
impairmentCarryingamount
(i) Group
Loans to individuals 91,233 (2,649) (506) (3,155) 88,078
Loans to corporate entities and other organisations 538,847 (10,482) (10,816) (21,298) 517,549
630,080 (13,131) (11,322) (24,453) 605,627
(ii) bankLoans to individuals 70,467 (2,158) (506) (2,664) 67,803
Loans to corporate entities and other organisations 494,509 (409) (9,377) (9,786) 484,723
564,976 (2,567) (9,883) (12,450) 552,526
(c) 1 January 2011
(i) GroupLoans to individuals 116,932 (14,329) (2,322) (16,651) 100,281
Loans to corporate entities and other organisations 514,435 (11,158) (12,761) (23,919) 490,516
631,367 (25,487) (15,083) (40,570) 590,797
(ii) bankLoans to individuals 101,460 (13,372) (2,695) (16,067) 85,393
Loans to corporate entities and other organisations 488,122 (5,337) (10,954) (16,291) 471,831
589,582 (18,709) (13,649) (32,358) 557,224
Group Bank
December2012
December2011
December2012
December2011
(d) Current 374,680 445,684 317,781 365,106
Non-current 284,242 159,943 252,933 187,420
658,922 605,627 570,714 552,526
(e) Impairment allowance on loans and advances to customers
Specific impairment
Balance, beginning of year 13,131 25,487 2,567 18,709
Impairment charge for the year 6,414 28,670 4,578 10,741
Reversal for the year (8,513) (16,195) (1,130) (8,045)
Write-offs (5,585) (24,831) (4,621) (18,838)
Balance, end of year 5,447 13,131 1,394 2,567
Portfolio impairment
Balance, beginning of year 11,322 15,083 9,883 13,649
Impairment reversal for the year 677 (5,102) (2,945) (3,766)
Charge for the year (1,641) 1,341 251 –
Balance, end of year 10,358 11,322 7,189 9,883

149
24. Investment securities
Group Bank
In millions of Nigerian NairaDecember
2012December
2011January
2011December
2012December
2011January
2011
Investment securities 680,817 722,308 493,079 527,994 560,028 391,461
Available-for-sale investment securities comprise (see note (i)):
Treasury bills 93,091 30,660 78,858 91,517 30,475 78,858
93,091 30,660 78,858 91,517 30,475 78,858
Equity investments at cost (see note (ii)) 2,941 30,511 17,825 2,345 2,299 2,364
Less: Specific allowance impairment (see note (vi)) (1,372) (4,393) (4,374) (1,221) (1,221) (1,221)
1,569 26,118 13,451 1,124 1,078 1,143
Equity investments at fair value 34,005 39,966 31,835 34,005 31,875 27,316
128,665 96,744 124,144 126,646 63,428 107,317
Held-to-maturity investment securities comprise(see note (i)):
Treasury bills 69,390 137,396 45,937 – 67,814 –
Promissory 79 120 651 79 120 651
Bonds (note (iii and iv)) 482,683 488,048 322,347 401,269 428,666 283,493
552,152 625,564 368,935 401,348 496,600 284,144
Current 197,264 171,112 82,802 206,974 141,001 82,802
Non-current 483,553 551,196 410,277 321,020 419,027 308,659
680,817 722,308 493,079 527,994 560,028 391,461
(i) Included in available-for-sale and held-to-maturity investments securities are financial assets that may be repledged or resold by counterparties, and these securities are stated as follows:
Group Bank
In millions of Nigerian NairaDecember
2012December
2011January
2011December
2012December
2011January
2011
Pledged assets:
Treasury bills 8,031 17,150 8,250 8,031 17,150 8,250
Bonds 123,000 52,254 27,900 123,000 52,254 27,900
131,031 69,404 36,150 131,031 69,404 36,150
(ii) Certain unquoted investments for which fair values could not be reliably estimated have been carried at cost less impairment. These include investments by the Bank under the Small and Medium Enterprises Equity Investment Scheme (SMEEIS). These investments were made in compliance with the regulatory requirement in force as at the time of the investment (Monetary Policy Cicular No. 35). However, this regulatory requirement has been abolished.
(iii) Included in bonds held-to-maturity are bonds issued by the Asset Management Company of Nigeria (AMCON). These bonds were received as consideration for non-performing loans sold by the Bank. These bonds are fully guaranteed by the Federal government of Nigeria and are zero coupon bonds with annual yield ranging from 13.5% to 14.3%.
(iv) Included in bonds held to maturity are Federal Government of Nigeria bonds amounting to 2012: N187 billion; 2011: N223 billion; 2010: N211 billion. The bonds are stated at amortised cost.

Annual Report 2012
150
Notes to the consolidated and separate financial statementscontinued …
25. Other assets
Group Bank
In millions of Nigerian NairaDecember
2012December
2011January
2011December
2012December
2011January
2011
Accounts receivables 15,003 6,856 19,252 9,296 10,417 16,883
Prepayments 4,888 7,557 9,038 2,662 4,663 4,823
Deposit for shares – 3,132 7,118 – 3,132 7,118
Others 18 620 – – 146 –
Impairment loss on other assets (1,311) (1,652) (5,118) (799) (1,467) (3,947)
18,598 16,513 30,290 11,159 16,891 24,877
(a) Movement in impairment loss for other assets
At start of year 1,652 5,118 1,467 3,947
Charge for the year 1,055 719 281 672
Provision no longer required (934) (1,531) (934) (1,258)
Write-off (462) (2,654) (15) (1,894)
1,311 1,652 799 1,467
(b) Current 16,930 15,032 27,573 10,158 15,376 22,645
Non-current 1,668 1,481 2,717 1,001 1,515 2,232
18,598 16,513 30,290 11,159 16,891 24,877
26. Investment in equity accounted investee
In millions of Nigerian Naira
Group Bank
December2012
December2011
January2011
December2012
December2011
January2011
Total investment in associate and joint venture – 10,356 10,118 – 10,843 10,843
(a) Associates
Balance, beginning of year 9,211 9,179 9,943 9,943
Fair value of previously held interest in associate 31 – 31 –
Share of current year result (54) 32 – –
Reclassification to investment in subsidiaries (note 27(vii)) (9,188) – (9,974) –
Balance, end of year – 9,211 – 9,943
The Bank’s only Associate was UBA Capital Europe Limited, a UK-based investment banking company primarily engaged in brokerage, trade finance and wealth management businesses. During the year, the Group increased its stake in the Company from 49% to 100%. Accordingly, this has been reclassified to investments in subsidiaries (note 27).
Prior to the Group’s acquisition of controlling stake in UBA Capital Europe Limited, there were no significant restrictions on the ability of the associate to transfer funds to the Group in the form of cash dividends, or repayment of loans and advances. This remains the case post-acquisition.

151
Group Bank
In millions of Nigerian NairaDecember
2012December
2011December
2012December
2011
(b) Joint venture
Balance, beginning of year 1,145 939 900 900
Share of current year result 250 206 – –
Reclassification to non-current assets held for disposal (note 18(a)) (1,395) – (900) –
Balance, end of year – 1,145 – 900
The investment in Joint Venture (JV) is represented by the Bank’s 50% holding in UBA Metropolitan Life Insurance Limited. Following the approval by Shareholders at an extra-ordinary general meeting held in December 2012, UBA Metropolitan Life Insurance Limited has been spun-off from the Group post-year-end. Accordingly, the investment has been reclassified to non-current assets held for distribution. See note 18.
There are no contingent liabilities relating to the Group’s interest in joint venture and no contingent liabilities of the venture itself.
(c) Summarised financial information of the Group’s associate and joint venture accounted for using the equity method are as follows:
In millions of Nigerian Naira Assets Liabilities Revenues Profit/(Loss)
2010
Joint venture 3,740 1,386 1,246 138
Associates 14,248 6,129 408 (152)
17,988 7,515 1,654 (14)
2011
Joint venture 4,122 1,832 1,819 (64)
Associates 11,676 3,082 578 66
15,798 4,914 2,397 2
2012
Joint venture 5,383 2,474 3,249 560
Associates 10,966 3,160 493 (84)
16,349 5,634 3,742 476

Annual Report 2012
152
Notes to the consolidated and separate financial statementscontinued …
27. Investment in subsidiaries
Bank Bank Bank
In millions of Nigerian NairaDecember
2012December
2011January
2011
Bank subsidiaries (see note (i) below):
Year of acquisition/commence-ment Holding Country Industry
UBA Ghana Limited 2004 91% Ghana Banking 8,048 8,048 8,048
UBA Cameroun SA Limited 2007 100% Cameroun Banking 1,845 1,845 1,845
UBA Cote d’Ivoire 2008 100% Cote d’Ivoire Banking 5,995 4,850 4,850
UBA Liberia Limited 2008 100% Liberia Banking 2,330 1,795 1,784
UBA (SL) Limited 2008 100% Sierra Leone Banking 1,269 1,269 1,160
UBA Uganda Limited 2008 100% Uganda Banking 2,718 2,718 2,070
Banque International Du Burkina Faso 2008 64% Burkina Faso Banking 5,352 5,352 3,832
Continental Bank Benin 2008 76% Benin Republic Banking 6,726 6,726 6,726
UBA Kenya Bank Limited 2009 100% Kenya Banking 1,770 1,770 1,770
UBA Chad SA) 2009 100% Chad Banking 2,440 2,210 2,210
UBA Senegal (SA) 2009 100% Senegal Banking 2,400 2,400 2,400
UBA Zambia Limited 2010 100% Zambia Banking 1,770 1,770 1,770
UBA Tanzania Limited 2010 100% Tanzania Banking 1,770 1,770 1,770
UBA Gabon Limited 2010 100% Gabon Banking 2,760 1,996 1,996
UBA Guinea Limited 2010 100% Guinea Banking 1,475 1,475 1,475
UBA Congo DRC Limited 2011 100% Congo DRC Banking 1,690 1,346 –
UBA Congo Brazaville Limited 2011 100% Congo Brazzaville
Banking 3,024 3,024 –
UBA Mozambique Limited 2011 100% Mozambique Banking 869 754 –
UBA Retail Financial Services Limited (RFS)
2008 100% Nigeria Banking – 667 1,739
Non-bank subsidiaries:UBA Asset Management Limited (see (ii) below)
1964 100% Nigeria Asset management
– 403 403
UBA Pensions Custodian Limited (see (iii) below)
2004 100% Nigeria Pension custody
2,000 2,000 2,000
UBA Capital (Africa) Limited (see (iv) below)
2005 100% Nigeria Investment banking
– 2,000 2,000
UBA Insurance Brokers Limited (see (v) below)
2006 100% Nigeria Insurance brokerage
– 5 5
UBA FX Mart Limited (see (vi) below) 2008 100% Nigeria Banking 502 502 502
UBA Capital Holding Mauritius (see (vii) below)
2012 100% Mauritius Investment banking
– – –
UBA Capital Europe Limited (see (vii) below)
2012 98% United Kingdom
Investment banking
9,974 – –
66,727 56,695 50,355

153
Bank Bank
In millions of Nigerian NairaDecember
2012December
2011
The movement in investment in subsidiaries during the year is as follows:
Balance, beginning of year 56,695 50,355
Additional investments during the year 3,133 7,412
Reclassification from investment in associates (note 26(a)) 9,974 –
Reclassification of non-current assets held for distribution (note 18(a)) (2,408) –
Impairment loss (667) (1,072)
Balance, end of year 66,727 56,695
(i) UBA Ghana, UBA Cameroon SA, UBA Cote d’ivoire, UBA Liberia, UBA Uganda, Banque International Du Burkina Fasso, UBA Retail Financial Services, UBA Chad SA, UBA Senegal SA, Continental Bank Benin, UBA Kenya, UBA Zambia, UBA Tanzania, UBA Gabon, UBA Guinea, UBA Sierra Leone, UBA Mozambique, UBA Congo DRC and UBA Congo Brazaville are engaged in the business of banking and provide corporate, commercial, consumer and international banking, trade services, cash management and treasury services.
(ii) UBA Asset Management Limited is engaged in the business of management and administration of funds, trusteeship business; receivership/liquidation; agency business; property management; mortgage; capital raising; royalty; venture capital fund activities; corporation registration; wholesale portfolio and other financial services to individuals, corporate bodies and the Government. It was incorporated on 1 June 1964 and commenced operations on same day. Following the approval by Shareholders at an extra-ordinary general meeting held in December 2012, UBA Asset Management Limited has been spun-off from the Group post-year-end. Accordingly, the investment has been reclassified to non-current assets held for distribution.
(iii) UBA Pensions Custodian Limited was incorporated on 30 September 2005. It obtained an operating license on 20 February 2006 and commenced operations on 3 May 2006. It principal operates as a custodian of pension assets, to hold and deal in such assets as directed by the Pension Fund Administrators and in line with regulations of National Pension Commission in conformity with the Pensions Reforms Act 2004.
(iv) UBA Capital Limited was incorporated on 19 August 2005. It engages principally in investment banking activities, IPO underwriting, securities trading, issuing house functions, mergers and acquisitions advisory and general corporate finance. It also does securities registrarship business through its subsidiary – African Prudential Registrars and strockbroking business through another subsidiary – UBA Stockbrokers Limited. Following the approval by Shareholders at an extra-ordinary general meeting held 13 December 2012, UBA Capital Limited has been spun-off from the Group in 2013. Accordingly, the investment has been reclassified to non-current assets held for distribution in the statement of financial position.
(v) UBA Insurance Brokers Limited was incorporated 1 September 2006 and commenced operations on 1 April 2007. It operates as an insurance broker as well as general insurance advisory services. Following the approval by Shareholders at an extra-ordinary general meeting held 13 December 2012, UBA Insurance Brokers Limited has been spun-off from the Group in 2013. Accordingly, the investment has been reclassified to non-current assets held for distribution in the statement of financial position.
(vi) UBA FX Mart was incorporated on 30 January 2008 and commenced operations 22 May 2008. It operates as a licenced bureau de change dealing in foreign currency and traveller’s cheques.
(vii) UBA Capital Europe Limited is a London-based investment banking company which was incorporated on 25 September 1995. It is primarily engaged in brokerage, trade finance and wealth management businesses. UBA Plc acquired additional stake of 49% in the company in the current year, and this increased the Bank’s stake in UBA Capital Europe Limited from 49% to 98% thereby making it a subsidiary of the Bank. The remaining 2% is held by UBA Capital Holding Mauritius (formerly Afrinvest Holdings Mauritius), a fully owned non-operating subsidiary of the Bank. Subsequent to year-end, the Bank commenced liquidation of UBA Capital Holdings Limited and upon liquidation, existing holdings of UBA Capital Holdings Limited in UBA Capital Europe Limited will be transferred to the Bank.
(viii) There are no significant restrictions on the ability of the subsidiaries to transfer funds to the Group in the form of cash dividends, or repayment of loans and advances.

Annual Report 2012
154
Notes to the consolidated and separate financial statementscontinued …
28. Property and equipment
(a) (i) Group
As at 31 December 2012
In millions of Nigerian Naira Land
Buildings and
leasehold improve-
ment
Other transport-
ation equipment
Motor vehicles
Furniture and office
equipmentWork in
progress Total
Cost
Balance at 1 January 2012 13,715 30,669 3,723 10,490 46,707 2,557 107,861
Additions 18,250 4,916 55 316 3,216 3,119 29,872
Disposals – (1,317) – (1,312) (1,077) (775) (4,481)
Transfers – 384 99 51 397 (931) –
Transfer to non-current assets held for distribution (1,422) (370) – – – (708) (2,500)
Exchange difference – (13) – (14) (8) (2) (37)
Balance at 31 December 2012 30,543 34,269 3,877 9,531 49,235 3,260 130,715
Accumulated depreciation
Balance at 1 January 2012 – 10,661 1,019 7,644 32,919 – 52,243
Charge for the year – 1,490 193 1,133 6,959 – 9,775
Disposals – (644) (88) (477) (799) – (2,008)
Exchange difference – (19) – (7) (15) – (41)
Balance at 31 December 2012 – 11,488 1,124 8,293 39,064 – 59,969
Carrying amounts
Balance at 31 December 2012 30,543 22,781 2,753 1,238 10,171 3,260 70,746
Balance at 31 December 2011 13,715 20,008 2,704 2,846 13,788 2,557 55,618
(ii) Bank
Cost
Balance at 1 January 2012 13,715 23,009 3,723 8,016 40,137 2,169 90,769
Additions 18,250 3,740 55 146 825 2,954 25,970
Disposals – (961) – (290) (295) (448) (1,994)
Transfers – 384 99 51 397 (931) –
Transfer to non-current assets held for distribution (1,422) (370) – – – (708) (2,500)
Balance at 31 December 2012 30,543 25,802 3,877 7,923 41,064 3,036 112,245
Accumulated depreciation
Balance at 1 January 2012 – 7,218 1,018 6,429 29,038 – 43,703
Charge for the year – 658 193 765 4,427 – 6,043
Disposals – (44) – (262) (313) – (619)
Balance at 31 December 2012 – 7,832 1,211 6,932 33,152 – 49,127
Carrying amounts
Balance at 31 December 2012 30,543 17,970 2,666 991 7,912 3,036 63,118
Balance at 31 December 2011 13,715 15,791 2,705 1,587 11,099 2,169 47,066

155
(b) (i) Group
As at 31 December 2011
In millions of Nigerian Naira Land
Buildings and
leasehold improve-
ment
Other transport-
ation equipment
Motor vehicles
Furniture and office
equipmentWork in
progress Total
Cost
Balance at 1 January 2011 13,715 30,490 3,185 10,543 45,615 3,022 106,570
Additions – 1,539 288 349 1,669 2,097 5,942
Disposals – (994) – (318) (1,820) (2,005) (5,137)
Transfers – (449) 250 (138) 906 (569) –
Exchange difference – 83 – 54 337 12 486
Balance at 31 December 2011 13,715 30,669 3,723 10,490 46,707 2,557 107,861
Accumulated depreciation
Balance at 1 January 2011 – 9,459 555 6,600 27,947 – 44,561
Charge for the year – 1,295 464 1,249 6,340 – 9,348
Disposals – (148) – (160) (1,520) – (1,828)
Transfers – – – (70) 70 – –
Exchange difference – 55 – 25 82 – 162
Balance at 31 December 2011 – 10,661 1,019 7,644 32,919 – 52,243
Carrying amounts
Balance at 31 December 2011 13,715 20,008 2,704 2,846 13,788 2,557 55,618
Balance at 1 January 2011 13,715 21,031 2,630 3,943 17,668 3,022 62,009
(ii) Bank
Cost
Balance at 1 January 2011 13,715 23,676 3,185 8,268 38,394 2,719 89,957
Additions – 262 287 89 676 1,806 3,120
Disposals – (460) – (91) (47) (1,710) (2,308)
Transfers – (469) 251 (250) 1,114 (646) –
Balance at 31 December 2011 13,715 23,009 3,723 8,016 40,137 2,169 90,769
Accumulated depreciation
Balance at 1 January 2011 – 6,526 554 5,748 23,866 – 36,694
Charge for the year – 708 464 755 5,201 – 7,128
Disposals – (16) – (74) (29) – (119)
Balance at 31 December 2011 – 7,218 1,018 6,429 29,038 – 43,703
Carrying amounts
Balance at 31 December 2011 13,715 15,791 2,705 1,587 11,099 2,169 47,066
Balance at 1 January 2011 13,715 17,150 2,631 2,520 14,528 2,719 53,263

Annual Report 2012
156
Notes to the consolidated and separate financial statementscontinued …
29. Intangible assets
In millions of Nigerian Naira GoodwillPurchased
software Total
(a) (i) Group
Cost
Balance at 1 January 2012 3,479 9,086 12,565
Additions 2,194 558 2,752
Exchange difference – (8) (8)
Balance at 31 December 2012 5,673 9,636 15,309
Amortisation and impairment losses
Balance at 1 January 2012 – 6,635 6,635
Amortisation for the period – 1,113 1,113
Exchange difference – (7) (7)
Balance at 31 December 2012 – 7,741 7,741
Carrying amounts
Balance at 31 December 2012 5,673 1,895 7,568
Balance at 31 December 2011 3,479 2,451 5,930
(ii) Bank
Cost
Balance at 1 January 2012 7,661 7,661
Additions 339 339
Balance at 31 December 2012 8,000 8,000
Amortisation and impairment losses
Balance at 1 January 2012 5,562 5,562
Amortisation for the period 860 860
Balance at 31 December 2012 6,422 6,422
Carrying amounts
Balance at 31 December 2012 1,578 1,578
Balance at 31 December 2011 2,099 2,099

157
29. Intangible assets continued …
In millions of Nigerian Naira GoodwillPurchased
software Total
As at 31 December 2011
(b) (i) Group
Cost
Balance at 1 January 2011 3,479 8,630 12,109
Additions – 456 456
Balance at 31 December 2011 3,479 9,086 12,565
Amortisation and impairment losses
Balance at 1 January 2011 – 5,483 5,483
Amortisation for the period – 1,152 1,152
Balance at 31 December 2011 – 6,635 6,635
Carrying amounts
Balance at 31 December 2011 3,479 2,451 5,930
Balance at 1 January 2011 3,479 3,147 6,626
(ii) Bank
Cost
Balance at 1 January 2011 – 7,403 7,403
Additions – 258 258
Balance at 31 December 2011 – 7,661 7,661
Amortisation and impairment losses
Balance at 1 January 2011 – 4,451 4,451
Amortisation for the period – 1,111 1,111
Balance at 31 December 2011 – 5,562 5,562
Carrying amounts
Balance at 31 December 2011 – 2,099 2,099
Balance at 1 January 2011 – 2,952 2,952
The Bank (Parent Company) increased the stake in UBA Capital Europe Limited to 100% with an effective date of 31 August 2012. The previously held percentage holding of 49% was increased by the conversion of existing preference shares to equity and by the issue of additional shares to the former equity holders. This increased the Bank’s stake to 98% with the remaining 2% owned by UBA Capital Holdings Mauritius (a wholly owned non-operating subsidiary of the Bank). Subsequent to year-end, the Bank commenced liquidation of UBA Capital Holdings Limited and upon liquidation, existing holdings of UBA Capital Holdings Limited in UBA Capital Europe Limited will be transferred to the Bank.

Annual Report 2012
158
Notes to the consolidated and separate financial statementscontinued …
Goodwill arising on the acquisition of UBA Capital Europe Limited is shown below:
Fair value of assets acquired as at 31 August 2012
In millions of Nigerian Naira Total
Assets
Cash and cash equivalents 2,865
Loans and advances to banks 4,445
Investment securities 2,913
Other assets 114
Total assets 10,337
Creditors and accruals 1,893
Other current liabilities 12
Total liabilities 1,905
Fair value of net assets as at 31 August 2012 8,432
Fair value of previously held interest 626
Consideration for additional stake (Preference shares converted to equity) 10,000
Total consideration 10,626
Goodwill on acquisition (note 29 (a)) 2,194
The profit made on the measurement of the previously held interest in UBA Capital Europe Limited is N31.7 million and it is included as part of other income.
The post-acquisition profit included in the statement of comprehensive income is N26 million. The total revenue made by UBA Capital Europe Limited during the year is N487 million, while the loss for the year is N84 million.
Impairment testing for cash-generating units containing goodwillFor the purpose of impairment testing, goodwill acquired through business combinations is allocated to cash-generating units (CGUs). The recoverable amounts of the CGUs have been determined based on the value-in-use calculations; using cash flow projections based on the financial budgets approved by senior management covering a period of five years.
The calculation of value-in-use was based on the following key assumptions:
– the value of the CGUs for Continental Bank Du Benin and UBA Capital Europe Limited are N8.2 billion and N10.6 billion, respectively;
– the carrying amounts of the Goodwill in Continental Bank Du Benin and UBA Capital Europe Limited is N3.48 billion and N2.19 billion, respectively;
– the cash flows were projected based on the Bank’s approved budget. The cash flows were based on past experiences and were adjusted to reflect expected future performances of the company putting into consideration the country’s gross domestic product;
– a terminal growth rate of 3% and 1% were applied in determining the terminal cash flows;
– discount rates of 16.8% and 11% were applied in determining the value in use of UBA Benin and UBA Capital Europe, respectively.
– the Group acquired UBA Capital Europe Limited by exercising the option to convert the existing preference shares to equity. Upon exercise of the option, the Group gained control of UBA Capital Europe Limited; and
– the Group expects that through this acquisition, it would create synergy that enhances its ability to tap into opportunities in the European market.

159
30. DEFERRED TAX ASSETS AND LIABILITIES
Recognised deferred tax assets and liabilities
Deferred tax assets and liabilities are attributable to the following:
In millions of Nigerian Naira
Group Bank
Assets Liabilities Assets Liabilities
(a) 31 December 2012Property, equipment, and software 7,452 59 5,980 –Allowances for loan losses 2,213 – 2,213 –Other assets 240 – 240 –Tax losses carried forward 19,352 – 19,352 –Others 367 – 367 –Net tax assets/liabilities 29,624 59 28,152 –
Deferred tax assets and liabilities
Movements in temporary differences during the year
GroupIn millions of Nigerian Naira Opening
Recognisedin profit or
lossRecognised
in equityClosingbalance
Property, equipment and software 5,935 1,459 – 7,394Allowances for loan losses 1,909 303 – 2,212Other assets 440 (200) – 240Tax losses carried forward 17,308 2,044 – 19,352Others 1,380 (1,013) – 367
26,972 2,593 – 29,565Deferred tax assets:To be recovered within 12 months 7,651To be recovered after more than 12 months 28,200
Deferred tax liabilitiesTo be recovered within 12 months (53)To be recovered after more than 12 months (6,233)
29,565
BankIn millions of Nigerian Naira Opening
Recognisedin profit or
lossRecognised
in equityClosingbalance
Property, equipment and software 4,566 1,414 – 5,980Allowances for loan losses 1,909 303 – 2,212Other assets 440 (200) – 240Tax losses carried forward 17,308 2,044 – 19,352Others 1,381 (1,013) – 368
25,604 2,548 – 28,152Deferred tax assets:To be recovered within 12 months 7,710To be recovered after more than 12 months 26,728
Deferred tax liabilitiesTo be recovered within 12 months (53)To be recovered after more than 12 months (6,233)
28,152

Annual Report 2012
160
Notes to the consolidated and separate financial statementscontinued …
30. DEFERRED TAX ASSETS AND LIABILITIES continued …
In millions of Nigerian Naira
Group Bank
Assets Liabilities Assets Liabilities
(b) 31 December 2011Property, equipment and software 5,961 26 4,567 –
Allowances for loan losses 1,909 – 1,909 –
Other assets 440 – 440 –
Tax losses carried forward 17,308 – 17,308 –
Others 1,380 – 1,380
Net tax assets/liabilities 26,998 26 25,604 –
Deferred tax assets and liabilities
Movements in temporary differences during the year
GroupIn millions of Nigerian Naira Opening
Recognisedin profit or
lossRecognised
in equityClosingbalance
Property, equipment and software 2,062 3,873 – 5,935
Allowances for loan losses 2,221 (312) – 1,909
Mark to market loss on valuation of securities 2,805 (2,805) – –
Other assets – 440 – 440
Tax losses carried forward – 17,308 – 17,308
Others (69) 1,449 – 1,380
7,019 19,953 – 26,972
Deferred tax assets:To be recovered within 12 months 9,380
To be recovered after more than 12 months 26,258
Deferred tax liabilitiesTo be recovered within 12 months (1,350)
To be recovered after more than 12 months (7,316)
26,972
BankProperty, equipment and software 1,598 2,968 – 4,566
Allowances for loan losses 2,220 (311) – 1,909
Mark to market loss on valuation of securities 2,805 (2,805) – –
Other assets – 440 – 440
Tax losses carried forward – 17,308 – 17,308
Others (68) 1,449 – 1,381
6,555 19,049 – 25,604
Deferred tax assets:To be recovered within 12 months – – – 9,406
To be recovered after more than 12 months – – – 24,864
Deferred tax liabilitiesTo be recovered within 12 months – – – (1,350)
To be recovered after more than 12 months – – – (7,316)
25,604

161
In assessing the recoverability of deferred tax assets, management considers whether there is any doubt that some portion or all of the deferred tax assets will not be recovered. The ultimate realisation of deferred tax assets is dependent upon the generation of future taxable income during the periods in which those temporary differences become deductible. Management considered the projected future taxable income in making this assessment and believes that the Bank will realise the benefits of these deductible differences. The amount of the deferred tax asset considered realisable, however, could be reduced in the near term if estimates of future taxable income during the carry forward period are reduced.
31. DERIVATIVE LIABILITIES
Group Bank
In millions of Nigerian NairaDecember
2012December
2011January
2011December
2012December
2011January
2011
Instrument type:
Commodities – – 9,310 – – 9,310
Cross-currency swap 124 817 – 124 817 –
124 817 9,310 124 817 9,310
The movement in derivatives liability is as follows:
Balance, beginning of year 817 9,310 817 9,310
Fair value losses – 7,647 – 7,647
Fair value (gain)/loss on cross-currency swap (693) 817 (693) 817
Payment on maturity – (16,957) – (16,957)
Balance, end of year 124 817 124 817
32. DEPOSITS FROM BANKS
Group Bank
In millions of Nigerian NairaDecember
2012December
2011January
2011December
2012December
2011January
2011
Money market deposits 51,596 16,154 7,456 16,844 22,803 51
Items in the course of collection 6,184 3,356 – 6,031 605 –
57,780 19,510 7,456 22,875 23,408 51
Current 57,780 19,510 7,456 22,875 23,408 51
Non-current – – – – – –
57,780 19,510 7,456 22,875 23,408 51
30. DEFERRED TAX ASSETS AND LIABILITIES continued …

Annual Report 2012
162
Notes to the consolidated and separate financial statementscontinued …
33. DEPOSITS FROM CUSTOMERS
Group Bank
In millions of Nigerian NairaDecember
2012December
2011January
2011December
2012December
2011January
2011
Retail customers:
Term deposits 98,274 95,111 83,572 83,483 74,001 68,165
Current deposits 101,211 134,857 118,496 87,544 111,395 102,608
Savings deposits 285,369 247,201 217,209 224,780 216,979 199,867
Domiciliary deposits 30,837 15,425 13,554 26,196 15,005 13,822
Corporate customers:
Term deposits 249,077 217,845 191,415 225,329 191,136 176,061
Current deposits 414,416 507,971 446,342 354,373 396,141 364,898
Domiciliary deposits 540,824 227,412 199,854 459,426 211,854 195,145
1,720,008 1,445,822 1,270,409 1,461,131 1,216,511 1,120,566
Current 1,652,674 1,445,822 1,245,606 1,461,131 1,216,511 1,108,480
Non-curent 67,334 – 24,803 – – 12,086
1,720,008 1,445,822 1,270,409 1,461,131 1,216,511 1,120,566
34. OTHER LIABILITIES
Group Bank
In millions of Nigerian NairaDecember
2012December
2011January
2011December
2012December
2011January
2011
Liability for defined contribution obligations (note (i)) 600 665 674 600 665 674
Creditors 48,983 24,411 19,972 26,847 24,734 20,303
Accruals 6,108 11,704 5,830 4,105 5,608 3,326
Customers’ deposit for foreign trade (note (ii)) 12,694 21,366 15,082 12,694 18,853 14,366
Provisions 146 64 113 146 64 113
Dividend in specie (note (iii)) 12,907 – – 12,907 – –
81,438 58,210 41,671 57,299 49,924 38,782
Current 81,438 58,210 41,671 57,299 49,924 38,782
Non-current – – – – – –
81,438 58,210 41,671 57,299 49,924 38,782
(i) The Bank and its employees each contributes a minimum of 7.5% of basic salary, housing and transport allowance to each employee’s retirement savings account maintained with their nominal pension fund administrators. The amount not yet transferred as at period- end of N600 million (December 2011: N665 million) was settled subsequent to reporting date.

163
34. OTHER LIABILITIES continued …The movement in liability for defined contribution obligations is as follows:
In millions of Nigerian Naira
Group BankDecember
2012December
2011December
2012December
2011
Balance, beginning of the year 665 674 665 674
Charge to profit or loss 1,317 1,345 850 861
Contributions remitted (1,382) (1,354) (915) (870)
Balance, end of the year 600 665 600 665
(ii) Customers’ deposit for foreign trade represents the naira value of foreign currencies held on behalf of customers in various foreign accounts to cover letter of credit transactions. The corresponding balance is included in cash and balances with banks. See note 20.
(iii) This represents estimated fair value of the assets to be distributed to owners as of the end of the reporting period. Level 2 of the fair value hierarchy has been used to determine these estimated fair values; further explanations regarding the Group’s Level 2 valuation hierarchy is contained in note 5 of the financial statements, while additional information regarding assets held for distribution to owners is contained in note 18 of the financial statements.
35. SURBORDINATED LIABILITIES
Group BankDecember
2012December
2011January
2011December
2012December
2011January
2011
Medium term notes – series 1 18,555 18,501 18,335 20,310 20,255 20,147
Medium term notes – series 2 35,164 34,999 – 35,164 34,999 –
53,719 53,500 18,335 55,474 55,254 20,147
Current – – – – – –
Non-current 53,719 53,500 18,335 55,474 55,254 20,147
53,719 53,500 18,335 55,474 55,254 20,147
(i) Subordinated liabilities represent medium-term bonds issued by the Bank. In 2010, the Bank offered for subscription N20 billion fixed rate subordinated unsecured notes, maturing in 2017 with a coupon of 13%. In prior year, the Bank also offered N35 billion fixed rate subordinated unsecured notes, maturing in 2018 with a coupon of 14%. These represent the first and second issuance, respectively under the Bank’s N400 billion medium-term note programme. Coupon on the note is payable semi-annually.
36. BORROWINGS
Group Bank
In millions of Nigerian NairaDecember
2012December
2011January
2011December
2012December
2011January
2011
On-lending facilities:
– African Development Bank (AfDB) (note 36.1) 23,707 23,662 22,574 23,707 23,662 22,573
– Central Bank of Nigeria (note 36.2) 36,612 38,756 35,157 36,612 38,756 35,158
– Bank of Industries (BoI) (note 36.3) 13,869 42,063 5,596 13,869 42,063 5,596
– Afrexim (note 36.4) 14,452 15,537 – 14,452 15,537 –
– SCB (note 36.5) 25,093 15,923 – 25,093 15,923 –
– HSBC (note 36.6) 787 1,099 – 787 1,099 –
114,520 137,040 63,327 114,520 137,040 63,327
Current 53,500 13,949 10,858 53,500 16,013 10,858
Non-current 61,020 123,091 52,469 61,020 121,027 52,469
114,520 137,040 63,327 114,520 137,040 63,327

Annual Report 2012
164
Notes to the consolidated and separate financial statementscontinued …
36. BORROWINGS continued …36.1 This represents the amount drawn down under the African Development Bank (AfDB) long-term unsecured loan facilities. The AfDB
borrowing comprises an unsecured emergency liquidity funding (ELF) and an unsecured trade finance initiative facility (TFI). Interest rate on the ELF is six (6) months USD LIBOR plus 500 basis points. Interest rate on the TFI is six (6) months USD LIBOR plus 450 basis points. Interest on both the ELF and TFI loans are payable semi-annually.
36.2 Amount represents on-lending facilities provided by the Central Bank of Nigeria (CBN) with the sole purpose of granting loans, at subsidised rates, to companies engaged in agriculture. The funds are at concessionary rates.
36.3 Amount represents on-lending facilities provided by the Bank of Industry (BoI) with the sole purpose of granting loans, at subsidised rates, to companies engaged in manufacturing, power and aviation industries. The funds are at concessionary rates.
36.4 This represents the amount drawn down under a secured term loan facility granted by Afrexim and amount drawn down under a guaranteed note purchase. Interest rate on the term loan facility is three (3) months USD LIBOR plus 430 basis points while Interest rate on the guaranteed note purchase facility is three (3) months USD LIBOR plus 475 basis points. Interests on the loans are payable quarterly.
36.5 This represents the amount drawn down under a secured term loan facilities granted by Standard Chartered Bank. The borrowing comprises a term loan facility of USD55 million and a term loan facility of NGN equivalent of USD45 million. Interest rate on the USD55 million term loan facility is six (6) months USD LIBOR plus 450 basis points. Interest rate on the USD45 million term loan is six (6) months USD LIBOR plus 530 basis points. Interest on both term loans are payable semi-annually.
36.6 This represents the amount drawn down under a HSBC Export Credit Agency-backed framework agreement facility. Interest rate on the facility is six (6) months USD LIBOR plus 125 basis points. Interest on the loan is payable semi-annually.
37. CAPITAL AND RESERVES
(a) Share capital
Share capital comprises:In millions of Nigerian Naira
Group Bank
December 2012
December 2011
January 2011
December 2012
December 2011
January 2011
(i) Authorised:
45,000,000,000 ordinary shares of 50k each 22,500 22,500 17,500 22,500 22,500 17,500
(ii) Issued and fully paid:
32,981,387,565 ordinary shares of 50k each 16,491 16,168 12,934 16,491 16,168 12,934
Number of shares in issue, at start of the year 32,982 32,336 25,868 32,982 32,336 25,868
Transfer from share premium – 646 6,468 – 646 6,468
On issue, at year-end 32,982 32,982 32,336 32,982 32,982 32,336
(b) Share premium
Share premium is the excess paid by shareholders over the nominal value for their shares.
(c) Retained earnings
Retained earnings is the carried forward recognised income net of expenses plus current period profit attributable to shareholders.

165
37. CAPITAL AND RESERVES continued …
(d) Other reserves
Other reserves include the following: Group Bank
December 2012
December 2011
January 2011
December 2012
December 2011
January 2011
Translation reserve (note (i)) (1,514) 1,607 – – – –
Statutory reserve (note (ii)) 33,120 26,014 25,214 31,224 24,118 24,118
Fair value reserve (note (iii)) 15,223 11,460 7,387 15,834 12,300 8,088
Regulatory risk reserve (note (iv)) 1,113 – – 1,113 – –
Treasury shares (note (v)) (32,831) (32,193) (32,591) – – –
15,111 6,888 10 48,171 36,418 32,206
(i) Translation reserve
Translation reserve comprises all foreign exchange differences arising from translation of the financial statements of foreign operations.
(ii) Statutory reserve
In accordance with existing legislation, the Bank transferred 15% (2011: Nil) of its profit after taxation to statutory reserves. Also included in statutory reserves is the Bank’s Small and Medium Enterprises Equity Investment Scheme (SMEEIS) reserves. The Bank has suspended further appropriation to SMEEIS reserves (now known as Microcredit Fund) reserve account in line with the decision reached at the Banker’s Committee meeting and approved by CBN.
(iii) Fair value reserve
The fair value reserve includes the net cumulative change in the fair value of available-for-sale investments until the investment is derecognised or impaired.
(iv) regulatory credit risk reserve
The regulatory credit risk reserve warehouses the difference between the impairment on loans and advances determined using the Central Bank of Nigeria prudential guidelines, compared with the incurred loss model used in determining the impairment loss under IFRSs.
Where the loan loss impairment determined using the Central Bank of Nigeria prudential guidelines is higher than the loan loss impairment determined using the incurred loss model under IFRSs, the difference is transferred to regulatory credit risk reserve and it is non-distributable to owners of the Bank.
(vi) Treasury shares
Treasury shares represent the Bank’s shares held by the Staff Investment Trust as at 31 December 2012.
38. DIVIDENDS
A dividend in respect of the year ended 31 December 2012 of N0.5 per share (2011: Nil) amounting to a total dividend of N16.491billion is has been proposed for Approval at the Annual General Meeting. The amount is not reflected in these financial statements.

Annual Report 2012
166
Notes to the consolidated and separate financial statementscontinued …
39. CONTINGENCIES
(i) Litigation and claims
There were contingent liabilities in respect of legal actions against the Group for amounts totalling N74.5 billion (2011: N229 million) for which provisions amounting to N146 million (2011: N64 million) have been made. The Directors having sought the advice of professional legal counsel are of the opinion that based on the advice received, no significant liability will crystallise from these cases beyond the provision made in the financial statements.
(ii) Contingent liabilities
In the normal course of business, the Group conducts business involving acceptances, performance bonds and indemnities. The majority of these facilities are offset by corresponding obligations of third parties. Contingent liabilities and commitments comprise acceptances, endorsements, guarantees and letters of credit.
(iii) Capital commitments
At the balance sheet date, the Group had capital commitments amounting to N1.3 billion in respect of authorised and contracted capital projects.
Nature of instruments
An acceptance is an undertaking by a bank to pay a bill of exchange drawn on a customer. The Group expects most acceptances to be presented, but reimbursement by the customer is normally immediate. Endorsements are residual liabilities of the Group in respect of bills of exchange, which have been paid and subsequently rediscounted.
Guarantees and letters of credit are given to third parties as security to support the performance of a customer to third parties. As the Group will only be required to meet these obligations in the event of the customer’s default, the cash requirements of these instruments are expected to be considerably below their nominal amounts.
Other contingent liabilities include performance bonds and are, generally, short-term commitments to third parties which are not directly dependent on the customers’ credit worthiness.
Documentary credits commit the Group to make payments to third parties, on production of documents, which are usually reimbursed immediately by customers.
The following tables summarise the nominal principal amount of contingent liabilities and commitments with off-balance sheet risk:
Contingent liabilities: Group Bank
In millions of Nigerian NairaDecember
2012December
2011January
2011December
2012December
2011January
2011
Performance bonds and guarantees 305,492 239,014 139,653 284,359 228,852 124,602
Letters of credits 95,820 121,874 73,524 78,543 84,465 62,468
Bankers acceptances – 11,159 9,227 – 11,159 9,227
401,312 372,047 222,404 362,902 324,476 196,297

167
40. RELATED PARTIES
United Bank for Africa Plc (UBA Plc) is the ultimate Bank/controlling party of the Group. The shares of UBA Plc is listed on the Nigerian Stock Exchange and held by widely varied investors.
Parties are considered to be related if one party has the ability to control the other party or exercise influence over the other party in making financial and operational decisions, or one other party controls both. The definition includes subsidiaries, associates, joint ventures as well as key management personnel.
(a) Subsidiaries
Transactions between United Bank for Africa Plc and the subsidiaries also meet the definition of related party transactions. Where these are eliminated on consolidation, they are not disclosed in the consolidated financial statements.
(b) Key management personnel
Key management personnel is defined as members of the Board of Directors of the Bank, including their close members of family and any entity over which they exercise control. Close members of family are those family members who may be expected to influence, or be influenced by that individual in the dealings with UBA Plc and its subsidiaries.
Key management personnel and their immediate relatives engaged in the following transactions with the Bank during the year:
In millions of Nigerian NairaDecember
2012December
2011
Loans and advances to key management personnel
Loans and advances as at end of year 1,245 571
Interest income earned during the year 108 74
Loans and advances to key management personnel’s related persons and entities as at end of year.
In millions of Nigerian NairaName of company/individual Relationship
Name of Director
Facility type Security Status
December 2012
December 2011 Rate Currency
Bridge House College
Director-related Mrs. Foluke Abdulrazaq
Term loan Real EstateLegal ownership over assets secured
Performing 24 32 18% NGN
Vine Foods Limited
Director-related Mr. Emmanuel Nnorom
Overdraft Real EstateLegal ownership over assets secured
Performing 3 4 27% NGN
Vine Foods Limited
Director-related Mr. Emmanuel Nnorom
Term loan Otherwise Performing – 27 18% NGN
Paki International Motors Limited
Director-related Alhaji Ja'afaru Paki
Term loan Secured Performing 1 3 24% NGN
Sahara Energy Resources
Director-related Ms. Angela Aneke
Term loan Cash Performing 2,723 3,631 8% USD
Sahara Energy Resources
Director-related Ms. Angela Aneke
Overdraft Cash Performing 15,703 22,113 6% USD
The Regent School
Director-related Mrs. Foluke Abdulrazaq
Term loan Real Estate Performing 643 924 8% USD
Nigeria Pipes Limited
Director-related Mr. Abdulqadir Bello
Bankers’acceptance
Mortgage Debenture
Performing 31 76 19% NGN
Cole Uyi Sylvia Director-related Ms. Angela Aneke
Mortgage Real Estate Performing 4 5 8% GBP
Heirs Holdings Limited
Ex-Director Mr. Tony Elumelu
Term loan Real EstateLegal ownership
Performing 6,492 7,211 10% NGN
25,624 34,026
Interest income earned during the year 1,298 1,518

Annual Report 2012
168
Notes to the consolidated and separate financial statementscontinued …
40. RELATED PARTIES continued …Loans to key management personnel are granted on the same terms and conditions as loans to other employees. Interest charged on loans to close members of family of key management personnel as well as entities in which they exercise control were charged at commercial and market rates. Related party loans are secured over real estate, equity and other assets of the respective borrowers. No specific impairment losses (2011: Nil) have been recorded against related party loans.
Deposit liabilities
In millions of Nigerian NairaDecember
2012December
2011
Deposits as at end of year 782 650
Interest expense during the year 7 6
Compensation
Aggregate remuneration paid to key management staff during the year is as follows:
In millions of Nigerian NairaDecember
2012December
2011
Executive compensation 614 694
Retirement benefit costs 13 89
Short-term employee benefits 627 783
41. COMPENSATION TO EMPLOYEES AND DIRECTORS
(i) The number of persons in the employment of the Group as at year-end is as follows:
Group Bank
(In absolute units)December
2012December
2011December
2012December
2011
Group Executive Directors 8 9 8 9
Management 355 796 244 275
Non-management 11,174 12,173 8,791 9,569
11,537 12,978 9,043 9,853
Compensation for the above staff (excluding Executive Directors):
In millions of Nigerian Naira
Salaries and wages 42,135 46,529 32,149 37,242
Retirement benefit costs:
Defined contribution plans 1,317 1,345 850 861
43,452 47,874 32,999 38,103

169
41. COMPENSATION TO EMPLOYEES AND DIRECTORS
(ii) The number of employees of the Group, other than Directors, who received emoluments in the following ranges (excluding pension contributions) were:
Group Bank
(In absolute units)December
2012December
2011December
2012December
2011
N300 001 – N2 000 000 7,281 8,144 6,260 6,998
N2 000 001 – N2 800 000 586 588 4 4
N2 800 001 – N3 500 000 262 406 – –
N3 500 001 – N4 000 000 959 976 807 675
N4 000 001 – N5 500 000 666 741 472 456
N5 500 001 – N6 500 000 592 749 528 607
N6 500 001 – N7 800 000 449 510 378 425
N7 800 001 – N9 000 000 222 285 190 235
N9 000 001 – above 512 570 396 444
11,529 12,969 9,035 9,844
Group Bank
In millions of Nigerian NairaDecember
2012December
2011December
2012December
2011
Remuneration paid to the Group’s Directors was:
Fees and sitting allowances 37 67 37 67
Executive compensation 614 694 614 694
Retirement benefit costs 13 89 13 89
664 850 664 850
Fees and other emoluments disclosed above including amounts paid to:
The Chairman 3 4 3 4
The highest paid Director 116 63 116 63
The number of Directors who received fees and other emoluments (excluding pension contributions) in the following ranges was:
(In absolute units)
Below N1 000 000 – 2 – 2
N1 000 001 – N2 000 000 2 1 2 1
N2 000 001 – N3 000 000 2 – 2 –
N3 000 001 – N5 000 000 5 4 5 4
N5 500 001 and above 9 12 9 12
18 19 18 19

Annual Report 2012
170
Notes to the consolidated and separate financial statementscontinued …
42. SUBSEQUENT EVENTS
There are no post-balance sheet events that could materially affect either the reported state of affairs of the Bank and the Group as at 31 December 2012 or the profit/(loss) for the year ended on the same date which have not been adequately provided for or disclosed.
43. COMPLIANCE WITH BANKING REGULATIONS
The Bank contravened the Banks and Other Financial Institutions Act CAP B3 LFN 2004 during the period and was penalised a total sum of N6.65 million for delayed response on ATM complaints; wrong crediting of FEM winnings by our correspondent bank; and wrong filing of rating reports in credit files.
44. EXPLANATION OF TRANSITION TO IFRS
(A) Implementation of IFRS
As stated in note 1 (a), these are the Group’s and Bank’s first financial statements prepared in accordance with IFRS. The Group and Bank have applied IFRS 1 in preparing these consolidated and separate financial statements and the accounting policies set out in note 2 have been applied in preparing the financial statements for the year ended 31 December 2012, the comparative information presented in these financial statements for the year ended 31 December 2011, and in the preparation of an opening IFRS statement of financial position at 1 January 2011(the date of the Bank’s transition to IFRS).
In preparing its opening IFRS statement of financial position, the Group and the Bank have adjusted amounts reported previously in financial statements prepared in accordance with Statements of Accounting Standards issued by the Financial Reporting Council of Nigeria, previously the Nigerian Accounting Standards Board (“Nigerian GAAP”). An explanation of how the transition from Nigerian GAAP to IFRS has affected the Group’s and the Bank’s financial position, financial performance and cash flows is set out in the following tables and the notes that accompany the tables.
The most significant IFRS impact for the Group and the Bank resulted from the implementation of IAS 39 Financial Instruments – Recognition and Measurement. IAS 39 requires financial assets and liabilities to be measured at fair value or at amortised cost (using the effective interest method) depending on their classification. The impairment principles of IAS 39 require the impairment of financial assets only in cases where there is objective evidence of impairment as a result of one or more loss events that occurred after the initial recognition of the asset (referred to as an ‘incurred loss’ model).
In preparing these consolidated and separate financial statements in accordance with IFRS 1, the Group has applied the mandatory exceptions from full retrospective application of IFRS.
(i) Exceptions from full retrospective application – followed by the Group and the BankThe Group and the Bank applied the following mandatory exceptions from retrospective application:
Estimates exception
Estimates under IFRS at 1 January 2011 are consistent with estimates made for the same date under Nigerian GAAP, unless there is evidence that those estimates were in error.
Derecognition of financial assets and liabilities exception
Financial assets and liabilities derecognised before 1 January 2004 are not rerecognised under IFRS.
Hedge accounting exception
This exception requires the Group and the Bank to use hedge accounting only if the hedge relationship meets all the hedge accounting criteria under IAS 39. The Group and the Bank have not used hedge accounting under IFRS.

171
44. EXPLANATION OF TRANSITION TO IFRS continued …
Non-controlling interests exception
The Group elected not to restate business combinations that occurred prior to the date of transition to IFRS. Therefore, the guidance contained in IFRS on accounting for the loss of control of a subsidiary, the attribution of total comprehensive income between non-controlling interests and the owners of the Bank and changes in ownership interests without loss of control are applied prospectively from 1 January 2011.
Classification and measurement of financial assets exception
The assessment of whether the Group’s financial assets meet the requirements to be measured at amortised cost, as set out in IFRS 9, was performed at 1 July 2007.
(ii) Exemptions (elections) made by the GroupThe Group has applied the following transition exemptions (elections) to full retrospective application of IFRS:
(a) Cumulative translation adjustment
(b) Business combination
Cumulative translation adjustment
In accordance with IFRS transitional provisions, the Group has elected to reset the cumulative translation adjustment account, which includes gains and losses arising from the translation of foreign operations, to zero at the date of transition to IFRS.
business combination
In accordance with IFRS transitional provisions, the Group elected to apply IFRS relating to business combinations prospectively from 1 January 2011. As such, Nigerian GAAP balances relating to business combinations entered into before that date, including goodwill, have been carried forward without adjustment.

Annual Report 2012
172
Notes to the consolidated and separate financial statementscontinued …
Reconciliation of equity
In millions of Nigerian Naira Group Notes
PreviousGAAP
Effect oftransition to
IFRS1 January
2011 IFRS
Assets
Cash and cash equivalents k 68,056 317,341 385,397
Due from other banks and financial institutions k 302,272 (302,272) –
Trading assets l – 2,594 2,594
Loans and advances to banks a, c, m – 11,226 11,226
Loans and advances to customers a, c, m 628,811 (38,014) 590,797
Treasury bills and government bonds j 123,455 (123,455) –
Investment in equity accounted investees 10,118 – 10,118
Investment securities b c, j, n 384,453 108,626 493,079
Property and equipment e, o 65,200 (3,191) 62,009
Intangible assets o p 3,479 3,147 6,626
Deferred tax assets f 3,341 3,708 7,049
Other assets i 28,511 1,779 30,290
Total assets 1,617,696 (18,511) 1,599,185
Liabilities
Derivative liabilities h – 9,310 9,310
Deposits from banks d, r – 7,456 7,456
Deposits from customers d, r 1,267,171 3,238 1,270,409
Due to other banks d, r 7,456 (7,456) –
Liability on investment contracts s 33,090 (33,090) –
Managed funds s – 32,753 32,753
Current tax liabilities 2,794 75 2,869
Deferred tax liabilities f 30 – 30
Other liabilities d, t 45,585 (3,914) 41,671
Subordinated liabilities d, u – 18,335 18,335
Borrowings d, u 82,144 (18,817) 63,327
Total liabilities 1,438,270 7,890 1,446,160
Equity
Share capital and share premium 124,423 – 124,423
Retained earnings and other reserves 52,106 (26,401) 25,705
Total equity attributable to equity holders of the Bank 176,529 (26,401) 150,128
Non-controlling interest 2,897 – 2,897
Total equity 179,426 (26,401) 153,025
Total liabilities and equity 1,617,696 (18,511) 1,599,185

173
Reconciliation of equity
In millions of Nigerian Naira Bank Notes
PreviousGAAP
Effect oftransition to
IFRS1 January
2011 IFRS
Assets
Cash and cash equivalents k 39,819 290,882 330,701
Due from other banks and financial institutions k 290,735 (290,735) –
Trading assets l – 1,267 1,267
Loans and advances to banks a, c, m – 11,226 11,226
Loans and advances to customers a, c, m 569,312 (12,088) 557,224
Treasury bills and government bonds j 78,703 (78,703) –
Investment in subsidiaries 50,355 – 50,355
Investment in equity-accounted investees 10,843 – 10,843
Investment securities b c, j, n 313,659 77,802 391,461
Property and equipment e, o 56,216 (2,953) 53,263
Intangible assets o p – 2,952 2,952
Deferred tax assets f 3,131 3,424 6,555
Other assets i 19,859 5,018 24,877
Total assets 1,432,632 8,092 1,440,724
Liabilities
Derivative liabilities h – 9,310 9,310
Deposits from banks d, r – 51 51
Deposits from customers d, r 1,119,063 1,503 1,120,566
Due to other banks d, r 51 (51) –
Current tax liabilities 1,148 37 1,185
Other liabilities d, t 40,684 (1,902) 38,782
Subordinated liabilities d, u – 20,147 20,147
Borrowings d, u 83,956 (20,629) 63,327
Total liabilities 1,244,902 8,466 1,253,368
Equity
Share capital and share premium 124,423 – 124,423
Retained earnings and other reserves 63,307 (374) 62,933
Total equity attributable to equity holders of the Bank 187,730 (374) 187,356
Total liabilities and equity 1,432,632 8,092 1,440,724

Annual Report 2012
174
Notes to the consolidated and separate financial statementscontinued …
Reconciliation of equity
In millions of Nigerian Naira Group Notes
PreviousGAAP
Effect oftransition to
IFRS31 December
2011 IFRS
Assets
Cash and cash equivalents k 178,295 255,923 434,218
Due from other banks and financial institutions k 251,514 (251,514) –
Financial assets held-for-trading l – 1,303 1,303
Loans and advances to banks a m – 41,564 41,564
Loans and advances to customers a 689,625 (83,998) 605,627
Treasury bills and government bonds j 175,525 (175,525) –
Investment in equity-accounted investees 10,356 – 10,356
Investment securities b, c, j, n 525,975 196,333 722,308
Property and equipment e 52,852 2,766 55,618
Intangible assets o p 9,658 (3,728) 5,930
Deferred tax assets f 25,062 1,936 26,998
Other assets i 23,931 (7,418) 16,513
Total assets 1,942,793 (22,358) 1,920,435
Liabilities
Derivative liabilities h – 817 817
Deposits from banks r – 19,510 19,510
Deposits from customers r 1,444,988 834 1,445,822
Due to other banks r 17,201 (17,201) –
Liability on investment contracts u 41,996 (41,996) –
Managed funds s – 51,943 51,943
Current tax liabilities 2,005 622 2,627
Deferred tax liabilities f 26 – 26
Other liabilities t 74,421 (16,211) 58,210
Subordinated liabilities u – 53,500 53,500
Borrowings u 192,123 (55,083) 137,040
Total liabilities 1,772,760 (3,265) 1,769,495
Equity
Share capital and share premium 124,423 – 124,423
Retained earnings and other reserves 42,038 (19,116) 22,922
Total equity attributable to equity holders of the Bank 166,461 (19,116) 147,345
Non-controlling interest 3,572 23 3,595
Total equity 170,033 (19,093) 150,940
Total liabilities and equity 1,942,793 (22,358) 1,920,435

175
Reconciliation of equity
In millions of Nigerian Naira Bank Notes
PreviousGAAP
Effect oftransition to
IFRS31 December
2011 IFRS
Assets
Cash and cash equivalents k 124,826 227,674 352,500
Due from other banks and financial institutions k 227,582 (227,582) –
Financial assets held-for-trading l – 237 237
Loans and advances to banks a, c, m – 41,564 41,564
Loans and advances to customers a, c, m 596,457 (43,931) 552,526
Treasury bills and government bonds j 98,289 (98,289) –
Investment in subsidiaries 56,695 – 56,695
Investment in equity accounted investees 10,843 – 10,843
Investment securities b, c, j, n 446,408 113,620 560,028
Property and equipment e, o 44,225 2,841 47,066
Intangible assets o p 5,855 (3,756) 2,099
Deferred tax assets f 24,585 1,019 25,604
Other assets i 19,700 (2,809) 16,891
Total assets 1,655,465 10,588 1,666,053
Liabilities
Derivative liability h – 817 817
Deposits from banks d, r – 23,408 23,408
Deposits from customers d, r 1,216,464 47 1,216,511
Due to other banks d, r 21,763 (21,763) –
Current tax liabilities 784 – 784
Other liabilities d, t 52,518 (2,594) 49,924
Subordinated liabilities d, u – 55,254 55,254
Borrowings d, u 193,878 (56,838) 137,040
Total liabilities 1,485,407 (1,669) 1,483,738
Equity
Share capital and share premium 124,423 – 124,423
Other reserves 45,635 12,257 57,892
Total equity attributable to equity holders of the Bank 170,058 12,257 182,315
Total liabilities and equity 1,655,465 10,588 1,666,053

Annual Report 2012
176
Notes to the consolidated and separate financial statementscontinued …
Reconciliation of equity
In millions of Nigerian Naira Group Notes
NigerianGAAP
Effect oftransition to
IFRS31 December
2011 IFRS
Interest and discount income a v 121,422 (7,832) 113,590
Interest expense w (46,125) 702 (45,423)
Net interest income (Interest margin) 75,297 (7,130) 68,167
Net fees and commission income x 41,613 (2,953) 38,660
Net trading income y – 3,546 3,546
Other operating income z 21,798 (13,202) 8,596
63,411 (12,609) 50,802
Operating income 138,708 (19,739) 118,969
Operating expenses ab (130,344) (15,257) (145,601)
Net impairment loss on financial assets aa (22,628) 3,025 (19,603)
Loss on loans sold to Asset Management Corporation of Nigeria – AMCON – (19,894) (19,894)
Personnel expenses ab (37,153) (10,721) (47,874)
Depreciation and amortisation ab (10,386) (114) (10,500)
Other expenses ab (60,177) 12,447 (47,730)
Exceptional charges (36,851) 36,851 –
Share of profit in associate and Joint venture (9) 41 32
Profit before income tax (28,496) 1,896 (26,600)
Income tax expense 18,849 (914) 17,935
Profit for the year from discontinued operations – 1,864 1,864
Profit for the year (9,647) 2,846 (6,801)
Non controlling Interest 827 23 850
Attributable to:
Equity holders of the Bank (10,474) 2,823 (7,651)
(9,647) 2,846 (6,801)
Basic loss per share (Naira) (32) (22)

177
Reconciliation of equity
In millions of Nigerian Naira Bank Notes
NigerianGAAP
Effect oftransition to
IFRS31 December
2011 IFRS
Interest and discount income a v 102,784 (5,357) 97,427
Interest expense w (40,862) (341) (41,203)
Net interest income (Interest margin) 61,922 (5,698) 56,224
Net fees and commission income x 30,065 (1,339) 28,726
Net trading income y – (2,563) (2,563)
Other operating income z 8,658 (5,895) 2,763
38,723 (9,797) 28,926
Operating income 100,645 (15,495) 85,150
Operating expenses ab (101,086) (10,532) (111,618)
Net impairment loss on financial assets aa (18,116) 8,476 (9,640)
Loss on loans sold to Asset Management Corporation of Nigeria – AMCON – (19,894) (19,894)
Personnel expenses (26,716) (11,387) (38,103)
Depreciation and amortization ab (8,180) (59) (8,239)
Other expenses (48,074) 12,332 (35,742)
Exceptional charges ab (36,851) 36,851 –
Profit before income tax (37,292) 10,824 (26,468)
Income tax expense 20,907 (2,405) 18,502
Profit for the year (16,385) 8,419 (7,966)
Attributable to: –
Equity holders of the Bank (16,385) 8,419 (7,966)
(16,385) 8,419 (7,966)
Basic loss per share (Naira) (50) (24)

Annual Report 2012
178
Notes to the consolidated and separate financial statementscontinued …
44. EXPLANATION OF TRANSITION TO IFRS continued …
(B) An explanation of how the transition from Nigerian GAAP (NGAAP) to IFRSs has affected the Bank and Group’s financial position, financial performance and cashflows is set out in the accompanying notes and tables:
Material adjustments reconciling the equity under NGAAP to IFRS:
Group Bank
In millions of Nigerian NairaDecember
2011January
2011December
2011January
2011
Shareholders’ equity under NGAAP 170,033 179,426 170,058 187,730
(a) Loan loss provision
(i) Impairment (3,033) (6,301) (3,133) (11,504)
(ii) Interest in suspense/interest income on impaired loans 2,905 10,773 2,556 10,399
(b) Available-for-sale financial instruments 12,601 7,860 13,227 8,561
(c) Financial assets at amortised cost (238) (982) 9 (1,597)
(d) Financial liabilities at amortised cost (71) 226 (12) 226
(e) Restatement of landed property and componentisation (105) (44) (59)
(f) Deferred tax 1,313 3,602 1,019 3,424
(g) Treasury shares (31,067) (31,542) –
(h) Derivative liabilities (817) (9,310) (817) (9,310)
(i) Other provisions on non-financial assets (583) (683) (534) (573)
Shareholders’ equity under IFRS 150,940 153,025 182,315 187,356
Material adjustments reconciling the profit before tax (PBT) under NGAAP to IFRS:
Group Bank
In millions of Nigerian NairaDecember
2011December
2011
Loss before tax under NGAAP (9,647) (16,385)
Loan loss impairment 3,068 8,371
Interest in suspense/interest income on impaired loans (8,832) (7,843)
Available-for-sale financial instruments 459 458
Financial assets at amortised cost 724 1,416
Financial liabilities at amortised cost (70) (12)
Restatement of landed property and componentisation (61) (59)
Derivative 8,493 8,493
Other provisions on non-financial assets (1,886) –
Taxation (914) (2,405)
Loss before taxation for the year from continuing operations (8,665) (7,966)
Profit for the year from discontinued operations 1,864 –
Loss for the year (6,801) (7,966)
Other comprehensive income:
Foreign currency translation differences 1,607 –
Fair value gains on available-for-sale investments 4,073 4,212
Total comprehensive loss for the year (1,121) (3,754)

179
Material adjustments reconciling the consolidated statement of cash flows under previous GAAP to IFRS:
Under the previous GAAP, treasury bills are classified as cash and cash equivalents. Under IFRS, treasury bills have been classified under their respective financial asset classes. On transitioning to IFRS, the net effect of IFRS on the cash flow statements are as follows:
GroupPrevious
GAAP
Effect oftransition
to IFRSGroup
IFRS
Bank Previous
GAAP
Effect oftransition
to IFRSBank IFRS
In millions of Nigerian NairaDecember
2011December
2011December
2011December
2011
Net cash from operating activities (20,647) (2,890) (23,537) (92,115) (11,083) (103,198)
Net cash from investing activities (108,168) 2,809 (105,359) (71,425) 22,736 (48,689)
Net cash from financing activities 103,564 4,502 108,066 103,564 3,969 107,533
Decrease in cash and cash equivalents (25,251) 4,421 (20,830) (59,976) 15,622 (44,354)
Effects of exchange rate changes on cash and cash equivalents – 324 324 – 166 166
Cash and cash equivalents at beginning of year 373,908 (973) 372,935 338,138 (15,696) 322,442
Cash and cash equivalents at end of year 348,657 3,772 352,429 278,162 92 278,254

Annual Report 2012
180
44. EXPLANATION OF TRANSITION TO IFRS continued …(a) Loan loss provision
(i) ImpairmentSpecific impairment:The provision under NGAAP is determined using the prudential guidelines. A specific provision for loan impairment is established to provide for management’s estimate of credit losses as soon as the recovery of an exposure is identified as doubtful. The prudential guidelines specify the percentage provision to made on each loan depending on the classification (substandard – 10%; doubtful – 50%; lost – 100%). The objective criteria for classifying loans under prudential guidelines is dependent on the number of days the due and unpaid balance has been outstanding. Under IFRS, a loan is assessed for impairment if there is objective evidence that an impairment has occurred after initial recognition. The Group assess all significant loans for impairment trigger. An impairment is recognised when the present value of the estimated future cashflows, discounted using the original effective interest rate, is lower than the carrying balance of the loan.
Collective impairment:Under NGAAP a provision of at least 1% is made for all performing accounts to recognise losses in respect of risks inherent in any credit portfolio. Under IFRS an impairment loss can only be recognised if there is objective evidence that a loss has occurred after the initial recognition but before the balance sheet date. The Group performs a collective impairment evaluation of all insignificant loans and all significant loans that are not impaired. The collective impairment was determined using the ‘Incurred loss model’ and the inputs into the model are Probability of Default (PD), Loss given default (LGD) and Emergence period (EP).
(ii) Interest in suspense/interest income on impaired loans:Under NGAAP, interest is accrued on loans and advances using the contractually agreed rates and such interest is suspended and included as part of specific impairment on loans and advances. Under IFRS, interest is accrued on impaired loans using the original effective interest rate and recognised as part of interest income on loans and advances. However, the interest income recognised on impaired loans and advances are disclosed in the financial statements.
(b) Financial assets classified as availabe-for-sale:Under NGAAP, investment securities are classified either as short-term or long-term investments. Short term investments are investments that management intends to hold for less than one year. These investments are carried at the lower of cost and market value. Long-term investments are investments that management intend to hold for more than one year and include all other investments other than short-term investments. These investments are carried at cost less impairment or revalued amounts. Under IFRS, financial assets are categorised into four:
– held-for-tading: measured at fair value through profit or loss. There is no gap between this and the NGAAP;
– available-for-sale: measured at fair value through equity;
– held-to-maturity: measure at amortised cost; and
– loans and receivables: measured at amortised cost.
(c) Financial assets at amortised cost:Under NGAAP, premium and discounts arising on the purchase of financial instruments are amortised on a straight-line basis and reported as part of other income/other expenses. Fees integral to loans and advances are recognised immediately in the income statement and reported as part of commission and fee income. IFRS requires financial assets carried at amortised cost to be measured using the effective interest method. The effective interest rate is the rate that exactly discounts estimated future cash payments or receipts through the expected life of the financial instrument, or where appropriate, a shorter period to the net carrying amount of the financial asset or financial liability.
(d) Financial liabilities at amortised costUnder NGAAP, fees on long-term borrowings are charged directly to the profit or loss and the corporate bond issue costs are not recognised using the effective interest rate. Under IFRS, long-term borrowings are carried at amortised cost and the bond issue expenses and fees on long-term borrowings are amortised using the original effective interest rate.
Notes to the consolidated and separate financial statementscontinued …

181
44. EXPLANATION OF TRANSITION TO IFRS continued …
(e) Restatement of landed property and componentisationUnder NGAAP, the cost of land was not separated from buildings and was depreciated along with buildings. Aircraft frame/engine/other body parts included in other transportation equipment were depreciated using one estimate while strong rooms were depreciated as part of furniture and office equipment. Under IFRS, the cost of land is separated from the cost of building and is not depreciated along with the building. The air craft frame/engine/other body parts were depreciated using separate accounting estimates that reflect their useful lives. The strong rooms were depreciated separately from office equipment.
(f) Deferred taxThe defered tax implications arising on the application of IFRS was recognised in the books.
(g) Treasury sharesUnder NGAAP, the financial statements of Staff Share Investment Trust Scheme (The ‘Scheme’); a special purpose entity (SPE) was not consolidated. Under IFRS, SPEs are consolidated. The shares issued to the SPE was accounted for as treasury shares and were backed out of equity, as the bank was deemed to have control based on guidance from Standing Interpretations Committee (SIC 12) on ‘Consolidation – Special Purpose Entities’.
(h) DerivativeUnder NGAAP, there was no accounting standard for derivatives. The estimated or probable losses that may arise on transactions that are derivative in nature are recognised as off balance sheet transactions while under IFRS, such derivatives are accounted for on-balance sheet and recognised at fair value through the profit or loss.
(i) Other provisions on non-financial assetsUnder NGAAP, non-financial assets (excluding goodwill) are assessed by management for impairment and any impairment losses recognised in profit or loss. The assessment by management is highly subjective. Under IFRS, the carrying amount of non-financial assets is compared to the higher of value-in-use and the fair value less costs to sale and an impairment loss is recognised when the carrying amount is found to be higher.
(j) Treasury billsTreasury bills were reclassified to investment securities under IFRS.
(k) Cash and cash equivalentsPlacements and other balances with Banks were reclassified to cash and cash equivalents.
(l) Financial assets held-for-tradingNon-pledged trading assets were reclassified out of short term investments.
(m) Loans and advances to banksLoans and advances to banks were presented separately from loans to other entities.
(n) Investment securitiesInvestment securities under NGAAP comprised financial assets currently classified as held-for-trading, available-for-sale (AFS), and those held-to-maturity (HTM). Under IFRS, each class of investment security has been properly classified and accorded their respective treatments under IAS 39.
(o) Property and equipmentThe difference arose from the reclassification of intangible assets from property and equipment. Under NGAAP, Property and equipment and Intangible asset items were classified together as a class of assets – property and equipment. Under the IFRS, intangible assets were reclassified from property and equipment as appropriate.
(p) Intangible assetsThe difference is as a result of the intangible assets reclassified from property and see (o) above.

Annual Report 2012
182
44. EXPLANATION OF TRANSITION TO IFRS continued …
(q) Other assetsThe difference comprises interest receivables on various financial assets reclassified to the principal portion of the assets and the impact of below market rate loans carried as prepayments in other assets.
(r) Deposit from banks and customersThe difference is as a result of interest payables on customers deposit liabilities reclassified from other liabilities and balances due from other banks reclassified to deposit liabilities.
(s) Managed fundsRepresents a reclassification of liability on investment contracts.
(t) Other liabilitiesThe difference in other liabilities is accounted for by the interest payables reclassified out of Other liabilities to the principal portion of the liabilities.
(u) Subordinated liabilitiesThe difference arose from the restatement of the liabilities at amortised cost and a reclassification from borrowings.
(v) Interest incomeThe difference is as a result of interest in suspense reclassified to interest income and changes arising from the restatement of financial assets at amortised cost. It is also affected by the unwinding of staff loans issued at below market rates.
(w) Interest expenseThe difference is as a result of the restatement of financial liabilities at amortised cost.
(x) Net fee and commision incomeThe difference is accounted for by the deferred fees arising from the restatement of loans and advances at amortised cost and the reclassification of fee expenses from other expenses.
(y) Net trading incomeThe net trading income comprise foreign exchange gain under NGAAP and derivative gains and losses under IFRS.
(z) Other operating incomeThis comprises mostly of the other income under NGAAP.
(aa) Net impairment loss on loans and receivables and net gains/(losses) on investment securitiesThe balances under these captions represent the diminution in asset values arising from the impairment of loans and advances under IFRS as well as the impairment of investment securities and other assets arising from the application of IAS 36.
(ab) Other operating expensesThe depreciation and amortisation, personnel expenses and fee and commission expenses were reclassified out of operating expenses under NGAAP to their respective lines under IFRS.
(ac) Other comprehensive incomeThis is made up of foreign currency translation differences arising from the consolidation of foreign subsidiaries and fair value gains or losses arising from the fair valuation of available for sale financial instruments.
.
Notes to the consolidated and separate financial statementscontinued …

183
Statement of value added For the Year Ended 31 December
2012 2011
N’million % N’million %
GroupGross revenue 220,129 163,732Interest paid (58,386) (45,423)
161,743 118,309
Administrative overheads:– local 41,358 40,759– foreign (6,186) (8,239)
Value added 114,199 100 69,311 100
Distribution
Employees– Salaries and benefits 43,452 38 47,874 70
Providers of funds– Proposed dividend – – – –
Government– Taxation 533 – – –
The future– Asset replacement (depreciation and amortisation) 10,888 9 10,500 16– Asset replacement (provision for losses) 4,560 4 17,738 26– Expansion (transfer to reserves and
non-controlling interest) 54,766 49 (6,801) (12)
114,199 100 69,311 100

Annual Report 2012
184
Statement of value added For the Year Ended 31 December
2012 2011
N’million % N’million %
BankGross revenue 177,429 126,098Interest paid (51,302) (41,203)
126,127 84,895
Administrative overheads:– local 36,748 37,737– foreign (643) (602)
Value added 88,736 100 46,556 100
Distribution
Employees– Salaries and benefits 32,999 37 38,103 82
Providers of funds– Proposed dividend – – –
Government– Taxation (1,195) (2) – –
The future– Asset replacement (depreciation and amortisation) 6,903 8 8,239 17– Asset replacement (provision for losses) 2,654 2 8,180 18– Expansion (transfer to reserves and
non-controlling interest) 47,375 55 (7,966) (17)
88,736 100 46,556 100

185
IFRS NGAAPGroupIn millions of Nigerian Naira
31 December 2012
31 December 2011
1 January 2011
31 December 2009
30 September 2008
ASSETSCash and cash equivalents 714,115 434,218 385,397 68,225 120,088Treasury bills and other eligible bills – – – 42,035 174,005Financial assets held for trading 457 1,303 2,594Due from other banks – – – 470,195 654,869Loans and advances to banks 28,513 41,564 11,226 – –Loans and advances to customers 658,922 605,627 590,797 606,616 431,410Investment securities – – – 188,407 126,895– Available-for-sale investments 128,665 96,744 124,144 – –– Held to maturity investments 552,152 625,564 368,935 – –Investments in equity accounted investee – 10,356 10,118 9,506 1,488Goodwill – – – 2,983 –Investment property – – – 269 589Property and equipment 70,746 55,618 62,009 73,042 61,553Intangible assets 7,568 5,930 6,626 – –Deferred tax assets 29,624 26,998 7,049 – –Other assets 18,598 16,513 30,290 87,003 102,436Non-current assets held for distribution 63,563 – – – –
TOTAL ASSETS 2,272,923 1,920,435 1,599,185 1,548,281 1,673,333
LIABILITIESDerivative liabilities 124 817 9,310 – –Deposits from banks 57,780 19,510 7,456 15,807 32,000Deposits from customers 1,720,008 1,445,822 1,270,409 1,245,650 1,333,289Managed funds – 51,943 32,753 22,138 40,558Current tax liabilities 1,274 2,627 2,869 3,385 5,606Dividend payable – – – 20 42Deferred tax liabilities 59 26 30 2 993Subordinated liabilities 53,719 53,500 18,335 – –Borrowings 114,520 137,040 63,327 14,760 –Other liabilities 81,438 58,210 41,671 58,187 65,564Retirement benefit obligations – – – 1,503 –Liabilities held for distribution 51,534 – – – –
TOTAL LIABILITIES 2,080,456 1,769,495 1,446,160 1,361,452 1,478,052
EQUITYShare capital and share premium 124,423 124,423 124,423 124,423 122,658Reserves 64,683 22,922 25,705 57,090 70,802
EQUITY ATTRIBUTABLE TO EQUITY – HOLDERS OF THE BANK 189,106 147,345 150,128 181,513 193,460Non-controlling interest 3,361 3,595 2,897 5,316 1,821
TOTAL EQUITY 192,467 150,940 153,025 186,829 195,281
TOTAL LIABILITIES AND EQUITY 2,272,923 1,920,435 1,599,185 1,548,281 1,673,333
Five-Year Financial Summary

Annual Report 2012
186
IFRS NGAAPGroupIn millions of Nigerian Naira
31 December 2012
31 December 2011
1 January 2011
31 December 2009
30 September 2008
Net operating income 153,039 119,001 153,936 187,066 128,151Operating expenses (102,592) (125,998) (126,037) (135,228) (68,720)Write-back/provision for losses 1,563 (19,603) (30,824) (38,176) (2,616)
Profit/(loss) before taxation and exceptional items 52,010 (26,600) (2,925) 13,662 56,815Exceptional items – – – (7,025) (8,786)Taxation (533) 17,935 981 (4,262) (7,204)
Profit/(loss) after taxation and exceptional items 51,477 (8,665) (1,944) 2,375 40,825Profit from discontinued operations 3,289 1,864 – – –
Profit/(loss) for the period 54,766 (6,801) (1,944) 2,375 40,825
– Non-controlling interest 102 850 70 262 (414)– Equity holders of the Bank 54,664 (7,651) (2,014) 2,113 41,239Other comprehensive income for the period 764 5,680 8,088 – –
Total comprehensive income for the period 55,530 (1,121) 6,144 2,375 40,825
Five-Year Financial Summary continued …

187
IFRS NGAAPBankIn millions of Nigerian Naira
31 December 2012
31 December 2011
31 December 2010
31 December 2009
30 September 2008
ASSETSCash and cash equivalents 629,481 352,500 330,701 38,972 95,733Treasury bills and other eligible bills – – – 15,945 171,401Financial assets held for trading 456 237 1,267Due from other banks – – – 459,829 591,791Loans and advances to banks 27,878 41,564 11,226 – –Loans and advances to customers 570,714 552,526 557,224 543,289 405,540Investment securities – – – 150,565 96,397– Available-for-sale investments 126,646 63,428 107,317 – –– Held to maturity investments 401,348 496,600 284,144 – –Investments in subsidiaries 66,727 56,695 50,355 37,753 13,562Investments in equity accounted investee – 10,843 10,843 10,843 1,495Property and equipment 63,118 47,066 53,263 63,497 56,165Intangible assets 1,578 2,099 2,952 – –Deferred tax assets 28,152 25,604 6,555 – –Other assets 11,159 16,891 24,877 80,186 88,007Non-current assets held for distribution 5,808 – – – –
TOTAL ASSETS 1,933,065 1,666,053 1,440,724 1,400,879 1,520,091
LIABILITIESDerivative liabilities 124 817 9,310 – –Deposits from banks 22,875 23,408 51 10,080 32,000Deposits from customers 1,461,131 1,216,511 1,120,566 1,151,086 1,258,036Current tax liabilities 1,325 784 1,185 1,416 3,443Dividend payable – – – 42 42Deferred tax liabilities – – – – 991Subordinated liabilities 55,474 55,254 20,147 – –Borrowings 114,520 137,040 63,327 14,760 –Other liabilities 57,299 49,924 38,782 34,273 37,424Retirement benefit obligations – – – 1,503 –
TOTAL LIABILITIES 1,712,748 1,483,738 1,253,368 1,213,160 1,331,936
EQUITYShare capital and share premium 124,423 124,423 124,423 124,423 122,658Reserves 95,894 57,892 62,933 63,296 65,497
TOTAL EQUITY 220,317 182,315 187,356 187,719 188,155
TOTAL LIABILITIES AND EQUITY 1,933,065 1,666,053 1,440,724 1,400,879 1,520,091

Annual Report 2012
188
IFRS NGAAPBankIn millions of Nigerian Naira
31 December 2012
31 December 2011
31 December 2010
31 December 2009
30 September 2008
Net operating income 124,356 85,150 122,986 165,547 114,530Operating expenses (75,393) (101,978) (104,419) (111,653) (58,345)Provision for losses (2,783) (9,640) (26,761) (30,905) (1,548)
Profit/(loss) before taxation and exceptional items 46,180 (26,468) (8,194) 22,989 54,637Exceptional items – – – (7,025) (8,786)Taxation 1,195 18,502 1,898 (3,075) (5,849)
Profit/(loss) for the period 47,375 (7,966) (6,295) 12,889 40,002Other comprehensive income for the period 3,534 4,212 8,088 – –
Total comprehensive income/(loss) for the period 50,909 (3,754) 1,793 12,889 40,002
Five-Year Financial Summary continued …

189
UBA is one of the largest financial services groups in Nigeria with operations in 18 other African countries. Its shares have been listed on the Nigerian Stock Exchange since 1970. The Bank’s current number of shares outstanding is 32,981,387,565 with an average daily trading volume of 30 million shares. A summary of its key share data is shown below.
Share data as of the last trading day in 2012
Year 2012 2011
NSE ticker UBA UBA
Bloomberg ticker UBA NL UBA NL
Share price (N) 4.59 2.59
Shares outstanding (million) 32,981 32,334
Market capitalisation (N’ billion) 151,383 83,745
Market capitalisation (US$’ million) 962.99 536.14
12-month average trading volume (million) 30 30
52-week high share price (N) 5.65 11.70
52-week low share price (N) 1.64 2.42
Share price performance, last one year – UBA versus Banking Index
+200%
+100%
Feb2012
Mar Apr May Jun Jul Aug Sep Oct Nov Dec Jan2013
0
UBA
Banking Index
Source: Financial Times
Share Capital (Authorised and Fully Paid)
The Bank’s Authorised Share Capital as of 31 December 2012 amounted to N22,500,000,000 consisting 45,000,000,000 shares of 50 kobo each. Of this amount, 32,981,387,565 shares have been issued and fully paid for – and are listed on the Nigerian Stock Exchange for trading.
Investor Information

Annual Report 2012
190
Shareholders
As at the end of 2012, UBA’s shares were held by a total of 282,432 shareholders as analysed in the table below:
ShareholdingNumber of
shares held% of total
shareholdingNumber of
shareholders% of total
shareholders
1 – 1,000 11,334,642 0.03% 23,110 8.19
1,001 – 5,000 313,293,402 0.95% 122,974 43.47
5,001 – 10,000 337,456,711 1.02% 46,689 17.26
10,001 – 50,000 1,321,120,644 4.01% 62,145 22.03
50,001 – 100,000 843,793,334 2.56% 12,497 4.43
100,001 – 500,000 2,034,724,924 6.17% 10,168 3.60
500,001 – 1,000,000 58,717,987 2.91% 1,413 0.50
1,000,001 & above 27,160,945,924, 82.35% 1,436 0.51
Total 32,981,387,565 100.00% 282,432 100.00
Shareholding structure (Investor type)HNIs5%Nominees
16%
Others45%
PFAs1%
Corporates29%
Government 4%
Investor Information continued …

191
Top ten shareholders as at 31 December 2012
Shareholder Shareholding % holding
Stanbic Nominees Nigeria Limited (SNNL) 3,637,413,911 11.03%
UBA Staff Investment Trust Scheme 2,506,439,842 7.60%
Consolidated Trust Funds Limited 1,549,571,533 4.70%
The Bank of New York Mellon 1,458,100,028 4.42%
Heirs Holdings Limited 1,113,569,770 3.38%
STH Limited 867,127,500 2.63%
Bank of America Merrill Lynch 743,540,657 2.25%
International Finance Corporation 592,396,875 1.80%
Poshville Investments Limited 571,064,834 1.73%
African Development Bank 517,563,476 1.57%
Totals 13,556,788,426 41.10%
(SNNL holds these shares on behalf of several investors under a nominee arrangement)
Ten-year history of share capitalisation
DateAuthorised
(N)
Issued and fully paid capital
(N) Consideration
3 August 2002 2,000,000,000 1,275,000,000 Bonus (1:2)
30 September 2004 6,000,000,000 1,530,000,000 Bonus (1:5)
1 August 2005 6,000,000,000 3,530,000,000 Merger with STB
22 February 2007 6,000,000,000 4,236,000,000 Bonus (1:5)
4 May 2007 6,000,000,000 4,290,214,285.5 Foreign loan stock conversion
25 September 2007 6,000,000,000 5,645,139,990 Cash [rights & public offering]
18 January 2008 7,500,000,000 5,645,139,990 –
18 June 2008 12,500,000,000 8,622,584,985 Bonus (1:2) (interim)
5 January 2009 12,500,000,000 10,778,231,231 Bonus (1:4) (final)
2 October 2009 17,500,000,000 10,778,231,231 –
13 May 2010 17,500,000,000 12,933,877,477 Bonus (1:5) (final)
13 May 2011 17,500,000,000 16,167,346,850 Bonus (1:4) (final)
18 May 2012 22,500,000,000 16,490,693,782 Bonus (1:50) (final)

Annual Report 2012
192
Ten-year dividend payment history
Dividend number Year ended Date declared
Total amount (N’ million)
Dividend per share
(N)% of
issued capital
49 31 March 2002 1 August 2002 510 0.30 60
50 31 March 2003 8 August 2003 1,148 0.45 90
51 31 March 2004 30 September 2004 1,530 0.60 120
52 31 March 2005 22 July 2005 1,836 0.60 120
53 30 September 2006 31 January 2007 7,060 1.00 200
54 30 September 2007 18 January 2007 13,796 1.20 244
55 30 September 2008 18 June 2008 2,874 0.25 51
56 30 September 2008 8 January 2009 12,934 0.75 150
57 31 December 2009 13 May 2010 2,113 0.10 20
58 31 December 2011 13 May 2011 1,293 0.05 10
Record of unclaimed dividends as at 31 December 2012
Dividend year Number of yearsAmount
declared
Amount claimed to date
Unclaimed and returned to
the Company
Paid out in current period
1994 18 27,000,000.00 26,398,761.02 601,238.98 –
1995 17 68,200,000.00 67,562,054.01 637,945.99 –
1996 16 200,000,000.00 199,726,170.44 273,829.56 –
1997 15 32,400,000.00 31,365,013.08 1,034,986.92 596.20
1998 14 272,100,000.00 271,555,696.03 544,303.97 28,868.40
1999 13 580,000,000.00 579,579,446.60 420,553.40 59,352.51
2000 12 770,950,000.00 770,904,748.75 45,251.25 2,130.44
2001 11 382,500,000.00 381,601,299.74 898,700.26 208,046.53
2002 10 462,570,000.00 462,568,451.60 1,548.40 –
2003 9 1,040,782,500.00 1,040,767,299.78 15,200.22 251.68
2004 8 1,387,710,000.00 1,385,804,889.80 1,905,110.20 82,975.46
2005 7 1,665,252,000.00 1,665,111,749.67 140,250.33 64,092.74
2007 6 6,986,560,000.00 6,976,279,394.00 10,280,606.00 896,739.08
2008 4 13,796,000,000.00 27,525,523,587.90 32,625,680.10 1,085,021.74
2008 3 2,874,194,995.00 2,859,686,930.75 14,508,064.25 805,710.38
2009 3 12,933,877,477.50 12,893,876,972.50 40,000,505.02 3,117,571.45
2010 2 2,155,646,246.20 1,954,639,236.18 201,007,010.02 336,817.71
2011 1 1,293,387,748.00 1,112,400,373.49 180,987,374.51 8,673,632.35
Investor Information continued …

193
Credit rating summary
As of 31 December 2012 Fitch GCR Agusto
Short-term rating B A1 + (NG) A
Long-term rating B+ BB- –
Previous rating Unchanged Changed Changed
Outlook Stable Stable –
2013 Financial Calendar
Date Event
Early May 2013 Full year 2012 results are released to Nigerian Stock Exchange (NSE) published
Mid-May 2013 Notice of Annual General Meeting is published
Mid-May 2013 Full year 2012 and first quarter 2013 results’ investor/analyst briefing holds
Mid-June 2013 Full year 2012 Annual General Meeting holds
Mid-July 2013 Half-year 2013 results are released to the NSE
End of July 2013 Half-year 2013 results’ investor/analyst briefing holds
Mid-October 2013 Nine months 2013 results are released to the NSE
End of October 2013 Nine months 2013 results’ Investor/Analyst Briefing holds
Shareholder information
The Bank maintains an investor relations section on its website (www.ubagroup.com/ir), which allows access to share price data, management biographies, copies of annual reports, presentation on interim reports, credit rating reports and other useful investor information.
Contact us:
For all enquiries on shareholding, financial and business update, please contact our investor relations desk as follows:
Kayode Fadahunsi Bili OdumDirector, Investor Relations Group Company Secretary
UBA House (14th Floor) UBA House (18th Floor)57 Marina, Lagos 57 Marina, LagosTel: +234 1 2808 349 Tel: +234 1 2807 012Email: [email protected] Email: [email protected]
You can also visit the investor relations section of our website for more information. www.ubagroup.com/ir.
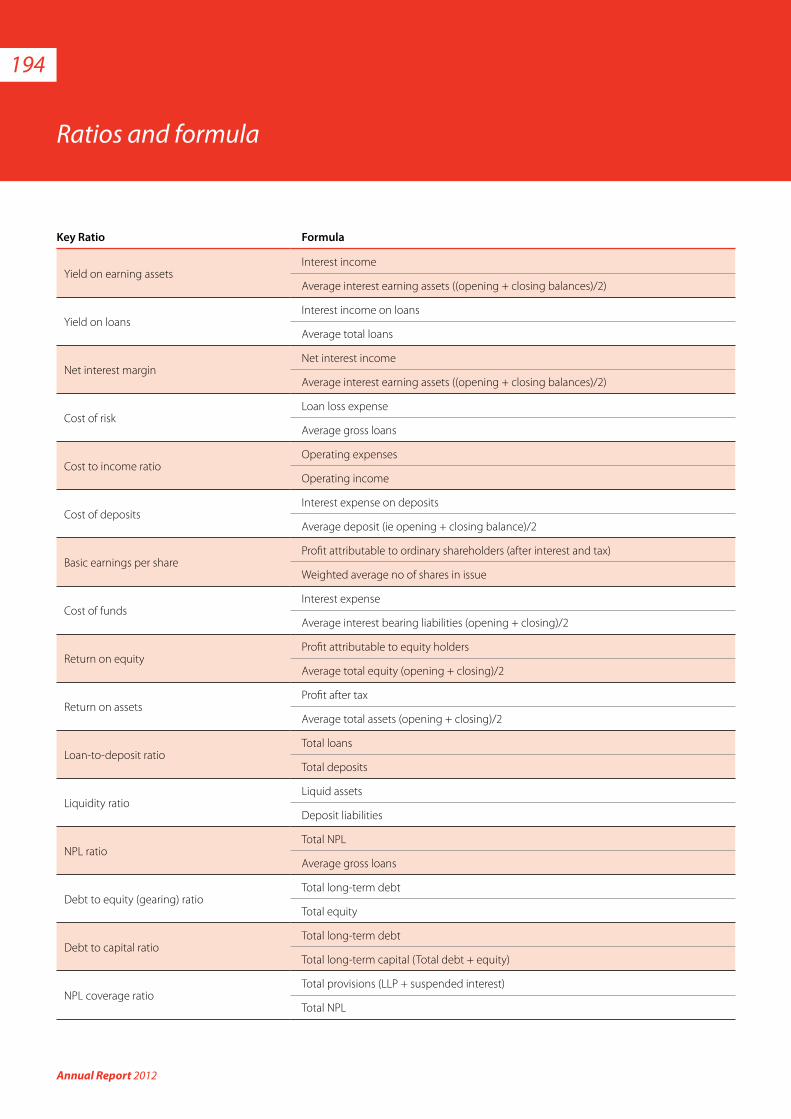
Annual Report 2012
194
Key Ratio Formula
Yield on earning assetsInterest income
Average interest earning assets ((opening + closing balances)/2)
Yield on loansInterest income on loans
Average total loans
Net interest marginNet interest income
Average interest earning assets ((opening + closing balances)/2)
Cost of riskLoan loss expense
Average gross loans
Cost to income ratioOperating expenses
Operating income
Cost of deposits Interest expense on deposits
Average deposit (ie opening + closing balance)/2
Basic earnings per share Profit attributable to ordinary shareholders (after interest and tax)
Weighted average no of shares in issue
Cost of funds Interest expense
Average interest bearing liabilities (opening + closing)/2
Return on equityProfit attributable to equity holders
Average total equity (opening + closing)/2
Return on assetsProfit after tax
Average total assets (opening + closing)/2
Loan-to-deposit ratioTotal loans
Total deposits
Liquidity ratioLiquid assets
Deposit liabilities
NPL ratioTotal NPL
Average gross loans
Debt to equity (gearing) ratioTotal long-term debt
Total equity
Debt to capital ratioTotal long-term debt
Total long-term capital (Total debt + equity)
NPL coverage ratioTotal provisions (LLP + suspended interest)
Total NPL
Ratios and formula

195
Key Ratio Formula
Capital adequacy ratioTotal qualifying capital
Risk weighted assets
Tier 1 capital adequacy ratioTotal equity capital
Risk weighted assets
Total asset leverage ratioTotal assets
Total equity
Risk asset leverageTotal Loans
Total equity
Important Notes
Key Ratio Formula
Net revenue Operating income (net interest income + other income)
Net revenue from funds Net interest income less loan loss expense
Risk weighted assetsAddition of (each asset class multiplied by their respective risk weighting), as prescribed by the CBN
Interest earning assetsCash and short-term funds (excl. mandatory deposit with the CBN) + interbank placements and loans & advances + investment securities (excluding equity)
Average of balance sheet items Average of opening and closing balances of the item

Annual Report 2012
196
NOTICE IS HEREBY GIVEN that the 51st Annual General Meeting of United Bank for Africa Plc will hold at the Transcorp Hilton Hotel, Abuja on Friday the 7th day of June 2013 at 10:00am to transact the following business:
Ordinary business1. To receive the audited accounts for the year ended December 31, 2012 together with the reports of the Directors, Auditors and the Audit
Committee thereon.
2. To declare a dividend.
3. To elect/re-elect Directors.
4. To authorise the Directors to fix the remuneration of the Auditors.
5. To elect members of the Audit Committee.
Notes1. PROXY
A member entitled to attend and vote at the General Meeting is entitled to appoint a proxy to attend and vote in his/her stead. A proxy need not be a member of the Company. To be valid, a proxy form must be duly stamped at the Stamp Duties office and returned to the Registrar, Africa Prudential Registrars Plc, 220B Ikorodu Road, Palmgrove, Lagos, Nigeria, not less than 48 hours prior to the time of the Meeting.
2. DIVIDEND WARRANTS
If the dividend recommended by the Directors is approved, dividend warrants will be posted on Monday, June 10, 2013 to all shareholders whose names appear in the Company’s Register of Members at the close of business on May 21, 2013.
3. CLOSURE OF REGISTER OF MEMBERS
The Register of Members will be closed from May 22, 2013 to May 24, 2013, both dates inclusive, for the purpose of paying a dividend.
4. AUDIT COMMITTEE
The Audit Committee consists of three shareholders and three Directors. Any member may nominate a shareholder as a member of the Audit Committee by giving notice in writing of such nomination to the Secretary of the Company at least 21 days before the Annual General Meeting.
Dated this 10th day of May 2013
By Order of the Board.
Bili A OdumGroup Company Secretary
57 Marina, Lagos
Notice of AGM

United Bank for Africa PlcRC: 2457
Shareholder Data Form
1. SURNAME/COMPANY NAME*
2. FIRST NAME* 3. OTHER NAMES
4. SPOUSE’S NAME
5. MOTHER’S MAIDEN NAME
6. EMAIL*
7. ALTERNATE E-MAIL
8. MOBILE NO. 9. PHONE NO. (HOME)
10. POSTAL ADDRESS
11. SEX: MALE FEMALE 12. CSCS CLEARING HOUSE NO.*
13. OCCUPATION 14. NATIONALITY
15. NEXT OF KIN
DECLARATION“I declare that the information I have provided is true and correct.”
Signature: Signature:
for joint/corporate accounts only
( =Compulsory fields)*
SHAREHOLDER DATA FORM
Africa Prudential Registrars Plc RC NO: 649007
LAGOS220B, Ikorodu Road PalmgroveTel: 01-893150, 01-7450427, 01-8401153Email: [email protected]: www.africaprudentialregistrars.com
ABUJA11, Lafia Close,Area 8 GarkiTel: 09-8701645, 09-2348562
PORT-HARCOURTPlot 137, Olu Obasanjo Road(2nd Floor)Tel: 08-4803171


United Bank for Africa PlcRC: 2457
LAGOS220B, Ikorodu RoadPalmgroveTel: 01-893150, 01-7450427, 01-8401153Email: [email protected]: www.africaprudentialregistrars.com
ABUJA11, Lafia Close,Area 8 GarkiTel: 09-8701645, 09-2348562
PORT-HARCOURTPlot 137, Olu Obasanjo Road(2nd Floor)Tel: 08-4803171
DISCLAIMER"In no event shall Africa Prudential Registrars be liable for any damages , losses or liabilities including without limitation, direct or indirect, special, incidental, consequential damages, losses or liabilities, in connection wit your use of this form or your inability to use the information, materials, or in connection with any failure, error, omission, defect, delay in operation or transmission, or system failure, even if you advice us of the possibility of such damages, losses of expenses, whether express or implied in respect of such. information."
1. SURNAME/COMPANY NAME*
2. FIRST NAME* 3. OTHER NAMES
4. SPOUSE’S NAME
5. MOTHER’S MAIDEN NAME
6. EMAIL*
7. ALTERNATE E-MAIL
8. MOBILE NO. 9. PHONE NO. (HOME)
10. POSTAL ADDRESS
11. SEX: MALE FEMALE 12. CSCS CLEARING HOUSE NO.*
13. OCCUPATION 14. NATIONALITY
15. NEXT OF KIN
16. TEST QUESTIONS (answer one)
I. FATHER’S MIDDLE NAME
ii. PLACE OF BIRTH
*
DECLARATION“I declare that the information I have provided is true and correct.”
Signature:
for joint/corporate accounts only
( =Compulsory fields)*
E-SHARE REGISTRATION FORM
Africa Prudential Registrars Plc RC NO: 649007
E-Share Registration Form


United Bank for Africa PlcRC: 2457
E-Share Allotment Mandate Form
LAGOS220B, Ikorodu Road PalmgroveTel: 01-893150, 01-7450427, 01-8401153Email: [email protected]: www.africaprudentialregistrars.com
ABUJA11, Lafia Close,Area 8 GarkiTel: 09-8701645, 09-2348562
PORT-HARCOURTPlot 137, Olu Obasanjo Road(2nd Floor)Tel: 08-4803171
SHAREHOLDER'S NAME :*
MOBILE NUMBER :*
E-MAIL :*
CSCS CLEARING HOUSE NO :*
NAME OF STOCKBROKER : ..............................................................................................................................................
.....................................................................................................................................................................................................
*
ADDRESS OF STOCKBROKER : ..........................................................................
....................................................................................................................................................................................................
* .............................................................
e - SHARE ALLOTMENT MANDATE FORM
Surname
First name
Other name
I/We hereby request that from now on, all my/our shares (Bdue to me/us from my/our holdings in the companies ticked below
be credited directly to my/our CSCS account as per the details provided below.
onus, Right Issue, Public Offer and Reconstructed Shares)
To:The Registrar,Africa Prudential Registrars Plc220B, Ikorodu Road, Palmgrove,Lagos
Authorised signature and stamp of stockbroking firm..........................................................................................
If Company,Authorised Signatories: 1. ..............................
2. ..............................
Company Seal: ..................................................The provision of information on your CSCS Clearing House Number, and Mobile Numberis very important to enable us process your mandate.
Signature : ......................................*
Joint Shareholders'
Signature : 2. ................................
Shareholderto affixN50:00 stamp
and sign across
( = Compulsory fields)*
For other enquiries, kindly contact us via our e-mail: [email protected] attach a copy of your CSCS statement to this form as evidence that a CSCS account has been opened for you.
Africa Prudential Registrars Plc RC NO: 649007
1. ABBEY BUILDING SOCIETY PLC
2. A & g INSURANCE PLC
3. ALUMACO PLC
4. ARM PROPERTIES PLC
5. BECO PETROLEUM PRODUCT LTD
6. CAPPA AND D’ALBERTO PLC
7. CEMENT COY OF NORTHERN NIG.
8. CHAMPION BREWERIES PLC
9. COMPUTER WAREHOUSE
10. CRYSTALIFE ASSUARANCECOY PLC
11. DORMAN LONG
12. GOLDEN SECURITIES PLC
13. INTERNATIONAL BREWERIES PLC
14. INVESTMENT & ALLIED ASSURANCE
15. JAIZ INTERNATIONAL PLC
16. NEM INSURANCE PLC
17. PERSONAL TRUST & SAVINGS LTD
18. P.S MANDRIES PLC
19. POLY PRODUCT
20. PORTLAND PAINTS & PRODUCTS
21. PREMIER BREWERIES PLC
22. RESORT SAVINGS & LOANS LTD
23. ROADS NIGERIA PLC
24. SCOA NIGERIA PLC
25. UBA BALANCE FUND
26. UBA BOND FUND
27. UBA EQUITY FUND
28. UBA MONEY MARKET
29. UNITED BANK FOR AFRICA PLC
30. UTC NIGERIA PLC
31. WEST AFRICAN GLASS IND PLC
32. TRANSCORP PLC
Please tick against the company(ies) where you have shareholding
CLIENTELE
Other(s) specify..........................................................
.........................................................................................


United Bank for Africa PlcRC: 2457
E-Dividend Mandate/Replacement Form
Please take this as authority to credit my/our under mentioned account with any dividend payment(s)/lost/misplaced/stale/unclaimed dividend warrants due on my/our
shareholding in the aforementioned company(ies) the particulars of which are stated below from the date hereof:
(Other Names)(Surname)Shareholder's Name :*
Shareholder's Account No. (if Known):
Address :*
Mobile Number :*
e-mail Address :*
Branch :*
Account Type :*
Fax Number:
Bank Name :*
Bank Account No :*
Dated this day of 20*
Bank Stamp & Authorized Signatories Shareholder(s) Signatories
Note:
*The provision of information on your Bank Name, Bank Account No., E-mail address and Mobile number are very important to enable us process your request. All asterisked fields ( ) are compulsory.
Shareholders in the North and South-south region of the country are advised to contact our Abuja or Port-Harcourt Liaison Office for all enquiries concerning shareholding in any of our client companies (see addresses below).
Others (please specify in the boxes provided)
The Managing Director/RegistrarAfrica Prudential Registrars Plc220B, Ikorodu Road, PalmgroveLagos.
UBA PlcUTC Nigeria PlcSCOA Nigeria PlcNEM Insurance PlcJaiz International PlcALUMACOResort Savings and Loans PlcTranscorp PlcComputer Warehouse
Company(ies) where share is held (please tick appropriate boxes like this )
Poly ProductWest African Glass Industries PlcCement Company of Northern Nig. PlcCappa & D'Alberto PlcChampion Breweries PlcInternational Breweries PlcRoads Nigeria PlcARM Properties Plc Portland Paints & Products
E-DIVIDEND MANDATE/REPLACEMENT FORM
Dear Shareholder,
Please use the name(s) in which your shares are held, with the signature on your Application or Transfer Form.
Should you prefer this service, kindly fill the spaces provided below and return to us.
We are pleased to advise you of our new e-dividend service, which enables direct credit of your dividend(s) [new dividend payments/lost/misplaced/ stale/unclaimed dividend warrants to your bank account regardless of the bank or account type, i.e Current/Savings Accounts.
Thank you.
LAGOS220B, Ikorodu Road PalmgroveTel: 01-893150, 01-7450427, 01-8401153Email: [email protected]: www.africaprudentialregistrars.com
ABUJA11, Lafia Close,Area 8 GarkiTel: 09-8701645, 09-2348562
PORT-HARCOURTPlot 137, Olu Obasanjo Road(2nd Floor)Tel: 08-4803171
Africa Prudential Registrars Plc RC NO: 649007


United Bank for Africa PlcRC: 2457
PLEASE RETAIN THIS SECTION TO FACILITATE YOUR ADMISSION TO THE MEETING
ADMISSION FORM
Annual General MeetingUnited Bank for Africa Plc RC 2457
Please admit the shareholder named on this admission form or his/her duly appointed proxy to the Annual General Meeting of the company to be held as follows:
DATE: June 7, 2013
TIME: 10:00 am
VENUE: Transcorp Hilton Hotel, Abuja
Name of Shareholder:
Address:
Account Number Number of shares held:
Proxy Shareholder
Please tick appropriate box before Admission to the meeting
Bili A. Odum Company Secretary
Shareholder’s signature:
This card is to be signed at the venue in the presence of the Registrar.
Africa Prudential Registrars Plc220B, Ikorodu Road, PalmgroveLagos, Nigeria
Registrars’ Stamp
Admission Form


United Bank for Africa PlcRC: 2457
RC 2457
51st Annual General Meeting of United Bank for Africa Plc
ORDINARY BUSINESS For Against Abstain
1. To receive the audited Accountsfor the year ended December 31,2012 together with the reports ofthe Directors, Auditors and theAudit Committee thereon
2. To declare a dividend
3. To elect/re-elect Directors
4. To authorise the Directors to fix
Proxy Form
This proxy form is solicited on behalf of the Board of Directors and isto be used at the 51st Annual General Meeting to be held on Friday,7th June 2013.
I/We,
Shareholder’s Name:
Address:
No. of Shares held:
being the registered holder(s) of the ordinary shares of United Bank for Africa Plchereby appoint**
or failing him, the Chairman of the Meeting as my/our proxy to vote for me/uson my/our behalf at the Annual General Meeting of the holders of the ordinaryshares of the Company to be held at the Transcorp Hilton Hotel, Abuja onFriday the 7th day of June 2013 or at any adjournment thereof.
Signed this …………….……...………day of …………………….….. 2013
Shareholder’s Signature:…………………………..………………..……….
Proxy’s Signature:……………………………………..…………………..….
NOTE:1. Please sign this form and deliver or post it to reach the
Registrar Africa Prudential Registrars Plc, 220B, IkoroduRoad, Palmgrove, P.O. Box 6492, Lagos, not later than48 hours before the meeting and ensure that the proxy formis dated, signed and stamped by the Commissioner for Stamp the remuneration of the Auditors
5. To elect members of the AuditCommittee
Please indicate by marking “X” in the appropriate space, how youwish your votes to be cast on the resolutions set out above, unlessotherwise instructed, the proxy will vote or abstain from voting at hisor discretion.
dated, signed and stamped by the Commissioner for StampDuties
2. Provision has been made on this form for the Chairman ofthe meeting to act as a proxy, but if you wish, you mayinsert in the blank space on the form (marked)** the name ofany person, whether a member of the Company or not, whowill attend the meeting and vote on your behalf instead ofthe Chairman of the meeting.
3. If the shareholder is a Corporation, this form must be underits common seal or under the hand of a duly authorisedofficer or attorney.
Before posting the above form, please tear off this part and retain for admission at the meeting
ANNUAL GENERAL MEETINGUnited Bank for Africa Plc RC 2457
Please admit the shareholder named on this admission form or his/her duly appointed proxy to the annual general meetingof the company to be held at Transcorp Hilton Hotel, Abuja at 10.00a.m on Friday, June 7, 2013.
Name and address of Shareholder:
Account number: Number of shares held:
Shareholder’s signature: _____________________________
This card is to be signed at the venue in the presence of the Registrar.
ADMISSION CARD
Please tick appropriate box before Admission to the meeting
Proxy
Shareholder
Bili A. OdumCompany Secretary
Shareholder’s signature: _____________________________
Proxy Form


209
Registered office
UBA House57 MarinaLagos, Nigeria
Company registration
RC: 2457
Company Secretary
Bili Odum
Auditors
PricewaterhouseCoopersPlot 252E, Muri Okunola StreetVictoria IslandLagos, Nigeria
Registrars
Africa Prudential Registrars Limited220B IKorodu RoadPalmgrove Bus StopPalmgrove, Lagos, NigeriaPhone +234-1- 8752604www.africaprudentialregistrars.com
UBA businesses
UBA PENSIONS CUSTODIAN
30 Adeola Hopewell StreetVictoria IslandLagos, NigeriaPhone +234-1-271- 8000-4Fax +234-1-271-8009www.ubapensions.com
UBA CAPITAL (EUROPE)
3rd floor, 2-4 King StreetLondon SW1Y 6QLUnited KingdomPhone +44-20 7766 4606Fax +44-20 7766 4601www.ubacapital.com
UBA FX MART LIMITED
11th FloorUBA House57 MarinaLagosPhone +2341-2808-446Fax +2341-2808-677
Corporate Information

Annual Report 2012
Subsidiaries with Contact Details
NAME OF COUNTRY HEAD OFFICE ADDRESS TELEPHONE NUMBERS
Ghana Heritage TowersNear Cedi House Ambassadorial Enclave Off Liberia Road, West Ridge, Accra, Ghana
Office: +233 21 683526-30+233 21 672727683509-1268944
Liberia Bushrod IslandFreeport of Monrovia, Monrovia
+231 77448000 / 6448000/ 5448000
Sierra Leone 15 Charlotte Street, FreetownSierra Leone
+232-22-225508, +232-22-227990
Cote d’Ivoire Abidjan PlateauBoulevard Botreau-RousselImmeuble Kharrat2è Etage, 17 BP 808, Abidjan 17
Office: +225-20-312221-2; 312225;+225-07464092
Burkina Faso Banque Internationale du Burkina (BIB)1340 Avenue Dimdolobsom01 BP 362, Ouagadougou
Office : +226 50 49 33 29226 50 49 33 06226 50 49 33 02
Cameroon Boulevard De la Liberté2088 Douala, Cameroon
Office: +237-33-433638; 433707+237-33-433636; 334-336-38
Benin Republic Continental Bank du Benin (CBB)Boulevard Inter-EtratCarrefour des Irois BanquesAvenue Pape Jean-Paul IICotonou
+229 21 31 24 24+229 21 31 20 35
Uganda Spear House, 22A Jinja RdPO Box 7396, Kampala, Uganda
Office: +256 417 715102 +256 417 715138
Senegal Zone 12, Lot D, Route des AlmadiesDakar, Senegal
Office : +221 33 820 34 46+221 33 859 51 12; +221 33 859 51 40
Kenya 1st floor, Apollo Center Ring Road, Vale Close, Westlands
Office: +254-20-3673686/87 +254-20 361 2000; +254-30 361 2007
TChad UBA TchadAvenue Charles de GaullePO Box 1148, N’djamena, Tchad
Office: +235 252 19 53 +235 252 19 54
Tanzania 30C/30D Nyerere RoadDar es Salaam, Tanzania
Office: +255 222 86 3459+255 222 86 3452-3
Gabon 282 Avenue Marquis de CompiegneBP 12035, Libreville, Gabon
Office: +241 014 0624+241 0572 9898
Zambia Stand 22768, Thabo Mbeki RoadLusaka, Zambia
Office: +260 211 255 951-3
Guinea Conakry BP 1198 Conakry Rue chateau d’eau , Marché Niger - Kaloum
Office: +224-65800800
Gabon 8th Floor, Imm. Panoramique, 228 av Marquis de Compiègne, Libreville, Gabon
Office: +241 07 68 03 63
Mozambique UBA Moçambique, SA Praça 16 Junho-Malanga-Maputo Moçambique
Office: + 258-848623703
Congo DRC 1853 Avenue de la liberation Kinshasa GombeDR Congo
Office: +243992006651


AFRICA LONDON NEW YORK PARIS
www.ubagroup.comHead office: UBA House, 57 Marina, Lagos, Nigeria
Related Documents