created 02.07.2014 v.1.00 For information and permission to use our PDF manuals, please contact [email protected] PDFs available at www.uits.arizona.edu/workshops UAccess ANALYTICS Next Steps: Working with Bins, Groups, and Calculated Items: Combining Data Your Way © Arizona Board of Regents, 2014 THE UNIVERSITY OF ARIZONA

Welcome message from author
This document is posted to help you gain knowledge. Please leave a comment to let me know what you think about it! Share it to your friends and learn new things together.
Transcript

created 02.07.2014 v.1.00
For information and permission to use our PDF manuals, please contact [email protected] PDFs available at www.uits.arizona.edu/workshops
UAccess ANALYTICS Next Steps: Working with Bins, Groups, and Calculated Items:
Combining Data Your Way
© Arizona Board of Regents, 2014
THE UNIVERSITY OF ARIZONA

COPYRIGHT & TRADEMARKS
Copyright © 2014, Arizona Board of Regents
Record of Changes Date Version # Description
02/07/2014 1.00 Original

Training Guide Combining Data Your Way
Page iii
Table of Contents
About this Booklet ................................................................................................................... iv Access to Analytics Data ......................................................................................................... iv UAccess Community ............................................................................................................... iv
Prerequisites ............................................................................................................. 1
Preliminary Definitions ............................................................................................. 1
Overview .................................................................................................................... 1
Premises or Assumptions ........................................................................................ 2 Bins - You’ve Already Created Your Analysis (Turn to Page 5) .............................................. 2 Groups – You’ve selected the Dashboard (Turn to Page 11) .................................................. 2 Calculated Items – You’ve selected the Dashboard (Turn to Page 17) ................................... 3
What are Bins? .......................................................................................................... 5
Creating Bins............................................................................................................. 5 Plan Your Bins .......................................................................................................................... 6 Create the Bins ......................................................................................................................... 7 Editing or Deleting Bins .......................................................................................................... 10
What are Groups? ....................................................................................................11 Planning Your Groups ............................................................................................................ 11 Creating Groups ..................................................................................................................... 12 Viewing or Deleting Groups ................................................................................................... 14
What are Calculated Items? ....................................................................................17 Planning Your Calculated Items ............................................................................................. 17 Creating Calculated Items ...................................................................................................... 18 Viewing or Deleting Calculated Items .................................................................................... 20

Training Guide Combining Data Your Way
Page iv
About this Booklet
This UAccess Analytics booklet is designed to help you become familiar with Bins, Groups, and Calculated Items in UAccess Analytics.
For more information on Bins, please refer to the Edit Column Formula dialog: Bins tab section of the UAccess Analytics online Help documentation at https://analytics.uaccess.arizona.edu/analytics/olh/l_en/biee0096.htm.
For more information on Groups and Calculated Items, refer to the Working with Groups and Calculated Items section of the UAccess Analytics online Help documentation at https://analytics.uaccess.arizona.edu/analytics/olh/l_en/filter011.htm.
This booklet is generic by necessity, but will provide you with the information you need to build and maintain your own basic bins or groups.
For information on workshops in which you can learn how to build analyses and dashboards, as well as information about other brown bag demonstrations, go to the Workshops and Training Team website at http://workshops.arizona.edu.
Access to Analytics Data
Request for Individual access to UAccess Analytics can be submitted to https://request.uaccess.arizona.edu.
UAccess Community
The UAccess Community is an online networking resource available to everyone on campus who uses UAccess systems.
If you have an official UA email address, you can request membership in the UAccess Community. Just go to http://community.uaccess.arizona.edu and click the Sign Up link in the upper right corner of the screen.
Once your membership is confirmed – usually within a few hours – you’ll have access to valuable information about all of the various aspects of the UAccess systems. You’ll want to join one or more of the groups within the Community, because that’s where the value comes in.
There is a Welcome Center available through a link on the Home page, as well as a great set of frequently asked questions (FAQs) linked through the top menu. Be sure to browse through the different Forums, check out upcoming Events, and peruse the extensive Resources provided through the Community.

Training Guide Combining Data Your Way
Page v
Please take advantage of the opportunity and become a member of the UAccess Community now.


Training Guide Combining Data Your Way
Page 1
Prerequisites
If you’re interested in Bins, you should be familiar with creating a basic analysis, probably having gone through the Basic Reports and Dashboards workshop at some point. If you haven’t created analyses of your own, you should certainly be familiar with the process.
At a minimum, you should have read and understand the contents of the UAccess Analytics: Basic Reports and Dashboards booklet. You can download a copy of that document from UAccess Community > Resources > Analytics Resources.
If you’re interested in Groups, you should be familiar with how dashboards work, including some aspects of the right-click menu.
Preliminary Definitions
Bins are structures created by an analysis builder for a specific column of data. With bins, you can combine values for that column into a cohesive set or sets of values. You determine what bins are needed for any specific data column and which of the values present in that data column should go into what bin.
Groups are bin-like structures, but they are created directly on a dashboard by any Analytics user. You simply select the values you wish to have included in the group using a right-click menu.
Calculated Items are also created by Analytics users directly on the nearly any dashboard page. The difference between Groups and Calculated Items is that, with calculated items, you can change the way numeric values associated with the rows of data used in the calculated item are combined.
Overview
There are just a few basic steps you need to accomplish to create Bins in your analysis. Of course, there are many intermediate steps, but it’s helpful to start with a quick outline.
1. Create and/or edit your analysis. a. Decide which column and column values you wish to include in
your bins. 2. Create your bins using the Column Formula screen for the column and
values you selected in step 1.a.

Training Guide Combining Data Your Way
Page 2
Groups are created by Analytics users directly on the existing analyses on nearly any dashboard page.
1. Access the desired dashboard page and analysis. a. Decide which column and column values you wish to include in a
group. 2. Select the desired column values, right-click on one of those selected
values, and create your group. 3. Remove the original column values to prevent duplication.
Calculated Items are also created by Analytics users directly on the existing analyses on nearly any dashboard page following the same basic steps as Groups. There is a difference, however, as mentioned above.
Premises or Assumptions
Bins - You’ve Already Created Your Analysis (Turn to Page 5)
The particular analysis used in this booklet for explaining Bins is a modified version of the Income / Expense analysis from the Financials > General – Financial Management dashboard.
For the purposes of this booklet, we’ll assume that you’ve already created a basic analysis similar to the one presented on the following pages, but have not yet created the bins.
As you created the analysis, your boss told you she wanted to see the Object Codes collected into different categories. Those categories are similar to, but not exactly the same as, the available Consolidation Object Codes or Names.
One way to gather the Object Codes into the desired categories is to use Bins.
Groups – You’ve selected the Dashboard (Turn to Page 11)
To create a group, you simply have to select the dashboard and analysis in which you wish to create the group. Once you’ve done that, you identify those values you wish to include in the group.
For the exercise in this booklet, we’ve selected the Financials > General – Financial Management > Income Expense dashboard. Using the Summary by Object Code view, we will group values in the Object Code column.

Training Guide Combining Data Your Way
Page 3
Calculated Items – You’ve selected the Dashboard (Turn to Page 17)
To create a calculated item, you select the dashboard and analysis in which you wish to create the item. Once you’ve done that, you identify those values you wish to include in the calculated item.
For the exercise in this booklet, we’ve selected the Financials > General – Financial Management > Income/Expense dashboard. Using the Summary by Object Code view, we will group values in the Object Code column.

Training Guide Combining Data Your Way
Page 4

Training Guide Combining Data Your Way
Page 5
What are Bins?
Bins are structures – many people think of them as buckets, but the term used here and in the Analytics software is bins – created in the Edit Column Formula screen for a specific column of data.
Bins enable you to combine values for that column into a cohesive set or sets of values. As the creator or builder of the analysis, you determine what bins are needed for any specific data column and which of the values present in that data column should go into what bin.
The example used throughout this booklet uses the Object Code column of a specific analysis and “bins” the many different possible codes into ten distinct bins.
Creating Bins
The analysis in our example is constructed using the columns you see above, from the KFS – Account Monthly and Cumulative subject area. We started out by clicking the Analyze link on the Financials > General – Financial Management > Income/Expense dashboard. We then modified the Department Summary – Find Group by Consolidation Code view to get the columns you see.
In the example, the Consolidation Object Name contains six different values: CAPITAL, GENERAL EXPENSES, INDIRECT COST RECOVERY EXPENSE, PERSONNEL SERVICES, STUDENT SUPPORT, and TRAVEL. Some of those values are close to what your boss wanted, but you need ten different values. You will not be able to use that column to create your categories.

Training Guide Combining Data Your Way
Page 6
Plan Your Bins
Using the results from the initial running of the analysis, you should go through the Object Code column and determine how you need to break up the object codes into the ten bins your boss wants. Those bins are: Salaries, ERE, Operations – General, Operations – Training, Travel, Subcontracts, Student Support, Capital, Indirect Costs, and Unassigned Object Codes.
Each of the ten bins will contain a specific series of object codes. For example, the Salaries bin will include all object codes that begin with the number one (1). The ERE bin will include all object codes that begin with the number two (2). The Travel bin will include object codes 6000, 6100, 6140, 6200, 6240, 6340, and 7936. The other bins will include their own unique sets of object codes.
One method you might wish to use to get your lists of object codes for the different bins would be to export the data to Excel using the Export > Data > Tab delimited data function. You can then manipulate the data in Excel to gather the object codes into the proper groups.
The exact procedure will be different for every circumstance, and probably for nearly every person. The end result should be that you should have a list of the different object codes or other data arranged as you’d like to see the data put into Bins in Analytics.
For this analysis, we sorted the Excel results by Consolidation Object Name, then by Object Code. The Consolidation Object Name column is similar to what we need for the end results and is helpful in this instance in arranging the data. Then we selected the different values available in each Consolidation Object Name / Object Code combination and copied and pasted them into a second Excel sheet.
We ended up with a spreadsheet that looked like this:

Training Guide Combining Data Your Way
Page 7
Create the Bins
Back in Analytics, you’ll start on the Criteria tab and will edit the Object Code column’s formula to create your bins.
Procedure
1. Click the Options button on the Object Code column and select the Edit formula option.
On the Edit Column Formula screen, you will see two tabs at the top: Column Formula and Bins.
2. Click the Bins tab.
The resulting nearly-blank screen is a bit disconcerting until you notice the small Add Bin button in the lower left corner.
3. Click the Add Bin button.
Creating bins is really just a matter of creating filters to include specific values in the bin, then naming the grouped values. Here is where your Excel spreadsheet will come in handy.
4. Click the “binoculars” (Search) button on the New Filter screen.
5. Click the “pencil” (Edit) button in the upper-right corner of the Select Values screen.
6. Copy the values from the first column in your Excel spreadsheet and paste them into the Edit screen. The only criteria here is that the values must match the value available in the list, and that each value is on a separate line.
7. Click OK three times to get to the Edit Bin Name screen.
8. Enter the name of your new bin, which is Capital. Click OK.

Training Guide Combining Data Your Way
Page 8
9. You will see your new bin, along with an option to combine all other values into another bin. At the bottom of the screen you’ll see the Add Bin and Clear All buttons.
10. Click the Add Bin button.
11. This second bin will be for ERE. This filter is easy, as all of the Object Codes for ERE are those that begin with a two (2). Build your filter accordingly.
12. Click OK on the New Filter screen.
13. Enter ERE as the name of your new bin, then click OK.
14. Continue creating bins using the values in the remaining columns on your Excel spreadsheet.
15. Once you’ve created all of the bins that you need, you still have to account for any other object code numbers you may have missed in your initial list. Check the Create a bin for all other values checkbox.
16. Name this final bin Other Object Codes.
17. Rather than clicking the OK button, click the Column Formula tab. You’ll discover what you’ve actually been doing is creating a CASE statement.

Training Guide Combining Data Your Way
Page 9
Had you known how, you could simply have typed the CASE statement in by hand. In this case, creating the bins was decidedly much simpler than trying to create that CASE statement manually.
You should note the comment at the bottom of the screen:
Select the 'Bins' tab to edit the definition of this column. If you wish to edit the formula directly, choose 'Clear All' from the 'Bins' tab.
18. Before you leave the Edit Column Formula screen, change the Column Heading to Object Code Category.
19. Click OK.
20. Click the Results tab.
You will no longer see the list of Object Codes. Instead, you’ll see the broad categories you’ve created. You’ll see your Bins.
21. Now that you’ve created the bins, you can right-click and Exclude the Object Code Name column. What you’re left with is a relatively concise analysis in which the object codes are categorized as your boss requires.
Training Guide Combining Data Your Way
Page 10
Editing or Deleting Bins
Once you’ve created your bins, there may come a time when you’ll have to edit those bins. In our example above, you might discover at some point that you’ve not included all of the required object codes in one or more of the bins you created. Fortunately, the editing procedure is quite simple.
Procedure
1. Open the analysis and click the Criteria tab.
2. Click the Options button on the Object Code Category column and select the Edit formula option.
3. Click the Bins tab, as you did earlier when you created your bins.
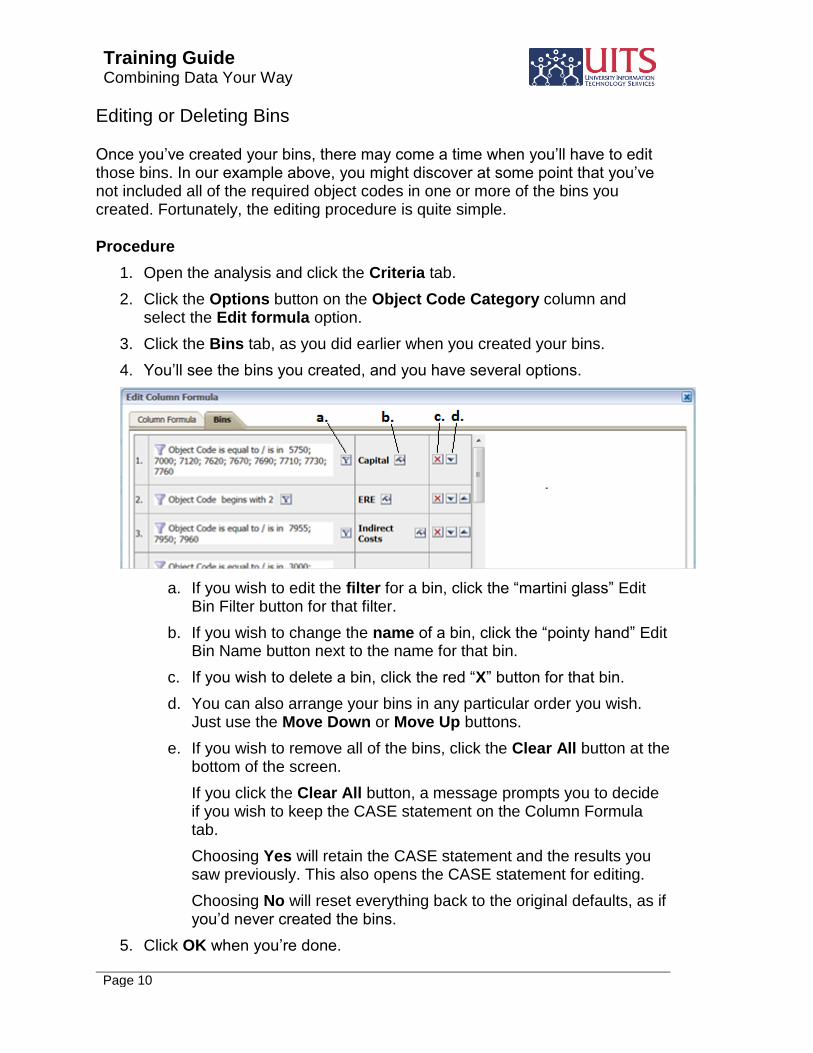
4. You’ll see the bins you created, and you have several options.
a. If you wish to edit the filter for a bin, click the “martini glass” Edit Bin Filter button for that filter.
b. If you wish to change the name of a bin, click the “pointy hand” Edit Bin Name button next to the name for that bin.
c. If you wish to delete a bin, click the red “X” button for that bin.
d. You can also arrange your bins in any particular order you wish. Just use the Move Down or Move Up buttons.
e. If you wish to remove all of the bins, click the Clear All button at the bottom of the screen.
If you click the Clear All button, a message prompts you to decide if you wish to keep the CASE statement on the Column Formula tab.
Choosing Yes will retain the CASE statement and the results you saw previously. This also opens the CASE statement for editing.
Choosing No will reset everything back to the original defaults, as if you’d never created the bins.
5. Click OK when you’re done.

Training Guide Combining Data Your Way
Page 11
What are Groups?
A group, according to the Help documentation, is “a user-defined member of a column.” A better definition, perhaps, is that groups are a way for a user to combine multiple values in any data column into one value so that the grouped values are viewed as one row rather than as multiple rows.
Here’s a more succinct definition: groups are essentially bins created on the fly on any dashboard by any Analytics user! You simply select the values you wish to have included in the group or groups.
Groups are always displayed at the bottom of the column in which they were created, in the order in which they were created. Groups can contain other groups.
The groups you create will only last for as long as you’re viewing that particular dashboard. If you wish to retain those groups for future use, be sure to save your dashboard customization.
Planning Your Groups
The same time and effort you put into planning your bins should go into planning your groups. You should lay out – in your head, on paper, in an Excel spreadsheet, etc. – how you are going to combine whatever data it is you’re interested in.
Planning is a bit easier with groups, however, since you’re already looking at the results in your report and you just have to decide how you’ll be grouping the data. Be sure to fully expand the analysis before you continue.
In our example in this booklet, we’re grouping the information in the same manner we did for creating bins. We’re using the Object Code column to create Salaries and ERE groups.
The Salaries group will consist of all the object codes that start with a one (1), and the ERE group will include all of the object codes that start with a two (2).

Training Guide Combining Data Your Way
Page 12
Creating Groups
Procedure
1. Navigate to the Financials > General – Financial Management > Income / Expense dashboard.
2. Once the analysis runs, select the Summary by Object Code view. You should also expose all of the available data rows. You’ll start with data that resembles this:
In this example, we’ll create groups in the Personnel Services area of the analysis.
3. Identify the specific Object Code values that you’d like to include in a specific group. For example, you could group all of the object codes that begin with a one (1) in a group called Salaries and all of the object codes that begin with a two (2) in another group named ERE.
4. Click in the cell that contains one of the values you wish to include in your first group.
Note: Do not click on the actual object code value. In this particular report, clicking on the value will cause you to drill down. Simply click in the cell where the value lives.
5. Hold the CTRL key down on your keyboard and click in the individual cells for all of the remaining values you wish to include in your first group. If you inadvertently click on a cell you don’t wish to include, just click the cell again to deselect it. You’ll have something like this:

Training Guide Combining Data Your Way
Page 13
6. Right-click on one of the selected cells and select Create Group from the menu.
7. Type the name Salaries into the Display Label field. Click OK.
The analysis will refresh itself and, at the bottom of the column of object codes, you’ll see a new item named Salaries.
You should also note that the original object code items are still present in the table. You have to remove the original rows of data, because right now your values are duplicated.
8. Once again, select all of the same object code values you previously selected. Use the CTRL key and the mouse as you did before.
9. Right-click on one of the selected cells and select Remove from the menu.
The analysis will refresh itself, having removed the selected individual object code rows from the analysis.

Training Guide Combining Data Your Way
Page 14
10. Repeat steps 3 – 9 above for each additional group you’d like to create.
In the example here, we’ve also right-clicked and Excluded the Object Code Name column. What we’re left with are the two groups we created, with the dollar values totaled in the far-right column.
Viewing or Deleting Groups
Once you’ve created a group, you may have a need to view the values that are in the group. You might also wish to delete a group you’ve created.
Procedure to View Group Definition
1. Right-click on the cell that contains the name of the group.
2. Select View Group Definition from the menu.
The system will present a small window displaying the values included in the group you created.
Close the window when you’re through.
Procedure #1 to Delete Group
Deleting will not restore the original rows of data. Deleting simply removes the group from the analysis.
1. Select the Salaries cell to select the group item.
2. Right-click and select Delete Group from the menu.
3. The analysis will refresh itself, having removed the group.
Note: The original rows of data will not be restored.

Training Guide Combining Data Your Way
Page 15
Procedure #2 to Delete Group
This isn’t really deleting a group, per se, but this simple procedure surely removes the group from the analysis. It also restores the original rows of data.
1. Click the Page Options button in the upper-right corner of the dashboard screen.
2. Select Clear My Customization from the menu.
Note: This will remove all of the changes you’ve made to the dashboard during this session.
Remember, if you wish to retain your groups for future use, be sure to save your dashboard customization.

Training Guide Combining Data Your Way
Page 16

Training Guide Combining Data Your Way
Page 17
What are Calculated Items?
A calculated item is really just a group with one added feature or function. You, the creator of the calculated item, are able to determine how the calculated item will aggregate any numeric values included in the calculated item.
This means that, if a column of data were being summed, you would have the option of getting an average for the values included in the calculated item. You could alternatively get a count, a max value, a minimum value, or choose one of several other options.
Calculated items might be thought of as a way to get a particular type of aggregate value – an average, a count, etc. – from an analysis that doesn’t inherently contain that aggregate value. Once you’ve retrieved the value, you could then delete the calculated item.
Just like groups, calculated items are always displayed at the bottom of the column in the order in which they were added.
Any calculated items you create will only exist for as long as you’re viewing that particular dashboard. If you wish to retain the calculated items for future use, be sure to save your dashboard customization.
Planning Your Calculated Items
Just as you’ve done with bins or groups, you need to spend some amount of time planning your calculated items. You should lay out – in your head, on paper, in an Excel spreadsheet, etc. – how you are going to combine whatever data it is you’re interested in and what aggregation method you’re going to employ.
Planning is a bit easier with calculated items, however, since you’re already looking at the results in your report and you just have to decide how you’ll be grouping and aggregating the data. Be sure to fully expand the analysis before you continue.
In our example in this booklet, we’re creating a calculated item to determine the average leave ending balance for employees in a specific department.
Training Guide Combining Data Your Way
Page 18
Creating Calculated Items
Procedure
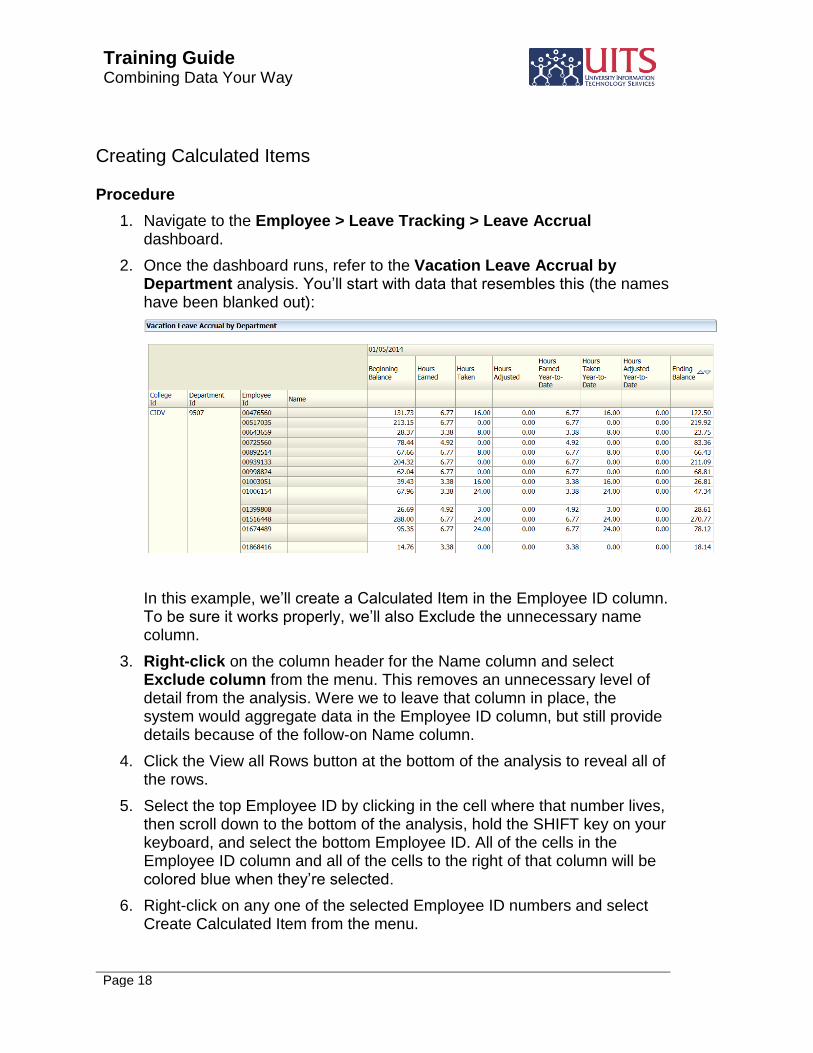
1. Navigate to the Employee > Leave Tracking > Leave Accrual dashboard.
2. Once the dashboard runs, refer to the Vacation Leave Accrual by Department analysis. You’ll start with data that resembles this (the names have been blanked out):
In this example, we’ll create a Calculated Item in the Employee ID column. To be sure it works properly, we’ll also Exclude the unnecessary name column.
3. Right-click on the column header for the Name column and select Exclude column from the menu. This removes an unnecessary level of detail from the analysis. Were we to leave that column in place, the system would aggregate data in the Employee ID column, but still provide details because of the follow-on Name column.
4. Click the View all Rows button at the bottom of the analysis to reveal all of the rows.
5. Select the top Employee ID by clicking in the cell where that number lives, then scroll down to the bottom of the analysis, hold the SHIFT key on your keyboard, and select the bottom Employee ID. All of the cells in the Employee ID column and all of the cells to the right of that column will be colored blue when they’re selected.
6. Right-click on any one of the selected Employee ID numbers and select Create Calculated Item from the menu.

Training Guide Combining Data Your Way
Page 19
7. Enter a label for the temporary calculated item and set the Function field to Average. Because you are only creating this calculated item on a temporary basis, you can leave the “Remove” checkbox as is. Click OK.
8. The analysis will refresh itself and will create the calculated item. Expand the analysis to view all rows.
9. The bottom-most row in the analysis will be your new calculated item.
Each of the values in that row will be an average of all of the values in the column above. In this department, the average leave balance available to employees is 136.90 hours.
In this second example, we’ve created additional calculated items to show the differences in the values you’ll see. A group item was also created. The group displays the same values as the Leave Sums calculated item.

Training Guide Combining Data Your Way
Page 20
Viewing or Deleting Calculated Items
Once you’ve created a calculated item, you may have a need to view the values that are in the item. You might also wish to delete the calculated item you’ve created.
Procedure to View the Calculated Item Definition
1. Right-click on the cell that contains the name of the item.
2. Select View Calculated Item Definition from the menu.
The system will present a small window displaying the values included in the item you created.
Close the window when you’re through.
Procedure #1 to Delete the Calculated Item
Deleting a calculated item will not restore the original rows of data to the analysis. Deleting simply removes the item.
1. Right-click the cell that contains the name of the calculated item.
2. Right-click and select Delete Calculated Item from the menu.
3. The analysis will refresh itself, having removed the item.
Note: The original rows of data will not be restored.
Procedure #2 to Delete the Calculated Item
This isn’t really deleting a calculated item, per se, but this simple procedure surely removes the item from the analysis. It also restores the original rows of data.
3. Click the Page Options button in the upper-right corner of the dashboard screen.
4. Select Clear My Customization from the menu.
Note: This will remove all of the changes you’ve made to the dashboard during this session.
Remember, if you wish to retain your groups for future use, be sure to save your dashboard customization.

Training Guide Combining Data Your Way
Page 21
Related Documents