Pulmonary Board Review: Study Design and Statistical Principles Terry Shaneyfelt, MD, MPH UAB Division of General Internal Medicine @EBMTeacher EBMTeacher.com UABEBMcourse YouTube logo image credit (CC0): http ://commons.wikimedia.org/wiki/File:Youtube.svg

UAB Pulmonary board review study design and statistical principles
Aug 05, 2015
Welcome message from author
This document is posted to help you gain knowledge. Please leave a comment to let me know what you think about it! Share it to your friends and learn new things together.
Transcript

Pulmonary Board Review:Study Design and Statistical Principles
Terry Shaneyfelt, MD, MPHUAB Division of General Internal Medicine
@EBMTeacher
EBMTeacher.com
UABEBMcourseYouTube logo image credit (CC0): http://commons.wikimedia.org/wiki/File:Youtube.svg

Topics to be covered Diagnostic testing
Choosing a test and interpreting studies
Randomized controlled trialsRandomization, power, types 1 and 2 errors,
outcome measures
Observational studiesStudy design, RR, OR
ScreeningOutcomes and biases
Diagnostic Testing
Diagnostic Testing Choosing a test
Sensitivity, specificity, likelihood ratiosSpPin and SnNout
Interpreting the results of a diagnostic test studyPositive and negative predictive values
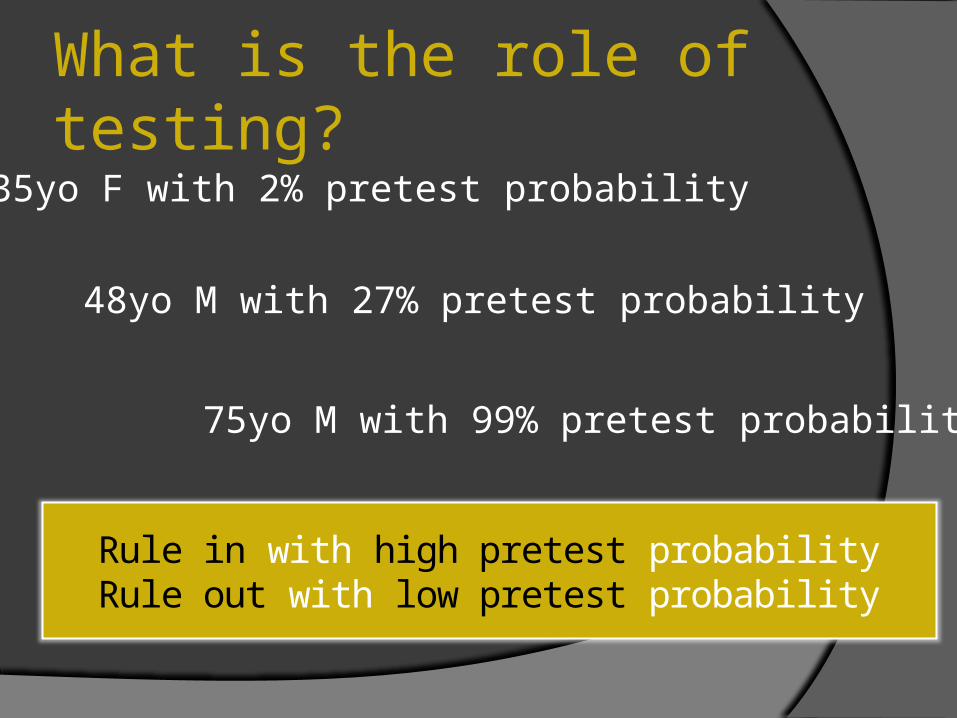
What is the role of testing?
35yo F with 2% pretest probability
48yo M with 27% pretest probability
75yo M with 99% pretest probability
Rule in with high pretest probabilityRule out with low pretest probability

Which test would you choose to rule in disease?
Sensitivity Specificity LR + LR -
Test A 95% 80% 4.75 0.06
Test B 90% 90% 9 0.11
Test C 70% 95% 14 0.32
Which test would you choose to rule out disease?
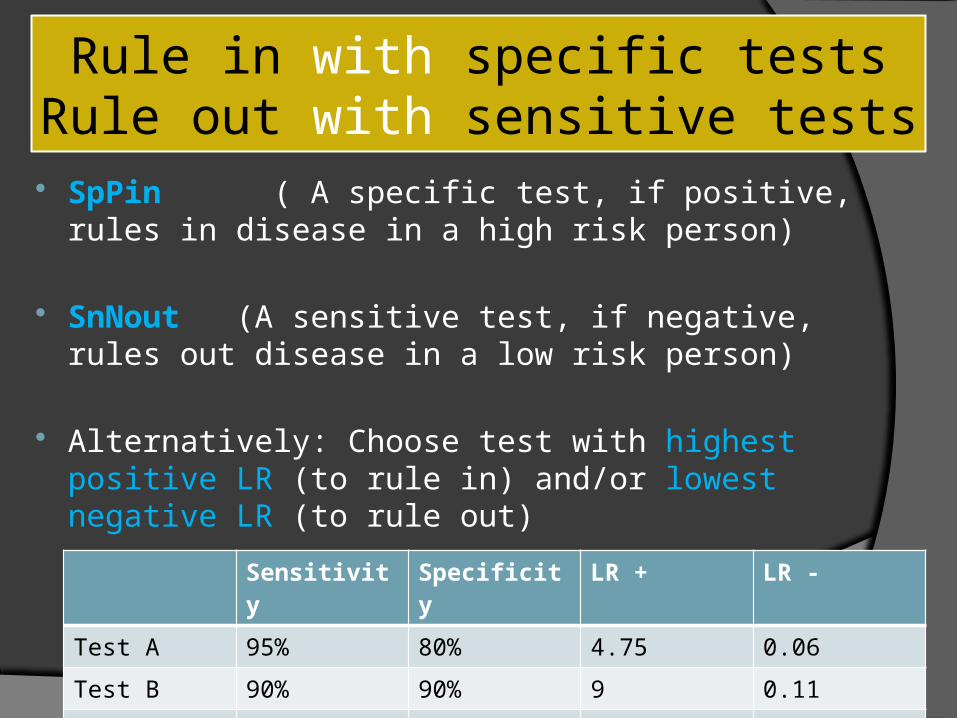
Rule in with specific testsRule out with sensitive tests
SpPin ( A specific test, if positive, rules in disease in a high risk person)
SnNout (A sensitive test, if negative, rules out disease in a low risk person)
Alternatively: Choose test with highest positive LR (to rule in) and/or lowest negative LR (to rule out)
Sensitivity Specificity LR + LR -
Test A 95% 80% 4.75 0.06
Test B 90% 90% 9 0.11
Test C 70% 95% 14 0.32
To learn more watch my other videos
Sensitivity: http://bit.ly/1FOlqry
Specificity: http://bit.ly/1IYjv2A
LR: http://bit.ly/1JOofZz
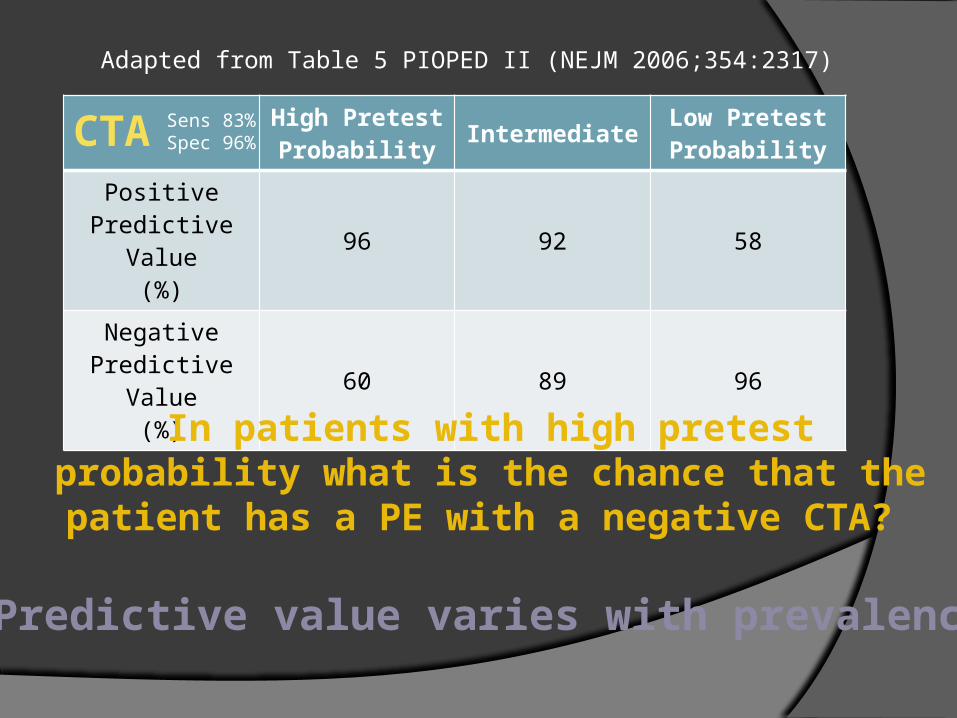
CTA High Pretest Probability
IntermediateLow Pretest Probability
Positive Predictive Value
(%)96 92 58
Negative Predictive Value
(%)60 89 96
Adapted from Table 5 PIOPED II (NEJM 2006;354:2317)
In patients with high pretest probability what is the chance that the patient has a PE with a negative
CTA?
Sens 83%Spec 96%
Predictive value varies with prevalence
To learn more watch my other videos
PPV: http://bit.ly/1HDXWpm
NPV: http://bit.ly/1Faegbq
Randomized ControlledTrials

RCTs Study design
Randomization
Power, type 2 error, and sample size
p-values and type I error
Outcome measuresRRR, ARR, HR, NNT

Image from PrevMedFellow (CC A SA license): http://commons.wikimedia.org/wiki/File:Flowchart_of_Phases_of_Parallel_Randomized_Trial_-_Modified_from_CONSORT_2010.png
Control
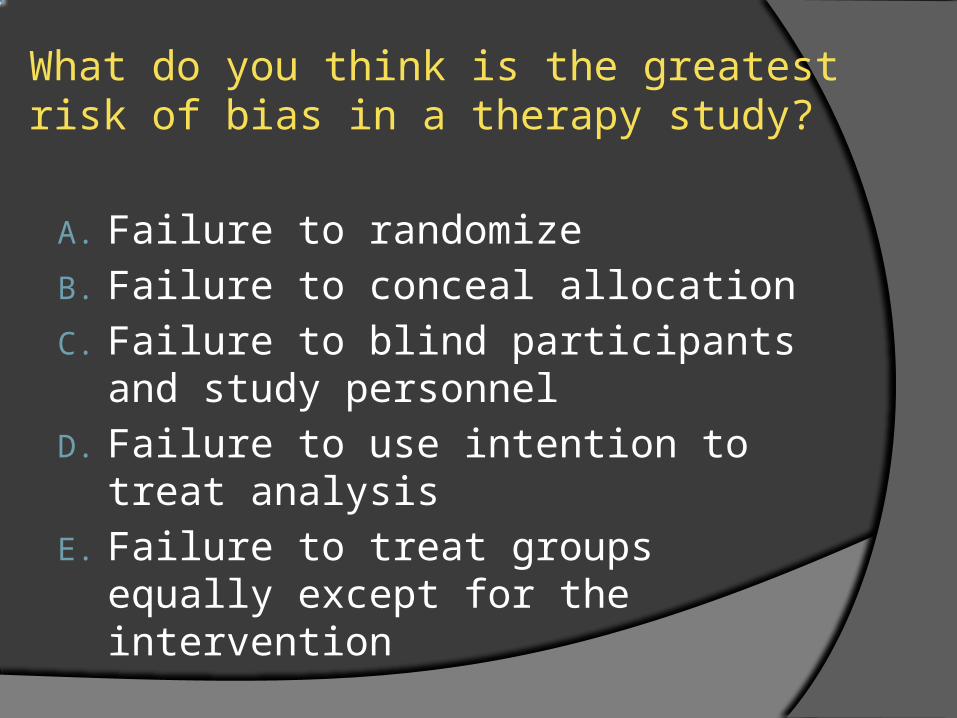
What do you think is the greatest risk of bias in a therapy study?
A. Failure to randomize
B. Failure to conceal allocation
C. Failure to blind participants and study personnel
D. Failure to use intention to treat analysis
E. Failure to treat groups equally except for the intervention

2 Reasons:
1. Reduces selection bias
2. Equally distributes prognostic factors (both known and unknown)
Why Is Randomization So Important?
The validity of a clinical trial depends on treated & control patients being prognostically equal, other than
the intervention being tested
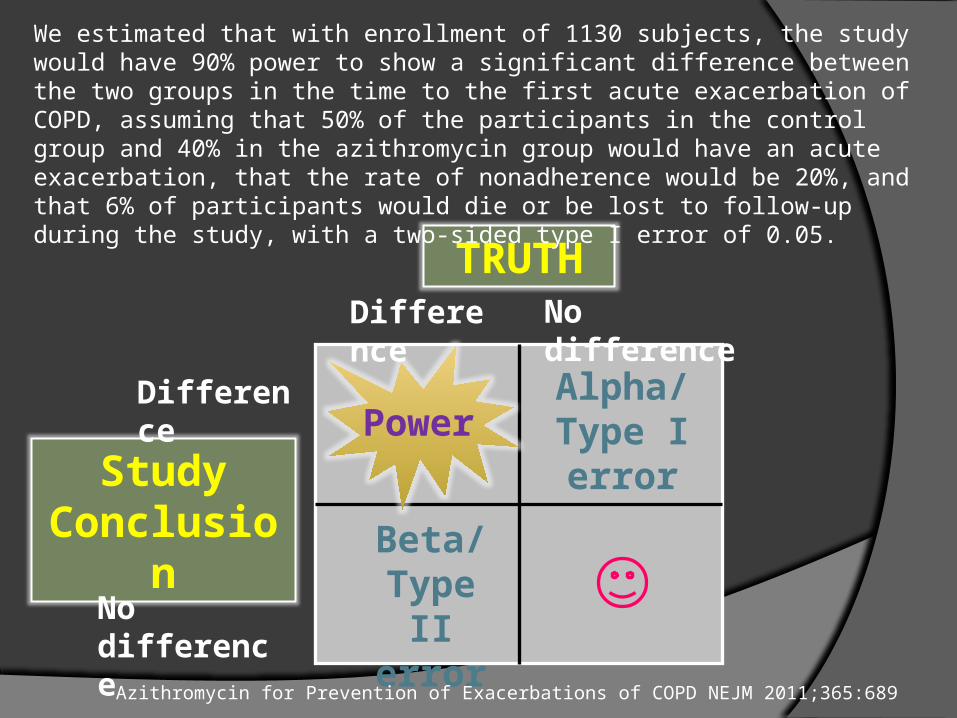
TRUTHDifference No difference
Study Conclusion
Difference
No difference
Beta/ Type II error
Alpha/ Type I error
We estimated that with enrollment of 1130 subjects, the study would have 90% power to show a significant difference between the two groups in the time to the first acute exacerbation of COPD, assuming that 50% of the participants in the control group and 40% in the azithromycin group would have an acute exacerbation, that the rate of nonadherence would be 20%, and that 6% of participants would die or be lost to follow-up during the study, with a two-sided type I error of 0.05.
Azithromycin for Prevention of Exacerbations of COPD NEJM 2011;365:689
Power

Power (greater the desired power the greater the sample size)
Estimated difference between groups (smaller the difference the greater the sample size)
Type 1 error rate (usually 0.05 but the smaller the greater the sample size)
Variability in the measurements made within each comparison group (greater the variability the greater the sample size)
Sample size is affected by…
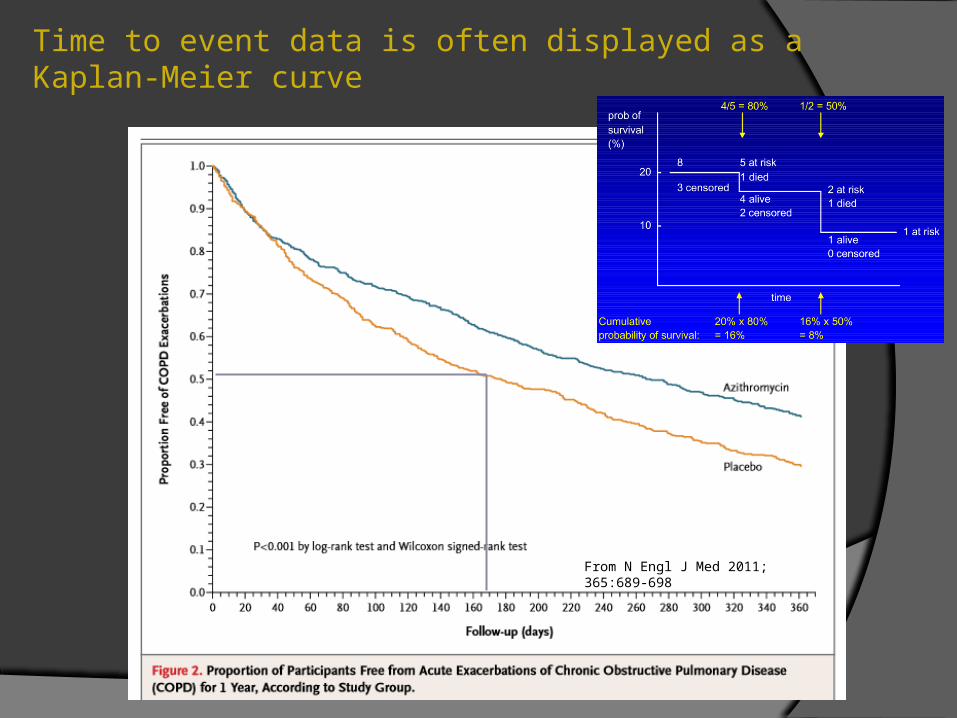
Time to event data is often displayed as a Kaplan-Meier curve
From N Engl J Med 2011; 365:689-698
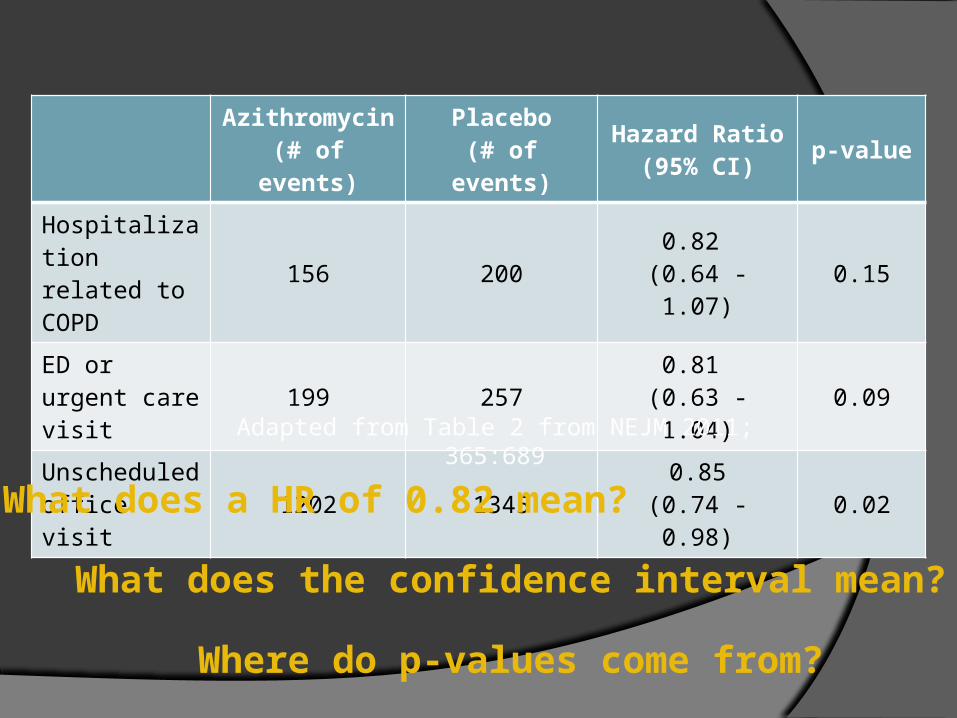
Azithromycin(# of events)
Placebo(# of events)
Hazard Ratio(95% CI)
p-value
Hospitalization related to COPD
156 2000.82
(0.64 - 1.07)0.15
ED or urgent care visit
199 2570.81
(0.63 - 1.04)0.09
Unscheduled office visit
1202 13450.85
(0.74 - 0.98)0.02
Adapted from Table 2 from NEJM 2011; 365:689
What does a HR of 0.82 mean?
What does the confidence interval mean?
Where do p-values come from?
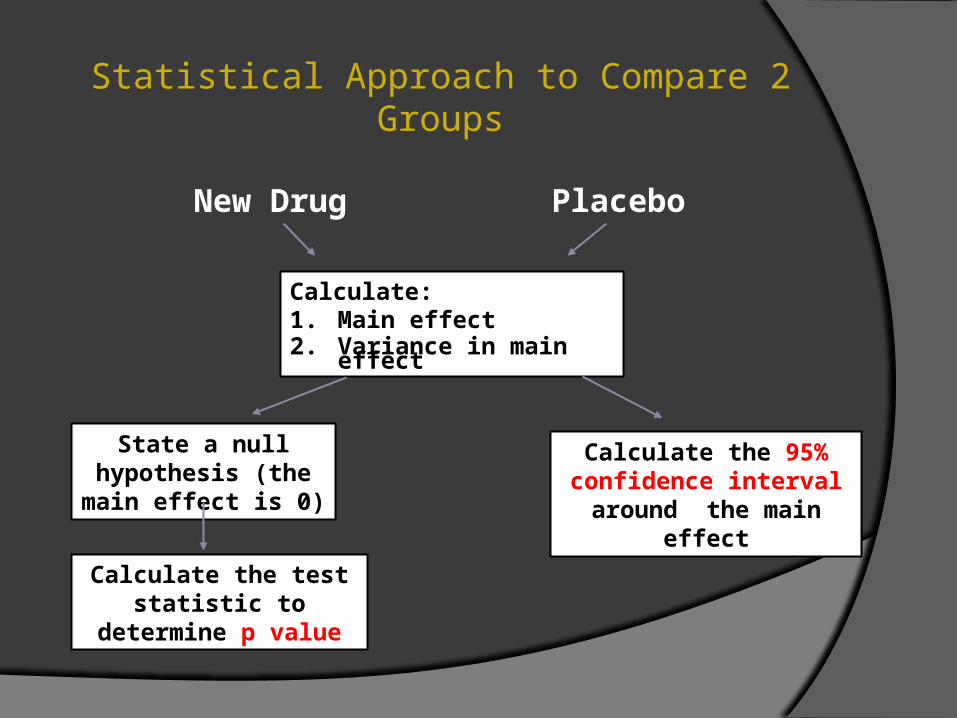
Statistical Approach to Compare 2 Groups
Calculate:1. Main effect2. Variance in main
effect
State a null hypothesis (the main effect is 0)
Calculate the test statistic to
determine p value
Calculate the 95% confidence interval around the main
effect
New Drug
Placebo
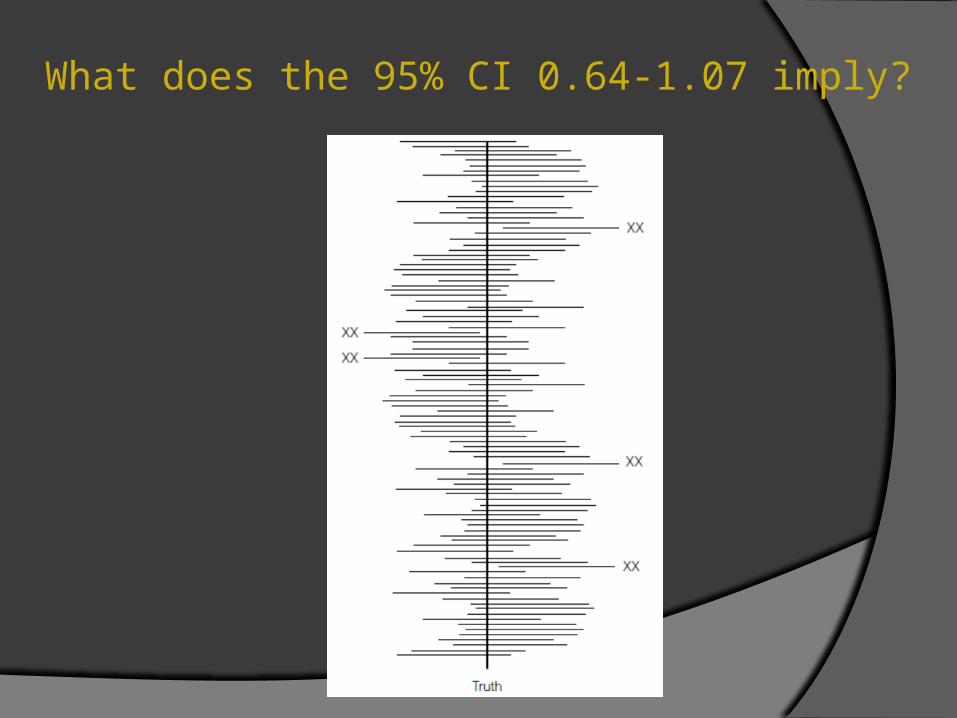
What does the 95% CI 0.64-1.07 imply?
Statistical Tests Mathematical formulas that produce test
statistics to assess the likelihood that chance (or sampling error) accounts for the results observed in the study
Many different tests. Choice depends on several factors:
Type of data (continuous, dichotomous, etc) Distribution of data (normally distributed or not) Study design (# of groups, etc)


TRUTHDifference No difference
Study Conclusion
Difference
No difference
Beta/ Type II error
Alpha/ Type I error
2 errors can be made with hypothesis testing
P-value
Probability that the results seen (or one more extreme) could have occurred by chance alone
○ Assuming that there is in fact no difference between groups (null hypothesis)
Cannot tell you if there is bias in a study
Does not indicate clinical significance

To learn more watch my other videos
NNT: http://bit.ly/1F4xONy
RRR: http://bit.ly/1Fyef3F

Observational Studies
Observational Studies
Study design
Measures of effectOR and RR

Overview of Study Designs
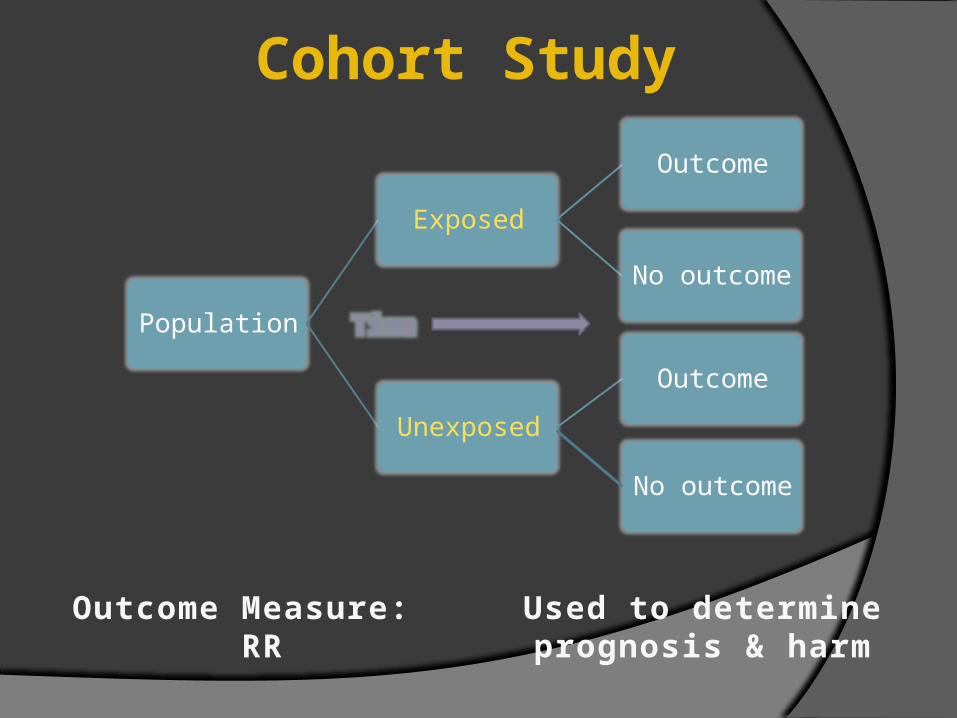
Used to determineprognosis & harm
Outcome Measure: RR
Population
Exposed
Outcome
No outcome
Unexposed
Outcome
No outcome
Time
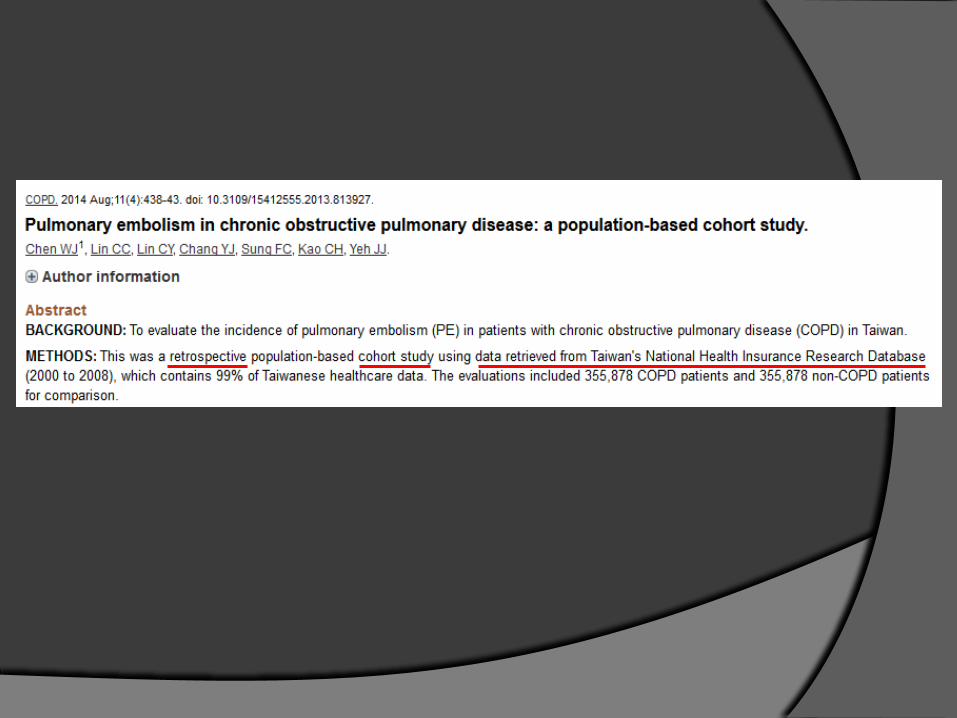
Cohort Study

Establish incidence (risk) directly
Multiple outcomes
Study of rare exposures
Strengths Weaknesses
Not good for rare diseases
Not good for diseases that take a long time to develop
Can’t study multiple exposures
Cohort: Strengths & Weaknesses

The incidence of pulmonary embolism in the COPD cohort was 1.37 per 10,000 persons/year and in the non-COPD cohort was 0.35 per 10,000 persons/year.
Multiple ways to express riskIncidenceRisk difference (attributable risk)Relative risk (risk ratio)
Interpreting RRRR = 1 (no association)RR > 1 (increased risk of disease)RR < 1 (decreased risk of disease)
http://bit.ly/1dtFFhV

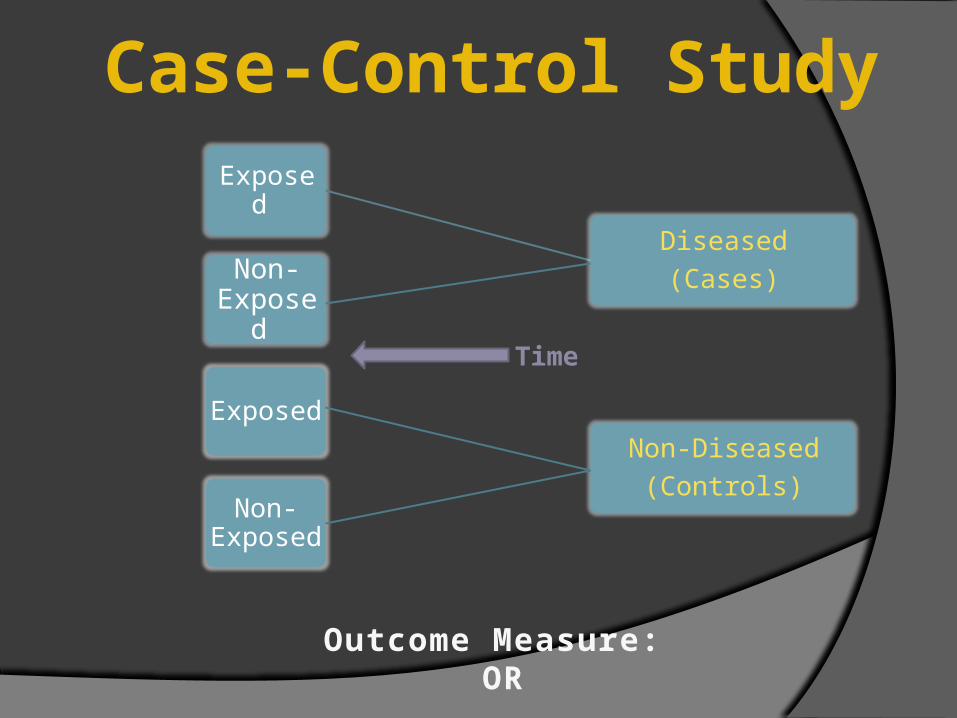
Outcome Measure: OR
Exposed
Diseased
(Cases)
Non-Diseased
(Controls)
Non- Exposed
Exposed
Non-Exposed
Time
Case-Control Study
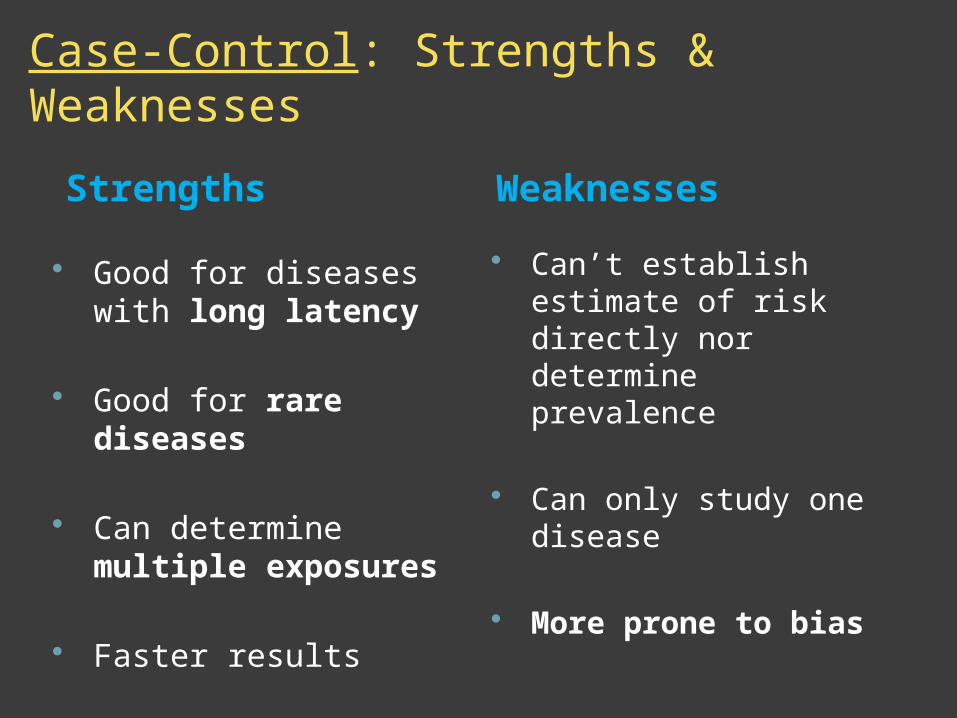
Good for diseases with long latency
Good for rare diseases
Can determine multiple exposures
Faster results
Strengths Weaknesses
Can’t establish estimate of risk directly nor determine prevalence
Can only study one disease
More prone to bias
Case-Control: Strengths & Weaknesses
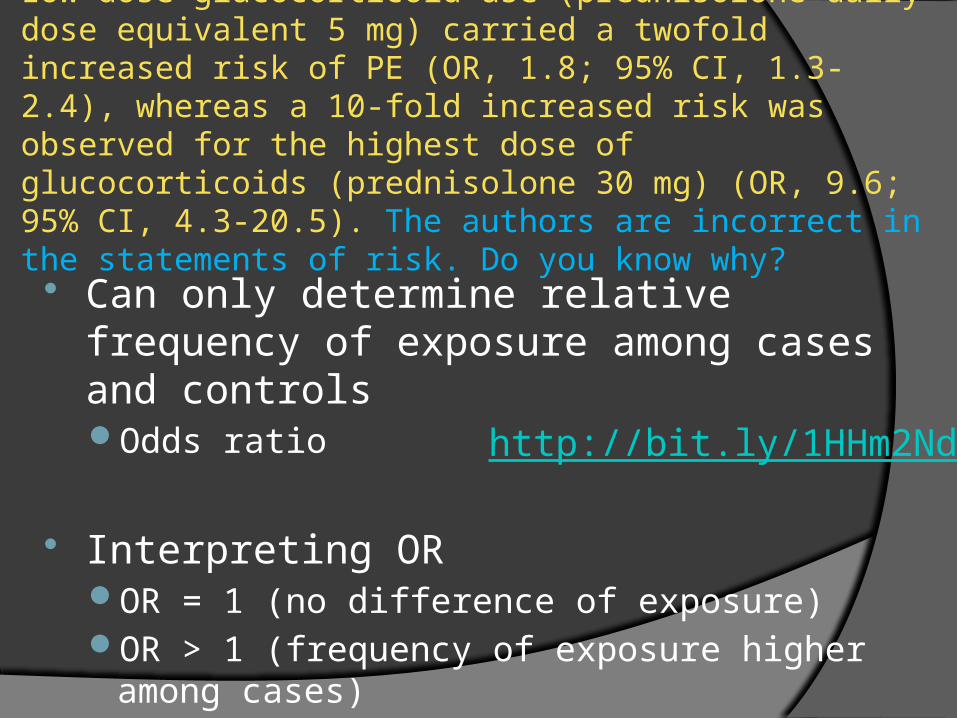
Low-dose glucocorticoid use (prednisolone daily dose equivalent 5 mg) carried a twofold increased risk of PE (OR, 1.8; 95% CI, 1.3-2.4), whereas a 10-fold increased risk was observed for the highest dose of glucocorticoids (prednisolone 30 mg) (OR, 9.6; 95% CI, 4.3-20.5). The authors are incorrect in the statements of risk. Do you know why?
Can only determine relative frequency of exposure among cases and controlsOdds ratio
Interpreting OROR = 1 (no difference of exposure)OR > 1 (frequency of exposure higher among cases)OR < 1 (frequency of exposure lower among cases)
http://bit.ly/1HHm2Nd
Screening
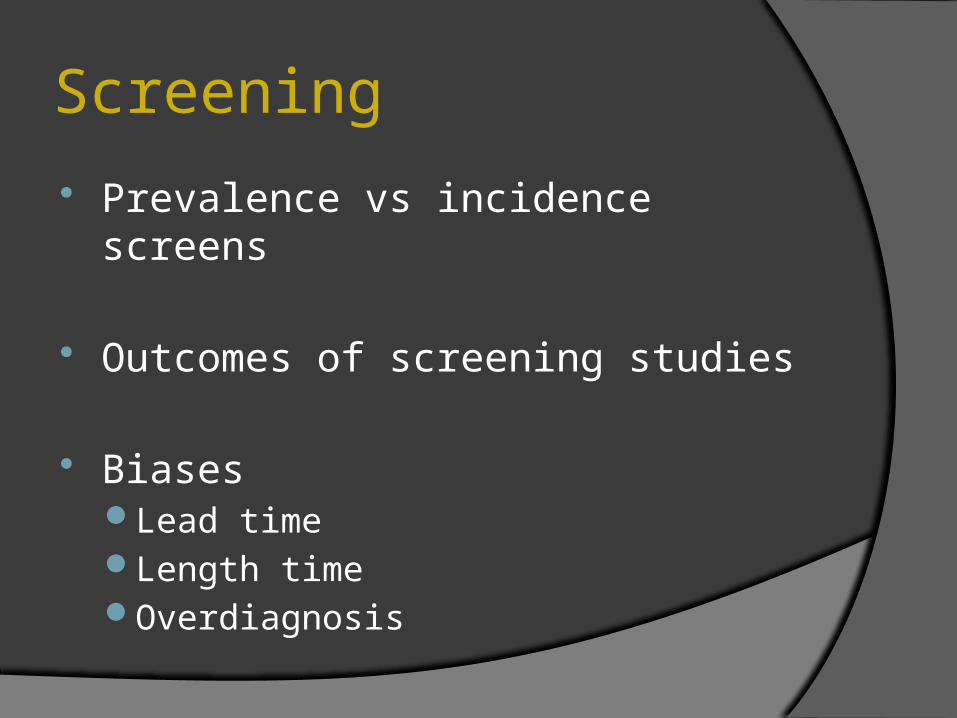
Screening
Prevalence vs incidence screens
Outcomes of screening studies
BiasesLead timeLength timeOverdiagnosis

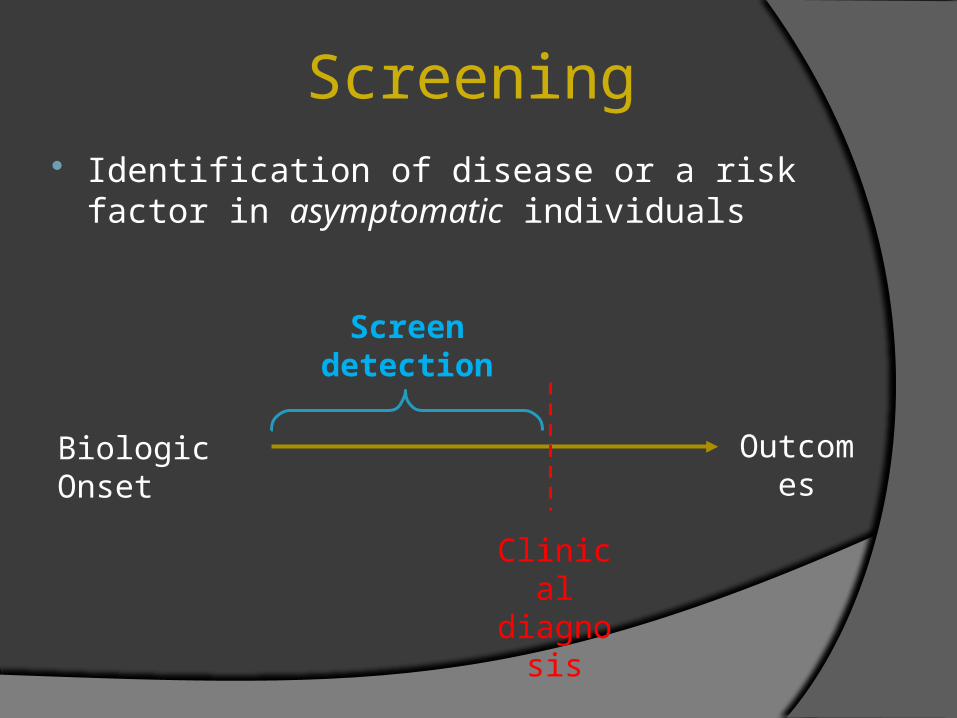
Identification of disease or a risk factor in asymptomatic individuals
Screening
Biologic Onset Outcomes
Clinical diagnosis
Screen detection

Fundamental Principles of Screening-1
3 prerequisites:▪ Disease must have a great enough burden of
suffering
▪ Screening test can identify disease earlier than usual
▪ Earlier therapy leads to better outcomes
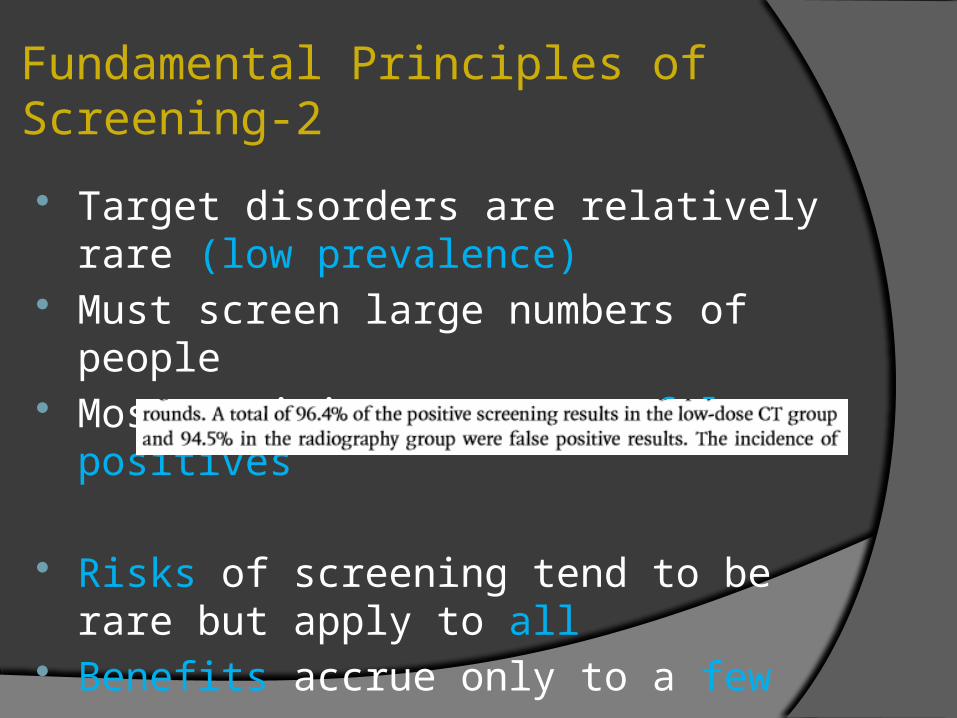
Fundamental Principles of Screening-2
Target disorders are relatively rare (low prevalence)
Must screen large numbers of people Most positive tests are false positives
Risks of screening tend to be rare but apply to all
Benefits accrue only to a few

Disease Prevalence is Low LOW low predictive value
Sensitivity=95%Specificity=95%
LR=19
Prevalence Predictive value
10% 67%
1% 16%
0.1% 1.8%Watch Predictive Value Estimates From Studies Can Be Misleading
http://youtu.be/3zq82uiGS3o
When choosing a test for a screening program you want the test to be….?
1. Highly sensitive
2. Highly specific

Do you find more cases of disease on the first round of screening or subsequent rounds?
Dx
Dx
Dx
Dx
Dx
Dx
Dx
Dx
Dx
Dx
Dx
Dx
1 2 3Round of screening
Number of cases newly detected
5 3 2
What is the appropriate outcome of a screening study?
A. Survival?
B. Mortality?
C. Disease detected?
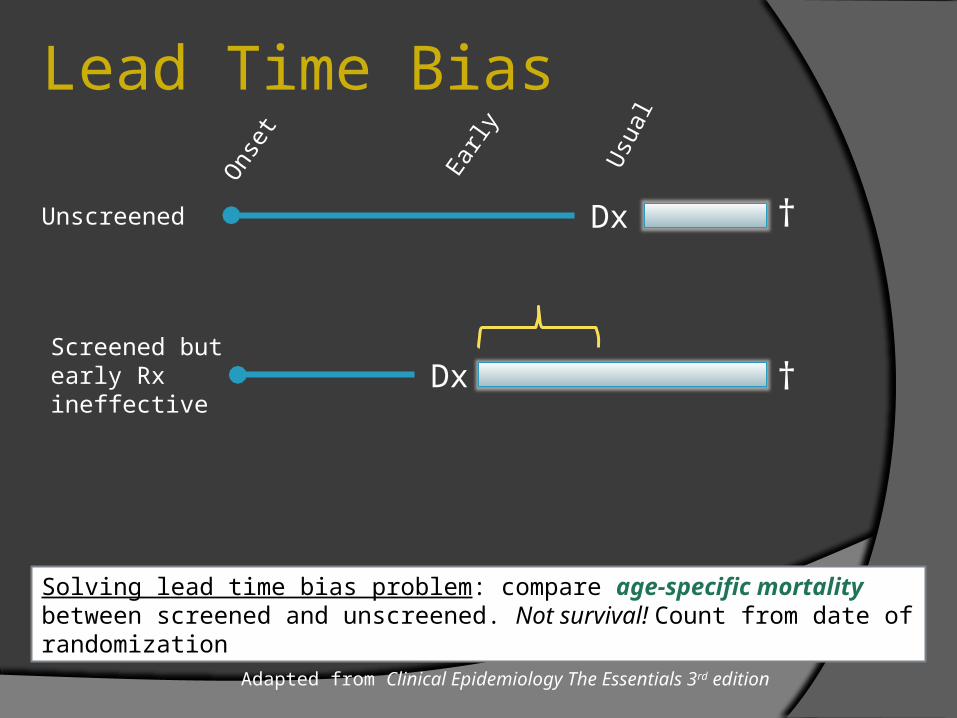
Solving lead time bias problem: compare age-specific mortality between screened and unscreened. Not survival! Count from date of randomization
Adapted from Clinical Epidemiology The Essentials 3rd edition
Dx †
Dx †
Unscreened
Screened but early Rx ineffective
Ons
et
Early
Usu
al
Lead Time Bias

From cancer.gov

Compare outcomes via RCT with a control group and a group offered screening
Count all outcomes regardless of method of detection
Avoiding Length Time Bias

Is PSA screening causing prostate cancer ???
From cancer.org
PSA approved
Thank You
Related Documents