RTI International RTI International is a trade name of Research Triangle Institute. www.rti.org NMR Data Pre-processing UAB Metabolomics Training Course June 14-18, 2015 Wimal Pathmasiri, Rodney Snyder NIH Eastern Regional Comprehensive Metabolomics Resource Core (RTI RCMRC)

Welcome message from author
This document is posted to help you gain knowledge. Please leave a comment to let me know what you think about it! Share it to your friends and learn new things together.
Transcript

RTI International
RTI International is a trade name of Research Triangle Institute. www.rti.org
NMR Data Pre-processingUAB Metabolomics Training Course
June 14-18, 2015
Wimal Pathmasiri, Rodney SnyderNIH Eastern Regional Comprehensive Metabolomics Resource Core
(RTI RCMRC)
RTI International
NIH Common Fund Metabolomics Cores
NIH Metabolomics Centers Ramp Up | November 4, 2013 Issue - Vol. 91 Issue 44 | Chemical & Engineering News. by Jyllian Kemsley

RTI International
Sample Receipt
Entry into BSI II
Sample Preparation
QC Standards
Pooled Samples
Data Capture& Storage
Empirical & Standards
Library Matching
Support for Experimental Design
DataReduction & Visualization Discovery
&PathwayMapping
Communicating Results
_ __ _
TARGETED
BROAD
SPECTRUM
NIH Eastern Regional Comprehensive Metabolomics Resource Core at RTI

RTI International
NMR Metabolomics Workflow
Processed NMR Spectrum
1r, cnx, esp, jdx
Statistical Analysis
Binned NMR Data
Library Matched
Data
Multivariate Data
Analysis
NMRData
Acquisition
Fourier Transform Phase
and Baseline Correction
Peak AlignmentQC Check
Sample Preparation
Raw NMR data(FID)
Pathway Analysis
-40
-30
-20
-10
0
10
20
30
40
-50 -40 -30 -20 -10 0 10 20 30 40 50
t[2]
t[1]
Scores Comp[1] vs. Comp[2] colored by Condition
PooledFemale
Males
NIST

RTI International
Data Pre-processing
After NMR data acquisition, the result is a set of spectra for all samples.
For each spectrum, quality of the spectra should be assessed.– Line shape– Phase– Baseline
Spectra should be referenced– Compounds commonly used: DSS, TSP, Formate
Variations of pH, ionic strength of samples has effects on chemical shift– Peak alignment– Bucket integration
Remove unwanted regions

RTI International
Quality Control Steps
Quality of metabolomics analysis depends on data quality
Typical problems– Water peak (suppression issues)– Baseline (not set at zero and not a flat line)– Alignment of peaks (chemical shift, due to pH variation)– Variation in concentration (eg. Urine)
High quality of data is needed for best results

RTI International
Water Suppression Effects and Other Artifacts If water is not correctly suppressed or removed there will
be effects on normalization
Need to remove other artifacts
Remove drug or drug metabolites
Poor water suppression
Poor_Water_Suppression.esp
8.5 8.0 7.5 7.0 6.5 6.0 5.5 5.0 4.5 4.0 3.5 3.0 2.5 2.0 1.5 1.0 0.5 0Chemical Shift (ppm)
0.1
0.2
0.3
0.4
0.5
0.6
0.7
0.8
0.9
Nor
mal
ized
Inte
nsity
Good_Water_Suppression.esp
8.5 8.0 7.5 7.0 6.5 6.0 5.5 5.0 4.5 4.0 3.5 3.0 2.5 2.0 1.5 1.0 0.5 0Chemical Shift (ppm)
0.1
0.2
0.3
0.4
0.5
0.6
0.7
0.8
0.9
Nor
mal
ized
Inte
nsity
Good water suppression
Water WaterSame Serum sample

RTI International
NMR Pre-processing
UCASE10470.esp
9 8 7 6 5 4 3 2 1 0Chemical Shift (ppm)
0.05
0.10
0.15
0.20
0.25
0.30
0.35
0.40
Nor
mal
ized
Inte
nsity
DSS
UCASE10470.esp
9 8 7 6 5 4 3 2 1 0Chemical Shift (ppm)
0.05
0.10
0.15
0.20
0.25
0.30
0.35
0.40
Nor
mal
ized
Inte
nsity
DSS
PhaseBaseline to be corrected
Reference, Line shape
Before After

RTI International
pH Dependence of Chemical Shift Chemical shift variability pH ionic strength metal concentration
Methods to overcome this problem Use a buffer when preparing
samples Binning (Bucketing)
o Fixed binningo Intelligent binningo Optimized binning
Available data alignment toolso Recursive Segment-wise
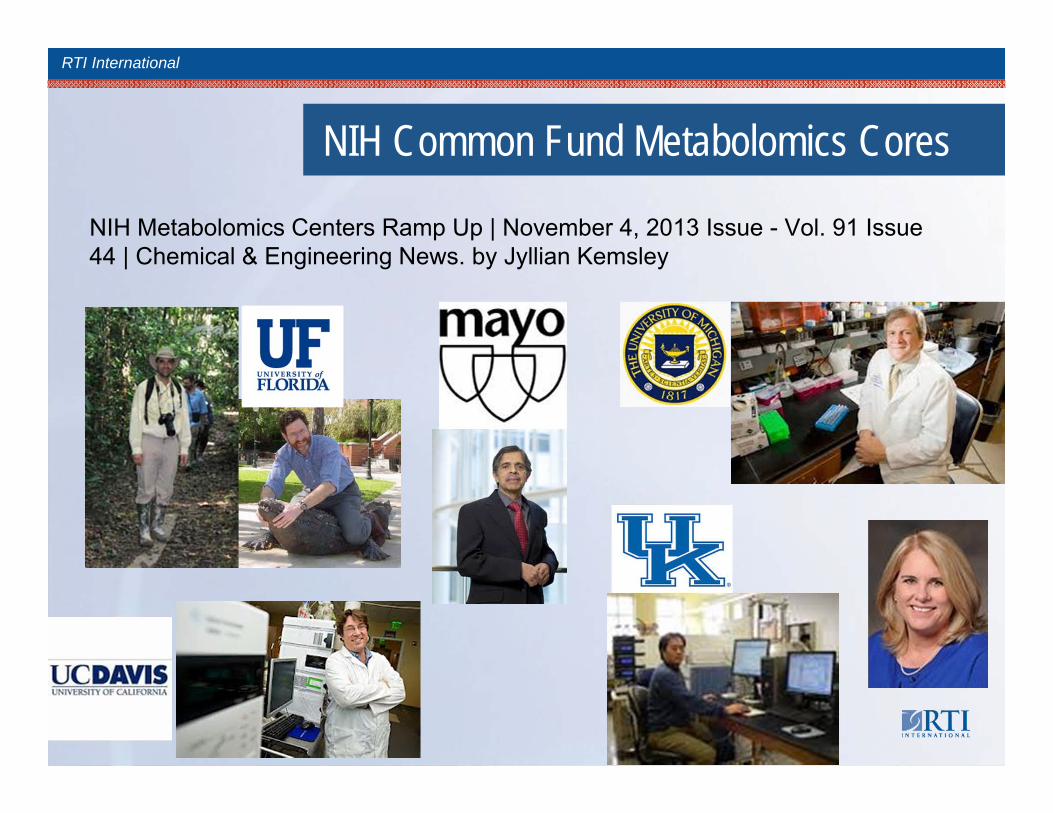
Peak Alignment (RSPA)o Icoshifto speaq
http://www.chenomx.com/software/software.phpSavorani , F. et al, Journal of Magnetic Resonance, Volume 202, Issue 2, 2010, 190 – 202Vu, T. N. et al., BMC Bioinformatics 2011, 12:405

RTI International
Peak Alignment
Savorani , F. et al, Journal of Magnetic Resonance, Volume 202, Issue 2, 2010, 190 - 202
icoshift
before
after
Example
One of the Citrate peaks
RTI International
Vu, T. N. et al., BMC Bioinformatics 2011, 12:405
speaq
Example Peak Alignment
RTI International
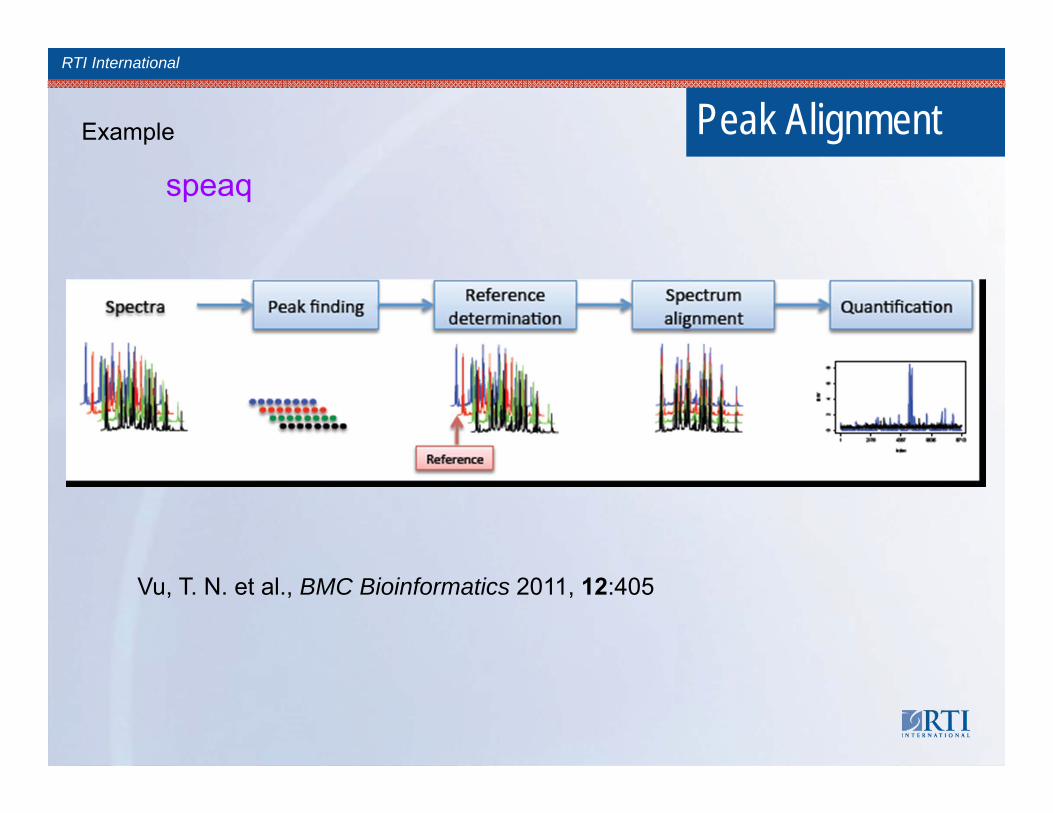
NMR Binning A form of quantification that consists of segmenting a spectrum
into small areas (bins/buckets) and attaining an integral value for that segment
Binning attempts to minimize effects from variations in peak positions caused by pH, ionic strength, and other factors.
Two main types of binning– Fixed binning– Flexible binning

RTI International
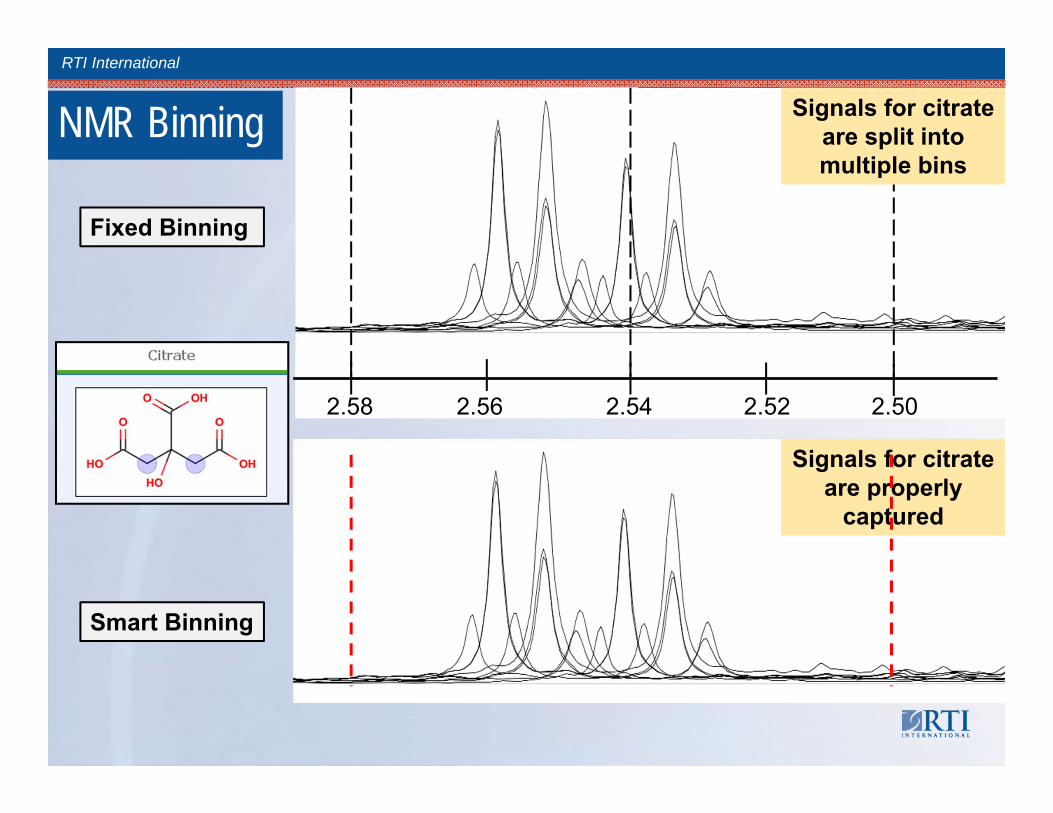
NMR Binning The entire NMR spectrum is split into evenly spaced integral
regions with a spectral window of typically 0.04 ppm.
The major drawback of fixed binning is the non-flexibility of the boundaries.
If a peak crosses the border between two bins it can significantly influence your data analysis
Peak shift can cause the same
peak across multiple samples
to fall into different bins
2.502.522.542.562.58
Signals for citrate are split into multiple bins
Fixed Binning
RTI International
NMR Binning
Signals for citrate are properly
captured
Smart Binning
2.502.522.542.562.58
Signals for citrate are split into multiple bins
Fixed Binning
NMR Binning

RTI International
PETROVIC_SPECTRA_OVERLAYED.QC.WP.12.04.2013.ESP
10 9 8 7 6 5 4 3 2 1 0Chemical Shift (ppm)
-0.5
0
0.5
1.0
Nor
mal
ized
Inte
nsity
Sam
ples
NMR Binning

RTI International
PETROVIC_SPECTRA_OVERLAYED.QC.WP.12.04.2013.ESP
10 9 8 7 6 5 4 3 2 1 0Chemical Shift (ppm)
-0.5
0
0.5
1.0
Nor
mal
ized
Inte
nsity
Urea WaterDSS and up field
Downfield region
Remove regions

RTI International
Sample ID Disease Group [0.40 .. 0.46] [0.46 .. 0.52] [0.52 .. 0.54] [0.54 .. 0.57] [0.57 .. 0.60] [0.60 .. 0.66] [0.66 .. 0.68] [0.68 .. 0.71] [0.71 .. 0.75]C0559 Cases 7.60E-05 0.00E+00 7.32E-02 8.48E-02 3.20E-02 1.84E+00 1.31E-01 3.60E-01 3.67E-01C0629 Cases 0.00E+00 1.78E-02 0.00E+00 2.18E-02 0.00E+00 1.08E+01 0.00E+00 0.00E+00 3.02E-02C0640 Cases 3.44E-04 0.00E+00 1.83E-03 1.86E-04 0.00E+00 4.51E+00 0.00E+00 0.00E+00 0.00E+00C0835 Cases 6.41E-04 0.00E+00 6.44E-03 0.00E+00 3.96E-03 3.28E+00 0.00E+00 5.12E-03 1.75E-02D0613 Cases 6.63E-03 0.00E+00 0.00E+00 1.06E-02 0.00E+00 5.79E+00 0.00E+00 6.36E-02 3.02E-01D0762 Cases 0.00E+00 0.00E+00 1.79E-02 1.98E-02 0.00E+00 9.37E+00 0.00E+00 0.00E+00 1.74E-02D1113 Cases 3.14E-03 2.42E-03 8.02E-02 1.04E-01 5.32E-03 3.74E+00 0.00E+00 2.02E-02 1.84E-01D1158 Cases 0.00E+00 3.71E-03 2.35E-02 4.83E-02 0.00E+00 5.02E+00 0.00E+00 1.91E-02 0.00E+00D2090 Cases 0.00E+00 0.00E+00 2.45E-03 9.98E-04 0.00E+00 5.76E+00 0.00E+00 1.24E-02 1.04E-02E0004 Cases 1.72E-03 0.00E+00 6.85E-02 3.05E-02 0.00E+00 1.47E+00 6.90E-02 3.61E-01 4.08E-01E0195 Cases 0.00E+00 1.69E-03 5.57E-02 6.29E-02 0.00E+00 2.77E+00 1.34E-01 2.04E-01 4.56E-01E0225 Cases 1.25E-03 0.00E+00 4.40E-03 1.69E-02 0.00E+00 9.17E+00 0.00E+00 1.08E-02 2.30E-02E0309 Cases 4.11E-03 0.00E+00 2.23E-02 7.54E-03 3.08E-03 3.54E+00 0.00E+00 3.28E-02 9.09E-01E0487 Cases 1.72E-03 0.00E+00 0.00E+00 1.00E-02 0.00E+00 4.00E+00 0.00E+00 1.36E-02 0.00E+00F0036 Cases 1.66E-02 0.00E+00 0.00E+00 2.06E-02 0.00E+00 1.22E+01 1.04E-02 0.00E+00 5.97E-01F0108 Cases 0.00E+00 2.31E-03 6.30E-03 1.11E-02 0.00E+00 7.17E+00 0.00E+00 1.65E-02 2.21E-01A0233 Control 0.00E+00 1.86E-02 0.00E+00 1.82E-02 0.00E+00 1.61E+01 0.00E+00 2.91E-03 0.00E+00A0490 Control 0.00E+00 0.00E+00 2.99E-03 3.60E-02 0.00E+00 2.97E+00 0.00E+00 4.00E-02 5.46E-01A2003 Control 0.00E+00 0.00E+00 3.45E-02 2.20E-02 0.00E+00 1.80E+00 0.00E+00 0.00E+00 0.00E+00C0586 Control 0.00E+00 1.69E-02 0.00E+00 6.64E-03 0.00E+00 1.92E+01 0.00E+00 6.51E-02 0.00E+00C2177 Control 0.00E+00 0.00E+00 3.02E-02 3.59E-02 0.00E+00 2.35E+00 0.00E+00 3.19E-02 1.49E-01D0177 Control 9.21E-03 0.00E+00 1.69E-02 1.47E-02 0.00E+00 2.43E+00 0.00E+00 4.46E-02 0.00E+00D0729 Control 0.00E+00 1.88E-03 5.58E-02 7.87E-02 2.92E-02 3.16E+00 6.59E-02 2.80E-01 4.30E-01D0909 Control 0.00E+00 1.08E-03 0.00E+00 5.69E-03 0.00E+00 2.49E+00 0.00E+00 1.01E-02 1.87E-01D0945 Control 0.00E+00 4.79E-04 7.00E-03 0.00E+00 4.19E-03 3.99E+00 0.00E+00 1.11E-03 3.96E-02D1174 Control 0.00E+00 9.33E-04 0.00E+00 3.43E-03 1.30E-02 7.21E+00 6.53E-03 0.00E+00 1.66E-02D2054 Control 1.55E-03 0.00E+00 0.00E+00 1.22E-02 0.00E+00 2.07E+00 0.00E+00 1.28E-02 3.90E-01D2062 Control 2.39E-05 0.00E+00 6.04E-02 2.99E-02 0.00E+00 4.94E+00 0.00E+00 9.95E-03 0.00E+00D2079 Control 2.73E-02 0.00E+00 1.81E-03 1.17E-02 0.00E+00 3.38E+01 7.87E-02 0.00E+00 5.91E+00
Integrate bins (0.04 ppm bin size) Normalize integral of each bin to the total integral of each spectrum Merge metadata Result is a spreadsheet ready for further multivariate data analysis and
other statistical analysis
Binning
Normalized binned dataMetadata

RTI International
Data Normalization, Transformation, and Scaling

RTI International
Data Normalization
Normalization reduces the sample to sample variability due to differences in sample concentrations—particularly important when the matrix is urine
– Normalization to total intensity is the most common method For each sample, divide the individual bin integral by the total integrated
intensity
– Other Methods Normalize to a peak that is always present in the same
concentration, for example normalizing to creatinine Probabilistic quotient normalization Quantile and cubic spline normalization

RTI International
Centering, Scaling, and Transformations
Analysis results vary depending on the scaling/ transformation methods used.
Van den Berg et al 1006, BMC Genomics, 7, 142

RTI International
Data Transformation
Susan Wicklund, Multivariate data analysis for omics, Sept 2-3 2008, Umetrics training

RTI International
Scaling
Unit variance (autoscaling) divides the bin intensity by the standard deviation– May increase your baseline noise– Dimensionless value after scaling
Pareto scaling divides the bin intensity by the square root of the standard deviation– Not dimensionless after scaling
For NMR data, centering with pareto scaling is commonly used

RTI International
Multivariate Data Analysis and Other Statistical Analyses
PCA
OPLS-DA
VIP[1]
3.03
4.04
2.58
2.46
2.60
4.12
1.48
4.03
7.55
4.34
3.15
3.41
3.79
4.33
4.18
7.63
4.35
4.31
1.22
8.12
3.84
Mean centered and scaled data Non-supervised analysis
o Principal component analysis (PCA)
Supervised analysiso PLS-DA and OPLS-DA
Loadings plots and VIP Plots to identify discriminatory bins
p-Value, fold change
VIP Plot

RTI International
ACKNOWLEDGEMENTS
Related Documents