WORKING PAPER SERIES U. S. Regional Business Cycles and the Natural Rate of Unemployment Howard J. Wall and Gylfi Zoega Working Paper 2003-030A http://research.stlouisfed.org/wp/2003/2003-030.pdf October 2003 FEDERAL RESERVE BANK OF ST. LOUIS Research Division 411 Locust Street St. Louis, MO 63102 ______________________________________________________________________________________ The views expressed are those of the individual authors and do not necessarily reflect official positions of the Federal Reserve Bank of St. Louis, the Federal Reserve System, or the Board of Governors. Federal Reserve Bank of St. Louis Working Papers are preliminary materials circulated to stimulate discussion and critical comment. References in publications to Federal Reserve Bank of St. Louis Working Papers (other than an acknowledgment that the writer has had access to unpublished material) should be cleared with the author or authors. Photo courtesy of The Gateway Arch, St. Louis, MO. www.gatewayarch.com

Welcome message from author
This document is posted to help you gain knowledge. Please leave a comment to let me know what you think about it! Share it to your friends and learn new things together.
Transcript

WORKING PAPER SERIES
U. S. Regional Business Cycles and the Natural Rate of Unemployment
Howard J. Wall and
Gylfi Zoega
Working Paper 2003-030A http://research.stlouisfed.org/wp/2003/2003-030.pdf
October 2003
FEDERAL RESERVE BANK OF ST. LOUIS Research Division 411 Locust Street
St. Louis, MO 63102
______________________________________________________________________________________
The views expressed are those of the individual authors and do not necessarily reflect official positions of the Federal Reserve Bank of St. Louis, the Federal Reserve System, or the Board of Governors.
Federal Reserve Bank of St. Louis Working Papers are preliminary materials circulated to stimulate discussion and critical comment. References in publications to Federal Reserve Bank of St. Louis Working Papers (other than an acknowledgment that the writer has had access to unpublished material) should be cleared with the author or authors.
Photo courtesy of The Gateway Arch, St. Louis, MO. www.gatewayarch.com

U. S. Regional Business Cycles and theNatural Rate of Unemployment*
Howard J. Wall$
Federal Reserve Bank of St. Louis
Gylfi Zoega£
University of Iceland;Birkbeck College, University of London;
Central Bank of Iceland
September 2003
Abstract
Estimates of the natural rate of unemployment are important in many macroeconomic modelsused by economists and policy advisors. This paper shows how such estimates might benefitfrom closer attention to regional developments. Regional business cycles do not move inlockstep and greater dispersion among regions can affect estimates of the natural rate ofunemployment. There is microeconomic evidence that employers are more reluctant to cutwages than they are to raise them. Accordingly, this means that the relationship between wageinflation and vacancies is convex: an increase in vacancies raises wage inflation at an increasingrate. Our empirical results are consistent with this and indicate that if all else had remainedconstant, the reduction in the dispersion of regional unemployment rates between 1982 and 2000would have meant a two-percentage point drop in the natural rate of aggregate unemployment.
JEL: J6, E2Keywords: Regional unemployment, inflation, natural rate of unemployment, Phillips curve
* We would like to thank seminar participants at the Central Bank of Iceland, the FederalReserve Bank of St. Louis, and the Institute for Monetary and Economic Studies of the Bank ofJapan for the comments and suggestions. The views expressed are those of the authors and donot necessarily represent official positions of the Central Bank of Iceland, the Federal ReserveBank of St. Louis, or the Federal Reserve System.
$ Research Division, Federal Reserve Bank of St. Louis, 411 Locust St., St. Louis, Missouri63166, United States. E-mail: [email protected]£ Birkbeck College, London, and University of Iceland, 101 Reykjavik, Iceland. E-mail:[email protected]

1
Milton Friedman and Edmund Phelps convinced the economics profession in the late 1960s of
the absence of a long-run trade off between inflation and unemployment. A policy that tries to
maintain the unemployment rate below a certain threshold – dubbed the natural rate of
unemployment by Friedman – would lead to rising inflation, while trying to maintain it above the
threshold would lead to ever-declining rates of inflation. The proposition of a long-run neutrality
of inflation and money growth soon gained wide acceptance and work in this area has focused on
making the natural rate of unemployment fully endogenous in general-equilibrium models
(Pissarides, 2000; Layard, Nickell, and Jackman, 1991; and Phelps, 1994). This theory can be
used to show how a variety of macroeconomic shocks – such as the rate of technical progress,
real interest rates, and oil prices – affect the natural rate and social welfare.
Inflation-targeting central banks often monitor employment and wage changes in the
hope of preventing wage inflation in the labor market from generating general price inflation.1
The use of the notion of an equilibrium level of unemployment that is independent of current and
past monetary variables has made the estimation of the natural rate important. This practice
relies on models of the representative-agent type – the ones used to provide microeconomic
foundations for the inflation-unemployment relationship – to assess the state of the economy on
the basis of aggregate data. A central banker may then use data on aggregate employment,
unemployment and average wage inflation across all sectors of the economy to assess the
position of the economy in relation to an estimate of the natural rate of unemployment. Most
often, the estimate is the implied natural rate in an econometric model of the aggregate Phillips
curve.
1 Such considerations have led to the appointment of a labor economist – Steve Nickell – to Britain’s MonetaryPolicy Committee.

2
The objective of this paper is to show that the sole reliance on aggregate data may lead to
incorrect inferences about the natural rate of unemployment. We show how regional business
cycles might affect aggregate wage inflation, and how attention paid to regional labor-market
trends can be useful for understanding the aggregate labor market. Moreover, we show how the
natural rate of unemployment may depend directly on the dispersion of economic activity across
regions.
Our regional approach has some parallel with the sectoral approach of Lilien (1982),
Abraham and Katz (1986), and Brainard and Cutler (1993). Lilien (1982) found that a measure
of sector-specific disturbances accounted for a significant portion of the variation in aggregate
employment: When it takes less time for an industry to shed redundant labor than it does for the
affected workers to find employment elsewhere, unemployment rises when the pace of sectoral
reallocation of labor (and capital) increases. Abraham and Katz (1986) pointed out that Lilien’s
estimates might exaggerate the role of sectoral disturbances by failing to take into account
differences in the sensitivity of different industries to macroeconomic shocks. Brainard and
Cutler (1993) developed a data series to measure the intensity of reallocation shocks. They
constructed a time series of the variance of sectoral stock market excess returns and found that
they had a modest – though statistically significant – role in explaining aggregate employment
fluctuations.
Our paper follows recent work illustrating the significant regional differences in
economic conditions, business cycle dynamics, and reactions to monetary policy. Overman and
Puga (2002) demonstrate the increased polarization of unemployment within Europe where
unemployment increasingly appears in regional clusters that cross national borders. Crone
(1998/1999) groups the U.S. states into regions based on common cyclical behavior, while

3
Carlino and Sill (2001) find considerable state differences in the volatility of regional cycles (of
GDP per capita). Owyang, Piger, and Wall (2003) identify distinct state-level
recession/expansion phases, finding a great deal of business cycle discord among the states and
between states and the country as a whole. They also find significant cross-state differences in
the depths of recessions and the speed of expansions. Recent research has also found that states
and regions respond differently to monetary policy (Carlino and DeFina, 1998; Fratantoni and
Schuh, 2003; Owyang and Wall, 2003).
It follows from these studies that the national economy of the United States is a
composite of significantly diverse but interrelated regional economies. In this paper, we show
how the diversity in regional labor-market conditions can be used to enrich policy makers’
understanding of the aggregate economy. In the section immediately following, we briefly lay
out a state-level view of recent U.S. labor market trends. In section 2 we describe how
differences in regional business cycles can lead to changes in aggregate wage inflation. In
section 3 we test for the underlying conditions for this to occur, and demonstrate how region-
level data can be used to estimate the aggregate natural rate of unemployment in the United
States. Section 4 concludes.
1. A state-level view of U.S. unemployment
This paper relies on two suppositions about the dispersion of regional labor market
conditions: (i) that the dispersion is related to aggregate labor-market conditions, and (ii) that the
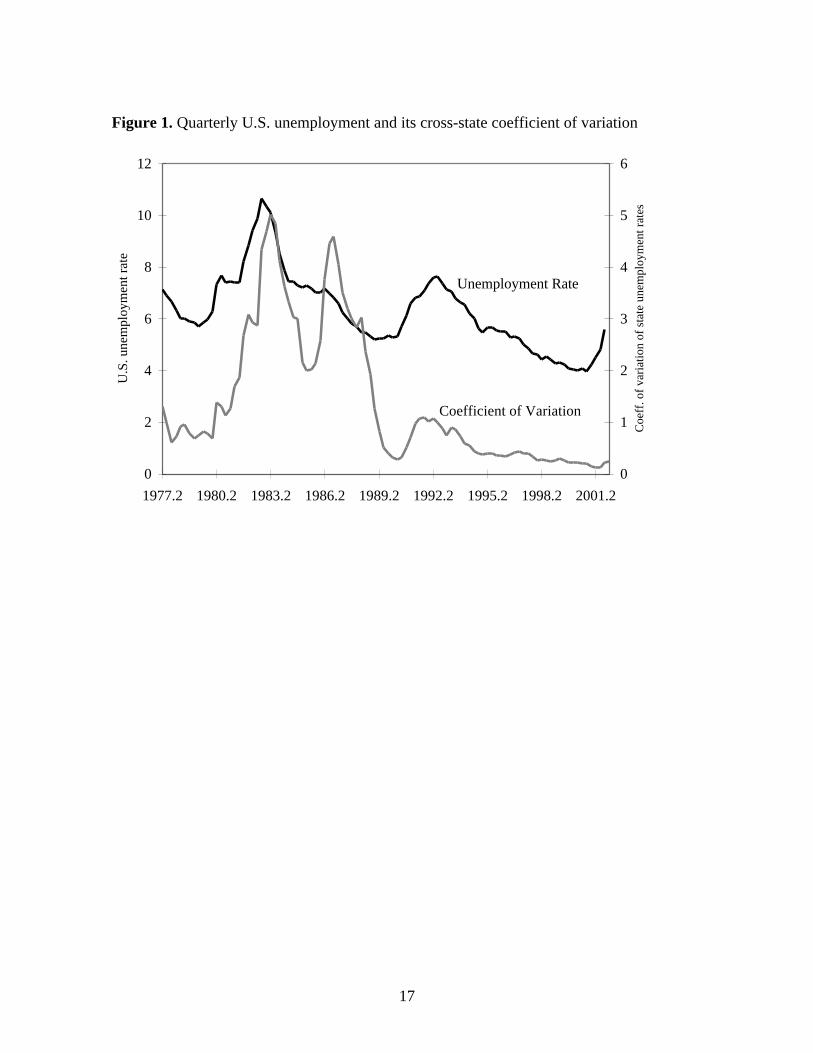
dispersion changes over time. Both suppositions are supported by Figure 1, which illustrates that
the movements in the aggregate unemployment rate over the last 25 years have largely been in
synch with changes in the dispersion of state unemployment rates (as measured by the cross-state

4
coefficient of variation). Correspondingly, the 1990s saw steadily declining unemployment
alongside a convergence of state unemployment rates. The only period during which aggregate
unemployment was out of synch with the coefficient of variation was in 1986-87, when a handful
of states had sudden increases in unemployment following the crash of energy prices in 1986.2
Along with the country as a whole, all other states saw falling unemployment during this period.
More evidence of the potential importance of regional labor-market variation is provided
by Figure 2, which illustrates the distribution of changes in state unemployment surrounding the
three most recent recession episodes.3 Associated with the 1981-82 recession, the US
unemployment rate rose by about 3.3 percentage points from the third quarter of 1981 to the
fourth quarter of 1982. Over the same period, 29 states saw their unemployment rates rise by
less than this, with 14 states seeing increases that were less than half as large (Nevada actually
saw a small decrease). On the other hand, of the 21 states whose unemployment rates rose
relatively more than the national average, six states saw them rise by more than 4.8 percentage
points.
The period surrounding the 1990-91 recession is perhaps the most regionally distinct of
the three. The aggregate unemployment rate rose by 2.3 percentage points from the second
quarter of 1990 to the third quarter of 1992. The brunt of the increase was felt on the coasts
where most states saw much larger than average increases in their unemployment rates,
particularly the large states of California, New York, North Carolina, and Washington. At the
other end, a significant majority of states (36), mostly located in the vast middle of the country,
2 These states were Alaska, Alabama, Colorado, Louisiana, Mississippi, Texas, and Wyoming.3 The official dates for these recessions are July 1981-November 1982, July 1990-March 1991, and March 2001-November 2001.

5
saw a milder than average increase in unemployment. In fact, four states actually saw their
unemployment rates fall during the period.
Associated with the 2001 recession was a runup in unemployment that began in the
fourth quarter of 2000 and continued well after the official end of the recession. By the first
quarter of 2002, the fact of a regionally diverse unemployment experience, and an increasing
coefficient of variation, had become clear. By that time, the aggregate unemployment rate had
risen by 1.6 percentage points, although 35 states saw smaller increases than this, and six had
seen declines. The states hit most severely were scattered across the country, with pockets in the
Great Lakes region, the Atlantic Seaboard, the western Plains, and the Southwest.
2. How regional business cycles might matter
Here, we describe how a non-linear relationship between inflation and measures of labor-
market pressures – such as vacancies, unemployment, and employment growth – would mean
that differences in regional business cycles can affect measures of aggregate conditions. Such
nonlinearities are standard in the theory of unemployment and it is not difficult to find empirical
evidence backing them up.
Numerous statistical studies of the distribution of wage changes point to a potential role
for asymmetric wage adjustments and heterogeneity (see, for example, McLaughlin, 1999; Card
and Hyslop, 1997). These studies show that the distribution of wage changes is skewed away
from small increases and absolute cuts and towards large increases. There is a thinning of the
left-hand tail to the left of the zero-inflation point, thereby indicating nominal wage rigidity. As
McLaughlin (1999) documents, the skewness of the distribution exists even in the absence of any
nominal wage rigidity: Even if the distribution is truncated at zero wage increases, the

6
distribution is still skewed. According to survey results from Truman Bewley (1999), managers
are hesitant to cut wages because of considerations about worker morale. Wage cuts are likely to
introduce personnel and incentive problems beyond the intended effect on turnover. It follows
that in an economy where some sectors and/or regions are declining and others are expanding,
the relative wage cuts (relative to the rise of average wages) occurring in the former are smaller
than the wage increases (relative to the rise of average wages) offered in the latter.
This microeconomic evidence suggests a potential role for regional labor-market
disaggregation in understanding aggregate labor market outcomes. This can be illustrated most
simply with the textbook version of the Phillips curve that traces its origins to Phelps (1968). In
this model, wage inflation persists because firms cannot adjust instantaneously to changes in
vacancies. This might be due to the costs of setting wages, or because wage setting is staggered
over time. Thus, for a given unemployment rate, the rate of wage inflation is increasing in the
number of vacancies that firms would like to fill and on inflation expectations. There is a critical
vacancy rate v at which actual wage inflation equals expected wage inflation. When the
vacancy rate is above v , there is unexpected wage inflation. Conversely, when the vacancy rate
is below v , there is unexpected wage deflation.
The microeconometric evidence we cite above suggests that the slope of the relationship
between wage inflation and the vacancy rate differs above and below v . This is because firms
are more reluctant to cut expected wages than to raise them. So, starting from v , a decrease in
the vacancy rate will lead to wage deflation that is smaller in absolute terms than the wage
inflation that would follow an equivalent increase in the vacancy rate. In other words, the
relationship between wage inflation and the vacancy rate is convex because it is flatter for
vacancy rates below v .

7
To see how this convexity matters, consider an economy with two equal-sized regions,
both with vacancy rates of v . Now consider equal but opposite-signed changes in the regions'
vacancy rates (i.e., the changes are mean-preserving). One region experiences unexpected wage
inflation that is greater in absolute terms than the unexpected wage deflation in the other. Thus,
a mean-preserving increase in the dispersion of regional vacancy rates is associated with higher
average wage inflation. More generally, with a strictly convex relationship between wage
inflation and the vacancy rate, the larger is the dispersion of regional vacancy rates, the higher is
the aggregate wage inflation for any given aggregate vacancy rate.
3. Convexity and the natural rate in the United States
The discussion above describes how aggregate wage inflation can be affected by the
dispersion of regional labor-market conditions when the region-level relationship between wage
inflation and labor-market conditions is convex. To test for this convexity, we use state
unemployment rates and rates of growth of employment as our measures of state labor market
conditions. Unfortunately, there are no state-level data for vacancies. This gives rise to the
following equation, which we estimate with state-level panel data:
itt
et
ititit
it
it
iti
it
it
ww
uuNN
NN
ww
ε+α+α+α+
α+α+α=
&&&&3
222
2
110 . (1)
In (1), where i refers to the state and t refers to the time period, itit ww& is wage inflation, i0α is a
state fixed effect, itit NN& is employment growth, itu is the unemployment rate, and tet ww& is
expected aggregate wage inflation. We use quarterly data from 1977.3 to 2002.1. Our wage
measure is hourly earnings in manufacturing, employment data are from the establishment
survey, and the unemployment rate is from the household survey. Expected wage inflation at the

8
aggregate level is measured by actual CPI inflation lagged one quarter. We estimate (1) with
Feasible Generalized Least Squares (FGLS) so as to correct for state-specific autocorrelation and
heteroscedasticity that is correlated across states.4
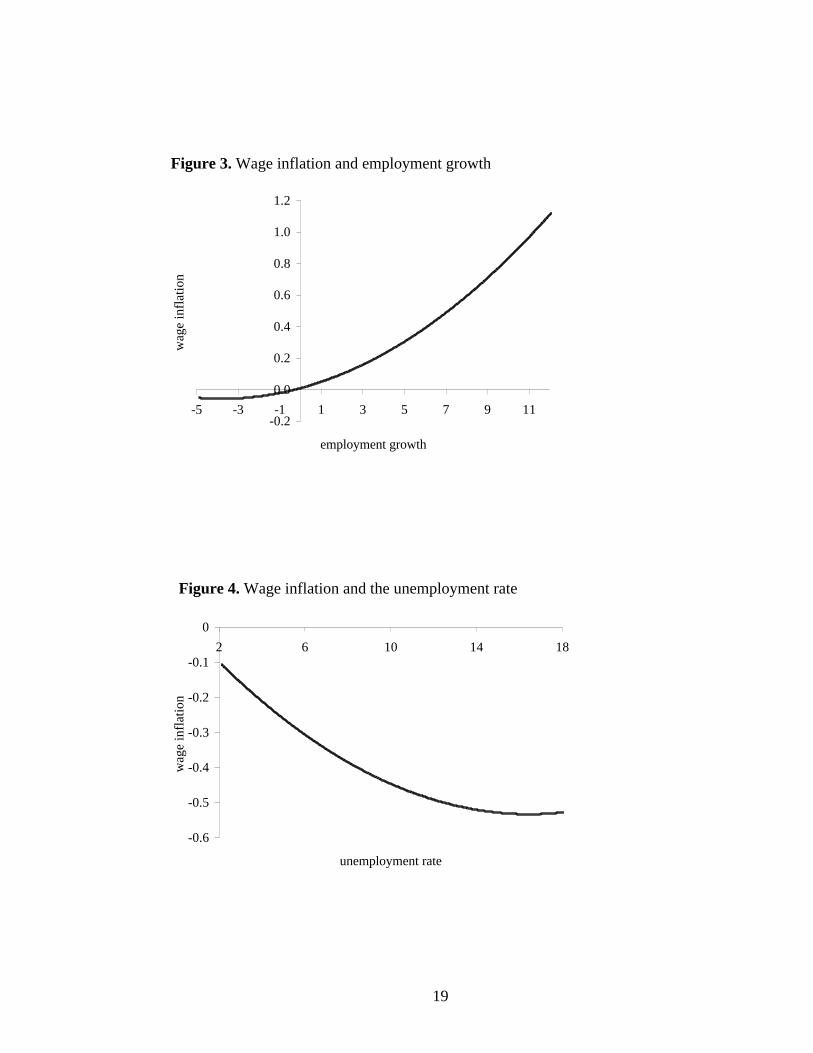
As reported in Table 1 and illustrated by Figures 3 and 4, the coefficients for employment
growth and the unemployment rate (in levels and squared) imply a convex relationship between
wage inflation and regional labor market conditions. However, the coefficient on the squared
employment term is not statistically significant at traditional levels, so the relationship is not
statistically different from linearity. On the other hand, the convexity of the relationship between
wage inflation and the unemployment rate is statistically significant.
The weight of this empirical evidence indicates that the relationship between labor-
market conditions and wage inflation is convex, meaning that changes in the dispersion of
conditions across states will have repercussions at the aggregate level. In particular, divergent
regional business cycles cause measured wage inflation to rise for a given aggregate
unemployment rate. In other words, the aggregate unemployment rate at which wage inflation is
unchanged will be higher.
These results suggest one possible reason for the non-inflationary boom that took place in
the United States in the 1990s. Recall Figure 1, which shows that the coefficient of variation of
state unemployment rates fell throughout the period, indicating a convergence of economic
activity. Consistent with our discussion, this decreased dispersion was accompanied by a falling
aggregate unemployment rate but no increase in wage inflation.
4 We are able to correct for this most-general form of heteroskedasticity because our time-series is relatively long fora cross-state panel. A useful rule of thumb is that this is possible if there are twice as many time periods as cross-sectional units (Beck and Katz, 1995), which our panel just satisfies.

9
In order to explore this possibility further we estimate a relatively simple Phillips curve
for the United States, including features common to Phillips curve models:5
tettt
et
t
t Xuww
ε+π++λ+α−α=θ− ? Fln10&
. (2)
In (2), the dependent variable is nominal hourly wage growth averaged over years t and t+1 net
of expected productivity growth, etθ , measured by the trend growth of output per worker in the
non-farm business sector. We also include a vector of demographic variables F to control for
changes in the composition of the labor force (Phelps and Zoega, 1997; Shimer, 1998;
Francesconi, et al, 2000; and Staiger, Stock, and Watson, 2002). Following Staiger, et al. (2002),
these variables are the percentages of the adult population that are: high school dropouts, college
graduates, white, female, and aged 25-54. Expected wage inflation, etπ , is measured by average
CPI inflation for years t-1 and t-2.
Our innovation is to include tX , the coefficient of variation of state unemployment rates,
which we expect to be positively related to wage inflation: Even if the aggregate unemployment
rate is unchanged, an increase in the dispersion of labor market conditions will raise the
aggregate rate of wage inflation.
In choosing the time frame for estimating (2), we are hampered by the lack of state-level
data before 1977 and of demographic variables after 2000. In addition, to eliminate the
estimation problems associated with the so-called Monetarist experiment period, we include only
5 The variety of Phillips curve specifications is vast; Staiger, Stock, and Watson (2002) alone has dozens of differentPhillips curve specifications and estimates. As Phelps (1968) noted thirty-five years ago, and which is no less truetoday, “(t)he numerous Phillips curve studies of the past ten years have … (offered) countless independent variablesin numerous combinations to explain wage movements. But it is difficult to choose among these econometricmodels, and rarely is there a clear rational for the model used” (p.678).

10
1982 and later. Despite these data restrictions, we are able to obtain the fairly reasonable results
reported by Table 2.
Results for our more general specification – which includes demographic variables and
the coefficient of variation of state unemployment rates – indicate that the education and age
variables have all been important in determining the rate of wage inflation. More importantly for
our present purposes, the results are consistent with our hypothesis that the regional dispersion of
economic activity can affect aggregate wage inflation: The coefficient on the coefficient of
variation of state unemployment is positive and statistically significant.
Table 2 also reports the results when the aggregate Phillips curve is estimated under the
restriction that the coefficient of variation of state unemployment does not matter statistically.
From these results it is clear that this restriction is not supported. When the coefficient of
variation is excluded, the coefficient on only one of the demographic variables – the share of
college graduates – is any where near to being statistically significant. In addition, the constant
term becomes smaller and statistically insignificant, making it very difficult to use the results to
calculate a natural rate of unemployment. In sum, as supported by a likelihood-ratio test
rejecting the null hypothesis that the restriction does not have a statistically significant effect, the
estimates with the coefficient of variation are preferred.
According to Ball and Mankiw (2002), the primary sources of the changes in the natural
rate of unemployment in the 1990s was the acceleration of productivity growth (see also
Pissarides, 2000; Hoon and Phelps, 1997). An additional factor was the changing composition of
the labor force (Phelps and Zoega, 1997; Shimer, 1998; Francesconi, et al, 2000). Our Phillips
curve estimation indicates that the convergence of state labor-market conditions also had a role.
The extent of this role can be obtained by examining the natural rates of unemployment implied

11
by our Phillips curve estimation. Specifically, solving equation (2) by assuming that expected
wage inflation is equal to last year's wage inflation, it can be rewritten as:
( ) itntt
t
t uuww
ε+−α−=
∆ )log()log(1
&; (3)
where ( )[ ]10 /exp α+λ+α= ? FXu nt is the time-variant natural rate of unemployment.6
The trend natural rate from our estimation and the actual trend unemployment rate are
illustrated by Figure 5. According to our results, the natural rate fell steadily between 1982 and
2000, from 6.7 percent to 5.4 percent. Although relatively large, this 1.3 percentage point drop
understates the importance of changes in the dispersion of state-level unemployment rates. This
is because the net effect of the period’s demographic changes on the natural rate was to increase
it. To remove the effect of these changes, the dashed gray line in Figure 5 is what the trend
natural rate of unemployment would have been if the demographic variables had remained fixed
at their 1982 levels.7 As the figure indicates, if all else in the model had remained constant,
changes in the dispersion of state unemployment rates would have lowered the trend natural rate
of unemployment to 4.7 percent by the year 2000.
4. Conclusions
Using state-level data, we find that there is a convex relationship between unexpected
wage inflation and labor-market conditions – as measured by the unemployment rate and
employment growth. This convexity suggests that increases in the cross-state dispersion of
unemployment rates and employment growth mean a higher level of aggregate wage inflation
6 See Staiger, Stock, and Watson (1997) for an analysis of the precision of natural rate estimates.7 Note that because our dependent variable in (2) is wage inflation net of productivity growth, the trend natural ratesshown in Figure 5 are also net of the effect of productivity changes.

12
even if aggregate unemployment and employment growth are unchanged. Finally, we include
the coefficient of variation of state unemployment rates in our estimation of an aggregate Phillips
curve. From this, we find that the convergence of state labor-market performance between 1982
and 2000 was responsible for a two-percentage point drop in the natural rate of aggregate
unemployment.
13
References
Abraham, Katharine and Lawrence Katz (1986), “Cyclical Unemployment: Sectoral Shifts or
Aggregate Disturbances?,” Journal of Political Economy, 94, 507-522.
Ball, Laurence and N. Gregory Mankiw (2002), “The NAIRU in Theory and Practice,” Journal
of Economic Perspectives, 16(4), 115-136.
Beck, Nathaniel and Jonathan N. Katz (1995), “What to Do (and Not To Do) with Time-Series
Cross-Section Data,” American Political Science Review, 89, 634-647.
Bewley, Truman (1999), Why Wages Don’t Fall During a Recession, Harvard University Press.
Brainard, S. Lael and David M. Cutler (1993), “Sectoral Shifts and Cyclical Unemployment
Reconsidered,” The Quarterly Journal of Economics, 108, 219-243.
Card, David and Dean Hyslop (1997), “Does Inflation ‘Grease the Wheels of the Labor
Market’?,” in Christina Romer and David Romer, Eds., Reducing Inflation: Motivation
and Strategy, University of Chicago Press.
Carlino, Gerald and Robert DeFina (1998), "The Differential Regional Effects of Monetary
Policy," Review of Economics and Statistics 80, 572-587.
Carlino, Gerald and Keith Sill (2001), “Regional Income Fluctuations: Common Trends and
Common Cycles,” Review of Economics and Statistics, 83, 446-56.
Crone, Theodore M. (1998/1999), “Using State Indexes to Define Economic Regions in the
U.S.,” Journal of Economic and Social Measurement, 25, 259-75.
Francesconi, Marco, J. Michael Orszag, Edmund S. Phelps, and Gylfi Zoega (2000), “Education
and the Natural Rate of Unemployment,” Oxford Economic Papers, 52, 204-223.
Fratantoni, M. and Scott Schuh (2003), "Monetary Policy, Housing, and Heterogeneous Regional
Markets," Journal of Money, Credit, and Banking, forthcoming.
Friedman, Milton (1968), “The Role of Monetary Policy,” American Economic Review, 58, 1-17.
Hoon, Hian Teck and Edmund S. Phelps (1997) “Growth, Wealth and the Natural Rate: Is
Europe's Jobs Crisis a Growth Crisis?,” European Economic Review, 41, 549-57.
Layard, Richard, Steve Nickell, and Richard Jackman (1991), Unemployment, Oxford University
Press.

14
Lilien, David (1982), “Sectoral Shifts and Cyclical Unemployment,” Journal of Political
Economy, 90, 777-793.
McLaughlin, Kenneth J. (1999), “Are Nominal Wage Changes Skewed Away from Wage
Cuts?,” Federal Reserve Bank of St. Louis Review, 81, 117-132.
Owyang, Michael T., Jeremy Piger, and Howard J. Wall (2003), “Business Cycle Phases of U.S.
States,” Federal Reserve Bank of St. Louis Working Paper 2003-011.
Owyang, Michael T. and Howard J. Wall (2003), “Regional Disparities in the Transmission of
Monetary Policy,” Federal Reserve Bank of St. Louis Working Paper 2003-008.
Overman, Henry G. and Diego Puga (2002), “Unemployment Clusters Across Europe’s Regions
and Countries,” Economic Policy, 17, 115-47.
Phelps, Edmund S. (1968), “Money-Wage Dynamics and Labor-Market Equilibrium,” Journal of
Political Economy, 76, 678-711.
Phelps, Edmund S. (1994), Structural Slumps, Harvard University Press.
Phelps, Edmund S. and Gylfi Zoega (1997), “The Rise and Downward Trend of the Natural
Rate,” American Economic Review, 87, 283-289.
Pissarides, Christopher (2000), Equilibrium Unemployment Theory, second edition, MIT Press.
Shimer, Robert (1998), “Why is the U.S. Unemployment Rate So Much Lower?,” in Benjamin
Bernanke and Julio Rotemberg, Eds., NBER Macroeconomics Annual, vol. 13, MIT
Press, Cambridge.
Staiger, Douglas, James H. Stock, and Mark W. Watson (1997), “How Precise are Estimates of
the Natural Rate of Unemployment?,” in Christina Romer and David Romer, Eds.,
Reducing Inflation: Motivation and Strategy, University of Chicago Press.
Staiger, Douglas, James H. Stock, and Mark W. Watson (2002), “Prices, Wages and the U.S.
NAIRU in the 1990s,” in Alan Krueger and Robert Solow, Eds., The Roaring Nineties,
Russell Sage Foundation.

15
Table 1. Wage inflation and vacancies in a state panel
Coeff. s.e. t
Employment growth 0.0365* 0.0146 2.50
Employment growthsquared
0.0047 0.0036 1.31
Unemployment rate -0.0679* 0.0207 3.28
Unemployment ratesquared
0.0021* 0.0012 1.66
Expected wage inflation 0.5907* 0.0293 20.14
State fixed effects (48) Yes
Observations 4752
Estimated covariances 1176
Estimated Autocorrelations 48
Log-likelihood -4587.42
A ‘*’ indicates statistical significance at the 10 percent level. The estimator is FGLS andcorrects for state-specific autocorrelation and heteroskedasticity with cross-statecorrelations. Quarterly state-level data, 1977.3-2002.1. Indiana and Kansas are excludedbecause of missing earnings data in early years of the sample. For space considerations,we do not report the estimates of the state fixed effects.

16
Table 2. U.S. Phillips curve estimation
Coefficient of Variation andDemographics Demographics Only
Constant -112.326* (57.196) -51.097 (68.513)
Log unemployment rate -3.300* (0.741) -3.036* (0.958)
Coefficient of variation ofstate unemployment rates 0.263* (0.080) -
Share high school dropout 0.957* (0.542) 1.098 (0.817)
Share college graduate 0.542* (0.218) 0.486* (0.242)
Share white -0.044 (1.057) -0.082 (1.389)
Share female 1.645 (1.751) 0.798 (2.561)
Share aged 25-54 0.240* (0.116) 0.005 (0.119)
Expected wage inflation 0.452* (0.059) 0.474* (0.117)
Observations 19 19
Log-likelihood 7.781 1.5662R 0.944 0.8933
White-corrected standard errors are in parentheses. A ‘*’ indicates significance at the 10 percentlevel. Yearly aggregate data, 1982-2000.
17
Figure 1. Quarterly U.S. unemployment and its cross-state coefficient of variation
0
2
4
6
8
10
12
1977.2 1980.2 1983.2 1986.2 1989.2 1992.2 1995.2 1998.2 2001.2
U.S
. une
mpl
oym
ent r
ate
0
1
2
3
4
5
6
Coe
ff. o
f var
iatio
n of
sta
te u
nem
ploy
men
t rat
es
Unemployment Rate
Coefficient of Variation

18
Figure 2. Changes in state unemployment rates during recessions
1981.3 to 1982.4
change in unemp. rate
5.97 to 7.59 (1)4.37 to 5.97 (7)2.77 to 4.37 (19)1.17 to 2.77 (16)
-0.43 to 1.17 (7)
1990.2 to 1992.3
change in unemp. rate
4.37 to 6.62 (2)2.1 to 4.37 (15)
-0.17 to 2.1 (31)-2.44 to -0.17 (2)
2000.4 to 2002.1
change in unemp. rate
2.09 to 3.22 (7)0.95 to 2.09 (19)
-0.19 to 0.95 (19)-1.33 to -0.19 (5)
19
Figure 3. Wage inflation and employment growth
-0.2
0.0
0.2
0.4
0.6
0.8
1.0
1.2
-5 -3 -1 1 3 5 7 9 11
employment growth
wag
e in
flat
ion
Figure 4. Wage inflation and the unemployment rate
-0.6
-0.5
-0.4
-0.3
-0.2
-0.1
02 6 10 14 18
unemployment rate
wag
e in
flat
ion

20
Figure 5. The falling U.S. natural rate, 1982-2000
4
5
6
7
8
9
1982 1985 1988 1991 1994 1997 2000
8.9
4.2
6.7
5.4
Trend Unemployment Rate
Trend Natural Rate
4.
Trend Natural Ratewith fixed Demographics
Related Documents


![[PPT]Business Cycles, Unemployment, and Inflationeconjchs.weebly.com/uploads/4/7/6/3/476385/chap026__1_.ppt · Web viewTitle Business Cycles, Unemployment, and Inflation Author Stephanie](https://static.cupdf.com/doc/110x72/5afb10287f8b9aac2490aeb1/pptbusiness-cycles-unemployment-and-viewtitle-business-cycles-unemployment.jpg)

