User Guide, DistrictBuilder Mapping Platform September 2018 Congratulations! You’ve decided to make your voice heard about what democracy in Pennsylvania should look like. This guide will help you use the DistrictBuilder mapping platform to make your own congressional map based on your common sense and your values. Then you can enter in the the Draw the Lines PA public mapping competition. For a while, political operatives have used powerful software and data to create election maps whose main goal was to keep their bosses in power. They used to be the only ones with the resources to draw maps so precisely. Now, we’re bringing those tools to you, for free. We won’t kid you. Using DistrictBuilder to map the entire state will require some time and work. But your effort will pay off. It will set you up to play a significant role in how maps are drawn during the redistricting process in 2021. It will show you another way to use your voice to affect the issues you care about. And you might just win some cash in the bargain. Our first recommendation: Print this guide out, it’ll be easier to follow instead of flipping between windows. So, let’s dive in and help save democracy in Pennsylvania! Step 1 - Familiarize yourself with the Draw the Lines mapping competition Your map could win up to $5,000 if it wins on both the regional and state level. It will be judged on quantitative and qualitative factors and by age. Read our draft competition rules and judging criteria. You can certainly do a map without entering, but … why not? To complete a valid map, you have to map all 18 of PA’s congressional districts. Step 2 - Identify your mapping priorities Every election map is a statement about what the mapper cares about most. The PA congressional map drawn in 2011 aimed to elect as many Republicans as possible, while protecting certain Democratic incumbents. Those crazy lines that produced Donald Kicking Goofy were no accident. So before you start mapping, take a minute to identify your priorities: For example: 1

Welcome message from author
This document is posted to help you gain knowledge. Please leave a comment to let me know what you think about it! Share it to your friends and learn new things together.
Transcript
User Guide, DistrictBuilder Mapping Platform September 2018
Congratulations! You’ve decided to make your voice heard about what democracy in Pennsylvania should look like. This guide will help you use the DistrictBuilder mapping platform to make your own congressional map based on your common sense and your values. Then you can enter in the the Draw the Lines PA public mapping competition. For a while, political operatives have used powerful software and data to create election maps whose main goal was to keep their bosses in power. They used to be the only ones with the resources to draw maps so precisely. Now, we’re bringing those tools to you, for free. We won’t kid you. Using DistrictBuilder to map the entire state will require some time and work. But your effort will pay off. It will set you up to play a significant role in how maps are drawn during the redistricting process in 2021. It will show you another way to use your voice to affect the issues you care about. And you might just win some cash in the bargain.
Our first recommendation: Print this guide out, it’ll be easier to follow instead of flipping between windows.
So, let’s dive in and help save democracy in Pennsylvania!
Step 1 - Familiarize yourself with the Draw the Lines mapping competition Your map could win up to $5,000 if it wins on both the regional and state level. It will be judged on quantitative and qualitative factors and by age. Read our draft competition rules and judging criteria. You can certainly do a map without entering, but … why not? To complete a valid map, you have to map all 18 of PA’s congressional districts.
Step 2 - Identify your mapping priorities Every election map is a statement about what the mapper cares about most. The PA congressional map drawn in 2011 aimed to elect as many Republicans as possible, while protecting certain Democratic incumbents. Those crazy lines that produced Donald Kicking Goofy were no accident. So before you start mapping, take a minute to identify your priorities: For example:
1

● “I want the Lehigh Valley to have its own district.” ● “I want as many competitive districts as possible.” ● “I believe a map should respect existing county boundaries as much as possible.” ● “I want to create at least two majority-minority districts.”
Our recommendation: Try “Flashes of Insight,” an activity that encourages you to consider the values that go into creating a voting map. Go through the flashcards and order the values that you would prioritize. If possible, do it with a small group; no doubt, you’ll hear different opinions that can inform your thinking.
Step 3 - Get started Go here to sign up: map.drawthelinespa.org. DistrictBuilder is designed to be used on a desktop or laptop; it is not yet user-friendly on a mobile device or tablet. Sign up to create an account and draw your own map. For now, you cannot do much as a guest, so it’s best to ignore that option.
Step 4 - Select your mapping template In Box 2, you can select one of three templates:
1. A “Blank” slate of the commonwealth, without any lines. 2. The “Old” map, in use since 2012 and drawn by the PA legislature. 3. The “New” map that is the set of district lines drawn in 2018 after the PA Supreme Court
overturned the “Old” map.
Our recommendation: Start with a blank map; that’s the simplest path to doing you first map. As you get comfortable with DistrictBuilder, you can try other approaches.
2

Give your map a name in Box 3, and press "Start Drawing".
If you leave and later return, retrieve your map from “My Maps” in Box 1. There is no limit to the number of maps you can draw.
Step 5 - Get comfortable with features On the blank map, you’ll first see PA’s 67 counties. As you zoom, you’ll soon see census tracts. Counties and census tracts are the two mapping units that you will use to create your districts. These are shaded by total population. Darker = more people.
Counties (zoomed out)
Census Tracts (zoomed in)
Our recommendation: From the blank map template, work at the county level to draw a basic map, and then zoom to the census tract level to refine it to meet your goals.
3

Next, take a look at the box with “Transparency” and “Basemap” labels.
The Transparency tool is a slider. Take the blue circle and move it along the slider. See what happens? When the slider is all the way to the left, you are seeing the map of counties and, when zoomed in, census tracts that you are using to draw your map. When the slider is all the way to the right, you’re seeing one of three possible choices. They’re listed in the row beneath the slider. You choose which one you want to view by clicking the name. The Topo map shows Pennsylvania’s natural features like mountains, valleys, and rivers. The Road map shows Pennsylvania’s roadways. And the Municipality map shows PA’s municipal boundaries. *Note: the municipality map only populates when you’re zoomed in several levels. Play around with the slider and each of the three choices between Topo/Road/Municipalities. This will be helpful when you are trying to put certain municipalities together or figuring out which roads or geography creates natural boundaries.
4

Step 6 - Get comfortable with your most frequent commands
1. Pan: Select this button to pan across the map. 2. Info: Click here, and then click on a county or tract (based on zoom level) to get key stats. 3. Polygon Select: To select multiple jurisdictions, click this button. Hold and trace to touch each
unit that you want to include. This is the tool to use to start sketching out your districts at the county level. Note: This button is NOT used for selecting the shape of your district. Only for touching all jurisdictions that you want to include in your selection. Try it out and get a feel for it.
4. Single Select: Use this button to select a single jurisdiction. This is helpful to move a single unit from one district to another, particularly to fine-tune your map.
Quick note: If you are having problems with ‘Polygon Select’, an alternative is to select the ‘Single Select’ and then press+hold the Shift button to select multiple jurisdictions, one at a time.
To assign jurisdictions to a district, you have two options:
5. Select your jurisdictions. Go to Assign to District in the toolbar. Select either a New District or an already existing one. This is best for creating a new district.
6. Make your selection, and click Click and Drag. Then click and drag your selection into a previously created district. This is best for moving selections to already created districts. Note: To use Click and Drag, you need to first select the “Click and Drag” button, then select how you want to select districts (Single or Polygon). Then single click on the unit you want to move. Then grab and drag that district. A little counter-intuitive, we get it. But you’ll get used to it.
5
7. Make a bad move? Click the Undo button on the top right side.
Our recommendation: Use ‘Polygon Select’ and ‘Assign to District’ to build the general look of your map. Again, it’s best to do this on the county level. Then fine-tune with Single Select and Click and Drag. It’s best to your fine-tuning on the census tract level.
Lastly, you don’t have to save your map; it saves automatically. Neat, right?
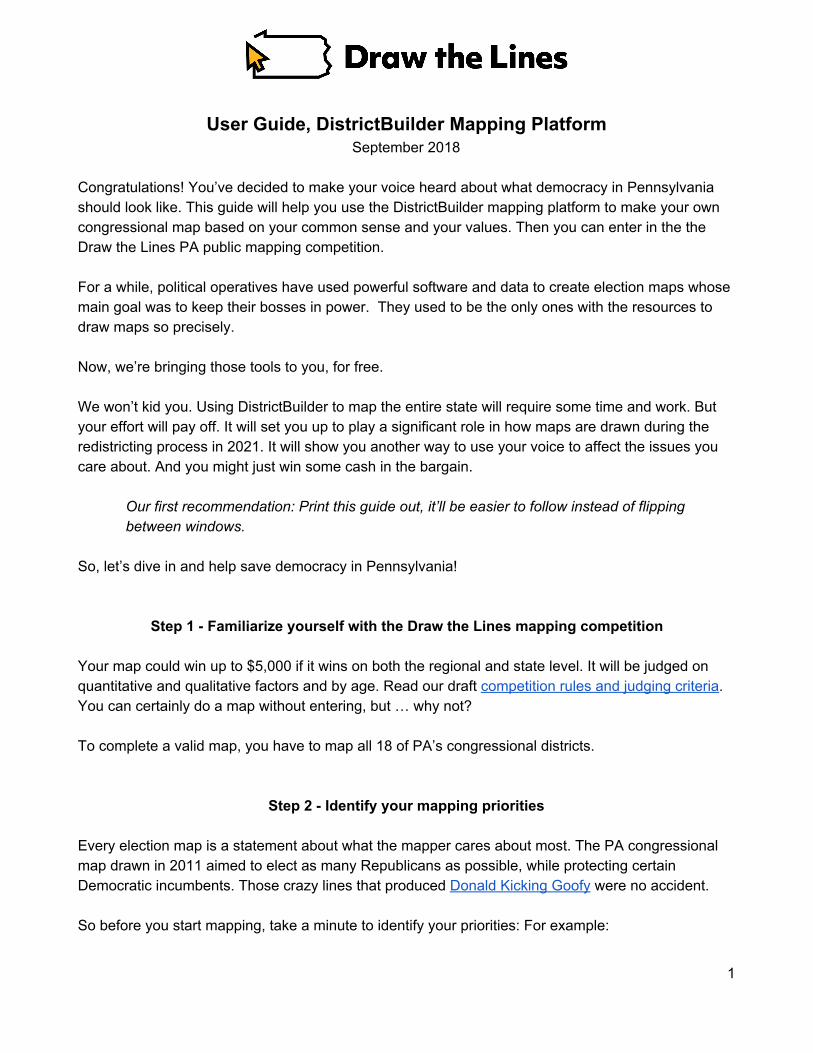
Step 7 - Pro Tip for checking how you’re doing The Statistics box on the right side contains both state and district-level details that will update with every move you make. You can select which table of district-level stats you see.
The default table is called “Basic Information,” which includes a district’s total population, it’s compactness score, and if it is contiguous. A can also view competitiveness and demographics tables. Mappers can additionally save your own sets (up to three). Click ““Edit Display Stats” (upper right corner) to select three metrics that you can monitor as you update each district.
Our recommendation: Use the priorities that you identified in Step 2 to build out your stats panel.
*Note: To see your splits, go into “District Tools,” the second tab on the task bar above the map. Select “Generate Splits Report.” This presents your total county splits at the top of the report and gives you a district-by-district read-out of which counties are split by each district.
6
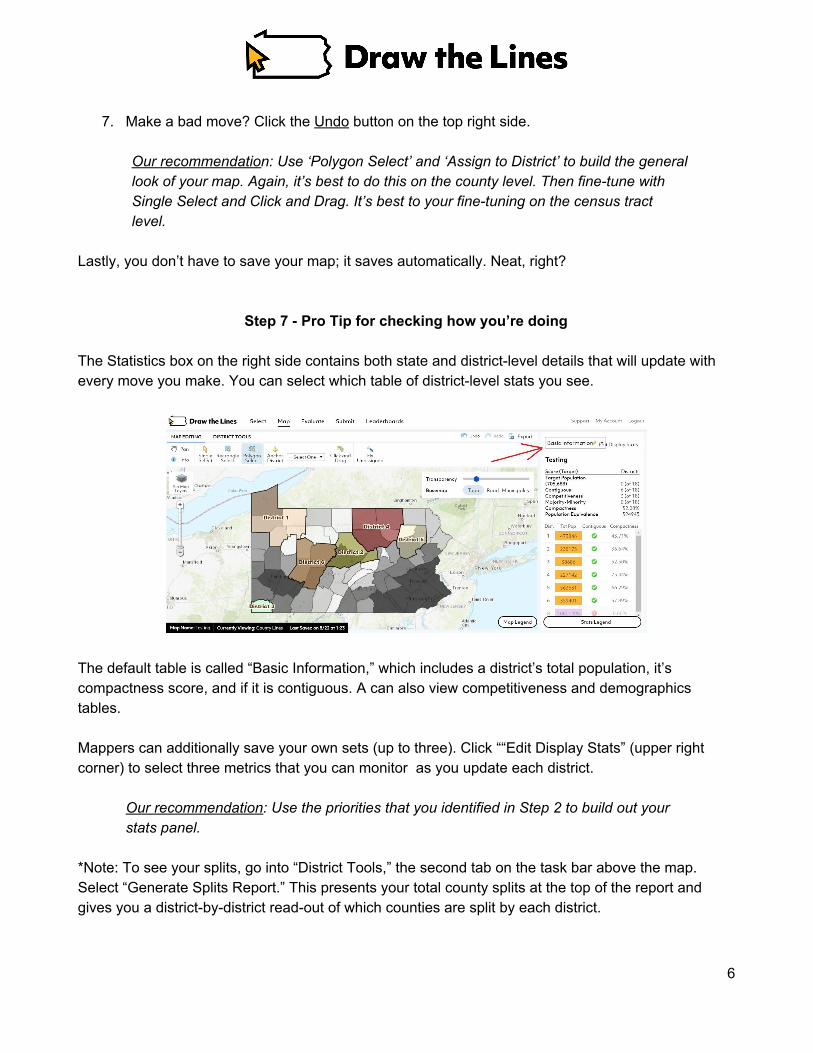
Step 8 - Let’s map! PA’s full congressional map has 18 districts. To complete your map, you’ll need to do all 18 as well. Our testing shows that creating a valid map but without any fine-tuning usually takes 2-3 hours, depending on the individual. Fine-tuning is up to each individual mapper.
Our recommendation: It’s best to create and number your districts in some geographic order. This will help you keep order as you move across PA.
Our recommendation: Again, it’s best to start with counties. Draw a rough district, say within +/- 50,000 of the target population, and then move on. You can fine-tune later.
All 18 districts must have a population between 702,160 and 709,216. This is +/- 0.5% of the exact target population, 705,668. As you get close to finishing, it’s possible that you missed a small census tract somewhere. The stats panel will show you at the bottom, beneath all individual district stats, how many people are not assigned to any of the districts you’ve created (see the red arrow). If you want to see where they are, click on that part of the table where the population is still unassigned (the bottom of the stats table). You will see a blue outline on the map of jurisdictions that aren’t assigned. Alternatively, the handy-dandy “Fix Unassigned” button will do it for you. Click that, and the software will automatically apply any unassigned jurisdictions to their nearest district.
7

Step 9 - Evaluate page… feel free to skip that.
After you map, you can run different reports in the “Evaluate” page. This is feature for people who really like to dig into the details.
Our recommendation: As we enhance DistrictBuilder in the coming weeks, you’ll be able to see your metrics on a link you’ll receive after you submit your map in Step 8, so unless you really want to nerd out, you can skip this step for simplicity’s sake.
Step 10 - Validating and submitting your map When you are satisfied with your map, click on “Submit” on the very top menu bar. Click on Validate to check to be sure that your map meets both of the equal population and contiguity requirements.
If your map is valid, then you’ll be able to submit your map to our leaderboard, which will give you immediate feedback on how your map stacks up to other maps that have entered. Write your personal statement or complete a video about what values you prioritized, how you demonstrated those in your map, and who you talked to around PA to help you understand new and diverse viewpoints about how others want to be represented.
Our recommendation: Spend some time with the personal statement. It’s a crucial piece to how your map will be judged. Refresh your memory again by looking at our competition details.
8

Step 11 - Leave feedback Now that you’ve taken DistrictBuilder for a test-drive, we want to hear about your experience. Go to http://dtlfeedback.org/ and let us know what you think of it. We very much appreciate your feedback!
9

DistrictBuilder-Specific FAQs Can I use a tablet or mobile device to draw a map? This current version of DistrictBuilder was designed only for laptop or desktop computers. DistrictBuilder was originally developed in 2011, ages ago in the digital world. Azavea, the firm that built it, is working on a full update. But, given all the news about gerrymandering in Pennsylvania, this year, we felt some urgency to put this tool in your hands so you could begin mapping. So for now, we’ve chosen to take the old car out of the garage, give it a tuneup and some new tires and put it out on the road. No, it’s not a Tesla, but it’ll get you there. Also, this isn’t a “computer game.” Fortnite doesn’t have to worry about the competition. It’s just a useful tool to help you show what voters can do when someone gives them a proper chance. For teachers: How can students sign up for an account? We recommend creating an email address (like Google) for each classroom that will be drawing a map. That email address can be tied to multiple usernames and passwords if you are breaking the classroom into smaller teams. What if the district I drew stinks, and I want to redo it? Go into “District Tools” (the second tab on the menu bar above the map). Click on “Unassign District.” Then click anywhere on the district you want to clear, and select OK when it asks for confirmation that you want to unassign all parts of that district. Voila. How am I going to map the whole state if I don’t know anything about other parts of PA? Draw the Lines has a wealth of resources to help you out, including our crowd-sourced Hometown Portrait project and, coming soon, our community user forum to connect you with resources to map the entire commonwealth. What does a map need to be valid for the competition? It needs to meet two criteria: (1) it falls within +/- 0.5% of the target population (Pennsylvania’s total population divided by our number of congressional districts, 18); and (2) the district is contiguous, meaning it is a single, unbroken shape. Doesn’t the constitution require that populations across congressional districts in one state be exactly the same? Close. According to redistricting expert Justin Levitt: “states must make a good-faith effort to draw districts with exactly the same number of people in each district within the state.” Because
10

DistrictBuilder mappers can’t go below the census tract level, it’s not realistic to expect you to create equally populated districts down to the person. We believe that a 0.5% acceptable range was satisfactory. Will these maps be constitutional? The maps you will draw will reflect the broad principles that define a constitutional map, including compactness, contiguity, equal population, respect for majority-minority districts as required by the Voting Rights Act of 1965, and honoring jurisdictional boundaries. Because mappers are using larger base geounits (census tracts instead of voting precincts), these maps are meant for engagement and education, not the kind of precision that would stand up to a legal challenge. Over the next three years, we hope to keep improving the tool. Your feedback can help us do that. As Draw the Lines and Azavea work together to raise more funds, they aim to build a DistrictBuilder 2.0, which will allow users to build maps that will be fully updated and modernized, along with the use of 2020 Census data. Is this available to people outside of Pennsylvania? Yes, anyone is welcome to draw their map. However, the competition is only open to Pennsylvania residents. Why can’t I use municipalities as a base geounit to create my map? Two answers, one technical and one for user experience. DistrictBuilder requires that all of the geographies loaded into the configuration nest perfectly within each other. Voting precincts -> Municipalities -> Counties don't all roll-up and nest perfectly. Fixing this would have required a significant investment in time and money that the project does not currently have (but hopes to with the next version of DistrictBuilder by 2020). As for user experience… municipalities and voting precincts are much more convoluted in Pennsylvania than census tracts, and boundary irregularities made creating contiguous maps very challenging. Given that the mission of Draw the Lines is to create a project open to people of all ages and levels of sophistication to start a conversation about redistricting, we felt it best to minimize any confusion or frustration. We think it would be better to get 1,000 less-than-perfect-but-meaningful maps, rather just 10 perfect ones. However, we worked with Azavea to include a PA municipality map as one of the basemaps that a mapper can refer to as they draw their districts. Using the transparency slider, a mapper can see which municipalities are included in each district, and can move census tracts accordingly.
11

What data does this platform use? For now, DistrictBuilder is using the 2010 United States Census data. For later competitions, we plan to add later data sets. What should be my targets for each metric in the panel?
● Target Population: All 18 districts must have a population between 702,160 and 709,216. This is +/- 0.5% of the exact target population, 705,668.
● Contiguous: All 18 districts must be contiguous (represented by a green check mark). ● Competitiveness: This is subjective, and will not be a judging feature unless the mapper
explicitly states that it was a top priority that they attempted to reflect on their map. We considered a district that has +/- 5% difference between registered Democrats and registered Republicans to be competitive.
● Majority-Minority: There is not a required number of districts that Pennsylvania needs in which the majority of its population is comprised of people of color. However, the Voting Rights Act of 1965 protects minority groups from having the power of their vote diluted, so that they can have regular and meaningful opportunities to elect a candidate of their choice. DistrictBuilder defines a majority-minority district as one in which people who are nonwhite ethnicities are in the majority. Because it is subjective, it will not be a judging feature unless the mapper explicitly states that it was a top priority that they attempted to reflect on their map.
● Compactness: As close to 100% as possible. DistrictBuilder uses the Polsby-Popper method for determining compactness. Read more about it here.
● Population Equivalence: 0. This measures the difference between your smallest district and your largest. It is not mentioned explicitly in the Pennsylvania or U.S. Constitutions, but it helps demonstrate your skill in getting your populations as equal as possible.
What about jurisdictional splits? The Pennsylvania State Constitution states that “Unless absolutely necessary no county, city, incorporated town, borough, township or ward shall be divided in forming… a district.” However, as we saw, the political operatives stretched those rules egregiously, creating hundreds of splits across the state in 2011. DistrictBuilder measures county splits, but due to computing limitations, they are not automatically tabulated like the other metrics. Instead, to see your splits, go into “District Tools,” the second tab on the task bar above the map. You can see which counties are split by selecting “Show Splits.” Counties that are split are then highlighted in blue. To see the total number of splits, select “Generate Splits Report.” Click Generate Report at the bottom of the pop-up. This gives you a district-by-district read out of which counties are split by this district, and your total splits at the top of the report.
12

Your goal should be to keep this as low as possible, and it will be a feature for judges to consider. (Don’t worry, you’ll have to split Philadelphia County, as there are more than 709,216 people in the City of Brotherly Love.) Why can’t I measure municipality splits? Because we did not have the time or resources to edit the platform to include municipalities as a geounit (see the previous question on this issue), we are unable to measure splits. However, using the municipality base map and the transparency slider, you can work to minimize those splits yourself, despite their not being a digital measurement for how many you have generated. Why do you have voter registration data and not election results? We tossed and turned over this one. Ultimately, we agree with the reform proposal that previous election results should not be considered in the creation of future maps. However, we know that some citizen mappers will want to see the political impact their maps would have. So we compromised. Can I take a district map from another program and upload it? Yes, you can upload it in the “Select” section on the very top tool bar, right after you first login. Go to “Upload Map.” Then upload your District Index File, and your map will be transferred to DistrictBuilder. The order of the districts in the statistics panel keeps changing. Why? Districts are shown in the table based on visibility on the map. So if your current zoom level includes Districts 2,4,6, and 7, those will be the top four districts listed on the statistics panel.
13
Related Documents