U. S. Department of Transportation Pipeline and Hazardous Materials Safety Administration www.dot.go v

U. S. Department of Transportation Pipeline and Hazardous Materials Safety Administration .
Dec 17, 2015
Welcome message from author
This document is posted to help you gain knowledge. Please leave a comment to let me know what you think about it! Share it to your friends and learn new things together.
Transcript

U. S. Department of Transportation
Pipeline and Hazardous Materials Safety Administration
www.dot.gov
Pipeline Safety Data
“Thoughts on PHMSA Data”
Karen Butler
Pipeline Safety Trust ConferencePerformance Evaluation Group
Office of Pipeline Safety

Mistake in Steelers game costs some bettors bigThe Associated Press Tuesday, November 18, 2008; 8:08 AM (Washington Post)
SCORE: 11 to 10

Thoughts on Data
Confusing . . . . . . So Why Look At Data?Where is the Data and Does It Say Anything?Seen Anything Lately?
PEG Some Recent Data
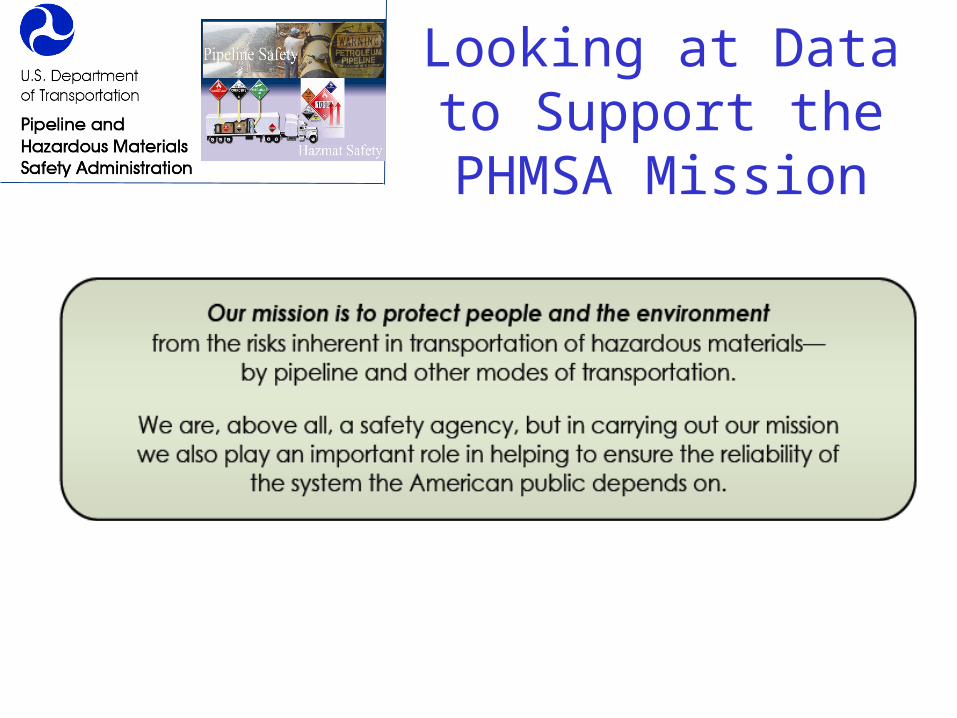
Looking at Data to Support the PHMSA
Mission
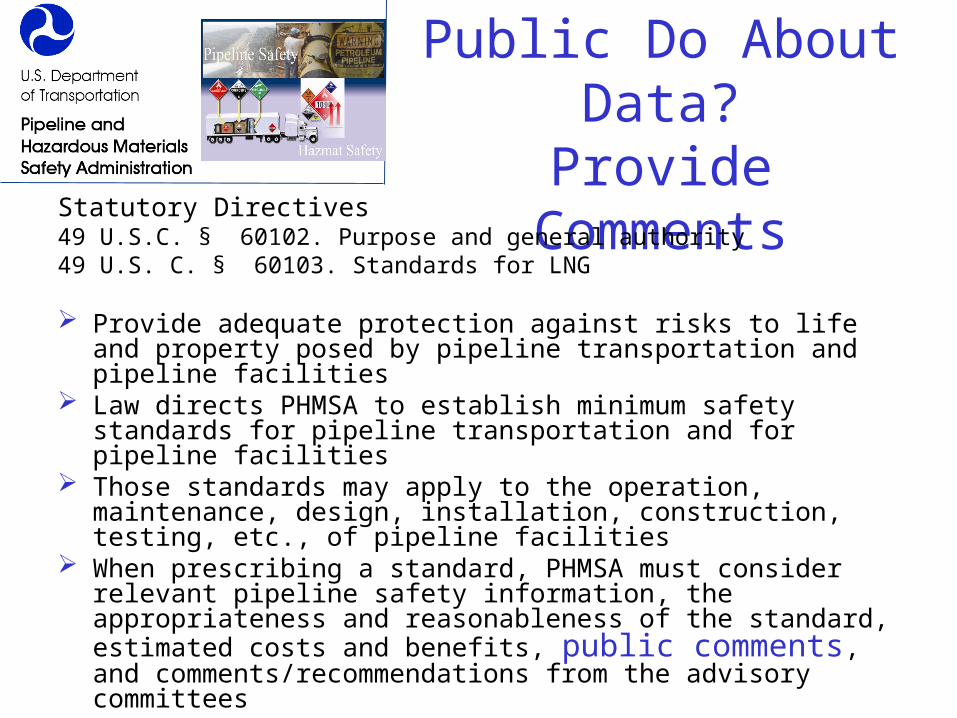
What Can the Public Do About Data?
Provide CommentsStatutory Directives49 U.S.C. § 60102. Purpose and general authority49 U.S. C. § 60103. Standards for LNG
Provide adequate protection against risks to life and property posed by pipeline transportation and pipeline facilities
Law directs PHMSA to establish minimum safety standards for pipeline transportation and for pipeline facilities
Those standards may apply to the operation, maintenance, design, installation, construction, testing, etc., of pipeline facilities
When prescribing a standard, PHMSA must consider relevant pipeline safety information, the appropriateness and reasonableness of the standard, estimated costs and benefits, public comments, and comments/recommendations from the advisory committees

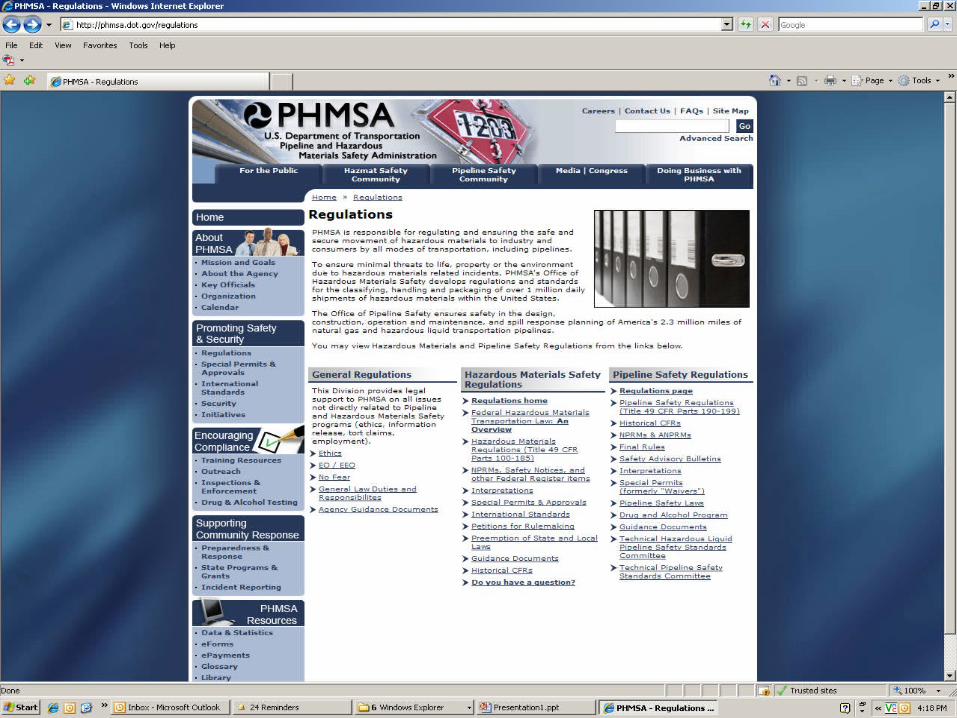
What Can We See with PHMSA Data?
Shows Jurisdictional Transmission Lines by County Regulations, Forms, Form Instructions, Definitions Identifies Who Implements Inspection Presents Accidents/Incidents detail from an Operator’s
perspective Highlights activities that transpire while operators
work to meet the regulations Identifies which operators realize that they have
jurisdictional facilities Provides insight regarding a particular state’s activities Enforcement Activities

What Can We See with PHMSA Data?
Shows Jurisdictional Transmission Lines by County Regulations, Forms, Form Instructions Identifies Who Implements Inspection Presents Accidents/Incidents detail from an Operator’s
perspective Highlights activities that transpire while operators
work to meet the regulations Identifies which operators realize that they have
jurisdictional facilities Provides insight regarding a particular state’s activities Enforcement Activities
NPMS
What Can We See with PHMSA Data?
Shows Jurisdictional Transmission Lines by CountyRegulations, Forms, Form Instructions, Definitions Identifies Who Implements Inspection Presents Accidents/Incidents detail from an Operator’s
perspective Highlights activities that transpire while operators
work to meet the regulations Identifies which operators realize that they have
jurisdictional facilities Provides insight regarding a particular state’s activities Enforcement Activities

Outreach Stakeholder
Communications
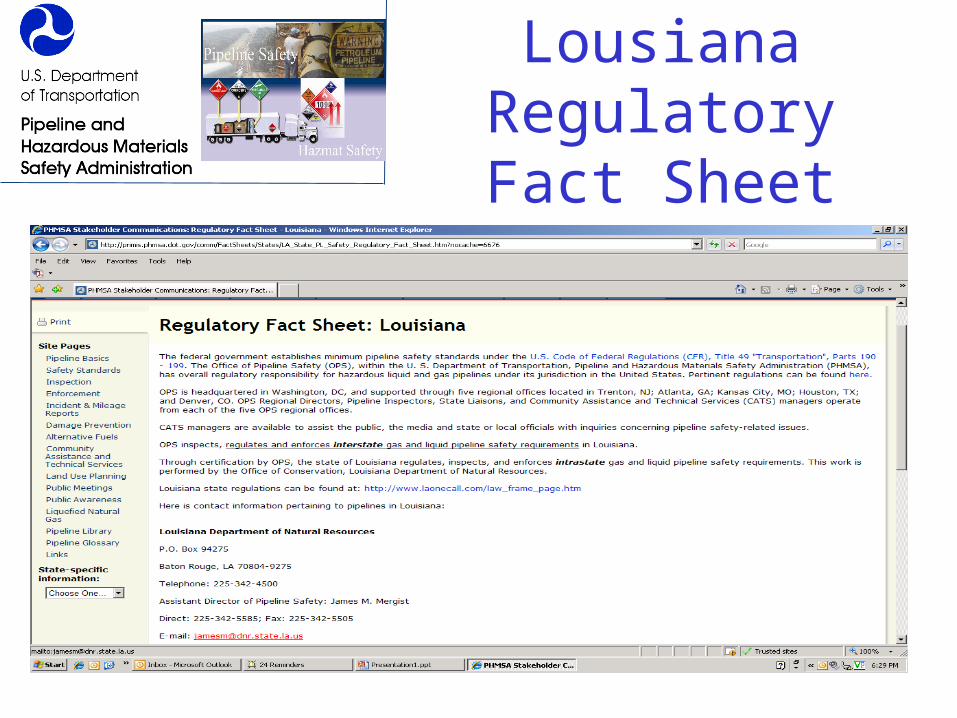
Lousiana RegulatoryFact Sheet
What Can We See with PHMSA Data?
Shows Jurisdictional Transmission Lines by CountyRegulations, Forms, Form Instructions Identifies Who Implements Inspection Presents Accidents/Incidents detail from an Operator’s
perspective Highlights activities that transpire while operators
work to meet the regulations Identifies which operators realize that they have
jurisdictional facilities Provides insight regarding a particular state’s activities Enforcement Activities
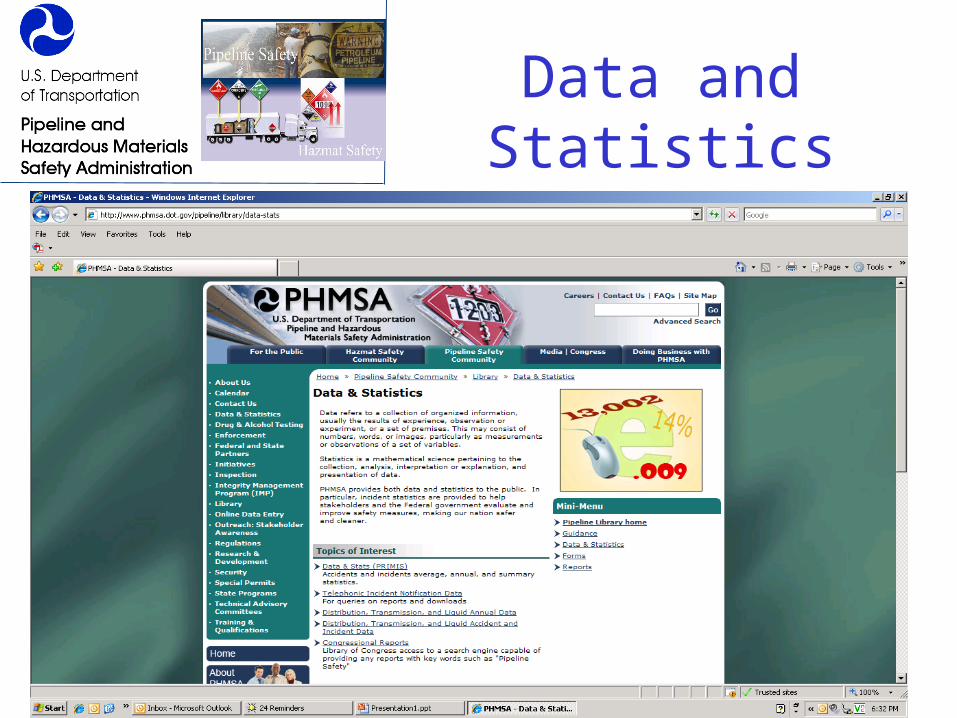
Data and Statistics

What Can We See with PHMSA Data?
Shows Jurisdictional Transmission Lines by CountyRegulations, Forms, Form Instructions Identifies Who Implements Inspection Presents Accidents/Incidents detail from an Operator’s
perspective Highlights activities that transpire while operators
work to meet the regulations Identifies which operators realize that they have
jurisdictional facilities Provides insight regarding a particular state’s activities Enforcement Activities

Gas Integrity Management

Liquid Integrity Management

What Can We See with PHMSA Data?
Shows Jurisdictional Transmission Lines by CountyRegulations, Forms, Form Instructions Identifies Who Implements Inspection Presents Accidents/Incidents detail from an Operator’s
perspectiveHighlights activities that transpire while operators
work to meet the regulations Identifies which operators realize that they have
jurisdictional facilities Provides insight regarding a particular state’s activities Enforcement Activities

Outreach Stakeholder
Communications

What Can We See with PHMSA Data?
Shows Jurisdictional Transmission Lines by CountyRegulations, Forms, Form Instructions Identifies Who Implements Inspection Presents Accidents/Incidents detail from an Operator’s
perspectiveHighlights activities that transpire while operators
work to meet the regulations Identifies which operators realize that they have
jurisdictional facilities Provides insight regarding a particular state’s activities Enforcement Activities
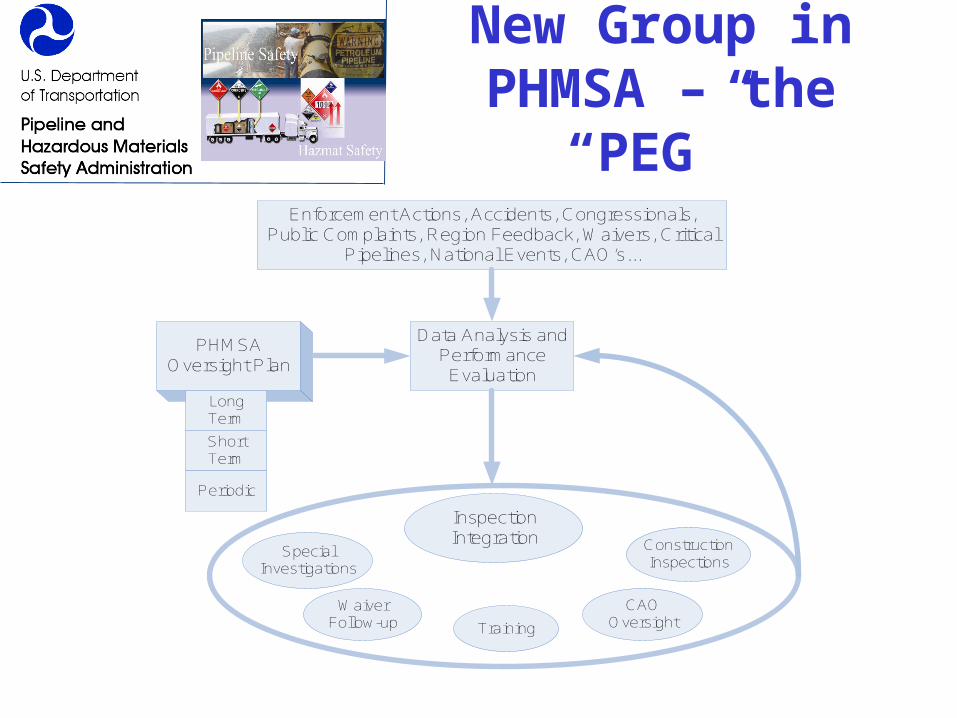
New Group in PHMSA – the “PEG”
Enforcement Actions, Accidents, Congressionals, Public Complaints, Region Feedback, Waivers, Critical
Pipelines, National Events, CAO’s...
Data Analysis and Performance Evaluation
PHMSA Oversight Plan
Long Term
Short Term
Periodic
Inspection Integration
Special Investigations
Waiver Follow-up Training
Construction Inspections
CAO Oversight
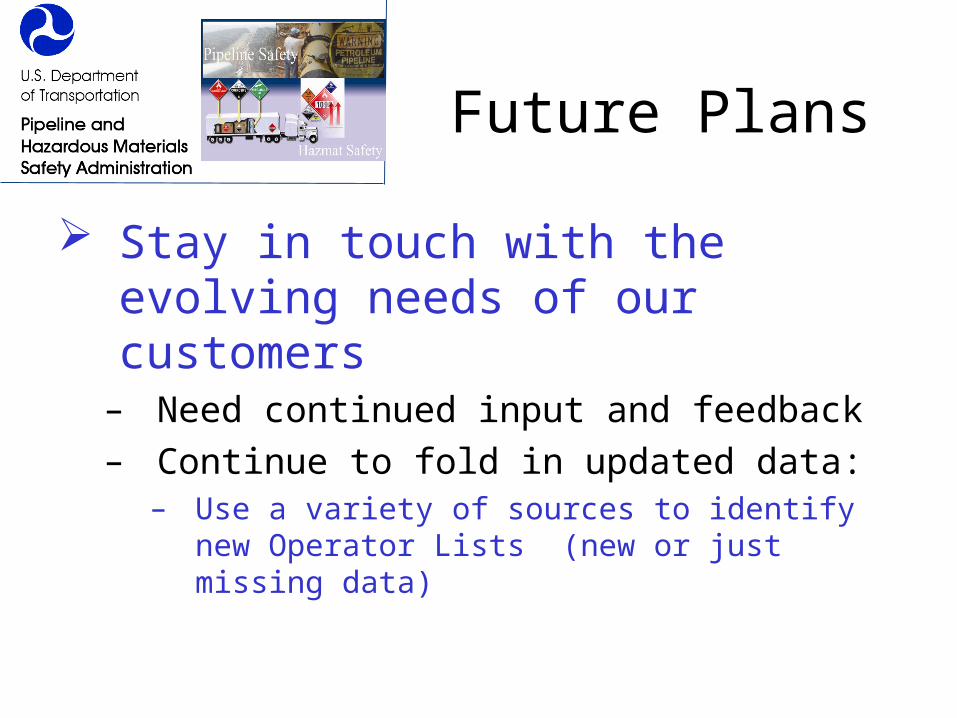
Future Plans
Stay in touch with the evolving needs of our customers
– Need continued input and feedback – Continue to fold in updated data:
– Use a variety of sources to identify new Operator Lists (new or just missing data)
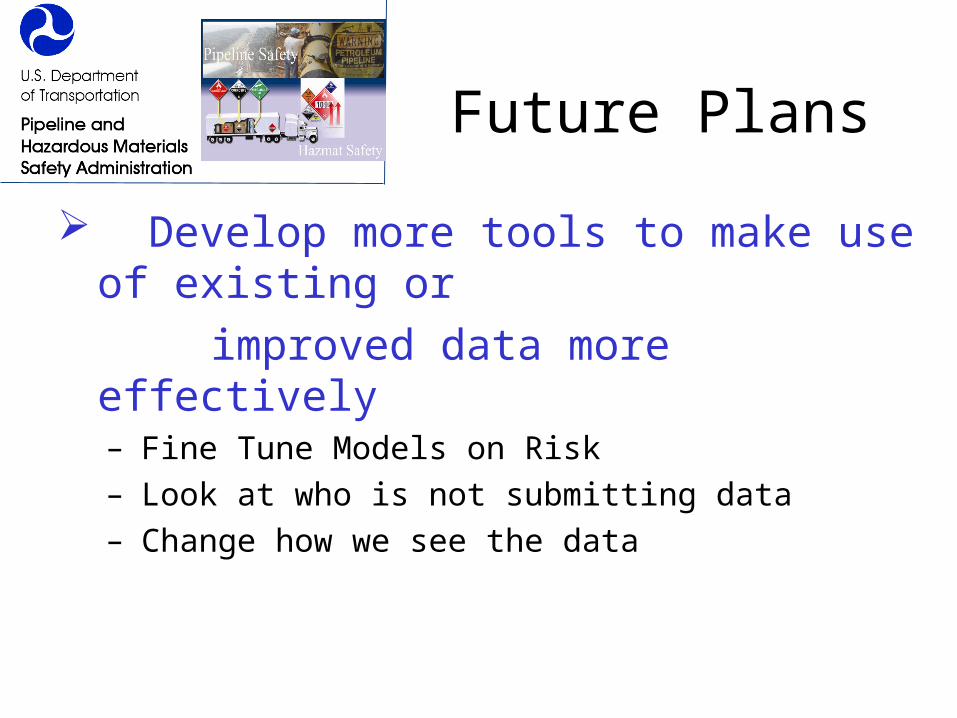
Future Plans
Develop more tools to make use of existing or
improved data more effectively– Fine Tune Models on Risk
– Look at who is not submitting data
– Change how we see the data

Future Plans
Assist in defining and updating required data– What repeat enforcement actions exist and does this
lead to changes that may be needed?
Continue work to define and share Region best practices

Some Items Data Revealed Lately

Data Trends
43 42 40 38
0102030405060708090
100
Serious Pipeline IncidentsInvolving Death or Injury (1998-2007)
Targets 2006-2009 Actual + 2007 Projected
Proj
ecte
d
Source: DOT/PHMSA Incident Data, as of Dec. 21, 2007
43 42 40 38
0102030405060708090
100
Serious Pipeline IncidentsInvolving Death or Injury (1998-2007)
Targets 2006-2009 Actual + 2007 Projected
Proj
ecte
d
Source: DOT/PHMSA Incident Data, as of Dec. 21, 2007
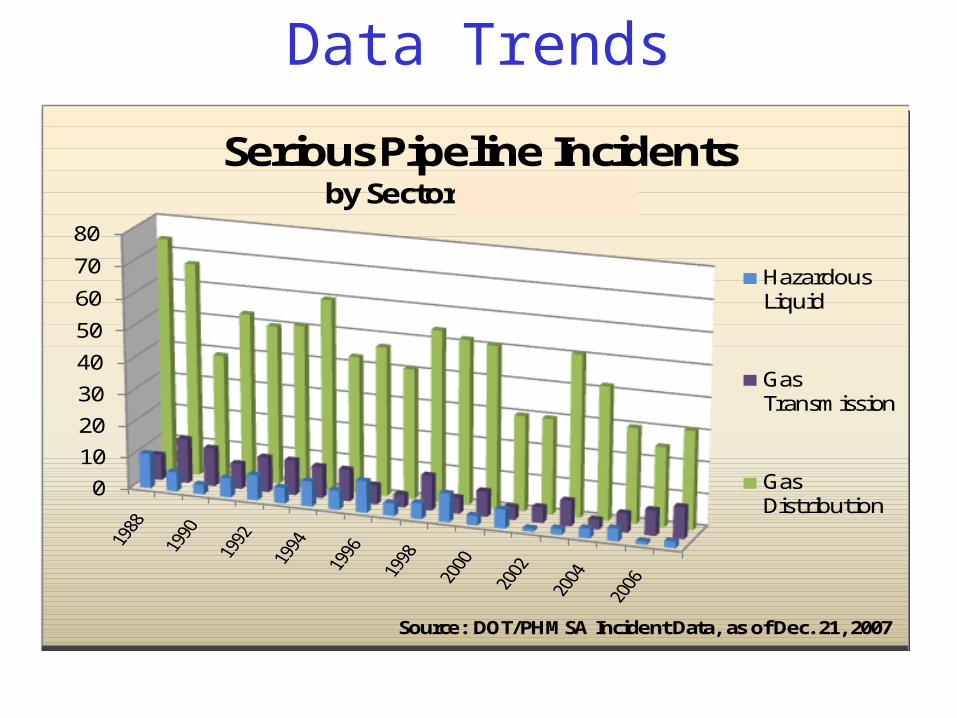
Data Trends
01020
30
40
50
60
70
80
Serious Pipeline Incidents by Sector (1998-2007)
Hazardous Liquid
Gas Transmission
Gas Distribution
Source: DOT/PHMSA Incident Data, as of Dec. 21, 2007
01020
30
40
50
60
70
80
Serious Pipeline Incidents by Sector (1998-2007)
Hazardous Liquid
Gas Transmission
Gas Distribution
Source: DOT/PHMSA Incident Data, as of Dec. 21, 2007

Data Trends

Data Trends

Working TogetherExcavation

Civil Penalty Provision?
Source: One-Call Systems International Committee of the Common Ground Alliance

Total Mileage by System2004 - 2007
0
10000000
20000000
30000000
40000000
50000000
60000000
70000000
GasTransmission
HazardousLiquids
GasDistribution
(Main)
GasDistribution
(Service)
2004 2005 2006 2007

Total Mileage by System2004 - 2007
0
200000
400000
600000
800000
1000000
1200000
1400000
Gas Transmission Hazardous Liquids Gas Distribution(Main)
2004 2005 2006 2007

Average Mile of Pipes by DecadeFor Gas Transmission
0
10
20
30
40
50
60
70
80
90
2004 2005 2006 2007
UNK Pre 1940s 1940s 1950s 1960s 1970s 1980s 1990s 2000s

Change in Decade of Pipe UsedGas Transmission 2004 - 2007
0
2000
4000
6000
8000
10000
12000
UNK Pre1940s
1940s 1950s 1960s 1970s 1980s 1990s 2000s
2004 2005 2006 2007

Average Mile of Pipes by Decade For Gas Distribution (Main)
0
20
40
60
80
100
120
140
160
180
2004 2005 2006 2007
UNK Pre 1940s 1940s 1950s 1960s 1970s 1980s 1990s 2000s

Change in Decade of Pipeline Used Gas Distribution (Main) 2004 - 2007
0
20
40
60
80
100
120
140
160
180
UNK Pre1940s
1940s 1950s 1960s 1970s 1980s 1990s 2000s
2004 2005 2006 2007

Average Mile of Pipes by Decade For Gas Distribution (Service)
0
2000
4000
6000
8000
10000
12000
2004 2005 2006 2007
UNK Pre 1940s 1940s 1950s 1960s 1970s 1980s 1990s 2000s

Change in Decade of Pipeline UsedGas Distribution (Service) 2004 - 2007
0
2000
4000
6000
8000
10000
12000
UNK Pre1940s
1940s 1950s 1960s 1970s 1980s 1990s 2000s
2004 2005 2006 2007

Average Mile of Pipes by Decade For Hazardous Liquids
0
20
40
60
80
100
120
2004 2005 2006 2007
UNK 1920s 1930s 1940s 1950s 1960s 1970s 1980s 1990s 2000s
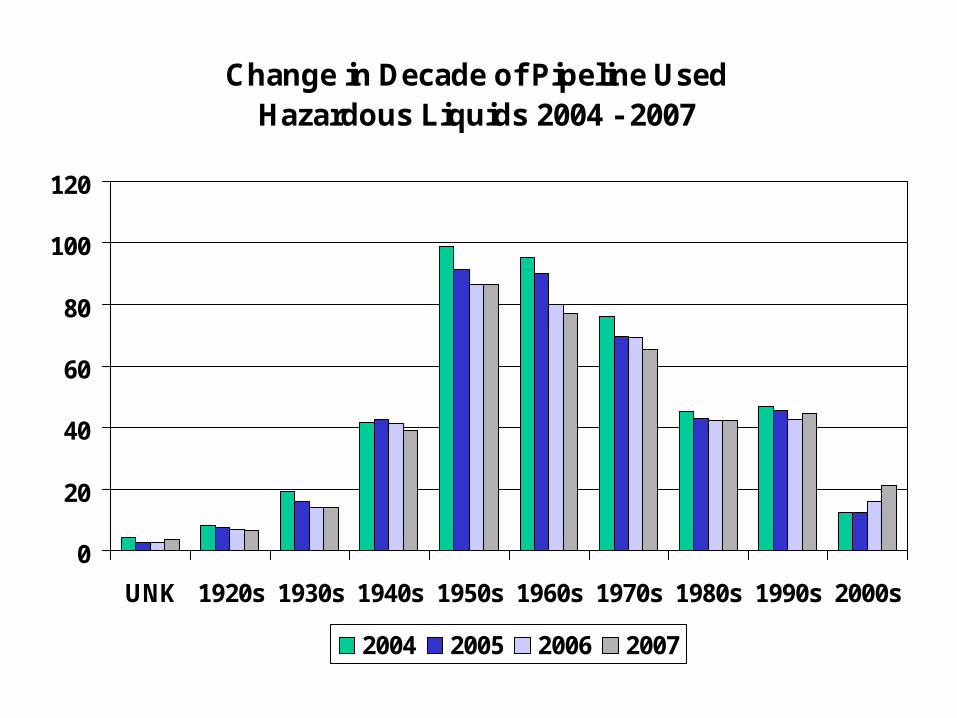
Change in Decade of Pipeline Used Hazardous Liquids 2004 - 2007
0
20
40
60
80
100
120
UNK 1920s 1930s 1940s 1950s 1960s 1970s 1980s 1990s 2000s
2004 2005 2006 2007
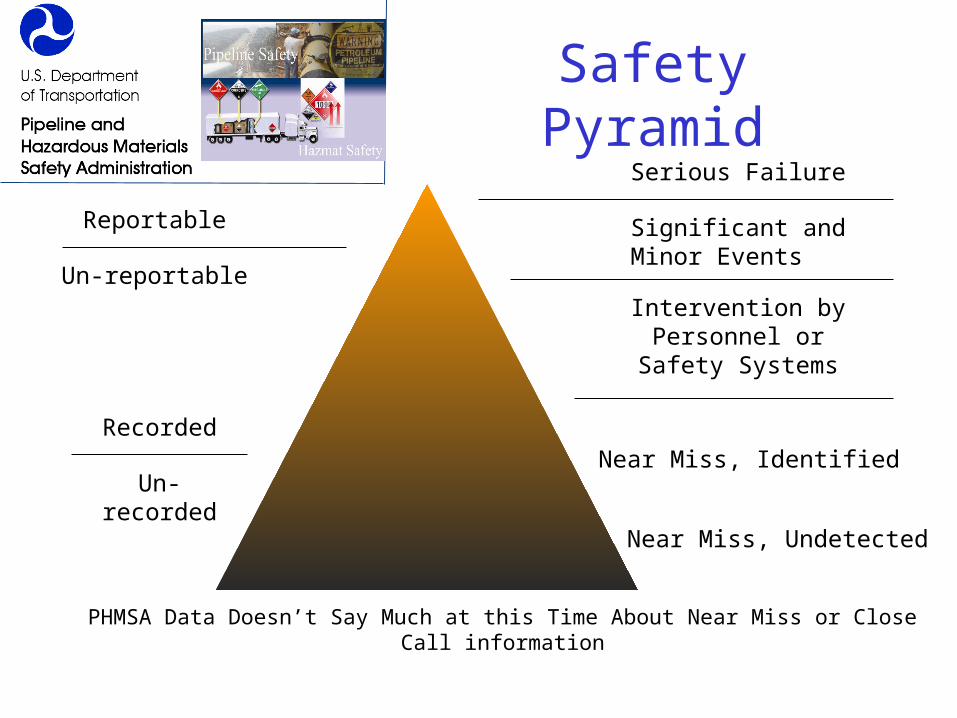
Safety PyramidSerious Failure
Significant andMinor Events
Intervention by Personnel orSafety Systems
Near Miss, Identified
Reportable
Un-reportable
Recorded
Un-recorded
Near Miss, Undetected
PHMSA Data Doesn’t Say Much at this Time About Near Miss or Close Call information

The Routan Boom


Have a Baby For Love, Not For The Love of German Engineering
Related Documents