UNIVERSITY of VAASA Communications and Systems Engineering Group UNIVERSITY of VAASA Communications and Systems Engineering Group TLTE.3120 Computer Simulation in Communication and Systems (5 ECTS) http://www.uva.fi/~timan/tlte3120/ Lecture 6 – 14.10.2015 Timo Mantere Professor, Communications & systems University of Vaasa http://www.uva.fi/~timan [email protected] 1

U NIVERSITY of V AASA Communications and Systems Engineering Group U NIVERSITY of V AASA Communications and Systems Engineering Group TLTE.3120 Computer.
Dec 13, 2015
Welcome message from author
This document is posted to help you gain knowledge. Please leave a comment to let me know what you think about it! Share it to your friends and learn new things together.
Transcript

UNIVERSITY of VAASA Communications and Systems Engineering Group
UNIVERSITY of VAASA Communications and Systems Engineering Group
TLTE.3120 Computer Simulation in Communication and Systems (5 ECTS)
http://www.uva.fi/~timan/tlte3120/
Lecture 6 – 14.10.2015
Timo Mantere
Professor, Communications & systemsUniversity of Vaasa
http://www.uva.fi/[email protected]
1
UNIVERSITY of VAASA Communications and Systems Engineering Group
UNIVERSITY of VAASA Communications and Systems Engineering Group
Outline
Some Systems theory Systems engineering System identification Parameter estimationProbability calculus Regression analysisDynamic models Stochastics
2
UNIVERSITY of VAASA Communications and Systems Engineering Group
UNIVERSITY of VAASA Communications and Systems Engineering Group
Systems theory
3
• Systems theory is a cross-disciplinary field where aim to find those principles that can be applied to all types of systems in different areas of research.
• The term can be regarded as systems thinking as a special case and a generalization of the general system of science, which forms a systemic perspective.
• The concept of systems theory has its origins in Ludwig von Bertalanff’s general systems theory. It has been applied later in other areas such as the theory of functions and social systems theory.
• More limited concept of systems theory is linked to the analysis, design and control of various systems based on the use of mathematical models that describe the system variables in the cause-effect relationships and interactions.

UNIVERSITY of VAASA Communications and Systems Engineering Group
UNIVERSITY of VAASA Communications and Systems Engineering Group
Systems engineering
4
• Systems engineering is an interdisciplinary field of technology, which focuses on how to plan and manage complex technical systems over their life cycle.
• It handles questions such as requirements specification, reliability, logistics, coordination of the various engineering teams, testing and evaluation, maintainability, and many other disciplines necessary for successful system development, design, execution, and the finally decommission of product.
• Systems engineering deals with the work processes, optimization methods and risk management tools in different technical projects.

UNIVERSITY of VAASA Communications and Systems Engineering Group
UNIVERSITY of VAASA Communications and Systems Engineering Group
Systems engineering
5
• It is combination of technical and human oriented disciplines such as control engineering, industrial management, software engineering, organizational studies, and project management.
• Designing of systems to ensure that all aspects of the project are likely to be taken account and a system is considered and integrated into the whole.
• In product development, the first and most important task is to identify, understand and interpret the operational demands of the new product and technical limitations.
• In general, it is not enough that the product will work, but it must also meet several other requirements, e.g. one need take account also future demands for flexibility with regard for modifications and additions, and other factors such as product cost, manufacturability, usability and serviceability.
UNIVERSITY of VAASA Communications and Systems Engineering Group
UNIVERSITY of VAASA Communications and Systems Engineering Group
Systems engineering
6
• While searching for the proper solution to implement the list of requirements for new product designers take advantage of their knowledge of the technology, mathematics, and their experience, and the analysis of the problem.
• By creating a mathematical model of the problem in hand, different solutions can be tested.
• Generally, there is always several viable solutions, so the designers have to evaluate the different choices with their knowledge and to choose the most suitable solution.
• If a designer is talented (s)he will find the best solution among the possible solutions.
• Sometimes innovative designer may find a solution that completely removes the need for new product i.e. new way of doing things.

UNIVERSITY of VAASA Communications and Systems Engineering Group
UNIVERSITY of VAASA Communications and Systems Engineering Group
System identification
7
• System identification uses different statistical methods to build mathematical model of the system based on the measurement done from the system
• The field of system identification include the design of experiments which efficiently extracts informative information from the system.
• Based on the measurements one can do different kind of data analysis, e.g. correlation analysis, curve fittings and model fittings.
• System identification has some relations to the data analysis, i.e. in this case we try identify from the data which kind of system has produced that data• These days we are also talking about Big data and
Cloud computing which can also do data modelling

UNIVERSITY of VAASA Communications and Systems Engineering Group
UNIVERSITY of VAASA Communications and Systems Engineering Group
System identification
8
• Internet of things
• These days IoT creates a huge amount of sensory etc. data which can be analyzed with cloud computing
• Many companies wants to utilize that data in order to sell their products or designing new products based on that data, i.e direct marketing etc.
• Quite often the biggest problem at the moment is that many companies do not have, or are unable to build “earnings logic”, i.e. how to make money from that that data or data analyses.
UNIVERSITY of VAASA Communications and Systems Engineering Group
UNIVERSITY of VAASA Communications and Systems Engineering Group
System Identification
9
To better understand what system identification means, see additional information e.g. from:
System identification:http://en.wikipedia.org/wiki/System_identification
Curve fitting:http://en.wikipedia.org/wiki/Curve_fitting
Nonlinear regression:http://en.wikipedia.org/wiki/Nonlinear_regression

UNIVERSITY of VAASA Communications and Systems Engineering Group
UNIVERSITY of VAASA Communications and Systems Engineering Group
System Identification - Introduction
In continuous and discrete time modeling the model was formed based on the physical knowledge about the system and then simulatedDifferential equation, state-space
presentation and transfer function in continuous timeDifference equation, discrete state-space
presentation and discrete transfer function in discrete time
10

UNIVERSITY of VAASA Communications and Systems Engineering Group
UNIVERSITY of VAASA Communications and Systems Engineering Group
System Identification - Introduction
Open Box: Model structure and parameters are known based on system structure and on the laws of the physics
Gray Box: We know the model structure, but we must define the parameter values by using measurements
Black Box: The measurement data is the only information we have. Both model structure and model parameters must be defined by using the measurement data.
11
UNIVERSITY of VAASA Communications and Systems Engineering Group
UNIVERSITY of VAASA Communications and Systems Engineering Group
System Identification - Introduction
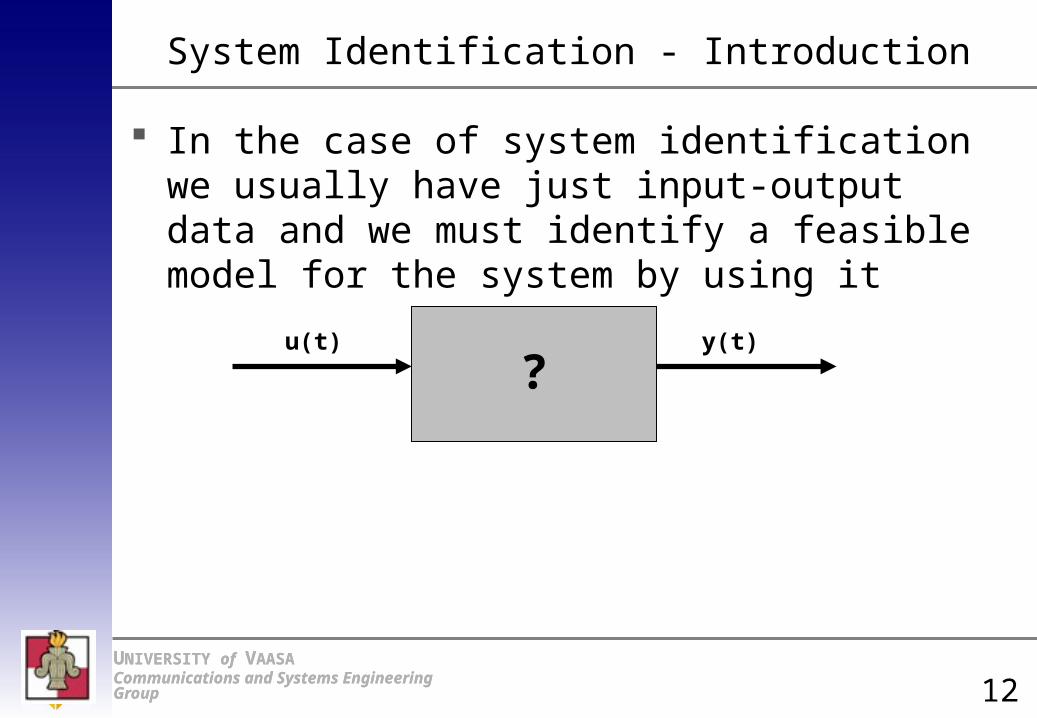
In the case of system identification we usually have just input-output data and we must identify a feasible model for the system by using it
?u(t) y(t)
12
UNIVERSITY of VAASA Communications and Systems Engineering Group
UNIVERSITY of VAASA Communications and Systems Engineering Group
System Identification - Introduction
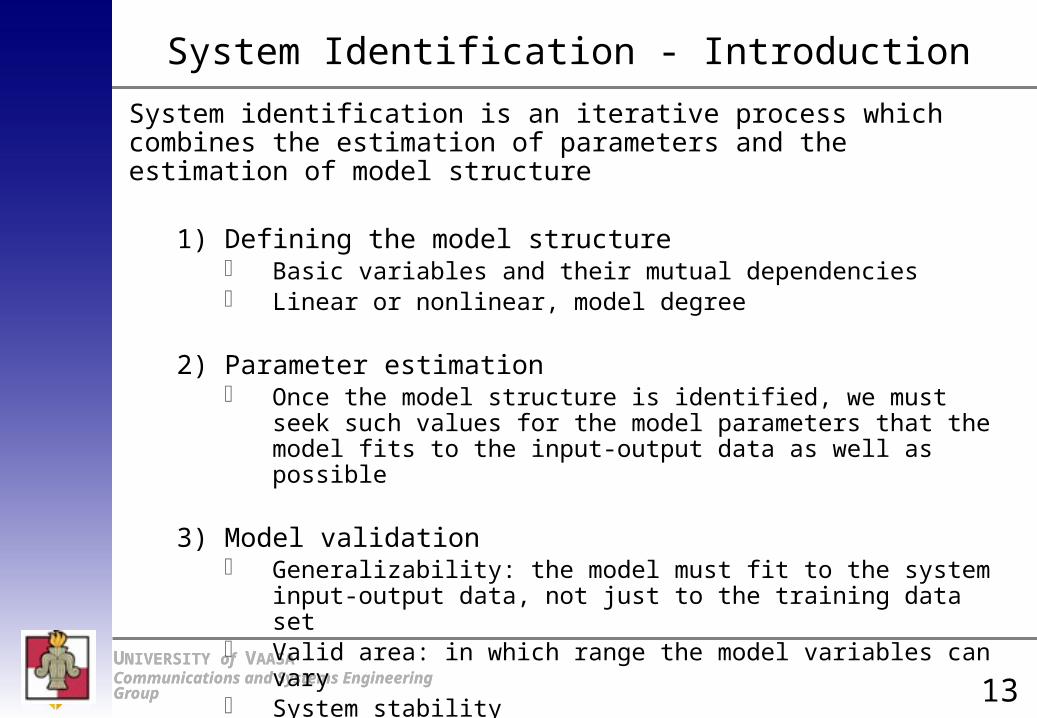
System identification is an iterative process which combines the estimation of parameters and the estimation of model structure
1) Defining the model structure- Basic variables and their mutual dependencies- Linear or nonlinear, model degree
2) Parameter estimation- Once the model structure is identified, we must seek such
values for the model parameters that the model fits to the input-output data as well as possible
3) Model validation- Generalizability: the model must fit to the system input-
output data, not just to the training data set- Valid area: in which range the model variables can vary- System stability
13
UNIVERSITY of VAASA Communications and Systems Engineering Group
UNIVERSITY of VAASA Communications and Systems Engineering Group
Parameter Estimation
Fitting the parameter values to the dataOptimization problem: fitting error must be
minimized
One can see the statistical properties of the system from the dataExpectation value, variance, etc.
Usually the parameters are identified by using computation programMATLAB Identification Toolbox
14
UNIVERSITY of VAASA Communications and Systems Engineering Group
UNIVERSITY of VAASA Communications and Systems Engineering Group
Parameter Estimation
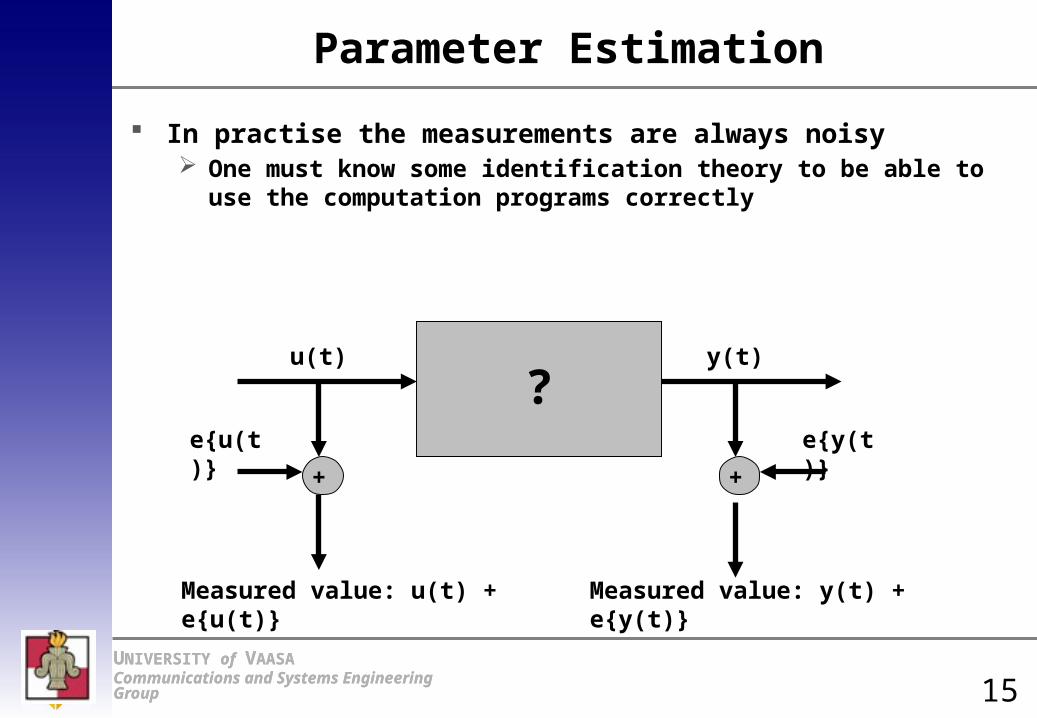
In practise the measurements are always noisy One must know some identification theory to be able to
use the computation programs correctly
?u(t) y(t)
Measured value: u(t) + e{u(t)} Measured value: y(t) + e{y(t)}
e{u(t)} e{y(t)}
+ +
15

UNIVERSITY of VAASA Communications and Systems Engineering Group
UNIVERSITY of VAASA Communications and Systems Engineering Group
Probability Calculus Refreshment
Discrete distribution is defined just in separate points xi. Respective probability function values are pi.
Continuous distribution is defined in a continuous real axis. Variable value x gives a probability density funvction value p(x).
Estimation theory: http://en.wikipedia.org/wiki/Estimation_theory
Propability: http://en.wikipedia.org/wiki/Propability
16

UNIVERSITY of VAASA Communications and Systems Engineering Group
UNIVERSITY of VAASA Communications and Systems Engineering Group
Probability Calculus Refreshment
Probability density function fills following two conditions:
1)( dxxp
xxp 0)(
i
ip 1)(
0)( ip
Continuous: Discrete:
17

UNIVERSITY of VAASA Communications and Systems Engineering Group
UNIVERSITY of VAASA Communications and Systems Engineering Group
Probability Calculus Refreshment
For continuous distribution
For discrete distribution
b
a
dxxpbxaP )()(
b
at
tpbxaP )()(
18

UNIVERSITY of VAASA Communications and Systems Engineering Group
UNIVERSITY of VAASA Communications and Systems Engineering Group
Probability Calculus Refreshment
The most important continuous distribution is Gaussian Distribution. A Gaussian distribution with average and standard deviation σ is noted by N(, σ). Its probability density function is
Gaussian Distribution is often normalized such that its avarage is 0 and standard deviation 1. Normalization is done by applying a transform
22
2)(
2
1)( x
xx
expx
xN
xx
19
UNIVERSITY of VAASA Communications and Systems Engineering Group
UNIVERSITY of VAASA Communications and Systems Engineering Group
Probability Calculus Refreshment
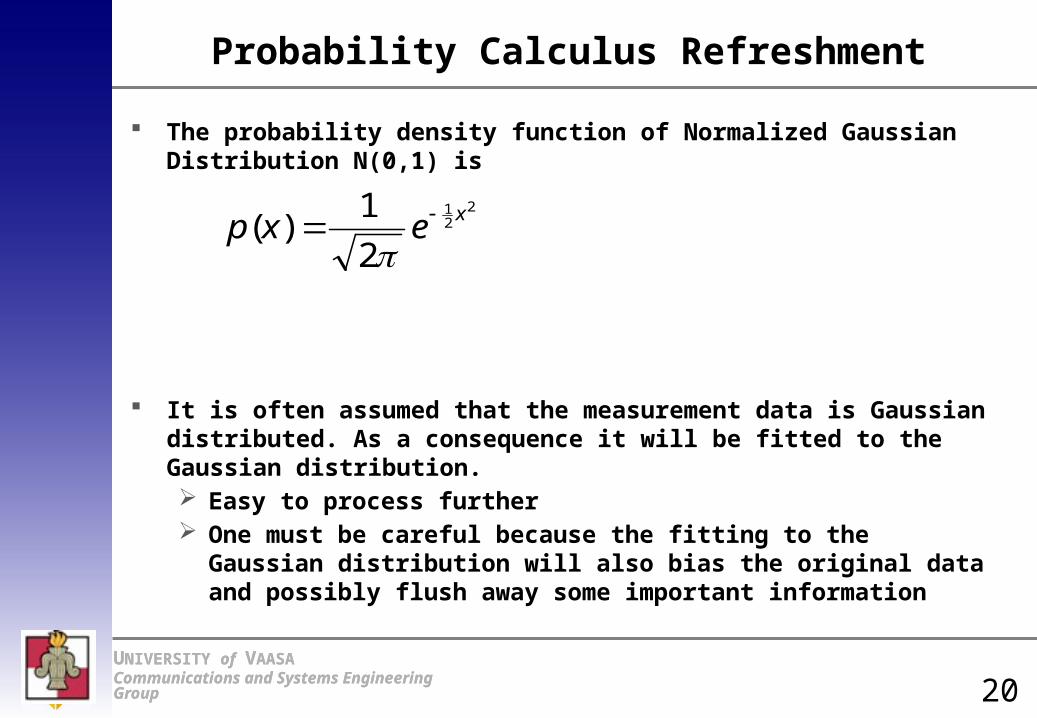
The probability density function of Normalized Gaussian Distribution N(0,1) is
It is often assumed that the measurement data is Gaussian distributed. As a consequence it will be fitted to the Gaussian distribution. Easy to process further One must be careful because the fitting to the Gaussian
distribution will also bias the original data and possibly flush away some important information
221
2
1)( xexp
20
UNIVERSITY of VAASA Communications and Systems Engineering Group
UNIVERSITY of VAASA Communications and Systems Engineering Group
Probability Calculus Refreshment
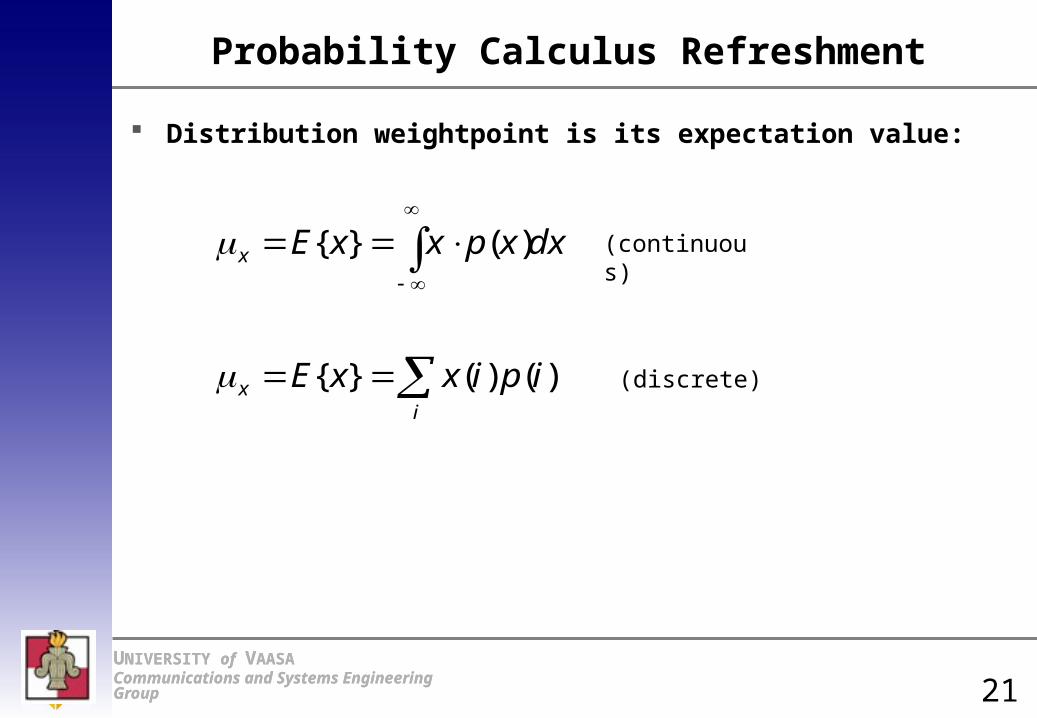
Distribution weightpoint is its expectation value:
ix
x
ipixxE
dxxpxxE
)()(}{
)(}{
(continuous)
(discrete)
21
UNIVERSITY of VAASA Communications and Systems Engineering Group
UNIVERSITY of VAASA Communications and Systems Engineering Group
Probability Calculus Refreshment
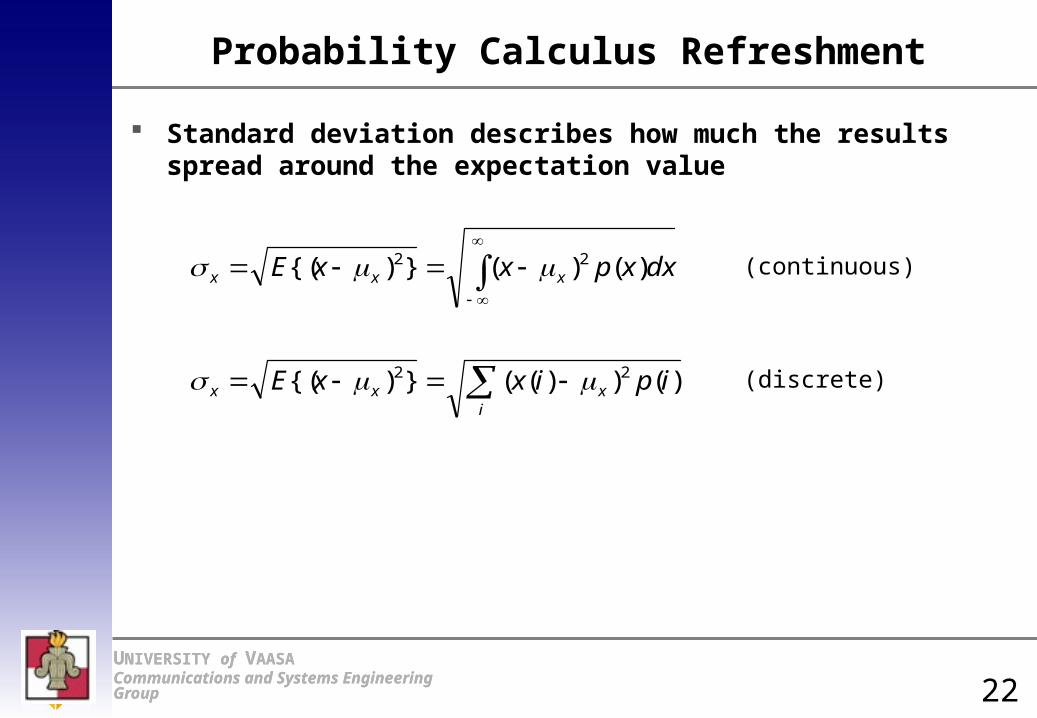
Standard deviation describes how much the results spread around the expectation value
ixxx
xxx
ipixxE
dxxpxxE
)())((}){(
)()(}){(
22
22
(continuous)
(discrete)
22
UNIVERSITY of VAASA Communications and Systems Engineering Group
UNIVERSITY of VAASA Communications and Systems Engineering Group
Probability Calculus Refreshment
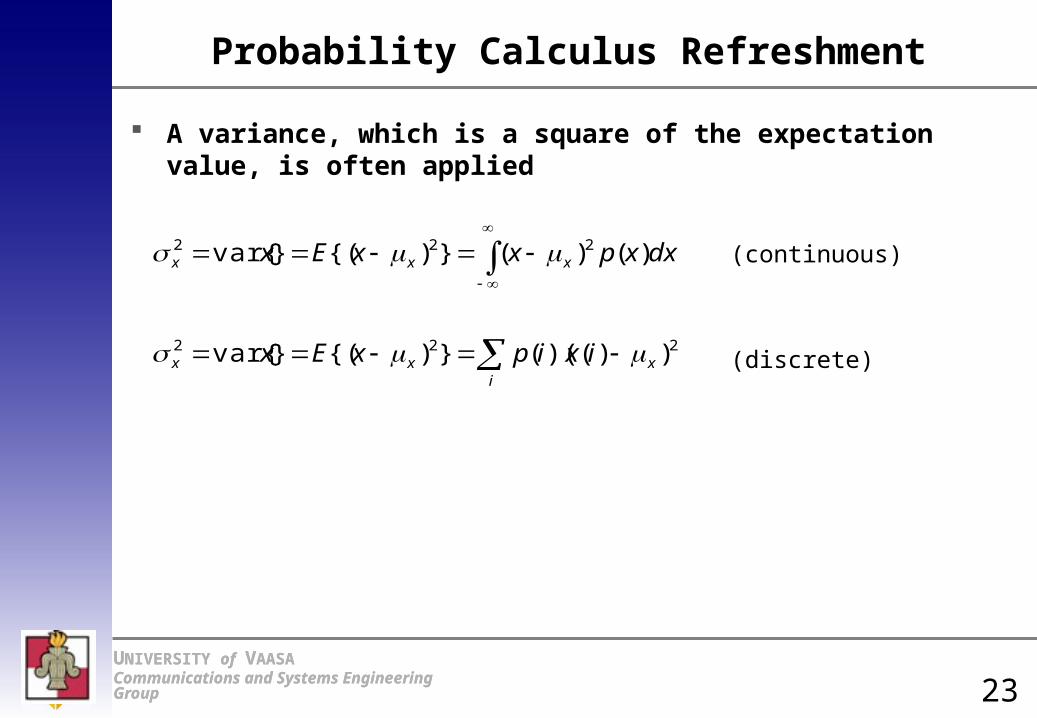
A variance, which is a square of the expectation value, is often applied
ixxx
xxx
ixipxEx
dxxpxxEx
222
222
))()((}){(}var{
)()(}){(}var{
(continuous)
(discrete)
23

UNIVERSITY of VAASA Communications and Systems Engineering Group
UNIVERSITY of VAASA Communications and Systems Engineering Group
Discrete Data
Usually the processed data is discrete. If we have measurements x(k) in time range k = 1,...,n Expectation value is
Covariance is
m
kx kx
m 1
)(1
m
k
Txxx kxkx
nmR
1
))()()((1
24
UNIVERSITY of VAASA Communications and Systems Engineering Group
UNIVERSITY of VAASA Communications and Systems Engineering Group
Discrete Data
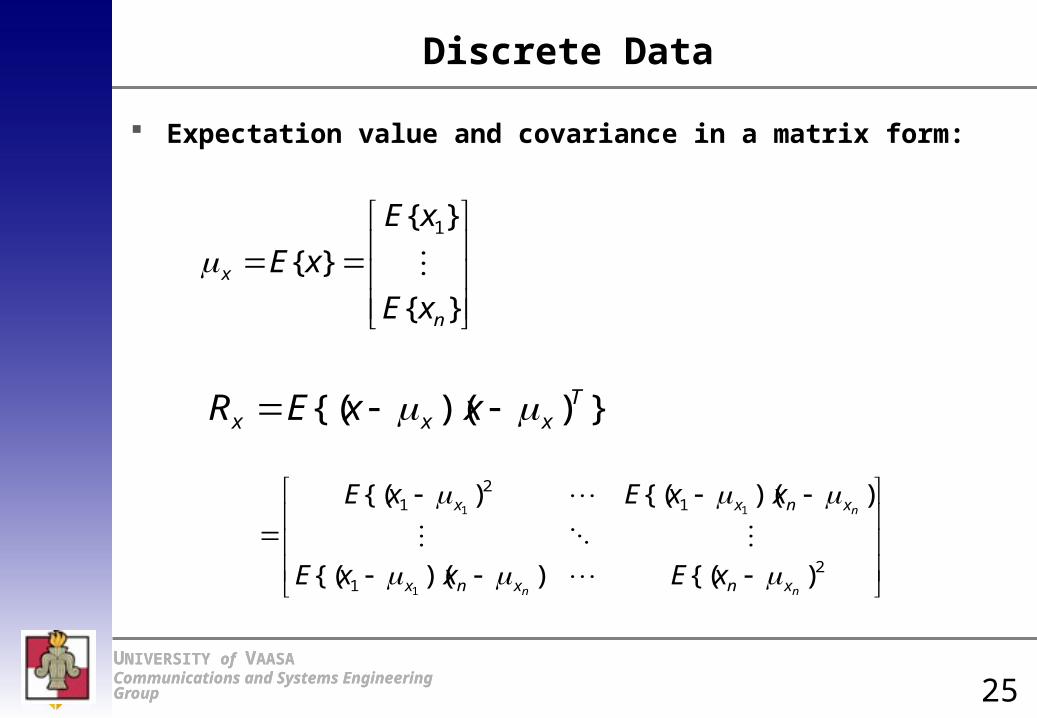
Expectation value and covariance in a matrix form:
}{
}{
}{1
n
x
xE
xE
xE
}))({( Txxx xxER
21
12
1
){())({(
))({(){(
1
11
nn
n
xnxnx
xnxx
xExxE
xxExE
25

UNIVERSITY of VAASA Communications and Systems Engineering Group
UNIVERSITY of VAASA Communications and Systems Engineering Group
Regression Analysis
We select a model structure y = f(, ), in which one can measure variables and one must estimate parameters .
During the parameter estimation we select a criteria J( ), which will be optimized with respect to the parameters.
26

UNIVERSITY of VAASA Communications and Systems Engineering Group
UNIVERSITY of VAASA Communications and Systems Engineering Group
Regression Analysis
Example Present variable y by using variables x and z:
Select the model structure
Model parameters
Tzx
221),( xzkxkfy
Tkk 21
27

UNIVERSITY of VAASA Communications and Systems Engineering Group
UNIVERSITY of VAASA Communications and Systems Engineering Group
Regression Analysis
Collect a sample set
Select optimization criteria
The optimal solution can be find by minimizing the criteria J
Tii
TT yY 22,5,,,,,20,1,31,2),(
i i
iiiii zxkxkyeJ 2221
2 )()(
Tkk *2
*1
*
28

UNIVERSITY of VAASA Communications and Systems Engineering Group
UNIVERSITY of VAASA Communications and Systems Engineering Group
Regression Analysis
Developed model will be validated by using suitable method. If the model behavior is not satisfactory, the model structure can be modified. The validation data should be completely different than the
training data
There exist always random disturbances in a real-world system. As a consequence the measurement data and the model will never fit completely ion every measurement point.
29

UNIVERSITY of VAASA Communications and Systems Engineering Group
UNIVERSITY of VAASA Communications and Systems Engineering Group
Regression Analysis
Assume model structure
Real values in the data points:
Thus the estimate and the measured value are
okxkxy ˆˆ)(ˆ
ioiii ekkxxy )(
)(ˆ)(
ˆˆ)(ˆ
)( 0
iiii
oii
iii
xyxye
kxkxy
ekkxxy
30
UNIVERSITY of VAASA Communications and Systems Engineering Group
UNIVERSITY of VAASA Communications and Systems Engineering Group
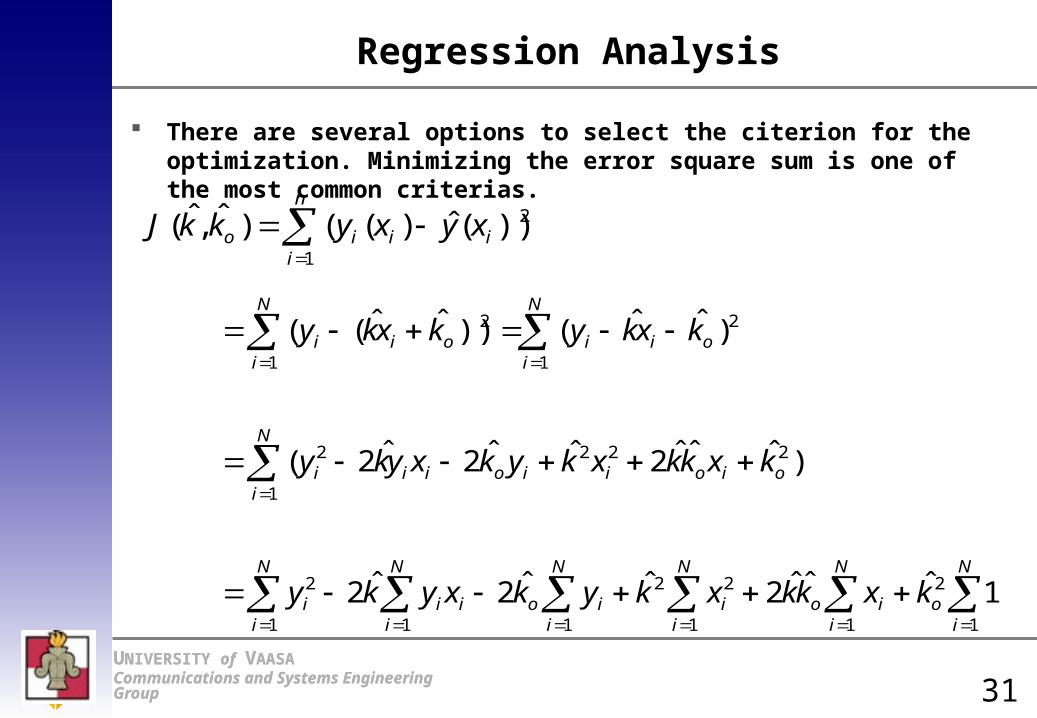
Regression Analysis
There are several options to select the citerion for the optimization. Minimizing the error square sum is one of the most common criterias.
n
iiiio xyxykkJ
1
2))(ˆ)(()ˆ,ˆ(
N
i
N
io
N
iio
N
ii
N
iio
N
iiii
N
ioioiioiii
N
ioii
N
ioii
kxkkxkykxyky
kxkkxkykxyky
kxkykxky
1 1
2
11
22
11
2
1
2222
1
2
1
2
1ˆˆˆ2ˆˆ2ˆ2
)ˆˆˆ2ˆˆ2ˆ2(
)ˆˆ())ˆˆ((
31
UNIVERSITY of VAASA Communications and Systems Engineering Group
UNIVERSITY of VAASA Communications and Systems Engineering Group
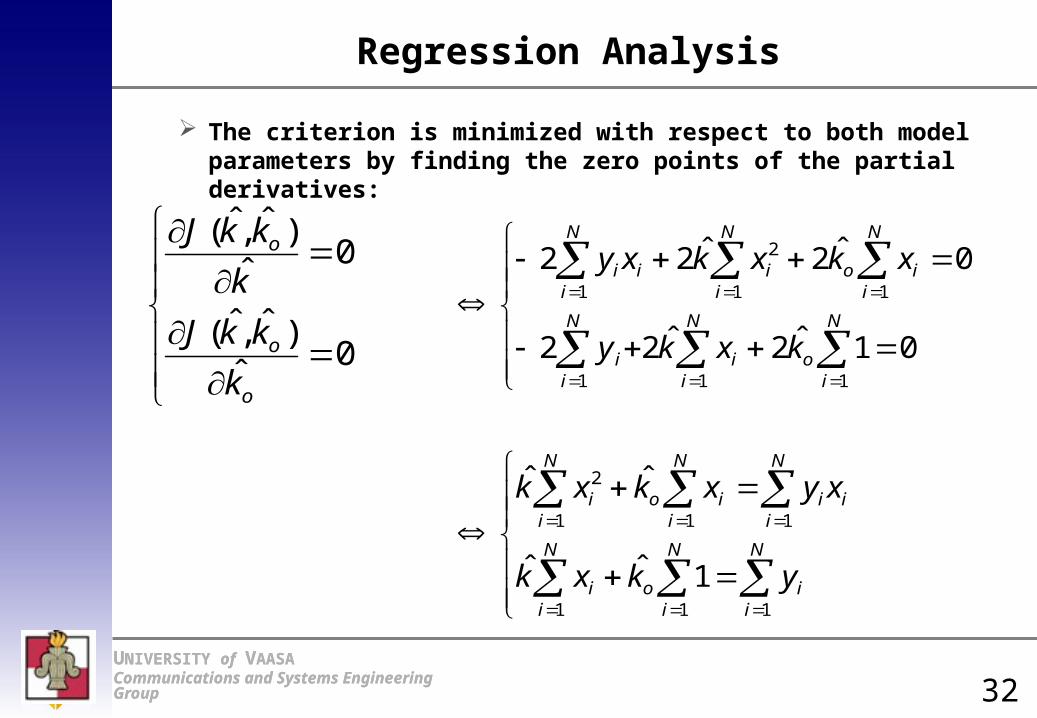
Regression Analysis
The criterion is minimized with respect to both model parameters by finding the zero points of the partial derivatives:
0ˆ
)ˆ,ˆ(
0ˆ
)ˆ,ˆ(
o
o
o
k
kkJ
k
kkJ
N
i
N
ii
N
ioi
N
i
N
i
N
iiiioi
N
i
N
io
N
iii
N
i
N
i
N
iioiii
ykxk
xyxkxk
kxky
xkxkxy
1 11
1 1 1
2
1 11
1 1 1
2
1ˆˆ
ˆˆ
01ˆ2ˆ22
0ˆ2ˆ22
32

UNIVERSITY of VAASA Communications and Systems Engineering Group
UNIVERSITY of VAASA Communications and Systems Engineering Group
Regression Analysis
Solution of parameters:
N
ii
N
iii
N
i
N
ii
N
ii
N
ii
o
N
ii
N
iii
o
N
i
N
ii
N
ii
N
ii
y
xy
x
xx
k
k
y
xy
k
k
x
xx
1
1
1
11
11
2
1
1
11
11
2
1ˆ
ˆ
ˆ
ˆ
1
33
UNIVERSITY of VAASA Communications and Systems Engineering Group
UNIVERSITY of VAASA Communications and Systems Engineering Group
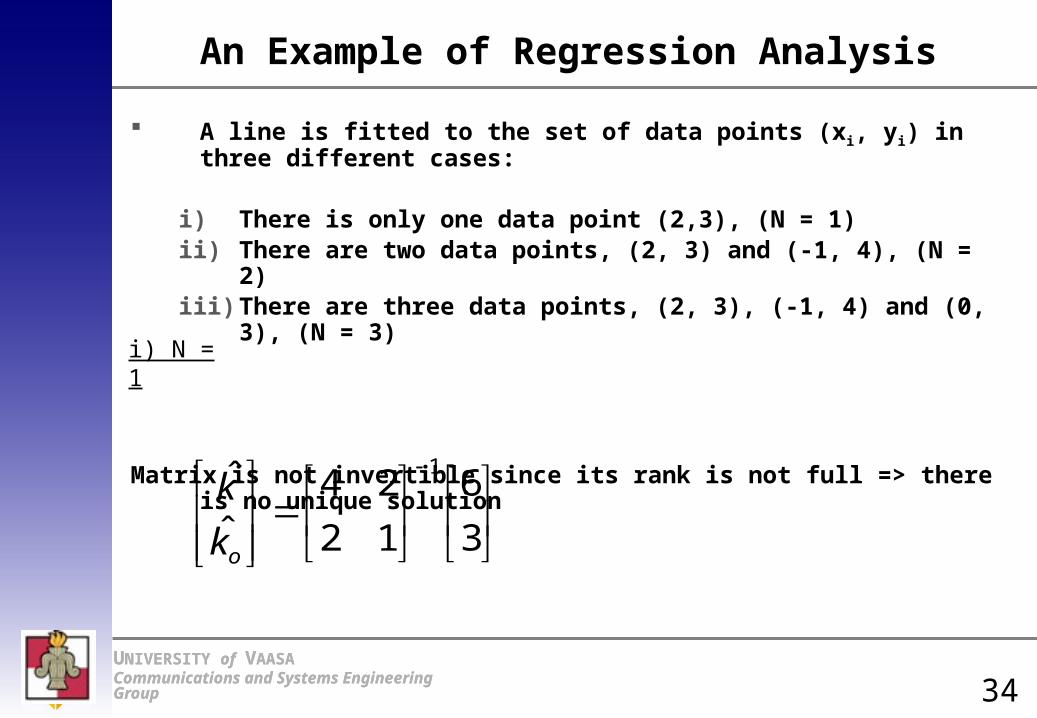
An Example of Regression Analysis
A line is fitted to the set of data points (xi, yi) in three different cases:
i) There is only one data point (2,3), (N = 1)ii) There are two data points, (2, 3) and (-1, 4), (N = 2)iii) There are three data points, (2, 3), (-1, 4) and (0, 3), (N
= 3)
Matrix is not invertible since its rank is not full => there is no unique solution
3
6
12
24ˆ
ˆ 1
ok
k
i) N = 1
34
UNIVERSITY of VAASA Communications and Systems Engineering Group
UNIVERSITY of VAASA Communications and Systems Engineering Group
An Example of Regression Analysis
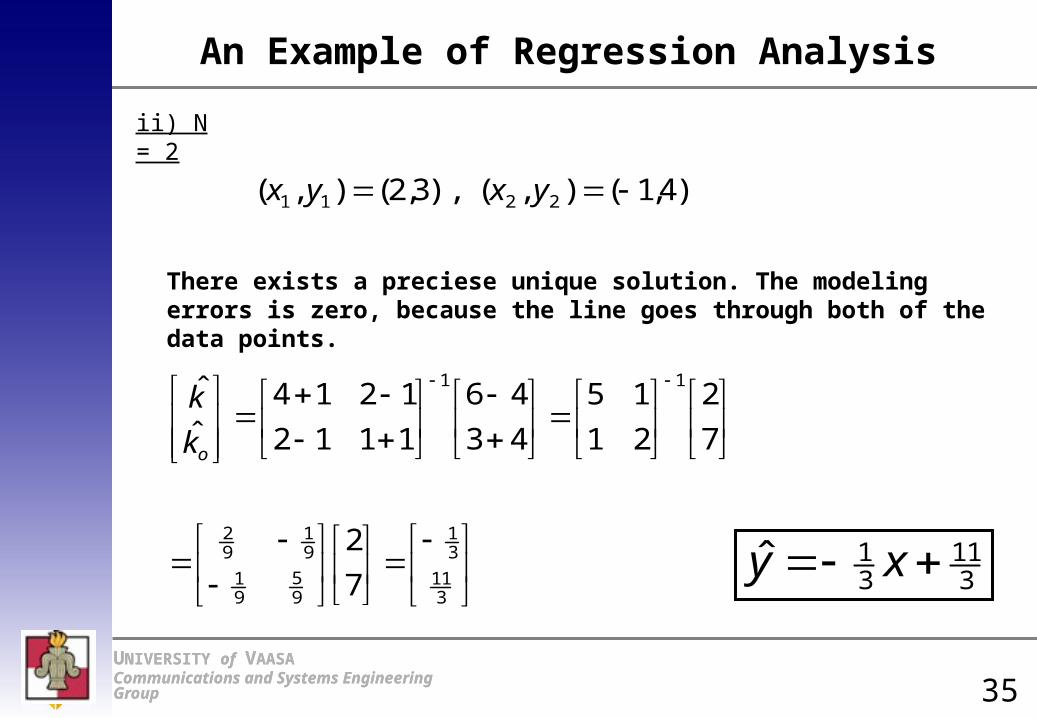
There exists a preciese unique solution. The modeling errors is zero, because the line goes through both of the data points.
)4,1(),(),3,2(),( 2211 yxyx
311
31
95
91
91
92
11
7
2
7
2
21
15
43
46
1112
1214ˆ
ˆ
ok
k
311
31ˆ xy
ii) N = 2
35
UNIVERSITY of VAASA Communications and Systems Engineering Group
UNIVERSITY of VAASA Communications and Systems Engineering Group
An Example of Regression Analysis
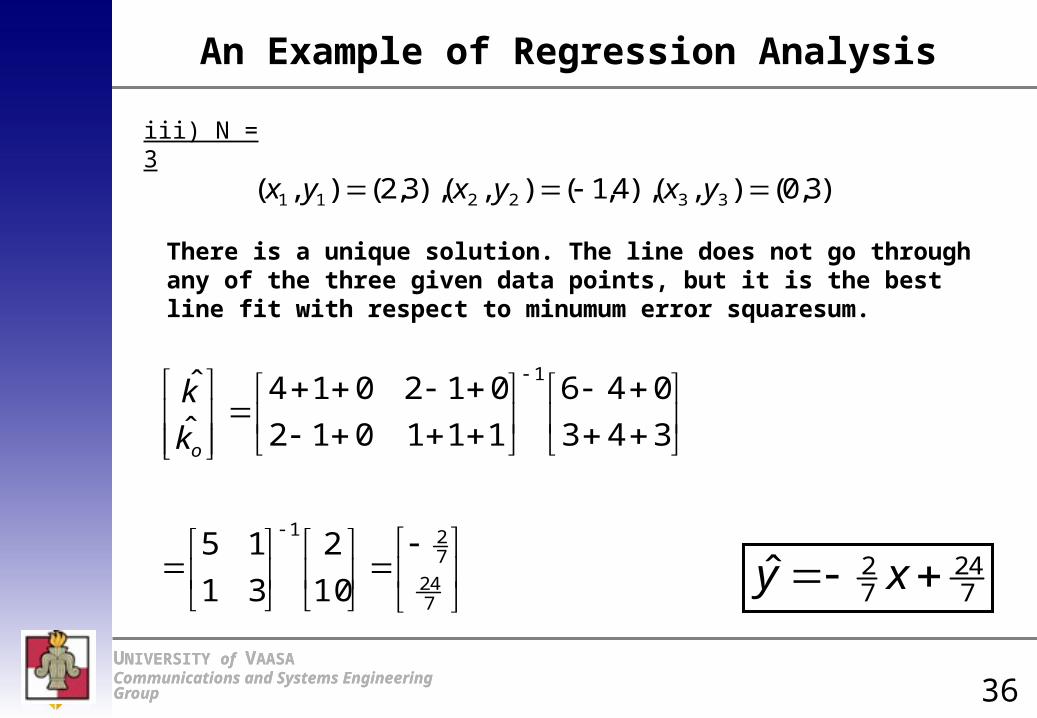
There is a unique solution. The line does not go through any of the three given data points, but it is the best line fit with respect to minumum error squaresum.
)3,0(),(),4,1(),(),3,2(),( 332211 yxyxyx
724
721
1
10
2
31
15
343
046
111012
012014ˆ
ˆ
ok
k
724
72ˆ xy
iii) N = 3
36

UNIVERSITY of VAASA Communications and Systems Engineering Group
UNIVERSITY of VAASA Communications and Systems Engineering Group
General Regression Model
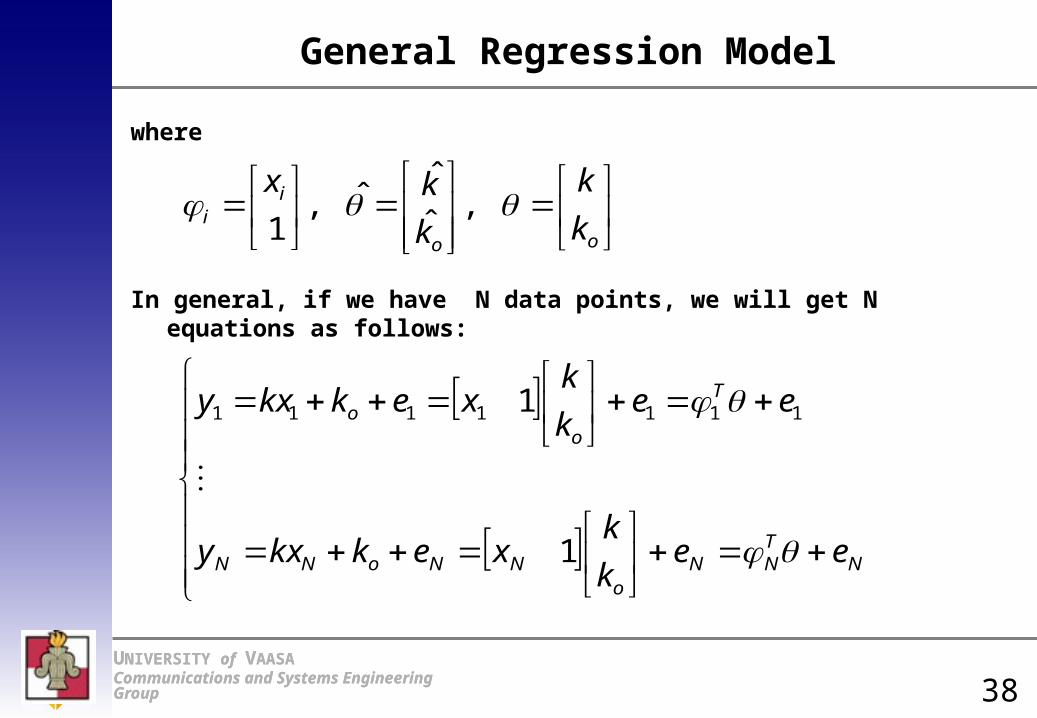
In the previous example, measurable variables were x and 1 and estimated parameters k and ko. Next we apply general regression model.
Parameters and measurable variables are collected to their own matrices:
iTii
oiioiioii
Ti
o
ioioii
eek
kxekkxekkxy
k
kxkxkkxky
11
ˆˆ
ˆ11ˆˆˆˆˆ
37
UNIVERSITY of VAASA Communications and Systems Engineering Group
UNIVERSITY of VAASA Communications and Systems Engineering Group
General Regression Model
where
In general, if we have N data points, we will get N equations as follows:
oo
ii k
k
k
kx ,
ˆ
ˆˆ,
1
NTNN
oNNoNN
T
oo
eek
kxekkxy
eek
kxekkxy
1
1 1111111
38
UNIVERSITY of VAASA Communications and Systems Engineering Group
UNIVERSITY of VAASA Communications and Systems Engineering Group
General Regression Model
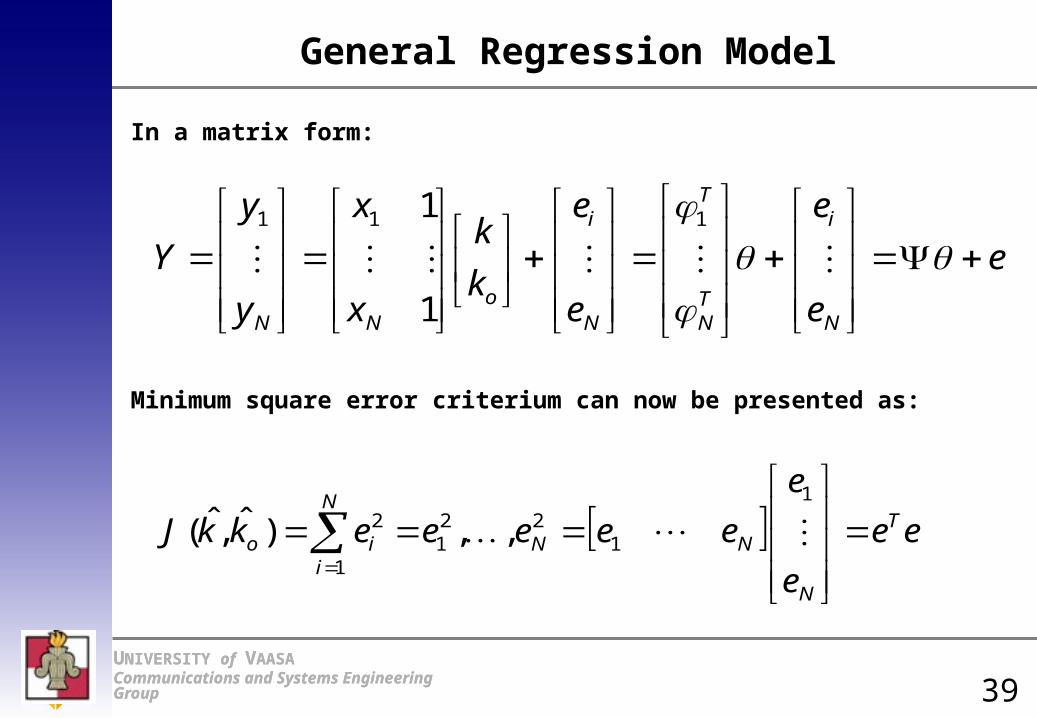
In a matrix form:
Minimum square error criterium can now be presented as:
e
e
e
e
e
k
k
x
x
y
y
Y
N
i
TN
T
N
i
oNN
111
1
1
N
i
T
N
NNio ee
e
e
eeeeekkJ1
1
122
12 ,,)ˆ,ˆ(
39

UNIVERSITY of VAASA Communications and Systems Engineering Group
UNIVERSITY of VAASA Communications and Systems Engineering Group
General Regression Model / Pseudoinverse
The error becomes
Set the error expression to the square error criterium:
YYYe ˆ
ˆˆˆˆ
)ˆ)(ˆ()ˆ()ˆ()ˆ,ˆ(
TTTTTT
TTTTTo
YYYY
YYYYeekkJ
40

UNIVERSITY of VAASA Communications and Systems Engineering Group
UNIVERSITY of VAASA Communications and Systems Engineering Group
General Regression Model / Pseudoinverse
The optimal solution is find by solving the zero point of the parameter estimate derivative:
0ˆ22ˆ2ˆ
)ˆ(
TTTTT YYY
d
dJ
Y
Y
Y
TT
TTTT
TT
1
11
)(ˆ
)(ˆ)(
ˆ
41
UNIVERSITY of VAASA Communications and Systems Engineering Group
UNIVERSITY of VAASA Communications and Systems Engineering Group
Pseudoinverse
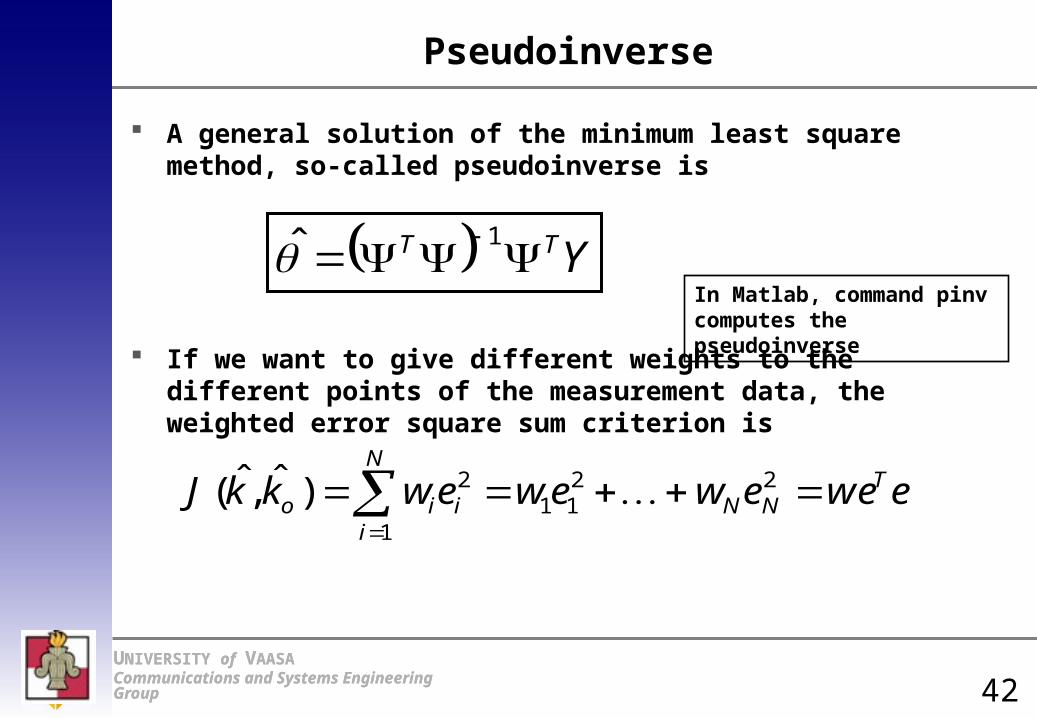
A general solution of the minimum least square method, so-called pseudoinverse is
If we want to give different weights to the different points of the measurement data, the weighted error square sum criterion is
YTT 1̂
N
i
TNNiio eweewewewkkJ
1
2211
2)ˆ,ˆ(
In Matlab, command pinv computes the pseudoinverse
42

UNIVERSITY of VAASA Communications and Systems Engineering Group
UNIVERSITY of VAASA Communications and Systems Engineering Group
Pseudoinverse
In mathematics pseudoinverse Matrix is a matrix that has some properties of inverse matrix, but not necessarily all of them
The idea of generating pseudoinverse matrix is that it when we have a measured collection of point, they do not present actual values which can be linearly inversed, instead we need some kind of generalized inverse in order analyze what formulas explain those points
It is needed when the function group does not have exact solution, instead we try to find closest possible solution (with the least fitment error) Eg so that the function based on pseudoinverse causes
the minimum square error when compared to those points
43
UNIVERSITY of VAASA Communications and Systems Engineering Group
UNIVERSITY of VAASA Communications and Systems Engineering Group
Weighted Pseudoinverse
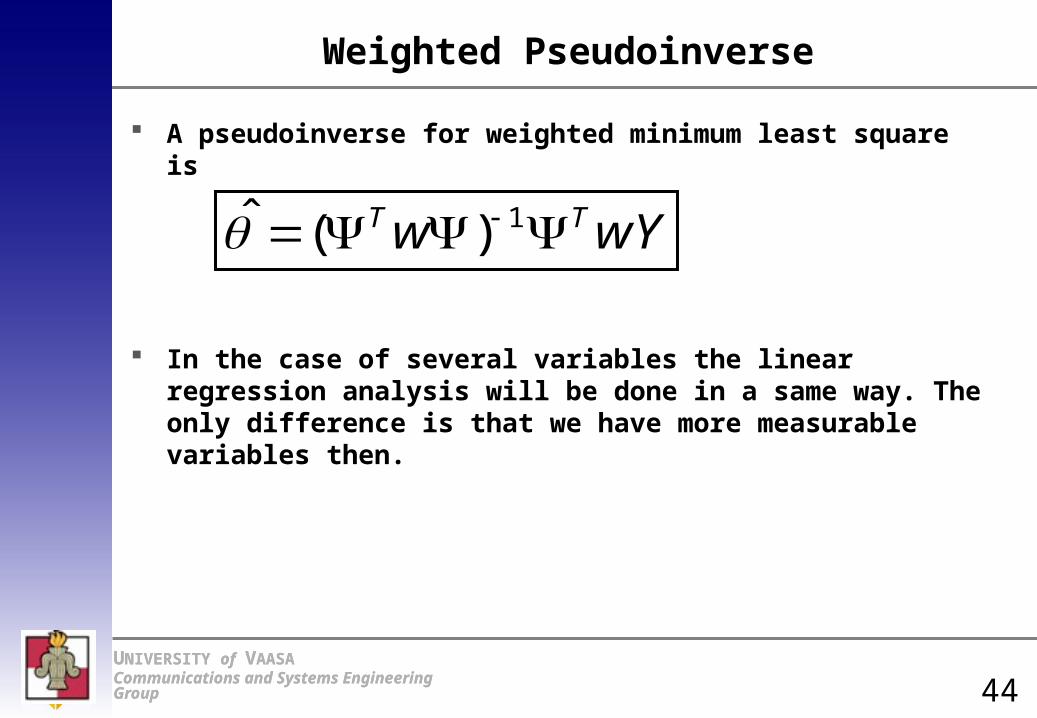
A pseudoinverse for weighted minimum least square is
In the case of several variables the linear regression analysis will be done in a same way. The only difference is that we have more measurable variables then.
wYw TT 1)(̂
44
UNIVERSITY of VAASA Communications and Systems Engineering Group
UNIVERSITY of VAASA Communications and Systems Engineering Group
Regression Analysis / Several Variables
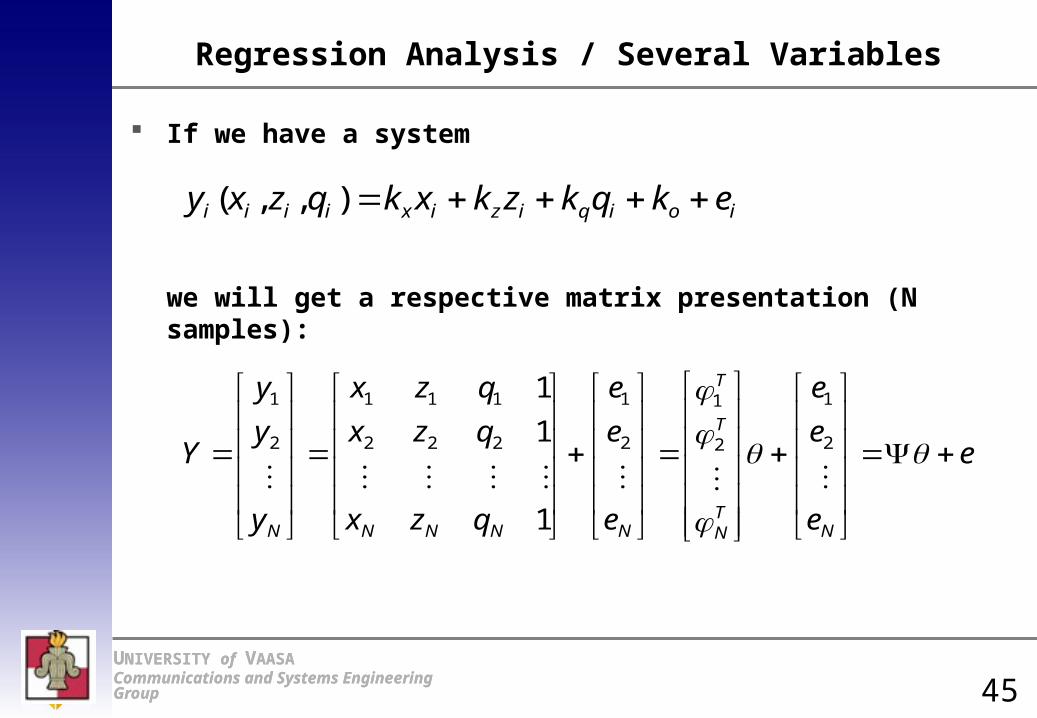
If we have a system
we will get a respective matrix presentation (N samples):
ioiqizixiiii ekqkzkxkqzxy ),,(
e
e
e
e
e
e
e
qzx
qzx
qzx
y
y
y
Y
NTN
T
T
NNNNN
2
1
2
1
2
1
222
111
2
1
1
1
1
45

UNIVERSITY of VAASA Communications and Systems Engineering Group
UNIVERSITY of VAASA Communications and Systems Engineering Group
TRANSFER FUNCTION - SCALAR
GU Y
Y = G*U
46
LINEAR SYSTEMS - TRANSFER FUNCTIONS

UNIVERSITY of VAASA Communications and Systems Engineering Group
UNIVERSITY of VAASA Communications and Systems Engineering Group
LINEAR SYSTEMS – MIMO TRANSFER FUNCTIONS
Linear, time-invariant state equation
,x Ax Bu
y Cx
MIMO (MULTI INPUT - MULTI OUTPUT)TRANSFER FUNCTION
G( ) C( I A) B1s s continuous ,
CONTINUOUS
47
UNIVERSITY of VAASA Communications and Systems Engineering Group
UNIVERSITY of VAASA Communications and Systems Engineering Group
LINEAR SYSTEMS - TRANSFER FUNCTIONS
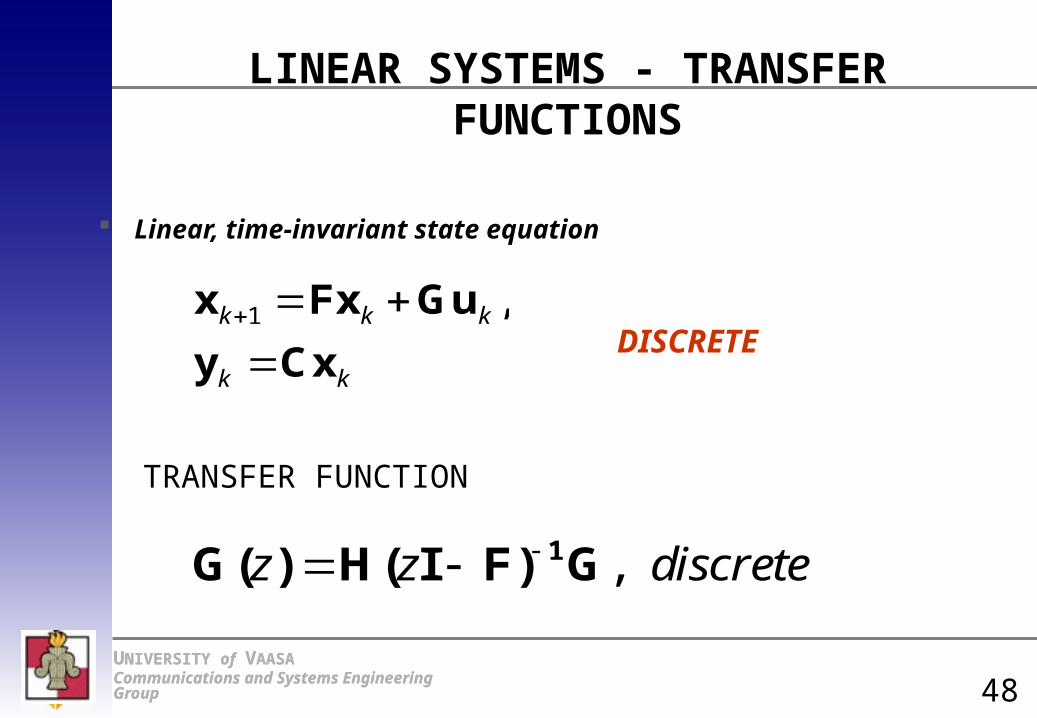
Linear, time-invariant state equation
TRANSFER FUNCTION
x Fx Gu
y Cxk k k
k k
1 ,
G( ) H( I F) G1z z discrete ,
DISCRETE
48
UNIVERSITY of VAASA Communications and Systems Engineering Group
UNIVERSITY of VAASA Communications and Systems Engineering Group
STOCHASTICS
WHITE NOISE
Current state depends neither on history nor future values
Noise spectrum is constant
49

UNIVERSITY of VAASA Communications and Systems Engineering Group
UNIVERSITY of VAASA Communications and Systems Engineering Group
STOCHASTICS
WHITE NOISE
50

UNIVERSITY of VAASA Communications and Systems Engineering Group
UNIVERSITY of VAASA Communications and Systems Engineering Group
STOCHASTICS
WHITE NOISE
51
UNIVERSITY of VAASA Communications and Systems Engineering Group
UNIVERSITY of VAASA Communications and Systems Engineering Group
STOCHASTICS
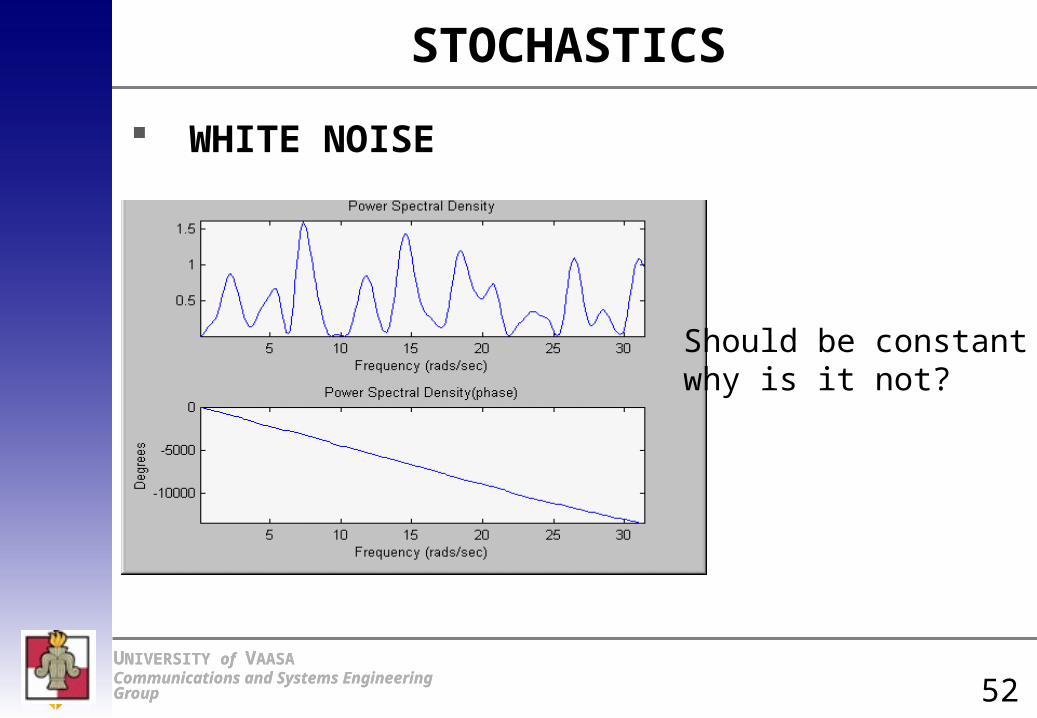
WHITE NOISE
Should be constant -why is it not?
52

UNIVERSITY of VAASA Communications and Systems Engineering Group
UNIVERSITY of VAASA Communications and Systems Engineering Group
STOCHASTICS
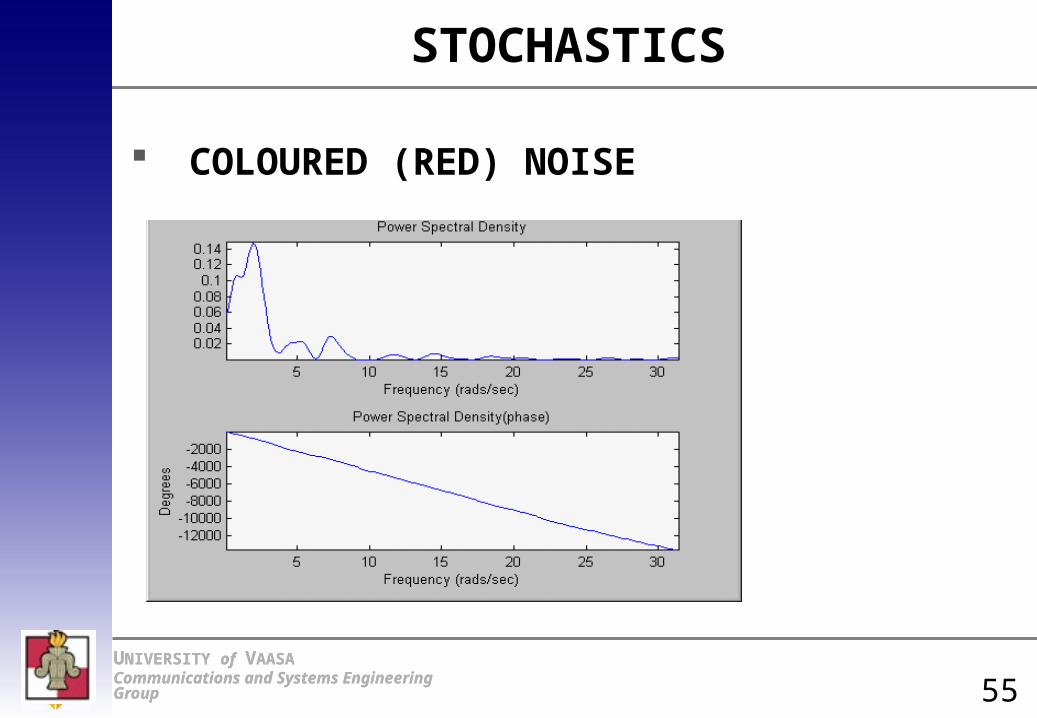
COLOURED (RED) NOISE
White noise throughfirst order filter
53

UNIVERSITY of VAASA Communications and Systems Engineering Group
UNIVERSITY of VAASA Communications and Systems Engineering Group
STOCHASTICS
COLOURED (RED) NOISE
54
UNIVERSITY of VAASA Communications and Systems Engineering Group
UNIVERSITY of VAASA Communications and Systems Engineering Group
STOCHASTICS
COLOURED (RED) NOISE
55

UNIVERSITY of VAASA Communications and Systems Engineering Group
UNIVERSITY of VAASA Communications and Systems Engineering Group
INTERPOLATION POLYNOMIALS AND SPLINES
Noisy data, repeat curve fitting - Splines
Better to filter data first! 56
Related Documents


![AASA, Feb. 22 2013 [3]](https://static.cupdf.com/doc/110x72/61da034707d2a503330ec69e/aasa-feb-22-2013-3.jpg)