University of Pennsylvania University of Pennsylvania ScholarlyCommons ScholarlyCommons Publicly Accessible Penn Dissertations 2020 Type 1 Conventional Dendritic Cells Are Systemically Type 1 Conventional Dendritic Cells Are Systemically Dysregulated Early In Pancreatic Carcinogenesis Dysregulated Early In Pancreatic Carcinogenesis Jeffrey Howard Lin University of Pennsylvania Follow this and additional works at: https://repository.upenn.edu/edissertations Part of the Allergy and Immunology Commons, Cell Biology Commons, Immunology and Infectious Disease Commons, Medical Immunology Commons, and the Oncology Commons Recommended Citation Recommended Citation Lin, Jeffrey Howard, "Type 1 Conventional Dendritic Cells Are Systemically Dysregulated Early In Pancreatic Carcinogenesis" (2020). Publicly Accessible Penn Dissertations. 4107. https://repository.upenn.edu/edissertations/4107 This paper is posted at ScholarlyCommons. https://repository.upenn.edu/edissertations/4107 For more information, please contact [email protected].

Welcome message from author
This document is posted to help you gain knowledge. Please leave a comment to let me know what you think about it! Share it to your friends and learn new things together.
Transcript

University of Pennsylvania University of Pennsylvania
ScholarlyCommons ScholarlyCommons
Publicly Accessible Penn Dissertations
2020
Type 1 Conventional Dendritic Cells Are Systemically Type 1 Conventional Dendritic Cells Are Systemically
Dysregulated Early In Pancreatic Carcinogenesis Dysregulated Early In Pancreatic Carcinogenesis
Jeffrey Howard Lin University of Pennsylvania
Follow this and additional works at: https://repository.upenn.edu/edissertations
Part of the Allergy and Immunology Commons, Cell Biology Commons, Immunology and Infectious
Disease Commons, Medical Immunology Commons, and the Oncology Commons
Recommended Citation Recommended Citation Lin, Jeffrey Howard, "Type 1 Conventional Dendritic Cells Are Systemically Dysregulated Early In Pancreatic Carcinogenesis" (2020). Publicly Accessible Penn Dissertations. 4107. https://repository.upenn.edu/edissertations/4107
This paper is posted at ScholarlyCommons. https://repository.upenn.edu/edissertations/4107 For more information, please contact [email protected].

Type 1 Conventional Dendritic Cells Are Systemically Dysregulated Early In Type 1 Conventional Dendritic Cells Are Systemically Dysregulated Early In Pancreatic Carcinogenesis Pancreatic Carcinogenesis
Abstract Abstract Pancreatic ductal adenocarcinoma (PDA) is a highly lethal cancer with a 9% survival rate and rising incidence. Currently, surgical resection remains the only means of curing PDA. Unfortunately, most PDA continues to be diagnosed at advanced or metastatic stage and are unresectable. As such, there is great need to extend immunotherapy to the treatment of PDA. However, PDA has proven to be almost universally unresponsive to immune checkpoint blockade (ICB), consistent with impaired or absent anti-tumor T cell immunity in this disease.
Here, we present evidence that type 1 conventional dendritic cells (cDC1s) – the critical antigen presenting cells (APCs) for anti-tumor T cell priming – are dysregulated early in preinvasive pancreatic intraepithelial neoplasia (PanIN) in the KrasG12D Trp53R172H Pdx1-Cre-driven (KPC) mouse model of pancreatic cancer. cDC1 dysfunction is systemic and progressive, driven by increased apoptosis, and results in suboptimal upregulation of T cell-polarizing cytokines during cDC1 maturation. The underlying mechanism is linked to elevated IL-6 concomitant with neoplasia. Neutralization of IL-6 in vivo ameliorates cDC1 apoptosis, rescuing cDC1 abundance in tumor-bearing mice. CD8+ T cell response to vaccination is impaired as a result of cDC1 dysregulation. Yet, combination therapy with CD40 agonist and Flt3 ligand restores cDC1 abundance to normal levels, decreases cDC1 apoptosis, and repairs cDC1 maturation. This drives increased CD8+ and CD4+ T cell activation, resulting in improved response to vaccination and superior control of tumor outgrowth.
We also present evidence of a central role for CD4+ T cells in the response to CD40 agonist. Our group has previously shown that systemic activation of CD40 drives T cell infiltration into KPC tumors. Combination treatment with CD40 agonist and immune checkpoint blockade (ICB) leads to durable tumor regressions that are both CD8+ and CD4+ T cell-dependent. Yet, the mechanisms by which CD4+ T cells infiltrate tumors following CD40 agonist remain unknown. Here, we use single-cell transcriptomics to query immune populations within the tumor microenvironment after various combinations of CD40 agonist and ICB. We discover that intratumoral myeloid cells produce the chemokine CCL5 following CD40 activation, mediating CD4+ T cell influx into the tumor microenvironment. Disruption of CCL5 genetically or pharmacologically mitigates the influx of CD4+ but not CD8+ T cells into tumors and diminishes therapeutic efficacy, resulting in impaired immune control of tumor outgrowth.
Thus, our studies reveal the unexpectedly early and systemic onset of cDC1 dysregulation during pancreatic carcinogenesis and suggest therapeutically tractable strategies towards cDC1 repair while highlighting a previously unappreciated role for CCL5 in CD4+ T cell intratumoral chemotaxis in response to immunotherapy.
Degree Type Degree Type Dissertation
Degree Name Degree Name Doctor of Philosophy (PhD)
Graduate Group Graduate Group Immunology
First Advisor First Advisor Robert H. Vonderheide

Keywords Keywords CD40, dendritic cells, IL-6, pancreatic cancer
Subject Categories Subject Categories Allergy and Immunology | Cell Biology | Immunology and Infectious Disease | Medical Immunology | Oncology
This dissertation is available at ScholarlyCommons: https://repository.upenn.edu/edissertations/4107

TYPE 1 CONVENTIONAL DENDRITIC CELLS
ARE SYSTEMICALLY DYSREGULATED
EARLY IN PANCREATIC CARCINOGENESIS
Jeffrey H Lin
A DISSERTATION
in
Immunology
Presented to the Faculties of the University of Pennsylvania
in
Partial Fulfillment of the Requirements for the
Degree of Doctor of Philosophy
2020
Supervisor of Dissertation
_____________________
Robert H Vonderheide, MD/DPhil
John H. Glick Abramson Cancer Center Director
Professor of Medicine
Graduate Group Chairperson
_______________________
David Allman, PhD
Professor of Pathology and Laboratory Medicine
Dissertation Committee
___________________
Laurence Eisenlohr, VMD/PhD, Professor of Pathology and Laboratory Medicine
Gregory Beatty, MD/PhD, Assistant Professor of Medicine
Golnaz Vahedi, PhD, Assistant Professor of Genetics
Andrew Wells, PhD, Associate Professor of Pathology and Laboratory Medicine

ii
DEDICATION
To my family and friends, who have provided me with
inspiration and strength.

iii
ACKNOWLEDGEMENT
For the past five years, my thesis advisor Dr. Robert H Vonderheide has inspired
me as a role model and guided my growth as a physician scientist. As the Director of the
Abramson Cancer Center at the University of Pennsylvania, his relentless drive to facilitate
our university’s efforts to bring forth latchkey discoveries and innovations in our fight
against cancer has been a constant motivator and source of inspiration. His twenty-year
effort to bring CD40 agonist as a cancer immunotherapeutic from the laboratory bench to
the patient’s bedside has been a testament to his patience, determination, and perseverance
– which he has carried through to the mentorship of his graduate students. In the
Vonderheide Lab, I have been fortunate to meet and work alongside many talented
scientists who have aided me in my development as an investigator. I thank all past and
present members, especially our lab manager Nuné Markosyan, as well as Katelyn Byrne,
and my co-IGG graduate student Austin Huffman.
I would also like to thank the members of my thesis committee Drs. Laurence
Eisenlohr, Gregory Beatty, Andrew Wells, and Golnaz Vahedi for their valuable
discussions and support throughout my thesis. I would also like to acknowledge the
University of Pennsylvania Medical Scientist Training Program (MSTP), especially Dr.
Skip Brass and Maggie Krall. Lastly, I would like to thank my family and friends for
supporting me throughout graduate school, as well as my partner Tracie Tran. Without
their love and unwavering support, I could not have pursued my dream of becoming a
physician scientist.
iv
ABSTRACT
TYPE 1 CONVENTIONAL DENDRITIC CELLS
ARE SYSTEMICALLY DYSREGULATED
EARLY IN PANCREATIC CARCINOGENESIS
Jeffrey H Lin
Robert H Vonderheide
Pancreatic ductal adenocarcinoma (PDA) is a highly lethal cancer with a 9%
survival rate and rising incidence. Currently, surgical resection remains the only means of
curing PDA. Unfortunately, most PDA continues to be diagnosed at advanced or metastatic
stage and are unresectable. As such, there is great need to extend immunotherapy to the
treatment of PDA. However, PDA has proven to be almost universally unresponsive to
immune checkpoint blockade (ICB), consistent with impaired or absent anti-tumor T cell
immunity in this disease.
Here, we present evidence that type 1 conventional dendritic cells (cDC1s) – the
critical antigen presenting cells (APCs) for anti-tumor T cell priming – are dysregulated
early in preinvasive pancreatic intraepithelial neoplasia (PanIN) in the KrasG12D Trp53R172H
Pdx1-Cre-driven (KPC) mouse model of pancreatic cancer. cDC1 dysfunction is systemic
and progressive, driven by increased apoptosis, and results in suboptimal upregulation of
T cell-polarizing cytokines during cDC1 maturation. The underlying mechanism is linked
to elevated IL-6 concomitant with neoplasia. Neutralization of IL-6 in vivo ameliorates
cDC1 apoptosis, rescuing cDC1 abundance in tumor-bearing mice. CD8+ T cell response
v
to vaccination is impaired as a result of cDC1 dysregulation. Yet, combination therapy with
CD40 agonist and Flt3 ligand restores cDC1 abundance to normal levels, decreases cDC1
apoptosis, and repairs cDC1 maturation. This drives increased CD8+ and CD4+ T cell
activation, resulting in improved response to vaccination and superior control of tumor
outgrowth.
We also present evidence of a central role for CD4+ T cells in the response to CD40
agonist. Our group has previously shown that systemic activation of CD40 drives T cell
infiltration into KPC tumors. Combination treatment with CD40 agonist and immune
checkpoint blockade (ICB) leads to durable tumor regressions that are both CD8+ and CD4+
T cell-dependent. Yet, the mechanisms by which CD4+ T cells infiltrate tumors following
CD40 agonist remain unknown. Here, we use single-cell transcriptomics to query immune
populations within the tumor microenvironment after various combinations of CD40
agonist and ICB. We discover that intratumoral myeloid cells produce the chemokine
CCL5 following CD40 activation, mediating CD4+ T cell influx into the tumor
microenvironment. Disruption of CCL5 genetically or pharmacologically mitigates the
influx of CD4+ but not CD8+ T cells into tumors and diminishes therapeutic efficacy,
resulting in impaired immune control of tumor outgrowth.
Thus, our studies reveal the unexpectedly early and systemic onset of cDC1
dysregulation during pancreatic carcinogenesis and suggest therapeutically tractable
strategies towards cDC1 repair while highlighting a previously unappreciated role for
CCL5 in CD4+ T cell intratumoral chemotaxis in response to immunotherapy.
vi
TABLE OF CONTENTS
ACKNOWELDGEMENT …………………………………………………………….. iii
ABSTRACT …………………………………………………………………………..... iv
LIST OF TABLES ..…………...…………………………………………….………..... ix
LIST OF ILLUSTRATIONS ...…………………………………………........................ x
CHAPTER 1: Introduction
Cancer immune evasion ………………………………………………………….. 1
Conventional dendritic cells ……………………………………………………... 2
Type 1 conventional dendritic cells in anti-tumor immunity …………………...... 4
Modulation of DC abundance and function in cancer …………………………… 5
Therapeutic manipulation of cDC1s ……………………………………………... 6
Immune checkpoint blockade unresponsiveness ………………………………… 8
Pancreatic ductal adenocarcinoma ……………………………………………...... 9
T cell chemotaxis in the tumor microenvironment ……………………………… 11
Figures and figure legends …………………………………………………….... 13
CHAPTER 2: Type 1 Conventional Dendritic Cells are Systemically Dysregulated
Early in Pancreatic Carcinogenesis
Abstract ………………………………………………………………………… 15
Introduction …………………………………………………………………….. 16
Results ………………………………………………………………………….. 18
Discussion ……………………………………………………………………… 28
Materials and methods …………………………………………………………. 32

vii
Figures and figure legends ……………………………………………………... 40
Tables ……………………………………………………................................... 60
CHAPTER 3: Type 1 Conventional Dendritic Cell Dysregulation is Reversible
Through Combination CD40 Agonist and Flt3L
Abstract …………………………………………………………………….…... 63
Introduction ……………………………………………………………….……. 64
Results …………………………………………………………………….……. 66
Discussion ……………………………………………………………….……... 71
Materials and methods ………………………………………………….……… 74
Figures and figure legends …………………………………………….……….. 79
Tables ……………………………………………………................................... 90
CHAPTER 4: CCL5 Mediates CD40-Driven CD4+ T cell Tumor Infiltration and
Immunity
Abstract …………………………………………………………………….…... 92
Introduction ……………………………………………………………….……. 94
Results ………………………………………………………………………….. 96
Discussion …………………………………………………………………….. 103
Materials and methods ………………………………………………………… 107
Figures and figure legends …………………………………………………….. 114
Tables ……………………………………………………................................. 132
CHAPTER 5: Concluding Remarks and Future Directions
cDC1s in pancreatic ductal adenocarcinoma …………………….……………. 134
CD4+ T cell chemotaxis in CD40 agonism ……………………………………. 140

viii
Figures and figure legends …………………………………………………….. 145
BIBLIOGRAPHY ...…………………………………………………………………. 147

ix
LIST OF TABLES
Table 2.1: Antibodies used in flow cytometric analyses of murine studies ………..….. 60
Table 2.2: Antibodies used in mass cytometric analysis of human studies ……........… 62
Table 3.1: Antibodies used in flow cytometric analyses ……………….……………… 90
Table 4.1: Most upregulated genes in CD40/ICB-treated macrophages ……………... 132
Table 4.2: Antibodies used in flow cytometric analyses ……………………………... 133
x
LIST OF ILLUSTRATIONS
Figure 1.1: Type 1 conventional DCs (cDC1s) convey three signals to prime antigen-
specific CD8+ T cell responses ……………..…………………………………………... 13
Figure 1.2: Growth factors and transcription factors drive differentiation of dendritic cell
progenitors in the bone marrow …………………………………………………………. 14
Figure 2.1: cDC1 abundance declines systemically during pancreatic carcinogenesis .... 40
Figure 2.2: cDC1 abundance only declines based on cell fractions during pancreatic
carcinogenesis ………………………….……………...……………………………….. 42
Figure 2.3: cDC1 maturation marker expression declines systemically during preinvasive
neoplasia …………………………………………………………………………....…... 44
Figure 2.4: cDC1 maturation is progressively impaired during pancreatic oncogenesis . 45
Figure 2.5: cDC1-mediated CD8+ T cell priming is impaired in PanIN- and tumor-bearing
mice ……………………...…………………………………………………................... 47
Figure 2.6: cDC1 abundance and maturation are associated with increased cytolytic
activity in human pancreatic ductal adenocarcinoma ………………..………..………… 48
Figure 2.7: Systemic cDC1 dysregulation requires neoplastic development ……....…... 50
Figure 2.8: Systemic cDC1 dysfunction does not occur in the KP mouse model of lung
adenocarcinoma ……………………………………………………………...….……… 52
Figure 2.9: cDC1 generation is unaffected by pancreatic neoplastic development …...... 54

xi
Figure 2.10: Increased serum IL-6 drives cDC1 apoptosis systemically in tumor-bearing
KPC mice …………………………………………………………………….………..... 56
Figure 2.11 cDC1 maturation marker expression is unaffected by IL-6 depletion …….. 59
Figure 3.1: CD40 activation repairs cDC1 maturation in KPC tumors ………..……….. 79
Figure 3.2: CD40-driven cDC1 maturation is associated with an IFN- response signature
…………………………………………………………………………………………... 82
Figure 3.3: Flt3 ligand synergizes with CD40 activation to promote cDC1 survival and
function ….……………..……………………………………………………………….. 84
Figure 3.4: Combination therapy with CD40 agonist and Flt3 ligand results in superior T
cell activation in the tumor-draining lymph node …..…………………………………… 86
Figure 3.5: Tumor growth curves from subcutaneous implantation of 6419c5 and
combination treatment with CD40 agonist and Flt3L …….…………………...……...… 88
Figure 3.6: Addition of Flt3L attenuates CD40 activation-induced depletion of bone
marrow cDC1 progenitors ………………………………………………………………. 89
Figure 4.1: Single-cell RNA sequencing identifies intratumoral immune populations .. 114
Figure 4.2: Single cell RNA sequencing analysis pipeline and details ……..………..... 116
Figure 4.3: Myeloid cell differentiation is unaffected by treatment with CD40 agonist and
immune checkpoint blockade …………………………………..……...……….……... 117
Figure 4.4: Anti-tumor myeloid populations upregulate Ccl5 transcripts after CD40
activation ……………...………………………………………………………………. 119

xii
Figure 4.5 …………………………………………………….…………...………..…. 121
Figure 4.6: CCL5 is upregulated by anti-tumor myeloid populations following CD40/ICB
therapy ……………………………………………………………………...……....…. 123
Figure 4.7 ………………………………………….………………………………...... 125
Figure 4.8: CCL5 is required for treatment efficacy ………………..………………..... 126
Figure 4.9: CCL5 is required for CD4+ T-cell infiltration following CD40/ICB ……... 128
Figure 4.10 ……………………………………………………………………….….... 130
Figure 4.11: Effects of CCL5 and CXCL9 pharmacologic blockade on growth of CD40
agonist/ICB-treated subcutaneously implanted KPC tumor …………………………... 131
Figure 5.1: Model representation of cDC1 dysregulation and rescue in murine pancreatic
ductal adenocarcinoma ………………………………………………………………... 145
Figure 5.2: Model representation of the role of CCL5 in untreated and CD40 agonist-
treated KPC tumors ………………………………………………….………..……….. 146

1
CHAPTER 1: Introduction
Cancer immune evasion
Solid tumors have been proposed to subvert T cell immune surveillance through a
variety of mechanisms. In the “cancer immunoediting” hypothesis first elaborated by Dr.
Robert Schreiber in 2002, cytotoxic T cell selective pressure drives “immunoediting” of
tumors in three phases: elimination, equilibrium, and escape1. During “elimination,”
peptide:MHC expressed on the surface of tumor cells results in their recognition by T cell
receptor (TCR) and their subsequent elimination. However, due to the genetic instability
of tumor cells, T cell selective pressure gives rise to immune evasive tumor cell variants
with lower expression of the target antigen or defective antigen processing and presentation
machinery. Tumor cells that are less sensitive to immune effector cytokines are also
selected for. During “equilibrium,” T cells, IL-12, and IFN- contribute to adaptive
immune control of tumor outgrowth, but immune evasive tumor cells are not eliminated.
Finally, during “escape,” T cell selective pressure gives rise to tumor cells that have
overcome adaptive immune surveillance. Tumor cell outgrowth is no longer controlled by
the immune system, and solid tumors emerge clinically.
More recently, it has become understood that solid tumors can subvert immune
surveillance through immune suppression within the tumor microenvironment. Stromal
cells, immune cells, and tumor cells can express immune checkpoint molecules such as
PD-L1 that inhibit T cell activation and effector function through inhibitory receptors on T
cells such as PD-12. Another example is the competitive binding of CD80/CD86 expressed
on professional antigen presenting cells (APCs) by inhibitory CTLA-4 (versus stimulatory
CD28) expressed on the surface of T cells. These suppressive mechanisms normally
2
function to maintain immune homeostasis and protect against autoimmunity as part of
immune peripheral tolerance. Thus, immune checkpoint blockade (ICB) immunotherapies
such as anti-PD-1 and anti-CTLA-4 block these inhibitory signals and enable tumor-
reactive T cells to regain antitumor effector function, leading to tumor regression.
However, many cancer types such as pancreatic ductal adenocarcinoma remain
unresponsive to ICB3. These tumors exhibit low intratumoral T cell infiltration, which
often predicts poor prognosis and a lack of response to ICB. Instead, the microenvironment
of such tumors is often dominated by immune suppressive cell types such as tumor-
associated macrophages (TAMs), myeloid-derived suppressor cells (MDSCs), and
regulatory T cells (Tregs). In an oncogene-driven mouse model of pancreatic ductal
adenocarcinoma, hallmarks of cancer immunoediting were found to be absent4. Depletion
of CD4+ and CD8+ T cells did not alter tumor outgrowth; and transplantation of a tumor
from an immune-deficient donor to an immune-competent host did not result in tumor
rejection. These findings are consistent with absent cytotoxic T cell selective pressure and
suggest that T cell reactivity fails to develop during tumor development. It is therefore
critical to understand which cell types drive anti-tumor T cell priming and how their
function is altered in malignancy and even earlier during carcinogenesis.
Conventional dendritic cells
Dendritic cells (DCs) are highly specialized APCs that function primarily to ingest
and present antigen to T cells5. DCs in peripheral tissue continuously sample their
environment and ingest antigen through pinocytosis. Upon activation of pattern recognition
receptors by pathogen-associated molecular patterns, tissue dendritic cells become

3
activated as part of the innate immune response. Activated DCs then migrate to local
lymphoid tissues and mature into cells that are highly effective at presenting antigen to
naïve T cells, activating them through three canonical “signals”6,7 (Fig. 1.1). The process
by which naïve T cells are induced into clonal expansion upon encounter with their specific
antigen is known as T cell priming. Thus, DCs are critical initiators of spontaneous T cell
immune responses.
DCs are derived from a variety of bone marrow precursors and progenitors8–10 (Fig.
1.2). The earliest commitment of myeloid precursors to mononuclear phagocytes such as
macrophages and DCs is thought to occur in macrophage dendritic cell progenitors
(MDPs). MDPs differentiate into monocytes or common DC progenitors (CDPs).
Monocytes can differentiate into macrophages or monocyte-derived DCs (moDCs) at
inflammatory sites in vivo. CDPs, on the other hand, give rise to pre-conventional DCs
(pre-cDCs) or plasmacytoid DCs (pDCs). Pre-cDCs are CD11c+MHCII- proliferative
precursors to conventional DCs (cDCs) that can be subdivided into subsets that are
predestined to differentiate into type 1 conventional DCs (pre-cDC1s) or type 2
conventional DCs (pre-cDC2s)11. Thus, pre-cDCs are cDC-restricted precursors that are
continuously generated in the bone marrow, circulate to peripheral tissues, and differentiate
locally into cDCs, resulting in constant turnover.
cDCs can be phenotypically divided into two main subsets based on their
expression of XCR1 and SIRP. Type 1 conventional DCs (cDC1s) are XCR1hiSIRPlo
while type 2 conventional DCs (cDC2s) are XCR1loSIRPhi. These populations can be
found in all lymphoid and most non-lymphoid tissues. Batf3-/- mice that lack cDC1s have
been instrumental in showing that cDC1s are functionally specialized in antigen cross-

4
presentation, a process by which exogenous antigens are presented to CD8+ T cells on
MHC I rather than to CD4+ T cells on MHC II5,13. cDC1s are also highly efficient at
producing IL-12, a T cell-polarizing cytokine critical for activation of Th1 CD4+ and CD8+
T cells. As a result, cDC1s are critical for anti-viral and anti-tumor T cell responses. cDC2s
are distinguished from cDC1s by their inability to efficiently perform antigen cross-
presentation or produce IL-125,14. Unlike cDC1s which are largely homogeneous, cDC2s
are much more heterogenous. Assigning specific functions to cDC2s has remained
challenging due to a lack of specific knockout models for cDC2s. Thus far, cDC2s have
been shown to be superior to cDC1s for the activation of Th2 and Th17 CD4+ T cells,
coinciding with their increased expression of MHC II presentation machinery and ability
to produce cytokines such as IL-6 and IL-2315–17. Recent studies have also elucidated novel
functional subsets of cDC2s in humans that have not yet been shown to have counterparts
in mice18–20.
Type 1 conventional dendritic cells in anti-tumor immunity
cDC1s have been shown to be critical for spontaneous T cell-based rejection of
tumors as well as response to T cell-based cancer immunotherapies21. Batf3-/- mice that
lack cDC1s consistently fail to reject implanted tumors or respond to CD40 agonist and
ICB immunotherapies13,22–27. The unique efficiency of cDC1s at performing antigen cross-
presentation makes them crucial for initiating CD8+ T cell-mediated tumor cell killing.
cDC1 content in tumors is therefore associated with increased survival and responsiveness
to immunotherapy in cancer patients.
5
Initially, cDC1s in tumors are “immature,” constantly sampling the tumor
microenvironment (TME) through pinocytosis and engulfing tumor-associated antigens
(TAAs). Upon activation of pattern recognition receptors by pathogen-associated or
damage-associated molecular patterns, cDC1s undergo maturation and migrate to draining
lymph nodes to perform T cell priming14,21. An example of this is the sensing of nucleic
acids in the TME through the cGAS-STING pathway, which has been shown to drive cDC1
activation and type 1 interferon production in melanoma28. During maturation, cDC1s
upregulate costimulatory molecules like CD80 and CD86 that bind CD28 on T cells during
T cell priming (Fig. 1.1). They also upregulate CCR7, a receptor for the chemokines
CCL19 and CCL21, that allows cDC1s to home to draining lymph nodes where they cross-
present TAAs to CD8+ T cells6,23. cDC1s also secrete cytokines like IL-12 that are critical
for the differentiation of Th1 CD4+ T cells that provide powerful “T cell help” to CD8+ T
cells. IL-12 is also critical for the priming and activation of CD8+ T cells. Finally, cDC1s
in the TME have been shown to recruit CD8+ T cells in murine melanoma through the
secretion of the chemokines CXCL9 and CXCL1025. cDC1 accumulation and maturation
in tumors are therefore crucial to their ability to orchestrate anti-tumor T cell immunity.
Modulation of cDC1 abundance and function in cancer
cDC1s can be co-opted by tumors to drive adaptive immune tolerance in the TME14.
Presentation of tumor antigen (“signal 1”) in the absence of the costimulatory ligands CD80
and CD86 (“signal 2”) induces a state of T cell non-responsiveness known as T cell anergy6
(Fig. 1.1). Furthermore, cDC1s can upregulate inhibitory molecules like PD-L1 that bind
PD-1 on T cells to counteract the action of costimulatory ligands. cDC1s can also produce

6
metabolic substrates that suppress T cell activity. For example, cDC1s have been shown to
produce indoleamine-2,3-dioxygenase 1 (IDO1) following recognition of apoptotic cells
or after binding of CD80 or CD86 to CTLA4, a molecule highly expressed on immune
suppressive CD4+ T regulatory cells (Tregs)29. These mechanisms of peripheral tolerance
have been co-opted by tumors to suppress CD8+ T cell or Th1 CD4+ T cell differentiation
by cDC1s, instead promoting differentiation of Tregs.
Tumors are also known to secrete immune suppressive factors that limit cDC1
abundance and maturation in the TME. For example, tumor-intrinsic active -catenin has
been shown to suppress levels of the DC-chemotactic molecule CCL4 in the TME,
reducing cDC1 infiltration24. Prostaglandin E2 has similarly been shown to reduce cDC1
density in the TME through suppression of NK cell-mediated cDC1 recruitment via
secretion of XCL1 (the ligand for the cDC1-specific receptor XCR1) and Flt3 ligand
(Flt3L; a critical survival factor for cDC1s)30,31. Tumors also suppress cDC1 survival and
differentiation in the TME. Vascular endothelial growth factor (VEGF) is known to be
secreted by many solid tumors and has been shown to counteract Flt3L32. IL-6 secreted
from the TME has also been shown to polarize pre-cDC differentiation towards cDC2s
rather than cDC1s33. Finally, a diverse variety of other factors secreted by the TME have
been shown to suppress cDC1 activation, antigen processing, and maturation14. In
summary, solid tumors possess mechanisms to limit the immune stimulatory function of
DCs and polarize DCs towards an anti-inflammatory or pro-tumor phenotype.
Therapeutic manipulation of cDC1s

7
Due to the potency with which cDC1s can prime anti-tumor T cell responses,
cDC1s have been targeted in a variety of therapeutic strategies. One such strategy involves
the administration of agents that promote immunogenic functions of cDC1s14. Examples
include the administration of Flt3 ligand (Flt3L), which is essential for the development of
cDC1s and promotes their mobilization and attraction to the tumor microenvironment.
TLR3 agonists, such as poly(I:C), have been used to promote cDC1-mediated Th1 CD4+
and CD8+ T cell priming and cytotoxic function. TLR7, TLR8, and TLR9 agonists have
also been used in a similar capacity. IDO inhibitors are used to reverse the immune
suppressive functions of indoleamine 2,3-dioxygenase (IDO) secreted by tumor-
dysregulated tolerogenic cDC1s. IL-6 receptor signaling has been shown to suppress cDC1
function and differentiation33. STAT3 inhibitors are therefore used to inhibit this process,
aid cDC1 activation, and prevent cDC1 acquisition of immune-suppressive functions.
Another agent that has been administered immunotherapeutically to potentiate
cDC1 function is CD40 agonist. CD40 is a receptor expressed on APCs that licenses them
to mature upon binding CD40 ligand (CD40L) expressed on activated CD4+ T cells34,35.
Prior studies from our group have shown that systemic administration of an agonistic CD40
monoclonal antibody (CD40 agonist) is effective in driving T cell infiltration into tumors
and potentiating response to ICB36–38. This response has been shown to be dependent upon
IFN-, CD40, CD8+ T cells, CD4+ T cells, and cDC1s. However, it has never been
determined whether cDC1s are merely required for response to CD40 agonist or are being
induced to mature following CD40 agonism.
Beyond traditional vaccination strategies with tumor-associated antigens (TAAs)
and adjuvant, cDC1s themselves are also being used as an immunotherapeutic agent14.

8
cDC1 vaccines typically involve the isolation or in vitro generation and amplification of
autologous cDC1s that are then manipulated in vitro and reinfused into patients. This in
vitro manipulation consists of pulsing cDC1s with TAA and then activating them with an
agent such as a TLR agonist. This research has resulted in an FDA-approved APC vaccine
known as sipuleucel-T (Provenge) for prostate cancer in which autologous blood APCs are
loaded with prostatic acid phosphatase and GM-CSF and reinfused into the patient,
extending their median overall survival by about four months39. However, the optimal
combination of TAAs, adjuvants, and TLR agonists remains an active area of study,
opening exciting possibilities for future therapeutic advances.
Immune checkpoint blockade unresponsiveness
ICB describes the use of therapeutic antibodies that disrupt or inhibit negative
immune regulatory checkpoints, unleashing pre-existing T cell responses against TAAs40.
Among cancer immunotherapies, ICBs have had by far the most success. Multiple
antibodies targeting CTLA4 and PD-1/PD-L1 have been approved by the Food and Drug
Administration (FDA) as first-line therapies for metastatic melanoma and PD-L1-
overexpressing non-small cell lung adenocarcinoma. Many of these patients experience
deep tumor regressions, with some achieving complete remission. However, most patients
still fail to respond to ICB or experience tumor relapse following a period of initial
response. The tumor-intrinsic mechanisms of this resistance remain an active area of study.
Another urgent area of investigation, however, is determining why certain cancers
fail to show any response to ICB at all3. A prime example of this is pancreatic ductal
adenocarcinoma (PDA) in which less than 1% of patients (specifically those with

9
microsatellite instability) show any clinical response to ICB. Across all cancer types, there
appear to be two correlates to ICB response: 1) CD8+ and Th1 CD4+ T cell abundance in
the TME and 2) mutational burden41. However, this paradigm is being challenged as many
ICB-unresponsive cancers possess potentially actionable neoantigens and modest though
relatively low CD8+ T cell content42.
In the prevailing view of cancer immune surveillance, T cell recognition of TAAs
on tumor cells leads to the gradual loss of antigen expression and presentation from tumors
over time, resulting in immune evasion43. This process is known as “cancer
immunoediting.” However, in ICB-unresponsive cancers such as PDA, T cell responses
appear to be absent or impaired throughout the entire natural history of the tumor3.
Supporting evidence comes from attempts to reproduce cancer immunoediting in mouse
models of PDA. Unlike carcinogen-induced mouse models of sarcoma, transplanting
murine PDA from an immunodeficient mouse into an immunocompetent mouse does not
result in T cell-mediated tumor rejection44. In fact, such tumors are never rejected despite
the presence of fully functional T cells in the recipient. Thus, in the absence of T cell
selective pressure, it is likely such cancers could be susceptible to T cell killing if anti-
tumor T cell responses can be primed. As cDC1s are the critical APC for anti-tumor T cell
priming, understanding cDC1 dysregulation and repair could unlock the potential for
extending immunotherapy to ICB-unresponsive cancers.
Pancreatic ductal adenocarcinoma
Pancreatic ductal adenocarcinoma (PDA) is a highly lethal cancer with a 9%
survival rate and rising incidence, predicted to be the third largest cause of cancer-related

10
deaths in the United States in 202045. PDA accounts for over 90% of pancreatic cancers.
Strongly associated risk factors include tobacco use, obesity, diabetes, and chronic
pancreatitis. Currently, surgical resection remains the only means of curing PDA, though
advances in adjuvant chemotherapy have improved survival rates in unresectable PDA in
recent years. Unfortunately, no reliable biomarkers exist for early detection of PDA on a
mass scale and most PDA is still diagnosed at advanced or metastatic stage, making them
unresectable. As such, there is enormous interest to extend immunotherapy to the treatment
of PDA.
PDA development consists of a stepwise acquisition of mutations as normal
mucosa transforms to precursor intraepithelial neoplasias and finally to malignant
carcinoma46. Pancreatic intraepithelial neoplasias (PanINs) are non-invasive microscopic
lesions found in pancreatic ducts that are precursors to PDA. The acquisition of oncogenic
mutations mirrors the histological progression of PanINs from low-grade PanIN-1A
mucinous metaplasia without dysplasia to high-grade PanIN-3 carcinoma in situ. The
primary driver mutations often include KRAS (90%), CDKN2A (90%), TP53 (70%), and
SMAD4 (55%)45. Once PanIN-3s are observed to spread beyond the basement membrane
of the epithelium, they are classified as PDA.
The KPC mouse model of PDA driven by oncogenic KrasLSL-G12D/+ Trp53 LSL-R172H/+
Pdx1-Cre has been invaluable for elucidating much of the basic biology of this disease47.
KPC mice develop significant chromosomal instability in pancreatic ductal epithelial cells
that drives progression of PanINs to metastatic PDA with complete penetrance, resulting
in a dramatically reduced median survival of five months in these mice. Histologically,
KPC lesions progress through all the same precursor PanIN states as human PDA. Fully
11
invasive and metastatic KPC tumors likewise closely match the histologic features seen in
human PDA, including an intense fibroinflammatory reaction that results in a high degree
of desmoplasia and infiltration of immune suppressive leukocytes. PanIN formation is
accompanied by a variety of changes to the immune milieu of the pancreas, including an
influx of tumor-associated macrophages, myeloid derived suppressor cells, and CD4+
regulatory T cells48. These changes persist and intensify upon progression to malignancy
with prominent expansion and recruitment of myeloid cells driven by tumor-derived
cytokines and chemokines such as GM-CSF and CXCR249,50. Anti-neoplastic T cells are
also strongly excluded from KPC tumors, consistent with deficiencies in T cell priming4.
As such, the KPC mouse model of PDA is an ideal system in which to study the onset of
cDC1 dysfunction as it relates to ICB-unresponsive cancers.
T cell chemotaxis in the tumor microenvironment
The recruitment and trafficking of Th1 CD4+ and CD8+ T cells to the tumor
microenvironment is a critical step in anti-tumor adaptive immunity. Following T cell
priming by cDC1s in secondary lymphoid organs such as tumor-draining lymph nodes, T
cells are recruited from the vasculature to the tumor by a series of distinct processes. This
includes attachment and adhesion to cell adhesion molecules expressed on activated
endothelial cells, rolling and tethering, chemotaxis, and extravasation. Tumors generally
develop mechanisms to exclude T cells from the tumor microenvironment as part of
immune evasion. Thus, it is important to understand how T cells are attracted to the tumor
microenvironment so that we may overcome these barriers to enable and maintain
immunotherapeutic response.

12
T cell trafficking is a tightly controlled process. Upon priming, effector T cells lose
expression of CD62L and CCR7, thus losing the ability to access lymph nodes51. Instead,
they gain expression of a specific set of homing molecules that enable them to migrate to
their target diseased tissues. This includes chemokine receptors such as CXCR3 that bind
inflammatory chemokines CXCL9 and CXCL10 secreted by intratumoral cDC1s25. The
binding of such chemokine receptors subsequently upregulates integrins which bind cell
adhesion molecules on activated endothelial cells, facilitating the extravasation of T cells
into the tumor.
Importantly, the CXCR3-CXCL9/10 signaling axis has primarily been
demonstrated for CD8+ T cell chemotaxis into tumors. The chemokine-chemokine receptor
axes regulating Th1 CD4+ T cell chemotaxis into the tumor microenvironment remain
largely uncharacterized. The chemokine CCL5 is a known CD4+ T cell chemoattractant
but has primarily been shown to promote cancer progression and metastasis through
recruitment of immune suppressive populations such as Tregs and MDSCs52,53. Yet,
inhibiting Th1 CD4+ T cell trafficking with sphingosine-1-phosphate receptor inhibitor in
the context of CD40 agonism does results in a loss of treatment efficacy54. Thus, while it
is known that Th1 CD4+ T cell trafficking is critical for response to immunotherapy, the
chemokine(s) that regulate this process, the cell types that secrete them, and the contexts
in which they have anti-tumor versus pro-tumor properties remain unknown.

13
Figures and figure legends
Figure 1.1 Type 1 conventional DCs (cDC1s) convey three signals to prime antigen-
specific CD8+ T cell responses. Signal 1 comprises the presentation of antigen peptide, in
the context of MHC class I molecules, which is recognized by antigen-specific TCR on
a CD8+ T cell. Signal 2 involves the stabilization of the synapse through adhesion
molecules and the generation of signals via costimulatory molecules present on the surface
of cDC1s and T cells. CD80/CD86 interact with CD28 on T cells to generate activating
signals. Signal 3 is produced by the secretion of cytokines like IL-12 by cDC1s which
signal T cells to differentiate into an effector phenotype.

14
Figure 1.2 Growth factors and transcription factors drive differentiation of dendritic
cell (DC) progenitors in the bone marrow. The bone marrow precursors of type 1
conventional DCs (cDC1s), type 2 conventional DCs (cDC2s), and monocyte-derived DCs
are shown. In the bone marrow, hematopoietic stem cells (HSCs) differentiate into
common myeloid progenitors (CMPs) and differentiate into macrophage-DC progenitors
(MDPs) and common DC progenitors (CDPs) under the influence of Flt3 ligand (Flt3L).
MDPs are the direct precursor to CDPs, which produce pre-conventional DCs (pre-cDCs)
that exit the bone marrow and travel through the blood to secondary lymphoid organs and
non-hematopoietic tissues. Pre-cDCs are further polarized towards cDC1 development
under the influence of Flt3L and the transcription factors IRF8 and BATF3.

15
CHAPTER 2: Type 1 Conventional Dendritic Cells are Systemically Dysregulated
Early in Pancreatic Carcinogenesis
The contents of this chapter have been published:
Lin JH, Huffman AP, Wattenberg MM, Walter DM, Carpenter EL, Feldser DM,
Beatty GL, Furth EE, Vonderheide RH. Type 1 conventional dendritic cells are
systemically dysregulated early in pancreatic carcinogenesis. J. Exp. Med. 217 (8),
e20190673 (2020).
Abstract
Type 1 conventional dendritic cells (cDC1s) are typically thought to be dysregulated
secondarily to invasive cancer. Here, we report that cDC1 dysfunction instead develops in
the earliest stages of preinvasive pancreatic intraepithelial neoplasia (PanIN) in the KrasLSL-
G12D/+ Trp53LSL-R172H/+ Pdx1-Cre-driven (KPC) mouse model of pancreatic ductal
adenocarcinoma (PDA). cDC1 dysfunction is systemic and progressive, driven by
increased apoptosis, and results in suboptimal upregulation of T cell-polarizing cytokines
during cDC1 maturation. CD8+ T cell response to vaccination is subsequently impaired in
PanIN- and tumor-bearing KPC mice. The underlying mechanism is linked to elevated IL-
6 concomitant with neoplasia. Neutralization of IL-6 in vivo ameliorates cDC1 apoptosis
and rescues cDC1 abundance in tumor-bearing mice. This study therefore reveals the
unexpectedly early and systemic onset of cDC1 dysregulation during pancreatic
carcinogenesis and highlights IL-6 as a systemic mediator of para-neoplastic cDC1
suppression.

16
Introduction
Solid tumors are typically thought to subvert immune surveillance through evasion
of T cell recognition43. Yet, immunologically “cold” cancers that do not respond to immune
checkpoint blockade (ICB) often exclude anti-neoplastic T cells from the earliest stages of
disease and exhibit no evidence of immunoediting by T cell selective pressure4,48. This
phenotype is consistent with impaired T cell priming rather than evasion of pre-existing T
cell immunity as the means of subverting adaptive immune surveillance3. Suppression of
T cell priming may therefore be an early rather than secondary event to tumor formation in
such cancers.
Type 1 conventional dendritic cells (cDC1s) are the critical professional antigen
presenting cell (APC) for T cell priming in spontaneous anti-tumor adaptive immunity21.
cDC1s are necessary for tumor antigen trafficking to draining lymph nodes, antigen cross-
presentation, and CD8+ T cell activation22,23,55. cDC1s have also been shown to recruit
CD8+ T cells into the tumor microenvironment25. They are required for spontaneous T cell-
mediated tumor rejection and response to ICB in a variety of cancer mouse models13,22,24–
27,30. A recent study in murine pancreatic cancer demonstrates that dendritic cell paucity
can lead to dysfunctional immune surveillance against an engineered model neoantigen,
accelerating neoplastic progression56. Studies of cDC1s in the B-Raf/PTEN-/--driven
genetically engineered mouse model (GEMM) of melanoma have also elucidated cancer
cell-intrinsic mechanisms of cDC1 suppression and exclusion such as through -catenin
signaling24,26,28. Here, we examine the onset of cDC1 dysregulation during carcinogenesis
as it relates to T cell priming.

17
The KPC GEMM of pancreatic ductal adenocarcinoma (PDA) driven by Pdx1-Cre
KrasLSL-G12D/+ Trp53LSL-R172H/+ enables the study of immune dynamics in response to
developing carcinomas from inception to invasion47,48,57. These mice develop preinvasive
pancreatic intraepithelial neoplasias (PanINs) at an early age that progress to metastatic
carcinomas with complete penetrance. PanIN formation is accompanied by a variety of
changes to the immune milieu of the pancreas, including an influx of tumor-associated
macrophages, myeloid derived suppressor cells (MDSCs), and CD4+ regulatory T cells.
These changes persist and intensify upon progression to malignancy with prominent
expansion and recruitment of myeloid cells driven by tumor-derived cytokines and
chemokines such as GM-CSF and CXCR249,50. Anti-neoplastic T cells are also strongly
excluded from KPC tumors, consistent with deficiencies in T cell priming.
In the present study, we use the KPC GEMM to quantify cDC1 abundance and
maturation from preinvasive neoplasia to invasive carcinoma. We reveal significant
systemic changes in cDC1 biology that impair CD8+ T cell priming from the earliest stages
of disease. Elevated serum IL-6 is especially prominent and found to be a key driver of
cDC1 apoptosis. Systemic cDC1 dysfunction and elevated serum IL-6 are found to be
specific to the KPC GEMM and absent from mouse models of non-small cell lung
adenocarcinoma and cerulein-induced chronic pancreatitis. Thus, we uncover IL-6 as a
systemic driver of cDC1 dysfunction, resulting in defective T cell priming in PDA.

18
Results
cDC1 abundance declines progressively and systemically during pancreatic
carcinogenesis
To examine cDC1 biology in the KPC GEMM, we defined groups of mice that
represent distinct stages of carcinogenesis. Mice homozygous for Pdx1-Cre but lacking
mutant Kras and Trp53 were chosen as healthy controls. Littermates from the same colony
were chosen to control for potential differences in genetics and microbiota. Eight-week-
old KPC mice, confirmed not to have tumors by ultrasound, were used as PanIN-bearing
mice. The pancreata of eight-week-old KPC mice were confirmed to harbor lesions
characteristic of stage 1A PanINs (Fig. 2.1 A). Finally, KPC mice that were confirmed to
have tumors by palpation and ultrasound served as tumor-bearing mice.
To quantify cDCs across tissues, we used a consistent set of phenotypic markers
and defined cDCs as live CD45+CD64-Lin-MHC II+CD11c+ cells. We then delineated
cDC1s and cDC2s based on XCR1 and SIRP expression, respectively (Fig. 2.1 B). This
strategy minimizes contamination by B cells, macrophages, monocytes, and MDSCs12.
cDC1 abundance was found to decline as a proportion of live cells in PanIN-bearing
pancreas and KPC tumor (Fig. 2.1 C). To explore whether cDC1 exclusion was being
driven by an influx of myeloid cells, cDC1s were also quantified as a percentage of CD45+
cells. When quantified in this manner, cDC1 abundance was confirmed to decline in KPC
tumors with a trend towards decline in PanIN-bearing pancreas (Fig. 2.1C), consistent with
prior reports (Li et al., 2018). Quantification of cDC1s in the draining peri-pancreatic
lymph nodes (ppLNs) revealed a similar decline in cDC1 abundance in tumor-draining
ppLNs with a trend towards decline in PanIN-draining ppLNs (Fig. 2.1 D).
19
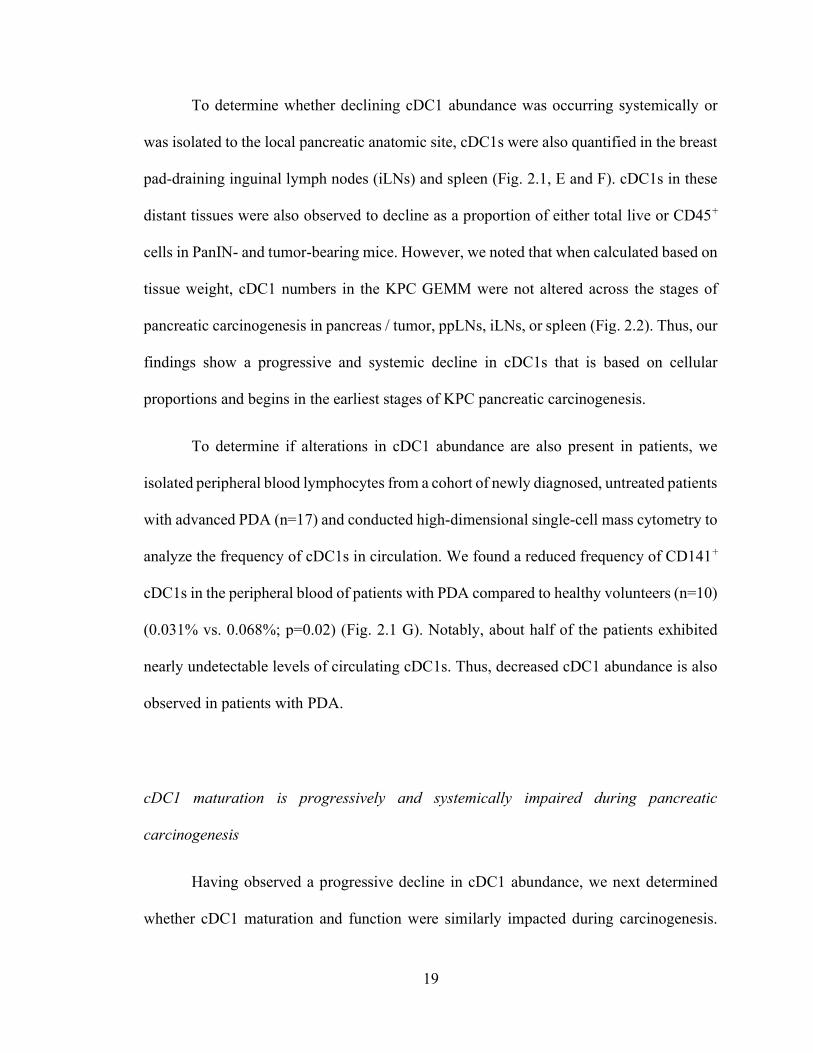
To determine whether declining cDC1 abundance was occurring systemically or
was isolated to the local pancreatic anatomic site, cDC1s were also quantified in the breast
pad-draining inguinal lymph nodes (iLNs) and spleen (Fig. 2.1, E and F). cDC1s in these
distant tissues were also observed to decline as a proportion of either total live or CD45+
cells in PanIN- and tumor-bearing mice. However, we noted that when calculated based on
tissue weight, cDC1 numbers in the KPC GEMM were not altered across the stages of
pancreatic carcinogenesis in pancreas / tumor, ppLNs, iLNs, or spleen (Fig. 2.2). Thus, our
findings show a progressive and systemic decline in cDC1s that is based on cellular
proportions and begins in the earliest stages of KPC pancreatic carcinogenesis.
To determine if alterations in cDC1 abundance are also present in patients, we
isolated peripheral blood lymphocytes from a cohort of newly diagnosed, untreated patients
with advanced PDA (n=17) and conducted high-dimensional single-cell mass cytometry to
analyze the frequency of cDC1s in circulation. We found a reduced frequency of CD141+
cDC1s in the peripheral blood of patients with PDA compared to healthy volunteers (n=10)
(0.031% vs. 0.068%; p=0.02) (Fig. 2.1 G). Notably, about half of the patients exhibited
nearly undetectable levels of circulating cDC1s. Thus, decreased cDC1 abundance is also
observed in patients with PDA.
cDC1 maturation is progressively and systemically impaired during pancreatic
carcinogenesis
Having observed a progressive decline in cDC1 abundance, we next determined
whether cDC1 maturation and function were similarly impacted during carcinogenesis.
20
Dendritic cells (DCs) are considered immature until encountering an activating signal
during tissue surveillance and antigen uptake8. DCs then mature, upregulate CCR7, and
home to the draining lymph node where antigen presentation and T cell priming occur23.
During this process, cDC1s upregulate antigen processing and cross-presentation
machinery; upregulate cell surface molecules such as CD40, CD80, CD86, MHC II, and
PD-L1; and produce essential T cell-polarizing cytokines such as IL-12 to induce Th1
CD4+ T cell differentiation and CD8+ T cell activation58.
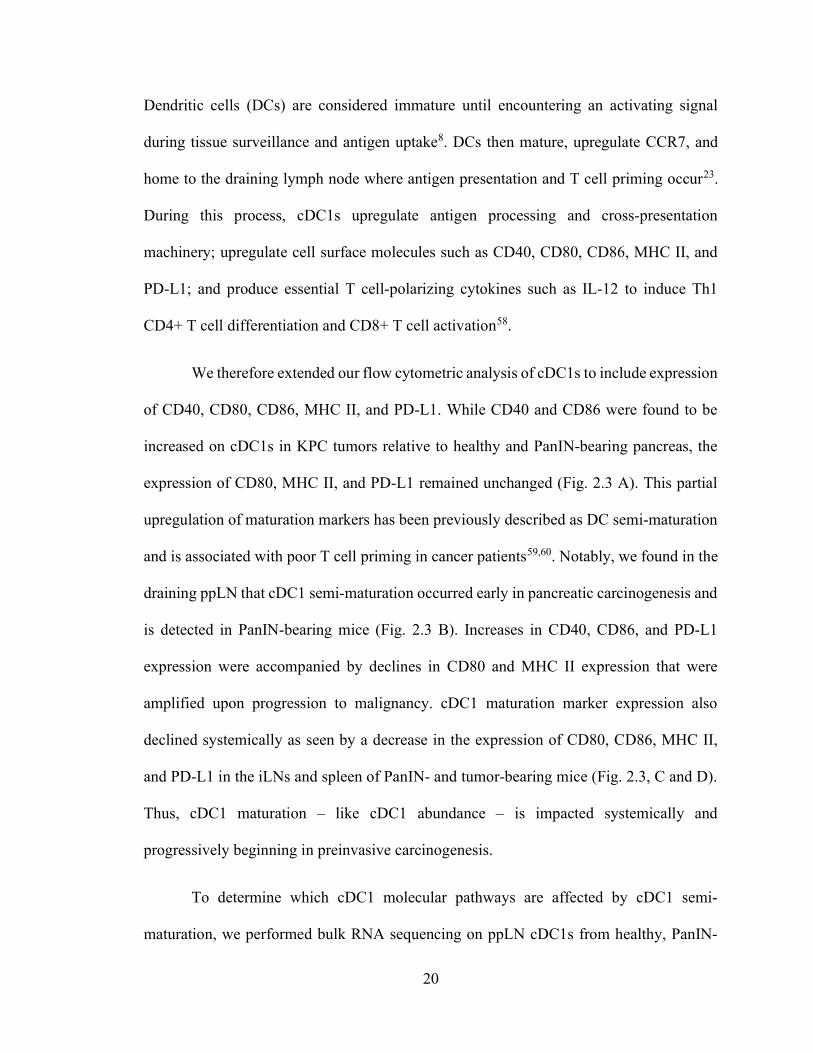
We therefore extended our flow cytometric analysis of cDC1s to include expression
of CD40, CD80, CD86, MHC II, and PD-L1. While CD40 and CD86 were found to be
increased on cDC1s in KPC tumors relative to healthy and PanIN-bearing pancreas, the
expression of CD80, MHC II, and PD-L1 remained unchanged (Fig. 2.3 A). This partial
upregulation of maturation markers has been previously described as DC semi-maturation
and is associated with poor T cell priming in cancer patients59,60. Notably, we found in the
draining ppLN that cDC1 semi-maturation occurred early in pancreatic carcinogenesis and
is detected in PanIN-bearing mice (Fig. 2.3 B). Increases in CD40, CD86, and PD-L1
expression were accompanied by declines in CD80 and MHC II expression that were
amplified upon progression to malignancy. cDC1 maturation marker expression also
declined systemically as seen by a decrease in the expression of CD80, CD86, MHC II,
and PD-L1 in the iLNs and spleen of PanIN- and tumor-bearing mice (Fig. 2.3, C and D).
Thus, cDC1 maturation – like cDC1 abundance – is impacted systemically and
progressively beginning in preinvasive carcinogenesis.
To determine which cDC1 molecular pathways are affected by cDC1 semi-
maturation, we performed bulk RNA sequencing on ppLN cDC1s from healthy, PanIN-

21
bearing, and tumor-bearing mice. Both principal component and differential gene
expression analyses revealed a progressive change in cDC1 gene expression from healthy
to tumor-bearing mice, with PanIN-draining ppLN cDC1s representing an intermediate
state (Fig. 2.4, A and B). Gene set enrichment analyses (GSEA) were performed comparing
tumor-draining and PanIN-draining ppLN cDC1s to those of healthy mice (Fig. 2.4 C). In
both comparisons, the proteasome degradation gene set (an aspect of antigen processing
machinery that is upregulated during DC maturation) was upregulated, while genes
encoding T cell polarizing cytokines such as Il-12b failed to be optimally upregulated (Fig.
2.4, D and E). Because cancer cells have been known to exploit DCs to produce immune
suppressive factors like indoleamine 2,3-dioxygenase (IDO), we determined whether
PanIN- and tumor-draining ppLN cDC1s might be directly enforcing adaptive immune
tolerance (Munn and Mellor, 2016). Genes encoding known DC-secreted immune
suppressive factors were therefore examined (Fig. 2.4 F). While Ido1 and Arg2 trended
towards increased expression in tumor-bearing mice, their transcript abundance remained
below five transcripts per million reads. Thus, it is unlikely that cDC1s in the ppLNs are
acquiring immune suppressive function over the course of KPC carcinogenesis. Rather,
suboptimal maturation marker upregulation coincides with insufficient upregulation of T
cell-polarizing cytokines during cDC1 semi-maturation. Rather, we find that cDC1s
undergo semi-maturation with insufficient upregulation of T cell-polarizing cytokines in
the setting of pancreatic carcinogenesis.
cDC1-mediated CD8+ T cell priming is impaired in PanIN- and tumor-bearing mice

22
To determine whether cDC1 semi-maturation impairs function, we sought to
quantify CD8+ T cell priming in response to an antigen-specific challenge. Our group
previously demonstrated that a clonal chicken ovalbumin (OVA)-expressing KPC cell line
4662.V6ova gives rise to spontaneous protective CD8+ T cell immunity following
subcutaneous implantation4. Therefore, we subcutaneously implanted 4662.V6ova cells
into healthy, PanIN-bearing, and tumor-bearing mice. Seven days post-implantation,
splenocytes from these mice were stained for OVA-specific H-2Kb:SIINFEKL tetramer-
positive CD8+ T cells. Consistent with the early onset of cDC1 semi-maturation, the
generation of OVA-specific CD8+ T cells progressively declined in PanIN- and tumor-
bearing KPC mice (Fig. 2.5 A). CD8+ T cell priming in tumor-bearing KPC mice was so
profoundly impaired that findings were statistically indistinguishable from Batf3-/- mice
that lack cDC1s13.
Due to the potential for shared suppression between autochthonous KPC neoplasia
and 4662.V6ova, we sought to confirm our findings using a non-tumor vaccination strategy.
Healthy, PanIN-bearing, and tumor-bearing mice were vaccinated with OVA protein and
the TLR9 agonist CpG (OVA/CpG). While the total number of tetramer-positive T cells
were equivalent across all groups, the proportion of CD62L-CD44+ effector memory T cells
was depressed in PanIN- and tumor-bearing mice (Fig. 2.5 B). Their expression of T-bet,
Granzyme B, Ki-67, CTLA-4, and PD-1 declined as well (Fig. 2.5 C). Thus, like our
findings with 4662.V6ova challenge, the CD8+ T cell response to OVA/CpG is defective
in PanIN- and tumor-bearing KPC mice.

23
cDC1 abundance and maturation correlate with increased cytolytic activity in patients
with pancreatic adenocarcinoma
To determine whether cDC1 abundance correlates with cytolytic activity in human
pancreatic adenocarcinoma, transcript abundance of XCR1, CLEC9A, CD86, HLA-DRA,
GZMA, PRF1, and IFNG were quantified from pancreatic carcinoma samples in The
Cancer Genome Atlas (TCGA-PAAD)61. Because XCR1 and CLEC9A are known markers
of cDC1s in humans, the expression of these genes were used as an indication of cDC1
abundance14. As a metric of cytolytic activity, cytolytic index was calculated using the
geometric mean of GZMA and PRF1, as previously experimentally validated62. Both
XCR1 and CLEC9A gene expression were found to exhibit a strong correlation with
cytolytic index (Fig. 2.6, A and B). Similarly, transcripts of the DC maturation markers
HLA-DRA and CD86 also exhibited a strong correlation with cytolytic index (Fig. 2.6, C
and D). Finally, the expression of HLA-DRA and CD86 were compared to intratumoral
transcript abundance of IFNG and found to have a moderate correlation (Fig. 2.6, E and
F). Intratumoral cDC1 abundance and maturation, therefore, correlate with cytolytic
activity in human pancreatic adenocarcinoma.
Systemic deficits in cDC1 abundance and maturation are specific to pancreatic neoplasia
PanIN development in KPC mice occurs in the setting of chronic mutant Kras-
driven inflammation48,63. To determine if systemic declines in cDC1 abundance and
maturation could be reproduced in the setting of chronic pancreatitis, C57BL/6J mice were
treated for eleven weeks with supraphysiologic levels of the cholecystokinin analogue

24
cerulein64. Repeated administration resulted in significant intrapancreatic edema,
inflammatory infiltrate, acinar atrophy, ductal dilation, and parenchymal fibrosis
characteristic of cerulein-induced chronic pancreatitis (Fig. 2.7 A). In both the iLNs and
spleen, cDC1 abundance remained unchanged while maturation marker expression either
remained unchanged or changed minimally compared to the declines seen in PanIN- and
tumor-bearing mice (Fig. 2.7, B and C). Cerulein-induced chronic pancreatitis, therefore,
fails to recapitulate the systemic cDC1 deficits seen in preinvasive pancreatic
carcinogenesis.
We next sought to confirm that neoplastic development was required for systemic
cDC1 dysregulation to occur. To address this, cDC1s were compared between four-week-
old Cre/Cre mice and four-week-old KPC mice that have not yet developed PanINs. While
cDC1 abundance was slightly increased in KPC pancreas, cDC1 maturation marker
expression did not differ between KPC vs. Cre/Cre pancreas (Fig. 2.7 D). Maturation
marker expression likewise remained unchanged on cDC1s from KPC vs. Cre/Cre ppLNs
(Fig. 2.7 E). KPC and Cre/Cre ppLNs did not differ in their proportions of CD11chiMHC
IIint resident vs. CD11cintMHC IIhi migratory cDCs or their proportions of cDC1s vs. cDC2s
(Fig. 2.7, F-H).
To rule out the possibility that defective response to vaccination is an inherent
feature of the KPC genotype – independent of neoplasia – four-week-old KPC mice (that
lack PanINs and have normal cDC1s at this age) were also vaccinated with OVA/CpG.
Both groups generated similar numbers of H-2Kb:SIINFEKL tetramer-positive CD8+ T
cells in response to vaccination (Fig. 2.7 I). The proportion of CD62L-CD44+ T cells was
the same in four-week-old KPC mice and Cre/Cre mice, though the proportion of

25
CD62L+CD44+ T cells was decreased in four-week-old KPC mice. Expression of Tbet
and IFN- were also similar between both groups. Thus, systemic cDC1 dysfunction is seen
in KPC mice only after the initiation of neoplasia.
Evaluation of cDC1s in the KP GEMM of lung adenocarcinoma
To study cDC1 biology in another mouse model of carcinoma, cDC1 abundance
and maturation marker expression were quantified in the KrasLSL-G12D/+;p53fl/fl (KP) mouse
model of lung adenocarcinoma65. Expression of Cre recombinase was induced through
endotracheal instillation of Ad:SPC-Cre adenovirus. Tissues were harvested from KP mice
at eight, twelve, and sixteen weeks post-adenoviral induction of Cre recombinase. Control
mice were sacrificed sixteen weeks after infection with Ad:CMV-FlpO. While cDC1
abundance declined progressively in the lung/tumor, cDC1 abundance was observed to
increase in the mediastinal lymph node, iLNs, and spleen of Cre-infected KP mice (Fig.
2.8, A-D). cDC1 maturation marker expression in the lung/tumor also remained largely
unchanged apart from increases in CD40 and PD-L1 at sixteen weeks post-induction (Fig.
2.8 E). cDC1 maturation marker expression did not change in the iLNs (Fig. 2.8 F). Thus,
although declines in cDC1 abundance and cDC1 semi-maturation are present in the tumor
microenvironment of both Kras/p53-driven mouse models, systemic declines in cDC1
abundance, maturation, and function were unique to the KPC GEMM of pancreatic
adenocarcinoma.
cDC1 abundance declines as a result of apoptosis

26
We next determined whether declining cDC1 abundance was due to impaired bone
marrow generation. cDC1 progenitors consist of pre-cDCs, common DC progenitors
(CDPs), and monocyte DC precursors (MDPs)8. MDPs have the potential to generate
CDPs, monocytes, and monocyte-derived DCs, while CDPs give rise to pre-cDCs which
include pre-cDC1s and pre-cDC2s. Pre-cDC1s then circulate to peripheral tissues where
they differentiate into cDC1s. Using flow cytometry, MDPs, CDPs, and pre-cDCs were
quantified in the bone marrow of healthy, PanIN-bearing, and tumor-bearing mice (Fig.
2.9 A). Pre-cDC1s and pre-cDC2s were distinguished based on their expression of Ly6C
and Siglec H11. Numbers of bone marrow pre-cDC1s did not decline over the course of
pancreatic oncogenesis (Fig. 2.9 B). Pre-cDC1s in the peripheral blood were similarly
unchanged (Fig. 2.9 C). Ki-67 levels in mesenteric lymph node (mLN) and iLN cDC1s
were not significantly decreased in tumor-bearing mice compared to healthy controls,
though Ki-67 was transiently decreased in the iLNs of PanIN-bearing mice (Fig. 2.9 D).
Thus, we conclude that cDC1 generation in this model is not affected at the level of the
bone marrow, peripheral blood, or proliferation during pancreatic carcinogenesis.
We next considered that systemic declines in cDC1 number might instead be driven
by increased apoptosis. Therefore, we examined cDC1 apoptosis in the ppLNs and iLNs
by staining for active cleaved caspase 3 (Fig. 2.10, A and B). We found that active cleaved
caspase 3 increased progressively during pancreatic carcinogenesis in both the ppLNs and
iLNs. Furthermore, transcriptomic analysis of ppLN cDC1s from PanIN- and tumor-
bearing mice revealed a positive enrichment for genes involved in apoptosis including
Apaf1, Bcl2l11, and Casp3 (Fig. 2.10, C and D; Fig. 2.4 C).

27
IL-6 drives increased cDC1 apoptosis
To define mechanisms of cDC1 dysfunction that might be unique to the KPC
model, serum levels of 13 chemokines and cytokines were quantified and compared in KPC
pancreatic carcinogenesis, KP pulmonary carcinogenesis, and cerulein-induced chronic
pancreatitis (Fig. 2.8 G). Serum IL-6 and IL-1 levels were found to be significantly higher
in KPC pancreatic adenocarcinoma compared to KP lung adenocarcinoma and cerulein-
induced chronic pancreatitis. To assess whether these cytokines drive systemic declines in
cDC1 survival, we first confirmed that serum IL-6 could be experimentally neutralized
following administration of an IL-6 depleting antibody MP5-20F3 (Fig. 2.10 E). Following
six days of treatment with MP5-20F3 in tumor-bearing mice, quantification of cDC1s in
the mLNs and iLNs revealed a rebound in cDC1 abundance (Fig. 2.10 F). To determine
whether this rebound was being driven by decreased cDC1 apoptosis, active cleaved
caspase 3 was quantified in mLN and iLN cDC1s (Fig. 2.10, G and H). Levels of active
cleaved caspase 3 in cDC1s from tumor-bearing mice declined to levels close to those of
healthy mice following IL-6 neutralization. Quantification of cleaved caspase 3 in
macrophages and non-macrophage CD11b+ cells showed no increased apoptosis in tumor-
bearing mice and no effect with IL-6 neutralization; thus, the observed phenotype is
specific to cDC1s (Fig. 2.10, I and J). However, neutralization of IL-6 did not affect cDC1
maturation marker expression (Fig. 2.11). Administration of an IL-1 blocking antibody
AF-401-NA, in contrast, failed to alleviate declines in cDC1 abundance and in fact seemed
to worsen these deficits (Fig. 2.10, K and L). Together, these data suggest that declines in
systemic cDC1 abundance in the KPC GEMM are attributable to increased apoptosis
driven by IL-6.
28
Discussion
In this study, we aimed to decipher the nature and mechanism of cDC1 dysfunction
during cancer progression. Using the KPC GEMM of pancreatic adenocarcinoma, we
report that cDC1 dysregulation develops systemically and with early onset, prior to
invasive tumor formation in mice bearing PanINs. Elevated serum IL-6 in the setting of
cancer development resulted in increased cDC1 apoptosis and systemically decreased
cDC1 abundance. cDC1 maturation was also uniquely impacted in KPC mice, resulting in
impaired T cell response to vaccination from the earliest stage of preinvasive neoplasia.
A key conclusion of our study is that systemically decreased cDC1 abundance in
the KPC model results from increased cDC1 apoptosis driven by IL-6. Antibody-based
neutralization of elevated serum IL-6 abrogated increased expression of active cleaved
caspase 3 in cDC1s from tumor-bearing mice and restored cDC1 abundance to levels seen
in healthy controls. IL-6 in both murine and human pancreatic adenocarcinoma has been
shown to be primarily produced by tumor-associated macrophages and inflammatory
cancer-associated fibroblasts66–68. In KrasG12D mice, IL-6 signaling promotes PanIN
progression and development of pancreatic cancer69. Patients with pancreatic cancer also
have elevated levels of serum IL-6 compared to age-matched healthy controls70.
Overproduction of IL-6 has been strongly associated with chemoresistance, decreased
survival, poor performance status, and cachexia in patients71. Here, we argue that IL-6 is
linked to cDC1 dysfunction in cancer. Serum IL-6 is found to be elevated in KPC
pancreatic adenocarcinoma but not KP lung adenocarcinoma or cerulein-induced chronic
pancreatitis. Likewise, out of these three models, systemic cDC1 dysfunction is only
observed in the KPC GEMM. In non-tumor-bearing mice, IL-6 has been shown to play a

29
major role in maintaining immature DCs. IL-6 knockout mice have increased numbers of
mature DCs, indicating that IL-6 blocks DC maturation in vivo33. In addition, autocrine IL-
6 and IL-10 promote differentiation of IL-10-producing immunosuppressive DCs72.
Interestingly, targeted inhibition of IL-6 with antibodies enables sensitivity to PD-L1
blockade and cooperates with chemotherapy to drive tumor regression in mouse models of
pancreatic cancer70,73. It will be essential to perform cDC1 immunohistochemistry in future
studies to determine whether cDC1 spatial distribution is also altered during pancreatic
carcinogenesis or in tumor-bearing mice following IL-6 blockade. Overall, data in mice
indicate that IL-6 plays a major role in DC biology. Our findings here point to a previously
unappreciated role for IL-6 in cDC1 apoptosis in cancer.
A core component of cDC1 dysfunction in KPC mice is DC semi-maturation, again
evident from the earliest stage of preinvasive neoplasia. DC semi-maturation is currently
understood as the inconsistent upregulation of maturation markers on peripheral blood DCs
associated with suboptimal T cell priming59,60. As noted above, IL-6 signaling can enforce
such a phenotype physiologically33,72. In the present study, high-throughput RNA
sequencing demonstrates that cDC1 semi-maturation coincides with induction of genes
involved in proteasomal degradation and antigen processing whereas genes encoding T
cell-polarizing cytokines fail to be appropriately upregulated. This results in a suspended
state of cDC1 semi-maturation during pancreatic carcinogenesis. In KPC mice, OVA-
specific CD8+ T cell priming following challenge with OVA as a model tumor antigen or
vaccination with OVA/CpG are significantly reduced. cDC1 semi-maturation is therefore
associated with impaired induction of T cell-polarizing cytokines and defective T cell
priming in PanIN- and tumor-bearing mice.

30
A decline in cDC1 abundance has previously been reported in tumor-bearing KPC
mice74. However, the conclusion provided in that study contrasts with our findings. While
Meyer et al. attribute decreased cDC1 abundance to impaired bone marrow cDC1
generation caused by G-CSF-mediated suppression of IRF8, we observe that cDC1
generation is unaffected during pancreatic carcinogenesis. Rather, we focus on very early
events in cDC1 dysfunction and show prominent apoptosis and semi-maturation of cDC1s
in PanIN-bearing mice that have not previously been reported.
Our findings in KPC mice have relevance to patients with pancreatic cancer. As the
critical APC for antigen cross-presentation, cDC1s in humans are critical for CD8+ T cell
responses against necrotic cell antigens22,23,75. Here, we show that peripheral blood cDC1s
are significantly reduced in patients with newly diagnosed and untreated metastatic
pancreatic cancer compared to healthy volunteers. Furthermore, we analyzed
transcriptomic data from 182 patients with pancreatic ductal adenocarcinoma in The
Cancer Genome Atlas (TCGA-PAAD). Using expression of known human cDC1 markers
XCR1 and CLEC9A as an indication of cDC1 abundance in the tumor
microenvironment14,21, we found a statistically significant correlation between cDC1
markers and cytolytic activity. Furthermore, expression of the maturation markers HLA-
DR and CD86 also correlated strongly with cytolytic index in this human data set. Thus,
like the KPC GEMM, cDC1 abundance and maturation correlate with cytolytic activity in
human pancreatic tumors76. It was recently shown that cDC1 abundance is significantly
reduced as a proportion of CD45+ cells in the tumor microenvironment of human PDA
relative to non-small cell lung adenocarcinoma56. This recent finding is consistent with a
previous observation that total DC abundance as measured by immunohistochemistry
31
declines progressively in human pre-malignant pancreatic intraepithelial neoplasias,
consistent with our findings in the KPC GEMM77.
Systemic DC dysfunction has been reported in advanced-stage cancer patients78–80.
Although cancer patients generally do not suffer opportunistic infections like patients with
AIDS, there is evidence for cancer patients having immunodeficiencies. One example is
the higher risk of Varicella zoster, a classically T cell-controlled pathogen, across multiple
liquid and solid malignancies compared to age-matched controls81. Pancreatic cancer
patients also exhibit abnormalities in T cell subsets and activation at the time of diagnosis
prior to therapy82. It seems likely that progressive cancer itself reflects - to a greater or
lesser extent – failed immune surveillance, even in pancreatic cancer83. With these new
insights into cDC1 dysfunction in KPC mice, it will be important to examine T cell
immunity in cancer patients more deeply with a mindful eye towards clinical and immune
phenotypes in the future.

32
Materials and methods
Human subjects research
Blood samples from patients with advanced pancreatic cancer and healthy volunteers were
collected and enriched using Ficoll centrifugation and cryopreserved in liquid nitrogen
until analysis. Samples were obtained after informed consent and Institutional Review
Board approval from the University of Pennsylvania. A total of 17 patients (40 - 81 years
old, males and females) with untreated advanced pancreatic ductal adenocarcinoma (two
locally advanced, fifteen metastatic) and 10 healthy volunteers (54 - 75 years old) were
included in the study. Patients with PDA and healthy volunteers were comparable (median
age of patients 59, median age of healthy volunteers, 65; p=0.059 by two-tailed Student’s
t test).
Animal studies
All mouse experiments were done at the University of Pennsylvania Perelman School of
Medicine, approved by the UPenn Institutional Animal Care and Use Committee, and
performed in strict compliance with protocols 804666 & 804774. Mice were housed under
pathogen-free conditions in a barrier facility. C57BL/6 mice were purchased from Jackson
Laboratories or bred in-house. The size of each animal cohort was determined by
estimating biologically relevant effect sizes between control and experimental groups and
then using the minimum number that could reveal statistical significance.

33
Antibody-based experiments
IL-6 blockade in tumor-bearing KPC mice was performed by injecting 200 g IL-6
depleting antibody (InVivomAb MP5-20F3) in 100 l PBS intraperitoneally on day 0 and
day 3 before flow cytometric analysis on day 6. IL-1 blockade in tumor-bearing KPC
mice was performed by injecting 10 g IL-1 blocking antibody (InVivomAb AF-401-
NA) in 100 l PBS intraperitoneally on days 0, 2, 4 before flow cytometric analysis on day
6.
Vaccination studies
Vaccination of OVA/CpG was performed by subcutaneous injection of 200 g endotoxin-
free OVA (Invivogen vac-pova-100) + 10 g endotoxin-free ODN1826 CpG (Invivogen
tlrl-1826-1) in 200 L PBS subcutaneously into the right flank.
Cerulein chronic pancreatitis
Cerulein-induced chronic pancreatitis was performed via intraperitoneal injection of
cerulein (Sigma Aldrich C9026) at 50 ug/kg/hr x 6hr twice a week for 11 wks.
KPC mouse model
The KPC genetically engineered mouse model of pancreatic ductal adenocarcinoma is
driven by Pdx1-Cre KrasLSL-G12D/+Trp53LSL-R172H/+. As previously published, KPC mice in
our colony are fully backcrossed to C57BL/6 based on the DartMouse Illumina

34
GoldenGate Genotyping Assay, which interrogated 1,449 SNPs spread throughout the
genome4.
KP mouse model
KrasLSL-G12D mice (JAX stock number 008179) and Trp53fl/fl mice (JAX stock number
008462) have previously been described84,85. Mice are mixed B6J/129S4vJae. Non tumor-
bearing control mice were transduced with 2.5×10⁷ plaque-forming units (PFUs) of
Ad:CMV-FlpO 16 weeks before sacrifice, while tumor-bearing mice were given 2×10⁸
PFUs of Ad:SPC-Cre at 16, 12 or 8 weeks prior to sacrifice. Viral particles were obtained
from University of Iowa Viral Vector Core and mice were transduced by endotracheal
instillation as previously described65.
Pancreas and tumor histology
Pancreas and KPC tumor were harvested and fixed in 4% PFA overnight, then paraffin
processed and stained with hematoxylin and eosin (H&E) following standard protocols.
Images were obtained using a Nikon Eclipse 50i microscope and Nikon Elements BR
v5.01.01 software.
Tissue processing and cell isolation
Tumors and pancreas were dissected and minced in DMEM-F12 + 10% FBS at 4C, then
digested in DMEM-F12 with 1 mg/ml collagenase with protease inhibitor (Sigma-Aldrich

35
C6079) for 30 min at 37C. Tissues were filtered through a 70 m cell strainer, then a 40
m cell strainer, with 9 ml FACS buffer (PBS w/ 0.2% BSA + 2 mM EDTA). Lymph
nodes, spleens, and bone marrow were dissected and minced in RPMI + 5% FBS at 4C,
then digested in RPMI with 1 mg/ml collagenase (Sigma-Aldrich C5138) for 20 min at
37C. Spleens and bone marrow were subject to two rounds of RBC lysis using 1mL of
ACK Lysis Buffer (Gibco A1049201). Samples were then filtered through a 40 m cell
straining and rinsed with 9 ml FACS buffer. Due to the small size of peri-pancreatic lymph
nodes (especially in healthy mice), peri-pancreatic lymph node samples were always
pooled across all mice per experimental group to achieve sufficient cDC1 quantities for
downstream analysis.
Flow cytometric analysis
All stainings were performed in the dark. Tissue-derived cells were washed with PBS
before viability stain with LIVE/DEAD Fixable Aqua (Invitrogen L34957) for 20 min at
room temperature. Samples for DC analysis were then washed with FACS Buffer before
being stained for immune markers CD45, CD64, F4/80, CD3, CD19, B220, NK1.1, Gr-1,
I-A/I-E, CD11c, XCR1, SIRP, CD103, CD11b, CD40, CD80, CD86, and PD-L1 for 30
min at 4C. Where appropriate, cDC1s were intracellularly stained for Ki-67 and cleaved
caspase 3 overnight at 4C. Samples for T-cell analysis were stained for immune markers
CD45, CD3, CD8, CD4, H-2Kb:SIINFEKL tetramer, TIM-3, LAG3, CTLA-4, PD-1,
CD62L, and CD44 extracellularly for 30 min at 4C; and FOXP3, CTLA-4, Eomes,
Granzyme B, Tbet, Ki-67, and IFN- intracellularly overnight at 4C. Bone marrow samples
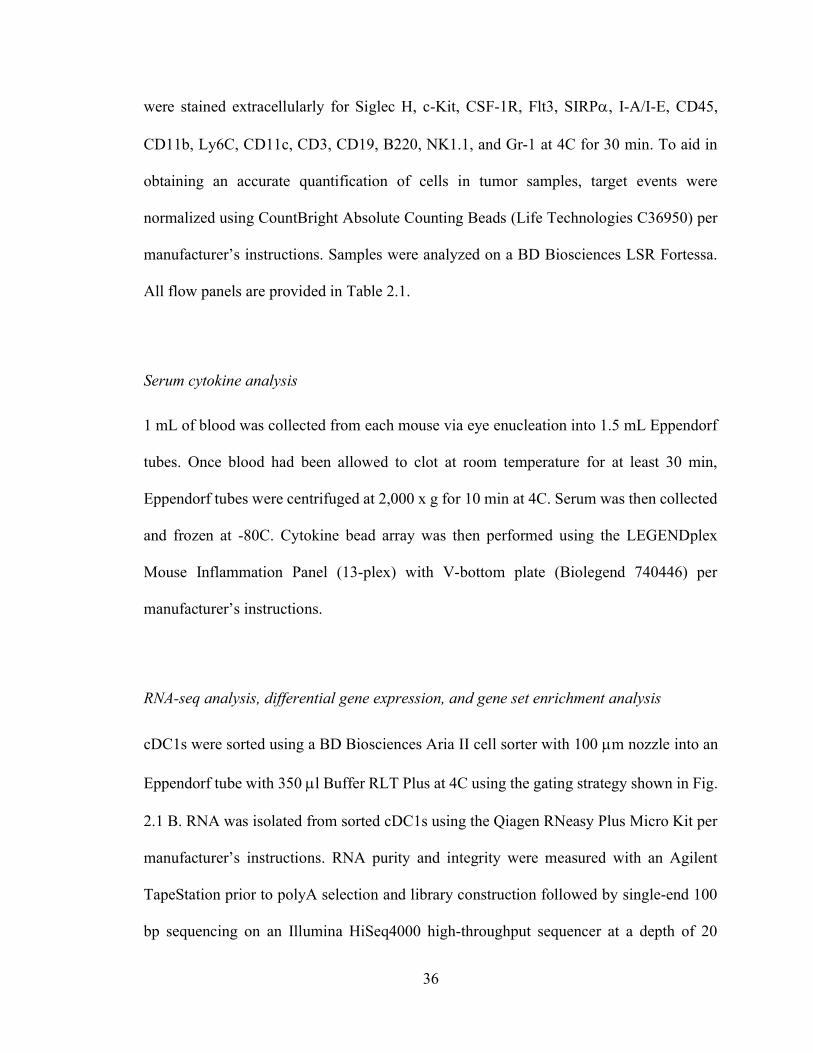
36
were stained extracellularly for Siglec H, c-Kit, CSF-1R, Flt3, SIRP, I-A/I-E, CD45,
CD11b, Ly6C, CD11c, CD3, CD19, B220, NK1.1, and Gr-1 at 4C for 30 min. To aid in
obtaining an accurate quantification of cells in tumor samples, target events were
normalized using CountBright Absolute Counting Beads (Life Technologies C36950) per
manufacturer’s instructions. Samples were analyzed on a BD Biosciences LSR Fortessa.
All flow panels are provided in Table 2.1.
Serum cytokine analysis
1 mL of blood was collected from each mouse via eye enucleation into 1.5 mL Eppendorf
tubes. Once blood had been allowed to clot at room temperature for at least 30 min,
Eppendorf tubes were centrifuged at 2,000 x g for 10 min at 4C. Serum was then collected
and frozen at -80C. Cytokine bead array was then performed using the LEGENDplex
Mouse Inflammation Panel (13-plex) with V-bottom plate (Biolegend 740446) per
manufacturer’s instructions.
RNA-seq analysis, differential gene expression, and gene set enrichment analysis
cDC1s were sorted using a BD Biosciences Aria II cell sorter with 100 m nozzle into an
Eppendorf tube with 350 l Buffer RLT Plus at 4C using the gating strategy shown in Fig.
2.1 B. RNA was isolated from sorted cDC1s using the Qiagen RNeasy Plus Micro Kit per
manufacturer’s instructions. RNA purity and integrity were measured with an Agilent
TapeStation prior to polyA selection and library construction followed by single-end 100
bp sequencing on an Illumina HiSeq4000 high-throughput sequencer at a depth of 20

37
million reads per sample by the UPenn Next-Generation Sequencing Core (NGSC). The
curated RNA-seq analysis pipeline from bcbio-nextgen was used for downstream analysis
(https://github.com/chapmanb/bcbio-nextgen). FASTQ files were checked for quality
using FastQC and qualimap. Alignment was performed with STAR under default settings
using the mm10 reference genome. Raw counts of gene transcripts were obtained from
BAM files using featureCounts86. The resulting count matrix was then imported into R
(version 3.6.1) and used as input to DESeq2 for normalization and differential gene
expression analysis87. Salmon / Sailfish quasi-alignment was used to normalize and
quantify gene expression, and generate a transcripts per million (tpm) matrix to be used as
input for gene set enrichment analysis (GSEA)88. Pathway and gene ontology analyses
were performed using GSEA and Gene Set Knowledgebase (GSKB), a curated functional
genomics database for murine transcriptomes89. RNA-seq data have been submitted to and
may be accessed at the Gene Expression Onmibus database repository (accession number:
GSE126389).
The Cancer Genome Atlas
RNA-seq datasets were downloaded with authorization for all patients with pancreatic
ductal adenocarcinoma from The Cancer Genome Atlas (TCGA PAAD) on the National
Cancer Institute’s Genomic Data Commons Portal61.
Mass cytometry antibodies

38
Metal-conjugated antibodies were purchased from Fluidigm. Antibody, metal conjugate
and clone information are available in Table 2.2.
Mass cytometry sample preparation and data acquisition
Samples were thawed for analysis and washed with fluorescence-activated sorting (FACS)
buffer. Total cell concentration was determined using a TC20 automated cell counter (Bio-
Rad). A 1 μM solution of 198Pt monoisotopic cisplatin (Fluidigm) was added to at most
4x10⁶ cells for 1 minute at room temperature. Cells were immediately washed twice with
FACS buffer and incubated with Cytofix fixation buffer (BD) for 25 minutes on ice.
Samples were washed twice in FACS buffer and then split. 1.5x10⁶ cells were
cryopreserved for future use and the remaining cells were labeled using palladium
barcoding per the manufacturer’s protocol (Fluidigm). Following barcoding, samples were
pooled and incubated with Human TruStain FcX (Biolegend) for 10 minutes at room
temperature. Then, a 2x master mix of metal-tagged antibodies was added directly to the
samples for 30 minutes at room temperature. After washing with permeabilization working
solution (eBioscience) samples were fixed again with 2.4% formaldehyde in PBS
containing 125 nM iridium nucleic acid intercalator (Fluidigm) and left overnight. Samples
were cryopreserved in 10% DMSO in FBS and stored at -80°C until thawing immediately
prior to acquisition. Samples were washed twice with PBS + 0.2% BSA, once with cell
acquisition solution (CAS) and then resuspended at a concentration of 1x10⁶ cells/mL in
CAS containing 5% EQ beads. Samples were acquired on a Helios mass cytometer
(Fluidigm) using a standardized acquisition template following routine tuning and
optimization.

39
Mass cytometry data analysis
Flow cytometry standard (FCS) data files were bead-normalized using CyTOF Software
v6.7 (Fluidigm) and de-barcoded using Astrolabe (Astrolabe Diagnostics). Manual gating
in FlowJo (BD) was used to exclude debris, dead cells and doublets. The frequency of
CD141+ classical/conventional type 1 dendritic cells (cDC1) was defined by manual gating
as follows; exclusion of CD3, CD19, CD14 and CD56 positive cells, selection for HLA-
DR and CD11c positive cells followed by exclusion of CD1b and positive selection for
CD141. The frequency of cDC1s among patients and healthy volunteers was compared by
Mann-Whitney Test using Prism 8.0 software (GraphPad).
Statistical analysis
Data points that were more than two standard deviations from the mean were removed as
outliers. All statistical analyses of flow cytometry were performed using Graphpad Prism
7 or 8. Statistics in gene set enrichment analysis (GSEA) were performed using the gene
set permutation setting within the Broad Institute GSEA software. Adjusted p-values (p-
adj) below 0.05 and false discovery rate (FDR) q-values below 0.25 were considered
statistically significant. Correlation analyses of TCGA PAAD gene expression were
performed using Kendall’s tau rank correlation coefficient due to a lack of bivariate
normality as determined using the Shapiro-Wilks test in R v3.6.1.
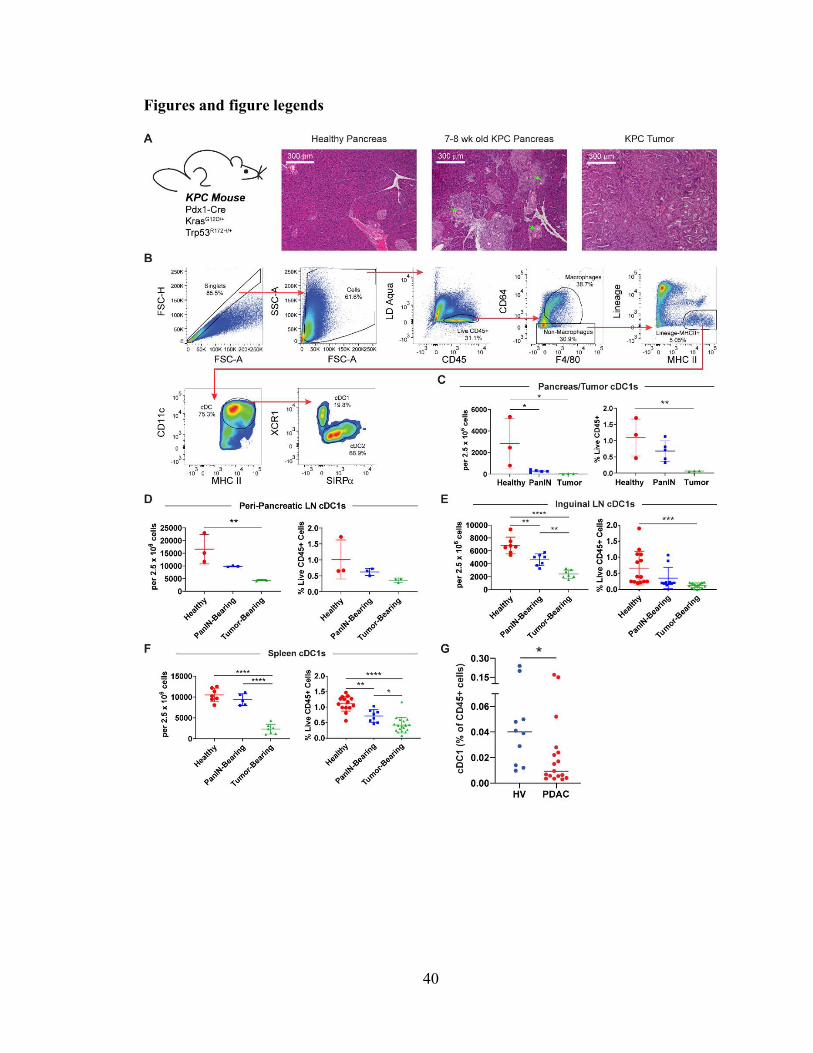
40
Figures and figure legends

41
Figure 2.1 cDC1 abundance declines systemically during pancreatic carcinogenesis.
Histopathology shown in A interpreted by Dr. Emma Furth. Experiment shown in G
performed by Dr. Max Wattenberg and provided courtesy of Dr. Gregory Beatty.
(A) Hematoxylin and eosin staining of healthy pancreas, PanIN-bearing pancreas, and
pancreatic ductal adenocarcinoma. Arrows highlight ducts featuring mucinous
metaplasia without dysplasia characteristic of stage 1A pancreatic intraepithelial
neoplasias (PanINs). All images are taken at 10X magnification.
(B) Flow gating strategy for CD45+CD64-F4/80-Lin-MHC II+CD11c+ conventional
dendritic cells (cDCs) in a representative subcutaneously implanted KPC tumor.
Lineage gate is comprised of CD3, CD19, B220, NK1.1, and Gr-1.
(C-F) Quantification of cDC1s in the (C) pancreas/tumor, (D) peri-pancreatic lymph nodes
(ppLN), (E) inguinal lymph nodes (iLN), and (F) spleen as a proportion of live cells
and CD45+ cells.
(G) Frequency of CD141+ cDC1s in peripheral blood of patients with untreated advanced
PDA vs. healthy volunteers.
n=17 PDAC and n=10 HV in G. Error bars indicate mean +/- SD. ****p<0.0001;
***p<0.001; **p<0.01; *p<0.05 (one-way ANOVA with Tukey’s HSD post-test in C-F;
Mann-Whitney test in G). Data shown in B-F are representative of at least three
independent experiments with at least three mice per group.

42

43
Figure 2.2. cDC1 abundance only declines based on cell fractions during pancreatic
carcinogenesis.
Tissue weight, cDC1 number per organ, and cDC1 abundance by mg tissue in the (A)
pancreas/tumor, (B) peri-pancreatic lymph node, (C) inguinal lymph node, and (D) spleen
from healthy, PanIN-bearing, and tumor-bearing mice.
****p<0.0001; *p<0.05 (one-way ANOVA with Tukey’s HSD post-test). Data shown are
representative of one independent experiment.

44
Figure 2.3 cDC1 maturation marker expression declines systemically during
preinvasive neoplasia.
Expression of maturation markers CD40, CD80, CD86, MHC II (I-A/I-E), and PD-L1 on
cDC1s in the (A) pancreas/tumor, (B) peri-pancreatic lymph nodes (ppLN), (C) inguinal
lymph nodes (iLN), and (D) spleen of healthy, PanIN-bearing, and tumor-bearing mice.
Geometric MFIs shown.
Samples were pooled across 3-6 mice per treatment group in B. Error bars indicate mean
+/- SD. ****p<0.0001; ***p<0.001; **p<0.01; *p<0.05 (one-way ANOVA with Tukey’s
HSD post-test). Data shown are representative of four independent experiments with at
least three mice per group.

45

46
Figure 2.4 cDC1 maturation is progressively impaired during pancreatic oncogenesis.
(A) Principal component analysis (PCA) of cDC1s collected from healthy, PanIN-draining,
and tumor-draining peri-pancreatic lymph nodes (ppLN).
(B) Heatmap of differentially expressed genes by z-score across samples.
(C) Top hits from gene set enrichment analysis (GSEA) comparing cDC1s from tumor-
draining vs. healthy ppLNs.
(D) Enrichment plots of proteasome degradation and T cell polarizing cytokine gene sets
in cDC1s from GSEA shown in C.
(E and F) Expression in transcripts per million reads (tpm) of genes encoding (E)
inflammatory cytokines and (F) immune suppressive factors in cDC1s from healthy,
PanIN-draining, and tumor-draining ppLNs.
n=3 samples per group. Each sample consists of total RNA collected from 10,000 sorted
ppLN cDC1s pooled from 3-6 mice. Error bars indicate mean +/- SD. ***p<0.001; *p<0.05
(one-way ANOVA with Tukey’s HSD post-test).
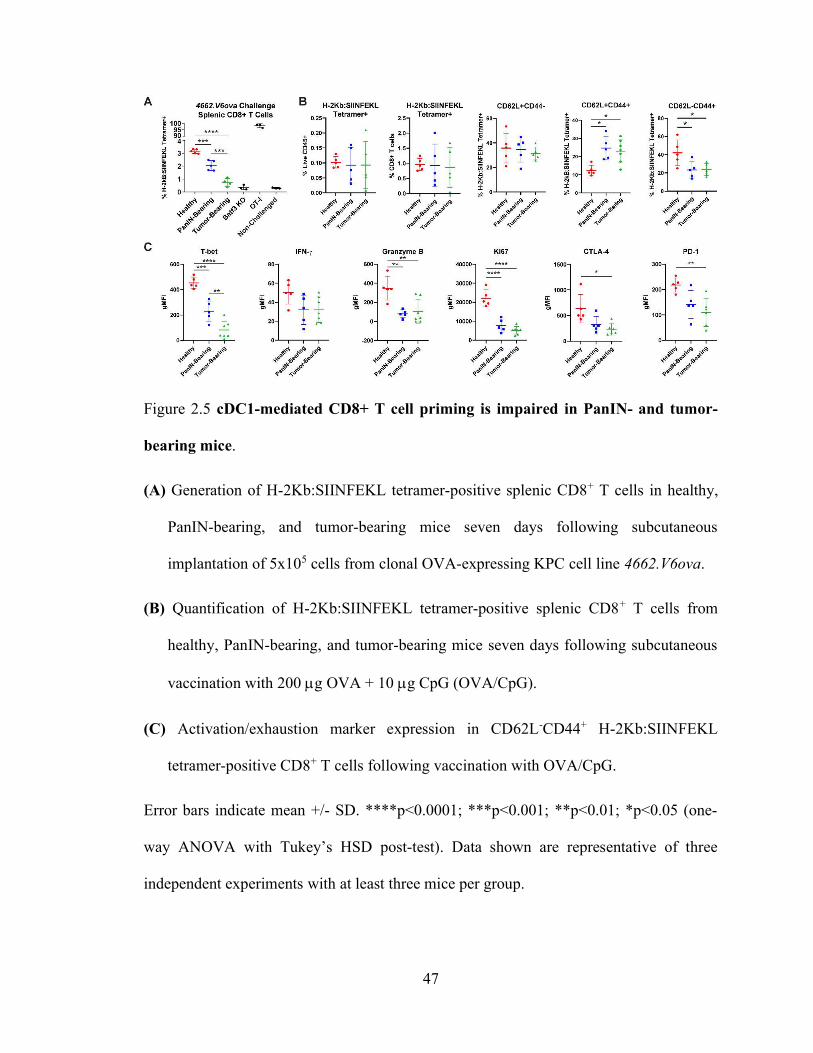
47
Figure 2.5 cDC1-mediated CD8+ T cell priming is impaired in PanIN- and tumor-
bearing mice.
(A) Generation of H-2Kb:SIINFEKL tetramer-positive splenic CD8+ T cells in healthy,
PanIN-bearing, and tumor-bearing mice seven days following subcutaneous
implantation of 5x10⁵ cells from clonal OVA-expressing KPC cell line 4662.V6ova.
(B) Quantification of H-2Kb:SIINFEKL tetramer-positive splenic CD8+ T cells from
healthy, PanIN-bearing, and tumor-bearing mice seven days following subcutaneous
vaccination with 200 g OVA + 10 g CpG (OVA/CpG).
(C) Activation/exhaustion marker expression in CD62L-CD44+ H-2Kb:SIINFEKL
tetramer-positive CD8+ T cells following vaccination with OVA/CpG.
Error bars indicate mean +/- SD. ****p<0.0001; ***p<0.001; **p<0.01; *p<0.05 (one-
way ANOVA with Tukey’s HSD post-test). Data shown are representative of three
independent experiments with at least three mice per group.
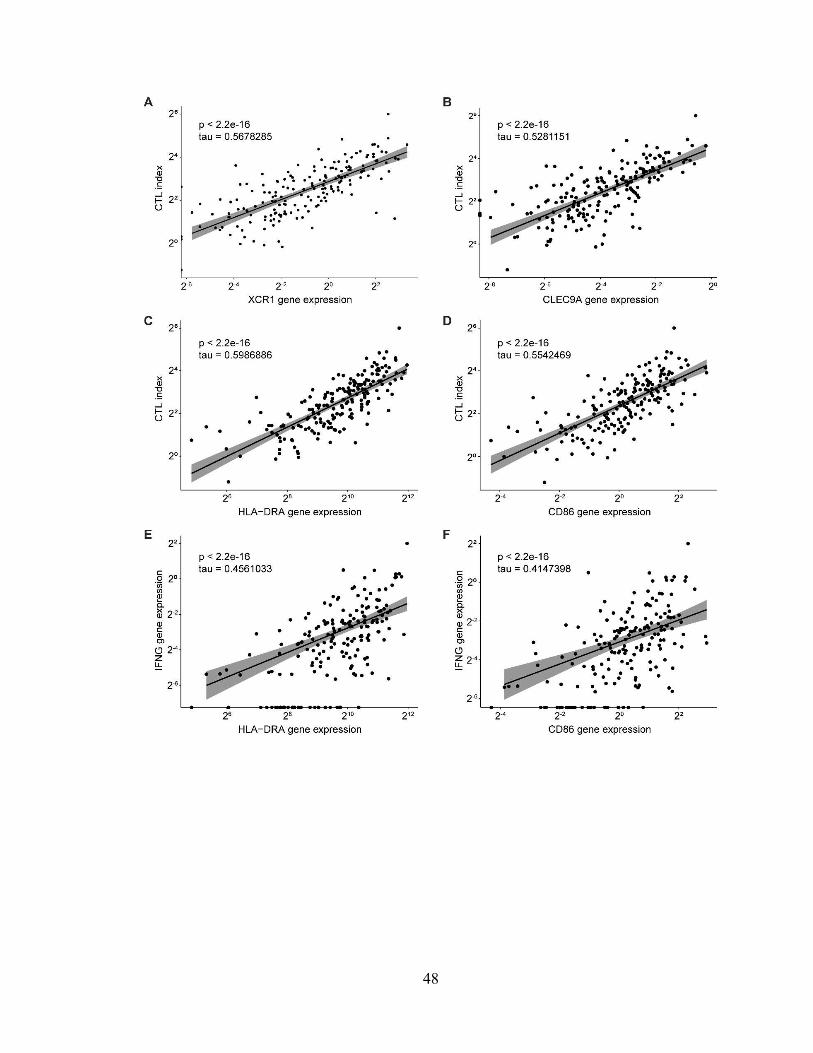
48

49
Figure 2.6 cDC1 abundance and maturation are associated with increased cytolytic
activity in human pancreatic ductal adenocarcinoma.
Correlation analyses of (A) XCR1 gene expression and cytolytic index (CTL), (B)
CLEC9A gene expression and cytolytic index, (C) HLA-DRA gene expression and
cytolytic index, (D) CD86 gene expression and cytolytic index, (E) HLA-DRA gene
expression and IFNG gene expression, and (F) CD86 gene expression and IFNG gene
expression in tumors of patients from The Cancer Genome Atlas with pancreatic ductal
adenocarcinoma (TCGA-PAAD).
n=182 total patients in TCGA PAAD. Regression line, 95% confidence interval, Kendall’s
tau rank correlation coefficient, and associated p-value shown for all correlation analyses.
Cytolytic index is calculated using the geometric mean of PRF1 and GZMA.

50

51
Figure 2.7 Systemic cDC1 dysregulation requires neoplastic development.
(A) Hematoxylin and eosin staining of pancreas from mice treated for 11 weeks with PBS
or cerulein. All images taken at 20X magnification.
(B and C) Enumeration of and expression of maturation markers CD40, CD80, CD86,
MHC II, and PD-L1 on (B) inguinal lymph node and (C) splenic cDC1s from PBS-
treated and cerulein-treated mice.
(D and E) Enumeration of and maturation marker expression on cDC1s from (D) pancreas
and (E) peri-pancreatic lymph node (ppLN) cDC1s from four-week-old Cre/Cre and
KPC mice. Geometric MFIs are shown in E.
(F) Proportions of CD11chiMHCIIint resident/resting vs. CD11cintMHCIIhi
migratory/activated ppLN cDCs.
(G and H) Proportion of cDC1s and cDC2s among (G) resident/resting and (H)
migratory/activated ppLN cDCs shown in F.
(I) Quantification of and Tbet and IFN- expression in H-2Kb:SIINFEKL tetramer-positive
splenic CD8+ T cells seven days following vaccination with 200 g OVA + 10 g CpG.
Samples pooled across three mice per group in E. Error bars indicate mean +/- SD.
**p<0.01; *p<0.05 (two-tailed Student’s t-test). Data shown in A-C are representative of
one independent experiment. Data shown in D-E are representative of three independent
experiments with at least three mice per group.

52

53
Figure 2.8 Systemic cDC1 dysfunction does not occur in the KP mouse model of lung
adenocarcinoma. Experiment performed in collaboration with Dr. David Walter and
provided courtesy of Dr. David Feldser.
(A) Enumeration of cDC1s as a proportion of live cells and CD45+ cells in the lung/tumor
of AdFlp-treated controls and KP mice 8, 12, or 16 weeks post-inhalation of adenoviral
Cre recombinase.
(B-D) Enumeration of cDC1s as a proportion of live CD45+ cells and total cDCs in the (B)
mediastinal lymph node, (C) inguinal lymph nodes, and (D) spleen.
(E-F) Expression of maturation markers CD40, CD80, CD86, MHC II, and PD-L1 on
cDC1s from the (E) lung/tumor and (F) inguinal lymph nodes.
(G) Serum levels of IL-6 and IL-1 as determined by cytokine bead array in the KP and
KPC cancer mouse models, as well as cerulein-induced chronic pancreatitis.
Samples pooled across 4-7 mice per group in B. Error bars indicate mean +/- SD. **p<0.01;
*p<0.05 (one-way ANOVA with Tukey’s HSD post-test). Data shown are representative
of one independent experiment.

54

55
Figure 2.9 cDC1 generation is unaffected by pancreatic neoplastic development.
(A) Flow gating strategy for monocyte DC precursors (MDPs), common DC progenitors
(CDPs), pre-cDCs, pre-cDC1s, and pre-cDC2s in RBC-lysed bone marrow suspension
from a wild-type C57BL/6J mouse. Lineage gate consists of CD3, CD19, B220, NK1.1,
and Gr-1.
(B) Enumeration of MDPs, CDPs, pre-cDCs, pre-cDC1s, pre-cDC2s in the bone marrow
of healthy, PanIN-bearing, and tumor-bearing mice.
(C) Enumeration of pre-cDCs, pre-cDC1s, pre-cDC2s in peripheral blood.
(D) Expression of Ki67 in cDC1s from the mesenteric lymph nodes (mLN) and inguinal
lymph nodes (iLN) of healthy, PanIN-bearing, and tumor-bearing mice.
Error bars indicate mean +/- SD. ****p<0.0001; **p<0.01; *p<0.05 (one-way ANOVA
with Tukey’s HSD post-test). Data shown are representative of at least two independent
experiments with at least three mice per group.
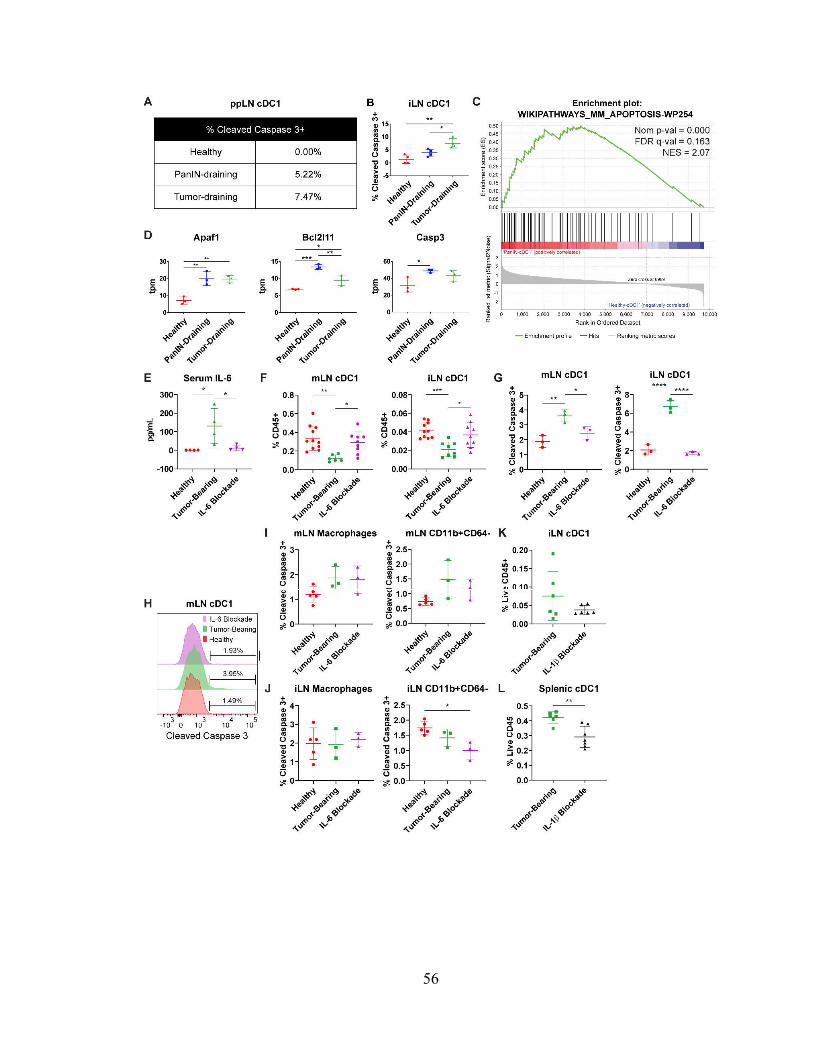
56

57
Figure 2.10 Increased serum IL-6 drives cDC1 apoptosis systemically in tumor-
bearing KPC mice.
Percentage of (A) peri-pancreatic lymph node (ppLN) and (B) inguinal lymph node (iLN)
cDC1s positive for expression of active cleaved caspase 3 in healthy, PanIN-bearing,
and tumor-bearing mice.
(C) Enrichment plot of apoptosis gene set in cDC1s from PanIN-draining vs. healthy
ppLNs.
(D) Expression of select genes in transcripts per million reads (tpm) from gene set shown
in C.
(E) Serum IL-6 levels as determined by cytokine bead array in healthy mice, tumor-bearing
mice, and tumor-bearing mice treated with IL-6-neutralizing antibody (MP5-20F3).
(F) Enumeration of cDC1s in the mesenteric lymph nodes (mLN) and inguinal lymph
nodes (iLN).
(G) Percentage of mLN and iLN cDC1s positive for expression of cleaved caspase 3.
(H) Representative histogram of cleaved caspase 3 expression in mLN cDC1s from G.
(I and J) Percentage of CD64+F4/80+ macrophages and CD64-CD11b+ myeloid cells
positive for expression of cleaved caspase 3 in the (I) mLN and (J) iLN.
(K and L) Quantification of cDC1s as a percentage of live CD45+ cells in (K) iLN cDC1s
and (L) splenic cDC1s from tumor-bearing KPC mice treated with IL-1 blocking
monoclonal antibody (AF-401-NA).

58
Samples pooled across at least four mice per treatment group in A. (C and D): Each sample
consists of total RNA collected from 10,000 sorted ppLN cDC1s pooled across 3-6 mice.
Error bars indicate mean +/- SD. ****p<0.0001; ***p<0.001; **p<0.01; *p<0.05 (one-
way ANOVA with Tukey’s HSD post-test in B, D, E-G, I, J; two-tailed Student’s t-test in
K and L). Data shown are representative of at least two independent experiments with at
least three mice per group.

59
Figure 2.11 cDC1 maturation marker expression is unaffected by IL-6 depletion.
Maturation marker expression on cDC1s from the (A) tumor microenvironment, (B)
inguinal lymph nodes (iLNs), and (C) spleen of healthy, tumor-bearing KPC mice, and
tumor-bearing KPC mice treated with IL-6-depleting antibody. *p<0.05 (two-tailed
Students’ t-test in A; one-way ANOVA with Tukey’s HSD post-test in B and C). Data
corresponds with Fig. 2.10, E-J.

60
Table 2.1
REAGENT or RESOURCE SOURCE IDENTIFIER Antibodies for Flow Cytometric Analysis – cDC Phenotype Panel FITC anti-mouse XCR1 Biolegend 148210 PerCP-Cy5.5 anti-mouse H-2Kb Biolegend 116516 PE anti-mouse CD40 Biolegend 124610 PE Dazzle 594 anti-mouse CD64 Biolegend 139320 PE-Cy5 anti-mouse CD11b Biolegend 101210 PE-Cy7 anti-mouse SIRP Biolegend 144008 APC anti-mouse I-A/I-E Biolegend 107614 AF700 anti-mouse CD45 Biolegend 103128 APC-Cy7 anti-mouse F4/80 Biolegend 123118 BV421 anti-mouse CD103 Biolegend 121422 Live/Dead Fixable Aqua Invitrogen L34957 BV605 anti-mouse CD11c Biolegend 117334 BV650 anti-mouse CD80 Biolegend 104732 BV711 anti-mouse CD3 Biolegend 100241 BV711 anti-mouse CD19 Biolegend 115555 BV711 anti-mouse B220 Biolegend 103255 BV711 anti-mouse NK1.1 Biolegend 108745 BV711 anti-mouse Gr-1 Biolegend 108443 BV785 anti-mouse CD86 Biolegend 105043 BUV395 anti-mouse PD-L1 BD Biosciences 745616 Antibodies for Flow Cytometric Analysis – cDC Progenitor Panel FITC anti-mouse Siglec H Biolegend 129604 PE anti-mouse CD117 (c-Kit) Biolegend 105808 PE Dazzle 594 anti-mouse CD115 (CSF-1R) Biolegend 135528 PE-Cy5 anti-mouse CD135 (Flt3) Biolegend 135312 PE-Cy7 anti-mouse SIRP Biolegend 144008 APC anti-mouse I-A/I-E Biolegend 107614 AF700 anti-mouse CD45 Biolegend 103128 APC-Cy7 anti-mouse CD11b Biolegend 101226 BV421 anti-mouse Ly6C Biolegend 128032 Live/Dead Fixable Aqua Invitrogen L34957 BV605 anti-mouse CD11c Biolegend 117334 BV711 anti-mouse CD3 Biolegend 100241 BV711 anti-mouse CD19 Biolegend 115555 BV711 anti-mouse B220 Biolegend 103255 BV711 anti-mouse NK1.1 Biolegend 108745 BV711 anti-mouse Gr-1 Biolegend 108443 Antibodies for Flow Cytometric Analysis – cDC Apoptosis Panel PE-Cy7 anti-mouse Ki-67 Biolegend 116516 AF700 anti-mouse CD45 Biolegend 103128 APC-Cy7 anti-mouse CD11b Biolegend 101226 BV421 anti-mouse XCR1 Biolegend 148216 Live/Dead Fixable Aqua Invitrogen L34957 BV605 anti-mouse CD11c Biolegend 117334 BV650 anti-mouse Cleaved Caspase 3 BD Biosciences 564096 BV785 anti-mouse I-A/I-E Biolegend 107645

61
Antibodies for Flow Cytometric Analysis – OVA Tetramer+ CD8+ T Cells FITC anti-mouse TIM-3 Invitrogen 11-5870-82 PerCP-Cy5.5 anti-mouse LAG-3 Biolegend 125212 PE H-2Kb:SIINFEKL Tetramer MBL International TB-5001-1 PE594 anti-mouse CTLA-4 Biolegend 106318 PE-Cy5 anti-mouse Eomes Thermo Fisher 15-4875-82 PE-Cy7 anti-mouse PD-1 Biolegend 109110 APC anti-mouse CD4 Biolegend 100516 AF700 anti-mouse CD45 Biolegend 103128 APC-Cy7 anti-mouse CD62L Biolegend 101226 BV421 anti-mouse T-bet Biolegend 644816 Live/Dead Fixable Aqua Invitrogen L34957 BV605 anti-mouse Ki-67 Biolegend 652413 BV650 anti-mouse IFN- Biolegend 505832 BV711 anti-mouse CD3 Biolegend 100241 BV785 anti-mouse CD44 Biolegend 103059 BUV395 anti-mouse CD4 BD Biosciences 563790 BUV805 anti-mouse CD8a BD Biosciences 564920 Critical Commercial Assays
MACS Pan Dendritic Cell negative selection kit
Miltenyi Biotec 130-100-875
MACS CD11c Microbeads UltraPure positive selection kit
Miltenyi Biotec 130-108-338
MACS Naïve CD8a+ T Cell negative selection kit
Miltenyi Biotec 130-096-543
RNeasy Plus Micro Kit Qiagen 74034
LEGENDplex Mouse Inflammation Panel (13-plex) with V-bottom plate
Biolegend 740446
Deposited Data Pan-KPC peri-pancreatic LN cDC1 total RNA GEO Ascension GSE126389 Experimental Models: Mouse Strains
KrasLSL-G12D/+; Trp53LSL-R172H/+; Pdx1-Cre Generated N/A Batf3-/- Jackson Laboratories 013755 OT-I Jackson Laboratories 003831 C57BL/6 Jackson Laboratories 000664 Software and Algorithms BCBio-NextGen (https://github.com/bcbio/bcbio-nextgen)
Github bcbio-nextgen
Gene Set Enrichment Analysis Broad Institute N/A Gene Set Knowledgebase Bioconductor gskb DESeq2 Bioconductor DESeq2

62
Table 2.2
Antibody Source Product # Tag Clone CD196/CCR6 Fluidigm 3141014A 141Pr 11A9
CD11a Fluidigm 3142006B 142Nd HI111 CD123 Fluidigm 3143014B 143Nd 6H6 CD38 Fluidigm 3144014B 144Nd HIT2 CD4 Fluidigm 3145001B 145Nd RPAT4
CD64 Fluidigm 3146006B 146Nd 10.1 CD11c Fluidigm 3147008B 147Sm Bu15 CD16 Fluidigm 314800rB 148Nd WM53 CD66a Fluidigm 3149018B 149Sm ASL32
MIP1beta Fluidigm 3150004B 150Nd D211351 LAMP1 Fluidigm 3151002B 151Eu H4A3 TNFa Fluidigm 3152002B 152Sm Mab11
BDCA-2/CD303 Fluidigm 3153007B 153Eu 201A CD163 Fluidigm 3154007B 154Sm GHI/61 CD1b Fluidigm 3155007B 155Gd SN13 CD86 Fluidigm 3156008B 156Gd IT2.2 CD169 Fluidigm 3158027B 158Gd CD169 PD-L1 Fluidigm 3159029B 159Tb 29E.2A3 CD14 Fluidigm 3160001B 160Gd M5E2 CD80 Fluidigm 3161023B 161Dy 2D10.4 CD8a Fluidigm 3162015B 162Dy RPAT8 CD33 Fluidigm 3163023B 163Dy WM53 CD15 Fluidigm 3164001B 164Dy W6D3 CD40 Fluidigm 3165005B 165Ho 5C3 CD34 Fluidigm 3166012B 166Er 581 CD1a Fluidigm 3167012B 167Er HI149 CD206 Fluidigm 3168008B 168Er 152 CD19 Fluidigm 3169011B 169Tm HIB19 CD3 Fluidigm 3170001B 170Er UCHT1
CXCR5 Fluidigm 3171014B 171Yb RF8B2 CX3CR1 Fluidigm 3172017B 172Yb 2A91 CD141 Fluidigm 3173002B 173Yb 1A4
HLA-DR Fluidigm 3174001B 174Yb L243 PD1 Fluidigm 3175008B 175Lu EH12.2H7
CD56 Fluidigm 3176003B 176Yb CMSSB CD11b Fluidigm 3209003B 209Bi ICRF44 CD45 Fluidigm 3089003B Y89 HI30

63
CHAPTER 3: Type 1 Conventional Dendritic Cell Dysregulation is Reversible
Through Combination CD40 Agonist and Flt3L
The contents of this chapter have been published:
Lin JH, Huffman AP, Wattenberg MM, Walter DM, Carpenter EL, Feldser DM,
Beatty GL, Furth EE, Vonderheide RH. Type 1 conventional dendritic cells are
systemically dysregulated early in pancreatic carcinogenesis. J. Exp. Med. 217 (8),
e20190673 (2020).
Abstract
Type 1 conventional dendritic cells (cDC1s) are systemically and progressively
dysregulated during carcinogenesis in the KPC mouse model of pancreatic ductal
adenocarcinoma (PDA) driven by KrasLSL-G12D/+ Trp53 LSL-R172H/+ Pdx1-Cre. IL-6-driven
cDC1 apoptosis and impaired cDC1 maturation result in impaired CD8+ T cell response to
vaccination. Here, we demonstrate that treatment with CD40 agonist induces an IFN
response signature in cDC1s that drives their maturation and migration from the tumor
microenvironment to the tumor-draining lymph node. Combining CD40 agonist with Flt3
ligand additionally returns cDC1 abundance to normal levels, decreases cDC1 apoptosis,
and further potentiates cDC1 maturation to drive improved response to vaccination and
improved control of tumor outgrowth. This study therefore elaborates therapeutically
tractable strategies towards cDC1 repair for the immunotherapy of immune checkpoint
blockade (ICB)-unresponsive and T cell priming-deficient cancers like PDA.

64
Introduction
Type 1 conventional dendritic cells (cDC1s) are progressively dysregulated early
in carcinogenesis in the KPC mouse model of pancreatic ductal adenocarcinoma (PDA)
driven by KrasLSL-G12D/+ Trp53 LSL-R172H/+ Pdx1-Cre. cDC1 abundance and maturation are
simultaneously affected, resulting in impaired T cell priming following vaccination and
upon subcutaneous implantation of neoantigen-expressing KPC cell line. Decreased cDC1
abundance is attributable to IL-6-driven cDC1 apoptosis. Dendritic cell (DC) scarcity in
KPC has also been shown to contribute to pathologic immunity against model neoantigen,
accelerating neoplastic progression in PDA56. Thus, restoring cDC1 abundance and
maturation could unlock the potential for response to immunotherapy in this disease.
CD40 is a receptor expressed on APCs that licenses them to mature upon binding
CD40 ligand (CD40L) expressed on activated CD4+ T cells34,35. Prior studies from our
group have shown that systemic administration of an agonistic CD40 monoclonal antibody
(CD40 agonist hereafter) is effective in driving T cell infiltration into KPC tumors and
potentiating response to immune checkpoint blockade (ICB)36–38. This response is
dependent upon IFN-, CD40, CD8+ T cells, CD4+ T cells, and cDC1s. However, it was
never determined in these prior studies whether cDC1s were dysregulated in the KPC
model. It was also never established whether cDC1s were merely required for response to
CD40 agonist or were being induced to mature following CD40 agonism. Thus, changes
in cDC1 abundance and maturation following systemic CD40 activation warrant
investigation.
Another factor with potential to promote cDC1 abundance and maturation is Fms
like tyrosine kinase 3 ligand (Flt3L). Fms like tyrosine kinase 3 (Flt3) is a receptor tyrosine

65
kinase that is highly expressed on cDC1 hematopoietic progenitors including MDPs,
CDPs, and pre-cDCs90 (Fig. 1.2). Administration of Flt3L has been shown to expand these
progenitor populations, polarize pre-cDCs towards a cDC1 cell fate, and promote cDC1
survival in peripheral and lymphoid tissues91. Considering the role we have demonstrated
for IL-6 in driving cDC1 apoptosis in the KPC model, Flt3L serves as a strong candidate
for combatting cDC1 apoptosis in tumor-bearing mice.
In the present study, we demonstrate that combination therapy with CD40 agonist
and Flt3L successfully repairs both quantitative and functional deficits in cDC1s, enabling
a return to full CD8+ T cell activation. This combined rescue of cDC1 dysfunction results
in improved control of tumor outgrowth and superior response to vaccination in tumor-
bearing KPC mice.

66
Results
CD40 activation rescues cDC1 maturation
To determine whether CD40 activation can reverse cDC1 dysfunction, a KPC cell line
6419.c5 was subcutaneously implanted into C57BL/6J mice, then treated with FGK45 –
an agonistic monoclonal rat antibody directed against murine CD40 (Fig. 3.1 A). cDC1
abundance declined in the tumor microenvironment following treatment (Fig. 3.1 B). This
was found to be driven by cDC1 migration to the tumor-draining iLN, as numbers of
CD11cintMHC IIhi activated/migratory cDC1s increased in the tumor-draining iLN
following treatment (Fig. 3.1 C). The expression of Ccr7 in tumor-draining iLN CD11c+
cells also increased, further supporting the migration and maturation of activated cDC1s
from the tumor microenvironment (Fig. 3.1 D). Maturation marker expression increased
universally on cDC1s in the tumor microenvironment following FGK45 administration,
consistent with fully repaired cDC1 maturation (Fig. 3.1 E). In the tumor-draining iLN, the
expression of CD40, CD86, and PD-L1 also increased in response to FGK45 (Fig. 3.1 F).
In the spleen, maturation marker expression increased, except for MHC II which declined
(Fig. 3.1 G).
Tumor-bearing KPC mice were then subcutaneously implanted with 4662.V6ova and
treated with FGK45 to determine whether cDC1-mediated CD8+ T cell priming can be
restored. Indeed, administration of FGK45 restored the generation of H-2Kb:SIINFEKL
tetramer-positive CD8+ T cells to levels seen in healthy mice (Fig. 3.1 H).

67
To determine which cDC1 molecular pathways are upregulated by treatment with FGK45,
RNA sequencing was performed on tumor-draining iLN (TdLN) cDC1s from mice bearing
subcutaneous tumors. Principal component analysis revealed a broad transcriptomic
change in cDC1s along PC1 following FGK45 administration (Fig. 3.2 A). However,
differential gene expression analysis revealed that treatment with FGK45 induced a
significantly different transcriptomic signature depending on whether tumor was present
(Fig 3.2 B). GSEA comparing cDC1s in FGK45-treated vs. untreated tumor-bearing mice
showed an induction of genes associated with type II interferon signaling including Stat1
and Stat2 (Fig. 3.2, C-E). Thus, our data demonstrate that cDC1 maturation and function
are rescued by CD40 activation and associated with induction of a type II interferon
transcriptomic signature.
Flt3 ligand synergizes with CD40 agonist to rescue cDC1 abundance and maturation
While CD40 agonism successfully rescued cDC1 maturation in tumor-bearing mice, it
failed to increase cDC1 abundance in the tumor microenvironment. We hypothesized that
Flt3L would synergize effectively with CD40 activation to increase cDC1 abundance in
tumor-bearing mice. To explore this possibility, we subcutaneously implanted C57BL/6J
mice with cells derived from the clonal KPC cell line 4662.MD10. Fourteen days post-
implantation, mice were treated with FGK45 in combination with Flt3L (Fig. 3.3 A).
Tissues were then harvested after nine days of daily treatment with Flt3L. Quantification
of cDC1s demonstrated that while Flt3L alone increased cDC1 abundance in the spleen,
decreased the abundance in the tumor and had no effect on cDC1 abundance in TdLN. We
again found that FGK45 alone decreased cDC1 abundance in tumor with no effect on

68
spleen or TdLN. In contrast, we observed a strong increase in cDC1 abundance in TdLN
with the combination of FGK45 and Flt3L. Combination therapy also increased cDC1
abundance in the spleen and increased cDC1 abundance in the tumor compared to Flt3L or
FGK45 alone. Combination treatment also potentiated cDC1 expression of MHC II in the
TdLN beyond levels seen with FGK45 alone (Fig. 3.3 C). Expression of CD80 and CD86
also trended higher in combination-treated mice compared to mice treated with FGK45
alone. Because Flt3L also serves as a survival factor for cDC1s, active cleaved caspase 3
was quantified in ppLN and iLN cDC1s from tumor-bearing KPC mice treated with
combination FGK45 and Flt3L. Levels of active cleaved caspase 3 in ppLN and iLN cDC1s
were significantly reduced after combination treatment (Fig. 3.3, D and E). Flt3L also
promotes the generation of bone marrow cDC progenitors. While CD40 agonist resulted in
a durable decline in progenitor populations, the addition of Flt3L allowed normal levels of
cDC progenitors to be maintained (Fig. 3.6). Combination FGK45 and Flt3L, therefore,
promotes cDC1 generation and reverses the increased cDC1 apoptosis seen in PanIN- and
tumor-bearing KPC mice while further potentiating cDC1 maturation beyond levels seen
with CD40 agonist alone.
To determine whether this combined rescue of cDC1 abundance and maturation results in
improved cDC1-mediated CD8+ T cell priming, tumor-bearing mice were vaccinated with
OVA/CpG and treated with FGK45 and Flt3L. The generation of H-2Kb:SIINFEKL
tetramer-positive CD8+ T cells was significantly increased in combination-treated tumor-
bearing mice beyond levels seen in healthy mice (Fig. 3.3 F). Likewise, the proportion of
effector memory CD62L-CD44+ vaccine-responsive T cells and their expression of IFN-

69
also reflected greater activation than in healthy mice. Thus, combination treatment with
FGK45 and Flt3L reverses the quantitative and functional cDC1 deficits seen in PanIN-
and tumor-bearing KPC mice, enabling productive CD8+ T cell priming and activation.
Combination CD40 agonist and Flt3L results in superior T cell activation
To determine whether combination FGK45 and Flt3L can enhance anti-tumor adaptive
immunity, CD8+ and CD4+ T cells in the tumor microenvironment and tumor-draining iLN
were examined using flow cytometry. Consistent with our prior studies, CD8+ T cells
trended towards an increase in the tumor microenvironment following CD40 agonism36,37
(Fig. 3.4 A). The addition of Flt3L did not further enhance CD8+ T cell enrichment in the
tumor microenvironment. However, based on proportions of CD62L-CD44+ T cells and
expression of IFN-, combination CD40 agonist and Flt3L improved CD8+ T cell
activation in the tumor-draining iLN (Fig. 3.4 B). CD40 agonism also resulted in an influx
of CD4+FOXP3- T cells into the tumor microenvironment (Fig. 3.4 C). Combination
FGK45 and Flt3L enhanced the activation of FOXP3-CD4+ T cells in the tumor-draining
iLN (Fig. 3.4 D), and FOXP3+ CD4+ T regulatory cells in the tumor microenvironment
decreased after CD40 agonism and combination treatment (Fig. 3.4 E).
To determine whether enhanced T cell priming produced with FGK45 and Flt3L in the
draining lymph node might drive improved immune control of tumor outgrowth, a T cell
low KPC cell line 6419c5 was implanted subcutaneously into C57BL/6J mice76. Beginning
on day 12 post-implantation, combination treatment with CD40 agonist and Flt3L was

70
initiated according to the schedule described in Fig. 3.3 A. CD40 agonist and Flt3L induced
superior control of tumor outgrowth compared to CD40 agonist monotherapy (Fig. 3.4 F;
Fig. 3.5). Notably, Flt3L monotherapy had no discernable effect. Furthermore, the
combination treatment extended overall survival of tumor-bearing mice (Fig. 3.4 G). Thus,
we conclude that combined rescue of cDC1 abundance and maturation through CD40
agonist and Flt3L results in superior T cell activation in the draining lymph node and
improved immune control of KPC tumor outgrowth.

71
Discussion
cDC1 dysregulation develops systemically and with early onset, prior to invasive tumor
formation in KPC mice bearing PanINs. This results in systemically decreased cDC1
abundance due to IL-6-driven apoptosis and impaired cDC1 maturation. CD8+ T cell
activation in response to vaccination is subsequently impaired. In the present study, we
demonstrate that these deficits are reversible in vivo. Treatment with CD40 agonist induced
an IFN- response signature in cDC1s, driving their maturation and migration to draining
lymph nodes. Combination treatment of tumor-bearing mice with CD40 agonist and Flt3L
additionally reversed deficits in cDC1 abundance, ameliorated apoptosis, and improved
CD8+ T cell activation driving increased response to vaccination and immune control of
tumor outgrowth.
Prior studies from our group have shown that CD40 agonist effectively promotes T cell
infiltration into KPC tumors, enabling response to ICB in a cDC1-dependent manner36,37,92.
Here, we reveal CD40 agonism specifically induces an IFN- response signature in cDC1s
that rescues their maturation. It remains unclear whether this is driven by direct ligation of
CD40 on cDC1s or IFN- secretion by another CD40-expressing cell type34,93. We also
find that to rescue cDC1 abundance as well as maturation, addition of Flt3L is needed and
in fact potentiates cDC1 maturation beyond levels seen with CD40 agonist alone. This
boosts CD8+ T cell activation and drives superior response to vaccination and immune
control of tumor outgrowth. However, while combination treatment with CD40 agonist and
Flt3L drives superior T cell priming in tumor-bearing mice, we cannot rule out that these
differences may be due at least in part to changes in the MDSC compartment. Our group

72
has previously described a significant increase in MDSCs that occurs in the KPC GEMM
and underlies tumor-intrinsic mechanisms of immune suppression, particularly evident at
the invasive stage49. It remains possible that the rescued T cell priming following
combination CD40 agonist and Flt3L is at least partially driven by changes in MDSC
abundance and function in addition to the increased cDC1 abundance and maturation
described in our study.
A separate study recently utilized endogenously expressed OVA as a model neoantigen in
the KPC model to demonstrate that Flt3L reverses cDC paucity and restores T cell priming
upon combination with CD40 agonist56. While their results with combination CD40 agonist
and Flt3L in neoantigen-negative KPC closely mirror ours, we find that Flt3L monotherapy
is ineffective in neoantigen-negative KPC mice for increasing the cDC1 content of tumors
and tumor-draining lymph nodes. Our group has demonstrated in prior studies that cDC1s
are necessary for response to CD40 agonism. Therefore, it will be critical in future studies
to experimentally establish whether cDC1s are required for therapeutic response to
combination CD40 agonist and Flt3L37,38.
The reversal of cDC1 dysfunction through CD40 agonism is interesting in light of recent
efforts to use agonist CD40 antibodies as cancer immunotherapy in patients3. In metastatic
pancreatic adenocarcinoma, preliminary results are promising94. These and other trials of
agonistic CD40 antibody provide the opportunity to study treatment effects on patient DCs
in tissue and blood, using strategies informed by our mouse studies here. Our findings

73
suggest that CD40 agonist may synergize with Flt3L clinically to enable T cell responses
in cancer patients for whom T cell priming is deficient.

74
Materials and methods
Animal studies
All mouse experiments were done at the University of Pennsylvania Perelman School of
Medicine, approved by the UPenn Institutional Animal Care and Use Committee, and
performed in strict compliance with protocols 804666 & 804774. Mice were housed under
pathogen-free conditions in a barrier facility. C57BL/6 mice were purchased from Jackson
Laboratories or bred in-house. The size of each animal cohort was determined by
estimating biologically relevant effect sizes between control and experimental groups and
then using the minimum number that could reveal statistical significance.
Subcutaneous tumor implantation
Subcutaneously implanted KPC tumors were generated by injecting 3x10⁵ cells in sterile
DMEM into the right flank of female C57BL/6 mice unless otherwise specified. Cre/Cre
and KPC mice were bred in-house. Tumor volume was calculated as greater diameter x
smaller diameter2. Mice were considered to have reached endpoint in survival analyses
upon reaching a tumor volume of 500 mm3.
Antibody-based experiments
CD40 agonist studies were performed via a single intraperitoneal injection of 100 g of
monoclonal CD40 agonistic antibody (InVivomAb FGK45) in 100 l PBS. Flt3 ligand
(Flt3L) studies were performed with once daily injections of 10 g Flt3L in 100 l PBS
subcutaneously at the nape of the neck.

75
Vaccination studies
Vaccination of OVA/CpG was performed by subcutaneous injection of 200 g endotoxin-
free OVA (Invivogen vac-pova-100) + 10 g endotoxin-free ODN1826 CpG (Invivogen
tlrl-1826-1) in 200 L PBS subcutaneously into the right flank.
KPC mouse model
The KPC genetically engineered mouse model of pancreatic ductal adenocarcinoma is
driven by Pdx1-Cre KrasLSL-G12D/+Trp53LSL-R172H/+. As previously published, KPC mice in
our colony are fully backcrossed to C57BL/6 based on the DartMouse Illumina
GoldenGate Genotyping Assay, which interrogated 1,449 SNPs spread throughout the
genome4.
KPC cell lines and cell culture
Tumor cell lines were derived from spontaneous tumors in the KPC GEMM. 4662.V6ova
is an OVA-transduced clonal KPC cell line4. 4662.MD10 and 6419.c5 are clonal KPC cell
lines76. Cell culture was performed using DMEM supplemented with 10% FBS, L-
glutamine, and penicillin/streptomycin. Cell lines were tested for mycoplasma
contamination once every six months.
Tissue processing and cell isolation

76
Tumors and pancreas were dissected and minced in DMEM-F12 + 10% FBS at 4C, then
digested in DMEM-F12 with 1 mg/ml collagenase with protease inhibitor (Sigma-Aldrich
C6079) for 30 min at 37C. Tissues were filtered through a 70 m cell strainer, then a 40
m cell strainer, with 9 ml FACS buffer (PBS w/ 0.2% BSA + 2 mM EDTA). Lymph
nodes, spleens, and bone marrow were dissected and minced in RPMI + 5% FBS at 4C,
then digested in RPMI with 1 mg/ml collagenase (Sigma-Aldrich C5138) for 20 min at
37C. Spleens and bone marrow were subject to two rounds of RBC lysis using 1mL of
ACK Lysis Buffer (Gibco A1049201). Samples were then filtered through a 40 m cell
straining and rinsed with 9 ml FACS buffer. Due to the small size of peri-pancreatic lymph
nodes (especially in healthy mice), peri-pancreatic lymph node samples were always
pooled across all mice per experimental group to achieve sufficient cDC1 quantities for
downstream analysis.
Flow cytometric analysis
All stainings were performed in the dark. Tissue-derived cells were washed with PBS
before viability stain with LIVE/DEAD Fixable Aqua (Invitrogen L34957) for 20 min at
room temperature. Samples for DC analysis were then washed with FACS Buffer before
being stained for immune markers CD45, CD64, F4/80, CD3, CD19, B220, NK1.1, Gr-1,
I-A/I-E, CD11c, XCR1, SIRP, CD103, CD11b, CD40, CD80, CD86, and PD-L1 for 30
min at 4C. Where appropriate, cDC1s were intracellularly stained for Ki-67 and cleaved
caspase 3 overnight at 4C. Samples for T-cell analysis were stained for immune markers
CD45, CD3, CD8, CD4, H-2Kb:SIINFEKL tetramer, TIM-3, LAG3, CTLA-4, PD-1,
CD62L, and CD44 extracellularly for 30 min at 4C; and FOXP3, CTLA-4, Eomes,

77
Granzyme B, Tbet, Ki-67, and IFN- intracellularly overnight at 4C. Bone marrow samples
were stained extracellularly for Siglec H, c-Kit, CSF-1R, Flt3, SIRP, I-A/I-E, CD45,
CD11b, Ly6C, CD11c, CD3, CD19, B220, NK1.1, and Gr-1 at 4C for 30 min. To aid in
obtaining an accurate quantification of cells in tumor samples, target events were
normalized using CountBright Absolute Counting Beads (Life Technologies C36950) per
manufacturer’s instructions. Samples were analyzed on a BD Biosciences LSR Fortessa.
All flow panels are provided in Table 3.1.
RNA-seq analysis, differential gene expression, and gene set enrichment analysis
cDC1s were sorted using a BD Biosciences Aria II cell sorter with 100 m nozzle into an
Eppendorf tube with 350 l Buffer RLT Plus at 4C using the gating strategy shown in Fig.
2.1 B. RNA was isolated from sorted cDC1s using the Qiagen RNeasy Plus Micro Kit per
manufacturer’s instructions. RNA purity and integrity were measured with an Agilent
TapeStation prior to polyA selection and library construction followed by single-end 100
bp sequencing on an Illumina HiSeq4000 high-throughput sequencer at a depth of 20
million reads per sample by the UPenn Next-Generation Sequencing Core (NGSC). The
curated RNA-seq analysis pipeline from bcbio-nextgen was used for downstream analysis
(https://github.com/chapmanb/bcbio-nextgen). FASTQ files were checked for quality
using FastQC and qualimap. Alignment was performed with STAR under default settings
using the mm10 reference genome. Raw counts of gene transcripts were obtained from
BAM files using featureCounts86. The resulting count matrix was then imported into R
(version 3.6.1) and used as input to DESeq2 for normalization and differential gene
expression analysis87. Salmon / Sailfish quasi-alignment was used to normalize and

78
quantify gene expression, and generate a transcripts per million (tpm) matrix to be used as
input for gene set enrichment analysis (GSEA)88. Pathway and gene ontology analyses
were performed using GSEA and Gene Set Knowledgebase (GSKB), a curated functional
genomics database for murine transcriptomes89. RNA-seq data have been submitted to and
may be accessed at the Gene Expression Onmibus database repository (accession number:
GSE126389).
Statistical analysis
Data points that were more than two standard deviations from the mean were removed as
outliers. All statistical analyses of flow cytometry were performed using Graphpad Prism
7 or 8. Statistics in gene set enrichment analysis (GSEA) were performed using the gene
set permutation setting within the Broad Institute GSEA software. Adjusted p-values (p-
adj) below 0.05 and false discovery rate (FDR) q-values below 0.25 were considered
statistically significant.

79
Figures and figure legends

80
Figure 3.1 CD40 activation repairs cDC1 maturation in KPC tumors.
(A) Timeline of subcutaneous implantation of KPC cell line 6419.c5, administration of
CD40 agonist (FGK45), and harvest of tissues for flow cytometric analysis.
(B) Enumeration of cDC1s per live cells in subcutaneous KPC tumors from untreated and
FGK45-treated mice.
(C) Enumeration of CD11cintMHCIIhi migratory/activated cDC1s in the tumor-draining
inguinal lymph node (iLN).
(D) Expression of Ccr7 in CD11c+ cells purified from the iLNs of healthy mice and tumor-
draining iLNs of untreated and FGK45-treated mice bearing subcutaneously implanted
KPC tumors.
(E) Expression of maturation markers CD40, CD80, CD86, MHC II (I-A/I-E), and PD-L1
on cDC1s from the tumors of untreated and FGK45-treated mice.
Maturation marker expression on cDC1s from the (F) tumor-draining iLN and (G) spleen
of healthy mice, untreated tumor-bearing mice, and FGK45-treated tumor-bearing
mice.
(H) Enumeration of H-2Kb:SIINFEKL tetramer-positive splenic CD8+ T cells from
healthy mice, untreated tumor-bearing KPC mice, and FGK45-treated tumor-bearing
KPC mice twelve days following subcutaneous implantation of OVA-expressing clonal
KPC cell line 4662.V6ova. 100 g FGK45 was administered on day 9 post-
implantation.
Error bars indicate mean +/- SD. ****p<0.0001; ***p<0.001; **p<0.01; *p<0.05 (two-
tailed Student’s t-test in B, C, E; one-way ANOVA with Tukey’s HSD post-test in D, F,

81
G, H). Data shown are representative of four independent experiments with at least three
mice per group.
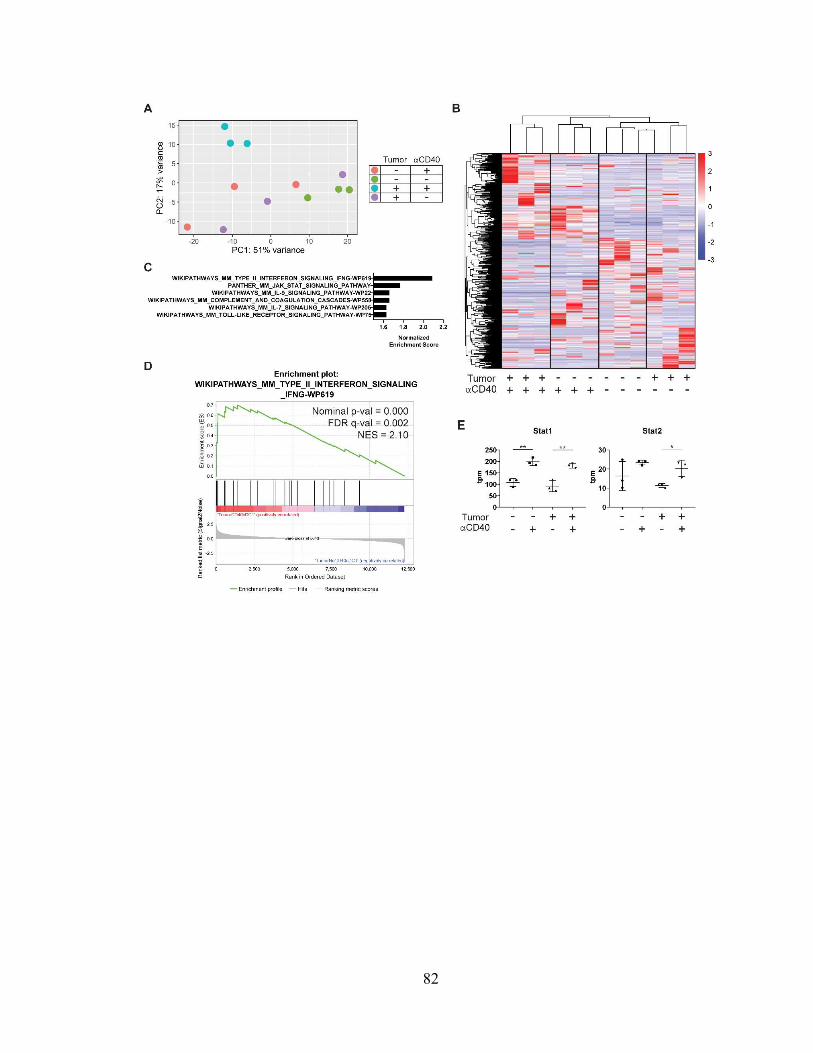
82

83
Figure 3.2 CD40-driven cDC1 maturation is associated with an IFN- response
signature.
(A) Principal component analysis (PCA) of inguinal lymph node (iLN) cDC1
transcriptomes in the presence or absence of subcutaneously implanted KPC tumor,
either treated or untreated with CD40 agonist (FGK45).
(B) Heatmap comparing expression of differentially expressed genes across samples,
scaled by z-score.
(C) Top hits from gene set enrichment analysis (GSEA) of tumor-draining iLN cDC1s
from FGK45-treated vs. untreated mice.
(D) Enrichment plot of type II interferon response gene set from GSEA shown in C.
(E) Expression of Stat1 and Stat2 in transcripts per million reads (tpm) from gene set shown
in D.
n=3 samples per group. Each sample consisted of total RNA collected from 10,000 sorted
iLN cDC1s pooled from five mice per group. Error bars indicate mean +/- SD. **p<0.01;
*p<0.05 (one-way ANOVA with Tukey’s HSD post-test).

84

85
Figure 3.3 Flt3 ligand synergizes with CD40 activation to promote cDC1 survival and
function.
(A) Timeline of treatment of mice subcutaneously implanted with 3x10⁵ KPC cell line
4662.MD10 with CD40 agonist (FGK45) and Flt3 ligand (Flt3L). Treatment was
initiated 14 days post-transplant.
(B) Enumeration of cDC1s in the tumor microenvironment, tumor-draining inguinal lymph
node (TdLN), and spleen of untreated, Flt3L-treated, FGK45-treated, and combination-
treated mice.
(C) Expression of MHC II, CD80, and CD86 on TdLN cDC1s.
(D and E) Percentage of cDC1s positive for expression of active cleaved caspase 3 in the
(D) peri-pancreatic lymph nodes (ppLN) (percentages in healthy and tumor-bearing
mice are also reported in Fig. 6 A) and (E) inguinal lymph nodes (iLN) of healthy mice,
tumor-bearing KPC mice, and tumor-bearing KPC mice treated with FGK45 and Flt3L.
(F) Enumeration of and IFN- expression in H-2Kb:SIINFEKL tetramer-positive splenic
CD8+ T cells seven days following subcutaneous vaccination with 200 g OVA + 10
g CpG in tumor-bearing KPC mice treated with FGK45 and Flt3L.
Samples were pooled across at least 4 mice per treatment group in D. Error bars indicate
mean +/- SD. ****p<0.0001; ***p<0.001; **p<0.01; *p<0.05 (one-way ANOVA with
Tukey’s HSD post-test). Data shown are representative of at least two independent
experiments with at least three mice per group.

86

87
Figure 3.4 Combination therapy with CD40 agonist and Flt3 ligand results in superior
T cell activation in the tumor-draining lymph node.
(A) Enumeration of CD8+ T cells in the tumor microenvironment of untreated, Flt3 ligand
(Flt3L)-treated, CD40 agonist (FGK45)-treated, or combination-treated
subcutaneously implanted KPC tumors as shown in Figure 6A.
(B) Enumeration of and IFN- production in CD8+ T cells from the tumor-draining
inguinal lymph node (TdLN).
(C) Enumeration of FOXP3- CD4+ T cells in the tumor microenvironment.
(D) Enumeration of and IFN- production in FOXP3- CD4+ T cells from the TdLN.
(E) Enumeration of FOXP3+ CD4+ T cells in the tumor microenvironment.
(F) Tumor growth and (G) survival curves from mice subcutaneously implanted with 5x10⁵
KPC cell line 6419c5. Mice were treated with CD40 agonist and Flt3L beginning on day
12 post-implantation using the treatment schedule shown in Fig. 9 A.
n=10 mice per group in F and G. ****p<0.0001; ***p<0.001; **p<0.01; *p<0.05 (one-
way ANOVA with Tukey’s HSD post-test in A-E; two-way ANOVA with Tukey’s HSD
post-test in F; pairwise Kaplan-Meier survival log-rank test in G). Data shown are
representative of three independent experiments with at least five mice per group.

88
Figure 3.5 Tumor growth curves from subcutaneous implantation of 6419c5 and
combination treatment with CD40 agonist and Flt3L.
Individual tumor growth curves following subcutaneous implantation of 5x10⁵ T cell low
KPC cell line 6419c5 in (A) untreated, (B) Flt3L-treated, (C) CD40 agonist-treated, and
(D) combination-treated mice. CD40 agonist and Flt3L were administered beginning day
12 post-implantation using the treatment schedule shown in Fig. 9 A. Data shown are
representative of three independent experiments with at least five mice per group.

89
Figure 3.6 Addition of Flt3L attenuates CD40 activation-induced depletion of bone
marrow cDC1 progenitors.
Quantification of monocyte DC precursors (MDPs), common DC progenitors (CDPs), pre-
conventional DCs (pre-cDCs), pre-type 1 conventional DCs (pre-cDC1s), and pre-type 2
conventional DCs (pre-cDC2s) following treatment according to the schema shown in Fig.
3.3 A. *p<0.05 (one-way ANOVA with Tukey’s HSD post-test). Data corresponds with
Fig. 3.3 B.

90
Table 3.1
REAGENT or RESOURCE SOURCE IDENTIFIER Antibodies for Flow Cytometric Analysis – cDC Phenotype Panel FITC anti-mouse XCR1 Biolegend 148210 PerCP-Cy5.5 anti-mouse H-2Kb Biolegend 116516 PE anti-mouse CD40 Biolegend 124610 PE Dazzle 594 anti-mouse CD64 Biolegend 139320 PE-Cy5 anti-mouse CD11b Biolegend 101210 PE-Cy7 anti-mouse SIRP Biolegend 144008 APC anti-mouse I-A/I-E Biolegend 107614 AF700 anti-mouse CD45 Biolegend 103128 APC-Cy7 anti-mouse F4/80 Biolegend 123118 BV421 anti-mouse CD103 Biolegend 121422 Live/Dead Fixable Aqua Invitrogen L34957 BV605 anti-mouse CD11c Biolegend 117334 BV650 anti-mouse CD80 Biolegend 104732 BV711 anti-mouse CD3 Biolegend 100241 BV711 anti-mouse CD19 Biolegend 115555 BV711 anti-mouse B220 Biolegend 103255 BV711 anti-mouse NK1.1 Biolegend 108745 BV711 anti-mouse Gr-1 Biolegend 108443 BV785 anti-mouse CD86 Biolegend 105043 BUV395 anti-mouse PD-L1 BD Biosciences 745616 Antibodies for Flow Cytometric Analysis – cDC Apoptosis Panel PE-Cy7 anti-mouse Ki-67 Biolegend 116516 AF700 anti-mouse CD45 Biolegend 103128 APC-Cy7 anti-mouse CD11b Biolegend 101226 BV421 anti-mouse XCR1 Biolegend 148216 Live/Dead Fixable Aqua Invitrogen L34957 BV605 anti-mouse CD11c Biolegend 117334 BV650 anti-mouse Cleaved Caspase 3 BD Biosciences 564096 BV785 anti-mouse I-A/I-E Biolegend 107645 Antibodies for Flow Cytometric Analysis – OVA Tetramer+ CD8+ T Cells FITC anti-mouse TIM-3 Invitrogen 11-5870-82 PerCP-Cy5.5 anti-mouse LAG-3 Biolegend 125212 PE H-2Kb:SIINFEKL Tetramer MBL International TB-5001-1 PE594 anti-mouse CTLA-4 Biolegend 106318 PE-Cy5 anti-mouse Eomes Thermo Fisher 15-4875-82 PE-Cy7 anti-mouse PD-1 Biolegend 109110 APC anti-mouse CD4 Biolegend 100516 AF700 anti-mouse CD45 Biolegend 103128 APC-Cy7 anti-mouse CD62L Biolegend 101226 BV421 anti-mouse T-bet Biolegend 644816 Live/Dead Fixable Aqua Invitrogen L34957 BV605 anti-mouse Ki-67 Biolegend 652413 BV650 anti-mouse IFN- Biolegend 505832 BV711 anti-mouse CD3 Biolegend 100241 BV785 anti-mouse CD44 Biolegend 103059 BUV395 anti-mouse CD4 BD Biosciences 563790

91
BUV805 anti-mouse CD8a BD Biosciences 564920 Critical Commercial Assays
MACS Pan Dendritic Cell negative selection kit
Miltenyi Biotec 130-100-875
MACS CD11c Microbeads UltraPure positive selection kit
Miltenyi Biotec 130-108-338
MACS Naïve CD8a+ T Cell negative selection kit
Miltenyi Biotec 130-096-543
RNeasy Plus Micro Kit Qiagen 74034
LEGENDplex Mouse Inflammation Panel (13-plex) with V-bottom plate
Biolegend 740446
Deposited Data SubQ Tumor CD40 agonist iLN CD11c+ total RNA
GEO Ascension GSE126361
SubQ Tumor CD40 agonist iLN cDC1 total RNA GEO Ascension GSE126357 Experimental Models: Cell Lines PENN 4662.MD10 Generated N/A PENN 6419.c5 Generated/B.Z.
Stanger N/A
Experimental Models: Mouse Strains
KrasLSL-G12D/+; Trp53LSL-R172H/+; Pdx1-Cre Generated N/A C57BL/6 Jackson Laboratories 000664 Software and Algorithms BCBio-NextGen (https://github.com/bcbio/bcbio-nextgen)
Github bcbio-nextgen
Gene Set Enrichment Analysis Broad Institute N/A Gene Set Knowledgebase Bioconductor gskb DESeq2 Bioconductor DESeq2

92
CHAPTER 4: CCL5 Mediates CD40-Driven CD4+ T Cell Tumor Infiltration and
Immunity
The contents of this chapter have been published:
Huffman AP*, Lin JH*, Kim SI, Byrne KT, Vonderheide RH. CCL5 mediates
CD40-driven CD4+ T-cell tumor infiltration and immunity. JCI Insight 5 (10), 137263
(2020).
* These authors contributed equally to this work.
Abstract
The role CD4+ T cells play in tumor immunity is less well-appreciated than the cytotoxic
role of CD8+ T cells. Despite clear evidence of CD4+ T cell dependency across multiple
cancer immunotherapeutic approaches, the mechanisms by which CD4+ T cells infiltrate
tumors remain poorly understood. Prior studies by our group have shown that systemic
activation of CD40 drives T cell infiltration into tumors in murine pancreatic cancer.
Combination treatment with CD40 agonist and immune checkpoint blockade (ICB) leads
to durable tumor regressions that are both CD8+ and CD4+ T cell-dependent. Here, we use
single-cell transcriptomics to query immune populations within the tumor
microenvironment after treatment with various combinations of CD40 agonist and ICB.
We discover that intratumoral myeloid cells produce the chemokine CCL5 following CD40
activation, mediating CD4+ T cell influx into the tumor microenvironment. Disruption of
CCL5 genetically or pharmacologically mitigates the influx of CD4+ but not CD8+ T cells

93
into tumors and diminishes therapeutic efficacy. Our findings therefore highlight a
previously unappreciated role for CCL5 in selectively mediating CD4+ T cell tumor
infiltration in response to immunotherapy.

94
Introduction
CD4+ T cells play a critical role in anti-tumor immunity and response to
immunotherapy, but their mechanisms of action remain incompletely understood54,95–99.
Canonical functions of CD4+ T cells are well known: CD4+ T cells provide T cell help to
professional antigen-presenting cells (APCs) and produce important anti-tumor cytokines
like IFN-γ100–102. A recent study demonstrated that spontaneous and immunotherapy-
mediated anti-tumor T cell responses require CD4+ in addition to CD8+ T cells, even when
the target tumor cells lack MHC class II103. These findings recall early preclinical
experiments with CTLA-4 monoclonal antibody (mAb) in which anti-tumor responses
were dependent on not only CD8+ but also CD4+ T cells97. CD4+ T cell dependency has
since been observed in many other cancer immunotherapeutic approaches54,95–99,104–107. In
the clinic, major tumor regressions have been observed following adoptive transfer of
CD4+ T cells in refractory MHC II- solid tumors108,109. Further mechanistic study of CD4+
T cells in the context of immunotherapy is therefore warranted.
The TNF superfamily member CD40 is a receptor expressed on the surface of APCs
and confers cellular maturation upon ligation with CD40 ligand (CD40L), which is
classically expressed on activated CD4+ T cells110. Our group has previously shown that
systemically administered agonistic CD40 mAb (referred to henceforth as CD40 agonist)
induces intratumoral T cell infiltration in a genetically engineered mouse model of
pancreatic ductal adenocarcinoma (PDA), potentiating response to immune checkpoint
blockade (ICB)36,38. Tumor regressions with CD40 agonist have required both CD8+ and
CD4+ T cells despite the lack of MHC II on target tumors. Mice depleted of CD4+ T cells
fail to reject implanted pancreatic cancer cell lines despite combinations of CD40 agonist

95
with chemotherapy, radiotherapy, or ICB37,38,92,111. Furthermore, CD4+ but not CD8+ T
cells are required for memory protection against rechallenge in mice cured of these MHC
II- tumors38. Formation of this immune memory relies upon strong upregulation of cytokine
production by intratumoral CD4+ T cells upon combination treatment with CD40 agonist
and ICB. As such, CD40 agonism provides an ideal system in which to elucidate
prerequisites of anti-tumor CD4+ T cell effector function.
CD4+ T cell chemotaxis into the tumor microenvironment is required for response
to CD40 agonist, as demonstrated by the loss of treatment efficacy upon systemic
administration of sphingosine-1-phosphate receptor antagonist which blocks CD4+ T cell
lymph node egress54. Recent studies have elucidated multiple mechanisms of CD8+ T cell
tumor infiltration, most notably the CXCL9/CXCL10/CXCR3 axis. But the extent to which
these mechanisms are shared with CD4+ T cells remains to be explored25,105–107,112.
Here, we use single-cell RNA sequencing to query immune populations within the
tumor microenvironment (TME) following various combinations of CD40 agonism and
ICB19,113. We discover a broad and consistent upregulation of the chemokine CCL5 by a
subset of intratumoral myeloid cells following CD40 activation. Blocking the CCL5-CCR5
pathway pharmacologically or genetically decreases tumor CD4+ T cell infiltration in
response to CD40 agonist, resulting in impaired immune control of tumor outgrowth and
significantly diminished survival. Our findings therefore highlight the importance of both
CCL5 and CD4+ T cell chemotaxis as critical mediators of cancer immunotherapy.
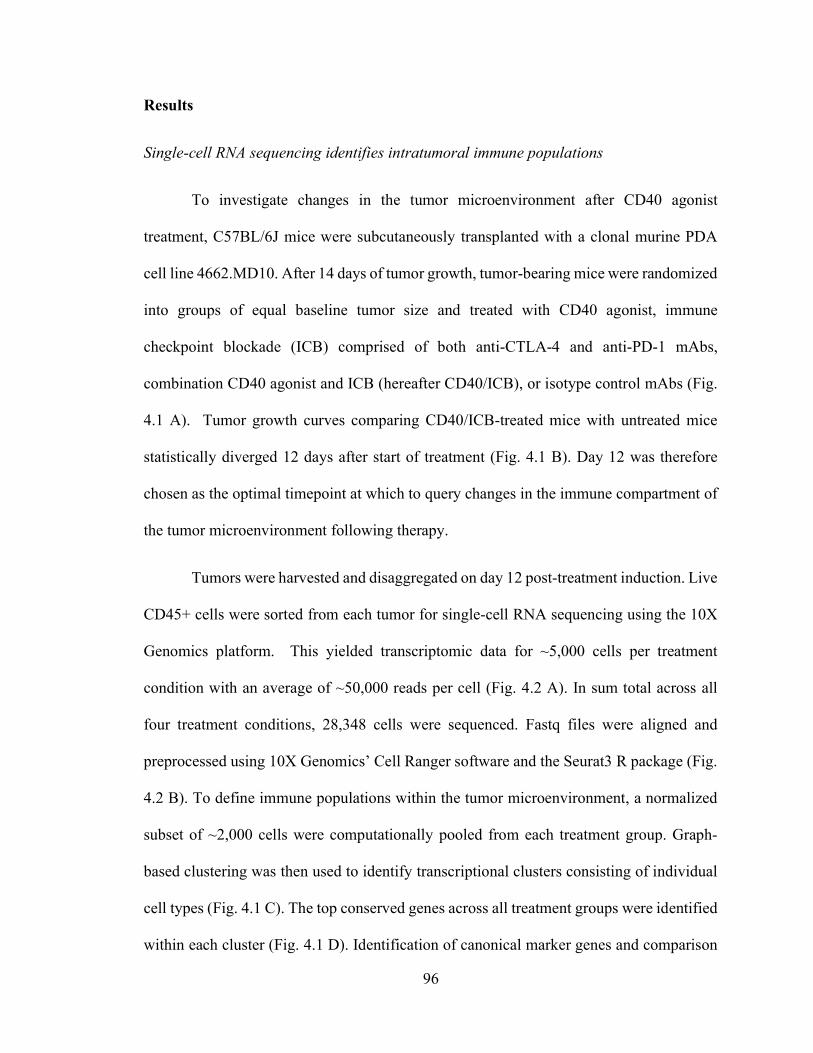
96
Results
Single-cell RNA sequencing identifies intratumoral immune populations
To investigate changes in the tumor microenvironment after CD40 agonist
treatment, C57BL/6J mice were subcutaneously transplanted with a clonal murine PDA
cell line 4662.MD10. After 14 days of tumor growth, tumor-bearing mice were randomized
into groups of equal baseline tumor size and treated with CD40 agonist, immune
checkpoint blockade (ICB) comprised of both anti-CTLA-4 and anti-PD-1 mAbs,
combination CD40 agonist and ICB (hereafter CD40/ICB), or isotype control mAbs (Fig.
4.1 A). Tumor growth curves comparing CD40/ICB-treated mice with untreated mice
statistically diverged 12 days after start of treatment (Fig. 4.1 B). Day 12 was therefore
chosen as the optimal timepoint at which to query changes in the immune compartment of
the tumor microenvironment following therapy.
Tumors were harvested and disaggregated on day 12 post-treatment induction. Live
CD45+ cells were sorted from each tumor for single-cell RNA sequencing using the 10X
Genomics platform. This yielded transcriptomic data for ~5,000 cells per treatment
condition with an average of ~50,000 reads per cell (Fig. 4.2 A). In sum total across all
four treatment conditions, 28,348 cells were sequenced. Fastq files were aligned and
preprocessed using 10X Genomics’ Cell Ranger software and the Seurat3 R package (Fig.
4.2 B). To define immune populations within the tumor microenvironment, a normalized
subset of ~2,000 cells were computationally pooled from each treatment group. Graph-
based clustering was then used to identify transcriptional clusters consisting of individual
cell types (Fig. 4.1 C). The top conserved genes across all treatment groups were identified
within each cluster (Fig. 4.1 D). Identification of canonical marker genes and comparison

97
with the ImmGen database yielded 11 distinct clusters of immune cell types. UMAP non-
linear dimensional reduction revealed three larger meta-clusters containing cells associated
with distinct immune characteristics: a T cell meta-cluster containing CD4+ and CD8+ T-
cells, a “pro-tumor myeloid” meta-cluster containing immune suppressive lineages such as
myeloid-derived suppressor cells and granulocytes, and an “anti-tumor myeloid” meta-
cluster containing monocytes, macrophages, and dendritic cells.
We next determined whether differentiation of intratumoral myeloid cells was
affected upon treatment. Single-cell myeloid clusters were subject to pseudo-temporal
analysis using the Monocle2 package in R (Fig. 4.3 A). Monocle2 is an algorithm that
aligns single cells based on gene expression along a trajectory that mirrors biological
processes such as differentiation. Cell populations from all four treatment conditions
aligned as expected along the pseudotime trajectory. Immature myeloid-derived suppressor
cells aligned earlier in pseudotime, while more terminally differentiated macrophage
populations aligned later (Fig. 4.3 B). Examination of myeloid clusters within each
treatment group did not reveal any differences in their distribution along the pseudotime
trajectory (Fig. 4.3 C). Treatment with ICB, CD40 agonist, or both therefore does not
appear to alter the differentiation state of myeloid cells within the tumor microenvironment.
Intratumoral myeloid populations upregulate CCL5 in response to CD40 activation
We next queried transcriptional changes within each cluster as a function of
treatment. Differential gene expression analysis was used to compare gene expression in
macrophages isolated from CD40/ICB-treated vs. untreated tumors. After filtering for

98
genes that achieved an adjusted p-value < 0.05, we ranked genes based on absolute value
of fold-change in expression (Table 4.1). This list of genes was then intersected with genes
known to be associated with T-cell trafficking. The most upregulated of these genes was
Ccl5 (Fig. 4.4 A). Differential gene expression analysis of macrophages from CD40
agonist-treated vs. untreated tumors also yielded Ccl5. Notably, macrophages from tumors
treated with ICB alone did not upregulate Ccl5. The chemokine CCL5, also known as
RANTES, is a T cell chemoattractant that has been best described for its critical roles in
immune control of viral infections114. The role of CCL5 in cancer remains poorly
understood, as it has been associated with both anti-tumor and pro-tumor functions
including CD4+ T regulatory cell chemotaxis, cancer progression and metastasis, tumor-
associated macrophage function, and the indirect modulation of both CD8+
chemoattraction and repulsion52,53,112,115–117.
To examine if other cell clusters upregulated Ccl5 in response to CD40 agonist
treatment, a heatmap of Ccl5 expression was overlaid onto the UMAP visualization of our
graph-based clustering (Fig. 4.4 B). The macrophage, proliferating macrophage, monocyte,
and cDC2 clusters all increased Ccl5 expression following CD40/ICB treatment – based
on both the proportion within each cluster expressing Ccl5 as well as the average
expression of Ccl5 per cell (Fig. 4.4 C). In contrast, Ccl5 expression remained insignificant
within the granulocyte, monocytic myeloid-derived suppressor cell (mMDSC),
granulocytic myeloid-derived suppressor cell (gMDSC), and non-conventional monocyte
populations, as none of these clusters expressed Ccl5 in more than 6% of their cells even
following CD40 agonism. The proportion of cells within the CD8+ T cell and type 1
conventional dendritic cell (cDC1) clusters that expressed Ccl5 remained unchanged from

99
baseline, though the average expression of Ccl5 per cell increased among CD8+ T cells
(Fig. 4.4 C).
To examine CCL5 induction at the protein level, 4662.MD10 tumor cells were
subcutaneously implanted into C57BL/6J mice. Mice were then treated with CD40/ICB
and sacrificed on day 12 post-treatment induction. Tumors were harvested for flow
cytometric analyses and cell subsets were gated according to the schema outlined in Fig.
4.5 A. Consistent with our single-cell transcriptomic analysis, macrophages increased
expression of CCL5 in response to treatment (Fig. 4.6, A and B). Monocytes also increased
expression of CCL5 in response to treatment. MDSCs did not express CCL5 in either the
untreated or treated settings, nor did the CD45- compartment comprised of tumor cells,
stroma, and fibroblasts. In the T cell compartment at baseline, relatively high CCL5
expression was observed in CD8+ T cells and relatively low CCL5 expression was observed
in both FOXP3+ and FOXP3- CD4+ T cells (Fig. 4.6, C and D). Again consistent with our
single-cell transcriptomic analysis, the proportion of T cell subsets expressing CCL5 did
not change as a result of treatment. The magnitude of CCL5 expression also remained
unchanged in T cells from CD40/ICB-treated tumors.
To determine if CD40 agonism can directly induce CCL5 expression, F4/80+
splenic macrophages were isolated from C57BL/6J mice and cultured for 24 hours with
cross-linked CD40 agonist. Macrophages cultured with CD40 agonist significantly
upregulated CCL5 compared to unstimulated controls as quantified by flow cytometry
(Fig. 4.6 E). Having confirmed our findings at the protein level, we next set out to
interrogate the functional relevance of CCL5 in the context of CD40/ICB immunotherapy.

100
CCL5 mediates treatment efficacy
To determine whether CCL5 is required for response to CD40 agonism, we
implanted syngeneic CCL5 genetic knockout mice (B6.129P2-Ccl5tm1Hso/J) with
4662.MD10 and compared tumor growth kinetics and survival to C57BL/6J wild-type
controls. Half of each group then received CD40/ICB while the other half remained
untreated, as described in Fig. 4.7 A. Additionally, we confirmed that 4662.MD10
expressed MHC class I but not MHC class II following IFN- treatment in vitro (Fig. 4.5
B). Tumors in WT mice responded to treatment with CD40/ICB, both in terms of tumor
growth retardation (Fig. 4.8 A) and rate of tumor regressions (Fig. 4.8 B). In CCL5 KO
mice, however, the treatment effect of CD40/ICB-treated mice was no longer statistically
significant relative to untreated CCL5 KO controls. Over the 75-day course of the entire
experiment, CD40/ICB-treated CCL5 KO mice exhibited statistically worse long-term
survival than wild-type controls (Fig. 4.8 C). These results were consistent with a potential
role of CCL5 in mediating response to CD40/ICB immunotherapy.
However, CCL5 KO mice are known to have baseline defects in T cell
development118. To eliminate this potential confounder, we used a pharmacological
inhibitor of CCL5 given just prior to CD40/ICB immunotherapy. C57BL/6J mice were
subcutaneously implanted with 4662.MD10 and treated with CD40/ICB, anti-CCL5, both,
or neither, as shown in the schema in Fig. 4.7 B. CCL5 blockade alone did not affect tumor
growth, nor impact the rate of tumor progression (Fig. 4.8, D and E). Although CD40/ICB
successfully delayed tumor growth and induced a high rate of tumor regressions, these
effects were abrogated with anti-CCL5. Tumor-bearing mice treated with anti-CCL5 and
CD40/ICB also had significantly worse long-term survival (Fig. 4.8 F). In contrast, tumor-

101
bearing mice treated with CD40/ICB and anti-CXCL9 exhibited no statistically significant
differences in tumor growth kinetics (Fig. 4.11).
To determine which immune cell types mediated this treatment dependency on
CCL5, we compared the T cell content of untreated tumors in wildtype and CCL5 KO mice
16 days after subcutaneous implantation with 4662.MD10. CCL5 KO mice had statistically
lower proportions of FOXP3+ CD4+ T cells as a proportion of CD45+ cells in the tumor
microenvironment compared to wildtype, although no differences were otherwise found in
total T cell, FOXP3- CD4+ T cell, or CD8+ T cell quantity (Fig. 4.9 A). We next examined
the effect of pharmacologic CCL5 blockade on the tumor microenvironment of tumor-
bearing wildtype mice, with and without CD40/ICB. In contrast to CCL5 KO mice,
wildtype tumor-bearing mice treated with anti-CCL5 did not have altered T cell content
compared to untreated mice at day 12 post-treatment induction (Fig. 4.9 B). Treatment with
CD40/ICB increased the percentage of total T cells, CD4+ T cells, and CD8+ T cells,
consistent with prior observations37. The addition of anti-CCL5 to CD40/ICB, however,
decreased total T cell infiltration and significantly reduced FOXP3- CD4+ T cell influx
following therapy. Notably, CCL5 blockade did not affect the proportion of FOXP3+ CD4+
T cells or CD8+ T cells. These trends in T cell abundance were also observed when
quantified based on tumor weight (Fig. 4.10). FOXP3- CD4+ and CD8+ T cells in the tumor
microenvironment were further examined for expression of a panel of T cell activation
markers. None of these markers changed in CD8+ T cells as a function of treatment or
CCL5 deficiency (Fig. 4.9 C). In contrast, anti-CCL5 treatment increased the percentage
of CD4+ T cells positive for expression of CD39, LAG-3, and PD-1 (Fig. 4.9 D).
Furthermore, CD40/ICB decreased the percentage of CD4+ T cells expressing LAG-3 and

102
markedly increased PD-1+ CD4+ T cells compared to untreated controls. The addition of
anti-CCL5 to CD40/ICB increased the percentage of CD4+ T cells expressing CD39,
increased the percentage expressing LAG-3, and did not affect the percentage expressing
PD-1.
The best-characterized receptor for CCL5 is CCR5119. CCR5 expression on
intratumoral T cells was confirmed by flow cytometry and did not change as a function of
CD40/ICB treatment or CCL5 blockade (Fig. 4.9 E). To determine whether CD4+ T cell
trafficking to the tumor after CD40/ICB was mediated by CCR5, an equal mixture of CCR5
KO and wildtype CD4+ T cells was adoptively transferred into tumor-bearing mice thirteen
days post-tumor implantation. Mice were then treated with CD40/ICB according to the
schema shown in Fig. 4.7 B and sacrificed seven days later to compare the ability of CCR5
KO CD4+ T cells to traffic to the tumor relative to wildtype CD4+ T cells. Tumors of
untreated mice contained equal proportions of CCR5 KO and wildtype CD4+ T cells but
tumors from CD40/ICB-treated mice contained more than twice as many wildtype CD4+
T cells on average as CCR5 KO cells (Fig. 4.9 F). Thus, CCR5 at least partially mediates
CD4+ T cell tumor infiltration following CD40/ICB immunotherapy.

103
Discussion
CD4+ T cells are critical mediators of anti-tumor immunity but mechanisms of
intratumoral CD4+ T cell chemotaxis remain incompletely understood. Our group has
previously demonstrated that CD40 agonism drives CD4+ T cell influx into tumors and
synergizes with ICB in a CD4+ and CD8+ T cell-dependent manner. Here, we report that
the chemokine CCL5 is broadly induced in a subset of myeloid cells within the tumor
microenvironment after treatment with agonist CD40 mAb. Using a suite of genetic and
pharmacologic experiments in vivo, we show that CCL5 mediates CD4+ T cell tumor influx
via CCR5 following CD40 therapy. The effect of CCL5 is selective for CD4+ but not CD8+
T cells. Therapeutic benefit is significantly diminished in the absence of CCL5. Our results
therefore demonstrate a previously unappreciated role for CCL5 as a molecular prerequisite
to CD4+ T cell chemotaxis and therapeutic adaptive immunity following CD40 agonism.
Given the diverse range of cell types that express CD40, it has long been
appreciated that the activity of CD40 agonist is likely pleiotropic. CD40 agonism has been
shown to have antitumor effects on a variety of CD40-expressing myeloid cell types.
Macrophages have been shown to remodel tumor stroma after CD40 agonist120. Monocytes
have been shown to degrade fibrosis and enhance the effects of chemotherapy upon CD40
activation121. We have also observed that the anti-tumor efficacy of CD40 agonist requires
cDC1s, the subset of dendritic cells uniquely proficient at antigen cross-presentation3,37,38.
Due to past technological limitations, it has been difficult to query all CD40-expressing
cell types simultaneously following treatment. The recent emergence of single-cell RNA
sequencing allows us to examine these pleiotropic effects in a highly dimensional and
unbiased manner for the first time. Our single-cell transcriptomic analysis reveals an

104
upregulation of the chemokine Ccl5 across a broad range of myeloid cells following CD40
agonism. This is shown to critically and selectively mediate CD4+ T cell chemotaxis and
immune control of tumor outgrowth following therapy. Thus, we demonstrate that the anti-
tumor effects of CD40 agonism are largely dependent on the upregulation of a single
chemokine.
The current understanding of CCL5 in cancer posits that the chemokine is generally
a negative prognostic marker and attracts FOXP3+ T regulatory cells and tumor-associated
macrophages to the tumor microenvironment52,53,122. Consistent with prior studies, we
observe fewer T regulatory cells in the tumors of CCL5 KO mice. When CD40 agonist is
administered, however, the primary effect of CCL5 in our system was the promotion of
CD4+ FOXP3- T cell infiltration into the tumor. CCL5 blockade also increased the
expression of CD39, LAG-3, and PD-1 in intratumoral CD4+ T cells with no effect on
CD8+ T cells, suggesting a role for CCL5 in maintaining CD4+ T cell activation within the
tumor microenvironment. Thus, we show a strikingly different role for CCL5 in tumor
immune biology prior to and following CD40 agonism: CCL5 attracts pro-tumor T
regulatory cells at baseline but plays a critical anti-tumor role in recruiting FOXP3- CD4+
T cells following CD40 agonism. Additionally, in a separate cancer mouse model, CCL5
derived from tumor cells has been shown to indirectly enable chemoattraction of CD8+ T
cells via CXCL9116. In our system, however, CCL5 did not modulate CD8+ T cell
infiltration and was not produced by any non-hematopoietic tumor components. This
differential effect is particularly interesting given the comparable expression levels of
CCR5 between CD4+ and CD8+ T cells in our system. It is possible that different homing
receptors carry more importance in certain T cell subsets than others; for instance, CCR5

105
dominating CD4+ T cell homing and CXCR3 dominating CD8+ T cell homing.
Alternatively, there may be additional chemokine-chemokine receptor interactions at play
in CD8+ T cells acting in opposition to the CCL5-CCR5 axis or differentially modulating
T cell egress from lymph nodes in our system. Our data, therefore, highlight the context-
dependent nature of CCL5 in tumor immunology.
While we predict that the effect of CCL5 in our system is source-agnostic, it
remains possible that other cell types contribute to CCL5 production and CD4+ T cell
chemotaxis beyond the anti-tumor myeloid cells that we have identified. For instance,
CD8+ T cells and cDC1s were identified as strong producers of CCL5 in our analyses.
However, CD8+ T cells and cDC1s were far less abundant than macrophages in our tumors
at baseline and neither lineage showed an increase in the proportion of cells positive for
expression of CCL5 following CD40/ICB treatment. Nevertheless, CD8+ T cells and
cDC1s could contribute to CD4+ T cell chemotaxis in our system. Thus, an important future
direction will be to perform tumor implantation and CD40/ICB therapy in a variety of
myeloid cell type-specific CCL5 KO systems.
Our findings raise several additional preclinical questions. This study was
performed in a subcutaneously implanted model of pancreatic cancer, which facilitated
single-cell transcriptomic analysis. T cell trafficking to the pancreas in orthotopic or
autochthonous models in response to CD40/ICB therapy may operate under different
biology. Whether our findings extend to other priming-deficient cancers beyond PDA is
also of significant interest. In addition, while we have no evidence to support a role for
CCL5 beyond attracting CD4+ T cells to the tumor, we cannot rule out that possibility.
Finally, while our results implicate CCR5 as the dominant receptor for CCL5 in our system,

106
chemokine-chemokine receptor interactions are notoriously complex. Thus, supplemental
or compensatory roles for other CCL5 receptors may exist.

107
Materials and Methods
Animal studies
Mice were housed under specific pathogen-free conditions in a barrier facility. All mouse
experiments were performed at the Perelman School of Medicine of the University of
Pennsylvania in accordance with University IACUC and ULAR approvals and regulations.
C57BL/6J mice were purchased from Jackson Laboratories; B6.129P2-Ccl5tm1Hso/J
(CCL5 KO) mice were purchased from Jackson Laboratories then bred in-house. Tumor
cell lines were derived from spontaneous tumors in the KPC (KrasLSL-G12D/+; Trp53LSL-
R172H/+; Pdx1-Cre) mouse model of PDA as previously described47,123. 4662 is a polyclonal
KPC cell line and 4662.MD10 is a clonal KPC cell line derived from 4662. Cell culture
was performed in DMEM supplemented with 10% FBS, L-glutamine, and gentamycin.
Subcutaneous tumor implantation
Transplanted tumors were generated by injecting 3x10⁵ cells in serum-free DMEM
subcutaneously into the right flank. Tumors were then allowed to grow for 14 days to an
average size of 30-60 mm3. Mice were then randomized to groups such that average tumor
volume at baseline did not vary by treatment condition. Tumors were measured every three
days by caliper. Tumor volumes were calculated using the formula (L x W2)/2, where “L”
is the longer diameter and “W” is the diameter perpendicular to “L.” For survival studies,
mice were deemed to have reached endpoint when their tumor exceeded 500 mm3. Mice
that died suddenly or developed large tumor ulcerations were censored from survival
studies on the day of death or euthanasia.

108
In vivo antibody studies
Mice were injected intraperitoneally with immune checkpoint blockade (αPD-1: RMP1-
14; BioXcell; 200 µg/dose on days 0, 3, 6, 9, and 12 and αCTLA4: 9H10; BioXcell;
200µg/dose on days 0, 3, 6) and CD40 agonist (FGK45; BioXcell; endotoxin-free; 100
µg/dose) on day 3. For CCL5 blockade studies, mice were injected intraperitoneally with
αCCL5 blocking antibody (PeproTech; 32μg/dose on days -1, 2, 5, 8, and 11) or polyclonal
rabbit isotype control (PeproTech; 32μg/dose on days -1, 2, 5, 8, and 11). For CXCL9
blockade studies, mice were injected intraperitoneally with CXCL9 blocking antibody
(InVivoMAb; 200 g/dose on days -1, 2, 5, 8, and 11).
Tissue processing and flow cytometry
Mice were sacrificed on day 12 post-treatment. The entire tumor was dissected, washed in
DMEM-F12 + 10% FBS, minced into small fragments and digested in DMEM-F12 with 1
mg/ml collagenase and protease inhibitor (Sigma-Aldrich C6079) for 30 min at 37C. Cells
were then filtered through a 70 μm cell strainer then 40 μm strainer. Tissue-derived cells
were washed with PBS before viability stain with LIVE/DEAD Fixable Aqua (Invitrogen
L34957) for 20 min at room temperature. Samples were then washed with FACS Buffer
(PBS w/ 0.2% BSA + 2 mM EDTA) before being stained for surface markers for 30 min
at 4C. Samples were then fixed and permeabilized using the eBioscience
Fixation/Permeabilization kit (eBioscience 88-8824-00) and stained intracellularly
overnight at 4C. Flow cytometry antibodies can be found in Table 4.2. Samples were run

109
on an LSR Fortessa Flow Cytometer (BD Biosciences). Data were analyzed using FlowJo
v10 (Treestar).
In vitro stimulation assay
Spleens from five female C57BL/6J mice were isolated and macrophages were enriched
by magnet assisted cell sorting (MACS) column using the F4/80 positive selection kit
(Miltenyi 130-110-443). Macrophages were cultured in a 96-well plate overnight in an
incubator at 37C in DMEM w/ 10% FBS, L-glutamine, and gentamycin and stimulated
with cross-linked CD40 agonist (FGK45; BioXcell; endotoxin-free). Cells were then
stained for CCL5 by flow cytometry as already described.
Single-cell RNA sequencing library generation
5,000 live CD45+ cells were isolated from each tumor by fluorescence activated cell
sorting (FACS) using the 100 m nozzle on a BD Biosciences Aria II. Sorted cells were
then barcoded and used to generate single-cell RNA libraries using the droplet-based 10X
Genomics Chromium platform according to manufacturer’s protocol. Library quality was
verified with an Agilent BioAnalyzer and LifeTech QuBit fluorimeter. Libraries were then
sequenced as 150bp paired-end reads on an Illumina HiSeq4000 to a depth of
approximately 312 million read pairs.
Library alignment, barcode assignment, and UMI counting
110
10X Genomics’ Cell Ranger Single-Cell Software Suite v. 3.1.0 was used to perform
sample demultiplexing, barcode processing, and single-cell 3’ counting from the
generated fastq files. The “count” function was used to align samples to the mm10 Mus
musculus genome, filter cells, and quantify reads. The resulting analysis files were
aggregated per treatment group using the “aggr” function which performs between-
sample normalization and sample merging. These combined datasets were used as input
into Seurat v3.0 on R v. 3.6.1124,125.
Preprocessing
Cells that contained reads for over 2,500 or less than 200 genes were excluded as
doublets or empty wells, respectively. Cells that contain reads for which >5% align to
mitochondrial genes were excluded as dead cells. Data was normalized with a scale factor
of 104. Highly variable genes between cells were identified using variance stabilizing
transformation (“vst”) which directly models mean-variance relationships within single-
cell datasets. The number of cells in each treatment group was then reduced to 2,072
cells. Batch correction within treatment groups was performed using the
“FindIntegrationAnchors” and “IntegrateData” functions, generating a “batch-corrected”
expression matrix. Cells across all treatment groups were then integrated into a single
dataset using the same functions (i.e., “FindIntegrationAnchors” and “IntegrateData”).
Linear Dimensional Reduction and Clustering

111
The fully merged dataset was linearly transformed using the “ScaleData” function such
that the mean expression of a given gene across all cells was 0 and the variance of that
gene across all cells was 1. Linear dimensional reduction was then performed using
principal component analysis. Based on the distribution of p-values per principal
component, the first 20 principal components were used to cluster cells using the
“FindNeighbors” and “FindClusters” functions which implement SNN (shared nearest
neighbor) modularity optimization-based clustering. This was performed using a chosen
resolution of 0.5, yielding 16 total clusters. Non-linear dimensional reduction was then
performed using UMAP (Uniform Manifold Approximation and Projection) to visualize
clusters in two-dimensional space.
Cluster Identification
To identify cell type within a given cluster, the “FindConservedMarkers” function was
used to identify genes for which expression was conserved across treatment groups. This
function performs differential gene expression testing for each treatment group and
combines the p-values using meta-analysis methods from the MetaDE R package. Cell
type identities were then assigned to clusters based on identification of canonical cell
markers and characterization of top conserved genes using the MyGeneSet tool from the
Immunological Genome (ImmGen) Project. Clusters that comprised contaminating non-
immune populations (i.e., tumor cells and fibroblasts) were removed. Scaled expression
of conserved marker genes were used for heatmap representation.

112
Differential gene expression analysis
A Wilcoxon Rank Sum test was used to identify differentially expressed genes between
two treatment groups within a given cluster. The fold-change in expression and adjusted
p-value for each gene were used for volcano plot representation using the ggplot2 R
package. After filtering for genes with an adjusted p-value < 0.05, genes were then
ranked based on highest-to-lowest absolute value of fold-change.
Pseudotime analysis
Myeloid clusters identified using Seurat (as described above) were used as input to the
Monocle v. 2.4.0 R package126. Genes expressed in 10 or more cells were ranked based
on differential analysis between clusters. Genes with a q-value < 0.01 were used for
downstream pseudo-temporal analysis. Dimensionality reduction was done using the
DDRTree method. Cells were ordered along pseudotime trajectory with the orderCells
function and visualized in two-dimensional space.
Statistical analysis
Comparison of two groups was performed using two-tailed Student’s t test unless
otherwise indicated. Tumor growth curves were analyzed by two-way ANOVA, with
Tukey multiple comparisons of means as a post hoc test to assess differences between
any two groups. Survival curves were compared using log rank (Mantel-Cox) test.
Statistical analyses were performed in Prism 7 (GraphPad) or Excel (Microsoft). p < 0.05

113
was considered statistically significant and * denotes p < 0.05, ** p <0.01, *** p < 0.001,
and **** p <0.0001.

114
Figures and figure legends
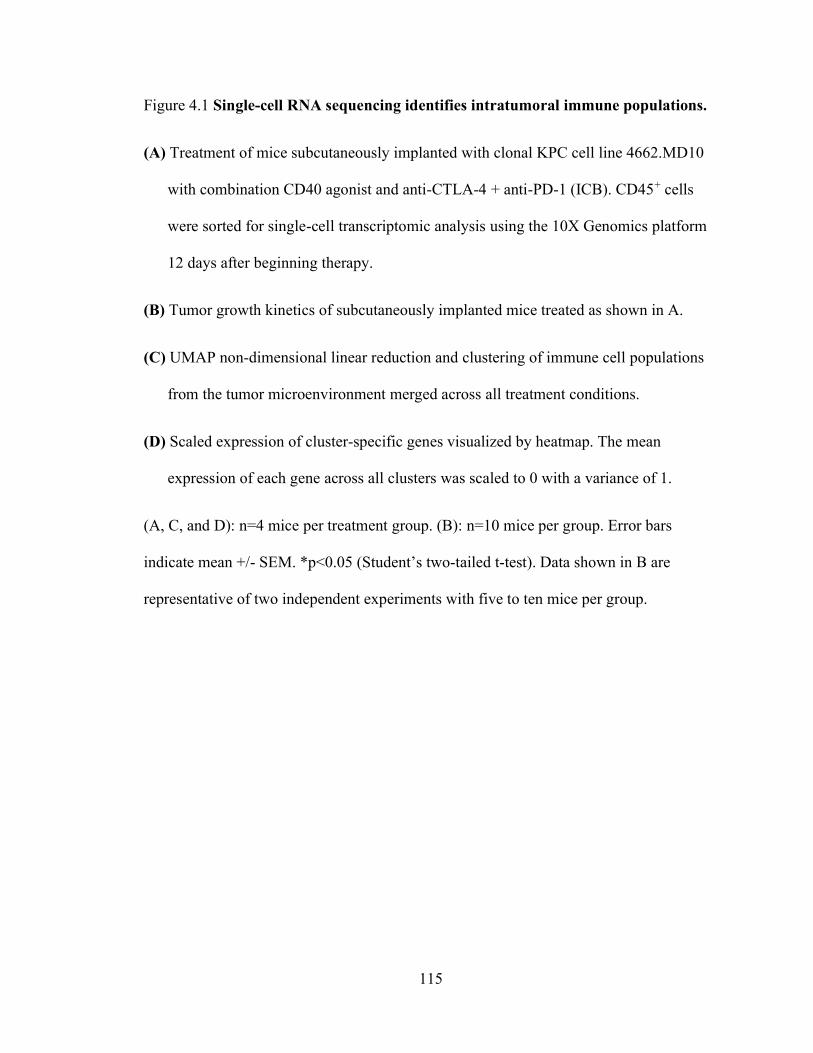
115
Figure 4.1 Single-cell RNA sequencing identifies intratumoral immune populations.
(A) Treatment of mice subcutaneously implanted with clonal KPC cell line 4662.MD10
with combination CD40 agonist and anti-CTLA-4 + anti-PD-1 (ICB). CD45+ cells
were sorted for single-cell transcriptomic analysis using the 10X Genomics platform
12 days after beginning therapy.
(B) Tumor growth kinetics of subcutaneously implanted mice treated as shown in A.
(C) UMAP non-dimensional linear reduction and clustering of immune cell populations
from the tumor microenvironment merged across all treatment conditions.
(D) Scaled expression of cluster-specific genes visualized by heatmap. The mean
expression of each gene across all clusters was scaled to 0 with a variance of 1.
(A, C, and D): n=4 mice per treatment group. (B): n=10 mice per group. Error bars
indicate mean +/- SEM. *p<0.05 (Student’s two-tailed t-test). Data shown in B are
representative of two independent experiments with five to ten mice per group.

116
Figure 4.2 Single cell RNA sequencing analysis pipeline and details.
(A) Cell and transcriptomic metrics from each single-cell library. Metrics were generated
using the 10X Genomics CellRanger 3.0 software.
(B) Single-cell transcriptomic analysis pipeline following library sequencing. Software
packages are color-coded.
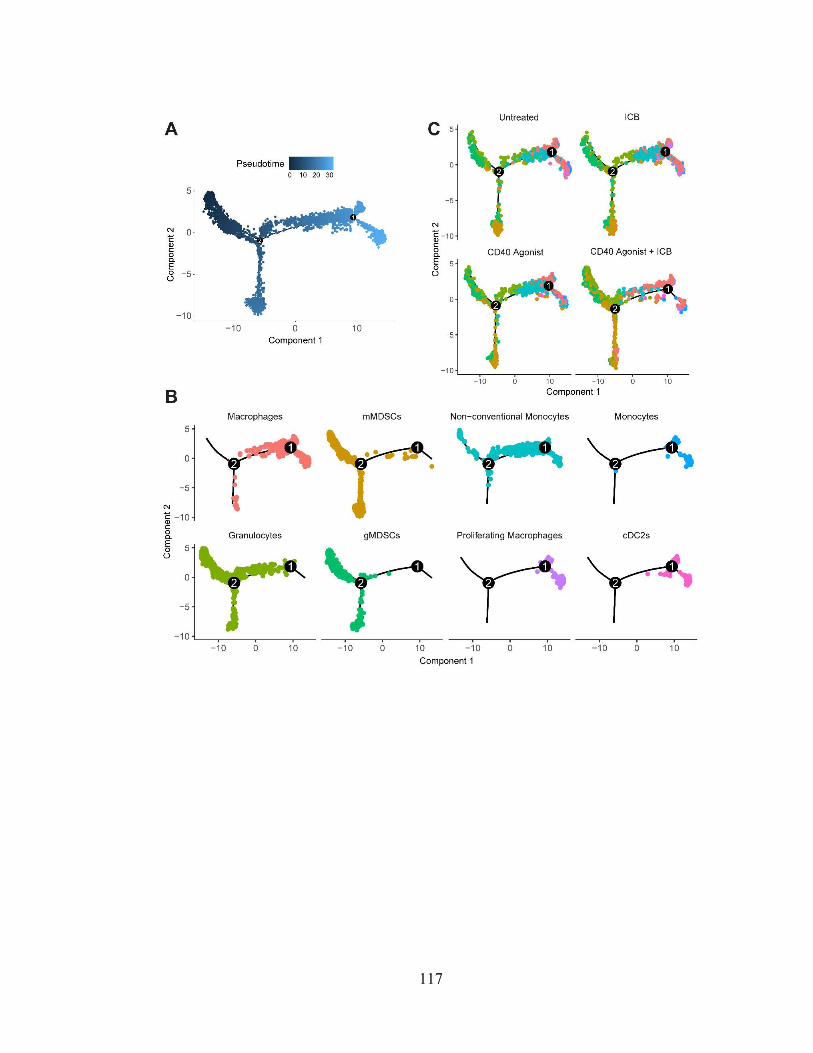
117

118
Figure 4.3 Myeloid cell differentiation is unaffected by treatment with CD40 agonist
and immune checkpoint blockade.
(A) Pseudotime trajectory of myeloid cell clusters across all treatment groups as
calculated using Monocle2.
(B) Plots of each myeloid cell cluster along pseudotime trajectory.
(C) Pseudotime trajectory of myeloid cell clusters split by treatment group.
(A): n=6,510 cells from myeloid cell clusters across all treatment groups as determined in
Seurat were used as input for Monocle pseudotime analysis. (B): n=1,764 macrophages,
n=1,301 mMDSCs, n=1218 granulocytes, n=802 gMDSCs, n=710 non-conventional
monocytes,
n=252 monocytes, n=241 proliferating macrophages, and n=222 cDC2s shown. (C):
n=1,448
untreated, n=1,635 ICB, n=1,284 CD40 agonist, n=2,143 CD40/ICB cells shown.

119

120
Figure 4.4 Anti-tumor myeloid populations upregulate Ccl5 transcripts after CD40
activation.
Differential gene expression analysis was performed on immune cell clusters from the
tumor microenvironment as resolved by UMAP non-linear dimensional reduction shown
in Figure 1.
(A) Volcano plot of differentially expressed genes in macrophages as a function of
treatment.
(B) Expression of Ccl5 overlaid onto UMAP clusters. Color intensity scale represents
average number of Ccl5 transcripts per Ccl5+ cell.
(C) Proportion of cells positive for reads of Ccl5 gene transcript in immune clusters from
untreated vs combination treated (CD40/ICB) tumors. Size of circle indicates
proportion of cells within a cluster positive for Ccl5 transcript. Color intensity scale
represents average number of Ccl5 transcripts per Ccl5+ cell.

121

122
Figure 4.5. Experiment shown in B was performed by Sam Kim and provided courtesy of
Dr. Katelyn Byrne.
(A) Gating scheme for flow cytometric identification of immune populations in a
representative subcutaneously implanted KPC tumor.
(B) Comparison of MHC II expression in 4662.MD10 and B16-F10 cell lines stimulated
with IFN-.

123
124
Figure 4.6 CCL5 is upregulated by anti-tumor myeloid populations following
CD40/ICB therapy. Experiments performed by Austin P Huffman.
Female C57BL/6J mice were subcutaneously transplanted with 3x10⁵ 4662.MD10 cells
and treated with CD40/ICB as shown in Fig. 4.1 A. Flow cytometric analysis of tumors
was then performed on day 12 following initiation of therapy. Gating scheme for flow
cytometric analysis is shown in Fig. 4.5 A.
(A and B) Expression of CCL5 in intratumoral macrophages, monocytes, MDSCs, and
the CD45- compartment from untreated vs CD40/ICB treated mice.
(C and D) Expression of CCL5 in intratumoral CD8+ T cells, CD4+ T cells, and FOXP3+
T regulatory cells from untreated vs. CD40/ICB-treated mice.
(E) Proportion of CCL5-expressing macrophages. Splenic macrophages were isolated
and cultured for 24 hours either unstimulated or stimulated with cross-linked CD40
agonist.
(A-D): n=3 mice per group. *p≤0.05, **p≤0.01 (one-tailed Student’s t-test). Data shown
are representative of three independent experiments with three to five mice per group.
(E): n=5 mice per group. *p≤0.05 (paired, one-tailed Student’s t-test). Data shown are
representative of three independent experiments with three to five biological replicates.

125
Figure 4.7 Experiments performed by Austin P Huffman.
(A) Treatment schema of C57BL/6J and CCL5 KO mice subcutaneously implanted with
clonal KPC cell line 4662.MD10 with combination CD40/ICB.
(B) Treatment schema of C57BL/6J mice subcutaneously implanted with clonal KPC cell
line 4662.MD10 with combination CD40/ICB +/- anti-CCL5.
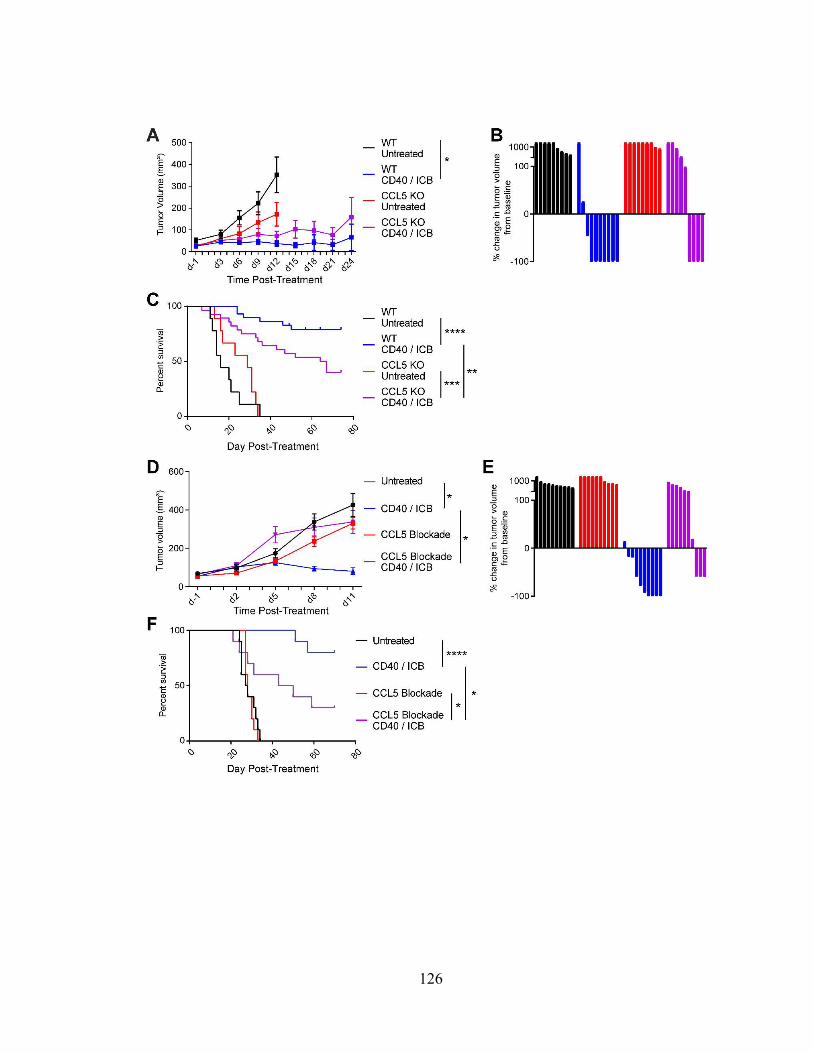
126

127
Figure 4.8 CCL5 is required for treatment efficacy. Experiments performed by Austin
P Huffman.
(A) 3x10⁵ 4662.MD10 cells were subcutaneously implanted into C57BL/6J or B6.129P2-
Ccl5tm1Hso/J CCL5 knockout mice. Mice were treated with CD40/ICB as shown in
Fig. 4.7 A. Tumor growth kinetics shown over the course of treatment.
(B) Change in tumor volume of mice from A on day 24 (or most recent available)
compared to day 0.
(C) Survival of mice from A from each treatment group.
(D) 3x10⁵ 4662.MD10 cells were subcutaneously implanted into C57BL/6J mice that
were then treated with CD40/ICB and/or CCL5-blocking antibody as shown in Fig.
4.7 B. Tumor growth kinetics shown over the course of treatment.
(E) Change in tumor volume of mice from D on day 16 (or most recent available)
compared to day 0.
(F) Survival of mice from D from each treatment group.
(A-B): n=10 mice per group. (C): combined results of two identical experiments with
n=10 mice per group. (D-F): n=10 mice per group. ****p≤0.0001, ***p≤0.001,
**p≤0.01, *p≤0.05 (one-way ANOVA with Tukey’s HSD post-test in A and D; log-rank
test in C and F). Data shown are representative of two independent experiments with 10-
20 mice per group.

128
129
Figure 4.9 CCL5 is required for CD4+ T-cell infiltration following CD40/ICB.
Experiments in A-E performed by Austin P Huffman. Experiment in F performed by and
provided courtesy of Dr. Katelyn Byrne.
(A) Enumeration of T cell populations by flow cytometry in tumors of untreated CCL5
KO and WT control mice on day 16 post-implantation.
(B) Enumeration of T-cell populations in tumors of mice treated with combination
CD40/ICB +/- αCCL5 day 12 post-implantation, as outlined in Fig. 4.7 B.
(C) Expression of T cell activation markers on CD4+ T cells from B.
(D) Expression of T cell activation markers on CD8+ T cells from B.
(E) Expression of CCR5 on CD8+ T cells, CD4+ T cells, and FOXP3+ T regulatory cells
from B.
(F) Enumeration of adoptively transferred WT and CCR5 KO CD4+ T cells in tumors of
mice treated with combination CD40/ICB relative to untreated mice.
(A): n=6 C57BL/6J and n=8 CCL5 KO mice.
(B-E): n=3-5 C57BL/6J mice each group. ****p≤0.0001, ***p≤0.001, **p≤0.01,
*p≤0.05 (two-tailed Student’s t-test in A-E; two-tailed paired Student’s t-test in F). Data
shown are representative of two independent experiments with at least 5 mice per group.
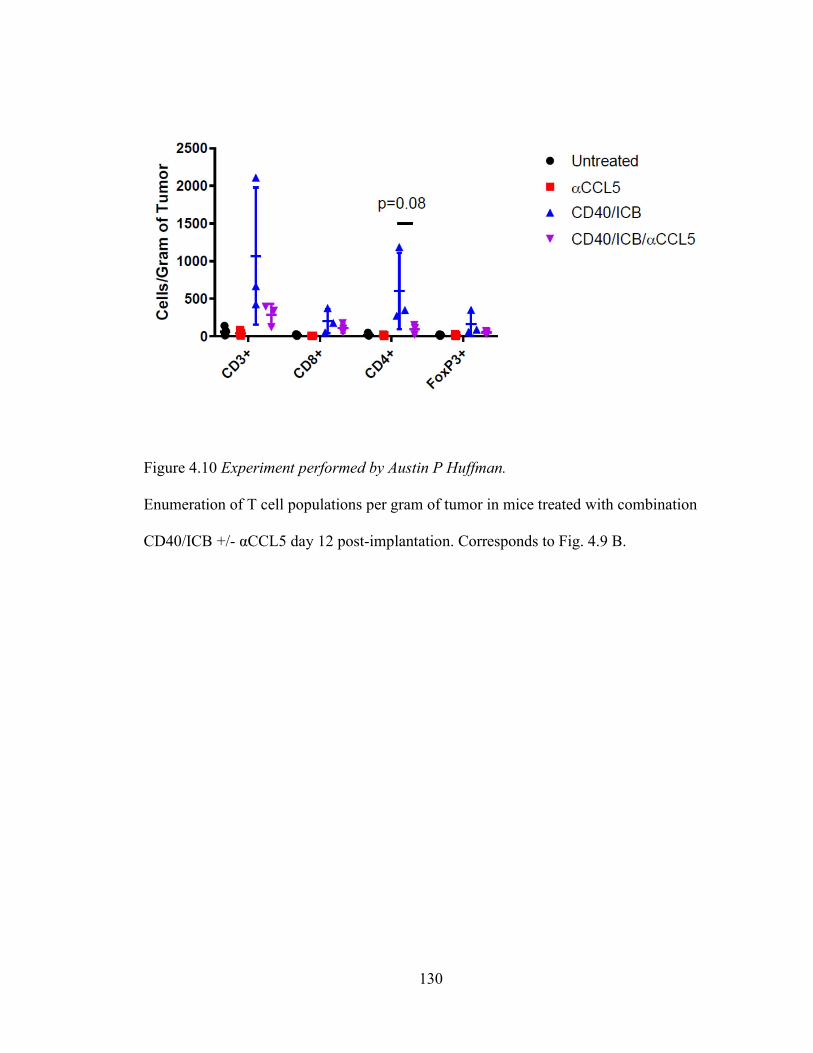
130
Figure 4.10 Experiment performed by Austin P Huffman.
Enumeration of T cell populations per gram of tumor in mice treated with combination
CD40/ICB +/- αCCL5 day 12 post-implantation. Corresponds to Fig. 4.9 B.

131
Figure 4.11 Effects of CCL5 and CXCL9 pharmacologic blockade on growth of CD40
agonist/ICB-treated subcutaneously implanted KPC tumor. Experiment performed
jointly between Jeffrey H Lin and Austin P Huffman.
(A) 3 x 10⁵ 4662.MD10 KPC cell line were subcutaneously implanted into C57BL/6J mice.
Treatments with CD40 agonist, ICB, and anti-CCL5 or anti-CXCL9 antibody were
initiated thirteen days post-implantation (d-1). All treatments were administered
intraperitoneally.
(B) Tumor growth curves from experiment shown in A.

132
Table 4.1
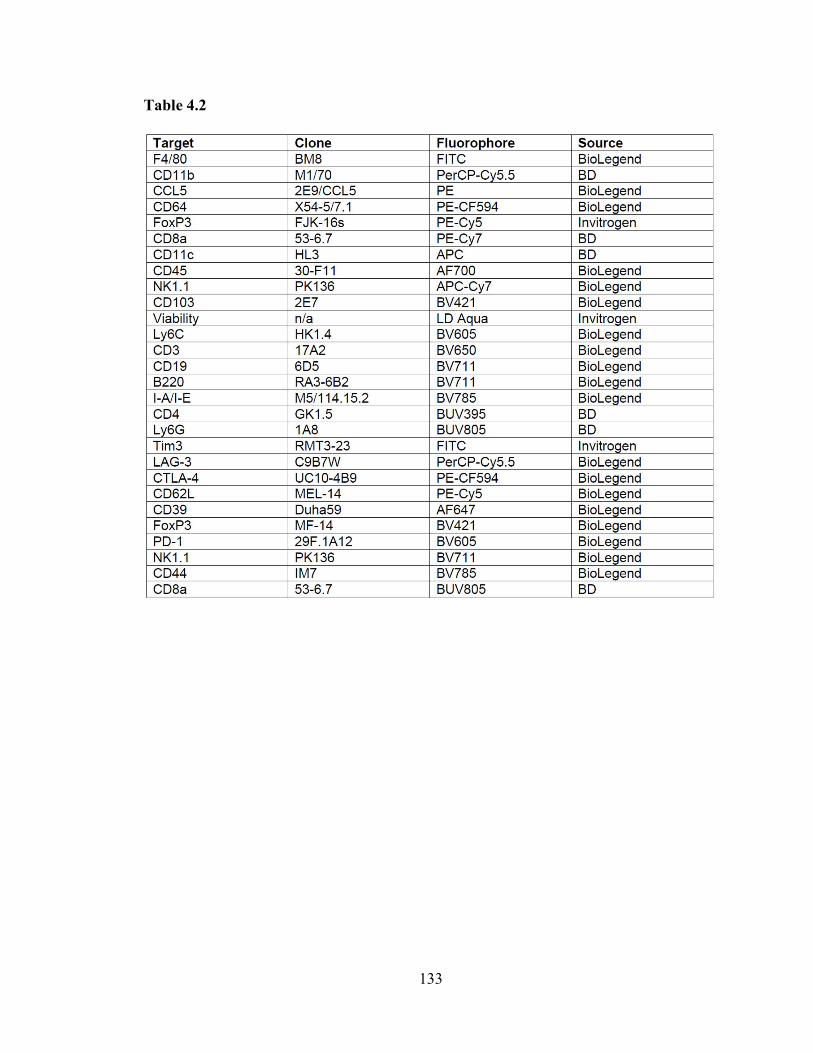
133
Table 4.2

134
CHAPTER 5: Concluding Remarks and Future Directions
cDC1s in pancreatic ductal adenocarcinoma
IL-6 and cDC1 abundance
A primary conclusion of the studies presented here is that elevated serum IL-6
drives cDC1 apoptosis in the KPC model. Increased serum IL-6 is observed in tumor-
bearing KPC mice but not healthy or PanIN-bearing mice (Fig. 2.8 G; Fig. 5.1).
Furthermore, it is not observed in the KP mouse model of non-small cell lung
adenocarcinoma or in cerulein-induced chronic pancreatitis – both of which lack systemic
cDC1 dysfunction. Upon depletion of serum IL-6 in tumor-bearing KPC mice, cDC1
abundance rebounds close to levels seen in healthy mice, and levels of cleaved caspase 3
in cDC1s decline to near-baseline levels observed in healthy mice. The abundance of bone
marrow cDC1 progenitors also remains unaffected over the course of KPC carcinogenesis
(Fig. 2.9 B). As such, serum IL-6-driven cDC1 apoptosis seems to largely account for the
systemic deficit in cDC1 abundance observed in tumor-bearing KPC mice. However, the
exact mechanism by which IL-6 drives increased cDC1 apoptosis remains incompletely
understood.
While elevated serum IL-6 was associated with increased cleaved caspase 3 in
cDC1s, it remains unknown whether cDC1 apoptosis is directly driven by IL-6R signaling
on cDC1s. IL-6R signaling can be quantified through measuring levels of phosphorylated
STAT3 (pSTAT3)127. Thus, pSTAT3 should be quantified in cDC1s alongside cleaved
caspase 3. It will also be critical to examine how pSTAT3 levels change in cDC1s from
healthy, PanIN-bearing, and tumor-bearing KPC mice. IL-6 can also indirectly drive cDC1
apoptosis through IL-6R signaling on another cell type. For example, pSTAT3

135
homodimerization is known to drive expression of vascular endothelial growth factor
(VEGF) in tumor cells and tumor-associated macrophages, which itself has been shown to
counteract the effects of Flt3L and reduce DC survival32,128,129.
While we demonstrate a role for elevated serum IL-6 in decreasing cDC1 survival,
IL-6 has classically been known to polarize differentiation of pre-cDCs towards a cDC2
rather than cDC1 cell fate33. This was not observed in our studies of the KPC model.
Despite elevated serum IL-6 in tumor-bearing mice (Fig. 2.8 G), pre-cDC1 abundance
trended towards increase and pre-cDC2 abundance trended towards decline (Fig. 2.9 B).
Nonetheless, to definitively rule out an effect on cDC differentiation, pre-cDC1s and pre-
cDC2s should be quantified following IL-6 depletion or IL-6 receptor (IL-6R) blockade.
Bone marrow pre-cDC1s and pre-cDC2s should be quantified on a per femur basis to
examine how they change in absolute quantity in addition to cellular proportions. cDC1s
and cDC2s should also be systemically quantified based on tissue weight following IL-6
depletion. Only upon completion of these experiments can a role for IL-6 in cDC
differentiation be confidently ruled out.
Finally, it remains unknown what drives decreased cDC1 abundance in PanIN-
bearing mice. Elevated serum IL-6 is notably absent at this stage despite systemically
increased cDC1 apoptosis (Fig. 2.8 G; Fig. 2.10, A-D). If IL-6 is responsible for the
increased cDC1 apoptosis in PanIN-bearing mice, it is not produced at high enough levels
to be observed in sera. Bulk RNA sequencing of peri-pancreatic LN cDC1s offered few
clues to what drives decreased cDC1 survival upon PanIN development (Fig. 2.4, A-C). It
may therefore be worth trying IL-6 depletion or single-cell RNA sequencing in PanIN-

136
bearing mice to uncover the basis of reduced cDC1 survival early in preinvasive pancreatic
carcinogenesis.
cDC1 maturation and function
We demonstrate for the first time that cDC1 semi-maturation (i.e., the inconsistent
upregulation of maturation markers) not only correlates with impaired T cell priming but
is directly associated with incomplete acquisition of DC maturation molecular pathways in
PanIN- and tumor-bearing KPC mice. Specifically, antigen processing machinery such as
the proteasome degradation pathway are successfully upregulated, while genes encoding T
cell-polarizing cytokines such as Il-12b fail to be sufficiently induced (Fig. 2.4, D and E).
This was associated with impaired CD8+ T cell priming, both upon challenge with OVA-
expressing KPC cell line as well as in response to vaccination with OVA/CpG (Fig. 2.5).
However, while we demonstrate a role for elevated serum IL-6 in driving cDC1 apoptosis,
we were unable to identify the mechanism underlying cDC1 semi-maturation in the KPC
model.
IL-6 has been known to impair DC maturation and function in addition to
suppressing cDC1 differentiation. DCs from IL-6 KO mice show greater expression of
maturation markers compared to DCs from healthy mice, suggesting a role for IL-6 in
maintaining immature DCs at baseline33. This was not observed in our studies of tumor-
bearing KPC mice. While depleting IL-6 decreased cDC1 apoptosis and increased cDC1
abundance (Fig. 2.10, E-H), cDC1 maturation marker expression was unaffected (Fig.
2.11). However, we have not quantified cDC1-mediated T cell priming such as challenge
with OVA-expressing KPC cell line or vaccination with OVA/CpG in the setting of IL-6

137
depletion. Gene expression was also never queried in cDC1s following IL-6 depletion.
These experiments will be essential to fully characterize the effects of IL-6 on cDC1
maturation in the KPC model.
A recent innovation that may help shed light on the mechanism of cDC1 semi-
maturation is the ability to generate bone marrow-derived cDC1s130. It was recently
discovered that while Flt3L-supplemented ex vivo bone marrow cultures fail to produce
bona fide cDC1s, culturing Flt3L-supplemented primary bone marrow on a layer of OP9
bone marrow stromal cells engineered to express the Notch ligand FL1 successfully
generates true cDC1s in vitro. While we have not yet had the opportunity to take advantage
of this new protocol, it may prove extremely valuable in discovering whether KPC cell line
supernatant – and thus a factor produced by the tumor cells themselves – is capable of
epigenetically altering cDC1 chromatin landscape and suppressing cDC1 maturation and
function. Combined with the ability to perform co-culture assays with naïve T cells, this
technique could finally allow us to directly demonstrate that cDC1s are dysregulated by
KPC-derived factors.
Therapeutic implications
We have demonstrated that CD40 agonist synergizes effectively with Flt3L to
rescue both cDC1 maturation and abundance, enabling improved response to vaccination
with OVA/CpG and superior immune control of tumor outgrowth (Figs. 3.3 – 3.5).
Importantly, we show that Flt3L monotherapy is ineffective at increasing cDC1 abundance
in the tumor microenvironment and tumor-draining LN in the absence of neoantigen. This

138
is an important observation, considering the relatively low number of non-synonymous
mutations in pancreatic ductal adenocarcinoma42. Flt3L only increases cDC1 abundance
and improves immune control of tumor outgrowth in the setting of CD40 agonism. Thus,
Flt3L monotherapy fails to improve immune control of tumor outgrowth (Fig. 3.4, F and
G). However, there remain a few peculiarities worth discussing.
The first concerns the effect of CD40 agonist monotherapy on cDC1 abundance.
Administration of CD40 agonist increased maturation marker expression universally on
cDC1s in the tumor microenvironment (Fig. 3.1 B), drove cDC1 migration to the draining
lymph node (Fig. 3.1, C and D), induced a IFN- signaling gene expression signature within
cDC1s (Fig. 3.2), increased CD8+ and FOXP3-CD4+ T cell priming (Fig. 3.4, B and D),
and increased CD8+ and FOXP3-CD4+ T cell content in tumors (Fig. 3.4, A and C). This
resulted in delayed tumor outgrowth compared to no treatment and Flt3L monotherapy
(Fig. 3.4, F and G; Fig. 3.5). However, we did not expect that cDC1 content in the tumor
microenvironment and cDC1 progenitors in the bone marrow would remain decreased nine
days after CD40 agonism (Fig. 3.3 B; Fig. 3.6). It remains unclear why CD40 agonism
induces such a drastic and durable decrease in cDC1 abundance and generation. The effects
of CD40 agonism on hematopoiesis remain poorly understood. Nonetheless, co-
administration of Flt3L remedies these deficits. With addition of Flt3L, cDC1 content in
the tumor microenvironment is maintained in the setting of CD40-induced cDC1
maturation (Fig. 3.3 B); and bone marrow pre-cDC1 abundance is maintained by
combination CD40 agonist and Flt3L (Fig. 3.6).
Combination therapy with CD40 agonist and Flt3L also yielded some unexpected
findings. It was surprising that addition of Flt3L to CD40 agonist successfully increased

139
cDC1 maturation marker expression beyond levels seen with CD40 agonist alone (Fig. 3.3
C). It is possible that the induction of IFN- response transcriptional signature and the
upregulation of maturation marker expression are part of a CD40-induced positive
feedback loop that is amplified through increased cDC1 abundance. We also hypothesized
that CD8+ and FOXP3-CD4+ T cell content in tumors would be higher following
combination CD40 agonist and Flt3L than with CD40 agonist monotherapy. However, T
cell content within these tumors were identical to those treated with CD40 agonist alone
(Fig. 3.4, A and C). FOXP3+CD4+ T cells also did not decrease in abundance beyond levels
seen with CD40 agonist alone (Fig. 3.4 E). Despite this, CD40 agonist and Flt3L
combination therapy resulted in superior control of tumor outgrowth (Fig. 3.4, F and G;
Fig. 3.5). We propose two explanations. CD8+ and FOXP3-CD4+ T cell activation in the
draining lymph node were higher with combination CD40 agonist and Flt3L than with
CD40 agonist alone (Fig. 3.4, B and D). As such, improved control of tumor outgrowth
might simply be a function of superior T cell priming. However, cDC1 content in the tumor
microenvironment is also bolstered by combination CD40 agonist and Flt3L (Fig. 3.3 B).
It is therefore also possible that constant re-priming of T cells by cDC1s could be driving
improved tumor cell killing and resistance to T cell exhaustion.
Our results support further preclinical studies of IL-6 blockade in the treatment of
pancreatic ductal adenocarcinoma. Inhibition of IL-6/IL-6R signaling is currently available
in four forms128. A monoclonal antibody targeted against IL-6 known as siltuximab and a
monoclonal antibody against IL-6R known as tocilizumab have been approved by the Food
and Drug Administration (FDA) for treatment of multicentric Castleman disease, arthritis,
and chimeric antigen receptor (CAR) T cell-induced cytokine release syndrome. A small-

140
molecule tyrosine kinase inhibitor known as tofacitinib that primarily targets JAK1 and
JAK3 is also FDA-approved for arthritis. Another small-molecule inhibitor of JAK1 and
JAK2 known as ruxolitinib is approved for use in patients with myelofibrosis and
polycythemia vera. All four of these therapies are actively in preclinical and/or clinical
investigations in the treatment of hematopoietic or solid cancers. While our data may
suggest a role for IL-6 blockade in the treatment of pancreatic ductal adenocarcinoma,
further preclinical studies must be performed to determine whether IL-6 inhibition
synergizes effectively with CD40 agonist. The role of IL-6 is well-known to be context-
dependent127. Quantification of IL-6, as well as IL-6 and IL-6R blockade, must be
performed following administration of CD40 agonist to determine whether IL-6 plays a
harmful or beneficial role in the context of CD40 agonism.
CD4+ T cell chemotaxis in CD40 agonism
CCL5 producers in the tumor microenvironment
CD40 is known to be expressed on macrophages, monocytes, dendritic cells, B
cells, and endothelial cells34. The activity of CD40 agonist has therefore always been
assumed to be pleiotropic, mediated through multiple cell types. Until recently, the
technology did not exist to simultaneously query how all these cell types respond to CD40
activation. Single-cell RNA sequencing enables us to examine gene expression patterns
across multiple cell types in a highly dimensional and unbiased manner. In the present
study, single-cell RNA sequencing and flow cytometric analysis reveal that CCL5

141
production is increased in macrophages and monocytes in the tumor microenvironment
following CD40 agonism (Fig. 5.2).
While Ccl5 was found to be upregulated most strongly in tumor-associated
macrophages and monocytes following CD40 activation, Ccl5 transcript was present at
high baseline levels in CD8+ T cells (Fig. 4.4, B and C). Though the proportion of CD8+ T
cells positive for expression of Ccl5 did not change with treatment, the transcript
abundance of Ccl5 increased substantially in CD8+ T cells following CD40 agonism.
However, this pattern was not corroborated at the protein level, as neither the proportion
of CCL5+ CD8+ T cells nor the magnitude of expression of CCL5 in CD8+ T cells changed
upon treatment (Fig. 4.6 C). Nonetheless, CCL5 is expressed at high levels by CD8+ T cells
which become significantly enriched in the tumor microenvironment after CD40 agonism.
It is therefore possible that the CCL5-mediated CD4+ T cell chemotaxis reported in this
study may not be attributable to CCL5 production by tumor-associated macrophages but
may instead rely upon the influx of CD8+ T cells. This is a possibility we were not able to
rule out in the present study. The source of CCL5 following CD40 agonism must therefore
be determined in the future using selective knockout models in which Ccl5 expression is
disabled in macrophages and CD8+ T cells.
CD4+ T cell selectivity in CCL5 chemotaxis
The CD4+ T cell selectivity of CCL5 was an unexpected result. Though both CD4+
and CD8+ T cells exhibited similar expression of CCR5 (Fig. 4.9 E), only CD4+ T cell
influx was impaired by blockade of CCL5 following CD40 agonism (Fig. 4.9 B). This trend

142
was also observed when T cells were quantified based on tumor weight (Fig. 4.10). The
role of CCR5 in CCL5-mediated CD4+ T cell chemotaxis was also demonstrated through
adoptive transfer of WT and CCR5 KO CD4+ T cells (Fig. 4.9 F). Thus, the CD4+ T cell
exclusivity of CD40-induced CCL5-mediated chemotaxis remains unexplained.
Though Ccl5 was significantly upregulated in response to CD40 agonist, transcripts
of another T cell chemotactic molecule Cxcl9 were upregulated to a similar degree in
tumor-associated macrophages (Table 4.1). We had therefore initially tested blockade of
both CCL5 and CXCL9 individually. While CCL5 blockade significantly impaired
immune control of tumor outgrowth following CD40 agonism (Fig. 4.8 D), CXCL9
blockade only resulted in a modest deficit in CD40-induced anti-tumor immunity (Fig.
4.11). This leads us to hypothesize that CXCL9 may mediate CD8+ T cell chemotaxis
through CXCR3 in response to CD40 agonist. It will be critical in future studies to
determine whether CD8+ T cell chemotaxis in the tumor microenvironment is mediated by
CXCL9-CXCR3 signaling in CD40 agonist-treated tumors.
However, the CXCL9-CXCR3 hypothesis still does not explain how CD4+ and
CD8+ T cells are recruited differently despite equal expression of CCR5 on both subsets.
An alternative hypothesis lies in endothelial cell activation. It was recently demonstrated
that CCL5 plays a critical role in endothelial cell activation as part of a senescence-
activated secretory phenotype (SASP) in the KPC model131. Specifically, CCL5 induces
endothelial cells to upregulate the adhesion molecule VCAM-1 which mediates CD4+ and
CD8+ T cell extravasation into the tumor microenvironment. In the absence of CCL5, CD4+
and CD8+ T cell influx in response to SASP are impaired due to absent endothelial cell
activation. Though CCL5 induced both CD4+ and CD8+ T cell extravasation in SASP, it is
143
critical to remember that endothelial cells express CD4034. Thus, CD40 signaling may alter
the adhesion molecules upregulated by endothelial cells upon activation by CCL5,
resulting in a preference for CD4+ over CD8+ T cells. If this hypothesis is correct, such
studies could deepen our understanding of which endothelial cell adhesion molecules
mediate CD4+ vs. CD8+ T cell extravasation in the context of immunotherapy. This
hypothesis can be tested by generating endothelial cell-specific Tek-Cre Cd40fl/fl mice and
repeating the T cell trafficking studies performed here132.
Therapeutic implications
Past manipulations of the CCL5-CCR5 signaling axis in cancer patients have been
dominated by the use of CCR5 antagonists like maraviroc to mitigate T regulatory cell and
tumor associated macrophage infiltration117,133,134. CCR5 inhibition has also been used in
attempts to sensitize tumors to chemotherapy and prevent metastasis, showing promise as
a means of preventing visceral graft versus host disease in cancer patients after allogenic
bone marrow transplant135–138. Our finding that T regulatory cell content is reduced in
tumors implanted into CCL5 knockout mice corroborates these findings and supports the
use of CCL5 inhibitors at baseline prior to immunotherapy. However, our findings suggest
that the use of CCR5 antagonists may be harmful once immunotherapy has been initiated.
This may have immediate clinical relevance for at least two ongoing clinical trials
combining the CCR5 small molecule inhibitors maraviroc and vicriviroc with the PD-1
inhibitor pembrolizumab (NCT03631407, NCT03274804). Our findings here should
therefore inform future combinations in which CCR5 inhibitors are trialed.

144
CD40 agonist immunotherapies are currently being tested in clinic (NCT03214250,
NCT02588443)94,139,140. Early results are promising, especially in combination with PD-1
inhibitors. Recently, as part of an ongoing clinical trial, pancreatic adenocarcinoma patients
received a CD40 agonist mAb (APX005M) in addition to standard-of-care
gemcitabine/nab-paclitaxel chemotherapy94. The overall response rate was 54.2%
compared to historical controls of 18% with standard-of-care chemotherapy alone. Moving
forward, CCL5 can be evaluated as a potential biomarker of response to CD40 agonism.
Finally, our findings provide rationale for enhancing CD40 agonist or other cancer
immunotherapies through ectopic delivery of CCL5 using CCL5-expressing oncolytic
viruses or intratumoral injection of recombinant CCL5.

145
Figures and figure legends
Figure 5.1 Model representation of cDC1 dysregulation and rescue in murine
pancreatic ductal adenocarcinoma. IL-6 released by murine PDA enters the systemic
circulation, resulting in apoptosis of cDC1s and reduction in cDC1 abundance. cDC1
maturation is also suppressed during pancreatic carcinogenesis, resulting in impaired CD8+
T cell priming. Combined rescue of cDC1 maturation and abundance through CD40
agonist and Flt3L, respectively, induces migration of cDC1s to tumor-draining lymph
nodes where successful CD8+ T cell priming then occurs. CD8+ T cell infiltration into the
tumor microenvironment subsequently increases, driving immune control of tumor
outgrowth.

146
Figure 5.2 Model representation of the role of CCL5 in untreated and CD40 agonist-
treated KPC tumors. At baseline, production of CCL5 by tumor-associated macrophages
and monocytes drive the recruitment of regulatory T cells. Upon treatment with CD40
agonist, macrophages and monocytes in the tumor microenvironment substantially increase
their production of CCL5. In this context, CCL5 recruits CD4+ T cells rather than
regulatory T cells, driving immune control of tumor outgrowth. These CD4+ T cells are
critical for therapeutic response to CD40 agonist.

147
BIBLIOGRAPHY
1. Dunn, G. P., Bruce, A. T., Ikeda, H., Old, L. J. & Schreiber, R. D. Cancer
immunoediting: From immunosurveillance to tumor escape. Nature Immunology 3,
991–998 (2002).
2. Wei, S. C., Duffy, C. R. & Allison, J. P. Fundamental mechanisms of immune
checkpoint blockade therapy. Cancer Discovery 8, 1069–1086 (2018).
3. Vonderheide, R. H. The immune revolution: A case for priming, not checkpoint.
Cancer Cell 33, 563–569 (2018).
4. Evans, R. A. et al. Lack of immunoediting in murine pancreatic cancer reversed
with neoantigen. JCI Insight 1, (2016).
5. Durai, V. & Murphy, K. M. Functions of murine dendritic cells. Immunity 45,
719–736 (2016).
6. Guermonprez, P., Valladeau, J., Zitvogel, L., Théry, C. & Amigorena, S. Antigen
presentation and T cell stimulation by dendritic cells. Annu. Rev. Immunol. 20,
621–67 (2002).
7. Gutcher, I. & Becher, B. APC-derived cytokines and T cell polarization in
autoimmune inflammation. J. Clin. Invest. 117, 1119–27 (2007).
8. Merad, M., Sathe, P., Helft, J., Miller, J. & Mortha, A. The dendritic cell lineage:
ontogeny and function of dendritic cells and their subsets in the steady state and
the inflamed setting. Annu. Rev. Immunol. 31, 563–604 (2013).
9. Mildner, A. et al. Development and function of dendritic cell subsets. Immunity
40, 642–56 (2014).
10. Belz, G. T. & Nutt, S. L. Transcriptional programming of the dendritic cell

148
network. Nature Reviews Immunology 12, 101–113 (2012).
11. Schlitzer, A. et al. Identification of cDC1- and cDC2-committed DC progenitors
reveals early lineage priming at the common DC progenitor stage in the bone
marrow. Nat. Immunol. 16, 718–728 (2015).
12. Guilliams, M. et al. Unsupervised high-dimensional analysis aligns dendritic cells
across tissues and species. Immunity 45, 669–684 (2016).
13. Hildner, K. et al. Batf3 deficiency reveals a critical role for CD8alpha+ dendritic
cells in cytotoxic T cell immunity. Science 322, 1097–100 (2008).
14. Wculek, S. K. et al. Dendritic cells in cancer immunology and immunotherapy.
Nature Reviews Immunology (2019). doi:10.1038/s41577-019-0210-z
15. Schlitzer, A. et al. IRF4 transcription factor-dependent CD11b+ dendritic cells in
human and mouse control mucosal IL-17 cytokine responses. Immunity 38, 970–
983 (2013).
16. Persson, E. K. et al. IRF4 transcription-factor-dependent CD103+CD11b+
dendritic cells drive mucosal T helper 17 cell differentiation. Immunity 38, 958–
969 (2013).
17. Gao, Y. et al. Control of T helper 2 responses by transcription factor IRF4-
dependent dendritic cells. Immunity 39, 722–732 (2013).
18. Binnewies, M. et al. Unleashing type-2 dendritic cells to drive protective antitumor
CD4+ T cell immunity. Cell 177, 556-571.e16 (2019).
19. Villani, A. et al. Single-cell RNA-seq reveals new types of human blood dendritic
cells, monocytes, and progenitors. Science 356, e1–e12 (2017).
20. Yin, X. et al. Human blood CD1c + dendritic cells encompass CD5 high and CD5

149
low subsets that differ significantly in phenotype, gene expression, and functions.
J. Immunol. 198, 1553–1564 (2017).
21. Böttcher, J. P. & Reis e Sousa, C. The role of type 1 conventional dendritic cells in
cancer immunity. Trends in Cancer 4, 784–792 (2018).
22. Broz, M. L. et al. Dissecting the tumor myeloid compartment reveals rare
activating antigen-presenting cells critical for T cell immunity. Cancer Cell 26,
638–652 (2014).
23. Roberts, E. W. et al. Critical role for CD103+/CD141+ dendritic cells bearing
CCR7 for tumor antigen trafficking and priming of T cell immunity in melanoma.
Cancer Cell 30, 324–336 (2016).
24. Spranger, S., Bao, R. & Gajewski, T. F. Melanoma-intrinsic β-catenin signalling
prevents anti-tumour immunity. Nature 523, 231–235 (2015).
25. Spranger, S., Dai, D., Horton, B. & Gajewski, T. F. Tumor-residing Batf3
dendritic cells are required for effector T cell trafficking and adoptive T cell
therapy. Cancer Cell 31, 711-723.e4 (2017).
26. Salmon, H. et al. Expansion and activation of CD103 + dendritic cell progenitors
at the tumor site enhances tumor responses to therapeutic PD-L1 and BRAF
inhibition. Immunity 44, 924–938 (2016).
27. Sanchez-Paulete, A. R. et al. Cancer immunotherapy with immunomodulatory
anti-CD137 and anti-PD-1 monoclonal antibodies requires BATF3-dependent
dendritic cells. Cancer Discov. 6, 71–79 (2016).
28. Woo, S. et al. STING-dependent cytosolic DNA sensing mediates innate immune
recognition of immunogenic tumors. Immunity 41, 830-842 (2014).

150
doi:10.1016/j.immuni.2014.10.017
29. Munn, D. H. & Mellor, A. L. IDO in the tumor microenvironment: inflammation,
counter-regulation, and tolerance. Trends in Immunology 37, 193–207 (2016).
30. Böttcher, J. P. et al. NK cells stimulate recruitment of cDC1 into the tumor
microenvironment promoting cancer immune control. Cell 172, 1022-1037.e14
(2018).
31. Barry, K. C. et al. A natural killer–dendritic cell axis defines checkpoint therapy–
responsive tumor microenvironments. Nat. Med. 24, 1178–1191 (2018).
32. Ohm, J. E. et al. Effect of vascular endothelial growth factor and FLT3 ligand on
dendritic cell generation in vivo. J. Immunol. 163, 3260–8 (1999).
33. Park, S. et al. IL-6 regulates in vivo dendritic cell differentiation through STAT3
activation. J Immunol 173, 3844–3854 (2004).
34. Grewal, I. S. & Flavell, R. A. The CD40 ligand. At the center of the immune
universe? Immunol. Res. 16, 59–70 (1997).
35. van Kooten, C. & Banchereau, J. CD40-CD40 ligand. J. Leukoc. Biol. 67, 2–17
(2000).
36. Winograd, R. et al. Induction of T-cell immunity overcomes complete resistance to
PD-1 and CTLA-4 blockade and improves survival in pancreatic carcinoma.
Cancer Immunol. Res. 3, 399–411 (2015).
37. Byrne, K. T. & Vonderheide, R. H. CD40 stimulation obviates innate sensors and
drives T cell immunity in cancer. Cell Rep. 15, 1–14 (2016).
38. Morrison, A. H., Diamond, M. S., Hay, C. A., Byrne, K. T. & Vonderheide, R. H.
Sufficiency of CD40 activation and immune checkpoint blockade for T cell

151
priming and tumor immunity. Proc. Natl. Acad. Sci. 201918971 (2020).
doi:10.1073/pnas.1918971117
39. Cheever, M. A. & Higano, C. S. PROVENGE (sipuleucel-T) in prostate cancer:
The first FDA-approved therapeutic cancer vaccine. Clinical Cancer Research 17,
3520–3526 (2011).
40. Sharma, P. & Allison, J. P. The future of immune checkpoint therapy. Science 348,
(2015).
41. Chan, T. A. et al. Development of tumor mutation burden as an immunotherapy
biomarker: utility for the oncology clinic. Ann. Oncol. Off. J. Eur. Soc. Med.
Oncol. 30, 44–56 (2019).
42. Rech, A. J. et al. Tumor immunity and survival as a function of alternative
neopeptides in human cancer. Cancer Immunol. Res. 6, 276–287 (2018).
43. Schreiber, R. D., Old, L. J. & Smyth, M. J. Cancer immunoediting: Integrating
immunity’s roles in cancer suppression and promotion. Science 331, 1565–1570
(2011).
44. Beatty, G. L. et al. Exclusion of T cells from pancreatic carcinomas in mice is
regulated by Ly6C low F4/80 extratumoral macrophages. Gastroenterology
(2015). doi:10.1053/j.gastro.2015.04.010
45. Longo, D. L., Adenocarcinoma, P., Ryan, D. P., Hong, T. S. & Bardeesy, N.
Pancreatic adenocarcinoma. (2014). doi:10.1056/NEJMra1404198
46. Hruban, R. H. et al. Pancreatic intraepithelial neoplasia: A new nomenclature and
classification system for pancreatic duct lesions. Am. J. Surg. Pathol. 25, 579–586
(2001).

152
47. Hingorani, S. R. et al. Trp53R172H and KrasG12D cooperate to promote
chromosomal instability and widely metastatic pancreatic ductal adenocarcinoma
in mice. Cancer Cell 7, 469–83 (2005).
48. Clark, C. E. et al. Dynamics of the immune reaction to pancreatic cancer from
inception to invasion. Cancer Res 67, 9518–27 (2007).
49. Bayne, L. J. et al. Tumor-derived granulocyte-macrophage colony-stimulating
factor regulates myeloid inflammation and T cell immunity in pancreatic cancer.
Cancer Cell 21, 822–835 (2012).
50. Chao, T., Furth, E. E. & Vonderheide, R. H. CXCR2-dependent accumulation of
tumor-associated neutrophils regulates T-cell immunity in pancreatic ductal
adenocarcinoma. Cancer Immunol. Res. 4, 968–982 (2016).
51. Slaney, C. Y., Kershaw, M. H. & Darcy, P. K. Trafficking of T cells into tumors.
Cancer Research 74, 7168–7174 (2014).
52. Aldinucci, D. & Colombatti, A. The inflammatory chemokine CCL5 and cancer
progression. Mediators Inflamm. 2014, (2014).
53. Wang, X. et al. Cancer-FOXP3 directly activated CCL5 to recruit FOXP3+Treg
cells in pancreatic ductal adenocarcinoma. Oncogene 36, 3048–3058 (2017).
54. Spitzer, M. H. et al. Systemic immunity is required for effective cancer
immunotherapy. Cell 168, 487-502.e15 (2017).
55. Engelhardt, J. J. et al. Marginating dendritic cells of the tumor microenvironment
cross-present tumor antigens and stably engage tumor-specific T cells. Cancer Cell
21, 402–417 (2012).
56. Hegde, S. et al. Dendritic cell paucity leads to dysfunctional immune surveillance

153
in pancreatic cancer. Cancer Cell 37, 289-307.e9 (2020).
57. Feig, C. et al. Targeting CXCL12 from FAP-expressing carcinoma-associated
fibroblasts synergizes with anti-PD-L1 immunotherapy in pancreatic cancer. Proc.
Natl. Acad. Sci. U. S. A. 110, 20212–20217 (2013).
58. Dalod, M., Chelbi, R., Malissen, B. & Lawrence, T. Dendritic cell maturation:
functional specialization through signaling specificity and transcriptional
programming. EMBO J. 33, 1104–16 (2014).
59. Tjomsland, V. et al. Semi mature blood dendritic cells exist in patients with ductal
pancreatic adenocarcinoma owing to inflammatory factors released from the
tumor. PLoS One 5, e13441 (2010).
60. Dudek, A. M., Martin, S., Garg, A. D. & Agostinis, P. Immature, semi-mature, and
fully mature dendritic cells: Toward a DC-cancer cells interface that augments
anticancer immunity. Front. Immunol. 4, 438 (2013).
61. Raphael, B. J. et al. Integrated genomic characterization of pancreatic ductal
adenocarcinoma. Cancer Cell 32, 185-203.e13 (2017).
62. Rooney, M. S., Shukla, S. A., Wu, C. J., Getz, G. & Hacohen, N. Molecular and
genetic properties of tumors associated with local immune cytolytic activity. Cell
160, 48–61 (2015).
63. McAllister, F. et al. Oncogenic Kras activates a hematopoietic-to-epithelial IL-17
signaling axis in preinvasive pancreatic neoplasia. Cancer Cell 25, 621–637
(2014).
64. Elsässer, H. P., Haake, T., Grimmig, M., Adler, G. & Kern, H. F. Repetitive
cerulein-induced pancreatitis and pancreatic fibrosis in the rat. Pancreas 7, 385–90
154
(1992).
65. DuPage, M., Dooley, A. L. & Jacks, T. Conditional mouse lung cancer models
using adenoviral or lentiviral delivery of Cre recombinase. Nat. Protoc. 4, 1064–
1072 (2009).
66. Martignoni, M. E. et al. Role of mononuclear cells and inflammatory cytokines in
pancreatic cancer-related cachexia. Clin. Cancer Res. 11, 5802–5808 (2005).
67. Öhlund, D. et al. Distinct populations of inflammatory fibroblasts and
myofibroblasts in pancreatic cancer. J. Exp. Med. 214, 579–596 (2017).
68. Lee, J. W. et al. Hepatocytes direct the formation of a pro-metastatic niche in the
liver. Nature 567, 249–252 (2019).
69. Lesina, M. et al. Stat3/Socs3 activation by IL-6 transsignaling promotes
progression of pancreatic intraepithelial neoplasia and development of pancreatic
cancer. Cancer Cell 19, 456–469 (2011).
70. Long, K. B. et al. IL6 receptor blockade enhances chemotherapy efficacy in
pancreatic ductal adenocarcinoma. Mol. Cancer Ther. 16, 1898–1908 (2017).
71. Ebrahimi, B., Tucker, S. L., Li, D., Abbruzzese, J. L. & Kurzrock, R. Cytokines in
pancreatic carcinoma. Cancer 101, 2727–2736 (2004).
72. Tang, M. et al. Toll-like receptor 2 activation promotes tumor dendritic cell
dysfunction by regulating IL-6 and IL-10 receptor signaling. Cell Rep. 13, 2851-
2864 (2015). doi:10.1016/j.celrep.2015.11.053
73. Mace, T. A. et al. IL-6 and PD-L1 antibody blockade combination therapy reduces
tumour progression in murine models of pancreatic cancer. Gut 67, 320–332
(2018).

155
74. Meyer, M. A. et al. Breast and pancreatic cancer interrupt IRF8-dependent
dendritic cell development to overcome immune surveillance. Nat. Commun. 9,
1250 (2018).
75. Jongbloed, S. L. et al. Human CD141+ (BDCA-3)+ dendritic cells (DCs) represent
a unique myeloid DC subset that cross-presents necrotic cell antigens. J. Exp. Med.
207, 1247–1260 (2010).
76. Li, J. et al. Tumor cell-intrinsic factors underlie heterogeneity of immune cell
infiltration and response to immunotherapy. Immunity 49, 178-193 (2018).
77. Hiraoka, N. et al. CXCL17 and ICAM2 are associated with a potential anti-tumor
immune response in early intraepithelial stages of human pancreatic
carcinogenesis. Gastroenterology 140, 310-321.e4 (2011).
78. Gabrilovich, D. I. et al. Decreased antigen presentation by dendritic cells in
patients with breast cancer’ Clin. Cancer Res. 3, 483–490 (1997).
79. Almand, B. et al. Clinical significance of defective dendritic cell differentiation in
cancer. Clin. Cancer Res. 6, 1755–66 (2000).
80. Hoffmann, T. K. et al. Alterations in the frequency of dendritic cell subsets in the
peripheral circulation of patients with squamous cell carcinomas of the head and
neck. Clin. Cancer Res. 8, 1787–93 (2002).
81. Hansson, E., Forbes, H. J., Langan, S. M., Smeeth, L. & Bhaskaran, K. Herpes
zoster risk after 21 specific cancers: Population-based case-control study. Br. J.
Cancer 116, 1643–1651 (2017).
82. Alanio, C. et al. Abstract A123: Skewed CD4 and CD8 T-cell differentiation in
pancreatic cancer patients. in A123–A123 (American Association for Cancer

156
Research (AACR), 2019). doi:10.1158/2326-6074.cricimteatiaacr18-a123
83. Balachandran, V. P. et al. Identification of unique neoantigen qualities in long-
term survivors of pancreatic cancer. Nature 551, S12–S16 (2017).
84. Jackson, E. L. et al. Analysis of lung tumor initiation and progression using
conditional expression of oncogenic K-ras. Genes Dev. 15, 3243–3248 (2001).
85. Jackson, E. L. et al. The differential effects of mutant p53 alleles on advanced
murine lung cancer. Cancer Res. 65, 10280–10288 (2005).
86. Liao, Y., Smyth, G. K. & Shi, W. featureCounts: an efficient general purpose
program for assigning sequence reads to genomic features. Bioinformatics 30,
923–930 (2014).
87. Love, M. I., Huber, W. & Anders, S. Moderated estimation of fold change and
dispersion for RNA-seq data with DESeq2. Genome Biol. 15, 550 (2014).
88. Mootha, V. K. et al. PGC-1α-responsive genes involved in oxidative
phosphorylation are coordinately downregulated in human diabetes. Nat. Genet.
34, 267–273 (2003).
89. Bares V, G. X. gskb: Gene Set data for pathway analysis in mouse. R package
version 1.12.0. (2015).
90. Lyman, S. D. & Jacobsen, S. E. W. c-kit ligand and flt3 ligand: Stem/progenitor
cell factors with overlapping yet distinct activities. Blood 91, 1101–1134 (1998).
91. Karsunky, H., Merad, M., Cozzio, A., Weissman, I. L. & Manz, M. G. Flt3 ligand
regulates dendritic cell development from Flt3+ lymphoid and myeloid-committed
progenitors to Flt3+ dendritic cells in vivo. J. Exp. Med. 198, 305–313 (2003).
92. Twyman-Saint Victor, C. et al. Radiation and dual checkpoint blockade activate

157
non-redundant immune mechanisms in cancer. Nature 520, 373–377 (2015).
93. Schoenberger, S. P., Toes, R. E. M., van der Voort, E. I. H., Offringa, R. & Melief,
C. J. M. T-cell help for cytotoxic T lymphocytes is mediated by CD40-CD40L
interactions. Nature 393, 480–483 (1998).
94. O’Hara, M. H. et al. A Phase Ib study of CD40 agonistic monoclonal antibody
APX005M together with gemcitabine and nab-paclitaxel with or without
nivolumab in untreated metastatic ductal pancreatic adenocarcinoma patients. in
AACR Annual Meeting 2019 (2019).
95. Veatch, J. R. et al. Endogenous CD4+ T cells recognize neoantigens in lung cancer
patients, including recurrent oncogenic KRAS and ERBB2 (Her2) driver
mutations. Cancer Immunol. Res. 7, 910–922 (2019).
96. Carmi, Y. et al. Allogeneic IgG combined with dendritic cell stimuli induce
antitumour T-cell immunity. Nature 521, 99–104 (2015).
97. Hurwitz, A. A., Yu, T. F., Leach, D. R. & Allison, J. P. CTLA-4 blockade
synergizes with tumor-derived granulocyte-macrophage colony-stimulating factor
for treatment of an experimental mammary carcinoma. Proc. Natl. Acad. Sci. U. S.
A. 95, 10067–71 (1998).
98. Gubin, M. M. et al. Checkpoint blockade cancer immunotherapy targets tumour-
specific mutant antigens. Nature 515, 577–581 (2014).
99. Currie, A. J. et al. Dual control of antitumor CD8 T cells through the programmed
death-1/programmed death-ligand 1 pathway and immunosuppressive CD4 T cells:
regulation and counterregulation. J. Immunol. 183, 7898–7908 (2009).
100. Borst, J., Ahrends, T., Bąbała, N., Melief, C. J. M. & Kastenmüller, W. CD4+ T

158
cell help in cancer immunology and immunotherapy. Nat. Rev. Immunol. 18, 635–
647 (2018).
101. Bogen, B., Fauskanger, M., Haabeth, O. A. & Tveita, A. CD4+ T cells indirectly
kill tumor cells via induction of cytotoxic macrophages in mouse models. Cancer
Immunol. Immunother. 68, 1865–1873 (2019).
102. Kim, H.-J. & Cantor, H. CD4 T-cell subsets and tumor immunity: the helpful and
the not-so-helpful. Cancer Immunol. Res. 2, 91–8 (2014).
103. Alspach, E. et al. MHC-II neoantigens shape tumour immunity and response to
immunotherapy. Nature 574, 696-701 (2019). doi:10.1038/s41586-019-1671-8
104. Sterman, D. H. et al. Eradication of intraperitoneal and distant tumor by
adenovirus-mediated interferon-β gene therapy is attributable to induction of
systemic immunity. Cancer Res. 61, 6201–6212 (2001).
105. Palomba, M. L. et al. CD8+ T-cell-dependent immunity following xenogeneic
DNA immunization against CD20 in a tumor challenge model of B-cell
lymphoma. Clin. Cancer Res. 11, 370–9 (2005).
106. Zamarin, D. et al. Localized oncolytic virotherapy overcomes systemic tumor
resistance to immune checkpoint blockade immunotherapy. Sci. Transl. Med. 6,
226ra32 (2014).
107. Liang, H. et al. Radiation-induced equilibrium is a balance between tumor cell
proliferation and T cell-mediated killing. J. Immunol. 190, 5874–81 (2013).
108. Lu, Y. et al. Treatment of patients with metastatic cancer using a major
histocompatibility complex class II-restricted T-cell receptor targeting the cancer
germline antigen MAGE-A3. J. Clin. Oncol. 35, 3322–3329 (2017).

159
109. Tran, E. et al. Cancer immunotherapy based on mutation-specific CD4+ T cells in
a patient with epithelial cancer. Science 344, 641–645 (2014).
110. Banchereau, J. et al. The CD40 antigen and its iigand. Annu. Rev. Immunol. 12,
881–926 (1994).
111. Rech, A. J. et al. Radiotherapy and CD40 activation separately augment immunity
to checkpoint blockade in cancer. Cancer Res. 78, 4282–4291 (2018).
112. Harlin, H. et al. Chemokine expression in melanoma metastases associated with
CD8 + T-ceII recruitment. Cancer Res. 69, 3077–3085 (2009).
113. Papalexi, E. & Satija, R. Single-cell RNA sequencing to explore immune cell
heterogeneity. Nature Reviews Immunology 18, 35–45 (2018).
114. Crawford, A., Angelosanto, J. M., Nadwodny, K. L., Blackburn, S. D. & Wherry,
E. J. A role for the chemokine RANTES in regulating CD8 T cell responses during
chronic viral infection. PLoS Pathog. 7, e1002098 (2011).
115. Zhang, S. et al. CCL5-deficiency enhances intratumoral infiltration of CD8+ T
cells in colorectal cancer. Cell Death Dis. 9, 766 (2018).
116. Dangaj, D. et al. Cooperation between constitutive and inducible chemokines
enables T cell engraftment and immune attack in solid tumors. Cancer Cell 35,
885-900.e10 (2019).
117. Aldinucci, D. & Casagrande, N. Inhibition of the CCL5/CCR5 axis against the
progression of gastric cancer. Int. J. Mol. Sci. 19, 1477 (2018).
118. Makino, Y. et al. Impaired T cell function in RANTES-deficient mice. Clin.
Immunol. 102, 302–9 (2002).
119. Sarvaiya, P. J., Guo, D., Ulasov, I., Gabikian, P. & Lesniak, M. S. Chemokines in

160
tumor progression and metastasis. Oncotarget 4, 2171–2185 (2013).
120. Beatty, G. L. et al. CD40 agonists alter tumor stroma and show efficacy against
pancreatic carcinoma in mice and humans. Science 331, 1612–1616 (2011).
121. Long, K. B. et al. IFNγ and CCL2 cooperate to redirect tumor-infiltrating
monocytes to degrade fibrosis and enhance chemotherapy efficacy in pancreatic
carcinoma. Cancer Discov. 6, 400–413 (2016).
122. Cambien, B. et al. CCL5 neutralization restricts cancer growth and potentiates the
targeting of PDGFRβ in colorectal carcinoma. PLoS One 6, (2011).
123. Lo, A. et al. Tumor-promoting desmoplasia is disrupted by depleting FAP-
expressing stromal cells. Cancer Res. 75, 2800–2810 (2015).
124. Stuart, T. et al. Comprehensive integration of single-cell data. Cell 177, 1888-
1902.e21 (2019).
125. Butler, A., Hoffman, P., Smibert, P., Papalexi, E. & Satija, R. Integrating single-
cell transcriptomic data across different conditions, technologies, and species. Nat.
Biotechnol. 36, 411–420 (2018).
126. Trapnell, C. et al. The dynamics and regulators of cell fate decisions are revealed
by pseudotemporal ordering of single cells. Nat. Biotechnol. 32, 381–386 (2014).
127. Kang, S., Narazaki, M., Metwally, H. & Kishimoto, T. Historical overview of the
interleukin-6 family cytokine. (2020). doi:10.1084/jem.20190347
128. Johnson, D. E., O’keefe, R. A. & Grandis, J. R. Targeting the IL-6/JAK/STAT3
signalling axis in cancer. Nature Reviews Clinical Oncology 15, 234–248 (2018).
129. Apte, R. S., Chen, D. S. & Ferrara, N. VEGF in signaling and disease: beyond
discovery and development. Cell 176, 1248–1264 (2019).

161
130. Kirkling, M. E. et al. Notch signaling facilitates in vitro generation of cross-
presenting classical dendritic cells. Cell Rep. 23, 3658-3672.e6 (2018).
131. Ruscetti, M. et al. Senescence-induced vascular remodeling creates therapeutic
vulnerabilities in pancreas cancer. Cell 181, 424–441 (2020).
132. Koni, P. A. et al. Conditional vascular cell adhesion molecule 1 deletion in mice:
Impaired lymphocyte migration to bone marrow. J. Exp. Med. 193, 741–753
(2001).
133. Jiao, X. et al. Recent advances targeting CCR5 for cancer and its role in immuno-
oncology. Cancer Res. 79, 4801–4807 (2019).
134. Pervaiz, A. et al. CCR5 blockage by maraviroc: a potential therapeutic option for
metastatic breast cancer. Cell. Oncol. (Dordr). 42, 93–106 (2019).
135. Reshef, R. et al. Blockade of lymphocyte chemotaxis in visceral graft-versus-host
disease. N. Engl. J. Med. 367, 135–145 (2012).
136. Reshef, R. et al. High graft CD8 cell dose predicts improved survival and enables
better donor selection in allogeneic stem-cell transplantation with reduced-
intensity conditioning. J. Clin. Oncol. 33, 2392–2398 (2015).
137. Moy, R. H. et al. Clinical and immunologic impact of CCR5 blockade in graft-
versus-host disease prophylaxis. Blood 129, 906–916 (2017).
138. Huffman, A. P. et al. Pharmacodynamic monitoring predicts outcomes of CCR5
blockade as graft-versus-host disease prophylaxis. Biol. Blood Marrow Transplant.
24, 594–599 (2018).
139. Vonderheide, R. H. CD40 agonist antibodies in cancer immunotherapy. Annu. Rev.
Med. 71, 47–58 (2020).
162
140. Bajor, D. L. et al. Long-term outcomes of a phase I study of agonist CD40
antibody and CTLA-4 blockade in patients with metastatic melanoma.
Oncoimmunology 7, e1468956 (2018).
Related Documents