Pesticide Runoff Effects on Microbial Life Tyler Barkich Grade 9 Pittsburgh Central Catholic High School

Welcome message from author
This document is posted to help you gain knowledge. Please leave a comment to let me know what you think about it! Share it to your friends and learn new things together.
Transcript

Pesticide Runoff Effects on Microbial Life
Tyler BarkichGrade 9
Pittsburgh Central Catholic High School

Any chemical, antibacterial, biological agent, or other similar substance used to kill or repel unwanted species.
Used commonly in agriculture and around homes
877 million pounds of pesticides were used agriculturally in 2007.
Bayer Pesticide Active Ingredients:β-cyfluthrin and imidacloprid.
Pesticides
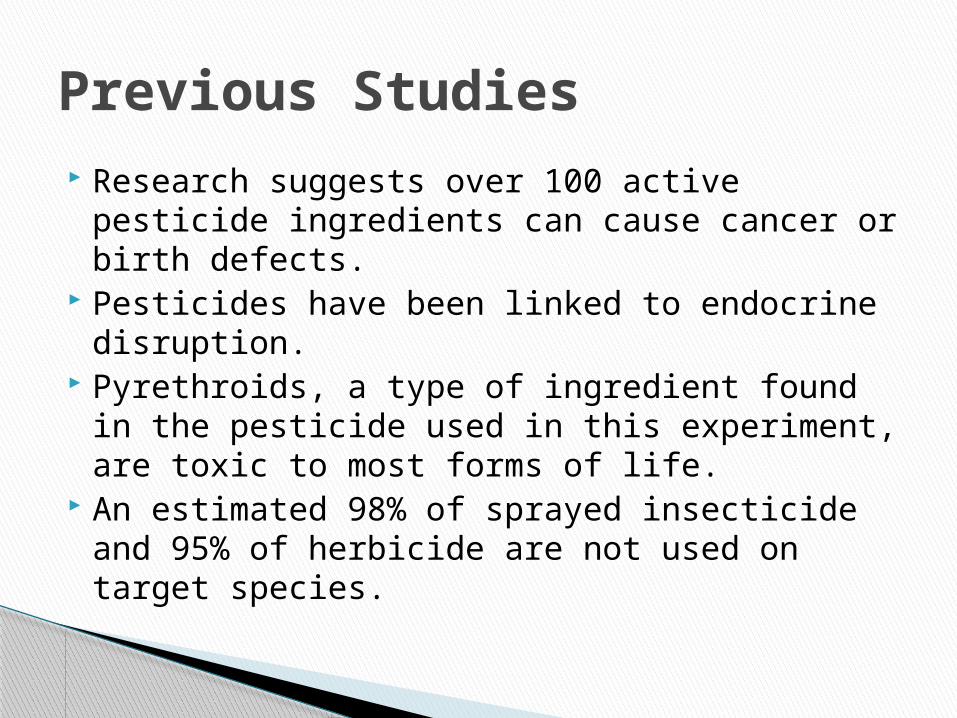
Research suggests over 100 active pesticide ingredients can cause cancer or birth defects.
Pesticides have been linked to endocrine disruption.
Pyrethroids, a type of ingredient found in the pesticide used in this experiment, are toxic to most forms of life.
An estimated 98% of sprayed insecticide and 95% of herbicide are not used on target species.
Previous Studies

Rod shaped cells, usually 2 nanometers in length
Prokaryotic Gram-negative Found in the intestines of many mammals Commonly used model Reproduces rapidly, usually within thirty
minutes Many strains, most non-pathogenic
Escherichia coli (E. coli)

Bacteria that is mostly harmless and lives normally on skin and mucous membranes of humans
Gram-positive
Many forms are considered non-pathogenic
Pathogenic forms can be lethal
Staphylococcus epidermidis

Gram+
• Most pathogenic• Simple cell wall.• Antibiotics work against
the formation of the cell wall.
• Staphylococcus epidermidis
Gram-
• The cell wall is a thin layer of lipopolysaccharide, which adds extra protection.
• This layer protects the cell from certain antibiotics.
• Escherichia coli
Gram+ vs. Gram- Bacteria
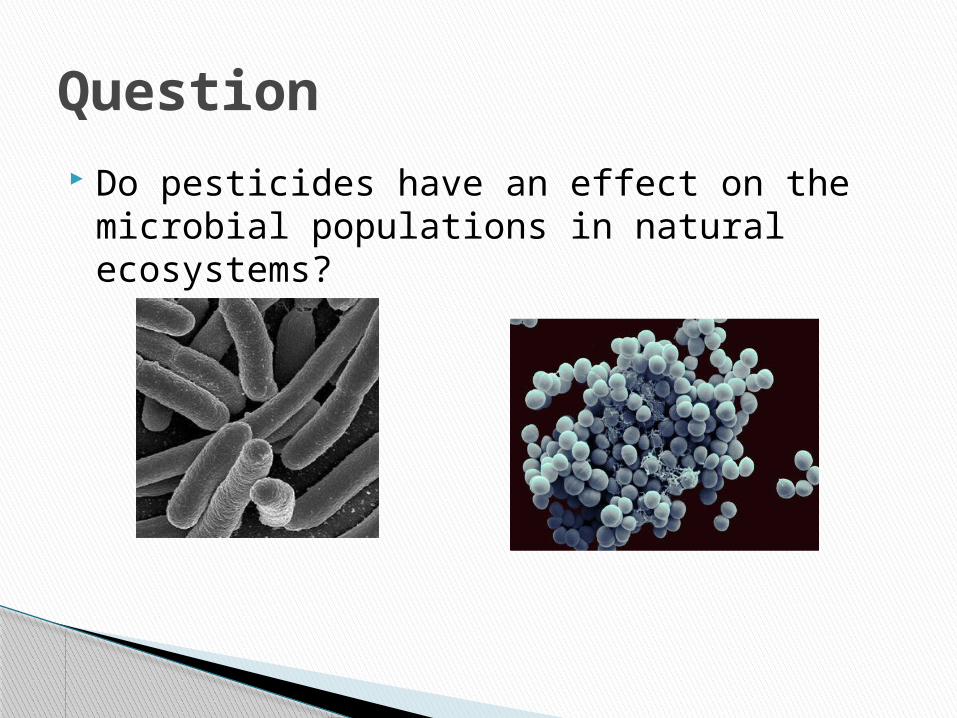
Do pesticides have an effect on the microbial populations in natural ecosystems?
Question

To determine if the Bayer Advanced Pesticide in different concentrations will affect the survivorship or Escherichia coli or Staphylococcus epidermidis.
Purpose

Null Hypothesis: The pesticide will not significantly reduce the survivorship of Escherichia coli or Staphylococcus epidermidis.
Alternative Hypothesis: The pesticide will significantly reduce the survivorship of Escherichia coli or Staphylococcus epidermidis.
Hypotheses

Materials Sterile test tubes Micropipettes Bayer Pesticide
(0.015% β-cyfluthrin, 0.012 % imidacloprid)
Vortex Ethanol Spreader LB Agar Plates LB Media (0.5% yeast
extract, 1% tryptone, 1% sodium chloride)
Incubator Labeling Tape Marker
Escherichia coli (DH5-Alpha)
Staphylococcus epidermidis
Test tube rack Sidearm flask Sterile filters Klett Spectrophotometer Pipette tips Sterile Dilution Fluid
(100mM KH2PO4, 100mM K2HPO4, 10mM MgSO4, 1mM NaCl)
Bunsen Burners Matches Latex gloves

1. Escherichia coli and Staphylococcus epidermidis were grown overnight in sterile LB media.
2. A sample of those cultures were added to media in a sidearm flask.
3. The cultures were incubated until a density of 50 Klett spectrophotometer units was reached. This represents a density of 108-109 cells/ml.
4. This cultures were diluted in sterile dilution fluid to a density of 105 cells/ml.
5. The pesticide was sterile filtered and was diluted to concentrations of 0%, 0.01%, 0.1%, and 1% in sterile dilution fluid.
Procedure

0% Pesticide
0.01% Pesticide
0.1% Pesticide
1% Pesticide
SDF 9.9 mL 9.899 mL 9.89 mL 9.8 mL
Pesticide 0 mL 0.001 mL 0.01 mL 0.1 mLE. Coli/Staph 0.1 mL 0.1 mL 0.1 mL 0.1 mL
Total 10 mL 10 mL 10 mL 10 mL
Chart of Liquid Concentrations

6. 0.1 mL of the E. coli culture was added to 4 tubes of each concentration of pesticide and 0.1 mL of the Staphylococcus was added to 4 tubes of each concentration of pesticide. This produced a final volume of 10 mL, and a cell density of 103 cells/ml.
7. After vortexing to evenly suspend cells, 0.1 mL aliquots from each tube was spread evenly on LB agar plates.
8. The plates were incubated at 37 °C overnight.
9. The resulting colonies were counted. Each colony is assumed to have risen from one cell.
Procedure (cont.)
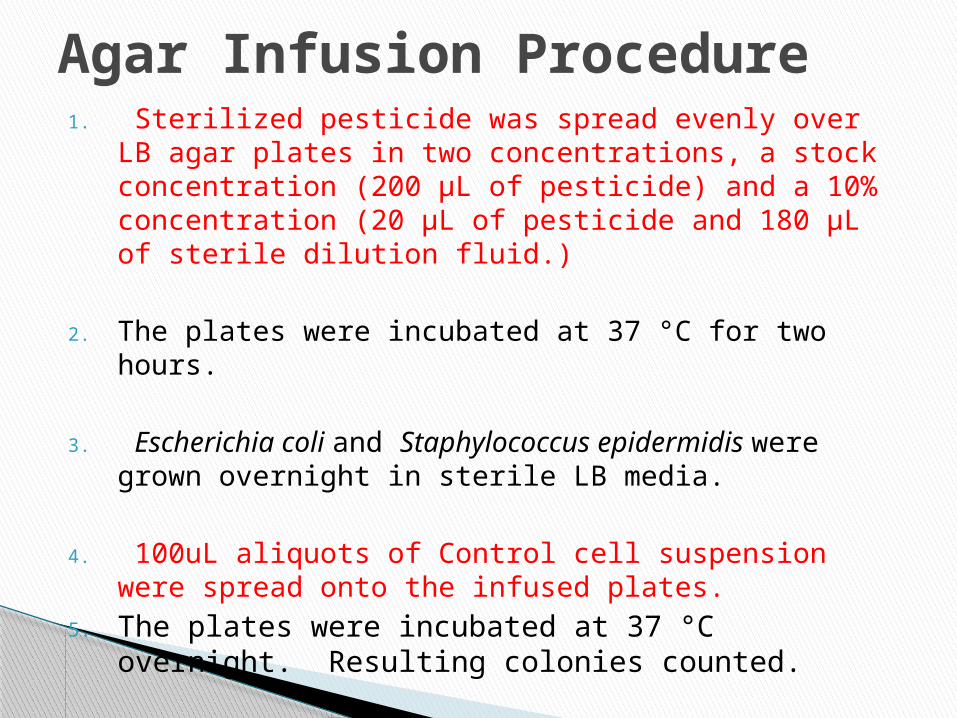
1. Sterilized pesticide was spread evenly over LB agar plates in two concentrations, a stock concentration (200 µL of pesticide) and a 10% concentration (20 µL of pesticide and 180 µL of sterile dilution fluid.)
2. The plates were incubated at 37 °C for two hours.
3. Escherichia coli and Staphylococcus epidermidis were grown overnight in sterile LB media.
4. 100uL aliquots of Control cell suspension were spread onto the infused plates.
5. The plates were incubated at 37 °C overnight. Resulting colonies counted.
Agar Infusion Procedure

0.00% 0.01% 0.10% 1.00%0
50
100
150
200
250
300
350309.5
290.25275
239
Colonies
[Pesticide]
Nu
mb
er
of
Colo
nie
sPesticide Effects on E. coli
SurvivorshipP value: 8.19E-06

0.00% 0.01% 0.10% 1.00%0
50
100
150
200
250228.25
191
154.5138.5
Colonies
[Pesticide]
Nu
mb
er
of
Colo
nie
sPesticide Effects on Staphylococcus
epidermidis SurvivorshipP value: 2.23E-06

Dunnett’s Tests
Pesticide concentration
T value Interpretation
0.01% 2.47 Not significant
0.1% 4.43 Significant
1% 9.06 Significant
T critical = 3.5Alpha = .05
Pesticide concentration
T value Interpretation
0.01% 4.03 Significant
0.1% 7.98 Significant
1% 9.72 Significant
Escherichia coli
Staphylococcus epidermidis
𝑡𝑑=𝑀𝑖−𝑀𝑐
√ 2𝑀𝑆𝐸𝑛h
0.00% 0.01% 0.10% 1.00%0
102030405060708090
100
E. coliStaph
[Pesticide]
Perc
en
t S
urv
ivors
hip
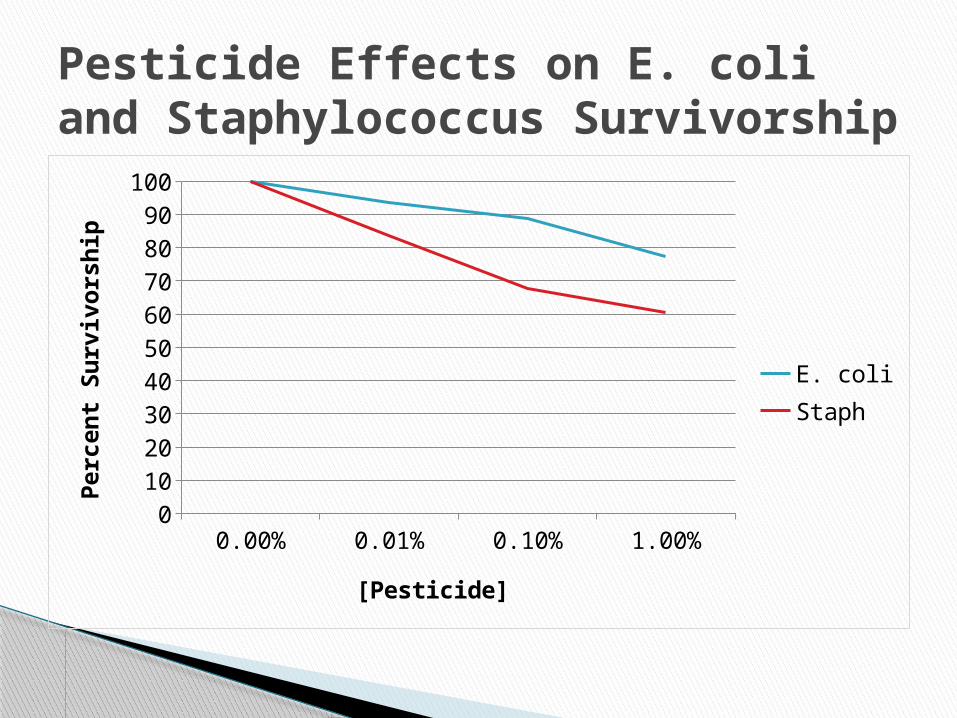
Pesticide Effects on E. coli and Staphylococcus Survivorship

Pesticide Effects on E. coli and Staphylococcus Survivorship: Infused Plates
E. Coli Staph0
50
100
150
200
250
300
350
400
198.375
333.875
178.5
288.625
146.125
248.75
Control Low Concentration High Concentration
Nu
mb
er
of
Colo
nie
s
P-value:1.8E-09
P-value:1.07E-08

Dunnett’s Tests: Infused
Pesticide concentration
T value Interpretation
Low 4.16 Significant
High 10.93 Significant
T critical = 2.67Alpha = .05
Pesticide concentration
T value Interpretation
Low 5.3 Significant
High 9.97 Significant
Escherichia coli
Staphylococcus epidermidis
𝑡𝑑=𝑀𝑖−𝑀𝑐
√ 2𝑀𝑆𝐸𝑛h

A. Liquid Exposure• The null hypothesis that pesticide will not affect E.
coli or Staphylococcus epidermidis survivorship was rejected for all of the concentrations of pesticide, except for the 0.01% exposure to E. coli.
• Evidence suggests that the pesticide significantly reduces the survivorship in both species.
B. Agar Infusion• The null hypothesis was rejected.• Evidence suggests that the pesticide significantly
reduces the survivorship in both species.
Conclusions

Limitations
It was difficult to exactly synchronize the plating for the microbes, possibly contributing to the varying colony counts.
Infusion of pesticide into LB agar was not exact.
Extensions and Future Studies
Higher and lower concentrations of pesticide Different types of pesticides More species of bacteria More replicates Liquid agar infusion Vary pesticide exposure time Perform a growth rate experiment
Limitations, Extensions, and Future Studies

http://www.epa.gov/opp00001/pestsales/07pestsales/market_estimates2007.pdf
http://www.epa.gov/pesticides/about/ http://www.green-networld.com/facts/
pollution.htm http://www.beyondpesticides.org/
pesticides/factsheets/Synthetic%20Pyrethroids.pdf
http://www.docstoc.com/docs/9271628/Effect-of-pesticides-on-environment
References

SUMMARYGroups Count Sum Average Variance
0% 4 1238 309.5 1270.01% 4 1161 290.25 80.250.1% 4 1100 275 1241% 4 956 239 153.3333
ANOVASource of Variation SS df MS F P-value F crit
Between Groups 10686.19 3 3562.063 29.4031 8.19E-06 3.490295Within Groups 1453.75 12 121.1458
Total 12139.94 15
E. coli ANOVA

SUMMARYGroups Count Sum Average Variance
0% 4 913 228.25 188.250.01% 4 764 191 270.66670.1% 4 618 154.5 203.66671% 4 554 138.5 19.66667
ANOVASource of Variation SS df MS F P-value F crit
Between Groups 19226.19 3 6408.729 37.57408 2.23E-06 3.490295Within Groups 2046.75 12 170.5625
Total 21272.94 15
Staphylococcus ANOVA

SUMMARY
Groups Count Sum Average Variance
Control 8 1587 198.375 114.2679
Low 8 1428 178.5 57.14286
High 8 1169 146.125 102.4107
ANOVASource of Variation SS df MS F P-value F crit
Between Groups 11128.58 2 5564.292 60.96263 1.8E-09 3.4668
Within Groups 1916.75 21 91.27381
Total 13045.33 23
E. coli ANOVA: Infused

Groups Count Sum Average Variance
Control 8 2671 333.875 166.4107
Low 8 2309 288.625 304.8393
High 8 1990 248.75 403.3571
ANOVA
Source of Variation SS df MS F P-value F crit
Between Groups 29023.58 2 14511.79 49.77706 1.07E-08 3.4668
Within Groups 6122.25 21 291.5357
Total 35145.83 23
Staphylococcus ANOVA: Infused
Related Documents