PHYSICAL REVIEW B 85, 205206 (2012) Two-step charge photogeneration dynamics in polymer/fullerene blends for photovoltaic applications Sanjeev Singh, 1,*,† Bill Pandit, 1,† Tek P. Basel, 1 Sergey Li, 2 Darin Laird, 2 and Z. Valy Vardeny 1,‡ 1 Department of Physics and Astronomy, University of Utah, Salt Lake City, Utah 84112, USA 2 Plextronics, 2180 William Pitt Way, Pittsburgh, PA 15238 (Received 5 January 2012; revised manuscript received 16 April 2012; published 15 May 2012) We measured the picoseconds (ps) transient dynamics of photoexcitations in blends of poly(3-hexyl-thiophene) (P3HT; donors-D) and fullerene [6,6]-phenyl-C61-butyric acid methyl ester (PCBM; acceptor-A), using the transient pump/probe photomodulation technique in an unprecedented broad spectral range from 0.25 to 2.5 eV, and compared the results with organic solar cell performance based on the same blends. In D-A blends with maximum domain separation such as regio-regular P3HT/PCBM with (1.2:1) weight ratio having solar cell power conversion efficiency of ∼4%, we found that, although the photogenerated intrachain excitons in the polymer nano-domains decay within ∼10 ps, no charge polarons are generated on their expense up to ∼2 ns. Instead, there is a buildup of charge transfer (CT) excitons at the D-A interfaces having the same kinetics as the exciton decay, which dissociate into separate polarons in the D and A domains at a much later time (1 ns). This two-step charge photogeneration process may be typical in organic bulk heterojunction cells. Although the CT excitons are photogenerated on the exciton expense much faster in D-A blends having smaller domain size such as in regio-random P3HT/PCBM, their dissociation is less efficient because of larger binding energy. This explains the poor solar cell power conversion efficiency (<0.1%) based on this blend. Our results support the two-step charge photogeneration mechanism in polymer/fullerene blends and emphasize the important role of the CT binding energy in generating free charge polarons in organic solar cells. DOI: 10.1103/PhysRevB.85.205206 PACS number(s): 78.66.Qn, 78.40.Me, 78.45.+h, 78.47.−p The process of charge photogeneration in organic photo- voltaic (OPV) cells is still a matter of debate. In contrast to the labyrinth photosynthesis process that has evolved in nature, 1 the charge photogeneration process in OPV cells utilizes one type of heterojunction between two organic semiconductors. The two organic semiconductors, dubbed donor (D-) and acceptor (A-) are cast from solution mixtures to form thin films having nanosize domains of relatively pristine materials and large D-A interface area. 2–4 This type of architecture, dubbed bulk heterojunction usually allows for light absorption in the bulk donor domains that generate excitons, followed by exciton dissociation at the D-A interfaces. However, the process by which the excitons reach the D-A interfaces and dissociate to generate separate charge polarons in the D-A nano-domains is only now becoming the focus of attention. 5,6 It was originally postulated that, once the exciton in the bulk donor domain reaches the D-A interface, it undergoes an ul- trafast electron transfer to the acceptor forming a hole-polaron (P + ) in the donor and electron-polaron (P − ) in the acceptor, which are free to participate in the subsequent charge transport process towards the device electrodes. 7 However, the mutual P + -P − Coulomb attraction should prevent a complete charge separation even if the offset energy of the donor and acceptor active levels is taken into account. 8 On the contrary, the bound P + -P − pair forms a charge transfer (CT) state at the D-A interface deep below the D and A optical gaps. However, in spite of ample spectroscopic evidence for the existence of such a CT state at the D-A interfaces, 9–13 it has been argued that it lies too deep in the gap to have any effect on the charge photogeneration process in the blends. 10 In this paper, we used the pump/probe transient photomod- ulation spectroscopy in an unprecedented broad spectral range to elucidate the early stages of the charge photogeneration process in the prototype D-A blend, namely the donor polymer regio-regular (RR-) (3 hexyl thiophene) [P3HT; see Fig. 1(a) inset] and the fullerene acceptor molecule [6,6]-phenyl-C 61 - butyric acid methyl ester [PCBM; Fig. 1(b) inset]. This blend shows separated D-A domains and consequently has high solar power conversion efficiency η ∼ 4%. 13 Although there have been several studies on the photoexcitation dynamics of the P3HT/PCBM blend, many questions still remain unresolved regarding the role of the CT state on the charge generation processes. 14–25 We present compelling evidence that, after the photoexcited excitons in the polymer domains reach the D-A interfaces, the charge generation process proceeds via the formation of CT excitons at the interfaces. In RR- P3HT/PCBM with (1.2:1) weight ratio the photogenerated excitons in the polymer domain reach the D-A interfaces forming CT excitons within ∼10 ps. In contrast, in regio- random (RRa)-P3HT/PCBM blend where the D and A domain sizes are much smaller, the CT excitons at the D-A interfaces are generated within ∼200 fs. However, the subsequent exciton dissociation process in this blend is hampered by the large CT binding energy, 11 which explains the smaller η value (<0.1%) of solar cells based on this blend. Our findings support a two- step process for the charge photogeneration in organic D-A blends 5 and emphasize the important role of the CT exciton binding energy in generating free charges in organic solar cells. The P3HT polymers and PCBM fullerene were supplied by Plextronics Inc. 13 The mixing ratio of the P3HT/PCBM blends was 1.2:1 by weight, which gives the optimal η value in solar cells. 6 The films were spin cast onto CaF 2 or CsI that are transparent in the mid-infrared (IR) spectral range. The RR-P3HT/PCBM blend film was thermally annealed at 150 ◦ C for 30 min to enhance the D-A domains size; 6 whereas the RRa-P3HT/PCBM film was used as deposited. 205206-1 1098-0121/2012/85(20)/205206(7) ©2012 American Physical Society

Welcome message from author
This document is posted to help you gain knowledge. Please leave a comment to let me know what you think about it! Share it to your friends and learn new things together.
Transcript
PHYSICAL REVIEW B 85, 205206 (2012)
Two-step charge photogeneration dynamics in polymer/fullerene blends forphotovoltaic applications
Sanjeev Singh,1,*,† Bill Pandit,1,† Tek P. Basel,1 Sergey Li,2 Darin Laird,2 and Z. Valy Vardeny1,‡1Department of Physics and Astronomy, University of Utah, Salt Lake City, Utah 84112, USA
2Plextronics, 2180 William Pitt Way, Pittsburgh, PA 15238(Received 5 January 2012; revised manuscript received 16 April 2012; published 15 May 2012)
We measured the picoseconds (ps) transient dynamics of photoexcitations in blends of poly(3-hexyl-thiophene)(P3HT; donors-D) and fullerene [6,6]-phenyl-C61-butyric acid methyl ester (PCBM; acceptor-A), using thetransient pump/probe photomodulation technique in an unprecedented broad spectral range from 0.25 to 2.5 eV,and compared the results with organic solar cell performance based on the same blends. In D-A blends withmaximum domain separation such as regio-regular P3HT/PCBM with (1.2:1) weight ratio having solar cell powerconversion efficiency of ∼4%, we found that, although the photogenerated intrachain excitons in the polymernano-domains decay within ∼10 ps, no charge polarons are generated on their expense up to ∼2 ns. Instead, thereis a buildup of charge transfer (CT) excitons at the D-A interfaces having the same kinetics as the exciton decay,which dissociate into separate polarons in the D and A domains at a much later time (�1 ns). This two-stepcharge photogeneration process may be typical in organic bulk heterojunction cells. Although the CT excitonsare photogenerated on the exciton expense much faster in D-A blends having smaller domain size such as inregio-random P3HT/PCBM, their dissociation is less efficient because of larger binding energy. This explains thepoor solar cell power conversion efficiency (<0.1%) based on this blend. Our results support the two-step chargephotogeneration mechanism in polymer/fullerene blends and emphasize the important role of the CT bindingenergy in generating free charge polarons in organic solar cells.
DOI: 10.1103/PhysRevB.85.205206 PACS number(s): 78.66.Qn, 78.40.Me, 78.45.+h, 78.47.−p
The process of charge photogeneration in organic photo-voltaic (OPV) cells is still a matter of debate. In contrast to thelabyrinth photosynthesis process that has evolved in nature,1
the charge photogeneration process in OPV cells utilizes onetype of heterojunction between two organic semiconductors.The two organic semiconductors, dubbed donor (D-) andacceptor (A-) are cast from solution mixtures to form thinfilms having nanosize domains of relatively pristine materialsand large D-A interface area.2–4 This type of architecture,dubbed bulk heterojunction usually allows for light absorptionin the bulk donor domains that generate excitons, followedby exciton dissociation at the D-A interfaces. However, theprocess by which the excitons reach the D-A interfaces anddissociate to generate separate charge polarons in the D-Anano-domains is only now becoming the focus of attention.5,6
It was originally postulated that, once the exciton in the bulkdonor domain reaches the D-A interface, it undergoes an ul-trafast electron transfer to the acceptor forming a hole-polaron(P+) in the donor and electron-polaron (P−) in the acceptor,which are free to participate in the subsequent charge transportprocess towards the device electrodes.7 However, the mutualP+-P− Coulomb attraction should prevent a complete chargeseparation even if the offset energy of the donor and acceptoractive levels is taken into account.8 On the contrary, the boundP+-P− pair forms a charge transfer (CT) state at the D-Ainterface deep below the D and A optical gaps. However, inspite of ample spectroscopic evidence for the existence of sucha CT state at the D-A interfaces,9–13 it has been argued thatit lies too deep in the gap to have any effect on the chargephotogeneration process in the blends.10
In this paper, we used the pump/probe transient photomod-ulation spectroscopy in an unprecedented broad spectral rangeto elucidate the early stages of the charge photogeneration
process in the prototype D-A blend, namely the donor polymerregio-regular (RR-) (3 hexyl thiophene) [P3HT; see Fig. 1(a)inset] and the fullerene acceptor molecule [6,6]-phenyl-C61-butyric acid methyl ester [PCBM; Fig. 1(b) inset]. This blendshows separated D-A domains and consequently has high solarpower conversion efficiency η ∼ 4%.13 Although there havebeen several studies on the photoexcitation dynamics of theP3HT/PCBM blend, many questions still remain unresolvedregarding the role of the CT state on the charge generationprocesses.14–25 We present compelling evidence that, afterthe photoexcited excitons in the polymer domains reachthe D-A interfaces, the charge generation process proceedsvia the formation of CT excitons at the interfaces. In RR-P3HT/PCBM with (1.2:1) weight ratio the photogeneratedexcitons in the polymer domain reach the D-A interfacesforming CT excitons within ∼10 ps. In contrast, in regio-random (RRa)-P3HT/PCBM blend where the D and A domainsizes are much smaller, the CT excitons at the D-A interfacesare generated within ∼200 fs. However, the subsequent excitondissociation process in this blend is hampered by the large CTbinding energy,11 which explains the smaller η value (<0.1%)of solar cells based on this blend. Our findings support a two-step process for the charge photogeneration in organic D-Ablends5 and emphasize the important role of the CT excitonbinding energy in generating free charges in organic solar cells.
The P3HT polymers and PCBM fullerene were suppliedby Plextronics Inc.13 The mixing ratio of the P3HT/PCBMblends was 1.2:1 by weight, which gives the optimal η valuein solar cells.6 The films were spin cast onto CaF2 or CsIthat are transparent in the mid-infrared (IR) spectral range.The RR-P3HT/PCBM blend film was thermally annealed at150 ◦C for 30 min to enhance the D-A domains size;6 whereasthe RRa-P3HT/PCBM film was used as deposited.
205206-11098-0121/2012/85(20)/205206(7) ©2012 American Physical Society
bbpand01
Highlight
bbpand01
Sticky Note
Equally contributed by 2 authors
SINGH, PANDIT, BASEL, LI, LAIRD, AND VARDENY PHYSICAL REVIEW B 85, 205206 (2012)
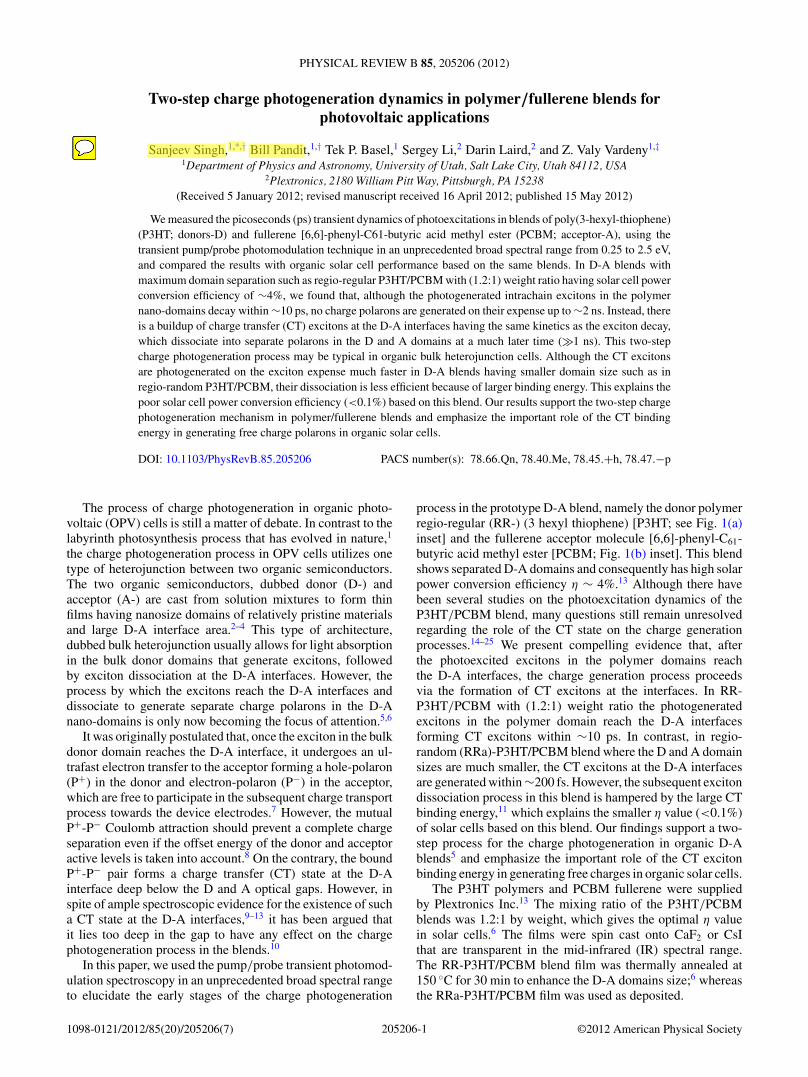
FIG. 1. (Color online) (a) The transient photomodulation spec-trum of a pristine RR-P3HT film at t = 0 and 100 ps, respectively;the exciton bands PA1, SE, and PB are indicated. The right insetshows the transient decay of PA1 and PB bands up to t = 160 ps;the left inset shows the polymer backbone chain. (b) The transientphotomodulation spectrum of a PCBM film at t = 0; the exciton PAbands EX1 and EX2, and CT exciton band are indicated. The rightinset shows the �T/T (0) spectrum of isolated PCBM molecules inpolystyrene (weight ratio of 1:100) that lacks the CT exciton band.The left inset shows the PCBM molecular structure.
For the polarized transient photomodulation spectroscopy,we used the femtosecond (fs) two-color pump/probe cor-relation technique with two different pulsed laser systemsbased on a Ti: Sapphire oscillator.26 These are: a low-power(energy/pulse ∼0.1 nJ) high-repetition rate (∼80 MHz) pulsedlaser system for the mid-IR spectral range, and a high-power(energy/pulse ∼10 μJ) low-repetition rate (∼1 kHz) pulsedlaser system for the near-IR/visible spectral range. The pumpexcitation photon energy hω(pump) was set at 3.1 eV forabove-gap and 1.55 eV for below-gap excitation, respectively.The pulse energy flux on the film was adjusted so that theinitial photoexcited exciton density N (0) ≈ 1016/cm3 [N (0)≈ 1017/cm3] for the mid-IR (near-IR) laser system. Forthe probe in the mid-IR measurements, we used an opticalparametric oscillator (OPAL, Spectra Physics) that generates
hω(probe) ranging from 0.55 to 1.05 eV. In addition, we alsoused a difference-frequency crystal (AgGaS2) and the signaland idler beams of the OPAL for generating hω(probe) inthe spectral interval 0.25 to 0.43 eV.11 The pump beam wasmodulated at frequency f = 40 kHz, and the changes �T in theprobe transmission T were measured using a phase-sensitivetechnique. For the transient near-IR/visible spectroscopymeasurements, we used white light super-continuum as probe,spanning the spectral range from 1.15 to 2.5 eV; the pumpmodulation frequency here was synchronized with the laserrepetition rate. The transient photomodulation signal �T /T
is positive for photoinduced absorption (PA) and negative forphoto-bleaching and stimulated emission. Here, �T (t)/T wasmeasured using a computer-controlled translation stage up to2 ns, with time resolution of ∼150 fs set by the pump/probecross-correlation. The �T (0)/T spectra from the two lasersystems were normalized to each other at several wavelengthsin the near-IR/visible spectral range.26
Since some photoexcitations may live longer than the timeinterval between successive pulses, then a background PA maybe formed. An advantage of the mid-IR laser system is thatthe background PA spectrum can be readily measured usingthe same pump/probe set up as for the ultrafast response. Thiswas achieved by measuring the PA signal at t < 0 since theprobe pulse in this situation arrives before the pump pulse andtherefore is affected by the leftover photoexcitations in thefilm that survive in between successive pulses.27 Recall thatthe background PA is modulated at a frequency of 40 kHzand thus is sensitive to long-lived photoexcitations in the filmhaving lifetime longer than ∼1/f (=25 μsec).
The bulk heterojunction OPV solar cell devices werecomposed of a transparent indium tin oxide (ITO) anode; aspin-cast polyethylenedioxythiophene/polystyrene sulphonate(PEDOT/PSS) hole transport layer; an active material layerspin-cast from a blend of a P3HT donor and a PCBMacceptor; and capped with an LiF/Al cathode. The ITO-coatedglass substrates (Delta Technology, CB-50IN) were cleanedby ultrasonic treatment and oxygen plasma treatment. ThePEDOT/PSS (Clevios, P VP AI 4083) layer was spin-castat 5000 RPM for 20 s at ambient conditions and transferredto a nitrogen-filled glovebox (O2 < 1 ppm) for annealing at120 ◦C for 30 min. The organic blend comprised of P3HT(Plextronics, Plexcore OS 2100) and PCBM (purity > 99.9%)were prepared at a weight ratio of 1.2:1 in 1,2-dichlorobenzenesolution that was heated at 50 ◦C for 30 min and stirredovernight. The device active layer was spin-cast from thesolution blend at 400 RPM for 6 min and annealed at 150 ◦Cfor 30 min; the device active area was 2 × 2.5 mm. Thefabrication was completed by thermally evaporating a 1-nm-thick film of LiF layer followed by a 100-nm-thick film of Al.Finally, the device was encapsulated under a cover glass usingUV-curable optical adhesive (Norland, NOA 61). The deviceI-V characteristics under illumination were measured using aKeithley 236 Source-Measure unit. The light intensity of thesolar simulator composed of a xenon lamp and an AM1.5Gfilter was calibrated at 100 mW/cm2 using a precalibratedsilicon photovoltaic cell. The OPV device output current wasmeasured using a phase sensitive lock-in technique.
In order to identify photogenerated polarons in the photo-modulation spectrum, we also measured the doping-induced
205206-2
TWO-STEP CHARGE PHOTOGENERATION DYNAMICS IN . . . PHYSICAL REVIEW B 85, 205206 (2012)
a-
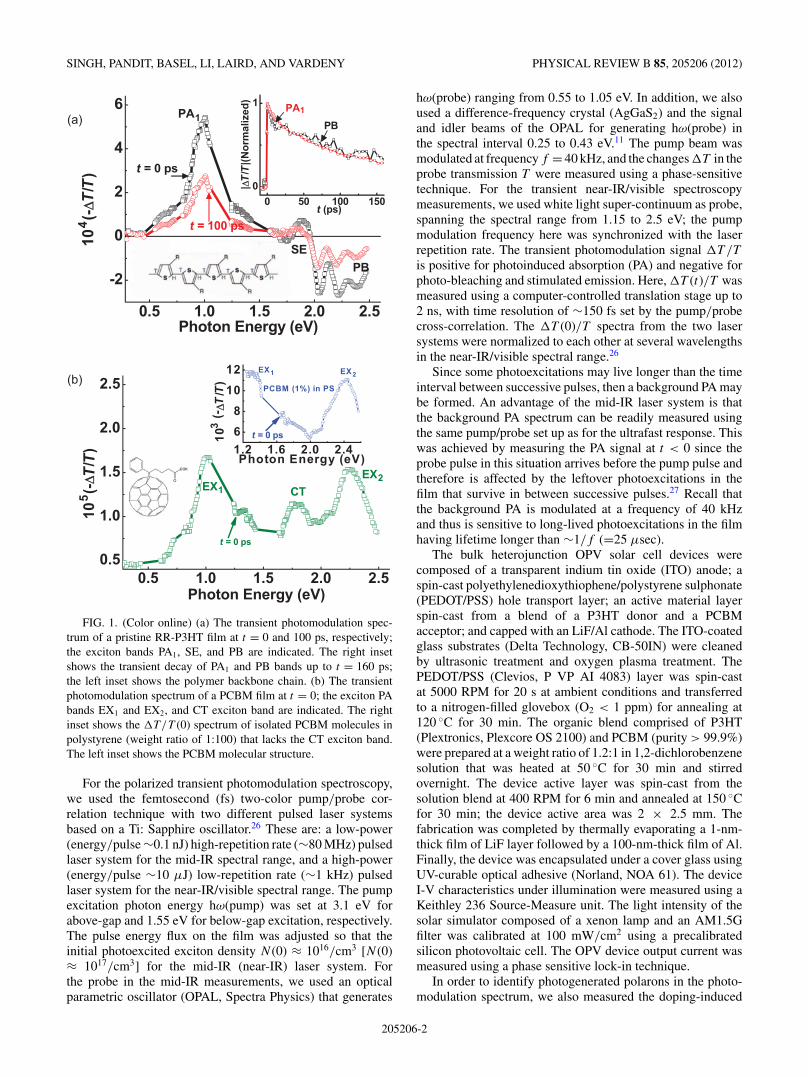
FIG. 2. (Color online) The XRD pattern from RRa-P3HT/PCBM(red) and RRa-P3HT/PCBM (blue), where the P3HT bands [100],[200], and [300] and PCBM band [311] are assigned; the inset focuseson the PCBM band.
absorption spectrum in P3HT, where a thin polymer filmwas exposed to low-pressure iodine gas for ∼10 s. Thedoping-induced absorption spectrum was then obtained bysubtracting the optical density of the pristine polymer film fromthat of the doped film, as shown in the Fig. 3(a) inset. It is seenthat the doping-induced absorption spectrum in RR-P3HT (andRRa-P3HT) is dominated by two absorption bands, namely P1
and P2 that peak at 0.1 and 1.8 eV, respectively,28 which aredue to delocalized hole-polarons on the polymer chains.
We first measured �T (t)/T spectra of pristine polymerand fullerene films (Fig. 1). The �T (0)/T spectrum ofpristine RR-P3HT film [Fig 1(a)] is dominated by a singlePA1 band at 1 eV followed by photo-bleaching above 1.97eV and a small stimulated emission band at 1.75 eV, whichattests to the excellent quality of the RR-P3HT polymerused here.13 These three spectral features originate fromphotogenerated excitons since they decay together [Fig. 1(a)right inset] with an exponential time constant τ0 = 70 ps.No photogenerated polarons of which PA peaks at 0.1 and1.8 eV [see Fig. 3(a) inset] are observed here. Figure 1(b)shows the �T (0)/T spectrum of pristine PCBM film. It isdominated by two PA bands, namely EX1 and EX2 at 1.0 and2.25 eV, respectively, that are due to photogenerated excitons.A third PA band, CT at 1.75 eV, originates from charge-transferexcitons in the fullerene film since it does not exist in thephotomodulation spectrum of isolated PCBM molecules inpolystyrene [Fig. 1(b) right inset]. No photogenerated polaronsof which PA peaks at 1.15 eV29,30 are discerned.
To better understand the transient PA spectra in thepolymer/fullerene blends, we measured the x-ray diffraction(XRD) pattern from the RRa- and RR-P3HT/PCBM blendfilms (Fig. 2) using the CuKα x-ray line at λ = 0.154 nm. TheXRD pattern of RR-P3HT/PCBM contains a prominent Braggband at 2θ[100] = 5.3◦ and its harmonics at 2θ = 10.7◦ and16◦, respectively, that originate from the P3HT nanocrystallinedomains in the film;31 as well as a smaller Bragg band at2θ[311] = 19.3◦ that originates from the PCBM nanocrystallinedomains in the blend.32 We therefore conclude that theannealed RR-P3HT/PCBM blend film contains separate donorand acceptor crystalline domains. We may estimate the averagenanocrystalline domain size D from the full width at half
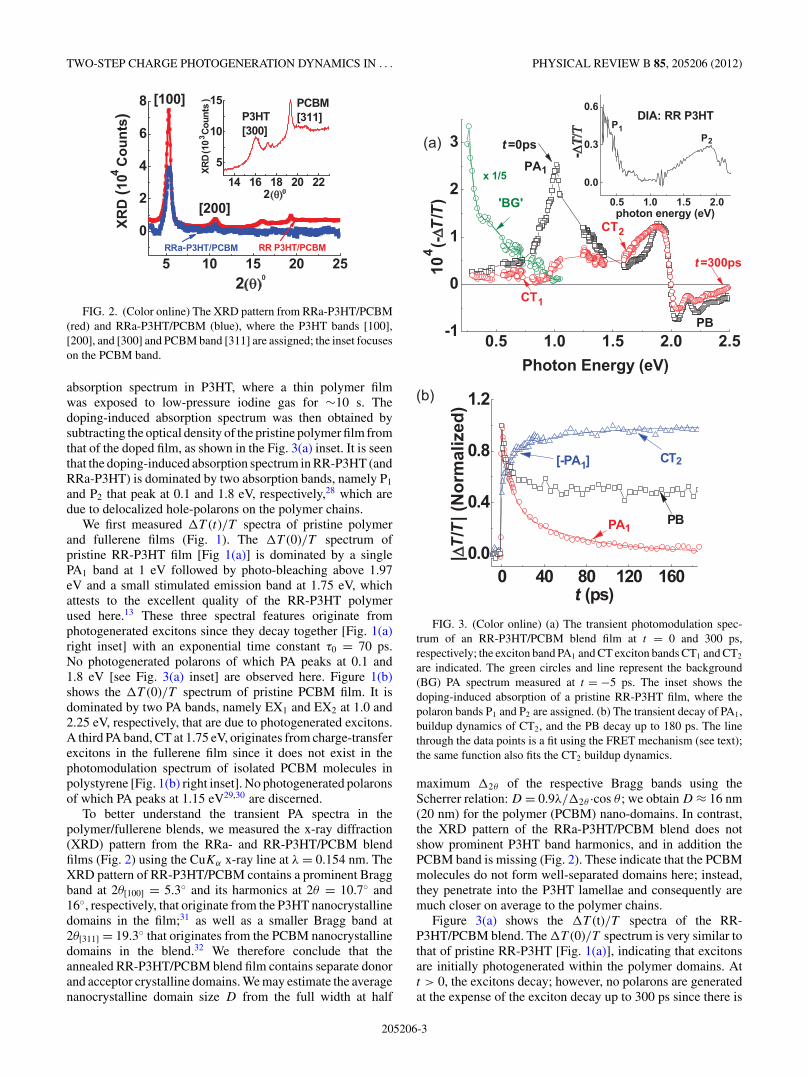
FIG. 3. (Color online) (a) The transient photomodulation spec-trum of an RR-P3HT/PCBM blend film at t = 0 and 300 ps,respectively; the exciton band PA1 and CT exciton bands CT1 and CT2
are indicated. The green circles and line represent the background(BG) PA spectrum measured at t = −5 ps. The inset shows thedoping-induced absorption of a pristine RR-P3HT film, where thepolaron bands P1 and P2 are assigned. (b) The transient decay of PA1,buildup dynamics of CT2, and the PB decay up to 180 ps. The linethrough the data points is a fit using the FRET mechanism (see text);the same function also fits the CT2 buildup dynamics.
maximum �2θ of the respective Bragg bands using theScherrer relation: D = 0.9λ/�2θ ·cos θ ; we obtain D ≈ 16 nm(20 nm) for the polymer (PCBM) nano-domains. In contrast,the XRD pattern of the RRa-P3HT/PCBM blend does notshow prominent P3HT band harmonics, and in addition thePCBM band is missing (Fig. 2). These indicate that the PCBMmolecules do not form well-separated domains here; instead,they penetrate into the P3HT lamellae and consequently aremuch closer on average to the polymer chains.
Figure 3(a) shows the �T (t)/T spectra of the RR-P3HT/PCBM blend. The �T (0)/T spectrum is very similar tothat of pristine RR-P3HT [Fig. 1(a)], indicating that excitonsare initially photogenerated within the polymer domains. Att > 0, the excitons decay; however, no polarons are generatedat the expense of the exciton decay up to 300 ps since there is
205206-3
SINGH, PANDIT, BASEL, LI, LAIRD, AND VARDENY PHYSICAL REVIEW B 85, 205206 (2012)
no PA buildup at low hω(probe), where the polaron P1 banddominates the absorption spectrum [as seen in the Fig. 3(a)inset]. We thus conclude that the photogenerated excitonsin the polymer domains decay into a new state that is notseparated free polarons. This new state must be related with theD-A interfaces in the films since the excitons do not form sucha state in the pristine polymer, and we thus propose that is a CTexciton at the D-A interface. In contrast, the background PAspectrum in the mid-IR [Fig. 3(a)] is very similar to the P1 bandin the polaron doping-induced absorption spectrum [Fig. 3(a)inset], showing that charge polarons are indeed photogeneratedin this RR-P3HT/PCBM film but at later time, in agreementwith the high solar cells efficiency based on this blend.13 Wethus conclude that the charge photogeneration process in theblend proceeds in two stages.5,16 The first stage is excitontrapping in CT states at the D-A interfaces followed by amuch slower exciton dissociation into free polarons in the Dand A domains at t � 2 ns (=the time limit of our translationstage).
The exciton decay dynamics in the blend are much fasterthan in the pristine polymer [see PA1 decays in Figs. 3(a) and1(a)]. The shorter lifetime in the blend is related to the excitondynamics towards the D-A interfaces, and therefore we studiedthe PA1 decay kinetics in more detail. Here, PA1 decay cannotbe fit with a single or a few exponential decay functions;nor can it be fit using a diffusion model ∼ (1 + t/τ )−1.Alternatively, PA1 decay can be fit using multiple power-lawdecays that originate from a Forster resonant energy transfer(FRET) into the CT exciton,33 averaged over the exciton initialdistance from the D-A interface (see the Appendix). Thismodel yields the following time-dependent surviving excitondensity N (t) in the polymer nano-grains:
N (t)
N (0)= exp
(− t
τ0
) [m1 + m2
(C1t
1/2 − C2t1/3 + C3t
1/6)]
,
(1)
where τ0 = 70 ps is the natural exciton lifetime in RR-P3HTthat is obtained from the PA1 dynamics of Fig. 1; m1 andm2 are fitting parameters; and the C constants are given bythe relations: C1 = 0.2u−3, C2 = 0.66u−2 and C3 = 0.54/u,where u = D/2R0 is the parameter ratio of the grain size D
to twice the FRET radius R0, which was measured before tobe between 3 and 9 nm.34 Using R0 = 6 nm and D = 16 nmfrom the XRD studies, we obtain u = 1.3. Subsequently, theexcellent fit to the PA1 decay seen in Fig. 3(b) was obtainedusing m1 = 0.14 and m2 = 7.
In support of the CT intermediate role in the chargephotogeneration process in the blend, Fig. 3(a) also showsthat PA buildup indeed occurs in both mid-IR and near-IR35
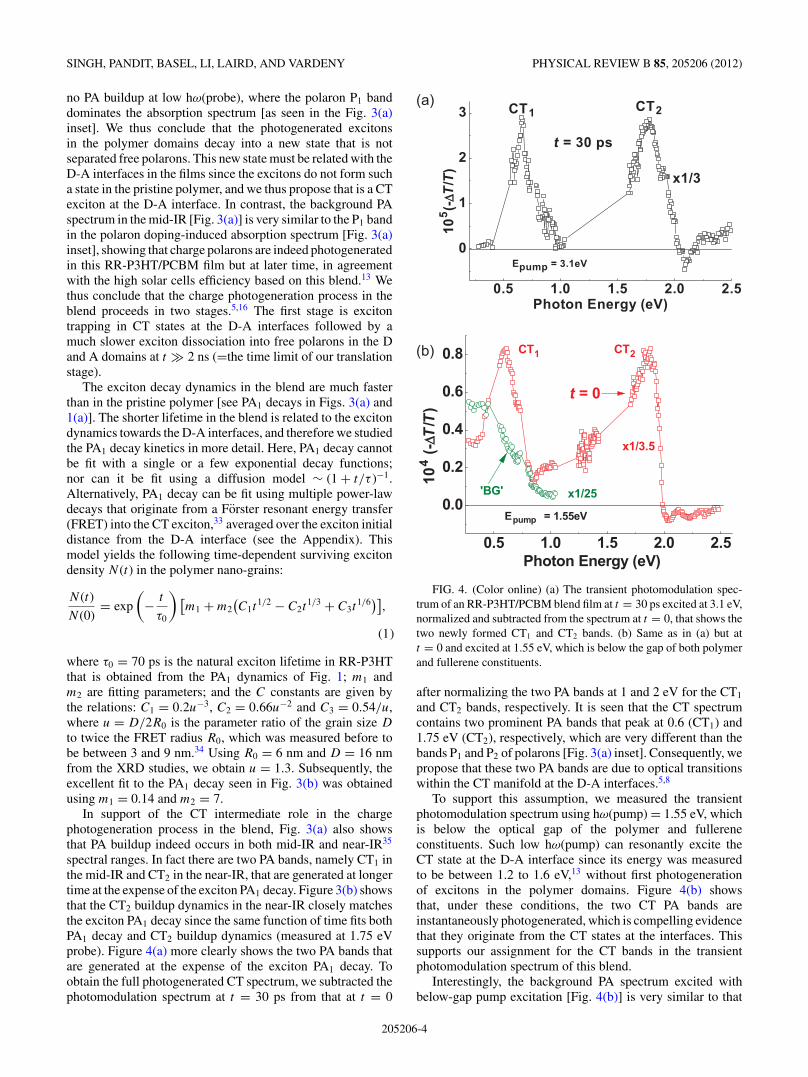
spectral ranges. In fact there are two PA bands, namely CT1 inthe mid-IR and CT2 in the near-IR, that are generated at longertime at the expense of the exciton PA1 decay. Figure 3(b) showsthat the CT2 buildup dynamics in the near-IR closely matchesthe exciton PA1 decay since the same function of time fits bothPA1 decay and CT2 buildup dynamics (measured at 1.75 eVprobe). Figure 4(a) more clearly shows the two PA bands thatare generated at the expense of the exciton PA1 decay. Toobtain the full photogenerated CT spectrum, we subtracted thephotomodulation spectrum at t = 30 ps from that at t = 0
FIG. 4. (Color online) (a) The transient photomodulation spec-trum of an RR-P3HT/PCBM blend film at t = 30 ps excited at 3.1 eV,normalized and subtracted from the spectrum at t = 0, that shows thetwo newly formed CT1 and CT2 bands. (b) Same as in (a) but att = 0 and excited at 1.55 eV, which is below the gap of both polymerand fullerene constituents.
after normalizing the two PA bands at 1 and 2 eV for the CT1
and CT2 bands, respectively. It is seen that the CT spectrumcontains two prominent PA bands that peak at 0.6 (CT1) and1.75 eV (CT2), respectively, which are very different than thebands P1 and P2 of polarons [Fig. 3(a) inset]. Consequently, wepropose that these two PA bands are due to optical transitionswithin the CT manifold at the D-A interfaces.5,8
To support this assumption, we measured the transientphotomodulation spectrum using hω(pump) = 1.55 eV, whichis below the optical gap of the polymer and fullereneconstituents. Such low hω(pump) can resonantly excite theCT state at the D-A interface since its energy was measuredto be between 1.2 to 1.6 eV,13 without first photogenerationof excitons in the polymer domains. Figure 4(b) showsthat, under these conditions, the two CT PA bands areinstantaneously photogenerated, which is compelling evidencethat they originate from the CT states at the interfaces. Thissupports our assignment for the CT bands in the transientphotomodulation spectrum of this blend.
Interestingly, the background PA spectrum excited withbelow-gap pump excitation [Fig. 4(b)] is very similar to that
205206-4
TWO-STEP CHARGE PHOTOGENERATION DYNAMICS IN . . . PHYSICAL REVIEW B 85, 205206 (2012)
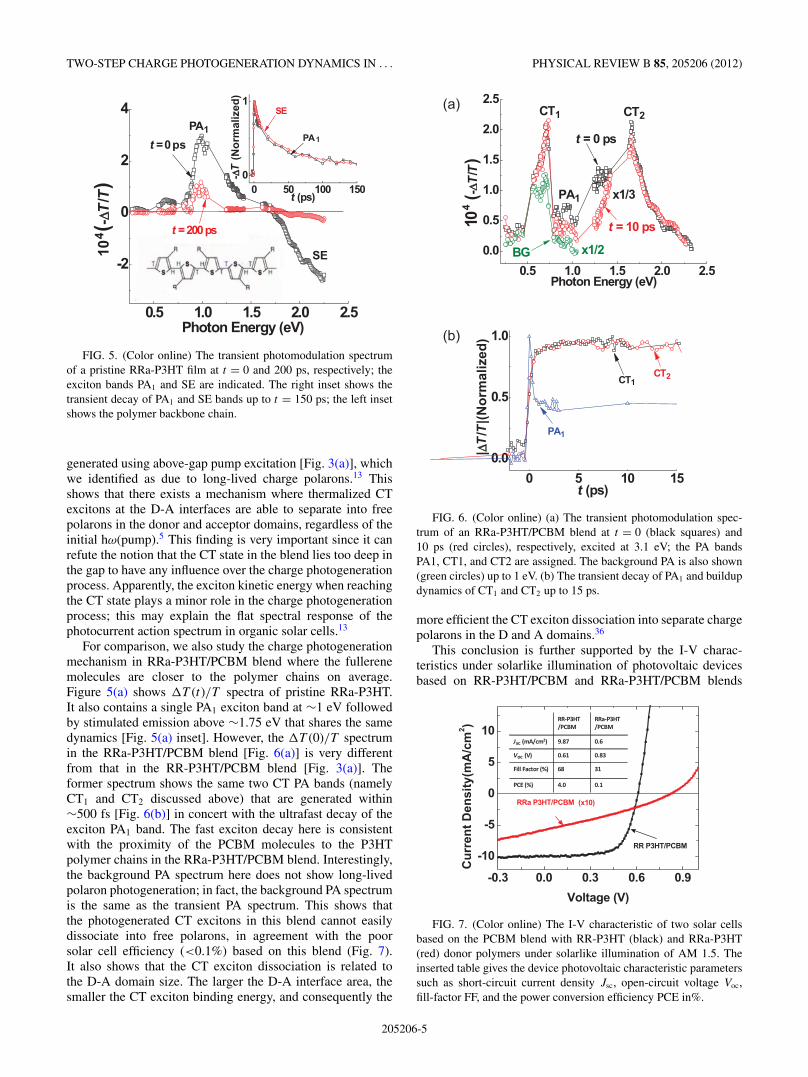
FIG. 5. (Color online) The transient photomodulation spectrumof a pristine RRa-P3HT film at t = 0 and 200 ps, respectively; theexciton bands PA1 and SE are indicated. The right inset shows thetransient decay of PA1 and SE bands up to t = 150 ps; the left insetshows the polymer backbone chain.
generated using above-gap pump excitation [Fig. 3(a)], whichwe identified as due to long-lived charge polarons.13 Thisshows that there exists a mechanism where thermalized CTexcitons at the D-A interfaces are able to separate into freepolarons in the donor and acceptor domains, regardless of theinitial hω(pump).5 This finding is very important since it canrefute the notion that the CT state in the blend lies too deep inthe gap to have any influence over the charge photogenerationprocess. Apparently, the exciton kinetic energy when reachingthe CT state plays a minor role in the charge photogenerationprocess; this may explain the flat spectral response of thephotocurrent action spectrum in organic solar cells.13
For comparison, we also study the charge photogenerationmechanism in RRa-P3HT/PCBM blend where the fullerenemolecules are closer to the polymer chains on average.Figure 5(a) shows �T (t)/T spectra of pristine RRa-P3HT.It also contains a single PA1 exciton band at ∼1 eV followedby stimulated emission above ∼1.75 eV that shares the samedynamics [Fig. 5(a) inset]. However, the �T (0)/T spectrumin the RRa-P3HT/PCBM blend [Fig. 6(a)] is very differentfrom that in the RR-P3HT/PCBM blend [Fig. 3(a)]. Theformer spectrum shows the same two CT PA bands (namelyCT1 and CT2 discussed above) that are generated within∼500 fs [Fig. 6(b)] in concert with the ultrafast decay of theexciton PA1 band. The fast exciton decay here is consistentwith the proximity of the PCBM molecules to the P3HTpolymer chains in the RRa-P3HT/PCBM blend. Interestingly,the background PA spectrum here does not show long-livedpolaron photogeneration; in fact, the background PA spectrumis the same as the transient PA spectrum. This shows thatthe photogenerated CT excitons in this blend cannot easilydissociate into free polarons, in agreement with the poorsolar cell efficiency (<0.1%) based on this blend (Fig. 7).It also shows that the CT exciton dissociation is related tothe D-A domain size. The larger the D-A interface area, thesmaller the CT exciton binding energy, and consequently the
FIG. 6. (Color online) (a) The transient photomodulation spec-trum of an RRa-P3HT/PCBM blend at t = 0 (black squares) and10 ps (red circles), respectively, excited at 3.1 eV; the PA bandsPA1, CT1, and CT2 are assigned. The background PA is also shown(green circles) up to 1 eV. (b) The transient decay of PA1 and buildupdynamics of CT1 and CT2 up to 15 ps.
more efficient the CT exciton dissociation into separate chargepolarons in the D and A domains.36
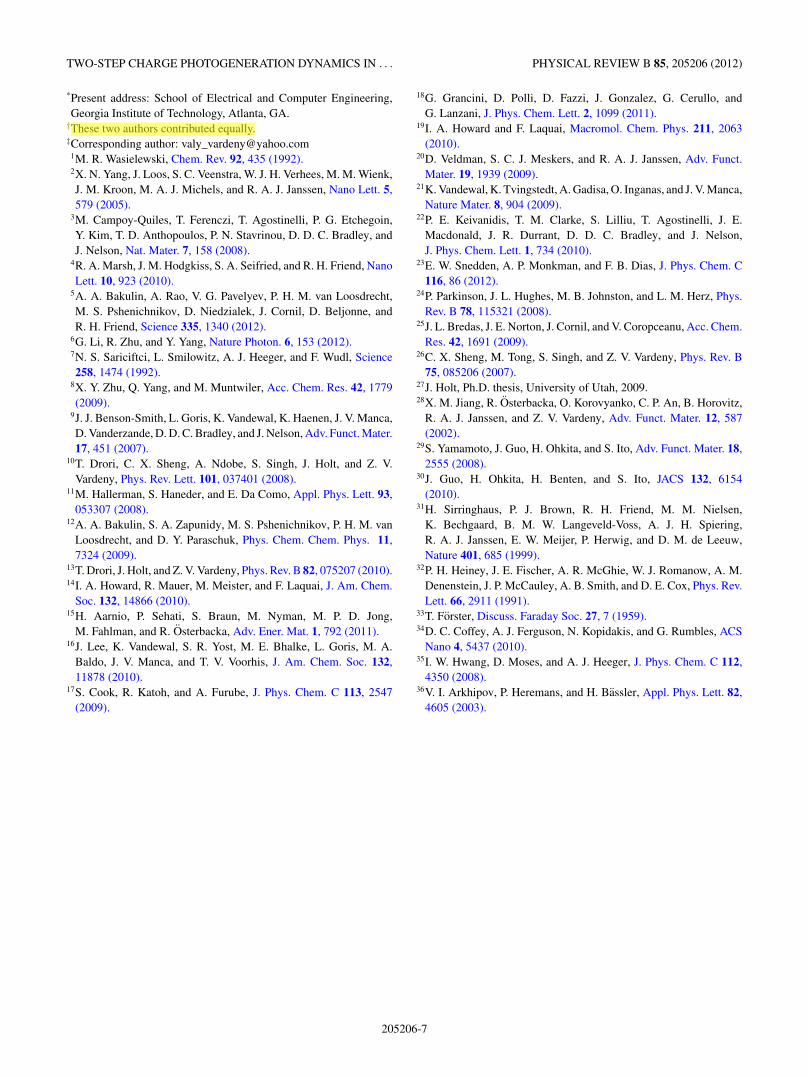
This conclusion is further supported by the I-V charac-teristics under solarlike illumination of photovoltaic devicesbased on RR-P3HT/PCBM and RRa-P3HT/PCBM blends
FIG. 7. (Color online) The I-V characteristic of two solar cellsbased on the PCBM blend with RR-P3HT (black) and RRa-P3HT(red) donor polymers under solarlike illumination of AM 1.5. Theinserted table gives the device photovoltaic characteristic parameterssuch as short-circuit current density Jsc, open-circuit voltage Voc,fill-factor FF, and the power conversion efficiency PCE in%.
205206-5
SINGH, PANDIT, BASEL, LI, LAIRD, AND VARDENY PHYSICAL REVIEW B 85, 205206 (2012)
using an AM1.5 filter as shown in Fig. 7. It is seen that thepower conversion efficiency and short circuit current of theRR-P3HT/PCBM blend are more than an order of magnitudehigher than that of the RRa-P3HT/PCBM blend.
In summary, using the ps transient pump/probe photo-modulation technique in P3HT/PCBM blends with typicalD-A bulk heterojunction morphology, we demonstrated thatthe charge photogeneration mechanism in organic solar cellsoccurs in two steps. First, the photogenerated excitons in thepolymer domains reach the D-A interfaces within a few pstime depending on the domain size, where they form CTexcitons. This process is followed by CT exciton dissociationinto free charged polarons in the D and A domains in thens-μsec timescale, which remains to be observed. The CTexciton dissociation depends on the CT binding energy, whichis significantly lower for larger D-A interface area. Our resultsemphasize the importance of the D-A domain size in organicsolar cells based on bulk heterojunction morphology.
ACKNOWLEDGMENTS
We acknowledge the assistance of Y. Zhang in measuringthe XRD pattern. This work was supported in part by the DOEGrant No. DE-FG02-04ER46109 at the University of Utah.
APPENDIX: DERIVATION OF FORSTER ENERGYTRANSFER DYNAMICS FOR EXCITONS IN THE
POLYMER GRAINS
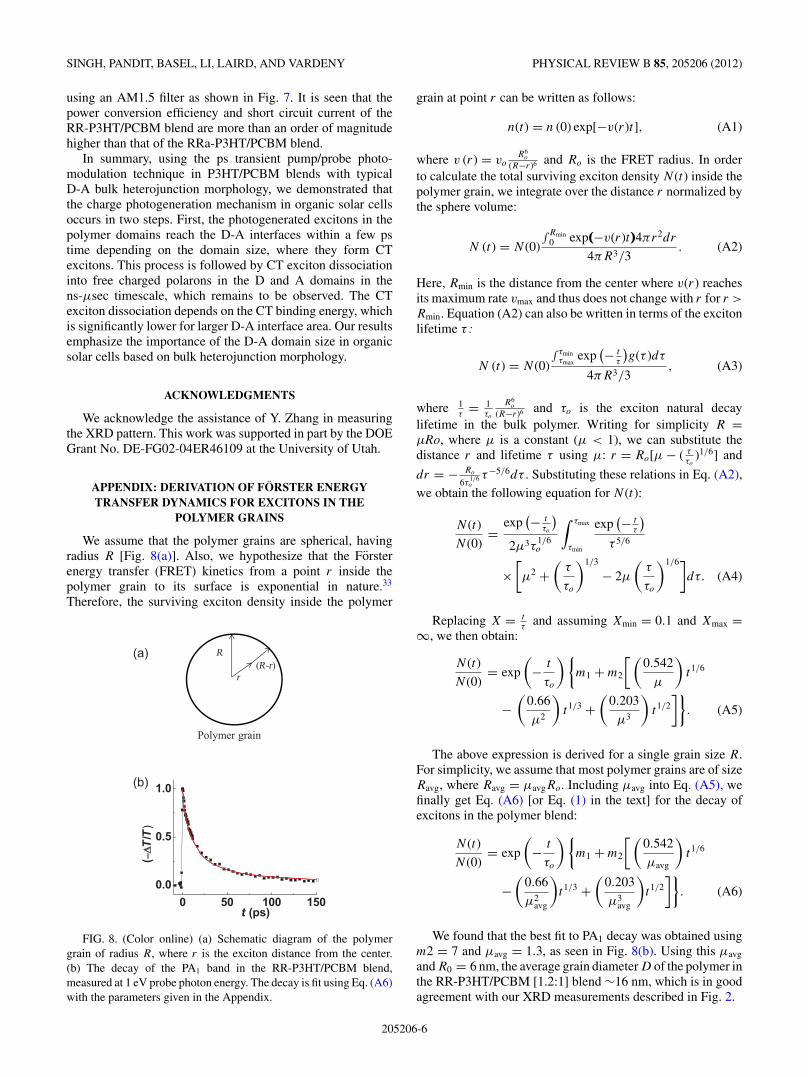
We assume that the polymer grains are spherical, havingradius R [Fig. 8(a)]. Also, we hypothesize that the Forsterenergy transfer (FRET) kinetics from a point r inside thepolymer grain to its surface is exponential in nature.33
Therefore, the surviving exciton density inside the polymer
FIG. 8. (Color online) (a) Schematic diagram of the polymergrain of radius R, where r is the exciton distance from the center.(b) The decay of the PA1 band in the RR-P3HT/PCBM blend,measured at 1 eV probe photon energy. The decay is fit using Eq. (A6)with the parameters given in the Appendix.
grain at point r can be written as follows:
n(t) = n (0) exp[−v(r)t], (A1)
where v (r) = voR6
o
(R−r)6 and Ro is the FRET radius. In orderto calculate the total surviving exciton density N (t) inside thepolymer grain, we integrate over the distance r normalized bythe sphere volume:
N (t) = N (0)∫Rmin
0 exp(−v(r)t)4πr2dr
4πR3/3. (A2)
Here, Rmin is the distance from the center where v(r) reachesits maximum rate vmax and thus does not change with r for r >
Rmin. Equation (A2) can also be written in terms of the excitonlifetime τ :
N (t) = N (0)∫τmin
τmaxexp
(− tτ
)g(τ )dτ
4πR3/3, (A3)
where 1τ
= 1τo
R6o
(R−r)6 and τo is the exciton natural decaylifetime in the bulk polymer. Writing for simplicity R =μRo, where μ is a constant (μ < 1), we can substitute thedistance r and lifetime τ using μ: r = Ro[μ − ( τ
τo)1/6] and
dr = − Ro
6τ1/6o
τ−5/6dτ . Substituting these relations in Eq. (A2),we obtain the following equation for N (t):
N (t)
N (0)=
exp(− t
τo
)2μ3τ
1/6o
∫ τmax
τmin
exp(− t
τ
)τ 5/6
×[μ2 +
(τ
τo
)1/3
− 2μ
(τ
τo
)1/6]dτ. (A4)
Replacing X = tτ
and assuming Xmin = 0.1 and Xmax =∞, we then obtain:
N (t)
N (0)= exp
(− t
τo
){m1 + m2
[(0.542
μ
)t1/6
−(
0.66
μ2
)t1/3 +
(0.203
μ3
)t1/2
]}. (A5)
The above expression is derived for a single grain size R.For simplicity, we assume that most polymer grains are of sizeRavg, where Ravg = μavgRo. Including μavg into Eq. (A5), wefinally get Eq. (A6) [or Eq. (1) in the text] for the decay ofexcitons in the polymer blend:
N (t)
N (0)= exp
(− t
τo
){m1 + m2
[(0.542
μavg
)t1/6
−(
0.66
μ2avg
)t1/3 +
(0.203
μ3avg
)t1/2
]}. (A6)
We found that the best fit to PA1 decay was obtained usingm2 = 7 and μavg = 1.3, as seen in Fig. 8(b). Using this μavg
and R0 = 6 nm, the average grain diameter D of the polymer inthe RR-P3HT/PCBM [1.2:1] blend ∼16 nm, which is in goodagreement with our XRD measurements described in Fig. 2.
205206-6
TWO-STEP CHARGE PHOTOGENERATION DYNAMICS IN . . . PHYSICAL REVIEW B 85, 205206 (2012)
*Present address: School of Electrical and Computer Engineering,Georgia Institute of Technology, Atlanta, GA.
†These two authors contributed equally.‡Corresponding author: [email protected]. R. Wasielewski, Chem. Rev. 92, 435 (1992).2X. N. Yang, J. Loos, S. C. Veenstra, W. J. H. Verhees, M. M. Wienk,J. M. Kroon, M. A. J. Michels, and R. A. J. Janssen, Nano Lett. 5,579 (2005).
3M. Campoy-Quiles, T. Ferenczi, T. Agostinelli, P. G. Etchegoin,Y. Kim, T. D. Anthopoulos, P. N. Stavrinou, D. D. C. Bradley, andJ. Nelson, Nat. Mater. 7, 158 (2008).
4R. A. Marsh, J. M. Hodgkiss, S. A. Seifried, and R. H. Friend, NanoLett. 10, 923 (2010).
5A. A. Bakulin, A. Rao, V. G. Pavelyev, P. H. M. van Loosdrecht,M. S. Pshenichnikov, D. Niedzialek, J. Cornil, D. Beljonne, andR. H. Friend, Science 335, 1340 (2012).
6G. Li, R. Zhu, and Y. Yang, Nature Photon. 6, 153 (2012).7N. S. Sariciftci, L. Smilowitz, A. J. Heeger, and F. Wudl, Science258, 1474 (1992).
8X. Y. Zhu, Q. Yang, and M. Muntwiler, Acc. Chem. Res. 42, 1779(2009).
9J. J. Benson-Smith, L. Goris, K. Vandewal, K. Haenen, J. V. Manca,D. Vanderzande, D. D. C. Bradley, and J. Nelson, Adv. Funct. Mater.17, 451 (2007).
10T. Drori, C. X. Sheng, A. Ndobe, S. Singh, J. Holt, and Z. V.Vardeny, Phys. Rev. Lett. 101, 037401 (2008).
11M. Hallerman, S. Haneder, and E. Da Como, Appl. Phys. Lett. 93,053307 (2008).
12A. A. Bakulin, S. A. Zapunidy, M. S. Pshenichnikov, P. H. M. vanLoosdrecht, and D. Y. Paraschuk, Phys. Chem. Chem. Phys. 11,7324 (2009).
13T. Drori, J. Holt, and Z. V. Vardeny, Phys. Rev. B 82, 075207 (2010).14I. A. Howard, R. Mauer, M. Meister, and F. Laquai, J. Am. Chem.
Soc. 132, 14866 (2010).15H. Aarnio, P. Sehati, S. Braun, M. Nyman, M. P. D. Jong,
M. Fahlman, and R. Osterbacka, Adv. Ener. Mat. 1, 792 (2011).16J. Lee, K. Vandewal, S. R. Yost, M. E. Bhalke, L. Goris, M. A.
Baldo, J. V. Manca, and T. V. Voorhis, J. Am. Chem. Soc. 132,11878 (2010).
17S. Cook, R. Katoh, and A. Furube, J. Phys. Chem. C 113, 2547(2009).
18G. Grancini, D. Polli, D. Fazzi, J. Gonzalez, G. Cerullo, andG. Lanzani, J. Phys. Chem. Lett. 2, 1099 (2011).
19I. A. Howard and F. Laquai, Macromol. Chem. Phys. 211, 2063(2010).
20D. Veldman, S. C. J. Meskers, and R. A. J. Janssen, Adv. Funct.Mater. 19, 1939 (2009).
21K. Vandewal, K. Tvingstedt, A. Gadisa, O. Inganas, and J. V. Manca,Nature Mater. 8, 904 (2009).
22P. E. Keivanidis, T. M. Clarke, S. Lilliu, T. Agostinelli, J. E.Macdonald, J. R. Durrant, D. D. C. Bradley, and J. Nelson,J. Phys. Chem. Lett. 1, 734 (2010).
23E. W. Snedden, A. P. Monkman, and F. B. Dias, J. Phys. Chem. C116, 86 (2012).
24P. Parkinson, J. L. Hughes, M. B. Johnston, and L. M. Herz, Phys.Rev. B 78, 115321 (2008).
25J. L. Bredas, J. E. Norton, J. Cornil, and V. Coropceanu, Acc. Chem.Res. 42, 1691 (2009).
26C. X. Sheng, M. Tong, S. Singh, and Z. V. Vardeny, Phys. Rev. B75, 085206 (2007).
27J. Holt, Ph.D. thesis, University of Utah, 2009.28X. M. Jiang, R. Osterbacka, O. Korovyanko, C. P. An, B. Horovitz,
R. A. J. Janssen, and Z. V. Vardeny, Adv. Funct. Mater. 12, 587(2002).
29S. Yamamoto, J. Guo, H. Ohkita, and S. Ito, Adv. Funct. Mater. 18,2555 (2008).
30J. Guo, H. Ohkita, H. Benten, and S. Ito, JACS 132, 6154(2010).
31H. Sirringhaus, P. J. Brown, R. H. Friend, M. M. Nielsen,K. Bechgaard, B. M. W. Langeveld-Voss, A. J. H. Spiering,R. A. J. Janssen, E. W. Meijer, P. Herwig, and D. M. de Leeuw,Nature 401, 685 (1999).
32P. H. Heiney, J. E. Fischer, A. R. McGhie, W. J. Romanow, A. M.Denenstein, J. P. McCauley, A. B. Smith, and D. E. Cox, Phys. Rev.Lett. 66, 2911 (1991).
33T. Forster, Discuss. Faraday Soc. 27, 7 (1959).34D. C. Coffey, A. J. Ferguson, N. Kopidakis, and G. Rumbles, ACS
Nano 4, 5437 (2010).35I. W. Hwang, D. Moses, and A. J. Heeger, J. Phys. Chem. C 112,
4350 (2008).36V. I. Arkhipov, P. Heremans, and H. Bassler, Appl. Phys. Lett. 82,
4605 (2003).
205206-7
bbpand01
Highlight
Related Documents