1 Two-photon excitation fluorescence imaging of the living juxtaglomerular apparatus János Peti-Peterdi 1,2 , Shigeru Morishima 1,3 , P. Darwin Bell 1,2 , and Yasunobu Okada 1,3 1 CREST, Japan Science and Technology Corporation , 2 Nephrology Research and Training Center, Department of Medicine, Division of Nephrology, University of Alabama at Birmingham, Birmingham, Alabama 35294, USA, and 3 Department of Cell Physiology, National Institute for Physiological Sciences, Okazaki 444-8585, Japan Running title: Multiphoton imaging of the JGA Corresponding author: Janos Peti-Peterdi 865 Sparks Center 1720 Seventh Avenue South Birmingham, AL 35294 Tel: (205)934-5783 Fax: (205)934-1147 Email:[email protected] Copyright 2002 by the American Physiological Society. AJP-Renal Articles in PresS. Published on January 28, 2002 as DOI 10.1152/ajprenal.00356.2001

Welcome message from author
This document is posted to help you gain knowledge. Please leave a comment to let me know what you think about it! Share it to your friends and learn new things together.
Transcript

1
Two-photon excitation fluorescence imaging of the
living juxtaglomerular apparatus
János Peti-Peterdi1,2, Shigeru Morishima1,3, P. Darwin Bell1,2, and Yasunobu Okada1,3
1CREST, Japan Science and Technology Corporation, 2Nephrology Research and Training
Center, Department of Medicine, Division of Nephrology, University of Alabama at Birmingham,
Birmingham, Alabama 35294, USA, and 3Department of Cell Physiology, National Institute for
Physiological Sciences, Okazaki 444-8585, Japan
Running title: Multiphoton imaging of the JGA
Corresponding author: Janos Peti-Peterdi 865 Sparks Center 1720 Seventh Avenue South Birmingham, AL 35294 Tel: (205)934-5783 Fax: (205)934-1147 Email:[email protected]
Copyright 2002 by the American Physiological Society.
AJP-Renal Articles in PresS. Published on January 28, 2002 as DOI 10.1152/ajprenal.00356.2001

2
ABSTRACT
Recently, multi-photon excitation fluorescence microscopy has been developed that offers important
advantages over confocal imaging, particularly for in vivo visualization of thick tissue samples. We used
this state-of-the-art technique to capture high quality images and study the function of otherwise
inaccessible cell types and complex cell structures of the juxtaglomerular apparatus (JGA) in living
preparations of the kidney. This structure has multiple cell types that exhibit a complex array of functions
that regulate the process of filtrate formation and renal hemodynamics. We now report, for the first time,
high-resolution 3D morphology and Z-sectioning through isolated, perfused kidney glomeruli, tubules,
and JGA. Time-series images show how alterations in tubular fluid composition causes striking changes
in single cell volume of the unique macula densa tubular epithelium in situ and how it also affects
glomerular filtration through alterations in associated structures within the JGA. In addition, calcium
imaging of the glomerulus and JGA demonstrates the utility of this system in capturing the complexity of
events and effects that are exerted by the specific hypertensive autacoid angiotensin II. This imaging
approach, to study isolated perfused live tissue with multi-photon microscopy may be applied in other
biological systems where multiple cell types form a functionally integrated syncytium.
KEY WORDS: multi-photon excitation; fluorescence microscopy; real-time imaging; juxtaglomerular
apparatus; macula densa

3
INTRODUCTION
The process of glomerular filtration and its control by local hemodynamics and the hormonal
milieu involves the complex interaction of a number of different cell types. Regulation of glomerular
filtration occurs at the juxtaglomerular apparatus (JGA), a complex structure that consists of a number
of different cell types including vascular smooth muscle cells, secretory granular epitheloid cells, vascular
endothelium, mesangial cells, and the macula densa (MD) tubular epithelial cells (2). MD cells, in the
distal nephron, function as specific sensor cells detecting changes in tubular fluid osmolality and/or salt
concentration via specific transport mechanisms (3), and sending signals through mesangial cells in the
JGA. These signals effect afferent arteriolar smooth muscle cells and renin granular cells to control
preglomerular vascular resistance (tubuloglomerular feedback, TGF) and renin release, respectively (1-
3, 13). It has been difficult to study these cellular interactions within the JGA, in living preparations,
given the constraints of existing technologies.
Recently, multi-photon excitation laser scanning fluorescence microscopy has been developed
(8, 14) that is particularly applicable for deep optical sectioning of living tissue samples. This technique
offers a tremendous increase in image resolution versus conventional confocal microscopy. Importantly,
it can optically section through an entire glomerulus (glomerular diameter ≈100 µm), thus, providing the
ability to directly study structures and cellular components that lie deep within the glomerulus. This new
technology was used in the present work to visualize the living perfused JGA.

4
MATERIALS AND METHODS
Isolated perfused afferent arteriole - cortical thick ascending limb preparations were used as
previously described (10, 11). Preparations were visualized using a two-photon laser scanning
fluorescence microscope (MRC1024MP, Bio-Rad, Japan) composed of a mode-locked titanium-
sapphire laser (Tsunami, Spectra Physics, Japan), and a photo-diode pump laser (Millennium, Spectra
Physics, Japan). Individual preparations were transferred to a thermoregulated Lucite chamber mounted
on a Zeiss Axiolab inverted microscope and visualized using a X40 water-immersion lens. The
fluorescent membrane staining dye TMA-DPH (Dojin Inc., Japan, 5 µM) or the Ca2+-sensitive
fluorophore indo-1AM (Molecular Probes, Eugene, OR, 5 µM) was added to the tubular and/or
arteriolar perfusion solutions for a loading period of 5 min in order to visualize cellular structures or
monitor [Ca2+]i. After loading, TMA-DPH or indo-1AM was removed. TMA-DPH fluorescence was
captured using a band-width emission filter at 430 ± 15 nm in response to a two-photon excitation
wavelength of 755 nm. Indo-1 fluorescence was measured at emission wavelengths of 453 and 405 nm
in response to two-photon excitation wavelength of 720 nm. A 405 ± 17 nm band pass filter, placed
prior to detection by a PMT (channel 2) was used to select indo-1 emissions which increase with
increasing Ca2+ concentrations, while a 453 ± 2 nm band pass filter, placed before a second PMT
(channel 1) was used to select isosbestic emissions of indo-1 which are independent of Ca2+
concentration. After ~15 min incubation with control perfusion solutions, fluorescence intensities for
both wavelengths stabilized at a constant level. Ratiometric (405 nm/453 nm) images were collected and
analyzed using a time series function of the LaserSharp1.2 software (Bio-Rad, Japan) with the most
frequently used application of cycle time 10 sec, for 30 cycles.
5
RESULTS
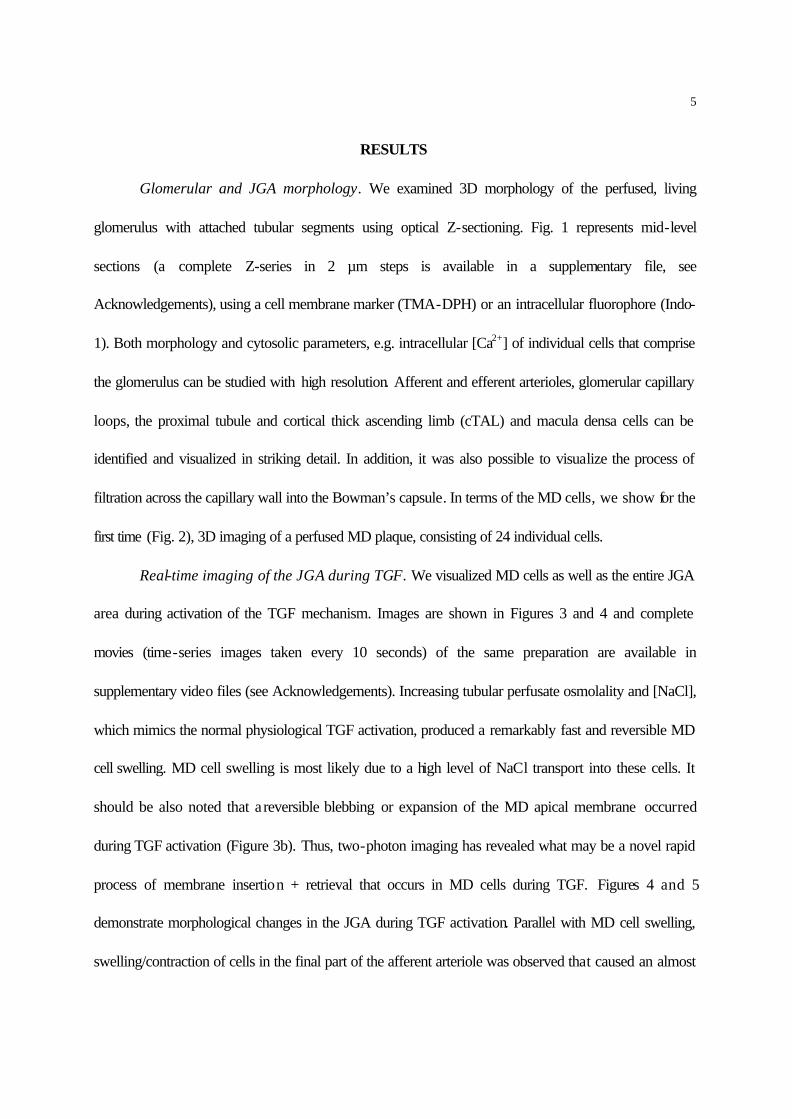
Glomerular and JGA morphology. We examined 3D morphology of the perfused, living
glomerulus with attached tubular segments using optical Z-sectioning. Fig. 1 represents mid-level
sections (a complete Z-series in 2 µm steps is available in a supplementary file, see
Acknowledgements), using a cell membrane marker (TMA-DPH) or an intracellular fluorophore (Indo-
1). Both morphology and cytosolic parameters, e.g. intracellular [Ca2+] of individual cells that comprise
the glomerulus can be studied with high resolution. Afferent and efferent arterioles, glomerular capillary
loops, the proximal tubule and cortical thick ascending limb (cTAL) and macula densa cells can be
identified and visualized in striking detail. In addition, it was also possible to visualize the process of
filtration across the capillary wall into the Bowman’s capsule. In terms of the MD cells, we show for the
first time (Fig. 2), 3D imaging of a perfused MD plaque, consisting of 24 individual cells.
Real-time imaging of the JGA during TGF. We visualized MD cells as well as the entire JGA
area during activation of the TGF mechanism. Images are shown in Figures 3 and 4 and complete
movies (time-series images taken every 10 seconds) of the same preparation are available in
supplementary video files (see Acknowledgements). Increasing tubular perfusate osmolality and [NaCl],
which mimics the normal physiological TGF activation, produced a remarkably fast and reversible MD
cell swelling. MD cell swelling is most likely due to a high level of NaCl transport into these cells. It
should be also noted that a reversible blebbing or expansion of the MD apical membrane occurred
during TGF activation (Figure 3b). Thus, two-photon imaging has revealed what may be a novel rapid
process of membrane insertion + retrieval that occurs in MD cells during TGF. Figures 4 and 5
demonstrate morphological changes in the JGA during TGF activation. Parallel with MD cell swelling,
swelling/contraction of cells in the final part of the afferent arteriole was observed that caused an almost
6
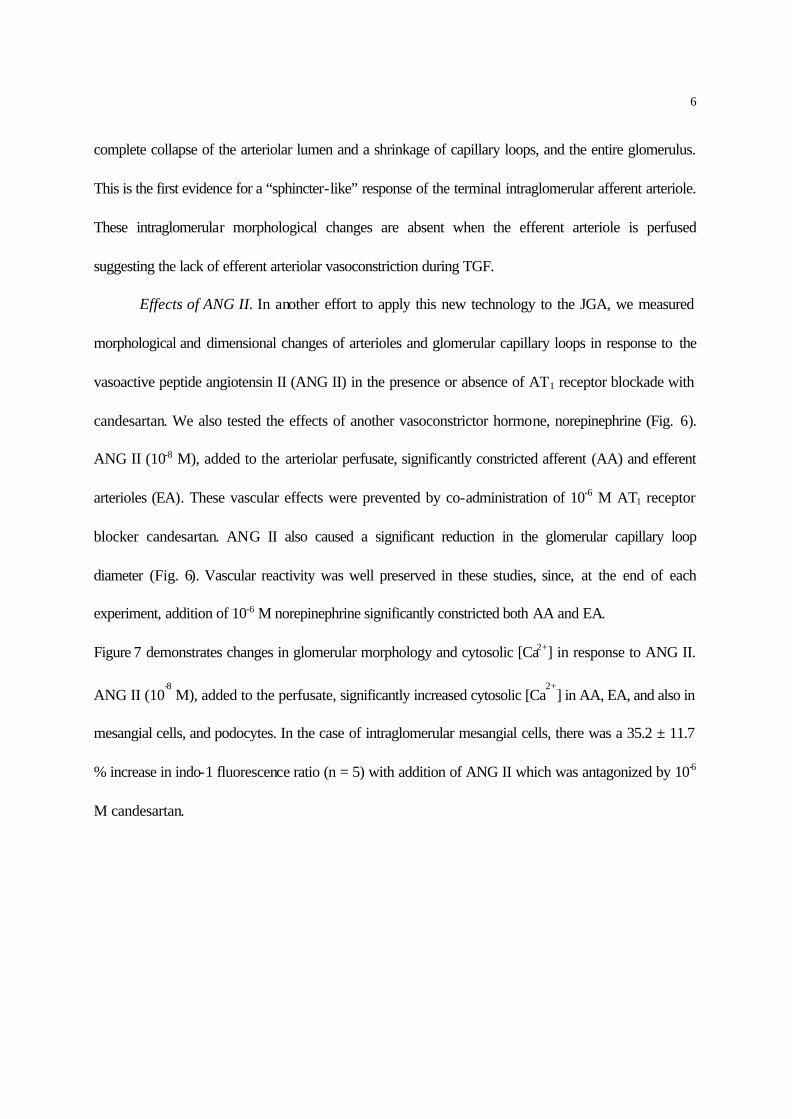
complete collapse of the arteriolar lumen and a shrinkage of capillary loops, and the entire glomerulus.
This is the first evidence for a “sphincter-like” response of the terminal intraglomerular afferent arteriole.
These intraglomerular morphological changes are absent when the efferent arteriole is perfused
suggesting the lack of efferent arteriolar vasoconstriction during TGF.
Effects of ANG II. In another effort to apply this new technology to the JGA, we measured
morphological and dimensional changes of arterioles and glomerular capillary loops in response to the
vasoactive peptide angiotensin II (ANG II) in the presence or absence of AT1 receptor blockade with
candesartan. We also tested the effects of another vasoconstrictor hormone, norepinephrine (Fig. 6).
ANG II (10-8 M), added to the arteriolar perfusate, significantly constricted afferent (AA) and efferent
arterioles (EA). These vascular effects were prevented by co-administration of 10-6 M AT1 receptor
blocker candesartan. ANG II also caused a significant reduction in the glomerular capillary loop
diameter (Fig. 6). Vascular reactivity was well preserved in these studies, since, at the end of each
experiment, addition of 10-6 M norepinephrine significantly constricted both AA and EA.
Figure 7 demonstrates changes in glomerular morphology and cytosolic [Ca2+] in response to ANG II.
ANG II (10-8 M), added to the perfusate, significantly increased cytosolic [Ca
2+] in AA, EA, and also in
mesangial cells, and podocytes. In the case of intraglomerular mesangial cells, there was a 35.2 ± 11.7
% increase in indo-1 fluorescence ratio (n = 5) with addition of ANG II which was antagonized by 10-6
M candesartan.

7
DISCUSSION
In spite of the key role that the JGA plays in regulation of renin release, tubuloglomerular
feedback (TGF), and control of glomerular filtration and blood flow (1, 2, 13), it has been very difficult
to examine single cells of the JGA even with conventional video microscopy (4-7). However, we now
report that with two-photon microscopy, one can visualize in real-time single cells of the living JGA and
glomerulus in striking detail.
With simultaneous increases in tubular osmolality and [NaCl], MD cells produced a significant
cell swelling. This was primarily due to an increase in cell height (Figure 3), consistent with an earlier
work (4). However, in contrast to the studies of Gonzalez et al (4) we found much larger increases in
MD cell volume. Remarkably, these cells are capable of almost doubling their initial cell volume within
30 seconds in spite of a concomitant increase in luminal osmolality. This cell swelling is primarily due to
NaCl entry into the cell, since the same change in the tubular perfusate osmolality at constant [NaCl] did
not produce any significant change in cell volume.
We also examined TGF activation on intraglomerular elements. For the first time, we observed
a sphincter-like constriction of the afferent arteriole in the terminal, intraglomerular segment of this
vessel. During TGF, the vascular diameter of this sphincter decreased to almost zero. Compared to this
strong vasoconstrictor response, we observed only minor changes in vascular diameter in more
proximal, extraglomerular segments of the afferent arteriole (Fig. 5). These studies indicate that the
principal effector site for TGF occurs in the terminal – intraglomerular afferent arteriole. These studies
also suggest that measurements of proximal afferent arteriolar diameter, as used by others (5, 12), may
not accurately reflect TGF responses. One can further speculate that the minor vasoconstriction seen in
the proximal afferent arteriole may be, at least in part, a myogenic response that is a consequence of the
8
terminal – TGF mediated sphincter activity. Also, the TGF-mediated reduction in intraglomerular
afferent arteriolar diameter is more consistent with the magnitude of in vivo TGF responses obtained
with micropuncture (9). Further studies are needed to identify the cell type in the afferent arteriole that
constituents this sphincter like structure.
In other experiments we tested the effects of ANG II on glomerular and JGA morphology, since
ANG II is a well known modulator of renal hemodynamics and kidney function (9). In addition to the
expected arteriolar vasoactive effects, this is, to our knowledge, the first study that demonstrates an
increase in mesangial cell calcium in the intact JGA. Thus these studies suggest that ANG II, perhaps
through activation of mesangial cells and podocytes, may modify the glomerular capillary filtration
surface area and that these effects are inhibited by AT1 receptor blockade with candesartan. This
approach has allowed us to identify a novel intraglomerular sphincter-like effector site for TGF. It has
also permitted us to begin to define the intraglomerular effects of ANG II.
In summary, multi-photon excitation fluorescence microscopy in combination with isolated perfused
JGA offers a powerful new tool to investigate the structural and cellular components that regulate the
process of glomerular filtrate formation and renal hemodynamics.

9
ACKNOWLEDGEMENTS
Supplementary digital video files are available on Am. J. Physiol. Renal Physiol.’s World-Wide Web
site at http://www.ajp-renal.com
We thank M. Ohara for excellent technical assistance, T. Okayasu and M. Yeager for secretarial help.
This work was supported by grants from CREST to Y.O., NIDDK (32032) to P.D.B., AHA SDG
(0230074N) and Aventis Pharma Deutschland GmbH to J.P.P. Janos Peti-Peterdi was a National
Kidney Foundation Postdoctoral Research Fellow during parts of these studies.
Correspondence and requests for materials should be addressed to J.P.P. (e-mail: [email protected]).
10
REFERENCES
1. Barajas L. Renin secretion: an anatomical basis for tubular control. Science 172: 485-487,
1971.
2. Barajas L. Anatomy of the juxtaglomerular apparatus. Am. J. Physiol. 237: F333-F343,
1979.
3. Bell PD, Lapointe JY. Characteristics of membrane transport processes of macula densa
cells. Clin. Exp. Pharmacol. Physiol. 24: 541-547, 1997.
4. González E, Salomonsson M, Müller-Suur C, and Persson AEG. Measurements of macula
densa cell volume changes in isolated and perfused rabbit cortical thick ascending limb. I.
Isosmotic and anisosmotic cell volume changes. Acta Physiol. Scand. 133: 149-157,
1988.
5. Ito S, Carretero OA. An in vitro approach to the study of macula densa-mediated
glomerular hemodynamics. Kidney Int. 38: 1206-1210, 1990.
6. Juncos LA, Garvin J, Carretero OA, and Ito S. Flow modulates myogenic responses in
isolated microperfused rabbit afferent arterioles via endothelium-derived nitric oxide. J.
Clin. Invest . 95: 2741-2748, 1995.
7. Kirk KL, Bell PD, Barfuss DW, and Ribadeneira M. Direct visualization of the isolated and
perfused macula densa. Am. J. Physiol. 248: F890-F894, 1985.
8. Maiti S, Shear JB, Williams RM, Zipfel WR and Webb WW. Measuring serotonin
distribution in live cells with three-photon excitation. Science 275: 530-532, 1997.
9. Navar LG et al. Paracrine regulation of the renal microcirculation. Physiol. Rev. 76: 425-
536, 1996.

11
10. Peti-Peterdi J et al. Macula densa Na+/H+ exchange activities mediated by apical NHE2
and basolateral NHE4 isoforms. Am. J. Physiol. Renal Physiol. 278: F452-F463, 2000.
11. Peti-Peterdi J, and Bell PD. Cytosolic [Ca2+] signaling pathway in macula densa cells. Am.
J. Physiol. Renal Physiol. 46: F472-F476, 1999.
12. Ren Y, Yu H, Wang H, Carretero OA, and Garvin JL. Nystatin and valinomycin induce
tubuloglomerular feedback Am. J. Physiol. Renal Physiol. 281: F1102-F1108, 2001.
13. Schnermann J, Briggs J. Function of the juxtaglomerular apparatus: local control of
glomerular hemodynamics. In: The Kidney, edited by Seldin DW, and Giebisch G. New
York: Raven, 1985, p. 669-697.
14. Xu C, Zipfel W, Shear JB, Williams RM, and Webb WW. Multiphoton fluorescence
excitation: New spectral windows for biological nonlinear microscopy. PNAS 93: 10763-
10768, 1996.
12
FIGURE LEGENDS
Figure 1. Visualization of various glomerular and JGA structures in situ. (a) Glomerulus perfused
through the afferent arteriole with attached cortical thick ascending limb (cTAL) and macula densa
(MD). Tissue was stained with TMA-DPH. Note the dilation of Bowman’s capsule and exit of
glomerular filtrate via the proximal tubule (PT). (b) Ca2+-image of the double-perfused afferent arteriole
(AA) and cTAL containing the MD. Tissue was loaded with Indo-1. Bar = 10 µm.
Figure 2. Sectioning of the MD (arrowheads) plaque stained with TMA-DPH in the longitudinal (a),
sagittal (b) and horizontal (c) planes. Bar = 10 µm.
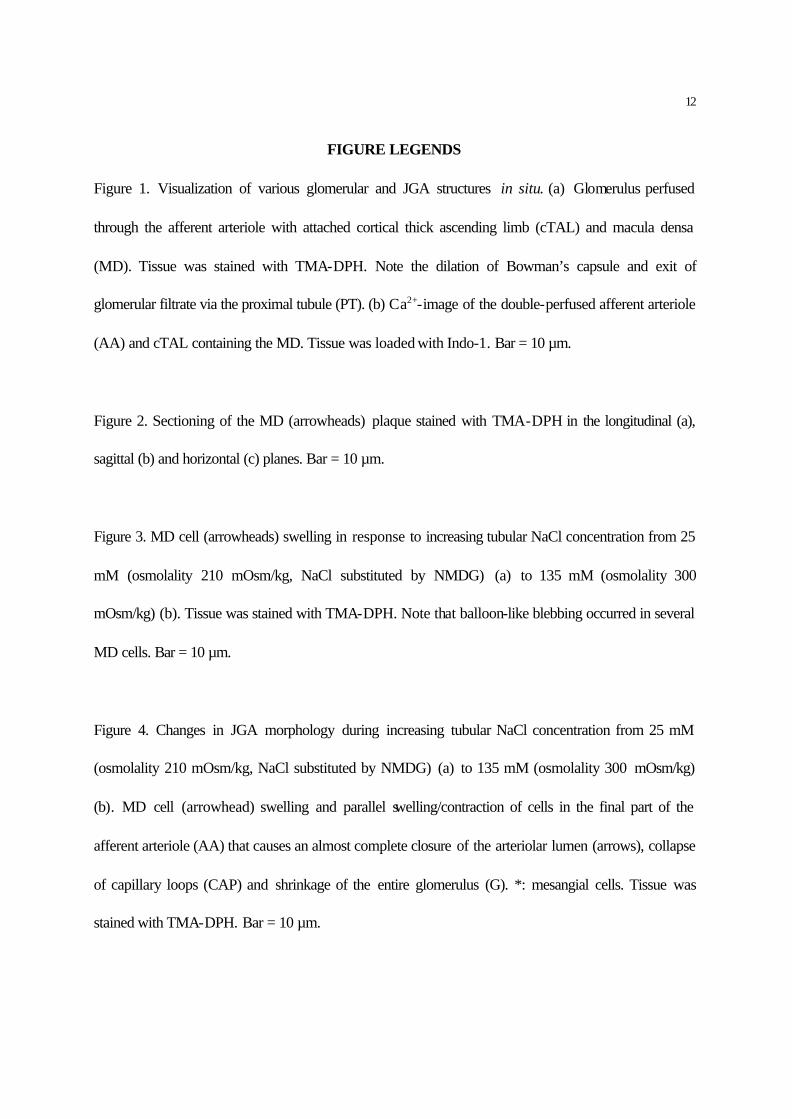
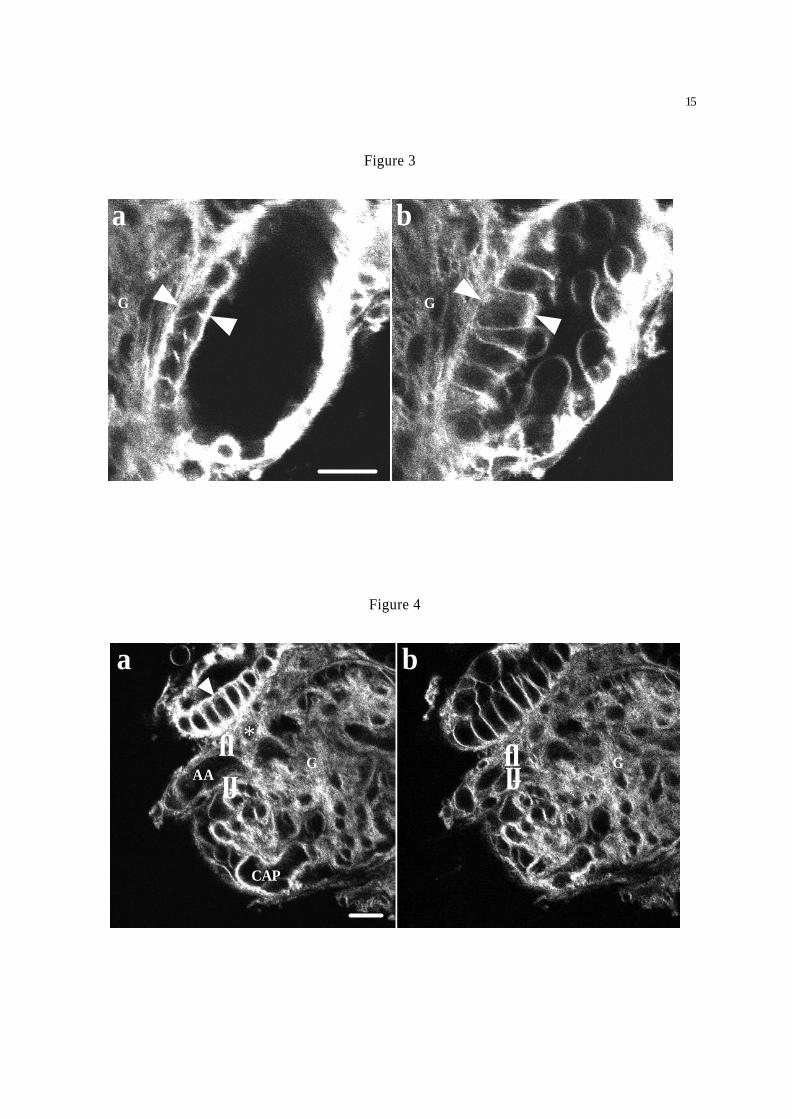
Figure 3. MD cell (arrowheads) swelling in response to increasing tubular NaCl concentration from 25
mM (osmolality 210 mOsm/kg, NaCl substituted by NMDG) (a) to 135 mM (osmolality 300
mOsm/kg) (b). Tissue was stained with TMA-DPH. Note that balloon-like blebbing occurred in several
MD cells. Bar = 10 µm.
Figure 4. Changes in JGA morphology during increasing tubular NaCl concentration from 25 mM
(osmolality 210 mOsm/kg, NaCl substituted by NMDG) (a) to 135 mM (osmolality 300 mOsm/kg)
(b). MD cell (arrowhead) swelling and parallel swelling/contraction of cells in the final part of the
afferent arteriole (AA) that causes an almost complete closure of the arteriolar lumen (arrows), collapse
of capillary loops (CAP) and shrinkage of the entire glomerulus (G). *: mesangial cells. Tissue was
stained with TMA-DPH. Bar = 10 µm.

13
Figure 5. Comparison of changes in afferent arteriolar diameter in intra-, and extraglomerular segments.
Tubular NaCl concentration was increased from 25 mM (osmolality 210 mOsm/kg, NaCl substituted
by NMDG) (a) to 135 mM (osmolality 300 mOsm/kg) (b). Tissue was stained with TMA-DPH. Bar =
10 µm.
Figure 6. Effects of ANG II alone or with AT1 receptor blockade (CAND), and norepinephrine (NE)
on afferent (AA), efferent arteriolar (EA) and glomerular capillary loop (GCL) internal diameter (ID).
(*: P < 0.05, ns: non-significant, compared to control in each group, n = 5 each)
Figure 7. Ca2+-image of the perfused afferent arteriole (AA)-glomerulus (G)-efferent arteriole (EA)
complex before (a) and 2 min after (b) the addition of ANG II to the lumen. Tissue was loaded with
Indo-1. Bar = 10 µm.
Table 1. Composition of luminal perfusion solutions.
Component (mM) Low NaCl Hypotonic Ringer
NaCl 25 25 135KCl 5 5 5MgCl2 1 1 1CaCl2 1.5 1.5 1.5Glucose 5 5 5NMDG 110 65 0Cyclamic acid 110 65 0HEPES 10 10 10Osmolality (mosmol/kg) 300 210 300pH 7.4 7.4 7.4
Table 1
Component (mM) Low NaCl Hypotonic Ringer
NaCl 25 25 135KCl 5 5 5MgCl2 1 1 1CaCl2 1.5 1.5 1.5Glucose 5 5 5NMDG 110 65 0Cyclamic acid 110 65 0HEPES 10 10 10Osmolality (mosmol/kg) 300 210 300pH 7.4 7.4 7.4
Table 1

14
cTAL
MD
PT
Figure 1
EA
AA
G
cTALMD
a bCAP
low Ca2 + high Ca2+
a b c
Figure 2
GG
15
Figure 3
a b
GG
Figure 4
a b
AA
CAP
*↓
↓ ↓↓ GG

16
Figure 6
Figure 5
a b
AA
0
2
4
6
8
10
ID
AA EA GCL
ctrl AngII Cand+AngII NE
*
*
* **
0
2
4
6
8
10
ID(µm)
0
2
4
6
8
10
0
2
4
6
8
10
ID
AA EA GCL
ctrl AngII Cand+AngII NE
*
*
* **
0
2
4
6
8
10
ID(µm)

1777
ANGIIFigure 7
AA EA
G
a b
low Ca2+ high Ca2+
Related Documents


![[377] Two-photon Excitation Fluorescence Microscopy](https://static.cupdf.com/doc/110x72/577d1dd81a28ab4e1e8d18f5/377-two-photon-excitation-fluorescence-microscopy.jpg)