Graduate Theses, Dissertations, and Problem Reports 2016 Two Photon Absorption Laser Induced Fluorescence for Fusion Two Photon Absorption Laser Induced Fluorescence for Fusion Class Plasmas Class Plasmas Drew B. Elliott Follow this and additional works at: https://researchrepository.wvu.edu/etd Recommended Citation Recommended Citation Elliott, Drew B., "Two Photon Absorption Laser Induced Fluorescence for Fusion Class Plasmas" (2016). Graduate Theses, Dissertations, and Problem Reports. 5537. https://researchrepository.wvu.edu/etd/5537 This Dissertation is protected by copyright and/or related rights. It has been brought to you by the The Research Repository @ WVU with permission from the rights-holder(s). You are free to use this Dissertation in any way that is permitted by the copyright and related rights legislation that applies to your use. For other uses you must obtain permission from the rights-holder(s) directly, unless additional rights are indicated by a Creative Commons license in the record and/ or on the work itself. This Dissertation has been accepted for inclusion in WVU Graduate Theses, Dissertations, and Problem Reports collection by an authorized administrator of The Research Repository @ WVU. For more information, please contact [email protected].

Welcome message from author
This document is posted to help you gain knowledge. Please leave a comment to let me know what you think about it! Share it to your friends and learn new things together.
Transcript

Graduate Theses, Dissertations, and Problem Reports
2016
Two Photon Absorption Laser Induced Fluorescence for Fusion Two Photon Absorption Laser Induced Fluorescence for Fusion
Class Plasmas Class Plasmas
Drew B. Elliott
Follow this and additional works at: https://researchrepository.wvu.edu/etd
Recommended Citation Recommended Citation Elliott, Drew B., "Two Photon Absorption Laser Induced Fluorescence for Fusion Class Plasmas" (2016). Graduate Theses, Dissertations, and Problem Reports. 5537. https://researchrepository.wvu.edu/etd/5537
This Dissertation is protected by copyright and/or related rights. It has been brought to you by the The Research Repository @ WVU with permission from the rights-holder(s). You are free to use this Dissertation in any way that is permitted by the copyright and related rights legislation that applies to your use. For other uses you must obtain permission from the rights-holder(s) directly, unless additional rights are indicated by a Creative Commons license in the record and/ or on the work itself. This Dissertation has been accepted for inclusion in WVU Graduate Theses, Dissertations, and Problem Reports collection by an authorized administrator of The Research Repository @ WVU. For more information, please contact [email protected].

Two Photon Absorption Laser Induced Fluorescence
for Fusion Class Plasmas
Drew B. Elliott
Dissertation Submitted to the Eberly College of Arts and Sciences
at West Virginia University
in partial fulfillment of the requirements for the degree of
Doctor of Philosophy
in Physics
Earl E. Scime, Ph.D. Chair
Paul A. Cassak, Ph.D.
Amy M. Keesee, Ph.D.
Weichao Tu, Ph.D.
Fabien Goulay, Ph.D.
Department of Physics and Astronomy
Morgantown, West Virginia
2016
Keywords: laser induced fluorescence, neutral density, absolute calibration
Copyright 2016 Drew B. Elliott

ABSTRACT Two Photon Absorption Laser Induced Fluorescence for Fusion Class Plasmas
Drew B. Elliott
Neutral hydrogen particles play an important role in many fusion systems. The edge region of
fusion plasmas is strongly influenced by these neutral particles and is of growing importance
because of the challenges of plasma material interaction. A two photon absorption laser induced
fluorescence diagnostic at West Virginia University has been constructed to measure the local
density and velocity distribution of these neutral particles. The diagnostic measures the ground
state of hydrogen isotopes by way of two photon absorption from the 1s to 3d state and
subsequent single photon emission to the 2p state. These measurements are absolutely calibrated
by comparing the integrated emission spectra to that of a measurement performed on a known
density of calibration gas and knowing the relative absorption cross sections for the two species.
Measurements were performed on deuterium atoms in the Helicity Injected Torus with Steady
Induction 3 and calibrated using the standard krypton calibration scheme. Measured neutral
densities were well below predicted values and the measurement process identified a flaw in the
krypton calibration scheme. A new calibration scheme using xenon gas was developed to
eliminate any possibility of chromatic aberration through refractive optics. This new xenon
calibration scheme required measurement of the relative absorption cross section between the 5p6
to 4p57f to 5p55d Xe scheme and the 4p6 to 4p55p to 4p55s Kr scheme, then comparison of the Xe
to Kr relative cross section to the Kr to H relative cross section to determine the overall Xe to H
relative absorption cross section. Doppler free two photon absorption laser induced fluorescence
measurements were also performed on the compact helicon for waves and instabilities
experiment (CHEWIE), for hydrogen, deuterium, and krypton neutrals. The Doppler free
technique increased signal intensity and narrowed the measured spectral width of the absorption
line. The Doppler free technique allows for higher sensitivity and faster data acquisition rates of
neutral density measurements on high temperature systems. These experiments demonstrated the
efficacy and improved the performance of the two photon absorption laser induced fluorescence
diagnostic.

iii
Acknowledgement
I would like to thank my advisor Dr. Earl Scime, whose dedication is infectious and
whose scientific and personal ethics I very much admire. I should also recognize Dr. Mark
Koepke and Dr. Amy Keesee who both encouraged my entry into plasma physics at WVU. I may
have taken a very different path without them. I would like to thank all of the Professors from
whom I had the pleasure of learning while here at WVU, especially Dr. Paul Cassak who was
exceptionally patient with a young student and whose courses and notes continue to guide my
understanding of plasma physics.
I should thank all of the other graduate and undergraduate students with whom I have had
the pleasure to work with: Dr. Dustin McCarren for his experience and advice, Robert
Vandervort and Mark Soderholm for being team and goal oriented, John S. McKee for keeping it
real, Evan Aguirre for never letting anyone get too full of themselves, Derek Thompson for
sharing the office and several hot beverages, Miguel Hernandez for making everyone else look
bad, Dr. Matthew Galante for making my path a much clearer one and assisting a graduate
student who was not your responsibility, and everyone who entered the Physics and Astronomy
department as a graduate student in 2012 who helped me through this experience, especially
helping me learn how to properly study. A special thanks to Dr. M. Umair Siddiqui, who I shared
a very long time alone with and who helped me during a day that was especially challenging.
I should also acknowledge my family: my mother who still inspires me and my father
who has always encouraged and challenged me.
I will have certainly forgotten some who are deserved of praise; them, I thank for one
more round of forgiveness.

iv
Dedication
I dedicate this work to my daughter, Zia. I would hope that you benefit from this, as my diverted
attention on this work has likely cost you the most.

v
Contents
ABSTRACT .................................................................................................................................. II
ACKNOWLEDGEMENT .......................................................................................................... III
DEDICATION............................................................................................................................. IV
CHAPTER 1 INTRODUCTION ................................................................................................. 1
1.1 HISTORY AND CONTEXT ..................................................................................................... 1
1.2 THE PHOTON AS THE IDEAL PLASMA PROBE .................................................................... 4
CHAPTER 2 SPECTRAL FEATURE CONSIDERATIONS ................................................ 11
2.1 TALIF BASICS ..................................................................................................................... 11
2.2 ISOTOPIC EFFECTS ............................................................................................................... 17
2.3 FIELD EFFECTS, ZEEMAN SPLITTING ................................................................................. 20
2.4 EXPERIMENTAL BROADENING EFFECTS............................................................................. 23
2.5 DOPPLER EFFECTS .............................................................................................................. 27
CHAPTER 3 EXPERIMENTAL APPARATUS ..................................................................... 31
3.1 THE LASER SYSTEM ............................................................................................................ 31
3.2 OPTICAL DESIGN CONSIDERATIONS ................................................................................... 35
3.2.1 The HIT-SI3 Optics ................................................................................................................................... 36
3.2.2 Xe Calibration Scheme Development Optics .......................................................................................... 39
3.2.3 Doppler Free Optics .................................................................................................................................. 40
3.3 DATA COLLECTION ............................................................................................................. 42
3.4 NOBLE GAS CALIBRATION .................................................................................................. 44
CHAPTER 4 DISCUSSION AND RESULTS .......................................................................... 46
4.1 MEASUREMENTS ON HIT-SI3 ............................................................................................. 46
4.1.1 Experimental Apparatus ........................................................................................................................... 48
4.1.2 Neutral Density in the HIT-SI3 spheromak ............................................................................................ 53
4.2 XENON CALIBRATION SCHEME ........................................................................................... 59
4.2.1 Experimental Apparatus ........................................................................................................................... 61
4.2.2 Krypton and Xenon Measurements ......................................................................................................... 63

vi
4.3 DOPPLER FREE MEASUREMENTS ........................................................................................ 65
4.3.1 Doppler free measurement calculations .................................................................................................. 67
4.3.2 Doppler Free Measurements .................................................................................................................... 70
CHAPTER 5 DISCUSSION AND CONCLUSIONS .............................................................. 75
5.1 TALIF as a Tool............................................................................................................................................ 75
5.2 How this Work has Advanced TALIF ........................................................................................................ 77
5.3 The Next Step for TALIF measurements ................................................................................................... 80
REFERENCES ............................................................................................................................ 85

vii
Table of Figures and Tables
FIGURE 1.1. PARTIAL GROTRIAN DIAGRAMS OF HYDROGEN AND DEUTERIUM ............................... 3
FIGURE 1.2. A BASIC DIAGRAM OF LIF ............................................................................................ 8
FIGURE 1.3. DIAGRAM OF TALIF AND SINGLE PHOTON LIF COMPARISON ...................................... 9
FIGURE 2.1. THE CALCULATED SPECTRAL MASS SHIFTS FOR THE ISOTOPES OF HYDROGEN ........... 17
FIGURE 2.2. THE ISOTOPIC MASS SHIFTS FOR KR AND XE. ............................................................. 19
FIGURE 2.3. THE CALCULATED ZEEMAN SPLITTING OF DEUTERIUM .............................................. 22
FIGURE 2.4. INTEGRATED KR TALIF SIGNAL VERSUS LASER INTENSITY ...................................... 26
FIGURE 3.1. A DIAGRAM OF THE COBRA-STRETCHTM
LASER SYSTEM ........................................... 33
FIGURE 3.2. THE HIT-SI3 OPTICAL CONFIGURATION .................................................................... 36
FIGURE 3.3. THE RELATIVE SIGNAL INTENSITY LOCALIZATION FOR LIF AND TALIF .................... 38
FIGURE 3.4. THE OPTICAL CONFIGURATION USED FOR CALIBRATION EXPERIMENTS ...................... 39
FIGURE 3.5. THE DOPPLER FREE OPTICAL CONFIGURATION .......................................................... 41
FIGURE 4.1. A CURRENT VERSUS TIME TRACE OF A TYPICAL HIT-SI3 PLASMA ............................. 47
FIGURE 4.2. THE HIT-SI3 EXPERIMENT ........................................................................................ 48
FIGURE 4.3. THE PMT SIGNAL VERSUS TIME ................................................................................. 49
FIGURE 4.4. THE KRYPTON TALIF CALIBRATION MEASUREMENTS ............................................... 54
FIGURE 4.5. TALIF SIGNAL FROM DEUTERIUM PLASMAS IN THE HIT-SI3 SPHEROMAK ............... 55
FIGURE 4.6. THE ABSOLUTELY CALIBRATED VELOCITY DISTRIBUTIONS OF DEUTERIUM ............... 56
FIGURE 4.7. ABSOLUTE DEUTERIUM DENSITY AND TEMPERATURE VERSUS TIME .......................... 57
FIGURE 4.8. ABSOLUTE DEUTERIUM DENSITY AND TEMPERATURE VERSUS POSITION.................... 58
FIGURE 4.9. RATIO OF THE EFFECTIVE IMAGE AREA FOR 826 NM AND 656 NM LIGHT .................... 59
FIGURE 4.10. THE PARTIAL GROTRIAN DIAGRAMS OF DEUTERIUM, KRYPTON, AND XENON .......... 60
FIGURE 4.11. A TYPICAL DEUTERIUM TALIF SPECTRUM .............................................................. 62
FIGURE 4.12. NORMALIZED TALIF SIGNAL FOR XENON AND KRYPTON ........................................ 63
FIGURE 4.13. RELATIVE ABSORPTION CROSS SECTION BETWEEN KR AND XE VERSUS PRESSURE. . 64
FIGURE 4.14. THE LASER INTENSITY AT THE COLLECTION AREA FOR DF MEASUREMENTS. ........... 68
FIGURE 4.15. HYDROGEN DOPPLER-FREE MEASUREMENTS........................................................... 70
FIGURE 4.16. DEUTERIUM DOPPLER FREE MEASUREMENTS .......................................................... 71
FIGURE 4.17. KRYPTON DOPPLER FREE MEASUREMENTS .............................................................. 72

viii
FIGURE 5.1. PREDICTED DOPPLER FREE SPECTRA MATCHED HIT-SI3 DATA ................................. 79
FIGURE 5.2. PROPOSED REFLECTION BASED DOPPLER FREE OPTICAL CONFIGURATIONS ............... 80
FIGURE 5.3. PROPOSED BEAM SPLITTING BASED DOPPLER FREE OPTICAL CONFIGURATIONS ......... 82
TABLE 1 ........................................................................................................................................ 35
1
Chapter 1 Introduction
1.1 History and Context
Since the term plasma was coined by Irving Langmuir in 1928, plasma behavior has proven
difficult to predict with calculation or simulation [1]. Experimental observations have frequently
defied predictive models. Two of the most significant examples of experiment deviating from
theory are the divergence between classical and “neo-classical” transport and H-mode confinement
in tokamak plasmas [2]–[4]. The multiscale nature of plasmas makes analytical predictions of their
behavior especially challenging. Even the same phenomena, gyro-motion, takes four thousand
times as long for deuterons as it does for electrons. This separation of scales leads to models which
average over certain effects to focus on others, e.g. magneto-hydrodynamics averages over all
individual particle motions. For this reason, simulations which incorporate several physical models
simultaneously are especially useful in predicting plasma behavior. Measurements which are
accurate, absolutely calibrated, and independent of other plasma parameters are necessary to test
these large scale simulations.
Fusion science began, as an open academic pursuit, in the United States, after the
declassification of project Matterhorn and the publication of “The Stellarator Concept” [5]. In that
work, Spitzer outlined many basic concepts for magnetic confinement fusion, discussing
configurations which would later be known as both stellarators and tokamaks [5]. There have been
many significant improvements made to those initial concepts. Diverted configurations reduce
plasma material interactions (PMIs) and allow for higher confinement modes [3], [4]. Advanced
stellarators have reduced energy transport, and thus improved energy confinement times[6]–[9].
Tokamak confinement increased greatly with the discovery of the H-mode [4]. Shaping of the core

2
flux surfaces has been shown to positively affect confinement as well [10], [11]. For the most part,
improvements have focused on increasing the confinement of the core plasma through
manipulation of the magnetic topology in this region. Although core optimization is the main focus
for fusion, edge plasma behavior and PMI are increasingly important hurdles on the way towards
practical fusion energy. It is in the edge region where temperatures must transition from ten times
that of the core of the sun to the cryogenic temperatures necessary to operate superconducting
magnets [12]–[14]. Edge plasma effects are especially important for building a fusion reactor
because it is in this region where the physical components of the reactor must interact with the
plasma, plasma material interactions (PMIs) occur.
Edge plasmas have fundamentally different behavior than the core plasma. There are long
lived electrostatic fields which accelerate ions toward the wall and give energy to neutrals through
collisions [15]. Magnetic field lines and particle trajectories in this region intersect with the device
wall, which means there are strong PMIs [16], [17]. It is in this edge region where the transport
barrier, the turbulent region of low heat flux that creates the H-mode, exists. In the edge of fusion
plasmas, the concentration of neutrals and impurities is much higher than in the core plasma.
Although these neutrals may have densities orders of magnitude smaller than that of the main ions
they have been shown to affect bulk properties of the plasma [18].

3
Predicting the behavior of the edge plasma and the various species within the edge, such
as neutrals and impurities, is performed with simulation codes like UEDGE, and EMC3-EIRENE
[19]–[21]. However, there are few direct experimental verifications of such simulations. Optical
emission spectroscopy (OES) can measure relative density of various atomic states of a species
and the temperature of these species in the edge plasma [22]–[24]. While this information is useful,
absolute values are a more rigorous test of simulation and give greater information about particle
and heat fluxes. Absolute density values can be extracted from OES through the use of a collisional
radiative model (CRM), but these models require accurate information about the electron
distributions [25], [26]. Such electron measurements are especially difficult in the plasma edge
where inversion techniques break down since field lines do not close on themselves [27]–[29]. For
all of these reasons, a diagnostic for directly measuring the velocity distributions of neutral
hydrogen and its isotopes has been constructed at West Virginia University (WVU).
The two-photon absorption laser induced fluorescence (TALIF) system developed at WVU
uses a high intensity ultraviolet (UV) laser to excite the ground state of hydrogen or one of its
isotopes; then the emitted light associated with decay from the excited state is collected [30]–[32].
Figure 1.1. Partial Grotrian diagrams of Hydrogen and Deuterium TALIF schemes, the main species of interest
for these TALIF studies.

4
The TALIF scheme being utilized was discovered by J. Bokor and is depicted in Figure 1.1 [33].
Two 205 nm photons, created by a narrow wavelength laser, are absorbed by the hydrogen atoms
and their emission is collected with a photomultiplier tube (PMT). By scanning a very narrow
bandwidth laser through wavelength space, while monitoring the wavelength of the laser and the
intensity of the fluorescence emission, it is possible to generate an absorption spectrum. This
absorption spectrum, generated by the TALIF diagnostic, was used to measure the velocity
distribution of hydrogen isotope neutrals with high spatial and temporal resolution [34]. By
performing a TALIF measurement with the same laser on a known density of a calibration gas,
absolute calibration of the density can be derived through these measurements[30], [31], [35].
Because the TALIF technique excites the ground state of the hydrogen isotope, these
measurements sample a majority of the target species and thus a CRM is not needed. A
measurement of the ground state is equivalent to a measurement of the entire species at the
temperatures expected for neutrals.
1.2 The Photon as the Ideal Plasma Probe
Plasmas, especially fusion plasmas, pose many unique challenges for diagnosticians. Not
only are the energy density and heat flux incredibly high, but the energy of the individual particles
is so high that sputtering and secondary electron emission are very common. Plasmas have three
dimensional characteristics, so spatial resolution and the ability to sample a large portion of the
plasma is also preferable. This means an ideal plasma diagnostic is highly resistant to heat flux
and particle impacts, highly spatially localized, and able to measure a large volume of the plasma.
The earliest plasma measuring devices were electrostatic probes [1]. Electrostatic probes
can be placed in low temperature, ≳ 1 eV, plasmas without experiencing significant damage.
Because in low temperature scenarios there is very little erosion on these probes, they can be made

5
relatively small, less than 1 mm in diameter, and thus do not perturb the plasma significantly. In
the case where the probe is undamaged, very small, and samples large volumes of the plasma, it
acts as a nearly ideal probe. Such is not the case in fusion plasmas. There are no materials that can
withstand the high temperatures and high energy particle impacts of a core fusion plasma without
experiencing some damage over time. This leads to erosion of the probe, which both changes the
measurement and the plasma. Particles sputtered off of materials interacting with the plasma
contaminate the plasma with high atomic number impurities and even occasionally dust [36]–[38].
Such contamination can greatly reduce the confinement of energy within the plasma through
enhanced line radiation. If the probe is made larger to mitigate the damage, the interaction of a
large object with the plasma is strongly perturbative. Perturbations such as impurity introduction
and a change in the boundary of the system, as well as damage to the measuring tool itself, render
electrostatic probes unsuitable in many fusion scenarios.
Modern probes use various techniques to mitigate probe damage and contamination or
perturbation of the plasma. Multi-tipped probe arrays with heat resistant materials survive in very
low temperature regions of plasmas without experiencing significant damage or causing large
perturbations. Such probes can be extended into high temperature fusion plasmas for only short
periods of time [39]–[41]. Reciprocating probes need to be larger to deal with the high forces
experienced during their motion and the high speed nature of their movement makes their
measurements less accurate than stationary probes [39]–[41]. These probes can be made very small
and access much of the plasma volume, but if such a probe is placed in a fusion plasma it will be
significantly damaged and introduce impurities to the plasma. Electrostatic probes are therefore
successful at meeting some requirements for an ideal plasma diagnostic, in fusion plasmas, but not
all of the requirements simultaneously.

6
Pressure gauges offer a possible technique for measuring neutral particle density and
temperature [42], [43]. Pressure gauges give data quickly and are easy to interpret, while their
location outside of the plasma keeps them largely undamaged. However, all of the faults which
were present in electrostatic probes are also present in pressure gauges. Pressure gauges are large
and placing them into the plasma could yield localized measurements, but would likely damage
the gauge and contaminate the plasma. An additional shortfall of pressure gauges is their
convolution of density and temperature. Such a convolution can be corrected for by utilizing an
independent temperature or density measurement, but this often leads to compounded errors due
to requiring multiple measurement tools to render a single value. Because pressure gauges are very
difficult to place throughout a plasma, are large, and convolute temperature and density they are
not a very ideal plasma probe.
Since no material has a binding energy higher than the energy of individual particles in a
fusion plasma (> 1 keV), physical probes are not ideal for fusion plasmas. The ideal probe is
undamaged by high heat flux or energetic particle impact, small in scale, and relatively unaffected
by strong electromagnetic fields. Photons are thus ideal candidates for creating a measurement tool
for fusion plasmas. These fundamental particles match the requirements most closely and are both
easy to create and detect. Photons can also be optimized to interact strongly with several plasma
species individually either by scattering off of electrons or by atomic state excitation.
Laser spectroscopy is a method of using photons to measure the properties of particles by
exciting their atomic or ionic state transitions. In this work, we have used laser spectroscopy.
Excitation of an atomic state is performed by injecting light of a very narrow spectral bandwidth
into the plasma which is then absorbed by these atoms. By analyzing how strongly different
wavelengths of light are absorbed by the target species, the velocity distribution of the species is

7
measured. The relationship between wavelength and velocity is made via the Doppler effect.
Absorption which occurs away from the resonance frequency is due to Doppler shifts of the laser
in the frame of the moving atoms. The spectrum generated by absorption of the laser light can be
directly converted into a velocity distribution via the Doppler relation. A centroid shift of the
spectrum corresponds to a bulk flow and the width of the distribution defines the temperature.
Through Zeeman and Stark splitting, it is also possible to use laser spectroscopy to measure local
electric and magnetic fields.
We will classify absorption spectroscopy into two groups, direct and fluorescence based.
Direct absorption laser spectroscopy measures the fraction of laser light which is absorbed by a
species. This is accomplished by monitoring the laser power before and after it has passed through
the particles being probed. Laser fluorescence spectroscopy measures the light emitted from an
atomic state which was excited by photons from a laser. Because the region from which light is
collected in fluorescence spectroscopy is controlled, spatial localization is more straightforward
with this technique [44], [45]. With fluorescence spectroscopy, a confocal optical scheme can be
utilized which allows for measurements to be taken from just one optical port and light collected
from a very small region [46]. For these reasons, this work focuses on a fluorescence spectroscopy
method, laser induced fluorescence (LIF). In LIF the wavelength of a very narrow bandwidth laser
and the intensity of fluorescent emission are monitored simultaneously. This is depicted in Figure

8
1.2 with the states and measurement types labeled. In this way, very precise absorption wavelength
spectra are measured and very localized measurements are made.
In traditional LIF, an atomic state is excited by absorbing one photon. The excited state
then decays by emitting one photon. It is possible for an atom or ion to absorb two photons
simultaneously. Such LIF schemes are referred to as two-photon absorption LIF (TALIF). A
comparison between TALIF and single photon LIF requirements can be seen in Figure 1.3. Decay
occurs normally from the excited state, through single photon emission, and so the collection of
the emitted light does not differ much from how the emission is collected from LIF. The TALIF
method is especially well suited to measuring light atoms and ions, because absorption of two
photons allows for larger excitation energies than single photon absorption, and TALIF is thus
especially useful in a fusion plasma context. TALIF is also intrinsically non-resonant as two
photon emission is very rare.
Figure 1.2. A basic diagram of LIF, indicating what measurements are taken and what atomic transitions occur.

9
The most obvious advantage of TALIF over single photon LIF is that higher energy
transitions are accessible with TALIF with lower energy photons. This is useful because generally
the higher energy a photon is the more difficult it is to create. This is true in most visible to near
visible wavelengths. The energy needed for the excitation is supplied by two photons so the laser
wavelength can be twice that normally required to excite a transition of similar energy. Focusing
the injected light localizes a TALIF measurement much more so than LIF because the absorption
is proportional to the incident light intensity squared. LIF often requires localization by advanced
collection optics schemes [34], [46]. Typical TALIF absorption cross sections are much smaller
than those for LIF. This means that measurements can be made far into a system without a
substantial loss in signal due to absorption along the injection path. For these reasons, a semi-
portable high precision TALIF diagnostic has been developed at WVU with the intended use of
measuring the neutral populations of various fusion plasmas.
This work will focus on three major advances of the TALIF program at WVU: the
implementation of the TALIF system on the helicity injected torus with steady induction 3 (HIT-
SI3), a spheromak fusion experiment; an improved absolute calibration technique using xenon gas;
and Doppler free excitation demonstrated in the compact helicon for waves and instabilities
Figure 1.3. Diagram of TALIF and single photon LIF comparison, transition selection rules noted.

10
experiment (CHEWIE). The spheromak measurements demonstrated the precision of the TALIF
system, the applicability of the system on short pulse devices, and the usefulness of the confocal
optical setup to acquire spatially resolved measurements from one optical port. These
measurements also deviated significantly from the predicted neutral density and brought to light a
possible chromatic issue with the calibration scheme. The new xenon absolute calibration scheme
solved an alignment problem with the standard krypton calibration scheme which became
noticeable during the HIT-SI3 measurements. The Doppler free method, discussed more in
chapters 3 and 4, improved the sensitivity and density measurement rate of the diagnostic at high
temperatures and our analyses addressed some of the challenges inherent to a Doppler free
measurement. The HIT-SI3 experiments demonstrated the sensitivity and applicability of this
TALIF diagnostic in a fusion edge scenario. The WVU experiments then increased the
measurement rate and sensitivity of the diagnostic.

11
Chapter 2 Spectral Feature Considerations
The TALIF diagnostic at West Virginia University was created to measure neutral
density, temperature, and bulk flow in a fusion plasma. There are several effects which distort
the measured spectra and make extracting portions of the desired information difficult. Isotopic
shifts of the absorption line appear as both flow and, in the case of large mass atoms with many
isotopes, broadening and thus higher temperature. Strong electromagnetic fields also split the
once degenerate atomic states. This effect can be either a confounding factor or a secondary
application of the diagnostic. The experimentally induced effects on the measured TALIF spectra
are a result of the high power pulsed laser used. High power can lead to saturation broadening
and the laser linewidth, which is typically larger for short pulsed lasers than for continuous
lasers, may also add to the width of the spectrum. The remaining effects on the measured spectra
are mainly due to the Doppler effect from the velocity distribution of the atoms. These Doppler
effects are what allow for the temperature and flow to be determined and are thus integral to the
measurement. Each of the confounding terms must be well understood in order to accurately
isolate and quantify these Doppler effects.
2.1 TALIF Basics
The TALIF schemes being investigated for hydrogen and its isotopes involve excitation
from the 1s state to the 3d state and decay to the 2p state. This state was chosen because excitation
from the ground state samples a majority of the species, and 1n to 3n to 2n is the lowest energy
ground state excitation scheme which does not involve emission in the UV. Excitation from the 1n
to 3n states would require a 102 nm photon by way of single photon LIF. Any light with a
wavelength below 200 nm is referred to as vacuum ultraviolet and is strongly absorbed in air and

12
all known refractive materials. For these reasons, two photon absorption is the method we have
chosen for investigating the ground state of hydrogen.
Two photon absorption can be analyzed as two single photon absorptions occurring in a
two-step process[47]. This seemingly obvious condition allows for selection rules and polarization
to spin relations for two photon absorption to be described. Knowledge of these relations combined
with the state lifetime of the 3d and 3s states of hydrogen allow us to describe exactly which state
is being excited and measured. Reviewing the selection rules for single photon absorption then
applying them twice will describe the selection rules for the two photon absorption process.
When discussing the angular momentum of our atomic system or of photons we will use
units of Planck’s constant, for convenience. For single photon transitions, the change in total
angular momentum is plus or minus 1. This is because photons have total angular momentum of
either 1 or minus 1. Typically, this results in a change in orbital angular momentum of 1, Δl = ±1.
Assuming that the excited electron does not flip spin, an electron in an s-orbital can only transition
to a p-orbital, an electron in a p-orbital can transition to an s-orbital or a d-orbital, and an electron
in a d-orbital can transition to either a p-orbital or an f-orbital [45]. These relations continue to
higher angular momentum states but those listed are enough to describe the hydrogen transitions
being investigated, 1n 3n 2n.
The difference in the amount of angular momentum parallel to an external magnetic field,
m, between the initial and final states is determined by comparing the polarization of the incident
laser light to that of the external magnetic field. When the laser propagation direction is
perpendicular to the external magnetic field, ∆m equals either ± 1 or 0 [48]. These two conditions
can be selected by aligning or misaligning the linear polarization of the incident laser light with
the external magnetic field. When the polarization is parallel to the external field the change in m

13
is 0; when the polarization is perpendicular to the magnetic field the change in m is ± 1. In the
experiments performed at WVU on CHEWIE, the polarization of the laser was aligned with the
external magnetic field, which selected ∆m equals 0.
Single photon absorption occurs most probably when the energy of the absorbed photon is
equal to the transition energy from one atomic state to another. However, resonant energies are
only the most likely energies at which a photon can be absorbed. It is possible for an atom or ion
to absorb a photon whose energy is disparate from a resonant energy. Such non-resonant
absorption or emission can be seen in the natural line shape of any atomic transition, a Lorentzian
spectrum unrelated to Doppler broadening. This shape defines the probability of emission or
absorption at a given photon energy. Lorentzians are sharply peaked but do not decay quickly far
away from their centroid, which is advantageous because for our two photon absorption the first
photon is absorbed far away from resonance as described by the center of the Lorentzian.
Determining the width of this shape and ultimately the probability of absorbing a photon whose
energy is far away from any resonant state involves the uncertainty relation between energy and
time, ∆𝐸∆𝑡 ≥ℎ
4𝜋, and how uncertainty in the energy of a state relates to that state’s lifetime.
Because atomic states have finite lifetimes, there is some uncertainty of the energy of those
states. The state lifetime, an uncertainty in time at which the atom has a certain energy, can be
converted to an uncertainty in photon frequency by taking the reciprocal of the state lifetime. That
relationship comes from coupling the uncertainty relation of time and energy with the relationship
between energy and photon frequency. Treating this value as a full width at half max (FWHM) of
the Lorentzian which describes the probability of absorption near atomic state transitions and
assuming that single photon absorption probabilities are roughly equal at resonance for all the

14
states nearby, we can make some rough calculations to determine what this non-resonant TALIF
absorption might behave like and how likely it is to occur.
The states close in energy to the 1s to 3d transition which have finite lifetimes include the
2s, 2p, 3s, 3p, and 3d states. The energy of the individual photons used for exciting the TALIF
scheme described in Figure 1.1 are not near any of the energies of these states, so the probability
of their absorption is small. The value of a Lorentzian far from its centroid goes as 1
4𝑛2 where n is
the number of FWHMs away from the centroid a value is. The 2s state has a very long lifetime
and which results in a much smaller uncertainty in energy [49]. Such low uncertainty in that state’s
energy makes the probability of absorption far away from resonance roughly 16 orders of
magnitude smaller than all the other terms, so its contribution has been ignored. The n values
derived from their state lifetimes are roughly 1.6∙106, 2.3∙108, 8.9∙106, and 2.3∙107 for the states
2p, 3s, 3p, and 3d, respectively [49]. This makes the combined probability of absorption at 205 nm
roughly 10-13 of the probability of absorption on resonance. This very low probability seems to
suggest that the signal to noise ratio (SNR) in a TALIF measurement would always be small.
However, the SNR of the TALIF measurements presented in this work have been greatly increased
due to the high intensity and short pulse nature of the laser used, ~4 mJ in 8 ns.
It is illustrative to compare the SNR of the pulsed laser system used for these TALIF
measurements to that of a continuous wave (CW) system of similar power. The ratio of averaged
power during a laser pulse to the continuously averaged power is 4 mJ/8 ns to 4 mJ∙20 Hz. The
difference is a factor of 6.25∙106, and for TALIF excitation signal is proportional to intensity
squared [47]. Including the squared relation this is an increase of roughly 4∙1013. The amount of
stray light, noise, collected during a measurement is proportional to the sampling interval. The
interval over which the PMT signal was sampled for the TALIF measurements was 50 ns every

15
50 ms, which encompassed the entirety of the fluorescence from the excited state. A CW system
would sample over the entire 50 ms interval. This comparison to CW operation yields another
factor of 106. The increased intensity and decreased background light collection lead to a predicted
improvement in SNR of 4∙1019. The calculated improvement to SNR is a rough approximation, but
shows that TALIF signal can be at least comparable to the reduced likelihood of absorption. Thus
the TALIF SNR can be comparable to that of a CW system investigating the 1s to 3d transition.
TALIF is also intrinsically non-resonant which allows for much higher laser light rejection
increasing signal to noise in practice. Combining the comparable SNR with the difficulty involved
with using vacuum ultraviolet light and the lack of tunable lasers operating in that range, TALIF
becomes the obvious choice for ground state hydrogen excitation.
As mentioned previously, the selection rules for two photon transitions are determined by
applying the selection rules for single photon excitation twice. We will assume for all of these
scenarios that the electron does not flip its spin because that is a very unlikely occurrence. Each
two photon transition must have a change in total angular momentum, ∆j of ± 2 or 0. This is the
single photon rule, ∆j = ± 1 (Δl = ±1 for simple atoms like hydrogen), applied twice. Excitation
from the hydrogen ground state, 1s, can therefore result in either a 3d or 3s excited state through
two photon absorption. Changes in m have a similar form and can either be ± 2 or 0, assuming that
incident light has only one polarization. For experiments within CHEWIE, where the polarization
was aligned with the external background field, the change in m remained zero. If the linear
polarization were perpendicular to the magnetic field then all of the possible states, m = + 2, − 2,
or 0, would be excited with m = 0 excitation occurring twice as likely as m = + 2 or − 2. The
proportionality of states comes from equally likely transitions up and down in angular momentum

16
(+ 1 + 1 = + 2; + 1 − 1 = 0; − 1 + 1 = 0; − 1 − 1 = − 2). The resultant spectra are described later in
section 2.2.
In the CHEWIE experiments, where the polarization is aligned parallel to the magnetic
field, there are two possible states which can be excited from the 1s state, the 3s m = 0 state or the
3d m = 0 state. These states are close together energetically and accessible by our laser system.
The 3d excitation cross section is larger than that of the 3s, but not so much larger as to allow for
complete elimination of the 3s excitation and emission. Another factor for this determination is
the lifetime of each of these states; the 3s state has a lifetime of over 150 ns, while the 3d state has
a lifetime of 16 ns [49]. The time interval over which emission light was collected was 50 ns in all
of the experiments performed. This means that effectively all of the 3d state’s emission was
collected and only a small portion of the 3s state’s emission was collected. Combined these effects,
the 3d m=0 state was the dominant emission and absorption source and thus the state being
measured.
That the 3d state is the state being excited is advantageous for two reasons: the decay from
the 3d state is completely into the 2p state, which means all of the emission is measured using one
wavelength filter; and because the 3d state has orbital angular momentum of 2 if the incident light
polarization is aligned perpendicular to that of an external magnetic field, the m = ± 2 states will
be excited. For very high magnetic fields the separation in energy, and subsequently in wavelength,
of the states with different m is larger than the laser bandwidth. In such a scenario magnetic field
strength and direction could be determined through analysis of a measured TALIF spectrum.

17
2.2 Isotopic effects
Atoms of the same element with different atomic masses, isotopes, have different electron
energy levels. This is most easily understood quasi-classically as a shift in the reduced mass of the
electron-nucleus system. For low mass atoms, such as hydrogen and its isotopes, these shifts can
be much larger than the measured spectral widths of our TALIF measurements and can thus be
used to distinguish between isotopes. For higher mass atoms, such as krypton and xenon, these
isotopic shifts are often smaller than the width of the measurement and therefore contribute to
broadening of the measured TALIF spectral width. For large atoms, variation in the atom’s size
can also play a role in the energy level shifts. These shifts are more difficult to calculate than the
mass effect shifts, therefore obtaining accurate temperature information from TALIF
measurements of such species is especially challenging. To fully account for these isotopic effects,
Figure 2.1. The calculated spectral mass shifts for the isotopes of hydrogen with tritium in red, deuterium in blue,
and hydrogen in green. Each isotope has equal density within a section and between sections. The different
sections represent various temperatures: (a) 0 eV (Doppler free), (b) 1 eV, (c) 5 eV, and (d) 10 eV. The dashed
black line is the observable composite spectrum.

18
the relative abundance of each isotope being measured, the relative absorption cross section of
each isotope, and the total mass and volume shifts must be known. In this work, TALIF performed
on large mass, multi-isotope species was only used for calibration and thus extracting temperature
information from the measured spectra was not considered.
The isotopic mass shift arises from the energy of atomic states being proportional to the
reduced mass of the atomic system [50]
𝜇 =𝑚1 × 𝑚2
𝑚1 + 𝑚2. (2.1)
Here m1 and m2 are the nucleus and electron mass, while μ is the reduced mass of the system. The
ratio of the reduced masses of isotopes is the ratio of the energy shifts and subsequently the shifts
of peak absorption and induced fluorescence between isotopes. Using Eq. (2.1), the ratio of the
atomic transition energies for the hydrogen isotopes are 1:1.00027:1.00036 for hydrogen,
deuterium, and tritium respectively. The hydrogen isotope shifts are shown in Figure 2.1 for
various temperatures. The offset in the signal axis is constant and estimates how a constant noise
background would compare to the peak signal for various temperatures. For the two most common
isotopes of Kr, Kr84 and Kr86, the ratio is 1:1.0000053. For the two most common isotopes of Xe,
Xe129 and Xe132, the ratio is 1:1.0000052. The mass shifted excitation of all Kr and Xe isotope with
greater than 5% abundance are shown in Figure 2.2 along with the sum of their predicted spectra
for a Doppler free or 0 eV measurement. The relative shift for the hydrogenic isotopes is nearly
two orders of magnitude larger than that of the heavier elements used in the calibration schemes.
Thus, the hydrogen isotope peaks are clearly distinguishable while the Kr and Xe isotope peaks
are not.

19
The mass shifts of the hydrogen isotopes are roughly 1-3∙10-4 of the unshifted energies,
depending on which two isotopes are being compared. The photons used to excite hydrogen from
the 1s to 3d energy level in this TALIF scheme need to have a wavelength of 205.1443 nm[51].
The laser system used has a full width at half max bandwidth of 0.291 pm at this wavelength,
which results in a measured spectral width of approximately 2∙10-6 of the resonant wavelength.
The laser bandwidth is approximately two orders of magnitude smaller than the expected mass
dependent shifts for hydrogen. For thermal effects to obscure this splitting, the FWHM of the
distribution would need to be roughly twice the 1∙10-4 proportional shift, which for the hydrogen
deuterium split corresponds to a temperature above 20 eV. For all of the scenarios presented in
this work, the splitting between hydrogen and its isotopes is clearly distinguishable as splitting and
would not appear as broadening. Thus for hydrogen under 20 eV, the isotopic splitting allows for
the ratio of isotopes to be determined with this TALIF scheme
Isotopic splitting takes on a different role for the calibration gasses, Kr and Xe. Both of
these atoms have 4 isotopes of greater than 10% abundance and their splitting is on the same order
as the laser linewidth. These isotopically mass split lines have significant overlap, as can be seen
in Figure 2.2. It is also in these large atoms when other isotopic effects, such as the size of the
Figure 2.2. The isotopic mass shifts for Kr (a) and Xe (b). The spectra shown here include each mass shift of
any isotope, shown in dashed blue, with greater than 5% abundance and the predicted summed spectra, in black.
The widths of the individual isotope lines are set by the minimum width of the laser.

20
atom, become dominant [52], [53]. For these large noble gasses, the isotopic splitting appears as
broadening and thus an abnormally high temperature measurement. Although this splitting
increases the widths of the measured spectra, it also decreases the amplitude of the peak signal
proportionately. In this way the splitting does not affect the total integrated area of the spectrum
or the calibration factor derived from the area of the spectrum. To accurately extract temperature
from an isotopically broadened signal the relative absorption cross section, the relative decay
probabilities, and the relative abundance within the measurement region of each isotope must be
known. For these reasons, this work makes no claims about the temperature of these high mass
species and only uses the signal integrated over wavelength as a measurement of the density of
these atoms.
2.3 Field Effects, Zeeman Splitting
When atoms or ions are in electric or magnetic fields, the energies of their atomic states
lose their degeneracy [54]–[56]. These energy level changes are referred to as Stark and Zeeman
splitting for electric and magnetic fields, respectively. Electric fields are typically weak or short
lived in plasmas, due to the shielding effects of highly mobile electrons [1]. For this reason, Stark
splitting is typically not of great concern for non-relativistic particles in low to moderate density
plasmas. Magnetic fields are not as strongly shielded as electric fields within plasmas. Magnetic
fields can also be especially high in the fusion plasmas edge, as high as 10 T [12], [13], [57]. Thus,
Zeeman splitting has the potential to significantly affect measured TALIF spectra.
The Zeeman effect can be modeled as an increase in potential energy due to a torque
imposed upon a magnetic dipole by an external magnetic field,
∆𝐸𝑍 = 𝜇𝐵𝐵𝑔𝑚𝑗 . (2.2)

21
Here ∆𝐸𝑍 is the change in the energy of the state, due to the Zeeman effect. The remaining terms,
𝜇𝐵, 𝐵, 𝑔, 𝑎𝑛𝑑 𝑚𝑗, are the Bohr magneton, the magnetic field strength, the Lande g-factor, and the
component of the total angular momentum of the atom parallel to the magnetic field, respectively.
The Lande g-factor, described in Equation (2.3), comes from the various angular momentum
components of the atomic state, j, s, and l for total, spin, and orbital angular momentum,
𝑔 = 1 +𝑗(𝑗+1)+𝑠(𝑠+1)−𝑙(𝑙+1)
2𝑗(𝑗+1). (2.3)
The two terms which vary in Equation (2.2) are B and mj. B varies according to the
experimental configuration and mj is varied to account for the possible spin states. It is possible to
calculate the splitting of these energy states without considering the electron spin terms, if the
assumption that the spin of the electron does not flip in the excitation or decay process holds. This
is done because the electron spin terms partially cancel out in the Zeeman equation, Equation (2.3),
and fully cancel out in the high field Paschen-Back equation, Equation (2.4). In that case there are
five possible ml values in the 3d state, ± 2, ± 1, and 0. Only 3 of those, ± 2 and 0, are possible to
excite with linearly polarized light incident perpendicular to the magnetic field through a two-
photon transition [48]. All plasma based experiments performed in CHEWIE have the polarization
of the laser radiation aligned to that of the magnetic field, and thus the change in ml is zero. The
only possible Zeeman effect in such a case is due to the electron spin, which is small or zero. The
Zeeman splitting due to the electron spin is much smaller than the width of the laser, corresponding
to an absorption line shift of < 0.1 pm/kG at 205 nm. All of the plasmas presented in this work had
magnetic field of less than 1 kG. The resultant Zeeman splitting of the spectra was less than one
tenth of the laser linewidth and thus was ignored.

22
When performing measurements on a tokamak or stellarator, the fields will not be as
uniform in direction as they are in CHEWIE and may be orders of magnitude larger [12], [13]. The
ITER edge field is predicted to be two orders of magnitude larger than the typical fields within
CHEWIE with significant rotational transform which varies radially. In such a scenario,
continuously aligning the polarization of the laser with the magnetic field direction may not be
possible, therefore consideration of the ml = ± 2 states is required. When the external magnetic
field becomes greater than the field generated by the atom locally, near 1 T, a modification to
Equation (2.2) is necessary. This modification to the Zeeman equation is required due to a
decoupling of the electron spin momentum from the orbital angular momentum. The strong field
form of the Zeeman equation is referred to as the Paschen-Back equation
Figure 2.3. The calculated Zeeman splitting of deuterium. Sigma lines, corresponding to ml = ± 2, are given in
red; Pi lines, corresponding to ml = 0, are given in blue. Their sum is the black dashed line. Parts (a) and (c) show
the predicted splitting for 1 Tesla, while parts (b) and (d) show splitting for 10 Tesla. Parts (a) and (b) represent a
Doppler free or zero temperature measurement, while parts (c) and (d) show 1 eV thermal broadening convolved
with Zeeman splitting. The reduction in amplitude of (c) and (d) represent the reduction in absolute absorption
predicted for Doppler broadening.

23
∆𝐸𝑃𝐵 = 𝜇𝐵𝐵(𝑚𝑙 + 2𝑚𝑠). (2.4)
Here the Lande g-factor has been dropped and the total angular momentum projection has been
replaced by ml and ms, which correspond to the projection along the field of the orbital and spin
angular momenta. The inclusion of both ml and ms and the exclusion of the Lande g-factor signifies
the separation of the orbital angular momentum components. This change does not significantly
affect the scaling factor, as the total angular momentum of the final state can only be 2 greater than
the original state. Thus, the term in brackets is at most ± 3. The largest splitting term in the Paschen-
Bach equation is nearly identical to that predicted using the standard Zeeman effect, but in a 10 T
field the splitting would be 10 times the width of the laser and would require consideration for
neutrals whose temperature is on the order of 10 eV. Such a convolution of thermal broadening
and Zeeman effects is illustrated in Figure 2.3 for deuterium atoms.
The spectra in Figure 2.3 demonstrate the predicted spectra if the laser polarization was
linear and perpendicular to the magnetic field, showing the maximum Zeeman effect. Zeeman
effects are small in both CHEWIE and the HIT-SI3 experiment where the magnetic field strengths
are below 0.1 T. Zeeman effects have therefore been ignored during this analysis. For large enough
background magnetic fields and either low temperature or Doppler free configurations, the Zeeman
effect could be utilized to turn the TALIF measurement into a local magnetic field strength and
pitch angle measurement.
2.4 Experimental Broadening Effects
Symmetric two-photon absorption, where the two photons are of the same wavelength, has
much smaller absorption cross sections than single photon absorption. The small cross section is
due to the decrease in probability of exciting a virtual state the further the energy of the virtual
state is from an eigenvalue state. Having a small cross section results in a lower signal for TALIF

24
when compared to a single photon LIF measurement using equivalent lasers. To compensate for
this small cross section, a very high intensity short pulse laser is used. The quadratic relationship
between TALIF absorption and incident intensity means that with high power pulsed lasers and
focusing of the injected light the SNR of a TALIF measurement may be comparable to that of
single photon LIF measurement. For the WVU TALIF diagnostic, the laser system has a pulse
length of approximately 10 nanoseconds and an average power during the pulse of 100-1000 kW.
This type of laser is necessary for the reasons discussed in section 2.1. Using such a laser system
introduces two additional sources of broadening, laser linewidth and saturation broadening.
Pulsed laser systems have a laser linewidth which is typically much larger than that of
continuous wave (CW) lasers. The fundamental limit on this linewidth comes from Heisenberg’s
uncertainty relationship between time and energy. For a 10 ns pulse of light, the minimum
frequency dispersion is 100 MHz. This is much higher than narrow bandwidth CW lasers whose
linewidth can be in the kHz range. Practically the linewidth of pulsed lasers is much higher than
their uncertainty limited linewidth. The linewidth of the laser system used in these studies is
minimally 0.04 cm-1 or 1.2 GHz before the light passes through two nonlinear crystals and is tripled
in frequency [58]. The frequency tripling process results in further broadening of the laser
linewidth, by approximately a factor of √3 [58]. This resultant laser linewidth of the 205 nm light
is 0.07 cm-1, 2.1 GHz or 0.291 nm. This width defines the minimum measured spectral width, and
would correspond to a temperature of 0.1 eV for krypton without any Doppler broadening. The
apparent temperature is due to the convolution of the laser linewidth with the Doppler width
∆𝜆𝑠 = √2Δ𝜆𝑙2 + Δ𝜆𝐷
2 . (2.5)
25
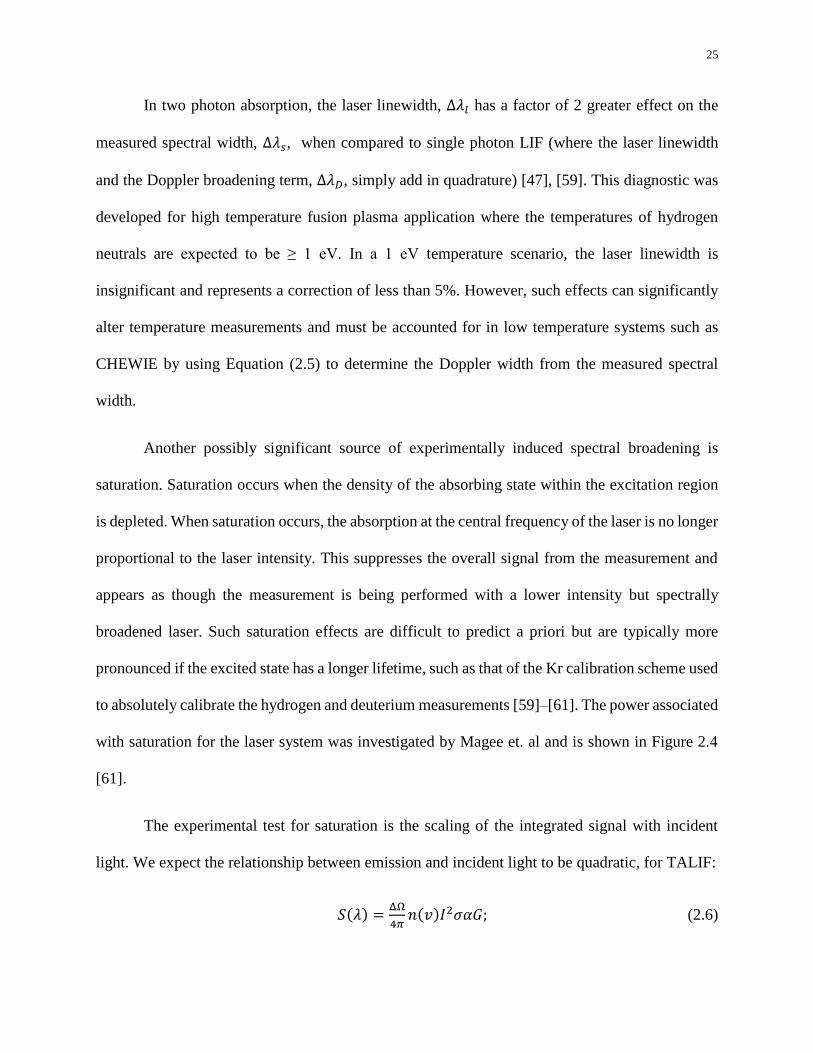
In two photon absorption, the laser linewidth, Δ𝜆𝑙 has a factor of 2 greater effect on the
measured spectral width, ∆𝜆𝑠, when compared to single photon LIF (where the laser linewidth
and the Doppler broadening term, Δ𝜆𝐷, simply add in quadrature) [47], [59]. This diagnostic was
developed for high temperature fusion plasma application where the temperatures of hydrogen
neutrals are expected to be ≥ 1 eV. In a 1 eV temperature scenario, the laser linewidth is
insignificant and represents a correction of less than 5%. However, such effects can significantly
alter temperature measurements and must be accounted for in low temperature systems such as
CHEWIE by using Equation (2.5) to determine the Doppler width from the measured spectral
width.
Another possibly significant source of experimentally induced spectral broadening is
saturation. Saturation occurs when the density of the absorbing state within the excitation region
is depleted. When saturation occurs, the absorption at the central frequency of the laser is no longer
proportional to the laser intensity. This suppresses the overall signal from the measurement and
appears as though the measurement is being performed with a lower intensity but spectrally
broadened laser. Such saturation effects are difficult to predict a priori but are typically more
pronounced if the excited state has a longer lifetime, such as that of the Kr calibration scheme used
to absolutely calibrate the hydrogen and deuterium measurements [59]–[61]. The power associated
with saturation for the laser system was investigated by Magee et. al and is shown in Figure 2.4
[61].
The experimental test for saturation is the scaling of the integrated signal with incident
light. We expect the relationship between emission and incident light to be quadratic, for TALIF:
𝑆(𝜆) =ΔΩ
4𝜋𝑛(𝑣)𝐼2𝜎𝛼𝐺; (2.6)

26
The signal, 𝑆(𝜆), is linearly proportional to the solid angle of collection, ΔΩ, the phase space
density, 𝑛(𝑣), the absorption cross section, 𝜎, the branching ratio and spectral efficiency of the
detector, 𝛼, and the gain, 𝐺, of the detector the measurements. If all of these quantities are held
constant and only the intensity of the incident laser light, 𝐼, is varied, the subsequent change in
integrated signal should vary quadratically
∫ 𝑆 𝑑𝜆 ∝ 𝐼2. (2.7)
If saturation has occurred, the relationship between integrated signal and laser intensity will be
less than the quadratic relation depicted in Equation (2.7) and the intensity of the laser must be
reduced to accurately measure density and temperature
Figure 2.4. Integrated Kr TALIF signal versus laser intensity. With a 25 cm focal length lens saturation occurs
near 0.2 mJ with a 50 cm focal length lens saturation occurs near 1 mJ. For unfocused light as was used in most
of these experiments the saturation level would be many 10’s of mJ. These figures are reproduced from Galante
[61].

27
Both of these effects are controlled by controlling and monitoring the laser system itself.
Monitoring the laser linewidth and including the linewidth terms in low temperature calculations
allows for elimination of laser linewidth effects. Saturation effects are not typically observed in
hydrogen because the state lifetime is so short. However, saturation in the calibration gas is often
observed when the beam is focused. Calculations and characterization of such saturation has been
performed by Galante for Kr, and their results are shown in Figure 2.4 [61]. The saturation strongly
depends on the beam waist when the beam is focused, as that determines the peak intensity of the
system. For an unfocused beam saturation is not a concern because the intensity is more than an
order of magnitude lower than that of a focused beam.
2.5 Doppler Effects
If all of the above effects have been considered or eliminated, the remaining spectral
features are due to the Doppler effect. These Doppler related spectral features represent the
velocity distribution of the absorbers and are a primary measurement objective of this diagnostic.
The nonrelativistic Doppler relation describes the motion of the particles well if they are below
100 eV, conditions which the diagnostic was designed for. The Doppler relation relates a shift in
the absorption wavelength to the speed of an absorber along the direction of the laser propagation.
The average velocity measured describes the bulk flow of the particles and the distribution of these
velocities is proportional to the thermal speed of the particles.
The equation for a non-relativistic Doppler shift is
Δ𝜆
𝜆=
𝑣
𝑐 𝑜𝑟
Δ𝜐
𝜐=
𝑣
𝑐 , (2.8)
where Δ𝜆 is the magnitude of the wavelength shift from the rest frame wavelength, 𝜆, and Δ𝜐 is
the magnitude of the frequency shift from the rest frame frequency, 𝜐, due to a given velocity, 𝑣,

28
along the path of the incident light, traveling at 𝑐. The shifts for wavelength and frequency are
opposite in sign. If the wave vector of the light and the velocity of the particle point towards one
another the wavelength shift is negative and the frequency shift is positive. Although in the frame
of the particle the wavelength decreases, the laser will have to be set to a higher wavelength for
absorption to occur and thus the measured spectrum shifts are opposite of the shift from the
particle’s perspective. Such a shift from the central wavelength normalized to wavelength is
constant for any wavelength and any moving particle.
Thus, spectra generated by measuring the fundamental (615 nm) or UV (205 nm)
wavelengths would result in identical velocity and temperature measurements. Determining bulk
flow and thermal speed from a TALIF measurement is accomplished by fitting a Gaussian curve,
𝐺(𝜆) = 𝑛𝐺 exp {−(𝜆0−𝜆)2
2𝛥𝜆2 } , (2.9)
to the measured spectrum. The fit parameters in the Gaussian 𝑛𝐺 , 𝜆0, and 𝛥𝜆 are related to the
density, bulk flow, and temperature. 𝜆0 and 𝛥𝜆 must be compared to the transition wavelength,
𝜆𝑇, to determine bulk flow and local temperature. The bulk flow comes from the Doppler relation,
𝜆0−𝜆𝑇
𝜆𝑇=
𝑣
𝑐 , (2.10)
and the temperature, T, comes from an assumed one dimensional Maxwell-Boltzmann distribution
of particle velocities. The temperature is also related to the transition wavelength, 𝜆𝑇 , and the mass
of the species being measured, 𝑀𝑠
𝑇 =2𝛥𝜆2𝑀𝑠𝑐2
𝜆𝑇2 . (2.11)

29
After correcting for, or determining negligible, isotopic effects, Zeeman effects, saturation
broadening, and linewidth effects on 𝛥𝜆, these Doppler relations describe the local velocity
distribution of the particles and can be made without calibration. With calibration, the quantities
𝛥𝜆 and 𝑛𝐺 allow for absolute density of the hydrogen neutrals to be quantified.
There is another TALIF technique which removes Doppler effects from the measured
spectra. Because TALIF involves the absorption of two photons simultaneously, if counter
propagating beams are used or a single beam is retro-reflected onto itself, a particle may absorb
two photons propagating in opposite directions. This means, in the frame of each particle, the
Doppler shift of each photon perfectly cancels with a photon propagating in the opposite direction.
While this Doppler free TALIF technique removes any information about the velocity of
the particles from the TALIF measurement, it provides advantages in speed of data collection and
improved signal strength. Because no velocity effects broaden the measured spectra, the entire
velocity distribution can be sampled with a single laser pulse at the transition frequency. When
comparing Doppler free and Doppler broadened spectra, the integrated area of the spectrum
remains constant for the same density and laser intensity. Therefore, a Doppler free measurement
has an increase in peak signal of a factor of the Doppler width divided by the remaining width of
the spectrum, typically the laser linewidth. Especially in high temperature scenarios, where the
Doppler broadened spectrum would be much broader than the laser linewidth and therefore much
lower in intensity than the Doppler free spectrum, a Doppler free measurement could be performed
with a single laser pulse. For 1 eV deuterium, the increase in peak signal between a Doppler free
and Doppler broadened spectrum is more than an order of magnitude, assuming identical laser
intensity in the measurement region.

30
If a spectrum is obtained using a Doppler free configuration the spectral features become
very sharp. If the Zeeman effect is small, or well understood and accounted for, and the laser
linewidth is known, there is no need to scan the laser in wavelength. If the Zeeman effect is not
able to be eliminated by polarization alignment and the magnetic field is expected to be large, a
Doppler free TALIF spectrum could be used, regardless of temperature, to measure the magnetic
field strength and angle. Magnetic fields of 1 Tesla are clearly discernable from a Doppler free
spectrum of deuterium, such as that shown in Figure 2.3 (a). Not having to scan the laser in
wavelength is a huge advantage experimentally as scanning the laser is typically a slow process
and difficult to do without changing beam characteristics. These advantages make Doppler free
TALIF an attractive technique when temperatures and field strengths are high or when transient
plasma processes are of interest.

31
Chapter 3 Experimental Apparatus
Two photon absorption laser induced fluorescence (TALIF) necessitates several special
experimental requirements. The strongest requirement for TALIF measurements is a high
intensity laser system, a constraint that arises from the small absorption cross section of TALIF
transitions and the quadratic relationship between signal and the intensity of incident light. The
common method for achieving such high intensity is through the use of pulsed laser systems.
These systems allow for much higher instantaneous intensity while keeping the time averaged
power to a relatively reasonable value. The approximately 10 ns pulsed laser used in these
studies has a repetition rate of 20 Hz, thus representing a factor of 5∙106 increase in
instantaneous intensity and 1013 in TALIF signal when compared to a continuous wave (CW)
system of similar average power. The fast time scale established by the laser pulse also allows
for further separation of signal from background via short interval gating. Such techniques
require fast photo detectors and fast digitization. Specialty optics are also important for these
TALIF measurements as the laser light is in the deep UV and is strongly absorbed by most
glasses. Focusing of the injection beam is often desirable because of the quadratic relationship
between intensity and signal. In experiments where focusing was used signal was optimized by
overlapping the focal spots of collection and injection optics.
3.1 The Laser System
There are three parts to the laser system used in these TALIF experiments. The first stage
is a custom, frequency-doubled, Spectra Physics Quanta-Ray Nd:YAG laser which pulses at 20
Hz and produces 10 ns pulses with energies of 300-800 mJ at 532 nm. The Nd:YAG laser pumps
a Sirah Cobra-StretchTM dye laser system which operates between 610-630 nm with pulse energies

32
of 50-150 mJ. The fundamental ~615 nm light is then sent through a second-harmonic generating
crystal and recombined with the residual of the fundamental beam through a sum harmonic
generating crystal, at up to 4% efficiency, to produce 203-210 nm light. The final laser pulse is
slightly shorter than the original at 8 ns FWHM and ≤ 1.5% of the original Nd:YAG energy. The
key parameters of the laser system are summarized in Table 1.
The Quanta-Ray laser system consists of four Nd:YAG crystals pumped by xenon flash
lamps which can produce > 1.5 J of 1064 nm laser light. The timescale of the flash lamps is much
longer than 10 ns, and so the pulse interval is controlled by a Q-switch. This Q-switch quickly
alters the quality, Q-value, of the laser cavity surrounding the lamps and rods and thus the
efficiency of the cavity goes down and the energy which was stored in the cavity quickly exits.
The Q-switching is done through the use of a Pockels cell, which can vary the polarization of light
very quickly via a nonlinear electrostatic response within the Pockels cell crystal. The Pockels cell
combined with a polarizer and quarter-wave plate make up the Q-switch for the Quanta-Ray laser
system.
The Quanta-Ray system has several other subsystems which are all necessary for the dye
laser to operate efficiently. There are automated divergence and steering corrections. These
systems sample a small fraction of the beam power, and both are necessary to maintain alignment
through the later stages of the laser system. There is a second harmonic generating crystal which
converts the 1064 nm light into 532 nm light, at roughly 50% efficiency. This is required to
efficiently pump the dye at 615 nm, because pumping occurs much more efficiently if the pump
photons are of higher energy than the light they are trying to amplify. The final output of the
Nd:YAG laser system is a beam of 1 cm diameter 300-800 mJ per 10 ns pulse centered at 532 nm
with a linewidth of 1 cm-1.

33
The dye and harmonic generating stages are part of a Cobra-StretchTM laser system which
was constructed by Sirah Lasertechnik in Grevenbroich, Germany. The main components of the
dye stage are the oscillator/pre-amplification cell, two steerable gratings, and a final capillary
amplification cell. The harmonic generating stage is relatively simple, having only two barium
borate (BBO) harmonic generating crystals, a compensating rhomb, and a set of dichroic mirrors
to separate the UV light from the fundamental light of the dye stage. These stages determine the
beam quality, laser linewidth, and efficiency of conversion of the entire system.
As shown in Figure 3.1, the 532 nm light enters the dye laser and interacts with the
oscillator portion of the first dye cell. The light then reflects off of two diffraction gratings, 2400
lines/mm, which determine both the central wavelength of the laser based on their relative
orientation and the linewidth of the dye laser based on their separation from a cavity mirror and
their groove density. The chosen wavelength of light then passes through the same dye cell again,
exciting transitions within the dye at the same frequency and is further pumped by the 532 nm
light in a pre-amplification stage. The pre-amplified beam continues on and is then shaped and
collimated in order to pass through the final capillary amplification dye cell. Here the final beam
Figure 3.1. A diagram of the Cobra-StretchTM laser system with mirrors (mx), beams splitters (bsx), and various
other optical components labeled.

34
shape is defined and the final amplification occurs. The result of this entire system is a beam of 5
mm diameter with 50-120 mJ per 10-12 ns pulse with a FWHM bandwidth of 0.04 cm-1 or 1.2
GHz, which is 1.51 pm at 615 nm.
The final 615 nm fundamental light then goes through harmonic generation stages to be
converted into the deep UV, 205 nm, light to be used for two photon excitation. The first
temperature stabilized barium borate (BBO) crystal is a second harmonic generating crystal which
constructively interferes the fundamental beam with itself to create 307 nm light. This second
harmonic light and residual fundamental light then pass through a compensation rhomb, to account
for the alignment shift which comes from passing through the second harmonic crystal. The two
beams then are combined in a sum harmonic BBO crystal to generate the final deep UV (205 nm)
light. The angle of these crystals is selected to optimize the conversion efficiency from 615 nm to
205 nm in this UV stage of the laser system. There is a wave plate before both BBO crystals which
selects a portion of the fundamental frequency which will pass through the first crystal and interact
with the second crystal, as the second crystal requires both the fundamental and second harmonic
light to generate the third harmonic, deep UV, 205 nm light. The orientation of this wave plate is
optimized after the angle of both crystals have already been optimized because the goal is to
produce the most 205 nm light which is not necessarily when the most 307 nm light has been
produced. Each crystal requires the creation of a look up table for frequency conversion to occur
most efficiently at a wide wavelength range. The look up tables set the angle of the crystals for
specific wavelengths and for all wavelengths in between there is an interpolation of the crystal
angle to maintain high conversion efficiency. The angle of incidence of the beam on the BBO
crystals greatly affects the efficiency of conversion. This final beam has 1-4 mJ per 8 ns pulse, a

35
beam diameter of ~ 5 mm, and a FWHM linewidth of 0.07 cm-1 or 2.08 GHz which is 0.291 pm at
205 nm.
Since the final UV pulse is shorter than the state lifetime of the 3d hydrogen state and of
the Kr state used for calibration, the collection gating window is determined by the state lifetime
and does not need to be extended because of the pulse time. The short pulse time also makes the
beam relatively short in physical length. 1 ns corresponds to 30 cm of light. This means that a
Doppler-free measurement using a retro-reflected beam will need to compensate for a change in
the spatiotemporal laser intensity at the measurement location, even if the retro-reflection occurs
less than 1 m away. This length compensation is discussed more completely in section 4.3.1.
Table 1
Stage Pulse Period Energy/Pulse Central WL Linewidth (FWHM) Diameter
Nd:YAG 10 ns 300-750 mJ 532 nm 1 cm-1, 32 pm 10 mm
Dye 10-12 ns 50-120 mJ 615 nm 0.04 cm-1, 1.51 pm 5 mm
UV 8 ns 0.5-5 mJ 205 nm 0.07 cm-1, 0.291 pm ≤ 5 mm
3.2 Optical Design Considerations
The optical arrangements were designed to meet the specific goals of each experiment.
Largely, the changes were in how the laser light was injected and how the fluorescence was
collected. These changes effectively varied the sampling region and incident intensity. When
spatial localization was important, focusing of the injection and collection was performed. When
spatial localization was not critical, unfocused optics offered simpler alignment, less opportunity
for aberrations, and a greater sampling volume. Unfocused injection beams meant the emission
intensity was several orders of magnitude smaller than that which would have resulted from
focusing the injection beam. Leaving the beam unfocused was done when alignment and accuracy
were the most important factors and background light was expected to be small. During the

36
measurements to create a new calibration scheme, aberrations in refractive optics precluded the
use of focusing lenses. In the Doppler free measurements, focusing would have required
overlapping several, micron sized, focal points with approximately 1 m long optical axes.
Some elements of the experimental apparatus remained unchanged between experiments.
The same fast response photomultiplier tube (PMT), a Hamamatsu H11526-20-NF, was used for
all experiments. A HighFinesse WS7 wavemeter was used to measure the absolute wavelength in
each of the experiments. The power meter used for normalization of the signal to the laser intensity
was a pyroelectric sensor PEM 45K USB. Throughout all of the experiments, fused silica optics
and optical ports were used for injection to allow the deep UV light of the laser to pass into the
plasma. Maintaining these elements, the fundamental sensors for the experiments, helped to ensure
a consistent measurement quality.
3.2.1 The HIT-SI3 Optics
Figure 3.2. The HIT-SI3 optical configuration, showing the external boundary of the vacuum chamber, the
closed flux surfaces of the spheromak, and the two measurement location (X’s). The injection and collection
optics are confocal.

37
For the measurements performed on the helicity injected torus with steady induction 3
(HIT-SI3) spatial resolution and localization of the measurement were both very important. The
machine also had fairly limited optical access (which would not allow for perpendicular collection
of multiple spatial locations). For these reasons, confocal optics were used in the HIT-SI3
measurements. Confocal optics use a special mirror to allow the injected laser light and collected
fluorescence to be focused and collected respectively through the same lens, yet follow different
optical paths which diverge at the mirror. In the TALIF confocal design, the special mirror is a 2
in. diameter circular mirror with a 1 cm hole cut at 45-degrees through the center of the mirror.
The mirror design allows for the laser light to pass through unimpeded and for the collected
fluorescence to be redirected towards the PMT. This type of confocal mirror is preferred for TALIF
because maintaining the highest intensity of UV light is of great importance.
Focusing of the laser light increases the intensity and thus the overall signal in TALIF
measurements. For TALIF, focusing also has a strong localizing effect on the measurement. This
can be seen in Figure 3.3 where the localization of TALIF emission due to focusing is compared
to that of single photon LIF, for equivalent laser intensities. In a confocal system focusing is
required, but the collection volume is not as localized as the source of fluorescence. In the HIT-
SI3 experiments this led to large amounts of light from the plasma making it to the PMT reducing
the SNR of the measurement. To reduce the collection volume and thus improve the SNR a spatial
filter was installed. When optimized through krypton calibration, the spatial filter decreased the
collection of stray light by approximately a factor of 5, without reducing signal from Kr. Although
the amount of stray light collected was reduced, implementation of the spatial filter did not increase

38
the SNR of the deuterium TALIF measurements. It was not until after the spatial filter was
removed that TALIF signal in deuterium plasmas was obtained.
The HIT-SI3 experiments had similar diagnostic requirements as what would be expected
for large scale fusion devices. Port access was limited, localization and profile measurements were
needed, and background light was especially large. For these reasons, confocal optics were used
to localize the measurement and minimize needed port access. A spatial filter was also
incorporated into the collection optics in an attempt to reduce background light. Although TALIF
signal was eventually collected, removal of the spatial filter was required to obtain D signal. In
both the spatial filter configuration and unfiltered configuration excellent TALIF SNRs were
measured during calibration measurements of Kr gas. The lack of deuterium TALIF signal when
the spatial filter was used despite Kr SNR remaining high suggested a problem with the calibration
method. Chromatic shifts in focal length are the most likely cause for the lack of D signal when
the spatial filter configuration was used. While the excitation wavelengths for Kr and D are very
close to one another, 204 nm and 205 nm, the wavelengths of the fluorescence for the calibration
and the D schemes are very different, 826 nm and 656 nm. Ray tracing simulations, created in
ZemaxTM, show chromatic effects become more pronounced the smaller the pinhole portion of the
Figure 3.3. The relative signal intensity localization for single photon LIF (a) and for TALIF (b) given constant
laser intensity and equivalent focusing.

39
spatial filter becomes. These same simulations show that without a spatial filter the chromatic
effects on image area are negligible. The measurements presented in section 4.1 were taken without
a spatial filter.
3.2.2 Xe Calibration Scheme Development Optics
To develop a new calibration method, which would be free of chromatic aberrations, a new
calibration scheme was identified which uses xenon gas. To define the relative cross section
between Xe and H, TALIF on room temperature xenon and krypton gasses was performed in a
small test chamber. The intended purpose of the experiments was to measure the relative cross
section between the standard Kr calibration scheme and a new Xe calibration scheme and then to
use the relative cross section between Kr and H from the literature to calculate a Xe to H relative
absorption cross section [30]. Because the purpose of these measurements was to overcome
chromatic effects and the density of absorbers was expected to be fairly high and could be easily
varied by adjusting the pressure, the injected beams were not focused. The choice to leave the
beams unfocused was made to minimize chromatic effects through refractive optics. The signal
Figure 3.4. The optical configuration used for calibration experiments. BS: beamsplitter; I1 and I2: irises; M1-
M3: mirrors

40
intensity was expected to be relatively high and localization of the measurement was not especially
important, therefore focusing was not necessary.
The Xe scheme involved excitation with the laser output at 209 nm and emission at 656
nm. The krypton scheme to which it was being compared involved excitation with the laser at 204
nm and emission of 826 nm. The optics, shown in Figure 3.4, were selected so that the light passed
through the fewest number of refractive elements and irises were positioned to ensure that the same
beam path was used for Kr and Xe. To increase the collected signal, a single lens was used to focus
the fluorescence towards the PMT.
Because the injected light wavelength varied by a relatively large amount (the difference
in wavelength between Kr and H excitation is 1 nm while the difference between Kr and Xe was
5 nm), the laser had to be retuned and realigned when switching between Xe and Kr measurements.
To account for the changes in the laser beam path, two irises were inserted and beam walking
mirrors were used to maintain the beam path of the UV light. The goal of the optical design for the
xenon calibration experiments was to minimize complexity to reduce any possible sources of
misalignment or chromatic shifts.
3.2.3 Doppler Free Optics
The Doppler free measurements were performed in CHEWIE with the intent to maximize
signal and to ease the difficult task of overlapping beams. For these reasons perpendicular
telescopic collection and unfocused injection were employed. Using a telescope in the collection
optics allowed for a greater solid angle of collection and thus increased signal. The injection was
unfocused because the counter propagating beam was created via retro reflection and if focusing
had occurred, alignment would have required four foci, the injection, the collimating element, the
second injection, and collection, to be overlapped with one another. Unfocused injection and

41
telescopic collection gave the greatest signal while maintaining an achievable level of difficulty in
alignment.
The iris and beam walking mirrors, shown on the left side of Figure 3.5, were used in order
to maintain a consistent path within CHEWIE when switching from Kr to H or D. Although the
wavelength shift from Kr to D was very small, overlapping the beam was critically important and
thus alignment needed to be very tightly maintained. Shifts in the retroreflected beam position at
the iris were on the order of 1 mm when switching between Kr and H excitation. Such a small shift
over the 80 cm path length corresponds to only a 1.25 mrad angular shift and the beam walking
mirrors were used to ensure that the actual difference between the Kr and H paths was well below
this value. Had focusing optics been used the angular deviation would have needed to be less than
a few µrad for the foci to overlap.
Figure 3.5. The Doppler free optical configuration. Mirrors are designated with “M”s. The UV laser light is
shown in blue and the emission is shown in light red. The gate valve also acts as a beam block so that Doppler
broadened measurements are possible.

42
3.3 Data Collection
The data acquisition methods utilized at WVU were different than those which were
utilized at University of Washington on the HIT-SI3 experiment. The difference which lead to the
different acquisition methods was the duty cycle of the plasma. At WVU the helicon plasmas are
steady state and the measurements on noble gasses had no time requirements. One spectrum
measurement performed on a CHEWIE plasma or within a test chamber can take up to an hour
and there is no hard upper limit on the measurement time. The entirety of the HIT-SI3 data
presented constitutes less than 500 ms of total plasma time. The plasma pulses on the HIT-SI3
experiment were approximately 2 ms, so the data needed to be taken over several plasma pulses.
To maximize the amount of information extracted from this limited plasma time, the raw data from
the HIT-SI3 measurements was saved then digital processing and analyses were performed after
the conclusion of the experiment. The WVU data collection system saved only integrated averaged
values because the amount of raw data was so large. Although the specifics changed, the basic
elements of the data collection remained the same for the two cases. The same PMT was used to
measure signal intensity, integration of PMT signal over the same time interval was used to sample
that signal, the same wavemeter was used for wavelength determination, and the same energy
meter was used to measure laser power and normalize the TALIF signal.
The signal collected during the HIT-SI3 campaign was collected directly from a high speed
oscilloscope, a Lecroy Waverunner 604Zi, which can digitize at up to 20 gigasamples per second.
The PMT was also gated in these experiments to prevent saturation. The PMT “gated-on” period
was roughly 1 microsecond wide and centered on the laser pulse. A 150 ns section of the “gated-
on” period was subsequently analyzed. The first and last 50 ns were used to establish a background
for each plasma pulse. The middle 50 ns had the background value subtracted and its integrated

43
value provided the total signal intensity. This method allowed for subtraction of a background
which varied between plasma pulses and linearly through time. Although the relative change in
the background between plasma pulses was small, its absolute change was significant when
compared to the signal. Simply integrating over the signal interval would have been much less
accurate, due to the changing background. The laser wavelength and energy which were recorded
were averaged over many pulses leading up to the measurement, as the radio frequency
interference from the plasma pulse interfered with the energy and wavelength measurements of
the laser pulses which were synchronized to the plasma.
The data acquisition method utilized at WVU was similar in principle to that used during
the HIT-SI3 campaign, but with two significant differences: synchronization and integration. The
data acquired at WVU utilized a custom LabWindows™ program to synchronize signal, laser
energy, and wavelength. The averaged integrated signal from the PMT was collected from a
Stanford Research Systems SR-250 Fast Gated Integrator and Boxcar Averager. The energy of the
laser pulse came directly from the analog output of the energy meter. Lastly the wavelength of the
fundamental dye laser was recorded by the previously mentioned WS-7 wavemeter. The
fluorescence intensity and laser energy measurements were fed into a National Instruments PCI
DAQ card, NI-PCI-6281, to record the analog signal output of the boxcar and energy meter. The
program also controlled the wavelength of the laser system, which was stepped through a set
spectral range in adjustable increments for an adjustable number of laser pulses at each spectral
point.
Because the fluorescence signal recorded came from the boxcar rather than directly from
the PMT, the signal was an integration of the PMT output. The boxcar was not configured to
perform active background subtraction as was done digitally with the HIT-SI3 data acquisition

44
system. The background level was determined by scanning the laser far off resonance and
establishing a zero signal value, which was later subtracted from the total signal. Establishing such
a zero value is possible because the data collection time is not limited and so data collection with
zero signal is feasible. In a fusion scenario, where the plasma time is more limited, active
background subtraction is preferred.
3.4 Noble Gas Calibration
All of the measurements performed on hydrogen and deuterium require some type of
calibration in order for them to yield absolute density. Creating a specific known density of atomic
hydrogen for calibration is quite difficult as hydrogen is diatomic up to temperatures of several
thousand kelvins. For this reason, the calibration technique used for these measurements involves
performing a TALIF measurement on a known density of some noble gas and then comparing the
signal from that noble gas measurement to the signal from the hydrogen or deuterium
measurement. Having a known cross section for the two transitions allows for the ratio of total
emission to be converted into a ratio of densities and since the density of the calibration gas is
known, the absolute density of the hydrogen isotope can be determined.
For calibration, TALIF measurements are first performed on a noble gas at a known
pressure and density then on the hydrogen isotope. Signal intensity, laser power, PMT gain, PMT
and filter efficiency, and density of the calibration gas are all quantified. The signal is normalized
appropriately for each of those terms. The normalized integrated signal is proportional to the
density and the absorption cross section. Their relationship is a simplification of Equation (2.6),
∫ 𝑆𝑛𝑜𝑟𝑚 =ΔΩ
4𝜋𝜎 𝑛. (3.1)
To use Equation (2.6) to obtain absolute density from a hydrogen spectrum, the absolute
absorption cross section, the absolute emission intensity, and the solid angle of collection all must

45
be known. While all of these are possible to obtain they are fairly difficult to measure with high
precision. Calibration in that manner would also require all of the incident intensity and
fluorescence measurements to be absolutely calibrated. With the calibration gas method, none of
these quantities are required to be absolutely known. Using noble gasses for calibration requires
only relative measurements. The solid angle of collection is held constant between the calibration
and science measurements, so it is removed from the calculation. After normalization, the only
quantities which are needed are the relative absorption cross section and the relative spectral
response of the PMT. This second factor is not needed for Xe calibration, because the emission of
Xe is nearly identical to that of H and its isotopes. For krypton and hydrogen, the relative
absorption cross section has been reported in the literature [30]. For xenon and hydrogen, the
relative absorption cross section was recently determined at WVU [35]. The absorption cross
section is the same for both hydrogen and deuterium.
𝑛𝐻 = 𝑛𝐶 (𝑆𝑛−𝐻
𝑆𝑛−𝐶) (
𝜎𝐶
𝜎𝐻) ; (3.2)
Each term in Equation (3.2) marked with an “H” is related to hydrogen and each term
related to the calibration gas is marked with a “C.” Sx terms refer to the integrated signal from
Equation (3.1) and nx terms refer to density from Equation (3.1). Comparing the ratios of
normalized signal and relative cross section to the measured density of the calibration gas
(measured using a pressure gauge and at room temperature) gives the absolute density of hydrogen
in the measurement region. Using this method, the absolute calibration of the instruments, the PMT
and energy meter, is not needed. Relative measurements of energy and emission result in absolute
measurements of density, because any calibration factors cancel one another when comparing
normalized signal. The only quantities which must be known exactly are the density of the
calibration gas, the PMT spectral response, and the cross section ratio.

46
Chapter 4 Discussion and Results
The results of three different experimental campaigns are described in this chapter. Each
campaign involved a separate advancement of the two photon absorption laser induced
fluorescence diagnostic at WVU. The first section discusses the measurements obtained from the
helicity injected torus with steady induction 3 (HIT-SI3) spheromak. The second and third sections
focus on measurements obtained at West Virginia University (WVU) in a gas test chamber and
the compact helicon experiment for waves and instabilities (CHEWIE), respectively. The
spheromak measurements demonstrate the feasibility of the diagnostic on a short pulse high
temperature plasma and demonstrate the instrument sensitivity. The WVU measurements advance
the calibration method, allowing for greater noise reduction and measurement localization, and
demonstration of Doppler-free measurement capabilities will allow densities to be measured much
faster than was previously possible with single sided injection. The results show the need for
neutral measurements on fusion relevant plasmas, the capabilities of the TALIF diagnostic to make
such measurements, and the potential for advanced TALIF diagnostic development.
4.1 Measurements on HIT-SI3
The HIT-SI3 experiment is designed to make sustained spheromaks for current drive and
alternative fusion reactor investigations. For all spheromaks the magnetic fields used to contain
the plasma are generated purely by plasma currents. For this reason, total plasma current and the
coupling of input power to plasma current are key parameters for spheromak performance. HIT-
SI3 differs from most spheromak experiments in that helicity and, through Taylor relaxation,
current are injected into the system continuously. This results in a plasma which lasts ~2 ms and
has a peak plasma current on the order of 10 kA.

47
Figure 4.1 shows the typical plasma current versus time of the spheromak discharge.
Figures 4.2 shows the HIT-SI3 device, and optical port through which the data was collected. All
of the experiments were performed on the HIT-SI3 spheromak (Figure 4.2) operating in deuterium.
Before the TALIF campaign, the power driven into the helicity injectors was not coupling as
efficiently into plasma current as was predicted. One proposed reason for poor coupling was a high
neutral density which would lead to higher resistivity. For this reason, TALIF measurements of
deuterium neutrals were performed to determine the absolute neutral density, temperature, and to
help determine the ionization fraction within the experiment.
Figure 4.1. A current versus time trace of a typical HIT-SI3 plasma during the TALIF campaign. The thicker green
region represents the time when neutral data were successfully collected.

48
4.1.1 Experimental Apparatus
TALIF emission, S(λ), follows the form shown in Equation (2.6) and calibration of these
measurements followed the procedure outlined in section 3.4. The densities of krypton used for
calibration were 1019 and 6.5∙1018 m-3. The relative gain of the PMT was between 15 and 150 times
higher for the deuterium measurements than for the krypton measurements. The sensitivity of the
PMT to hydrogen emission was also a factor of 2.5 higher than it was for krypton emission. The
krypton calibration signal to noise was greater than 10:1. Combining all of these factors gives a
very conservative estimate of the sensitivity of the diagnostic at ~1015 m-3.
Figure 4.2. The HIT-SI3 experiment, depicting the copper flux conserver, three inductive helicity injectors, and
the diagnostic view ports locate on the outboard mid-plane as well as near the helicity injectors. The flux
conserver has a major radius of R = 55 cm and a minor radius of a = 23 cm. The optical access port used for
TALIF measurements is indicated by the blue arrow.

49
To acquire the signal, the output of the PMT was integrated over a short time interval cen-
tered on the time of the laser pulse. To subtract the background signal from the total signal, the
PMT current before and after the laser pulse was sampled for a time interval set by the observed
time interval of the signal peak. The choice of integration window is constrained by the PMT rise
time and fall time, the laser pulse length (10 ns), and the excited state lifetime (16 ns for 3d state)
[49]. The form of the sampling is explained mathematically in Equation (4.1) and graphically in
Figure 4.3.
𝑆(𝜆) = ∫ 𝐴(𝑡)𝑡0+∆𝑡𝑚
𝑡0
𝑑𝑡 −∆𝑡𝑚
2∆𝑡𝐵𝐺∫ 𝐴(𝑡)
𝑡0
𝑡0−∆𝑡𝐵𝐺
𝑑𝑡 −∆𝑡𝑚
2∆𝑡𝐵𝐺∫ 𝐴(𝑡)
𝑡0+∆𝑡𝑚+∆𝑡𝐵𝐺
𝑡0+∆𝑡𝑚
𝑑𝑡, (4.1)
𝐴(𝑡) is the PMT current, 𝑡0 is the start of the laser pulse, and ∆𝑡𝑚 = 50 𝑛𝑠 was the
measurement time interval used in this analysis. Equal background sampling measurement times
Figure 4.3. The PMT signal versus time for the PMT gate “on” interval for (a) a laser pulse tuned to a
wavelength outside of the absorption linewidth and (b) with a laser pulse on resonance. The integration window
intervals are magnified in (c) and (d). The thick line in (c) and (d) is the averaged background from sampling
outside of the integration window.

50
were used, ∆𝑡𝐵𝐺 = ∆𝑡𝑚, for simplicity. The most significant plasma density oscillations of the
HIT-SI3 system occurred at the frequency of the helicity injectors, 55.25 kHz, corresponding to a
period of 18 µs. The fastest time scales of the system were on the order of the Alfvén transit time
across the minor radius of the device, approximately 1.5 μs. Because the sampling time was much
smaller than these characteristic oscillation periods, the background contributions are treated as
linear throughout the sampling interval.
Because TALIF is a two photon process without an intermediate, single photon allowed
transition, the absorption cross-sections, 𝜎, for TALIF transitions are much smaller than for LIF
transitions. Therefore, TALIF requires high intensity, short pulse lasers. The laser used in these
studies was a frequency-tripled, pulsed dye laser pumped with a frequency-double Nd:YAG laser
operating at 20 Hz. The YAG laser generated up to 750 mJ of 532 nm light in a 1 cm diameter
beam in a 10 ns pulse. The 532 nm light pumped a Cobra-Stretch™ dye laser optimized for
producing narrow linewidth 612-630 nm light of up to 120 mJ per pulse. The spectral width of the
fundamental beam in the dye laser light was 0.04 cm-1. The dye laser pulses were 12 ns long and
were then tripled, via second harmonic generation followed by sum harmonic generation, to pro-
duce up to 4 mJ of 204-210 nm light in a 6-8 ns pulse with a 5 mm beam diameter. The harmonic
generation process broadened the laser in frequency space by a factor of √3, resulting in a FWHM
of 0.07 cm-1 or 2 GHz which is .291 pm at 205 nm. All of these measurements reported here were
obtained with less than 2 mJ of final output power to ensure optical components were not damaged.
Normalizing the integrated TALIF signal by the square of the laser intensity, the PMT gain,
and the quantum efficiency of the various filters and detector yields:
𝑆𝑛(𝜆) =∆𝛺
4𝜋𝑛(𝑣)𝜎. (4.2)

51
The relative TALIF absorption cross sections between the krypton and the deuterium schemes,
(𝜎𝐾𝑟 𝜎𝐷𝑒𝑢⁄ ), is known to be 0.62 [30]. Therefore, by comparing separate TALIF measurements
performed on krypton gas and deuterium plasmas with known fill pressures of krypton and using
the same optical system, absolute measurements of the velocity integrated deuterium ground state
density are obtained:
𝑛𝐷𝑒𝑢 = ∫ 𝑛𝐷𝑒𝑢(𝑣)𝑑𝑣 = 𝑛𝐾𝑟 (𝑆𝑛−𝐷𝑒𝑢
𝑆𝑛−𝐾𝑟) (
𝜎𝐾𝑟
𝜎𝐷𝑒𝑢). (4.3)
Because the optical paths were the same for the krypton and deuterium measurements, the factor
of ∆𝛺 in Equation (4.2) does not appear in Equation (4.3). Contrary to tokamak or stellarator
configurations, spheromak magnetic fields are fully generated by internal plasma currents. HIT-
SI3’s currents were maintained by three inductive, non-axisymmetric, helicity injectors which
impart a characteristic oscillation on the plasma with a period of 18 μs. Flows within the plasma
vary by 100-200% on this timescale [62]. The electron temperatures were estimated to be between
5-20 eV and electron number densities were measured on the order of 1018-1019 m-3. All the TALIF
data was collected when the helicity injectors were turned off and the spheromak was resistively
decaying [63]–[65].
TALIF measurements were obtained with a confocal collection scheme (see Figure 3.1)
where both the emitted and injected photons pass through the same final focusing/collecting lens.
The confocal system used a mirror with a 1 cm diameter hole cut through the center at a 45-degree
angle. The mirror allowed the laser light, with its small beam diameter of 5 mm, to pass into the
chamber while reflecting a majority of the collected fluorescent emission towards the PMT. The
measurement location in the chamber was changed by moving only the final focusing lens, as
depicted in Figure 3.2. The only optical component changed between the Kr calibration
measurements and the D measurements was the optical filter. The filter used for D was centered

52
at 656 nm, had a FWHM of 1 nm, and a peak transmission of 45%. The filter used for Kr calibration
had a peak transmission of 70% at 830 nm, with a FWHM of 10 nm, giving it 46% transmission
at the Kr emission wavelength of 826 nm. The difference in sensitivity of the photo detector
between 826 nm and 656 nm light was a factor of 2.505, with the PMT being more sensitive to the
656 nm light.
The results of these measurements were previously published in Review of Scientific
Instruments (RSI), with slightly different values, due to a change in understanding of the TALIF
excitation scheme, and to better coincide with previous WVU TALIF publications [31], [60], [66].
The densities reported here are a factor of 2 smaller than those reported in the RSI because the
calculations in the RSI assumed the excited state was an arbitrary 3n state. The 3n state in hydrogen
decays 50% of the time to the 1n and 50% of the time to the 2n states. The previous interpretation
was that using a chromatic filter which was optimized for 3n to 2n emission was blocking half of
the emitted light. A more thorough understanding of two photon absorption, as discussed in section
2.1, showed that the majority of the excitation was into the 3d state, which decays almost 100%
into the 2p state. Therefore, all of the emission did pass through the single chromatic filter
optimized at 656 nm. The temperatures drop by a factor of two, and the spectra are plotted using
the UV wavelengths rather than the fundamental dye wavelengths to coincide with the conventions
used in previous WVU TALIF works [31], [60], [66]. The method for temperature calculation is
described in section 2.4, and corresponds to a one dimensional velocity distribution which is
proportional to 𝑒(−𝑣2
𝑣𝑇2⁄ )
.
Measurements were attempted with and without a spatial filter in the collection optics. The
spatial filter, an adjustable iris at the focus of a Keplerian telescope, was intended to limit the depth
of field of the collection optics to the focal plane of the injected laser light and thereby reduce the

53
amount of background light striking the surface of the PMT. It was observed that after optimization
of the optics during calibration and with the use of the spatial filter, no D signal was obtained from
the plasma; regardless of other system parameters. A likely explanation for the lack of D signal
when using the spatial filter is the differences in focal properties of the optics at the different
fluorescence wavelengths. Such chromatic differences are especially apparent with long optical
axes or high precision techniques such as spatial filtering. To avoid this problem in future
experiments, there is now a new xenon-based calibration scheme that fluoresces at nearly the same
wavelength as D. The xenon ground state is pumped to the 7f state which then fluoresces at 656
nm [35].
Because of the confocal injection/collection and TALIF’s quadratic dependence on laser
intensity, these measurements were well localized. The resolution along the laser path is less than
1 cm, based on beam waist and the TALIF’s quadratic dependence of fluorescence on incident
light intensity. Based on beam waist measurements, the off-axis resolution is sub millimeter. This
resolution is much better than that of single photon LIF using similar optics.
4.1.2 Neutral Density in the HIT-SI3 spheromak
The Kr calibration TALIF measurements were obtained with a pressure of 0.2-0.4 mTorr
in the HIT-SI3 chamber. The measured calibration spectra can be seen in Figure 4.4. The widths
of Kr spectra were anomalously wide due to isotopic broadening, as reported by Magee, so the
widths of those velocity distributions do not correspond to the temperature of the neutral gas [67].
For each measurement location, a new Kr calibration was performed. The signal-to-noise ratio
(SNR) of the Kr measurements, the peak signal compared to the average standard deviation of the

54
measurements and the resultant calibration factors, were excellent. Therefore, the dominant source
of error in the absolute D measurements was the SNR of the D TALIF measurements
At a given spatial location and a fixed time index in the decay phase of HIT-SI3 discharges,
six separate TALIF measurements were obtained for at least five different wavelengths between
205.077 nm to 205.110 nm. Two sample TALIF signal versus time measurements for two different
wavelengths in two separate HIT-SI3 discharges are shown in Figure 4.3, one with the laser
wavelength on resonance for the deuterium transition and one with the laser wavelength far from
resonance. The PMT is gated on for only 1 µs for each measurement and the laser is triggered at
the center of the gate interval to eliminate switching noise and PMT saturation. The PMT gate
interval and laser firing time were moved to different times in the HIT-SI3 discharge to explore
the time evolution of the neutral D density in the discharge. In Figures 4.3 (a) and (c), the laser
was tuned to a wavelength off the absorption line whereas in Figures 4.3 (b) and (d), the laser was
tuned to the peak of the D absorption line. It can be seen in Figure 4.3 that the entirety of the
Figure 4.4. The krypton TALIF calibration measurements had excellent signal-to-noise as indicated by the small
error bars away from resonance. The data in (a) were obtained 11 cm into the experiment; (b) were obtained 18
cm into the experiment.

55
TALIF signal pulse falls within the 50 ns integration window. The background levels subtracted
from the measurements are also shown in 4.3 as a solid black line in parts (c) and (d).
Several deuterium TALIF signal versus laser wavelength plots are shown in Figure 4.5.
The deuterium TALIF neutral velocity distribution (NVD) measurements have a signal-to-noise
ratio (SNR), peak signal to standard deviation of signal, of approximately 4:1. A single Gaussian
distribution was fit to each set of data. The amplitude multiplied by the width of the fit is directly
proportional to the density of the deuterium ground state and the width of the fit, 𝛥𝜆, is proportional
Figure 4.5. TALIF signal from Deuterium plasmas in the HIT-SI3 spheromak. The error bars come from the
standard deviation of the measured data. The black line is a Gaussian fit from which the temperature is
determined. Dataset (a) was recorded 18 cm into the chamber at 2.16 ms. Datasets (b)-(d) were recorded 11 cm
into the discharge at 2.18, 2.16 and 2.10 ms

56
to the temperature of the deuterium ground state population through the Maxwell-Boltzmann
relation, as described in section 2.4.
The width of the fit in Figure 4.5 (a) is 𝛥𝜆 = 3.12 pm, which corresponds to a FWHM of
7.35 pm. The measured width is more than 10 times the spectral width of the laser, whose FWHM
is 0.291 pm. Thus, the measured broadening is estimated to be entirely thermal, and the laser
linewidth correction described in section 2.3 is ignored. The NVDs themselves are shown in Figure
4.6. The velocities were determined from the Doppler relation between the wavelength of the
absorption light and the peak absorption. The density values were determined through the
normalization process described in section 3.4.
The resultant neutral densities and temperatures at 11 cm are shown in Figure 4.7 for
different times in the decay phase of the discharge. Because there was no significant shift in the
centroid of the fits from the resonance frequency of the 1s to 3d atomic transition in D, the TALIF
Figure 4.6. The absolutely calibrated velocity distributions of deuterium measured in HIT-SI3. These data are
created by comparing the data shown in Figure 4.5 with that in 4.4. The letter designation matches that found in
Figure 4.5.

57
measurements show no evidence of neutral flows in HIT-SI3. The ~1.3 pm spacing in measured
wavelengths corresponds to a flow resolution of ~2 km/s. The laser system was capable of
measurements with much finer spectral resolution, but to increase the data collection rate the
spectral resolution was sacrificed.
Although attempts were made to collect data during the main helicity injection phase, 0.8-
2.0 ms in the current trace shown in Figure 4.1, no measurable TALIF signal was observed. Note
that the absolute densities measured in the afterglow were approximately 1015 m-3 and neutral
temperatures ranged from 0.37 eV to 0.87 eV. These measurements suggest that the neutral density
during the main phase of the discharge is less than 1015 m-3 at both radial positions investigated
(see Figure 4.8). The measured density values are very near the predicted sensitivity limit of the
TALIF diagnostic predicted by Magee et al. and span nearly the entire density range predicted in
UEDGE simulations of the DIII-D plasma edge [31]. The neutral density increased monotonically
by approximately a factor of 3, through time, as would be expected for a decaying plasma.
Figure 4.7. Absolute deuterium density (blue dashes) and temperature (red “x”’s) versus time in the decay phase
of the spheromak discharge.

58
Figure 4.8 shows the difference in density and temperature at the two spatial locations
sampled 2.16 ms into the discharge. The density varied only slightly, but the temperature more
than doubles moving from 11 cm to 18 cm from the chamber wall. While a tokamak edge profile
is expected to have strong gradients in the neutral density (increasing exponentially at the near the
edge) and such a gradient is not observed here, the positions at which measurements were taken
did not represent the edge of the HIT-SI3 device. From Figure 3.2, it is clear that these
measurements were taken well within the closed flux region of HIT-SI3. Such a region of the
device would not be expected to have strong gradients in neutral density. The errors shown in
Figure 4.7 and 4.8 are based on the uncertainties in the fitting results to each measured spectrum.
Smaller fitting errors, and therefore smaller uncertainties in the measured densities, are obtainable
with an increase in the number of laser pulses per wavelength or with an increase in the number
of wavelengths. If the velocity distribution is non-Maxwellian, the error in the temperature may
not decrease as a single Maxwellian distribution was assumed in the fits. With many more
Figure 4.8. Absolute deuterium density (blue dashes) and temperature (red “x”’s) versus position at time t =
2.16 ms.

59
spectral points sampled an integrated signal value could be determined without fitting a Gaussian,
this could greatly reduce the uncertainty in density.
All of the neutral temperatures recorded in Figures 4.7 and 4.8 are on the order of 1 eV.
This is approximately an order of magnitude smaller than the reported ion temperatures during the
helicity injection phase [62], [64], [65]. These measurements could be used to constrain models of
the ion-neutral coupling in the HIT-SI3 device.
4.2 Xenon Calibration Scheme
As mentioned earlier there was a surprising lack of signal when utilizing a spatial filter for
stray light reduction in the HIT-SI3 measurements. The likely cause for this was determined to be
chromatic aberrations within the refractive collection optics used. The impact of differing
fluorescent wavelengths is demonstrated with a Zemax™ model of a confocal TALIF optical
system with various aperture sizes, shown in Figure 4.9. This figure shows how reducing the
aperture size of a spatial filter, optimized for 826 nm light, can block 656 nm light originating from
the same location. The image area is proportional to the amount of light which has traveled from
the starting focal point (the far left of the Zemax™ model, or the focal region in a TALIF
Figure 4.9. Ratio of the effective image area for 826 nm and 656 nm light after passing through a spatial filter of
varying diameter. Inset is the ZemaxTM model of the confocal configuration including a spatial filter that was
used for these calculations.

60
measurement). Any ratio of image areas other than 1 means a different amount of 656 nm light
passes through the spatial filter than 826 nm light. It can be seen that as the aperture size decreases
the relative area of the 826 nm image and the 656 nm image changes. For a light collection path
of 1-2 meters, as is typical of TALIF designs for fusion systems, the Zemax™ model shows
significant blockage of the 656 nm light originating from the same location as the 826 nm light,
when the system is optimized for the 826 nm krypton TALIF fluorescence. Therefore, this new
xenon calibration scheme is much better suited for calibration of hydrogenic TALIF diagnostics,
because it has the same decay emission as deuterium and hydrogen.
The Xe state being excited is the 7f j=2 state with two 209 nm photons which subsequently
decays to the 5d state through the emission of a 656 nm photon which is almost identical in
wavelength to that of hydrogen, deuterium, and tritium emission in the TALIF scheme discussed
throughout this work. The comparison of the Kr, Xe, and D TALIF schemes are shown in Figure
4.10. The excitation wavelength for Xe is significantly different than that required for Kr
calibration, but it is of longer wavelength. Longer wavelength photons are generally easier to create
than shorter wavelength photons, meaning that a Xe calibrated diagnostic would not be required
Figure 4.10. The partial Grotrian diagrams of deuterium (a), krypton (b), and xenon (c) showing the excitation
photons and the emission photons for each TALIF scheme.

61
to produce light as deep into the UV as the current WVU TALIF system. This may allow future
TALIF systems to be cheaper or of slightly higher power.
4.2.1 Experimental Apparatus
This TALIF system begins with a Spectra-Physics Quanta-Ray Pro-270 pulsed Nd:YAG
laser with a maximum power of 750 mJ per pulse at 532 nm at a repetition rate of 20 Hz. The dye
laser is a Sirah Cobra-StretchTM optimized for 615 nm light with a mixture of Rhodamine B and
Rhodamine 101 dyes [58]. With this dye mixture, the useable output wavelength range of the dye
laser is 612 nm to 630 nm. The output energy of the dye laser is ∼100 mJ/ pulse and the pulse
width is 12 ns. The output of the dye laser is frequency doubled to 306-315 nm in a second
harmonic generating BBO crystal, mixed back with the 615 nm fundamental then passed through
a sum harmonic generating BBO crystal to generate a third harmonic of the fundamental beam at
204-209 nm. The 205 nm light has a typical power of 1 mJ/ pulse, a temporal FWHM of ~8 ns,
energy stability of 5%-7%, and a spatial profile with a diameter of 5 mm. The linewidth of the 615
nm beam is .04 cm-1, which should result in a linewidth which is √3 times wider in frequency
space, per the design specifications, at 205 nm [58].
The collected light is filtered with a bandpass filter and focused onto a photomultiplier tube
(PMT) (Hamamatsu H11526-20-NF). The PMT signal is then processed by a Stanford Research
Systems Fast Gated Integrator and Boxcar Averager (model SR250). The boxcar acquires the
integrated output of the PMT over a 50 ns interval synchronized to the laser pulse, averages 10
such measurements, and outputs a voltage proportional to the averaged integrated signal intensity.
The result is recorded along with the measured wavelength of the ~615 nm beam; obtained with a
High Finesse WS7 wavelength meter that is accurate to 0.075 pm. The laser is stepped in
wavelength over a spectral range and several laser pulses are taken at each wavelength within that

62
range. A hydrogen TALIF spectrum recently obtained through measurements on the HIT-SI3
spheromak with this TALIF system is shown in Figure 4.11, with the laser and its narrow linewidth
depicted alongside the measured spectrum.
Because the objective of these experiments was to establish the relative absorption cross
sections for krypton and xenon, and thereby determine a value for the relative cross section value
between xenon and hydrogen, the measurements were performed in a simple, low pressure, gas
filled chamber. A diagram of the experimental configuration of the optics is shown in Figure 3.2.
To avoid saturation effects and minimize optical complexity, the injected laser beam was not
focused in the gas. Fluorescent light collection was accomplished through a 1” diameter, 15 cm
focal lens oriented perpendicular to the injected laser beam. The gas pressure was simultaneously
measured with a Baratron and a Pirani gauge for improved accuracy. The fluorescent emission
from krypton was filtered with a 10 nm wide bandpass filter centered on 830 nm and the xenon
emission was filtered with the same bandpass filter, 656 ± 1.0 nm, used for hydrogen TALIF.
Therefore, as with the HIT-SI3 measurements, transmission efficiency was nearly identical.
Figure 4.11. A typical deuterium TALIF spectrum obtained in a spheromak. Red is the measured signal, black
is the Gaussian fit, and green is the fundament width of the laser (shown for comparison).

63
4.2.2 Krypton and Xenon Measurements
As indicated by Equation (2.6), TALIF signal is proportional to the density of the probed
species, the square of the intensity of the incident light, the sensitivity of the light detector, and the
absorption cross section of that TALIF transition. The total, integrated over wavelength, TALIF
signal normalized by the square of the laser energy, the detector gain, and the wavelength
dependent PMT quantum efficiency is therefore directly proportional to neutral gas density. To
ensure that the two measurements employed the exact same optical path and collection volumes,
two fixed irises were placed along the optical path and the injection beam constrained to pass
through both irises at all times (see Figure 3.3).
The normalized TALIF signals for both krypton and xenon are shown in Figure 4.12 as a
function of neutral gas pressure. Note, from the axes, that the xenon absorption cross section is
significantly smaller than the krypton absorption cross section. At low gas pressures, both sets of
measurements are linear with increasing neutral pressure. At the largest pressures investigated, the
krypton TALIF signal diverges from linearity; the deviation is most likely a result of increased
absorption of the laser light along the injected beam path. That the krypton data saturates at the
highest pressures is consistent with a krypton absorption cross section that is much larger than the
Figure 4.12. Normalized TALIF signal for (a) xenon and (b) krypton as a function of neutral gas pressure.

64
xenon cross section. Also shown in Figure 4.12 are linear fits to the TALIF measurement. For
krypton, two different linear fits are shown; one fit includes the measurements up to 60 mTorr
(solid line) and one stops at 50 mTorr (dashed line). The slopes of the linear fits are proportional
to the absorption cross sections of the species. The uncertainty in the pressure measurement is ±
1.5 mTorr and the linear fits for both species cross the pressure axis within the pressure uncertainty
range.
Shown in Figure 4.13 is the ratio of the measured krypton and xenon two-photon absorption
cross sections as a function of neutral gas pressure. The dots are interpolated relative cross sections
from the raw data. The lines were created by comparing the linear fits from Figure 4.12. The two
dashed lines correspond to the two different krypton fits. The solid line is an average of the two.
Using the ratio of the fits, the relative cross section is 0.038 ± 0.005. The average of the ratio from
direct measurement comparisons, for pressures less than 50 mTorr, yields a relative cross section
of 0.041 ± 0.008. Using the krypton to hydrogen two photo absorption ratio of 0.62, we obtain a
relative two-photon absorption cross section between xenon and hydrogen of 0.024 ± 0.001.
Figure 4.13. Relative absorption cross section between Kr and Xe versus pressure.

65
4.3 Doppler Free Measurements
CHEWIE was utilized for both hydrogen and deuterium plasma production for these
experiments. In both cases, the magnetic field was set to 650 Gauss and the input power was 500
Watts. For these conditions, neutral temperatures are expected to be low and Zeeman splitting is
negligible. The hydrogen gas fill pressure was 25 mTorr and the deuterium fill pressure was 22
mTorr. The gas pressures were somewhat high for a helicon plasma, but since the creation of
neutrals was the objective, higher gas pressures were used. The krypton calibration measurements
were performed with cold gas in the same system but with no magnetic field. The krypton fill
pressures were 20.7 and 13.5 mTorr for the hydrogen and deuterium calibrations, respectively.
For all of these measurements, the optical configuration outlined in section 3.2.3 was
utilized. The Doppler broadened (DB) measurements were taken with the gate valve closed so that
all photons absorbed during the TALIF excitation were propagating in the same direction. The
Doppler free (DF) measurements were taken using the same optics but with the gate valve open
and the beam reflected off of the retroreflecting mirror to allow for absorption of photons
propagating in both directions. The laser used was the laser described in section 3.1, although it
was found to have a wider laser linewidth than that reported in Table 1.
Measurement of and normalization to the energy of each laser pulse was not performed as
part of this analysis. The decision to disregard normalization was made because the unfocused
nature of the optics made the TALIF signal very low. Therefore, diverting a significant portion of
the beam for power measurement would have reduced the laser intensity in the measurement region
and subsequently the signal to unacceptably low levels. For these proof-of-concept measurements,
increased signal was more important than absolute calibration.

66
The difference between a DF two photon excitation and a DB excitation is that the two
photons absorbed during a DF excitation were originally propagating in opposite directions. In DF
excitation the Doppler shift on one photon, in the frame of the particle, is equal and opposite to the
Doppler shift of the other photon the particle absorbs. For this type of excitation to be possible,
there must be two laser beams which propagate in opposite directions and overlap at the
measurement region. Because the Doppler shift of each photon is canceled by another in DF
excitation, the entire velocity distribution is excited when the laser is set to the two photon
transition wavelength. Therefore, the measured spectrum obtained from DF excitation is narrower
than a DB spectrum and could, in some scenarios, be measured with DF excitation at a single
wavelength. Sampling the entire velocity distribution without the need to scan the wavelength of
the laser would greatly improve the data collection rate.
For all DF measured spectra there are three spectral components: the signal due to the beam
propagating in one direction, that due to the sum of both beams (the DF portion), and the signal
caused by the beam propagating in the opposite direction. Although all three components are
present in a DF measurement, the properties of DF excitation help to distinguish the spectral
components. The narrower the linewidth of the laser and the hotter the neutrals, the easier
separating these components becomes.
DF excitation typically increases the amplitude of the peak signal when compared to DB
excitation. The increase in signal comes from two sources: the narrower DF spectrum and
increased laser intensity. Although a DF spectrum is narrower than a DB spectrum, the area of the
two spectra should remain constant; making the peak of the DF spectrum larger. The width related
increase is proportional to the square root of the temperature when the Doppler width is much
greater than the laser linewidth. In the DF measurements taken at WVU, the counter propagating
67
beams were created by retroreflecting a beam onto itself, which resulted in increased laser intensity
at the measurement region. Signal is proportional to intensity as described in Equation (2.6) and
thus this increased intensity results in increased signal. The intensity increase is related to the
separation distance between the retroreflecting mirror and the measurement region and the pulse
length of the laser.
4.3.1 Doppler free measurement calculations
Every DF measurement has DB spectral components. When the temperature of the particles
being measured is low and the linewidth of the laser is high, these spectral components become
difficult to subtract. To subtract the DB portions of the measurement from the DF TALIF
measurements, a detailed analysis of the expected relationship between the spectral components
was performed.
For these DF TALIF experiments a retroreflecting mirror was used to overlay the beam
onto itself and thus provide the counter propagating beam for DF excitation. However, the laser
intensity at the measurement region was never twice that of the initial laser intensity. The reduction
in intensity from simply double the initial intensity was due to the short time nature of the laser
pulse. The laser pulses were 8 ns FWHM and the measurement region was 38 cm away from the
retroreflecting mirror. This results in a temporal correction to the expected intensity at the
measurement region,
𝜏2 = {4[∫ 𝐺2−𝑡
−∞ 𝑑𝑡+∫ 𝐺2∞𝑡 𝑑𝑡]
∫ 𝐺2∞−∞ 𝑑𝑡
} . (4.5)
The time correction to the expected intensity, 𝜏, is calculated by integrating the Gaussian shape of
the laser’s intensity with respect to time, squared, 𝐺2, while excluding the transit time of 1.27 ns,
t, between the measurement region and the mirror; effectively removing the middle 2.54 ns of the

68
laser’s intensity profile. This addition of intensities is not linear with the distance between the
measurement region and the reflecting mirror, but for any distance less than 84 cm retroreflection
results in greater integrated intensity than that generated from the Doppler broadened excitation.
The differences in the single sided and reflected intensities are depicted in Figure 4.14. The area
of the red curve corresponds to the difference in intensity, while the black curve corresponds to
this function squared and is thus the difference in signal.
The Doppler-free peak signal intensity is greater than that of a DB measurement by the
ratio of the Doppler width and the minimum width of the measurement. The minimum width of a
measured spectra from the WVU TALIF diagnostic is typically set by the laser linewidth. Because
the laser linewidth had recently been measured to be 4 times that of the design specification of the
laser system and the measured DF spectral width was on the same order as the DB spectral width,
the DF component of the signal was difficult to determine, and had to be extracted from the DF
measurements by carefully subtracting away the DB components of the spectra.
The exact reflectivity of the retroreflecting mirror was also unknown. The reflectivity was
measured to be ~95%, but reflectivity of the mirror changes with angle of incidence and measuring
the reflectivity at normal incidence is impossible. Knowledge of the reflectivity is needed for
Figure 4.14 The laser intensity at the collection area, calculated using an 8 ns FWHM Gaussian as the function
of intensity versus time. Intensity is shown in red and intensity squared is shown in black. The integrand of the
black curve is proportional to the expected signal and the ratio of the integral of the red curves is proportional to
time term, τ. The two blue dashed lines represent the initial laser pulse and its own retroreflection.

69
accurate subtraction of the DB components from the DF measured spectra because it scales directly
with two portions of the DF measurement spectra: the DF excitation and the DB component which
results from the retroreflection. The two unknowns, reflectivity and minimum measurement width
or laser linewidth, were determined self consistently through a comparison of the measured width
of a DF measured spectrum minus the expected DB components.
An initial guess of 95% reflectivity, R, was made and used to subtract the expected DB
signal components, 𝑆𝑖𝑔𝐷𝐵(𝜆), which was determined from a separate DB measurement, from the
measured DF signal, 𝑆𝑖𝑔𝐷𝐹(𝜆),
𝑆𝑖𝑔𝐷𝐹(𝜆) − 𝑆𝑖𝑔𝐷𝐵(𝜆) × (1 + 𝑅2) = 𝑆𝑖𝑔𝑃𝑢𝑟𝑒𝐷𝐹. (4.6)
This subtraction produces a spectral component, 𝑆𝑖𝑔𝑃𝑢𝑟𝑒𝐷𝐹, which should be purely a result of
Doppler free excitation and thus have no Doppler broadening. The width of this new spectral
component, Δ𝜆𝐷𝐹, can then be compared to the width of the DB measurement, ∆𝜆𝐷𝐵, the temporal
intensity increase, from Equation (4.5), the peak signals of the DF measurement, 𝑀𝑎𝑥(𝑆𝑖𝑔𝐷𝐹(𝜆)),
and the peak signal of the DB measurements, 𝑀𝑎𝑥(𝑆𝑖𝑔𝐷𝐵(𝜆)),
𝑀𝑎𝑥(𝑆𝑖𝑔𝐷𝐹(𝜆)) = 𝑀𝑎𝑥(𝑆𝑖𝑔𝐷𝐵(𝜆)) {(1 + 𝑅2) + 𝑅2 (𝜏∆𝜆𝐷𝐵
Δ𝜆𝐷𝐹)}, (4.7)
to solve for the reflectivity, R. This process is repeated until the solutions for reflectivity and DF
width are consistent with one another.
This type of analysis results in measurements of the laser linewidth, the reflectivity of the
mirror, and of corrections to the temperature from assuming the laser linewidth was small during
DB measurement. Converting the measured spectral widths to Doppler broadened widths is

70
described in Equation (2.5) and determining the temperature from these widths is given in Equation
(2.11).
4.3.2 Doppler Free Measurements
The Doppler free measurements presented here were sampled at many wavelengths so that
the DB spectra could be accurately subtracted. The subtraction method described in the previous
section was applied to measurements on hydrogen and deuterium plasmas as well as room
temperature Kr gas measurements. Although the measurements were not normalized and the low
signal of the DB measurements leads to a fairly low SNR, the measurement features are consistent
with what we would expect for DF measurements.
The results of DB measurements, DF measurements, the pure DF components extracted
from the DF measurements are shown in Figure 4.15. The Doppler free portion of the
measurement, indicated in blue, is noticeably narrower than the DB measurement, indicated in red.
The blue, purely DF component, was determined via the subtraction method outlined in the
previous section.
Figure 4.15 Hydrogen Doppler-free measurements. In part (a) the measured DF spectrum is given in black
dashed lines, the DB measurement scaled to match with the calculated reflectance is given in red and the purely
DF component of the spectra is given in blue. The DB and purely DF components are scaled identically so their
widths can be more directly compared in part (b).

71
The same measurements were performed with deuterium plasmas and the same type of
analysis was also performed. Doppler broadened measurements were taken with the gate valve,
depicted in Figure 3.5, closed and Doppler-free measurements were performed on the same plasma
with the same optics ensuring that the beam passed through the iris when entering CHEWIE and
when exiting it. The results of the deuterium measurements are shown in Figure 4.16, where again
the DF component is significantly narrower than the DB component.
Narrowing of both the D and H spectra strongly suggested that some form of Doppler
free excitation was occurring. If the DF measurement was the same width as the DB measurement
subtracting any multiple of the DB spectra from the DF spectra would not result in a narrowing of
the residual spectral component. The DF measurement was expected to be the same width as the
DB measurement on the room temperature noble gas calibration measurements. If these
measurements did not change their width under the same analysis, it would give further support to
the claim that the narrowing of this residual, purely DF component, of the measurements made
with the DF optical configuration was indeed a DF measurement.
Figure 4.16. Deuterium Doppler free measurements. In part (a) the measured DF spectrum is given in black
dashed lines, the DB measurement scaled to match with the calculated reflectance is given in red, and the purely
DF component of the spectra is given in blue. The DB and purely DF components are scaled identically so their
widths can be more directly compared in part (b).

72
Figure 4.17 shows the krypton measurements after passing through the same analysis.
The width of the component which was suspected to be purely Doppler free is the same width as
the Doppler broadened measurement, to within the uncertainty of the measurement. Therefore, the
analysis of the measurements obtained in a Doppler free setup behaved as would be expected.
When there is no Doppler broadening, because the krypton is very heavy and at room temperature,
a Doppler free measurement does not result in a narrower measured spectrum.
While the increased signal and data collection rate possible with DF measurements was
not taken advantage of in these studies, key information about the TALIF system was determined.
Figure 4.17. Krypton Doppler free measurements. In parts (a) and (c) the measured DF spectrum is given in
black dashed lines, the DB measurement scaled to match with the calculated reflectance is given in red, and the
purely DF component of the spectra is given in blue. The DB and purely DF components are scaled identically
so their widths can be more directly compared in parts (b) and (d).

73
The reflectivity of the mirror, as calculated using Equations (4.6) and (4.7) was found to be roughly
85%. For the hydrogen measurement, the calculated reflectivity was 115%, but this was likely due
to not normalizing the measured signal to the laser energy, some misalignment in the DB
measurement which reduced the peak DB signal compared to the DF signal, or a combination of
the two. The higher calculated reflectivity did not have a substantial effect on the final, purely
Doppler free, width. It was also possible to calculate the laser linewidth by using Equation (2.5)
and the measured purely DF spectral width. The value of the laser linewidth was determined to be
between 1.9 pm and 1.5 pm with the hydrogen and deuterium measurements reporting the higher
widths. The disparity between these widths could be real and caused by a shift in linewidth as the
laser changes its central wavelength, but it is likely that the disparity is due to incomplete DB
component subtraction of the DF measurements and the uncertainty of the measurement. The
averaged laser linewidth measured, 1.7 pm, was nearly 6 times the specified width of the laser,
0.291 pm, and approximately twice the linewidth inferred through measurements of the
fundamental dye laser, ~4 pm at 615 nm which corresponds to 0.77 pm at 205 nm. Despite the
uncertainty in the measurements it is clear that the laser linewidth is larger than it has been in
previous measurements and that measuring the fundamental.
The final amount of information which can be discerned from these measurements is the
corrected temperature of the DB measurements on H and D. The specified laser linewidth was
very small compared to the FWHMs of their DB measured spectra, 3.4 and 3.5 pm respectively.
Using these widths to calculate temperature for H and D would have yielded values of 0.1 and 0.2
eV. Correcting for the measured linewidth resulted in temperatures of 0.03 eV for H and 0.076 eV
for Deuterium. The uncertainty on these measurements is fairly large due to the uncertainty in the

74
laser linewidth, but the corrected temperatures are much closer to the temperatures expected in a
CHEWIE plasma [66].
These measurements demonstrate the capabilities of the WVU TALIF system to make
Doppler free measurements and help characterize the diagnostic. The true advantages of DF
measurements may only appear in higher temperature systems, but this work describes the basic
methodology for discerning DF signal from DB signal and explores the DB components of a DF
measurement. If the laser system were to be restored to its original specified linewidth, these DF
techniques would allow for much more efficient data collection in high temperature plasma
systems.

75
Chapter 5 Discussion and Conclusions
The TALIF diagnostic has been shown, through these experiments, to be a powerful tool
for measuring neutral velocity distributions. Because the ground state is being probed, the TALIF
scheme used in these studies measures the majority of atomic hydrogen. With noble gas
calibration, it is possible to absolutely calibrate these measurements and thus measure the absolute
value of the neutral density. The new calibration and Doppler free techniques presented here will
increase the utility of TALIF diagnostics in higher temperature plasmas and when they are
integrated into more complex experiments. The DF technique has clear experimental advantages
for neutral density measurements, but obviously sacrifices the ability to measure flows and
temperatures. Making a DB measurement may be too slow to use as a feedback control or require
too much plasma time to be used as a practical test of simulation in a fusion device.
5.1 TALIF as a Tool
Neutral density in the edge of fusion reactors is an important quantity for fusion reactor
performance. Fueling is controlled by the edge neutral density. Transport of energy and particles
is influenced by these neutrals, which can freely cross field lines. Measurements of the neutral
concentration and isotopic ratios will only increase in importance as fusion reactors become larger
and their chemistry and dynamics become more complex. The TALIF diagnostic at West Virginia
University can measure neutral density in a way which is less perturbative than many other plasma
diagnostics, is independent of other diagnostics and collisional radiative models, and is absolutely
calibrated.
Measurement of atomic transitions and their subsequent shifts allow for not only the state
density and the velocity of particles in those states to be measured but also the field environments

76
around the particles to be measured, through Stark and Zeeman effects. Excitation or laser based
diagnostics allow for the ground state of a species to be measured, which is not possible in purely
emission based spectroscopy techniques. Ground states typically represent a majority of the total
population of a species, and is therefore the ideal state to measure if you are interested in the
properties of the species.
The difficulty with ground state excitation in atomic hydrogen and its isotopes is the energy
difference between the ground state and all of the other states. For excitation from the ground state
to result in emission which is outside of the vacuum ultraviolet, the excitation must be from the 1n
to the 3n energy level. Lasers which produce photons of high enough energy to excite from the
ground state to the 3n state, 102 nm or 12 eV, have low power output and the VUV light they
produce is strongly absorbed in air.
Because TALIF can cut the required single photon energy in half, two photon absorption
is the simplest solution to the need for very large excitation energies. Scanning through wavelength
and creating an absorption spectrum allows for the velocity distribution to be measured as well as
the total density. The TALIF diagnostic at WVU is able to scan over very large ranges in
wavelength, allowing for velocity distribution measurements of hydrogen isotopes, as well as Xe
and Kr calibration gasses. It was shown that measuring deuterium velocity distributions in this
way was possible in short pulse plasmas through the HIT-SI3 measurements. Needing to measure
the velocity distribution in order to measure the density decreased the collection rate of density
information. Had the measurements been taken Doppler free, density data collection would have
been increased by 5 times or more.
TALIF also offers some unique experimental advantages beyond simply being able to
supply higher transition energy than single photon LIF with the same photon energy. TALIF’s

77
intensity squared relationship to signal allows for intrinsic localization of measurements when the
injection beam is focused and Doppler free excitation allows for the reduction or elimination of
thermal broadening. The Doppler free method of excitation makes auxiliary measurements such
as the relative density of isotopes and field measurements, through Zeeman and Stark splitting,
more sensitive.
5.2 How this Work has Advanced TALIF
The work presented here had the goals of improving the accuracy of and increasing the
sensitivity of neutral measurements in fusion plasmas. The HIT-SI3 measurements demonstrated
the feasibility of TALIF on a short pulsed device. The Xe calibration method will allow for more
hydrogen TALIF systems to be absolutely calibrated and for increased accuracy in calibration. The
Doppler free measurements allow for increased sensitivity, especially at high temperatures and
when magnetic field effects are expected to be substantial.
The results of the HIT-SI3 measurements established minimum values for the plasma time
required to generate a single NVD. In most cases, to generate 1 NVD from TALIF required 1.5
seconds or 30 plasma pulses. This data acquisition time is well below the pulse length for many
advanced tokamaks, such as EAST which has H-modes that last 30 seconds or longer [68]. The
measured density values were also well below those predicted for the HIT-SI3 device, 1015 m-3 as
compared to 1017-19 m-3. These measurement results eliminated the possibility of neutrals being
responsible for the collisionality and resistivity of the spheromak.
The spatially filtered confocal measurements attempted at HIT-SI3 showed how the
disparity in Kr and D emission negatively impact TALIF diagnostic performance. Large scale
fusion facilities will have optical alignment paths which are many meters in length, meaning that
a focal length shift of < 1 % would be unacceptable. The use of off axis parabolic mirrors would

78
eliminate the chromatic shifts in focal length, but would introduce additional complexity to the
optical alignment of the TALIF diagnostic.
The Xe calibration scheme has nearly identical emission to that of all hydrogen isotopes.
Because the emission is identical, regardless of the optics used, calibration using the Xe scheme
cannot be compromised due to chromatic shifts in focal length. This makes the Xe calibration
TALIF scheme more accurate in its determination of absolute density in complex optical
configurations. The Xe calibration scheme also uses a longer wavelength than the Kr scheme,
which means, in general, the photons required for Xe excitation can be created more efficiently
than those required for Kr excitation. Since the standard Kr excitation scheme requires light of
lower wavelength than hydrogen excitation, the Kr excitation wavelength determines the minimum
wavelength at which the laser system must be able to operate. A laser system designed to use the
Xe calibration scheme would not have to operate at quite as low of a wavelength as the current
WVU TALIF diagnostic. Not having to produce photons so deep into the UV should allow future
TALIF diagnostic systems to operate at slightly higher powers.
The Doppler free measurements allowed for the bandwidth of the laser to be determined in
the helicon scenario. However, the real advantages of DF measurements become evident in higher
temperature plasma measurements. In a high temperature plasma, the absolute maximum DB
signal decreases with the square root of temperature, while DF signal is constant regardless of
temperature. For 10 eV neutral hydrogen, the DF signal of deuterium TALIF would be more than
50 times greater than that of the DB signal, assuming the laser bandwidth was its designed value.
Even with the widened linewidth observed in the DF measurements presented here, the signal
would increase by nearly an order of magnitude. With the DF contribution to the measured spectra
being so much larger than the DB contribution, a DF measurement could be made without DB

79
subtraction. In a plasma of that temperature, if the linewidth of the laser was known, a density
measurement could be made with only one spectral point sampled. DF measurements do not yield
temperature information, so DB measurements would remain necessary to measure NVDs.
If a DF technique had been implemented on the HIT-SI3 measurements, density data
collection would have increased by at least a factor of 5. Had the measurements been performed
with the expected laser linewidth, the signal intensity would have also increased by more than a
factor of 15. The increase in absolute signal could either lead to greater data collection rates and/or
decreased uncertainty in the measurement. A prediction of what a HIT-SI3 measured spectrum,
based on the measurement depicted in Figure 4.5 (a), would have looked like had the measurement
been performed using the Doppler free technique is presented in Figure 5.1. The disparity in
intensity between the DF and DB components is largely due to the higher temperatures in the HIT-
SI3 experiment. Because of the high temperature, the composite peak is roughly equal in amplitude
to the DF peak. Because these peaks are nearly the same, knowledge of the laser linewidth and one
sampled wavelength would yield a complete neutral density measurement.
Figure 5.1. Predicted Doppler free spectra matched to the data collected during the HIT-SI3 campaign. The red
is the Doppler broadened spectral component, the blue the Doppler free component and the dotted black line
their sum. Figure (a) shows DF excitation where each DB component has the same incident intensity as the DF
component in the spectrum and Figure (b) shows predicted spectra if the laser was split and recombined at the
measurement region giving each DB component half the intensity of the DF component

80
5.3 The Next Step for TALIF measurements
The TALIF diagnostic at WVU has been shown capable of measuring the velocity
distributions of hydrogen atoms in a fusion experiment. While the velocity distribution of neutral
hydrogen could be measured with a single sided DB TALIF measurement, the purpose of ground
state excitation is to measure the neutral density without the need for further measurements or
models. The DF technique loses velocity information but is capable of higher sensitivity and data
acquisition rates especially at high temperatures. Because the purpose of the ground state
Figure 5.2. Proposed reflection based Doppler free optical configurations. Configuration (a) utilizes confocal
optics to reduce the number of ports necessary for a DF measurement, while (b) utilizes a focusing mirror to
reduce alignment difficulty and increase the applicability of the retroreflecting method.

81
excitation scheme is to measure the total density of the species, DF excitation is the preferable
implementation of this TALIF system in the future. Using the information gathered from these
experiments, it is possible to suggest future implementations of the TALIF techniques shown
previously and new techniques to develop.
Doppler free measurements have advantages in data acquisition rate and sensitivity,
especially at high temperatures. The major disadvantage of the DF system implemented at WVU
was that 3 optical ports were required to make the measurements. The amount of access required
could be reduced to 2 ports through use of confocal optics and focusing of the beams, as is seen in
Figure 5.2 (a). A Doppler free optical configuration which incorporates focusing, as shown in
Figure 5.2, would also increase the localization and signal intensity of DF measurements.
Replacing a second lens and retroreflecting mirror with a focusing mirror, as is the difference
between Figures 5.2 (a) and (b), decreases the path length, which increases the signal via Equation
(4.5). The major difficulty of implementing a focused DF optical configuration would be in
overlapping all of the focal regions of the various optical components.
Implementation of a Doppler free optical design on a fusion reactor would likely require
splitting and recombination of the UV beam to maximize signal, some examples of configuration
which incorporate beam splitting are shown in Figure 5.3. For the WVU TALIF diagnostic, with
an 8 ns FWHM laser pulse, if the retroreflecting mirror is more than 84 cm away from the
measurement region, splitting and recombining the beam results in higher DF signal. This distance
decreases as the temporal width of the intensity decreases. Utilizing a confocal Doppler free
configuration while injecting split beams, would also allow for two confocal measurements to be
made simultaneously, as shown in Figure 5.3 (b), effectively doubling the signal and decreasing
the distance at which splitting becomes advantageous, 48 cm for an 8 ns FWHM beam. These

82
configurations, although challenging in their alignment, would have several benefits when
incorporating a TALIF diagnostic onto a larger plasma device or when performing measurements
on a system with lower neutral density.
Figure 5.3. Proposed beam splitting based Doppler free optical configurations. Configuration (a) is the simplest
DF configuration which utilizes beam splitting, while (b) utilizes two sets of confocal optics to decrease the
amount of optical access needed while increasing the amount of collected signal.

83
Velocity distribution measurements are a key component of most LIF measurements as
they are with the Doppler broadened TALIF measurements. Measuring an entire spectrum with
the deep UV laser used in this work for ground state pumping is very time consuming. The long
timescale is mainly due to the repetition rate of the laser system used. The laser system operates at
20 Hz, which means each spectral point takes at least 50 ms to acquire, and for the HIT-SI3
measurements a full spectrum took, minimally, 30 synchronized plasma and laser pulses. Had the
plasma been steady-state, a spectrum would have corresponded to 1.5 seconds of measurement
time. A laser system operating at higher frequency could greatly improve this required
measurement time, but laser systems with higher frequency, comparable pulse energy, and equal
or lesser spectral width are not readily available in the deep UV. Since states of the same species
have the same velocity characteristics, optical emission spectroscopy or a different LIF scheme
could be used to measure the velocity distribution of hydrogen neutrals. Higher wavelength laser
systems often operate at higher frequencies, supply more energy per laser pulse, and have narrower
spectral widths. Coupling a velocity distribution measurement from one of these other
spectroscopic methods to a ground state TALIF measurement could allow for DF or DB TALIF to
measure density with 1 to 2 spectral measurements.
Another aspect of the TALIF system’s diagnostic capabilities is the ability to measure
magnetic fields through the Zeeman effect. The sensitivity of magnetic field measurements is
enhanced in a DF configuration, as is evident in Figure 2.3. DF excitation can only be done with
multi-photon absorption LIF, of which TALIF is by far the simplest method for completely
cancelling Doppler effects. The same difficulties of data collection time as discussed in the velocity
measurement are present in this Zeeman measurement, but neither single photon LIF or OES are

84
possible solutions as their measured spectra are Doppler broadened. A TALIF scheme which has
a very similar Zeeman spectrum as that discussed in section 2.2 and has greater sensitivity would
be a 2s to 3d to 2p scheme. The 2s state is metastable, so it should be well populated in a hot dense
plasma scenario. Because the 2s to 3d excitation energy is 6.4 times lower than the 1s to 3d
discussed throughout this work, exciting from the 2s state would give a Zeeman measurement 6.4
times more sensitive. A 2s to 3d TALIF scheme would require a 1312 nm laser; pulsed lasers in
that wavelength range are available with firing rates of approximately ~1 kHz. kHz data collection
would allow for an entire spectrum, whose resolution is equivalent to the HIT-SI3 measurements,
to be generated in 30 ms. Combining the increased measurement rate of a longer wavelength laser,
with the increased signal of a DF measurement, and the increased probability of absorption due to
the symmetric TALIF excitation light being much closer to resonance states for the 2s to 3d scheme
than for the 1s to 3d scheme, and this DF TALIF method of magnetic field measurement could
rival the utility of more standard techniques such as motional stark effect spectroscopy (MSE).

85
References
[1] I. Langmuir, “Oscillations in ionized gases,” Phys. Rev., vol. 33, no. 2, pp. 195–210, 1929.
[2] C. C. Hegna, J. D. Callen, T. A. Gianakon, W. X. Qu, A. I. Smolyakov, and J. P. Wang,
“Magnetic islands and their effects in Tokamak plasmas,” Plasma Phys. Control. Fusion,
vol. 35, no. 8, pp. 987–1002, 1993.
[3] F. Wagner, G. Becker, K. Behringer, D. Campbell, A. Eberhagen, W. Engelhardt, G.
Fussmann, O. Gehre, J. Gernhardt, G. V. Gierke, G. Haas, M. Huang, F. Karger, M.
Keilhacker, O. Kl̈ber, M. Kornherr, K. Lackner, G. Lisitano, G. G. Lister, H. M. Mayer,
D. Meisel, E. R. M̈ller, H. Murmann, H. Niedermeyer, W. Poschenrieder, H. Rapp, H.
Röhr, F. Schneider, G. Siller, E. Speth, A. Stäbler, K. H. Steuer, G. Venus, O. Vollmer,
and Z. Ÿ, “Regime of improved confinement and high beta in neutral-beam-heated
divertor discharges of the ASDEX tokamak,” Phys. Rev. Lett., vol. 49, no. 19, pp. 1408–
1412, 1982.
[4] F. Wagner, G. Fussmann, T. Grave, M. Keilhacker, M. Kornherr, K. Lackner, K.
McCormick, E. R. M??ller, A. St??bler, G. Becker, K. Bernhardi, U. Ditte, A. Eberhagen,
O. Gehre, J. Gernhardt, G. v. Gierke, E. Glock, O. Gruber, G. Haas, M. Hesse, G.
Janeschitz, F. Karger, S. Kissel, O. Kl??ber, G. Lisitano, H. M. Mayer, D. Meisel, V.
Mertens, H. Murmann, W. Poschenrieder, H. Rapp, H. R??hr, F. Ryter, F. Schneider, G.
Siller, P. Smeulders, F. S??ldner, E. Speth, K. H. Steuer, Z. Szymanski, and O. Vollmer,
“Development of an Edge Transport Barrier at the H-Mode Transition of ASDEX,” Phys.
Rev. Lett., vol. 53, no. 15, pp. 1453–1456, 1984.
[5] J. Lyman Spitzer, “The Stellarator Concept,” Phys. Fluids, vol. 1, no. 1958, pp. 253–264,
1958.
[6] F. Najmabadi, A. Rene Raffray, L. P. Ku, and J. F. Lyon, “Optimization of compact
stellarator configuration as fusion devices,” Phys. Plasmas, vol. 13, no. 5, 2006.
[7] J. D. Hanson and J. R. Cary, “Elimination of stochasticity in stellarators,” Phys. Fluids,
vol. 27, no. 4, pp. 767–769, 1984.
[8] S. R. Hudson, D. Monticello, A. . H. Reiman, A. H. Boozer, D. J. Strickler, S. P.
Hirshman, and M. C. Zarnstorff, “Eliminating Islands in High-Pressure Free-Boundary
Stellarator Magnetohydrodynamic Equilibrium Solutions,” Phys. Rev. Lett., vol. 89, no.
27, p. 275003(4), 2002.
[9] H. E. Mynick, “Transport optimization in stellarators,” Phys. Plasmas, vol. 13, no. 5,
2006.
[10] W. Yu, D. Zhou, and N. Xiang, “The shaping effect of cross section on ballooning modes
in tokamak plasmas,” Phys. Scr., vol. 90, no. 3, p. 35602, 2015.
[11] A. Kendl and B. D. Scott, “Flux-surface shaping effects on tokamak edge turbulence and
flows,” Phys. Plasmas, vol. 13, no. 1, pp. 1–9, 2006.
[12] L. R. Baylor, S. K. Combs, N. Commaux, P. W. Fisher, S. J. Meitner, M. Lyttle, and D. A.
Rasmussen, “Conceptual Design Review Highlights - Options for ITER,” 2013.

86
[13] Y. L. Igitkhanov, “A review of edge physics issues for ITER,” J. Nucl. Mater., vol. 176–
177, no. C, pp. 102–109, 1990.
[14] M. Saito, K. Ueno, T. Maruyama, S. Murakami, N. Takeda, S. Kakudate, M. Nakahira,
and A. Tesini, “Preliminary assessment for dust contamination of ITER In-Vessel
Transporter,” Fusion Eng. Des., vol. 89, no. 9–10, pp. 2352–2356, 2014.
[15] M. U. Siddiqui, D. S. Thompson, J. M. McIlvain, Z. D. Short, and E. E. Scime, “Direct
measurements of classical and enhanced gradient-aligned cross-field ion flows in a
helicon plasma source using laser-induced fluorescence,” Phys. Plasmas, vol. 22, no. 12,
pp. 1–8, 2015.
[16] V. Philipps, “Tungsten as material for plasma-facing components in fusion devices,” J.
Nucl. Mater., vol. 415, no. 1 SUPPL, pp. S2–S9, 2011.
[17] S. Putvinski, “Disruption mitigation in ITER,” Proc 23rd IAEA Fusion Energy Conf., vol.
100, p. ITR/1-6, 2010.
[18] J. S. V. Mertens, M. Kaufmann, J. Neuhauser, J. Schweinzer, “High density operation
close to the Greenwald limit and H mode limit in ASDEX Upgrade,” Nucl. Fusion, vol.
37, no. 11, p. 1607, 1997.
[19] A. Järvinen, C. Giroud, M. Groth, K. Krieger, D. Moulton, S. Wiesen, and S. Brezinsek,
“DIVIMP simulation of W transport in the SOL of JET H-mode plasmas,” Phys. Scr., vol.
T145, p. 14013, 2011.
[20] M. V. Umansky, R. H. Bulmer, R. H. Cohen, T. D. Rognlien, and D. D. Ryutov,
“Analysis of geometric variations in high-power tokamak divertors,” Nucl. Fusion, vol.
49, no. 7, p. 75005, 2009.
[21] O. Schmitz, M. Becoulet, P. Cahyna, T. E. Evans, Y. Feng, H. Frerichs, A. Loarte, R. A.
Pitts, D. Reiser, M. E. Fenstermacher, and D. Harting, “Three-dimensional modeling of
plasma edge transport and divertor fluxes during application of resonant magnetic
perturbations on ITER,” Nucl. Fusion, vol. 0, p. 0, 2016.
[22] H. S. McLean, a Ahmed, D. Buchenauer, D. Den Hartog, C. W. Domier, D. N. Hill, C.
Holcomb, E. B. Hooper, E. C. Morse, M. Nagata, Y. Roh, B. Stallard, R. D. Wood, S.
Woodruff, G. Wurden, and Z. Wang, “Plasma diagnostics for the sustained spheromak
physics experiment,” Rev. Sci. Instrum., vol. 72, no. 1, pp. 556–61, 2004.
[23] M. Abdel-Rahman, V. S. Der Gathen, T. Gans, K. Niemi, and H. F. Döbele,
“Determination of the degree of dissociation in an inductively coupled hydrogen plasma
using optical emission spectroscopy and laser diagnostics,” Plasma Sources Sci. Technol.,
vol. 15, no. 4, pp. 620–626, 2006.
[24] M. Podest,̀ W. W. Heidbrink, R. E. Bell, and R. Feder, “The NSTX fast-ion D-alpha
diagnostic,” Rev. Sci. Instrum., vol. 79, no. 10, pp. 1–5, 2008.
[25] A. M. Keesee and E. E. Scime, “Neutral argon density profile determination by
comparison of spectroscopic measurements and a collisional-radiative model (invited),”
Rev. Sci. Instrum., vol. 77, no. 10, pp. 1–6, 2006.

87
[26] C. M. Samuell and C. S. Corr, “Low-pressure hydrogen plasmas explored using a global
model,” Plasma Sources Sci. Technol., vol. 25, 2016.
[27] J. W. Hughes, D. A. Mossessian, A. E. Hubbard, E. S. Marmar, D. Johnson, and D.
Simon, “High-resolution edge Thomson scattering measurements on the Alcator C-Mod
tokamak,” Rev. Sci. Instrum., vol. 72, no. 1 II, pp. 1107–1110, 2001.
[28] P. Bohm, M. Aftanas, P. Bilkova, E. Stefanikova, O. Mikulin, R. Melich, F. Janky, J.
Havlicek, D. Sestak, V. Weinzettl, J. Stockel, M. Hron, R. Panek, R. Scannell, L.
Frassinetti, A. Fassina, G. Naylor, and M. J. Walsh, “Edge Thomson scattering diagnostic
on COMPASS tokamak: Installation, calibration, operation, improvements,” Rev. Sci.
Instrum., vol. 85, no. 11, pp. 2014–2017, 2014.
[29] A. Alfier and R. Pasqualotto, “New Thomson scattering diagnostic on RFX-mod,” Rev.
Sci. Instrum., vol. 78, no. 1, 2007.
[30] K. Niemi, V. Schulz-von der Gathen, and H. F. Dobele, “Absolute Calibration of atomic
density measurements by laser-induced fluorescence spectroscopy with two-photon
excitation,” J. Phys. D. Appl. Phys., vol. 34, pp. 2330–2335, 2001.
[31] R. M. Magee, M. E. Galante, D. Mccarren, E. E. Scime, R. L. Boivin, N. H. Brooks, R. J.
Groebner, D. N. Hill, and G. D. Porter, “A two photon absorption laser induced
fluorescence diagnostic for fusion plasmas,” Rev. Sci. Instrum., vol. 83, no. 10, pp. 157–
160, 2012.
[32] J. Jolly and J. P. Booth, “Atomic hydrogen densities in capacitively coupled very high-
frequency plasmas in H 2: Effect of excitation frequency,” J. Appl. Phys., vol. 97, no. 10,
pp. 2–7, 2005.
[33] J. Bokor, R. R. Freeman, J. C. White, and R. H. Storz, “Two-photon excitation of the n=3
level in H and D atoms,” Phys. Rev. A, vol. 24, no. 1, pp. 612–614, 1981.
[34] D. Elliott, D. Sutherland, U. Siddiqui, E. Scime, C. Everson, K. Morgan, A. Hossack, B.
Nelson, and T. Jarboe, “Two-photon LIF on the HIT-SI3 experiment: Absolute density
and temperature measurements of deuterium neutrals,” Rev. Sci. Instrum., vol. 87, no. 11,
p. 11E506, 2016.
[35] D. Elliott, E. Scime, and Z. Short, “Novel xenon calibration scheme for two-photon
absorption laser induced fluorescence of hydrogen,” Rev. Sci. Instrum., vol. 87, no. 11, p.
11E504, 2016.
[36] J. Winter, “Dust: A new challenge in nuclear fusion research?,” Phys. Plasmas, vol. 7, no.
2000, pp. 3862–3866, 2000.
[37] T. Putterich, R. Neu, R. Dux, a. D. Whiteford, and M. G. O’Mullane, “Modelling of
measured tungsten spectra from asdex upgrade and predictions for iter,” Plasma Phys.
Control. Fusion, vol. 50, no. 8, p. 85016, 2008.
[38] R. Dux, R. Neu, and A. G. Peeters, “Influence of the heating profile on impurity transport
in ASDEX Upgrade,” Plasma Phys. Control. Fusion, vol. 45, p. 1815, 2003.
[39] D. N. Hill and M. Ulrickson, “Reciprocating and fixed probe measurements of density and

88
temperature in the DIII-D divertor,” J. Nucl. Mater., vol. 243, pp. 645–649, 1997.
[40] T. Uckan, C. Hidalgo, J. D. Bell, J. H. Harris, J. L. Dunlap, G. R. Dyer, P. K.
Mioduszewski, J. B. Wilgen, C. P. Ritz, A. J. Wootton, T. L. Rhodes, and K. Carter, “ATF
edge plasma turbulence studies using a fast reciprocatingLangmuir probe *,” J. Nucl.
Mater., vol. 177, pp. 693–698, 1990.
[41] J. G. Watkins, J. Hunter, B. Tafoya, M. Ulrickson, R. D. Watson, R. A. Moyer, J. W.
Cuthbertson, G. Gunner, R. Lehmer, P. Luong, D. N. Hill, M. Mascaro, J. I. Robinson, R.
Snider, and R. Stambaugh, “Fast reciprocating Langmuir probe for the DIII-D divertor,”
Rev. Sci. Instrum., vol. 68, no. 1, p. 373, 1997.
[42] G. Lewin and G. Martin, “Fast ion gauge for the measurement of neutral gas density in the
presence of magnetically confined plasma,” Rev. Sci. Instrum., vol. 33, no. 4, pp. 447–
449, 1962.
[43] C. C. Klepper, “Neutral pressure studies with a fast ionization gauge in the divertor region
of the DIII-D tokamak,” J. Vac. Sci. Technol. A Vacuum, Surfaces, Film., vol. 11, no. 2, p.
446, 1993.
[44] E. Erlangen-Nürnberg, Introduction to Plasma Spectroscopy, vol. 19. 1991.
[45] W. Demtroeder, Laser Spectroscopy: Basic Concepts and Instruments. .
[46] R. VanDervort, D. Elliott, D. McCarren, J. McKee, M. Soderholm, S. Sears, and E. Scime,
“Optimization of confocal laser induced fluorescence in a plasmaa),” Rev. Sci. Instrum.,
vol. 85, no. 11, pp. 11–13, 2014.
[47] W. Demtröder, Laser Spectroscopy Vol. 2: Experimental Techniques. 2008.
[48] G. R. Fowles, Introduction to Modern Optics. 1975.
[49] H. a. Bethe and E. E. Salpeter, Quantum Mechanics of One- and Two-Electron Systems.
1957.
[50] D. S. H. and C. Eckart, “The effect of the motion of the nucleus on the spectra of Li I and
Li II,” Phys. Rev., vol. 36, pp. 694–698, 1930.
[51] A. E. Kramida, “A critical compilation of experimental data on spectral lines and energy
levels of hydrogen, deuterium, and tritium,” At. Data Nucl. Data Tables, vol. 96, no. 6, pp.
586–644, 2010.
[52] H. Search, C. Journals, A. Contact, M. Iopscience, and I. P. Grant, “Many-Electron
Effects in the Theory of Nuclear Volume Isotope Shift,” Phys. Scr., vol. 21, pp. 443–447,
1980.
[53] L. Wilets, D. L. Hill, and K. W. Ford, “Isotope shift anomalies and nuclear structure,”
Phys. Rev., vol. 91, no. 6, pp. 1488–1500, 1953.
[54] T. Arabatzis, “The discovery of the Zeeman effect: A case study of the interplay between
theory and experiment,” Stud. Hist. Philos. Sci., vol. 23, no. 3, pp. 365–388, 1992.
[55] A. Kox, “The discovery of the electron: II. The Zeeman effect,” Eur. J. Phys., vol. 18, pp.

89
139–144, 1997.
[56] M. Courtney, N. Spellmeyer, H. Jiao, and D. Kleppner, “Classical, semiclassical, and
quantum dynamics in the lithium Stark system,” Phys. Rev. A, vol. 51, no. 5, pp. 3604–
3620, 1995.
[57] L. R. Baylor, S. K. Combs, C. R. Foust, T. C. Jernigan, S. J. Meitner, P. B. Parks, J. B.
Caughman, D. T. Fehling, S. Maruyama, A. L. Qualls, D. A. Rasmussen, and C. E.
Thomas, “Pellet fuelling, ELM pacing and disruption mitigation technology development
for ITER,” Nucl. Fusion, vol. 49, p. 85013, 2009.
[58] Spectra-Physics, “Sirah Dye Laser Operating Manual,” 2011.
[59] W. Demtroder, Laser Spectroscopy Vol 1: Basic Principles. 2008.
[60] R. M. Magee, M. E. Galante, J. Carr, G. Lusk, D. W. McCarren, and E. E. Scime,
“Neutral depletion and the helicon density limit,” Phys. Plasmas, vol. 20, no. 12, pp. 2–6,
2013.
[61] M. E. Galante, “Two photon absorption laser induced fluorescence measurements of
neutral density in a helicon plasma,” 2013.
[62] J. Scott, “A Study of HIT-SI Plasma Dynamics Using Surface Magnetic Field
Measurements,” University of Washington, 2011.
[63] D. A. Ennis, T. R. Jarboe, B. S. Victor, A. C. Hossack, C. Akcay, C. J. Hansen, G. J.
Marklin, B. A. Nelson, and R. J. Smith, “Overview of HIT-SI Results and Plans,” pp. 1–5,
2012.
[64] R. G. O’Neill, R. J. Smith, C. Akcay, W. T. Hamp, R. Z. Aboul Hosn, T. R. Jarboe, A. J.
Redd, P. E. Sieck, G. L. Sutphin, and J. S. Wrobel, Overview of HIT-SI diagnostic
systems, vol. 26, no. 1–2. 2007.
[65] D. A. Sutherland, T. R. Jarboe, K. D. Morgan, M. Pfaff, E. S. Lavine, Y. Kamikawa, M.
Hughes, P. Andrist, G. Marklin, and B. A. Nelson, “The dynomak: An advanced
spheromak reactor concept with imposed-dynamo current drive and next-generation
nuclear power technologies,” Fusion Eng. Des., vol. 89, no. 4, pp. 412–425, 2014.
[66] M. E. Galante, R. M. Magee, and E. E. Scime, “Two photon absorption laser induced
fluorescence measurements of neutral density in a helicon plasma,” Phys. Plasmas, vol.
55704, pp. 1–7, 2014.
[67] R. M. Magee, M. E. Galante, N. Gulbrandsen, D. W. McCarren, and E. E. Scime, “Direct
measurements of the ionization profile in krypton helicon plasmas,” Phys. Plasmas, vol.
19, no. 12, pp. 5–11, 2012.
[68] J. S. Hu, G. Z. Zuo, J. Ren, Q. X. Yang, Z. X. Chen, H. Xu, L. E. Zakharov, R. Maingi, C.
Gentile, X. C. Meng, Z. Sun, W. Xu, Y. Chen, D. Fan, N. Yan, Y. M. Duan, Z. D. Yang,
H. L. Zhao, Y. T. Song, X. D. Zhang, B. N. Wan, and J. G. Li, “First results of the use of a
continuously flowing lithium limiter in high performance discharges in the EAST device,”
Nucl. Fusion, vol. 56, no. 4, p. 46011, 2016.

90
Related Documents