Two-photon absorption cross section measurements of various two-photon initiators for ultrashort laser radiation applying the Z-scan technique A. Ajami, 1, * W. Husinsky, 1 R. Liska, 2 and N. Pucher 2 1 Vienna University of Technology, Institute of Applied Physics, Wiedner Hauptstrasse 8-10, 1040 Wien, Austria 2 Vienna University of Technology, Institute of Applied Synthetic Chemistry, Getreidemarkt 9, 1060 Wien, Austria * Corresponding author: [email protected] Received July 28, 2010; revised September 7, 2010; accepted September 9, 2010; posted September 10, 2010 (Doc. ID 132470); published October 14, 2010 In this paper, we describe the Z-scan measurements of the two-photon absorption (TPA) cross section of various two-photon initiators that are suitable for real three-dimensional structuring of photo-polymerizable formula- tion. The value of the TPA cross section for the initiator P3K was measured to be 256 GM as the maximum value among the synthesized initiators. Procedures for a precise Z-scan measurement including the measure- ment of Rayleigh length and beam waist radius are presented. The effect of the pulse width on the Z-scan signal is demonstrated. We also used a flow-cell geometry instead of a static cell in order to refresh the mate- rials to avoid the decomposition of the molecules. This resulted in a more realistic TPA cross section which has been proven by suitable reference compounds. © 2010 Optical Society of America OCIS codes: 190.4180, 190.4710, 160.4330, 120.6710. 1. INTRODUCTION The observation that the absorption coefficient of materi- als can increase or decrease with intensity is referred to as nonlinear absorption, which is frequently observed in many materials exposed to ultrashort laser pulses. The former (increase) is called reverse saturable absorption and can be caused by multi-photon absorption (MPA) [two-photon absorption (TPA) or three-photon absorption] or excited state absorption (ESA). The latter (decrease) is known as saturable absorption (saturation of the linear absorption) [1]. In the case where the absorption coeffi- cient increases with intensity, it is a serious challenge to determine which kind of absorption takes place for a typi- cal material under investigation. TPA is a third-order nonlinear resonance process, where two photons are si- multaneously absorbed to excite the subject molecule from ground state to a real exited state through an inter- mediate virtual state [2]. In the simultaneous presence of ESA and MPA it is difficult to measure pure MPA coeffi- cients, because in many cases the experimental technique cannot distinguish between the individual nonlinearities [3]. The advantage of using low repetition rate laser pulses is that the ESA does not contribute significantly to nonlinear absorption. TPA in molecular systems using near infrared ul- trashort pulsed laser radiation has attracted much atten- tion of researchers due to its potential applicability in the field of modern photonics such as two-photon induced photo-polymerization (TPIP) [4], three-dimensional (3D) optical data storage [5], photonic crystals [6], photody- namic therapy [7], two-photon fluorescence microscopy [8], and many more. This wide range of applications of TPA has encouraged many researchers to put much em- phasis on designing and synthesizing organic molecules with significantly higher TPA cross sections than in com- mon materials [9]. Several different experimental techniques can be em- ployed to measure TPA cross sections such as nonlinear transmission [10], upconverted fluorescence emission [11], transient absorption [12], four-wave mixing [13], and the Z-scan technique [14]. Among these techniques, the Z-scan technique, which was first introduced by Sheik- Bahae et al. in 1990 [15], is a particularly sensitive tech- nique [16] and is very easy to perform. It is especially suitable for non-fluorescence materials, for which the up- converted fluorescence emission experiment is not an ap- propriate method to measure TPA cross sections. This technique relies on the transformation of phase distortion to amplitude distortion during beam propagation through a nonlinear medium. Z-scan can be performed in two ways. The open-aperture (OA) Z-scan method, which is sensitive to nonlinear absorption, and the closed-aperture (CA) Z-scan version, which is sensitive to nonlinear ab- sorption as well as the nonlinear refractive index. Modifications of the original Z-scan technique have been proposed, such as the two-color Z-scan [17] [to mea- sure the non-degenerate susceptibility at frequencies (probe beam frequency) and p (pump beam frequency)], the eclipse Z-scan [18] (the aperture in the CA Z-scan is replaced with an obscuration disk with a diameter smaller than the beam size), the reflection Z-scan method [19] (the reflected laser beam from a non-transparent ma- 2290 J. Opt. Soc. Am. B/Vol. 27, No. 11/November 2010 Ajami et al. 0740-3224/10/112290-8/$15.00 © 2010 Optical Society of America

Welcome message from author
This document is posted to help you gain knowledge. Please leave a comment to let me know what you think about it! Share it to your friends and learn new things together.
Transcript
1Taamfa[okacdcnmfmEcc[pn
ttfipon
2290 J. Opt. Soc. Am. B/Vol. 27, No. 11 /November 2010 Ajami et al.
Two-photon absorption cross sectionmeasurements of various two-photon initiators
for ultrashort laser radiation applying theZ-scan technique
A. Ajami,1,* W. Husinsky,1 R. Liska,2 and N. Pucher2
1Vienna University of Technology, Institute of Applied Physics, Wiedner Hauptstrasse 8-10, 1040 Wien, Austria2Vienna University of Technology, Institute of Applied Synthetic Chemistry, Getreidemarkt 9,
1060 Wien, Austria*Corresponding author: [email protected]
Received July 28, 2010; revised September 7, 2010; accepted September 9, 2010;posted September 10, 2010 (Doc. ID 132470); published October 14, 2010
In this paper, we describe the Z-scan measurements of the two-photon absorption (TPA) cross section of varioustwo-photon initiators that are suitable for real three-dimensional structuring of photo-polymerizable formula-tion. The value of the TPA cross section for the initiator P3K was measured to be 256 GM as the maximumvalue among the synthesized initiators. Procedures for a precise Z-scan measurement including the measure-ment of Rayleigh length and beam waist radius are presented. The effect of the pulse width on the Z-scansignal is demonstrated. We also used a flow-cell geometry instead of a static cell in order to refresh the mate-rials to avoid the decomposition of the molecules. This resulted in a more realistic TPA cross section which hasbeen proven by suitable reference compounds. © 2010 Optical Society of America
OCIS codes: 190.4180, 190.4710, 160.4330, 120.6710.
[Tpwm
pt[tZBnscpttaws(s
bs(trs[
. INTRODUCTIONhe observation that the absorption coefficient of materi-ls can increase or decrease with intensity is referred tos nonlinear absorption, which is frequently observed inany materials exposed to ultrashort laser pulses. The
ormer (increase) is called reverse saturable absorptionnd can be caused by multi-photon absorption (MPA)two-photon absorption (TPA) or three-photon absorption]r excited state absorption (ESA). The latter (decrease) isnown as saturable absorption (saturation of the linearbsorption) [1]. In the case where the absorption coeffi-ient increases with intensity, it is a serious challenge toetermine which kind of absorption takes place for a typi-al material under investigation. TPA is a third-orderonlinear resonance process, where two photons are si-ultaneously absorbed to excite the subject molecule
rom ground state to a real exited state through an inter-ediate virtual state [2]. In the simultaneous presence ofSA and MPA it is difficult to measure pure MPA coeffi-ients, because in many cases the experimental techniqueannot distinguish between the individual nonlinearities3]. The advantage of using low repetition rate laserulses is that the ESA does not contribute significantly toonlinear absorption.TPA in molecular systems using near infrared ul-
rashort pulsed laser radiation has attracted much atten-ion of researchers due to its potential applicability in theeld of modern photonics such as two-photon inducedhoto-polymerization (TPIP) [4], three-dimensional (3D)ptical data storage [5], photonic crystals [6], photody-amic therapy [7], two-photon fluorescence microscopy
0740-3224/10/112290-8/$15.00 © 2
8], and many more. This wide range of applications ofPA has encouraged many researchers to put much em-hasis on designing and synthesizing organic moleculesith significantly higher TPA cross sections than in com-on materials [9].Several different experimental techniques can be em-
loyed to measure TPA cross sections such as nonlinearransmission [10], upconverted fluorescence emission11], transient absorption [12], four-wave mixing [13], andhe Z-scan technique [14]. Among these techniques, the-scan technique, which was first introduced by Sheik-ahae et al. in 1990 [15], is a particularly sensitive tech-ique [16] and is very easy to perform. It is especiallyuitable for non-fluorescence materials, for which the up-onverted fluorescence emission experiment is not an ap-ropriate method to measure TPA cross sections. Thisechnique relies on the transformation of phase distortiono amplitude distortion during beam propagation through
nonlinear medium. Z-scan can be performed in twoays. The open-aperture (OA) Z-scan method, which is
ensitive to nonlinear absorption, and the closed-apertureCA) Z-scan version, which is sensitive to nonlinear ab-orption as well as the nonlinear refractive index.
Modifications of the original Z-scan technique haveeen proposed, such as the two-color Z-scan [17] [to mea-ure the non-degenerate susceptibility at frequencies �probe beam frequency) and �p (pump beam frequency)],he eclipse Z-scan [18] (the aperture in the CA Z-scan iseplaced with an obscuration disk with a diametermaller than the beam size), the reflection Z-scan method19] (the reflected laser beam from a non-transparent ma-
010 Optical Society of America
tZswlrettomaZaatspcwk
qtmlrvptbbmvrrfts
2Fttfi
wn�1
d
wm
cdbf
f
wwwit
wd
Tmet
Idttbummwfi
3ATRusOc
ticariav
Ajami et al. Vol. 27, No. 11 /November 2010 /J. Opt. Soc. Am. B 2291
erial is monitored through an aperture), the second-scan [20] (provides measurement of the nonlinear ab-orption and the nonlinear refraction in the materials forhich the nonlinear refraction is accompanied by the non-
inear absorption performing OA and CA Z-scans sepa-ately at the same conditions), off-axis Z-scan [21] (the ap-rture placed on the optical axis for on-axis Z-scan isransversely shifted), and the so-called differential Z-scanechnique [22] [in which the sample oscillates along theptical axis on each position, and the differential trans-ission (not total intensity transmission) is measured asfunction of the sample position]. In essence, in an OA
-scan experiment, a nonlinear medium is translatedlong the beam propagation direction through the focus oftight focused laser beam, and the laser energy transmit-
ed through the sample is measured as a function of theample position. By fitting the theoretical curve to the ex-erimental data [16], the nonlinear absorption coefficientould be extracted when the Rayleigh length, the beamaist radius, and the peak intensity at the focus arenown.To determine a reliable TPA cross section, a few re-
uirements have to be fulfilled such as a stable laser sys-em, a well aligned Z-scan setup, and a practicableethod to determine the beam waist radius and the Ray-
eigh length. In this paper the TPA cross section for a se-ies of two-photon initiators (TPIs) for TPIP has been in-estigated using the OA Z-scan technique [23]. Weropose what we believe to be a new method to measurehe beam waist radius by scanning an aperture along theeam propagation direction. We also explain how theeam quality factor M2 must be taken into account. Thisight be the reason why different TPA cross sections for
arious reference dyes such as Rhodamine B have beeneported in the literature [24]. The effect of the pulse du-ation on the OA Z-scan signal will also be discussed, andurthermore it will be demonstrated that refreshing ma-erials results in measuring a more realistic TPA crossection.
. THEORETICAL CONSIDERATIONSor a molecular system, the TPA cross section � describes
he efficiency of a particular molecule in the ground stateo reach the excited state via a TPA process, and it is de-ned as follows:
� =���
NA� � 10−3 �cm4 s photon−1 molecule−1�, �1�
here � is the reduced Planck constant, NA is Avogadro’sumber, and � is the concentration in mole per liter [25].is commonly given in a new SI unit (GM) defined asGM=10−50 cm4 s photon−1 molecule−1.The normalized transmittance through a nonlinear me-
ium where TPA occurs is given by [16]
T�z� = �n=0
� �− q0�n
�n + 1�3/2�1 + x2�n , �2�
here x=z /zR, q0=�LeffI0, Leff= �1−e−�0L� /�0, and I0 is theaximum on-axis intensity in the focus. The TPA coeffi-
ient � can be extracted by fitting to the experimentalata using Eq. (2) provided that I0 and zR have alreadyeen measured. The TPA cross section is also obtainedrom Eq. (1) for any solution with a certain concentration.
Assuming a Gaussian pulse form, I0 can be calculatedrom the following relation:
I0 = 4�ln 2
PAver
�02R
= 4�ln 2
PAver
M2�zRR, �3�
here PAver is the average laser power, �0 is the beamaist radius, R is the pulse repetition rate, is the pulseidth, zR is the Rayleigh length, and M2 is the beam qual-
ty factor. The power P�z , t� transmitted through an aper-ure of radius a located at the position z is given by
P�z,t� =�0
2
2I0�z,t��1 − e−2a2/��z�2
�, �4�
here a is the aperture radius, and ��z� is the beam ra-ius in the aperture plane given as
��z�2 = �02�1 +
z2
zR2 � . �5�
herefore, the normalized aperture transmittance as aeasurable quantity is defined as the quotient of the ap-
rture transmittance at the position z to the transmit-ance at the beam waist position:
TNorm�z� =1 − e−2a2/��z�2
1 − e−2a2/�02 . �6�
f one scans an aperture along the laser beam propagationirection and measures the energy transmitted throughhe aperture as a function of the aperture position rela-ive to the focus, the beam waist radius can be obtainedy means of the theoretical fitting to the measured datasing Eq. (6) provided that the Rayleigh length has beeneasured via other means. By using a beam profiler foreasuring the beam diameter at different positionsithin the vicinity of focal point and also at far enough
rom the focus and then fitting to the measured data us-ng Eq. (5), one could obtain the Rayleigh length.
. EXPERIMENTS. Sample Preparationhe fluorescence dye standards (Rhodamine B andhodamine 6G) were bought from Sigma-Aldrich andsed as received. Detailed information on the syntheses,pectroscopic data, and TPIP activity of the TPIs (H3K,3K, M3K, M2K, B3K, P3K, M3P, M3P+, R1, and R2)
ould be found elsewhere [23,26].For the OA Z-scan measurements an equimolar concen-
ration of the compounds �1�10−2 M� was prepared us-ng spectroscopic grade solvents. For the two rhodamineompounds, methanol (MeOH) was chosen as the solvents often described in the literature in order to achieve aeliable reference and to test the Z-scan device. The othernitiators were all dissolved in tetrahydrofuran (THF) asll compounds showed a sufficient solubility in this sol-ent. For comparison, it is important that the same sol-
vim
BWCp8Tafih(etEmttms
Fvur=tfapatsama
s(s
ritcsflbatppmcttcptsltdebfiovacctoos
CTpptbetlbb=dr
DZIlddhi
qdZ
2292 J. Opt. Soc. Am. B/Vol. 27, No. 11 /November 2010 Ajami et al.
ent is used for all compounds, because a different polar-ty of the solvent causes a change in activity of the
olecules.
. Z-Scan Experimental Setupe used an ultrashort laser system (FEMTOPOWERompact PRO). This system delivers ultrashort laserulses with a maximum average power of approximately00 mW (800 �J per pulse) at a repetition rate of 1 kHz.he minimum pulse duration, estimated as the full widtht half-maximum (FWHM) of a Gaussian temporal pro-le, is typically 25 fs and can be stretched up to a fewundreds of femtoseconds with help of a Dazzler systeman acousto-optic programmable dispersive filter) whichnables one to control separately both the spectral ampli-ude and the spectral phase. An autocorrelator (modelNV40CSG from Femtolasers Company) is employed toeasure the pulse duration. The bandwidth, estimated as
he FWHM of the spectrum profile, is 41 nm and the spec-rum is centered at 796 nm. The incident laser power waseasured using a digital power meter prior to each mea-
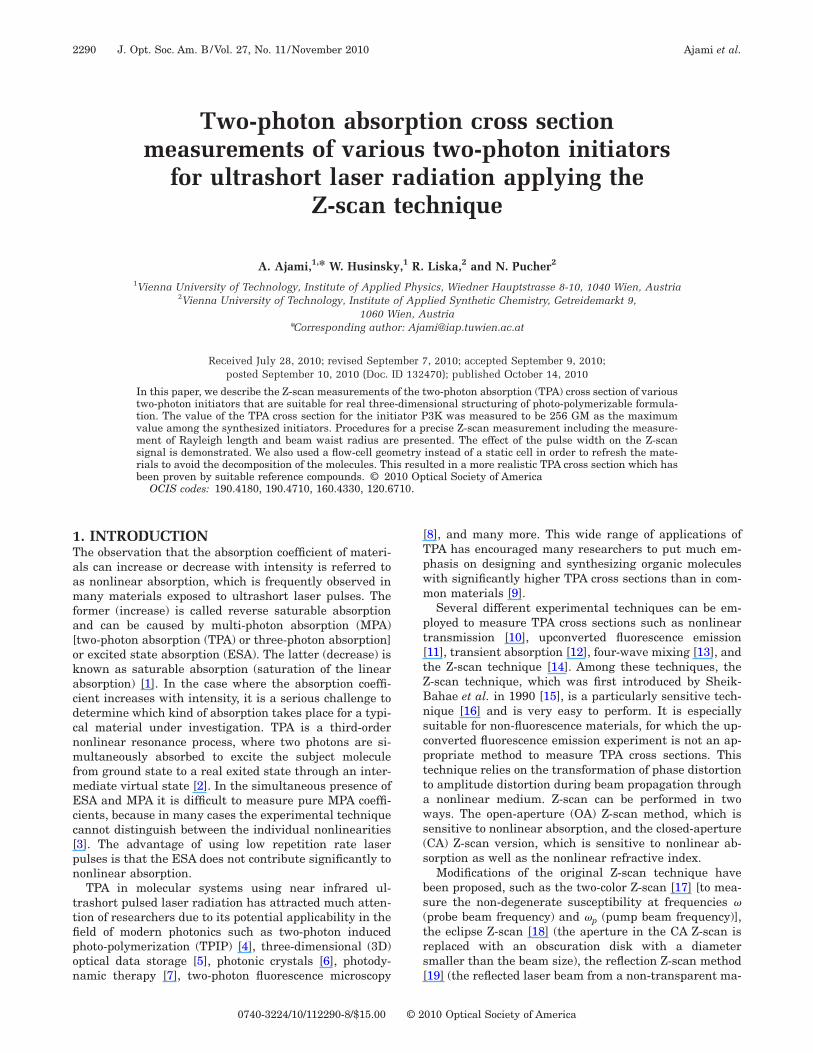
urement before the sample.The schematic of the experimental setup is shown in
ig. 1. A telescope consisting of a 150 mm focal length con-ex lens followed by a 100 mm focal length concave lens issed to reduce the beam diameter by a factor of 2/3. Thisesults in a Rayleigh length increased by a factor of 2.25�3/2�2 to ensure that it is larger than the thickness of
he sample, and thus the criterion of the thin sample isulfilled for the Z-scan measurements. A continuous vari-ble attenuator (Model C-VARM from COHERENT Com-any) with a maximum attenuation by a factor of 10−7
nd a fine pitch adjustment control to precisely set the at-enuation is employed to attenuate the pulse energy fromeveral hundred microjoules to a few nanojoules so thatn appropriate Z-scan signal with the normalized trans-ittance higher than 0.765 (corresponds to q0 1) can be
chieved.The transited laser beam through the attenuator is
plit in two orthogonal directions using a beam splitter67% transmission and 33% reflection). The lower inten-ity part is used as the intensity reference (detected at the
Fig. 1. (Color online) Schematic of the OA Z-scan setup.
eference diode Dr), and the other is directed to the focus-ng lens (a 175 mm focal length plano–convex lens) andhen through the sample. A 0.2 mm thick one-time flow-ell (170.700 QS from HELLMA Company) connected to ayringe pump (NE-300 from SYRINGPUMP) for variableow rates is used for the test solutions. The flow-cell com-ined with an xyz stage (Newport, M-DS25-XYZ) for finedjustment of the sample position was mounted on aranslation stage (DC-Motor model MFA-CC from New-ort Company) and can be moved 25 mm along the beamropagation direction through the beam focus in mini-um steps of 50 nm. This allows detecting any small
hange in nonlinear absorption although, in general,here is no need to translate the sample in steps smallerhan 100 �m, because smaller steps lead to a smallhange in transmittance which is comparable to the ex-erimental errors and thus very difficult to detect. Theransmitted energy was collected by a large diameterhort focal length lens (50 mm diameter and 60 mm focalength) to ensure that the whole energy transmittedhrough the sample is collected. A Si diode with a 1 cm2
etector area was used to measure the transmitted en-rgy. For adjusting the absolute intensity at the diodes,ut to stay within their dynamic range, neutral densitylters were used. A low-pass filter was mounted before di-de Dc, which blocks unwanted emissions such as upcon-erted fluorescence from the excited sample. The signalst the diodes were recorded with a two-channel personalomputer oscilloscope (model Picoscope3204 from Pi-otech Company). The computer software analyzed the in-ensity of individual laser pulses (including averagingver several laser shots) and also handled the movementf the translation stage as well as the entire data acqui-ition process (LabView).
. Rayleigh Length and Beam Quality Measuremento measure the beam quality factor M2, we used a beamrofiler (model Lasercam HR from Coherent). For thisurpose, the camera was mounted in the Z-scan appara-us on the translation stage and was moved along theeam propagation direction in small steps of 0.1 mm. Inach position, the laser beam radius was recorded, andhe resulting data were fitted to Eq. (5) to obtain the Ray-eigh length. The beam waist radius for an ideal Gaussianeam can be calculated from �0= ��zR /�1/2, and then theeam quality factor M2 can be calculated from M2
W02 /�0
2 (W0 is the measured beam waist radius). Afteretermining the beam quality factor M2, one can simplyeplace the wavelength � with M2� in all equations [27].
. Determining the Beam Waist Radius Using the OA-Scan Techniquen the previous section, we explained how the Rayleighength could be determined by measuring the beam ra-ius using a beam profiler. The beam waist radius is pre-icted within the range of a few tens of micrometers, andence the value measured by a beam profiler at the focus
s not reliable enough because of its limited resolution.In order to obtain the beam waist radius with the re-
uired accuracy, the new method was used. A 50 �m ra-ius aperture was mounted on the translation stage of the-scan device. The aperture was moved 10 mm along the
bvtlztl
EIdflettftetcswmsistiiif
4AUt
etiacmdbob
=cqvtF
ft1fiwaldbEbist
a
Ftdstt
Fsas
Ajami et al. Vol. 27, No. 11 /November 2010 /J. Opt. Soc. Am. B 2293
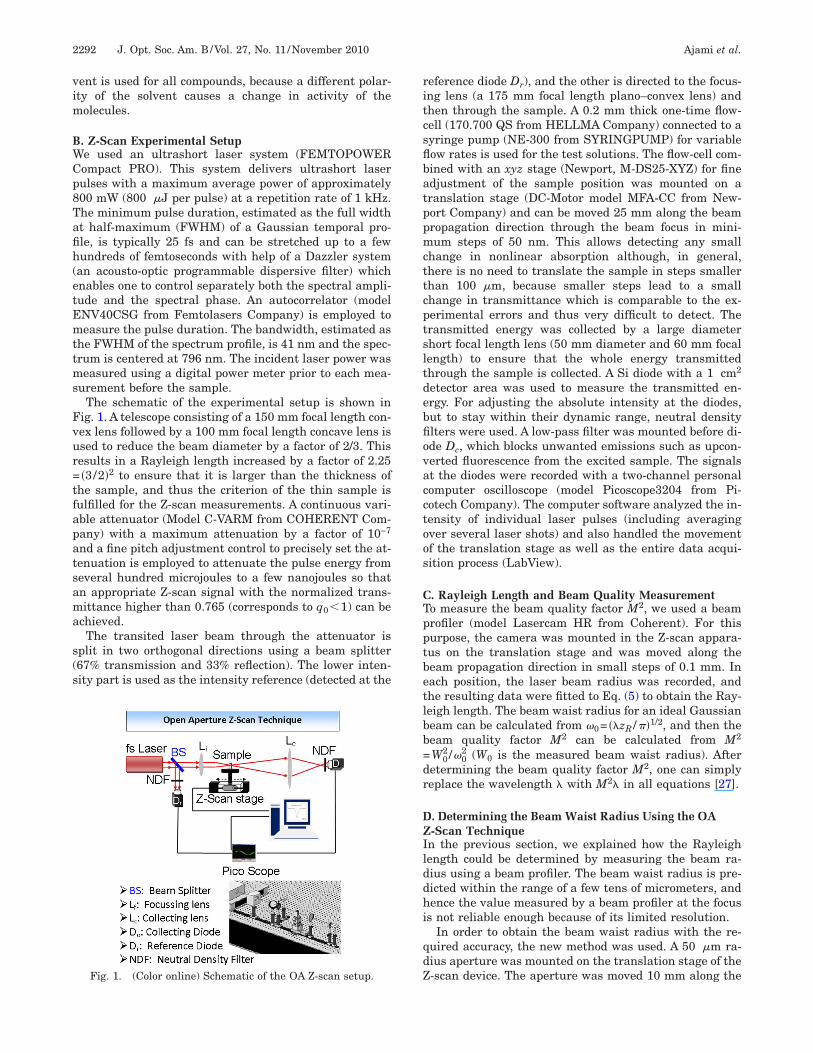
eam propagation direction through the focal point inery small steps of 0.2 mm. The energy transmittedhrough the aperture was collected with a 60 mm focalength convex lens and detected on diode Dc. The obtained-dependent transmittance was fitted to Eq. (6) to obtainhe accurate beam waist radius as shown in Fig. 3(b) be-ow.
. Determining the Beam Radius on the Focusing Lensn most cases found in the literature, the beam waist ra-ius and subsequently the Rayleigh length are calculatedrom �0=�f /�, where f is the focal length of the focusingens, and � is the beam radius on the lens. In reality, how-ver, the measured beam waist radius is always largerhan the value obtained from the equation above due tohe fact that the beam quality factor is larger than 1, evenor lasers beams with a TEM00 mode. Since, according tohe equation above, any inaccuracy in � results in anqual error for �0, and consequently for the TPA cross sec-ion, the beam diameter on the focusing lens must be ac-urately determined. For this purpose, the translationtage was turned by 90°, and a 1 mm diameter apertureas mounted on it so that the plane of aperture was nor-al to the beam propagation direction. The aperture was
canned orthogonally to the beam propagation directionn steps of 0.4 mm, and the transmitted energy was mea-ured as a function of the aperture position using a pho-odiode. A Gaussian function was fitted to the measuredntensity spatial profile to obtain the beam radius. It ismportant to show that the measured beam waist radiuss equal to the calculated value, if the real beam qualityactor �1 is taken into account.
. RESULTS AND DISCUSSION. Determining the Beam Parameterssing the beam profiler [Figs. 2(b) and 2(c)] and the or-
hogonal scanning method [scanning a 1 mm diameter ap-
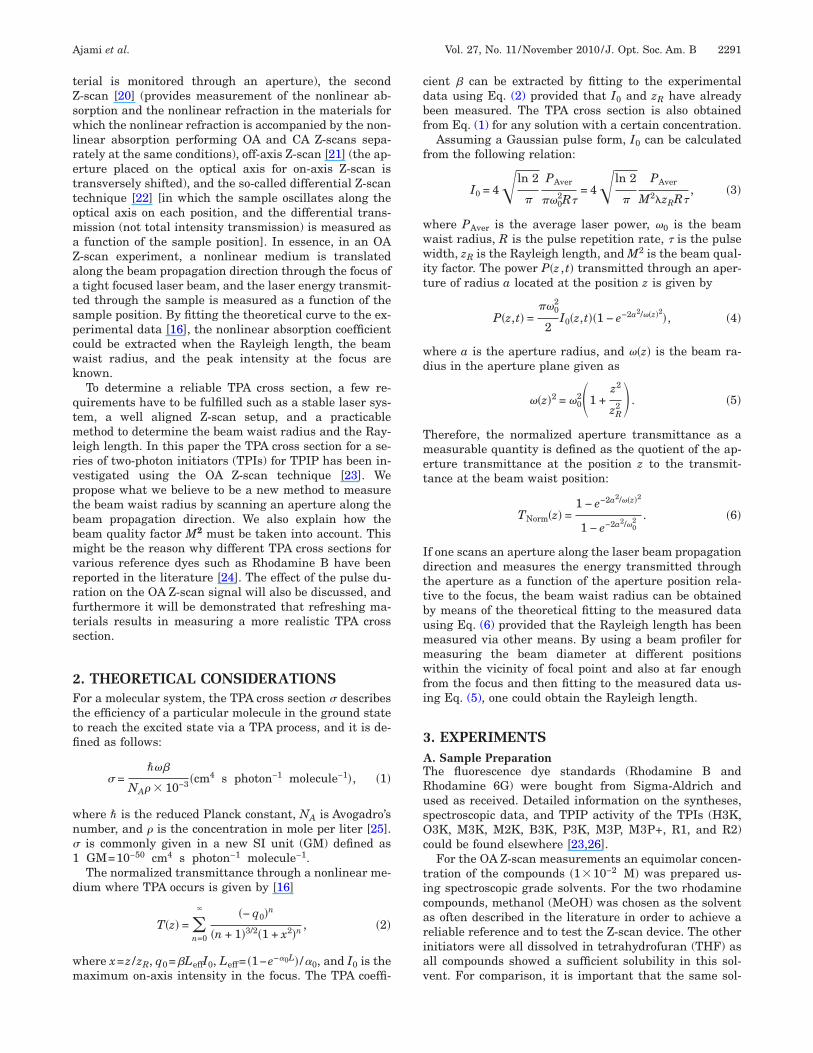
ig. 2. (Color online) Intensity spatial profile. (a) Transmissionhrough a pinhole scanned orthogonal to the beam propagationirection (scattered points are the experimental data, and theolid line is the Gaussian fit to the experimental data). (b) 2D in-ensity profile. (c) 3D intensity profile. [Both (b) and (c) wereaken by a beam profiler.]
rture in the X direction orthogonal to the beam propaga-ion direction; Fig. 2(a)], it could be verified that thentensity profile of the laser beam after the amplifier has
Gaussian spatial profile; therefore, the beam diameteran be determined. From the Gaussian fit to the experi-ental data in Fig. 2(a) as well as from the two-
imensional (2D) intensity profile measurement using aeam profiler shown in Fig. 2(b), the same beam diameterf 10 mm was obtained (full width at 1/e2 of maximum)efore the focusing lens.According to the equations mentioned earlier ��0
�f /��, with �=5 mm, �=796 nm, and f=175 mm, thealculated beam waist radius is 8.9 �m, and conse-uently a Rayleigh length of 0.3 mm would result. Thesealues are not in agreement with the measured values ob-ained from the fits to the measured data as shown inigs. 3(a) and 3(b).Figure 3(a) shows the beam radius measurement per-
ormed using a beam profiler. According to the Interna-ional Organization for Standardization (ISO) Standard1146, some data points near the focus and some at a suf-cient distance from it are required. Although the beamaist radius measured with the beam profiler is not reli-ble enough, however, it can be used to obtain the Ray-eigh length, because the Rayleigh length is defined as theistance from the focus where the beam radius increasesy a factor of �2. By fitting to the data in Fig. 3(a) usingq. (5), a Rayleigh length of 0.7 mm was obtained. As wille shown later, this value for the Rayleigh length resultedn the best fits of the Z-scan data to Eq. (2) for all mea-urements. This can be taken as a strong argument forhe reliability of the Rayleigh length measurement.
Figure 3(b) shows the energy transmitted through anperture (50 �m diameter) scanned along the beam
ig. 3. (Color online) (a) Beam radius versus the z position mea-ured from the focal point. (b) Normalized transmittance through50 �m diameter aperture versus the aperture position mea-
ured from the focal point.
pdEw
w�csb
iaa
lstvvEvblttww
BAT(azflppavncttwti
iaicssctBtrmg
sAtmttffdcwiotmpr
Ftrsp
Fp1
2294 J. Opt. Soc. Am. B/Vol. 27, No. 11 /November 2010 Ajami et al.
ropagation direction. Points represent the measuredata, and the solid curve is the best fit to the data usingq. (6) with zR=0.7 mm. A beam waist radius of 20 �mas extracted from the best fit to the data.The measured beam waist radius W0 is 20 �m,
hereas for an ideal Gaussian beam, a beam waist radius0 of 13.35 �m was calculated (assuming zR=0.7). As aonsequence, a beam quality factor M2 of 2.24 would re-ult. Therefore, one can still use the theoretical Gaussianeam parameters replacing � with M2�.In summary, in order to evaluate the TPA cross section
n the next section, the beam waist radius values obtainednd described above have to be used. See also Table 1 forn ideal and real Gaussian beam.The value in the first row is invalid for a diffraction-
imited beam as well as for a real beam. The value in theecond row has been calculated from a Gaussian equa-ion, and it is valid for a diffraction-limited beam. Thealue in the third row is the experimentally obtainedalue for the beam waist radius [from fit to the data usingq. (6) in Fig. 3(b)], and it is valid for the real beam. Thealue in the fourth row is the calculated value for theeam waist radius from a frequently used equation in theiterature ��0=�f /��, replacing � with M2� in order toake into account the beam quality factor. It was illus-rated that the value theoretically calculated for the beamaist radius is equal to the value experimentally obtainedhen the beam quality factor is taken into account.
. TPA Cross Sectionsll the following measurements for the determining of thePA cross section have been performed with 100 fs pulses
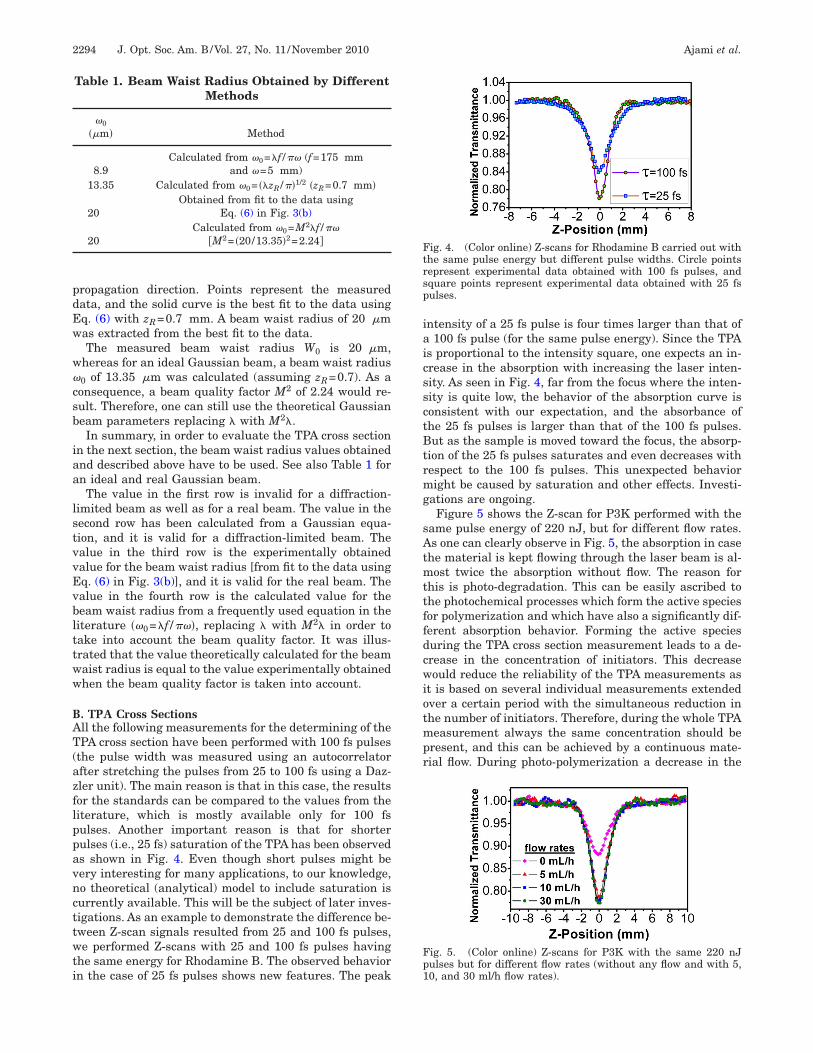
the pulse width was measured using an autocorrelatorfter stretching the pulses from 25 to 100 fs using a Daz-ler unit). The main reason is that in this case, the resultsor the standards can be compared to the values from theiterature, which is mostly available only for 100 fsulses. Another important reason is that for shorterulses (i.e., 25 fs) saturation of the TPA has been observeds shown in Fig. 4. Even though short pulses might beery interesting for many applications, to our knowledge,o theoretical (analytical) model to include saturation isurrently available. This will be the subject of later inves-igations. As an example to demonstrate the difference be-ween Z-scan signals resulted from 25 and 100 fs pulses,e performed Z-scans with 25 and 100 fs pulses having
he same energy for Rhodamine B. The observed behaviorn the case of 25 fs pulses shows new features. The peak
Table 1. Beam Waist Radius Obtained by DifferentMethods
�0��m� Method
8.9Calculated from �0=�f /� (f=175 mm
and �=5 mm)13.35 Calculated from �0= ��zR /�1/2 �zR=0.7 mm�
20Obtained from fit to the data using
Eq. (6) in Fig. 3(b)
20Calculated from �0=M2�f /�
�M2= �20/13.35�2=2.24�
ntensity of a 25 fs pulse is four times larger than that of100 fs pulse (for the same pulse energy). Since the TPA
s proportional to the intensity square, one expects an in-rease in the absorption with increasing the laser inten-ity. As seen in Fig. 4, far from the focus where the inten-ity is quite low, the behavior of the absorption curve isonsistent with our expectation, and the absorbance ofhe 25 fs pulses is larger than that of the 100 fs pulses.ut as the sample is moved toward the focus, the absorp-
ion of the 25 fs pulses saturates and even decreases withespect to the 100 fs pulses. This unexpected behavioright be caused by saturation and other effects. Investi-
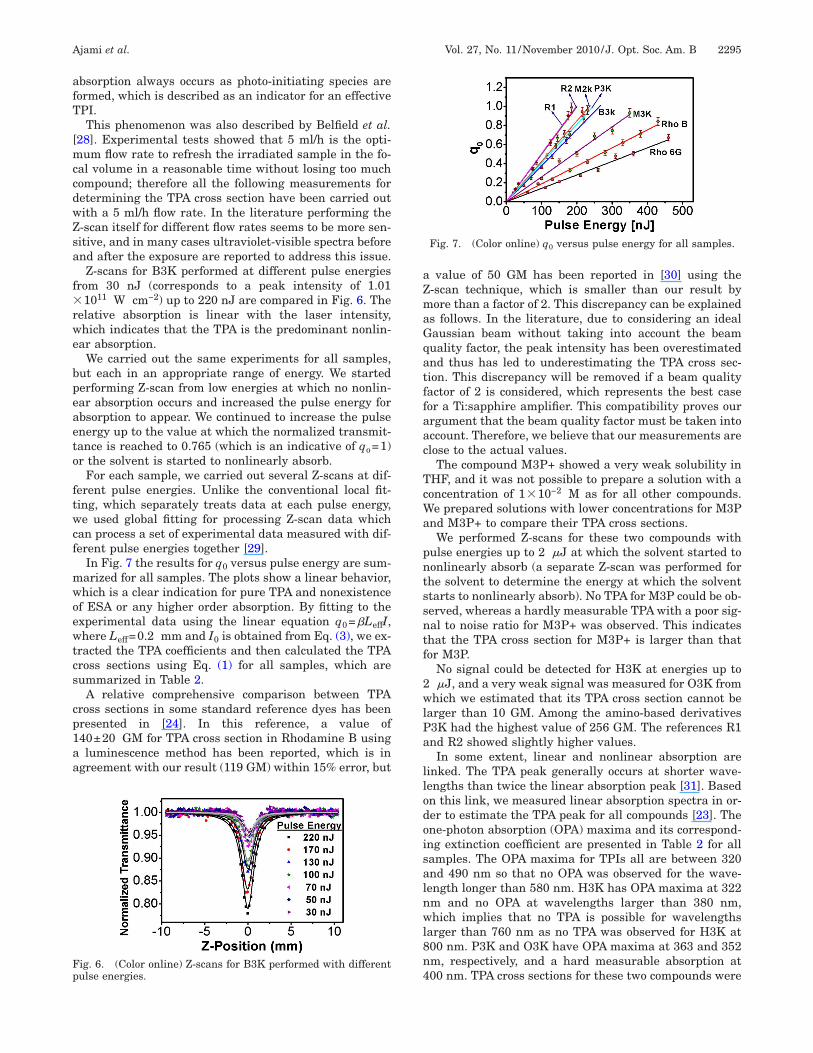
ations are ongoing.Figure 5 shows the Z-scan for P3K performed with the
ame pulse energy of 220 nJ, but for different flow rates.s one can clearly observe in Fig. 5, the absorption in case
he material is kept flowing through the laser beam is al-ost twice the absorption without flow. The reason for
his is photo-degradation. This can be easily ascribed tohe photochemical processes which form the active speciesor polymerization and which have also a significantly dif-erent absorption behavior. Forming the active speciesuring the TPA cross section measurement leads to a de-rease in the concentration of initiators. This decreaseould reduce the reliability of the TPA measurements as
t is based on several individual measurements extendedver a certain period with the simultaneous reduction inhe number of initiators. Therefore, during the whole TPAeasurement always the same concentration should be
resent, and this can be achieved by a continuous mate-ial flow. During photo-polymerization a decrease in the
ig. 4. (Color online) Z-scans for Rhodamine B carried out withhe same pulse energy but different pulse widths. Circle pointsepresent experimental data obtained with 100 fs pulses, andquare points represent experimental data obtained with 25 fsulses.
ig. 5. (Color online) Z-scans for P3K with the same 220 nJulses but for different flow rates (without any flow and with 5,0, and 30 ml/h flow rates).
afT
[mccdwZsa
f�rwe
bpeaeto
ftwcf
mwoewtcs
cp1aa
aZmaGqatffaac
TcWa
pntssntf
2wlPa
llodoisalnwl8n4
Fp
Ajami et al. Vol. 27, No. 11 /November 2010 /J. Opt. Soc. Am. B 2295
bsorption always occurs as photo-initiating species areormed, which is described as an indicator for an effectivePI.This phenomenon was also described by Belfield et al.
28]. Experimental tests showed that 5 ml/h is the opti-um flow rate to refresh the irradiated sample in the fo-
al volume in a reasonable time without losing too muchompound; therefore all the following measurements foretermining the TPA cross section have been carried outith a 5 ml/h flow rate. In the literature performing the-scan itself for different flow rates seems to be more sen-itive, and in many cases ultraviolet-visible spectra beforend after the exposure are reported to address this issue.Z-scans for B3K performed at different pulse energies
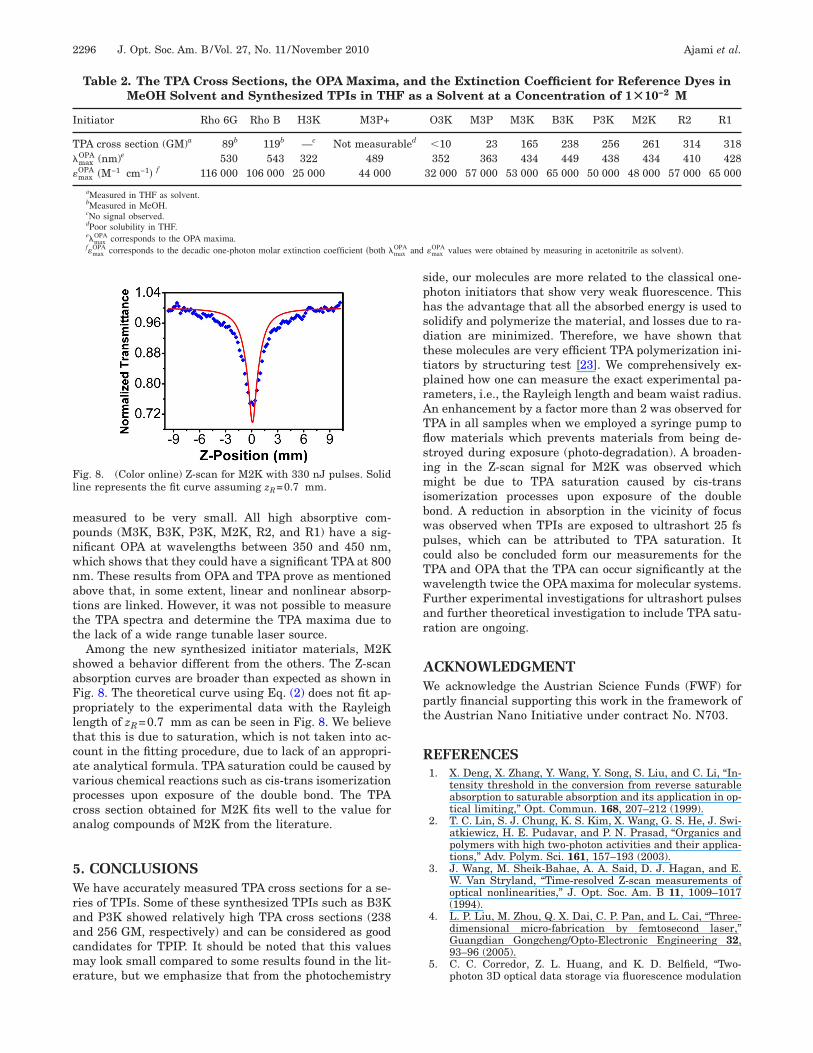
rom 30 nJ (corresponds to a peak intensity of 1.011011 W cm−2) up to 220 nJ are compared in Fig. 6. The
elative absorption is linear with the laser intensity,hich indicates that the TPA is the predominant nonlin-ar absorption.
We carried out the same experiments for all samples,ut each in an appropriate range of energy. We startederforming Z-scan from low energies at which no nonlin-ar absorption occurs and increased the pulse energy forbsorption to appear. We continued to increase the pulsenergy up to the value at which the normalized transmit-ance is reached to 0.765 (which is an indicative of qo=1)r the solvent is started to nonlinearly absorb.
For each sample, we carried out several Z-scans at dif-erent pulse energies. Unlike the conventional local fit-ing, which separately treats data at each pulse energy,e used global fitting for processing Z-scan data which
an process a set of experimental data measured with dif-erent pulse energies together [29].
In Fig. 7 the results for q0 versus pulse energy are sum-arized for all samples. The plots show a linear behavior,hich is a clear indication for pure TPA and nonexistencef ESA or any higher order absorption. By fitting to thexperimental data using the linear equation q0=�LeffI,here Leff=0.2 mm and I0 is obtained from Eq. (3), we ex-
racted the TPA coefficients and then calculated the TPAross sections using Eq. (1) for all samples, which areummarized in Table 2.
A relative comprehensive comparison between TPAross sections in some standard reference dyes has beenresented in [24]. In this reference, a value of40±20 GM for TPA cross section in Rhodamine B usingluminescence method has been reported, which is in
greement with our result (119 GM) within 15% error, but
ig. 6. (Color online) Z-scans for B3K performed with differentulse energies.
value of 50 GM has been reported in [30] using the-scan technique, which is smaller than our result byore than a factor of 2. This discrepancy can be explained
s follows. In the literature, due to considering an idealaussian beam without taking into account the beamuality factor, the peak intensity has been overestimatednd thus has led to underestimating the TPA cross sec-ion. This discrepancy will be removed if a beam qualityactor of 2 is considered, which represents the best caseor a Ti:sapphire amplifier. This compatibility proves ourrgument that the beam quality factor must be taken intoccount. Therefore, we believe that our measurements arelose to the actual values.
The compound M3P+ showed a very weak solubility inHF, and it was not possible to prepare a solution with aoncentration of 1�10−2 M as for all other compounds.e prepared solutions with lower concentrations for M3P
nd M3P+ to compare their TPA cross sections.We performed Z-scans for these two compounds with
ulse energies up to 2 �J at which the solvent started toonlinearly absorb (a separate Z-scan was performed forhe solvent to determine the energy at which the solventtarts to nonlinearly absorb). No TPA for M3P could be ob-erved, whereas a hardly measurable TPA with a poor sig-al to noise ratio for M3P+ was observed. This indicateshat the TPA cross section for M3P+ is larger than thator M3P.
No signal could be detected for H3K at energies up to�J, and a very weak signal was measured for O3K from
hich we estimated that its TPA cross section cannot bearger than 10 GM. Among the amino-based derivatives3K had the highest value of 256 GM. The references R1nd R2 showed slightly higher values.In some extent, linear and nonlinear absorption are
inked. The TPA peak generally occurs at shorter wave-engths than twice the linear absorption peak [31]. Basedn this link, we measured linear absorption spectra in or-er to estimate the TPA peak for all compounds [23]. Thene-photon absorption (OPA) maxima and its correspond-ng extinction coefficient are presented in Table 2 for allamples. The OPA maxima for TPIs all are between 320nd 490 nm so that no OPA was observed for the wave-ength longer than 580 nm. H3K has OPA maxima at 322m and no OPA at wavelengths larger than 380 nm,hich implies that no TPA is possible for wavelengths
arger than 760 nm as no TPA was observed for H3K at00 nm. P3K and O3K have OPA maxima at 363 and 352m, respectively, and a hard measurable absorption at00 nm. TPA cross sections for these two compounds were
Fig. 7. (Color online) q0 versus pulse energy for all samples.
mpnwnattt
saFpltcavpca
5Wraacme
sphsdttprATflsimibwpcTwFar
AWpt
R
Fl
I
T�
�
max
2296 J. Opt. Soc. Am. B/Vol. 27, No. 11 /November 2010 Ajami et al.
easured to be very small. All high absorptive com-ounds (M3K, B3K, P3K, M2K, R2, and R1) have a sig-ificant OPA at wavelengths between 350 and 450 nm,hich shows that they could have a significant TPA at 800m. These results from OPA and TPA prove as mentionedbove that, in some extent, linear and nonlinear absorp-ions are linked. However, it was not possible to measurehe TPA spectra and determine the TPA maxima due tohe lack of a wide range tunable laser source.
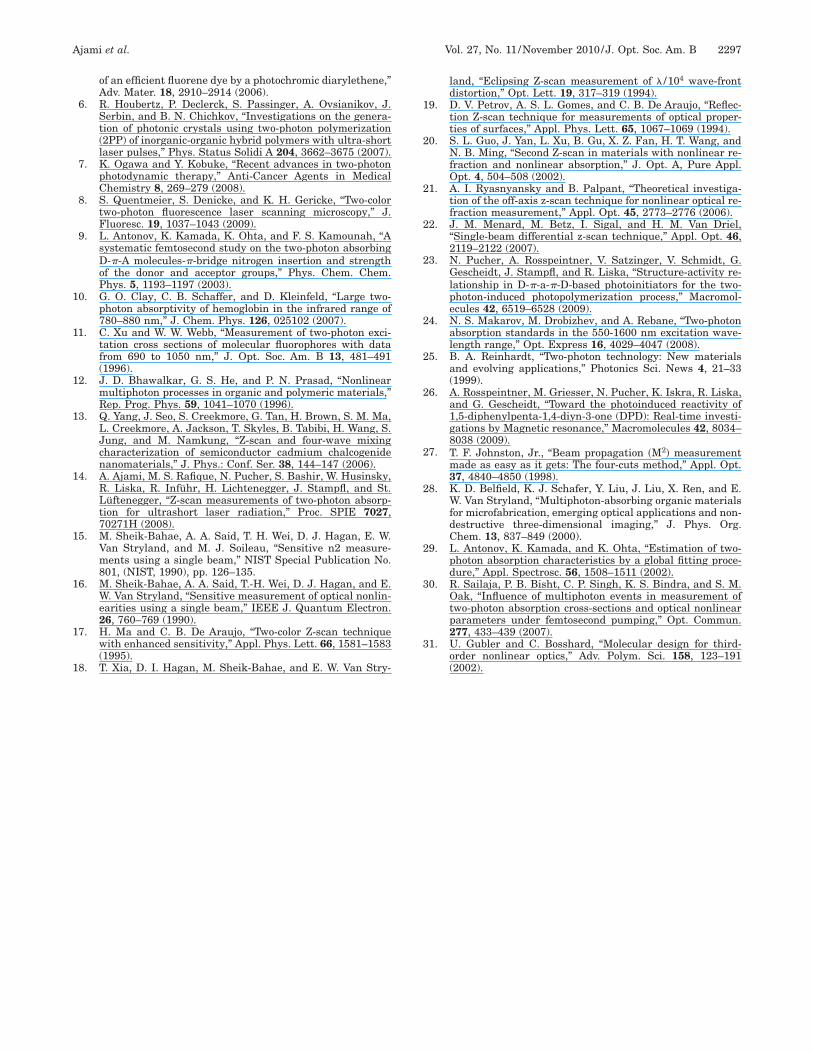
Among the new synthesized initiator materials, M2Khowed a behavior different from the others. The Z-scanbsorption curves are broader than expected as shown inig. 8. The theoretical curve using Eq. (2) does not fit ap-ropriately to the experimental data with the Rayleighength of zR=0.7 mm as can be seen in Fig. 8. We believehat this is due to saturation, which is not taken into ac-ount in the fitting procedure, due to lack of an appropri-te analytical formula. TPA saturation could be caused byarious chemical reactions such as cis-trans isomerizationrocesses upon exposure of the double bond. The TPAross section obtained for M2K fits well to the value fornalog compounds of M2K from the literature.
. CONCLUSIONSe have accurately measured TPA cross sections for a se-
ies of TPIs. Some of these synthesized TPIs such as B3Knd P3K showed relatively high TPA cross sections (238nd 256 GM, respectively) and can be considered as goodandidates for TPIP. It should be noted that this valuesay look small compared to some results found in the lit-
rature, but we emphasize that from the photochemistry
ig. 8. (Color online) Z-scan for M2K with 330 nJ pulses. Solidine represents the fit curve assuming zR=0.7 mm.
Table 2. The TPA Cross Sections, the OPA MaximaMeOH Solvent and Synthesized TPIs in TH
nitiator Rho 6G Rho B H3K M3P+
PA cross section (GM)a 89b 119b —c Not measur
maxOPA (nm)e 530 543 322 489
maxOPA �M−1 cm−1� f 116 000 106 000 25 000 44 000
aMeasured in THF as solvent.bMeasured in MeOH.cNo signal observed.dPoor solubility in THF.e�max
OPA corresponds to the OPA maxima.f�max
OPA corresponds to the decadic one-photon molar extinction coefficient �both �
ide, our molecules are more related to the classical one-hoton initiators that show very weak fluorescence. Thisas the advantage that all the absorbed energy is used toolidify and polymerize the material, and losses due to ra-iation are minimized. Therefore, we have shown thathese molecules are very efficient TPA polymerization ini-iators by structuring test [23]. We comprehensively ex-lained how one can measure the exact experimental pa-ameters, i.e., the Rayleigh length and beam waist radius.n enhancement by a factor more than 2 was observed forPA in all samples when we employed a syringe pump toow materials which prevents materials from being de-troyed during exposure (photo-degradation). A broaden-ng in the Z-scan signal for M2K was observed which
ight be due to TPA saturation caused by cis-transsomerization processes upon exposure of the doubleond. A reduction in absorption in the vicinity of focusas observed when TPIs are exposed to ultrashort 25 fsulses, which can be attributed to TPA saturation. Itould also be concluded form our measurements for thePA and OPA that the TPA can occur significantly at theavelength twice the OPA maxima for molecular systems.urther experimental investigations for ultrashort pulsesnd further theoretical investigation to include TPA satu-ation are ongoing.
CKNOWLEDGMENTe acknowledge the Austrian Science Funds (FWF) for
artly financial supporting this work in the framework ofhe Austrian Nano Initiative under contract No. N703.
EFERENCES1. X. Deng, X. Zhang, Y. Wang, Y. Song, S. Liu, and C. Li, “In-
tensity threshold in the conversion from reverse saturableabsorption to saturable absorption and its application in op-tical limiting,” Opt. Commun. 168, 207–212 (1999).
2. T. C. Lin, S. J. Chung, K. S. Kim, X. Wang, G. S. He, J. Swi-atkiewicz, H. E. Pudavar, and P. N. Prasad, “Organics andpolymers with high two-photon activities and their applica-tions,” Adv. Polym. Sci. 161, 157–193 (2003).
3. J. Wang, M. Sheik-Bahae, A. A. Said, D. J. Hagan, and E.W. Van Stryland, “Time-resolved Z-scan measurements ofoptical nonlinearities,” J. Opt. Soc. Am. B 11, 1009–1017(1994).
4. L. P. Liu, M. Zhou, Q. X. Dai, C. P. Pan, and L. Cai, “Three-dimensional micro-fabrication by femtosecond laser,”Guangdian Gongcheng/Opto-Electronic Engineering 32,93–96 (2005).
5. C. C. Corredor, Z. L. Huang, and K. D. Belfield, “Two-photon 3D optical data storage via fluorescence modulation
the Extinction Coefficient for Reference Dyes ina Solvent at a Concentration of 1Ã10−2 M
O3K M3P M3K B3K P3K M2K R2 R1
10 23 165 238 256 261 314 318352 363 434 449 438 434 410 428
32 000 57 000 53 000 65 000 50 000 48 000 57 000 65 000
�maxOPA values were obtained by measuring in acetonitrile as solvent�.
, andF as
abled
OPA and
1
1
1
1
1
1
1
1
1
1
2
2
2
2
2
2
2
2
2
2
3
3
Ajami et al. Vol. 27, No. 11 /November 2010 /J. Opt. Soc. Am. B 2297
of an efficient fluorene dye by a photochromic diarylethene,”Adv. Mater. 18, 2910–2914 (2006).
6. R. Houbertz, P. Declerck, S. Passinger, A. Ovsianikov, J.Serbin, and B. N. Chichkov, “Investigations on the genera-tion of photonic crystals using two-photon polymerization(2PP) of inorganic-organic hybrid polymers with ultra-shortlaser pulses,” Phys. Status Solidi A 204, 3662–3675 (2007).
7. K. Ogawa and Y. Kobuke, “Recent advances in two-photonphotodynamic therapy,” Anti-Cancer Agents in MedicalChemistry 8, 269–279 (2008).
8. S. Quentmeier, S. Denicke, and K. H. Gericke, “Two-colortwo-photon fluorescence laser scanning microscopy,” J.Fluoresc. 19, 1037–1043 (2009).
9. L. Antonov, K. Kamada, K. Ohta, and F. S. Kamounah, “Asystematic femtosecond study on the two-photon absorbingD--A molecules--bridge nitrogen insertion and strengthof the donor and acceptor groups,” Phys. Chem. Chem.Phys. 5, 1193–1197 (2003).
0. G. O. Clay, C. B. Schaffer, and D. Kleinfeld, “Large two-photon absorptivity of hemoglobin in the infrared range of780–880 nm,” J. Chem. Phys. 126, 025102 (2007).
1. C. Xu and W. W. Webb, “Measurement of two-photon exci-tation cross sections of molecular fluorophores with datafrom 690 to 1050 nm,” J. Opt. Soc. Am. B 13, 481–491(1996).
2. J. D. Bhawalkar, G. S. He, and P. N. Prasad, “Nonlinearmultiphoton processes in organic and polymeric materials,”Rep. Prog. Phys. 59, 1041–1070 (1996).
3. Q. Yang, J. Seo, S. Creekmore, G. Tan, H. Brown, S. M. Ma,L. Creekmore, A. Jackson, T. Skyles, B. Tabibi, H. Wang, S.Jung, and M. Namkung, “Z-scan and four-wave mixingcharacterization of semiconductor cadmium chalcogenidenanomaterials,” J. Phys.: Conf. Ser. 38, 144–147 (2006).
4. A. Ajami, M. S. Rafique, N. Pucher, S. Bashir, W. Husinsky,R. Liska, R. Inführ, H. Lichtenegger, J. Stampfl, and St.Lüftenegger, “Z-scan measurements of two-photon absorp-tion for ultrashort laser radiation,” Proc. SPIE 7027,70271H (2008).
5. M. Sheik-Bahae, A. A. Said, T. H. Wei, D. J. Hagan, E. W.Van Stryland, and M. J. Soileau, “Sensitive n2 measure-ments using a single beam,” NIST Special Publication No.801, (NIST, 1990), pp. 126–135.
6. M. Sheik-Bahae, A. A. Said, T.-H. Wei, D. J. Hagan, and E.W. Van Stryland, “Sensitive measurement of optical nonlin-earities using a single beam,” IEEE J. Quantum Electron.26, 760–769 (1990).
7. H. Ma and C. B. De Araujo, “Two-color Z-scan techniquewith enhanced sensitivity,” Appl. Phys. Lett. 66, 1581–1583(1995).
8. T. Xia, D. I. Hagan, M. Sheik-Bahae, and E. W. Van Stry-
land, “Eclipsing Z-scan measurement of � /104 wave-frontdistortion,” Opt. Lett. 19, 317–319 (1994).
9. D. V. Petrov, A. S. L. Gomes, and C. B. De Araujo, “Reflec-tion Z-scan technique for measurements of optical proper-ties of surfaces,” Appl. Phys. Lett. 65, 1067–1069 (1994).
0. S. L. Guo, J. Yan, L. Xu, B. Gu, X. Z. Fan, H. T. Wang, andN. B. Ming, “Second Z-scan in materials with nonlinear re-fraction and nonlinear absorption,” J. Opt. A, Pure Appl.Opt. 4, 504–508 (2002).
1. A. I. Ryasnyansky and B. Palpant, “Theoretical investiga-tion of the off-axis z-scan technique for nonlinear optical re-fraction measurement,” Appl. Opt. 45, 2773–2776 (2006).
2. J. M. Menard, M. Betz, I. Sigal, and H. M. Van Driel,“Single-beam differential z-scan technique,” Appl. Opt. 46,2119–2122 (2007).
3. N. Pucher, A. Rosspeintner, V. Satzinger, V. Schmidt, G.Gescheidt, J. Stampfl, and R. Liska, “Structure-activity re-lationship in D--a--D-based photoinitiators for the two-photon-induced photopolymerization process,” Macromol-ecules 42, 6519–6528 (2009).
4. N. S. Makarov, M. Drobizhev, and A. Rebane, “Two-photonabsorption standards in the 550-1600 nm excitation wave-length range,” Opt. Express 16, 4029–4047 (2008).
5. B. A. Reinhardt, “Two-photon technology: New materialsand evolving applications,” Photonics Sci. News 4, 21–33(1999).
6. A. Rosspeintner, M. Griesser, N. Pucher, K. Iskra, R. Liska,and G. Gescheidt, “Toward the photoinduced reactivity of1,5-diphenylpenta-1,4-diyn-3-one (DPD): Real-time investi-gations by Magnetic resonance,” Macromolecules 42, 8034–8038 (2009).
7. T. F. Johnston, Jr., “Beam propagation �M2� measurementmade as easy as it gets: The four-cuts method,” Appl. Opt.37, 4840–4850 (1998).
8. K. D. Belfield, K. J. Schafer, Y. Liu, J. Liu, X. Ren, and E.W. Van Stryland, “Multiphoton-absorbing organic materialsfor microfabrication, emerging optical applications and non-destructive three-dimensional imaging,” J. Phys. Org.Chem. 13, 837–849 (2000).
9. L. Antonov, K. Kamada, and K. Ohta, “Estimation of two-photon absorption characteristics by a global fitting proce-dure,” Appl. Spectrosc. 56, 1508–1511 (2002).
0. R. Sailaja, P. B. Bisht, C. P. Singh, K. S. Bindra, and S. M.Oak, “Influence of multiphoton events in measurement oftwo-photon absorption cross-sections and optical nonlinearparameters under femtosecond pumping,” Opt. Commun.277, 433–439 (2007).
1. U. Gubler and C. Bosshard, “Molecular design for third-order nonlinear optics,” Adv. Polym. Sci. 158, 123–191(2002).
Related Documents