INTERNATIONAL JOURNAL OF PROFESSIONAL ENGINEERING STUDIES Volume VIII /Issue 5 / AUG 2017 IJPRES TWO PHASE FLOW SIMULATION IN “Y” JOINT DUCT USED IN PIPELINE APPLICATIONS 1 JALA HARIKA 2 Mr. M.PRASAD 1 PG Scholar, Department of MECH, Methodist College of Engineering & Technology. Abids, Hyderabad – 500 001. 2 Assistant Professor, Department of MECH, Methodist College of Engineering & Technology. Abids, Hyderabad – 500 001. Abstract Flow diversion through Y branch and T junction ducts are extensively used in pipeline applications for uniform distribution of fluids. In order to understand flow uniformity, typical geometrical situations of different configurations are developed for CAD models using Altair Hyper mesh. The of curvatures in the duct geometry flow takes sharp turns leading to severe turbulent fluctuations whose consequent effects give rises to unequal flow at its exit location. In many physical situations, these ducts are subjected to more than one fluid is called two phase air-dust particles or water and sand particles. In order to understand flow mechanism, geometrical models generated are further subjected computational mesh on which conservation equations are iterated to obtain successful solution with inlet velocity and exit pressure conditions. After successful flow simulation discrete phase module is activated to track particle trajectories along with impact parameters. From the solution, several parameters through graphical forms are visualized and interpreted. In order to improve velocity and flow path in computational domain, several simulations are repeated with refinements in the mesh elements in terms of type and density. It is expected that two phase flow analysis dealing with fluid-particles will provide several insights for design of pipeline layout for proper flow distribution. 1. Introduction Pipe networks are very common in industries, where fluid or gases to be transported from one location to the other. The pressure loss may vary depending on the type of components coming across in the network, material of the pipe, the fluid that is being transported through the network and pipe fitting. The analysis of pipe network is very important in engineering point of view. A lot of engineering problem dealt with it. Due to rigorous engineering application and implications the analysis is important. Fittings are used in pipe and plumbing systems to connect straight pipe or tubing sections, to adapt to different sizes or shapes, and for other purposes, such as regulating or measuring fluid flow. A wye branch (as the name implies, this fitting device is "Y" shaped) allows splitting a branch line equally in two directions. It is a fitting with three openings and is used to create branch lines. A standard wye allows one pipe to be joined to another at a 45 degree angle. Wyes are similar to this except that the branch line is angled to reduce friction that could hamper the flow and that the connection is typically at a 45-degree angle rather than a 90-degree angle . Economy wyes are often spot welded together; industrial wyes have a continuous weld at each seam. In the present work, fluid dynamic analysis for different Y- shape connections will be done, for laminar. The effect of bend angle, pipe diameter, pipe length, Reynolds number on the resistance coefficient is studied and. It

Welcome message from author
This document is posted to help you gain knowledge. Please leave a comment to let me know what you think about it! Share it to your friends and learn new things together.
Transcript

INTERNATIONAL JOURNAL OF PROFESSIONAL ENGINEERING STUDIES Volume VIII /Issue 5 / AUG 2017
IJPRES
TWO PHASE FLOW SIMULATION IN “Y” JOINT DUCT USED IN PIPELINE APPLICATIONS
1 JALA HARIKA 2 Mr. M.PRASAD 1 PG Scholar, Department of MECH, Methodist College of Engineering & Technology.
Abids, Hyderabad – 500 001.
2 Assistant Professor, Department of MECH, Methodist College of Engineering & Technology.
Abids, Hyderabad – 500 001.
Abstract
Flow diversion through Y branch and T junction
ducts are extensively used in pipeline applications for
uniform distribution of fluids. In order to understand
flow uniformity, typical geometrical situations of
different configurations are developed for CAD
models using Altair Hyper mesh. The of curvatures in
the duct geometry flow takes sharp turns leading to
severe turbulent fluctuations whose consequent
effects give rises to unequal flow at its exit location.
In many physical situations, these ducts are subjected
to more than one fluid is called two phase air-dust
particles or water and sand particles. In order to
understand flow mechanism, geometrical models
generated are further subjected computational mesh
on which conservation equations are iterated to
obtain successful solution with inlet velocity and exit
pressure conditions. After successful flow simulation
discrete phase module is activated to track particle
trajectories along with impact parameters. From the
solution, several parameters through graphical forms
are visualized and interpreted. In order to improve
velocity and flow path in computational domain,
several simulations are repeated with refinements in
the mesh elements in terms of type and density. It is
expected that two phase flow analysis dealing with
fluid-particles will provide several insights for design
of pipeline layout for proper flow distribution.
1. Introduction
Pipe networks are very common in industries, where
fluid or gases to be transported from one location to
the other. The pressure loss may vary depending on
the type of components coming across in the
network, material of the pipe, the fluid that is being
transported through the network and pipe fitting. The
analysis of pipe network is very important in
engineering point of view. A lot of engineering
problem dealt with it. Due to rigorous engineering
application and implications the analysis is important.
Fittings are used in pipe and plumbing systems to
connect straight pipe or tubing sections, to adapt to
different sizes or shapes, and for other purposes, such
as regulating or measuring fluid flow. A wye branch
(as the name implies, this fitting device is "Y"
shaped) allows splitting a branch line equally in two
directions. It is a fitting with three openings and is
used to create branch lines. A standard wye allows
one pipe to be joined to another at a 45 degree angle.
Wyes are similar to this except that the branch line is
angled to reduce friction that could hamper the flow
and that the connection is typically at a 45-degree
angle rather than a 90-degree angle . Economy wyes
are often spot welded together; industrial wyes have a
continuous weld at each seam. In the present work,
fluid dynamic analysis for different Y- shape
connections will be done, for laminar. The effect of
bend angle, pipe diameter, pipe length, Reynolds
number on the resistance coefficient is studied and. It
Gurmeet
Typewritten Text
312

INTERNATIONAL JOURNAL OF PROFESSIONAL ENGINEERING STUDIES Volume VIII /Issue 5 / AUG 2017
IJPRES
was observed that resistance coefficient vary with the
change in flow.
Multiphase flow in reciprocating internal combustion
engines is widely used for prediction of
thermodynamic parameters of gases in the branched
ducts of inlet and outlet systems. These ducts are
connected to the branch of “Y” and “T” type, where
the gas is transferred from supplier pipes to the
outflow pipes in varying of changing in the time gas
properties. In the engine ducts the gas parameters are
a function of temperature and chemical composition.
Taking into account the dynamics of the gases with
incident and reflected pressure waves the filling and
emptying of the cylinder depends on the flow in the
branches particularly in multi-cylinder engines. The
concept of calculations, based on the balance of
mass, energy, and the values of the pressure loss
between the pipes oriented relative to each other, has
to determine the thermodynamic parameters of gas
and the mass fraction of each component in the
branch node. Although the model refers to the three
branched ducts, and test results are considered to “T”
type of branched pipes, one can apply it to the layout
consisting of more pipes. This allows a definition of
incoming or outgoing pressure waveforms in the
ducts from the valves or the ports of individual
cylinders in internal combustion engines. Unsteady
gas flow in the engine ducts influences on the mass
filling ratio of the gas in each cylinder. In the
simulation of any engine, where its performance is
related to the mass trapped in the cylinder and
pressure wave motion through the branched pipes
was considered .
Flexible duct junction boxes are commonly used to
split airflows in residential heating, ventilation, and
air conditioning (HVAC) systems of insulated
flexible ducts. Junction boxes typically are made of
fiberglass duct board or insulated sheet metal.
Junction boxes are popular and, properly designed,
can result in an HVAC system that performs well.
However, junction boxes that are poorly designed can
have high pressure losses relative to other duct
fittings. That is, each junction box creates a higher
resistance (e.g., duct friction) that may impede the
ability of the air handler unit (AHU) to move the air
through the ducts, which in turn may result in
occupant comfort complaints. With any duct runout,
balancing dampers are needed to adjust the pressure
of airflow through the outlets because self-balancing
systems are not realistic. Junction boxes are not
necessarily the most energy-efficient option for an
HVAC system. It is important to weigh their benefits
as a low first-cost and easily installed option versus
the benefits of using a trunk and branch system that
will provide more certainty to Effective Length
values information provided other calculation tools
and information provided by manufacturers’
performance data. This measure guideline assumes
that designers have an understanding of load
calculations for system and room airflow
requirements and duct run attributes such as airflow
rate, velocity, and friction rate.
1.2. Problem definition
The transport of fluids in branched duct generated
pressure losses and turbulence due to different turns
around sharp corners.The curvatures in the duct
geometry flow takes sharp turns leading to severe
turbulent fluctuations whose consequent effects give
rises to unequal flow at its exit location. Performance
degradations of ducts will be more significant if the
working fluid is of particulate laden nature.
Besides thermal gradients on wall surfaces,
structurally ducts are subjected to large deformations
altering principal stresses.
Gurmeet
Typewritten Text
313
INTERNATIONAL JOURNAL OF PROFESSIONAL ENGINEERING STUDIES Volume VIII /Issue 5 / AUG 2017
IJPRES
In order to understand multiphase flow mechanism
in the branched duct, detailed numerical studies are
essential under three dimensional environments.
3. EXPERIMENTAL METHODOLOGY
3.1 Overview of Altair-Hyperworks
HyperWorks Desktop is an integrated user
environment for modeling and visualization. It can be
used to pre-and post-process finite element and multi-
body dynamics simulations as well as to manage and
visualize simulation and test data.
3.1.2 Construction of Geometrical Model
When Altair-Hypermesh is activated on the
desktop/laptop, graphical user display opens as
shown in Figure 3.1 for development of geometrical
model using bottom up approach.
Figure: 3.1 Development of Geometrical Model Using
Bottom up Approach
With the options available in 2dimensional options,
the line drag command is used to generate the
cylindrical tube Surface in xy direction. In the line
drag options, one must ensure that drag geometrical
option – line to be selected and type should be
toggled to surface.
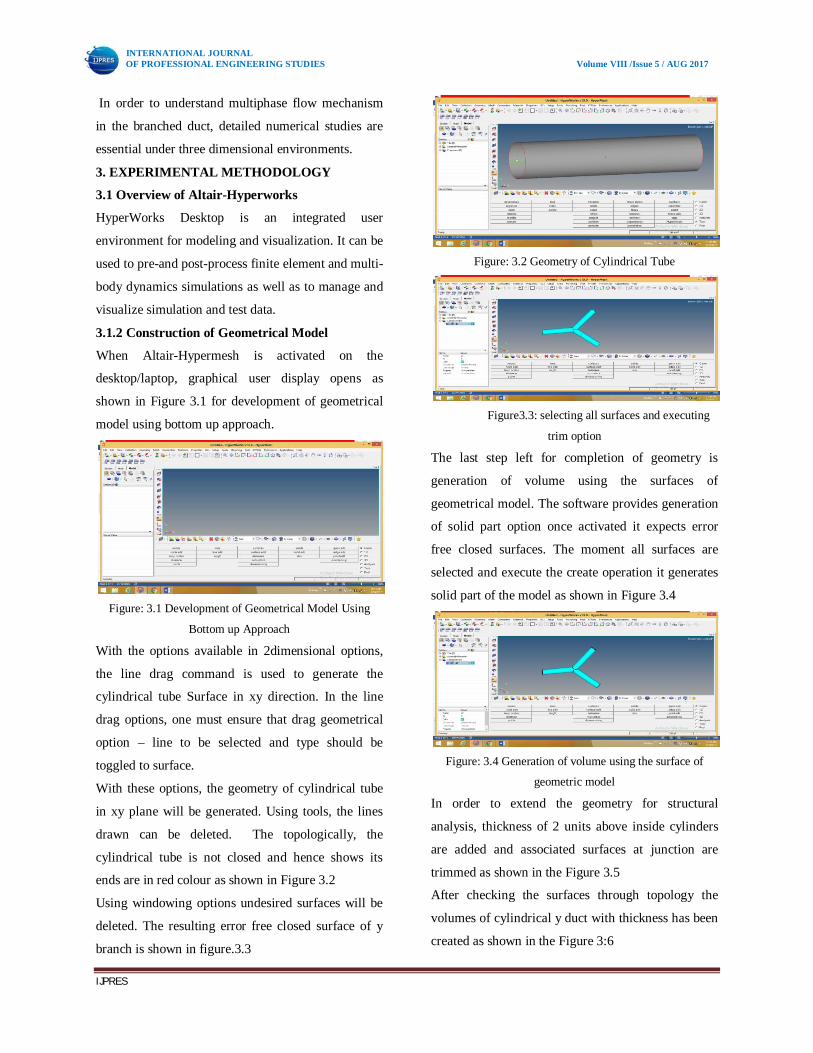
With these options, the geometry of cylindrical tube
in xy plane will be generated. Using tools, the lines
drawn can be deleted. The topologically, the
cylindrical tube is not closed and hence shows its
ends are in red colour as shown in Figure 3.2
Using windowing options undesired surfaces will be
deleted. The resulting error free closed surface of y
branch is shown in figure.3.3
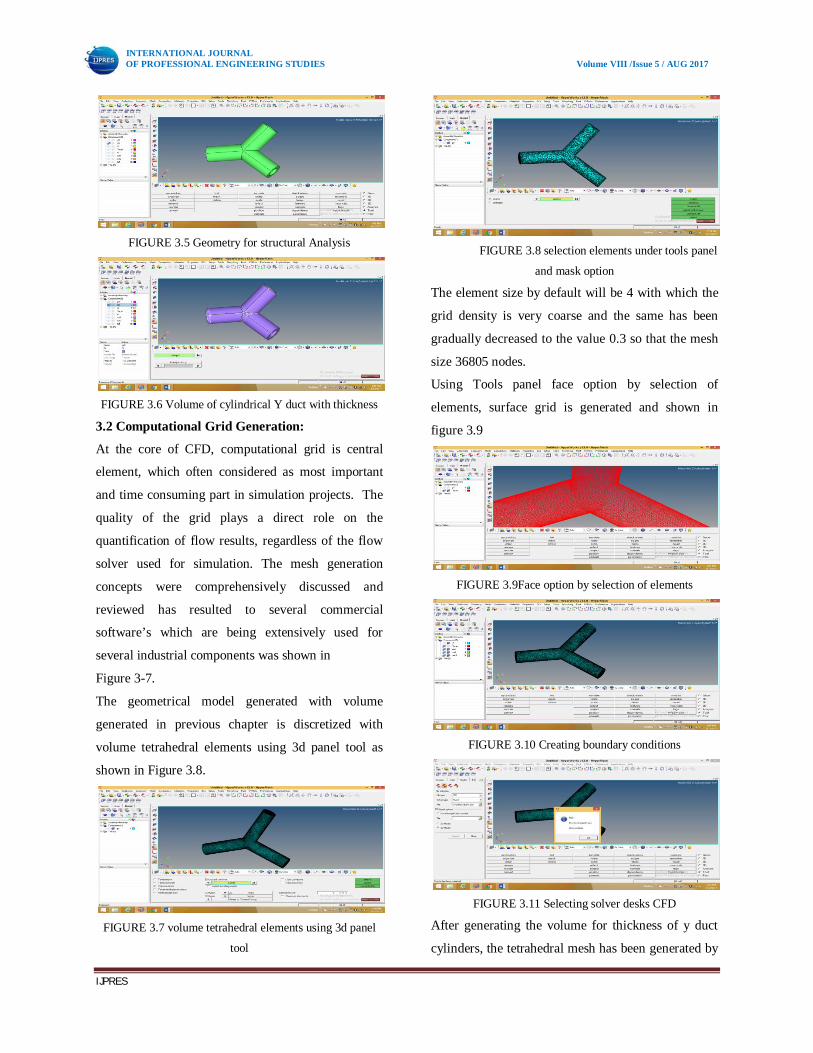
Figure: 3.2 Geometry of Cylindrical Tube
Figure3.3: selecting all surfaces and executing
trim option
The last step left for completion of geometry is
generation of volume using the surfaces of
geometrical model. The software provides generation
of solid part option once activated it expects error
free closed surfaces. The moment all surfaces are
selected and execute the create operation it generates
solid part of the model as shown in Figure 3.4
Figure: 3.4 Generation of volume using the surface of
geometric model
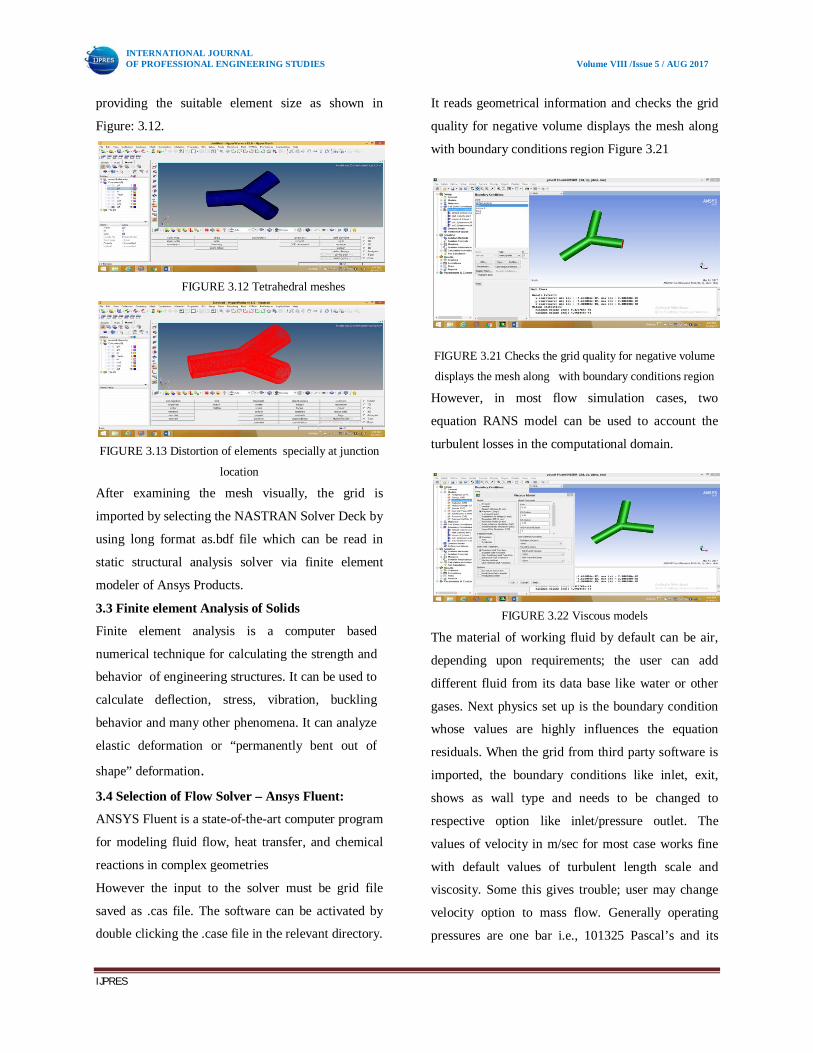
In order to extend the geometry for structural
analysis, thickness of 2 units above inside cylinders
are added and associated surfaces at junction are
trimmed as shown in the Figure 3.5
After checking the surfaces through topology the
volumes of cylindrical y duct with thickness has been
created as shown in the Figure 3:6
Gurmeet
Typewritten Text
314
INTERNATIONAL JOURNAL OF PROFESSIONAL ENGINEERING STUDIES Volume VIII /Issue 5 / AUG 2017
IJPRES
FIGURE 3.5 Geometry for structural Analysis
FIGURE 3.6 Volume of cylindrical Y duct with thickness
3.2 Computational Grid Generation:
At the core of CFD, computational grid is central
element, which often considered as most important
and time consuming part in simulation projects. The
quality of the grid plays a direct role on the
quantification of flow results, regardless of the flow
solver used for simulation. The mesh generation
concepts were comprehensively discussed and
reviewed has resulted to several commercial
software’s which are being extensively used for
several industrial components was shown in
Figure 3-7.
The geometrical model generated with volume
generated in previous chapter is discretized with
volume tetrahedral elements using 3d panel tool as
shown in Figure 3.8.
FIGURE 3.7 volume tetrahedral elements using 3d panel
tool
FIGURE 3.8 selection elements under tools panel
and mask option
The element size by default will be 4 with which the
grid density is very coarse and the same has been
gradually decreased to the value 0.3 so that the mesh
size 36805 nodes.
Using Tools panel face option by selection of
elements, surface grid is generated and shown in
figure 3.9
FIGURE 3.9Face option by selection of elements
FIGURE 3.10 Creating boundary conditions
FIGURE 3.11 Selecting solver desks CFD
After generating the volume for thickness of y duct
cylinders, the tetrahedral mesh has been generated by
Gurmeet
Typewritten Text
315
INTERNATIONAL JOURNAL OF PROFESSIONAL ENGINEERING STUDIES Volume VIII /Issue 5 / AUG 2017
IJPRES
providing the suitable element size as shown in
Figure: 3.12.
FIGURE 3.12 Tetrahedral meshes
FIGURE 3.13 Distortion of elements specially at junction
location
After examining the mesh visually, the grid is
imported by selecting the NASTRAN Solver Deck by
using long format as.bdf file which can be read in
static structural analysis solver via finite element
modeler of Ansys Products.
3.3 Finite element Analysis of Solids
Finite element analysis is a computer based
numerical technique for calculating the strength and
behavior of engineering structures. It can be used to
calculate deflection, stress, vibration, buckling
behavior and many other phenomena. It can analyze
elastic deformation or “permanently bent out of
shape” deformation. 3.4 Selection of Flow Solver – Ansys Fluent:
ANSYS Fluent is a state-of-the-art computer program
for modeling fluid flow, heat transfer, and chemical
reactions in complex geometries
However the input to the solver must be grid file
saved as .cas file. The software can be activated by
double clicking the .case file in the relevant directory.
It reads geometrical information and checks the grid
quality for negative volume displays the mesh along
with boundary conditions region Figure 3.21
FIGURE 3.21 Checks the grid quality for negative volume
displays the mesh along with boundary conditions region
However, in most flow simulation cases, two
equation RANS model can be used to account the
turbulent losses in the computational domain.
FIGURE 3.22 Viscous models
The material of working fluid by default can be air,
depending upon requirements; the user can add
different fluid from its data base like water or other
gases. Next physics set up is the boundary condition
whose values are highly influences the equation
residuals. When the grid from third party software is
imported, the boundary conditions like inlet, exit,
shows as wall type and needs to be changed to
respective option like inlet/pressure outlet. The
values of velocity in m/sec for most case works fine
with default values of turbulent length scale and
viscosity. Some this gives trouble; user may change
velocity option to mass flow. Generally operating
pressures are one bar i.e., 101325 Pascal’s and its
Gurmeet
Typewritten Text
316

INTERNATIONAL JOURNAL OF PROFESSIONAL ENGINEERING STUDIES Volume VIII /Issue 5 / AUG 2017
IJPRES
value in the pressure out boundary condition should
be mentioned as zero. .
The calculate command solves transport equations
using iteratively to reduce the errors and its
convergence history for the case one of y-duct
geometry is shown in Figure: 3.23
FIGURE 3.23 Command solves transport equation using
iterations
In order to see the results are computed in right
direction, using report mass flow flux values of at
inlet and outlets are computed and shown below.
In order to see the results are computed in right
direction, using report mass flow flux values of at
inlet and outlets are computed and shown below.
The balance of mass flow across inlet and exit
locations ensures the mass conservation principle
which implies that quantity of mass entered in the
volume of the component should leave with the same
amount.
3.5 Simulation of Discrete Phase Model using
Ansys Fluent:
The flowing fluid in the y-duct is subjected to micron
level dust/carbon particles, component performance
via particle motion can be simulated using discrete
phase model available in Fluent Solver. However the
computational grid used for flow simulation along
with the turbulence model selected is remain same.
When discrete phase model is made on, a pop-up
menu shown in Figure 3.24 displays on the flow
solver.
FIGURE 3.24 Discrete phase model
Under Discrete phase model, the solver expects to
choose injection of particles which a pop-up-menu
shown in Figure: 3.25
In the analysis three injection locations are chosen
with the particle sizes 1 micron, 10 microns and 100
microns. The particles are considered to spherical
whose drag law available in the solver is utilized.
FIGURE 3.25 injections of particles The flows with particles are simulated whose
convergence history of equation residuals is shown in
Figure 3.26.
FIGURE 3.26 convergence history of equation residual
3.6 Structural Analysis of Y duct using Ansys
Work Bench:
The geometry of Y-duct with thickness created and
mesh generated in Altair Hypermesh has been saved
with the user preferences as NASTRAN. The mesh
Gurmeet
Typewritten Text
317

INTERNATIONAL JOURNAL OF PROFESSIONAL ENGINEERING STUDIES Volume VIII /Issue 5 / AUG 2017
IJPRES
file has been saved as long format of NASTRAN
Solver deck as .bdf File. When structural analysis for
Y-duct envisaged, one of the essential condition is
pressure load which comes from CFD solution
Figure 3.27 Structural analysis graphic user displays
Figure 3.28 Structural Analysis
Under analysis settings, solver expects user inputs as
constraints as fixed support has been used and
imported pressure load inner surface of y-duct has
been assigned. With these boundary conditions, the
solver executed to simulate the structural analysis for
total deformation and equivalent stresses.
4. Discussion of Results
FIGURE 4.1 velocity magnitudes in the plane of
computational along z direction
It is observed that velocity of fluid up to junction of
y-duct is uniform and at the location of turning, the
flow left side taking place on upper portion creating
turbulence at bottom portion of right side cylinder.
However there exists small quantity of flow left side
cylinder upper portion and at rest of the place flow is
creating strong turbulence.
FIGURE 4.2 Backflow occurring in y-duct vector plot
FIGURE 4.3 Flow Recirculation
FIGURE 4.4 Absolute pressure variations in the plane
The pressure on Pascal’s indicates lowest at junction
location of Y-duct and maximum exhibits at the
location where three pipes in x y z direction meeting.
For considered inlet velocities, the pressure drop
across inlet and exit can be estimated using
reports/surface integrals/mass averaged quantity inlet
to outlet1 is as follows.
Similarly the pressure drop across inlet to out2 of y-
duct pipe estimated with the help of reports/surface
integrals/mass weight average/absolute pressure as
Gurmeet
Typewritten Text
318
Gurmeet
Typewritten Text
INTERNATIONAL JOURNAL OF PROFESSIONAL ENGINEERING STUDIES Volume VIII /Issue 5 / AUG 2017
IJPRES
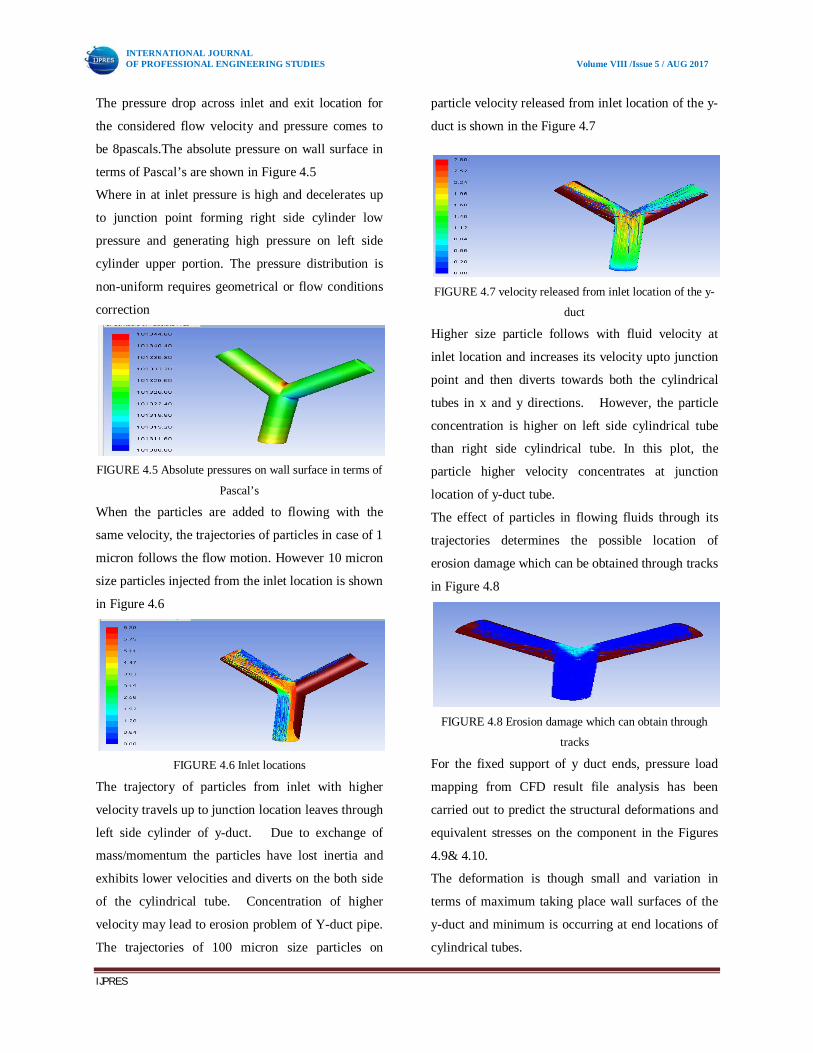
The pressure drop across inlet and exit location for
the considered flow velocity and pressure comes to
be 8pascals.The absolute pressure on wall surface in
terms of Pascal’s are shown in Figure 4.5
Where in at inlet pressure is high and decelerates up
to junction point forming right side cylinder low
pressure and generating high pressure on left side
cylinder upper portion. The pressure distribution is
non-uniform requires geometrical or flow conditions
correction
FIGURE 4.5 Absolute pressures on wall surface in terms of
Pascal’s
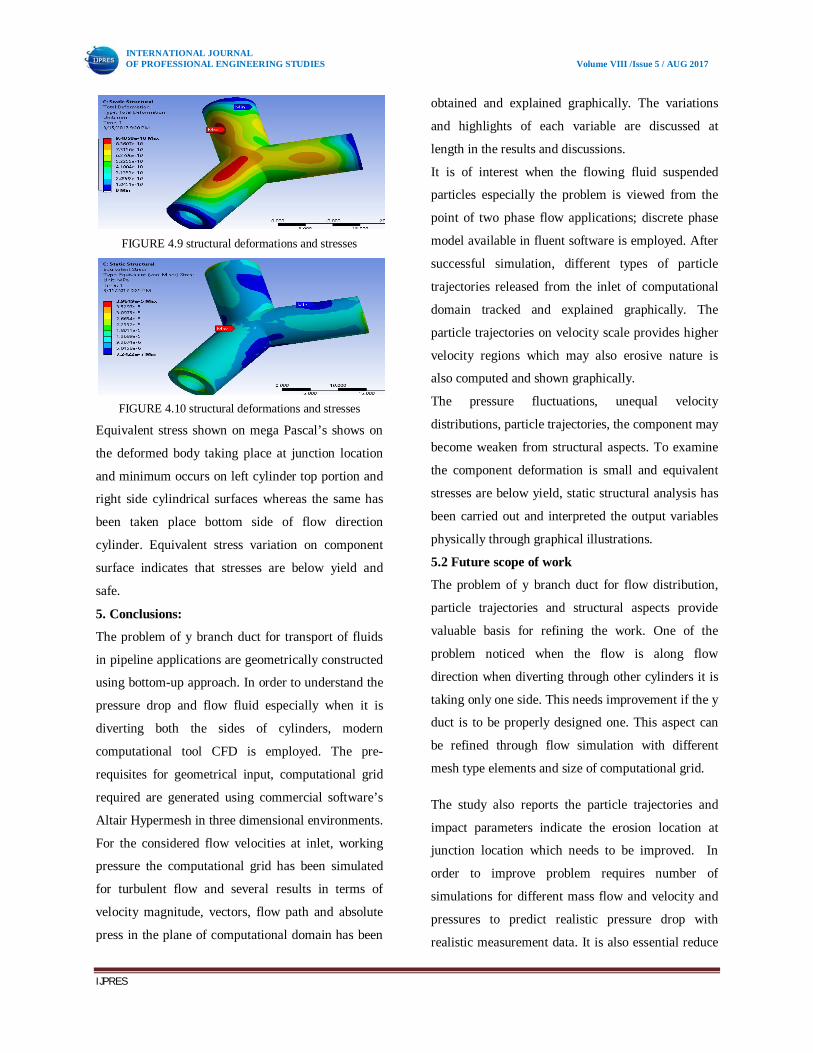
When the particles are added to flowing with the
same velocity, the trajectories of particles in case of 1
micron follows the flow motion. However 10 micron
size particles injected from the inlet location is shown
in Figure 4.6
FIGURE 4.6 Inlet locations
The trajectory of particles from inlet with higher
velocity travels up to junction location leaves through
left side cylinder of y-duct. Due to exchange of
mass/momentum the particles have lost inertia and
exhibits lower velocities and diverts on the both side
of the cylindrical tube. Concentration of higher
velocity may lead to erosion problem of Y-duct pipe.
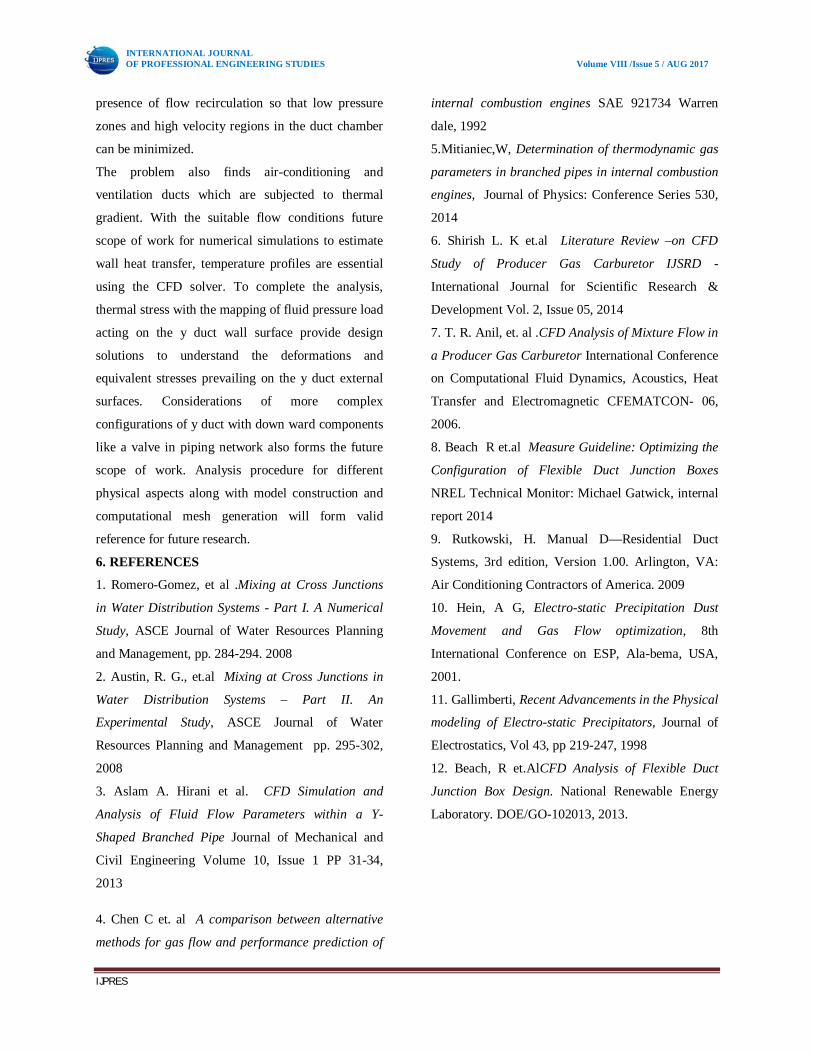
The trajectories of 100 micron size particles on
particle velocity released from inlet location of the y-
duct is shown in the Figure 4.7
FIGURE 4.7 velocity released from inlet location of the y-
duct
Higher size particle follows with fluid velocity at
inlet location and increases its velocity upto junction
point and then diverts towards both the cylindrical
tubes in x and y directions. However, the particle
concentration is higher on left side cylindrical tube
than right side cylindrical tube. In this plot, the
particle higher velocity concentrates at junction
location of y-duct tube.
The effect of particles in flowing fluids through its
trajectories determines the possible location of
erosion damage which can be obtained through tracks
in Figure 4.8
FIGURE 4.8 Erosion damage which can obtain through
tracks
For the fixed support of y duct ends, pressure load
mapping from CFD result file analysis has been
carried out to predict the structural deformations and
equivalent stresses on the component in the Figures
4.9& 4.10.
The deformation is though small and variation in
terms of maximum taking place wall surfaces of the
y-duct and minimum is occurring at end locations of
cylindrical tubes.
Gurmeet
Typewritten Text
319
INTERNATIONAL JOURNAL OF PROFESSIONAL ENGINEERING STUDIES Volume VIII /Issue 5 / AUG 2017
IJPRES
FIGURE 4.9 structural deformations and stresses
FIGURE 4.10 structural deformations and stresses
Equivalent stress shown on mega Pascal’s shows on
the deformed body taking place at junction location
and minimum occurs on left cylinder top portion and
right side cylindrical surfaces whereas the same has
been taken place bottom side of flow direction
cylinder. Equivalent stress variation on component
surface indicates that stresses are below yield and
safe.
5. Conclusions:
The problem of y branch duct for transport of fluids
in pipeline applications are geometrically constructed
using bottom-up approach. In order to understand the
pressure drop and flow fluid especially when it is
diverting both the sides of cylinders, modern
computational tool CFD is employed. The pre-
requisites for geometrical input, computational grid
required are generated using commercial software’s
Altair Hypermesh in three dimensional environments.
For the considered flow velocities at inlet, working
pressure the computational grid has been simulated
for turbulent flow and several results in terms of
velocity magnitude, vectors, flow path and absolute
press in the plane of computational domain has been
obtained and explained graphically. The variations
and highlights of each variable are discussed at
length in the results and discussions.
It is of interest when the flowing fluid suspended
particles especially the problem is viewed from the
point of two phase flow applications; discrete phase
model available in fluent software is employed. After
successful simulation, different types of particle
trajectories released from the inlet of computational
domain tracked and explained graphically. The
particle trajectories on velocity scale provides higher
velocity regions which may also erosive nature is
also computed and shown graphically.
The pressure fluctuations, unequal velocity
distributions, particle trajectories, the component may
become weaken from structural aspects. To examine
the component deformation is small and equivalent
stresses are below yield, static structural analysis has
been carried out and interpreted the output variables
physically through graphical illustrations.
5.2 Future scope of work
The problem of y branch duct for flow distribution,
particle trajectories and structural aspects provide
valuable basis for refining the work. One of the
problem noticed when the flow is along flow
direction when diverting through other cylinders it is
taking only one side. This needs improvement if the y
duct is to be properly designed one. This aspect can
be refined through flow simulation with different
mesh type elements and size of computational grid.
The study also reports the particle trajectories and
impact parameters indicate the erosion location at
junction location which needs to be improved. In
order to improve problem requires number of
simulations for different mass flow and velocity and
pressures to predict realistic pressure drop with
realistic measurement data. It is also essential reduce
Gurmeet
Typewritten Text
320
INTERNATIONAL JOURNAL OF PROFESSIONAL ENGINEERING STUDIES Volume VIII /Issue 5 / AUG 2017
IJPRES
presence of flow recirculation so that low pressure
zones and high velocity regions in the duct chamber
can be minimized.
The problem also finds air-conditioning and
ventilation ducts which are subjected to thermal
gradient. With the suitable flow conditions future
scope of work for numerical simulations to estimate
wall heat transfer, temperature profiles are essential
using the CFD solver. To complete the analysis,
thermal stress with the mapping of fluid pressure load
acting on the y duct wall surface provide design
solutions to understand the deformations and
equivalent stresses prevailing on the y duct external
surfaces. Considerations of more complex
configurations of y duct with down ward components
like a valve in piping network also forms the future
scope of work. Analysis procedure for different
physical aspects along with model construction and
computational mesh generation will form valid
reference for future research.
6. REFERENCES
1. Romero-Gomez, et al .Mixing at Cross Junctions
in Water Distribution Systems - Part I. A Numerical
Study, ASCE Journal of Water Resources Planning
and Management, pp. 284-294. 2008
2. Austin, R. G., et.al Mixing at Cross Junctions in
Water Distribution Systems – Part II. An
Experimental Study, ASCE Journal of Water
Resources Planning and Management pp. 295-302,
2008
3. Aslam A. Hirani et al. CFD Simulation and
Analysis of Fluid Flow Parameters within a Y-
Shaped Branched Pipe Journal of Mechanical and
Civil Engineering Volume 10, Issue 1 PP 31-34,
2013
4. Chen C et. al A comparison between alternative
methods for gas flow and performance prediction of
internal combustion engines SAE 921734 Warren
dale, 1992
5.Mitianiec,W, Determination of thermodynamic gas
parameters in branched pipes in internal combustion
engines, Journal of Physics: Conference Series 530,
2014
6. Shirish L. K et.al Literature Review –on CFD
Study of Producer Gas Carburetor IJSRD -
International Journal for Scientific Research &
Development Vol. 2, Issue 05, 2014
7. T. R. Anil, et. al .CFD Analysis of Mixture Flow in
a Producer Gas Carburetor International Conference
on Computational Fluid Dynamics, Acoustics, Heat
Transfer and Electromagnetic CFEMATCON- 06,
2006.
8. Beach R et.al Measure Guideline: Optimizing the
Configuration of Flexible Duct Junction Boxes
NREL Technical Monitor: Michael Gatwick, internal
report 2014
9. Rutkowski, H. Manual D—Residential Duct
Systems, 3rd edition, Version 1.00. Arlington, VA:
Air Conditioning Contractors of America. 2009
10. Hein, A G, Electro-static Precipitation Dust
Movement and Gas Flow optimization, 8th
International Conference on ESP, Ala-bema, USA,
2001.
11. Gallimberti, Recent Advancements in the Physical
modeling of Electro-static Precipitators, Journal of
Electrostatics, Vol 43, pp 219-247, 1998
12. Beach, R et.AlCFD Analysis of Flexible Duct
Junction Box Design. National Renewable Energy
Laboratory. DOE/GO-102013, 2013.
Gurmeet
Typewritten Text
321
Related Documents