Two fluoroalcohols as components of basic buffers for liquid chromatography electrospray ionization mass spectrometric determination of antibiotic residues† Karin Kipper, * a Koit Herodes, a Ivo Leito a and Lembit Nei b Received 14th February 2011, Accepted 9th August 2011 DOI: 10.1039/c1an15123a Two fluoroalcohols—1,1,1,3,3,3-hexafluoro-2-propanol (HFIP) and 1,1,1,3,3,3-hexafluoro-2-methyl- 2-propanol (HFTB)—were evaluated for the first time as volatile buffer acids in the basic mobile phase for reversed-phase chromatography with electrospray ionization-mass spectrometric (LC-ESI-MS) detection of five antibiotics. Chromatographic separation as well as positive and negative ion ESI-MS intensities using these novel buffer components were compared to traditional buffer systems. Overall, the highest signal intensities and best chromatographic separation for the five antibiotics (ciprofloxacin, norfloxacin, ofloxacin, sulfadimethoxine and sulfamethoxazole) were achieved using 5 mM HFIP as the buffer acid to methanol : water mobile phase (pH of the aqueous component adjusted to 9.0 with ammonium hydroxide). Comparable results were achieved using 5 mM HFTB (pH adjusted to 9.0 with ammonium hydroxide). The suitability of HFIP for analysis of antibiotic residues in lettuce is demonstrated. Introduction The analysis of basic compounds with reversed-phase (RP) chromatographic separation in the low pH range often presents difficulties due to strong interactions with the residual silanol groups in the silica-based column packing. 1 Silanol groups cause poor peak shapes and low efficiency as well as retention and column-to-column reproducibility problems. 2 The impact of these problems is wide-ranging, because most of the pharma- ceuticals (estimated over 70%) have basic properties. At the same time about 20% are acids. 1 Basic compounds are present predominantly in their protonated form if the pH of the solution is lower than the pK a value of the base. Protonated, i.e. cationic, form is polar and has poor retention in the RP column. At a pH value higher than the pK a of the base, the basic center is deprotonated. As a result better retention behavior is expected. Therefore, for the separation of basic compounds by RP liquid chromatography, a basic buffer solution would be preferable. Buffer solution components provide the separation of analytes using the pH or ion pairing effect. 3 Buffer solutions more frequently used in the liquid chromatography-mass spectrometry (LC-MS) analysis should not suppress the ionization of the analyte and must be volatile. Use of non-volatile buffer components causes contamination of the electrospray ionization (ESI) source. 4 There are only a limited number of basic buffer systems available for LC-MS analysis with suitable properties 5–7 and additional suitable buffer systems would be highly welcome. As an example, selection of basic buffer components for LC-MS use (on the example of the Waters XBridge column) is presented in Table S1 in the ESI†. Working in a high pH range also sets requirements for the column. Selection of the column for working in a high pH range should be made according to its resistance to high pH. Fluorinated alcohols are a potentially promising class of compounds to be used as weak acids for preparing buffers of pH value above 7. 1,1,1,3,3,3-Hexafluoro-2-propanol (HFIP, pK a ¼ 9.3) 8 has been used in several studies 8–15 as an additive to the LC mobile phase at neutral or at slightly basic pH. In these studies the pH of the buffer was adjusted to 7.0 (ref. 8–10), 7.5 (ref. 13), 7.9 (ref. 11 and 12), 8.2–8.4 (ref. 15), 8.5 (ref. 14) with triethylamine where oligonucleotides and oligosaccharides were analyzed. However, these pH values are in most cases signifi- cantly different from the pK a value of HFIP and the concen- trations of HFIP were in the range of 100 mM to 800 mM (ca. 2% to 15% by mass), by far exceeding the buffer concentration levels commonly used for LC-MS applications. Thus the role of HFIP was rather that of an additional solvent component than a buffer acid. Using the HFIP as the weak acid and triethyl- amine (TEA) as the weak base in buffer systems resulted in high ESI intensities, high efficiency of dissociation of the oligonu- cleotide–TEA ion pairs and good chromatographic separa- tion. 8,9 Interestingly, this promising approach has not been extended to analysis of other compounds or to the use of other polyfluorinated alcohols. a University of Tartu, Institute of Chemistry, 14a Ravila Street, 50411 Tartu, Estonia. E-mail: [email protected]; Tel: +372 5666 7504 b Department of Environmental Protection, Tartu College of Tallinn University of Technology, Puiestee 78, 51008 Tartu, Estonia † Electronic supplementary information (ESI) available. See DOI: 10.1039/c1an15123a This journal is ª The Royal Society of Chemistry 2011 Analyst, 2011, 136, 4587–4594 | 4587 Dynamic Article Links C < Analyst Cite this: Analyst, 2011, 136, 4587 www.rsc.org/analyst PAPER

Welcome message from author
This document is posted to help you gain knowledge. Please leave a comment to let me know what you think about it! Share it to your friends and learn new things together.
Transcript
Dynamic Article LinksC<Analyst
Cite this: Analyst, 2011, 136, 4587
www.rsc.org/analyst PAPER
Two fluoroalcohols as components of basic buffers for liquid chromatographyelectrospray ionization mass spectrometric determination of antibioticresidues†
Karin Kipper,*a Koit Herodes,a Ivo Leitoa and Lembit Neib
Received 14th February 2011, Accepted 9th August 2011
DOI: 10.1039/c1an15123a
Two fluoroalcohols—1,1,1,3,3,3-hexafluoro-2-propanol (HFIP) and 1,1,1,3,3,3-hexafluoro-2-methyl-
2-propanol (HFTB)—were evaluated for the first time as volatile buffer acids in the basic mobile phase
for reversed-phase chromatography with electrospray ionization-mass spectrometric (LC-ESI-MS)
detection of five antibiotics. Chromatographic separation as well as positive and negative ion ESI-MS
intensities using these novel buffer components were compared to traditional buffer systems. Overall,
the highest signal intensities and best chromatographic separation for the five antibiotics (ciprofloxacin,
norfloxacin, ofloxacin, sulfadimethoxine and sulfamethoxazole) were achieved using 5mMHFIP as the
buffer acid to methanol : water mobile phase (pH of the aqueous component adjusted to 9.0 with
ammonium hydroxide). Comparable results were achieved using 5 mMHFTB (pH adjusted to 9.0 with
ammonium hydroxide). The suitability of HFIP for analysis of antibiotic residues in lettuce is
demonstrated.
Introduction
The analysis of basic compounds with reversed-phase (RP)
chromatographic separation in the low pH range often presents
difficulties due to strong interactions with the residual silanol
groups in the silica-based column packing.1 Silanol groups cause
poor peak shapes and low efficiency as well as retention and
column-to-column reproducibility problems.2 The impact of
these problems is wide-ranging, because most of the pharma-
ceuticals (estimated over 70%) have basic properties. At the same
time about 20% are acids.1 Basic compounds are present
predominantly in their protonated form if the pH of the solution
is lower than the pKa value of the base. Protonated, i.e. cationic,
form is polar and has poor retention in the RP column. At a pH
value higher than the pKa of the base, the basic center is
deprotonated. As a result better retention behavior is expected.
Therefore, for the separation of basic compounds by RP liquid
chromatography, a basic buffer solution would be preferable.
Buffer solution components provide the separation of analytes
using the pH or ion pairing effect.3 Buffer solutions more
frequently used in the liquid chromatography-mass spectrometry
(LC-MS) analysis should not suppress the ionization of the
analyte and must be volatile. Use of non-volatile buffer
components causes contamination of the electrospray ionization
aUniversity of Tartu, Institute of Chemistry, 14a Ravila Street, 50411Tartu, Estonia. E-mail: [email protected]; Tel: +372 5666 7504bDepartment of Environmental Protection, Tartu College of TallinnUniversity of Technology, Puiestee 78, 51008 Tartu, Estonia
† Electronic supplementary information (ESI) available. See DOI:10.1039/c1an15123a
This journal is ª The Royal Society of Chemistry 2011
(ESI) source.4 There are only a limited number of basic buffer
systems available for LC-MS analysis with suitable properties5–7
and additional suitable buffer systems would be highly welcome.
As an example, selection of basic buffer components for LC-MS
use (on the example of the Waters XBridge column) is presented
in Table S1 in the ESI†.
Working in a high pH range also sets requirements for the
column. Selection of the column for working in a high pH range
should be made according to its resistance to high pH.
Fluorinated alcohols are a potentially promising class of
compounds to be used as weak acids for preparing buffers of
pH value above 7. 1,1,1,3,3,3-Hexafluoro-2-propanol (HFIP,
pKa ¼ 9.3)8 has been used in several studies8–15 as an additive to
the LC mobile phase at neutral or at slightly basic pH. In these
studies the pH of the buffer was adjusted to 7.0 (ref. 8–10), 7.5
(ref. 13), 7.9 (ref. 11 and 12), 8.2–8.4 (ref. 15), 8.5 (ref. 14) with
triethylamine where oligonucleotides and oligosaccharides were
analyzed. However, these pH values are in most cases signifi-
cantly different from the pKa value of HFIP and the concen-
trations of HFIP were in the range of 100 mM to 800 mM (ca.
2% to 15% by mass), by far exceeding the buffer concentration
levels commonly used for LC-MS applications. Thus the role of
HFIP was rather that of an additional solvent component than
a buffer acid. Using the HFIP as the weak acid and triethyl-
amine (TEA) as the weak base in buffer systems resulted in high
ESI intensities, high efficiency of dissociation of the oligonu-
cleotide–TEA ion pairs and good chromatographic separa-
tion.8,9 Interestingly, this promising approach has not been
extended to analysis of other compounds or to the use of other
polyfluorinated alcohols.
Analyst, 2011, 136, 4587–4594 | 4587
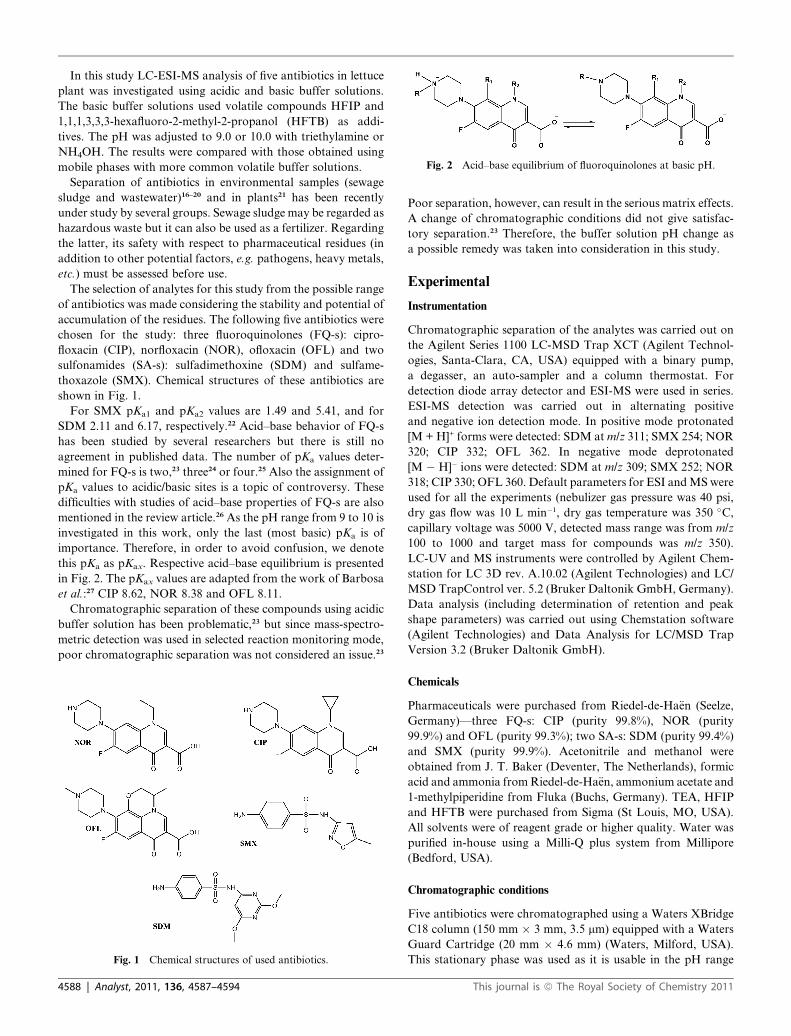
Fig. 2 Acid–base equilibrium of fluoroquinolones at basic pH.
In this study LC-ESI-MS analysis of five antibiotics in lettuce
plant was investigated using acidic and basic buffer solutions.
The basic buffer solutions used volatile compounds HFIP and
1,1,1,3,3,3-hexafluoro-2-methyl-2-propanol (HFTB) as addi-
tives. The pH was adjusted to 9.0 or 10.0 with triethylamine or
NH4OH. The results were compared with those obtained using
mobile phases with more common volatile buffer solutions.
Separation of antibiotics in environmental samples (sewage
sludge and wastewater)16–20 and in plants21 has been recently
under study by several groups. Sewage sludge may be regarded as
hazardous waste but it can also be used as a fertilizer. Regarding
the latter, its safety with respect to pharmaceutical residues (in
addition to other potential factors, e.g. pathogens, heavy metals,
etc.) must be assessed before use.
The selection of analytes for this study from the possible range
of antibiotics was made considering the stability and potential of
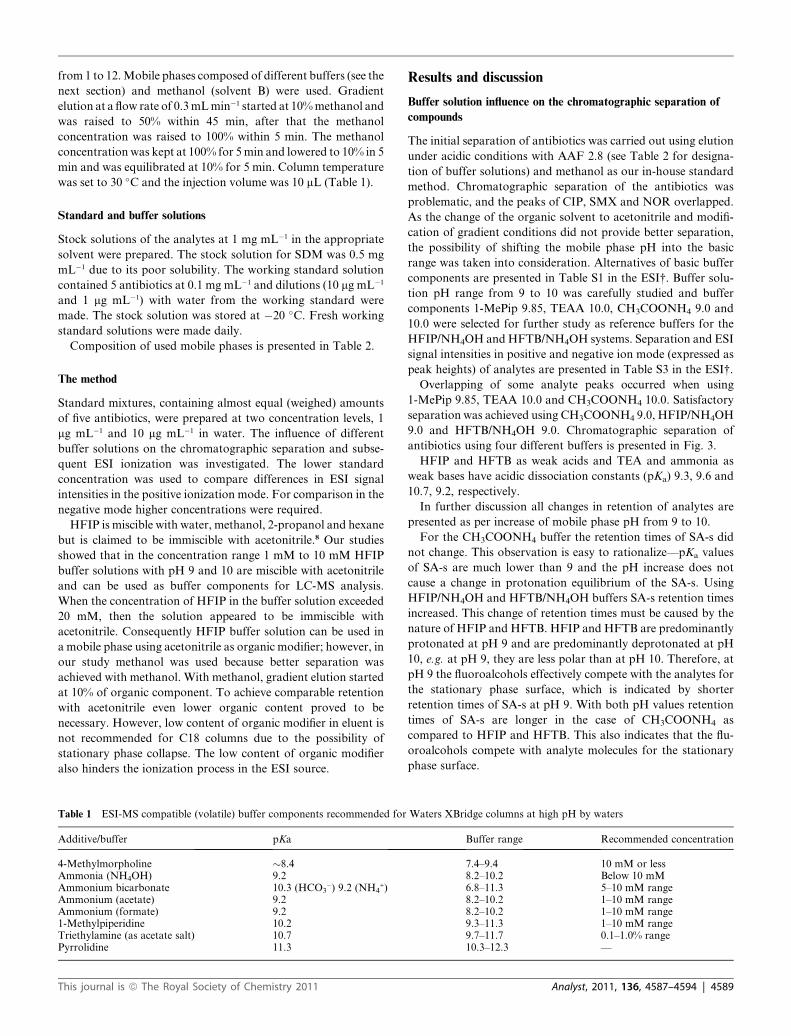
accumulation of the residues. The following five antibiotics were
chosen for the study: three fluoroquinolones (FQ-s): cipro-
floxacin (CIP), norfloxacin (NOR), ofloxacin (OFL) and two
sulfonamides (SA-s): sulfadimethoxine (SDM) and sulfame-
thoxazole (SMX). Chemical structures of these antibiotics are
shown in Fig. 1.
For SMX pKa1 and pKa2 values are 1.49 and 5.41, and for
SDM 2.11 and 6.17, respectively.22 Acid–base behavior of FQ-s
has been studied by several researchers but there is still no
agreement in published data. The number of pKa values deter-
mined for FQ-s is two,23 three24 or four.25 Also the assignment of
pKa values to acidic/basic sites is a topic of controversy. These
difficulties with studies of acid–base properties of FQ-s are also
mentioned in the review article.26 As the pH range from 9 to 10 is
investigated in this work, only the last (most basic) pKa is of
importance. Therefore, in order to avoid confusion, we denote
this pKa as pKax. Respective acid–base equilibrium is presented
in Fig. 2. The pKax values are adapted from the work of Barbosa
et al.:27 CIP 8.62, NOR 8.38 and OFL 8.11.
Chromatographic separation of these compounds using acidic
buffer solution has been problematic,23 but since mass-spectro-
metric detection was used in selected reaction monitoring mode,
poor chromatographic separation was not considered an issue.23
Fig. 1 Chemical structures of used antibiotics.
4588 | Analyst, 2011, 136, 4587–4594
Poor separation, however, can result in the serious matrix effects.
A change of chromatographic conditions did not give satisfac-
tory separation.23 Therefore, the buffer solution pH change as
a possible remedy was taken into consideration in this study.
Experimental
Instrumentation
Chromatographic separation of the analytes was carried out on
the Agilent Series 1100 LC-MSD Trap XCT (Agilent Technol-
ogies, Santa-Clara, CA, USA) equipped with a binary pump,
a degasser, an auto-sampler and a column thermostat. For
detection diode array detector and ESI-MS were used in series.
ESI-MS detection was carried out in alternating positive
and negative ion detection mode. In positive mode protonated
[M + H]+ forms were detected: SDM atm/z 311; SMX 254; NOR
320; CIP 332; OFL 362. In negative mode deprotonated
[M � H]� ions were detected: SDM at m/z 309; SMX 252; NOR
318; CIP 330; OFL 360. Default parameters for ESI andMSwere
used for all the experiments (nebulizer gas pressure was 40 psi,
dry gas flow was 10 L min�1, dry gas temperature was 350 �C,capillary voltage was 5000 V, detected mass range was from m/z
100 to 1000 and target mass for compounds was m/z 350).
LC-UV and MS instruments were controlled by Agilent Chem-
station for LC 3D rev. A.10.02 (Agilent Technologies) and LC/
MSD TrapControl ver. 5.2 (Bruker Daltonik GmbH, Germany).
Data analysis (including determination of retention and peak
shape parameters) was carried out using Chemstation software
(Agilent Technologies) and Data Analysis for LC/MSD Trap
Version 3.2 (Bruker Daltonik GmbH).
Chemicals
Pharmaceuticals were purchased from Riedel-de-Ha€en (Seelze,
Germany)—three FQ-s: CIP (purity 99.8%), NOR (purity
99.9%) and OFL (purity 99.3%); two SA-s: SDM (purity 99.4%)
and SMX (purity 99.9%). Acetonitrile and methanol were
obtained from J. T. Baker (Deventer, The Netherlands), formic
acid and ammonia fromRiedel-de-Ha€en, ammonium acetate and
1-methylpiperidine from Fluka (Buchs, Germany). TEA, HFIP
and HFTB were purchased from Sigma (St Louis, MO, USA).
All solvents were of reagent grade or higher quality. Water was
purified in-house using a Milli-Q plus system from Millipore
(Bedford, USA).
Chromatographic conditions
Five antibiotics were chromatographed using a Waters XBridge
C18 column (150 mm � 3 mm, 3.5 mm) equipped with a Waters
Guard Cartridge (20 mm � 4.6 mm) (Waters, Milford, USA).
This stationary phase was used as it is usable in the pH range
This journal is ª The Royal Society of Chemistry 2011
from 1 to 12.Mobile phases composed of different buffers (see the
next section) and methanol (solvent B) were used. Gradient
elution at a flow rate of 0.3mLmin�1 started at 10%methanol and
was raised to 50% within 45 min, after that the methanol
concentration was raised to 100% within 5 min. The methanol
concentration was kept at 100% for 5min and lowered to 10% in 5
min and was equilibrated at 10% for 5 min. Column temperature
was set to 30 �C and the injection volume was 10 mL (Table 1).
Standard and buffer solutions
Stock solutions of the analytes at 1 mg mL�1 in the appropriate
solvent were prepared. The stock solution for SDM was 0.5 mg
mL�1 due to its poor solubility. The working standard solution
contained 5 antibiotics at 0.1 mg mL�1 and dilutions (10 mg mL�1
and 1 mg mL�1) with water from the working standard were
made. The stock solution was stored at �20 �C. Fresh working
standard solutions were made daily.
Composition of used mobile phases is presented in Table 2.
The method
Standard mixtures, containing almost equal (weighed) amounts
of five antibiotics, were prepared at two concentration levels, 1
mg mL�1 and 10 mg mL�1 in water. The influence of different
buffer solutions on the chromatographic separation and subse-
quent ESI ionization was investigated. The lower standard
concentration was used to compare differences in ESI signal
intensities in the positive ionization mode. For comparison in the
negative mode higher concentrations were required.
HFIP is miscible with water, methanol, 2-propanol and hexane
but is claimed to be immiscible with acetonitrile.8 Our studies
showed that in the concentration range 1 mM to 10 mM HFIP
buffer solutions with pH 9 and 10 are miscible with acetonitrile
and can be used as buffer components for LC-MS analysis.
When the concentration of HFIP in the buffer solution exceeded
20 mM, then the solution appeared to be immiscible with
acetonitrile. Consequently HFIP buffer solution can be used in
a mobile phase using acetonitrile as organic modifier; however, in
our study methanol was used because better separation was
achieved with methanol. With methanol, gradient elution started
at 10% of organic component. To achieve comparable retention
with acetonitrile even lower organic content proved to be
necessary. However, low content of organic modifier in eluent is
not recommended for C18 columns due to the possibility of
stationary phase collapse. The low content of organic modifier
also hinders the ionization process in the ESI source.
Table 1 ESI-MS compatible (volatile) buffer components recommended for
Additive/buffer pKa
4-Methylmorpholine �8.4Ammonia (NH4OH) 9.2Ammonium bicarbonate 10.3 (HCO3
�) 9.2 (NH4+)
Ammonium (acetate) 9.2Ammonium (formate) 9.21-Methylpiperidine 10.2Triethylamine (as acetate salt) 10.7Pyrrolidine 11.3
This journal is ª The Royal Society of Chemistry 2011
Results and discussion
Buffer solution influence on the chromatographic separation of
compounds
The initial separation of antibiotics was carried out using elution
under acidic conditions with AAF 2.8 (see Table 2 for designa-
tion of buffer solutions) and methanol as our in-house standard
method. Chromatographic separation of the antibiotics was
problematic, and the peaks of CIP, SMX and NOR overlapped.
As the change of the organic solvent to acetonitrile and modifi-
cation of gradient conditions did not provide better separation,
the possibility of shifting the mobile phase pH into the basic
range was taken into consideration. Alternatives of basic buffer
components are presented in Table S1 in the ESI†. Buffer solu-
tion pH range from 9 to 10 was carefully studied and buffer
components 1-MePip 9.85, TEAA 10.0, CH3COONH4 9.0 and
10.0 were selected for further study as reference buffers for the
HFIP/NH4OH and HFTB/NH4OH systems. Separation and ESI
signal intensities in positive and negative ion mode (expressed as
peak heights) of analytes are presented in Table S3 in the ESI†.
Overlapping of some analyte peaks occurred when using
1-MePip 9.85, TEAA 10.0 and CH3COONH4 10.0. Satisfactory
separation was achieved using CH3COONH4 9.0, HFIP/NH4OH
9.0 and HFTB/NH4OH 9.0. Chromatographic separation of
antibiotics using four different buffers is presented in Fig. 3.
HFIP and HFTB as weak acids and TEA and ammonia as
weak bases have acidic dissociation constants (pKa) 9.3, 9.6 and
10.7, 9.2, respectively.
In further discussion all changes in retention of analytes are
presented as per increase of mobile phase pH from 9 to 10.
For the CH3COONH4 buffer the retention times of SA-s did
not change. This observation is easy to rationalize—pKa values
of SA-s are much lower than 9 and the pH increase does not
cause a change in protonation equilibrium of the SA-s. Using
HFIP/NH4OH and HFTB/NH4OH buffers SA-s retention times
increased. This change of retention times must be caused by the
nature of HFIP and HFTB. HFIP and HFTB are predominantly
protonated at pH 9 and are predominantly deprotonated at pH
10, e.g. at pH 9, they are less polar than at pH 10. Therefore, at
pH 9 the fluoroalcohols effectively compete with the analytes for
the stationary phase surface, which is indicated by shorter
retention times of SA-s at pH 9. With both pH values retention
times of SA-s are longer in the case of CH3COONH4 as
compared to HFIP and HFTB. This also indicates that the flu-
oroalcohols compete with analyte molecules for the stationary
phase surface.
Waters XBridge columns at high pH by waters
Buffer range Recommended concentration
7.4–9.4 10 mM or less8.2–10.2 Below 10 mM6.8–11.3 5–10 mM range8.2–10.2 1–10 mM range8.2–10.2 1–10 mM range9.3–11.3 1–10 mM range9.7–11.7 0.1–1.0% range10.3–12.3 —
Analyst, 2011, 136, 4587–4594 | 4589
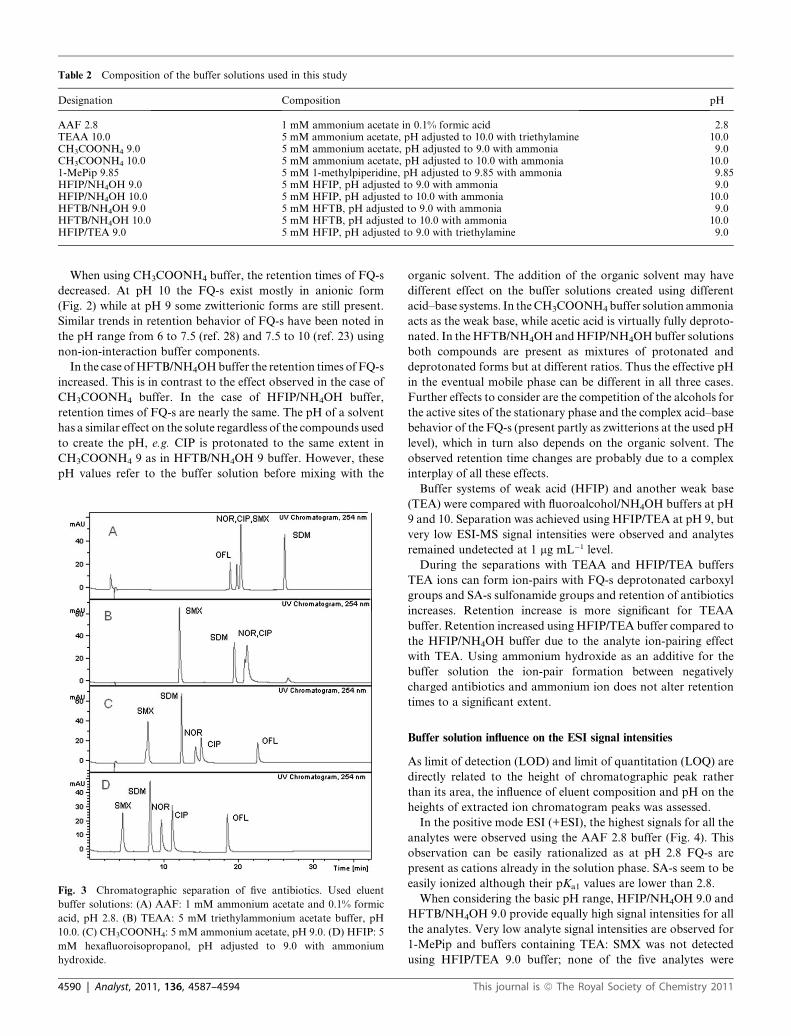
Table 2 Composition of the buffer solutions used in this study
Designation Composition pH
AAF 2.8 1 mM ammonium acetate in 0.1% formic acid 2.8TEAA 10.0 5 mM ammonium acetate, pH adjusted to 10.0 with triethylamine 10.0CH3COONH4 9.0 5 mM ammonium acetate, pH adjusted to 9.0 with ammonia 9.0CH3COONH4 10.0 5 mM ammonium acetate, pH adjusted to 10.0 with ammonia 10.01-MePip 9.85 5 mM 1-methylpiperidine, pH adjusted to 9.85 with ammonia 9.85HFIP/NH4OH 9.0 5 mM HFIP, pH adjusted to 9.0 with ammonia 9.0HFIP/NH4OH 10.0 5 mM HFIP, pH adjusted to 10.0 with ammonia 10.0HFTB/NH4OH 9.0 5 mM HFTB, pH adjusted to 9.0 with ammonia 9.0HFTB/NH4OH 10.0 5 mM HFTB, pH adjusted to 10.0 with ammonia 10.0HFIP/TEA 9.0 5 mM HFIP, pH adjusted to 9.0 with triethylamine 9.0
When using CH3COONH4 buffer, the retention times of FQ-s
decreased. At pH 10 the FQ-s exist mostly in anionic form
(Fig. 2) while at pH 9 some zwitterionic forms are still present.
Similar trends in retention behavior of FQ-s have been noted in
the pH range from 6 to 7.5 (ref. 28) and 7.5 to 10 (ref. 23) using
non-ion-interaction buffer components.
In the case ofHFTB/NH4OHbuffer the retention times of FQ-s
increased. This is in contrast to the effect observed in the case of
CH3COONH4 buffer. In the case of HFIP/NH4OH buffer,
retention times of FQ-s are nearly the same. The pH of a solvent
has a similar effect on the solute regardless of the compounds used
to create the pH, e.g. CIP is protonated to the same extent in
CH3COONH4 9 as in HFTB/NH4OH 9 buffer. However, these
pH values refer to the buffer solution before mixing with the
Fig. 3 Chromatographic separation of five antibiotics. Used eluent
buffer solutions: (A) AAF: 1 mM ammonium acetate and 0.1% formic
acid, pH 2.8. (B) TEAA: 5 mM triethylammonium acetate buffer, pH
10.0. (C) CH3COONH4: 5 mM ammonium acetate, pH 9.0. (D) HFIP: 5
mM hexafluoroisopropanol, pH adjusted to 9.0 with ammonium
hydroxide.
4590 | Analyst, 2011, 136, 4587–4594
organic solvent. The addition of the organic solvent may have
different effect on the buffer solutions created using different
acid–base systems. In theCH3COONH4buffer solution ammonia
acts as the weak base, while acetic acid is virtually fully deproto-
nated. In theHFTB/NH4OH andHFIP/NH4OHbuffer solutions
both compounds are present as mixtures of protonated and
deprotonated forms but at different ratios. Thus the effective pH
in the eventual mobile phase can be different in all three cases.
Further effects to consider are the competition of the alcohols for
the active sites of the stationary phase and the complex acid–base
behavior of the FQ-s (present partly as zwitterions at the used pH
level), which in turn also depends on the organic solvent. The
observed retention time changes are probably due to a complex
interplay of all these effects.
Buffer systems of weak acid (HFIP) and another weak base
(TEA) were compared with fluoroalcohol/NH4OH buffers at pH
9 and 10. Separation was achieved using HFIP/TEA at pH 9, but
very low ESI-MS signal intensities were observed and analytes
remained undetected at 1 mg mL�1 level.
During the separations with TEAA and HFIP/TEA buffers
TEA ions can form ion-pairs with FQ-s deprotonated carboxyl
groups and SA-s sulfonamide groups and retention of antibiotics
increases. Retention increase is more significant for TEAA
buffer. Retention increased using HFIP/TEA buffer compared to
the HFIP/NH4OH buffer due to the analyte ion-pairing effect
with TEA. Using ammonium hydroxide as an additive for the
buffer solution the ion-pair formation between negatively
charged antibiotics and ammonium ion does not alter retention
times to a significant extent.
Buffer solution influence on the ESI signal intensities
As limit of detection (LOD) and limit of quantitation (LOQ) are
directly related to the height of chromatographic peak rather
than its area, the influence of eluent composition and pH on the
heights of extracted ion chromatogram peaks was assessed.
In the positive mode ESI (+ESI), the highest signals for all the
analytes were observed using the AAF 2.8 buffer (Fig. 4). This
observation can be easily rationalized as at pH 2.8 FQ-s are
present as cations already in the solution phase. SA-s seem to be
easily ionized although their pKa1 values are lower than 2.8.
When considering the basic pH range, HFIP/NH4OH 9.0 and
HFTB/NH4OH 9.0 provide equally high signal intensities for all
the analytes. Very low analyte signal intensities are observed for
1-MePip and buffers containing TEA: SMX was not detected
using HFIP/TEA 9.0 buffer; none of the five analytes were
This journal is ª The Royal Society of Chemistry 2011
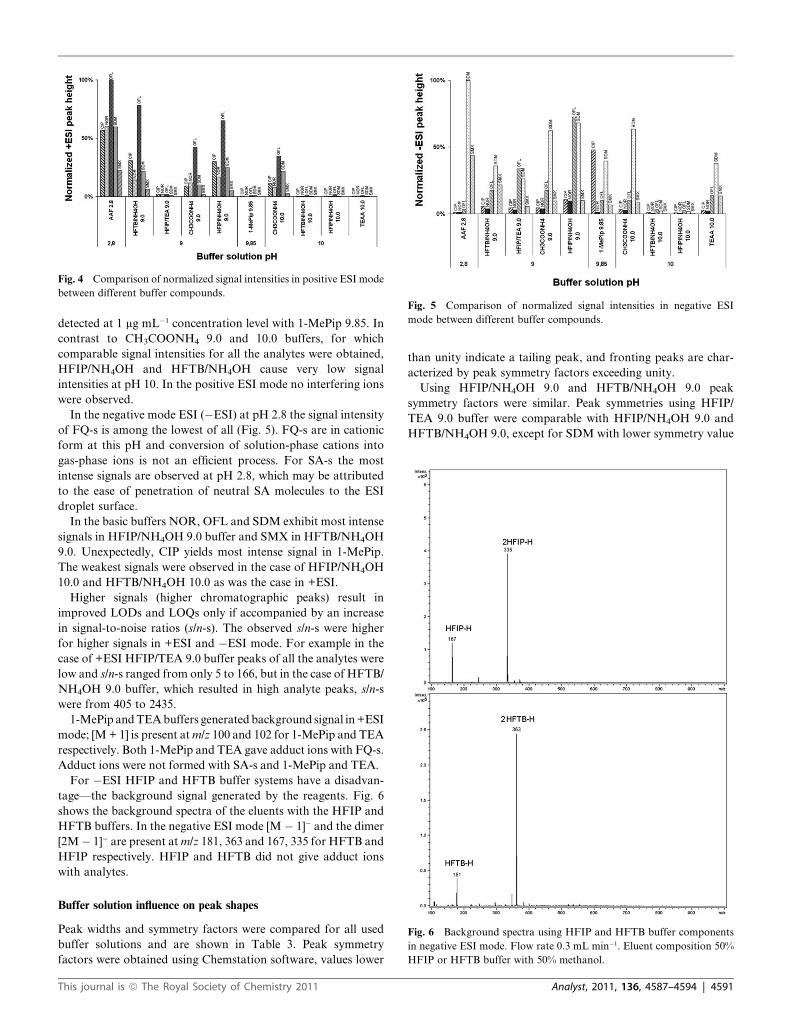
Fig. 4 Comparison of normalized signal intensities in positive ESI mode
between different buffer compounds.Fig. 5 Comparison of normalized signal intensities in negative ESI
mode between different buffer compounds.
Fig. 6 Background spectra using HFIP and HFTB buffer components
in negative ESI mode. Flow rate 0.3 mL min�1. Eluent composition 50%
HFIP or HFTB buffer with 50% methanol.
detected at 1 mg mL�1 concentration level with 1-MePip 9.85. In
contrast to CH3COONH4 9.0 and 10.0 buffers, for which
comparable signal intensities for all the analytes were obtained,
HFIP/NH4OH and HFTB/NH4OH cause very low signal
intensities at pH 10. In the positive ESI mode no interfering ions
were observed.
In the negative mode ESI (�ESI) at pH 2.8 the signal intensity
of FQ-s is among the lowest of all (Fig. 5). FQ-s are in cationic
form at this pH and conversion of solution-phase cations into
gas-phase ions is not an efficient process. For SA-s the most
intense signals are observed at pH 2.8, which may be attributed
to the ease of penetration of neutral SA molecules to the ESI
droplet surface.
In the basic buffers NOR, OFL and SDM exhibit most intense
signals in HFIP/NH4OH 9.0 buffer and SMX in HFTB/NH4OH
9.0. Unexpectedly, CIP yields most intense signal in 1-MePip.
The weakest signals were observed in the case of HFIP/NH4OH
10.0 and HFTB/NH4OH 10.0 as was the case in +ESI.
Higher signals (higher chromatographic peaks) result in
improved LODs and LOQs only if accompanied by an increase
in signal-to-noise ratios (s/n-s). The observed s/n-s were higher
for higher signals in +ESI and �ESI mode. For example in the
case of +ESI HFIP/TEA 9.0 buffer peaks of all the analytes were
low and s/n-s ranged from only 5 to 166, but in the case of HFTB/
NH4OH 9.0 buffer, which resulted in high analyte peaks, s/n-s
were from 405 to 2435.
1-MePip andTEAbuffers generated background signal in+ESI
mode; [M + 1] is present atm/z 100 and 102 for 1-MePip and TEA
respectively. Both 1-MePip and TEA gave adduct ions with FQ-s.
Adduct ions were not formed with SA-s and 1-MePip and TEA.
For �ESI HFIP and HFTB buffer systems have a disadvan-
tage—the background signal generated by the reagents. Fig. 6
shows the background spectra of the eluents with the HFIP and
HFTB buffers. In the negative ESI mode [M � 1]� and the dimer
[2M� 1]� are present atm/z 181, 363 and 167, 335 for HFTB and
HFIP respectively. HFIP and HFTB did not give adduct ions
with analytes.
Buffer solution influence on peak shapes
Peak widths and symmetry factors were compared for all used
buffer solutions and are shown in Table 3. Peak symmetry
factors were obtained using Chemstation software, values lower
This journal is ª The Royal Society of Chemistry 2011
than unity indicate a tailing peak, and fronting peaks are char-
acterized by peak symmetry factors exceeding unity.
Using HFIP/NH4OH 9.0 and HFTB/NH4OH 9.0 peak
symmetry factors were similar. Peak symmetries using HFIP/
TEA 9.0 buffer were comparable with HFIP/NH4OH 9.0 and
HFTB/NH4OH 9.0, except for SDM with lower symmetry value
Analyst, 2011, 136, 4587–4594 | 4591
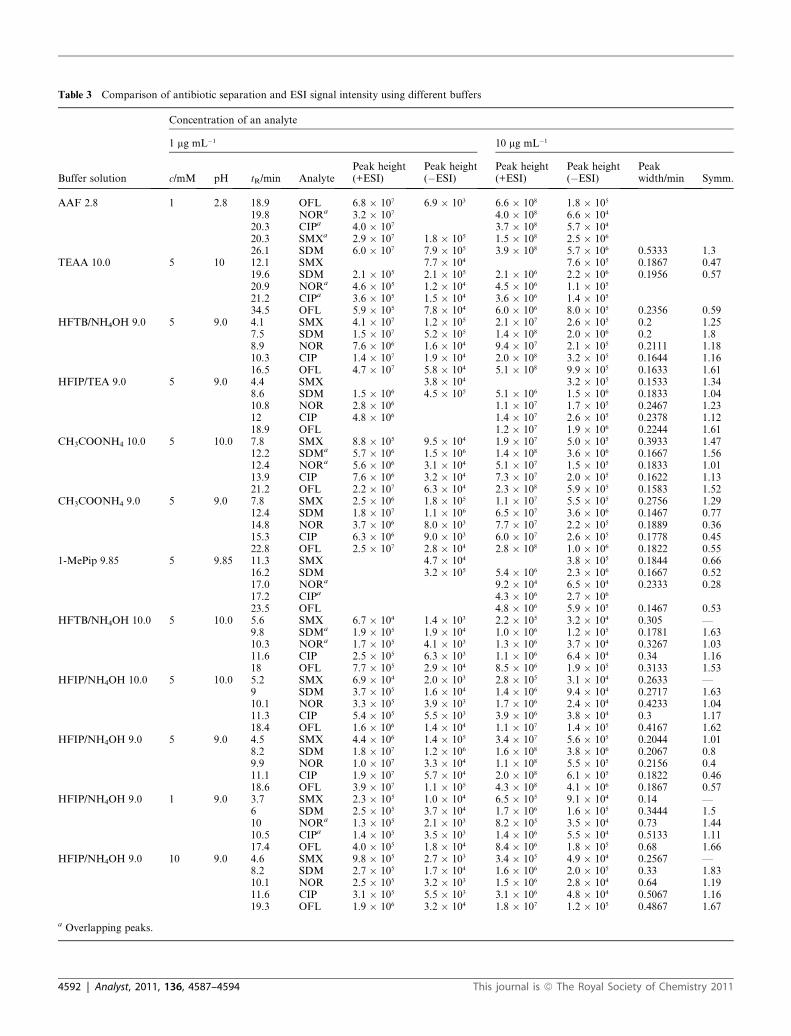
Table 3 Comparison of antibiotic separation and ESI signal intensity using different buffers
Buffer solution
Concentration of an analyte
1 mg mL�1 10 mg mL�1
c/mM pH tR/min AnalytePeak height(+ESI)
Peak height(�ESI)
Peak height(+ESI)
Peak height(�ESI)
Peakwidth/min Symm.
AAF 2.8 1 2.8 18.9 OFL 6.8 � 107 6.9 � 103 6.6 � 108 1.8 � 105
19.8 NORa 3.2 � 107 4.0 � 108 6.6 � 104
20.3 CIPa 4.0 � 107 3.7 � 108 5.7 � 104
20.3 SMXa 2.9 � 107 1.8 � 105 1.5 � 108 2.5 � 106
26.1 SDM 6.0 � 107 7.9 � 105 3.9 � 108 5.7 � 106 0.5333 1.3TEAA 10.0 5 10 12.1 SMX 7.7 � 104 7.6 � 105 0.1867 0.47
19.6 SDM 2.1 � 105 2.1 � 105 2.1 � 106 2.2 � 106 0.1956 0.5720.9 NORa 4.6 � 105 1.2 � 104 4.5 � 106 1.1 � 105
21.2 CIPa 3.6 � 105 1.5 � 104 3.6 � 106 1.4 � 105
34.5 OFL 5.9 � 105 7.8 � 104 6.0 � 106 8.0 � 105 0.2356 0.59HFTB/NH4OH 9.0 5 9.0 4.1 SMX 4.1 � 107 1.2 � 105 2.1 � 107 2.6 � 105 0.2 1.25
7.5 SDM 1.5 � 107 5.2 � 105 1.4 � 108 2.0 � 106 0.2 1.88.9 NOR 7.6 � 106 1.6 � 104 9.4 � 107 2.1 � 105 0.2111 1.1810.3 CIP 1.4 � 107 1.9 � 104 2.0 � 108 3.2 � 105 0.1644 1.1616.5 OFL 4.7 � 107 5.8 � 104 5.1 � 108 9.9 � 105 0.1633 1.61
HFIP/TEA 9.0 5 9.0 4.4 SMX 3.8 � 104 3.2 � 105 0.1533 1.348.6 SDM 1.5 � 106 4.5 � 105 5.1 � 106 1.5 � 106 0.1833 1.0410.8 NOR 2.8 � 106 1.1 � 107 1.7 � 105 0.2467 1.2312 CIP 4.8 � 106 1.4 � 107 2.6 � 105 0.2378 1.1218.9 OFL 1.2 � 107 1.9 � 106 0.2244 1.61
CH3COONH4 10.0 5 10.0 7.8 SMX 8.8 � 105 9.5 � 104 1.9 � 107 5.0 � 105 0.3933 1.4712.2 SDMa 5.7 � 106 1.5 � 106 1.4 � 108 3.6 � 106 0.1667 1.5612.4 NORa 5.6 � 106 3.1 � 104 5.1 � 107 1.5 � 105 0.1833 1.0113.9 CIP 7.6 � 106 3.2 � 104 7.3 � 107 2.0 � 105 0.1622 1.1321.2 OFL 2.2 � 107 6.3 � 104 2.3 � 108 5.9 � 105 0.1583 1.52
CH3COONH4 9.0 5 9.0 7.8 SMX 2.5 � 106 1.8 � 105 1.1 � 107 5.5 � 105 0.2756 1.2912.4 SDM 1.8 � 107 1.1 � 106 6.5 � 107 3.6 � 106 0.1467 0.7714.8 NOR 3.7 � 106 8.0 � 103 7.7 � 107 2.2 � 105 0.1889 0.3615.3 CIP 6.3 � 106 9.0 � 103 6.0 � 107 2.6 � 105 0.1778 0.4522.8 OFL 2.5 � 107 2.8 � 104 2.8 � 108 1.0 � 106 0.1822 0.55
1-MePip 9.85 5 9.85 11.3 SMX 4.7 � 104 3.8 � 105 0.1844 0.6616.2 SDM 3.2 � 105 5.4 � 106 2.3 � 106 0.1667 0.5217.0 NORa 9.2 � 104 6.5 � 104 0.2333 0.2817.2 CIPa 4.3 � 106 2.7 � 106
23.5 OFL 4.8 � 106 5.9 � 105 0.1467 0.53HFTB/NH4OH 10.0 5 10.0 5.6 SMX 6.7 � 104 1.4 � 103 2.2 � 105 3.2 � 104 0.305 —
9.8 SDMa 1.9 � 105 1.9 � 104 1.0 � 106 1.2 � 105 0.1781 1.6310.3 NORa 1.7 � 105 4.1 � 103 1.3 � 106 3.7 � 104 0.3267 1.0311.6 CIP 2.5 � 105 6.3 � 103 1.1 � 106 6.4 � 104 0.34 1.1618 OFL 7.7 � 105 2.9 � 104 8.5 � 106 1.9 � 105 0.3133 1.53
HFIP/NH4OH 10.0 5 10.0 5.2 SMX 6.9 � 104 2.0 � 103 2.8 � 105 3.1 � 104 0.2633 —9 SDM 3.7 � 105 1.6 � 104 1.4 � 106 9.4 � 104 0.2717 1.6310.1 NOR 3.3 � 105 3.9 � 103 1.7 � 106 2.4 � 104 0.4233 1.0411.3 CIP 5.4 � 105 5.5 � 103 3.9 � 106 3.8 � 104 0.3 1.1718.4 OFL 1.6 � 106 1.4 � 104 1.1 � 107 1.4 � 105 0.4167 1.62
HFIP/NH4OH 9.0 5 9.0 4.5 SMX 4.4 � 106 1.4 � 105 3.4 � 107 5.6 � 105 0.2044 1.018.2 SDM 1.8 � 107 1.2 � 106 1.6 � 108 3.8 � 106 0.2067 0.89.9 NOR 1.0 � 107 3.3 � 104 1.1 � 108 5.5 � 105 0.2156 0.411.1 CIP 1.9 � 107 5.7 � 104 2.0 � 108 6.1 � 105 0.1822 0.4618.6 OFL 3.9 � 107 1.1 � 105 4.3 � 108 4.1 � 106 0.1867 0.57
HFIP/NH4OH 9.0 1 9.0 3.7 SMX 2.3 � 105 1.0 � 104 6.5 � 105 9.1 � 104 0.14 —6 SDM 2.5 � 105 3.7 � 104 1.7 � 106 1.6 � 105 0.3444 1.510 NORa 1.3 � 105 2.1 � 103 8.2 � 105 3.5 � 104 0.73 1.4410.5 CIPa 1.4 � 105 3.5 � 103 1.4 � 106 5.5 � 104 0.5133 1.1117.4 OFL 4.0 � 105 1.8 � 104 8.4 � 106 1.8 � 105 0.68 1.66
HFIP/NH4OH 9.0 10 9.0 4.6 SMX 9.8 � 105 2.7 � 103 3.4 � 105 4.9 � 104 0.2567 —8.2 SDM 2.7 � 105 1.7 � 104 1.6 � 106 2.0 � 105 0.33 1.8310.1 NOR 2.5 � 105 3.2 � 103 1.5 � 106 2.8 � 104 0.64 1.1911.6 CIP 3.1 � 105 5.5 � 103 3.1 � 106 4.8 � 104 0.5067 1.1619.3 OFL 1.9 � 106 3.2 � 104 1.8 � 107 1.2 � 105 0.4867 1.67
a Overlapping peaks.
4592 | Analyst, 2011, 136, 4587–4594 This journal is ª The Royal Society of Chemistry 2011
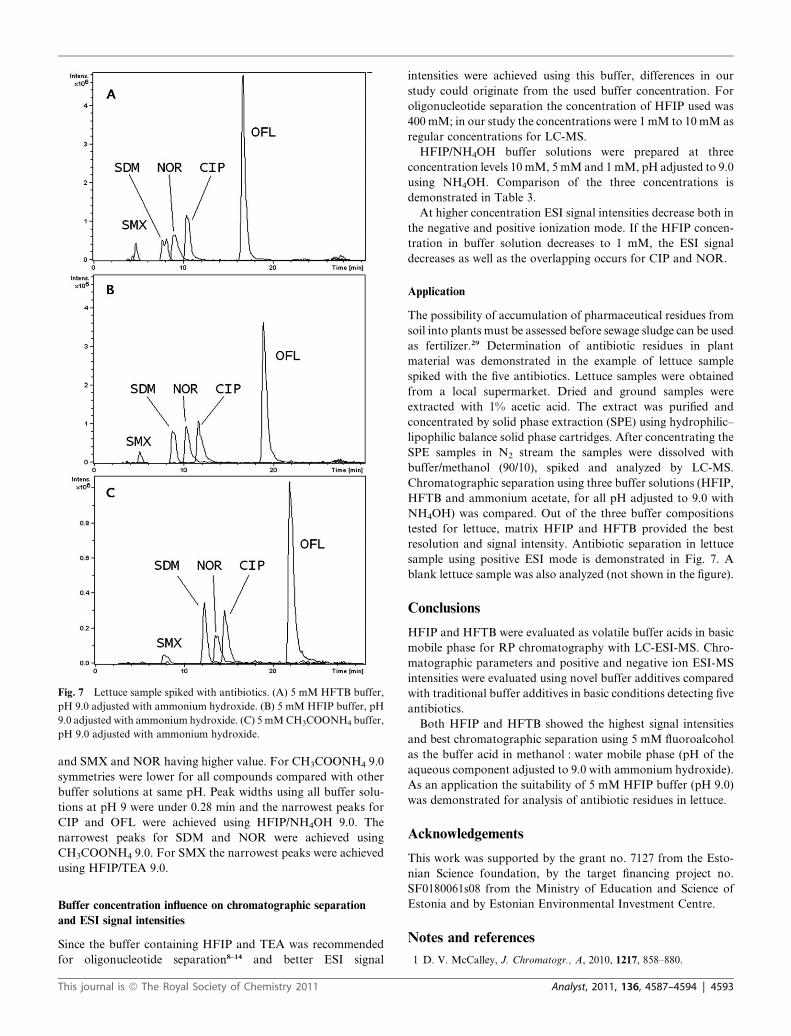
Fig. 7 Lettuce sample spiked with antibiotics. (A) 5 mM HFTB buffer,
pH 9.0 adjusted with ammonium hydroxide. (B) 5 mM HFIP buffer, pH
9.0 adjusted with ammonium hydroxide. (C) 5 mMCH3COONH4 buffer,
pH 9.0 adjusted with ammonium hydroxide.
and SMX and NOR having higher value. For CH3COONH4 9.0
symmetries were lower for all compounds compared with other
buffer solutions at same pH. Peak widths using all buffer solu-
tions at pH 9 were under 0.28 min and the narrowest peaks for
CIP and OFL were achieved using HFIP/NH4OH 9.0. The
narrowest peaks for SDM and NOR were achieved using
CH3COONH4 9.0. For SMX the narrowest peaks were achieved
using HFIP/TEA 9.0.
Buffer concentration influence on chromatographic separation
and ESI signal intensities
Since the buffer containing HFIP and TEA was recommended
for oligonucleotide separation8–14 and better ESI signal
This journal is ª The Royal Society of Chemistry 2011
intensities were achieved using this buffer, differences in our
study could originate from the used buffer concentration. For
oligonucleotide separation the concentration of HFIP used was
400 mM; in our study the concentrations were 1 mM to 10 mM as
regular concentrations for LC-MS.
HFIP/NH4OH buffer solutions were prepared at three
concentration levels 10 mM, 5 mM and 1mM, pH adjusted to 9.0
using NH4OH. Comparison of the three concentrations is
demonstrated in Table 3.
At higher concentration ESI signal intensities decrease both in
the negative and positive ionization mode. If the HFIP concen-
tration in buffer solution decreases to 1 mM, the ESI signal
decreases as well as the overlapping occurs for CIP and NOR.
Application
The possibility of accumulation of pharmaceutical residues from
soil into plants must be assessed before sewage sludge can be used
as fertilizer.29 Determination of antibiotic residues in plant
material was demonstrated in the example of lettuce sample
spiked with the five antibiotics. Lettuce samples were obtained
from a local supermarket. Dried and ground samples were
extracted with 1% acetic acid. The extract was purified and
concentrated by solid phase extraction (SPE) using hydrophilic–
lipophilic balance solid phase cartridges. After concentrating the
SPE samples in N2 stream the samples were dissolved with
buffer/methanol (90/10), spiked and analyzed by LC-MS.
Chromatographic separation using three buffer solutions (HFIP,
HFTB and ammonium acetate, for all pH adjusted to 9.0 with
NH4OH) was compared. Out of the three buffer compositions
tested for lettuce, matrix HFIP and HFTB provided the best
resolution and signal intensity. Antibiotic separation in lettuce
sample using positive ESI mode is demonstrated in Fig. 7. A
blank lettuce sample was also analyzed (not shown in the figure).
Conclusions
HFIP and HFTB were evaluated as volatile buffer acids in basic
mobile phase for RP chromatography with LC-ESI-MS. Chro-
matographic parameters and positive and negative ion ESI-MS
intensities were evaluated using novel buffer additives compared
with traditional buffer additives in basic conditions detecting five
antibiotics.
Both HFIP and HFTB showed the highest signal intensities
and best chromatographic separation using 5 mM fluoroalcohol
as the buffer acid in methanol : water mobile phase (pH of the
aqueous component adjusted to 9.0 with ammonium hydroxide).
As an application the suitability of 5 mM HFIP buffer (pH 9.0)
was demonstrated for analysis of antibiotic residues in lettuce.
Acknowledgements
This work was supported by the grant no. 7127 from the Esto-
nian Science foundation, by the target financing project no.
SF0180061s08 from the Ministry of Education and Science of
Estonia and by Estonian Environmental Investment Centre.
Notes and references
1 D. V. McCalley, J. Chromatogr., A, 2010, 1217, 858–880.
Analyst, 2011, 136, 4587–4594 | 4593
2 A. Espada and A. Rivera-Sagredo, J. Chromatogr., A, 2003, 987, 211–220.
3 J. Dai and P. W. Carr, J. Chromatogr., A, 2005, 1072, 169–184.4 L. R. Snyder, J. J. Kirkland and J. W. Dolan, Introduction to ModernLiquid Chromatography, John Wiley & Sons Inc, New York, 3rd edn,2010, p. 810.
5 J. J. Zhao, A. Y. Yang and J. D. Rogers, J. Mass Spectrom., 2002, 37,421–433.
6 K. Petritis, H. Dessans, C. Elfakir and M. Dreux, LC GC Eur., 2002,2, 98–102.
7 L. R. Snyder, J. J. Kirkland and J. L. Glajch, Practical HPLCMethodDevelopment, John Wiley & Sons Inc, New York, 2nd edn, 1997, pp.296–310.
8 A. Apffel, J. A. Chakel, S. Fischer, K. Lichtenwalter andW. S. Hancock, Anal. Chem., 1997, 69, 1320–1325.
9 A. Apffel, J. Chakel, S. Fischer, K. Lichtenwalter andW. Hancock, J.Chromatogr., A, 1997, 777, 3–21.
10 C. G. Huber and H. Oberacher, Mass Spectrom. Rev., 2001, 20, 310–343.
11 M. Gilar, K. J. Fountain, Y. Budman, U. D. Neue, K. R. Yardley,P. D. Rainville, R. J. Russell, II and J. C. Gebler, J. Chromatogr.,A, 2002, 958, 167–182.
12 M. Beverly, K. Hartsough, L. Machemer, P. Pavco and J. Lockridge,J. Chromatogr., B: Anal. Technol. Biomed. Life Sci., 2006, 835, 62–70.
13 G. Zhang, J. Lin, K. Srinivasan, O. Kavetskaia and J. N. Duncan,Anal. Chem., 2007, 79, 3416–3424.
14 Y. Zou, P. Tiller, I.-W. Chen, M. Beverly and J. Hochman, RapidCommun. Mass Spectrom., 2008, 22, 1871–1881.
15 C. E. Doneanu, W. Chen and J. C. Gebler, Anal. Chem., 2009, 81,3485–3499.
4594 | Analyst, 2011, 136, 4587–4594
16 J. R. Marengo, R. A. Kok, G. K. O’Brien, R. R. Velagaletti andJ. L. Stamm, Environ. Toxicol. Chem., 1997, 16, 462–471.
17 T. Christian, R. J. Schneider, H. A. F€arber, D. Skutlarek,M. T. Meyer and H. E. Goldbach, Acta Hydrochim. Hydrobiol.,2003, 31, 36–44.
18 S. Thiele-Bruhn and M. O. Aust, Arch. Environ. Contam. Toxicol.,2004, 47, 31–39.
19 R. H. Lindberg, P. Wennberg, M. Johansson, M. Tysklind andB. A. V. Andersson, Environ. Sci. Technol., 2005, 39, 3421–3429.
20 M. Lillenberg, S. Yurchenko, K. Kipper, K. Herodes, V. Pihl,R. Lohmus, M. Ivask, A. Kuu, S. Kutti, S. V. Litvin and L. Nei,Int. J. Environ. Sci. Technol., 2010, 7, 307–312.
21 L. Migliore, G. Brambilla, S. Cozzolino and L. Gaudio, Agric.Ecosyst. Environ., 1995, 52, 103–110.
22 M. Lillenberg, S. Yurchenko, K. Kipper, K. Herodes, V. Pihl,K. Sepp, R. Lohmus and L. Nei, J. Chromatogr., A, 2009, 1216,5949–5954.
23 V. Sanz-Nebot, I. Toro and J. Barbosa, J. Chromatogr., A, 2001, 933,45–56.
24 C.-E. Lin, Y.-J. Deng, W.-S. Liao, S.-W. Sun, W.-Y. Lin andC.-C. Chen, J. Chromatogr., A, 2004, 1051, 283–290.
25 Z. Qiang and C. Adams, Water Res., 2004, 38, 2874–2890.26 S. Babi�c, A. J. M. Horvat, D. M. Pavlovi�c and M. Ka�stelan-Macan,
TrAC, Trends Anal. Chem., 2007, 26, 1043–1061.27 J. Barbosa, R. Berg�es, I. Toro and V. Sanz-Nebot, Talanta, 1997, 44,
1271–1283.28 C. Pistos, A. Tsantili-Kakoulidou and M. Koupparis, J. Pharm.
Biomed. Anal., 2005, 39, 438–443.29 A. J. Moffat, A. T. Armstrong and J. Ockleston, Biomass Bioenergy,
2001, 20, 161–169.
This journal is ª The Royal Society of Chemistry 2011
Related Documents


![Electrospray tandem mass spectrometric measurements of ...downloads.hindawi.com/journals/spectroscopy/2004/763030.pdf · plasma atomic absorption (MIP-AES) [15] and to mass spectrometry](https://static.cupdf.com/doc/110x72/5ff8277403e5837e055ebd73/electrospray-tandem-mass-spectrometric-measurements-of-plasma-atomic-absorption.jpg)