University of Kentucky University of Kentucky UKnowledge UKnowledge Theses and Dissertations--Finance and Quantitative Methods Finance and Quantitative Methods 2014 TWO ESSAYS ON NONBANK FINANCIAL INSTITUTIONS TWO ESSAYS ON NONBANK FINANCIAL INSTITUTIONS Di Kang University of Kentucky, [email protected] Right click to open a feedback form in a new tab to let us know how this document benefits you. Right click to open a feedback form in a new tab to let us know how this document benefits you. Recommended Citation Recommended Citation Kang, Di, "TWO ESSAYS ON NONBANK FINANCIAL INSTITUTIONS" (2014). Theses and Dissertations-- Finance and Quantitative Methods. 3. https://uknowledge.uky.edu/finance_etds/3 This Doctoral Dissertation is brought to you for free and open access by the Finance and Quantitative Methods at UKnowledge. It has been accepted for inclusion in Theses and Dissertations--Finance and Quantitative Methods by an authorized administrator of UKnowledge. For more information, please contact [email protected].

Welcome message from author
This document is posted to help you gain knowledge. Please leave a comment to let me know what you think about it! Share it to your friends and learn new things together.
Transcript

University of Kentucky University of Kentucky
UKnowledge UKnowledge
Theses and Dissertations--Finance and Quantitative Methods Finance and Quantitative Methods
2014
TWO ESSAYS ON NONBANK FINANCIAL INSTITUTIONS TWO ESSAYS ON NONBANK FINANCIAL INSTITUTIONS
Di Kang University of Kentucky, [email protected]
Right click to open a feedback form in a new tab to let us know how this document benefits you. Right click to open a feedback form in a new tab to let us know how this document benefits you.
Recommended Citation Recommended Citation Kang, Di, "TWO ESSAYS ON NONBANK FINANCIAL INSTITUTIONS" (2014). Theses and Dissertations--Finance and Quantitative Methods. 3. https://uknowledge.uky.edu/finance_etds/3
This Doctoral Dissertation is brought to you for free and open access by the Finance and Quantitative Methods at UKnowledge. It has been accepted for inclusion in Theses and Dissertations--Finance and Quantitative Methods by an authorized administrator of UKnowledge. For more information, please contact [email protected].

STUDENT AGREEMENT: STUDENT AGREEMENT:
I represent that my thesis or dissertation and abstract are my original work. Proper attribution
has been given to all outside sources. I understand that I am solely responsible for obtaining
any needed copyright permissions. I have obtained needed written permission statement(s)
from the owner(s) of each third-party copyrighted matter to be included in my work, allowing
electronic distribution (if such use is not permitted by the fair use doctrine) which will be
submitted to UKnowledge as Additional File.
I hereby grant to The University of Kentucky and its agents the irrevocable, non-exclusive, and
royalty-free license to archive and make accessible my work in whole or in part in all forms of
media, now or hereafter known. I agree that the document mentioned above may be made
available immediately for worldwide access unless an embargo applies.
I retain all other ownership rights to the copyright of my work. I also retain the right to use in
future works (such as articles or books) all or part of my work. I understand that I am free to
register the copyright to my work.
REVIEW, APPROVAL AND ACCEPTANCE REVIEW, APPROVAL AND ACCEPTANCE
The document mentioned above has been reviewed and accepted by the student’s advisor, on
behalf of the advisory committee, and by the Director of Graduate Studies (DGS), on behalf of
the program; we verify that this is the final, approved version of the student’s thesis including all
changes required by the advisory committee. The undersigned agree to abide by the statements
above.
Di Kang, Student
Dr. Donald J. Mullineaux, Major Professor
Dr. Steven Skinner, Director of Graduate Studies

TWO ESSAYS ON NONBANK FINANCIAL INSTITUTIONS
DISSERTATION
A dissertation submitted in partial fulfillment of the
requirements for the degree of Doctor of Philosophy in the College of Business and Economics
at the University of Kentucky
By
Di Kang
Lexington, Kentucky
Co-Directors: Dr. Donald J. Mullineaux, Professor of Finance
and Dr. Kristine Hankins, Assistant Professor of Finance
Lexington, Kentucky
Copyright © Di Kang 2014

ABSTRACT OF DISSERTATION
TWO ESSAYS ON NONBANK FINANCIAL INSTITUTIONS
Evidence shows that nonbanks, which are now significant participants in the corporate loan market, exploit information gained from lending to trade in public securities. In the first essay, I examine whether these institutions use loan-based information to facilitate merger and acquisition (M&A) deals. I find that firms are more likely to become targets if they borrow from nonbanks rather than banks. Borrowing from a larger number of nonbanks or from those with a sizeable client network also enhances a firm’s acquisition prospects. When nonbanks gain more information about borrowers through loan amendments or multiple loans, the impact of nonbank lending grows stronger. I also identify three channels that might allow nonbanks to exploit loan-based information in the M&A market.
In the second essay, I focus on the difference in covenant structure between
nonbank loans and bank loans. Previous studies show that loans to riskier borrowers are more likely to have stronger financial covenants in order to mitigate agency problems and conflicts of interest between debt and equity holders. Interestingly, I find that nonbanks loans have fewer, less restrictive financial covenants than commercial banks, all else equal. Although the prior literature shows that banks play an active role in corporate governance following covenant violations, I find that nonbanks are less likely to intervene in borrowers’ decision making in similar circumstances. Nonbank borrowers are significantly more likely than bank clients to experience severe financial distress. KEYWORDS: Nonbanks, syndicated loans, mergers and acquisitions, financial contracting, covenant structure
Di Kang Student’s Signature
June 17th, 2014
Date

TWO ESSAYS ON NONBANK FINANCIAL INSTITUTIONS
By Di Kang
Dr. Donald J. Mullineaux Co-Director of Dissertation
Dr. Kristine Hankins
Co-Director of Dissertation
Dr. Steven Skinner Director of Graduate Studies
June 17nd, 2014

To my husband and daughter

iii
ACKNOWLEDGMENT
I would like to express my deepest gratitude to my advisor, Dr. Donald Mullineaux, for his guidance, caring, and patience. I am very lucky and truly proud to be his last student. I also am grateful to my committee co-chair, Dr. Kristine Hankins, and members, Dr. Alice Bonaimé and Dr. James Ziliak. Without their insight and direction, I cannot successfully complete my dissertation.
I thank my parents, Bing Kang and Yanjie Cui, who have always supported, encouraged, and believed in me. Last, I would like to thank my husband, Xin Hong, who always stood by me through the good times and bad.

iv
TABLE OF CONTENTS ACKNOWLEDGMENT.................................................................................................... iii
TABLE OF CONTENTS ................................................................................................... iv
LIST OF TABLES ............................................................................................................. vi
LIST OF FIGURES .......................................................................................................... vii
Chapter One: Introduction .................................................................................................. 1
Chapter Two: The Impact of Nonbank Lending on Mergers and Acquisitions ................. 5
1. Introduction ................................................................................................................. 5
2. Background and Literature Review ............................................................................. 9
2.1. Private information in the syndicated loan market ............................................... 9
2.2. Brief review of related literature ........................................................................ 11
3. Data and Empirical Design ....................................................................................... 14
3.1. Sample construction ........................................................................................... 14
3.2. The role of nonbank lenders ............................................................................... 16
4. Nonbank Lenders and the Likelihood of Takeover Bids .......................................... 18
4.1. Nonbank participation and the likelihood of M&A bids .................................... 19
4.2. Subcategories of nonbanks and additional measures of nonbank roles .............. 22
5. Investigating Causality .............................................................................................. 24
5.1. Propensity score matching .................................................................................. 24
5.2. Instrumental variable estimation ........................................................................ 26
6. Relevance of Repeat Transactions and Loan Amendments ...................................... 29
6.1. Frequent lenders and the likelihood of M&A ..................................................... 29
6.2. Nonbank participation in loan amendments ....................................................... 30
7. Information Transmission Channels ......................................................................... 32
7.1. Nonbanks could pass information about borrowing firms to other clients ......... 32
7.2. Nonbanks could launch M&A bids themselves ................................................. 34
7.3. Exploiting information to gain advisory fees ..................................................... 35
8. Other Robustness Tests ............................................................................................. 36
9. Conclusions ............................................................................................................... 37
Chapter Three: Nonbank Loan Covenants and Their Implications for Borrowers ........... 56
1. Introduction ............................................................................................................... 56
2. Literature Review ...................................................................................................... 59
3. Sample Construction and Covenant Characteristics ................................................. 62

v
3.1. Data sources and sample construction ................................................................ 62
3.2. Measures of covenant strictness ......................................................................... 64
3.3. Summary of sample ............................................................................................ 68
4. Nonbank Loans and the Covenant Strictness ............................................................ 70
5. What Covenants Do Nonbank Lenders Tend to Impose on Their Borrowers? ........ 77
6. Implications of covenant violation to nonbank borrowers ........................................ 79
7. Nonbank Loans and Borrower Exits ......................................................................... 83
8. Conclusions ............................................................................................................... 85
Chapter Four: Conclusion ............................................................................................... 104
Appendices ...................................................................................................................... 108
Appendix A: Variable Definitions in Chapter Two .................................................... 108
Appendix B: Variable Definitions in Chapter Three .................................................. 111
Appendix C: Appendix Tables in Chapter Two .......................................................... 114
References ....................................................................................................................... 117
Vita .................................................................................................................................. 123

vi
LIST OF TABLES Table 2.1: Sample characteristics ..................................................................................... 39 Table 2.2: Nonbank lenders and the likelihood of M&A bids .......................................... 41 Table 2.3: Results for different types of nonbank lenders and additional measures of nonbank roles .................................................................................................................... 43 Table 2.4: The estimated impact of nonbank lending with propensity score matching ... 44 Table 2.5: The estimated impact of nonbank lending with an instrumental variable (IV) approach ............................................................................................................................ 46 Table 2.6: Estimated effects of nonbank lending for cases of frequent lenders and loan amendments ...................................................................................................................... 48 Table 2.7: Nonbanks pass information to other clients ..................................................... 50 Table 2.8: Nonbanks launch M&A bids themselves ........................................................ 51 Table 2.9: Nonbanks transfer information in the role of M&A advisor ........................... 52 Table 2.10: Robustness test with alternative samples ...................................................... 53 Table 2.11: Robustness tests with different lengths of estimation windows .................... 54 Table 3.1: Summary Statistics .......................................................................................... 87 Table 3.2: Frequency of Financial Covenants .................................................................. 91 Table 3.3: Covenant Strictness of Nonbank Loans ........................................................... 92 Table 3.4: Propensity Score Matching on Covenant Strictness ........................................ 95 Table 3.5: Univariate and Multivariate Tests of Nonbank Financial Covenant Structure 96 Table 3.6: Covenant Violations and Firm Investment and Financing Decisions ............. 98 Table 3.7: Nonbank Lending and Firm Exits.................................................................. 101

vii
LIST OF FIGURES Figure 2.1: Percentage of banks and nonbanks relative to all participants in the U.S. loan market ............................................................................................................................... 55 Figure 3.1: Number of banks and nonbanks relative to all participants in the U.S. loan market ............................................................................................................................. 102 Figure 3.2: Nonbank loans in the U.S. commercial loan market .................................... 103

Chapter One: Introduction
Since the turmoil generated by the financial crisis of 2007-09, non-commercial
bank financial institutions (nonbanks) have received much more attention in the academic
literature, given the perception that their risky activities played a causal role in the crisis.
My dissertation examines the actions and relevance of nonbank participants in the loan
market, specifically, in the syndicated loan market. Today, most large corporate loans are
syndicated. A syndicated loan is funded by a group (or a syndicate) of lenders rather than
one lender. The number of lenders in a syndicated loan can range from two to hundreds.
An important recent development in the market is that most syndicated loan participants
are no longer commercial banks, but nonbanks. Following the introduction of syndicated
loan ratings in 1995, institutions such as investment banks, private equity firms, hedge
funds, and other institutional investors have frequently participated as syndicate members
and, in some cases, act as loan arrangers (Boot, Milbourn and Schmeits 2006; Sufi 2009).
A lead arranger negotiates the relevant terms of the loan with the borrower and markets
the loan to potential participants. The proportion of nonbank participants in the
syndication market increased from 11% in 1987 to 26% by 2007. Commercial banks,
once the major providers of loans to corporations, were 52% of participants in 1987, but
only 13% in 2007.
The entry of nonbanks into the loan market raises a number of important
questions and issues that research has yet to address. Nonbank lenders do not accept
deposits and consequently face much less regulation than commercial banks. Harjoto,
Mullineaux and Yi (2006) show that nonbanks typically assume more credit risk in their
syndicated lending than commercial banks. My dissertation investigates whether
nonbanks play different roles than banks in firm governance in the market for corporate
1
control (via mergers and acquisitions) or by exercising control rights with different
covenant structures than banks.
My first essay investigates whether lending by nonbanks affects the probability
that a borrower will subsequently be acquired. Participating in a loan can generate more
value than simply the return on lending money. One reason why is that loan origination
and loan administration generate information about borrowers, ranging from current
business conditions to their financial projections (Dennis and Mullineaux 2000; Bruner
2004). Some of this information is private and consequently available only to the lenders.
Bruner (2004) emphasizes the importance of high quality, credible information about
target firms in the process of acquisition search, due diligence, and deal negotiation, and
calls special attention to the value of private information. The loan market could be a
source of such information to potential acquirers because loan providers typically seek a
broader and deeper set of information than bond-market lenders when underwriting deals
(LSTA 2007). One of my main contributions to the literature is to demonstrate that
nonbanks, rather than commercial banks, are the primary capital market participants
linking lending activity to future M&A transactions. In a sample of public firms from
1987 to 2010, I find that a nonbank borrower is 1.6% more likely to become an M&A
target than a bank borrower. I also find that borrowers are more likely to receive
acquisition bids when they contract with larger numbers of nonbank lenders, especially if
they are institutional asset managers. When nonbanks gain more information about
borrowers through loan amendments or multiple loans, the impact of nonbank lending
grows even stronger. I also identify three channels that might allow nonbanks to exploit
loan-based information in the M&A market. First, nonbank lenders could transfer loan-
2

based information about borrowers to other clients who subsequently become acquirers
of these borrowing firms. Second, nonbank lenders could exploit private information by
launching their own M&A bids for borrowers. I show that firms borrowing from
institutional asset managers are more likely to become their lenders’ targets. Finally,
nonbank lenders might use information gained from lending to reap advisory fees from
M&A activity. I find that firms borrowing from investment banks are significantly more
likely to receive takeover bids in which the investment bank lender acts also as an advisor
to the acquirer.
My second essay focuses on the covenant structure of nonbank loans. Debt
covenants are restrictions or limitations that the lender places on the borrower to enhance
the probability of repayment. For example, the lender might require the firm to maintain a
certain amount of equity, limit the firm’s ability to sell assets, or disallow any additional
financing. Although nonbank loans are an economically important financing source, prior
empirical work on debt covenants has not distinguished between nonbank and bank
providers, implicitly assuming that the distinction is of no empirical relevance. Studies
have usually focused on bond covenants, where borrower characteristics are the major
factors affecting covenant structures. In private debt contracts like loans, however, the
covenants are negotiated between borrowers and lenders. I believe that supply-side
factors, particularly the institutional nature of the lender, could play a role in shaping the
terms of the loan contract. In a sample of commercial loans from 1995 to 2012, I compare
the “tightness” of loan covenants contained in commercial bank and nonbank loan
contracts. Holding borrower risk and other loan characteristics fixed, I find that nonbanks
impose less restrictive constraints on the financial condition of their borrowers than banks
3

do. Although the prior literature shows that banks play an active role in corporate
governance following covenant violations, I find that nonbanks are less likely to
intervene in borrowers’ decision making in similar circumstances. I also investigate the
implications of nonbank lending on firm behavior in states of serious financial distress,
and find that nonbank borrowers are significantly more likely than bank clients to
experience severe financial distress.
4
Chapter Two: The Impact of Nonbank Lending on Mergers and Acquisitions
1. Introduction
Recent publications in the academic and practitioner literature reveal that
nonbanks view the commercial loan market a fruitful source of information for a variety
of purposes. One line of research demonstrates, for instance, that nonbanks use
confidential information gained in the lending process to trade in the stocks of their
borrowers before the information becomes public (Ivashina, Nair, Saunders, Massoud
and Stover 2009; Bushman, Smith and Wittenberg-Moerman 2010; Massoud, Nandy,
Saunders and Song 2011). Another line of inquiry indicates that hedge funds sometimes
purchase small amounts of loans to get inside information about borrowers and exploit
that information in stock market trading (Sargent 2005; Anderson 2006; Smith and
Wittenberg-Moerman 2011). We explore a third prospect, that nonbanks might seek to
enhance revenues by using loan-based information to facilitate mergers and acquisitions.
Non-commercial bank financial institutions (nonbanks) are increasingly active in
the corporate loan market.1 While commercial banks dominated business lending through
the late 1980’s, investment banks, private equity firms, insurance companies, and hedge
funds became increasingly active lenders thereafter, especially following the introduction
of syndicated loan ratings in 1995 (Boot et al. 2006; Sufi 2009). The proportion of
nonbank participants in the syndication market increased from 11% in 1987 to 26% in
2007, and there were more nonbank than commercial bank lenders in every year from
1992-2009 (Figure 2.1).
1 We identify “nonbanks” as financial institutions that do not accept FDIC-insured deposits. Nonbank
lenders include investment banks, private equity firms, hedge funds, collateralized loan obligations (CLO), mutual funds, insurance companies, and a small set of specialized lenders. Bank lenders are “depository institutions.”
5

Unlike commercial banks, nonbank lenders do not accept deposits and
consequently face less regulation. Harjoto et al. (2006) show that nonbanks typically
assume more credit risk than commercial banks and view leveraged loans (those to
borrowers with speculative credit ratings) as especially attractive. In 2005, nonbanks,
attracted by high fees and substantial risk premiums, financed more than 75% of all
leveraged loans (Taylor and Sansone 2007). Nonbanks are less likely than commercial
bank to be focused on “relationship-driven lending,” which typically involves the sale of
multiple financial products over an extended period of time.2 Consequently, nonbanks
might be willing to take actions that commercial banks would not (e.g., exploit private
information) for fear of losing the future stream of revenues that flows from an
established relationship (Boot 2000). Therefore, we contend these institutions have
stronger incentives and capabilities than commercial banks to use loan-based information
in the acquisitions market.
Bruner (2004) emphasizes the importance of high quality, credible information
about target firms in the process of acquisition search, due diligence, and deal
negotiation, and calls special attention to the value of private information.3 One might
argue that lenders should shrink from using information gained in due diligence and ex-
post monitoring lest they find themselves in agency conflicts with their clients. Indeed,
borrowers typically insert clauses in information memoranda and loan-agreement
contracts that mandate confidentiality and enjoin lenders from using loan-related
2 For example, commercial banks might provide clients with packages of services that include loans,
checking accounts, payments services, cash management, payroll services, and custody and pension management services.
3 Some examples of valuable private information might include strategic options, management quality, the nature and scope of risk exposures, access to future finance, and the value of intangible assets.
6

information for any purpose other than “in connection with the loan” (Taylor and
Sansone 2007). Buyers of loans in the secondary market face similar constraints. These
contractual provisions may prove difficult to enforce, however, since the “use” of
information is a relatively amorphous concept. Claims of contract breach are expensive to
prosecute and some cases have been dismissed by courts or found groundless by juries. 4
One of our main contributions to the literature is to demonstrate that nonbanks,
rather than commercial banks, are the primary capital market participants linking lending
activity to future M&A transactions. Institutional asset managers, such as hedge funds
and private equity funds, provide financing to prospective M&A participants. Activist
hedge fund managers sometimes “lobby” companies to seek partners in the M&A market.
Private equity firms are themselves major players in the acquisitions market and typically
pay smaller premiums for targets than operational buyers.5 Investment banks advise
buyers and sellers in M&A transactions and receive lucrative advisory fees for their
services. These fees average about 2% of deal value.6 Investment banks also earn fees
from any equity or debt underwriting services provided to acquirers.
In a sample of public firms from 1987 to 2012, we find that a nonbank borrower
is 1.6% more likely to become an M&A target than a bank borrower. Commercial bank
4 There have been a number of such claims. In February 1997, ADT sued Chase Manhattan, asserting that
the bank leaked information gained in during loan due diligence to an ADT rival, Western Resources.
ADT complained that Chase learned sensitive confidential financial information, including internal projections, detailed profit and loss statements, and trade secrets, and then used the information to advise Western Resources in its hostile bid for ADT. The court dismissed the claim that Chase Manhattan improperly released confidential information to Western Resources. Other litigation on lenders exploiting confidential information to facilitate M&A bids includes Mannesmann vs. Goldman Sachs, Dime vs. Salomon Smith Barney, and Dana vs. UBS. In each case, the plaintiff was unsuccessful in proving its claim.
5 In 2005, private equity buyers accounted for 15% of total M&A deal value in the U.S. and 18 of the top 100 deals in size (Bargeron, Schlingemann, Stulz and Zutter 2008).
6 We compute this figure as the average ratio of advisory fees to deal value for all acquisitions recorded in the SDC database from 1987 to 2010. Advisory fees are the sums of target advisory fees and acquirer advisory fees. The average deal value over this time horizon was $209.8 million.
7

lending does not affect takeover prospects when we control for firm fixed effects in the
analysis. We classify nonbank lenders into three categories -- institutional asset
managers, investment banks, and other nonbanks -- and find that lending by institutional
asset managers (mutual funds, hedge funds, private equity investors, and finance
companies) is most likely to result in future takeover attempts.
We also find that borrowers are more likely to receive acquisition bids when they
contract with larger numbers of nonbank lenders, especially if they are institutional asset
managers. The size of a nonbank lender’s client network also has a significant impact on
M&A activity, presumably because the prospect for information exchange increases with
network size. Once again, the main locus of the effect is with lending by institutional
asset managers. Since the factors and attributes that drive firms to borrow from nonbanks
may also make them attractive acquisition candidates, our results may be affected by
selection problems. We use a panel regression with firm fixed effects, a propensity-score
matching analysis, and an instrument variable estimator to address the identification issue
and continue to find robust, positive impacts of nonbank lending on the probability their
borrowers will receive M&A bids.
We also examine cases where nonbank lenders make multiple loans to the same
borrower or renegotiate the original loans, since information flows may be enhanced
and/or revised relative to the initial information set in these situations. When nonbanks
repeatedly participate in loan originations, the estimated effect on prospective M&A
increases relative to borrowers taking one-time loans. The effect is also stronger when
nonbank borrowers have their contract terms amended. We find the marginal impact is
most significant among institutional asset managers in both instances.
8

Finally, we investigate the relevance of several channels that nonbanks might
employ to exploit loan-based information in the M&A market. For instance, nonbank
lenders could transfer loan-based information about borrowers to other clients who
subsequently become acquirers of these borrowing firms. While the evidence is only
suggestive, we find that nonbanks are better able to connect loan clients than commercial
banks in the M&A market. Nonbank lenders also could exploit private information by
launching their own M&A bids for borrowers. We show that firms borrowing from
institutional asset managers are more likely to become their lenders’ targets. Finally,
nonbank lenders might use information gained from lending to reap advisory fees from
M&A activity. We find that firms borrowing from institutional asset managers and
investment banks are significantly more likely to receive takeover bids in which the
lender also acts as a financial advisor to the acquirer or target firm.
2. Background and Literature Review
2.1. Private information in the syndicated loan market
Like debt markets in general, the syndicated loan market cannot function unless
creditors obtain information about the past, current, and prospective financial condition
of borrowers. But finance research has long held that private debt markets provide
lenders with an enhanced set of information relative to public markets (Fama 1985).
Syndicated loans are a hybrid of private and public debt (Dennis and Mullineaux 2000).7
The syndication process starts when the borrower awards a mandate to an arranger and
provides that institution with details about its business and operations. The loan arranger
7 Dennis and Mullineaux (2000) and Sufi (2007) provide a detailed description of the characteristics of the
syndicated loan market.
9

prepares an “information memorandum” and distributes it to potential syndicate
participants.8 Arrangers and potential participants typically meet or hold conference calls
with borrowing company management and may request follow-up information based on
those discussions (Taylor and Sansone 2007).
Some parts of the information memorandum contain public information (and
consequently can be posted on the Securities and Exchange Commission’s EDGAR
service), while other parts contain private information, such as the extent of covenant
compliance, management’s financial projections, and prospective plans for acquisitions
or dispositions (Standard and Poor's 2010). Potential loan participants must declare a
preference for the “public side” or “private side” of the syndication. Participants gain
contractual rights to private information about borrowers only if they acknowledge an
intent to comply with all securities laws, including precluding information flows to
parties within the same firm that are responsible for investment decisions (Taylor and
Sansone 2007). This practice aims to protect borrowers issuing tradable securities and to
prevent insider trading. The participants on the public side are blocked from access to
“material nonpublic information,” as defined under the U.S. federal securities laws.9
However, the prohibition may not be fully efficacious.10
8 According to Standard and Poor's (2010), a typical information memorandum includes an executive
summary, investment considerations, an industry overview, and a financial model. 9 Information is defined as "material" under the U.S. federal securities laws when (1) there is a "substantial
likelihood" that a "reasonable investor" would consider the information important in making an investment decision, (2) the disclosure of the information would be "viewed by the reasonable investor as having significantly altered the 'total mix' of information made available," or (3) the disclosure of the information is "reasonably certain to have a substantial effect on the market price of the security” (Taylor and Sansone 2007).
10 For example, on March 6, 2006, a large movie rental company, Movie Gallery, held separate conference calls for private side and public side participants to request amendments that would relax existing financial covenants. Some contents of the private meeting were disclosed publicly on Debtwire (a website that delivers news about the fixed income market) that evening. Abnormal trading was detected the following day. See the article in The New York Times, October 16, 2006, titled “As lenders, hedge funds draw insider scrutiny.”
10

In fact, even the information awarded to “public side” lenders is not available to
all investors. For instance, participants on the public side have access to quasi-private
information in the form of various financial documents not made available in SEC
reports. Some examples include product-line and division financial reports, internal
projections of earnings and cash flows, internal budgets for each subsidiary, and
descriptions of management expertise (Taylor and Sansone 2007). In addition, both
public and private side lenders have access to management. Some of this non-public,
quasi-private information could prove useful to protential acquirers in the M&A market.
After a syndication closes, participants continue to obtain information about a
borrower through routine administration of the loan. Standard loan documentation grants
all participants the right to receive information such as monthly financial reports, material
information about the business, and various consultancy reports while the loan is
outstanding (Taylor and Sansone 2007). If borrowers seek to amend loan contracts, they
must provide fully updated financial information and explain the reasons for requested
adjustments in loan terms. Discussions take place in one or more conference calls
involving the borrower and all syndicate members. The new information disclosures
include financial condition updates, revised projections, and product-line and divisional
details. Roberts and Sufi (2009b) report that about 75% of all syndicated loans are
amended prior to maturity. Thus, lenders frequently gain updated borrower information,
some of it private, through the loan amendment request process.
2.2. Brief review of related literature
While the academic literature has little to say on whether nonbanks exploit
information gained from lending activities in the M&A market, Ivashina and Sun (2011)
11

show that nonbank institutions participating in loan amendment discussions subsequently
trade the stocks of the relevant borrowers. When comparing the abnormal stock returns
generated by nonbank investors following loan amendments with the returns generated
by others, they find significantly better performance by the nonbanks, especially when
amendments result in changes in loan spreads. Massoud et al. (2011) find that hedge
funds, which are increasingly active in the loan market, sell the stocks of their borrowers’
short more actively prior to announcements of loan originations and amendments. They
also show that short selling is larger when hedge funds act as lead syndicate arrangers
and in the days just prior to unfavorable loan amendments.
Bushman et al. (2010) also investigate whether nonbank institutional investors
exploit confidential loan information in the stock market. They find that participation by
nonbanks in loan syndications speeds up the arrival of private information in borrowers’
stock prices. In particular, the speed of price discovery increases when nonbank loans are
subject to more financial covenants, when borrowers violate covenants, when nonbank
loans have high default risk, and when loans are syndicated by relationship-based
nonbank lenders or by highly reputable lead arrangers. They also find that the impact of
nonbank lending is stronger when less public information is available about borrowing
firms.11
There is some research examining the roles and impacts of nonbank insitutions in
the M&A market. Bodnaruk, Massa and Simonov (2009) find that investment banks
exploit information gained as advisers to take equity positions in M&A targets prior to
takeover announcements. Investment adviser stakes are positively related to bid prospects
11 Bushman et al. (2010) treat firms that issue no management forecasts and relatively few press releases as
those with less publicly available information.
12

and to the size of the premiums paid for targets. They show that this strategy generates
much higher returns than a standard merger-arbitrage trading strategy. Dai, Massoud,
Nandy and Saunders (2011) find that hedge funds use material, nonpublic information to
take abnormally long positions in M&A target stocks and short positions in acquirer
stocks before deals are announced. They show that hedge funds’ holdings of target
shares in the quarter prior to M&A announcements are positively related to the target’s
premium. Anecdotal evidence shows that hedge fund managers use personal connections
in various industries to gain private information. Our paper reveals that information
obtained in the lending process could be another source of valuable information.
Another related strand of literature shows that relationship can generate
informational advantages for lenders. Drucker and Puri (2005) and Bharath, Dahiya,
Saunders and Srinivasan (2007) find that banks are more likely to win equity
underwriting assignments when they have a prior lending relationship with the issuer.
Yasuda (2005), Ljungqvist, Marston and Wilhelm (2006),and Bharath et al. (2007) report
similar findings for firms issuing new debt. Ivashina et al. (2009) investigate the impact
of the past history of firm borrowings on the prospect they will become acquisition
candidates. They find that relationship banks transmit private information about
borrowers to potential acquirers. Bank lending intensity is positively related to the
probability a borrower will be acquired within three years of loan origination. Our study
extends their research by focusing primarily on nonbank lending and finds that nonbanks
are more likely than commercial banks to foster future M&A activity. Ivashina et al.
(2009) show that relationship banks transfer information about poorly performing
borrowers to potential acquirers in order to preserve portfolio credit quality. They find no
13

support for the hypothesis that banks transmit information to gain merger-related fees or
financing. We do find evidence that certain nonbank lenders use information gained from
lending to earn advisory fees.
3. Data and Empirical Design
3.1. Sample construction
We use data on takeover announcements from the Securities Data Corporation
(SDC) database and loan information from Reuters Loan Pricing Corporation’s DealScan
database for the period 1987 to 2010.12 From SDC, we keep M&A activities that include
tender offers, mergers, and acquisitions of majority interests. If an acquirer tries several
bids for the same target within one year, we keep only the first bid. We extract lender
information at the facility level from DealScan because a significant portion of the deals
in our sample involves different lenders across the facilities.13
To construct the sample, we start with an annually merged CRSP-Compustat
database of all nonfinancial U.S. firms during the years 1987 to 2012.14 We first match
the M&A bids from SDC that occur within the fiscal year of each firm observation to the
CRSP-Compustat database by historical 6-digit CUSIPs, ticker names, and
announcement dates. This yields 9,455 takeover bid observations. Then, we aggregate
loan financing activities by each borrowing firm during the past three years and merge
these with our main sample by using the DealScan-Compustat link file from Chava and
12 Although SDC data contains records for M&A announcements since 1980, DealScan tracks loan
originations and amendments only since 1987. 13 Jiang, Li and Shao (2009) also point out that members of a syndicate may hold different proportions of
each loan facility within the same deal. We also use deal-level data to perform the analysis and get similar results.
14 We exclude financial institutions with two-digit SIC code 60 through 64, given the significant volume of acquisition activity in the banking industry over our sample period. The results are similar when financial firms are included, however.
14

Roberts (2008). They build the file by matching company names and loan origination
dates from DealScan to company names and corresponding active dates in the CRSP
historical header file.15 With the link file, we are able to add loan financing activities and
lender information by each borrowing firm from DealScan to our main sample based on
gvkey and loan origination or amendment dates. In the end, we have 101,464
observations in the sample.
Table 2.1 shows some descriptive statistics of the final sample. Panel A shows the
number and percentage of observations for firms with different types of financial
activities. The first column shows that 47% of observations in the sample of U.S. firms
involve loan-financing activities and 20% include nonbank participation. The second
column focuses on amended loans and shows amendments occur during the three years
following origination in 8% of the final sample, but amendments surface in over 20%
(4,139 out of 20,473) of the nonbank loan observations. The last column shows the bank
and nonbank breakdown for lenders that have participated in more than three loans
(“frequent lenders’) to the same borrower during the past five years. Among the 12,943
observations that involve frequent lenders, 18% (2,373 out of 12,943) borrow from
nonbanks.
In Panel B of Table 2.1, we show summary statistics for some key characteristics
of the firms in our sample. The first column involves all firms, while the second and third
columns show firm characteristics in subsamples of nonbank borrowers and M&A
targets, respectively. We define each variable in the Appendix. In our sample, the
unconditional probability of receiving an M&A bid is 9%, and the probability increase to
15 See Chava and Roberts (2008) for the details of data construction.
15

10% if the firm is a nonbank borrower. Relative to an average firm in our sample,
borrowers taking nonbank loans are larger, more profitable, have more institutional
ownership, and more likely to have a credit rating. They are also more leveraged, grow
less rapidly, have less liquidity, and less investment in research. Nonbank borrowers also
have lower Z-scores, implying that firms with low credit quality gravitate to such lenders
(Denis and Mihov 2003). The third column presents summary statistics for a sample of
firms who receive M&A bids. In general, these target firms are smaller, have lower credit
quality, and underperform in the stock market in the 24 months prior to a bid relative to
the average firms in our main sample.
3.2. The role of nonbank lenders
We capture the potential relevance of nonbank participation on the likelihood of
acquisitions in three ways. First, we use sets of dummy variables to identify the presence
of any nonbank lender. We define Nonbank as a dummy variable equal to one if a firm in
our sample has borrowed from at least one nonbank lender during the past three years.16
To determine whether different types of nonbank lenders have differential effects on the
prospect of future M&A activity, we disaggregate the variable Nonbank into three
categories: Institutional Asset Manager, Investment Bank, and Other Nonbank.17 For
instance, the indicator variable Institutional Asset Manager is equal to one if a firm has
borrowed from at least one institutional asset manager during the past three years. The
first column in Panel C of Table 2.1 shows that 68% of the firms relying on nonbank
16 We create a three-year window to analyze the impact of nonbank lending because the mean maturity of a
loan in the LPC database is approximately three years (Ivashina et al. 2009). We show later that our results are robust to using other time horizons.
17 Institutional asset managers include finance companies, mutual funds, hedge funds, and private equity investors. Other nonbanks include insurance companies, CDOs, pension funds, leasing companies, vulture funds, and trust companies.
16

borrowers relied on at least one institutional asset manager over three years, and 44% and
33% borrowed from at least one investment bank or other nonbank over three years,
respectively.
To capture variation in nonbank lending activity in each category, we use the
number of institutions lending to a firm over three years. We assume that the “amount” of
potential information that is prospectively transferable in the M&A market increases
when more lenders participate in a syndicated loan. We count the number of different
nonbank lenders participating in loans originated or amended to a given borrower during
the past three years. If a nonbank lender participates in multiple loans to the same
borrower simultaneously, we count it once. In the second column of Panel C, we show
that an average of 3 lenders participates in loans to nonbank borrowers during three
years. When we segregate nonbank lenders into the three categories, a nonbank borrower
obtains loan financings from about 1.77 institutional asset managers, 0.67 investment
banks and 0.94 other nonbanks.
We also employ the size of lender-generated client networks as an additional
measure of the capacity of nonbanks to generate and transmit information. If lenders
convey potentially useful information about borrowers to other clients, the likelihood of
acquisitions should increase with the size of lender client networks. Ivashina et al. (2009)
find that the probability of M&A bids increases with the size of relationship-bank client
networks, but limit network measures to clients in the same industry as the borrower. Our
network size variable takes account of all potential acquirers, regardless of industry. We
count the number potential acquirers as the total number of other firms that borrow from
17

the same lender as the potential target over a given time period.18 Once again, we
disaggregate among nonbank types and count the numbers of all client firms borrowing
from each type of nonbank lender. The last column of Panel C of Table 2.1 shows the
average number of nonbank clients for nonbank borrowers. During three years, nonbank
lenders extend credit to 72 companies that could be potential acquirers of the average
firm. Across the categories of nonbanks, investment banks have the largest networks in
the loan market with an average of 39 clients.
4. Nonbank Lenders and the Likelihood of Takeover Bids
We first analyze whether firms are more likely to become acquisition targets
when they have some history of borrowing from nonbank institutions. Ivashina et al.
(2009) show that companies are significantly more likely to be acquired when they have
relied on relationship loans as a source of funds. However, their analysis does not take
account of differences in lender type in the loan market. We contend that nonbank
lenders, such as investment banks, hedge funds, and private equity firms, are better able
to exploit information gained from lending in the M&A market than commercial banks.
Commercial banking organizations cannot trade equities or sell stocks short unless they
do so from a subsidiary or entity that is legally separate from the bank itself. Regulations
18 Solectron Corp is a firm in our sample that can serve to show how we construct the client network
variables. On August, 31, the end of its 2004 fiscal year, Solectron Corp had borrowed from 21 U.S. banks over the last three years, including Citicorp, Wachovia, and BOA, and from three nonbanks--Goldman Sachs Credit Partners, Goldman Sachs & Co., and Morgan Stanley Senior Funding. To calculate Nonbank Client Network, we first identify all borrowers in our sample at each of the three nonbank lenders over the three years period prior to the end of Solectron’s 2004 fiscal year. There were 62 companies borrowing from Morgan Stanley Senior Funding, 135 from Goldman Sachs & Co., and 73 from Goldman Sachs Credit Partners between September, 2001 and August, 2004. Some borrowers, such as AT&T, GE, and Wal-Mart, took loans with more than one lender, so there were 236 companies having potential linkages to Solectron through this nonbank lender network over the period. Similarly, we search for clients of the 21 bank lenders and identify 3,498 different clients with prospective information links to Solectron via the total lender network.
18

would preclude the transfer of information gained in the bank lending process to a
subsidiary engaged in trading. Nor can commercial banks acquire non-bank firms, save
for those judged “closely related to banking” by the Federal Reserve. While the largest
commercial banking organizations do play some role in the M&A market as advisers and
lenders, investment banks are equally, if not more, active as M&A advisers and
underwriters. Other nonbanks, such as private equity and hedge funds, can themselves be
acquirers of any type of firm.
4.1. Nonbank participation and the likelihood of M&A bids
Our dependent variable is binary with a value equal to one if the firm becomes a
target during the next fiscal year and zero otherwise. The key explanatory variable
Nonbank is an indicator variable of nonbank participation that equals one if a firm
borrowed from at least one nonbank lender during the past three years and zero
otherwise. To examine the differential effect of loans from nonbanks, we also add Loan
as a control variable that equals one if a firm in our sample has at least one loan
origination or loan amendment with any lender--bank or nonbank--during the past three
years, and zero if the firm is not a loan borrower.
In addition to our lending-related variables, we also include control variables used
in prior studies that focus on predicting acquisitions. These include the target’s return on
equity, sales growth rate, liquidity ratio, leverage ratio, market-to-book ratio, price-to-
earnings ratio, and market capitalization. We also include an industry takeover dummy,
the extent of institutional ownership, and the target’s past abnormal returns (Palepu 1986;
Mitchell and Stafford 2000; Schwert 2000; Officer 2003; Gaspar, Massa and Matos 2005;
Billett and Xue 2007; Massa and Zhang 2009). Following Schwert (2000), we average
19

these variables (except the dummy variables) over the two years prior to the
announcement of a takeover bid and trim the variables at the 1st and 99th percentiles. To
control for macroeconomic conditions, we also include a recession indicator and a merger
wave dummy. A recession indicator equals one during years defined as a recession
according to the National Bureau of Economic Research. Based on the findings of
Harford (2005) and Garfinkel and Hankins (2011), we create a wave dummy equal to one
for the years 1995 to 1999, 2001, and 2006, and zero otherwise.
We employ both linear and non-linear regressions to estimate the effect of
nonbank lending on the probability of an acquisition bid. The OLS estimates of a linear
probability model provide a convenient approximation to the underlying response
probability that is easy to interpret (Wooldridge 2011).19 A logit model estimated by
maximum likelihood estimator (MLE) techniques restricts the response probability to the
[0,1] interval and allows a nonlinear relationship between the explanatory variables and
the dependent variable. We use both cross-sectional and panel regressions with firm-fixed
effects.
We present estimation results for linear (OLS) and non-linear (logit) models, with
and without firm fixed effects in Table 2.2. Columns (1) and (2) shows the results of
cross-sectional regressions. The coefficient of Loan reveals that a firm is significantly
more likely to receive an M&A bid if it has borrowed from any lender during the past
three years. This result, estimated without firm fixed effects, is consistent with the
19The linear model has two shortcomings: 1) Some of the OLS fitted values might fall outside the unit
interval for probability; and 2) The linear probability model assumes each independent variable exerts a constant effect on probability, regardless of its initial value. Adding nonlinear elements, such as interaction terms, to the OLS estimation, might mitigate the second weakness.
20

findings of Ivashina et al. (2009).20 When we distinguish between bank and nonbank
loans, the evidence reveals a positive and significant impact on the likelihood of future
M&A bids when nonbanks provide loans to potential targets. The coefficient of Nonbank
shows that the probability of receiving an M&A bid is significantly higher if a firm
borrows from nonbanks rather than commercial banks. For example, in column (2), a
firm with prior loan financings is 1.3 % more likely to receive an M&A bid if it has
borrowed from nonbanks rather than banks.
In cross-sectional regressions, any unobserved heterogeneity (stemming perhaps
from variations in managerial quality) that is correlated with lending decisions across
firms could result in inconsistent estimates in cross-sectional regressions. Therefore, we
add firm fixed effects to each model in columns (3) and (4). Li and Prabhala (2007)
demonstrate that panel regressions with firm fixed effects can control for self-selection
stemming from unobserved attributes that are fixed over time.
The Nonbank coefficient becomes more significant than in our initial estimation,
while the Loan coefficient becomes insignificant, indicating that only loans involving
nonbanks have a significant impact on the prospect a borrower will become an
acquisition target. Based on the results in column (4), a firm is 1.6% more likely to
become a target if it has borrowed from nonbanks rather than banks. The impact is
economically significant, since the unconditional probability of an M&A bid for firms in
our sample is 9%.
20 Ivashina et al. (2009) find that the probability a firm becomes the target of a hostile bid increases from
3.3% when the firm has no bank loans to 4.1% when the firm had one loan over past three years. We find the probability a firm receives any type of bid increases from 7.5% to 9% when the firm had at least one loan over past three years.
21

With respect to the remaining variables, the models without firm fixed effects
shown in columns (1) and (2) produce results similar to those of previous studies using
cross-sectional regressions. Smaller firms with weaker earnings, higher leverage, lower
market-to-book values, and lower past abnormal returns are more likely to become
targets. When we add firm fixed effects to the models in columns (3) and (4), firms with
weaker sales and lower liquidity become attractive targets, but leverage ratio does not
matter. For macro controls, M&A bids are more likely during M&A waves and less likely
during the recession.
4.2. Subcategories of nonbanks and additional measures of nonbank roles
We next examine whether the impact of nonbank lending on acquisition prospects
varies with the type of lender. We segregate nonbanks into three categories: institutional
asset managers, investment banks, and other nonbanks. In addition to a participation
dummy for all nonbanks, we include three dummy variables to capture nonbank
participation in each subcategory as explanatory variables in the linear probability model
with firm fixed effects. The dummies equal one if a firm borrowed from at least one
nonbank lender in the specific category during the past three years, and zero otherwise.
Consistent with results in Table 2.2, the first column of Table 2.3 shows that a
borrowing firm is more likely to receive an M&A bid if it borrows from nonbanks during
the past three years. In terms of economic significance, the estimated coefficient of 0.018
indicates that, compared to bank borrowers, the probability of receiving M&A bids for
nonbank borrowers increases by 20% from their average (0.09) in the sample of
borrowers. In column (2), the coefficient for the presence of institutional asset managers
is positive and significant, while the impacts of the presence of other types of nonbank
22

lenders are either negative or insignificant. This indicates that lending by institutional
asset managers (private equity firms, hedge funds, and mutual funds) primarily accounts
for the observed influence of nonbank lending on merger probabilities.
We next allow for variation in our measures of nonbank influence across the
three subclasses, employing the logarithm of one plus the number of all nonbank lenders
in total and for each type of nonbank participating in loan originations or amendments
during the past three years in the model. Column (3) in Table 2.3 shows a significant
positive impact of more nonbank lenders in general and Column (4) reveals that ending
by institutional asset managers is again the primary source of the link between nonbank
lending and future acquisitions.
The final set of tests includes client network variables constructed by type of
nonbank lender. We use the logarithm of one plus the total number of other firms that
borrow from the same nonbank lender as a potential target over three years as the proxy
for the size of the client network. We again disaggregate among nonbank types and
include the size of client network for each type of nonbank as well. In columns (5) and
(6), the coefficients of the client network variables associated with nonbanks in general
and with the institutional asset manager subgroup have the hypothesized positive sign.
In sum, under various specifications and using different estimation methods, we
find that firms are more likely to become M&A targets if they borrow from nonbank
lenders, especially if the lenders fall in the institutional asset manager group. 21
21 In Appendix Table I, we show the results also hold for logit models for each type of nonbank lender
using alternative measures of nonbank participation.
23

5. Investigating Causality
5.1. Propensity score matching
A drawback of our nonbank participation measures is that a firm’s decision to
borrow from a nonbank lender may be endogenous (Massoud et al. 2011). Although firm
fixed effects estimation can mitigate the endogeneity problem associated with unobserved
attributes, this technique assumes the unobserved factors are time invariant. Firms with
certain characteristics may be more likely to borrow from nonbank lenders and also more
likely to become merger targets, and we cannot be confident that any unobserved factors
are constant over time. Ideally, we would like to run an experiment with groups of
matched firms that are identical in all respects except for nonbank participation. One firm
in each group would borrow from a nonbank lender, while the other borrows from a bank
lender. The observed difference in M&A likelihood between the groups would then be a
robust estimate of the effects of nonbank participation on merger probabilities. Since
such an experiment is not feasible, we follow Dehejia and Wahba (2002) and Heckman,
Ichimura and Todd (1997) who use propensity score matching methods (PSM) to address
the identification problem based on observable characteristics.
PSM allows us to examine future acquisition bids for firms in the treatment
sample (firms that borrowed from nonbanks) by conditioning selection on certain
observables that we compare with a matched control sample containing firms that borrow
from commercial banks. We first estimate a logit model to create a propensity score that
indicates the probability a firm borrows from a nonbank. A binary dependent variable
equals one if a firm borrows from a nonbank institution over the past three years and zero
otherwise. We include borrower characteristics that affect the likelihood a firm borrows
24

from nonbanks as explanatory variables. Following Massoud et al. (2011), Maskara and
Mullineaux (2011), and Agarwal and Meneghetti (2011), we use the leverage ratio and
the Altman z-score as proxies for firm credit risk, profitability and sales growth as
measures of firm performance, and asset size, book-to-market, and cash flow as measures
of idiosyncratic risk. Sufi (2007) finds that the extent of information asymmetry affects
the composition of lending syndicates. Consequently, we add positive accruals, R&D
expenses, and a dummy for the existence of a credit rating to our model to measure the
scope of information asymmetries.
Panel A of Table 2.4 shows the results of logit regressions on the likelihood of
being in the treatment sample: firms taking loans in which nonbanks participate. Column
(1) indicates that nonbank borrowers have more assets, higher sales growth, and less
liquidity (lower EBIT and a lower cash ratio) than other firms. Nonbank borrowers also
pose less information asymmetry, as measured by R&D expenditures, positive accounting
accruals, and the existence of a credit rating. Firms borrowing from nonbanks have
significantly higher default risk in terms of leverage ratios or z-scores. Columns (2) and
(4) show that firms borrowing from insitutional asset managers or other nonbanks have
characteristics similar to nonbank borrowers in general, except that investment bank
borrowers have more liquidity. Year dummies and industry dummies are also included in
the regressions.
Based on the logit regression, we calculate each firm’s propensity score, the
probability the firm will borrow from nonbanks rather than banks during a three-year
period. We then match each nonbank borrower with a group of bank borrowers that have
25

propensity scores similar to the nonbank borrowers using Leuven and Sianesi’s (2010)
PSM procedure at the nearest one-to-one neighborhood with replacement.22
Panel B of Table 2.4 reports the average probability of future M&A bids for firms
that borrow from nonbank lenders and a sample of matching firms that borrow from bank
lenders. The first row shows that the probability of receiving M&A bids for nonbank
borrowers is 3% higher than bank borrowers. The mean difference between the two
groups is significant at the 1% level with adjusted stadared errors bootstrapping with fifty
replications. When we perform the propensity matching analysis for the three types of
nonbank lenders, firms borrowing from insitutional asset managers and investment banks
are associated with higher M&A bids prospects, while the role of other nonbanks is not as
significant. In Appendix Table II, we also report a placebo test for bank borrowers with
the same PSM procedure and do not find treatment effects similar to those for nonbank
borrowers. In sum, the PSM findings are consistent with the postive efects of nonbank
participation on merger probabilities reported in Table 2.2.23
5.2. Instrumental variable estimation
While propensity score matching can alleviate the problem of self-selection, we
cannot fully rule out the possibility that omitted variables may be driving the relation
between the likelihood of being a target and nonbank lending. For instance, complete
information about a borrower’s financial strength or managers’ capabilities might be
unobservable to lenders or be measured with error. To clarify identification of the
22 Appendix Table II shows the PSM results are robust when we use alternative matching methods with
nearest neighbor estimators with n= 10 and n=50, and kernel estimators with more weight given to bank borrowers with propensity scores that are closer to the nonbank borrower propensity scores.
23 We also compare the average probability of M&A bids for firms borrowing from nonbanks versus matched firms that do not borrow at all. The unreported results show that the treatment effects of nonbank participation are more positive and significant.
26

nonbank-M&A relation, we use an instrument variable (IV) that is correlated with
nonbank lending but does not affect M&A likelihood itself: the introduction of
syndicated loan ratings.
Yi and Mullineaux (2006) and Sufi (2009) show that syndicated loan ratings led
to an explosive increase in nonbank participation in the loan market. In March and
December of 1995, Moody’s and S&P began rating syndicated loans to cater to a
growing number of nonbanks that had weak monitoring and screening abilities, but a
strong desire to enter the syndicated loan market.24 A key identification assumption of the
IV approach is that the introduction of syndicated loan ratings does not affect the M&A
prospects of nonbank borrowers for reasons other than receiving nonbank loans. We
believe this assumption is valid. Anecdotal evidence suggests that the introduction of
syndicated loan ratings was supply-driven rather than a response to changes in borrower
financial conditions or demand for financing. For instance, an American Banker article in
1996 stated that “the increase (in syndicated loan ratings) underscores efforts by
corporate customers to cater to the growing number of institutional investors who want a
piece of the bank loan syndication market.” 25 Sufi (2009) studies the introduction of
syndicated loan ratings and shows that borrowers relied on an expanded the set of
creditors following the ratings introduction.
We create an indicator for the introduction of syndicated loan ratings that equals
one for the period later than 1995 as an instrument for nonbank participation in a panel
setting. In the first-stage estimation, we predict the type of firms that receive nonbank
24 For research on the importance of information asymmetry in the syndicated loan market, see Dennis and
Mullineaux (2000), Lee and Mullineaux (2004), Sufi (2007), and Ivashina (2009). 25 See more anecdotal evidence of reasons to introduce loan rating in Sufi (2009).
27
loan participation. We use three measures to proxy for nonbank participation: a dummy
of nonbank participation, the number of nonbanks, and the size of the client network of
nonbank lenders. Table 2.5 shows our results using the IV approach in 2SLS regressions
with firm fixed-effects. Panel A of Table 2.5 shows the results of the first-stage
regression. The coefficients of introduction of syndicated loan rating are positive and
significant, implying more nonbank participation after the rating introduction. The first-
stage F-statistics reject the null that the coefficients on the instrument are insignificantly
different from zero at the 1% level.
We show the IV results in Panel B of Table 2.5. In the first column, we use the
dummy of nonbank presence as proxy for nonbank participation. We find the coefficient
of nonbank participation is 0.23, or about 12 times larger than the coefficient in Table
2.3, when it is instrumented using the introduction of loan ratings. The positive and
significant coefficients on nonbank participation in the last two columns reveal that
participation by more nonbanks or the presence of a larger nonbank client network also
significantly increases the likelihood borrowers will receive M&A bids using the IV
estimation technique. Although we cannot verify the key assumption underpinning IV
estimation empirically since the error term is by definition unobservable, we can use the
Heckman selection model as a robustness test of the IV estimation results. In Appendix
Table III, we show our IV results are robust when we estimate a Heckman selection
model.
In sum, we seek to support the causal nature of our earlier results by using PSM
and IV estimation to confirm the results of the firm fixed effects model. The strong
relationship between nonbank lending and future M&A activity continues to hold.
28

6. Relevance of Repeat Transactions and Loan Amendments
In this section, we examine whether the estimated impact of nonbank participation
on M&A activity grows larger when lenders gain more information about borrowers
through repeat loan transactions or obtain updated information via the loan amendment
process.
6.1. Frequent lenders and the likelihood of M&A
Nonbank lenders could gain more and updated information in the syndication
market if they participate frequently in loans to the same borrower. Frequent lenders will
have access to multiple information memos and could obtain updates about the
borrower’s condition, which could prove useful in the M&A market. We define a
frequent lender as one that participates in more than three loans to the same borrower
during the past five years. To examine whether the impact of nonbank participation is
stronger when firms borrow frequently from the same lender, we first restrict our sample
to all nonbank borrowers. Then we define a frequent dummy that equals one if a firm has
borrowed from at least one frequent nonbank lender over the three-year period. We
hypothesize that the impact of nonbank participation on the probability of an M&A bid
will be stronger if borrowers seek loans from frequent nonbank lenders.
The first two columns of Panel A in Table 2.6 show the impact of frequent lender
on the likelihood of M&A bids in the linear probability model with firm fixed effects.
The coefficient of nonbank in the first column is 0.025, statistically significant at 1%
level. The coefficient shows that a nonbank borrower is 2.5% more likely to receive an
M&A bid if it borrows from a frequent nonbank lender than a one-time lender. We also
29

segregate frequent nonbank lenders into the 3 subcategories to again examine the
prospect of differential effects. Column (2) of Panel A shows that the impact is stronger
when institutional asset managers participate repeatedly in loans to the same borrower. In
Panel B of Table 2.6, we show similar results based on a PSM analysis, again applying
the one-to-one nearest neighbor matching scheme. We first create propensity score using
a probit model to calculate the probability a firm will borrow from a frequent nonbank
lender rather than a one-time nonbank lender.26 We then compare the merger probability
of firms borrowing from frequent nonbank lenders with a group of firms borrowing from
first-time nonbank lenders that have similar propensity scores.
In the first row, the mean difference between the two groups is 0.017, statistically
significant at 10% level. The PSM result is consistent with the linear probability model
findings with firm fixed effects, but less statistically significant. We also conduct the
PSM analysis within each category of nonbank lender and find an M&A bid is more
likely when firms borrow frequently from institutional asset managers. In general, we
find stronger impacts of nonbank lending when these lenders have repeat access to
borrower information through frequent lending.
6.2. Nonbank participation in loan amendments
In the syndicated loan market, participating lenders routinely obtain updated
information when firms request amendments to the terms of their original loan contracts.
The arrival of new information about default prospects can trigger loan renegotiation
(Roberts and Sufi 2009b). Borrowers must report any breaches of financial covenants and
26 We also use the linear probability model with firm fixed effects to calculate the propensity score and get
similar matching results.
30

provide lenders with reasons for any requests to amend loan terms.27 All public and
private side lenders will vote on any proposed alterations to loan contract terms, such as
changes in principal, interest, maturity, or collateral (Standard and Poor's 2010). Lenders
consequently receive updates on various aspects of a borrower’s business each time an
amendment request occurs and loan renegotiations serve as fertile sources of new, and
possibly private, information about borrower conditions. In our sample of nonbank
borrowers, we construct an amended loan dummy equal to one if at least one of a
borrower’s loans is amended over three years and zero otherwise. We hypothesize that
the influence of nonbank lending on the probability of M&A bids will grow stronger
when borrower loans are amended.
In Panel A of Table 2.6, we show the linear probability model results with firm
fixed effects. The coefficient of the nonbank dummy in column (3) is positive and
significant, confirming the hypothesis. In column (4), we report the effects of amended
loans for each category of nonbank. The positive coefficient for the institutional asset
manager dummy indicates that borrowers are more likely to receive M&A bids when
institutional asset managers participate in past loan amendments. We also conduct a PSM
analysis for the amended loans, using the basic one-to-one nearest neighbor matching
scheme. In the first row of Panel B in Table 2.6, the mean difference between two groups
is 0.026, statistically significant at 1% level. This is twice as strong as the coefficient in
the fixed effects model. When we segregate nonbank lenders into three groups and
27 Violations of one or more financial covenants in the loan contract can prompt requests for amendments.
Financial covenants establish hurdle values for factors such as net worth, the current ratio, leverage ratio, the interest coverage ratio and capital expenditures. However, loan amendments do not necessarily reflect deterioration in a borrower’s financial condition. Roberts and Sufi (2009b) demonstrate that more than 90% of long-term loans are amended prior to their stated maturity, yet fewer than 18% of loan amendments are associated with a violation or payment default.
31

conduct the PSM within each category separately, we consistently find borrowers are
more likely to receive an acquisition offer when they rely on amended loans from
institutional asset managers. In sum, nonbank borrowers with amended loans are even
more likely to receive an acquisition bid than borrowers without amended loans.
7. Information Transmission Channels
Our evidence indicates that nonbank lenders facilitate acquisitions in some
fashion. An obvious question is how they might do so. We contend that loan-based
information could affect the likelihood of acquisitions through a variety of channels,
ranging from casual gossip among the various players in the loan and M&A markets to
an effort to earn merger-related fees to becoming the actual acquirer in a deal. We next
consider three explicit channels that could link borrowing from a nonbank to the chance
of becoming an M&A target.
7.1. Nonbanks could pass information about borrowing firms to other clients
Nonbank lenders could transfer information about a borrower to other clients that
subsequently bid to acquire that firm. For instance, one nonbank lender in our sample,
GE Capital, participated in a $1.45 billion loan to NRG Energy at the end of 2003. Mirant
Corp, another GE Capital loan client, made a bid for NRG Energy in 2006. We have no
way to know whether GE Capital provided information about NRG Energy to Mirant, but
the prior lending relationship provides the potential for an information transfer tied to the
acquisition bid.
Our approach to the issue of information transfer will be to ask whether nonbank
lenders are more likely than commercial banks to form large networks of borrowers that
could become future merger partners. We have already argued that nonbanks have more
32

to gain in the M&A market than commercial banks, so observing more network linkages
for nonbank lenders could constitute evidence consistent with information transfer. We
create a lender-year panel for all credit providers in the DealScan database and collect
their borrowers’ information over three years. The dependent variable in our model is the
number of M&A bids that a borrower receives from acquirers that are loan customers of
the same lender. We call such acquirers “connected” in the sense that they could be
potential recipients of information transfers. The explanatory variables include indicators
for the types of nonbanks, as well as variables interacting these dummies with an
indicator for whether the lender serves as lead arranger in the syndicated loan transaction.
We hypothesize that lead arrangers are less likely to transfer information to loan clients
for reputational reasons. The lead arranger typically earns the largest fees among the
syndicate participants and has strong incentives to seek repeat transactions with any given
borrower (Dennis and Mullineaux 2000). For most lenders, the number of annual M&A
bids that borrowers receive from connected acquirers is zero. Therefore, we employ
Poisson regression to estimate whether nonbank lenders are more likely to connect clients
that might engage in M&A.
Table 2.7 presents univariate and multivariate results. The coefficient in column
(1) shows that nonbanks, in general, do not have more clients connected to firms
receiving acquisition bids than commercial banks. But when we disaggregate by nonbank
type, the results in column (2) reveal that investment banks do have significantly more
borrowers receiving bids from connected clients. Other nonbank types are less likely to
have such borrowers. The results in column (3) capture the impact of taking account of
lead arranger status and show that such lenders are significantly less likely to have
33
borrowers that garner bids from other clients. While our evidence does not reveal that
nonbank lenders pass information to clients about other customers, it is consistent with
the prospect that such transfers could take place, at least in the case of investment banks.
7.2. Nonbanks could launch M&A bids themselves
Nonbank lenders might use loan-based information about borrowers to launch
their own M&A bids. Some prior literature reports that information flows within financial
conglomerates can result in conflicts of interests (Aggarwal, Nagpurnanand and Puri
2002; Drucker and Puri 2005; Massa and Rehman 2008).28 Within nonbank institutions,
private information could flow from the loan division to the acquisitions division,
assuming both exist within the same firm. As a possible example of such a flow in our
sample, High River LP participated in a $100 million syndicated loan to Philip Services
in 2000 and High River successfully acquired Philip Service in 2003. In our sample, we
are able to identify 34 cases where lenders launched bids for their borrowers.
To determine whether firms borrowing from nonbanks are more likely to receive
bids directly from their lenders, we find 1,571 control firms from Compustat that do not
receive any M&A offers that we match to the 34 acquired firms based on event year and
one-digit SIC codes.29 The dependent variable in our model is an indicator for this
specific channel, equal to one if a firm receives a bid from its lender, and zero otherwise.
The results in column (1) of Table 2.8 show that firms with prior loan financings are not
more likely to receive M&A bids from their borrowers unless they borrowed from
28 For instance, Massa and Rehman (2008) find evidence that lending divisions transfer private information
to investment divisions within financial conglomerates. They contend that such information transmission could result from personal acquaintances within the firm.
29 We also use match firms with the same two-digit SIC codes and allow matched firms to be in the finance industry as in Ivashina et al. (2009). The results are not significantly different.
34

nonbanks. When we disaggregate by nonbank category, the coefficient of
Loan*Institutional Asset Manager in column (2) is positive and significant at the 1%
level, indicating that mutual funds, hedge funds and private equity firms are the more
likely than other nonbanks to pursue acquisitions directly.
7.3. Exploiting information to gain advisory fees
Nonbank lenders that provide M&A advisory services might seek to exploit loan-
based information to gain the fee income associated with these activities. A nonbank
lender active in the advisory market could transfer borrower information to a prospective
bidder in its advisory capacity, for instance. Some advisers have faced lawsuits over this
issue. As one example, UBS Warburg participated in a $1 billion syndicated loan to Dana
Corp in November, 2000. Thirty-six months later, UBS Warburg acted as a financial
adviser to Arvin Meritor, which pursued Dana in a hostile takeover. Dana sued UBS for
passing substantial amounts of confidential information it gained from the loan to its
rival.30 In our sample, there are 13,981 cases where lenders serve as advisors to acquirers
or targets in the M&A market.
We examine the potential relevance of this channel with a model that uses an
indicator variable equal to one if a lender also acts an adviser to a borrower that makes a
bid for another of the lender’s clients, and zero otherwise. We locate 67,798 control firms
in Compustat that do not face any M&A offers, matching to the aforementioned 13,981
cases based on event years and one-digit SIC codes. The results in column (1) of Table
2.9 show that a borrowing firm is more likely to receive a takeover bid when its lender
30 The lawsuit claimed that UBS was given “substantial amounts of confidential information about Dana, its
financial condition, its business plan and prospects, its competitive postures, its trade secrets, and its potential liabilities” as a result of its participation in the loan and the amendment process.
35

acts as an adviser to an acquirer or provides advisory service to the borrower target. This
probability increases significantly if the lender is a nonbank. The results in column (2)
reveal that institutional asset managers and investment banks are the primary sources of
this linkage.
8. Other Robustness Tests
We next examine whether our main results continue to hold for alternative
samples and for different specifications of the dependent variables. In Table 2.10, we
show the results of linear probability model with firm fixed effects when we focus only
on successful takeover bids, when we use a different sample period, and when we take
account of the roles of very large participants in the loan market and the M&A advisory
business.
When we limit our analysis to successful M&A bids, the results in column (1) of
Table 2.10 on the predictive relevance of nonbank lenders show even stronger results
than those already reported. In column (2), we present results from re-estimations using a
subsample from 1995 to 2010. We might argue that observations in the period from 1987
to 1994 should be excluded from the sample, since nonbanks became significantly more
active in the syndicated loan market following the introduction of loan ratings in 1995.
We find a robust estimated impact of nonbank lending on future M&A using the shorter
estimation period.
The M&A advisory business is extremely concentrated, with the top ten advisers
accounting for the lion’s share of the business (Morrison and Wilhelm 2007). If these
advisers also participate in the loan market, our results could be driven primarily by the
activities of these top advisers. In addition, large nonbank lenders might drive our results.
36

In columns (3) and (4), we re-estimate our baseline model, but excluding the top ten
M&A advisers and the top ten nonbank lenders from our sample. The top ten M&A
advisers are from rankings in buyouts magazine in 2009 and the top ten nonbank lenders
are calculated from the total amount of loan originations in our sample. The coefficients
of Nonbank remain positive and statistically significant at the 1% level.
In the prior estimations, we use a three-year window to capture the amount of
information obtained by nonbank lenders from loan originations and amendments and a
one-year window to capture M&A activity. To verify that our results are not driven
strictly by the selection of these time horizons, we also measure the information horizons
based on one, two, three, and four-year windows and M&A activities based on one- and
two-year windows. The results in Table 2.11 show that the impact of nonbank lending is
robust to different lengths of estimation windows.
9. Conclusions
Prior research emphasizes the relevance that information plays in the M&A
market and identifies the capital markets as an important source of information. We
connect these lines of research with evidence supporting the hypothesis that firms
borrowing from nonbanks are more likely to become acquisition candidates than bank
borrowers. We use panel model regression with firm fixed effects, propensity score
matching techniques, and an IV approach to identify the causal link between nonbank
lending and future M&A prospects. The impact of nonbank lending on M&A deals
remains positive and significant when we use either the number of nonbank lenders or the
extent of a nonbank’s client network to proxy for information flows. The estimated
effects are stronger if the lender is an institutional asset manager, such as a private equity
37

firm, hedge fund, or mutual fund. Activist hedge fund managers sometimes “lobby”
companies to seek partners in the M&A market. Private equity firms and finance
companies are themselves major players in the acquisitions market.
Nonbank lenders could gain more and updated information in the syndication
market if they participate frequently in loans to the same borrower. When nonbanks
repeatedly participate in loan originations, the estimated effect on prospective M&A
increases relative to borrowers with one-time lenders. When new or revised information
is produced during the loan amendment process, the prospects for future acquisitions are
again enhanced. A borrowing firm is significantly more likely to be acquired if it has at
least one nonbank loan amendment during the past three years.
We also examine three potential channels that different types of nonbanks could
exploit to take advantage of information gained in the loan market for M&A-related
purposes. We find that investment banks build larger networks of potential targets and
bidders than commercial banks. Institutional asset managers are more likely to launch
M&A bids themselves. Finally, we find that firms borrowing from institutional asset
managers and investment banks are more likely to receive M&A bids from acquirers
advised by investment banks that have made loans to the target. The fact that
professionals that work for financial firms frequently change jobs and spend time
socializing with one another could prove another prospective means of information
transfer, but we are not able to explore these channels empirically. We plan to examine
the role informal networks might play in M&A in further research.
38
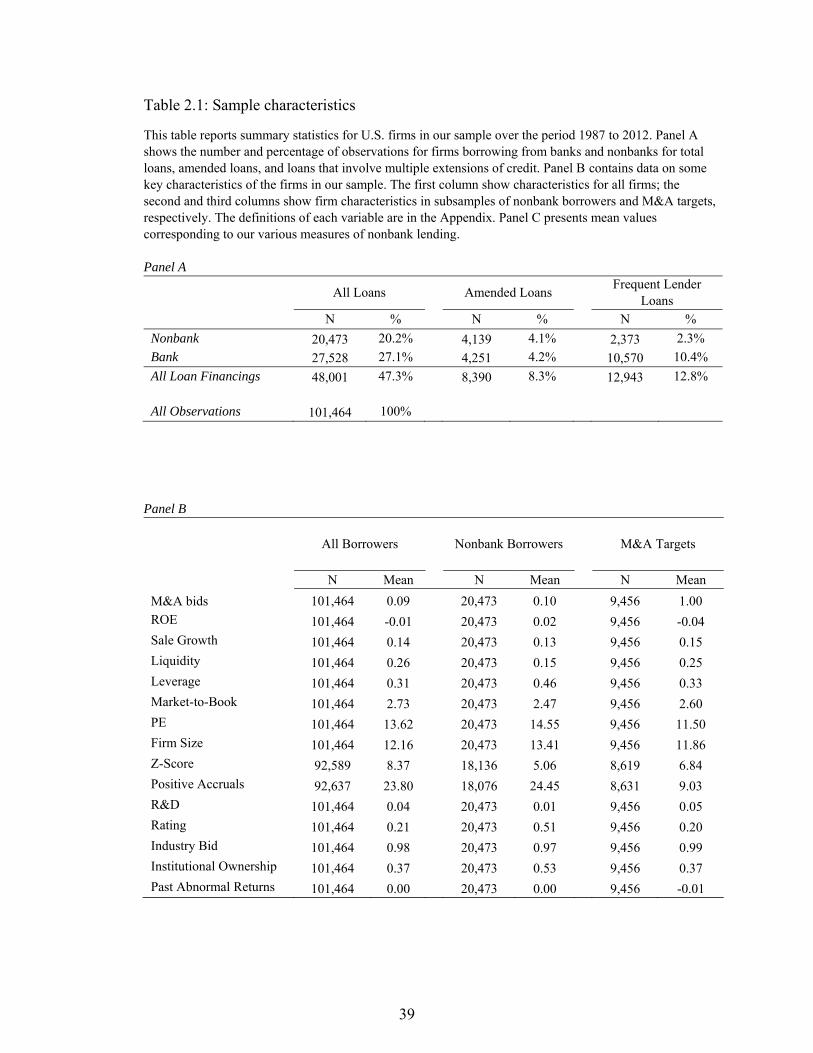
Table 2.1: Sample characteristics
This table reports summary statistics for U.S. firms in our sample over the period 1987 to 2012. Panel A shows the number and percentage of observations for firms borrowing from banks and nonbanks for total loans, amended loans, and loans that involve multiple extensions of credit. Panel B contains data on some key characteristics of the firms in our sample. The first column show characteristics for all firms; the second and third columns show firm characteristics in subsamples of nonbank borrowers and M&A targets, respectively. The definitions of each variable are in the Appendix. Panel C presents mean values corresponding to our various measures of nonbank lending. Panel A
All Loans Amended Loans Frequent Lender
Loans N % N % N %
Nonbank 20,473 20.2% 4,139 4.1% 2,373 2.3%
Bank 27,528 27.1% 4,251 4.2% 10,570 10.4%
All Loan Financings 48,001 47.3% 8,390 8.3% 12,943 12.8%
All Observations 101,464 100%
Panel B
All Borrowers Nonbank Borrowers M&A Targets
N Mean N Mean N Mean
M&A bids 101,464 0.09 20,473 0.10 9,456 1.00
ROE 101,464 -0.01 20,473 0.02 9,456 -0.04
Sale Growth 101,464 0.14 20,473 0.13 9,456 0.15
Liquidity 101,464 0.26 20,473 0.15 9,456 0.25
Leverage 101,464 0.31 20,473 0.46 9,456 0.33
Market-to-Book 101,464 2.73 20,473 2.47 9,456 2.60
PE 101,464 13.62 20,473 14.55 9,456 11.50
Firm Size 101,464 12.16 20,473 13.41 9,456 11.86
Z-Score 92,589 8.37 18,136 5.06 8,619 6.84
Positive Accruals 92,637 23.80 18,076 24.45 8,631 9.03
R&D 101,464 0.04 20,473 0.01 9,456 0.05
Rating 101,464 0.21 20,473 0.51 9,456 0.20
Industry Bid 101,464 0.98 20,473 0.97 9,456 0.99
Institutional Ownership 101,464 0.37 20,473 0.53 9,456 0.37
Past Abnormal Returns 101,464 0.00 20,473 0.00 9,456 -0.01
39

Table 2.1, continued Panel C
Dummy for Nonbank Presence
Number of
Participating Nonbanks
Number of Nonbank Clients
Institutional Asset Managers 0.68 1.77 29.17 Investment Banks 0.44 0.67 38.89 Other Nonbanks 0.33 0.94 8.80 Nonbank 1.00 3.38 72.54
Observations 20,473
40

Table 2.2: Nonbank lenders and the likelihood of M&A bids
This table reports the estimated effects of nonbank lending on the probability of subsequent M&A bids for borrowers. The dependent variable is a dummy equal to one if the firm becomes a target, and zero otherwise. Definitions of the variables are in the Appendix. The results in column (1) are for a pooled logit model; column (2) for a pooled linear probability model; column (3) for a fixed effects logit model; and column (4) for a fixed effects panel model. Industry fixed effects are the 48 industry dummies designated by Fama and French (1997). The t-statistics in parentheses are based on standard errors clustered at the firm level. For the fixed effects logit model, we adjust the t-statistics based on bootstrapped standard errors. The symbols *, **, and *** represent statistical significance at the 10%, 5%, and 1% levels, respectively.
41
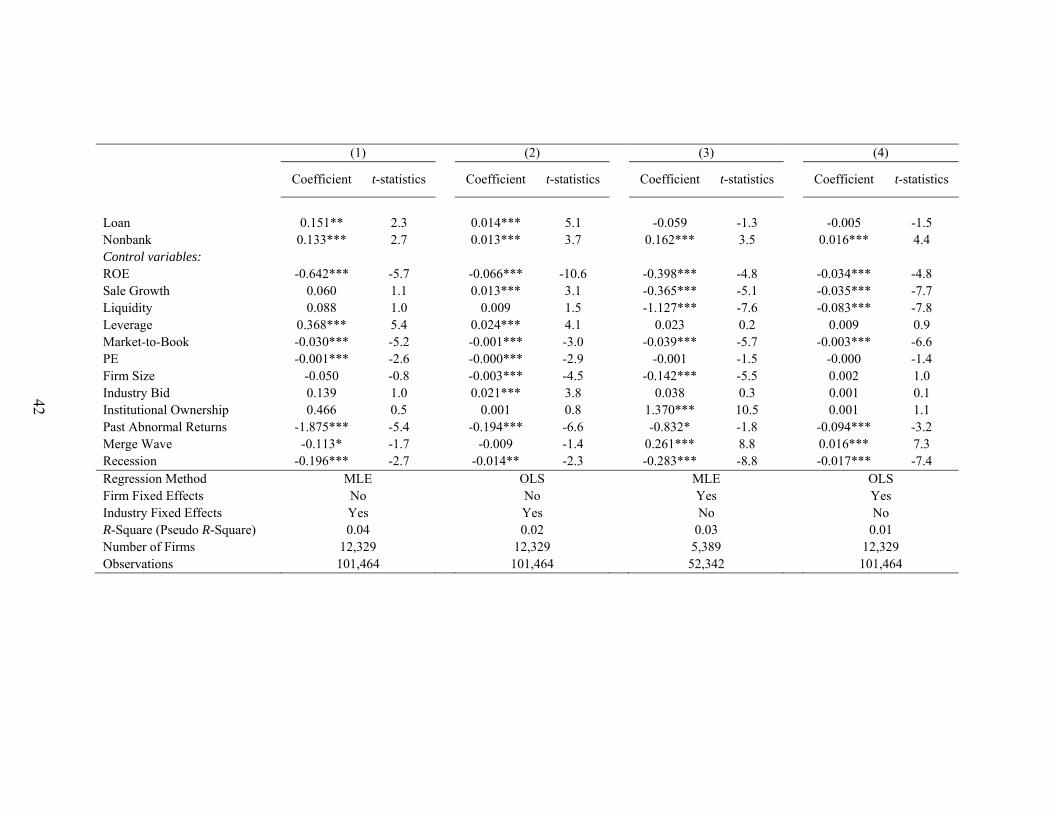
(1) (2) (3) (4)
Coefficient t-statistics
Coefficient t-statistics
Coefficient t-statistics
Coefficient t-statistics
Loan 0.151** 2.3 0.014*** 5.1 -0.059 -1.3 -0.005 -1.5 Nonbank 0.133*** 2.7 0.013*** 3.7 0.162*** 3.5 0.016*** 4.4 Control variables: ROE -0.642*** -5.7 -0.066*** -10.6 -0.398*** -4.8 -0.034*** -4.8 Sale Growth 0.060 1.1 0.013*** 3.1 -0.365*** -5.1 -0.035*** -7.7 Liquidity 0.088 1.0 0.009 1.5 -1.127*** -7.6 -0.083*** -7.8 Leverage 0.368*** 5.4 0.024*** 4.1 0.023 0.2 0.009 0.9 Market-to-Book -0.030*** -5.2 -0.001*** -3.0 -0.039*** -5.7 -0.003*** -6.6 PE -0.001*** -2.6 -0.000*** -2.9 -0.001 -1.5 -0.000 -1.4 Firm Size -0.050 -0.8 -0.003*** -4.5 -0.142*** -5.5 0.002 1.0 Industry Bid 0.139 1.0 0.021*** 3.8 0.038 0.3 0.001 0.1 Institutional Ownership 0.466 0.5 0.001 0.8 1.370*** 10.5 0.001 1.1 Past Abnormal Returns -1.875*** -5.4 -0.194*** -6.6 -0.832* -1.8 -0.094*** -3.2 Merge Wave -0.113* -1.7 -0.009 -1.4 0.261*** 8.8 0.016*** 7.3 Recession -0.196*** -2.7 -0.014** -2.3 -0.283*** -8.8 -0.017*** -7.4 Regression Method MLE OLS MLE OLS Firm Fixed Effects No No Yes Yes Industry Fixed Effects Yes Yes No No R-Square (Pseudo R-Square) 0.04 0.02 0.03 0.01 Number of Firms 12,329 12,329 5,389 12,329 Observations 101,464 101,464 52,342 101,464
42
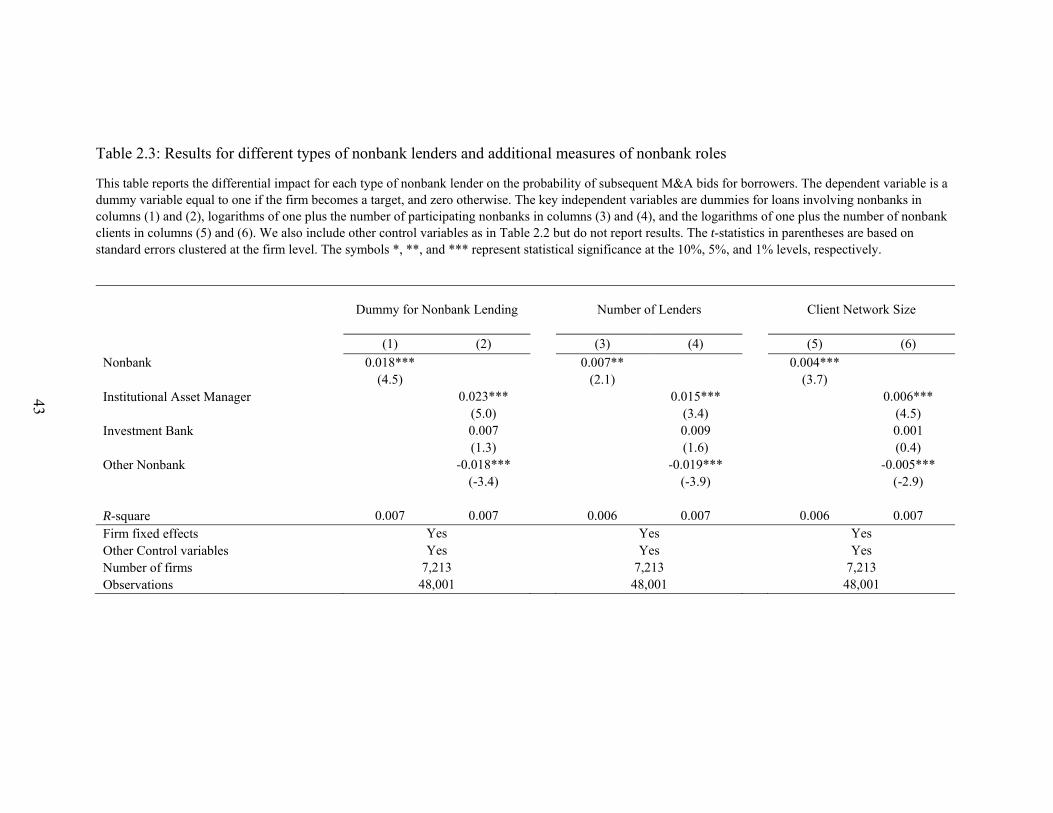
Table 2.3: Results for different types of nonbank lenders and additional measures of nonbank roles
This table reports the differential impact for each type of nonbank lender on the probability of subsequent M&A bids for borrowers. The dependent variable is a dummy variable equal to one if the firm becomes a target, and zero otherwise. The key independent variables are dummies for loans involving nonbanks in columns (1) and (2), logarithms of one plus the number of participating nonbanks in columns (3) and (4), and the logarithms of one plus the number of nonbank clients in columns (5) and (6). We also include other control variables as in Table 2.2 but do not report results. The t-statistics in parentheses are based on standard errors clustered at the firm level. The symbols *, **, and *** represent statistical significance at the 10%, 5%, and 1% levels, respectively.
Dummy for Nonbank Lending
Number of Lenders
Client Network Size
(1) (2) (3) (4) (5) (6)
Nonbank 0.018*** 0.007** 0.004*** (4.5) (2.1) (3.7)
Institutional Asset Manager 0.023*** 0.015*** 0.006*** (5.0) (3.4) (4.5)
Investment Bank 0.007 0.009 0.001 (1.3) (1.6) (0.4)
Other Nonbank -0.018*** -0.019*** -0.005*** (-3.4) (-3.9) (-2.9)
R-square 0.007 0.007 0.006 0.007 0.006 0.007 Firm fixed effects Yes Yes Yes Other Control variables Yes Yes Yes Number of firms 7,213 7,213 7,213 Observations 48,001 48,001 48,001
43
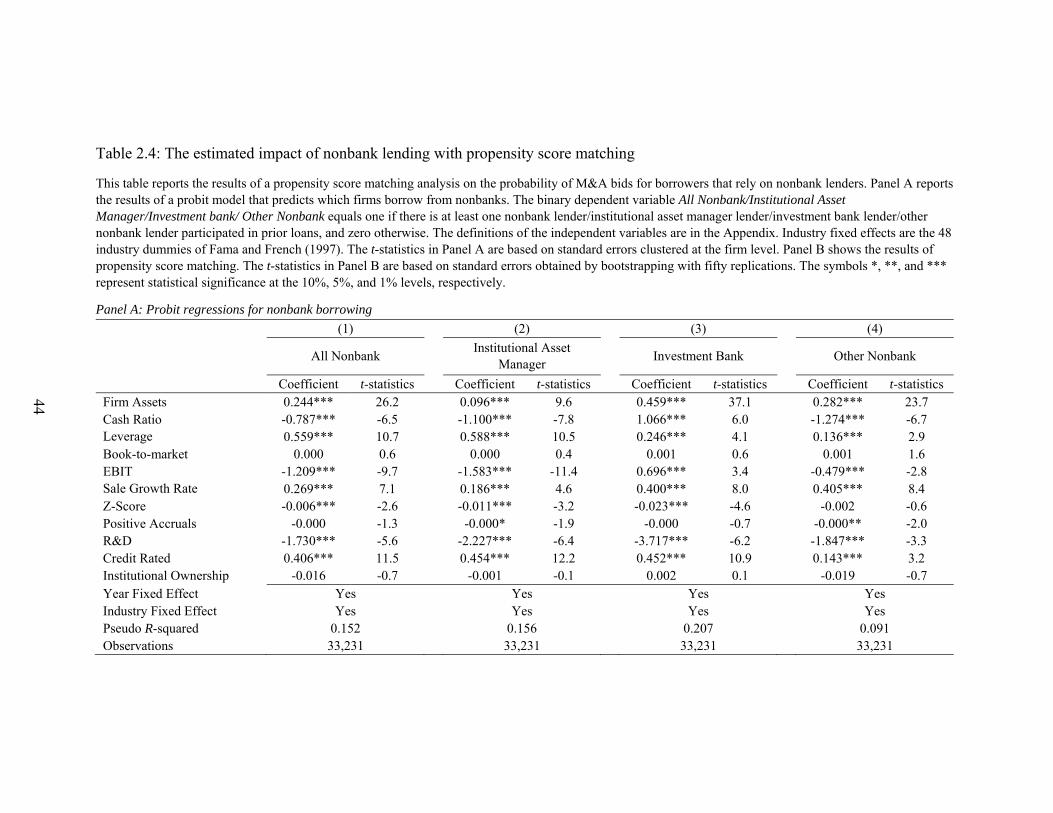
Table 2.4: The estimated impact of nonbank lending with propensity score matching
This table reports the results of a propensity score matching analysis on the probability of M&A bids for borrowers that rely on nonbank lenders. Panel A reports the results of a probit model that predicts which firms borrow from nonbanks. The binary dependent variable All Nonbank/Institutional Asset Manager/Investment bank/ Other Nonbank equals one if there is at least one nonbank lender/institutional asset manager lender/investment bank lender/other nonbank lender participated in prior loans, and zero otherwise. The definitions of the independent variables are in the Appendix. Industry fixed effects are the 48 industry dummies of Fama and French (1997). The t-statistics in Panel A are based on standard errors clustered at the firm level. Panel B shows the results of propensity score matching. The t-statistics in Panel B are based on standard errors obtained by bootstrapping with fifty replications. The symbols *, **, and *** represent statistical significance at the 10%, 5%, and 1% levels, respectively.
Panel A: Probit regressions for nonbank borrowing
(1) (2) (3) (4)
All Nonbank
Institutional Asset Manager
Investment Bank Other Nonbank
Coefficient t-statistics Coefficient t-statistics Coefficient t-statistics Coefficient t-statistics Firm Assets 0.244*** 26.2 0.096*** 9.6 0.459*** 37.1 0.282*** 23.7 Cash Ratio -0.787*** -6.5 -1.100*** -7.8 1.066*** 6.0 -1.274*** -6.7 Leverage 0.559*** 10.7 0.588*** 10.5 0.246*** 4.1 0.136*** 2.9 Book-to-market 0.000 0.6 0.000 0.4 0.001 0.6 0.001 1.6 EBIT -1.209*** -9.7 -1.583*** -11.4 0.696*** 3.4 -0.479*** -2.8 Sale Growth Rate 0.269*** 7.1 0.186*** 4.6 0.400*** 8.0 0.405*** 8.4 Z-Score -0.006*** -2.6 -0.011*** -3.2 -0.023*** -4.6 -0.002 -0.6 Positive Accruals -0.000 -1.3 -0.000* -1.9 -0.000 -0.7 -0.000** -2.0 R&D -1.730*** -5.6 -2.227*** -6.4 -3.717*** -6.2 -1.847*** -3.3 Credit Rated 0.406*** 11.5 0.454*** 12.2 0.452*** 10.9 0.143*** 3.2 Institutional Ownership -0.016 -0.7 -0.001 -0.1 0.002 0.1 -0.019 -0.7 Year Fixed Effect Yes Yes Yes Yes Industry Fixed Effect Yes Yes Yes Yes Pseudo R-squared 0.152 0.156 0.207 0.091 Observations 33,231 33,231 33,231 33,231
44

Table 2.4, continued Panel B: Propensity score matching: the probability of M&A bids
Treated sample Matching Sample Mean Difference (ATT)
(nonbank borrowers) (bank borrowers) Observations Mean Observations Mean Difference t-statistics
All Nonbanks 14,771 0.093 14,771 0.063 0.030 6.99*** Institutional Asset Managers 10,153 0.096 10,153 0.071 0.025 4.71*** Investment Banks 6,469 0.085 6,469 0.066 0.019 3.08*** Other Nonbanks 4,817 0.085 4,817 0.073 0.012 1.89*
45

Table 2.5: The estimated impact of nonbank lending with an instrumental variable (IV) approach
This table reports the results from IV estimations for the effect of the introduction of syndicated loan ratings on firms’ likelihoods of receiving future M&A bids. The dependent variable is a dummy variable equal to if the firm becomes a target in the coming year and zero otherwise. Panel A shows the first-stage regression of the 2SLS estimation with firm fixed-effects. The instrument variable is an indicator of introduction of syndicated loan rating that equal to one for the period after year 1995. The variables that we instrument for in each column is a dummy of nonbank presence, the logarithm of one plus number nonbank lenders, and the logarithm of one plus the number of nonbank clients. Panel B shows results of 2SLS regressions for our three measures of nonbank activity in the loan market. The t-statistics are based on standard errors clustered at the firm level. The symbols *, **, and *** represent statistical significance at the 10%, 5%, and 1% levels, respectively.
Panel A: First-stage regression of 2SLS Dummy of Presence Number of Lender Client Network Size
Coefficient t-statistics
Coefficient t-statistics
Coefficient t-statistics
Introduction of Syndicated Loan Rating 0.194*** 18.0 0.243*** 15.4 1.029*** 25.1 ROE -0.040*** -5.8 -0.050*** -4.9 -0.134*** -4.9 Sale Growth 0.001 0.1 0.007 1.1 0.019 1.1 Liquidity 0.033** 2.5 0.079*** 4.5 0.078 1.5 Leverage 0.223*** 15.8 0.353*** 16.0 0.757*** 13.2 Market-to-Book -0.004*** -6.8 -0.007*** -7.2 -0.018*** -6.9 PE -0.000* -1.7 -0.000** -2.1 -0.000** -2.5 Firm Size 0.035*** 14.6 0.051*** 14.2 0.161*** 16.0 Industry Bid -0.013 -1.3 -0.001 -0.1 -0.089** -2.1 Institutional Ownership -0.000 -0.7 -0.000 -0.3 0.000 0.1 Past Abnormal Returns -0.042 -1.4 -0.050 -1.3 -0.360*** -3.2 Merge Wave -0.049*** -15.7 -0.056*** -13.6 -0.224*** -19.1 Recession 0.006** 2.4 0.003 1.0 -0.036*** -4.1 R-square 0.182 0.130 0.145 Observations 48,001 48,001 48,001
46

Table 2.5, continued Panel B: IV results of 2SLS
Dummy for Nonbank
Lending Number of Lenders
Client Network Size
Coefficient t-statistics
Coefficient t-statistics
Coefficient t-statistics
Nonbank 0.234*** 7.2 0.187*** 7.0 0.044*** 7.5
ROE -0.016 -1.1 -0.016 -1.1 -0.022* -1.7 Sale Growth -0.033*** -3.7 -0.035*** -4.0 -0.035*** -4.0 Liquidity -0.075*** -3.4 -0.088*** -3.9 -0.069*** -3.2 Leverage -0.073*** -3.6 -0.103*** -4.3 -0.043** -2.6 Market-to-Book -0.001 -0.5 0.000 0.2 -0.001 -1.0 PE 0.000 0.3 0.000 0.5 0.000 0.5 Firm Size -0.020*** -5.0 -0.023*** -5.2 -0.018*** -4.9 Industry Bid 0.002 0.3 -0.003 -0.4 0.005 0.6 Institutional Ownership 0.000** 2.6 0.000** 2.4 0.000 1.6 Past Abnormal Returns -0.188*** -3.7 -0.193*** -3.7 -0.169*** -3.4 Merge Wave 0.022*** 5.3 0.020*** 4.9 0.019*** 5.0 Recession -0.016*** -4.2 -0.014*** -3.6 -0.009** -2.5
Firm fixed effects Yes Yes Yes
First-stage F-statistics 84.32*** 62.65*** 118.52***
Observations 48,001 48,001 48,001
47

Table 2.6: Estimated effects of nonbank lending for cases of frequent lenders and loan amendments
This table reports the effects of nonbank lending on M&A when borrowers have amended loans or borrow multiple times from the same bank. In Panel A, the dependent variable is a dummy variable equal to if the firm becomes a target and zero otherwise. The key independent variables are dummies reflecting nonbank lending. The results in column (1) are for a pooled logit model; in column (2) for a pooled linear probability model; in column (3) for a fixed effects logit model; and in column (4) for a fixed effects panel model. Industry fixed effects are the 48 industry dummies designated by Fama and French (1997). The t-statistics in parentheses are based on standard errors clustered at the firm level. The symbols *, **, and *** represent statistical significance at the 10%, 5%, and 1% levels, respectively. Panel B shows the mean differences between the treated and matching samples for all nonbank activity and for the s subgroups.
Frequent Lenders Loan Amendments
(1) (2) (3) (4)
Nonbank 0.025*** 0.012*
(3.3) (1.9)
Institutional Asset Manager 0.043*** 0.016**
(3.7) (2.0)
Investment Bank 0.009 0.004
(1.0) (0.5)
Other Nonbank 0.007 -0.038***
(0.3) (-2.9)
R-square 0.001 0.001 0.001 0.001
Firm fixed effects Yes Yes
Other Control variables Yes Yes
Number of firms 3,980 3,980
Observations 20,473 20,473
48

Table 2.6, continued Panel B
Treated sample Matching Sample Mean Difference (ATT)
(Amendment) (No Amendment)
Observations Mean Observations Mean Difference t-statistics
Nonbank 4,139 0.095 4,139 0.070 0.026 3.37*** Institutional Asset Manager 3,330 0.095 3,330 0.068 0.028 3.43*** Investment Bank 1,687 0.091 1,687 0.082 0.009 0.86 Other Nonbank 951 0.096 951 0.087 0.008 0.61
Panel C
Treated sample Matching Sample Mean Difference (ATT)
(Frequent lender) (Non-frequent lender)
Observations Mean Observations Mean Difference t-statistics
Nonbank 2,373 0.081 2,373 0.064 0.017 1.94*
Institutional Asset Manager 1,114 0.098 1,114 0.067 0.031 2.51**
Investment Bank 1,307 0.070 1,307 0.057 0.013 1.2
Other Nonbank 285 0.091 285 0.088 0.004 0.14
49

Table 2.7: Nonbanks pass information to other clients This table reports the results of Poisson regressions. The dependent variable is the number of M&A bids that a lender’s borrower receives from other clients that borrowed from the same lender. The t-statistics in parentheses are based on standard errors clustered at the firm level. *, **, and *** represent statistical significance at the 10%, 5%, and 1% levels, respectively.
(1) (2) (3)
Coefficient t-statistics
Coefficient t-statistics
Coefficient t-statistics
Nonbank -0.472 -1.6
Institutional Asset Manager -2.107*** -4.1 -2.386*** -4.5
Investment Bank 1.327*** 4.0 1.083*** 2.9
Other Nonbank -2.649*** -4.5 -2.649*** -4.5
Lead Arranger -0.946*** -3.3
Pseudo R-Square 0.03 0.08 0.10
Regression Method Poisson Poisson Poisson
Year Fixed Effects Yes Yes Yes
Observations 24,740 24,740 24,740
50

Table 2.8: Nonbanks launch M&A bids themselves
This table shows the results of probit regressions, where the dependent variable is an indicator equal to one if a firm receives an M&A bid from one of its lenders, and zero otherwise. The t-statistics in parentheses are based on standard errors clustered at the firm level. The symbols *, **, and *** represent statistical significance at the 10%, 5%, and 1% levels, respectively.
(1) (2)
Coefficient t-statistics
Coefficient t-statistics
Key independent variables: Loan -0.981 -0.6 0.633 0.6
Nonbank 4.363** 2.4 Institutional Asset Manager 3.987*** 4.7
Investment Bank 0.655 1
Other Nonbank -0.637 -1.1
Control variables: ROE -0.641** -2 -0.283 -0.9
Sale Growth -3.977*** -2.9 -4.189*** -3.5
Liquidity -2.420** -2.2 -1.809 -1.4
Leverage 0.111 1.3 0.057 0.7
Market-to-Book 0.046 0.7 0.052 1.3
PE 0 -0.4 0.001 0.8
Institutional Ownership 0.11 0.1 0.582 0.7
Past Abnormal Returns -2.944 -0.4 -4.202 -0.6
Regression Method Logit Logit
Year Fixed Effects Yes Yes
Industry Fixed Effects Yes Yes
Pseudo R-Square 0.3 0.39
Observations 1,605 1,605
51

Table 2.9: Nonbanks transfer information in the role of M&A advisor
This table shows the results of probit regressions, where the dependent variable is an indicator equal to one if a lender to the target firm acts as a financial adviser to the target or acquiring firm, and zero otherwise. The t-statistics in parentheses are based on standard errors clustered at the firm level. The symbols *, **, and *** represent statistical significance at the 10%, 5%, and 1% levels, respectively.
(1) (2)
Coefficient t-statistics
Coefficient t-statistics
Key independent variables: Loan 1.051*** 6.2 1.051*** 6.4
Nonbank 0.491*** 3.7 Institutional Asset Manager 0.368*** 2.7
Investment Bank 0.460*** 3.2
Other Nonbank 0.126 0.8
Control variables: ROE -0.008*** -2.6 -0.008*** -2.6
Sale Growth 0.097 0.5 0.084 0.5
Liquidity -1.855*** -5.4 -1.855*** -5.4
Leverage 0.103* 1.9 0.088* 1.7
Market-to-Book -0.000 -1.3 -0.000 -1.3
PE -0.000 -0.1 -0.000 -0.1
Institutional Ownership 0.002 1.1 0.002 1.1
Past Abnormal Returns -2.105 -1.4 -1.993 -1.3
Regression Method Logit Logit
Year Fixed Effects Yes Yes
Industry Fixed Effects Yes Yes
Pseudo R-Square 0.2 0.21
Observations 71,702 71,702
52

Table 2.10: Robustness test with alternative samples
This table reports the main results with alternative sample constructions. Column (1) shows the impact of nonbank lending on only successful bids. Column (2) uses a sample from 1994 to 2010. Columns (3) and (4) exclude large M&A advisors and large lenders from the sample. The t-statistics in parentheses are based on standard errors clustered at the firm level. The symbols *, **, and *** represent statistical significance at the 10%, 5%, and 1% levels, respectively.
(1)
Successful Bids (2)
Excluding Period 1987-1994
(3) Excluding Big M&A
Advisors
(4) Excluding Big Lenders
Coefficient t-statistics Coefficient t-statistics Coefficient t-statistics Coefficient t-statistics
Loan -0.002 -0.6 -0.008** -2.2 -0.004 -1.3 -0.005 -1.6 Nonbank 0.010*** 3.3 0.015*** 3.9 0.013*** 3.3 0.018*** 3.9 Control Variables: ROE -0.021*** -3.5 -0.016** -2.1 -0.032*** -4.5 -0.035*** -4.9 Sale Growth -0.037*** -10.0 -0.024*** -4.8 -0.033*** -7.0 -0.035*** -7.4 Liquidity -0.073*** -8.5 -0.073*** -6.2 -0.085*** -7.9 -0.086*** -7.9 Leverage 0.001 0.1 0.007 0.7 0.003 0.4 0.009 0.9 Market-to-Book -0.003*** -6.5 -0.002*** -3.5 -0.003*** -6.1 -0.004*** -6.9 PE -0.000 -0.6 -0.000 -0.4 -0.000 -1.2 -0.000* -1.9 Firm Size 0.002 1.5 -0.001 -0.7 -0.000 -0.1 0.002 1.0 Industry Bid 0.000 0.0 0.002 0.3 -0.000 -0.0 -0.004 -0.6 Institutional Ownership
0.000 1.1 0.000 1.1 0.018 1.6 0.000 1.1
Past Abnormal Returns
-0.044* -1.8 -0.143*** -4.4 -0.086*** -2.9 -0.091*** -3.0
Merge Wave 0.018*** 9.8 -0.021*** -8.3 0.017*** 7.3 0.017*** 7.2 Recession -0.016*** -8.4 0.007*** 2.6 -0.018*** -7.6 -0.018*** -7.6 Firm Fixed Effects Yes Yes Yes Yes R-Square 0.01 0.01 0.01 0.01 Number of Firms 12,329 76,804 97,045 93,612 Observations 101,464 10,764 12,241 12,179
53

Table 2.11: Robustness tests with different lengths of estimation windows
This table shows our main results using different specifications of dependent variables. In Panel B, [-1, 1] indicates the impact of nonbank lending in past one year on the probability of M&A bids in next one year; [-2, 1] indicates the impact of nonbank lending in past two years on the probability of M&A bids in next one year; [-3, 1] indicates the impact of nonbank lending in past three years on the probability of M&A bids in next one year; [-4, 1] indicates the impact of nonbank lending in past four years on the probability of M&A bids in next one year; [-1, 2] indicates the impact of nonbank lending in past one year on the probability of M&A bids in next two years; [-2, 2] indicates the impact of nonbank lending in past two years on the probability of M&A bids in next two years [-3,2] indicates the impact of nonbank lending in past three years on the probability of M&A bids in next two years; [-3, 2] indicates the impact of nonbank lending in past three years on the probability of M&A bids in next two years; [-4, 2] indicates the impact of nonbank lending in past four years on the probability of M&A bids in next two years. Our results reported in the previous tables are based on [-4, 2]. We do not report results for control variables to save space.
(1) (2) (3) (4)
[-1,1] [-2,1] [-3,1] [-4,1]
Coefficient t-statistics
Coefficient t-statistics
Coefficient t-statistics
Coefficient t-statistics
Loan -0.011*** -3.8 -0.011*** -3.7 -0.005 -1.5 -0.000 -0.1
Nonbank 0.011** 2.6 0.014*** 3.8 0.016*** 4.4 0.016*** 4.4
R-square 0.006 0.007 0.007 0.007
Firm fixed effects Yes Yes Yes Yes
Observations 101,464 101,464 101,464 101,505
(5) (6) (7) (8)
[-1,2] [-2,2] [-3,2] [-4,2]
Coefficient t-statistics
Coefficient t-statistics
Coefficient t-statistics
Coefficient t-statistics
Loan -0.016*** -3.0 -0.017*** -3.1 -0.007 -1.2 -0.002 -0.4
Nonbank 0.014* 1.8 0.022*** 3.2 0.023*** 3.5 0.024*** 3.6
R-square 0.009 0.009 0.009 0.009
Firm fixed effects Yes Yes Yes Yes
Observations 117,814 117,814 117,814 117,814
54

Figure 2.1: Percentage of banks and nonbanks relative to all participants in the U.S. loan market
The bar graphs reflect the number of U.S. commercial bank lenders and non-bank lenders as a percentage of all lenders in the U.S. loan market. The category of lenders not shown in the figure is foreign banks.
0%
10%
20%
30%
40%
50%
60%
1987 1988 1989 1990 1991 1992 1993 1994 1995 1996 1997 1998 1999 2000 2001 2002 2003 2004 2005 2006 2007 2008 2009 2010
Nonbank Financial Institutions U.S. Commercial Banks
% o
f th
e to
tal n
umbe
r of
lend
ers
Year
55

Chapter Three: Nonbank Loan Covenants and Their Implications for Borrowers
1. Introduction
Nonbank financial institutions have become significant providers of commercial
loans in past two decades, especially following the introduction of ratings on syndicated
loans in the mid-1990’s (Boot et al. 2006; Sufi 2009; Agarwal and Meneghetti 2011;
Kang and Mullineaux 2011). According to DealScan, a comprehensive loan database, the
proportion of nonbank lenders in the syndication market increased from 25% in 1987 to
80% in 2007, and more nonbank than commercial bank lenders extended such credits in
every year after 1998 (Figure 1). Nonbank loans increased from $19 billion in 1988 (12%
of total loans outstanding) to $1.5 trillion dollars in 2007 (35% of total loans) before the
loan market collapsed during the recent financial crisis (Figure 2). Nonbanks are also
more likely to arrange loans, meaning they take more primary responsibility for
negotiating the terms of each loan and facilitate monitoring by the syndicate members. In
this paper, we study loans that are arranged by non-commercial banks in the private debt
market, including finance companies, insurance companies, institutional investors, and
some other asset management firms.
Although nonbank loans are an economically important financing source, prior
empirical work on debt covenants has not distinguished between nonbank and bank
providers, implicitly assuming that the distinction is of no empirical relevance. Studies
have usually focused on bond covenants, where borrower characteristics are the major
factors affecting covenant structures (Smith and Warner 1979; Malitz 1986; Leland 1994;
Billett, King and Mauer 2007; Gârleanu and Zwiebel 2009). In private debt contracts like
56

loans, however, the covenants are negotiated between borrowers and lenders. We believe
that supply-side factors, particularly the institutional nature of the lender, could play a
role in shaping the terms of the loan contract.
We find that nonbank borrowers and lenders negotiate fewer and less restrictive
financial covenants than those common in commercial bank loans at the time of contract
originations. We compare the “tightness” of loan covenants contained in commercial
bank and nonbank loan contracts using five different measures of covenant “strictness.”
Holding borrower risk and other loan characteristics fixed, we find that nonbank loan
contracts have different covenant structures than bank loans. Interestingly, although
nonbank borrowers are riskier, in general, than bank borrowers, we consistently find that
nonbanks impose less restrictive constraints on the financial condition of their borrowers
than banks do. We use propensity-score matching to address the identification issue and
find a robust, negative relationship between nonbank loans and covenant strictness.
Nonbanks might rely less heavily on financial covenants than bank because they
have less incentive to monitor loans. Because banks rely, to some extent, on insured
deposits to fund loans, each of their credit decisions is potentially subject to review, and
criticism, from bank examiners. Banks with excessive credit risk exposures face costly
intervention by regulators, such as increased capital requirements, monetary fines, or
restrictions on strategic decisions, such as mergers and acquisitions. Most nonbanks, on
the other hand, usually treat commercial loans as an investment and hence are less likely
57

to place significant value on the “relationship” aspect of lending.31 Consequently,
nonbanks could prove more inclined to sell loans than commercial banks, which could
result in relatively less incentive to monitor their borrowers.
Nonbank behavior could also differ from that of banks when borrowers violate the
conditions established by the covenants, which represent situations of “technical default.”
While violating a covenant usually grants the lender the option to demand immediate
repayment of the loan, more commonly commercial banks respond by renegotiating the
terms of the loan contract, sometimes in ways that limit the borrower’s discretion to
undertake new investments or seek new financing. Although the prior literature shows
that banks play an active role in corporate governance following covenant violations, we
find that nonbanks are less likely to intervene in borrowers’ decision making in similar
circumstances. Using a first-difference specification similar to Nini, Smith and Sufi
(2012), we find no evidence that nonbank borrowers change their investment or financing
strategies after covenant violations.
We also investigate the implications of nonbank lending on firm behavior in states
of serious financial distress. Although covenant violations increase the probability of firm
exits through bankruptcy or liquidation, we find again that the outcome differs between
bank and nonbank lenders. Nonbank borrowers are significantly more likely than bank
clients to experience severe financial distress, such as delisting from stock exchanges or
declaring bankruptcy. However, while such outcomes are unambiguously negative events
31 Commercial banks are more likely to sell commercial customers a package of services, of which loans a
just one component. Other services could include transactions processing, treasury and cash management, and payroll or pension-related services. The value of “relationship” to a bank reflects the present value of the cash flows generated by the service package (Petersen and Rajan 1994).
58
for banks, nonbanks in some circumstances can exploit these situations to create value by
means unavailable to banks. In particular, nonbanks might seek to take control of its
defaulting borrower via acquisition. Regulations preclude banking organizations from
owning nonbank entities.
2. Literature Review
Loan covenants are conditions that lenders write into loan agreements that
borrowers must satisfy continuously over the life of the loan in order to avoid technical
default.32 Rajan and Winton (1995) demonstrate that covenants can be rationalized as
mechanisms that provide lenders with an incentive to monitor the borrower. Covenants
can require certain behaviors (submit audited financial statements quarterly) or preclude
certain actions that might adversely affect borrower cash flow (no sale of assets or change
in business strategy). Historically, bank loan contracts have contained an array of
“financial covenants,” which require borrowers to maintain certain financial ratios above
or below specified levels (e.g., debt-to-EBITDA should not exceed 3.25.) Lenders could
also include other types of covenants in the credit agreement, such as “excess cash flow
sweeps” or dividend restrictions 33
Prior empirical work on loan covenants focuses mainly on identifying the
borrower characteristics that influence covenant structure. Early research by Jensen and
Meckling (1976), Myers (1977), and Smith and Warner (1979) shows that covenants in
32 Technical default differs from “financial default, which occurs when borrowers fail to make required
interest or principal payments... 33 An excess cash flow sweep covenant requires the borrower to use any excess free cash flows to pay
down the loan ahead of schedule.
59

debt contracts help mitigate agency problems and conflicts of interest between debt and
equity holders. Billett et al. (2007) investigate a large sample of bond covenants and find
that covenant protection is increasing in growth opportunities, debt maturity, and
leverage. Bradley and Roberts (2004) examine corporate loans, finding that loans to high-
growth firms contain dividend restrictions, collateral requirements, and tighter financial
covenants than loans to less growth-oriented firms. Nini, Smith and Sufi (2009) focus on
one financial covenant, the capital expenditures restriction, and find that creditors are
more likely to impose this restriction on borrowers with lower credit quality.
Demiroglu and James (2010) analyze the tightness of covenants by looking at
variability in the thresholds established for financial covenants such as the current ratio
and the debt-to-cash flow ratio. They find that riskier borrowers and firms with less
valuable growth options obtain loans with tighter financial covenants and suggest that
borrowers choose tight covenants to credibly signal favorable information about their
future performance.
Li, Vasvari and Wittenberg-Moerman (2012) focus on the dynamic thresholds in
earnings-based covenants with threshold values that become increasingly restrictive over
the life of a syndicated loan contract. They find that riskier borrowers negotiate gradually
tightening covenants. Rather than signaling favorable information, they contend that tight
covenants convey lenders’ concerns about borrowers’ future performance. In this paper,
we extend the literature by showing that lender type also plays a critical role in shaping
loan covenant structure.
60

Our paper, to the best of our knowledge, is the first to document the differential
influence of nonbank creditors on the structure of loan covenants. Carey, Post and Sharpe
(1998) compare commercial loans made by banks and finance companies and find that
finance-company borrowers are more highly leveraged than bank customers, but do not
present significantly different levels of information asymmetry. Denis and Mihov (2003)
show that nonbank loans accommodate the financing needs of firms with lower credit
quality. Harjoto et al. (2006) compare pricing policies between commercial banks and
investment banks and find that investment banks lend to less profitable, more leveraged
firms, price riskier classes of term loans more generously, and offer relatively longer-
term credits, usually with term, not commitment contracts. Lim, Minton and Weisbach
(2012) find borrowers pay larger premiums on nonbank loans, especially when borrowers
face financial constraints and when capital is less available from banks. We compare
covenant structures between nonbank loans and bank loans and find that nonbanks tend
to impose some less restrictive covenant structures in debt contracts, despite the fact that
their clients are typically more leveraged than bank borrowers.
61

3. Sample Construction and Covenant Characteristics
3.1. Data sources and sample construction
We obtain a comprehensive sample of loan contracts from Reuters Loan Pricing
Corporation’s DealScan database over the period of 1995-2012.34 We begin our sample
in 1995 because nonbank lending is fairly minimal prior to that year.35
In this paper, we treat non-depository lending institutions as nonbanks, which
include an array of institutional investors, investment banks, and some other type of
nonbanks. The primary institutional investors participating in the commercial loan market
are hedge funds, mutual funds, private equity funds, pension funds, and finance
companies. To identify institutional investors, we rely on DealScan’s classification and
note when the lender’s type is “Finance Company,” “Institutional Investor – Hedge
Fund,” “Institutional Investor – Prime fund,” “Mutual Fund,” “Pension Fund,” “Vulture
Fund,” or “Insurance Company.” We also treat a lender as an institutional investor if its
name is listed on the hedge/private equity fund database maintained by Barclay. A lender
falls in the category of investment bank if the lender’s type in DealScan is “investment
bank.” We group the lenders in the category of “other nonbanks” when the lender’s type
is “Leasing Company,” “Specialty,” “Corporation,” or “Trust Company.” To identify a
commercial bank, we start from DealScan’s classification as “US Bank,” “Thrift/S&L,”
“Asia-Pacific Bank,” “Western European Bank,” “East Europe/Russian Bank,” or
34 According to Bradley and Roberts (2004), the database contains most of the sizable commercial loans
originated over this period. About half of the Dealscan loan data are from SEC filings, and the remainder comes from contacts within the credit industry and from borrowers and lenders.
35 S&P first started rating syndicated loans in 1995 and the Loan Syndications and Trading Association (LSTA) was founded in 1995.
62

“Middle Eastern Bank.” We also check and add lenders with primary Standard Industrial
Classification (SIC) codes between 6011 and 6082, or between 6712 and 6719, to the
category of commercial banks.
Since our focus is on loan covenant structure, we require loans with non-missing
information on financial covenants. For each loan, we also obtain characteristics other
than the covenant structure from DealScan. We require non-missing data on loan pricing,
loan size, and maturity. Borrowers usually obtain multiple loan “facilities” or “tranches”
at the same time and group them in one “package” of loans or “deal.” Although covenant
structure remains the same for each loan in a deal, some loan characteristics such as loan
spreads and maturities are specific to the facility level. Since our main interest is loan
covenants, we carry out our analyses at the deal level and create an average of loan
spreads and maturities across all facilities in each deal, weighted by the size of the loan in
each facility as a percentage of the full deal.
We obtain control variables for borrower characteristics by matching each loan
contract with the quarterly Compustat database based on the DealScan-Compustat link
file from Chava and Roberts (2008). We limit the sample to all nonfinancial U.S. firms
with average book assets greater than $10 million in 2011 dollars and to firm-quarters at
loan originations with five available data items: total assets, total sales, common shares
outstanding, closing share price, and the calendar quarter of the filing. There are 10,552
contracts issued by 4,723 publicly traded firms matched successfully to the quarterly
Compustat. We also add an indicator of financial covenant violations for each firm
63
quarter from 1996 to 2008, which is collected from SEC 10-K and 10-Q filings by Nini et
al. (2012).36
3.2. Measures of covenant strictness
Dealscan provides detailed information about financial covenants and whether a
loan includes prepayment or dividend restrictions. We measure the strictness of a given
covenant structure in several ways. By “strictness,” we mean the extent to which the
covenants constrain the borrower’s capacity to make various business decisions. The first
set of measures are based on financial covenants, which are contractual provisions
requiring that specified accounting variables or ratios be maintained above (below)
established minimums (maximums) over the life of the loan contract. We collect 17 types
of financial covenants that are relatively common components of loan contracts from
DealScan.37 We use the Number of Covenants as a simple count index of the total number
of financial covenants included in a loan contract. The index assumes that a contract is
more stringent if there are more financial covenants in the contract. A loan with more
covenants will give the lender more monitoring power, enhanced prospects for technical
default, and greater capacity to constrain borrower activity. For instance, a loan with a
36 Nini et al. (2012) provide details on how the data base is constructed. Their dataset reveals when
covenant violations occur, but does not report which covenant was breached or on what loan. We assume the borrower violates covenants during the life of the most recent effective contract.
37 The financial covenants includes maximum debt to EBITDA, minimum interest coverage, minimum fixed-charge coverage, maximum capital expenditure, maximum leverage ratio, maximum debt to tangible-net-worth, minimum current ratio, minimum debt-service coverage, maximum senior-debt to EBIDTA, maximum debt to equity, maximum loan to value, maximum senior leverage, minimum cash-interest coverage, minimum quick ratio, minimum EBIDTA, minimum net-worth, and minimum tangible-net-worth. We give detailed definitions of each covenant in the Appendix.
64

single net worth covenant is less restrictive than a loan with both a net worth and cash
flow covenant.
One shortcoming of the count index is that it fails to capture the initial degree of
“slack” in each covenant, measured as the distance between the borrower’s accounting
numbers at loan initiation and what is allowed under the specified financial covenants.
With the same number of covenants, borrowers should be more likely to breach a
covenant with ratios set closer to the borrower’s current levels.38 To take account of both
the number of covenants and the degree of slack of each covenant, we follow Murfin
(2012) and create a comprehensive measure of covenant strictness. The Murfin Index also
considers the scale of contractual slack and the covariance between covenant ratios. First,
the same slack for different covenant ratios/levels could indicate very different distances
to trigger default.39 Also, because renegotiation could be triggered by any single covenant
violation, a loan contract with more independent covenant ratios has higher probability of
a violation, holding all else equal.40 In general, the Murfin Index captures the ex-ante
probability of a forced renegotiation between lender and borrower by considering the
number, slackness, scale, and covariance of financial covenants. It is estimated as:
1 ( , ~ 0, Σ , 12………………………………(1)
38 For example, a firm with a leverage ratio (defined as total debt to equity) of 1.5 at the time of loan
inception is more likely to violate the covenant if the lender requires a maximum leverage ratio of 1.6 rather than 1.8.
39 For example, a slack equal to one for capital expenditure indicates a one-dollar increase in capital expenditures would trigger the covenant violation, while the same slack for a leverage ratio covenant means the ratio of debt to total assets can change between 0.01 and 1 without any consequence.
40 For instance, a contract having a leverage covenant and an equity-to-asset ratio covenant should be less stringent than a contract with a leverage covenant and a cash-flow covenant since constraints on leverage also have implications for a borrower’s equity to asset ratio but not its cash flow.
65
where is the multivariate normal cumulative distribution function with mean 0 and
varianceΣ; Σ is the covariance matrix associated with quarterly changes in the logged
financial ratios of borrowers. We use rolling 10-year windows of backwards-looking data
to estimate Σ on each one-digit SIC industry. is the slack of each covenant
calculated as the absolute difference between the observed ratio in Compustat and the
contractual threshold in DealScan at the inception of the loan. is the variance of each
covenant slack.41
Although taking account of covenant slack makes the strictness measure more
complete, there are also some potential drawbacks with using such measures. First, we
lose some observations by requiring that the financial ratios are also calculable in
Compustat. Second, covenant slack is usually measured with error due to the fact that
lenders often rely on different definitions of financial concepts in establishing covenant
ratios (Dichev and Skinner 2002; Li et al. 2012).
Many loan contracts contain “covenant grids” which establish a dynamic
threshold with either a tightening or loosening trend for the relevant variable or ratio over
the life of the loan agreement. For instance, Johnstown America has such a covenant on
maximum capital expenditures in its syndicated credit agreement arranged by Chase
Manhattan (April 29, 1999). The covenant gets progressively less restrictive or “looser”
over time. According to the covenant, Johnstown America cannot spend more than $25
million on capital goods prior to December 31, 1999, but the limit increases to $30
million after the end of that year. The contract also contains a covenant specifying a
41 See Murfin (2012) for more detail on the construction of this variable.
66

maximum debt-to-EBITDA that gets progressively tighter over time, requiring Johnstown
America to maintain this ratio below 4 for the first four quarters, then 3.75 for the next
four quarters, and 3.5 thereafter.
In our sample, 60% of loans have at least one covenant grid in the financial
covenants. We label covenants as “build up” when a specified trend becomes
progressively more restrictive and “build down” when the trend becomes less restrictive
over the contract’s life.42 We construct two indicator variables to measure the dynamic
strictness of covenants: Build Up and Build Down. Build Up equals one if there is any
covenant in the contract reflecting a more restrictive trend; Build Down equals one if any
covenant has a less restrictive trend. For contracts with the same number of financial
covenants, we expect a borrower to have less financial flexibility if the Build Up value
equals one.
In addition to financial covenants, a loan contract can contain prepayment
covenants and/or dividend restrictions. DealScan contains several types of prepayment
covenants: equity sweeps, debt sweeps, and asset sweeps, which designate the percentage
of the loan that must be repaid if certain conditions occur.43 Also, lenders can include a
dividend restriction to limit the ability of the firm to distribute cash to its stockholders
under certain conditions. DealScan contains a flag variable indicating the presence of
such a restriction. We use Bradley and Robert’s (2004) covenant intensity index to take
42 Demiroglu and James (2010) define the strictness of covenants based on the level of covenant
thresholds. However, most financial covenants suffer significant measurement errors because lenders often make substantial adjustments to GAAP numbers when defining covenant thresholds (Dichev and Skinner 2002; Li et al. 2012) .
43 For example, a loan contract containing a 30% of equity sweep means that if the firm sells more than a certain dollar amount of equity, it must repay 30% of the principal value of the loan.
67

account of non-financial covenants. The Bradley and Roberts Index assigns one point for
the presence of each of the following six conditions: a dividend restriction, more than
two financial covenants, an asset sweep, a debt sweep, an equity sweep, or the loan is
secured. The Bradley and Roberts Index measures the scale of restrictions on borrowers
and whether lenders can intervene under adverse future events. The index ranges from 0
to 6 and a contract becomes more stringent as the index value increases.
3.3. Summary of sample
Table 3.1 shows summary statistics on the use of financial covenants by banks
and nonbanks, borrower characteristics, and loan contract terms in our final sample. We
identify a contract as a nonbank loan if the lead arranger of each loan in the contract is a
nonbank institution.44 On average, nonbank loans contain an almost identical number of
covenants (2.64) to bank loans (2.65), but nonbank loans contain more covenants with a
build-up or build-down threshold trend. As in Li et al. (2012), our sample reveals that
covenants with a less restrictive trend are uncommon. Although the Bradley and Roberts
Index shows that nonbanks impose more restrictions in their contracts, the Murfin Index
for the median loan indicates that bank loans (0.42) are slightly more restrictive than
nonbank loans (0.41).
Panel B of Table 3.1 is a summary of other loan contract terms. On average, a
bank loan contract has a size of $170 million and 9 syndicate lenders, while nonbank
loans are larger ($204 million), but have slightly fewer syndicate lenders (8 lender per
44 We have 434 loan contracts that are co-led by nonbanks and banks. To avoid any potential bias, we do
not identify these contracts as nonbank loan contracts and delete them from the sample. However, the main results of this paper are qualitatively similar with and without the observations.
68

loan). More banks (76%) than nonbanks (64%) include performance pricing in loan
contracts, which means the interest spreads on bank loans are more likely to vary with the
borrower’s performance in a specified manner. As noted above, lenders also impose
restrictions other than financial covenants in loan contracts. In our sample, more nonbank
loan contracts (83%) have restrictions on dividend payouts to shareholders than bank
loans (76%), and over half nonbank loans include sweep provisions that require a portion
of any cash generated by asset-sales, security issuance, or insurance payments to be used
to pay down loan principal. The weighted average maturity of a nonbank loan is 4 months
longer than a bank loan, and nonbank loan premiums are almost 100 basis points higher
than bank premiums. Consistent with prior literature, nonbank loans are more likely to be
leveraged loans and secured by some collateral. With respect to loan purposes, borrowers
tend to borrow more often from nonbanks for takeover deals and go to banks more for
other purposes, such as debt repayment and working capital. All of the differences
identified pass the standard statistical significance test.
We show borrower characteristics at the time of loan origination in Panel C of
Table 3.1. Nonbank borrowers are similar in asset size to bank borrowers, but have lower
market-to-book ratios, current ratios, and net worth ratios. Nonbank borrowers in general
present less information asymmetry problems, since more of them have S&P loan credit
ratings (49%) than bank borrowers (44%). In terms of credit quality, nonbank borrowers
are significantly riskier than bank borrowers, as reflected in their higher leverage ratios
and lower z-scores.
69

We also segregate the group of nonbanks into three categories: institutional asset
managers, investment banks, and other nonbanks. Institutional asset managers are finance
companies, hedge funds, prime funds, private-equity funds, mutual funds, and insurance
companies. Other nonbanks include corporations, CDOs, leasing companies, pension
funds, and trust companies. Panel D of Table 3.1 shows the covenant structure for
different types of nonbank loans. Although nonbanks such CDOs, trust companies, and
some corporations are active participants in the commercial loan market, they rarely
arrange loans themselves. In our sample, most nonbank loan arrangers are institutional
asset managers. Panel D indicates that investment banks are the primary driver of the
more restrictive covenants on nonbank loans reported in Panel A.
Table 3.2 reports the frequency of covenants and the distribution of different
covenant types. Among the 17 financial covenants in our sample, the most common is a
maximum for a borrower’s debt-to-EBIDTA. It appears in 6,154 loan contracts (58% of
the sample), and 45% of them are build-ups, while only 1% are build-downs. Restrictions
on net worth, interest coverage, fixed charge coverage and capital expenditures are also
relatively popular in loan agreements.45 Although a minimum EBITDA covenant only
appears in 10% of the sample loan contracts, over half of them are build-ups (66%).
4. Nonbank Loans and the Covenant Strictness
We now examine the impact of nonbank lending on the tightness of financial
covenants. Theory suggests that the allocation of control rights, which is determined in
45 All of the covenants on minimum net worth in DealScan are build-ups.
70
part by covenant structure, could be related to uncertainty concerning the borrowing
firm’s prospects, asymmetric information, monitoring and renegotiation costs, or
incentive conflicts (Gârleanu and Zwiebel 2009). The extant empirical literature finds
that loans to firms with low credit quality contain more covenants (Bradley and Roberts
2004; Billett et al. 2007; Nini et al. 2009; Demiroglu and James 2010). We examine the
effects of nonbank lending on contract strictness, measured in several different ways,
using the following regression model:
, ∗ , ∗ , ∗ ,
, , …………………… . . 2
where Nonbank is an indicator variable equal to one if the loan’s lead arranger is a
nonbank institution, LoanPurpose is a set of dummies variables capturing one of four
stated purposes at the time of loan origination (acquisition, debt repayment, general
corporate, or working capital),, Industry represents the 49 industry dummies designated
by Fama and French (1997), and Quarter represents calendar quarter indicator variables.
Strictness is the dependent variable. We construct five measures of the “tightness”
of covenant and estimate separate regressions for each. We first use Number of
Covenants, the total number of covenants in a loan contract, assuming that a contract is
more restrictive when it contains more covenants. Second, we use Build-Up, an indicator
of any financial covenant with a tightening trend over the life of the contract. Third, we
also include Build-Down, an indicator of any financial covenant with a loosening trend
over the life of the contract. We also use the Bradley and Roberts Index, which assigns
one point for the presence of each of the six indicators mentioned above: collateral,
71

dividend restrictions, more than two financial covenants, asset sweeps, debt sweeps, or
equity sweeps. The last measure is the Murfin Index, a proxy for the ex-ante probability
of a forced renegotiation between lender and borrower considering the number,
slackness, scale, and covariance of financial covenants.
The set of BorrowerControl variables include proxies for a firm’s default
prospects and information asymmetry characteristics and includes a firm’s size, z-score,
credit rating, current ratio, leverage ratio, net worth ratio, and market-to-book ratio.
Following Massoud et al. (2011), Maskara and Mullineaux (2011), and Agarwal and
Meneghetti (2011), we use the leverage ratio and the Altman z-score as proxies for firm
credit risk, and asset size, the book-to-market and net worth ratios as measures of
idiosyncratic risk. We also add an indicator variable, which is equal to one if the firm has
a S&P long term rating, to our model to measure the scope of information asymmetries.46
Following Demiroglu and James (2010) and Li et al. (2012), we also control for a
number of loan characteristics. The set of variables labeled LoanControl includes loan
size (the logarithm of loan contract amount), performance pricing (an indicator equal to
one if the loan contract contains a performance-based pricing provision), sweep provision
(an indicator equal to one if the loan contract requires a portion of cash generated by
asset-sales, security issuance, or insurance used to pay down principal), dividend
restriction (a dummy variable equal to one if the borrower is restricted from paying
dividends to its shareholders), syndicate size (the total number of lenders in a loan
46 Since many of the firms in our sample are unrated, we use a dummy for rated/unrated borrowers instead
of a numerical level corresponding to S&P credit ratings. When we replicate the analysis by using S&P credit ratings for the 4,367 available observations, the coefficient of credit rating remains negative and significant at the 1% level.
72

contract), loan spread (the weighted average interest spread across facilities in the loan
package, where the weights are the size of each facility), loan maturity (the weighted
average of loan maturities in months across facilities in the loan package, where the
weights are the size of each facility), secured (an indicator variable equal to one if lenders
hold collateral against any facility in the loan contract), and leveraged loan (an indicator
variable equal to one if any facility in the contract is a leverage loan or non-investment
grade loan). We expect loan size and maturity to be positively associated with the
tightness of covenants because empirical evidence shows that credit risk increases with
both. Dennis and Mullineaux (2000) and Sufi (2007) show that larger syndicate size
involve higher negotiation and administrative costs, so we expect larger syndicates to be
associated with more covenant restrictions.47
Table 3.3 reports results for the five models. We use Poisson estimation for the
dependent variable Number of Covenants and Bradley and Roberts Index, Probit
estimation for Build Up and Build Down, and linear regression for Murfin Index. For the
regression on the Bradley and Roberts Index, we exclude sweep provision, dividend
restriction, and secured as explanatory variables since the index includes these variables
in its construction. Standard errors are robust to heteroscedasticity and clustered at the
borrower level.
In Panel A, the results in columns (2) to (5) show that covenant tightness
increases significantly for smaller borrowers with higher leverage. We also find that
47In most cases, however, covenant structure is determined before the syndicate size is determined. We also
estimate specifications without syndicate size and find that our main results do not change.
73

some loan characteristics are important determinants of covenant structure.48 The positive
and significant coefficients of the dummies for pricing provisions, sweep provisions, and
dividend restrictions suggest that these covenants act as complements to financial
covenants. Consistent with the prior literature, we find that covenants become more
restrictive with increases in syndicate size. The coefficients for loan maturity is positive
and significant, suggesting that monitoring via short-term debt or via covenants on
longer-term debt are substitutes. Although Bradley and Roberts (2004) find a negative
relationship between loan spreads and covenant intensity, we find a slightly positive
relationship, consistent with the findings in Bharath et al. (2007).
Our primary focus is on whether the type of lender also influences the structure of
financial covenants. The prior literature and our descriptive statistics indicate that
nonbank borrowers are riskier firms with high leverage ratios and lower z-scores (Carey
et al. 1998; Lim et al. 2012). We might consequently conclude that nonbank loans should
have covenants that are more restrictive than commercial bank loans. Interestingly, we
find that holding borrower and loan characteristics constant, nonbank loans are
significantly less restrictive for all the different measures of covenant strictness. In Panel
A, the coefficients of Nonbank show that nonbanks tend to impose fewer restrictions
(column (1) and (5)) and less restrictive covenants (columns (4)) on their borrowers.
They are more likely to include loosening financial covenants (column (3)), but less
likely to include tightening covenants (column (2)) than banks.
48 However, as in any study that examines debt contract terms, our regression is subject to endogeneity
concerns, because all the contract terms are jointly determined.
74

We consider a loan to be a “nonbank loan” if at least one nonbank institution acts
as lead arranger for the loan. The lead arranger usually negotiates loan contract terms
with the borrower, including the covenant structure. In unreported results, we also use an
alternative classification process where we identify a loan as nonbank generated if any
nonbank institution takes the largest share of the loan, and we find consistent results with
those reported in the Table 3.3. We also estimated a model where the count variable
included non-financial as well as financial covenants and find a similar result.
In Panel B, we show the results of the same analysis for each type of nonbank
lender (asset managers, investment banks, and other nonbank). We find that asset
managers drive the finding that nonbanks negotiate less restrictive covenants. The
coefficents of Investment Bank Loans in Columns (1) and (5) show that these lenders
actually are more likely to impose restictive covenants than commercial banks. Other
nonbanks such as leasing companies, specialist lending firms, and trust companies do not
have a significantly different impact on covenant outcomes than banks.
A possible concern about our results is that a firm’s decision to borrow from a
nonbank lender might not be random (Massoud et al. 2011). We cannot rule out the
possibility that the negative relationship between nonbank loans and less restrictive
covenants is affected by some unobserved firm characteristics. Ideally, we would like to
run an experiment with groups of matched firms that are identical in all respects except
for nonbank borrowings. To test the robustness of our results, we follow Dehejia and
Wahba (2002) and Heckman et al. (1997)’s propensity score matching methods (PSM) to
address the potential identification problem.
75

PSM allows us to examine covenant strictness for borrowers in the treatment
sample (nonbank loans) by conditioning selection on certain observables compared with
a matched control sample of commercial bank loans. We first estimate a logit model to
create a propensity score that indicates the probability a firm borrows from a nonbank.
The binary dependent variable equals one for a nonbank loan. We include borrower
characteristics and loan contract specifications that might affect the likelihood of
choosing a nonbank lender as explanatory variables. Based on the logit regression, we
calculate each firm’s propensity score, the probability the firm will borrow from
nonbanks rather than banks. We then match each nonbank borrower with a group of bank
borrowers that have propensity scores similar to the nonbank borrowers using Leuven
and Sianesi (2010)’s PSM procedure at the nearest one-to-one neighborhood with
replacement.49
Table 3.4 reports the average covenant strictness for nonbank loans versus bank
loans. The standard errors of mean difference are adjusted by bootstrapping with fifty
replications. The first row shows that the average number of covenants in nonbank loans
is 0.19 lower than bank loans. The mean difference between the two groups is significant
at the 1% level. The second row indicates the probability of including a build-up
covenant in nonbank loans is 5% lower than bank loans. The Murfin index for nonbank
loans is 0.5 lower than for bank loans with significance at 1% level, implying that
nonbank loans are less restrictive. We also find that the Bradley and Roberts index of
49 We also find our PSM results are robust when we use alternative matching methods with nearest
neighbor estimator with n= 5 and n=10, and kernel estimators with more weight given to bank borrowers with propensity scores that are closer to the nonbank borrower propensity scores.
76

nonbank loans is 0.16 smaller than bank loans. In sum, the PSM findings are consistent
with the negative relationship between nonbank loans and covenant strictness reported in
Table 3.3.
Overall, our findings suggest that financial covenant structure differs significantly
in many cases between nonbank and bank loan contracts. The differences remain
significant even when we control for borrower characteristics and loan contract terms.
The results suggest that nonbanks tend to grant more flexibility to borrowing firms,
perhaps because nonbanks have different preferences for risk taking than commercial
banks or face different incentives to monitor borrowers or to assume control rights in the
default state. These different incentives are no doubt grounded in the fact that nonbanks
are much less regulated entities than banks.
5. What Covenants Do Nonbank Lenders Tend to Impose on Their Borrowers?
We next examine each type of financial covenant to probe into prospective
differences in covenant structures between banks and nonbanks at a deeper level. In
Table 3.5, we present the mean difference in the frequency of each kind of financial
covenant between nonbanks and banks. The univariate tests in Panel A show that
nonbank loans usually have more restrictions regarding borrower profitability and cash
flow, such as minimum fixed charge coverage and minimum EBITDA requirements,
while commercial banks are more likely to focus on debt levels with covenants on the
maximum leverage ratio, maximum debt-service coverage, maximum debt-to-tangible net
worth, minimum net worth, and minimum tangible net worth. Nonbank loans also are
77

more often collateralized and more likely to contain negative covenants, such as limits on
capital expenditures, sweep provisions, and dividend restrictions.
In Panel B of Table 3.5, we estimate multivariate regressions examining the
relationship between nonbank loans and the presence of each covenant type. The
dependent variables are a set of dummy variables indicating the inclusion of each
covenant, as well as for the inclusion of a build-up trend.50 The key independent variable
is Nonbank. As in equation (2), we control for firm characteristics and loan contract
terms, and include loan purpose, quarter, and industry fixed effects. To save space, we
report only the coefficients of Nonbank from Probit regressions. We report marginal
effects in the table. Standard errors are robust to heteroscedasticity and clustered at the
borrower level.
The results in Panel B yield somewhat different outcomes than the univariate
tests. Nonbanks are more likely than banks to place limits on capital expenditures and to
require sweep provisions. But nonbanks are significantly less likely to have covenants
related to borrower leverage (maximum debt to EBITDA and minimum net worth), cash
flow (minimum fixed- charge coverage, minimum debt-service coverage), and liquidity
(minimum quick ratio). In nonbank loan contracts, the covenant on maximum capital
expenditure also is more likely to have a tightening trend. Where nonbanks are less
likely to impose financial covenants than banks, they are likewise significantly less likely
50 We do not report results for build-down covenants because there are too few observations for any
meaningful analysis.
78

to require increasing degrees of strictness in the covenants that do appear in their loan
contracts.
The results reveal that nonbanks negotiate contracts that rely that less heavily than
banks on financial covenants. Accordingly, nonbank loans are less likely than bank loans
to enter the state of technical default, other things equal. Perhaps this behavior reflects
the fact that nonbank loans are more likely to be secured than bank loans and that
collateral serves as a substitute for tighter restrictions on borrower financial conditions.
Alternatively, nonbanks may be less inclined to engage in the process of loan
renegotiation, which a declaration of technical default usually triggers. As we noted
above, nonbanks are less likely than banks to place strong values on maintaining the
value of customer relationships. But while nonbank rely less heavily than banks on
financial covenants, the univariate results indicate that several of them appear in over
40% of nonbank loans. In the next section, we examine how nonbanks respond to
violations of these covenants relative to their bank peers.
6. Implications of covenant violation to nonbank borrowers
Several recent studies provide evidence that banks play an active role in the
governance of corporations in the event of covenant violations. For instance, Nini et al.
(2012) find that bank borrowers become more conservative in their financial and
investment policy following technical default. They argue that contract terms can become
more restrictive following a covenant violation, and the new restrictions influence firm
behavior in several ways.
79

We examine whether nonbank lenders intervene in the corporate governance of a
borrowing firm following technical default in ways similar to banks. We follow Roberts
and Sufi (2009a) and Nini et al. (2012) and use first-difference regressions on a large
sample of violating and non-violating firms in a dynamic model of firm outcomes,
including both investment and financing decisions. We focus on four-quarter changes in
firm outcomes post- covenant violation using Nini et al. (2012)’s specification as below:
, , ∗ , ∗ ,
∗ , ∗ ,
, , ………………… . 3
The dependent variables are changes in firm behaviors in the areas of fixed
investment and financing activity. The measures of fixed investment are total assets,
property, plant, and equipment (PPE), capital expenditures scaled by assets, and cash
acquisitions scaled by lagged asset, and the measures of financing activity include net
debt issuance scaled by assets, total debt, cash scaled by total assets, and total shareholder
payouts.
The sample includes all borrowers’ firm-quarter observations from 1996Q4 to
2008Q4 because of limited data availability on covenant violations.51 The variable
Violation indicates whether the borrower violates any financial covenant at quarter t and
we include separate variables for violations of covenants on bank and nonbank loans. To
obtain a clean identification of the effect of a violation, we also require that borrowers
51 We use the covenant violation data from Sufi’s website. See the Data Appendix in Nini, Sufi, and Smith
(2013) for a detailed description of their data collections.
80

have not violated covenants in the previous four quarters. Specifically, we separately
examine bank and nonbank loan covenant violations as our key independent variable. If a
covenant violation occurs when the borrower has multiple or overlapping loans, we
assume the strictest loan is violated.52 Once again, Industry represents the 49 industry
dummies designated by Fama and French (1997), and Quarter represents calendar quarter
indicator variables. We also add indicator variables of fiscal quarters to address the
possibility that financial covenant violations are more common in firms’ annual reports
than in quarterly filings.
We also control for borrower characteristics that might influence subsequent firm
performance after covenant violations. BorrowerControls includes the ratio of operating
cash flow to lagged assets, the leverage ratio, the ratio of interest expense to lagged
assets, the ratio of net worth to assets, the current ratio, and the market-to-book ratio. We
also include higher order measures of these variables in square and the third power
designated as HigherOrderBorrowerControls. We also include the four-quarter lag of
these variables to control for mean reversion of firm performance.
Panel A of Table 3.6 presents estimates of equation (2) for the four measures of
investment decisions. Consistent with Chava and Roberts (2008) and Nini et al. (2012),
the negative and significant coefficients for Bank Loan Violation show that bank
borrowers experience decreases in capital expenditures and cash acquisitions and a
reduction in the growth rate of total assets and PPE. However, in the cases of nonbank
52 Although DealScan does not disclose this information, some loan contracts have cross-default clause in
the loan agreement, which allows the lender to accelerate payment on all outstanding loans whenever a default occurs on any one. To be conservative, we also exclude the overlapping loans and find no significant differences in the response of firm performance.
81

loan violations, we find no significant effect of on changes of borrowers’ investment
activities. This suggests that nonbank lenders do not impose restrictions on a borrower’s
investment decisions after observing violations to the same extent as banks and perhaps
not at all.
Panel B of Table 3.6 shows effect of violation on firms’ outcome for four
measures of financing activity. The significant coefficients of the bank covenant violation
variables show that these violations are associated with implementation of a more
conservative financing policy, as reflected in decreased net debt issuance, lower total
debt, less shareholder payouts, and a buildup in cash. But again, we do not find any
significant changes in financing behaviors for nonbank violators. Nonbank borrowers do
not shift towards a more conservative financing policy after technical default like bank
borrowers do.
Overall, we find the active role of creditors in corporate governance around
covenant violations documented in the prior literature is limited to bank lenders.
Nonbank borrower behavior with respect to investment and financing decisions does not
change following technical default. This finding is consistent with the evidence we have
presented indicating that nonbank loans are less onerous than bank loans for borrowers in
some respects. Nonbanks seem to take a more tolerant attitude towards credit risk,
perhaps because their decisions are not subject to review by third parties such as bank
examiners or because nonbanks have less incentive to control risks than banks because
they are more likely to sell loans in the secondary market. Still another prospect is that
certain nonbank lenders may view borrower financial distress, as reflected in technical or
82

financial default, as advantageous to them in the sense that it could provide an
opportunity to acquire the borrowing firm. For example, In November 2003, Berkshire
Hathaway, a lead arranger of a loan to Oakwood Homes, bought the bankrupt borrower
for $373 million and combined it with one of Berkshire Hathaway’s subsidiaries, Clayton
Homes. In another example, Republic Airways Holdings, a lender to Frontier Airlines,
acquired the borrower in 2009 during Frontier’s efforts to reorganize in Chapter 11
bankruptcy.
Some recent literature documents that nonbank institutions, such as hedge funds
and private equity firms, actively participate in restructuring firms in bankruptcy
(Ivashina, Iverson and Smith 2011; Jiang, Li and Wang 2011; Lim 2013). These
nonbanks push to sell the firm’s assets or take a significant ownership interest in the
reorganized firm. We next examine whether taking loans from nonbanks makes it more
likely the firm will suffer negative outcomes such as delisting or bankruptcy.
7. Nonbank Loans and Borrower Exits
We find that nonbanks tend to give their borrowers more flexibility by requiring
less restrictive financial covenants and are less likely to intervene in governance
following covenant violations. In this section, we investigate how the relatively passive
monitoring by nonbanks affects their borrowers. Our hypothesis is that nonbank
borrowers will have more severe default consequences than bank borrowers since they
incur less restrictive monitoring and are less likely to alter their spending or financing
activities in technical default. We estimate the relationship between nonbank lending and
the likelihood of firm exit using Probit estimation as below:
83

Pr
∗ ∗
……………………………………………… 4
where the dependent variable is an indicator variable equal to one if a firm is delisted
from Compustat due to poor performance, declares bankruptcy, or enters liquidation;
Nonbank is an indicator variable equal to one if the loan’s lead arranger is a nonbank
institution; CovenantViolation is an indicator for whether the firm violates any covenants
during the life of loan. We also add a set of variables to control for borrower
characteristics including a firm’s size, z-score, credit rating, current ratio, leverage ratio,
net worth ratio, and market-to-book ratio as BorrowerControls. Industry represents the 49
industry dummies designated by Fama and French (1997), and Quarter represents
calendar quarter indicator variables. Standard errors are robust to heteroscedasticity and
clustered at the borrower level.
Table 3.7 presents the results. Consistent with the findings in DeAngelo,
DeAngelo and Wruck (2002) column (1) reveals a positive coefficient on Covenant
Violation, indicating that firms are significantly more likely to experience a bad outcome
if they have covenant violations. When we analyze the effect of nonbank lending on the
probability of firm exits in column (2), we find a positive and significant coefficient on
the nonbank loan dummy, after controlling for borrower risk, loan characteristics, and
covenant violations, indicating that borrowers are more likely to experience severe
consequence is they borrow from nonbanks rather than banks. In column (3), we run the
84

same regression for each type of nonbank lender and find that institutional asset manager
loans and other nonbank loans are driving the results.
8. Conclusions
An extensive literature reveals that covenants facilitate efficient monitoring of
borrowers and that violations of these restrictions has significant consequences for firm
investment and financing decisions. However, the prior literature implicitly assumes that
the identity of the lender does not influence the covenant structure of loan contracts or
have implications for firm behavior in the event of a declaration of technical default. Our
results indicate that lender identity does matter and that nonbanks rely less heavily on
covenants than commercial banks and are less likely to intervene in corporate governance
when borrowers breach the contractual covenants. Nonbank lenders impose fewer and
less restrictive covenants than commercial banks. More specifically, nonbanks rely less
heavily on financial covenants, but are more likely to impose restrictions such as sweep
provisions and limits on capital expenditures. The differences remains significant when
we control for borrower characteristics and loan contract terms. Since violations of
financial covenants often trigger loan restructurings, we might expect that nonbank loans
are less likely to be renegotiated than bank loans, a topic we will explore in further
research.
Although research shows that commercial banks play an active in corporate
governance following covenant violations, we find that nonbank lenders are significantly
less likely to intervene in firm decision making in the event of technical default., show
significant changes The relatively less aggressive stance of nonbanks in the use of
85

covenants may reflect a more tolerant preference for accepting default risk exposure or it
may indicate that nonbanks may gain benefits when borrowers default that are not
available to commercial banks. We also present evidence that firms borrowing from
nonbanks are significantly more likely to suffer negative outcomes such as delistings,
bankruptcy, or liquidation than bank borrowers and these situations might create
opportunities for nonbanks to take ownership control of at least some of their borrowers.
86

Table 3.1: Summary Statistics This table reports summary statistics on the use of financial covenants, loan contract terms, and borrower characteristics in our final sample of bank loan contracts and nonbank loan contracts over the period 1995 to 2012. Total covenants is the total number of financial covenants in a loan contract; Build-Up covenants is the total number of financial covenants with a tightening trend over the loan’s life; Build-Down Covenants is the total number of financial covenants with a loosening trend; Loan Size is the total loan package amount; Performance pricing is a dummy variable equal to one if the loan package contains a performance pricing provision, and zero otherwise; Sweep Provision is a dummy variable equal to one if the loan contract requires a portion of cash generated by asset-sales, security issuance, or insurance payments to be used to pay down principal, and zero otherwise; Dividend Restriction is a dummy variable equal to one if the borrower is restricted from paying dividends to its shareholders, and zero otherwise; Syndicate Size is the total number of different lenders participating in the loan package; Loan Spread is the weighted average interest spread across facilities in the loan package, where the weights are the size of each facility; Loan Maturity is the weighted average of the maturities in months across all facilities in the loan package, where the weights are the relative size of each facility. We also summarize borrower characteristics at the closest quarter end after loan origination: Assets is the logarithm of quarterly total assets; Z-score is a measurement that predicts bankruptcy calculated following the Altman (1968) model; Credit Rating is a dummy variable equal to one if the borrower is rated by S&P or Moody’s at the time of loan origination, and zero otherwise; Market-to-Book is the ratio of quarter-end market value over total assets; Leverage Ratio is quarter-end total debt over total assets. Net Worth Ratio is quarter-end market equity value of stockholders over total assets; Current Ratio is quarter-end current assets over current liabilities.
87

Panel A
Bank Loans
Nonbank Loans
Bank - Nonbank
N Mean Median N Mean Median Difference t-statistics Covenant Characteristics Total Covenants 8,985 2.65 3.00 1,487 2.64 3.00 0.01 0.4855 Build-Up Covenants 8,985 0.89 0.00 1,487 1.21 1.00 -0.32 -9.7163 Build-Down Covenants 8,985 0.09 0.00 1,487 0.21 0.00 -0.11 -10.0405 Murfin Index 3,550 0.42 0.42 519 0.43 0.41 -0.01 -1.1901 Bradley and Roberts Index 2,781 4.26 5.00 640 5.03 6.00 -0.77 -14.0198
Panel B
Bank Loans
Nonbank Loans
Bank - Nonbank
N Mean Median N Mean Median Difference t-statistics Borrower Characteristics Assets (logarithm) 8,985 6.41 6.35 1,487 6.41 6.31 0.01 -1.3679 Z-score 8,985 4.47 3.53 1,487 3.24 2.70 1.23 7.7619 Credit Rating (dummy) 8,985 0.44 0.00 1,487 0.49 0.00 -0.05 -4.7279 Market-to-Book 8,985 1.79 1.41 1,487 1.60 1.28 0.19 4.6253 Leverage Ratio 8,985 0.28 0.27 1,487 0.37 0.34 -0.09 -12.2274 Net Worth Ratio 8,985 0.42 0.44 1,487 0.31 0.35 0.11 10.4006 Current Ratio 8,985 2.11 1.63 1,487 1.96 1.55 0.15 1.3037
88

Table 3.1, continued Panel C
Bank Loans
Nonbank Loans
Bank - Nonbank
N Mean Median N Mean Median Difference t-statistics Loan Contract Characteristics Loan Size (logarithm) 8,985 5.13 5.27 1,487 5.32 5.30 -0.18 -6.1811 Performance Pricing (dummy) 8,985 0.76 1.00 1,487 0.64 1.00 0.11 8.4498 Sweep Provision (dummy) 8,985 0.36 0.00 1,487 0.62 1.00 -0.26 -20.6802 Dividend Restriction (dummy) 8,985 0.76 1.00 1,487 0.83 1.00 -0.07 -7.0406 Syndicate Size (number of lenders) 8,985 8.91 6.00 1,487 7.78 5.00 1.12 3.152 Loan Spread (basis point) 8,985 177.86 162.50 1,487 272.17 258.71 -94.31 -24.5814 Loan Maturity (month) 8,985 45.49 48.00 1,487 48.91 48.00 -3.42 -6.4045 Secured (dummy) 8,985 0.25 0.00 1,487 0.40 0.00 -0.16 -12.1591 Leverage Loan (dummy) 8,985 0.61 1.00 1,487 0.83 1.00 -0.22 -20.5385 Loan Purpose: Acquisition 8,985 0.12 0.00 1,487 0.16 0.00 -0.04 -4.8344 Loan Purpose: Corporate 8,985 0.27 0.00 1,487 0.23 0.00 0.04 3.4646 Loan Purpose: Debt Repayment 8,985 0.21 0.00 1,487 0.18 0.00 0.03 3.0387 Loan Purpose: Working Capital 8,985 0.26 0.00 1,487 0.23 0.00 0.03 2.6863
89

Table 3.1, continued Panel D
Nonbank Loans Asset Manager Loans Investment Bank Loans Other Nonbank Loans N Mean Median N Mean Median N Mean Median
Covenant Characteristics Total Covenants 935 2.52 2.00 526 2.87 3.00 98 2.45 2.00 Build-Up Covenants 935 1.09 1.00 526 1.43 1.00 98 1.04 1.00 Build-Down Covenants 935 0.22 0.00 526 0.20 0.00 98 0.20 0.00 Murfin Index 310 0.40 0.40 218 0.45 0.45 17 0.46 0.48 Bradley and Roberts Index 377 4.74 5.00 271 5.42 6.00 28 5.21 5.50
90

Table 3.2: Frequency of Financial Covenants This table shows the frequency of each type of financial covenant in our sample. The first column shows the number of loans that contain each type of financial covenant and the percentage of loans containing such a covenant. The second set of columns shows the number of loans that contain a certain type of financial covenant with a tightening trend. The third set of columns shows the number of loans that contain a certain type of financial covenant with a loosening trend. Definitions of each financial covenant are in the Appendix.
Financial Covenants Build Up Build Down
Percentage of the sample
Number of loans
Percentage of the covenant
Number Percentage of the covenant
Number
Max. Debt to EBITDA 58% 6154 45% 2746 1% 77
Min. Interest Coverage 39% 4150 32% 1319 1% 37
Min. Fixed Charge Coverage 39% 4141 28% 1157 2% 99
Max. Capex 23% 2423 17% 400 30% 729
Max. Leverage ratio 18% 1923 13% 258 1% 18
Max. Debt to Tangible Net Worth 9% 933 19% 173 1% 13
Min. Current Ratio 11% 1176 7% 82 1% 10
Min. Debt Service Coverage 8% 792 19% 149 2% 19
Max. Senior Debt to EBITDA 10% 1066 55% 585 1% 14
Min. EBITDA 9% 980 66% 651 6% 56
Max. Debt to Equity 1% 70 16% 11 1% 1
Max. Loan to Value 0% 12 17% 2 0% 0
Max. Senior Leverage 0% 16 25% 4 6% 1
Min. Cash Interest Coverage 1% 144 37% 53 2% 3
Min. Quick Ratio 2% 241 18% 43 3% 8
Min. Net Worth 20% 2114 56% 1181
Min. Tangible Net Worth 17% 1815 49% 882
Number of Loans 10,552 5,384 1,003
91

Table 3.3: Covenant Strictness of Nonbank Loans
This table reports the results of Poisson regression estimation on number of covenants and the Bradley and Roberts Index, probit estimation on Build Up and Build Down, and OLS regression on the Murfin Index. The key independent variable is Nonbank, a dummy variable equal to one if the loan contract is lead arranged by a nonbank institution, and zero otherwise. Loan Size is the logarithm of total loan package amount; Performance pricing is a dummy variable equal to one if the loan package contains a performance pricing provision, and zero otherwise; Sweep Provision is a dummy variable equal to one if the loan contract requires a portion of cash generated by asset-sales, security issuance, or insurance payments to be used to pay down principal, and zero otherwise; Dividend Restriction is a dummy variable equal to one if the borrower is restricted from paying dividends to its shareholders, and zero otherwise; Syndicate Size is the total number of different lenders participated in the loan package; Loan Spread is the weighted average interest spread across facilities in the loan package, where the weights are the size of each facility; Loan Maturity is the weighted average of the maturities in months across all facilities in the loan package, where the weights are the relative size of each facility. We also summarize borrower characteristics at the closest quarter end after loan originations: Assets is the logarithm of quarterly total assets; Z-score is a measurement that predicts bankruptcy calculated following the Altman (1968) model; Credit Rating is a dummy variable equal to one if the borrower is rated by S&P or Moody’s at the time of loan origination, and zero otherwise Market-to-Book is the ratio of quarter-end market value over total assets; Leverage Ratio is quarter-end total debt over total assets. Net Worth Ratio is quarter-end equity value of stockholders over total assets; Current Ratio is quarter-end current assets over current liabilities. Industry fixed effects are the 12 industry dummies designated byFama and French (1997). Standard errors Standard errors are robust to heteroscedasticity and clustered at the borrower level. t-statistics are reported in parentheses; * significant at 10%; ** significant at 5%; *** significant at 1%.
92

Panel A
Dependent Variable Number of Covenants
Build Up Build Down Murfin Index
Bradley and Roberts Index
(1) (2) (3) (4) (5) Nonbank -0.080*** -0.050*** 0.033*** -0.047*** -0.024**
(-5.9) (-3.6) (2.9) (-4.3) (-2.0) Firm Controls Firm Size -0.040*** -0.034*** -0.003 -0.007 -0.063***
(-6.8) (-5.2) (-0.8) (-1.2) (-7.2) Z-Score 0.002* -0.003*** 0.001 -0.002 0.004**
(1.8) (-3.0) (1.2) (-1.0) (2.4) Credit Rating -0.062*** -0.007 -0.006 -0.021** -0.035**
(-4.8) (-0.5) (-0.7) (-2.1) (-2.4) Market-to-Book -0.007 -0.006 -0.003 -0.033*** -0.035***
(-0.9) (-1.3) (-0.9) (-6.3) (-4.6) Leverage Ratio 0.058 0.103*** 0.050** 0.627*** 0.134***
(0.8) (3.0) (2.0) (15.8) (4.2) Net Worth Ratio 0.036 -0.005 -0.026 0.172*** -0.011
(0.5) (-0.2) (-1.4) (4.1) (-0.5) Current Ratio -0.001*** 0.000*** -0.000 -0.000*** -0.000**
(-4.0) (2.6) (-1.4) (-5.9) (-2.3) Loan Contract Controls Loan Size -0.017** 0.027*** 0.003 -0.021*** 0.031***
(-2.5) (3.8) (0.6) (-3.6) (3.5) Performance Pricing 0.083*** 0.097*** -0.013* 0.036*** 0.052***
(7.8) (8.2) (-1.7) (3.6) (3.9) Sweep Provision 0.082*** 0.117*** 0.045*** 0.052***
(7.4) (8.7) (5.5) (5.6) Dividend Restriction 0.119*** 0.099*** 0.024*** 0.029***
(10.9) (8.2) (4.0) (3.6) Syndicate Size 0.001*** 0.001** 0.000 0.002*** 0.001***
(3.5) (2.5) (0.1) (3.6) (2.8) Loan Spread 0.000*** 0.001*** 0.000*** 0.000 0.001***
(5.7) (11.8) (6.5) (0.5) (9.8) Loan Maturity 0.001*** 0.001*** 0.000 -0.000 0.002***
(5.8) (5.1) (1.6) (-0.5) (6.7) Secured 0.056*** 0.077*** 0.035*** -0.002
(5.1) (5.8) (3.5) (-0.2) Leverage Loan 0.102*** 0.122*** 0.026*** 0.072*** 0.203***
(8.1) (8.3) (3.6) (7.1) (7.4) Regression Method Poisson Probit Probit OLS Poisson Quarter & Industry Dummy
Yes Yes Yes Yes Yes
Loan Purpose Dummy Yes Yes Yes Yes Yes Pseudo R-Squared 0.046 0.255 0.187 0.403 0.096 Observations 10552 10552 10552 4037 3,407
93
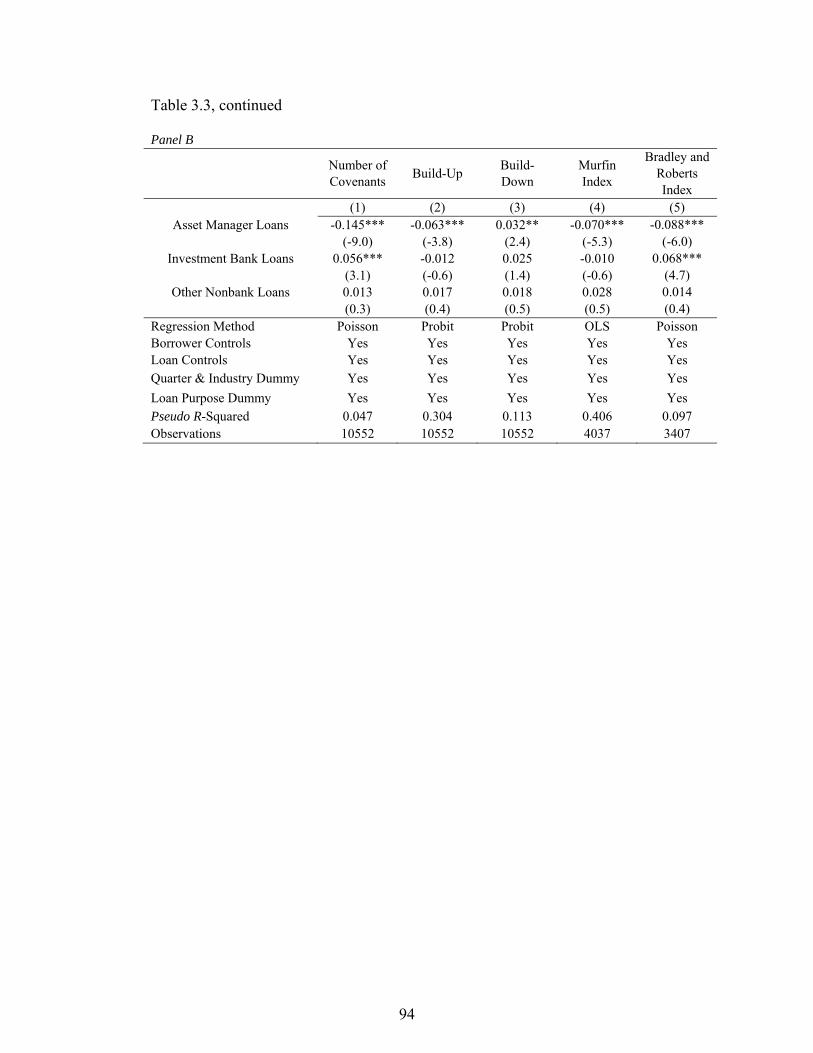
Table 3.3, continued Panel B
Number of Covenants
Build-Up Build-Down
Murfin Index
Bradley and Roberts Index
(1) (2) (3) (4) (5) Asset Manager Loans -0.145*** -0.063*** 0.032** -0.070*** -0.088***
(-9.0) (-3.8) (2.4) (-5.3) (-6.0) Investment Bank Loans 0.056*** -0.012 0.025 -0.010 0.068***
(3.1) (-0.6) (1.4) (-0.6) (4.7) Other Nonbank Loans 0.013 0.017 0.018 0.028 0.014
(0.3) (0.4) (0.5) (0.5) (0.4) Regression Method Poisson Probit Probit OLS Poisson Borrower Controls Yes Yes Yes Yes Yes Loan Controls Yes Yes Yes Yes Yes Quarter & Industry Dummy Yes Yes Yes Yes Yes
Loan Purpose Dummy Yes Yes Yes Yes Yes Pseudo R-Squared 0.047 0.304 0.113 0.406 0.097 Observations 10552 10552 10552 4037 3407
94
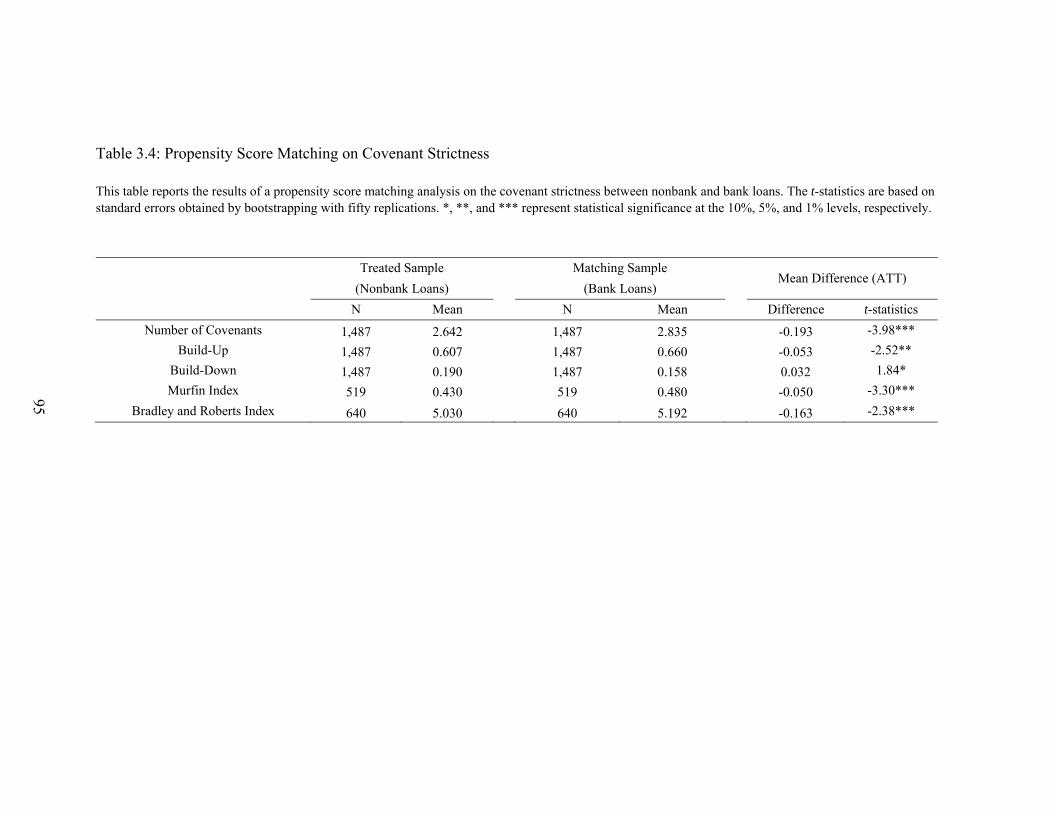
Table 3.4: Propensity Score Matching on Covenant Strictness This table reports the results of a propensity score matching analysis on the covenant strictness between nonbank and bank loans. The t-statistics are based on standard errors obtained by bootstrapping with fifty replications. *, **, and *** represent statistical significance at the 10%, 5%, and 1% levels, respectively.
Treated Sample Matching Sample Mean Difference (ATT)
(Nonbank Loans) (Bank Loans)
N Mean N Mean Difference t-statistics
Number of Covenants 1,487 2.642 1,487 2.835 -0.193 -3.98***
Build-Up 1,487 0.607 1,487 0.660 -0.053 -2.52**
Build-Down 1,487 0.190 1,487 0.158 0.032 1.84*
Murfin Index 519 0.430 519 0.480 -0.050 -3.30***
Bradley and Roberts Index 640 5.030 640 5.192 -0.163 -2.38***
95

Table 3.5: Univariate and Multivariate Tests of Nonbank Financial Covenant Structure
In this table we examine differences in the use of specific financial covenants between banks and nonbanks. Panel A is the univariate test of the equality of the observed differenced. Panel B shows the results of multivariate regressions on the inclusion of each type of covenant against a nonbank loan dummy, as well as controls for borrower and loan characteristics, and quarter, industry, and loan purpose fixed effects. To save space, we only show the coefficients of Nonbank in the table. Industry fixed effects are the 49 industry dummies designated by Fama and French (1997). t-statistics are obtained based on the Standard errors Standard errors robust to heteroscedasticity and clustered at the borrower level; * significant at 10%; ** significant at 5%; *** significant at 1%.
Panel A
Bank Loans
Nonbank Loans
Nonbank vs. Bank
Difference t-statistics
Max. Debt to EBITDA 59.9% 55.4% 0.04 2.64
Min. Interest Coverage 39.9% 41.0% -0.01 -1.38
Min. Fixed Charge Coverage 38.5% 43.2% -0.05 -3.22
Max. Capex 20.8% 43.7% -0.23 -17.79
Max. Leverage ratio 19.5% 9.4% 0.10 12.10
Max. Debt to Tangible Net Worth 8.9% 3.5% 0.05 10.50
Min. Current Ratio 10.8% 6.1% 0.05 7.37
Min. Debt Service Coverage 7.4% 3.6% 0.04 7.23
Max. Senior Debt to EBITDA 9.7% 14.7% -0.05 -5.62
Min. EBITDA 7.9% 16.8% -0.09 -8.68
Max. Debt to Equity 0.6% 0.4% 0.00 1.40
Max. Loan to Value 0.1% 0.1% 0.00 -0.27
Max. Senior Leverage 0.1% 0.3% 0.00 -1.08
Min. Cash Interest Coverage 1.4% 1.3% 0.00 -0.12
Min. Quick Ratio 2.3% 0.4% 0.02 8.84
Min. Net Worth 20.6% 13.1% 0.08 8.38
Min. Tangible Net Worth 16.6% 11.0% 0.06 7.11
Secured 24.6% 40.2% -0.16 -12.16
Sweep Provisions 36.2% 62.2% -0.26 -20.68
Dividend Provisions 75.6% 83.0% -0.07 -7.04
Number of Loans 8,985 1,487
96

Table 3.5, continued Panel B
Max. Debt to EBITDA
Min. Interest Coverage
Min. Fixed Charge
Coverage Max. Capex
Max. Leverage
ratio
Max. Debt to Tangible Net Worth
Min. Current Ratio
Min. Debt Service
Coverage
Max. Senior Debt to
EBITDA Min. EBITDA
(1) (2) (3) (4) (5) (6) (7) (8) (9) (10) Dependent Variables: Dummies of Covenants
-0.118*** -0.002 -0.033** 0.066*** -0.011 -0.009 -0.015** -0.030*** -0.006 0.011 (-9.1) (-0.1) (-2.4) (5.3) (-1.4) (-1.5) (-2.1) (-4.7) (-0.6) (1.1) 0.265 0.114 0.199 0.290 0.281 0.201 0.225 0.108 0.133 0.166
Dependent Variables: Dummies of Build-up Covenants -0.053*** 0.015 -0.009 0.027*** -0.003 0.002 0.002 -0.009*** -0.011 0.014
(-4.5) (1.5) (-0.9) (3.5) (-0.7) (0.5) (0.8) (-3.0) (-1.4) (1.5) 0.324 0.210 0.118 0.070 0.051 0.046 0.022 0.035 0.133 0.143
Max. Debt to Equity
Max. Loan to Value
Max. Senior Leverage
Min. Cash Interest
Coverage
Min. Quick Ratio
Min. Net Worth
Min. Tangible
Net Worth Secured
Sweep Provision
Dividend Restriction
(11) (12) (13) (14) (15) (16) (17) (18) (19) (20) Dependent Variables: Dummies of Covenants
-0.001 -0.001 0.000 -0.003 -0.008*** -0.060*** -0.004 0.033** 0.062*** -0.010 (-0.4) (-0.5) (0.2) (-0.8) (-3.3) (-5.6) (-0.4) (2.6) (4.7) (-0.9) 0.022 0.013 0.014 0.024 0.100 0.107 0.208 0.262 0.308 0.161
Dependent Variables: Dummies of Build-up Covenants 0.000 -0.001 0.001 -0.001 -0.004*** -0.054*** -0.007 (0.3) (-1.4) (1.3) (-0.4) (-4.7) (-6.6) (-0.9) 0.010 0.009 0.011 0.029 0.026 0.092 0.094
Observations: 10,552
Other Controls: Quarter & Industry Dummies, Loan Purpose Dummies, Firm Characteristics, and Loan characteristics
97
Table 3.6: Covenant Violations and Firm Investment and Financing Decisions
This table reports the first difference estimates of the marginal effect of a nonbank covenant violation on the financing and investment decisions of firms from the quarter of the violation to four quarters after the violations. Panel A shows the effect of covenant violations on firm investment decisions. ∆ASSET is the change in logarithm of total assets from the quarter of violation to four quarters after the violation. ∆PPE is the change of fixed investment. ∆CAPEXP is the change in capital expenditure scaled by average assets, and ∆ACQ is the change in cash acquisitions scaled by average assets. In Panel B, we test the impact of nonbank violations on firm financing decisions. ∆NDI is the change in net debt issuance scaled by average assets over the four quarters after a covenant violation. ∆DEBT is the growth rate in total debt. ∆CASH is the changes in cash holdings scaled by average assets, and ∆PAYOUT is the change in shareholder payouts. Industry fixed effects are the 49 industry dummies designated by Fama and French (1997). t-statistics are obtained based on the Standard errors Standard errors robust to heteroscedasticity and clustered at the borrower level; * significant at 10%; ** significant at 5%; *** significant at 1%.
98
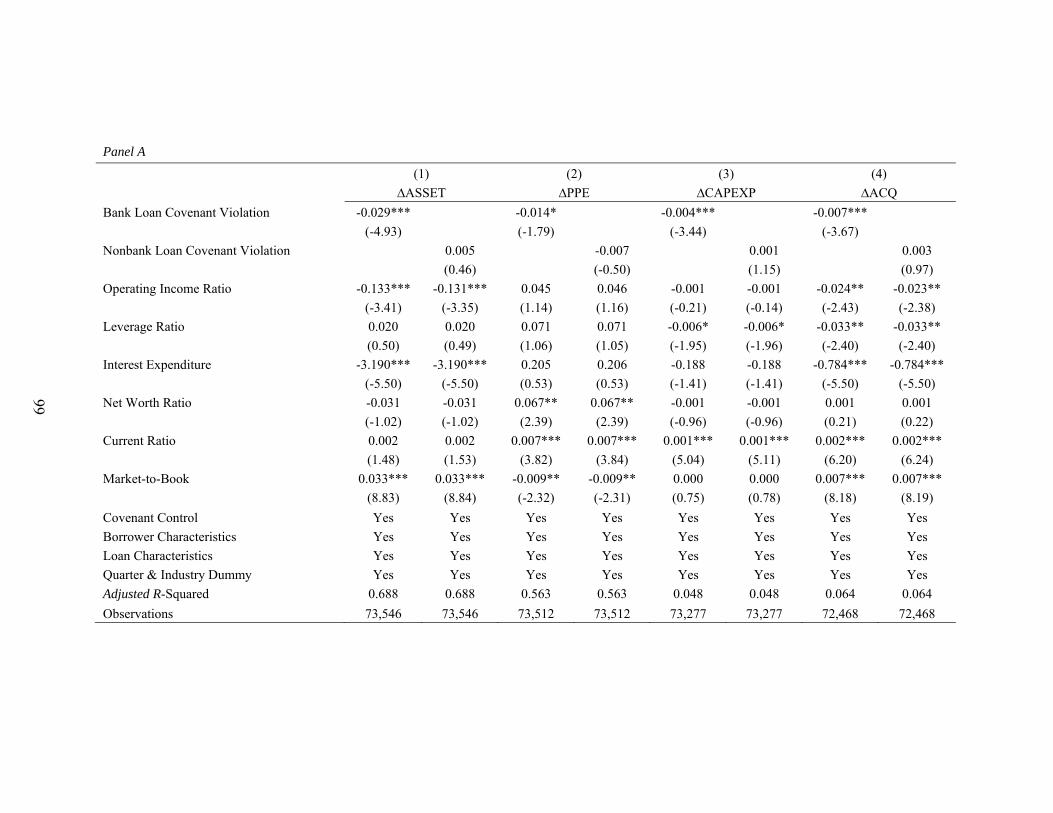
Panel A
(1) (2) (3) (4)
∆ASSET ∆PPE ∆CAPEXP ∆ACQ
Bank Loan Covenant Violation -0.029*** -0.014* -0.004*** -0.007***
(-4.93) (-1.79) (-3.44) (-3.67)
Nonbank Loan Covenant Violation 0.005 -0.007 0.001 0.003
(0.46) (-0.50) (1.15) (0.97)
Operating Income Ratio -0.133*** -0.131*** 0.045 0.046 -0.001 -0.001 -0.024** -0.023**
(-3.41) (-3.35) (1.14) (1.16) (-0.21) (-0.14) (-2.43) (-2.38)
Leverage Ratio 0.020 0.020 0.071 0.071 -0.006* -0.006* -0.033** -0.033**
(0.50) (0.49) (1.06) (1.05) (-1.95) (-1.96) (-2.40) (-2.40)
Interest Expenditure -3.190*** -3.190*** 0.205 0.206 -0.188 -0.188 -0.784*** -0.784***
(-5.50) (-5.50) (0.53) (0.53) (-1.41) (-1.41) (-5.50) (-5.50)
Net Worth Ratio -0.031 -0.031 0.067** 0.067** -0.001 -0.001 0.001 0.001
(-1.02) (-1.02) (2.39) (2.39) (-0.96) (-0.96) (0.21) (0.22)
Current Ratio 0.002 0.002 0.007*** 0.007*** 0.001*** 0.001*** 0.002*** 0.002***
(1.48) (1.53) (3.82) (3.84) (5.04) (5.11) (6.20) (6.24)
Market-to-Book 0.033*** 0.033*** -0.009** -0.009** 0.000 0.000 0.007*** 0.007***
(8.83) (8.84) (-2.32) (-2.31) (0.75) (0.78) (8.18) (8.19)
Covenant Control Yes Yes Yes Yes Yes Yes Yes Yes
Borrower Characteristics Yes Yes Yes Yes Yes Yes Yes Yes
Loan Characteristics Yes Yes Yes Yes Yes Yes Yes Yes
Quarter & Industry Dummy Yes Yes Yes Yes Yes Yes Yes Yes
Adjusted R-Squared 0.688 0.688 0.563 0.563 0.048 0.048 0.064 0.064
Observations 73,546 73,546 73,512 73,512 73,277 73,277 72,468 72,468
99

Table 3.6, continued Panel B
(1) (2) (3) (4)
∆NDI ∆DEBT ∆CASH ∆PAYOUT
Bank Loan Covenant Violation -0.014*** -0.124*** 0.006*** -0.064***
(-3.37) (-5.88) (3.16) (-2.87)
Nonbank Loan Covenant Violation 0.002 -0.079 0.001 -0.083*
(0.21) (-1.62) (0.13) (-1.66)
Operating Income Ratio -0.016 -0.016 -0.044 -0.042 0.030*** 0.030*** 0.210*** 0.213***
(-1.44) (-1.44) (-0.93) (-0.89) (8.37) (8.41) (4.69) (4.69)
Leverage Ratio -0.383*** -0.383*** -0.636*** -0.637*** 0.012 0.012 -0.251*** -0.252***
(-3.27) (-3.27) (-8.86) (-8.85) (1.63) (1.64) (-2.98) (-2.98)
Interest Expenditure -1.045*** -1.046*** 2.917*** 2.919*** -0.003 -0.003 0.147 0.148
(-3.41) (-3.41) (2.86) (2.86) (-0.03) (-0.02) (0.50) (0.50)
Net Worth Ratio -0.043** -0.043** -0.033 -0.033 -0.003 -0.003 0.017** 0.017**
(-2.57) (-2.57) (-0.83) (-0.83) (-0.80) (-0.81) (2.01) (2.02)
Current Ratio -0.000 -0.000 0.021*** 0.021*** -0.006*** -0.006*** -0.000 -0.000
(-1.23) (-1.20) (3.64) (3.65) (-4.69) (-4.69) (-0.11) (-0.08)
Market-to-Book 0.005*** 0.005*** 0.052*** 0.053*** 0.001 0.001 0.017*** 0.017***
(3.94) (3.96) (6.43) (6.47) (0.82) (0.80) (6.66) (6.68)
Covenant Control Yes Yes Yes Yes Yes Yes Yes Yes
Borrower Characteristics Yes Yes Yes Yes Yes Yes Yes Yes
Loan Characteristics Yes Yes Yes Yes Yes Yes Yes Yes
Quarter & Industry Dummy Yes Yes Yes Yes Yes Yes Yes Yes
Adjusted R-Squared 0.129 0.128 0.053 0.053 0.062 0.062 0.025 0.025
Observations 105,000 105,000 94,209 94,209 105,000 105,000 91,441 91,441
100

Table 3.7: Nonbank Lending and Firm Exits
This table reports the Probit estimation of the effect of nonbank lending on firm exits. The dependent variable Firm Exit is an indicator variable equal to one if a firm is delisted from Compustat due to poor performance, or enters bankruptcy or liquidation; Nonbank Loan is an indicator variable equal to one if a loan’s lead arranger is a nonbank institution; Covenant Violation is an indicator for whether the firm has any covenant violation during the life of loan contract. Industry fixed effects are the 49 industry dummies designated by Fama and French (1997). t-statistics are obtained based on the Standard errors Standard errors robust to heteroscedasticity and clustered at the borrower level; * significant at 10%; ** significant at 5%; *** significant at 1%.
(1) (2) (3) Covenant Violation 0.090*** 0.085** 0.084** (2.72) (2.55) (2.53) Nonbank Loan 0.093*** (6.74) Asset Manager Loan 0.117*** (6.82) Investment Bank Loan 0.027 (1.35) Other Nonbank Loan 0.103** (2.35) Borrower Controls Yes Yes Yes Loan Controls Yes Yes Yes Quarter & Industry Dummy Yes Yes Yes Loan Purpose Dummy Yes Yes Yes Pseudo R-Squared 0.1171 0.124 0.125 Observations 10,552 10,552 10,552
101

Figure 3.1: Number of banks and nonbanks relative to all participants in the U.S. loan market
The graph shows the number of U.S. commercial bank lenders and nonbank lenders as a percentage of all lenders in the U.S. Loan market from 1995 to 2011.
0%
10%
20%
30%
40%
50%
60%
70%
80%
90%
0
20
40
60
80
100
120
140
160
180
1987 1989 1991 1993 1995 1997 1999 2001 2003 2005 2007 2009 2011
Number of Nonbank Lenders Number of Bank Lenders
Percentage of Nonbanks in All Lenders
year
num
ber
of le
adar
rang
ers
% o
f to
tal n
umbe
r of
lead
arra
nger
s
102

Figure 3.2: Nonbank loans in the U.S. commercial loan market
This bar shows nonbank loans as a percentage of total loans outstanding (right scale) and the line graph is the aggregate value of nonbank loan outstanding each year from 1995 to 2009 (left scale). In this figure, a nonbank loan is a commercial loan in which at least one nonbank institution participates.
0%
5%
10%
15%
20%
25%
30%
35%
40%
0
200
400
600
800
1,000
1,200
1,400
1,600
1,800
1987 1989 1991 1993 1995 1997 1999 2001 2003 2005 2007 2009 2011
Percentage of Nonbank Loans in Total Loans Outstanding
year
Billions
103

Chapter Four: Conclusion
The prior literature assumes that the identity of a firm’s lender does not influence
borrower outcomes in the area of corporate strategy or the prospects for financial distress.
My dissertation disaggregates lenders in the corporate loan market into two groups:
commercial banks and non-commercial banks. I find that borrowing from nonbanks has a
differential impact on firm governance through the market of mergers and acquisitions
than borrowing from banks. I also find evidence that nonbanks exercise control rights
differently than banks by utilizing alternative covenant structures.
The main contribution of my first essay is to provide evidence that nonbanks
facilitate information transfer from the loan market to the M&A market more actively
than banks do. In a sample of public firms from 1987 to 2012, I show that a nonbank
borrower is 1.6% more likely to become an M&A target than a bank borrower. I classify
nonbank lenders into three categories – institutional asset managers, investment banks,
and other nonbanks – and find that lending by institutional asset managers (mutual funds,
hedge funds, private equity investors, and finance companies) is most likely to result in
future takeover attempts. Borrowers are also more likely to receive M&A bids when they
contract with larger numbers of nonbank lenders during a three-year period, especially if
they are institutional asset managers. I also investigate the relationship between the size
of client and the prospect of takeover bids. The results show the likelihood of M&A bids
increases when firms borrow from nonbank lenders with a larger client base. To address
potential selection problems in estimating the effect of nonbank lending on M&A activity,
I employ a propensity-score matching technique that compares nonbank borrowers with a
control sample of bank borrowers that have similar probabilities of borrowing from
104

nonbanks. To improve the prospects of better identification of the true relationship, I also
use the introduction of the syndicated loan rating as an instrument for nonbank
participation. Both the propensity-score matching and IV approach show consistently and
significantly that nonbank borrowers are more likely to receive takeover bids than bank
borrowers. I also examine whether the prospects of an acquisition increase when nonbank
lenders obtain a larger set of information about their borrowers or when the information
set is updated. I treat frequent nonbank lenders and nonbanks that renegotiate loans as
special sources of information and find the impact of nonbank participation is stronger in
both situations. Finally, I investigate the relevance of several potential channels of
information transmission. The evidence reveals that nonbanks are more able to connect
loan clients than commercial banks in the M&A market. When I disaggregate among
nonbank lenders, firms borrowing from institutional asset managers are more likely to
become their lender’s targets. Borrowers from investment banks are significantly more
likely to receive takeover bids in which the investment bank lender acts also as an advisor
to the acquirer.
In my second essay, I find that nonbanks play a more passive role in monitoring
borrowers than commercial banks. Nonbanks employ less restrictive financial covenants
and are less likely to intervene in the decisions of their borrowers after covenant
violations. I employ five different measures of the strictness of covenants and compare
the “tightness” of loan covenants contained in commercial bank with those in nonbank
loan contracts. I find that nonbank borrowers and lenders negotiate fewer and less
restrictive financial covenants than those common in commercial bank loans at the time
of loan originations. When disaggregating nonbanks into three categories (asset
105

managers, investment banks, and other nonbanks), I find that asset managers drive the
finding that nonbank loans have less restrictive covenants. To address the identification
issue of nonbank loans, I use propensity-score matching approach and match each
nonbank borrower with a bank borrower that has a similar propensity to borrow from
nonbanks. The results suggest that nonbanks grant more flexibility to borrowing firms. I
also estimate multivariate regressions examining the relationship between nonbank loans
and the presence of each covenant type. The results reveal that nonbank lenders rely less
heavily than banks on financial covenants, but they are more likely to place limits on
capital expenditures and to require sweep provisions. Although research shows that
commercial banks play an active role in corporate governance following covenant
violations, I find no evidence that nonbank borrowers move towards more conservative
investment or financing strategies after covenant violations as bank borrowers. I also
investigate the implications of nonbank lending on firm behavior in states of serious
financial distress and find nonbank borrowers are significantly more likely to suffer
negative outcomes, such as delisting, bankruptcy, or liquidation, than bank borrowers.
These findings may reflect a more tolerant preference for accepting default risk exposure
among nonbanks or it may indicate that nonbanks could gain benefits when borrowers
default that are not available to commercial banks, such as an opportunity to acquire the
defaulting firm.
Given the limitations in my data availability, I am not able to explore certain
relevant research questions empirically. For instance, the fact that professionals working
for financial firms frequently change jobs and spend time socializing with one another
could prove another prospective means of information transfer. I plan to examine the role
106

informal networks might play in M&A in further research. I also plan to collect data
about the change in covenant structures following covenant breaches to explore the role
of nonbank lenders in loan contracting in more depth.
107

Appendices
Appendix A: Variable Definitions in Chapter Two
A.1. Variables from LPC’s DealScan
Loan: A dummy variable equal to one if a firm has at least one loan origination or loan amendment over a three-year period, and zero otherwise.
Nonbank: A dummy variable equal to one if a firm has at least one nonbank lender in any loan origination or loan amendment over a three-year period, and zero otherwise.
Institutional Asset Manager: A dummy variable equal to one if a firm has at least one nonbank lender that is an institutional asset manager in any loan origination or loan amendment over a three-year period during the past three years, and zero otherwise. Institutional asset managers include finance companies, hedge funds, prime funds, private-equity funds, and mutual funds.
Investment Bank: A dummy variable equal to one if a firm has at least one nonbank lender that is an investment bank in any loan origination or loan amendment over a three-year period, and zero otherwise.
Other Nonbank: A dummy variable equal to one if a firm has at least one nonbank lender that is not an investment bank or institutional asset manager in any loan origination or loan amendment over a three-year period, and zero otherwise. Other nonbanks include corporations, distressed funds, CDO’s, insurance companies, leasing companies, pension funds, and trust companies.
Lender: The number of different lenders who participated in any loan origination or amendment during the past three years.
Nonbank Lender: The number of different nonbank lenders who participated in any loan origination or amendment over a three-year period.
Institutional Asset Manager Lender: The number of different institutional asset managers who participated in any loan origination or amendment over a three-year period.
Investment Bank Lender: The number of different investment banks who participated in any loan origination or amendment over a three-year period.
Other Nonbank Lender: The number of other nonbank lenders who participated in any loan origination or amendment over a three-year period.
Amend: A dummy variable equal to one if a loan is amended during the past three years.
108

Lender Client Network: The number of different clients of all the lenders who participated in any loan origination or amendment during the past three years.
Nonbank Client Network: The number of different clients of all the nonbank lenders who participated in any loan origination or amendment during the past three years.
Institutional Asset Manager Client Network: The number of different clients of all the institutional asset managers who participated in any loan origination or amendment during the past three years.
Investment Bank Client Network: The number of different clients of all the investment banks who participated in any loan origination or amendment during the past three years.
Other Nonbank Client Network: The number of different clients of all the other nonbank lenders who participated in any loan origination or amendment during the past three years.
Lead Arranger: A dummy variable equal to one if the lender acts as the lead arranger in a loan origination, and zero otherwise.
A.2. Variables from CRSP-Compustat
ROE: Ratio of earnings to average equity (COMPUSTAT items 20/ ((60+60(t-1))/2)) Sale Growth: Proportional change in sales (log (COMPUSTAT items 12/12(t-1))) Liquidity: Ratio of net liquid assets to total assets (COMPUSTAT items (4-5)/6). If both items 4 and 5 are missing, we replace the liquidity ratio with the ratio of cash and short-term investments to total assets (COMPUSTAT items 1/6)
Leverage: Total debt over the sum of total debt and book equity (COMPUSTAT items (9+5)/ (9+5+60))
Market-to-Book: Year-end market value of common stock over equity book value (COMPUSTAT items 24*25/60)
PE: Ratio of year-end stock price to earnings per share (COMPUSTAT items 58/24)
Firm Size: The natural log of market capitalization at the beginning of the year before the takeover announcement (log (PRC* SHROUT) from CRSP, where price (PRC) is inflated to 2010 dollars by the Consumer Price Index (CPI) (CPI data are downloaded from U.S. Bureau of Labor Statistics)
109

Z-Score: Following the Altman (1968) model, z = 12 (Working capital/Total assets) + 1.4 (Retained earnings/Total assets) + 3.3 (EBIT/Total assets) + 0.6 (Market value of equity/Book value of total liabilities) + 1.0 (Sales/Total assets) Credit Rating: A dummy variable equal to one if a firm has S&P long-term loan rating, and zero otherwise
Positive Accruals: A dummy variable equal to one if the ratio of accruals to total assets is positive, and zero otherwise; we define accruals similarly to Sloan (1996): (COMPUSTAT item ((4-1) - (5-34) - 71) -14)
R&D: The ratio of research and development (R&D) expense to total assets ((COMPUSTAT items 46/6)
Cash Ratio: The ratio of cash and short-term investments to total assets (COMPUSTAT items 1/6) EBIT: The ratio of earnings before interest and taxes to total assets
Past Abnormal Returns: The cumulative abnormal return measured relative to a CRSP value-weighted market model regression and estimated using the third year prior to the forecast year
Firm Assets: The natural log of total assets inflated to 2010 dollars by CPI (log (COMPUSTAT items 6))
Merger Wave: A dummy variable for industrial merger waves equal to one for years 1995 to 1999, 2001, and 2006, and zero otherwise. Measures of industrial merger waves are taken from Harford (2005) for the period before 2001 and from Garfinkel and Hankins (2011) for the period after 2001
Recession: A dummy variable equal to one during years (1990, 1994, 2001, 2008, and 2009) defined as a recession according to the National Bureau of Economic Research. A.3. Variables from SDC
Industry Bid: A dummy variable equal to one if a bid occurred in the same four-digit SIC industry in the year prior to the takeover bid, and zero otherwise
A.4. Variables from Thompson/CDA Spectrum
Institutional Ownership: Institutional ownership at the end of fiscal year, calculated as the ratio of a firm’s shares held by institutional investors relative to total shares outstanding. The holdings data are from Thompson/CDA Spectrum, which collects quarterly information from SEC 13f filings.
110

Appendix B: Variable Definitions in Chapter Three
B.1. Variables from LPC’s DealScan
Nonbank: a dummy variable equal to one if one or more nonbank institutions arrange a syndicated loan, and zero otherwise. Nonbank lenders include investment banks, private equity firms, hedge funds, collateralized loan obligations (CLO), mutual funds, and insurance companies
Total Covenants: the total number of financial covenants in a loan contract
Build-Up: an indicator equal to one if at least one of the financial covenants has a tightening trend over the life of loan contract
Build-Down: an indicator equal to one if at least one of the financial covenants has a loosening trend over the life of loan contract
Loan Size: the natural logarithm of loan package amount stated in 2011 dollars by Consumer Price Index (CPI) (CPI data are downloaded from U.S. Bureau of Labor Statistics)
Performance Pricing: a dummy variable equal to one if the loan package contains a performance pricing provision, and zero otherwise
Sweep Provision: a dummy variable equal to one if the loan contract requires a portion of cash generated by asset-sales, security issuance, or insurance payments to be used to pay down principal, and zero otherwise
Dividend Restriction: a dummy variable equal to one if the borrower is restricted from paying dividends to its shareholders, and zero otherwise
Syndicate Size: the total number of different lenders participated in the loan package
Loan Spread: the weighted average interest spread across facilities in the loan package, where the weights are the size of each facility
Loan Maturity: the weighted average of loan maturities (in months) across facilities in the loan package, where the weights are the size of each facility
Secured: an indicator variable equal to one if lenders hold collateral against any facility in the loan contract
Leverage Loan: an indicator variable equal to one if any facility in the contract is a leverage loan or non-investment grade loan
111

B.2. Variables from Compustat
Assets: the natural logarithm of quarter-end total assets inflated to 2011 dollars by CPI
Z-score: a measurement that predicts bankruptcy calculated following the Altman (1968) model. z = 12 (Working capital/Total assets) + 1.4 (Retained earnings/Total assets) + 3.3 (EBIT/Total assets) + 0.6 (Market value of equity/Book value of total liabilities) + 1.0 (Sales/Total assets)
Credit Rating: a dummy variable equal to one if the borrower is rated by S&P or Moody’s at the time of loan origination, and zero otherwise
Leverage: total debt over the sum of total debt and book equity (COMPUSTAT items (9+5)/ (9+5+60))
Market-to-Book: year-end market value of common stock over equity book value (COMPUSTAT items 24*25/60)
Net Worth Ratio: ratio of quarter-end equity value of stockholders to total assets
Current Ratio: ratio of quarter-end current assets to current liabilities.
B.3. Definitions of Financial Covenants
In our sample, we identify 17 commonly used financial covenants in loan contracts. In loan contracts, lenders can give different definitions for the same covenant. The definition of each kind of covenant in our sample heavily relies on chapter 5 in Taylor and Sansone (2007).
Maximum Debt to EBITDA: a covenant restricts the maximum of the ratio of Debt to EBITDA. Debt usually includes current accounts payable and accrued expenses. EBITDA stands for earnings before interest, taxes, depreciation, and amortization.
Minimum Interest Coverage: a covenant restricts the minimum of the ratio of EBITDA to interest expense. Interest expense is usually refers to cash interest.
Minimum Fixed Charge Coverage: a covenant restricts the minimum of the ratio of EBITDA to fixed charges. Fixed charges include debt services, capital expenditures, and often taxes and regular dividends.
Maximum Capital Expenditure: a covenant restricts the maximum of the aggregate capital expenditures that the borrower may make during a fiscal quarter or fiscal year.
Maximum Leverage ratio: a covenant restricts the maximum of the ratio of total debt to total assets at a given date.
112

Maximum Debt to Tangible Net Worth: a covenant restricts the maximum of the ratio of debt at a given date to tangible net worth for the rolling four quarters most recently ended prior to that date.
Tangible net worth refers to shareholders’ equity excluding intangibles (such as goodwill, research and development costs, and licenses) carried on the balance sheet.
Minimum Current Ratio: a covenant restricts the minimum of the ratio of current assets to current liabilities at a given date.
Minimum Debt Service Coverage: a covenant restricts the minimum of the ratio of EBITDA to debt service during a fiscal period. Debt service usually consists of interest expense and scheduled principal payments.
Maximum Senior Debt to EBITDA: a covenant restricts the maximum of the ratio of senior debt at a given date to EBITDA for the rolling four quarters most recently ended prior to that date.
Minimum EBITDA: a covenant restricts the minimum level of EBITDA at a given date.
Minimum Net Worth: a covenant restricts the minimum level of net worth at a given date. Net worth usually refers to the book value of shareholders’ equity.
113

Appendix C: Appendix Tables in Chapter Two
Appendix Table I: Estimated effects on M&A likelihood for different types of nonbank lenders and additional measures of nonbank roles using logit models with firm fixed effects
This table reports the differential impact of each type of nonbank lenders on the probability of subsequent M&A bids for borrowers using a logit model with firm fixed effects. The dependent variable is a dummy variable equal to one if the firm becomes a target, and zero otherwise. The key independent variables are dummies for nonbank loan participation in columns (1) and (2), logarithms of one plus the number of participating nonbanks in columns (3) and (4), and the logarithms of one plus the number of nonbank clients in columns (5) and (6). We also include other control variables as in Table 2.2 but do not report the coefficients. The t-statistics in parentheses are based on bootstrapped standard errors. The symbols *, **, and *** represent statistical significance at the 10%, 5%, and 1% levels, respectively.
Dummy of Presence
Number of Lender
Size of Client Network
(1) (2) (3) (4) (5) (6) Nonbank 0.018*** 0.007** 0.004***
(4.5) (2.1) (3.7) Institutional Asset Manager 0.023*** 0.015*** 0.006***
(5.0) (3.4) (4.5) Investment Bank 0.007 0.009 0.001
(1.3) (1.6) (0.4) Other Nonbank -0.018*** -0.019*** -0.005***
(-3.4) (-3.9) (-2.9)
R-square 0.007 0.007 0.006 0.007 0.006 0.007 Firm fixed effects Yes Yes Yes Other Control variables Yes Yes Yes Number of firms 7,213 7,213 7,213 Observations 48,001 48,001 48,001
114

Appendix Table II: Alternative estimators of propensity score matching
This table reports the results of the propensity score matching analysis contained in Table 2.4 using alternative estimators. We predict propensity scores first as in Panel A of Table 2.4. The t-statistics in parentheses are based on standard errors obtained by bootstrapping with fifty replications. *, **, and *** represent statistical significance at the 10%, 5%, and 1% levels, respectively. This table shows the PSM results are robust when we use alternative matching methods with nearest neighbor estimators with n= 10 and n=50, and kernel estimators with more weight given to bank borrowers with propensity scores that are closer to the nonbank borrower propensity scores. The last row contains the results of a placebo test for bank borrowers with the same PSM procedure.
Nearest Neighbor Estimator (k=10)
Nearest Neighbor Estimator (k=50)
Kernel Estimator (Gaussian)
ATT t-statistics ATT t-statistics ATT t-statistics All Nonbank 0.014 3.12*** 0.012 2.79*** 0.012 2.87*** Institutional Asset Manager 0.020 4.64*** 0.019 4.46*** 0.018 4.5*** Investment Bank 0.008 1.60 0.006 1.26 0.004 0.96 Other Nonbank -0.002 -0.39 -0.002 -0.45 -0.005 -1.05 Bank 0.004 0.42 0.005 0.48 -0.007 -0.88
115

Appendix Table III: The impact of nonbank lending using the Heckman selection model
This table reports the results of IV estimations of the effect of nonbank lending the likelihood of M&A using the two-step Heckman selection model. As an alternative to the 2SLS model results in Table 2.5, we add the introduction of syndicated loan ratings as the first-stage instrument to satisfy the exclusion restrictions. The Heckman selection model does not assume the instrument is uncorrelated with the error term, but it does assume the error terms in two steps are bivariate normal, which cannot be justified empirically. Therefore, both 2SLS and Heckman selection models have strengths and weaknesses. We report the second-stage regressions of Heckman selection model with firm fixed effects. The variables that we instrument for in each column are a dummy of nonbank presence, the logarithm of one plus number nonbank lenders, and the logarithm of one plus the number of nonbank clients. The symbols *, **, and *** represent statistical significance at the 10%, 5%, and 1% levels, respectively.
Dummy of Presence Number of Lender Size of Client Network
Coefficient t-statistics Coefficient t-statistics Coefficient t-statistics
Nonbank 0.017*** 4.1 0.007** 2.1 0.004*** 3.3
ROE -0.006 -0.3 -0.006 -0.3 -0.007 -0.4 Sale Growth -0.006 -0.5 -0.006 -0.4 -0.006 -0.5 Liquidity -0.124*** -3.5 -0.132*** -3.5 -0.124*** -3.6 Leverage -0.036 -1.4 -0.038 -1.4 -0.033 -1.3 Market-to-Book -0.002 -1.2 -0.002 -1.1 -0.002 -1.2 PE -0.000 -0.2 -0.000 -0.1 -0.000 -0.1 Firm Size -0.015*** -2.9 -0.015*** -2.7 -0.015*** -2.9 Industry Bid 0.006 0.4 0.006 0.3 0.007 0.4 Institutional Ownership -0.000 -0.1 -0.000 -0.1 -0.000 -0.1 Past Abnormal Returns -0.196** -2.4 -0.193** -2.2 -0.195** -2.4 Merge Wave 0.006 1.2 0.006 1.0 0.006 1.2 Recession -0.009 -1.5 -0.009 -1.4 -0.009 -1.4 Firm fixed effects Yes Yes Yes Lambda -0.463*** -0.500*** -0.457*** Observations 48,001 48,001 48,001
116
References
Agarwal, V., Meneghetti, C., 2011. The Role of Hedge Funds as Primary Lenders. Review of Derivatives Research 14, 241-261-261
Aggarwal, R., Nagpurnanand, R.P., Puri, M., 2002. Institutional Allocation in Initial Public Offerings: Empirical Evidence. The Journal of Finance 57, 1421-1442
Altman, E.I., 1968. Financial Ratios, Discriminant Analysis and the Prediction of Corporate Bankruptcy. The Journal of Finance 23, 589-609
Anderson, J., 2006. As Lenders, Hedge Funds Draw Insider Scrutiny. In: The New York Times
Bargeron, L.L., Schlingemann, F.P., Stulz, R.M., Zutter, C.J., 2008. Why do private acquirers pay so little compared to public acquirers? Journal of Financial Economics 89, 375-390
Bharath, S., Dahiya, S., Saunders, A., Srinivasan, A., 2007. So what do I get? The bank's view of lending relationships. Journal of Financial Economics 85, 368-419
Billett, M.T., King, T.-H.D., Mauer, D.C., 2007. Growth Opportunities and the Choice of Leverage, Debt Maturity, and Covenants. The Journal of Finance 62, 697-730
Billett, M.T., Xue, H., 2007. The Takeover Deterrent Effect of Open Market Share Repurchases. The Journal of Finance 62, 1827-1850
Bodnaruk, A., Massa, M., Simonov, A., 2009. Investment Banks as Insiders and the Market for Corporate Control. Review of Financial Studies 22, 4989-5026
Boot, A., 2000. Relationship Banking: What Do We Know? Journal of Financial Intermediation 9, 7-25
Boot, A., Milbourn, T.T., Schmeits, A., 2006. Credit Ratings as Coordination Mechanisms. Review of Financial Studies 19, 81-118
Bradley, M., Roberts, M., 2004. The Structure and Pricing of Corporate Debt Covenants. Social Science Research Network Working Paper Series
Bruner, R.F., 2004. Applied Mergers and Acquisitions. John Wiley & Sons, New York.
Bushman, R.M., Smith, A.J., Wittenberg-Moerman, R., 2010. Price Discovery and Dissemination of Private Information by Loan Syndicate Participants. Journal of Accounting Research 48, 921-972
Carey, M., Post, M., Sharpe, S.A., 1998. Does Corporate Lending by Banks and Finance Companies Differ? Evidence on Specialization in Private Debt Contracting. The Journal of Finance 53, 845-878
117

Chava, S., Roberts, M.R., 2008. How Does Financing Impact Investment? The Role of Debt Covenants. The Journal of Finance 63, 2085-2121
Dai, R., Massoud, N., Nandy, D.K., Saunders, A., 2011. Hedge Funds in M&A Deals: Is There Exploitation of Private Information? SSRN eLibrary
DeAngelo, H., DeAngelo, L., Wruck, K.H., 2002. Asset liquidity, debt covenants, and managerial discretion in financial distress:: the collapse of L.A. Gear. Journal of Financial Economics 64, 3-34
Dehejia, R.H., Wahba, S., 2002. Propensity Score-Matching Methods for Nonexperimental Causal Studies. The Review of Economics and Statistics 84, 151-161
Demiroglu, C., James, C.M., 2010. The Information Content of Bank Loan Covenants. Review of Financial Studies 23, 3700-3737
Denis, D.J., Mihov, V.T., 2003. The choice among bank debt, non-bank private debt, and public debt: evidence from new corporate borrowings. Journal of Financial Economics 70, 3-28
Dennis, S.A., Mullineaux, D.J., 2000. Syndicated Loans. Journal of Financial Intermediation 9, 404-426
Dichev, I.D., Skinner, D.J., 2002. Large–Sample Evidence on the Debt Covenant Hypothesis. Journal of Accounting Research 40, 1091-1123
Drucker, S., Puri, M., 2005. On the Benefits of Concurrent Lending and Underwriting. The Journal of Finance 60, 2763-2799
Fama, E.F., 1985. What's different about banks? Journal of Monetary Economics 15, 29-39
Fama, E.F., French, K.R., 1997. Industry Costs of Equity. Journal of Financial Economics 43, 153-193
Garfinkel, J.A., Hankins, K.W., 2011. The role of risk management in mergers and merger waves. Journal of Financial Economics 101, 515-532
Gârleanu, N., Zwiebel, J., 2009. Design and Renegotiation of Debt Covenants. Review of Financial Studies 22, 749-781
Gaspar, J.-M., Massa, M., Matos, P., 2005. Shareholder Investment Horizons and the Market for Corporate Control. Journal of Financial Economics 76, 135-165
Harford, J., 2005. What drives merger waves? Journal of Financial Economics 77, 529-560
118
Harjoto, M., Mullineaux, D.J., Yi, H.C., 2006. A Comparison of Syndicated Loan Pricing at Investment and Commercial Banks. Financial Management 35, 49-70
Heckman, J.J., Ichimura, H., Todd, P.E., 1997. Matching as an econometric evaluation estimator: Evidence from evaluating a job training programme. Review of Economic Studies 64, 605-654
Ivashina, V., 2009. Asymmetric information effects on loan spreads. Journal of Financial Economics 92, 300-319
Ivashina, V., Iverson, B.C., Smith, D.C., 2011. The Ownership and Trading of Debt Claims in Chapter 11 Restructurings. SSRN eLibrary
Ivashina, V., Nair, V.B., Saunders, A., Massoud, N., Stover, R., 2009. Bank Debt and Corporate Governance. Review of Financial Studies 22, 41-77
Ivashina, V., Sun, Z., 2011. Institutional Stock Trading on Loan Market Information. Journal of Financial Economics 100, 284-303
Jensen, M.C., Meckling, W.H., 1976. Theory of the firm: Managerial behavior, agency costs and ownership structure. Journal of Financial Economics 3, 305-360
Jiang, W., Li, K., Shao, P., 2009. When Shareholders are Creditors: Effects of the Simultaneous Holding of Equity and Debt by Institutional Investors. SSRN eLibrary
Jiang, W., Li, K., Wang, W., 2011. Hedge Funds and Chapter 11. Journal of Finance, Forthcoming
Kang, D., Mullineaux, D.J., 2011. The Impact of Non-Bank Lending on Mergers and Acquisitions. SSRN eLibrary
Lee, S.W., Mullineaux, D.J., 2004. Monitoring, Financial Distress, and the Structure of Commercial Lending Syndicates. Financial Management 33, 107-130
Leland, H.E., 1994. Corporate Debt Value, Bond Covenants, and Optimal Capital Structure. The Journal of Finance 49, 1213-1252
Leuven, E., Sianesi, B., 2010. PSMATCH2: Stata Module to Perform Full Mahalanobis and Propensity Score Matching, Common Support Graphing, and Covariate Imbalance Testing. Statistical Software Components, Boston College Department of Economics
Li, K., Prabhala, N., 2007. Self-Selection Models in Corporate Finance. Chapter 2 in: Handbook of Corporate Finance: Empirical Corporate Finance. Handbooks in Finance Series. Elsevier/North Holland
119

Li, N., Vasvari, F.P., Wittenberg-Moerman, R., 2012. The Information Content of Threshold Values in Earnings-Based Covenants. SSRN eLibrary
Lim, J., 2013. The Role of Activist Hedge Funds in Financially Distressed Firms. Social Science Research Network Working Paper Series
Lim, J., Minton, B.A., Weisbach, M., 2012. Syndicated Loan Spreads and the Composition of the Syndicate. National Bureau of Economic Research Working Paper Series No. 18356
Ljungqvist, A., Marston, F., Wilhelm, W.J., 2006. Competing for Securities Underwriting Mandates: Banking Relationships and Analyst Recommendations. The Journal of Finance 61, 301-340
LSTA, 2007. The Handbook of Loan Syndications and Trading. the McGraw-Hill Companies.
Malitz, I., 1986. On Financial Contracting: The Determinants of Bond Covenants. Financial Management 15, 18-25
Maskara, P.K., Mullineaux, D.J., 2011. Small Firm Capital Structure and the Syndicated Loan Market. Journal of Financial Services Research 39, 55-70
Massa, M., Rehman, Z., 2008. Information flows within financial conglomerates: Evidence from the banks–mutual funds relation. Journal of Financial Economics 89, 288-306
Massa, M., Zhang, L., 2009. Cosmetic Mergers: The Effect of Style Investing on the Market for Corporate Control. Journal of Financial Economics 93, 400-427
Massoud, N., Nandy, D., Saunders, A., Song, K.K., 2011. Do hedge funds trade on private information? Evidence from syndicated lending and short-selling. Journal of Financial Economics 99, 477-499
Mitchell, M., Stafford, E., 2000. Managerial Decisions and Long-term Stock Price Performance. The Journal of Business 73, 287-329
Morrison, A.D., Wilhelm, W.J., 2007. Investment Banking: Institutions, Politics, and Law. Oxford University Press.
Murfin, J., 2012. The Supply-Side Determinants of Loan Contract Strictness. The Journal of Finance 67, 1565-1601
Myers, S.C., 1977. Determinants of corporate borrowing. Journal of Financial Economics 5, 147-175
Nini, G., Smith, D.C., Sufi, A., 2009. Creditor control rights and firm investment policy. Journal of Financial Economics 92, 400-420
120
Nini, G., Smith, D.C., Sufi, A., 2012. Creditor Control Rights, Corporate Governance, and Firm Value. Review of Financial Studies 25, 1713-1761
Officer, M.S., 2003. Termination Fees in Mergers and Acquisitions. Journal of Financial Economics 69, 431-467
Palepu, K.G., 1986. Predicting Takeover Targets : A Methodological and Empirical Analysis. Journal of Accounting and Economics 8, 3-35
Petersen, M.A., Rajan, R.G., 1994. The Benefits of Lending Relationships: Evidence from Small Business Data. The Journal of Finance 49, 3-37
Rajan, R., Winton, A., 1995. Covenants and Collateral as Incentives to Monitor. The Journal of Finance 50, 1113-1146
Roberts, M.R., Sufi, A., 2009a. Control rights and capital structure: An empirical investigation. The Journal of Finance 64, 1657-1695
Roberts, M.R., Sufi, A., 2009b. Renegotiation of financial contracts: Evidence from private credit agreements. Journal of Financial Economics 93, 159-184
Sargent, C., 2005. The New Insider Trading? Concerns Mount that Private Information Furnished to Lenders is Seeping into Trading. In: Investment Dealers Digest
Schwert, G.W., 2000. Hostility in Takeovers: In the Eyes of the Beholder? The Journal of Finance 55, 2599-2640
Sloan, R.G., 1996. Do Stock Prices Fully Reflect Information in Accruals and Cash Flows about Future Earnings? The Accounting Review 71, 289-315
Smith, A.J., Wittenberg-Moerman, R., 2011. Privileged Lending: Synidcate Loans and Inside Information. In: Forbes India Magazine
Smith, C.W., Warner, J.B., 1979. On financial contracting: An analysis of bond covenants. Journal of Financial Economics 7, 117-161
Standard, Poor's, 2010. A guide to the U.S. loan market.
Sufi, A., 2007. Information Asymmetry and Financing Arrangements: Evidence from Syndicated Loans. The Journal of Finance 62, 629-668
Sufi, A., 2009. The Real Effects of Debt Certification: Evidence from the Introduction of Bank Loan Ratings. Review of Financial Studies 22, 1659-1691
Taylor, A., Sansone, A., 2007. The Handbook of Loan Syndications and Trading. The McGraw-Hill Companies.
Wooldridge, J.M., 2011. Econometric Analysis of Cross Section and Panel Data. The MIT Press.
121

Yasuda, A., 2005. Do Bank Relationships Affect the Firm's Underwriter Choice in the Corporate-Bond Underwriting Market? The Journal of Finance 60, 1259-1292
Yi, H.C., Mullineaux, D.J., 2006. The Informational Role of Bank Loan Ratings. Journal of Financial Research 29, 481-501
122

Vita
Di Kang Place of Birth Qinghai, China Educational Institutions Attends and Degrees Already Awarded University of Nebraska– Masters of Science – Economics Peking University – Bachelors of Arts – Public Finance Scholastic and Professional Honors Outstanding Teaching Assistant Award Asian Financial Management Association Conference Semifinalist for Best Paper Award FMA Asian Meeting, 2013 Gatton Doctoral Fellowship Midwest Financial Annual Meeting Doctoral Student Travel Grant Max Steckler Fellowship
123
Related Documents