Louisiana State University LSU Digital Commons LSU Doctoral Dissertations Graduate School 2010 Two essays on analyst bias and management entrenchment Bahar Ulupinar Louisiana State University and Agricultural and Mechanical College, [email protected] Follow this and additional works at: hps://digitalcommons.lsu.edu/gradschool_dissertations Part of the Finance and Financial Management Commons is Dissertation is brought to you for free and open access by the Graduate School at LSU Digital Commons. It has been accepted for inclusion in LSU Doctoral Dissertations by an authorized graduate school editor of LSU Digital Commons. For more information, please contact[email protected]. Recommended Citation Ulupinar, Bahar, "Two essays on analyst bias and management entrenchment" (2010). LSU Doctoral Dissertations. 440. hps://digitalcommons.lsu.edu/gradschool_dissertations/440

Welcome message from author
This document is posted to help you gain knowledge. Please leave a comment to let me know what you think about it! Share it to your friends and learn new things together.
Transcript

Louisiana State UniversityLSU Digital Commons
LSU Doctoral Dissertations Graduate School
2010
Two essays on analyst bias and managemententrenchmentBahar UlupinarLouisiana State University and Agricultural and Mechanical College, [email protected]
Follow this and additional works at: https://digitalcommons.lsu.edu/gradschool_dissertations
Part of the Finance and Financial Management Commons
This Dissertation is brought to you for free and open access by the Graduate School at LSU Digital Commons. It has been accepted for inclusion inLSU Doctoral Dissertations by an authorized graduate school editor of LSU Digital Commons. For more information, please [email protected].
Recommended CitationUlupinar, Bahar, "Two essays on analyst bias and management entrenchment" (2010). LSU Doctoral Dissertations. 440.https://digitalcommons.lsu.edu/gradschool_dissertations/440

TWO ESSAYS ON ANALYST BIAS AND MANAGEMENT ENTRENCHMENT
A Dissertation
Submitted to the Graduate Faculty of the
Louisiana State University and
Agriculture and Mechanical College
in partial fulfillment of the
requirements for the degree of
Doctor of Philosophy
in
The Interdepartmental Program in The E.J. Ourso College of Business
(Finance)
by
Bahar Ulupinar
B.A., Ege University, 2004
May 2010

ii
ACKNOWLEDGEMENTS
My parents have supported me to get the best possible education since I started primary
school. My pursuit of a doctorate degree in U.S. was my dad’s passion as well as mine. Even though
my mom did not like the idea of living on the two sides of the Atlantic Ocean, she flew over the
Atlantic whenever I needed assistance. My brother, who was my roommate for the first four years of
my Ph.D life, has been a psychological support to me, especially after he met his beautiful wife Elif.
I feel so fortunate to have such a supporting family.
I would like to express my deepest gratitude to Ji-Chai Lin. Even in my first years of
program, when we had not decided to work together, he was the first person in the department whom
I talked to whenever I had a problem and he always helped me out. This dissertation has been shaped
to this way through his guidance and support. I would also like to thank the members of my
dissertation committee, Shan He, Robert Newman, Ken Reichelt and Gary Sanger, who provided
their most invaluable comments at the proposal defense and final exam stages. Additionally, I cannot
thank enough to Yasemin Aksoy, without whose encouragement and help I would not be able to
come to LSU, and to Dr. Carlos Slawson who has offered great support as a department head.
The best part of my Ph.D program was the person I met when I first came to Louisiana. Since
the very beginning of the program till the end, he has always been by my side, supporting and
encouraging me. He is my boyfriend, my best friend, my husband, Isa’cim. I love you so much, and
with all my heart, I dedicate this study to you and our little baby-girl, Guler’cigimiz.

iii
TABLE OF CONTENTS
ACKNOWLEDGEMENTS.…….……………………………….…………………………..…….…ii
ABSTRACT……………………………………………………….……………………………..…...iv
CHAPTER 1. INTRODUCTION ………………………………...………………………………...…1
CHAPTER 2. ARE COMPANIES INNOCENT WHILE ANALYSTS ARE BIASED?......………....4
2. 1 Introduction.………………………………………………………………………………4
2.2 Literature Review and Hypothesis……………………………………………………......9
2.2.1. Conflict of Interest………………………………………………….………......9
2.2.2. Reputation Hypothesis…………………………………………….………......13
2.2.3. Managerial Entrenchment…………………………………………………… 15
2.2.4. Recent Regulations……………………………………………….…………...20
2.3 Data and Methodology……………………………..………………………..…………..21
2.4 Empirical Tests and Results…………………….…..…………………………………...26
2.5 Conclusion………………………………………....………………………...…………..51
CHAPTER 3. DO FIRMS WITH POOR SHAREHOLDER RIGHTS ACTUALLY SUFFER?
EVIDENCE FROM SEASONED EQUITY OFFERINGS………………………………………….53
3.1 Introduction.…………………………………………….…………………………….....53
3.2 Literature Review and Hypothesis……………………………………………………....59
3.2.1 International Perspective on Shareholder Rights………………..….………....59
3.2.2 Shareholder Rights in U.S. and Equity Financing……………………….........61
3.2.3 Underwriters’ Effort to Place Securities and Analyst Coverage……………...63
3.2.4 Underwriter Compensation and Flotation Costs………………….…...……...66
3.3 Data and Methodology……………………………..………………………..…………..68
3.4 Empirical Tests and Results…………………….…..…………………………………...74
3.4.1 Univariate Analysis………………………..……………………….…………74
3.4.2 Multivariate Analysis…………………..…………………………….……….78
3.4.2.1 Shareholder Rights in U.S. and Equity Financing………………….78
3.4.2.2 Underwriters’ Effort to Place Securities and Analyst Coverage……83
3.4.2.3 Underwriter Compensation and Flotation Costs…….…………..….93
3.4.3 Robustness Check……………………………………………….……………..97
3.5 Conclusion………………………………………....………………………...…………..99
CHAPTER 4. CONCLUSION……………………………………...………………………………101
REFERENCES..……………...……………………………………………………………………..103
APPENDIX (CORPORATE GOVERNANCE PROVISIONS)..………………...………….……..109
VITA…………..…………………………………………………………………………...………..112
iv
ABSTRACT
This dissertation examines the interactions of corporate governance on analyst behavior.
Analyst bias is well documented in the previous literature. However, the relationship between
managerial entrenchment and analyst bias has not been explored. In my first essay, I hypothesize that
while analysts strike a balance between personal reputation and revenue generation for their
employers, entrenched managers of covered firms are more likely to induce analysts’ collaboration
using management access and underwriting businesses. My hypothesis suggests that managerial
entrenchment is a potential source of analyst bias. Consistent with my hypothesis, using the G-Index
as a proxy for managerial entrenchment, I show that analysts provide more upward biased
recommendations as managerial entrenchment becomes worse. Interestingly, I find that affiliated
analyst bias is present only for medium level entrenchment sample where G-Index is between 6 and
13. Furthermore, my results show that recent regulations are very effective to alleviate conflict of
interest since regulations emphasize the importance of reputation and eliminate the tools managers
use to induce analysts to bias their research.
In my second essay, I hypothesize that it is more difficult for firms that grant investors weak
shareholder rights to raise equity, and that since any difficulty in firm commitment offerings
transferred to underwriters, they would ask for higher underwriting spreads to compensate for the
difficulty and put more efforts to promote SEOs. Consistent with this hypothesis, I find that analyst
recommendations on firms with weak shareholders rights increase sharply, starting one year prior to
SEOs, and their recommendations reverse back two months after the SEOs. Issuing firms that grant
investors strong shareholder rights do not experience such an increase and then a decrease in analyst
recommendations surrounding their SEOs. Furthermore, I find that underwriting spreads are
positively related to analyst recommendations and inversely related to shareholder rights. My
findings suggest that firms with weak shareholders rights have to pay underwriters more to raise

v
capital and thus suffer financially. Overall, my results improve our understanding of interactions
between corporate governance and analyst behavior, and highlight the importance of corporate
governance in corporate financing. .
1
CHAPTER 1: INTRODUCTION
The main goal of my dissertation is to link analyst coverage and corporate governance. Both
of the topics have been extensively studied separately. Analysts’ conflict of interest due to revenue
generation for their investment banks, the effect of analyst forecasts and recommendations on stock
prices, and investor behavior and analyst characteristics are among the hottest topics examined in the
recent analyst coverage literature. However, as I argue and present evidence in this dissertation,
corporate governance of covered firms play a role in influencing analyst behavior.
My dissertation consists of two essays. In my first essay I examine how corporate governance
affects analyst bias through the balance analysts strike between reputational capital and revenue
generation for their employers. In my second essay, I examine the same relationship during an
important corporate event, seasoned equity offerings (SEOs). More specifically, I study how
corporate governance affects investors’ demand for SEO shares, and thereby underwriters’ risk
associated with reselling shares to public, and how underwriters improve investor demand through
analyst recommendations.
Analyst bias is well documented in the literature. Studies find that analysts increase their
recommendations to generate underwriting and M&A advising business for their investment banks,
to gather non-public company information from managers, and to increase trading commissions for
their brokerage firms. While revenue generation is one facet of analysts’ compensation structure,
analyst reputation is the other one. Analysts build their reputation which helps them to move up a
high status brokerage house job or to get better pay. In my first essay, “Are Companies Innocent
while Analysts Are Biased?”, I suggest that managerial entrenchment is an external factor that affects
analysts’ compensation structure through the balance between revenue generation and reputation.
Based on Tirole’s (2005) argument that entrenched managers tend to seek cooperation from analysts
when managers engage in accounting manipulations, I hypothesize that entrenched managers are

2
more likely to induce analysts’ cooperation by management access and investment banking
businesses.
Further, I examine the effect of managerial entrenchment on affiliated analyst bias. I suggest
that managerial entrenchment has a stronger effect on affiliated analyst bias because, through
investment banking relationship, managers can put more pressure on analysts’ bosses or investment
bankers who have power over analysts.
Consistent with my hypothesis, using the G (Governance) Index as a proxy for managerial
entrenchment, I show that analysts provide more upward-biased recommendations as managerial
entrenchment becomes worse. Interestingly, I find that affiliated analyst bias is present only for the
medium level entrenchment sample where G-Index is between 6 and 13. For the least and the most
entrenchment subsamples, affiliated analysts do not provide more optimistic recommendations than
unaffiliated analysts do due to their reputational capital concerns. Furthermore, my results show that
recent regulations are very effective to alleviate conflict of interest since regulations emphasize the
importance of reputation and eliminate the tools managers use to induce analyst to bias their
research.
In my second essay, “Do firms with poor shareholder rights actually suffer? Evidence from
Seasoned Equity Offerings” I ask whether firms that grant fewer rights to shareholders face more
difficulty to attract investor to buy shares in SEOs. When corporate governance is not strong,
shareholders have weaker rights, which could create an obstacle for managers to get equity financing.
Investors would be less willing to finance companies during SEOs when they have fewer shareholder
rights to protect themselves with. However, when firms sign a firm commitment contract with
underwriters to place equity, they pass this problem to underwriters. Investment banks face a price
risk associated with reselling shares to the public, and this risk is greater if weaker shareholder rights
adversely affect investor demand for SEOs. Therefore, I hypothesize that it is more difficult for firms
that grant investors weak shareholder rights to raise equity, and that since any difficulty in firm
3
commitment offerings transferred to underwriters, they would ask for higher underwriting spreads to
compensate for the difficulty and put more efforts to promote SEOs. Consistent with this hypothesis,
I find that analyst recommendations on firms with weak shareholders rights increase sharply, starting
one year prior to SEOs, and their recommendations reverse back two months after the SEOs. Issuing
firms that grant investors strong shareholder rights do not experience such an increase and then a
decrease in analyst recommendations surrounding their SEOs. Furthermore, I find that underwriting
spreads are positively related to analyst recommendations and inversely related to shareholder rights.
My findings suggest that firms with weak shareholders right have to pay underwriters more to raise
capital and thus suffer financially.

4
CHAPTER 2: ARE COMPANIES INNOCENT WHILE ANALYSTS ARE BIASED?
2.1 Introduction
Previous studies show how reputation helps financial intermediaries earn higher returns, in
terms of higher fees, due to certifying role of reputation. Like other financial intermediaries, financial
analysts want to build their reputation which generates returns in terms of favorable career outcomes
like moving up to a high status brokerage houses job (Hong and Kubik (2003)), and better pay
(Stickel (1992)). However, even though previous literature support reputation hypothesis with
theoretical models and empirical tests,1 it is puzzling to see analysts who take opportunistic behavior
by providing biased research that hurts their reputation.
Fang and Yasuda (2009) point out that there are two distinct facets in the analyst
compensation structure that produce two opposing incentives. While reputational compensation is an
incentive to provide accurate research, compensation, related to conflict of interest, is an incentive
for analysts to bias their recommendations. Therefore, analysts strike a balance between their own
reputation and generating revenues for their employers’ brokerage and investment banking
departments and revenues for themselves in terms of non-public company information (Ljungqvist et
al (2007)).
This paper extends this literature and proposes that an external factor, managerial
entrenchment, affects analysts’ compensation structure through the balance between revenue
generation and reputation. More specifically, I ask a very simple but important question that would
improve my understanding of analysts’ conflict of interest: Do entrenched managers demand more
favorable recommendations?
Tirole (2005) suggests that accounting manipulations and lack of transparency are two
general forms of dysfunctional corporate governance. Accounting manipulations protect managers
1 See Chemmanur and Fulgeri (1994), Diamond (1989), Diamond (1991) for theoretical papers and
Slovin et al (1990) for empirical research.
5
against dismissals and takeovers by hiding poor performance so that entrenched managers, who
pursue private benefits, are more likely to take these actions. However, accounting manipulations
may have severe consequences on managers when revealed2, therefore managers seek cooperation
from analysts (Tirole (2005)) to cover managers’ actions. Entrenched managers may hire analysts’
investment banks and may provide non-public company information to analysts if analysts provide
optimistic research. These revenue generations increase analysts’ incentives related to conflict of
interest and their willingness to cater entrenched managers.
Furthermore, lack of transparency in firms with dysfunctional governance shields optimism
in analyst research. Shleifer and Vishny (1989) suggest that self interested managers are reluctant to
reveal their private information and poor disclosure weaken investors’ ability to discipline managers
so that managers become entrenched and corporate governance gets worse. The negative relationship
between managerial entrenchment and information disclosure suggests that investors do not have
enough information about companies, run by entrenched managers, so that investors cannot evaluate
the accuracy of analyst research. As a result analysts do not face reputational cost when they bias
their recommendations for companies with entrenched managers who also offer compensation related
to conflict of interest. Consequently, analysts are more inclined to shift the balance towards revenue
generation when they cover companies with more entrenched management.
On the other hand, least entrenched managers are less likely to pursue private benefits so that
they increase transparency of their firm and do not engage in actions such as accounting
manipulations that may be detrimental to shareholders. Consequently, they do not need analysts’
cooperation. Therefore, they would not use non-public company information and investment banking
businesses to induce analysts to give favorable recommendations. Furthermore, transparent structure
of companies with less entrenched managers increases reputational costs for analyst bias. Higher
2 Desai et al (2006) find that 60 percent of restating firms experience a turnover of at least on top
manager within 24 months of the restatement.

6
reputational costs without any revenue generation make analysts shift the balance towards reputation.
Therefore, I posit that there is a positive relationship between managerial entrenchment and analyst
bias.
However, recent regulations, including the SarBox (2002) and the Global Settlement would
change the relationship between managerial entrenchment and analyst bias. SarBox (2002) require
managers to be responsible for their financial statements and to disclose more information to the
market. Increased responsibility of managers for financial statements leads to less accounting
manipulations and thereby decreases managers’ need for analysts’ cooperation (Li et al (2008), Zhou
and Lobo (2006)). Even if managers want to put pressure on analysts, they lose their tools to appeal
analysts for two reasons. Firstly, Fair disclosure (2000) mandates that all publicly traded companies
must disclose material information to all investors at the same time so that entrenched managers
cannot attract analysts with non-public information. Secondly, Global Settlement (2003) requires
analyst independence and strict Chinese walls, cutting the link between analyst compensation and
optimism. In addition to restriction on revenue generation, emphasize on personal reputation during
Global Settlement period3 cause analysts to refrain themselves from bias. Therefore, I posit that the
effect of managerial entrenchment on analyst bias would become insignificant after the Global
Settlement.
Zsuzsanna (1999) define an entrenched manager as one who is unlikely to be fired because
dispersed equity holders have difficulty in coordinating their effort to carry out a successful control
challenge. Based on her definition, I use G-Index4 to measure managerial entrenchment. G index
ranges from 1 to 18 where each number refers to a provision that limit shareholder rights. Higher
3 During Global Settlement many analysts were investigated and fined. For instance Jack Grubman
was banned from securities industry and paid $15 million in fines. Similar events reminded the
importance and costs of personal reputation. 4 For robustness check, I also use E-Index which consists of only 6 provisions out of 24 provisions
that limit shareholder power.

7
numbers refer to extensive power for management to resist corporate takeover activities and places
strong restrictions on shareholders’ ability to replace directors and executives. Therefore, a high G-
Index coincides with the difficulty of carrying out a successful control challenge, thus entrenching
managers.
To test my hypothesis, I use 255,144 analyst recommendations. I show that one unit increase
in a firm’s G-Index increases (decreases) its probability of receiving optimistic (pessimistic)
recommendations by 1.54% (1.55%). Further, following Gompers et al (2003), I create three
subsamples based on the G-index to examine the relationship in more detail. Even though the G-
index seems to be significant only for medium level entrenchment in subsample regressions, I show
that analyst bias for companies with most entrenched managers is significantly greater than analyst
bias for companies with medium level entrenched managers, which is also significantly greater than
analyst bias for companies with least entrenched managers.
This negative relationship between entrenched managers and analyst bias has two major
contributions to my understanding of conflict of interest and managerial entrenchment. Our results
show that even though analysts provide bias, this bias is demanded by entrenched managers so that
managerial entrenchment is the source of analyst bias. In other words, analysts cater to entrenched
managers, who demand analyst bias, and they do not just provide favorable recommendation to any
company. Secondly, my results emphasize the capability of entrenched managers by touching agency
problem. Entrenched managers can make analysts cooperate with them and conceal their actions by
aligning their own interest with the interest of analysts, not shareholders.
Secondly, I examine how affiliated analyst behavior change based on managerial
entrenchment. The literature has shown that affiliated analysts are more biased than unaffiliated
analysts. However, I show that affiliated bias depends on managerial entrenchment. Affiliated analyst
behavior is not significantly different from unaffiliated analyst behavior for companies with the most
and least entrenched managers. When managerial entrenchment is very severe, affiliated analysts do

8
not submit managers’ pressure due to reputational concerns so that their recommendations are not
significantly different from unaffiliated analysts’ recommendations. On the other hand, in a well-
governed firms, managers are least entrenched and would demand biased research neither from
unaffiliated analysts nor from affiliated analysts. Therefore, commonly documented affiliated analyst
bias should be present only for companies with a medium level of entrenched managers. Indeed, I
find that the affiliation dummy is positive and significant only for companies with a medium level of
entrenched management.
I also examine relationship between managerial entrenchment and analyst bias for two sub-
sample periods, pre-regulation and post-regulation periods, to investigate the effects of the recent
regulations. As I predict, corporate governance does not have any effect on analyst optimism in the
post-regulation period. Furthermore affiliated analyst behavior is not significantly different from that
of unaffiliated behavior in the later period for all sub-samples, suggesting that regulations were
effective to alleviate analyst bias.
While showing that managerial entrenchment is a source of analyst bias, my results also
emphasize the importance of corporate governance. Good corporate governance ensures that
managers do not divert resources from corporations, and choose underwriters based on merit
(Laporta et al (2000)). While corporate governance is a set of mechanisms that aim to alleviate
managers’ expropriation of residual control rights, it also has an positive effect on the functioning of
financial intermediaries.
The rest of the paper is as follows. Section II reviews the literature and elaborates the effect
of entrenchment on analyst bias. Section III describes data and methodology. Section IV presents
empirical work, and section V concludes.

9
2.2 Literature Review and Hypothesis
2.2.1 Conflict of Interest
Mehran and Stulz (2007) define conflict of interest as a situation in which a party to a
transaction can potentially gain by taking actions that adversely affect its counterparty. Sell side
analysts upwardly bias their recommendations which have adverse effect on investors. In return,
analysts increase trading commissions for brokerage departments of investment banks, gather more
non-public company information and increase their compensation which is based on the business
they generate for underwriting departments of investment banks.
Analyst conflict of interest is well documented in the literature5 Literature points out that
there are three main sources of incentives analyst have to bias their research. First of all, two main
investment bank businesses, underwriting and advising, are incentives for analysts to bias their
research since analysts’ compensation is tied to the revenue of these businesses. For instance,
Bernard Ebbers, former CEO of WorldCom, explicitly stated that “I have to get better ratings [from
Merrill Lynch analyst Mark Kastan] before Merrill Lynch would do any investment banking”.
Barber et al (2006) compare independent research firm recommendations to investment bank
recommendations where investment banks include all those that participated in at least one equity
offering in the sample period. They find that market discounts buy recommendations of investment
banks since investors realize potential optimism in analyst recommendations of investment banks.
Whereas sell and hold recommendations outperform those of independent firms because investors
believe that companies must be performing really bad so that even analysts of investment banks
disseminate their dislike. Similarly, many studies suggest that analysts of investment banks are more
5 Following prior literature, I use the term optimism relative to benchmark of median analyst
recommendation for a specific company in a given quarter. Even though using median
recommendation as a benchmark is problematic due to the potential that benchmark itself may be
optimistic, for recommendations I do not have an actual value such as EPS to find bias in earnings
estimates. With this caveat I use median recommendation as a benchmark following the literature.
10
optimistic than those of independent firms due to potential and existing business relation with
covered companies. (Cliff (2007))
After an investment bank underwrites IPO, SEO or debt offering, analysts of that investment
bank are expected to initiate or continue to provide, presumably positive, coverage. Supporting this
argument, James and Karceski (2006) show that affiliated analysts provide positive
recommendations, as booster shots, to IPO firms. On the other hand Krigman et al (2000) examines
what happens to the relationship between IPO firms and the lead IPO underwriter in a three year
period after the IPO if analysts of IPO underwriter do not meet the expectations of managers. They
find that untimely or non-existent research coverage by the lead underwriter is the main determinant
of underwriter switching for following SEOs. The implicit agreement in the market suggests that
positive analyst coverage is a part of investment banking service (Michaely and Womack (1999),
O’Brien et al (2005) Barber, Lehavy and Trueman (2006), Cowen et al (2006)).
Manager expectations of getting analyst coverage are not unique to IPO companies.
(Michaely and Womack (1999), O’Brien et al (2005) Barber, Lehavy and Trueman (2006), Cowen et
al (2006)). In other words, when managers hire underwriters, they expect to get optimistic
recommendations from analysts of the hired underwriter and they assume that optimistic coverage is
a part of investment bank service. Otherwise firms leave analysts’ investment banks out of future
business deals. Since analysts’ compensation is tied to generation of investment bank business, they
are wary of anything that would upset company managers. Therefore, investment bank business is a
tool that managers use to make analysts positively bias their recommendations.
Second investment banking business that creates an incentive for analysts to bias their
recommendations is M&A advising business. Kolasinski and Kothari (2007) argue that M&A
business is a stronger tool than underwriting business, to encourage analysts to bias their

11
recommendations because M&As are more frequent and they generate higher fees6. They show that
starting in 1995 M&A revenues are greater than underwriting revenues for investment banks.
Therefore, managers use M&A fees as a tool to reward analysts and to push them to provide
optimistic recommendations.
Another incentive for analysts to provide optimistic research is non-public company
information. Schipper (1991) argues that there are two broad types of services analysts provide to the
investment community. The first one is assimilation and processing of publicly available information
and the second one is acquisition and dissemination of new information which is hard to gather.
Major source of private information is company managements which have meetings, analyst
briefings, outings and conference calls to inform their favorite investors and analysts. Non public
company information helps analysts to disseminate unique information7 before other analysts even
hear about them. Therefore they may have timely and good calls which affect their job replacements
(Hong and Kubik (1998)), their research stands out in securities market and has more demand from
institutional investors who pays for research and select all star analysts. Institutional investors
emphasize the importance of non-public company information. According to participants in the 2008
All-America Research Team survey, when institutional investors rank analysts, management access
is the fourth most important attribute of analysts despite of Fair Disclosure8. Since being all star
analysts has direct benefits in analysts’ career, non-public company information is too crucial for
6 Hunter and Jagtiani finds that, on average, target firms paid $4.4 million (0.84 percent of
transaction value) in advisory fees per deal and acquiring firms paid $2.4 million (0.38 percent of
transaction value) in advisory fees per deal. On average, total fees (paid by the targets and the
acquirers combined) were 1.22 percent of the transaction value. Even though this percentage is much
less than 7% for underwriting fees, higher frequency of M&A activities compensates the difference.
Kolasinski and Kothari (2007) show that starting with 1995 M&A fee revenues is greater that
underwriting revenues for investment banks. 7 However information that companies release in special meetings is more likely positive information
since the management is slow to provide bad news (Hong et al (2000)). 8 Fair Disclosure is enacted in 2000 by SEC. It mandated that all publicly traded companies must
disclose material information to all investors at the same time.

12
analysts to ignore (Hong and Kubik (1998), Stickel (1992)). A former analysts, Jack Grubman, who
had close tie with the CEO of WorldCom once said that there is no Chinese Wall between him and
Ebbers which helped Grubman to have good calls and increase his reputation.
While private information is beneficial for analysts, to gather it analysts need to cater
managers. Das et al (1998) find that analysts provide more optimistic recommendations for
companies whose earnings are difficult to be accurately forecasted using only public information
because optimistic recommendations open doors of management. Similarly Francis and Philbrick
(1993) find that analyst forecasts are more optimistic after sell recommendations compared to analyst
forecasts after hold recommendations because analysts are willing to repair their relations with
managements after they issue bad recommendations. Since company managers are well aware of the
importance of private information to analyst calls, they use it as a tool to allure analysts to provide
optimistic research.
Finally, trading commissions have a direct effect on analyst optimism. Given that investors,
especially individual investors, follow analysts literally (Malmendier and Shantikumar (2007)) buy
and strong buy recommendations increase trading in recommended stocks. Increased trading
generates revenues for brokerage departments of analysts’ investment banks. Supporting this
argument Francis and Willis (2000) find that the average monthly stock volume is positively related
to analysts' forecast optimism. Jackson (2005) provides more concrete evidence and shows that
optimistic recommendation can create more trading commission for analysts’ brokerage firms
whereas sell and strong sell recommendations do not have such an effect due to short sale constraints.
Similarly, Irvine (2004) suggests that analysts' coverage decisions depend, at least in part, on the
amount of trading revenues their reports will generate.
Akin to trading commissions, stock holdings of analysts' affiliated mutual funds may
motivate analysts to be optimistic. Guidolin and Mola (1999) find that even all star analysts report
the most optimism when they recommend stocks in the portfolios of the affiliated mutual funds.

13
2.2.2 Reputation Hypothesis
Conflict of interest issues mentioned above give analysts an incentive to bias their
recommendations. I claim that managers can use these incentives as a tool to put pressure on analysts
to bias their research. On the other hand, reputational capital disciplines analysts as it does all
financial intermediaries and limit analyst bias because reputation hypothesis suggests that analysts
earn return on their reputation and bear costs of reputation loss.
Reputation building helps financial actors to alleviate moral hazard and adverse selection
problems, and to have stronger certifying and monitoring roles. For example Chemmnanur and
Fulghieri (1994) state that reputation is established by putting stringent evaluation standards and
reputable investment banks have more certifying roles. Therefore they can decrease information
asymmetry more and less risky issuers are willing to pay higher fees for reputable investment banks.
Slovin et al (1990) examine SEOs and show that stock price reaction is a positive function of the
reputable auditing firms and underwriters. This finding highlights the fact that reputation encourages
financial intermediaries to provide valuable and trustworthy information to the market.
The effect of reputation on analysts has anecdotal and empirical evidence. Reputable analysts
may earn two types of returns on their reputation. The first one is the direct return such as higher
pays and better job placements. Using All-star ranking9 Stickel (1992) find that reputable analysts
have better pays. Similarly Hong and Kubik (2003) find that reputation affects analysts’ career
outcomes and helps them moving up to a high status brokerage houses job. The second type of return
analysts earn on their reputation is the amount of business they generate for their investment banks.
This return has an indirect effect on their compensation when their compensation is tied to businesses
9 Institutional investor magazine send surveys to portfolio managers, directors of research, and chief
investment officers of the world’s largest pension funds, hedge funds and mutual funds, asking them
to rank the analysts in each industry. Every October issue of the magazine announces the best
analysts of the year. All star rankings is the most accepted way to evaluate analyst’s contribution in
Wall Street and is used as a proxy for analyst reputation in empirical studies.

14
they generate and reputable analysts generate more business compared to their less reputable
colleagues.
Since analyst coverage is considered as a part of investment banking service, companies want
to hire investment banks that have reputable analysts who have more power to promote stocks.
Reputable analysts are invited to major T.V. stations such as CNBC and they have close relationships
with big institutional investors. Ljungqvist et al (2006) find that among equity (debt) deals, 32.7%
(41.4%) of winning banks have an all-star analyst covering the issuer versus only 26.3% (34.1%) for
losing banks. Similarly Jackson (2005) points out that analysts with better reputations generate
significantly higher future trading volume for the brokers they work for.
While reputation offers analysts direct and indirect benefits, it also disciplines analysts and
penalize them when they take actions which hurt reputation (Fang and Yasuda (2009), Jackson
(2005)). For instance Jack Grubman, who ranked the number one telecommunication analyst in
institutional investor poll from 1997 to 2001, lost all of his reputation, banned from securities
industry and paid million dollar fines when conflict is detected in his recommendations. In other
words, reputation both rewards and punishes analysts by imposing costs on them. I define
reputational cost as a product of probability of being detected (as a biased or conflicted analyst) and
the cost of detection.
As a result, analysts’ compensation structure has two dimensions that have opposing effect.
While analysts want to remain unbiased to build their reputation and reap returns on it, they are also
attracted to bias their recommendations to get management access, generate underwriting and
advising business for the investment banks and increase trading commissions for their brokerage
firms. Therefore as Ljungqvist (2007) suggests, there is a tradeoff for analysts between their
reputation and revenue generation for their employers’ brokerage and investment banking business.
15
In this study, I examine the effect of managerial entrenchment on analyst behavior through the
balance between revenue generation and reputational capital.
2.2.3 Managerial Entrenchment
Under the modern diffuse ownership structure of corporations, separation of management and
ownership results in agency problems (Jensen and Meckling (1976)) because both principals and
agents are utility maximizers and agents may not always act at the best interest of principles. A
contractual view of firm suggests that there are contracts between principal and agents (Coase
(1932), Alchian and Demsetz (1957)). As Shleifer and Vishny (1997) define, in principle, these
contracts are complete, suggesting that principles’ relationship with agents is perfectly defined, so
that principals, suppliers of finance, do not hesitate to part with their money. However in real world,
these complete contracts are hard to achieve because most future contingencies are hard to describe
and foresee. Consequently, principals allocate residual contract rights, the rights to make decisions in
circumstances not fully foreseen by the contract, to their agents. In these circumstances managers
may engage in actions that are not in line with shareholders’ interest and entrench themselves.
Berger et al (1997) define entrenchment as the extent to which managers fail to experience
discipline from the full range of corporate governance and control mechanisms so that entrenched
managers can pursue private benefits instead of maximizing shareholders’ wealth without threat of
being replaced. Cronqvist et al (2008) find that entrenched managers pay more to their workers to
enjoy lower bargaining power of and improved social relations with employees. Berger et al (1997)
show that as managerial entrenchment increases, managers avoid debt in their capital structure to
protect their under-diversified human capital.
Similarly, Tirole (2005) states that entrenched managers manipulate performance measures
so that their firms “look good” to investors in order to secure their positions. However, accounting
manipulations lead to severe penalties when revealed. Therefore entrenched managers may take two
actions to conceal their actions. First, as Tirole (2005) suggests, managers require cooperation from

16
analysts and second, entrenched managers decrease information disclosure so that investors cannot
reveal manipulations easily. These two actions of entrenched managers form the basis of this study.
Accounting manipulations may provide private benefits for managers at least in the short run.
Investors believe value of companies is better than what it really is, so that managers decrease the
probability of getting replaced, get more bonuses or increase their compensation. On the other hand,
short term benefits that managers are seeking by accounting manipulations are detrimental to
shareholders because companies cannot produce the performance required to justify manipulated
stock price for the long run so that stock prices are sure to decrease in the long run (Jensen (2005))
and when accounting manipulations are detected stock prices plummet. Dechow et al (1996) find that
stock prices decline by 9% when earnings manipulations are announced. Furthermore bid ask spread
and uncertainty increases. Desai et al (2006) examine the consequences of accounting manipulations
on managers and find that managers are punished when frauds are revealed. In short, while managers
use accounting manipulations to pursue private benefits, they face severe consequences if these
manipulations are revealed.
Yu (2008) argue that analysts have monitoring power on managers and find that as the
number of analysts covering a company increases earnings, management decreases. Given that
analysts have this power to discipline managers, as Tirole (2005) suggests, entrenched mangers who
engage in accounting manipulations need analysts’ cooperation. Therefore I suggest that as managers
get more entrenched they put more pressure on analysts to cooperate with them.
Then the question is; “How can managers achieve making analysts to cooperate with them?”
The answer to this question is related to analysts’ incentive structure. As I discuss in the previous
section, analysts’ compensation is tied to trading, underwriting and advising businesses they generate
and analysts are willing to gather non-public company information. I claim that managers use these

17
analyst incentives as a tool to put pressure on them.10 As long as analysts benefit from non-public
company information and their compensation is based on trading commissions and investment
banking and advising business they generate, entrenched managers may allure analyst to distort their
research. Since managerial entrenchment and accounting manipulations are positively related,
entrenched managers need more analyst cooperation and thereby put more pressure on analysts.
More importantly managerial entrenchment may be the root of analyst bias.
Even though analysts yield to manager pressures to get compensation related to revenue
generation, reputational cost, which I define as the product of probability of being detected and costs
at detection, limit analyst optimism. However, I claim that as managers appeal analysts with
incentives, they also decrease the probability of being detected by increasing information asymmetry.
Shleifer and Vishny (1987) state that entrenched managers decrease transparency to decrease market
discipline. Similarly Kim et al (2008) suggest that entrenched managers have incentives to disclose
less information and make the firm less transparent, which in turn causes market makers to face
higher information asymmetry risk. It may be harder for investors to recognize the bias in analyst
recommendations since investors have limited information about companies with entrenched
managers. Supporting this argument Shanthikumar and Malmendier (2007) find that individual
investors follow even affiliated analysts literally whereas institutional investors discount affiliated
recommendations since they have less information asymmetry problem with companies. In short,
lack of transparency decreases analysts’ reputational cost because the probability of detection is
lower when there is a high information asymmetry between investors and companies.
Conversely, since least entrenched managers do not pursue private benefits and serve for
shareholders, they do not engage in actions that would harm shareholders’ value. As a result, they do
10 When analysts do not provide what managers are looking for, these tools enable managers punish
analysts. Managers can cut non public information flow to analysts or remove analysts’ investment
banks from future business deals.
18
not need any cooperation from analysts and do not try to appeal them to bias their recommendations.
Furthermore, least entrenched managers are not afraid of market discipline therefore they disclose
more and make themselves open for monitoring. This leads to less information asymmetry between
investors and companies so that analysts cannot deceive investors about the value of the firm by
biasing their recommendations. In other words, increased transparency limits analysts’ bias due to
their reputational concerns.
I suggest that interests of managers and analysts complement each other. As managerial
entrenchment gets worse, managers appeal analysts to cover their actions. Increased incentives
related to conflict of interest and decreased reputational cost motivate analysts to cater managers, and
analysts shift the balance towards revenue generation. Similarly, as managers become more
concerned about shareholders’ interest, they motivate analysts to provide their true valuations for
companies. Lack of incentives related to conflict of interest and increased reputational cost due to
transparency make analysts shift the balance towards personal reputation. Therefore managerial
entrenchment affects analyst bias through the balance between personal reputation and revenue
generation.
Hypothesis 1: There is a positive relationship between level of managerial entrenchment and analyst
bias.
Literature specifically examined affiliated analysts’ bias (Hong and Lim (1998),
Shanthikumar and Malmendier (2007), Cowen et al (2006) etc). Affiliated analysts are the ones who
provide coverage for companies that hire covering analysts’ investment bank to advise during M&A
or to underwrite securities. Entrenched managers may put pressure on affiliated analysts more easily
due to two reasons. Michaely and Womack (1998) state that “implicit in the underwriter-issuer
relationship is the underwriter’s intention to follow the newly issued security in the aftermarket: that
is to provide (presumably positive) analyst coverage.” Therefore entrenched managers assume that it
is their right to put pressure on affiliated analysts. Secondly, managers may have an indirect way of

19
putting pressure through investment bankers or even CEOs. Any pressure put directly by CEO can be
more effective due to analysts’ concern over job security. For instance Sandy Weill, former CEO of
CitiGroup admitted asking Jack Grubman to increase his recommendation on AT&T.
While affiliated analysts are more biased than unaffiliated analysts, I suggest that at the
extreme levels of managerial entrenchment, affiliated analyst behavior may be different from what
the literature states. Affiliated analysts may shift the balance towards personal reputation and prefer
staying unbiased. When managerial entrenchment is the upmost level, managers hold strong power to
stay in their posts and they are not concerned with shareholders’ right. Therefore they may engage in
accounting manipulations and decrease information asymmetry. While these two conditions lead to
managers’ pressure on analysts for biased recommendations, analysts’ incentives do not align with
those of managers. To cooperate with the most entrenched managers creates great reputation cost
since the cost at detection increases sharply. For instance Henry Blodget was banned from the
securities industry for life and paid $2 million fine when he was found guilty of biasing his
recommendations. Therefore, contradictory to common “affiliated analyst bias” perception, I claim
that affiliated analysts do not provide more biased recommendations than unaffiliated analysts when
managerial entrenchment is at the highest level.
Similarly, I claim that on the other extreme, when managers are least entrenched, affiliated
analyst bias is not significantly different from unaffiliated analyst bias. When least entrenched
managers do not need any cooperation from affiliated analysts they do not put pressure on either
analysts or their employers to bias their research. In addition to fewer incentives related to revenue
generation, transparency of companies with least entrenched managers motivates analysts to remain
unbiased. In short, I suggest that affiliated analysts’ behavior depends on the level of managerial
entrenchment.
Hypothesis 2: Affiliated analysts are not more biased than unaffiliated analysts when managers are
of the most and least entrenchment sample.

20
2.2.4 Recent Regulations
Conflict of interest problems triggered a series of regulations that aim to stop analyst bias
after the bubble burst period. I suggest that these regulations affect the relationship between analyst
behavior and managerial entrenchment in three ways. First, the effect of revenue generation on
analyst compensation is banned, second reputational cost increased so that analysts start to pay more
attention to their reputation and third managers become more responsible for their actions therefore
limit their actions that requires cooperation from analysts. Consequently, analysts shift the balance
towards personal reputation after regulation period.
Fair Disclosure implemented in October 2000 by SEC. It mandated that all publicly traded
companies disclose material information to all investors at the same time. This regulation weakens
the importance of non-public company information for analysts therefore managers cannot use it as
tool to allure analysts to bias recommendations. If all analysts get non public company information at
the same time then they do not need to cater company management or to be optimistic to get non-
public information.
United States federal law enacted Sarbanes-Oxley on July 30, 2002 in response to a number
of major corporate and accounting scandals. Finally in 2003 SEC, Nasd, NYSE, and ten largest
investment banks agreed on Global Settlement, that regulated and punished these investment banks.
This settlement forces investment banks to have strict “Chinese wall” between analysts and
investment bankers and it is banned to tie analyst compensations on underwriting, trading or advising
business. If analysts’ compensation is no longer tied to the amount of business they generate then
they are less willing to bias their research and managers cannot put pressure on analysts by alluring
them with underwriting and advising business. Even though these regulations did not hold companies
and managers responsible for analyst bias, managers lost the tools that they use to put pressure on
analysts.
21
Second, managers become more responsible for financial statements and they are required to
disclose more information to the market which limit accounting manipulations and alleviate
managerial entrenchment problem. Therefore, managers no longer need cooperation from analysts.
Finally, as importance of revenue generation vanishes, I claim that analysts start to put more
emphasis on their reputation. Furthermore regulations increase reputational cost by increasing both
the probability of being detected and costs at detection. Firstly, SarBox aims to increase transparency
of financial statements by enhancing corporate disclosure and governance practices. Less information
asymmetry between companies and investors make it harder for analysts to bias their research since
bias may be more easily detected in the market so that probability of detection increased. Secondly,
harsh punishments of analysts, such as million dollars monetary fines, sentences or bans from
securities industry, during investigations warn remaining analysts in the industry about the increased
reputational costs at detection.
Increased reputational cost and decreased incentives related to revenue generation alter the
balance between reputation and revenue generation analysts have before regulations. I suggest that
after these regulations analysts put more weight on their reputation and managerial entrenchment
cannot affect both affiliated and unaffiliated analyst behavior.
Hypothesis 3a: Managerial entrenchment cannot affect analyst behavior after 2003.
Hypothesis 3b: Affiliated analyst recommendations are not systematically different from those of
unaffiliated analysts after 2003.
2.3 Data and Methodology
Data set consists of the intersection of two databases: IBES Recommendation Detail US data
and Risk Metrics Governance data (Formerly known as IRRC). Recommendation data is available
since 1993. My sample period starts in 1994 because I use median of prior quarter’s
recommendations to find analyst bias and IBES data is not complete for 1993. G-Index is from Risk
Metrics and it is available until 2006 thus sample period ends in 2006.

22
IBES provides each analyst’s recommendation for the companies she covers.
Recommendations range from 1 to 5 and for easier interpretation I reverse IBES recommendation
code so that the lowest and the highest recommendations refer to strong sell and strong buy
respectively. The dependent variable is analyst bias which requires a basis point which is used to be
compared to each recommendation. Analyst forecast bias is calculated as the difference between
analyst recommendation and EPS, announced by companies. However for analyst recommendation
there is not an actual value, such as EPS, to be compared. Therefore following Ljungqvist et al
(2007), I measure consensus recommendation and compare recommendations to the consensus.
Consensus recommendation is the median recommendation of the previous quarter. To find
consensus recommendation, I use the most recent recommendation of each analyst covering the stock
within one year period. Analyst bias ranges from -4 to 4 where positive numbers refer to optimistic
bias and negative numbers refer to pessimism.
I use G-Index, created by Gompers (2003), from Risk Metrics as a proxy for managerial
entrenchment because this variable measures how much power managers and shareholders hold11.
There are 22 charter provisions, bylaw provisions and other firm-level rules and 6 state takeover
laws. Due to overlapping among state laws and 22 provisions there are 24 unique provisions. Each
provision, except for secret ballot and cumulative voting, gives management a tool to resist different
types of shareholder activism. For each provision, which restricts shareholders’ right, one is added to
G-Index. For secret ballot and cumulative voting one is added to G-Index when companies do not
have these provisions. G-Index has a possible range from 1 to 24. Higher numbers reflect greater
managerial power and weaker shareholder rights. Similarly, lower numbers refer to stronger
shareholder rights and less power for management. G-Index is available for almost every other year.
11 See appendix, for more information regarding to G-Index provisions.

23
Following prior studies, I fill in the missing years by assuming that G-Index in the previous year do
not change until the next available year when G-Index is available.
G-Index variable is widely used in the literature, however, recent studies cast doubt on
importance of each provision. Bebchuk et al (2008) argues that only six out of 24 provisions,
staggered boards, limits to shareholder bylaw amendments, poison pills, golden parachutes and
supermajority requirements for mergers and charter amendments, play a key role between
governance and firm value. Therefore, they create an entrenchment index which ranges from 1 to 6
where higher numbers refer to worse governance. I create E-index following Gompers et al (2003)
and Bebchuk et at (2008) and use E-Index in robustness test.
To examine whether managerial entrenchment affect affiliated analyst behavior I define
affiliation status of analyst following Malmendier and Shantikumar (2007). I define an analyst as
affiliated if her investment bank has an underwriting relationship with a given company. More
specifically the bank is required to be the lead underwriter or co-underwriter in an IPO in the past
five years or in an SEO in the past two years or in the next one or two years, or lead underwriter of
bonds in the past year. I get underwriting data from Securities Data Corporation (SDC) New Issues
database and merge underwriter name to broker name in the IBES data. However IBES only provides
broker abbreviations and used to provide a translation file that has actual broker names for each
abbreviation. Since Thomson Financial does no longer provide translation file, I manually find the
actual broker names by following analysts’ name and their employment history12.
I claim that managerial entrenchment affects the balance between revenue generation and
reputation. I use all star ranking of Institutional Investor magazine to measure analyst reputation.
Institutional investor magazine send surveys to portfolio managers, directors of research, and chief
investment officers of the world’s largest pension funds, hedge funds and mutual funds, asking them
12 Zoominfo.com is the best beneficial source to find where analysts work for given years.

24
to rank the analysts in each industry. Every October issue of the magazine announces the best
analysts of the year. All star rankings is the most accepted way to evaluate analyst’s contribution in
Wall Street and is widely used as a proxy for analyst reputation in empirical studies (Ljungqvist et al
(2006), Malmendier and Shanthikumar (2007)).
For each industry Institutional Investor provide top three rankings and runner-ups, if any,
who get as at least 35% vote as the third ranking analyst. Analyst dummy is equal to one if that
analyst is ranked. Since rankings are announced in October, analyst is called all star mostly for the
next year. More specifically if an analyst is ranked in October, 2000, all-star dummy is equal to one
for quarter ends December-2000, March 2001, June 2001 and September 2001. Since IBES only
provides last name and initial of first name of analysts I also compare analysts’ employer provided in
Institutional Investor magazine with the broker names in IBES to have accurate match between the
name of ranked analyst and analyst name in IBES.
I control for experience and workload of analysts. Career experience is defined as log of
number of days the analyst’s forecasts have been appearing in IBES database. IBES recommendation
data starts from 1993 therefore I use IBES Detailed Forecast data, which starts in 1983, in addition to
recommendation data to decide the first date an analyst enters the database. Similarly, firm specific
experience is measured as the log of difference from recommendation date and the first date an
analyst starts covering a specific firm. Workload is the number of firms an analyst cover during a
year.
I also control for institutional holding because Ljungqvist et al (2006) show that institutional
investors have moderating influence on a sell-side analyst’s incentives, presumably through the
institutions’ ability to evaluate the analyst (in public surveys). Institutional Data is from Thomson
Financial 13F. Institutions with more than $100 million in equities must report their equity ownership
in quarterly 13f filings to the SEC. I match amount of shares hold by institutions with the market
capitalization from CRPS data for each quarter-ends to eliminate concerns related to accurateness of

25
market capitalization information in 13f data. Where 13f does not provide any institutional holding I
assume companies do not have any institutions holding their shares and assign zero percent for
institutional holding. Where institutional holding is greater than market capitalization I assume data
is missing. Panel A of Table 2.1 shows that mean of institutional holding variable is 62% which is
slightly greater than the mean level of institutional holding in Ljungqvist et al (2006). This slight
increase is expected since institutional holdings increase over time (Gompers and Metrick (2001)).
Size and book to market is from CRSP and Compustat. I measure size for quarter ends as a
product of shares outstanding and price. Following Das and Zhang (2003), I find quarterly book to
market as compustat data item 59 divided by the product of data item 14 and data item 61.
There are 467,448 recommendations in IBES data from 1994 to 2006. Governance index is
available for S&P 1500 companies and the number of companies in IRRC increases in recent years.
Therefore not every company in IBES data has G-Index. Even though governance sample is smaller
than Compustat sample Gompers et al (2003) state that governance sample constitutes most of
Compustat sample based on market capitalization. After eliminating observations that do not have
governance data I have 225,144 observations in the sample.
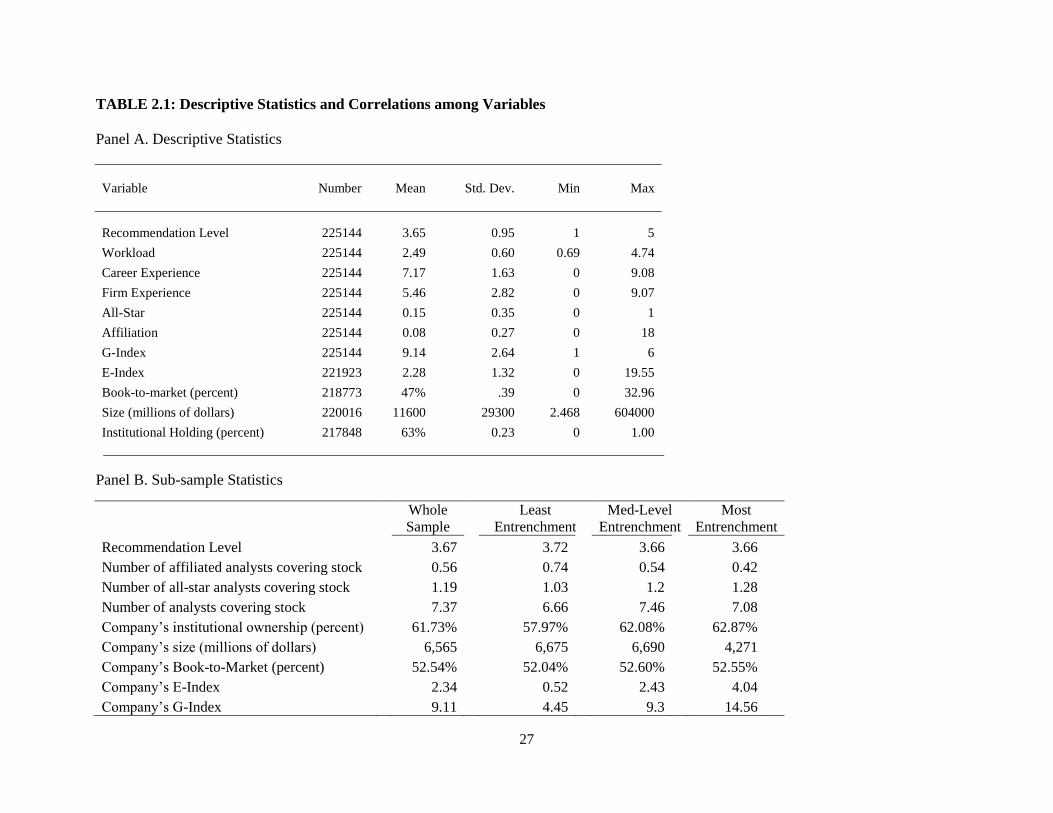
Panel A of Table 2.1 summaries the sample. Mean recommendation level is 3.65. 16.32% of
recommendations is made by all-star analysts and 7.62% of recommendations is made by affiliated
analysts. G-Index ranges from 1 to 18 and E-Index ranges from 1 to 6. Mean G-Index is 9.14 whereas
mean E-Index is 2.28.
To examine the effect of managerial entrenchment on analyst bias in more detail, I create
three sub samples, based on G index, following Gompers et al (2003). Least entrenchment sample
includes firms that have G-Index less than 6 whereas most entrenchment sample consists of
companies that have G-Index greater than 13. Remaining companies make up medium-level
entrenchment sample. Panel B shows differences of three subsamples.

26
There are on average 6.7, 7.5, and 7.1 analysts covering least, med-level and most entrenchment
companies. Number of affiliated analysts is the greatest for least entrenchment sample whereas
number of all star analysts is the greatest for most entrenchment sample. Most entrenchment sample
consists of smaller companies and their book-to-market is the highest. Institutional holding does not
vary much among the sub-samples. Average G-index for most entrenchment sample is 14.57 which
is very close the threshold level used to define sub-samples. Similarly the average of G- Index in
least entrenchment sample is 4.4 which is close to 5. Bebchuk et al (2009) raises concern about the
soundness of G-Index and introduces Entrenchment Index which is highly correlated with G-Index.
Average E-Index is .55 for least entrenchment, 2.49 for medium-level entrenchment and 4.02 for
most entrenchment sample.
Panel C of table 2.1 shows correlations among variables. Correlations between dependent
variable and independent variable are as expected. As managerial entrenchment gets worse, analyst
optimism increases. Correlation coefficient is significant at 1% level. G-Index and E-Index are
73.5% correlated which confirms that G-Index and E-Index measure managerial entrenchment
similarly. E-Index is positively correlated with analyst bias however only at 10% significant level.
Affiliated analysts are more optimistic. On the other hand all star ranking career experience, firm-
specific experience and workload decreases analyst bias. Institutional holding has a negative
correlation with analyst bias which confirms Ljungqvist et al (2007).
2.4 Empirical Tests and Results
For multivariate analysis I use ordered probit regression because my dependent variable,
analyst bias, is based on a transform of an ordinal scale. Dependent variable has three choice levels:
issuing a recommendation that is below, at or above consensus referring to pessimistic, objective and
optimistic recommendation respectively.
I use following regression to investigate the effect of corporate governance on analyst bias
and affiliated analyst bias.
27
TABLE 2.1: Descriptive Statistics and Correlations among Variables
Panel A. Descriptive Statistics
Variable
Number
Mean
Std. Dev.
Min
Max
Recommendation Level 225144 3.65 0.95 1 5
Workload 225144 2.49 0.60 0.69 4.74
Career Experience 225144 7.17 1.63 0 9.08
Firm Experience 225144 5.46 2.82 0 9.07
All-Star 225144 0.15 0.35 0 1
Affiliation 225144 0.08 0.27 0 18
G-Index 225144 9.14 2.64 1 6
E-Index 221923 2.28 1.32 0 19.55
Book-to-market (percent) 218773 47% .39 0 32.96
Size (millions of dollars) 220016 11600 29300 2.468 604000
Institutional Holding (percent) 217848 63% 0.23 0 1.00
Panel B. Sub-sample Statistics
Whole
Sample
Least
Entrenchment
Med-Level
Entrenchment
Most
Entrenchment
Recommendation Level
3.67
3.72
3.66
3.66
Number of affiliated analysts covering stock
0.56
0.74
0.54
0.42
Number of all-star analysts covering stock
1.19
1.03
1.2
1.28
Number of analysts covering stock
7.37
6.66
7.46
7.08
Company’s institutional ownership (percent)
61.73%
57.97%
62.08%
62.87%
Company’s size (millions of dollars)
6,565
6,675
6,690
4,271
Company’s Book-to-Market (percent)
52.54%
52.04%
52.60%
52.55%
Company’s E-Index
2.34
0.52
2.43
4.04
Company’s G-Index
9.11
4.45
9.3
14.56

28
Panel C. Correlation Table
Analyst Bias
Analyst Bias G-Index E-Index Affiliation All-Star Ins. Holding B/M Size Career Exp. Firm Exp. Workload
1
G-Index 0.012 *** 1
E-Index 0.004 * 0.735 *** 1
Affiliation 0.005 ** -0.042 *** -0.002
1
All-Star -0.02 *** 0.022 *** 0.005
0.128 *** 1
Ins. Holding -0.029 *** 0.008 *** 0.061 *** -0.005 ** 0.052 *** 1
B/M 0.01 ** 0.034 *** 0.072 *** 0.041 *** 0.025 *** -0.078 *** 1
Size 0.004 ** 0.06 *** -0.125 *** -0.014 *** 0.073 *** 0.033 *** -0.347 *** 1
Career Exp. -0.006 ** 0.028 *** 0.016 *** 0.037 *** 0.215 *** 0.008 *** 0.022 *** 0.025 *** 1
Firm Exp. -0.006 *** 0.049 *** 0.016 *** 0.023 *** 0.189 *** -0.029 *** 0.044 *** 0.054 *** 0.549 *** 1
Workload -0.015 *** 0.027 *** 0.019 *** 0.007 *** 0.102 *** -0.133 *** 0.063 *** -0.039 *** 0.242 *** 0.188 *** 1
The sample consists of 225,144 recommendations, representing the intersection of the Thomson 13f and Institutional Brokers’ Estimates System (I/B/E/S) .Workload is the log of number of firms an analyst cover during a year. Career
experience is defined as log of number of days the analyst’s forecasts have been appearing in IBES database. Firm specific experience is measured as the log of difference from recommendation date and the first date an analyst starts
covering a specific firm. Affiliated analyst variable is a dummy that takes value 1 if her investment bank has an underwriting relationship with a given company (Shanthikumar and Malmendier (2007)). Analysts are called All-Star
analyst if they are ranked on Institutional Investor magazine. Governance index and entrenchment index data is from IRRC. Gompers et al (2003). Book to market is Compustat quarterly database (data59/(data14*data61). Size is equity
market capitalization. Institutional Holding is 13F. Three sub-samples are created following Gompers et al (2003). Least entrenchment sample includes companies with G-Index less than 6. Companies that have G-Index greater than 13 constitute most entrenchment sample. The remaining companies are in medium-level entrenchment sample. Number of analysts, affiliated analysts and all-star analysts covering stock are the mean level of analysts covering a company
per year. ***,**,* refer to one percent, five percent, and ten percent significance levels

29
𝐴𝑛𝑎𝑙𝑦𝑠𝑡 𝑏𝑖𝑎𝑠𝑖𝑗 = 𝛼𝑖 + 𝛽1 ∗ 𝐴𝑓𝑓𝑖𝑙𝑖𝑎𝑡𝑖𝑜𝑛𝑖𝑗 + 𝛽2 ∗ 𝐺𝑖𝑛𝑑𝑒𝑥𝑗 + 𝛽3 ∗ 𝐴𝑙𝑙𝑆𝑡𝑎𝑟𝑖𝑗 + 𝛽4 ∗ 𝐹𝑖𝑟𝑚𝐸𝑥𝑝𝑖𝑗 + 𝛽5
∗ CarExpij + β6 ∗ Workloadij + β7 ∗ InsHoldj + β8 ∗ BMj + β9 ∗ Logsizej
Affiliation is a dummy variable that equals to 1 if analyst is affiliated and 0 otherwise. G
index is governance index that ranges from 1 to 18 where higher numbers refer to weaker
shareholder rights and more entrenchment. All-Star dummy is equal to 1 if analysts are ranked on
Institutional Investor magazine. I run the above regression for whole sample and three sub-samples
constructed based on entrenchment level. I control for career experience, defined as log of number of
days the analyst’s forecasts have been appearing in IBES database, firm specific experience,
measured as the log of difference from recommendation date and the first date an analyst starts
covering a specific firm, workload, number of companies followed by that analyst. I also control for
institutional ownership because Ljungqvist et al (2006) suggests that institutional holding limits
analyst bias.
To test for negative relationship between managerial entrenchment and analyst bias I run the
first equation without affiliated dummy. G-Index is positive significant and marginal effects suggest
that one unit increase in G-Index increases the likelihood of having optimistic recommendation by
.158% and decreases the likelihood of having pessimistic recommendation by .162%. (Results are
not tabulated).
To see whether the effect of G-Index is still present when affiliation dummy is included I run
the full model in first equation. Model 1 in table 2.2 shows that G-Index coefficient is positive and
statistically significant at 1% level. Coefficients of ordered probit regression do not tell how much
independent variable affects the dependent variable. Therefore I find marginal effects of independent
variables for choice levels: optimism and pessimism and Panel B of Table 2.2 shows marginal
effects. One unit increase in G-Index increases the probability of having optimistic recommendation

30
by .17% whereas same increase in G-Index leads to a decrease in the probability of issuing
pessimistic recommendation by .17%.
Negative relationship between managerial entrenchment and analyst bias tabulated in Table
2.2 suggests that the level of analyst bias is not the same for all firms. Entrenched managers reap
short term benefits while engaging in value destroying actions (Burns and Kedia (2006), Efendi et al
(2007)). Therefore as managerial entrenchment becomes worse managers seek more cooperation
from analysts (Tirole (2005)) and force analysts to cooperate and bias their research by rewarding
analysts with underwriting and advising business and non-public company information. Overall
results in the first column of table 2.2 confirm my first hypothesis and contribute to the literature by
showing that managerial entrenchment affects analyst behavior.
This negative relationship is robust to control variables which show consistent pattern with
the findings of literature. As Ljungqvist et al (2007) suggests institutional investors have an
alleviating effect on analyst bias. One percent increase in institutional holding decreases the
probability of analyst optimism by 7.6% and one percent decrease in institutional holding increases
the probability of analyst pessimism by 7.8%.
All-star dummy is an important variable since it is a proxy for analyst reputation. I claim that
managerial entrenchment affects the balance analysts strike between revenue generation, which
motivates analysts to upwardly bias their recommendation, and personal reputation which requires
analyst to remain unbiased. Negative coefficient of all-star dummy suggests that all-star analysts
provide less optimism compared to non-star analysts and reputable analysts are more willing to
protect their reputation by limiting optimistic bias thereby giving up incentives related to revenue
generation. Marginal effects on panel B of table 2.2 suggests that all-star analysts 2.18% less likely
compared to non-ranked analysts to provide optimistic recommendation and 2.28% more likely to

31
have pessimistic recommendation13. Remaining control variables, except for workload are
insignificant.
Gompers et al (2003) examines the differences between dictatorship and democracy samples
which I rename as most entrenchment and least entrenchment samples and they show that there are
striking differences between subsamples. I divide whole sample into three subsamples: least,
medium- level, and most entrenchment samples and I expect to see that the effect of managerial
entrenchment is different for these subsamples due to two reasons. For least entrenchment sample
probability of detection is very high for analysts when they upwardly bias their recommendation due
to transparent structure of companies with least entrenched managers (Eng and Mak (2003)).
Secondly, managers do not put pressure on analyst to make them cooperate with management since
least entrenched managers are less likely to engage in value destroying activities. Therefore, I
examine the same relationship for different entrenchment levels to see whether managerial
entrenchment has the same level of effect on analyst bias in extreme managerial entrenchment
samples as in medium-level entrenchment sample.
Columns 6 to 8 of table 2.2 show regression results for subsamples. For medium-level
entrenchment sample coefficient of G-Index is still positive and significant. However G-Index
becomes insignificant for least entrenchment sample. On the other hand table 2.2 shows an
interesting result about the effect of corporate governance on analyst bias for most-entrenchment
sample. G-Index is negative significant suggesting that as corporate governance gets worse analysts
provide more pessimistic recommendation.
The coefficient of G-Index explains the relationship between managerial entrenchment and
analyst bias within each sub-sample. However it does not tell whether how analyst bias changes from
13 It is important to examine the effect of reputation on analyst bias in sub-periods, before and after
Global Settlement. My finding changes slightly for the effect of reputation on analyst bias for sub-
periods. I will discuss this issue in more detail in Table 4.

32
TABLE 2.2: The Effect of Managerial Entrenchment on Analyst Bias and Marginal Effects
PANEL A: Regression Results
Whole Sample
Affiliated
Analysts
Unaffiliated
Analysts
Sub-Samples
Model 1
Model 2
Model 3
Model 4
Model 5
Least
Entrenchment
Med-Level
Entrenchment
Most
Entrenchment
Firm Experience -0.001
-0.001
-0.001
-0.002 *
0.01 **
-0.004
-0.001
-0.001
(-0.90)
(-0.76)
(-0.76)
(-1.67)
(2.56)
(-1.21)
(-0.57)
(-0.21)
Career Experience 0.004
0.003 *
0.003 *
0.004 *
0.008
0.002
0.005 **
-0.011
(1.88)
(1.78)
(1.78)
(1.8)
(1.01)
(-0.27)
(-2.25)
(-1.28)
Workload -0.034 ***
-0.033 ***
-0.033 ***
-0.032 ***
-0.05 ***
-0.003
-0.036 ***
-0.033 *
(-7.69)
(-7.51)
(-7.5)
(-7.12)
(-3.03)
(-0.18)
(-7.79)
(-1.65)
Size 0.003 *
0.004 **
0.004 **
0.002
0.018 ***
0.001
0.003 *
-0.001
(1.75)
(2.16)
(2.16)
(0.98)
(2.83)
(-0.17)
(-1.83)
(-0.10)
Book-to-market 0.013 **
0.015 **
0.015 **
0.02 ***
-0.065 ***
0.055 **
0.008
0.055
(2.02)
(2.35)
(2.35)
(2.99)
(-2.97)
(-2.45)
(-1.19)
(-1.27
Institutional Holding -0.214 ***
-0.213 ***
-0.212 ***
-0.213 ***
-0.242 ***
-0.172 ***
-0.22 ***
-0.261 ***
(-15.62)
-(15.52)
(-15.5)
(-14.84)
(-5.01)
(-4.15)
(-14.74)
(-3.81)
All-Star -0.062 ***
-0.06 ***
-0.06 ***
-0.064 ***
-0.067 ***
-0.086 ***
-0.06 ***
-0.06 *
(-8.55)
(-8.4)
(-8.4)
(-8.24)
(-3.19)
(-3.33)
(-7.70)
(-1.89)
Affiliation 0.043 ***
0.042 ***
0.012
0.012
0.048 ***
0.026
(4.49)
(4.42)
(0.43)
(-0.43)
(-4.65)
(-0.55)
G-Index 0.005 ***
0.004 ***
0.006 *
-0.005
0.004 ***
-0.035 **
(4.84)
(4.5)
(1.91)
(-0.49)
(-3.2)
(-2.12)
Dummy_med
0.032 ***
0.028 ***
(3.51)
(2.93)
Dummy_most
0.039 ***
0.037 **
(2.79)
(2.56)
Aff* Dummy_med
0.036
(1.22)
Aff*Dummy_med
0.002
(0.04)
Cut-off 1 -0.509
-0.502
-0.504
-0.534
-0.239
-0.503
-0.509
-1.279
Cut-off 2 0.373
0.38
0.377
0.345
0.676
0.368
0.374
-0.412

33
Panel B. Marginal Effects
Whole Sample
Model 1
Model 2
Least
Entrenchment
Med-Level
Entrenchment
Most
Entrenchment
Firm Experience -0.0003
-0.0003
-0.0015
-0.0002
-0.0004
(0.0004)
(0.0003)
(0.0016)
(0.0002)
(0.0004)
Career Experience 0.0013
0.0012
0.0006
0.0016
-0.004
(-0.0013)
(-0.0012)
(-0.0006)
(-0.0017)
(0.0041)
Workload -0.012
-0.0117
-0.001
-0.013
-0.0121
(0.0123)
(0.012)
(0.001)
(0.0134)
(0.0122)
Size 0.0011
0.0014
0.0003
0.0012
-0.0004
(-0.0011)
(-0.0014)
(-0.0003)
(-0.0012)
(0.0004)
Book-to-market 0.0046
0.0054
0.0195
0.0029
0.0201
(-0.0047)
(-0.0055)
(-0.0204)
(-0.0029)
(-0.0202)
Institutional Holding -0.0766
-0.0755
-0.0609
-0.0787
-0.0945
(0.0786)
(0.0774)
(0.0635)
(0.0806)
(0.0954)
All-Star -0.0218
-0.0214
-0.03
-0.0211
-0.0213
(0.0228)
(0.0223)
(0.0322)
(0.022)
(0.0219)
Affiliation 0.0154
0.0149
0.0043
0.0173
0.0096
(-0.0155)
(-0.0151)
(-0.0045)
(-0.0174)
(-0.0096)
G-Index 0.0017
-0.0019
0.0015
-0.0126
(-0.0017)
(0.002)
(-0.0015)
(0.0127)
Dummy_Med
0.0113
(-0.0117)
Dummy_Most
0.0138
(-0.0140)

34
Dependent variable is analyst bias. Following Ljungqvist et al (2007) I measure analyst bias for analyst i as the difference between recommendation of analyst i and consensus recommendation which is
the median recommendation for the previous quarter. To find consensus I use the most recent recommendation of each analyst covering the stock within one year period. Analyst bias variable ranges
from -4 to 4 and I use three level choice variable where positive numbers refer to optimism, negative numbers refer to pessimism and 0 is objective recommendation. Governance Index data is from
IRRC. Gompers et al (2003). First column represents regression results for entire sample. Democratic sample consists of companies that have Gindex lower than 6, Dictatorship has G index higher than
14 and remaining companies make up medium sample. Affiliated analyst variable is a dummy that takes value 1 if her investment bank has an underwriting relationship with a given company (Shanthikumar and Malmendier (2007)). Career experience is defined as log of number of days the analyst’s forecasts have been appearing in IBES database. Firm specific experience is measured as the
log of difference from recommendation date and the first date an analyst starts covering a specific firm. Analysts are called All-Star analyst if they are ranked on Institutional Investor magazine. Book to
market is compustat quarterly database (data59/(data14*data61). Size is in logs. Democratic is equal to one if G-Index is less than 6 and 0 otherwise. Dictatorship is equal to one if G-Index is greater than 13 and 0 otherwise. Aff*Dictatorship and Aff*Medium are interaction variables. Model 1-3 are for the whole sample. Model 4 includes recommendations of unaffiliated analysts and Model 5
includes recommendations of affiliated analysts Table provides ordered probit regression estimates and z-stats are in parentheses. ***,**,* refer to one percent, five percent, and ten percent significance
levels. Panel B provides marginal effects of coefficients in Panel A. Choice level is optimism for the first row of each coefficient. Marginal effects of choice level pessimism are given in parenthesis. Significant levels are the same as significance levels in the regression.

35
one subsample to another. Therefore I create dummy variables for each subsample and run the
regression with dummy variables for least and medium-level entrenchment. Dummy_med is positive
significant, suggesting that analyst bias in medium-level entrenchment samples is significantly greater
than analyst bias in least entrenchment sample. Dummy_most is positive significant and its coefficient
is greater than the coefficient of Dummy_med. This finding suggests that analyst bias in most
entrenchment sample is greater than bias in least entrenchment sample and the difference between
analyst bias in medium-level and least entrenchment samples is less than the difference between analyst
bias in least and most entrenchment samples14. Together with this result, the negative and significant
coefficient of G-Index in the last column imply that managerial entrenchment still has a positive effect
on analyst bias however this bias decreases as G-Index gets bigger.
Panel B of Table 2.2 show that one unit increase in G-Index for most entrenchment subsample,
decreases the probability of providing optimistic recommendation by 1.26% whereas one unit increase
in G-Index increases the probability of providing pessimistic recommendation by 1.27%. Since costs at
detection of bias increases reputational costs, analysts give up incentives managers use to attract
analysts and protect their reputation. The results for most entrenchment sample confirm the finding of
Clarke et al (2006). They suggest that recently passed legislation to reduce analysts’ conflict of interest
might be an overreaction. Furthermore they also state market does not view recommendations upgrades
by affiliated analysts as biased. These findings are totally opposite of main stream conflict of interest
results in the literature. However the negative relationship between managerial entrenchment and
analyst bias in most entrenchment sample shed light on these seemingly conflicting results of Clarke et
al (2006).
G-Index is positive significant for medium-level entrenchment sample. This finding suggests
that the negative relationship between managerial entrenchment and analyst bias of the whole sample is
14 Table 4 shows regression results for post and pre regulation periods. I will further discuss dummy
variables under the effect of regulations.

36
mainly derived by the companies that are in medium-level entrenchment sample. For medium-level
entrenchment companies managers put pressure on analysts by alluring them with underwriting and
advising business and non-public company information. Additionally by increasing information
asymmetry problem for investors, managers help analyst bias to remain unrecognized. Overall, my
results show that managerial entrenchment affects analyst behavior through the balance between
revenue generation and reputation and it is the source of analyst bias and this effect is specific to
subsamples.
Institutional Investor and all-star ranking have consistent results for all subsamples unlike G-
Index. They both have alleviating affect on analyst bias and G-Index is positive significant not only in
medium-level entrenchment sample but also in least and most entrenchment samples.
My second hypothesis suggests that managerial entrenchment affect affiliated analyst behavior
as well. There is much anecdotal evidence of managers’ pressure on affiliated analysts through analysts’
bosses or investment bankers. Additionally implicit agreement on the Street urges affiliated analyst to
provide presumably positive coverage for underwritten companies. To examine the effect of managerial
entrenchment on analyst bias the best method is to use an interaction term between affiliation dummy
and G-Index. However the interaction term is highly correlated with governance index. To address
multicollinearity problem, following Djankov et al (2007), Acemoglu and Johnson (2005) among
others, I examine affiliation dummy for three subsamples.
Affiliation dummy is positive and significant at 1% level for the whole sample confirming
previous literature. Affiliated analysts are 1.54% more likely than unaffiliated analysts to provide
optimistic recommendations and they are 1.55% less likely than unaffiliated analysts to provide
pessimistic recommendations. For medium-level entrenchment sample affiliation dummy has similar
results. However the coefficient of affiliated dummy is greater in medium level entrenchment sample
than it is in the whole sample. This increase suggests that behavior of affiliated analysts is different for
different managerial entrenchment sub-samples.
37
Affiliated analysts provide optimistic recommendation only for medium-level entrenchment
sample. For least and most entrenchment samples affiliation dummy becomes insignificant. Therefore
looking at the regression results for the whole sample overlooks an important result about the affiliated
analyst bias. Failing to differentiate companies based on managerial entrenchment leads to widely
accepted result: affiliated analysts provide optimistic recommendations for companies. However, I show
that managerial entrenchment is the source of analyst bias. Insignificant coefficients of affiliated dummy
for least and most entrenchment samples confirm that affiliated analysts are wary of providing more
optimistic research than unaffiliated analysts because the probability of losing their reputational capital
is greater when managerial entrenchment is on the two edges of G index. Benefits of providing
objective recommendations and protecting reputation are greater than the incentives analysts may get
from their compensation related to conflict of interest. Therefore affiliated analysts resist any pressure
from corporate managers and even from their bosses.
Cross sectional regression results presents a positive relationship between analyst bias and
managerial entrenchment. However, some analysts who are more interested in revenue generation they
may only cover companies run by most entrenched managers and some other analysts who are more
reputation oriented may only cover companies of least entrenchment sample. Therefore my argument
that managerial entrenchment leads to analyst bias may not hold. Affiliation dummy and G-Index do not
address to this concern. Therefore in the following test, I want to examine whether a same analyst
behaves in the same way for companies of different entrenchment levels. If managers from different
entrenchment levels put different levels of pressures on analysts, the same analyst who covers stocks of
different entrenchment levels may strike different balance between revenue generation and personal
reputation for different companies.
More specifically I focus on analysts who cover companies from different subsamples. Since I
want to compare analyst behavior for different levels of managerial entrenchment analyst characteristics

38
should be as similar as possible. Therefore I compare recommendations of same analysts at the same
year which results in same level of career experience and workload and same dummy for all-star
ranking. Furthermore I compare recommendations of an analyst if this analyst is affiliated (unaffiliated)
with companies of different entrenchment levels for a given year. Therefore this test will provide more
information about how analysts change their behavior based on managerial entrenchment.
There are three subsamples and I examine how analyst behavior changes for least and most
entrenchment sample where medium-level entrenchment sample is the base group. Panel A (panel B) of
table 2.3 shows unpaired t-test statistics for comparisons of affiliated (unaffiliated) analyst
recommendations.
TABLE 2.3 Tests between Recommendations for Different Quality Firms Made by Same Analysts
Panel A: Mean difference in recommendations of affiliated analysts
Entrenchment Level
Number of affiliated
analyst recommendations
Mean
Difference in
means(1-2)
Least Entrenchment
1,142
1.9116
-0.077 ***
Medium-level Entrenchment
1,951
1.9887
Medium-level Entrenchment
986
1.9371
-0.016
Most Entrenchment
381
1.9528
Panel B: Mean difference in recommendations of unaffiliated analysts
Entrenchment Level
Number of unaffiliated analyst
recommendations Mean
Difference in
means(1-2)
Least Entrenchment
15,046
1.9591
-0.013 **
Medium-level Entrenchment
63,050
1.9725
Medium-level Entrenchment
49,553
1.9717
-0.014 *
Most Entrenchment
9,168
1.9857
This table compares the mean differences of recommendations made by the same analysts for companies of different entrenchment levels. Panel A
examines recommendations made by affiliated analysts and Panel B examines recommendations made by unaffiliated analysts. Last column shows
the differences in same analysts’ recommendation mean level between sub-samples. ***,**,* refer to one percent, five percent, and ten percent
significance levels.

39
There are 686 unique affiliated analyst-recommendation year observations. First two rows of
panel A show that affiliated analysts provide 1,142 recommendations for least entrenchment companies
and the same analysts provide 1,951 recommendations for medium-level entrenchment companies. The
null hypothesis is that difference of means of these two groups is 0. The null is rejected at 10% level
suggesting that even the same analyst provide different level of optimism for companies of different
entrenchment levels. On the other hand, comparison of medium-level and bad governance
recommendations are not statistically significant even though affiliated optimism for most entrenchment
companies is greater than the same affiliated analysts’ optimism for medium-level entrenchment firms.
In panel B, I run similar t-tests for unaffiliated analysts. Difference in optimism means for least
entrenchment and medium-level entrenchment is negative and significant at 5% level. Similarly,
difference in optimism means for medium-level entrenchment and most entrenchment is negative and
significant at 10% level. These findings suggest that same affiliated/unaffiliated analysts present
different levels of bias for companies of different entrenchment levels. Therefore main source of analyst
bias is managerial entrenchment and managers’ pressure on analysts to bias research.
Analyst bias was a very severe problem in late 1990s and analysts’ bullish recommendations
especially for technological stocks expand the bubble in early 2000s. General attorney of New York
started an investigation on analysts’ conflict of interest which ends up with serial regulations. To
examine the effect of these regulations I partition the sample into two periods: sample period until 2003
is called pre-regulation period and sample period after 2002 is the post-regulation period.
Regulations break off the relationship between managerial entrenchment and analyst bias with
three means. First of all quality of corporate governance is aimed to improved with SarBox so that
managerial entrenchment is alleviated. Managers held more responsible for financial statements and
companies were required disclose more information to investors. Secondly conflict of interest is targeted
directly by banning the compensation tie on revenue generation and role of reputation is strengthened
(Global Settlement (2003)). Furthermore Fair Disclosure (2000) forced managers to disclose non-public
40
information to all investors at the same time. Finally, reputational capital became more important since
the cost at detection increased considerably.
Table 2.4 shows the regression results for sub-periods. Least entrenchment sample is the only
sample that does not have any changes after regulations. For the whole sample one unit increase in G-
Index leads to .27% increase (.28% decrease) in probability of having optimistic (pessimistic) in the pre-
regulation period. On the other hand, for the post-regulation period the effect of managerial
entrenchment on analyst bias is not significant. Similar results are present for medium-level
entrenchment sample. These results confirm that managerial entrenchment cannot affect the balance
analyst behavior because entrenched managers lose the tools to appeal analyst bias and analysts are
more interested in their reputational capital.
Marginal tables for table 2.2 show that analyst are 1.13% (1.38%) more likely to be optimistic
for medium-level entrenchment (most entrenchment) sample compared to least entrenchment sample.
However looking at sub periods reveal that analysts’ likelihood of being optimistic is driven by pre-
regulation period. Panel B of table 2.4 presents that, in pre-regulation period, analyst are 1.25% (2.23%)
more likely to be optimistic for medium-level entrenchment (most entrenchment) sample compared to
least entrenchment sample. Furthermore the difference in coefficients of dummy_most and dummy_med
increases sharply for pre-regulation period compared to that in the whole time period.
Regulations have alleviating effect on affiliated analysts as well. For whole sample and
medium-level entrenchment sample affiliation is positive significant for pre-regulation period. Affiliated
analysts are 2.1% (2.3%) more likely than unaffiliated analysts to provide optimistic recommendation in
the whole (medium-level governance) sample in the pre-regulation period. However in the post-
regulation period affiliated analyst behavior is not significantly different from unaffiliated analyst
behavior suggesting that affiliated analyst put more weight on their reputation and stay away from
optimism as well.

41
Examining sub-periods reveal important result related to analysts’ reputational concerns. In
table 2.2 all-star dummy is negative and significant for all subsamples and the whole sample suggesting
that all-star analysts provide less biased recommendation compared to non all star analysts. However
table 2.4 shows that negative and significant coefficient of all-star dummy is mainly derived by post-
period sample. For all subsamples all star dummy is negative but insignificant before regulations.15 For
the whole subsample all star dummy is significant only at 10% level for the first model. This finding
suggests that analysts shift the weight to revenue generation and bias their recommendation in the pre-
regulation period. Therefore my results support the view that all star ranking is a “beauty contest” for
the pre-regulation period.
All-star dummy for post-regulation for the whole sample shows that all star analysts are 5.63%
less (5.94% more) likely to issue optimistic (pessimistic) recommendations than unaffiliated analysts.
Compared to probabilities in Panel B of table 2.2, much higher probabilities in Panel B of table 2.4
confirm that all results related to all-star dummy is derived by post-regulation period. This finding has
an important implication for effectiveness of regulations. Regulations and penalties imposed on some
analysts in Global Settlement remind analysts, who could survive Global Settlement, how important
reputation is for financial intermediaries and how severe reputational cost could be. Therefore in the
post-regulation period all star analysts shift weight towards reputation and even provide more
pessimistic recommendations.
The effect of institutional holding on analyst bias mainly stays the same for both sub-periods.
However its magnitude decreases for post-regulation period. While one unit increase in institutional
holding leads to 12.16% decrease (12.62% increase) in the probability to issue optimistic (pessimistic)
recommendation in the pre-regulation period, the same increase in institutional holding leads to 3.65%
decrease (3.65% increase) in the probability to issue optimistic (pessimistic) recommendation in the
15 Ljungqvist et al (2007) have similar result in ordered probit regressions.
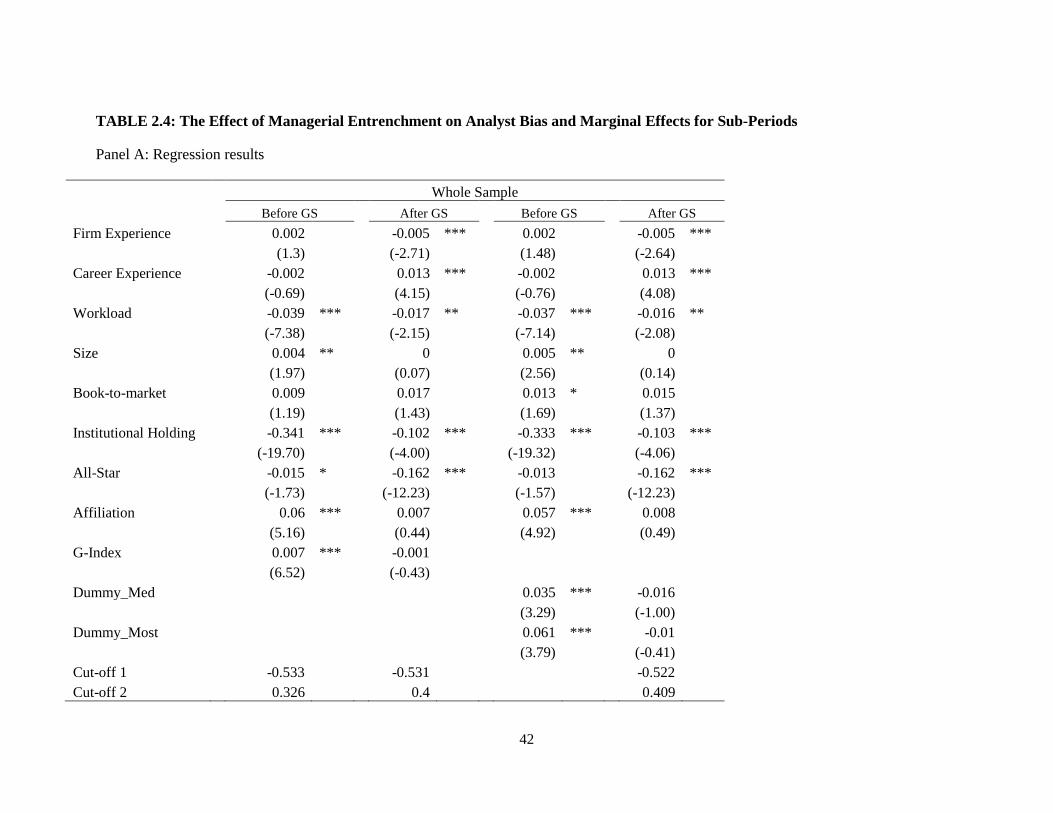
42
TABLE 2.4: The Effect of Managerial Entrenchment on Analyst Bias and Marginal Effects for Sub-Periods
Panel A: Regression results
Whole Sample
Before GS
After GS
Before GS
After GS
Firm Experience
0.002
-0.005 ***
0.002
-0.005 ***
(1.3)
(-2.71)
(1.48)
(-2.64)
Career Experience -0.002
0.013 ***
-0.002
0.013 ***
(-0.69)
(4.15)
(-0.76)
(4.08)
Workload
-0.039 ***
-0.017 **
-0.037 ***
-0.016 **
(-7.38)
(-2.15)
(-7.14)
(-2.08)
Size
0.004 **
0
0.005 **
0
(1.97)
(0.07)
(2.56)
(0.14)
Book-to-market
0.009
0.017
0.013 *
0.015
(1.19)
(1.43)
(1.69)
(1.37)
Institutional Holding -0.341 ***
-0.102 ***
-0.333 ***
-0.103 ***
(-19.70)
(-4.00)
(-19.32)
(-4.06)
All-Star
-0.015 *
-0.162 ***
-0.013
-0.162 ***
(-1.73)
(-12.23)
(-1.57)
(-12.23)
Affiliation
0.06 ***
0.007
0.057 ***
0.008
(5.16)
(0.44)
(4.92)
(0.49)
G-Index
0.007 ***
-0.001
(6.52)
(-0.43)
Dummy_Med
0.035 ***
-0.016
(3.29)
(-1.00)
Dummy_Most
0.061 ***
-0.01
(3.79)
(-0.41)
Cut-off 1
-0.533
-0.531
-0.522
Cut-off 2
0.326
0.4
0.409

43
(Table 2.4 Continued)
Least Entrenchment
Medium Level Entrenchment
Most Entrenchment
Before GS
After GS
Before GS
After GS
Before GS
After GS
Firm Experience -0.001
-0.011
0.002
-0.005 **
-0.001
-0.001
(-0.32)
(-1.64)
(1.5)
(-2.39)
(-0.12)
(-0.17)
Career Experience -0.007
0.022 *
0
0.013 ***
-0.019 *
0.006
(-0.92)
(1.85)
(0.05)
(3.8)
(-1.81)
(0.4)
Workload -0.006
0.013
-0.042 ***
-0.02 **
-0.044 *
0.007
(-0.33)
(0.44)
(-7.40)
(-2.42)
(-1.86)
(0.18)
Size 0.003
-0.007
0.004 *
0.001
0.004
-0.023
(0.52)
(-0.63)
(1.85)
(0.38)
(0.33)
(-1.11)
Book-to-market 0.055 **
0.026
0.003
0.015
0.058
0.065
(2.25)
(0.46)
(0.39)
(1.2)
(1.13)
(0.76)
Institutional Holding -0.243 ***
-0.107
-0.354 ***
-0.111 ***
-0.397 ***
0.012
(-4.92)
(-1.31)
(-18.66)
(-4.03)
(-4.74)
(0.1)
All-Star -0.045
-0.202 ***
-0.01
-0.161 ***
-0.034
-0.127 **
(-1.53)
(-3.74)
(-1.11)
(-11.51)
(-0.91)
(-2.06)
Affiliation 0.025
-0.017
0.064 ***
0.015
0.092
-0.111
(0.77)
(-0.32)
(4.98)
(0.86)
(1.6)
(-1.26)
G-Index -0.007
-0.001
0.008 ***
-0.002
-0.041 *
-0.022
(-0.51)
(-0.07)
-4.91
(-0.83)
(-1.95)
(-0.79)
Cut-off 1 -0.519
-0.563
-0.531
-0.539
-1.388
-1.223
Cut-off 2 0.341
0.338
0.329
0.395
-0.551
-0.274 `

44
Panel B: Marginal Effects
Whole Sample
Model 1
Model 2
Least Entrenchment
Med-Level
Entrenchment
Most Entrenchment
Before
GS
After GS
Before GS After GS
Before GS After GS
Before GS After GS
Before GS After GS
Firm Experience 0.0006
-0.0017
0.0007
-0.0017
-0.0005
-0.0039
0.0008
-0.0016
-0.0003
-0.0005
(-0.0006)
(0.0017)
(-0.0007)
(0.0017)
(0.0005
(0.0039)
(-0.0008)
(0.0016)
(0.0003)
(0.0005)
Career Experience -0.0006
0.0047
-0.0006
0.0046
-0.0024
0.0078
0
0.0045
-0.0069
0.0022
(0.0006)
(-0.0047)
-0.0007)
(-0.0046)
(0.0025
(-0.0078)
0
(-0.0045)
(0.007)
(-0.0023)
Workload
-0.0139
-0.0061
-0.0134
-0.0059
-0.0021
0.0048
-0.015
-0.0073
-0.016
0.0025
(0.0144)
(0.0061)
-0.0139)
(0.0059)
(0.0022
(-0.0049)
(0.0155)
(0.0073)
(0.0161)
(-0.0026)
Size
0.0015
0.0001
0.0019
0.0001
0.0012
-0.0025
0.0015
0.0004
0.0016
-0.0082
(-0.0015)
(-0.0001)
(-0.0020)
(-0.0001)
(-0.0012)
(0.0026)
(-0.0016)
(-0.0004)
(-0.0016)
(0.0083)
Book-to-market 0.0032
0.006
0.0045
0.0055
0.0195
0.0095
0.0011
0.0052
0.0211
0.023
(-0.0034)
(-0.0060)
(-0.0047)
(-0.0055)
(-0.0206)
(-0.0095)
(-0.0012)
(-0.0052)
(-0.0213)
(-0.0232)
Institutional Holding -0.1216
-0.0365
-0.1187
-0.0369
-0.0858
-0.0386
-0.1264
-0.0398
-0.1446
0.0044
(0.1262)
(0.0365)
-0.1232)
(0.0369)
(0.0907
(0.0388)
(0.131)
(0.0397)
(0.1458)
(-0.0045)
All-Star
-0.0053
-0.0563
-0.0048
-0.0562
-0.0157
-0.0697
-0.0037
-0.0561
-0.0121
-0.0438
(0.0055)
(0.0594)
-0.005)
(0.0593)
(-0.0169
(0.0751)
(0.0038)
(0.0591)
(0.0124)
(0.0462)
Affiliation
0.0218
0.0026
0.0207
0.0029
0.0089
-0.0062
0.0231
0.0054
0.0341
-0.0382
(-0.0221)
(-0.0026)
(-0.0210)
(-0.0029)
(-0.0093)
(0.0062)
(-0.0234)
(-0.0054)
(-0.0332)
(0.0405)
G-Index
0.0027
-0.0003
-0.0024
-0.0005
0.0028
-0.0007
-0.015
-0.0077
(-0.0028)
(0.0003)
(0.0025)
(0.0005
(-0.0029)
(0.0007)
(0.0151)
(0.0078)
Dummy_Least
0.0125
0.006
-0.0079)
(-0.0061)
Dummy_Most
0.0223
-0.0038
(-0.0226)
(-0.0039)

45
Panel A presents the regression results. Dependent variable is analyst bias. Following Ljungqvist et al (2007) I measure analyst bias for analyst i as the difference between recommendation of analyst i and consensus recommendation
which is the median recommendation for the previous quarter. To find consensus I use the most recent recommendation of each analyst covering the stock within one year period. Analyst bias variable ranges from -4 to 4 and I use three
level choice variable where positive numbers refer to optimism, negative numbers refer to pessimism and 0 is objective recommendation. Governance Index data is from IRRC. Gompers et al (2003). First column represents regression
results for entire sample. Democratic sample consists of companies that have Gindex lower than 6, Dictatorship has G index higher than 14 and remaining companies make up medium sample. Affiliated analyst variable is a dummy that
takes value 1 if her investment bank has an underwriting relationship with a given company (Shanthikumar and Malmendier (2007)). Career experience is defined as log of number of days the analyst’s forecasts have been appearing in
IBES database. Firm specific experience is measured as the log of difference from recommendation date and the first date an analyst starts covering a specific firm. Analysts are called All-Star analyst if they are ranked on Institutional
Investor magazine. Book to market is compustat quarterly database (data59/(data14*data61). Size is in logs. Democratic is equal to one if G-Index is less than 6 and 0 otherwise. Dictatorship is equal to one if G-Index is greater than 13
and 0 otherwise. Aff*Dictatorship and Aff*Medium are interaction variables. Table provides ordered probit regression estimates and z statistics are in parentheses. ***,**,* refer to one percent, five percent, and ten percent significance
levels. Panel B provides marginal effects of coefficients in Panel A. Choice level is optimism for the first row of each coefficient. Marginal effects of choice level pessimism are given in parenthesis. Significant levels are the same as
significance levels in the regression.

46
post-regulation period for the whole sample. Similarly even though institutional holding still stays
significant at 1% level for medium level entrenchment sample for both sub-samples, its marginal effect
declines in magnitude for the post-regulation period compared to marginal effect in the pre-
regulationperiod. On the other hand for good and bad governance samples the effect of institutional
holding in the post-regulation period is insignificant.
Finally, I examine how managerial entrenchment affects size-adjusted cumulative abnormal
return around recommendations. If analyst bias is known for market participants, investors should
discount this bias. Lin and McNichols (1998) show that investors respond similarly to lead underwriter
and unaffiliated Strong buy and Buy recommendations, but three-day returns to lead underwriter Hold
recommendations are significantly more negative than those to unaffiliated Hold recommendations.
Michaely and Womack (1999) find that market cannot fully diagnose analyst bias. Shanthikumar and
Malmendier (2007) suggest that individual investors follow recommendations literally whereas
institutional investors discount analyst bias.
I find five-day abnormal return and run regression in equation one where dependent variable is
five-day abnormal CAR for each recommendation level. Table 2.5 shows the results for strong buy and
buy recommendations separately for each sub-period and sub-sample. Strong buy recommendation
imply either a reiteration or an upgrade in both cases it is good news for covered companies. Panel A
shows that as G-Index increases stock return reaction to recommendation decreases for medium level
sample. On the other hand for most entrenchment sample G-Index is positive, suggesting that investors
react more to recommendations for worse governance companies. The effect of G-Index is no longer
present for post-regulation period.
Even though G-Index is widely used in the literature there are recent concerns about whether
each one of the 24 provision in G-Index has same effect on the governance quality. Bebchuk et al
(2008) address this question and they suggest only 6 of the provision are of importance. To test whether
the relationship between G-Index and analyst bias is due to spurious governance variable, I substitute G-

47
TABLE 2.5: Regression of cumulative abnormal return on managerial entrenchment
Panel A: regressions of sub-samples
BUY
STRONG BUY
Least
Entrenchment
Med-Level
Medium
Most
Entrenchment
Least
Entrenchment
Med-Level
Medium
Most
Entrenchment
Intercept
0.03513 *
0.06106 ***
0.12002 ***
0.13906 ***
0.12596 ***
0.07753 *
-(0.0204)
-(0.0064)
-(0.0394)
-(0.0214)
-(0.0066)
-(0.0403)
G-Index
0.00172
0.00036 **
-0.00186
0.00174
-0.00048 **
0.00333 *
-(0.0016)
-(0.0002)
-(0.0017)
-(0.0017)
-(0.0002)
-(0.0018)
Firm Experience
-0.00022
-0.00032 **
-0.00053
0.0012 **
0.00116 ***
0.00126 **
-(0.0005)
-(0.0001)
-(0.0005)
-(0.0005)
-(0.0002)
-(0.0005)
Career Experience
-0.00065
0.00019
0.00072
0.00093
0.00091 ***
-0.00027
-(0.0009)
-(0.0003)
-(0.0009)
-(0.0009)
-(0.0003)
-(0.0009)
Workload
-0.00019
-0.00191 ***
-0.00228
-0.00412 *
-0.00624 ***
-0.00146
-(0.0023)
-(0.0006)
-(0.0022)
-(0.0024)
-(0.0007)
-(0.0021)
All-Star
0.00584
0.00624 ***
0.00151
-0.00048
0.00652 ***
0.00678 *
-(0.0037)
-(0.0010)
-(0.0033)
-(0.0042)
-(0.0012)
-(0.0036)
Institutional Holding
-0.01129 *
-0.00531 ***
0.0027
0.00823
0.00176
0.01543 **
-(0.0059)
-(0.0020)
-(0.0076)
-(0.0063)
-(0.0022)
-(0.0077)
Affiliation
-0.00109
-0.00303 **
-0.00775
0.00568
0.00248 *
0.00963 *
-(0.0038)
-(0.0013)
-(0.0048)
-(0.0041)
-(0.0015)
-(0.0050)
Size
-0.00155 **
-0.00257 ***
-0.00414 ***
-0.00613 ***
-0.00487 ***
-0.00599 ***
-(0.0008)
-(0.0002)
-(0.0011)
-(0.0008)
-(0.0003)
-(0.0012)
Book-to-market
0.01122 ***
0.00659 ***
0.00585
-0.00525
0.00489 ***
0.01441 ***
-(0.0041)
-(0.0011)
-(0.0047)
-(0.0045)
-(0.0011)
-(0.0055)
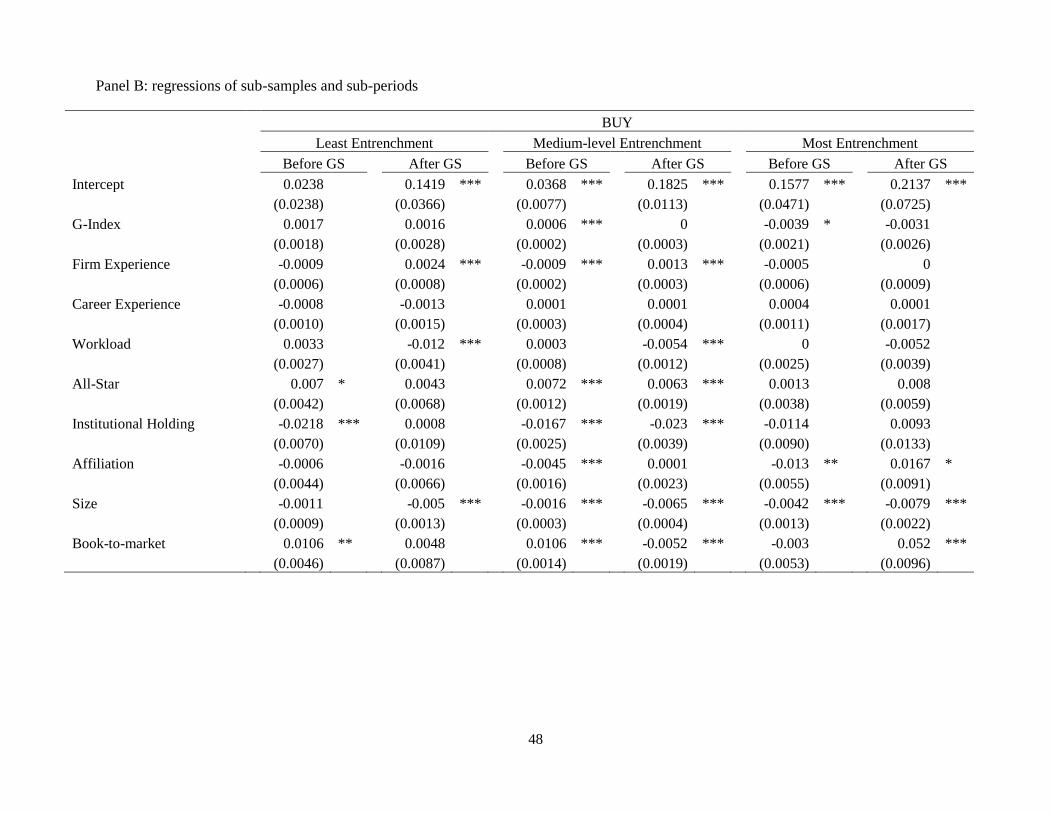
48
Panel B: regressions of sub-samples and sub-periods
BUY
Least Entrenchment
Medium-level Entrenchment
Most Entrenchment
Before GS
After GS
Before GS
After GS
Before GS
After GS
Intercept
0.0238
0.1419 ***
0.0368 ***
0.1825 ***
0.1577 ***
0.2137 ***
(0.0238)
(0.0366)
(0.0077)
(0.0113)
(0.0471)
(0.0725)
G-Index
0.0017
0.0016
0.0006 ***
0
-0.0039 *
-0.0031
(0.0018)
(0.0028)
(0.0002)
(0.0003)
(0.0021)
(0.0026)
Firm Experience
-0.0009
0.0024 ***
-0.0009 ***
0.0013 ***
-0.0005
0
(0.0006)
(0.0008)
(0.0002)
(0.0003)
(0.0006)
(0.0009)
Career Experience
-0.0008
-0.0013
0.0001
0.0001
0.0004
0.0001
(0.0010)
(0.0015)
(0.0003)
(0.0004)
(0.0011)
(0.0017)
Workload
0.0033
-0.012 ***
0.0003
-0.0054 ***
0
-0.0052
(0.0027)
(0.0041)
(0.0008)
(0.0012)
(0.0025)
(0.0039)
All-Star
0.007 *
0.0043
0.0072 ***
0.0063 ***
0.0013
0.008
(0.0042)
(0.0068)
(0.0012)
(0.0019)
(0.0038)
(0.0059)
Institutional Holding
-0.0218 ***
0.0008
-0.0167 ***
-0.023 ***
-0.0114
0.0093
(0.0070)
(0.0109)
(0.0025)
(0.0039)
(0.0090)
(0.0133)
Affiliation
-0.0006
-0.0016
-0.0045 ***
0.0001
-0.013 **
0.0167 *
(0.0044)
(0.0066)
(0.0016)
(0.0023)
(0.0055)
(0.0091)
Size
-0.0011
-0.005 ***
-0.0016 ***
-0.0065 ***
-0.0042 ***
-0.0079 ***
(0.0009)
(0.0013)
(0.0003)
(0.0004)
(0.0013)
(0.0022)
Book-to-market
0.0106 **
0.0048
0.0106 ***
-0.0052 ***
-0.003
0.052 ***
(0.0046)
(0.0087)
(0.0014)
(0.0019)
(0.0053)
(0.0096)

49
(Panel B of Table 2.5 Continued)
STRONG BUY
Least Entrenchment
Medium-level Entrenchment
Most Entrenchment
Before GS
After GS
Before GS
After GS
Before GS
After GS
Intercept
0.1227 ***
0.2106 ***
0.1121 ***
0.1779 ***
0.0676
0.1356 **
(0.0252)
(0.0386)
(0.0083)
(0.0106)
(0.0510)
(0.0620)
G-Index
0.003
-0.0022
-0.0005 **
-0.0003
0.0031
0.0032
(0.0020)
(0.0030)
(0.0002)
(0.0003)
(0.0024)
(0.0023)
Firm Experience
0.0012 **
0.0011
0.0009 ***
0.0019 ***
0.0008
0.0029 ***
(0.0006)
(0.0008)
(0.0002)
(0.0002)
(0.0006)
(0.0008)
Career Experience
0.001
0.0005
0.0008 **
0.0009 **
0.0002
-0.0019
(0.0011)
(0.0015)
(0.0004)
(0.0004)
(0.0011)
(0.0014)
Workload
-0.003
-0.0072 *
-0.0057 ***
-0.0063 ***
0.0004
-0.0064 *
(0.0028)
(0.0042)
(0.0008)
(0.0011)
(0.0025)
(0.0038)
All-Star
-0.0001
0.0025
0.0082 ***
0.0045 *
0.0094 **
-0.0099
(0.0047)
(0.0099)
(0.0014)
(0.0024)
(0.0041)
(0.0075)
Institutional Holding
0.0115
-0.0149
-0.0017
-0.0083 **
0.0073
0.0357 ***
(0.0075)
(0.0113)
(0.0028)
(0.0037)
(0.0095)
(0.0121)
Affiliation
0.0028
0.0164 **
0.0049 ***
-0.0045 *
0.0119 **
0.0096
(0.0048)
(0.0072)
(0.0018)
(0.0024)
(0.0060)
(0.0085)
Size
-0.0059 ***
-0.0073 ***
-0.0042 ***
-0.0069 ***
-0.0053 ***
-0.0086 ***
(0.0010)
(0.0015)
(0.0003)
(0.0004)
(0.0014)
(0.0020)
Book-to-market
-0.0063
-0.0029
0.0048 ***
0.0045 **
0.0103
0.0272 ***
(0.0052)
(0.0094)
(0.0014)
(0.0018)
(0.0067)
(0.0086)
Panel A shows the regression results of five-day abnormal return on managerial entrenchment. Governance Index data is from IRRC. Gompers et al (2003). First column represents regression results for entire
sample. Democratic sample consists of companies that have Gindex lower than 6, Dictatorship has G index higher than 14 and remaining companies make up medium sample. Affiliated analyst variable is a
dummy that takes value 1 if her investment bank has an underwriting relationship with a given company (Shanthikumar and Malmendier (2007)). Career experience is defined as log of number of days the
analyst’s forecasts have been appearing in IBES database. Firm specific experience is measured as the log of difference from recommendation date and the first date an analyst starts covering a specific firm.
Analysts are called All-Star analyst if they are ranked on Institutional Investor magazine. Book to market is compustat quarterly database (data59/(data14*data61). Size is in logs. Democratic is equal to one if G-
Index is less than 6 and 0 otherwise. Dictatorship is equal to one if G-Index is greater than 13 and 0 otherwise. Aff*Dictatorship and Aff*Medium are interaction variables. Table provides ordered probit
regression estimates and z statistics are in parentheses. ***,**,* refer to one percent, five percent, and ten percent significance levels.
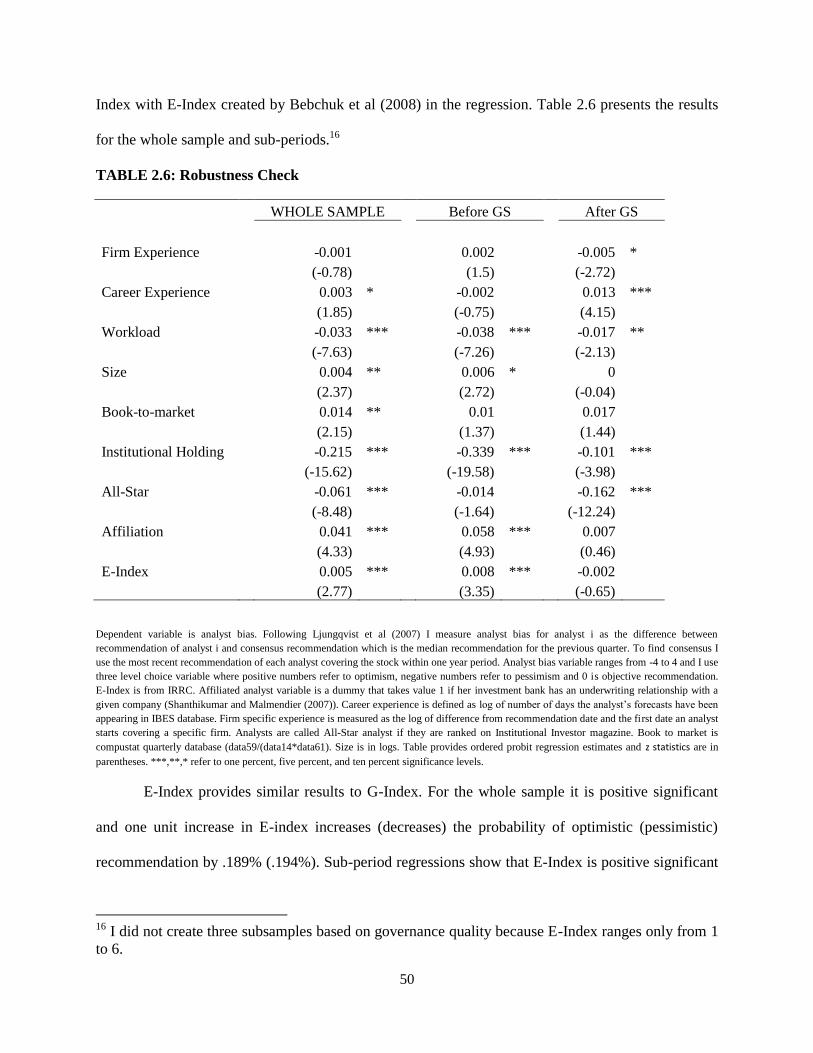
50
Index with E-Index created by Bebchuk et al (2008) in the regression. Table 2.6 presents the results
for the whole sample and sub-periods.16
TABLE 2.6: Robustness Check
WHOLE SAMPLE
Before GS
After GS
Firm Experience
-0.001
0.002
-0.005 *
(-0.78)
(1.5)
(-2.72)
Career Experience
0.003 *
-0.002
0.013 ***
(1.85)
(-0.75)
(4.15)
Workload
-0.033 ***
-0.038 ***
-0.017 **
(-7.63)
(-7.26)
(-2.13)
Size
0.004 **
0.006 *
0
(2.37)
(2.72)
(-0.04)
Book-to-market
0.014 **
0.01
0.017
(2.15)
(1.37)
(1.44)
Institutional Holding
-0.215 ***
-0.339 ***
-0.101 ***
(-15.62)
(-19.58)
(-3.98)
All-Star
-0.061 ***
-0.014
-0.162 ***
(-8.48)
(-1.64)
(-12.24)
Affiliation
0.041 ***
0.058 ***
0.007
(4.33)
(4.93)
(0.46)
E-Index
0.005 ***
0.008 ***
-0.002
(2.77)
(3.35)
(-0.65)
Dependent variable is analyst bias. Following Ljungqvist et al (2007) I measure analyst bias for analyst i as the difference between
recommendation of analyst i and consensus recommendation which is the median recommendation for the previous quarter. To find consensus I
use the most recent recommendation of each analyst covering the stock within one year period. Analyst bias variable ranges from -4 to 4 and I use
three level choice variable where positive numbers refer to optimism, negative numbers refer to pessimism and 0 is objective recommendation.
E-Index is from IRRC. Affiliated analyst variable is a dummy that takes value 1 if her investment bank has an underwriting relationship with a
given company (Shanthikumar and Malmendier (2007)). Career experience is defined as log of number of days the analyst’s forecasts have been
appearing in IBES database. Firm specific experience is measured as the log of difference from recommendation date and the first date an analyst
starts covering a specific firm. Analysts are called All-Star analyst if they are ranked on Institutional Investor magazine. Book to market is
compustat quarterly database (data59/(data14*data61). Size is in logs. Table provides ordered probit regression estimates and z statistics are in
parentheses. ***,**,* refer to one percent, five percent, and ten percent significance levels.
E-Index provides similar results to G-Index. For the whole sample it is positive significant
and one unit increase in E-index increases (decreases) the probability of optimistic (pessimistic)
recommendation by .189% (.194%). Sub-period regressions show that E-Index is positive significant
16 I did not create three subsamples based on governance quality because E-Index ranges only from 1
to 6.

51
in the pre-regulation period. One unit increase in E-Index increases (decreases) the probability of
optimistic (pessimistic) recommendation by .278% (.288%). (Marginal effects are not tabulated). On
the other hand as in table 2.4 E-Index becomes insignificant in the post-regulation period. Therefore
my result for the effect of managerial entrenchment on analyst bias is robust to G-index.
2.5 Conclusion
Analysts are supposed to examine stock performance and decrease information asymmetry
between companies and investors by providing information. Like financial intermediaries, analysts
build reputation and earn return on their reputation. However, well documented analysts’ conflict of
interest raises an anomaly between reputation hypothesis and analyst behavior. I suggest that
entrenched managers affect analyst behavior by putting pressure on analysts to bias their
recommendation More specifically, managerial entrenchment explains this anomaly by affecting the
balance analysts strike between revenue generation and reputation.
Using G index, created by Gompers et al (2003), I show that analysts provide more optimistic
research as managerial entrenchment becomes worse. By increasing analysts’ incentives, such as
non-public information, investment banking and M&A advising business, managers motivate
analysts to shift their balance towards conflict of interest.
On the other hand the commonly documented affiliated analyst bias is present for only
medium level entrenchment sample. For most and least entrenchment samples affiliated bias is not
significant, suggesting that affiliated analysts do not behave differently from unaffiliated analysts
when they cover companies with least and most entrenched managers due to reputational concerns.
When managers are very entrenched, affiliated analysts wary of incentives provided by entrenched
managers. Even though entrenched managers increase information asymmetry problem for investors,
thereby decrease the probability of detection, higher costs at detection increases reputation cost for
affiliated analysts. On the other hand, when managerial entrenchment is lower, managers do not
provide incentives to analysts to bias their research. Furthermore, transparent structure of firms run

52
by least entrenched managers increases the probability of detection which increases reputation costs.
Therefore affiliated analysts prefer remaining similar to unaffiliated analysts, and shift their balance
towards reputational capital for the extreme levels of managerial entrenchment.
I finally examine whether recent regulations, taken to stop analysts’ conflict of interests, were
effective. I find that managerial entrenchment no longer affects analyst behavior and affiliated
analysts do not provide any biased research in the post-regulation period. We suggest that regulations
generate three main reasons for this finding. First, analysts compensation is banned to be based on
revenue generation for their investment bank so that managers lose their tools to put pressure on
analysts. Second, strict penalties imposed on investment banks and analysts increase the importance
of reputational capital therefore analysts become more concerned with their reputation. Finally,
quality of corporate governance is reinforced and managers become fully responsible for actions
which limit managerial entrenchment.
53
CHAPTER 3: DO FIRMS WITH POOR SHAREHOLDER RIGHTS ACTUALLY SUFFER?
EVIDENCE FROM SEASONED EQUITY OFFERINGS
3.1 Introduction
Weak shareholder rights enable managers to make corporate decisions without shareholders’
approval and empower managers. On the other hand, they present an obstacle for managers to raise
equity because weak shareholder rights do not encourage managers to increase shareholders’ return
on their investment (Gompers et al (2003) and therefore investors become less willing to finance
these firms during SEOs. While lower investor demand due to weak shareholder rights makes it
harder for firms to issue equity, it also increases the risk investment banks bear when they agree to
underwrite equity issuances of firms that grant fewer rights to shareholders.
In firm commitment agreements, underwriters buy the entire offering shares from issuers at a
fixed price and resell them to public. However, once investment banks sign the underwriting
contract, they bear entire price risk associated with reselling the shares to the public (Lee and Masulis
(2009)). This risk gets greater when, for any reason, investor demand for SEOs decreases and prices
of securities go down. Weak shareholder rights increase price risk of underwriters due to lower
demand to SEOs. Even though underwriters have an option to walk away from these firm
commitment agreements, I suggest that to get compensated in full, underwriters prefer showing extra
effort to place SEOs by firms with weak shareholder rights. I hypothesize that, when firms face
difficulty in selling shares in SEOs due to less shareholder rights granted to investors, underwriters
will spend more effort to promote and place the SEOs through analyst recommendations. In return,
underwriters will ask for more compensation through higher gross spread. The purpose of this study
is to examine this hypothesis.
There is a growing body of literature on shareholder rights and corporate governance. La
Porta et al (2000a) find that minority shareholders pressure managers to disgorge cash therefore
strong shareholder rights lead to higher dividend payments. Similarly, firms in countries where

54
shareholder rights are well protected, firms hold less cash (Dittmar et al (2004), Pinkowitz et al
(2006)). Furthermore shareholder rights affect firms’ ability to raise external capital because
investors are willing to finance firms when their rights are better protected (La Porta (2002)). La
Porta et al (1998) state that “rights attached to securities are what managers give up to get finance”.
Therefore in countries where shareholder rights are well protected, capital markets are well
developed and cost of equity is lower (La Porta et al (1998), (2000b), (2002)). On the other hand, in
countries where shareholder rights are not well protected, firms may find it harder to raise capital.
Therefore, Reese and Weisach (2002), among others (Coffee (1999), Stulz (2002), suggest that
foreign firms are willing to cross list in the U.S., where shareholder rights are stronger so that foreign
firms bond themselves to stricter U.S. laws, exchange regulations and improved shareholder
protection which lead to higher equity issues.
Even though shareholder protection is stronger in the U.S., compared to other countries, there
are still variations in shareholder rights among firms within the U.S. These variations affect corporate
decisions. Firms that grant weak rights to shareholders provide higher compensation to managers
(Borokhovich et al (1997), Jiraporn et al (2005)), indulge more in empire building acquisitions
(Masulis et al (2007)), and are more likely to diversify (Jiraporn et al (2006)). Consequently,
Gompers et al (2003) find that a trading strategy that sells firms with weak shareholder rights and
buys firms that grant weak shareholder rights earn an abnormal return of 8.5%. This finding suggests
that firms that grant more rights to shareholders generate investor confidence by providing more
return to investors. When investors feel more confidence about return on their investment, they
should be more willing to part with their money and finance firms (Shleifer and Vishny (1997)).
Given that shareholder rights vary considerable much in the U.S., my goal in this paper is to examine
whether firms that grant weak rights to shareholders face more difficulty to attract investors to buy
shares in seasoned equity offerings (SEOs) and if so, how these firms overcome this problem.

55
Since underwriters bear the risk of not being able to sell shares in firm commitment SEOs,
the problem of issuing firms become underwriters’ problem as well. Thus, to have a better
understanding of the issue, it is critical to examine the behavior of underwriters.
Even though underwriting and research departments are supposed to be separated from each
other by Chinese wall to prevent any bias in research, the literature shows that underwriters can ask
analysts in their investment banks to provide more coverage and increase their recommendations.
When underwriters anticipate less investor demand due to weak shareholder rights they can use
analyst recommendations which affect investor confidence on SEOs in two ways: improved investor
optimism and decreased information asymmetry. First of all, analyst recommendation is known to
affect investor optimism. Malmendier and Shanthikumar (2007) show that individual investors
follow analyst recommendations literally. Even institutional investors, who are aware of potential
analyst bias, show upward trading response for strong buy recommendations. Kolasinski and Kothari
(2006) find that target and acquirer analysts push up their recommendations to increase the odds that
shareholders approve the deal.
Underwriters’ effort to improve investor optimism to place SEOs effectively is also in line
with investor sentiment hypothesis of why IPOs come in waves (Lowry (2003)). She finds that
investors are sometimes overly optimistic and are willing to pay more for firms than they are worth.
Similarly, a Wall Street article states that “when investors go bullish, just about anyone can go
public.” With a similar reasoning, I suggest that underwriters improve investor confidence thereby
investor demand on SEOs via analyst recommendations.
Secondly, analyst coverage decreases information asymmetry problems. Information
disclosure is one of the shareholder rights and when shareholders have weaker rights, managers can
disclose less information. Managers may prefer limiting information disclosure especially when they
take actions at the expense of shareholders. However, information asymmetry creates some doubt for
investors’ decision to finance companies. Right before security issuances, underwriters may improve

56
informational problems via analyst recommendations. While upgraded recommendations or
additional coverage improves investor optimism they also decrease information asymmetry and
encourage investors to finance SEOs.
However, underwriters’ extra effort to place SEOs comes at a price. For instance, Butler et al
(2005) and Lee and Masulis (2009) show that underwriters charge more gross spreads when firms are
illiquid and have more information asymmetry problems which lead to less demand. Similarly, I
suggest that underwriters charge more gross spread to compensate their extra effort to place shares
offered by firms with weak shareholder rights. On the other hand, firms that grant fewer shareholder
rights are willing to pay for this extra cost because they need capital and face difficulty of selling
shares.
To test this hypothesis, I use G-Index as a proxy for shareholder rights. G-index is
constructed as adding one for each provision that limit shareholder rights.17 Higher G-Index refers to
lower shareholder rights and powerful managers. Our sample constitutes of 915 SEOs that took place
between 1995 and 2006.
I first examine frequency of SEOs offered by firms with different level of shareholder rights.
Based on Gompers et al (2003), I create three subsamples. Out of 915 SEOs, only 39 of them are
offered by firms that grant weak rights to shareholders, whereas 128 of them offered by firms with
strong shareholder rights. In entire IRRC universe, 4.7% of firms are of weak shareholder group.
However, in my sample, 39 SEOs constitute 4.1% of my sample. Similarly, while 9.6% of firms are
of strong shareholder rights in the IRRC universe, in my sample, 15.1% of SEOs are offered by firms
with strong shareholder rights. Hence, compared to IRRC sample, my sample includes more of good
shareholder rights firms and less of weak shareholder rights firms. This implies that the propensity of
17 These provisions are of five different categories: Voting rights, director and manager protection,
tactics for delaying hostile bidders, direct takeover defenses, and anti-takeover state laws. Please see
appendix for detailed description of these provisions.

57
issuing SEOs is lower for firms that grant weak shareholder rights to investors. Furthermore, the
average of the G-index in my sample is 8.66, whereas it is 9.02 for the universe of IRRC firms. The
lower G-Index in my sample suggests that firms that issue SEO are more likely to have stronger
shareholder rights.
To test whether underwriter effort is present, I examine how analyst recommendation mean
level changes around the SEO offering month. Mean analyst recommendation level increases starting
from 8 months prior to equity offering and starts to decrease 2 months after the event month. On the
other hand, a matched sample of non-issuing firms, matched by size, G-index, date and SIC code,
does not experience such a change in their consensus mean levels. Analyst recommendation stays
around 3.7 (in 5-point scale, it is between hold (3) and buy (4)) for the matched sample. Consistent
with my prediction that underwriters show more effort to improve investor confidence on offerings
by firms with weak shareholder rights, I find that analyst mean level increases sharply for bad
governance companies before equity offerings while good governance companies do not experience
such a sharp increase in consensus recommendation. Mean level increases from 3.6 to 4 for the weak
shareholder rights sample, whereas it increases from 4 to 4.1 for the good shareholder rights sample.
Increase in mean level for bad governance companies makes them as appealing as good governance
companies and increases investor confidence. However, the matched sub-samples do not experience
an increase in analyst recommendations. This finding confirms that underwriters’ effort to increase
investor confidence is unique to the SEO sample.
Finally, I examine how underwriters are compensated for their extra effort. To examine the
relationship between underwriters’ effort and compensation, I investigate how underwriting gross
spreads are related to the level of analyst recommendation. Unlike a uniform 7% underwriting spread
in IPOs, a range of 2%-8% in SEO flotation costs enables us to see whether underwriters charge a
larger spread for issuers of bad governance quality for whom they improve investor confidence.
Furthermore, unlike announcement effect or underpricing, gross spread is only cost issuing firms

58
bear to compensate underwriters’ effort. In my regression analysis, I find that gross spread, a sum of
underwriting fee, management fee and selling concession as a percentage of offer price, is higher for
companies that have higher mean recommendation level and for those that have a higher G-index.
This finding suggests that underwriters charge more gross spread for firms that grant fewer rights to
shareholders to compensate their effort to place SEOs, and that firms are paying a price for it.
Our contributions to literature are threefold. First, I show that how shareholder rights affect
firms’ ability to issue equity and answer La Porta et al (1998)’s puzzling question for U.S firms: Do
firms with poor investor protection actually suffer? The cross listing literature finds that firms in
countries where minority shareholder rights are not well protected are willing to cross list in the U.S.
and bond themselves to strict U.S. regulations. This bonding mechanism helps foreign companies to
improve shareholder rights and improved shareholder rights after cross listing help foreign firms
issue equity more easily. Even though shareholder rights vary much among firms in U.S., the
literature has been silent on the effect of shareholder rights on firms’ ability to issue equity. I fill this
gap by showing that firms that grant weak shareholder rights face more difficulty to issue equity.
Second, I investigate floatation costs which represent a big portion of issuance expenses. It is
important to know the determinants of the cost of raising equity capital because it affects major
corporate finance decisions such as capital structure, and long term investments. I contribute to this
literature by showing that shareholder rights are important determinant of gross spread.
Finally, I expand the literature on analyst bias. Prior literature shows that underwriters charge
more for placing SEOs when investor demand is lower. However, they do not explain how
underwriters manage to place securities effectively. I show that underwriters push analysts to
increase their recommendations during SEOs, especially for firms with lower shareholder rights.
Bradshaw et al (2006) show a similar pattern in analyst mean recommendation level around SEO
years and they claim that analysts are overly optimistic about prospects of issuing stocks. However,
my finding of positive relationship between analyst mean recommendation level and gross spread

59
implies that underwriters are helping out firms with weak shareholder rights and are compensated for
the effort.
The rest of the paper is organized as follows. In section 2 I discuss the related literature and
present my hypothesis. Section 3 describes my sample. I present my results in Section 4 and Section
5 concludes.
3.2 Literature Review and Hypothesis
3.2.1 International Perspective on Shareholder Rights
Corporate governance and shareholder rights in different countries have been examined
extensively in the literature. La Porta et al (2002) show that legal status of countries is main source of
differences in shareholder protection. One of the significances of shareholder protection for Finance
literature is that shareholder protection motivates investors to finance firms. For instance La Porta et
al (1997) state that legal environment, through empowering shareholder rights, protect investors from
managerial expropriation and therefore improves the scope of capital markets. Similarly La Porta et
al (2000) show that firms in common law countries with stronger shareholder rights make more
dividend payment to shareholders. Receiving dividend payments, opposed to retained earnings that
carry a risk of managerial expropriation, is better for shareholders. Getting return on their investment
encourages investors to finance firms. On the other hand, the importance of shareholder rights forces
managers to care more about shareholder rights if firms are willing to get external financing. As La
Porta (1998) states “the rights attached to securities are what managers and entrepreneurs give up to
get finance.”
This argument provides a simple explanation for cross listing. Coffee (1999) states that firms
get cross listed in U.S. because stronger shareholder protection laws in U.S. bond foreign firms to
improve shareholder rights. Foreign companies voluntarily choose to improve shareholder rights they
grant even if there is no legal enforcement to get cross listed. While some managers enjoy
empowering themselves and caring more about their own interest at the expense of shareholders, it is

60
interesting to see firms that bond themselves to U.S. regulations. Apparently, the benefit of getting
cross listed is greater for managers than losing some power to shareholders.
Doidge (2004) show that cross listed firms have 43% less voting premiums than firms that
are not cross listed in U.S. This represents a motivation for firms to cross list to improve shareholder
rights. Supporting this argument he finds that during the 11 days around the announcement date, the
high-voting share class gains 0.57%, while the low-voting class gains 1.69%. Importantly, the low-
voting share class gains by a significantly larger amount: the average difference in returns between
the low-voting class and high voting-class is 1.12%. Lang et al (2002) finds that cross listed firms
enjoy higher analyst coverage. Firms experience higher valuations after cross listing because higher
analyst coverage improves information environment and less information asymmetry leads to lower
cost of capital. Similarly Doidge et al (2002) find that firms that cross list in U.S. are more valuable.
These firms compared to non-cross listed firms, have 16.5% higher Tobin’s q. They explain their
finding by bonding mechanism. U.S. listing reduces the extent to which controlling shareholders can
engage in expropriation and thereby increases the firm’s ability to take advantage of growth
opportunities. On the other hand firms that do not have any good growth opportunities do not
constrain themselves with U.S. regulations because they do not need to access external capital
markets.
These studies imply that increased shareholder rights help firms to get equity financing.
Reese and Weisbach (2002) show specifically that bonding mechanism increases shareholder
protection and improves investor demand on security issuances. They find that among 2,038 firms
cross listed in U.S., 675 of them issue equity subsequent to cross listing in 947 separate occasions. In
the two years period prior to cross listing there are 46 SEOs compared to 111 SEOs in the two years
period after cross listing in NYSE and Nasdaq which enforces strict rules on shareholder rights. On
the other hand there is no change in equity issuance behavior for firms that cross list for OTC or
PORTAL markets. Furthermore, firms in countries where shareholder rights are weak have more

61
equity issuances in their home countries after cross listing compared to firms in countries where
shareholder rights are stronger. These empirical results suggest that firms want to take advantage of
improved shareholder confidence due to enhanced minority shareholder protection that comes with
cross listing in U.S.
3.2.2 Shareholder Rights in U.S. and Equity Financing
In spite of extensive literature on the effect of shareholder rights among different countries on
external financing, there is limited evidence for U.S firms. Shareholder rights in U.S. are
significantly stronger compared to even many developed countries (Shleifer and Vishny (1997), La
Porta et al (1997, 1999, 2000, 2002). However, within U.S. shareholder rights vary considerably
much from firm to firm. Strong shareholder rights allows shareholder to replace managers and
directors quickly while limiting managers’ power to get entrenched. On the other hand weak
shareholder rights empower management and encourage managers to take actions without consulting
sharheolders. When investors have limited rights they cannot vote for management decisions thereby
there may be a risk of getting inappropriate return on their investment. Gompers et al (2003) present
evidence supporting these arguments. They find that stronger shareholder rights had higher firm
value, higher profits, higher sales growth, lower capital expenditures, and made fewer corporate
acquisitions. Furthermore a trading strategy that sells firms with weak shareholder rights and buys
firms that grant weak shareholder rights earn an abnormal return of 8.5%.
If shareholder rights vary this much among firms in U.S., as they do among countries, then
accessibility to equity financing should be different for firms that have different balance of power
between shareholders and managers. As La Porta et al (1998) states, shareholder rights attached to
equity are what managers give up to get finance. If managers are not willing to give up their power,
weak shareholder rights may shy away investors from financing firms. However, literature has been
silent on the difficulty to get equity financing that firms face when shareholder rights are weak.

62
Some recent studies attempt to examine the relationship between corporate governance and
announcement returns of SEOs. In Myers and Majluf (1984) setting negative SEO announcement
effect is due to conflict between new shareholders and old shareholders when managers act in the
interest of old-passive investors. On the other, hand Kim and Purnanandam (2009) suggest that
conflict between shareholders and management leads to negative SEO announcement returns. They
state that firms’ governance is likely to affect investor confidence about profitable deployment of the
capital, which, in turn, affects the costs of raising external capital. Contrary to common perception of
negative SEO announcement returns, they find that investors react negatively to SEOs only when
they do not trust management and when possible expropriation is greater. On the contrary, investors
show positive announcement reaction for companies that have greater investor confidence. More
specifically, they find that firms in states that pass laws with deterrent effects against hostile takeover
attempts and firms raise takeover defenses prior to SEOs experience negative announcement return
which is considered as cost of equity. In this setting, as shareholder rights are weakened, investors
demonstrate their dislike by punishing firms at the announcement.
Similarly, Ferreira and Laux (2009) show that issuers with boards dominated by independent
directors experience higher abnormal SEO announcement returns than do issuers with boards
dominated by insiders. Huang and Tomkins (2009) find that investors react more positively for firms
in which different people hold the CEO and board chairman positions. While these studies examine
the effect of governance on SEO announcement returns, Kim and Purnanandam (2009) is closest to
my study since they try to explain negative returns with weak shareholder rights. Different from their
paper, I want to show that whether it is harder for firms with less shareholder rights to issue equity in
the first place and how firms overcome this problem.
Hypothesis 1: Firms that grant fewer shareholder rights to investors face difficulty to attract
investors buy shares when they need to get equity financing.

63
3.2.3 Underwriters’ Effort to Place Securities and Analyst Coverage
Cross listing literature show that to overcome less investor demand on equity issuances due
to weak shareholder protection, firms cross list in U.S. where shareholder rights are strictly enforced.
Even though there are not as many equity issuances made by firms with weak shareholder rights as
issuances offered by firms with strong shareholder rights, it remains a puzzling question how these
firms that grant weak shareholder rights to investors attract them buy shares. Do these firms act alone
to improve investor confidence on SEOs or do underwriters help them out? What is the incentive
structure of underwriters to show extra effort to place securities of weak shareholder rights firms?
Investor demand is not only firms’ concern but also underwriters’. In firm commitment
agreements underwriters agree to buy SEO shares and resell them to public. During this process they
face different types of risk. Butler et al (2005) state that underwriter carry an inventory risk when
they buy shares and face adverse selection risk if syndicate maintains a net position in the stock.
Similarly, Lee and Masulis (2009) and Eckbo et al (2007) mention about the price risk. When
underwriters sign the final agreement with issuers, generally 24 hours before the start of public
offering, underwriters accepts any change in price. These underwriting risks are higher when investor
demand is not strong because it is more difficult to place equity. Butler et al (2005) show that
underwriting risk is greater for illiquid stocks while Lee and Masulis (2009) suggests that there is
higher risk due to information asymmetry. If shareholder rights are important to investors when they
decide to finance firms, then weak shareholder firms face higher underwriting risk due to low
demand as well.
During underwriting process, underwriters gain information related to firms. Therefore they
can gauge investor demand on security issuances. If underwriters believe the risk they take is too
much then they can force issuers to decrease to offer price to attract investors. However, this
significantly increases cost of issuances for firms. Another option underwriters have is to cancel the
agreement until one day prior to offering date. However, prior studies show that cancelled SEOs are

64
very costly to issuers because of wasted management time and registration and marketing fees. More
importantly issuers end up either cancelling their projects or getting more costly financing.
On the other hand, to cancel SEOs is not the best option for underwriters. Backing out of
underwriting is costly for investment banks for at least two reasons. First, underwriters are not paid
in full when SEO is not complete. Underwriters are generally paid around 3-8% of SEO gross
proceeds, which consists of management fee, underwriting fee and selling concession. Management
fee is paid to compensate the managing group in return for documentation, road-show, marketing
efforts, assessment of market conditions, and other investment banking services. Underwriting fee is
paid for underwriting expenses. These two fees make up around 40% of gross spread. Remaining
60% is distributed to selling group in which book-runners get the lion’s share. Given that offer sizes
are millions of dollars, 60% of gross spread is an important source of revenue for investment banks.
If SEO is not completed, investment banks have to give up this revenue.
Secondly even though issue cancellation is mainly issuers-related event, backing from SEOs
may imply that underwriters could not certify and promote SEO enough to place shares. Underwriter
certification is one important service issuers buy when they hire underwriters. Lack of underwriter
certification leads to more negative announcement return for best offers compared to firm
commitments (Booth and Smith (1986)) and for shelf registered offerings (Denis (1991)). Therefore
issue cancellation may affect underwriter reputation and future business. Thus, I suggest that
investment banks promote shares when investor confidence is very low for issuers to complete
offerings.
Consequently, there is a common incentive for issuers and underwriters: to complete deals.
However, the question is how underwriters improve investor confidence on SEOs of firms that grant
fewer rights to shareholders. I suggest that underwriters push analysts, working at their investment
banks, to be more optimistic. Investment bankers’ putting pressure on analysts to improve their
recommendations is well documented. Especially for pre Global Settlement period, analysts submit

65
this pressure mainly because analyst compensation is based on how much investment banking
business they generate. For instance, Hong and Kubik (2003) find that brokerage houses promote
optimistic analysts who promote stocks. Investor reaction to recommendations of analysts from
independent research firms and investment banks shows that investors are aware of potential bias in
analyst working at investment bank due to investment bankers’ pressure on analysts (Barber et al
(2006), Cowen et al (2006)). This suggests analyst recommendations can be a significant tool for
investment bankers to impact investor demand on SEOs if analysts are able to affect investor
optimism.
There is extensive literature supporting analysts’ effect on investor behavior. Stickel (1995)
and Womack (1996) document a significantly positive (negative) price reaction to upgrades
(downgrades). Examining trading behavior of investors, Mikhail et al (2007) find that both large and
small traders act on recommendation revisions with little difference on their reaction. Large investors
trade more in response to the information conveyed by the analyst’s recommendation and earnings
forecast revision, and small investors trade more in response to the occurrence of a recommendation.
Similarly Malmendier and Shanthikumar (2007) show that both institutional and individual investors
follow analyst recommendations while the later follow them literally. Individual investors take
recommendations at face value and trust them too much. Even institutional analysts show positive
reaction to strong buys. These studies show that analysts are pundits who are followed by investors
and imply that positive coverage encourages investors to trade by improving investor optimism.
Kolasinski and Kothari (2005) show how improved shareholder optimism leads to M&A deal
completion. They find that sell-side analysts of acquirers and targets provide recommendations that
would lead to acceptance of mergers and acquisitions by shareholders. Analysts affiliated with
acquirers are more likely than unaffiliated analysts to upgrade their recommendations of the acquirer
around M&A deals. Increased recommendations improve investor optimism on acquirers and
optimistic shareholders are more willing to approve M&As. In a similar fashion, I suggest that

66
investment banks urge their sell-side analysts to be optimistic about SEO issuers, especially when
there is low demand on issuances, so that increased investor optimism encourages them to participate
SEOs.
Furthermore, analyst coverage increases investor demand on SEOs by decreasing information
asymmetry between firms and investors. Information disclosure is one of the shareholder rights.
When shareholder rights are strong, improved information disclosure help investors to gauge firms
and improve their confidence on firms. However, as shareholder rights become weaker, managers are
less likely to disclose much information to investors and information asymmetry creates a doubt for
investors about quality of firms. Since analyst coverage decreases informational problems (Chang et
al (2007), Hong et al (2000), Bowen et al (2004)) increased analyst coverage especially before SEOs
helps firms by decreasing information asymmetry problem for investors and thereby increasing their
confidence on issuers.
Consequently, I suggest that underwriters, through analyst coverage, support issuances
especially when there is a low demand due to weak shareholder rights.
Hypothesis 2: Underwriters, through analyst recommendations, put more effort to place SEOs
offered by firms that grant fewer shareholder rights to investors.
3.2.4 Underwriter Compensation and Flotation Costs
Eckbo et al (2007) define two main types of flotation costs. Indirect costs include
underpricing stock price reaction to initial offering announcement and probability to cancelation.
Direct costs are gross spread and fees to third parties such as, listing and registration fees. Among
these gross spread is the only direct revenue for underwriters. Gross spread is the difference between
the public offering price and underwriter purchase price from issuers. Gross spread a percent of the
offer price is commonly used as gross spread. Although for IPOs gross spread is unique and hovers
around 7% (Ritter and Chen (2000)), for SEOs it ranges from 3% to 8% (Lee and Masulis (2009)).
Since offer sizes are millions of dollars, gross spread constitutes the most important cost on issuers.
67
When the offer size is hundred million dollar, even 1% increase in gross spread causes one million
extra out of pocket expense on issuer. On the other hand, this increase leads to one million extra for
underwriter compensation.
As I suggest, both firms and underwriters have incentives to complete deals even if investor
demand on SEO is lower for firms that grant less shareholder rights. Firms need to either cancel their
projects due to lack of financing or get more costly financing in case of SEO cancellation.
Furthermore, any kind of expense done until the cancellation will be sunk cost for issuers. Therefore,
when investor demand is lower firms are willing to compensate underwriters more and complete
deals. This is very similar to Cliff and Denis (2004)’s argument of firms buying analyst coverage
through underpricing. They find that underpricing, which is an indirect cost of equity issuances, is
positively related to analyst coverage by lead underwriters and to the presence of all star analysts. In
other words, firms are willing to bear more costs to get analyst coverage which affect investor
optimism. Similarly, I suggest that paying more gross spread is a better option for firms than
cancelling SEOs and bearing sunk costs. Therefore to get more optimistic coverage before offerings
firms pay more fees to underwriters.
On the other hand, low shareholder demand increases underwriting risk for underwriters.
However, issue cancellation is not better than bearing underwriting risk if underwriters find a way to
decrease this risk and firms are willing to compensate them for higher risks. Selling concession,
which constitutes 60% of gross fee, is paid for lead and co-managers and syndicate members for
placing the securities with investors. If SEOs are not completed then underwriters would not get 60%
of gross spread which ranges between 1.8 million to 4.8 million dollar when offer size is 100 million
dollar. Therefore, I suggest that if underwriters have a means to improve investor demand then they
are willing to complete deals and get the whole gross spread. However, their effort to place securities
of firms with weak shareholder rights requires higher fees.

68
Butler et al (2005) examine how gross spread changes based on liquidity of firms. If illiquid
firms offer securities, underwriters will have more difficult time to place illiquid stocks. Therefore
underwriters charge more fees for illiquid firms. They find that the difference in the investment
banking fee for firms in the most liquid vs least liquid quintile is 21% of the average investment
banking fee. Similarly, Lee and Masulis (2009) examine how information asymmetry affects gross
spread. They suggest that poor accruals quality makes it harder for investors to evaluate a firm’s true
performance, it increases the asymmetric information between issuers and outside investors and
contributes to investor uncertainty thereby decreases investor demand on issuances. Therefore
underwriters face more underwriting risk and to compensate this risk they charge more gross spread
when accrual quality is low. Building on this literature I suggest that underwriters’ effort to place
securities of weak shareholder rights via analyst coverage is compensated by higher underwriter fees.
Hypothesis 3: When firms grant less shareholder rights to investors underwriters need to improve
investor optimism through analyst recommendations and to compensate their effort they change more
gross spread for these companies.
3.3 Data and Methodology
Our initial sample consists of a 4,651 SEOs listed on Securities Data Company's (SDC)
Global New Issues database over the period 1995-2006. Analyst recommendation data is from IBES
Detail U.S. file. Since I examine how analyst recommendation mean level changes one year around
SEO issue date and IBES Detail U.S. file is not complete in 1993, I start my sample in 1995. Our
sample ends in 2006 because governance variable, G-index, is available until 2006. To be included in
my sample, each observation must satisfy the following criteria: the company is present in both Risk
Metrics governance (formerly known as IRRC) and IBES recommendation databases, issuers’ offer
price is greater than $5, the company has a share code of 10 or 11 so that I exclude ADRs, closed-end
funds, unit investment trusts, and Real Estate Investment Trusts (REITs), the company has analyst
mean level recommendation during the issue month. This leaves 915 SEOs.

69
Eckbo et al (2007) states that there are two types of costs of issuing equity: indirect and direct
costs. However, gross spread is the only type of cost that issuers bear to compensate underwriters.
Therefore in this study I use gross spread to measure cost of issuing equity. Gross spread is the
difference between how much a share is sold and how much underwriters pay for it. Gross spread has
three major components: selling concession, underwriting fee and management fee. Management fee
is paid to compensate the managing group in return for documentation, road-show, marketing efforts,
assessment of market conditions, and other investment banking services. Underwriting fee is paid for
underwriting expenses. Selling concession is paid to managers and syndicate members to compensate
their selling effort. Butler et al (2005) suggests that these components of gross spread are fixed
fractions of gross spread and typical split is 20/20/60 for underwriting fee, management fee and
selling concession respectively. Since offer prices change based on the size of firms I use scaled
gross spread, the ratio of gross spread per price to offer price, to measure cost of issuing equity which
is typical in literature. Offer price and gross spread information is from SDC Platinum.
Governance Index data is from IRRC. Gompers et al (2003) construct G index by adding one
for each provision that restrict shareholders’ right. There are 22 firm level provisions and 6 state
takeover laws. Four of provisions are common at the firms and state level, thus G-Index ranges from
1 to 24. These provisions, except for cumulative voting and secret ballot, give management a tool to
resist different types of shareholder activism. G-Index is calculated by adding one for the existence
of these provisions. However, cumulative voting and secret ballot empower shareholders. Therefore
one is added for G-Index if firms do not have these provisions. Thus, higher numbers reflect greater
managerial power and weak shareholder rights. Low numbers refer to highest shareholder rights and
little power for management. IRRC provide data only for years 1990, 1993, 1995, 1998, 2000, 2002,
2004 and 2006. G-index for each company does not fluctuate much therefore I carry over G index to
the years when data is not available until next available year.

70
I create analyst consensus mean recommendation level from IBES Detail U.S. file to measure
analyst optimism which is a proxy for underwriters’ effort to place issuances. To find consensus
mean level, I take the average of the latest outstanding recommendation of each analyst covering the
stock within one year period. For instance, if I want to compute analyst recommendation mean level
for December 2000, I collect the latest recommendations made since January 1999. If an analyst has
more than one recommendation in December, or since January, I get the latest one.
Following Butler et al (2005) and Lee and Masulis (2009) I control for some variables. Size
of the company is used as a proxy for information asymmetry. Information asymmetry reduces
investor demand on issues since therefore investment banks face more challenging placement role
and charge more fees. However in my data net proceeds and size of the company are highly
correlated and to overcome this problem I use number of analyst covering the stock as a proxy for
information asymmetry (Chang et al (2005), Yu (2008)). I use the number of analysts who have
outstanding recommendation within one year period at the SEO issue month. Log (Principal) is the
principal amount for SEOs and taken from SDC. Offer size has economies of scale feature, bigger
SEOs require lower underwriting expense. However Altinkilic and Hansen (2000) suggests that offer
size proxies for certifying, monitoring and information asymmetry therefore they suggest that there is
a U-shaped relationship between spread and offer size. Figure 3.1 presents a scatter plot of the gross
fees against the offering size for my sample of SEOs. This figure shows that there is a negative
relationship between offer size and gross spread which confirms the presence of economies of scale.
Volatility, standard deviation of daily stock return during the trading period (-90,-11) prior to
the issue date (trading day 0), is a measure for risk. Risky stocks present more uncertainty for
investors who may not be very willing to buy shares of SEO. This makes it harder for underwriters to
place issuances therefore I expect that underwriters will charge more fees for riskier issuers. Butler et
al (2005) find that more liquid stocks are easier to place. I use share turnover to control the effect of
liquidity. Share turnover is calculated as the ratio of average daily share trading volume during the

71
Figure 3.1: Scatter Diagram of Proceeds and Gross Spreads
To be included in the sample seasoned equity offerings (SEOs) must meet following criteria; companies that are present in both IRRC
governance and IBES recommendation databases, issuers’ offer price is greater than $5, the company has a share code of 10 or 11 so that I
exclude ADR, closed-end fund, unit investment trusts, and Real Estate Investment Trusts (REITs), the company has analyst mean level
recommendation during the issue month. Sample period is between 1995 and 2006 and sample includes 915 SEOs. This figure plots gross spreads
(percent) versus log of net proceeds in millions of dollars.
trading period (-90,-11) prior to the issue date (trading day 0) divided by pre-SEO total shares
outstanding. I expect a negative relationship between share turnover and gross spread. Leverage ratio
is ratio of book value of short-and long-term debt over book value of total assets. I control for
leverage because it may have two opposing effect on gross spread. More levered firms are more
likely to experience financial distress and therefore it may be harder for underwriters to place more
levered firms. However managers who try to maximize shareholders’ wealth are willing to take
riskier investments when leverage is greater since greater portion of the risk added by riskier
investments is borne by debtholders while mostly shareholders benefit from the proceeds. This
suggests higher investor demand for these types of SEOs thereby lower underwriting effort to place
SEOs and a negative relationship between leverage and gross spread18. Tobin’s Q is the ratio of
market value to book value of total assets. Firms with better performance are more able to attract
18 However Masulis and Lee (2009) claim that higher leverage will cause higher gross spread.
0
1
2
3
4
5
6
7
8
9
-2 0 2 4 6 8 10
Gro
ss S
pre
ad (
pe
rce
nt)
Log (Net Proceeds. millions of dollars)
72
investors to buy their shares therefore a negative relationship between gross spread and Tobins’ q is
expected.
Investment banks, like all financial intermediaries, build reputation and earn return on their
reputation which suggests a positive relationship between reputation and gross spread (Slovin et al
(2000). However Li and Masulis (2007) suggest that more reputable analysts face less due diligence
costs therefore decrease gross spread. I use Carter and Manaster reputation measure in the year prior
to SEO filing, taken from Jay Ritter’s website as a measure for reputation. Reputation is a dummy
variable that takes value one if at least one of the co-managers have a ranking of 8 or higher. I
include reputation to see which effect is stronger.
NYSE stocks have more shareholders base, making it easier for underwriters to place issues.
Kadlec and McConnell (1994) show that firms listed in NYSE experience an increase in the number
of shareholders suggesting investor recognition factor of Merton (1987). Therefore I expect to have
negative relationship between NYSE dummy, which equals to 1 if issuer is listed in NYSE, and gross
spread. Institutional demand may be related to price since institutional investors stay away from low
priced securities. Size of institutional demand affects the ability of underwriters to place issues
easily. Price is taken from CRSP. Shelf registration allows issuers to issue securities within two-year
period of registration. Prior registration decreases investor doubt about whether the reason of
issuance is related to overvaluation. Therefore, I expect to have a negative relationship between gross
spread and shelf-dummy which is equal to one if the SEO issue was shelf registered and zero
otherwise. Butler et al (2005) suggest that multiple book-runners may be able to find investment
banks for selling and underwriting syndicates more efficiently than one book-runner. They suggest
that gross fee is greater when there is only one book-runner. However many book-runner may also
increase the amount of management fee which is paid to lead investment bank or book-runners for
managing the deal. I control for many book-runner which is equal to 1 if there are more than one

73
book-runner and zero otherwise however I do not predict the relationship between gross spread and
many book runner dummy.
Table 3.1 presents my SEO sample summary statistics. Panel A shows SEO characteristics
for the whole sample and subsamples based on governance quality. Following Gompers et al (2003)
companies that have more than 13 antitakeover provisions (ATPs) are included in weak shareholder
rights sample. Companies with less than 6 ATPs make up strong shareholder rights sample and
remaining is included in medium-level shareholder rights sample. I have 39, 128 and 748
observations for weak, strong and medium-level shareholder rights sub-samples respectively. G-
Index (E-index) is 8.73(2.22) for the whole sample and 9.12 (2.42) for medium-level shareholder
rights sample. For strong and weak shareholder right samples G-Index (E-index) is 4.51 (.53) and
15.10 (3.90).
Average gross spread for the whole sample is 3.65% of offer price. This percentage is
slightly lower for my sample compared to previous studies mainly because G-index is available for
big companies that have lower spreads. However, G-index gross spread varies based on. While gross
spread is 3.5% of offer strong shareholders rights sample it is 3.9% of offer price. Even though the
difference in gross spreads between strong and weak shareholder samples seem low, it is significant
in terms of cost of capital for companies and in terms of underwriting revenue for investment banks.
0.4% difference leads to $1,848,000 change in gross spread issuers pay (or in underwriting revenue
investment banks get) when net proceeds is 462 million dollar which is the average net proceeds in
my sample.
Mean recommendation level for the whole sample is 3.94 during the month of SEO offering
and there is no much difference between subsamples. Medium-level shareholder rights sample has
mean recommendation level of 3.91 whereas mean level for weak shareholder rights sample is 3.93.
Even though analyst recommendation mean levels are almost the same for sub-samples they are
significantly different from each other one year prior to issue month. I suggest that similar mean

74
levels among sub-samples are due to underwriters’ effort to improve investor confidence through
analyst recommendations.
Remaining variables have similar means as prior literature. Price of securities decreases as
shareholder rights become weaker. Similar pattern follows for offer price which is highly related to
security prices. Net proceeds is lowest for weak shareholder rights sample which is in line with the
argument that it is harder for firms that grant fewer rights to shareholders to attract investor
participation in SEOs. Means of variable change as expected among sub-samples. Turnover and
Tobin’s Q decreases monotonically as shareholder rights become weaker whereas price and leverage
increases. Volatility for subsamples remains the same.
Panel B shows the frequency distribution of SEOs for years. 2002 – 2004 period is the hot
period for SEOs. Almost 40% of SEOs happen during this period whereas the number of SEOs
decreases in 2005 and 2006. During these two years the percentage of SEOs are lowest in my sample.
Furthermore, while strong shareholder rights sample has 33% of SEOs during hot period, weak
shareholder rights sample has 43% of SEOs during this period, confirming their attempt to take
advantage of investor optimism. (Lowry (2003)).
3.4 Empirical Tests and Results
3.4.1 Univariate Analysis
Table 3.2 presents correlations between dependent variable and independent variables. I argue that
investor confidence is lower for firms with weak shareholder rights since empowered managers may
take actions at the expense of shareholders. Therefore, investment banks put more effort to place
shares of firms with weak shareholder rights through analyst recommendations. Correlations between
gross spread, G-index and mean level confirm my hypothesis. As analyst recommendation mean
level increases gross spread goes up. Positive correlation implies that underwriters charge more gross
spread when they try harder to increase investor optimism through analyst coverage. In other words,

75
TABLE 3.1: Descriptive Statistics for Whole Sample and Sub-samples
Panel A. SEO Characteristics
Whole Sample
Strong Shareholder Rights
Medium-Level Shareholder
Rights
Weak Shareholder Rights
No of Obs. Mean Std. Dev. No of Obs. Mean Std. Dev. No of Obs.
748
Mean
3.66
Std. Dev. No of Obs.
39
Mean
3.90
Std. Dev.
1.26 Gross Spread (%) 915 3.65 1.46
128 3.50 1.63
1.43
Mean Level 915 3.94 0.51
128 4.11 0.42
748 3.91 0.53
39 3.93 0.47
G-Index 915 8.73 2.78
128 4.51 0.68
748 9.12 2.00
39 15.10 1.31
E-Index 915 2.21 1.34
128 0.53 0.65
748 2.42 1.20
39 3.90 0.71
Number of Analyst 915 7.60 4.95
128 7.35 4.49
748 7.60 4.89
39 8.46 7.10
Turnover 915 8.26 8.86
128 9.02 9.55
748 8.22 8.85
39 6.57 6.03
Volatility 915 0.03 0.01
128 0.03 0.01
748 0.03 0.01
39 0.03 0.02
Log(Principal) 915 18.95 0.98
128 18.94 1.12
748 18.97 0.96
39 18.62 0.90
Price 915 34.34 22.95
128 36.86 21.27
748 34.14 23.51
39 29.94 16.04
Reputation 914 0.94 0.24
127 0.91 0.28
748 0.95 0.22
39 0.82 0.39
Shelf Dummy 915 0.41 0.49
128 0.33 0.47
748 0.42 0.49
39 0.41 0.50
Leverage 905 0.33 0.21
126 0.28 0.25
740 0.33 0.21
39 0.35 0.17
Tobin's Q 909 2.02 1.84
127 2.44 1.80
743 1.96 1.87
39 1.72 1.12
Many Book-runner 915 0.31 0.46
128 0.21 0.41
748 0.33 0.47
39 0.28 0.46
Exchange Dummy 915 0.73 0.45
128 0.59 0.49
748 0.75 0.43
39 0.77 0.43
Net Proceeds (In Mil.) 900 464.00 1290.00
124 385 548.00
737 482.00 1499.00
39 313.00 430.00
Offer Price 915 34.80 22.86
128 37.31 21.55
748 34.60 23.37
39 30.38 22.86

76
Panel B: Frequency of SEOs by Offer Year
Whole Sample
Strong Shareholder
Rights
Medium-Level Shareholder
Rights
Weak Shareholder
Rights
Year
Frequency
Percentage Frequency Percentage Frequency Percentage Frequency Percentage
1995
79
0.09
16
0.13
59
0.08
4
0.10
1996
50
0.05
5
0.04
41
0.05
4
0.10
1997
47
0.05
4
0.03
41
0.05
2
0.05
1998
83
0.09
18
0.14
62
0.08
3
0.08
1999
65
0.07
12
0.09
51
0.07
2
0.05
2000
65
0.07
13
0.10
50
0.07
2
0.05
2001
64
0.07
7
0.05
54
0.07
3
0.08
2002
124
0.14
16
0.13
103
0.14
5
0.13
2003
92
0.10
11
0.09
75
0.10
6
0.15
2004
133
0.15
14
0.11
113
0.15
6
0.15
2005
55
0.06
7
0.05
48
0.06
0
0.00
2006
58
0.06
5
0.04
51
0.07
2
0.05
Total
915
100%
128
100%
748
100%
39
100%
Panel A of this table provides descriptive statistic for the SEO sample and sub-samples. SEO sample consists of 915 firm commitment agreements over the 1995–2006 period by US issuers. Gross
spreads is the ratio of the difference between offer price and price that underwriter buys shares to offer price. G-Index ranges from 1 to 18 where higher numbers refer to bad governance. Number of analyst is a proxy for information asymmetry. Log (Principal) is the principal amount for SEOs and taken from SDC. Exchange dummy equals to 1 if issuer is listed in NYSE. Volatility is the standard
deviation of daily stock return during the trading period (-90,-11) prior to the issue date (tradingday0), taken from the CRSP database. Share turnover is the ratio of average daily share trading volume
during the trading period (-90,-11) prior to the issue date (tradingday0) divided by pre-SEO total shares outstanding, all taken from the CRSP database. Price is taken from CRSP. The Carter and Manaster reputation measure in the year prior to SEO filing, taken from Jay Ritter’s website. Shelf dummy is equal to one if the SEO issue was shelf registered and zero otherwise, taken from the
Thomson Financial New Issues database. Many book runner is equal to 1 if there are more than one book-runner and zero otherwise. Leverage ratio is ratio of book value of short-and long-term debt
(Compustat item9+item34) over book value of total assets (Compustat item 6) in the year prior to SEO filing Tobin’s q Market value to book value of total assets ((Compustatitem6_item 60+item25 * item 199)/item6) and is measured by book value of total assets minus book value of equity plus common shares outstanding multiplied by the year-end closing stock price, all at the year-end prior to the
SEO filing. Strong Shareholder Rights sample consists of firms that have a G-Index 5 or lower. Firms with Weak Shareholder Rights have a G-Index of 14 or greater. Remaining firms make up medium
shareholder rights sample. Panel B shows frequency distribution of SEOs for each year.

77
higher gross spread compensates underwriters for their effort.
Gross spread is also higher for firms with weak shareholder rights, referring to difficulty for
underwriters to place securities. Even though in univariate regression the relationship seems
insignificant, multivariate results prove otherwise. I also use E-Index as a proxy for shareholder
rights and it is positively correlated with gross spread at 10% significance level. Furthermore, mean
level and G-index are negatively correlated at the SEO month, showing that underwriters push their
analysts to increase recommendations especially for firms with weak shareholder rights. In
untabulated results, I find that gross spread is higher when change in analyst recommendation from 1
year prior to SEO issue month to SEO issue month is higher.
Univarite tests also presents expected correlation between gross spread and control variables.
I use number of analysts as a proxy for information asymmetry and there is a negative relationship
between number of analysts and gross spread, suggesting that analyst coverage decreases information
asymmetry and decreased asymmetry motivates investors to participate in SEOs (Lee and Masulis
(2009)). Underwriters require more spread for more volatile companies because investors are less
interested in risky companies. Log (principal) and gross spread are inversely related confirming
economies of scale in SEOs. Price reflects institutional demand and as it increases gross spread
decreases. Shelf dummy shows that gross spread is lower when SEO is a shelf registration because it
alleviates investor concern about managers’ timing the market due to overvaluation. Exchange
dummy shows that NYSE listed stocks are less costly to place. Contrary to my expectation, turnover
is not negatively correlated with gross spread however this positive relationship is not significant. For
many book-runner dummy, reputation and leverage I do not predict any sign for their correlation
with gross spread since there are explanations for both negative and positive relationships. Our
sample suggests that gross spread is positively correlated with leverage while it is negatively
correlated with many book-runner and reputation. Literature shows conflicting results about the
effect of reputation on gross spread. In my sample more reputable underwriters charge lower fee

78
confirming less due diligence costs. Contrary to Butler et al (2005) many book-runner dummy is
positively correlated with gross spread. I suggest that companies pay more gross spread to
compensate each of the book-runners. Negative relationship between leverage and gross spread
shows that investors are more willing to participate in SEOs when cost of risky projects are imposed
more on debt holders due to higher leverage.
Some of the correlations among some independent variables require some attention. Principal
amount is greater when analyst recommendation mean level is greater, and it is lower when
shareholder rights are weak. Analyst optimism may help companies to increase proceeds in SEOs,
while it is harder for firms that grant fewer rights to shareholders cannot raise much proceeds. Mean
level is negatively correlated with both E-Index and G-Index suggesting that analyst bias is
conditional on corporate governance. In other words, analysts provide more optimistic
recommendations when companies with weal shareholder rights demand for biased research.
3.4.2 Multivariate Analysis
3.4.2.1 Shareholder Rights in U.S. and Equity Financing
I create my sample as a sub-sample of Risk Metrics Governance database (formerly known as
IRRC) depending on firms’ having SEOs. Since I want to examine the effect of shareholder rights on
firms’ ability to raise equity capital, I first investigate the differences in my sample and universe of
IRRC database. If my argument that firms with weak shareholder rights face more difficulty to attract
investors participate in SEOs is correct than I should see more of firms that grant stronger rights to
shareholders in my SEO sample and fewer of firms with weak shareholder rights. To examine this, I
compare percentage of firms of different shareholder rights in my sample with those in entire IRRC
universe.
Table 3.3 shows percentage of firms in each sub-sample for my sample and entire IRRC
database. I only present percentages of firms with different shareholder rights for years 1995, which

79
TABLE 3.2: Correlations among Selected Variables
This table presents correlations among selected variables. SEO sample consists of 915 firm commitment agreements over the 1995–2006 period by US issuers. Gross spreads is the ratio of the difference between
offer price and price that underwriter buys shares to offer price. G-Index ranges from 1 to 18 where higher numbers refer to bad governance. Number of analyst is a proxy for information asymmetry. Log (Principal)
is the principal amount for SEOs and taken from SDC. Exchange dummy equals to 1 if issuer is listed in NYSE. Volatility is the standard deviation of daily stock return during the trading period (-90,-11) prior to the issue date (tradingday0), taken from the CRSP database. Share turnover is the ratio of average daily share trading volume during the trading period (-90,-11) prior to the issue date (tradingday0) divided by pre-SEO
total shares outstanding, all taken from the CRSP database. Price is taken from CRSP. The Carter and Manaster reputation measure in the year prior to SEO filing, taken from Jay Ritter’s website. Shelf dummy is
equal to one if the SEO issue was shelf registered and zero otherwise, taken from the Thomson Financial New Issues database. Many book runner is equal to 1 if there are more than one book-runner and zero otherwise. Leverage ratio is ratio of book value of short-and long-term debt (Compustat item9+item34) over book value of total assets (Compustat item 6) in the year prior to SEO filing Tobin’s q Market value to
book value of total assets ((Compustatitem6_item 60+item25 * item 199)/item6)and is measured by book value of total assets minus book value of equity plus common shares outstanding multiplied by the year-end
closing stock price, all at the year-end prior to the SEO filing. ***, **, * refer to 1%, 5% and 10% significance levels.
Gross Spread
Mean Level
G-Index
E-Index
Number of Analyst
Log(Principal)
Gross Spread
1
Mean Level
0.159 ***
1
G-Index
0.047
-0.134 ***
1
E-Index
0.074 **
-0.123 ***
0.779 ***
1
Number of Analyst
-0.342 ***
-0.109 ***
0.029
-0.030
1.000
Log(Principal)
-0.334 ***
0.060 *
-0.062 *
-0.089 ***
0.488
1.000
Tobin's Q
0.016
0.154 ***
-0.141 ***
-0.137 ***
0.145 ***
0.164 ***
Leverage
-0.091 ***
-0.057 *
0.062
0.100 ***
-0.012
0.028
Exchange Dummy
-0.190 ***
-0.076 **
0.159 ***
0.118 ***
0.036
0.187 ***
Turnover
0.048
0.028
-0.101 ***
-0.034
0.154 ***
0.039
Many Book-runner
0.136 ***
-0.083 **
0.064 *
0.075 **
0.126 ***
0.276 ***
Price
-0.161 ***
0.148 ***
-0.051
-0.097 ***
0.204 ***
0.412 ***
Shelf Dummy
-0.254 ***
-0.291 ***
0.080 **
0.117 ***
0.050
-0.030
Reputation
-0.141 ***
-0.026
-0.061 *
-0.042
0.146 ***
0.268 ***
Volatility
0.237 ***
0.182 ***
-0.089 ***
-0.084 **
0.099 ***
-0.010

80
is the beginning of my sample period, 1998, 2000, 2002, 2004, 2006 because IRRC publishes
detailed listings of governance provisions only for these years.19 There are 11,068 firm-year
observations in the universe of governance database and my sample size is 542 SEOs for the years
given above. In total 9.6% of firms are from strong shareholder rights sample for the entire
governance data. However in my sample 15.1% of SEOs are issued by firms with stronger
shareholder rights. Conversely, the percentage of weak shareholder rights subsample is greater for
entire governance sample than it is for my SEO sample. These results imply that my SEO sample is
more skewed towards strong shareholder rights sample. Firms that grant fewer rights to shareholder
TABLE 3.3: Percentage of Firms within Sub-samples
LEVEL OF SHAREHOLDERS RIGHT
Strong Shareholder
Rights
Medium Shareholder
Rights
Weak Shareholder Rights
YEAR
IRRC
Universe
SEO
Sample
IRRC
Universe
SEO
Sample
IRRC
Universe
SEO Sample
1995
0.097
0.203
0.842
0.747
0.061
0.051
1998
0.140
0.217
0.815
0.747
0.045
0.036
2000
0.098
0.200
0.856
0.769
0.046
0.031
2002
0.088
0.129
0.862
0.831
0.050
0.040
2004
0.083
0.105
0.874
0.850
0.043
0.045
2006
0.074
0.086
0.887
0.879
0.039
0.034
TOTAL
0.096
0.151
0.857
0.808
0.047
0.041
Number of firms/SEOs
1068
82
9481
438
519
22
This table reports test statistics for differences in means of IRRC universe and SEO sample, used in this paper. Test statistics are presented for the
years 1995, 1998, 2000, 2002, 2004, 2006 in which detailed listings of corporate governance provisions are published for individual firms in
Corporate Takeover Defenses. G-index is Governance index and constructed as adding one for each provision that restricts shareholder rights. Sub-samples are constructed based on Gompers et al (2003). Strong Shareholder Rights sample consists of firms that have a G-Index 5 or lower. Firms
with Weak Shareholder Rights have a G-Index of 14 or greater. Remaining firms make up medium shareholder rights sample.
19 Following literature (Masulis et al (2007), among others) I assume that during the years between
two consecutive publications, firms have the same governance provisions as in the previous
publication year for the years when G-Index is not calculated, for rest of the tests.

81
face more difficulty to attract investors participate in SEOs therefore I have fewer companies with
weak shareholder rights in my SEO sample. I also compare average G-Index in entire IRRC database
and in my sample. Since the percentage of strong shareholder rights firms is greater in my sample
compared to entire governance database, I expect G-Index in my sample to be lower compared to G-
Index of entire governance database. Table 3.4 presents G-index for entire sample and SEO sample
for each year when G-Index is created. G-index in my sample is always lower than G-Index of IRRC
universe for each year. The difference is in G-Index for IRRC universe and my sample is .36 in total
and it is significant at 1% level. Table 3.3 shows that 85% of firms are of medium-level shareholder
rights sample whereas firms with medium-level shareholder rights constitutes 80% of my sample. In
untabulated results I find that G-Index for IRRC universe is 9.24 whereas it is 9.09 for my sample
when medium-level shareholder rights samples are compared. These findings further confirm that my
sample is more tilted towards firms with lower G-Index that face less difficulty to raise equity
capital. Gompers et al (2003) divides provisions that limit shareholder rights into five groups. Delay
group includes four provisions designed to slow down a hostile bidder. Protection group includes six
provisions designed to insure of officers and directors against job-related liability or to compensate
them following a termination. The Voting group contains six provisions, all related to shareholders’
rights in elections or charter/bylaw amendments. The Other group includes the six remaining firm-
level provisions. State group includes six types of so-called “second-generation” state takeover
laws.20 By looking at these sub-groups, I further examine the main source of difference in G-Index
for my sample and entire governance database. Differences in voting and state sub-groups are
positive suggesting that these sub-groups contribute lower G-Index in my sample. However these
differences are not significant. On the other hand, the average of delay group for SEO sample is
significantly greater than it is for IRRC universe. This finding shows that SEO firms are more likely
20 Detailed information related to these provisions is provided in the appendix.

82
TABLE 3.4: Tests between SEO sample and IRRC universe
GINDEX
DELAY
PROTECTION
YEAR
IRRC
Universe
SEO
Sample
IRRC-SEO
IRRC
Universe
SEO
Sample
IRRC-SEO
IRRC
Universe
SEO
Sample
IRRC-SEO
1995
9.29 8.34 0.95 ***
2.07 1.95 0.12
2.52 2.27 0.26 *
1998
8.78 8.49 0.28
2.11 2.24 -0.13
2.09 1.94 0.16
2000
8.98 8.09 0.89 ***
2.18 2.16 0.02
2.19 1.73 0.46 ***
2002
9.03 8.92 0.11
2.42 2.40 0.02
2.06 2.10 -0.04
2004
9.06 8.98 0.08
2.47 2.43 0.04
2.05 2.09 -0.04
2006
9.02 8.67 0.35
2.46 2.50 -0.04
2.04 2.02 0.03
TOTAL
9.02 8.66 0.36 ***
2.21 2.30 -0.09 *
2.20 2.04 0.16 ***
VOTING
OTHER
STATE
YEAR
IRRC
Universe
SEO
Sample
IRRC-SEO
IRRC
Universe
\
SEO
Sample
IRRC-SEO
IRRC
Universe
SEO
Sample
IRRC-SEO
1995
2.12 2.01 0.11
1.06 0.75 0.31 *** 1.78 1.56 0.22
1998
2.16 2.12 0.04
0.94 0.82 0.12
1.68 1.65 0.04
2000
2.19 2.10 0.09
0.95 0.75 0.20 *
1.69 1.49 0.20
2002
2.22 2.10 0.11
0.89 0.76 0.13 *
1.66 1.96 -0.30 **
2004
2.22 2.25 -0.03
0.88 0.78 0.10
1.68 1.79 -0.11
2006
2.21 2.26 -0.05
0.84 0.67 0.17
1.72 1.52 0.20
TOTAL
2.18
2.14
0.04
0.95
0.76
0.19
***
1.71
1.71
0.01
This table reports test statistics for differences in means of IRRC universe and SEO sample, used in this paper. Test statistics are presented for the years 1995, 1998, 2000, 2002,
2004, 2006 in which detailed listings of corporate governance provisions are published for individual firms in Corporate Takeover Defenses. G-Index is Governance index and
constructed as adding one for each provision that restricts shareholder rights. Sub-indices are constructed based on Gompers et al (2003). Delay group includes four provisions designed to slow down a hostile bidder. These are Blank Check, Classified Board, Special Meeting and Written Consent. Protection group includes group contains six
provisions designed to insure of officers and directors against job-related liability or to compensate them following a termination. These provisions are Compensation Plans,
Contracts, Golden Parachutes, Indemnification, Liability and Severance. The Voting group contains six provisions, all related to shareholders’ rights in elections or charter/bylaw amendments. These are Bylaws, Charter, Cumulative Voting, Secret Ballot, Supermajority and Unequal Voting. The Other group includes the six remaining firm-
level provisions; Anti-greenmail, Directors’ Duties, Fair Price, Pension Parachutes, Poison Pill and Silver Parachutes. State group includes six types of so-called “second-
generation” state takeover laws which are Anti-greenmail Law, Business Combination Law, Cash-Out Law, Directors’ Duties Law, Fair Price Law and Control Share Acquisition Law. ***, **, and * indicate significance at the 1, 5 and 10 percent level respectively for the difference in means of sub-groups of IRRC universe and SEO sample.

83
to have provisions in Delay group compared to entire database. I find that the main source of
difference in G-Index is related to protection and other sub-groups. Firms in SEO sample are less
likely to have provisions in protection and other sub-groups compared to firms in entire database.21
3.4.2.2 Underwriters’ Effort to Place Securities and Analyst Coverage
I suggest that underwriters push their analyst to improve recommendations when it is harder
to place SEOs. Therefore, I examine how analyst mean recommendation changes around SEOs.
Event month is the month in which SEO is offered to public. Figure 3.2 shows mean
recommendation for SEO and match samples between months -12 and +12. For SEO sample, analyst
recommendation stays stable for months from -12 to -9 at 3.82. Starting with the -8th month mean
level starts to increase and this increase continues even after the event month. During the event
month, mean recommendation level reaches 3.92. In my sample, the median difference between SEO
filing date and issue date is almost 2 months. Confirming my argument, I show that underwriters,
both lead managers and syndicate members, start to improve investor confidence on issuers way
before the filing month. Recommendation mean level reaches its peak after event months. Figure 3.2
shows that in the second month after issuance companies enjoy highest consensus recommendation.
This continued increase in mean level after the event month is in line with “booster shots” (James
and Karceski (2005)). They find that affiliated analysts provide protection of stronger coverage if the
firm experiences poor aftermarket stock performance after IPO. However, this pattern in mean level
around issue month may not be specific to my SEO sample. As a common practice in SEO studies, I
create a match sample and examine whether match sample presents similar patterns in analyst
recommendations. To create the match sample I require match companies to have analyst
21 When I compare IRRC universe and SEO sample, I did not exclude SEO firms (both in my sample
and firms that are not in my sample due to sample selection criteria) from IRRC universe. Therefore I
believe the difference between entire database and my sample would be stronger if I compared
average sub-indices of SEO sample and IRRC universe excluding all SEOs.

84
recommendation data for the event month, to be in the same subsample based on G-index, and to
have a size which is between 75% and 125% of the SEO
Figure 3.2: Recommendation Mean Level Change around the SEO Issue Month for SEO and
Match Samples.
Recommendation mean level is calculated as the average of latest outstanding analyst recommendations issued within one year period. SEO
sample includes SEOs from 1995 to 2006 that meet following criteria; companies that are present in both IRRC governance and IBES
recommendation databases, issuers’ offer price is greater than $5, the company has a share code of 10 or 11 so that I exclude ADR, closed-end
fund, unit investment trusts, and Real Estate Investment Trusts (REITs), the company has analyst mean level recommendation during the issue
month. Match sample consists of 913 observations matched by size, G-index, SIC. Event month is the month in which SEO is offered.
companies.22 I also require match firm and SEO firm to have same 3-digit SIC code. However I
alleviate this restriction to 1-digit SIC code gradually if I cannot find a match sample that has 3-digit
or 2-digit SIC codes. Our matching procedure results in 911 matches.
Dashed line in figure 3.2 shows how consensus mean level changes around SEO month for
match sample. In month -12 analyst recommendation mean is 3.7 which is very close to 3.8, analyst
recommendation mean, for SEO sample. However, different from SEO sample, match sample does
not experience any upgrading in analyst recommendations before event month. Consensus
22 I have to relax this matching criterion since I could not match some of the SEOs. After matching
based on remaining criteria, I pick match firms that have closest size to SEO firms when I cannot
find a match firm that has a size which is between 75% and 125% of the size of SEO firm.
3.3
3.4
3.5
3.6
3.7
3.8
3.9
4
4.1
4.2
-12 -10 -8 -6 -4 -2 0 2 4 6 8 10 12
Re
com
me
nd
atio
n M
ean
Le
vel
Months relative to SEO issue month
SEO Sample
Match Sample

85
recommendation stays around 3.7 until the 6th month after the event month and then slightly
decreases. This pattern confirms that increase in recommendation level is unique to SEO sample.
To examine whether underwriters show extra effort for companies that are difficult to place I
investigate analyst recommendation around SEO month for subsamples. Figure 3.3 shows mean
levels for bad governance, good governance and medium-level governance samples. For all
subsamples analyst recommendation mean level increases around SEO month. However there are
significant differences among subsamples. First of all, mean levels are distinctly different for
subsamples in month -12. As expected good governance companies, on average, have buy
recommendation. On the other hand, consensus recommendation is the lowest for bad governance. It
starts at 3.6 which is between buy and hold recommendation. Medium-level governance sample has
Figure 3.3: Recommendation Mean Level Change around the SEO Issue Month for SEO Sub-
samples
Recommendation mean level is calculated as the average of latest outstanding analyst recommendations issued within one year period. SEO
sample includes SEOs from 1995 to 2006 that meet following criteria; companies that are present in both IRRC governance and IBES recommendation databases, issuers’ offer price is greater than $5, the company has a share code of 10 or 11 so that I exclude ADR, closed-end
fund, unit investment trusts, and Real Estate Investment Trusts (REITs), the company has analyst mean level recommendation during the issue
month. Strong Shareholder Rights sample consists of firms that have a G-Index 5 or lower. Firms with Weak Shareholder Rights have a G-Index of 14 or greater. Remaining firms make up medium shareholder rights sample. Each sub-sample includes 128, 39, 748 SEOs respectively. Event
month is the month in which SEO is offered.
3.3
3.4
3.5
3.6
3.7
3.8
3.9
4
4.1
4.2
-12 -10 -8 -6 -4 -2 0 2 4 6 8 10 12
Re
com
me
nd
atio
n M
ean
Le
vel
Months relative to SEO issue month
Strong Shareholder Rights
Medium Shareholder Rights
Weak Shareholder Rights

86
recommendation level which right between 3.6 and 4. Secondly, recommendation levels start to
increase -8th month for medium-level and good governance samples whereas for bad governance
sample it starts to increase one year prior to SEO. The most significant difference among subsamples
is related to magnitude of change in mean levels before SEOs. Table 3.5 shows the tabulated results
for change in analyst recommendation mean level. For good and medium-level governance samples
there is an increase in analyst recommendation. For medium-level sample analyst recommendation
means for months -12 and -9 (-6) are lower from mean at the event month and these differences are
statistically significant at 1% (5%) level. Medium-level companies enjoy 0.11 increase, from 3.80 to
3.91, in analyst recommendation which represents 2.6% increase. Similarly, good governance
companies experience 0.10 increase, from 3.99 to 4.10, in consensus recommendation. However,
Figure 3.4: Recommendation Mean Level Change around the SEO Issue Month for match Sub-
samples
Recommendation mean level is calculated as the average of latest outstanding analyst recommendations issued within one year period. SEO
sample includes SEOs from 1995 to 2006 that meet following criteria; companies that are present in both IRRC governance and IBES
recommendation databases, issuers’ offer price is greater than $5, the company has a share code of 10 or 11 so that I exclude ADR, closed-end fund, unit investment trusts, and Real Estate Investment Trusts (REITs), the company has analyst mean level recommendation during the issue
month. Match sample consists of 913 observations matched by size, G-index, SIC. Strong Shareholder Rights sample consists of firms that have
a G-Index 5 or lower. Firms with Weak Shareholder Rights have a G-Index of 14 or greater. Remaining firms make up medium shareholder rights sample. Each sub-sample includes 128, 37, 748 SEOs respectively. Event month is the month in which SEO is offered.
3.3
3.4
3.5
3.6
3.7
3.8
3.9
4
4.1
4.2
-12 -10 -8 -6 -4 -2 0 2 4 6 8 10 12
Strong Shareholder Rights
Medium Shareholder Rights
Weak Shareholder Rights

87
TABLE 3.5: Analyst Mean Recommendation Level Surrounding Issue Month
Panel A
SEO sample Pre-Issue Month Period
Issue
Month
Post-Issue Month Period
-12
-9
-6
-3
-1
0
1
3
6
9
12
Strong SH Rights 3.991 * 3.985 ** 4.042
4.061
4.082
4.107
4.110
4.060
4.001 * 3.950 *** 3.921 ***
Medium SH Rights 3.805 *** 3.802 *** 3.847 ** 3.877 * 3.887
3.915
3.930
3.931
3.897
3.841 *** 3.804 ***
Weak SH Rights 3.594 *** 3.686 ** 3.723 ** 3.862
3.890
3.935
3.971
4.019
3.968
3.836
3.733 *
Panel B
Match Sample Pre-Issue Month Period
Issue
Month
Post-Issue Month Period
-12
-9
-6
-3
-1
0
1
3
6
9
12
Strong SH Rights 3.791
3.652
3.655
3.741
3.726
3.744
3.731
3.737
3.743
3.750
3.692
Medium SH Rights 3.713
3.704
3.697
3.679
3.718
3.700
3.723
3.719
3.677
3.589 *** 3.575 ***
Weak SH Rights 3.699
3.740
3.767
3.747
3.773
3.677
3.615
3.657
3.545
3.478
3.762
Panel C
SEO-Match Pre-Issue Month Period
Issue
Month
Post-Issue Month Period
-12
-9
-6
-3
-1
0
1
3
6
9
12
Strong SH Rights 0.200 ** 0.333 *** 0.386 *** 0.320 *** 0.356 *** 0.363 *** 0.379 *** 0.323 *** 0.258 *** 0.200 *** 0.229 ***
Medium SH Rights 0.092 *** 0.097 *** 0.150 *** 0.198 *** 0.170 *** 0.215 *** 0.206 *** 0.212 *** 0.221 *** 0.252 *** 0.229 ***
Weak SH Rights -0.105
-0.054
-0.044
0.115
0.117
0.258 ** 0.356 *** 0.361 *** 0.423 *** 0.358 ** -0.029
Recommendation mean level is calculated as the average of latest outstanding analyst recommendations issued within one year period. SEO sample includes SEOs from 1995 to 2006 that meet following criteria;
companies that are present in both IRRC governance and IBES recommendation databases, issuers’ offer price is greater than $5, the company has a share code of 10 or 11 so that I exclude ADR, closed-end fund, unit
investment trusts, and Real Estate Investment Trusts (REITs), the company has analyst mean level recommendation during the issue month. Strong Shareholder Rights sample consists of firms that have a G-Index 5 or
lower. Firms with Weak Shareholder Rights have a G-Index of 14 or greater. Remaining firms make up medium shareholder rights sample. Each sub-sample includes 128, 39, 748 SEOs respectively. Match sample consists
of 913 observations matched by size, G-index, SIC. Each sub-sample includes 128, 37, 748 SEOs respectively. Event month is the month in which SEO is offered. Panel A and Panel B presents mean analyst
recommendation and whether it is significantly different in event month compared to other months for SEO and Match samples. Panel C show the difference in mean analyst recommendation for two sample and ***, **, *
refer to 1%, 5% and 10% significance levels.
88
recommendation mean level increases sharply for bad governance companies. Consensus
recommendation increases from 3.59 in month -12 to 3.93 at the event month. Even though my weak
shareholder sample is very small the difference in mean levels in months -12, -9 and -6 are
significantly lower than mean level in the event month. This 8.6% increase in analyst
recommendation makes bad governance companies look as good as medium level governance
companies, in terms of analyst optimism.
Even though there are increases in analyst recommendation mean level, some may claim that
these increases are not very big. For weak shareholder rights samples, outstanding analyst consensus
is 3.59 which is between buy and hold in month -12 and it becomes 3.93 which is very close to buy. I
claim that while underwriters push analysts to improve their recommendations to improve investor
optimism, analysts cannot risk their reputation by increasing recommendations beyond a reasonable
level. Jackson (2005) states that analysts strike a balance between their reputation and optimism. I
suggest that analysts increase their recommendation around 10% which both increase investor
optimism and protect analyst reputation. I also examine recommendation pattern for match
subsamples to see whether match sample experience same changes in analyst recommendation or the
increase in analyst mean level is unique to SEO sample. Figure 3.4 presents how analyst
recommendation changes over two-year period and show that analyst recommendations stay pretty
stable. While SEO bad governance sample experiences a sharp increase in analyst recommendation,
there is not such a trend for match sample bad governance companies. In the event month consensus
recommendation is at the same level as it was 1 year prior to event month. Panel B of Table 3.5
shows that analyst mean level is 3.71 in month -12 and it is 3.70 in the event month. The mean levels
in months -12, -9, -6, -3 and -1 are not significantly different from the mean level in event month. For
good governance match sample consensus recommendation decreases slightly between month -12
and -6 and then increases to the same level at the event month. Medium-level governance match
sample stays exactly around 3.7. .

89
In panel C of Table 3.5, I show the differences in mean levels for SEO and match sub-
samples. For strong and medium-level governance samples differences are always positive and
statistically significant at 1% level, except for month -12 in which the difference is 5% significant.
This finding suggests that SEO firms always enjoy higher recommendation compared to match firms.
For weak shareholder sample, SEO sample has lower analyst mean recommendation than match
sample until month -6 however then difference becomes positive in month -3. Furthermore, at the
SEO issue month difference in mean levels is .258 and it is significant at 1% level. These subsample
findings confirm that underwriters show some effort especially for bad governance sample during
SEOs to increase investor confidence and place shares more easily and this effort is unique to SEO
sample.
Increased analyst coverage also leads to an improved in investor confidence for issuances
mainly because increased coverage decreases information asymmetry problem (Chang et al (2005)).
Figure 3.5: Number of Analysts around the SEO Issue Month for SEO and Match Samples
Number of analysts is the sum of analysts who have outstanding recommendations issued within one year period. SEO sample includes SEOs
from 1995 to 2006 that meet following criteria; companies that are present in both IRRC governance and IBES recommendation databases,
issuers’ offer price is greater than $5, the company has a share code of 10 or 11 so that I exclude ADR, closed-end fund, unit investment trusts,
and Real Estate Investment Trusts (REITs), the company has analyst mean level recommendation during the issue month. Match sample consists
of 913 observations matched by size, G-index, SIC. Event month is the month in which SEO is offered.
3
4
5
6
7
8
9
10
-12 -10 -8 -6 -4 -2 0 2 4 6 8 10 12
Nu
mb
er
of
An
alys
ts
Months relative to SEO month
SEO Sample
Match Sample

90
Therefore I examine how number of analysts change around the SEO month for SEO and match
samples. Figure 3.5 compares the change in number of analysts for two samples. To start with, SEO
sample, on average, has more analyst coverage than match sample. An important difference between
two samples is that SEO sample experiences an increase in the number of analyst coverage after the
event month while match sample does not. This finding confirms prior literature that analyst
coverage is part of underwriting service investment banks provide. The number of analysts covering
SEO firms increases from 7.2 in the event month to almost 9 ten months after SEO issue month. On
the other hand, the number of analysts covering match firms stays around 5 for two-year period
around SEO month.
Figure 3.6 and figure 3.7 present changes in analyst coverage for SEO and match sub-
samples. While the number of analysts covering medium-level and strong shareholder right samples
stays the same until the SEO month, it starts to increase 10 months prior to event month for weak
Figure 3.6: Number of Analysts around the SEO Issue Month for SEO Sub-samples
Number of analysts is the sum of analysts who have outstanding recommendations issued within one year period. SEO sample includes SEOs
from 1995 to 2006 that meet following criteria; companies that are present in both IRRC governance and IBES recommendation databases, issuers’ offer price is greater than $5, the company has a share code of 10 or 11 so that I exclude ADR, closed-end fund, unit investment trusts,
and Real Estate Investment Trusts (REITs), the company has analyst mean level recommendation during the issue month. Strong Shareholder
Rights sample consists of firms that have a G-Index 5 or lower. Firms with Weak Shareholder Rights have a G-Index of 14 or greater. Remaining firms make up medium shareholder rights sample. Each sub-sample includes 128, 39, 748 SEOs respectively. Event month is the month in which
SEO is offered.
3
4
5
6
7
8
9
10
-12 -10 -8 -6 -4 -2 0 2 4 6 8 10 12
Nu
mb
r o
f A
nal
ysts
Months Relative to SEO Month
Strong Shareholder Rights
Medium Shareholder Rights
Weak Shareholder Rights

91
shareholder rights sample. Table 3.6 shows that the number of analysts covering weak shareholder
rights sample increases gradually from 1 year prior to SEO month to event month. On average, there
are 7.54 analysts covering firms and it increases to 8.46 at the issue month. Conversely, number of
analysts is the same for all subsample of match sample over two-year period around SEO month.
Panel C of Table 3.6 shows the difference in number of analysts for sub-samples of SEO and match
samples. The differences are always positive and most of the cases they are statistically significant.
These results confirm the findings of Bradshaw et al (2006) who show that analyst recommendation
level increase on the SEO year. They suggest that analysts are overoptimistic about the prospects of
issuing stocks during the external financing year. However I claim that increase in analyst
recommendation is concentrated in a period one year before issue month because underwriters show
some effort to improve investor confidence before issuances. Furthermore I show that analyst
optimism is related to quality of governance and difficulty in placing offerings. Analyst
Figure 3.7: Number of Analysts around the SEO Issue Month for match Sub-samples
Number of analysts is the sum of analysts who have outstanding recommendations issued within one year period. SEO sample includes SEOs from 1995 to 2006 that meet following criteria; companies that are present in both IRRC governance and IBES recommendation databases,
issuers’ offer price is greater than $5, the company has a share code of 10 or 11 so that I exclude ADR, closed-end fund, unit investment trusts,
and Real Estate Investment Trusts (REITs), the company has analyst mean level recommendation during the issue month. Match sample consists of 913 observations matched by size, G-index, SIC. Strong Shareholder Rights sample consists of firms that have a G-Index 5 or lower. Firms
with Weak Shareholder Rights have a G-Index of 14 or greater. Remaining firms make up medium shareholder rights sample. Each sub-sample
includes 128, 37, 748 SEOs respectively. Event month is the month in which SEO is offered.
3
4
5
6
7
8
9
10
-12 -10 -8 -6 -4 -2 0 2 4 6 8 10 12
Nu
mb
er
of
An
alys
ts
Months Relative to SEO Month
Strong Shareholder Rights
Medium Shareholder Rights
Weak Shareholder Rights

92
TABLE 3.6: Number of Analysts around Level Surrounding Issue Month
Panel A: SEO Sample
Pre-Issue Month Period
Issue
Month
Post-Issue Month Period
-12
-9
-6
-3
-1
0
1
3
6
9
12
Strong Shareholder Rights 6.90
7.22
7.21
7.15
7.10
7.35
7.68
7.97
8.23
8.54 ** 8.55 **
Medium Shareholder Rights 7.26 * 7.27 * 7.39
7.39
7.44
7.60
7.83
8.13 ** 8.38 *** 8.68 *** 8.61 ***
Weak Shareholder Rights 7.54
7.74
8.05
8.31
8.47
8.46
8.69
8.59
9.21
9.13
9.16
Panel B: Match Sample
Pre-Issue Month Period
Issue
Month
Post-Issue Month Period
-12
-9
-6
-3
-1
0
1
3
6
9
12
Strong Shareholder Rights 5.59
5.11
5.06
5.06
4.63
4.80
4.93
4.94
5.26
5.52
5.76 **
Medium Shareholder Rights 5.25
5.16
5.11
5.15
4.98
4.91
4.92
5.04
5.20
5.10
5.02
Weak Shareholder Rights 4.91
5.58
5.16
4.11
4.56
4.59
4.57
4.24
4.15
4.03
4.30
Panel C: SEO-Match
Pre-Issue Month Period
Issue
Month
Post-Issue Month Period
-12
-9
-6
-3
-1
0
1
3
6
9
12
Strong Shareholder Rights 1.31 ** 2.10 *** 2.15 *** 2.09 *** 2.47 *** 2.55 *** 2.75 *** 3.03 *** 2.97 *** 3.03 *** 2.79 ***
Medium Shareholder Rights 2.01 *** 2.12 *** 2.28 *** 2.23 *** 2.46 *** 2.69 *** 2.91 *** 3.09 *** 3.19 *** 3.57 *** 3.59 ***
Weak Shareholder Rights 2.63 * 2.17
2.90 ** 4.19 *** 3.92 *** 3.87 *** 4.12 *** 4.35 *** 5.06 *** 5.10 *** 4.86 ***
Number of analysts is the sum of analysts who have outstanding recommendations issued within one year period. SEO sample includes SEOs from 1995 to 2006 that meet following criteria; companies that are
present in both IRRC governance and IBES recommendation databases, issuers’ offer price is greater than $5, the company has a share code of 10 or 11 so that I exclude ADR, closed-end fund, unit investment trusts,
and Real Estate Investment Trusts (REITs), the company has analyst mean level recommendation during the issue month. Match sample consists of 913 observations matched by size, G-index, SIC. Event month is
the month in which SEO is offered. Strong Shareholder Rights sample consists of firms that have a G-Index 5 or lower. Firms with Weak Shareholder Rights have a G-Index of 14 or greater. Remaining firms make
up medium shareholder rights sample. Each sub-sample includes 128, 39, 748 SEOs respectively. Panel A and Panel B presents number of analysts and whether number of analysts is significantly different in event
month compared to other months for SEO and Match samples. Panel C show the difference in number of analysts for two sample and ***, **, * refer to 1%, 5% and 10% significance levels.

93
recommendations around SEOs for subsamples have an important implication. Investor optimism is
improved a lot more for bad governance sample. Figure 3.3 shows that there are more upgrades in
analyst recommendations for weak shareholder rights sample, on average, than those for strong
shareholder rights sample. Similarly, strong shareholder rights sample have more reiterations
compared to bad governance sample. While consensus recommendation stays around “buy” for
strong shareholder rights sample, it increases to “buy” level for weak shareholder rights sample.
Upgrades to buy convey more positive information than buy reiterations (Malmendier and
Shanthikumar (2007)). Furthermore, Figure 3.5 shows that there is an increase in the number of
analysts covering firms with weak shareholder rights. Increase in analyst coverage also improves
investor confidence on issuances. Therefore even if investors are not very willing to participate in
SEOs, mainly because they do not trust whether they will get appropriate return on their investment,
increase in analyst recommendation and number of analysts covering the stock improves investor
confidence about SEOs. Increased confidence leads to more demand and more demand makes it a lot
easier for underwriters to place SEO shares.
3.4.2.3 Underwriter Compensation and Flotation Costs
After showing that increase in analyst recommendation is related to SEO issue month I
examine whether this increase is related to underwriters’ effort to increase investors’ confidence.
Chinese wall between underwriting and research department has known to be crossed over and
investment bankers push analysts to be optimistic to win underwriting business. Bradshaw et al
(2003) find that analysts are overly optimistic for companies that have more external financing. This
may imply analysts’ effort to generate underwriting business. However Ljungqvist et al (2006) find
that overoptimistic recommendations do not help investment banks to win underwriting business. On
the other hand managers may be timing the market (Baker and Wurgler (2002)); managers may find
it as a good time to issue equity when analysts are optimistic and stocks are overvalued. I suggest
increase in analyst recommendation around SEOs is related to underwriters’ effort to improve

94
investor confidence. To test this hypothesis I examine how gross spread varies with mean
recommendation level during the event month and with governance quality of companies.
Table 3.7 shows gross spread for each 9 portfolios created based on recommendation mean
level and shareholder rights. I divide the sample into three samples based on shareholder rights then I
create three portfolios within each three sub-sample based on analyst mean level. There are around
43 SEOs in strong shareholder rights portfolios. Medium level governance sample has 748 SEOs is
total. However the number of SEOs in bad governance portfolios is only 13. I calculate mean gross
spread for each portfolio. Sixth row and fifth column show differences in gross spread between
strong and weak shareholder rights portfolios and low and high mean level portfolios respectively.
TABLE 3.7: Gross Investment Banking Fees by Shareholder Rights-Analyst Mean
Recommendation Portfolios
This table presents average gross spreads for portfolios created based on mean analyst recommendation at the issue month for each shareholder
rights sub-samples. Gross spreads is the ratio of the difference between offer price and price that underwriter buys shares to offer price. SEO sample includes SEOs from 1995 to 2006 that meet following criteria; companies that are present in both IRRC governance and IBES
recommendation databases, issuers’ offer price is greater than $5, the company has a share code of 10 or 11 so that I exclude ADR, closed-end
fund, unit investment trusts, and Real Estate Investment Trusts (REITs), the company has analyst mean level recommendation during the issue month. Strong Shareholder Rights sample consists of firms that have a G-Index 5 or lower. Firms with Weak Shareholder Rights have a G-Index
of 14 or greater. Remaining firms make up medium shareholder rights sample. Each sub-sample includes 128, 39, 748 SEOs respectively. Low,
Medium and High Mean for each sub-sample consist of same number of SEOs. Column 5 shows the differences in gross spreads (H-L) between High Mean Quintile and Low Mean Quintile. Row 6 shows the differences in gross spreads (W-S) between Weak Shareholder Rights portfolio
and Quintile and Strong Shareholder Rights portfolio. The cell at the right bottom is the difference between Strong Shareholder Rights & Low
portfolio and Weak Shareholder Rights & High portfolio. ***, **, * refer to 1%, 5% and 10% significance levels for one-tail test.
Gross spreads show monotonic increase as I move from strong shareholder portfolio to weak
shareholder portfolio within each mean quintile and as I move from low mean portfolio to high mean
portfolio within each shareholder rights sub-samples. The differences in the sixth row show that
Mean Quintile
Difference
(H-L)
Shareholder Rights
Low
Medium
High
Strong Shareholder Rights
3.290
3.433
3.778 0.488 *
Medium Shareholder Rights
3.411
3.641
3.938
0.527 ***
Weak Shareholder Rights
3.699
3.781
4.213
0.514
*
Difference (W-S)
0.409
0.348
0.435*
0.923
***

95
underwriters charge more fees to firms that grant fewer rights to shareholders. This finding suggests
that underwriters find it more challenging to place shares as shareholder rights becomes weaker due
to decreasing investor demand. To compensate the risk associated with lower demand, underwriters
charge more fees. When I move from Low portfolios to High portfolios gross spread increases by
around .50 for all shareholder rights subsamples at statistically significant levels. This increase, from
3.29 to 3.778 for strong shareholder rights sample, represents almost 15% increase in gross spread.
Given that gross spreads are millions of dollars, 15% makes a lot of difference in cost of equity for
issuers and in revenues for underwriters. Average net proceeds in my sample is 464 million dollar
and average gross spread is 3.65% of net proceeds. Therefore 15% increase in gross spread leads to
2.5 million dollar increase in out of pocket money for issuers and revenues for investment banks.
I also compare gross spread for two extreme portfolios: strong shareholder rights sample with
lowest mean level and weak shareholder rights sample with highest mean level. The difference is
almost 0.923 which represents 29% increase in gross spread when I move from the first portfolio to
latter. This increase imposes almost 5 million dollar extra cost on issuers at weak shareholder rights
and high mean level portfolio. Overall results in this table confirm that underwriters charge more
when shareholder rights becomes weaker and when they put extra effort to improve investor
optimism through analyst coverage.
To further examine the effect of governance quality and recommendation mean level I
regress the gross investment banking fees on mean level, G-index and a vector of control variables.
Supporting the results from the univariate analysis, results of Table 3.8 indicate that fees are strongly
related to analyst mean recommendation at the event month and governance measure of G-index
even after controlling for other factors. As my hypothesis predicts, underwriters charge more fees as
governance quality becomes worse. Underwriters push analysts to increase their recommendation to
investor confidence and they charge higher fees to compensate their efforts. In model 2, I exclude
mean level in the regression and find that one unit increase in G-index leads to 0.03 increase gross

96
TABLE 3.8: The Effect of Analyst Recommendation on Underwriting Fees
Model 1
Model 2
Model 3
Intercept
8.53 ***
9.21 ***
9.13 ***
(6.16)
(6.71)
(6.77)
Mean Level
0.24 ***
0.22 **
(2.69)
(2.52)
G-Index
0.04 **
0.03 **
(2.45)
(2.23)
Number of Analyst
-0.08 ***
-0.08 ***
-0.08 ***
-(6.70)
-(6.90)
-(6.45)
Log(Principal)
-0.29 ***
-0.28 ***
-0.31 ***
-(3.85)
-(3.65)
-(3.96)
Exchange Dummy
-0.35 ***
-0.36 ***
-0.33 ***
-(3.17)
-(3.23)
-(2.94)
Volatility
20.08 ***
20.90 ***
20.26 ***
(4.34)
(4.46)
(4.39)
Turnover
0.00
0.00
0.00
-(0.66)
-(0.74)
-(0.76)
Price
-0.01 **
-0.01 **
0.00 **
-(2.35)
-(2.32)
-(2.22)
Reputation
-0.29
-0.31 *
-0.32 *
-(1.61)
-(1.70)
-(1.76)
Shelf Dummy
-0.44 ***
-0.47 ***
-0.43 ***
-(3.96)
-(4.30)
-(3.84)
Many Book-runner
0.86 ***
0.86 ***
0.88 ***
(9.57)
(9.44)
(9.76)
Leverage
-0.36
-0.37
-0.35
-(1.64)
-(1.64)
-(1.54)
Tobin's Q
0.00
0.01
0.00
(0.16)
(0.28)
-(0.01)
No.
903
903
903 Adj R-Square
0.37
0.37
0.37
This table presents OLS estimates of underwriting fees on analyst recommendation mean levels. The SEO sample consists of 913 firm
commitment agreements over the 1995–2006 period by US issuers. The dependent variable is ration of gross spreads per share to offer price. G-
Index ranges from 1 to 18 where higher numbers refer to bad governance. Number of analyst is a proxy for information asymmetry. Log
(Principal) is the principal amount for SEOs and taken from SDC. Exchange dummy equals to 1 if issuer is listed in NYSE. Volatility is the
standard deviation of daily stock return during the trading period (-90,-11) prior to the issue date (tradingday0), taken from the CRSP database.
Share turnover is the ratio of average daily share trading volume during the trading period (-90,-11) prior to the issue date (tradingday0) divided
by pre-SEO total shares outstanding, all taken from the CRSP database. Price is taken from CRSP. The Carter and Manaster reputation measure
in the year prior to SEO filing, taken from Jay Ritter’s website. Shelf dummy is equal to one if the SEO issue was shelf registered and zero
otherwise, taken from the Thomson Financial New Issues database. Many book runner is equal to 1 if there are more than one book-runner and
zero otherwise. Leverage ratio is ratio of book value of short-and long-term debt (Compustat item9+item34) over book value of total assets
(Compustat item 6)in the year prior to SEO filing Tobin’s q Market value to book value of total assets ((Compustatitem6_item 60+item25 * item
199)/item6)and is measured by book value of total assets minus book value of equity plus common shares outstanding multiplied by the year-end
closing stock price, all at the year-end prior to the SEO filing. Regression also includes year dummies but not reported. Robust standard errors are
not reported instead t-stats are in parenthesis. ***, **, * refer to 1%, 5% and 10% significance levels.
97
spread. In model 3 I want to see the effect of mean level when G-index is excluded. 1 unit increase in
mean level increase gross spread by .22. Model 1 incorporates G-index and mean level and inclusion
of G-index fortifies the effect of mean level on gross spreads.
Remaining control variables have expected signs. I use number of analysts as a proxy for
information asymmetry. As number of analysts covering stocks increases information asymmetry
becomes less concern for investors therefore underwriters charge companies less with higher number
of analysts. Log (principal) confirms economies of scale as in prior literature. NYSE listed stocks
have lower cost of equity capital since they have more shareholder base. Volatility as a measure for
risk increases gross spread. Turnover has expected negative relationship with gross spread however it
is not significant as opposed to liquidity argument of Butler et al (2005). However since I limit my
SEO sample to issuers with G-index information average company size is five times greater than
Butler et al (2005)’s sample. Insignificant coefficient may be a result of large size of companies in
my sample. Issuers with higher prices are easier to place due to institutional demand therefore
underwriters charge less these issuers. Shelf registration is negative, suggesting that gross spread is
lower when SEO is a shelf registration. Reputation is insignificant however negative. Leverage and
Tobin’s Q are insignificant. Finally, as opposed to Butler et al (2005) many book-runner dummy is
positive suggesting that issuers pay more gross spread when there is more than one lead underwriter.
3.4.3 Robustness Check
Despite its common use, Bebchuk et al (2008) state that only six of provisions are correlated
with significant reductions in firm valuation as well as large negative abnormal returns during the
1990–2003 period while rest of the provisions are not significant. Based on these six provisions23,
they create entrenchment index (E-Index) and suggest that E-Index is a better proxy than G-Index for
shareholder rights.
23 These provisions are staggered boards, limits to shareholder bylaw amendments, poison pills,
golden parachutes, and supermajority requirements for mergers and charter amendments.

98
TABLE 3.9: Robustness Check - The Effect of Analyst Recommendation on Underwriting Fees
Model 1
Model 2
Model 3
Intercept
8.58 ***
9.13 ***
9.22 ***
(6.37)
(6.77)
(6.90)
Mean Level
0.24 ***
0.22 **
(2.65)
(2.53)
E-Index
0.10 ***
0.09 ***
(3.06)
(2.94)
Number of Analyst
-0.08 ***
-0.08 ***
-0.08 ***
-(6.65)
-(6.45)
-(6.88)
Log(Principal)
-0.29 ***
-0.31 ***
-0.28 ***
-(3.85)
-(3.97)
-(3.65)
Exchange Dummy
-0.36 ***
-0.33 ***
-0.36 ***
-(3.22)
-(2.95)
-(3.28)
Volatility
20.50 ***
20.27 ***
21.28 ***
(4.40)
(4.39)
(4.51)
Turnover
0.00
0.00
0.00
-(0.87)
-(0.76)
-(0.93)
Price
0.00 **
0.00 **
0.00 **
-(2.28)
-(2.22)
-(2.26)
Reputation
-0.30 *
-0.32 *
-0.32 *
-(1.68)
-(1.75)
-(1.76)
Shelf Dummy
-0.44 ***
-0.43 ***
-0.47 ***
-(3.96)
-(3.84)
-(4.30)
Many Book-runner
0.86 ***
0.88 ***
0.86 ***
(9.60)
(9.77)
(9.46)
Leverage
-0.39 *
-0.35
-0.39 *
-(1.75)
-(1.55)
-(1.75)
Tobin's Q
0.00
0.00
0.01
(0.17)
-(0.02)
(0.30)
No.
903.00
903
903
Adj R-Square
0.379
0.372
0.373
This table presents OLS estimates of underwriting fees on analyst recommendation mean levels. The SEO sample consists of 913 firm
commitment agreements over the 1995–2006 period by US issuers. The dependent variable is ration of gross spreads per share to offer price. G-
Index ranges from 1 to 18 where higher numbers refer to bad governance. Number of analyst is a proxy for information asymmetry. Log
(Principal) is the principal amount for SEOs and taken from SDC. Exchange dummy equals to 1 if issuer is listed in NYSE. Volatility is the
standard deviation of daily stock return during the trading period (-90,-11) prior to the issue date (tradingday0), taken from the CRSP database.
Share turnover is the ratio of average daily share trading volume during the trading period (-90,-11) prior to the issue date (tradingday0) divided
by pre-SEO total shares outstanding, all taken from the CRSP database. Price is taken from CRSP. The Carter and Manaster reputation measure
in the year prior to SEO filing, taken from Jay Ritter’s website. Shelf dummy is equal to one if the SEO issue was shelf registered and zero
otherwise, taken from the Thomson Financial New Issues database. Many book runner is equal to 1 if there are more than one book-runner and
zero otherwise. Leverage ratio is ratio of book value of short-and long-term debt (Compustat item9+item34) over book value of total assets
(Compustat item 6)in the year prior to SEO filing Tobin’s q Market value to book value of total assets ((Compustatitem6_item 60+item25 * item
199)/item6)and is measured by book value of total assets minus book value of equity plus common shares outstanding multiplied by the year-end
closing stock price, all at the year-end prior to the SEO filing. Regression also includes year dummies but not reported. Robust standard errors are
not reported instead t-stats are in parenthesis. ***, **, * refer to 1%, 5% and 10% significance levels.

99
For robustness check, I use E-Index instead of G-Index in my regression analysis. Table 3.9
present regression results. Overall E-Index does not change my results. However in model one E-
Index has higher coefficient, suggesting that the effect of shareholder rights is greater on gross
spread. Its significance level increases to 1% level while G-Index is significant at 5% level.
Similarly, in model three E-Index has higher and more significant coefficient. While E-Index
confirms my finding, as Bebchuk et al (2008) states, E-Index eliminates the noise of the eighteen
provisions and shows that firms with weaker shareholder rights pay more gross spread during SEOs.
3.5 Conclusion
International evidence on the effect of shareholder rights on external financing suggests that
minority shareholder protection leads to more developed capital markets because financiers do not
have much doubt on the return they will get for their investment. Therefore some foreign firms want
to cross list in U.S. where shareholders hold more power. So that improved protection enables
foreign firms to get equity financing more easily. However, even though there is much variation in
shareholder rights for U.S. firms, literature has not studied the effect of shareholder rights on SEOs.
In this paper, I want to fill this gap by asking whether firms that grant weaker rights to shareholders
face more difficulty to attract investor demand and I explain how firms overcome this problem with
the help of underwriters.
First, I find that firms that grant fewer rights to shareholder face more difficulty to attract
investors buy shares during SEOs. I measure this difficulty with the number of SEOs offered by
firms with different level of shareholder rights and shareholder rights of SEO firms compared to
shareholder rights of all firms in IRRC database.
Second, I show that firms overcome lower investor demand during SEOs with the help of
underwriters. Both firms and underwriters are better off if SEO is placed effectively. Firms do not
have to search for other financing opportunities or forgo their projects. On the other hand,
underwriters are paid in full when deal is completed. I find that underwriters push their analysts to

100
improve their recommendations before SEO issue months. More interestingly, these “booster shots”
are the strongest for firms that grant fewer rights to shareholders.
Third, I find that underwriters’ effort comes at a cost for firms. By focusing on gross spread,
which is the only type of cost that firms bear to compensate underwriters, I show that firms with
weaker shareholder rights and firms with higher analyst recommendations have more out of pocket
expense during SEOs.
These findings suggest that shareholder rights are so important that they affect corporate
finance decisions through cost of equity. Shareholder rights are what managers have to give up to
decrease their cost of capital. Improved shareholder rights increase investors’ confidence and demand
on SEOs therefore it becomes easier for firms to get equity financing. Our paper also improves my
understanding how investor confidence is improved with the help of underwriters. Recent work
shows that problems with corporate governance lead to low SEO announcement returns and that
firms with high information asymmetry pay more gross spread. However, they do not provide an
explanation to how firms successfully end up getting equity financing. By pointing out underwriters’
incentive to complete SEOs, I show that analyst recommendations improve investor optimism and
their willingness to finance firms.

101
CHAPTER 4. CONCLUSION
This dissertation examines the effect of corporate governance on analyst bias. In my first
essay, I investigate how managerial entrenchment affects analyst bias through the balance analysts
strike between reputation and revenue generation. In my second essay, I explore whether weak
shareholder rights create more difficulty for firms when they issue equity and how underwriters
overcome this difficulty via analyst recommendations. Main findings of this dissertation are as
follows.
First, I find that managerial entrenchment and analyst bias is positively related. By increasing
analysts’ incentives, such as non-public information, investment banking and M&A advising
business, managers motivate analysts to shift their balance towards conflict of interest.
Second, I show that commonly documented affiliated analyst bias is present only for
medium-level entrenchment sample. Affiliated analysts do not behave different from unaffiliated
analysts when their reputation is at risk.
Third, I find that recent regulations taken to stop analysts’ conflict of interest were effective.
By improving corporate governance, increasing the role of reputation and cutting the link between
analyst compensation and investment banking business generation, regulations improved the way
financial institutions work.
Fourth, following La Porta et al (1998)’s argument that rights attached the securities what
managers have to give up to get financing, I show that firms with weak shareholder rights face
difficulty to attract investors to buy shares in seasoned equity offerings. I suggest that investors are
not willing to participate in SEOs of firms with weak shareholder rights because weak shareholder
rights do not encourage managers to increase shareholders’ return on their investment.
Fifth, due to firm commitment agreements, firms’ problem of lower investor demand for
weak shareholder rights firms becomes underwriters’ problem as well. I document that underwriters
show more effort to promote and place securities through analyst recommendations. By asking their

102
analysts to improve their recommendations, underwriters try to improve investor optimism thereby
investor demand on SEOs.
Finally, I show that underwriters’ effort to improve investor optimism comes at a cost for
firms. Firms that grant fewer rights to shareholders pay more gross spread to underwriters to
compensate their extra effort.

103
REFERENCES
Acemoglu, D., Johnson, S., 2005. Unbundling Institutions, Journal of Political Economy 113, 949-
995.
Alchian, A., Demsetz, H., 1972. Production, Information Costs, and Economic Organization.
American Economic Review, 62, 777-795.
Altinkilic, O., Hansen, R.S., 2000. Are there economies of scales in underwriting fees? Evidence of
Raising External Financing Costs, Review of Financial Studies 13, 191–218.
Baker, Malcolm and Jeffrey Wurgler, 2002, Market Timing and Capital Structure Journal of Finance
57, 1-32.
Barber, B., Lehavy, R., Trueman, B., 2007. Comparing the Stock Recommendation Performance of
Investment Banks and Independent Research Firms, Journal of Financial Economics, 85, 490-517.
Bebchuk, L., Cohen, A., Ferrell, A., 2009. What matters in corporate governance? Review of
Financial Studies, 22, 783-827.
Berger, P., G., Ofek, E., Yermack., D., L., 1997. Managerial Entrenchment and Capital Structure
Decisions, Journal of Finance, 52, 1411-1438.
Bowen, R., M., Chen, X., Cheng, Q., 2008. Analyst Coverage and the Cost of Raising Equity
Capital: Evidence from Underpricing of Seasoned Equity Offerings, Contemporary Accounting
Research, 25 657-699.
Booth, J., R., and Smith, R., 1986. Capital Raising, Underwriting and the Certification Hypothesis,
Journal of Financial Economics 15, 261-281.
Bradshaw, M., S. Richardson, and R. Sloan. 2006. The Relation between Corporate Financing
Activities, Analysts’ Forecasts, and Stock Returns, Journal of Accounting in Economics, 85, 42-53.
Burns, N., and Kedia, S.,2007. The Impact of Performance-based Compensation on Misreporting,
Journal of Financial Economics, 79, 35-67.
Butler, A., Grullon, G., Weston, J.P., 2005. Stock Market Liquidity and the Cost of Issuing Equity,
Journal of Financial and Quantitative Analysis 40, 331–348.
Chang, Xin; Dasgupta, Sudipto; and Gilles Hilary, 2006, Analyst Coverage and Financing Decisions,
Journal of Finance 61, 3009- 3048.
Chemmanur, T., Fulghieri, P., 1994. Investment Bank Reputation, Information Production and
Financial Intermediation, Journal of Finance, 49, 57-79.
Chemmanur, Hu, He, 2009. The Role of Institutional Investors in Seasoned Equity Offerings.
Forthcoming in Journal of Financial Economics.
Chen H., Ritter, J., R., 2000. The Seven Percent Solution, Journal of Finance, 55, 1105-1131.
Clarke, J. E., Ferris S. P., Jayaraman N., Lee J., 2006. Are Analyst Recommendations Biased?
Evidence from Corporate Bankruptcies, Journal of Financial and Quantitative Analysis, 41, 169-196.

104
Cliff, M., T., 2008. Do affiliated Analysts Mean What They Say? Financial Management, 38, 32-34.
Cliff, Michael T., and David J. Denis, 2004, Do IPO Firms Purchase Analyst Coverage with
Underpricing? Journal of Finance 59, 2871–2901.
Coase, R., 1937. The nature of the firm, Economica, 4, 386-405.
Coffee, J., 1999. The Future as History: the Prospects for Global Convergence in Corporate
Governance and Its Implications, Northwestern University Law Review 93, 641–708.
Cowen, A., Groysberg, B., Healy, P., 2006. Which Types of Analyst Firms Are More Optimistic?
Journal of Accounting and Economics 41, 119–146.
Cronqvist, H., Heyman, F., Nilsson, M., Svaleryd, H., Vlachos, J. 2009. Do entrenched managers pay
their workers more?, Journal of Finance, 64, 309- 339.
Das, S., Levine, C., B., and Sivaramakrishnan, K., 1998. Earnings Predictability and Bias in
Analysts’ Earnings Forecast, Accounting Review, 73, 277-294.
Das, S., Zhang, H., 2003. Rounding-up in Reported EPS, Behavioral Thresholds, and Earnings
Management, Journal of Accounting and Economics, 35, 31-50.
Dechow, P., Sloan, R., Sweeney, A., 1996. Causes and Consequences of Earnings Manipulation: an
Analysis of Firms Subject to Enforcement Actions by the SEC, Contemporary Accounting Research,
13, 1–36.
Denis, D., J., 1991. Shelf Registration and Market for Seasoned Equity Offerings, Journal of
Business, 64, 189-212.
Desai, H., Hogan, C. E., Wilkins, M. S. 2006. The Reputational Penalty for Aggressive Accounting:
Earnings Restatements and Management Turnover, The Accounting Review, 81, 83-112.
Doige, C., 2004. US Cross Listing and Private Benefits of Control Evidence from Dual Class Firms.
Journal of Financial Economics, 72, 519-553
Doidge, C., Karolyi, A., Stulz, R., 2004. Why Are Foreign Firms Listed in the U.S. Worth More?
Journal of Financial Economics, 71, 205-238.
Eckbo, B., E., Masulis, R., W., Norli, Q., 2007, Security Offerings, Handbook of Corporate Finance:
Empirical Corporate Finance, Volume 1, Ch. 6, 233-373.
Efendi, J., Srivastava, A., Swanson, E., P., 2007. Why do Corporate Managers Misstate Financial
Statement? The Role of Option Compensation and Other Factors. Journal of Financial Economics,
85, 677-708.
Eng, L.L., Mak, Y.T. 2003. Corporate Governance and Voluntary Disclosure. Journal of Accounting
and Public Policy 22, 325-345.
Fang, L., Yasuda, A., 2009 The Effectiveness of Reputation as a Disciplinary Mechanism in Sell-side
Research, Forthcoming in Review of Financial Studies
Ferreira, M.A. and Laux, P.A. 2008, Corporate Boards and SEOs: The Effect of Certification and
Monitoring, working Paper, University of Delaware.
105
Francis, J., Philbrick, D., R., 1993. Analysts’ Decisions as Products of a Multi-task Environment,
Journal of Accounting Research 31, 216–230.
Francis, J., Willis, R., 2000. A Multivariate Test of Incentive Selection and Judgmental Explanations
for Analyst Bias, working paper.
Gasparino, C., 2002. Deals or Deal Makers: Outlook for Analysts: Skepticism and Blame, Wall
Street Journal.
Gompers, P., A., Joy L., I., Metrick, A., 2003. Corporate Governance and Equity Prices, Quarterly
Journal of Economics 118, 107-155.
Gompers, P., A., and Metrick, A., 2001. Institutional Investors and Equity Prices, Quarterly Journal
of Economics 116, 229-259.
Guidolin, M., Mola, S., 2009. Affiliated Mutual Funds and Analyst Optimism, Forthcoming in
Journal of Financial Economics.
Hart, O., 1995. Corporate Governance: Some Theory and Implications, The Economic Journal, 105,
678-689.
Hong, H., Kubik, J.D., 2003. Analyzing the Analysts: Career Concerns and Biased Earnings
Forecasts, Journal of Finance 58, 313–351.
Hong, H., Lim, T., Stein, J., C., 2000. Bad News Travels Slowly: Size, Analyst Coverage, and the
Profitability of Momentum Strategies, Journal of Finance, 55, 265-295.
Huang, R., Tompkins, J., G., 2009. Corporate Governance and Investor Reactions to Seasoned
Equity Offerings, working paper.
Hunter, W., C., Jagtiani, J., 2003. An analysis of Advisor Choice, Fees and Effort in Mergers and
Acquisitions, Review of Financial Economics, 12, 65-81.
Irvine, P., 2004. Analysts' Forecasts and Brokerage Firm Trading, The Accounting Review 79, 125-
149.
Jackson, A., R., 2005. Trade Generation, Reputation and Sell Side Analysts, Journal of Finance 60,
673-717.
James, C., Karceski, J., 2006. Strength of Analyst Coverage Following IPOs, Journal of Financial
Economics, 82, 1-34.
Jensen, M., C., 2005. Agency Costs of Overvalued Equity, Financial Management, 34, 5-19. 42
Jensen, M., C., Meckling, W., H., 1976. Theory of the firm: Managerial behavior, agency costs, and
capital structure, Journal of Financial Economics, 3, 305-360.
Kadlec, G., B., and McConnell, J., J., 1994. The Effect of Market Segmentation and Illiquidity on
Asset Prices: Evidence from Exchange Listings, The Journal of Finance, 49, 611-636.
Kedia, S., Burns, N., 2006. The Impact of Performance Based Compensation on Misreporting,
Journal of Financial Economics, 79, 35-67.

106
Klein, A., 2002. Audit Committee, Board of Director Characteristics, and Earnings Management.
Journal of Accounting and Economics.
Kim Y., and Park, M. 2005. Pricing of Seasoned Equity Offers and Earnings Management, Journal of
Financial and Quantitative Analysis, 40, 435-463.
Kim, E.H., and Purnanandam, A., 2006, Why do Investors React Negatively to Seasoned Equity
Offerings?, working paper, University of Michigan.
Kolasinski, A., Kothari, S.P., 2004. Analyst Objectivity and Investment Banking Relationships:
Evidence on Analysts Affiliated with M&A Advisors, Journal of Financial and Qualitative Analysis.
Krigman, L., Shaw, H. W., Womack, H., 2001. Why do Firms Switch Underwriters Journal of
Financial Economics, 60, 245-284.
Knyazeva, D., 2008. Corporate Governance, Analyst Following, and Firm Behavior, Working paper
La Porta, R., Lopez-de-Silanes, F., Shleifer, A., Vishny, R., 1997. Legal Determinants of External
Finance, Journal of Finance 52, 1131–1150.
La Porta, R., Lopez-de-Silanes, F., Shleifer, A., Vishny, R., 1998. Law and Finance. Journal of
Political Economy 106, 1113–1155.
La Porta, R., F., Lopez-de-Silanes, A., Shleifer, A., Vishny, R., 2000. Investor Protection and
Corporate Governance, Journal of Financial Economics 58, 3-27.
La Porta, Rafael, Florencio Lopez-de-Silanes, Andrei Shleifer, and Robert Vishny, 2002, Investor
protection and corporate valuation, The Journal of Finance 57, 1147-1170.
Lang, M., Lins, K., and Miller, D., 2003. ADRs, analysts, and accuracy: does cross-listing in the U.S.
improve a firm’s information environment and increase market value? Journal of Accounting
Research 41, 317–345.
Lee, Gemma, Masulis, 2009, Seasoned Equity Offerings Quality of Accounting Information and
Expected Flotation Costs, Journal of Financial Economics
Leland, Hayne E., and David H. Pyle, 1977, Informational Asymmetries, Financial Structure, and
Financial Intermediation, The Journal of Finance, 32, 371-387.
Ljungqvist, A., Marston, F., Starks, L.T., Wei, K., Yan, H., 2007. Conflicts of Interest in Sell-Side
Research and the Moderating Role of Institutional Investors, Journal of Financial Economics 85,
420-456.
Ljungqvist, A., Marston, F., Wilhelm, J. W., Jr., 2006. Competing for Securities Underwriting
Mandates: Banking Relationships and Analyst Recommendations, Journal of Finance 61(1), 301-340.
Li, Ha., Pincus, M., Rego, O., R., 2008. Market Reaction to Events Surrounding the Sarbanes-Oxley
Act of 2002 and Earnings Management, Journal of Law and Economics, 51, 111-134.
Li, X., Masulis, R.W., 2007. Venture Capital Investment by IPO under- writers: Certification,
Alignment of Interest, or Moral Hazard? Unpublished Working Paper
Lim, T., 2001. Rationality and analysts’ forecast bias. Journal of Finance 56, 369-385.

107
Lin, H., McNichols, M., 1998. Underwriting Relationships, Analysts’ Earnings Forecasts and
Investment Recommendations, Journal of Accounting and Economics, 25, 101–127.
Lobo, G., J., and Zhou, J., 2006. Did Conservatism in Financial Reporting Increase after the
Sarbanes-Oxley Act? Initial Evidence, Accounting Horizons, 20, 56-73.
Lowry, M., 2003, Why Does IPO Volume Fluctuate So Much? Journal of Financial Economics 67,
3-40.
Malmendier, U., and D. Shanthikumar, 2007 Are Small Investors Naive about Incentives? Journal of
Financial Economics, 85, 457-89.
Mehran, H., Stulz, R., M., 2007. The Economics of Conflicts of Interest in Financial Institutions,
Journal of Financial Economics, 85, 267-296 43.
Merton, R., C., 1987. A Simple Model of Capital Market Equilibrium with Incomplete Information,
Journal of Finance 42, 483-510.
Michaely, R., Womack, K., 1999. Conflict of Interest and the Credibility of Underwriter Analyst
Recommendations, Review of Financial Studies 12, 653–686.
Mikhail, M., Walther, B., Willis, R., 2006. When Security Analysts Talk, Who Listens? The
Accounting Review, 82, 1227-1253.
Myers, Stewart C., and Nicholas S. Majluf, 1984, Corporate Financing and Investment Decisions
When Firms Have Information That Investors Do Not Have, Journal of Financial Economics 13,
187- 221.
O’Brien, P. C., McNichols, M., Lin, H.-W., 2005. Analyst impartiality and Investment Banking
Relationships, Journal of Accounting and Research 43, 623-650.
Reingold, D., Reingold, J. 2006. Confessions of a Wall Street Analyst, Harper Collins, New York.
Schipper, K., 1991. Analysts’ Forecasts, Accounting Horizons, 5, 105-121.
Shleifer, A., Vishny, R., 1998. A Survey of Corporate Governance, Journal of Finance 52, 737-783.
Siconolfi, M.1995. Incredible buys: Many Companies Press Analysts to Steer Clear of Negative
Ratings, Wall Street Journal.
Slovin, M., Sushka, M., Hudson, C., 1990. External Monitoring and its Effect on Seasoned Common
Stock Issues. Journal of Accounting and Economics 12, 397-417.
Slovin M.B., Sushka M.E., and W. Lai, 2000, Alternative Flotation Methods, Adverse Selection, and
Ownership Structure: Evidence from Seasoned Equity Issuance in the UK, Journal of Financial
Economics, 57, 157-190.
Stickel, S. E., 1992. Reputation and Performance among Security Analysts, Journal of Finance 47,
1811–1836.
Teoh, S. H., Wong, T. J., 2002. Why New Issues and High Accrual Firms Underperform: The Role
of Analyst Credulity. Review of Financial Studies 15, 869-900.

108
Teoh, S. H., Welch, I., Wong, T. J., 1998. Earnings Management and the Underperformance of
Seasoned Equity Offerings, Journal of Financial Economics, 50, 63-99
Tirole, J., 2005. Princeton University Press.
Yu, F., 2008. Analyst Coverage and Earnings Management, Journal of Financial Economics, 88,
245-271.
Womack, K., L., 1996. Do Brokerage Analysts' Recommendations have Investment Value?, The
Journal of Finance, 54, 137-157.
109
APPENDIX24
CORPORATE GOVERNANCE PROVISIONS
TAKEOVER DELAY GROUP
Blank Check: Blank Check preferred stock is stock over which the board of directors has broad
authority to determine voting, dividend, conversion, and other rights.
Classified Board: Classified board allows only a part of directors to be changed each year, making it
difficult for an outsider who gains control of corporation to replace directors fast.
Special Meeting: It eliminates or requires more shareholder support than stated in state law to call
for a special meeting.
Written Consent: Written consent allows shareholders to approve actions taken or to be taken by the
company, without a formal meeting such as annual shareholder meeting. Limitations to this right
make it harder for acquirers to vote by written consent (or special meeting) to replace the board of
target quickly.
MANAGEMENT PROTECTION GROUP
Compensation Plans: Enables managers to accelerate the payout of bonuses and to cash out options
in case of change in control.
Contracts: Director Indemnification contracts indemnify particular officer and directors from certain
legal expenses and judgments resulting from lawsuits pertaining to their conduct.
Golden Parachutes: Golden Parachutes are severance agreements that provide cash and noncash
compensation to senior executives upon an event such as termination, demotion, or resignation
following a change in control without shareholder approval.
24
Some of the definitions of provisions are taken from Gompers et al (2003). For more detailed
information for these provisions, see Gompers et al (2003).

110
Indemnification: Director Indemnification uses the bylaws, charter, or both to indemnify officers
and directors from certain legal expenses and judgments resulting from lawsuits pertaining to their
conduct.
Liability: Limitations on director Liability are charter amendments that limit directors’ personal
liability to the extent allowed by state law.
Severance package: Assure high level officers of their positions and some compensation and is
independent of change in control.
SPECIAL VOTING GROUP
Bylaws and Charters: Bylaw and Charter amendment limitations limit shareholders’ ability to
amend the governing documents of the corporation.
Cumulative Voting:
Secret Ballot: Secret ballots prohibit management to look at individual proxy cards.
Supermajority: supermajority increases the thresholds requires by the state law to approve mergers
and other form of business combinations.
Unequal Voting: These rights limit the voting rights of some shareholders and expand those of
others
DIRECT TAKEOVER DEFENSES GROUP
Antigreenmail: Antigreenmail prohibits large shareholder to sell their stock back to company at a
premium. By limiting large shareholders’ exit from company, Antigreenmail discourages
accumulation of large blocks of stock.
Directors' Duties: Allows director to consider interest of stakeholders other than shareholders.
Fair Price: The goal of this provision is to prevent pressure on the target’s shareholders to tender
their shares in the front end of a two-tiered tender offer, and they have the result of making such an
acquisition more expensive.

111
Pension Parachutes: Pension Parachutes prevent an acquirer from using surplus cash in the pension
fund of the target to finance an acquisition.
Poison Pill: Typical poison pills give the holders of the target’s stock other than the bidder the right
to purchase stock in the target or the bidder’s company at a steep discount, making the target
unattractive or diluting the acquirer’s voting power.
Silver Parachutes: It is like golden parachutes but offered to a large number of employees.
STATE LAWS GROUP
Antigreenmail Law
Directors' Duties Law
Fair Price Law
Control Share Acquisition Law (supermajority)
Business Combination Law: These laws impose a moratorium on certain kinds of transactions (e.g.,
asset sales, mergers) between a large shareholder and the firm, unless the transaction is approved by
the Board of Directors.
Cash-Out Law: Cash-out laws enable shareholders to sell their stakes to a “controlling” shareholder
at a price based on the highest price of recently acquired shares.

112
VITA
Bahar Ulupinar started her doctoral studies in finance at Louisiana State University after getting her
bachelor’s degree in business administration with specialization in finance at Ege University, Izmir,
Turkey. She expects to obtain her Doctor of Philosophy in business administration with a
concentration in finance in May 2010. Recently, she has accepted an offer of a tenure-track faculty
position at West Chester University in Pennsylvania. During her program study at Louisiana State
University, she taught three different courses at the undergraduate level and won a teaching award.
Her research focused on corporate governance and analyst coverage.
Related Documents