1 1 Two-dimensional Plots ELEC 206 Prof. Siripong Potisuk 2 The Plot Command The simplest command for 2-D plotting Syntax: >> plot(x,y) The arguments x and y are vectors (1-D arrays) which must be of the same length, but any type x contains data points along the horizontal axis y contains data points along the vertical axis When executed, a figure window pops up containing the figure with the graph of y vs. x

Welcome message from author
This document is posted to help you gain knowledge. Please leave a comment to let me know what you think about it! Share it to your friends and learn new things together.
Transcript
1
1
Two-dimensional Plots
ELEC 206
Prof. Siripong Potisuk
2
The Plot Command
The simplest command for 2-D plotting
Syntax: >> plot(x,y)
The arguments x and y are vectors (1-D arrays)
which must be of the same length, but any type
x contains data points along the horizontal axis
y contains data points along the vertical axis
When executed, a figure window pops up containing the figure with the graph of y vs. x
2
The Figure Window Every time a plot command is issued, MATLAB
checks if a figure window is currently opened
If one is, MATLAB will erase the plot in it and
draw a new one.
If none is, a new figure window pops up and a
graph drawn in it
If multiple windows are opened, MATLAB will
draw in the latest one
3
The Figure Window To specify the figure window number, use
>> figure(n) where n is an integer indicated
the figure number
If figure window n exists, makes it the active
window
If figure window n doesn't exist, creates it and
makes it the active window
If n is omitted, the new figure window will be
labeled “figure n” where n is the integer greater
than the current active figure number by 1 4
3
5
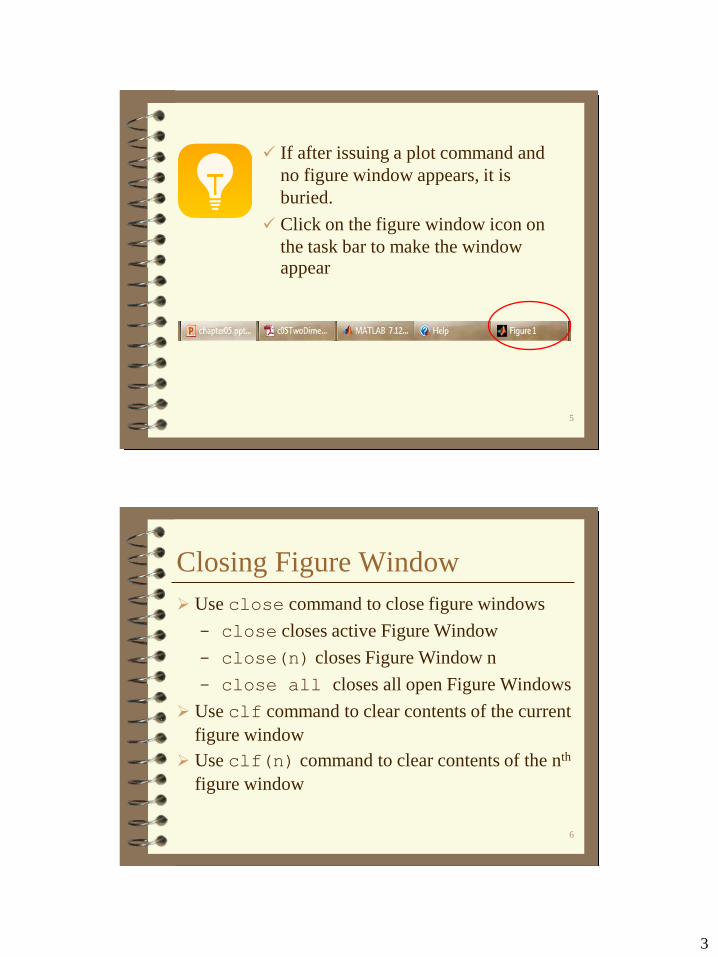
If after issuing a plot command and
no figure window appears, it is
buried.
Click on the figure window icon on
the task bar to make the window appear
Closing Figure Window
Use close command to close figure windows
- close closes active Figure Window
- close(n) closes Figure Window n
- close all closes all open Figure Windows
Use clf command to clear contents of the current
figure window
Use clf(n) command to clear contents of the nth
figure window
6
4
7
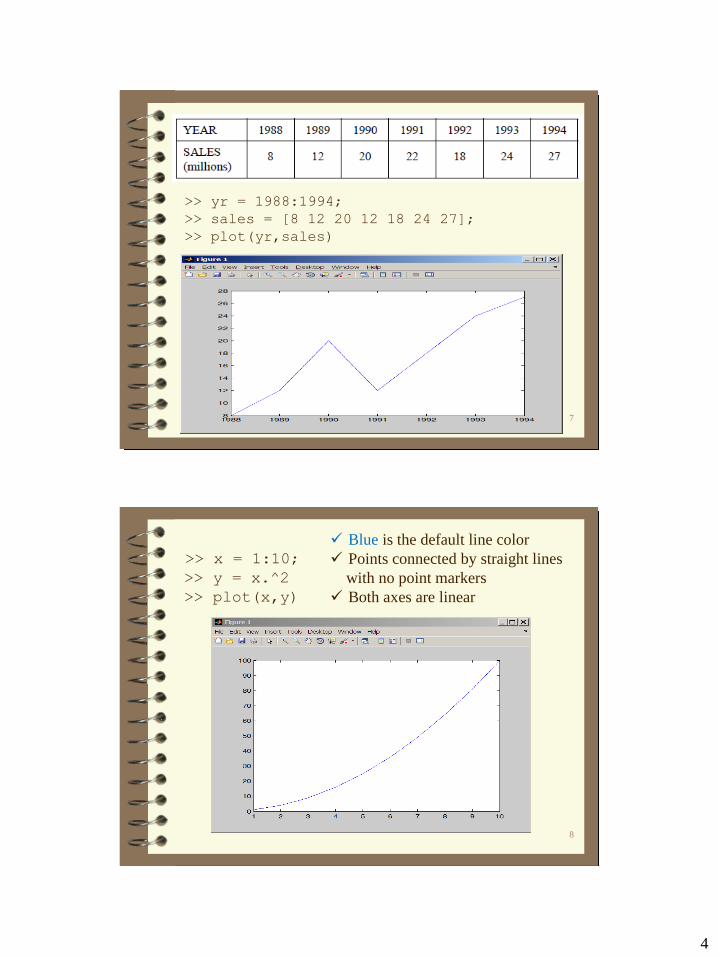
>> yr = 1988:1994;
>> sales = [8 12 20 12 18 24 27];
>> plot(yr,sales)
8
>> x = 1:10;
>> y = x.^2
>> plot(x,y)
Blue is the default line color
Points connected by straight lines
with no point markers
Both axes are linear
5
9
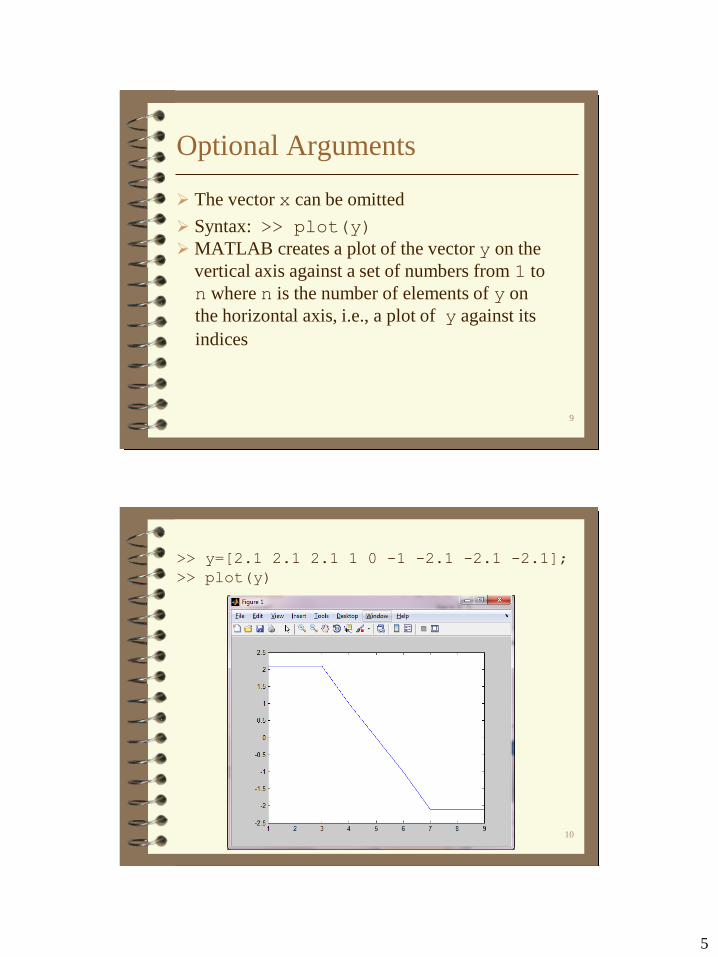
Optional Arguments
The vector x can be omitted
Syntax: >> plot(y)
MATLAB creates a plot of the vector y on the
vertical axis against a set of numbers from 1 to
n where n is the number of elements of y on
the horizontal axis, i.e., a plot of y against its
indices
10
>> y=[2.1 2.1 2.1 1 0 -1 -2.1 -2.1 -2.1];
>> plot(y)
6
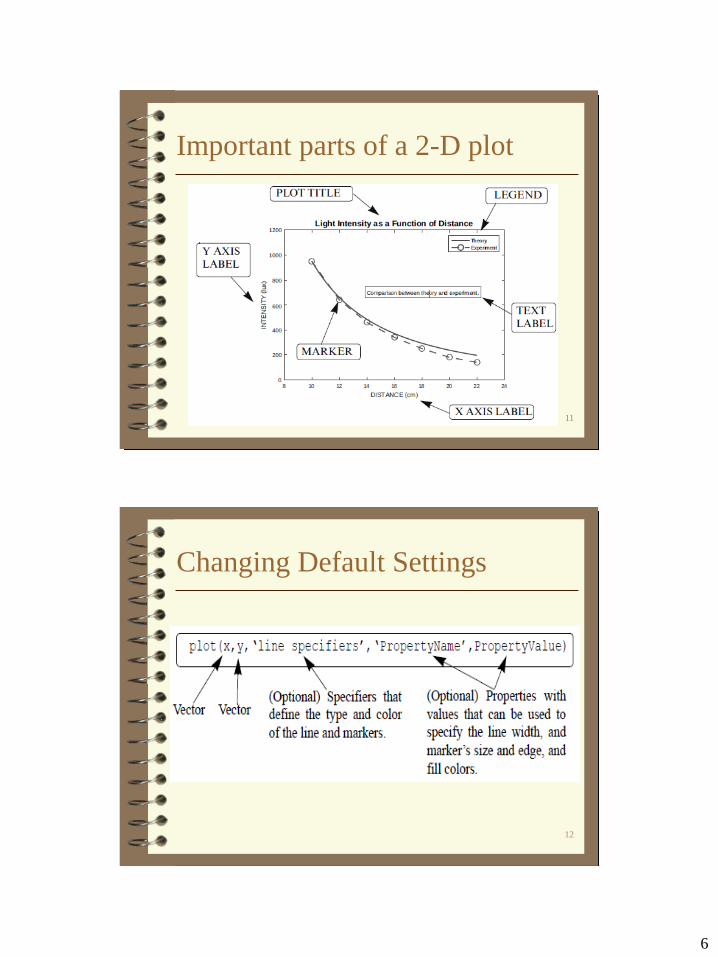
Important parts of a 2-D plot
11
Changing Default Settings
12
7
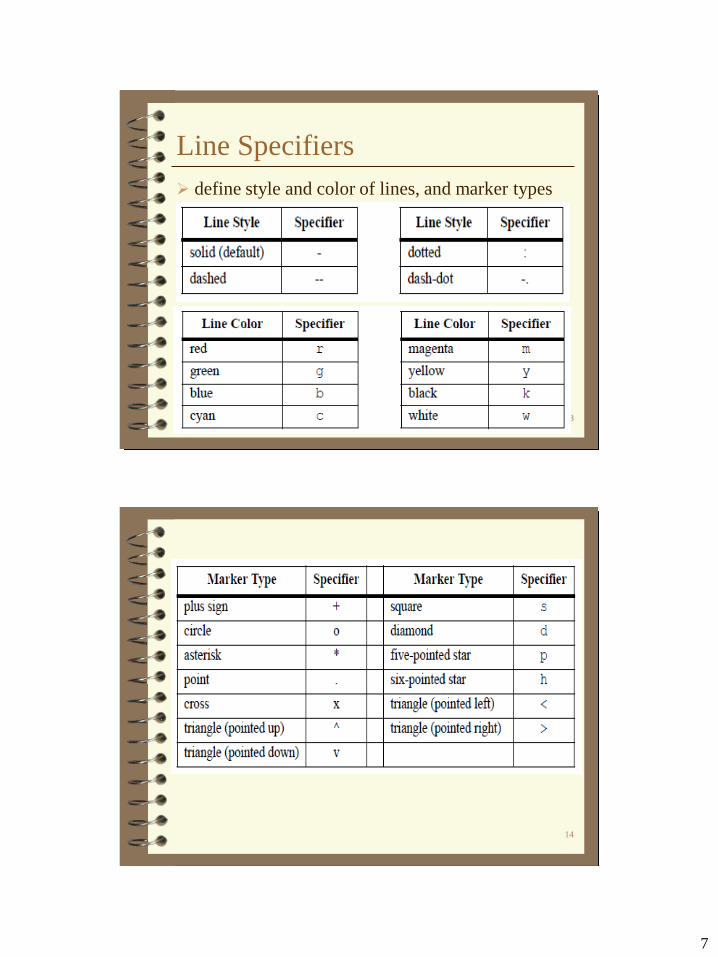
Line Specifiers
define style and color of lines, and marker types
13
14
8
15
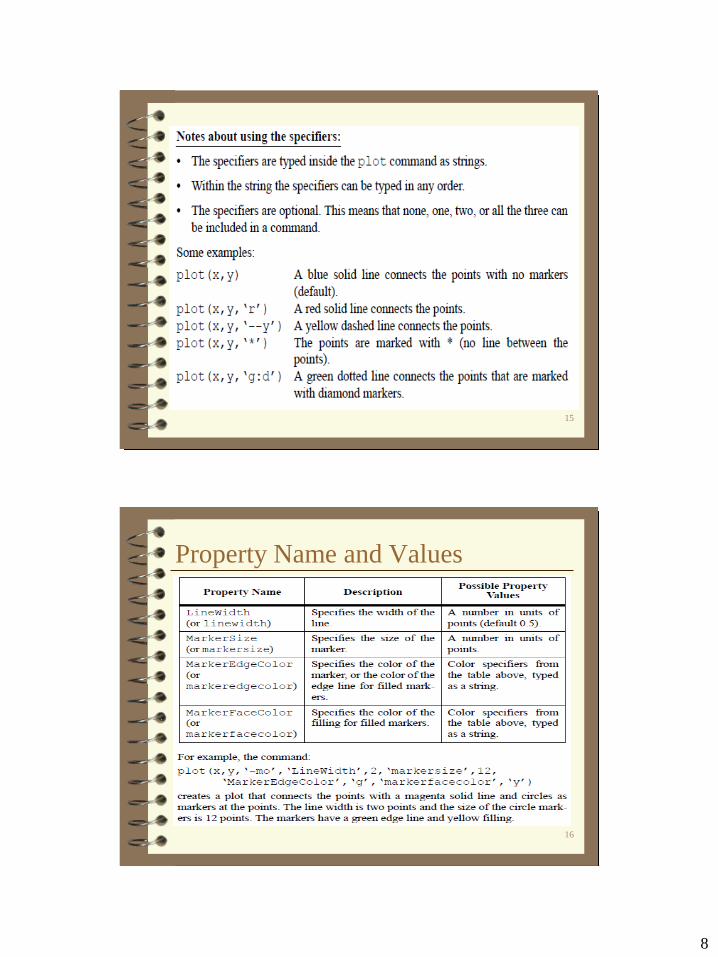
Property Name and Values
16
9
17
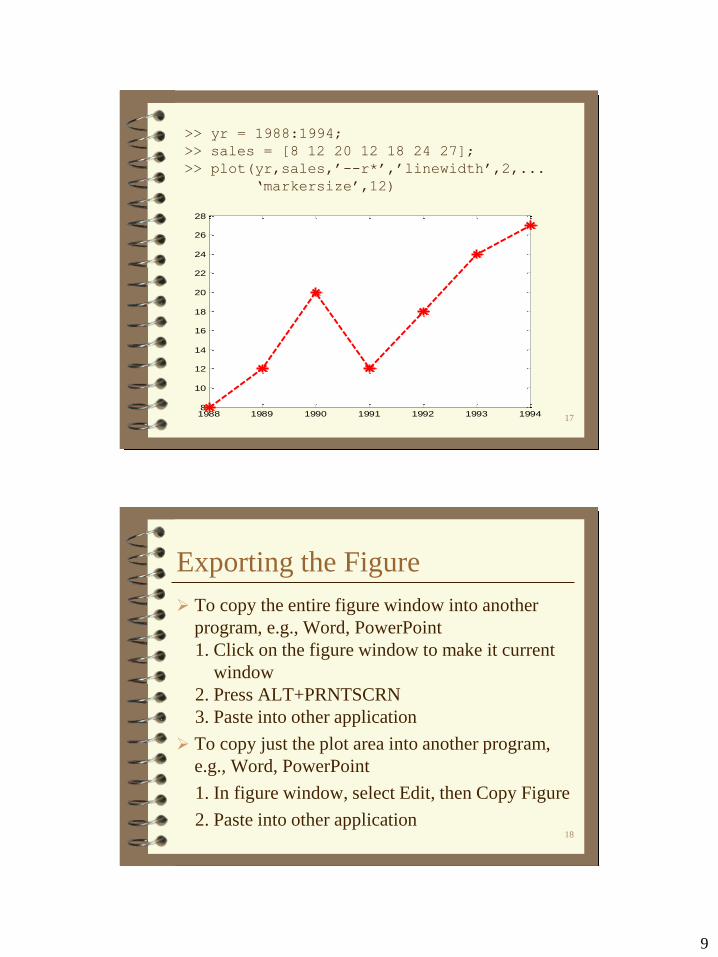
>> yr = 1988:1994;
>> sales = [8 12 20 12 18 24 27];
>> plot(yr,sales,’--r*’,’linewidth’,2,...
‘markersize’,12)
1988 1989 1990 1991 1992 1993 19948
10
12
14
16
18
20
22
24
26
28
Exporting the Figure
To copy the entire figure window into another
program, e.g., Word, PowerPoint
1. Click on the figure window to make it current
window
2. Press ALT+PRNTSCRN
3. Paste into other application
To copy just the plot area into another program,
e.g., Word, PowerPoint
1. In figure window, select Edit, then Copy Figure
2. Paste into other application 18
10
Superimposing Multiple Graphs
19
Plot two or more graphs on the same plot as
follows (e.g., for three graphs)
plot(x,y,u,v,t,h)
Plots y vs. x, v vs. u, and h vs. t
Vectors of each pair must be of the same size
Different pairs can be of different sizes
Can use line specifiers by putting in triplets (x-
data, y-data, specifier), e.g.,
plot(x,y,'-b',u,v,'--r','t,h,'g:')
20
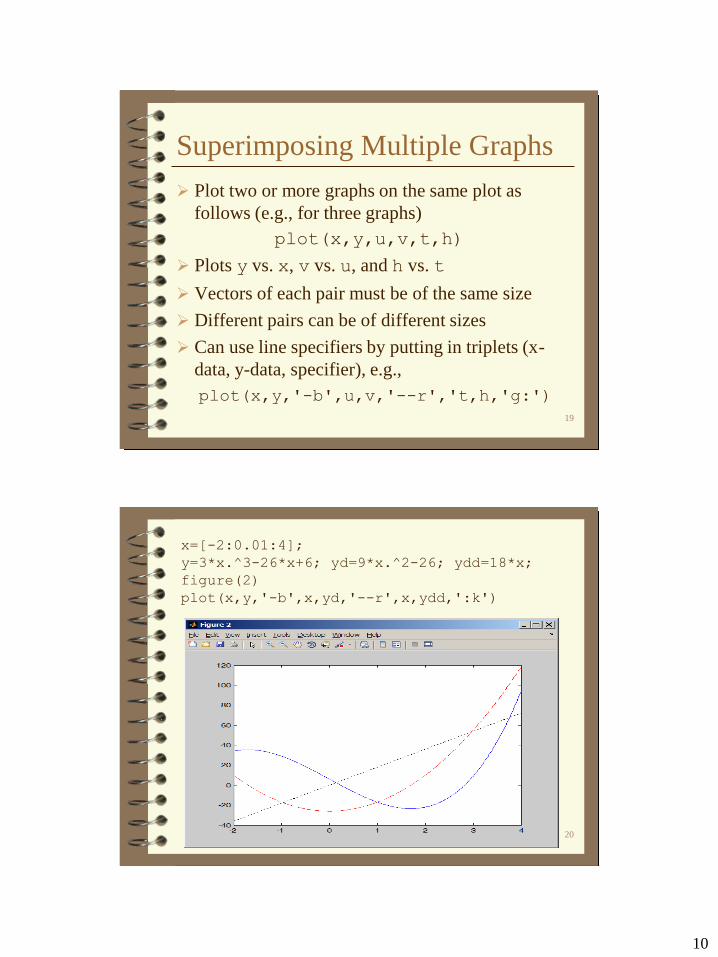
x=[-2:0.01:4];
y=3*x.^3-26*x+6; yd=9*x.^2-26; ydd=18*x;
figure(2)
plot(x,y,'-b',x,yd,'--r',x,ydd,':k')
11
Superimposing Multiple Graphs
21
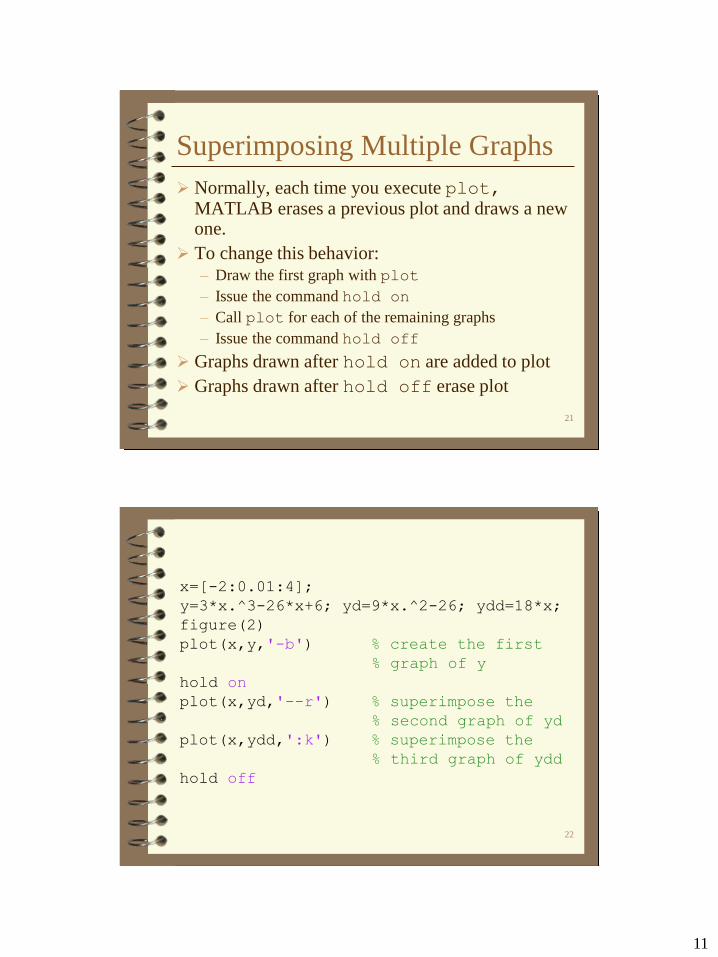
Normally, each time you execute plot, MATLAB erases a previous plot and draws a new one.
To change this behavior: – Draw the first graph with plot
– Issue the command hold on
– Call plot for each of the remaining graphs
– Issue the command hold off
Graphs drawn after hold on are added to plot
Graphs drawn after hold off erase plot
22
x=[-2:0.01:4];
y=3*x.^3-26*x+6; yd=9*x.^2-26; ydd=18*x;
figure(2)
plot(x,y,'-b') % create the first
% graph of y
hold on
plot(x,yd,'--r') % superimpose the
% second graph of yd
plot(x,ydd,':k') % superimpose the
% third graph of ydd
hold off
12
Superimposing Multiple Graphs
23
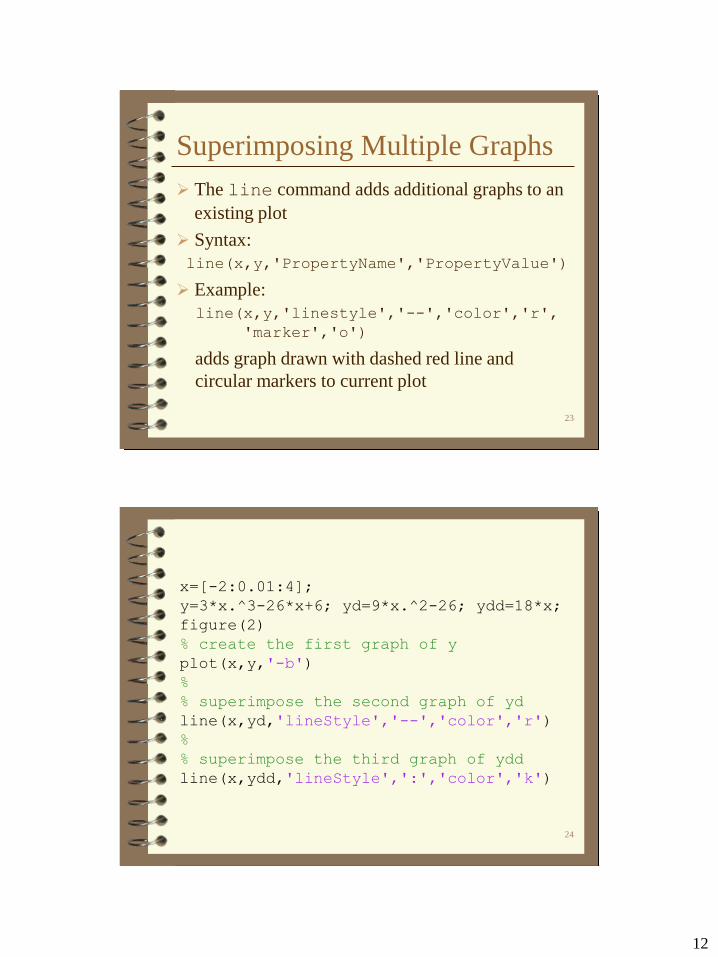
The line command adds additional graphs to an
existing plot
Syntax:
line(x,y,'PropertyName','PropertyValue')
Example:
line(x,y,'linestyle','--','color','r',
'marker','o')
adds graph drawn with dashed red line and
circular markers to current plot
24
x=[-2:0.01:4];
y=3*x.^3-26*x+6; yd=9*x.^2-26; ydd=18*x;
figure(2)
% create the first graph of y
plot(x,y,'-b')
%
% superimpose the second graph of yd
line(x,yd,'lineStyle','--','color','r')
%
% superimpose the third graph of ydd
line(x,ydd,'lineStyle',':','color','k')
13
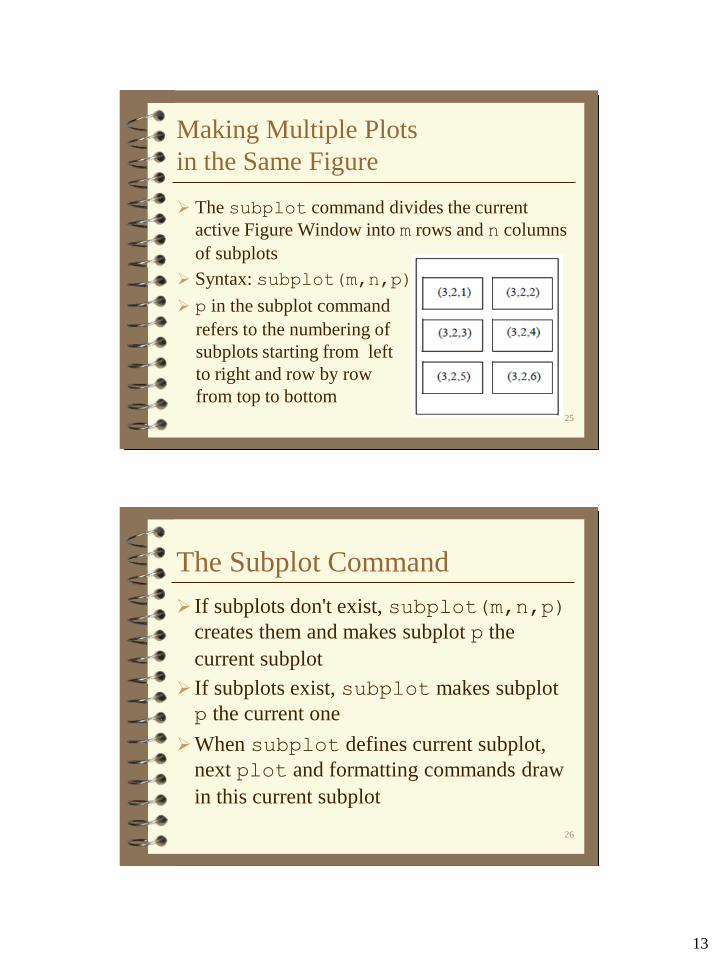
Making Multiple Plots
in the Same Figure
25
The subplot command divides the current
active Figure Window into m rows and n columns
of subplots
Syntax: subplot(m,n,p)
p in the subplot command
refers to the numbering of
subplots starting from left
to right and row by row
from top to bottom
The Subplot Command
If subplots don't exist, subplot(m,n,p)
creates them and makes subplot p the
current subplot
If subplots exist, subplot makes subplot
p the current one
When subplot defines current subplot,
next plot and formatting commands draw
in this current subplot
26
14
27
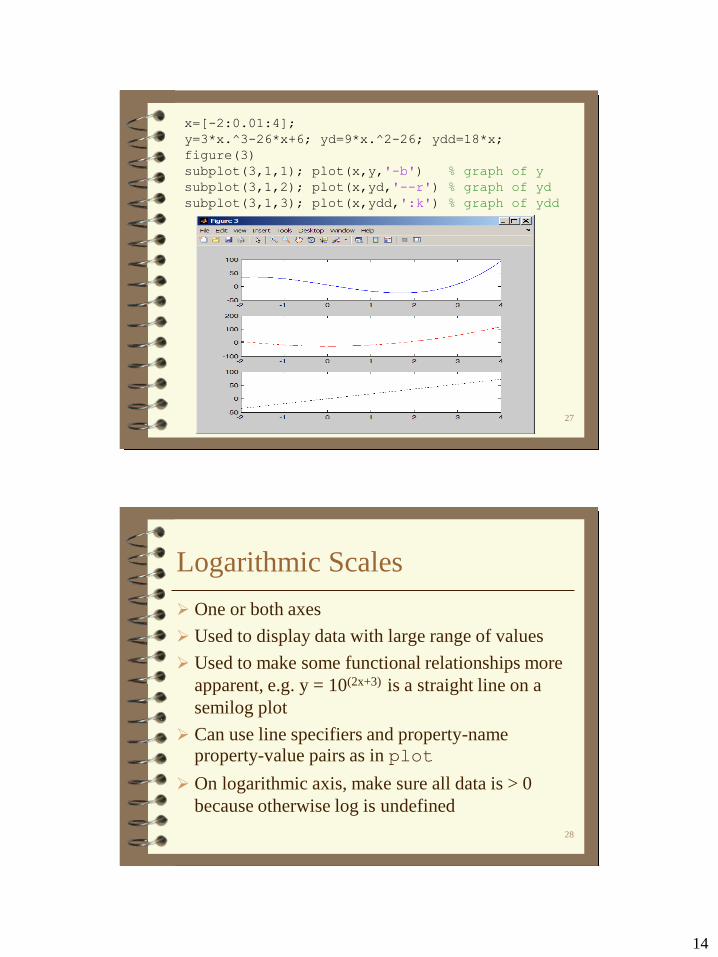
x=[-2:0.01:4];
y=3*x.^3-26*x+6; yd=9*x.^2-26; ydd=18*x;
figure(3)
subplot(3,1,1); plot(x,y,'-b') % graph of y
subplot(3,1,2); plot(x,yd,'--r') % graph of yd
subplot(3,1,3); plot(x,ydd,':k') % graph of ydd
Logarithmic Scales
One or both axes
Used to display data with large range of values
Used to make some functional relationships more
apparent, e.g. y = 10(2x+3) is a straight line on a
semilog plot
Can use line specifiers and property-name property-value pairs as in plot
On logarithmic axis, make sure all data is > 0
because otherwise log is undefined
28
15
29
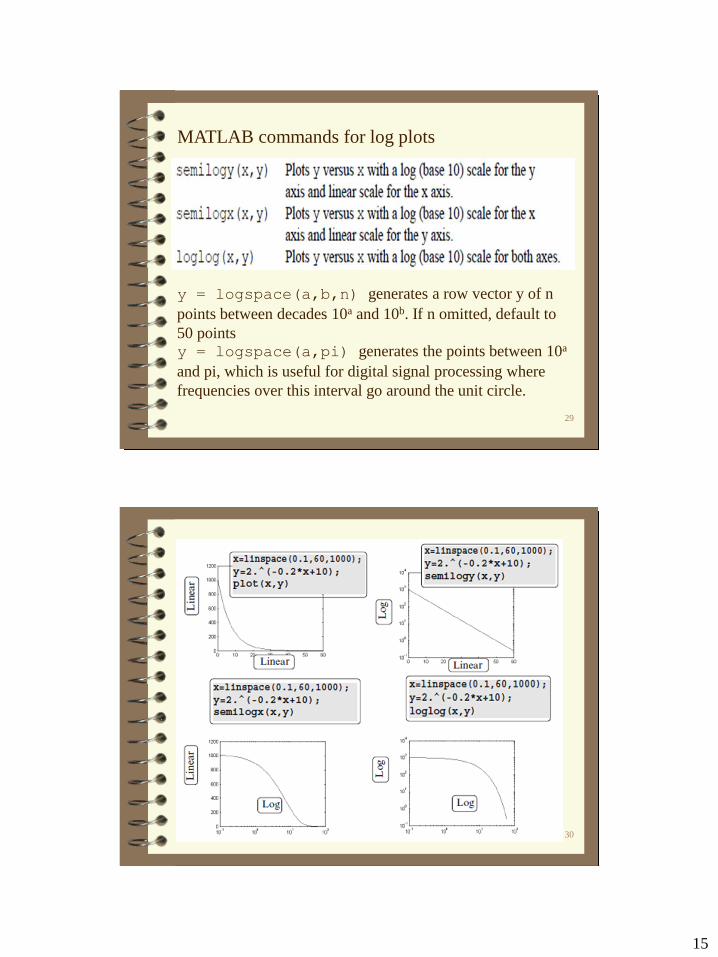
MATLAB commands for log plots
y = logspace(a,b,n) generates a row vector y of n
points between decades 10a and 10b. If n omitted, default to
50 points y = logspace(a,pi) generates the points between 10a
and pi, which is useful for digital signal processing where
frequencies over this interval go around the unit circle.
30
Related Documents