JOURNAL OF GEOPHYSICAL RESEARCH, VOL. 104, NO. D4, PAGES 3953-3969, FEBRUARY 27, 1999 Two-day wave structure and mean flow interactions observed by radar and High Resolution Doppler Imager DavidC. Fritts 1, Joseph R. Isler 2, Ruth S. Lieberman 3'6, Mark D. Burrage 3, Daniel R. Marsh 3, Takuji Nakamura 4, Toshitaka Tsuda 4, Robert A. Vincent 5, lain M. Reid 5 Abstract. Data obtained with four MF a, nd meteor radars at equatorial and subtropical sites and with the High Resolution Doppler Imager (HRDI) instrument aboard the UARS satellite were used to examine the structure, wave-mean flow interactions, and potential sources of the 2-day wave in the middle atmosphere during three southernhemisphere summers. The three wave eventswere highly transient, having typical durations of 20 to 30 days and exhibiting modulation at shorter periods. Temporal variationswere found to exhibit good correlations between radar and HRDI data. Radar and HRDI data were used to estimate those components of the Eliassen-Palmflux that could be assessed with these data. Meridional fluxes of momentum and heat were computed using HRDI data and agreereasonably with the momentumfluxes computed from radar data at discrete locations. These fluxes were found to exhibit consistent latitudinal structures e•ch year, suggesting systematic w•ve excitation •nd w•ve-me•n flow interactions. Meridional momentum flux gradients were seen to be anticorrelated with zonal wind accelerations in a manner consistent with wave forcing of the large-scale circulation. The apparent wave-mean flow interactions suggest that the 2-day wave could be a transient response to baroclinicinstability of the summer hemisphere mesospheric jet. A calculationof the rneridionalgradient of quasi-geostrophic potential vorticity using HRDI winds and the COSPAR International Reference Atmosphere (CIRA 1986)temperatures exhibits a region of instability in the lower and middle mesosphere extendinginto subtropical latitudes and providesadditional evidence of a possible source of this motion via baroclinicinstability of the summer hemispherejet structure. 1. Introduction Observational and theoretical studies over the last two decades have yielded significant progress in our understandingof the structure, characteristics, possi- ble sources, and hemispheric differencesof the quasi •Colorado Research Associates/NWRA, Boulder. 2Physics Department, Wagner College, StatenIsland, New York. aSpace Physics Research Laboratory, University of Michi- gan, Ann Arbor. 4Radio Atmospheric Science Center, University of Kyoto, Kyoto, Japan. SDepartment of Physicis, University of Adelaide, Ade- laide, South Australia. enowat Colorado Research Associates/NWRA, Boulder. Copyright 1999by the American Geophysical Union. Paper number 1998JD200024. 0148- 00227 / 99 / 1998 J D200024509.00 two-day (hereafter 2-day) wave in the middle atmo- sphere. These motions were first detected in meteor radar and spaced antenna drift wind measurements near the mesopause [Muller, 1972; Kal'chenko andBulgakov, 1973; Clark, 197.5; Kingsley et al., 1978; $tening et al., 1978; Ifal'che•ko, 1979; Salby and Roper, 1980; Craig andElford, 1981] and in rocket wind measurements near the stratopause [Coy, 1979]. Typical eventsexhibit wind and temperature perturbations confined largely to the summer hemisphere and the subtropicalwinter hemisphere,with latitudinal extents of ~ 60ø. Other radar, satellite, and National Center for En- vironmental Prediction(NCEP) analyses showed the southern hemisphere 2-day waveto have a predominant zonal wavenumber of 3 [Muller andNelson, 1978;Craig et al., 1980; Rodgers andPrata, 1981; BurksandLeovy, 1986;Lair and Stanford, 1988; Wu et al., 1993;Randel, 1994], a characteristic period of ~ 48 to 49 hours, often appearing to be phase locked at 48 hours suggestive of a tidal influence [Walterscheid and Vincent, 1996], and a short-lived, large-amplitude response during January or early February [Muller and Nelson, 1978;Craigand 3953

Welcome message from author
This document is posted to help you gain knowledge. Please leave a comment to let me know what you think about it! Share it to your friends and learn new things together.
Transcript
JOURNAL OF GEOPHYSICAL RESEARCH, VOL. 104, NO. D4, PAGES 3953-3969, FEBRUARY 27, 1999
Two-day wave structure and mean flow interactions observed by radar and High Resolution Doppler Imager
David C. Fritts 1, Joseph R. Isler 2, Ruth S. Lieberman 3'6, Mark D. Burrage 3, Daniel R. Marsh 3, Takuji Nakamura 4, Toshitaka Tsuda 4, Robert A. Vincent 5, lain M. Reid 5
Abstract. Data obtained with four MF a, nd meteor radars at equatorial and subtropical sites and with the High Resolution Doppler Imager (HRDI) instrument aboard the UARS satellite were used to examine the structure, wave-mean flow interactions, and potential sources of the 2-day wave in the middle atmosphere during three southern hemisphere summers. The three wave events were highly transient, having typical durations of 20 to 30 days and exhibiting modulation at shorter periods. Temporal variations were found to exhibit good correlations between radar and HRDI data. Radar and HRDI data were used to estimate
those components of the Eliassen-Palm flux that could be assessed with these data. Meridional fluxes of momentum and heat were computed using HRDI data and agree reasonably with the momentum fluxes computed from radar data at discrete locations. These fluxes were found to exhibit consistent latitudinal structures
e•ch year, suggesting systematic w•ve excitation •nd w•ve-me•n flow interactions. Meridional momentum flux gradients were seen to be anticorrelated with zonal wind accelerations in a manner consistent with wave forcing of the large-scale circulation. The apparent wave-mean flow interactions suggest that the 2-day wave could be a transient response to baroclinic instability of the summer hemisphere mesospheric jet. A calculation of the rneridional gradient of quasi-geostrophic potential vorticity using HRDI winds and the COSPAR International Reference Atmosphere (CIRA 1986) temperatures exhibits a region of instability in the lower and middle mesosphere extending into subtropical latitudes and provides additional evidence of a possible source of this motion via baroclinic instability of the summer hemisphere jet structure.
1. Introduction
Observational and theoretical studies over the last
two decades have yielded significant progress in our understanding of the structure, characteristics, possi- ble sources, and hemispheric differences of the quasi
•Colorado Research Associates/NWRA, Boulder. 2Physics Department, Wagner College, Staten Island,
New York.
aSpace Physics Research Laboratory, University of Michi- gan, Ann Arbor.
4Radio Atmospheric Science Center, University of Kyoto, Kyoto, Japan.
SDepartment of Physicis, University of Adelaide, Ade- laide, South Australia.
enow at Colorado Research Associates/NWRA, Boulder.
Copyright 1999 by the American Geophysical Union.
Paper number 1998JD200024.
0148- 00227 / 99 / 1998 J D200024509.00
two-day (hereafter 2-day) wave in the middle atmo- sphere. These motions were first detected in meteor radar and spaced antenna drift wind measurements near the mesopause [Muller, 1972; Kal'chenko and Bulgakov, 1973; Clark, 197.5; Kingsley et al., 1978; $tening et al., 1978; Ifal'che•ko, 1979; Salby and Roper, 1980; Craig and Elford, 1981] and in rocket wind measurements near the stratopause [Coy, 1979]. Typical events exhibit wind and temperature perturbations confined largely to the summer hemisphere and the subtropical winter hemisphere, with latitudinal extents of ~ 60 ø.
Other radar, satellite, and National Center for En- vironmental Prediction (NCEP) analyses showed the southern hemisphere 2-day wave to have a predominant zonal wavenumber of 3 [Muller and Nelson, 1978; Craig et al., 1980; Rodgers and Prata, 1981; Burks and Leovy, 1986; Lair and Stanford, 1988; Wu et al., 1993; Randel, 1994], a characteristic period of ~ 48 to 49 hours, often appearing to be phase locked at 48 hours suggestive of a tidal influence [Walterscheid and Vincent, 1996], and a short-lived, large-amplitude response during January or early February [Muller and Nelson, 1978; Craig and
3953
3954 FRITTS ET AL.' TWO-DAY WAVE STRUCTURE AND MEAN FLOW INTERACTIONS
Elford, 1981; Salby, 1981a; Phillips, 1989; Poole, 1990; Wu et al., 1993; Harris and Vincent, 1993; Fritts and Islet, 1994].
The 2-day wave in the northern hemisphere, in con- trast, was found to comprise a mix of zonal wavenum- bers 3 and 4 [Randel, 1994; Meek et al., 1996], to ex- hibit both shorter and longer periods of ~ 44 and 50 to 52 hours, apparently corresponding to the two zonal wavenumbers observed during such events, and to per- sist at smaller amplitudes for a much longer interval extending from July into September or early October [Harris and Vincent, 1993; Wu et al., 1993; Fritts and Islet, 1994; Clark et al., 1994]. In both cases, the merid- ional winds appear to be in phase in both hemispheres, implying an antiphase relation in the thermal structures within, and outside of, the zone of maximum response [ Tsuda et al. , 1988; Randel, 1994].
Initial theoretical studies by Salby [1981b, c] sug- gested that the 2-day wave is a manifestation of a west- ward propagating (3,0) Rossby normal mode. These studies also showed the modeled wave structure to be
consistent with a number of the observed wave char-
a. cteristics, including the approximate period and spa- tial structure. Subsequent studies by Plumb [1983] and Pfistcr [1985] a,rgued instead that the 2-day wave might arise as a consequence of a baroclinic instability of the summer hemisphere jet structure. More recently, Ha- gan ctal. [1993] returned to an analysis of neutral nor- real modes in order to explore the sensitivity of the 2-day wave resonance to forcing frequency and various mean wind structures. These results showed the 2-day wave to be very sensitive, not only to mean winds at lower altitudes, but also to mean winds in the meso- sphere and lower thermosphere (MLT). A more recent study by Norton and Thuburn [1996] found a 2-day wave to arise in a general circulation model in the summer hemisphere, to accompany a baroclinic instability due to curvature around the westward jet core, and to ex- hibit a transition from zonal wavenumber 3 to 4 during the latter stages of each event. In each of these studies, the 2-day wave structure wa,s found to exhibit qualita- tively similar characteristics, with wind, temperature, and geopotential maxima, in the summer mesosphere. In the studies by Salby [1981b, c], however, the maximum thermal and wind responses were confined to equatorial and subtropical latitudes, while Pfister [1985], Hagan ctal. [1993], and Norton and Thuburn [1996] obtained wind maxima confined to lower latitudes, but with tem- perature and geopotential maxima occurring at middle to high latitudes.
Despite uncertainties concerning the source(s) and middle atmosphere influences of the northern and southern hemisphere 2-day wave events, only two stud- ies to date have examined closely the relation between significant wave events and the associated mean struc- tures or tendencies. The study by Plumb et al. [1987] examined the southern hemisphere 2-day wave event
that occurred during January and early February 1984 and related this strong, transient event to simultaneous changes in the zonal and meridional mean motions. The 2-day wave structure, maximizing between ~ January 20 and 30, was found to accompany an initial decel- eration/acceleration of the zonal/meridional mean flow of ~ 20 m s -•, with the initial flow recovering from the maximum perturbation over ~ 5 days in each case. Making assumptions about the latitudinal structure of this wave event, these authors showed the mean wind tendencies implied by the observed wave structure to provide a plausible explanation for the observed varia- tions. A more recent analysis of NCEP data by Ran- del [1994] demonstrated a strong correlation of 2-day wave temperature variance maxima with small or nega- tive latitudinal gradients of quasi-geostrophic (QG) po- tential vorticity, corroborating earlier analysis efforts [Bur]cs and Leovy, 1986] and providing additional sup- port, for the theory of wave excitation via a baroclinic instability of the zonal mean flow. Randel [1994] further argued that baroclinic instability most likely served to excite a, (3,0) Rossby normal mode because of the strong simila, rity of the observed wave and the computed modal structure.
This paper is organized as follows. We describe our data analysis procedures in section 2. In section 3, wind measurements obtained by four equatorial and subtrop- ical medium-frequency (MF) and meteor radars and the High Resolution Doppler Imager (HRDI) aboard the Upper Atmosphere Research Satellite (UARS) are used to investigate the 2-day wave structure during succes- sive southern hemisphere summers. Radar and HRDI measurements are used in section 4 to estimate the
meridional fluxes of zonal momentum and temperature, their latitudinal gradients, and their correlations with observed mean flow variations. Motivated by the inter- a,nnua.1 consistency of the momentum and heat fluxes in latitude and the temporal correlations of momentum fluxes and zonal accelerations, we evaluate in section 5 the possibility of baroclinic instability of the zonal mean-flow during January 1993. Our conclusions are presented in section 6.
2. Data Sets and Analyses
2.1. MF Radars
The MF radars at Adelaide (35øS, 138øE), Christ- mas Island (2øN, 157øW), and Hawaii (22øN, 159øW) all operate in a spaced antenna drift mode with wind estimates obtained at temporal and spatial intervals of 2 rain and '2 kin. In each case, the spatial data are over- sampled by 2 times, yielding independent wind mea- surements only every 4 km. Depending on altitude and time of day, the diurnally averaged acceptance rates for velocity estimates vary from ~ 10 to 60%, with the best data obtained from ~ 8'2 to 94 km. Above these heights,
FRITTS ET AL.' TWO-DAY WAVE STRUCTURE AND MEAN FLOW INTERACTIONS 3955
MF v spectra Jan-Feb 1998
Adelaide
4 --.Christmas I. '' Hawaii
I, I I i i [ ill ] I I I I [ ill
2.2. Meteor Radar
- Data obtained with the Jakarta meteor radar (6øS, 108øE) is likewise used to obtain hourly averaged winds at 2-kin intervals at altitudes from 70 to 110 kin. To
' fitrther reduce uncertainties in the estimates of 2-day wave amplitudes and phases, these data are binned into 4-hour averages. The resulting data yield 2-day wave estimates over a height range of ,-• 82 - 98 km. 2-day wave amplitudes and mean winds are determined from these data using the same procedures described for the MF radars above.
2.3. UARS/HRDI The HRDI instrument aboard UARS has performed
global measurements of winds in the middle atmosphere 0.1
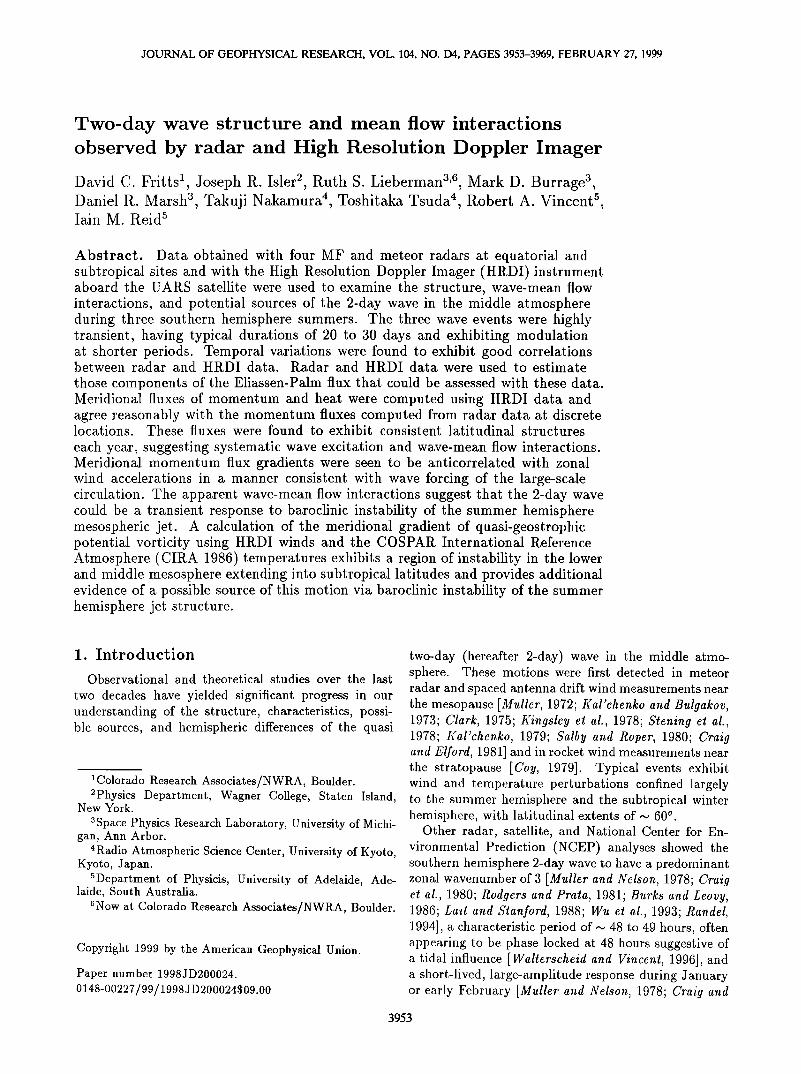
day Figure 1. Two-month spectra for January and Febru- ary, 1993, of meridional wind fluctuations at 90-kin al- titudes at Hawaii (22øN, solid line), Christmas Island (2øN, dotted line), and Adelaide (35øS, dashed line) showing the significance of the 2-day wave during these times.
valid data are more sparse and are included in our anal- ysis only where they permit valid hourly averaged wind estimates. This is much less stringent than needed for studies of higher-frequency motions, however, and we judge six valid measurements per hour to be acceptable for this purpose. Below 82 kin, nighttime data rates are sufficiently sparse to prevent full diurnal coverage and are thus unsuitable for the present study. Additional details on the MF radar technique and the application of these systems to middle atmosphere dynamics studies may be found in the papers by Vincent [1984], Vincent and Lesicar [1991], Fritts and Islet [1994], and Islet and Fritts [1996].
Our analysis in this paper focuses on the 2-day wave during southern hemisphere summers. As noted above, these events are characterized by transient events having periods indistinguishable in most cases from 48 hours. This is confirmed by 2-month spectra of the zonal and meridional winds at Hawaii, Christmas Island, and Adelaide displayed in Figure 1 for January and February, 1993. Thus we assume, consistent with previous studies of this event, that the predominant re- sponse is at 48 hours and use this period for amplitude and phase estimates in each wind component in slid- ing 4-day intervals. For comparison with other results, phase is displayed in solar local time and represents the time of maximum amplitude. We also use 4-day in- tervals for estimates of the mean zonal and meridional
winds in order to avoid biasing these estimates by the large 2-day wave amplitudes.
1.0 10.0 since November, 1991. HRDI temperature retrievals have only become available more recently, but are also used in our study to assess 2-day temperature per- turbations. The HRDI instrument, which employs a triple-etalon Fabry-Perot interferometer to measure the Doppler shift of rotational lines in the O2 atmospheric band, has been described in detail by flays ½t al. [1993]. During daytime, MLT wind fields are obtained in the altitude range 50 to 115 kin, while at night the observed emission is confined to a narrow layer, restricting mea- surements to a single altitude of ,-• 95 km [it Burrage et a.l., 1996]. The amplitudes and phases of the two-day wave velocities were determined with a least squares fitting method employing a two-dimensional (space and time) Fourier analysis [Wu ½t al., 1995]. It was assumed that the zonal wavenumber for the 2-day fits is 3, and the results were generated using a sliding 4-day interval. The sampling rate during daytime is typically either ev- ery other day or daily, while at night it is usually daily. For several CADRE (Coupling And Dynamics of Re- gions Equatorial, J. Geophys. Res. special section, Nov. 1997) and other campaigns, however, HRDI was oper- ated in a dedicated mode providing continuous sampling of the MLT. In order to minimize noise and aliasing ef- fects of insufficient sampling at other times, the analysis of the wind and temperature fields presented here was restricted to the altitude of continuous full diurnal cow
erage, ,-• 95 km. Simulations have demonstrated that the confidence level in the 2-day wind estimates derived in this manner are in the range ,-• 10 to 20 m s -• [Wu et al., 1993].
Our assessment of the structure of the zonal mean
QG potential vorticity field for the 1993 southern hemi- sphere January-February 2-day wave event uses HRDI data to define the zonal mean wind field smoothed onto
the first 12 Legendre polynomials (P,•(q•), with n = 1 to 12) in order to yield well-defined shear and curvature es- timates. Because HRDI mean temperatures experience residual contamination due to tidal aliasing for short- term averages, however, we have also used CIRA 1986
3956 FRITTS ET AL.' TWO-DAY WAVE STRUCTURE AND MEAN FLOW INTERACTIONS
w
90
60
30
0
-30
-60
-90
' ' I ' ' I ' ' I ' ' I ' ' I '
-180 -120 -60 ' 0 60 120 180
LONGITUDE
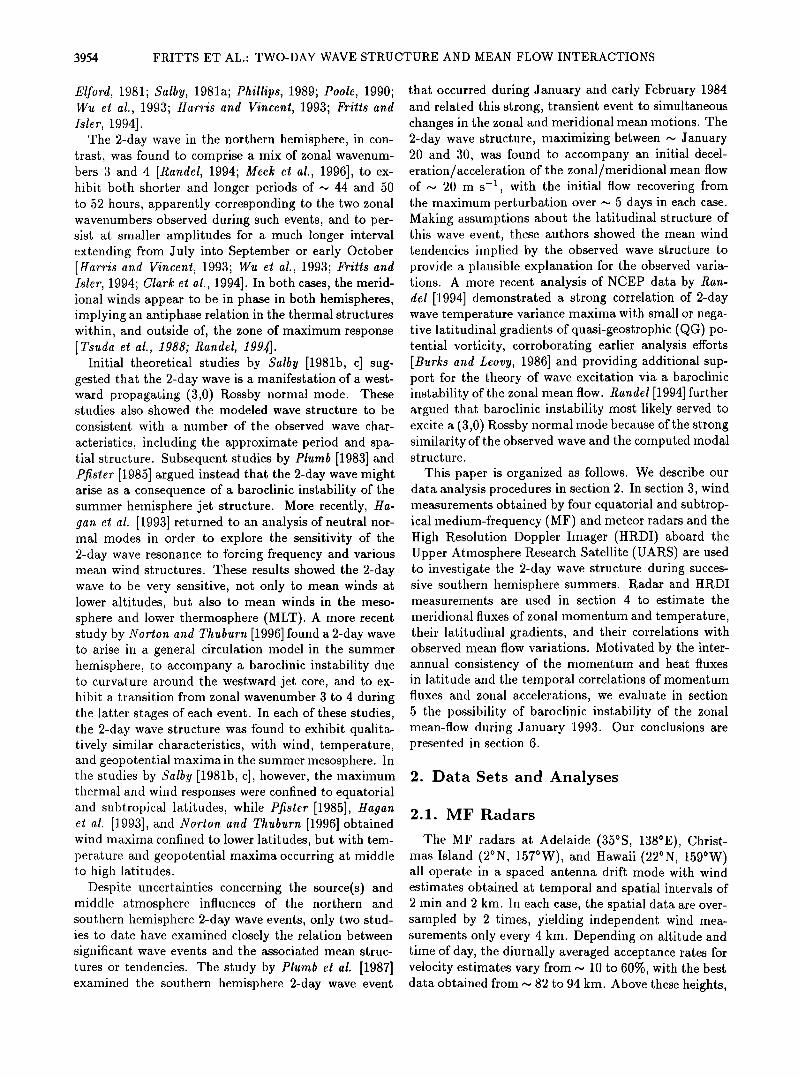
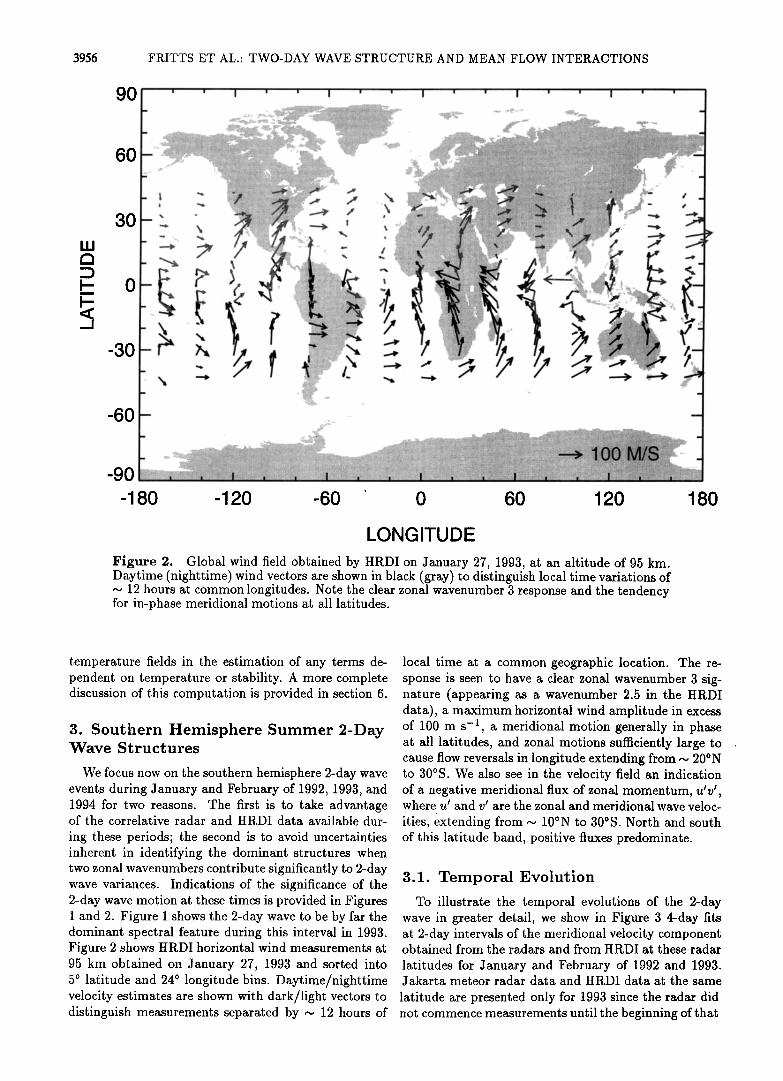
Figure 2. Global wind field obtained by HRDI on January 27, 1993, at an altitude of 95 km. Daytime (nighttime) wind vectors are shown in black (gray) to distinguish local time variations of • 12 hours at common longitudes. Note the clear zonal wavenumber 3 response and the tendency for in-phase meridional motions at all latitudes.
temperature fields in the estimation of any terms de- pendent on temperature or stability. A more complete discussion of this computation is provided in section 6.
3. Southern Hemisphere Summer 2-Day Wave Structures
We focus now on the southern hemisphere 2-day wave events during January and February of 1992, 1993, and 1994 for two reasons. The first is to take advantage of the correlative radar and HRDI data available dur-
ing these periods; the second is to avoid uncertainties inherent in identifying the dominant structures when two zonal wavenumbers contribute significantly to 2-day wave variances. Indications of the significance of the 2-day wave motion at these times is provided in Figures 1 and 2. Figure 1 shows the 2-day wave to be by far the dominant spectral feature during this interval in 1993. Figure 2 shows HRDI horizontal wind measurements at 95 km obtained on January 27, 1993 and sorted into 5 o latitude and 24 o longitude bins. Daytime/nighttime velocity estimates are shown with dark/light vectors to
local time at a common geographic location. The re- sponse is seen to have a clear zonal wavenumber 3 sig- nature (appearing as a wavenumber 2.5 in the HRDI data), a maximum horizontal wind amplitude in excess of 100 m s -•, a meridional motibn generally in phase at all latitudes, and zonal motions sufficiently large to cause flow reversals in longitude extending from • 20øN to 30øS. We also see in the velocity field an indication of a negative meridional flux of zonal momentum, utv •, where u t and v t are the zonal and meridional wave veloc-
it. ies, •xt. ending from -• 10øN to 30øS. North and south of this latitude band, positive fluxes predominate.
3.1. Temporal Evolution To illustrate the temporal evolutions of the 2-day
wave in greater detail, we show in Figure 3 4-day fits at 2-day intervals of the meridional velocity component obtained from the radars and from HRDI at these radar
latitudes for January and February of 1992 and 1993. Jakarta meteor radar data and HRDI data at the same
latitude are presented only for 1993 since the radar did distinguish measurements separated by • 12 hours of not commence measurements until the beginning of that
FRITTS ET AL ß TWO-DAY WAVE STRUCTURE AND MEAN FLOW INTERACTIONS 3957
6O
4O
2O
HRDI 1992
' ' Aft 6 ' ' elai e
..... Jakarta
........ Christmas I.
Hawaii -,
• ',
// , /\ .t.-. >..,.....
'v' \ •/. 7' ,.• - ,. 5 15 25 4 14 24
HRDI 1993 i i / \ i i
',,/ ' " \ •t,
,
ß •_ .
I I I I
5 15 25 4 14 24
5O
4O
7• 3O 2O
10
MF radar 1992
i i i i i I ,
]•' ,'"'/ , I\\ \ I\ / • I• • :'/',,/ / '. • - " I \ :
\ ,, \ :
5 15 25 4 14 24
Jan Feb
MF radar 1993 i i i i i i
,
,, , , , ,,
,
• "' / I, I\ •,,,•1•,, ,\ / "i. / \,
' v'•,/ '•./ •.. • ! _:
i i
5 15 25 4 14 24
Jan Feb
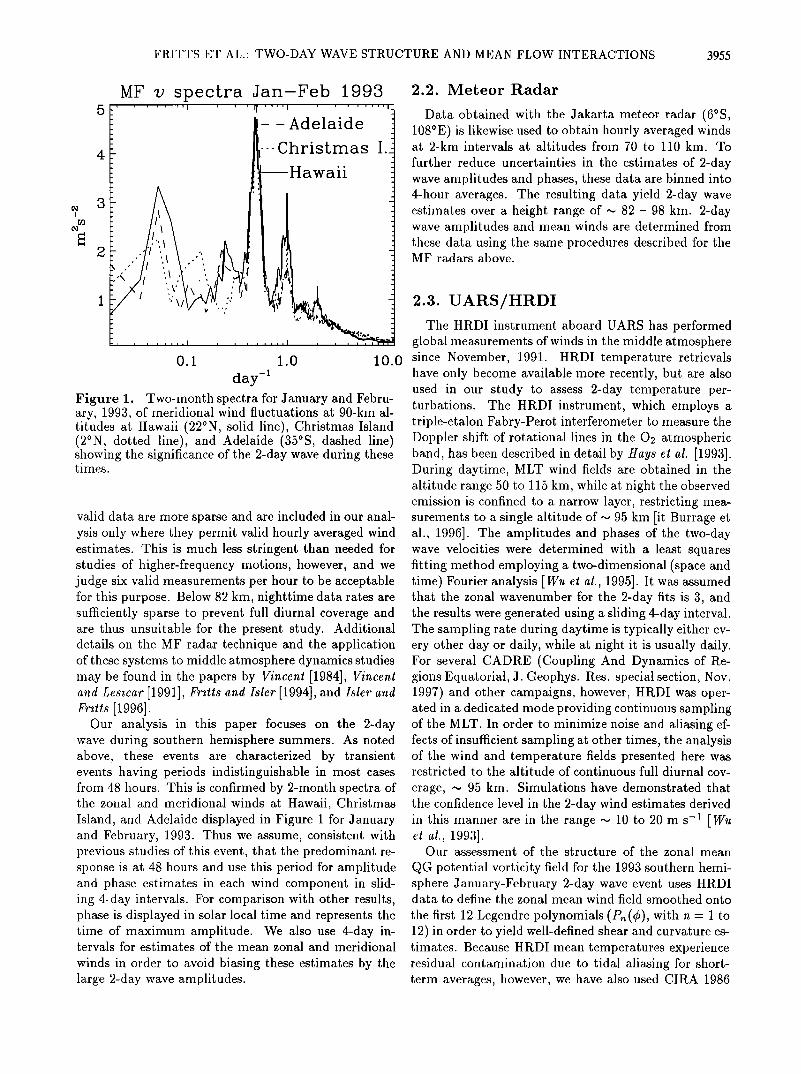
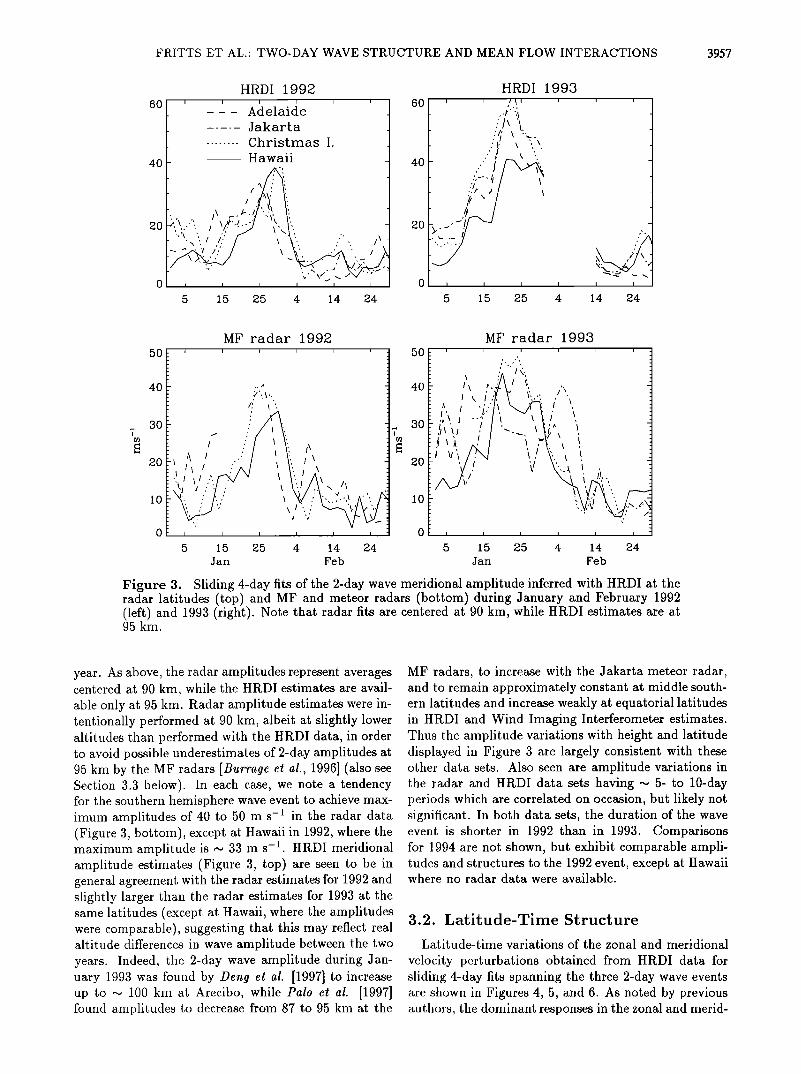
Figure 3. Sliding 4-day fits of the 2-day wave meridional amplitude inferred with HRDI at the radar latitudes (top) and MF and meteor radars (bottom) during January and February 1992 (left) and 1993 (right). Note that radar fits are centered at 90 km, while HRDI estimates are at 95 kin.
year. As above, the radar amplitudes represent averages centered at 90 km, while the HRDI estimates are avail- able only at 95 km. Radar amplitude estimates were in- tentionally performed at 90 kin, albeit at slightly lower altitudes than performed with the HRDI data, in order to avoid possible underestimates of 2-day amplitudes at 95 km by the MF radars [Burrage el al., 1996] (also see Section 3.3 below). In each case, we note a tendency for the southern hemisphere wave event to achieve max- imum amplitudes of 40 to 50 m s -1 in the radar data (Figure 3, bottom), except at Hawaii in 1992, where the maximum amplitude is ~ 33 m s -1. HRDI meridional amplitude estimates (Figure 3, top) are seen to be in general agreement with the radar estimates for 1992 and slightly larger than the radar estimates for 1993 at the same latitudes (except at Hawaii, where the amplitudes were comparable), suggesting that this may reflect real altitude differences in wave amplitude between the two years. Indeed, the 2-day wave amplitude during Jan- uary 1993 was found by Dcng ½t al. [1997] to increase up to ~ 100 km at Arecibo, while Palo ½t al. [1997] found amplitudes to decrease from 87 to 95 km at the
MF radars, to increase with the Jakarta meteor radar, and to remain approximately constant at middle south- ern latitudes and increase weakly at equatorial latitudes in HRDI and Wind hnaging Interferometer estimates. Thus the amplitude variations with height and latitude displayed in Figure 3 are largely consistent with these other data sets. Also seen are amplitude variations in the radar and HRDI data sets having • 5- to 10-day periods which are correlated on occasion, but likely not significant. In both data sets, the duration of the wave event is shorter in 1992 than in 1993. Comparisons for 1994 are not shown, but exhibit comparable ampli- tudes and structures to the 1992 event, except at Hawaii where no radar data were available.
3.2. Latitude-Time Structure
La.titude-time variations of the zonal and meridional
velocity perturbations obtained from HRDI data for sliding 4-day fits spanning the three 2-day wave events are shown in Figures 4, 5, and 6. As noted by previous authors, the dominant responses in the zonal and merid-
3958 FRITTS ET AL.' TWO-DAY WAVE STRUCTURE AND MEAN FLOW INTERACTIONS
40
20
0
-20
-40
-60
40
20
0
-20
-40
-60
40
20
0
-20
-40
-60
HRDI two-day z• amp. 1992
->
5 10 15 20 25 30 4 9 14
HRDI two-day v amp. 1992
_
5 10 15 20 25 30 4
HRDI two-day T amp. 1992
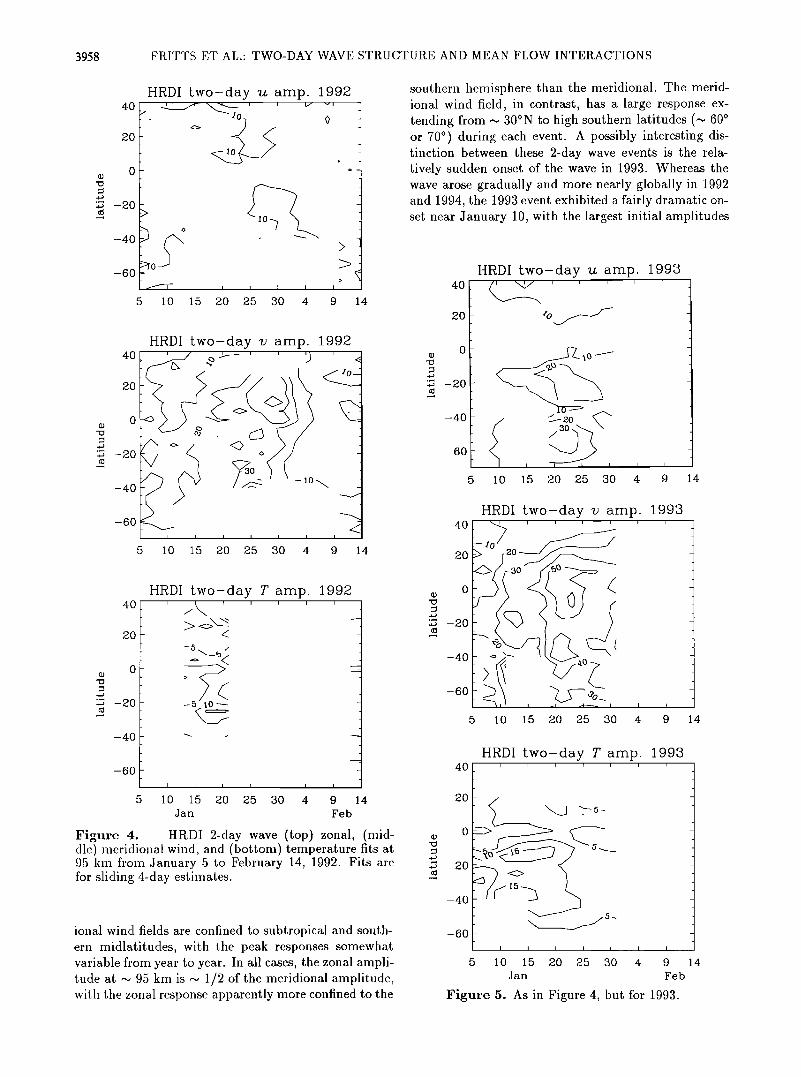
southern hemisphere than the meridional. The merid- ional wind field, in contrast, has a large response ex- tending from • 30øN to high southern latitudes (• 600 or 70 ø) during each event. A possibly interesting dis- tinction between these 2-day wave events is the rela- tiveiv sudden onset of the wave in 1993. Whereas the
wave arose gradually and more nearly globally in 1992 and 1994, the 1993 event exhibited a fairly dramatic on- set near January 10, with the largest initial amplitudes
40
20
0
-20
-40
-60
• 40
9 , 14 20 i • ,• 0
• -20
-40
-60
[ 10 15 20 25 30 4 9 14 Jan Feb
Figure 4. HRDI 2-day wave (top) zonal, (mid- dle) meridional wind, and (botton•) temperature fits at, (•' , ß .)akm from January 5 to February 14 1992 Fits are for sliding 4-day estimates.
40
ional wind fields are confined to subtropical and south- ern midlatitudes, with the peak responses somewhat variable from year to year. In all cases, the zonal ampli- tude at, • 95 km is • 1/2 of the meridional amplitude, with the zonal response apparently more confined to the
20
0
-20
HRDI two-day z, amp. 1993
lO 15 20 25 30 4 9 14
HRDI t. wo-day v amp. 1993
5 10 15 20 25 30 4 14
HRDI two-day T amp. 1993
_40 •'•• 1<•>5 --• • 5 10 15 20 25 30
Jan
I I
4 9
Feb
14
Figure 5. As in Figure 4, but for 1993.
FRITTS ET AL.' TWO-DAY WAVE STRUCTURE AND MEAN FLOW INTERACTIONS 3959
4O
2O
0
-20
-4O
-6O
HRDI two-day u amp. 1994
10 15 20 25 30 4 9 5 14
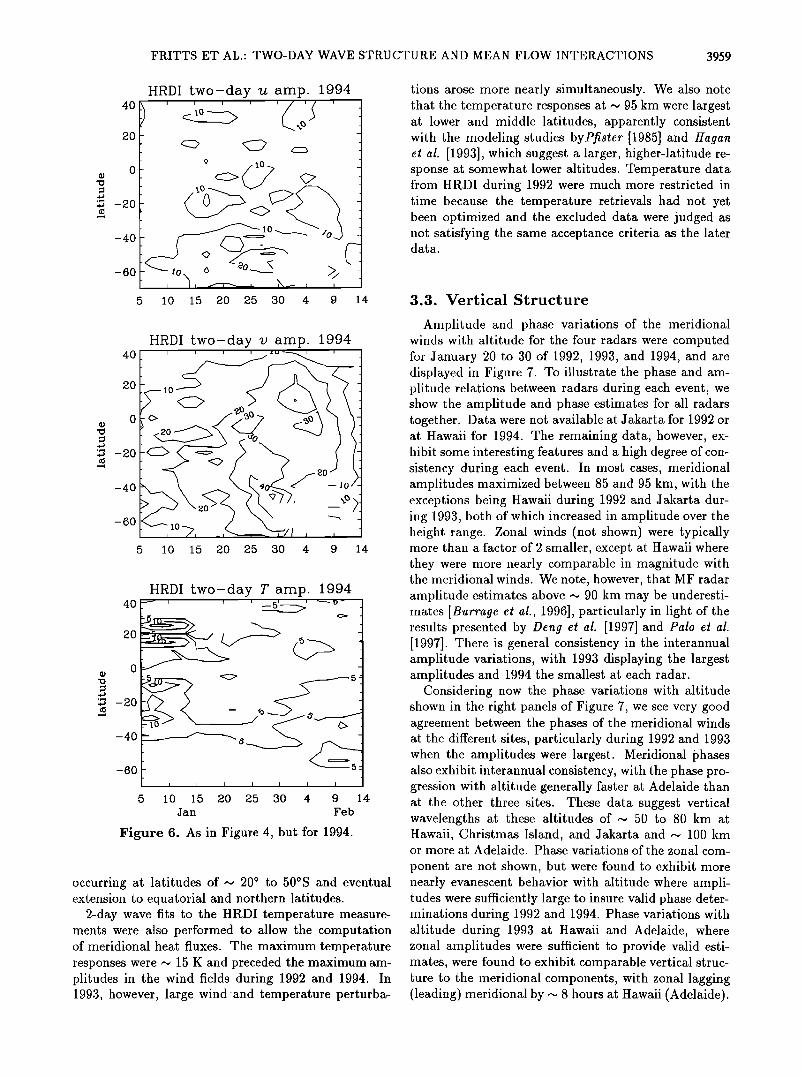
tions arose more nearly simultaneously. We also note that the temperature responses at ,• 95 km were largest at lower and middle latitudes, apparently consistent with the modeling studies byPfister [1985] and Hagan et al. [1993], which suggest a larger, higher-latitude re- sponse at somewhat lower altitudes. Temperature data from HRDI during 1992 were much more restricted in time because the temperature retrievals had not yet been optimized and the excluded data were judged as not satisfying the same acceptance criteria as the later data.
3.3. Vertical Structure
HRDI two-day v amp. 1994 0 / I i i i 1• i i /
20
o -20
-40
-60
5 10 15 20 25 30 4 9 14
4O
2O
0
-20
-4O
-6O
5 10 15 20 25 30 4 9
Jan Feb
Figure 6. As in Figure 4, but for 1994.
HRDI two-day T amp. 1994
14
occurring at latitudes of ,,• 200 to 50øS and eventual extension to equatorial and northern latitudes.
2-day wave fits to the HRDI temperature measure- ments were also performed to allow the computation of meridional heat fluxes. The maximum temperature responses were • 15 K and preceded the maximum am- plitudes in the wind fields during 1992 and 1994. In 1993, however, large wind and temperature perturba-
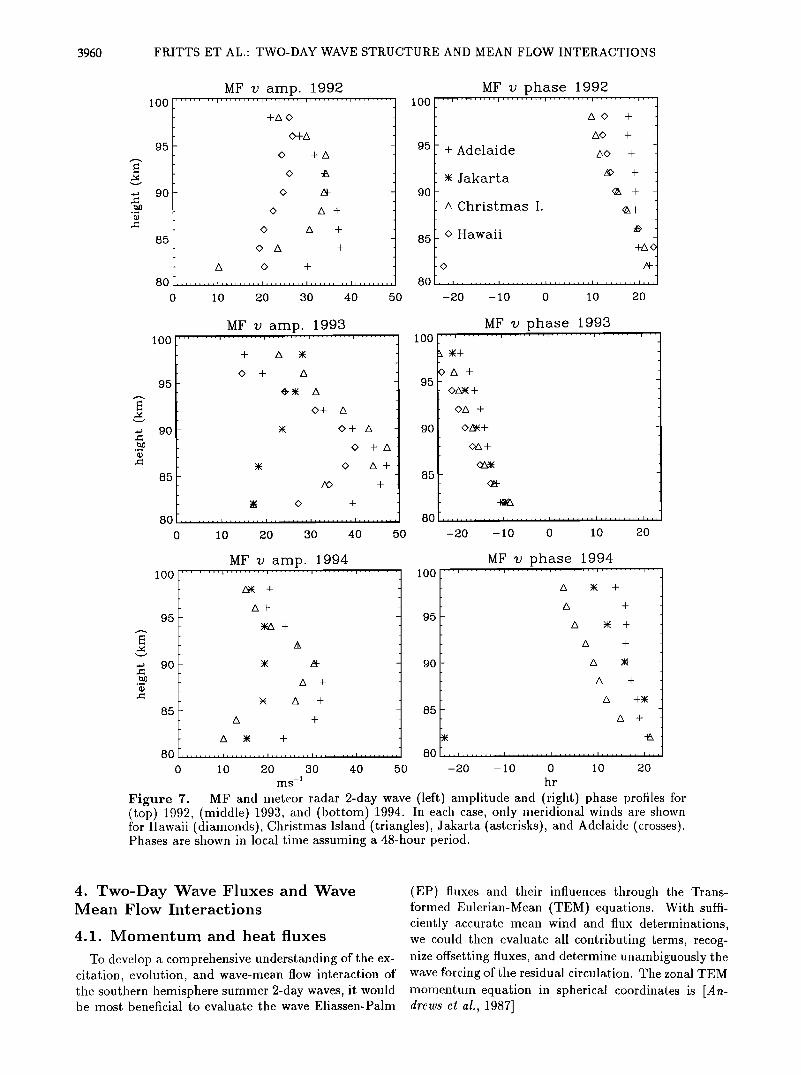
Amplitude and phase variations of the meridional winds with altitude for the four radars were computed for January 20 to 30 of 1992, 1993, and 1994, and are displayed in Figure 7. To illustrate the phase and am- plitude relations between radars during each event, we show the amplitude and phase estimates for all radars together. Data were not available at Jakarta for 1992 or at Hawaii for 1994. The remaining data, however, ex- hibit some interesting features and a high degree of con- sistency during each event. In most cases, meridional amplitudes maximized between 85 and 95 km, with the exceptions being Hawaii during 1992 and Jakarta dur- ing 1993, both of which increased in amplitude over the height range. Zonal winds (not shown) were typically more than a factor of 2 smaller, except at Hawaii where they were more nearly comparable in magnitude with the meridional winds. We note, however, that MF radar amplitude estimates above ,- 90 km may be underesti- mates [Burrage et al., 1996], particularly in light of the results presented by Deng et al. [1997] and Palo et al. [1997]. There is general consistency in the interannual amplitude variations, with 1993 displaying the largest amplitudes and 1994 the smallest at each radar.
Considering now the phase variations with altitude shown in the right panels of Figure 7, we see very good agreement between the phases of the meridional winds at the different sites, particularly during 1992 and 1993 when the amplitudes were largest. Meridional phases also exhibit interannual consistency, with the phase pro- gression with altitude generally faster at Adelaide than at the other three sites. These data suggest vertical wavelengths at these altitudes of ~ 50 to 80 km at Hawaii, Christmas Island, and Jakarta and ~ 100 km or more at Adelaide. Phase variations of the zonal com-
ponent are not shown, but were found to exhibit more nearly evanescent behavior with altitude where ampli- tudes were sufficiently large to insure valid phase deter- minations during 1992 and 1994. Phase variations with altitude during 1993 at Hawaii and Adelaide, where zonal amplitudes were sufficient to provide valid esti- mates, were found to exhibit comparable vertical struc- ture to the meridional components, with zonal lagging (leading) meridional by ,• 8 hours at Hawaii (Adelaide).
3960 FRITTS ET AL.' TWO-DAY WAVE STRUCTURE AND MEAN FLOW INTERACTIONS
100
95
90
85
80
MF v amp. 1992
¸
o A
,llll,,,,llllll,lllllll ......
0 l0 20
+A O
O+A
+A
A +
A +
+
+
30 40
10
9
9
8
8
50
MF v phase 1992 '''1 ......... i ......... i ......... I ......... I'''
AO +
AO +
+ Adelaide ao +
ß Jakarta • + • +
a Christmas I. •+
o Hawaii • +AO
i i t I , i I i i i , i i I i i ....... I ......... i ......... I,,,
-20 -10 0 l0 20
100
95
90
85
MF v amp. 1993 ......... i ......... i ......... i ......... i .........
+ A •(
¸ + A
O+ A
• ¸+ A
o +A
• ¸ A+
zx> +
•i o +
......... [ , i i i i i i I , I ......... I i , i i i i i , I I ........
i0 20 30 40
80
0 50
100
95
90
85
8C
MF v phase 1993 '''1 ......... i ......... i ......... i ......... i'''
• •+ •+ _
OA +
¸•+
, , i i i , i • i • , i , i ......... i , i , i i i • , , I ......... I , , ,
-20 -10 0 10 20
100
95
90
85
MF v amp. 1994
• +
A+
• +
A
A Y• +
A •
A +
A +
+
0 i i , i i i i i i I i ........ i ......... I ......... I .........
0 10 20 30 40 50
MF v phase 1994 '''1 ......... i ......... i ......... i ......... i''
A +
A +
A +
A +
-20 -10 0 10 20 hr
Figure 7. MF and meteor radar 2-day wave (left,) alnplitude and (right) phase profiles for (top) 1992, (middle) 1993, and (bottom) 1994. In each case, only lneridional winds are shown for Hawaii (dialnonds), Chrisrinds Island (triangles), Jakarta (asterisks), and Adelaide (crosses). Phases are shown in local tilne assuming a 48-hour period.
4. Two-Day Wave Fluxes and Wave Mean Flow Interactions
4.1. Momentum and heat fluxes
To develop a comprehensive understanding of the ex- citation, evolution, and wave-mean flow interaction of the southern hemisphere summer 2-day waves, it would be most beneficial to evaluate the wave Eliassen-Pahn
(EP) fluxes and their influences through the Trans- formed Euleria. n-Mean (TEM) equations. With suffi- ciently accurate lnean wind and flux determinations, we could then eva. luate all contributing terms, recog- nize offsetting fluxes, and determine unambiguously the wave forcing of the residual circulation. The zonal TEM molnentum equation in spherical coordinates is JAn- drews ctal., 1987]
FRITTS ET AL.' TWO-DAY WAVE STRUCTURE AND MEAN FLOW INTERACTIONS
HRDI 7x" ' 1992 l , -o--•, ----- ,• .... /--, / lO ....
20 ' c:>- ..:...v::::...:::.,••.• •0 o o o
.
_
-60 .•• , , I I -60 I I I I I
• 10 15 20 25 30 4 9 14 5 10 15 20 25
HRDI ¸-'T' 1992
i i
30 4 9 14
3961
HRDI ix-'¸' 1993
40•.J..._..J ' V' v ' YC '
• 10 15 20 25 30
20
0
-20
-40
-60
40
0
-20
-40
-60
HRDI ¸-'T' 1993
i I I I
4 9 14 4 9 14
HRDI •-'¸' 1994 HRDI ¸-'T' 1994
5 10 •5 20 25 30 4 9 14 5 10 15 20 25 30 4 9 14 Jan Feb Jan Feb
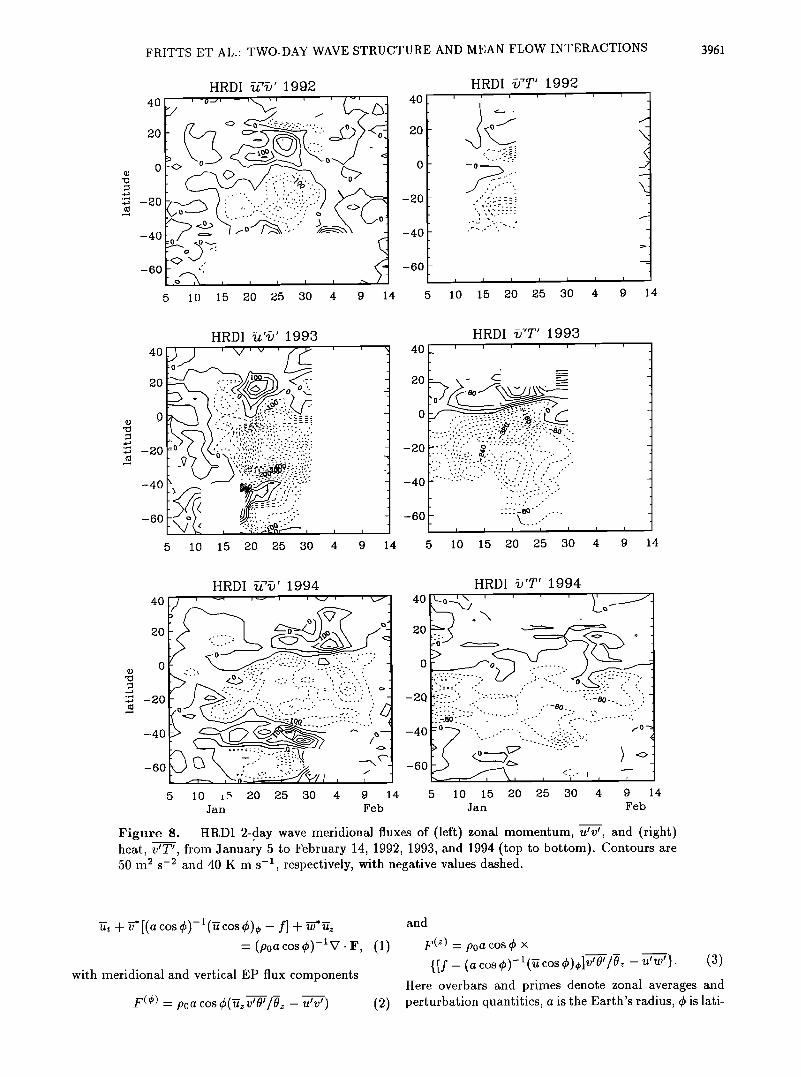
Figure 8. HRDI 2-.day wave meridional fluxes of (left) zonal momentum, u'v', and (right) heat, v'T', fi'om January 5 to February 14, 1992, 1993, and 1994 (top to bottom). Contours are 50 in 2 s -2 and 40 K m s-1 respectively, with negative values dashed , ß
'•7, + '•*[(a cos q•)-l(•cos •)• - f] + •*• = (p0acosq•)-•V .F, (1)
with meridional and vertical EP flux components
F © -- poacosd(•zV'O'/Oz -- •'v') (2)
and
FtZ) _ p0 a cos q• x {if_ (acosqb)-•(i•cosc))ol'v'O'/O,, - u'w'}. (3)
Here overbars and primes denote zonal averages and perturbation quantities, a is the Earth's radius, d is lati-
3962 FRITTS ET AL.' TWO-DAY WAVE STRUCTURE AND MEAN FLOW INTERACTIONS
rude, f is the Coriolis parameter, p0 the mean density, 0 is potential temperature, subscripts denote derivatives, and the residual mean meridional circulation (0, •*, •*) has components
- : + (,, (4)
Because HRDI wind and temperature measurements are available continuously only at ,-- 95 km, however, short-term estimates of 2-day wind and temperature perturbations are likewise confined to this altitude. Hence it is impossible to evaluate either •*, because of unresolved vertical gradients of v•O•/Oz, or •7*•z for these purposes and on short timescales, though the lat- ter term is likely negligible for estimates of •* and •z representative of the mesosphere. Nevertheless, we can define the latitudinal fluxes of zonal momentum
and temperature with confidence, and we will show be- low that these quantities are correlated with observed changes in the zonal (time-averaged) mean flow at spe- cific latitudes.
Two-day wave meridional fluxes of zonal momentum are estimated from both HRDI wind measurements and
MF radar data at their respective altitudes and lati- tudes. HRDI flux estimates as a h•nction of latitude
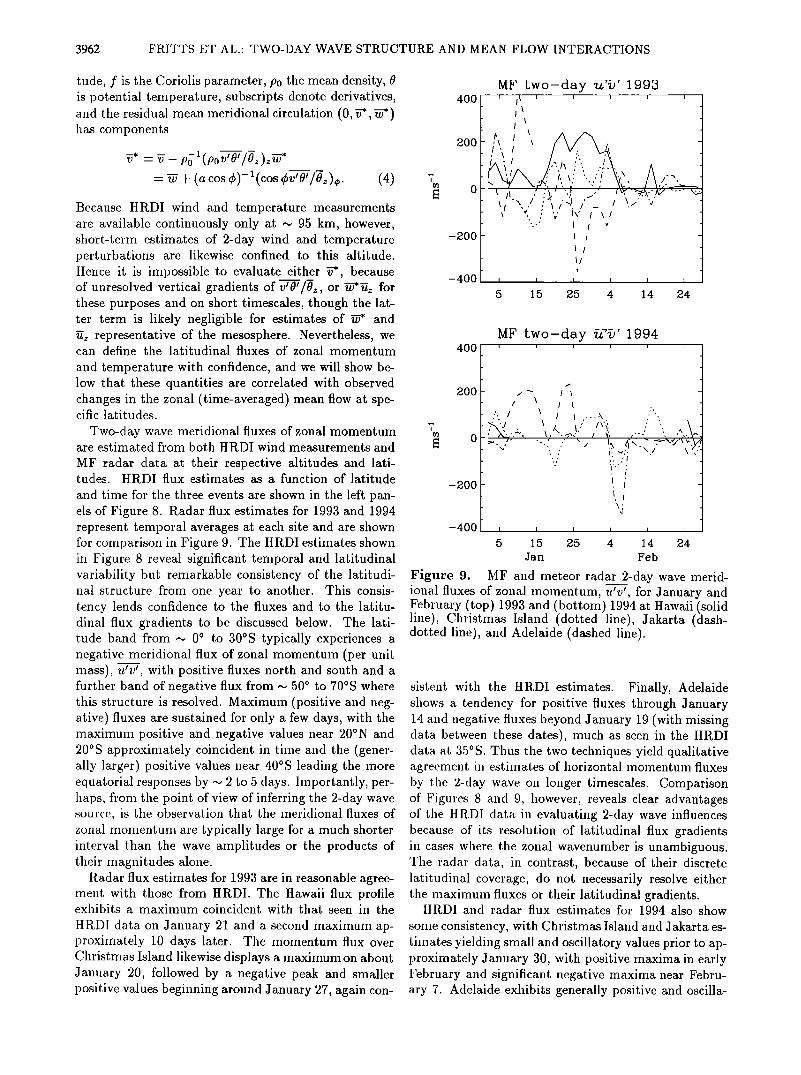
and time for the three events are shown in the left pan- els of Figure 8. Radar flux estimates for 1993 and 1994 represent temporal averages at, each site and are shown for comparison in Figure 9. The HRDI estimates shown in Figure 8 reveal significant temporal and latitudinal variability but remarkable consistency of the latitudi- nal structure from one year to another. This consis- tency lends confidence to the fluxes and to the latitu- dinal flux gradients to be discussed below. The lati- tude band from ,-- 0 ø to 30øS typically experiences a negative meridional flux of zonal momentum (per unit mass), u•v •, with positive fluxes north and south and a further band of negative flux from ,-- 500 to 70øS where this structure is resolved. Maximum (positive and neg- ative) fluxes are sustained for only a few days, with the maximum positive and negative values near 20øN and 20øS approximately coincident in time and the (gener- ally larger) positive values near 40øS leading the more equatorial responses by ,-- 2 to 5 days. Importantly, per- haps, from the point. of view of inferring the 2-day wave source, is the observation that the meridional fluxes of zonal momentum are typically large for a much shorter interval than the wave amplitudes or the products of their magnitudes alone.
Radar flux estimates for 1993 are in reasonable agree- ment with those from HRDI. The Hawaii flux profile exhibits a maximum coincident with that seen in the
HRDI data on January 21 and a second maximum ap- proximately 10 days later. The momentum flux over Christmas Island likewise displays a maximum on about January 20, followed by a negative peak and smaller positive values beginning around January 27, again con-
400
2OO
0
-2OO
-400
MF two-day 7Z-'•' 1993
/'\ ,I '\,
",\ /-'-x •. L ,..•._.L.,_,_,_,_,_,_•
•I,, / _ /,•,':•..x,x/ "•1 -x,,,,/ ;•/ , , ¾' I \ I
,, I i tl
I I I I
5 15 25 4 14 24
400
2OO
T
-2OO
-400
MF two-day 7z-'•' 1994 i i i i i
5 15 25 4 14 24
Jan Feb
Figure 9. MF and meteor radar 2-day wave merid- ional fluxes of zonal momentum, u•v •, for January and February (top) 1993 and (bottom) 1994 at Hawaii (solid line), Christmas Island (dotted line), Jakarta (dash- dotted line), and Adelaide (dashed line).
sistent with the HRDI estimates. Finally, Adelaide shows a tendency for positive fluxes through January 14 and negative fluxes beyond January 19 (with missing data between these dates), much as seen in the HRDI data at 35øS. Thus the two techniques yield qualitative agreement in estilnates of horizontal momentum fluxes by tl•e 2-day wave on longer timescales. Comparison of Figures $ and 9, however, reveals clear advantages of the HRDI data in evaluating 2-day wave influences because of its resolution of latitudinal flux gradients in cases where the zonal wavenumber is unambiguous. Whe radar data, in contrast, Because of their discrete latitudinal coverage, do not necessarily resolve either the maximun• fluxes or their latitudinal gradients.
HRDI and radar flux estimates for 1994 also show
some consistency, with Christmas Island and Jakarta es- timates yielding small and oscillatory values prior to ap- proximately January 30, with positive maxima in early February and significant negative maxima near Febru- a.ry 7. Adelaide exhibits generally positive and oscilla-
FRITTS ET AL' TWO-DAY WAVE STRUCTURE AND MEAN FLOW INTERACTIONS 3963
tory values until approximately January 26 and increas- ingly negative, but small, values thereafter. As above, however, there is more latitudinal structure in the mo- mentum flux profile than these radars at their discrete latitudes can resolve properly. More importantly, the rada.rs appear to be located at latitudes near the tran- sitions from positive to negative fluxes in the HRDI momentum flux estimates and are therefore unable to
capture the largest flux magnitudes. Momentum flux comparisons are not shown for 1992 because HRDI flux esti•nates at the radar latitudes are small, though large positive fluxes measured with the Hawaii radar from ap- proximately January 25 to 31 and at Christmas Island ending around January 28 and a negative maximum at Jakarta from around January 24 to 28 do coincide with nearby (in latitude) HRDI maxima and minima. Hence the qualitative consistency of the radar and HRDI esti- mates at the latitudes of these radars suggests greater confidence in the implications of these fluxes than would be possible with either technique alone.
Two-day wave meridional fluxes of heat, v•T •, were also estimated from the HRDI measurements and are
displayed in the right panels of Figure 8. While tem- perature data were limited in time during 1992, the latit, udinal variations of the heat flux exhibit consider-
able consistency among the three 2-day wave events for which they were computed. As noted in the discussion of Figures 4, 5, and 6, significant temperature perturba- t. ions typically begin somewhat in advance of large two- day wave velocity perturbations (particularly the zonal component). This results in meridional heat fluxes that likewise precede meridional momentum fluxes by the wave by • 5 to 10 days, at least for 1992 and 1993, during which the 2-day wave events were more tran- sient. The region of negative heat flux reaches from middle and high southern latitudes to somewhat north of the equator during each event, with the line of zero flux (and the maximum latitudinal gradients of heat flux) typically extending into the latitudes with large and positive momentran fluxes (see the top and middle panels of Figure 8 near 50 to 10øN at --• day 21 in each case). Unlike the momentum fluxes, the heat fluxes do not exhibit a strong positive maximum at middle or high southern latitudes, though values near zero are seen south of-,• 40øS during 1993 and 1994.
Taken together, the momentum and heat fluxes de- scribed in this section suggest a large degree of con- sistency in the excitation, propagation, and potential wave-mean flow interaction of the 2-day wave from one southern hemisphere event to another. As such, they also imply that these flux estimates are reasonable approximations to the (measureable) influences of the 2-day wave on its environment. In section 4.2, we dis- cuss the manner in which such fluxes might arise and the nature of the accompanying mean flow evolution within the constraints of our available EP flux estimates.
4.2. Implications for Wave-Mean Flow Interactions
We now consider the possible wave-mean flow in- teractions accompanying the 2-day wave event during January and February 1993 as this event exhibited the largest, wave amplitudes and fluxes of any during our ob- servations. As noted above, however, use of the TEM equations is prevented by lack of knowledge of the resid- ual mean circulation, (•*,•*), because of unresolved vertical gradients of v/0//0• and unknown •*. Alterna- tively, assuming adiabatic motions on short timescales, the Eulerian-mean zonal momentum equation in spheri- cal coordinates may be written as [Andrews et al., 1987]
•t + F[(a cos ½)-•(•cos ½)0 - f] + WUz : -(. cos cos pS(p0,W,)z. (a)
Again, overbars, primes, and subscripts denote zonal means, perturbation quantities, and derivatives, respec- t. ively, and variables are as in section 4.1. Of these terms, •(a cos ½)-1('i7 cos q•)½ and •-q,z have magnitudes • 10 -4 m s -• at middle and equatorial latitudes, while f• and the wave fluxes (large and small scale) on the right side of (5) are more typically--• 10 -3 m s -2 Thus substantial changes in the horizontal wave fluxes (and divergences) on short timescales must be reflected in compensating wave or mean fluxes, zonal accelerations, induced meridional motions, or some combination of these.
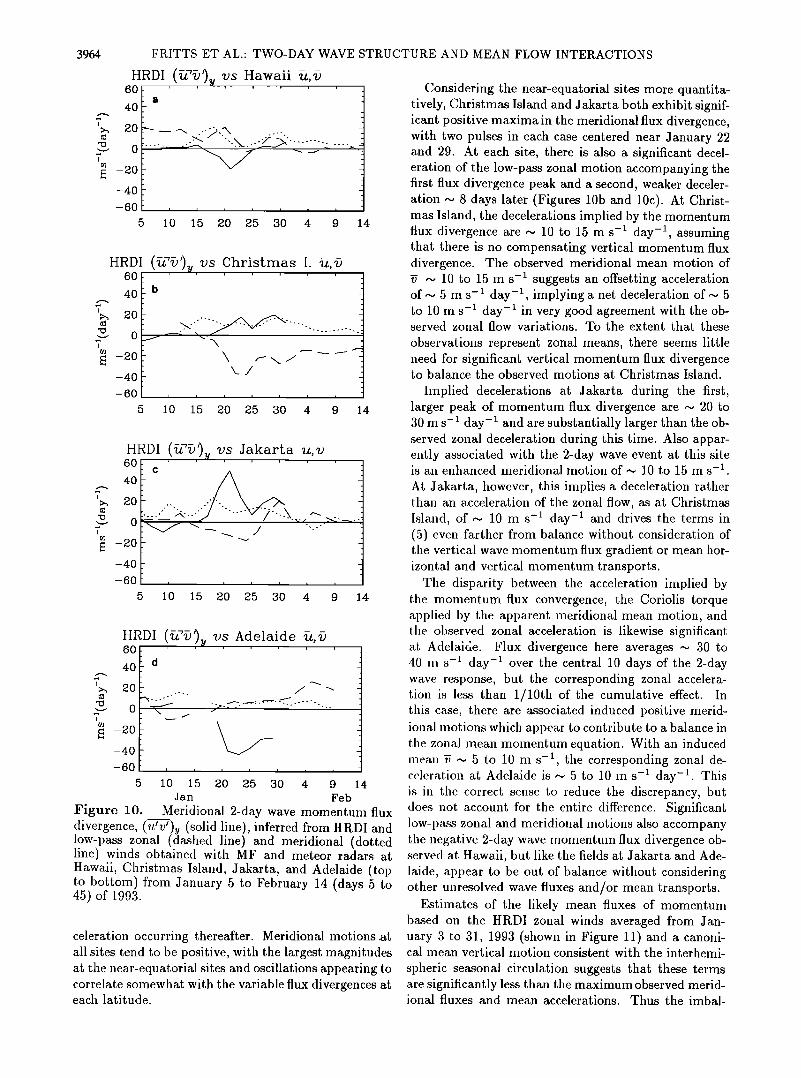
To examine the relations between these terms, we dis- play in Figure 10 the spatially and temporally smoothed meridional divergence of the 2-day wave horizontal mo- mentum flux, (u•v•)y, computed from the HRDI 2-day amplitude and phase fits and the low-pass zonal and meridional motions measured by the MF and meteor radars during January and February 1993. The scales in each case are shown at the left and are in m s -1
day-• and m s-•, respectively. Looking first at the flux divergence and mean flow changes at Adelaide (Fig- ure 10d), we see that as the wave amplitude increases and the momentum flux divergence becomes large and negative (beginning around January 18, see Figures 3, 5, and 8), there is a corresponding increase in the low- pass zonal wind. In fact, the zonal wind increase cor- relates well with the overall duration of the 2-day wave event. The meridional wind decreases initially and re- covers somewhat throughout the event, but these varia- tions are less distinct and may represent uncertainty in the low-pass wind estimates or natural variability due to other motions or forcing processes. Similar correla- tions, but having opposite flux divergences and zonal mean tendencies, are observed at Jakarta (Figure 10c) and Christmas Island (Figure 10b). Data at the lat- itude of Hawa.ii exhibit a weaker negative momentum flux divergence and a zonal acceleration which appears to lead rather than lag the divergence peak, with a de-
3964 FRITTS ET AL.- TWO-DAY WAVE STRUCTURE AND MEAN FLOW INTERACTIONS
4O
2O
0
-20 -4O
-6O
HRDI (Tz'')u vs Hawaii , 60
i i i i i
,5 10 1,5 20 2,5 30 4 9 14
HRDI (Tz"')• vs Christmas I. 7z,¸ 4O
2O
0
-20 -4O
-6O
,5 10 1,5 20 25 30 4 9 14
-20 -40
-60
HRDI (7x"')• vs Jakarta ,
60 40
20
o
5 10 15 20 25 30 4 9 14
2O
0
-20 -4O
-6O
HRDI (7x"')• vs Adelaide 40 d
,5 10 1,5 20 25 30 4 9 14 Jan Feb
Figure 10. Meridional 2-day wave momentuln flux divergence, (u•v•)y (solid line), inferred from HRDI and low-pass zonal (dashed line) and meridional (dotted line) winds obtained with MF and meteor radars at Hawaii, Christmas Island, Jakarta, and Adelaide (top to bottom) from January 5 to February 14 (days 5 to 45) of 1993.
celeration occurring thereafter. Meridional motions.at all sites tend to be positive, with the largest magnitudes at the near-equatorial sites and oscillations appearing to correlate somewhat with the variable flux divergences at each latitude.
Considering the near-equatorial sites more quantita- tively, Christmas Island and Jakarta both exhibit signif- icant positive maxima in the meridional flux divergence, with two pulses in each case centered near January 22 and 29. At each site, there is also a significant decel- eration of the low-pass zonal motion accompanying the first flux divergence peak and a second, weaker deceler- ation-.. 8 days later (Figures 10b and 10c). At Christ- mas Island, the decelerations implied by the momentum flux divergence are-.• 10 to 15 m s -• day -• assuming that there is no compensating vertical momentum flux divergence. The observed meridional mean motion of '• -.• 10 to 15 m s -• suggests an offsetting acceleration of -.. 5 m s- • day -•, implying a net deceleration of -.. 5 to 10 m s -• day -• in very good agreement with the ob- served zonal flow variations. To the extent that these
observations represent zonal means, there seems little need for significant vertical momentum flux divergence to balance the observed motions at Christmas Island.
hnplied decelerations at Jakarta during the first, larger peak of momentum flux divergence are • 20 to 30 in s-1 day- • and are substantially larger than the ob- served zonal deceleration during this time. Also appar- ently associated with the 2-day wave event at this site is an enhanced meridional motion of -,• 10 to 15 m s -•.
At Jakarta, however, this implies a deceleration rather thal• an acceleration of the zonal flow, as at Christmas Island, of -,• 10 m s. --• day -• and drives the terms in (5) even farther froin balance without consideration of the vertical wave momentum flux gradient or mean hor- izontal and vertical momentum transports.
The disparity between the acceleration implied by the lnomel•tum flux convergence, the Coriolis torque applied by the apparent meridional mean motion, and the observed zonal acceleration is likewise significant at. Adelaide. Flux divergence here averages-,• 30 to 40 m s -I day -• over the central 10 days of the 2-day wave response, but the corresponding zonal accelera- tion is less than 1/10th of the cumulative effect. In this case, there are associated induced positive merid- ional motions which appear to contribute to a balance in the zonal mean molnentum equation. With an induced mean • -,• 5 to 10 D_l S --1 the corresponding zonal de- celeration at Adelaide is • 5 to 10 ill S --1 day -• This is in the correct sense to reduce the discrepancy, but does not account for the entire difference. Significant low-pass zonal and meridional motions also accompany the negative 2-day wave lnomentuln flux divergence ob- served at Hawaii, but like the fields at Jakarta and Ade- laide, appear to be out of ba. lal•ce without considering other unresolved wave fluxes and/or mean transports.
Estilnates of the likely mean fluxes of momentum based on the HRDI zonal winds averaged from Jan- uary 3 to 31, 1993 (shown in Figure 11) and a canoni- cal mean vertical motion consistent with the interhemi-
spheric seasonal circulation suggests that these terms are significantly less than the maximum observed merid- ional fluxes and mean accelerations. Thus the imbal-
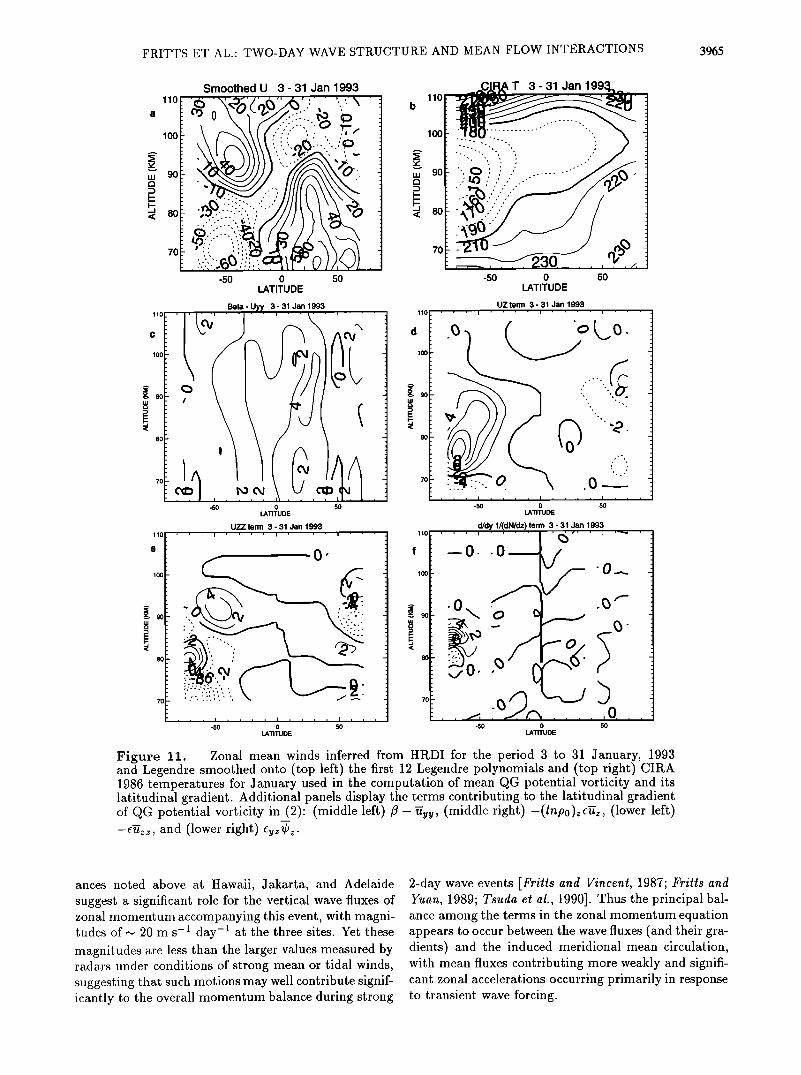
FRITTS ET AL.' TWO-DAY WAVE STRUCTURE AND MEAN FLOW INTERACTIONS
SmoothedU 3-31Jan1993 T 3-31Jan1 ..,,,,•C• 993,.,
110i! O'• 0 b 110 a .
100 100 ................. ',
70 70
-50 0 50 -50 0 50 LATITUDE •TITUDE
Beta - Uyy 3 - 31 Jan 1993 UZ term 3 - 31 Jan 1993 110 .... [ .... [ .... [ .... 1 , , , [ .... [ .... I ' ' '
C '
100 11
80
.
, , I -50 0 0 50 -50 LATITUDE LATITUDE
UZZ term 3 - 31 Jan 1993 d/dy 1/(dN/dz) term 3 - 31 Jan 1993
f --0..0•//,,/,• '0_•.
80
-50 0 50 -50 0 50 •TUDE •TITUDE
Figure 11. Zonal mean winds inferred from HRDI for the period 3 to 31 January, 1993 and Legendre smoothed onto (top left) the first 12 Legendre polynomials and (top right) CIRA 1986 temperatures for January used in the computation of mean QG potential vorticity and its latitudinal gradient. Additional panels display the terms contributing to the latitudinal gradient of QG potential vorticity in (2)' (middle •eft) (middle right) -(/np0)ze•,, (lower left) -e•z•, and (lower right)
3965
ances noted above at Hawaii, Jakarta, and Adelaide suggest a significant role for the vertical wave fluxes of zonal molnentum accompanying this event, with magni- tudes of • 20 m s-1 da,y-1 at the three sites. Yet these magnitudes are less than the larger values measured by radars under conditions of strong mean or tidal winds, suggesting that such motions may well contribute signif- icantly to the overall momentum balance during strong
2-day wave events [Fritts and Vincent, 1987; Frilts and •an, 1989; Tsuda et al., 1990]. Thus the principal bal- ance among the terms in the zonal momentum equation appears to occur between the wave fluxes (and their gra- dients) and the induced meridional mean circulation, with mean fluxes contributing more weakly and signifi- cant zona,1 a, ccelera,tions occurring primarily in response to transient wave forcing.
3966 FRITTS ET AL.' TWO-DAY WAVE STRUCTURE AND MEAN FLOW INTERACTIONS
11o
lOO
80
70 ,
,
ß
-50
(1.E5/s) 3- 31 Jan 1993
o 50 LATITUDE
110
100
LU 9O
< 80
70
dQ/dy (1.Ell/s-m) 3- 31 Jan 1993
' '/' ' ' '
-50 0 50 LATITUDE
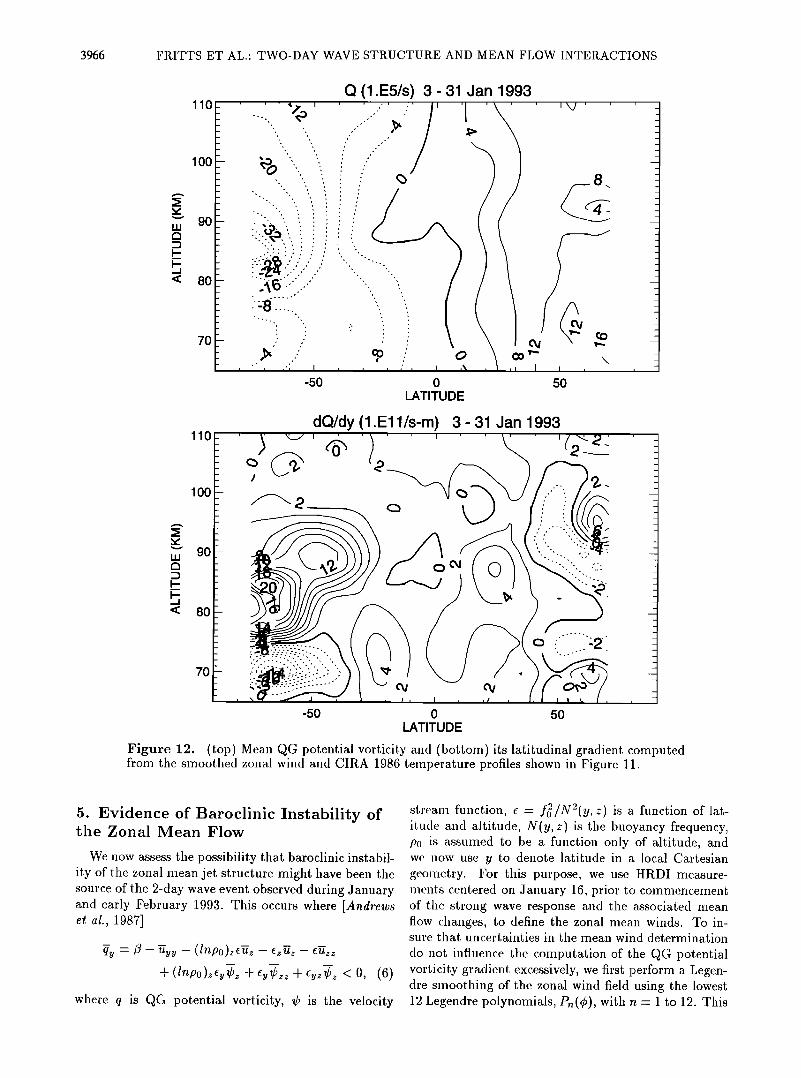
Figure 12. (top) Mean QG potential vorticity and (bottom) its latitudinal gradient computed from the smoothed zonal wind and CIRA 1986 temperature profiles shown in Figure 11.
5. Evidence of Baroclinic Instability of the Zonal Mean Flow
We now assess the possibility that baroclinic instabil- ity of the zonal lnean jet structure might have been the source of the 2-day wave event observed during January and early February 1993. This occurs where [Andrews ctal., 1987]
q-• -/• - • - (lnpo),e•, - • - •
+ (/.po)z•½• + •½..• + •½• < 0. (6)
where q is QG potential vorticity, ½ is the velocity
stream fi, nction, e = f•2/N2(y,z) is a function of lat- it. tide and altitude, N(y,z) is the buoyancy frequency, p0 is assumed to be a fi•nction only of altitude, and we now use y to denote latitude in a local Cartesian geometry. For this purpose, we use HRDI measure- ments centered on January 16, prior to colnmencement of the strong wave response and the associated mean flow changes, to define the zonal mean winds. To in- stire that uncertainties in the mean wind determination
do not influence the computation of the QG potential vorticity gradient excessively, we first perform a Legen- dre smoothing of the zonal wind field using the lowest 12 Legendre polynomia,ls, P,,(•), with n = 1 to 12. This
FRITTS ET AL.' TWO-DAY WAVE STRUCTURE AND MEAN FLOW INTERACTIONS 3967
smoothing yields a zonal wind field that preserves all of the major features of the observed flow (see Figure 11a). In particular, we note that the scales of the features in the resulting QG potential vorticity gradient field are significantly larger than the scales removed by the Leg- endre smoothing, suggesting the appropriateness of this procedure.
HRDI temperature determinations on short time scales in the mesosphere a. re known to exhibit diurnal tidal influences at lower latitudes and semidiurnal tidal
influences at higher latitudes, though longer-term av- erages conform more closely to the CIRA 1986 refer- ence atmosphere [Oftland et al., 1998]. Thus we have elected to use CIRA 1986 rather than HRDI tempera-
tures in computing N(y, z) and its vertical and latitu- dinal gra, dients. The temperature cross section used for this purpose is shown in Figure 11a. As above, the va- lidity of this substitution is supported by the resulting profiles, which suggest a weak dependence of the QG potential vorticity gradient on all but the vertical shear and curvature terms, except near the high-latitude sum- mer mesopause where latitudinal and vertical gradients of N(y, z) also contribute.
The HRDI mean winds and CIRA 1986 temperatures
(Figures 11a and lib) are then used to evaluate the various terms in (6). The dominant terms are displayed separately in Figure 11c -llf, with /3 - •yy contribu- tions shown together. As noted above, the dominant terms are clearly the vertical shear and vertical curva- ture terms shown in Figure lib and lie, respectively. Relative to these, the remaining terms make only --• 10 to 20% contributions to 5y at high latitudes in the sum- met hemisphere. We note, in particular, that both the vertical shear and curvature terms make very similar
contributions to 5y such that the total field is stronger in magnitude than either alone. The resulting 5 and 5y fields are displayed in the top and bottom panels of Figure 12 and are seen to exhibit a region of baroclinic instability in the high-latitude summer mesosphere ex- tending from --• 65 to 75 km in altitude and equatorially to latitudes of • 35øS. The implication is that baroclinic instability is a potential source of the 2-day wave event observed during January and February 1993, particu- larly in light of the evidence for such a source in the data analysis byRandel [1994] and the general circula- tion model results of Norton and Thuburn [1996].
As further possible evidence for a baroclinic instabil- ity source of this 2-day wave, we now consider the zonal mean QG potential vorticity equation, which in the ab- sence of fi'iction and diabatic effects may be written [Andrews et al., 1987]
•t -- --(v'q')y -- (lt'V')yy -- p•-l(pofoV'O'/OOz )yz, (7)
which were inferred in the above discussion to be signifi- cant in the momentum balance. However, this equation does express the effects of the 2-day wave on the mean QG potential vorticity distribution.
In order to make further progress, we now require an assumption about the vertical variation of the last term in (7). Assuming that (pofov'O'/Ooz) varies in the verti- ca.1 primarily through p0 and in the meridional direction primarily through v'O', (7) can be further simplified as
qt -('•t'V')yy q- ZZ2---•o(V'T')y, (8) which can be estimated using the fluxes we have de- rived from the HRDI data during this 2-day wave event. These approximations are likely very qualitative, as it is impossible with the existing data to be confident that vertical gradients in v'T' are not significant. Neverthe- less, this effort leads to some interesting insights based on the momentum and heat fluxes observed by HRDI.
Referring to the middle panels in Figure 8, we see, despite considerable variability of these fluxes in space and time, that there are features in each distribution a,t larger scales that are likely to be qualitatively accu- rate measures of the 2-day wave influences. Considering first the momentum fluxes, we note that the positive maxima at -.• 400 to 60øS and extending from the equa- tor to--• a0øN imply decreasing •, while the negative maximum in between implies an increasing • at those latitudes. Thus we expect an increasing •y due to hori- zontal momentum flux convergence extending from ap- proximately 20øS to 50øS that coincides with the rapid growth in 2-day wave amplitudes in the radar and HRDI data (see Figures 3 and 5). The opposite latitudinal gradient. in u'v' extending from • 20øS to 20øN implies a decreasing q-y at those latitudes. This decreasing •y appears to be delayed by several days relative to the in- creasing gradient farther south and suggests a possible causal relationship between wave excitation at middle and high latitudes and wave forcing of the mean flow at equatorial latitudes. The heat fluxes shown in the middle right panel in Figure 8 exhibit a general nega- tive gradient with lai, itude southward from --• 30øS and a reversed gradient northward of this latitude. From (8) we see that these gradients imply • decreases (in- creases) south (north) of 30øS. These heat fluxes and their associated • tendencies are seen to precede some- what the momentum fluxes discussed above. Together, the source terms in (8) suggest an increase in q--y extend- ing fi'om low to high southern latitudes (• 10 ø to 50øS) which correlates reasonably with the growth phase of the 2-day wave and the occurrence of a baroclinically unstable mesosphere poleward of • 35øS prior to this event.
where 0 = T(po/p) •/• is potential temperature, R is the gas constant, and cp is the specific heat at constant pressure. Importantly, (7) neglects the vertical (and other) flux contributions due to smaller-scale motions,
6. Summary and Conclusions We have presented an analysis of 2-day wa,ve struc-
ture, fluxes, and wave mean flow interactions using data
3968 FRITTS ET AL.: TWO-DAY WAVE STRUCTURE AND MEAN FLOW INTERACTIONS
collected with MF and meteor radars and the HRDI in- strument aboard UARS during the three southern hemi- sphere summer events spanning the CADRE equato- rial dynamics measurements. The southern hemisphere 2-day wave events were found to be very transient. with typical durations of 20 to 30 days, to have consistent phase structure from year to year, but to exhibit signifi- cant interannual variability in amplitude and amplitude variations with altitude.
Radar and HRDI data also were used to estimate
meridional fluxes of zonal momentum, and HRDI data were used to estimate meridional fluxes of heat. While it
was not possible to estimate the complete EP fluxes ac- companying the 2-day wave even[s, these efforts yielded consistent latitudinal variations of momentum and heat
fluxes from year to year and suggested that the flux esti- mates represent valid measures of 2-day wave influences on the zonal mean circulation and thermal structure at the measurement altitudes. The dominant features of
the meridionM momentum flux profiles include positive fluxes in latitude bands from near the equator to 200 or 30øN and from • 400 to 50øS and negative fluxes at other latitudes, with the largest negative fluxes at equatorial and middle southern latitudes. Heat fluxes were found to be primarily negative in the southern henrisphere and positive in the northern henrisphere, with the larger magnitudes confined within-,• 200 of the equator. Meridional gradients of the meridional flux of zonal momentum were found to be anticorrelated, in general, with the acceleration of the low-pass zonal mo- tion, as expected in the absence of other momentum sources or sinks. However, the responses were typically smaller than implied by the flux gradients, suggesting the genera[ion of meridional motions yielding compen- sating Coriolis torques or balancing vertical momentum fluxes (and divergences).
Motivated by the consistency of the 2-day wave mo- mentum and heat fluxes, we also assessed the potential for baroclinic instability as a viable source of the 2-day wave during January 1993. Using smoothed HRDI zonal winds and appropriate CIRA 1986 temperatures for this interval, we observed a zone extending in alti- tude from • 65 to 75 km and equatorward to ,-0 35øS,
having •y < 0 and suggesting a possible source of 2-day wave activity. The terms contributing most to the ap- parent instability of the zonal mean circulation were the vertical shear and curvature terms, suggesting that our use of the CIRA 1986 temperatures did not represent a major uncertainty in this estimate. Additional evidence for this interpretation was provided by the 5 tenden- cies implied by the horizontal wave fluxes of momen- tum and temperature. These suggested that the 2-day wave acted to increase •y at middle to high southern latitudes during the growth phase of the January 1993 event, with an equatorial response delayed by several days and a cessation of the wave-mean flow interaction accompanying the decay phase of the wave event.
We believe the results of our analysis of the south- ern hemisphere 2-day wave events provide evidence for
baroclinic instability as the source of this wave motion. As such, our conclusions support the suggestions by Plumb [1983], Pfister [19815], and Norton and Th. uburn [1996] that the 2-day wave arises as a result of instabil- ity. However, they also appear consistent with the stud- ies by Satby [1981c] •nd Itagan et al. [1993], support- ing • normal mode interpretation of the wave motion following excitation. Our results are thus consistent, as well, with the study by Randel [1994] using NCEP dat• at stratospheric altitudes. Further quantification of 2-d•y w•ve sources, characteristics, and mean flow in- teractions would be beneficial, but will require wind and temperature data at several altitudes in order to quan- tify wave structures and EP fluxes more completely.
Acknowledgments. This research was supported by the National Scieno• Foundation (NSF) under grants ATM- 9118899 and ATM-9414177 and by the National Aeronaut-
tics and Space Administration (NASA) under grants NAS- 5-27751 and NAGS-2786. Partial operational support of the
MF radar in Hawaii was provided under NSF grant ATM- 9302050.
References
Andrews, D. G., J. R. Holton, and C. B. Leovy, Middle Atmosphere Dynamics, 489 pp., Academic, San Diego, Calif., 1987.
Burks, D., and C. B. Leovy, Planetary waves near the meso- spheric easterly jet, Geophys. Res. Lett., 13, 193-196, 1986.
Burrage, M.D., et al. Validation of mesosphere and lower thermosphere winds froin the high resolution Doppler im- ager on UARS, J. Geophys. Res., 101, 10,365-10,392, 1996.
Clark, R. R., Meteor wind measurements at Durham, New Hampshire (43 ø N, 71 ø W), J. Atmos. Sci., 32, 6343-6357, 1975.
Clark, R. R., A. C. Current, A. H. Manson, C. E. Meek, S. K. Avery, S. E. Palo, and T. Aso, Global properties of the 2-day wave fi'om mesosphere-lower thermosphere radar observations, J. Atmos. Terr. Phys., 56, 1279-1288, 1994.
Coy, L., A possible 2-day oscillation near the tropical strato- pause, J. Atmos. ,5'ci., 36, 1615-1618, 1979.
Craig, R. L., and W. G. Elford, Observation of the quasi two-day wa. ve near 90 kin altitude, J. Atmos. Terr. Phys., •3, 11)51-11)56, 1981.
Craig, R. L., R. A. Vincent, G. J. Fraser, and M. J. Smith, The quasi-2-day wave in the Southern Hemisphere meso- sphere, Nature, 287, 319-320, 1980.
Deng, W., et al., Coordinated global radar observations of tidal and planetary waves in the mesosphere and lower thennosphere during January 20-30 1993, J. Geophys. Res., 102, 7307-7318, 1997.
Fritts, D.C., and J. R. Isler, Mean motions and tidal and two-day structure and variability in the lnesosphere and lower thennosphere over Ha. waii, J. Atmos. Sci., 51, 2145- 2164, 1994.
Fritts, D.C., and R. A. Vincent, Mesospheric momentum flux studies at Ade]Mde, AustrMia: Observations and a gravity wave/tidal interaction mode], J. Atmos. Sci., •, 605-619, 1987.
Fritts, D.C., and L. ¾uan, Measurement of momentum fluxes near the summer mesopause at Poker Fiat, Alaska, J. Atmos. Sci., •{6, 2569-2579, 1989.
FRITTS ET AL.: TWO-DAY WAVE STRUCTURE AND MEAN FLOW INTERACTIONS 3969
Hagan, M. E., J. M. Forbes, and F. Vial, Numerical investi- gation of the propagation of the quasi 2-day wave into the lower thermosphere, J. Geophys. Res., 98, 23,193-23,205, 1993.
Harris, T. J., and R. A. Vincent, The quasi-two-day wave ob- served in the equatorial middle atmosphere, J. Geophys. Res., 98, 10,481-10,490, 1993.
Hays, P. B., V. J. Abreu, M. E. Dobbs, D. A. Gell, H. J. Grassl, and W. R. Skinner, The high-resolution Doppler imager on the Upper Atmosphere Research Satellite, J. Geophys. Res., 98, 10,713-10,723, 1993.
Isler, J. R., and D.C. Fritts, Gravity wave variability and in- teraction with lower-frequency motions in the mesosphere and lower thermosphere over Hawaii, J. Atmos. Sci., 53, 37-48, 1996.
Kal•henko, B. V., Latitude and longitude features of the two-day disturbances of the drift of meteor trails (in Rus- sian), Meteor. Res., 6, 16-19, 1979.
Kaldhenko, B. V., and S. V. Bulgakov, Study of peri- odic components of wind velocity in the lower thermo- sphere above the equator, Geomag. Aeronomy, 13, 955- 956, 1973.
Kingsley, S., H. Muller, L. Nelson, and A. Scholefield, Me- teor winds over Sheffield, J. Atmos. Terr. Phys., d0, 917- 922, 1978.
Lait, L. R., and J. L. Stanford, Applications of asynoptic
Rodgers, C. D., and A. Prata, Evidence for a traveling 2- day wave in the middle atmosphere, J. Geophys. Res., 86, 9661-9664, 1981.
Salby, M. L., The 2-day wave in the middle atmosphere: Ob- servations and theory, J. Geophys. Res., 86, 9654-9660, 1981a.
Salby, M. L., Rossby normal modes in nonuniform back- ground configurations: Simple fields, J. Atmos. Sci., $8, 1803-1826, 1981b.
Salby, M. L., Rossby normal modes in nonuniform back- ground configurations: Equinox and solstice conditions, J. Atmos. Sci., 38, 1827-1840, 1981c.
Salby, M. L., and R. Roper, Long-period oscillations in the meteor region, J. A tmos. Sci., 37, 237-244, 1980.
Stening, R. J., C. E. Meek, A. H. Manson, and D. G. Stephenson, Winds and wave motions to 110 km at mid- latitudes, VI, Tidal, gravity and planetary waves, J. At- mos. Sci., 35, 2194-2204, 1978.
Tsuda, T., S. Kato, and R. A. Vincent, Long period oscilla- tions observed by the Kyoto meteor radar and comparison of the quasi-two-day wave with Adelaide MF radar obser- vations, J. Atmos. Terr. Phys., 50, 225-230, 1988.
Tsuda, T., Y. Murayama, M. Yamamoto, S. Kato, and S. Fukao, Seasonal variation of momentum flux in the meso- sphere observed with the MU radar, Geophys. Res. Left., 17, 725-728, 1990.
space-time Fourier transform methods to scanning satel- ' Vincent, R. A., Gravity wave motions in the mesosphere, J. lite measurements, J. Atmos. Sci., d5, 3784-3799, 1988.
Meek, C. E., et al., Global study of northern hemisphere quasi-2-day wave events in recent summers near 90 km altitude, J. Atmos. Terr. Phys., 58, 1401-1411, 1996.
Muller, H. G., Long-period meteor wind oscillations, Phil. Trans. R. Soc. London, 271,585-598, 1972.
Muller, H. G., and L. Nelson, A travelling quasi 2-day wave in the meteor region, J. Atmos. Terr. Phys., d0, 761-766, 1978.
Norton, W. A., and Thuburn, The two-day wave in a middle atmosphere GCM, J. Geophys. Res., 23, 2113-2116, 1996.
Oftland, D. A., P. B. Hays, W. R. Skinner, and J.-H. Yee, Remote sensing of mesospheric temperature and 02 band volume emission rates with the High-Resolution Doppler Imager, J. Geophys. Res., 103, 1821-1835, 1998.
Palo, S. E., et al., An intercomparison between the GSWM, UARS, and ground based radar observations: A case- study in January 1993, Ann. Geophys., 15, 1123-1141, 1997.
Pfister, L., Baroclinic instability of easterly jets with appli- cations to the summer mesosphere, J. A tmos. Sci., 42, 313-330, 1985.
Phillips, A., Simultaneous observations of the quasi 2-day wave at Mawson, Antarctica and Adelaide, South Aus- tralia, J. Atmos. Terr. Phys., 51,119-124, 1989.
Plumb, R. A., Baroclinic instability of the summer meso- sphere: A mechanism for the quasi-two-day wave?, J. At- mos. Sci., •0, 262-270, 1983.
Plumb, R. A., R. A. Vincent, and R. L. Craig, The quasi- two-day wave event of January 1984 and its impact on the mean mesospheric circulation, J. Atmos. Sci., JJ, 3030- 3036, 1987.
Poole, L. M. G., The characteristics of the mesospheric two- day wave as observed at Grahamstown (33.3S, 26.5E), J. Atmos. Terr. Phys., 52, 259-268, 1990.
Randel, W. J., Observations of the 2-Day wave in NMC stratospheric analyses, J. Atmos. Sci., 51,306-313, 1994.
Atmos. Terr. Phys., d6, 119-128, 1984. Vincent, R. A., and D. Lesicar, Dynamics of the equatorial
mesosphere: First results with a new generation partial reflection radar, Geophys. Res. Lett., 18, 825-828, 1991.
Walterscheid, R. L., and R. A. Vincent, Tidal generation of the phase-locked 2-day wave in the southern hemisphere summer by wave-wave interactions, J. Geophys. Res., 101, 26,567-26,576, 1996.
Wu, D. L., P. B. Hays, W. R. Skinner, A. R. Marshall, M. D. Burrage, R. S. Lieberman, and D. A. Oftland, Obser- vations of the quasi 2-day wave from the High Resolution Doppler Imager on UARS, Geophys. Res. Lett., 20, 2853- 2856, 1993.
Wu, D. L., P. B. Hays, and W. R. Skinner, A least squares method for spectral analysis of space-time series, J. At- mos. Sci., 52, 3501-3511, 1995.
M. D. Burrage, and D. R. Marsh, Space Physics Research Laboratory, University of Michigan, Ann Ar- bor, MI 48109. (e-mail: [email protected]; d anielm @ umich. ed u)
D. C. Fritts, and R. S. Lieberman, Colorado Re- search Associates/NWRA, 3380 Mitchell Lane, Boul- der, CO 80301. (e-mail: [email protected]; rut h @color ad o- r ese arch. corn )
J. R. Isler, Physics Department, Wagner College, Staten Island, NY 10301. (e-mail: [email protected])
T. Nakamura and T. Tsuda, Radio Atmospheric Sci- ence Center, University of Kyoto, Kyoto, Japan. (e-mail: [email protected]. ac.jp; [email protected] u.ac.jp)
I. M. Reid and R. A. Vincent, Department of Physicis, University of Adelaide, Adelaide, South Australia. (e-mail: [email protected]; rvincent@physics. adelaide.edu.au)
(Received July 1, 1997; revised June 16, 1998; accepted July 13, 1998.)
Related Documents