Two Business Lines. One Vision for Growth. 2017 Annual Report

Welcome message from author
This document is posted to help you gain knowledge. Please leave a comment to let me know what you think about it! Share it to your friends and learn new things together.
Transcript

Two Business Lines.One Vision for Growth. 2017 Annual Report

(millions of dollars) (1) 2017 2016
Total assets 2,336.7 1,847.5
Total liabilities 1,560.7 918.9
Net capital expenditures (2) 218.7 86.1
Senior secured debt 463.4 244.7
Total debt 1,063.4 541.7
Senior secured debt/Adjusted EBITDA (3) (4) 1.6x 1.1X
Total debt/Adjusted EBITDA (3) (4) (5) 3.3x 2.1X
(millions of dollars) (1) 2017 2016
Revenues 2,385.0 2,023.7
Gross profit 735.4 656.4
EBITDA from operations (1) 306.8 276.5
Adjusted EBITDA (1) 297.6 230.3
Adjusted operating cash flow before transaction and other costs (1) 250.5 189.8
Adjusted operating cash flow (1) 217.4 139.6
Net (loss) earnings from continuing operations (27.9) 114.2
Dividends declared 102.8 102.2
(dollar per basic share except shares outstanding) 2017 2016
EBITDA from operations (1) 2.15 1.95
Adjusted EBITDA (1) 2.08 1.62
Adjusted operating cash flow before transaction and other costs (1) 1.75 1.34
Adjusted operating cash flow (1) 1.52 0.98
Net (loss) earnings from continuing operations, basic (0.20) 0.80
Dividends paid 0.72 0.72
Weighted average shares outstanding (millions) 142.8 142.1
(1) Results and amounts per share for 2016 have been restated to exclude the results of Construction Products Distribution (“CPD”). Refer to “Basis of Presentation” in Superior’s Management’s Discussion and Analysis (“MD&A”) for further details.
Financial Position
Financial Results
(1) Total assets, total liabilities and net capital expenditures for 2016 have been restated to exclude the results of Construction Products Distribution (“CPD”). Refer to “Basis of Presentation” in Superior’s Management’s Discussion and Analysis (“MD&A”) for further details.
(2) Excludes investment in finance leases amounting to $24.9 million in 2017 and $14.1 million in 2016.
(3) See Non-GAAP Financial Measures in Superior’s Management’s Discussion and Analysis (MD&A) for additional details.
(4) Senior secured debt and total debt are stated before deferred issue costs.
(5) 2017 Adjusted EBITDA for purposes of this calculation includes proforma adjusted EBITDA for Canwest and Tuck-in acquisitions completed in 2017. 2016 Adjusted EBITDA for purposes of this calculation includes the results of CPD up to the date of disposition, August 9, 2016.
Performance Highlights
President’s Message
Management’s Discussion and Analysis
Management’s Report
Independent Auditor’s Report
Consolidated Financial Statements
Notes to the Consolidated Financial Statements
Selected Historical Information
Corporate Information
Businesses and Shareholder Information
IFC13
444546509798
IBC

Superior Plus Corp. President’s Message 1
As I reflect on 2017, I am proud of our operational and business initiative accomplishments. The Superior Plus team made great strides toward achieving our ambitious Evolution 2020 goals. Our strong balance sheet positioned us well to take advantage of opportunities in the market. In all my time at Superior, I believe we are in the best position to execute our strategy to drive increased shareholder value. Superior today is a diversified and focused company of two business lines unified and directed through one vision for growth.
Last year at this time I talked about how Superior was positioned for growth, and in 2017, Superior delivered, growing in size and profitability. Leveraging the benefits of our multi-year focus on operational excellence, our businesses and the Company as a whole performed on many levels – financial, operational, technological and strategic.
The acquisition of Canwest Propane (Canwest) and the five tuck-in acquisitions in the Energy Distribution and Specialty Chemicals businesses, coupled with the improvements in the chlor-alkali market, have positioned us well to exceed the lower end of our Evolution 2020 goal of increasing our EBITDA from operations by $50 million to $150 million compared to 2016.
One of the year’s highlights was the acquisition of Canwest from Gibson
Energy for $412 million(1). We completed the acquisition in September after receiving Competition Bureau approval, requiring Superior to divest of less than 5% of the acquired volumes and EBITDA of Canwest(2). The combination of Canwest with our Canadian propane distribution business further enhances our Energy Distribution platform and provides an opportunity to expand our industry-leading mySuperior service offering to more customers in Western Canada.
The Canwest acquisition provides many benefits to Superior, including synergies, good acquisition pricing due to the timing of the acquisition during the low part of the commodity cycle, optimizing the combined fleet capital and combining the technical strengths of Canwest with Superior Propane. Our Canadian propane distribution business now has:
» Annual sales volumes of approximately 2.0 billion litres(3) of propane;
» Approximately 270,000 customers across Canada;
» 1,776 employees;
» 287 locations; and
» Annual EBITDA of over $200 million(4)
before anticipated synergies of approximately $20 million per year.
We are highly confident of achieving the estimated $20 million in annual synergies due to the overlap of numerous distribution
locations in Western Canada and the opportunity to implement our operating platform in the Canwest business. The run-rate synergies of $20 million are expected to be achieved by the second quarter of 2019, with full run-rate anticipated in 2020.
From a financial perspective, in 2017 Superior achieved AOCF before transaction and other costs of $1.75 per share, which was 31% higher than in the prior year and at the top end of our 2017 guidance. This was due to the contribution from Canwest, improved chlor-alkali results and a decrease in foreign exchange hedging losses. The Energy Distribution business performed well considering the challenges we faced in 2017 with warmer weather in the first quarter and weakness in the wholesale propane market fundamentals. The positive Canwest results more than offset the negative impact from those two trends. Specialty Chemicals had a significant improvement in EBITDA over 2016, driven primarily by the strong chlor-alkali market. In 2017 we also used some of the proceeds from the sale of our Construction Products Distribution business to settle foreign exchange hedge contracts, which had a positive impact on adjusted EBITDA in 2017.
Superior’s Energy Distribution business generated EBITDA from operations of $180.4 million, which was $13.0 million higher than in 2016 primarily due to the contribution from Canwest and increased sales volumes. Superior’s Specialty Chemicals business generated EBITDA from operations of $126.4 million, which was $17.3 million higher than in the prior year primarily due to the positive
President’sMessage
Luc Desjardins
President and Chief Executive Officer
(1) Excluding working capital.(2) Estimated based on Canwest retail propane volumes and Adjusted EBITDA based on trailing twelve months ending June 30, 2017.(3) Estimated 2017 Canadian Propane distribution volumes including full year results for Canwest.(4) Proforma Energy Distribution EBITDA including Canwest.

Superior Plus Corp. 2017 Annual Report
impact of the strong chlor-alkali market, which resulted in increased caustic soda and hydrochloric acid sales prices and increased caustic potash and hydrochloric acid sales volumes. We anticipate the strength in chlor-alkali markets to continue into 2018, which will partially offset the impact of higher electricity prices on sodium chlorate gross profits.
From a total debt and leverage perspective, Superior’s debt levels increased due to the acquisition of Canwest and the tuck-in acquisitions completed in 2017. With total debt of approximately $1.1 billion at year-end 2017, our total debt to adjusted EBITDA ratio as at December 31, 2017 was 3.3x compared to 2.1x at December 31, 2016. We are targeting a reduction in this ratio to 3.0x for the longer term and we hope to achieve this by the second quarter of 2019 through strong cash flows from the 2017 acquisitions and our base businesses, and a continued disciplined approach to strategic acquisitions.
We also entered into an agreement with the Canada Revenue Agency for resolution of our appeal in connection with the conversion from an income trust structure. This recovered a significant amount of cash as well as removing uncertainty and allowing us to focus on the Evolution 2020 initiatives.
In 2017, we were able to complete five tuck-in acquisitions: one in our Canadian propane distribution business, three in our U.S. refined fuels business and one in our Specialty Chemicals business. All four of the tuck-ins in the Energy Distribution business were propane assets, consistent with our strategy to grow the propane business in the U.S. The International Dioxcide Inc. acquisition in Specialty Chemicals provides an opportunity to move farther along the value chain and sell more product directly to our end-use customers. While small, this acquisition is of strategic significance, creating the beginnings of vertical
integration for our Specialty Chemicals business. Consistent with the achievements in 2017, this year and onward we will push to exceed our goal of two to four tuck-in acquisitions per year.
In addition to growing the business through acquisitions, in 2017 we also continued to make improvements to the operations, enhancing our digitalization strategy in the Energy Distribution business. The time for technology and innovation is now. Our digital platform will drive lower operating costs and set us apart from our competitors by offering digital differentiation by market segment. In Specialty Chemicals, we operated at industry-leading utilization rates with a focus on safety and the environment.
Superior’s 2018 guidance includes AOCF of $1.65-$1.95 per share and Adjusted EBITDA in the range of $295 million to $335 million. Our goals this year include achieving our financial targets and continuing to strengthen the Company. Goals for Energy Distribution include continuing the integration with Canwest and building a strong propane platform focused on western Canada. Goals for Specialty Chemicals include building out the chlor-alkali business, bringing the business’ sound environmental, safety and community programs to greater prominence, and pursuing further vertical integration to build up our direct sales to end-use customers.
I’m excited by what the future holds for Superior Plus as we continue along the path of our multi-year Evolution 2020 strategy. Strategically, we remain focused
on long-term, sustainable success. With an experienced management team, strong balance sheet, solid businesses and a thorough and realistic strategic plan, Superior anticipates being able to realize the Evolution 2020 aspirations. Along the way we have an attractive dividend of $0.72 per share per year, currently yielding approximately 6%. I feel we are in the best position to grow the Company and build shareholder value than we have ever been before.
Acknowledgements
I would like to thank Walentin (Val) Mirosh for providing his strategic and operational expertise to the Board for the past 10 years. Consistent with our board retirement policy, Val will not stand for re-election in 2018.
Our 3,400 employees represent some of the best talent in the industries in which Superior competes. I would like to thank each of you for your hard work and commitment to your respective businesses. On behalf of the entire organization, I would like to thank our shareholders and other security holders for your continued support and confidence in Superior.
On behalf of the Board of Directors,
Luc Desjardins
President and Chief Executive Officer February 14, 2018
In 2017, we were able to complete five tuck-in acquisitions; one in our Canadian propane distribution business, three in our U.S. refined fuels business and one in our Specialty Chemicals business.
We’ve grown the business through acquisitions and we also continued to make improvements to the operations and enhancing our digitalization strategy in the Energy Distribution business.

Superior Plus Corp. Management’s Discussion and Analysis 3
Management’s Discussion and Analysis of 2017 Annual and Fourth Quarter ResultsThis Management’s Discussion and Analysis (MD&A) contains information about the performance and financial position of Superior Plus Corp. (Superior) as at and for the year ended December 31, 2017 and 2016, as well as forward-looking information about future periods. The information in this MD&A is current to February 14, 2018, and should be read in conjunction with Superior’s audited consolidated financial statements and notes thereto as at and for the years ended December 31, 2017 and 2016.
The accompanying audited consolidated financial statements of Superior were prepared by and are the responsibility of Superior’s management. Superior’s audited consolidated financial statements as at and for the years ended December 31, 2017 and 2016 were prepared in accordance with International Financial Reporting Standards (IFRS).
All financial amounts in this MD&A are expressed in millions of Canadian dollars except where otherwise noted. All tables are for the 12 months ended December 31 of the year indicated, unless otherwise stated. This MD&A includes forward-looking statements and assumptions. See “Forward-Looking Information” for more details.
Overview of Superior
Superior is a diversified business corporation. Superior holds 99.9% of Superior Plus LP (Superior LP), a limited partnership formed between Superior General Partner Inc. (Superior GP) as general partner and Superior as limited partner. Superior owns 100% of the shares of Superior GP and Superior GP holds 0.1% of Superior LP. The cash flow of Superior is solely dependent on the results of Superior LP and is derived from the allocation of Superior LP’s income to Superior by means of partnership allocations.
Superior, through its ownership of Superior LP and Superior GP, has two operating segments: the Energy Distribution segment, which includes a Canadian propane distribution business and a U.S. refined fuels distribution business; and the Specialty Chemicals segment, which produces and distributes sodium chlorate, chlor-alkali products and sodium chlorite.
Non-GAAP Financial Measures
Throughout the MD&A, Superior has used the following terms that are not defined under Canadian generally accepted accounting principles (GAAP), but are used by management to evaluate the performance of Superior and its businesses: adjusted operating cash flow (AOCF) before and after transaction and other costs, earnings before interest, taxes, depreciation and amortization (EBITDA) from operations, and Adjusted EBITDA, Adjusted revenue, Adjusted cost of sales, Adjusted operating and administrative costs. These measures may also be used by investors, financial institutions and credit rating agencies to assess Superior’s performance and ability to service debt. Non-GAAP financial measures do not have standardized meaning prescribed by GAAP and are therefore unlikely to be comparable to similar measures presented by other companies. Securities regulations require that Non-GAAP financial measures are clearly defined, qualified and reconciled to their most comparable GAAP financial measures. Except as otherwise indicated, these Non-GAAP financial measures are calculated and disclosed on a consistent basis from period to period. Specific items may only be relevant in certain periods.
The intent of using Non-GAAP financial measures is to provide additional useful information to investors and analysts; the measures do not have standardized meaning under IFRS. The measures should not, therefore, be considered in isolation or used in substitute for measures of performance prepared in accordance with IFRS. Other issuers may calculate Non-GAAP financial measures differently.
See “Non-GAAP Financial Measures” for more information about these measures.
Forward-Looking Information
Certain information included herein is forward-looking information within the meaning of applicable Canadian securities laws. Forward-looking information may include statements regarding the objectives, business strategies to achieve those objectives, expected financial results (including those in the area of risk management), economic or market conditions, and the outlook of or involving Superior, Superior LP and its businesses. Such information is typically identified by words such as “anticipate”, “believe”, “continue”, “estimate”, “expect”, “plan”, “forecast”, “future”, “outlook”, “guidance”, “may”, “project”, “should”, “strategy”, “target”, “will” or similar expressions suggesting future outcomes.

Superior Plus Corp. 2017 Annual Report4
Forward-looking information in this document includes: future financial position, consolidated and business segment outlooks, expected EBITDA from operations, expected Adjusted EBITDA, expected AOCF and AOCF per share, expected leverage ratios and debt repayment, expectations in terms of the cost of operations, business strategy and objectives, development plans and programs, business expansion and cost structure and other improvement projects, expected product margins and sales volumes, market conditions in Canada and the U.S., continued improvements in operational efficiencies and sales and marketing initiatives in Energy Distribution, expected synergies as a result of the acquisition of the Canwest Propane (Canwest), the smaller tuck-in acquisitions, future economic conditions, future exchange rates, exposure to such rates and incremental earnings associated with such rates, expected weather, expectations for the global economic environment, Superior’s trading strategy and the risk involved in these strategies, the impact of certain hedges on future reported earnings and cash flows, commodity prices and costs, the impact of contracts for commodities, demand for propane, heating oil and similar products, demand for chemicals including sodium chlorate and chlor-alkali, effect of operational and technological improvements, anticipated costs and benefits of business enterprise system upgrade plans, future working capital levels, expected governmental regulatory regimes and legislation and their expected impact on regulatory and legislative compliance costs, expectations for the outcome of existing or potential legal and contractual claims, Superior’s ability to obtain financing on acceptable terms, expected life of facilities and statements regarding net working capital and capital expenditure requirements of Superior or Superior LP.
Forward-looking information is included to provide information about management’s expectations and plans about the future and may not be appropriate for other purposes. Forward-looking information herein is based on various assumptions and expectations that Superior believes are reasonable in the circumstances. No assurance can be given that these assumptions and expectations will prove to be correct. Those assumptions and expectations are based on information currently available to Superior, including information obtained from third-party industry analysts and other third-party sources, and the historical performance of Superior’s businesses. Such assumptions include anticipated financial performance, current business and economic trends, the amount of future dividends paid by Superior, business prospects, availability and utilization of tax basis, regulatory developments, currency, exchange and interest rates, future commodity prices relating to the oil and gas industry, future oil rig activity levels, trading data, cost estimates, Superior’s ability to obtain financing on acceptable terms, and the assumptions set forth under “Financial Outlook” in this MD&A all of which are subject to the risks and uncertainties set forth below.
By its very nature, forward-looking information involves numerous assumptions, risks and uncertainties, both general and specific. Should one or more of these risks and uncertainties materialize or should underlying assumptions prove incorrect, as many important factors are beyond Superior’s control, Superior’s or Superior LP’s actual performance and financial results may vary materially from those estimates and intentions contemplated, expressed or implied in the forward-looking information. These risks and uncertainties include incorrect assessments of value when making acquisitions, increases in debt servicing charges, the loss of key personnel, fluctuations in foreign currency and exchange rates, inadequate insurance coverage, liability for cash taxes, counterparty risk, compliance with environmental laws and regulations, reduced customer demand, operational risks involving Superior’s facilities, force majeure, labour relations matters, Superior’s ability to access external sources of debt and equity capital, and the risks identified in (i) this MD&A under “Risk Factors” and (ii) Superior’s most recent Annual Information Form. The preceding list of assumptions, risks and uncertainties is not exhaustive.
When relying on Superior’s forward-looking information to make decisions with respect to Superior, investors and others should carefully consider the preceding factors, other uncertainties and potential events. Any forward-looking information is provided as of the date of this document and, except as required by law, neither Superior nor Superior LP undertakes to update or revise such information to reflect new information, subsequent or otherwise. For the reasons set forth above, investors should not place undue reliance on forward-looking information.
Basis of Presentation
In the prior year, Superior divested its Fixed-Price Energy Services business and its Construction Products Distribution (CPD) business, which distributed drywall, insulation, framing and other construction products mainly in Canada and the United States. Accordingly, the prior period financial information in this MD&A has been restated to exclude the results of operations of CPD. This MD&A reflects the results of continuing operations, unless otherwise noted.

Superior Plus Corp. Management’s Discussion and Analysis 5
Financial Overview
Summary of AOCF(millions of dollars except per share amounts) 2017 2016
Revenue 2,385.0 2,023.7
Gross profit 735.4 656.4
EBITDA from operations(1) 306.8 276.5
Income from Canwest(4) 11.9 –
Corporate adjusted operating and administrative costs(1) (21.6) (20.2)
Realized gains (losses) on foreign currency hedging contracts 0.5 (26.0)
Adjusted EBITDA(1) 297.6 230.3
Interest expense (43.8) (35.6)
Cash income tax expense (3.3) (4.9)
AOCF before transaction and other costs(1) 250.5 189.8
Transaction and other costs(2) (33.1) (50.2)
AOCF(1) 217.4 139.6
AOCF per share before transaction and other costs, basic and diluted (1)(3) $1.75 $1.34
AOCF per share, basic and diluted(1)(3) $1.52 $0.98
Dividends paid per share $0.72 $0.72
(1) EBITDA from operations, Adjusted EBITDA and AOCF are Non-GAAP measures. See “Non-GAAP Financial Measures” and “Reconciliation of Adjusted Revenue, Adjusted Cost of Sales and Adjusted Operating and Administrative Costs” and “Reconciliation of Net Earnings before income taxes to Adjusted EBITDA”. Reconciliations between GAAP and Non-GAAP measures can be found on pages 34-37.
(2) Transaction and other costs for the year ended December 31, 2017 are related primarily to the acquisition and integration of Canwest and other tuck-in acquisitions. Transaction and other costs for the year ended December 31, 2016 relate to the terminated acquisition of Canexus Corporation, the divestiture of CPD and restructuring. See “Transaction and Other Costs” for further details.
(3) The weighted average number of shares outstanding for the year ended December 31, 2017, is 142.8 million (year ended December 31, 2016 – 142.1 million). There were no dilutive instruments with respect to AOCF per share for the years ended December 31, 2017 and 2016.
(4) As of March 1, 2017 and up to the acquisition closing date of September 27, 2017, Superior was entitled to the benefit of the income from Canwest.
Comparable GAAP Financial Information(millions of dollars except per share amounts) 2017 2016
Net (loss) earnings from continuing operations $(27.9) $114.2
Net (loss) earnings per share from continuing operations, basic $(0.20) $0.80
Net (loss) earnings per share from continuing operations, diluted $(0.20) $0.78
Net cash flows from operating activities before income tax and interest paid $192.5 $188.5
Net cash flows from operating activities per share, basic and diluted $1.35 $1.33
Segmented Information(millions of dollars) 2017 2016
EBITDA from operations(1)
Energy Distribution 180.4 167.4
Specialty Chemicals 126.4 109.1
306.8 276.5
(1) EBITDA from operations is a Non-GAAP measure. See “Non-GAAP” Financial Measures.

Superior Plus Corp. 2017 Annual Report6
AOCF Reconciled to Net Cash Flow from Operating Activities (1)
(millions of dollars) 2017 2016
Net cash flow from operating activities before income tax and interest paid 192.5 188.5
Add (deduct):
Non-cash interest expense 10.0 7.4
Changes in non-cash working capital 61.2 35.1
Discontinued operations – (8.2)
Canwest depreciation, amortization and other 10.8 –
Cash income tax expense (3.3) (4.9)
Finance expense recognized in net earnings (53.8) (78.3)
AOCF 217.4 139.6
(1) AOCF is a Non-GAAP measure. See “Non-GAAP Financial Measures”. Reconciliations between GAAP and Non-GAAP measures can be found on pages 34-37.
Acquisition of Canwest Propane (Canwest)
On March 1, 2017, Superior entered into certain agreements to purchase the entities that carry on the industrial propane business of Canwest from Gibson Energy ULC (Canwest Option) for cash consideration of $412.0 million plus $20.4 million, of working capital adjustments.
On September 27, 2017, Superior received regulatory approval from the Government of Canada’s Competition Bureau (Competition Bureau) and closed the acquisition of Canwest subject to certain conditions. As outlined in a consent agreement registered with the Competition Bureau, Superior agreed to divest five local branches and nine satellite locations from the combined Superior Propane and Canwest organization.
Canwest was founded in 1987 and is a leading propane supply and distribution franchise in western Canada, serving a diverse customer base of oil and gas, commercial, industrial, residential and construction customers under the brands of Canwest and Stittco. Canwest has established long-term relationships with a customer base that includes international, national and large regional companies.
Subsequent to the year end, Superior signed agreements with two third-parties to sell the propane assets required by the consent agreement entered into with the Competition Bureau as part of the Canwest acquisition. Both transactions are subject to approval by the Competition Bureau and other customary closing conditions.
Acquisition of Pomerleau Propane Gaz Inc. (Pomerleau)
On April 20, 2017, Superior GP, a subsidiary of Superior, acquired Pomerleau, a propane distributor serving residential and commercial customers in southeastern Québec for cash consideration of $10.7 million.
Acquisition of Yankee Propane Inc. and Virginia Propane Inc. (together, Yankee)
On August 1, 2017, Superior Plus Energy Services Inc., a subsidiary of Superior LP, acquired all of the assets of Yankee, a propane distributor serving residential and commercial customers in New York, New Jersey and Virginia for total consideration of US $31.5 million (CDN $38.7 million).
Acquisition of the Propane Distribution Assets of R.W. Earhart Company (Earhart)
On October 2, 2017, Superior Plus Energy Services Inc., a subsidiary of Superior, acquired all of the propane distribution assets of R.W. Earhart Company, a propane distributor serving residential and commercial customers in Ohio for total consideration of US $38.0 million (CDN $44.3 million).
Acquisition of International Dioxcide, Inc. (IDI)
On October 31, 2017, Superior Plus US Holdings Inc., a subsidiary of Superior, acquired all of the issued and outstanding shares of IDI, a provider of sodium chlorite based solutions for total consideration of US $11.1 million (CDN $14.4 million).
Superior Plus Corp. Management’s Discussion and Analysis 7
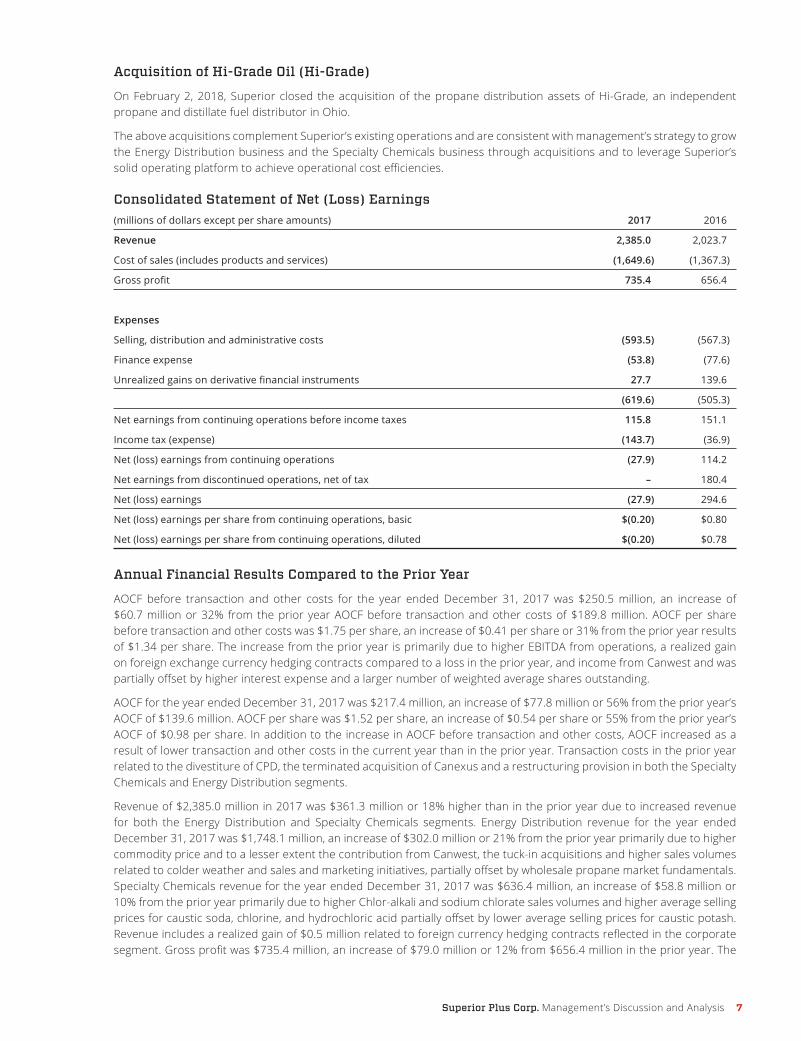
Acquisition of Hi-Grade Oil (Hi-Grade)
On February 2, 2018, Superior closed the acquisition of the propane distribution assets of Hi-Grade, an independent propane and distillate fuel distributor in Ohio.
The above acquisitions complement Superior’s existing operations and are consistent with management’s strategy to grow the Energy Distribution business and the Specialty Chemicals business through acquisitions and to leverage Superior’s solid operating platform to achieve operational cost efficiencies.
Consolidated Statement of Net (Loss) Earnings (millions of dollars except per share amounts) 2017 2016
Revenue 2,385.0 2,023.7
Cost of sales (includes products and services) (1,649.6) (1,367.3)
Gross profit 735.4 656.4
Expenses
Selling, distribution and administrative costs (593.5) (567.3)
Finance expense (53.8) (77.6)
Unrealized gains on derivative financial instruments 27.7 139.6
(619.6) (505.3)
Net earnings from continuing operations before income taxes 115.8 151.1
Income tax (expense) (143.7) (36.9)
Net (loss) earnings from continuing operations (27.9) 114.2
Net earnings from discontinued operations, net of tax – 180.4
Net (loss) earnings (27.9) 294.6
Net (loss) earnings per share from continuing operations, basic $(0.20) $0.80
Net (loss) earnings per share from continuing operations, diluted $(0.20) $0.78
Annual Financial Results Compared to the Prior Year
AOCF before transaction and other costs for the year ended December 31, 2017 was $250.5 million, an increase of $60.7 million or 32% from the prior year AOCF before transaction and other costs of $189.8 million. AOCF per share before transaction and other costs was $1.75 per share, an increase of $0.41 per share or 31% from the prior year results of $1.34 per share. The increase from the prior year is primarily due to higher EBITDA from operations, a realized gain on foreign exchange currency hedging contracts compared to a loss in the prior year, and income from Canwest and was partially offset by higher interest expense and a larger number of weighted average shares outstanding.
AOCF for the year ended December 31, 2017 was $217.4 million, an increase of $77.8 million or 56% from the prior year’s AOCF of $139.6 million. AOCF per share was $1.52 per share, an increase of $0.54 per share or 55% from the prior year’s AOCF of $0.98 per share. In addition to the increase in AOCF before transaction and other costs, AOCF increased as a result of lower transaction and other costs in the current year than in the prior year. Transaction costs in the prior year related to the divestiture of CPD, the terminated acquisition of Canexus and a restructuring provision in both the Specialty Chemicals and Energy Distribution segments.
Revenue of $2,385.0 million in 2017 was $361.3 million or 18% higher than in the prior year due to increased revenue for both the Energy Distribution and Specialty Chemicals segments. Energy Distribution revenue for the year ended December 31, 2017 was $1,748.1 million, an increase of $302.0 million or 21% from the prior year primarily due to higher commodity price and to a lesser extent the contribution from Canwest, the tuck-in acquisitions and higher sales volumes related to colder weather and sales and marketing initiatives, partially offset by wholesale propane market fundamentals. Specialty Chemicals revenue for the year ended December 31, 2017 was $636.4 million, an increase of $58.8 million or 10% from the prior year primarily due to higher Chlor-alkali and sodium chlorate sales volumes and higher average selling prices for caustic soda, chlorine, and hydrochloric acid partially offset by lower average selling prices for caustic potash. Revenue includes a realized gain of $0.5 million related to foreign currency hedging contracts reflected in the corporate segment. Gross profit was $735.4 million, an increase of $79.0 million or 12% from $656.4 million in the prior year. The

Superior Plus Corp. 2017 Annual Report8
increase in gross profit is a result of higher sales volumes and average selling prices in Specialty Chemicals, the acquisition of Canwest and to a lesser extent the colder weather partially offset by lower gross profits due to the impact of weaker market fundamentals on the supply portfolio management business in the Canadian Propane Distribution business.
Selling, distribution and administrative costs were $593.5 million in 2017, an increase of $26.2 million or 5% from the prior year primarily due to higher costs for Energy Distribution and Specialty Chemicals. Energy Distribution costs for the year ended December 31, 2017 were $407.8 million, an increase of $25.6 million from $382.2 million in the prior year. The increase is mainly due to the acquisition of Canwest and to a lesser extent the tuck-in acquisitions and expenses related to higher sales volumes. Energy Distribution costs also include net income of $1.2 million from Canwest for the period from March 1, 2017 until the acquisition closing date of September 27, 2017. Specialty Chemicals costs were $146.4 million for the year ended December 31, 2017, an increase of $3.2 million from the prior year due to higher freight costs on higher sales volumes. Corporate selling, distribution and administrative costs were $39.3 million, compared to $41.9 million in the prior year. The $2.6 million decrease was primarily due to higher transaction and other costs in the prior year related to the terminated acquisition of Canexus.
Finance expense was $53.8 million compared to $77.6 million in the prior year, a decrease of $23.8 million or 31%. The decrease is primarily related to a $33.4 million loss from the settlement of foreign exchange hedging contracts in the prior year partially offset by higher interest expense due to higher debt and higher interest rates in the U.S. and Canada. The increased debt is primarily due to debt incurred to fund the acquisition of Canwest and tuck-in acquisitions.
Unrealized gains on derivative financial instruments were $27.7 million in 2017 compared to a gain of $139.6 million in the prior year. This is mainly related to the strengthening of the Canadian dollar relative to the U.S. dollar during 2017, financial swaps entered into in the prior year and the timing of maturities of the underlying financial instruments. For additional details, refer to Note 20 of the 2017 audited consolidated financial statements.
Total income tax expense of $143.7 million was $106.8 million higher than the prior year’s expense of $36.9 million. Current income tax expense was $3.3 million a decrease of $1.7 million from the prior year. The decrease is due to lower state taxes in the current year. Deferred income tax expense was $140.4 million, an increase of $108.5 million from the prior year. The increase is primarily due to the settlement with the Canada Revenue Agency regarding its objection to the tax consequences of the corporate conversion transaction, which occurred on December 31, 2008.
The net loss from continuing operations for the year ended December 31, 2017 was $27.9 million, compared to net earnings of $114.2 million in the prior year. The decrease from the prior year is primarily due to a lower unrealized gain on derivative financial instruments and a higher deferred income tax expense in the current year related to settling the dispute with the CRA with respect to the company’s corporate conversion transaction. Basic net loss per share from continuing operations for the year ended December 31, 2017 was $(0.20), compared to earnings of $0.80 per basic share in the prior year.
Net earnings from discontinued operations for the year ended December 31, 2017 was nil, compared to $180.4 million in the prior year. The decrease in net earnings from discontinued operations was mainly due to the gain of $177.6 million from the sale of CPD on August 9, 2016 and the sale of the Fixed-Price Energy Services business in the first quarter of 2016. Basic net earnings per share from discontinued operations was nil, compared to $1.27 per share in the prior year. For additional details, refer to Note 4 of the 2017 audited consolidated financial statements.

Superior Plus Corp. Management’s Discussion and Analysis 9
Annual Financial Results of Superior’s Operating Segments
Energy Distribution
Energy Distribution’s condensed operating results for 2017 and 2016:
(millions of dollars) 2017 2016
Revenue 1,748.1 1,446.1
Adjusted cost of sales (1,233.2) (957.1)
Gross profit 514.9 489.0
Less: Adjusted operating and administrative costs(1) (334.5) (321.6)
EBITDA from operations(1)(2) 180.4 167.4
GAAP Measures
Selling, distribution and administrative costs 407.8 382.2
Net earnings before income tax 108.6 143.4
(1) See “Reconciliation of Adjusted Revenue, Adjusted Cost of Sales and Adjusted Operating and Administrative Costs”. Reconciliations between GAAP and Non-GAAP reconciliations can be found on pages 34-37.
(2) EBITDA from operations is a Non-GAAP financial measure. See “Non-GAAP Financial Measures” and “Reconciliation of Net Earnings Before Income Taxes to EBITDA from Operations”.
Revenue was $1,748.1 million in 2017, an increase of $302.0 million or 21% from the prior year. The increase was primarily due to higher wholesale propane supply prices driven by lower inventory levels in 2017 due to higher exports out of North America and the higher WTI crude oil prices, incremental revenue from Canwest and to a lesser extent higher volumes. Total gross profit for 2017 was $514.9 million, an increase of $25.9 million or 5% from the prior year. The increase in gross profit is primarily due to incremental contribution from Canwest and to a lesser extent higher volumes from the base business of Canadian propane distribution and higher average unit margins in U.S refined fuels. A review of gross profit is provided below.
Gross Profit Review(millions of dollars) 2017 2016
Canadian propane distribution 316.4 299.0
U.S. refined fuels distribution 168.5 159.4
Other services 30.0 30.6
Total gross profit 514.9 489.0
Canadian Propane Distribution
Canadian propane distribution’s gross profit for 2017 was $316.4 million, an increase of $17.4 million from 2016. The increase is primarily due to contribution from Canwest, and higher sales volumes partially offset by lower unit margins. Residential sales volumes in 2017 increased by 25 million litres or 20% from the prior year, primarily due to incremental volumes sold associated with Canwest and to a lesser extent colder weather than in the prior year. Average weather across Canada for the year, as measured by degree days, was 5% colder than in the prior year and in line with the five-year average. Commercial volumes increased by 50 million litres or 21% from the prior year primarily due to incremental volumes sold associated with Canwest and to a lesser extent colder weather than in the prior year. Industrial volumes increased by 71 million litres or 19% from the prior year primarily due to incremental volumes sold associated with Canwest and to a lesser extent sales growth in the oilfield and mining business and colder weather. Agricultural volumes increased by 3 million litres or 5% due to greater crop-drying demand driven by wet weather conditions in the fourth quarter. Wholesale propane volumes were higher by 210 million litres or 45% primarily due to sales and marketing initiatives with a focus on increasing third-party sales.
Average propane sales margins for 2017 decreased to 18.7 cents per litre from 22.4 cents per litre in the prior year. The decrease was due to a weaker wholesale propane market fundamentals including basis differentials and regional arbitrage opportunities, on the supply portfolio management business and an increased proportion of lower-margin wholesale volumes.

Superior Plus Corp. 2017 Annual Report10
Canadian Propane Distribution Sales Volumes
Volumes by End-Use Application(millions of litres) 2017 2016
Residential 150 125
Commercial 290 240
Agricultural 66 63
Industrial 437 366
Wholesale 678 468
Automotive 74 73
Total 1,695 1,335
Volumes by Region (1)
(millions of litres) 2017 2016
Western Canada 823 630
Eastern Canada 529 460
Atlantic Canada 113 107
United States 230 138
Total 1,695 1,335
(1) Regions: Western Canada region consists of British Columbia, Alberta, Saskatchewan, Manitoba, Northwest Ontario, Yukon and Northwest Territories; Eastern Canada region consists of Ontario (except for Northwest Ontario) and Québec; Atlantic Canada region consists of New Brunswick, Newfoundland & Labrador, Nova Scotia and Prince Edward Island. United States region consists primarily of Maine, Idaho, Kansas, Michigan, Washington, Alaska and California.
Income from Canwest
As of March 1, 2017 and up to the acquisition closing date of September 27, 2017, Superior was entitled to the benefit of the net profits of Canwest. As a result, Superior recorded net income of $1.2 million, $10.7 of amortization and $11.9 million in consolidated Adjusted EBITDA for the current year. These amounts are not included in the EBITDA from operations for the annual financial results of the Energy Distribution segment.
On September 27, 2017, Superior received regulatory approval from the Competition Bureau and closed the acquisition of Canwest subject to certain conditions. The results of Canwest subsequent to September 27, 2017 are included in the results of the Energy Distribution segment.
Below is a summary of Canwest’s financial results and volumes in 2017:
March 1 Sep 27(millions of dollars) Q1(1) Q2 Q3(2) – Sept 27 –Dec 31 2017
Revenue 25.7 34.6 34.4 94.7 77.1 171.8
Cost of sales (13.2) (16.0) (17.1) (46.3) (46.4) (92.7)
Gross profit 12.5 18.6 17.3 48.4 30.7 79.1
Selling, distribution and administrative costs (excluding depreciation and amortization) (6.3) (15.8) (14.4) (36.5) (13.6) (50.1)
EBITDA from operations 6.2 2.8 2.9 11.9 17.1 29.0
GAAP measures:
Depreciation and amortization (1.8) (4.5) (4.4) (10.7) (1.2) (11.9)
Net earnings (loss) 4.4 (1.7) (1.5) 1.2 15.9 17.1
Volumes (millions of litres) 52.6 74.2 72.4 199.2 140.0 339.2
(1) Q1 includes activity from March 1-31, 2017.
(2) Q3 includes activity from July 1 – September 27, 2017.
Superior Plus Corp. Management’s Discussion and Analysis 11
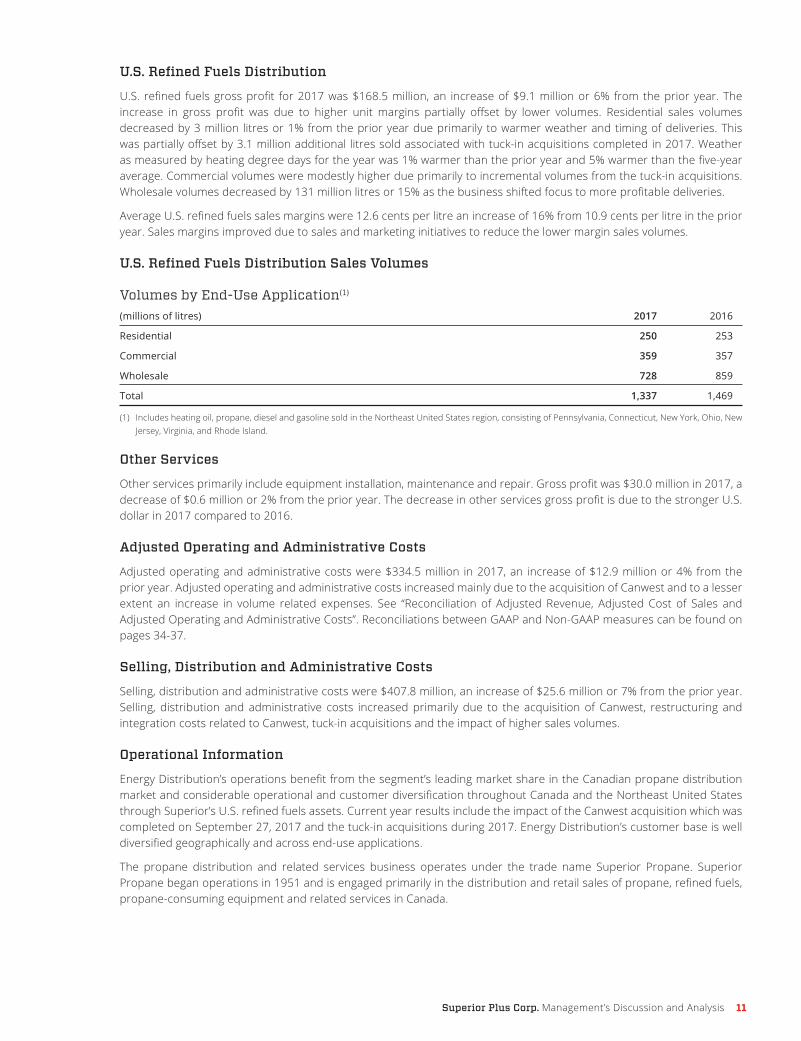
U.S. Refined Fuels Distribution
U.S. refined fuels gross profit for 2017 was $168.5 million, an increase of $9.1 million or 6% from the prior year. The increase in gross profit was due to higher unit margins partially offset by lower volumes. Residential sales volumes decreased by 3 million litres or 1% from the prior year due primarily to warmer weather and timing of deliveries. This was partially offset by 3.1 million additional litres sold associated with tuck-in acquisitions completed in 2017. Weather as measured by heating degree days for the year was 1% warmer than the prior year and 5% warmer than the five-year average. Commercial volumes were modestly higher due primarily to incremental volumes from the tuck-in acquisitions. Wholesale volumes decreased by 131 million litres or 15% as the business shifted focus to more profitable deliveries.
Average U.S. refined fuels sales margins were 12.6 cents per litre an increase of 16% from 10.9 cents per litre in the prior year. Sales margins improved due to sales and marketing initiatives to reduce the lower margin sales volumes.
U.S. Refined Fuels Distribution Sales Volumes
Volumes by End-Use Application(1)
(millions of litres) 2017 2016
Residential 250 253
Commercial 359 357
Wholesale 728 859
Total 1,337 1,469
(1) Includes heating oil, propane, diesel and gasoline sold in the Northeast United States region, consisting of Pennsylvania, Connecticut, New York, Ohio, New Jersey, Virginia, and Rhode Island.
Other Services
Other services primarily include equipment installation, maintenance and repair. Gross profit was $30.0 million in 2017, a decrease of $0.6 million or 2% from the prior year. The decrease in other services gross profit is due to the stronger U.S. dollar in 2017 compared to 2016.
Adjusted Operating and Administrative Costs
Adjusted operating and administrative costs were $334.5 million in 2017, an increase of $12.9 million or 4% from the prior year. Adjusted operating and administrative costs increased mainly due to the acquisition of Canwest and to a lesser extent an increase in volume related expenses. See “Reconciliation of Adjusted Revenue, Adjusted Cost of Sales and Adjusted Operating and Administrative Costs”. Reconciliations between GAAP and Non-GAAP measures can be found on pages 34-37.
Selling, Distribution and Administrative Costs
Selling, distribution and administrative costs were $407.8 million, an increase of $25.6 million or 7% from the prior year. Selling, distribution and administrative costs increased primarily due to the acquisition of Canwest, restructuring and integration costs related to Canwest, tuck-in acquisitions and the impact of higher sales volumes.
Operational Information
Energy Distribution’s operations benefit from the segment’s leading market share in the Canadian propane distribution market and considerable operational and customer diversification throughout Canada and the Northeast United States through Superior’s U.S. refined fuels assets. Current year results include the impact of the Canwest acquisition which was completed on September 27, 2017 and the tuck-in acquisitions during 2017. Energy Distribution’s customer base is well diversified geographically and across end-use applications.
The propane distribution and related services business operates under the trade name Superior Propane. Superior Propane began operations in 1951 and is engaged primarily in the distribution and retail sales of propane, refined fuels, propane-consuming equipment and related services in Canada.

Superior Plus Corp. 2017 Annual Report12
The U.S refined fuels business distributes propane, heating oil and refined fuels into the north-eastern United States. U.S. refined fuels distributes liquid fuels and propane gas to customers located in Pennsylvania, Delaware, Maryland, New Jersey, Connecticut, Rhode Island, Massachusetts, Vermont, New York, West Virginia and Ohio. Its products are used by a wide range of customers in a variety of applications, including home heating, water heating and motor vehicle fuel.
The Energy Distribution business also provides value-added supply portfolio management services under the trade name “Superior Gas Liquids”, primarily to Superior Propane and small and medium sized propane retailers in the United States and Canada. Superior Gas Liquids provides transportation, storage, risk management, supply and logistics services to its customers.
Energy Distribution’s top ten customers account for approximately 9% of its revenue with its largest customer comprising approximately 1.4% of its revenue.
Initiatives to improve results in the Energy Distribution business continued during 2017 in conjunction with Superior’s Evolution 2020 initiatives and Superior’s goal for each of its businesses to become best-in-class. Business improvement projects for 2017 included: a) acquisition strategy focused on retail and wholesale propane; b) increased provision of value-added services; c) utilizing Superior’s supply cost advantage; and d) maximizing logistics capabilities.
Financial Outlook
EBITDA from operations for Energy Distribution is anticipated to be higher than in 2017. The anticipated increase in EBITDA is primarily due to the expected contribution from Canwest anticipated synergies of $5 million to $10 million to be realized in 2018 and the full year results from Canwest and the tuck-in acquisitions completed in 2017. Supply market fundamentals in the Canadian propane distribution business are anticipated to be consistent with 2017. Average weather for 2018, as measured by degree days, is anticipated to be consistent with the five-year average.
In addition to the significant assumptions referred to above, refer to “Forward-Looking Information” and “Risk Factors to Superior” for a detailed review of significant business risks affecting the Energy Distribution businesses.
Specialty Chemicals
Specialty Chemicals’ condensed operating results for 2017 and 2016:(millions of dollars except per metric tonne (MT) amounts) 2017 2016
$ per MT $ per MT
Adjusted revenue(1) 631.7 742 602.2 741
Adjusted cost of sales(1) (364.1) (428) (355.0) (437)
Adjusted gross profit(1) 267.6 314 247.2 304
Less: Adjusted operating and administrative costs(1) (141.2) (165) (138.1) (170)
EBITDA from operations(2) 126.4 149 109.1 134
GAAP Measures:
Revenue 636.4 577.6
Cost of sales (416.4) (410.3)
Gross profit 220.0 167.3
Selling, distribution and administrative costs (146.4) (143.2)
Net earnings 72.9 30.7
(1) See “Reconciliation of Adjusted Revenue, Adjusted Cost of Sales and Adjusted Operating and Administrative Costs”. Reconciliations between GAAP and Non-GAAP measures can be found on pages 34-37.
(2) EBITDA from operations is a Non-GAAP financial measure. See “Non-GAAP Financial Measures” and “Reconciliation of Net Earnings before Income Taxes to EBITDA from Operations”.

Superior Plus Corp. Management’s Discussion and Analysis 13
Sales Volumes by Product(thousands of MTs) 2017 2016
Sodium chlorate 502 499
Chlor-alkali 341 307
Chlorite 8 7
Total 851 813
Adjusted revenue was $631.7 million in 2017, an increase of $29.5 million from the prior year. Adjusted gross profit was $267.6 million, an increase of $20.4 million or 8% from the prior year. Adjusted revenue and adjusted gross profit both increased due to higher chlor-alkali sales and sodium chlorate sales volumes and higher caustic soda and hydrochloric acid average sales prices, partially offset by lower caustic potash prices. See “Reconciliation of Adjusted Revenue, Adjusted Cost of Sales and Adjusted Operating and Administrative Costs”. Reconciliations between GAAP and Non-GAAP measures can be found on pages 34-37.
Revenue was $636.4 million in 2017, an increase of $58.8 million from the prior year. In addition to the $29.5 million increase noted above, the remaining increase was primarily related to a $26.1 million realized loss on foreign currency hedging contracts in the prior year.
Sodium chlorate sales volumes increased by 3,000 tonnes over the prior year. The average sales price decreased by 1% due to customer mix and the impact of the stronger Canadian dollar on U.S. denominated sales.
Chlor-alkali sales volumes increased by 34,000 tonnes or 11% due to increased demand for hydrochloric acid primarily from the U.S. oil and gas sector related to rig activity and increased demand for caustic potash primarily in the agriculture sector.
Adjusted cost of sales was $428/MT, a decrease of $9/MT due primarily to higher chlor-alkali sales volumes on a similar level of fixed manufacturing costs between years. Adjusted gross profit was $267.6 million in 2017, an increase of $20.4 million from the prior year and is primarily due to the increased chlor-alkali and sodium chlorate sales volumes and higher average sales prices for caustic soda and hydrochloric acid. See “Reconciliation of Adjusted Revenue, Adjusted Cost of Sales and Adjusted Operating and Administrative Costs”. Reconciliations between GAAP and Non-GAAP measures can be found on pages 34-37.
Cost of sales was $416.4 million in 2017, an increase of $6.1 million from the prior year. The increase is primarily related to the increased sales volumes and to a lesser extent increased power costs. Gross profit was $220.0 million in 2017, an increase of $52.7 million from the prior year. The increase is due to higher sales volumes and the realized loss on foreign currency hedging contracts in the prior year.
Average electrical costs in North America for sodium chlorate, which represent 70% to 85% and 30% to 40% of the variable costs of the production of sodium chlorate and chlor-alkali, respectively, increased approximately 6% over the prior year.
Adjusted operating and administrative costs of $141.2 million were $3.1 million or 2% higher than in the prior year due to higher distribution costs. See “Reconciliation of Adjusted Revenue, Adjusted Cost of Sales and Adjusted Operating and Administrative Costs”. Reconciliations between GAAP and Non-GAAP measures can be found on pages 34-37.
Selling, distribution and administrative costs were $146.4 million or $3.2 million higher than in the prior year. The increase was a result of higher distribution costs partially offset by restructuring costs incurred in the prior year. Distribution costs include the cost of freight and delivery to customers.
Operational Information
Specialty Chemicals is a manufacturer of sodium chlorate, chlorine dioxide, sodium chlorite, chlorine, caustic soda, hydrochloric acid and potassium hydroxide and produces hydrogen as a by-product of electrolysis. It owns and operates nine production facilities across North America and one in Chile. In addition, Specialty Chemicals provides chlorine dioxide generators and related technology to pulp and paper customers worldwide. Chlorine dioxide generators use sodium chlorate as the primary feedstock in the production of chlorine dioxide, an environmentally preferred bleaching agent used in the production of bleached pulp which, in turn, is used in a wide range of products, including high-quality print and writing paper.

Superior Plus Corp. 2017 Annual Report14
ERCO’s production facilities use proven and safe manufacturing processes and are located close to major rail terminals and reliable supplies of raw materials. Electrical energy costs generally represent 70% to 85%, and salt approximately 10%, of the variable costs of producing sodium chlorate.
Specialty Chemicals’ top ten customers account for approximately 55% of its revenue with its largest customer comprising approximately 9% of its revenue.
For the year ended December 31, 2017, global sodium chlorate, sodium chlorite and chlorine dioxide technology-related sales represented 62% of Specialty Chemicals revenue. Sodium chlorate is principally sold to bleached pulp manufacturers. It is used to generate chlorine dioxide for bleaching pulp and represents approximately 5% or less of the variable cost to manufacture bleached pulp. As a result, sodium chlorate sales volumes and prices tend to be stable over time despite the volatility of bleached pulp prices.
Financial Outlook
EBITDA from operations for Specialty Chemicals is anticipated to be consistent to modestly lower than in 2017 as electricity costs and the impact of a weaker U.S. dollar on U.S. denominated revenue are expected to have a negative impact on gross profit, partially offset by an increase in chlor-alkali sales volumes and pricing.
In addition to the significant assumptions detailed above, refer to “Forward-Looking Information” and to “Risk Factors to Superior” for a detailed review of the significant business risks affecting Superior’s Specialty Chemicals segment.
Consolidated Capital Expenditure Summary
Superior classifies its capital expenditures into three main categories: efficiency, process improvement and growth-related; maintenance capital; and investment in finance leases.
Efficiency, process improvement and growth-related expenditures will include expenditures such as acquisition of new customer equipment to facilitate growth, system upgrades and initiatives to facilitate improvements in customer service.
Maintenance capital expenditures will include required regulatory spending on tank refurbishments, replacement of chlorine railcars, replacement of plant equipment and any other required expenditures related to maintaining operations.
Superior’s capital expenditures for 2017 and 2016:
(millions of dollars) 2017 2016
Efficiency, process improvement and growth-related 19.8 18.1
Maintenance capital 57.2 67.0
77.0 85.1
Proceeds on disposition of capital and intangible assets (7.6) (3.2)
Property, plant and equipment acquired through acquisition 149.3 4.2
Total net capital expenditures 218.7 86.1
Investment in finance leases 24.9 14.1
Total expenditures including finance leases 243.6 100.2
Efficiency, process improvement and growth-related expenditures were $19.8 million in 2017, compared to $18.1 million in the prior year. The increase is primarily related to the purchase of tanks, pumps and regulators for customer growth and to a lesser extent the impact of Canwest partially offset by Energy Distribution system upgrades in the prior year.
Maintenance capital expenditures were $57.2 million in 2017, compared to $67.0 million in the prior year, consisting primarily of required maintenance and general capital across Superior’s segments. The decrease is mainly due to Specialty Chemicals’ investment in chlorine railcars in the prior year.
During 2017, Superior entered into new leases with capital-equivalent value of $24.9 million, primarily related to vehicles for the Energy Distribution segment to support growth and replace aging vehicles.
Capital expenditures were funded from a combination of operating cash flow and revolving-term bank credit facilities.

Superior Plus Corp. Management’s Discussion and Analysis 15
Corporate Adjusted Operating and Administrative Costs
Corporate adjusted operating and administrative costs were $21.6 million in 2017, compared to $20.2 million in the prior year. The $1.4 million increase was primarily due to higher incentive plan costs and professional fees. See “Reconciliation of Adjusted Revenue, Adjusted Cost of Sales and Adjusted Operating and Administrative Costs”. Reconciliations between GAAP and Non-GAAP measures can be found on pages 34-37.
Corporate Selling, Distribution Administrative Costs
Corporate costs were $39.3 million in 2017, compared to $41.9 million in the prior year. The $2.6 million decrease was primarily due to lower transaction costs and was partially offset by higher incentive plan costs and professional fees.
Interest Expense
Interest expense on borrowing and finance lease obligations was $43.8 million in 2017, compared to $35.6 million in the prior year. The increase was mainly due to higher average debt related to acquisitions and higher average effective interest rates.
Transaction and Other Costs
Superior’s transaction and other costs have been categorized together and excluded from segmented results. The table below summarizes these costs:
(millions of dollars) 2017 2016
Transaction costs 16.5 21.4
Restructuring and integration costs 16.6 7.1
CPD disposal costs – 21.7
Total transaction and other costs 33.1 50.2
For the year ended December 31, 2017, Superior incurred $16.5 million in costs related to the acquisition of Canwest and the other tuck-in acquisitions and $16.6 million in costs related to the integration and restructuring of the new acquisitions.
For the year ended December 31, 2016, Superior incurred $21.7 million in costs related to the divestiture of CPD, $21.4 million related to the terminated acquisition of Canexus and $7.1 million of restructuring costs. The restructuring costs related to a reduction in Canadian Propane Distribution’s western Canada headcount in response to lower oilfield and related demand, and a reduction in Specialty Chemicals headcount across multiple plants and the corporate office in response to lower product demand, primarily for chlor-alkali.
Income Taxes
Consistent with prior periods, Superior recognizes a provision for income taxes for its subsidiaries that are subject to current and future income taxes, including U.S., Luxembourg, and Chilean income tax.
Total income tax expense for 2017 was $143.7 million, comprised of $3.3 million in cash income tax expense and $140.4 million in deferred income tax expense. This compares to a total income expense of $36.9 million in the prior year, which consisted of $5.0 million in cash income tax expense and a $31.9 million deferred income tax expense.
Cash income taxes for 2017 were $3.3 million, consisting of income taxes in Canada of $1.9 million (2016 – nil), income tax recovery in the U.S. of $1.4 million (2016 – $1.5 million of U.S. cash tax expense), income taxes in Chile of $2.1 million (2016 - $3.5 million), and income taxes in Luxembourg of $0.7 million (2016 – nil). Deferred income tax expense for 2017 was $140.4 million (2016 – $32.9 million), resulting in a corresponding net deferred income tax asset of $69.9 million as at December 31, 2017 (December 31, 2016 – $231.8 million). The increase in deferred income tax expense was due to settling the dispute with the CRA with respect to the company’s corporate conversion transaction.

Superior Plus Corp. 2017 Annual Report16
As at December 31, 2017, Superior had the following tax pools available to be used in future years:
Canada (millions of dollars)
Tax basis 335.4
Non-capital losses 4.5
Capital losses 4.8
Canadian scientific research expenditures 282.6
Investment tax credits 88.2
United States
Tax basis 262.2
Non-capital losses 142.6
Chile
Tax basis 18.5
See the audited consolidated financial statements for the year ended December 31, 2017 for a summary of the expiry of the non-capital loss carry-forwards and investment tax credits. Capital loss carry-forwards and Canadian scientific research expenditures are eligible to be carried forward indefinitely.
Canada Revenue Agency (CRA) Income Tax Update
As announced on August 1, 2017, Superior reached an agreement with the CRA regarding its objection to the tax consequences of Superior’ corporate conversion transaction on December 31, 2008. Superior elected to enter into the agreement with the CRA to avoid further legal proceedings and allow management to focus on its Evolution 2020 strategic initiatives. The agreement with the CRA will not give rise to any cash outlay by Superior for prior tax years. The payment of approximately $33 million to the CRA and related provincial agencies for 50% of the estimated tax liabilities for prior taxation years was to be refunded, of which $31.3 million was received in the fourth quarter. The agreement with the CRA resulted in a non-cash charge of $119 million related to the write-off of a portion of Superior’s deferred tax assets. The tax pools impacted by the agreement have been restated at December 31, 2016 as follows:
Carry forward available 2016 2016 (restated)
Canadian non-capital losses (1) $ 62.2 $ 14.3
Canadian scientific research expenditures $ 625.8 $ 349.9
Canadian capital losses $ 541.2 $ 6.6
Canadian federal and provincial investment tax credits(2) $ 145.7 $ 92.2
(1) Expiring beyond 2019.
(2) $4.6 million expired in 2017, the remainder expires beyond 2020.

Superior Plus Corp. Management’s Discussion and Analysis 17
Financial Outlook
Superior achieved AOCF before transaction and other costs per share of $1.75 which was at the top end of the 2017 financial outlook range provided in its third quarter 2017 MD&A. See the detailed discussion on each segment for a breakdown of the results achieved.
Superior’s current 2018 financial outlook of AOCF per share of $1.65 to $1.95 and 2018 Adjusted EBITDA guidance of $295 million to $335 million is consistent with the guidance provided in its third quarter 2017 MD&A. Achieving Superior’s AOCF and Adjusted EBITDA depends on the operating results of its segments. In addition to the operating results of Superior’s segments, significant assumptions underlying the achievement of Superior’s 2018 midpoint guidance are:
» Economic growth in Canada and the U.S. is expected to increase modestly;
» Superior is expected to continue to attract capital and obtain financing on acceptable terms;
» Superior’s estimated total debt to Adjusted EBITDA ratio is based on maintenance and growth-related expenditures as well as capital equivalent of operating leases of $100 million to $105 million in 2018 and on working capital funding requirements which do not contemplate any significant commodity price changes;
» Superior is substantially hedged for its estimated U.S. dollar exposure for 2018, and due to the hedge position, a change in the Canadian to U.S, dollar exchange rate for 2018 would not have a material impact on Superior;
» The foreign currency exchange rate between the Canadian dollar and U.S. dollar is expected to average 0.78 for 2018 on all unhedged foreign currency transactions;
» Financial and physical counterparties are expected to continue fulfilling their obligations to Superior;
» Regulatory authorities are not expected to impose any new regulations impacting Superior;
» Superior’s average interest rate on floating-rate debt is expected to modestly increase over 2017. Interest expense is anticipated to increase due to higher average debt levels related to the Canwest acquisition and tuck-in acquisitions;
» Realized losses on foreign currency hedging contracts are anticipated to be higher than 2017 due to the decrease in the average effective hedging rate; and
» Canadian, Chilean and U.S.-based cash taxes are expected to be in the range of $5 million to $10 million for 2018 based on existing statutory income tax rates and the ability to use available tax basis.
Energy Distribution
» Wholesale propane and U.S. refined fuels-related prices are not anticipated to significantly affect demand for propane and refined fuels and related services; and
» Operating costs are expected to realize some synergies due to the restructuring and integration of Canwest.
Specialty Chemicals
» Average plant utilization will approximate 90%-95% in 2018.
Debt Management Update
Superior remains focused on managing both its total debt and its total debt to Adjusted EBITDA ratio. Superior’s total debt to Adjusted EBITDA ratio for the trailing twelve months was 3.3x as at December 31, 2017, compared to 2.1x at December 31, 2016. The debt levels and total leverage ratio as at December 31, 2017 were higher than on December 31, 2016, due to increased borrowings on credit facilities related primarily to the acquisition of Canwest. The trailing 12 months Adjusted EBITDA includes pro forma Adjusted EBITDA for Canwest and the tuck-in acquisitions completed in 2017.
The total debt to Adjusted EBITDA ratio is currently above the long-term target of 3.0x. Superior anticipates the total debt to Adjusted EBITDA ratio will be in the range of 3.0x to 3.4x as at December 31, 2018.
In addition to Superior’s significant assumptions detailed above, refer to “Forward-Looking Information” and for a detailed review of Superior’s significant business risks, refer to “Risk Factors to Superior.”

Superior Plus Corp. 2017 Annual Report18
Liquidity and Capital Resources
Borrowing
Superior’s revolving syndicated bank facility (credit facility), term loans and finance lease obligations (collectively borrowing) before deferred financing fees was $1,063.4 million as at December 31, 2017, an increase of $618.7 million from $444.7 million as at December 31, 2016. Total debt increased primarily due to the acquisition of Canwest and tuck-in acquisitions and to a lesser extent the acquisitions of property, plant and equipment.
Superior’s total and available sources of credit are detailed below:
As at December 31, 2017
Total Letters of Amount(millions of dollars) Amount Borrowing Credit Issued Available
Revolving term bank credit facilities(1) 620.0 387.1 31.7 201.2
Term loans(1) 600.0 600.0
Other debt 13.2 13.2
Finance lease obligations 63.1 63.1
Total 1,296.3 1,063.4 31.7 201.2
(1) Revolving term bank credit facilities and term loan balances are presented before deferred financing fees.
On February 1, 2018 Superior LP closed a private placement of CDN $220 million in Senior Unsecured Notes bearing interest at 5.125% and due August 27, 2025. The net proceeds reduced the balance under Superior’s revolving credit facility. Superior expects to use the revolving credit facility to redeem $200 million of its outstanding 6.5% senior unsecured debentures due December 9, 2021.
Extension of Credit Facility
On May 1, 2017, Superior extended the maturity date of its credit facility to April 28, 2022. In addition to the extension of the syndicated credit facility, Superior had agreed with its lenders that the syndicated credit facility would be increased to $620.0 million from the existing $570.0 million with ten lenders and can be further expanded up to $800.0 million.
Convertible Debentures
During the year the Company issued $150 million of 5.25% senior unsecured notes. Part of the proceeds were used to fund the redemption of the $97 million of 6% convertible unsecured debentures due June 30, 2019. The redemption occurred on November 15, 2017.
Net Working Capital
Consolidated net working capital was $115.7 million as at December 31, 2017, an increase of $3.6 million from $112.1 million as at December 31, 2016. Superior’s net working capital requirements are financed from its credit facility.
Compliance
In accordance with the credit facility, Superior must maintain certain covenants and ratios that require Non-GAAP financial measures. Superior is in compliance with the lender covenants as at December 31, 2017 and the covenant details are found in the credit facility documents filed in the System for Electronic Document Analysis and Retrieval (“SEDAR”).
Credit Ratings
As of February 14, 2018 Dominion Bond Rating Service (DBRS) and the Standard & Poor’s (S&P) rating for Superior’s corporate credit and its 6.5% and 5.25% notes are respectively, BB (high) and BB.
Pension Plans
As at December 31, 2017, Superior had an estimated defined benefit going concern surplus of approximately $26.2 million (December 31, 2016 – $33.4 million surplus) and a pension solvency surplus of approximately $4.5 million (December 31, 2016 – $4.3 million deficiency). Funding requirements required by applicable pension legislation are based upon going concern and solvency actuarial assumptions. These assumptions differ from the going concern actuarial assumptions used in Superior’s audited consolidated financial statements.

Superior Plus Corp. Management’s Discussion and Analysis 19
Contractual Obligations and Other Commitments Payments Due In
(millions of dollars) Note (1) Total 2018 2019-2020 2021-2022 Thereafter
Borrowing 16 1,063.4 28.7 33.4 598.6 402.7
Present value of minimum future lease payment under finance leases 17 63.1 19.5 23.1 11.9 8.6
Operating leases(2) 17 187.8 34.4 54.8 43.1 55.5
US$ foreign currency forward sales contracts (US$) 20 328.8 166.1 144.7 18.0 –
Natural gas, diesel, WTI, propane, heating oil, and electricity purchase commitments (3) 20 93.9 49.3 44.6 – –
Total contractual obligations and other commitments 1,737.0 298.0 300.6 671.6 466.8
(1) Notes to the 2017 audited consolidated financial statements.
(2) Operating leases comprise Superior’s off-balance-sheet obligations.
(3) Does not include the impact of financial derivatives.
In the normal course of business, Superior is subject to lawsuits and claims. Superior believes the resolution of these matters will not have a material adverse effect, individually or in the aggregate, on Superior’s liquidity, consolidated financial position or results of operations. Superior records costs as they are incurred or when they become determinable.
Shareholders’ Capital
The weighted average number of common shares issued and outstanding during 2017 was 142.8 million shares. Superior suspended its DRIP program after the payment of the August 2016 dividend on September 15, 2016. Superior’s DRIP program will remain in place should Superior elect to reactivate the DRIP, subject to regulatory approval, at a future date.
As at December 31, 2017 and 2016, the following common shares and securities convertible into common shares were issued and outstanding:
December 31, 2017 December 31, 2016
Convertible Convertible (millions) Securities Shares Securities Shares
Common shares outstanding 142.8 142.8
6.00% debentures(1) – – $97.0 5.8
Shares outstanding and issuable upon conversion of debentures – 142.8 148.6
(1) Convertible at $16.75 per share. Redeemed in November 2017.
Dividends Paid to Shareholders
Dividends paid to Superior’s shareholders depend on its cash flow from operating activities with consideration for Superior’s changes in working capital requirements, investing activities and financing activities. See “Summary of AOCF” for 2017, above, and “Summary of Cash Flow” for additional details.
Dividends paid to shareholders for 2017 were $102.8 million or $0.72 per share compared to $102.2 million or $0.72 per share in 2016. Dividends paid to shareholders increased by $0.6 million. Dividends to shareholders are declared at the discretion of Superior’s Board of Directors.

Superior Plus Corp. 2017 Annual Report20
Summary of Cash Flow
Superior’s primary sources and uses of cash are detailed below:
(millions of dollars) 2017 2016
Cash flows from operating activities 183.1 146.8
Investing activities:
Purchase of property, plant and equipment (77.0) (98.0)
Proceeds from sale of discontinued operation – SEM – 4.3
Proceeds from sale of discontinued operation – CPD – 390.5
Proceeds on disposal of property, plant and equipment and intangible assets 7.6 3.3
Acquisitions (494.6) (8.2)
Cash flows (used in) from in investing activities (564.0) 291.9
Financing activities:
Net proceeds (repayment) of revolving term bank credits and other debt 229.4 (147.1)
Redemption of convertible debentures (97.0) (150.0)
Proceeds from 5.25% senior secured notes 400.0 –
Repayment of finance lease obligation (16.0) (21.4)
Debt issuance costs (7.2) –
Settlement of foreign currency forward contracts – (34.6)
Proceeds from dividend reinvestment program – 22.8
Dividends paid to shareholders (102.8) (102.2)
Cash flows from (used in) financing activities 406.4 (432.5)
Net increase in cash and cash equivalents 25.5 6.2
Cash and cash equivalents , beginning of period 5.0 –
Effect of translation of foreign-denominated cash 1.3 (1.2)
Cash and cash equivalents, end of period 31.8 5.0
Cash flows from operating activities were $183.1 million in 2017, an increase of $36.3 million from the prior year. The increase was the result of higher EBITDA from operations, income from Canwest, a realized gain on foreign currency hedging contracts compared to a loss in the prior year and lower transaction and other costs.
Cash flow used in investing activities was $(564.0) million, a decrease of $855.9 million from cash flow of $291.9 million the prior year. The decrease occurred mainly because of acquisitions in 2017 and the cash flow from the CPD disposition in 2016.
Cash flow from financing activities was $406.4 million, an increase of $838.9 million from cash used of $432.5 million in the prior year and was mainly related to repayments in the prior year from proceeds on the CPD sale compared to proceeds received in the current year to fund acquisitions.

Superior Plus Corp. Management’s Discussion and Analysis 21
Financial Instruments – Risk Management
Derivative and non-financial derivatives are used by Superior to manage its exposure to fluctuations in foreign currency exchange rates, interest rates, share-based compensation and commodity prices. Superior assesses the inherent risks of these instruments by grouping derivative and non-financial derivatives related to the exposures these instruments mitigate. Superior’s policy is not to use derivative or non-financial derivative instruments for speculative purposes. Superior does not formally designate its derivatives as hedges and, as a result, Superior does not apply hedge accounting and is required to designate its derivatives and non-financial derivatives as held for trading.
As at December 31, 2017, Superior has substantially hedged its estimated U.S. dollar exposure for 2018 and 57% for 2019. Due to the hedge position, a change in the Canadian to U.S. dollar exchange rate for 2018 would not have a material impact on Superior. A summary of Superior’s U.S. dollar forward contracts for the remainder of 2018 and beyond is provided in the table below.
(US$ millions except exchange rates) 2018 2019 2020 2021 2022 Total
Net US$ forward sales 166.1 107.7 37.0 18.0 – 328.8
Net average external US$/CDN$ exchange rate 1.25 1.25 1.32 1.31 – 1.26
For additional details on Superior’s financial instruments, including the amount and classification of gains and losses recorded in Superior’s annual consolidated financial statements, summary of fair values, notional balances, effective rates and terms, and significant assumptions used in the calculation of the fair value of Superior’s financial instruments, see Note 20 to the audited consolidated financial statements.
Sensitivity Analysis
Superior’s estimated cash flow sensitivity in 2017 to various changes is provided below:
Impact on Change % Change AOCF Per Share (millions)
Energy Distribution
Change in propane sales margin $0.005/litre 3% $8.5 $0.06
Change in propane sales volume 50 million litres 3% $8.0 $0.06
Change in U.S. refined fuels sales margin $0.005/litre 4% $6.7 $0.05
Change in U.S. refined fuels sales volume 50 million litres 4% $4.7 $0.03
Specialty Chemicals
Change in sales price $10.00/MT 1% $6.9 $0.05
Change in sales volume 15,000 MT 2% $3.8 $0.03
Corporate
Change in CDN$/US$ exchange rate on US$ denominated debt $0.01 1% – –
Change in interest rates 0.5% 19% $1.4 $0.01

Superior Plus Corp. 2017 Annual Report22
Disclosure Controls and Procedures and Internal Controls Over Financial Reporting
Disclosure controls and procedures (DC&P) are designed by or under the supervision of Superior’s President and Chief Executive Officer (CEO) and the Executive Vice President and Chief Financial Officer (CFO) in order to provide reasonable assurance that all material information relating to Superior is communicated to them by others in the organization as it becomes known and is appropriately disclosed as required under the continuous disclosure requirements of securities legislation and regulation. In essence, these types of controls are related to the quality, reliability and transparency of financial and non-financial information that is filed or submitted under securities legislation and regulation. The CEO and CFO are assisted in this responsibility by a Disclosure Committee, which is composed of senior leadership of Superior. The Disclosure Committee has established procedures so that it becomes aware of any material information affecting Superior in order to evaluate and discuss this information and determine the appropriateness and timing of its public release.
Internal Controls over Financial Reporting (ICFR) are also designed by or under the supervision of Superior’s CEO and CFO and effected by Superior’s Board of Directors, management and other personnel in order to provide reasonable assurance regarding the reliability of financial reporting and the preparation of financial statements for external purposes in accordance with IFRS. A control system, no matter how well conceived and operated, can provide only reasonable, not absolute, assurance that its objectives are met. Due to inherent limitations in all such systems, no evaluation of controls can provide absolute assurance that all control issues within a company have been detected. Accordingly, Superior’s disclosure controls and procedures are designed to provide reasonable, not absolute, assurance that the objectives of the corporation’s disclosure control system are met.
Changes in Internal Controls over Financial Reporting
No changes were made in Superior’s ICFR that have materially affected, or are reasonably likely to materially affect, Superior’s ICFR in the quarter ended December 31, 2017.
Effectiveness
An evaluation of the effectiveness of Superior’s DC&P and ICFR was conducted as at December 31, 2017 by and under the supervision of Superior’s management, including the CEO and CFO. Based on this evaluation, the CEO and CFO have concluded that Superior’s DC&P and ICFR were effective at December 31, 2017 with the following exception:
Section 3.3(1) of National Instrument 52-109, Certification of Disclosure in Issuers’ Annual and Interim Filings, states that a company may limit its design of disclosure controls and procedures and internal controls over financial reporting for a business that it acquired not more than 365 days before the end of the financial period to which the certificate relates. Under this section, Superior’s CEO and CFO have limited the scope of the design, and subsequent evaluation, of DC&P and ICFR to exclude controls, policies and procedures of Canwest effective September 27, 2017, and Yankee and Earhart. Summary financial information pertaining to these acquisitions that was included in the consolidated financial statements of Superior as at December 31, 2017, is as follows:
Canadian Propane Distribution – Canwest Three months ended Year ended (millions of Canadian dollars) December 31, 2017 December 31, 2017
Sales 77.1 77.1
Net earnings for the period 17.1 17.1
Current assets 70.0
Non-current assets 420.2
Current liabilities 33.7
Non-current liabilities 16.8

Superior Plus Corp. Management’s Discussion and Analysis 23
U.S. Refined Fuels – Earhart and Yankee Three months ended Year ended (millions of Canadian dollars) December 31, 2017 December 31, 2017
Earhart Yankee Earhart Yankee
Sales 9.1 6.1 9.3 8.4
Net earnings for the period 2.1 0.7 2.2 0.2
Current assets 7.8 3.4
Non-current assets 43.0 38.3
Current liabilities 2.9 1.0
Non-current liabilities 0.0 3.4
Critical Accounting Policies and Estimates
Superior’s audited consolidated financial statements were prepared in accordance with IFRS. The significant accounting policies are described in the audited consolidated financial statements for the period ended December 31, 2017. Certain of these accounting policies, as well as estimates made by management in applying such policies, are recognized as critical because they require management to make subjective or complex judgments about matters that are inherently uncertain. Superior’s critical accounting estimates relate to the allowance for doubtful accounts, employee future benefits, deferred income tax assets and liabilities, the valuation of financial and non-financial derivatives, asset impairments and the assessment of potential provision retirement obligations.
Recent Accounting Pronouncements
Certain new standards, interpretations, amendments and improvements to existing standards were issued by the International Accounting Standards Board (IASB) or International Financial Reporting Interpretations Committee (IFRIC) effective for accounting periods beginning on or after January 1, 2016, or later periods. The standards applicable to Superior are as follows:
New and revised IFRS standards not yet effective
IFRS 9 – Financial Instruments: Classification and Measurement
IFRS 9 was issued in November 2009 and is intended to replace IAS 39 – Financial Instruments: Recognition and Measurement. IFRS 9 uses a single approach to determine whether a financial asset is measured at amortized cost or fair value, replacing the multiple rules in IAS 39. The approach in IFRS 9 is based on how an entity manages its financial instruments in the context of its business model and the contractual cash flow characteristics of the financial assets. The new standard also requires a single impairment method to be used, replacing the multiple impairment methods in IAS 39. Requirements for financial liabilities were added in October 2010 and they largely carried forward existing requirements in IAS 39 except that fair value changes due to credit risk for liabilities designated at fair value through profit and loss would generally be recorded in other comprehensive income.
A final version of IFRS 9 was issued in July 2014 to include impairment requirements for financial assets and limited amendments to the classification and measurement requirements by introducing a fair value through other comprehensive income measurement category for certain simple debt instruments. This standard must be applied for accounting periods beginning on or after January 1, 2018, with earlier adoption permitted. In the first quarter of 2018 Superior will elect to apply the limited exemption in IFRS 9 relating to transition for classification and measurement and impairment, and accordingly will not restate comparative periods in the year of initial application. It is anticipated that the adoption of IFRS 9 will have no impact on the Company’s consolidated financial statements on the date of initial application. There will be no change in the carrying amounts on the basis of allocation from original measurement categories under IAS 39 – Financial Instruments: Recognition and Measurement to the new measurement categories under IFRS 9.

Superior Plus Corp. 2017 Annual Report24
IFRS 15 – Revenue from Contracts with Customers
IFRS 15 was issued in May 2014, establishing a single comprehensive model for entities to use in accounting for revenue arising from contracts with customers. IFRS 15 supersedes the current revenue recognition guidance including International Accounting Standard (IAS 18) – Revenue and IAS 11 – Construction Contracts, as well as the related interpretation when it becomes effective. Under IFRS 15, an entity should recognize revenue to depict the transfer of promised goods or services to customers in an amount that reflects the consideration to which the entity expects to be entitled in exchange for those goods or services. An entity is required to recognize revenue when the performance obligation is satisfied. Either a full or modified retrospective application is required for annual periods beginning on or after January 1, 2018 with early adoption permitted. Superior has analyzed its revenue streams under IFRS 15 by assessing customer contracts. The implementation of IFRS 15 will not have a material impact on the consolidated statement of net earnings and comprehensive income. IFRS 15 will require revenue to be disclosed in greater detail while not providing information that is seriously prejudicial to the interests of Superior. The additional disclosure will include revenue by type, such as sale of product, services and rental, by country and by segment.
IFRS 16 – Leases
On January 13, 2016, the IASB issued IFRS 16 – Leases (IFRS 16), which replaces IAS 17 – Leases and related interpretations. IFRS 16 provides a single lessee accounting model, requiring the recognition of assets and liabilities for all leases, except those that meet limited exception criteria. IFRS 16 will be applied retrospectively for annual periods beginning on or after January 1, 2019. Although Superior has made progress in its assessment of IFRS 16, it is not yet possible to make a reliable estimate of the impact of the new standard on the consolidated financial statements.
Selected Financial Information(millions of dollars except per share amounts) 2017 2016
GAAP measures:
Total assets (as at December 31) 2,336.7 1,847.5
Revenue 2,385.0 2,023.7
Gross profit 735.4 656.4
Net earnings (loss) from continuing operations (27.9) 114.2
Per share, basic $(0.20) $0.80
Per share, diluted $(0.20) $0.78
Cash flow from operating activities 183.1 146.8
Dividends per share $0.72 $0.72
Current and long-term borrowing(1) (as at December 31) 1,063.4 444.7
Non-GAAP financial measures(2):
AOCF 217.4 139.6
Per share, basic $1.52 $0.98
Per share, diluted $1.52 $0.98
AOCF before transaction and other costs 250.5 189.8
Per share before transaction and other costs, basic and diluted $1.75 $1.34
(1) Current and long-term borrowing before deferred financing fees and debentures.
(2) See “Non-GAAP Financial Measures” and “Reconciliation of Net Earnings to Adjusted EBITDA from Operations”.

Superior Plus Corp. Management’s Discussion and Analysis 25
Fourth Quarter Results
Summary of AOCF Three months ended December 31
(millions of dollars, except per share amounts) 2017 2016
Revenue 768.9 583.1
Gross profit 238.1 193.6
EBITDA from operations(1) 116.8 94.0
Corporate adjusted operating and administrative costs(2) (8.7) (7.0)
Realized gains (losses) on foreign currency hedging contracts 1.0 (1.5)
Adjusted EBITDA(1) 109.1 85.5
Interest expense (11.5) (7.1)
Cash income tax (expense) recovery 1.1 (1.1)
AOCF before transaction costs 98.7 77.3
Transaction and other costs(3) (4.7) (8.9)
AOCF(1) 94.0 68.4
AOCF per share before transaction and other costs, basic and diluted(4) $0.69 $0.54
AOCF per share, basic and diluted(3) $0.66 $0.48
Dividends paid per share $0.18 $0.18
(1) EBITDA from operations and AOCF are Non-GAAP measures. See “Non-GAAP Financial Measures” and “Reconciliation of Net Earnings before Income Taxes to Adjusted EBITDA from Operations”. Reconciliations between GAAP and Non-GAAP measures can be found on pages 34-37.
(2) See “Reconciliation of Adjusted Revenue, Adjusted Cost of Sales and Adjusted Operating and Administrative Costs”. Reconciliations between GAAP and Non-GAAP measures can be found on pages 34-37.
(3) Transaction and other costs for the three months ended December 31, 2017 are related to the acquisition of Canwest and other tuck-in acquisitions. For the three months ended December 31, 2016 transaction and other costs are related to the terminated acquisition of Canexus, the divestiture of the CPD business, and restructuring. See “Transaction and Other Costs” for further details.
(4) The weighted average number of shares outstanding for the three months ended December 31, 2017 and 2016 is 142.8 million and 142.8 million, respectively. There were no dilutive instruments with respect to AOCF per share for the three months ended December 31, 2017 or 2016.
Comparable GAAP Financial Information Three months ended December 31
(millions of dollars, except per share amounts) 2017 2016
Net earnings (loss) from continuing operations 45.3 (22.8)
Net earnings (loss) per share from continuing operations, basic $0.32 $(0.16)
Net earnings (loss) per share from continuing operations, diluted $0.32 $(0.19)
Net cash flows from operating activities 38.9 27.6
Net cash flows from operating activities per share, basic and diluted $0.27 $0.19
Segmented Information Three months ended December 31
(millions of dollars) 2017 2016
EBITDA from operations(1)
Energy Distribution 81.3 59.8
Specialty Chemicals 35.5 34.2
116.8 94.0
(1) EBITDA from operations is a Non-GAAP measure. See “Non-GAAP Financial Measures.” Reconciliations between GAAP and Non-GAAP measures can be found on pages 34-37.

Superior Plus Corp. 2017 Annual Report26
AOCF
AOCF before transaction and other costs for the three months ended December 31, 2017 was $98.7 million, an increase of $21.4 million from the prior year’s fourth quarter AOCF of $77.3 million. AOCF per share before transaction and other costs of $0.69 per share was $0.15 per share or 28% higher than the prior year’s fourth quarter AOCF of $0.54 per share. The increase per share is primarily due to higher EBITDA from operations and was partially offset by higher interest costs.
AOCF for the three months ended December 31, 2017 was $94.0 million, an increase of $25.6 million or 37% from the prior year’s fourth quarter AOCF of $68.4 million. AOCF per share of $0.66 per share was $0.18 per share or 38% higher than the prior year’s fourth quarter AOCF per share of $0.48 per share. Transaction and other costs for the three months ended December 31, 2017 were $4.7 million, and consisted of transaction costs related primarily to the acquisition and integration of Canwest and the other tuck-in acquisitions. See “Transaction and Other Costs” for further details.
Energy Distribution
Energy Distribution’s condensed operating results for the three months ended December 31, 2017 and 2016(1):
Three months ended December 31
(millions of dollars) 2017 2016
Revenue 608.3 436.1
Cost of sales (429.1) (295.6)
Gross profit 179.2 140.5
Less: Adjusted operating and administrative costs(1) (97.9) (80.7)
Adjusted EBITDA from operations(1)(2) 81.3 59.8
GAAP measures
Selling, distribution and administrative costs 114.8 98.6
Net earnings 65.1 48.5
(1) See “Reconciliation of Adjusted Revenue, Adjusted Cost of Sales and Adjusted Operating and Administrative Costs”. Reconciliations between GAAP and Non-GAAP measures can be found on pages 34-37.
(2) Adjusted EBITDA from operations is a Non-GAAP financial measure. See “Non-GAAP Financial Measures” and “Reconciliation of Net Earnings to Adjusted EBITDA from Operations”. Reconciliations between GAAP and Non-GAAP measures can be found on pages 34-37.
Revenue for the fourth quarter of 2017 were $608.3 million, an increase of $172.2 million or 39% from the prior year’s fourth quarter. The increase is primarily due to higher wholesale propane prices, incremental revenue from Canwest and to a lesser extent higher volumes. Total gross profit for the fourth quarter of 2017 was $179.2 million, an increase of $38.7 million or 28% over the prior year’s fourth quarter. The increase in gross profit principally reflects incremental gross profit from Canwest and higher volumes from Canadian propane distribution than in the prior year’s period. A detailed review of gross profit is provided below.
Gross Profit Review Three months ended December 31
(millions of dollars) 2017 2016
Canadian propane distribution 115.1 88.0
U.S. refined fuels distribution 52.5 42.9
Other services 11.6 9.6
Total gross profit 179.2 140.5

Superior Plus Corp. Management’s Discussion and Analysis 27
Canadian Propane Distribution
Canadian propane distribution gross profit for the fourth quarter of 2017 was $115.1 million, an increase of $27.1 million or 31% over the prior year’s fourth quarter. The increase is principally due to contribution from Canwest and higher volumes related to colder weather. Residential sales volumes increased by 20 million litres or 48% from the prior year’s fourth quarter primarily reflecting incremental volumes sold associated with Canwest and to a lesser extent colder weather than in the prior year’s fourth quarter. Average weather across Canada for the fourth quarter, as measured by degree days, was 7% colder than in the prior year fourth quarter and 4% colder than the five-year average. Industrial volumes increased by 92 million litres or 110% primarily due to Canwest. Wholesale volumes increased by 72 million litres or 43% on higher third party sales from the supply portfolio management business than in the prior year’s fourth quarter, related to sales and marketing initiatives as compared to the prior year.
Average propane sales margins for the fourth quarter decreased to 18.0 cents per litre from 21.1 cents per litre in the prior year’s fourth quarter due to weaker basis differentials and overall wholesale propane market fundamentals on the supply portfolio management business and an increased proportion of lower-margin wholesale volumes.
Canadian Propane Distribution Sales Volumes
Volumes by End-Use Application (1) Three months ended December 31
(millions of litres) 2017 2016
Residential 62 42
Commercial 108 73
Agricultural 34 34
Industrial 176 84
Wholesale 240 168
Automotive 21 16
Total 641 417
Volumes by Region (1) Three months ended December 31
(millions of litres) 2017 2016
Western Canada 359 182
Eastern Canada 178 142
Atlantic Canada 30 32
United States 74 61
Total 641 417
(1) Regions: Western Canada region consists of British Columbia, Alberta, Saskatchewan, Manitoba, Northwest Ontario, Yukon and Northwest Territories; Eastern Canada region consists of Ontario (except for Northwest Ontario) and Québec; Atlantic Canada region consists of New Brunswick, Newfoundland & Labrador, Nova Scotia and Prince Edward Island; and United States region consists primarily of Maine, Idaho, Kansas, Michigan, Washington, Alaska and California.
U.S. Refined Fuels Distribution
U.S. refined fuels distribution gross profit for the fourth quarter of 2017 was $52.5 million, an increase of $9.6 million or 22% over the prior year’s fourth quarter, due to the impact of higher margins, colder weather and tuck-in acquisitions completed in the fourth quarter. Sales volumes of 369 million litres decreased by 4 million litres or 1% from the prior year’s fourth quarter. Residential sales volumes increased by 8 million litres or 10% from the prior year’s fourth quarter primarily due to the benefit from tuck-in acquisitions completed in 2017 and colder weather. Average weather across the Northeast U.S. for the fourth quarter, as measured by degree days, was 8% colder than the prior year and the five-year average. Commercial sales volumes increased by 9 million litres or 10% largely due to colder weather. Wholesale volumes decreased by 21 million litres or 10% as the business shifts its focus to more profitable business or customers.
Average U.S. refined fuels sales margins increased to 14.2 cents per litre in the fourth quarter of 2017 from 11.5 cents per litre in the prior year’s fourth quarter mainly due to sales and marketing initiatives focused on higher margin business, including retail propane customer growth.

Superior Plus Corp. 2017 Annual Report28
U.S. Refined Fuels Distribution Sales Volumes
Volumes by End-Use Application (1) Three months ended December 31
(millions of litres) 2017 2016
Residential 86 78
Commercial 103 94
Wholesale 180 201
Total 369 373
(1) Includes heating oil, propane, diesel and gasoline sold in the Northeast United Sates region, consisting of Pennsylvania, Connecticut, New York and Rhode Island.
Other Services
Other services gross profit was $11.6 million in the fourth quarter, an increase of $2.0 million or 21% over the prior year’s fourth quarter. The increase relates to the acquisition of Canwest.
Adjusted Operating and Administrative Costs
Energy Distribution’s adjusted operating and administrative costs were $97.9 million in the fourth quarter of 2017, an increase of $17.2 million or 21% from the prior year’s fourth quarter. Operating costs increased mainly due to the acquisition of Canwest and higher sales volumes. See “Reconciliation of Adjusted Revenue, Adjusted Cost of Sales and Adjusted Operating and Administrative Costs”.
Selling, Distribution and Administrative Costs
Energy Distribution’s selling, distribution and administrative costs were $114.8 million in the fourth quarter of 2017, an increase of $16.2 million or 16% from the prior year’s fourth quarter. Operating costs increased mainly due to the acquisition of Canwest.
SPECIALTY CHEMICALS
Specialty Chemicals’ condensed operating results for the three months ended December 31, 2017 and 2016:
Three months ended December 31
2017 2016
(millions of dollars, except per metric tonne (MT) amounts) $ per MT $ per MT
Adjusted revenue(1) 160.1 755 150.0 739
Adjusted cost of sales(1) (87.5) (413) (79.5) (392)
Adjusted gross profit(1) 72.6 342 70.5 347
Less: Adjusted operating and administrative costs(1) (37.1) (175) (36.3) (179)
EBITDA from operations(1)(2) 35.5 167 34.2 168
GAAP Measures
Revenue 159.6 147.0
Cost of sales (101.7) (93.9)
Gross profit 57.9 53.1
Selling, distribution and administrative costs (37.1) (37.9)
Net earnings (loss) 20.5 21.6
(1) See “Reconciliation of Adjusted Revenue, Adjusted Cost of Sales and Adjusted Operating and Administrative Costs”. Reconciliations of GAAP and Non-GAAP measures can be found on pages 34-37.
(2) EBITDA from operations is a Non-GAAP financial measure. See “Non-GAAP Financial Measures” and “Reconciliation of Net Earnings to EBITDA from Operations”. Reconciliation of GAAP and Non-GAAP measures can be found on pages 34-37.

Superior Plus Corp. Management’s Discussion and Analysis 29
Sales Volumes by Product
Three months ended December 31 (thousands of MTs) 2017 2016
Sodium chlorate 127 125
Chlor-alkali 83 76
Chlorite 2 2
Total 212 203
Adjusted revenue for the fourth quarter of 2017 of $160.1 million was $10.1 million or 7% higher than in the prior year’s fourth quarter primarily due to higher sales volumes of sodium chlorate, hydrochloric acid and caustic potash and higher average sales prices for caustic soda and hydrochloric acid partially offset by lower average sales prices for caustic potash and sodium chlorate and lower realized foreign currency gains on the translation of US denominated working capital in 2017. See “Reconciliation of Adjusted Revenue, Adjusted Cost of Sales and Adjusted Operating and Administrative Costs”.
Revenue for the fourth quarter of 2017 of $159.6 million was $12.6 million or 9% higher than the prior year’s fourth quarter primarily due to increased sales volumes of caustic potash, hydrochloric acid and sodium chlorate and increased average sales prices for caustic soda and hydrochloric acid partially offset by a decrease in average sales prices for caustic potash and sodium chlorate.
Sodium chlorate sales volumes increased by 2 MT over the prior year’s fourth quarter. The average sales price decreased by 2% due to customer mix and the impact of the stronger Canadian dollar on US denominated sales in the fourth quarter compared to the prior year’s fourth quarter.
Chlor-alkali sales volumes increased by 7 MT or 9% due to increased demand for hydrochloric acid primarily from the U.S. oil and gas sector related to rig activity and increased demand for caustic potash primarily in the agriculture sector.
Adjusted cost of sales for the fourth quarter increased 10% to $87.5 million primarily due to higher electricity costs in the sodium chlorate business.
Adjusted gross profit for the fourth quarter was $72.6 million, an increase of $2.1 million or 3% from the prior year’s fourth quarter. The lower adjusted gross profit per MT is due primarily to higher electricity costs in the sodium chlorate business. See “Reconciliation of Adjusted Revenue, Adjusted Cost of Sales and Adjusted Operating and Administrative Costs”.
Cost of sales for the fourth quarter of $101.7 was $7.8 million or 8% higher than in the prior year’s fourth quarter. The increase is primarily due to higher electricity costs and to a lesser extent increased amortization partially offset by restructuring costs recorded in the prior year.
Adjusted selling, distribution and administrative costs of $37.1 million was 0.8 million or 2% higher than the prior year fourth quarter. See “Reconciliation of Adjusted Revenue, Adjusted Cost of Sales and Adjusted Operating and Administrative Costs”.
Selling, distribution and administrative costs of $37.1 million were $0.8 million or 2% lower than in the prior year’s fourth quarter. Higher distribution costs in the current period were offset by a restructuring provision and a foreign exchange gain on working capital recorded in the prior year’s fourth quarter.
Consolidated Capital Expenditure Summary Three months ended December 31
(millions of dollars) 2017 2016
Efficiency, process improvement and growth-related 10.7 6.7
Maintenance capital 20.3 18.5
31.0 25.2
Proceeds on disposition of capital and intangible assets (4.3) (1.1)
Property, plant and equipment acquired through acquisition 17.6 –
Total net capital expenditures 44.3 24.1
Investment in finance leases 5.6 5.3
Total expenditures including finance leases 49.9 29.4
Superior Plus Corp. 2017 Annual Report30
Efficiency, process improvement and growth related expenditures were $10.7 million in the fourth quarter of 2017 compared to $6.7 million in the prior year’s quarter. The increase is principally associated with Canwest growth-related capital and system integration capital.
Maintenance capital expenditures were $20.3 million in the fourth quarter compared to $18.5 million in the prior year’s fourth quarter, an increase of $1.8 million mainly due to timing of expenditures and tank refurbishment costs at Energy Distribution.
Proceeds on disposition were $4.3 million in the fourth quarter of 2017 compared to $1.1 million in the prior year’s quarter primarily due to the disposal of a Canwest property as Superior has begun to divest of excess facilities and properties while executing on synergies.
Superior entered into new leases with capital-equivalent value of $5.6 million in the fourth quarter of 2017 compared to $5.3 million in the prior year’s fourth quarter. Superior continues to invest in trucks and equipment to support growth and replace aging vehicles in the fleet.
Corporate Adjusted Operating and Administrative Costs
Corporate adjusted operating and administrative costs were $8.7 million in the fourth quarter, compared to $7.0 million in the prior comparable quarter. The $1.7 million increase was primarily due to higher incentive plan costs and professional fees. See “Reconciliation of Adjusted Revenue, Adjusted Cost of Sales and Adjusted Operating and Administrative Costs”. Reconciliations between GAAP and Non-GAAP measures can be found on pages 34-37.
Corporate Selling, Distribution Administrative Costs
Corporate costs were $11.0 million in the fourth quarter, compared to $8.8 million in the prior comparable quarter. The $2.2 million increase was primarily due to higher amortization and depreciation, higher incentive plan costs and professional fees.
Interest Expense
Interest expense on borrowing and finance lease obligations was $11.5 million in the fourth quarter, compared to $7.1 million in the prior comparable quarter. The increase was mainly due to the higher average debt related to acquisitions and to a lesser extent the higher average effective interest rates.
Transaction and Other Costs
For the fourth quarter Superior incurred $4.7 million in transaction and other costs compared to $8.9 million in the prior comparable quarter. The decrease is primarily related to restructuring costs incurred in the prior year related to a reduction in Canadian Propane Distribution’s western Canada headcount and a reduction in Specialty Chemicals headcount across multiple plants and the corporate office partially offset by integration costs associated with Canwest and the transaction costs related to the tuck-in acquisitions.
Non-GAAP Financial Measures
Throughout the MD&A, Superior has used the following terms that are not defined by GAAP, but are used by management to evaluate the performance of Superior and its business. These measures may also be used by investors, financial institutions and credit rating agencies to assess Superior’s performance and ability to service debt. Non-GAAP financial measures do not have standardized meaning prescribed by GAAP and are therefore unlikely to be comparable to similar measures presented by other companies. Securities regulations require that Non-GAAP financial measures be clearly defined, qualified and reconciled to their most comparable GAAP financial measures. Except as otherwise indicated, these Non-GAAP financial measures are calculated and disclosed on a consistent basis from period to period. Specific items may only be relevant in certain periods.
The intent of using Non-GAAP financial measures, which also do not have any standardized meaning under IFRS is to provide additional useful information to investors and analysts. The measures should not, therefore, be considered in isolation or used in substitute for measures of performance prepared in accordance with IFRS. Other issuers may calculate Non-GAAP financial measures differently.

Superior Plus Corp. Management’s Discussion and Analysis 31
Investors should be cautioned that AOCF, EBITDA from operations, Adjusted EBITDA, Adjusted revenue, Adjusted cost of sales, Adjusted gross profit and Adjusted operating and administrative costs should not be construed as alternatives to net earnings, cash flow from operating activities or other measures of financial results determined in accordance with GAAP as an indicator of Superior’s performance. Non-GAAP financial measures are identified and defined as follows:
AOCF and AOCF per Share
AOCF is equal to cash flow from operating activities as defined by IFRS, adjusted for changes in non-cash working capital, other expenses, non-cash interest expense, current income taxes and finance costs. Superior may deduct or include additional items in its calculation of AOCF; these items would generally, but not necessarily, be infrequent in nature and could distort the analysis of trends in business performance. Excluding these items does not imply they are non-recurring. AOCF and AOCF per share are presented before and after transaction and other costs.
AOCF per share before transaction and other costs is calculated by dividing AOCF before transaction and other costs by the weighted average number of shares outstanding. AOCF per share is calculated by dividing AOCF by the weighted average number of shares outstanding.
AOCF is the main performance measure used by management and investors to evaluate Superior’s ongoing performance of its businesses and ability to generate cash flow. AOCF represents cash flow generated by Superior that is available for, but not necessarily limited to, changes in working capital requirements, investing activities and financing activities. AOCF is also used as one component in determining short-term incentive compensation for certain management employees.
The seasonality of Superior’s individual quarterly results must be assessed in the context of annualized AOCF. Adjustments recorded by Superior as part of its calculation of AOCF include, but are not limited to, the impact of the seasonality of Superior’s businesses, principally the Energy Distribution segment, by adjusting for non-cash working capital items, thereby eliminating the impact of the timing between the recognition and collection/payment of Superior’s revenue and expenses, which can differ significantly from quarter to quarter.
Adjusted EBITDA
Adjusted EBITDA represents earnings before interest, taxes, depreciation, amortization, losses (gains) on disposal of assets, finance expense, restructuring costs, transaction and other costs, and unrealized gains (losses) on derivative financial instruments. Adjusted EBITDA is used by Superior and investors to assess its consolidated results and ability to service debt. Adjusted EBITDA is reconciled to net earnings before income taxes.
EBITDA from operations
EBITDA from operations is defined as Adjusted EBITDA excluding gains and losses on foreign currency hedging contracts, corporate costs and transaction and other costs. For purposes of this MD&A, foreign currency hedging contract gains and losses are excluded from the results of the operating segments. EBITDA from operations is used by Superior and investors to assess the results of its operating segments. EBITDA from operations is reconciled to net earnings before income taxes.
Adjusted revenue
Adjusted revenue is defined as revenue adjusted for foreign currency gains (losses) related to working capital and realized losses on foreign currency hedging contracts. Adjusted revenue is used as a measure to analyze the performance of sales transactions and to evaluate Superior’s ongoing performance of its businesses and ability to generate cash flow. Adjusted revenue is used in the determination of EBITDA from Operations and is reconciled to revenue.
Adjusted cost of sales
Adjusted cost of sales is defined as cost of sales adjusted for depreciation that is included in cost of sales and restructuring costs. Adjusted cost of sales is used as a measure to analyze costs and performance on margins. Adjusted costs of sales is used in the determination of EBITDA from Operations and is reconciled to cost of sales.
Adjusted gross profit
Adjusted gross profit is defined as adjusted revenue less adjusted cost of sales. Adjusted revenue and adjusted cost of sales are reconciled to revenue and cost of sales respectively. Adjusted gross profit is used as a measure to evaluate Superior’s ongoing performance of its businesses and ability to generate cash flow. Adjusted gross profit is used in the determination of EBITDA from Operations.

Superior Plus Corp. 2017 Annual Report32
Adjusted operating and administrative costs
Adjusted operating and administrative costs is defined as selling, distribution and administrative costs adjusted for non-cash items such as depreciation, amortization, gains/losses on disposal of assets, restructuring and integration costs and foreign currency gains/losses related to working capital. Adjusted operating and administrative costs are used as a measure to analyze recurring costs excluding non-cash items such as amortization and depreciation. Adjusted operating and administrative costs is used in the determination of EBITDA from Operations and is reconciled to selling, distribution and administrative costs.
Quarterly Financial and Operating Information
GAAP Measures(millions of dollars, except per share amounts)
Q4 2017 Q3 2017 Q2 2017 Q1 2017 Q4 2016 Q3 2016 Q2 2016 Q1 2016
Revenue 768.9 465.5 474.9 675.7 583.1 429.0 448.1 563.5
Gross profit 238.1 133.6 138.0 225.7 193.6 119.0 127.2 216.6
Net earnings (loss) from
continuing operations 45.3 (124.8) (1.6) 53.2 (22.8) 52.8 (15.7) 99.9
Per share, basic $0.32 $(0.87) $(0.01) $0.37 $(0.16) $0.37 $(0.11) $0.71
Per share, diluted $0.32 $(0.87) $(0.01) $0.34 $(0.19) $0.36 $(0.11) $0.66
Net working capital(1) 115.7 85.3 107.4 133.6 112.1 84.6 232.5 236.8
(1) Net working capital as at the quarter-end is comprised of trade and other receivables, prepaid expenses and inventories, less trade and other payables, deferred revenue, and dividends and interest payable.
Non-GAAP Financial Measures(1)
(millions of dollars, except per share amounts)
Q4 2017 Q3 2017 Q2 2017 Q1 2017 Q4 2016 Q3 2016 Q2 2016 Q1 2016
AOCF before transaction
and other costs 98.7 15.0 27.5 109.3 77.3 8.0 16.5 88.0
Per share, basic $0.69 $0.11 $0.19 $0.77 $0.54 $0.06 $0.12 $0.62
Per share, diluted $0.69 $0.11 $0.19 $0.77 $0.54 $0.06 $0.12 $0.62
AOCF 94.0 (4.5) 20.1 107.8 68.4 (13.3) 5.0 79.5
Per share, basic $0.66 $(0.03) $0.14 $0.75 $0.48 $(0.09) $0.04 $0.56
Per share, diluted $0.66 $(0.03) $0.14 $0.75 $0.48 $(0.09) $0.04 $0.56
(1) AOCF before transaction and other costs, AOCF and the related per share amounts, are Non-GAAP financial measures. See “Non-GAAP Financial Measures” and “Reconciliation of Net Earnings to EBITDA from Operations”. Reconciliations between GAAP and Non-GAAP financial measures can be found on pages 34-37.
The seasonality of Superior’s individual quarterly results must be assessed when comparing quarterly results. During 2017 Superior acquired Canwest, Pomerleau, Yankee, IDI and Earhart. Each acquisition will affect quarterly results. See Note 4 in the annual audited financial statements for more information on these acquisitions.
Volumes
Q4 2017 Q3 2017 Q2 2017 Q1 2017 Q4 2016 Q3 2016 Q2 2016 Q1 2016
Canadian propane sales
volumes (millions of litres) 641 293 283 478 417 234 255 429
U.S. refined fuels sales
volumes (millions of litres) 369 273 298 397 373 321 353 422
Chemical sales volumes
(thousands of MT) 212 217 210 212 203 209 196 205

Superior Plus Corp. Management’s Discussion and Analysis 33
Canadian propane sales by end-use application are as follows: (millions of litres) Q4 2017 Q3 2017 Q2 2017 Q1 2017 Q4 2016 Q3 2016 Q2 2016 Q1 2016
Residential 62 16 19 53 42 15 20 48
Commercial 108 34 45 103 73 35 42 90
Agricultural 34 8 7 17 34 7 7 15
Industrial 176 84 84 93 84 81 93 108
Wholesale 240 132 109 197 168 76 73 151
Automotive 21 19 19 15 16 20 20 17
Total 641 293 283 478 417 234 255 429
U.S. Refined Fuels sales by end-use application are as follows:(millions of litres) Q4 2017 Q3 2017 Q2 2017 Q1 2017 Q4 2016 Q3 2016 Q2 2016 Q1 2016
Residential 86 17 32 115 78 17 41 117
Commercial 103 80 82 94 94 80 87 96
Wholesale 180 176 184 188 201 224 225 209
Total 369 273 298 397 373 321 353 422
Specialty Chemicals sales volumes by product are as follows: (thousands of MT)
Q4 2017 Q3 2017 Q2 2017 Q1 2017 Q4 2016 Q3 2016 Q2 2016 Q1 2016
Sodium chlorate 127 128 119 128 125 127 117 130
Chlor-alkali 83 87 88 83 76 80 77 74
Chlorite 2 2 3 1 2 2 2 1
Total 212 217 210 212 203 209 196 205

Superior Plus Corp. 2017 Annual Report34
Reconciliation of Net Earnings Before Income Taxes to Adjusted EBITDA
(millions of dollars) Energy Specialty For the year ended December 31, 2017 Distribution Chemicals Corporate Total
Net earnings (loss) before income taxes 108.6 72.9 (65.7) 115.8
Add:
Depreciation and amortization included in selling, distribution and administrative costs 59.7 – 0.9 60.6
Depreciation included in cost of sales – 52.3 – 52.3
Losses (gains) on disposal of assets and other (1.8) 0.5 0.3 (1.0)
Income from Canwest (11.9) – 11.9 –
Canwest depreciation, amortization and other costs 10.7 – – 10.7
Finance expense 3.5 0.7 49.6 53.8
Unrealized (gains) on derivative financial instruments (5.0) – (22.7) (27.7)
Transaction, restructuring and other costs 16.6 – 16.5 33.1
Adjusted EBITDA 180.4 126.4 (9.2) 297.6
(millions of dollars) Energy Specialty For the year ended December 31, 2016 Distribution Chemicals Corporate Total
Net earnings (loss) before income taxes 143.4 30.7 (23.0) 151.1
Add:
Depreciation and amortization included in selling, distribution and administrative costs 58.2 − 0.3 58.5
Depreciation included in cost of sales − 54.5 − 54.5
Realized losses (gains) on foreign currency hedging contracts (0.1) 26.1 (26.0) −
Losses (gains) on disposal of assets (1.0) 0.7 − (0.3)
Finance expense 2.9 0.4 74.3 77.6
Unrealized (gains) on derivative financial instruments (39.4) (7.0) (93.2) (139.6)
Transaction, restructuring and other costs 3.4 3.7 21.4 28.5
Adjusted EBITDA 167.4 109.1 (46.2) 230.3

Superior Plus Corp. Management’s Discussion and Analysis 35
Reconciliation of Net Earnings Before Income Taxes to Adjusted EBITDA(millions of dollars) Energy SpecialtyFor the three months ended December 31, 2017 Distribution Chemicals Corporate Total
Net earnings (loss) before income taxes 65.1 20.5 (28.3) 57.3
Add:
Depreciation and amortization included in selling, distribution and administrative costs 14.8 − 0.4 15.2
Depreciation included in cost of sales − 14.2 − 14.2
Losses (gains) on disposal of assets (0.9) 0.5 − (0.4)
Finance expense 0.9 0.3 16.5 17.7
Unrealized losses (gains) on derivative financial instruments (1.6) − 1.8 0.2
Transaction, restructuring and other costs 3.0 − 1.9 4.9
Adjusted EBITDA 81.3 35.5 (7.7) 109.1
(millions of dollars) Energy SpecialtyFor the three months ended December 31, 2016 Distribution Chemicals Corporate Total
Net earnings (loss) before income taxes 48.5 21.6 (15.9) 54.2
Add:
Depreciation and amortization included in selling, distribution and administrative costs 15.0 – – 15.0
Depreciation included in cost of sales – 13.6 – 13.6
Realized losses (gains) on foreign currency hedging contracts – 1.5 (1.5) –
Losses (gains) on disposal of assets (0.5) 0.2 – (0.3)
Finance expense 0.7 0.1 7.4 8.2
Unrealized (gains) on derivative financial instruments (7.3) (6.5) (0.3) (14.1)
Transaction, restructuring and other costs 3.4 3.7 1.8 8.9
Adjusted EBITDA 59.8 34.2 (8.5) 85.5

Superior Plus Corp. 2017 Annual Report36
Reconciliation of Adjusted Revenue, Adjusted Cost of Sales and Adjusted Operating and Administrative Costs
For the year ended For the year ended December 31, 2017 December 31, 2016
Energy Specialty Energy Specialty (millions of dollars) Distribution Chemicals Corporate Distribution Chemicals Corporate
Revenue 1,748.1 636.4 0.5 1,446.1 577.6 −
Foreign currency gains (losses) related to working capital − (4.7) − − (1.5) −
Realized losses on foreign currency hedging contracts − − − − 26.1 (26.1)
Adjusted revenue 1,748.1 631.7 0.5 1,446.1 602.2 (26.1)
Cost of sales (1,233.2) (416.4) − (957.0) (410.3) −
Depreciation included in cost of sales − 52.3 − − 54.5 −
Transaction, restructuring and other costs − − − − 0.8 −
Realized losses (gains) on foreign currency hedging contracts − − − (0.1) − 0.1
Adjusted cost of sales (1,233.2) (364.1) − (957.1) (355.0) 0.1
Adjusted gross profit 514.9 267.6 0.5 489.0 247.2 (26.0)
Selling, distribution and administrative costs (407.8) (146.4) (39.3) (382.2) (143.2) (41.9)
Depreciation and amortization 59.7 0.9 58.2 − 0.3
(Gains) losses on disposal of assets and other (1.8) 0.5 0.3 (1.0) 0.7 −
Income from Canwest (1.2) − − − − −
Transaction, restructuring and other costs 16.6 − 16.5 3.4 2.9 21.4
Realized losses (gains) on foreign currency hedging contracts − − − − − −
Foreign currency losses (gains) related to working capital − 4.7 − − 1.5 −
Adjusted operating and administrative costs (334.5) (141.2) (21.6) (321.6) (138.1) (20.2)
EBITDA from operations 180.4 126.4 (21.1) 167.4 109.1 (46.2)

Superior Plus Corp. Management’s Discussion and Analysis 37
Reconciliation of Adjusted Revenue, Adjusted Cost of Sales and Adjusted Operating and Administrative Costs
For the three months ended For the three months ended December 31, 2017 December 31, 2016
Energy Specialty Energy Specialty (millions of dollars) Distribution Chemicals Corporate Distribution Chemicals Corporate
Revenue 608.3 159.6 1.0 436.1 147.0 −
Foreign currency gains related to working capital − 0.5 − − 1.5 −
Realized losses on foreign currency hedging contracts − − − − 1.5 (1.5)
Adjusted revenue 608.3 160.1 1.0 436.1 150.0 (1.5)
Cost of sales (429.1) (101.7) − (295.6) (93.9) −
Depreciation included in cost of sales − 14.2 − − 13.6 −
Transaction, restructuring and other costs − − − − 0.8 −
Adjusted cost of sales (429.1) (87.5) − (295.6) (79.5) −
Adjusted gross profit 179.2 72.6 1.0 140.5 70.5 (1.5)
Selling, distribution and administrative costs (114.8) (37.1) (11.0) (98.6) (37.9) (8.8)
Depreciation and amortization 14.8 − 0.4 15.0 − −
Losses (gains) on disposal of assets and other (0.9) 0.5 0.2 (0.5) 0.2 −
Transaction, restructuring and other costs 3.0 − 1.7 3.4 2.9 1.8
Reclassification of foreign currency (gains) related to working capital − (0.5) − − (1.5) −
Adjusted operating and administrative costs (97.9) (37.1) (8.7) (80.7) (36.3) (7.0)
EBITDA from operations 81.3 35.5 (7.7) 59.8 34.2 (8.5)

Superior Plus Corp. 2017 Annual Report38
Calculation of Consolidated Secured Debt, Consolidated Debt and Total Debt(1) As at December 31 2017 2016
Total shareholders’ equity 776.0 928.6
Exclude accumulated other comprehensive gain (89.4) (111.3)
Shareholders’ equity excluding accumulated other comprehensive gain 686.6 817.3
Current borrowing(1) 28.7 18.3
Borrowing(1) 1,034.7 426.4
Less: Senior unsecured debt (600.0) (200.0)
Consolidated secured debt 463.4 244.7
Add: Senior unsecured debt 600.0 200.0
Consolidated debt 1,063.4 444.7
Convertible unsecured subordinated debentures(1) 0.0 97.0
Total debt 1,063.4 541.7
Total capital 1,750.0 1,359.0
(1) Borrowing and convertible unsecured subordinated debentures are before deferred issuance costs and option value.
Risk Factors to Superior
The risks factors and uncertainties detailed below are a summary of Superior’s assessment of its material risk factors as detailed in Superior’s 2017 Annual Information Form (“AIF”) under “Risks associated with our business” which is filed on the Canadian Securities Administrators’ website, www.sedar.com, and on Superior’s website, www.superiorplus.com. The AIF describes some of the most material risks to Superior’s business by type of risk: financial; strategic; operational; and legal.
General risks to Superior are as follows:
Cash Dividends to Shareholders are Dependent on the Performance of Superior LP
Superior depends entirely on the operations and assets of Superior LP. Superior’s ability to make dividend payments to its shareholders depends on Superior LP’s ability to make distributions on its outstanding limited partnership units, as well as on the operations and business of Superior LP.
There is no assurance regarding the amount of cash to be distributed by Superior LP or generated by Superior LP and, therefore, there is no assurance regarding funds available for dividends to shareholders. The amount distributed in respect of the limited partnership units will depend on a variety of factors including, without limitation, the performance of Superior LP’s operating businesses, the effect of acquisitions or dispositions on Superior LP, and other factors that may be beyond the control of Superior LP or Superior. In the event significant sustaining capital expenditures are required by Superior LP or the profitability of Superior LP declines, there would be a decrease in the amount of cash available for dividends to shareholders and such decrease could be material.
Superior’s dividend policy and the distribution policy of Superior LP are subject to change at the discretion of the Board of Directors of Superior or the Board of Directors of Superior General Partner Inc., the general partner of Superior LP, as applicable. Superior’s dividend policy and the distribution policy of Superior LP are also limited by contractual agreements including agreements with lenders to Superior and its affiliates and by restrictions under corporate law.
Additional Shares
If the Board of Directors of Superior decides to issue additional common shares, preferred shares or securities convertible into common shares, existing shareholders may suffer significant dilution.

Superior Plus Corp. Management’s Discussion and Analysis 39
Access to Capital
The credit facilities and U.S. notes of Superior LP contain covenants that require Superior LP to meet certain financial tests and that restrict, among other things, the ability of Superior LP to incur additional debt, dispose of assets or pay dividends/distributions in certain circumstances. These restrictions may preclude Superior LP from returning capital or making distributions on the limited partnership units.
The payout by Superior LP of substantially all of its available cash flow means that capital expenditures to fund growth opportunities can only be made in the event that other sources of financing are available. Lack of access to such additional financing could limit the future growth of the business of Superior LP and, over time, have a material adverse effect on the amount of cash available for dividends to shareholders.
To the extent that external sources of capital, including public and private markets, become limited or unavailable, Superior’s and Superior LP’s ability to make the necessary capital investments to maintain or expand the current business and to make necessary principal payments and debenture redemptions under its term credit facilities may be impaired.
Interest Rates
Superior maintains substantial floating interest rate exposure through a combination of floating interest rate borrowing and the use of derivative instruments. Demand for a significant portion of Energy Distribution’s sales and substantially all of Specialty Chemicals’ sales are affected by general economic trends. Generally speaking, when the economy is strong, interest rates increase, as does demand from Superior’s customers, thereby increasing Superior’s sales and its ability to pay higher interest costs. The opposite is also true. In this way, there is a common relationship among economic activity levels, interest rates and Superior’s ability to pay higher or lower rates. Increased interest rates will, however, affect Superior’s borrowing costs, which will have an adverse effect.
Foreign Exchange Risk
A portion of Superior’s net cash flow is denominated in U.S. dollars. Accordingly, fluctuations in the Canadian/U.S. dollar exchange rate can impact profitability. Superior attempts to mitigate this risk with derivative financial instruments.
Changes in Legislation and Expected Tax Profile
There can be no assurance that income tax laws in the numerous jurisdictions in which Superior operates will not be changed, interpreted or administered in a manner which adversely affects Superior and its shareholders. In addition, there can be no assurance that the CRA (or a provincial tax agency), the U.S. Internal Revenue Service (or a state or local tax agency), the Chilean Internal Revenue Service or the Luxembourg Tax Authorities (collectively, the “tax agencies”) will agree with how Superior calculates its income for tax purposes or that these various tax agencies referenced herein will not change their administrative practices to the detriment of Superior or its shareholders.
Acquisitions and Divestitures
Superior may not be able to find or buy appropriate acquisition targets on economically acceptable terms. Superior’s acquisition agreements will contain certain representations, warranties and indemnities from the respective vendors subject to certain applicable limitations and thresholds and Superior will conduct due diligence prior to completion of such acquisitions. If, however such representations and warranties are inaccurate or limited in applicability or if any liabilities that are discovered exceed such limits or are not covered by the representations, warranties or indemnities, or the applicable vendors default in their obligations or if certain liabilities are not identified in such agreements, Superior could become liable for any such liabilities which may have an adverse effect on Superior. In addition, there may be liabilities or risks that were not discovered in such due diligence investigations which could have an adverse effect on Superior.

Superior Plus Corp. 2017 Annual Report40
Acquiring complementary businesses is often required to optimally execute Superior’s business strategy. Distribution systems, technologies, key personnel or businesses of companies Superior acquires may not be effectively assimilated into its business, or its alliances may not be successful. There is also no assurance regarding the completion of a planned acquisition as Superior may be unable to obtain shareholder approval for a planned acquisition or Superior may be unable to obtain government and regulatory approvals required for a planned acquisition, or required government and/or regulatory approvals may result in delays. There may be penalties associated with not completing a planned acquisition. Superior may not be able to successfully complete certain divestitures on satisfactory terms, if at all. Divestitures may reduce Superior’s total revenue and net earnings by more than the sales price. The terms and conditions, representations, warranties and indemnities, if any, associated with divestiture activity may hold future risks.
Canwest Acquisition
On September 27, 2017, Superior achieved regulatory approval receiving a no-action letter from the Government of Canada’s Competition Bureau. In a consent agreement registered September 27, 2017, Superior agreed to divest of five local branches and nine satellite locations from the combined Superior Propane and Canwest footprint. The estimated impact from the required divestitures is less than 5% of the Canwest retail propane volumes and Adjusted EBITDA based on the trailing 12 months ended June 30, 2017.
A variety of factors may adversely affect Superior’s ability to achieve the anticipated benefits of the acquisition. A failure to realize the anticipated benefits of the acquisition, including but not limited to, the anticipated synergies associated with the acquisition and included in the assumptions relating to expected accretion, could have a material adverse effect on Superior’s business, financial condition, operations, assets or future prospects.
Superior will compete with other potential employers for employees, and it may not be successful in keeping the services of the executives and other employees that it needs to realize the anticipated benefits of the acquisition. Superior LP’s failure to retain key personnel as part of the management team of Canwest in the period following the acquisition could have a material adverse effect on the business and operations of Superior.
Integrating Canwest’s operations with Superior’s existing business will be a complex, time consuming and costly process. Failure to successfully integrate Canwest and its operations in a timely manner may have a material adverse effect on Superior’s business, results of operations, cash flows and financial position. The difficulties of integrating Canwest include, but are not limited to, coordinating geographically disparate organizations, systems and facilities, adapting to additional regulatory and other legal requirements, integrating corporate, technological and administrative function and employment and compensation policies and practices, and diverting management’s attention from other business concerns.
Information Technology and Cyber Security
Superior utilizes a number of information technology systems for the management of its business and the operation of its facilities. The reliability and security of these systems is critical. If the function of these systems is interrupted or fails and cannot be restored quickly, or if the technologies are no longer supported, Superior’s ability to operate its facilities and conduct its business could be compromised. Superior has continued to mature its approach to technology planning. Superior continually assesses and monitors its cyber security risk. In an effort to mitigate such risks, Superior has employed a fully managed third party cyber security service that deploys industry leading technology, conducted comprehensive employee training and utilizes monitoring software to protect its systems.
Although the technology systems Superior utilizes are intended to be secure and Superior has employed various methods to mitigate cyber risks, there is still a risk that an unauthorized third party could access the systems. Such a security breach could lead to a number of adverse consequences, including but not limited to, the unavailability, disruption or loss of key function within Superior’s control systems and the unauthorized disclosure, corruption or loss of sensitive company, customer or personal information. Superior attempts to prevent such breaches through the implementation of various technology security measures, segregation of control systems from its general business network, engaging skilled consultants and employees to manage Superior’s technology applications, conducting periodic audits and adopting policies and procedures as appropriate.
To date, Superior has not been subject to a cyber-security breach that has resulted in a material impact on its business or operations; there is no guarantee, however, that the measures it takes to protect its business systems and operational control systems will be effective in protecting against a breach in the future.

Superior Plus Corp. Management’s Discussion and Analysis 41
Risks to Superior’s Segments
Risks associated with the Energy Distribution business are set out below. Canwest, being in the same industry as Superior Propane, is subject to similar risks.
Canadian Propane Distribution and U.S. Refined Fuels
Competition
Propane is sold in competition with other energy sources such as fuel oil, electricity and natural gas, some of which are less costly on an energy-equivalent basis. While propane is usually more cost-effective than electricity, electricity is a major competitor in most areas. Fuel oil is also used as a residential, commercial and industrial source of heat and, in general, is less costly on an equivalent-energy basis, although operating efficiencies, environmental and air quality factors help make propane competitive with fuel oil. Except for certain industrial and commercial applications, propane is generally not competitive with natural gas in areas with natural gas service. Other alternative energy sources such as compressed natural gas, methanol and ethanol are available or could be further developed and could have an impact on the future of the propane industry in general and Canadian propane distribution in particular. The trend towards increased conservation measures and technological advances in energy efficiency may have a detrimental effect on propane demand and Canadian Propane Distribution’s sales. Increases in the cost of propane encourage customers to reduce fuel consumption and to invest in more energy efficient equipment, reducing demand. Propane commodity prices are affected by crude oil and natural gas commodity prices.
Automotive propane demand depends on propane pricing, the market’s acceptance of propane conversion options and the availability of infrastructure. Superior Propane has strategic partnerships with companies focused on after-market conversion technologies. This segment has been impacted by the development of more fuel efficient and complicated engines which increase the cost of converting engines to propane and reduce the savings per kilometre driven.
Competition in the U.S. refined fuels business’ markets generally occurs on a local basis between large, full-service, multi-state marketers and smaller, independent local marketers. Marketers primarily compete based on price and service and tend to operate in close proximity to customers, typically within a 35-miles marketing radius from a central depot, in order to minimize delivery costs and provide prompt service.
Volume Variability, Weather Conditions and Economic Demand
Weather, general economic conditions and the volatility in the cost of propane affect propane market volumes. Weather influences the demand for propane, primarily for home and facility heating uses and also for agricultural applications, such as crop drying.
Harsh weather can create conditions that exacerbate demand for propane, impede the transportation and delivery of propane, or restrict the ability of Superior to obtain propane from its suppliers. Such conditions may also increase Superior’s operating costs and may reduce customers demand for propane, any of which may have an adverse effect on Superior. Conversely, low prices tend to make customers less price sensitive and less focused on their consumption volume.
Spikes in demand caused by weather or other factors can stress the supply chain and hamper Superior’s ability to obtain additional quantities of propane. Transportation providers (railways and trucking companies) have limited ability to provide resources in times of extreme peak demand. Changes in propane supply costs are normally passed through to customers, but timing lags (between when Superior purchases the propane and when the customer purchases the propane) may result in positive or negative gross margin fluctuations.
For U.S. Refined Fuels, demand from end-use heating applications is predictable. Weather and general economic conditions, however, affect distillates and propane market volumes. Weather influences the immediate demand, primarily for heating, while longer-term demand declines due to economic conditions as customer’s trend towards conservation and supplement heating with alternative sources such as wood pellets.

Superior Plus Corp. 2017 Annual Report42
Demand, Supply and Pricing
Superior offers its customers various fixed-price propane and heating oil programs. In order to mitigate the price risk from offering these services, Superior uses its physical inventory position, supplemented by forward commodity transactions with various third parties having terms and volumes substantially the same as its customer’s contracts. In periods of high propane price volatility, the fixed-price programs create exposure to over or under-supply positions as the demand from customers may significantly exceed or fall short of supply procured. In addition, if propane prices decline significantly subsequent to customers signing up for a fixed-price program, there is a risk that customers will default on their commitments.
Health, Safety and Environment
Superior’s operations are subject to the risks associated with handling, storing and transporting propane in bulk. To mitigate risks, Superior has established a comprehensive environmental, health and safety protection program. It consists of an environmental policy, codes of practice, periodic self-audits, employee training, quarterly and annual reporting and emergency prevention and response.
The U.S. refined fuels business, through a centralized safety and environment management system, ensures that safety practices and regulatory compliance are an important part of its business. The storage and delivery of refined fuels pose the risk of spills which could adversely affect the soil and water of storage facilities and customer properties.
Superior’s fuel distribution businesses are based and operate in Canada and the United States and, as a result, such operations could be affected by changes to laws, rules or policies which could either be more favourable to competing energy sources or increase compliance costs or otherwise negatively affect the operations of Energy Distribution in comparison with such competing energy sources. Any such changes could have an adverse effect on the operations of Energy Distribution.
Employee and Labour Relations
Approximately 15% of Superior’s Canadian propane distribution business employees and 3% of U.S. refined fuels distribution business employees are unionized. Collective bargaining agreements are renegotiated in the normal course of business. While labour disruptions are not expected, there is always risk associated with the renegotiation process that could have an adverse impact on Superior.
Specialty Chemicals
Risks associated with the Specialty Chemicals business are as follows:
Competition
Specialty Chemicals competes with sodium chlorate, chlor-alkali and potassium producers on a worldwide basis. Key competitive factors include price, product quality, logistics capability, reliability of supply, technical capability and service. The end-use markets for products are correlated to the general economic environment and the competitiveness of customers, all of which are outside of the segment’s control, along with market pricing for pulp.
Supply Arrangements
Specialty Chemicals has long-term electricity contracts or electricity contracts that renew automatically with power producers in each of the jurisdictions where its plants are located. There is no assurance that Specialty Chemicals will be able to secure adequate supplies of electricity at reasonable prices or on acceptable terms.
Potassium chloride (KCl) is a major raw material used in the production of potassium hydroxide at the Port Edwards, Wisconsin facility. Substantially all of Specialty Chemicals’ KCl is received from Nutrien Inc. (formerly Potash Corporation of Saskatchewan). Specialty Chemicals has limited ability to source KCl from additional suppliers.
Foreign Currency Exchange
Specialty Chemicals is exposed to fluctuations in the U.S. dollar and the euro versus the Canadian dollar. Specialty Chemicals manages its exposure to fluctuations between the U.S. dollar and Canadian dollar by entering into hedge contracts with external third parties and internally with other Superior businesses.

Superior Plus Corp. Management’s Discussion and Analysis 43
Health, Safety and Environment
Specialty Chemicals’ operations involve the handling, production, transportation, treatment and disposal of materials that are classified as hazardous and are regulated by environmental, health and safety laws, regulations and requirements. There is potential for the release of highly toxic and lethal substances, including chlorine from a facility or transportation equipment. Equipment failure could result in damage to facilities, death or injury and liabilities to third parties. If at any time the appropriate regulatory authorities deem any of the segment’s facilities unsafe, they may order that such facilities be shut down.
Regulatory
Specialty Chemicals’ operations and activities in various jurisdictions require regulatory approval for the handling, production, transportation and disposal of chemical products and waste substances. The failure to obtain or comply fully with such applicable regulatory approval may materially adversely affect Specialty Chemicals.
Manufacturing and Production
Specialty Chemicals’ production facilities maintain complex process and electrical equipment. The facilities have existed for many years and undergone upgrades and improvements. Routine maintenance is regularly completed to ensure equipment is operated within appropriate engineering and technical requirements. Notwithstanding Specialty Chemicals’ operating standards and history of limited downtime, breakdown of electrical transformer or rectifier equipment would temporarily reduce production at the affected facility. Although the segment has insurance to mitigate substantial loss due to equipment outage, Specialty Chemicals’ reputation and its ability to meet customer requirements could be harmed by a major electrical equipment failure.
Employee and Labour Relations
Approximately 25% of Specialty Chemicals’ employees are unionized. Collective bargaining agreements are renegotiated in the normal course of business. While labour disruptions are not expected, there is always risk associated with the negotiation process that could have an adverse impact on Superior.

Superior Plus Corp. 2017 Annual Report44
Management’s Responsibility for Financial StatementsThe accompanying consolidated financial statements of Superior Plus Corp. (Superior) are the responsibility of management and have been approved by the Board of Directors.
The consolidated financial statements were prepared by management in accordance with International Financial Reporting Standards and include certain estimates that are based on management’s best judgments. Actual results may differ from these estimates and judgments. Management has ensured that the consolidated financial statements are presented fairly in all material respects.
Management has developed and maintains a system of internal controls to provide reasonable assurance that Superior’s assets are safeguarded, transactions are accurately recorded, and the financial statements report Superior’s operating and financial results in a timely manner. Financial information presented elsewhere in this annual report has been prepared on a basis consistent with that in the consolidated financial statements.
The Board of Directors of Superior is responsible for reviewing and approving the consolidated financial statements and, primarily through its Audit Committee, ensures that management fulfills its responsibilities for financial reporting. The Audit Committee meets with management and Superior’s external auditor, to discuss internal controls over the financial reporting process, auditing matters and financial reporting issues, to satisfy itself that each party is properly discharging its responsibilities and to review the consolidated financial statements. The Audit Committee reports its findings to the Board of Directors for approval of the consolidated financial statements for issuance to the shareholders. The Audit Committee also considers, for review by the Board of Directors and approval by the shareholders, the engagement or re-appointment of the external auditor.
The consolidated financial statements have been audited by Deloitte LLP, who were appointed at Superior’s last annual meeting.
Luc Desjardins Beth Summers
President and Chief Executive Officer Executive Vice-President and Chief Financial Officer Superior Plus Corp. Superior Plus Corp.
Toronto, Ontario February 14, 2018

Superior Plus Corp. Management’s and Auditor’s Reports 45
Independent Auditor’s Report To the Shareholders of Superior Plus Corp.
We have audited the accompanying consolidated financial statements of Superior Plus Corp., which comprise the consolidated balance sheets as at December 31, 2017 and December 31, 2016, and the consolidated statement of changes in equity, consolidated statements of net (loss) earnings and total comprehensive (loss) income, and consolidated statements of cash flows for the years then ended, and a summary of significant accounting policies and other explanatory information.
Management’s Responsibility for the Consolidated Financial Statements
Management is responsible for the preparation and fair presentation of these consolidated financial statements in accordance with International Financial Reporting Standards, and for such internal control as management determines is necessary to enable the preparation of consolidated financial statements that are free from material misstatement, whether due to fraud or error.
Auditor’s Responsibility
Our responsibility is to express an opinion on these consolidated financial statements based on our audits. We conducted our audits in accordance with Canadian generally accepted auditing standards. Those standards require that we comply with ethical requirements and plan and perform the audit to obtain reasonable assurance about whether the consolidated financial statements are free from material misstatement.
An audit involves performing procedures to obtain audit evidence about the amounts and disclosures in the consolidated financial statements. The procedures selected depend on the auditor’s judgment, including the assessment of the risks of material misstatement of the consolidated financial statements, whether due to fraud or error. In making those risk assessments, the auditor considers internal control relevant to the entity’s preparation and fair presentation of the consolidated financial statements in order to design audit procedures that are appropriate in the circumstances, but not for the purpose of expressing an opinion on the effectiveness of the entity’s internal control. An audit also includes evaluating the appropriateness of accounting policies used and the reasonableness of accounting estimates made by management, as well as evaluating the overall presentation of the consolidated financial statements.
We believe that the audit evidence we have obtained in our audits is sufficient and appropriate to provide a basis for our audit opinion.
Opinion
In our opinion, the consolidated financial statements present fairly, in all material respects, the financial position of Superior Plus Corp. as at December 31, 2017 and December 31, 2016, and its financial performance and its cash flows for the years then ended in accordance with International Financial Reporting Standards.
Chartered Professional AccountantsLicensed Public Accountants February 14, 2018 Toronto, Ontario

Superior Plus Corp. 2017 Annual Report46
(millions of Canadian dollars) Note December 31, 2017 December 31, 2016
Assets Current Assets
Cash 31.8 5.0
Trade and other receivables 6 318.5 243.2
Prepaid expenses 7 29.4 52.1
Inventories 8 137.0 101.1
Unrealized gains on derivative financial instruments 20 30.0 15.4
Assets held for sale 4 & 5 14.8 0.3
Total Current Assets 561.5 417.1
Non-Current Assets
Property, plant and equipment 9 1,077.1 933.7
Intangible assets 10 85.3 32.0
Goodwill 11 504.5 199.2
Notes and finance lease receivables 2.7 3.4
Employee future benefits 19 8.1 6.1
Deferred tax 21 87.4 254.2
Unrealized gains on derivative financial instruments 20 10.1 1.8
Total Non-Current Assets 1,775.2 1,430.4
Total Assets 2,336.7 1,847.5
Liabilities and EquityCurrent Liabilities
Trade and other payables 13 350.7 261.7
Deferred revenue 14 9.9 8.5
Borrowing 16 28.7 18.3
Dividends and interest payable 8.6 11.5
Unrealized losses on derivative financial instruments 20 21.8 9.0
Liabilities classified as discontinued operations 4 – 2.9
Total Current Liabilities 419.7 311.9
Non-Current Liabilities
Borrowing 16 1,024.1 420.7
Convertible unsecured subordinated debentures 18 – 89.8
Other liabilities 15 4.0 11.4
Provisions 12 69.9 20.5
Employee future benefits 19 21.0 22.1
Deferred tax 21 17.5 22.4
Unrealized losses on derivative financial instruments 20 4.5 20.1
Total Non-Current Liabilities 1,141.0 607.0
Total Liabilities 1,560.7 918.9
Equity
Capital 1,953.5 1,953.5
Deficit 23 (1,266.9) (1,136.2)
Accumulated other comprehensive income 22 89.4 111.3
Total Equity 22 776.0 928.6
Total Liabilities and Equity 2,336.7 1,847.5
See accompanying Notes to the Consolidated Financial Statements.
Consolidated Balance Sheets
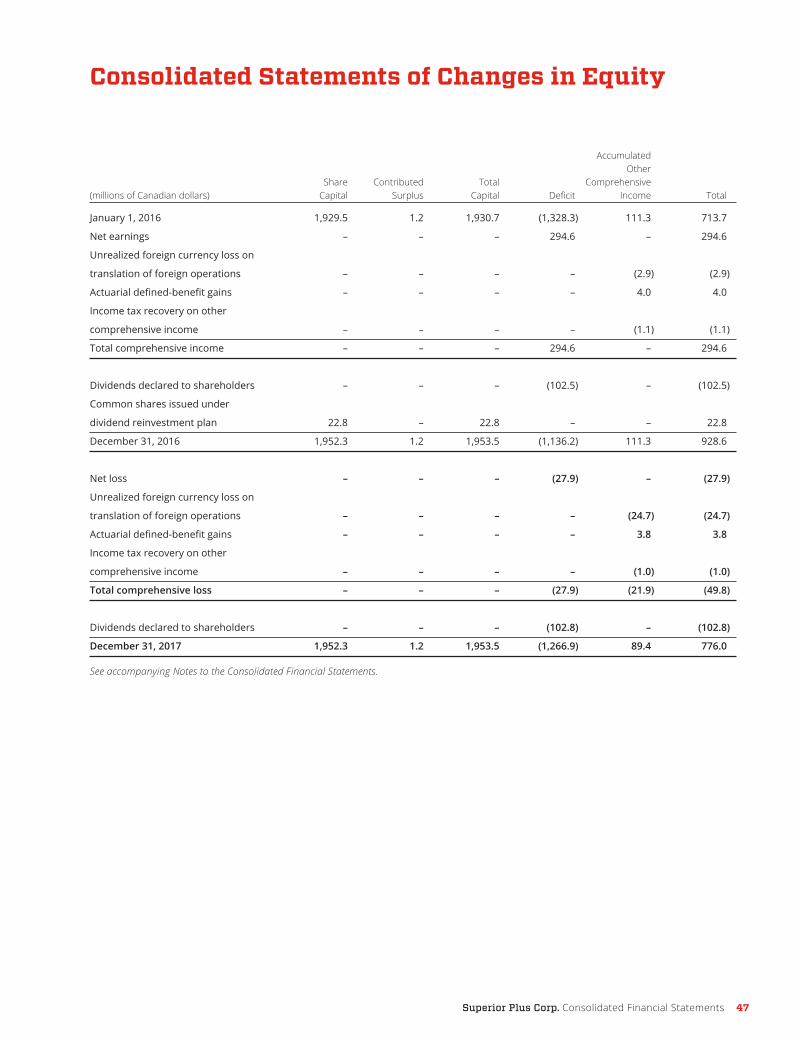
Superior Plus Corp. Consolidated Financial Statements 47
Consolidated Statements of Changes in Equity
Accumulated Other Share Contributed Total Comprehensive (millions of Canadian dollars) Capital Surplus Capital Deficit Income Total
January 1, 2016 1,929.5 1.2 1,930.7 (1,328.3) 111.3 713.7
Net earnings – – – 294.6 – 294.6
Unrealized foreign currency loss on
translation of foreign operations – – – – (2.9) (2.9)
Actuarial defined-benefit gains – – – – 4.0 4.0
Income tax recovery on other
comprehensive income – – – – (1.1) (1.1)
Total comprehensive income – – – 294.6 – 294.6
Dividends declared to shareholders – – – (102.5) – (102.5)
Common shares issued under
dividend reinvestment plan 22.8 – 22.8 – – 22.8
December 31, 2016 1,952.3 1.2 1,953.5 (1,136.2) 111.3 928.6
Net loss – – – (27.9) – (27.9)
Unrealized foreign currency loss on
translation of foreign operations – – – – (24.7) (24.7)
Actuarial defined-benefit gains – – – – 3.8 3.8
Income tax recovery on other
comprehensive income – – – – (1.0) (1.0)
Total comprehensive loss – – – (27.9) (21.9) (49.8)
Dividends declared to shareholders – – – (102.8) – (102.8)
December 31, 2017 1,952.3 1.2 1,953.5 (1,266.9) 89.4 776.0
See accompanying Notes to the Consolidated Financial Statements.

Superior Plus Corp. 2017 Annual Report48
Consolidated Statements of Net (Loss) Earnings and Total Comprehensive (Loss) Income
Years ended December 31(millions of Canadian dollars except per share amounts) Note 2017 2016
Revenues 24 2,385.0 2,023.7
Cost of sales (includes products and services) 24 (1,649.6) (1,367.3)
Gross profit 735.4 656.4
Expenses
Selling, distribution and administrative costs 24 (593.5) (567.3)
Finance expense 24 (53.8) (77.6)
Unrealized gains on derivative financial instruments 20 27.7 139.6
(619.6) (505.3)
Net earnings from continuing operations before income taxes 115.8 151.1
Income tax expense 21 (143.7) (36.9)
Net (loss) earnings from continuing operations (27.9) 114.2
Net earnings from discontinued operations, net of tax expense – 180.4
Net (loss) earnings (27.9) 294.6
Other comprehensive (loss) income:
Items that may be reclassified subsequently to net earnings
Unrealized foreign currency losses on translation of foreign operations (24.7) (26.3)
Other comprehensive income from discontinued operations – 23.4
22 (24.7) (2.9)
Items that will not be reclassified to net earnings
Actuarial defined-benefit gains 22 3.8 4.0
Income tax expense on other comprehensive income 21 (1.0) (1.1)
Other comprehensive loss (21.9) –
Total comprehensive (loss) income (49.8) 294.6
Net (loss) earnings per share
From continuing operations:
Basic 25 $(0.20) $0.80
Diluted 25 $(0.20) $0.78
From discontinued operations:
Basic 25 – $1.27
Diluted 25 – $1.23
See accompanying Notes to the Consolidated Financial Statements.

Superior Plus Corp. Consolidated Financial Statements 49
Consolidated Statements of Cash Flows
Years ended December 31
(millions of Canadian dollars) Note 2017 2016
OPERATING ACTIVITIES
Net (loss) earnings (27.9) 294.6
Adjustments for:
Depreciation included in selling, distribution and administrative costs 9 51.0 58.4
Amortization of intangible assets 10 9.6 7.7
Depreciation included in cost of sales 9 52.3 54.5
Gain on sale of discontinued operations 4 – (177.6)
Gains on disposal of assets and other non-cash items (1.1) (0.3)
Unrealized gains on derivative financial instruments 20 (27.7) (139.6)
Finance expense recognized in net earnings 53.8 78.3
Income tax expense recognized in net earnings 143.7 47.6
Changes in non-cash operating working capital 27 (61.2) (35.1)
Net cash flows from operating activities before income tax and interest paid 192.5 188.5
Income taxes received (paid) 30.5 (7.5)
Interest paid (39.9) (34.2)
Cash flows from operating activities 183.1 146.8
INVESTING ACTIVITIES
Purchase of property, plant and equipment 30 (77.0) (98.0)
Proceeds from sale of discontinued operation Superior Energy Management 4 – 4.3
Proceeds from sale of discontinued operation CPD (net of disposal costs) 4 – 390.5
Proceeds from disposal of property, plant and equipment and intangible assets 7.6 3.3
Acquisitions 5 (494.6) (8.2)
Cash flows (used in) from investing activities (564.0) 291.9
FINANCING ACTIVITIES
Net proceeds (repayment) of revolving term bank credits and other debt 229.4 (147.1)
Redemption of 6.0% convertible debentures 18 (97.0) (150.0)
Proceeds from 5.25% senior secured notes 16 400.0 –
Repayment of finance lease obligations (16.0) (21.4)
Debt issuance costs (7.2) –
Settlement of foreign currency forward contracts – (34.6)
Proceeds from dividend reinvestment program – 22.8
Dividends paid to shareholders 22 (102.8) (102.2)
Cash flows from (used in) financing activities 406.4 (432.5)
Net increase in cash 25.5 6.2
Cash, beginning of the year 5.0 –
Effect of translation of foreign currency-denominated cash 1.3 (1.2)
Cash, end of the year 31.8 5.0
See accompanying Notes to the Consolidated Financial Statements.

Superior Plus Corp. 2017 Annual Report50
Notes to the Consolidated Financial Statements(Tabular amounts in millions of Canadian dollars, except per share amounts and as otherwise noted. Tables labelled “2017” and “2016” are as at and for the year ended December 31)
1. Organization
Superior Plus Corp. (Superior or the Company) is a diversified business corporation, incorporated under the Canada Business Corporations Act. The registered office is at suite 401, 200 Wellington Street West, Toronto, Ontario. Superior holds 99.9% of Superior Plus LP (Superior LP), a limited partnership formed between Superior General Partner Inc. (Superior GP) as general partner and Superior as limited partner. Superior owns 100% of the shares of Superior GP and Superior GP holds 0.1% of Superior LP. Superior does not conduct active business operations but rather distributes to shareholders a portion of the income it receives from Superior Plus LP in the form of partnership allocations, net of expenses and interest payable on the convertible unsecured subordinated debentures (the debentures). Superior’s investments in Superior Plus LP are financed by share capital and debentures. Superior is a publicly traded company with its common shares trading on the Toronto Stock Exchange (TSX) under the exchange symbol SPB.
The consolidated financial statements of Superior for the year ended December 31, 2017 and 2016 were authorized for issuance by the Board of Directors on February 14, 2018.
Reportable Operating Segments
Superior currently operates two distinct reportable operating segments: Energy Distribution and Specialty Chemicals. Superior’s Energy Distribution operating segment provides distribution, wholesale procurement and related services in relation to propane, heating oil and other refined fuels under the Canadian propane division and the U.S. refined fuels division. Specialty Chemicals is a leading supplier of sodium chlorate and technology to the pulp and paper industry and a regional supplier of potassium and chlor-alkali products in the U.S. Midwest and Western Canada.
During the prior year, Superior divested one of its previously reportable operating segments, Construction Products Distribution, a distributor of commercial and industrial insulation in North America and a distributor of specialty construction products to the walls and ceilings industry in Canada.
2. Basis of Presentation
(a) Preparation of Financial Statements
The accompanying consolidated financial statements were prepared in accordance with International Financial Reporting Standards (IFRS) using the accounting policies Superior adopted in its annual consolidated financial statements as at and for the year ended December 31, 2017. The financial statements were prepared on a going-concern basis.
The consolidated financial statements are presented in Canadian dollars, Superior’s functional currency. All financial information presented in Canadian dollars has been rounded to the nearest hundred-thousand.
The consolidated financial statements were prepared on the historical cost basis except for the revaluation of certain financial instruments and incorporate the accounts of Superior and its subsidiaries. Subsidiaries are all entities over which Superior has the power to govern the financial and operating policies, generally accompanying a shareholding of more than one-half of the voting rights. The results of subsidiaries are included in Superior’s statement of net earnings from date of acquisition, or in the case of disposals, up to the effective date of disposal. During the year ended December 31, 2016, Superior disposed of the Construction Products Distribution business. Superior sold assets of its Fixed-Price Energy Services business and has minimal activity in the associated subsidiaries. See Note 4.
All transactions and balances between Superior and Superior’s subsidiaries are eliminated upon consolidation. Superior’s subsidiaries are all wholly owned directly or indirectly by Superior Plus Corp.
Significant Accounting Policies
(a) Cash and Cash Equivalents
Cash and cash equivalents include cash and highly liquid short-term investments which, on the date of acquisition, have a term to maturity of three months or less.

Superior Plus Corp. Notes to Consolidated Financial Statements 51
(b) Inventories
Energy Distribution
Inventories are valued at the lower of cost and net realizable value. Costs of inventories are determined either on a weighted average cost or first-in, first-out basis. Materials, supplies, and other inventories are stated at the lower of cost and net realizable value, as appropriate. The net realizable value of inventory is based on estimated selling price in the ordinary course of business less the estimated costs necessary to complete the sale.
Specialty Chemicals
Inventories are valued at the lower of cost and net realizable value. The cost of chemical inventories is determined on a first-in, first-out basis. Stores and supply inventories are costed on a weighted average basis. Transactions are entered into from time to time with other companies to exchange chemical inventories in order to minimize working capital requirements and to facilitate distribution logistics. The net realizable value of inventory is based on estimated selling price in the ordinary course of business less the estimated costs necessary to complete the sale. In the case of manufactured inventories, cost includes an appropriate share of production overhead based on normal operating capacity.
(c) Financial Instruments and Derivative Financial Instruments
Derivative Financial Instruments
Superior enters into a variety of derivatives to manage its exposure to certain financial risks. Further details of derivative financial instruments are disclosed in Note 20.
Derivatives are initially recognized at fair value at the date a derivative contract is entered into and are subsequently re-valued to their fair value at each balance sheet date. The resulting gain or loss is recognized in net earnings. Realized gains and losses on derivatives are recognized as a component of revenue, cost of sales or finance expense/revenue, the classification of which depends on the underlying nature of the economic exposure being managed. Derivatives embedded in other financial instruments or other host contracts are treated as separate derivatives when their risks and characteristics are not closely related to those of the host contracts and the host contracts are not measured at fair value with changes in fair value recognized in net earnings.
Superior does not formally designate and document economic hedges, in accordance with the requirements of applying hedge accounting under IFRS and, therefore, does not apply hedge accounting.
Financial Assets
A financial asset is classified at fair value through profit and loss (FVTPL) if it is classified as held for trading or is designated as such upon initial recognition. Upon initial recognition, attributable transaction costs are recognized in net earnings as incurred. Financial assets at FVTPL are measured at fair value, and changes therein are recognized in net earnings.
Loans and Receivables
Loans and receivables are financial assets with fixed or determinable payments that are not quoted in an active market. Such assets are recognized initially at fair value plus any directly attributable transaction costs. Subsequent to initial recognition, loans and receivables are measured at amortized cost using the effective interest method, less any impairment losses.
Separable Embedded Derivatives
Changes in the fair value of separable embedded derivatives are recognized immediately in net earnings.
Impairment of Financial Assets
Financial assets measured at amortized cost are assessed for indicators of impairment at each reporting date. Financial assets are impaired when there is objective evidence that, as a result of one or more events that occurred after the financial asset’s initial recognition, the estimated future cash flows of the investment have been negatively impacted enough to render recovery of the amortized value doubtful.
For certain categories of financial assets, such as trade receivables, assets that are assessed as not impaired individually are subsequently assessed for collective impairment. Objective evidence of the impairment of a portfolio of receivables could include Superior’s past experience of collecting payments, or an increase in the number of delayed payments past the average credit period, in addition to changes in economic conditions that correlate with defaults on receivables. For

Superior Plus Corp. 2017 Annual Report52
financial assets carried at amortized cost, the amount of impairment recognized is the difference between the asset’s carrying amount and the present value of estimated future cash flows, discounted at the financial asset’s original effective interest rate.
The carrying amount of the financial asset is reduced by the impairment loss directly for all financial assets with the exception of trade receivables, in which case the carrying amount is reduced through the use of an allowance account. When a trade receivable is considered uncollectible, it is written off against the allowance account. Subsequent recoveries of amounts previously written off are credited to the statement of net earnings and comprehensive income. Changes in the carrying amount of the allowance account are recognized in net earnings.
Classification as Debt or Equity
Debt and equity instruments are classified either as financial liabilities or as equity in accordance with the substance of the contractual arrangement.
Equity Instruments
An equity instrument is any contract which has a residual interest in the assets of an entity after deducting all of its liabilities. Equity instruments issued by Superior are recorded at the proceeds received, net of direct issuance costs.
Compound Financial Instruments
The components of compound instruments issued by Superior are classified separately as financial liabilities and equity in accordance with the substance of the contractual arrangement. At the date of issuance, the fair value of the liability component is estimated using the prevailing market interest rate for a similar non-convertible instrument. This amount is recorded as a liability on an amortized cost basis using the effective interest method until extinguished upon conversion or at the instrument’s maturity. The equity component is determined by deducting the liability component from the fair value of the compound instrument as a whole. This is recognized and included in equity, net of income tax, and is not subsequently re-measured.
Financial Liabilities
Financial liabilities are classified as either financial liabilities at FVTPL or other financial liabilities.
Financial Liabilities at FVTPL
Financial liabilities are classified as FVTPL upon initial recognition or when held for trading. Financial liabilities at FVTPL are stated at fair value with any resulting gain or loss recognized in net earnings. The net gain or loss recognized in net earnings incorporates any related interest expense. Upon initial recognition, attributable transaction costs are recognized in net earnings or loss as incurred. Fair value is determined in the manner described in Note 20.
Other Financial Liabilities
Other financial liabilities, including borrowing, are initially measured at fair value, net of transaction costs. Other financial liabilities are subsequently measured at amortized cost using the effective interest method, with interest expense recognized on an effective interest basis.
Derecognition of Financial Liabilities
Superior derecognizes financial liabilities solely when Superior’s obligations are discharged, cancelled or expired.
Financial Guarantees at FVTPL
Financial guarantees are classified as FVTPL when the financial liability is designated as FVTPL upon initial recognition. Financial guarantees at FVTPL are stated at fair value with any resulting gain or loss recognized in net earnings. Fair value is determined in the manner described in Note 20.

Superior Plus Corp. Notes to Consolidated Financial Statements 53
(d) Property, Plant and Equipment
Cost
Property, plant and equipment are recorded at cost less accumulated depreciation and impairment losses. Major renewals and improvements which provide future economic benefits and can be reliably measured are capitalized, while repair and maintenance expenses are charged to operations as incurred. Property, plant and equipment in the course of construction are carried at cost less any recognized impairment losses. Cost includes directly attributable expenses, professional fees and, for qualifying assets, borrowing costs capitalized in accordance with Superior’s accounting policy. Depreciation of these assets, on the same basis as other property assets, commences when the assets are available for their intended use. Disposals are derecognized at carrying costs less accumulated depreciation and impairment losses, with any resulting gain or loss reflected in net earnings.
Borrowing Costs
Borrowing costs directly attributable to the acquisition, construction or production of qualifying assets, which are assets that necessarily take substantial time to ready for their intended use or sale, are included in the cost of those assets, until such time as the assets are available for their intended use. All other borrowing costs are recognized in net earnings in the period in which they are incurred.
Depreciation
Depreciation is calculated using the straight-line method, based on the estimated useful life. Land is not depreciated. Depreciation of property in the course of construction commences when the assets are available for their intended use. In the majority of cases, residual value is estimated to be insignificant. Depreciation by class of assets is as follows:
Buildings 15 to 40 years
Leasehold improvements over the lease term up to 10 years
Energy Distribution tanks and cylinders 30 years
Energy Distribution truck tank bodies, chassis and other 5 to 15 years
Manufacturing equipment 5 to 40 years
Furniture and fixtures 10 years
Computer equipment 3 years
Useful life, residual values and depreciation methods are reviewed at the end of each annual reporting period, with the effect of any changes in estimate being accounted for on a prospective basis.
(e) Intangible Assets
Intangible assets are reported at cost less accumulated amortization and accumulated impairment losses. For intangible assets with a determinate life, amortization is charged on a straight-line basis over their estimated useful lives.
Intangible assets acquired in a business combination are identified and recognized separately from goodwill when they satisfy the recognition criteria. The initial cost of such intangible assets is their fair value at the acquisition date. Subsequent to initial recognition, intangible assets acquired in a business combination are reported at cost less accumulated amortization and accumulated impairment losses, on the same basis as intangible assets acquired separately. Software costs are capitalized for new systems if there are significant enhancements to existing systems. In addition to the cost of software, the capitalized costs include cost of installation and consulting services related to the system implementation or enhancement.
Useful life, residual values and amortization methods are reviewed at least annually, with the effect of any changes in estimate being accounted for on a prospective basis.
Energy Distribution
As a result of Energy Distribution’s operating activities in Québec, Superior is required to purchase sufficient Compliance Instruments to offset its carbon footprint. Costs incurred by Energy Distribution to acquire Québec Cap and Trade Compliance Instruments are recorded as intangible assets and measured at cost. As the Compliance Instruments do not diminish over time, they are deemed intangible assets with an indefinite life and are not amortized. The assets are subject to impairment testing subsequent to initial recognition. The Compliance Instruments are classified as non-current and reclassified as current at the end of the compliance period. The assets are settled against the corresponding Cap and Trade liabilities at the end of the compliance period.

Superior Plus Corp. 2017 Annual Report54
Superior’s other intangible assets and related amortization rates are summarized as follows:
Non-competition agreements Term of the agreements (1- 5 years)
Royalty agreements 1-10 years
Software 1- 5 years
Technology patents Approximately 10 years
Customer contracts 5 -10 years
(f) Impairment of Property, Plant and Equipment, Intangible Assets and Investment Properties
At each balance sheet date and when circumstances indicate that the carrying value may be impaired, Superior reviews the carrying amounts of its tangible and intangible assets to determine whether there is any indication that those assets have suffered an impairment loss to confirm whether the assets have indeed suffered an impairment loss. If so, the recoverable amount of the asset is estimated in order to determine the extent of the impairment loss, if any. Where it is not possible to estimate the recoverable amount of an individual asset, Superior estimates the recoverable amount of the cash-generating unit (CGU) to which the asset belongs. A CGU is the smallest level of assets that generates cash inflows from continuing use that are largely independent of the cash inflows of other assets or groups.
Recoverable amount is the higher of fair value less costs to sell and value-in-use.
An impairment loss is recognized if the carrying amount of an asset, CGU or group of CGUs exceeds its recoverable amount. Impairment losses are recognized immediately as a separate line item in the consolidated statements of net earnings.
A previous impairment, if any, is subsequently assessed for any indication that the impairment has been reduced or no longer exists. An impairment loss is reversed if there has been an increase in the recoverable amount of an asset or CGU over its carrying value. Impairment losses are reversed only to the extent that the asset’s or CGU’s carrying amount would not exceed the carrying amount that would have been reported if no impairment loss had been recognized.
(g) Business Combinations
All business combinations are accounted for using the acquisition method. The consideration transferred in a business combination is measured at fair value at the acquisition date of the assets given up, the liabilities incurred or assumed and equity instruments issued by Superior in exchange for control of the acquiree. Transaction costs, other than those associated with the issuance of debt or equity securities, that Superior incurs in connection with a business combination, are expensed as incurred. The acquiree’s identifiable assets, liabilities and contingent liabilities that meet the conditions for recognition under IFRS 3 – Business Combinations are recognized at their fair value at the acquisition date, except that:
» Deferred tax assets or liabilities and liabilities or assets related to employee benefit arrangements are recognized and measured in accordance with International Accounting Standard (IAS) 12 – Income Taxes and IAS 19 – Employee Benefits, respectively;
» Liabilities or equity instruments related to the replacement by Superior of an acquiree’s share-based payment awards are measured in accordance with IFRS 2 – Share-based Payment; and
» Assets or disposals that are classified as held for sale in accordance with IFRS 5 – Non-current Assets Held for Sale and Discontinued Operations are measured in accordance with that standard.
Contingent liabilities acquired in a business combination are initially measured at fair value at the date of acquisition. At subsequent reporting dates, such contingent liabilities are measured at the amount that would be recognized in accordance with IAS 37 – Provisions, Contingent Liabilities and Contingent Assets.
Intangible assets arising on acquisition are recognized at fair value at the date of acquisition. The fair value is based on detailed cash flow models and other metrics depending on the type of intangible asset being recognized.
Goodwill arising on acquisition is recognized as an asset and initially measured at cost, being the excess of the cost of the business combination over Superior’s interest in the net fair value of the identifiable assets, liabilities and contingent liabilities recognized. If the net amounts assigned to the assets acquired and liabilities assumed exceed the cost of the purchase, then Superior is required to reassess the value of both the cost and net assets acquired and any excess remaining after this reassessment is recognized immediately in net earnings. Goodwill is initially recognized as an asset at cost and is subsequently measured at cost less any accumulated impairment losses.

Superior Plus Corp. Notes to Consolidated Financial Statements 55
If the initial accounting for a business combination is incomplete by the end of the reporting period in which the combination occurs, Superior will report provisional amounts for the items for which the accounting is incomplete. Those provisional amounts are adjusted during the measurement period (see below), or additional assets or liabilities are recognized, to reflect new information obtained about facts and circumstances at the acquisition date that, if known, would have affected the amounts recognized at that date.
The measurement period is the period from the date of acquisition to the date Superior obtains complete information about facts and circumstances as of the acquisition date, to a maximum of one year.
(h) Discontinued Operations
Discontinued operations are either separate major lines of business or geographical operations that have been sold or classified as held for sale. When held for sale, discontinued operations were a cash-generating unit (CGU) or a group of CGUs, where a CGU is the smallest identifiable group of assets that generates cash inflows that are largely independent of the cash inflows from other assets. These comprise operations and cash flows that can be clearly distinguished, operationally and for financial reporting purposes, from the rest of the Company. The applicable results from discontinued operations are presented separately in the consolidated statements of net earnings and total comprehensive income on a comparative basis.
(i) Goodwill
Goodwill arising in a business combination is recognized as an asset at the date control commences (the acquisition date). Goodwill is not amortized but is reviewed for impairment at least annually, on December 31. For purposes of impairment testing, goodwill is allocated to each of Superior’s CGUs expected to benefit from the synergies of the combination. CGUs to which goodwill has been allocated are tested for impairment annually or more frequently upon indication of impairment. If the recoverable amount of the CGU is less than its carrying amount, the impairment loss is allocated first to reduce the carrying amount of any goodwill allocated to the unit and then to other assets of the unit pro-rata on the basis of the carrying amount of each asset in the unit. An impairment loss recognized for goodwill is not reversed in a subsequent period.
On disposal of a subsidiary, the attributable amount of goodwill is included in the determination of the net gain or loss on disposal.
(j) Revenue Recognition
Revenue is measured at the fair value of the consideration received or receivable. Revenue is reduced for estimated customer returns, rebates and other similar allowances. Revenue from the sale of goods is recognized when all the following conditions are satisfied:
» Superior has transferred to the buyer the significant risks and rewards of ownership of the goods;
» Superior retains neither continuing managerial involvement to the degree usually associated with ownership nor effective control over the goods sold;
» The amount of revenue can be measured reliably;
» It is probable that the economic benefits associated with the transaction will flow to Superior; and
» The costs incurred or to be incurred in respect of the transaction can be measured reliably.
Energy Distribution
Revenues from sales are recognized at the time of delivery, or when related services are performed and the above conditions related to revenue from sale of goods are satisfied.
Rental revenues arising from operating leases are accounted for based on the terms contained in the lease agreements as earned.
Specialty Chemicals
Revenues from chemical sales are recognized at the time of delivery and when the above conditions related to revenue from sale of goods are satisfied.

Superior Plus Corp. 2017 Annual Report56
Construction Contracts
When the outcome of a construction contract for the construction of chlorine dioxide generators can be estimated reliably, revenues and costs are recognized by reference to the percentage of completion of the contract activity at the end of the reporting period, measured based on the proportion of contract costs incurred for work performed to date relative to the estimated total contract costs. Engineer’s reviews are used to determine the stage of completion of contracts in progress.
When the outcome of a construction contract cannot be estimated reliably, contract revenue is recognized to the extent it is probable that contract costs are recoverable. Contract costs are recognized as expenses in the period in which they are incurred.
When it is probable that total contract costs will exceed total contract revenue, the expected loss is immediately recognized as an expense.
(k) Leases
Leases are classified as finance leases whenever the terms of the lease transfer substantially all of the risks and rewards of ownership to the lessee. All other leases are classified as operating leases.
Assets held under finance leases are initially recognized as assets of Superior at their fair value at the inception of the lease or, if lower, at the present value of the minimum lease payments. The corresponding liability to Superior is included in the balance sheet as a finance lease obligation as part of borrowing.
Lease payments are apportioned between finance expenses and reduction of the lease obligation so as to achieve a constant rate of interest on the remaining balance of the liability. Finance expenses are recognized immediately in net earnings, unless they are directly attributable to qualifying assets, in which case they are capitalized in accordance with Superior’s general policy on borrowing costs (see (d) above). Contingent rentals are recognized as expenses in the period in which they are incurred.
Operating lease payments are recognized as an expense based on terms contained in the lease agreements. Contingent rentals arising under operating leases are recognized as an expense in the period in which they are incurred.
In the event lease incentives are received to enter into operating leases, such incentives are recognized as a liability. The aggregate benefit of incentives is recognized as a reduction of rental expense and amortized over the term of the lease.
(l) Provisions
Provisions are recognized when there is a present legal or constructive obligation as a result of past events, for which it is probable that payment will be required to settle the obligation, and where the amount can be reliably estimated.
The amount is the best estimate of the consideration required to settle the present obligation at the reporting date, taking into account the risks and uncertainties surrounding the obligation. When a provision is measured using the cash flows estimated to settle the present obligation, its carrying amount is the present value of those cash flows.
When some or all of the economic benefit required to settle a provision is expected to be recovered from a third party, the receivable is recognized as an asset if it is virtually certain that reimbursement will be received and the receivable can be measured reliably.
Decommissioning Costs
Liabilities for decommissioning costs are recognized when Superior has an obligation to dismantle and remove a facility or an item of plant and to restore the site on which it is located, and when a reliable estimate of that liability can be made. Generally, the costs relate to Specialty Chemicals facilities and Energy Distribution assets. Decommissioning costs are provided at the present value of expected costs to settle the obligation using estimated cash flows. The cash flows are discounted at a current pre-tax rate that reflects the risks specific to the decommissioning liability. The unwinding of the discount is expensed as incurred and recognized in net earnings as a finance expense. The estimated future costs of decommissioning are reviewed annually and adjusted as appropriate. A corresponding item of property, plant and equipment of an amount equal to the provision is also created. This is subsequently amortized as part of the asset. Changes in the estimated future costs or in the discount rate applied are added to or deducted from the cost of the asset.
Environmental Expenditures and Liabilities
Environmental expenditures that relate to current or future revenues are expensed or capitalized as appropriate. Expenditures that relate to an existing condition caused by past operations and do not contribute to current or future earnings are expensed.

Superior Plus Corp. Notes to Consolidated Financial Statements 57
Liabilities for environmental costs are recognized when a clean-up is probable and the associated costs can be reliably estimated. Generally, the timing of recognition of these provisions coincides with the commitment to a formal plan of action or, if earlier, on divestment or on closure of inactive sites.
The amount recognized is the best estimate of the expenditure required. When the liability will not be settled for a number of years, the amount recognized is the present value of the estimated future expenditure.
Restructuring
A restructuring provision is recognized when Superior has developed a detailed formal restructuring plan and has raised a valid expectation in those affected that it will carry out the restructuring by starting to implement the plan or announcing its main features to those affected. The measurement of a restructuring provision includes only the direct expenditures arising from the restructuring.
(m) Employee Future Benefits
Superior has a number of defined-benefit and defined contribution plans providing pension and other post-employment benefits to most of its employees. Superior accrues its obligations under the plans and the related costs, net of plan assets.
Contributions to defined contribution plans are recognized as an expense when employees have rendered service entitling them to the contributions.
For defined-benefit plans, the cost of providing benefits is determined using the projected unit credit method, with actuarial valuations being carried out at each balance sheet date. The net obligation for each defined-benefit plan is discounted to determine the present value using the yield at the reporting date on high-quality Canadian corporate bonds. Plan assets are measured at fair value and the difference between the fair value of the plan assets and the present value of the defined-benefit obligation is recognized on the Consolidated Balance Sheets as an asset or liability. Costs charged to Consolidated Statements of Net (Loss) Earnings include current service cost, any past service costs, any gains or losses from curtailments and interest on the net defined-benefit asset or liability. Actuarial gains and losses arising from experience adjustments and changes in actuarial assumptions are recognized in other comprehensive income in the period in which they occur.
The defined-benefit obligation recognized in the balance sheet represents the present value adjusted for unrecognized actuarial gains and losses and unrecognized past service cost, and reduced by the fair value of plan assets. Any asset resulting from this calculation is limited to unrecognized actuarial losses and past service cost, plus the present value of available refunds and reductions in future contributions to the plan.
(n) Income Taxes
Income tax expense represents the sum of current income taxes payable and deferred income taxes.
Current Income Taxes
The income tax currently payable is based on taxable net earnings for the year. Taxable net earnings differ from net earnings as reported in the consolidated statement of net earnings and total comprehensive income because they exclude items of income or expense that are taxable or deductible in other years as well as items that are never taxable or deductible. Superior’s liability for current income tax is calculated using tax rates that have been enacted or substantively enacted by the balance sheet date.
Deferred Income Taxes
Deferred income tax is recognized on differences between the carrying amounts of assets and liabilities in the financial statements and the corresponding tax basis used in the computation of taxable net earnings. Deferred income tax assets are generally recognized for all deductible temporary differences to the extent that it is probable that taxable net earnings will be available against which those deductible temporary differences can be utilized. Deferred tax liabilities are recognized for all taxable temporary differences, except for the following:
» When the deferred tax liability arises from the initial recognition of goodwill;
» When an asset or liability in a transaction is not a business combination and, at the time of the transaction, affects neither the accounting net earnings or taxable net earnings; or

Superior Plus Corp. 2017 Annual Report58
» In respect of taxable temporary differences associated with investments in subsidiaries, associates and interests in joint ventures, where the timing of the reversal of the temporary differences can be controlled by Superior and it is unlikely that the temporary differences will be reversed in the foreseeable future.
Deferred tax assets arising from deductible temporary differences associated with such investments and interests are only recognized to the extent that they are expected to be reversed in the foreseeable future and it is probable that there will be sufficient taxable net earnings against which to utilize the benefits of the temporary differences. A deferred tax asset may also be recognized for the benefit expected from unused tax losses available for carry-forward, to the extent that it is probable that future taxable earnings will be available against which the tax losses can be applied.
Deferred tax assets and liabilities are measured at the tax rates that are expected to apply in the period in which the liability is settled or the asset realized, based on tax rates and laws that have been enacted or substantively enacted by the balance sheet date. The measurement of deferred tax liabilities and assets reflects the tax consequences that would follow from the manner in which Superior expects, at the reporting date, to recover or settle the carrying amount of its assets and liabilities.
Deferred tax assets and liabilities are offset when there is a legally enforceable right to offset current tax assets against current liabilities and when they are related to income taxes levied by the same taxation authority and Superior intends to settle its current tax assets and liabilities on a net basis. Also, Superior recognizes any benefit associated with investment tax credits as deferred tax assets to the extent they are expected to be utilized in accordance with IAS 12 – Income Taxes.
Uncertain Tax Positions
Superior is subject to taxation in numerous jurisdictions. There are many transactions and calculations during the course of business for which the ultimate tax determination is uncertain. It is possible, however, that at some future date, liabilities in excess of Superior’s provisions could result from audits by or litigation with tax authorities. Where the final outcome of these tax-related matters is different from the amounts that were initially recorded, such differences will affect the tax provisions in the period in which such determination is made.
Current and Deferred Tax for the Period
Current and deferred tax are recognized as an expense in net earnings, except where they relate to amounts recognized outside of net earnings (whether in other comprehensive income or directly in equity), in which case the tax is also recognized outside of net earnings, or where they arise from the initial accounting for a business combination. In the case of a business combination, the tax effect is included in the accounting for the business combination.
(o) Foreign Currencies
The financial statements of each subsidiary of Superior are translated into the currency of the subsidiary’s primary economic environment (its functional currency). For the purpose of the consolidated financial statements, the results and balance sheets of each subsidiary are expressed in Canadian dollars, Superior’s presentation currency. Transactions are recognized at the rates of exchange prevailing at the transaction date.
At the end of each reporting period, monetary items denominated in foreign currencies are retranslated at the rates prevailing at the period-end. Non-monetary items that are measured at fair value in a foreign currency shall be translated using the exchange rates at the date when the fair value is measured. Non-monetary items that are measured in terms of historical cost in a foreign currency shall be translated using the exchange rate at the date of the transaction and are not retranslated.
For the purposes of presenting Superior’s consolidated financial statements, the assets and liabilities of Superior’s foreign operations, namely of Energy Distribution and Specialty Chemicals in the United States, and of Specialty Chemicals in Chile, are translated using exchange rates prevailing at the end of each reporting period. Income and expense items are translated at the average exchange rates for the period.
Goodwill and fair value measurements of identifiable assets acquired and liabilities assumed through acquisition of a foreign operation are treated as assets and liabilities of the foreign operation and translated at the rate of exchange prevailing at the end of each reporting period. Exchange differences are recognized in other comprehensive income for the period.

Superior Plus Corp. Notes to Consolidated Financial Statements 59
(p) Share-Based Payments
Superior has established share-based compensation plans whereby notional restricted shares and/or notional performance shares may be granted to employees. The fair value of these notional shares is estimated using the period-end quoted market price and recorded as an expense with an offsetting amount to accrued liabilities, re-measured at each balance sheet date. All share-based payments are settled in cash.
(q) Net (Loss) Earnings per Common Share
Basic net earnings per share are calculated by dividing the net earnings by the weighted average number of shares outstanding during the period, which is calculated using the number of shares outstanding at the end of each month in that year. Diluted net earnings per share are calculated by factoring in the dilutive impact of the dilutive instruments, including the conversion of debentures to shares using the if-converted method to assess the impact of dilution. Superior uses the treasury stock method to determine the impact of dilutive options, which assumes that the proceeds from in-the-money share options are used to repurchase shares at the average market price during the period.
(r) Significant Accounting Judgments, Estimates and Assumptions
The preparation of Superior’s consolidated financial statements in accordance with IFRS requires management to make judgments, estimates and assumptions that affect the reported amounts of assets, liabilities, net earnings and related disclosure. The estimates and associated assumptions are based on historical experience and various other factors deemed reasonable under the circumstances, the results of which form the basis of making the judgments about carrying values of assets and liabilities that are not readily apparent from other sources. Actual results may differ from these estimates. The areas involving a higher degree of judgment or complexity, or where assumptions and estimates are significant to the financial statements, are as follows:
Fair Value of Derivative and Non-Financial Derivative Instruments
Where the fair values of financial derivative and non-financial derivatives cannot be derived from active markets, they are determined using valuation techniques including a discounted cash flow model. This requires assumptions concerning the amount and timing of estimated future cash flows and discount rates. Differences between actual values and assumed values will affect net earnings in the period when the difference is determined.
Allowance for Doubtful Accounts
Superior recognizes an allowance for doubtful accounts based on historical customer collection history, general economic indicators and other customer-specific information, all of which require Superior to make certain assumptions. Where the actual collectability of accounts receivable differs from these estimates, such differences will have an impact on net earnings in the period such a determination is made.
Property, Plant and Equipment and Intangible Assets
Capitalized assets, including property, plant and equipment and intangible assets, are amortized over their respective estimated useful lives. All estimates of useful lives are set out in 2(d) and 2(e) above.
Provisions
Provisions have been estimated for decommissioning costs, restructuring and environmental expenditures. The actual costs and timing of future cash flows depend on future events. Any differences between estimates and the actual future liability will be accounted for in the period when such determination is made. Determining decommissioning liabilities requires estimates regarding the useful life of certain operating facilities, the timing and cost of future remediation activities, discount rates and the interpretation and changes to various environmental laws and regulations. Differences between estimates and results will affect Superior’s accrual for decommissioning liabilities, with an effect on net earnings.
Employee Future Benefits
Superior has a number of defined-benefit pension plans and other benefit plans. The cost of defined-benefit pension plans and the present value of the pension obligation are determined using actuarial valuations. These require assumptions including the determination of the discount rate, future salary increases, mortality rates and future pension increases. Due to the valuation’s complexity, its underlying assumptions and long-term nature, a defined benefit obligation is highly sensitive to changes in the underlying assumptions.

Superior Plus Corp. 2017 Annual Report60
Income Tax Assets and Liabilities
Superior recognizes expected tax assets and liabilities based on estimates of current and future taxable net earnings, which may require significant judgment regarding the ultimate tax determination of certain items. If taxable net earnings differ from the estimates, there may be an impact on current and future income tax provisions in the period when the difference is determined.
Asset Impairments
Financial and non-financial assets are subject to impairment reviews based on whether current or future events and circumstances suggest that their recoverable amount may be less than their carrying value. Recoverable amounts are based on a calculation of expected future cash flows, which includes management assumptions and estimates of future performance.
Critical Judgments in Applying Accounting Policies
In applying Superior’s accounting policies, described above, management makes judgments that could significantly affect the amounts recognized in the consolidated financial statements. The most critical of these judgments are:
Impairment of Property, Plant and Equipment
An impairment evaluation involves consideration of whether there are indicators of impairment. Indicators include: significant underperformance relative to historical or projected operating results, significant changes in the manner in which an asset is used or in Superior’s overall business strategy, or significant negative industry or economic trends. In some cases, these events are clear. In many cases, however, there is no clearly identifiable event. Instead, a series of individually insignificant events, some of them only later known, leads to an indication that an asset may be impaired. Management continually monitors Superior’s segments, the markets, and the business environment, and makes judgments and assessments about conditions and events in order to conclude whether there may be an impairment.
Income Taxes
Preparation of the consolidated financial statements involves making an estimate of, or provision for, income taxes in each of the jurisdictions in which Superior operates. The process also involves estimating taxes currently payable and taxes expected to be payable or recoverable in future periods, referred to as deferred income taxes. Deferred income taxes result from the effects of temporary differences due to items that are treated differently for tax and accounting purposes. The tax effects of these differences are reflected in the balance sheet as deferred income tax assets and liabilities. An assessment must also be made to determine the likelihood that Superior’s future taxable income will be sufficient to permit the recovery of deferred income tax assets. To the extent that such recovery is not probable, recognized deferred income tax assets must be reduced. Judgment is required in determining the provision for income taxes and recognition of deferred income tax assets and liabilities. Management must also exercise judgment in its assessment of continually changing tax interpretations, regulations and legislation, to ensure deferred income tax assets and liabilities are complete and fairly presented. The effects of differing assessments and applications could be material.
Purchase Price Allocation
All business combinations are accounted for using the acquisition method. This requires management to recognize all identifiable assets, liabilities and contingent liabilities at the acquisition date fair values with a few exceptions. The allocation of the purchase price to property, plant and equipment and intangible assets requires management to exercise judgment when determining the acquisition fair value of each asset and its respective useful life. Consideration paid in a business combination that exceeds the net fair value of assets and liabilities acquired is allocated to goodwill. Goodwill is reviewed for impairment at least annually. As disclosed in Note 5, a number of acquisitions were completed during 2017. The purchase price allocations related to Canwest and IDI Holdings are considered preliminary as at December 31, 2017. Changes in the purchase price allocation could occur during the 12-month period following acquisition. Changes to the fair value of the assets and liabilities acquired could affect the purchase price allocation and the Energy Distribution’s net income.
Financial Instruments
The fair value of financial instruments is determined and classified in three categories, which are outlined below and discussed in more detail in Note 20.

Superior Plus Corp. Notes to Consolidated Financial Statements 61
Level I
Fair values in Level I are determined using quoted prices in active markets for identical instruments.
Level II
Fair values in Level II are determined using quoted prices for similar instruments in active markets; quoted prices for identical or similar instruments in markets that are not active; and model-derived valuations in which all significant inputs and value drivers are observable in active markets.
Level III
Fair values in Level III are determined using valuations derived from valuation techniques in which one or more significant inputs or significant value drivers are unobservable.
The fair value measurement of a financial instrument is included in only one of the three levels, the determination of which is based on the lowest-level input that is significant to the derivation of the fair value. Classification of financial instruments requires management to use judgment in respect of both the determination of fair value and the lowest-level input of significance.
Recent Accounting Pronouncements
Certain new standards, interpretations, amendments and improvements to existing standards were issued by the International Accounting Standards Board (IASB) or the International Financial Reporting Interpretations (IFRIC) that are mandatory for accounting periods beginning on January 1, 2018 or later periods.
New and revised IFRS standards issued but not yet effective
IFRS 9 – Financial Instruments: Classification and Measurement
IFRS 9 was issued in November 2009 and is intended to replace IAS 39 – Financial Instruments: Recognition and Measurement. IFRS 9 uses a single approach to determine whether a financial asset is measured at amortized cost or fair value, replacing the multiple rules in International Accounting Standard (IAS) 39. The approach in IFRS 9 is based on how an entity manages its financial instruments in the context of its business model and the contractual cash flow characteristics of the financial assets. The new standard also requires a single impairment method to be used, replacing the multiple impairment methods in IAS 39. Requirements for financial liabilities were added in October 2010 and they largely carried forward existing requirements in IAS 39 except that fair value changes due to credit risk for liabilities designated at fair value through profit and loss would generally be recorded in other comprehensive income.
A final version of IFRS 9 was issued in July 2014 to include impairment requirements for financial assets and limited amendments to the classification and measurement requirements by introducing a fair value through other comprehensive income measurement category for certain simple debt instruments. This standard must be applied for accounting periods beginning on or after January 1, 2018, with earlier adoption permitted. In 2018 Superior will elect to apply the limited exemption in IFRS 9 relating to transition for classification and measurement and impairment and, accordingly, will not restate comparative periods in the year of initial application. The adoption of IFRS 9 will have no impact on the Company’s consolidated financial statements on the date of initial application. There will be no change in the carrying amounts on the basis of allocation from original measurement categories under IAS 39 – Financial Instruments: Recognition and Measurement to the new measurement categories under IFRS 9.
IFRS 15 – Revenue from Contracts with Customers
IFRS 15 was issued in May 2014, establishing a single comprehensive model for entities to use in accounting for revenue arising from contracts with customers. IFRS 15 supersedes the current revenue recognition guidance including IAS 18 – Revenue and IAS 11 – Construction Contracts, as well as the related interpretation when it becomes effective. Under IFRS 15, an entity should recognize revenue to depict the transfer of promised goods or services to customers in an amount that reflects the consideration to which the entity expects to be entitled in exchange for those goods or services. An entity is required to recognize revenue when the performance obligation is satisfied. The Company will adopt IFRS 15 effective January 1, 2018 and apply this policy retrospectively using the practical expedient in IFRS 15, under which the Company does not disclose the amount of consideration allocated to the remaining performance obligations or an explanation of when the Company expects to recognize that amount as revenue for all reporting periods presented before the date of the

Superior Plus Corp. 2017 Annual Report62
initial application being January 1, 2018. The implementation of IFRS 15 will not have a material impact on the consolidated statement of net earnings and comprehensive income. IFRS 15 will require revenue to be disclosed in greater detail while not providing information that is seriously prejudicial to the interests of Superior. The additional disclosure will include revenue by type, such as but not limited to sale of product, services and rental, by country and by segment.
IFRS 16 – Leases
On January 13, 2016, the IASB issued IFRS 16 – Leases, which replaces IAS 17 – Leases and related interpretations. IFRS 16 provides a single lessee accounting model, requiring the recognition of assets and liabilities for all leases, except those that meet limited exception criteria. IFRS 16 will be applied retrospectively for annual periods beginning on or after January 1, 2019. Management is currently evaluating the impact of IFRS 16 on the consolidated financial statements.
3. Seasonality of Operations
Energy Distribution
Sales typically peak in the first quarter when approximately one-third of annual propane and other refined fuels sales volumes and gross profits are generated due to the demand from heating end-use customers. They then decline through the second and third quarters, rising seasonally again in the fourth quarter with heating demand. Similarly, net working capital is typically at seasonal highs during the first and fourth quarters, and normally declines to seasonal lows in the second and third quarters. Net working capital is also significantly influenced by wholesale propane prices and other refined fuels.
4. Discontinued Operations
The Fixed-Price Energy Services assets were divested during the first quarter of 2016, and substantially all of the intangible assets, consisting mainly of customer contracts, were sold for total consideration of $4.3 million, which includes contingent consideration. Certain assets divested were disposed of with an effective date of January 1, 2016 and the earnings related to these assets were collected by Superior and remitted to the purchaser. During the fourth quarter of 2016, Superior received the final contingent payment of $0.7 million contingent consideration.
A gain of $3.8 million was recorded in discontinued operations during the year ended December 31, 2016. Results of the Fixed-Price Energy Services business were previously presented in the Energy Distribution operating segment.
On August 9, 2016, Superior completed the sale of its Construction Products Distribution (CPD) business to Foundation Building Materials, LLC for total cash consideration of US $325 million, less a working capital adjustment of US $20.3 million (CDN$26.9 million). The disposal is consistent with Superior’s long-term strategy to focus its activities on the Energy Distribution and Specialty Chemicals businesses. The transaction took place in the form of a share sale, and effectively included all assets Superior held in its CPD operating segment. With CPD classified as a discontinued operation, the CPD segment is no longer presented in Note 30, Reportable Segment Information. The consideration substantially exceeded the carrying amount of the related net assets of the CPD business, and thus no impairment was identified.
The gain of $173.8 million was recorded in results from discontinued operations during the year ended December 31, 2016 based on the excess of the proceeds less costs to sell over the carrying value of the CPD net assets, as well as cumulative foreign currency translation adjustments attributable to CPD previously recorded in other comprehensive income.
The assets and liabilities classified as discontinued operations presented on the consolidated balance sheets were $0.3 million in trade and other receivables and $2.9 million in trade and other payables in the prior year.

Superior Plus Corp. Notes to Consolidated Financial Statements 63
Net earnings from discontinued operations reported in the consolidated statements of net earnings are as follows:
2016
Revenues
Revenue from products 639.7
Realized losses on derivative financial instruments (3.6)
636.1
Cost of sales (includes products and services)
Cost of products and services (476.8)
Realized losses on derivative financial instruments (6.1)
(482.9)
Selling, distribution and administrative costs
General and administrative costs (35.4)
Employee costs (84.0)
Depreciation of property, plant, and equipment (4.8)
Facilities maintenance expense (1.9)
Vehicle operating expense (10.2)
Amortization of intangible assets (2.7)
(139.0)
Finance expenses
Finance lease obligation interest (0.7)
(0.7)
Net earnings from discontinued operations before income taxes 13.5
Gain on disposal of discontinued operations including a cumulative
exchange loss of $18.5 million reclassified from other comprehensive income(1) 177.6
Income tax expense (10.7)
Net earnings from discontinued operations 180.4
(1) $177.6 million consists of a $173.8 million gain from the sale of CPD on August 9, 2016 as well as a $3.8 million gain from the sale of the Fixed-Price Energy Services business in first quarter of 2016.
Cash flows from discontinued operations reported in the consolidated statement of cash flows are as follows:
2016
Cash flows from operating activities 25.0
Cash flows from investing activities 381.9
Cash flows used in financing activities (2.6)
Net increase in cash from discontinued operations 404.3
Change in cash from continuing operations (398.1)
Effect of translation of foreign denominated cash (1.2)
Cash, beginning of the year –
Cash, end of the year 5.0

Superior Plus Corp. 2017 Annual Report64
5. Acquisitions Yankee Propane Inc. and Virginia R.W. Pomerleau Canwest Propane, Inc. Earhart International Gaz Propane Inc. Propane (collectively Company Dioxcide Inc. 2017 (Pomerleau) (Canwest) Yankee) (Earhart) (IDI Holdings)
Current assets 2.2 (includes 58.5 (includes – 1.8 11.6 (includes cash of 0.5) cash of 39.2) cash of 1.2)
Property, plant and equipment 5.1 116.5 9.8 16.7 1.2
Other assets – 3.9 – – –
Intangibles 5.8 7.1 18.9 18.8 7.3
Assets held for sale – 11.1 – – –
Accounts payable and accrued liabilities (0.8) (16.1) – (1.3) (6.3)
Other liabilities – (2.5) – – (0.3)
Long-term debt (1.3) – – – –
Provisions – (7.7) – – –
Deferred tax liability (1.1) (24.1) – – (0.1)
Net identifiable assets and liabilities 9.9 146.7 28.7 36.0 13.4
Goodwill arising on acquisition 0.8 285.7 10.0 8.3 1.0
Total consideration 10.7 432.4 38.7 44.3 14.4
Pomerleau Gaz Propane Inc. (Pomerleau)
On April 20, 2017, Superior acquired 100% of the shares of Pomerleau, a propane distributor serving residential and commercial customers in southeastern Québec, for cash consideration of $10.7 million excluding taxes. Revenue and net earnings for the year ended December 31, 2017 would have been $9.2 million and $0.6 million, respectively, if the acquisition had occurred on January 1, 2017. Subsequent to the acquisition date on April 20, 2017, the acquisition contributed revenue and net earnings of $4.5 million and $0.7 million, respectively, to the Energy Distribution segment for the year ended December 31, 2017. Goodwill arising on acquisition is not deductible for tax purposes.
Canwest Propane
On March 1, 2017, Superior entered into certain agreements to purchase 100% of the entities that carry on the industrial propane business of Canwest from Gibson Energy ULC (the Canwest Option) for cash consideration of $412.0 million plus $20.4 million of working capital. The acquisition was subject to the satisfaction of certain conditions, including the receipt of customary regulatory approvals. On September 27, 2017, Superior received regulatory approval from the Competition Bureau and closed the acquisition of Canwest subject to certain conditions. As outlined in the consent agreement registered with the Competition Bureau, Superior agreed to divest five local branches and nine satellite locations from the combined Superior Propane and Canwest Propane organization. The assets associated with the consent agreement have been separated and treated as assets held for sale on the balance sheet. As at December 31, 2017, this included $12.6 million of assets from Canwest and $2.2 million of assets from Superior.
The purchase price allocation is considered preliminary, and as a result, will be adjusted during the 12-month period following the acquisition once all the required information is obtained and assessed. Superior has allocated the purchase price to the identified assets and liabilities acquired based on their current book value as an estimated fair value at the time of acquisition.
During the three months ended December 31, 2017, the purchase price allocation was adjusted to reduce assets held for sale by $2.0 million to reflect the expected fair value on disposal of these assets, working capital was adjusted by $3.9 million, a provision related to an onerous contract (Note 12) for $7.7 million was recorded and the deferred tax liability at acquisition was decreased by $4.0 million. As a result, goodwill was increased by $9.6 million. Goodwill arising on acquisition is not deductible for tax purposes.
As of March 1, 2017 and up to the acquisition closing date of September 27, 2017, Superior was entitled to the benefit of the net profits of Canwest. As a result, Superior recorded net income of $1.2 million for the current year. These

Superior Plus Corp. Notes to Consolidated Financial Statements 65
results were recorded as part of selling, distribution and administrative costs. The results since the acquisition closed to December 31, 2017 have been consolidated. Revenue and net earnings for the year ended December 31, 2017 would have been $211.7 million and $27.9 million, respectively, if the acquisition had occurred on January 1, 2017. Subsequent to the acquisition date, the acquisition contributed revenue and net earnings of $77.1 million and $17.1 million, respectively, to the Energy Distribution segment for the year ended December 31, 2017.
Yankee Inc. and Virginia Propane Inc. (Yankee)
On August 1, 2017, Superior acquired the assets of Yankee, propane distributors serving residential and commercial customers in New York, New Jersey and Virginia for total consideration of $38.7 million excluding taxes. Included in the total consideration are US $4.0 million in deferred payments to be paid over five years. Superior allocated the purchase price to the identified assets and liabilities acquired based on their fair values at the time of acquisition. The goodwill acquired relates primarily to the access U.S. refined fuels will have in new markets such as New Jersey and Virginia. The purchase price allocation resulted in goodwill of $10.0 million, which is not tax deductible.
Revenue and net earnings for the year ended December 31, 2017 would have been $19.5 million and $2.8 million, respectively, if the acquisition had occurred on January 1, 2017. Subsequent to the acquisition date on August 1, 2017, the acquisition contributed revenue and net earnings of $8.2 million and $0.2 million, respectively, to the Energy Distribution segment for the year ended December 31, 2017.
R.W. Earhart Company (Earhart)
On October 12, 2017, Superior acquired the assets of Earhart for an aggregate purchase of US $38.0, less working capital and other adjustments for a final purchase price of US $35.4 (CDN $44.3 million). Goodwill arising on acquisition is not deductible for tax purposes.
Revenue and net earnings for the year ended December 31, 2017 would have been $25.3 million and $3.4 million, respectively, if the acquisition had occurred on January 1, 2017. Subsequent to the acquisition date on October 2, 2017, the acquisition contributed revenue and net earnings of $9.1 million and $2.1 million, respectively, to the Energy Distribution segment for the year ended December 31, 2017.
International Dioxcide Inc. (IDI Holdings)
On October 12, 2017, Superior acquired 100% of the shares of IDI from LANXESS Corporation for cash consideration of $14.4 million excluding taxes. IDI is a well-established company in the chlorine dioxide industry, operating for over 65 years with manufacturing operations in Rhode Island. Goodwill arising on acquisition is not deductible for tax purposes.
Revenue and net earnings for the year ended December 31, 2017 would have been $19.0 million and $2.9 million, respectively, if the acquisition had occurred on January 1, 2017. Subsequent to the acquisition date on October 12, 2017, the acquisition contributed revenue and net earnings of $7.6 million and $0.7 million, respectively, to the Specialty Chemicals segment for the year ended December 31, 2017.
6. Trade and Other Receivables
A summary of trade and other receivables is as follows:
2017 2016
Trade receivables, net of allowances 292.9 235.3
Accounts receivable – other 25.6 7.9
Trade and other receivables 318.5 243.2

Superior Plus Corp. 2017 Annual Report66
Pursuant to their respective terms, trade receivables, before deducting allowance for doubtful accounts, are aged as follows:
2017 2016
Current 212.4 183.0
Past due less than 90 days 80.4 51.5
Past due over 90 days 7.0 5.1
Trade receivables 299.8 239.6
The current portion of Superior’s trade receivables is neither impaired nor past due and there are no indications as of the reporting date that the debtors will not make payment.
Superior’s trade receivables are stated after deducting a provision of $6.9 million as at December 31, 2017 (December 31, 2016 − $4.3 million). The movement in the provision for doubtful accounts was as follows:
2017 2016
Allowance for doubtful accounts, beginning of the year (4.3) (7.3)
Opening adjustment due to acquisitions (3.1) –
Derecognized on sale of CPD – 1.9
Additions (4.0) (4.2)
Amounts written off during the year as uncollectible 2.3 1.4
Amounts recovered 2.2 3.9
Allowance for doubtful accounts, end of the year (6.9) (4.3)
7. Prepaid expenses 2017 2016
Prepaid insurance 14.5 13.2
Tax installments 5.9 33.1
Deposits 1.4 1.0
Leases and licenses 2.4 2.6
Storage and rent 1.0 0.9
Miscellaneous prepaids and other 4.2 1.3
Balance, end of the year 29.4 52.1
8. Inventories 2017 2016
Propane, heating oil and other refined fuels 85.6 54.0
Propane retailing materials, supplies, appliances and other 8.0 7.7
Chemical finished goods and raw materials 28.3 25.6
Chemical stores, supplies and other 15.1 13.8
137.0 101.1
Continuing Operations 2017 2016
Cost of inventories recognized as an expense 1,435.6 1,157.3
Inventory write-downs 2.6 2.2
Write-down reversals 1.1 1.0
Discontinued Operations 2017 2016
Cost of inventories recognized as an expense – 448.3
Inventory write-downs – 0.1

Superior Plus Corp. Notes to Consolidated Financial Statements 67
9. Property, Plant and Equipment Specialty Energy Construction Chemicals Distribution Products Plant and Retailing Distribution Leasehold Land Buildings Equipment Equipment Equipment Improvements Total
Cost
Balance at December 31, 2015 32.8 207.2 960.5 765.9 78.8 14.5 2,059.7
Additions – 5.9 30.1 53.3 12.8 0.4 102.5
Acquisitions through business combinations – – – 4.2 – – 4.2
Adjustments related to ARO and provisions – (0.5) – (1.3) – – (1.8)
Disposals (0.8) (3.4) (2.1) (16.7) (88.0) (9.1) (120.1)
Net foreign currency exchange differences (0.4) (2.9) (12.9) (8.2) (2.6) 0.1 (26.9)
Transfers between divisions – – – 0.2 – (0.2) –
Reclassification – – – – (0.4) 0.4 –
Other – – (11.5) – (0.6) (0.1) (12.2)
Balance at December 31, 2016 31.6 206.3 964.1 797.4 – 6.0 2,005.4
Additions 0.2 3.9 25.9 59.3 – 1.2 90.5
Acquisitions through business combinations 18.8 11.2 1.2 116.6 – 1.5 149.3
Adjustments related to ARO and provisions – 44.6 – 0.1 – – 44.7
Disposals (1.0) (1.8) (1.8) (20.5) – (0.1) (25.2)
Net foreign currency exchange differences (0.7) (6.1) (28.1) (18.1) – – (53.0)
Reclassification (0.2) 0.3 – (0.1) – – –
Other (0.4) (0.7) – (0.2) – – (1.3)
Balance at December 31, 2017 48.3 257.7 961.3 934.5 – 8.6 2,210.4
Accumulated Depreciation
Balance at December 31, 2015 – 75.2 512.1 411.2 34.9 9.6 1,043.0
Depreciation expense – 7.9 48.2 51.4 4.7 0.7 112.9
Eliminated on disposal of assets – (2.3) (1.5) (13.5) (39.6) (6.9) (63.8)
Net foreign currency exchange differences – (0.8) (9.0) (2.6) – (0.1) (12.5)
Transfers between divisions – – – 0.1 – (0.1) –
Other – – (7.9) – – – (7.9)
Balance at December 31, 2016 – 80.0 541.9 446.6 – 3.2 1,071.7
Depreciation expense – 8.8 45.4 48.0 – 1.1 103.3
Eliminated on disposal of assets – (0.3) (1.3) (14.1) – (0.1) (15.8)
Net foreign currency exchange differences – (2.2) (14.1) (7.6) – – (23.9)
Reclassification – (0.1) – – – 0.1 –
Transfers between divisions – – – – – – –
Other – (0.8) – (1.2) – – (2.0)
Balance at December 31, 2017 – 85.4 571.9 471.7 – 4.3 1,133.3
Carrying Amount
As at December 31, 2016 31.6 126.3 422.2 350.8 – 2.8 933.7
As at December 31, 2017 48.3 172.3 389.4 462.8 – 4.3 1,077.1

Superior Plus Corp. 2017 Annual Report68
Depreciation per cost category: 2017 2016
Cost of sales 52.3 54.5
Selling, distribution and administrative costs – continuing operations 51.0 53.6
Selling, distribution and administrative costs – discontinued operations – 4.8
Total 103.3 112.9
Superior’s property, plant and equipment were tested for impairment as at December 31, 2017 and 2016 and no impairment was identified. Therefore, the carrying value was not adjusted. See Note 11 for further details on testing of property, plant, and equipment impairment in CGUs. The carrying value of Superior’s property, plant, and equipment includes $63.9 million of leased assets as at December 31, 2017 (December 31, 2016 – $64.9 million).
10. Intangible Assets Québec Energy and Distribution Ontario Trademarks, Cap and Non-Compete Construction Specialty Customer Trade Agreements Products Chemicals Contract Emissions and Other Distribution Royalty Other Related Units Intangible Intangible Assets and Intangible Costs Purchased Assets Assets Patents Assets Total
Cost
Balance at December 31, 2015 11.7 – 42.1 1.9 65.4 – 121.1
Additions acquired separately – 9.1 10.2 – – – 19.3
Disposals (11.7) – (3.6) (1.9) (65.4) – (82.6)
Net foreign currency exchange differences – – (0.3) – – – (0.3)
Balance at December 31, 2016 – 9.1 48.4 – – – 57.5
Acquisitions through business combinations 5.3 – 45.2 – 7.3 – 57.8
Additions from internal development – – – – – 0.1 0.1
Additions acquired separately – 1.1 4.7 – – – 5.8
Net foreign currency exchange differences – – (0.9) – (0.2) – (1.1)
Balance at December 31, 2017 5.3 10.2 97.4 – 7.1 0.1 120.1
Accumulated Amortization
Balance at December 31, 2015 10.2 – 23.0 1.4 65.4 – 100.0
Amortization expense 1.5 – 6.2 – – – 7.7
Disposals (11.7) – (3.7) (1.4) (65.4) – (82.2)
Balance at December 31, 2016 – – 25.5 – – – 25.5
Amortization expense 0.6 – 9.0 – – – 9.6
Net foreign currency exchange differences – – (0.3) – – – (0.3)
Balance at December 31, 2017 0.6 – 34.2 – – – 34.8
Carrying value(1)
As at December 31, 2016 – 9.1 22.9 – – – 32.0
As at December 31, 2017 4.7 10.2 63.2 – 7.1 0.1 85.3
(1) Superior has pledged 100% of the intangible assets balance at December 31, 2017, excluding leased assets, as security on its borrowing.

Superior Plus Corp. Notes to Consolidated Financial Statements 69
Superior’s intangibles were tested for impairment as at December 31, 2017 and 2016 and the Company did not identify any impairment. Therefore, the carrying value was not adjusted for the current year.
During the year, the Company invested $4.7 million (2016 – $10.2 million) in new software systems and enhancements to existing systems. These additions include the cost of the software, the installation and consulting services relating to the enhancements and implementation of these systems.
11. Goodwill 2017 2016
Balance, beginning of the year 199.2 196.2
Additional amounts recognized from business combinations during the year 305.8 3.3
Effect of foreign currency differences (0.5) (0.3)
Balance, end of the year 504.5 199.2
Goodwill is a result of a number of previous business combinations and is generally attributable to anticipated synergies expected from those acquisitions. Goodwill by definition has an indefinite life and, therefore, is not amortized.
Impairment of property, plant and equipment, goodwill and intangible assets
Goodwill is subject to impairment tests at least annually. For purposes of impairment testing, Superior assesses goodwill at the cash-generating unit (CGU) level.
Before recognition of impairment losses, the carrying amount of goodwill as at December 31 was allocated to the segments as follows:
2017 2016
Energy Distribution 503.5 199.2
Specialty Chemicals 1.0 –
504.5 199.2
Superior conducts assessments for indicators of impairment on a quarterly basis and performs a detailed impairment assessment at least annually. At December 31, 2017 and 2016, an impairment test was performed for all CGUs with allocated goodwill and no impairment was identified. The recoverable amount of each CGU was based on its value in use and was determined by estimating the future cash flows that would be generated from the continuing use of the CGU, incorporating the following assumptions:
Basis on which recoverable amount was determined
The recoverable amount for each CGU is determined using a detailed cash flow model which is based on evidence from an internal budget approved by the Board of Directors. Management’s internal budgets are based on past experience and are adjusted to reflect market trends and economic conditions.
Key rates used in calculation of recoverable amount
Growth rate to perpetuity
The first five years of cash flow projections used in the model are based on management’s internal budgets and projections after five years are extrapolated using growth rates in line with historical long-term growth rates. The long-term growth rate used in determining the recoverable amount for each CGU is 2.0% (2016 – 2.0%).
Discount rates
Cash flows in the model are discounted using a discount rate specific to each CGU which is adjusted based on risk assessments for each CGU. Discount rates reflect the current market assessments of the time value of money and are derived from the CGU’s weighted average cost of capital. The weighted average cost of capital is then adjusted to reflect the impact of tax in order to calculate an equivalent pre-tax discount rate. The after-tax discount rates used in determining the recoverable amount for the CGUs range from 9.6% to 11.2% (2016 – 9.0% to 9.3%).

Superior Plus Corp. 2017 Annual Report70
Inflation rates
Inflation rates used in the cash flow model are based on a blend of a number of publicly available inflation forecasts. The inflation rate used in determining the recoverable amount for each CGU in 2017 is 2.0% (2016 – 2.0%).
Key assumptions
In determining the recoverable amount of each CGU, business, market and industry factors were considered.
As at December 31, 2017 and 2016, using the assumptions outlined above, Superior determined there was no impairment for the Energy Distribution CGU or the Specialty Chemicals CGU. Therefore, the carrying values of Energy Distribution’s property, plant and equipment, goodwill and intangibles were not adjusted. No impairment charge was recognized as an expense against Superior’s net earnings for the years ended December 31, 2017 and 2016.
12. Provisions Restructuring Decommissioning Other Total
Balance at December 31, 2015 0.5 22.2 1.0 23.7
Additions 7.0 – 0.3 7.3
Utilization (2.3) (0.1) (0.7) (3.1)
Amounts reversed during the year – (0.4) (0.5) (0.9)
Unwinding of discount – (0.4) – (0.4)
Impact of change in discount rate – (0.4) – (0.4)
Divestitures (0.4) (0.2) – (0.6)
Net foreign currency exchange difference – (0.3) – (0.3)
Balance at December 31, 2016 4.8 20.4 0.1 25.3
Additions 12.5 41.0 7.8 61.3
Utilization (3.9) – (0.1) (4.0)
Amounts reversed during the year (0.1) (0.7) – (0.8)
Unwinding of discount – 0.6 – 0.6
Impact of change in discount rate – 3.6 – 3.6
Divestitures – 0.3 – 0.3
Net foreign currency exchange difference 0.1 (1.2) – (1.1)
Balance at December 31, 2017 13.4 64.0 7.8 85.2
As at December 31, 2017 2016
Current 15.3 4.8
Non-current 69.9 20.5
85.2 25.3
Restructuring
Restructuring costs are recorded in selling, distribution, and administrative costs as well as cost of sales. Provisions for restructuring are recorded in provisions, except for the current portion, which is recorded in trade and other payables. As at December 31, 2017, the current portion of the restructuring provision was $13.4 million (December 31, 2016 – $4.8 million). As at December 31, 2017, the long-term portion of the restructuring provision was nil (December 31, 2016 – nil). The provision is primarily for severance costs.

Superior Plus Corp. Notes to Consolidated Financial Statements 71
Decommissioning
Specialty Chemicals
Superior makes full provision for the future cost of decommissioning Specialty Chemicals’ chemical facilities. The provision is on a discounted basis and is based on existing technologies at current prices or long-term price assumptions, depending on the activities’ expected timing. As at December 31, 2017, the discount rate used in Superior’s calculation was 2.26% (December 31, 2016 – 2.31%). Superior estimates the total undiscounted expenditures required to settle its decommissioning liabilities at December 31, 2017 to be approximately $115 million (December 31, 2016 – $22.7 million) which will be paid over the next 1 to 40 years. While Superior’s provision for decommissioning costs is based on the best estimate of future costs and the economic lives of the chemical facilities, the amount and timing of incurring these costs is uncertain.
Energy Distribution
Superior makes full provision for the future costs of decommissioning certain assets associated with the Energy Distribution segment. Superior estimates the total undiscounted expenditures required to settle its asset retirement obligations to be approximately $8.5 million at December 31, 2017 (December 31, 2016 – $10.2 million) which will be paid over the next 15 years. The risk-free rate of 2.5% at December 31, 2017 (December 31, 2016 – 2.31%) was used to calculate the present value of the estimated cash flows.
Other
Environmental
Provisions for environmental remediation are made when a clean-up is probable and the amount of the obligation can be reliably estimated. Generally, this coincides with commitment to a formal plan or, if earlier, on divestment or closure of inactive sites. Superior estimates the total undiscounted expenditures required to settle its environmental expenditures to be approximately $0.1 million at December 31, 2017 (December 31, 2016 – $0.1 million) which will be paid over the next year. The provision for environmental expenditures has been estimated using existing technology at current prices. No discount rate has been applied as the liability is to be settled within 12 months. The extent and cost of future remediation programs are inherently difficult to estimate. They depend on the scale of any possible contamination, the timing and extent of corrective actions, and Superior’s share of the liability.
Supply contract
As part of the bidding process to acquire Canwest, Superior was required to enter into a five year supply agreement with the seller. The supply agreement was for terms that were unfavourable to Superior based on current supply arrangements under contract. As a result Superior has recorded a provision of $7.7 million related to this contract.
Other claims
Superior is subject to various claims and potential claims in the normal course of business, but the Company does not expect the ultimate settlement of any of these to have a material effect on its financial results. The outcomes of all the proceedings and claims against Superior are subject to future resolution that includes the uncertainties of litigation. It is not possible for Superior to predict the result or magnitude of the claims due to the various factors and uncertainties involved in the legal process. Based on information currently known to Superior, it is not probable that the ultimate resolution of any proceedings and claims, individually or in total, will have a material effect on the consolidated statement of net (loss) earnings and total comprehensive (loss) income or consolidated balance sheets. If it becomes probable that Superior is liable, Superior will record a provision in the period the change in probability occurs, and the resulting impact could be material to the consolidated statement of net (loss) earnings and total comprehensive (loss) income or consolidated balance sheets.

Superior Plus Corp. 2017 Annual Report72
13. Trade and Other Payables
A summary of trade and other payables is as follows:
As at December 31, 2017 2016
Trade payables 228.5 182.6
Provisions 15.3 4.8
Other payables 82.5 59.2
Québec cap and trade program 8.9 –
Share-based payments 15.5 15.1
Trade and other payables 350.7 261.7
The average credit period on purchases by Superior is 21 days (2016 – 29 days). No interest is charged on the trade payables up to 10 days (2016 – 15 days) from the date of the invoice. Thereafter, interest is charged at a rate of up to 17% (2016 – 18%) per annum on the balance. Superior’s financial risk management policies ensure that payables are normally paid within the pre-agreed credit terms.
14. Deferred Revenue 2017 2016
Balance, beginning of the year 8.5 9.7
Deferred during the year 37.3 17.1
Released to net earnings (36.2) (17.7)
Foreign exchange impact 0.3 (0.6)
Balance, end of the year 9.9 8.5
The deferred revenue relates to Energy Distribution’s unearned service revenue.
15. Other LiabilitiesDecember 31, 2017 2016
Supply agreement 2.5 5.2
Québec cap and trade payable – 6.2
Ontario cap and trade payable 1.5 –
4.0 11.4
The supply agreement above relates to the Specialty Chemicals purchase and supply agreements with Tronox LLC (Tronox) whereby Superior agreed to purchase up to 130,000 metric tonnes (MT) of sodium chlorate per year from Tronox’s Hamilton, Mississippi facility as nominated annually by Specialty Chemicals. Specialty Chemicals also agreed to supply Tronox with certain products to service Tronox requirements in North America. Tronox commenced decommissioning of the facility upon completion of Superior’s 2015 sodium chlorate requirements. However, Specialty Chemicals’ supply portion of the agreement will continue to 2019.
Superior transports propane to and from Québec and Ontario and therefore must purchase compliance instruments to comply with the Québec cap and trade regulations (Québec) and Ontario cap and trade regulations (Ontario). Intangible assets are recorded when purchased, and cap and trade liabilities are recorded upon the import of propane. The liability at December 31, 2017 is $8.9 million for Québec (December 31, 2016 – $6.2 million), which was reclassified to trade and other payables and $1.5 million (December 31, 2016 – nil) for Ontario. Superior is required to settle the compliance instruments with the Québec and Ontario provincial governments at the end of each compliance period. The compliance period from 2015 to 2017 for the Québec cap and trade is due in November 2018. The total Québec cap and trade liability of $8.9 million has been classified to current other payables.

Superior Plus Corp. Notes to Consolidated Financial Statements 73
16. Borrowing Year of Effective December 31, December 31, Maturity Interest Rate 2017 2016
Revolving Term Bank Credit Facilities (1)
Floating BA rate plus
Bankers’ Acceptances (BA) 2022 applicable credit spread 31.0 20.0
Prime rate plus
Canadian Prime Rate Loan 2022 applicable credit spread – 10.7
LIBOR Loans Floating LIBOR rate plus
(US $267.0 million; 2016 – US $104.0 million) 2022 applicable credit spread 335.6 139.7
US Base Rate Loans U.S. Prime rate plus
(US $16.3 million; 2016 – US $8.6 million) 2022 credit spread 20.5 11.5
387.1 181.9
Other Debt
Accounts receivable factoring program(2) Floating BA plus 2.1 1.7
Deferred consideration and other 2018 - 2019 non-interest-bearing 11.1 4.4
13.2 6.1
Senior Unsecured Notes
Senior unsecured notes(3) 2021 6.50% 200.0 200.0
Senior unsecured notes(4) 2024 5.25% 400.0 –
600.0 200.0
Finance Lease Obligations
Finance lease obligation 63.1 56.7
Total borrowing before deferred financing fees 1,063.4 444.7
Deferred financing fees (10.6) (5.7)
Borrowing 1,052.8 439.0
Current maturities (28.7) (18.3)
Borrowing 1,024.1 420.7
(1) As at December 31, 2017, Superior had $31.7 million of outstanding letters of credit (December 31, 2016 – $21.7 million) and $157.0 million of outstanding financial guarantees on behalf of its businesses (December 31, 2016 – $148.7 million). The fair value of Superior’s revolving term bank credit facilities, other debt, letters of credit, and financial guarantees approximates their carrying value as a result of the market-based interest rates, the short-term nature of the underlying debt instruments and other related factors. On May 1, 2017, Superior extended its syndicated credit facility with ten lenders, increasing the size of the facility to $620 million from $570 million, with no changes to the financial covenants. The facility matures on April 28, 2022 and can be expanded up to $800 million.
(2) Superior has entered into a Master Receivables Purchase Agreement with a financial institution by which it may purchase from time to time, on an uncommitted revolving basis, 100% interest in receivables from Superior. The maximum aggregate amount of purchased receivables purchased by the financial institution under this agreement and outstanding at any time is limited to $15.0 million. As at December 31, 2017, the accounts receivable factoring program totaled $2.1 million (December 31, 2016 – $1.7 million).
(3) On December 9, 2014, Superior completed an offering of $200.0 million in 6.50% senior unsecured notes (the senior notes). The senior notes were issued at par value and mature on December 9, 2021. The senior notes contain certain early redemption options under which Superior has the option to redeem all or a portion of the senior notes at various redemption prices, which include the principal plus accrued and unpaid interest, if any, to the application redemption date. Interest is payable semi-annually on June 9 and December 9, and commenced June 9, 2015.
(4) On February 27, 2017, Superior completed an offering of $250.0 million is 5.25% senior unsecured notes (the notes). The notes were issued at par value and mature on February 27, 2024. The notes contain certain early redemption options under which Superior has the option to redeem all or a portion of the notes at various redemption prices, which include the principal plus accrued and unpaid interest, if any, to the application redemption date. Interest is payable semi-annually on February 27 and August 27, and commences August 27, 2017. On October 16, 2017, Superior issued an additional $150.0 million in notes due on February 27, 2024. Superior intended to use the net proceeds to fund the redemption of Superior’s issued and outstanding 6.0% convertible unsecured subordinated debentures.

Superior Plus Corp. 2017 Annual Report74
Repayment requirements of borrowing before deferred finance fees are as follows:
Current maturities 28.7
Due in 2019 20.6
Due in 2020 12.8
Due in 2021 8.1
Due in 2022 590.5
Due in 2023 2.7
Subsequent to 2023 400.0
Total 1,063.4
17. Leasing Arrangements
Operating Lease Commitments
Superior has entered into leases on certain vehicles, rail cars, premises and other equipment. Leases have an average life of between three and five years with no renewal option included in the contracts. There are no restrictions placed upon Superior by entering into these leases.
Future minimum lease payments under non-cancellable operating leases are as follows:
2017 2016
Not later than one year 34.4 34.6
Later than one year and not later than five years 97.9 82.5
Later than five years 55.5 34.2
187.8 151.3
Obligations under Finance Lease
Finance leases relate to fuel distribution vehicles, equipment and office space with lease terms of five to 15 years. Superior has options to purchase the assets for a nominal amount at the conclusion of the lease agreements. Superior’s obligations under finance leases are secured by the lessors’ title to the leased assets.
The present values of minimum lease payments are as follows:
Present Value of Minimum Minimum Lease Payments Lease Payments
2017 2016 2017 2016
Not later than one year 20.6 13.4 19.5 13.4
Later than one year and not later than five years 40.9 41.9 35.0 36.9
Later than five years 9.4 6.9 8.6 6.4
Less: future finance charges (7.8) (5.5) – –
Present value of minimum lease payments 63.1 56.7 63.1 56.7
Included in the consolidated balance sheets as at December 31:
2017 2016
Current portion of finance lease 19.5 13.4
Non-current portion of finance lease 43.6 43.3
63.1 56.7

Superior Plus Corp. Notes to Consolidated Financial Statements 75
18. Convertible Unsecured Subordinated Debentures
Superior’s debentures are as follows:
Maturity June 2019
Interest Rate 6.00%
Conversion price per share $16.75
Debentures outstanding as at December 31, 2017 Nil
Debentures outstanding as at December 31, 2016 89.8
Quoted market value as at December 31, 2017 Nil
Quoted market value as at December 31, 2016 99.5
On November 15, 2017, the issued and outstanding 6.00% convertible unsecured subordinated debentures due June 30, 2019 (of which principal of $97 million is outstanding at the time prior to redemption) were redeemed. Upon redemption, Superior recognized a gain of $3.9 million, recorded as part of non-cash interest expense.
19. Employee Future Benefits
The most recent actuarial valuations of plan assets and the present value of the defined benefit obligation were carried out on December 31, 2017. The present value of the defined benefit obligation, and the related current and past service costs, were measured using the projected unit credit method.
The principal assumptions used for the purpose of the actuarial valuation were as follows:
Defined-benefit Plans Other Benefit Plans
2017 2016 2017 2016
Discount rate 3.50% 3.75% 3.50% 3.75%
Expected rate of compensation increase 3.00% 3.00% 3.00% 3.00%
Mortality rate 10.00% 10.00% 10.00% 10.00%
Energy Distribution and Specialty Chemicals have defined-benefit and defined contribution pension plans covering most employees. The benefits provided under defined-benefit pension plans are based on the individual employee’s years of service and the highest average earnings for a specified number of consecutive years. Information about Superior’s defined-benefit and other post-retirement benefit plans as at December 31, 2017 and December 31, 2016 in aggregate is as follows:
Recognized net (asset) liability arising from defined-benefit obligation Specialty Energy Distribution Chemicals Pension Pension Benefit Other Benefit Plans Plans Benefit Plans
Balance at December 31, 2017
Present value of defined-benefit obligations 38.8 134.4 21.0
Fair value of plan assets (43.1) (138.2) –
Net (asset) liability arising from defined-benefit obligation (4.3) (3.8) 21.0
Balance at December 31, 2016
Present value of defined-benefit obligations 41.9 126.9 22.1
Fair value of plan assets (45.0) (129.9) –
Net (asset) liability arising from defined-benefit obligation (3.1) (3.0) 22.1

Superior Plus Corp. 2017 Annual Report76
Movements in defined benefit obligations and plan assets:
Specialty Energy Distribution Chemicals Pension Pension Benefit Other Benefit Plans Plans Benefit Plans
2017 2016 2017 2016 2017 2016
Movement in the present value of the defined benefit
obligation during the year:
Benefit obligation at January 1 41.9 43.5 126.9 123.0 22.1 24.9
Current service cost – – 2.1 2.2 0.3 0.4
Interest cost 1.4 1.6 4.7 4.6 0.8 0.9
Contributions by the plan participants – – 0.1 0.1 – –
Actuarial gains (losses) (0.8) 0.7 6.8 2.1 (1.0) (3.0)
Benefits paid (3.7) (3.9) (6.2) (5.1) (1.2) (1.1)
Benefit obligation at December 31 38.8 41.9 134.4 126.9 21.0 22.1
Movement in the fair value of the plan assets
during the year:
Fair value of plan assets at January 1 45.0 47.8 129.9 122.6 – –
Expected return on plan assets 1.5 1.7 4.8 4.6 – –
Excess return (shortfall) on plan assets 0.5 (0.6) 8.4 4.2 – –
Contributions by the employer – – 1.5 3.7 1.1 1.2
Contributions by plan participants – – 0.1 0.1 – –
Benefits paid (3.7) (3.8) (6.2) (5.1) (1.1) (1.2)
Administration expenses (0.2) (0.1) (0.3) (0.2) – –
Fair value of plan assets at December 31 43.1 45.0 138.2 129.9 – –
Funded status – plan surplus (deficit) 4.3 3.1 3.8 3.0 (21.0) (22.1)
Assets related to defined-benefit obligation 4.3 3.1 3.8 3.0 – –
Liabilities related to defined-benefit obligation – – – – (21.0) (22.1)
Net asset (obligation) arising from defined-
benefit obligation 4.3 3.1 3.8 3.0 (21.0) (22.1)
Non-current net benefit asset (obligation) 4.3 3.1 3.8 3.0 (21.0) (22.1)
The accrued net pension asset related to the Energy Distribution pension benefit plan on December 31, 2017 was $4.3 million (December 31, 2016 –$3.1 million), and the expense for 2017 was $0.1 million (2016 – $0.1 million). The accrued net pension asset related to the Specialty Chemicals pension benefit plan on December 31, 2017 was $3.8 million (2016 –$3.0 million), and the expense for 2017 was $2.2 million (2016 – $2.5 million).
The accrued net benefit obligation related to the total other benefit plans of Energy Distribution and Specialty Chemicals on December 31, 2017 was $21.0 million (2016 –$22.1 million), and the expense for 2017 was $1.2 million (year ended December 31, 2016 – $1.2 million). Amounts recognized in net earnings in respect of these defined-benefit plans are as follows for the years ended December 31:
2017 2016
Service Cost:
Current service cost 2.4 2.6
Administrative expense 0.5 0.5
Net interest expense 0.6 0.7
Components of defined-benefit costs recognized in net earnings 3.5 3.8

Superior Plus Corp. Notes to Consolidated Financial Statements 77
The service cost, administrative expense and net interest expense related to Energy Distribution and Specialty Chemicals on December 31, 2017 was $3.5 million (December 31, 2016 – $3.8 million) and is included in selling, distribution and administrative costs.
The re-measurement of the net defined-benefit liability is included in other comprehensive income. The amounts recognized in accumulated other comprehensive income in respect of these benefit plans are as follows:
2017 2016
Actuarial defined-benefit losses (before income taxes) 3.9 3.9
Cumulative actuarial losses (before income taxes) (3.1) (6.9)
Re-measurement on the net benefit obligation: 2017 2016
Cumulative actuarial losses, beginning of the year (7.0) (10.8)
Actuarial asset experience gain 8.9 3.6
Actuarial loss arising from changes in demographic assumptions (1.1) (1.7)
Actuarial loss arising from changes in financial assumptions (7.7) (1.3)
Actuarial gain arising from changes in experience adjustments 3.8 3.3
Cumulative actuarial losses, end of the year (3.1) (6.9)
Significant actuarial assumptions for the determination of the accrued defined-benefit obligation are discount rate, compensation increase, mortality scale and trend rate. The sensitivity analyses below have been determined based on reasonably possible changes of the respective assumptions occurring as at December 31, 2017, while holding all other assumptions constant.
Discount Rate
A 1% change in the discount rate would result in a change to the accrued defined-benefit obligation related to Energy Distribution of $4.4 million at December 31, 2017 (December 31, 2016 – $4.3 million) and a change to the current service expense of $0.1 million at December 31, 2017 (December 31, 2016 – $0.1 million). A 1% change in the discount rate would result in a change to the accrued defined-benefit obligation related to Specialty Chemicals of $22.1 million at December 31, 2017 (December 31, 2016 – $20.2 million) and a change to the current service expense of $1.0 million at December 31, 2017 (December 31, 2016 – $1.0 million).
Compensation Increase
A 1% change in the salary would result in a change to the accrued defined-benefit obligation related to Energy Distribution of nil at December 31, 2017 (December 31, 2016 – nil) and a change to the current service expense of nil at December 31, 2017 (December 31, 2016 – nil). A 1% change in salary would result in a change to the accrued defined-benefit obligation related to Specialty Chemicals of $1.6 million at December 31, 2017 (2016 – $1.8 million) and a change to the current service expense of $0.2 million at December 31, 2017 (2016 – $0.2 million).
Mortality Scale
A 10% change in the mortality scale would result in a change to the accrued defined-benefit obligation related to Energy Distribution of $1.8 million at December 31, 2017 (2016 – $2.1 million) and a change to the current service expense of $0.1 million at December 31, 2017 (2016 – $0.1 million). A 10% change in the mortality scale would result in a change to the accrued defined-benefit obligation related to Specialty Chemicals of $3.4 million at December 31, 2017 (2016 – $3.4 million) and a change to the current service expense of $0.2 million at December 31, 2017 (2016 – $0.2 million).
Trend Rate
A 1% change in the trend rate would result in a change to the accrued defined-benefit obligation related to Energy Distribution of $0.4 million at December 31, 2017 (2016 – $0.4 million) and a change to the current service expense of nil at December 31, 2017 (2016 – nil). A 1% change in the trend rate would result in a change to the accrued defined-benefit obligation liability related to Specialty Chemicals of $1.2 million at December 31, 2017 (2016 – $1.2 million) and a change to the current service expense of $0.1 million at December 31, 2017 (2016 – $0.1 million).

Superior Plus Corp. 2017 Annual Report78
The sensitivity presented above may not be representative of the actual change in the accrued defined-benefit obligation as it is unlikely that the change in assumptions would occur in isolation, as some of the assumptions may be correlated.
The present value of the defined-benefit obligation was calculated using the projected unit credit as at December 31, 2017, which is the same as that applied in calculating the accrued defined-benefit obligation recognized in the consolidated balance sheets.
There were no changes in the methods or assumptions used in preparing the sensitivity analysis from prior years.
The average duration of the net benefit obligation related to Energy Distribution is 8.8 years at December 31, 2017 (2016 – 8.4 years) and related to Specialty Chemicals is 14.1 years at December 31, 2017 (2016 – 13.0 years).
At December 31, 2017, Superior expects to make a contribution to the Energy Distribution Pension Benefit Plans of $1.4 million and to the Specialty Chemicals Pension Benefit Plans of $2.0 million during 2018.
The fair values of plan assets as at December 31, 2017, by major asset category, are as follows:
Energy Distribution Pension Specialty Chemicals Pension Benefit Plans Benefit Plans Level 2 Percentage Level 2 Percentage
Canadian Equities 4.0 9.2% 37.4 27.1%
Foreign Equities – – 36.9 26.7%
Foreign Income 0.2 0.4% – –
Fixed Income 38.9 90.4% 63.9 46.2%
Total 43.1 100% 138.2 100%
The fair values of plan assets as at December 31, 2016, by major asset category, are as follows:
Energy Distribution Pension Specialty Chemicals Pension
Benefit Plans Benefit Plans
Level 2 Percentage Level 2 Percentage
Canadian and U.S. Equities 3.6 8.1% 34.5 26.6%
Foreign Equities – – 34.5 26.6%
Foreign Income 0.1 0.2% – –
Fixed Income 41.2 91.7% 60.8 46.8%
Total 44.9 100% 129.8 100%
The actual returns on Energy Distribution and Specialty Chemicals plan assets in 2017 were 4.7% (2016 – 2.5%) and 10.0% (2016 – 7.1%), respectively.
As at December 31, 2017, the asset-matching strategic choices that are formulated in the actuarial and Superior’s Statement of Investment Policy (SIPP) of the total defined-benefit plan assets are:
Specialty Energy Distribution Chemicals Pension Pension Benefit Benefit Plans Plans Other Range(1)(2) Range(1)(2) Range(1)(2)
Canadian Equities – 25.0%-35.0% 7.5%-17.5%
Global Equities – 25.0%-35.0% 7.5%-17.5%
Fixed Income 100% 35.0%-45.0% 65.0%-85.0%
(1) Based on Superior’s SIPP.
(2) Energy Distribution and Specialty Chemicals’ SIPPs do not provide ranges for U.S. and Foreign Equities; instead, they provide in aggregate ranges classified as global equities.

Superior Plus Corp. Notes to Consolidated Financial Statements 79
As at December 31, 2016, the asset-matching strategic choices that are formulated in the actuarial and Superior’s SIPP of the total defined-benefit plan assets are:
Specialty Energy Distribution Chemicals Pension Pension Benefit Benefit Plans Plans Other Range(1)(2)(3) Range(1)(2) Range(1)(2)
Canadian Equities – 25.0%-35.0% 7.5%-17.5%
Global Equities – 25.0%-35.0% 7.5%-17.5%
Fixed Income 100% 35.0%-45.0% 65.0%-85.0%
(1) Based on Superior’s SIPP.
(2) Energy Distribution and Specialty Chemicals’ SIPPs do not provide ranges for U.S. and Foreign Equities; instead, they provide in aggregate ranges classified as global equities.
(3) Energy Distribution moved to 100% fixed income in 2015 to derisk the plans given the maturity and low number of active participants.
20. Financial Instruments
IFRS requires disclosure around fair value and specifies a hierarchy of valuation techniques based on whether the inputs to those valuation techniques are observable or unobservable. Observable inputs reflect market data obtained from independent sources, while unobservable inputs reflect Superior’s market assumptions. These two types of input create the following fair-value hierarchy:
» Level 1 – Quoted prices in active markets for identical instruments.
» Level 2 – Quoted prices for similar instruments in active markets; quoted prices for identical or similar instruments in markets that are not active; and model-derived valuations in which all significant inputs and value drivers are observable in active markets.
» Level 3 – Valuations derived from valuation techniques in which one or more significant inputs or significant value drivers are unobservable.
The fair value of a financial instrument is the price that would be received to sell an asset or paid to transfer a liability in an orderly transaction between market participants at the measurement date. Fair values are determined by reference to quoted bid or asking prices, as appropriate, in the most advantageous active market for that instrument to which Superior has immediate access (Level 1). Where bid and ask prices are unavailable, Superior uses the closing price of the instrument’s most recent transaction. In the absence of an active market, Superior estimates fair values based on prevailing market rates (bid and ask prices, as appropriate) for instruments with similar characteristics and risk profiles or internal or external valuation models, such as discounted cash flow analysis using, to the extent possible, observable market-based inputs (Level 2). Superior uses internally developed methodologies and unobservable inputs to determine the fair value of some financial instruments when required (Level 3).
Fair values determined using valuation models require assumptions concerning the amount and timing of estimated future cash flows and discount rates. In determining those assumptions, Superior looks primarily to available readily observable external market inputs including forecast commodity price curves, interest rate yield curves, currency rates, and price and rate volatilities as applicable.
All financial and non-financial derivatives are designated as held-for-trading upon their initial recognition.

Superior Plus Corp. 2017 Annual Report80
As at December 31, 2017
Level 1 Level 2 Level 3 Total
Assets
Foreign currency forward contracts, net sale 11.6 – – 11.6
Natural gas financial swaps – AECO – 3.6 – 3.6
Propane, diesel, butane and heating oil wholesale purchase and sale contracts, net sale – Energy Distribution – 24.9 – 24.9
Total assets 11.6 28.5 – 40.1
Liabilities
Natural gas financial swaps – AECO – 3.6 – 3.6
Foreign currency forward contracts, net sale 8.1 – – 8.1
Cross-currency interest rate exchange agreements 2.7 – – 2.7
Equity derivative contract – 0.9 – 0.9
Propane and butane wholesale purchase and sale contracts, net sale – Energy Distribution – 10.8 – 10.8
WTI wholesale purchase and sale contracts, net sale – Energy Distribution – 0.2 – 0.2
Total liabilities 10.8 15.5 – 26.3
Total net assets 0.8 13.0 – 13.8
Current portion of assets 4.9 25.1 – 30.0
Current portion of liabilities 8.2 13.6 – 21.8
As at December 31, 2016
Level 1 Level 2 Level 3 Total
Assets
Foreign currency forward contracts, net sale 0.8 – – 0.8
Debenture – embedded derivative – – 3.9 3.9
Natural gas financial swaps – AECO – 2.5 – 2.5
Electricity swaps – Energy Distribution – 0.7 – 0.7
Propane, diesel, butane and heating oil wholesale purchase and sale contracts, net sale – Energy Distribution – 9.3 – 9.3
Total assets 0.8 12.5 3.9 17.2
Liabilities
Natural gas financial swaps – AECO – 2.8 – 2.8
Electricity swaps – Energy Distribution – 0.7 – 0.7
Foreign currency forward contracts, net sale 24.5 – – 24.5
Cross-currency interest rate exchange agreements 0.2 – – 0.2
Propane and butane wholesale purchase and sale contracts, net sale – Energy Distribution – 0.9 – 0.9
Total liabilities 24.7 4.4 – 29.1
Total net liability (assets) (23.9) 8.1 3.9 (11.9)
Current portion of assets 0.5 11.0 3.9 15.4
Current portion of liabilities 6.2 2.8 – 9.0

Superior Plus Corp. Notes to Consolidated Financial Statements 81
The following table outlines quantitative information about how the fair values of these financial and non-financial assets and liabilities are determined, including valuation techniques and inputs used:
Description Notional Term Effective Rate Valuation Technique(s) and Key Input(s)
Level 1 fair value hierarchy:
Foreign currency forward US $328.8 2018 –2020 1.26 Quoted bid prices in the active market. contracts, net sale
Cross currency interest rate US $236.6 2018 1.34 Quoted bid prices in the active market. exchange agreements
Level 2 fair value hierarchy:
Natural gas financial swaps –AECO – 2018 –2020 – Discounted cash flow – Future cash flows are estimated based on forward market prices (from observable yield curves at the end of the reporting period) applied to contract volumes, discounted at a rate that reflects the credit risk of various counterparties. Impact of sleeve transactions entered into in 2016 result in a notional amount and effective rate of $nil.
Equity derivative contracts $16.9 2018 $12.52 Discounted cash flow – Future cash flows are estimated based on equity derivative contracts.
Heating oil, diesel and propane 70.06 USG(1) 2018 –2019 $0.67 - $1.83 Quoted bid prices for similar products in the wholesale purchase and sale active market. contracts, net sale – Energy Distribution
Electricity swaps – – 2018 – Discounted cash flow – Future cash flows are Energy Distribution estimated based on forward market prices (from observable yield curves at the end of the reporting period) applied to contract volumes, discounted at a rate that reflects the credit risk of various counterparties. Impact of sleeve transactions entered into in 2016 result in a notional amount and effective rate of nil.
(1) Millions of United States gallons (USG) purchased.
Valuation techniques and significant unobservable inputs
Financial Instrument Valuation Technique Significant Unobservable Inputs Sensitivity of Input to Fair Value
Debenture – Black-Scholes model Volatility – 28.34% The estimated fair value would embedded (2016 – 27.90%) increase (decrease) if: derivative Volatility decreased (increased)

Superior Plus Corp. 2017 Annual Report82
The changes in the fair value of Superior’s Level 3 financial instruments for the years ended December 31, 2017 and 2016 are as follows:
Fixed Price Debenture Electricity - Embedded PurchaseDescription Derivative Agreements Total
Balance at December 31, 2015 (2.4) (6.9) (9.3)
Unrealized gains (1) 6.3 6.9 13.2
Balance at December 31, 2016 3.9 – 3.9
Unrealized losses(1) (3.9) – (3.9)
Balance at December 31, 2017 – – –
(1) Recorded in “Unrealized gains (losses) on derivative financial instruments” through net income in the statement of net earnings and total comprehensive income.
Superior’s realized and unrealized financial instrument gains (losses) for the years ended December 31, 2017 and 2016 are as follows:
2017 2016
Realized Unrealized Realized UnrealizedDescription Gain (Loss) Gain (Loss) Gain (Loss) Gain (Loss)
Natural gas financial swaps – AECO – 0.4 (4.3) 21.3
Electricity swaps – Energy Distribution – – (1.8) –
Foreign currency forward contracts, net sale 0.8 27.5 (62.9) 86.1
Cross-currency interest rate swaps – (5.5) – (0.2)
Interest rate swaps – – 1.2 (1.2)
Equity derivative contracts 0.2 (0.9) (0.2) 3.1
Propane, WTI, butane, heating oil and diesel wholesale purchase and sale contracts – Energy Distribution 8.7 4.6 (9.3) 18.1
Fixed-price electricity purchase agreements – Specialty Chemicals (0.4) – (1.1) 6.9
Total gains (losses) on financial and non-financial derivatives 9.3 26.1 (78.4) 134.1
Foreign currency translation of borrowings – 5.5 – (0.8)
Change in fair value of debenture-embedded derivative – (3.9) – 6.3
Total gains (losses) 9.3 27.7 (78.4) 139.6
Total gains (losses) attributed to continuing operations 9.3 27.7 (74.8) 139.6
Total loss attributed to discontinued operations – – (3.6) –
Total gains (losses) 9.3 27.7 (78.4) 139.6
Realized gains or losses on financial and non-financial derivatives and foreign currency translation gains or losses on the revaluation of Canadian domiciled US denominated working capital have been classified on the statement of net earnings based on the underlying nature of the financial statement line item and/or the economic exposure being managed.

Superior Plus Corp. Notes to Consolidated Financial Statements 83
The following summarizes Superior’s classification and measurement of financial assets and liabilities:
Classification Measurement
Financial Assets
Cash Loans and receivables Amortized cost
Trade and other receivables Loans and receivables Amortized cost
Derivative assets FVTPL Fair Value
Notes and finance lease receivable Loans and receivables Amortized cost
Financial liabilities
Trade and other payables Other liabilities Amortized cost
Dividends and interest payable Other liabilities Amortized cost
Borrowing Other liabilities Amortized cost
Convertible unsecured subordinated debentures (1) Other liabilities Amortized cost
Derivative liabilities FVTPL Fair Value
(1) Except for derivatives embedded in the related financial instruments that are classified as FVTPL and measured at fair value.
Non-Derivative Financial Instruments
The fair value of Superior’s trade and other receivables, notes and finance lease receivables, trade and other payables, and dividends and interest payable approximates their carrying value due to the short-term nature of these amounts. The carrying value and the fair value of Superior’s borrowing and debentures is provided in Notes 16 and 18.
Financial Instruments – Risk Management
Market Risk
Derivative and non-financial derivatives are used by Superior to manage its exposure to fluctuations in foreign currency exchange rates, interest rates and commodity prices. Superior assesses the inherent risks of these instruments by grouping financial and non-financial derivatives according to the exposures these instruments mitigate. Superior’s policy is not to use derivative or non-financial derivative instruments for speculative purposes. Superior does not formally designate its derivatives as hedges and, as a result, Superior does not apply hedge accounting and is required to designate its derivatives and non-financial derivatives as held-for-trading.
At the time Superior Energy Management (SEM) was divested the Company entered into financial swaps to offset any financial swaps that could not be transferred to the buyer. As a result the Energy Distribution segment has nominal exposure to any losses or gains related to the remaining natural gas and electricity financial swaps.
Energy Distribution enters into various propane forward purchase and sale agreements to manage the economic exposure of its wholesale customer supply contracts. Energy Distribution monitors its fixed-price propane positions on a daily basis to monitor compliance with established risk management policies. Energy Distribution maintains a substantially balanced fixed-price propane position in relation to its wholesale customer supply commitments.
Superior, on behalf of its operating divisions, enters into foreign currency forward contracts to manage the economic exposure of its operations to movements in foreign currency exchange rates. Energy Distribution contracts a portion of its fixed-price natural gas, and propane purchases and sales in U.S. dollars and enters into forward U.S. dollar purchase contracts to create an effective Canadian dollar fixed-price purchase cost. Superior Plus enters into U.S. dollar forward sales contracts on an ongoing basis to mitigate the impact of foreign exchange fluctuations on sales margins on production from its Canadian plants that is sold in U.S. dollars. Interest expense on Superior’s U.S. dollar debt is also used to mitigate the impact of foreign exchange fluctuations.
Superior has interest rate swaps with four counterparties to manage the interest rate mix of its debt portfolio and related overall cost of borrowing. Superior manages its overall liquidity risk in relation to its general funding requirements by utilizing a mix of short-term and longer-term debt instruments. Superior reviews its mix of short-term and longer-term debt instruments on an ongoing basis to ensure it is able to meet its liquidity requirements.

Superior Plus Corp. 2017 Annual Report84
Credit Risk
Superior utilizes a variety of counterparties in relation to its derivative and non-financial derivative instruments in order to mitigate its counterparty risk. Superior assesses the credit-worthiness of its significant counterparties at the inception and throughout the term of a contract. Superior is also exposed to customer credit risk. Energy Distribution deals with a large number of small customers, thereby reducing this risk. Specialty Chemicals, due to the nature of its operations, sells its products to a relatively small number of customers. Specialty Chemicals mitigates its customer credit risk by actively monitoring the overall credit-worthiness of its customers. Energy Distribution has minimal exposure to customer credit risk as local natural gas and electricity distribution utilities have been mandated, for a nominal fee, to provide Energy Distribution with invoicing, collection and the assumption of bad debt risk for residential customers. Energy Distribution actively monitors the credit-worthiness of its commercial customers. Overall, Superior’s credit quality is enhanced by its portfolio of customers, which is diversified across geographical (primarily Canada and the United States) and end-use (primarily commercial, residential and industrial) markets.
Allowances for doubtful accounts and past due receivables are reviewed by Superior at each balance sheet date. Superior updates its estimate of the allowance for doubtful accounts based on the evaluation of the recoverability of trade receivables with each customer, taking into account historical collection trends of past due accounts and current economic conditions. Trade receivables are written-off once it is determined they are uncollectible.
Liquidity Risk
Liquidity risk is the risk that Superior cannot meet a demand for cash or fund an obligation as it comes due. Liquidity risk also includes the risk of not being able to liquidate assets in a timely manner at a reasonable price.
To ensure it is able to react to contingencies and investment opportunities quickly, Superior maintains sources of liquidity at the corporate and subsidiary levels. The main sources of liquidity are cash and other financial assets, the undrawn committed revolving-term bank credit facility, equity markets and debenture markets.
Superior is subject to the risks associated with debt financing, including the ability to refinance indebtedness at maturity. Superior believes these risks are mitigated through the use of long-term debt secured by high-quality assets, maintaining debt levels that in management’s opinion are appropriate, and by diversifying maturities over an extended period. Superior also seeks to include in its agreements terms that protect it from liquidity issues of counterparties that might otherwise affect liquidity.
Equity Price Risk
Equity price risk is the risk of volatility in earnings as a result of volatility in Superior’s share price. Superior has equity price risk exposure to shares that it issues under various forms of share-based compensation programs, which affect earnings when outstanding units are revalued at each reporting period. Superior uses equity derivatives to manage volatility derived from its share-based compensation program.
As at December 31, 2017, Superior estimates that a 10% increase in its share price would have resulted in a $1.4 million increase in earnings due to the revaluation of equity derivative contracts.
Superior’s contractual obligations associated with its financial liabilities as at December 31, 2017 are as follows:
2023 and 2018 2019 2020 2021 2022 thereafter Total
Borrowing 28.7 20.6 12.8 8.1 590.5 402.7 1,063.4
US $ foreign currency forward sales contracts 166.1 107.7 37.0 18.0 – – 328.8
Natural gas, butane, propane, heating oil and diesel purchases 49.3 41.9 2.7 – – – 93.9
Superior’s contractual obligations are considered normal-course operating commitments and do not include the impact of mark-to-market fair values on financial and non-financial derivatives. Superior expects to fund these obligations through a combination of cash flow from operations, proceeds on its revolving term bank credit facilities and proceeds on the issuance of share capital.

Superior Plus Corp. Notes to Consolidated Financial Statements 85
Superior’s financial instruments’ sensitivities to changes in foreign currency exchange rates, interest rates and various commodity prices and the resulting impact to net earnings are detailed below:
2017
Decrease to net earnings of a $0.01 increase in the CDN $ to the US $ (3.7)
Decrease to net earnings of a 0.5% increase in interest rates (0.5)
Increase to net earnings of a $0.04/litre increase in the price of heating oil (0.6)
Increase to net earnings of a $0.04/litre increase in the price of propane 9.5
The calculation of Superior’s sensitivity to changes in foreign currency exchange rates, interest rates and various commodity prices represent the change in fair value of the financial instrument without consideration of the value of the underlying variable, such as the underlying customer contracts. The recognition of the sensitivities identified above would have affected Superior’s unrealized gain or loss on financial instruments and would not have had a material impact on Superior’s cash flow from operations.
21. Income Taxes
Consistent with prior periods, Superior recognizes a provision for income taxes for its subsidiaries that are subject to current and deferred income taxes, including United States income tax, United States non-resident withholding tax, Luxembourg income tax, and Chilean income tax.
Total income taxes are different from the amount computed by applying the corporate Canadian federal-provincial enacted statutory rate for 2017 of 26.86% (2016 – 26.9%). The statutory rates reflect previously enacted provincial tax rate increases. The reasons for these differences are as follows:
2017 2016
Net (loss) earnings from continuing operations (27.9) 114.2
Income tax expense from continuing operations 143.7 36.9
Net earnings from continuing operations before taxes 115.8 151.1
Computed income tax expense 31.1 40.6
Changes in effective foreign tax rates 1.0 (0.9)
Changes in future income tax rates(1) (4.6) 0.2
Non-deductible costs and other (1.9) (8.1)
Prior-period adjustment 1.0 4.8
De-recognition of a previously recognized liability (0.2) (15.2)
Impact from sale/use of consolidation losses from discontinued operations – 15.3
Settlement of corporate conversion transaction 119.4 –
Other (2.1) 0.2
Income tax expense from continuing operations 143.7 36.9
Income tax expense from continuing operations 143.7 36.9
Income tax expense from discontinued operations – 10.7
Total income tax expense 143.7 47.6
(1) $4.5 million relates to the revaluation of opening deferred tax assets and liabilities based on the recently enacted Tax Cuts and Jobs Act in the United States.

Superior Plus Corp. 2017 Annual Report86
Income tax expense for the years ended December 31, 2017 and 2016 is comprised of the following:
2017 2016
Current income tax expense
Current income tax charge 5.3 4.8
Adjustments in respect of previous year (2.0) 0.1
Total current income tax expense 3.3 4.9
Deferred income tax expense
Relating to origination and reversal of temporary difference 22.5 7.3
Relating to changes in tax rates or the imposition of new taxes(1) (4.6) 5.9
Adjustments in respect of previous year 3.1 4.7
Impact from sale of discontinued operations and other – 14.1
Impact of corporate conversion transaction 119.4 –
Total deferred income tax expense 140.4 32.0
Total income tax expense from continuing operations 143.7 36.9
Income tax recognized in other comprehensive income 2017 2016
Deferred tax
Income tax on amortization of actuarial gains and losses (1.0) (1.1)
Total income tax expense recognized in other comprehensive income (1.0) (1.1)
(1) $4.5 million relates to the revaluation of opening deferred tax assets and liabilities based on the recently enacted Tax Cuts and Jobs Act in the United States.
Deferred tax for the years ended December 31, 2017 and 2016 is comprised of the following:
(Credited) (Credited) Charged to Charged to Other Opening Net Earnings Comprehensive Exchange Closing2017 Balance (Continuing) Loss Acquisitions Differences Balance
Provisions 7.2 10.5 – 0.4 (0.1) 18.0
Finance leases 21.0 (1.7) – – (1.6) 17.7
Borrowing (2.0) 2.7 – – (0.1) 0.6
Financing fees 1.1 1.0 – – – 2.1
Investment tax credits 104.9 (40.5) – – – 64.4
Non-capital losses 63.0 (19.0) – – (5.4) 38.6
Property, plant and equipment (151.8) 3.6 – (22.6) 9.7 (161.1)
Reserves and employee benefits 16.8 2.2 (1.0) 0.1 (0.7) 17.4
Scientific research and development 168.1 (92.0) – – – 76.1
Unrealized foreign exchange gains (losses) 4.0 (7.4) – – (0.1) (3.5)
Other (0.5) 0.2 – – (0.1) (0.4)
Total 231.8 (140.4) (1.0) (22.1) 1.6 69.9

Superior Plus Corp. Notes to Consolidated Financial Statements 87
Deferred tax for the years ended December 31, 2017 and 2016 is comprised of the following:
(Credited) (Credited) Charged to (Credited) Charged to Other Charged to Opening Net Earnings Comprehensive Net Earnings Exchange Closing2016 Balance (Continuing) Loss (Discontinued) Differences Balance
Provisions 8.2 (0.8) – – (0.2) 7.2
Finance leases 29.8 (0.7) – (7.4) (0.7) 21.0
Borrowing (17.7) 16.2 – (0.4) (0.1) (2.0)
Financing fees 2.6 (1.5) – – – 1.1
Investment tax credits 106.0 (1.1) – – – 104.9
Non-capital losses 66.0 1.0 – (2.3) (1.7) 63.0
Property, plant and equipment (151.5) (9.2) – 6.0 2.9 (151.8)
Reserves and employee benefits 23.5 2.3 (1.1) (7.8) (0.1) 16.8
Scientific research and development 166.8 1.3 – – – 168.1
Unrealized foreign exchange gains (losses) 41.8 (37.9) – 0.1 – 4.0
Other 0.3 (1.5) – 1.1 (0.4) (0.5)
Total 275.8 (31.9) (1.1) (10.7) (0.3) 231.8
Deferred taxes reported in the two preceding tables are presented on a functional basis while deferred taxes reported on the balance sheet are on a legal-entity basis.
The net deferred income tax asset relates to the following tax jurisdictions as at December 31, 2017 and 2016:
2017 2016
Canada 86.4 252.4
United States (9.1) (12.2)
Chile (7.4) (8.4)
Total net deferred income tax asset 69.9 231.8
Superior has available to carry forward the following as at December 31, 2017 and 2016:
2017 2016
Canadian non-capital losses 4.5 62.2
Canadian scientific research expenditures 282.6 625.8
Canadian capital losses 4.8 541.2
United States non-capital losses 142.6 132.2
Canadian federal and provincial investment tax credits 88.2 145.7
As at December 31, 2017, Superior had non-capital loss carry-forwards available to reduce future years’ taxable income for Canada of $4.5 million and United States of $142.6 million, all due to expire beyond 2021.
The Canadian scientific research expenditures and the Canadian capital losses may be carried forward indefinitely. Management believes there will be sufficient taxable profits in the future to offset these losses.
In Chile, the local tax laws provide that any profits distributed outside of Chile be subject to a 35% tax.
As at December 31, 2017, Superior had Canadian federal and provincial investment tax credits available to reduce future years’ taxable income, which expire as follows:
2020 0.6
2021 18.6
2022 8.7
Thereafter 60.3
Total 88.2

Superior Plus Corp. 2017 Annual Report88
As at December 31, 2017 and 2016, Superior had the following balances in respect of which no deferred tax asset was recognized:
2017 2016
Canadian non-capital losses – 24.6
Canadian capital losses 4.8 541.2
Total unrecognized deferred income tax assets 4.8 565.8
Deferred tax assets have not been recognized for the above temporary differences as it is not probable that the respective entities to which they relate will generate sufficient future taxable income against which to utilize the temporary differences.
As announced on August 1, 2017, Superior entered into an agreement with the CRA regarding its objection to the tax consequences of Superior’s corporate conversion transaction, which occurred on December 31, 2008. Superior elected to enter into the agreement with the CRA to avoid further legal proceedings and allow management to focus on its Evolution 2020 strategic initiatives and enhance shareholder value. The agreement with the CRA will not give rise to any cash outlay by Superior for prior tax years. The payment of approximately $33 million to the CRA and related provincial agencies for 50% of the estimated tax liabilities for prior taxation years will be refunded, of which $31.3 million was received in the fourth quarter. The agreement with the CRA resulted in a non-cash charge of $119 million related to the write-off of a portion of Superior’s deferred tax assets. The tax pools affected by the agreement were revised at December 31, 2016 as follows:
Carry forward available 2016 2016 (restated)
Canadian non-capital losses(1) 62.2 14.3
Canadian scientific research expenditures 625.8 349.9
Canadian capital losses 541.2 6.6
Canadian federal and provincial investment tax credits(2) 145.7 92.2
(1) Expiring beyond 2019.
(2) $4.6 million expired in 2017, the remainder expires beyond 2020.
22. Total Equity
Superior is authorized to issue an unlimited number of common shares and an unlimited number of preferred shares. The holders of common shares are entitled to dividends if, as and when declared by the Board of Directors; to one vote per share at shareholders’ meetings; and upon liquidation, dissolution or winding up of Superior to receive pro rata the remaining property and assets of Superior, subject to the rights of any shares having priority over the common shares, of which none is outstanding.
Preferred shares are issuable in series with each class of preferred share having such rights as the Board of Directors may determine. Holders of preferred shares are entitled, in priority over holders of common shares, to be paid ratably with holders of each other series of preferred shares the amount of accumulated dividends, if any, specified to be payable preferentially to the holders of such series upon liquidation, dissolution or winding up of Superior. Superior has no preferred shares outstanding.
Issued Number of Common Shares Total (Millions) Equity
Total equity, December 31, 2015 140.6 713.7
Net earnings – 294.6
Issuance of common shares through DRIP 2.2 22.8
Dividends declared to shareholders(1) – (102.5)
Total equity, December 31, 2016 142.8 928.6
Net earnings – (27.9)
Other comprehensive income – (21.9)
Dividends declared to shareholders(1) – (102.8)
Total equity, December 31, 2017 142.8 776.0
(1) Dividends to shareholders are declared at the discretion of Superior’s Board of Directors. During the year ended December 31, 2017, Superior paid cash dividends of $102.8 million or $0.72 per share (2016 – $102.5 million or $0.72 per share) and made distributions through its dividend reinvestment program (DRIP) of nil (2016 – $22.8).

Superior Plus Corp. Notes to Consolidated Financial Statements 89
Accumulated other comprehensive income as at December 31, 2017 and 2016 consisted of the following components:
2017 2016
Accumulated other comprehensive income
Currency translation adjustment
Balance, beginning of the year 123.6 126.5
Unrealized foreign currency losses on translation of foreign operations (24.7) (2.9)
Balance, end of the year 98.9 123.6
Actuarial defined benefits
Balance, beginning of the year (5.2) (8.1)
Actuarial defined benefit gains 3.8 4.0
Income tax expense on other comprehensive income (1.0) (1.1)
Balance, end of the year (2.4) (5.2)
Accumulated derivative losses (7.1) (7.1)
Accumulated other comprehensive income, end of the year 89.4 111.3
Other Capital DisclosureAdditional Capital Disclosure
Superior’s objectives when managing capital are: (i) to maintain a flexible capital structure to preserve its ability to meet its financial obligations, including potential obligations from acquisitions; and (ii) to safeguard its assets while maximizing the growth of its businesses and returns to its shareholders.
In the management of capital, Superior includes shareholders’ equity (excluding accumulated other comprehensive (loss) income), current and long-term borrowing, and convertible unsecured subordinated debentures. Superior manages its capital structure and makes adjustments in light of changes in economic conditions and the nature of the underlying assets. In order to maintain or adjust the capital structure, Superior may adjust the amount of dividends to shareholders, issue additional share capital, conduct additional borrowing or issue convertible unsecured subordinated debentures, or conduct new borrowing or issue convertible unsecured subordinated debentures with different characteristics.
Superior monitors its capital based on the ratio of senior debt outstanding to net earnings before interest, taxes, depreciation, amortization and other non-cash expenses (EBITDA), as defined by its revolving term credit facility, and the ratio of total debt outstanding to EBITDA. Superior’s reference to EBITDA as defined by its revolving term credit facility may be referred to as compliance EBITDA in its other public reports.
Superior is subject to various financial covenants in its credit facility agreements, including senior debt, total debt to EBITDA ratio and restricted payments tests, which are measured on a quarterly basis. As at December 31, 2017 and December 31, 2016 Superior was in compliance with all of its financial covenants.
Superior’s financial objectives and strategy related to managing its capital as described above remained unchanged from the prior year. Superior believes that its debt to EBITDA ratios are within reasonable limits, in light of Superior’s size, the nature of its businesses and its capital management objectives.
23. Deficit 2017 2016
Balance, beginning of the year (1,136.2) (1,328.3)
Net earnings (27.9) 294.6
Dividends declared (102.8) (102.5)
Balance, end of the year (1,266.9) (1,136.2)

Superior Plus Corp. 2017 Annual Report90
24. Supplemental Disclosure of Consolidated Statement of Total Comprehensive Income From Continuing Operations
Revenue is recognized at the fair value of consideration received or receivable when the significant risks and rewards of ownership have been transferred.
2017 2016
Revenues
Revenue from products 2,293.8 1,972.9
Revenue from the rendering of services 57.8 56.9
Rental revenue 25.7 22.6
Realized gains (losses) on derivative financial instruments 7.7 (28.7)
2,385.0 2,023.7
Cost of sales (includes products and services)
Cost of products and services (1,598.9) (1,305.5)
Restructuring costs – (0.8)
Depreciation included in cost of sales (52.3) (54.5)
Realized gains (losses) on derivative financial instruments 1.6 (6.5)
(1,649.6) (1,367.3)
Selling, distribution and administrative costs
Other selling, distribution and administrative costs (218.4) (195.6)
Restructuring, transaction and other costs (33.1) (27.7)
Employee future benefit expense (2.8) (3.0)
Employee costs (226.8) (235.7)
Vehicle operating costs (43.8) (40.2)
Facilities maintenance expense (4.7) (5.0)
Depreciation included in selling, distribution and administrative costs (51.0) (53.6)
Amortization of intangible assets (9.6) (5.0)
Net earnings from Canwest Propane 1.2 –
Gain on disposal of assets 1.1 0.3
Realized losses on long-term incentive program (LTIP) (0.9) (0.3)
Realized losses on the translation of U.S.-denominated net working capital (4.7) (1.5)
(593.5) (567.3)
Finance expense
Interest on borrowing (35.5) (21.8)
Interest on convertible unsecured subordinated debentures (5.1) (12.2)
Interest on obligations under finance leases (3.2) (2.8)
Unwinding of discount on debentures, borrowing and decommissioning liabilities (10.0) (7.4)
Realized losses on derivative financial instruments – (33.4)
(53.8) (77.6)
Unrealized gains on derivative financial instruments 27.7 139.6
Net earnings from continuing operations before income taxes 115.8 151.1
Income tax expense (143.7) (36.9)
Net (loss) earnings from continuing operations (27.9) 114.2

Superior Plus Corp. Notes to Consolidated Financial Statements 91
25. Net (Loss) Earnings per Share 2017 2016
Net earnings (loss) per share computation, basic, from continuing operations
Net (loss) earnings for the year (27.9) 114.2
Weighted average shares outstanding (millions) 142.8 142.1
Net (loss) earnings per share, basic $(0.20) $0.80
2017 2016
Net earnings (loss) per share computation, diluted, from continuing operations
Net (loss) earnings for the year (27.9) 115.8
Weighted average shares outstanding (millions) 142.8 147.9
Net (loss) earnings per share, diluted $(0.20) $0.78
2017 2016
Net earnings per share computation, basic, from discontinued operations
Net earnings for the year – 180.4
Weighted average shares outstanding (millions) – 142.1
Net earnings per share, basic – $1.27
2017 2016
Net earnings per share computation, diluted, from discontinued operations
Net earnings for the year – 182.0
Weighted average shares outstanding (millions) – 147.9
Net earnings per share, diluted – $1.23
26. Share-Based Compensation
Restricted and Performance Shares
Under Superior’s long-term incentive program, restricted shares (RSs), performance shares (PSs) and/or director shares (DSs) can be granted to directors, senior officers and employees of Superior. All three types of shares entitle the holder to receive cash compensation in relation to the value of a specified number of underlying notional shares. RSs vest evenly over three years from the grant date, except for RSs issued to directors which vest three years from the grant date. Payments are made on the anniversaries of the RSs to the holders entitled to receive them on the basis of a cash payment equal to the value of the underlying notional shares. PSs vest three years from the grant date and their notional value depends on Superior’s performance as compared to established benchmarks. DSs vest immediately on the grant date and payments are made to directors once they resign or retire based on the number of notional shares outstanding and the value of the shares on that date. Employee compensation expense for these plans is charged against net earnings or loss over the vesting period of the RSs, PSs, and DSs. The amount payable by Superior in respect of RSs, PSs and DSs changes as a result of dividends and share price movements. The fair value of all the RSs, PSs and DSs is equal to Superior’s common share market price and the divisional notional share price if related to a divisional plan. In the event of an employee termination, any unvested shares are forfeited on that date.
For the year ended December 31, 2017, total compensation expense related to RSs, PSs and DSs was $5.2 million (2016 – $8.0 million). Exercises during the year ended December 31, 2017 under the long-term incentive plan were completed at a weighted average price of $12.86 per share (2016 – $8.98 per share) for RSs, and $12.61 per share (2016 – $9.39 per share) for PSs. For the year ended December 31, 2017, the total carrying amount of the liability related to RSs, PSs and DSs was $15.5 million (2016 – $15.1 million).

Superior Plus Corp. 2017 Annual Report92
The movement in the number of shares under the long-term incentive program was as follows:
2017 2016
RSs PSs DSs Total RSs PSs DSs Total
Opening number of shares 507,413 885,068 349,496 1,741,977 429,602 639,592 266,011 1,335,205
Granted 314,071 314,071 73,320 701,462 287,335 301,506 77,192 666,033
Performance factor adjustment − − − − − − − −
Dividends reinvested 35,034 66,415 21,830 123,279 37,847 62,800 18,611 119,258
Forfeited (44,725) − − (44,725) (57,070) (110,519) − (167,589)
Exercised (233,967) (284,619) − (518,586) (190,301) (8,311) (12,318) (210,930)
Ending number of shares 577,826 980,935 444,646 2,003,407 507,413 885,068 349,496 1,741,977
Superior entered into equity derivative contracts in order to manage the volatility and costs associated with its share-based compensation plans. As at December 31, 2017, Superior had outstanding notional values of $16.9 million of equity derivative contracts at an average share price of $12.52. See Note 20 for further details.
27. Supplemental Disclosure of Non-Cash Operating Working Capital Changes 2017 2016
Changes in non-cash working capital
Trade receivables and other (80.1) (17.3)
Inventories (43.5) (12.4)
Trade and other payables 72.2 18.2
Purchased working capital 9.1 −
Other, including foreign exchange (18.9) (23.6)
(61.2) (35.1)
Changes in non-cash operating working capital attributed to continuing operations (61.2) (38.5)
Changes in non-cash operating working capital attributed to discontinued operations − 3.4
(61.2) (35.1)
Convertible Borrowing Debentures (Note 16) (Note 18) Total
Changes in liabilities arising from financing activities
January 1, 2017 balance 439.0 89.8 528.8
Net proceeds (repayment) of revolving term bank credits and other debt 613.4 (97.0) 516.4
Non-cash finance expense 2.2 7.2 9.4
Deferred acquisition payments 5.0 − 5.0
Finance lease additions 24.9 − 24.9
Debt issue costs (7.2) − (7.2)
Other, including foreign exchange (24.5) − (24.5)
December 31, 2017 balance 1,052.8 − 1,052.8
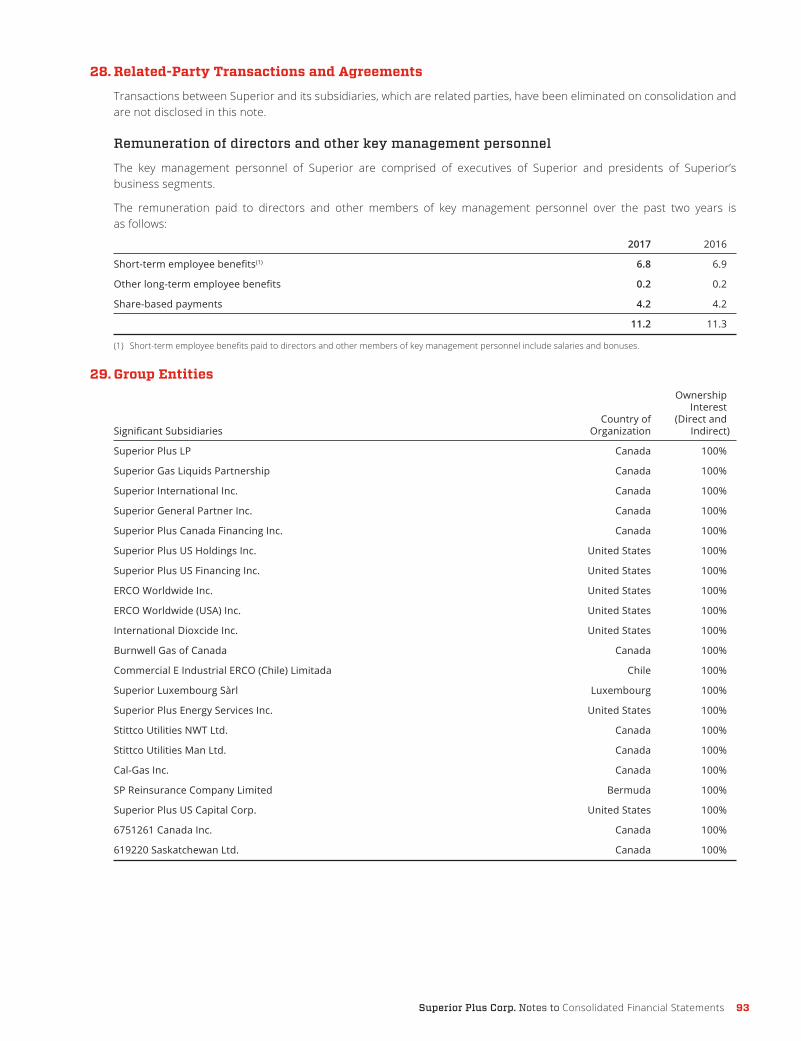
Superior Plus Corp. Notes to Consolidated Financial Statements 93
28. Related-Party Transactions and Agreements
Transactions between Superior and its subsidiaries, which are related parties, have been eliminated on consolidation and are not disclosed in this note.
Remuneration of directors and other key management personnel
The key management personnel of Superior are comprised of executives of Superior and presidents of Superior’s business segments.
The remuneration paid to directors and other members of key management personnel over the past two years is as follows:
2017 2016
Short-term employee benefits(1) 6.8 6.9
Other long-term employee benefits 0.2 0.2
Share-based payments 4.2 4.2
11.2 11.3
(1) Short-term employee benefits paid to directors and other members of key management personnel include salaries and bonuses.
29. Group Entities Ownership Interest Country of (Direct andSignificant Subsidiaries Organization Indirect)
Superior Plus LP Canada 100%
Superior Gas Liquids Partnership Canada 100%
Superior International Inc. Canada 100%
Superior General Partner Inc. Canada 100%
Superior Plus Canada Financing Inc. Canada 100%
Superior Plus US Holdings Inc. United States 100%
Superior Plus US Financing Inc. United States 100%
ERCO Worldwide Inc. United States 100%
ERCO Worldwide (USA) Inc. United States 100%
International Dioxcide Inc. United States 100%
Burnwell Gas of Canada Canada 100%
Commercial E Industrial ERCO (Chile) Limitada Chile 100%
Superior Luxembourg Sàrl Luxembourg 100%
Superior Plus Energy Services Inc. United States 100%
Stittco Utilities NWT Ltd. Canada 100%
Stittco Utilities Man Ltd. Canada 100%
Cal-Gas Inc. Canada 100%
SP Reinsurance Company Limited Bermuda 100%
Superior Plus US Capital Corp. United States 100%
6751261 Canada Inc. Canada 100%
619220 Saskatchewan Ltd. Canada 100%

Superior Plus Corp. 2017 Annual Report94
30. Reportable Segment Information
Superior operates two distinct businesses, being Energy Distribution and Specialty Chemicals. Superior’s Energy Distribution operating segment provides distribution, wholesale procurement and related services in relation to propane, heating oil and other refined fuels under the following: Canadian propane division and U.S. refined fuels division. Due to the nature of the product sold and methods of distribution, these divisions are aggregated under the Energy Distribution operating segment.
Specialty Chemicals is a leading supplier of sodium chlorate and technology to the pulp and paper industries and a regional supplier of potassium and chloralkali products in the U.S. Midwest.
Superior’s corporate office arranges intersegment foreign exchange contracts from time to time. Realized gains and losses pertaining to intersegment foreign exchange gains and losses are eliminated under the corporate cost column.
Superior’s Chief Operating Decision Maker, the President, reviews the operating results, assesses performance, and makes capital allocation decisions with respect to the Energy Distribution and Speciality Chemicals businesses and the corporate office. Therefore, Superior has presented these as operating segments for financial reporting purposes in accordance with IFRS 8 – Operating Segments.
All of Superior’s operating segments conduct business with customers of various sizes and do not rely extensively on any single customer for their revenue stream. Energy Distribution’s top ten customers account for approximately 9% of its revenues with its largest customer comprising approximately 4% of its revenues. Specialty Chemicals’ top ten customers account for approximately 58% of its revenues with its largest customer comprising approximately 9% of its revenues.
Total from Energy Specialty Continuing2017 Distribution Chemicals Corporate Operations
Revenue 1,748.1 636.4 0.5 2,385.0
Cost of sales (includes products and services) (1,233.2) (416.4) – (1,649.6)
Gross Profit 514.9 220.0 0.5 735.4
Expenses
Depreciation included in selling, distribution
and administrative costs (50.1) – (0.9) (51.0)
Amortization of intangible assets included in selling,
distribution and administrative costs (9.6) – – (9.6)
Selling, distribution and administrative costs (348.1) (146.4) (38.4) (532.9)
Finance expense (3.5) (0.7) (49.6) (53.8)
Unrealized gains on derivative financial instruments 5.0 – 22.7 27.7
(406.3) (147.1) (66.2) (619.6)
Net earnings (loss) before income taxes 108.6 72.9 (65.7) 115.8
Income tax expense – – (143.7) (143.7)
Net Earnings (Loss) 108.6 72.9 (209.4) (27.9)

Superior Plus Corp. Notes to Consolidated Financial Statements 95
Total From Energy Specialty Continuing2016 Distribution Chemicals Corporate Operations
Revenue 1,446.1 577.6 – 2,023.7
Cost of sales (includes product and services) (957.0) (410.3) – (1,367.3)
Gross Profit 489.1 167.3 – 656.4
Expenses
Depreciation included in selling, distribution and
administrative costs (53.3) – (0.2) (53.5)
Amortization of intangible assets (4.9) – (0.1) (5.0)
Selling, distribution and administrative costs(1) (324.0) (143.2) (41.6) (508.8)
Finance expense (2.9) (0.4) (74.3) (77.6)
Unrealized gains on derivative financial instruments 39.4 7.0 93.2 139.6
(345.7) (136.6) (23.0) (505.3)
Net earnings (loss) before income taxes 143.4 30.7 (23.0) 151.1
Income tax expense – – (36.9) (36.9)
Net Earnings (Loss) 143.4 30.7 (59.9) 114.2
Net Working Capital, Total Assets, Total Liabilities, Acquisitions and Purchase of Property, Plant and Equipment Total from Energy Specialty Discontinued Distribution Chemicals Corporate Total Operations
As at December 31, 2017
Net working capital(1) 88.4 54.3 (27.0) 115.7 –
Total assets 1,529.5 682.5 124.7 2,336.7 –
Total liabilities 387.4 201.0 972.3 1,560.7 –
As at December 31, 2016
Net working capital(1) 63.7 53.8 (2.8) 114.7 (2.6)
Total assets 696.5 662.5 488.2 1,847.2 0.3
Total liabilities 276.7 170.3 469.0 916.0 2.9
For the year ended December 31, 2017
Purchase of property, plant and equipment 47.3 28.9 0.8 77.0 N/A
For the year ended December 31, 2016
Purchase of property, plant and equipment 48.6 36.1 0.4 85.1 N/A
(1) Net working capital reflects amounts at year-end and is comprised of trade and other receivables, prepaid expenses and inventories, less trade and other accounts payable, deferred revenue and dividends and interest payable.

Superior Plus Corp. 2017 Annual Report96
United Total Canada States Other Consolidated
Revenue for the year ended December 31, 2017
from continuing operations 948.3 1,335.6 101.1 2,385.0
Property, plant and equipment as at December 31, 2017 608.7 423.1 45.3 1,077.1
Intangible assets as at December 31, 2017 39.8 45.5 – 85.3
Goodwill as at December 31, 2017 479.1 25.4 – 504.5
Total assets held by continuing operations
as at December 31, 2017 1,562.4 720.7 53.6 2,336.7
Revenue from continuing operations for the year
ended December 31, 2016 704.4 1,217.1 102.2 2,023.7
Revenue from discontinued operations for the year
ended December 31, 2016 201.3 434.8 – 636.1
Property, plant and equipment as at December 31, 2016 458.7 428.9 46.1 933.7
Intangible assets as at December 31, 2016 19.6 12.4 – 32.0
Goodwill as at December 31, 2016 191.5 7.7 – 199.2
Total assets held by continuing operations
as at December 31, 2016 1,202.9 590.1 54.2 1,847.2
Total assets held by discontinued operations
as at December 31, 2016 0.3 – – 0.3
31. Subsequent Events
On February 1, 2018, Superior LP closed a private placement of CDN $220 million in senior unsecured notes bearing interest at 5.125% and due August 27, 2025. The net proceeds reduced the outstanding balance under Superior’s revolving credit facility. Superior expects to use the revolving credit facility to redeem $200 million of its outstanding 6.5% senior unsecured debentures due December 9, 2021.
On February 2, 2018, Superior closed the acquisition of the propane distribution assets of Hi-Grade Oil, an independent propane and distillate fuel distributor in Ohio.
Subsequent to the year end, Superior signed agreements with two third parties to sell the propane assets required by the consent agreement entered into with the Government of Canada’s Competition Bureau (Competition Bureau) as part of the Canwest acquisition. Both transactions are subject to approval by the Competition Bureau and other customary closing conditions.

97Superior Plus Corp. Selected Historical Information
Energy Distribution Years Ended December 31(millions of dollars except where noted) 2017 2016 2015 2014 2013
Canadian propane distribution sales volumes (millions of litres sold)(1) 1,695 1,335 1,467 1,512 1,513
U.S. refined fuels sales volumes (millions of litres sold) 1,337 1,469 1,563 1,571 1,633
Average Canadian propane distribution sales margin (cents per litre) 18.7 22.4 21.7 20.1 18.8
Average U.S. refined fuels sales margin (cents per litre) 12.6 10.9 11.2 10.0 8.0
Gross profit (2) 514.9 489.0 505.4 502.7 446.1
EBITDA from operations(2)(3) 180.4 167.4 166.3 170.2 128.2
Specialty Chemicals Years Ended December 31(millions of dollars except where noted) 2017 2016 2015 2014 2013
Total chemical sales volume (MT) 851 813 851 910 826
Average chemical selling price (dollars per MT) 742 741 792 739 704
Adjusted Gross profit(4) 267.6 247.2 275.6 270.5 233.9
EBITDA from operations(3) 126.4 109.1 117.4 123.6 112.2
Superior Plus Corp. Consolidated Years Ended December 31(dollar per basic share except shares outstanding) 2017 2016 2015 2014 2013
Revenues(6) 2,385.0 2,023.7 2,253.1 2,996.6 2,790.5
Gross profit(6) 735.4 656.4 658.2 710.1 655.2
EBITDA from operations(2)(3)(5) 306.8 276.5 331.6 329.8 272.8
AOCF before transaction and other costs(2)(3)(5) 250.5 189.8 213.6 242.6 199.8
AOCF(2)(3)(5) 217.4 139.6 203.6 231.3 184.5
AOCF per share before transaction and other costs(2)(3)(5) $1.75 $1.34 $1.65 $1.92 $1.62
AOCF per share(2)(3)(5) $1.52 $0.98 $1.58 $1.83 $1.50
Weighted average shares outstanding (millions) 142.8 142.1 129.0 126.2 123.1
Total assets 2,336.7 1,847.5 2,142.9 2,114.9 2,141.1
Senior debt(7) 1,063.4 444.7 425.6 333.2 578.7
Total debt(7) 1,063.4 541.7 872.6 1,027.4 1,073.2
(1) Includes external sales volumes of the supply portfolio management division, which was previously reported as a separate division of Energy Distribution. Comparative figures have been reclassified to reflect the current period presentation.
(2) Financial results exclude the results of the Fixed-price energy services business as substantially all assets were divested during Q1 2016. Comparative figures have been reclassified to reflect the current period presentation.
(3) Adjusted EBITDA from operations and AOCF are non-GAAP financial measures. See “Non-GAAP Financial Measures”.
(4) 2015 and prior periods were restated to reflect a reclassification of certain costs between selling, distribution and administrative costs and cost of sales. For further detail, see “Reclassification of Prior Periods” in the 2016 Annual Report.
(5) In the prior year, Superior divested its Construction Products Distribution (CPD) business, which distributed drywall, insulation, framing and other construction products mainly in Canada and the United States. Accordingly, the 2016 results financial information has been restated to exclude the results of operations of CPD. 2015 results and prior include the results of CPD.
(6) As a result of the divestiture of the Fixed-price energy services business during Q1 2016, and CPD as of August 9, 2016, amounts have been restated for 2016 to exclude the results of those businesses. Results for 2015 and prior include the results of CPD and exclude the results of the Fixed price energy services business.
(7) Senior debt and total debt are stated before deferred issuance costs.
Selected Historical Information

Superior Plus Corp. 2017 Annual Report98
Corporate Information
Board of Directors Corporate Officers and Senior Management
Catherine (Kay) M. BestCalgary, Alberta
Eugene V.N. BissellGladwyne, Pennsylvania
Richard BradeenMontreal West, Québec
Luc DesjardinsPresident and Chief Executive OfficerToronto, Ontario
Randall J. FindlayCalgary, Alberta
Patrick (Pat) E. GottschalkPhiladelphia, Pennsylvania
Douglas HarrisonBurlington, Ontario
Mary JordanVancouver, British Columbia
Walentin (Val) MiroshCalgary, Alberta
David P. SmithChairmanCalgary, Alberta
Ed BechbergerPresident, Specialty Chemicals
Luc DesjardinsPresident and Chief Executive Officer
Rob DorranVice President, Investor Relations and Treasurer
John EngelenVice President, Mergers and Acquisitions
Julien HouleVice President, Human Resources
Darren HribarSenior Vice President and Chief Legal Officer
Harry KanwarVice President, Risk and Compliance
Greg L. McCamusPresident, Energy Distribution and Superior Propane
Inder MinhasVice President, Finance
Andy PeytonPresident, U.S. Refined Fuels
Erin SeamanVice President, Tax
Beth SummersExecutive Vice President and Chief Financial Officer
Shawn VammenSenior Vice President, Superior Gas Liquids

2017 2016
Period High Low Volume High Low Volume
First quarter $�13.24 $�12.22 20,630,167 $�10.99 $�8.42 27,391,080
Second quarter $�13.34 $�11.22 19,746,744 $�11.75 $�8.78 24,870,310
Third quarter $�12.78 $�10.80 16,776,889 $�12.20 $�10.56 26,194,690
Fourth quarter $�13.13 $�11.67 13,566,359 $�12.95 $�11.14 19,942,850
Year $�13.34 $�10.80 70,720,159 $�12.95 $�8.42 98,398,930
Prod
uced
by
Mer
lin E
dge
Inc.
ww
w.m
erlin
edge
.com
Prin
ted
in C
anad
a
Businesses and Shareholder Information
Superior Plus Corp.
401, 200 Wellington Street West Toronto, Ontario M5V 3C7
Telephone: 416-345-8050 Facsimile: 416-340-6030 Toll Free: 1-866-490-PLUS (7587)
[email protected] www.superiorplus.com
Energy Distribution
Canadian Propane Distribution
Superior Propane 6750 Century Avenue Suite 400 Mississauga, Ontario L5N 2V8
Toll-free: 1-877-341-7500 Fax: 1-877-730-5575
Superior Gas Liquids 840 – 7 Avenue SW Suite 1400 Calgary, Alberta T2P 3G2
Toll-free: 1-888-849-3525 Fax: 403-283-6589
U.S. Refined Fuels
Superior Energy Services
1870 South Winton Road Suite 200 Rochester, New York 14618
Toll-free: 1-877-927-6488 Fax: 585-328-7114
Specialty Chemicals
ERCO Worldwide
302 The East Mall Suite 200 Toronto, Ontario M9B 6C7
Tel: 416-239-7111 Fax: 416-239-0235
Trustee and Transfer Agent
Computershare Trust Company of Canada
Suite 600, 530 – 8 Avenue SW Calgary, Alberta T2P 3S8
or:
Suite 800, 100 University Avenue Toronto, Ontario M5J 2Y1
Toll Free: 1-800-564-6253 Website: www.computershare.com/ca
Auditors
Deloitte LLP
Chartered Professional Accountants, Chartered Accountants
8 Adelaide Street West, Suite 200 Toronto, Ontario M5H 0A9
Annual and Special Meeting of Shareholders
The Corporation’s Annual and Special Meeting of shareholders will be held at the TMX Broadcast Centre, The Exchange Tower, 130 King Street West, Toronto, Ontario, Canada on Tuesday, May 8, 2018 at 4:00 p.m. (EDT).
Toronto Stock Exchange (TSX) Listings
SPB: Superior Plus Corp. shares
Superior Plus Share Price and Volumes – TSX
Quarterly high, low, close and volumes for 2017 and 2016. The table below sets forth the high and low prices, as well as the volumes, for the shares as traded on the TSX, on a quarterly basis.

Superior Plus Corp.401, 200 Wellington Street West, Toronto, Ontario M5V 3C7
Tel: 416-345-8050 Fax: 416-340-6030 Toll-Free: 1-866-490-PLUS (7587)
For more information send your enquiries to: [email protected]
www.superiorplus.com
Related Documents