PRIMARY RESEARCH PAPER Twenty-three-year timeline of ecological stable states and regime shifts in upper Amazon oxbow lakes John W. Terborgh . Lisa C. Davenport . Alana U. Belcon . Gabriel Katul . Jennifer J. Swenson . Sherilyn C. Fritz . Paul A. Baker Received: 6 March 2017 / Revised: 16 September 2017 / Accepted: 18 September 2017 Ó Springer International Publishing AG 2017 Abstract Regime shifts in shallow lakes are often associated with anthropogenic impacts, such as land- use change, non-point source nutrient loading, and overfishing. These shifts have mostly been examined in lakes in temperate and boreal regions and within anthropogenically disturbed basins. Here, it is demon- strated that tropical floodplain lakes in a region of virtually no human disturbance naturally undergo frequent regime shifts. We demonstrate this using satellite imagery to provide a 23-year time series of 22-oxbow lakes or ‘‘cochas’’ along 300 km of the Manu River in SE Peru ´ . In any year, a majority of these lakes is in a macrophyte-free, phytoplankton-domi- nated state. However, over the 23 years covered by images, roughly a third of the lakes experienced abrupt shifts to a floating macrophyte state. Macrophyte cover persisted for B 3 year. Analysis of water level fluctuations sampled on a subset of the lakes for 1 year suggests that lake isolation from streams and the main river facilitates regime shifts. Multiple forcing factors, both internal and external to the lakes themselves, could drive the observed regime shifts, but insufficient data exist from this remote region to identify the key processes. Keywords Amazon Floodplain lakes Peru ´ Lake hydrology Regime shifts Remote sensing Introduction Since catastrophe theory was first introduced in the 1970s (Zeeman, 1977), equilibria and bifurcation analysis has permeated numerous ecological fields. Regime shifts in shallow lakes provide an important application of this theory and have been a topic of growing interest in recent decades (Richey et al., 1989; Izaguirre et al., 2004; Scheffer, 2004; Scheffer & Jeppesen, 2007; Scheffer et al., 2012). Here we shall be concerned with shifts between phytoplankton and Electronic supplementary material The online version of this article (doi:10.1007/s10750-017-3384-z) contains supple- mentary material, which is available to authorized users. Handling editor: Mariana Meerhoff J. W. Terborgh (&) L. C. Davenport A. U. Belcon G. Katul J. J. Swenson P. A. Baker Nicholas School of the Environment, Duke University, Durham, NC 27708, USA e-mail: [email protected] J. W. Terborgh L. C. Davenport Florida Museum of Natural History and Department of Biology, University of Florida, Gainesville, FL 32611, USA S. C. Fritz Department of Earth and Atmospheric Sciences and School of Biological Sciences, University of Nebraska– Lincoln, Lincoln 68588-0340, USA P. A. Baker Yachay Tech, Urcuqui, Ecuador 123 Hydrobiologia DOI 10.1007/s10750-017-3384-z

Welcome message from author
This document is posted to help you gain knowledge. Please leave a comment to let me know what you think about it! Share it to your friends and learn new things together.
Transcript

PRIMARY RESEARCH PAPER
Twenty-three-year timeline of ecological stable statesand regime shifts in upper Amazon oxbow lakes
John W. Terborgh . Lisa C. Davenport . Alana U. Belcon . Gabriel Katul .
Jennifer J. Swenson . Sherilyn C. Fritz . Paul A. Baker
Received: 6 March 2017 / Revised: 16 September 2017 / Accepted: 18 September 2017
� Springer International Publishing AG 2017
Abstract Regime shifts in shallow lakes are often
associated with anthropogenic impacts, such as land-
use change, non-point source nutrient loading, and
overfishing. These shifts have mostly been examined
in lakes in temperate and boreal regions and within
anthropogenically disturbed basins. Here, it is demon-
strated that tropical floodplain lakes in a region of
virtually no human disturbance naturally undergo
frequent regime shifts. We demonstrate this using
satellite imagery to provide a 23-year time series of
22-oxbow lakes or ‘‘cochas’’ along 300 km of the
Manu River in SE Peru. In any year, a majority of these
lakes is in a macrophyte-free, phytoplankton-domi-
nated state. However, over the 23 years covered by
images, roughly a third of the lakes experienced abrupt
shifts to a floating macrophyte state. Macrophyte
cover persisted for B 3 year. Analysis of water level
fluctuations sampled on a subset of the lakes for 1 year
suggests that lake isolation from streams and the main
river facilitates regime shifts. Multiple forcing factors,
both internal and external to the lakes themselves,
could drive the observed regime shifts, but insufficient
data exist from this remote region to identify the key
processes.
Keywords Amazon � Floodplain lakes � Peru � Lakehydrology � Regime shifts � Remote sensing
Introduction
Since catastrophe theory was first introduced in the
1970s (Zeeman, 1977), equilibria and bifurcation
analysis has permeated numerous ecological fields.
Regime shifts in shallow lakes provide an important
application of this theory and have been a topic of
growing interest in recent decades (Richey et al., 1989;
Izaguirre et al., 2004; Scheffer, 2004; Scheffer &
Jeppesen, 2007; Scheffer et al., 2012). Here we shall
be concerned with shifts between phytoplankton and
Electronic supplementary material The online version ofthis article (doi:10.1007/s10750-017-3384-z) contains supple-mentary material, which is available to authorized users.
Handling editor: Mariana Meerhoff
J. W. Terborgh (&) � L. C. Davenport �A. U. Belcon � G. Katul � J. J. Swenson � P. A. BakerNicholas School of the Environment, Duke University,
Durham, NC 27708, USA
e-mail: [email protected]
J. W. Terborgh � L. C. DavenportFlorida Museum of Natural History and Department of
Biology, University of Florida, Gainesville, FL 32611,
USA
S. C. Fritz
Department of Earth and Atmospheric Sciences and
School of Biological Sciences, University of Nebraska–
Lincoln, Lincoln 68588-0340, USA
P. A. Baker
Yachay Tech, Urcuqui, Ecuador
123
Hydrobiologia
DOI 10.1007/s10750-017-3384-z
macrophyte-dominated states in a series of tropical
floodplain lakes. Such lakes normally reside in a
steady state stabilized by positive feedback mecha-
nisms that maintain the system within a given range of
conditions (Ludwig et al., 1978; Scheffer & van Ness,
2007). Shifts from phytoplankton to macrophytes or
vice versa can occur as a response to a subtle drift in
endogenous conditions, such as the accumulation or
loss of nutrients, or to abrupt exogenous events such as
floods (Hilt et al., 2011; de Tezanos Pinto & O’Farrell,
2014). Many types of perturbations have been con-
firmed or suspected as triggers of regime shifts
(Scheffer et al., 2001), including changes in trophic
structure (Carpenter, 2003), nutrient pulses from
exogenous sources (Camargo and Esteves, 1995),
fluctuations in water level (Loverde-Oliveira et al.,
2009; O’Farrell et al., 2011), fish migrations (Bron-
mark et al., 2010; Mormul et al., 2012), internal
heterogeneity (Meerhoff et al., 2007), and grazing by
zooplankton (Lacerot et al., 2013) or arthropods
(Marshall & Junor, 1981). Interactions between
drivers can, in certain circumstances, produce highly
complex dynamics (Schooler et al., 2011).
Regime shifts are prototypical to anthropogenically
impacted basins in temperate and boreal regions,
where rapid decreases in water clarity (eutrophica-
tion), have been observed in association with land-use
change, increased nutrient loading, and manipulation
of trophic structure (Carpenter, 2003). Despite the
extensive literature on regime shifts in shallow lakes,
few studies have documented natural regime shifts in
shallow lakes, largely because lakes free of human
influences are rare (Scheffer & Jeppesen, 2007). Here
we report on the occurrence of spontaneous regime
shifts in a set of floodplain (oxbow) lakes along the
Manu River in a protected and largely unpopulated
watershed at the base of the Andes in Peru.
The Manu River is a white-water, upper tributary of
the Amazon River and has its headwaters on the
Eastern Slope of the Andes. The Manu River water-
shed is entirely contained within the 1.9 M hectare
Manu National Park (Fig. 1) and encompasses an
elevational range from 300 m in the lowlands
to[ 4,000 m in the Andes. Fewer than 2,000 indige-
nous inhabitants live in the watershed, or about 0.1 per
km2. There are no roads within the lowland sector of
the park, the only access being by boat.
The Manu River basin contains approximately 33
lakes within a floodplain that ranges from 2 to more
than 8 km wide (Fig. 1). One of these lakes, Cocha
Cashu, has been the site of a research station since
1969 and thus provides a long-term perspective on the
stability of lake states. Cocha Cashu is 2.5 km long
and up to 150 m wide with a mean depth of about
1.4 m and amaximum depth of 2.1 m in the dry season
(June to October). From 1973 until 2003, the water
body was open and supported a high concentration of
phytoplankton. In January 2003, the most extreme
flood in 40 years passed down the Manu River,
inundating the entire floodplain for several days. A
strong current scoured Cocha Cashu and replaced the
entire water body with floodwater, essentially runoff
from a torrential rain. There then ensued a series of
slow-motion transformations of lake state, from 2003
to 2008, beginning with a period of dominance by
submerged aquatic vegetation (SAV), followed by
2 years in which more than half of the lake surface was
covered by floating macrophytes, at first Pistia
stratiotes L., and later Oxycaryum cubense Poeppig
& Kunth (Lye). The lake did not return to a phyto-
plankton state until late 2008. During the years
following the flood, 2003–2008, Cocha Cashu thus
assumed 3 distinct states dominated, respectively, by
SAV (Najas spp.), floating macrophytes, and phyto-
plankton (Dent et al., 2002). It was the first-hand
experience of observing these transformations after
30 years of stability that inspired us to undertake the
present research.
We designed the research to address the following
questions: Do all the lakes of the Manu basin exhibit
distinct ecological states and abrupt shifts between
them? How often do these shifts occur? Are regime
shifts floodplain-wide phenomena? Can the tendency
to undergo regime changes be associated with a lake’s
physical features (area, depth and location in the
watershed and connectivity to the river)? We endeav-
ored to answer these questions by analyzing a 23-year
time series of Landsat images covering 22Manu River
floodplain lakes and visiting 27 lakes in 2012 to
document their physical state and vegetation.
Methods
Identification of regime shifts via remote sensing
Much of the Manu National Park lies within a single
Landsat scene (Row 4, Path 68; Landsat 5 and 7). We
Hydrobiologia
123

selected 22 lakes for analysis, beginning with the lake
farthest upstream and ending with the last lake above
the confluence of the Rio Pinquen, a major tributary of
the lower Manu. Several of the lakes farthest upstream
are remote and have not been named. The remaining
lakes are labeled by name as well as number, the
number referring to the lake’s position in the water-
shed (Table 1; Fig. 1). Only 4 of the lakes are
regularly fished by indigenous people (#’s 4, 9, 13,
29). The remaining lakes are unfished and support
naturally regulated populations of piscivores, includ-
ing giant otters, caimans, and birds.
As described above, Manu floodplain lakes can
assume 3 distinct states with respect to primary
producers: phytoplankton, submerged aquatic vegeta-
tion (SAV), and floating macrophytes. These states are
readily distinguished by eye (Fig. 2). Lakes in the
phytoplankton state have low transparency and may or
may not carry narrow fringes of floating vegetation on
the shallow side, but contain little SAV. The trans-
parency of lakes containing SAV is characteristically
much greater than that of phytoplankton-dominated
lakes. Floating macrophyte cover is conspicuous, both
to a ground observer and from space, and by shading
the water column, suppresses phytoplankton or SAV
development (Penuelas et al., 1993). Senescent lakes
become gradually shallower through time as river-
borne sediment accumulates, eventually becoming
carpeted by floating vegetation containing a diversity
of plants, including Azolla sp., Salvinia sp., grasses,
sedges, Polygonum sp., Ludwigia spp., ferns, orchids,
etc.
To evaluate lake states, we collected all available
images with less than 50% cloud cover over the
floodplain from archives of the United States Geolog-
ical Survey (USGS) and the Brazilian National
Institute for Space Research (INPE). This resulted in
a collection of 27 Landsat-5 images spanning 23 years
from 1986 to 2008. All images were radiometrically
and atmospherically corrected using the revised cal-
ibration procedures of Chander et al. (2009) and Dark
Object Subtraction (Song et al., 2001). To detect lake
surface vegetation, Bands 3 (Red), and 4 (Near
Infrared (NIR)) of the corrected images were then
used to create a Normalized Difference Vegetation
Index (NDVI) image, (NIR-Red)/(NIR ? Red)
Fig. 1 Map of the Manu River basin in Peru showing the locations of the 29 lakes listed in Table 1
Hydrobiologia
123

Table
1Locationsandfeaturesof29floodplain
lakes
intheManuRiver
basin,Madre
deDios,Peru
Lakenumber
andrankin
watershed
Lakenam
eLatitude/longitude
Area
(ha)
Connectivity
Shortest
distance
toriver
Mean
depth
(m)
Max
depth
(m)
NVDI
2012
No.observed
statechanges
Vegetation
observed
August–
September,2012
1Cocha1
11�360 2700 S
72o40 1600 W
9.8
I120
NM
NM
NM
0NM
2Cocha2
11�390 3300 S
71�510 4800 W
5.7
Ft
480
1.5
2.7
0.330
0FV
(fringing)
3Cocha3
11�390 2300 S
71�490 1
00 W0.4
I200
1.3
1.5
0.505
9FV
(scattered)
4CochaSophuapa
11�390 3000 S
71�480 9
00 W10.1
I/Ft
350
1.7
4.8
0.080
NM
Phytoplankton
5Cocha5
11�380 5500 S
71�470 4200 W
0.7
I425
0.8
0.8
0.475
2FV
(scattered)
6Cocha6
11�380 3000 S
71�450 3000 W
5.2
I400
0.8
1.2
0.347
0FV
(Pistia)
7CochaPirana
11�380 5200 S
71�410 3400 W
6.2
ND
600
NM
NM
0.239
3FV
(covering)
8CochaVieja
11�400 3200 S
71�400 3700 W
4.2
I/Ft
275
1.6
2.0
0.113
0FV
(scattered)
9CochaNuevaFelipe
11�410 4100 S
71�400 4600 W
20.2
I/Ft
350
0.9
2.0
0.090
NM
Phytoplankton
10
CochaGam
arota
11�490 2100 S
71�280 3100 W
15.4
I500
1.3
1.5
0.592
3FV
(covering)
11
CochaMaizal
11�510 5
00 S71�280 1200 W
27.1
I200
1.3
3.0
Clouds
0Phytoplankton
12
CochaSecreta
11�510 1400 S
71�270 5
00 W1.5
I550
0.4
0.4
Clouds
1FV
(water
lilies)
13
CochaNueva
11�510 3500 S
71�270 1400 W
13.5
I/Ft
320
0.9
2.0
Clouds
0Phytoplankton
14
CochaCashu
11�530 5
00 S71�240 3100 W
23.0
I450
1.4
2.1
0.135
2Phytoplankton
15
CochaTotora
11�520 3800 S
71�230 2100 W
3.5
I/Ft
1300
0.5
0.8
0.190
2FV
(scattered)
16
CochaGallareta
11�570 2200 S
71�180 6000 W
15.2
I1050
1.0
2.0
0.177
0SAV
17
CochaSalvadorcillo
11�590 3700 S
71�150 3700 W
16.7
Ft
475
1.4
2.4
0.150
0FV
(fringing)
18
CochaSalvador
11�590 4500 S
71�130 5700 W
77.8
I200
2.5
5.6
0.117
0Phytoplankton
19
CochaOtorongo
12�2
0 4000 S
71�110 2700 W
43.7
Ft
225
1.7
3.3
0.160
0FV
(fringing)
20
CochaSacarita
12�5
0 3400 S
71�8
0 3300 W
16.8
I1500
1.4
2.4
Clouds
5FV
(scattered)
21
CochaJuarez
12�7
0 500 S
71�5
0 5.0000 W
26.9
I450
1.1
2.2
0.034
0Phytoplankton
22
CochaGarza
12�8
0 2900 S
71�5
0 40.0000 W
10.5
ND
575
1.5
2.7
0.184
4FV
(scattered)
23
CochaLargarto
12�9
0 5400 S
71�2
0 1900 W
19.2
I475
1.0
2.1
0.010
0Phytoplankton
24
CochaBrasco
12�100 3
00 S71�0
0 3000 W
15.6
I800
1.6
3.7
0.054
0Phytoplankton
25
CochaTipisca
12�100 4100 S
70�590 1300 W
14.4
I1625
2.3
2.5
0.126
NM
Phytoplankton
26
CochaRomero
12�130 5000 S
70�570 4300 W
34.2
I650
NA
NA
NM
NM
FV
(covering)
27
CochaLim
onal
12�130 1800 S
70�570 9
00 W3.9
ND
250
1.1
2.4
NM
NM
Phytoplankton
28
CochaPana
12�140 5100 S
70�560 7
00 W5.8
I260
NM
NM
NM
NM
NM
29
CochadelosValles
12�150 3800 S
70�540 5900 W
36.0
Ft
100
1.6
3.2
Clouds
NM
FV
(fringing)
Iisolatedlake,
Ftflow-throughlake,
I/Ftisolatedarm
ofadual
lake(see
text),ND
statusnotdetermined,NM
notmeasured,FVfloatingvegetation
Hydrobiologia
123
(Rouse et al., 1973). We did not succeed in distin-
guishing SAV from phytoplankton lakes in the images
because the spatial resolution of the imagery proved to
be too coarse and the signal of subsurface vegetation
too weak to confidently differentiate between them.
Therefore, transitions between these states could not
be detected.
For estimates of lake area and NDVI, we used the
largest body of open water in a given lake, avoiding
vegetation, whether floating or fringing, unless the
lake was in a macrophyte-dominated state, in which
case, the NDVI measurement was taken from the
floating vegetation. In the case of dual lakes possess-
ing flow-through and isolated arms (see below for
explanation), measurements of area and NDVI were
taken of the arm with the largest area of open water, in
all cases, the dead (isolated) arm. Within each lake,
300 random points were sampled within the area of
open water and averaged to calculate a mean NDVI
and standard deviation for each date. In the smaller
lakes, individual pixels were sampled multiple times,
but this should not have affected the estimated mean
NDVI.
Regime Shifts
We based our initial detection of regime shifts on the
known historical record for Cocha Cashu (1973–2014)
compared with NDVI values calculated from the
Landsat imagery (Fig. 3). A regime shift from phyto-
plankton-dominated open water to cover by floating
macrophytes was determined to have occurred if the
NDVI value for the lake was C 0.3. This value
represents approximately the mid-point between the
highest values of NDVI (ca 0.15) observed for Cocha
Cashu in the phytoplankton state and the highest value
observed in the floating macrophyte state (0.53). We
chose the criterion realizing that threshold values
greater than 0.3 would risk underestimating transitions
to the floating macrophyte state and lower values
would risk overestimating them. The criterion
of C 0.3 is high enough to reduce potential error
caused by inadvertent inclusion of fringing vegetation
along lake margins. To allow for hysteresis, we
employed separate criteria for forward (NDVI C 0.3)
and backward (NDVI B 0.15) transitions between
phytoplankton and floating macrophyte states in the
chronoseries of images. Had we used a single criterion
for both forward and backward transitions, for exam-
ple, NDVI = 0.3, this would have led to serious
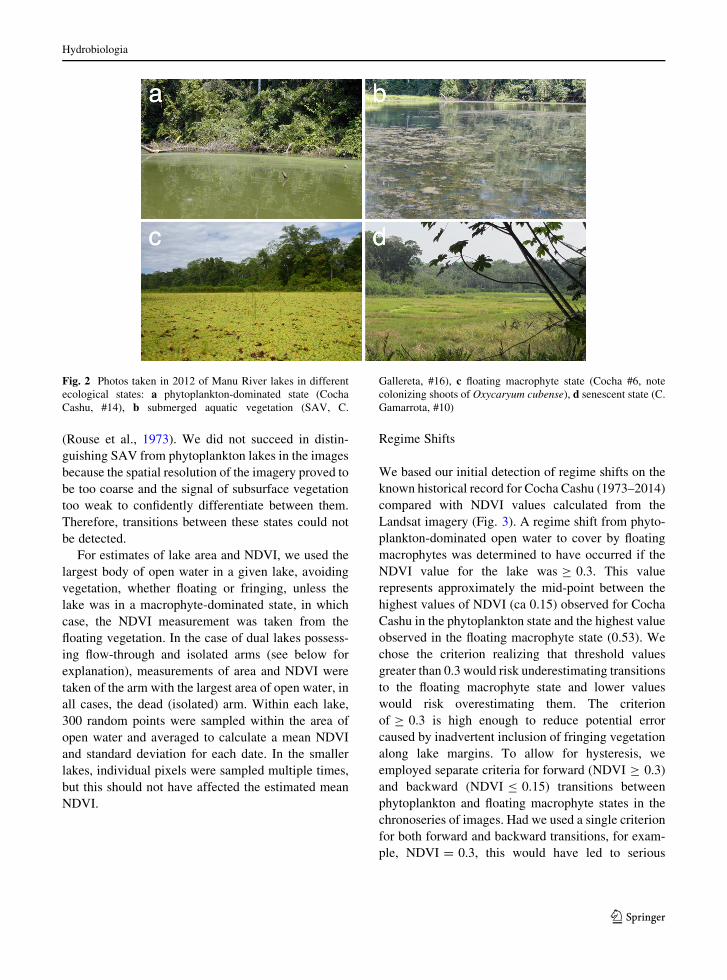
Fig. 2 Photos taken in 2012 of Manu River lakes in different
ecological states: a phytoplankton-dominated state (Cocha
Cashu, #14), b submerged aquatic vegetation (SAV, C.
Gallereta, #16), c floating macrophyte state (Cocha #6, note
colonizing shoots of Oxycaryum cubense), d senescent state (C.
Gamarrota, #10)
Hydrobiologia
123

overcounting of transitions in lakes where NDVI
values fluctuated around 0.3 in successive images.
Ground truth
Landsat imagery is capable of distinguishing vegeta-
tion from open water but lacks sufficient resolution to
identify the diversity of macrophyte-dominated veg-
etation types occurring in these lake ecosystems. To
assess lake states by visual inspection, we mounted an
expedition between July 16 and September 12, 2012 to
visit Manu River lakes. In all, we evaluated 27 lakes,
including 21 of the 22 lakes used in the image analysis.
The remaining lake (#1) was far upriver in an area
occupied by uncontacted tribes, so was not assessed.
At each lake visited, we took a series of photographs,
wrote a verbal account of its vegetation and general
setting, conducted a series of physical, chemical and
biological measurements (not reported here), and
identified the principal floating and submerged
macrophytes.
To evaluate the interpretation of the 1986–2008
Landsat images, we also analyzed Landsat 7 images
from August and September, 2012, which coincided in
time with the ground truth survey. Landsat 7 images
after 2003 (SLC-off) are banded so that the
information for roughly a quarter of each scene is
missing. Nevertheless, some portion of most Rıo
Manu lakes was included in resolved sections of the
image, allowing evaluation of NDVI for 20 lakes.
These images (from USGS) were corrected and
processed in the same manner as the historical dataset.
Analysis
To investigate whether the tendency of a lake to
undergo state changes could be related to any of the
measured variables listed in Table 1 (lake area,
distance to river, connectedness (isolated or flow-
through), mean depth, maximum depth, and NDVI in
August, 2012), we conducted a series of exploratory
univariate and multivariate analyses using linear
regression or ANOVA, as appropriate, with the
number of observed state changes for each lake as
the response variable (N = 22 lakes in most cases).
Hydrology of isolated versus flow-through lakes
Lakes that are entered by a stream are referred to here
as ‘‘flow-through’’ lakes to distinguish them from
‘‘isolated’’ lakes that are decoupled from the river by
its fringing levee except during occasional and brief
Fig. 3 NDVI values extracted from Landsat images of Cocha
Cashu (Lake #14) covering the period 1987 to 2012. The lake
was observed to be in a phytoplankton state except in 2006 to
2008 when it was covered by floating macrophytes. By
September, 2008, it had returned to the phytoplankton state
Hydrobiologia
123

periods of high water (Tejerina-Garro et al., 1998).
The constantly exiting flow creates a permanent
connection between flow-through lakes and the river.
Sediment-laden main-stem river water frequently
backs up into flow-through lakes but only infrequently
intrudes into isolated lakes (Davenport, 2008; Osorio
et al., 2011). The stream entering a flow-through lake
rapidly forms a plug of sediment at the point of entry.
The plug then often creates a dual lake by deflecting
the stream toward one end while leaving the other arm
in an isolated condition. We used satellite imagery
(Google Earth) and on the ground assessments (ver-
ification of incoming streams) to distinguish isolated
from flow-through lakes or lake arms.
To document the differences in annual flooding
regimes in isolated versus flow-through lakes, we
placed 6 Onset Hobo U20 Water Level loggers in 3
isolated lakes (Cashu, Gallareta and Salvador, #s14,
16 and 18, respectively) and 3 flow-through lakes
(Nueva, Otorongo, and Valles, #s 13, 19 and 29).
Loggers were deployed at depths between 0.5 and
1.0 m in September 2009 (dry season) by attaching
them to stakes driven deep into the lake bottom.
Loggers recorded hourly the height of water over the
sensor via static pressure measurements. An additional
U20 datalogger was placed under forest cover at
Cocha Cashu Biological station to maintain a record of
changes in air pressure throughout the year. Data were
retrieved after 1 y at the end of the 2010 dry season.
Water level estimates were corrected using the
Barometric Pressure Compensation assistant of Hobo-
ware Pro software (v. 3.7.2) for the period September
4, 2009 through November 7, 2010.
We analyzed the depth data to assess whether lake-
level fluctuations differed between isolated and flow-
through lakes. Because the lakes differed in size and
contributing sources of floodwater (affecting the
absolute size of excursions), the behavior of positive
excursions (or the probability density function positive
‘tail,’ denoted as dH) was explored for the normalized
water level (i.e., normalized to zero long-term mean
and unit variance for each lake). Normalization
standardizes the mean squared amplitude water level
excursions among lakes. Differences in hydrologic
regimes manifest themselves as differences in the
probability density function or autocorrelation func-
tion of the dH time series. Exceedance probability
(Exc) refers to the frequency of occurrence of values
exceeding a reference value. The choice of analyzing
pdf and Exc of dH instead of raw water level changes
is to minimize the effects of differences in rainfall
pattern, contributing area, and lake size.
Results
NDVI versus on-site observations in 2012
Table 1 lists Rıo Manu oxbow lakes in order of their
locations within the watershed along with depths,
NDVI values in 2012 from images of 20 cloud-free
lakes, and an on-site assessment of lake vegetation in
2012. Open water NDVI values of 14 phytoplankton-
or SAV-dominated lakes in 2012 fell in the range of
0.01–0.20. Several lakes with relatively low open
water NDVI values supported extensive floating
meadows, either in the shallows at the ends and/or
along the margins (e.g., #s 2, 8, 17, 19, 22). One lake
(#7) yielded an open water NDVI
value C 0.20,\ 0.30 and was heavily blanketed with
floating vegetation of various sorts, affirming the
conservative nature of our criterion of NDVI C 0.3 for
regime changes. Five lakes (#s 2, 3, 5, 6, 10) yielded
NDVI values C 0.3 in 2012. One of these is a flow-
through lake with broad fringing mats of floating
vegetation (#2), two are small, isolated lakes that were
observed to be partially covered by Pistia stratiotes L.
and other floating plants in 2012 (#s 3, 5), one was
completely covered by P. stratiotes (#6, see Fig. 2c)
and the fifth was in a senescent state (#10, see Fig. 2d).
Senescent lakes (#s 7, 10, 26 appear to be more or less
permanently covered by floating meadows that must
rise and fall with seasonal fluctuations in water level.
Regime shifts
NDVI values range from -1 to ?1, but all vegetation
produces positive values. Forest cover in the Manu
Basin ranged between 0.6 and 0.7 NDVI, whereas the
lake surfaces varied between small negative values
and?0.53. The observed carpeting of Cocha Cashu by
floating vegetation in 2006–2007 yielded values as
high as 0.53 NDVI, whereas NDVI values from
periods of SAV dominance fall within the range
yielded by open water (Fig. 3).
Using the conservative NDVI value of C 0.3 as a
minimum criterion for the floating macrophyte state
and, to allow for hysteresis, a value of B 0.15 for a
Hydrobiologia
123

return to the phytoplankton state, we identified floating
vegetation in one or more images in 9 lakes (Fig. 4),
which amounts to 41% of all lakes in the sample.
Three lakes exhibited NDVI values C 0.3 in 1990, 4
in 2004 and 7 in 2006/2007. Thirteen lakes did not
undergo a state change during the 23 years of obser-
vation. Three of the lakes that experienced state
changes are senescent lakes (#’s 3, 7, and 10) that have
been chronically covered by floating vegetation,
respectively, since 2006, 2004, and 1992. Three more
(#5, 12, 15) are small (0.4–3.5 ha), shallow
(0.5–1.5 m maximum depth) lakes that were partially
to largely covered by floating vegetation in 2012. The
remaining 3 (#14, 20, 22) are larger (10.5–24 ha),
deeper (2.1–2.7 m maximum depth) lakes that once or
twice in 23 years experienced brief episodes of
floating macrophyte dominance.
Four of the 22 lakes (#s 1, 2, 11, 17) exhibited
NDVI values of C 0.2 and\ 0.3 in one or more
images in the chronoseries, but never[ 0.3. Two of
these were flow-through lakes (#s 2, 17) that supported
dense mats of floating vegetation extending from the
margins toward the center and partially covering the
water body. The other two are phytoplankton lakes for
which the NDVI value exceeded 0.2 in only 2–4 out of
27 images. Overall, the record contains a total of 31
regime shifts, 18 in the upper 11 (#s1–13) lakes, and
13 in the lower 11 (#s 14–24).
Univariate and multivariate regression or ANOVA
analyses with lake area, distance to river, connected-
ness (isolated or flow-through), mean depth, maxi-
mum depth, and NDVI in August 2012 as explanatory
variables and the number of regime shifts as response
variable were all statistically negative except for one,
the 2012 NDVI value (P = 0.014, N = 17). However,
it is no surprise that the amount of floating vegetation
on a lake, as represented by NDVI, provides a
prediction of tendency to change states to the floating
macrophyte condition.
A recurrent pattern in the chronosequences was a
rapid appearance of floating vegetation, persistence
for one to 3 years, followed by a rapid return to the
phytoplankton state. NDVI values C 0.3 did not
persist for longer, with the exception of senescing
Fig. 4 NDVI values for 22 Manu River lakes over a 23-year
chronosequence extending from 1986 to 2008. Shading indi-
cates NDVI values C 0.3, the threshold value for distinguishing
the floating macrophyte state. ND indicates that the value was
not determined because of obscuring clouds. Lake numbers
given in top row. The corresponding names are listed in Table 1
Hydrobiologia
123
Lakes 3 and 10. Transitions were often rapid, raising,
or lowering NDVI values between\ 0.15 and[ 0.3
in less than a year.
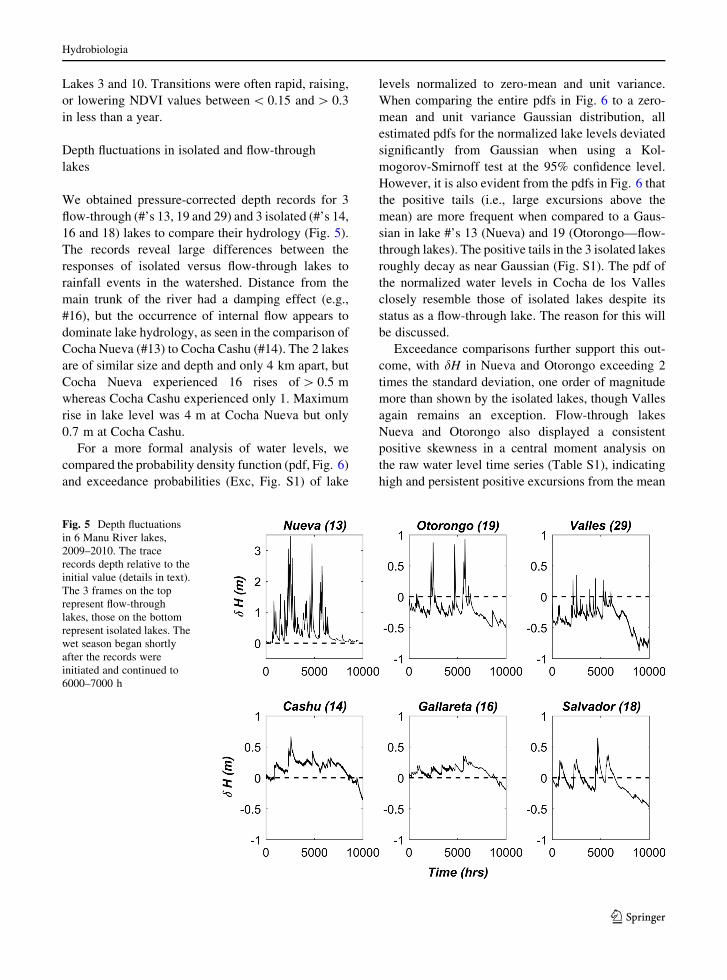
Depth fluctuations in isolated and flow-through
lakes
We obtained pressure-corrected depth records for 3
flow-through (#’s 13, 19 and 29) and 3 isolated (#’s 14,
16 and 18) lakes to compare their hydrology (Fig. 5).
The records reveal large differences between the
responses of isolated versus flow-through lakes to
rainfall events in the watershed. Distance from the
main trunk of the river had a damping effect (e.g.,
#16), but the occurrence of internal flow appears to
dominate lake hydrology, as seen in the comparison of
Cocha Nueva (#13) to Cocha Cashu (#14). The 2 lakes
are of similar size and depth and only 4 km apart, but
Cocha Nueva experienced 16 rises of[ 0.5 m
whereas Cocha Cashu experienced only 1. Maximum
rise in lake level was 4 m at Cocha Nueva but only
0.7 m at Cocha Cashu.
For a more formal analysis of water levels, we
compared the probability density function (pdf, Fig. 6)
and exceedance probabilities (Exc, Fig. S1) of lake
levels normalized to zero-mean and unit variance.
When comparing the entire pdfs in Fig. 6 to a zero-
mean and unit variance Gaussian distribution, all
estimated pdfs for the normalized lake levels deviated
significantly from Gaussian when using a Kol-
mogorov-Smirnoff test at the 95% confidence level.
However, it is also evident from the pdfs in Fig. 6 that
the positive tails (i.e., large excursions above the
mean) are more frequent when compared to a Gaus-
sian in lake #’s 13 (Nueva) and 19 (Otorongo—flow-
through lakes). The positive tails in the 3 isolated lakes
roughly decay as near Gaussian (Fig. S1). The pdf of
the normalized water levels in Cocha de los Valles
closely resemble those of isolated lakes despite its
status as a flow-through lake. The reason for this will
be discussed.
Exceedance comparisons further support this out-
come, with dH in Nueva and Otorongo exceeding 2
times the standard deviation, one order of magnitude
more than shown by the isolated lakes, though Valles
again remains an exception. Flow-through lakes
Nueva and Otorongo also displayed a consistent
positive skewness in a central moment analysis on
the raw water level time series (Table S1), indicating
high and persistent positive excursions from the mean
Fig. 5 Depth fluctuations
in 6 Manu River lakes,
2009–2010. The trace
records depth relative to the
initial value (details in text).
The 3 frames on the top
represent flow-through
lakes, those on the bottom
represent isolated lakes. The
wet season began shortly
after the records were
initiated and continued to
6000–7000 h
Hydrobiologia
123

state and high flatness factors (i.e., on–off behavior)
when compared to isolated lakes, again with the
exception of Cocha de los Valles. It is also interesting
to note that the raw time series variance was not
effective at discriminating isolated and flow-through
lakes, suggesting that large positive excursions and
on–off pattern in lake level better distinguish the two
types of lakes.
Discussion
Ecological regime shifts
The goal of our study was to document the occurrence
and frequency of regime shifts between phytoplankton
and floating macrophyte states in a series of floodplain
lakes in a remote upper Amazon watershed. Landsat
images covering the period 1986 through 2008
revealed 31 spontaneous regime shifts in these upper
Amazonian lakes, most of which were free of human
disturbance, including fishing. We were not able to
find cloud-free images for every year between 1986
and 2008, leaving open the possibility that we missed
some short-lived state changes, so the number of
observed shifts is likely to be an underestimate. We
did not attempt to determine the forcing factors that
triggered the observed regime shifts, most of which
took place long before we initiated the research in
lakes few of us had then ever seen.
Low-resolution Landsat images permit only a
rough qualitative interpretation of lake states, because
several distinct types of floating vegetation occur in
Manu River lakes. Macrophyte dominance typically
begins with a carpet of P. stratiotes. The free-floating
plants are driven back-and-forth by the wind from one
end of a lake to the other. In two cases we have
witnessed, P. stratiotes dominance ended under dry
season conditions in the absence of flooding when the
P. stratiotes carpet was colonized by a sedge,
Oxycaryum cubense, that used the P. stratiotes plants
as a platform on which to establish (facilitation,
Fig. 2b). Points of O. cubense establishment then
expanded at the expense of the supporting P. stra-
tiotes, forming floating islands laced firmly together
by intertwined O. cubense roots. In Cocha Cashu, the
O. cubense phase lasted two years (2007–2008) before
declining for unknown reasons.
Shifts from phytoplankton to floating vegetation
typically occurred at the end of the rainy/beginning of
the dry season, with the highest NDVI values recorded
between May and July. In the majority of cases,
Fig. 6 Probability density
functions (pdf) of depth in 3
flow-through (top row) and
3 isolated lakes (lower row)
in the Manu River basin,
Peru, normalized to zero-
mean and unit variance. The
positive tails (i.e., large
excursions above the mean)
are more frequent when
compared to a Gaussian in
Nueva and Otorongo (flow-
through lakes). The positive
tails in the 3 isolated lakes
roughly decay as near
Gaussian. The pdf of the
normalized water levels in
C. de los Valles closely
resemble those of isolated
lakes despite its status as a
flow-through lake. The
reason for this is discussed
in the text
Hydrobiologia
123
floating vegetation had gone or been greatly reduced
by the next year’s dry season. However, one or two
images a year are not enough to associate shifts with
seasonal events, such as major fluctuations in water
level (Loverde-Oliveira et al. 2009). Short-term per-
sistence of floating macrophytes raises the question of
whether the condition truly represents an alternative
state in this system. Two lines of evidence suggest it
does. First, the normal positive feedbacks that main-
tain the condition are operative, in that cover by
floating plants casts shade that prevents the develop-
ment of either phytoplankton or SAV. Second, floating
macrophyte dominance sometimes persisted 2 years
or more (as at Cocha Cashu 2006–2008), prevailing
through successive wet and dry seasons. Floods offer
one obvious mechanism to disrupt the floating
macrophyte state by washing out the plants and
leaving behind open water suitable for phytoplankton
development (Wanzten et al., 2008). Floods represent
the type of catastrophic pulse event that can overcome
hysteresis and reset the system (Scheffer et al., 2001;
Guttal & Jayaprakash, 2008; O’Farrell et al., 2011).
In any given year, the majority of lakes in the Manu
River basin are in a phytoplankton-dominated state
regardless of degree of isolation, with floating vege-
tation covering less than 12% of the lakes. Floating
macrophytes are dependent on high nutrient availabil-
ity and are therefore favored in shallow lakes where
wind-driven turbulence drives sediment suspension
(Scheffer et al., 2003). However, the default state of
most Manu lakes is the phytoplankton condition in
direct contrast to shallow temperate lakes where the
default state is one of submerged macrophytes (Sch-
effer et al., 2001).
Limnological research in Amazonia has been
concentrated in the downstream portions of the basin
in Brazil where the hydrological regime consists of a
high-amplitude (up to 14 m) seasonal rise and fall of
river level (Sioli, 1984; Melack & Forsberg, 2001).
Most lakes in this region are partially or completely
covered with floating vegetation, regardless of season
(Tundisi, 1983; Camargo & Esteves, 1995). Oxbow
lakes in the lower Parana River, the second largest
river in South America, display similar features.
Annual flooding lasts for months and lakes are
frequently covered with floating vegetation (Camargo
&Esteves, 1995; Izaguirre et al., 2004; O’Farrell et al.,
2011).
In contrast with the situation in central Amazonia,
there is no long-term flooding at the base of the Andes
where our research was conducted. Throughout the
rainy season, the river is continuously rising or falling
in response to rains in the headwaters. The low
amplitude, short-duration flood regime apparently
favors phytoplankton-dominated systems over float-
ing macrophytes. Complete inundation of the Manu
River floodplain has been observed only 3 times since
1973, in 1982, 1999, and 2003. Lakes closer to the
river, especially flow-through lakes, experience more
of the river’s short-term fluctuations than isolated
lakes like Cocha Cashu (Osorio et al., 2011). Thus, the
level of direct interaction with the river can vary
greatly among lakes in a single river basin with likely
consequences for susceptibility to regime shifts
(Fantin-Cruz et al., 2008).
Statistical analysis of the number of regime shifts
observed for each lake over the 23-year chronose-
quence failed to reveal lake features associated with a
tendency to change states. However, as only 9 out of
22 lakes exhibited regime shifts, the analyses lacked
statistical power. All recorded instances of regime
shift involved isolated lakes or the dead arms of dual
lakes. No flow-through lake changed state. Figure 4
reveals many instances (e.g., Lake 3) in which a high
NDVI value for a given lake reverted to a low value in
the next image, suggesting that ecosystem state is
more volatile in isolated than in flow-through lakes
(Carpenter & Brock, 2006; Scheffer et al., 2012).
We have drawn a distinction between ‘‘isolated’’
and ‘‘flow-though’’ lakes because they differ in
important features (Schneider et al., 2015). The record
for flow-through lakes indicates considerable variabil-
ity through time within a range of low to moderate but
not high (C 0.3), NDVI values. High NDVI values are
precluded by the presence of a central band of flowing
open water. The marginal floating meadows of these
lakes are tightly laced together by deep intertwined
root masses, making the floating vegetation of these
lakes less subject to washout than carpets of unan-
chored floating plants like P. stratiotes.
Hydrological records from 6 lakes, 3 isolated, and 3
flow-through, revealed that depth fluctuations in
isolated lakes are damped and slow to return to the
resting state, implying persistent water levels, whereas
flow-through lakes, being directly coupled to the river,
undergo frequent and abrupt high-amplitude depth
fluctuations. Residence times of water in flow-through
Hydrobiologia
123

lakes are thus short, leaving little time for the
development of conditions needed to induce regime
shifts (van Geest et al., 2005; Hilt et al., 2011).
The one exception to a consistent hydrological
difference between isolated and flow-through lakes
was #29 (Cocha de los Valles). This lake occupies
what until 1978 was the final section of the Manu
River. In that year, the river forged a new mouth,
abandoning its former channel and leaving the lake,
which drains into the high-gradient Madre de Dios
River and is independent of its parent river, the Manu.
The Madre de Dios has a braded channel and wide
floodplain such that its floods are of relatively low
amplitude, accounting for the idiosyncratic hydrology
of Cocha de los Valles.
Changes in top-down forcing can trigger regime
shifts (Carpenter et al., 1987; Daskalov et al., 2007),
but only fourManu lakes experience any fishing (#’s 4,
9, 13, and 29) and none of these experienced regime
shifts during the period of observation.
Conclusion
Using Landsat imagery, we constructed a 23-y time-
line of NDVI values of 22 oxbow lakes in the Manu
River basin of southeastern Peru, documenting 31
spontaneous shifts from low to high or high to low
values. Forty years of observing one lake (Cocha
Cashu) and first-hand inspection of 27 Manu River
lakes in 2012 affirmed that high NDVI values are
produced by floating macrophytes. Regime shifts from
phytoplankton to macrophyte states occurred only in
isolated lakes or lake arms that are decoupled from the
main river except during brief interludes of high water.
Streams flowing down the length of flow-through
lakes wash out plankton and free-floating plants like P.
stratiotes, permitting the outgrowth of coherent float-
ing meadows from lake margins. Such lakes undergo
relatively minor fluctuations in NDVI values.
Although the current understanding of ecological
regime shifts in shallow lakes is heavily biased
towards anthropogenically impacted ecosystems, our
research demonstrates that regime shifts occur fre-
quently and naturally in remote upper Amazonian
floodplain lakes. Further research in protected regions
with limited anthropogenic impacts, such as the Manu
National Park, will be necessary to fully understand
the mechanisms behind natural regime shifts in
freshwater systems.
Acknowledgements We are grateful to the Matsigenka
community of Tayakome for hospitality and assistance,
particularly Romulo and Niconor who accompanied the 2012
expedition. Antonio Guerra Rosas, Marcos Maguina, Ricardo
Ricci Bazan and Jessica Espino Ciudad are thanked for essential
collaboration in the field. We also thank SERNANP (Peruvian
parks agency) for authorizations that allowed us to carry out the
research. A National Geographic Society grant (#8672-09)
provided partial financial support.
References
Bronmark, C., J. Brodersen, B. B. Chapman, A. Nicolle, P.
A. Nilsson, C. Skov & L.-A. Hansson, 2010. Regime shifts
in shallow lakes: the importance of seasonal fish migration.
Hydrobiologia 646: 91–100.
Camargo, A. F. M. & F. A. Esteves, 1995. Influence of water
level variation on fertilization of an oxbow lake of Rio
Mogi-Guacu, state of Sao Paulo, Brazil. Hydrobiologia
299: 185–193.
Carpenter, S., 2003. Regime Shifts in Lake Ecosystems: Pattern
and Variation. International Ecology Institute, Oldendorf/
Luhe.
Carpenter, S. R. & W. A. Brock, 2006. Rising variance: a
leading indicator of ecological transition. Ecology Letters
9: 311–318.
Carpenter, S. R., J. F. Kitchell, J. R. Hodgson, P. A. Cochran, J.
Elser, D. M. Lodge, D. Kretchmer, X. He & C. N. von
Ende, 1987. Regulation of lake primary productivity by
food web structure. Ecology 68: 1863–1876.
Chander, G., B. L. Markham &D. L. Helder, 2009. Summary of
current radiometric calibration coefficients for Landsat
MSS, TM, ETM ? , and EO-1 ALI sensors. Remote
Sensing of Environment 113: 893–903.
Daskalov, G. M., A. N. Grishin, S. Rodionov & V. Mihneva,
2007. Trophic cascades triggered by overfishing reveal
possible mechanisms of ecosystem regime shifts. Pro-
ceedings of the National Academy of Sciences 104:
10518–10523.
Davenport, L.C., 2008. Behavior and ecology of the giant otter
(Pteroneura brasiliensis) in oxbow lakes of the Manu
Biosphere Reserve, Peru. PhD dissertation. University of
North Carolina, Chapel Hill, NC.
Dent, C. L., G. S. Cumming & S. R. Carpenter, 2002. Multiple
states in river and lake ecosystems. Philosophical Trans-
actions of the Royal Society of London Series B: Biolog-
ical Sciences 357: 635–645.
de Tezanos Pinto, P. & I. O’Farrell, 2014. Regime shifts
between free-floating plants and phytoplankton: a review.
Hydrobiologia 740: 13–24.
Fantin-Cruz, I., S. M. Loverde-Oliveira & P. Girard, 2008.
Caracterizacao morfometrica e suas implicacoes na lim-
nologia de lagoas do Pantanal Norte. Acta Scientiarum
Biological Sciences 30: 133–140.
Hydrobiologia
123

Guttal, V. & C. Jayaprakash, 2008. Changing skewness: an early
warning signal of regime shifts in ecosystems. Ecology
Letters 11: 450–460.
Hilt, S., J. Kohler, H.-P. Kozerski, E. H. van Nes &M. Scheffer,
2011. Abrupt regime shifts in space and time along rivers
and connected lake systems. Oikos 120: 766–775.
Izaguirre, I., I. O’Farrell, F. Unrein, R. Sinistro, M. dos Santos
Afonso & G. Tell, 2004. Algal assemblages across a wet-
land, from a shallow lake to relictual oxbow lakes (Lower
Parana River, South America). Hydrobiologia 511: 25–36.
Lacerot, G., C. Kruk, M. Lurling & M. Scheffer, 2013. The role
of subtropical zooplankton as grazers of phytoplankton
under different predation levels. Freshwater Biology 58:
494–503.
Loverde-Oliveira, S. M., V. L. Moraes Huszar, N. Mazzeo &M.
Scheffer, 2009. Hydrology-driven regime shifts in a shal-
low tropical lake. Ecosystems 12: 807–819.
Ludwig, D., D. D. Jones & C. S. Holling, 1978. Qualitative
analysis of insect outbreak systems: the spruce budworm
and forest. Journal of Animal Ecology 47: 315–322.
Marshall, B. E. & F. J. R. Junor, 1981. Decline of Salvinia
molesta on Lake Kariba. Hydrobiologia 83: 477–484.
Meerhoff, M., C. Iglesias, F. Teixeira de Mello, J. M. Clemente,
E. Jensen, T. L. Lauridsen & E. Jeppsen, 2007. Effects of
habitat complexity on community structure and predator
avoidance behaviour of littoral zooplankton in temperate
versus subtropical shallow lakes. Freshwater Biology 52:
1009–1021.
Melack, J. M. & B. R. Forsberg, 2001. Biogeochemistry of
Amazon floodplain lakes and associated wetlands. In
McClain, M. E., R. L. Victoria & J. E. Richey (eds), The
Biogeochemistry of the Amazon Basin. Oxford University
Press, Oxford.
Mormul, R. P., S. M. Tomaz, A. A. Agostinho, C. C. Bonecker
& N. Mazzeo, 2012. Migratory benthic fishes may induce
regime shifts in a tropical floodplain pond. Freshwater
Biology 57: 1592–1602.
O’Farrell, I., I. Izaguirre, G. Chaparro, F. Unrein, R. Sinistro, H.
Pizarro, P. Rodrıguez, P. de Tezanos Pinto, R. Lombardo &
G. Tell, 2011. Water level as the main driver of the alter-
nation between a free-floating plant and a phytoplankton
dominated state: a long-term study in a floodplain lake.
Aquatic Sciences 73: 275–287.
Osorio, D., J. Terborgh, A. Alvarez, H. Ortega, R. Quispe, V.
Chipollini & L. C. Davenport, 2011. Lateral migration of
fish between an oxbow lake and an Amazonian headwater
river. Ecology of Freshwater Fish 20: 619–627.
Penuelas, J., J. A. Gamon, K. L. Griffin & C. B. Field, 1993.
Assessing community type, plant biomass, pigment com-
position, and photosynthetic efficiency of aquatic vegeta-
tion from spectral reflectance. Remote Sensing of
Environment 46: 110–118.
Richey, J. E., L. A. K. Mertes, T. Dunne, R. L. Victoria, B.
R. Forsberg, A. C. N. S. Tancredi & E. Oliveira, 1989.
Sources and routing of the Amazon River flood wave.
Global Biogeochemical Cycles 3: 191–204.
Rouse, J.W., Jr., R.H. Haas, J.A. Schell & D.W. Deering, 1973.
Monitoring the vernal advancement and retrogradation
(green wave effect) of natural vegetation. Progress Report
RSC 1978-1, Remote Sensing Center, Texas A&M
University, College Station (NTIS No. E73-106393).
Scheffer, M., 2004. Ecology of Shallow Lakes. Princeton
University Press, Princeton, NJ.
Scheffer, M. & E. Jeppesen, 2007. Regime shifts in shallow
lakes. Ecosystems 10: 1–3.
Scheffer, M. & E. H. van Ness, 2007. Shallow lakes theory
revisited: various alternative regimes driven by climate,
nutrients, depth and lake size. Hydrobiologia 2007(584):
455–466.
Scheffer, M., S. Carpenter, J. A. Foley, C. Folke & B. Walker,
2001. Catastrophic shifts in ecosystems. Nature 413:
591–596.
Scheffer, M., S. Szabo, A. Gragnani, E. H. van Nes, S. Rinaldi,
N. Kautsky, J. Norberg, R. M. M. Roijackers & R. J. M.
Franken, 2003. Floating plant dominance as a stable state.
Proceedings of the National Academy of Sciences 100:
4040–4045.
Scheffer, M., S. R. Carpenter, T. M. Lenton, J. Bascompte, W.
Brock, V. Dakos, J. V. de Koppel, I. A. van de Leemput, S.
A. Levin, E. H. van Nes, M. Pascual & J. Vandermeer,
2012. Anticipating critical transitions. Science 338:
344–348.
Schneider, B., E. R. Cunha, M. Marchese & M. Thomaz, 2015.
Explanatory variables associated with diversity and com-
position of aquatic macrophytes in a large subtropical river
floodplain. Aquatic Botany 121: 67–75.
Schooler, S. S., B. Salau, M. H. Julien & A. R. Ives, 2011.
Alternative stable states explain unpredictable biological
control of Salvinia molesta in Kakadu. Nature 470: 86–89.
Sioli, H., 1984. The Amazon: Limnology and Landscape
Ecology of aMighty Tropical River and its Basin. W. Junk,
Dordrecht.
Song, C., C. E. Woodcock, K. C. Seto, M. P. Lenney & S.
A. Macomber, 2001. Classification and change detection
using Landsat TM data: when and how to correct atmo-
spheric effects? Remote Sensing of Environment 75:
230–244.
Tejerina-Garro, F. L., R. Fortin & M. A. Rodriguez, 1998. Fish
community structure in relation to environmental variation
in floodplain lakes of the Araguaia River, Amazon Basin.
Environmental Biology of Fishes 51: 399–410.
Tundisi, J. G., 1983. A review of basic ecological processes
interacting with production and standing-stock of phyto-
plankton in lakes and reservoirs in Brazil. Hydrobiologia
100: 223–243.
van Geest, G. J., H. Coops, R. M. M. Roijackers, A. D. Buijse &
M. Scheffer, 2005. Succession of aquatic vegetation driven
by reduced water-level fluctuations in floodplain lakes.
Journal of Applied Ecology 42: 251–260.
Wanzten, K. M., W. J. Junk & K.-O. Rothhaupt, 2008. An
extension of the floodpulse concept (FPC) for lakes.
Hydrobiologia 613: 151–170.
Zeeman, E. C., 1977. Catastrophe Theory. Collected Papers,
1972–1977. Addison-Wesley, Oxford.
Hydrobiologia
123
Related Documents