1 Twentieth Century Tropical Sea Surface Temperature Trends Revisited 1 2 Clara Deser and Adam S. Phillips 3 National Center for Atmospheric Research, Boulder, Colorado 4 5 Michael A. Alexander 6 NOAA/Earth System Research Laboratory, Boulder, Colorado 7 8 March 18, 2010 (Submitted to GRL) 9 10 Abstract 11 This study compares the global distribution of 20th century SST and marine air 12 temperature trends from a wide variety of data sets including un-interpolated archives as 13 well as globally-complete reconstructions. Apart from the eastern equatorial Pacific, all 14 datasets show consistency in their statistically significant trends, with warming 15 everywhere except the far northwestern Atlantic; the largest warming trends are found in 16 the middle latitudes of both hemispheres. Two of the SST reconstructions exhibit 17 statistically significant cooling trends over the eastern equatorial Pacific, in disagreement 18 with the un-interpolated SST and marine air temperature datasets which show statistically 19 significant warming in this region. Twentieth century trends in tropical marine 20 cloudiness, precipitation and SLP from independent data sets provide physically 21 consistent evidence for a reduction in the strength of the atmospheric Walker Circulation 22 accompanied by an eastward shift of deep convection from the western to the central 23 equatorial Pacific. 24 25 1. Introduction 26 Sea surface temperature (SST), a fundamental physical parameter of the climate 27 system, is well suited for monitoring climate change due to the oceans’ large thermal 28

Welcome message from author
This document is posted to help you gain knowledge. Please leave a comment to let me know what you think about it! Share it to your friends and learn new things together.
Transcript
1
Twentieth Century Tropical Sea Surface Temperature Trends Revisited 1 2
Clara Deser and Adam S. Phillips 3 National Center for Atmospheric Research, Boulder, Colorado 4
5 Michael A. Alexander 6
NOAA/Earth System Research Laboratory, Boulder, Colorado 7 8
March 18, 2010 (Submitted to GRL) 9 10
Abstract 11
This study compares the global distribution of 20th century SST and marine air 12
temperature trends from a wide variety of data sets including un-interpolated archives as 13
well as globally-complete reconstructions. Apart from the eastern equatorial Pacific, all 14
datasets show consistency in their statistically significant trends, with warming 15
everywhere except the far northwestern Atlantic; the largest warming trends are found in 16
the middle latitudes of both hemispheres. Two of the SST reconstructions exhibit 17
statistically significant cooling trends over the eastern equatorial Pacific, in disagreement 18
with the un-interpolated SST and marine air temperature datasets which show statistically 19
significant warming in this region. Twentieth century trends in tropical marine 20
cloudiness, precipitation and SLP from independent data sets provide physically 21
consistent evidence for a reduction in the strength of the atmospheric Walker Circulation 22
accompanied by an eastward shift of deep convection from the western to the central 23
equatorial Pacific. 24
25
1. Introduction 26
Sea surface temperature (SST), a fundamental physical parameter of the climate 27
system, is well suited for monitoring climate change due to the oceans’ large thermal 28
2
inertia compared with that of the atmosphere and land. Accurate determination of long-29
term SST trends is hampered, however, by poor spatial and temporal sampling and 30
inhomogeneous measurement practices (Hurrell and Trenberth, 1999; Rayner et al., 31
2009). As a result, 20th century SST trends are subject to considerable uncertainty, 32
limiting their physical interpretation and utility as verification for climate model 33
simulations. This uncertainty is especially evident in the tropical Pacific where even the 34
sign of the centennial trend is in question (Vecchi et al., 2008). Given the influence of 35
tropical Pacific SST anomalies on climate worldwide, resolving these discrepancies 36
remains an important task. 37
Previous studies have focused largely on SST trends from reconstructed data sets. 38
The purpose of this study is to provide a broad assessment of 20th century global SST 39
trends by considering a wide variety of gridded data sources including un-interpolated 40
archives as well as globally complete reconstructions. The SST trends are compared with 41
independently measured night-time marine air temperature (NMAT) trends for evidence 42
of physical consistency. The SST/NMAT trends over the tropical Pacific are further 43
evaluated in the context of trends in tropical cloudiness, precipitation, and sea level 44
pressure. 45
46
2. Data and Methods 47
Global SST trends since 1900 are computed for 5 different datasets: Hadley 48
Centre SST version 2 (HadSST2; Rayner et al., 2006); Minobe and Maeda (2005); 49
Hadley Centre sea ice and SST version 1 (HadISST1; Rayner et al., 2003); National 50
Oceanic and Atmospheric Administration Extended Reconstructed SST version 3 51
3
(ERSSTv3b; Smith et al., 2008); and Kaplan Extended SST version 2 (Kaplanv2; Kaplan 52
et al., 1998). HadSST2 and Minobe/Maeda (both on a 2ºx2º latitude/longitude grid) are 53
based on the International Comprehensive Atmosphere-Ocean Data Set (ICOADS) and 54
employ different quality-control and bias correction procedures; no "analysis" of the data 55
is performed (e.g., no spatial or temporal smoothing or interpolation) and missing grid 56
boxes are not filled in. HadISST1 (1ºx1º), ERSSTv3b (2ºx2º), and Kaplanv2 (5ºx5º) are 57
analysis products which use different optimal statistical procedures to smooth the data 58
and fill in missing values; further information is given in the cited references. 59
In addition to SST, we compute trends in night-time marine air temperatures 60
(NMAT) from Meteorological Office Historical Marine Air Temperature version 4 61
(MOHMAT4; Rayner et al., 2003) and terrestrial air temperatures from Hadley 62
Centre/Climate Research Unit Temperature version 3 variance-adjusted (HadCRUT3v; 63
Brohan et al., 2005). Both datasets are on a 5º x 5º grid, and like HadSST2 missing grid 64
boxes are not filled in and no "analysis" of the data is performed. It should be noted that 65
MOHMAT4, HadCRUTv3 and HadSST2 are independent in that they consist of 66
measurements from different observational platforms or instruments (N. Rayner, personal 67
communication, 2010). Over the tropics, we also compute trends in land station 68
precipitation from Hulme et al. (1998), total cloud amount and sea level pressure (SLP) 69
from ICOADS version 2.4 (Woodruff et al., 2008), and SLP from Hadley Centre SLP 70
version 2 (Allan and Ansell, 2006). The Hulme (2.5º x 3.75º) and ICOADS (2º x 2º) data 71
are neither smoothed nor interpolated, while HadSLP2 (5º x 5º) is a globally complete 72
optimal reconstruction based on terrestrial station records and marine observations from 73
ICOADS. 74
4
We calculate linear trends from monthly anomalies using the method of least-75
squares, and assess their statistical significance using a Student’s-t test and taking into 76
account serial autocorrelation based on the method of Zwiers and von Storch (1995). 77
78
3. Results 79
a. Data Coverage 80
In order to discriminate between secular climate change and naturally-occurring 81
multi-decadal variability, it is important to consider as long a period of record as possible. 82
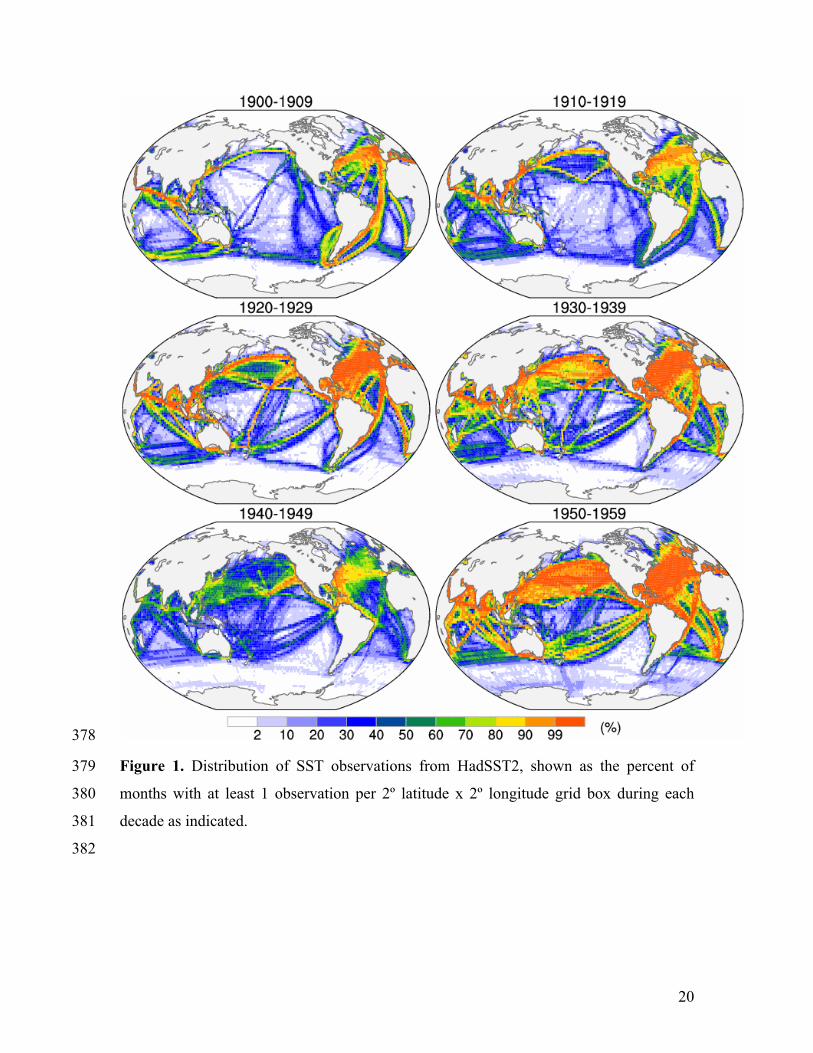
Seeking a balance between adequate data coverage (see Fig. 1 in the Supplemental 83
Materials) and length of record, we have examined SST trends using a variety of start 84
dates (1900, 1910 and 1920) and data sampling thresholds; all of the results discussed 85
below are robust to the different choices. In the figures that follow, we show trend maps 86
based on the period 1900-2008 using a 3 month per decade threshold; trends based on 87
1920-2008 using a 24 month per decade threshold are shown in Fig. 2 of the 88
Supplemental Materials. We emphasize that although our sampling criterion is lenient, 89
we rely on additional factors such as regional coherency (note that no additional spatial 90
smoothing has been applied to any of the data sets) and consistency with independently 91
measured marine air temperatures to assess the reality of the SST trends. 92
93
b. Global SST trends 94
The 20th century SST trend distributions from the 5 different data sets are 95
compared in Fig. 1 for the period 1900 to 2008 (2002 for Minobe/Maeda, the latest year 96
available), along with air temperature trends based on HadCRUTv3 over land and 97
5
MOHMAT4 over the oceans for the period 1900 to 2005 (the latest year available). The 98
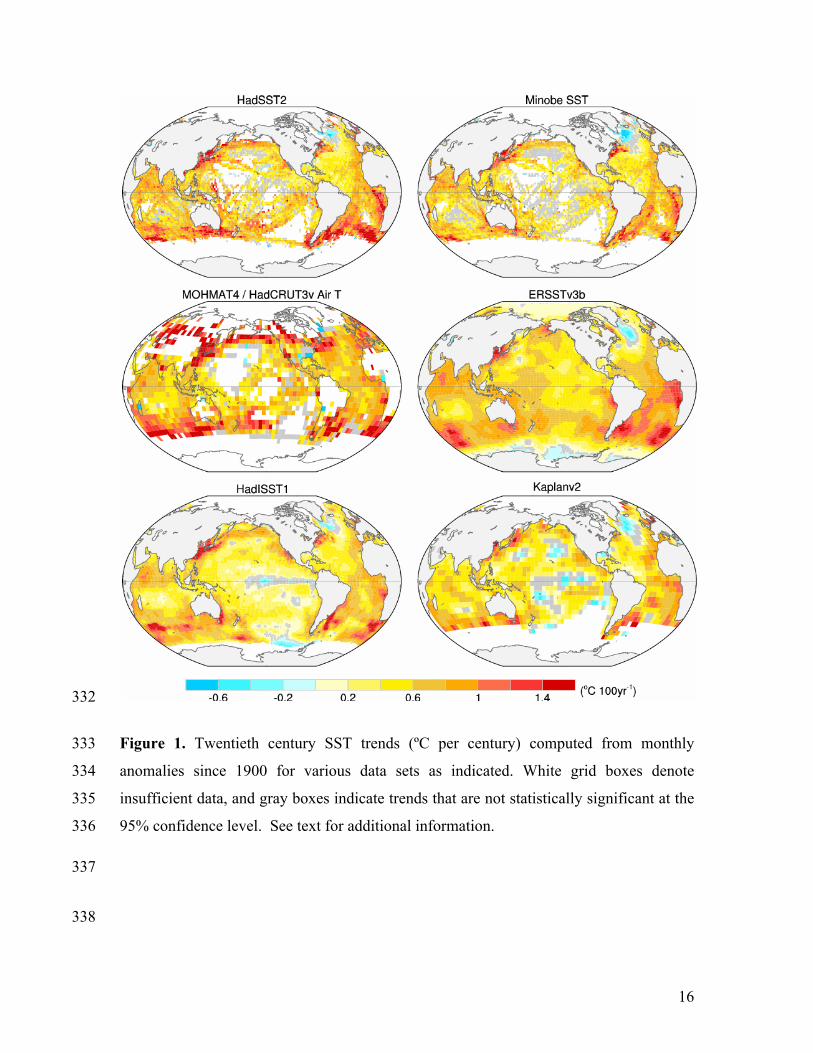
SST trends from the un-interpolated HadSST2 and Minobe/Maeda archives are similar, 99
exhibiting positive values everywhere except the western portion of the northern North 100
Atlantic. The largest warming trends (approximately 1.2-1.6 ºC per century) occur 101
directly east of the continents in the northern hemisphere, in the Southern Ocean and the 102
eastern tropical Atlantic. The eastern tropical Pacific warms by approximately 0.8-1.0 ºC 103
per century, similar in magnitude to the tropical Indian Ocean and the central tropical 104
Atlantic. Trends in NMAT from the un-interpolated MOHMAT4 dataset corroborate 105
those in SST from HadSST2 and Minobe/Maeda, with generally similar large-scale 106
patterns and amplitudes. The agreement between NMAT and SST, physically related 107
quantities from independent data sets, provides strong support for the reality of their 108
trends. Another important confirmation of the marine NMAT trends is their coherence 109
with independent air temperature trends over nearby land areas from HadCRUT3v. For 110
example, the terrestrial warming over the islands of Indonesia and coastal regions of 111
Australia, South America, South Africa, North America, Europe, and eastern Asia is 112
remarkably similar in amplitude to the air temperature increases over the adjacent oceanic 113
regions (even the cooling at the southern tip of Greenland agrees with the cooling over 114
the far north Atlantic). There are a few isolated areas where the air temperature trends 115
over land do not match those over nearby maritime areas, for example Madagascar, the 116
southeastern United States, and northern Chile. 117
The 3 reconstructed SST data sets (ERSSTv3b, HadISST1, and Kaplanv2) exhibit 118
broad similarity in their trend patterns and amplitudes, as well as overall agreement with 119
the un-interpolated SST data sets, with the notable exception of the central and eastern 120
6
equatorial Pacific. In this region, HadISST1 and Kaplanv2 exhibit weak but significant 121
cooling while ERSSTv3b shows significant warming, the latter in agreement with 122
HadSST2, Minobe/Maeda, and MOHMAT4. The discrepancy between HadISST1 and 123
ERSST was highlighted by Vecchi et al. (2008; see also Hurrell and Trenberth, 1999). 124
125
c. Tropical climate trends 126
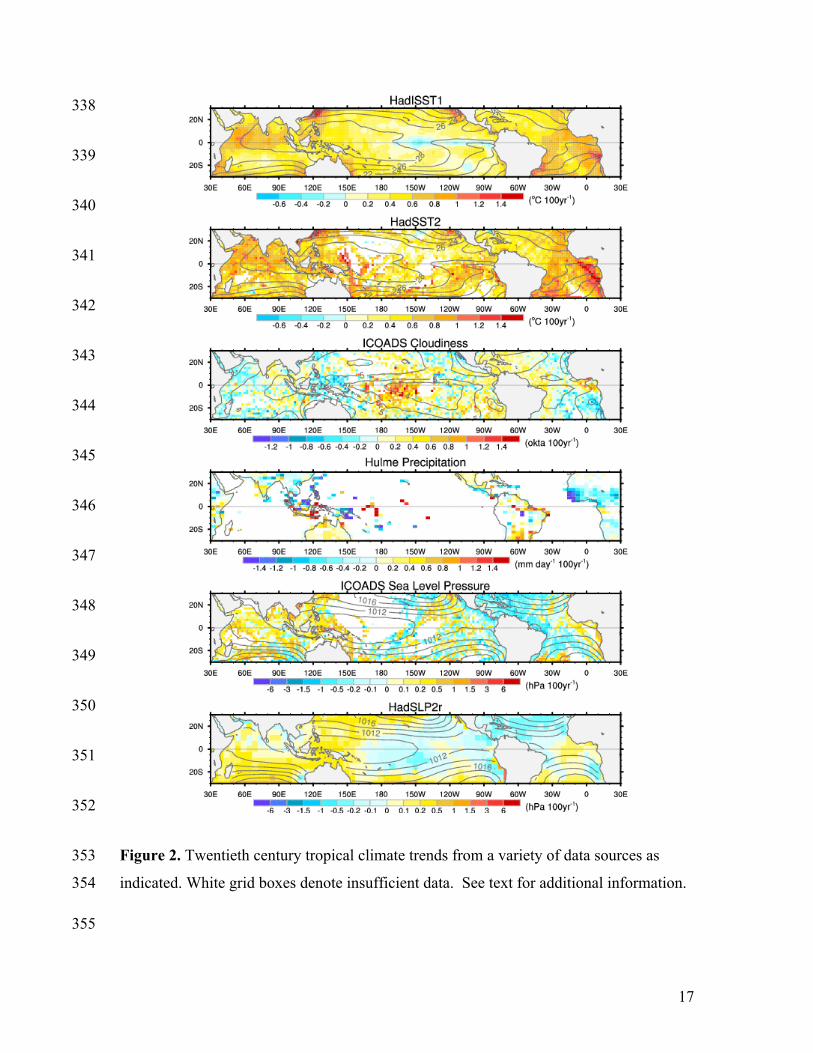
Trends in tropical marine cloudiness from ICOADS, land station precipitation 127
from Hulme, and SLP from ICOADS and HadSLP2r are shown in Fig. 2; SST trends 128
from HadISST1 and HadSST2 are also shown for reference. All trends are computed 129
based on monthly anomalies beginning in 1900 and ending in 2008 (2006 for ICOADS) 130
except for precipitation which uses a start date of 1920 due to insufficient data coverage 131
before that time and an end date of 1996, the last year of data available. As in Fig. 1, no 132
spatial smoothing has been applied to any of the trend maps. Changes in observing 133
practice may have caused spurious increases in ICOADS cloudiness (Norris, 1999). 134
Following Deser and Phillips (2006), we account for these artificial trends by removing 135
the tropical (30ºN - 30ºS) mean cloudiness trend from each oceanic grid box. The 136
resemblance of the spatial patterns of land station precipitation and residual cloudiness 137
trends provides strong evidence for the spurious nature of the tropical mean cloudiness 138
trend (Fig. 2). 139
The distribution of residual cloudiness trends exhibits positive values (0.8 – 1.4 140
oktas per century) over the central equatorial Pacific accompanied by negative values 141
over the western equatorial Pacific (-0.4 – -0.8 oktas per century). This pattern is 142
reminiscent of the cloudiness (and precipitation) changes that occur in association with El 143
7
Nino events (Deser et al., 2004) and the 1976/77 climate regime “shift” (Deser and 144
Phillips, 2006). Negative cloudiness trends are also found over the western Indian 145
Ocean, the Pacific Inter-Tropical Convergence Zone (ITCZ) east of 135ºW and the 146
subtropical eastern Pacific and Atlantic. Precipitation trends are generally consistent with 147
residual cloudiness trends in regions where the two data sets overlap: in particular, 148
positive precipitation trends are found at island stations in the central equatorial Pacific 149
between 160ºE and 140ºW, and negative trends to the west between130ºE and 160ºE. 150
SLP trends from ICOADS are generally positive over the tropical Indian Ocean and 151
western Pacific, and a mixture of negative and positive values over the eastern Tropical 152
Pacific. The smoother HadSLP2r trends corroborate the large-scale pattern evident in 153
ICOADS, and are indicative of a weakening of the SLP gradient between the eastern 154
Pacific and the Indian Ocean/West Pacific. Collectively, the independent trends in marine 155
cloudiness, precipitation and SLP provide physically consistent evidence for a reduction 156
in the strength of the atmospheric Walker Circulation accompanied by an eastward shift 157
in convection from the western to the central equatorial Pacific. 158
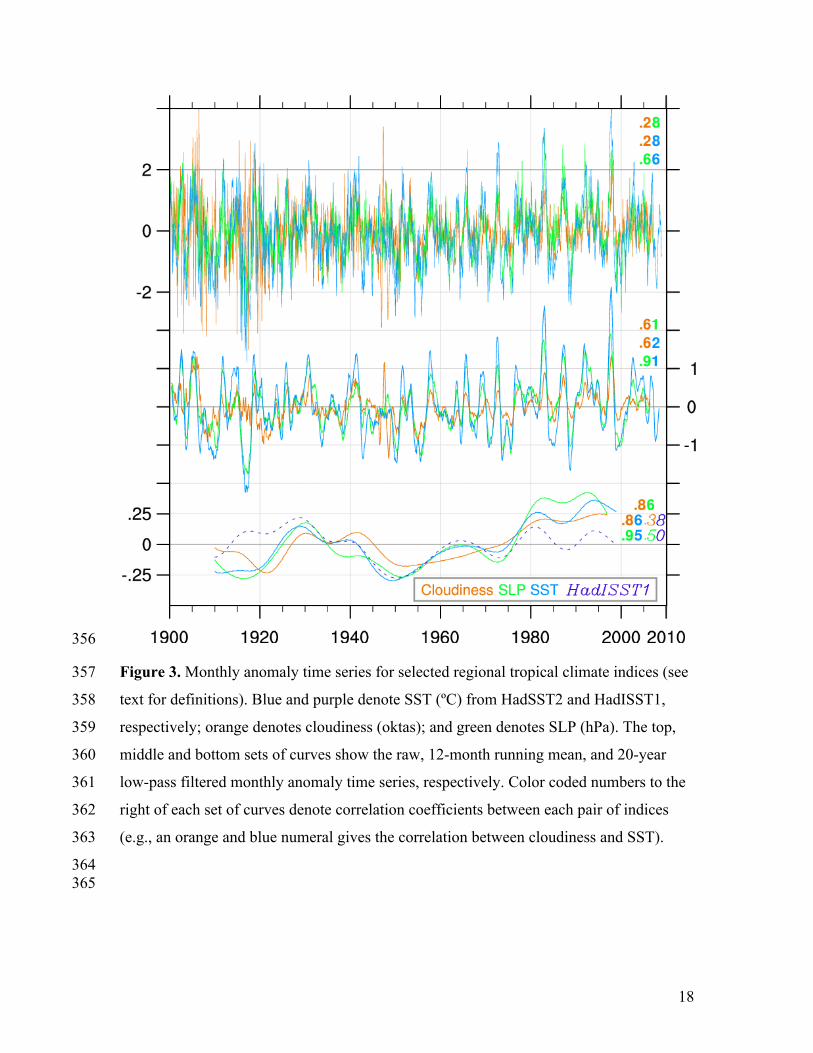
Based on the maps shown in Fig. 2, we formed the following regional time series: 159
eastern equatorial Pacific SST (1ºN - 1ºS, 170ºW - 90ºW) from HadSST21; central 160
equatorial Pacific cloudiness (6ºN - 12ºS, 165ºE - 150ºW) minus central north Pacific 161
cloudiness (18ºN - 6ºN, 165ºE - 150ºW) from ICOADS; and Indian Ocean/West Pacific 162
SLP (20ºN - 20ºS, 30ºE - 150ºE) minus eastern Pacific SLP (20ºN - 20ºS, 180º - 70ºW) 163
from ICOADS. These indices are not sensitive to the precise definitions of the regions 164
except for cloudiness, which exhibits some differences in the first few decades of the 20th 165
1 A narrow equatorial box is used for later comparison with HadISST1, but similar results are obtained for 5ºN - 5ºS.
8
century (not shown); similar regions were used for characterizing Pacific multi-decadal 166
variability in Deser et al. (2004). These indices are displayed in Fig. 3 using various 167
degrees of temporal smoothing to emphasize different aspects of the variability. 168
Although the raw monthly anomaly time series exhibit considerable high 169
frequency noise, they are coherent on interannual and longer time scales and exhibit 170
prominent ENSO variability throughout the record. The main periods of disagreement 171
occur in association with high levels of noise due to paucity of data especially during the 172
first two decades and World War II. The correlation coefficients between each pair of 173
indices (marked directly on Fig. 3) are all significant at the 99% level: the 0.66 174
correlation between the SST and SLP records is particularly noteworthy given the large 175
number of data points and lack of temporal smoothing. There is also strong 176
correspondence among the 12-month running mean records, with 95% significant 177
correlations of 0.61-0.91. The 20-year low-pass filtered records also exhibit high 178
correlations (0.86-0.95) reflecting consistency in their multi-decadal fluctuations as well 179
as in their overall upward trends. Note that the trends constitute only a small fraction of 180
the total variability of the raw monthly anomaly time series and less than half of the 181
variability on time scales longer than 20 years. Strong correspondence between two 182
canonical SLP and SST records of ENSO dating back to 1877 was shown by Bunge and 183
Clarke (2009) using more sophisticated analysis techniques. 184
The disagreement in sign between the trends in HadSST2 and HadISST1 in the 185
eastern equatorial Pacific is readily apparent by comparing their 20-year low-pass filtered 186
records (Fig. 3). Note that the two SST indices agree well on inter-annual and multi-187
decadal timescales (correlation coefficients of 0.95 for detrended 12-month running 188
9
means and 0.90 for detrended 20yr lowpass filtered data): only their long term trends 189
differ. The correlations between the 20-yr lowpass filtered equatorial Pacific SST index 190
based on HadISST1 and the cloudiness and SLP records shown in Fig. 3 (0.38 and 0.50, 191
respectively) are substantially lower than those based on HadSST2 (0.86 and 0.95, 192
respectively). 193
194
4. Summary and Discussion 195
We have evaluated 20th century (1900 to approximately 2008) SST trends from a 196
variety of data sources including un-interpolated archives as well as globally complete 197
reconstructions. Statistically significant SST trends from the two un-interpolated datasets 198
(HadSST2 and Minobe/Maeda) are positive everywhere except the northern North 199
Atlantic, with magnitudes approximately 0.4-1.0 ºC per century in the tropics and 200
subtropics and 1.2-1.6 ºC per century at higher latitudes. These SST trends are 201
corroborated by independently measured NMAT trends from the un-interpolated 202
MOHMAT4 dataset and by terrestrial air temperature trends at coastal locations from the 203
un-interpolated HadCRUT3v archive. SST trends from the reconstructed datasets 204
(ERSSTv3b, HadISST1 and Kaplanv2) are generally similar to those from the un-205
interpolated archives with the notable exception of the tropical Pacific which exhibits 206
cooling in HadISST1 and Kaplanv2. 207
The intensified warming trends off the east coasts of China and northern North 208
America and over the northern North Pacific may be related to the relatively shallow 209
bathymetry and associated ocean mixed layer depths as suggested by Xie et al. (2002). In 210
addition, advection of continental air temperature trends by the prevailing westerlies and 211
10
a reduction in cloud cover (not shown) may play a role. The cooling trend directly south 212
of Greenland may be related to the century-long upward trend in the North Atlantic 213
Oscillation via the associated increase in wind speed and resulting heat loss from the 214
ocean surface. Enhanced warming over the Southern Ocean may be due in part to a 215
decrease in cloud cover (not shown). Alternatively, the pattern of cooling in the far north 216
Atlantic coupled with warming in the Southern Ocean may be a signature of a weakened 217
oceanic thermohaline circulation in response to global warming. Further work is needed 218
to assess the mechanisms responsible for the spatial distribution of the 20th century SST 219
trends. 220
The HadISST1 and Kaplanv2 reconstructions disagree with ERSSTv3b and the 221
un-interpolated datasets on the sign of the SST trend in the eastern equatorial Pacific. 222
Independent NMAT measurements show a warming trend in this region that is very close 223
in magnitude to that from HadSST2 (0.36 ºC compared to 0.35 ºC per century). Given 224
that marine air temperature and SST anomalies are physically constrained by surface 225
energy exchange, the agreement between NMAT and HadSST2 provides strong support 226
for the reality of the warming trend in the eastern equatorial Pacific. Though the trends in 227
HadISST1 and Kaplanv2 over the eastern equatorial Pacific appear to be erroneous, their 228
interannual to decadal variations are in agreement with those in HadSST2 and NMAT 229
(correlation coefficients of 0.95 and 0.92, respectively, based on detrended 12-month 230
running mean anomalies for the region 1ºN - 1ºS, 170ºW - 90ºW). Our results have 231
implications for the design of atmospheric model experiments forced with observed SST 232
trends. In particular, specifying the 20th century trend component from HadISST1 or 233
11
Kaplanv2 in the eastern tropical Pacific may lead to an unrealistic atmospheric circulation 234
response. 235
Centennial trends in tropical marine cloudiness, precipitation, and SLP from 236
independent data sources were also evaluated. These additional climate parameters were 237
shown to exhibit physically consistent trends consisting of a weakening of the zonal SLP 238
gradient between the eastern Pacific and the Indian Ocean/western Pacific accompanied 239
by an eastward shift of cloudiness and precipitation from the western to the central 240
equatorial Pacific. The causal relationship between the tropical Pacific SST and 241
atmospheric circulation trends is open to interpretation. On the one hand, a weakening of 242
the atmospheric Walker Circulation is expected to occur in response to increasing GHG 243
concentrations, even with a zonally uniform warming of the tropical oceans, as discussed 244
by Vecchi and Soden (2007). In this view, the role of tropical ocean dynamics is to 245
reduce the amplitude of both the Walker Circulation change and the warming in the 246
eastern equatorial Pacific. Alternatively, the physical paradigm for ENSO holds that a 247
weakening of the zonal SLP gradient (e.g., the Walker Circulation) is accompanied by a 248
weakening of the zonal SST gradient (more warming in the eastern compared to the 249
western equatorial Pacific) due to the Bjerknes feedback mechanism. Both mechanisms 250
could contribute to the observed centennial trends documented in this study. 251
Recently, Karnauskas et al. (2009) reported that the HadISST1, Kaplanv2 and 252
ERSSTv3b reconstructions all exhibit a strengthening of the east-to-west SST gradient 253
across the equatorial Pacific during the 20th century, despite disagreeing on the sign of the 254
SST trend in east. However, only the month of September showed a statistically 255
significant strengthening for ERSSTv3b, compared to June-January (July-January) for 256
12
HadISST1 (Kaplanv2). Using data from all months of the year, we find no evidence for a 257
statistically significant strengthening of the zonal gradient in ERSSTv3b, HadSST2, 258
Minobe/Maeda, or MOHMAT4. Further, we emphasize that data coverage constraints 259
make it difficult to accurately determine the 20th century trend in the zonal SST gradient 260
across the equatorial Pacific (Fig. 1 of the Supplemental Materials), and indeed no such 261
determination is possible when a 20% threshold (24 months per decade) is used for 262
computing the trends since 1920 (Fig. 2 of the Supplemental Materials). 263
Characterizing the pattern and amplitude of SST trends over the past century 264
remains a challenge due to observational uncertainties associated with limited data 265
sampling, changing measurement techniques and analysis procedures. Thus, there is a 266
continuing need for refining and improving the development of homogeneous gridded 267
SST data sets and associated globally-complete reconstructions for climate change 268
research following the recommendations in Rayner et al. (2009). 269
270
Acknowledgments 271
We thank Drs. Lucia Bunge, Allan Clarke, Matt Newman, Yuko Okumura, Nick Rayner 272
and Kevin Trenberth for useful discussions during the course of this work. We also 273
appreciate the comments of two anonymous reviewers on a previous draft. 274
275
References 276
Allan, R. J. and Ansell, T. J., 2006: A new globally complete monthly historical mean sea 277
level pressure data set (HadSLP2): 1850-2004. J. Clim., 19, 5816-5842. 278
279
13
Brohan et al., 2005: Uncertainty estimates in regional and global observed temperature 280
changes: a new dataset from 1850. J. Geophys. Res, 111, D12106, 281
doi:10.1029/2005JD006548. 282
283
Bunge, L. and A.J. Clarke, 2009: A verified estimate of the El Nino Index Nino-3.4 since 284
1877. J. Clim., 22, 3979-3992. 285
286
Deser, C., A.S. Phillips and J.W. Hurrell, 2004: Pacific interdecadal climate variability: 287
linkages between the Tropics and the North Pacific during boreal winter since 1900. J. 288
Clim., 17, 3109–3124. 289
290
Deser, C., and A. S. Phillips, 2006: Simulation of the 1976/1977 climate transition over 291
the North Pacific: Sensitivity to tropical forcing. J. Climate, 19, 6170-6180. 292
293
Hulme M., T. J. Osborn, and T. C. Johns, 1998: Precipitation sensitivity to global 294
warming: Comparison of observations with HadCM2 simulations. Geophys. Res. Lett, 25, 295
3379–3382. 296
297
Kaplan et al., 1998: Analyses of global sea surface temperature 1856-1991. J. Geophys. 298
Res., 103, 18,567-18,589. 299
300
Norris J. R., 1999: On trends and possible artifacts in global ocean cloud cover between 301
1952 and 1995. J. Climate, 12, 1864–1870. 302
14
303
Rayner et al., 2003: Global analyses of sea surface temperature, sea ice, and night marine 304
air temperature since the late nineteenth century. J. Geophys. Res., 108, No. D14, 4407, 305
doi:10.1029/2002JD002670, 2003 306
307
Rayner et al., 2006: Improved analyses of changes and uncertainties in sea surface 308
temperature measured in situ since the mid-nineteenth century: the HadSST2 data set. J. 309
Clim., 19, 446-469. 310
311
Rayner et al., 2009: Evaluating Climate Variability and Change From Modern and 312
Historical SST Observations" in Proceedings of OceanObs’09: Sustained Ocean 313
Observations and Information for Society (Vol. 2), Venice, Italy, 21-25 September 314
2009, Hall, J., Harrison D.E. & Stammer, D., Eds., ESA Publication WPP-306. 315
316
Smith et al., 2008: Improvements to NOAA's historical merged land-ocean surface 317
temperature analysis (1880-2006). J. Clim., 21, 2283-2296. 318
319
Vecchi, G. A., A. Clement, and B. J. Soden, 2008: Pacific signature of global warming: 320
El Niño or La Niña?, Eos Trans. AGU, 89(9), 81-83. 321
322
Vecchi, G.A., and B.J. Soden, 2007: Global Warming and the Weakening of the Tropical 323
Circulation. J. Clim., 20, 4316–4340. 324
325
15
Woodruff et al., 2008: The evolving SST record from ICOADS. In Climate Variability 326
and Extremes during the Past 100 Years (Broennimann et al., Eds.), in Global Change 327
Research, 33, Springer, 65-83. 328
329
Zwiers, F.W., and H. von Storch, 1995: Taking serial correlation into account in tests of 330
the mean. J. Clim., 8, 336–351. 331
332
16
332
Figure 1. Twentieth century SST trends (ºC per century) computed from monthly 333
anomalies since 1900 for various data sets as indicated. White grid boxes denote 334
insufficient data, and gray boxes indicate trends that are not statistically significant at the 335
95% confidence level. See text for additional information. 336
337
338
17
338
339
340
341
342
343
344
345
346
347
348
349
350
351
352
Figure 2. Twentieth century tropical climate trends from a variety of data sources as 353
indicated. White grid boxes denote insufficient data. See text for additional information. 354
355
18
356
Figure 3. Monthly anomaly time series for selected regional tropical climate indices (see 357
text for definitions). Blue and purple denote SST (ºC) from HadSST2 and HadISST1, 358
respectively; orange denotes cloudiness (oktas); and green denotes SLP (hPa). The top, 359
middle and bottom sets of curves show the raw, 12-month running mean, and 20-year 360
low-pass filtered monthly anomaly time series, respectively. Color coded numbers to the 361
right of each set of curves denote correlation coefficients between each pair of indices 362
(e.g., an orange and blue numeral gives the correlation between cloudiness and SST). 363
364 365
19
Auxiliary Material for 365 366
Twentieth Century Tropical Sea Surface Temperature Trends Revisited 367 368
Clara Deser and Adam S. Phillips 369 National Center for Atmospheric Research, Boulder, Colorado 370
371 Michael A. Alexander 372
NOAA/Earth System Research Laboratory, Boulder, Colorado 373 374
March 18, 2010 (submitted to GRL) 375 376 377
20
378
Figure 1. Distribution of SST observations from HadSST2, shown as the percent of 379
months with at least 1 observation per 2º latitude x 2º longitude grid box during each 380
decade as indicated. 381
382
21
383 384 385
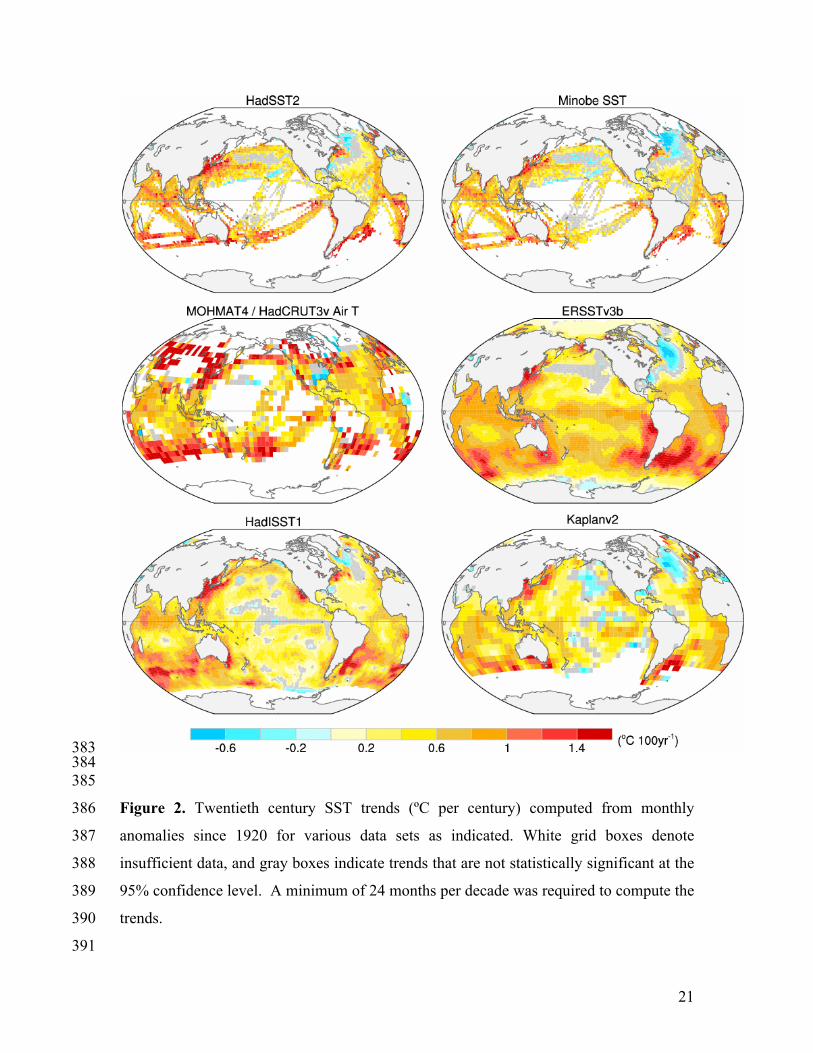
Figure 2. Twentieth century SST trends (ºC per century) computed from monthly 386
anomalies since 1920 for various data sets as indicated. White grid boxes denote 387
insufficient data, and gray boxes indicate trends that are not statistically significant at the 388
95% confidence level. A minimum of 24 months per decade was required to compute the 389
trends. 390
391
Related Documents