Twelve automated thresholding methods for segmentation of PET images: a phantom study This article has been downloaded from IOPscience. Please scroll down to see the full text article. 2012 Phys. Med. Biol. 57 3963 (http://iopscience.iop.org/0031-9155/57/12/3963) Download details: IP Address: 67.227.199.122 The article was downloaded on 04/06/2012 at 09:11 Please note that terms and conditions apply. View the table of contents for this issue, or go to the journal homepage for more Home Search Collections Journals About Contact us My IOPscience

Welcome message from author
This document is posted to help you gain knowledge. Please leave a comment to let me know what you think about it! Share it to your friends and learn new things together.
Transcript
Twelve automated thresholding methods for segmentation of PET images: a phantom study
This article has been downloaded from IOPscience. Please scroll down to see the full text article.
2012 Phys. Med. Biol. 57 3963
(http://iopscience.iop.org/0031-9155/57/12/3963)
Download details:IP Address: 67.227.199.122The article was downloaded on 04/06/2012 at 09:11
Please note that terms and conditions apply.
View the table of contents for this issue, or go to the journal homepage for more
Home Search Collections Journals About Contact us My IOPscience

IOP PUBLISHING PHYSICS IN MEDICINE AND BIOLOGY
Phys. Med. Biol. 57 (2012) 3963–3980 doi:10.1088/0031-9155/57/12/3963
Twelve automated thresholding methods forsegmentation of PET images: a phantom study
Elena Prieto1, Pablo Lecumberri2, Miguel Pagola3, Marisol Gomez2,Izaskun Bilbao4, Margarita Ecay4, Ivan Penuelas1
and Josep M Martı-Climent1,5
1 Department of Nuclear Medicine, Clınica Universidad de Navarra, Pıo XII 36,31008 Pamplona, Spain2 Department of Mathematics, Universidad Publica de Navarra, Pamplona, Spain3 Department of Automatics and Computing, Universidad Publica de Navarra, Pamplona, Spain4 Small Animal Imaging Research Unit, Center for Applied Medical Research (CIMA) andClınica Universidad de Navarra, Pamplona, Spain
E-mail: [email protected] and [email protected]
Received 14 February 2012Published 31 May 2012Online at stacks.iop.org/PMB/57/3963
AbstractTumor volume delineation over positron emission tomography (PET) images isof great interest for proper diagnosis and therapy planning. However, standardsegmentation techniques (manual or semi-automated) are operator dependentand time consuming while fully automated procedures are cumbersome orrequire complex mathematical development. The aim of this study was tosegment PET images in a fully automated way by implementing a set of 12automated thresholding algorithms, classical in the fields of optical characterrecognition, tissue engineering or non-destructive testing images in high-tech structures. Automated thresholding algorithms select a specific thresholdfor each image without any a priori spatial information of the segmentedobject or any special calibration of the tomograph, as opposed to usualthresholding methods for PET. Spherical 18F-filled objects of different volumeswere acquired on clinical PET/CT and on a small animal PET scanner,with three different signal-to-background ratios. Images were segmented with12 automatic thresholding algorithms and results were compared with thestandard segmentation reference, a threshold at 42% of the maximum uptake.Ridler and Ramesh thresholding algorithms based on clustering and histogram-shape information, respectively, provided better results that the classical42%-based threshold (p < 0.05). We have herein demonstrated that fullyautomated thresholding algorithms can provide better results than classicalPET segmentation tools.
(Some figures may appear in colour only in the online journal)
5 Author to whom any correspondence should be addressed.
0031-9155/12/123963+18$33.00 © 2012 Institute of Physics and Engineering in Medicine Printed in the UK & the USA 3963

3964 E Prieto et al
Introduction
Main applications of positron emission tomography (PET) include tumor diagnosis, staging,detection of relapse, restaging, follow-up and therapy response evaluation. Nowadays, dueto the high diagnostic accuracy of PET and the invaluable importance of the functionalinformation that it provides (Jentzen et al 2007), its role in therapy planning is beinginvestigated (van Baardwijk et al 2006, Pirotte et al 2006). The principal requirement forradiotherapy or surgery planning is the determination of the extent of the disease. In clinicalroutine, accurate tumor volume estimation is based on manual delineation over anatomicalimages such as computed tomography (CT) or magnetic resonance imaging (MRI). Thedefinition of volumes on PET images is likely to be more problematic than in CT due to itspoorer resolution and its higher level of noise.
Different options have been described for defining lesion volumes over PET images (Zaidiand El Naqa 2010). The simplest method is the visual interpretation of the PET scan and themanual delineation of contours, with an appropriate computer interface, as judged visuallyby a trained nuclear medicine physician. However, this method depends on the window-levelsettings of the images and is subject to notable inter-operator variability.
Several studies have been published about segmentation with a fixed threshold based onthe standard uptake value (SUV). This threshold has been defined by several researchers eitherin the form of an absolute SUV value (2.5) (Paulino et al 2005) or as a relative threshold, thatis, a specific percentage (e.g. 42%) of the maximum SUV in the lesion (Schinagl et al 2007,Nestle et al 2005). The optimum percentage has been demonstrated to depend on the size, shapeand contrast of the lesion (Erdi et al 1997). Therefore, adaptive thresholding methods havebeen developed, where the threshold is adjusted for each image attending to some calibrationcurves. Two types of adaptive methods exist, with calibration curves obtained either fromempirical measurements (Daisne et al 2003) or from analytical assessment (van Dalen et al2007). Empirical adaptive methods rely on phantom studies with objects of various sizes andprovide the ideal threshold for each studied object as a function of signal-to-background ratio(SBR) and target size. Then, regression is carried out in order to obtain the ideal thresholdfor a wider range of conditions. Alternatively, calibration curves can be obtained analytically,through the mathematical simulation of blur by convolving simulated images of differentspherical objects with a Gaussian function that approximates the point-spread function of thePET system (van Dalen et al 2007). The resulting curves represent the relationship betweenthe ideal threshold and the sphere diameter.
Independently of the origin of the curves, empirical or analytical, all these methods requirea priori knowledge of some characteristics obtained from the particular image in order to selectthe suitable threshold for each patient (Jarritt et al 2006). Particularly, in all cases the size ofthe object is required prior to its segmentation, and this is in fact the unknown parameter tobe found out through the segmentation process. Several simplifications have been developedto overcome this drawback (Daisne et al 2003, Black et al 2004) and also iterative methodshave been proposed (Vauclin et al 2009). A simplified widely used approach is to apply asingle threshold from 40% to 50% of the maximum uptake in the lesion. This approach hasproved to provide good results for objects greater than 4 cm3 in a specific PET tomograph(Erdi et al 1997).
Alternatively, automated segmentation methods based either on thresholding or otherparadigms such as clustering or region growing can be used. Some non-thresholding automatedmethodologies have been previously proposed for PET including fuzzy C-means (Zhu andJiang 2004), gradient-based segmentation (Graves et al 2007), fuzzy locally adaptive Bayesiansegmentation (Hatt et al 2009, 2010) or possibility theory (Dewalle-Vignion et al 2011). These
Twelve automated thresholding methods for segmentation of PET images 3965
methods are usually complex, requiring deep mathematical development and several pre- orpost-processing steps (Zaidi and El Naqa 2010). On the other hand, many straightforwardautomated thresholding methods are classical for 2D image applications in the fields of opticalcharacter recognition (Stathis et al 2008), tissue engineering (Rajagopalan et al 2004) ornon-destructive testing images in high-tech structures (Sezgin and Sankur 2004). However, tothe best of our knowledge, these techniques have never been applied to 3D PET images. Theobjective of this study was to evaluate some of these kinds of classical automated thresholdingmethods to segment 3D PET images.
1. Methods
1.1. Experimental sets
Two different tomographs were used in this study: a clinical Siemens Biograph DuoPET/CT (Knoxville, TN, USA) and a dedicated small animal Philips Mosaic PET tomograph(Cleveland, OH, USA). The spatial resolution of the Biograph Duo system is 6.3 mm full-width at half-maximum (FWHM) in the transverse direction and 5.8 mm FWHM in the axialdirection at a radial distance of 1 cm (Erdi et al 2004). The spatial resolution of the MosaicPET is 2.7 mm FWHM in the radial direction and 3.4 mm FWHM in the axial direction at thecenter of the field of view (Huisman et al 2007). A detailed description of this system can befound in the paper by Surti et al (2005).
PET images of six hollow spheres (Data Spectrum Corporation, Hillsborough, NC, USA)with nominal diameter ranging from 10 to 31 mm and filled with fluorine-18 (18F) wereacquired. Each sphere was suspended within a cylindrical phantom specially designed to fitinto the mosaic gantry (diameter: 6 cm, height: 18 cm). The cylindrical phantom was alsofilled with 18F to provide a radioactive surrounding background to the target object. Then,each sphere was imaged separately in each tomograph (mosaic and biograph), positioned inthe center within the field of view.
Three different SBRs (2:1, 4:1 and 8:1) were simulated, by introducing approximately5.3 kBq cm!3 in the background (as referred in NEMA recommendations (National ElectricalManufactures Association 2001) for image quality tests) and 10.6, 21.2 and 42.4 kBq cm!3
respectively in the spheres. Therefore, a set of 36 images was acquired in this study: six sphereswith three different contrasts acquired in two different PET tomographs.
The acquisition and reconstruction were performed following the standard protocolin each tomograph. In the Siemens Biograph PET/CT, a CT scan was performed forattenuation correction followed by a 3 min emission scan. Attenuation-corrected PET imageswere reconstructed with an ordered-subset expectation maximization iterative reconstructionalgorithm (OSEM, 2 iterations, 8 subsets) in a 128 " 128 " 47 matrix, with a voxel (volumeelement) size of 5.3 " 5.3 " 3.4 mm3. In the Philips Mosaic PET, a 20 min emission scanwas performed followed by a transmission study acquired using a 137Cs source for attenuationcorrection. Images were reconstructed with a full 3D iterative algorithm (Philips-supplied3D-RAMLA) in a 128 " 128 " 120 matrix, with a voxel size of 1 " 1 " 1 mm3, includingcorrections for dead time, random and scatter coincidences, radioactive decay and attenuation.
Images were cropped so that the contribution of the non-radioactive background wasremoved from the image and only two different concentrations were observed in the image(sphere and cylinder). The bit-depth of each image was then reduced from 16-bits to 8-bitsper pixel.
A voxel-to-voxel ground truth was generated for each sphere. Sphere inner volumes werecalculated by accurate weight of full and empty spheres with a calibrated analytical balance
3966 E Prieto et al
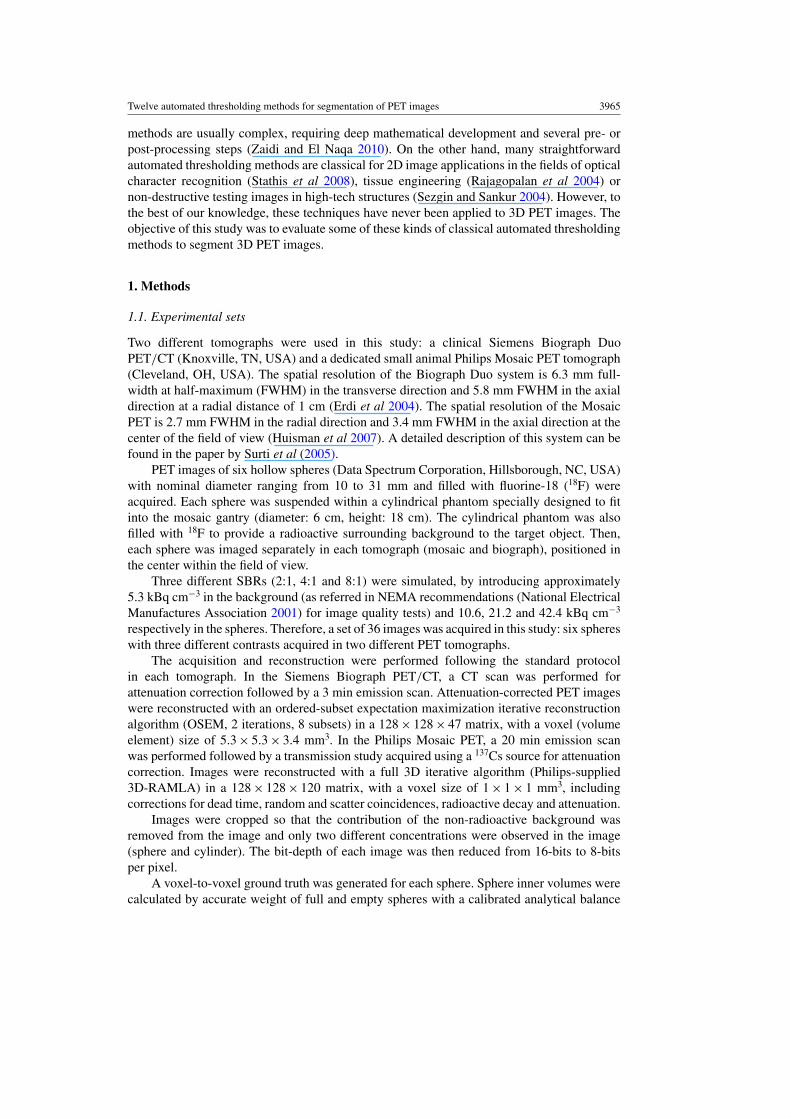
Figure 1. Images of three spheres (1, 3 and 5) with three different contrasts in both tomographs.The central slice of each 3D PET image was selected for illustration purposes.
Table 1. Measured volume and estimated radius of each sphere.
Sphere Volume (cm3) Diameter (mm)
1 16.04 31.282 11.57 28.063 5.40 21.764 2.18 16.085 1.26 13.386 0.60 10.48
(DiFilippo et al 2010). The characteristics of the spheres are listed in table 1. Besides, in orderto determine the exact position of the sphere in the image, the center of mass of each image wasdetermined. In order to exclude noisy data of the background for the calculation of the center ofmass, only pixels with intensity values exceeding a specific percentage of the maximum valuewithin the image were considered. The percentage threshold was selected by visual inspectionfor each image. Knowing diameters and centers of each sphere, binary spheres were simulatedwith a Matlab algorithm. It was unfeasible to create the ground-truth image for the smallestsphere (6) with the lowest contrast (2:1) from both tomographs because it was not even visuallydetected. Therefore, these data were discarded from the analysis and finally 34 images wereprocessed. A selection of the images processed in this study is illustrated in figure 1.
1.2. Thresholding techniques
The survey published by Sezgin and Sankur was used as in Sezgin and Sankur (2004). In thatreview, 40 different automated thresholding algorithms were described and classified into sixgroups according to the exploited information.

Twelve automated thresholding methods for segmentation of PET images 3967
(1) Clustering-based methods. This category includes algorithms where either gray-levelsamples are clustered in two parts as background and foreground or modeled as a mixtureof two Gaussians representing foreground and background.
(2) Histogram shape-based methods. These methods are based on the analysis of some featureof the smoothed histogram such as peaks, valleys and curvatures.
(3) Object attribute-based methods. These methods measure the similarity between the gray-level and the binarized images, using the fuzzy shape similarity, edge coincidence or otherimage feature.
(4) Entropy-based methods. These methods analyze some feature of the image related toentropy, such as the entropy of the foreground and background regions or the cross-entropy between the original and binarized image.
(5) Spatial methods. This category includes methods based on the analysis of higher orderprobability distribution and/or correlation between pixels.
(6) Local methods. These methods calculate a threshold for each pixel adapted to the localimage characteristics.
Some of these 40 algorithms involve application-dependent parameters (i.e. window size).Optimum values have been reported for non-destructive testing and document images, but theseparameters should be adjusted for any other type of image. Since the objective of this study wasto test completely automated methods, suitable to segment PET images obtained in differenttomographs and conditions, we have excluded 19 algorithms with user-adjustable parameters.In order to have a preliminary approximation to the behavior of the remaining methods,one slice of a 3D PET image of a sphere was saved as a 2D image. Then,the 21 algorithms were run on this image using an application for 2D images(OTIMEC software, Automated Image Thresholding Framework software, available athttp://mehmetsezgin.net/). Only the methods that provided acceptable results in thispreliminary analysis were further studied (table 2). The criterion for exclusion consistedin discarding algorithms that were unable to distinguish a circular object and provideda segmentation with all pixels belonging either to the background or to the foregroundobject.
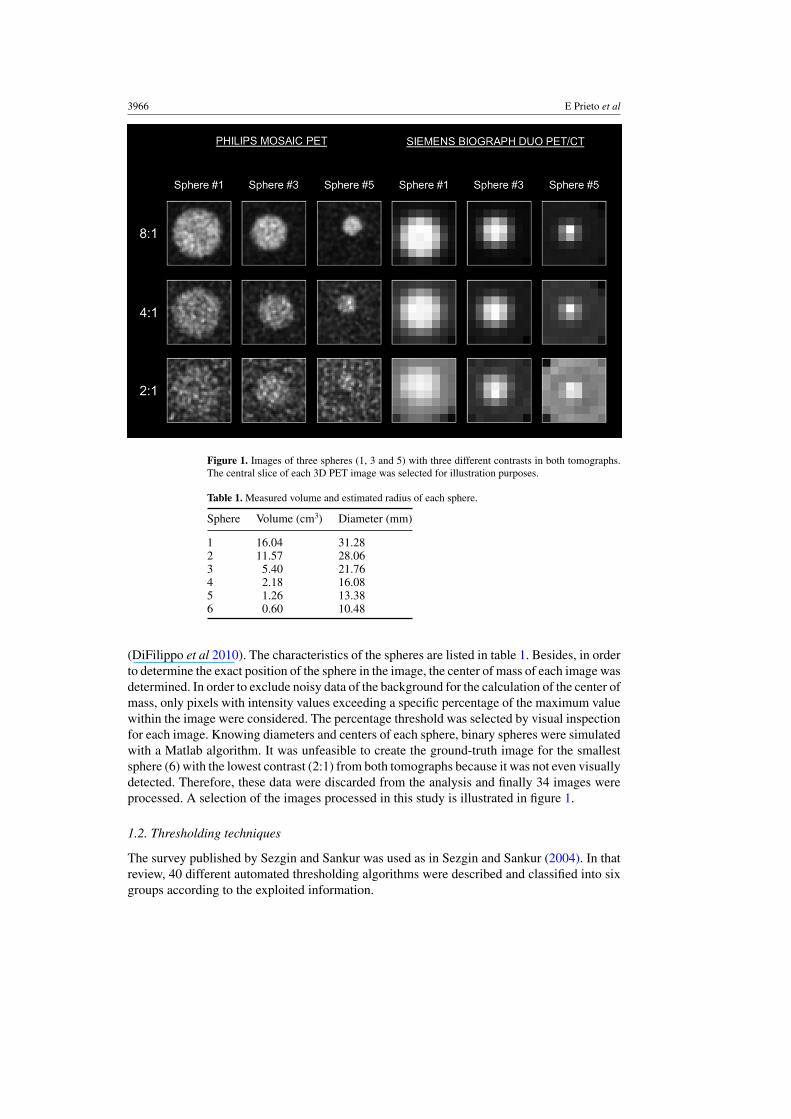
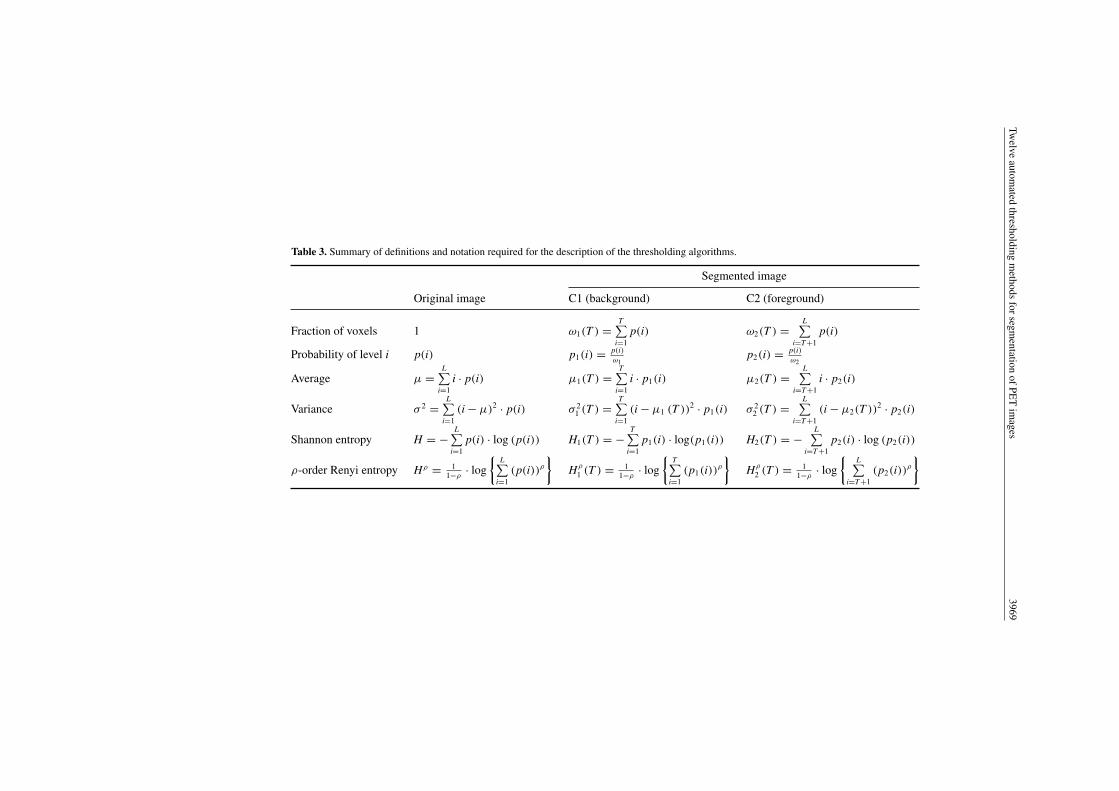
Consequently, 12 methods are included in this analysis for the segmentation of PETimages. These 12 thresholding methods were implemented in Matlab for 3D image processing.A brief description of each method is included here, using the following notation: an imageis a gray-scale intensity function, and contains N voxels with levels from 1 to L, where L isthe maximum intensity value in the image (i.e. 255 for 8-bit quantization). The number ofvoxels in the image with intensity level i is denoted, with fi being the probability of that ilevel p(i) = (fi/N). The thresholding process divides the voxels of the image into two classes,C1 with intensity values [1, . . . , T] and C2 with intensity values [T+1, . . . ,L], with T being thethreshold level. The result of segmentation is a binary image where all voxels assigned to classC1 (background) have the value 0 (black) and all pixels assigned to class C2 (foreground) havethe value 1 (white). The variables required for the description of the methods are summarizedin table 3:
A brief description of each algorithm is included below.

3968 E Prieto et al
Table 2. Automated thresholding algorithms evaluated (Sezgin and Sankur 2004).
Category Algorithm
Clustering KittlerLloyda
Otsua
Ridlera
Yannia
Histograme-shape Ramesha
RosenfeldObject-Attribute Hertza
Huanga
PikazTsaia
Entropy BrinkKapura
Lia
PunSahooa
ShanbhagYena
Spatial BeghdadiPal aPal b
a Included in the 3D study after preliminary tests in 2D.
1.2.1. Clustering-based methods.
• Lloyd (1985) assumes that the image can be modeled by a mixture distribution of twoequal variance Gaussian density function and minimizes the total misclassification errorvia iterative research. For the (n +1)-iteration, optimum threshold is updated as follows:
Tn+1 = µ1(Tn) + µ2(Tn)
2+ ! 2
µ1(Tn) + µ2(Tn)· log
"2(Tn)
"1(Tn). (1)
Iterations finish when the changes between Tn and Tn+1 become sufficiently small.• Otsu (1975) calculates the threshold that maximizes the between-class variance of the
foreground and background pixels, or equivalently, minimizes within-class variance. Thismethod gives satisfactory results when the number of pixels in each class are similar:
T = arg max {"1(T ) · (µ1(T ) ! µ)2 + "2(T ) · (µ2(T ) ! µ)2}. (2)
• Ridler and Calvard (2007) model the gray-level distribution of the image as a mixture oftwo Gaussian distributions and find the optimum threshold with an iterative scheme. Forthe (n+1)-iteration, optimum threshold is assessed as the average of the foreground andbackground class means, assuming foreground and background contain same number ofvoxels. Iterations finish when the changes between Tn and Tn+1 become sufficiently small:
Tn+1 = µ1(Tn) + µ2(Tn)
2. (3)
• Yanni and Horne (1994) initialize the threshold as the midpoint between the highest andlowest gray values (imax, imin) in the histogram.
T1 = imax + imin
2. (4)
Twelve
automated
thresholdingm
ethodsforsegm
entationofPE
Tim
ages3969
Table 3. Summary of definitions and notation required for the description of the thresholding algorithms.
Segmented image
Original image C1 (background) C2 (foreground)
Fraction of voxels 1 "1(T ) =T!
i=1p(i) "2(T ) =
L!i=T+1
p(i)
Probability of level i p(i) p1(i) = p(i)"1
p2(i) = p(i)"2
Average µ =L!
i=1i · p(i) µ1(T ) =
T!i=1
i · p1(i) µ2(T ) =L!
i=T+1i · p2(i)
Variance ! 2 =L!
i=1(i ! µ)2 · p(i) ! 2
1 (T ) =T!
i=1(i ! µ1 (T ))2 · p1(i) ! 2
2 (T ) =L!
i=T+1(i ! µ2(T ))2 · p2(i)
Shannon entropy H = !L!
i=1p(i) · log (p(i)) H1(T ) = !
T!i=1
p1(i) · log(p1(i)) H2(T ) = !L!
i=T+1p2(i) · log (p2(i))
#-order Renyi entropy H# = 11!#
· log"
L!i=1
(p(i))#
#H#
1 (T ) = 11!#
· log"
T!i=1
(p1(i))#
#H#
2 (T ) = 11!#
· log"
L!i=T+1
(p2(i))#
#

3970 E Prieto et al
Histogram peaks on each side of the first threshold are calculated and final threshold is sethalf-way between the two peaks:
Ipeak1 = arg maxi=1:T1
p(i)} (5)
Ipeak2 = arg maxi=(T1+1):L
{p(i)} (6)
T =ipeak1 + ipeak2
2(7)
This algorithm assumes that foreground and background have sufficiently separateddistributions.
1.2.2. Histogram-shape-based methods.
• Ramesh et al (1995) approximate the probability mass function to a bilevel function wherethe partition point between levels provided the optimum threshold value. In order to findthe optimal approximation, an error function is defined as the sum of squares betweeneach possible bilevel function and the original gray-level histogram. This error is thenminimized:
T = arg min
$T%
i=1
(i ! µ1(T ))2 +L%
i=T+1
(i ! µ2(T ))2
&
. (8)
1.2.3. Attribute similarity-based methods.
• Hertz and Schafer (1988) consider that a thresholded image is a good representationof the original image if their corresponding edge images are approximately coincident.Edge information is determined by applying the Sobel operator, which is based on imagegradient, followed by the thinning operator that reduces all edges detected by Sobel tosingle pixel thickness. The threshold is assessed by maximization of the coincidencebetween the edge field from the gray-level image and the edge field derived from thebinarized image:
T = arg max' %
(Edge(Original Image) # Edge(BinaryImage(T )))(
(9)
• Huang and Wang (1995) consider the image as a composition of two fuzzy sets, where themembership coefficient of each gray value i to each class is as follows:
U1(i, T ) = 11 + abs(i ! µ1(T ))
(10)
U2(i, T ) = 11 + abs(i ! µ2(T ))
. (11)
Given the fuzzy membership value for each pixel, an index of fuzziness can be obtainedvia the Shannon entropy of both fuzzy sets:
Hfuzzy1 (T ) = !
L%
i=1
p(i) · [U1(i, T ) · log(U1(i, T )) ! (1 ! U1(i, T )) · log(1 ! U1(i, T ))],
(12)
Twelve automated thresholding methods for segmentation of PET images 3971
Hfuzzy2 (T ) = !
L%
i=1
p(i) · [U2(i, T ) · log(U2(i, T )) ! (1 ! U2(i, T )) · log(1 ! U2(i, T ))].
(13)
The optimum threshold is found by minimizing the fuzziness of the whole image:
T = arg min)Hfuzzy
1 (T ) + Hfuzzy2 (T )
*(14)
• Tsai (1995) considers the gray-level images as the blurred version of the ideal binary imageand establishes the threshold so that the first four moments of the original image match tothe first four moments of the binary image. The k-order moment of the gray-level image(mk) is as follows:
mk =L%
i=1
ik · p(i) for k = 0, 1, 2, 3. (15)
With z1 and z2 being the representative gray values of classes 1 and 2, respectively, thek-order moment of the binary image mk(T) is as follows:
mk(T ) = "1(T ) · zk1 + "2(T ) · zk
2 for k = 0, 1, 2, 3. (16)
Thus, the following equation system must be solved:
"1(T ) · zk1 + "2(T ) · zk
2 =L%
i=1
ik · p(i) for k = 0, 1, 2, 3. (17)
These equations are solved in the following four steps.
(1) Solve the following equations to obtain the auxiliary values c0 and c1:"c0 · m0 + c1 · m1 = !m2
c0 · m1 + c1 · m2 = !m3. (18)
(2) Solve the polynomial equation to obtain z1 and z2:$z2
1 + c1 · z1 + c0 = 0
z22 + c1 · z2 + c0 = 0
. (19)
(3) Substitute z1 and z2 in the first moment (k = 1) preserving equations to obtain "1(T).(4) The threshold T should be chosen as the gray value closest to the "1(T)-tile:
T = "1(T ) ! tile. (20)
1.2.4. Entropy-based methods.
• Kapur et al (1985) consider the image foreground and background as two differentclasses and assess the Shannon entropy of each class, as a measure of the uncertainty ofits distribution. According to Kapur, when the sum of the two classes’ entropies reachesits maximum, the image is said to be optimally thresholded:
T = arg max {H1(T ) + H2(T )}. (21)
This maximization of entropy is justified by the fact that for the correct threshold, both theobject and background regions are expected to have more or less uniform distribution ofgray values (high uncertainty within class).
3972 E Prieto et al
• Li and Tam (1998) calculate the relative entropy or Kullbak–Leibler divergence, whichmeasures the distance between the distribution of the original image and each segmentedobject. This divergence is minimized under the constraint that original and segmentedimages have identical average intensity in their foreground and background:
T = arg min{!µ1(T ) · "1(T ) · log(µ1(T )) ! µ2(T ) · "2(T ) · log(µ2(T ))}. (22)
• Sahoo et al (1997), as the Kapur algorithm, maximize entropy, but combine the results ofthree threshold values obtained from different definitions of entropy: Shannon entropy andRenyi entropies of order # = 2 and # = 1/2:
TA = arg max{H1(T ) + H2(T )}, (23)
TB = arg max)H2
1 (T ) + H22 (T )
*, (24)
TC = arg max)H1/2
1 (T ) + H1/22 (T )
*. (25)
Denoting T1, T2 and T3 as the rank ordered TA, TB and TC values, the optimum threshold isfound by their weighted combination:
T = T1
+"1(T1) + 1
4("1(T3) ! "1(T1)) · b1
,+ 1
4T2 ("1(T3) ! "1(T1)) · b2
+ T3
+1 ! p(T3) + 1
4("1(T3) ! "1(T1)) · b3
,. (26)
With b1, b2 and b3 being the weighting factors,
(b1, b2, b3) =
-../
..0
(1, 2, 1) if abs (T1 ! T2) ! 5 and abs (T2 ! T3) ! 5(1, 2, 1) if abs (T1 ! T2) > 5 and abs (T2 ! T3) > 5(0, 1, 3) if abs (T1 ! T2) ! 5 and abs (T2 ! T3) > 5(3, 1, 0) if abs (T1 ! T2) > 5 and abs (T2 ! T3) ! 5
. (27)
• Yen et al (2002) maximize the Renyi entropy with # = 2, under the same assumptions asthat of Kapur’s:
T = arg max)H2
1 (T ) + H22 (T )
*. (28)
1.3. Performance evaluation
Three quantitative metrics were used to compare the segmented object provided by eachmethod with the corresponding ground-truth image (Dewalle-Vignion et al 2011). WithF0 being the ground-truth foreground set, B0 the ground-truth background set and FT andBT the foreground and background objects segmented by the method under test, the threemetrics are defined as follows:
• Volume error (VE) measures the difference between ground-truth volume and thesegmented volume, expressed as percentage respect to the ground-truth volume:
VE(%) = 100 · abs1 |F0| ! |FT |
|F0|
2, (29)
where |X| represents the size of the set X.

Twelve automated thresholding methods for segmentation of PET images 3973
• Classification error (CE) is a classical metric widely used in PET segmentation thatmeasures the total amount of voxels that have been wrongly assigned to foreground orbackground in the tested image with respect to the volume of the ground-truth foregroundobject (Hatt et al 2009), that is,
CE(%) = 100 ·|F0 # BT | + |B0 # FT |
|F0|, (30)
where |F0 # BT| represents the number of false negative errors (voxels wrongly assigned tobackground) and |B0 # FT| represents the number of false positive errors (voxels wronglyassigned to object).
• Dice similarity index (DSI) is a similarity measure defined as twice the intersection ofsegmented and ground-truth foreground objects over their combined set:
DSI(%) = 100 · 2 · |F0 # FT ||F0| + |FT |
. (31)
The metric VE is extensively used in clinical environments (radiotherapy or surgery),because the tumor volume is an essential parameter in oncology. However, VE offerslimited information: an exact segmented volume does not guarantee that contours of realand segmented object match. Overlap measures such as CE or DSI overcome this limitation.Nevertheless, both types of metrics are used in this study, as was done in previous studies(Hatt et al 2009, Dewalle-Vignion et al 2011).
CE and VE measure error while DSI is a measurement of similarity. In order to use thesame criterion for all metrics, in the following (1-DSI) will be represented instead of DSI.Therefore, a lower value in any of the metrics represents a better segmentation. Although VEand CE can be bigger than 100%, maximum errors considered in this study were limited to100%, representing complete failure of the segmentation process. The average of the threemetrics was considered as the final metric representing overall performance.
The evaluation of the proposed algorithms includes a comparison with a standard methodused for PET images. Particularly, a threshold at 42% of the maximum value inside the lesion(Erdi et al 1997) was chosen as the standard thresholding criterion, as has been performed inprevious publications (Hatt et al 2009, Dewalle-Vignion et al 2011).
1.4. Statistical analysis
Statistical analyses were carried out in order to find significant differences among the resultsobtained with the studied methods. The use of non-parametric tests was considered due tothe fact that distribution normality, that guarantees the reliability of the parametric tests,was not satisfied for most variables. For multiple comparisons, Friedman’s test for k-relatedsamples was used to detect statistical differences among the whole group of methods. Pairwisecomparisons were evaluated using the sign test. Analyses were conducted using statisticalsoftware (SPSS, version 11.0, Chicago, IL). The significance level was set at p <0.05 for allcomparisons.
2. Results
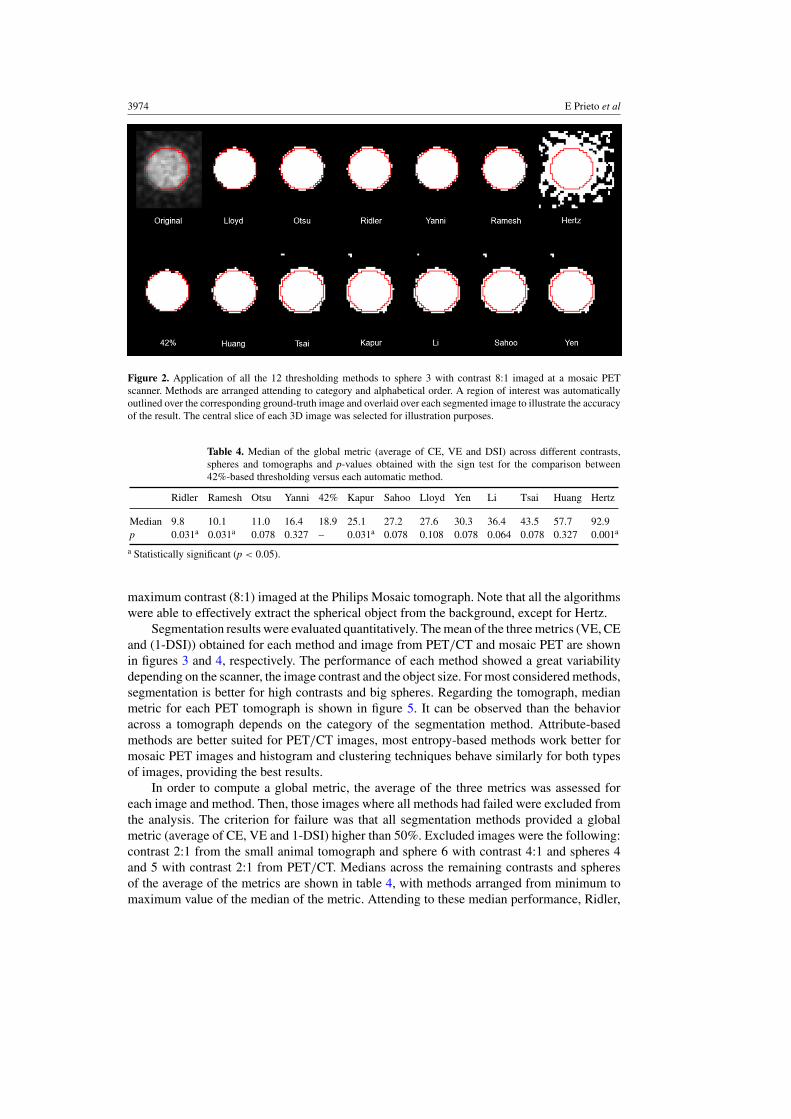
The set of 34 images was segmented with the 12 thresholding methods under test and thestandard method with a threshold at 42% of the maximum intensity level. Segmentationresults were first evaluated by visual inspection. As an example, figure 2 provides an overviewof the segmentation results obtained for a sphere with intermediate size (sphere 3) and the
3974 E Prieto et al
Figure 2. Application of all the 12 thresholding methods to sphere 3 with contrast 8:1 imaged at a mosaic PETscanner. Methods are arranged attending to category and alphabetical order. A region of interest was automaticallyoutlined over the corresponding ground-truth image and overlaid over each segmented image to illustrate the accuracyof the result. The central slice of each 3D image was selected for illustration purposes.
Table 4. Median of the global metric (average of CE, VE and DSI) across different contrasts,spheres and tomographs and p-values obtained with the sign test for the comparison between42%-based thresholding versus each automatic method.
Ridler Ramesh Otsu Yanni 42% Kapur Sahoo Lloyd Yen Li Tsai Huang Hertz
Median 9.8 10.1 11.0 16.4 18.9 25.1 27.2 27.6 30.3 36.4 43.5 57.7 92.9p 0.031a 0.031a 0.078 0.327 – 0.031a 0.078 0.108 0.078 0.064 0.078 0.327 0.001a
a Statistically significant (p < 0.05).
maximum contrast (8:1) imaged at the Philips Mosaic tomograph. Note that all the algorithmswere able to effectively extract the spherical object from the background, except for Hertz.
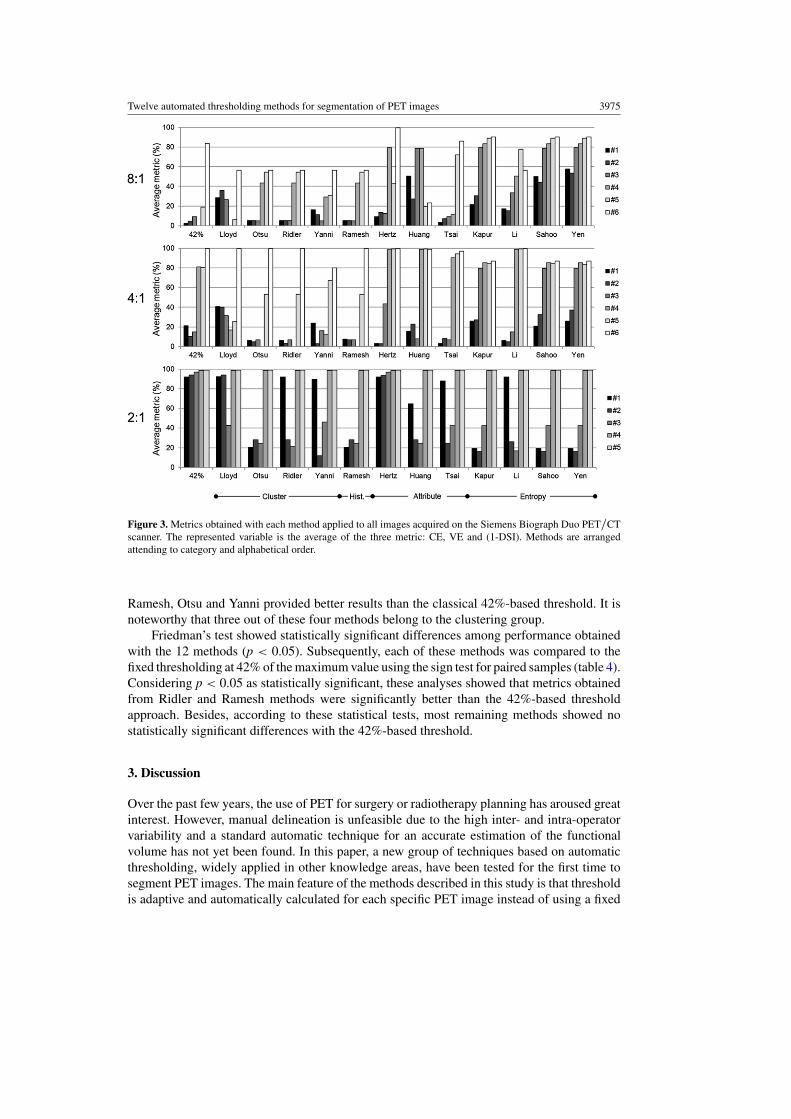
Segmentation results were evaluated quantitatively. The mean of the three metrics (VE, CEand (1-DSI)) obtained for each method and image from PET/CT and mosaic PET are shownin figures 3 and 4, respectively. The performance of each method showed a great variabilitydepending on the scanner, the image contrast and the object size. For most considered methods,segmentation is better for high contrasts and big spheres. Regarding the tomograph, medianmetric for each PET tomograph is shown in figure 5. It can be observed than the behavioracross a tomograph depends on the category of the segmentation method. Attribute-basedmethods are better suited for PET/CT images, most entropy-based methods work better formosaic PET images and histogram and clustering techniques behave similarly for both typesof images, providing the best results.
In order to compute a global metric, the average of the three metrics was assessed foreach image and method. Then, those images where all methods had failed were excluded fromthe analysis. The criterion for failure was that all segmentation methods provided a globalmetric (average of CE, VE and 1-DSI) higher than 50%. Excluded images were the following:contrast 2:1 from the small animal tomograph and sphere 6 with contrast 4:1 and spheres 4and 5 with contrast 2:1 from PET/CT. Medians across the remaining contrasts and spheresof the average of the metrics are shown in table 4, with methods arranged from minimum tomaximum value of the median of the metric. Attending to these median performance, Ridler,
Twelve automated thresholding methods for segmentation of PET images 3975
Figure 3. Metrics obtained with each method applied to all images acquired on the Siemens Biograph Duo PET/CTscanner. The represented variable is the average of the three metric: CE, VE and (1-DSI). Methods are arrangedattending to category and alphabetical order.
Ramesh, Otsu and Yanni provided better results than the classical 42%-based threshold. It isnoteworthy that three out of these four methods belong to the clustering group.
Friedman’s test showed statistically significant differences among performance obtainedwith the 12 methods (p < 0.05). Subsequently, each of these methods was compared to thefixed thresholding at 42% of the maximum value using the sign test for paired samples (table 4).Considering p < 0.05 as statistically significant, these analyses showed that metrics obtainedfrom Ridler and Ramesh methods were significantly better than the 42%-based thresholdapproach. Besides, according to these statistical tests, most remaining methods showed nostatistically significant differences with the 42%-based threshold.
3. Discussion
Over the past few years, the use of PET for surgery or radiotherapy planning has aroused greatinterest. However, manual delineation is unfeasible due to the high inter- and intra-operatorvariability and a standard automatic technique for an accurate estimation of the functionalvolume has not yet been found. In this paper, a new group of techniques based on automaticthresholding, widely applied in other knowledge areas, have been tested for the first time tosegment PET images. The main feature of the methods described in this study is that thresholdis adaptive and automatically calculated for each specific PET image instead of using a fixed
3976 E Prieto et al
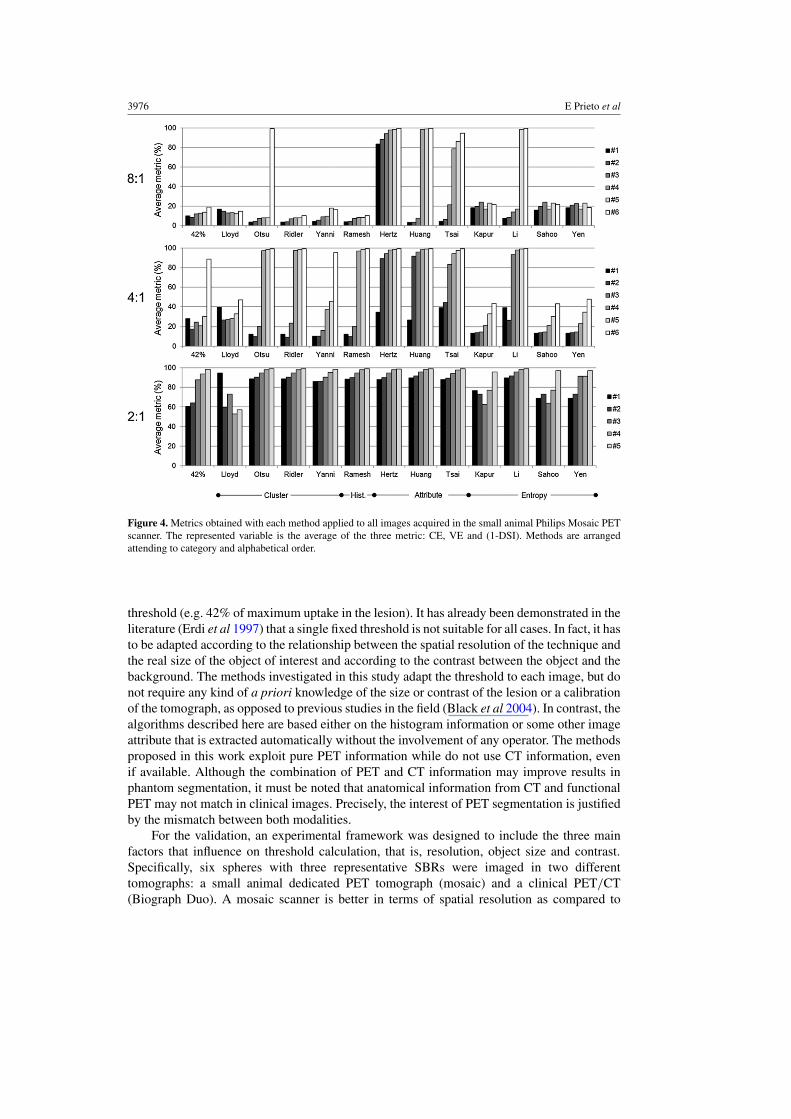
Figure 4. Metrics obtained with each method applied to all images acquired in the small animal Philips Mosaic PETscanner. The represented variable is the average of the three metric: CE, VE and (1-DSI). Methods are arrangedattending to category and alphabetical order.
threshold (e.g. 42% of maximum uptake in the lesion). It has already been demonstrated in theliterature (Erdi et al 1997) that a single fixed threshold is not suitable for all cases. In fact, it hasto be adapted according to the relationship between the spatial resolution of the technique andthe real size of the object of interest and according to the contrast between the object and thebackground. The methods investigated in this study adapt the threshold to each image, but donot require any kind of a priori knowledge of the size or contrast of the lesion or a calibrationof the tomograph, as opposed to previous studies in the field (Black et al 2004). In contrast, thealgorithms described here are based either on the histogram information or some other imageattribute that is extracted automatically without the involvement of any operator. The methodsproposed in this work exploit pure PET information while do not use CT information, evenif available. Although the combination of PET and CT information may improve results inphantom segmentation, it must be noted that anatomical information from CT and functionalPET may not match in clinical images. Precisely, the interest of PET segmentation is justifiedby the mismatch between both modalities.
For the validation, an experimental framework was designed to include the three mainfactors that influence on threshold calculation, that is, resolution, object size and contrast.Specifically, six spheres with three representative SBRs were imaged in two differenttomographs: a small animal dedicated PET tomograph (mosaic) and a clinical PET/CT(Biograph Duo). A mosaic scanner is better in terms of spatial resolution as compared to

Twelve automated thresholding methods for segmentation of PET images 3977
Figure 5. Median across different contrasts and spheres of the global metric (average of CE, VE and 1-DSI).Comparison between the mosaic small animal PET and the Biograph Duo PET/CT.
typical clinical PET/CT scanners, such us the Biograph Duo (spatial resolution $3 mm inall directions as opposed to $6 mm). However, the lower signal-to-noise level in mosaicPET-reconstructed images, determined by the number of detected events per voxel, produceshigher level of statistical noise than in biograph PET/CT (Chatziioannou 2002), consideringthat acquisition time was selected according to the standard protocols. Therefore, differentconditions of noise and resolution are covered with these two tomographs.
Statistics were performed after discarding some of the images, under the criterion thatall segmentation methods, even the reference one (42%-based threshold), should provide anaverage metric higher that 50%. Therefore, the smallest spheres with contrasts 4:1 and 2:1imaged on the PET/CT scanner and images with the lowest contrast images on the mosaic PETwere excluded. All segmentation methods proposed here, and even the reference method, havefailed to segment these images. However, it seems reasonable because these images present asmall ratio between object size and voxel size in the case of PET/CT and a high level of noiseas compared to the SBR.
Among the 12 algorithms evaluated in this paper, a great variability on the performancecan be observed. Regarding the global behavior in the whole set of images, evaluated throughthe median metric across images and analyzed statistically, two methods, Ridler and Ramesh,have proven to be better than the reference method: a threshold at 42% of the maximum uptakevalue. Besides, figure 5 shows that these methods give similar results in both tomographs.Individual results (figure 3) show that, the great advantage of Ridler and Ramesh methods isthat they are able to segment some spheres with 2:1 contrast acquired on the biograph PET/CT,impossible to segment with the 42%-based threshold, due to fact that this threshold falls in thebackground range. On the other side, these methods fail to segment the smallest spheres, due tothe fact that the size of these small spheres is close to the spatial resolution of the equipment.In fact, with the high-resolution equipment (mosaic PET) even sphere 6 (contrast 8:1) iscorrectly segmented and the metric is better than that obtained with the reference 42%-based
3978 E Prieto et al
technique. In this framework, new-generation PET systems integrating more sensitive crystaldetectors, the time–of-flight technique and optimized reconstruction algorithms improve thespatial resolution of the technique, resulting in a more precise representation of the target.Therefore, a more accurate segmentation would be obtained with the automatic thresholdingmethods applied to images from brand new PET/CT tomographs.
Regarding the whole set of methods, we can clearly observe a dependence of theperformance attending to the type of information that the algorithm exploit, that is, thecategory to which they belong (see figure 5), and the operating assumptions of each algorithm.Clustering-based algorithms show good performance and robustness across tomographs. Infact, these methods are based on assumptions that are mostly fulfilled in PET images: histogramsimilar to two mixed Gaussian distributions for Lloyd and Ridler, same number of pixels inboth classes (true in cropped images) for Otsu and Ridler and separated distributions of bothclasses for Yanni. Ramesh, assuming a bilevel distribution in the image, also presented goodperformance for both tomographs. Furthermore, the Hertz, Huang and Tsai methods based onimage attributes show clearly worse performance for mosaic PET with that for the BiographDuo. Hertz is based on borders that are more difficult to identify in the noisy image frommosaic PET, and Tsai assumes that the original image is a blurred version of the segmentedone, which is only true for Biograph PET images. Among the entropy-based methods, Kapur,Sahoo and Yen are based on maximization of entropy, assuming a uniform distribution withineach class. This condition adjusts better to mosaic PET images due to the fact that reducedspatial reduction and blurred edges in Biograph images result in an approximate Gaussian-shaped distribution. However, the Li algorithm is better designed for Biograph PET images.
This paper has proposed a new group of techniques to segment PET images and, althoughevaluation has shown promising results in phantom images, further research should beperformed to investigate the behavior of these methods in patient’s images. It must be noted thatwell-defined spheres with cold walls simulated with phantom images are not physiologicallyrealistic and the accuracy of these 12 methods must be evaluated under clinical circumstances.
4. Conclusion
Automated thresholding represents a promising tool in PET, where standard procedures arebased on manual techniques or semi-automated methods. In this paper, we have reviewedand implemented a spectrum of classical automated thresholding algorithms in order tosegment PET images. These methods are completely operator independent and select a specificthreshold for each image attending to some image feature that can be automatically extracted.These techniques have been evaluated over images with different spatial resolution, contrastand object size and results have demonstrated that Ridler and Ramesh are clearly better than therest of the studied methods and statistically better than 42%-based thresholding in global terms.While these initial results are encouraging, further work is required to test these techniques inreal oncologic images.
Acknowledgments
Pablo Lecumberri, Miguel Pagola and Marisol Gomez are partially supported by grantTIN2011-29520 from the government of Spain.
References
Black Q C, Grills I S, Kestin L L, Wong C Y O, Wong J W, Martinez A A and Yan D 2004 Defining a radiotherapytarget with positron emission tomography Int. J. Radiat. Oncol. Biol. Phys. 60 1272–82
Twelve automated thresholding methods for segmentation of PET images 3979
Chatziioannou A F 2002 Molecular imaging of small animals with dedicated PET tomographs Eur. J. Nucl.Med. 29 98–114
Daisne J F, Sibomana M, Bol A, Doumont T, Lonneux M and Gregoire V 2003 Tri-dimensional automaticsegmentation of PET volumes based on measured source-to-background ratios: influence of reconstructionalgorithms Radiother. Oncol. 69 247–50
Dewalle-Vignion A S, Betrouni N, Lopes R, Huglo D, Stute S and Vermandel M 2011 A new method for volumesegmentation of PET images, based on possibility theory IEEE Trans. Med. Imaging 30 409–23
DiFilippo F P, Gallo S L, Klatte R S and Patel S 2010 A fillable micro-hollow sphere lesion detection phantom usingsuperposition Phys. Med. Biol. 55 5363
Erdi Y E, Mawlawi O, Larson S M, Imbriaco M, Yeung H, Finn R and Humm J L 1997 Segmentation of lung lesionvolume by adaptive positron emission tomography image thresholding Cancer 80 (Suppl.12) 2505–9
Erdi Y E, Nehmeh S A, Mulnix T, Humm J L and Watson C C 2004 PET performance measurements for an LSO-based combined PET/CT scanner using the National Electrical Manufacturers Association NU 2-2001 standardJ. Nucl. Med. 45 813–21
Graves E E, Quon A and Loo B W 2007 RT_image: an open-source tool for investigating PET in radiation oncologyTechnol. Cancer Res. Treat. 6 111–21
Hatt M, Cheze-Le Rest C, Aboagye E O, Kenny L M, Rosso L, Turkheimer F E, Albarghach N M, Metges J P,Pradier O and Visvikis D 2010 Reproducibility of 18F-FDG and 3%-deoxy-3%-18F-fluorothymidine PET tumorvolume measurements J. Nucl. Med. 51 1368
Hatt M, Cheze le Rest C, Turzo A, Roux C and Visvikis D 2009 A fuzzy locally adaptive Bayesian segmentationapproach for volume determination in PET IEEE Trans. Med. Imaging 28 881–93
Hertz L and Schafer R W 1988 Multilevel thresholding using edge matching Comput. Vis. Graph. ImageProcess. 44 279–95
Huang L K and Wang M J J 1995 Image thresholding by minimizing the measures of fuzziness PatternRecognit. 28 41–51
Huisman M C, Reder S, Weber A W, Ziegler S I and Schwaiger M 2007 Performance evaluation of the PhilipsMOSAIC small animal PET scanner Eur. J. Nucl. Med. Mol. Imaging 34 532–40
Jarritt P H, Carson K J, Hounsell A R and Visvikis D 2006 The role of PET/CT scanning in radiotherapy planningBr. J. Radiol. 79 S27 (special issue)
Jentzen W, Freudenberg L, Eising E G, Heinze M, Brandau W and Bockisch A 2007 Segmentation of PET volumesby iterative image thresholding J. Nucl. Med. 48 108–14
Kapur J N, Sahoo P K and Wong A K C 1985 A new method for gray-level picture thresholding using the entropy ofthe histogram Comput. Vis. Graph. Image Process. 29 273–85
Li C H and Tam P K S 1998 An iterative algorithm for minimum cross entropy thresholding Pattern Recognit.Lett. 19 771–6
Lloyd D E 1985 Automatic target classification using moment invariants of image shapes Technical Report RAE IDNAW126
National Electrical Manufactures Association 2001 Performance measurements of positron emission tomographsNEMA Standards Publication NU 2-2001
Nestle U, Kremp S, Schaefer-Schuler A, Sebastian-Welsch C, Hellwig D, Rube C and Kirsch C M 2005 Comparisonof different methods for delineation of 18F-FDG PET-positive tissue for target volume definition in radiotherapyof patients with non-small cell lung cancer J. Nucl. Med. 46 1342
Otsu N 1975 A threshold selection method from gray-level histograms Automatica 11 285–96Paulino A C, Koshy M, Howell R, Schuster D and Davis L W 2005 Comparison of CT-and FDG-PET-defined
gross tumor volume in intensity-modulated radiotherapy for head-and-neck cancer Int. J. Radiat. Oncol. Biol.Phys. 61 1385–92
Pirotte B et al 2006 Integrated positron emission tomography and magnetic resonance imaging-guided resection ofbrain tumors: a report of 103 consecutive procedures J. Neurosurg. Pediatr. 104 238–53
Rajagopalan S, Yaszemski M J and Robb R A 2004 Evaluation of thresholding techniques for segmenting scaffoldimages in tissue engineering Med. Imaging 5370 1456–65
Ramesh N, Yoo J H and Sethi I K 1995 Thresholding based on histogram approximation IEE Proc., Vis. Image SignalProcess. 142 271–9
Ridler T W and Calvard S 2007 Picture thresholding using an iterative selection method IEEE Trans. Syst. ManCybern. 8 630–2
Sahoo P, Wilkins C and Yeager J 1997 Threshold selection using Renyi’s entropy Pattern Recognit. 30 71–84Schinagl D A X, Vogel W V, Hoffmann A L, van Dalen J A, Oyen W J and Kaanders J H A M 2007 Comparison
of five segmentation tools for 18F-fluoro-deoxy-glucose-positron emission tomography-based target volumedefinition in head and neck cancer Int. J. Radiat. Oncol. Biol. Phys. 69 1282–9
3980 E Prieto et al
Sezgin M and Sankur B 2004 Survey over image thresholding techniques and quantitative performance evaluationJ. Electron. Imaging 13 146–68
Stathis P, Kavallieratou E and Papamarkos N 2008 An evaluation technique for binarization algorithms J. Univ.Comput. Sci. 14 3011–30
Surti S, Karp J S, Perkins A E, Cardi C A, Daube-Witherspoon M E, Kuhn A and Muehllehner G 2005 Imagingperformance of A-PET: a small animal PET camera IEEE Trans. Med. Imaging 24 844–52
Tsai D M 1995 A fast thresholding selection procedure for multimodal and unimodal histograms Pattern Recognit.Lett. 16 653–66
van Baardwijk A, Baumert B G, Bosmans G, van Kroonenburgh M, Stroobants S, Gregoire V, Lambin P andDe Ruysscher D 2006 The current status of FDG-PET in tumour volume definition in radiotherapy treatmentplanning Cancer Treat. Rev. 32 245–60
van Dalen J A, Hoffmann A L, Dicken V, Vogel W V, Wiering B, Ruers T J, Karssemeijer N and Oyen W J G2007 A novel iterative method for lesion delineation and volumetric quantification with FDG PET Nucl. Med.Commun. 28 485
Vauclin S, Doyeux K, Hapdey S, Edet-Sanson A, Vera P and Gardin I 2009 Development of a generic thresholdingalgorithm for the delineation of 18FDG-PET-positive tissue: application to the comparison of three thresholdingmodels Phys. Med. Biol. 54 6901
Yanni M K and Horne E 1994 A new approach to dynamic thresholding EUSIPCO’94: 9th European Conf. Sig.Process pp 34–44
Yen J C, Chang F J and Chang S 2002 A new criterion for automatic multilevel thresholding IEEE Trans. ImageProcess. 4 370–8
Zaidi H and El Naqa I 2010 PET-guided delineation of radiation therapy treatment volumes: a survey of imagesegmentation techniques Eur. J. Nucl. Med. Mol. Imaging 37 2165–87
Zhu W and Jiang T 2004 Automation segmentation of PET image for brain tumors IEEE Nuclear Science Symp.Conf. Record (2003) pp 2627–9
Related Documents