This booklet consists of two separate documents: INVESTMENT ADVISER’S LETTER TO SHAREHOLDERS - - - - - - - - - - - - - - - - - - - - - - - - - - - - - - - - - - - - - - - - - - - - - - - - - - - - - - - - - - - - - - - - - - - - - - - - - - - - - - - - - - - - - - - - - - - - - - - - - - - - - - - - - - - - - - - - - - - - - - - - - - - - - - - - - - - - - - - - - - - ANNUAL REPORT Tweedy, Browne Global Value Fund Tweedy, Browne Value Fund Tweedy, Browne Worldwide High DividendYield Value Fund MARCH 31, 2008 TWEEDY, BROWNE FUND INC.

Welcome message from author
This document is posted to help you gain knowledge. Please leave a comment to let me know what you think about it! Share it to your friends and learn new things together.
Transcript

This booklet consists of two separate documents:
INVESTMENT ADVISER’S LETTERTO SHAREHOLDERS
- - - - - - - - - - - - - - - - - - - - - - - - - - - - - - - - - - - - - - - - - - - - - - - - - - - - - - - - - - - - - - - - - - - - - - - - - - - - - - - - - - - - - - - - - - - - - - - - - - - - - - - - - - - - - - - - - - - - - - - - - - - - - - - - - - - - - - - - - - -
ANNUAL REPORT
Tweedy, Browne Global Value FundTweedy, Browne Value Fund
Tweedy, Browne Worldwide High Dividend Yield Value Fund
MARCH 31, 2008
TWEEDY, BROWNE FUND INC.
TWEEDY, BROWNE FUND INC.
Investment Adviser’s Letter to Shareholders . . . . . . . . . . . . . . . . . . . . . . . . . . . . . . . . . . . . . . . . . . . . . . . . . I-1
Annual Report . . . . . . . . . . . . . . . . . . . . . . . . . . . . . . . . . . . . . . . . . . . . . . . . . . . . . . . . . . . . . . . . . . . . . . . . . . II-1
Tweedy, Browne Fund Inc.Investment Adviser’s Note . . . . . . . . . . . . . . . . . . . . . . . . . . . . . . . . . . . . . . . . . . . . . . . . . . . . . . . . . . . . II-2Expense Information . . . . . . . . . . . . . . . . . . . . . . . . . . . . . . . . . . . . . . . . . . . . . . . . . . . . . . . . . . . . . . . . II-5
Tweedy, Browne Global Value FundPortfolio Highlights . . . . . . . . . . . . . . . . . . . . . . . . . . . . . . . . . . . . . . . . . . . . . . . . . . . . . . . . . . . . . . . . . II-6Perspective on Assessing Investment Results . . . . . . . . . . . . . . . . . . . . . . . . . . . . . . . . . . . . . . . . . . . . . II-7Portfolio of Investments . . . . . . . . . . . . . . . . . . . . . . . . . . . . . . . . . . . . . . . . . . . . . . . . . . . . . . . . . . . . . . II-8Sector Diversification . . . . . . . . . . . . . . . . . . . . . . . . . . . . . . . . . . . . . . . . . . . . . . . . . . . . . . . . . . . . . . . . II-11Portfolio Composition . . . . . . . . . . . . . . . . . . . . . . . . . . . . . . . . . . . . . . . . . . . . . . . . . . . . . . . . . . . . . . . II-11Schedule of Forward Exchange Contracts . . . . . . . . . . . . . . . . . . . . . . . . . . . . . . . . . . . . . . . . . . . . . . . II-12
Tweedy, Browne Value FundPortfolio Highlights . . . . . . . . . . . . . . . . . . . . . . . . . . . . . . . . . . . . . . . . . . . . . . . . . . . . . . . . . . . . . . . . . II-13Perspective on Assessing Investment Results . . . . . . . . . . . . . . . . . . . . . . . . . . . . . . . . . . . . . . . . . . . . . II-14Portfolio of Investments . . . . . . . . . . . . . . . . . . . . . . . . . . . . . . . . . . . . . . . . . . . . . . . . . . . . . . . . . . . . . . II-15Sector Diversification . . . . . . . . . . . . . . . . . . . . . . . . . . . . . . . . . . . . . . . . . . . . . . . . . . . . . . . . . . . . . . . . II-16Portfolio Composition . . . . . . . . . . . . . . . . . . . . . . . . . . . . . . . . . . . . . . . . . . . . . . . . . . . . . . . . . . . . . . . II-16Schedule of Forward Exchange Contracts . . . . . . . . . . . . . . . . . . . . . . . . . . . . . . . . . . . . . . . . . . . . . . . II-17
Tweedy, Browne Worldwide High Dividend Yield Value FundPortfolio Highlights . . . . . . . . . . . . . . . . . . . . . . . . . . . . . . . . . . . . . . . . . . . . . . . . . . . . . . . . . . . . . . . . . II-18Perspective on Assessing Investment Results . . . . . . . . . . . . . . . . . . . . . . . . . . . . . . . . . . . . . . . . . . . . . II-19Portfolio of Investments . . . . . . . . . . . . . . . . . . . . . . . . . . . . . . . . . . . . . . . . . . . . . . . . . . . . . . . . . . . . . . II-20Sector Diversification . . . . . . . . . . . . . . . . . . . . . . . . . . . . . . . . . . . . . . . . . . . . . . . . . . . . . . . . . . . . . . . . II-21Portfolio Composition . . . . . . . . . . . . . . . . . . . . . . . . . . . . . . . . . . . . . . . . . . . . . . . . . . . . . . . . . . . . . . . II-21
Tweedy, Browne Fund Inc.Statements of Assets and Liabilities. . . . . . . . . . . . . . . . . . . . . . . . . . . . . . . . . . . . . . . . . . . . . . . . . . . . . II-22Statements of Operations . . . . . . . . . . . . . . . . . . . . . . . . . . . . . . . . . . . . . . . . . . . . . . . . . . . . . . . . . . . . . II-23Statements of Changes in Net Assets . . . . . . . . . . . . . . . . . . . . . . . . . . . . . . . . . . . . . . . . . . . . . . . . . . . II-24Financial Highlights . . . . . . . . . . . . . . . . . . . . . . . . . . . . . . . . . . . . . . . . . . . . . . . . . . . . . . . . . . . . . . . . . II-25Notes to Financial Statements . . . . . . . . . . . . . . . . . . . . . . . . . . . . . . . . . . . . . . . . . . . . . . . . . . . . . . . . . II-27Investment in the Fund by the Investment Adviser and Related Parties . . . . . . . . . . . . . . . . . . . . . . . II-29Report of PricewaterhouseCoopers LLP, Independent Registered Public Accounting Firm . . . . . . . . . II-31Other Information . . . . . . . . . . . . . . . . . . . . . . . . . . . . . . . . . . . . . . . . . . . . . . . . . . . . . . . . . . . . . . . . . . II-32

TWEEDY, BROWNE FUND INC.
Tweedy, Browne Global Value FundTweedy, Browne Value FundTweedy, Browne Worldwide High Dividend Yield Value Fund
INVESTMENT ADVISER’S LETTERTO SHAREHOLDERS
March 31, 2008
I-1

TWEEDY, BROWNE FUND INC.
Investment Adviser’s Letter
I-2
To Our Shareholders:We are pleased to present the Investment Adviser’s Letter
to Shareholders for the Tweedy, Browne Global Value Fund,Tweedy, Browne Value Fund and Tweedy, Browne WorldwideHigh Dividend Yield Value Fund for the year ended March 31,2008. Investment results* for the past six months and the lastone, three, five and ten years, and results since inception ofeach Fund are presented in the tables below:
Tweedy, Browne MSCI EAFE MSCI EAFE Period Ended Global Value Index Hedged Index3/31/08 Fund to US$(1)(2) in US$(1)(2)
6 Months -11.03% -17.55% -10.50%
1 Year -6.35 -14.05 -2.70
3 Years 9.32 10.07 13.32
5 Years 17.36 15.35 21.40
10 Years 8.68 3.63 6.18
Since Inception (6/15/93)(3) 11.86 6.76 7.35
Total Annual Fund Operating Expense Ratio as of 3/31/07 was 1.37%†
Total Annual Fund Operating Expense Ratio as of 3/31/08 was 1.37%†
MSCI WorldPeriod Ended Tweedy, Browne Index Hedged 3/31/08 Value Fund to US$(1)(4) S&P 500(1)(5)
6 Months -9.98% -14.57% -12.46%
1 Year -5.41 -9.22 -5.08
3 Years 4.01 N/A 5.84
5 Years 9.15 N/A 11.30
10 Years 3.93 N/A 3.50
Since Inception (12/8/93)(3) 9.52 N/A 9.53
Total Annual Fund Operating Expense Ratio as of 3/31/07 was 1.38%†
Total Annual Fund Operating Expense Ratio as of 3/31/08 was 1.37%†
Tweedy, Browne MSCI World Period Ended Worldwide High Dividend Index3/31/08 Yield Value Fund in US$(1)(4)
6 Months -3.85% -11.26%
Since Inception (9/5/07)(3) -2.69 -6.72
30-Day Standardized Yield as of 3/31/08: 2.90%
Gross Annual Operating Expense Ratio for current fiscal year ending
3/31/08 was 1.86%†‡
Net Annual Operating Expense Ratio for current fiscal year ending
3/31/08 was 1.37%†‡
* The preceding performance data represents past performance andis not a guarantee of future results. Total return and principalvalue of an investment will fluctuate so that an investor’s shares,when redeemed, may be worth more or less than their original cost.The returns shown do not reflect the deduction of taxes that ashareholder would pay on Fund distributions or the redemption ofFund shares. Current performance may be lower or higher thanthe performance data shown. Please visit www.tweedy.com toobtain performance data, which is current to the most recentmonth end. See pages I-9 and I-10 for footnotes 1 through 5,which describe the indices and inception dates of each Fund.Results are annualized for all periods greater than one year.
† The Funds do not impose any front-end or deferred sales charge.However, the Global Value Fund and the Worldwide HighDividend Yield Value Fund impose a 2% redemption fee onproceeds from redemptions or exchanges made within 60 days ofpurchase.
‡ The Adviser has contractually agreed to waive its investmentadvisory fee and/or to reimburse expenses of the WorldwideHigh Dividend Yield Value Fund to the extent necessary tomaintain the total annual fund operating expenses(excluding brokerage, interest, taxes and extraordinaryexpenses) at no more than 1.37%. This arrangement willcontinue at least through March 31, 2009. In thisarrangement, the Worldwide High Dividend Yield Value
Left to right: Will Browne, Bob Wyckoff, Chris Browne, Tom Shrager and John Spears.

I-3
Fund has agreed, during the two-year period following anywaiver or reimbursement by the Adviser, to repay suchamount to the extent that after giving effect to suchrepayment such adjusted total annual fund operatingexpenses would not exceed 1.37% on an annualized basis.The performance data shown above would be lower had feesand expenses not been waived and/or reimbursed.
The five-year old global bull market across virtually allasset classes came to a grinding halt last summer when two BearStearns-sponsored hedge funds that were invested in subprimemortgages collapsed, and Bear refused to come to the rescue.That, metaphorically, was the day the music died. The collapseof these funds signaled to financial markets that there wereserious problems in the mortgage markets, and ever since wehave all been reading the post mortems on how this allhappened, how extensive the damage might be, and who is toblame. Failure, of course, has a lot of fathers, and we are nodoubt about to see the start of the paternity suits in pursuit ofthe guilty. We are not in the business of finding guilty parties.We would rather focus on how we might benefit from thecurrent mess. What has been underestimated, in our judgment,is the magnitude of the bad credit, the ripple effect on othermarkets and the resulting crisis of confidence and uncertainty.This uncertainty has led to an unwillingness to provideliquidity at the old price levels, kicking off a series of problemsin leveraged balance sheets and portfolios – read Bear Stearnsand Peloton Partners among others. Leverage, as we all know,is great on the upside and deadly on the downside, and thecommon denominator in the markets’ troubles today is theunhappy combination of leverage and greed coupled with WallStreet’s ever-enabling creativity in packaging questionablecredits. The result has been an enormous financial super fundsite.
In previous letters, we warned of a “worrisome degree ofconfidence and complacency among investors fueled by cheapcredit, which in turn led to dramatic rises in many assetcategories and rampant speculation in stocks, bonds, real estateand commodities.” Major participants included banks,mortgage banks, investment banks, hedge funds and privateequity groups, many of which used large amounts of leverage(borrowed money) to supercharge their returns. Figurativelyspeaking, it was a veritable banquet of debt. A passingfamiliarity with margin account arithmetic should have beenadequate to make most funds leave the table. In fact, we thinkmost people probably knew in their hearts or heads it couldn’tlast, the only question being when the music would stop. Thereturns, it seems, were just simply too good to resist. We wouldnot make any predictions about when the music was going tostop and will not make a prediction as to when the music willresume, although we are confident that we will look back onthis period as an opportunity to buy into some good businessesat very attractive prices. We just tried to stay away from thetable. Now, of course, we are inundated with opinions whichrange from talk of a new depression to “I see the light at the endof the tunnel.” We will leave the timing to others and makejust one economic observation based upon our reading ofeconomic history, and that is the depression was not caused bythe 1929 market crash but rather by the economic policies of
the Hoover Administration. There seems to be fairly broadagreement that the people in charge of policy today areextremely capable and working hard to help unwind the mess.When thinking about investing, we happen to believe thatmarkets are not formulas. They are financial town hallmeetings with real people, some rational, others irrational, andmost, from time to time, emotional. The trick is to figure out away to separate yourself from the roar of the crowd and try tobe rational. We believe Ben Graham had a pretty good processfor doing that.
A brief history on how we got to where we are, while itmight be boring, may be instructive. The entire mess beganwith the lowly mortgage. Large numbers of people (estimatesrun into the millions) with limited financial resources werepersuaded to borrow too much money to either buy orrefinance a house with a low initial interest rate. Nobody, itseems, was too concerned about how high that rate might go ina few years. Maybe it was too far in the future to consider. Sowas born the subprime borrower. The oxygen for this was cheapmoney. Responding to deflationary fears following 9/11, theFederal Reserve lowered interest rates to unprecedented levels,and with cheap money, residential real estate skyrocketed.With escalating house prices, mortgages seemed like a low riskbet. The problem in all of this, in our humble opinion, was two-fold. Lenders no longer cared whether the loan was good ornot. They took a fee for originating the loan and sold it on toanother who packaged the loans, the packagers then in turntook a fee and sold it on to another financial firm who slicedthe loans up into CDOs (collateralized debt obligations), tooka fee, and sold them to investors. Rating agencies broughtmagic to the process by converting pools of subprime mortgagesinto investment grade paper. As we sometimes say, no one hadany real skin in the game. The fees drove the process; the creditwas going to be someone else’s problem. The process turnedreally toxic when the buyers – banks, investment banks, hedgefunds – borrowed large amounts of money on a short-term basisto buy the CDOs on which they received a higher rate ofinterest. They used the CDOs as collateral to borrow moremoney to buy more CDOs. It isn’t too hard to see howproblems might develop. Layered on top of this are creditdefault swaps (CDSs). We won’t say too much about theseinstruments. They were originally created to provide insuranceagainst debt defaults, albeit without any reserves, whichprobably wasn’t a good idea to begin with. With the help ofhedge funds and proprietary trading desks, CDSs mutated intoa mechanism to speculate on these new debt instruments withthe nominal value of the swaps today exceeding the value ofthe underlying instruments by a factor of roughly eight times,by some estimates. Today we have trillions of dollars of theseCDOs, CMOs, CDSs, etc. in the financial system with fewbuyers and a weakening housing market. Our view is that it willtake time to unwind the debt and there will be plenty ofvolatility, and no doubt very gloomy predictions in the process.We believe the most rational way to behave is to look for theoccasional baby that gets thrown out with the bath water, andto focus on identifying a good business with strong financialand competitive characteristics at attractive prices. In the notso long run, the economics should win out to our benefit.

I-4
Performance: Results and Attribution
So how have our Funds weathered this turbulent period?While all three of our Funds were not immune to the downturnover the last year, all three significantly outperformed theirrespective benchmarks as the credit crisis unfolded. TheTweedy, Browne Global Value Fund finished this roller coasterperiod down 6.35% while the MSCI EAFE Index hedged backinto U.S. dollars was down 14.05% during the period. TheTweedy, Browne Value Fund marginally underperformed theS&P 500 for the year, but held up very well against the MSCIWorld Index hedged back into U.S. dollars, declining 5.41%versus 9.22% for the index. The Value Fund now hasapproximately 35% of its net assets invested in non-U.S.companies. The new Tweedy, Browne Worldwide HighDividend Yield Value Fund, which began operations onSeptember 5th of last year, has also gotten off to a good relativestart, declining since its inception 2.69% versus a decline of6.72% for the MSCI World Index. While negative results arenothing to boast about, we were gratified that the Funds heldup fairly well during perhaps one of the most volatile periodsthat we have experienced in our 30 plus years of investing.
The subprime mortgage crisis has spawned anunprecedented level of equity market volatility over the lasteight months. Since the bursting of the credit bubble back inAugust, the MSCI EAFE Index has had 17 days of gains orlosses in excess of 2%. In contrast, in the first half of the 2007calendar year, there were only three such days, and in thecombined years of 2005 and 2006 there were a total of just sixsuch days. This increased volatility was not confined to theinternational markets. The S&P 500 also had 26 days duringthe last eight months with gains or losses in excess of 2%. Thiscompares to two days in the first half of 2007, and only twosuch days for the combined years 2005 and 2006. Needless tosay, this kind of market churn generally produces pricingopportunities for value investors such as ourselves.
Ebullient markets such as we had over the last five yearsjust prior to the inception of the credit crisis are generally notthe kind of environment in which value investing shines, atleast not on a relative basis, and this proved to be the caseparticularly in our Value Fund. For the one, three and five-yearannualized periods ending June 30, 2007 for instance, ourValue Fund underperformed the S&P 500 and the MSCIWorld Index hedged to U.S. dollars despite generating solidabsolute returns. During rapidly rising markets, we and othervalue investors often have a hard time finding undervaluedstocks, which leads to rising cash positions, which in turn dragdown portfolio returns. As you will recall, we closed our doorsto new investors in early 2005, preferring not to dilute ourexisting shareholders’ returns by taking on new money that webelieved could not effectively be put to work. With the recentmarket downturn, our Value Fund is now starting to gainconsiderable ground on its benchmark indices.
Over the long term, we believe that how one performs indifficult environments is as important, or perhaps even moreimportant than how one performs in the bull market phase, andin that respect, we believe we have more than held our own.Looking back over the last 14 plus years, the MSCI EAFEIndex hedged to U.S. dollars and the S&P 500 had four and
three down market years, respectively. As you can see from thefollowing chart, our Global Value Fund and Value Fundoutperformed these indices in each of those down periods,producing a cumulative net loss of 1.76% and 2.70%,respectively, versus a cumulative loss of 42.55% and 37.61% forthe MSCI EAFE Index hedged to U.S. dollars and the S&P500, respectively.(6)
Performance in Down Market Years
The most recent downturn over the last nine months is noexception. While we have faced declines in our Funds, thesehave not been as significant as the declines in the broad marketindices. Between June 30, 2007 and March 31, 2008, whenmost of the carnage occurred, the MSCI EAFE Index (Hedgedto U.S. dollars), the MSCI World Index (Hedged to U.S.dollars), and the S&P 500 declined 19.23%, 14.54% and10.68%, respectively. In contrast, our Global Value and ValueFunds finished this same period down an estimated 11.60% and10.05%, respectively. The Worldwide High Dividend YieldValue Fund also held up well during this period declining2.69% since its inception on September 5, 2007 versus adecline of 6.72% for the MSCI World Index in U.S. dollars.(6)
The downturn in our Funds was muted, at least in part,due to the fact that we have had modest direct exposure to thesubprime problem. With the exception of our holdings in AIG,HSBC and Bank of America, which, we believe, havemanageable amounts of capital invested in subprime mortgagesand have many other compensating competitive advantages,we have had very little investment in those areas of the marketthat were the most affected.(7)
The returns for our portfolios over the last year werefueled, in large part, by solid returns in our food, beverage, andindustrial holdings, and continued strength in our Finnish,Dutch, Mexican and South Korean stocks. Our significantunderweighting in Japan also held us in good stead, as thismarket has been under pressure over the last year or so. Ourfinancial stocks, which were down in double digits, still faredbetter than their index counterparts. Our lack of anymeaningful exposure to energy stocks, aside from those in ourhigh dividend yield portfolios, was a drag on our relative results.Those energy stocks that we did own in the Worldwide HighDividend Yield Value Fund underperformed their peers. Oursignificant weighting in media stocks also did not serve us wellduring this period.
Among the most significant individual contributors toportfolio returns over the last year were stocks such as ABNAMRO (Global Value and Value), Kone OYJ (Global Value),Nestle (Global Value and Value), Coca-Cola Femsa (Global
05
-5
10
-10
20
-20
15
-15
30
-30
25
-25
35
-35
TB Global Value Fund MSCI EAFE (Hedged) TB Value Fund S&P 500
4.36
1994 2000 2001 2002
12.39
-4.38
14.45
-9.13-4.67
-15.87
-0.09
-11.88 -12.14
-27.37
-14.91-22.09
TB Value Fund
-1.67
All returns are after the deduction of fees and expenses.

I-5
Value), Samsung SDI (Global Value), Leucadia National(Value), Kimberly-Clark (Worldwide High Dividend YieldValue), AKZO Nobel (Global Value and Worldwide HighDividend Yield Value), and Grolsch (Global Value). As youmay recall, ABN AMRO was acquired by the Royal Bank ofScotland consortium in late October, after a long andcontentious battle with Barclays. When we first purchasedABN AMRO, we believed it was cheap on a fundamental basis,selling at approximately 10 times earnings with a dividend yieldof over 5%. Moreover, while the performance of the bankoverall was below average, our research indicated that they hadseveral very valuable businesses within the bank which wouldbe attractive to competitors. Our return on the investment wasapproximately 130% in local currency in the Global ValueFund, and 125% for the Value Fund, including dividends forboth Funds, during the roughly six year period that we ownedit, with much of our return being realized when it was acquiredby the consortium, which split up the various pieces amongthemselves. As is frequently the case, getting in at a cheap pricewas the key to getting a good return on our investment.
Similarly, in our Global Value Fund, Grolsch, the Dutchbeer brewer, has been acquired by SABMiller PLC, and was uproughly 190% over our original cost at the time we tenderedour shares. Again, we’ve held this stock since March 1999, andmost of our return occurred in a concentrated burstimmediately after the takeover bid was announced.
Another stock that contributed significantly to last year’sresults was Nestle, the large Swiss food company. This is a stockthat has been a core holding in many of our portfolios for thelast seventeen years. Many of our clients may think that thebulk of our returns over the long term are attributable to oursmaller and medium capitalization holdings. That is not alwaysthe case. Nestle, which we first purchased for the Global ValueFund and the Value Fund back in 1993, has compounded at anaverage annualized return of 12.5% and 12.7% per yearincluding dividends, for the Global Value Fund and the ValueFund, respectively, over the last fifteen years. We believe thatNestle is well managed, has a diversified array of over 100different branded products sold on a worldwide basis, producessteady and consistent growth in earnings, and affords investorsa relatively safe way to participate in the growth of emergingmarkets around the globe.
The increase in Nestle’s stock price has been significant since Tweedy, Browne began buying it
in 1993
Larger capitalization securities such as Nestle now accountfor roughly two-thirds of net assets in the Global Value Fundversus one-third in smaller and medium capitalizationcompanies. Five years ago, the reverse was the case withsmaller and medium capitalization companies accounting fortwo-thirds of net assets. This change in composition has comeabout simply because there is more value to be found today inlarger companies. We sold a number of our smaller companiesas they surged in price over the last five years.
Another segment of our Funds’ portfolios that producedattractive returns over the last year were our South Koreanstocks. The values we have been able to uncover in this mostdeveloped of developing nations have been nothing less thanextraordinary. Even in the short run, value has been borne outby rapidly advancing stock prices. Stocks such as Samsung SDI,Dongah Tire & Rubber, Taeyoung Engineering, Hanil Cementand Youngone Corporation, among others, produced attractivereturns for our Global Value Fund.
Despite these gains, a number of the stocks in our Fundswere dragged down in price during the year, not surprisinglysome of our financial, retail and media-related holdings. Stockssuch as Comcast (Value), Axel Springer (Global Value),Mediaset (Global Value, Value and Worldwide High DividendYield Value), Mondadori (Global Value, Value and WorldwideHigh Dividend Yield Value), Home Depot (Value andWorldwide High Dividend Yield Value), and AIG (GlobalValue and Value) all finished the year in negative territory,despite what we feel are very attractive long-term fundamentalsfor each of them.
Currency Hedging and Its Impact on Recent Returnsand Peer Group Comparisons
As you know, over 14 years ago when we established theGlobal Value Fund, we decided to try to eliminate currency riskfrom our non-U.S. investments by hedging our foreigncurrency exposure back into the U.S. dollar. By doing this, webelieved we would be able to earn our returns in the stocks andnot the currencies. After all, we had gone abroad looking forcheap stocks, not to speculate in foreign currencies. From ourpoint of view, valuing a stock was one thing, valuing a currencywas something entirely different. We knew we couldn’t do it,and quite frankly, we were not at all confident that anyone elsecould either, at least on a reasonably consistent basis.
It was also comforting to know that we could eliminatewhat we felt to be an undesirable element of internationalinvesting at a de minimis cost over the long term.(8) Study afterstudy had indicated that over long measurement periods,currency was generally a wash in terms of its impact on returns,and whether you hedged or didn’t hedge, you tended to comeout in roughly the same place in terms of performance. We alsofound added reassurance in a paper written by André Perold,the noted Harvard Business School professor entitled, The FreeLunch in Currency Hedging,a where he found that hedgingcurrency exposure greatly enhanced the diversificationpotential of foreign investments. He went on to find thatoutside of transaction costs associated with hedging, whichappeared to be minimal, it was hard to make the case thatcurrency hedging reduced long-run expected returns.
0
100
200
300
400
500
600
6/30/1
993
6/30/1
994
6/30/1
995
6/30/1
996
6/30/1
997
6/30/1
998
6/30/1
999
6/30/2
000
6/30/2
001
6/30/2
002
6/30/2
003
6/30/2
004
6/30/2
005
6/30/2
006
TB Global Value Fund6/24/93 - 3/31/08Cumulative Return:Annualized Return:
465.5%12.5%
TB Value Fund12/9/93 - 3/31/08Cumulative Return:Annualized Return:
457.2%12.7%
Including the return from dividends, $10,000 investedin June and December 1993 would be valued at
$56,500 and $55,700 at March 31, 2008, respectively.
Split
-Adj
uste
d Pr
ice
Source: Bloomberg

I-6
So how did the theory hold up in reality over the last 14plus years? Surprisingly well. In fact, back in September of lastyear, had you gone to our website and looked at the annualizedreturns since the inception of our Fund for the EAFE Index,both hedged and unhedged, you would have found only a onebasis point difference between EAFE Hedged and EAFEUnhedged over a 14 plus year period. During that period theU.S. dollar strengthened in seven of the calendar year periodsand weakened in the other seven. The theory, indeed, hadproven out at least for that period.
That said, in the shorter term, hedged and unhedgedreturns can diverge dramatically. For example, the U.S. dollarhas declined vis-à-vis the Euro in four out of the last five years,giving a large currency boost to the returns of unhedgedinternational investors. This is one of the main reasons whydespite having beaten the hedged MSCI EAFE Index in sevenout of the last eight years, in recent years the Tweedy, BrowneGlobal Value Fund has trailed many of the funds to which weare closely compared, as they are for the most part unhedged.
We don’t know when the U.S. dollar will strengthen, butif the past is indeed prologue, it will strengthen at some point,and when it does, our portfolios will be protected from thedilutive impact of weakening foreign currencies, and our peergroup performance comparisons should reverse.
When we opened the Global Value Fund in 1993, thedollar had been under pressure for most of the previous eightplus years. We had record twin deficits, and there were nodollar bulls to be found. Many investors, when learning of ourFund, liked our investment approach, but didn’t like ourhedging policy. Well, we all know what happened over thenext eight plus years. The Federal budget fell into balance andthe dollar strengthened. During this period, our forwardhedging contracts protected our Fund to a great degree from thedilutive impact of declining foreign currencies relative to thedollar. Again, theory became reality.
While we would prefer not to go through periods when ourpeer group comparisons suffer due to our hedging policy, we areconfident — based on empirical data and our own experience— that it will correct itself over time, and currency will onceagain prove to be a wash in terms of its impact on internationalinvestment returns.
We’d like to make one more point regarding our hedgingprocess. We hedge what we believe to be our perceived non-U.S.currency exposure back into the dollar. What do we mean byperceived exposure? Some big multinational corporations thatare domiciled in a foreign country and whose shares aredenominated in a foreign currency earn a substantial amount oftheir profits in U.S. dollars through the sale of products to U.S.consumers. For example, Nestle, which is headquartered inSwitzerland and whose shares are denominated in Swiss Francs,earns as much as 40% of its annual profits in U.S. dollars. Thismeans we are already somewhat hedged with respect to theSwiss franc exposure of our Nestle shares without having toenter into a forward hedging contract. If the dollar strengthens,we feel that we are somewhat protected from the decline inSwiss franc-denominated Nestle by the fact that Nestle’s stockshould benefit from the currency translation profits theyreceive from their U.S. sales. Because of this fact, we onlypartially hedge our position in Nestle back into the dollar. In
essence, we are only hedging our perceived exposure to the Swissfranc as best as we can determine, which is the non-U.S. profitcomponent of Nestle. As a matter of policy, we only partiallyhedge the nominal currency exposure of companies who earnwhat in our analysis is a material or significant portion of theirprofits in U.S. dollars. As of March 31, 2008, our hedge ratio,or the value of our forward contracts versus our total nominalnon-U.S. currency exposure, was approximately 70%. Theother 30% was implicitly hedged by the U.S. profits of thesecompanies.
We intend to continue, absent extraordinarycircumstances, to hedge the perceived foreign currencyexposure inherent in our non-U.S. equity investments backinto the U.S. dollar. Remember, we believe that we neithermake money nor do we lose money over the long term onforeign currency in the overall portfolio by hedging. When yousee losses in our hedging contracts, they are generally offset bycorresponding currency translation gains in the shares of ournon-U.S. holdings. We are simply attempting to set aside whatwe believe to be the unmanageable and speculative componentof the return that results when one invests in a stockdenominated in a currency other than the U.S. dollar. Thetheory suggests that aside from transaction expenses which arede minimis, there is virtually no cost in doing this over the longterm, and our experience over the last 14 years, we believe, hasborne this out.
New OpportunitiesThe silver lining in our current rather grim investment
environment is that we believe that we are in the process ofbeing presented with an unusual opportunity to buy trulyundervalued businesses on our terms. While broad marketindices have declined roughly 15% since the credit bubbleburst in August of last year, there has been heightenedvolatility in certain sectors, industry groups and countries, andsome stocks are beginning to offer what appear to becompelling values.
Perhaps the segment of the stock market that has causedthe most anxiety of late, aside from housing stocks, is financialstocks. As a group, these stocks are down approximately 34%from their highs in the face of large and serious markdowns,which for many has caused considerable damage to theirbalance sheets. One must tread cautiously here, but there aresome very good companies that we feel are “being thrown outwith the bathwater,” companies such as Lloyds TSB, AmericanExpress, AIG and U.S. Bancorporation. We have been addingto our positions in these companies. While there might befurther markdowns in financial stocks to come, given the levelof uncertainty in the stock market, at current prices, adiversified group of financials such as these should proverewarding looking beyond the current environment.
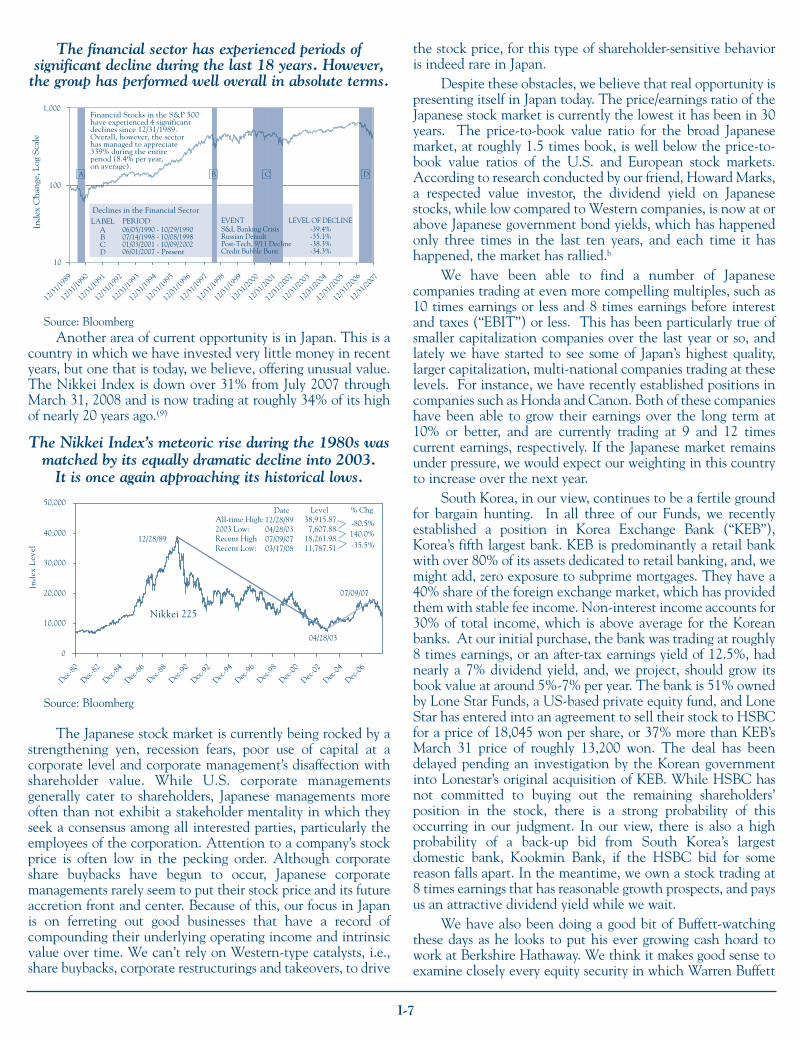
While the past performance of any stock or industry sectoris not necessarily indicative of future returns in general, or ourFunds in particular, over the last 18 years, there have been fourtimes when financial stocks corrected by as much as 30% ormore. Yet over this entire period, a buy and hold investor wouldhave made a cumulative return of 339% or roughly 8.40% peryear on average. If you include estimated dividends during thisperiod, your return would have been approximately 10% to11% annualized. Not bad for such a turbulent period.
I-7
The financial sector has experienced periods of significant decline during the last 18 years. However,
the group has performed well overall in absolute terms.
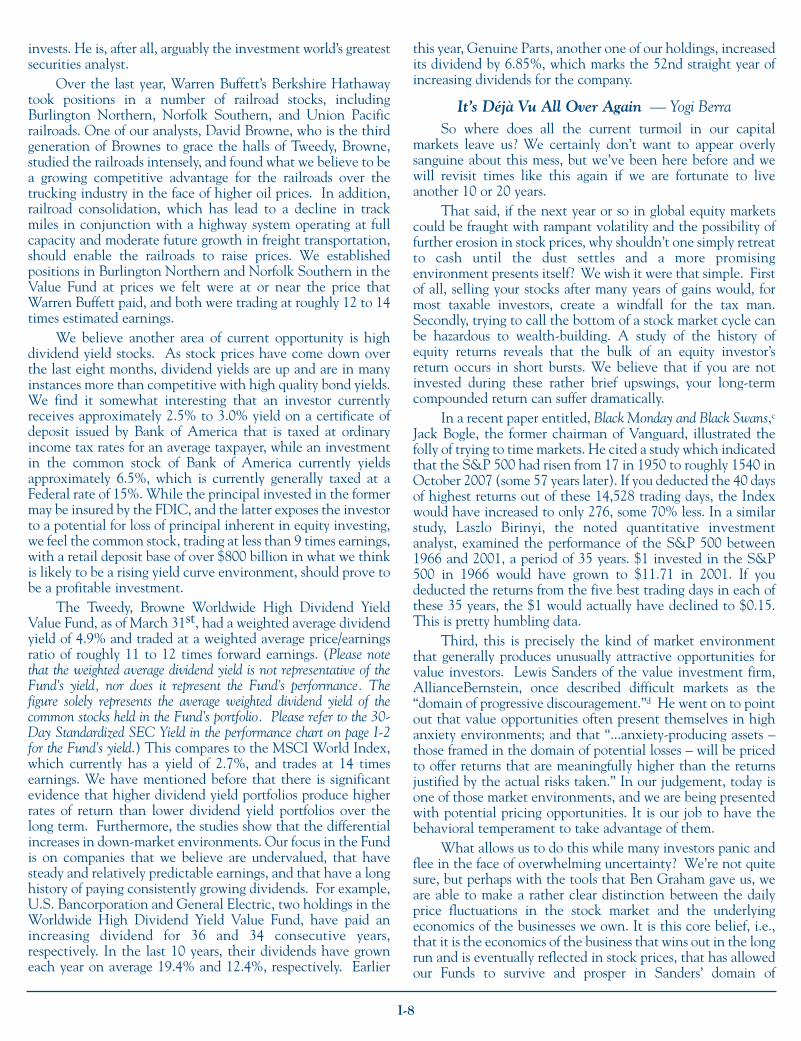
Another area of current opportunity is in Japan. This is acountry in which we have invested very little money in recentyears, but one that is today, we believe, offering unusual value.The Nikkei Index is down over 31% from July 2007 throughMarch 31, 2008 and is now trading at roughly 34% of its highof nearly 20 years ago.(9)
The Nikkei Index’s meteoric rise during the 1980s wasmatched by its equally dramatic decline into 2003.
It is once again approaching its historical lows.
The Japanese stock market is currently being rocked by astrengthening yen, recession fears, poor use of capital at acorporate level and corporate management’s disaffection withshareholder value. While U.S. corporate managementsgenerally cater to shareholders, Japanese managements moreoften than not exhibit a stakeholder mentality in which theyseek a consensus among all interested parties, particularly theemployees of the corporation. Attention to a company’s stockprice is often low in the pecking order. Although corporateshare buybacks have begun to occur, Japanese corporatemanagements rarely seem to put their stock price and its futureaccretion front and center. Because of this, our focus in Japanis on ferreting out good businesses that have a record ofcompounding their underlying operating income and intrinsicvalue over time. We can’t rely on Western-type catalysts, i.e.,share buybacks, corporate restructurings and takeovers, to drive
the stock price, for this type of shareholder-sensitive behavioris indeed rare in Japan.
Despite these obstacles, we believe that real opportunity ispresenting itself in Japan today. The price/earnings ratio of theJapanese stock market is currently the lowest it has been in 30years. The price-to-book value ratio for the broad Japanesemarket, at roughly 1.5 times book, is well below the price-to-book value ratios of the U.S. and European stock markets.According to research conducted by our friend, Howard Marks,a respected value investor, the dividend yield on Japanesestocks, while low compared to Western companies, is now at orabove Japanese government bond yields, which has happenedonly three times in the last ten years, and each time it hashappened, the market has rallied.b
We have been able to find a number of Japanesecompanies trading at even more compelling multiples, such as10 times earnings or less and 8 times earnings before interestand taxes (“EBIT”) or less. This has been particularly true ofsmaller capitalization companies over the last year or so, andlately we have started to see some of Japan’s highest quality,larger capitalization, multi-national companies trading at theselevels. For instance, we have recently established positions incompanies such as Honda and Canon. Both of these companieshave been able to grow their earnings over the long term at10% or better, and are currently trading at 9 and 12 timescurrent earnings, respectively. If the Japanese market remainsunder pressure, we would expect our weighting in this countryto increase over the next year.
South Korea, in our view, continues to be a fertile groundfor bargain hunting. In all three of our Funds, we recentlyestablished a position in Korea Exchange Bank (“KEB”),Korea’s fifth largest bank. KEB is predominantly a retail bankwith over 80% of its assets dedicated to retail banking, and, wemight add, zero exposure to subprime mortgages. They have a40% share of the foreign exchange market, which has providedthem with stable fee income. Non-interest income accounts for30% of total income, which is above average for the Koreanbanks. At our initial purchase, the bank was trading at roughly8 times earnings, or an after-tax earnings yield of 12.5%, hadnearly a 7% dividend yield, and, we project, should grow itsbook value at around 5%-7% per year. The bank is 51% ownedby Lone Star Funds, a US-based private equity fund, and LoneStar has entered into an agreement to sell their stock to HSBCfor a price of 18,045 won per share, or 37% more than KEB’sMarch 31 price of roughly 13,200 won. The deal has beendelayed pending an investigation by the Korean governmentinto Lonestar’s original acquisition of KEB. While HSBC hasnot committed to buying out the remaining shareholders’position in the stock, there is a strong probability of thisoccurring in our judgment. In our view, there is also a highprobability of a back-up bid from South Korea’s largestdomestic bank, Kookmin Bank, if the HSBC bid for somereason falls apart. In the meantime, we own a stock trading at8 times earnings that has reasonable growth prospects, and paysus an attractive dividend yield while we wait.
We have also been doing a good bit of Buffett-watchingthese days as he looks to put his ever growing cash hoard towork at Berkshire Hathaway. We think it makes good sense toexamine closely every equity security in which Warren Buffett
10
100
1,000
12/31
/1989
12/31
/1990
12/31
/1991
12/31
/1992
12/31
/1993
12/31
/1994
12/31
/1995
12/31
/1996
12/31
/1997
12/31
/1998
12/31
/1999
12/31
/2000
12/31
/2001
12/31
/2002
12/31
/2003
12/31
/2004
12/31
/2005
12/31
/2006
12/31
/2007
A B C D
Inde
x C
han
ge, L
og S
cale
Financial Stocks in the S&P 500have experienced 4 significantdeclines since 12/31/1989.Overall, however, the sectorhas managed to appreciate339% during the entireperiod (8.4% per year,on average).
Declines in the Financial SectorLABEL
ABCD
PERIOD06/05/1990 - 10/29/199007/14/1998 - 10/08/199801/03/2001 - 10/09/200206/01/2007 - Present
EVENTS&L Banking CrisisRussian DefaultPost-Tech, 9/11 DeclineCredit Bubble Burst
LEVEL OF DECLINE-39.4%-35.1%-38.3%-34.3%
Source: Bloomberg
0
10,000
20,000
30,000
40,000
50,000
Dec-80
Dec-82
Dec-84
Dec-86
Dec-88
Dec-90
Dec-92
Dec-94
Dec-96
Dec-98
Dec-00
Dec-02
Dec-04
Dec-06
Nikkei 225
Date12/28/8904/28/0307/09/0703/17/08
All-time High:2003 Low:Recent HighRecent Low:
Level 38,915.877,607.88
18,261.9811,787.51
% Chg
-80.5%140.0%-35.5%
Inde
x L
evel
12/28/89
04/28/03
07/09/07
Source: Bloomberg
I-8
invests. He is, after all, arguably the investment world’s greatestsecurities analyst.
Over the last year, Warren Buffett’s Berkshire Hathawaytook positions in a number of railroad stocks, includingBurlington Northern, Norfolk Southern, and Union Pacificrailroads. One of our analysts, David Browne, who is the thirdgeneration of Brownes to grace the halls of Tweedy, Browne,studied the railroads intensely, and found what we believe to bea growing competitive advantage for the railroads over thetrucking industry in the face of higher oil prices. In addition,railroad consolidation, which has lead to a decline in trackmiles in conjunction with a highway system operating at fullcapacity and moderate future growth in freight transportation,should enable the railroads to raise prices. We establishedpositions in Burlington Northern and Norfolk Southern in theValue Fund at prices we felt were at or near the price thatWarren Buffett paid, and both were trading at roughly 12 to 14times estimated earnings.
We believe another area of current opportunity is highdividend yield stocks. As stock prices have come down overthe last eight months, dividend yields are up and are in manyinstances more than competitive with high quality bond yields.We find it somewhat interesting that an investor currentlyreceives approximately 2.5% to 3.0% yield on a certificate ofdeposit issued by Bank of America that is taxed at ordinaryincome tax rates for an average taxpayer, while an investmentin the common stock of Bank of America currently yieldsapproximately 6.5%, which is currently generally taxed at aFederal rate of 15%. While the principal invested in the formermay be insured by the FDIC, and the latter exposes the investorto a potential for loss of principal inherent in equity investing,we feel the common stock, trading at less than 9 times earnings,with a retail deposit base of over $800 billion in what we thinkis likely to be a rising yield curve environment, should prove tobe a profitable investment.
The Tweedy, Browne Worldwide High Dividend YieldValue Fund, as of March 31st, had a weighted average dividendyield of 4.9% and traded at a weighted average price/earningsratio of roughly 11 to 12 times forward earnings. (Please notethat the weighted average dividend yield is not representative of theFund’s yield, nor does it represent the Fund’s performance. Thefigure solely represents the average weighted dividend yield of thecommon stocks held in the Fund’s portfolio. Please refer to the 30-Day Standardized SEC Yield in the performance chart on page I-2for the Fund’s yield.) This compares to the MSCI World Index,which currently has a yield of 2.7%, and trades at 14 timesearnings. We have mentioned before that there is significantevidence that higher dividend yield portfolios produce higherrates of return than lower dividend yield portfolios over thelong term. Furthermore, the studies show that the differentialincreases in down-market environments. Our focus in the Fundis on companies that we believe are undervalued, that havesteady and relatively predictable earnings, and that have a longhistory of paying consistently growing dividends. For example,U.S. Bancorporation and General Electric, two holdings in theWorldwide High Dividend Yield Value Fund, have paid anincreasing dividend for 36 and 34 consecutive years,respectively. In the last 10 years, their dividends have growneach year on average 19.4% and 12.4%, respectively. Earlier
this year, Genuine Parts, another one of our holdings, increasedits dividend by 6.85%, which marks the 52nd straight year ofincreasing dividends for the company.
It’s Déjà Vu All Over Again — Yogi BerraSo where does all the current turmoil in our capital
markets leave us? We certainly don’t want to appear overlysanguine about this mess, but we’ve been here before and wewill revisit times like this again if we are fortunate to liveanother 10 or 20 years.
That said, if the next year or so in global equity marketscould be fraught with rampant volatility and the possibility offurther erosion in stock prices, why shouldn’t one simply retreatto cash until the dust settles and a more promisingenvironment presents itself? We wish it were that simple. Firstof all, selling your stocks after many years of gains would, formost taxable investors, create a windfall for the tax man.Secondly, trying to call the bottom of a stock market cycle canbe hazardous to wealth-building. A study of the history ofequity returns reveals that the bulk of an equity investor’sreturn occurs in short bursts. We believe that if you are notinvested during these rather brief upswings, your long-termcompounded return can suffer dramatically.
In a recent paper entitled, Black Monday and Black Swans,cJack Bogle, the former chairman of Vanguard, illustrated thefolly of trying to time markets. He cited a study which indicatedthat the S&P 500 had risen from 17 in 1950 to roughly 1540 inOctober 2007 (some 57 years later). If you deducted the 40 daysof highest returns out of these 14,528 trading days, the Indexwould have increased to only 276, some 70% less. In a similarstudy, Laszlo Birinyi, the noted quantitative investmentanalyst, examined the performance of the S&P 500 between1966 and 2001, a period of 35 years. $1 invested in the S&P500 in 1966 would have grown to $11.71 in 2001. If youdeducted the returns from the five best trading days in each ofthese 35 years, the $1 would actually have declined to $0.15.This is pretty humbling data.
Third, this is precisely the kind of market environmentthat generally produces unusually attractive opportunities forvalue investors. Lewis Sanders of the value investment firm,AllianceBernstein, once described difficult markets as the“domain of progressive discouragement.”d He went on to pointout that value opportunities often present themselves in highanxiety environments; and that “...anxiety-producing assets –those framed in the domain of potential losses – will be pricedto offer returns that are meaningfully higher than the returnsjustified by the actual risks taken.” In our judgement, today isone of those market environments, and we are being presentedwith potential pricing opportunities. It is our job to have thebehavioral temperament to take advantage of them.
What allows us to do this while many investors panic andflee in the face of overwhelming uncertainty? We’re not quitesure, but perhaps with the tools that Ben Graham gave us, weare able to make a rather clear distinction between the dailyprice fluctuations in the stock market and the underlyingeconomics of the businesses we own. It is this core belief, i.e.,that it is the economics of the business that wins out in the longrun and is eventually reflected in stock prices, that has allowedour Funds to survive and prosper in Sanders’ domain of

progressive discouragement.In a recent interview discussing his new book entitled,
Your Money and Your Brain,e Jason Zweig opined that thebiggest key to the investment success of Warren Buffett andBenjamin Graham was that they were “inversely emotional.”They have an ability, as Warren Buffett has described, to begreedy when others are fearful and fearful when others aregreedy. Zweig went on to say that great investors seem to sharea quality that goes beyond calm, “a certain imperturbability orimplacability,” and used a classical Greek term, “ataraxia,” todescribe the state of not being bothered by the things thatbother most people. However one may describe it, perhaps weshare the affliction, because in a perverse sort of way, despitethe head winds we face near term, we are beginning to getexcited by the opportunities that appear to be headed our way.
We would remind our shareholders that over the last 50years, the stock market has endured some pretty grim news.From the rise and fall of the “Nifty Fifty” and the rampaginginflation of the 1970s, to the double digit interest rates of theearly 1980s, to the crash of 1987, to the banking and Savings& Loan crisis of the early 1990s, the Asian crisis and theRussian default of 1998, the Y2K systems threat of 1999, to thebursting of the technology bubble and the Presidential electioncrisis of 2000, followed by the terrorist attacks of September 11,2001 and the year-end collapse of Enron, all leading up totoday’s housing and credit conflagration – through all theseconfidence-shattering events, our Funds have survived andprospered.
In closing, perhaps Lew Sanders said it best:The principal dynamics in the world’s capital marketsrevolve around a tug-of-war between feeling secure andmaking money. In the end, the feelings generally win out.A substantial amount of money can thus be made if avalue investment manager is willing to spend the bulk ofhis or her professional life feeling depressed, isolated, andafraid, waiting for the forces of mean reversion to relievethe stress, at which point the manager will sell and use theproceeds to rebuild anxiety. Is it worth it? This question,of course, is philosophical, but the money on the table isconsiderable, and the question deserves serious thought.
As your Fund manager, we feel that we have an obligationto try to put anxiety in perspective and to behave rationally, sothat we can capture for you some of the rewards which we areconfident will come in the future. We hope in some small way,through our actions and our words, that we are able to do justthat. We would encourage you to keep the faith. 2008 could bea terrific year for planting the seeds from which attractivefuture returns will grow.
Thank you for investing alongside us, and for yourcontinued confidence.
Very truly yours,
TWEEDY, BROWNE COMPANY LLCChristopher H. BrowneWilliam H. BrowneJohn D. SpearsThomas H. ShragerRobert Q. Wyckoff, Jr.Managing Directors
April 24, 2008
Notes:
(1)Indexes are unmanaged, and the figures for the indexesshown include reinvestment of dividends and capitalgains distributions and do not reflect any fees orexpenses. Investors cannot invest directly in an index.We strongly recommend that these factors beconsidered before an investment decision is made.
(2)MSCI EAFE Index US$ is an unmanagedcapitalization-weighted index of companiesrepresenting the stock markets of Europe, Australasia and the Far East. MSCI EAFE IndexHedged consists of the results of the MSCI EAFEIndex hedged 100% back into US dollars and accountsfor interest rate differentials in forward currencyexchange rates. Results for both indexes are inclusiveof dividends and net of foreign withholding taxes.
(3)Inception dates for the Global Value Fund, Value Fundand Worldwide High Dividend Yield Value Fund wereJune 15, 1993, December 8, 1993, and September 5,2007, respectively. Information with respect to MSCIEAFE indexes used is available at month end only;therefore the closest month end to the Global ValueFund’s inception date, May 31, 1993, was used.
(4)The MSCI World Index is a free float-adjusted marketcapitalization weighted index that is designed tomeasure the equity market performance of developedmarkets. As of March 2008, the MSCI World Indexconsisted of the following 23 developed marketcountry indices: Australia, Austria, Belgium, Canada,Denmark, Finland, France, Germany, Greece, HongKong, Ireland, Italy, Japan, the Netherlands, NewZealand, Norway, Portugal, Singapore, Spain, Sweden,Switzerland, the United Kingdom, and the UnitedStates. The MSCI World Index (US$) reflects thereturn of this index for a US dollar investor. MSCIWorld Index (Hedged to US$) consists of the results ofthe MSCI World Index with its foreign currencyexposure hedged 100% back into US dollars. The
I-9

I-10
index accounts for interest rate differentials in forwardcurrency exchange rates. Results for this index areinclusive of dividends and net of foreign withholdingtaxes.
(5)S&P 500 Index is an unmanaged capitalization-weighted index composed of 500 widely held commonstocks listed on the New York Stock Exchange,American Stock Exchange and over-the-countermarket and includes the reinvestment of dividends.
(6)Returns shown are for a specific time period where theFunds outperformed their relevant indexes. While theFunds outperformed the relevant indexes for theperiod shown, there have been previous periods whenthe Funds underperformed these indices. Since pastperformance is not indicative of future results, therecan be no guarantee that the Funds will outperformtheir relevant indexes in the future. Please refer to pageI-2 of the letter for the Funds’ standardizedperformance results.
(7)As of March 31, 2008, Tweedy, Browne Global ValueFund, Tweedy, Browne Value Fund, and Tweedy,Browne Worldwide High Dividend Yield Value Fundhad invested the following percentages of its net assets,respectively, in the following portfolio holdings: AIG(2.8%, 3.5%, 0.0%); HSBC (1.3%, 0.0%, 1.7%); Bankof America (0.0%, 2.0%, 1.6%); ABN AMRO (0.0%,0.0%, 0.0%); Kone OYJ (5.8%, 0.0%, 0.0%); Nestle(6.6%, 9.2%, 0.0%); Coca-Cola Femsa (1.6%, 0.0%,0.0%); Samsung SDI (1.0%, 0.0%, 0.0%); LeucadiaNational (0.0%, 3.9%, 0.0%); Kimberly-Clark (0.0%,0.0%, 3.3%); AKZO Nobel(2.5%, 0.0%, 2.2%);Grolsch (0.0%, 0.0%, 0.0%); Royal Bank of Scotland(0.0%, 0.0%, 0.0%); Barclays (0.0%, 0.0%, 0.0%);SABMiller PLC (0.0%, 0.0%, 0.0%); Dongah Tire &Rubber (0.0%, 0.0%, 0.0%); Taeyoung Engineering(0.0%, 0.0%, 0.0%); Hanil Cement (0.4%, 0.0%,0.0%); Youngone Corporation (0.3%, 0.0%, 0.0%);Comcast (0.0%, 4.0%, 0.0%); Axel Springer (2.9%,0.0%, 0.0%); Mediaset (2.2%, 0.6%, 3.0%);Mondadori (1.5%, 0.5%, 1.9%); Home Depot (0.0%,4.1%, 0.9%); Lloyds TSB (2.1%, 1.1%, 2.5%);American Express (2.0%, 4.3%, 0.0%); U.S.Bancorporation (0.0%, 0.0%, 2.6%); Honda (0.7%,0.0%, 0.0%); Canon (1.1%, 0.0%, 0.0%); KoreaExchange Bank (1.6%, 1.0%, 2.6%); BurlingtonNorthern (0.0%, 1.2%, 0.0%); Norfolk Southern(0.0%, 1.3%, 0.0%); Union Pacific (0.0%, 0.0%,0.0%); General Electric (0.0%, 0.0%, 4.4%); andGenuine Parts (0.0%, 0.0%, 2.9%).
(8)Although hedging against currency exchange ratechanges reduces the risk of loss from exchange ratemovements, it also reduces the ability of the Funds togain from favorable exchange rate movements whenthe U.S. dollar declines against the currencies inwhich the Funds’ investments are denominated and insome interest rate environments may impose out-of-pocket costs on the Funds.
(9)The Nikkei 225 Index is an unmanaged price-weighted average of 225 Japanese companies listed inthe First-Section of the Tokyo Stock Exchange.
Investing in foreign securities involves additional risks beyondthe risks of investing in U.S. securities markets. These risksinclude currency fluctuations; political uncertainty; differentaccounting and financial standards; different regulatoryenvironments; and different market and economic factors invarious non-U.S. countries. In addition, the securities of small,less well-known companies may be more volatile than those oflarger companies. Investors should refer to the Funds’prospectus for a description of risk factors associated withinvestments in securities held by the Funds.
This letter contains opinions and statements on investmenttechniques, economics, market conditions and other matters.Of course there is no guarantee that these opinions andstatements will prove to be correct, and some of them areinherently speculative. None of them should be relied upon asstatements of fact.
Tweedy, Browne Global Value Fund, Tweedy, Browne ValueFund, and Tweedy, Browne Worldwide High Dividend YieldValue Fund are distributed by Tweedy, Browne Company LLC.
This material must be preceded or accompanied by a prospectusfor Tweedy, Browne Fund Inc.
REFERENCESa. André Perold and Evan C. Schulman, “The Free
Lunch in Currency Hedging: Implications forInvestment Policy and Performance Standards,”Financial Analysts Journal, May-June 1988, p. 45.
b. Howard Marks, “OCM Japan Opportunities Fund,”client letter, January 18, 2008.
c. Jack Bogle, “Black Monday and Black Swans,” speechbefore the Risk Management Association, Boca RatonFlorida, October 11, 2007.
d. Lewis A. Sanders, “The Advantage to ValueInvesting,” Association for Investment Managementand Research, 1995.
e. Zweig, Jason, “Mind Games - Jason Zweig Talks AboutNew Book on the Brain Science of Money.”Welling@Weeden – A Journal of IndependentResearch, Analysis and Opinion, May 11, 2007.

II-1
TWEEDY, BROWNE FUND INC.
Tweedy, Browne Global Value FundTweedy, Browne Value FundTweedy, Browne Worldwide High Dividend Yield Value Fund
ANNUAL REPORT
March 31, 2008

TWEEDY, BROWNE FUND INC.
Investment Adviser’s Note
II-2
To Our Shareholders:We are pleased to present the Annual Report to
Shareholders for the Tweedy, Browne Global Value Fund,Tweedy, Browne Value Fund and Tweedy, Browne WorldwideHigh Dividend Yield Value Fund for the year ended March 31,2008. Investment results* for the past six months and the lastone, three, five and ten years, and results since inception ofeach Fund are presented in the tables below:
Tweedy, Browne MSCI EAFE MSCI EAFE Period Ended Global Value Index Hedged Index3/31/08 Fund to US$(1)(2) in US$(1)(2)
6 Months -11.03% -17.55% -10.50%
1 Year -6.35 -14.05 -2.70
3 Years 9.32 10.07 13.32
5 Years 17.36 15.35 21.40
10 Years 8.68 3.63 6.18
Since Inception (6/15/93)(3) 11.86 6.76 7.35
Total Annual Fund Operating Expense Ratio as of 3/31/07 was 1.37%†
Total Annual Fund Operating Expense Ratio as of 3/31/08 was 1.37%†
MSCI WorldPeriod Ended Tweedy, Browne Index Hedged3/31/08 Value Fund to US$(1)(4) S&P 500(1)(5)
6 Months -9.98% -14.57% -12.46%
1 Year -5.41 -9.22 -5.08
3 Years 4.01 N/A 5.84
5 Years 9.15 N/A 11.30
10 Years 3.93 N/A 3.50
Since Inception (12/8/93)(3) 9.52 N/A 9.53
Total Annual Fund Operating Expense Ratio as of 3/31/07 was 1.38%†
Total Annual Fund Operating Expense Ratio as of 3/31/08 was 1.37%†
Tweedy, Browne MSCI World Period Ended Worldwide High Dividend Index3/31/08 Yield Value Fund in US$(1)(4)
6 Months -3.85% -11.26%
Since Inception (9/5/07)(3) -2.69 -6.72
30-Day Standardized Yield as of 3/31/08: 2.90%
Gross Annual Operating Expense Ratio for current fiscal year ending
3/31/08 was 1.86%†‡
Net Annual Operating Expense Ratio for current fiscal year ending
3/31/08 was 1.37%†‡
* The preceding performance data represents past performance andis not a guarantee of future results. Total return and principalvalue of an investment will fluctuate so that an investor’s shares,when redeemed, may be worth more or less than their original cost.The returns shown do not reflect the deduction of taxes that ashareholder would pay on Fund distributions or the redemption ofFund shares. Current performance may be lower or higher thanthe performance data shown. Please visit www.tweedy.com to
obtain performance data, which is current to the most recentmonth end. See page II-4 for footnotes 1 through 5, which describethe indices and inception dates of each Fund. Results areannualized for all periods greater than one year.
† The Funds do not impose any front-end or deferred sales charge.However, the Global Value Fund and the Worldwide HighDividend Yield Value Fund impose a 2% redemption fee onproceeds from redemptions or exchanges made within 60 days ofpurchase.
‡ The Adviser has contractually agreed to waive its investmentadvisory fee and/or to reimburse expenses of the WorldwideHigh Dividend Yield Value Fund to the extent necessary tomaintain the total annual fund operating expenses(excluding brokerage, interest, taxes and extraordinaryexpenses) at no more than 1.37%. This arrangement willcontinue at least through March 31, 2009. In thisarrangement, the Worldwide High Dividend Yield ValueFund has agreed, during the two-year period following anywaiver or reimbursement by the Adviser, to repay suchamount to the extent that after giving effect to suchrepayment such adjusted total annual fund operatingexpenses would not exceed 1.37% on an annualized basis.The performance data shown above would be lower had feesand expenses not been waived and/or reimbursed.
Performance: Results and AttributionWhile all three of our Funds were not immune to the
downturn over the last year, all three significantlyoutperformed their respective benchmarks as the credit crisisunfolded. The Tweedy, Browne Global Value Fund finishedthis roller coaster period down 6.35% while the MSCI EAFEIndex hedged back into U.S. dollars was down 14.05% duringthe period. The Tweedy, Browne Value Fund marginallyunderperformed the S&P 500 for the year, but held up very wellagainst the MSCI World Index hedged back into U.S. dollars,declining 5.41% versus 9.22% for the index. The Value Fundnow has approximately 35% of its net assets invested in non-U.S. companies. The new Tweedy, Browne Worldwide HighDividend Yield Value Fund which began operations onSeptember 5th of last year has also gotten off to a good relativestart, declining since its inception 2.69% versus a decline of6.72% for the MSCI World Index. While negative results arenothing to boast about, we were gratified that the Funds heldup fairly well during perhaps one of the most volatile periodsthat we have experienced in our 30 plus years of investing.
The subprime mortgage crisis has spawned anunprecedented level of equity market volatility over the lasteight months. Since the bursting of the credit bubble back inAugust, the MSCI EAFE Index has had 17 days of gains orlosses in excess of 2%. In contrast, in the first half of the 2007calendar year, there were only three such days, and in thecombined years of 2005 and 2006 there were a total of just sixsuch days. This increased volatility was not confined to the

II-3
international markets. The S&P 500 also had 26 days duringthe last eight months with gains or losses in excess of 2%. Thiscompares to two days in the first half of 2007, and only twosuch days for the combined years 2005 and 2006. Needless tosay, this kind of market churn generally produces pricingopportunities for value investors such as ourselves.
Ebullient markets such as we had over the last five yearsjust prior to the inception of the credit crisis are generally notthe kind of environment in which value investing shines, atleast not on a relative basis, and this proved to be the caseparticularly in our Value Fund. For the one, three and five-yearannualized periods ending June 30, 2007 for instance, ourValue Fund underperformed the S&P 500 and the MSCIWorld Index hedged to U.S. dollars despite generating solidabsolute returns. During rapidly rising markets, we and othervalue investors often have a hard time finding undervaluedstocks, which leads to rising cash positions, which in turn dragdown portfolio returns. As you will recall, we closed our doorsto new investors in early 2005, preferring not to dilute ourexisting shareholders’ returns by taking on new money that webelieved could not effectively be put to work. With the recentmarket downturn, our Value Fund is now starting to gainconsiderable ground on its benchmark indices.
Over the long term, we believe that how one performs indifficult environments is as important, or perhaps even moreimportant than how one performs in the bull market phase, andin that respect, we believe we have more than held our own.The most recent downturn over the last nine months is noexception. While we have faced declines in our Funds, thesehave not been as significant as the declines in the broad marketindices. Between June 30, 2007 and March 31, 2008, whenmost of the carnage occurred, the MSCI EAFE Index (Hedgedto U.S. dollars), the MSCI World Index (Hedged to U.S.dollars), and the S&P 500 declined 19.23%, 14.54% and10.68%, respectively. In contrast, our Global Value and ValueFunds finished this same period down an estimated 11.60% and10.05%, respectively. The Worldwide High Dividend YieldValue Fund also held up well during this period declining2.69% since its inception on September 5, 2007 versus adecline of 6.72% for the MSCI World Index in U.S. dollars.(6)
The downturn in our Funds was muted, at least in part,due to the fact that we have had modest direct exposure to thesubprime problem. With the exception of our holdings in AIG,HSBC and Bank of America, which, we believe, havemanageable amounts of capital invested in subprime mortgagesand have many other compensating competitive advantages,we have had very little investment in those areas of the marketthat were the most affected.(7)
The returns for our portfolios over the last year werefueled, in large part, by solid returns in our food, beverage, andindustrial holdings, and continued strength in our Finnish,Dutch, Mexican and South Korean stocks. Our significantunderweighting in Japan also held us in good stead, as thismarket has been under pressure over the last year or so. Ourfinancial stocks, which were down in double digits, still faredbetter than their index counterparts. Our lack of anymeaningful exposure to energy stocks, aside from those in ourhigh dividend yield portfolios, was a drag on our relative results.Those energy stocks that we did own in the Worldwide High
Dividend Yield Value Fund underperformed their peers. Oursignificant weighting in media stocks also did not serve us wellduring this period.
Larger capitalization securities now account for roughlytwo-thirds of net assets in the Global Value Fund versus one-third in smaller and medium capitalization companies. Fiveyears ago, the reverse was the case with smaller and mediumcapitalization companies accounting for two-thirds of netassets. This change in composition has come about simplybecause there is more value to be found today in largercompanies. We sold a number of our smaller companies as theysurged in price over the last five years.
Another segment of our Funds’ portfolios that producedattractive returns over the last year were our South Koreanstocks. The values we have been able to uncover in this mostdeveloped of developing nations have been nothing less thanextraordinary. Even in the short run, value has been borne outby rapidly advancing stock prices. Stocks such as Samsung SDI,Dongah Tire & Rubber, Taeyoung Engineering, Hanil Cementand Youngone Corporation, among others, produced attractivereturns for our Global Value Fund.
Despite these gains, a number of the stocks in our Fundswere dragged down in price during the year, not surprisinglysome of our financial, retail and media-related holdings. Stockssuch as Comcast (Value), Axel Springer (Global Value),Mediaset (Global Value, Value and Worldwide High DividendYield Value), Mondadori (Global Value, Value and WorldwideHigh Dividend Yield Value), Home Depot (Value andWorldwide High Dividend Yield Value), and AIG (GlobalValue and Value) all finished the year in negative territory,despite what we feel are very attractive long-term fundamentalsfor each of them.
Thank you for investing alongside us, and for yourcontinued confidence.
Very truly yours,
TWEEDY, BROWNE COMPANY LLCChristopher H. BrowneWilliam H. BrowneJohn D. SpearsThomas H. ShragerRobert Q. Wyckoff, Jr.Managing Directors
April 24, 2008

II-4
Notes:(1)Indexes are unmanaged, and the figures for the indexes
shown include reinvestment of dividends and capitalgains distributions and do not reflect any fees orexpenses. Investors cannot invest directly in an index.We strongly recommend that these factors beconsidered before an investment decision is made.
(2)MSCI EAFE Index US$ is an unmanagedcapitalization-weighted index of companiesrepresenting the stock markets of Europe, Australasiaand the Far East. MSCI EAFE Index Hedged consistsof the results of the MSCI EAFE Index hedged 100%back into US dollars and accounts for interest ratedifferentials in forward currency exchange rates.Results for both indexes are inclusive of dividends andnet of foreign withholding taxes.
(3)Inception dates for the Global Value Fund, Value Fundand Worldwide High Dividend Yield Value Fund wereJune 15, 1993, December 8, 1993, and September 5,2007, respectively. Information with respect to MSCIEAFE indexes used is available at month end only;therefore the closest month end to the Global ValueFund’s inception date, May 31, 1993, was used.
(4)The MSCI World Index is a free float-adjusted marketcapitalization weighted index that is designed tomeasure the equity market performance of developedmarkets. As of March 2008, the MSCI World Indexconsisted of the following 23 developed marketcountry indices: Australia, Austria, Belgium, Canada,Denmark, Finland, France, Germany, Greece, HongKong, Ireland, Italy, Japan, the Netherlands, NewZealand, Norway, Portugal, Singapore, Spain, Sweden,Switzerland, the United Kingdom, and the UnitedStates. The MSCI World Index (US$) reflects thereturn of this index for a US dollar investor. MSCIWorld Index (Hedged to US$) consists of the results ofthe MSCI World Index with its foreign currencyexposure hedged 100% back into U.S. dollars. Theindex accounts for interest rate differentials in forwardcurrency exchange rates. Results for this index areinclusive of dividends and net of foreign withholdingtaxes.
(5)S&P 500 Index is an unmanaged capitalizationweighted index composed of 500 widely held commonstocks listed on the New York Stock Exchange,American Stock Exchange and over-the-countermarket and includes the reinvestment of dividends.
(6)Returns shown are for a specific time period where theFunds outperformed their relevant indexes. While theFunds outperformed the relevant indexes for theperiod shown, there have been previous periods whenthe Funds underperformed these indices. Since pastperformance is not indicative of future results, therecan be no guarantee that the Funds will outperformtheir relevant indexes in the future. Please refer to page2 of the letter for the Funds’ standardized performanceresults.
(7)As of March 31, 2008, Tweedy, Browne Global ValueFund, Tweedy, Browne Value Fund, and Tweedy,Browne Worldwide High Dividend Yield Value Fundhad invested the following percentages of its net assets,respectively, in the following portfolio holdings: AIG(2.8%, 3.5%, 0.0%); HSBC (1.3%, 0.0%, 1.7%); Bankof America (0.0%, 2.0%, 1.6%); Samsung SDI (1.0%,0.0%, 0.0%); Dongah Tire & Rubber (0.0%, 0.0%,0.0%); Taeyoung Engineering (0.0%, 0.0%, 0.0%);Hanil Cement (0.4%, 0.0%, 0.0%); YoungoneCorporation (0.3%, 0.0%, 0.0%); Comcast (0.0%,4.0%, 0.0%); Axel Springer (2.9%, 0.0%, 0.0%);Mediaset (2.2%, 0.6%, 3.0%); Mondadori (1.5%,0.5%, 1.9%); Home Depot (0.0%, 4.1%, 0.9%).
Investing in foreign securities involves additional risks beyondthe risks of investing in US securities markets. These risksinclude currency fluctuations; political uncertainty; differentaccounting and financial standards; different regulatoryenvironments; and different market and economic factors invarious non-U.S. countries. In addition, the securities of small,less well-known companies may be more volatile than those oflarger companies. Investors should refer to the Funds’prospectus for a description of risk factors associated withinvestments in securities held by the Funds.
Tweedy, Browne Global Value Fund, Tweedy, Browne ValueFund, and Tweedy, Browne Worldwide High Dividend YieldValue Fund are distributed by Tweedy, Browne Company LLC.
This material must be preceded or accompanied by a prospectusfor Tweedy, Browne Fund Inc.

TWEEDY, BROWNE FUND INC.
Expense Information
II-5II-5
Hypothetical ExpensesActual Expenses (5% Return Before Expenses)
Expenses Expenses Beginning Ending Paid During Beginning Ending Paid During Account Account Period* Account Account Period*
Value Value 10/1/07 – Value Value 10/1/07 – Expense10/1/07 3/31/08 3/31/08 10/1/07 3/31/08 3/31/08 Ratio
Global Value Fund $1,000 $890 $6.47 $1,000 $1,018 $6.91 1.37%Value Fund $1,000 $900 $6.51 $1,000 $1,018 $6.91 1.37%Worldwide High Dividend
Yield Value Fund (†) $1,000 $962 $6.72 $1,000 $1,018 $6.91 1.37%
(†) The Tweedy, Browne Worldwide High Dividend Yield Value Fund commenced operations on September 5, 2007.
* Expenses are equal to each Fund’s annualized expense ratio, multiplied by the average account value over the period, multiplied by the number of days in the period, divided by 366 (to reflect the one-half year period).
A shareholder of the Global Value Fund, Value Fund orWorldwide High Dividend Yield Value Fund (collectively, the“Funds”) incurs two types of costs: (1) transaction costs and (2)ongoing costs, including management fees and other Fundexpenses. The Example below is intended to help a shareholderunderstand their ongoing costs (in U.S. dollars) of investing inthe Funds and to compare these costs with the ongoing costs ofinvesting in other mutual funds.
The Example is based on an investment of $1,000 investedat the beginning of the period and held for the entire period ofOctober 1, 2007 to March 31, 2008.
Actual Expenses The first part of the table presentedbelow, under the heading “Actual Expenses”, providesinformation about actual account values and actual expenses.The information in this line may be used with the amount ashareholder invested to estimate the expenses that were paid bythe shareholder over the period. Simply divide theshareholder’s account value by $1,000 (for example, an $8,600account value divided by $1,000 = 8.6), then multiply theresult by the number in the first line under the heading entitled“Expenses Paid During Period” to estimate the expenses paidduring this period.
Hypothetical Example for Comparison Purposes Thesecond part of the table presented below, under the heading“Hypothetical Expenses”, provides information about
hypothetical account values and hypothetical expenses basedon each Fund’s actual expense ratio and an assumed rate ofreturn of 5% per year before expenses, which is not each Fund’sactual return. The hypothetical account values and expensesmay not be used to estimate the actual ending account balanceor expenses paid by the shareholder of the Funds for the period.This information may be used to compare the ongoing costs ofinvesting in the Funds and other funds. To do so, compare this5% hypothetical example with the 5% hypothetical examplesthat appear in the shareholder reports of the other funds.
Please note that the expenses shown in the table below aremeant to highlight a shareholder’s ongoing costs only and donot reflect redemption fees. Redemptions from the GlobalValue Fund and the Worldwide High Dividend Yield ValueFund, including exchange redemptions, within 60 days ofpurchase are subject to a redemption fee equal to 2% of theredemption proceeds, which will be retained by the Funds.There are no other transactional expenses associated with thepurchase and sale of shares charged by the Funds, such ascommissions, sales loads and/or redemption fees on shares heldlonger than 60 days. Other mutual funds may have suchtransactional charges. Therefore, the second part of the table isuseful in comparing ongoing costs only, and will not help ashareholder determine the relative total costs of owningdifferent funds. In addition, if redemption fees were included, ashareholder’s costs would have been higher.

TWEEDY, BROWNE GLOBAL VALUE FUND
Portfolio Highlights (Unaudited)
SEE NOTES TO FINANCIAL STATEMENTS
II-6
March 31, 2008Hypothetical Illustration of $10,000 Invested in
Tweedy, Browne Global Value Fund vs. Morgan Stanley Capital International (“MSCI”) Europe, Australasia and Far East (“EAFE”)
Index (in US Dollars and Hedged)6/15/93 through 3/31/08
________________________________________________________________________________________________________________________________________________________________________________________________________________
MSCI EAFE Index represents the change in market capitalizations of Europe, Australasia and the Far East (EAFE), including dividends reinvested monthly, net after foreign withholding taxes.
Index and Average information is available at month end only; therefore, the closest month end to inception date of the Fund, May 31, 1993, has been used.
$52,473
$26,423$28,757
Tweedy, Browne Global Value Fund*Index: MSCI EAFE Index (in US Dollars)*Index: MSCI EAFE Index (Hedged)*
Jun 19
93
Sep 1
993
Mar
1994
Sep 1
994
Mar
1995
Sep 1
995
Mar
1996
Sep 1
996
Mar
1997
Sep 1
997
Mar
1998
Sep 1
998
Mar
1999
Sep 1
999
Mar
2001
Sep 2
001
Sep 2
002
Mar
2002
Mar
2003
Sep 2
003
Mar
2004
Sep 2
004
Mar
2005
Sep 2
005
Sep 2
006
Sep 2
007
Mar
2006
Mar
2008
Mar
2007
Sep 2
000
Mar
2000
$5,000
$10,000
$15,000
$20,000
$25,000
$30,000
$35,000
$40,000
$45,000
$50,000
$55,000
$60,000
AVERAGE ANNUAL TOTAL RETURN* AGGREGATE TOTAL RETURN*Year Inception
Without Ended (6/15/93)–The Fund Actual Waivers** 3/31/08 3/31/08———————— —————— ————————— ———————— ————————Inception (6/15/93)
through 3/31/08 11.86% 11.85% The Fund (6.35)% 424.73%Year Ended 3/31/08 (6.35)% (6.35)% MSCI EAFE (in
US Dollars) (2.70)% 186.32%MSCI EAFE (Hedged) (14.05)% 164.07%
________________________________________________________________________________________________________________________________________________________________________________________________________________
Note: The performance shown represents past performance and is not a guarantee of future results. The Fund’s share price and investment return will vary with market conditions, and the principal value of shares, when redeemed, may be more or less than original cost.
* Assumes the reinvestment of all dividends and distributions and is net of foreign withholding tax.
** The Adviser waived a portion of its fee from June 15, 1993 through March 31, 1994. The Administrator waived a portion of its fee from February 15, 1997 through May 15, 1997.

SEE NOTES TO FINANCIAL STATEMENTS
II-7
TWEEDY, BROWNE GLOBAL VALUE FUND
Perspective On Assessing Investment Results
March 31, 2008
In accordance with rules and guidelines set out by theUnited States (US) Securities and Exchange Commission, wehave provided a comparison of the historical investment resultsof Tweedy, Browne Global Value Fund to the historicalinvestment results of the most appropriate broad-basedsecurities indices, the Morgan Stanley Capital International(MSCI) Europe, Australasia and the Far East (EAFE) Index inUS dollars and hedged into US dollars. However, the historicalresults of the MSCI EAFE indices in large measure representthe investment results of stocks that we do not own. Anyportfolio which does not own exactly the same stocks in exactlythe same proportions as the index to which the particularportfolio is being compared is not likely to have the sameresults as the index. The investment behavior of a diversifiedportfolio of undervalued stocks tends to be correlated to theinvestment behavior of a broad index; i.e., when the index isup, probably more than one-half of the stocks in the entireuniverse of public companies in all the countries that areincluded in the same index will be up, albeit, in greater or lesserpercentages than the index. Similarly, when the index declines,probably more than one-half of the stocks in the entireuniverse of public companies in all the countries that areincluded in the index will be down in greater or lesserpercentages than the index. But it is almost a mathematicaltruth that “different stocks equal different results.”
We believe that favorable or unfavorable historicalinvestment results in comparison to an index are notnecessarily predictive of future comparative investment results.In Are Short-Term Performance and Value Investing Mutually Exclusive?, Eugene Shahan analyzed the investmentperformance of seven money managers, about whom WarrenBuffett wrote in his article, The Super- investors of Graham andDoddsville. Over long periods of time, the seven managerssignificantly outperformed the market as measured by the DowJones Industrial Average (the “DJIA”) or the Standard & Poor’s500 Stock Index (the “S&P 500”) by between 7.7% and 16.5%annually. (The goal of most institutional money managers is tooutperform the market by 2% to 3%.) However, for periodsranging from 13 years to 28 years, this group of managersunderperformed the market between 7.7% and 42% of theyears. Six of the seven investment managers underperformedthe market between 28% and 42% of the years. In today’senvironment, they would have lost many of their clients duringtheir periods of underperformance. Longer term, it would havebeen the wrong decision to fire any of those money managers.In examining the seven long-term investment records,unfavorable investment results as compared to either index didnot predict the future favorable comparative investment resultswhich occurred, and favorable investment results incomparison to the DJIA or the S&P 500 were not alwaysfollowed by future favorable comparative results. Stretches ofconsecutive annual underperformance ranged from one to sixyears.
Mr. Shahan concluded: Unfortunately, there is no way to distinguish between apoor three-year stretch for a manager who will do wellover 15 years, from a poor three-year stretch for amanager who will continue to do poorly. Nor is there anyreason to believe that a manager who does well from theoutset cannot continue to do well, and consistently.

TWEEDY, BROWNE GLOBAL VALUE FUND
Portfolio of InvestmentsMarch 31, 2008
SEE NOTES TO FINANCIAL STATEMENTS
II-8SEE NOTES TO FINANCIAL STATEMENTS
II-8
COMMON STOCKS—94.7%Belgium—3.2%
1,646,311 KBC Groep NV . . . . . . . . . . . . . . . . . . . . $214,276,863————————————
Canada—1.2%100,000 Melcor Developments Ltd. . . . . . . . . . . . 1,546,708
1,631,760 National Bank of Canada, Toronto . . . . . 76,081,476————————————
77,628,184————————————
Czech Republic—0.0%†2,800 Philip Morris CR a.s. . . . . . . . . . . . . . . . . 1,263,288
————————————
Finland—7.7%2,435,000 Cargotec Corporation, B Share . . . . . . . . 119,957,7711,000,000 Huhtamaki Oyj . . . . . . . . . . . . . . . . . . . . 10,743,3179,340,000 Kone Oyj, Class B . . . . . . . . . . . . . . . . . . 384,646,564
————————————515,347,652
————————————
France—7.0%433,783 BNP Paribas SA . . . . . . . . . . . . . . . . . . . . 43,915,124
2,192,565 CNP Assurances . . . . . . . . . . . . . . . . . . . . 271,269,510122,200 Nexans SA . . . . . . . . . . . . . . . . . . . . . . . . 14,464,403
1,000 NSC Groupe . . . . . . . . . . . . . . . . . . . . . . 104,1851,825,000 Sanofi-Aventis . . . . . . . . . . . . . . . . . . . . . 137,419,386
————————————467,172,608
————————————
Germany—4.1%64,173 Boewe Systec AG . . . . . . . . . . . . . . . . . . . 2,080,49542,354 KSB AG . . . . . . . . . . . . . . . . . . . . . . . . . . 28,757,016
265,714 Linde AG . . . . . . . . . . . . . . . . . . . . . . . . . 37,678,85163,276 Merck KGaA . . . . . . . . . . . . . . . . . . . . . . 7,827,659
1,560,342 Springer (Axel) Verlag AG . . . . . . . . . . . 192,851,536————————————
269,195,557————————————
Hong Kong—2.1%8,226,564 Jardine Strategic Holdings Ltd. . . . . . . . . 138,370,806
200,000 Swire Pacific Ltd., Class B . . . . . . . . . . . . 445,595————————————
138,816,401————————————
Ireland—0.6%11,955,638 Independent News & Media PLC . . . . . . 39,404,4071,111,317 Unidare PLC †† . . . . . . . . . . . . . . . . . . . . 105,657
————————————39,510,064
————————————
Italy—5.0%3,561,000 Banco Popolare Scarl . . . . . . . . . . . . . . . . 59,191,066
925,100 Maffei SPA . . . . . . . . . . . . . . . . . . . . . . . . 3,444,81015,720,000 Mediaset SPA . . . . . . . . . . . . . . . . . . . . . . 145,968,40412,147,709 Mondadori (Arnoldo) Editore SPA . . . . . 102,980,9432,470,700 Natuzzi SPA, Sponsored ADR ††. . . . . . . 9,141,5901,005,000 Sol SPA . . . . . . . . . . . . . . . . . . . . . . . . . . 7,166,173
805,250 Vincenzo Zucchi SPA †† . . . . . . . . . . . . . 3,674,785————————————
331,567,771————————————
Japan—5.7%1,594,700 Canon, Inc. . . . . . . . . . . . . . . . . . . . . . . . 73,538,685
414,900 Chofu Seisakusho Company Ltd. . . . . . . 8,332,598530 Coca-Cola Central Japan Company Ltd. 4,557,995
COMMON STOCKSJapan (continued)
410,900 Daikoku Denki Company Ltd. . . . . . . . . $3,608,0435,251,000 Fujitec Company Ltd. . . . . . . . . . . . . . . . 29,542,975
570,600 Fukuda Denshi Company Ltd. . . . . . . . . . 13,987,6831,203,000 Hi-Lex Corporation . . . . . . . . . . . . . . . . . 16,799,8191,512,500 Honda Motor Company Ltd. . . . . . . . . . . 43,231,652
22,100 Hurxley Corporation . . . . . . . . . . . . . . . . 267,327319,000 Inaba Seisakusho Company Ltd. . . . . . . . 3,413,221321,000 Katsuragawa Electric Company Ltd. . . . . 1,964,023
1,461,000 Kawasumi Laboratories Inc. . . . . . . . . . . . 8,792,2741,849,500 Kuroda Electric Company Ltd. . . . . . . . . 24,434,546
69,100 Mandom Corporation . . . . . . . . . . . . . . . 2,082,684477,000 Matsumoto Yushi-Seiyaku Company Ltd. 7,562,22421,670 Medikit Company Ltd. . . . . . . . . . . . . . . 4,637,273
121,800 Meito Sangyo Company Ltd. . . . . . . . . . . 2,581,98636,240 Milbon Company Ltd. . . . . . . . . . . . . . . . 793,723
307,100 Mirai Industry Company Ltd. . . . . . . . . . 3,532,72255,000 Nankai Plywood Company Ltd. . . . . . . . 347,56640,000 Nippon Antenna Company Ltd. . . . . . . . 245,140
162,780 Nippon Kanzai Company Ltd. . . . . . . . . . 4,832,6211,253,000 Nippon Konpo Unyu Soko
Company Ltd. . . . . . . . . . . . . . . . . . . . . 17,208,530685,500 Nitto FC Company Ltd. . . . . . . . . . . . . . 2,995,856451,000 Sangetsu Company Ltd. . . . . . . . . . . . . . . 9,832,421314,800 Shikoku Coca-Cola Bottling
Company Ltd. . . . . . . . . . . . . . . . . . . . . 3,760,458289,300 Shingakukai Company Ltd. . . . . . . . . . . . 1,421,286204,000 SK Kaken Company Ltd. . . . . . . . . . . . . . 6,087,105612,000 Sonton Food Industry Company Ltd. . . . 4,918,873528,500 T. Hasegawa Company Ltd. . . . . . . . . . . . 9,339,745
2,946,000 Takata Corporation . . . . . . . . . . . . . . . . . 65,114,784106,300 Tenma Corporation . . . . . . . . . . . . . . . . . 1,404,375
————————————381,170,213
————————————
Mexico—3.7%1,921,351 Coca-Cola Femsa SA de CV,
Sponsored ADR †††. . . . . . . . . . . . . . . . 108,229,70214,623,380 Embotelladoras Arca SA de CV . . . . . . . 56,346,063
151,327 Grupo Aeroportuario del Sureste SA de CV, ADR . . . . . . . . . . . . . . . . . . 8,624,126
30,132,400 Grupo Continental SA †† . . . . . . . . . . . . 72,741,952————————————
245,941,843————————————
Netherlands—13.4%2,093,000 Akzo Nobel NV . . . . . . . . . . . . . . . . . . . . 168,543,726
23,620 Crown Van Gelder Gemeenschappelijk Bezit NV . . . . . . . . . . . . . . . . . . . . . . . . 552,053
5,477,810 Heineken Holding NV . . . . . . . . . . . . . . 276,455,4162,810,041 Heineken NV . . . . . . . . . . . . . . . . . . . . . . 163,814,049
450,000 Imtech NV . . . . . . . . . . . . . . . . . . . . . . . . 11,986,40450,000 Randstad Holding NV . . . . . . . . . . . . . . . 2,350,695
4,374,175 Telegraaf Media Groep NV . . . . . . . . . . . 142,088,430288,708 TKH Group NV . . . . . . . . . . . . . . . . . . . . 6,802,656
3,612,751 Unilever NV, CVA . . . . . . . . . . . . . . . . . 121,762,686————————————
894,356,115————————————
Market ValueShares (Note 2)—————— ––––––————————————
Market ValueShares (Note 2)—————— ––––––————————————

TWEEDY, BROWNE GLOBAL VALUE FUND
Portfolio of InvestmentsMarch 31, 2008
SEE NOTES TO FINANCIAL STATEMENTS
II-9
COMMON STOCKSNorway—1.0%
2,302,000 Schibsted ASA . . . . . . . . . . . . . . . . . . . . . $68,855,020————————————
Singapore—2.3%33,542,550 Fraser and Neave Ltd. . . . . . . . . . . . . . . . 118,043,2952,400,000 Jardine Cycle & Carriage Ltd. . . . . . . . . . 34,028,226
————————————152,071,521
————————————
South Korea—5.3%8,615 Asia Cement Company, Ltd. . . . . . . . . . . 507,148
23,260 Daehan City Gas Company Ltd. . . . . . . . 738,65593,346 Dong Ah Tire & Rubber Company Ltd. . 902,026
280,921 Hanil Cement Company Ltd. . . . . . . . . . 26,181,6618,791 Hyundai Elevator Company Ltd. . . . . . . . 710,133
8,003,555 Korea Exchange Bank . . . . . . . . . . . . . . . 106,676,35323,200 Sam Young Electronics Company, Ltd. . . 267,05736,890 Samchully Company Ltd. . . . . . . . . . . . . 5,848,165
886,070 Samsung SDI Company, Ltd. . . . . . . . . . . 69,697,433241,172 SK Telecom Company, Ltd. . . . . . . . . . . . 45,416,851
3,479,352 SK Telecom Company, Ltd., ADR . . . . . 75,188,79755,630 Taegu Department Store
Company Ltd. †† . . . . . . . . . . . . . . . . . . 808,878363,340 Taeyoung Engineering & Construction . . 2,971,731
2,159,497 Youngone Corporation . . . . . . . . . . . . . . . 17,509,730————————————
353,424,618————————————
Sweden—0.0%†33,000 Cloetta Fazer AB, B Shares . . . . . . . . . . . 1,274,378
————————————
Switzerland—15.2%45,065 AFG Arbonia-Foster Holding AG,
Bearer . . . . . . . . . . . . . . . . . . . . . . . . . . . 13,441,3582,021,000 Compagnie Financiere Richemont AG . 113,815,985
570,116 Daetwyler Holding AG, Bearer . . . . . . . . 44,615,51892,315 Edipresse SA, Bearer . . . . . . . . . . . . . . . . 35,374,73882,113 Forbo Holding AG . . . . . . . . . . . . . . . . . . 43,586,59829,327 Loeb Holding AG . . . . . . . . . . . . . . . . . . 7,264,663
186,990 Medisize Holding AG . . . . . . . . . . . . . . . 16,627,845875,160 Nestle SA, Registered . . . . . . . . . . . . . . . 439,106,365
8 Neue Zuercher Zeitung †† . . . . . . . . . . . . 620,1242,368,760 Novartis AG, Registered . . . . . . . . . . . . . 121,904,741
45,425 Phoenix Mecano AG . . . . . . . . . . . . . . . . 22,906,546179,979 PubliGroupe SA, Registered . . . . . . . . . . 56,047,249182,827 Siegfried Holding AG . . . . . . . . . . . . . . . 27,912,519
7,400 Sika AG, Bearer . . . . . . . . . . . . . . . . . . . . 14,589,758473,990 Tamedia AG . . . . . . . . . . . . . . . . . . . . . . . 54,681,016
————————————1,012,495,023————————————
United Kingdom—11.7%2,535,000 AGA Foodservice Group PLC . . . . . . . . 15,807,8497,123,125 BBA Group PLC . . . . . . . . . . . . . . . . . . . 21,306,7953,979,658 Carclo PLC . . . . . . . . . . . . . . . . . . . . . . . . 6,565,003
11,378,577 Clinton Cards PLC . . . . . . . . . . . . . . . . . 13,229,8498,225,426 Diageo PLC . . . . . . . . . . . . . . . . . . . . . . . 166,097,5313,675,000 Ennstone PLC . . . . . . . . . . . . . . . . . . . . . 2,154,718
15,690,684 G4S PLC . . . . . . . . . . . . . . . . . . . . . . . . . 70,347,608969,024 GlaxoSmithKline PLC . . . . . . . . . . . . . . . 20,530,655593,139 GlaxoSmithKline PLC, Sponsored ADR 25,166,888
COMMON STOCKSUnited Kingdom (continued)
923,006 Headlam Group PLC . . . . . . . . . . . . . . . . $6,971,0665,037,262 HSBC Holdings PLC . . . . . . . . . . . . . . . . 83,096,686
15,740,603 Lloyds TSB Group PLC . . . . . . . . . . . . . . 141,094,140263,075 Partridge Fine Arts PLC †† . . . . . . . . . . . 98,665779,500 Raven Mount PLC . . . . . . . . . . . . . . . . . . 1,154,206
24,695,000 Signet Group PLC . . . . . . . . . . . . . . . . . . 30,307,98512,262,000 Trinity Mirror PLC . . . . . . . . . . . . . . . . . . 71,894,2905,038,361 TT Electronics PLC . . . . . . . . . . . . . . . . . 9,738,4532,879,718 Unilever PLC . . . . . . . . . . . . . . . . . . . . . . 97,242,118
————————————782,804,505
————————————
United States—5.3%3,085,645 American Express Company . . . . . . . . . . 134,904,4004,257,094 American International Group, Inc. . . . . 184,119,316
75,700 American National Insurance Company 8,077,1903,926,230 Sun-Times Media Group Inc., Class A †† 2,826,886
49,884 Torchmark Corporation . . . . . . . . . . . . . . 2,998,527269,276 Transatlantic Holdings Inc. . . . . . . . . . . . 17,866,463
————————————350,792,782
————————————
Miscellaneous—0.2%Undisclosed Securities* . . . . . . . . . . . . . . 10,017,316
————————————
TOTAL COMMON STOCKS(COST $3,635,167,852) . . . . . . . . . . . . 6,307,981,722
————————————
PREFERRED STOCKS—0.4%154,144 Adris Grupa d.d. . . . . . . . . . . . . . . . . . . . . 12,866,04911,800 KSB AG, Vorzugsakt . . . . . . . . . . . . . . . . 7,179,958
700,000 Villeroy & Boch AG . . . . . . . . . . . . . . . . 9,882,901————————————
TOTAL PREFERRED STOCKS(COST $17,582,512) . . . . . . . . . . . . . . . 29,928,908
————————————
REGISTERED INVESTMENT COMPANY—4.0%266,501,595 Dreyfus Government Prime
Cash Management . . . . . . . . . . . . . . . . . 266,501,595————————————
TOTAL REGISTERED INVESTMENT COMPANY
(COST $266,501,595) . . . . . . . . . . . . . . 266,501,595————————————
Face Value——————————
U.S. TREASURY BILLS—5.2%$335,000,000 3.205% ** due 5/8/08 †††. . . . . . . . . . . . . 334,493,276
14,000,000 1.535% ** due 8/28/08 ††† . . . . . . . . . . . 13,911,352————————————
TOTAL U.S. TREASURY BILLS(COST $347,661,621) . . . . . . . . . . . . . . 348,404,628
————————————
Market ValueShares (Note 2)—————— ––––––————————————
Market ValueShares (Note 2)—————— ––––––————————————

TWEEDY, BROWNE GLOBAL VALUE FUND
Portfolio of InvestmentsMarch 31, 2008
SEE NOTES TO FINANCIAL STATEMENTS
II-10SEE NOTES TO FINANCIAL STATEMENTS
II-10
REPURCHASE AGREEMENTS—0.8%$50,000,000 Agreement with Bank of America Corp.,
1.25% dated 3/31/08, to be repurchased at $50,001,736 on 4/1/08, collateralized by $50,000,158 U.S. Treasury Notes, 4.625% due 11/16/09 (market value $51,000,162) . . . . . . . . . . . $50,000,000
3,130,000 Agreement with UBS Warburg LLC, 1.44% dated 3/31/08, to be repurchased at $3,130,125 on 4/1/08, collateralized by $3,130,000 U.S. Treasury Notes, 6.875% due 8/15/25 (market value $3,193,330) . . . . . . . . . . . . 3,130,000
—————————————
TOTAL REPURCHASE AGREEMENTS(COST $53,130,000) . . . . . . . . . . . . . . . 53,130,000
—————————————TOTAL INVESTMENTS
(Cost $4,320,043,580***) . . . . . . . . . . . . . . . 105.1% 7,005,946,853UNREALIZED DEPRECIATION ON
FORWARD CONTRACTS (Net) . . . . . . . . . (5.7) (378,434,683)OTHER ASSETS AND LIABILITIES (Net) 0.6 36,358,325
———— —————————————NET ASSETS . . . . . . . . . . . . . . . . . . . . . . . . . . . 100.0% $6,663,870,495
———— ————————————————— —————————————————————————
* “Undisclosed Securities” represents issuers, generally smaller capitalizationissuers, where disclosure may be disadvantageous to the Fund’s accumulationor disposition program.
** Rate represents annualized yield at date of purchase.*** Aggregate cost for federal tax purposes is $4,318,213,005.
† Amount represents less than 0.1% of the net assets.†† Non-income producing security.
††† At March 31, 2008, liquid assets totaling $135,121,390 have been designatedas collateral for open forward contracts.
Abbreviations:ADR — American Depository ReceiptCVA — Certificaaten van aandelen (Share Certificates)
Market ValueFace Value (Note 2)—————————— ––––––———————————

TWEEDY, BROWNE GLOBAL VALUE FUND
Sector Diversification (Unaudited)March 31, 2008
SEE NOTES TO FINANCIAL STATEMENTS
II-11SEE NOTES TO FINANCIAL STATEMENTS
II-11
Percentage of Market ValueSector Diversification Net Assets (Note 2)———————————————————— ——————————— ––––—————————————
COMMON STOCKS:Media . . . . . . . . . . . . . . . . . . . . . . . . . . . . . . . . . . . . . . 13.8% $918,556,477Beverage. . . . . . . . . . . . . . . . . . . . . . . . . . . . . . . . . . . . 12.8 852,003,166Capital Goods . . . . . . . . . . . . . . . . . . . . . . . . . . . . . . . 11.8 788,618,428Banks . . . . . . . . . . . . . . . . . . . . . . . . . . . . . . . . . . . . . . 10.9 724,331,708Food . . . . . . . . . . . . . . . . . . . . . . . . . . . . . . . . . . . . . . . 10.1 676,226,151Insurance . . . . . . . . . . . . . . . . . . . . . . . . . . . . . . . . . . . 7.3 484,331,006Materials . . . . . . . . . . . . . . . . . . . . . . . . . . . . . . . . . . . 4.9 324,442,891Pharmaceuticals, Biotechnology & Life Sciences. . . . 4.7 312,849,329Diversified Financials . . . . . . . . . . . . . . . . . . . . . . . . . 4.1 273,275,206Consumer Durables & Apparel . . . . . . . . . . . . . . . . . . 3.8 250,289,450Technology Hardware & Equipment . . . . . . . . . . . . . 2.8 187,170,120Automobiles & Components . . . . . . . . . . . . . . . . . . . 1.9 126,048,281Telecommunication Services. . . . . . . . . . . . . . . . . . . . 1.8 120,605,648Retailing. . . . . . . . . . . . . . . . . . . . . . . . . . . . . . . . . . . . 1.3 85,745,258Commercial Services & Supplies . . . . . . . . . . . . . . . . 1.2 77,629,589Transportation . . . . . . . . . . . . . . . . . . . . . . . . . . . . . . . 0.7 47,139,451Health Care Equipment & Services . . . . . . . . . . . . . . 0.7 44,045,075Utilities . . . . . . . . . . . . . . . . . . . . . . . . . . . . . . . . . . . . 0.1 6,586,820Household & Personal Products . . . . . . . . . . . . . . . . . 0.0† 2,876,407Real Estate . . . . . . . . . . . . . . . . . . . . . . . . . . . . . . . . . . 0.0† 1,992,303Consumer Services . . . . . . . . . . . . . . . . . . . . . . . . . . . 0.0† 1,688,613Tobacco . . . . . . . . . . . . . . . . . . . . . . . . . . . . . . . . . . . . 0.0† 1,263,288Semiconductors & Semiconductor Equipment . . . . . 0.0† 267,057— — — — — — — —————————————Total Common Stocks . . . . . . . . . . . . . . . . . . . . . . . . 94.7 6,307,981,722— — — — — — — —————————————Preferred Stocks . . . . . . . . . . . . . . . . . . . . . . . . . . . . . 0.4 29,928,908Registered Investment Company. . . . . . . . . . . . . . . . 4.0 266,501,595U.S. Treasury Bills . . . . . . . . . . . . . . . . . . . . . . . . . . . 5.2 348,404,628Repurchase Agreements. . . . . . . . . . . . . . . . . . . . . . . 0.8 53,130,000Unrealized Depreciation on Forward Contracts (Net) (5.7) (378,434,683)Other Assets and Liabilities (Net) . . . . . . . . . . . . . . 0.6 36,358,325— — — — — — — —————————————Net Assets . . . . . . . . . . . . . . . . . . . . . . . . . . . . . . . . . . 100.0% $6,663,870,495— — — — — — — —————————————— — — — — — — —————————————————————————
† Amount represents less than 0.1% of net assets
Portfolio Composition (Unaudited)March 31, 2008
† Amount represents less than 1% of net assets† Amount represents less than 1% of net assets†† Includes Unrealized Depreciation on Forward Contracts (Net)†† Includes Unrealized Depreciation on Forward Contracts (Net)
CroatiaCroatia-0%†-0%†Czech RepublicCzech Republic-0%†-0%†SwedenSweden-0%†-0%†Miscellaneous-0%†Miscellaneous-0%†
Cash Equivalents
United States
United Kingdom
Switzerland
South Korea
Singapore
Norway
Netherlands
Mexico
Japan
Italy
Ireland
Hong Kong
Germany
France
Finland
Canada
Belgium
Belgium-3%Belgium-3%Canada-1%Canada-1%
Finland-8%Finland-8%
France-7%France-7%
Germany-4%Germany-4%Hong Kong-2%Hong Kong-2%
Italy-5%Italy-5%
Japan-6%Japan-6%
Mexico-4%Mexico-4%
Netherlands-13%Netherlands-13%
Norway-1%Norway-1%
Singapore-2%Singapore-2%
South Korea-5%South Korea-5%
Spain-2%
Switzerland-15%Switzerland-15%
United Kingdom-12%United Kingdom-12%
United States-5%United States-5%
Cash Equivalents and Cash Equivalents and Other Assets and Other Assets and Liabilities (Net)Liabilities (Net)††††-6%-6%
IrelandIreland-1%-1%

SEE NOTES TO FINANCIAL STATEMENTS
II-12
TWEEDY, BROWNE GLOBAL VALUE FUND
Schedule of Forward Exchange ContractsMarch 31, 2008
SEE NOTES TO FINANCIAL STATEMENTS
II-12
Contract Market ValueContracts Value Date (Note 2)———————— —————————— ————————————
Contract Market ValueContracts Value Date (Note 2)———————— —————————— ————————————
SEE NOTES TO FINANCIAL STATEMENTS
II-12SEE NOTES TO FINANCIAL STATEMENTS
II-12
FORWARD EXCHANGE CONTRACTS TO BUY70,000,000 Danish Krone . . . . . . . . . . . . . . . . . 5/14/08 $14,846,525 20,000,000 European Union Euro . . . . . . . . . . . 4/17/08 31,672,857 47,000,000 European Union Euro . . . . . . . . . . . 4/23/08 74,416,013
100,000,000 European Union Euro . . . . . . . . . . . 5/5/08 158,251,635 30,000,000 European Union Euro . . . . . . . . . . . 5/14/08 47,452,512 7,000,000 Great Britain Pound Sterling . . . . . 4/23/08 13,889,465
12,000,000 Great Britain Pound Sterling . . . . . 5/14/08 23,769,766 5,000,000 Great Britain Pound Sterling . . . . . 5/20/08 9,898,951
30,000,000 Great Britain Pound Sterling . . . . . 7/7/08 59,158,266 170,000,000 Hong Kong Dollar. . . . . . . . . . . . . . 5/14/08 21,872,474 130,000,000 Hong Kong Dollar. . . . . . . . . . . . . . 5/23/08 16,729,432 210,000,000 Hong Kong Dollar. . . . . . . . . . . . . . 7/29/08 27,056,566 165,000,000 Hong Kong Dollar. . . . . . . . . . . . . . 8/19/08 21,265,699 195,000,000 Hong Kong Dollar. . . . . . . . . . . . . . 9/2/08 25,137,682
2,000,000,000 Japanese Yen . . . . . . . . . . . . . . . . . . 4/17/08 20,115,422 3,550,000,000 Japanese Yen . . . . . . . . . . . . . . . . . . 5/16/08 35,765,634 5,600,000,000 Japanese Yen . . . . . . . . . . . . . . . . . . 5/23/08 56,440,349
100,000,000 Norwegian Krone . . . . . . . . . . . . . . 5/16/08 19,597,845 75,000,000 Norwegian Krone . . . . . . . . . . . . . . 6/11/08 14,661,882 16,500,000 Singapore Dollar . . . . . . . . . . . . . . . 4/23/08 11,985,734 15,000,000 Singapore Dollar . . . . . . . . . . . . . . 8/19/08 10,934,534 60,000,000 Singapore Dollar . . . . . . . . . . . . . . 9/16/08 43,764,458 24,000,000 Swiss Franc . . . . . . . . . . . . . . . . . . . 4/17/08 24,268,546
—————————————TOTAL (Contract Amount $777,083,021). . . . . . . . $782,952,247
——————————————————————————
FORWARD EXCHANGE CONTRACTS TO SELL4,000,000 Canadian Dollar . . . . . . . . . . . . . . . 4/23/08 $(3,896,611)7,000,000 Canadian Dollar . . . . . . . . . . . . . . . 5/5/08 (6,817,340)7,000,000 Canadian Dollar . . . . . . . . . . . . . . . 5/23/08 (6,814,628)9,500,000 Canadian Dollar . . . . . . . . . . . . . . . 6/3/08 (9,246,300)
13,000,000 Canadian Dollar . . . . . . . . . . . . . . . 11/18/08 (12,611,960)17,000,000 Canadian Dollar . . . . . . . . . . . . . . . 12/19/08 (16,482,005)17,000,000 Canadian Dollar . . . . . . . . . . . . . . . 3/9/09 (16,454,588)34,000,000 Danish Krone . . . . . . . . . . . . . . . . . 4/17/08 (7,220,067)70,000,000 Danish Krone . . . . . . . . . . . . . . . . . 5/14/08 (14,846,525)48,000,000 Danish Krone . . . . . . . . . . . . . . . . . 5/16/08 (10,179,354)83,000,000 Danish Krone . . . . . . . . . . . . . . . . . 5/23/08 (17,595,021)20,000,000 European Union Euro . . . . . . . . . . . 4/17/08 (31,672,857)47,000,000 European Union Euro . . . . . . . . . . . 4/23/08 (74,416,012)
100,000,000 European Union Euro . . . . . . . . . . . 5/5/08 (158,251,636)50,000,000 European Union Euro . . . . . . . . . . . 5/14/08 (79,087,520)45,000,000 European Union Euro . . . . . . . . . . . 5/16/08 (71,171,113)30,000,000 European Union Euro . . . . . . . . . . . 5/20/08 (47,437,205)82,000,000 European Union Euro . . . . . . . . . . . 5/23/08 (129,640,784)
100,000,000 European Union Euro . . . . . . . . . . . 7/7/08 (157,717,661)100,000,000 European Union Euro . . . . . . . . . . . 7/15/08 (157,644,464)100,000,000 European Union Euro . . . . . . . . . . . 7/22/08 (157,580,472)30,000,000 European Union Euro . . . . . . . . . . . 8/7/08 (47,230,320)
115,000,000 European Union Euro . . . . . . . . . . . 9/2/08 (180,777,106)145,000,000 European Union Euro . . . . . . . . . . . 9/15/08 (227,764,599)100,000,000 European Union Euro . . . . . . . . . . . 10/1/08 (156,939,011)60,000,000 European Union Euro . . . . . . . . . . . 10/7/08 (94,135,662)
100,000,000 European Union Euro . . . . . . . . . . . 12/19/08 (156,332,343)75,000,000 European Union Euro . . . . . . . . . . . 1/12/09 (117,111,103)
100,000,000 European Union Euro . . . . . . . . . . . 2/2/09 (155,987,016)40,000,000 European Union Euro . . . . . . . . . . . 3/3/09 (62,306,024)7,000,000 Great Britain Pound Sterling . . . . . 4/23/08 (13,889,465)
12,000,000 Great Britain Pound Sterling . . . . . 5/14/08 (23,769,766)5,000,000 Great Britain Pound Sterling . . . . . 5/20/08 (9,898,951)
30,000,000 Great Britain Pound Sterling . . . . . 7/7/08 (59,158,266)16,000,000 Great Britain Pound Sterling . . . . . 7/29/08 (31,492,995)22,000,000 Great Britain Pound Sterling . . . . . 9/15/08 (43,128,510)20,000,000 Great Britain Pound Sterling . . . . . 10/1/08 (39,156,710)35,000,000 Great Britain Pound Sterling . . . . . 10/14/08 (68,459,632)20,000,000 Great Britain Pound Sterling . . . . . 10/20/08 (39,102,750)4,500,000 Great Britain Pound Sterling . . . . . 10/28/08 (8,793,007)
52,000,000 Great Britain Pound Sterling . . . . . 12/19/08 (101,224,110)10,000,000 Great Britain Pound Sterling . . . . . 1/12/09 (19,432,078)15,000,000 Great Britain Pound Sterling . . . . . 2/2/09 (29,103,356)
14,000,000 Great Britain Pound Sterling . . . . . 3/3/09 $(27,105,439)170,000,000 Hong Kong Dollar. . . . . . . . . . . . . . 5/14/08 (21,872,474)130,000,000 Hong Kong Dollar. . . . . . . . . . . . . . 5/23/08 (16,729,432)210,000,000 Hong Kong Dollar. . . . . . . . . . . . . . 7/29/08 (27,056,566)165,000,000 Hong Kong Dollar. . . . . . . . . . . . . . 8/19/08 (21,265,699)195,000,000 Hong Kong Dollar. . . . . . . . . . . . . . 9/2/08 (25,137,682)55,000,000 Hong Kong Dollar. . . . . . . . . . . . . . 10/2/08 (7,093,390)
150,000,000 Hong Kong Dollar. . . . . . . . . . . . . . 2/24/09 (19,385,683)2,000,000,000 Japanese Yen . . . . . . . . . . . . . . . . . . 4/17/08 (20,115,423)3,550,000,000 Japanese Yen . . . . . . . . . . . . . . . . . . 5/16/08 (35,765,634)5,600,000,000 Japanese Yen . . . . . . . . . . . . . . . . . . 5/23/08 (56,440,350)4,000,000,000 Japanese Yen . . . . . . . . . . . . . . . . . . 6/16/08 (40,362,534)3,000,000,000 Japanese Yen . . . . . . . . . . . . . . . . . . 8/19/08 (30,351,017)2,500,000,000 Japanese Yen . . . . . . . . . . . . . . . . . . 9/2/08 (25,306,343)
900,000,000 Japanese Yen . . . . . . . . . . . . . . . . . . 9/16/08 (9,115,268)2,300,000,000 Japanese Yen . . . . . . . . . . . . . . . . . . 10/20/08 (23,324,521)1,500,000,000 Japanese Yen . . . . . . . . . . . . . . . . . . 2/2/09 (15,271,268)
10,542,970,000 Japanese Yen . . . . . . . . . . . . . . . . . . 2/19/09 (107,404,506)2,000,000,000 Japanese Yen . . . . . . . . . . . . . . . . . . 3/3/09 (20,383,757)
264,000,000 Mexican Peso . . . . . . . . . . . . . . . . . 4/4/08 (24,736,921)170,000,000 Mexican Peso . . . . . . . . . . . . . . . . . 4/17/08 (15,901,444)295,000,000 Mexican Peso . . . . . . . . . . . . . . . . . 5/16/08 (27,489,288)165,000,000 Mexican Peso . . . . . . . . . . . . . . . . . 5/20/08 (15,367,470)145,000,000 Mexican Peso . . . . . . . . . . . . . . . . . 9/2/08 (13,327,988)245,000,000 Mexican Peso . . . . . . . . . . . . . . . . . 10/23/08 (22,373,292)225,000,000 Mexican Peso . . . . . . . . . . . . . . . . . 12/19/08 (20,403,092)140,000,000 Mexican Peso . . . . . . . . . . . . . . . . . 1/12/09 (12,657,953)300,000,000 Mexican Peso . . . . . . . . . . . . . . . . . 1/20/09 (27,097,642)260,000,000 Mexican Peso . . . . . . . . . . . . . . . . . 2/3/09 (23,444,475)315,000,000 Mexican Peso . . . . . . . . . . . . . . . . . 3/3/09 (28,307,099)100,000,000 Norwegian Krone . . . . . . . . . . . . . . 5/16/08 (19,597,845)115,000,000 Norwegian Krone . . . . . . . . . . . . . . 6/11/08 (22,481,553)145,000,000 Norwegian Krone . . . . . . . . . . . . . . 9/16/08 (28,065,837)110,000,000 Norwegian Krone . . . . . . . . . . . . . . 10/7/08 (21,246,612)80,000,000 Norwegian Krone . . . . . . . . . . . . . . 10/28/08 (15,420,926)16,500,000 Singapore Dollar . . . . . . . . . . . . . . . 4/23/08 (11,985,734)15,000,000 Singapore Dollar . . . . . . . . . . . . . . . 8/19/08 (10,934,534)65,000,000 Singapore Dollar . . . . . . . . . . . . . . . 9/16/08 (47,411,496)15,000,000 Singapore Dollar . . . . . . . . . . . . . . . 10/2/08 (10,944,775)30,000,000 Singapore Dollar . . . . . . . . . . . . . . . 10/14/08 (21,894,649)44,000,000 Singapore Dollar . . . . . . . . . . . . . . . 11/18/08 (32,133,986)
10,151,200,000 South Korean Won . . . . . . . . . . . . . 4/23/08 (10,255,671)30,000,000,000 South Korean Won . . . . . . . . . . . . . 5/16/08 (30,315,381)18,000,000,000 South Korean Won . . . . . . . . . . . . . 7/7/08 (18,194,581)21,000,000,000 South Korean Won . . . . . . . . . . . . . 9/25/08 (21,236,552)20,000,000,000 South Korean Won . . . . . . . . . . . . . 10/7/08 (20,226,310)28,000,000,000 South Korean Won . . . . . . . . . . . . . 10/14/08 (28,317,613)53,000,000,000 South Korean Won . . . . . . . . . . . . . 10/23/08 (53,603,094)73,000,000,000 South Korean Won . . . . . . . . . . . . . 12/19/08 (73,847,232)15,000,000,000 South Korean Won . . . . . . . . . . . . . 2/2/09 (15,176,776)33,000,000,000 South Korean Won . . . . . . . . . . . . . 3/3/09 (33,392,717)30,000,000,000 South Korean Won . . . . . . . . . . . . . 3/13/09 (30,358,210)
24,000,000 Swiss Franc . . . . . . . . . . . . . . . . . . . 4/17/08 (24,268,546)24,000,000 Swiss Franc . . . . . . . . . . . . . . . . . . . 4/23/08 (24,269,547)41,000,000 Swiss Franc . . . . . . . . . . . . . . . . . . . 7/15/08 (41,440,563)13,000,000 Swiss Franc . . . . . . . . . . . . . . . . . . . 7/22/08 (13,138,594)27,000,000 Swiss Franc . . . . . . . . . . . . . . . . . . . 7/29/08 (27,285,571)90,000,000 Swiss Franc . . . . . . . . . . . . . . . . . . . 8/7/08 (90,942,142)30,000,000 Swiss Franc . . . . . . . . . . . . . . . . . . . 9/2/08 (30,304,637)75,000,000 Swiss Franc . . . . . . . . . . . . . . . . . . . 9/16/08 (75,748,846)65,000,000 Swiss Franc . . . . . . . . . . . . . . . . . . . 9/25/08 (65,641,899)40,000,000 Swiss Franc . . . . . . . . . . . . . . . . . . . 10/2/08 (40,391,209)35,000,000 Swiss Franc . . . . . . . . . . . . . . . . . . . 10/7/08 (35,339,828)30,000,000 Swiss Franc . . . . . . . . . . . . . . . . . . . 10/14/08 (30,288,305)27,000,000 Swiss Franc . . . . . . . . . . . . . . . . . . . 10/20/08 (27,257,180)28,000,000 Swiss Franc . . . . . . . . . . . . . . . . . . . 10/28/08 (28,263,532)25,000,000 Swiss Franc . . . . . . . . . . . . . . . . . . . 11/18/08 (25,227,863)40,000,000 Swiss Franc . . . . . . . . . . . . . . . . . . . 1/12/09 (40,333,396)14,000,000 Swiss Franc . . . . . . . . . . . . . . . . . . . 1/20/09 (14,115,095)
—————————————TOTAL (Contract Amount $4,479,565,481) . . . . . . $(4,863,869,390)
——————————————————————————
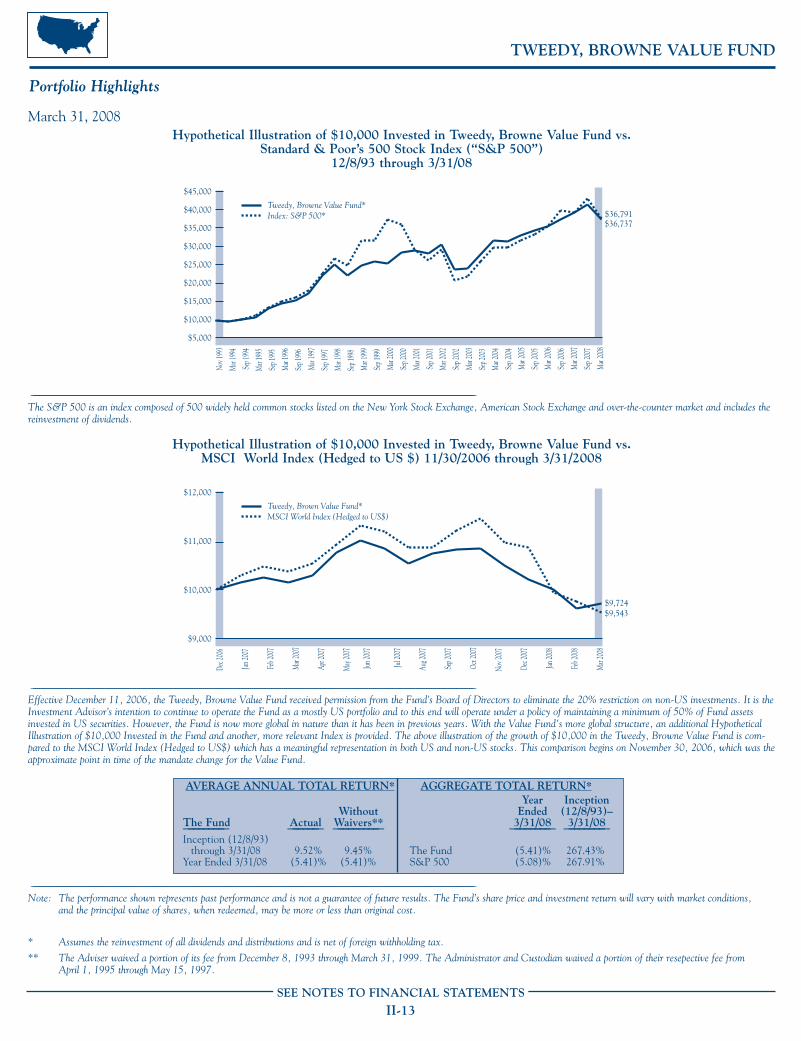
TWEEDY, BROWNE VALUE FUND
Portfolio Highlights
SEE NOTES TO FINANCIAL STATEMENTS
II-13
March 31, 2008Hypothetical Illustration of $10,000 Invested in Tweedy, Browne Value Fund vs.
Standard & Poor’s 500 Stock Index (“S&P 500”)12/8/93 through 3/31/08
________________________________________________________________________________________________________________________________________________________________________________________________________________
The S&P 500 is an index composed of 500 widely held common stocks listed on the New York Stock Exchange, American Stock Exchange and over-the-counter market and includes thereinvestment of dividends.
$5,000
$10,000
$15,000
$20,000
$30,000
$25,000
$45,000
$40,000
$35,000
Tweedy, Browne Value Fund*Index: S&P 500*
$36,737$36,791
50001000015000200002500030000350004000045000 S&P 500 Monthly Reinv.
Tweedy, Brown Value Fund*
03/31/0809/30/073/31/079/30/063/31/069/30/053/31/059/30/043/31/049/30/033/31/039/30/023/31/029/30/013/31/019/30/003/31/009/30/993/31/999/30/983/31/989/30/973/31/979/30/963/31/969/30/953/31/959/30/943/31/9411/8/93
Nov 1
993
Mar
1994
Sep 1
994
Mar
1995
Sep 1
995
Mar
1996
Sep 1
996
Mar
1997
Sep 1
997
Mar
1998
Sep 1
998
Mar
1999
Sep 1
999
Mar
2001
Sep 2
001
Sep 2
002
Mar
2002
Mar
2003
Sep 2
003
Mar
2004
Sep 2
004
Mar
2005
Sep 2
000
Mar
2000
Sep 2
005
Sep 2
006
Sep 2
007
Mar
2006
Mar
2008
Mar
2007
AVERAGE ANNUAL TOTAL RETURN* AGGREGATE TOTAL RETURN*Year Inception
Without Ended (12/8/93)–The Fund Actual Waivers** 3/31/08 3/31/08———————— —————— ————————— ———————— ————————Inception (12/8/93)
through 3/31/08 9.52% 9.45% The Fund (5.41)% 267.43%Year Ended 3/31/08 (5.41)% (5.41)% S&P 500 (5.08)% 267.91%
________________________________________________________________________________________________________________________________________________________________________________________________________________
Note: The performance shown represents past performance and is not a guarantee of future results. The Fund’s share price and investment return will vary with market conditions, and the principal value of shares, when redeemed, may be more or less than original cost.
* Assumes the reinvestment of all dividends and distributions and is net of foreign withholding tax.
** The Adviser waived a portion of its fee from December 8, 1993 through March 31, 1999. The Administrator and Custodian waived a portion of their resepective fee from April 1, 1995 through May 15, 1997.
$9,000
$12,000
$11,000
$10,000
Tweedy, Brown Value Fund*MSCI World Index (Hedged to US$)
$9,543$9,724
9000
10000
11000
12000 MSCI World Index (Hedged to US$)
Tweedy, Brown Value Fund*
3/31/082/29/081/31/0812/31/0711/30/0710/31/079/30/078/31/077/31/076/30/075/31/074/30/073/31/072/28/071/31/0712/31/0611/30/06
Dec 2
006
Jan 20
07
Feb 2
007
Mar
2007
Apr 2
007
May
2007
Jun 20
07
Jul 20
07
Aug 2
007
Sep 2
007
Oct 2
007
Nov 2
007
Dec 2
007
Jan 20
08
Feb 2
008
Mar
2008
Hypothetical Illustration of $10,000 Invested in Tweedy, Browne Value Fund vs. MSCI World Index (Hedged to US $) 11/30/2006 through 3/31/2008
________________________________________________________________________________________________________________________________________________________________________________________________________________
Effective December 11, 2006, the Tweedy, Browne Value Fund received permission from the Fund’s Board of Directors to eliminate the 20% restriction on non-US investments. It is theInvestment Advisor’s intention to continue to operate the Fund as a mostly US portfolio and to this end will operate under a policy of maintaining a minimum of 50% of Fund assetsinvested in US securities. However, the Fund is now more global in nature than it has been in previous years. With the Value Fund's more global structure, an additional HypotheticalIllustration of $10,000 Invested in the Fund and another, more relevant Index is provided. The above illustration of the growth of $10,000 in the Tweedy, Browne Value Fund is com-pared to the MSCI World Index (Hedged to US$) which has a meaningful representation in both US and non-US stocks. This comparison begins on November 30, 2006, which was theapproximate point in time of the mandate change for the Value Fund.

SEE NOTES TO FINANCIAL STATEMENTS
II-14
TWEEDY, BROWNE VALUE FUND
Perspective On Assessing Investment Results
March 31, 2008
In accordance with rules and guidelines set out by theUnited States (US) Securities and Exchange Commission, wehave provided a comparison of the historical investment resultsof Tweedy, Browne Value Fund to the historical investmentresults of the most appropriate broad-based securities marketindex, the Standard & Poor’s 500 Stock Index (the “S&P500”). The S&P 500 is an index composed of 500 widely heldcommon stocks listed on the New York Stock Exchange,American Stock Exchange and over-the-counter market. TheMSCI World Index (Hedged to US $) is a free float-adjustedmarket capitalization weighted index that is designed tomeasure the equity market performance of developed markets.We include results of the MSCI World Index since November30, 2006, which was the approximate date of the Value Fund’smandate change from a restriction of 20% non-U.S.investments. However, the historical results of the S&P 500and the MSCI World Index in large measure represent theinvestment results of stocks that we do not own. Any portfoliowhich does not own exactly the same stocks in exactly thesame proportions as the index to which the particular portfoliois being compared is not likely to have the same results as theindex. The investment behavior of a diversified portfolio ofundervalued stocks tends to be correlated to the investmentbehavior of a broad index; i.e., when the index is up, probablymore than one-half of the stocks in the entire universe ofpublic companies that are included in the same index will beup, albeit, in greater or lesser percentages than the index.Similarly, when the index declines, probably more than one-half of the stocks in the entire universe of public companiesthat are included in the index will be down in greater or lesserpercentages than the index. But it is almost a mathematicaltruth that “different stocks equal different results.”
We believe that favorable or unfavorable historicalinvestment results in comparison to an index are notnecessarily predictive of future comparative investment results.In Are Short-Term Performance and Value Investing MutuallyExclusive?, Eugene Shahan analyzed the investmentperformance of seven money managers, about whom WarrenBuffett wrote in his article, The Super Investors of Graham andDoddsville. Over long periods of time, the seven managerssignificantly outperformed the market as measured by the DowJones Industrial Average (the “DJIA”) or the S&P 500 bybetween 7.7% and 16.5% annually. (The goal of mostinstitutional money managers is to outperform the market by2% to 3%.) However, for periods ranging from 13 years to 28years, this group of managers underperformed the marketbetween 7.7% and 42% of the years. Six of the seveninvestment managers underperformed the market between28% and 42% of the years. In today’s environment, they wouldhave lost many of their clients during their periods ofunderperformance. Longer term, it would have been the wrongdecision to fire any of those money managers. In examining theseven long-term investment records, unfavorable investment
results as compared to either index did not predict the futurefavorable comparative investment results which occurred, andfavorable investment results in comparison to the DJIA or theS&P 500 were not always followed by future favorablecomparative results. Stretches of consecutive annualunderperformance ranged from one to six years.
Mr. Shahan concluded: Unfortunately, there is no way to distinguish between apoor three-year stretch for a manager who will do wellover 15 years, from a poor three-year stretch for amanager who will continue to do poorly. Nor is there anyreason to believe that a manager who does well from theoutset cannot continue to do well, and consistently.

SEE NOTES TO FINANCIAL STATEMENTS
II-15
TWEEDY, BROWNE VALUE FUND
Portfolio of InvestmentsMarch 31, 2008
SEE NOTES TO FINANCIAL STATEMENTS
II-15
COMMON STOCKS—92.7%France—2.0%
220,000 Sanofi-Aventis, ADR . . . . . . . . . . . . . . . . $8,258,800————————————
Italy—1.1%253,300 Mediaset SPA . . . . . . . . . . . . . . . . . . . . . . 2,352,023264,000 Mondadori (Arnoldo) Editore SPA . . . . . 2,238,033
————————————4,590,056
————————————
Netherlands—9.7%573,000 Heineken Holding NV . . . . . . . . . . . . . . 28,918,300323,571 Unilever NV, ADR . . . . . . . . . . . . . . . . . 10,914,050
————————————39,832,350
————————————
South Korea—3.5%318,400 Korea Exchange Bank . . . . . . . . . . . . . . . 4,243,833467,163 SK Telecom Company, Ltd., ADR . . . . . 10,095,392
————————————14,339,225
————————————
Switzerland—9.2%302,400 Nestle SA, Registered, Sponsored ADR . 37,931,846
————————————
United Kingdom—9.6%276,000 Diageo PLC, Sponsored ADR . . . . . . . . . 22,444,320487,000 Lloyds TSB Group PLC . . . . . . . . . . . . . . 4,365,325376,200 Trinity Mirror PLC . . . . . . . . . . . . . . . . . . 2,205,728308,880 Unilever PLC, Sponsored ADR . . . . . . . 10,415,434
————————————39,430,807
————————————
United States—57.6%406,003 American Express Company . . . . . . . . . . 17,750,451329,361 American International Group, Inc. . . . . 14,244,86363,462 American National Insurance Company 6,771,39515,200 Anheuser-Busch Companies, Inc. . . . . . . 721,240
213,245 Bank of America Corporation . . . . . . . . . 8,084,11855,219 Burlington Northern Santa Fe
Corporation . . . . . . . . . . . . . . . . . . . . . . 5,092,296858,590 Comcast Corporation, Special Class A . . 16,287,452164,671 Con-Way, Inc. . . . . . . . . . . . . . . . . . . . . . 8,147,92110,000 ConocoPhillips . . . . . . . . . . . . . . . . . . . . . 762,100
344,736 Federated Investors Inc., Class B . . . . . . . 13,499,86272,560 FinishMaster Inc. . . . . . . . . . . . . . . . . . . . 1,814,000
608,850 Home Depot, Inc. . . . . . . . . . . . . . . . . . . 17,029,53569,124 Johnson & Johnson . . . . . . . . . . . . . . . . . 4,484,074
357,000 Leucadia National Corporation . . . . . . . . 16,143,54056,652 National Western Life Insurance
Company, Class A . . . . . . . . . . . . . . . . . 12,281,58798,000 Norfolk Southern Corporation . . . . . . . . 5,323,360
119,906 PNC Financial Services Group Inc. . . . . 7,862,23655,225 Ramco-Gershenson Properties Trust, REIT 1,165,800
185,088 Rayonier Inc., REIT . . . . . . . . . . . . . . . . . 8,040,223228,376 Torchmark Corporation . . . . . . . . . . . . . . 13,727,681229,032 Transatlantic Holdings Inc. . . . . . . . . . . . 15,196,273
COMMON STOCKSUnited States—(continued)
259,154 UniFirst Corporation . . . . . . . . . . . . . . . . $9,612,022276,425 Wal-Mart Stores, Inc. . . . . . . . . . . . . . . . 14,562,069620,600 Wells Fargo & Company . . . . . . . . . . . . . 18,059,460
————————————236,663,558
————————————
TOTAL COMMON STOCKS(COST $216,242,190) . . . . . . . . . . . . . . 381,046,642
————————————
REGISTERED INVESTMENT COMPANY—4.1%
16,651,206 Dreyfus Government Prime Cash Management . . . . . . . . . . . . . . . . . 16,651,206
————————————
TOTAL REGISTERED INVESTMENT COMPANY
(COST $16,651,206) . . . . . . . . . . . . . . . 16,651,206————————————
Face Value–––––––––
U.S. TREASURY BILLS—4.0%$14,000,000 3.205% * due 5/8/08 †. . . . . . . . . . . . . . . . 13,978,823
2,500,000 1.535% * due 8/28/08 † . . . . . . . . . . . . . . 2,484,170————————————
TOTAL U.S. TREASURY BILLS(COST $16,429,366) . . . . . . . . . . . . . . . 16,462,993
————————————
REPURCHASE AGREEMENT—0.3%(Cost $1,383,000)
1,383,000 Agreement with UBS Warburg LLC, 1.44% dated 3/31/08, to be repurchased at $1,383,055 on 4/1/08, collateralized by $1,383,000 U.S. Treasury Note, 5.250% due 2/15/29 (market value $1,411,223) . . . . . . . . . . . . 1,383,000
————————————TOTAL INVESTMENTS
(Cost $250,705,762**) . . . . . . . . . . . . . . . . . . 101.1% 415,543,841UNREALIZED DEPRECIATION ON
FORWARD CONTRACTS (Net) . . . . . . . . . (1.1) (4,404,365)OTHER ASSETS AND LIABILITIES (Net) 0.0†† 98,014———— ————————————NET ASSETS . . . . . . . . . . . . . . . . . . . . . . . . . . . 100.0% $411,237,490———— ———————————————— ————————————————————————
* Rate represents annualized yield at date of purchase.** Aggregate cost for federal tax purposes is $250,705,762.† At March 31, 2008, liquid assets totalling $3,981,901 have been designated
as collateral for open forward contracts.†† Amount represents less than 0.1% of net assets.
Abbreviations:ADR — American Depository ReceiptREIT — Real Estate Investment Trust
Market ValueShares (Note 2)—————— —————————————
Market ValueShares (Note 2)—————— —————————————

SEE NOTES TO FINANCIAL STATEMENTS
II-16
TWEEDY, BROWNE VALUE FUND
Sector Diversification (Unaudited)March 31, 2008
Portfolio Composition (Unaudited)March 31, 2008
Cash Equivalents
United States
United Kingdom
Switzerland
South Korea
Netherlands
Italy
France
† Amount represents less than 1% of net assets
Automotive Parts-0%†Energy-0%†Real Estate-0%†Miscellaneous-0%†
Cash Equivalents and Cash Equivalents and Other Assets and Other Assets and Liabilities (Net)Liabilities (Net)†-7%-7%
United States-58%United States-58%United Kingdom-10%United Kingdom-10%
Switzerland-9%Switzerland-9%
South Korea-3%South Korea-3%
Netherlands-10%Netherlands-10%
Italy-1%Italy-1%
France-2%France-2%
† Includes Unrealized Depreciation on Forward Contracts (Net)† Includes Unrealized Depreciation on Forward Contracts (Net)
SEE NOTES TO FINANCIAL STATEMENTS
II-16
Percentage of Market ValueSector Diversification Net Assets (Note 2)———————————————————— ——————————— ––––—————————————
COMMON STOCKS:Insurance . . . . . . . . . . . . . . . . . . . . . . . . . . . . . . . . . . . 15.1% $62,221,799Food . . . . . . . . . . . . . . . . . . . . . . . . . . . . . . . . . . . . . . . 14.5 59,261,330Diversified Financials . . . . . . . . . . . . . . . . . . . . . . . . . 13.6 55,477,971Beverage. . . . . . . . . . . . . . . . . . . . . . . . . . . . . . . . . . . . 12.7 52,083,860Banks . . . . . . . . . . . . . . . . . . . . . . . . . . . . . . . . . . . . . . 8.4 34,530,854Media . . . . . . . . . . . . . . . . . . . . . . . . . . . . . . . . . . . . . . 5.6 23,083,236Transportation . . . . . . . . . . . . . . . . . . . . . . . . . . . . . . . 4.5 18,563,577Retailing. . . . . . . . . . . . . . . . . . . . . . . . . . . . . . . . . . . . 4.1 17,029,535Food & Staples Retailing . . . . . . . . . . . . . . . . . . . . . . 3.5 14,562,069Pharmaceuticals, Biotechnology & Life Sciences. . . . 3.1 12,742,874Telecommunication Services. . . . . . . . . . . . . . . . . . . . 2.5 10,095,392Consumer Durables & Apparel . . . . . . . . . . . . . . . . . . 2.3 9,612,022Real Estate . . . . . . . . . . . . . . . . . . . . . . . . . . . . . . . . . . 2.2 9,206,023Automobiles & Components . . . . . . . . . . . . . . . . . . . 0.4 1,814,000Energy . . . . . . . . . . . . . . . . . . . . . . . . . . . . . . . . . . . . . 0.2 762,100— — — — — — — —————————————Total Common Stocks . . . . . . . . . . . . . . . . . . . . . . . . 92.7 381,046,642— — — — — — — —————————————Registered Investment Company. . . . . . . . . . . . . . . . 4.1 16,651,206U.S. Treasury Bills . . . . . . . . . . . . . . . . . . . . . . . . . . . 4.0 16,462,993Repurchase Agreement . . . . . . . . . . . . . . . . . . . . . . . 0.3 1,383,000Unrealized Depreciation on Forward Contracts (Net) (1.1) (4,404,365)Other Assets and Liabilities (Net) . . . . . . . . . . . . . . 0.0† 98,014— — — — — — — —————————————Net Assets . . . . . . . . . . . . . . . . . . . . . . . . . . . . . . . . . . 100.0% $411,237,490— — — — — — — —————————————— — — — — — — —————————————————————————
† Amount represents less than 0.1% of net assets

SEE NOTES TO FINANCIAL STATEMENTS
II-17
TWEEDY, BROWNE VALUE FUND
Schedule of Forward Exchange ContractsMarch 31, 2008
SEE NOTES TO FINANCIAL STATEMENTS
II-17SEE NOTES TO FINANCIAL STATEMENTS
II-17
Contract Market ValueContracts Value Date (Note 2)———————— —————————— ——————————
FORWARD EXCHANGE CONTRACTS TO BUY500,000 Great Britain Pound Sterling . . . . . 4/4/08 $993,472
4,500,000 Great Britain Pound Sterling . . . . . 4/23/08 8,928,941 —————————————
TOTAL (Contract Amount $9,940,980) . . . . . . . . . . . $9,922,413 ——————————————————————————
FORWARD EXCHANGE CONTRACTS TO SELL 1,700,000 European Union Euro . . . . . . . . . . . 5/14/08 $(2,688,976)5,250,000 European Union Euro . . . . . . . . . . . 7/14/08 (8,276,814)8,000,000 European Union Euro . . . . . . . . . . . 7/22/08 (12,606,438)4,000,000 European Union Euro . . . . . . . . . . . 11/18/08 (6,262,794)1,600,000 European Union Euro . . . . . . . . . . . 12/19/08 (2,501,317)
500,000 Great Britain Pound Sterling . . . . . 4/4/08 (993,472)4,500,000 Great Britain Pound Sterling . . . . . 4/23/08 (8,928,942)1,800,000 Great Britain Pound Sterling . . . . . 5/14/08 (3,565,465)4,000,000 Great Britain Pound Sterling . . . . . 7/22/08 (7,877,869)4,600,000 Great Britain Pound Sterling . . . . . 11/18/08 (8,974,690)
1,700,000,000 South Korean Won . . . . . . . . . . . . . 5/14/08 (1,717,860)3,200,000,000 South Korean Won . . . . . . . . . . . . . 3/3/09 (3,238,082)9,000,000,000 South Korean Won . . . . . . . . . . . . . 3/13/09 (9,107,463)
1,500,000 Swiss Franc . . . . . . . . . . . . . . . . . . . 4/16/08 (1,516,774)4,000,000 Swiss Franc . . . . . . . . . . . . . . . . . . . 5/14/08 (4,044,934)2,500,000 Swiss Franc . . . . . . . . . . . . . . . . . . . 7/22/08 (2,526,653)2,500,000 Swiss Franc . . . . . . . . . . . . . . . . . . . 9/2/08 (2,525,386)4,000,000 Swiss Franc . . . . . . . . . . . . . . . . . . . 10/7/08 (4,038,837)
—————————————
TOTAL (Contract Amount $87,006,968) . . . . . . . . . . $(91,392,766)——————————————————————————

TWEEDY, BROWNE WORLDWIDE HIGH DIVIDEND YIELD VALUE FUND
Portfolio Highlights
SEE NOTES TO FINANCIAL STATEMENTS
II-18
March 31, 2008Hypothetical Illustration of $10,000 Invested in
Tweedy, Browne Worldwide High Dividend Yield Value Fund vs. Morgan Stanley Capital International (“MSCI”)
World Index (in US Dollars)9/5/07 through 3/31/08
________________________________________________________________________________________________________________________________________________________________________________________________________________
The MSCI World Index is a free float-adjusted market capitalization weighed index that is designed to measure equity market performance of developed markets.
$9,731
$9,296
Tweedy, Browne Worldwide High Dividend Yield Value FundIndex: MSCI World Index*
Sep 5
, 200
7
Sep 2
007
Mar
2008
$9,000
$10,000
$11,000
AVERAGE ANNUAL TOTAL RETURN* AGGREGATE TOTAL RETURN*Year Inception
Without Ended (9/5/07)–The Fund Actual Waivers** 3/31/08 3/31/08———————— —————— ————————— ———————— ————————Inception (9/5/07)
through 3/31/08 (2.69)% (2.96)% The Fund (2.69)% (2.69)%Year Ended 3/31/08 (2.69)% (2.96)% MSCI World (in
US Dollars) (6.72)% (6.72)%
________________________________________________________________________________________________________________________________________________________________________________________________________________
Note: The performance shown represents past performance and is not a guarantee of future results. The Fund’s share price and investment return will vary with market conditions, and the principal value of shares, when redeemed, may be more or less than original cost.
* Assumes the reinvestment of all dividends and distributions and is net of foreign withholding tax.
** The Adviser has waived a portion of its fees since inception, September 5, 2007.

SEE NOTES TO FINANCIAL STATEMENTS
II-19
TWEEDY, BROWNE WORLDWIDE HIGH DIVIDEND YIELD VALUE FUND
Perspective On Assessing Investment Results
March 31, 2008
In accordance with rules and guidelines set out by theUnited States (US) Securities and Exchange Commission, wehave provided a comparison of the historical investment resultsof Tweedy, Browne Worldwide High Dividend Yield ValueFund to the historical investment results of the mostappropriate broad-based securities indices, the Morgan StanleyCapital International (MSCI) World Index (in US dollars).However, the historical results of the MSCI World Index (inUS dollars) in large measure represent the investment results ofstocks that we do not own. Any portfolio which does not ownexactly the same stocks in exactly the same proportions as theindex to which the particular portfolio is being compared is notlikely to have the same results as the index. The investmentbehavior of a diversified portfolio of undervalued stocks tendsto be correlated to the investment behavior of a broad index;i.e., when the index is up, probably more than one-half of thestocks in the entire universe of public companies in all thecountries that are included in the same index will be up, albeit,in greater or lesser percentages than the index. Similarly, whenthe index declines, probably more than one-half of the stocksin the entire universe of public companies in all the countriesthat are included in the index will be down in greater or lesserpercentages than the index. But it is almost a mathematicaltruth that “different stocks equal different results.”
We believe that favorable or unfavorable historicalinvestment results in comparison to an index are notnecessarily predictive of future comparative investment results.In Are Short-Term Performance and Value Investing MutuallyExclusive?, Eugene Shahan analyzed the investmentperformance of seven money managers, about whom WarrenBuffett wrote in his article, The Super- investors of Graham andDoddsville. Over long periods of time, the seven managerssignificantly outperformed the market as measured by the DowJones Industrial Average (the “DJIA”) or the Standard & Poor’s500 Stock Index (the “S&P 500”) by between 7.7% and 16.5%annually. (The goal of most institutional money managers is tooutperform the market by 2% to 3%.) However, for periodsranging from 13 years to 28 years, this group of managersunderperformed the market between 7.7% and 42% of theyears. Six of the seven investment managers underperformedthe market between 28% and 42% of the years. In today’senvironment, they would have lost many of their clients duringtheir periods of underperformance. Longer term, it would havebeen the wrong decision to fire any of those money managers.In examining the seven long-term investment records,unfavorable investment results as compared to either index didnot predict the future favorable comparative investment resultswhich occurred, and favorable investment results incomparison to the DJIA or the S&P 500 were not alwaysfollowed by future favorable comparative results. Stretches ofconsecutive annual underperformance ranged from one to sixyears.
Mr. Shahan concluded:
Unfortunately, there is no way to distinguish between apoor three-year stretch for a manager who will do wellover 15 years, from a poor three-year stretch for amanager who will continue to do poorly. Nor is there anyreason to believe that a manager who does well from theoutset cannot continue to do well, and consistently.
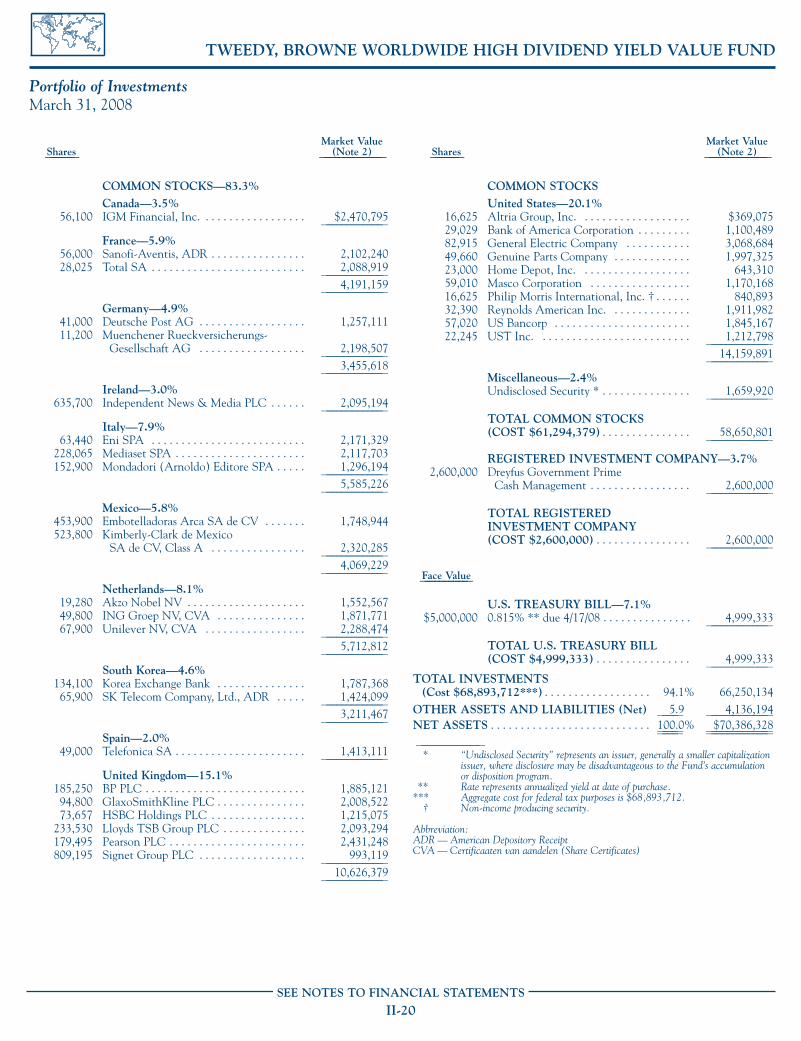
TWEEDY, BROWNE WORLDWIDE HIGH DIVIDEND YIELD VALUE FUND
Portfolio of InvestmentsMarch 31, 2008
SEE NOTES TO FINANCIAL STATEMENTS
II-20SEE NOTES TO FINANCIAL STATEMENTS
II-20
Market ValueShares (Note 2)—————— —————————————
Market ValueShares (Note 2)—————— —————————————
COMMON STOCKS—83.3%Canada—3.5%
56,100 IGM Financial, Inc. . . . . . . . . . . . . . . . . . $2,470,795————————————
France—5.9%56,000 Sanofi-Aventis, ADR . . . . . . . . . . . . . . . . 2,102,24028,025 Total SA . . . . . . . . . . . . . . . . . . . . . . . . . . 2,088,919
————————————4,191,159
————————————
Germany—4.9%41,000 Deutsche Post AG . . . . . . . . . . . . . . . . . . 1,257,11111,200 Muenchener Rueckversicherungs-
Gesellschaft AG . . . . . . . . . . . . . . . . . . 2,198,507————————————
3,455,618————————————
Ireland—3.0%635,700 Independent News & Media PLC . . . . . . 2,095,194
————————————
Italy—7.9%63,440 Eni SPA . . . . . . . . . . . . . . . . . . . . . . . . . . 2,171,329
228,065 Mediaset SPA . . . . . . . . . . . . . . . . . . . . . . 2,117,703152,900 Mondadori (Arnoldo) Editore SPA . . . . . 1,296,194
————————————5,585,226
————————————
Mexico—5.8%453,900 Embotelladoras Arca SA de CV . . . . . . . 1,748,944523,800 Kimberly-Clark de Mexico
SA de CV, Class A . . . . . . . . . . . . . . . . 2,320,285————————————
4,069,229————————————
Netherlands—8.1%19,280 Akzo Nobel NV . . . . . . . . . . . . . . . . . . . . 1,552,56749,800 ING Groep NV, CVA . . . . . . . . . . . . . . . 1,871,77167,900 Unilever NV, CVA . . . . . . . . . . . . . . . . . 2,288,474
————————————5,712,812
————————————
South Korea—4.6%134,100 Korea Exchange Bank . . . . . . . . . . . . . . . 1,787,36865,900 SK Telecom Company, Ltd., ADR . . . . . 1,424,099
————————————3,211,467
————————————
Spain—2.0%49,000 Telefonica SA . . . . . . . . . . . . . . . . . . . . . . 1,413,111
————————————
United Kingdom—15.1%185,250 BP PLC . . . . . . . . . . . . . . . . . . . . . . . . . . . 1,885,12194,800 GlaxoSmithKline PLC . . . . . . . . . . . . . . . 2,008,52273,657 HSBC Holdings PLC . . . . . . . . . . . . . . . . 1,215,075
233,530 Lloyds TSB Group PLC . . . . . . . . . . . . . . 2,093,294179,495 Pearson PLC . . . . . . . . . . . . . . . . . . . . . . . 2,431,248809,195 Signet Group PLC . . . . . . . . . . . . . . . . . . 993,119
————————————10,626,379
————————————
COMMON STOCKSUnited States—20.1%
16,625 Altria Group, Inc. . . . . . . . . . . . . . . . . . . $369,07529,029 Bank of America Corporation . . . . . . . . . 1,100,48982,915 General Electric Company . . . . . . . . . . . 3,068,68449,660 Genuine Parts Company . . . . . . . . . . . . . 1,997,32523,000 Home Depot, Inc. . . . . . . . . . . . . . . . . . . 643,31059,010 Masco Corporation . . . . . . . . . . . . . . . . . 1,170,16816,625 Philip Morris International, Inc. † . . . . . . 840,89332,390 Reynolds American Inc. . . . . . . . . . . . . . 1,911,98257,020 US Bancorp . . . . . . . . . . . . . . . . . . . . . . . 1,845,16722,245 UST Inc. . . . . . . . . . . . . . . . . . . . . . . . . . 1,212,798
————————————14,159,891
————————————
Miscellaneous—2.4%Undisclosed Security * . . . . . . . . . . . . . . . 1,659,920
————————————
TOTAL COMMON STOCKS(COST $61,294,379) . . . . . . . . . . . . . . . 58,650,801
————————————
REGISTERED INVESTMENT COMPANY—3.7%2,600,000 Dreyfus Government Prime
Cash Management . . . . . . . . . . . . . . . . . 2,600,000————————————
TOTAL REGISTERED INVESTMENT COMPANY(COST $2,600,000) . . . . . . . . . . . . . . . . 2,600,000
————————————
Face Value——————————
U.S. TREASURY BILL—7.1%$5,000,000 0.815% ** due 4/17/08 . . . . . . . . . . . . . . . 4,999,333
————————————
TOTAL U.S. TREASURY BILL (COST $4,999,333) . . . . . . . . . . . . . . . . 4,999,333
————————————TOTAL INVESTMENTS
(Cost $68,893,712***) . . . . . . . . . . . . . . . . . . 94.1% 66,250,134OTHER ASSETS AND LIABILITIES (Net) 5.9 4,136,194———— ————————————NET ASSETS . . . . . . . . . . . . . . . . . . . . . . . . . . . 100.0% $70,386,328———— ———————————————— ————————————————————————
* “Undisclosed Security” represents an issuer, generally a smaller capitalizationissuer, where disclosure may be disadvantageous to the Fund’s accumulationor disposition program.
** Rate represents annualized yield at date of purchase.*** Aggregate cost for federal tax purposes is $68,893,712.
† Non-income producing security.
Abbreviation:ADR — American Depository ReceiptCVA — Certificaaten van aandelen (Share Certificates)

TWEEDY, BROWNE WORLDWIDE HIGH DIVIDEND YIELD VALUE FUND
Sector Diversification (Unaudited)March 31, 2008
SEE NOTES TO FINANCIAL STATEMENTS
II-21SEE NOTES TO FINANCIAL STATEMENTS
II-21
COMMON STOCKS:Media . . . . . . . . . . . . . . . . . . . . . . . . . . . . . . . . . . . . . . 11.3% $7,940,339Banks . . . . . . . . . . . . . . . . . . . . . . . . . . . . . . . . . . . . . . 9.9 6,940,904Energy . . . . . . . . . . . . . . . . . . . . . . . . . . . . . . . . . . . . . 8.7 6,145,369Diversified Financials . . . . . . . . . . . . . . . . . . . . . . . . . 7.7 5,443,055Tobacco . . . . . . . . . . . . . . . . . . . . . . . . . . . . . . . . . . . . 6.2 4,334,748Capital Goods . . . . . . . . . . . . . . . . . . . . . . . . . . . . . . . 5.9 4,238,852Pharmaceuticals, Biotechnology & Life Sciences. . . . 5.8 4,110,762Insurance . . . . . . . . . . . . . . . . . . . . . . . . . . . . . . . . . . . 5.5 3,858,427Retailing. . . . . . . . . . . . . . . . . . . . . . . . . . . . . . . . . . . . 5.2 3,633,754Telecommunication Services. . . . . . . . . . . . . . . . . . . . 4.0 2,837,210Household & Personal Products . . . . . . . . . . . . . . . . . 3.3 2,320,285Food . . . . . . . . . . . . . . . . . . . . . . . . . . . . . . . . . . . . . . . 3.3 2,288,474Beverage. . . . . . . . . . . . . . . . . . . . . . . . . . . . . . . . . . . . 2.5 1,748,944Materials . . . . . . . . . . . . . . . . . . . . . . . . . . . . . . . . . . . 2.2 1,552,567Transportation . . . . . . . . . . . . . . . . . . . . . . . . . . . . . . . 1.8 1,257,111— — — — — — — —————————————Total Common Stocks . . . . . . . . . . . . . . . . . . . . . . . . 83.3 58,650,801— — — — — — — —————————————Registered Investment Company. . . . . . . . . . . . . . . . 3.7 2,600,000U.S. Treasury Bill . . . . . . . . . . . . . . . . . . . . . . . . . . . 7.1 4,999,333Other Assets and Liabilities (Net) . . . . . . . . . . . . . . 5.9 4,136,194— — — — — — — —————————————Net Assets . . . . . . . . . . . . . . . . . . . . . . . . . . . . . . . . . . 100.0% $70,386,328— — — — — — — —————————————— — — — — — — —————————————
Percentage of Market ValueSector Diversification Net Assets (Note 2)———————————————————— ———————————–––––—— ————————————
Portfolio Composition (Unaudited)March 31, 2008
Cash Equivalents
United States
United Kingdom
Miscellaneous
Spain
South Korea
Netherlands
Mexico
Italy
Ireland
Germany
France
Canada
Canada-3%Canada-3%
France-6%France-6%
Germany-5%Germany-5%Ireland-3%Ireland-3%
Italy-8%Italy-8%
Mexico-6%Mexico-6%
Netherlands-8%Netherlands-8%
Spain-2%Spain-2%
Miscellaneous-2%Miscellaneous-2%
South Korea-5%South Korea-5%United Kingdom-15%United Kingdom-15%
United States-20%United States-20%
Cash Equivalents Cash Equivalents and Other Assets and Other Assets and Liabilities (Net)-17%and Liabilities (Net)-17%
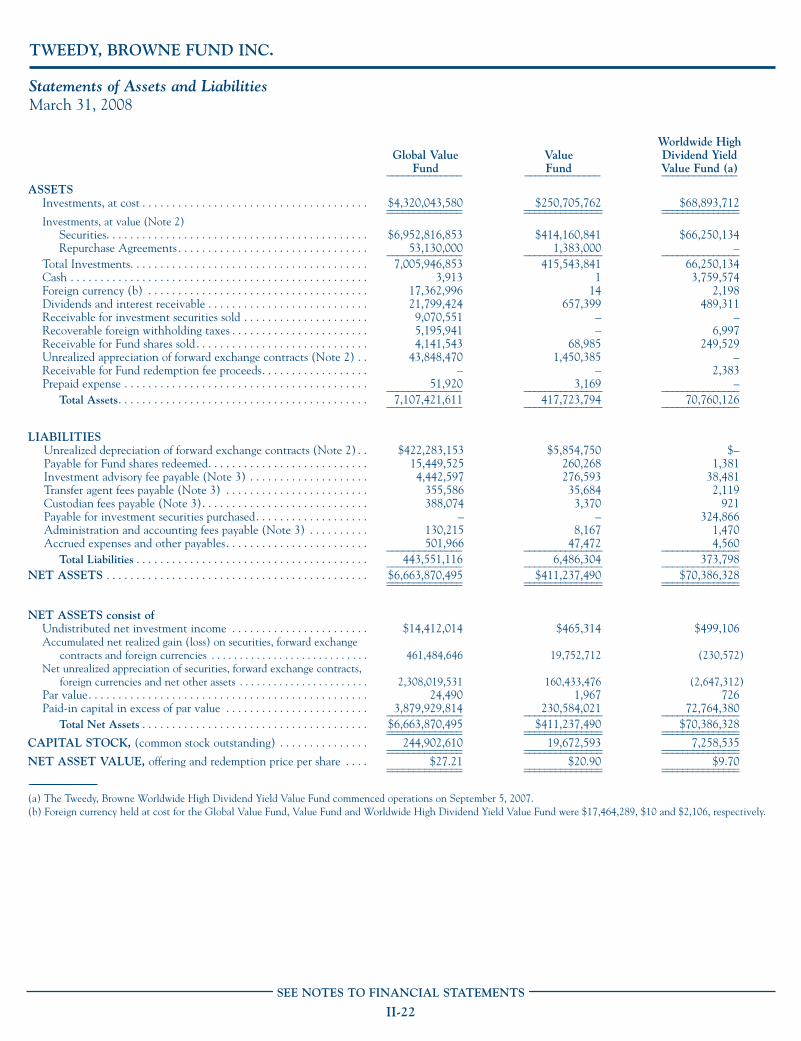
TWEEDY, BROWNE FUND INC.
Statements of Assets and LiabilitiesMarch 31, 2008
SEE NOTES TO FINANCIAL STATEMENTS
II-22SEE NOTES TO FINANCIAL STATEMENTS
II-22SEE NOTES TO FINANCIAL STATEMENTS
II-22SEE NOTES TO FINANCIAL STATEMENTS
II-22SEE NOTES TO FINANCIAL STATEMENTS
II-22SEE NOTES TO FINANCIAL STATEMENTS
II-22SEE NOTES TO FINANCIAL STATEMENTS
II-22SEE NOTES TO FINANCIAL STATEMENTS
II-22SEE NOTES TO FINANCIAL STATEMENTS
II-22SEE NOTES TO FINANCIAL STATEMENTS
II-22SEE NOTES TO FINANCIAL STATEMENTS
II-22SEE NOTES TO FINANCIAL STATEMENTS
II-22
Worldwide High Global Value Value Dividend Yield
Fund Fund Value Fund (a)______________ ______________ ______________
ASSETSInvestments, at cost . . . . . . . . . . . . . . . . . . . . . . . . . . . . . . . . . . . . . . $4,320,043,580 $250,705,762 $68,893,712______________ _______________ _____________________________ _______________ _______________Investments, at value (Note 2)
Securities. . . . . . . . . . . . . . . . . . . . . . . . . . . . . . . . . . . . . . . . . . . . $6,952,816,853 $414,160,841 $66,250,134Repurchase Agreements . . . . . . . . . . . . . . . . . . . . . . . . . . . . . . . . 53,130,000 1,383,000 –______________ _______________ _______________
Total Investments. . . . . . . . . . . . . . . . . . . . . . . . . . . . . . . . . . . . . . . . 7,005,946,853 415,543,841 66,250,134Cash . . . . . . . . . . . . . . . . . . . . . . . . . . . . . . . . . . . . . . . . . . . . . . . . . . 3,913 1 3,759,574Foreign currency (b) . . . . . . . . . . . . . . . . . . . . . . . . . . . . . . . . . . . . . 17,362,996 14 2,198Dividends and interest receivable . . . . . . . . . . . . . . . . . . . . . . . . . . . 21,799,424 657,399 489,311Receivable for investment securities sold . . . . . . . . . . . . . . . . . . . . . 9,070,551 – –Recoverable foreign withholding taxes . . . . . . . . . . . . . . . . . . . . . . . 5,195,941 – 6,997Receivable for Fund shares sold. . . . . . . . . . . . . . . . . . . . . . . . . . . . . 4,141,543 68,985 249,529Unrealized appreciation of forward exchange contracts (Note 2) . . 43,848,470 1,450,385 –Receivable for Fund redemption fee proceeds. . . . . . . . . . . . . . . . . . – – 2,383Prepaid expense . . . . . . . . . . . . . . . . . . . . . . . . . . . . . . . . . . . . . . . . . 51,920 3,169 –______________ _______________ _______________
Total Assets. . . . . . . . . . . . . . . . . . . . . . . . . . . . . . . . . . . . . . . . . . 7,107,421,611 417,723,794 70,760,126______________ _______________ _______________
LIABILITIESUnrealized depreciation of forward exchange contracts (Note 2) . . $422,283,153 $5,854,750 $–Payable for Fund shares redeemed. . . . . . . . . . . . . . . . . . . . . . . . . . . 15,449,525 260,268 1,381Investment advisory fee payable (Note 3) . . . . . . . . . . . . . . . . . . . . 4,442,597 276,593 38,481Transfer agent fees payable (Note 3) . . . . . . . . . . . . . . . . . . . . . . . . 355,586 35,684 2,119Custodian fees payable (Note 3). . . . . . . . . . . . . . . . . . . . . . . . . . . . 388,074 3,370 921Payable for investment securities purchased. . . . . . . . . . . . . . . . . . . – – 324,866Administration and accounting fees payable (Note 3) . . . . . . . . . . 130,215 8,167 1,470Accrued expenses and other payables. . . . . . . . . . . . . . . . . . . . . . . . 501,966 47,472 4,560______________ _______________ _______________
Total Liabilities . . . . . . . . . . . . . . . . . . . . . . . . . . . . . . . . . . . . . . . 443,551,116 6,486,304 373,798______________ _______________ _______________NET ASSETS . . . . . . . . . . . . . . . . . . . . . . . . . . . . . . . . . . . . . . . . . . . . $6,663,870,495 $411,237,490 $70,386,328______________ _______________ _____________________________ _______________ _______________
NET ASSETS consist ofUndistributed net investment income . . . . . . . . . . . . . . . . . . . . . . . $14,412,014 $465,314 $499,106Accumulated net realized gain (loss) on securities, forward exchange
contracts and foreign currencies . . . . . . . . . . . . . . . . . . . . . . . . . . . . 461,484,646 19,752,712 (230,572)Net unrealized appreciation of securities, forward exchange contracts,
foreign currencies and net other assets . . . . . . . . . . . . . . . . . . . . . . . 2,308,019,531 160,433,476 (2,647,312)Par value. . . . . . . . . . . . . . . . . . . . . . . . . . . . . . . . . . . . . . . . . . . . . . . 24,490 1,967 726Paid-in capital in excess of par value . . . . . . . . . . . . . . . . . . . . . . . . 3,879,929,814 230,584,021 72,764,380______________ _______________ _______________
Total Net Assets . . . . . . . . . . . . . . . . . . . . . . . . . . . . . . . . . . . . . . $6,663,870,495 $411,237,490 $70,386,328______________ _______________ _____________________________ _______________ _______________CAPITAL STOCK, (common stock outstanding) . . . . . . . . . . . . . . . 244,902,610 19,672,593 7,258,535______________ _______________ _____________________________ _______________ _______________NET ASSET VALUE, offering and redemption price per share . . . . $27.21 $20.90 $9.70______________ _______________ _____________________________ _______________ _______________________________________________________________________________________________________________
(a) The Tweedy, Browne Worldwide High Dividend Yield Value Fund commenced operations on September 5, 2007.(b) Foreign currency held at cost for the Global Value Fund, Value Fund and Worldwide High Dividend Yield Value Fund were $17,464,289, $10 and $2,106, respectively.

SEE NOTES TO FINANCIAL STATEMENTS
II-23
TWEEDY, BROWNE FUND INC.
Statements of OperationsFor the Year Ended March 31, 2008
SEE NOTES TO FINANCIAL STATEMENTS
II-23SEE NOTES TO FINANCIAL STATEMENTS
II-23SEE NOTES TO FINANCIAL STATEMENTS
II-23SEE NOTES TO FINANCIAL STATEMENTS
II-23SEE NOTES TO FINANCIAL STATEMENTS
II-23SEE NOTES TO FINANCIAL STATEMENTS
II-23SEE NOTES TO FINANCIAL STATEMENTS
II-23SEE NOTES TO FINANCIAL STATEMENTS
II-23SEE NOTES TO FINANCIAL STATEMENTS
II-23SEE NOTES TO FINANCIAL STATEMENTS
II-23SEE NOTES TO FINANCIAL STATEMENTS
II-23SEE NOTES TO FINANCIAL STATEMENTS
II-23
Worldwide High Global Value Value Dividend Yield
Fund Fund Value Fund (a)______________ ______________ ______________
INVESTMENT INCOMEDividends. . . . . . . . . . . . . . . . . . . . . . . . . . . . . . . . . . . . . . . . . . . . . . $205,962,569 $8,952,912 $875,050Foreign witholding taxes. . . . . . . . . . . . . . . . . . . . . . . . . . . . . . . . . . (20,431,133) (406,995) (37,146)Interest. . . . . . . . . . . . . . . . . . . . . . . . . . . . . . . . . . . . . . . . . . . . . . . . 38,597,879 2,156,395 285,142______________ ______________ ______________
Total Investment Income . . . . . . . . . . . . . . . . . . . . . . . . . . . . . 224,129,315 10,702,312 1,123,046______________ ______________ ______________
EXPENSESInvestment advisory fee (Note 3). . . . . . . . . . . . . . . . . . . . . . . . . . . 99,326,048 6,092,860 374,607Custodian fees (Note 3) . . . . . . . . . . . . . . . . . . . . . . . . . . . . . . . . . . 4,426,914 42,602 14,820Transfer agent fees (Note 3) . . . . . . . . . . . . . . . . . . . . . . . . . . . . . . . 1,925,768 253,443 26,603Administration and accounting fees (Note 3) . . . . . . . . . . . . . . . . . 1,742,253 108,083 7,531Legal and audit fees. . . . . . . . . . . . . . . . . . . . . . . . . . . . . . . . . . . . . . 411,130 28,669 2,610Directors’ fees and expenses (Note 3) . . . . . . . . . . . . . . . . . . . . . . . 243,298 49,183 11,378Organizational expenses . . . . . . . . . . . . . . . . . . . . . . . . . . . . . . . . . . – – 87,363Other . . . . . . . . . . . . . . . . . . . . . . . . . . . . . . . . . . . . . . . . . . . . . . . . . 893,666 84,915 32,367______________ ______________ ______________
Total Expenses before waivers . . . . . . . . . . . . . . . . . . . . . . . . . . . 108,969,077 6,659,755 557,279Less: Investment advisory fees waived and/or expenses
reimbursed (Note 3) . . . . . . . . . . . . . . . . . . . . . . . . . . . . . . . . . . – – (146,360)______________ ______________ ______________Net Expenses . . . . . . . . . . . . . . . . . . . . . . . . . . . . . . . . . . . . . . . 108,969,077 6,659,755 410,919______________ ______________ ______________
NET INVESTMENT INCOME. . . . . . . . . . . . . . . . . . . . . . . . . . . . . 115,160,238 4,042,557 712,127______________ ______________ ______________
REALIZED AND UNREALIZED GAIN (LOSS) ON INVESTMENTS(Notes 2 and 4):
Net realized gain (loss) on:Securities . . . . . . . . . . . . . . . . . . . . . . . . . . . . . . . . . . . . . . . . . . . 1,192,862,264 50,436,677 (230,572)Forward exchange contracts . . . . . . . . . . . . . . . . . . . . . . . . . . . . (317,407,032) (5,663,444) –Foreign currencies and net other assets . . . . . . . . . . . . . . . . . . . 939,203 13,508 4,838______________ ______________ ______________
Net realized gain (loss) on investments during the year/period . . . 876,394,435 44,786,741 (225,734)______________ ______________ ______________Net unrealized appreciation (depreciation) of:
Securities . . . . . . . . . . . . . . . . . . . . . . . . . . . . . . . . . . . . . . . . . . . (1,130,498,105) (69,853,870) (2,643,578)Forward exchange contracts . . . . . . . . . . . . . . . . . . . . . . . . . . . . (287,780,064) (2,361,568) –Foreign currencies and net other assets . . . . . . . . . . . . . . . . . . . 360,953 (239) (3,734)______________ ______________ ______________
Net unrealized depreciation of investments during the year/period (1,417,917,216) (72,215,677) (2,647,312)______________ ______________ ______________NET REALIZED AND UNREALIZED LOSS ON INVESTMENTS. . . . . . . . . . . . . . . . . . . . . . . . . . . . . . . . . . . . . . (541,522,781) (27,428,936) (2,873,046)______________ ______________ ______________NET DECREASE IN NET ASSETS RESULTING FROM OPERATIONS. . . . . . . . . . . . . . . . . . . . . . . . . . . . . . . . . . . . . $(426,362,543) $(23,386,379) $(2,160,919)______________ ______________ ____________________________ ______________ ______________________________________________________________________________________________________________
(a) The Tweedy, Browne Worldwide High Dividend Yield Value Fund commenced operations on September 5, 2007.

TWEEDY, BROWNE FUND INC.
Statements of Changes in Net Assets
SEE NOTES TO FINANCIAL STATEMENTS
II-24SEE NOTES TO FINANCIAL STATEMENTS
II-24SEE NOTES TO FINANCIAL STATEMENTS
II-24SEE NOTES TO FINANCIAL STATEMENTS
II-24SEE NOTES TO FINANCIAL STATEMENTS
II-24SEE NOTES TO FINANCIAL STATEMENTS
II-24SEE NOTES TO FINANCIAL STATEMENTS
II-24SEE NOTES TO FINANCIAL STATEMENTS
II-24SEE NOTES TO FINANCIAL STATEMENTS
II-24
Worldwide HighDividend Yield
Global Value Fund Value Fund Value Fund____________________________ ___________________________ _____________Year Ended Year Ended Year Ended Year Ended Period Ended 3/31/2008 3/31/2007 3/31/2008 3/31/2007 3/31/2008(a)_____________________________________________________ _______________________________________________________ ___________________________________________________ _____________________________________________________ __________________________________________________
Net investment income . . . . . . . . . . . . . . $115,160,238 $121,325,157 $4,042,557 $4,239,259 $712,127Net realized gain (loss) on securities,
forward exchange contracts and currency transactions during the year/period . . . . . . . . . . . . . . . . . . . 876,394,435 531,631,518 44,786,741 48,644,928 (225,734)
Net unrealized appreciation (depreciation) of securities, forward exchange contracts, foreign currencies and net other assets during the year/period . . . . . . . . . . . . . (1,417,917,216) 539,412,026 (72,215,677) 1,187,224 (2,647,312)_____________________________________________________ _______________________________________________________ ___________________________________________________ _____________________________________________________ __________________________________________________
Net increase (decrease) in net assets resulting from operations . . . . . . . . . . . (426,362,543) 1,192,368,701 (23,386,379) 54,071,411 (2,160,919)
Distributions:Dividends to shareholders from
net investment income . . . . . . . . . . . . (110,718,203) (113,448,043) (3,498,339) (5,549,495) (197,387)Distributions to shareholders from
net realized gain on investments . . . . . (668,961,240) (92,487,665) (44,343,810) (39,621,758) –Net increase (decrease) in net assets from
Fund share transactions . . . . . . . . . . . . (454,010,757) (723,921,015) (33,060,554) (41,542,642) 72,739,240Redemption Fees . . . . . . . . . . . . . . . . . . . . 234,553 214,209 – – 5,394_____________________________________________________ _______________________________________________________ ___________________________________________________ _____________________________________________________ __________________________________________________Net increase (decrease) in net assets . . . . (1,659,818,190) 262,726,187 (104,289,082) (32,642,484) 70,386,328
NET ASSETSBeginning of year/period . . . . . . . . . . . . . . 8,323,688,685 8,060,962,498 515,526,572 548,169,056 –_____________________________________________________ _______________________________________________________ ___________________________________________________ _____________________________________________________ __________________________________________________End of year/period . . . . . . . . . . . . . . . . . . . $6,663,870,495 $8,323,688,685 $411,237,490 $515,526,572 $70,386,328_____________________________________________________ _______________________________________________________ ___________________________________________________ _____________________________________________________ _______________________________________________________________________________________________________ _______________________________________________________ ___________________________________________________ _____________________________________________________ __________________________________________________Undistributed Net Investment Income
at end of year/period . . . . . . . . . . . . . . $14,412,014 $18,857,934 $465,314 $— $499,106_____________________________________________________ _______________________________________________________ ___________________________________________________ _____________________________________________________ _______________________________________________________________________________________________________ _______________________________________________________ ___________________________________________________ _____________________________________________________ __________________________________________________________________________________________________________________________________________________
(a) The Tweedy, Browne Worldwide High Dividend Yield Value Fund commenced operations on September 5, 2007.
SEE NOTES TO FINANCIAL STATEMENTS
II-24SEE NOTES TO FINANCIAL STATEMENTS
II-24SEE NOTES TO FINANCIAL STATEMENTS
II-24SEE NOTES TO FINANCIAL STATEMENTS
II-24SEE NOTES TO FINANCIAL STATEMENTS
II-24SEE NOTES TO FINANCIAL STATEMENTS
II-24

TWEEDY, BROWNE FUND INC.
Financial HighlightsTweedy, Browne Global Value FundFor a Fund share outstanding throughout each year.
SEE NOTES TO FINANCIAL STATEMENTS
II-25SEE NOTES TO FINANCIAL STATEMENTS
II-25SEE NOTES TO FINANCIAL STATEMENTS
II-25SEE NOTES TO FINANCIAL STATEMENTS
II-25SEE NOTES TO FINANCIAL STATEMENTS
II-25SEE NOTES TO FINANCIAL STATEMENTS
II-25SEE NOTES TO FINANCIAL STATEMENTS
II-25SEE NOTES TO FINANCIAL STATEMENTS
II-25SEE NOTES TO FINANCIAL STATEMENTS
II-25SEE NOTES TO FINANCIAL STATEMENTS
II-25SEE NOTES TO FINANCIAL STATEMENTS
II-25
Year Year Year Year YearEnded Ended Ended Ended Ended
3/31/08 3/31/07 3/31/06 3/31/05 3/31/04------------------------------------------------------ ---------------------------------------------------------- -------------------------------------------------------- ------------------------------------------------------------ ----------------------------------------------------------Net asset value, beginning of year . . . . . . . . . . . . . . . . . . . . . . . . . . . . . . $32.31 $28.56 $24.08 $21.23 $14.44 ———— ———— ———— ———— ————Income from investment operations:Net investment income . . . . . . . . . . . . . . . . . . . . . . . . . . . . . . . . . . . . . . 0.50 0.47 0.34 0.31(a) 0.20Net realized and unrealized gain (loss) on investments . . . . . . . . . . . . . . (2.24) 4.06 4.51 2.81 6.78 ———— ———— ———— ———— ————
Total from investment operations . . . . . . . . . . . . . . . . . . . . . . . . . (1.74) 4.53 4.85 3.12 6.98 ———— ———— ———— ———— ————Distributions:Dividends from net investment income . . . . . . . . . . . . . . . . . . . . . . . . . . (0.48) (0.43) (0.37) (0.27) (0.20)Distributions from net realized gains. . . . . . . . . . . . . . . . . . . . . . . . . . . . . (2.88) (0.35) — — ————— ———— ———— ———— ————
Total distributions . . . . . . . . . . . . . . . . . . . . . . . . . . . . . . . . . . . . . (3.36) (0.78) (0.37) (0.27) (0.20)———— ———— ———— ———— ————Redemption fees . . . . . . . . . . . . . . . . . . . . . . . . . . . . . . . . . . . . . . . . . . . . 0.00(b) 0.00(b) 0.00(b) 0.00(b) 0.01———— ———— ———— ———— ————Net asset value, end of year . . . . . . . . . . . . . . . . . . . . . . . . . . . . . . . . . . . $27.21 $32.31 $28.56 $24.08 $21.23 ———— ———— ———— ———— ———————— ———— ———— ———— ————Total return (c) . . . . . . . . . . . . . . . . . . . . . . . . . . . . . . . . . . . . . . . . . . . . . . (6.35)% 16.01% 20.24% 14.75% 48.53%———— ———— ———— ———— ———————— ———— ———— ———— ————Ratios/Supplemental Data:Net assets, end of year (in 000s) . . . . . . . . . . . . . . . . . . . . . . . . . . . . . . . . $6,663,870 $8,323,689 $8,060,962 $6,707,322 $5,352,702Ratio of operating expenses to average net assets . . . . . . . . . . . . . . . . . . 1.37% 1.37% 1.38% 1.39% 1.39%Ratio of net investment income to average net assets . . . . . . . . . . . . . . 1.45% 1.53% 1.33% 1.41%(a) 1.08%Portfolio turnover rate. . . . . . . . . . . . . . . . . . . . . . . . . . . . . . . . . . . . . . . . 9% 13% 6% 13% 8%________________________________________________________________________________________________
(a) For year ended 3/31/05, investment income per share reflects a special dividend which amounted to $0.13 per share. Excluding the special dividend, the ratio of net investment income to average net assets would have been 0.78% per share.
(b) Amount represents less than $0.01 per share.(c) Total return represents aggregate total return for the periods indicated.
Tweedy, Browne Value FundFor a Fund share outstanding throughout each year.
Year Year Year Year YearEnded Ended Ended Ended Ended
3/31/08 3/31/07 3/31/06 3/31/05 3/31/04------------------------------------------------------ ---------------------------------------------------------- -------------------------------------------------------- ------------------------------------------------------------ ----------------------------------------------------------Net asset value, beginning of year . . . . . . . . . . . . . . . . . . . . . . . . . . . . . . $24.65 $24.27 $24.67 $24.38 $18.53 ———— ———— ———— ———— ————Income from investment operations:Net investment income. . . . . . . . . . . . . . . . . . . . . . . . . . . . . . . . . . . . . . . 0.22 0.21 0.30(a) 0.35(b) 0.27 Net realized and unrealized gain(loss) on investments . . . . . . . . . . . . . . (1.43) 2.38 1.49 0.69 5.68 ———— ———— ———— ———— ————
Total from investment operations . . . . . . . . . . . . . . . . . . . . . . . . . (1.21) 2.59 1.79 1.04 5.95 ———— ———— ———— ———— ————Distributions:Dividends from net investment income . . . . . . . . . . . . . . . . . . . . . . . . . . (0.19) (0.27) (0.33) (0.39) (0.10)Distributions from net realized gains. . . . . . . . . . . . . . . . . . . . . . . . . . . . . (2.35) (1.94) (1.86) (0.36) — ———— ———— ———— ———— ————
Total distributions . . . . . . . . . . . . . . . . . . . . . . . . . . . . . . . . . . . . . (2.54) (2.21) (2.19) (0.75) (0.10)———— ———— ———— ———— ————Net asset value, end of year . . . . . . . . . . . . . . . . . . . . . . . . . . . . . . . . . . . $20.90 $24.65 $24.27 $24.67 $24.38 ———— ———— ———— ———— ———————— ———— ———— ———— ————Total return (c) . . . . . . . . . . . . . . . . . . . . . . . . . . . . . . . . . . . . . . . . . . . . . . (5.41)% 10.76% 7.41% 4.18% 32.13%———— ———— ———— ———— ———————— ———— ———— ———— ————Ratios/Supplemental Data:Net assets, end of year (in 000s) . . . . . . . . . . . . . . . . . . . . . . . . . . . . . . . . $411,237 $515,527 $548,169 $659,077 $728,668 Ratio of operating expenses to average net assets . . . . . . . . . . . . . . . . . . 1.37% 1.38% 1.36% 1.37% 1.38%Ratio of net investment income to average net assets . . . . . . . . . . . . . . . 0.83% 0.80% 1.08%(a) 1.30%(b) 1.09%Portfolio turnover rate . . . . . . . . . . . . . . . . . . . . . . . . . . . . . . . . . . . . . . . 11% 9% 9% 4% 3%________________________________________________________________________________________________(a) For year ended 3/31/06, investment income per share reflects a special dividend which amounted to $0.05 per share. Excluding the special dividend,
the ratio of net investment income to average net assets would have been 0.88% per share.(b) For year ended 3/31/05, investment income per share reflects a special dividend which amounted to $0.22 per share. Excluding the special dividend,
the ratio of net investment income to average net assets would have been 0.45% per share.(c) Total return represents aggregate total return for the periods indicated.

TWEEDY, BROWNE FUND INC.
Financial HighlightsTweedy, Browne Worldwide High Dividend Yield Value FundFor a Fund share outstanding throughout the period.
SEE NOTES TO FINANCIAL STATEMENTS
II-26SEE NOTES TO FINANCIAL STATEMENTS
II-26SEE NOTES TO FINANCIAL STATEMENTS
II-26SEE NOTES TO FINANCIAL STATEMENTS
II-26SEE NOTES TO FINANCIAL STATEMENTS
II-26SEE NOTES TO FINANCIAL STATEMENTS
II-26SEE NOTES TO FINANCIAL STATEMENTS
II-26SEE NOTES TO FINANCIAL STATEMENTS
II-26SEE NOTES TO FINANCIAL STATEMENTS
II-26SEE NOTES TO FINANCIAL STATEMENTS
II-26SEE NOTES TO FINANCIAL STATEMENTS
II-26SEE NOTES TO FINANCIAL STATEMENTS
II-26SEE NOTES TO FINANCIAL STATEMENTS
II-26SEE NOTES TO FINANCIAL STATEMENTS
II-26SEE NOTES TO FINANCIAL STATEMENTS
II-26SEE NOTES TO FINANCIAL STATEMENTS
II-26
PeriodEnded
3/31/08 (a)--------------------------------------------------------------------------------------Net asset value, beginning of period . . . . . . . . . . . . . . . . . . . $ 10.00—————Income from investment operations:Net investment income . . . . . . . . . . . . . . . . . . . . . . . . . . . . . 0.10Net realized and unrealized gain (loss) on investments . . . . (0.37)—————
Total from investment operations . . . . . . . . . . . . . . . (0.27)—————Distributions:Dividends from net investment income. . . . . . . . . . . . . . . . . (0.03)Distributions from net realized gains . . . . . . . . . . . . . . . . . . . ——————
Total distributions . . . . . . . . . . . . . . . . . . . . . . . . . . . . (0.03)—————Redemption fees . . . . . . . . . . . . . . . . . . . . . . . . . . . . . . . . . . . 0.00(b)
—————Net asset value, end of period . . . . . . . . . . . . . . . . . . . . . . . . $ 9.70——————————Total return (c) . . . . . . . . . . . . . . . . . . . . . . . . . . . . . . . . . . . . . (2.69)%——————————Ratios/Supplemental Data:Net assets, end of period (in 000s) . . . . . . . . . . . . . . . . . . . . . . . . $ 70,386Ratio of operating expenses to average net assets . . . . . . . . . 1.37%(d)
Ratio of operating expenses to average net assets excludingwaivers and/or reimbursement of expenses . . . . . . . . . . . 1.86%(d)
Ratio of net investment income to average net assets . . . . . 2.38%(d)
Portfolio turnover rate . . . . . . . . . . . . . . . . . . . . . . . . . . . . . . 2%________________________________________________________________________________________________(a) The Tweedy, Browne Worldwide High Dividend Yield Value Fund commenced
operations on September 5, 2007.(b) Amount represents less than $0.01 per share.(c) Total return represents aggregate total return for the period indicated.(d) Annualized.

TWEEDY, BROWNE FUND INC.
Notes to Financial Statements
II-27II-27
1. Organization Tweedy, Browne Fund Inc. (the “Company”) is an open-
end management investment company registered with theUnited States (“U.S.”) Securities and Exchange Commissionunder the Investment Company Act of 1940, as amended. TheCompany was organized as a Maryland corporation on January28, 1993. Tweedy, Browne Global Value Fund (“Global ValueFund”),Tweedy, Browne Value Fund (“Value Fund”), andTweedy, Browne Worldwide High Dividend Yield Value Fund(“Worldwide High Dividend Yield Value Fund”), (collectively,the “Funds”), are each a diversified series of the Company.
The Funds commenced operations as follows:
Commencement of Fund Operations
Global Value Fund 06/15/93
Value Fund 12/08/93
Worldwide High Dividend Yield Value Fund 09/05/07
The Global Value Fund seeks long-term capital growth byinvesting primarily in foreign securities that Tweedy, BrowneCompany LLC (“Tweedy, Browne” or the “InvestmentAdviser”) believes are undervalued. The Value Fund seekslong-term capital growth by investing primarily in U.S. andforeign securities that Tweedy, Browne believes areundervalued. The Worldwide High Dividend Yield Value Fundseeks long-term capital growth by investing in U.S. and foreignsecurities that Tweedy, Browne believes to have above-averagedividend yields and valuations that are reasonable.
2. Significant Accounting Policies The preparation of financial statements in accordance with
accounting principles generally accepted in the United Statesrequires management to make estimates and assumptions thataffect the reported amounts and disclosures in the financialstatements. Actual results could differ from those estimates.The following is a summary of significant accounting policiesconsistently followed by the Funds in the preparation of theirfinancial statements.
Portfolio Valuation Generally, the Funds’ investments arevalued at market value or at fair value as determined by, orunder the direction of, the Company’s Board of Directors.Portfolio securities and other assets, listed on a U.S. nationalsecurities exchange, comparable foreign securities exchange orthrough any system providing for contemporaneouspublication of actual prices (and not subject to restrictionsagainst sale by the Fund on such exchange or system) arevalued at the last sale price prior to the close of regular tradingon the principal exchange or system for such security or assetor, if applicable, the NASDAQ Official Closing Price(“NOCP”). Portfolio securities and other assets, which arereadily marketable but for which there are no reported sales onthe valuation date, whether because they are not traded in asystem providing for same day publication of sales or because
there were no sales reported on such date, are generally valuedat the mean between the last asked price and the last bid priceprior to the close of regular trading. Securities and other assetsfor which current market quotations are not readily availableand those securities which are generally not readily marketabledue to significant legal or contractual restrictions, will bevalued at fair value as determined by the Investment Adviserunder the direction of the Board of Directors. Securities andother assets for which the most recent market quotations maynot be reliable (including because the last sales price does notreflect current market value at the time of valuing the Funds’asset due to developments since such last price) may be valuedat fair value if the Investment Adviser concluded that fairvaluation will likely result in a more accurate net assetvaluation. Debt securities purchased with a remaining maturityof more than 60 days are valued through pricing obtained bypricing services approved by the Funds’ Board of Directors.Debt securities purchased with a remaining maturity of 60 daysor less are valued at amortized cost, which approximates marketvalue, or by reference to other factors (i.e., pricing services ordealer quotations) by the Investment Adviser.
Repurchase Agreements The Funds may engage inrepurchase agreement transactions. Under the terms of atypical repurchase agreement, a Fund acquires an underlyingdebt obligation subject to an obligation of the seller torepurchase, and the Fund to resell the obligation at an agreed-upon price and time, thereby determining the yield during theFund’s holding period. This arrangement results in a fixed rateof return that is not subject to market fluctuations during theFunds’ holding period. The value of the collateral held onbehalf of the Fund is at all times at least equal to the totalamount of the repurchase obligations, including interest. In theevent of counterparty default, the Fund has the right to use thecollateral to offset losses incurred. There is potential loss to theFund in the event the Fund is delayed or prevented fromexercising its rights to dispose of the collateral securities,including the risk of a possible decline in the value of theunderlying securities during the period while the Fund seeks toassert its rights. The Funds’ Investment Adviser reviews thevalue of the collateral and the creditworthiness of those banksand dealers with which the Fund enters into repurchaseagreements to evaluate potential risks.
Foreign Currency The books and records of the Funds aremaintained in U.S. dollars. Foreign currencies, investmentsand other assets and liabilities are translated into U.S. dollarsat the exchange rates prevailing at the end of the period, andpurchases and sales of investment securities, income andexpenses are translated on the respective dates of suchtransactions. Unrealized gains and losses which result fromchanges in foreign currency exchange rates have been includedin the unrealized appreciation (depreciation) of currencies andnet other assets. Net realized foreign currency gains and lossesresulting from changes in exchange rates include foreigncurrency gains and losses between trade date and settlementdate on investments, securities transactions, foreign currency

TWEEDY, BROWNE FUND INC.
Notes to Financial Statements
II-28II-28
transactions and the difference between the amounts ofinterest and dividends recorded on the books of the Funds andthe amount actually received. The portion of foreign currencygains and losses related to fluctuation in the exchange ratesbetween the initial purchase trade date and subsequent saletrade date is included in realized gains and losses on investmentsecurities sold.
Forward Exchange Contracts The Funds may enter intoforward exchange contracts for non-trading purposes in orderto reduce their exposure to fluctuations in foreign currencyexchange on their portfolio holdings. Forward exchangecontracts are valued at the forward rate and are marked-to-market daily. The change in market value is recorded by theFund as an unrealized gain or loss. When the contract is closed,the Fund records a realized gain or loss equal to the differencebetween the value of the contract at the time that it wasopened and the value of the contract at the time that it wasclosed.
The use of forward exchange contracts does not eliminatefluctuations in the underlying prices of the Funds’ investmentsecurities, but it does establish a rate of exchange that can beachieved in the future. Although forward exchange contractslimit the risk of loss due to a decline in the value of the hedgedcurrency, they also limit any potential gain that might resultshould the value of the currency increase. In addition, the Fundcould be exposed to risks if the counterparties to the contractsare unable to meet the terms of their contracts.
Securities Transactions and Investment IncomeSecurities transactions are recorded as of the trade date.Realized gains and losses from securities transactions arerecorded on the identified cost basis. Dividend income anddistributions to shareholders are recorded on the ex-dividenddate. Large, nonrecurring dividends recognized by a Fund arepresented separately on the Statement of Operations as “specialdividends” and the impact of these dividends to net investmentincome per share is presented in the financial highlights.Interest income is recorded on the accrual basis. Dividendincome and interest income may be subject to foreignwithholding taxes. The Funds’ custodian applies for refunds onbehalf of each Fund where available.
Tweedy, Browne is reimbursed by the Funds for the cost ofsettling transactions in U.S. securities for the Funds through itsclearing broker. For the year ended March 31, 2008, GlobalValue Fund, Value Fund and Worldwide High Dividend YieldFund reimbursed Tweedy, Browne $1,897, $2,109 and $1,258,respectively, for such transaction charges.
Dividends and Distributions to Shareholders Dividendsfrom net investment income, if any, will be declared and paidannually for the Global Value Fund and Value Fund and semi-annually for the Worldwide High Dividend Yield Value Fund.Distributions from realized capital gains after utilization ofcapital loss carryforwards, if any, will be declared and paidannually for each of the Funds. Additional distributions of net
investment income and capital gains from the Fund may bemade at the discretion of the Board of Directors in order toavoid the application of a 4% non-deductible federal excise taxon certain undistributed amounts of ordinary income andcapital gains. Income dividends and capital gain distributionsare determined in accordance with income tax regulationswhich may differ from accounting principles generally acceptedin the United States. These differences are primarily due todiffering treatments of income and gains on various investmentsecurities held by the Fund, timing differences and differingcharacterization of distributions made by the Fund.
The character of distributions paid on a tax basis duringDecember 2007 for fiscal year 2008 is as follows:
Worldwide HighDistributions Global Dividend Yield paid from: Value Fund Value Fund Value Fund
InvestmentIncome $110,718,203 $3,498,339 $197,387
Short-termcapital gain — — —
Ordinary Income 110,718,203 3,498,339 197,387Long-term
capital gain 668,961,240 44,343,810 —Total
Distributions $779,679,443 $47,842,149 $197,387
The character of distributions paid on a tax basis duringDecember 2006 for fiscal year 2007 is as follows:
Distributions paid from: Global Value Fund Value Fund
Investment Income $113,448,043 $5,521,019Short-term capital gain — 230,023Ordinary Income 113,448,043 5,751,042Long-term capital gain 92,487,665 39,420,211Total Distributions $205,935,708 $45,171,253
As of March 31, 2008, the components of distributableearnings on a tax basis were as follows:
Worldwide HighGlobal Dividend Yield
Value Fund Value Fund Value Fund
Undistributedordinary income $14,412,014 $483,541 $561,020
Undistributed realized gain 95,083,572 15,348,347 —
Unrealized appreciation/depreciation 2,687,733,848 164,838,079 (2,643,578)
Accumulatedcapital andother losses — (18,227) (230,572)
Total $2,797,229,434 $180,651,740 $(2,31 , )1303

TWEEDY, BROWNE FUND INC.
Notes to Financial Statements
II-29II-29
Federal Income Taxes Each Fund has qualified and intendsto continue to qualify as a regulated investment company bycomplying with the requirements of the U.S. Internal RevenueCode of 1986, as amended, applicable to regulated investmentcompanies and by distributing substantially all of its taxableincome to its shareholders. Therefore, no federal income taxprovision is required.
In June 2006, the Financial Accounting Standards Board(“FASB”) issued Interpretation No. 48, “Accounting forUncertainty in Income Taxes - an Interpretation of FASBStatement No. 109 (“FIN 48”). FIN 48 applies to all registeredinvestment companies and establishes the minimum thresholdfor recognizing, and a system for measuring, the benefits of tax-return positions in the financial statements. FIN 48 becameeffective for the Funds on September 30, 2007. Managementhas analyzed the Funds’ tax positions taken on federal incometax returns for all open tax years (through tax years endedMarch 31, 2008) and has concluded that as of March 31, 2008,no provision for income tax is required in the Funds’ financialstatements. Additionally, the Funds are not aware of any eventsthat are reasonably possible to occur in the next twelve monthsthat would result in the amounts of any unrecognized taxbenefits significantly increasing or decreasing for the Funds.
Expenses Expenses directly attributable to each Fund as adiversified series of the Company are charged to such Fund.Other expenses of the Company are allocated to each seriesbased on the average net assets of each series or other equitableallocation method.
3. Investment Advisory Fee, Other Related PartyTransactions and Administration Fee
The Company, on behalf of each Fund, has entered intoseparate investment advisory agreements with Tweedy, Browne(each, an “Advisory Agreement”). Under each AdvisoryAgreement, the Company pays Tweedy, Browne a fee at theannual rate of 1.25% of the value of each Fund’s average dailynet assets. The fee is payable monthly, provided each Fund willmake such interim payments as may be requested by theInvestment Adviser not to exceed 75% of the amount of thefee then accrued on the books of the Fund and unpaid. For theyear ended March 31, 2008, Tweedy, Browne received$99,326,048 and $6,092,860 for Global Value Fund and ValueFund, respectively. For the period from September 5, 2007through March 31, 2008, Tweedy Browne received $228,247which was net of fees waived of $146,360 for Worldwide HighDividend Yield Value Fund.
The Adviser has contractually agreed to waive itsinvestment advisory fee and/or to reimburse expenses of theWorldwide High Dividend Yield Value Fund to the extentnecessary to maintain the total annual fund operating expenses(excluding brokerage, interest, taxes and extraordinaryexpenses) at no more than 1.37%. This arrangement willcontinue at least through March 31, 2009. In this arrangement,the Worldwide High Dividend Yield Value Fund has agreed,
during the two-year period following any waiver orreimbursement by the Adviser, to repay such amount to theextent that after giving effect to such repayment such adjustedtotal annual fund operating expenses would not exceed 1.37%on an annualized basis. At March 31, 2008, the amount ofpotential recovery expiring March 31, 2010, was $146,360.
The current and retired managing directors and theirfamilies, as well as employees of Tweedy, Browne, haveapproximately $91.6 million, $45.1 million and $6.8 million oftheir own money invested in Global Value Fund, Value Fundand Worldwide High Dividend Yield Value Fund, respectively,as of March 31, 2008.
The Company, on behalf of the Funds, has entered into anadministration agreement (the “Administration Agreement”)with PFPC Inc. (the “Administrator”), an indirect, majority-owned subsidiary of PNC Financial Services Group Inc. Underthe Administration Agreement, the Company pays theAdministrator an administration fee and a fund accounting feecomputed daily and payable monthly at the following annualrates of the aggregate average daily net assets of the Funds,allocated according to each Funds’ net assets:
Between Between$1 Billion $5 Billion
Up to and and Exceeding$1 Billion $5 Billion $10 Billion $10 Billion
Administration Fees 0.0300% 0.0180% 0.0100% 0.0090%Accounting Fees 0.0075% 0.0060% 0.0050% 0.0040%
No officer, director or employee of Tweedy, Browne, theAdministrator or any parent or subsidiary of those corporationsreceives any compensation from the Company for serving as adirector or officer of the Company. The Company pays eachNon-Interested Director $75,000 annually to be paid quarterlyin $18,750 increments plus out-of-pocket expenses for theirservices as directors. The annual fee of $75,000 paid to eachNon-Interested Director is divided proportionately betweenthe Funds. The current allocation ratio of the annual fee is 80%paid by Global Value Fund, 15% paid by Value Fund, and 5%paid by Worldwide High Dividend Yield Value Fund. TotalDirectors’ fees paid by each Fund for the year ended March 31,2008, excluding any out-of-pocket expenses, were $240,000,$48,750 and $11,250, respectively.
Mellon Trust of New England, N.A. (“MTONE”), a direct,wholly-owned subsidiary of The Bank of New York MellonCorporation, serves as the Funds’ custodian pursuant to acustody agreement (the “Custody Agreement”). PFPC Inc. alsoserves as the Funds’ transfer agent. Tweedy, Browne also servesas the distributor to the Funds and pays all distribution fees. Nodistribution fees are paid by the Funds.

TWEEDY, BROWNE FUND INC.
Notes to Financial Statements
II-30II-30
4. Securities Transactions Cost of purchases and proceeds from sales of investment
securities, excluding short-term investments, for the year endedMarch 31, 2008, are as follows:
Worldwide HighGlobal Dividend Yield
Value Fund Value Fund Value Fund
Purchases $686,599,453 $46,865,602 $62,119,102Sales 1,302,908,365 83,050,312 617,094
The aggregate gross unrealized appreciation anddepreciation and net unrealized appreciation/(depreciation) ascomputed on a federal income tax basis, at March 31, 2008 foreach Fund is as follows:
NetGross Gross Appreciation/
Appreciation Depreciation (Depreciation)
Global Value Fund $2,987,804,460 $(300,070,612) $2,687,733,848Value Fund $178,589,879 $(13,751,800) $164,838,079Worldwide High Dividend Yield Value Fund $1,636,969 $(4,280,547) $(2,643,578)
5. Capital Stock The Company is authorized to issue $1.4 billion shares of
$0.0001 par value capital stock, of which 600,000,000,400,000,000 and 400,000,000 of the unissued shares have beendesignated as shares of the Global Value Fund, Value Fund andWorldwide High Dividend Yield Value Fund, respectively.Redemptions from the Global Value Fund and the WorldwideHigh Dividend Yield Value Fund, including exchangeredemptions, within 60 days of purchase are subject to aredemption fee equal to 2% of the redemption proceeds, whichwill be retained by each Fund.
Changes in shares outstanding for the year ended March31, 2008 were as follows:
Global Value FundShares Amount
Sold 17,608,959 $553,900,749Reinvested 24,655,422 737,443,820Redeemed (54,963,288) (1,745,355,326)Net Decrease (12,698,907) $(454,010,757)
Value FundShares Amount
Sold 705,881 $17,040,395Reinvested 2,042,923 44,923,865Redeemed (3,989,699) (95,024,814)Net Decrease (1,240,895) $(33,060,554)
Worldwide High Dividend Yield Value FundShares Amount
Sold 8,328,156 $82,942,823Reinvested 18,984 190,598Redeemed (1,088,605) (10,394,181)Net Increase 7,258,535 $72,739,240
Changes in shares outstanding for the Global Value Fundand the Value Fund for the year ended March 31, 2007 were asfollows:
Global Value Fund Value FundShares Amount Shares Amount
Sold 21,616,948 $640,713,070 710,487 $17,777,508Reinvested 6,186,427 191,284,317 1,736,914 42,467,545Redeemed (52,475,756) (1,555,918,402) (4,119,879) (101,787,695)
Net Decrease (24,672,381) $(723,921,015) (1,672,478) $(41,542,642)
6. Foreign Securities Investing in securities of foreign companies and foreign
governments involves economic and political risks andconsiderations not typically associated with investing in U.S.companies and the U.S. Government. These considerationsinclude changes in exchange rates and exchange rate controls(which may include suspension of the ability to transfercurrency from a given country), costs incurred in conversionsbetween currencies, non-negotiable brokerage commissions,less publicly available information, not generally being subjectto uniform standards, practices and requirements with respectto accounting, auditing and financial reporting, lower tradingvolume, delayed settlements and greater market volatility, thedifficulty of enforcing obligations in other countries, lesssecurities regulation, different tax provisions (includingwithholding on dividends paid to a Fund), war, seizure, politicaland social instability and diplomatic developments.
7. Securities Lending The Funds may lend securities to brokers, dealers and other
financial organizations to earn additional income. Eachsecurity out on loan is collateralized with segregated assets heldwith the borrower in an amount equal to or greater than thecurrent market value of the loaned securities. At March 31,2008, the Funds did not have any securities out on loan.
8. New Accounting Pronouncements In September 2006, Statement of Financial Accounting
Standards No. 157, “Fair Value Measurements” (“SFAS 157”)was issued by the FASB and is effective for fiscal yearsbeginning after November 15, 2007. SFAS 157 defines fairvalue, establishes a framework for measuring fair value andexpands disclosures about fair value measurements.Management is currently evaluating the impact the adoption ofSFAS 157 will have on the Funds’ financial statementdisclosures.
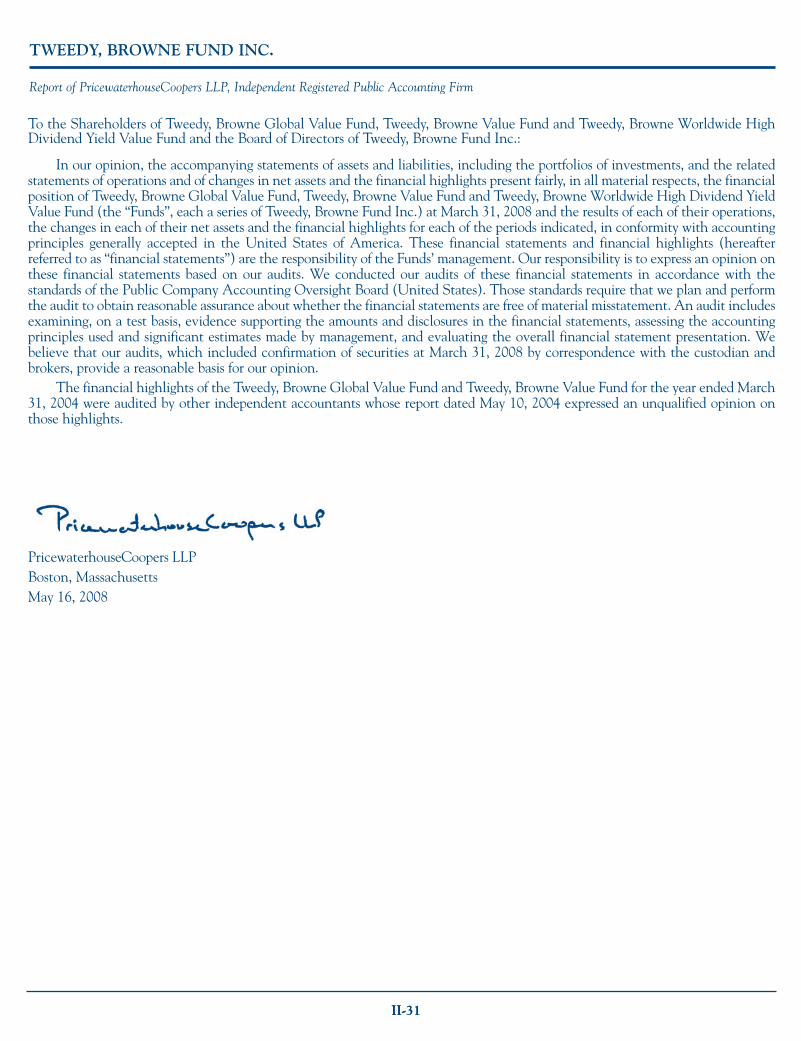
TWEEDY, BROWNE FUND INC.
Report of PricewaterhouseCoopers LLP, Independent Registered Public Accounting Firm
II-31II-31
To the Shareholders of Tweedy, Browne Global Value Fund, Tweedy, Browne Value Fund and Tweedy, Browne Worldwide HighDividend Yield Value Fund and the Board of Directors of Tweedy, Browne Fund Inc.:
In our opinion, the accompanying statements of assets and liabilities, including the portfolios of investments, and the relatedstatements of operations and of changes in net assets and the financial highlights present fairly, in all material respects, the financialposition of Tweedy, Browne Global Value Fund, Tweedy, Browne Value Fund and Tweedy, Browne Worldwide High Dividend YieldValue Fund (the “Funds”, each a series of Tweedy, Browne Fund Inc.) at March 31, 2008 and the results of each of their operations,the changes in each of their net assets and the financial highlights for each of the periods indicated, in conformity with accountingprinciples generally accepted in the United States of America. These financial statements and financial highlights (hereafterreferred to as “financial statements”) are the responsibility of the Funds’ management. Our responsibility is to express an opinion onthese financial statements based on our audits. We conducted our audits of these financial statements in accordance with thestandards of the Public Company Accounting Oversight Board (United States). Those standards require that we plan and performthe audit to obtain reasonable assurance about whether the financial statements are free of material misstatement. An audit includesexamining, on a test basis, evidence supporting the amounts and disclosures in the financial statements, assessing the accountingprinciples used and significant estimates made by management, and evaluating the overall financial statement presentation. Webelieve that our audits, which included confirmation of securities at March 31, 2008 by correspondence with the custodian andbrokers, provide a reasonable basis for our opinion.
The financial highlights of the Tweedy, Browne Global Value Fund and Tweedy, Browne Value Fund for the year ended March31, 2004 were audited by other independent accountants whose report dated May 10, 2004 expressed an unqualified opinion onthose highlights.
PricewaterhouseCoopers LLPBoston, MassachusettsMay 16, 2008
II-32
TWEEDY, BROWNE FUND INC.
Other Information (Unaudited)
II-32
Year Ended March 31, 2008
1. Tax InformationFor the fiscal year ended March 31, 2008, the amount of
long-term capital gain designated by the Funds which is taxableat a 15% rate gain for federal income tax purposes was:
Fund
Global Value Fund $727,575,277
Value Fund $47,277,108
Worldwide High Dividend Yield Value Fund $—
Of the ordinary income (including short-term capital gain)distributions made by the Funds during the fiscal year endedMarch 31, 2008, the percentage that qualifies for the dividendreceived deduction available to corporate shareholders was:
Fund
Global Value Fund 2.996%
Value Fund 100.000%
Worldwide High Dividend Yield Value Fund 41.230%
For the fiscal year ended March 31, 2008, the percentage ofthe distributions paid by the Funds that qualifies for the 15%dividend tax rate was:.
Fund
Global Value Fund 100%
Value Fund 100%
Worldwide High Dividend Yield Value Fund 100%
If the Fund meets the requirements of Section 853 of theInternal Revenue Code of 1986, as amended, the Funds mayelect to pass through to its shareholders credits for foreign taxespaid.
For the fiscal year ended March 31, 2008, the Tweedy,Browne Global Value Fund derived $199,587,508 of grossincome from foreign sources and paid foreign taxes of$20,431,133 (representing $0.8874 and $0.0908 per share,respectively).
2. Portfolio Information The Company files the Funds’ complete schedule of
portfolio holdings with the Securities and ExchangeCommission (“SEC”) for the first and third quarters of eachfiscal year on Form N-Q. The Company’s Form N-Q isavailable (1) on the SEC’s website at http://www.sec.gov; (2) for review and copying at the SEC’s Public Reference Room(“PRR”) in Washington, DC; or (3) by calling the Fund at 1-800-432-4789. Information regarding the operation of thePRR may be obtained by calling 1-202-551-8090.
3. Proxy Voting Information The policies and procedures that the Company uses to
determine how to vote proxies relating to portfolio securitiesheld by the Funds are included in the Company’s Statement ofAdditional Information, which is available without charge andupon request by calling the Fund at 1-800-432-4789.Information regarding how the Funds voted proxies relating toportfolio securities during the most recent twelve-monthperiod ended June 30 is available, without charge, athttp://www.sec.gov.
4. Directors and Officers InformationInformation pertaining to the Directors and officers* of the
Company is set forth on the following pages. The Board ofDirectors oversees the Company’s business and investmentactivities and is responsible for protecting the interest of theFund’s shareholders. You can find more information about theDirectors in the Company’s Statement of AdditionalInformation, which is available free of charge by calling 1-800-432-4789.——————* The term “officer” means the president, vice president, secretary,
treasurer, controller or any other officer who performs a policy makingfunction.

II-33
TWEEDY, BROWNE FUND INC.
Other Information (Unaudited)
II-33
NON-INTERESTED DIRECTORSNumber of
Portfolios in OtherTerm of
1Fund Trusteeships/
Office and Complex DirectorshipsName, Address, Age and Length of Principal Occupation(s) Overseen by Held by
Position(s) with Company Time Served During Past 5 Years Director or DirectorNominee for
Director
Paul F. BalserIronwood Partners LLC420 Lexington AvenueNew York, NY 10170Birthdate: 2/12/1942Director
7 years 3 Director, Janus CapitalGroup Inc. (asset
management)
Partner, Ironwood Manufacturing Fund, LP (privateequity investments), since 2003; Partner, IronwoodManagement Fund (private equity investments),since 2007; Partner, Ironwood Partners LLC(private equity investments), since 2001; Partner,Generation Partners (private equity investments)from August 1995 to September 30, 2004.
Bruce A. BealThe Beal Companies177 Milk StreetBoston, MA 02109Birthdate: 6/28/1936Director
14 years 3 NonePartner and Chairman, The Beal Companies (realestate development and investment companies);Real estate consultant.
John C. Hover II72 North Main StreetNew Hope, PA 18938Birthdate: 5/13/1943Director
5 years 3 Director, ExcelsiorVenture Partners III, LLC;
Director, ExcelsiorVenture Investors III, LLC
Former Executive Vice President, United StatesTrust Company of New York (Retired since 2001).
Richard B. SalomonWolf, Block, Schorr andSolis-Cohen LLP250 Park AvenueNew York, NY 10177Birthdate: 12/19/1947Director
13 years 3 NonePartner, Wolf, Block, Schorr and Solis-Cohen LLP(law firm) since April 2005. Prior to 2005, Partner,Salans (law firm) since prior to 2000.
Christopher H. Browne3
Tweedy, Browne Company LLC
350 Park AvenueNew York, NY 10022Birthdate: 12/19/1946Chairman
14 years 3 N/AManaging Director, Tweedy, Browne Company LLC.
Thomas H. ShragerTweedy, Browne
Company LLC350 Park AvenueNew York, NY 10022Birthdate: 5/7/1957Director
Since April2008
3 N/AManaging Director, Tweedy, Browne Company LLC.
INTERESTED DIRECTORS2

II-34
TWEEDY, BROWNE FUND INC.
Other Information (Unaudited)
II-34
OFFICERS WHO ARE NOT DIRECTORSNumber of
Portfolios in OtherTerm of
1Fund Trusteeships/
Office and Complex DirectorshipsName, Address, Age and Length of Principal Occupation(s) Overseen by Held by
Position(s) with Company Time Served During Past 5 Years Director or DirectorNominee for
Director
William H. Browne3
Tweedy, Browne Company LLC
350 Park AvenueNew York, NY 10022Birthdate: 9/19/1944President
Since April2007
N/A N/AManaging Director, Tweedy, Browne CompanyLLC.William H. Browne serves as Chairman of theBoard of Directors of funds managed by the Funds’investment adviser that are part of an offshore fundcomplex registered for public sale in certainEuropean jurisdictions.
Patricia A. RogersTweedy, Browne
Company LLC350 Park AvenueNew York, NY 10022Birthdate: 7/18/1966Chief Compliance Officer
3 years N/A N/AChief Compliance Officer of the Funds since June2004; Associate General Counsel, Tweedy, BrowneCompany LLC.
M. Gervase RosenbergerTweedy, Browne
Company LLC350 Park AvenueNew York, NY 10022Birthdate: 3/21/1951Chief Operating Officer,
Vice President and Secretary
14 years N/A N/AExecutive Vice President, Tweedy, BrowneCompany LLC since 2001; General Counsel andChief Compliance Officer, Tweedy, BrowneCompany LLC until 2001.
John D. SpearsTweedy, Browne
Company LLC350 Park AvenueNew York, NY 10022Birthdate: 9/7/1948Vice President
14 years N/A N/AManaging Director, Tweedy, Browne Company LLC.
Robert Q. Wyckoff, Jr.Tweedy, Browne
Company LLC350 Park AvenueNew York, NY 10022Birthdate: 11/26/1952Treasurer
5 years N/A N/AManaging Director, Tweedy, Browne Company LLC.
——————1 Directors serve for a term until the earliest of the next annual meeting of stockholders and the election and qualification of their successors, or their:
(i) removal, (ii) resignation or (iii) death.2 “Interested person” of the Company as defined in the Investment Company Act of 1940, as amended (“1940 Act”). Messrs. Christopher H. Browne
and Thomas H. Shrager are each an “interested person” because of their affiliation with Tweedy, Browne Company LLC, which acts as the Funds’investment adviser and distributor.
3 Mr. Christopher H. Browne and Mr. William H. Browne are brothers.

This page left blank intentionally.

TWEEDY, BROWNE FUND INC.350 Park Avenue, New York, NY 10022
800-432-4789www.tweedy.com
Related Documents