1 ArcView ArcView ArcView ArcView ArcView Geographic Information Systems and Geographic Information Systems and Geographic Information Systems and Geographic Information Systems and Geographic Information Systems and the GLOBE Program the GLOBE Program the GLOBE Program the GLOBE Program the GLOBE Program ArcView Edition ArcView Edition ArcView Edition ArcView Edition ArcView Edition

Welcome message from author
This document is posted to help you gain knowledge. Please leave a comment to let me know what you think about it! Share it to your friends and learn new things together.
Transcript
11111ArcViewArcViewArcViewArcViewArcView
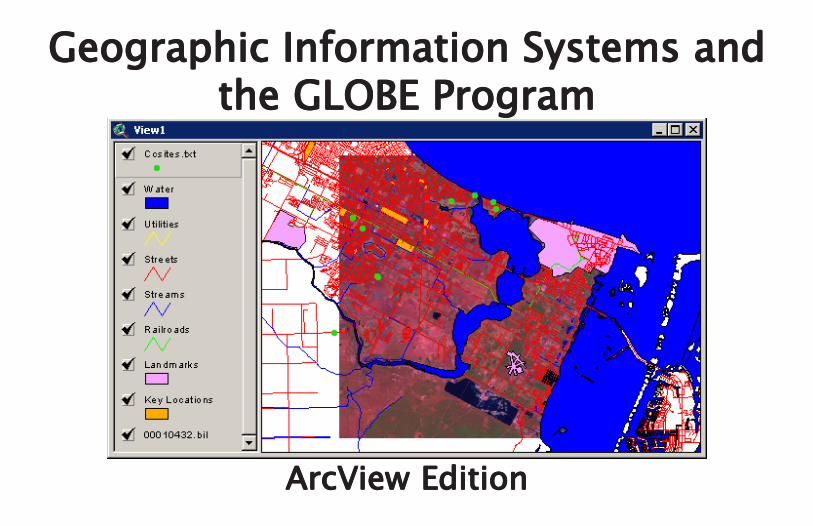
Geographic Information Systems andGeographic Information Systems andGeographic Information Systems andGeographic Information Systems andGeographic Information Systems andthe GLOBE Programthe GLOBE Programthe GLOBE Programthe GLOBE Programthe GLOBE Program
ArcView EditionArcView EditionArcView EditionArcView EditionArcView Edition

22222ArcViewArcViewArcViewArcViewArcView
Table of ContentsTable of ContentsTable of ContentsTable of ContentsTable of ContentsChapter 1: What is GIS?Chapter 1: What is GIS?Chapter 1: What is GIS?Chapter 1: What is GIS?Chapter 1: What is GIS? ............................................................................................................................................................................................................................................................................................................................................................................. 33333Chapter 2: What is ArcView?Chapter 2: What is ArcView?Chapter 2: What is ArcView?Chapter 2: What is ArcView?Chapter 2: What is ArcView? ........................................................................................................................................................................................................................................................................................................................... 1515151515Chapter 3: Finding the Data in ArcViewChapter 3: Finding the Data in ArcViewChapter 3: Finding the Data in ArcViewChapter 3: Finding the Data in ArcViewChapter 3: Finding the Data in ArcView........................................................................................................................................................................................................................................... 1717171717Chapter 4: A Beginning Map Using ESRI DataChapter 4: A Beginning Map Using ESRI DataChapter 4: A Beginning Map Using ESRI DataChapter 4: A Beginning Map Using ESRI DataChapter 4: A Beginning Map Using ESRI Data .............................................................................................................................................................................................. 2323232323Chapter 5: Creating a Printed Map and Exporting Your ProjectChapter 5: Creating a Printed Map and Exporting Your ProjectChapter 5: Creating a Printed Map and Exporting Your ProjectChapter 5: Creating a Printed Map and Exporting Your ProjectChapter 5: Creating a Printed Map and Exporting Your Project ............................................................ 7474747474Chapter 6: Downloading and Incorporating GLOBE Student DataChapter 6: Downloading and Incorporating GLOBE Student DataChapter 6: Downloading and Incorporating GLOBE Student DataChapter 6: Downloading and Incorporating GLOBE Student DataChapter 6: Downloading and Incorporating GLOBE Student Data ............................................. 8383838383Chapter 7: Other Data SourcesChapter 7: Other Data SourcesChapter 7: Other Data SourcesChapter 7: Other Data SourcesChapter 7: Other Data Sources.................................................................................................................................................................................................................................................................................................. 109109109109109Chapter 8: Creating Your Own DataChapter 8: Creating Your Own DataChapter 8: Creating Your Own DataChapter 8: Creating Your Own DataChapter 8: Creating Your Own Data .......................................................................................................................................................................................................................................................... 133133133133133Chapter 9: Hot LinksChapter 9: Hot LinksChapter 9: Hot LinksChapter 9: Hot LinksChapter 9: Hot Links ............................................................................................................................................................................................................................................................................................................................................................................. 164164164164164Chapter 10: Using GLOBE Landsat Images in ArcViewChapter 10: Using GLOBE Landsat Images in ArcViewChapter 10: Using GLOBE Landsat Images in ArcViewChapter 10: Using GLOBE Landsat Images in ArcViewChapter 10: Using GLOBE Landsat Images in ArcView........................................................................................................................ 173173173173173Chapter 11: Now What Do I Do With It And Where Do I Go Next?Chapter 11: Now What Do I Do With It And Where Do I Go Next?Chapter 11: Now What Do I Do With It And Where Do I Go Next?Chapter 11: Now What Do I Do With It And Where Do I Go Next?Chapter 11: Now What Do I Do With It And Where Do I Go Next? ................................... 194194194194194Appendix I: Local Sources of GIS DataAppendix I: Local Sources of GIS DataAppendix I: Local Sources of GIS DataAppendix I: Local Sources of GIS DataAppendix I: Local Sources of GIS Data ........................................................................................................................................................................................................................................... 199199199199199Appendix II: Importing Arc Export (E00) FilesAppendix II: Importing Arc Export (E00) FilesAppendix II: Importing Arc Export (E00) FilesAppendix II: Importing Arc Export (E00) FilesAppendix II: Importing Arc Export (E00) Files .................................................................................................................................................................................... 201201201201201Appendix III: Image RegistrationAppendix III: Image RegistrationAppendix III: Image RegistrationAppendix III: Image RegistrationAppendix III: Image Registration ................................................................................................................................................................................................................................................................................... 207207207207207Appendix IV: How Do I Get ArcView?Appendix IV: How Do I Get ArcView?Appendix IV: How Do I Get ArcView?Appendix IV: How Do I Get ArcView?Appendix IV: How Do I Get ArcView?................................................................................................................................................................................................................................. 210210210210210Appendix V: Image CorrectionAppendix V: Image CorrectionAppendix V: Image CorrectionAppendix V: Image CorrectionAppendix V: Image Correction ................................................................................................................................................................................................................................................................................... 211211211211211

33333ArcViewArcViewArcViewArcViewArcView
Chapter 1: What is GIS?Chapter 1: What is GIS?Chapter 1: What is GIS?Chapter 1: What is GIS?Chapter 1: What is GIS?Manual GISManual GISManual GISManual GISManual GIS: Students in a school in Jordan are assigned the task of preparing a detailed map
of their community. They gather resources such as topographic maps, road maps, their GLOBELandsat image, the locations of students’ homes, some aerial photos, and some charts providedby their local government showing locations of businesses, parks, etc.
Instead of making one map, the students decide that each team will map only one kind offeature. One team maps roads, while another maps water bodies. One maps the locations ofstudent homes, and another maps agricultural areas. Each of these features is called a “theme.”The students decide that they will map each theme on a separate sheet of transparent plastic, sothat themes can be placed one on top of another, or on top of other maps.
After much hard work (maps drawn at different scales must be enlarged or reduced so thatall layers are drawn to the same scale) the job is done, and the students begin to experiment withwhat these layers can show them.
They discover that by selectively placing one layer on top of another, they see therelationships between different kinds of surface features. They ask questions about the locationof large parking areas with respect to bodies of water (runoff from these areas can be a significantsource of pollution in water bodies). They look for patterns of business locations with respect totransportation routes.

44444ArcViewArcViewArcViewArcViewArcView
The layering of features made it easier to see how one particular feature is related to othersand to ask questions about these relationships. This is an example of a simple GeographicInformation System (GIS).
The illustration below shows their layers for water and roads stacked over their satelliteimage.
Layers, or “Themes”Layers, or “Themes”Layers, or “Themes”Layers, or “Themes”Layers, or “Themes”
From these layers, they couldinvestigate how the pattern ofroads and water bodies is relatedto local topography.

55555ArcViewArcViewArcViewArcViewArcView
What is Electronic GIS?What is Electronic GIS?What is Electronic GIS?What is Electronic GIS?What is Electronic GIS?
GIS software such as ArcView and ArcVoyager accomplish the same tasks as the students inthe previous example. With GIS software, the computer takes numbers and words that describeplaces on the Earth, stored in databases and spreadsheets, and displays them as map layers onyour computer monitor. In addition to allowing great flexibility in how data are displayed, GISsoftware also allows us to ask questions based on the data. The students’ question about thelocations of parking lots and bodies of water is called a QueryQueryQueryQueryQuery.
The key to relating different pieces of data that describe places on the earth is that thesedata are “geospatial.” That is, for every point we want to map there is a unique set of numbers,latitude and longitude, that describe where that place is.
GIS, then, is a system for entering, storing, displaying, manipulating and analyzing“geospatial” data.

66666ArcViewArcViewArcViewArcViewArcView
Who Uses GIS?Who Uses GIS?Who Uses GIS?Who Uses GIS?Who Uses GIS?
Geographic Information Systems are used by anyone who needs to work with informationthat is related to places on the Earth. In a few recent GIS publications, the following topics werecovered:
• Natural Resources: forestry management, habitat identification and evaluation.
• Community services: fire, ambulance, police, crime investigations, utility management.
• Health: mapping the spread of infectious agents .
• Energy: mapping oil, coal and natural gas deposits, exploring for energy resources.
• Mapping natural phenomena: earthquakes, tsunamis, volcanoes, hurricanes, floods.
• Business: courier services, real estate analysis, demographics, sales analysis.
• Water resources: mapping aquifers, planning water needs based on community growth.
• Sea floor exploration: mapping the sea floor, searching for wrecks.
• Education: bus routes, population demographics, student mapping of local environments.

77777ArcViewArcViewArcViewArcViewArcView
Why Should I Use GIS in My Classroom?Why Should I Use GIS in My Classroom?Why Should I Use GIS in My Classroom?Why Should I Use GIS in My Classroom?Why Should I Use GIS in My Classroom?
Real learning occurs when students work with problems that have significance to them as“explorers of learning” and members of communities that range in scope from local to world wide.
Whether their interest lies in looking for patterns to the world’s earthquakes, trackingwhales in their migration, looking at patterns of westward settlement, mapping old cemeteries intheir village, or investigating the watershed of a local water body, GIS provides a “hands-on”method of gathering, displaying, interacting with, and investigating geographic data from the realworld.
The data students use may be obtained from online services, local, state or regionalagencies, or it may be information that students have gathered in the field using an inexpensiveGPS (Global Positioning System) receiver to accurately locate data points.
Geography plays an important part in much of what we do, yet our students often have apoor knowledge of geographic data. GIS provides a tool that can bring Geography to life in andout of the classroom. For examples of the use of GIS in the classroom, see GIS in Schools.1
You can also visit ESRI’s (Earth Systems Research Institute) “Schools and Libraries”program at:
http://www.esri.com/industries/k-12/hrynggis.html
for information, tutorials, files and examples of GIS projects in education.

88888ArcViewArcViewArcViewArcViewArcView
What Is the Purpose of this Tutorial?What Is the Purpose of this Tutorial?What Is the Purpose of this Tutorial?What Is the Purpose of this Tutorial?What Is the Purpose of this Tutorial?
This series of tutorials will provide a brief introduction to two of the common softwarepackages available to schools: ArcView® and ArcVoyager®.
ArcView and ArcVoyager are produced by ESRI (Environmental Systems Research Institute) ofRedlands, CA. ArcView is one of the industry standard GIS programs and is relatively costly.ArcVoyager is a “school version” of ArcView and is available free to schools from ESRI. It containsmost of the functioning of ArcView. A separate tutorial will be devoted to each.
What this Tutorial is NOT:What this Tutorial is NOT:What this Tutorial is NOT:What this Tutorial is NOT:What this Tutorial is NOT:
There are many excellent books available that will give you a thorough introduction to GIS2. Manyare quite lengthy. This tutorial is not intended to replace any of them. It is designed to give you a“quick start” in using GIS software as part of your GLOBE teaching and learning experience.
1. Audet and Ludwig,GIS in Schools, ESRI Press, 2000
2. Getting to Know ArcView GIS, ESRI Press, 1996 - 1998

99999ArcViewArcViewArcViewArcViewArcView
A GIS ExampleA GIS ExampleA GIS ExampleA GIS ExampleA GIS Example
The map below is a GIS project for Corpus Christi, Texas. The layers of data that representwater, roads, etc. were downloaded free from Internet sites. The colored dots represent datagathered by participants at a GLOBE workshop for the validation of their GLOBE land cover map.
The participants created a table of their data in a word processor. They added this datatable to the GIS display as a series of dots. Each dot represents a site visited for accuracyassessment. Theinset tables showboth the data tablethey prepared fromtheir fieldobservations, andthe results of“querying” thesystem about theyellow point. Thisgroup was able tosee how the sitesthey visited arerelated to localfeatures.

1 01 01 01 01 0ArcViewArcViewArcViewArcViewArcView
What Kinds of Data Does a GIS System Work With?What Kinds of Data Does a GIS System Work With?What Kinds of Data Does a GIS System Work With?What Kinds of Data Does a GIS System Work With?What Kinds of Data Does a GIS System Work With?
A GIS system displays two basic types of data; raster raster raster raster raster andvectorvectorvectorvectorvector.
Raster DataRaster DataRaster DataRaster DataRaster Data: Raster data are items, usually images, that arecomposed of “pixels.” These may be satellite images, suchas the one shown to the right, scanned maps, aerialphotos, or any object that shows pixels when enlarged.Raster data are saved as independent files, just as youwould save a picture file.
Vector DataVector DataVector DataVector DataVector Data: Vector data, such as the sample fromCorpus Christi, TX, shown at the right, are drawingsthat represent features such as streets, rivers,railroads, lakes, city blocks, or almost any featureyou can imagine being drawn on a map.
1 11 11 11 11 1ArcViewArcViewArcViewArcViewArcView
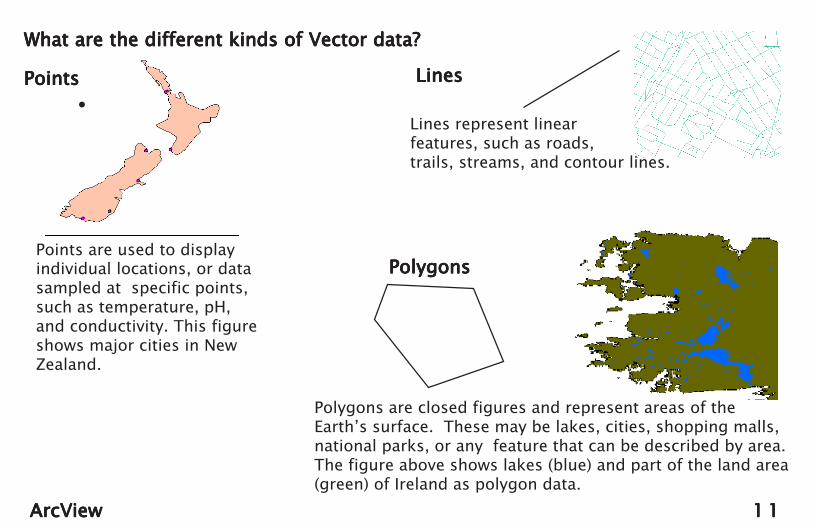
What are the different kinds of Vector data?What are the different kinds of Vector data?What are the different kinds of Vector data?What are the different kinds of Vector data?What are the different kinds of Vector data?
Points are used to displayindividual locations, or datasampled at specific points,such as temperature, pH,and conductivity. This figureshows major cities in NewZealand.
•PointsPointsPointsPointsPoints
Lines represent linearfeatures, such as roads,
LinesLinesLinesLinesLines
PolygonsPolygonsPolygonsPolygonsPolygons
Polygons are closed figures and represent areas of theEarth’s surface. These may be lakes, cities, shopping malls,national parks, or any feature that can be described by area.The figure above shows lakes (blue) and part of the land area(green) of Ireland as polygon data.
trails, streams, and contour lines.

1 21 21 21 21 2ArcViewArcViewArcViewArcViewArcView
Vector data are not stored as “images” the way raster data are. They are drawn onthe monitor from information contained in database or spreadsheet files. They are redrawnat best screen resolution every time you zoom in or out. Thus, they never show “pixels,” asraster data do.
The figure below shows GIS vector data for some of the streets in Corpus Christi, TX.

1 31 31 31 31 3ArcViewArcViewArcViewArcViewArcView
The three figures below show successive “zooms” on a part of this street data. Noticethat even with an increase of magnification, there are no pixels seen in the data. Thestreets are redrawn in each zoom at highest resolution using data about them stored in adatabase file.

1 41 41 41 41 4ArcViewArcViewArcViewArcViewArcView
The figure below shows part of the database file used by the GIS software to draw thestreets. These are the only data that are stored to produce this street layer, or themethemethemethemetheme. Thecolumns marked “L_add_from” to “R_add_to” contain the coordinates used to draw theindividual streets.
In addition to thelocation data, you will alsonote such information as“Streetname,” “Type,” and“Zip_left.” These data, alongwith others not shown, arecalled the AttributesAttributesAttributesAttributesAttributes of thetheme. They provide extrainformation about each featurein the theme, and can bedisplayed, analyzed orinvestigated by using the GISsoftware.
Each separate layer, orthemethemethemethemetheme, in a GIS view has aseparate AttributesAttributesAttributesAttributesAttributes table.

1 51 51 51 51 5ArcViewArcViewArcViewArcViewArcView
Chapter 2: What is ArcView?Chapter 2: What is ArcView?Chapter 2: What is ArcView?Chapter 2: What is ArcView?Chapter 2: What is ArcView?ArcView:ArcView:ArcView:ArcView:ArcView: ESRI, the producer of ArcView, has been an industry leader in theproduction of GIS software and in the support of GIS education. ArcView isavailable for both PC (V3.3) and Macintosh (V3.0). The Macintosh version is notsupported and cannot use many of the extensions that are available. ESRI hasrecently released a major update to it’s GIS offerings in the form of ARC GIS(V9.x) for high-end PC machines, but continues to support ArcView.
How Can I Get ArcView?How Can I Get ArcView?How Can I Get ArcView?How Can I Get ArcView?How Can I Get ArcView? ArcView can be purchased from ESRI. However,schools can earn a free copy of ArcView by completing a project for the ESRIESRIESRIESRIESRICommunity Atlas Project.Community Atlas Project.Community Atlas Project.Community Atlas Project.Community Atlas Project. See Appendix IV for more details.

1 61 61 61 61 6ArcViewArcViewArcViewArcViewArcView
Installing ArcViewInstalling ArcViewInstalling ArcViewInstalling ArcViewInstalling ArcView
ArcView (PC)ArcView (PC)ArcView (PC)ArcView (PC)ArcView (PC): ArcView is simple to install. Like most PC software, the installation CDautomatically loads an installation wizard. Unless you wish to install on a drive other than “C,”select the “default” values at each step and ArcView will install two folders: AV_GIS30, which is theprogram folder, and ESRIdata, which contains data supplied by ESRI.
ArcView (Mac)ArcView (Mac)ArcView (Mac)ArcView (Mac)ArcView (Mac): Insert the ArcView CD into your CD drive. The disk contains an installer which willinstall two folders when you double click the icon. AV_GIS30a, the program folder, and ESRIdata,a folder of data provided by ESRI.
Once installation is complete, you should create a new folder in your ESRIdata folder. Label thisGIS Projects. Storing all your projects here will simplify data access.

1 71 71 71 71 7ArcViewArcViewArcViewArcViewArcView
Chapter 3: Finding the Data in ArcViewChapter 3: Finding the Data in ArcViewChapter 3: Finding the Data in ArcViewChapter 3: Finding the Data in ArcViewChapter 3: Finding the Data in ArcViewThis section will guide you through opening ArcView and navigating to the built-in data files.
• Launch ArcView.
• ArcView may open withthe Welcome Window Welcome Window Welcome Window Welcome Window Welcome Window,shown to the right. TheProject WindowProject WindowProject WindowProject WindowProject Window allows youto create a new project oropen an existing project.If you do not see thisscreen, skip to page 19page 19page 19page 19page 19.
• Choose create a newproject with a new viewand click OKOKOKOKOK.
ObjectiveObjectiveObjectiveObjectiveObjective• Locate the data files
supplied with ArcView.
Finding Data in ArcViewFinding Data in ArcViewFinding Data in ArcViewFinding Data in ArcViewFinding Data in ArcView

1 81 81 81 81 8ArcViewArcViewArcViewArcViewArcView
• ArcView now asks if you want to add data.
• Click YESYESYESYESYES. Skip to page 22page 22page 22page 22page 22.

1 91 91 91 91 9ArcViewArcViewArcViewArcViewArcView
• If ArcView does not open with the Welcome WindowWelcome WindowWelcome WindowWelcome WindowWelcome Window, ArcView opens with the Project Project Project Project ProjectWindowWindowWindowWindowWindow, shown below. The Project WindowProject WindowProject WindowProject WindowProject Window shows the contents of your project. It is fromthis window that you bring certain types of data into your “view.”
Project WindowProject WindowProject WindowProject WindowProject Window

2 02 02 02 02 0ArcViewArcViewArcViewArcViewArcView
• Click the NewNewNewNewNew button in the menu for the Project WindowProject WindowProject WindowProject WindowProject Window. Arcview opens the View WindowView WindowView WindowView WindowView Window,shown below.
View WindowView WindowView WindowView WindowView Window

2 12 12 12 12 1ArcViewArcViewArcViewArcViewArcView
• This new View WindowView WindowView WindowView WindowView Window may cover the Project WindowProject WindowProject WindowProject WindowProject Window. Drag it by its title bar to the right,and drag its lower-right corner to fill the background window.

2 22 22 22 22 2ArcViewArcViewArcViewArcViewArcView
• Click the Add ThemeAdd ThemeAdd ThemeAdd ThemeAdd Theme button, shown to the right. It is at the left end of the button bar.
• Navigate to your ESRIdata folder, shown below and open this folder.
• From the ESRIdata folder, select the world folder and open it.
• The contents of this folder are listed. These files all have the extension “.shp.” These areArcView shape filesshape filesshape filesshape filesshape files, and represent different forms of vector data (Point, Line and Polygon).
Chapter summary: Chapter summary: Chapter summary: Chapter summary: Chapter summary: In this chapter, youlearned how to add data to a new view. Inthe next chapter, you will use this skill tobegin a new project and explore the powerof ArcView.

2 32 32 32 32 3ArcViewArcViewArcViewArcViewArcView
Chapter 4: A Beginning Map Using ESRI DataChapter 4: A Beginning Map Using ESRI DataChapter 4: A Beginning Map Using ESRI DataChapter 4: A Beginning Map Using ESRI DataChapter 4: A Beginning Map Using ESRI DataIn this chapter you will use and explore some of ArcView’s menus and windows.
ObjectivesObjectivesObjectivesObjectivesObjectives• Create a new project.• Add themes from ArcView’s data base.• Change the appearance of themes.• Examine the map scale for your view.• Use the Legend Editor, Fill Palette, and Color Palette.• Zoom to selected areas of your map.• Obtain information about features in the project’s themes.• Examine the information (attributes) in a theme’s data table.• Sort the data table and use the Query Tool to select specific entries.• Use ArcView’s maps and attribute tables to investigate topographic and geographic
problems.• Change the properties of a View.• Look at an unusual map projection.

2 42 42 42 42 4ArcViewArcViewArcViewArcViewArcView
ArcView ToolbarsArcView ToolbarsArcView ToolbarsArcView ToolbarsArcView ToolbarsAddTheme
Map Scale(Representative
Fraction)
Open ThemeTableEdit Legend
Cursor Location(lat/lon)
InformationTool
Distancetool
SelectTool
LabelTools
QueryBuilder
Special Zoom buttons
TextTools
DrawTools
Select FeaturesUsing Shape
Clear SelectedFeatures
HotLinkstool
ZoomIn, Out
UnselectRecords
PromoteRecordsField Menu
QueryBuilder
Sort RecordsAscending Descending
Number ofRecordsSelected
Number ofRecords inFile
Tables MenuTables MenuTables MenuTables MenuTables Menuand Toolbarand Toolbarand Toolbarand Toolbarand Toolbar
2 52 52 52 52 5ArcViewArcViewArcViewArcViewArcView
Starting with ArcViewStarting with ArcViewStarting with ArcViewStarting with ArcViewStarting with ArcView
• Launch ArcView.
• Create a new project.
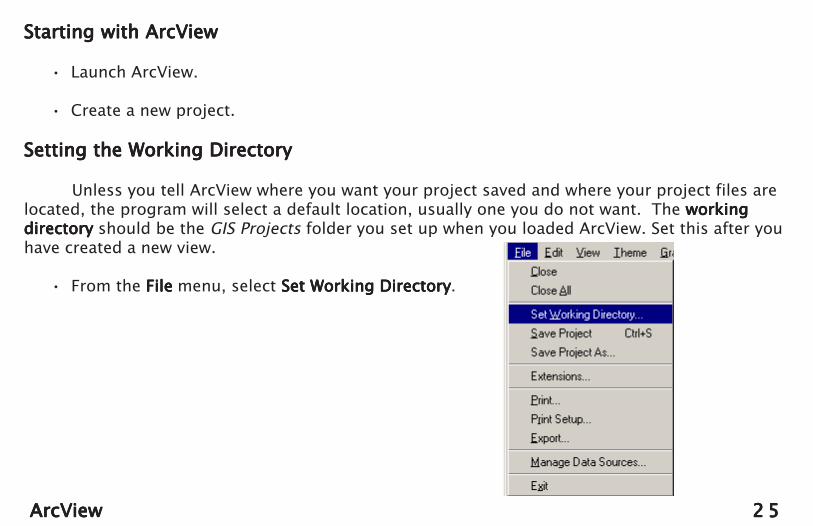
Setting the Working DirectorySetting the Working DirectorySetting the Working DirectorySetting the Working DirectorySetting the Working Directory
Unless you tell ArcView where you want your project saved and where your project files arelocated, the program will select a default location, usually one you do not want. The workingworkingworkingworkingworkingdirectory directory directory directory directory should be the GIS Projects folder you set up when you loaded ArcView. Set this after youhave created a new view.
• From the FileFileFileFileFile menu, select Set Working Directory Set Working Directory Set Working Directory Set Working Directory Set Working Directory.

2 62 62 62 62 6ArcViewArcViewArcViewArcViewArcView
• Specify the path path path path path to your GIS Projects folder. ArcView 3.xx does not have a browse capabilityfor this, so you must manually specify the path. The format for the PC platform is shownbelow and is in the standard format.
ExampleExampleExampleExampleExample: Suppose your GIS Projects folder is located in a directory called “esri” on your “C” drive,your path would be:
C:\esri\GIS Projects\C:\esri\GIS Projects\C:\esri\GIS Projects\C:\esri\GIS Projects\C:\esri\GIS Projects\
For Macintosh UsersFor Macintosh UsersFor Macintosh UsersFor Macintosh UsersFor Macintosh UsersFor Macintosh users the idea of a path name may be something new. The path consists of
each location you must double click to reach your folder.
• The author’s folder is stored on the hard drive My Drive, in a folder called ESRI and is calledGIS Projects. Note that each step is separated by a colon (:) and there are no spaces, exceptwhere they occur in location names.
A Macintosh ExampleA Macintosh ExampleA Macintosh ExampleA Macintosh ExampleA Macintosh Example: Suppose your GIS Projects folder is located in a folder called “ESRI” on yourmain fixed drive, which you have named “My Drive.” Your path would be:
My Drive:ESRI:GIS ProjectsMy Drive:ESRI:GIS ProjectsMy Drive:ESRI:GIS ProjectsMy Drive:ESRI:GIS ProjectsMy Drive:ESRI:GIS Projects

2 72 72 72 72 7ArcViewArcViewArcViewArcViewArcView
Saving Projects and Opening Saved ProjectsSaving Projects and Opening Saved ProjectsSaving Projects and Opening Saved ProjectsSaving Projects and Opening Saved ProjectsSaving Projects and Opening Saved Projects
Saving a ProjectSaving a ProjectSaving a ProjectSaving a ProjectSaving a Project: Now that we have the working directory set, it is a good idea to learn to saveyour project. ArcView does not automatically save your work for you so remember to save yourwork often.
• From the FileFileFileFileFile menu, select Save Project Save Project Save Project Save Project Save Project .
• If you have set the working directory, ArcView will open your GIS Projects folder. If not,navigate to that folder.
• Give your project an appropriate name, and be certain to attach the extension .prj.
Opening a ProjectOpening a ProjectOpening a ProjectOpening a ProjectOpening a Project
• Launch ArcView if it is not already open.
• From the FileFileFileFileFile menu, select Open ProjectOpen ProjectOpen ProjectOpen ProjectOpen Project.
• Navigate to your working directory, select your project and click OpenOpenOpenOpenOpen.
Note: Note: Note: Note: Note: A saved ArcView project contains the path to each of the files used in it. If you move any ofthese files, ArcView will not find them, and will prompt you for the location of each. This is onereason you should keep your working projects and files in one area.

2 82 82 82 82 8ArcViewArcViewArcViewArcViewArcView
• Click the Add ThemesAdd ThemesAdd ThemesAdd ThemesAdd Themes button.
• Navigate to the world data folder and select the country.shp file in the AddAddAddAddAddThemeThemeThemeThemeTheme window.
• Click OK in the Add ThemeAdd ThemeAdd ThemeAdd ThemeAdd Theme box.

2 92 92 92 92 9ArcViewArcViewArcViewArcViewArcView
• Your ViewViewViewViewView window now shows the country.shp theme added to the View Table of ContentsView Table of ContentsView Table of ContentsView Table of ContentsView Table of Contentswindow. Although there is one country.shp file, each separate country has been given adifferent color. For simplicity, let’s make all the countries the same color.

3 03 03 03 03 0ArcViewArcViewArcViewArcViewArcView
• Double click on the name of any country in the ViewViewViewViewViewTable of ContentsTable of ContentsTable of ContentsTable of ContentsTable of Contents listing. This opens the LegendLegendLegendLegendLegendEditorEditorEditorEditorEditor. Here is where we select some of the options fordisplaying themes.
• Notice that the Legend TypLegend TypLegend TypLegend TypLegend Type pull-down menu displaysunique valueunique valueunique valueunique valueunique value. This means that each country isdisplayed as a separate color based on its name.
• Click on the Legend TypeLegend TypeLegend TypeLegend TypeLegend Type pull-down menu, and selectsingle symbolsingle symbolsingle symbolsingle symbolsingle symbol .
• Click the ApplyApplyApplyApplyApply button. The LegendLegendLegendLegendLegendEditorEditorEditorEditorEditor view changes (the colorselected by the system may differ).
• Close the Legend EditorLegend EditorLegend EditorLegend EditorLegend Editor.

3 13 13 13 13 1ArcViewArcViewArcViewArcViewArcView
• The View View View View View window Table of Contents Table of Contents Table of Contents Table of Contents Table of Contents will now showthe country.shp file as all one color. The coloryou see may be different from what is shown.
• Click once in the small box before the country.shptheme to turn on this theme. The world countrymap appears.
3 23 23 23 23 2ArcViewArcViewArcViewArcViewArcView
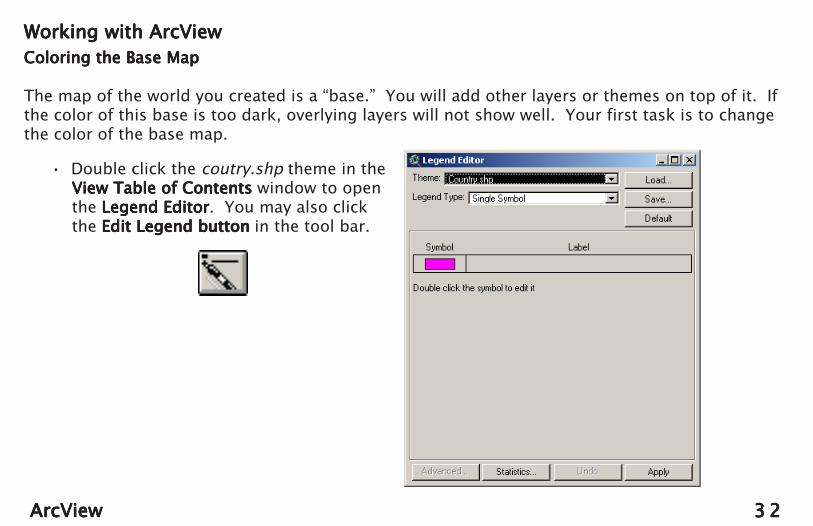
Working with ArcViewWorking with ArcViewWorking with ArcViewWorking with ArcViewWorking with ArcViewColoring the Base MapColoring the Base MapColoring the Base MapColoring the Base MapColoring the Base Map
The map of the world you created is a “base.” You will add other layers or themes on top of it. Ifthe color of this base is too dark, overlying layers will not show well. Your first task is to changethe color of the base map.
• Double click the coutry.shp theme in theView Table of ContentsView Table of ContentsView Table of ContentsView Table of ContentsView Table of Contents window to openthe Legend EditorLegend EditorLegend EditorLegend EditorLegend Editor. You may also clickthe Edit Legend buttonEdit Legend buttonEdit Legend buttonEdit Legend buttonEdit Legend button in the tool bar.

3 33 33 33 33 3ArcViewArcViewArcViewArcViewArcView
• Double click the color patch beneath the symbol heading inthe Legend EditorLegend EditorLegend EditorLegend EditorLegend Editor.
• This will open the Fill PaletteFill PaletteFill PaletteFill PaletteFill Palette window. The Fill PaletteFill PaletteFill PaletteFill PaletteFill Palettechanges the display characteristics of a theme.
• Click once on the paint brushpaint brushpaint brushpaint brushpaint brush in the Fill Palette menu.
• From the Color Palette Color Palette Color Palette Color Palette Color Palette menu, select alight color, such as the pink that isshown to the right.
• Close the Color Palette Color Palette Color Palette Color Palette Color Palette.
• Click ApplyApplyApplyApplyApply and Close the Legend EditorLegend EditorLegend EditorLegend EditorLegend Editor.

3 43 43 43 43 4ArcViewArcViewArcViewArcViewArcView
• Your world map should now appear like the one below.
Hint:Hint:Hint:Hint:Hint: Now would be a good time to save your project.

3 53 53 53 53 5ArcViewArcViewArcViewArcViewArcView
Adding More ThemesAdding More ThemesAdding More ThemesAdding More ThemesAdding More Themes
• Using the add themes button, navigate to your world folder, and select the files for theworld’s cities, rivers and lakes. To select multiple files, hold down the Shift Shift Shift Shift Shift key as you clickeach one (Shift-click).
• Click OK OK OK OK OK when you have all of the files selected.
3 63 63 63 63 6ArcViewArcViewArcViewArcViewArcView
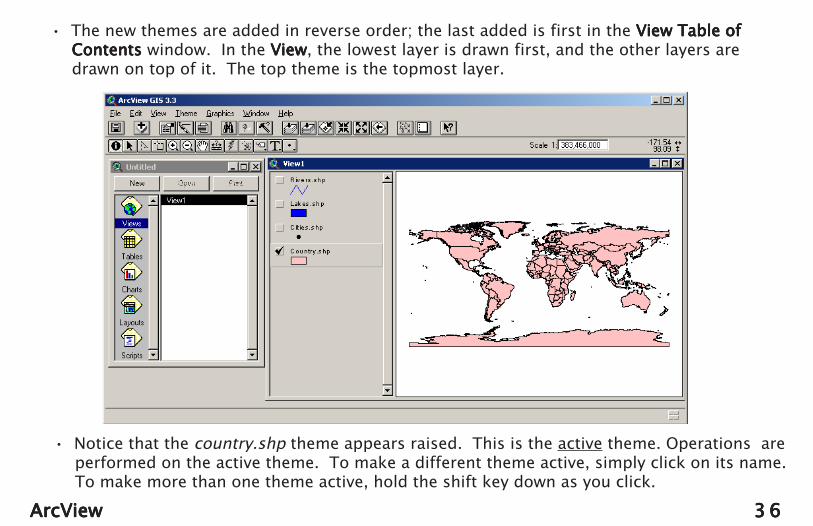
• The new themes are added in reverse order; the last added is first in the View Table ofView Table ofView Table ofView Table ofView Table ofContentsContentsContentsContentsContents window. In the ViewViewViewViewView, the lowest layer is drawn first, and the other layers aredrawn on top of it. The top theme is the topmost layer.
• Notice that the country.shp theme appears raised. This is the active theme. Operations areperformed on the active theme. To make a different theme active, simply click on its name.To make more than one theme active, hold the shift key down as you click.

3 73 73 73 73 7ArcViewArcViewArcViewArcViewArcView
• Turn on the rivers, lakes and cities themes by clicking in the boxes before their names.
• Note how jumbled things look. ArcView draws rivers, lakes and cities at one size regardlessof magnification.

3 83 83 83 83 8ArcViewArcViewArcViewArcViewArcView
• Notice the value in the ScaleScaleScaleScaleScale window. This is the “Representative Fraction” (RF) scale of themap. It means that one of any unit on the map is equal to 383,466,000 of the same unit onthe ground. Example:Example:Example:Example:Example: Objects that are 5 cm apart on the screen are 1,917,330,000 cm or19,173 km apart on the ground. Watch this scale as you change magnification in your viewwindow. Your values may vary slightly, depending on the size of your view window andyour exact amount of zoom.
What If My Scale Window IsWhat If My Scale Window IsWhat If My Scale Window IsWhat If My Scale Window IsWhat If My Scale Window IsBlank?Blank?Blank?Blank?Blank?
If your View ScaleView ScaleView ScaleView ScaleView Scale window is blankit is because ArcView does notknow the units of the map anddata.
• From the ViewViewViewViewView menu, selectPropertiesPropertiesPropertiesPropertiesProperties. The ViewViewViewViewViewPropertiesPropertiesPropertiesPropertiesProperties box opens. Notethat both Map UnitsMap UnitsMap UnitsMap UnitsMap Units andDistance UnitsDistance UnitsDistance UnitsDistance UnitsDistance Units are unknown.

3 93 93 93 93 9ArcViewArcViewArcViewArcViewArcView
• Unless you know that your data are projected differently, from the Map UnitsMap UnitsMap UnitsMap UnitsMap Units pull-downmenu, select decimal degrees decimal degrees decimal degrees decimal degrees decimal degrees.

4 04 04 04 04 0ArcViewArcViewArcViewArcViewArcView
• From the Distance Units Distance Units Distance Units Distance Units Distance Units pull-down menu, select meters meters meters meters meters .
• Click OKOKOKOKOK to close the View PropertiesView PropertiesView PropertiesView PropertiesView Properties box. Your View Scale Scale Scale Scale Scale window should read properly.
• You may change the scale of your view at any time by using the View ScaleView ScaleView ScaleView ScaleView Scale window. Clickonce in the View ScaleView ScaleView ScaleView ScaleView Scale window and enter a scale. You may use commas in your entry.

4 14 14 14 14 1ArcViewArcViewArcViewArcViewArcView
Zooming in on AfricaZooming in on AfricaZooming in on AfricaZooming in on AfricaZooming in on Africa• Select the Zoom InZoom InZoom InZoom InZoom In tool from the tool bar.
• Click several times on the east coast of Africa,until your view window looks like the oneshown below.
Now the overlying themes have a betterproportion.
• If you wish to recolor any of thethemes use the same procedureyou used to change the color ofthe base country map. The viewto the left shows the lakes andrivers themes colored blue.
• Note the value in the ScaleScaleScaleScaleScale windowat this level of magnification. Thevalue of 1:92,230,639 means that1 unit on the map covers a smallerarea on the ground than thatshown on page 38. The smallerthe number, the more detail itshows.....
In this example, 5 cm on the screen would equal 4,611 km on theground.

4 24 24 24 24 2ArcViewArcViewArcViewArcViewArcView
Zooming in to a Specific AreaZooming in to a Specific AreaZooming in to a Specific AreaZooming in to a Specific AreaZooming in to a Specific Area
Rather than zooming one step at a time,you can quickly zoom to aspecific area.
• Select the Zoom InZoom InZoom InZoom InZoom In tool
• Hold down your mouse button and draw a boxdraw a boxdraw a boxdraw a boxdraw a box around the areashown to the right. You will zoom in on the area that youboxed.
• Note the scale at thismagnification. Now 5 cm onthe screen is even less.

4 34 34 34 34 3ArcViewArcViewArcViewArcViewArcView
Along with data that describe how and where to draw themes, each theme contains additionalinformation. These data are called the theme’s attributes.attributes.attributes.attributes.attributes. There are two tools to examine theseattributes.
• Click once on the lakes (or w_lakes))))) theme to make it active. Its title should appear raised.Tools and measurements are applied to the active theme.
• Select the Information ToolInformation ToolInformation ToolInformation ToolInformation Tool from the tool bar.
• Move your cursor into the ViewViewViewViewView window. Notice the cursor appears like this:
• Move your cursor over the large lake near the center of your screen and click once.
• The Identify Results Identify Results Identify Results Identify Results Identify Results table opens, as shown on the next page.
Theme Attribute TablesTheme Attribute TablesTheme Attribute TablesTheme Attribute TablesTheme Attribute Tables
4 44 44 44 44 4ArcViewArcViewArcViewArcViewArcView
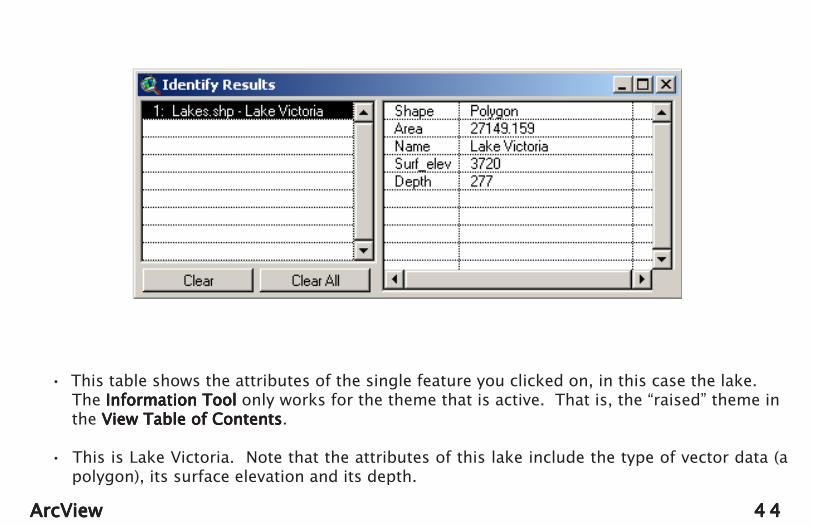
• This table shows the attributes of the single feature you clicked on, in this case the lake.The Information ToolInformation ToolInformation ToolInformation ToolInformation Tool only works for the theme that is active. That is, the “raised” theme inthe View Table of ContentsView Table of ContentsView Table of ContentsView Table of ContentsView Table of Contents.
• This is Lake Victoria. Note that the attributes of this lake include the type of vector data (apolygon), its surface elevation and its depth.

4 54 54 54 54 5ArcViewArcViewArcViewArcViewArcView
• Use the Information ToolInformation ToolInformation ToolInformation ToolInformation Tool to click on the long lake to the southwest of Lake Victoria.
• Lake Tanganyika is added to the table, and its attributes are displayed. You may view thecharacteristics of any feature in the table by clicking on its name.
• Close Close Close Close Close this table.

4 64 64 64 64 6ArcViewArcViewArcViewArcViewArcView
What About the Other Lakes?What About the Other Lakes?What About the Other Lakes?What About the Other Lakes?What About the Other Lakes?
• Rather than viewing the lakes of theworld one at a time, you canexamine the data for the wholecollection at once.
• With the lakes theme active, click theOpen Theme TableOpen Theme TableOpen Theme TableOpen Theme TableOpen Theme Table button.
• The attribute table for all the lakesin the lakes.shp file opens.
• Notice that there is a new menu andtoolbar, the Tables Menu and TablesTables Menu and TablesTables Menu and TablesTables Menu and TablesTables Menu and TablesToolbarToolbarToolbarToolbarToolbar.

4 74 74 74 74 7ArcViewArcViewArcViewArcViewArcView
• Scroll through this table until you find Lake Victoria, and click once on its name. Notice thatboth the name in the table and the shape in the View View View View View window are highlighted in yellow.
• The Tables MenuTables MenuTables MenuTables MenuTables Menu, displays how many items you selected and how many are in the database.

4 84 84 84 84 8ArcViewArcViewArcViewArcViewArcView
• Select more than one item by using the “shift-click” method. Hold down the shift key as youselect Lakes Turkana, Tanganyika, Albert and Victoria. The visual below shows the resultsof selecting all the lakes in the vicinity of Lake Victoria.
• Turn off your selections by clicking the Unselect Records Unselect Records Unselect Records Unselect Records Unselect Records button.
• Take some time now to experiment with the tools you have just used.
• When you are ready to proceed, click the Unselect Records Unselect Records Unselect Records Unselect Records Unselect Records button.

4 94 94 94 94 9ArcViewArcViewArcViewArcViewArcView
You may have noticed that the lakes in the table are not arranged in any particular order.ArcVoyager has several ways to arrange the data.
• Click Click Click Click Click once on the heading of the Depthcolumn. It turns gray as shown right.
• From the FieldFieldFieldFieldField menu select SortSortSortSortSortDescendingDescendingDescendingDescendingDescending.
• The lakes in the file are sorted bydepth, from deepest to mostshallow, as shown in the partialtable to the right.

5 05 05 05 05 0ArcViewArcViewArcViewArcViewArcView
• Shift-ClickShift-ClickShift-ClickShift-ClickShift-Click the names of the fourlakes in your view area (Victoria,Tanganyika, Turkana and Albert).
• Click the Promote RecordsPromote RecordsPromote RecordsPromote RecordsPromote Recordsbutton. The selected records arebrought to the top of the file.
5 15 15 15 15 1ArcViewArcViewArcViewArcViewArcView
Now a questionNow a questionNow a questionNow a questionNow a question
Lake Tanganyika is much deeper than the other three lakes. Lake Turkana is much deeperthan Victoria or Albert. Why should this be so? What is there about the Geography of this part ofAfrica that might cause this to occur? This question links Geography and Geology, and helpsstudents see the connections between surface features (Topography) and the Geophysical forcesthat produce them.
Find Lake Nyasa. What would you predict about its depth? Why? What geophysical forceshave acted in this region?
(For the answer to this question see Chapter 7)

5 25 25 25 25 2ArcViewArcViewArcViewArcViewArcView
How Large is a Feature?How Large is a Feature?How Large is a Feature?How Large is a Feature?How Large is a Feature?
ArcView has a distance measuring tool todetermine linear distances.
• Click the Distance toolDistance toolDistance toolDistance toolDistance tool to make it active.• Place the cursorrrrr at the north end of Lake
Tanganika (you may have to adjust yourview)
• Hold the mouse button down, and drag thelength of the lake as shown to the right.
• Double click Double click Double click Double click Double click at the south end of the lake.• The length of the lake will be displayed on
the screen. The PC display is in the lower-left screen, and for Macintosh computers it isin the upper left. Your result will varyslightly, depending on where you draw yourline segment. The distance is the length youmeasured - not necessarily the actual lengthof the lake.

5 35 35 35 35 3ArcViewArcViewArcViewArcViewArcView
Labeling LocationsLabeling LocationsLabeling LocationsLabeling LocationsLabeling Locations
• Make the Country.shp theme active.
• Click the Label Tool Label Tool Label Tool Label Tool Label Tool button.
• Click once in the country south of Lake Victoria.
• The country is labeled Tanzania.
• Click on the Select Tool.Select Tool.Select Tool.Select Tool.Select Tool.
• Be sure the Tanzania label is active (its cornerhandles are visible). If they are not, click once onthe label.
• You can now drag and resizedrag and resizedrag and resizedrag and resizedrag and resize the label.

5 45 45 45 45 4ArcViewArcViewArcViewArcViewArcView
• Double-click the Tanzania label.The Text PropertiesText PropertiesText PropertiesText PropertiesText Properties box opens. Youcan change the appearance of thelabel.
• To remove a label:- Click the Select Tool. Select Tool. Select Tool. Select Tool. Select Tool.- Click the label to make it active.- Hit the DeleteDeleteDeleteDeleteDelete key.
• Label the other countries in theregion around Lake Victoria.

5 55 55 55 55 5ArcViewArcViewArcViewArcViewArcView
• Make the Lakes theme active, and label the lakes in your view area.
• Repeat this process for the rivers in your view area.

5 65 65 65 65 6ArcViewArcViewArcViewArcViewArcView
Another Question:Another Question:Another Question:Another Question:Another Question:
• Zoom outZoom outZoom outZoom outZoom out until your view is similar to the one shown to theright.
• Select the Drag ToolDrag ToolDrag ToolDrag ToolDrag Tool.
• Position the Drag Tool Drag Tool Drag Tool Drag Tool Drag Tool over Africa. Hold the mouse buttondown, and drag the image to your left until you see theregion shown to the right.
QuestionsQuestionsQuestionsQuestionsQuestions: Why does the drainage pattern (thepattern shown by these rivers) appear the wayit does? Are there topographical features thatinfluence the pattern that rivers take? Wheredo these rivers flow? What are their outlets?Can you use Arcview to find different kinds ofdrainage patterns in other areas? (Try theCentral United States, or Northern SouthAmerica). What topographic features affect thedrainage patterns in these areas?

5 75 75 75 75 7ArcViewArcViewArcViewArcViewArcView
• Make the cities.shp theme active.
• Open the Attributes table Attributes table Attributes table Attributes table Attributes table of this theme(Use the TablesTablesTablesTablesTables button).
Building a QueryBuilding a QueryBuilding a QueryBuilding a QueryBuilding a Query
A query is an ArcVoyager tool to makesophisticated inquiries (called queries) aboutdata contained in attribute tables.

5 85 85 85 85 8ArcViewArcViewArcViewArcViewArcView
• A QueryQueryQueryQueryQuery is a set of instructions that act on the attribute table using logical operatorslogical operatorslogical operatorslogical operatorslogical operators. Theseare operations such as “equals,” “is greater than,” or comparisons such as “and” or “or”.
• Select the Query Tool Query Tool Query Tool Query Tool Query Tool button shown to the right.
• The Query BoxQuery BoxQuery BoxQuery BoxQuery Box opens.
Find the cities of the world which have a population greaterthan or equal to 6,000,000 people.
• Note the set of logical operators represented by the keys in the top center of the window.

5 95 95 95 95 9ArcViewArcViewArcViewArcViewArcView
To create the query: To create the query: To create the query: To create the query: To create the query:
• Double click the Population Population Population Population Population entry in theFieldsFieldsFieldsFieldsFields column. PopulationPopulationPopulationPopulationPopulation now appears inthe query dialog area.
• Click once on the “greater than or equal to”button in the set of logical operators.
• Enter the value 6000000 6000000 6000000 6000000 6000000. The value must beentered without spaces or commas.
• Click the New SetNew SetNew SetNew SetNew Set button in the Query BoxQuery BoxQuery BoxQuery BoxQuery Box. Thedata table shows several cities highlighted. Closethe Query Box.

6 06 06 06 06 0ArcViewArcViewArcViewArcViewArcView
• The results of the query are distributed throughout the table. PromotePromotePromotePromotePromote them usingthe Promote toolPromote toolPromote toolPromote toolPromote tool. Promoting brings all the entries satisfying your query to the topof the table and displays them in the order they appeared in the attributes table.They have not been sorted.

6 16 16 16 16 1ArcViewArcViewArcViewArcViewArcView
Sorting the Results of the QuerySorting the Results of the QuerySorting the Results of the QuerySorting the Results of the QuerySorting the Results of the Query• Click on the title of the Population column to make it active.
• From the Field Field Field Field Field menu, select Sort DescendingSort DescendingSort DescendingSort DescendingSort Descending. The cities of 6,000,000 or more inhabitantsare now arranged in order of decreasing population.
More QuestionsMore QuestionsMore QuestionsMore QuestionsMore Questions: Is there a pattern to thelocations of the world’s most populouscities? Are there exceptions to this pattern?In which country (or countries) are there themost large cities? How many of these arecountry capitals? Do you need moreinformation to help you answer any parts ofthis question?

6 26 26 26 26 2ArcViewArcViewArcViewArcViewArcView
SuggestionsSuggestionsSuggestionsSuggestionsSuggestions: Examine the locations of the largest cities on a regional or continental basis. Thisinvolves zooming in and out. ArcView has some tools that will help you do this quickly.
1 2 3 4 5 61 2 3 4 5 61 2 3 4 5 61 2 3 4 5 61 2 3 4 5 6
1. Zoom to the Extent of all ThemesZoom to the Extent of all ThemesZoom to the Extent of all ThemesZoom to the Extent of all ThemesZoom to the Extent of all Themes: This zooms you out to the largest area covered by anytheme.
2. Zoom to the Extent of Active ThemeZoom to the Extent of Active ThemeZoom to the Extent of Active ThemeZoom to the Extent of Active ThemeZoom to the Extent of Active Theme: This zooms you out to the largest area covered by theactiveactiveactiveactiveactive theme. In the current project, all themes are global, and buttons 1 and 2 do thesame thing. If you had a theme that covered only one continent, it would zoom out to theextent of that continent if that was the active theme.
3. Zoom to the Extent of Selected FeaturesZoom to the Extent of Selected FeaturesZoom to the Extent of Selected FeaturesZoom to the Extent of Selected FeaturesZoom to the Extent of Selected Features: This zooms you out to the largest area covered bythe features you have selected (they appear yellow on your view.) If you selected all thelakes in Europe, the zoom would cover only Europe.
4. Zoom In on Center of View:Zoom In on Center of View:Zoom In on Center of View:Zoom In on Center of View:Zoom In on Center of View: Zooms in one step on the center of the current view.
5. Zoom Out from Center of ViewZoom Out from Center of ViewZoom Out from Center of ViewZoom Out from Center of ViewZoom Out from Center of View: Zooms out one step from the center of the current view.
6. Return to your previous extent of viewReturn to your previous extent of viewReturn to your previous extent of viewReturn to your previous extent of viewReturn to your previous extent of view. Takes you back to your previous degree of zoom.

6 36 36 36 36 3ArcViewArcViewArcViewArcViewArcView
Building A More Sophisticated QueryBuilding A More Sophisticated QueryBuilding A More Sophisticated QueryBuilding A More Sophisticated QueryBuilding A More Sophisticated Query
Multiple logical operators can be combined in a single query. To illustrate this:
How many cities in Canada have a population of at least 500,000?How many cities in Canada have a population of at least 500,000?How many cities in Canada have a population of at least 500,000?How many cities in Canada have a population of at least 500,000?How many cities in Canada have a population of at least 500,000?
• Make the cities.shp theme active.• Open the Attributes tableAttributes tableAttributes tableAttributes tableAttributes table of the cities theme.• Open the Query BuilderQuery BuilderQuery BuilderQuery BuilderQuery Builder.• Make the following selections:
- Double click the country field in the FieldsFieldsFieldsFieldsFields column.- Click the “=” button from the logical operators.- Scroll down to and double click Canada from the ValuesValuesValuesValuesValues menu on the right.- Click the “and” operator.- Double click population in the Fields Fields Fields Fields Fields menu.- Click the “>=>=>=>=>=” operator.- Enter 500000.
• Your Query Dialog boxQuery Dialog boxQuery Dialog boxQuery Dialog boxQuery Dialog box shouldappear like the one to the right.

6 46 46 46 46 4ArcViewArcViewArcViewArcViewArcView
• Click the New SetNew SetNew SetNew SetNew Set button and then close the Query Dialogue.
• Two cities are highlighted. There are others but they are farther down in the table.

6 56 56 56 56 5ArcViewArcViewArcViewArcViewArcView
• Click the PromotePromotePromotePromotePromote button, and see the full results of the Query Query Query Query Query. You can string togethermultiple queries to make your information search as precise as necessary.

6 66 66 66 66 6ArcViewArcViewArcViewArcViewArcView
• Click in your View window to make it active. Click the zoom to selected button. The citiesselected by your query are highlighted.

6 76 76 76 76 7ArcViewArcViewArcViewArcViewArcView
Changing the Way a Theme is DisplayedChanging the Way a Theme is DisplayedChanging the Way a Theme is DisplayedChanging the Way a Theme is DisplayedChanging the Way a Theme is Displayed
You have been working with all the nations of the worlddisplayed as one color. This is not typical of political maps.Now you will display each country as a separate color.
• Zoom to the Extent of All Themes Zoom to the Extent of All Themes Zoom to the Extent of All Themes Zoom to the Extent of All Themes Zoom to the Extent of All Themes so that you see theentire world.
• Turn off the display of the lakes, rivers, and citiesthemes.
• Double-click on the country.shp theme in the ViewViewViewViewViewwindow Table of ContentsTable of ContentsTable of ContentsTable of ContentsTable of Contents. This brings up the theme’sLegend EditorLegend EditorLegend EditorLegend EditorLegend Editor box.
• Notice that the Legend Type Legend Type Legend Type Legend Type Legend Type pull-down menu displaysSingle SymbolSingle SymbolSingle SymbolSingle SymbolSingle Symbol. This means that every feature in thetheme is displayed with the same color.
• In this Legend TypeLegend TypeLegend TypeLegend TypeLegend Type pull-down menu, select UniqueUniqueUniqueUniqueUniqueValueValueValueValueValue.

6 86 86 86 86 8ArcViewArcViewArcViewArcViewArcView
• The Legend Editor Legend Editor Legend Editor Legend Editor Legend Editor should appear asshown to the right. You must tell thesystem what field, or column in thetheme’s data table you wish to havethe legend linked to.
• From the Values FieldValues FieldValues FieldValues FieldValues Field pull-down menu,select NameNameNameNameName, or Country NameCountry NameCountry NameCountry NameCountry Name.
• The Legend Editor Legend Editor Legend Editor Legend Editor Legend Editor now shows a unique color for eachcountry, based on its name. The Color SchemesColor SchemesColor SchemesColor SchemesColor Schemespull-down menu near the bottom of the windowallows you to choose different sets of colors. Chooseone you like.
• Click the ApplyApplyApplyApplyApply button and close the Legend Editor Legend Editor Legend Editor Legend Editor Legend Editor.

6 96 96 96 96 9ArcViewArcViewArcViewArcViewArcView
• Each of the countries of the world is now listed in the View Table of ContentsView Table of ContentsView Table of ContentsView Table of ContentsView Table of Contents. The mapnow resembles traditional political maps.
You will work with the Legend EditorLegend EditorLegend EditorLegend EditorLegend Editor much more in later projects.

7 07 07 07 07 0ArcViewArcViewArcViewArcViewArcView
A First Look at Projections and UnitsA First Look at Projections and UnitsA First Look at Projections and UnitsA First Look at Projections and UnitsA First Look at Projections and Units
Any map is an attempt to render a round Earth on a flat surface, whether it be on yourcomputer screen or a piece of paper. Imaging trying to flatten an orange; no matter how you cutand push, there is going to be some distortion, somewhere. Numerous schemes, calledprojections, have been devised to transfer the Earth to flat surfaces and each has certainadvantages and disadvantages. ArcView can use and display data in many different projections.You will examine one interesting projection. As you add other sources of data in later projects,you will deal more in depth with projections.
• Zoom to Extent of All ThemesZoom to Extent of All ThemesZoom to Extent of All ThemesZoom to Extent of All ThemesZoom to Extent of All Themes.
• From the main menu, select View -->View -->View -->View -->View -->PropertiesPropertiesPropertiesPropertiesProperties.
• The View PropertiesView PropertiesView PropertiesView PropertiesView Properties box opens.
• You may rename the View WindowView WindowView WindowView WindowView Window by typinga new name in the NameNameNameNameName line.
7 17 17 17 17 1ArcViewArcViewArcViewArcViewArcView
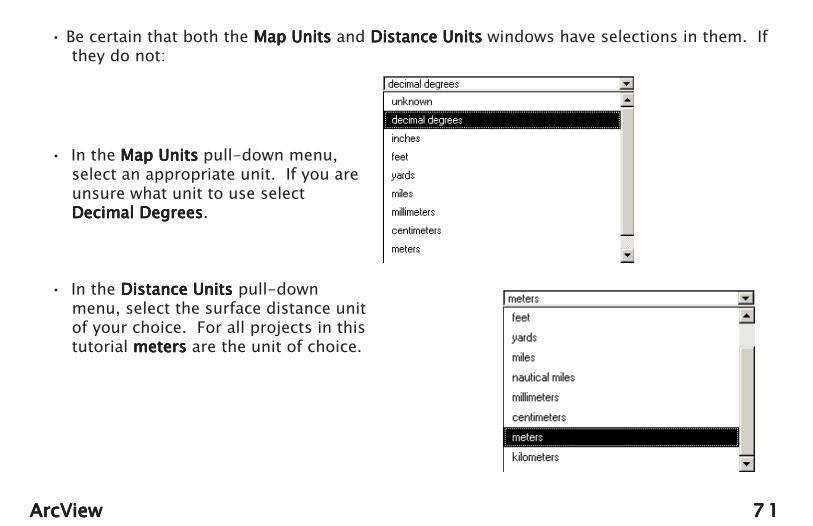
• Be certain that both the Map Units Map Units Map Units Map Units Map Units and Distance UnitsDistance UnitsDistance UnitsDistance UnitsDistance Units windows have selections in them. Ifthey do not:
• In the Map UnitsMap UnitsMap UnitsMap UnitsMap Units pull-down menu,select an appropriate unit. If you areunsure what unit to use selectDecimal DegreesDecimal DegreesDecimal DegreesDecimal DegreesDecimal Degrees.
• In the Distance Units Distance Units Distance Units Distance Units Distance Units pull-downmenu, select the surface distance unitof your choice. For all projects in thistutorial meters meters meters meters meters are the unit of choice.

7 27 27 27 27 2ArcViewArcViewArcViewArcViewArcView
• Click once on the ProjectionProjectionProjectionProjectionProjection button in the View PropertiesView PropertiesView PropertiesView PropertiesView Properties box.
• The Projection Properties Projection Properties Projection Properties Projection Properties Projection Properties window opens.
• From the TypeTypeTypeTypeType pull-down menu, selectThe World from SpaceThe World from SpaceThe World from SpaceThe World from SpaceThe World from Space.
• Click OK OK OK OK OK to close the ProjectionsProjectionsProjectionsProjectionsProjectionsPropertiesPropertiesPropertiesPropertiesProperties box.
• Click OK OK OK OK OK to close the View PropertiesView PropertiesView PropertiesView PropertiesView Propertieswindow.

7 37 37 37 37 3ArcViewArcViewArcViewArcViewArcView
• The View View View View View window shows an approximation of the Earth as seen from space. Unfortunately,this view cannot be rotated, and is only useful for Western Hemisphere projects.
Chapter Summary:Chapter Summary:Chapter Summary:Chapter Summary:Chapter Summary: In this chapter, you started a new project, added themes from ArcView’sinternal data base, and manipulated and analyzed some of the properties of these themes.
Later projects in this tutorial will acquaint you with methods of acquiring local more detailed datasets and show you how to incorporate GLOBE student data as themes in your projects.

7 47 47 47 47 4ArcViewArcViewArcViewArcViewArcView
Chapter 5: Creating a Printed Map and Exporting Your ProjectChapter 5: Creating a Printed Map and Exporting Your ProjectChapter 5: Creating a Printed Map and Exporting Your ProjectChapter 5: Creating a Printed Map and Exporting Your ProjectChapter 5: Creating a Printed Map and Exporting Your ProjectArcView has two methods of producing printed output. One is to print directly from ArcView bycreating a Layout. The other is to Export the View or Layout window in a form that can be used ingraphics or word processing programs.
Creating a LayoutCreating a LayoutCreating a LayoutCreating a LayoutCreating a Layout
• Open an existing or create a new ArcView project.
• From the ViewViewViewViewView menu in the main menu bar, select LayoutLayoutLayoutLayoutLayout.
• The Template ManagerTemplate ManagerTemplate ManagerTemplate ManagerTemplate Manager opens.

7 57 57 57 57 5ArcViewArcViewArcViewArcViewArcView
• From the list, select a template for your Layout Layout Layout Layout Layout and click OK OK OK OK OK. The author selected PortraitPortraitPortraitPortraitPortrait.
• A LayoutLayoutLayoutLayoutLayout is created with the elements from your view.It contains:
- The map from your ViewViewViewViewView window.- The Theme LegendTheme LegendTheme LegendTheme LegendTheme Legend from the View TableView TableView TableView TableView Table
of Contentsof Contentsof Contentsof Contentsof Contents.- A scale.- A compass rose.
• At this point, you may select PrintPrintPrintPrintPrint from the FileFileFileFileFilemenu and print the Layout Layout Layout Layout Layout as it appears. Thenext pages will show you how to makemodifications to this LayoutLayoutLayoutLayoutLayout.

7 67 67 67 67 6ArcViewArcViewArcViewArcViewArcView
Changing the LayoutChanging the LayoutChanging the LayoutChanging the LayoutChanging the Layout
There are some simple modifications you can make to the appearance of your Layout Layout Layout Layout Layout that will giveit a customized look.
Controlling When Themes are DisplayedControlling When Themes are DisplayedControlling When Themes are DisplayedControlling When Themes are DisplayedControlling When Themes are Displayed
• Click on the SelectSelectSelectSelectSelect tool.
• Double click on the Legend Legend Legend Legend Legend in theLayout. Layout. Layout. Layout. Layout. The Legend Frame PropertiesLegend Frame PropertiesLegend Frame PropertiesLegend Frame PropertiesLegend Frame Propertiesbox opens.
• The Display Display Display Display Display pull-down menu in this boxhas two options.
• These options cause a Theme in your View to be displayed in the Layout:- at all times.- or only when the theme is active in the View window.
• Choose “Always” and click OK.

7 77 77 77 77 7ArcViewArcViewArcViewArcViewArcView
The Compass RoseThe Compass RoseThe Compass RoseThe Compass RoseThe Compass Rose
• Double click on the Compass RoseCompass RoseCompass RoseCompass RoseCompass Rose in the Layout.You can select any of the forms shown.
• Click OK.
The Layout TitleThe Layout TitleThe Layout TitleThe Layout TitleThe Layout Title
• Double click on the Title Title Title Title Title in the Layout. The TextTextTextTextTextProperties Properties Properties Properties Properties box opens. Here you can change theLayout title by typing a new one in the dialogarea.
• Click OK.
7 87 87 87 87 8ArcViewArcViewArcViewArcViewArcView
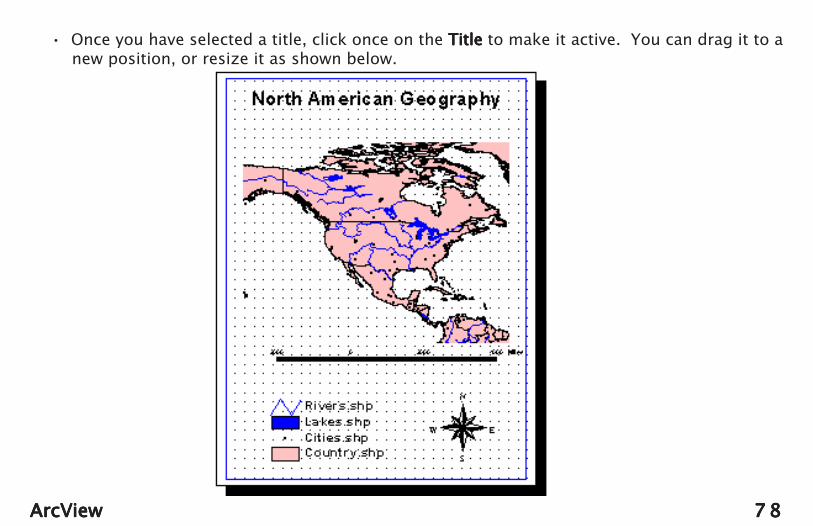
• Once you have selected a title, click once on the TitleTitleTitleTitleTitle to make it active. You can drag it to anew position, or resize it as shown below.

7 97 97 97 97 9ArcViewArcViewArcViewArcViewArcView
The Map ScaleThe Map ScaleThe Map ScaleThe Map ScaleThe Map Scale
• Double click on the Scale Bar Scale Bar Scale Bar Scale Bar Scale Bar in theLayout. In the Scale Bar PropertiesScale Bar PropertiesScale Bar PropertiesScale Bar PropertiesScale Bar Properties box,you may change the Scale StyleScale StyleScale StyleScale StyleScale Style and theUnitsUnitsUnitsUnitsUnits of measure for the map. The intervalinformation is determined by the areashown in the View View View View View window.
• Click OK.
Note:Note:Note:Note:Note: If the Scale Bar in your Layout Layout Layout Layout Layout appears“gray” as in the example below, it is because nodistance units have been specified in your ViewViewViewViewView.See Chapter 4.Chapter 4.Chapter 4.Chapter 4.Chapter 4.

8 08 08 08 08 0ArcViewArcViewArcViewArcViewArcView
Adding Text to the LayoutAdding Text to the LayoutAdding Text to the LayoutAdding Text to the LayoutAdding Text to the Layout
You may add text to your Layout:
• Select the Text ToolText ToolText ToolText ToolText Tool from the tool bar.
• Click a location in the Layout Layout Layout Layout Layout to inserttext.
• The Text PropertiesText PropertiesText PropertiesText PropertiesText Properties Box opens.
• Enter your text in the Text WindowText WindowText WindowText WindowText Window.When you click OKOKOKOKOK, that text will beinserted into the LayoutLayoutLayoutLayoutLayout.
• To move or resize this text box To move or resize this text box To move or resize this text box To move or resize this text box To move or resize this text box: - Choose the SelectSelectSelectSelectSelect tool. - Click on the text. - Drag and resize the text box.

8 18 18 18 18 1ArcViewArcViewArcViewArcViewArcView
Exporting the View and Layout WindowsExporting the View and Layout WindowsExporting the View and Layout WindowsExporting the View and Layout WindowsExporting the View and Layout Windows
ArcView will allow you to export the contents of the ViewViewViewViewView window or the Layout Layout Layout Layout Layout in graphicsformat. These images can be used in graphics or word processing programs.
• To ExportExportExportExportExport either the ViewViewViewViewView or LayouLayouLayouLayouLayout window, select ExportExportExportExportExport fromthe File File File File File menu. The Export Export Export Export Export window, along with supported filetypes are shown.
8 28 28 28 28 2ArcViewArcViewArcViewArcViewArcView
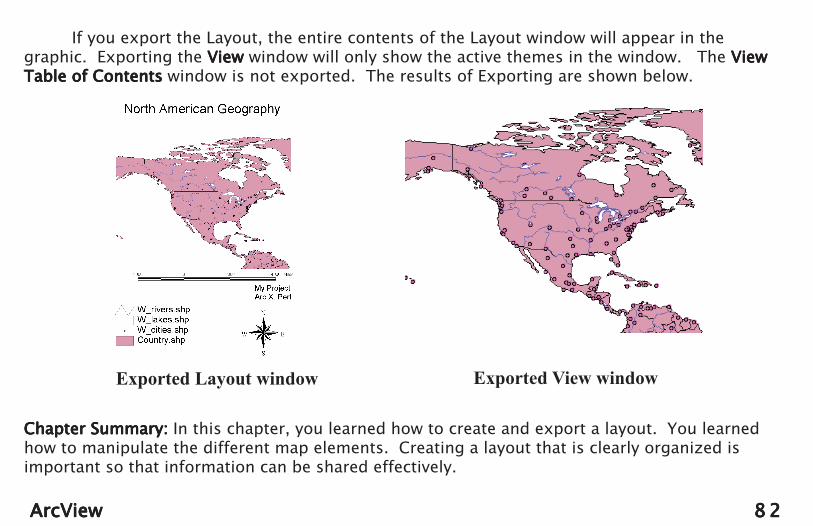
If you export the Layout, the entire contents of the Layout window will appear in thegraphic. Exporting the ViewViewViewViewView window will only show the active themes in the window. The ViewViewViewViewViewTable of Contents Table of Contents Table of Contents Table of Contents Table of Contents window is not exported. The results of Exporting are shown below.
Exported Layout window Exported View window
Chapter Summary: Chapter Summary: Chapter Summary: Chapter Summary: Chapter Summary: In this chapter, you learned how to create and export a layout. You learnedhow to manipulate the different map elements. Creating a layout that is clearly organized isimportant so that information can be shared effectively.

8 38 38 38 38 3ArcViewArcViewArcViewArcViewArcView
Chapter 6: Downloading and Incorporating GLOBE Student DataChapter 6: Downloading and Incorporating GLOBE Student DataChapter 6: Downloading and Incorporating GLOBE Student DataChapter 6: Downloading and Incorporating GLOBE Student DataChapter 6: Downloading and Incorporating GLOBE Student DataThis chapter and Chapter 7 will deal with acquiring and displaying other data sets in
ArcView. In order to be useful, such data must be geospatial. That is, they must containcoordinates that relate each data item to a place on the Earth.
Consider the data you send to the GLOBE database. Every item is related to a measurementsite that you have defined with latitude and longitude. These are the geospatial components ofyour data and make them appropriate for use in ArcView.
In this chapter, you will:In this chapter, you will:In this chapter, you will:In this chapter, you will:In this chapter, you will:
• Enter the GLOBE site, select a dataset to view, and create a table of those data.• Download this data table to your computer.• Incorporate these data as an Event Theme in ArcView.• Save this theme as a Shapefile.• Use the Legend Editor to change the nature of the data display.
Note:Note:Note:Note:Note:1. It is assumed that you are familiar with the GLOBE website.2. The appearance of pages on the GLOBE website changes, so the screens you meet may differ slightly from those in place at the time of this writing.

8 48 48 48 48 4ArcViewArcViewArcViewArcViewArcView
Part I: Getting the Data from the GLOBE WebsitePart I: Getting the Data from the GLOBE WebsitePart I: Getting the Data from the GLOBE WebsitePart I: Getting the Data from the GLOBE WebsitePart I: Getting the Data from the GLOBE Website
Note: All files used in these tutorials are available from theNote: All files used in these tutorials are available from theNote: All files used in these tutorials are available from theNote: All files used in these tutorials are available from theNote: All files used in these tutorials are available from theUniversity of New Hampshire GLOBE site at www.globe.unh.edu.University of New Hampshire GLOBE site at www.globe.unh.edu.University of New Hampshire GLOBE site at www.globe.unh.edu.University of New Hampshire GLOBE site at www.globe.unh.edu.University of New Hampshire GLOBE site at www.globe.unh.edu.Follow the “GIS” links. You may also order the complete tutorialFollow the “GIS” links. You may also order the complete tutorialFollow the “GIS” links. You may also order the complete tutorialFollow the “GIS” links. You may also order the complete tutorialFollow the “GIS” links. You may also order the complete tutorialand the necessary files on CD from the UNH site.and the necessary files on CD from the UNH site.and the necessary files on CD from the UNH site.and the necessary files on CD from the UNH site.and the necessary files on CD from the UNH site.
• Go to the GLOBE website, www.globe.gov, and select EnterEnterEnterEnterEnterthe GLOBE Sitethe GLOBE Sitethe GLOBE Sitethe GLOBE Sitethe GLOBE Site.
• You do not have to log in with your GLOBE ID and password.You will be using the public parts of the GLOBE webspace.
• From the main menu, under GLOBE DATAGLOBE DATAGLOBE DATAGLOBE DATAGLOBE DATA select Maps andMaps andMaps andMaps andMaps andGraphs.Graphs.Graphs.Graphs.Graphs.
8 58 58 58 58 5ArcViewArcViewArcViewArcViewArcView
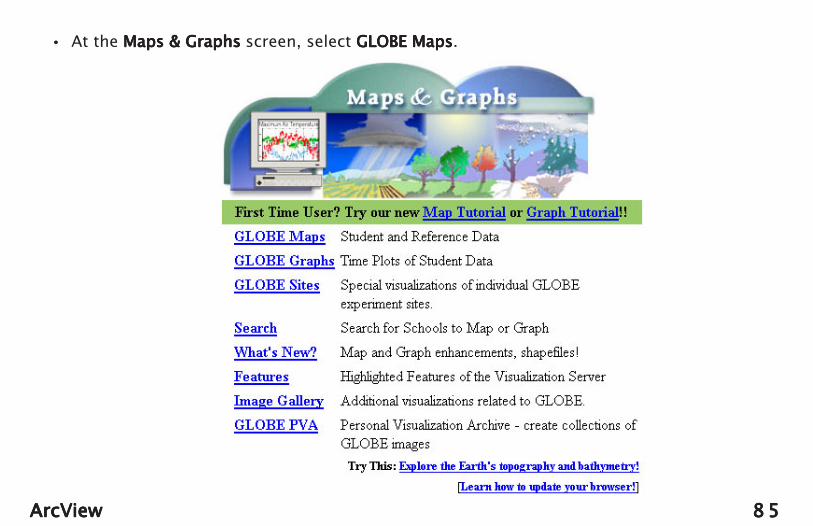
• • • • • At the Maps & Graphs Maps & Graphs Maps & Graphs Maps & Graphs Maps & Graphs screen, select GLOBE MapsGLOBE MapsGLOBE MapsGLOBE MapsGLOBE Maps.

8 68 68 68 68 6ArcViewArcViewArcViewArcViewArcView
• At the Maps Maps Maps Maps Maps screen, use the default protocol which is Maximum Temperature. As shown inthe visual, select the date of April 11, 2002, and click the Redraw Map Redraw Map Redraw Map Redraw Map Redraw Map button.
• There are about 500 data points shown for Maximum Temperature for this data set. Theseare the data you will incorporate as a layer in a GIS project.

8 78 78 78 78 7ArcViewArcViewArcViewArcViewArcView
Downloading the DataDownloading the DataDownloading the DataDownloading the DataDownloading the Data
• Below the map is the Other OptionsOther OptionsOther OptionsOther OptionsOther Options pull-downmenu.
• From this menu select Download DataDownload DataDownload DataDownload DataDownload Data (right).
• Click the GoGoGoGoGo button.

8 88 88 88 88 8ArcViewArcViewArcViewArcViewArcView
• After your screen “refreshes,” scroll to the bottom of the screen where you will see the Data Data Data Data DataSpecificationsSpecificationsSpecificationsSpecificationsSpecifications window.
• The only change you shouldmake is to turn off the Map Map Map Map Mapitem in the list of parametersat the bottom of the box.
• Click the Create a data fileCreate a data fileCreate a data fileCreate a data fileCreate a data filebutton.

8 98 98 98 98 9ArcViewArcViewArcViewArcViewArcView
• The system will prompt you to select a location for this file. You should select the GISProjects folder you created when you installed ArcView.
The GLOBE Maximum Temperature data have been saved to your GIS Projects folder. Youcan now incorporate them into a GIS project.

9 09 09 09 09 0ArcViewArcViewArcViewArcViewArcView
Using the GLOBE data in ArcViewUsing the GLOBE data in ArcViewUsing the GLOBE data in ArcViewUsing the GLOBE data in ArcViewUsing the GLOBE data in ArcView
• Start a new project using the same themesfrom Chapter 4.
• Turn off the cities.shp theme.
• Click in the Project WindowProject WindowProject WindowProject WindowProject Window to make itactive. You may have to move your ViewViewViewViewViewwindow to find it.
• In the Project WindowProject WindowProject WindowProject WindowProject Window, clickonce on the TablesTablesTablesTablesTables button asshown to the right. Notice thatthe upper set of buttonschanges.

9 19 19 19 19 1ArcViewArcViewArcViewArcViewArcView
• Click on the AddAddAddAddAdd button in the Project WindowProject WindowProject WindowProject WindowProject Window. The Add Table Add Table Add Table Add Table Add Table dialog box opens. Navigateto the GIS Projects folder where you stored the data you downloaded from the GLOBE page.
• Notice that your file globedat.txt does notappear in the file window. This is becauseArcView expects file types created by DBaseDBaseDBaseDBaseDBase, adatabase software. You need to tell the systemwhat type of file format you are using.
• From the List Files of Type List Files of Type List Files of Type List Files of Type List Files of Type pull-down menu inthe bottom-left of this box select Delimited Delimited Delimited Delimited DelimitedText (.txt)Text (.txt)Text (.txt)Text (.txt)Text (.txt), as shown to the right.1
• Your file should appear in the files window.
• Click on the file globedat.txt globedat.txt globedat.txt globedat.txt globedat.txt to select it, andclick OKOKOKOKOK.
1. The term Delimited text refers to the structure of the file you downloaded. The file is a plain, or “text file, butsince it contains columns of data, a character is needed to separate the columns. GLOBE data use a tab key toseparate individual columns; they are called “tab-delimited files.” Selecting Delimited textDelimited textDelimited textDelimited textDelimited text tells ArcVoyager to lookfor a character to separate columns in the file.

9 29 29 29 29 2ArcViewArcViewArcViewArcViewArcView
• Your downloaded file opens with items separated into columns. Notice that the columncontaining the school name appears incomplete. The data are all there, but the defaultvalue for the width of the column is not large enough to show it all. You can use all of theTable ToolsTable ToolsTable ToolsTable ToolsTable Tools you saw in Chapter 5 with this table.

9 39 39 39 39 3ArcViewArcViewArcViewArcViewArcView
• Select your View WindowView WindowView WindowView WindowView Window to make it active.
• You will now add these data to your ViewViewViewViewView as an Event ThemeEvent ThemeEvent ThemeEvent ThemeEvent Theme.
• From the View View View View View menu, select Add Event ThemeAdd Event ThemeAdd Event ThemeAdd Event ThemeAdd Event Theme.
• The Add Event ThemeAdd Event ThemeAdd Event ThemeAdd Event ThemeAdd Event Themespecifications box opens.Here you tell the system whatcolumns in your data tablecontain the important spatialdata (latitude and longitude.)GLOBE data tables use columnheadings of “lat” and “lon” thatArcView recognizes, so thesecolumns are automaticallyselected.
• Click OKOKOKOKOK.

9 49 49 49 49 4ArcViewArcViewArcViewArcViewArcView
• The data are added to the View Window Table of ContentsView Window Table of ContentsView Window Table of ContentsView Window Table of ContentsView Window Table of Contents and named globedat.txt.

9 59 59 59 59 5ArcViewArcViewArcViewArcViewArcView
• Turn on the globedat.txt theme. The data points are added, but it does not look like thedisplay on the GLOBE website. All the points are displayed in the same color and at thisscale the dots representing the data points are very large.
9 69 69 69 69 6ArcViewArcViewArcViewArcViewArcView
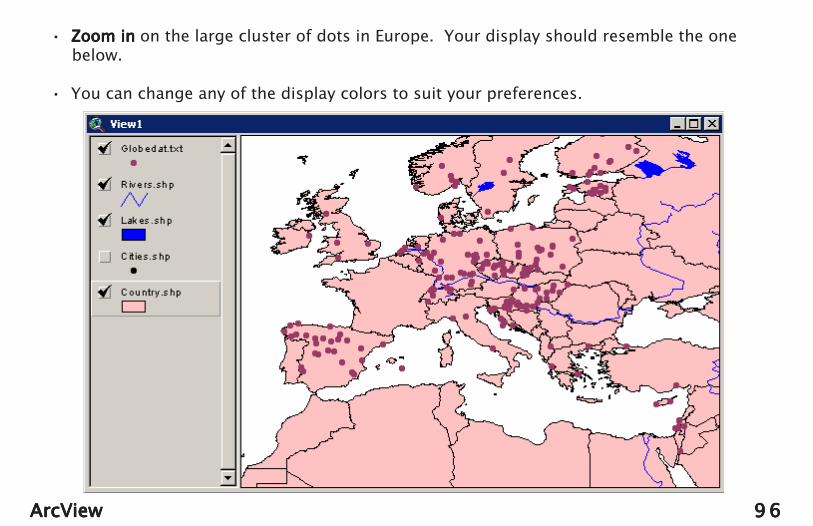
• Zoom inZoom inZoom inZoom inZoom in on the large cluster of dots in Europe. Your display should resemble the onebelow.
• You can change any of the display colors to suit your preferences.

9 79 79 79 79 7ArcViewArcViewArcViewArcViewArcView
• Make the globedat.txt theme active.
• Use the InformationInformationInformationInformationInformation tool to see data from any one of the points.

9 89 89 89 89 8ArcViewArcViewArcViewArcViewArcView
Changing the DisplayChanging the DisplayChanging the DisplayChanging the DisplayChanging the Display
All of the data points in your ViewViewViewViewView are displayed with thesame color. A better understanding of the data occurswhen the points are displayed with a color scheme keyedto temperature.
• Double click on the globedat.txt theme in the ViewViewViewViewViewTable of ContentsTable of ContentsTable of ContentsTable of ContentsTable of Contents. This opens the Legend Editor Legend Editor Legend Editor Legend Editor Legend Editor.
• The Legend TypeLegend TypeLegend TypeLegend TypeLegend Type pull-down menu lists SingleSingleSingleSingleSingleSymbolSymbolSymbolSymbolSymbol. This causes all data in the globedat.txtfile to be displayed with the same color symbol.
• From the Legend TypeLegend TypeLegend TypeLegend TypeLegend Type menu select GraduatedGraduatedGraduatedGraduatedGraduatedColorColorColorColorColor.

9 99 99 99 99 9ArcViewArcViewArcViewArcViewArcView
• Notice the Legend EditorLegend EditorLegend EditorLegend EditorLegend Editor view nowchanges. You will now have to tell thesystem which variable in the data tableyou wish to use to control the colorscheme.
• From the Classification FieldClassification FieldClassification FieldClassification FieldClassification Field pull-down menu, select MxTmpMxTmpMxTmpMxTmpMxTmp (maximumtemperature) . This will use thereported maximum temperatures tocontrol the color of the data points.

100100100100100ArcViewArcViewArcViewArcViewArcView
• The Color Ramp Color Ramp Color Ramp Color Ramp Color Ramp pull-down menu near thebottom of the Legend EditorLegend EditorLegend EditorLegend EditorLegend Editor window liststhe color schemes you can use. From thismenu, select TemperatureTemperatureTemperatureTemperatureTemperature. Using thisColor RampColor RampColor RampColor RampColor Ramp gives a uniform standard fordisplaying temperature data.
• Click the Apply Apply Apply Apply Apply button and close the Legend Editor Legend Editor Legend Editor Legend Editor Legend Editor. Europe’s temperature data aredisplayed with the new classification.
• Examine the globedat.txtlegend. There are 5ranges of temperature.
What do you notice aboutWhat do you notice aboutWhat do you notice aboutWhat do you notice aboutWhat do you notice aboutthe temperatures in eachthe temperatures in eachthe temperatures in eachthe temperatures in eachthe temperatures in eachrange? Why do they occurrange? Why do they occurrange? Why do they occurrange? Why do they occurrange? Why do they occurthis way?this way?this way?this way?this way?

101101101101101ArcViewArcViewArcViewArcViewArcView
• The ArcView system defaults to 5 classes and selects natural breaks in the data to separatethe groups. This often results in peculiar looking legends.
• Double click on the globedat.txt theme to reopen the Legend EditorLegend EditorLegend EditorLegend EditorLegend Editor.
• Click on the Classify... Classify... Classify... Classify... Classify... button to the right of the MxTmpMxTmpMxTmpMxTmpMxTmp and note its settings.• These settings tell the system to:
• Find natural breaks in the data toproduce the classes.
• Find only 5 classes.
• Display the data to 3 decimalpoints.

102102102102102ArcViewArcViewArcViewArcViewArcView
You will now change these settings.
• From each of the pull-downmenus in the Classification Classification Classification Classification Classificationwindow, make the followingchanges:
• Set Type Type Type Type Type to Equal Intervals. Equal Intervals. Equal Intervals. Equal Intervals. Equal Intervals.• Set Number of classes Number of classes Number of classes Number of classes Number of classes to 10. 10. 10. 10. 10.• Set Round value at d. Round value at d. Round value at d. Round value at d. Round value at d.
• Your ClassificationClassificationClassificationClassificationClassification window should look like the one below.
• Click OKOKOKOKOK in the Classification Classification Classification Classification Classification window.

103103103103103ArcViewArcViewArcViewArcViewArcView
• Notice that the Color RampColor RampColor RampColor RampColor Ramp may havereverted to Monochromatic Red.
• Change the Color RampColor RampColor RampColor RampColor Ramp back toTemperatureTemperatureTemperatureTemperatureTemperature.
• Click Apply Apply Apply Apply Apply in the Legend EditorLegend EditorLegend EditorLegend EditorLegend Editor window.
• The Legend EditorLegend EditorLegend EditorLegend EditorLegend Editor should now resemblethe one to the right.
• Close the Legend Editor Legend Editor Legend Editor Legend Editor Legend Editor.
• The legend in theView Table ofView Table ofView Table ofView Table ofView Table ofContentsContentsContentsContentsContents windowshould now resemblethe one shown to theright. Temperaturesare rounded to thenearest wholedegree, and are inclasses of equalrange.

104104104104104ArcViewArcViewArcViewArcViewArcView
• Your ViewViewViewViewView window should resemble the one below.
Observe the locations of data points. Do you have any questions about any of these? NoticeObserve the locations of data points. Do you have any questions about any of these? NoticeObserve the locations of data points. Do you have any questions about any of these? NoticeObserve the locations of data points. Do you have any questions about any of these? NoticeObserve the locations of data points. Do you have any questions about any of these? Noticethat some points appear to be plotted out in the ocean. What is the cause of this error? Is itthat some points appear to be plotted out in the ocean. What is the cause of this error? Is itthat some points appear to be plotted out in the ocean. What is the cause of this error? Is itthat some points appear to be plotted out in the ocean. What is the cause of this error? Is itthat some points appear to be plotted out in the ocean. What is the cause of this error? Is iterrors in site definition? Are they typographical errors or errors in the GPS measurements? Areerrors in site definition? Are they typographical errors or errors in the GPS measurements? Areerrors in site definition? Are they typographical errors or errors in the GPS measurements? Areerrors in site definition? Are they typographical errors or errors in the GPS measurements? Areerrors in site definition? Are they typographical errors or errors in the GPS measurements? Arethey errors in thethey errors in thethey errors in thethey errors in thethey errors in the country.shp file provided with ArcView? How could you and your students file provided with ArcView? How could you and your students file provided with ArcView? How could you and your students file provided with ArcView? How could you and your students file provided with ArcView? How could you and your studentsfind out?find out?find out?find out?find out?

105105105105105ArcViewArcViewArcViewArcViewArcView
Your new theme displays maximum temperature, but is still named globedat.txt.
• Make the globedat.txt theme active.
• From ThemeThemeThemeThemeTheme in the main menu,select PropertiesPropertiesPropertiesPropertiesProperties. The ThemeThemeThemeThemeThemePropertiesPropertiesPropertiesPropertiesProperties window opens, shown atthe right.
• Change the theme name by entering Max TempsMax TempsMax TempsMax TempsMax Tempsin the Theme NameTheme NameTheme NameTheme NameTheme Name box.
• Click OK.OK.OK.OK.OK.
• The legend now is labeled to properly describewhat is being shown (left).

106106106106106ArcViewArcViewArcViewArcViewArcView
• Your ViewViewViewViewView now shows the GLOBE data as a color coded theme, in 10 equal classes.
• Remember to save your project. You can now create a LayoutLayoutLayoutLayoutLayout and either PrintPrintPrintPrintPrint or Export Export Export Export Export it.

107107107107107ArcViewArcViewArcViewArcViewArcView
What Other GLOBE Datasets Can I Use?What Other GLOBE Datasets Can I Use?What Other GLOBE Datasets Can I Use?What Other GLOBE Datasets Can I Use?What Other GLOBE Datasets Can I Use?
All GLOBE data are downloaded in the form of tab-delimited text files and can be broughtinto ArcVoyager as Event Themes using the process outlined in this chapter. The figure belowshows the result of importing pH values for April 11, 2002.
The pH data wereclassified to 7 classesbecause the reported range inthe table was from pH 4 to9+. The Monochromatic RedColor Ramp was used. Thecities are represented by theyellow triangles.
Is there any pattern to theIs there any pattern to theIs there any pattern to theIs there any pattern to theIs there any pattern to thedistribution of pH values fordistribution of pH values fordistribution of pH values fordistribution of pH values fordistribution of pH values forthis map? What otherthis map? What otherthis map? What otherthis map? What otherthis map? What otherinformation might you needinformation might you needinformation might you needinformation might you needinformation might you needto help you answer thisto help you answer thisto help you answer thisto help you answer thisto help you answer thisquestion? Are the pH valuesquestion? Are the pH valuesquestion? Are the pH valuesquestion? Are the pH valuesquestion? Are the pH valuesrelated to the proximity of a site to a city? Does topography play a part? How could you findrelated to the proximity of a site to a city? Does topography play a part? How could you findrelated to the proximity of a site to a city? Does topography play a part? How could you findrelated to the proximity of a site to a city? Does topography play a part? How could you findrelated to the proximity of a site to a city? Does topography play a part? How could you findout?out?out?out?out?
108108108108108ArcViewArcViewArcViewArcViewArcView
Presenting data in a visual, geographically-related form allows students to develop theirown questions for investigations, and helps them to visualize other types of data they may needto answer their questions.Chapter Summary:Chapter Summary:Chapter Summary:Chapter Summary:Chapter Summary: In this chapter, you saw how to download GLOBE student data from the GLOBEserver and incorporate those data as an event theme in ArcView. You also saw how to use theLegend Editor to change the nature of the data display.
What is Next?What is Next?What is Next?What is Next?What is Next? Upcoming chapters will cover locating other sources of GIS data, and using satelliteimages as themes in a View.

109109109109109ArcViewArcViewArcViewArcViewArcView
Chapter 7: Other Data SourcesChapter 7: Other Data SourcesChapter 7: Other Data SourcesChapter 7: Other Data SourcesChapter 7: Other Data SourcesSo far the data sets you have worked with have been small scale. That is: Objects on the
map appear small. Another way to think about this is that one unit on the map covers a large areaon the ground (ex: 1:500,000). Such maps cover large areas and are limited in detail. On alarge scale map, one map unit covers a small area on the ground (ex: 1:25,000) and shows moredetail.
ObjectivesObjectivesObjectivesObjectivesObjectives
• Investigate data sets provided with ArcView• Investigate other data sets provided with ArcVoyager• Incorporate ArcView’s images into GIS projects• Become familiar with some types of GIS data available from other sources
ArcVoyager’s Data SetsArcVoyager’s Data SetsArcVoyager’s Data SetsArcVoyager’s Data SetsArcVoyager’s Data Sets
ArcView is a professional GISpackage. The example data sets includedwith it are very limited. BecauseArcVoyager is designed as an educationaltool, many data sets are supplied with it.You may wish to download the ArcVoyagerdata sets to explore them. Some examplesof projects using these files follow.

110110110110110ArcViewArcViewArcViewArcViewArcView
Using data from the Canada folder, the ecological zones of Canada can be investigated.

111111111111111ArcViewArcViewArcViewArcViewArcView
Data from the Prairie folder shows the land cover types of the central prairiesof the United States.

112112112112112ArcViewArcViewArcViewArcViewArcView
Data from the World folder shows the relationship between the Earth’s tectonicplates, volcanic eruptions, and earthquakes.

113113113113113ArcViewArcViewArcViewArcViewArcView
This view of the Mid-Atlantic Ridge, which shows plate boundaries, volcanoes and earthquakes,helps students visualize the actions occurring along our planet’s tectonic boundaries.
All of these views can be created using the ArcView tools you have learned so far from thedata contained in ArcVoyager’s geo folder.

114114114114114ArcViewArcViewArcViewArcViewArcView
The Answer to a Question:The Answer to a Question:The Answer to a Question:The Answer to a Question:The Answer to a Question:
This is the view of Africa you used in Chapters 4 and 5. Lakes Tanganyika and Turkana liein the great Rift Valley of Africa. This valley is being created as the African and Somali platesmove apart. It is similar to the Mid-Atlantic Ridge, except that it is tearing a continent apartinstead of an ocean floor. It may be the site of a future ocean.

115115115115115ArcViewArcViewArcViewArcViewArcView
Using ArcVoyager Image Data in ArcViewUsing ArcVoyager Image Data in ArcViewUsing ArcVoyager Image Data in ArcViewUsing ArcVoyager Image Data in ArcViewUsing ArcVoyager Image Data in ArcView
In addition to the world data files,ArcVoyager’s data also contains a folder of images.Part of this image listing is shown to the right.Each of these images is provided as a TIF file. Thisis a common graphic format. Note that each isaccompanied by a .TFW file. This is a World File,which contains the georeferencing data needed toplace the image in ArcVoyager.

116116116116116ArcViewArcViewArcViewArcViewArcViewAverage World Minimum Temperatures for January

117117117117117ArcViewArcViewArcViewArcViewArcViewAverage World Precipitation

118118118118118ArcViewArcViewArcViewArcViewArcView
The view below shows the world precipitation image used as a base layer forworld lakes and cities zoomed in on Africa.

119119119119119ArcViewArcViewArcViewArcViewArcView
The visual below was produced from one of the .TIF files in the Image folder, andthe minerals shape file from the world data file.
From this image, and other data available, can you relate the locationof mineral deposits to any other world features?

120120120120120ArcViewArcViewArcViewArcViewArcView
How Do I Use These Images in ArcView?How Do I Use These Images in ArcView?How Do I Use These Images in ArcView?How Do I Use These Images in ArcView?How Do I Use These Images in ArcView?
• The images available appear in theData sourcesData sourcesData sourcesData sourcesData sources window.
• You can select these images justas you would a shape file. Theywill appear like any other theme inyour View Table of ContentsView Table of ContentsView Table of ContentsView Table of ContentsView Table of Contentswindow. Note that the .TFW(world) files are not shown in theData sourcesData sourcesData sourcesData sourcesData sources list. These providegeoreferencing information only.
• From the Data Source TypesData Source TypesData Source TypesData Source TypesData Source Types pull-down menu, select Image Data SourceImage Data SourceImage Data SourceImage Data SourceImage Data Source.
To incorporate one of these images in a view:
• Be sure your View windowView windowView windowView windowView window is active.
• Click the Add Themes Add Themes Add Themes Add Themes Add Themes button, andnavigate to your Voyager images folder.
• OpenOpenOpenOpenOpen the folder. It appears empty.

121121121121121ArcViewArcViewArcViewArcViewArcView
• The visual below shows the contents of the TFW file for the January minimum temperaturesimage. It is a simple text file and can be opened in any word processor. This file containsdata on latitude, longitude and pixel size and it is read by ArcVoyager to establish locations.With the appropriate data, you can write world files to use many different images inArcView.
The lines of the world file provide thefollowing data:
- Horizontal size of a pixel- Rotation term for a row of pixels- Rotation term for a column of pixels- Vertical size of a pixel- Longitude of the center of the upper-
left pixel- Latitude of the center of the upper-left
pixel

122122122122122ArcViewArcViewArcViewArcViewArcView
External Sources of GIS DataExternal Sources of GIS DataExternal Sources of GIS DataExternal Sources of GIS DataExternal Sources of GIS Data
There are many sources of GIS data besides those provided with ArcView and ArcVoyager.Some are World Wide Web based and others may be found locally. A list of some types of localsources of GIS data is given in Appendix I.
The balance of this chapter will be devoted to GIS data that can be downloaded from theInternet.
GIS on the InternetGIS on the InternetGIS on the InternetGIS on the InternetGIS on the Internet
There is a vast number of World Wide Web sites that provide GIS data in one form oranother. Searching for “GIS data” with your favorite search engine will produce many pages oflistings. This tutorial will not try to list any significant number of these, but will deal mostly withhow to handle some of the various forms of data that they provide. A short list of reliable sourcesis given in Appendix I.
Drawbacks to GIS Data on the InternetDrawbacks to GIS Data on the InternetDrawbacks to GIS Data on the InternetDrawbacks to GIS Data on the InternetDrawbacks to GIS Data on the Internet
There are several significant drawbacks to obtaining data on the Internet.
a. Many data files are large, even when compressed, and require long download times on adial-up connection. If you must use a dial-up connection, you can often request these fileson compact discs at a reasonable cost. A university contact may be of help here, too, asuniversities have faster internet connections.

123123123123123ArcViewArcViewArcViewArcViewArcView
b. Not all GIS data files are provided in the same geographic projectionprojectionprojectionprojectionprojection. This will be dealtwith as you look at some sample data.
c. Files that you download may not have the same precision in their registrationregistrationregistrationregistrationregistration. There maybe significant differences (up to tens of meters) between a feature’s location in a file and itsactual location on the ground. This is generally a function of the accuracy and precision ofthe data that were gathered to prepare the file.
What Kinds of Files are Available?What Kinds of Files are Available?What Kinds of Files are Available?What Kinds of Files are Available?What Kinds of Files are Available?
Some of the common GIS files available for download include:
• Shape Files and Database tables, similar to those you have already used• TIFF format images, either with external world files, or as GEOTIF files, with built-in
location data.• Digital Line Graphics (DLG) files: These are usually scanned topographic maps that contain
spatial data. They can be used as a base layer for other themes. These are large fileswhich, depending on their scale, cover relatively small areas.
• Digital Orthographic Quadrangle (DOQ) files: These are generally scanned aerialphotographs, often with 1m resolution. These are large files that cover a small area in greatdetail.
Downloading DLG and DOQ files can be a frustrating and time consuming process if you are usinga dial-up connection. If you wish to incorporate these types of data, you should try to find acontact who can supply these on compact discs (CD’s).

124124124124124ArcViewArcViewArcViewArcViewArcView
Handling the Data Once You Have Downloaded It:Handling the Data Once You Have Downloaded It:Handling the Data Once You Have Downloaded It:Handling the Data Once You Have Downloaded It:Handling the Data Once You Have Downloaded It:
Generally the data you download are compressed in some fashion. At the simplest levelthey will be in the zipped format. Your PC should have extraction software built in while StuffitExpander for the Macintosh will unzip such files.1
You will sometimes receive files with the extension .tar. These are files compressed witha Unix operating system. Stuffit Expander for the Macintosh and PC will decompress thesefiles.1
Often GIS shapefile data are supplied in a file format that contains the extension .e00..... Thisis an Arc/Info Interchange file. Arc/Info is the software used to produce these data files. Thesefiles must be imported into ArcView using an ESRI utility program called Import. If Import is notinstalled on your computer with ArcView, it is available as a free download for both Macintosh andPC computers.2 If you need to Import .e00 files, see Appendix II: Importing Arc Export Appendix II: Importing Arc Export Appendix II: Importing Arc Export Appendix II: Importing Arc Export Appendix II: Importing Arc Export(E00) Files(E00) Files(E00) Files(E00) Files(E00) Files for details of the process.
1. A free version of Stuffit Expander can be downloaded from Aladdin Co. at: http://www.aladdinsys.com/downloads/index.html
2. The Import utility can be downloaded for Macintosh or PC computers from the ESRI site at: http://gis.esri.com/download/index.cfm?fuseaction=download.all

125125125125125ArcViewArcViewArcViewArcViewArcView
Using A Sample Data SetUsing A Sample Data SetUsing A Sample Data SetUsing A Sample Data SetUsing A Sample Data Set
This section of the tutorial will use a sample dataset for Durham, New Hampshire. Thesedata will also be used in Chapters 8, 9 and 10. The full set of data for these chapters may befound on the available CD. The data are contained in the Ch_7Data folder.
These files were downloaded from the U.S. Census Bureau’s TIGER/Line® site at:
What Do The Files Contain?What Do The Files Contain?What Do The Files Contain?What Do The Files Contain?What Do The Files Contain?
The files are in the Chapter 7 folderlabeled Durham_data. Its contentsare shown to the right.
www.census.gov/geo/www/tiger
The Census TIGER data in shapefileformat are used courtesy of ESRI.
Users outside the United States shouldsearch for GIS data sites within their owncountries, provinces or states. See AppendixAppendixAppendixAppendixAppendixIIIII for further information.

126126126126126ArcViewArcViewArcViewArcViewArcView
Each folder contains the files for one theme, in a code used by the Census Bureau. The threeletters identify the theme according to the following:
CodeCodeCodeCodeCode ThemeThemeThemeThemeThemekgl Key Geographic Locationslpy LandmarkslkA RoadslkB RailslkC Misc. TransportlkE PhysicallkF Non-VisiblelkH Hydrographyurb Urban Areaswat Water Polygons
• Opening the KGL folder shows theshape files and database table thatare provided.

127127127127127ArcViewArcViewArcViewArcViewArcView
Using These FilesUsing These FilesUsing These FilesUsing These FilesUsing These Files
• Launch ArcView and create a new project.
• Don’t forget to set your working directory.
• Use the Add Themes Add Themes Add Themes Add Themes Add Themes button to access each of the themes. You will noticeas you open each folder that only the .shp file (shape file) is shown.
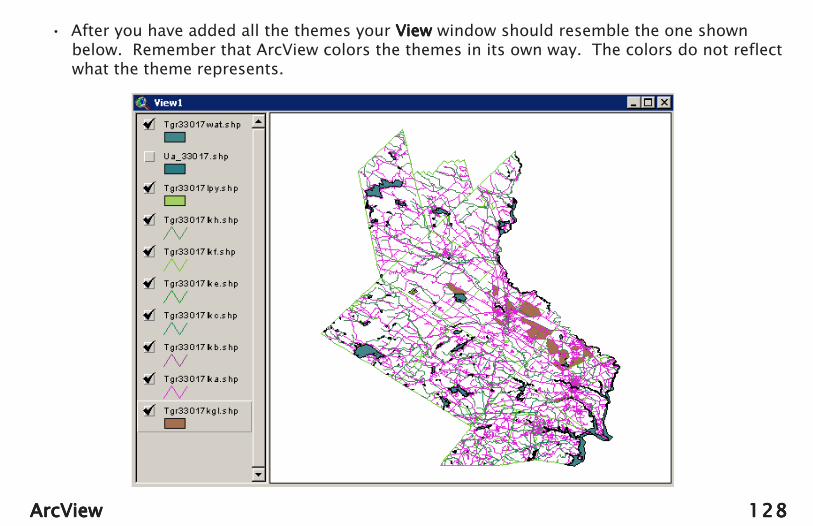
128128128128128ArcViewArcViewArcViewArcViewArcView
• After you have added all the themes your View View View View View window should resemble the one shownbelow. Remember that ArcView colors the themes in its own way. The colors do not reflectwhat the theme represents.

129129129129129ArcViewArcViewArcViewArcViewArcView
• You may wish to relabel and recolor the themes. The figure shows one possible way ofcoloring and labeling these themes.
AAAAA
• Zoom in on the area shown by the letter “A” above.

130130130130130ArcViewArcViewArcViewArcViewArcView
• Note the scale of this view. The small number of this scaleindicates that the view covers a small area, but in muchgreater detail than in the files provided with ArcView orArcVoyager.

131131131131131ArcViewArcViewArcViewArcViewArcView
So far, these tutorials have not addressed the subject of data projection. Chapter 4 made abrief reference to projections, and it is now time to examine this idea in more detail. A projectionis a mathematical way of transferring points on a sphere (the Earth) to a flat surface (your map orGIS project). There are many different types of projections, each one having certain advantagesand disadvantages. No projection can accurately render all aspects of the Earth onto a flat map.Some show size and shape accurately, others show distances and directions. Except for a globe,no map can be accurate in all aspects.
The most commonly known projection is the Mercator Projection, used in most familiarworld maps. The data you have been working with so far have been projected in geographic form,using standard longitude and latitude in the Mercator system. The GLOBE data you used inChapter 6 are also Mercator projected and they are compatible with ArcView’s data. Data that yougather with your GPS, as long as you are using GLOBE’s WGS-84 standard1, are also completelycompatible with ArcView. With other data sources, this will not always be the case. Many states,provinces, countries or regions use specific projections, such as individual state projections in theUnited States, or Great Britain’s National Grids. Before you try to use datasets, you shoulddetermine how they are projected.
ArcView can handle many different projections, but all your data need to be in the samesamesamesamesameprojection. “Mix and match” does not work. ArcView has the capability to convert the projectionof point, line and polygon data. The process is beyond the scope of this tutorial. See the UsingArcView GIS manual.2
Chapter SummaryChapter SummaryChapter SummaryChapter SummaryChapter Summary: In this chapter, you have seen that there are other sources of GIS data that canbe incorporated into ArcView. There are many sources of such data on the Internet, but manydata types are represented by very large files and need a fast connection to download. Also, theprojection of the data must be considered.

132132132132132ArcViewArcViewArcViewArcViewArcView
What Comes NextWhat Comes NextWhat Comes NextWhat Comes NextWhat Comes Next? In Chapter 8 you will create event themes and shape files from GPS data youhave gathered locally, and Chapter 9 will deal with incorporating your GLOBE Landsat image as atheme in a GIS project.
1. See the GPS section of your GLOBE Program Teacher’s Guide
2. Using ArcView GIS, ESRI, 1996

133133133133133ArcViewArcViewArcViewArcViewArcView
Chapter 8: Creating Your Own DataChapter 8: Creating Your Own DataChapter 8: Creating Your Own DataChapter 8: Creating Your Own DataChapter 8: Creating Your Own DataYou have been working with data prepared by someone else. The value of GIS liesin the ability to include your own data as a theme in a project. Such data mightinclude:
- the locations of local sites with endangered plant or animal species.- local cemeteries.- historical sites.- students’ homes.- the location of your GLOBE study sites.- or any other geographically-referenced feature the could be the subject of
student investigations.
ObjectivesObjectivesObjectivesObjectivesObjectives• Prepare a text formatted data table of “local” point locations.• Add this table to a View as an Event Theme.• Convert this Event Theme to a Shape Table.• Prepare a Text Table with the boundaries of a Polygon Theme.• Add this Table to a View as an Event Theme.• Convert this Event Theme to a Shape Table.• Change the appearance of this Shape Table.

134134134134134ArcViewArcViewArcViewArcViewArcView
The Data:The Data:The Data:The Data:The Data: For this project, you will use data from Durham, New Hampshire. You will prepare atable of locations on the campus of the University of New Hampshire and add this to your view asa shape file. In the second part of the project, you will use some data on property boundaries toadd a polygon file to the same Durham data.
Part I - Point Sources of DataPart I - Point Sources of DataPart I - Point Sources of DataPart I - Point Sources of DataPart I - Point Sources of Data
In Chapter 6 you downloaded and incorporated GLOBE Program data. These data were inthe form of a tab-delimited text file which you included as a point theme in your ViewViewViewViewView. You willnow prepare a similar file from scratch.
Assume that you have been out wandering the campus of the University of New Hampshire,which is in Durham, New Hampshire. Using your GPS unit, you have determined the locations offour important campus sites. You will combine these locations with the Durham data layers fromChapter 7.
Your notes for your walk are shown below.
Site number latitude longitude site name
1 43.13448o N 70.93633o W Morse Hall 2 43.13614o N 70.93247o W Thompson Hall 3 43.13464o N 70.93018o w The Student Union 4 43.13602o N 70.93434o W Vinny’s Coffee

135135135135135ArcViewArcViewArcViewArcViewArcView
ArcView’s Conventions:ArcView’s Conventions:ArcView’s Conventions:ArcView’s Conventions:ArcView’s Conventions:
In recording coordinates we generally include a degree symbol (o), and north, south, east orwest notations. Neither is used in ArcView. If we are using a geographic (Mercator) projection,which is ArcView’s default, ArcView assumes that the units are degrees. Direction is representedin a Cartesian system. This is the common graph format we are familiar with, (below) wherepositive and negative directions are given with respect to the intersection of the X and Y axes.In ArcView, the Equator and the Prime Meridian are the axes, and latitude becomes positive inthe Northern Hemisphere and negative in the Southern Hemisphere. Similarly, easternlongitudes are positive, and western longitudes are negative.
X
Y
+
+-
-
Prime Meridian
Cartesian Graphing Conventions ArcView Direction Conventions
Equator
North = +
South = -
West = - East = +

136136136136136ArcViewArcViewArcViewArcViewArcView
Preparing The Table:Preparing The Table:Preparing The Table:Preparing The Table:Preparing The Table:
• Open your favorite word processing program. You may use any word processor, includingNotepad for the PC and Simpletext for the Macintosh. The only requirement is that itutilizes the Tab Tab Tab Tab Tab key and save files as plain text. This includes almost all common wordprocessors. Notepad and Simpletext are ideal for this because .txt files are their defaultformat.
• Enter the data from the notes in your word processor. Between entries, press the Tab Tab Tab Tab Tab keyonceonceonceonceonce. This will tell ArcView where the column separators in the table are. Do not Do not Do not Do not Do not usespaces or multiple tabs to line up your entries. Press Enter (Return) Enter (Return) Enter (Return) Enter (Return) Enter (Return) at the end of each line.Do not Do not Do not Do not Do not include any special formatting, such as fancy fonts, underlines, boldface, etc. Youmay use either “latitude” and “longitude” or their abbreviations “lat” and “lon” for columnheadings. ArcView will recognize both.
Site number latitude longitude site name
1 43.13448o N 70.93633o W Morse Hall 2 43.13614o N 70.93247o W Thompson Hall 3 43.13464o N 70.93018o w The Student Union 4 43.13602o N 70.93434o W Vinny’s Coffee

137137137137137ArcViewArcViewArcViewArcViewArcView
• When finished, your table should look something like the one below. The actual spacingmay vary depending on the word processor you use.
Data point Lat Lon Name1 43.13448 -70.93633 Morse Hall2 43.13614 -70.93247 Thompson Hall3 43.13464 -70.93018 Student Union4 43.13602 -70.93434 Vinney’s Coffee
The fact that column headings do not line up with column entries is not important. ArcViewwill use the tab separators to create the proper alignment in the data table.
Save Your FileSave Your FileSave Your FileSave Your FileSave Your File
• From your program’s File File File File File menu, select Save As Save As Save As Save As Save As. Name the file locations.txt and select“text” from your program’s file format menu. (If you are using Notepad or Simpletext thefile will automatically be saved as text.) This saves the file as a simple text file with nospecial formatting. Be certain that the extension .txt is appended to the file name and saveyour file in the \Chapter 8\Durham_sub folder that contains your Durham data layers.

138138138138138ArcViewArcViewArcViewArcViewArcView
Including the Table inIncluding the Table inIncluding the Table inIncluding the Table inIncluding the Table inYour ViewYour ViewYour ViewYour ViewYour View
• LaunchLaunchLaunchLaunchLaunch ArcView.
• Navigate to the\Chapter8\Durham_subfolder, and add thefiles contained in it.....For convenience,this is a subset ofthe data used inChapter 7.
• Zoom to the FullZoom to the FullZoom to the FullZoom to the FullZoom to the FullExtentExtentExtentExtentExtent of thethemes.
• Your view shouldresemble the oneshown.
• ZoomZoomZoomZoomZoom in on the labeled area shown in the figure.

139139139139139ArcViewArcViewArcViewArcViewArcView
• Adjust your ViewViewViewViewView until see the area shown below.

140140140140140ArcViewArcViewArcViewArcViewArcView
• Click on the Project Project Project Project Project windowto make it active.
• Click the TablesTablesTablesTablesTables button andthen click AddAddAddAddAdd.

141141141141141ArcViewArcViewArcViewArcViewArcView
• From the List Files of TypeList Files of TypeList Files of TypeList Files of TypeList Files of Type menu, selectDelimited TextDelimited TextDelimited TextDelimited TextDelimited Text.
• Navigate to your data folder and selectthe locations.txt file you prepared. ClickOpenOpenOpenOpenOpen.
• Your table opens. Note that everythingis in its proper column, because of thetab characters between entries.
• From the ViewViewViewViewView menu,select Add Event ThemeAdd Event ThemeAdd Event ThemeAdd Event ThemeAdd Event Theme.
• ArcView shouldautomatically detect thefile name, and select“lon” (or longitude) forthe X Field and “lat” forthe Y Field. If it doesnot, use the pull-downmenus to select thesevalues.
• In the Add Event ThemeAdd Event ThemeAdd Event ThemeAdd Event ThemeAdd Event Themebox, click OK.OK.OK.OK.OK.

142142142142142ArcViewArcViewArcViewArcViewArcView
• The View Table of ContentsView Table of ContentsView Table of ContentsView Table of ContentsView Table of Contents now shows your locations.txt file added asan event theme.
• Activate the theme and the campus locations appear. The authorchanged their color to red for contrast.

143143143143143ArcViewArcViewArcViewArcViewArcView
Converting the Locations Theme to a Shape FileConverting the Locations Theme to a Shape FileConverting the Locations Theme to a Shape FileConverting the Locations Theme to a Shape FileConverting the Locations Theme to a Shape File
If you have a set of features that you want to work with, it is advantageous to convert themto a shape file. They can be a permanent part of your map and be worked with as any othershape file.
• Be sure the Locations.txt event theme is active.
• From the ThemeThemeThemeThemeTheme menu in the main menu bar,select Convert to ShapefileConvert to ShapefileConvert to ShapefileConvert to ShapefileConvert to Shapefile.
• The Save ShapefileSave ShapefileSave ShapefileSave ShapefileSave Shapefile box opens.

144144144144144ArcViewArcViewArcViewArcViewArcView
• Rename the shapefile Locations.shp and navigate to the folder you wish to save it in.
• Click OKOKOKOKOK.
• You will be prompted to add theshapefile as a theme to the view.Click YesYesYesYesYes.
• With the Locations.txt theme active,select Delete Theme Delete Theme Delete Theme Delete Theme Delete Theme from the EditEditEditEditEditmenu. In the Delete Themes Delete Themes Delete Themes Delete Themes Delete Themes box clickYesYesYesYesYes.

145145145145145ArcViewArcViewArcViewArcViewArcView
• The View Table of ContentsView Table of ContentsView Table of ContentsView Table of ContentsView Table of Contents window now shows the Locations.shp file.
• If you examine the folder where you saved the locations shp file, you will see that there arethree files added. They are:
- Locations.dbf is the database table in Dbase format. Dbase is a popular databaseprogram.
- Locations.shp and Locations.shx are the actual shape file. All three must be available toArcView.
Using the process outlined here, you can incorporate any locally-collected data into yourArcView projects. The only qualification is that your local data must be in the same projectionas the base layers. You will look more closely at projections in Chapter 10: Using Images in Chapter 10: Using Images in Chapter 10: Using Images in Chapter 10: Using Images in Chapter 10: Using Images inArcViewArcViewArcViewArcViewArcView.
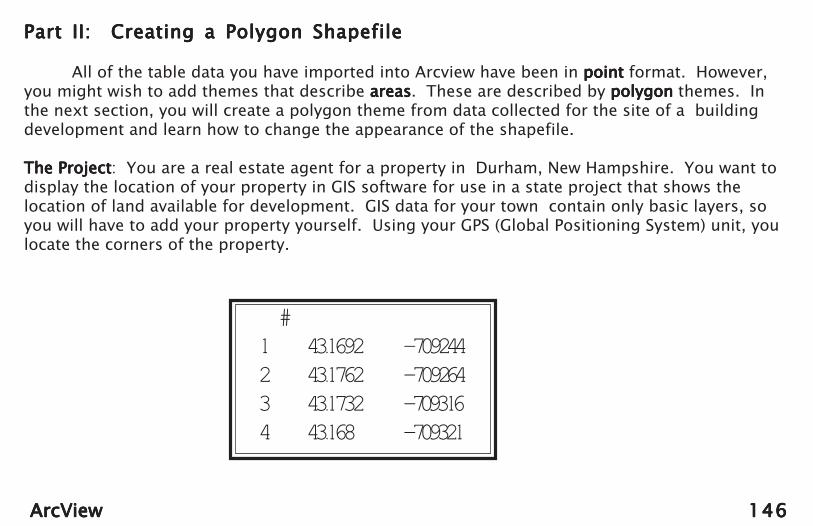
146146146146146ArcViewArcViewArcViewArcViewArcView
Part II: Creating a Polygon ShapefilePart II: Creating a Polygon ShapefilePart II: Creating a Polygon ShapefilePart II: Creating a Polygon ShapefilePart II: Creating a Polygon Shapefile
All of the table data you have imported into Arcview have been in point point point point point format. However,you might wish to add themes that describe areasareasareasareasareas. These are described by polygonpolygonpolygonpolygonpolygon themes. Inthe next section, you will create a polygon theme from data collected for the site of a buildingdevelopment and learn how to change the appearance of the shapefile.
The ProjectThe ProjectThe ProjectThe ProjectThe Project: You are a real estate agent for a property in Durham, New Hampshire. You want todisplay the location of your property in GIS software for use in a state project that shows thelocation of land available for development. GIS data for your town contain only basic layers, soyou will have to add your property yourself. Using your GPS (Global Positioning System) unit, youlocate the corners of the property.
����# ��� ���1 43.1692 -70.92442 43.1762 -70.92643 43.1732 -70.93164 43.168 -70.9321

147147147147147ArcViewArcViewArcViewArcViewArcView
Preparing the DataPreparing the DataPreparing the DataPreparing the DataPreparing the Data
• Before beginning set your working directory to the folder containing the data for thischapter.
• Use your word processorto create a tab-delimitedtext (.txt) file of thecorner-point data.Name this fileproperty.txt.
• Launch ArcView andfrom the Chapter 8 files,open and add the GISdata files for Durham.They are located in theDurham_Sub folder.Your view shouldresemble the one shownto the right (color andorder of themes is notimportant.)

148148148148148ArcViewArcViewArcViewArcViewArcView
• From the ProjectProjectProjectProjectProject window, AddAddAddAddAdd the property.txt table.
• Create an Event ThemeEvent ThemeEvent ThemeEvent ThemeEvent Theme fromthis table.
• Activate the Property.txttheme and zoom in on thearea of the propertyboundary markers.

149149149149149ArcViewArcViewArcViewArcViewArcView
Making the ShapefileMaking the ShapefileMaking the ShapefileMaking the ShapefileMaking the Shapefile• From the Drawing ToolsDrawing ToolsDrawing ToolsDrawing ToolsDrawing Tools
in the tools bartools bartools bartools bartools bar selectthe rectanglerectanglerectanglerectanglerectangle tool.
• Your cursor becomes a“+” shape when youmove it into the ViewViewViewViewViewWindowWindowWindowWindowWindow.
• Move your cursor into theview. Hold down the leftmouse button and draw adraw adraw adraw adraw arectanglerectanglerectanglerectanglerectangle around thedots as shown in thediagram to the right.
• The size of the rectangleis not critical, but it doesneed to include all cornerpoints.
RectangleTool

150150150150150ArcViewArcViewArcViewArcViewArcView
• Make sure the Property.txt theme is active.
• Click the Select Features Using ShapeSelect Features Using ShapeSelect Features Using ShapeSelect Features Using ShapeSelect Features Using Shape button (right). The dots representing theproperty boundaries will turn yellow ( see below.) This button selects allmembers of the active theme within the shape you drew.

151151151151151ArcViewArcViewArcViewArcViewArcView
• From the ThemeThemeThemeThemeTheme menu, select Convert to ShapefileConvert to ShapefileConvert to ShapefileConvert to ShapefileConvert to Shapefile.
• In the dialog box that opens, be certain that your GIS Data folder is the destination. Leavethe default name as it is and click Save. Save. Save. Save. Save. This is only a temporary file and does not need tobe renamed.
• The next dialog box asks if you want to Add shapefile as theme to a viewAdd shapefile as theme to a viewAdd shapefile as theme to a viewAdd shapefile as theme to a viewAdd shapefile as theme to a view? Click YesYesYesYesYes.
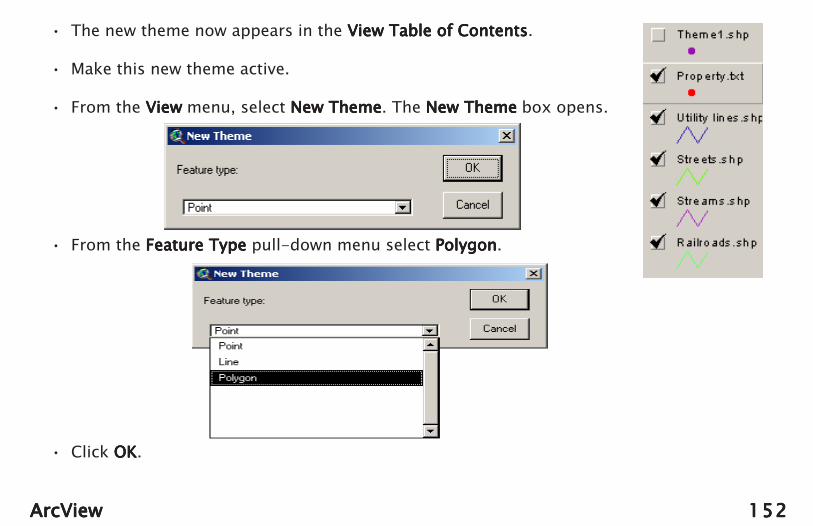
152152152152152ArcViewArcViewArcViewArcViewArcView
• The new theme now appears in the View Table of ContentsView Table of ContentsView Table of ContentsView Table of ContentsView Table of Contents.
• Make this new theme active.
• From the ViewViewViewViewView menu, select New ThemeNew ThemeNew ThemeNew ThemeNew Theme. The New ThemeNew ThemeNew ThemeNew ThemeNew Theme box opens.
• From the Feature TypeFeature TypeFeature TypeFeature TypeFeature Type pull-down menu select PolygonPolygonPolygonPolygonPolygon.
• Click OK OK OK OK OK.

153153153153153ArcViewArcViewArcViewArcViewArcView
• In the Save New ThemeSave New ThemeSave New ThemeSave New ThemeSave New Theme dialog box, give the file the name Property.shp.
• Click OKOKOKOKOK.
• The Property.shp theme appears in the ViewViewViewViewViewTable of ContentsTable of ContentsTable of ContentsTable of ContentsTable of Contents window. Note that itscheck box is outlined with a dashed line.This means that the shapefile can be edited.
• Double Click on the name Property.shp to open theLegend EditorLegend EditorLegend EditorLegend EditorLegend Editor.

154154154154154ArcViewArcViewArcViewArcViewArcView
• Double Click on the colored rectangle below SymbolSymbolSymbolSymbolSymbol to open the Fill Palette Fill Palette Fill Palette Fill Palette Fill Palette.
• Select a fill pattern Select a fill pattern Select a fill pattern Select a fill pattern Select a fill pattern from thoseshown, then select a color for yourshapefile.
• After you have done this:- close the Fill PaletteFill PaletteFill PaletteFill PaletteFill Palette.- click ApplyApplyApplyApplyApply in the Legend EditorLegend EditorLegend EditorLegend EditorLegend Editor.- close the Legend EditorLegend EditorLegend EditorLegend EditorLegend Editor.
• Your new fill pattern and color are now displayed in the View TableView TableView TableView TableView Tableof Contentsof Contentsof Contentsof Contentsof Contents.

155155155155155ArcViewArcViewArcViewArcViewArcView
• From the DrawDrawDrawDrawDraw menu, select the Polygon Polygon Polygon Polygon Polygon tool.
• Use this tool to draw a multisided shape (a polygon) that encloses all of theproperty boundary points. To do this:- Ignore the rectangle you drew earlier.- Click close to, but outside one of the corner points.- Move the cursor in any direction to start to “corral” the dots.- When you need to turn a corner, click the mouse button once. This forms a corner, or vertex.- When you have enclosed all four points, double click to end the process.
Polygontool
• You should have a shape,outlining the property, coloredand filled as you selected.

156156156156156ArcViewArcViewArcViewArcViewArcView
• From the ThemeThemeThemeThemeTheme menu, select Stop EditingStop EditingStop EditingStop EditingStop Editing.
• At the Save EditsSave EditsSave EditsSave EditsSave Edits dialog box click YesYesYesYesYes.
• Property.shp now appears as a theme in the View Table of ContentsView Table of ContentsView Table of ContentsView Table of ContentsView Table of Contents .
• Click Click Click Click Click once on the Clear Selected FeaturesClear Selected FeaturesClear Selected FeaturesClear Selected FeaturesClear Selected Features button.
• Choose the Select Select Select Select Select (arrow) tool and click once on theoriginal rectangle that you drew. Its “handles” appear.
• From the EditEditEditEditEdit menu, select Cut GraphicsCut GraphicsCut GraphicsCut GraphicsCut Graphics. This removes therectangle.
• If either the Theme1.shp or the Property.txt theme is on,turn it off.
• Make both these themes (Property.txt and Theme1.shp) active.- click on one to make it active- Shift-click the other and both will be active
• From the EditEditEditEditEdit menu, select Delete ThemesDelete ThemesDelete ThemesDelete ThemesDelete Themes. Delete both themes.

157157157157157ArcViewArcViewArcViewArcViewArcView
• Your View Table of ContentsView Table of ContentsView Table of ContentsView Table of ContentsView Table of Contents should resemble the one below, with the property as ashapefile.

158158158158158ArcViewArcViewArcViewArcViewArcView
Editing the Theme Attributes TableEditing the Theme Attributes TableEditing the Theme Attributes TableEditing the Theme Attributes TableEditing the Theme Attributes Table
Now that you have created a shapefile, you need to add information to its Attribute TableAttribute TableAttribute TableAttribute TableAttribute Table.As with other shapefiles, this table will provide the user with information about the featurerepresented by the shapefile.
• Be sure that the Property.shp file is active.
• From the Theme Theme Theme Theme Theme menu, select TableTableTableTableTable, or click theOpen Theme TableOpen Theme TableOpen Theme TableOpen Theme TableOpen Theme Table button.
• The Attributes TableAttributes TableAttributes TableAttributes TableAttributes Table of your new shapefileopens.
• The table contains no data except for the shapeand ID of the theme. You will now add data(attributes) to this table. First, a note about theAttribute TableAttribute TableAttribute TableAttribute TableAttribute Table structure. Columns in this table are called fieldsfieldsfieldsfieldsfields, while rows are calledrecordsrecordsrecordsrecordsrecords. You will first add a new field to the table, then add data to that field. Notice thatthe first field in the table is used by ArcView to identify the type of shapefile (polygon) andthe second field is used to record the ID number.

159159159159159ArcViewArcViewArcViewArcViewArcView
• From the TableTableTableTableTable menu, select Start EditingStart EditingStart EditingStart EditingStart Editing.
• From the EditEditEditEditEdit menu, select Add FieldAdd FieldAdd FieldAdd FieldAdd Field. The Field DefinitionField DefinitionField DefinitionField DefinitionField Definition box opens,
• Enter Property in the NameNameNameNameName field.
• In the TypeTypeTypeTypeType pull-down menu, select StringStringStringStringString(right). This tells the system that the contentsof the filed will be a “string” of characters.These may be numbers, letters or symbols.
• In the WidthWidthWidthWidthWidth field, enter 30. That gives enoughspace to enter a description.
• Click OKOKOKOKOK.

160160160160160ArcViewArcViewArcViewArcViewArcView
• The Attributes Table Attributes Table Attributes Table Attributes Table Attributes Table appears again.
• Click on the first RecordRecordRecordRecordRecord in the table. The Field line turns yellow, and the table appears asshown below.

161161161161161ArcViewArcViewArcViewArcViewArcView
• Click on the Table EditTable EditTable EditTable EditTable Edit Tool. This allows you to enter new data in the table.
Table EditTool
• Enter “Property zonedcommercial” in this space. Youcan add as many fields to thistable as needed to describe theproperty.
• Click in the space underProperty, A cursor appears atthe right end of the space.

162162162162162ArcViewArcViewArcViewArcViewArcView
• From the TableTableTableTableTable menu, select Stop Editing Stop Editing Stop Editing Stop Editing Stop Editing.
• In the Save EditsSave EditsSave EditsSave EditsSave Edits box, click YesYesYesYesYes.
• Be sure to Save Save Save Save Save your project.
• Close the Attributes Table Attributes Table Attributes Table Attributes Table Attributes Table.
• The Project window Project window Project window Project window Project window lists the Attributes of Property.shpAttributes of Property.shpAttributes of Property.shpAttributes of Property.shpAttributes of Property.shp tableas part of your project.
• When you close your project, and quit ArcView, you will seethat the system has added a number of files to yourdirectory. Several are from the intermediary steps and maybe deleted. The only ones you need to keep are the parts ofthe Property shapefile listed below:
property.dbfproperty.shpproperty.shx
These are the files necessary to describe the Property shapefile.

163163163163163ArcViewArcViewArcViewArcViewArcView
Chapter Summary:Chapter Summary:Chapter Summary:Chapter Summary:Chapter Summary: In the U.S., detailed GIS data can be downloaded for every county from theTIGER data base, which is accessed through the ESRI site at www.esri.com. Most states maintainOffices of GIS which have state data available for downloading, generally free or at a very low cost.Most nations maintain national or regional GIS databases which can often be obtained bycontacting local universities.
These data usually do not include small-scale features that are of interest in local projectsingeography, science or history. The ability to include such student-gathered data gives GIS greatvalue as an educational mapping and visualization tool.
Shapefiles represent a way of displaying a theme that covers a part of the Earth’s surface. Inexploring the various theme layers included with ArcView, you have discovered that most of themare shapefiles.

164164164164164ArcViewArcViewArcViewArcViewArcView
Chapter 9: Hot LinksChapter 9: Hot LinksChapter 9: Hot LinksChapter 9: Hot LinksChapter 9: Hot LinksIn Chapter 8 you added “local” data to a view by the following process:
- Gathering field data including GPS values.- Preparing a text-formatted table of these data.- Importing these data as an Event ThemeEvent ThemeEvent ThemeEvent ThemeEvent Theme in ArcView.
Plotting the location of local features or data sources is valuable, but the user who is notfamiliar with the area of the ViewViewViewViewView can only evaluate the data by what is included in the AttributesAttributesAttributesAttributesAttributesTableTableTableTableTable. It would be helpful if the user could see a picture or an Mpeg movie of the area, or viewother files such as charts, graphs, or documents that are important to understanding the feature.
Making such data about a location available is accomplished using Hot LinksHot LinksHot LinksHot LinksHot Links. A Hot LinkHot LinkHot LinkHot LinkHot Linkprovides a connection between a feature in the ViewViewViewViewView and an external file.
Objectives:Objectives:Objectives:Objectives:Objectives:
• Create a data table of campus locations that includes references to local images.• Import this table as an Event Theme.• Hot Link each separate entry to a campus photograph.• Activate these Hot Links in ArcView.

165165165165165ArcViewArcViewArcViewArcViewArcView
The DataThe DataThe DataThe DataThe Data
Use the same data as we used in Chapter 8. They are reproduced below:
����# ��� ���1 43.13448 -70.936332 43.13614 -70.932473 43.13464 -70.930184 43.13602 -70.93434
• Prepare a text table of these data (review the process from Chapter 8) but this time you willadd another field specifying the location of the images you wish to link to the campuslocations.

166166166166166ArcViewArcViewArcViewArcViewArcView
Hot Links in ArcViewHot Links in ArcViewHot Links in ArcViewHot Links in ArcViewHot Links in ArcView
Because ArcView is flexible about the location of data, you can place the files for this projectin your GIS Projects folder.
From the Chapter 10 Files, copy the folders Campus and Durham_Sub into your GIS Projectsfolder.
• Examine the contents of the folder Campus. Each file is a digital image of a location on theUNH campus. The Durham_sub folder contains the same data you used in Chapter 8.
• In NotePad, SimpleText,,,,, or your favorite word processor, create a tab delimited file of thedata. This time, add another column containing the data shown below. Your table mustspecify the complete path to your data. An examples is given below. Be certain to specifythe complete path to your directory.
• SaveSaveSaveSaveSave your file as a text file, and be certain that the extension .txt is appended.

167167167167167ArcViewArcViewArcViewArcViewArcView
• Launch ArcView.
• Add ThemesAdd ThemesAdd ThemesAdd ThemesAdd Themes and select the files in theDurham_sub folder. You can add allthe files at once by using the shift-clickmethod.
• Make all the Themes active.
• From the Project Project Project Project Project window, select TablesTablesTablesTablesTables,then AddAddAddAddAdd.
• Navigate to your ArcView Data folderand AddAddAddAddAdd the table you created.
• Make your ViewViewViewViewView window active, and from the ViewViewViewViewView menu,select Add Event Theme.Add Event Theme.Add Event Theme.Add Event Theme.Add Event Theme. If the entries are correct, click OKOKOKOKOK.
• Click on the Theme in the ViewViewViewViewView window to make it active.

168168168168168ArcViewArcViewArcViewArcViewArcView
• Zoom in so your ViewViewViewViewView window resembles the one below. Again, the dots show the campuslocations.

169169169169169ArcViewArcViewArcViewArcViewArcView
• From the Theme Theme Theme Theme Theme menu, select PropertiesPropertiesPropertiesPropertiesProperties.
• The Theme PropertiesTheme PropertiesTheme PropertiesTheme PropertiesTheme Properties window opens.
• Scroll down the menu on the left side of this window and select Hot LinksHot LinksHot LinksHot LinksHot Links.

170170170170170ArcViewArcViewArcViewArcViewArcView
• From the FieldFieldFieldFieldField pull-down menu, selectImageImageImageImageImage. This tells the system that you will belinking to whatever file is named in theAttributes TableAttributes TableAttributes TableAttributes TableAttributes Table field named ImageImageImageImageImage.
• In the Predefined Action Predefined Action Predefined Action Predefined Action Predefined Action pull-down menu,select Link to Image FileLink to Image FileLink to Image FileLink to Image FileLink to Image File. This tellsArcVoyager that the Hot LinkedHot LinkedHot LinkedHot LinkedHot Linked file will bein an image format.
• Your Theme PropertiesTheme PropertiesTheme PropertiesTheme PropertiesTheme Properties window should nowresemble the one below.
• Click OK OK OK OK OK.
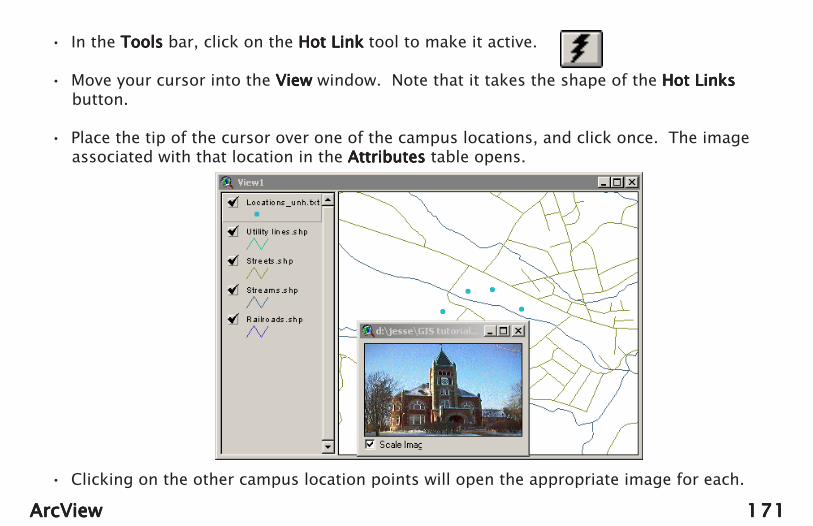
171171171171171ArcViewArcViewArcViewArcViewArcView
• In the ToolsToolsToolsToolsTools bar, click on the Hot LinkHot LinkHot LinkHot LinkHot Link tool to make it active.
• Move your cursor into the ViewViewViewViewView window. Note that it takes the shape of the Hot Links Hot Links Hot Links Hot Links Hot Linksbutton.
• Place the tip of the cursor over one of the campus locations, and click once. The imageassociated with that location in the AttributesAttributesAttributesAttributesAttributes table opens.
• Clicking on the other campus location points will open the appropriate image for each.

172172172172172ArcViewArcViewArcViewArcViewArcView
Chapter Summary:Chapter Summary:Chapter Summary:Chapter Summary:Chapter Summary: Using Hot Links allows you to link elements of a theme to external files.Images, movies, tables, charts, and graphs can all be used to provide the user with moreinformation about the contents of a theme.
What Can I Do With This?What Can I Do With This?What Can I Do With This?What Can I Do With This?What Can I Do With This?
Many aspects of the study of science, history, geography, mathematics and language arelinked to places. A few projects are suggested below.
• Plot the locations of your GLOBE Program measurement sites, and Hot Link to photographsof your sites or graphs of your GLOBE data.
• Have students collect locations and photographs of historic sites in your area and displaythem, along with historical information.
• Data about environmentally sensitive areas can be Hot Linked to their locations in a View.
• Using data from on-line environmental sites, track the migration of wildlife species andmake Hot Links to images of breeding or nesting grounds.
• Collect data about the locations of old cemeteries in your region, and Hot Link these to listsof family names represented there.

173173173173173ArcViewArcViewArcViewArcViewArcView
Chapter 10: Using GLOBE Landsat Images in ArcViewChapter 10: Using GLOBE Landsat Images in ArcViewChapter 10: Using GLOBE Landsat Images in ArcViewChapter 10: Using GLOBE Landsat Images in ArcViewChapter 10: Using GLOBE Landsat Images in ArcViewAs part of the GLOBE Program, your school has received a Landsat Thematic Mapper (TM)
image of the 15 km x 15 km area around your school.* Since this is the area your students will betaking most of their GLOBE measurements, it would be ideal to include this image as a theme inArcVoyager.
Beginning in 2001, the GLOBE Program began supplying these images in a format that iscompatible with ArcView. For images prior to 2001, it is necessary to to register the images (seeAppendix IIIAppendix IIIAppendix IIIAppendix IIIAppendix III).
ObjectivesObjectivesObjectivesObjectivesObjectives• Set the projection for your view.• Select an Image Data Source.• Add a Landsat Thematic Mapper image to the View window.• Overlay vector data on this image.
The data you will use for this exercise are from Corpus Christi, Texas. Download theChapter 10 data folder from the University of New Hampshire GLOBE site, or copy the Chapter 10data folder from the CD you received. Place this folder in your GIS Projects folder.
*. Schools that joined GLOBE prior to 2001 automatically received an image. If do not have an image, call the GLOBEHelp Desk at 1 - 800 - 858 - 9947. If you have joined GLOBE since 2001, your school must have a GLOBE-trainedteacher, and have submitted at least 250 data entries to receive an image. If you have questions, please contact the HelpDesk at 1 - 800 - 858 - 9947.

174174174174174ArcViewArcViewArcViewArcViewArcView
• Open the Chapter 10 data folder. Its contents areshown to the right.
• Open the ImageImageImageImageImage folder. Its contents are shownbelow. It contains three files. The numerical partof the file name is a code used by the imagesupplier to identify each image.

175175175175175ArcViewArcViewArcViewArcViewArcView
Image File FormatsImage File FormatsImage File FormatsImage File FormatsImage File Formats:
The Image folder contains three files.
NoteNoteNoteNoteNote: Before beginning to work with your own local image, copy all the files from the GLOBE-supplied disk to your computer’s hard drive. Put the GLOBE disk in a safe place as your “archive.”If you are going to make copies of the image to load on other machines, make copies from yourcomputer’s hard drive.
This is the actual Landsat image of CorpusChristi. While it is GIS compatible, it is stillcompletely readable by MultiSpec, the imageanalysis software used in GLOBE, and allMultiSpec activities can be performed asusual.
00010432.hdrThis header file is used to provide your GISsoftware with the coordinates necessary tolocate this image on the Earth’s surface.
00010432.prtThis is a projection file. It is a simple text file thatcontains information you will need to use thisimage in ArcView.
00010432.bil

176176176176176ArcViewArcViewArcViewArcViewArcView
Examining the Projection FileExamining the Projection FileExamining the Projection FileExamining the Projection FileExamining the Projection File• Use Notepad, Simple Text, or your favorite word processor to open the projection (.prt) file
for the Corpus Christi image. The figure below shows the first page of that file.

177177177177177ArcViewArcViewArcViewArcViewArcView
What This File Tells YouWhat This File Tells YouWhat This File Tells YouWhat This File Tells YouWhat This File Tells You
The important part of this file, outlined in red, tells you that this image is projected in thesystem known as Universal Transverse Mercator (UTM) Universal Transverse Mercator (UTM) Universal Transverse Mercator (UTM) Universal Transverse Mercator (UTM) Universal Transverse Mercator (UTM) and that the image is located in Zone 14 Zone 14 Zone 14 Zone 14 Zone 14.
What Is UTM?What Is UTM?What Is UTM?What Is UTM?What Is UTM?
As discussed earlier, (Chapter 4 and Chapter 7) there are many different methods oftransferring the round Earth to a flat surface. Each of these methods, called a projection, hasadvantages and disadvantages. Looking at a Mercator map of the Earth (the most commonprojection for world maps) you can see that a disadvantage of this projection is that it greatlydistorts the sizes of land masses far from the equator. Greenland is not really as large as thisprojection makes it appear.
In the UTM system, the Earth is divided into 60 zones of longitude. Each zone is 6o oflongitude wide. Imagine peeling an orange and finding it made of 60 equal-size segments. Eachof these segments, running from north to south, is analogous to a zone in the UTM system.
The numbering of these zones begins at the International Date Line, and increases to theeast. The United States is covered by 10 zones, beginning with #10 on the west coast and endingwith #19 on the east coast. Positions in the UTM system are measured in meters north (callednorthings) and east (called eastings) of fixed reference lines.
For the Northern Hemisphere, the Equator is assigned a value of 0,000,000. Latitude, or thenorthing coordinate is measured in meters from the equator.
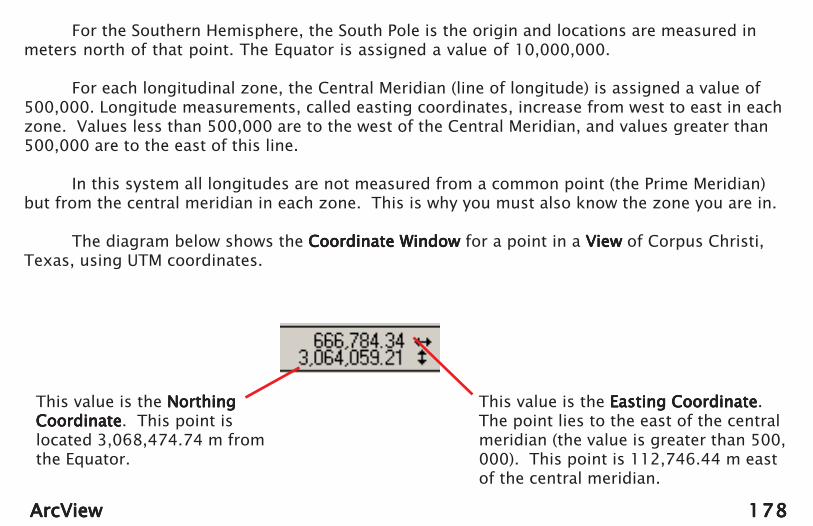
178178178178178ArcViewArcViewArcViewArcViewArcView
For the Southern Hemisphere, the South Pole is the origin and locations are measured inmeters north of that point. The Equator is assigned a value of 10,000,000.
For each longitudinal zone, the Central Meridian (line of longitude) is assigned a value of500,000. Longitude measurements, called easting coordinates, increase from west to east in eachzone. Values less than 500,000 are to the west of the Central Meridian, and values greater than500,000 are to the east of this line.
In this system all longitudes are not measured from a common point (the Prime Meridian)but from the central meridian in each zone. This is why you must also know the zone you are in.
The diagram below shows the Coordinate WindowCoordinate WindowCoordinate WindowCoordinate WindowCoordinate Window for a point in a ViewViewViewViewView of Corpus Christi,Texas, using UTM coordinates.
This value is the NorthingNorthingNorthingNorthingNorthingCoordinateCoordinateCoordinateCoordinateCoordinate. This point islocated 3,068,474.74 m fromthe Equator.
This value is the Easting CoordinateEasting CoordinateEasting CoordinateEasting CoordinateEasting Coordinate.The point lies to the east of the centralmeridian (the value is greater than 500,000). This point is 112,746.44 m eastof the central meridian.

179179179179179ArcViewArcViewArcViewArcViewArcView
Adding the Corpus Christi Image to ArcViewAdding the Corpus Christi Image to ArcViewAdding the Corpus Christi Image to ArcViewAdding the Corpus Christi Image to ArcViewAdding the Corpus Christi Image to ArcView
• Launch ArcView and start a New ProjectNew ProjectNew ProjectNew ProjectNew Project.
• From the ViewViewViewViewView menu, in the main menu bar, select PropertiesPropertiesPropertiesPropertiesProperties.
• The View PropertiesView PropertiesView PropertiesView PropertiesView Properties window opens.

180180180180180ArcViewArcViewArcViewArcViewArcView
• Click the ProjectionProjectionProjectionProjectionProjection button in the ViewViewViewViewViewPropertiesPropertiesPropertiesPropertiesProperties window. The ProjectionProjectionProjectionProjectionProjectionPropertiesPropertiesPropertiesPropertiesProperties window opens.
• Click on the pull-down CategoryCategoryCategoryCategoryCategorymenu and select UTMUTMUTMUTMUTM from the list.If your menu shows more than oneentry for UTM, select the UTM - 1983UTM - 1983UTM - 1983UTM - 1983UTM - 1983entry.
• From the TypeTypeTypeTypeType pull-down menu,select Zone 14Zone 14Zone 14Zone 14Zone 14 for the Corpus Christiimage. Remember that your Zone isobtained from the .prt file thataccompanies your image.

181181181181181ArcViewArcViewArcViewArcViewArcView
• The Projection Properties Projection Properties Projection Properties Projection Properties Projection Properties window should resemble the one shown below.
• Click OK.OK.OK.OK.OK.
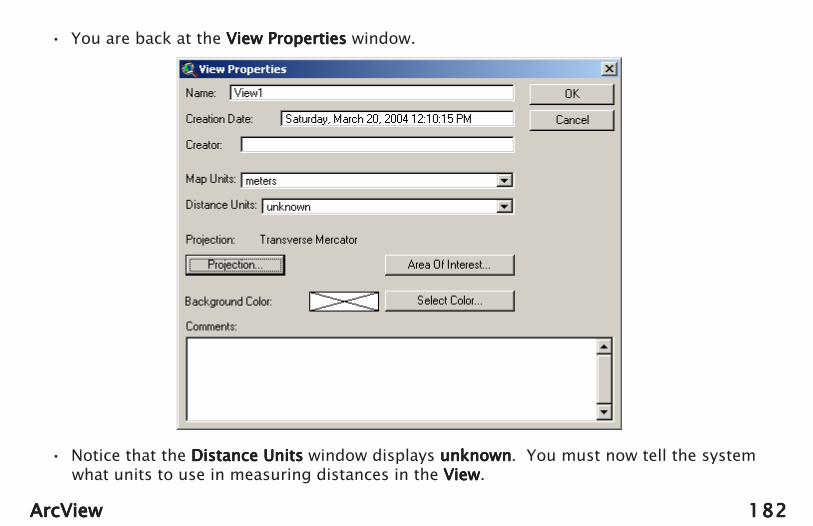
182182182182182ArcViewArcViewArcViewArcViewArcView
• You are back at the View PropertiesView PropertiesView PropertiesView PropertiesView Properties window.
• Notice that the Distance Units Distance Units Distance Units Distance Units Distance Units window displays unknownunknownunknownunknownunknown. You must now tell the systemwhat units to use in measuring distances in the ViewViewViewViewView.

183183183183183ArcViewArcViewArcViewArcViewArcView
• From the Distance UnitsDistance UnitsDistance UnitsDistance UnitsDistance Units pull-down menu,select meters meters meters meters meters.
• The completed View PropertiesView PropertiesView PropertiesView PropertiesView Properties window isshown below.
• Click OKOKOKOKOK to close the ViewViewViewViewViewPropertiesPropertiesPropertiesPropertiesProperties window.

184184184184184ArcViewArcViewArcViewArcViewArcView
Adding the Image to the ViewAdding the Image to the ViewAdding the Image to the ViewAdding the Image to the ViewAdding the Image to the View
• Click the Add ThemesAdd ThemesAdd ThemesAdd ThemesAdd Themes button andnavigate to the folder containingthe Chapter 10 data files.
• Select the folder Image.
• As shown below, there do notappear to be any ArcView files inthis folder. The image is there,but we must tell ArcView that weare looking for image-type data.
• From the Data Source TypesData Source TypesData Source TypesData Source TypesData Source Types pull-down menu, select Image Data SourceImage Data SourceImage Data SourceImage Data SourceImage Data Source.

185185185185185ArcViewArcViewArcViewArcViewArcView
• The window now lists the Corpus Christi image. Only the actual image (.bil) file is listed.
• Select this image.
• Click OKOKOKOKOK.
• The image is now added to the View Table of ContentsView Table of ContentsView Table of ContentsView Table of ContentsView Table of Contentsas a ThemeThemeThemeThemeTheme.
An Important Note:An Important Note:An Important Note:An Important Note:An Important Note: As stated earlier (Chapter 7) all themes in your Viewmust be in the same projection. If the .prj file for your image indicates aprojection other than UTM, you can still use your image in ArcView, butyou will not be able to overlay data in normal geographic (latitude/longitude) format over the image. Also, images you may obtain fromother sources may not be in UTM projection. It is important to know theprojection of your image data.

186186186186186ArcViewArcViewArcViewArcViewArcView
• Activate the image theme.
• You can improve the appearance of the image by changing the monitor colors to which thechannels in your Landsat image are assigned.

187187187187187ArcViewArcViewArcViewArcViewArcView
• Double click on the image Legend Legend Legend Legend Legend in the ViewViewViewViewViewTable of ContentsTable of ContentsTable of ContentsTable of ContentsTable of Contents (the name 00010432.bil).The Image Legend EditorImage Legend EditorImage Legend EditorImage Legend EditorImage Legend Editor opens.
The Image Legend Editor Image Legend Editor Image Legend Editor Image Legend Editor Image Legend Editor gives you the followinginformation about this image:
a. This image is MultibandMultibandMultibandMultibandMultiband. All GLOBE images areprovided with 5 bands, or channels:
ChannelChannelChannelChannelChannel ColorColorColorColorColor 1 Visible Blue 2 Visible Green 3 Visible Red 4 Near Infrared 5 Middle Infrared
b. By default, ArcView makes the following assignments:
Monitor ColorMonitor ColorMonitor ColorMonitor ColorMonitor Color Channel AssignedChannel AssignedChannel AssignedChannel AssignedChannel Assigned Red 1 (Visible Blue) Green 2 (Visible Green) Blue 3 (Visible Red)

188188188188188ArcViewArcViewArcViewArcViewArcView
This is not a normal color assignment for a Landsat image. For more information on bandassignments, see the GLOBE MultiSpec tutorialsGLOBE MultiSpec tutorialsGLOBE MultiSpec tutorialsGLOBE MultiSpec tutorialsGLOBE MultiSpec tutorials provided in your GLOBE Teachers Kit.
To change the appearance of the image:
• Use the pull-down menu next to the RedRedRedRedRed monitorsymbol to select Band 3Band 3Band 3Band 3Band 3.
• Use the pull-down menus for the greengreengreengreengreen and blue blue blue blue bluemonitor colors to select the color combination below.
• Click the Apply Apply Apply Apply Apply button in the ImageImageImageImageImage Legend EditorLegend EditorLegend EditorLegend EditorLegend Editor.
• Close the Image Legend Editor. Image Legend Editor. Image Legend Editor. Image Legend Editor. Image Legend Editor.

189189189189189ArcViewArcViewArcViewArcViewArcView
This should improve the brightness of the image and the visibility of features.
The amount of improvement will depend, to some degree, on the quality of your monitor, and thenumber of colors you have it set to display.

190190190190190ArcViewArcViewArcViewArcViewArcView
• You can also try the combination shown below. Although the colors in this combination arenot the Earth’s true colors, it may give you a significant increase in brightness.

191191191191191ArcViewArcViewArcViewArcViewArcView
• Also contained in the Chapter 10 data folder is a set of GIS data for Corpus Christi. Theseare provided as shape files through the courtesy of ESRI.
• Add these Themes Themes Themes Themes Themes to your View View View View View and rename them.

192192192192192ArcViewArcViewArcViewArcViewArcView
• During a workshop in Corpus Christi, participants gathered Land Cover data from sites in thearea. These data are included as a text file, CCSites.txt, which is also included in theChapter 10 data folder.
• Add this file to the ViewViewViewViewView as an Event ThemeEvent ThemeEvent ThemeEvent ThemeEvent Theme. The result is shown below.

193193193193193ArcViewArcViewArcViewArcViewArcView
Chapter Summary:Chapter Summary:Chapter Summary:Chapter Summary:Chapter Summary: In this chapter you have seen how to incorporate a Landsatimage into a View and overlay vector data on top of it.
What Can I Do With This?What Can I Do With This?What Can I Do With This?What Can I Do With This?What Can I Do With This?
The ability to use your GLOBE Landsat image as the base layer for a GIS Viewis valuable in helping your students determine locations and land cover types inyour GLOBE Study Site. If you and your students are performing the GLOBEProgram land cover mapping and accuracy assessment protocols, your Land CoverSample sites can be accurately located on your image. This can help improve theaccuracy of the land cover maps your students produce.
In addition, local student investigations in social studies, geography, history,biology, environmental studies, and geology can all benefit from seeing how localenvironmental measurements are related to land cover features.

194194194194194ArcViewArcViewArcViewArcViewArcView
Chapter 11: Now What Do I Do With It And Where Do I Go Next?Chapter 11: Now What Do I Do With It And Where Do I Go Next?Chapter 11: Now What Do I Do With It And Where Do I Go Next?Chapter 11: Now What Do I Do With It And Where Do I Go Next?Chapter 11: Now What Do I Do With It And Where Do I Go Next? Now that you have had a taste of what GIS software can do, the next question is “How do I
apply this to my curriculum?” A number of possibilities have been suggested during this tutorial,but one of the best ways to address the question is to look at some projects that have beencreated by students.
ESRI maintains a library of student projects in its Community Atlas:
www.esri.com/communityatlaswww.esri.com/communityatlaswww.esri.com/communityatlaswww.esri.com/communityatlaswww.esri.com/communityatlas
The following images, sampled from the Community Atlas, show some of the possibilitiesof GIS in the classroom.

195195195195195ArcViewArcViewArcViewArcViewArcView
1. Where Are We?Where Are We?Where Are We?Where Are We?Where Are We? In this project students map the location of their school on a relief map ofNew England with water bodies and streams.
Image courtesy ESRI. © ESRI, 1999

196196196196196ArcViewArcViewArcViewArcViewArcView
2. Our WatershedOur WatershedOur WatershedOur WatershedOur Watershed: Students have shown their school location in the watershed of a localwater body.
Image courtesy ESRI. © ESRI, 1999

197197197197197ArcViewArcViewArcViewArcViewArcView
References:References:References:References:References:
“Can Young Students Use GIS?” This article, written by Charlie Fitzpatrick, director of ESRI’sSchools and Libraries Project, addresses using GIS with very young students. It can be found at:
http://www.esri.com/industries/k-12/hrynggis.htmlhttp://www.esri.com/industries/k-12/hrynggis.htmlhttp://www.esri.com/industries/k-12/hrynggis.htmlhttp://www.esri.com/industries/k-12/hrynggis.htmlhttp://www.esri.com/industries/k-12/hrynggis.html
ESRI also provides more than a dozen prepackaged lessons and projects designed for use withArcVoyager that can be used with ArcView. These cover all grade levels, and can be downloadedfrom:
http://www.esri.com/industries/k-12/voyager.html#lessonshttp://www.esri.com/industries/k-12/voyager.html#lessonshttp://www.esri.com/industries/k-12/voyager.html#lessonshttp://www.esri.com/industries/k-12/voyager.html#lessonshttp://www.esri.com/industries/k-12/voyager.html#lessons
SummarySummarySummarySummarySummary:
GIS software provides students the opportunity to explore and interact with data that cross manydisciplinary lines. The ability to access local, regional and national data on the Internet givesstudents the power to explore the relationships between phenomena and place. Students canexplore geography with maps, tables and graphs that they create with world wide data and theycan add local data to their projects.
Making “place” an important part of learning, especially in the sciences, reinforces the idea thatknowledge develops in the context of time and place.

198198198198198ArcViewArcViewArcViewArcViewArcView
GIS also provides an educationally important use of computer technology and the Internet. Thevast amount of free data available provides students with the raw material for meaningfulexploration.
For questions about this tutorial contact the developer:
GLOBE Land Cover/Biology [email protected]

199199199199199ArcViewArcViewArcViewArcViewArcView
Appendix I: Local Sources of GIS DataAppendix I: Local Sources of GIS DataAppendix I: Local Sources of GIS DataAppendix I: Local Sources of GIS DataAppendix I: Local Sources of GIS DataMany local, regional, state, provincial or national groups use GIS data, and these are often
willing to share such data with schools for educational use. A few suggestions for the types ofagencies you might contact are given below.
• Local, county, state, provincial or national offices of GIS.• Surveying organizations, both public and private.• Mapping agencies.• Environmental agencies.• Local or regional governmental planning agencies.• University departments of geography, remote sensing, natural resources and geosciences.• Highway and transportation departments.• Architectural firms.• Urban and suburban planning agencies.• Police and emergency services.• Utility agencies such as electricity, water and telephone.• Large local/state delivery firms: These companies often use GIS to dispatch vehicles or plan routes.• Your local school districts.• Forestry planning and management agencies.• Farmers and farm organizations.

200200200200200ArcViewArcViewArcViewArcViewArcView
Some Reliable Internet Sites for GIS DataSome Reliable Internet Sites for GIS DataSome Reliable Internet Sites for GIS DataSome Reliable Internet Sites for GIS DataSome Reliable Internet Sites for GIS Data
http://www.esri.com/company/free.htmlRun by Earth Systems Research Institute, the developers of ArcVoyager, there are links to freesoftware and free GIS data.
http://www.geo.ed.ac.uk/home/giswww.htmlThis United Kingdom site has lots of links to many GIS related topics, including some data.
http://www.calmit.unl.edu/calmit/left_links/gisrs.htmMost of these links are U.S. based.
http://www.census.gov/geo/www/tiger/http://www.census.gov/geo/www/tiger/tigerua/ua_tgr2k.htmlThese links supply U.S. data on a county level from the U.S. Census Bureau.,
http://gislounge.com/ll/worlddata.shtmlA clearinghouse for world wide GIS resources.
http://www.gisdatadepot.com/DataDepot has lots of international GIS downloads.

201201201201201ArcViewArcViewArcViewArcViewArcView
Appendix II: Importing Arc Export (E00) FilesAppendix II: Importing Arc Export (E00) FilesAppendix II: Importing Arc Export (E00) FilesAppendix II: Importing Arc Export (E00) FilesAppendix II: Importing Arc Export (E00) FilesBefore You BeginBefore You BeginBefore You BeginBefore You BeginBefore You Begin:
• Some download sites, such as Data Depot (www.gisdatadepot.com) provide their files withthe .GZ (gzip) extension. This is a Unix OS compression format. Other sites may providedata compressed in .tar format (another UNIX compression) and some may be inconventional .zip form. Before you can import the file into ArcView, you must uncompressit.
• Tar, gzip and PC zip files can all be decoded by Stuffit Expander. This is an easy-to-usedecompression program that handles many different file formats. Simply drag the file’sicon and drop it on top of the Stuffit Expander icon which is placed on your desktop whenyou download and install Expander. Expander is available for Macintosh, PC, Unix andSolaris platforms. It can be downloaded free from the Aladdin website at:
http://www.stuffit.com/expander/
• Once you have unstuffed the .GZ file, you will have an .e00 file.

202202202202202ArcViewArcViewArcViewArcViewArcView
Import for Macintosh ComputersImport for Macintosh ComputersImport for Macintosh ComputersImport for Macintosh ComputersImport for Macintosh Computers
• For practice you will find a file named Coast.e00 in the Appendix folder.
• Before launching Import move the .e00 files you wish to import to the Macintosh desktop.It is a quirk of Import for the Macintosh that it prefers files on the desktop.
• Launch Import. Import’s screen is very simple, asshown to the right.
• From the FileFileFileFileFile menu, select ImportImportImportImportImport.
• Navigate to the location of your .e00 file.
• Select the file and click OpenOpenOpenOpenOpen.
• Import will prompt you for alocation to save the file.Use the default name thatImport provides, andnavigate to your destinationfolder.

203203203203203ArcViewArcViewArcViewArcViewArcView
• Import will do its work, and if the import is successful, you will see ascreen similar to theone below.
• The destination you selected will now have a folder, in thiscase Coast, with contents similar to those shown to theright. These data may now be used in ArcView.

204204204204204ArcViewArcViewArcViewArcViewArcView
Import 71 for PC MachinesImport 71 for PC MachinesImport 71 for PC MachinesImport 71 for PC MachinesImport 71 for PC Machines
Import 71 is the PC version of the Import software. If you do not have Import 71,you must download the Import 71 installer. You should install Import 71 in thesame folder that contains your ArcView software.
Importing the e00 fileImporting the e00 fileImporting the e00 fileImporting the e00 fileImporting the e00 file
• For practice, you will find a file named Coast.e00 in the Appendix folder.
• Launch Import 71. You will see the dialog box below.

205205205205205ArcViewArcViewArcViewArcViewArcView
• There are no menus for Import 71. You simply specify the file to import, the destination ofthe imported file, and click OK OK OK OK OK.
• In the top line of the dialog box, specify the complete path for the location of your .e00 fileor use the BrowseBrowseBrowseBrowseBrowse button to navigate to it. Be sure to include the extension .e00, as in theexample shown below.

206206206206206ArcViewArcViewArcViewArcViewArcView
• In the second line, specify the complete path for the files destination. You should include afile name that is the same as the .e00 file, so you know what feature the file contains, or usethe Browse button.
• Click OK OK OK OK OK, and Import 71 will import the file.
• Examining your directory, you will find a folder named Coast containing the new files.
• These files are now ready to be used in ArcView.
• Import 71 quits after it has done its work. To import more files, you must relaunch Import71.
A Cautionary NoteA Cautionary NoteA Cautionary NoteA Cautionary NoteA Cautionary Note: Import 71 is particular about its location. The author has tried installingImport 71 in directories other than the ArcView directory and on other disks with mixed results.For best results, you should install Import 71 in the same directory as ArcView.

207207207207207ArcViewArcViewArcViewArcViewArcView
Appendix III: Image RegistrationAppendix III: Image RegistrationAppendix III: Image RegistrationAppendix III: Image RegistrationAppendix III: Image RegistrationFor any image to be used in a GIS program, it must contain location data.
Such data registerregisterregisterregisterregister the image to the ground. These data are generally provided in aheader file (.hdr) or a world file. Prior to 2001, GLOBE school images wereprovided without such information and could not be used unless one of these fileswas created.
To Register an ImageTo Register an ImageTo Register an ImageTo Register an ImageTo Register an Image
Create a World File from “scratch.” The contents of a typical world file are shownbelow.
The lines of the world file provide the following data:
- Horizontal size of a pixel.- Rotation term for a row of pixels.- Rotation term for a column of pixels.- Vertical size of a pixel.- Longitude of the center of the upper-left pixel.- Latitude of the center of the upper-left pixel.

208208208208208ArcViewArcViewArcViewArcViewArcView
You can create your own world files for images that are not registered. If you are usingLandsat Thematic Mapper (TM) imagery, such as older GLOBE images, the following parametersapply:
Note the value forthe vertical sizeof the pixel isnegativenegativenegativenegativenegative
Horizontal size of pixel = 30.000Vertical size of pixel = -30.000Rotation for row = 0Rotation for column = 0
The most important part of the world file is accurately locating the latitude and longitude ofthe center of the upper left pixel in your image. The greater the accuracy and precision of thisvalue, the better your image will match other GIS data you use. Be sure to follow the GLOBE GPSprotocol in taking your measurements.
Create the world file in any word processor, but be certain to save it as a text-only file.Using NotePad (PC) or SimpleText (Macintosh) will insure you have the proper file format.Naming the world fileNaming the world fileNaming the world fileNaming the world fileNaming the world file: The world file name must follow a specific protocol. It consists of:
a. The file name must be the same as the image file nameb. The extension must contain the first two letters of the extension of your image plus the letter “w,” for world file.

209209209209209ArcViewArcViewArcViewArcViewArcView
ExampleExampleExampleExampleExample: If your image file is named MyHome.bil, then the world file has the name MyHome.blw.If your older image has the extension .lan, rename the file with the extension .bil. “Bil” stands forband interleaved by line and all older GLOBE images were actually in this format.
When you open a ViewViewViewViewView that is to contain your image, be certain that both Map UnitsMap UnitsMap UnitsMap UnitsMap Units and DistanceDistanceDistanceDistanceDistanceUnits Units Units Units Units have been set to metersmetersmetersmetersmeters in the View PropertiesView PropertiesView PropertiesView PropertiesView Properties window (See Chapter 10).

210210210210210ArcViewArcViewArcViewArcViewArcView
Appendix IV: How Do I Get ArcView?Appendix IV: How Do I Get ArcView?Appendix IV: How Do I Get ArcView?Appendix IV: How Do I Get ArcView?Appendix IV: How Do I Get ArcView?Schools may earn a full version of ArcView through the Community AtlasCommunity AtlasCommunity AtlasCommunity AtlasCommunity Atlas project of ESRI’s SchoolsSchoolsSchoolsSchoolsSchoolsand Libraries Programand Libraries Programand Libraries Programand Libraries Programand Libraries Program.
You may purchase ArcView outright from ESRI. See their web page
www.esri.comfor details.
ESRI's US Community AtlasESRI's US Community AtlasESRI's US Community AtlasESRI's US Community AtlasESRI's US Community Atlas
Classes in K-12 schools are encouraged to compose a profile of their community,consisting of 10-20 maps (in GIF or JPG format) and 1000-2500 words (in HTML documents).After constructing and testing their group project, classes post the files on the ESRI CommunityAtlas web site, and create an entry in a searchable database.
http://www.esri.com/communityatlas
The Community Atlas is a great opportunity for teachers in science, social studies, Englishor language arts, and technology! Classes can choose between three main types of projects:general community profile, local conservation issue, or a historically focused presentation. Eacharena offers broad flexibility, and suggestions are listed on the DetailsDetailsDetailsDetailsDetails page of the web site.

211211211211211ArcViewArcViewArcViewArcViewArcView
Appendix V: Image CorrectionAppendix V: Image CorrectionAppendix V: Image CorrectionAppendix V: Image CorrectionAppendix V: Image CorrectionImages in MultiSpec, ArcView and ArcVoyagerImages in MultiSpec, ArcView and ArcVoyagerImages in MultiSpec, ArcView and ArcVoyagerImages in MultiSpec, ArcView and ArcVoyagerImages in MultiSpec, ArcView and ArcVoyager
When you open your image in the free MultiSpec software used in the GLOBE program,your image will appear as shown below (an image of Durham, New Hampshire is used anexample).
However, the same image opened in ArcView would appear darker and fewer detailswould be visible.

212212212212212ArcViewArcViewArcViewArcViewArcView
Why Does This Happen?Why Does This Happen?Why Does This Happen?Why Does This Happen?Why Does This Happen?
Every pixel in your GLOBE Landsat image contains 5 numbers that describe the brightnessof that pixel in each of the 5 Landsat channels supplied by GLOBE. These values can range fromzero (0) for no reflectance (which appears black) to a maximum of 255 for high reflectance(which appears white).
The data in your image however, do not make use of this full range of brightness. Thediagram below illustrates the process that is responsible for this. Light from the sun passesthrough our atmosphere to the Earth’s surface (1). It is reflected back through the atmosphereto the satellite (2), where sensors convert the light to digital data. It is these data that arerecorded by a ground station (3).

213213213213213ArcViewArcViewArcViewArcViewArcView
During its two passages through our atmosphere, significant amounts of light arescattered, absorbed and reflected, so the satellite actually sees less energy than it would if ourplanet had no atmosphere. The result is that much of the image data are compressed into thelower portion of the 0 - 255 scale of brightness so the image appears quite dark. To correctthis, we must stretch the data in each channel so they use the full range of brightness.
The distribution of pixel values is illustrated in a graph know as a histogram.” A histogramshows how many pixels in the image are represented by each value in the image’s range ofvalues. A tutorial on producing histograms in MultiSpec is available from the University of NewHampshire’s GLOBE site at
http://www.globe.unh.edu/MultiSpec/MultiSpec.html
The graph below is a histogram of Landsatchannel 4, the Near Infrared channel, from theDurham image as supplied by GLOBE. Notice thatthe greatest number of pixels, shown by thelarge peak, is concentrated in data (calledreflectance) values of about 60 - 100, with almostno pixels in the brighter (higher number) values.The limit of the reflectance values of 255 isshown by the blue line.

214214214214214ArcViewArcViewArcViewArcViewArcView
MultiSpec automatically “stretches” the data when the image is displayed. They literallygrab both ends of the data and stretch it out to cover the full range of brightness valuesavailable. This is why the image displays properly. ArcVoyager does not have that stretchingfunction so the user must do the job him/herself.
The graph below is the same channel from the same image after the stretching process.
The data now cover much more of the range of available Brightness values (0 - 255) andthe resulting image will appear much brighter.

215215215215215ArcViewArcViewArcViewArcViewArcView
This image stretching can be done in MultiSpec, either on a Macintosh or PC computer. Adetailed tutorial for doing this stretch can be found at the University of New Hampshire GLOBEsite. The tutorial is entitled Blue Band, because it also corrects for extra reflection in theLandsat blue channel (channel 1) caused by atmospheric scattering. The tutorial is small (258 k)and is provided in Adobe’s .pdf format. You will need Adobe’s free Acrobat Reader software toview and print this tutorial. Most computers come equipped with Reader, but you can reachAdobe’s download page from the GLOBE home page, the UNH MultiSpec page, or directly at:
http://www.adobe.com http://www.adobe.com http://www.adobe.com http://www.adobe.com http://www.adobe.com
If you are using a PC computer, there is a small (65 k) supplement, Blue Band PCBlue Band PCBlue Band PCBlue Band PCBlue Band PC, whichyou will also need to download. It covers the slight differences in the process between theMacintosh and PC versions of the MultiSpec software. This document will not duplicate all thesteps of the Blue Band tutorial, but will only list the changes you need to make to stretch yourimage and keep its ArcVoyager compatibility.

216216216216216ArcViewArcViewArcViewArcViewArcView
How Do I Do It? How Do I Do It? How Do I Do It? How Do I Do It? How Do I Do It?
• Begin by downloading the Blue Band tutorial (and the PC supplement if necessary) from the UNH GLOBE site.
• Familiarize yourself with the tutorial until you are comfortable with the process.
• Before you begin your stretching create a new folder or directory to hold your results.
• After you have completed the stretch, and are ready to save the new image, be certain tofollow the instructions contained on page 18 of the Blue Band tutorial. These instructionsare specifically designed for the newer georeferenced (containing position data) GLOBEimages.
Related Documents