June 2011 | Edi�on No. 4 Poverty Reduc�on and Economic Management Unit Africa Region Turning the Tide in Turbulent Times Making the most of Kenya’s demographic change and rapid urbaniza�on

Welcome message from author
This document is posted to help you gain knowledge. Please leave a comment to let me know what you think about it! Share it to your friends and learn new things together.
Transcript
June 2011 | Edi�on No. 4
Poverty Reduc�on and Economic Management Unit Africa Region
Turning the Tide in Turbulent Times
Making the most of Kenya’s demographic change and rapid urbaniza�on
TABLE OF CONTENTS
ABBREVIATIONS AND ACRONYMS i
FOREWORD ii
ACKNOWLEDGEMENT iii
EXECUTIVE SUMMARY iv
THE STATE OF KENYA’S ECONOMY 1
1. Naviga�ng the 2011 Economic Storm 22. S�ll at The Tipping Point? Outlook for 2011 and Beyond 113. New Products and New Markets 13
MAKING THE MOST OF KENYA’S DEMOGRAPHIC CHANGE AND RAPID URBANIZATION 174. Demographic Change: More People, Living Longer 185. Geographic Change: From Rural to Urban 206. Devolu�on: From Central to Local 27
ANNEXES 32
Annex 1: Impact of Exchange Rate Changes on Kenya’s Domes�c Oil Prices 33
Annex 2: Analyzing Kenya’s Export Diversity 34
Annex 3: What is Rural and What is Urban? 35
Annex 4: Data Tables and Figures 37
LIST OF TABLES
Table 1: S�ll at the �pping point? Growth scenarios for 2011 and beyond 11
Table 2: Kenya’s key macroeconomic indicators 12
Table 3: Fer�lity rates in Kenya: A rural – urban divide 19
Table 4: Kenya’s rapidly growing towns 24
LIST OF FIGURES
Figure 1: Kenya outperformed Sub-Saharan Africa in five of the last six years v
Figure 2: Kenya can s�ll become a Middle Income Country within this decade vii
Figure 3: By 2033, most Kenyans will live in ci�es viii
Figure 4: A strong performance in 2010; growth has been balanced across sectors and quarters 3
Figure 5: Naviga�ng an economic storm in 2011 - infla�on rises and stock market declines 3
Figure 6: Global oil prices are s�ll below the 2008 peak – but Kenya’s prices are at their highest level ever 4
Figure 7: Monetary �ghtening has began, as the shilling has weakened 6
Figure 8: Credit growth to the private sector has recovered - real estate & household sectors benefi�ed most 7
Figure 9: The fiscal s�mulus led to higher development spending - financed through domes�c borrowing 8
Figure 10: With higher growth Kenya can afford higher deficits and s�ll reach its debt targets 8 Figure 11: Kenya’s exports are weak - the current account deficit widened and the overall
balance shrunk 10
Figure 12: Oil, machinery & transport equipment are driving Kenya’s exports 10
Figure 13: Rising oil prices have a nega�ve impact on Kenya’s external posi�on 11
Figure 14: In 2011, the economy is expected to grow at 4.8 % but, with shocks, could moderate to 4.2 % 13
Figure 15: Kenya’s main exports remain tea, hor�culture, and tourism - which make it vulnerable to external shocks 14
Figure 16: New markets - Africa overtakes Europe 14
Figure 17: The transforma�on of Kenya’s tea exports - UK has been overtaken by Pakistan and Egypt 15
Figure 18: Tex�les, chemicals, and machines have the highest export poten�al 15
Figure 19: New products - exponen�al export growth in some manufactured products, but from a very low base 16
Figure 20: Kenya today and tomorrow - double the popula�on but not many more children 18
Figure 21: Urbaniza�on – a fact of life in Kenya and beyond 20
Figure 22: Richer countries are more urbanized 20
Figure 23: Two hubs – Kenya’s best jobs are in Nairobi and Mombasa 22
Figure 24: Kenya has the best market access in East and Central Africa 26
Figure 25: Despite rapid urbaniza�on, most coun�es are s�ll predominantly rural 29
Figure 26: Service provision has not kept pace with rapid urbaniza�on 29
LIST OF BOXES
Box 1: Protec�ng the poor - what can policy makers do? 5
Box 2: The demographic dividend 19
Box 3: Life in the city is hard, but it offers opportuni�es 21
Box 4: Korea’s Urbaniza�on: A model for Kenya? 23
Box 5: Short routes but long economic distance – the case of Kenya’s manufacturers 26
ABBREVIATIONS AND ACRONYMS
AGOA Africa Growth and Opportunity ActBPO Business Process OutsourcingCBK Central Bank of KenyaCBR Central Bank RateCCK Communica�on Commission of KenyaCOMESA Common Market of Eastern and Southern AfricaCPI Consumer Price IndexCRR Cash Reserve Ra�oDRC Democra�c Republic of CongoEAC East African CommunityFDI Foreign Direct InvestmentGDP Gross Domes�c ProductHA HectareICC Interna�onal Criminal CourtICT Informa�on and Communica�on TechnologyIT Informa�on TechnologyJKIA Jomo Kenya�a Interna�onal AirportKEU Kenya Economic UpdateKNBS Kenya Na�onal Bureau of Sta�s�csKRA Kenya Revenue AuthorityMIC Middle Income CountryMT Metric TonNBFI Non Bank Financial Ins�tu�onsNEER Nominal Effec�ve Exchange RateODA Official Development AssistanceOECD Organiza�on for Economic Co-opera�on and DevelopmentRCA Revealed Compara�ve AdvantageREER Real Effec�ve Exchange RateSME Small & Medium EnterprisesSSA Sub-Saharan AfricaUN United Na�onsUS United States VAT Value Added TaxWRS Warehouse Receip�ng SystemWB World Bank
June 2011 | Edi�on No. 4 i
June 2011 | Edi�on No. 4
It is my great pleasure to present the fourth edi�on of the World Bank’s Kenya Economic Update. The year 2011 will be challenging for Kenya. Global and domes�c shocks are tes�ng Kenya’s resilience
yet again. The Government has started to implement the new cons�tu�on, which Kenyans haveembraced with high hopes for sustained structural change. Rapid popula�on growth and urbaniza�onhave been changing Kenya’s face, and these trends will con�nue to shape the country’s developmentprospects. This is why we chose as the �tle of this report “Turning the Tide in Turbulent Times”. We argue that Kenya can manage its major challenges successfully, while addressing short-term shocks at the same �me.
The Kenya Economic Updates, which the Bank is publishing every six months, have become our leading vehicle to analyze development trends in Kenya. With these reports, we want to support all those who want to improve the economic management of Kenya. In par�cular, we intend to help inform ands�mulate debate on topical policy issues, and to make a contribu�on to unleashing Kenya’s growthpoten�al.
This edi�on has three main messages. First, Kenya will need to navigate through another economicstorm in 2011. This will reduce growth to a projected 4.8 percent, which is lower than last year but s�ll substan�ally higher than the average of the last decade. Second, Kenya had a good economicstart for the current decade, because in 2010, growth was higher than expected, at 5.6 percent. In fact, if growth would accelerate to 6 percent, Kenya could reach Middle Income Country status, or a per capita income of US$ 1,000, by 2019. Third, Kenya is at the beginning of a major demographic transi�on and is urbanizing rapidly. Kenya will con�nue to grow each year by more than one millionpeople, who will increasingly live longer, be be�er educated, and choose to make their home in ci�es.This social and economic transforma�on, if managed well, can create a posi�ve development impactfor Kenya.
The World Bank remains ready to work with all Kenyan stakeholders who want to turn the �de inthese turbulent �mes and make the most of the major structural shi�s that are currently underway.
Johannes Zu�World Bank
Country Director for Kenya
FOREWORD
ii
ACKNOWLEDGEMENT
This fourth edi�on of the Kenya Economic Update was prepared by a team led by Jane Kiringai and Wolfgang Fengler. The report’s special focus on demographic change and urbaniza�on was led by
Anton Dobronogov and Aurelien Kruse. The core team also included Allen Dennis, John Randa, Be�yMaina, Fred Owegi, Philip Jespersen, Rosemary O�eno, Roger Sullivan, Catherine Gachukia, and FredWamalwa. The team acknowledges the contribu�ons of Brian Blankespoor, Sumila Gulyani, TraceyLane, Laban Maiyo, Yira Mascaró, Diana Or�z, Ravi Ruparel, Emi Suzuki, Aaron Thegea, and KathyWhimp, as well as Dimitri Stoelinga and Sachin Gathani from Laterite.
The report benefited from the insights of several peer reviewers, including Indermit Gill, GabrielDemombynes, and Aly Khan Satchu, as well as from the comments shared by Uwe Deichmann, Jonathan Rose, and Birgt Hansl. The team received guidance from Kathie Krumm and Johannes Zu�.
The report was made possible by a successful partnership with key Kenyan policy makers. An earlier dra� of this report was presented to the Quartely Economic Roundtable chaired by Professor Njuguna Ndung’u, Governor of the Central Bank of Kenya, on May 6, 2011. Roundtable par�cipants includedsenior officials from the Ministry of Finance, the Prime Minister’s Office, the Central Bank of Kenya,the Kenya Na�onal Bureau of Sta�s�cs, the Kenya Ins�tute of Public Policy and Research Analysis,the Kenya Revenue Authority, the Interna�onal Monetary Fund, the Australian High Commission andAusAID. We also add our thanks to AusAid for suppor�ng the World Bank’s Fiscal Decentraliza�onKnowledge Program, a source of important informa�on for this report.
June 2011 | Edi�on No. 4 iii
Main Messages • Kenya will need to navigate through another economic storm in 2011. This will reduce growth to a projected
4.8 percent, which is s�ll substan�ally higher than the average of the last decade.
• The decade started on a bullish note for Kenya. In 2010, growth was higher than expected at 5.6 percent. If growth accelerated to 6 percent, Kenya could reach Middle Income Country status by 2019.
• Kenya is at the threshold of a major demographic transi�on and is urbanizing rapidly. Each year, Kenya will con�nue to grow by more than one million people, who will live longer, be be�er educated, and increasinglylive in ci�es. This social and economic transforma�on needs to be managed well to catalyze its developmentimpact.
Key Recommenda�ons to Respond to the Economic Turbulence
• Maintain macroeconomic stability, and contain infla�on and further increases in debt. This entails �ghtermonetary policies and a reduc�on of the fiscal deficit. If there is a need for addi�onal expenditures in responseto external shocks, realloca�ons seem to be the most appropriate response.
• If high food prices persist and it becomes necessary to cushion the most vulnerable, distribute cash rather than food, if poor families in need can be iden�fied. Given Kenya’s success with ‘mobile money’, this is a more effec�ve approach and one that would also help to build a more robust social protec�on system.
• Enhance export compe��veness. Kenya can leverage its auspicious loca�on and its role as a hub for the largerEast African region by upgrading its infrastructure, crea�ng a good business environment, and con�nuingwith regional integra�on. This would also posi�on Kenya globally and generate addi�onal exports in servicesand manufacturing. The best way to start making Kenya more compe��ve is to strengthen its coastal hub andto modernize the port of Mombasa.
Key Recommenda�ons to Help Manage Kenya’s Demographic and Geographic Transi�ons
• Invest in people rather than places. Economic ac�vity will always be uneven, but development can s�ll beinclusive if the government adopts “spa�ally blind” social policies and provides access to basic services for allKenyans. As people move to urban areas they will then be in a posi�on to find or to create be�er jobs.
• Let ci�es grow and thrive. Kenya will become a predominantly urban country by 2033. Ci�es are the world’sgrowth poles. To allow its ci�es to thrive, Kenya needs to further upgrade infrastructure in and betweenci�es. The more determined Kenya will be in establishing this “connec�ng infrastructure”, the more likely itwill succeed in its development efforts.
• Manage devolu�on to empower ci�es, and to provide basic services to rural Kenyans. Even though Kenya is rapidly urbanizing, 42 out of the 47 new coun�es will be predominantly rural. Devolu�on will provideopportuni�es for be�er accountability and local service delivery. At the same �me, there is a risk that Kenya’smedium-sized ci�es with 100,000 to 400,000 people, will not receive the autonomy and resources they need. Kenya needs a separate urban �er to help manage rapid urbaniza�on successfully.
Main Messages and Key Recommenda�ons
June 2011 | Edi�on No. 4 iv
EXECUTIVE SUMMARY
June 2011 | Edi�on No. 4 v
Over the last decade, Kenya’s society and economy have changed fundamentally and these deep trends will con�nue. Rapid popula�on growth and urbaniza�on will create many new
challenges which need to be managed well to support Kenya’s economic take-off in the medium-term. This fourth edi�on of the Kenya Economic Update argues that Kenya can Turn the Tide in Turbulent Times and make the most of the ongoing structural shi�s. In 2011, Kenya will need toaddress short-term domes�c and interna�onal shocks, including higher infla�on, pressures on the exchange rate and, most importantly, a vola�le poli�cal environment. The government will needto navigate through these shocks successfully and to con�nue with its economic reform program toachieve higher growth. At the same �me, the government will be making major strategic decisionsin Kenya’s decentraliza�on architecture which will shape the medium-term development prospectsof the country. Economic success is possible, as the 5.6 percent growth in 2010 has shown. If growth would accelerate to an average of 6 percent this decade, Kenya would achieve Middle Income Country status by 2019.
1. Naviga�ng through AnotherEconomic Storm
In 2011, Kenya will need to navigate through another economic storm. Since the end of
2010, infla�on has increased from 3 percentto 12 percent, the shilling has lost ground, and the stock market has declined by 10 percent. Global shocks, especially the rapid rise in food and fuel prices, have added to Kenya’s economic challenges. The poor rainfall during the tradi�onallong rains of March-May has put further stress on food prices. Poli�cal uncertainty, linked to theInterna�onal Criminal Court’s (ICC) inves�ga�oninto prominent public figures and the prospectof the 2012 elec�ons, also adds to economicvola�lity, as investors and interna�onal partnershave again become more cau�ous.
Despite these challenges, Kenya began 2011 with the strong momentum generated in 2010, where growth exceeded expecta�ons at 5.6percent. Last year, economic ac�vity was led byrebounding agricultural and industrial sectors, while most services sub-sectors con�nued toperform strongly as well. Economic growth has been above 4.0 percent for four consecu�ve
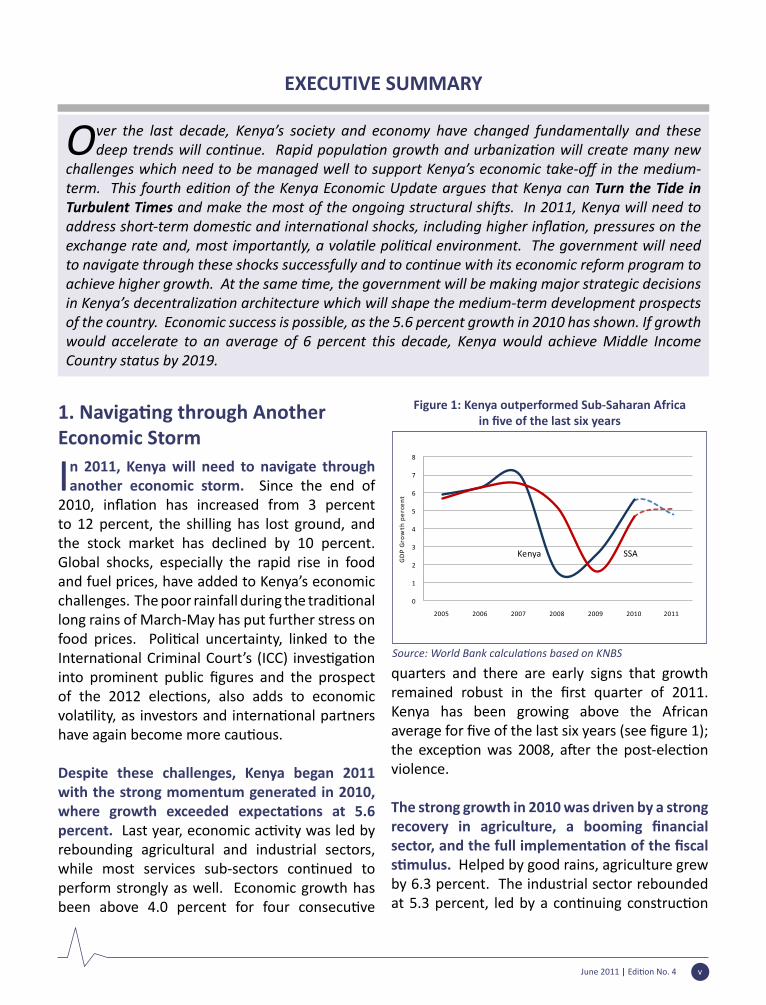
quarters and there are early signs that growth remained robust in the first quarter of 2011.Kenya has been growing above the African average for five of the last six years (see figure 1);the excep�on was 2008, a�er the post-elec�onviolence.
The strong growth in 2010 was driven by a strong recovery in agriculture, a booming financialsector, and the full implementa�on of the fiscals�mulus. Helped by good rains, agriculture grew by 6.3 percent. The industrial sector rebounded at 5.3 percent, led by a con�nuing construc�on
Figure 1: Kenya outperformed Sub-Saharan Africain five of the last six years
Source: World Bank calcula�ons based on KNBS
June 2011 | Edi�on No. 4 vi
boom. The services sectors, which have been the backbone of Kenya’s economy in recent years, grew robustly at 5.4 percent.
For growth to remain robust in 2011 and 2012, Kenya needs to preserve its sound macroeconomic policies. A�er successfully implemen�ng thefiscal s�mulus, the country must now rebuild itsfiscal buffers. Since 2009, Kenya has been runningrela�vely high fiscal deficits of 6 percent (of GDP)and more, mainly to finance the fiscal s�mulus.This has led the debt-to-GDP ra�o to increase toclose to 50 percent, exceeding the government’s target rate of 45 percent. This is a small increase compared to those seen in most countries, but reason enough to revert back to lower fiscaldeficits. If Kenya’s growth rate remains close to5 percent, the government can only afford torun a fiscal deficit of around 4 percent―abouttwo percentage points lower than currently―if it wants to achieve a 45 percent debt-to-GDP ra�oby 2013/14.
In 2011, infla�on has been rising rapidly a�erreaching its lowest level in a decade in October 2010 and averaging 4.1 percent for the whole year. Like elsewhere, higher food and fuel prices in 2011 have been driving infla�on, whichdispropor�onally hit the poor as they spend alarge share of their income on food. However, when global food prices started to increase, Kenya was in a be�er posi�on than during the2008/09 food crisis because the domes�c priceof maize declined as a result of good rains and a strong 2010 harvest. As prices rose steadily through April 2011, the government took ini�almeasures to respond, while learning the lessons from the 2009 drought and corrup�on scandalwhen import du�es on maize were lowered.
Kenya has also been hit by rising and vola�leoil prices, which have weakened its external posi�on. Oil and hydrocarbon products, which
account for 25 percent of Kenya’s imports, have risen sharply in 2011, adding to Kenya’s import bill. At the same �me, some of Kenya’s major exportmarkets such as Egypt, which consumes large amounts of Kenya’s tea, are experiencing their own domes�c shocks. Kenya’s overall externalbalance weakened due to a deteriora�ng currentaccount. If oil prices stay above US$ 100 per barrel in 2011, it is possibly that Kenya’s overall balance will turn nega�ve for the first �me sincethe global financial crisis. As a result the Kenyashilling depreciated to its lowest level against the dollar in 15 years, pu�ng further upward pressureon prices given Kenya’s substan�al import bill. Inthe medium-term, the lower exchange rate could benefit exports, but this would also depend onmany other improvements in the investment climate and in infrastructure.
2. S�ll at the Tipping Point?
For 2011, the World Bank is lowering its growth forecast to 4.8 percent. This is half
a percentage point lower than our previous forecast and in line with the expected overall decline in Africa’s growth. While lower than ini�ally expected, this year’s growth would s�llrank among the high growth periods of the last 30 years.
For 2012, we project growth at 5.0 percent, assuming a more favorable external environment and a peaceful run-up to the general elec�ons. There are a number of structural factors which will benefit Kenya in the medium-term andalready bear fruits in 2012. These include improved infrastructure services (especially roads and energy), the spill-over effects of the ICTrevolu�on, and an accelera�on of south-southintegra�on. These improvements will boostinvestor confidence, especially if the governmentcon�nues with its ins�tu�onal reforms to easethe cost of business.
June 2011 | Edi�on No. 4 vii
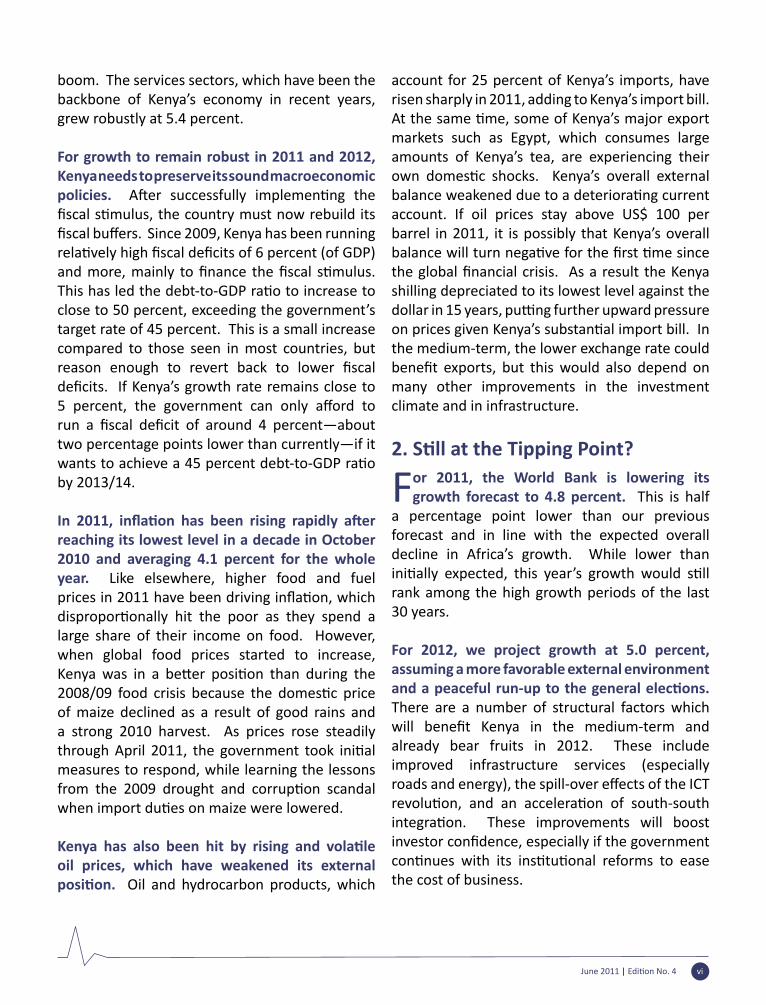
With projected growth at 5.1 percent over 2010 to 2012, Kenya will have started the decade on a posi�ve note. This is higher than the average of all previous decades (including 2000-2009), but substan�ally lower than the 10 percentgrowth rate an�cipated under Kenya’s Vision 2030 development strategy. Kenya could s�llreach Middle Income Country status of $1,000 GDP per capita even by the end of this decade if growth accelerates to an average of 6 percent. However, if growth slowed down to an average of 3.7 percent (the level experienced over 2000-2010), Kenyans would need to wait un�l 2036 toa�ain this status (see figure 2).
Over the last years, Kenya has started to diversify its export markets. Since 2000, there has been a major shi� away from Europe towards Africaand Asia. Today, more than 45 percent of Kenya’s trade is with other African countries, while trade with Asia is rising exponen�ally. This geographicdiversifica�on of Kenya’s exports has been mainlytaking place both in new and tradi�onal exportproducts. For tea―Kenya’s top foreign exchange earner at US$ 1.2 billion―the United Kingdom is now in third place behind Egypt and Pakistan. The USA is a special case as Kenya’s apparel exports there have soared as a result of the Africa Growth and Opportunity Act (AGOA).
Star�ng from a low base, Kenya’s has alsobroadened its export product range. This is par�cularly so in a number of manufacturingsub-sectors, including machinery, apparel, and chemicals. In the 1990s, these three sub-sectors accounted jointly for about US$ 120 million in average yearly export earnings. In the 2000s, the figure was four �mes larger at US$ 480 million. Formachineries and chemicals, the export markets are almost exclusively in Africa and Asia, while tex�les are predominantly going to the USA.
These sectoral shi�s demonstrate that Kenyacan indeed start its export engine and establish an industrial base. Kenya would be in a good posi�on to benefit from “scale economies” andbecome one of Africa’s manufacturing hubs if it improved its investment climate. It has be�eraccess to global markets than most African countries, thanks partly to a good geographical loca�on, and a large supply of labor. With abe�er business environment and upgradedinfrastructure, especially a modernized port of Mombasa, Kenya will have a great opportunity to accelerate its export performance.
3. Harnessing Kenya’s Demographic and Geographic Transi�on
Kenya’s momentous transi�on to devolvedgovernment under the new cons�tu�on
comes at a �me of fundamental structuraltransforma�ons. These trends are changing the face of the na�on. The average Kenyan used tobe young, dependent, and rural; increasingly Kenyans will be middle-aged, ac�ve, and urban. The first shi� is demographic. Kenya’s popula�onwill con�nue to grow rapidly, adding more thanone million people every year, albeit for differentreasons than in the past. Kenyans will live longer, have fewer children, and become increasingly educated. The second shi� is geographic. Whiles�ll being predominantly rural, Kenya is rapidly
Figure 2: Kenya can s�ll become a Middle IncomeCountry within this decade
Source: World Bank projec�ons
June 2011 | Edi�on No. 4 viii
urbanizing. The challenge for policy makers will be to make the most out of this process by managing the growth of ci�es to leverage the economic andsocial dividends of urbaniza�on.
Kenya’s popula�on is rising rapidly. Today, it is home to 40 million people. This is a five-fold increase compared to1963, at the eve of independence, when it had just over 8 million people. Rapid popula�on growth is set to con�nue - by 2040, Kenya will have an es�mated75 million people and become the 21st largest country in the world, larger than the United Kingdom, Germany, or France.
Steady popula�on growth masks a deepdemographic transi�on. While popula�ongrowth appears steady, the factors driving it are changing fundamentally. Un�l about 2000, it wasdue to increasing numbers of children. Today, the average number of children per family has fallen sharply, from 8.1 in 1978 to 4.6 in 2008, and it is projected to decline further to 2.4 children by 2050. Kenya’s popula�on con�nues to growbecause people live longer and because there is an increasing number of women in their twen�esand thir�es.
These trends create the opportunity to reap a “demographic dividend”. Adults in their working ages (16-64) will increasingly outnumber their dependents; children and the elderly. At the end of the 1990s, the number of working adults overtook the number of children and elderly. By 2030, there will be some 40 million working adults out of a total popula�on of 63 million, improvingthe “dependency ra�o” to almost 2:1.
This demographic transi�on coincideswith a spa�al transforma�on. Kenya is s�llpredominantly rural. Seven out of ten Kenyans live in rural areas. Agriculture remains a key
sector of the economy employing more than a third of adults. At the same �me, the country isurbanizing rapidly. Every year more than 250,000 Kenyans are moving to ci�es and formerly rural
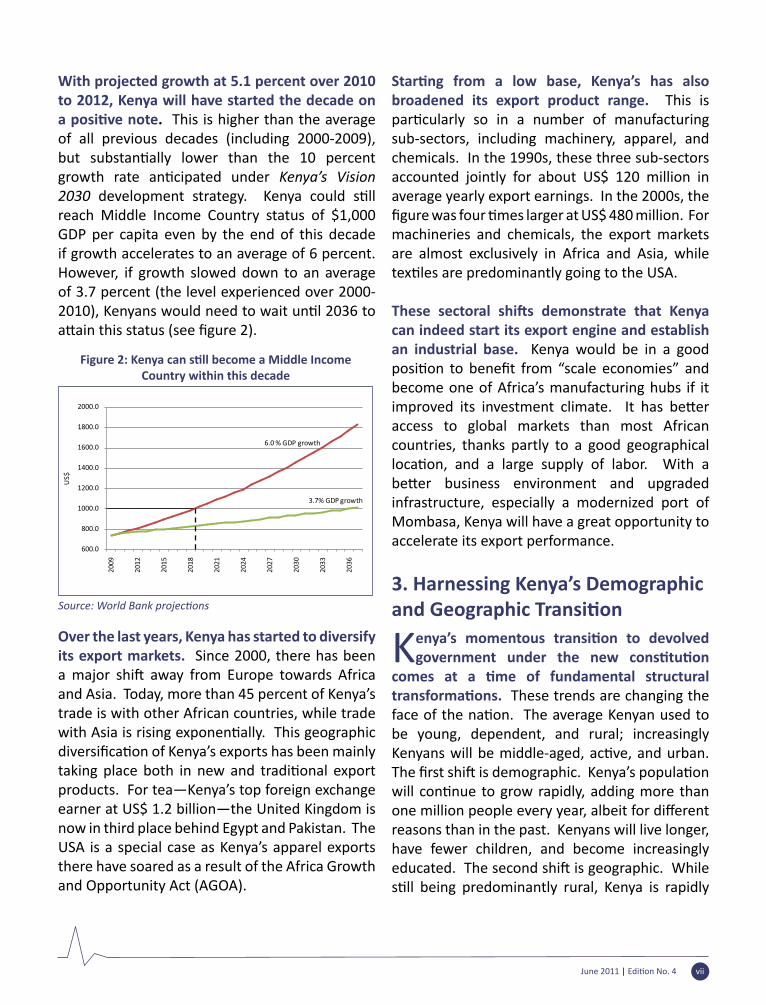
areas are becoming increasingly urban. Twenty years ago Kenya’s urbaniza�on level was only 18percent. Since then, Kenya’s urban popula�on has been rising rapidly. The share of the urban popula�onis set to rise to 37 percent by 2020, and in 2033 Kenya will reach an important milestone, when most of its popula�on will live in urbanareas (see figure 3).
As elsewhere, urbaniza�on provides manyopportuni�es for economic and socialdevelopment. Economic ac�vi�es located inthe ci�es and towns are on average much moreproduc�ve than those located in rural areas – sowhen more people live and work in the ci�es, thishelps economic growth. Economic growth, in turn, supports urbaniza�on by increasing demandfor goods and services produced in urban areas, and by helping to create urban jobs. Ci�es andtowns thrive when they can serve larger markets, internal and external. In addi�on, access tosocial services is higher in bigger ci�es, offering
Every year more than 250,000 Kenyans are
moving to ci�esand formerly rural
areas are becoming increasingly urban
Figure 3: By 2033, most Kenyans will live in ci�es
Source: World Bank calcula�ons based on KNBS, 2009, Census andUnited Na�ons, 2009, World Popula�on Prospects
June 2011 | Edi�on No. 4 ix
migrants the prospects of be�er, healthier livesand economic promo�on for them and their(fewer) children.
With urbaniza�onKenya could expand its emerging industrial sectors. People and firms benefit fromloca�ng in proximityto each other – and these benefits usuallymaterialize in urban areas. Kenya can increasingly benefitfrom agglomera�oneffects, which aregenera�ng largeenough markets for products, sufficient labor to work in factories,and new space for innova�on. While servicesare already thriving in Kenya�offering newproducts to mass markets at low cost�industrial produc�on has yet to take-off in most sub-sectors.The high costs of doing business, especially due to infrastructure constraints―congested roads, unreliable energy, and an inefficient port―arethe major hindrance for local and interna�onalinvestors.
Urbaniza�on may be a necessary condi�on fordevelopment, but it is not sufficient. Over the last two decades Kenya has been urbanizing with low growth and minimal industrializa�on. Thedecline in agriculture has been compensated by an expanding service sector, while manufacturing remained stagnant at a low 11 percent of GDP (see the Kenya Economic Update, June 2010). Kenya’s leading ci�es are also suffering from conges�onand crime which are partly offse�ng the benefitsof agglomera�on. Urban government will alsobe fundamentally challenged under the new cons�tu�on, which will alter the “ins�tu�onal
geography” of the country, possibly for the be�er, but with substan�al risks if this transi�onis handled poorly.
Nairobi is Kenya’s main hub, with 3.1 million people, represen�ng 8.1 percent of the totalpopula�on. Mombasa is Kenya’s second city, with 940,000 people, followed by 19 medium sized ci�es of 100,000 to 400,000 people. One ofthese is Nakuru, which is one of the world’s fastest growing ci�es. By 2020, when Kenya will be 37percent urban, there will be two ci�es above onemillion―Nairobi and Mombasa―and another 37 ci�es above 100,000 people.
Nairobi and Mombasa can both become growth poles in Kenya’s budding system of ci�es. Nairobi has already established itself as a regional hub for the East African region. Many interna�onal companies have locatedtheir regional headquarters in Nairobi, crea�ngaddi�onal incen�ves for new market entrants tolocate here as well. The capital is also home to major manufacturers, mainly because most of their markets are in central and western Kenya and their exports to the East African Community (EAC).
Looking beyond these regional confines, in-dustrial produc�onhas become globally integrated but “ver�-cally disintegrated.” Manufactured goods are less and less pro-duced at one loca�onbut at several loca�onswhich are connected with each other. Due to the high transport
costs within East Africa, only a coastal hub would be in a posi�on to become a manufacturing hub
¹ See more in Adams, Collier, Ndungu, Kenya – Prospects for Prosperity, Oxford 2011
The high costs of doing business, especially due
to infrastructure constraints―
congested roads, unreliable energy, and an inefficient
port― are the major hindrance for local and interna�onal
investors
Due to the high transport costs
within East Africa, only a coastal
hub would be in a posi�on to become
a manufacturing hub for global
products
June 2011 | Edi�on No. 4 x
for global products. Hence, Mombasa would be much be�er placed than Nairobi to produce forglobal markets. Rising wages in Asia will provide increasing incen�ves for manufacturing compa-nies to locate to Africa, and Mombasa could be an a�rac�ve investment des�na�on.
Devolu�on can foster development, but there arethree major risks. First, if ci�es are to con�nue tonurture and to foster economic ac�vity they haveto be properly managed. This will be par�cularlychallenging in a context where largely rural coun�es may end up ‘running’ Kenya’s ci�es.At the same �me there is a unique opportunityto re-think the management, financing, andaccountability structures of Kenya’s ci�es. Second,
devolu�on will profoundly affect service delivery,with significant responsibili�es now beingshi�ed to new county governments. Major risksinclude the interrup�on of key services duringthe transi�on to devolved government and thepossible development of inequi�es in Kenyans’access to a minimum package of services. These risks are counterbalanced by the opportunity to bring services closer to the people and make governments more accountable for service quan�ty and quality. Finally, there is a challengeto maintain, upgrade, and ra�onalize the country’sconnec�ve infrastructure as, increasingly,investment decisions will be fragmented across levels of government.
The State of Kenya’s Economy
June 2011 | Edi�on No. 4 2
Following a year of strong economic growth, Kenya has found itself dealing with a number of shocks, both external and internal, in the first half of 2011. As a result, Kenya is expected to
grow at 4.8 percent this year. For 2012, growth could reach 5 percent as long as weather condi�onsare favorable, global shocks moderate, and the poli�cal climate remains stable. While lower thanini�ally projected these growth rates are substan�ally higher than the average of the last decade. IfKenya could unblock its main bo�lenecks�infrastructure and the investment climate�Kenya could become an industrial hub and a stronger exporter. This would posi�on the country well to reachat least 6 percent in the medium term which would propel it to Middle Income Country status (US$ 1,000 per capita income) by the end of this decade.
1. Naviga�ng the 2011 EconomicStorm 1.1. Recent Economic Developments
Kenya entered 2011 on a strong economic foo�ng, but is now experiencing a series
of shocks, which could dampen its growth prospects. The most visible shock is the sharp rise in oil prices as a result of supply interrup�onslinked to unrest in the Middle East and North Africa. A second major shock in the making is the steady hike in food prices following the global trend, but also partly fueled by expecta�ons thatshortages will materialize in Kenya in the second half of 2011. Infla�on is emana�ng from thesetwo shocks and clouding the growth prospects for 2011. Kenya has been partly cushioned from the severity of the shocks because of its excep�onallystrong economic performance in 2010. The economy benefi�ed from a stable economicenvironment, especially low prices. Infla�on forthe year averaged 4.1 percent, levels last seen in 2002, and remained below the Central Bank of Kenya’s (CBK) target of 5 percent. Infla�ondeclined during 2010 as a result of lower food, oil, and telecommunica�on prices.
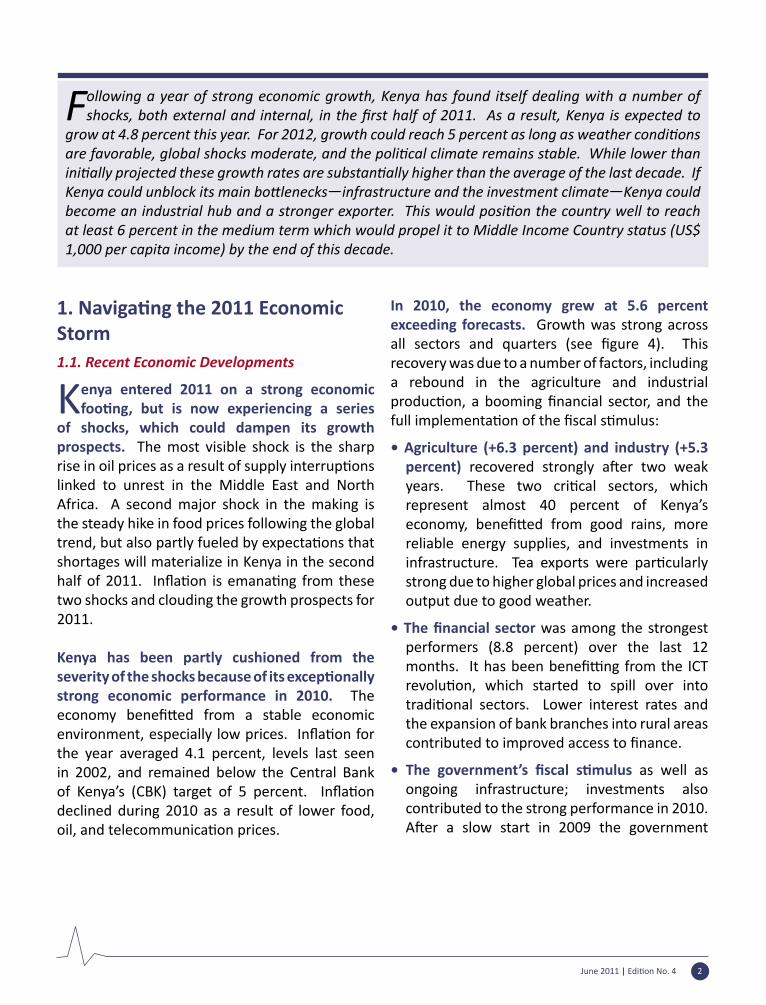
In 2010, the economy grew at 5.6 percent exceeding forecasts. Growth was strong across all sectors and quarters (see figure 4). Thisrecovery was due to a number of factors, including a rebound in the agriculture and industrial produc�on, a booming financial sector, and thefull implementa�on of the fiscal s�mulus:
• Agriculture (+6.3 percent) and industry (+5.3 percent) recovered strongly a�er two weakyears. These two cri�cal sectors, whichrepresent almost 40 percent of Kenya’s economy, benefi�ed from good rains, morereliable energy supplies, and investments in infrastructure. Tea exports were par�cularlystrong due to higher global prices and increased output due to good weather.
• The financial sector was among the strongest performers (8.8 percent) over the last 12 months. It has been benefi�ng from the ICTrevolu�on, which started to spill over intotradi�onal sectors. Lower interest rates andthe expansion of bank branches into rural areas contributed to improved access to finance.
• The government’s fiscal s�mulus as well as ongoing infrastructure; investments also contributed to the strong performance in 2010. A�er a slow start in 2009 the government
June 2011 | Edi�on No. 4 3
The State of Kenya’s Economy
succeeded in implemen�ng the fiscal s�mulus,which came together with an expansion of public investment into infrastructure, government consump�on expanded by 8.9 percent.
In 2010 Kenya’s GDP growth exceeded the average for Sub Saharan-Africa. All of Kenya’s immediate neighbors also experienced higher growth rates than in 2009 (Uganda 6.3, Tanzania
7.0, Rwanda 6.5, Sudan 5.9, and Burundi 3.7) reflec�ng improved prospects in the region. ButKenya can do even be�er and catch up with itsneighbors. There are a number of structural factors which it can leverage to achieve higher growth. These include improved infrastructure services (especially roads and energy), the spill-over effects of the ICT revolu�on, and an accelera�onof south-south integra�on. These improvements
Figure 4: A strong performance in 2010; growth has been balanced across sectors and quarters
Source: World Bank es�mates; KNBSNote: Sector share in GDP in parenthesis
Figure 5: Naviga�ng an economic storm in 2011 - infla�on rises and stock market declines
Source: KNBS, Central Bank of Kenya, Nairobi Stock Exchange, Dow Jones
June 2011 | Edi�on No. 4 4
The State of Kenya’s Economy
will also boost investor confidence, especially ifthe government con�nues to pursue ins�tu�onalreforms to ease the cost of business.
In 2011, the country will have to grapple with internal and external shocks. On the domes�cfront, the proceedings of the ICC against some of the country’s most prominent poli�cians haveincreased poli�cal risk percep�ons, such thatpoten�al investors may defer their plans. Inaddi�on, rains have arrived late for the agriculturalplan�ng seasons of March - May 2011. On externalside, Kenya has been hit by hikes in fuel and food prices. These shocks have contributed to higher infla�on, a weaker currency, and a weakening ofthe stock market. The Nairobi Stock Exchange was a star performer in 2010, recording one of the highest gains globally, but this reversed in 2011 (figure 5). This reversal can be explained inpart by foreign investors taking profits on their2010 investments, capital flight in an�cipa�on of further deprecia�on of the Kenya shilling, and thepoli�cal risks associated with ICC process.
The increase in food prices, especially for maize, comes at a �me when Kenya s�ll has enoughstocks. Food and beverages, which cons�tute 36percent of the Consumer Price Index (CPI) rose by 19.4 percent un�l April 2011; the prices of maizeand kale increased by more than 50 percent. Kenya was partly sheltered from the global food price increases because the 2010 harvest was excep�onally strong, especially in maize whereproduc�on increased by 19 percent (See Annex4, table A23).
The Na�onalCerealsandProduceBoardhasfacedchallenges in procuring maize. Many farmers are not selling maize in an�cipa�on of higher pricesif the rains fail and food markets con�nue toperform poorly. In Kenya, high food prices are hur�ng the poor dispropor�onately because theydevote 70 percent of their spending on food. Even in the rural areas the poor are hurt because only a small number of large farmers�two percent control 50 percent of the maize market�benefitfrom higher prices.² Managing high and vola�le
Figure 6: Global oil prices are s�ll below the 2008 peak – but Kenya’s prices are at their highest level ever
Source: World Bank calcula�ons based on KNBS
� See Kenya Economic Update, S�ll Standing: Kenya’s Slow Recovery from a Quadruple Shock(December 2009) for a detailed analysis of Kenya’s maize sector and previous food crisis.
June 2011 | Edi�on No. 4 5
The State of Kenya’s Economy
Box 1: Protec�ng the poor – what can policy makers do?
Source: World Bank, KEU team; Marcelo Giugale, Huffington Post, April 2011
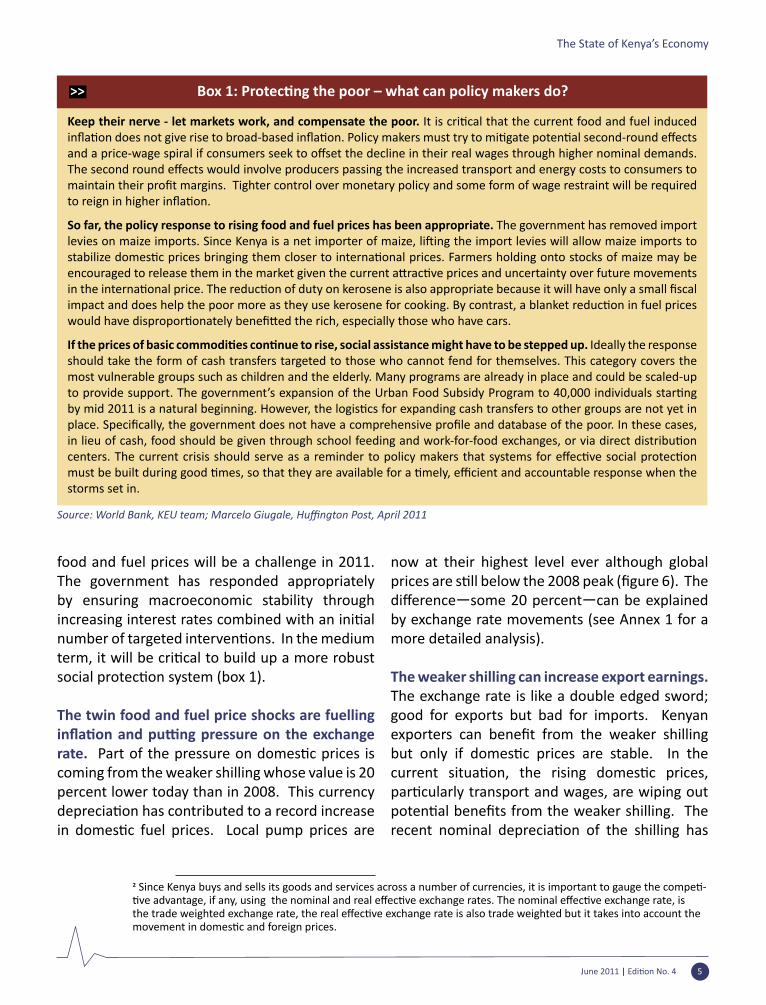
Keep their nerve - let markets work, and compensate the poor. It is cri�cal that the current food and fuel inducedinfla�on does not give rise to broad-based infla�on. Policy makers must try to mi�gate poten�al second-round effectsand a price-wage spiral if consumers seek to offset the decline in their real wages through higher nominal demands. The second round effects would involve producers passing the increased transport and energy costs to consumers tomaintain their profit margins. Tighter control over monetary policy and some form of wage restraint will be requiredto reign in higher infla�on.
So far, the policy response to rising food and fuel prices has been appropriate. The government has removed import levies on maize imports. Since Kenya is a net importer of maize, li�ing the import levies will allow maize imports tostabilize domes�c prices bringing them closer to interna�onal prices. Farmers holding onto stocks of maize may beencouraged to release them in the market given the current a�rac�ve prices and uncertainty over future movementsin the interna�onal price. The reduc�on of duty on kerosene is also appropriate because it will have only a small fiscalimpact and does help the poor more as they use kerosene for cooking. By contrast, a blanket reduc�on in fuel priceswould have dispropor�onately benefi�ed the rich, especially those who have cars.
If the prices of basic commodi�es con�nue to rise, social assistance might have to be stepped up. Ideally the response should take the form of cash transfers targeted to those who cannot fend for themselves. This category covers the most vulnerable groups such as children and the elderly. Many programs are already in place and could be scaled-up to provide support. The government’s expansion of the Urban Food Subsidy Program to 40,000 individuals star�ngby mid 2011 is a natural beginning. However, the logis�cs for expanding cash transfers to other groups are not yet inplace. Specifically, the government does not have a comprehensive profile and database of the poor. In these cases,in lieu of cash, food should be given through school feeding and work-for-food exchanges, or via direct distribu�oncenters. The current crisis should serve as a reminder to policy makers that systems for effec�ve social protec�onmust be built during good �mes, so that they are available for a �mely, efficient and accountable response when the storms set in.
food and fuel prices will be a challenge in 2011. The government has responded appropriately by ensuring macroeconomic stability through increasing interest rates combined with an ini�alnumber of targeted interven�ons. In the mediumterm, it will be cri�cal to build up a more robustsocial protec�on system (box 1).
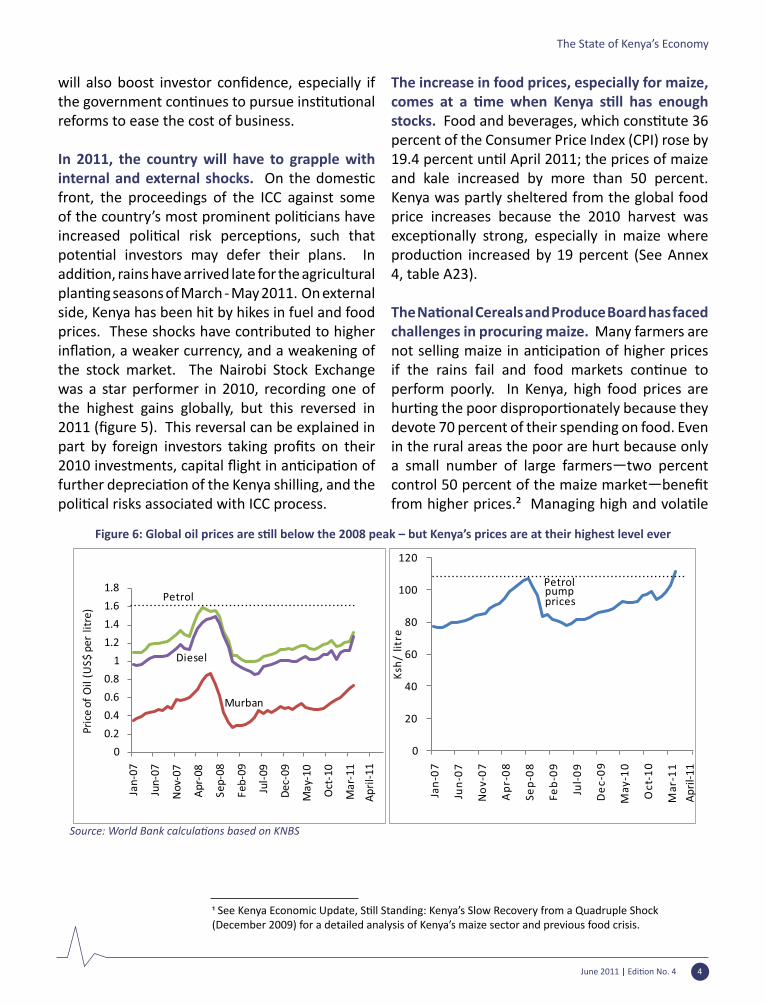
The twin food and fuel price shocks are fuelling infla�on and pu�ng pressure on the exchangerate. Part of the pressure on domes�c prices iscoming from the weaker shilling whose value is 20 percent lower today than in 2008. This currency deprecia�on has contributed to a record increasein domes�c fuel prices. Local pump prices are
now at their highest level ever although global prices are s�ll below the 2008 peak (figure 6). Thedifference�some 20 percent�can be explained by exchange rate movements (see Annex 1 for a more detailed analysis).
The weaker shilling can increase export earnings. The exchange rate is like a double edged sword; good for exports but bad for imports. Kenyan exporters can benefit from the weaker shillingbut only if domes�c prices are stable. In thecurrent situa�on, the rising domes�c prices,par�cularly transport and wages, are wiping outpoten�al benefits from the weaker shilling. Therecent nominal deprecia�on of the shilling has
� Since Kenya buys and sells its goods and services across a number of currencies, it is important to gauge the compe�-�ve advantage, if any, using the nominal and real effec�ve exchange rates. The nominal effec�ve exchange rate, isthe trade weighted exchange rate, the real effec�ve exchange rate is also trade weighted but it takes into account themovement in domes�c and foreign prices.
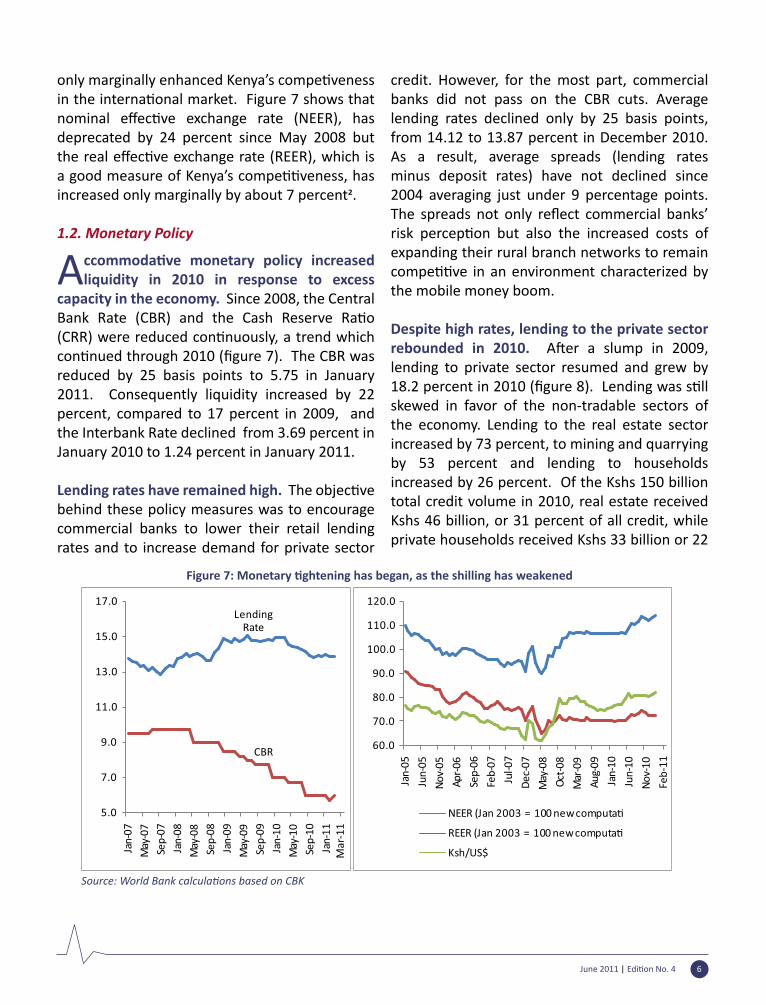
only marginally enhanced Kenya’s compe�venessin the interna�onal market. Figure 7 shows thatnominal effec�ve exchange rate (NEER), hasdeprecated by 24 percent since May 2008 but the real effec�ve exchange rate (REER), which isa good measure of Kenya’s compe��veness, hasincreased only marginally by about 7 percent�. 1.2. Monetary Policy
Accommoda�ve monetary policy increasedliquidity in 2010 in response to excess
capacity in the economy. Since 2008, the Central Bank Rate (CBR) and the Cash Reserve Ra�o(CRR) were reduced con�nuously, a trend whichcon�nued through 2010 (figure 7). The CBR wasreduced by 25 basis points to 5.75 in January 2011. Consequently liquidity increased by 22 percent, compared to 17 percent in 2009, and the Interbank Rate declined from 3.69 percent in January 2010 to 1.24 percent in January 2011.
Lending rates have remained high. The objec�vebehind these policy measures was to encourage commercial banks to lower their retail lending rates and to increase demand for private sector
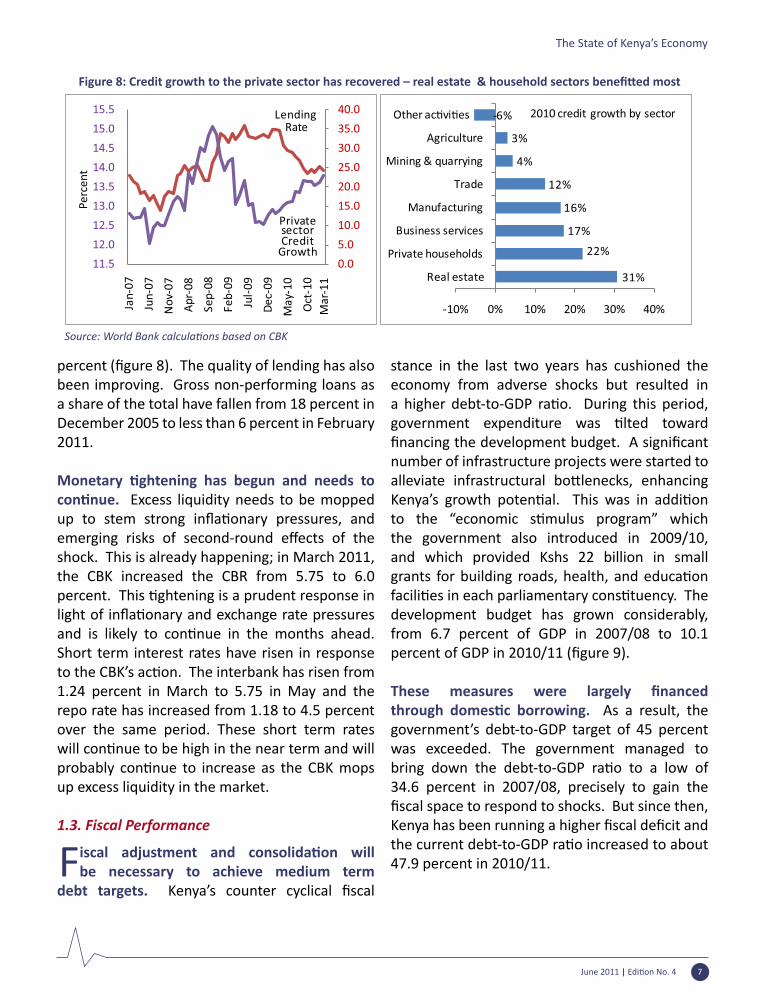
credit. However, for the most part, commercial banks did not pass on the CBR cuts. Average lending rates declined only by 25 basis points, from 14.12 to 13.87 percent in December 2010. As a result, average spreads (lending rates minus deposit rates) have not declined since 2004 averaging just under 9 percentage points. The spreads not only reflect commercial banks’risk percep�on but also the increased costs ofexpanding their rural branch networks to remain compe��ve in an environment characterized bythe mobile money boom. Despite high rates, lending to the private sector rebounded in 2010. A�er a slump in 2009,lending to private sector resumed and grew by 18.2 percent in 2010 (figure 8). Lending was s�llskewed in favor of the non-tradable sectors of the economy. Lending to the real estate sector increased by 73 percent, to mining and quarrying by 53 percent and lending to households increased by 26 percent. Of the Kshs 150 billion total credit volume in 2010, real estate received Kshs 46 billion, or 31 percent of all credit, while private households received Kshs 33 billion or 22
Figure 7: Monetary �ghtening has began, as the shilling has weakened
Source: World Bank calcula�ons based on CBK
June 2011 | Edi�on No. 4 6
June 2011 | Edi�on No. 4 7
The State of Kenya’s Economy
percent (figure 8). The quality of lending has alsobeen improving. Gross non-performing loans as a share of the total have fallen from 18 percent in December 2005 to less than 6 percent in February 2011.
Monetary �ghtening has begun and needs tocon�nue. Excess liquidity needs to be mopped up to stem strong infla�onary pressures, andemerging risks of second-round effects of theshock. This is already happening; in March 2011, the CBK increased the CBR from 5.75 to 6.0 percent. This �ghtening is a prudent response inlight of infla�onary and exchange rate pressuresand is likely to con�nue in the months ahead. Short term interest rates have risen in response to the CBK’s ac�on. The interbank has risen from1.24 percent in March to 5.75 in May and the repo rate has increased from 1.18 to 4.5 percent over the same period. These short term rates will con�nue to be high in the near term and willprobably con�nue to increase as the CBK mopsup excess liquidity in the market.
1.3. Fiscal Performance Fiscal adjustment and consolida�on will
be necessary to achieve medium term debt targets. Kenya’s counter cyclical fiscal
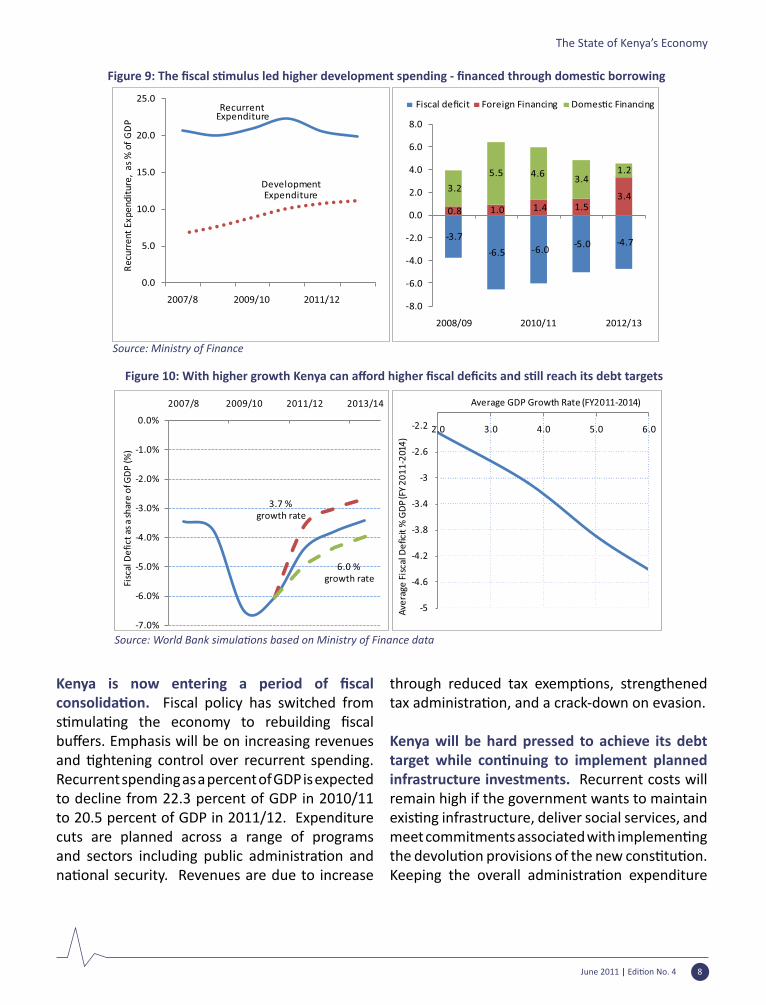
stance in the last two years has cushioned the economy from adverse shocks but resulted in a higher debt-to-GDP ra�o. During this period,government expenditure was �lted towardfinancing the development budget. A significantnumber of infrastructure projects were started to alleviate infrastructural bo�lenecks, enhancingKenya’s growth poten�al. This was in addi�onto the “economic s�mulus program” whichthe government also introduced in 2009/10, and which provided Kshs 22 billion in small grants for building roads, health, and educa�onfacili�es in each parliamentary cons�tuency. Thedevelopment budget has grown considerably, from 6.7 percent of GDP in 2007/08 to 10.1 percent of GDP in 2010/11 (figure 9).
These measures were largely financedthrough domes�c borrowing. As a result, the government’s debt-to-GDP target of 45 percent was exceeded. The government managed to bring down the debt-to-GDP ra�o to a low of34.6 percent in 2007/08, precisely to gain the fiscal space to respond to shocks. But since then,Kenya has been running a higher fiscal deficit andthe current debt-to-GDP ra�o increased to about47.9 percent in 2010/11.
Figure 8: Credit growth to the private sector has recovered – real estate & household sectors benefi�ed most
Source: World Bank calcula�ons based on CBK
June 2011 | Edi�on No. 4 8
The State of Kenya’s Economy
Kenya is now entering a period of fiscalconsolida�on. Fiscal policy has switched from s�mula�ng the economy to rebuilding fiscalbuffers. Emphasis will be on increasing revenuesand �ghtening control over recurrent spending. Recurrent spending as a percent of GDP is expected to decline from 22.3 percent of GDP in 2010/11 to 20.5 percent of GDP in 2011/12. Expenditure cuts are planned across a range of programs and sectors including public administra�on andna�onal security. Revenues are due to increase
through reduced tax exemp�ons, strengthenedtax administra�on, and a crack-down on evasion. Kenya will be hard pressed to achieve its debt target while con�nuing to implement plannedinfrastructure investments. Recurrent costs will remain high if the government wants to maintain exis�ng infrastructure, deliver social services, andmeet commitments associated with implemen�ngthe devolu�on provisions of the new cons�tu�on.Keeping the overall administra�on expenditure
Figure 9: The fiscal s�mulus led higher development spending - financed through domes�c borrowing
Source: Ministry of Finance
Figure 10: With higher growth Kenya can afford higher fiscal deficits and s�ll reach its debt targets
Source: World Bank simula�ons based on Ministry of Finance data
June 2011 | Edi�on No. 4 9
The State of Kenya’s Economy
constant in real terms is going to be especially challenging as government implements the cons�tu�onally mandated decentraliza�onprogram. Addi�onal fiscal pressure is expected in2012 in the run-up to the general elec�ons.
The magnitude of adjustment will depend on economic performance. Reducing the level of public debt as share of GDP from 47.9 percent in 2010/11 to 45 percent in 2013/14 will require fiscal adjustment and consolida�on. Currently,the government is running a budget deficit of6.1 percent of GDP. To achieve the medium term debt target of 45 percent of GDP by 2014, the fiscaldeficit will have todecline from its current level by about 2 percent if growth stays at current levels. The magnitude of the adjustment that will be needed depends on economic performance.
The fiscal adjustment will be less severe if growthwould accelerate to 6 percent but more painful if growth slackens (figure 10):
• In a low case scenario, it is assumed that domes�c and external shocks would slowgrowth to 3.7 percent (average of last decade). Even though the government will be tempted to increase spending in response to the shocks, debt targets could only be met with
a reduc�on of the fiscal deficit to an average of 3.1 percent.
• The second scenario (baseline) assumes that GDP growth con�nues at 5 percent up to 2014. Under this scenario, the fiscal deficit will needto come to 3.9 percent.
• In a high case scenario, where GDP growth averages 6 percent star�ng 2012, Kenya couldafford to run a deficit of 4.4 percent, s�ll 1.5percent lower than the average of the last two years.
1.4. External Posi�on
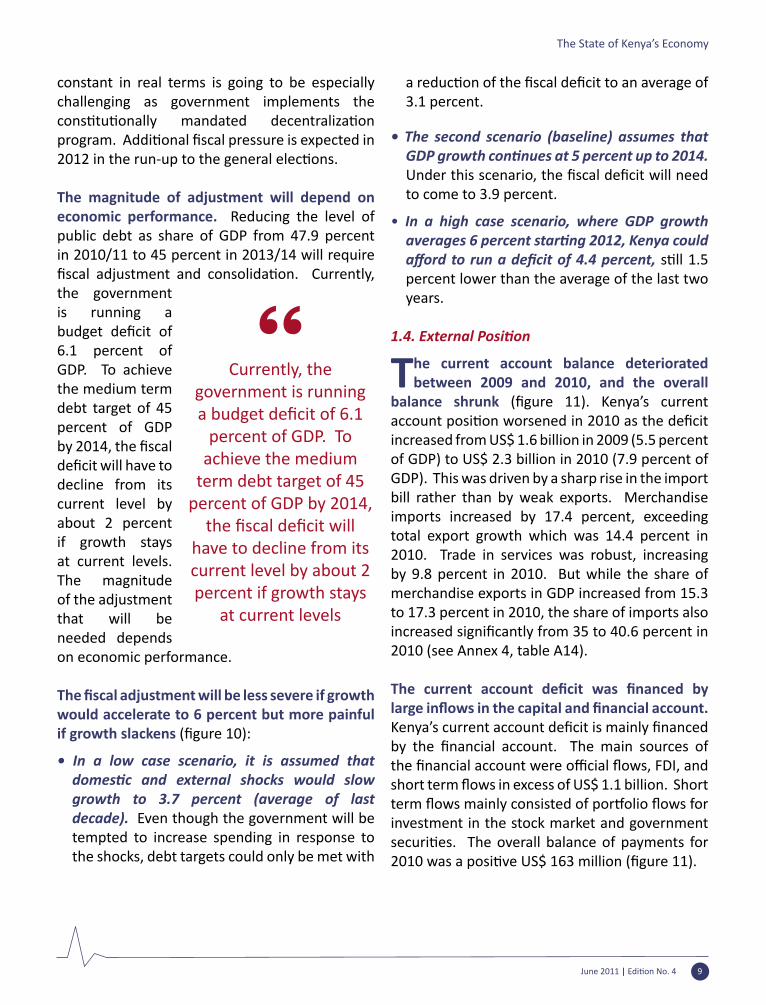
The current account balance deteriorated between 2009 and 2010, and the overall
balance shrunk (figure 11). Kenya’s currentaccount posi�on worsened in 2010 as the deficitincreased from US$ 1.6 billion in 2009 (5.5 percent of GDP) to US$ 2.3 billion in 2010 (7.9 percent of GDP). This was driven by a sharp rise in the import bill rather than by weak exports. Merchandise imports increased by 17.4 percent, exceeding total export growth which was 14.4 percent in 2010. Trade in services was robust, increasing by 9.8 percent in 2010. But while the share of merchandise exports in GDP increased from 15.3 to 17.3 percent in 2010, the share of imports also increased significantly from 35 to 40.6 percent in2010 (see Annex 4, table A14).
The current account deficit was financed bylarge inflows in the capital and financial account. Kenya’s current account deficit is mainly financedby the financial account. The main sources ofthe financial account were official flows, FDI, and short term flows in excess of US$ 1.1 billion. Shortterm flows mainly consisted of por�olio flows forinvestment in the stock market and government securi�es. The overall balance of payments for2010 was a posi�ve US$ 163 million (figure 11).
Currently, the government is running a budget deficit of 6.1
percent of GDP. To achieve the medium
term debt target of 45 percent of GDP by 2014,
the fiscal deficit willhave to decline from its current level by about 2 percent if growth stays
at current levels
June 2011 | Edi�on No. 4 10
The State of Kenya’s Economy
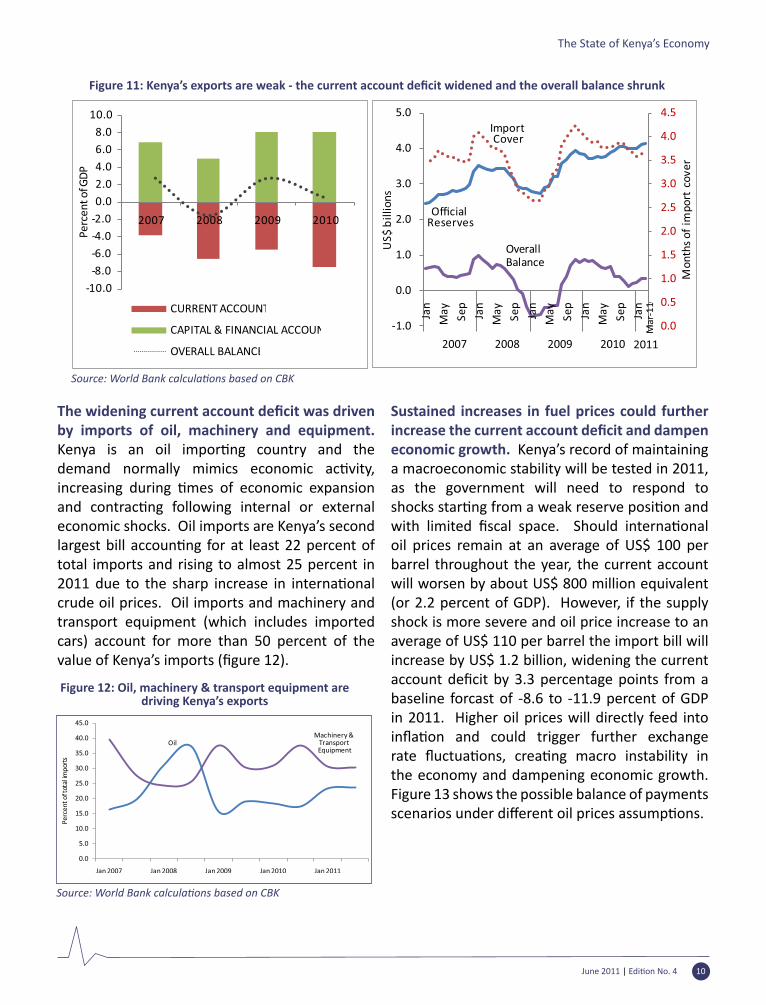
The widening current account deficit was drivenby imports of oil, machinery and equipment. Kenya is an oil impor�ng country and thedemand normally mimics economic ac�vity,increasing during �mes of economic expansionand contrac�ng following internal or externaleconomic shocks. Oil imports are Kenya’s second largest bill accoun�ng for at least 22 percent oftotal imports and rising to almost 25 percent in 2011 due to the sharp increase in interna�onalcrude oil prices. Oil imports and machinery and transport equipment (which includes imported cars) account for more than 50 percent of the value of Kenya’s imports (figure 12).
Sustained increases in fuel prices could further increase the current account deficit and dampeneconomic growth. Kenya’s record of maintaining a macroeconomic stability will be tested in 2011, as the government will need to respond to shocks star�ng from a weak reserve posi�on andwith limited fiscal space. Should interna�onaloil prices remain at an average of US$ 100 per barrel throughout the year, the current account will worsen by about US$ 800 million equivalent (or 2.2 percent of GDP). However, if the supply shock is more severe and oil price increase to an average of US$ 110 per barrel the import bill will increase by US$ 1.2 billion, widening the current account deficit by 3.3 percentage points from abaseline forcast of -8.6 to -11.9 percent of GDP in 2011. Higher oil prices will directly feed into infla�on and could trigger further exchangerate fluctua�ons, crea�ng macro instability in the economy and dampening economic growth. Figure 13 shows the possible balance of payments scenarios under different oil prices assump�ons.
Figure 11: Kenya’s exports are weak - the current account deficit widened and the overall balance shrunk
Source: World Bank calcula�ons based on CBK
Figure 12: Oil, machinery & transport equipment are driving Kenya’s exports
Source: World Bank calcula�ons based on CBK

June 2011 | Edi�on No. 4 11
The State of Kenya’s Economy
2. S�ll at the Tipping Point?Outlook for 2011 and Beyond2.1 Growth Expecta�ons
The last Kenya Economic Update argued that Kenya could be at a �pping point to sustained
growth, driven by structural changes in Kenya, a recovering global economy, and high growth in Africa. Over the last months, Kenya has been confronted with a number of external shocks and there is also a risk of domes�c shocks, especiallypoor rains and poli�cal instability. The ICC processhas increased poli�cal risk and uncertainty,implementa�on of the cons�tu�on is delayed,and external shocks are pu�ng macroeconomicstability to test.
In view of these recent developments, the World Bank projects a growth rate of 4.8 percent in 2011 increasing to 5.0 percent in 2012 (table 1). The growth forecast for 2011 has been lowered by half a percentage point in light of the nega�veshocks to the economy. Both public and private consump�on growth will dampen as infla�onstarts to bite and as the government embarks on fiscal consolida�on to bring the debt back tosustainable levels. In the near term, infla�on isexpected to remain in the double digit range, and it will depress the growth of private consump�on.Public consump�on will remain subdued as thegovernment reduces the recurrent component of the fiscal s�mulus it has been implemen�ng overthe last two years. However, capital investments in roads and energy already planned and commi�edunder Vision 2030 will con�nue to drive growth.
Early indicators point to robust growth in the first quarter of 2011. First quarter results for the commercial banks and electricity consump�onindicate that the economy is s�ll expanding ata strong pace. Looking ahead, Kenya’s exports should also benefit from posi�ve trends in globalgrowth. Business confidence in Kenya remainsstrong and foreign private investment flows areexpected to con�nue. The EAC and the largerCOMESA market together account for about 40
Table 1. S�ll at the �pping point? Growth scenarios for 2011 and beyond
Past performance 3.7 Average growth for the last decade (2000-2009)
4.2 Low growth scenario for 2011
4.8 Baseline growth forecast for 2011
5.0 Baseline growth forecast for 2012
5.5 High growth scenario for 2011/12
Aspira�on 6.0+ Required to reach US$ 1000 income per capita and become
Growth (%) Scenarios
a middle income country by 2019
2011 and 2012
Source: World Bank, KEU team
Figure 13: Rising oil prices have a nega�ve impact onKenya’s external posi�on
Source: CBK and World Bank Simula�ons
June 2011 | Edi�on No. 4 12
The State of Kenya’s Economy
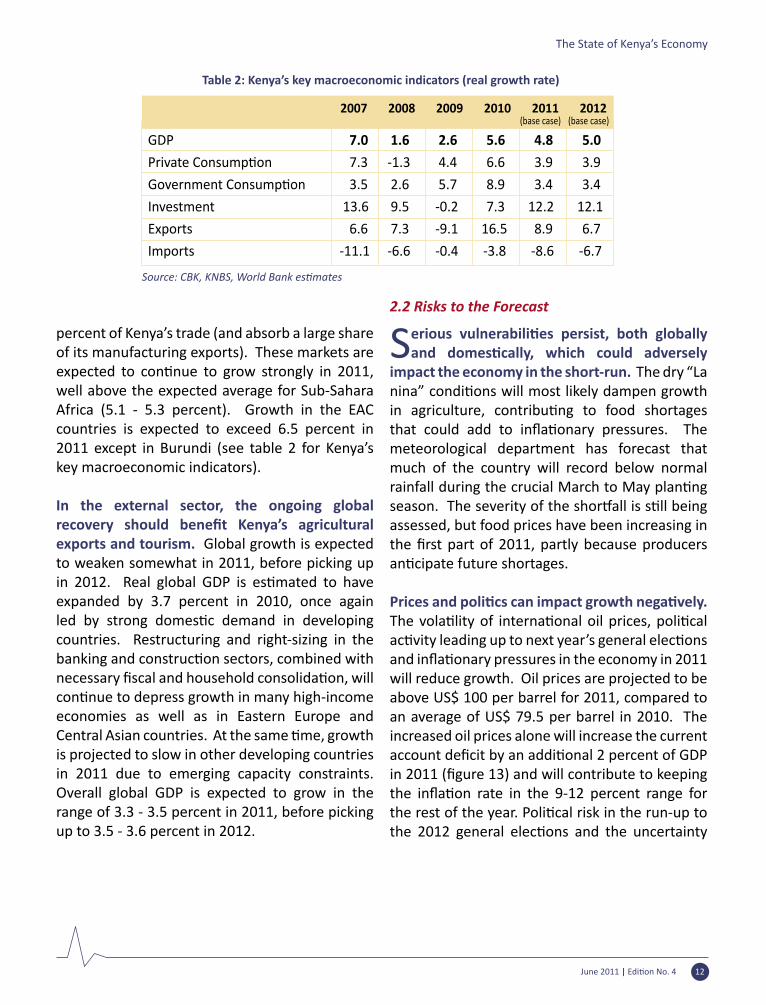
percent of Kenya’s trade (and absorb a large share of its manufacturing exports). These markets are expected to con�nue to grow strongly in 2011,well above the expected average for Sub-Sahara Africa (5.1 - 5.3 percent). Growth in the EAC countries is expected to exceed 6.5 percent in 2011 except in Burundi (see table 2 for Kenya’s key macroeconomic indicators).
In the external sector, the ongoing global recovery should benefit Kenya’s agriculturalexports and tourism. Global growth is expected to weaken somewhat in 2011, before picking up in 2012. Real global GDP is es�mated to haveexpanded by 3.7 percent in 2010, once again led by strong domes�c demand in developingcountries. Restructuring and right-sizing in the banking and construc�on sectors, combined withnecessary fiscal and household consolida�on, willcon�nue to depress growth in many high-incomeeconomies as well as in Eastern Europe and Central Asian countries. At the same �me, growthis projected to slow in other developing countries in 2011 due to emerging capacity constraints. Overall global GDP is expected to grow in the range of 3.3 - 3.5 percent in 2011, before picking up to 3.5 - 3.6 percent in 2012.
2.2 Risks to the Forecast
Serious vulnerabili�es persist, both globallyand domes�cally, which could adversely
impact the economy in the short-run. The dry “La nina” condi�ons will most likely dampen growthin agriculture, contribu�ng to food shortagesthat could add to infla�onary pressures. Themeteorological department has forecast that much of the country will record below normal rainfall during the crucial March to May plan�ngseason. The severity of the shor�all is s�ll beingassessed, but food prices have been increasing in the first part of 2011, partly because producersan�cipate future shortages.
Prices and poli�cs can impact growth nega�vely. The vola�lity of interna�onal oil prices, poli�calac�vity leading up to next year’s general elec�onsand infla�onary pressures in the economy in 2011will reduce growth. Oil prices are projected to be above US$ 100 per barrel for 2011, compared to an average of US$ 79.5 per barrel in 2010. The increased oil prices alone will increase the current account deficit by an addi�onal 2 percent of GDPin 2011 (figure 13) and will contribute to keepingthe infla�on rate in the 9-12 percent range forthe rest of the year. Poli�cal risk in the run-up tothe 2012 general elec�ons and the uncertainty
GDP 7.0 1.6 2.6 5.6 4.8 5.0
Private Consump�on 7.3 -1.3 4.4 6.6 3.9 3.9
Government Consump�on 3.5 2.6 5.7 8.9 3.4 3.4
Investment 13.6 9.5 -0.2 7.3 12.2 12.1
Exports 6.6 7.3 -9.1 16.5 8.9 6.7
Imports -11.1 -6.6 -0.4 -3.8 -8.6 -6.7
2007 2008 2009 2010 2011 2012(base case) (base case)
Table 2: Kenya’s key macroeconomic indicators (real growth rate)
Source: CBK, KNBS, World Bank es�mates
June 2011 | Edi�on No. 4 13
The State of Kenya’s Economy
shrouding the ICC process may depress investor confidence. Past experience, especially 2002and 2008, has shown that economic momentum slows down as poli�cal uncertainty increases.
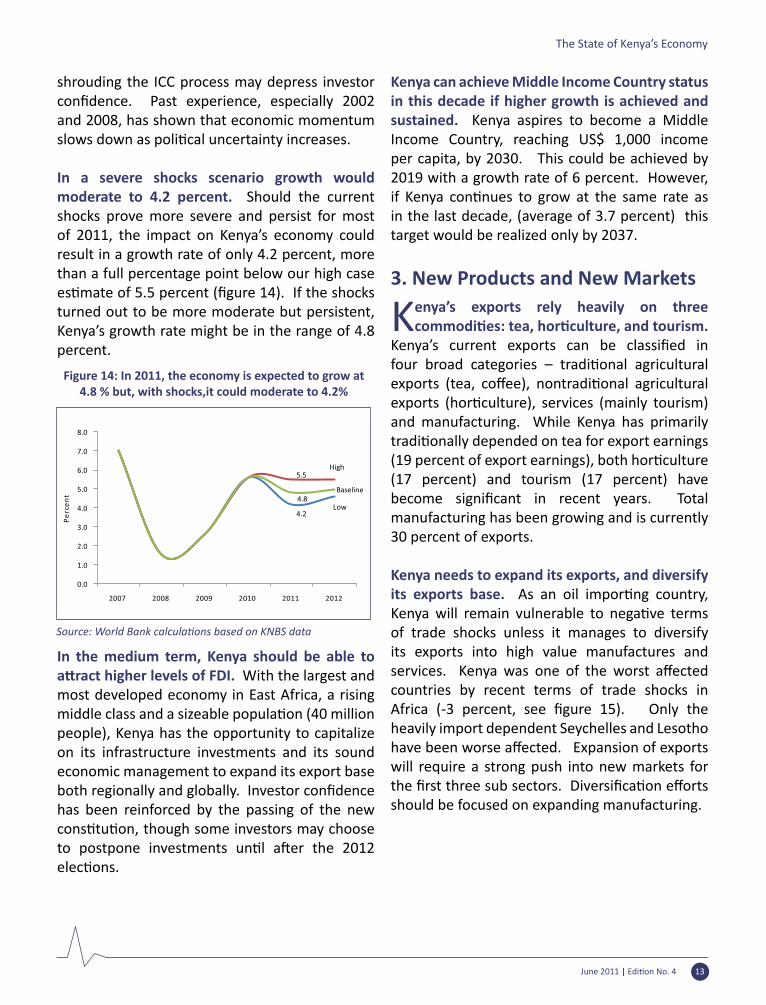
In a severe shocks scenario growth would moderate to 4.2 percent. Should the current shocks prove more severe and persist for most of 2011, the impact on Kenya’s economy could result in a growth rate of only 4.2 percent, more than a full percentage point below our high case es�mate of 5.5 percent (figure 14). If the shocksturned out to be more moderate but persistent, Kenya’s growth rate might be in the range of 4.8 percent.
In the medium term, Kenya should be able to a�ract higher levels of FDI. With the largest and most developed economy in East Africa, a rising middle class and a sizeable popula�on (40 millionpeople), Kenya has the opportunity to capitalize on its infrastructure investments and its sound economic management to expand its export base both regionally and globally. Investor confidencehas been reinforced by the passing of the new cons�tu�on, though some investors may chooseto postpone investments un�l a�er the 2012elec�ons.
Kenya can achieve Middle Income Country status in this decade if higher growth is achieved and sustained. Kenya aspires to become a Middle Income Country, reaching US$ 1,000 income per capita, by 2030. This could be achieved by 2019 with a growth rate of 6 percent. However, if Kenya con�nues to grow at the same rate asin the last decade, (average of 3.7 percent) this target would be realized only by 2037.
3. New Products and New Markets
Kenya’s exports rely heavily on three commodi�es: tea, hor�culture, and tourism.
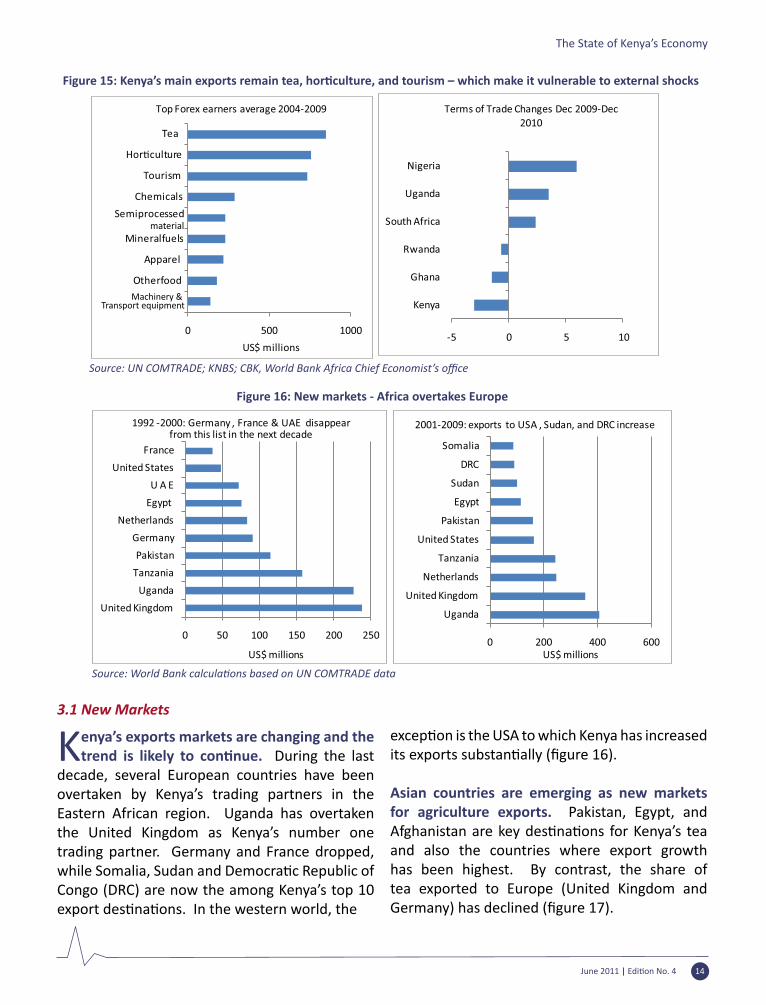
Kenya’s current exports can be classified infour broad categories – tradi�onal agriculturalexports (tea, coffee), nontradi�onal agriculturalexports (hor�culture), services (mainly tourism)and manufacturing. While Kenya has primarily tradi�onally depended on tea for export earnings(19 percent of export earnings), both hor�culture(17 percent) and tourism (17 percent) have become significant in recent years. Totalmanufacturing has been growing and is currently 30 percent of exports. Kenya needs to expand its exports, and diversify its exports base. As an oil impor�ng country,Kenya will remain vulnerable to nega�ve termsof trade shocks unless it manages to diversify its exports into high value manufactures and services. Kenya was one of the worst affectedcountries by recent terms of trade shocks in Africa (-3 percent, see figure 15). Only theheavily import dependent Seychelles and Lesotho have been worse affected. Expansion of exportswill require a strong push into new markets for the first three sub sectors. Diversifica�on effortsshould be focused on expanding manufacturing.
Figure 14: In 2011, the economy is expected to grow at 4.8 % but, with shocks,it could moderate to 4.2%
Source: World Bank calcula�ons based on KNBS data
June 2011 | Edi�on No. 4 14
The State of Kenya’s Economy
3.1 New Markets
Kenya’s exports markets are changing and the trend is likely to con�nue. During the last
decade, several European countries have been overtaken by Kenya’s trading partners in the Eastern African region. Uganda has overtaken the United Kingdom as Kenya’s number one trading partner. Germany and France dropped, while Somalia, Sudan and Democra�c Republic ofCongo (DRC) are now the among Kenya’s top 10 export des�na�ons. In the western world, the
excep�on is the USA to which Kenya has increasedits exports substan�ally (figure 16).
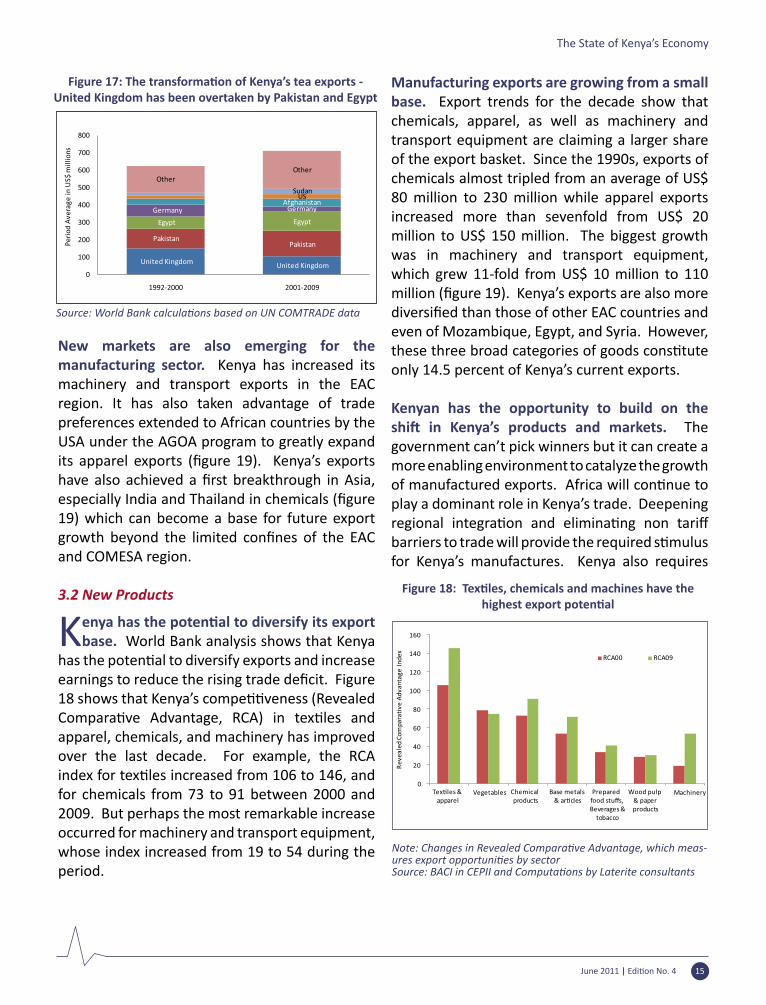
Asian countries are emerging as new markets for agriculture exports. Pakistan, Egypt, and Afghanistan are key des�na�ons for Kenya’s teaand also the countries where export growth has been highest. By contrast, the share of tea exported to Europe (United Kingdom and Germany) has declined (figure 17).
Figure 15: Kenya’s main exports remain tea, hor�culture, and tourism – which make it vulnerable to external shocks
Source: UN COMTRADE; KNBS; CBK, World Bank Africa Chief Economist’s office
Figure 16: New markets - Africa overtakes Europe
Source: World Bank calcula�ons based on UN COMTRADE data
June 2011 | Edi�on No. 4 15
The State of Kenya’s Economy
New markets are also emerging for the manufacturing sector. Kenya has increased its machinery and transport exports in the EAC region. It has also taken advantage of trade preferences extended to African countries by the USA under the AGOA program to greatly expand its apparel exports (figure 19). Kenya’s exportshave also achieved a first breakthrough in Asia,especially India and Thailand in chemicals (figure19) which can become a base for future export growth beyond the limited confines of the EACand COMESA region.
3.2 New Products
Kenya has the poten�al to diversify its exportbase. World Bank analysis shows that Kenya
has the poten�al to diversify exports and increaseearnings to reduce the rising trade deficit. Figure18 shows that Kenya’s compe��veness (RevealedCompara�ve Advantage, RCA) in tex�les andapparel, chemicals, and machinery has improved over the last decade. For example, the RCA index for tex�les increased from 106 to 146, andfor chemicals from 73 to 91 between 2000 and 2009. But perhaps the most remarkable increase occurred for machinery and transport equipment, whose index increased from 19 to 54 during the period.
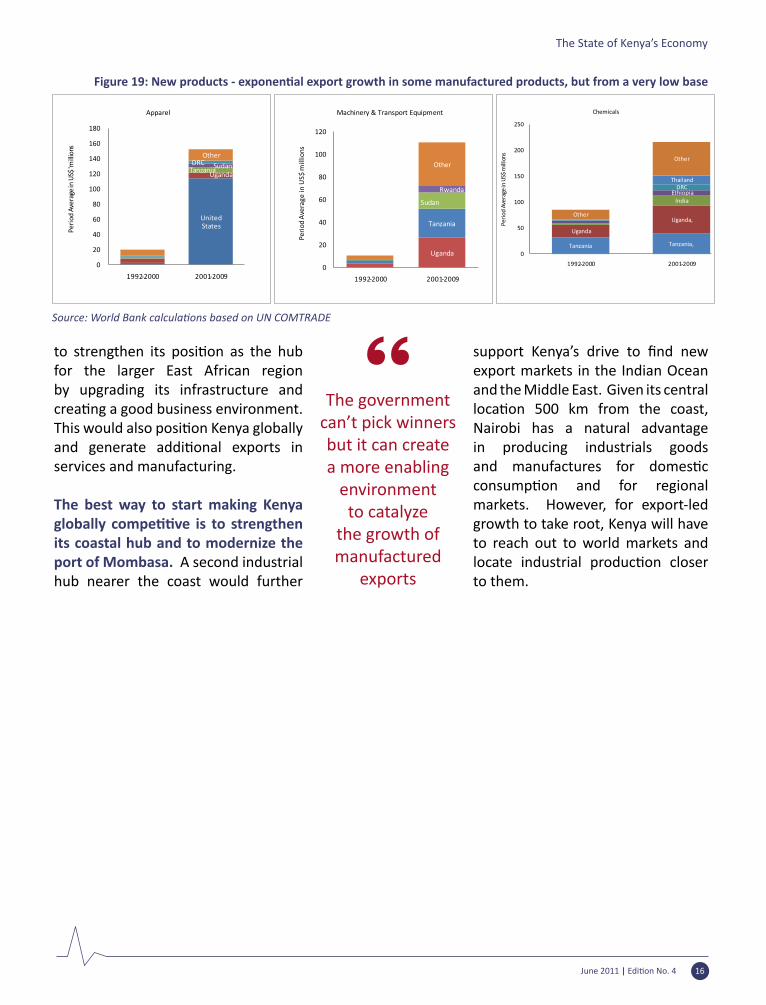
Manufacturing exports are growing from a small base. Export trends for the decade show that chemicals, apparel, as well as machinery and transport equipment are claiming a larger share of the export basket. Since the 1990s, exports of chemicals almost tripled from an average of US$ 80 million to 230 million while apparel exports increased more than sevenfold from US$ 20 million to US$ 150 million. The biggest growth was in machinery and transport equipment, which grew 11-fold from US$ 10 million to 110 million (figure 19). Kenya’s exports are also morediversified than those of other EAC countries andeven of Mozambique, Egypt, and Syria. However, these three broad categories of goods cons�tuteonly 14.5 percent of Kenya’s current exports.
Kenyan has the opportunity to build on the shi� in Kenya’s products and markets. The government can’t pick winners but it can create a more enabling environment to catalyze the growth of manufactured exports. Africa will con�nue toplay a dominant role in Kenya’s trade. Deepening regional integra�on and elimina�ng non tariffbarriers to trade will provide the required s�mulusfor Kenya’s manufactures. Kenya also requires
Figure 18: Tex�les, chemicals and machines have thehighest export poten�al
Note: Changes in Revealed Compara�ve Advantage, which meas-ures export opportuni�es by sectorSource: BACI in CEPII and Computa�ons by Laterite consultants
Figure 17: The transforma�on of Kenya’s tea exports -United Kingdom has been overtaken by Pakistan and Egypt
Source: World Bank calcula�ons based on UN COMTRADE data
June 2011 | Edi�on No. 4 16
The State of Kenya’s Economy
to strengthen its posi�on as the hubfor the larger East African region by upgrading its infrastructure and crea�ng a good business environment. This would also posi�on Kenya globallyand generate addi�onal exports inservices and manufacturing.
The best way to start making Kenya globally compe��ve is to strengthenits coastal hub and to modernize the port of Mombasa. A second industrial hub nearer the coast would further
support Kenya’s drive to find newexport markets in the Indian Ocean and the Middle East. Given its central loca�on 500 km from the coast,Nairobi has a natural advantage in producing industrials goods and manufactures for domes�cconsump�on and for regionalmarkets. However, for export-led growth to take root, Kenya will have to reach out to world markets and locate industrial produc�on closerto them.
Figure 19: New products - exponen�al export growth in some manufactured products, but from a very low base
Source: World Bank calcula�ons based on UN COMTRADE
The government can’t pick winners but it can create a more enabling
environment to catalyze
the growth of manufactured
exports
The State of Kenya’s EconomyMaking the Most of Kenya’s Demographic Change and Rapid Urbaniza�on
Kenya is going through demographic and geographic transi�ons which are mutually reinforcing,and which will have profound economic consequences in the coming decade. By 2030 Kenya’s
popula�on will exceed 60 million, and new genera�ons will have fewer children and will live longer.A majority of the popula�on will be ac�ve, and many former rural residents will have migrated tourban centers in search of economic opportuni�es. To make the most of these transi�ons, Kenyaneeds the economy to create employment opportuni�es and the urbaniza�on process to be suitablymanaged. In this regard, it is �me for Kenya to consider a mul�ple-hub urban model ini�ally centeredon Nairobi and Mombasa: Nairobi as the industrial and services hub for the domes�c and regionalmarkets, and Mombasa as a coastal industrial hub to cater for emerging global markets. Kenyans can also leverage the ongoing devolu�on process to ra�onalize the urban governance framework, toimprove the management of ci�es, and ensure that rural residents con�nue to benefit from qualitysocial services.
4. Demographic Change: More People, Living Longer
Kenya’s popula�on is growing fast, increasinglyso in ci�es. It has doubled over the last twenty
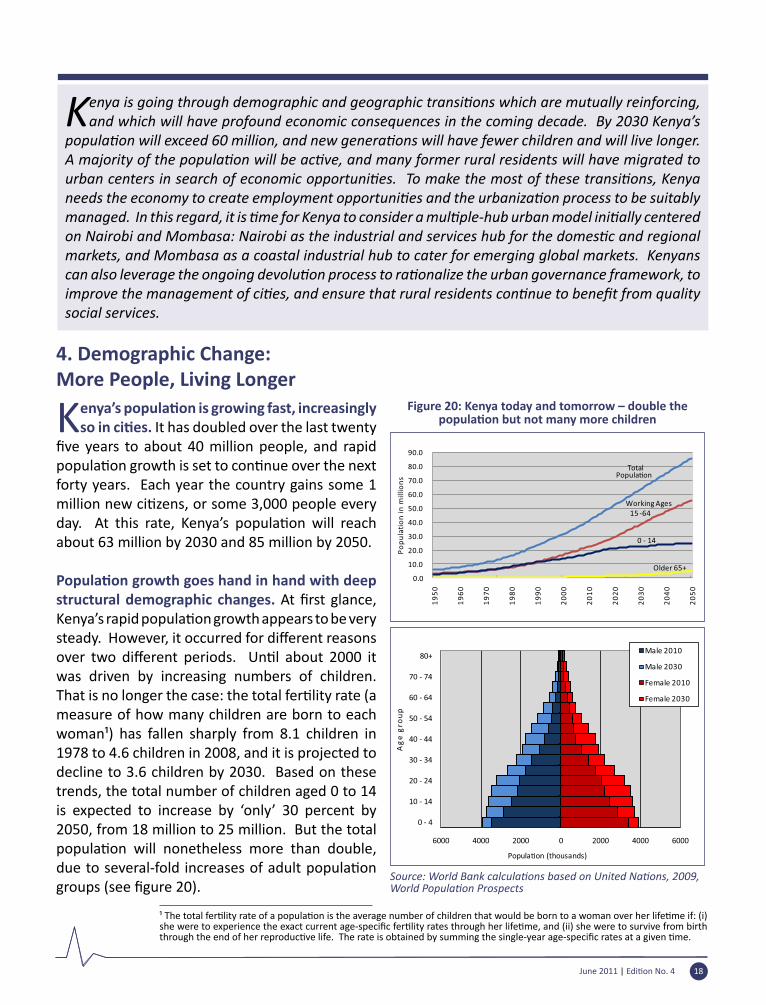
five years to about 40 million people, and rapidpopula�on growth is set to con�nue over the nextforty years. Each year the country gains some 1 million new ci�zens, or some 3,000 people everyday. At this rate, Kenya’s popula�on will reachabout 63 million by 2030 and 85 million by 2050.
Popula�on growth goes hand in hand with deepstructural demographic changes. At first glance,Kenya’s rapid popula�on growth appears to be verysteady. However, it occurred for different reasonsover two different periods. Un�l about 2000 itwas driven by increasing numbers of children. That is no longer the case: the total fer�lity rate (ameasure of how many children are born to each woman¹) has fallen sharply from 8.1 children in 1978 to 4.6 children in 2008, and it is projected to decline to 3.6 children by 2030. Based on these trends, the total number of children aged 0 to 14 is expected to increase by ‘only’ 30 percent by 2050, from 18 million to 25 million. But the total popula�on will nonetheless more than double,due to several-fold increases of adult popula�ongroups (see figure 20).
¹ The total fer�lity rate of a popula�on is the average number of children that would be born to a woman over her life�me if: (i)she were to experience the exact current age-specific fer�lity rates through her life�me, and (ii) she were to survive from birththrough the end of her reproduc�ve life. The rate is obtained by summing the single-year age-specific rates at a given �me.
Figure 20: Kenya today and tomorrow – double the popula�on but not many more children
Source: World Bank calcula�ons based on United Na�ons, 2009,World Popula�on Prospects
June 2011 | Edi�on No. 4 18
Kenya’s popula�on will con�nue to rise rapidlyfor two reasons. First, due to high fer�lity inprevious decades, there are many more families in Kenya today. So even though families are smaller, the total number of children con�nues to grow. Second, Kenyans are living longer. Life expectancy is projected to increase from 54 years today to 68 years by 2050. As a result of these trends, the fastest growing popula�on groups in Kenya arethose between 15 to 64 years. Incidentally, these are exactly the popula�on groups that work. From only 22 million working-age people today, Kenya will have about 56 million working-age people by 2050. This demographic transforma�on has profoundeconomic consequences. As demographic transi�on proceeds, there will be a drama�cimprovement in the “dependency ra�o”: theworking-age popula�on will grow much fasterthan the young and elderly popula�on groupsthat depend on them. This implies that Kenya can reap a demographic dividend and accelerate economic growth (box 2), especially by 2015, when this gap starts to widen.
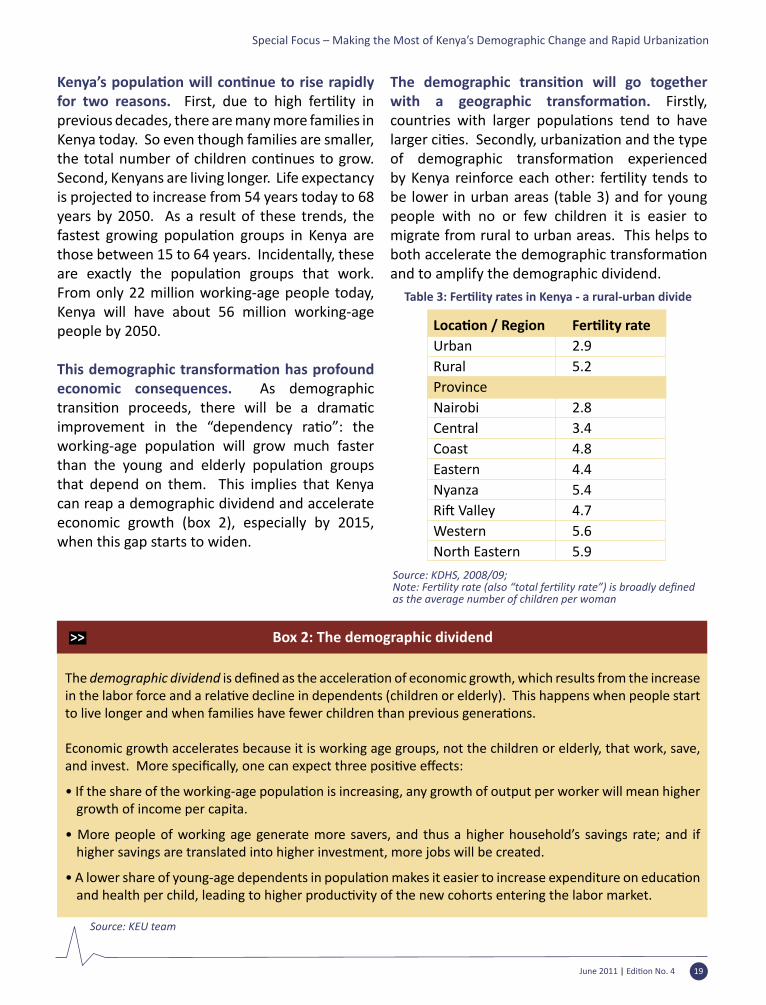
The demographic transi�on will go togetherwith a geographic transforma�on. Firstly, countries with larger popula�ons tend to havelarger ci�es. Secondly, urbaniza�on and the typeof demographic transforma�on experiencedby Kenya reinforce each other: fer�lity tends tobe lower in urban areas (table 3) and for young people with no or few children it is easier to migrate from rural to urban areas. This helps to both accelerate the demographic transforma�onand to amplify the demographic dividend.
The demographic dividend is defined as the accelera�on of economic growth, which results from the increasein the labor force and a rela�ve decline in dependents (children or elderly). This happens when people startto live longer and when families have fewer children than previous genera�ons.
Economic growth accelerates because it is working age groups, not the children or elderly, that work, save, and invest. More specifically, one can expect three posi�ve effects:
• If the share of the working-age popula�on is increasing, any growth of output per worker will mean highergrowth of income per capita.
• More people of working age generate more savers, and thus a higher household’s savings rate; and if higher savings are translated into higher investment, more jobs will be created.
• A lower share of young-age dependents in popula�on makes it easier to increase expenditure on educa�onand health per child, leading to higher produc�vity of the new cohorts entering the labor market.
Box 2: The demographic dividend
Source: KEU team
Loca�on / Region Fer�lity rateUrban 2.9Rural 5.2Province Nairobi 2.8Central 3.4Coast 4.8Eastern 4.4Nyanza 5.4Ri� Valley 4.7Western 5.6North Eastern 5.9
Table 3: Fer�lity rates in Kenya - a rural-urban divide
Source: KDHS, 2008/09; Note: Fer�lity rate (also “total fer�lity rate”) is broadly definedas the average number of children per woman
June 2011 | Edi�on No. 4 19
Special Focus – Making the Most of Kenya’s Demographic Change and Rapid Urbaniza�on
5. Geographic Change: From Rural to Urban
Kenya is s�ll a predominantly rural countrybut is urbanizing rapidly. Seven out of ten
Kenyans live in rural areas. Agriculture remains a key contributor to growth and employs more than a third of adults. At the same �me, the countryis urbanizing rapidly. Every year some 250,000 Kenyans are moving to ci�es and formerly ruralareas are becoming increasingly urban. Twenty years ago Kenya’s urbaniza�on level was only 18percent. By 2020, 40 percent of Kenyans will live in ci�es and, in 2033 Kenya will reach another�pping point because half of its popula�on willthen be living in urban areas.
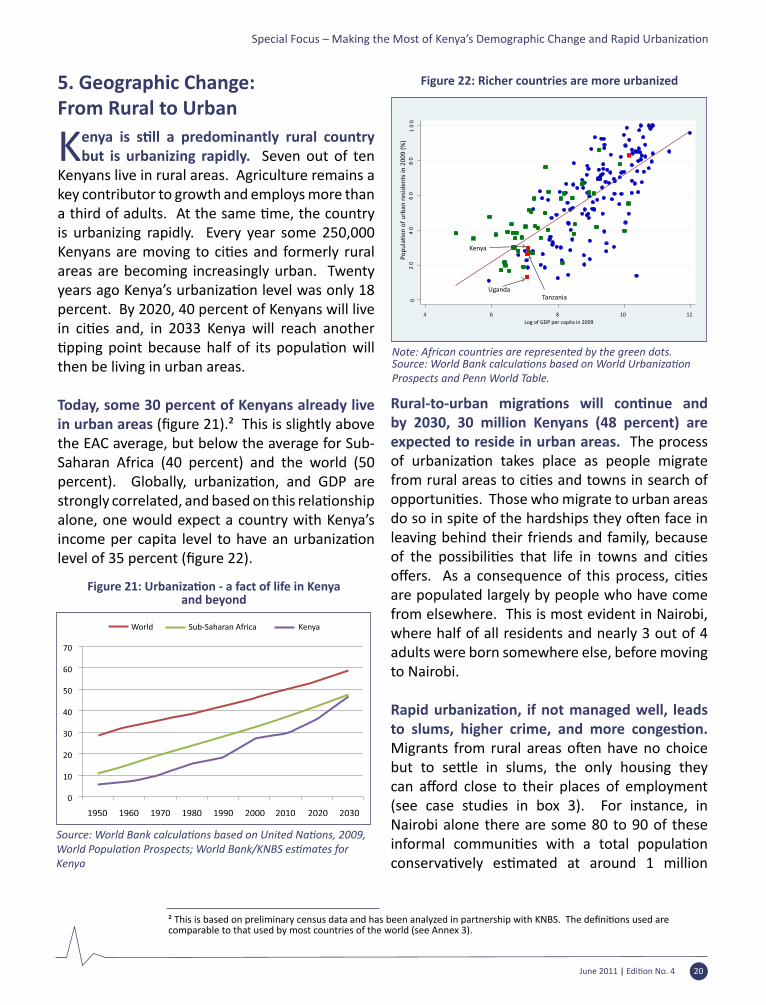
Today, some 30 percent of Kenyans already live in urban areas (figure 21).² This is slightly above the EAC average, but below the average for Sub-Saharan Africa (40 percent) and the world (50 percent). Globally, urbaniza�on, and GDP arestrongly correlated, and based on this rela�onshipalone, one would expect a country with Kenya’s income per capita level to have an urbaniza�onlevel of 35 percent (figure 22).
Rural-to-urban migra�ons will con�nue andby 2030, 30 million Kenyans (48 percent) are expected to reside in urban areas. The process of urbaniza�on takes place as people migratefrom rural areas to ci�es and towns in search ofopportuni�es. Those who migrate to urban areasdo so in spite of the hardships they o�en face inleaving behind their friends and family, because of the possibili�es that life in towns and ci�esoffers. As a consequence of this process, ci�esare populated largely by people who have come from elsewhere. This is most evident in Nairobi, where half of all residents and nearly 3 out of 4 adults were born somewhere else, before moving to Nairobi.
Rapid urbaniza�on, if not managed well, leadsto slums, higher crime, and more conges�on.Migrants from rural areas o�en have no choicebut to se�le in slums, the only housing theycan afford close to their places of employment(see case studies in box 3). For instance, in Nairobi alone there are some 80 to 90 of these informal communi�es with a total popula�onconserva�vely es�mated at around 1 million
² This is based on preliminary census data and has been analyzed in partnership with KNBS. The defini�ons used arecomparable to that used by most countries of the world (see Annex 3).
Figure 21: Urbaniza�on - a fact of life in Kenyaand beyond
Source: World Bank calcula�ons based on United Na�ons, 2009,World Popula�on Prospects; World Bank/KNBS es�mates forKenya
Figure 22: Richer countries are more urbanized
Note: African countries are represented by the green dots.Source: World Bank calcula�ons based on World Urbaniza�onProspects and Penn World Table.
June 2011 | Edi�on No. 4 20
Special Focus – Making the Most of Kenya’s Demographic Change and Rapid Urbaniza�on
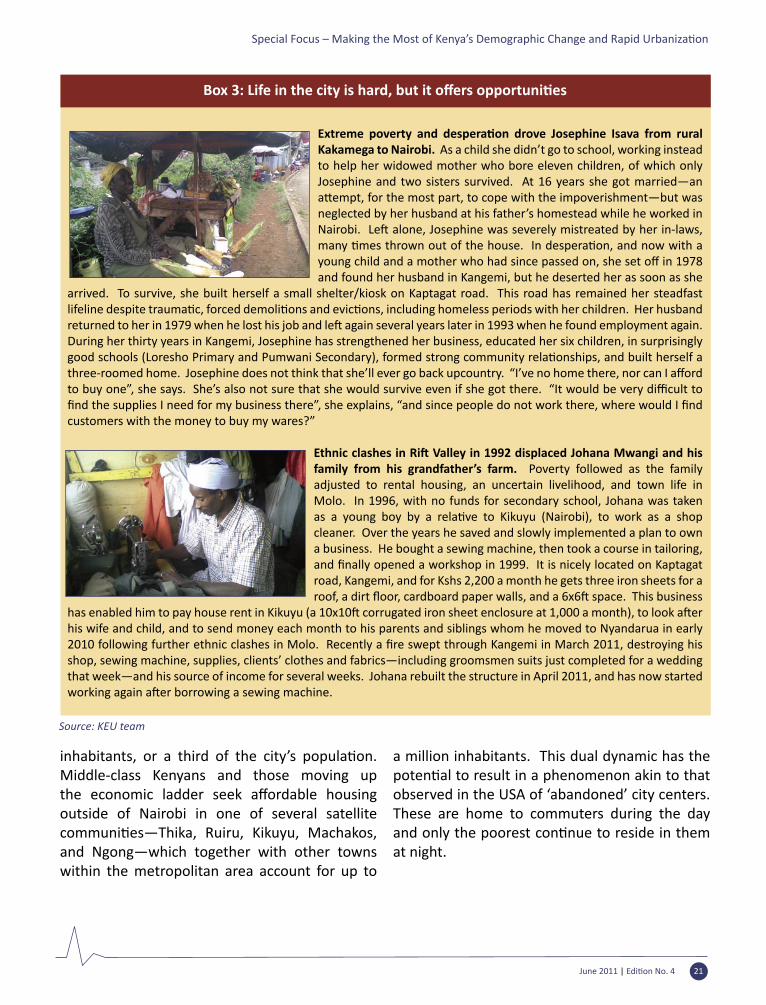
Box 3 – Life in the city is hard but it offers opportuni�esBox 3: Life in the city is hard, but it offers opportuni�es
Extreme poverty and despera�on drove Josephine Isava from ruralKakamega to Nairobi. As a child she didn’t go to school, working instead to help her widowed mother who bore eleven children, of which only Josephine and two sisters survived. At 16 years she got married―an a�empt, for the most part, to cope with the impoverishment―but wasneglected by her husband at his father’s homestead while he worked in Nairobi. Le� alone, Josephine was severely mistreated by her in-laws,many �mes thrown out of the house. In despera�on, and now with a young child and a mother who had since passed on, she set off in 1978and found her husband in Kangemi, but he deserted her as soon as she
arrived. To survive, she built herself a small shelter/kiosk on Kaptagat road. This road has remained her steadfast lifeline despite trauma�c, forced demoli�ons and evic�ons, including homeless periods with her children. Her husbandreturned to her in 1979 when he lost his job and le� again several years later in 1993 when he found employment again. During her thirty years in Kangemi, Josephine has strengthened her business, educated her six children, in surprisingly good schools (Loresho Primary and Pumwani Secondary), formed strong community rela�onships, and built herself athree-roomed home. Josephine does not think that she’ll ever go back upcountry. “I’ve no home there, nor can I affordto buy one”, she says. She’s also not sure that she would survive even if she got there. “It would be very difficult tofind the supplies I need for my business there”, she explains, “and since people do not work there, where would I findcustomers with the money to buy my wares?”
Ethnic clashes in Ri� Valley in 1992 displaced Johana Mwangi and hisfamily from his grandfather’s farm. Poverty followed as the family adjusted to rental housing, an uncertain livelihood, and town life in Molo. In 1996, with no funds for secondary school, Johana was taken as a young boy by a rela�ve to Kikuyu (Nairobi), to work as a shopcleaner. Over the years he saved and slowly implemented a plan to own a business. He bought a sewing machine, then took a course in tailoring, and finally opened a workshop in 1999. It is nicely located on Kaptagatroad, Kangemi, and for Kshs 2,200 a month he gets three iron sheets for a roof, a dirt floor, cardboard paper walls, and a 6x6� space. This business
has enabled him to pay house rent in Kikuyu (a 10x10� corrugated iron sheet enclosure at 1,000 a month), to look a�erhis wife and child, and to send money each month to his parents and siblings whom he moved to Nyandarua in early 2010 following further ethnic clashes in Molo. Recently a fire swept through Kangemi in March 2011, destroying hisshop, sewing machine, supplies, clients’ clothes and fabrics―including groomsmen suits just completed for a wedding that week―and his source of income for several weeks. Johana rebuilt the structure in April 2011, and has now started working again a�er borrowing a sewing machine.
inhabitants, or a third of the city’s popula�on. Middle-class Kenyans and those moving up the economic ladder seek affordable housingoutside of Nairobi in one of several satellite communi�es—Thika, Ruiru, Kikuyu, Machakos,and Ngong—which together with other towns within the metropolitan area account for up to
a million inhabitants. This dual dynamic has the poten�al to result in a phenomenon akin to thatobserved in the USA of ‘abandoned’ city centers. These are home to commuters during the day and only the poorest con�nue to reside in themat night.
Source: KEU team
June 2011 | Edi�on No. 4 21
Special Focus – Making the Most of Kenya’s Demographic Change and Rapid Urbaniza�on
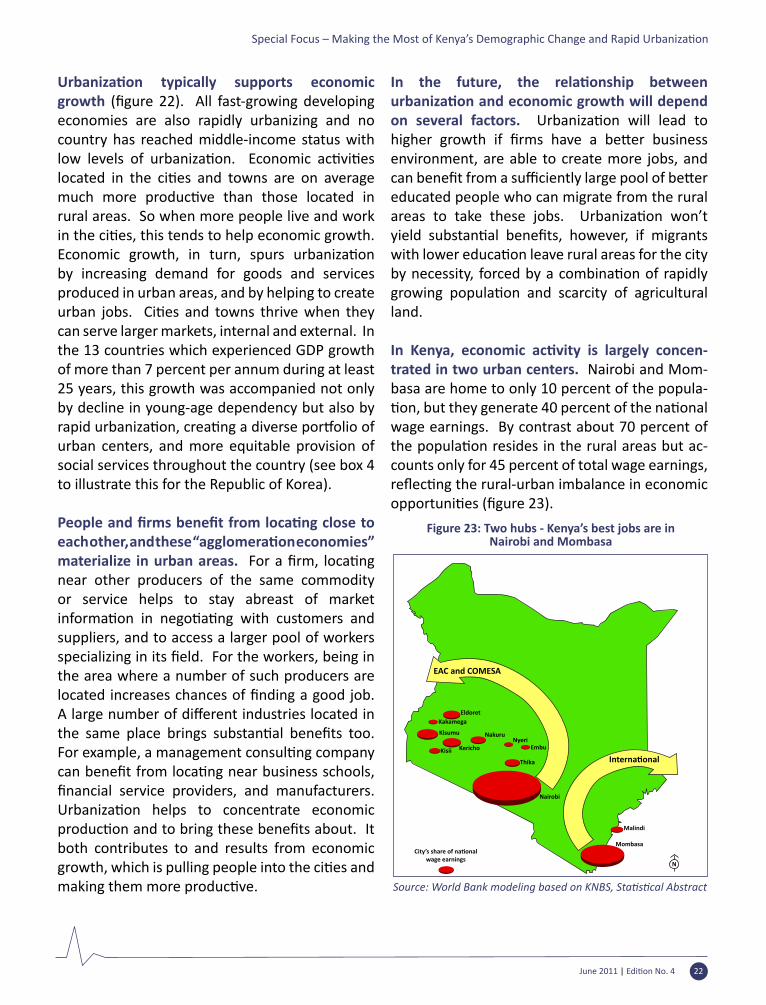
Urbaniza�on typically supports economicgrowth (figure 22). All fast-growing developingeconomies are also rapidly urbanizing and no country has reached middle-income status with low levels of urbaniza�on. Economic ac�vi�eslocated in the ci�es and towns are on averagemuch more produc�ve than those located inrural areas. So when more people live and work in the ci�es, this tends to help economic growth. Economic growth, in turn, spurs urbaniza�onby increasing demand for goods and services produced in urban areas, and by helping to create urban jobs. Ci�es and towns thrive when theycan serve larger markets, internal and external. In the 13 countries which experienced GDP growth of more than 7 percent per annum during at least 25 years, this growth was accompanied not only by decline in young-age dependency but also by rapid urbaniza�on, crea�ng a diverse por�olio of urban centers, and more equitable provision of social services throughout the country (see box 4 to illustrate this for the Republic of Korea).
People and firms benefit from loca�ng close to each other, and these “agglomera�oneconomies”materialize in urban areas. For a firm, loca�ngnear other producers of the same commodity or service helps to stay abreast of market informa�on in nego�a�ng with customers andsuppliers, and to access a larger pool of workers specializing in its field. For the workers, being inthe area where a number of such producers are located increases chances of finding a good job. A large number of different industries located inthe same place brings substan�al benefits too.For example, a management consul�ng companycan benefit from loca�ng near business schools,financial service providers, and manufacturers. Urbaniza�on helps to concentrate economicproduc�on and to bring these benefits about. Itboth contributes to and results from economic growth, which is pulling people into the ci�es andmaking them more produc�ve.
In the future, the rela�onship betweenurbaniza�on and economic growth will dependon several factors. Urbaniza�on will lead tohigher growth if firms have a be�er businessenvironment, are able to create more jobs, and can benefit from a sufficiently large pool of be�ereducated people who can migrate from the rural areas to take these jobs. Urbaniza�on won’tyield substan�al benefits, however, if migrantswith lower educa�on leave rural areas for the cityby necessity, forced by a combina�on of rapidlygrowing popula�on and scarcity of agriculturalland.
In Kenya, economic ac�vity is largely concen-trated in two urban centers. Nairobi and Mom-basa are home to only 10 percent of the popula-�on, but they generate 40 percent of the na�onalwage earnings. By contrast about 70 percent of the popula�on resides in the rural areas but ac-counts only for 45 percent of total wage earnings, reflec�ng the rural-urban imbalance in economicopportuni�es (figure 23).
EldoretKakamega
Kisumu NakuruNyeri
Embu
Thika
Nairobi
City’s share of na�onalwage earnings
Malindi
Mombasa
Interna�onal
EAC and COMESA
KerichoKisii
Figure 23: Two hubs - Kenya’s best jobs are inNairobi and Mombasa
Source: World Bank modeling based on KNBS, Sta�s�cal Abstract
June 2011 | Edi�on No. 4 22
Special Focus – Making the Most of Kenya’s Demographic Change and Rapid Urbaniza�on
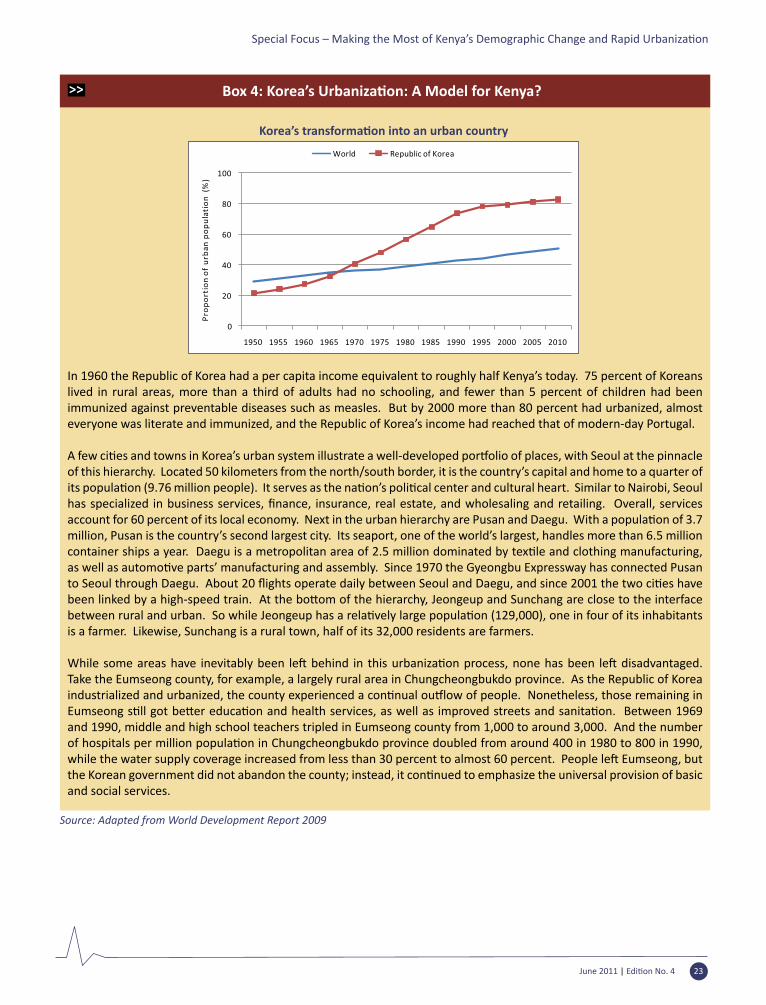
Box 4: Korea’s Urbaniza�on: A Model for Kenya?
Korea’s transforma�on into an urban country
In 1960 the Republic of Korea had a per capita income equivalent to roughly half Kenya’s today. 75 percent of Koreans lived in rural areas, more than a third of adults had no schooling, and fewer than 5 percent of children had been immunized against preventable diseases such as measles. But by 2000 more than 80 percent had urbanized, almost everyone was literate and immunized, and the Republic of Korea’s income had reached that of modern-day Portugal.
A few ci�es and towns in Korea’s urban system illustrate a well-developed por�olio of places, with Seoul at the pinnacleof this hierarchy. Located 50 kilometers from the north/south border, it is the country’s capital and home to a quarter of its popula�on (9.76 million people). It serves as the na�on’s poli�cal center and cultural heart. Similar to Nairobi, Seoulhas specialized in business services, finance, insurance, real estate, and wholesaling and retailing. Overall, servicesaccount for 60 percent of its local economy. Next in the urban hierarchy are Pusan and Daegu. With a popula�on of 3.7million, Pusan is the country’s second largest city. Its seaport, one of the world’s largest, handles more than 6.5 million container ships a year. Daegu is a metropolitan area of 2.5 million dominated by tex�le and clothing manufacturing,as well as automo�ve parts’ manufacturing and assembly. Since 1970 the Gyeongbu Expressway has connected Pusanto Seoul through Daegu. About 20 flights operate daily between Seoul and Daegu, and since 2001 the two ci�es havebeen linked by a high-speed train. At the bo�om of the hierarchy, Jeongeup and Sunchang are close to the interfacebetween rural and urban. So while Jeongeup has a rela�vely large popula�on (129,000), one in four of its inhabitantsis a farmer. Likewise, Sunchang is a rural town, half of its 32,000 residents are farmers.
While some areas have inevitably been le� behind in this urbaniza�on process, none has been le� disadvantaged.Take the Eumseong county, for example, a largely rural area in Chungcheongbukdo province. As the Republic of Korea industrialized and urbanized, the county experienced a con�nual ou�low of people. Nonetheless, those remaining inEumseong s�ll got be�er educa�on and health services, as well as improved streets and sanita�on. Between 1969and 1990, middle and high school teachers tripled in Eumseong county from 1,000 to around 3,000. And the number of hospitals per million popula�on in Chungcheongbukdo province doubled from around 400 in 1980 to 800 in 1990,while the water supply coverage increased from less than 30 percent to almost 60 percent. People le� Eumseong, butthe Korean government did not abandon the county; instead, it con�nued to emphasize the universal provision of basicand social services.
Source: Adapted from World Development Report 2009
June 2011 | Edi�on No. 4 23
Special Focus – Making the Most of Kenya’s Demographic Change and Rapid Urbaniza�on
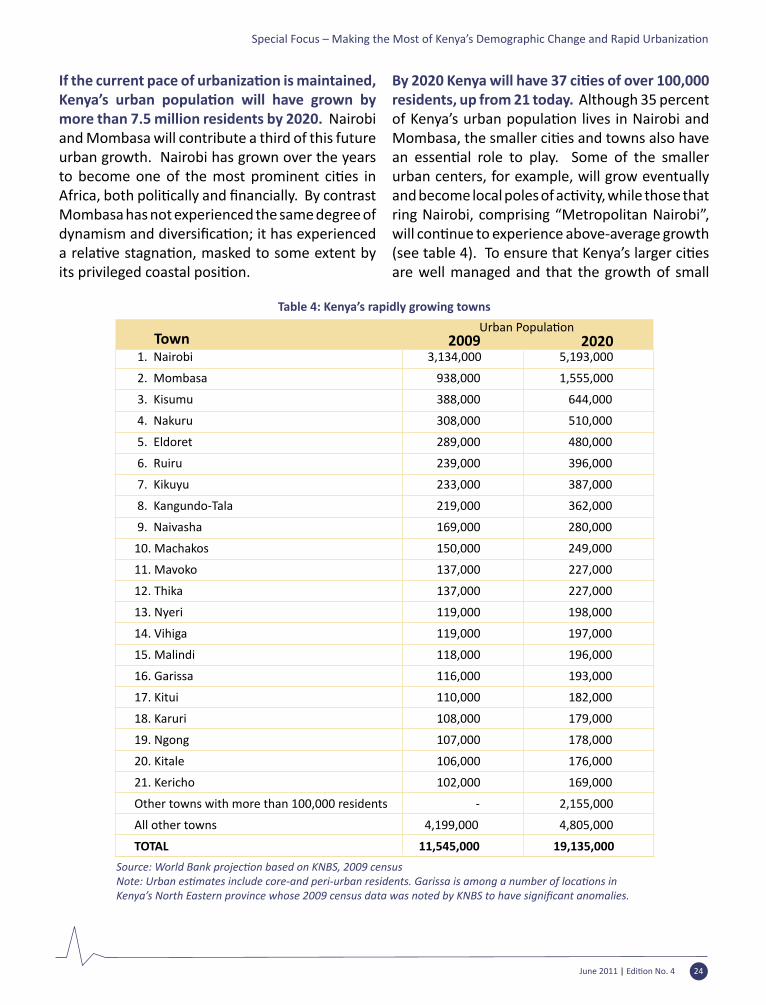
1. Nairobi 3,134,000 5,193,000
2. Mombasa 938,000 1,555,000
3. Kisumu 388,000 644,000
4. Nakuru 308,000 510,000
5. Eldoret 289,000 480,000
6. Ruiru 239,000 396,000
7. Kikuyu 233,000 387,000
8. Kangundo-Tala 219,000 362,000
9. Naivasha 169,000 280,000
10. Machakos 150,000 249,000
11. Mavoko 137,000 227,000
12. Thika 137,000 227,000
13. Nyeri 119,000 198,000
14. Vihiga 119,000 197,000
15. Malindi 118,000 196,000
16. Garissa 116,000 193,000
17. Kitui 110,000 182,000
18. Karuri 108,000 179,000
19. Ngong 107,000 178,000
20. Kitale 106,000 176,000
21. Kericho 102,000 169,000
Other towns with more than 100,000 residents - 2,155,000
All other towns 4,199,000 4,805,000
TOTAL 11,545,000 19,135,000
Source: World Bank projec�on based on KNBS, 2009 censusNote: Urban es�mates include core-and peri-urban residents. Garissa is among a number of loca�ons inKenya’s North Eastern province whose 2009 census data was noted by KNBS to have significant anomalies.
Table 4: Kenya’s rapidly growing towns
If the current pace of urbaniza�on is maintained,Kenya’s urban popula�on will have grown bymore than 7.5 million residents by 2020. Nairobi and Mombasa will contribute a third of this future urban growth. Nairobi has grown over the years to become one of the most prominent ci�es inAfrica, both poli�cally and financially. By contrastMombasa has not experienced the same degree of dynamism and diversifica�on; it has experienceda rela�ve stagna�on, masked to some extent byits privileged coastal posi�on.
By 2020 Kenya will have 37 ci�es of over 100,000residents, up from 21 today. Although 35 percent of Kenya’s urban popula�on lives in Nairobi andMombasa, the smaller ci�es and towns also havean essen�al role to play. Some of the smallerurban centers, for example, will grow eventually and become local poles of ac�vity, while those thatring Nairobi, comprising “Metropolitan Nairobi”, will con�nue to experience above-average growth(see table 4). To ensure that Kenya’s larger ci�esare well managed and that the growth of small
Town 2009 2020Urban Popula�on
June 2011 | Edi�on No. 4 24
Special Focus – Making the Most of Kenya’s Demographic Change and Rapid Urbaniza�on
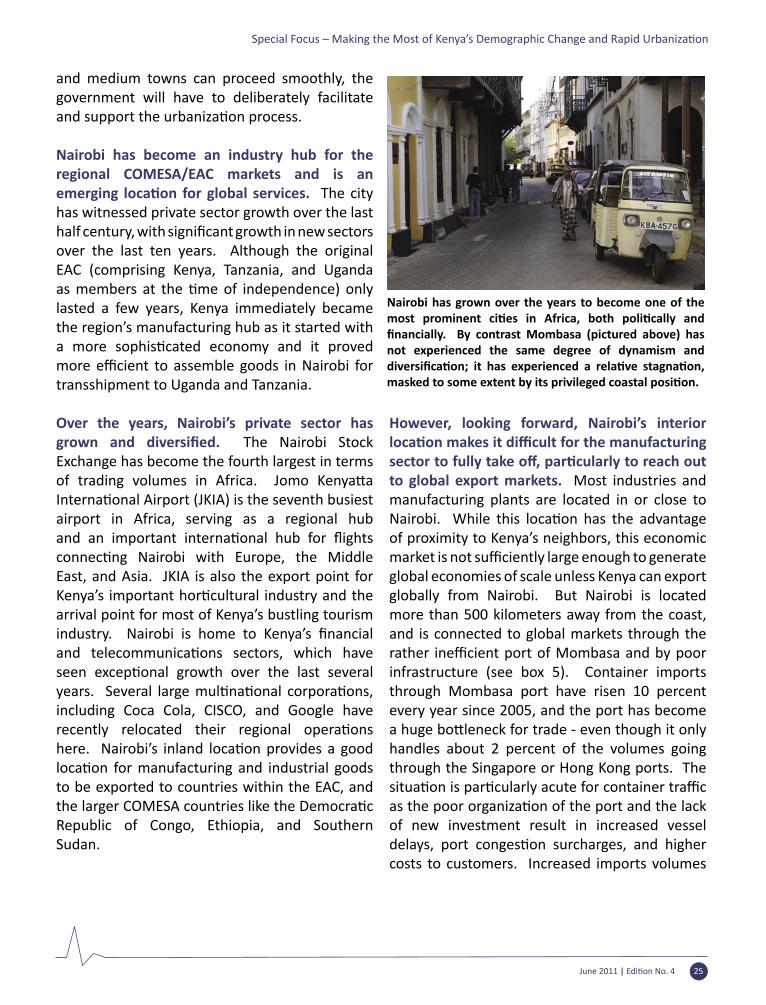
and medium towns can proceed smoothly, the government will have to deliberately facilitate and support the urbaniza�on process.
Nairobi has become an industry hub for the regional COMESA/EAC markets and is an emerging loca�on for global services. The city has witnessed private sector growth over the last half century, with significant growth in new sectorsover the last ten years. Although the original EAC (comprising Kenya, Tanzania, and Uganda as members at the �me of independence) onlylasted a few years, Kenya immediately became the region’s manufacturing hub as it started with a more sophis�cated economy and it provedmore efficient to assemble goods in Nairobi fortransshipment to Uganda and Tanzania.
Over the years, Nairobi’s private sector has grown and diversified. The Nairobi Stock Exchange has become the fourth largest in terms of trading volumes in Africa. Jomo Kenya�aInterna�onal Airport (JKIA) is the seventh busiestairport in Africa, serving as a regional hub and an important interna�onal hub for flightsconnec�ng Nairobi with Europe, the MiddleEast, and Asia. JKIA is also the export point for Kenya’s important hor�cultural industry and thearrival point for most of Kenya’s bustling tourism industry. Nairobi is home to Kenya’s financialand telecommunica�ons sectors, which haveseen excep�onal growth over the last severalyears. Several large mul�na�onal corpora�ons,including Coca Cola, CISCO, and Google have recently relocated their regional opera�onshere. Nairobi’s inland loca�on provides a goodloca�on for manufacturing and industrial goodsto be exported to countries within the EAC, and the larger COMESA countries like the Democra�cRepublic of Congo, Ethiopia, and Southern Sudan.
However, looking forward, Nairobi’s interior loca�on makes it difficult for the manufacturingsector to fully take off, par�cularly to reach outto global export markets. Most industries and manufacturing plants are located in or close to Nairobi. While this loca�on has the advantageof proximity to Kenya’s neighbors, this economic market is not sufficiently large enough to generateglobal economies of scale unless Kenya can export globally from Nairobi. But Nairobi is located more than 500 kilometers away from the coast, and is connected to global markets through the rather inefficient port of Mombasa and by poorinfrastructure (see box 5). Container imports through Mombasa port have risen 10 percent every year since 2005, and the port has become a huge bo�leneck for trade - even though it onlyhandles about 2 percent of the volumes going through the Singapore or Hong Kong ports. The situa�on is par�cularly acute for container trafficas the poor organiza�on of the port and the lackof new investment result in increased vessel delays, port conges�on surcharges, and highercosts to customers. Increased imports volumes
Nairobi has grown over the years to become one of the most prominent ci�es in Africa, both poli�cally andfinancially. By contrast Mombasa (pictured above) hasnot experienced the same degree of dynamism and diversifica�on; it has experienced a rela�ve stagna�on,masked to some extent by its privileged coastal posi�on.
June 2011 | Edi�on No. 4 25
Special Focus – Making the Most of Kenya’s Demographic Change and Rapid Urbaniza�on
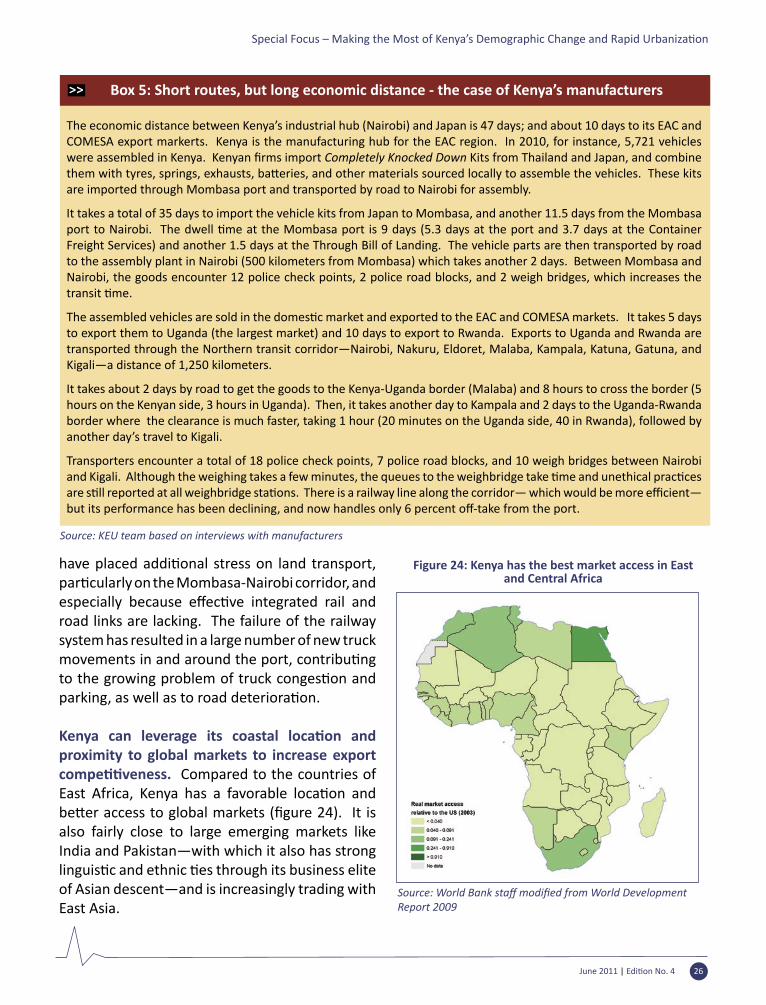
Box 5: Short routes, but long economic distance - the case of Kenya’s manufacturers
The economic distance between Kenya’s industrial hub (Nairobi) and Japan is 47 days; and about 10 days to its EAC and COMESA export markerts. Kenya is the manufacturing hub for the EAC region. In 2010, for instance, 5,721 vehicles were assembled in Kenya. Kenyan firms import Completely Knocked Down Kits from Thailand and Japan, and combine them with tyres, springs, exhausts, ba�eries, and other materials sourced locally to assemble the vehicles. These kitsare imported through Mombasa port and transported by road to Nairobi for assembly.
It takes a total of 35 days to import the vehicle kits from Japan to Mombasa, and another 11.5 days from the Mombasa port to Nairobi. The dwell �me at the Mombasa port is 9 days (5.3 days at the port and 3.7 days at the ContainerFreight Services) and another 1.5 days at the Through Bill of Landing. The vehicle parts are then transported by road to the assembly plant in Nairobi (500 kilometers from Mombasa) which takes another 2 days. Between Mombasa and Nairobi, the goods encounter 12 police check points, 2 police road blocks, and 2 weigh bridges, which increases the transit �me. The assembled vehicles are sold in the domes�c market and exported to the EAC and COMESA markets. It takes 5 days to export them to Uganda (the largest market) and 10 days to export to Rwanda. Exports to Uganda and Rwanda are transported through the Northern transit corridor―Nairobi, Nakuru, Eldoret, Malaba, Kampala, Katuna, Gatuna, and Kigali―a distance of 1,250 kilometers.
It takes about 2 days by road to get the goods to the Kenya-Uganda border (Malaba) and 8 hours to cross the border (5 hours on the Kenyan side, 3 hours in Uganda). Then, it takes another day to Kampala and 2 days to the Uganda-Rwanda border where the clearance is much faster, taking 1 hour (20 minutes on the Uganda side, 40 in Rwanda), followed by another day’s travel to Kigali.
Transporters encounter a total of 18 police check points, 7 police road blocks, and 10 weigh bridges between Nairobi and Kigali. Although the weighing takes a few minutes, the queues to the weighbridge take �me and unethical prac�cesare s�ll reported at all weighbridge sta�ons. There is a railway line along the corridor― which would be more efficient―but its performance has been declining, and now handles only 6 percent off-take from the port.
Source: KEU team based on interviews with manufacturers
have placed addi�onal stress on land transport,par�cularly on the Mombasa-Nairobi corridor, andespecially because effec�ve integrated rail androad links are lacking. The failure of the railway system has resulted in a large number of new truck movements in and around the port, contribu�ngto the growing problem of truck conges�on andparking, as well as to road deteriora�on.
Kenya can leverage its coastal loca�on andproximity to global markets to increase export compe��veness. Compared to the countries of East Africa, Kenya has a favorable loca�on andbe�er access to global markets (figure 24). It isalso fairly close to large emerging markets like India and Pakistan―with which it also has strong linguis�c and ethnic �es through its business eliteof Asian descent―and is increasingly trading with East Asia.
June 2011 | Edi�on No. 4 26
Special Focus – Making the Most of Kenya’s Demographic Change and Rapid Urbaniza�on
Figure 24: Kenya has the best market access in Eastand Central Africa
Source: World Bank staff modified from World DevelopmentReport 2009
The port of Mombasa needs upgrading. A shi� inprivate sector investment to Mombasa to reach out to global export markets will only occur if the government makes the necessary investments in infrastructure and improves management of the port. The private sector is largely making money from its produc�vecapacityinNairobi,anditsabilityto expand is constrained by the small size of the market. If the required infrastructure investments were made in Mombasa and the transit corridor to Nairobi improved, manufacturing and industry in Nairobi would benefit from lower import costswhich would expand exis�ng profit margins.Over the medium term, the new private sector operators could then exploit the opportunity offered by an efficiently opera�ng Mombasaport, and build a strong presence on the coast. Taking advantage of economies of scale and cost effec�ve sea transportthey could, as a result, export manufactures and industrial goods to the Middle East and Asia.
Investment in the port of Mombasa, and in the transport corridor connec�ngit to Nairobi and beyond, would have important benefitsfor the urban hubs along the northern corridor. In the short term, Mombasa would earn more revenue from increased port opera�ons. This would createemployment and could a�ract new migrants. Nairobi’s manufacturers and industrialists would benefit from lower input costs. Over the mediumterm, one would expect to see the agglomera�oneffects of urbaniza�on kick-in for Mombasa,as the private sector perceives opportuni�esfor global exports and the benefits from a poolof low-cost labor that has migrated in search
of employment. Meanwhile, Nairobi’s vibrant growth would con�nue, based on expansionof those areas where it is currently thriving, for example, banking and finance, ICT, construc�on,transporta�on, and tourism, as well as in thosemanufactures and industrial products des�ned toits neighbors for which its loca�on will con�nueto provide it with a compara�ve advantage.
Facilita�ng the establishment of a coastal hubwill not be easy, but not doing so would reduce Kenya’s growth poten�al. Crea�ng a secondindustrial hub is complicated by the very nature of agglomera�on effects: firms tend to locate whereother firms are (so once Nairobi was establishedand grew, alterna�ve growth poles had fewerchances to develop in coastal areas). But if Kenya improves its overall investment climate and the connec�vity between its two largest ci�es, aswell as Mombasa’s produc�ve infrastructure,it will improve its chances to leverage global manufacturing demand, including the compe��onfrom Asian coastal urban agglomera�ons.
6. Devolu�on:From Central to Local
The economic and social gains from urbaniza�on will materialize only if Kenya’s
main urban centers are well managed. Conversely, poor governance and management would lead to increased slumifica�on, crime, and conges�on. Effec�ve and efficient urban service delivery iscri�cal for economic growth. Ci�es over a certainsize and density need: (i) mandated func�ons;(ii) adequate financing; (iii) efficient technicalmanagement; and (iv) poli�cally accountablegovernance. Most commonly this is achieved thorough rela�vely autonomous structures thatcan collect revenues from urban residents and can use these to fund urban services. Interna�onally,na�onal governments are increasingly takingresponsibility for ensuring urban governance structures are in place and operate effec�vely.
Nairobi is located more than 500
kilometers away from the coast,
and is connected to global markets
through the rather inefficient port ofMombasa and by
poor infrastructure
June 2011 | Edi�on No. 4 27
Special Focus – Making the Most of Kenya’s Demographic Change and Rapid Urbaniza�on
Experience has shown that second-�er governments are prone tounder-resource and dis-empower third-level government, to the detriment of urban service delivery.
In Kenya, public services are currently provided through a wall-to-wall system of municipal, town, and county councils.⁴ At least 7 of the larger municipal councils have operated con�nuouslysince the 1950s when they were first established by the colonialadministra�on. These largermunicipal councils also provide some social services (schools and health centers). However, over �me their capacity and mandates havedwindled due to poorly structured and weak governance arrangements.
The new cons�tu�on sets the stage and createsan opportunity for a profound redefini�on ofurban governance arrangements. As of August 2012, 47 coun�es will be created and equippedwith significant resources and responsibili�esunder the authority of county assemblies and execu�ves. In addi�on to own-revenues, whichinclude all of the own-source revenues of Kenya’s current local authori�es, the new coun�es willcollec�vely receive a minimum transfer equivalentto 15 percent of na�onal revenue. Among theresponsibili�es of the county, the cons�tu�on listsa number of core urban government func�onswhich include, among others, street ligh�ng, solidwaste management, markets, trade licenses, and storm water management.
But Kenya’s cons�tu�on doesnot make it clear how urban areas outside Nairobi and Mombasa are to be governed. The majority of larger urban centers are located in predominantly rural coun�es. If urban service delivery is le�to the responsibility of these county governments (without catering for urban governments separately), Kenya will be out of step with most other countries in the world. The cons�tu�ondoes provide for a na�onal law
on ‘ci�es and urban areas’, but it is not clear what it should cover. While this law could deal with the classifica�on of urban areas (for example, basedon popula�on and other criteria), and prescribegovernance arrangements, it is less clear whether it could empower urban governments and deal with their resourcing. The fourth schedule of the cons�tu�on has already assigned urban powersand func�ons to the coun�es. These powerswould need to be delegated to urban governments in order for them to operate effec�vely. It wouldbe useful to clarify the legal posi�on so that thepolicy op�ons permi�ed under the cons�tu�onbecome explicit. There are two specific risks which could cripplethe development of Kenya’s ci�es in yearsto come. The first risk is that larger towns inpredominantly rural coun�es will have fundingfor urban services reduced. The second risk is to the con�nuity and viability of services currentlybeing provided in these towns if Kenya’s main
If Kenya improves its overall investment
climate it will improve its chances to leverage global manufacturing
demand, including the compe��on fromAsian coastal urban
agglomera�ons
June 2011 | Edi�on No. 4 28
Special Focus – Making the Most of Kenya’s Demographic Change and Rapid Urbaniza�on
⁴ Larger towns and cities (including Nairobi and Mombasa) are serviced by municipal councils. Smaller towns have town councils, and the remaining urban settlements are serviced by 62 county councils.
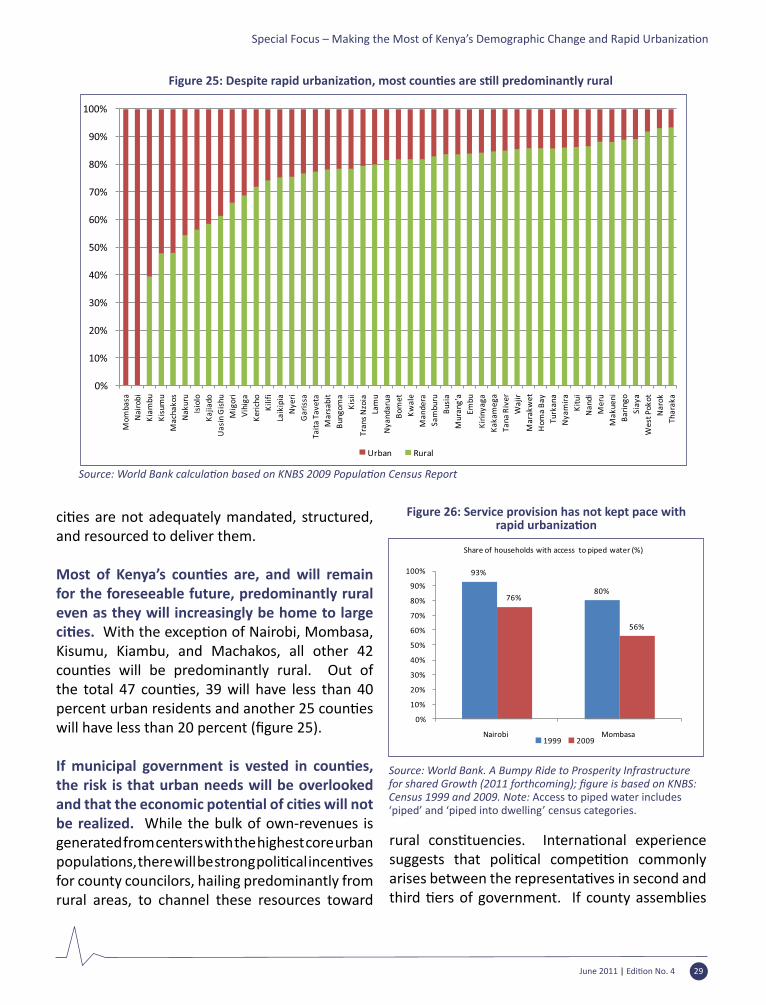
ci�es are not adequately mandated, structured,and resourced to deliver them. Most of Kenya’s coun�es are, and will remainfor the foreseeable future, predominantly rural even as they will increasingly be home to large ci�es. With the excep�on of Nairobi, Mombasa,Kisumu, Kiambu, and Machakos, all other 42 coun�es will be predominantly rural. Out ofthe total 47 coun�es, 39 will have less than 40percent urban residents and another 25 coun�eswill have less than 20 percent (figure 25).
If municipal government is vested in coun�es,the risk is that urban needs will be overlooked and that the economic poten�al of ci�es will notbe realized. While the bulk of own-revenues is generated from centers with the highest core urban popula�ons,therewillbestrongpoli�calincen�vesfor county councilors, hailing predominantly from rural areas, to channel these resources toward
rural cons�tuencies. Interna�onal experiencesuggests that poli�cal compe��on commonlyarises between the representa�ves in second andthird �ers of government. If county assemblies
June 2011 | Edi�on No. 4 29
Special Focus – Making the Most of Kenya’s Demographic Change and Rapid Urbaniza�on
Figure 25: Despite rapid urbaniza�on, most coun�es are s�ll predominantly rural
Source: World Bank calcula�on based on KNBS 2009 Popula�on Census Report
Figure 26: Service provision has not kept pace withrapid urbaniza�on
Source: World Bank. A Bumpy Ride to Prosperity Infrastructure for shared Growth (2011 forthcoming); figure is based on KNBS:Census 1999 and 2009. Note: Access to piped water includes ‘piped’ and ‘piped into dwelling’ census categories.
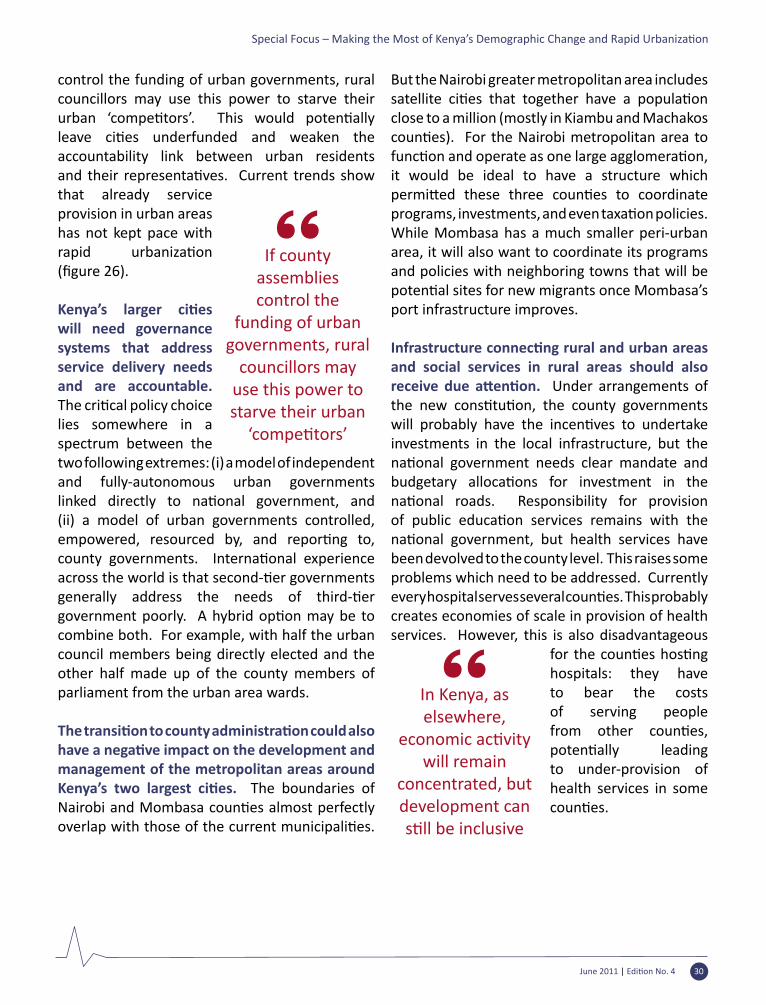
June 2011 | Edi�on No. 4 30
control the funding of urban governments, rural councillors may use this power to starve their urban ‘compe�tors’. This would poten�allyleave ci�es underfunded and weaken theaccountability link between urban residents and their representa�ves. Current trends showthat already service provision in urban areas has not kept pace with rapid urbaniza�on(figure 26).
Kenya’s larger ci�eswill need governance systems that address service delivery needs and are accountable. The cri�cal policy choicelies somewhere in a spectrum between the two following extremes: (i) a model of independent and fully-autonomous urban governments linked directly to na�onal government, and(ii) a model of urban governments controlled, empowered, resourced by, and repor�ng to,county governments. Interna�onal experienceacross the world is that second-�er governmentsgenerally address the needs of third-�ergovernment poorly. A hybrid op�on may be tocombine both. For example, with half the urban council members being directly elected and the other half made up of the county members of parliament from the urban area wards.
The transi�ontocountyadministra�oncouldalsohave a nega�ve impact on the development andmanagement of the metropolitan areas around Kenya’s two largest ci�es. The boundaries of Nairobi and Mombasa coun�es almost perfectlyoverlap with those of the current municipali�es.
But the Nairobi greater metropolitan area includes satellite ci�es that together have a popula�onclose to a million (mostly in Kiambu and Machakos coun�es). For the Nairobi metropolitan area tofunc�on and operate as one large agglomera�on,it would be ideal to have a structure which permi�ed these three coun�es to coordinateprograms, investments, and even taxa�onpolicies. While Mombasa has a much smaller peri-urban area, it will also want to coordinate its programs and policies with neighboring towns that will be poten�al sites for new migrants once Mombasa’sport infrastructure improves.
Infrastructure connec�ng rural and urban areasand social services in rural areas should also receive due a�en�on. Under arrangements of the new cons�tu�on, the county governmentswill probably have the incen�ves to undertakeinvestments in the local infrastructure, but the na�onal government needs clear mandate andbudgetary alloca�ons for investment in thena�onal roads. Responsibility for provisionof public educa�on services remains with thena�onal government, but health services havebeen devolved to the county level. This raises some problems which need to be addressed. Currently every hospital serves several coun�es. Thisprobablycreates economies of scale in provision of health services. However, this is also disadvantageous
for the coun�es hos�nghospitals: they have to bear the costs of serving people from other coun�es,poten�ally leadingto under-provision of health services in some coun�es.
If county assemblies control the
funding of urban governments, rural
councillors may use this power to starve their urban
‘compe�tors’
Special Focus – Making the Most of Kenya’s Demographic Change and Rapid Urbaniza�on
In Kenya, as elsewhere,
economic ac�vitywill remain
concentrated, but development can s�ll be inclusive
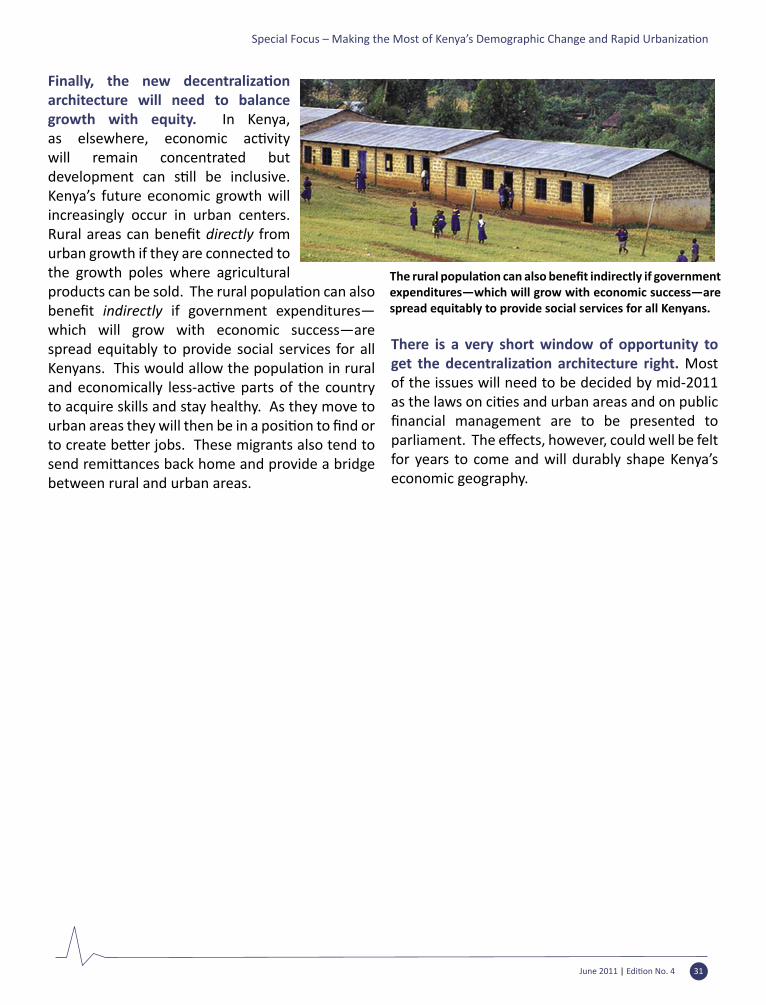
Finally, the new decentraliza�onarchitecture will need to balance growth with equity. In Kenya, as elsewhere, economic ac�vitywill remain concentrated but development can s�ll be inclusive. Kenya’s future economic growth will increasingly occur in urban centers. Rural areas can benefit directly from urban growth if they are connected to the growth poles where agricultural products can be sold. The rural popula�on can alsobenefit indirectly if government expenditures―which will grow with economic success―are spread equitably to provide social services for all Kenyans. This would allow the popula�on in ruraland economically less-ac�ve parts of the countryto acquire skills and stay healthy. As they move to urban areas they will then be in a posi�on to find orto create be�er jobs. These migrants also tend tosend remi�ances back home and provide a bridgebetween rural and urban areas.
There is a very short window of opportunity to get the decentraliza�on architecture right. Most of the issues will need to be decided by mid-2011 as the laws on ci�es and urban areas and on publicfinancial management are to be presented toparliament. The effects, however, could well be feltfor years to come and will durably shape Kenya’s economic geography.
The rural popula�on can also benefit indirectly if government expenditures―which will grow with economic success―are spread equitably to provide social services for all Kenyans.
June 2011 | Edi�on No. 4 31
Special Focus – Making the Most of Kenya’s Demographic Change and Rapid Urbaniza�on

ANNEXES
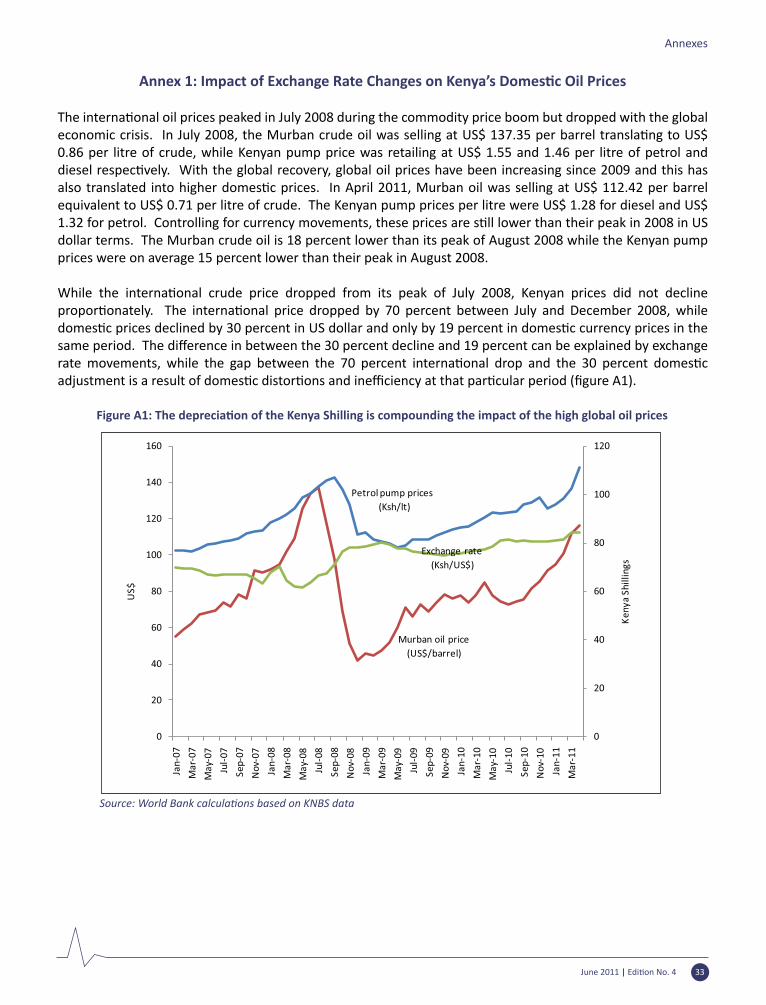
June 2011 | Edi�on No. 4 33
Annexes
Annex 1: Impact of Exchange Rate Changes on Kenya’s Domes�c Oil Prices
The interna�onal oil prices peaked in July 2008 during the commodity price boom but dropped with the globaleconomic crisis. In July 2008, the Murban crude oil was selling at US$ 137.35 per barrel transla�ng to US$0.86 per litre of crude, while Kenyan pump price was retailing at US$ 1.55 and 1.46 per litre of petrol and diesel respec�vely. With the global recovery, global oil prices have been increasing since 2009 and this hasalso translated into higher domes�c prices. In April 2011, Murban oil was selling at US$ 112.42 per barrelequivalent to US$ 0.71 per litre of crude. The Kenyan pump prices per litre were US$ 1.28 for diesel and US$ 1.32 for petrol. Controlling for currency movements, these prices are s�ll lower than their peak in 2008 in USdollar terms. The Murban crude oil is 18 percent lower than its peak of August 2008 while the Kenyan pump prices were on average 15 percent lower than their peak in August 2008.
While the interna�onal crude price dropped from its peak of July 2008, Kenyan prices did not declinepropor�onately. The interna�onal price dropped by 70 percent between July and December 2008, whiledomes�c prices declined by 30 percent in US dollar and only by 19 percent in domes�c currency prices in thesame period. The difference in between the 30 percent decline and 19 percent can be explained by exchangerate movements, while the gap between the 70 percent interna�onal drop and the 30 percent domes�cadjustment is a result of domes�c distor�ons and inefficiency at that par�cular period (figure A1).
Figure A1: The deprecia�on of the Kenya Shilling is compounding the impact of the high global oil prices
Source: World Bank calcula�ons based on KNBS data
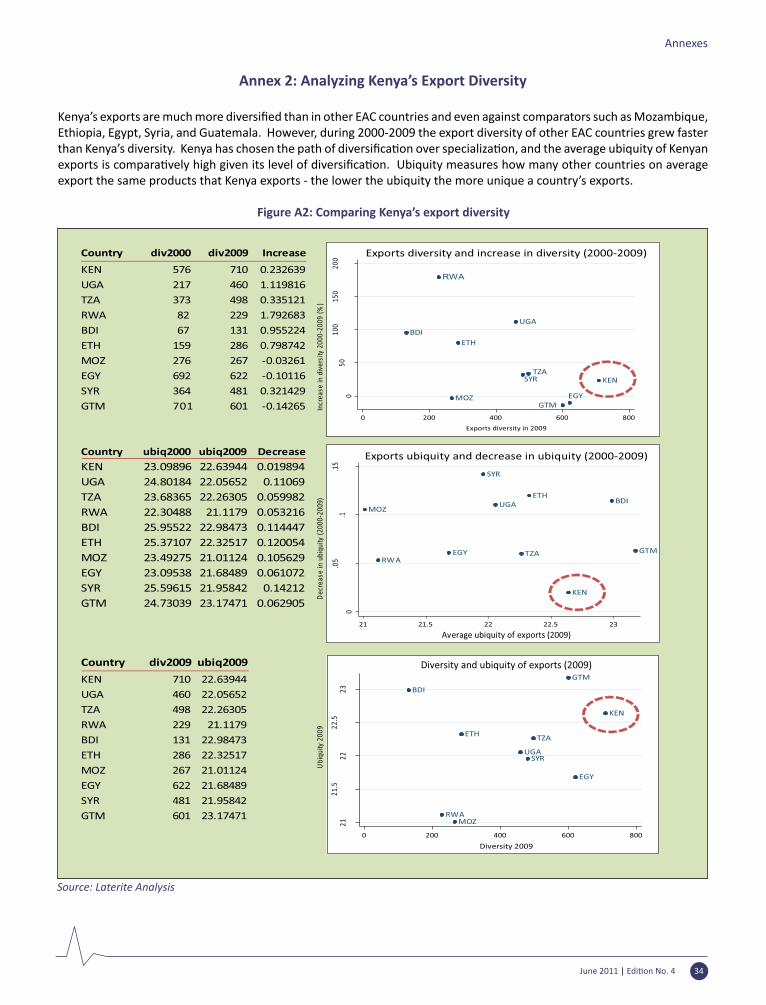
June 2011 | Edi�on No. 4 34
Annexes
Annex 2: Analyzing Kenya’s Export Diversity
Kenya’s exports are much more diversified than in other EAC countries and even against comparators such as Mozambique,Ethiopia, Egypt, Syria, and Guatemala. However, during 2000-2009 the export diversity of other EAC countries grew faster than Kenya’s diversity. Kenya has chosen the path of diversifica�on over specializa�on, and the average ubiquity of Kenyanexports is compara�vely high given its level of diversifica�on. Ubiquity measures how many other countries on averageexport the same products that Kenya exports - the lower the ubiquity the more unique a country’s exports.
Figure A2: Comparing Kenya’s export diversity
Source: Laterite Analysis
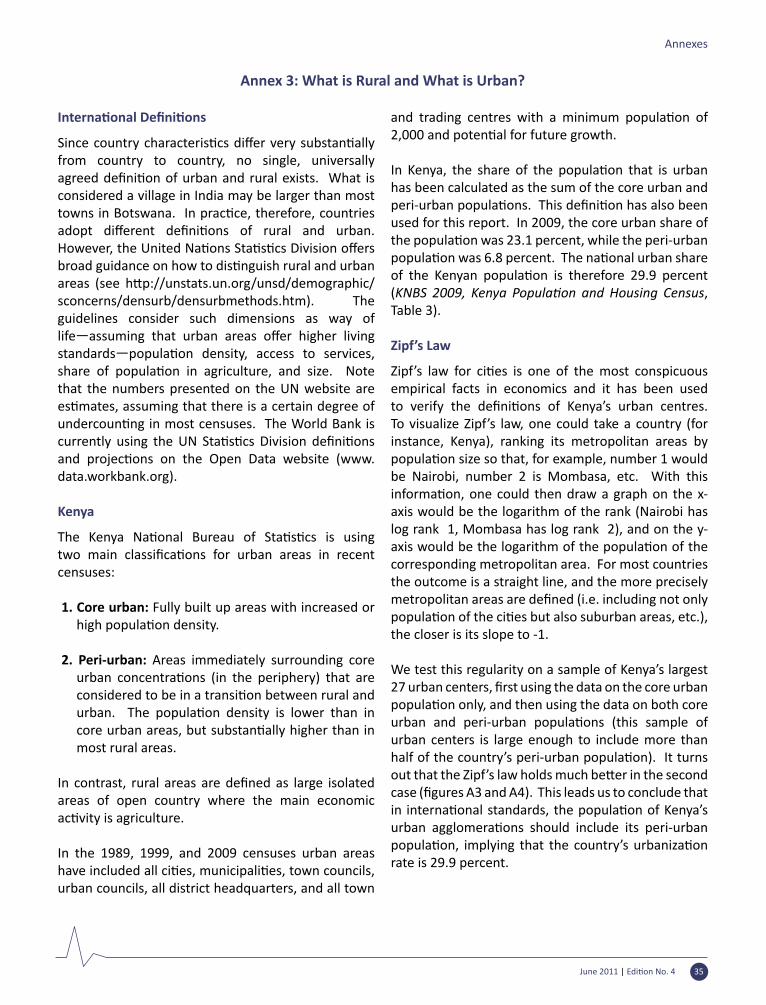
June 2011 | Edi�on No. 4 35
Annexes
Annex 3: What is Rural and What is Urban?
Interna�onal Defini�ons
Since country characteris�cs differ very substan�allyfrom country to country, no single, universally agreed defini�on of urban and rural exists. What isconsidered a village in India may be larger than most towns in Botswana. In prac�ce, therefore, countriesadopt different defini�ons of rural and urban.However, the United Na�ons Sta�s�cs Division offersbroad guidance on how to dis�nguish rural and urbanareas (see h�p://unstats.un.org/unsd/demographic/sconcerns/densurb/densurbmethods.htm). The guidelines consider such dimensions as way of life�assuming that urban areas offer higher livingstandards�popula�on density, access to services,share of popula�on in agriculture, and size. Notethat the numbers presented on the UN website are es�mates, assuming that there is a certain degree ofundercoun�ng in most censuses. The World Bank iscurrently using the UN Sta�s�cs Division defini�onsand projec�ons on the Open Data website (www.data.workbank.org).
Kenya
The Kenya Na�onal Bureau of Sta�s�cs is usingtwo main classifica�ons for urban areas in recentcensuses:
1. Core urban: Fully built up areas with increased or high popula�on density.
2. Peri-urban: Areas immediately surrounding core urban concentra�ons (in the periphery) that areconsidered to be in a transi�on between rural andurban. The popula�on density is lower than incore urban areas, but substan�ally higher than inmost rural areas.
In contrast, rural areas are defined as large isolatedareas of open country where the main economic ac�vity is agriculture.
In the 1989, 1999, and 2009 censuses urban areas have included all ci�es, municipali�es, town councils,urban councils, all district headquarters, and all town
and trading centres with a minimum popula�on of2,000 and poten�al for future growth.
In Kenya, the share of the popula�on that is urbanhas been calculated as the sum of the core urban and peri-urban popula�ons. This defini�on has also beenused for this report. In 2009, the core urban share of the popula�on was 23.1 percent, while the peri-urbanpopula�on was 6.8 percent. The na�onal urban shareof the Kenyan popula�on is therefore 29.9 percent(KNBS 2009, Kenya Popula�on and Housing Census, Table 3).
Zipf’s Law
Zipf’s law for ci�es is one of the most conspicuousempirical facts in economics and it has been used to verify the defini�ons of Kenya’s urban centres.To visualize Zipf’s law, one could take a country (for instance, Kenya), ranking its metropolitan areas by popula�on size so that, for example, number 1 wouldbe Nairobi, number 2 is Mombasa, etc. With this informa�on, one could then draw a graph on the x-axis would be the logarithm of the rank (Nairobi has log rank 1, Mombasa has log rank 2), and on the y-axis would be the logarithm of the popula�on of thecorresponding metropolitan area. For most countries the outcome is a straight line, and the more precisely metropolitan areas are defined (i.e. including not onlypopula�on of the ci�es but also suburban areas, etc.),the closer is its slope to -1.
We test this regularity on a sample of Kenya’s largest 27 urban centers, first using the data on the core urbanpopula�on only, and then using the data on both coreurban and peri-urban popula�ons (this sample ofurban centers is large enough to include more than half of the country’s peri-urban popula�on). It turnsout that the Zipf’s law holds much be�er in the secondcase (figures A3 and A4). This leads us to conclude thatin interna�onal standards, the popula�on of Kenya’surban agglomera�ons should include its peri-urbanpopula�on, implying that the country’s urbaniza�onrate is 29.9 percent.
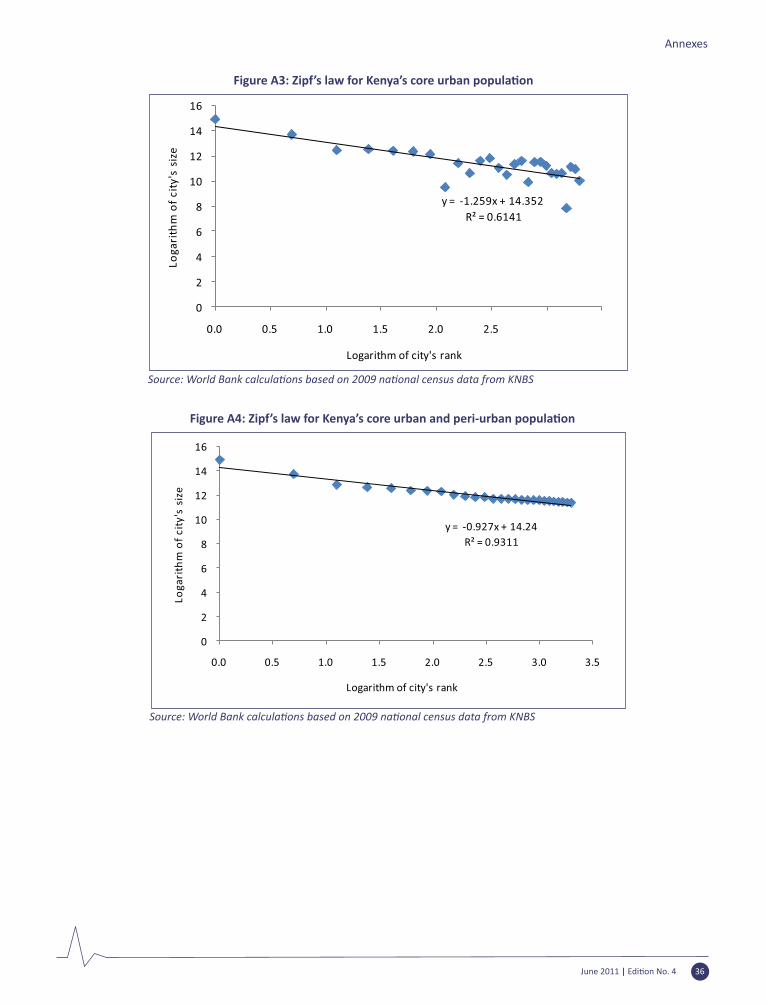
June 2011 | Edi�on No. 4 36
Annexes
Figure A3: Zipf’s law for Kenya’s core urban popula�on
Source: World Bank calcula�ons based on 2009 na�onal census data from KNBS
Figure A4: Zipf’s law for Kenya’s core urban and peri-urban popula�on
Source: World Bank calcula�ons based on 2009 na�onal census data from KNBS
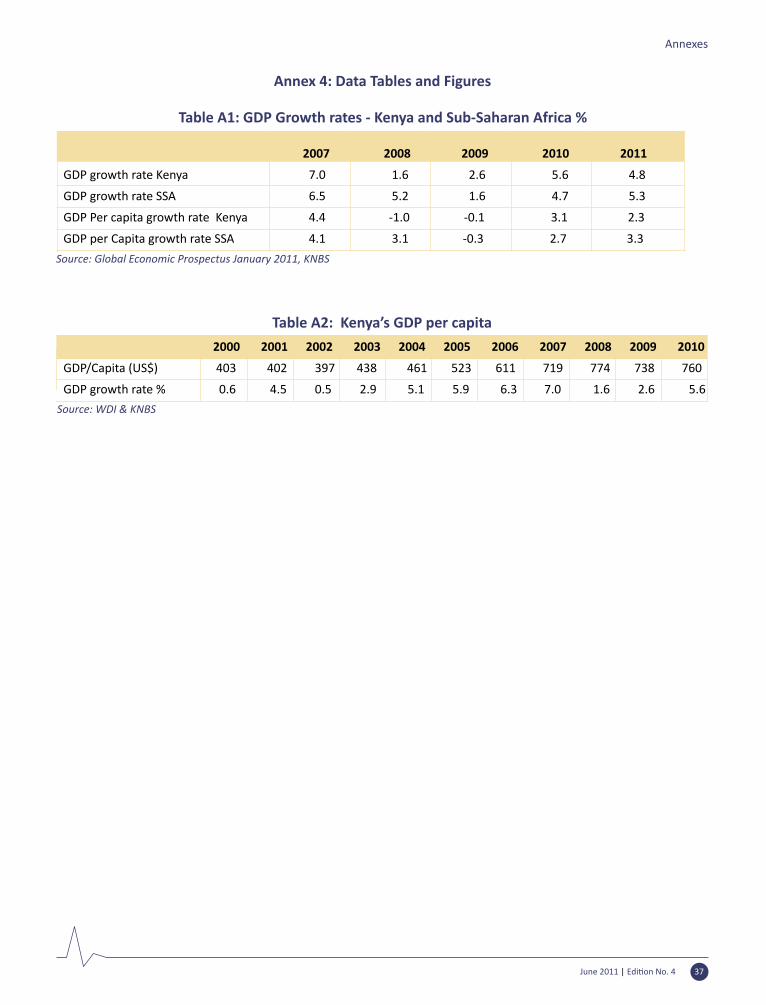
June 2011 | Edi�on No. 4 37
Annexes
Table A1: GDP Growth rates - Kenya and Sub-Saharan Africa %
Source: Global Economic Prospectus January 2011, KNBS
2007 2008 2009 2010 2011
GDP growth rate Kenya 7.0 1.6 2.6 5.6 4.8
GDP growth rate SSA 6.5 5.2 1.6 4.7 5.3
GDP Per capita growth rate Kenya 4.4 -1.0 -0.1 3.1 2.3
GDP per Capita growth rate SSA 4.1 3.1 -0.3 2.7 3.3
Table A2: Kenya’s GDP per capita
Source: WDI & KNBS
2000 2001 2002 2003 2004 2005 2006 2007 2008 2009 2010
GDP/Capita (US$) 403 402 397 438 461 523 611 719 774 738 760
GDP growth rate % 0.6 4.5 0.5 2.9 5.1 5.9 6.3 7.0 1.6 2.6 5.6
Annex 4: Data Tables and Figures
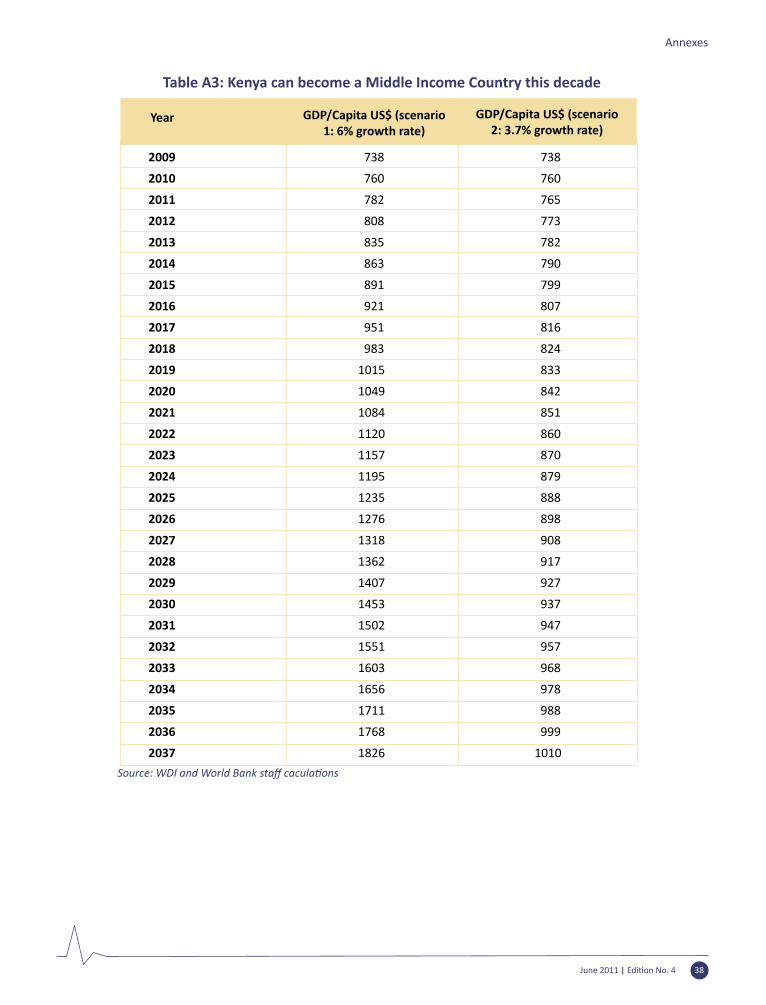
Table A3: Kenya can become a Middle Income Country this decade
2009 738 738
2010 760 760
2011 782 765
2012 808 773
2013 835 782
2014 863 790
2015 891 799
2016 921 807
2017 951 816
2018 983 824
2019 1015 833
2020 1049 842
2021 1084 851
2022 1120 860
2023 1157 870
2024 1195 879
2025 1235 888
2026 1276 898
2027 1318 908
2028 1362 917
2029 1407 927
2030 1453 937
2031 1502 947
2032 1551 957
2033 1603 968
2034 1656 978
2035 1711 988
2036 1768 999
2037 1826 1010
Source: WDI and World Bank staff cacula�ons
June 2011 | Edi�on No. 4 38
Annexes
GDP/Capita US$ (scenario 1: 6% growth rate)
GDP/Capita US$ (scenario 2: 3.7% growth rate)
Year
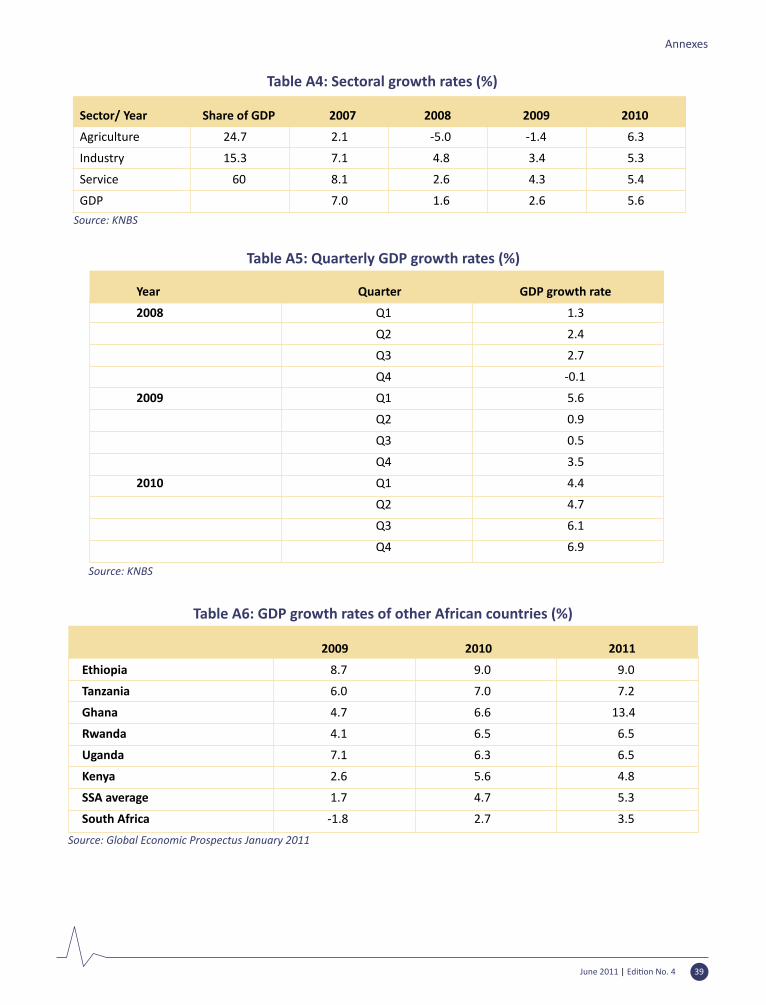
June 2011 | Edi�on No. 4 39
Annexes
Table A4: Sectoral growth rates (%)
Sector/ Year Share of GDP 2007 2008 2009 2010
Agriculture 24.7 2.1 -5.0 -1.4 6.3
Industry 15.3 7.1 4.8 3.4 5.3
Service 60 8.1 2.6 4.3 5.4
GDP 7.0 1.6 2.6 5.6
Source: KNBS
Table A5: Quarterly GDP growth rates (%)
Year Quarter GDP growth rate
2008 Q1 1.3
Q2 2.4
Q3 2.7
Q4 -0.1
2009 Q1 5.6
Q2 0.9
Q3 0.5
Q4 3.5
2010 Q1 4.4
Q2 4.7
Q3 6.1
Q4 6.9
Source: KNBS
Table A6: GDP growth rates of other African countries (%)
2009 2010 2011
Ethiopia 8.7 9.0 9.0
Tanzania 6.0 7.0 7.2
Ghana 4.7 6.6 13.4
Rwanda 4.1 6.5 6.5
Uganda 7.1 6.3 6.5
Kenya 2.6 5.6 4.8
SSA average 1.7 4.7 5.3
South Africa -1.8 2.7 3.5
Source: Global Economic Prospectus January 2011
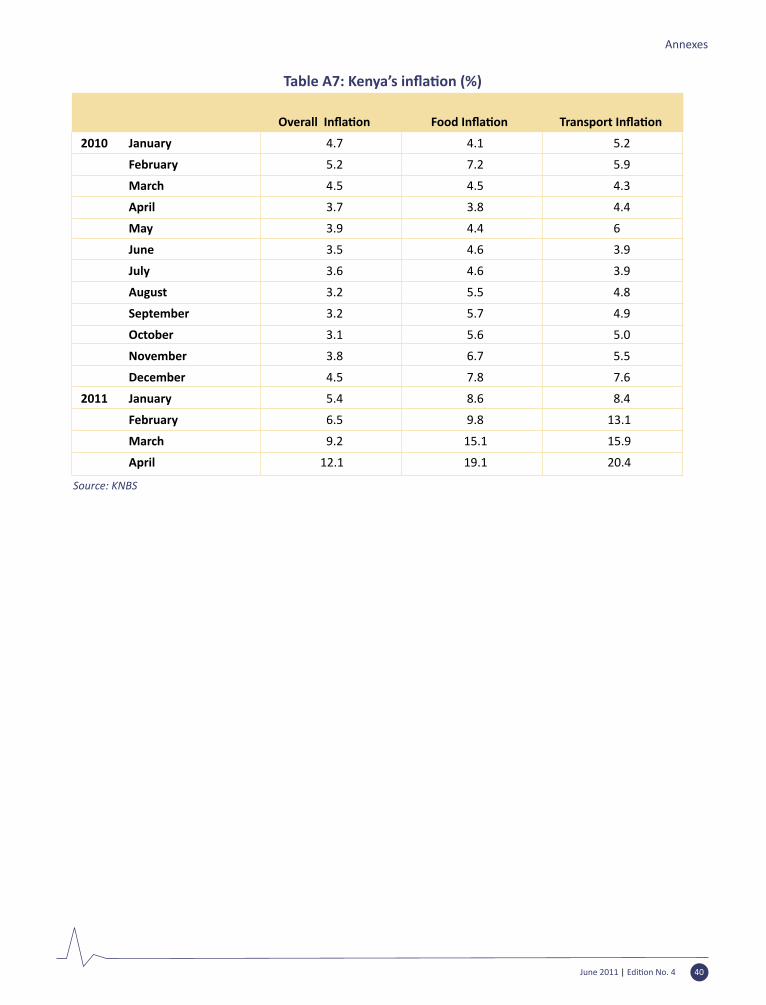
June 2011 | Edi�on No. 4 40
Annexes
Overall Infla�on Food Infla�on Transport Infla�on
2010 January 4.7 4.1 5.2
February 5.2 7.2 5.9
March 4.5 4.5 4.3
April 3.7 3.8 4.4
May 3.9 4.4 6
June 3.5 4.6 3.9
July 3.6 4.6 3.9
August 3.2 5.5 4.8
September 3.2 5.7 4.9
October 3.1 5.6 5.0
November 3.8 6.7 5.5
December 4.5 7.8 7.6
2011 January 5.4 8.6 8.4
February 6.5 9.8 13.1
March 9.2 15.1 15.9
April 12.1 19.1 20.4
Source: KNBS
Table A7: Kenya’s infla�on (%)
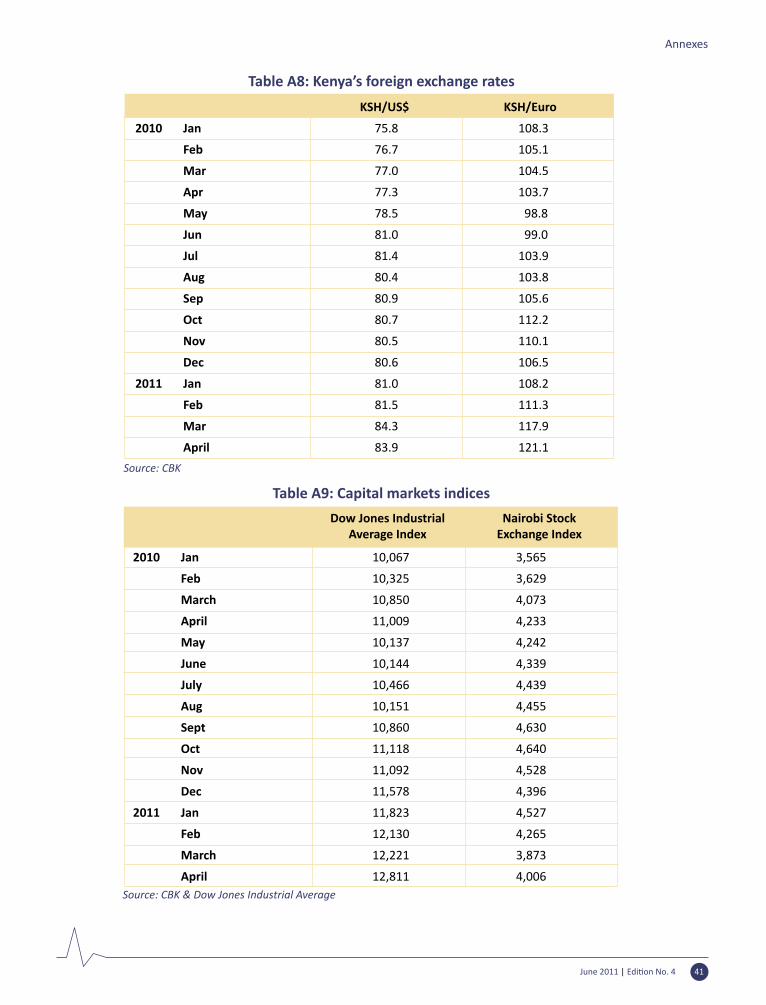
June 2011 | Edi�on No. 4 41
Annexes
Table A8: Kenya’s foreign exchange rates
KSH/US$ KSH/Euro
2010 Jan 75.8 108.3
Feb 76.7 105.1
Mar 77.0 104.5
Apr 77.3 103.7
May 78.5 98.8
Jun 81.0 99.0
Jul 81.4 103.9
Aug 80.4 103.8
Sep 80.9 105.6
Oct 80.7 112.2
Nov 80.5 110.1
Dec 80.6 106.5
2011 Jan 81.0 108.2
Feb 81.5 111.3
Mar 84.3 117.9
April 83.9 121.1
Source: CBK
Table A9: Capital markets indices
2010 Jan 10,067 3,565
Feb 10,325 3,629
March 10,850 4,073
April 11,009 4,233
May 10,137 4,242
June 10,144 4,339
July 10,466 4,439
Aug 10,151 4,455
Sept 10,860 4,630
Oct 11,118 4,640
Nov 11,092 4,528
Dec 11,578 4,396
2011 Jan 11,823 4,527
Feb 12,130 4,265
March 12,221 3,873
April 12,811 4,006 Source: CBK & Dow Jones Industrial Average
Dow Jones Industrial Average Index
Nairobi Stock Exchange Index
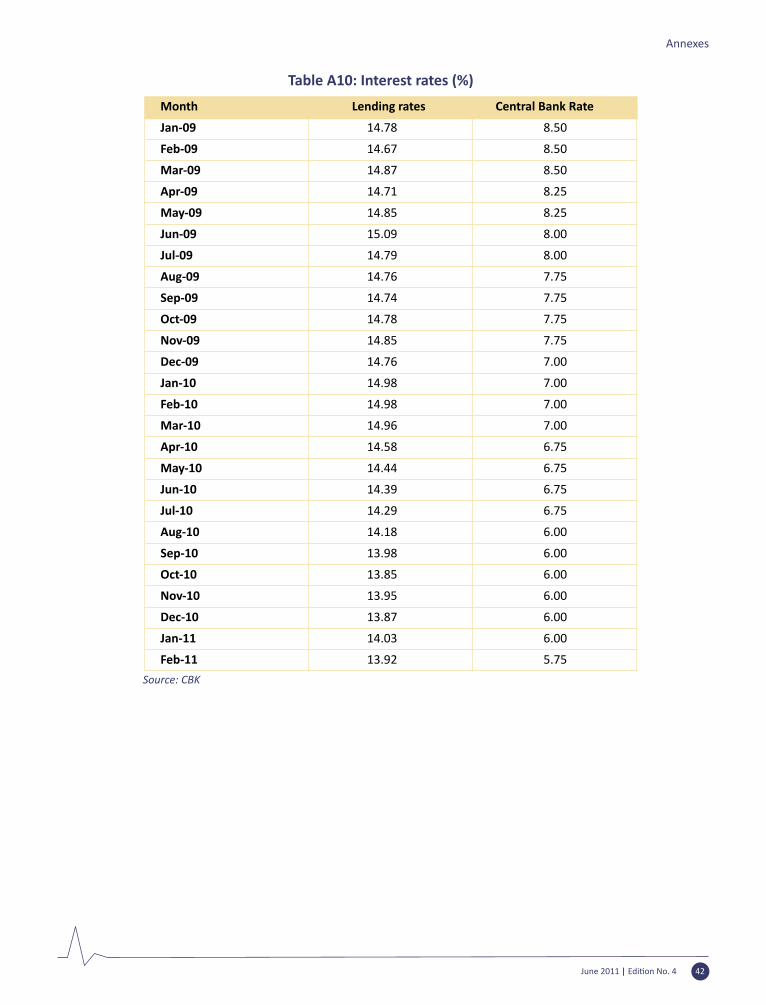
Table A10: Interest rates (%)
Month Lending rates Central Bank Rate
Jan-09 14.78 8.50
Feb-09 14.67 8.50
Mar-09 14.87 8.50
Apr-09 14.71 8.25
May-09 14.85 8.25
Jun-09 15.09 8.00
Jul-09 14.79 8.00
Aug-09 14.76 7.75
Sep-09 14.74 7.75
Oct-09 14.78 7.75
Nov-09 14.85 7.75
Dec-09 14.76 7.00
Jan-10 14.98 7.00
Feb-10 14.98 7.00
Mar-10 14.96 7.00
Apr-10 14.58 6.75
May-10 14.44 6.75
Jun-10 14.39 6.75
Jul-10 14.29 6.75
Aug-10 14.18 6.00
Sep-10 13.98 6.00
Oct-10 13.85 6.00
Nov-10 13.95 6.00
Dec-10 13.87 6.00
Jan-11 14.03 6.00
Feb-11 13.92 5.75
Source: CBK
June 2011 | Edi�on No. 4 42
Annexes
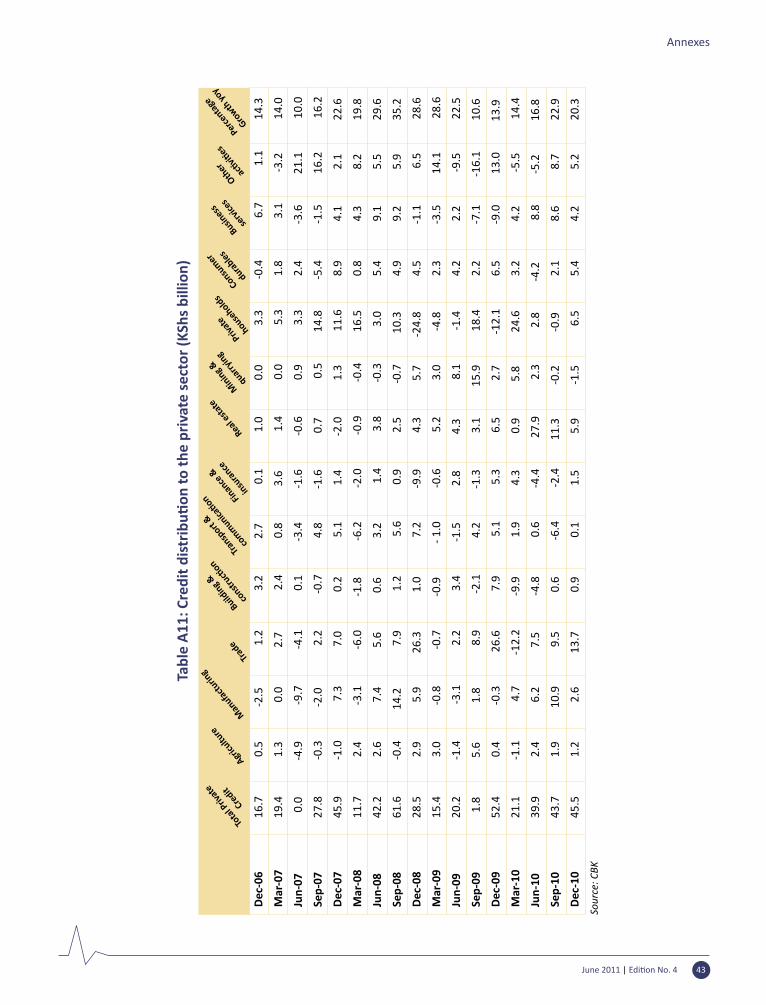
Tabl
e A
11: C
redi
t dis
trib
u�on
toth
epr
ivat
ese
ctor
(KSh
sbi
llion
)
June 2011 | Edi�on No. 4 43
Annexes
Dec
-06
16
.7
0.5
-
2.5
1.2
3.2
2.7
0.1
1.0
0.0
3.3
-
0.4
6.7
1.1
1
4.3
Mar
-07
19
.4
1
.3
0
.0
2
.7
2.4
0.8
3.6
1.4
0.0
5.3
1.8
3.1
-
3.2
1
4.0
Jun-
07
0
.0
-4
.9
-9
.7
-4
.1
0
.1
-3
.4
-1
.6
-0
.6
0
.9
3
.3
2.
4
-3
.6
21.
1
10.
0
Sep-
07
27
.8
-0
.3
-2
.0
2.2
-0.7
4.8
-1.6
0.7
0.5
1
4.8
-5
.4
-1
.5
16.
2
16.
2
Dec
-07
45
.9
-1
.0
7
.3
7
.0
0
.2
5
.1
1
.4
-2
.0
1
.3
11
.6
8.
9
4
.1
2
.1
22
.6
Mar
-08
11
.7
2
.4
-3
.1
-6
.0
-1
.8
-6
.2
-2
.0
-0
.9
-0
.4
16.
5
0.8
4.3
8.2
19.8
Jun-
08
42
.2
2
.6
7
.4
5
.6
0
.6
3
.2
1
.4
3
.8
-0
.3
3
.0
5.
4
9
.1
5
.5
29
.6
Sep-
08
61
.6
-0
.4
14.
2
7
.9
1
.2
5
.6
0
.9
2
.5
-0
.7
10.
3
4.9
9.2
5.9
35.2
Dec
-08
28
.5
2
.9
5
.9
26
.3
1
.0
7
.2
-9
.9
4
.3
5
.7
-24.
8
4.5
-1.1
6.5
28.6
Mar
-09
15
.4
3
.0
-0
.8
-0
.7
-0
.9
- 1
.0
-0
.6
5
.2
3
.0
-4
.8
2.
3
-3
.5
14.
1
28.
6
Jun-
09
20
.2
-1
.4
-3
.1
2
.2
3
.4
-1
.5
2
.8
4
.3
8
.1
-1
.4
4.
2
2
.2
-9
.5
22
.5
Sep-
09
1
.8
5
.6
1
.8
8.9
-2.1
4.2
-1.3
3.1
1
5.9
1
8.4
2.
2
-7
.1
-16.
1
10.
6
Dec
-09
52
.4
0
.4
-0
.3
26
.6
7
.9
5
.1
5
.3
6
.5
2
.7
-12
.1
6.
5
-9
.0
13.
0
13.
9
Mar
-10
21
.1
-1
.1
4
.7
-12
.2
-9
.9
1
.9
4
.3
0
.9
5
.8
24
.6
3.
2
4
.2
-5
.5
14
.4
Jun-
10
39
.9
2
.4
6
.2
7
.5
-4
.8
0
.6
-4
.4
27.
9
2.
3
2.
8
-4.2
8.
8
-5.2
16.8
Sep-
10
43
.7
1
.9
10
.9
9
.5
0
.6
-6
.4
-2
.4
11.
3
-0.
2
-0.
9
2.1
8.6
8.7
22.9
Dec
-10
45
.5
1
.2
2
.6
13
.7
0
.9
0
.1
1
.5
5
.9
-1
.5
6
.5
5.
4
4
.2
5
.2
20
.3
Man
ufact
uring
Trad
eBuild
ing &
constr
uc�on
Tran
sport
&
com
munica
�on Finan
ce &
insu
rance
Real e
state
Min
ing &
quarry
ing
Privat
e
household
s
Consum
er
durables
Busines
s
serv
ices
Other
ac�vi�
es
Perc
enta
ge
Growth
yoy
Agricu
lture
Sour
ce: C
BK
Tota
l Priv
ate
Credit
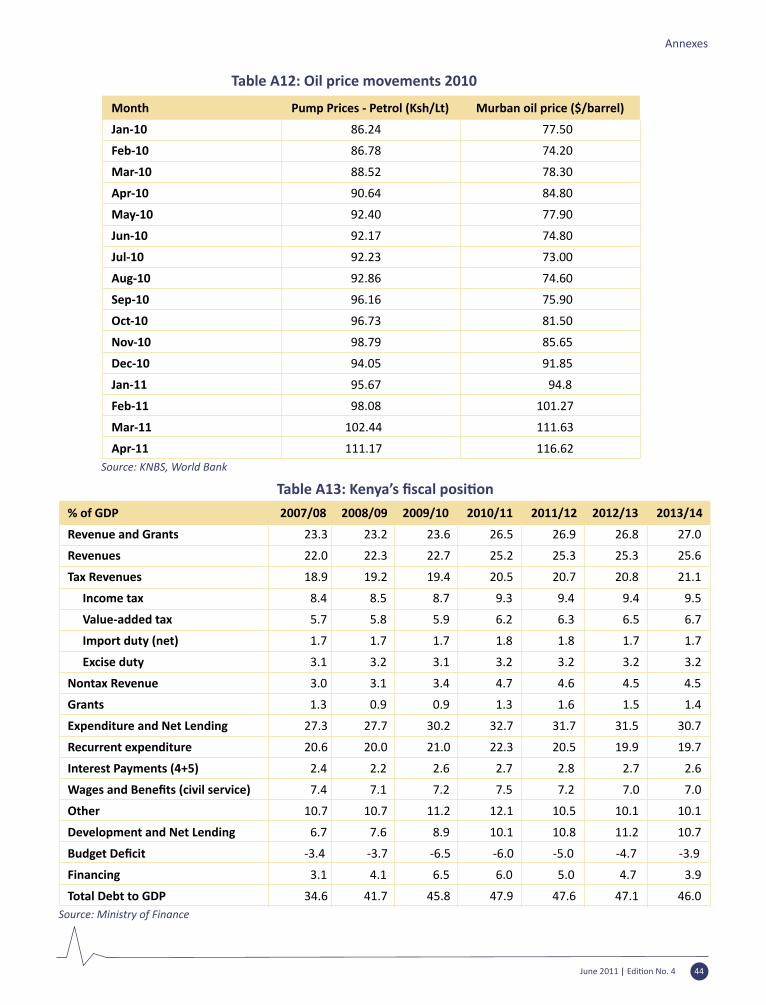
June 2011 | Edi�on No. 4 44
Annexes
Table A12: Oil price movements 2010
Month Pump Prices - Petrol (Ksh/Lt) Murban oil price ($/barrel)
Jan-10 86.24 77.50
Feb-10 86.78 74.20
Mar-10 88.52 78.30
Apr-10 90.64 84.80
May-10 92.40 77.90
Jun-10 92.17 74.80
Jul-10 92.23 73.00
Aug-10 92.86 74.60
Sep-10 96.16 75.90
Oct-10 96.73 81.50
Nov-10 98.79 85.65
Dec-10 94.05 91.85
Jan-11 95.67 94.8
Feb-11 98.08 101.27
Mar-11 102.44 111.63
Apr-11 111.17 116.62Source: KNBS, World Bank
Table A13: Kenya’s fiscal posi�on
% of GDP 2007/08 2008/09 2009/10 2010/11 2011/12 2012/13 2013/14
Revenue and Grants 23.3 23.2 23.6 26.5 26.9 26.8 27.0
Revenues 22.0 22.3 22.7 25.2 25.3 25.3 25.6
Tax Revenues 18.9 19.2 19.4 20.5 20.7 20.8 21.1
Income tax 8.4 8.5 8.7 9.3 9.4 9.4 9.5
Value-added tax 5.7 5.8 5.9 6.2 6.3 6.5 6.7
Import duty (net) 1.7 1.7 1.7 1.8 1.8 1.7 1.7
Excise duty 3.1 3.2 3.1 3.2 3.2 3.2 3.2
Nontax Revenue 3.0 3.1 3.4 4.7 4.6 4.5 4.5
Grants 1.3 0.9 0.9 1.3 1.6 1.5 1.4
Expenditure and Net Lending 27.3 27.7 30.2 32.7 31.7 31.5 30.7
Recurrent expenditure 20.6 20.0 21.0 22.3 20.5 19.9 19.7
Interest Payments (4+5) 2.4 2.2 2.6 2.7 2.8 2.7 2.6
Wages and Benefits (civil service) 7.4 7.1 7.2 7.5 7.2 7.0 7.0
Other 10.7 10.7 11.2 12.1 10.5 10.1 10.1
Development and Net Lending 6.7 7.6 8.9 10.1 10.8 11.2 10.7
Budget Deficit -3.4 -3.7 -6.5 -6.0 -5.0 -4.7 -3.9
Financing 3.1 4.1 6.5 6.0 5.0 4.7 3.9
Total Debt to GDP 34.6 41.7 45.8 47.9 47.6 47.1 46.0Source: Ministry of Finance
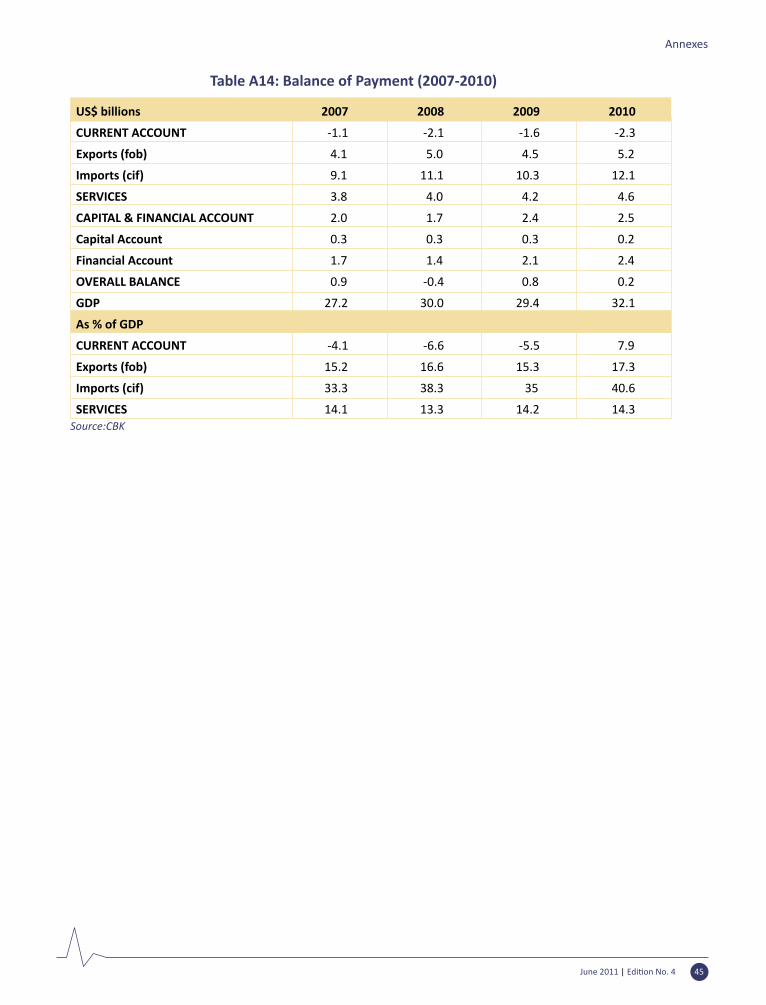
June 2011 | Edi�on No. 4 45
Annexes
Table A14: Balance of Payment (2007-2010)
US$ billions 2007 2008 2009 2010
CURRENT ACCOUNT -1.1 -2.1 -1.6 -2.3
Exports (fob) 4.1 5.0 4.5 5.2
Imports (cif) 9.1 11.1 10.3 12.1
SERVICES 3.8 4.0 4.2 4.6
CAPITAL & FINANCIAL ACCOUNT 2.0 1.7 2.4 2.5
Capital Account 0.3 0.3 0.3 0.2
Financial Account 1.7 1.4 2.1 2.4
OVERALL BALANCE 0.9 -0.4 0.8 0.2
GDP 27.2 30.0 29.4 32.1
As % of GDP
CURRENT ACCOUNT -4.1 -6.6 -5.5 7.9
Exports (fob) 15.2 16.6 15.3 17.3
Imports (cif) 33.3 38.3 35 40.6
SERVICES 14.1 13.3 14.2 14.3Source:CBK
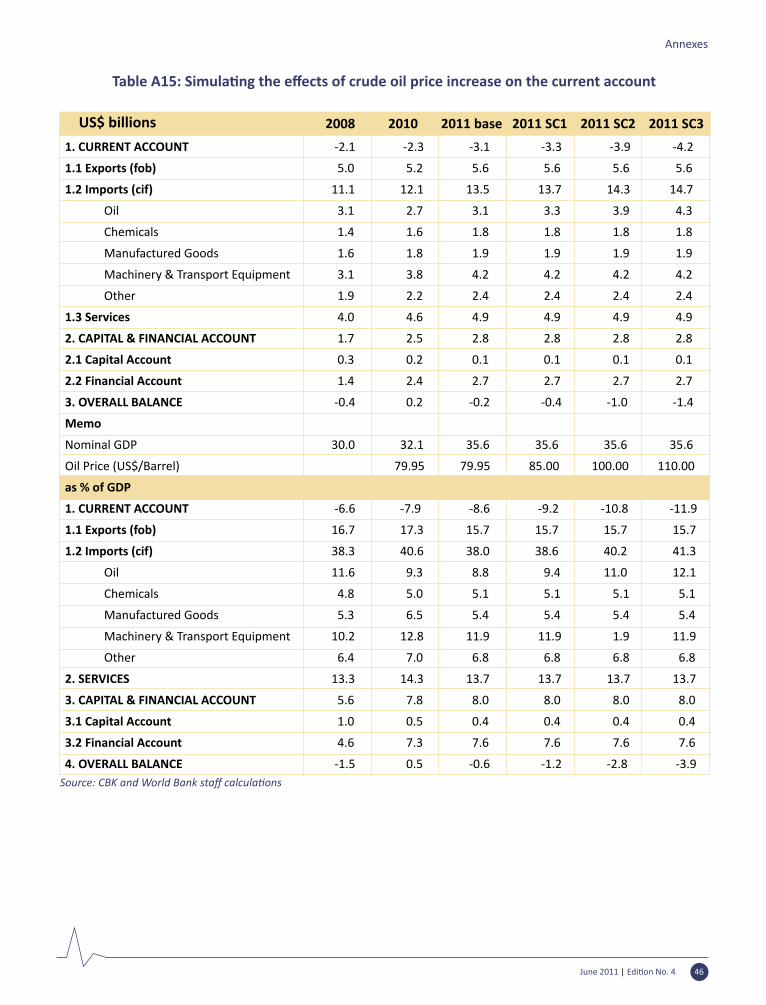
June 2011 | Edi�on No. 4 46
Annexes
Table A15: Simula�ng the effects of crude oil price increase on the current account
1. CURRENT ACCOUNT -2.1 -2.3 -3.1 -3.3 -3.9 -4.2
1.1 Exports (fob) 5.0 5.2 5.6 5.6 5.6 5.6
1.2 Imports (cif) 11.1 12.1 13.5 13.7 14.3 14.7
Oil 3.1 2.7 3.1 3.3 3.9 4.3
Chemicals 1.4 1.6 1.8 1.8 1.8 1.8
Manufactured Goods 1.6 1.8 1.9 1.9 1.9 1.9
Machinery & Transport Equipment 3.1 3.8 4.2 4.2 4.2 4.2
Other 1.9 2.2 2.4 2.4 2.4 2.4
1.3 Services 4.0 4.6 4.9 4.9 4.9 4.9
2. CAPITAL & FINANCIAL ACCOUNT 1.7 2.5 2.8 2.8 2.8 2.8
2.1 Capital Account 0.3 0.2 0.1 0.1 0.1 0.1
2.2 Financial Account 1.4 2.4 2.7 2.7 2.7 2.7
3. OVERALL BALANCE -0.4 0.2 -0.2 -0.4 -1.0 -1.4
Memo
Nominal GDP 30.0 32.1 35.6 35.6 35.6 35.6
Oil Price (US$/Barrel) 79.95 79.95 85.00 100.00 110.00
as % of GDP
1. CURRENT ACCOUNT -6.6 -7.9 -8.6 -9.2 -10.8 -11.9
1.1 Exports (fob) 16.7 17.3 15.7 15.7 15.7 15.7
1.2 Imports (cif) 38.3 40.6 38.0 38.6 40.2 41.3
Oil 11.6 9.3 8.8 9.4 11.0 12.1
Chemicals 4.8 5.0 5.1 5.1 5.1 5.1
Manufactured Goods 5.3 6.5 5.4 5.4 5.4 5.4
Machinery & Transport Equipment 10.2 12.8 11.9 11.9 1.9 11.9
Other 6.4 7.0 6.8 6.8 6.8 6.8
2. SERVICES 13.3 14.3 13.7 13.7 13.7 13.7
3. CAPITAL & FINANCIAL ACCOUNT 5.6 7.8 8.0 8.0 8.0 8.0
3.1 Capital Account 1.0 0.5 0.4 0.4 0.4 0.4
3.2 Financial Account 4.6 7.3 7.6 7.6 7.6 7.6
4. OVERALL BALANCE -1.5 0.5 -0.6 -1.2 -2.8 -3.9Source: CBK and World Bank staff calcula�ons
US$ billions 2008 2010 2011 base 2011 SC1 2011 SC2 2011 SC3
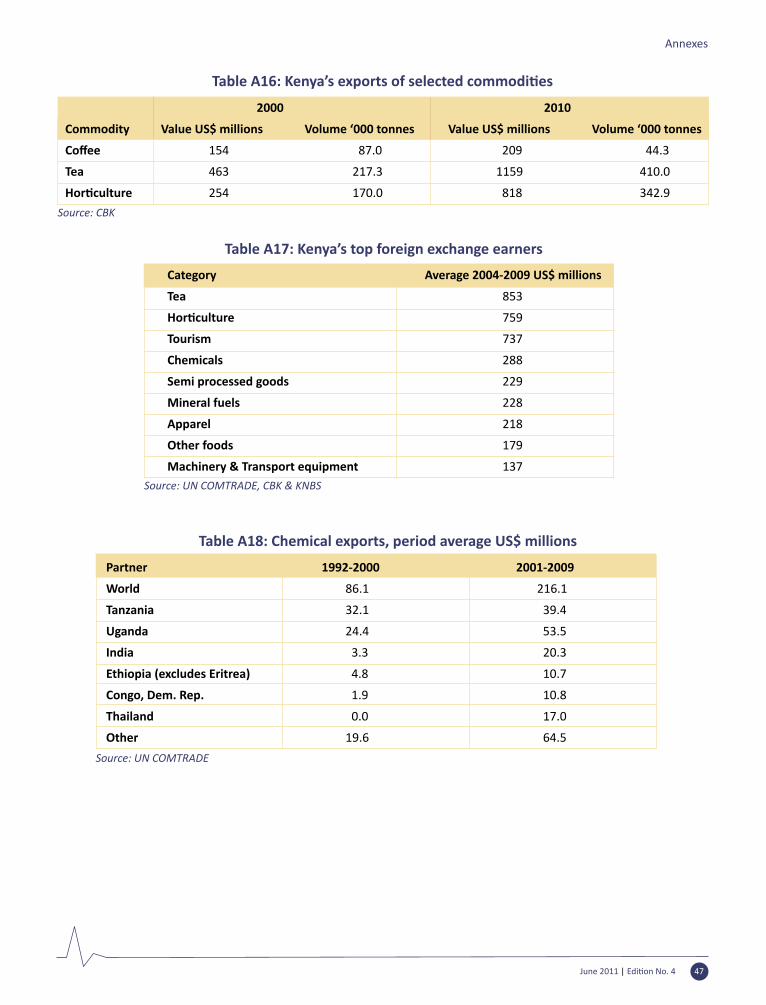
June 2011 | Edi�on No. 4 47
Annexes
Table A16: Kenya’s exports of selected commodi�es
2000 2010
Commodity Value US$ millions Volume ‘000 tonnes Value US$ millions Volume ‘000 tonnes
Coffee 154 87.0 209 44.3
Tea 463 217.3 1159 410.0
Hor�culture 254 170.0 818 342.9
Source: CBK
Table A17: Kenya’s top foreign exchange earners
Category Average 2004-2009 US$ millions
Tea 853
Hor�culture 759
Tourism 737
Chemicals 288
Semi processed goods 229
Mineral fuels 228
Apparel 218
Other foods 179
Machinery & Transport equipment 137 Source: UN COMTRADE, CBK & KNBS
Table A18: Chemical exports, period average US$ millions
Partner 1992-2000 2001-2009
World 86.1 216.1
Tanzania 32.1 39.4
Uganda 24.4 53.5
India 3.3 20.3
Ethiopia (excludes Eritrea) 4.8 10.7
Congo, Dem. Rep. 1.9 10.8
Thailand 0.0 17.0
Other 19.6 64.5
Source: UN COMTRADE
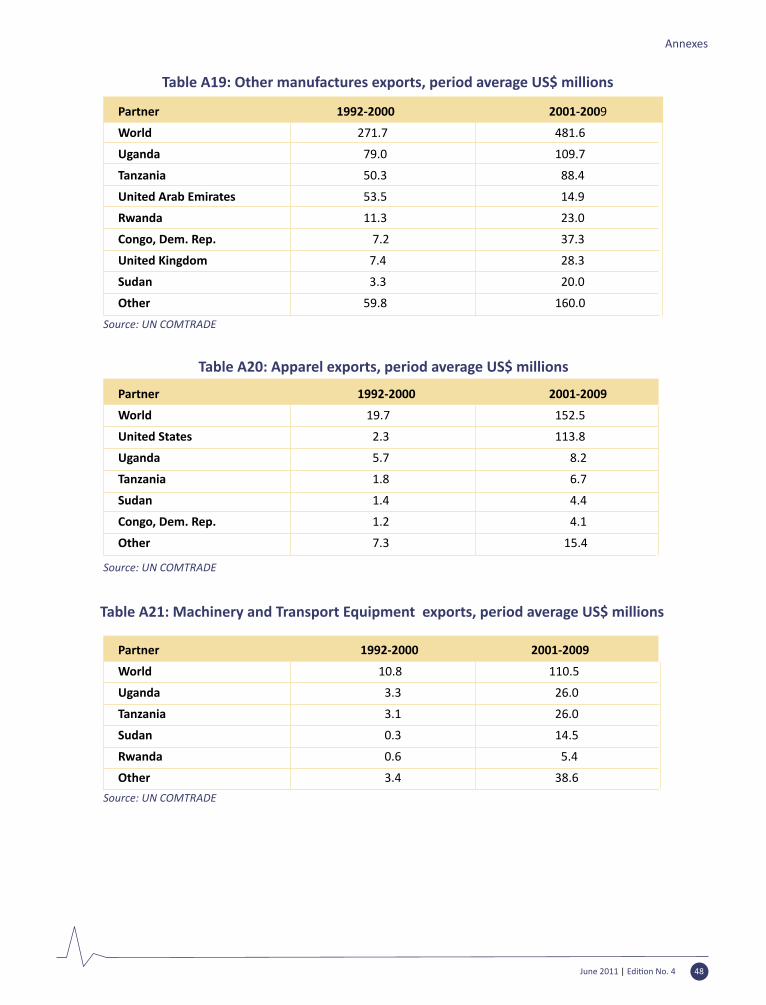
June 2011 | Edi�on No. 4 48
Annexes
Table A19: Other manufactures exports, period average US$ millions
Partner 1992-2000 2001-2009
World 271.7 481.6
Uganda 79.0 109.7
Tanzania 50.3 88.4
United Arab Emirates 53.5 14.9
Rwanda 11.3 23.0
Congo, Dem. Rep. 7.2 37.3
United Kingdom 7.4 28.3
Sudan 3.3 20.0
Other 59.8 160.0
Source: UN COMTRADE
Table A20: Apparel exports, period average US$ millions
Partner 1992-2000 2001-2009
World 19.7 152.5
United States 2.3 113.8
Uganda 5.7 8.2
Tanzania 1.8 6.7
Sudan 1.4 4.4
Congo, Dem. Rep. 1.2 4.1
Other 7.3 15.4
Source: UN COMTRADE
Table A21: Machinery and Transport Equipment exports, period average US$ millions
Partner 1992-2000 2001-2009
World 10.8 110.5
Uganda 3.3 26.0
Tanzania 3.1 26.0
Sudan 0.3 14.5
Rwanda 0.6 5.4
Other 3.4 38.6
Source: UN COMTRADE
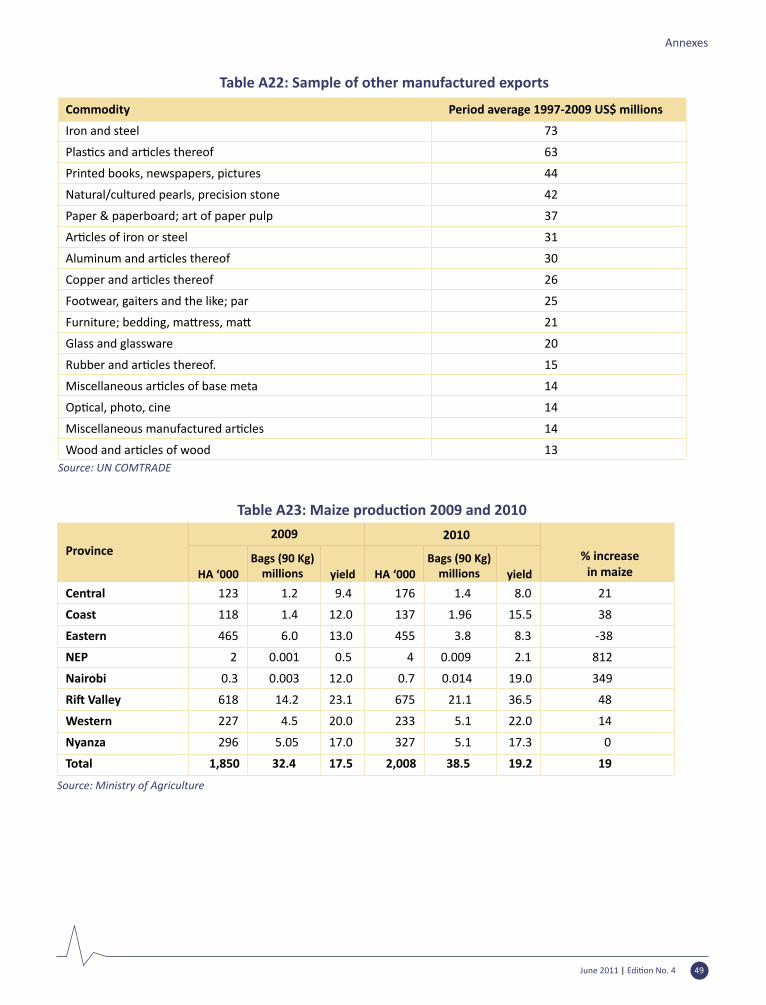
Table A22: Sample of other manufactured exports
Commodity Period average 1997-2009 US$ millions
Iron and steel 73
Plas�cs and ar�cles thereof 63
Printed books, newspapers, pictures 44
Natural/cultured pearls, precision stone 42
Paper & paperboard; art of paper pulp 37
Ar�cles of iron or steel 31
Aluminum and ar�cles thereof 30
Copper and ar�cles thereof 26
Footwear, gaiters and the like; par 25
Furniture; bedding, ma�ress, ma� 21
Glass and glassware 20
Rubber and ar�cles thereof. 15
Miscellaneous ar�cles of base meta 14
Op�cal, photo, cine 14
Miscellaneous manufactured ar�cles 14
Wood and ar�cles of wood 13 Source: UN COMTRADE
Table A23: Maize produc�on 2009 and 2010
Province
Central 123 1.2 9.4 176 1.4 8.0 21
Coast 118 1.4 12.0 137 1.96 15.5 38
Eastern 465 6.0 13.0 455 3.8 8.3 -38
NEP 2 0.001 0.5 4 0.009 2.1 812
Nairobi 0.3 0.003 12.0 0.7 0.014 19.0 349
Ri� Valley 618 14.2 23.1 675 21.1 36.5 48
Western 227 4.5 20.0 233 5.1 22.0 14
Nyanza 296 5.05 17.0 327 5.1 17.3 0
Total 1,850 32.4 17.5 2,008 38.5 19.2 19
Source: Ministry of Agriculture
June 2011 | Edi�on No. 4 49
Annexes
HA ‘000Bags (90 Kg)
millions yield
2009 2010
% increase in maizeHA ‘000
Bags (90 Kg) millions yield
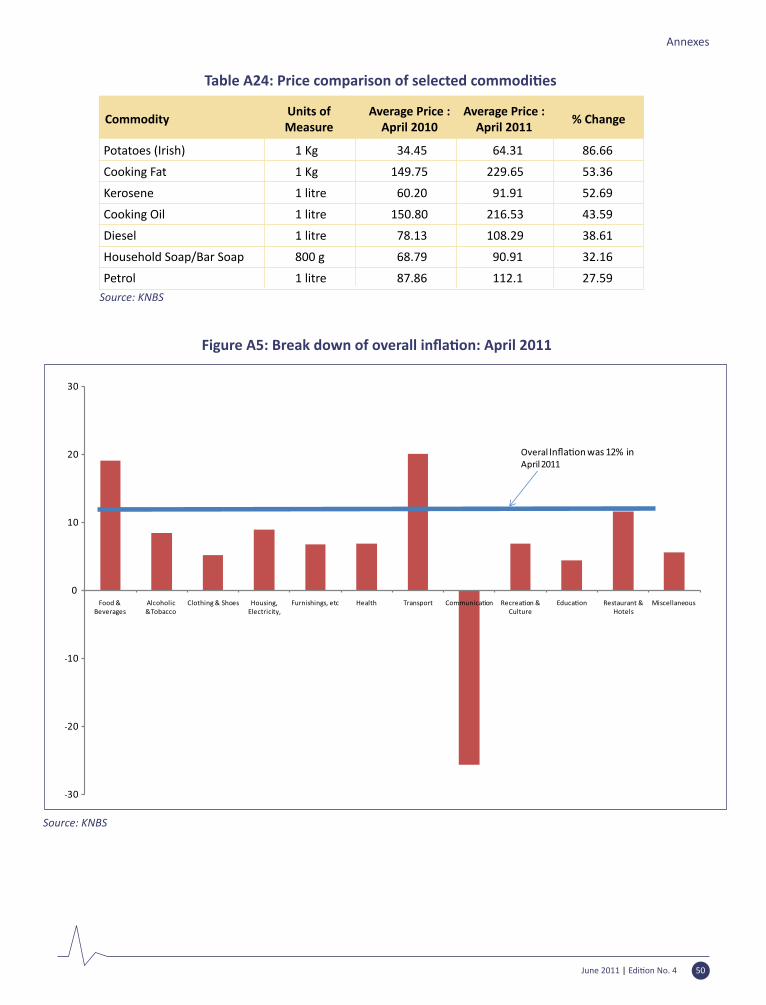
Table A24: Price comparison of selected commodi�es
Potatoes (Irish) 1 Kg 34.45 64.31 86.66
Cooking Fat 1 Kg 149.75 229.65 53.36
Kerosene 1 litre 60.20 91.91 52.69
Cooking Oil 1 litre 150.80 216.53 43.59
Diesel 1 litre 78.13 108.29 38.61
Household Soap/Bar Soap 800 g 68.79 90.91 32.16
Petrol 1 litre 87.86 112.1 27.59Source: KNBS
June 2011 | Edi�on No. 4 50
Annexes
CommodityUnits of Measure
Average Price : April 2010
Average Price : April 2011
% Change
Figure A5: Break down of overall infla�on: April 2011
Source: KNBS
Related Documents