THE UNIVERSITY OF CHICAGO CONSORTIUM ON CHICAGO SCHOOL RESEARCH Turning Around Low-Performing Schools in Chicago SUMMARY REPORT FEB 2012 University of Chicago Consortium on Chicago School Research: Marisa de la Torre, Elaine Allensworth, Sanja Jagesic, James Sebastian, and Michael Salmonowicz American Institutes for Research: Coby Meyers and R. Dean Gerdeman

Welcome message from author
This document is posted to help you gain knowledge. Please leave a comment to let me know what you think about it! Share it to your friends and learn new things together.
Transcript

THE UNIVERSITY OF CHICAGO CONSORTIUM ON CHICAGO SCHOOL RESEARCH
Turning Around Low-Performing Schools in Chicago
SUMMARY REPORT FEB 2012
University of Chicago Consortium on Chicago School Research: Marisa de la Torre, Elaine Allensworth, Sanja Jagesic, James Sebastian, and Michael Salmonowicz American Institutes for Research: Coby Meyers and R. Dean Gerdeman
The authors would like to recognize the many people who helped make this study
possible. Our colleagues at the University of Chicago Consortium on Chicago School
Research, REL Midwest, and AIR gave critical feedback and supported us at each
stage of this project. We are also very grateful for the critical review and feedback
we received from the anonymous reviewers as part of the original contract from
IES to do this work. We are indebted to members of the Steering Committee who
provided substantive feedback on our research. CCSR directors Melissa Roderick,
Sue Sporte, and Jenny Nagaoka each provided us with thoughtful comments on this
research summary. CCSR Associate Director for Communications Emily Krone was
instrumental in helping us edit and produce this report. Our work would not have been
possible without student records provided by Chicago Public Schools.
This work was supported in part under U.S. Department of Education Institute of
Education Sciences (IES) contract ED-06-CO-0019 by Regional Educational Laboratory
Midwest; it was administered by Learning Point Associates, an affiliate of American
Institutes for Research (AIR). The content does not necessarily reflect the views or
policies of IES or the U.S. Department of Education nor does mention of trade names,
commercial products, or organizations imply endorsement by the U.S. government.
This document is not verified as meeting IES standards.
Acknowledgements

2
consortium on chicago school research at the university of chicago 1
In recent years, the nation’s lowest-performing schools increasingly have
become a focal point of scrutiny and concern. Policymakers have called for
swift and dramatic action to improve the nation’s 5,000 lowest-performing
schools, arguing that the magnitude of their dysfunction requires a robust
response. Specific strategies for “turning around” chronically low-performing
schools have become prominent, with the U.S. Department of Education
enacting policies to promote four school improvement models that include
“fundamental, comprehensive changes in leadership, staffing, and gover-
nance” (State Fiscal Stabilization Fund Program: Final Rule, 2009, p. 58462).
Spurred by federal grants and incentive programs, states and districts are
attempting to catalyze rapid improvement in the lowest-performing schools
through efforts that range from replacing principals, to firing the entire staff,
to closing schools entirely.
Despite the attention and activity surrounding these types of school
improvement models, there is a lack of research on whether or how they
work. To date, most evidence has been anecdotal, as policymakers have
highlighted specific schools that have made significant test score gains as
exemplars of school turnaround and researchers have focused on case studies
of particular schools that have undergone one of these models. This has led
to a tremendous amount of speculation over whether these isolated examples
are, in fact, representative of turnaround efforts overall—in terms of the way
they were implemented, the improvements they showed in student outcomes,
and whether these schools actually served the same students before and
after reform.
THIS IS AN OVERVIEW OF FINDINGS, SUMMARIZED FROM A LARGER REPORT entitled Turning
Around Low-Performing Schools in Chicago: Full Report. For more information on the methodology
or findings of the study, please visit our website at ccsr.uchicago.edu.

2 Turning Around Low-Performing Schools in Chicago
To begin to address this knowledge gap, the University of Chicago Consortium on Chicago School Research and AIR partnered to examine five different models initiated by the Chicago Public Schools (CPS) in 36 schools. CPS was an early adopter of dramatic intervention strategies in low-performing schools, and the reforms in this study were implemented between 1997 and 2010. All of the schools were identified as chronically low performing and were reformed in ways consistent with the elements described in the school improvement models recommended by the federal government. The goals of the study were to make clear how school reform occurred in Chicago—showing the actual changes in the student population and teacher workforce at the schools—and to learn whether these efforts had a positive effect on student learning overall.
SUMMARY OF STUDENT OUTCOMES
• On average, Chicago elementary/middle schools that underwent reform made significant improve-ments over time. Four years after intervention, the gap in test scores between reformed elementary/middle schools and the system average decreased by almost half in reading and by almost two-thirds in mathematics.
• On average, Chicago high schools that underwent reform efforts did not perform differently than similar schools in terms of absences in grades nine through 12 or in terms of the percent of students on-track to graduate by the end of ninth grade.
Overview of Reform Models in ChicagoSince 1997, CPS has initiated five distinct reforms that aim to dramatically improve low-performing schools in a short time. These initiatives are Reconstitution (seven high schools), School Closure and Restart (six elementary schools and two high schools), placement into the School Turnaround Specialist Program (STSP) model (four elementary schools), placement into the Academy for Urban School Leadership (AUSL) model (ten elementary schools and two high schools), and placement into the CPS Office of School Improvement (OSI) model (two elementary schools and three high schools).1
All initiatives relied on changing the school leadership; this was the only lever of change under the STSP model. Administered by the University of Virginia’s Partnership for Leaders in Education, the STSP program focuses on the leadership aspect of low-performing schools by training principals to be “turnaround specialists.” This reform is similar to the federal transformational model, where one of the requirements, among other elements, is the replacement of the principal in the school.
Three other models relied on changing both the lead-ership and the school staff. These are Reconstitution, AUSL and OSI models. Schools start the new academic year with dramatic changes to staffing, but the same students remain assigned to the schools. These reforms are similar to the federal turnaround model, which includes, among other actions, replacing the principal and at least 50 percent of the school’s staff, adopting a new governance structure, and implementing a new or revised instructional program.
The last model, School Closure and Restart, was the most drastic intervention for several reasons: schools were closed for a year and students were moved into other schools; the schools subsequently reopened as charter schools; and student enrollment changed from assignment by neighborhood residence to an applica-tion and lottery system. In most cases, schools under the Closure and Restart model reopened with a few grades at a time and added a grade every year until the full grade structure was in place. This reform effort is similar to the federal restart model, in which schools are closed and reopened under the management of a charter school operator, a charter management organization, or an educational management organization. Table 1 shows some of the key elements of each of these strategies.
The fourth federal model is school closure, where schools are closed and students are sent to other schools in the district. While some schools in the district were closed permanently and students were displaced to other schools, these schools are not studied in this report since the schools are permanently closed. A prior CCSR study examined the outcomes of students who attended schools that were closed; it showed that displaced students in Chicago tended to transfer from one low-performing school to another. Overall, closings had no effect on student learning for displaced students.

Summary Report 3
TABLE 1
Five Reform Initiatives in CPS, 1997–2010
Staff Replacement
Leadership Replacement
Governance Replacement
Change in Attendance
Rules
Sample and Timinga
Reconstitution X X 7 HS (1997)
School Closure and Restart X X X X 6 ES; 2 HS (2002-2009)
School Turnaround Specialist Program X 4 ES (2006)
Academy for Urban School Leadership X X X 10 ES; 2 HS (2006-2010)
Office of School Improvement X X 2 ES; 3 HS (2008-2010)
a ES = elementary school (schools serving any of the grades K through 8 but not serving students in the high school grades); HS = high school (schools serving at least some of the grades 9–12).
Main Findings Elementary/middle schools that went through reform made
significant improvements in test scores compared with similar
schools that did not;however, large improvements did not
occur immediately in the first year. In the first year of reform, improvements in reading and math test scores were only marginally higher than those at comparison schools (see Figures 1 and 2). But there was progress during the years after reform at almost all schools that underwent reform, in both reading and math, so that the gap in test scores between reformed elementary/middle schools and the system average decreased by nearly half in reading and by almost two-thirds in mathematics four years after intervention. (See Figures A1 and A2 in the appendix for school-by-school changes after reform.) These trends are net of changes in student population that the schools might have experienced. That is to say, the analysis adjusts for the fact that some schools did not serve the same students before and after the intervention.
Figure 1. Reading achievement in elementary/middle schools was significantly better after intervention; after four years the gap with the system average was reduced by almost half
Aver
age
Test
Sco
res
(in S
tand
ard
Dev
iatio
ns fr
om S
yste
m A
vera
ge)
~p<0.10, *p<0.05, **p<0.01 and ***p<0.001. Adjusted for changes in student backgrounds.
34 2 1 21 3 4
– 0.30
– 0.40
– 0.50
– 0.60
– 0.70
– 0.10
– 0.20
– 0.80
Treated Schools Comparison Schools
– 0.46
– 0.26
Differences between Treated Schools and Comparison Schools0.030.05 0.02 0.00 0.10~0.05 0.15* 0.20**
Prior Year Reform Year
0.00System Avg.
FIGURE 1
Reading achievement in elementary/middle schools was significantly better after the second year of intervention; after four years the gap with the system average was reduced by almost half

4 Turning Around Low-Performing Schools in Chicago
Figure 2. Math achievement at elementary/middle schools was significantly better after the second year of intervention. After four years, the gap with the system average was cut by almost two-thirds.
Aver
age
Test
Sco
res
(In S
tand
ard
Dev
iatio
ns fr
om S
yste
m A
vera
ge)
~p<0.10, *p<0.05, **p<0.01 and ***p<0.001. Adjusted for changes in student backgrounds.
34 2 1 21 3 4
– 0.30
– 0.40
– 0.50
– 0.60
– 0.70
– 0.10
– 0.20
– 0.80
Treated Schools Comparison Schools
– 0.53
– 0.20
Differences between Treated Schools and Comparison Schools0.030.05 0.01 – 0.01 0.16*0.10~ 0.22** 0.29***
Prior Year Reform Year
0.00System Avg.
FIGURE 2
Math achievement at elementary/middle schools was significantly better after the second year of intervention. After four years, the gap with the system average was cut by almost two-thirds
High schools that underwent reform did not show significant
improvements in absences or ninth grade on-track-to-graduate
rates over matched comparison schools, but recent high school
efforts look more promising than earlier ones.3
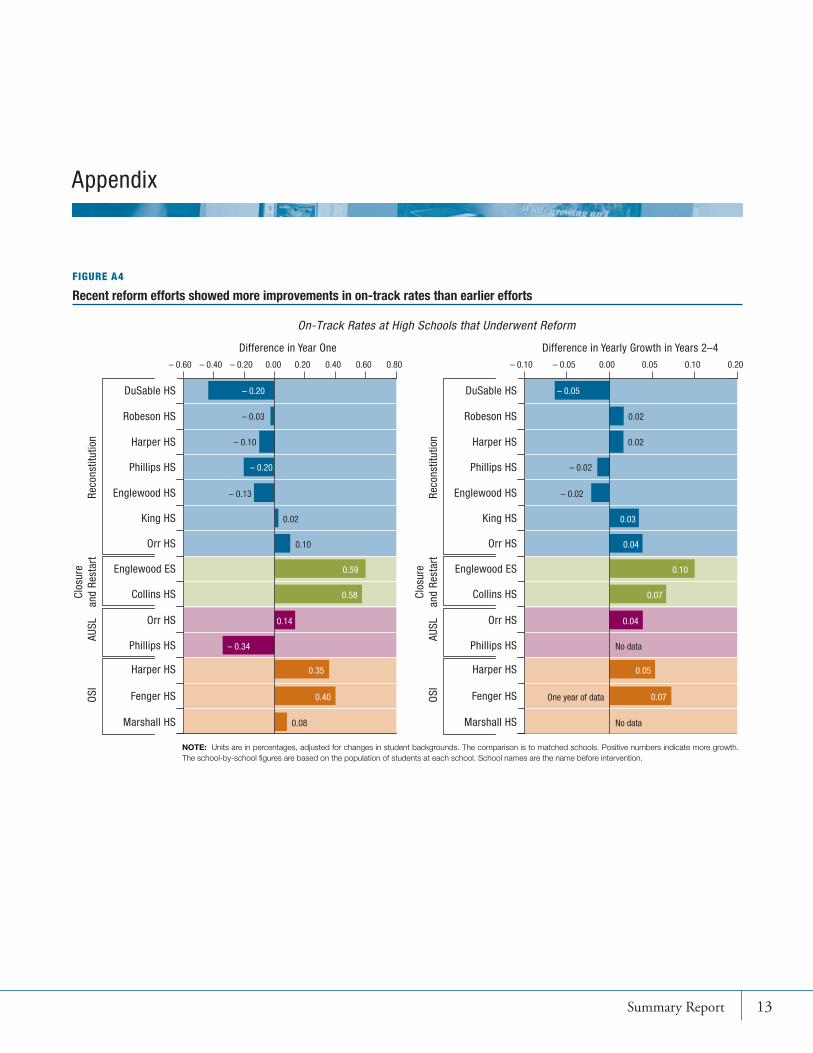
On average, there were no significant improvements in ninth grade on-track rates and absence rates among the schools that went through intervention (see Figures 3 and 4). While on-track rates have improved system-wide over the last several years, on-track rates did not improve more in schools that underwent reform com-pared to similar schools that did not undergo reform. There was a drop in absence rates in the first year after reform compared to matched schools, but the improve-ment was not sustained over time.
Many of the high schools in this study went through the Reconstitution model in the late 1990’s, and this particular model did not lead to improvements in at-tendance or on-track rates. (See Figures A3 and A4 in the appendix for school-by-school changes after reform.) CPS administration recognized the problems with earlier attempts at reconstitution, and many of the reconstituted schools were again targeted for reform in subsequent years.
Figure 3. Ninth grade on-track rates in treated schools were not different from comparison schools
Perc
ent o
f Stu
dent
s O
n-Tr
ack
to G
radu
ate
~p<0.10, *p<0.05, **p<0.01 and ***p<0.001. Adjusted for changes in student backgrounds.
34 2 1 21 3 4
70
0
Treated Schools Comparison Schools
46.1%
47.6%
61.1%
62.4%
Differences between Treated Schools and Comparison Schools0.6%1.6% – 0.5% – 1.5% – 0.4%0.1% – 0.9% – 1.3%
Prior Year Reform Year
60
50
40
30
20
10
FIGURE 3
Ninth grade on-track rates in treated schools were not different from comparison schools
Figure 4. High school absence rates were lower in the first year, on average, but not in subsequent years
Aver
age
Abse
nces
(In S
tand
ard
Dev
iatio
ns fr
om S
yste
m A
vera
ge)
~p<0.10, *p<0.05, **p<0.01 and ***p<0.001. Adjusted for changes in student backgrounds.
34 2 1 21 3 4
0.60
–0.20
Treated Schools Comparison Schools
0.44
0.48
0.30
0.39
Differences between Treated Schools and Comparison Schools0.020.05 – 0.01 – 0.04 – 0.26– 0.34~ – 0.18 – 0.10
Prior Year Reform Year
0.50
0.40
0.30
0.20
0.10
0.00
–0.10
System Avg.
FIGURE 4
High school absence rates were lower in the first year, on average, but not in subsequent years
Summary Report 5
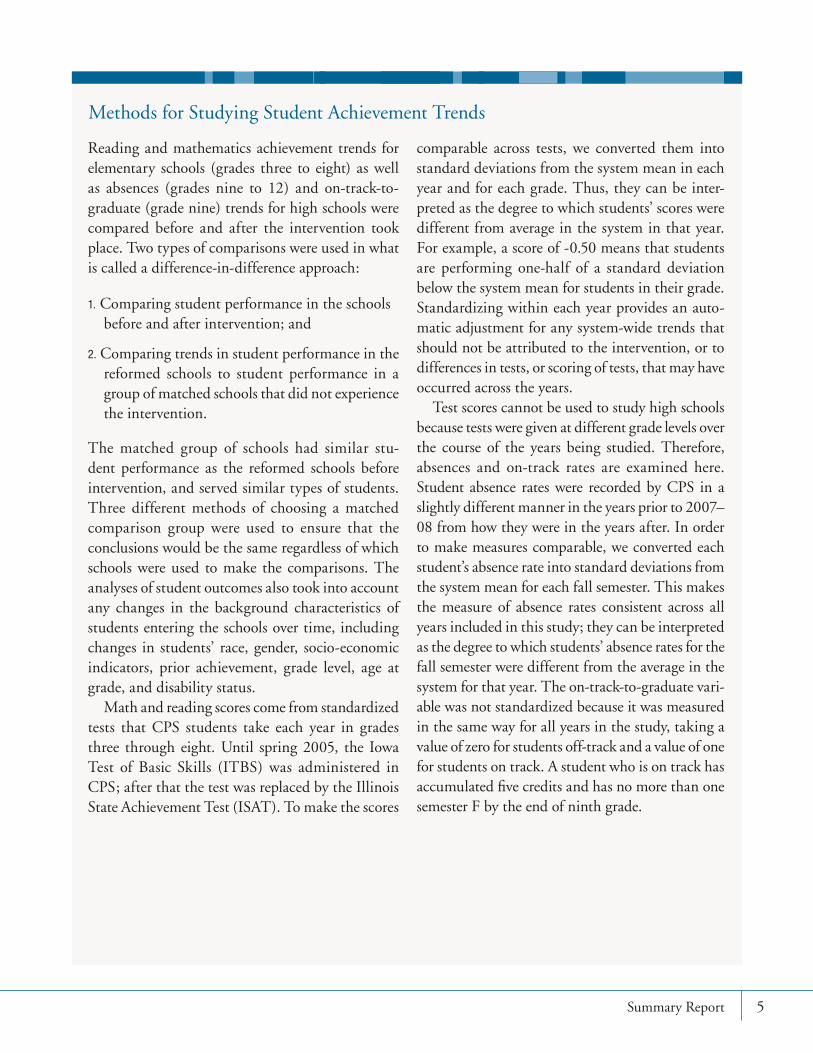
Reading and mathematics achievement trends for elementary schools (grades three to eight) as well as absences (grades nine to 12) and on-track-to-graduate (grade nine) trends for high schools were compared before and after the intervention took place. Two types of comparisons were used in what is called a difference-in-difference approach:
1. Comparing student performance in the schools before and after intervention; and
2. Comparing trends in student performance in the reformed schools to student performance in a group of matched schools that did not experience the intervention.
The matched group of schools had similar stu-dent performance as the reformed schools before intervention, and served similar types of students. Three different methods of choosing a matched comparison group were used to ensure that the conclusions would be the same regardless of which schools were used to make the comparisons. The analyses of student outcomes also took into account any changes in the background characteristics of students entering the schools over time, including changes in students’ race, gender, socio-economic indicators, prior achievement, grade level, age at grade, and disability status.
Math and reading scores come from standardized tests that CPS students take each year in grades three through eight. Until spring 2005, the Iowa Test of Basic Skills (ITBS) was administered in CPS; after that the test was replaced by the Illinois State Achievement Test (ISAT). To make the scores
comparable across tests, we converted them into standard deviations from the system mean in each year and for each grade. Thus, they can be inter-preted as the degree to which students’ scores were different from average in the system in that year. For example, a score of -0.50 means that students are performing one-half of a standard deviation below the system mean for students in their grade. Standardizing within each year provides an auto-matic adjustment for any system-wide trends that should not be attributed to the intervention, or to differences in tests, or scoring of tests, that may have occurred across the years.
Test scores cannot be used to study high schools because tests were given at different grade levels over the course of the years being studied. Therefore, absences and on-track rates are examined here. Student absence rates were recorded by CPS in a slightly different manner in the years prior to 2007–08 from how they were in the years after. In order to make measures comparable, we converted each student’s absence rate into standard deviations from the system mean for each fall semester. This makes the measure of absence rates consistent across all years included in this study; they can be interpreted as the degree to which students’ absence rates for the fall semester were different from the average in the system for that year. The on-track-to-graduate vari-able was not standardized because it was measured in the same way for all years in the study, taking a value of zero for students off-track and a value of one for students on track. A student who is on track has accumulated five credits and has no more than one semester F by the end of ninth grade.
Methods for Studying Student Achievement Trends

6 Turning Around Low-Performing Schools in Chicago
More recent attempts at high school reform have paid more attention to school organization. As yet, there are only seven high schools that experienced re-form models other than Reconstitution, and several of them have only been in existence for one or two years. We are hesitant to make sweeping conclusions based on such a small number of schools with limited data. However, among those schools with at least one year of data, most showed some improvement in on-track rates above the comparison schools. (See Figures A3 and A4 in the appendix for school-by-school changes after reform.) Most of the high schools reformed in recent years also showed a decline in absence rates in their first year, although not in subsequent years.
Schools that underwent reform generally served the same
students as before intervention, with the exception of one
model of reform (see Figure 5). With the exception of schools in the Closure and Restart model, schools reenrolled between 55 and 89 percent of students who could reenroll in the year after intervention—rates that were similar to their year-to-year reenrollment rates prior to intervention. These patterns held true in the second and third years following intervention as well. In fact, more students reenrolled in subsequent years than in the first year of reform. The composition of students in intervention schools—in terms of race/ethnicity, socioeconomic status, and special educa-tion status—was similar before and after intervention. These data contradict claims made by critics who argue that turnaround schools systematically push out low-performing and more disadvantaged students when schools undergo the transformation and turnaround models. Concerns about who the schools serve are valid, however, for the closure model.
Schools under the Closure and Restart model experienced
substantial changes to their student body composition, serving more economically advantaged students, students of higher prior achievement, and fewer special education students. After intervention, schools under the Closure and Restart model also served fewer students from the neighborhood around the school.
The vast majority of teachers in schools under Closure and
Restart, AUSL and OSI models were not rehired after reform. These schools rehired less than 10 percent of the teach-ers from the year before intervention. This is consistent
with the theory of change behind the federal restart model and turnaround model, which requires that at least half of the staff change. In contrast, most schools in the Reconstitution model rehired about half of their teachers. Schools that were reconstituted had only a few months for planning and hiring new staff, and this may account for the larger percentage of teachers who were rehired. The teacher workforce after intervention
across all models was more likely to be white, younger, and
less experienced, and was more likely to have provisional cer-
tification than the teachers who were at those schools before
the intervention.
How Should We View These Results?The results of this study suggest that turning around chronically low-performing schools is a process rather than an event. It does not occur immediately when staff or leadership or governance structures are replaced, but can occur when hard work and resources are sustained over time.
Other studies have suggested that successful efforts to turn around low-performing schools usually do so by building the organizational strength of the school over time, using staff changes as just one of many mechanisms to improve school climate and instruction. A list of recommendations compiled in the IES Practice Guide on School Turnaround4, based on case studies of schools that showed substantial improvement, starts with establishing strong leadership focused on improv-ing school climate and instruction, strengthening partnerships across school communities, monitoring instruction, addressing discipline, and building dis-tributed leadership among teachers in the school. The second recommendation is to maintain a consistent focus on improving instruction by having staff col-laborate around data to analyze school policies and learning conditions. The third recommendation is to pursue quick wins that target critical but immediately addressable problems, including student discipline and safety, conflict in the school community, and school beautification. The final recommendation is to build a committed staff, dedicated to school improvement through collaboration. None of the schools highlighted in the IES practice guide as successful examples of school improvement changed its entire staff, but all of

Summary Report 7
Figure 5. Reenrollment rates in the first year of intervention were similar to the rates before intervention, with the exception of schools that closed and restarted
Reco
nstit
utio
n
80%0 70% 100%90%60%50%40%30%20%10%
Percent of Students Re-enrolling Re-enrollment Prior Comparable Time Period
Clos
ure
and
Rest
art
STSP
OSI
AUSL
55.8%DuSable HS 58.7%
62.3%Robeson HS 67.0%
59.5%Harper HS 62.9%
61.6% 50.9%Phillips HS
58.4%Englewood HS 65.9%
60.9%King HS 59.7%
56.8%Orr HS 61.7%
46.5%Dodge ES 57.1%*
31.1%Williams ES 68.9%*
15.5%Howland ES 38.7%*
0.0%Englewood ES 28.6%*
11.4%Morse ES 41.8%*
88.6%Ames MS 76.9%
64.1%Earle ES 69.8%
72.1%Medill ES 68.6%
75.2%Jackson ES 74.7%
68.1%Harvard ES 65.8%
68.9%Howe ES 66.0%
65.2%Orr HS 67.7%
57.1%Morton ES 52.1%
76.6%Dulles ES 64.0%
63.1%Johnson ES 61.6%
70.9%Bethune ES 76.0%
70.0%Curtis ES 72.4%
69.4%Deneen ES 60.3%
65.1%Bradwell ES 52.9%
69.1%Phillips HS 65.2%
63.5%Copernicus ES 65.5%
64.6%Fulton ES 54.2%
55.3%Harper HS 70.2 %*
73.8%Fenger HS 71.2%
65.7%Marshall HS 64.1%
11.8%Bunche ES 41.6%*
8.9%Frazier ES 60.2%*
0.0% 46.7%*Collins HS
72.7%Sherman ES 73.3%
*Re-enrollment rate at this school was significantly different after reform
FIGURE 5
Reenrollment rates in the first year of intervention were similar to the rates before intervention, with the exception of restarts

8 Turning Around Low-Performing Schools in Chicago
them replaced teachers who did not share a commit-ment to change.
This is consistent with research at CCSR examining 100 elementary schools that made significant progress over a seven-year period—and 100 more that did not. The research found that schools strong on at least three of five essential elements—effective leaders, col-laborative teachers, strong family and community ties, ambitious instruction, and safe and orderly learning climate—were 10 times more likely to improve and 30 times less likely to stagnate than those that were strong on just one or two.5 Perhaps it is not surprising, then, that the recent reform models, OSI and AUSL—both of which have explicit blueprints for reform focused on building the organizational strength of schools—
achieved consistent improvement in all of the elemen-tary/middle schools they managed.
Continued study will be needed to know whether these gains are sustained beyond the first four years, particularly if attention and resources from the district start to fade. These schools started out with extremely low levels of student performance and presented sig-nificant barriers to reform. A prior study at CCSR showed that over the past 20 years, CPS schools that started out with the lowest performance showed the least improvement.6 From this perspective, this study provides promising evidence about efforts to improve chronically low performing schools—showing im-provements in schools that historically have been most impervious to reform.
Endnotes1. This office was previously known as the Office of School
Turnaround. AUSL is a local school management organization charged with the training of teachers to affect whole-school transformation. They partnered with CPS to transform low-performing schools.
2. De la Torre, M., and J. Gwynne (2009). When Schools Close: Effects on Displaced Students in Chicago Public Schools. Chicago: Consortium on Chicago School Research.
3. Because the district did not consistently administer tests to the same grade levels over the period being studied, we were unable to examine changes in test performance at the high school level.
4. Herman, R., Dawson, P., Dee, T., Greene, J., Maynard, R., Redding, S., and Darwin, M. (2008). Turning Around Chronically Low-Performing Schools: A practice guide (NCEE #2008-4020). Washington, DC: National Center for Education Evaluation and Regional Assistance, Institute of Education Sciences, U.S. Department of Education. Retrieved from http://ies.ed.gov/ncee/wwc/publications/practiceguides.
5. Bryk, A.S., P. Bender Sebring, E.M. Allensworth, S. Luppescu, and J.Q. Easton (2010). Organizing schools for improvement: Lessons from Chicago. Chicago: University of Chicago Press.
6. Luppescu, Stuart. Elaine M. Allensworth, Paul Moore, Marisa de la Torre, James Murphy with Sanja Jagesic. 2011. Trends in Chicago’s Schools Across Three Eras of Reform. http://ccsr.uchicago.edu/content/publications.php?pub_id=157

2
consortium on chicago school research at the university of chicago 9
Appendix
School-by-School Changes in Student Achievement
The figures presented in this appendix come from the same models that
estimate the overall effects on test scores. These figures are adjusted
for the same changes in students’ characteristics: changes in students’ race,
gender, socio-economic indicators, prior achievement, grade level, age at
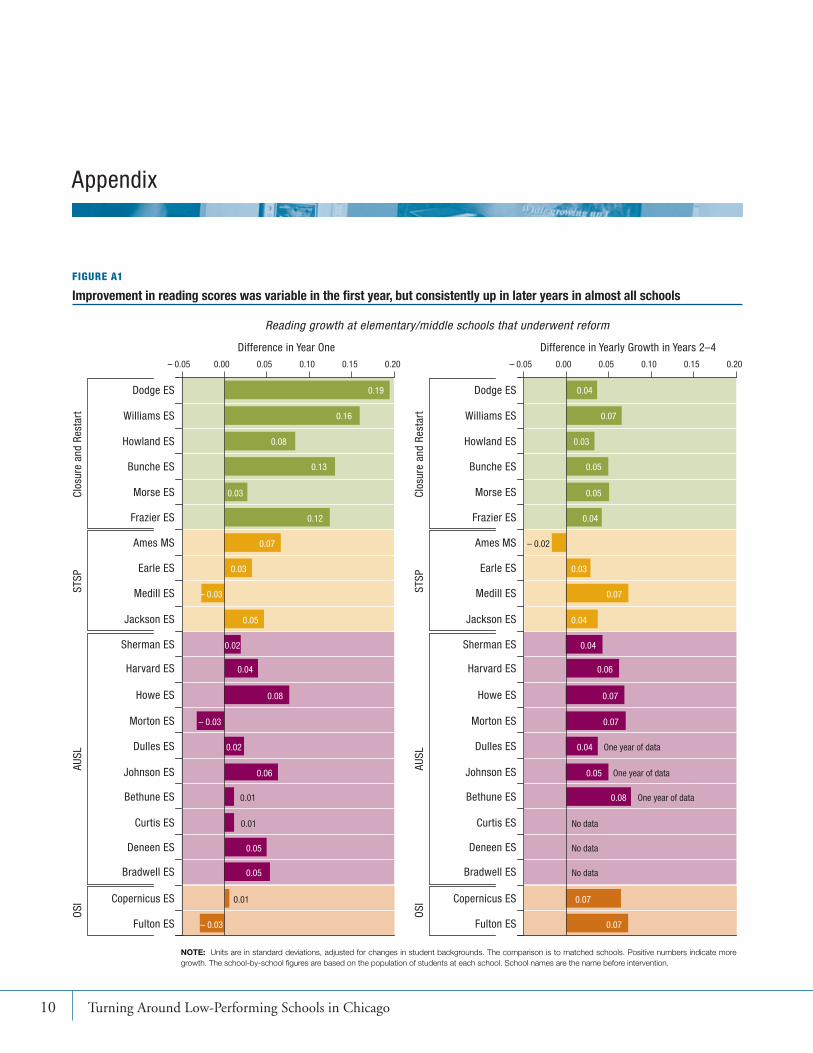
grade, and disability status. In each figure, the bars on the left represent the
difference in the first year after reform compared with similar schools that did
not undergo intervention. Bars that are positive indicate more growth than
comparison schools. Bars that are negative indicate less growth. The bars on
the right in each figure represent the difference in the yearly growth rate in
the years after the first year, up to the fourth year after reform. Schools that
were reformed less than four years ago have fewer years on which to calculate
their yearly growth after year one, and the bars represent the average of the
years they existed. To find the cumulative effect, the yearly growth should
be multiplied by the number of years since the first year of reform, plus the
year one effects.
10 Turning Around Low-Performing Schools in Chicago
FIGURE A1
Improvement in reading scores was variable in the first year, but consistently up in later years in almost all schoolsFigure 6. Improvement in reading scores was variable in year 1, but consistently up in later years in almost all schools
– 0.05 0.200.150.100.050.00
Difference in Year One
0.19Dodge ES
0.16Williams ES
0.08Howland ES
0.13Bunche ES
0.03Morse ES
0.12Frazier ES
0.07Ames MS
0.03Earle ES
– 0.03Medill ES
0.05Jackson ES
0.02Sherman ES
0.04Harvard ES
0.08Howe ES
– 0.03Morton ES
0.02Dulles ES
0.06Johnson ES
0.01Bethune ES
0.01Curtis ES
0.05Deneen ES
0.05Bradwell ES
0.01Copernicus ES
– 0.03Fulton ES
Clos
ure
and
Rest
art
STSP
OSI
AUSL
NOTE: Units are in standard deviations, adjusted for changes in student backgrounds. The comparison is to matched schools. Positive numbers indicate more growth. The school-by-school figures are based on the population of students at each school. School names are the name before intervention.
Reading growth at elementary/middle schools that underwent reform
– 0.05 0.200.150.100.050.00
Difference in Yearly Growth in Years 2–4
0.04Dodge ES
0.07Williams ES
0.03Howland ES
0.05Bunche ES
0.05Morse ES
0.04Frazier ES
– 0.02Ames MS
0.03Earle ES
0.07Medill ES
0.04Jackson ES
0.04Sherman ES
0.06Harvard ES
0.07Howe ES
0.07Morton ES
0.04 One year of dataDulles ES
0.05 One year of dataJohnson ES
0.08 One year of dataBethune ES
No dataCurtis ES
No dataDeneen ES
No dataBradwell ES
0.07Copernicus ES
0.07Fulton ES
Clos
ure
and
Rest
art
STSP
OSI
AUSL
Appendix

Summary Report 11
FIGURE A2
Improvement in math scores occurred at most elementary/middle schools that underwent reformFigure 7. Improvement in math scores occurred at most schools that underwent reform
– 0.05 0.200.150.100.050.00
Difference in Year One
0.13Dodge ES
0.12Williams ES
0.01Howland ES
0.13Bunche ES
0.10Morse ES
0.12Frazier ES
– 0.01Ames MS
0.07Earle ES
0.13Medill ES
0.06Jackson ES
0.08Sherman ES
0.15Harvard ES
0.15Howe ES
0.14Morton ES
0.10Dulles ES
0.13Johnson ES
0.11Bethune ES
0.11Curtis ES
0.11Deneen ES
0.11Bradwell ES
0.10Copernicus ES
0.12Fulton ES
Clos
ure
and
Rest
art
STSP
OSI
AUSL
NOTE: Units are in standard deviations, adjusted for changes in student backgrounds. The comparison is to matched schools. Positive numbers indicate more growth. The school-by-school figures are based on the population of students at each school. School names are the name before intervention.
Math growth at elementary/middle schools that underwent reform
– 0.05 0.200.150.100.050.00
Difference in Yearly Growth in Years 2–4
0.08Dodge ES
0.07Williams ES
0.00Howland ES
0.08Bunche ES
0.06Morse ES
0.07Frazier ES
– 0.03Ames MS
0.03Earle ES
0.09Medill ES
0.03Jackson ES
0.04Sherman ES
0.09Harvard ES
0.10Howe ES
0.09Morton ES
0.07 One year of dataDulles ES
0.08 One year of dataJohnson ES
0.07 One year of dataBethune ES
No dataCurtis ES
No dataDeneen ES
No dataBradwell ES
0.06Copernicus ES
0.08Fulton ES
Clos
ure
and
Rest
art
STSP
OSI
AUSL
Appendix

12 Turning Around Low-Performing Schools in Chicago
FIGURE A3
There was large variation across high schools in improvements in absence ratesFigure 8. There was large variation across high schools in improvements in absence rates
– 0.80 0.400.200.00– 0.20– 0.40– 0.60
Difference in Year One
– 0.20DuSable HS
– 0.07Robeson HS
– 0.28Harper HS
– 0.15Phillips HS
– 0.13Englewood HS
– 0.03King HS
– 0.71Orr HS
– 0.69Englewood ES
– 0.78Collins HS
– 0.11Orr HS
– 0.12Phillips HS
– 0.02Harper HS
– 0.21Fenger HS
– 0.67Marshall HS
Reco
nstit
utio
nCl
osur
ean
d Re
star
tO
SIAU
SL
NOTE: A lower absence number is better. Units are in standard deviations, adjusted for changes in student backgrounds. The comparison is to matched schools. The school-by-school figures are based on the population of students at each school. School names are the name before intervention.
Absences at High Schools that Underwent Reform
Difference in Yearly Growth in Years 2–4– 0.80 0.400.200.00– 0.20– 0.40– 0.60
0.31DuSable HS
0.21Robeson HS
– 0.07Harper HS
– 0.16Phillips HS
0.02Englewood HS
0.05King HS
0.04Orr HS
0.07Englewood ES
0.06Collins HS
0.28Orr HS
No dataPhillips HS
0.13Harper HS
0.05Fenger HS
No dataMarshall HS
Reco
nstit
utio
nCl
osur
ean
d Re
star
tO
SIAU
SL
Appendix
Summary Report 13
FIGURE A4
Recent reform efforts showed more improvements in on-track rates than earlier effortsFigure 9. Recent reform efforts showed more improvements in on-track rates than earlier efforts
– 0.60 0.800.40 0.600.200.00– 0.20– 0.40
Difference in Year One
– 0.20DuSable HS
– 0.03Robeson HS
– 0.10Harper HS
– 0.20Phillips HS
– 0.13Englewood HS
0.02King HS
0.10Orr HS
0.59Englewood ES
0.58Collins HS
0.14Orr HS
– 0.34Phillips HS
0.35Harper HS
0.40Fenger HS
0.08Marshall HS
Reco
nstit
utio
nCl
osur
ean
d Re
star
tO
SIAU
SL
NOTE: Units are in percentages, adjusted for changes in student backgrounds. The comparison is to matched schools. Positive numbers indicate more growth. The school-by-school figures are based on the population of students at each school. School names are the name before intervention.
Difference in Yearly Growth in Years 2–4– 0.10 0.200.100.050.00– 0.05
– 0.05DuSable HS
0.02Robeson HS
0.02Harper HS
– 0.02Phillips HS
– 0.02 Englewood HS
0.03King HS
0.04Orr HS
0.10Englewood ES
0.07Collins HS
0.04Orr HS
No dataPhillips HS
0.05Harper HS
0.07Fenger HS
No dataMarshall HS
Reco
nstit
utio
nCl
osur
ean
d Re
star
tO
SIAU
SL
One year of data
On-Track Rates at High Schools that Underwent Reform
Appendix

About the Authors
Marisa de la Torre is Associate Director at CCSR. Her work involves studying different Chicago Public Schools’ policies, including high school choice and school closings. Her work on high school choice in Chicago was recently published in School Choice and School Improvement. Currently, she is studying a number of different reforms aimed at low-performing schools and indicators of high school readiness. Before joining CCSR, she worked for the Chicago Public Schools in the Office of Research, Evaluation, and Accountability. She received a master’s degree in Economics from Northwestern University.
Elaine Allensworth, Ph.D., is Interim Executive Director at CCSR. She is best known for her research on early indicators of high school graduation, college readiness, and the transition from middle to high school. Her work on early indicators of high school graduation has been adopted for tracking systems used in Chicago and other districts across the country, and is the basis for a tool developed by the National High School Center. She is one of the authors of the book Organizing Schools for Improvement: Lessons from Chicago, which provides a detailed analysis of school practices and community conditions that promote school improvement. Currently, she is working on several studies of high school curriculum funded by the Institute of Education Sciences at the U.S. Department of Education and the National Science Foundation. She recently began a study of middle grade predictors of college readiness, funded by the Bill and Melinda Gates Foundation. Dr. Allensworth holds a Ph.D. in Sociology, an M.A. in Urban Studies from Michigan State University, and was once a high school Spanish and science teacher.
Sanja Jagesic is a Research Assistant at CCSR. She holds an M.A. in Sociology from the University of Chicago and a B.A. in Sociology and German from Wellesley College. She is currently working toward her Ph.D. in Sociology at the University of Chicago.
James Sebastian, Ph.D., is a Senior Researcher at CCSR. His research interests include school organization, organizational theory and behavior, and urban school reform. He received his M.S and Ph.D. in Educational Leadership and Policy Analysis from the University of Wisconsin Madison.
Michael Salmonowicz is a doctoral candidate at the University of Virginia’s Curry School of Education and a former Research Analyst at CCSR. He taught for three years in Chicago Public Schools and received his B.A. in English from the University of Michigan.
Coby Meyers, Ph.D., is a researcher at American Institutes for Research. His research interests include school turnaround, school effectiveness, urban education, and program evaluation. He plays integral roles in various school turnaround initiatives—an area in which he has presented and published, including coauthoring the book Turning Around Failing Schools: Lessons from the Organizational Sciences. He received his M.A. in secondary education from the University of Kentucky and his Ph.D. in education leadership, policy, and organizations at Vanderbilt University.
Dean Gerdeman, Ph.D., is a Principal Researcher on the Education, Human Development, and the Workforce team at the American Institutes for Research. Gerdeman leads and supports federally sponsored education research, evaluation, and technical assistance projects. He is deputy director of the Regional Educational Laboratory Midwest, a $45 million research center funded by the Institute of Education Sciences to serve a seven-state region, overseeing multiple project teams in applied education research and analysis. Gerdeman serves as project direc-tor for a $2 million Department of Education “Investing in Innovation” evaluation of a nationally recognized teacher certification initiative. Previously, Gerdeman was a program officer in the Institute of Education Sciences, where he managed a $105 million program portfolio. He is a past recipient of the American Association for the Advancement of Science policy fellowship at the NSF, in which he consulted with agency officials on evaluation and management of graduate education programs. At the University of California, Los Angeles (UCLA), he served as a researcher in science education and a field supervisor for first-year science teachers in urban schools. Gerdeman earned a doctorate in education and master’s degrees in biology and education from UCLA.
This report reflects the interpretation of the authors. Although CCSR’s Steering Committee provided technical advice, no formal endorsement by these individuals, organizations, or the full Consortium should be assumed.
This report was produced by CCSR’s publications and communications staff.
Graphic Design by Jeff Hall Design
Photos by David Schalliol 2-12 / [email protected]

Consortium on Chicago School Research
Steering CommitteeRuanda Garth McCullough Co-ChairLoyola University, Chicago
Matthew StagnerCo-Chair Chapin Hall Center for Children
INSTITUTIONAL MEMBERS
Clarice BerryChicago Principals and Administrators Association
Karen LewisChicago Teachers Union
Chris KochIllinois State Board of Education
INDIVIDUAL MEMBERS
Veronica AndersonCommunications Consultant
Andrew BroyIllinois Network of Charter Schools
Amie GreerVaughn Occupational High School-CPS
Reyna HernandezIllinois State Board of Education
Raquel Farmer-HintonUniversity of Wisconsin, Milwaukee
Timothy KnowlesUrban Education Institute
Dennis LacewellUrban Prep Charter Academy for Young Men
Lila LeffUmoja Student Development Corporation
Peter MartinezUniversity of Illinois at Chicago
Gregory MichieConcordia University of Chicago
Lisa ScruggsJenner and Block
Brian SpittleDePaul University
Luis R. SoriaEllen Mitchell Elementary School
Kathleen St. LouisProject Exploration
Amy TreadwellChicago New Teacher Center
Arie J. van der Ploeg American Institutes for Research
Josie Yanguas Illinois Resource Center
Kim ZalentBusiness and Professional People for the Public Interest
DirectorsElaine M. AllensworthInterim Executive Director Consortium on Chicago School Research
Melissa RoderickHermon Dunlap Smith Professor School of Social Service Administration University of Chicago
Penny Bender Sebring Founding Director Consortium on Chicago School Research

16 Rethinking Teacher Evaluation
1313 East 60th Street
Chicago, Illinois 60637
T 773-702-3364
F 773-702-2010
ccsr.uchicago.edu
OUR MISSION The Consortium on Chicago School Research (CCSR) at the University of Chicago conducts research of high technical quality that can inform and assess policy and practice in the Chicago Public Schools. We seek to expand communication among researchers, policy makers, and practitioners as we support the search for solutions to the problems of school reform. CCSR encourages the use of research in policy action and improvement of practice, but does not argue for particular policies or programs. Rather, we help to build capacity for school reform by identifying what matters for student success and school improvement, creating critical indicators to chart progress, and conducting theory-driven evaluation to identify how programs and policies are working.
Related Documents