Integration, Inclusion, Institutions Integraon, Inclusion, Instuons Turkey’s Transions Labor Welfare Fiscal Space Enterprise Trade Infrastucture Finance Cies Report No. 90509 - TR December 2014 Public Disclosure Authorized Public Disclosure Authorized Public Disclosure Authorized Public Disclosure Authorized

Welcome message from author
This document is posted to help you gain knowledge. Please leave a comment to let me know what you think about it! Share it to your friends and learn new things together.
Transcript
Integration, Inclusion, Institutions
i
Integration, Inclusion, Institutions
Turkey’s Transitions
Labor
Welfare
FiscalSpace
Enterprise
Trade
Infrastucture
Finance
Cities
Report No. 90509 - TR
December 2014
Pub
lic D
iscl
osur
e A
utho
rized
Pub
lic D
iscl
osur
e A
utho
rized
Pub
lic D
iscl
osur
e A
utho
rized
Pub
lic D
iscl
osur
e A
utho
rized
Turkey’s Transitions
ii
© 2014 International Bank for Reconstruction and Development / The World Bank1818 H Street NWWashington DC 20433Telephone: 202-473-1000Internet: www.worldbank.org
This work is a product of the staff of The World Bank with external contributions. The findings, interpretations, and conclusions expressed in this work do not necessarily reflect the views of The World Bank, its Board of Executive Directors, or the governments they represent.
The World Bank does not guarantee the accuracy of the data included in this work. The boundaries, colors, denominations, and other information shown on any map in this work do not imply any judgment on the part of The World Bank concerning the legal status of any territory or the endorsement or acceptance of such boundaries.
Rights and Permissions
The material in this work is subject to copyright. Because The World Bank encourages dissemination of its knowledge, this work may be reproduced, in whole or in part, for noncommercial purposes as long as full attribution to this work is given.
Any queries on rights and licenses, including subsidiary rights, should be addressed to World Bank Publications, The World Bank Group, 1818 H Street NW, Washington, DC 20433, USA; fax: 202-522-2625; e-mail: [email protected].

Integration, Inclusion, Institutions
iii
FOREWORD ix
ACKNOWLEDGEMENTS xi
ABBREVIATIONS xiii
OVERVIEW : TURKEY’S TRANSITIONS 1
CHAPTER 1 : TURKEY’S RISE 25
SPOTLIGHT 1 : ACCOUNTING FOR TURKEY’S GROWTH: PAST AND FUTURE 51
CHAPTER 2 : TRADE: BENEFITING FROM GLOBALIZATION 61
CHAPTER 3 : FINANCE: BANKING SECTOR RESTRUCTURING AND FINANCIAL INTEGRATION 85
CHAPTER 4 : ENTERPRISE: HARNESSING STRUCTURAL CHANGE FOR INTEGRATION AND INCLUSION 111
SPOTLIGHT 2 : INFRASTRUCTURE TO CONNECT AND FUEL THE ECONOMY 139
CHAPTER 5 : CITIES: MANAGING RAPID URBANIZATION 153
CHAPTER 6 : LABOR: CREATING JOBS FOR WOMEN AND YOUTH 179
CHAPTER 7 : WELFARE: ACHIEVING BETTER HEALTH AND EDUCATION OUTCOMES 203
SPOTLIGHT 3 : FISCAL STABILIZATION AND THE MOVE TO RULE BASED PUBLIC FINANCE MANAGEMENT 231
CHAPTER 8 : CROSSING THE THRESHOLD TO HIGH INCOME 245
SELECTEDINDICATORS : ANNEX TABLES & SOURCES AND DEFINITIONS 265
COUNTRY CODES AND NAMES 297
Contents

Turkey’s Transitions
iv
Box 1 : Turkey’s Prospects ...............................................................................................................21
Box 1.1 : Turkey’s Transitions – An Overview .....................................................................................43
Box 2.1 : Mavi Jeans – Made in Turkey, marketed globally ................................................................63
Box 2.2 : Trade in services..................................................................................................................70
Box 2.3 : Measuring a country’s export sophistication ......................................................................76
Box 3.1 : Restructuring the state banks ............................................................................................. 92
Box 3.2 : Corporate debt restructuring: The Istanbul approach and beyond ....................................95
Box 3.3 : Encouraging household savings by promoting voluntary private pension accounts ........107
Box 5.1 : A historical perspective on urbanization ...........................................................................157
Box 5.2 : Leveraging private sector participation for municipal solid waste services ......................175
Table 1 : Policy Simulations ...............................................................................................................21
Table 2 : Turkey’s Transitions: Achievements, Lessons and Challenges .............................................22
Table S1.1 : Real GDP growth and contributions of factors ....................................................................54
Table S1.2 : Long-term projections - Baseline scenario ..........................................................................57
Table S1.3 : Policy Simulations ...............................................................................................................58
Table 2.1 : Decomposition of export growth: Turkey versus selected peers, 2005-2010 (in percent) .69
Table 4.1 : Productivity growth has increased over time ...................................................................114
Table 4.2 : Productivity convergence between the West and the Tigers ...........................................121
Table 4.3 : Economic structures are similar in the West and the Tigers .............................................122
Table 4.4 : Manufacturing has been growing while retail trade has declined in both regions ...........122
Table 4.5 : Tiger firms in manufacturing have high productivity growth, reallocation dominates in the West ...................................................................................................... 123
Table 4.6 : Manufacturing firms in the Tiger provinces have recorded extraordinarily high TFP growth ........................................................................................124
Table 4.7 : Correlates of firm level productivity growth .....................................................................129
Table 4.8 : Firm investments in innovation capabilities – R&D and KBC ............................................130
Table 4.9 : Correlates of total factor productivity in manufacturing in Turkey ...................................134
Table 6.1 : Most jobs go to the better educated ................................................................................183
Table 6.2 : More skills would increase growth and reduce informality ..............................................197
Table 7.1 : Targeted spending contributed to leveling the playing field for more students ...............218
Table S3.1 : Decomposition of change in debt stock ............................................................................237
Table 8.1 : Growth spells, growth slowdowns: Determinants of sustained growth in middle income countries, selected findings from the literature ...................................................251
Table 8.2 : Turkey’s Transitions: Achievements, Lessons and Challenges ...........................................260
Boxes
Tables
Integration, Inclusion, Institutions
v
Figure 1 : Steady growth over the decades brings Turkey to the threshold to high income ................6Figure 2 : The middle class has doubled since 1993 in Turkey, although it remains smaller than expected ..........................................................................................................6Figure 3 : Prosperity shared in the 2000s - in Turkey and selected peers .............................................7Figure 4 : Turkey’s rising global presence ............................................................................................. 7Figure 5 : A robust banking sector has withstood the global financial crisis well .................................8Figure 6 : Dramatic structural change in Turkey ................................................................................... 9Figure 7 : Turkey’s enterprises have delivered strong productivity growth ........................................10Figure 8 : Turkey’s logistics performance compares favorably with other middle income countries ..11Figure 9 : Turkey’s regional productivity levels converged between 2004-2011 ................................11Figure 10 : Turkey’s urbanization has been a driver of rising income ...................................................12Figure 11 : Fast job creation in Turkey since the 2008-2009 crisis, not so fast over a longer hoziron ....13Figure 12 : Labor market outcomes have been central to Turkey’s shared prosperity .........................14Figure 13 : Sharp reduction in health gap with OECD and within Turkey .............................................15Figure 14 : The education gap has also been declining, though Turkey still lags behind ......................16Figure 15 : Turkey’s fiscal consolidation was accompanied by fundamental public finance reform .....17Figure 16 : Turkey’s per capita income has hovered around US$ 10,500 mark since 2007 ..................18Figure 17 : Turkey and peers and the factors driving high income .......................................................19Figure 18 : Turkey remains mid-field on most comparative indices of institutional performance .......20Figure 1.1 : The center of gravity of the world economy is shifting east ...............................................27Figure 1.2 : Turkey’s income lagged Europe since the 1600s but catch up started in the 1950s ...........28Figure 1.3 : Turkey’s income per capita compared to its peers..............................................................30Figure 1.4 : Benchmarking Turkey ..........................................................................................................32Figure 1.5 : The fruits of market-led structural change – a high level of total factor productivity ........33Figure 1.6 : Trade and foreign exchange liberalization in the 1980s ......................................................35Figure 1.7 : Turks are more entrepreneurial than the average European ..............................................35Figure 1.8 : Political and macroeconomic instability in the era of coalition politics ..............................37Figure 1.9 : Regulatory reforms during and after the 2001 crisis ..........................................................39Figure 1.10 : Fiscal consolidation created the space for growing social and investment spending after 2004 ............................................................................................................40Figure 1.11 : Turkey has made significant progress in poverty reduction over the past decade .............44Figure 1.12 : Shared prosperity in Turkey and peers ...............................................................................44Figure 1.13 : Shared prosperity measures show variable performance over time ..................................45Figure 1.14 : The labor market drives improvements in income (2002-2012) .........................................46Figure 1.15 : Shared prosperity is the pathway to the middle class ........................................................46Figure 1.16 : Turkey’s middle class has increased in line with rising GDP ................................................47
Figure S1.1 : Drivers of growth in different political periods ...................................................................55
Figure S1.2 : Turkish economy became more volatile relative to its peers in the last decade ................55Figure S1.3 : Economic growth has been financed by foreign capital inflows .........................................56Figure 2.1 : Turkey’s economy has dramatically opened up since 1980 ................................................64Figure 2.2 : The increase in Turkey’s openness since the 1970s is comparable to India and China .......65
Figures
Turkey’s Transitions
vi
Figure 2.3 : Tariffs for products covered by the Customs Union fell significantly ..................................66Figure 2.4 : FDI inflows to Turkey as a share of emerging markets ........................................................67Figure 2.5 : FDI Inflows, 2002 - 2012 annual average ............................................................................67Figure 2.6 : Turkey’s share in global exports has increased fourfold since 1970 ...................................68Figure 2.7 : In Turkey existing firms, existing products and existing markets contribute more to export growth than in other MICs ...................................................................................... 69Figure 2.8 : Turkey has more service exports than most peers .............................................................70Figure 2.9 : Turkey has diversified its export markets more than other countries ................................71Figure 2.10 : Exports to MENA are the mirror image of exports to Europe .............................................72Figure 2.11 : Export survival of export relationships in different world regions ......................................73Figure 2.12 : Vehicles increase, textiles decline ....................................................................................... 74Figure 2.13 : Medium-tech exports are up but high-tech exports remain small 2000-2010 ...................75Figure 2.14: Turkey’s export sophistication has increased (EXPY) 2000-2010 ........................................77Figure 2.15 : Export quality as reflected in unit prices has also gone up (2000 and 2010)......................77Figure 2.16 : Firms exporting higher quality goods and having greater reliance on imported inputs are more likely to survive .................................................................................................... 78Figure 2.17 : Bilateral trade costs for Turkey and comparator countries ..................................................80Figure 2.18 : Turkey ranks high in logistics performance compared to its neighbors… .............................81Figure 2.19 : …and performs better than countries with a similar per capita income .............................81Figure 2.20 : Turkey’s trade openness remains lover than in high-growth markets ................................82Figure 3.1 : Overnight borrowing rates during the 2000-2001 crisis .....................................................89Figure 3.2 : The ten most costly banking crises .....................................................................................90Figure 3.3 : Policy responses to banking crises ...................................................................................... 93Figure 3.4 : The results of the reforms are evident ...............................................................................94Figure 3.5 : Turkey’s banks are among the strongest in emerging markets ...........................................96Figure 3.6 : Post-crisis deleveraging in Europe - Continued inflows into Turkey ....................................96Figure 3.7 : A credit boom and rising external imbalances in 2010-2011 ..............................................99Figure 3.8 : Policy rate adjustments and the corridor ............................................................................99Figure 3.9 : Turkish financial markets came under severe pressure after the Fed’s tapering announcement ................................................................................................... 101Figure 3.10 : Turkey: Financial market depth indicators ........................................................................103Figure 3.11 : Financial intermediation at the household level is lopsided in Turkey .............................104Figure 3.12 : Financial intermediation is higher among men, and among the older and better educated ................................................................................................................105Figure 3.13 : Domestic debt securities issued by banks and non-financial corporations ......................105Figure 4.1 : Turkey had fast productivity growth over the past decade thanks to structural change ..115Figure 4.2 : Labor in Turkey has moved from agriculture to industry and services since the 1980s ...116Figure 4.3 : Structural change has contributed to productivity growth ...............................................117Figure 4.4 : Regulatory improvements to support global integration ..................................................118Figure 4.5 : Productivity levels have converged across regions in Turkey ............................................119Figure 4.6 : Identifying the Tigers (in blue): Fast growth from a low base ...........................................120Figure 4.7 : Average firm productivity is still higher in the West in spite of productivity convergence 124Figure 4.8 : Explaining Tiger catch-up – Faster expansion by more productive mid-size firms ............125Figure 4.9 : Explaining Tiger catch-up – Increase in Tiger exports, with exporters larger and more productive ...............................................................................................................126Figure 4.10 : Firms in the Tiger regions export products of similar quality to firms in the West ...........127Figure 4.11 : Increased public expenditures in physical and social infrastructure in Tiger and other regions .....................................................................................................................128Figure 4.12 : Measuring innovation capacities: Turkey vs. selected peers ............................................131

Integration, Inclusion, Institutions
vii
Figure 4.13 : Innovation scoreboard: Turkey and the European Union .................................................132Figure S2.1 : The expansion of two lane highways in Turkey during the past decade ...........................141Figure S2.2 : Turkey experienced considerable improvements in mobile and broad-band coverage in the last decade .............................................................................................. 142Figure S2.3 : Total electricity generation capacity increased rapidly after 1978....................................142Figure S2.4 : Quality indicators show improvements in all dimensions of infrastructure .....................143Figure S2.5 : Public vs. private investments as percentage of GDP .......................................................144Figure S2.6 : Improving infrastructure – a timeline of reforms .............................................................150Figure 5.1 : Development of Konya’s urban form as depicted in a series of urban planning schemes (1946-2020) ........................................................................................................156Figure 5.2 : Growth in share of urban population in Turkey and comparator countries (1950-2015) .158Figure 5.3 : Urbanization and growth around the world - a mixed picture (1980-2012) .....................159Figure 5.4 : Urbanization and population agglomerations ..................................................................160Figure 5.5 : Economic activity moves inland to feed the Anatolian Tigers...........................................161Figure 5.6 : Zipf’s city rank-size power law and the system of cities ....................................................162Figure 5.7 : Percentage share of total metropolitan municipality population, 2000 and 2012 ...........163Figure 5.8 : Water supply and sanitation service pricing and domestic consumption per capita in Turkey and comparator countries, 2011 ...........................................................................164Figure 5.9 : Firms locate in metropolitan municipalities .....................................................................165Figure 5.10 : Firm location across city area: Manufacturing and ICT firm comparison .........................166Figure 5.11 : Distribution of Turkish cities based on diversity and ubiquity of products, 2012 .............167Figure 5.12 : Turkey’s cities have high density .......................................................................................167Figure 5.13 : Development of railways and population concentrations in Turkey in 2000 ....................168Figure 5.14 : Turkey housing starts to need ratio (1958-2010) and landmark housing legal and institutional initiatives .........................................................170Figure 5.15 : Distribution of housing construction and occupancy licenses by ownership form ...........171Figure 5.16 : Weekly trends in mortgage financing ...............................................................................172Figure 5.17 : Rental share of housing market in Turkey and selected European countries (1994) ........172Figure 5.18 : Turkey substantially expanded public expenditures on water, wastewater and solid waste infrastructure between 2003 and 2008 ..................................................................173Figure 5.19 : Turkey’s water and sanitation service coverage (1991-2011) ...........................................174Figure 5.20 : Meters of high transit capacity per capita for selected cities ...........................................177Figure 6.1 : Labor force participation in Turkey is lower and unemployment higher than in most peers ................................................................................................... 182Figure 6.2 : Turkey’s remarkable post-crisis employment performance ..............................................183Figure 6.3 : The added worker effect ................................................................................................... 184Figure 6.4 : Employment rates are up but still low ..............................................................................184Figure 6.5 : The gender gap explains why employment rates are low .................................................185Figure 6.6 : Younger women are more likely to be active ....................................................................186Figure 6.7 : The gender gap is declining .............................................................................................. 186Figure 6.8 : The U-curve of female LFP in Turkey .................................................................................187Figure 6.9 : Women’s income does not (yet) contribute much to poverty reduction..........................188Figure 6.10 : Job informality: declining but remains high ......................................................................188Figure 6.11 : Informality is higher among women and youth ................................................................189Figure 6.12 : Turkey’s labor markets are segmented because of high costs of formality ......................189Figure 6.13 : Turkey reduced the tax wedge to boost job creation .......................................................191Figure 6.14 : Turkey increased spending on ALMPs ...............................................................................191Figure 6.15 : İŞKUR’s coverage and placement are increasing fast ........................................................192

Turkey’s Transitions
viii
Figure 6.16 : Turkey is young and already relatively rich .......................................................................193Figure 6.17 : Turkey’s demographic window of opportunity .................................................................194Figure 6.18 : Turkey is expected to have a lot more workers .................................................................195Figure 6.19 : Educational attainment in Turkey is increasing .................................................................196Figure 6.20 : Experience in peers shows that educational attainment can improve fast.......................196Figure 6.21 : The gender gap declines as educational attainment goes up ...........................................198Figure 6.22 : Enrollment in ECE is increasing .........................................................................................198Figure 6.23 : Few women work part-time, more may want to do so .....................................................199Figure 7.1 : Health: The gap between Turkey and the OECD is shrinking, with improved equity ........206Figure 7.2 : Education: Remarkable improvement in learning, particularly among low performers ...207Figure 7.3 : Increases in health human resources ...............................................................................209Figure 7.4 : Investments in medical personnel and infrastructure have led to better coverage..........211Figure 7.5 : Additional public financing for health was key for the reforms ........................................212Figure 7.6 : More efficient contribution collections have raised additional financing .........................213Figure 7.7 : Reforms led to significant gains in coverage for the most vulnerable ..............................214Figure 7.8 : Turkey performs impressively in immunizing its youngest citizens ...................................215Figure 7.9 : Turkey’s education workforce and infrastructure kept pace with growing education needs ................................................................................................... 217Figure 7.10 : The equity of expenditures – increasing investment in underserved regions ..................219Figure 7.11 : Turkey’s investments in education rapidly increased enrollment rates ............................220Figure 7.12 : Turkey has improved its PISA scores faster than any other participating country ............221Figure 7.13 : Graduating more students into the global economy ........................................................222Figure 7.14 : The case for continued reforms–the pension system is projected to run deficits long into the future ...................................................................................................................223Figure 7.15 : Turkey has the lowest pensionable age in the OECD ........................................................224Figure 7.16 : Turkey has been closing regional gaps in terms of enrollment in secondary education ...225Figure 7.17 : More access to early childhood education is still needed ................................................226Figure S3.1 : The unravelling of fiscal discipline between 1990-2001 ...................................................234Figure S3.2 : The consequence of fiscal profligacy: rising public debt ...................................................234Figure S3.3 : The fiscal stabilization effort ............................................................................................. 235Figure S3.4 : Turkey maintained fiscal discipline during the 2008-2009 crisis and beyond ...................236Figure S3.5 : The use of fiscal space in Turkey .......................................................................................237Figure S3.6 : The three pillars of public finance management reforms in Turkey post-2001 ................239Figure S3.7 : Credibility of the medium-term fiscal program ................................................................241Figure S3.8 : Turkey’s performance in the public expenditure and financial accountability assessment 242Figure 8.1 : Benchmarking Turkey’s high income potential .................................................................248Figure 8.2 : Turkey’s convergence to high income has slowed since 2007 ..........................................249Figure 8.3 : Only a handful of countries have escaped the middle income trap .................................250Figure 8.4 : The correlation between the quality of economic institutions and per capita income ....252Figure 8.5 : Turkey remains mid-field on most comparative indices of institutional performance .....253Figure 8.6 : Worldwide governance indicators ....................................................................................254Figure 8.7 : Crossing the threshold to high income: Challenges and policy priorities .........................255Figure 8.8 : Institutional reforms have slowed since the mid-2000s ...................................................257
Figure 8.9 : The convergence machine starting up again? ...................................................................259
Integration, Inclusion, Institutions
ix
Foreword
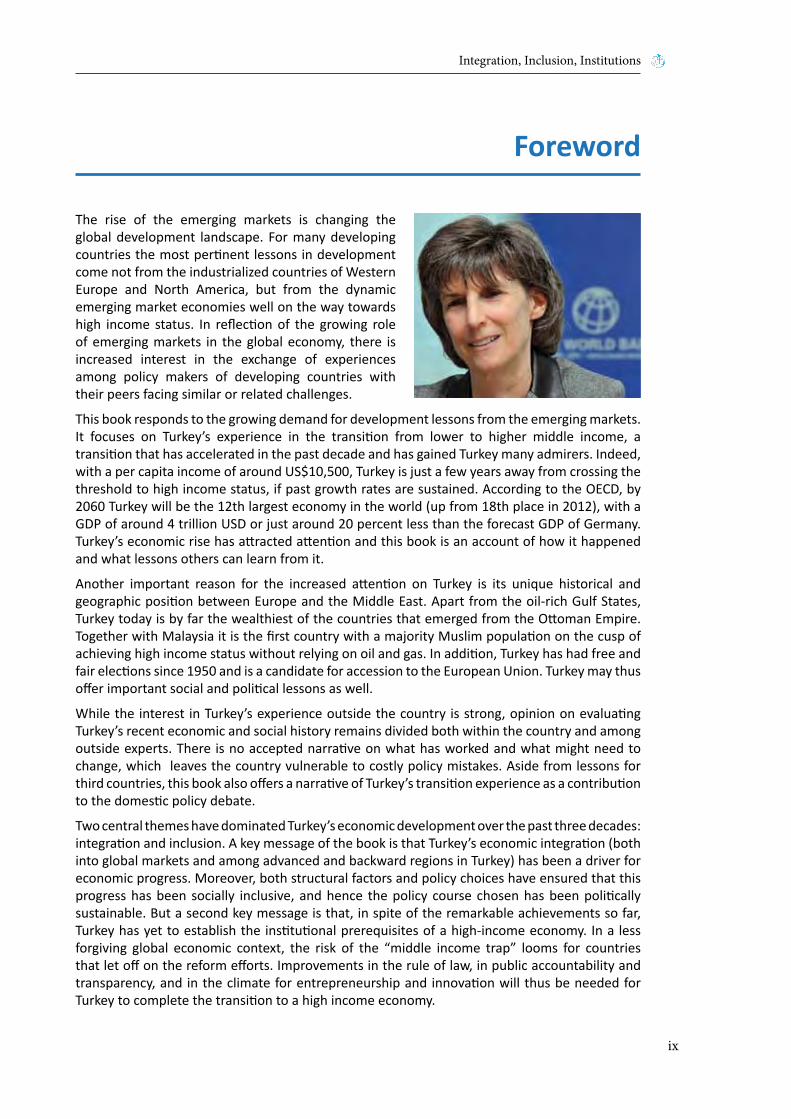
The rise of the emerging markets is changing the global development landscape. For many developing countries the most pertinent lessons in development come not from the industrialized countries of Western Europe and North America, but from the dynamic emerging market economies well on the way towards high income status. In reflection of the growing role of emerging markets in the global economy, there is increased interest in the exchange of experiences among policy makers of developing countries with their peers facing similar or related challenges.
This book responds to the growing demand for development lessons from the emerging markets. It focuses on Turkey’s experience in the transition from lower to higher middle income, a transition that has accelerated in the past decade and has gained Turkey many admirers. Indeed, with a per capita income of around US$10,500, Turkey is just a few years away from crossing the threshold to high income status, if past growth rates are sustained. According to the OECD, by 2060 Turkey will be the 12th largest economy in the world (up from 18th place in 2012), with a GDP of around 4 trillion USD or just around 20 percent less than the forecast GDP of Germany. Turkey’s economic rise has attracted attention and this book is an account of how it happened and what lessons others can learn from it.
Another important reason for the increased attention on Turkey is its unique historical and geographic position between Europe and the Middle East. Apart from the oil-rich Gulf States, Turkey today is by far the wealthiest of the countries that emerged from the Ottoman Empire. Together with Malaysia it is the first country with a majority Muslim population on the cusp of achieving high income status without relying on oil and gas. In addition, Turkey has had free and fair elections since 1950 and is a candidate for accession to the European Union. Turkey may thus offer important social and political lessons as well.
While the interest in Turkey’s experience outside the country is strong, opinion on evaluating Turkey’s recent economic and social history remains divided both within the country and among outside experts. There is no accepted narrative on what has worked and what might need to change, which leaves the country vulnerable to costly policy mistakes. Aside from lessons for third countries, this book also offers a narrative of Turkey’s transition experience as a contribution to the domestic policy debate.
Two central themes have dominated Turkey’s economic development over the past three decades: integration and inclusion. A key message of the book is that Turkey’s economic integration (both into global markets and among advanced and backward regions in Turkey) has been a driver for economic progress. Moreover, both structural factors and policy choices have ensured that this progress has been socially inclusive, and hence the policy course chosen has been politically sustainable. But a second key message is that, in spite of the remarkable achievements so far, Turkey has yet to establish the institutional prerequisites of a high-income economy. In a less forgiving global economic context, the risk of the “middle income trap” looms for countries that let off on the reform efforts. Improvements in the rule of law, in public accountability and transparency, and in the climate for entrepreneurship and innovation will thus be needed for Turkey to complete the transition to a high income economy.

Turkey’s Transitions
x
Turkey is undergoing multiple transitions en route to a high income economy, some more advanced than others. We hope Turkey’s experience inspires policy makers in other emerging markets to aim for high income status. And we hope that by drawing up a balance sheet of Turkey’s achievements and challenges, this book will also inspire Turkey’s policy makers to redouble their own reform efforts and lift their country into the ranks of the advanced high-income economies. That would make Turkey’s lessons all the more convincing.
Laura Tuck
Vice PresidentEurope and Central Asia RegionThe World Bank
Integration, Inclusion, Institutions
xi
This book was written by a team led by Martin Raiser, Country Director for Turkey, and Marina Wes, Country Manager for Poland (who at the time of writing was Lead Economist for Turkey).
Many people participated in the writing of the report. The main authors and contributors by chapter are:
• The Overview and Chapter 1 (Introduction) were written by Martin Raiser, with contributions from Ayberk Yılmaz (Chapter 1) and Joao Pedro Azevedo (Annex to Chapter 1).
• Chapter 2 (Trade) was written by Kamer Karakurum Özdemir and Marina Wes.
• Chapter 3 (Finance) was written by Carlos Piñerúa, with contributions from Engin Akçakoca, Cevdet Çağdas Ünal, Alper Oğuz and Jose Guilherme Reis.
• Chapter 4 (Enterprises) was written by Francis Rowe, with contributions from İzak Atiyas, Ozan Bakış, Mark Dutz and Stephen O’Connell.
• Chapter 5 (Cities) was written by Stephen Karam.
• Chapter 6 (Labor) was written by Altan Aldan, Rebekka Grun and Ana Maria Munoz Boudet.
• Chapter 7 (Welfare) was written by Roya Vakil and William Wiseman.
• Chapter 8 (Outlook) was written by Martin Raiser with contributions from Ayberk Yılmaz.
• Spotlight 1 was written by Cevdet Çağdaş Ünal.
• Spotlight 2 was written by Nancy Lozano Gracia.
• Spotlight 3 was written by Mediha Ağar.
• The annex tables were prepared by Ayberk Yılmaz.
Special thanks are due to Ayberk Yılmaz, Pınar Baydar and Bilgen Kahraman for excellent research assistance and editorial support. Without them, this book would never have been completed.
The team owes particular gratitude to colleagues in the Central Bank of the Republic of Turkey, the Ministry of Development, the Ministry of Economy, the Ministry of Finance, the Ministry of Labor and Social Security, the Undersecretariat of Treasury, and the Turkish Statistical Institute (TurkStat) for detailed comments on several drafts of this Report.
A panel of advisors provided guidance to the team. The panel included Ahmet T. Kuru (Univer-sity of Utah), Can Paker (The Turkish Economic and Social Studies Foundation (TESEV)), Dennis Snower (Institute of World Economics, Kiel), Güven Sak (Economic Policy Research Foundation of Turkey (TEPAV)), Marc Pierini (Carnegie Endowment), Ömer Taşpınar (School of Advanced International Studies (SAIS) at Johns Hopkins University), Seyfettin Gürsel (Bahcesehir University Center for Economic and Social Research (Betam)), Hedi Larbi (Minister of Infrastructure and Sustainable Development of Tunisia, former World Bank Director for Iran, Iraq, Jordan, Lebanon and Syria) and Yavuz Canevi (Economy Bank of Turkey (TEB)). The team also benefited from the advice provided by three peer reviewers: Sinan Ülgen, Manuela Ferro and Stefan Koeberle; as well as comments from Mark W. Lewis, Cevdet Denizer, Indermit Gill and Hans Timmer.
Acknowledgements

Turkey’s Transitions
xii
Integration, Inclusion, Institutions
xiii
ABPRS Address-Based Population Registration System AISS Annual Industry and Service Statistics AK Party Justice and Development PartyANAP Motherland Party ARPU Average Revenue per UserBEC Broad Economic CategoriesBIMER Prime Ministry Communication Centre BIS Bank for International SettlementsBOT Build-Operate-Transfer BRICS Brazil, Russia, India, China and South AfricaBRSA Banking Regulation and Supervision AgencyCBRT Central Bank of the Republic of TurkeyCCT Conditional Cash Transfer CDS Credit Default SwapsCGE Computable General EquilibriumCMB Capital Markets Board COMCEC The Standing Committee for Economic and Commercial Cooperation of the Organization of the Islamic CooperationCU The Customs UnionDALY Disability-adjusted LifeYearDB Defined Benefit DC Defined Contribution DHMI General Directorate of State Airports DOTS Direction of Trade StatisticsDPT diphtheria-pertussis-tetanusDSP Democratic Left Party EBA The Execution and Bankruptcy Act EBFs Extra Budgetary FundsEBRD European Bank for Reconstruction and DevelopmentECE Early Childhood EducationEEC European Economic Community EFTA European Free Trade AssociationEMRA Energy Market Regulatory AuthorityESI European Stability InitiativeEU European UnionEUAŞ Turkey National Energy Distribution CompanyEXPY Index of Export Sophistication, Country
FAR Floor Area Ratio FDI Foreign Direct Investment FLFP Female Labor Force Participation FSC Financial Stability Committee FSI Floor Space IndexFX Foreign ExchangeGDP Gross Domestic ProductGFS Government Finance StatisticsGNP Gross National ProductGSM Global System for MobileGVCs Global Value ChainsGWI Global Water IntelligenceHBS Household Budget SurveyHEC Higher Education CouncilHIPC High Indebted Poor CountriesHS Harmonized Classification HTP Health Transformation Program ICT Information and Communication Technologies IFI International Financial Institution IFPRI International Food Policy Research InstituteIMF International Monetary FundIPR Intellectual Property Rights İSKİ Istanbul Water and Sewerage AdministrationIT Information TechnologyKBC Knowledge Based Capital KGM Directorate of RoadsKOSTAT Korean StatisticsKÖYDES Small Villages Water and Sanitation ProjectLDC Least Developing Countries LOWESS Locally Weighted Scatterplot SmoothingLPI Logistics Performance Index MENA Middle East and North AfricaMHP Nationalist Movement PartyMICs Middle Income CountriesMoFSP Ministry of Family and Social PoliciesMoH Ministry of HealthMoLSS Ministry of Labor and Social Security MoNE Ministry of National Education MPC Monetary Policy Committee
List of Abbreviations
Turkey’s Transitions
xiv
MTFP Medium-Term Fiscal ProgramMVET The Modernization of Vocational Education and Training Project MW MegawattNACE Nomenclature des Activites Generales EconomiquesNCD Non-communicable diseasesNDP National Development PlanNUTS Nomenclature of Territorial Units for StatisticsOECD The Organisation for Economic Co-operation and DevelopmentOKS High School Entrance Examination OSYM Student Selection and Placement Center PEFA Public Expenditure and Financial Accountability PFM Public Finance Management PFMCL Law on Public Finance Management and ControlPISA Programme for International Student AssessmentPMR Product Market RegulationPPA Public Procurement AuthorityPPL Public Procurement Law PPP Purchasing Power Parity PPP Public Private Partnershippps PointsPRODY Index of Export Sophistication, Goods BasketPROST Pension Reform Option Simulation ToolkitPSBR Public Sector Borrowing RequirementPSO Public Service Obligation PWT Penn World TablesR&D Research and DevelopmentRCA Revealed Comparative Advantage RDAS Research and Development Activities Survey RGDPo Real Gross Domestic Product SeriesROCs Reserve Option Coefficients S&P Standard and Poor’sSABİM MoH Communications Centre SBS Level Determination ExamsSDIF State Deposit Insurance FundSME Small and Medium EnterpriseSOE State-Owned EnterpriseSPO State Planning OrganisationSSI Social Security Institution
SUKAP Water and Wastewater ProjectSVET The Project on Strengthening the Vocational Education and Training SystemSYDVs Social Assistance and Solidarity Foundations TCA Turkish Court of AccountsTCDD Turkish State RailwaysTEDAŞ Turkey National Energy Transmission CompanyTEİAŞ Turkish Electricity Transmission CompanyTEK Turkey National Power CompanyTEPAV Economic Policy Research Foundation of TurkeyTFP Total Factor Productivity THY Turkish Airlines TIMSS Trends in International Mathematics and Science StudyTL Turkish LiraTOBB The Union of Chambers and Commodity Exchanges of TurkeyTOKİ Housing Development Administration of TurkeyTRACE Tool for Rapid Assessment of City EnergyTSD Trade in Services Dataset TTIP Trans-Atlantic Trade and Investment PartnershipTurkStat Turkish Statistical InstituteUK United KingdomUN United NationsUNCTAD United Nations Conference on Trade and DevelopmentUNESCAP United Nations Economic and Social Commission for Asia and The PasificUNESCO United Nations Educational, Scientific and Cultural OrganizationUSA The United States of AmericaVA Value AddedVET Vocational Education and Training WB The World BankWDI World Development IndicatorsWEF World Economic ForumWGI Worldwide Governance Indicators WHO World Health OrganisationWITS World International Trade Statistics YASED International Investors Association
Overview
1
Overview:Turkey’s Transitions
Labor
Welfare
FiscalSpace
Enterprise
TradeInfrastucture
Finance
Cities
Turkey’s Transitions: Integration, Inclusion, Institutions

Turkey’s Transitions: Integration, Inclusion, Institutions
2

Overview
3
Turkey has always been a country of strate-gic significance. Its geographic position as a bridge between East and West, its long
and unique history of relations with the European Union (EU), and the particular route the Republic of Turkey chose towards modernization after its foun-dation in 1923 have attracted the attention of his-torians and political scientists alike. More recently, Turkey’s economic success has become a source of inspiration for a number of developing countries, particularly, but not only, in the Muslim world. The rise of Turkey’s economy is admired, all the more so because it seems to go hand in hand with demo-cratic political institutions and an expanding voice for the poor and lower middle classes. In the wake of the Arab Spring, Turkey was seen by many as a possible model for successful modernization in the Muslim world.
Over the past two years, however, questions have emerged over the lessons to be drawn from Tur-key’s experience. Economic growth has come down to a modest 3-4 percent range from well over 5 percent during 2002-2011, and risks related to the country’s large external financing needs have not been banished. Critics have raised questions over the strength of Turkey’s legal and economic insti-tutions, and economists are concerned that Turkey may remain “trapped” in its current middle income status.
The recent gloom may be as exaggerated as the ear-lier euphoria. Turkey’s achievements in economic development and social progress are noteworthy and neglecting them would be unfortunate for the many countries still looking for inspiration from suc-cess stories among emerging markets. Indeed, the interest in Turkey’s experience among other emerg-ing markets remains strong despite slower growth and external criticism. In the past two years, with the assistance of the World Bank Group, close to 20 delegations from countries as far flung as India, Uzbekistan, Tajikistan, Malaysia, Mauritania, Iraq, Kosovo, Tunisia, Kenya, Pakistan and Ukraine have come to Turkey to learn about topics as diverse as primary health care reform, the expansion of sec-ondary education, the removal of energy subsidies, the regulation of telecommunications, banking re-structuring, social housing and public finance man-
agement. For policy makers from these countries, Turkey’s lessons are valuable precisely because they have been learned in a political and institu-tional environment that remains in flux.
An objective assessment of what has worked well and what needs to change is also important in the context of Turkey’s domestic policy debate. A failure to appreciate the roots of Turkey’s achieve-ments and understand the policies that contributed to them may precipitate costly reversals. Turkey’s policy framework needs to adjust if the country is to progress to high income but such adjustment should build on the pro-market and pro-European orientation adopted in the aftermath of Turkey’s crisis in the early 2000s. Turkey’s achievements have had several fathers. Turkey’s vigorous politi-cal debate overshadows the fact that progress was based on a broad consensus in economic policy. This consensus should be nurtured.
This book is, thus, addressed to policy makers both from other emerging markets and from Turkey it-self. To the former, it offers lessons in how Turkey progressed towards international integration and increased social inclusion. To the latter, it offers a narrative of the country’s achievements and re-maining challenges that may help define the reform agenda going forward.
Our narrative starts in the early 1980s with the re-forms of Turgut Özal, who opened up the Turkish economy to international trade and investment. It considers the positive impact of these early re-forms and the reasons they, nonetheless, fell short and ushered in a period of economic and political instability. The response to a major financial crisis in 2001 led to a regime shift and a subsequent era of rapid economic and social advancement, which today faces a new test of deepening reforms to ease the country’s path to high income. While the focus is squarely on Turkey, throughout the report, its performance is benchmarked against other emerging market peers in Europe, in the Middle East and North Africa (MENA), and among the large middle income countries around the globe. Where appropriate, comparisons with the The Organisa-tion for Economic Co-operation and Development (OECD), of which Turkey was a founding member, are also made.1
Turkey’s Transitions:Integration, Inclusion, Institutions
1 The following peer groups are used throughout the Report: New EU Member States (Bulgaria, Czech Republic, Hungary, Poland, Romania, Slovakia), Accession Candidates (Albania, Serbia and Croatia – included in this group because our data stop mostly in 2012 prior to Croatia’s accession), MENA (Egypt, Jordan, Morocco, Tunisia and Syrian Arab Republic), the BRICS (Brazil, Russian Federation, India, China, and South Africa), and the Growth Markets (Indonesia, Malaysia, Mexico, Philippines and Republic of Korea; a group coined by Goldman Sachs).

Turkey’s Transitions: Integration, Inclusion, Institutions
4
Multiple transitionsEconomic development goes hand in hand with fundamental changes in society. Most high income countries today share broadly similar economic and social structures and political and economic insti-tutions: their economies are market-based, inter-nationally connected, and largely urbanized; they have a highly skilled workforce, low fertility and mortality rates, and offer extensive public services. Almost all high income countries are democracies and all of them have strong economic and politi-cal institutions based on the rule of law, the pro-tection of individual rights, and the establishment of a competitive or “open-access” order (North, 1990; Acemoğlu and Robinson, 2012; Ferguson, 2011; North, Wallis and Weingast, 2009)2. Among developing countries, both middle and low income, there is much higher variation in the way econo-mies and societies are organized. Far from a linear progress on a well-trodden path, economic devel-opment involves multiple transitions that lead to different configurations across countries and time.
Turkey itself is undergoing multiple transitions, some more advanced than others. It is open to foreign trade and finance, and yet domestic capi-tal markets remain underdeveloped. A majority of its population has moved from their place of birth as Turkey has undergone a dramatic process of ur-banization, yet traditional gender roles in the family have largely stayed intact. Turkey has harmonized many of its laws and regulations with EU standards and dramatically expanded access to public servic-es, but concerns over economic and public sector governance persist. To many outside observers, Turkey is a country of contrasts. As this report il-lustrates, these contrasts result from uneven prog-ress along various dimensions of Turkey’s economic and social development. They are also linked with each other in ways that offer important lessons on the sequencing and sustainability of economic reforms.The drivers of Turkey’s progress since the early 1980s are similar to trends in other emerg-ing markets. China opened up to the international economy around the same time as Turkey; Eastern Europe and India around a decade later. Russian Federation and Brazil are prominent examples of countries that fundamentally overhauled economic management following financial crises at the end of the 1990s or early 2000s and have subsequently benefited – as Turkey has – from the “great moder-ation” of abundant global liquidity thanks to sound
macro management and healthy financial and fis-cal buffers. Turkey’s economic catch-up with Eu-rope over the past decade mirrors the experience of other accession countries that benefited from Europe’s “Convergence Machine” (Gill and Raiser, 2012). The combination of these international driv-ers with Turkey’s unique national circumstances makes up the story of Turkey’s transitions. Three main features of this story stand out:
• Economic growth driven by structural change: The shift of employment out of agri-culture into industry and services has brought increases in productivity and rising income. Structural change has been seen as an engine of productivity growth in developing countries for many decades, going back to the work of Nobel Prize winning economist Arthur Lewis. But as Dani Rodrik and Margaret McMillan (2011) show, it is far from obvious that the en-gine actually works. That it did in Turkey has to do with the process of international and do-mestic market integration. Trade liberalization in the 1980s, followed by the Customs Union agreement with the EU in 1995, provided the price signals and competitive incentives for the modernization of Turkey’s industry. After 2001, banking sector restructuring allowed financing to flow to the business sector, and, together with more business friendly regulations, fa-cilitated the creation of jobs in manufacturing and services. Public and private investments in infrastructure, in particular transport and logis-tics, ensured that the benefits of international integration were spread inland. Rapid urbaniza-tion, including in the secondary cities of Ana-tolia, created an attractive production base for investors and an economically efficient system of cities emerged.
These are Turkey’s lessons in integration and they are mainly associated with its achieve-ments in trade, finance, enterprises and infra-structure.
• From debt service to public service: Turkey’s rising prosperity has been shared and inequali-ties in access to basic public services have been greatly reduced. Turkey remains a country of unequal opportunities; yet, for many of Turkey’s poor, the past decade, in particular, has brought unprecedented improvements in income, healthcare, education, housing and basic mu-nicipal services. Indeed, Turkey’s middle class3,
2 The term “open access order” is due to North, Wallis and Weingast (2009). It describes a set of political and economic institutions that ensure open competition on an even playing field, both for political power and for market share.
3 The middle class is defined here as the share of the population living on at least $10 per capita per day in Purchasing Power Parity (PPP) terms (Azevedo and Atamanov, 2014).

Overview
5
while still a minority at just over 40 percent of the population, has more than doubled since 1993. Improvements in living conditions for the poorer segments of the population are not an automatic outcome of economic growth. What makes Turkey’s experience interesting is that improvements in the income of the poor have not resulted from changes in the distribution of income as for instance in Latin America (Aze-vedo and Atamanov, 2014). Instead, they reflect rising labor market earnings across the distribu-tion, and public investment in the expansion of health, education and municipal infrastructure, as well as the strengthening of Turkey’s social security arrangements. These investments were made possible by the fiscal consolidation in the early 2000s which allowed spending to be re-allocated from debt service to public services. Turkey’s rapid urbanization has supported this process, because it has greatly reduced the unit cost of access to health and education. While much remains to be improved in municipal planning and management, Turkey’s cities have accommodated the flood of migrants from rural areas and provided them with housing, access to drinking water and sanitation.
These are Turkey’s lessons in inclusion and they mainly relate to the country’s achievements in urbanization, labor markets, health and educa-tion services, and in public finances.
• A pro-market consensus, but contested insti-tutions: Turkey’s transformation has been pre-dominantly private sector led and sustained by a political consensus in favor of market-based solutions. The rise of a new generation of entre-preneurs from Turkey’s inland provinces – often referred to as the “Anatolian Tigers” – and the growth of an urban middle class has created a political constituency for conservative social and liberal economic policies. The deep politi-cal and economic crisis at the end of the 1990s catalyzed a series of institutional reforms aim-ing to establish arms’ length relations between the state and the private sector. These were sustained and expanded by the Justice and De-velopment Party (AK Party) after 2002, with the prospect of EU membership and the process of Accession negotiations providing an important anchor for reform efforts. Turkey has been rich-ly rewarded for this choice.
However, Turkey has yet to establish the institu-tional prerequisites of a high income economy. The reform momentum has slowed since the global economic and financial crisis and the EU reform an-chor has notably weakened. Hidden by the ample
flow of cheap money to Turkey in the wake of the global economic and financial crisis, Turkey’s un-derlying competitiveness challenges have not been addressed. A new growth model is needed based on increases in firm-level productivity, as the gains from structural change peter out. Moreover, re-forms of the public financial management frame-work remain incomplete. The fiscal windfall from declining interest payments is almost exhausted and further improvements in the quality of public services will require greater attention to efficiency. Last but not least, Turkey needs to satisfy the aspira-tion of the new middle class while at the same time harnessing the resources and experience of the traditional urban intellectual and business elites. A renewed policy consensus in favor of competitive markets, political and civil liberties and improved economic governance would help Turkey consoli-date its institutions and thereby lay the foundation for the transition to high income.
Turkey’s achievementsTurkey’s average real income has risen fivefold since the 1950s. Decade by decade, Turkey’s real Gross Domestic Product (GDP) has grown, never by less than 4 percent on average (Figure 1). While not spectacular, this is a solid performance, and it has brought Turkey to the threshold of high income. In the 1960s and 1970s, Turkey progressed less quick-ly than its peers, but in the 1980s, 1990s and 2000s, Turkey’s performance was on par or exceeded aver-age growth in the peer group. This is the period of Turkey’s integration into the global economy which is the focus of this report.
Turkey’s progress towards high income has given rise to a growing middle class (Figure 2). This has had important economic and political implications. Economically, it has created a buoyant domestic market and stimulated both domestic and foreign investment. Politically, it has created demand for improved public services and support for pro-mar-ket policies as a means to open up new economic opportunities. Turkey’s growth has also been asso-ciated with a sharp fall in poverty rates. While pock-ets of poverty remain in rural areas, by and large economic conditions have improved for most peo-ple. The rising tide of growth has lifted most boats and Turkey’s prosperity has been shared (Figure 3).
Solid growth and shared prosperity have their roots in eight specific achievements which together rep-resent the story of Turkey’s transitions. We group them under the two central themes of integration and inclusion.

Turkey’s Transitions: Integration, Inclusion, Institutions
6
Integration:economic liberalization and the fruits of structural changeA rising global presence…In 1980, Turkey was virtually a closed economy. Exports accounted for just 5 percent of GDP, trade
and foreign exchange controls distorted relative prices. Only the rich could afford to pay the price for contraband imported luxury items, while the av-erage consumer and business was stuck with inferi-or domestic quality. All this changed with the trade liberalization introduced by Turgut Özal. Turkey’s trade has exploded since then, growing around 50 percent faster than world trade in the last decade
Source: Penn World Tables (PWT), Turkish Statistical Institute (TurkStat), The World Bank (WB) staff calculationsNote: Peers include the New EU Member States (Bulgaria, Czech Republic, Hungary, Poland, Romania, Slovakia), Accession Candidates (Albania, Croatia, Serbia), MENA (Egypt, Jordan, Morocco, Tunisia and Syrian Arab Republic), the BRICS (Brazil, Russian Federation, India, China and South Africa), and the Growth Markets (Indonesia, Malaysia, Mexico, Philippines and Republic of Korea). Period growth rates represent the average of the annual growth rates. GDP growth rates are calculated by using PWT database, which allows cross-country comparison in a consistent manner. Growth figures slightly change when calculations are made by using the Ministry of Development’s harmonized GDP dataset for the period before 1980; however, there is no significant divergence for the period following 1980. For reference, the average growth rates per decade using the Ministry of Development’s data are: 7.0 percent for the 1950s, 5.5 percent for the 1960s, 4.7 percent for the 1970s, 4.1 percent for the 1980s, 4.0 percent for the 1990s, 4.6 percent for the 2000s.
8.3
5.1 4.94.1 4.0
4.65.3
6.06.8
4.1
2.3
4.5
0%
2%
4%
6%
8%
10%
1950s 1960s 1970s 1980s 1990s 2000s
Turkey Real GDP Growth (percent) Average GDP growth in peers (percent)
Figure 1: Steady growth over the decades brings Turkey to the threshold to high income
Figure 2: The middle class has doubled since 1993 in Turkey, although it remains smaller than expected
BRA93
BRA10
CHL93
CHL10CRI10
ECU93
ECU10
HRV93
HRV10
KAZ93
KAZ10
LVA10
MEX93
MEX10
MYS10
PAN10
PER93
PER10
POL10
PRY93
ROM93
ROM10
RUS93
RUS10
UKR93
UKR10
TUR 1993
TUR 2010
R² = 0,4282
0%
10%
20%
30%
40%
50%
60%
70%
80%
90%
100%
3,000 7,000 11,000 15,000 19,000
Shar
e of
the
mid
dle c
lass
GDP per capita, in PPP US$
Source: Azevedo and Atamanov (2014)Note: The middle class is defined as the population living on at least $10 per capita per day in Purchasing Power Parity (PPP) terms.

Overview
7
alone. Consequently, Turkey’s share in global im-ports has more than tripled since 1980 and its ex-port share has risen four times (Figure 4).
The main policies that have made this possible were the trade liberalization of the 1980s, the Customs Union agreement of 1995, and in the 2000s, a con-scious commercial diplomacy to expand Turkey’s presence in new markets. The abolition of import licenses and government support for exporters in the 1980s created incentives for business to aim for international competitiveness and introduced many companies to foreign markets for the first time. The Customs Union agreement anchored Tur-key’s external tariffs at EU levels, greatly reduced non-tariff barriers to trade through the alignment of technical standards and regulations and en-couraged vertical integration of Turkish firms into European production networks by eliminating the
need for costly rules of origin (World Bank, 2014). The Customs Union also stimulated a wholesale modernization of Turkey’s customs administration. Public and private investments to improve Turkey’s transport, communications and logistics infrastruc-ture have complemented these efforts and Turkey today ranks among the top 30 countries globally for the quality of its logistics. In recent years, Tur-key’s exporters have also benefited from significant state support in identifying and opening new target markets and bridging information gaps. Efforts to strengthen export finance and insurance are under-way.
The rise in Turkey’s global footprint is impressive, but it still has a long way to go to reach the lev-els of export performance of Eastern Europe or East Asia. In comparative terms, Turkey’s open-ness is not much higher than that of much larger
Figure 3: Prosperity was shared in the 2000s - in Turkey and selected peers
Figure 4: Turkey’s rising global presence
-4%
-2%
0%
2%
4%
6%
8%
10%
12%
2004
-200
8
2005
-201
0
2005
-201
0
2005
-201
0
2006
-200
9
2003
-200
9
2007
-201
0
2005
-201
1
2006
-201
1
2006
-201
1
2006
-201
0
2005
-200
9
2004
-200
9
HRV IDN MEX IND ZAF CHL BGR COL TUR BRA ROM CHN RUS
Grow
th R
ate
Total Population Bottom 40
0%
10%
20%
30%
40%
50%
60%
70%
80%
90%
100%
0.0%
0.2%
0.4%
0.6%
0.8%
1.0%
1.2%
1.4%
1970
1972
1974
1976
1978
1980
1982
1984
1986
1988
1990
1992
1994
1996
1998
2000
2002
2004
2006
2008
2010
2012
Perc
ent o
f GDP
Shar
e of
Glo
bal E
xpor
ts
Turkey`s Global Import Share Turkey`s Global Export Share Openness (right axis)
Source: Azevedo and Atamanov (2014) Notes: Welfare aggregate is consumption plus durables and health. Geometric mean is used to calculate average growth rate.
Source: World Development Indicators (WDI), WB staff calculations
Turkey’s Transitions: Integration, Inclusion, Institutions
8
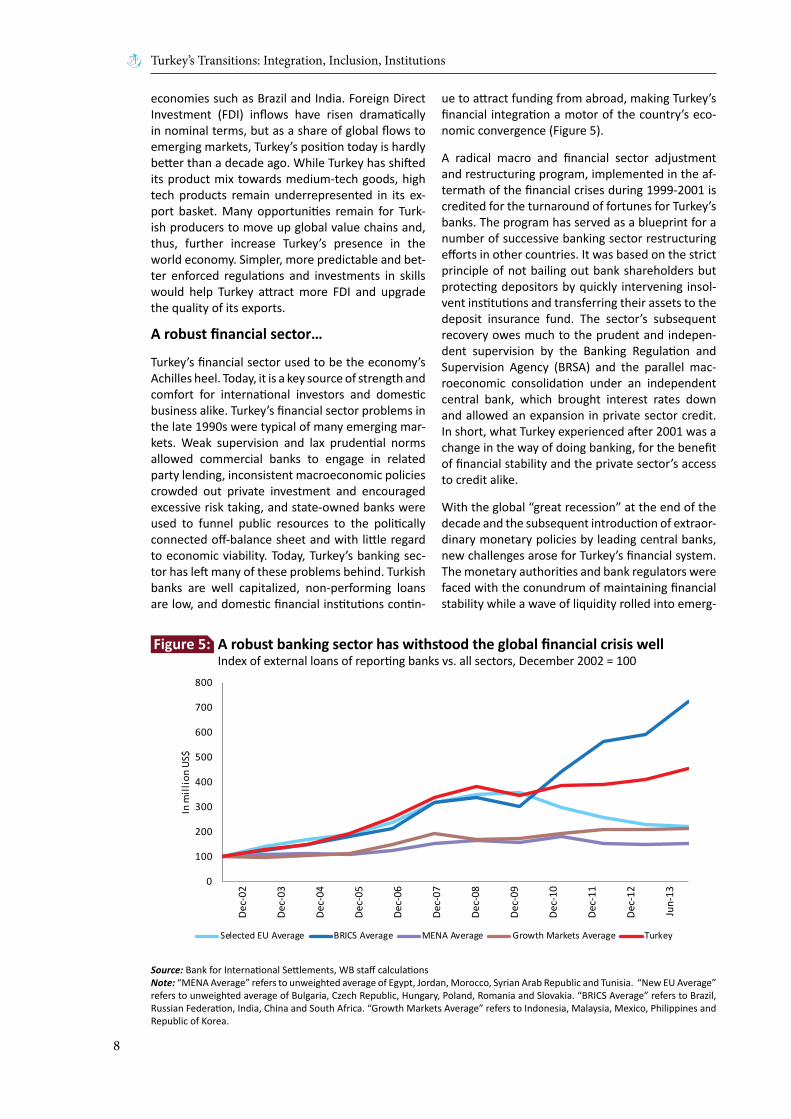
economies such as Brazil and India. Foreign Direct Investment (FDI) inflows have risen dramatically in nominal terms, but as a share of global flows to emerging markets, Turkey’s position today is hardly better than a decade ago. While Turkey has shifted its product mix towards medium-tech goods, high tech products remain underrepresented in its ex-port basket. Many opportunities remain for Turk-ish producers to move up global value chains and, thus, further increase Turkey’s presence in the world economy. Simpler, more predictable and bet-ter enforced regulations and investments in skills would help Turkey attract more FDI and upgrade the quality of its exports.
A robust financial sector…
Turkey’s financial sector used to be the economy’s Achilles heel. Today, it is a key source of strength and comfort for international investors and domestic business alike. Turkey’s financial sector problems in the late 1990s were typical of many emerging mar-kets. Weak supervision and lax prudential norms allowed commercial banks to engage in related party lending, inconsistent macroeconomic policies crowded out private investment and encouraged excessive risk taking, and state-owned banks were used to funnel public resources to the politically connected off-balance sheet and with little regard to economic viability. Today, Turkey’s banking sec-tor has left many of these problems behind. Turkish banks are well capitalized, non-performing loans are low, and domestic financial institutions contin-
ue to attract funding from abroad, making Turkey’s financial integration a motor of the country’s eco-nomic convergence (Figure 5).
A radical macro and financial sector adjustment and restructuring program, implemented in the af-termath of the financial crises during 1999-2001 is credited for the turnaround of fortunes for Turkey’s banks. The program has served as a blueprint for a number of successive banking sector restructuring efforts in other countries. It was based on the strict principle of not bailing out bank shareholders but protecting depositors by quickly intervening insol-vent institutions and transferring their assets to the deposit insurance fund. The sector’s subsequent recovery owes much to the prudent and indepen-dent supervision by the Banking Regulation and Supervision Agency (BRSA) and the parallel mac-roeconomic consolidation under an independent central bank, which brought interest rates down and allowed an expansion in private sector credit. In short, what Turkey experienced after 2001 was a change in the way of doing banking, for the benefit of financial stability and the private sector’s access to credit alike.
With the global “great recession” at the end of the decade and the subsequent introduction of extraor-dinary monetary policies by leading central banks, new challenges arose for Turkey’s financial system. The monetary authorities and bank regulators were faced with the conundrum of maintaining financial stability while a wave of liquidity rolled into emerg-
Source: Bank for International Settlements, WB staff calculationsNote: “MENA Average” refers to unweighted average of Egypt, Jordan, Morocco, Syrian Arab Republic and Tunisia. “New EU Average” refers to unweighted average of Bulgaria, Czech Republic, Hungary, Poland, Romania and Slovakia. “BRICS Average” refers to Brazil, Russian Federation, India, China and South Africa. “Growth Markets Average” refers to Indonesia, Malaysia, Mexico, Philippines and Republic of Korea.
0
100
200
300
400
500
600
700
800
In m
illio
n US
$
Selected EU Average BRICS Average MENA Average Growth Markets Average Turkey
Dec-
02
Dec-
03
Dec-
04
Dec-
05
Dec-
06
Dec-
07
Dec-
08
Dec-
09
Dec-
10
Dec-
11
Dec-
12
Jun-
13
Figure 5: A robust banking sector has withstood the global financial crisis well Index of external loans of reporting banks vs. all sectors, December 2002 = 100
Overview
9
ing markets. Turkey chose an innovative route in response, introducing an interest rate corridor and vastly expanding the arsenal of macro-prudential tools. However, Turkey’s experiment with unortho-dox monetary policy has not prevented sharp credit cycles and pressures on the currency and domestic prices as global investor appetite has waxed and waned. The return to a simpler and more ortho-dox policy framework in late January 2014 suggests that much remains to be learned for Turkey, and other emerging markets, in handling the world’s post-crisis financial conditions. One lesson is clear: monetary policy alone is no cure for fundamental savings-investment imbalances. To address these, fiscal policy and above all structural reforms are needed.
Turkey’s banking sector remains an asset as the country looks to high income. The policy agenda has now shifted towards the development of non-bank financial institutions. The aim to turn Istanbul into a financial center is symbolic for the weight Turkey places on the modernization of its capital markets. To do so successfully, however, Turkey will also need to address two legacies. It will need to follow macro-economic, financial and social secu-rity policies that encourage Turkish households to save; and it will need to continue to nurture the trust in Turkey’s financial system and protect the in-dependence of its regulatory institutions – the Cen-tral Bank (CBRT), the Capital Markets Board (CMB) and BRSA.
A dynamic private sector…
From Central Asia and the Western Balkans to Cen-tral Africa, Turkey’s entrepreneurs have earned a reputation for hard work, risk taking, and a can-do
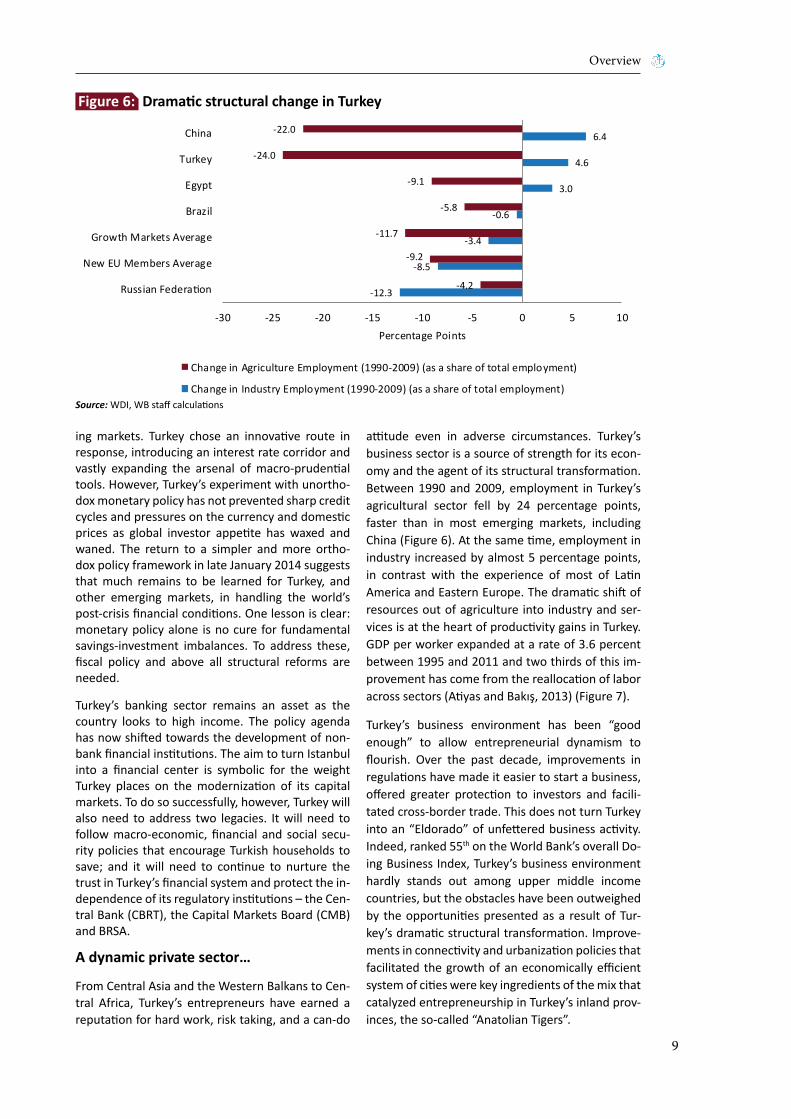
attitude even in adverse circumstances. Turkey’s business sector is a source of strength for its econ-omy and the agent of its structural transformation. Between 1990 and 2009, employment in Turkey’s agricultural sector fell by 24 percentage points, faster than in most emerging markets, including China (Figure 6). At the same time, employment in industry increased by almost 5 percentage points, in contrast with the experience of most of Latin America and Eastern Europe. The dramatic shift of resources out of agriculture into industry and ser-vices is at the heart of productivity gains in Turkey. GDP per worker expanded at a rate of 3.6 percent between 1995 and 2011 and two thirds of this im-provement has come from the reallocation of labor across sectors (Atiyas and Bakış, 2013) (Figure 7).
Turkey’s business environment has been “good enough” to allow entrepreneurial dynamism to flourish. Over the past decade, improvements in regulations have made it easier to start a business, offered greater protection to investors and facili-tated cross-border trade. This does not turn Turkey into an “Eldorado” of unfettered business activity. Indeed, ranked 55th on the World Bank’s overall Do-ing Business Index, Turkey’s business environment hardly stands out among upper middle income countries, but the obstacles have been outweighed by the opportunities presented as a result of Tur-key’s dramatic structural transformation. Improve-ments in connectivity and urbanization policies that facilitated the growth of an economically efficient system of cities were key ingredients of the mix that catalyzed entrepreneurship in Turkey’s inland prov-inces, the so-called “Anatolian Tigers”.
Source: WDI, WB staff calculations
-12.3
-8.5
-3.4
-0.6
3.0
4.6
6.4
-4.2
-9.2
-11.7
-5.8
-9.1
-24.0
-22.0
-30 -25 -20 -15 -10 -5 0 5 10
Russian Federation
New EU Members Average
Growth Markets Average
Brazil
Egypt
Turkey
China
Percentage Points
Change in Agriculture Employment (1990-2009) (as a share of total employment)
Change in Industry Employment (1990-2009) (as a share of total employment)
Figure 6: Dramatic structural change in Turkey

Turkey’s Transitions: Integration, Inclusion, Institutions
10
Turkey’s structural transformation is not complete but its pace is slowing. Turkey’s entrepreneurs to-day face new tasks. They need to shift their efforts from satisfying the housing and shopping needs of a rising urban population to producing and marketing the goods wanted by an increasingly sophisticated middle class and a demanding global economy. If Turkey’s businesses rise to this challenge, they will unleash a new wave of productivity improvements, this time associated with technological upgrading and innovation within sectors and firms. Turkey’s structural transformation would continue but with a greater emphasis on international linkages, spe-cialization and innovation, and based on a business climate that favors know-how over know-who.
Improved connectivity thanks to private investment…
For the casual visitor, the quality of a country’s transport and telecommunications infrastructure is often a first sign of its economic health. In this respect, Turkey leaves a good impression. The foundations for substantial improvements in the country’s physical infrastructure were already laid with a particular focus on road transport and power supply in the 1980s. Over the past decade, the positive trend accelerated. Turkey’s network of double lane inter-city roads has grown more than three times to 22,200 km while Turkey’s road fleet has been modernized. Turkish Airlines is one of the fastest growing airlines in the world and Istanbul’s Atatürk Airport is a major international transit hub. Turkey’s seaports have been upgraded and now compete for global transshipment business in the eastern Mediterranean. In the energy sector, too,
there has been a substantial expansion of capacity, from around 8,000 Megawatt (MW) in 1980 to al-most 60,000 MW in 2012, with a growing share for renewable energy resources. Improvements have also been realized in information and communica-tion technologies (ICT), with a threefold increase in mobile phone subscriptions after 2002 to over 90 million today.
Improvements in the quality of infrastructure have been an important component of Turkey’s rising international competitiveness. According to the World Economic Forum, Turkey is among the fastest improving countries in the area of quality of infra-structure and ranks in the top 50 worldwide for air-ports and roads. The World Bank’s Logistics Perfor-mance Index (LPI) ranks Turkey in the top 30, better than predicted by its per capita income (Figure 8).
Turkey’s achievements in improved connectivity have come from a combination of investment and reform. Public investment has rarely exceeded 3 percent of GDP, comparatively low among emerg-ing markets (Growth Commission, 2008). However, Turkey has been an early pioneer in public private partnerships (PPPs). Efforts in the 1980s were ill-advised, with many contracts ultimately revoked by the courts and others resulting in poorly regulated private monopolies and significant costs to consum-ers or the budget. In the 2000s an environment was created for the effective mobilization of the private sector, thanks to the creation of independent regu-latory agencies, the introduction of cost-reflective pricing, long-term concessions for ports and air-ports and privatization of strategic assets such as Turk Telekom, power generation and distribution.
Source: Penn World Tables
0.7%
2.1%
3.0%
3.6%
3.9%
0% 1% 2% 3% 4% 5%
Growth Markets Average
MENA Average
BRICS Average
Turkey
EU Average
Average Annual Compound Growth Rate
Figure 7: Turkey’s enterprises have delivered strong productivity growth Productivity growth (GDP per worker) 1995 - 2011

Overview
11
In the energy sector alone, since the creation of the independent regulator Energy Market Regulatory Authority (EMRA) in 2001, the private sector is es-timated to have invested around US$60-70 billion.
Turkey has high ambitions for attracting further pri-vate investment into a pipeline of PPPs amounting to some US$150 billion over the coming decade.
However, the size of the projects under consider-ation has raised the need for significantly increased capacity in project screening, risk and contract management. Financial closure has often been reached only after considerable delay, while con-tingent fiscal liabilities related to the PPP portfolio have been increasing.
Source: WDI, World Bank LPI
Source: TurkStat, WB staff calculationsNote: Regions are defined as ADA=Adana, Mersin; AGR=Ağrı, Kars, Iğdır, Ardahan; ANK=Ankara; ANT=Antalya, Isparta, Burdur; AYD=Aydın, Denizli, Muğla; BAL=Balıkesir, Çanakkale; BUR=Bursa, Eskişehir, Bilecik; ERZ=Erzurum, Erzincan, Bayburt; GAZ=Gaziantep, Adıyaman, Kilis; HAT=Hatay, Kahramanmaraş, Osmaniye; IST=İstanbul; IZM=İzmir; KAS=Kastamonu, Çankırı, Sinop; KAY=Kayseri, Sivas, Yozgat; KIR=Kırıkkale, Aksaray, Niğde, Nevşehir, Kırşehir; KOC=Kocaeli, Sakarya, Düzce, Bolu, Yalova; KON=Konya, Karaman; MAL=Malatya, Elazığ, Bingöl, Tunceli; MAN=Manisa, Afyon, Kütahya, Uşak; MAR=Mardin, Batman, Şırnak, Siirt; SAM=Samsun, Tokat, Çorum, Amasya; SAN=Şanlıurfa, Diyarbakır; TEK=Tekirdağ, Edirne, Kırklareli; TRA=Trabzon, Ordu, Giresun, Rize, Artvin, Gümüşhane; VAN=Van, Muş, Bitlis, Hakkari; ZON=Zonguldak, Karabük, Bartın.
BRARUS
IND
CHNZAF
ROM POLHUNBGR
CZE
SVK
ALB
HRV
SRB
MAR
TUN
EGY
JOR
MEX
IDN
MYS
PHL
TUR
MDA
UKR
GEO
THA
AZE
KAZ
GRC
PRTESP ITA
CAN
DEU
2.0
2.5
3.0
3.5
4.0
4.5
0 5,000 10,000 15,000 20,000 25,000 30,000 35,000 40,000 45,000
LPI S
core
201
4
GDP per capita 2012, PPP (current international $)
IST
TEK
BAL
IZM
AYD
MAN
BUR
KOC
ANK
KON
ANT
ADA
HATKIR
KAY
ZON
KAS
SAMTRA
ERZAGR MAL
VAN GAZSAN
MAR
TR
R² = 0.2599
1%
2%
3%
4%
5%
6%
7%
8%
9%
300 400 500 600 700 800 900 1,000 1,100 1,200 1,300 1,400 1,500 1,600 1,700 1,800
Grow
th in
Rea
l Per
Cap
ita V
alue
Add
ed 2
004-
2011
(Ann
ual A
vera
ge C
ompo
und
Grow
th R
ate)
Real Gross Value Added Per Capita in 2004 Constant TL
Figure 8: Turkey’s logistics performance compares favorably with other middle income countries
Figure 9: Turkey’s regional productivity levels converged between 2004 - 2011
Turkey’s Transitions: Integration, Inclusion, Institutions
12
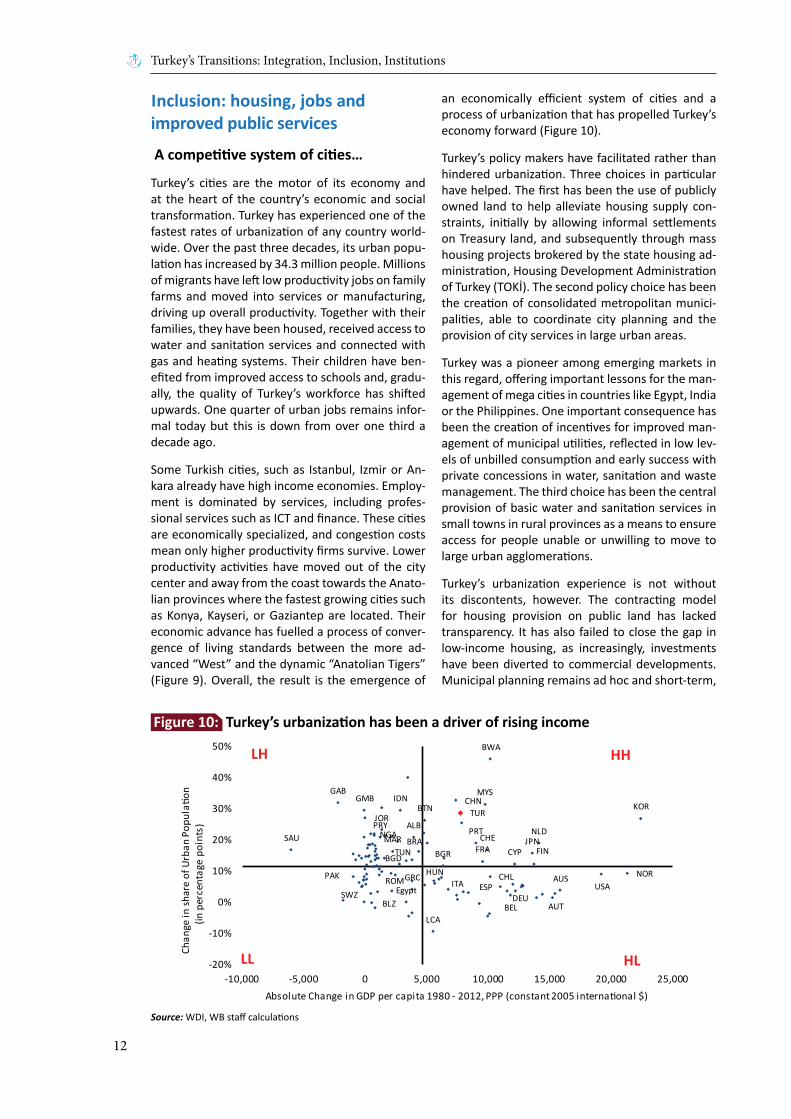
Inclusion: housing, jobs and improved public services
A competitive system of cities…
Turkey’s cities are the motor of its economy and at the heart of the country’s economic and social transformation. Turkey has experienced one of the fastest rates of urbanization of any country world-wide. Over the past three decades, its urban popu-lation has increased by 34.3 million people. Millions of migrants have left low productivity jobs on family farms and moved into services or manufacturing, driving up overall productivity. Together with their families, they have been housed, received access to water and sanitation services and connected with gas and heating systems. Their children have ben-efited from improved access to schools and, gradu-ally, the quality of Turkey’s workforce has shifted upwards. One quarter of urban jobs remains infor-mal today but this is down from over one third a decade ago.
Some Turkish cities, such as Istanbul, Izmir or An-kara already have high income economies. Employ-ment is dominated by services, including profes-sional services such as ICT and finance. These cities are economically specialized, and congestion costs mean only higher productivity firms survive. Lower productivity activities have moved out of the city center and away from the coast towards the Anato-lian provinces where the fastest growing cities such as Konya, Kayseri, or Gaziantep are located. Their economic advance has fuelled a process of conver-gence of living standards between the more ad-vanced “West” and the dynamic “Anatolian Tigers” (Figure 9). Overall, the result is the emergence of
an economically efficient system of cities and a process of urbanization that has propelled Turkey’s economy forward (Figure 10).
Turkey’s policy makers have facilitated rather than hindered urbanization. Three choices in particular have helped. The first has been the use of publicly owned land to help alleviate housing supply con-straints, initially by allowing informal settlements on Treasury land, and subsequently through mass housing projects brokered by the state housing ad-ministration, Housing Development Administration of Turkey (TOKİ). The second policy choice has been the creation of consolidated metropolitan munici-palities, able to coordinate city planning and the provision of city services in large urban areas.
Turkey was a pioneer among emerging markets in this regard, offering important lessons for the man-agement of mega cities in countries like Egypt, India or the Philippines. One important consequence has been the creation of incentives for improved man-agement of municipal utilities, reflected in low lev-els of unbilled consumption and early success with private concessions in water, sanitation and waste management. The third choice has been the central provision of basic water and sanitation services in small towns in rural provinces as a means to ensure access for people unable or unwilling to move to large urban agglomerations.
Turkey’s urbanization experience is not without its discontents, however. The contracting model for housing provision on public land has lacked transparency. It has also failed to close the gap in low-income housing, as increasingly, investments have been diverted to commercial developments. Municipal planning remains ad hoc and short-term,
Source: WDI, WB staff calculations
ALB
AUS
AUTBELBLZ
BTN
BWA
BGR
CHL
CYP
Egypt
FINFRA
GABGMB
DEU
GRC HUN
IDN
ITA
JPN
JOR
MYS
MARNLD
NORPAK
PRYPRT
SAU
ESP
LCA
SWZ
CHETUN
USA
BRA
CHNTUR
ROM
KOR
BGD
NGA
-20%
-10%
0%
10%
20%
30%
40%
50%
-10,000 -5,000 0 5,000 10,000 15,000 20,000 25,000
Chan
ge in
shar
e of
Urb
an P
opul
ation
(in
per
cent
age
poin
ts)
Absolute Change in GDP per capita 1980 - 2012, PPP (constant 2005 international $)
HHLH
LL HL
Figure 10: Turkey’s urbanization has been a driver of rising income

Overview
13
with increasing risk of urban sprawl and inefficient settlement patterns at the periphery of Turkey’s fast growing metropolitan areas. While service pro-vision has greatly improved, much scope remains for leveraging the private sector better and creating more room for local accountability. Turkey’s cities have been motors of the country’s economic trans-formation. They now need to become livable and sustainable cities that are at the heart of Turkey’s social modernization.
A post-crisis employment boom…
At a time when the world rightly worries that it may be running out of work for millions of young people coming into the labor market each year, Turkey can boast of an impressive record of job creation. Since the start of 2009, the country has created over 4 million jobs, an expansion of employment of al-most 5 percent per year (Figure 11), and these jobs have increasingly been formal sector jobs. Turkey’s job creation prowess is a new phenomenon, as the country’s labor market historically was character-ized by high and persistent unemployment and large rates of informality. Over the longer period of 1995-2011, employment creation in Turkey was still a respectable 1.4 percent, but hardly sufficient to keep up with the growth of the working age popu-lation.
The post-crisis dynamism is all the more welcome, because it has drawn a growing number of Turkish women into the labor force. After several decades
during which the labor force participation rate of women was declining, as families moved from rural to urban areas and farm workers became house-wives, female employment has been perking up since the late 2000s. Younger and better educated cohorts of women benefit from improved employ-ment prospects in Turkey’s growing services sec-tor, but employment rates have also risen among middle-aged women as falling family sizes and improved household amenities create the room for a return to the labor market. This is good news for the whole family: Turkey’s buoyant labor mar-ket has been the main driver of improvements in household income (Figure 12).
The pace of employment creation in Turkey has much to do with the pace of post-crisis recovery and the rapid rise of construction and urban ser-vices. More moderate growth prospects and a cool-ing down of the construction boom will inevitably dampen the rate of job creation. However, Turkey’s experience since 2009 holds useful lessons on the impact of targeted reductions in payroll taxes and the design of activation policies in emerging mar-kets. Turkey reduced the overall tax wedge by 7.0 percentage points in 2008 (from 43 to 36 percent) and waved social security contributions for unem-ployed youth and women. Simulations suggest the latter measure in particular may have contributed to greater female employment rates. At the same time, lower payroll taxes and improved enforce-ment have helped lower informality from 34 per-cent in 2005 to 25 percent in 2012.4
Source: TurkStat, Penn World Tables, WB staff calculations
-0.2%
1.3%
2.3%
2.0%
1.4%
-1.0%
1.1%
1.8%
2.4%
4.9%
-2% -1% 0% 1% 2% 3% 4% 5% 6%
EU Average
BRICS Average
MENA Average
Growth Markets Average
Turkey
Growth in Employment 2009 - 2012 (Annual Average Compound Growth Rate)
Growth in Employment 1995 - 2011 (Annual Average Compound Growth Rate)
Figure 11: Fast job creation in Turkey since the 2008 - 2009 crisis, not so fast over a longer horizon
4 Informality is calculated here from administrative data as the share of the labor force not registered for social security. See World Bank (2010) for an analysis of informality in Turkey, data sources and definitions.

Turkey’s Transitions: Integration, Inclusion, Institutions
14
Despite the recent track record in employment cre-ation, the job for Turkey’s labor market reformers is not done. Given the buoyant economy, there was little need to tackle labor market rigidities, resulting from disincentives against part time work and high hiring and firing costs. However, these are likely to become binding constraints to sustaining the pace of job creation in the years ahead and, in particular, to ensure that more Turkish women go to work. Tur-key will need around 700,000 new jobs each year to accommodate new labor force entrants among youth and women. Greater labor market flexibility, through part-time work and a reform of severance pay arrangements, as well as targeted measures to help women combine work and family could help sustain Turkey’s job miracle.
Improved health and educationoutcomes…
Turkey’s economic progress has gone hand in hand with improved social outcomes, allowing the coun-try to significantly reduce the gap separating it from the rest of the OECD. For example, life expectancy in Turkey has increased by 10.6 years since the 1990s, while infant mortality rates have fallen six times. Moreover, there has been a dramatic reduction in the inequality of health outcomes within Turkey in the past decade (Figure 13). For a poor Turkish family in a village or small town in eastern Turkey, health services have never been so good. No won-der satisfaction rates with health services have shot up from around 40 percent in the early 2000s to almost 80 percent today (Atun et al., 2013).
In the education sector the gap with OECD stan-dards has been falling too. Since 2003, Turkey’s average Programme for International Student As-sessment (PISA) scores improved more rapidly than among any other country participating in the survey. Enrolment in primary education is almost universal today and the gender gap has disap-peared. In secondary education, enrolment rates have almost doubled from 38 percent in 1998 to 67 percent in 2012, and the gender gap declined from around 9 percentage points to just 1.5 points. As in the case of health, inequalities in education outcomes across income quintiles have also dimin-ished (Figure 14). These achievements need to be seen against the background of a legacy of poor education performance. Even today, Turkey’s work-ing population on average has benefited from less than 7 years of education, compared to 11 years in most advanced countries. This legacy explains why education remains a top policy priority.
Improvements in social outcomes have resulted from increased spending as well as reforms. Health spending increased at a real rate of 10.7 percent between 2002 and 2011, the second fastest expan-sion in the OECD. Education spending increased less rapidly, but still grew faster than GDP, allowing for a significant expansion of capacity and declin-ing student-teacher ratios. The lesson to be derived from Turkey’s improvements in social services is the importance of combining additional spending with carefully designed and sequenced reform plans. This is true, in particular, for the health sector. Tur-key’s Health Transformation Program, launched
Source: Azevedo and Atamanov (2014)
Share of Adults; 9,7 Share of Adults; 7,4
Share of Employed; 41,1 Share of Employed;
21,8
Labor Earnings; 32,7
Labor Earnings; 45,8
Social Assistance; 10,8 Social Assistance; 19,1
Pensions; 19,8 Pensions; 22,2
-1,5 -7,8-12.2 -9.1-20%
0%
20%
40%
60%
80%
100%
120%
Total Population Bottom 40
Share of Adults Share of Employed Labor Earnings Social Assistance
Pensions Remittances Agricultural Income Other Income
Sour
ces o
f Hou
seho
ld In
com
e 20
02 -
2011
Figure 12: Labor market outcomes have been central to Turkey’s shared prosperity
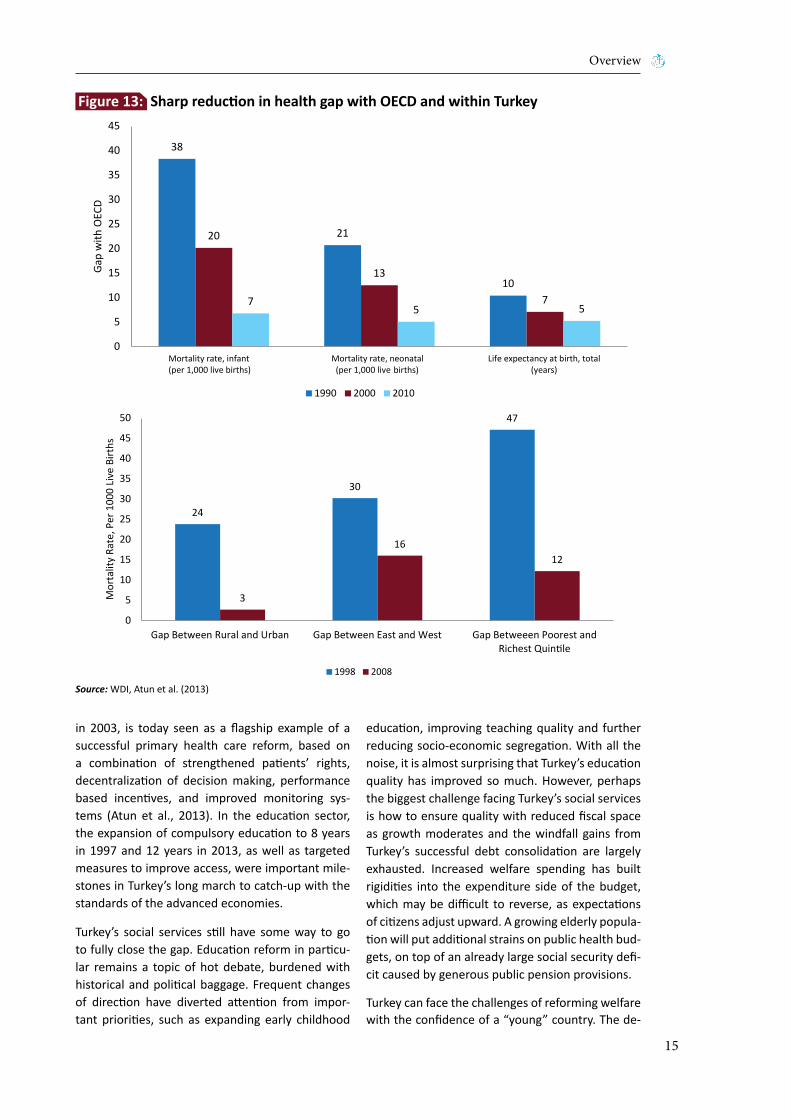
Overview
15
in 2003, is today seen as a flagship example of a successful primary health care reform, based on a combination of strengthened patients’ rights, decentralization of decision making, performance based incentives, and improved monitoring sys-tems (Atun et al., 2013). In the education sector, the expansion of compulsory education to 8 years in 1997 and 12 years in 2013, as well as targeted measures to improve access, were important mile-stones in Turkey’s long march to catch-up with the standards of the advanced economies.
Turkey’s social services still have some way to go to fully close the gap. Education reform in particu-lar remains a topic of hot debate, burdened with historical and political baggage. Frequent changes of direction have diverted attention from impor-tant priorities, such as expanding early childhood
education, improving teaching quality and further reducing socio-economic segregation. With all the noise, it is almost surprising that Turkey’s education quality has improved so much. However, perhaps the biggest challenge facing Turkey’s social services is how to ensure quality with reduced fiscal space as growth moderates and the windfall gains from Turkey’s successful debt consolidation are largely exhausted. Increased welfare spending has built rigidities into the expenditure side of the budget, which may be difficult to reverse, as expectations of citizens adjust upward. A growing elderly popula-tion will put additional strains on public health bud-gets, on top of an already large social security defi-cit caused by generous public pension provisions.
Turkey can face the challenges of reforming welfare with the confidence of a “young” country. The de-
Source: WDI, Atun et al. (2013)
38
21
10
20
13
775 5
0
5
10
15
20
25
30
35
40
45
Mortality rate, infant(per 1,000 live births)
Mortality rate, neonatal (per 1,000 live births)
Life expectancy at birth, total (years)
Gap
with
OEC
D
1990 2000 2010
24
30
47
3
1612
0
5
10
15
20
25
30
35
40
45
50
Gap Between Rural and Urban Gap Between East and West Gap Betweeen Poorest andRichest Quintile
Mor
talit
y Ra
te, P
er 1
000
Live
Birt
hs
1998 2008
Figure 13: Sharp reduction in health gap with OECD and within Turkey

Turkey’s Transitions: Integration, Inclusion, Institutions
16
mographic window of opportunity created by de-clining dependency rates will remain open for at least another decade. Turkey should use this time judiciously to close the remaining gaps in health and education outcomes, but not neglect to pre-pare for the coming age of maturity.
Solid public finances…
One dimension of government policy that clearly divides the pre- and post-2001 periods in Turkey’s recent economic history is the state of public fi-nances. Turkey experienced repeated bouts of mac-roeconomic instability during the 1980s and 1990s, generally linked to weak fiscal management. Pri-vate investment as well as spending on core public services was crowded out, monetary and exchange
rate policies were rendered inconsistent, and ulti-mately, the credibility of the government’s macro-economic framework was undermined. The failure to contain the build-up of implicit and explicit lia-bilities among state enterprises and in the banking sector was at the core of the deep financial crisis that shocked the country in 2000-2001. The crisis, in turn, proved to be a catalyst for fundamental re-forms of public finances, building an institutional framework that remains by and large in place to the present day. Turkey’s tax payers were rewarded with declining public debt levels, fiscal space for increased spending on public services, and reduc-tions in income and payroll tax rates, albeit at the expense of greater reliance on consumption based taxes.
Source: WB staff calculations based on OECD PISA dataset
0
10
20
30
40
50
60
70
80
Reading Math Science Average
Gap
betw
een
Turk
ey &
OEC
D PI
SA sc
ores
2003 2009 2012
0
100
200
300
400
500
600
1 2 3 4 5
Aver
age
Scor
e (a
ll di
scip
lines
)
Quintile of Socio-Economic Index
2003 2009 2012
Figure 14: The education gap has also been declining, though Turkey still lags behind

Overview
17
For students of Turkey’s experience in fiscal con-solidation, it is important to note that fiscal con-solidation was combined with a major overhaul of public financial management (Figure 15). Extra-budgetary funds, which had proliferated during the 1980s and 1990s, were mostly abolished, the pro-vision of subsidies off-budget through state banks was contained, and the room for discretionary spending greatly reduced through the 2002 Public Finance Management and Control Law. Public pro-curement was reformed in line with EU standards, and internal and external audit provisions were strengthened. Public debt management was mod-ernized, complementing efforts to improve macro fiscal discipline. In parallel, the role of the state in
the economy was substantially reduced through an accelerated privatization effort, covering infrastruc-ture, financial and other economic assets (such as in the food processing sector), and the introduction of independent regulatory agencies to attract and guide private sector investment.
Although Turkey’s public finance management re-forms were far reaching, laying the foundation for significant improvements in public sector delivery, the job of revamping public sector governance has not been finished. The alignment of spend-ing patterns with strategic priorities is weak, and the budget predominantly input based. New av-enues for quasi-fiscal activities have been created through the public housing administration, TOKİ,
Source: WB staff
MACRO FISCALDISCIPLINE
OPERATIONALALLOCATION
STRATEGICALLOCATION ofRESOURCES
2006
2002
2006
2001
Enactment of New PublicProcurement Law
Establishment of PublicProcurement Authority
2006
2001Rationalization of public
investment program leadingto significant decline incompletion rates
2006
2003Enactment of Public Finance
Management and Control(PFMC Law)
2006
2004Introductuon of New
MetropolitanMunicipality Law
2006
2005Amendment of
Law on Municipalities
2006
2000
2006
2003
2006
2008
2006
2003
Enactment of PFMC Law
2006
200620
0620
0220
0620
06
Establishment of InternalAudit Units
2006
2010
Enactment of New TCA Law
Abolishment of extrabudgetary funds
Rationalization of revolving funds
Legislation on PreventingAccumulation of Duty Losses inState Banks (for Agricultural SOEs)
Independence of Central BankRestructuring of public banks
Public Finance and DebtManagement LawNew Corporate Income Tax andPersonal Income Tax Legislation
Modernized debt managementsystem and separate riskaccount established in Treasury
Submission of Social Securityand Universal Health InsuranceLawIntroduction of Medium TermExpenditure FrameworkIntroduction of Indicative InstitutionalCeilings
2006
2006New Budget classification in
Line with GFS standards
Establishment of StrategyDevelopment Units inall Line Agencies
Reform of Inter-GovernmentalFiscal Transfers
Figure 15: Turkey’s fiscal consolidation was accompanied by fundamental public finance reform
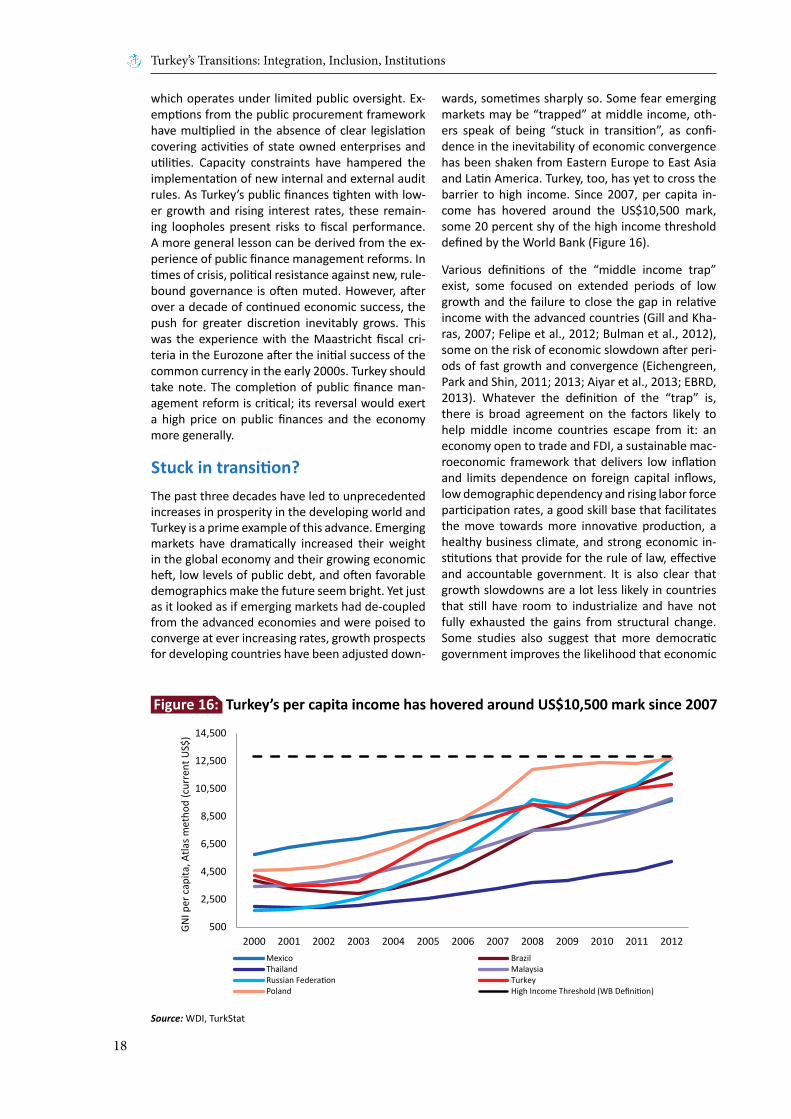
Turkey’s Transitions: Integration, Inclusion, Institutions
18
which operates under limited public oversight. Ex-emptions from the public procurement framework have multiplied in the absence of clear legislation covering activities of state owned enterprises and utilities. Capacity constraints have hampered the implementation of new internal and external audit rules. As Turkey’s public finances tighten with low-er growth and rising interest rates, these remain-ing loopholes present risks to fiscal performance. A more general lesson can be derived from the ex-perience of public finance management reforms. In times of crisis, political resistance against new, rule-bound governance is often muted. However, after over a decade of continued economic success, the push for greater discretion inevitably grows. This was the experience with the Maastricht fiscal cri-teria in the Eurozone after the initial success of the common currency in the early 2000s. Turkey should take note. The completion of public finance man-agement reform is critical; its reversal would exert a high price on public finances and the economy more generally.
Stuck in transition?The past three decades have led to unprecedented increases in prosperity in the developing world and Turkey is a prime example of this advance. Emerging markets have dramatically increased their weight in the global economy and their growing economic heft, low levels of public debt, and often favorable demographics make the future seem bright. Yet just as it looked as if emerging markets had de-coupled from the advanced economies and were poised to converge at ever increasing rates, growth prospects for developing countries have been adjusted down-
wards, sometimes sharply so. Some fear emerging markets may be “trapped” at middle income, oth-ers speak of being “stuck in transition”, as confi-dence in the inevitability of economic convergence has been shaken from Eastern Europe to East Asia and Latin America. Turkey, too, has yet to cross the barrier to high income. Since 2007, per capita in-come has hovered around the US$10,500 mark, some 20 percent shy of the high income threshold defined by the World Bank (Figure 16).
Various definitions of the “middle income trap” exist, some focused on extended periods of low growth and the failure to close the gap in relative income with the advanced countries (Gill and Kha-ras, 2007; Felipe et al., 2012; Bulman et al., 2012), some on the risk of economic slowdown after peri-ods of fast growth and convergence (Eichengreen, Park and Shin, 2011; 2013; Aiyar et al., 2013; EBRD, 2013). Whatever the definition of the “trap” is, there is broad agreement on the factors likely to help middle income countries escape from it: an economy open to trade and FDI, a sustainable mac-roeconomic framework that delivers low inflation and limits dependence on foreign capital inflows, low demographic dependency and rising labor force participation rates, a good skill base that facilitates the move towards more innovative production, a healthy business climate, and strong economic in-stitutions that provide for the rule of law, effective and accountable government. It is also clear that growth slowdowns are a lot less likely in countries that still have room to industrialize and have not fully exhausted the gains from structural change. Some studies also suggest that more democratic government improves the likelihood that economic
Source: WDI, TurkStat
500
2,500
4,500
6,500
8,500
10,500
12,500
14,500
2000 2001 2002 2003 2004 2005 2006 2007 2008 2009 2010 2011 2012
GNI p
er c
apita
, Atla
s met
hod
(cur
rent
US$
)
Mexico BrazilThailand MalaysiaRussian Federation TurkeyPoland High Income Threshold (WB Definition)
Figure 16: Turkey’s per capita income has hovered around US$10,500 mark since 2007

Overview
19
institutions are modernized and, thus, lowers the risk of a growth slowdown (Berg, Ostry and Zettel-meyer, 2008; Acemoğlu et al., 2014; EBRD, 2013).
Turkey’s prospects measured against this cross-country evidence are mixed (Figure 17). On one hand, Turkey has evident strengths in a young pop-ulation, solid infrastructure and reasonably good business regulations. Turkey’s economic struc-ture is also a relative source of strength, though a diminishing one. On the other hand, Turkey’s economy remains less open than those of its fast growing peers in East Asia or Eastern Europe, FDI inflows are low, labor force participation and edu-cation achievement are among the lowest in the peer group, and macroeconomic stability remains at risk due to Turkey’s high dependence on exter-nal financing. Turkey’s structural and demographic potential is balanced by relatively poor innovation potential and significant macro risks. Policies to increase openness, manage macro risks, promote education and innovation, and improve economic institutions are needed for Turkey to fulfill its aspi-rations.
Of all the challenges Turkey faces as it aims for high income, building the institutional prerequisites may be the most important. All high income countries
base their economies on the strength of the rule of law, effective and accountable government, and transparent and arms’ length market regulation. Moreover, the correlation between the quality of institutions and per capita income is much higher at high income than among low and middle income countries. The quality of Turkey’s economic insti-tutions is roughly as expected given its per capita income but it would have to improve significantly to match the levels of countries that have success-fully transitioned to high income in the past de-cade, such as the Republic of Korea or Poland. Yet, the reform process in Turkey has slowed in recent years. For instance, after a period of rapid deregu-lation during the early 2000s, Turkey has made hardly any progress since 2007 and has seen many competitors close the gap or even surpass Turkey in the quality of business, product and factor mar-ket regulations. Similarly, the quality of economic governance has improved only marginally since the mid-2000s after rapid reforms in the previous five years. For a country aspiring to join the rank of the top 10 economies in the world, it should be a con-cern that Turkey does not make it to the top 40 on any global ranking of the quality of economic insti-tutions (Figure 18).
Source: WB staff calculations based on data from WDI, Doing Business, Worldwide Governance Indicators, Transparency International, Open Budget Initiative, Fraser Institute and TurkStat.Note: Best in class analysis whereby the top performer in each category is indexed at 1 and all other countries are shown in relation to the top performer. Center of the diamond represents 0, whereas the outer edge of the diamond represents 1. When several indicators are used in one category, the indices are averaged and then normalized again to make the top performer equal to 1. Macro risks = inflation rate, net international investment position (percent of GDP), general government debt (percent of GDP); Openness = export + imports (percent of GDP), FDI inflows (percent of GDP), Logistics Performance Index; Demographic potential = old age dependency, labor force participation rate; Innovation potential = average years of schooling of the workforce, R&D investment (percent of GDP); Inclusion = Gini coefficient of consumption; Business regulation = Doing Business distance to frontier, Fraser Institute index of light regulation; Governance = Fraser Institute index of legal structure, Transparency International Corruption Perceptions Index, Open Budget Index, Worldwide Governance Indicators on rule of law, government effectiveness, voice and accountability; Structural potential = employment in agriculture (percent of total employment).
Macro Risks
Openness
Demographic Potential
Innovation
Inclusion
Business Regulation
Governance
Structural Potential
BRICS Average New EU Members Average EU Candidate Average
MENA Average Growth Markets Average Turkey
Figure 17: Turkey and peers and the factors driving high income

Turkey’s Transitions: Integration, Inclusion, Institutions
20
The road to high income:Integration, Inclusion,InstitutionsBecause of its young population, improving educa-tion attainment and remaining substantial invest-ment opportunities, Turkey is likely to graduate to high income status over the coming decade. With average growth rates of 3-4 percent, and assuming modest real exchange rate appreciation of 2 per-cent per annum, Turkey would cross the US$12,746 threshold by 2017. The speed of convergence with the standards of living of the advanced economies will depend on the policies chosen (Box 1).
Turkey’s 10th National Development Plan targets an average growth rate of 5.5 percent per annum between 2013 and 2018. It lays out a vision of eco-nomic development based on innovation, improve-ments in the country’s human capital base, and en-vironmentally and socially sustainable livelihoods. To make this vision a reality, Turkey will need to ad-dress three key challenges: (i) sustain productivity growth but shift its source from structural change to innovation; (ii) boost participation to reap the full gains from the demographic dividend; and, (iii) deepen institutional reform to encourage invest-ment and consolidate the gains in social inclusion.
Turkey can build on its many achievements in meet-ing these challenges (Table 2). Turkey’s experience since the 1980s has shown the benefits of open markets and economic integration, in particular with the EU. This could be widened to cover servic-
es and agriculture and, thus, bring further produc-tivity gains. Turkey’s banks have learned to manage risks prudently and to attract funding from deposi-tors and international capital markets. Their suc-cess could be emulated by non-bank financial insti-tutions to provide risk capital for Turkey’s domestic enterprises and develop new financial instruments for the country’s infrastructure development needs. Turkey’s cities have been the motor of eco-nomic growth, regional convergence and improved access to services for many people. They now need to transform themselves into centers for innovation and knowledge transfer, and find ways to combine economic efficiency with environmental and social concerns to become sustainable cities. Turkey’s labor markets have excelled at creating jobs over the past five years and brought rising prosperity to a growing middle class. They need to continue to do so to ensure Turkey reaps its full demographic dividend. Fiscal consolidation has created space for increased spending on social services bringing improved access even to Turkey’s most remote re-gions. Now, the managers of Turkey’s public servic-es need to shift their focus to increase quality and improve efficiency while preparing for the coming age of demographic maturity.
Nonetheless, Turkey’s past achievements will not suffice to propel the country to the ranks of the advanced high income economies. The process of reforming Turkey’s institutions needs a new boost. Turkey’s entrepreneurs and foreign investors know that to succeed in business, know-who still domi-nates know-how, relational contracting beats en-
Source: World Bank, World Economic Forum (WEF), Fraser Institute, Heritage Foundation, Transparency InternationalNote: Prepared with latest available data
98
148 152
177 177189
4256
112
6953 55
020406080
100120140160180200
Open BudgetIndex
WEF -Institutions
Fraser - LightRegulation
HeritageFoundation -
Index ofEconomicFreedom
CorruptionPerceptions
Index
WB - Ease ofDoing Business
Turk
ey`s
Ran
k ou
t of
Tota
l Num
ber o
f Cou
ntrie
s
Total Number of Countries Turkey`s Rank
Figure 18: Turkey remains mid-field on most comparative indices of institutional performance

Overview
21
forcement through the courts, and access to land zoning rights and lucratice public tenders offers higher returns than innovation in new business pro-cesses. While the fundamental governance reforms introduced in the late 1990s and early 2000s have formally insulated many economic institutions from political pressures, de facto their independence remains contested. Control over government still conveys control over large parts of the state, with accountability mechanisms limited, particularly at the local level. As a result, while unprecedented economic and political opportunities have opened up for Turkey’s lower and middle classes, many feel that these gains are contingent on the current government remaining in power and not rooted in the guarantee of fundamental individual rights. At the same time, Turkey’s established elites feel their rights are being curtailed, and their voices ignored.
Indeed, while economic growth has been socially in-clusive, Turkey’s society remains divided. Renewed commitment to greater government accountability and to creating and safeguarding a level playing
field in the economy, society and politics is needed to secure the gains of the past three decades and to sustain Turkey’s advance into the ranks of the high income countries. The EU Accession negotia-tions continue to represent a useful roadmap for the required reforms; but with Europe’s strength as an anchor weakened, ultimately the commit-ment to competitive economic and political insti-tutions needs to come from within Turkey. It will not be credible or sustainable without a return to more consensual policy making. Such a consensus arguably characterized the periods of the country’s most rapid economic advance under socially con-servative but economically liberal governments in the 1980s and 2000s. Turkey’s many admirers among other emerging markets are well aware of this, and are eager to study the country’s achieve-ments. This report was inspired by their interest. May it also inspire a renewed consensus around what has worked and what has not within Turkey, so that the country continues to offer valuable les-sons as it transits from middle to high income.
A simple simulation helps to illustrate the importance of policies. Today, Turkey’s per capita income is around 50 per-cent of the EU average. If EU per capita income continues to grow at the recent average of 1.9 percent (1995-2012), Turkey could reach between 63 and 89 percent of the EU average by 2030. The difference is accounted for by chang-ing assumptions regarding investment rates, labor force participation rates and increases in educational attainment of the workforce. The biggest impact results from allowing Total Factor Productivity (TFP) to grow at twice the rate of Turkey’s own historical average of 0.8 percent per year. Policies that increase savings and investment rates, boost participation, expand educational attainment and promote innovation and higher rates of TFP growth will determine how quickly Turkey convergences to the standards of living of the advanced economies.
Source: WB staff calculations, WDI Population Database
Box 1: Turkey’s Prospects
Table 1: Policy Simulations
(percent) Real GDP Growth (Y)
HumanCapital (H)
PhysicalCapital (K) TFP
Share of EU per capita
GDP
Baseline (2014-2030) 4.2 1.8 1.5 0.8 63.5
(I) Savings rate increases to 19 percent of GDP by 2018 while investment reaches 24 percent (Ministry of Development)(2014-2030)
4.5 1.8 1.9 0.8 66.9
(II) Female labor force participationincreases to 53.1 by 2030 (OECD av.) (2014-2030)
4.8 2.3 1.7 0.8 70.3
(III) Average years of schooling is projected to reach 10.57 by 2030 (Korean case) (2014-2030)
4.6 2.1 1.6 0.8 67.9
Combined II+III (2014-2030) 5.2 2.6 1.8 0.8 75.2
Combined I+II+III (2014-2030) 5.5 2.6 2.1 0.8 79.1
Combined I+II+III+Double TFP Growth (2014-2030) 6.3 2.6 2.1 1.6 89.7
Baseline (2031-2050) 3.3 1.2 1.3 0.8 75.2

Turkey’s Transitions: Integration, Inclusion, Institutions
22
Table 2: Turkey’s Transitions: Achievements, Lessons and Challenges
Turkey’s achievements Lessons Learnt from Turkey’s development experience
Challenges to reachinghigh-income status
INTEGRATIONTurkey‘s integration into the European and global economy has brought the country to the threshold to high income.
The liberalization of economic activity in the 1980s has created a powerful con-stituency for market-based solutions, and unleashed Turkey’s entrepreneurial spirit. The positive attitude towards the private sector is a distinguishing characteristic of Turkey’s development reminiscent of the transition process in Central and Eastern Europe.
Further increases in Turkey’s per capita income will need to rely on investment in support of an expansion of Turkey’s asset base. This will require further improve-ments in the investment climate and the rule of law, as well as continued invest-ments to upgrade Turkey’s skill base. It will also require steps to boost domestic savings and manage the volatility associ-ated with dependence on foreign financ-ing.
Trade: Turkey’s openness (the ratio of trade in goods and services to GDP) has risen from 11 percent in 1970 to 58 per-cent in 2012. Over the past decade, ex-ports of goods and services in US$ terms grew by 15 percent annually. Medium-technology exports have increased as Turkey has become more integrated in European production chains. Diversifi-cation of exports has allowed Turkey to mitigate the slump in EU demand.
The initial liberalization efforts of the early 1980s and their culmination in the 1995 Customs Union agreement with the EU have laid the basis for Turkey’s integration into the world economy. The process of integration with the EU has increased Turkey’s participation in global value chains and has resulted in higher technology content and sophistication of exports. Investments in logistics and dip-lomatic outreach have supported the di-versification of Turkey’s trading partners.
While Turkey has dramatically increased its medium-technology exports, it has stagnated in high-tech exports. Higher value added exports will require technol-ogy upgrading, innovation, and experi-mentation by large and medium-sized firms. Attracting more FDI would help move up the value chain which would also allow Turkey to more successfully compete in high growth markets in Asia.
Finance: Turkey’s banking system is re-silient and was the only one in the OECD that withstood the headwinds of the global economic and financial crisis with-out an injection of public funds. It boasts strong capital buffers and the sector’s loan to deposit ratio, while increasing, is only around 110 percent.
Governance reforms rooted in greater transparency and accountability, coupled with strong regulatory and legal steps to limit moral hazard, have enabled the turn-around of Turkey’s banking sector. However, despite an unorthodox policy framework and the use of a large arsenal of macro-prudential tools, Turkey has had limited success to insulate itself against volatile international capital markets.
Turkey’s capital markets remain thin compared to other countries at the same level of development and further deep-ening of financial markets would support Turkey’s transition to high income. By contributing to raise domestic savings, this would also make Turkey more resil-ient in the face of its dependence on ex-ternal flows.
Enterprise: Productivity growth has been strong, driven by a re-allocation of the la-bor force out of agriculture and into ser-vices and manufacturing. Patterns of pro-ductivity growth are supporting regional convergence within Turkey, although pro-ductivity levels in the Western part of the country remain the highest.
Improvements in the business environ-ment, policies to support urbanization, and the flexibility of labor markets due to the informal sector have facilitated structural change to date. Regional con-vergence can be linked to fiscal policy, including per capita public expenditures on transport and communications, as well as per capita expenditures on social infrastructure.
For Turkey to move to high income, pro-ductivity gains will need to come increas-ingly from within each sector and within the firm. Regulatory red tape, legal uncertainty, and segmented labor mar-kets may become greater constraints on productive labor reallocation within sec-tors going forward. Despite rising R&D spending, Turkey needs to strengthen the links between research and business ap-plications, improve patent and Intellec-tual property rights (IPR) protection, and boost the quality of its universities.
Infrastructure: Turkey has improved the quality of its infrastructure in transport, telecoms and energy and ranks in the top 30 worldwide for its logistics perfor-mance.
More than half of Turkey’s infrastructure investments in transport, energy and telecoms have come from the private sector. Sector unbundling, privatization of assets and strong independent regu-lation have led to significant efficiency improvements and better, cost-effective services for Turkey’s citizens and busi-nesses.
Despite an ambitious PPP pipeline, deal closures have been slow, and financing needs exceed domestic capacity. Turkey should use PPPs to attract greater long-term foreign financing given domestic constraints. This will require improve-ments in the regulatory framework, and also in project selection and appraisal and risk and contract management prac-tices.
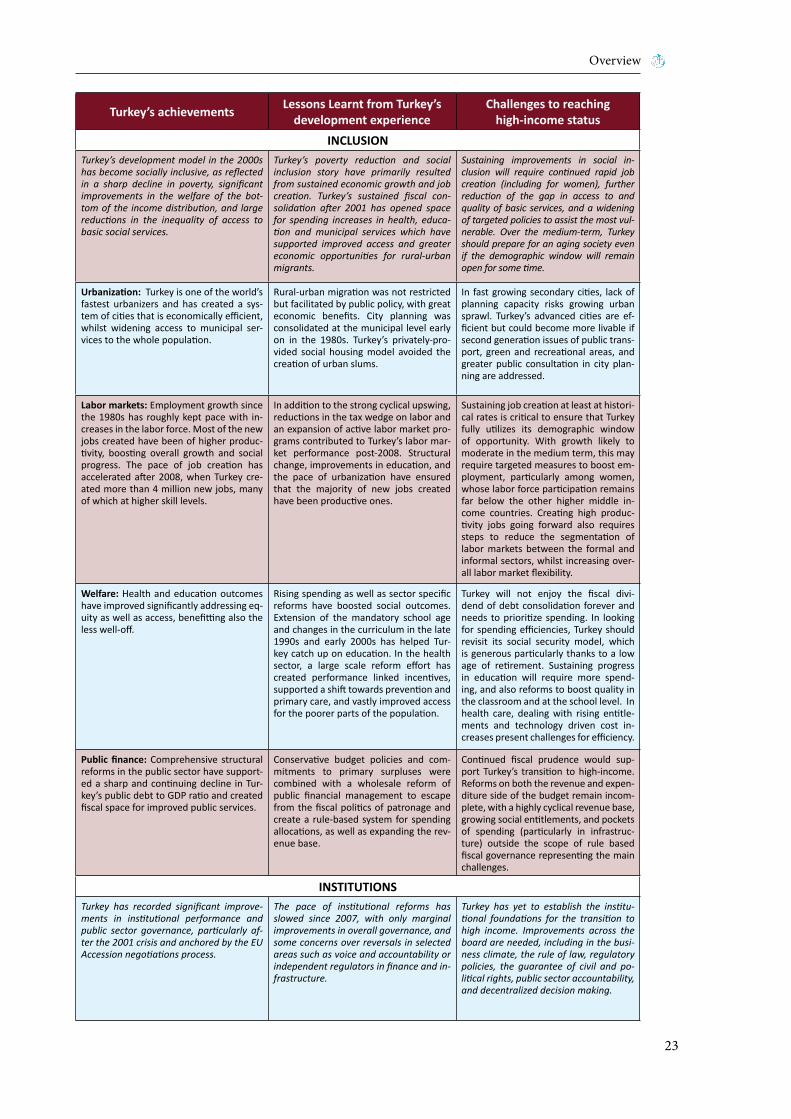
Overview
23
Turkey’s achievements Lessons Learnt from Turkey’s development experience
Challenges to reachinghigh-income status
INCLUSIONTurkey’s development model in the 2000s has become socially inclusive, as reflected in a sharp decline in poverty, significant improvements in the welfare of the bot-tom of the income distribution, and large reductions in the inequality of access to basic social services.
Turkey’s poverty reduction and social inclusion story have primarily resulted from sustained economic growth and job creation. Turkey’s sustained fiscal con-solidation after 2001 has opened space for spending increases in health, educa-tion and municipal services which have supported improved access and greater economic opportunities for rural-urban migrants.
Sustaining improvements in social in-clusion will require continued rapid job creation (including for women), further reduction of the gap in access to and quality of basic services, and a widening of targeted policies to assist the most vul-nerable. Over the medium-term, Turkey should prepare for an aging society even if the demographic window will remain open for some time.
Urbanization: Turkey is one of the world’s fastest urbanizers and has created a sys-tem of cities that is economically efficient, whilst widening access to municipal ser-vices to the whole population.
Rural-urban migration was not restricted but facilitated by public policy, with great economic benefits. City planning was consolidated at the municipal level early on in the 1980s. Turkey’s privately-pro-vided social housing model avoided the creation of urban slums.
In fast growing secondary cities, lack of planning capacity risks growing urban sprawl. Turkey’s advanced cities are ef-ficient but could become more livable if second generation issues of public trans-port, green and recreational areas, and greater public consultation in city plan-ning are addressed.
Labor markets: Employment growth since the 1980s has roughly kept pace with in-creases in the labor force. Most of the new jobs created have been of higher produc-tivity, boosting overall growth and social progress. The pace of job creation has accelerated after 2008, when Turkey cre-ated more than 4 million new jobs, many of which at higher skill levels.
In addition to the strong cyclical upswing, reductions in the tax wedge on labor and an expansion of active labor market pro-grams contributed to Turkey’s labor mar-ket performance post-2008. Structural change, improvements in education, and the pace of urbanization have ensured that the majority of new jobs created have been productive ones.
Sustaining job creation at least at histori-cal rates is critical to ensure that Turkey fully utilizes its demographic window of opportunity. With growth likely to moderate in the medium term, this may require targeted measures to boost em-ployment, particularly among women, whose labor force participation remains far below the other higher middle in-come countries. Creating high produc-tivity jobs going forward also requires steps to reduce the segmentation of labor markets between the formal and informal sectors, whilst increasing over-all labor market flexibility.
Welfare: Health and education outcomes have improved significantly addressing eq-uity as well as access, benefitting also the less well-off.
Rising spending as well as sector specific reforms have boosted social outcomes. Extension of the mandatory school age and changes in the curriculum in the late 1990s and early 2000s has helped Tur-key catch up on education. In the health sector, a large scale reform effort has created performance linked incentives, supported a shift towards prevention and primary care, and vastly improved access for the poorer parts of the population.
Turkey will not enjoy the fiscal divi-dend of debt consolidation forever and needs to prioritize spending. In looking for spending efficiencies, Turkey should revisit its social security model, which is generous particularly thanks to a low age of retirement. Sustaining progress in education will require more spend-ing, and also reforms to boost quality in the classroom and at the school level. In health care, dealing with rising entitle-ments and technology driven cost in-creases present challenges for efficiency.
Public finance: Comprehensive structural reforms in the public sector have support-ed a sharp and continuing decline in Tur-key’s public debt to GDP ratio and created fiscal space for improved public services.
Conservative budget policies and com-mitments to primary surpluses were combined with a wholesale reform of public financial management to escape from the fiscal politics of patronage and create a rule-based system for spending allocations, as well as expanding the rev-enue base.
Continued fiscal prudence would sup-port Turkey’s transition to high-income. Reforms on both the revenue and expen-diture side of the budget remain incom-plete, with a highly cyclical revenue base, growing social entitlements, and pockets of spending (particularly in infrastruc-ture) outside the scope of rule based fiscal governance representing the main challenges.
INSTITUTIONSTurkey has recorded significant improve-ments in institutional performance and public sector governance, particularly af-ter the 2001 crisis and anchored by the EU Accession negotiations process.
The pace of institutional reforms has slowed since 2007, with only marginal improvements in overall governance, and some concerns over reversals in selected areas such as voice and accountability or independent regulators in finance and in-frastructure.
Turkey has yet to establish the institu-tional foundations for the transition to high income. Improvements across the board are needed, including in the busi-ness climate, the rule of law, regulatory policies, the guarantee of civil and po-litical rights, public sector accountability, and decentralized decision making.

Turkey’s Transitions: Integration, Inclusion, Institutions
24
REFERENCESAcemoğlu, D., & Robinson, J. (2012). Why Nations Fail. The Origins of Power, Prosperity and Poverty. New York: Crown Business.
Acemoğlu, D., Naidu, S., & Restrepo, J. R. (2014, March). Democracy Does Cause Growth. NBER Working Paper, 20004.
Aiyar, S., Duval, R., Puy, D., Wu, Y., & Zhang, L. (2013, March). Growth Slowdowns and the Middle Income Trap. IMF Working Paper, 13/71.
Atiyas, I., & Bakış, O. (2013a). Structural Change and Industrial Policy in Turkey. REF Working Paper, 2013-3.
Atun, R.; Aydin, S.; Chakraborty, S.; Sumer, S.; Aran, M.; Gurol, I.; Nazlioglu, S.; Ozgulcu, S.; Aydogan, U.; Ayar, B.; Dilmen, U.; Akdag, R. (2013, June). Uni-versal health coverage in Turkey: enhancement of equity. The Lancet. Retrieved from http://dx.doi.org/10.1016/S0140-6736(13)61051-X
Azevedo, J., & Atamanov, A. (2014). Pathways to the Middle Class. Washington, D.C.: The World Bank.
Berg, A., Ostry, J., & Zettelmeyer, J. (2006). What Makes Growth Sustained? IMF Working Paper, March 2008, 8/59.
Bulman, D., Eden, M., & Nguyen, H. (2012). Tran-sitioning from Low-Income Growth to High-Income Growth: Is there a Middle Income Trap? Mimeo-graphed. The World Bank.
Eichengreen, B., Park, D., & Shin, K. (2011). When Fast Growing Economies Slow Down: International Evidence and Implications for China. Working Pa-per, 16919.
Eichgreen, B., Park, D., & Shin, K. (2013, January). Growth Slowdowns Redux: New Evidence on the Middle-Income Trap. Working Paper, 18673.
European Bank for Reconstruction and Develop-ment (EBRD). (2013). Stuck in Transition. Transition Report. London: European Bank for Reconstruction and Development.
Felipe, J., Abdon, A., & Kumar, U. (2012). Tracking the Middle-income Trap: What Is It, Who Is in It, and Why? 715. Levy Institute of Economics. Bard College.
Ferguson, N. (2011). Civilization. The West and the Rest. London: Allen Lane.
Gill, I., & Kharas, H. (2007). An East Asian Renais-sance. Washington, D.C.: The World Bank.
Gill, I., & Raiser, M. (2012). Golden Growth. Restor-ing the Luster of the European Economic Model. Washington, D.C.: The World Bank.
North, D. (1990). Institutions, Institutional Change and Economic Performance. New York: Cambridge University Press.
North, D., Wallis, J., & Weingast, B. (2009). Violence and Social Orders. New York: Cambridge University Press.
Rodrik, D., & McMillan, M. (2011, June). Globaliza-tion, Structural Change and Productivity Growth. NBER Working Paper, 17143.
The World Bank. (2014). Evaluation of the EU-Tur-key Customs Union.
The World Bank. (2010). Turkey Country Economic Memorandum: Informality: Causes, Consequences, Policies. Report No. 48523-TR. Washington. D.C.: World Bank.

Chapter 1: Turkey’s Rise
25
Turkey’s Rise
Chapter 1
Labor
Welfare
FiscalSpace
Enterprise
TradeInfrastucture
Finance
Cities
Turkey’s Transitions: Integration, Inclusion, Institutions

Turkey’s Transitions
26

Chapter 1: Turkey’s Rise
27
Turkey’s Rise“If the world was a single state, Istanbul would be its capital”, Napoleon Bonaparte is alleged to have said. Turkey’s largest city is also the largest city in Europe and vies to become a regional and perhaps even global center for commerce and finance. Is-tanbul’s geographic location is its biggest asset. It is the only city stretching across two continents. Over fifty countries in three continents are within a four hour plane journey from Istanbul and Turkish Airlines, Turkey’s rapidly expanding flagship carrier, proudly states that it flies to more countries in the world than any other airline. Both the New York and Tokyo stock exchanges are open during the Is-tanbul bourse’s trading hours. The Bosphorus since times immemorial has been a strategic prize, whose control made empires. Its shores with breathtaking views and a mild climate today attract jet-setters from around the world, who have pushed residen-tial property prices to dazzling height.
Istanbul’s growing importance is perhaps the most prominent sign of Turkey’s economic re-emergence. Since the 1980s, emerging market economies like Turkey have become more and more integrated into the global division of labor and increased their share of world trade and production, a pattern that accelerated considerably over the past decade. Ac-
cording to Danny Quah, Professor of Economics at the London School of Economics, the center of economic gravity in the world economy has shifted from a point somewhere in the Atlantic in 1980 to a location not far from Turkey in the Southeastern corner of the Mediterranean Sea in 2008 (Figure 1.1). Of course the rise of giants such as China and India and the dramatic transformation in much of East Asia over this period are behind this shift (Gill and Kharas, 2007). However, Turkey is also a part of it. Its share in global Gross Domestic Product (GDP) has almost doubled from 0.6 percent in the early 1980s to 1.1 percent today. In less than a decade, Turkey is expected to have the largest population in Europe, overtaking Germany and, with contin-ued convergence in productivity levels, is forecast by the Organisation for Economic Co-operation and Development (OECD) to have the world’s 12th larg-est economy by 2060 up from 17th place in 2013.
Turkey’s rise mirrors the pattern observed across the developing world over the past thirty years. Af-
ter World War II, many emerging markets, includ-ing Turkey, began to catch-up with the advanced economies of Europe and North America after sev-eral hundred years of relative decline (Figure 1.2).1
Initially, economic catch-up was based on import substitution strategies but in the past thirty years, the motor of emerging market growth has been
The global center of economic gravity has shifted east over the past 30 years (black dots), and could well shift even farther east over the next 30 years (red dots). Source: Quah (2011)
Figure 1.1: The center of gravity of the world economy is shifting east
1 Turkey’s per capita income was 60 percent of England in 1500, but declined to just 15 percent (of the United Kingdom) in 1923 the year the Republic was founded. Today, Turkey’s per capita income stands at 22 percent of the EU15 average and 27 percent of the UK.

Turkey’s Transitions
28
international integration. Turkey, China and Latin America opened-up their economies around the same time in the early 1980s. India and Eastern Eu-rope followed a decade later. As Peter Blair Henry (2012) argues, emerging markets “turned around” in the past three decades and adopted market based policies and macroeconomic discipline at the same time as some advanced economies seemed to neglect their importance.
Only a few countries have successfully made the transition to high income and, in the coming de-cade, the pace of convergence of emerging markets as a whole is projected to slow. Turkey is not im-mune to this trend. Large external financing needs make Turkey vulnerable in times of volatile and more expensive capital flows. Political uncertainty and weaknesses in the rule of law have affected investor confidence and highlighted that Turkey’s transition to a high income economy and a mod-ern society remains incomplete. In fact, it may be more appropriate to speak of multiple transitions in Turkey, each at various stages of advancement and offering important lessons to policy makers else-where. Turkey’s achievements have been a source of inspiration for other developing countries and a source of rising aspirations for many Turkish citi-zens. However, without addressing the remaining challenges, these aspirations may be disappointed.
This study addresses policy makers in other emerg-ing markets looking for lessons of experience in how to advance towards high middle income. It also addresses policy makers in Turkey, who wish to consolidate past achievements and forge ahead with economic and social modernization. In this
opening chapter, we set the stage for an account of Turkey’s economic and social progress in recent times. The chapter addresses three questions be-fore introducing the argument and structure of the remaining report:
• First, where does Turkey stand today in rela-tion to other emerging market peers? The short answer is that Turkey is closer than many of its peers to reaching the threshold of high in-come; but, in most structural respects remains clearly a middle income country. Favorable de-mographics, relatively strong infrastructure and logistics, an entrepreneurial private sector and a market-driven track record of rapid structural change add to Turkey’s strengths. At the same time, a number of challenges still need to be ad-dressed, such as the low depth of financial mar-kets, the low average years of schooling of the population (albeit increasing rapidly), the low participation of women in the labor force and, perhaps, most importantly the need to com-plete its institutional reforms to reach the stan-dards of high income economies. Given its asset base, Turkey’s level of per capita income is al-ready relatively high. Increasing income further requires investment and deepened reforms.
• Second, how did Turkey get to where it is today? This is, of course, a main focus of the report. The answer given in this introductory chap-ter traces Turkey’s progress back to the trade and currency liberalization measures taken at the beginning of the 1980s. These reforms un-leashed Turkey’s entrepreneurial initiative and established the private sector as the engine
02,5005,0007,500
10,00012,50015,00017,50020,00022,50025,000
1500 1700 1820 1870 1913 1923 1930 1950 1960 1970 1980 1990 2000 2010
In 1
990
Inte
rnati
onal
Ge
ary
Kham
is U
S$
France England/GB/UKSpain JapanIran Ottoman Empire/TurkeyHolland/Netherlands Germany(Centre-North) Italy Polynomial trend (England/GB/UK)Polynomial trend (Ottoman Empire/Turkey)
Source: Maddison Project Database, Bolt, J. and J. L. van Zanden (2013)
Figure 1.2: Turkey’s income lagged Europe since the 1600s but catch up started in the 1950s

Chapter 1: Turkey’s Rise
29
of the country’s economic progress. They also catalyzed a process of structural change with Turkey’s rural population moving to the cities to take more productive industrial and service sector jobs. Turkey’s initial liberalization efforts failed to be supported with improvements in fis-cal and public sector management and, hence, ensued in rising corruption and a series of mac-roeconomic and political crises. After 2001, this shortcoming was rectified and improvements in fiscal management and public sector gover-nance created fiscal space that allowed a sub-stantial expansion of government spending on public services including in less advanced re-gions. As a result, this report argues, Turkey’s growth over the past decade has been inclusive.
• Third, does Turkey have the institutional re-quirements to sustain the transition to high income? The short answer is that Turkey’s achievements may be at risk without further steps to strengthen public and private sector governance and deepen institutional reforms. Moreover, it appears that Turkey’s reform drive has slowed over the past five years. Turkey has been riding the post-crisis wave of abundant global liquidity, leaving the country vulnerable to reversals in investor sentiment. These issues are taken up again in the closing chapter of this book – how Turkey deals with them will be a key determinant of whether the achievements it has made can be sustained.
Turkey compared to its peers:quite rich but structurally middle incomeTurkey is an upper middle income country: its 2013 per capita income of around US$10,700 puts it at some 85 percent of the high income thresh-old in the World Bank’s classification of countries (around US$12,600 per capita). Turkey has steadily converged towards the income levels of advanced economies since the 1950s. In nominal terms, prog-ress during the period 2001-2008 was particularly impressive as per capita income increased three-fold from a trough of US$3,058 in 2001. A large part of this is accounted for by an appreciating real ex-change rate. Since the global economic and finan-cial crisis of 2008-2009, the real exchange rate (as well as GDP growth rates) has been quite volatile and US$ income have hardly changed as a result. Measured in constant prices, Turkey’s growth per-formance in the 2000s was better than in the 1990s but somewhat worse than the record in the 1950s-1980s (Spotlight 1).
Compared to its peers, Turkey’s growth perfor-mance is respectable albeit not spectacular. Be-tween 1950 and 2011, Turkey increased its per capita income by slightly over five times and pro-gressed at a similar rate as Bulgaria, Cyprus, Fin-land, Italy, Albania, Tunisia, and India. It grew faster than much of Western Europe, faster than Poland, Hungary and the Czech Republic, all of Middle East and North Africa (MENA) except Oman, Israel and Tunisia, most of Latin America (except Chile), and much of East Asia, with the notable exceptions of Republic of Korea, China, Malaysia and Indonesia. One reason Turkey does well relative to many of its peers is that, despite a volatile growth pattern year on year, Turkey has not endured a prolonged crisis such as the ones in Latin America in the 1980s or Eastern Europe in the 1990s. Turkey may not be a world champion in growth (that place belongs to Republic of Korea), but it plays in the first division.
Being part of Europe economically has helped Tur-key’s advance. Europe has accounted for half of the world’s successful transitions from middle to high income since the 1960s (Gill and Raiser, 2012). This is far from trivial: much is made of the difficulties of middle income countries to reach high income, as growth rates tend to slow down after the ini-tial momentum of catch-up growth is exhausted (Gill and Kharas, 2007; Eichengreen, Park and Shin, 2012; 2013). Close trade and financial links account for the unprecedented convergence of income in Europe. With the conclusion of the Customs Union agreement with the European Union (EU) in 1995, Turkey has deepened its trade and financial links with Europe and has become part of the “Conver-gence Machine” (Chapter 2). As Europe recovers from the deep economic crisis of the last five years, Turkey is well advised to persist with the path of Eu-ropean integration as a well-honed path to escape the “middle income trap”.
Before providing a brief historical account of the key economic policy changes that brought Turkey to its current position, this section compares the main structural features of Turkey’s economy with that of other middle income countries. From the large number of possible peers, five groups are se-lected for this comparison.
• The first group contains the new member states of the EU and the second the EU Accession can-didates.2 Both groups are of interest because, like Turkey, they benefit from the momentum of European integration, an asset other middle income countries do not share to the same ex-tent.
2 The chapter focuses on the larger of the EU member states and accession countries, excluding the Baltics, Slovenia, Bosnia-Herzegovina, FYR Macedonia, and Montenegro. Croatia is included in the group of EU accession candidates because our comparative data stops in 2012.

Turkey’s Transitions
30
• The third group contains those countries in the Middle East and North Africa (MENA) that do not have large oil and gas reserves.3 This group is of interest because they share a common his-tory with Turkey, and many look to Turkey for inspiration.
• The fourth group of countries contains the “BRICS” (Brazil, Russian Federation, India, China and South Africa).
• The fifth group is a set of “growth markets” among the middle income countries.4 These peers are selected because by size, expected growth rates and levels of income they are – as is Turkey – likely to count among the heavyweight emerging markets in the coming decades.
Figure 1.3 ranks these countries by their current GDP per capita using purchasing power parity (PPP) adjusted exchange rates: Turkey ranks closer to the top – it is among those countries in the sample that are on the threshold (or beyond) to high income.5
The basic framework chosen to compare the struc-tural features of Turkey’s economy with that of its
peers builds on a stylized model of a modern mar-ket economy. Drawing on the large literature of the main correlates of successful economic growth and development (see Growth Commission, 2008) the framework looks at the way the basic activities in any market economy are organized and distinguish-es the following main components:
• Trade: The organization of trade is a key de-terminant of a country’s welfare (Frankel and Romer, 1999). Greater openness to internation-al trade and greater success in penetrating glob-al markets characterize successful advanced, as well as emerging, market economies.
• Finance: The depth of financial markets is close-ly associated with the level of development in a country (Beck, Levine and Loayza, 2000; Levine, 2004; Levine, Loayza and Beck, 2000; Aghion, Howitt and Mayer-Foulkes, 2005). Well-functioning financial markets contribute to eco-nomic development by attracting national and international savings and allocating them to the most efficient uses. Financial market distortions are also often at the heart of macroeconomic instability.
0
5,000
10,000
15,000
20,000
25,000
30,000
Indi
a
Phili
ppin
es
Mor
occo
Indo
nesia
Alba
nia
Tuni
sia
Egyp
t
Chin
a
Jord
an
Serb
ia
Sout
h Af
rica
Braz
il
Bulg
aria
Mex
ico
Rom
ania
Turk
ey
Croa
tia
Mal
aysi
a
Pola
nd
Hung
ary
Russ
ian
Fed.
Slov
akia
Czec
h Re
publ
ic
Kore
a, R
ep.
Cons
tant
201
1 In
tern
ation
al $
Source: World Development Indicators (WDI)Note: Color codes distinguish the various peer groups: blue for new EU member states, dark blue for Accession candidates, light blue for BRICs, brown for the Growth Markets, and lilac for MENA
Figure 1.3: Turkey’s income per capita compared to its peers GDP per capita 2012, in PPP (constant 2011 international US$)
3 This group includes Morocco, Tunisia, Egypt, Jordan, and Syrian Arab Republic.
4 The fifth group includes Republic of Korea, Mexico, Indonesia, Malaysia, and the Philippines. The label “growth markets” like the BRICS was coined by Goldman Sachs. Their sample of growth markets also includes Bangladesh, Pakistan, Viet Nam, Nigeria and Egypt. The latter is grouped with the MENA countries in this study, while the other four have presently much lower income levels than Turkey and are, thus, less useful for comparative purposes.
5 The World Bank typically defines the high income threshold in current US$. The ranking in Figure would hardly change if, instead of constant 2011 international US$, 2012 current exchange rates were used. Brazil would be richer, Malaysia poorer than Turkey. Recently most emerging markets, including Turkey, have seen their exchange rates depreciate but the relative ranking is unlikely to change much.
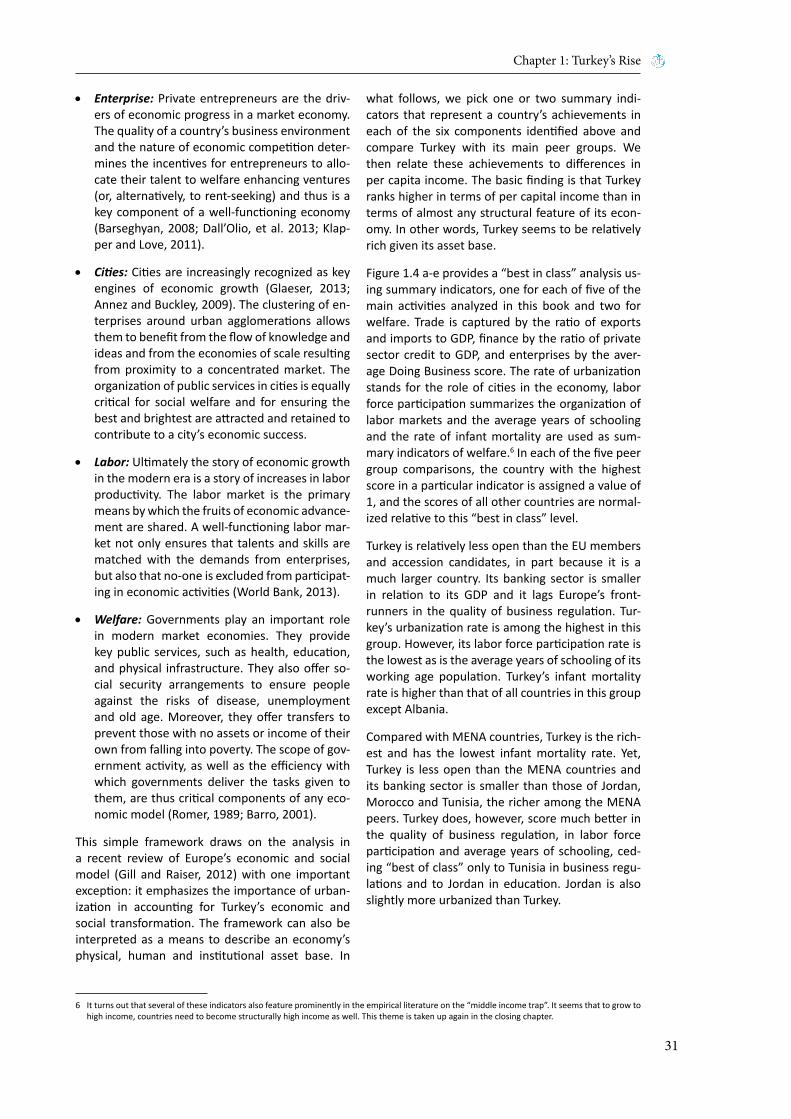
Chapter 1: Turkey’s Rise
31
• Enterprise: Private entrepreneurs are the driv-ers of economic progress in a market economy. The quality of a country’s business environment and the nature of economic competition deter-mines the incentives for entrepreneurs to allo-cate their talent to welfare enhancing ventures (or, alternatively, to rent-seeking) and thus is a key component of a well-functioning economy (Barseghyan, 2008; Dall’Olio, et al. 2013; Klap-per and Love, 2011).
• Cities: Cities are increasingly recognized as key engines of economic growth (Glaeser, 2013; Annez and Buckley, 2009). The clustering of en-terprises around urban agglomerations allows them to benefit from the flow of knowledge and ideas and from the economies of scale resulting from proximity to a concentrated market. The organization of public services in cities is equally critical for social welfare and for ensuring the best and brightest are attracted and retained to contribute to a city’s economic success.
• Labor: Ultimately the story of economic growth in the modern era is a story of increases in labor productivity. The labor market is the primary means by which the fruits of economic advance-ment are shared. A well-functioning labor mar-ket not only ensures that talents and skills are matched with the demands from enterprises, but also that no-one is excluded from participat-ing in economic activities (World Bank, 2013).
• Welfare: Governments play an important role in modern market economies. They provide key public services, such as health, education, and physical infrastructure. They also offer so-cial security arrangements to ensure people against the risks of disease, unemployment and old age. Moreover, they offer transfers to prevent those with no assets or income of their own from falling into poverty. The scope of gov-ernment activity, as well as the efficiency with which governments deliver the tasks given to them, are thus critical components of any eco-nomic model (Romer, 1989; Barro, 2001).
This simple framework draws on the analysis in a recent review of Europe’s economic and social model (Gill and Raiser, 2012) with one important exception: it emphasizes the importance of urban-ization in accounting for Turkey’s economic and social transformation. The framework can also be interpreted as a means to describe an economy’s physical, human and institutional asset base. In
what follows, we pick one or two summary indi-cators that represent a country’s achievements in each of the six components identified above and compare Turkey with its main peer groups. We then relate these achievements to differences in per capita income. The basic finding is that Turkey ranks higher in terms of per capital income than in terms of almost any structural feature of its econ-omy. In other words, Turkey seems to be relatively rich given its asset base.
Figure 1.4 a-e provides a “best in class” analysis us-ing summary indicators, one for each of five of the main activities analyzed in this book and two for welfare. Trade is captured by the ratio of exports and imports to GDP, finance by the ratio of private sector credit to GDP, and enterprises by the aver-age Doing Business score. The rate of urbanization stands for the role of cities in the economy, labor force participation summarizes the organization of labor markets and the average years of schooling and the rate of infant mortality are used as sum-mary indicators of welfare.6 In each of the five peer group comparisons, the country with the highest score in a particular indicator is assigned a value of 1, and the scores of all other countries are normal-ized relative to this “best in class” level.
Turkey is relatively less open than the EU members and accession candidates, in part because it is a much larger country. Its banking sector is smaller in relation to its GDP and it lags Europe’s front-runners in the quality of business regulation. Tur-key’s urbanization rate is among the highest in this group. However, its labor force participation rate is the lowest as is the average years of schooling of its working age population. Turkey’s infant mortality rate is higher than that of all countries in this group except Albania.
Compared with MENA countries, Turkey is the rich-est and has the lowest infant mortality rate. Yet, Turkey is less open than the MENA countries and its banking sector is smaller than those of Jordan, Morocco and Tunisia, the richer among the MENA peers. Turkey does, however, score much better in the quality of business regulation, in labor force participation and average years of schooling, ced-ing “best of class” only to Tunisia in business regu-lations and to Jordan in education. Jordan is also slightly more urbanized than Turkey.
6 It turns out that several of these indicators also feature prominently in the empirical literature on the “middle income trap”. It seems that to grow to high income, countries need to become structurally high income as well. This theme is taken up again in the closing chapter.
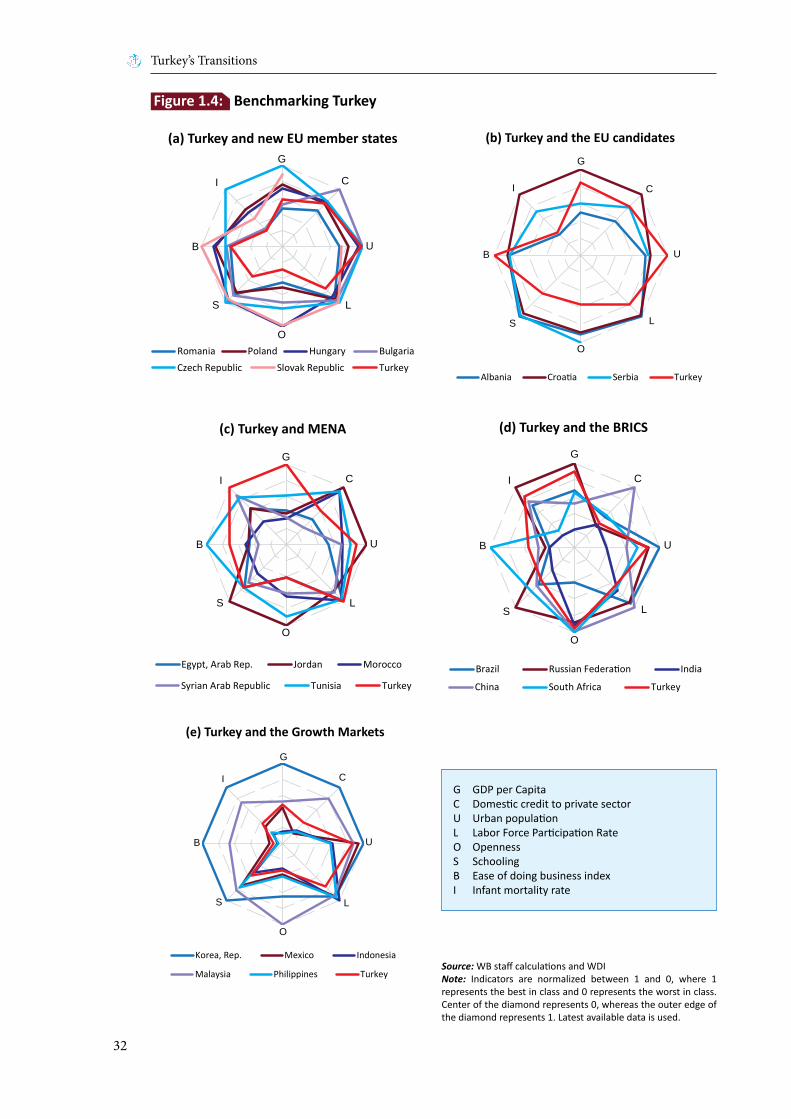
Turkey’s Transitions
32
Figure 1.4: Benchmarking Turkey
G
C
U
L
O
S
B
I
(a) Turkey and new EU member states
Romania Poland Hungary BulgariaCzech Republic Slovak Republic Turkey
G
C
U
L
O
S
B
I
(c) Turkey and MENA
Egypt, Arab Rep. Jordan Morocco
Syrian Arab Republic Tunisia Turkey
G
C
U
L
O
S
B
I
(d) Turkey and the BRICS
Brazil Russian Federation India
China South Africa Turkey
(e) Turkey and the Growth Markets
G
C
U
L
O
S
B
I
Korea, Rep. Mexico Indonesia
Malaysia Philippines Turkey
G
C
U
L
O
S
B
I
(b) Turkey and the EU candidates
Albania Croatia Serbia Turkey
G GDP per CapitaC Domestic credit to private sectorU Urban populationL Labor Force Participation RateO OpennessS SchoolingB Ease of doing business indexI Infant mortality rate
Source: WB staff calculations and WDINote: Indicators are normalized between 1 and 0, where 1 represents the best in class and 0 represents the worst in class. Center of the diamond represents 0, whereas the outer edge of the diamond represents 1. Latest available data is used.
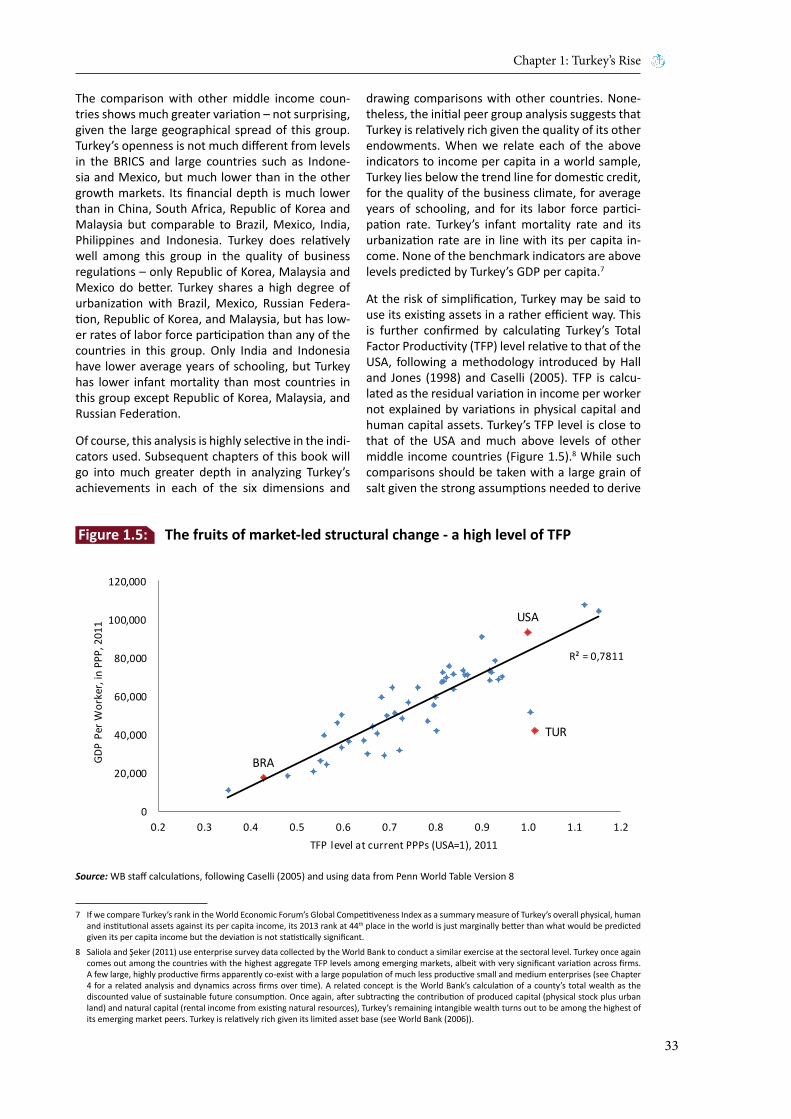
Chapter 1: Turkey’s Rise
33
The comparison with other middle income coun-tries shows much greater variation – not surprising, given the large geographical spread of this group. Turkey’s openness is not much different from levels in the BRICS and large countries such as Indone-sia and Mexico, but much lower than in the other growth markets. Its financial depth is much lower than in China, South Africa, Republic of Korea and Malaysia but comparable to Brazil, Mexico, India, Philippines and Indonesia. Turkey does relatively well among this group in the quality of business regulations – only Republic of Korea, Malaysia and Mexico do better. Turkey shares a high degree of urbanization with Brazil, Mexico, Russian Federa-tion, Republic of Korea, and Malaysia, but has low-er rates of labor force participation than any of the countries in this group. Only India and Indonesia have lower average years of schooling, but Turkey has lower infant mortality than most countries in this group except Republic of Korea, Malaysia, and Russian Federation.
Of course, this analysis is highly selective in the indi-cators used. Subsequent chapters of this book will go into much greater depth in analyzing Turkey’s achievements in each of the six dimensions and
drawing comparisons with other countries. None-theless, the initial peer group analysis suggests that Turkey is relatively rich given the quality of its other endowments. When we relate each of the above indicators to income per capita in a world sample, Turkey lies below the trend line for domestic credit, for the quality of the business climate, for average years of schooling, and for its labor force partici-pation rate. Turkey’s infant mortality rate and its urbanization rate are in line with its per capita in-come. None of the benchmark indicators are above levels predicted by Turkey’s GDP per capita.7
At the risk of simplification, Turkey may be said to use its existing assets in a rather efficient way. This is further confirmed by calculating Turkey’s Total Factor Productivity (TFP) level relative to that of the USA, following a methodology introduced by Hall and Jones (1998) and Caselli (2005). TFP is calcu-lated as the residual variation in income per worker not explained by variations in physical capital and human capital assets. Turkey’s TFP level is close to that of the USA and much above levels of other middle income countries (Figure 1.5).8 While such comparisons should be taken with a large grain of salt given the strong assumptions needed to derive
Source: WB staff calculations, following Caselli (2005) and using data from Penn World Table Version 8
TUR
USA
BRA
R² = 0,7811
0
20,000
40,000
60,000
80,000
100,000
120,000
0.2 0.3 0.4 0.5 0.6 0.7 0.8 0.9 1.0 1.1 1.2
GDP
Per W
orke
r, in
PPP
, 201
1
TFP level at current PPPs (USA=1), 2011
Figure 1.5: The fruits of market-led structural change - a high level of TFP
7 If we compare Turkey’s rank in the World Economic Forum’s Global Competitiveness Index as a summary measure of Turkey’s overall physical, human and institutional assets against its per capita income, its 2013 rank at 44th place in the world is just marginally better than what would be predicted given its per capita income but the deviation is not statistically significant.
8 Saliola and Şeker (2011) use enterprise survey data collected by the World Bank to conduct a similar exercise at the sectoral level. Turkey once again comes out among the countries with the highest aggregate TFP levels among emerging markets, albeit with very significant variation across firms. A few large, highly productive firms apparently co-exist with a large population of much less productive small and medium enterprises (see Chapter 4 for a related analysis and dynamics across firms over time). A related concept is the World Bank’s calculation of a county’s total wealth as the discounted value of sustainable future consumption. Once again, after subtracting the contribution of produced capital (physical stock plus urban land) and natural capital (rental income from existing natural resources), Turkey’s remaining intangible wealth turns out to be among the highest of its emerging market peers. Turkey is relatively rich given its limited asset base (see World Bank (2006)).

Turkey’s Transitions
34
comparable TFP levels, it, nonetheless, highlights that Turkey has made good use of those assets which it has.
By implication, however, further increases in per capita income will need to rely on an expansion of Turkey’s asset base. In other words, to continue to grow, Turkey will need to invest in physical and hu-man capital and upgrade its institutions. The mac-roeconomic constraints on investment are the sub-ject of Spotlight 1. The institutional asset base that is central to encouraging investment and, hence, sustaining the transition to high income is analyzed in Chapter 8.
How did Turkey become a relatively efficient mar-ket economy? The next two sections trace the story back to the initial liberalization efforts of the early 1980s (and their culmination in the 1995 Customs Union Agreement with the EU) and to the regula-tory reforms in the wake of the 2001 financial crisis in Turkey. These reforms have unleashed an entre-preneurial private sector, the key driver of Turkey’s progress.
Unleashing the private sector:Özal’s legacy and the liberalization of the early 1980sIn the 1950s and 1960s, Turkey industrialized rap-idly. However, following a foreign exchange crisis in the late 1950s and a military coup in 1960, under the leadership of the military, the country, as many of its emerging market peers at that time, embarked on an import substitution industrialization strategy (Mango, 2004). This strategy came under increasing strains in the 1970s. Turkey increased foreign bor-rowing in response to the first oil shock of 1973, but was cut off from capital markets in 1977. A series of International Monetary Fund (IMF) supported ad-justment programs followed, the implementation of which was, however, haphazard and hampered by increasing domestic instability, with rival gangs of left and right wing youths fighting street battles. Again, the military intervened in September 1980, dissolved parliament and banned political parties, put their most prominent leaders in jail, and sus-pended many civil and political rights.
Turgut Özal, an engineer by training and a former World Bank official, entered the political limelight as the Deputy Prime Minister and head of the eco-nomic team under the government of Süleyman Demirel, who came to power in November 1979. Özal and his team introduced a series of economic adjustment measures in January 1980, most impor-tantly devaluing the exchange rate by 33 percent and abolishing most multiple exchange rate practic-
es (Öniş and Webb, 1992; Canevi, 2014). Özal was kept by the military as the head of the economic team until 1982, and following the parliamentary elections of 1983, returned to power as the Prime Minister at the head of the Motherland Party (ANAP), which was to dominate Turkish politics un-til the late 1980s.
The Özal government’s economic policy rested on three main pillars. First, to tackle the chronic foreign exchange shortages of the 1970s, the government liberalized the foreign exchange market, abolished many domestic price controls and kept real wages low to ensure export competitiveness. Foreign ex-change liberalization was accompanied by financial sector liberalization, with caps on interest rates lifted in 1980, and after a banking crisis in 1982, the basic pillars of a financial market infrastructure were put in place (the Capital Markets Board in 1982, a Savings Deposit Insurance Fund in 1983, a new Banking Law in 1985). Second, the government switched from a policy of import substitution to a policy of export promotion, and after 1984, increas-ingly liberal trade policies. This was accompanied by a general policy of support to the private sector and some initial steps to privatize state companies, by selling revenue share certificates to the general population. Third, Özal introduced a series of insti-tutional reforms, which centralized economic pol-icy making around a group of like-minded market oriented technocrats in the Central Bank as well as the newly created Secretariat of Treasury under a Minister of State for the Economy (Öniş and Webb, 1992; Canevi, 2014). Figure 1.6 provides a timeline of the key reforms in the liberalization of foreign exchange, trade and capital account transactions.
These policies produced impressive results – but also rising corruption. The export drive led to a fourfold increase in exports during the decade 1980-1990 from just US$3 billion to US$13 billion (Chapter 2). Import growth was slower and Turkey’s current account deficit after 1983 never exceeded 3 percent of GDP, after it had averaged over five percent during the 1975-1980 period. Economic growth averaged over 7 percent during Özal’s first four year term of 1983 to 1987. The stepwise lib-eralization of the foreign exchange market and the abolition of most import licenses and the reduc-tion in import tariffs provided market signals and a competitive domestic environment. Özal’s vision was decidedly pro-business as he encouraged Turks to benefit from the new opportunities his policies provided. “Turning the corner” – meaning getting rich quickly - became the catch-phrase of the age (Mango, 2004). Indeed, today, Turks are far more entrepreneurial than most other people in Europe (Figure 1.7). However, the drawback of the unregu-

Chapter 1: Turkey’s Rise
35
lated expansion of private sector activity was an increase in corruption and conflicts of interest as powerful bureaucrats used the new-found entre-preneurial freedoms to enrich themselves or con-nected parties.
The Özal period also saw a dramatic increase in the pace of structural change. Between 1970 and 1980, the rural population declined only marginally from 61 percent to 56 percent. In the following ten years, it fell sharply to just 40 percent (Chapter 5). As government support shifted away from agricul-
ture to manufactured exports, people moved into the cities to seek their luck in textiles, light indus-try and construction, as well as in the burgeoning tourism sector. This structural change was sup-ported by major infrastructure initiatives, such as the modernization of telecommunications and the electrification of much of the country (Spotlight 2). The 1980s also saw major road investments linking Turkey’s more developed coastal areas with the still predominantly rural inland. In 1984, a law on mu-nicipalities was adopted, laying the foundation for urban development planning (Chapter 5).
0
2
4
6
8
10
1970 1975 1980 1985 1990 1995 2000 2005 2010
Freedom to own foreigncurrency bank accounts
Freedom to trade internationally
Controls of the capital and people
Capital controls
1989 - Capital account convertability1985 - Opening of individual forex deposits allowed
1984 - Current account convertability and further trade liberalization1980 - Reduction of import quotas, and unification of exchange rates
Source: WB staff calculations, based on Fraser Institute Indicators
Figure 1.6: Trade and foreign exchange liberalization in the 1980s Fraser Institute Indicators of economic freedom (range: 0 min - 10 max)
0%
20%
40%
60%
80%
% of people who have apositive view ofentrepreneurs
% of people who have apositive view of top-
managers in largeproduction companies
% of people who wouldstart a business if they
inherited a large sum ofmoney
% of people who haveexperience of starting up a
business
% of people who weretaking active steps to start a
new business
New EU Members Average Turkey EU27
Source: WB staff calculations, Eurobarometer - The Gallup OrganizationNote: The “New EU Members” refers to Bulgaria, Czech Republic, Hungary, Poland, Romania and Slovakia
Figure 1.7: Turks are more entrepreneurial than the average European Results from the 2010 Eurobarometer
Turkey’s Transitions
36
The 1980s, thus, mark the birth of the “Anatolian Tigers”, the rapidly growing cities in Turkey’s Ana-tolian heartland, home to a new generation of en-trepreneurs (Chapter 4). Private entrepreneurship in the two decades between 1960 and 1980 had grown largely as a result of state patronage and the government maintained a leading role in the alloca-tion of resources. After 1980 – while government support in the form of targeted subsidies remained important and benefited mainly the existing large family owned holdings – there was greater appre-ciation and room for growth of the SMEs indepen-dent of state largesse (Yavuz, 2009; Adaman, Akar-çay-Gürbüz, and Karaman, 2013).
The reforms did create losers among organized la-bor and agriculture. Yet, the military regime sup-pressed the opposition and, thus, the reforms ini-tially faced little political resistance, even if Özal distanced himself from the military after 1983 (Öniş and Webb, 1992). After 1987, political competition increased significantly with the two dominant po-litical leaders of the 1970s, Süleyman Demirel and Bülent Ecevit returning to the scene after the ban on their political activities was lifted. The increase in political competition brought back distributional politics and with it, macroeconomic instability re-turned. The decline in real wages was reversed af-ter 1986 at the same time as agricultural subsidies went back up. The two main losers of the 1980s sta-bilization, labor and agriculture, could no longer be contained as ANAP expanded fiscal spending in the run-up to the 1987 elections.
Growing economic populism in the late 1980s was reflected in increasingly discretionary spend-ing policies. The clearest manifestation of this was the proliferation of Extra Budgetary Funds (EBFs), which rose from 33 in 1980 to 57 by 1983 and to 105 by 1990. The EBFs were funded through special earmarked taxes such as on consumer goods im-ports (alcohol, cigarettes, luxury goods), and their resources used to support specific objectives. The most important of these funds were the Public Par-ticipation Fund, the Mass Housing Fund (both sup-porting the government’s extensive social housing program, discussed in greater detail in Chapter 5), the Support for Price Stabilization Fund (providing subsidies to agriculture) and the Defense Industries Support Fund. Smaller funds targeted the cement industry, tobacco, justice administration, universi-ties’ research and development, mosque construc-tion, and improvements in metrology (Öniş and Webb, 1992). The product specific levies imposed to fund the EBFs to some extent offset the liberal-ization of the import licensing regime (which itself was partially reversed), and with more and more government agencies allowed to administer their own EBFs, the central government started to lose
control over fiscal policy decisions. The EBFs in-creasingly resorted to borrowing to cover deficits, which accounted for 25 percent of total spending between 1988 and 1991 (Spotlight 3).
The result of growing public sector wage pressures, rising subsidies and increasing deficits of the EBFs was increased fiscal imbalances. Fiscal deficits were partially monetized and, as a result, inflation stayed stubbornly high throughout the decade at above 30 percent, peaking at 74 percent in 1988. The ex-change rate was allowed to depreciate in line with inflation, which maintained external balance, at the cost of further entrenching inflationary expec-tations. Growing macroeconomic instability began to erode ANAP’s popularity and, with Özal’s move to the Presidency in 1989, the party increasingly fragmented, eventually losing power in the 1993 parliamentary elections, which brought back coali-tion politics.
The following decade was punctuated by the eco-nomic crises of 1994 and 2001 and characterized by relatively frequent changes in governments, par-ticularly towards the end of the 1990s. During the 1980s, there had been a total of three Prime Min-isters under two different governments; the 1990s saw six Prime Ministers and six different coalition governments. Intense electoral competition and the return of the 1970s system of political patron-age undermined macroeconomic stability with in-flation remaining above 50 percent throughout the decade (Figure 1.8). While the government was no longer the leading economic actor – the Özal period had irreversibly brought the private sector to the fore – the state had not developed arms’ length re-lations with business. Discretionary favors, directed credits through the increasingly bloated public sec-tor banks, and rampant corruption characterized the governance model of the 1990s and, eventu-ally, led to the economic and political collapse of 2001 (Atiyas, 1995).
A regime shift:Turkey after the 2001 crisis
The 2001 Crisis
Turkey ended the 20th century in turmoil. The final government of the century was led by the veteran leader of the Democratic Left Party (DSP), Bülent Ecevit. Ecevit became Prime Minister in January 1999 at the head of an interim government. In the subsequent elections of April 1999, the DSP won the most seats and Ecevit led a coalition of DSP, Nationalist Movement Party (MHP) and ANAP. The first year of the coalition was marked by the dev-astating Marmara earthquake in August 1999. In

Chapter 1: Turkey’s Rise
37
the subsequent wave of international sympathy, the coalition managed to secure the EU’s commit-ment to open accession negotiations with Turkey at the Helsinki summit of December 1999. Neverthe-less, to many citizens, the poor preparedness of the authorities to deal with the disaster and the sense that its human cost with more than 10,000 casual-ties had been exacerbated by lax planning controls and numerous illegal settlements were symptoms of the state’s gradual corrosion through patronage and corruption (Mango, 2004; OECD, 2002).
The crisis came at the end of 2000. Under a 1999 macro program supported by an IMF stand-by ar-rangement and flanked by a series of structural re-forms with the World Bank support, a crawling peg exchange rate regime was introduced to try and tame chronic inflation. However, the program failed to contain the further accumulation of losses in state-owned banks, which were financed through short-term borrowing (Chapter 3). The crawling peg regime, in addition, brought a rise in domes-tic interest rates and growing liquidity problems in the banking sector, with weaker players gambling for survival by rolling over liabilities at increasingly short maturities.9 With inflation higher than fore-seen under the crawling peg regime, the result was a loss in competitiveness and, finally, in November 2000, a banking crisis followed by capital flight. While the authorities managed to control the situa-tion initially by taking over failed banks, confirming
the insurance of all bank deposits to prevent a bank run, and securing additional IMF support, a politi-cal crisis in February 2001 led market confidence to collapse and forced the government to float the Lira.
The result of the macroeconomic and banking cri-ses of late 2000 and early 2001 was a radical shift in economic policy and the beginning of a new model of economic governance, laying the foundation for the subsequent revival during the first decade of the 21st century. This shift is of central interest to the remainder of this book. Here, a very condensed summary is provided to set the stage.
In March 2001, the Ecevit government brought in a new economic team under Kemal Derviş, up to that point Vice President for MENA in the World Bank. Key personnel changes occurred in the com-ing months, such as the head of the Central Bank and the Banking Regulatory and Supervisory Agen-cy (BRSA), established under a new Banking Act in 1999 and operational as of January 2000. The new team swiftly moved to resolve the twin foreign ex-change and banking crisis with a three-pronged ap-proach.
First, the liquidity crisis in the banking sector was tackled through recapitalization of state banks, stress tests in all private banks, and the taking over of banks with insufficient capital by the State De-posit Insurance Fund (SDIF, see Chapter 3).
-4%
-2%
0%
2%
4%
6%
8%
10%
12%
14%
0%
20%
40%
60%
80%
100%
120%19
8119
8219
8319
8419
8519
8619
8719
8819
8919
9019
9119
9219
9319
9419
9519
9619
9719
9819
9920
0020
0120
0220
0320
0420
0520
0620
0720
0820
0920
1020
1120
12
Özal Governments Coalitions AK Party
Publ
ic S
ecto
r Bor
row
ing
Requ
irem
ent,
Perc
ent o
f GDP
Infla
tion
Inflation (Left Axis) Public Sector Borrowing Requirement (Right Axis)
Source: WB staff calculations, CBRT; TurkStat
Figure 1.8: Political and macroeconomic instability in the era of coalition politics
9 As Chapter 3 further explains, the crawling peg also offered banks the chance to borrow in forex and onlend at high rates domestically, often to related parties, hiding a substantial underlying deterioration in the quality of their balance sheets. Poor governance in the banking sector was a key reason for the accumulating difficulties.

Turkey’s Transitions
38
Second, fiscal policy was tightened by exerting con-trol over the operations of the state-owned banks, embarking on a major retrenchment of state-owned enterprises through privatization and employment reduction, and through measures to broaden the tax base and increase revenue collection. Fiscal consolidation was central to reestablishing mac-roeconomic credibility. Central Bank financing of the budget was prohibited by the amendment of the Central Bank Law in April 2001 and Treasury’s debt management improved under a new Debt Management Law (2002). Monetary policy under a floating exchange rate regime shifted the focus towards bringing down inflation, initially through implicit inflation targeting, and once monetary conditions had sufficiently stabilized, from 2005 onward through an explicit inflation target. Declin-ing inflation allowed nominal interest rates to come down, thereby, supporting fiscal consolidation as well as real sector recovery. Primary surpluses were recorded from 2003 onwards as the economy recovered and public sector debt came down from 69.2 percent of GDP in 2002 to 39.8 percent in 2012 (Spotlight 3).
Third, the 2001 program accelerated the pace of structural reforms, which had begun in 1999. These reforms, in their essence, targeted a reduction in direct intervention of the state in the economy and the move towards independent regulatory agen-cies to both encourage more private investment and better regulate economic activities in key sec-tors such as banking, energy, telecoms, and agricul-ture. These steps were flanked by improvements in public sector governance, such as through (i) a new, EU-compatible Public Procurement Law (2002), (ii) new civil service recruitment standards introduced in late 1999 and tightened in 2004, (iii) a Law on Public Finance Management and Control (PFMCL) (2003), (iv) a Law on Access to Information (2003) and (v) the introduction of e-signature (2004). Self-regulatory bodies were also strengthened, with measures like the foundation of the Turkish Ac-counting Standards Board in 1999 (operational in March 2002).
The deep crisis of 2001 provided an opportunity to introduce wholesale changes to Turkey’s gover-nance model and to overcome the inconsistencies between macroeconomic measures and microeco-nomic regulation and to get rid of incentives which had plagued repeated stabilization efforts through-out the late 1980s and 1990s. Vested interests were confronted head-on, sometimes at considerable risk to public officials who were charged with en-forcing new rules. Turkey did not waste this crisis. Yet, the scars of the recession in 2001 and the po-litical divisions and tensions created by steering the economy through troubled waters were deep. With
Prime Minister Ecevit’s health failing, the coalition government broke down in Spring 2002 and early elections were scheduled for November 2002. The elections led to the emergence of a new leading po-litical actor, the Justice and Development Party (AK Party), which won the largest share of votes and a majority in parliament and has governed Turkey as a single party ever since.
The post-2002 come-back
This most recent period in Turkey’s socio-economic progress is analyzed in greater detail in subsequent chapters. Here, three aspects deserve to be high-lighted.
The first is the considerable expansion in the role of the private sector in the economy, building on the creation of independent regulatory agencies be-tween 1999 and 2002. It is critical for understand-ing Turkey’s post-2002 come-back that successive AK Party governments sustained the structural re-forms introduced during the crisis at the start of the decade and oversaw their implementation (Atiyas, 2012; Ülgen, 2013). Figure 1.9 shows the evolution of key structural reform measures in five main ar-eas involving state-business relations: enterprise, finance, infrastructure, cities, and public finance management. The concentration of reform efforts during the period of 2001 to 2005 can be clearly seen.
The shift in the role of the state to a regulator and facilitator of private investment is exemplified by the steps taken to expand private investment in in-frastructure (Spotlight 2):
• Turkish Airlines (THY) and Halk Bank were par-tially sold through public offerings in 2004-2006 and 2007-2012 respectively and several conces-sions were tendered for the operation of air-ports and ports (World Bank, 2012).
• The electricity sector was unbundled; and, distribution and some generation assets were privatized in several stages, raising US$12.7 bil-lion in revenues.
• The telecommunications market became com-petitive with the issuance of mobile phone li-censes and the ending of the Turk Telekom mo-nopoly in 2003.
• A new Railway Law, effective in May 2013, pro-vides for unbundling of the state railways into a state-owned line operator, and a commercially oriented transport operator, the latter subject to competition from private freight and passen-ger companies.

Chapter 1: Turkey’s Rise
39
The EU Accession process, as well as successive IMF and World Bank supported programs, provided an important anchor to the reform effort particularly in the first half of the decade. The “tractor beam” of institutional convergence with EU standards paid important economic dividends as elsewhere in Eu-rope. The level of foreign direct investment (FDI)inflows multiplied from just around US$1 billion an-nually in the 1990s to an average of US$15 billion during 2007-2012. A new law on FDI was enacted in 2003 and the investment climate for international
as well as domestic investors improved through a series of steps to ease entry barriers and strength-en the protection of property and contract rights.
The second critical element of Turkey’s reformed policy environment post 2001 was a shift in gov-ernment policy towards greater emphasis on ac-cess to public services. The AK Party had acquired experience in managing public services through years of municipal government, for instance, Tur-key’s current President, Recep Tayyip Erdoğan was a mayor of Istanbul in the 1990’s. The successful fis-
2012
2011
2010
2009
2008
2007
2006
2005
2004
2003
2002
2001
2000
1999
1998
1997
1996
1995
1994
Foundation of the Competition Authority
Public Offering of %23 of THY
New Turkish Court of Accounts Law enacted
Law on Public Debt Management
Sale of %55 of Turkish Telecom
A new Energy Efficiency Strategywas approved
An Electricity Reform Privatization Strategywas approved
Secondary Offering of %23,92 of Halk Bank
New Central Bank Law
Closure of the budgetary and extra-budgetaryfunds in order to imporve budgetary transparency
Figure 9: Regulatory Reforms during and after the 2001 crisis
Competition Act was amended
Public Offering of %28,75 of THY
Law on Municipalities
The Public Financial Management andControl Law was enacted
Increase in retirement age
Foundation of theTelecommunication Authority
The Renewable Energy Law was enacted
The New Capital Market Law enacted
Foundation of the Banking Regulationand Supervision Agency (BRSA)
New Turkish Commercial Code enacted
Law on Metropolitan Municipality
Social Security Reform enacted
Permission to the Governmentto sell > %51 of
Turkish Telecom Corporation
The Energy Efficiency Law was enacted
The Gas Market Law was enacted The Electricity Market Law was enacted
Foundation of theEnergy Market Regulatory Board
%24,98 of Halk Bank sold by IPO
Vertical Axis: Financial Sector 2- Infrastructure 3- Fiscal/PFM 4- Cities 5- Enterprises
Figure 1.9: Regulatory reforms during and after 2001 crisis
Source: WB staff
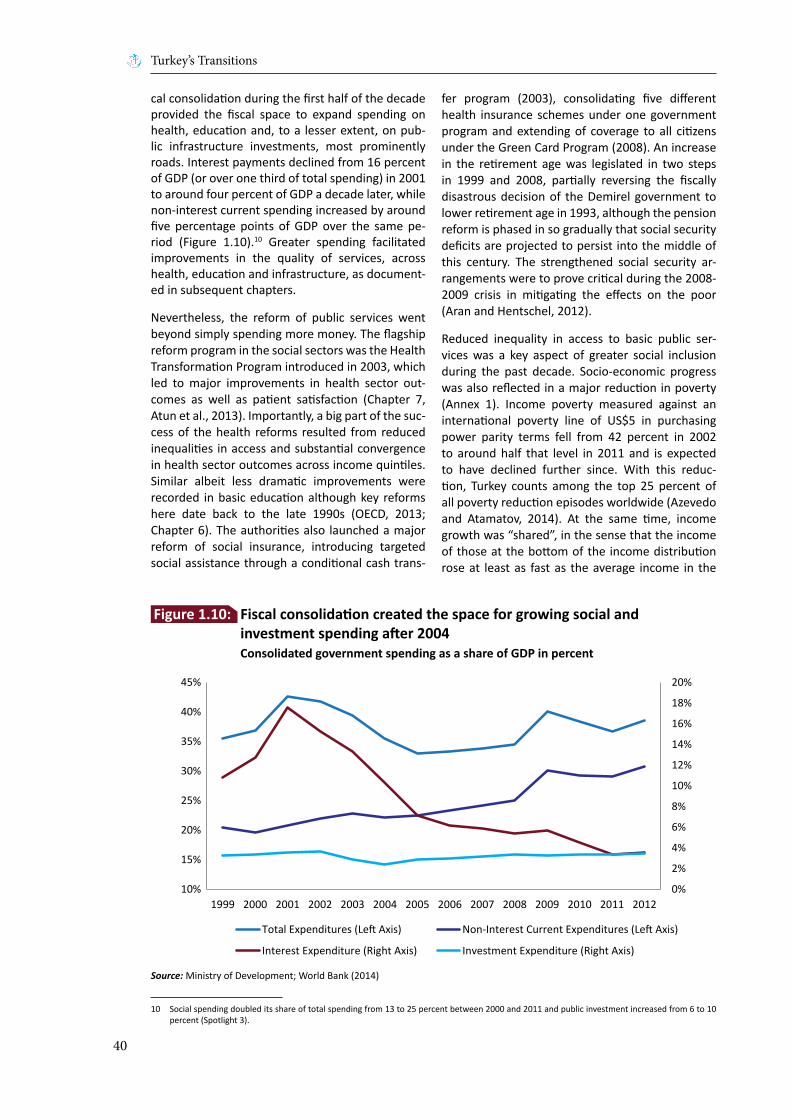
Turkey’s Transitions
40
cal consolidation during the first half of the decade provided the fiscal space to expand spending on health, education and, to a lesser extent, on pub-lic infrastructure investments, most prominently roads. Interest payments declined from 16 percent of GDP (or over one third of total spending) in 2001 to around four percent of GDP a decade later, while non-interest current spending increased by around five percentage points of GDP over the same pe-riod (Figure 1.10).10 Greater spending facilitated improvements in the quality of services, across health, education and infrastructure, as document-ed in subsequent chapters.
Nevertheless, the reform of public services went beyond simply spending more money. The flagship reform program in the social sectors was the Health Transformation Program introduced in 2003, which led to major improvements in health sector out-comes as well as patient satisfaction (Chapter 7, Atun et al., 2013). Importantly, a big part of the suc-cess of the health reforms resulted from reduced inequalities in access and substantial convergence in health sector outcomes across income quintiles. Similar albeit less dramatic improvements were recorded in basic education although key reforms here date back to the late 1990s (OECD, 2013; Chapter 6). The authorities also launched a major reform of social insurance, introducing targeted social assistance through a conditional cash trans-
fer program (2003), consolidating five different health insurance schemes under one government program and extending of coverage to all citizens under the Green Card Program (2008). An increase in the retirement age was legislated in two steps in 1999 and 2008, partially reversing the fiscally disastrous decision of the Demirel government to lower retirement age in 1993, although the pension reform is phased in so gradually that social security deficits are projected to persist into the middle of this century. The strengthened social security ar-rangements were to prove critical during the 2008-2009 crisis in mitigating the effects on the poor (Aran and Hentschel, 2012).
Reduced inequality in access to basic public ser-vices was a key aspect of greater social inclusion during the past decade. Socio-economic progress was also reflected in a major reduction in poverty (Annex 1). Income poverty measured against an international poverty line of US$5 in purchasing power parity terms fell from 42 percent in 2002 to around half that level in 2011 and is expected to have declined further since. With this reduc-tion, Turkey counts among the top 25 percent of all poverty reduction episodes worldwide (Azevedo and Atamatov, 2014). At the same time, income growth was “shared”, in the sense that the income of those at the bottom of the income distribution rose at least as fast as the average income in the
0%
2%
4%
6%
8%
10%
12%
14%
16%
18%
20%
10%
15%
20%
25%
30%
35%
40%
45%
1999 2000 2001 2002 2003 2004 2005 2006 2007 2008 2009 2010 2011 2012
Total Expenditures (Left Axis) Non-Interest Current Expenditures (Left Axis)
Interest Expenditure (Right Axis) Investment Expenditure (Right Axis)
Source: Ministry of Development; World Bank (2014)
Figure 1.10: Fiscal consolidation created the space for growing social and investment spending after 2004 Consolidated government spending as a share of GDP in percent
10 Social spending doubled its share of total spending from 13 to 25 percent between 2000 and 2011 and public investment increased from 6 to 10 percent (Spotlight 3).
Chapter 1: Turkey’s Rise
41
country. As Annex 1 explains in more detail, the main driver of shared prosperity in Turkey over the past decade has been the labor market, as labor earnings increased and as Turkey started to benefit from the demographic transition, with falling de-pendency ratios and a rising number of workers in each household. Unlike in Latin America, where the last decade was characterized by major reductions in income inequality and where government redis-tribution drove improvements in the income of the poor, Turkey’s story of inclusive growth remained private sector driven. Government redistribution played a modest role and overall income inequal-ity initially declined but then increased again after 2007. The role of the labor market and the govern-ment’s social policies is examined in greater detail in the second half of this book.
The third aspect of the post-2002 regime shift is the change in Turkey’s political economy (Yavuz, 2009; Ülgen, 2013; Mahçupyan, 2014). The 2000s not only saw the first extended period of uninter-rupted one-party government since the 1950s, it also witnessed a declining role for the military in parallel with the growing political voice of the con-servative Anatolian lower and middle classes – the main constituency for the ruling AK Party. The in-creasingly internationally active Anatolian small and medium enterprises (SMEs) furnished support for pro-market economic policies, while the rise of an urban middle class both demanded and re-warded the government for the increased attention to public services. The pro-market and pro-reform domestic policy consensus was further enhanced and anchored by the EU Accession process. This explains how reforms were sustained and is at the core of the fascination with Turkey’s mix of conser-vative social values and pragmatic, service-oriented economic management.
Turkey today: in need of a new reform boost
After more than a decade of progress, Turkey’s eco-nomic and social achievements have lately come under scrutiny. The reasons for this are both eco-nomic and social. Economically, the global crisis and subsequent rapid recovery in Turkey has divert-ed attention from remaining structural weaknesses and considerably complicated macroeconomic management. As outlined in Spotlight 1 and Chap-ter 3, Turkey’s growth has become quite volatile as it succumbed to the ups and downs on the global carry trade. In the past two years, public spending
started to sustain growth and construction became a main driver of the economy’s expansion. While this has supported a rapid pace of job creation since 2009, productivity has stagnated and external deficits have become stubbornly high.11
Turkey needs to find new sources of sustainable productivity growth to satisfy the aspirations of its growing urban middle class. These lie in technologi-cal upgrading and innovation, which ultimately de-pend on competitive markets and the quality of the regulatory environment. However, recent interven-tions in independent regulatory institutions suggest that the principles of arms’ length regulation have not yet put down deep roots (Atiyas, 2012; Özel, 2011). Government favors are no longer doled out through trade licenses or extrabudgetary funds, but there is concern over the transparency in pub-lic tenders and the allocation of land development rights. The anchor provided by the EU Accession process has been weakening ever since the mid-2000s and Turkey has been losing market share in the FDI going to emerging markets as a whole since 2007. Moreover, the fiscal windfall in the aftermath of the 2001 consolidation is largely exhausted, and improvements in the quality of public services will be more challenging to achieve than the expansion in access during the past decade.
Socially, among the new urban dwellers, traditional values rub against the opportunities of a modern market economy. This can be seen, for instance, in the changing role of women in urban families with conservative social norms gradually accommodat-ing rising female employment. The resulting adjust-ments are complex (Mahçupyan, 2014) but create a potentially receptive ground for identity based poli-tics (White, 2012). Meanwhile, among Turkey’s tra-ditional elites, the loss of political influence and the sharp public rhetoric have led to disenchantment. The consensus that has brought Turkey longlasting stability and an overwhelming pro-market constitu-ency needs to be nurtured.
Turkey’s prospects, thus, depend on a return to the focus on structural reforms and improved public sector governance that characterized the post-2002 come-back. Measures to boost competitiveness, a reinvigoration of Turkey’s EU Accession process, and steps to reconfirm the commitment to arms’ length regulation and the rule of law can set the stage for a new growth spurt taking Turkey to high income. The economic and social challenges of pro-gressing towards high income are well understood and addressed by the government’s 10th National
11 Kara and Sarıkaya (2013) argue that part of the post-crisis increase in external imbalances is due to low demand among Turkey’s main trading partners and booming demand at home. They estimate the cyclically adjusted current account deficit in Turkey to be around 5 percent of GDP. This corresponds to the “sustainable” deficit of 5 percent of GDP used in the long-term growth projections in Spotlight 1.

Turkey’s Transitions
42
Development Plan, approved in 2013. The plan foresees a deepening of structural reforms across a large number of areas, summarized in 25 develop-ment programs. Nonetheless, a heavy electoral cal-endar in 2014 and 2015 has complicated structural reform efforts.
Turkey’s transformation is not over yet, but the road the country has travelled so far still offers rich les-sons to policy makers and reformers elsewhere. Yet more lessons are bound to emerge from the way Turkey grapples with the challenges of the transi-tion to high income. To document the specific steps taken by past and present Turkish governments, to understand the context in which they worked and the challenges that remain yet to be addressed, and to draw lessons for policy makers in other emerging markets is the objective of the remainder of this book. A brief summary of its structure con-cludes this chapter.
The structure of the bookTurkey’s story is one of a growing number of case studies among emerging markets of sustained, rapid economic growth (Commission on Growth and Development, 2008). These stories collective-ly are changing the nature of the global economy and provide rich pickings for development practi-tioners. No longer do the experiences of Western Europe or North America provide the benchmark against which developing countries measure them-selves; neither are Japan and the Asian Tigers the only cases of successful, rapid convergence towards high income. The remainder of this book focuses on Turkey’s story in its own right. It moves beyond benchmarking to zoom in on the specific lessons emerging from Turkey – the “how to” of Turkey’s reforms and development outcomes.
As argued in the preceding two sections, Turkey contains lessons in both integration and inclu-sion. The liberalizing reforms of the 1980s laid the foundation for Turkey’s lessons in integration. The fiscal consolidation and new governance model that emerged after 2001 have laid the founda-tion for Turkey’s growth to become inclusive. The two themes of integration and inclusion provide an overall organizing principle for drawing lessons from Turkey. Box 1.1 provides an overview.
The structure of the book follows the analytical framework sketched in Box 1 of this chapter. In ad-dition to this introduction and a concluding chap-ter, the book has six core chapters, covering the six principal components of Turkey’s growth model: trade, finance, enterprise, cities, labor, and social services. Chapters 2 to 4 cover Turkey’s lessons in integration. How have successive Turkish govern-
ments coped with the challenges of successful in-tegration into world markets? What impact has this had on Turkish companies? Have Turkish enterpris-es adjusted and become internationally competi-tive? And is Turkey well positioned to benefit from the shifting patterns of global economic growth in coming decades? These are the key themes ad-dressed in the first part of the book.
Chapters 5 to 7 contain Turkey’s lessons in inclu-sion and cover urbanization, labor markets and so-cial services. This part tells Turkey’s social inclusion story. How much of Turkey’s social inclusion was driven by new economic opportunities opening up as a result of structural change, in particular, Tur-key’s fast rate of urbanization? What role did gov-ernment redistribution play? How important were public investments in health and education? At the same time, given low rates of labor force participa-tion (particularly among women), does the coun-try risk missing out on its demographic dividend by keeping women at home? These are the key ques-tions addressed in the second part of the book.
Chapters 2 to 7 are bracketed by three spotlights. The first spotlight uses a variety of macroeconomic modelling tools (Computable General Equilibrium (CGE) results and growth accounting) to understand the sources of past and potential future economic growth. A particular focus of the spotlight is to un-derstand the extent to which Turkey’s relatively low investment rate and low labor force participation rate present binding constraints on growth, as the analysis in Box 1 of this chapter would indicate. If the key to future growth is an increase in invest-ment, how can this be financed, given low and de-clining domestic savings? The spotlight looks at the implications of both for macroeconomic manage-ment and structural reforms.
The second spotlight – linking the chapters on enter-prises and urbanization – traces Turkey’s progress in the provision of public infrastructure services. The spotlight focuses on the expansion of transport links and improvements in logistics performance (an area in which Turkey has progressed signifi-cantly over the past decade and now ranks above many European countries), and the reforms in the energy sector, where Turkey offers valuable lessons in eliminating subsidies, unbundling the sector and creating the space for private investment. Turkey has significant further ambitions in this area with a pipeline for public-private partnerships amount-ing to some US$150 billion in areas ranging from transport to social services. The realization of these ambitious plans is not without challenges which the spotlight will summarize.
Chapter 1: Turkey’s Rise
43
The third spotlight summarizes Turkey’s fiscal con-solidation experience with a particular focus on the role of improved public finance management. It explains how fiscal consolidation was closely linked and supported by reforms that improved the alloca-tion of government spending and enhanced public finance controls. The spotlight acts as a bridge be-tween the discussions of Turkey’s expanding social services in the chapter on welfare and the conclud-ing chapter, which focuses on Turkey’s remaining institutional challenges.
Having benchmarked Turkey’s income status and asset base against that of its peers in Chapter 1 and reviewed the pace of progress in six principal areas in Chapters 2 to 7, the final chapter casts a look ahead. Few countries have successfully escaped the “middle income trap” and Turkey has yet to complete this transition. Chapter 8 summarizes the main challenges that remain to be addressed to put Turkey firmly on a path to high income. It argues that the quality of a country’s institutions ultimate-ly is a major determinant of a successful transition
to high income (see also Acemoğlu and Robinson, 2012). The chapter returns to the peer group analy-sis introduced in this chapter and demonstrates that Turkey’s institutions are mostly still those of a middle income country. Moreover, institutional re-forms have essentially stalled since the mid-2000s with some risks of reversals documented in Chap-ter 8. Yet, the rise of a strong middle class and the corresponding demand for improved governance may provide a foundation for further institutional reforms. If Turkey can build on this foundation, it has the potential to emerge as an example for a modern Muslim nation.
Introduction: After a decade of solid growth, Turkey today is on the threshold to high income. Turkey’s example is of considerable interest to many emerging markets and its prospects matter regionally and globally. Turkey’s success is based on economic integration and social inclusion. The roots are to be found both in the economic opening of the 1980s and the European integration process which accelerated after the late 1990s.
Spotlight 1: Growth and Macro Policy: Turkey’s growth has been driven mainly by investment and a growing popula-tion. Going forward, raising savings rates, increasing labor force participation and boosting total factor productivity will be necessary to sustain growth.
LESSONS IN INTEGRATION LESSONS IN INCLUSION
Trade Finance Enterprise Spotlight 2:Infrastructure Cities Labor Welfare
Turkey has become part of Europe’s Convergence Machine.
Turkey has managed financial integration prudently.
TheAnatolian Tigers have spread the benefits of integration inland.
Turkey hassignificantlyimproved the quality of publicinfrastructure,including bymobilizing private investment.
Turkey has managed one of the fastesturbanization rates in the world.
Turkey has created lots of jobs after the crisis.
Turkey’s health and education outcomes are rapidly closing the gap to high income.
Spotlight 3: Public Finances and Governance: Turkey’s fiscal consolidation after 2001 has opened the room for in-creased welfare spending. Improved public finance management has supported this shift but governance reforms remain incomplete.
Outlook: As Turkey moves to high income, the sources of growth will need to shift from the adaptation of technologies and structural change towards innovation and TFP growth within enterprises. This will require Turkey to strengthen the rule of law and arms’ length government regulation and to promote social and economic progress through the free exchange of ideas. As Turkey faces the challenge of modernizing its institutions, to what extent is it emerging as an example for a modern Muslim nation?
Box 1.1: Turkey’s Transitions - An Overview

Turkey’s Transitions
44
Annex 1: Pathways to the middle class: How Turkey’s growth was sharedTurkey has recorded rapid progress in poverty re-duction over the past decade, and economic growth in Turkey has benefited all groups, including those at the bottom of the distribution (Azevedo and Ata-manov, 2014). As a result, Turkey – as several other countries in Eastern Europe, Latin America and East Asia – has seen the emergence of a middle class, becoming an increasingly important economic and political actor. As illustrated in Figure 1.11 by using the World Bank definitions of US$2.5 in PPP per day as the threshold to absolute deprivation and US$5 in PPP per day as the threshold to poverty, Turkey has made enormous progress in poverty reduction.
Turkey’s growth has been shared. To measure the extent to which growth and prosperity were shared, the World Bank has developed a new metric, building on Basu (2013): it calculates the growth in income (or consumption) of the bottom 40 percent. If this growth is sufficiently high, and if absolute poverty has declined significantly, we may say that growth has lifted all boats. This metric of shared prosperity does not require reductions in inequality. Nonetheless, to put improvements of the bottom 40 percent into perspective, it is often compared with the average rate of progress in the country. Figure 1.12 shows that in international
comparison, the growth of consumption of the bot-tom 40 percent is quite respectable. However, it is also notable that unlike many of its middle income peers in Latin America (as well as in South Africa), Turkey’s progress in shared prosperity has taken place in an environment of overall strong growth and has not been the result of government led re-distribution.12 This makes the Turkish case rather more similar to the experiences in Asia and in most of Eastern Europe.
The basic finding that growth was widely shared is not dependent on the welfare aggregate but it does vary across time periods and the magnitudes also
0%
10%
20%
30%
40%
50%
60%
2002
2003
2004
2005
2006
2007
2008
2009
2010
2011
Pove
rty
Rate
ECATSD 2.5 USD PPP ECATSD 5 USD PPP
Source: WB staff calculations using Turkey’s household budget survey data. Welfare aggregate from ECAPOV is consumption per capita (+health, + durables, +rent)
Figure 1.11: Turkey has made significantprogress in poverty reduction over the past decade
-4%
-2%
0%
2%
4%
6%
8%
10%
12%
2004
-200
8
2005
-201
0
2005
-201
0
2005
-201
0
2006
-200
9
2003
-200
9
2007
-201
0
2005
-201
1
2006
-201
1
2006
-201
1
2006
-201
0
2005
-200
9
2004
-200
9
HRV IDN MEX IND ZAF CHL BGR COL TUR BRA ROM CHN RUS
Grow
th R
ate
Total Population Bottom 40
Source: Azevedo and Atamanov (2014) using Global Poverty Working Group Shared Prosperity database.Notes: Welfare aggregate is consumption plus durables and health. Geometric mean is used to calculate average growth rate.
Figure 1.12: Shared prosperity in Turkey and peers
12 In Latin America, around half of the reduction in poverty over the past decade came from redistribution against only 11 percent in Turkey. The balance is accounted for by economic growth.
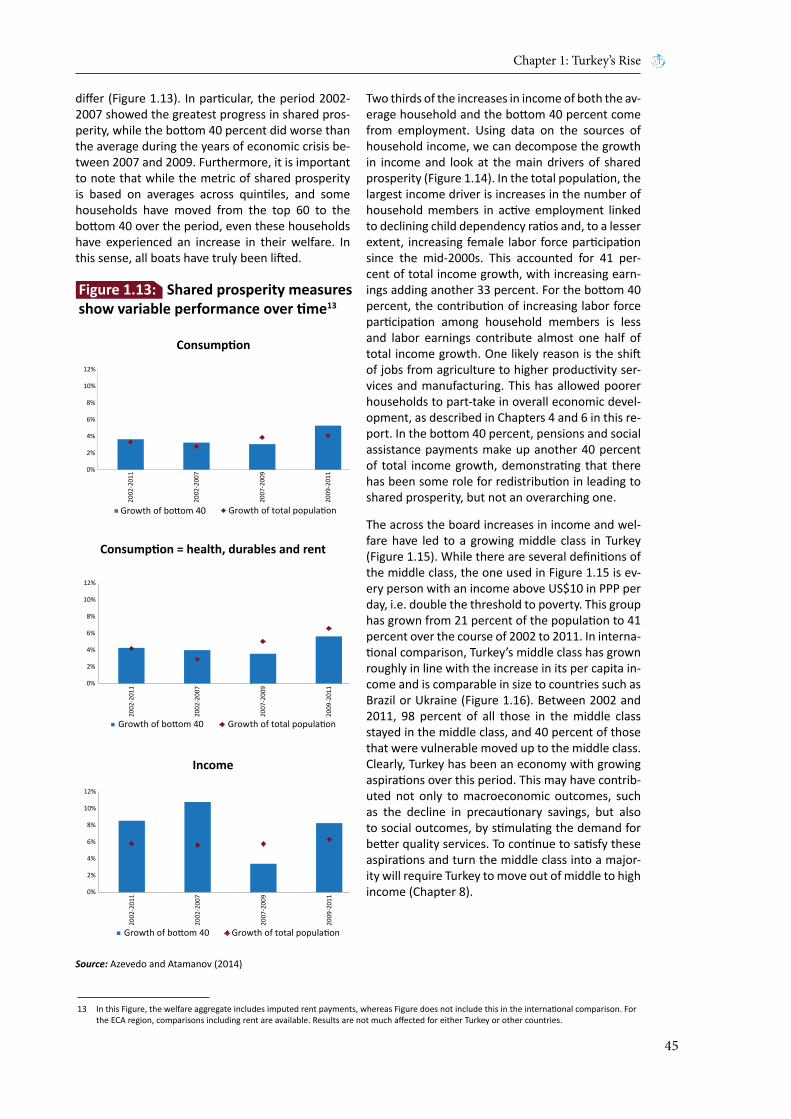
Chapter 1: Turkey’s Rise
45
differ (Figure 1.13). In particular, the period 2002-2007 showed the greatest progress in shared pros-perity, while the bottom 40 percent did worse than the average during the years of economic crisis be-tween 2007 and 2009. Furthermore, it is important to note that while the metric of shared prosperity is based on averages across quintiles, and some households have moved from the top 60 to the bottom 40 over the period, even these households have experienced an increase in their welfare. In this sense, all boats have truly been lifted.
Two thirds of the increases in income of both the av-erage household and the bottom 40 percent come from employment. Using data on the sources of household income, we can decompose the growth in income and look at the main drivers of shared prosperity (Figure 1.14). In the total population, the largest income driver is increases in the number of household members in active employment linked to declining child dependency ratios and, to a lesser extent, increasing female labor force participation since the mid-2000s. This accounted for 41 per-cent of total income growth, with increasing earn-ings adding another 33 percent. For the bottom 40 percent, the contribution of increasing labor force participation among household members is less and labor earnings contribute almost one half of total income growth. One likely reason is the shift of jobs from agriculture to higher productivity ser-vices and manufacturing. This has allowed poorer households to part-take in overall economic devel-opment, as described in Chapters 4 and 6 in this re-port. In the bottom 40 percent, pensions and social assistance payments make up another 40 percent of total income growth, demonstrating that there has been some role for redistribution in leading to shared prosperity, but not an overarching one.
The across the board increases in income and wel-fare have led to a growing middle class in Turkey (Figure 1.15). While there are several definitions of the middle class, the one used in Figure 1.15 is ev-ery person with an income above US$10 in PPP per day, i.e. double the threshold to poverty. This group has grown from 21 percent of the population to 41 percent over the course of 2002 to 2011. In interna-tional comparison, Turkey’s middle class has grown roughly in line with the increase in its per capita in-come and is comparable in size to countries such as Brazil or Ukraine (Figure 1.16). Between 2002 and 2011, 98 percent of all those in the middle class stayed in the middle class, and 40 percent of those that were vulnerable moved up to the middle class. Clearly, Turkey has been an economy with growing aspirations over this period. This may have contrib-uted not only to macroeconomic outcomes, such as the decline in precautionary savings, but also to social outcomes, by stimulating the demand for better quality services. To continue to satisfy these aspirations and turn the middle class into a major-ity will require Turkey to move out of middle to high income (Chapter 8).
Consumption
Consumption = health, durables and rent
Income
0%
2%
4%
6%
8%
10%
12%
2002
-201
1
2002
-200
7
2007
-200
9
2009
-201
1
Growth of bottom 40 Growth of total population
0%
2%
4%
6%
8%
10%
12%
2002
-201
1
2002
-200
7
2007
-200
9
2009
-201
1
Growth of bottom 40 Growth of total population
0%
2%
4%
6%
8%
10%
12%
2002
-201
1
2002
-200
7
2007
-200
9
2009
-201
1
Growth of bottom 40 Growth of total population
Source: Azevedo and Atamanov (2014)
Figure 1.13: Shared prosperity measures show variable performance over time13
13 In this Figure, the welfare aggregate includes imputed rent payments, whereas Figure does not include this in the international comparison. For the ECA region, comparisons including rent are available. Results are not much affected for either Turkey or other countries.
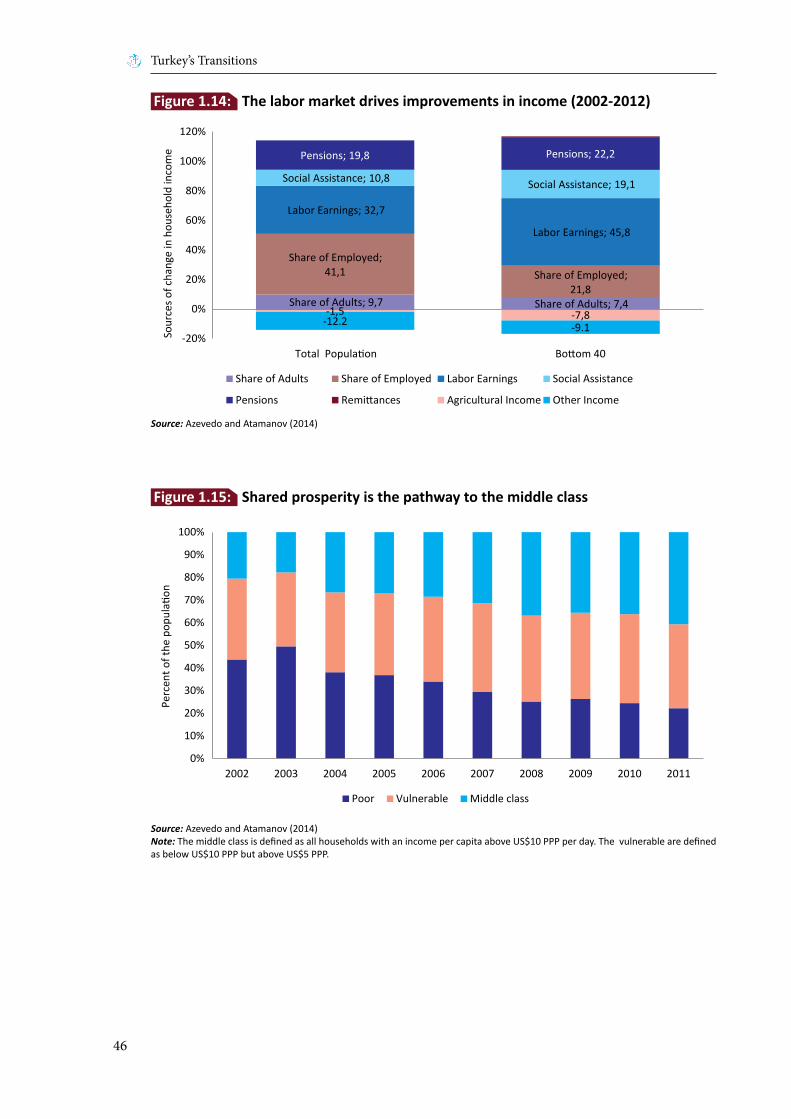
Turkey’s Transitions
46
Share of Adults; 9,7 Share of Adults; 7,4
Share of Employed; 41,1 Share of Employed;
21,8
Labor Earnings; 32,7
Labor Earnings; 45,8
Social Assistance; 10,8 Social Assistance; 19,1
Pensions; 19,8 Pensions; 22,2
-1,5 -7,8-12.2 -9.1-20%
0%
20%
40%
60%
80%
100%
120%
Total Population Bottom 40
Share of Adults
Sour
ces o
f cha
nge
in h
ouse
hold
inco
me
Share of Employed Labor Earnings Social Assistance
Pensions Remittances Agricultural Income Other Income
Source: Azevedo and Atamanov (2014)
Figure 1.14: The labor market drives improvements in income (2002-2012)
0%
10%
20%
30%
40%
50%
60%
70%
80%
90%
100%
2002 2003 2004 2005 2006 2007 2008 2009 2010 2011
Perc
ent o
f the
pop
ulati
on
Poor Vulnerable Middle class
Source: Azevedo and Atamanov (2014) Note: The middle class is defined as all households with an income per capita above US$10 PPP per day. The vulnerable are defined as below US$10 PPP but above US$5 PPP.
Figure 1.15: Shared prosperity is the pathway to the middle class

Chapter 1: Turkey’s Rise
47
BRA93
BRA10
CHL93
CHL10CRI10
ECU93
ECU10
HRV93
HRV10
KAZ93
KAZ10
LVA10
MEX93
MEX10
MYS10
PAN10
PER93
PER10
POL10
PRY93
ROM93
ROM10
RUS93
RUS10
UKR93
UKR10
TUR 1993
TUR 2010
R² = 0,4282
0%
10%
20%
30%
40%
50%
60%
70%
80%
90%
100%
3.000 7.000 11.000 15.000 19.000
Shar
e of
the
mid
dle
clas
s
GDP per capita, in PPP 2011 US$
Source: Azevedo and Atamanov (2014)
Figure 1.16: Turkey’s middle class has increased in line with rising GDP

Turkey’s Transitions
48
ReferencesAcemoğlu, D., & Robinson, J. (2012). Why Nations Fail. Crown Business.
Adaman, F., Karaman, K., & Akarçay-Gürbüz, A. (2013). The Political Economy of Turkey. Mimeo.
Aghion, P., Howitt, P., & Mayer-Foulkes, D. (2005). The Effect of Financial Development on Conver-gence: Theory And Evidence. Quarterly Journal of Economics120, 173-222.
Annez, P., & Buckley, R. (2009). Urbanization and Growth: Setting the Context. In Commission on Growth and Development. World Bank.
Aran, M. A., & Hentschel, J. S. (2012). Protection in Good and Bad Times?: The Turkish Green Card Health Program. The World Bank.
Atiyas, İ. (1995). Uneven Governance and Fiscal Failure : The Adjustment Experience in Turkey. The World Bank.
Atiyas, İ. (2012). Economic Institutions and Institu-tional Change in Turkey during the Neoliberal Era. New Perspectives on Turkey No: 14 pp. 45 - 69.
Atun, R., & et al. (2013). Universal Health Cover-age in Turkey: Enhancement of Equity. The Lancet, 382(9886), 65-99.
Azevedo, J., & Atamanov, A. (2014). Pathways to the middle class in Turkey: How have reducing pov-erty and boosting shared prosperity helped? Back-ground paper: World Bank Mimeo. World Bank.
Barro, R. (2001). Human Capital and Growth. Amer-ican Economic Review.
Barseghyan, L. (2008). Entry costs and cross-coun-try differences in productivity and output. Journal of Economic Growth, 13(2), 145-167.
Basu, K. (2013). Shared prosperity and the mitiga-tion of poverty: in practice and in precept. Policy Research Working Paper Series 6700. World Bank.
Beck, T., Levine, R., & Loayza, N. (2000). Finance and the sources of growth. Journal of Financial Eco-nomics, 58, 261-300.
Bolt, J., & van Zanden, J. (2013). The First Update of the Maddison Project: Re-Estimating Growth Be-fore 1820. Maddison Project Working Paper 4.
BRSA. (2010). From Crisis to Financial Stability (Tur-key Experience). BRSA.
Canevi, Y. (2014). I Witness Turkey 1984-2014. Is-tanbul: Forum Istanbul Institute.
Commission on Growth and Development. (2008). The Growth Report : Strategies for Sustained Growth and Inclusive Development. Washington DC: The World Bank.
Dall’Olio, A., Iootty, M., Kaneira, N., & Saliola, F. (2013). Productivity Growth in Europe. Policy Re-search Working Paper 6425. World Bank.
Eichengreen, B., Park, D., & Shin, K. (2012). When Fast Growing Economies Slow Down: International Evidence and Implications for China. Asian Econom-ic Papers, 42-87.
Eichengreen, B., Park, D., & Shin, K. (2013). Growth Slowdowns Redux: New Evidence on the Middle-Income Trap. NBER Working Papers.
Frankel, J. A., & Romer, D. (1999). Does Trade Cause Growth? The American Economic Review, 89(3), 379-399.
Gill, I. S., & Raiser, M. (2012). Golden Growth: Re-storing the Lustre of the European Economic Mod-el. The World Bank.
Gill, I., & Kharas, H. (2007). An East Asian Renais-sance: Ideas for Economic Growth. The World Bank.
Glaeser, E. (2013, December). A World of Cities: The Causes and Consequences of Urbanization in Poor-er Countries. Working Paper 19745. NBER.
Kara, A., & Sarıkaya, C. (2013). Cyclically Adjusted Current Account Balance. CBT Research Notes in Economics 1318. Ankara: Central Bank of the Re-public of Turkey.
Kaufmann , D., & et al. (2010). The Worldwide Gov-ernance Indicators: Methodology and Analytical Is-sues. World Bank Policy Research Working Paper , No. 5430 .
Klapper, L., & Love, I. (2011). The Impact of Busi-ness Environment Reforms on New Firm Regis-tration. Available at SSRN: http://ssrn.com/ab-stract=1786802 or http://dx.doi.org/10.2139/ssrn.1786802.
Kliman, D. M., & Fontaine, R. (2012). Global Swing States: Brazil, India, Indonesia, Turkey and the Fu-ture of International Order. The German Marshall Fund of the United States.
Levine, R. (2004). Finance and Growth: Theory and Evidence. Working Paper 10766. NBER.
Levine, R., Loayza, N., & Beck, T. (2000). Financial intermediation and growth: Causality and causes. Journal of Monetary Economics, 46, 31-77.

Chapter 1: Turkey’s Rise
49
Mahçupyan, E. (2014). Lessons from Turkey. Back-ground Paper. İstanbul: TESEV.
Mango, A. (2004). The Turks Today. London: John Murray.
OECD. (2002). TURKEY: Crucial Support for Econom-ic Recovery. OECD.
OECD. (2013). PISA 2012 Results in Focus. What 15-year-olds know and what they can do with what they know. Paris: OECD.
Öniş, Z., & Webb, S. B. (1992). Political Economy of Policy Reform in Turkey in the 1980s. The World Bank.
Özel, I. (2012). The Politics of De-delegation: Regu-latory (In)dependence in Turkey. Regulation & Gov-ernance, 6(1), 119-129.
Quah, D. (2011). The Global Economy’s Shifting Centre of Gravity. Global Policy, 3-9.
Romer, P. (1989). Human Capital and Growth: The-ory and Evidence. Working Paper No: 3173. NBER.
Ülgen, S. (2013, February). The Political Economy of Reform in Turkey and Its Relevance for the Arab World. Mimeo. World Bank.
White, J. (2012). Muslim Nationalism and the New Turks. Princeton University Press.
World Bank. (2012). Turkey Transport Sector Expen-diture Review: Synthesis Report.
World Bank. (2013). Good Jobs In Turkey. Report No: 83818-TR.
World Bank. (2014). Turkey in Transition: Time for a Fiscal Policy Pivot? Public Expenditure Review.
Yavuz, H. M. (2009). Secularism and Muslim De-mocracy in Turkey. Cambridge University Press.

Turkey’s Transitions
50
Spotlight 1: Accounting for Turkey’s growth: Past and future
51
Accounting for Turkey’s growth:Past and future
Spotlight 1
Turkey’s Transitions: Integration, Inclusion, Institutions
Labor
Welfare
FiscalSpace
Enterprise
Trade
Finance
Cities
Infrastucture

Turkey’s Transitions
52

Spotlight 1: Accounting for Turkey’s growth: Past and future
53
Accounting for Turkey’s growth: Past and future
“Once one starts to think about [economic growth], it is hard to think of anything else”.
Robert Lucas1
Since the 1950s, Turkey’s per capita income has been on a path of convergence with Europe. In this, Turkey resembles other countries at
the European periphery that have been closing the gap with the advanced countries in Continental and Northern Europe since World War II (Gill and Raiser, 2012). However, Turkey’s path was volatile and disrupted by repeated economic and political crises. Thus, at the end of 1950s the per capita in-come levels of Turkey and Spain were almost same at around 40 percent of the income level of the UK. While Spain steadily converged after joining the Eu-ropean Union (EU) and increased its income level to 90 percent of the UK in 2011, Turkey’s per capita income reached only 50 percent of the UK’s.2
To account for Turkey’s economic catch-up in recent years and to analyze the country’s growth pros-pects going forward, this Spotlight takes a look at the productive capacity of the economy as a func-tion of past and future savings and investments, the growth in the active population, and a productivity parameter that captures improvements in technol-ogy and efficiency. The first section presents the basic framework. The second section applies the framework to decompose Turkey’s past economic growth into its main determinants, while the third section projects Turkey’s growth into the future based on a series of assumptions about savings, in-creases in human capital, and demographics. In the best case scenario, we find that Turkey could reach almost 90 percent of the EU’s average per capita income by 2030, roughly the level where Spain is today.
Accounting for growth: the basic frameworkGrowth accounting is generally based on a stylized growth model that relates the output of an econo-my to a set of inputs, typically physical capital, hu-man capital and “raw” labor (Solow, 1957). In this spotlight, we follow the methodology of Hall and Jones (1999) which uses the following standard Cobb-Douglass production function with constant returns to scale:
Yi=Ki
α(AiHi)1- α
where:
• Y is Gross Domestic Product (GDP)
• A is an index of Total Factor Productivity (TFP)
• K is gross domestic capital stock (calculated us-ing the perpetual inventory method)
• H is schooling adjusted labor input (human capi-tal) and defined as: H=LeρS
• α is contribution of capital to output
• S is average years of schooling
• ρ is the Mincerian return to schooling
The parameter alpha is set to 0.33 as in Caselli (2005). This is a strong assumption, as several au-thors have pointed that a higher capital share may be appropriate for emerging market economies (see Altuğ, Filiztekin and Pamuk, 2008; Chen et al., 2010). Nonetheless, we choose a value of 0.33 consistent with the majority of growth accounting studies in the literature.3 Returns to schooling are assumed to be decreasing with rising education lev-els, in line with Hall and Jones (1999):4
0.135 if S ≤ 4
ρ = 0.101 if 4 < S ≤ 8
0.068 if S > 8
1 Robert Lucas (1988), “On the Mechanics of Economic Development”. Journal of Monetary Economics, 22( 3-42), p. 5.
2 For an analysis of Turkey’s relative underperformance compared to other Southern European countries, see Adamopoulos and Akyol (2009). As shown by Gill and Raiser (2012), EU enlargement was the driving motor of Southern Europe’s accelerated convergence during the 1970s and 1980s, bringing some 50 million people to high income. The same motor in the 1990s and 2000s brought another 100 million to the threshold to high income or beyond in Central and Eastern Europe. The role of the EU Anchor in Turkey’s rise is emphasized in Chapter 1, even though in the wake of political obstacles, it has worked less strongly than in Southern and Eastern Europe.
3 A higher capital share would affect our TFP estimates. For the full 1960-2012 period, average TFP growth would decline to 0.3 percent, for the 2000s to 0.8 percent. Capital inputs on the whole have grown faster than labor inputs in the past, so the amount of growth left to be explained by TFP is lower if the capital share is higher.
4 For an analysis of returns to education in Turkey, see Tansel and Daoud (2011).

Turkey’s Transitions
54
The analysis in the next, backward looking section is based on the Penn World Tables (PWT) version 8.0 by Feenstra et al. (2013) and the Barro-Lee Edu-cational Attainment Dataset version 1.3 (Barro and Lee, 2010). Population projections for the third, for-ward looking section are taken from World Devel-opment Indicators (WDI) (2013). We use the PWT as it includes longest series of investment and GDP (1950-2012). However, one should note that using other data sources such as the Conference Board, the Ministry of Development, TurkStat or WDI, does not alter the obtained results significantly.
Looking back: Solid growth but increasing volatilityThe Turkish economy has expanded by an average of 5.0 percent in real terms annually since 1950. Excluding the 1950s, which is an outlier in almost all countries as a result of the post-war reconstruc-tion boom, average annual growth was around 4.5 percent, somewhat lower than the average in a sample of peers for which data is available.5 The contributions of human capital and physical capital to aggregate growth was equal at 1.8 percentage points (pps) while the contribution of TFP growth was muted at 0.8 pps (Table S1.1).
In Turkey’s case, high average growth rates over longer periods mark significant variations from year to year. Turkey has not experienced sustained high growth over several decades, but neither has the
country experienced long periods with low or nega-tive growth. Nevertheless, the volatility of Turkey’s growth rates was below that in a group of peer countries over the period as a whole and in each decade with the exception of the 1950s and 2000s (Table S1.1).
Several episodes of economic development in post-war Turkey can be distinguished, marked by chang-ing political circumstances. Turkey has had four above average growth episodes. The country saw the highest average growth rate during the Demo-crat Party Government (1950-1959). The main con-tributor to average growth of 8.3 percent was TFP, which reached 6.4 percent growth reflecting the post-war recovery in demand and efficiency gains from agricultural reform (Figure S1.1). The second best performance occurred between two military interventions – the coups of 1960 and 1980. From 1961 to 1977, the average growth rate reached 6.1 percent and growth never turned negative. This pe-riod was characterized by central planning and im-port substitution. Public investments surged, boost-ing the contribution of the physical capital stock to growth to 2.2 pps. Following the military coup of 1980, the Turkish economy entered another vigor-ous growth episode under the Özal Government thanks to wide-reaching economic liberalization. The final above average growth episode occurred during the tenure of the current AK Party govern-ment, during which the country was enjoying an average growth rate of 5.2 percent. Structural re-
Table S1.1: Real GDP growth and contributions of factors6
Real GDP Growth (%)
Human Capital Stock
(pps)
Physical Capital Stock
(pps)
TFP (pps)
Volatility (%) Average growth in peers (%)
Average volatility in peers (%)
1950s 8.3 0.7 1.0 6.4 10.7 5.3 3.0
1960s 5.1 1.2 1.7 2.1 3.8 6.0 5.5
1970s 4.9 2.3 2.3 0.3 3.2 6.8 3.7
1980s 4.1 2.1 1.4 0.5 3.5 4.1 4.3
1990s 4.0 1.9 2.1 0.1 5.1 2.3 5.3
2000s 4.6 1.8 1.6 1.1 5.0 4.5 2.6
1960-2012 4.5 1.8 1.8 0.8 4.1 5.3 4.7Source: World Bank (WB) staff calculations, PWT
5 Peer group (with available data since 1960) includes South Africa, Philippines, Mexico, Romania, Brazil, Morocco, Jordan, Tunisia, India, Indonesia, Syrian Arab Republic, Egypt, Malaysia, Republic of Korea and China.
6 Both for Table S1.1 and Figure S1.1, period growth rates represent the average of the annual growth rates. GDP growth rates are calculated by using PWT database, which allows cross-country comparison in a consistent manner. Growth figures slightly change when calculations are made by using the Ministry of Development’s harmonized GDP dataset for the period before 1980; however, there is no significant divergence for the period follow-ing 1980. For reference, the average growth rates per decade using the Ministry of Development’s data are: 7.0 percent for the 1950s, 5.5 percent for the 1960s, 4.7 percent for the 1970s, 4.1 percent for the 1980s, 4.0 percent for the 1990s, 4.6 percent for the 2000s.
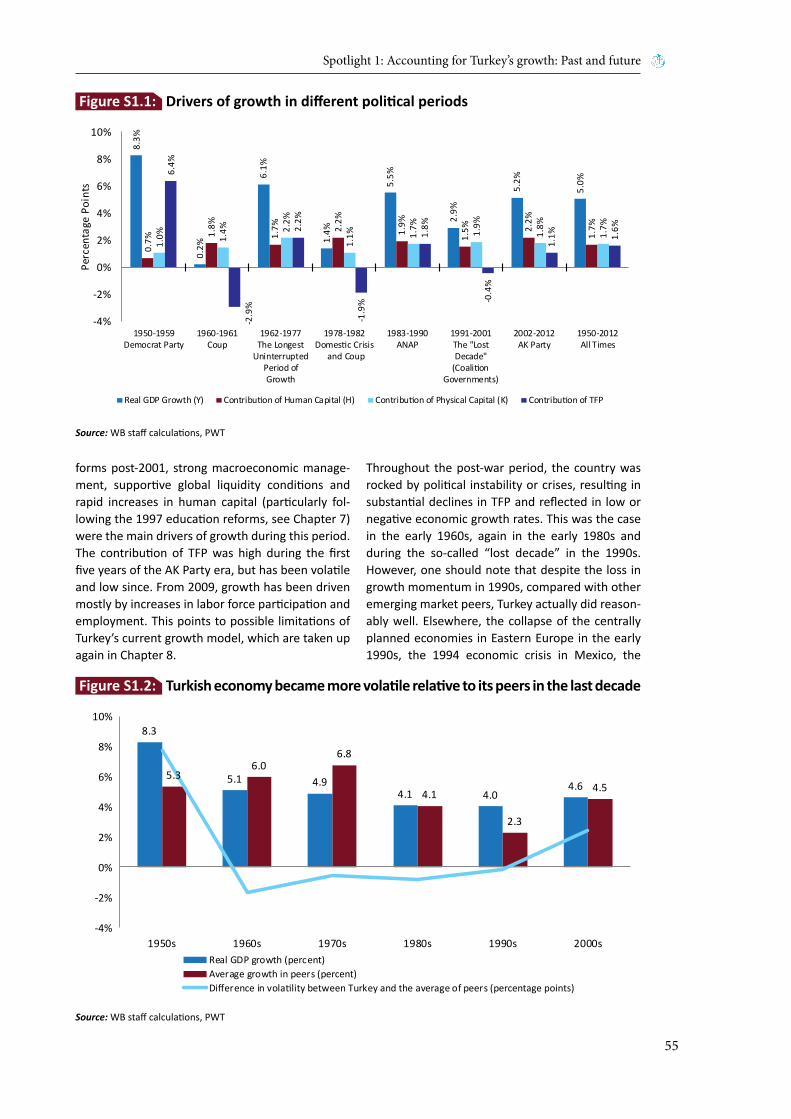
Spotlight 1: Accounting for Turkey’s growth: Past and future
55
forms post-2001, strong macroeconomic manage-ment, supportive global liquidity conditions and rapid increases in human capital (particularly fol-lowing the 1997 education reforms, see Chapter 7) were the main drivers of growth during this period. The contribution of TFP was high during the first five years of the AK Party era, but has been volatile and low since. From 2009, growth has been driven mostly by increases in labor force participation and employment. This points to possible limitations of Turkey’s current growth model, which are taken up again in Chapter 8.
Throughout the post-war period, the country was rocked by political instability or crises, resulting in substantial declines in TFP and reflected in low or negative economic growth rates. This was the case in the early 1960s, again in the early 1980s and during the so-called “lost decade” in the 1990s. However, one should note that despite the loss in growth momentum in 1990s, compared with other emerging market peers, Turkey actually did reason-ably well. Elsewhere, the collapse of the centrally planned economies in Eastern Europe in the early 1990s, the 1994 economic crisis in Mexico, the
Source: WB staff calculations, PWT
Source: WB staff calculations, PWT
8.3%
0.2%
6.1%
1.4%
5.5%
2.9%
5.2%
5.0%
0.7%
1.8%
1.7% 2.
2%
1.9%
1.5% 2.
2%
1.7%
1.0% 1.
4% 2.2%
1.1% 1.
7% 1.9%
1.8%
1.7%
6.4%
-2.9
%
2.2%
-1.9
%
1.8%
-0.4
%
1.1% 1.
6%
-4%
-2%
0%
2%
4%
6%
8%
10%
1950-1959Democrat Party
1960-1961Coup
1962-1977The Longest
UninterruptedPeriod ofGrowth
1978-1982Domestic Crisis
and Coup
1983-1990ANAP
1991-2001The "LostDecade"
(CoalitionGovernments)
2002-2012AK Party
1950-2012All Times
Perc
enta
ge P
oint
s
Real GDP Growth (Y) Contribution of Human Capital (H) Contribution of Physical Capital (K) Contribution of TFP
8.3
5.1 4.94.1 4.0
4.65.3
6.06.8
4.1
2.3
4.5
-4%
-2%
0%
2%
4%
6%
8%
10%
1950s 1960s 1970s 1980s 1990s 2000sReal GDP growth (percent)Average growth in peers (percent)Difference in volatility between Turkey and the average of peers (percentage points)
Figure S1.1: Drivers of growth in different political periods
Figure S1.2: Turkish economy became more volatile relative to its peers in the last decade
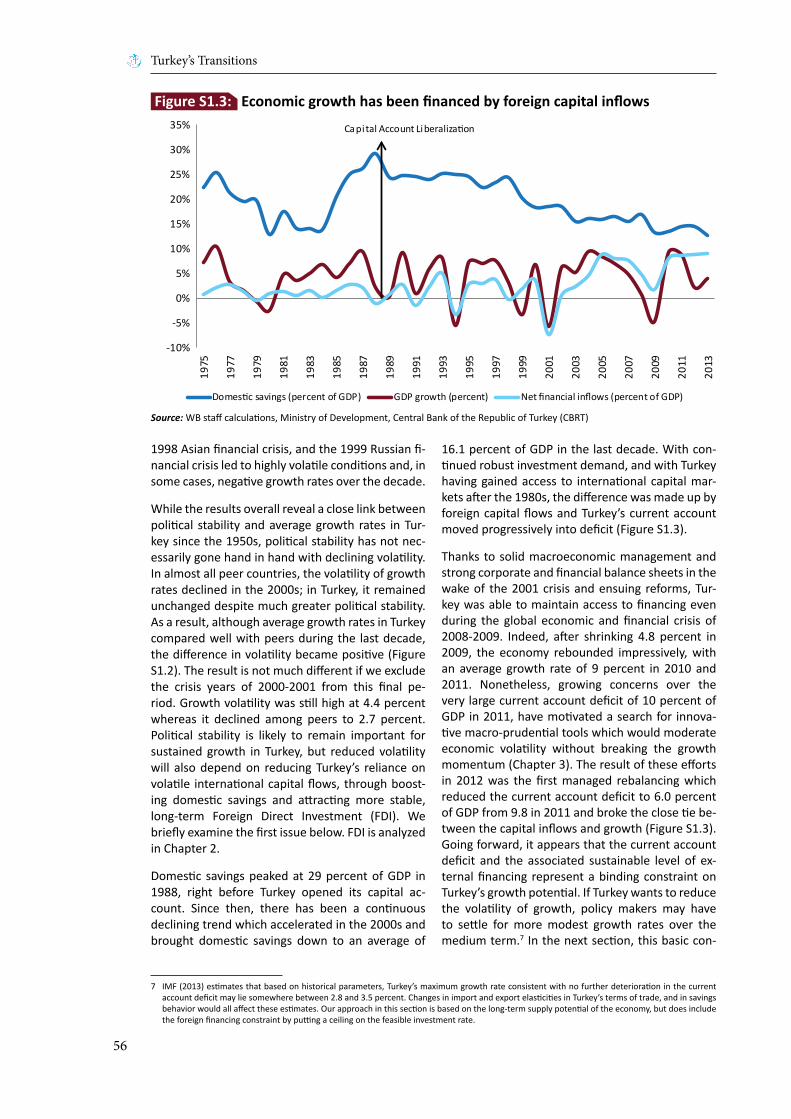
Turkey’s Transitions
56
1998 Asian financial crisis, and the 1999 Russian fi-nancial crisis led to highly volatile conditions and, in some cases, negative growth rates over the decade.
While the results overall reveal a close link between political stability and average growth rates in Tur-key since the 1950s, political stability has not nec-essarily gone hand in hand with declining volatility. In almost all peer countries, the volatility of growth rates declined in the 2000s; in Turkey, it remained unchanged despite much greater political stability. As a result, although average growth rates in Turkey compared well with peers during the last decade, the difference in volatility became positive (Figure S1.2). The result is not much different if we exclude the crisis years of 2000-2001 from this final pe-riod. Growth volatility was still high at 4.4 percent whereas it declined among peers to 2.7 percent. Political stability is likely to remain important for sustained growth in Turkey, but reduced volatility will also depend on reducing Turkey’s reliance on volatile international capital flows, through boost-ing domestic savings and attracting more stable, long-term Foreign Direct Investment (FDI). We briefly examine the first issue below. FDI is analyzed in Chapter 2.
Domestic savings peaked at 29 percent of GDP in 1988, right before Turkey opened its capital ac-count. Since then, there has been a continuous declining trend which accelerated in the 2000s and brought domestic savings down to an average of
16.1 percent of GDP in the last decade. With con-tinued robust investment demand, and with Turkey having gained access to international capital mar-kets after the 1980s, the difference was made up by foreign capital flows and Turkey’s current account moved progressively into deficit (Figure S1.3).
Thanks to solid macroeconomic management and strong corporate and financial balance sheets in the wake of the 2001 crisis and ensuing reforms, Tur-key was able to maintain access to financing even during the global economic and financial crisis of 2008-2009. Indeed, after shrinking 4.8 percent in 2009, the economy rebounded impressively, with an average growth rate of 9 percent in 2010 and 2011. Nonetheless, growing concerns over the very large current account deficit of 10 percent of GDP in 2011, have motivated a search for innova-tive macro-prudential tools which would moderate economic volatility without breaking the growth momentum (Chapter 3). The result of these efforts in 2012 was the first managed rebalancing which reduced the current account deficit to 6.0 percent of GDP from 9.8 in 2011 and broke the close tie be-tween the capital inflows and growth (Figure S1.3). Going forward, it appears that the current account deficit and the associated sustainable level of ex-ternal financing represent a binding constraint on Turkey’s growth potential. If Turkey wants to reduce the volatility of growth, policy makers may have to settle for more modest growth rates over the medium term.7 In the next section, this basic con-
Source: WB staff calculations, Ministry of Development, Central Bank of the Republic of Turkey (CBRT)
-10%
-5%
0%
5%
10%
15%
20%
25%
30%
35%
1975
1977
1979
1981
1983
1985
1987
1989
1991
1993
1995
1997
1999
2001
2003
2005
2007
2009
2011
2013
Domestic savings (percent of GDP) GDP growth (percent) Net financial inflows (percent of GDP)
Capital Account Liberalization
Figure S1.3: Economic growth has been financed by foreign capital inflows
7 IMF (2013) estimates that based on historical parameters, Turkey’s maximum growth rate consistent with no further deterioration in the current account deficit may lie somewhere between 2.8 and 3.5 percent. Changes in import and export elasticities in Turkey’s terms of trade, and in savings behavior would all affect these estimates. Our approach in this section is based on the long-term supply potential of the economy, but does include the foreign financing constraint by putting a ceiling on the feasible investment rate.
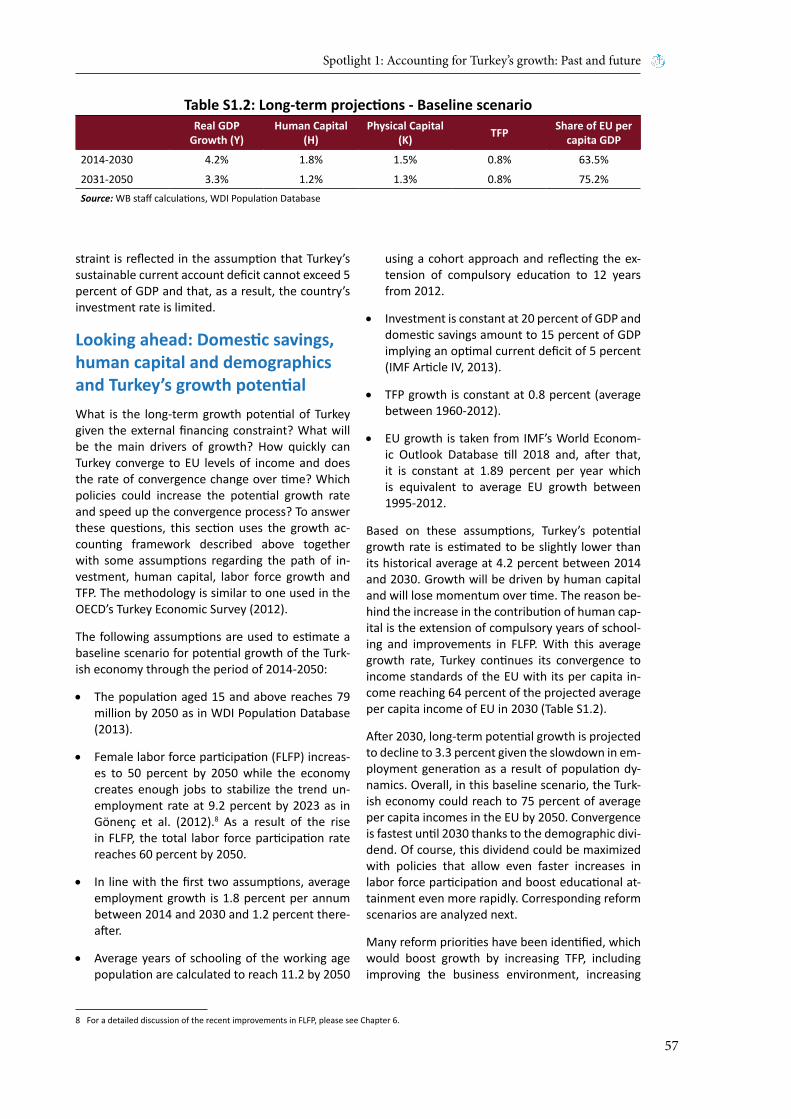
Spotlight 1: Accounting for Turkey’s growth: Past and future
57
straint is reflected in the assumption that Turkey’s sustainable current account deficit cannot exceed 5 percent of GDP and that, as a result, the country’s investment rate is limited.
Looking ahead: Domestic savings, human capital and demographics and Turkey’s growth potentialWhat is the long-term growth potential of Turkey given the external financing constraint? What will be the main drivers of growth? How quickly can Turkey converge to EU levels of income and does the rate of convergence change over time? Which policies could increase the potential growth rate and speed up the convergence process? To answer these questions, this section uses the growth ac-counting framework described above together with some assumptions regarding the path of in-vestment, human capital, labor force growth and TFP. The methodology is similar to one used in the OECD’s Turkey Economic Survey (2012).
The following assumptions are used to estimate a baseline scenario for potential growth of the Turk-ish economy through the period of 2014-2050:
• The population aged 15 and above reaches 79 million by 2050 as in WDI Population Database (2013).
• Female labor force participation (FLFP) increas-es to 50 percent by 2050 while the economy creates enough jobs to stabilize the trend un-employment rate at 9.2 percent by 2023 as in Gönenç et al. (2012).8 As a result of the rise in FLFP, the total labor force participation rate reaches 60 percent by 2050.
• In line with the first two assumptions, average employment growth is 1.8 percent per annum between 2014 and 2030 and 1.2 percent there-after.
• Average years of schooling of the working age population are calculated to reach 11.2 by 2050
using a cohort approach and reflecting the ex-tension of compulsory education to 12 years from 2012.
• Investment is constant at 20 percent of GDP and domestic savings amount to 15 percent of GDP implying an optimal current deficit of 5 percent (IMF Article IV, 2013).
• TFP growth is constant at 0.8 percent (average between 1960-2012).
• EU growth is taken from IMF’s World Econom-ic Outlook Database till 2018 and, after that, it is constant at 1.89 percent per year which is equivalent to average EU growth between 1995-2012.
Based on these assumptions, Turkey’s potential growth rate is estimated to be slightly lower than its historical average at 4.2 percent between 2014 and 2030. Growth will be driven by human capital and will lose momentum over time. The reason be-hind the increase in the contribution of human cap-ital is the extension of compulsory years of school-ing and improvements in FLFP. With this average growth rate, Turkey continues its convergence to income standards of the EU with its per capita in-come reaching 64 percent of the projected average per capita income of EU in 2030 (Table S1.2).
After 2030, long-term potential growth is projected to decline to 3.3 percent given the slowdown in em-ployment generation as a result of population dy-namics. Overall, in this baseline scenario, the Turk-ish economy could reach to 75 percent of average per capita incomes in the EU by 2050. Convergence is fastest until 2030 thanks to the demographic divi-dend. Of course, this dividend could be maximized with policies that allow even faster increases in labor force participation and boost educational at-tainment even more rapidly. Corresponding reform scenarios are analyzed next.
Many reform priorities have been identified, which would boost growth by increasing TFP, including improving the business environment, increasing
Table S1.2: Long-term projections - Baseline scenario
Real GDP
Growth (Y)Human Capital
(H)Physical Capital
(K) TFP Share of EU per capita GDP
2014-2030 4.2% 1.8% 1.5% 0.8% 63.5%
2031-2050 3.3% 1.2% 1.3% 0.8% 75.2%Source: WB staff calculations, WDI Population Database
8 For a detailed discussion of the recent improvements in FLFP, please see Chapter 6.
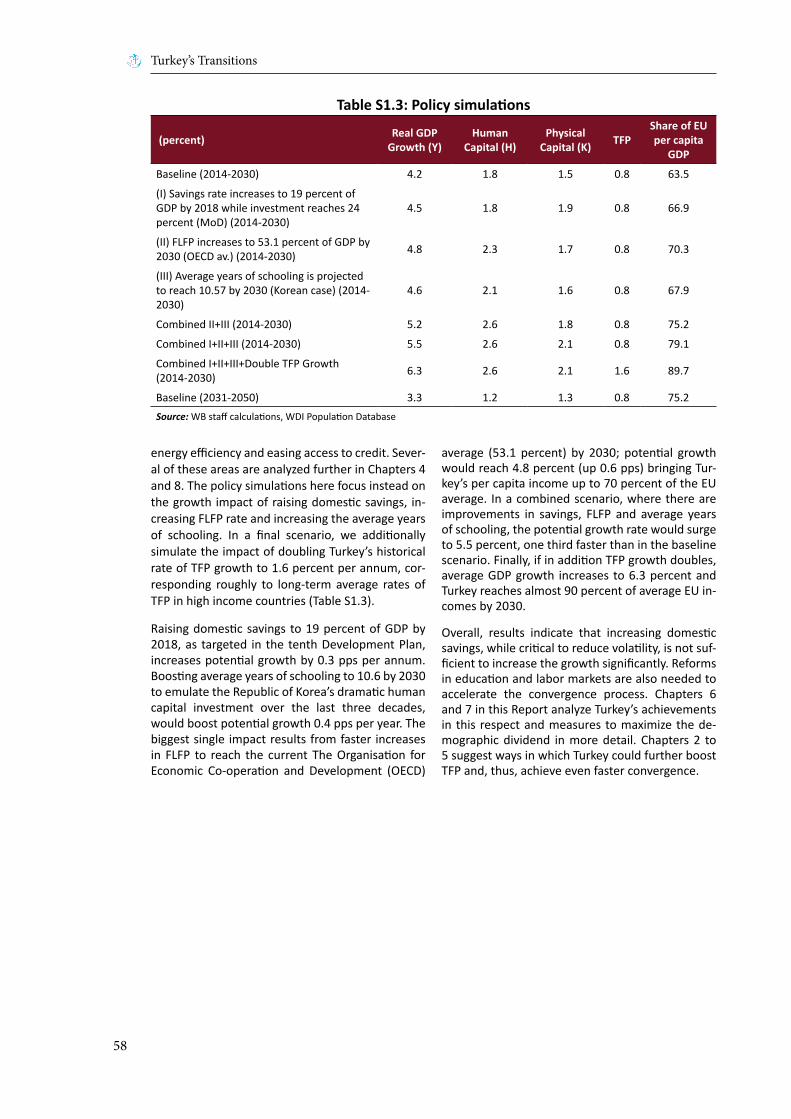
Turkey’s Transitions
58
energy efficiency and easing access to credit. Sever-al of these areas are analyzed further in Chapters 4 and 8. The policy simulations here focus instead on the growth impact of raising domestic savings, in-creasing FLFP rate and increasing the average years of schooling. In a final scenario, we additionally simulate the impact of doubling Turkey’s historical rate of TFP growth to 1.6 percent per annum, cor-responding roughly to long-term average rates of TFP in high income countries (Table S1.3).
Raising domestic savings to 19 percent of GDP by 2018, as targeted in the tenth Development Plan, increases potential growth by 0.3 pps per annum. Boosting average years of schooling to 10.6 by 2030 to emulate the Republic of Korea’s dramatic human capital investment over the last three decades, would boost potential growth 0.4 pps per year. The biggest single impact results from faster increases in FLFP to reach the current The Organisation for Economic Co-operation and Development (OECD)
average (53.1 percent) by 2030; potential growth would reach 4.8 percent (up 0.6 pps) bringing Tur-key’s per capita income up to 70 percent of the EU average. In a combined scenario, where there are improvements in savings, FLFP and average years of schooling, the potential growth rate would surge to 5.5 percent, one third faster than in the baseline scenario. Finally, if in addition TFP growth doubles, average GDP growth increases to 6.3 percent and Turkey reaches almost 90 percent of average EU in-comes by 2030.
Overall, results indicate that increasing domestic savings, while critical to reduce volatility, is not suf-ficient to increase the growth significantly. Reforms in education and labor markets are also needed to accelerate the convergence process. Chapters 6 and 7 in this Report analyze Turkey’s achievements in this respect and measures to maximize the de-mographic dividend in more detail. Chapters 2 to 5 suggest ways in which Turkey could further boost TFP and, thus, achieve even faster convergence.
Table S1.3: Policy simulations
(percent) Real GDP Growth (Y)
HumanCapital (H)
Physical Capital (K) TFP
Share of EU per capita
GDP
Baseline (2014-2030) 4.2 1.8 1.5 0.8 63.5
(I) Savings rate increases to 19 percent of GDP by 2018 while investment reaches 24 percent (MoD) (2014-2030)
4.5 1.8 1.9 0.8 66.9
(II) FLFP increases to 53.1 percent of GDP by 2030 (OECD av.) (2014-2030) 4.8 2.3 1.7 0.8 70.3
(III) Average years of schooling is projected to reach 10.57 by 2030 (Korean case) (2014-2030)
4.6 2.1 1.6 0.8 67.9
Combined II+III (2014-2030) 5.2 2.6 1.8 0.8 75.2
Combined I+II+III (2014-2030) 5.5 2.6 2.1 0.8 79.1
Combined I+II+III+Double TFP Growth (2014-2030) 6.3 2.6 2.1 1.6 89.7
Baseline (2031-2050) 3.3 1.2 1.3 0.8 75.2Source: WB staff calculations, WDI Population Database

Spotlight 1: Accounting for Turkey’s growth: Past and future
59
ReferencesAdamopoulos, T., & Akyol, A. (2009). Relative Un-derperformance A La Turca. Review of Economic Dynamics, 12, 697-717.
Altuğ, S., Filiztekin, A., & Pamuk, Ş. (2008). Sources of Long-term Economic Growth for Turkey 1880-2005. European Review of Economic History, 12, 393-430.
Barro, R. J., & Lee, J.-W. (2010, April). A New Data Set of Educational Attainment in the World, 1950-2010. NBER Working Paper No: 15902. National Bu-reau of Economic Research.
Caselli, F. (2005). Accounting for Cross-Country In-come Differences. CEP Discussion Papers dp0667. Centre for Economic Perfomance, LSE.
Chen, V., Gupta, A., Therrien, A., Levanon, G., & van Ark, B. (2010). Recent Productivity Developments in the World Economy: An Overview from the Con-ference Board Total Economy Database. Interna-tional Productivity Monitor, 3, 3-19.
Feenstra, R. C., Inklaar, R., & Timmer, M. P. (2013). The Next Generation of the Penn World Table. Re-trieved from available for download at www.ggdc.net/pwt
Gönenç, R., Rohn, O., Koen, V., & Saygılı, S. (2012). Structural Reforms to Boost Turkey’s Long-Term Growth. OECD Economics Department Working Pa-pers No: 987. OECD Publishing.
Hall, R., & Jones, C. (1999). Why Do Some Coun-tries Produce So Much More Output Per Worker Than Others? The Quarterly Journal of Economics, 114(1), 83-116.
IMF. (2013). Article IV Consultation. Staff Report
Lucas, R. (1988). On the Mechanics of Economic Development. Journal of Monetary Economics, 22 (1), 3-42.
Ministry of Development. (2013). 10th Develop-ment Plan.
OECD. (2012). OECD Economic Surveys: Turkey 2012. OECD Publishing.
Solow, R. (1957). Technical Change and the Aggre-gate Production Function. The Review of Economics and Statistics, 39(3), 312-320.
Tansel, A., & Daoud, Y. (2011). Comparative Essays on Returns to Education in Palestine and Turkey. ERC Working Papers 1102. Middle East Technical University Economic Research Center.
World Development Indicators. (2013). World Bank.

Turkey’s Transitions
60

Chapter 2: Trade: Benefiting from globalization
61
Trade: Benefiting from globalization
Chapter 2
Turkey’s Transitions: Integration, Inclusion, Institutions
Labor
Welfare
FiscalSpace
Enterprise
Infrastructure
Finance
Cities

Turkey’s Transitions
62

Chapter 2: Trade: Benefiting from globalization
63
Trade: Benefiting fromglobalization
Developing a global brand is perhaps the most visible sign of a country’s transition to high income. Republic of Korea’s meteoric rise
from low to high income in less than two genera-tions is vividly encapsulated by Samsung’s com-petition with the mighty Apple for the top spot in the tablet market. Plane maker Embraer stakes out Brazil’s claim to compete among the best in global air transport technology. Car manufacturer Skoda’s turnaround from the butt of jokes about Commu-nist engineering to a premium brand within the Volkswagen Group symbolizes the proud return of the Czech Republic into the ranks of high income economies. Samsung, Embraer and Skoda are fol-lowing in the footsteps of German and Japanese car makers, French and Italian fashion designers, and Scandinavian home outfitters in creating valuable global brands.
Turkey’s most notable branding successes are not in the area of high technology. But in a sure sign of the economic transformation the country expe-rienced over the past three decades, Turkey too has developed global brands, like jeans maker Mavi (Box 2.1). The company, established in 1991 as a family owned business, rapidly moved up the ranks of global design and marketing. In its 10th year, Mavi became the first ever Turkish brand which adver-
tised on US TV channels. In 2005, it featured in the Zagat magazine as New York City’s best jeans store. The company has had many special collections de-signed by some of the most well-known Turkish fashion designers.
Turkey’s textile industry is not the only sector to have dramatically increased its global presence. Turkey exports a large variety of goods to an in-creasingly diversified set of markets, from vehicles and vehicle parts to specialized foodstuffs, and from the European Union (EU) to the shores of West Af-rica. Turkish entrepreneurship as well as govern-
ment policies have supported the creation of global brands. For example, with the government’s sup-port and guidance regarding branding and market access, Turkish brands such as Beko (home appli-ances), Hidromek (construction machinery) and Çilek (furniture) became globally recognized. Over the past three decades Turkey has seen its exports share in global imports increase more than fourfold (from 0.2 percent to 0.9 percent). Turkey’s econom-ic opening is comparable to similar developments in India and China over the same period, and has been much more extensive than the experience in many Latin American countries. As this Chapter will argue, Turkey’s deepening trade relations with the EU have had a key role to play. Indeed, Turkey’s trade performance mirrors the experience of the new EU member states in Eastern Europe, which saw their role in the world economy transformed as a result of European integration. By becoming part of the European “Convergence Machine” Turkey, too, has transformed itself from a largely closed and predominantly rural economy into a major in-dustrial power and integrated into global manufac-turing value chains (Gill and Raiser, 2012).
In an attempt to document the reasons behind Tur-key’s strong trade performance, this Chapter spe-cifically addresses three questions:
• First, how did Turkey improve its export perfor-mance? The short answer is that the initial trade
liberalization efforts of the early 1980s and their culmination in the 1995 Customs Union (CU) with the EU have laid the basis for Turkey’s rapid integration into the European and global economy. As later chapters will show, Turkey’s economic opening went hand in hand with an accelerated shift of labor from agriculture into manufacturing and services which boosted Tur-key’s overall productivity. The easy access to the world’s largest consumer market complement-ed Turkey’s own liberalization efforts in assuring this positive outcome.
“If you aren’t already wearing Mavi, your kids probably are – the company sells hundreds of millions of dollars’ worth of high end, slim fitting denim all over the world. Building a global luxury brand is tough, especially for an emerging market firm that doesn’t have the cache of European heritage. But Mavi has managed to do it, in part because they kept an ownership stake in their factories, which allows them to have enough supply chain flexibility to respond quickly to market trends. If Mavi had outsourced production to Asia, where labor is half the price it is in Turkey, they wouldn’t have been able to get the product to market on time or on budget. But since they kept what’s known in trade as a “vertically integrated supply chain” (meaning, production, marketing, and sales are done in the same place) they’ve managed to thrive, and are now worn by the likes of Kate Winslet and Chelsea Clinton.”
Source: From Time.com, Three Economic Lessons Imported From Turkey. 1
1 http://business.time.com/2012/02/09/three-economic-lessons-imported-from-turkey/#ixzz2pcbQotAv
Box 2.1: Mavi Jeans - Made in Turkey, marketed globally

Turkey’s Transitions
64
• Second, how did Turkey diversify its export markets? The main reason for Turkey’s success in diversifying its export markets is that Turkey had goods to sell that many countries wanted to buy. Thanks to the CU, Turkish exports meet EU quality standards. This has helped export-ers penetrate new markets. In addition, invest-ments in logistics and diplomatic outreach have supported the diversification of Turkey’s trading partners. Turkey’s geographic location means it is well placed to benefit from the growing eco-nomic integration on the Eurasian continent.
• Third, how did Turkey upgrade its exports? Once again, the answer points towards European in-tegration. The process of integration with the EU has increased Turkey’s participation in Glob-al Value Chains (GVCs) and has resulted in high-er technology content and sophistication of ex-ports. Foreign Direct Investment (FDI) has been a driver of growing intra-industry trade as has been the reduction in trade costs that resulted from the harmonization with EU standards, the elimination of tariff and most non-tariff barriers to trade, and the improvement in Turkey’s logis-tics performance.
The chapter closes by casting a look ahead. Sustain-ing Turkey’s export performance into high income and beyond will require significant technological upgrading. While Turkey has dramatically increased its medium-technology exports, it has stagnated in high-tech exports. Higher value-added exports will require more skilled labor, greater efforts to attract FDI, and more innovation and experimentation by large and medium-sized firms. Moving up the val-ue chain should allow Turkey to more successfully compete in high-growth markets, including in Asia.
Turkey’s integration into the global economyLike many other countries in the world, Turkey has integrated substantially into the global economy during the final decades of the 20th and the first decade of the 21st century. Turkey’s economy has opened significantly since the 1980s, when exports amounted to only five percent of Gross Domestic Product (GDP). As shown in Figure 2.1, the pace at which the economy has opened to trade has varied significantly over the past few decades, with the fastest increase occurring during the 1980s, stag-nation during the 1990s, and a reacceleration over the past decade. During the 2000s, Turkey’s ex-ports increased by an average 15 percent annually in US$ terms, 6 percentage points above the global annual average growth rate of exports, and more than twice the growth rate of The Organisation for Economic Co-operation and Development (OECD) countries. Nevertheless, Turkey’s exports have re-mained relatively constant over the past decade as a share of GDP, unlike in most peers, with Turkey’s GDP measured in US$ terms tripling over the past decade as the real exchange rate appreciated.
Turkey’s openness - the ratio of trade in goods and services to GDP - has risen from 11 percent in 1970 to 58 percent by 2012. This reflects a pick-up in the export share by 22 percentage points and a 25 per-centage point rise in the import share of GDP. The change in the share of trade to GDP is similar to that in other integrating Middle Income Countries (MICs), like India and China (Figure 2.2). Turkey`s pace of trade integration has however not been as fast as in Republic of Korea or in some of the new EU member states such as Hungary.
Source: World Development Indicators (WDI)
05
1015202530354045505560
1970
1972
1974
1976
1978
1980
1982
1984
1986
1988
1990
1992
1994
1996
1998
2000
2002
2004
2006
2008
2010
2012
Perc
ent o
f GDP
Imports of goods and services (percent of GDP)
Exports of goods and services (percent of GDP)
Openness (Sum of imports and exports of goods and services, percent of GDP)
1980- Trade Liberalization
Figure 2.1: Turkey’s economy has dramatically opened up since 1980

Chapter 2: Trade: Benefiting from globalization
65
While increases in Turkey’s openness in the 1980s were driven by very rapid export growth, increas-es in Turkey’s openness over the past decade are linked to significant import growth, with the trade deficit widening sharply. This has led to some con-cern over excessive import dependence of Turkey’s economy and its exports in particular. However, as we argue further below, the rise in import penetra-tion has been intimately linked with Turkey’s inte-gration into GVCs and has allowed Turkish produc-ers to increase the quality of their exports. In other words, import growth and export success have been closely linked in Turkey, as well as in many other emerging markets. Indeed, while Turkey did increase imports 50 percent faster than the world average, and 75 percent faster than the OECD aver-age, Turkey’s rate of import growth was only half the rate observed in China over the decade.
Trade policy has played an important role in boost-ing Turkey’s export performance, especially in the 1980s when exports grew at a higher rate than in comparator countries. Trade policy and exchange rate reforms were central to the stabilization and adjustment program launched in January 1980, in-cluding an upfront 33 percent devaluation of the TL, the elimination of multiple exchange rate practices, and liberalization of access to foreign exchange in particular for exporters and banks involved in the export business (Öniş and Webb, 1992). This was accompanied by a sharp reduction in real wages as nominal wages did not keep up with inflation. Özal’s private-sector focused policies included a
shift from import substitution to export promotion and reduction in import quotas and tariffs. During this period, various export promotion policies were introduced, ranging from legislative changes for tax rebates and tax exemptions to credit and insurance mechanisms. In 1987, Turkish Eximbank was estab-lished to help Turkish exporters compete in exter-nal markets and support Turkey’s exports strategy.1
Export subsidies were a critical component of the reforms in the early 1980s, and included a variety of incentives. Subsidies in the early 1980s averaged about 22 percent of export value (Milanovic, 1986; Bateman and Arslan, 1989), and they were initially largely in the form of export credits (which ran as high as 40 percent for industrial exports in 1980-1981). The subsidy varied widely and some sectors received subsidies of over 100 percent. At the same time, import taxes on raw materials and intermedi-ate goods imported for use in Turkish exports were reduced to zero, thus further shifting relative prices in favor of export goods.
Turkey’s initial mix of export subsidies with selec-tive import restrictions was overall successful, but created considerable distortions. As these distor-tions became increasingly apparent, Turkey dur-ing the 1980s gradually dismantled its system of non-tariff barriers on imports. In 1989 and 1990, a major liberalization of import licenses and tariffs was undertaken and full convertibility of the TL was established, greatly reducing the opportunities for rent-seeking. This was combined with an opening of the capital account and financial sector liberal-
Source: WDI
0%
20%
40%
60%
80%
100%
120%
140%
160%
180%
200%
Brazil China Hungary India Korea,Republic of
Poland Turkey
Sum
of E
xpor
ts a
nd Im
port
s in
GDP
1970 1990 2011
Figure 2.2: The increase in Turkey’s openness since the 1970s is comparable to India and China
1 T.C. Başbakanlık Devlet Planlama Teşkilatı. 9. Kalkınma Planı 2007-2013, Özel Ihtisas Komisyonu Raporu: Dış Ticaret, Ankara 2007.

Turkey’s Transitions
66
ization. The rapid liberalization of the 1980s and early 1990s without concomitant tightening of bud-get constraints for state-owned enterprises (SOEs) and strengthening of regulatory institutions creat-ed growing imbalances which led to repeated mac-roeconomic crises in 1994, 1999 and again in 2001 (Atiyas, 2012), and which are discussed elsewhere in this volume (Chapter 1; Chapter 3). However, the opening up did lay the foundation for closer eco-nomic integration with the EU, which was to prove critical for trade performance in the 2000s.
The culmination of trade policy reform efforts was the establishment of a CU between Turkey and the EU on December 31, 1995. The CU covers trade in industrial goods (including the industrial compo-nents of processed agricultural products) and ex-cludes primary agriculture and services. Although Turkish exports of many industrial goods to the EU had been mostly duty free since the 1970s, in Tur-key, the CU drove a considerable reduction in tariff and non-tariff barriers and locked in Turkey’s liberal regime for manufacturing trade (Figure 2.3).
The CU has been a major instrument of integration of the Turkish economy into European and global markets. The value of bilateral trade between Tur-key and the EU has increased considerably. Be-tween 1996 and 2011, Turkey’s exports to the EU increased almost fourfold while Turkey’s imports from the EU increased nearly threefold. Bilateral trade between the EU and Turkey reached US$148 billion in 2012 making Turkey the EU’s sixth largest trading partner and the EU Turkey’s biggest (World Bank, 2014a). The EU-Turkey CU was the EU’s first
substantial functioning CU with a non-member state and was one of the earliest attempts by the EU to share its legal system with a non-member country. While originally seen as a stepping stone towards full membership and hence suffering from a number of design flaws which have caused in-creasing irritation over the years, the CU has, none-theless, delivered major benefits to both parties and must be considered a critical driver of Turkey’s emergence as a global trading power.
The CU and increased integration with the EU also played a role in the rise in FDI to Turkey during the last decade. The EU, led by the Netherlands, Aus-tria, UK, Luxembourg, Germany and Spain, is the largest foreign investor in Turkey accounting for three-quarters of total FDI inflows during the last five years. EU firms were attracted by the prospect of regulatory harmonization and accessing highly skilled labor with lower wages. Firms based in third countries that wished to export industrial goods to the EU market duty-free saw an opportunity. The CU being considered a stepping stone in Turkey’s accession process towards full EU membership was another positive factor. More recently, countries in the Gulf and Middle East are also becoming sig-nificant investors in Turkey, especially in the health sector and private equity, accounting for 12 percent of FDI inflows in 2012. Foreign investment into Tur-key is mostly for services and manufacturing. Large investors include Bosch, Mercedes and Toyota. However, investments in agro-processing are sig-nificant and growing, accounting for 7 percent of FDI inflows since 2007.
Source: World Bank (WB) staff calculations at Harmonized Classification (HS)-8 digit level based on United Nations Conference on Trade and Development (UNCTAD) Trade Analysis Information System (TRAINS)Note: Dark shaded bars reflect tariff increases, light shaded bars reflect tariff reductions relative to the pre CU level.
0%
50%
100%
150%
200%
250%
MFN
Tar
iff
Products not covered by the Customs Union
Products covered by the Customs Union
Figure 2.3: Tariffs for products covered by the Customs Union fell significantly

Chapter 2: Trade: Benefiting from globalization
67
While FDI has increased since 2003, Turkey contin-ues to lag behind large emerging market peers in attracting foreign investors (Figure 2.4). FDI peaked at US$19.1 billion in 2007, but fell sharply during the subsequent global financial crisis, and has since failed to recover both in absolute terms in as a share of total FDI inflows to peer developing coun-tries. During 2002-2012 period, the average level of FDI inflows to Turkey was modest, at US$11 bil-lion, compared to over US$20 billion in India and Mexico, and over US$30 billion in Russian Federa-tion and Brazil (Figure 2.5). According to surveys
regularly conducted by the International Investors Association (YASED), the main barriers to FDI in Tur-key are microeconomic. In the most recent survey (2013, 1st half), lack of legal assurance, economic instability and tax and incentive policies are the top three factors, followed by the size of the informal (unregistered) economy. At the same time, Turkey’s location is a key attraction, and its young popula-tion and improving infrastructure and logistics are assets.
The CU has also proved to be a powerful force of regulatory convergence, providing a significant im-
Source: UNCTADNote: “Emerging Economies” and “Middle Income Developing Economies” are UNCTAD’s definitions.
Source: UNCTAD
0%
2%
4%
6%
8%
10%
12%
14%
16%
18%
20%19
70
1972
1974
1976
1978
1980
1982
1984
1986
1988
1990
1992
1994
1996
1998
2000
2002
2004
2006
2008
2010
2012
FDI Inflows to Turkey as a share of Total FDI Inflows to Emerging Economies
FDI Inflows to Turkey as a share of Total FDI Inflows to Middle Income Developing Economies
1 1 2 2 2 2 2 3 4 4 5 5 6 6 7 8 11 1321 22
33 36
87
0102030405060708090
100
Alba
nia
Syria
n Ar
ab R
ep.
Tuni
sia
Jord
an
Phili
ppin
es
Mor
occo
Croa
tia
Slov
akia
Sout
h Af
rica
Bulg
aria
Egyp
t
Hung
ary
Rom
ania
Mal
aysi
a
Czec
h R.
Kore
a, R
ep.
Turk
ey
Pola
nd
Indi
a
Mex
ico
Braz
il
Russ
ian
Fed.
Chin
a
In B
illio
n US
$Figure 2.4: FDI inflows to Turkey as a share of emerging markets
Figure 2.5: FDI Inflows, 2002 - 2012 annual average
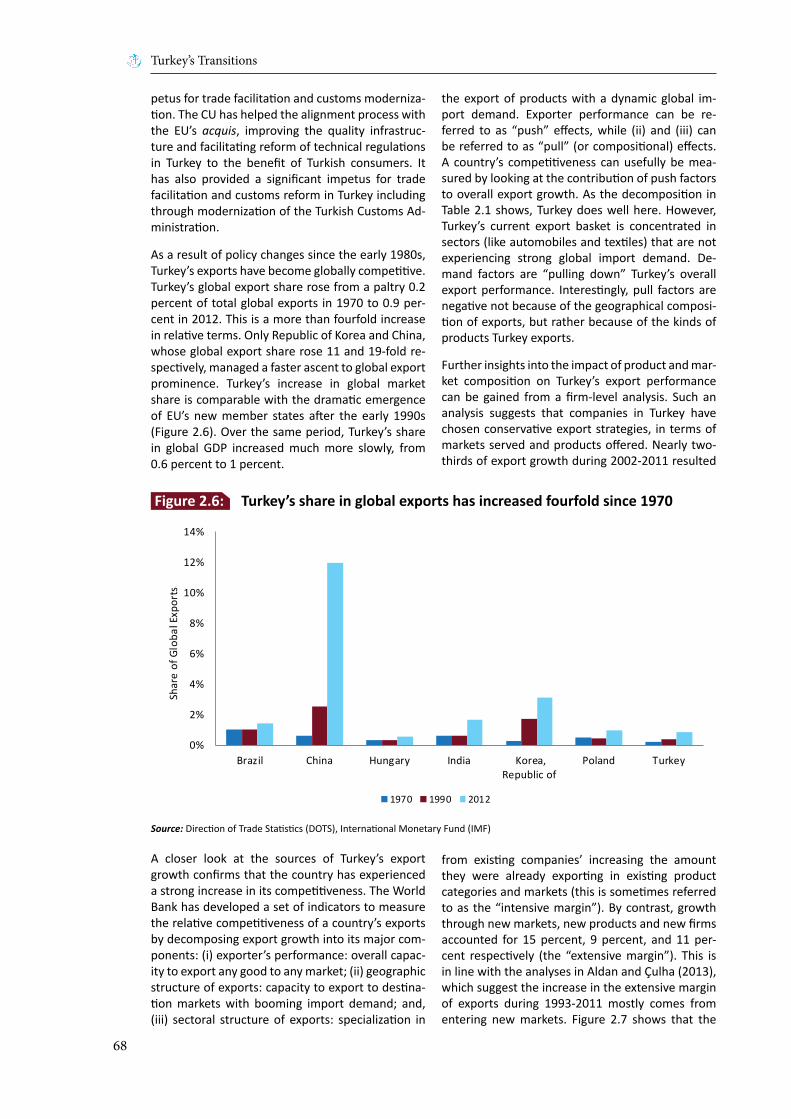
Turkey’s Transitions
68
petus for trade facilitation and customs moderniza-tion. The CU has helped the alignment process with the EU’s acquis, improving the quality infrastruc-ture and facilitating reform of technical regulations in Turkey to the benefit of Turkish consumers. It has also provided a significant impetus for trade facilitation and customs reform in Turkey including through modernization of the Turkish Customs Ad-ministration.
As a result of policy changes since the early 1980s, Turkey’s exports have become globally competitive. Turkey’s global export share rose from a paltry 0.2 percent of total global exports in 1970 to 0.9 per-cent in 2012. This is a more than fourfold increase in relative terms. Only Republic of Korea and China, whose global export share rose 11 and 19-fold re-spectively, managed a faster ascent to global export prominence. Turkey’s increase in global market share is comparable with the dramatic emergence of EU’s new member states after the early 1990s (Figure 2.6). Over the same period, Turkey’s share in global GDP increased much more slowly, from 0.6 percent to 1 percent.
A closer look at the sources of Turkey’s export growth confirms that the country has experienced a strong increase in its competitiveness. The World Bank has developed a set of indicators to measure the relative competitiveness of a country’s exports by decomposing export growth into its major com-ponents: (i) exporter’s performance: overall capac-ity to export any good to any market; (ii) geographic structure of exports: capacity to export to destina-tion markets with booming import demand; and, (iii) sectoral structure of exports: specialization in
the export of products with a dynamic global im-port demand. Exporter performance can be re-ferred to as “push” effects, while (ii) and (iii) can be referred to as “pull” (or compositional) effects. A country’s competitiveness can usefully be mea-sured by looking at the contribution of push factors to overall export growth. As the decomposition in Table 2.1 shows, Turkey does well here. However, Turkey’s current export basket is concentrated in sectors (like automobiles and textiles) that are not experiencing strong global import demand. De-mand factors are “pulling down” Turkey’s overall export performance. Interestingly, pull factors are negative not because of the geographical composi-tion of exports, but rather because of the kinds of products Turkey exports.
Further insights into the impact of product and mar-ket composition on Turkey’s export performance can be gained from a firm-level analysis. Such an analysis suggests that companies in Turkey have chosen conservative export strategies, in terms of markets served and products offered. Nearly two-thirds of export growth during 2002-2011 resulted
from existing companies’ increasing the amount they were already exporting in existing product categories and markets (this is sometimes referred to as the “intensive margin”). By contrast, growth through new markets, new products and new firms accounted for 15 percent, 9 percent, and 11 per-cent respectively (the “extensive margin”). This is in line with the analyses in Aldan and Çulha (2013), which suggest the increase in the extensive margin of exports during 1993-2011 mostly comes from entering new markets. Figure 2.7 shows that the
Source: Direction of Trade Statistics (DOTS), International Monetary Fund (IMF)
0%
2%
4%
6%
8%
10%
12%
14%
Brazil China Hungary India Korea,Republic of
Poland Turkey
Shar
e of
Glo
bal E
xpor
ts
1970 1990 2012
Figure 2.6: Turkey’s share in global exports has increased fourfold since 1970

Chapter 2: Trade: Benefiting from globalization
69
countries with the highest contribution of the in-tensive margin to export growth are all intensive in the production and export of commodities, where experimentation may be slower. Turkey, despite being intensive in manufacturing and at the upper end of the middle-income scale, stands closer to
the group of countries reliant on commodity ex-ports – rather than to countries with more similar patterns of specialization. A strategy to sustain Tur-key’s strong export performance into high income should focus on boosting product and process in-novation at the firm level to open up new markets.
Source: WB staff calculations based on data from TurkStat, World Bank’s Exporter Dynamics Database and WDINote: Due to data availability constraints, data for each country are an average across different years. See World Bank (2014b) for details.
CHL
COL
ECU
JOR
MKD
PAK
PER
MEX
ZAFNIC TUR
y = -0,258x + 2,7124
0%
20%
40%
60%
80%
100%
7.5 8.0 8.5 9.0 9.5 10.0Shar
e of
exp
ort g
row
th fr
om in
tens
ive m
argi
n
Log GDP per capita, Purchasing Power Parity (PPP) (Constant 2005 International Dollars)
Figure 2.7: In Turkey, existing firms, existing products and existing markets contribute more to export growth than in other MICs
Table 2.1: Decomposition of export growth: Turkey versus selected peers,2005-2010 (in percent)
Export Growth
Export market share
change
Performance (export growth without
composition effects)
Pull factors(specialization,
composition effects), of which:
Push factors(“performance”, i.e. export market share growth without composition
effects), of which:
Geographical Sectoral Overall (Value)
Pricecomponent
Volumes component
Turkey 11.8 2.4 13.1 1.0 -2.4 3.6 0.6 3.0
Brazil 14.9 5.6 11.7 2.1 1.1 1.8 2.6 -0.8
Russian Federation
12.4 3.0 8.4 0.9 3.1 -1.2 0.6 -1.8
India 14.9 5.5 14.4 0.4 0.0 4.6 -1.7 6.4
China 17.3 7.9 20.1 -0.2 -2.6 10.3 1.4 8.8
S. Africa 12.1 2.7 10.6 0.9 0.6 1.0 0.1 0.8
Germany 6.1 -3.2 6.8 -0.5 -0.2 -2.3 -1.3 -1.1
USA 7.4 -1.9 5.6 1.6 0.3 -3.6 -0.4 -3.2Source: WB staff calculations based on data from Turkish Statistical Institute (TurkStat), Gaulier, Guillaume & Santoni, Gianluca & Taglioni, Daria & Zignago, Soledad, 2013. “In the wake of the global crisis : evidence from a new quarterly database of export com-petitiveness,” Policy Research Working Paper Series 6733, The World Bank, and Gaulier, G. & Santoni, G. & Taglioni, D. & Zignago, S., 2013. “Market Shares in the Wake of the Global Crisis: the Quarterly Export Competitiveness Database,” Working Papers 472, Banque de France.Note: Figures are for the average annual growth in exports from 2005q1 to 2010q4.
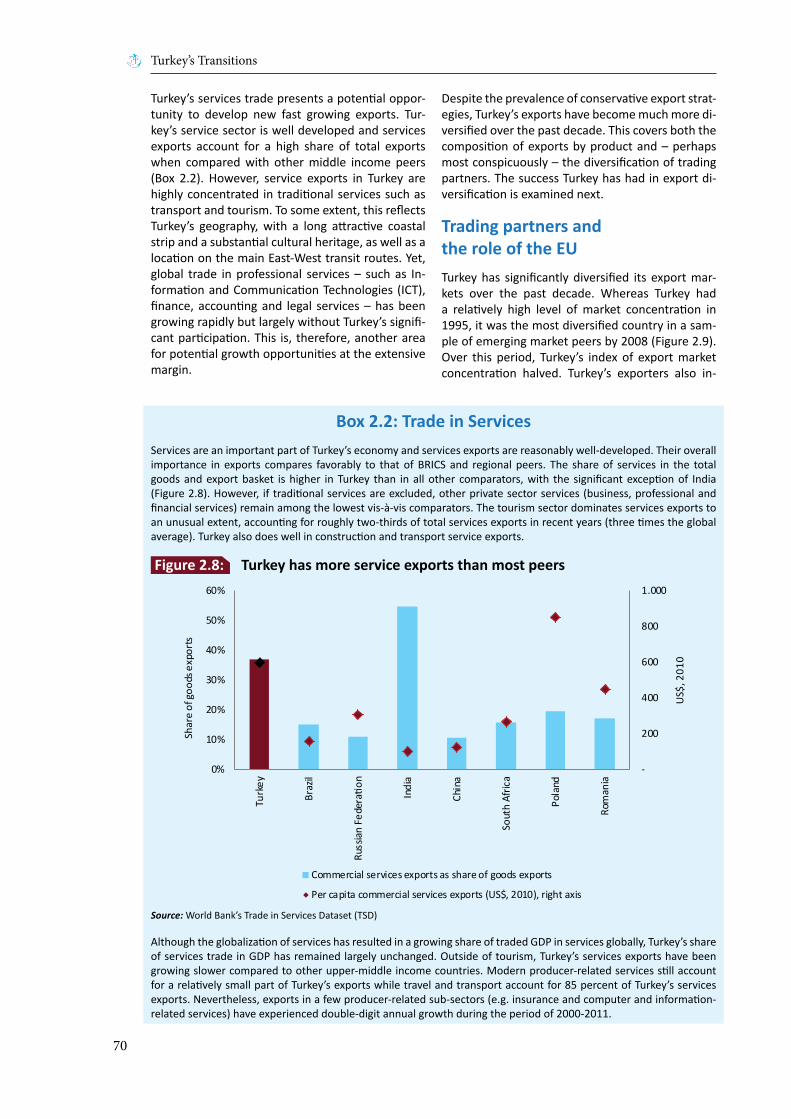
Turkey’s Transitions
70
Turkey’s services trade presents a potential oppor-tunity to develop new fast growing exports. Tur-key’s service sector is well developed and services exports account for a high share of total exports when compared with other middle income peers (Box 2.2). However, service exports in Turkey are highly concentrated in traditional services such as transport and tourism. To some extent, this reflects Turkey’s geography, with a long attractive coastal strip and a substantial cultural heritage, as well as a location on the main East-West transit routes. Yet, global trade in professional services – such as In-formation and Communication Technologies (ICT), finance, accounting and legal services – has been growing rapidly but largely without Turkey’s signifi-cant participation. This is, therefore, another area for potential growth opportunities at the extensive margin.
Despite the prevalence of conservative export strat-egies, Turkey’s exports have become much more di-versified over the past decade. This covers both the composition of exports by product and – perhaps most conspicuously – the diversification of trading partners. The success Turkey has had in export di-versification is examined next.
Trading partners andthe role of the EUTurkey has significantly diversified its export mar-kets over the past decade. Whereas Turkey had a relatively high level of market concentration in 1995, it was the most diversified country in a sam-ple of emerging market peers by 2008 (Figure 2.9). Over this period, Turkey’s index of export market concentration halved. Turkey’s exporters also in-
Services are an important part of Turkey’s economy and services exports are reasonably well-developed. Their overall importance in exports compares favorably to that of BRICS and regional peers. The share of services in the total goods and export basket is higher in Turkey than in all other comparators, with the significant exception of India (Figure 2.8). However, if traditional services are excluded, other private sector services (business, professional and financial services) remain among the lowest vis-à-vis comparators. The tourism sector dominates services exports to an unusual extent, accounting for roughly two-thirds of total services exports in recent years (three times the global average). Turkey also does well in construction and transport service exports.
Although the globalization of services has resulted in a growing share of traded GDP in services globally, Turkey’s share of services trade in GDP has remained largely unchanged. Outside of tourism, Turkey’s services exports have been growing slower compared to other upper-middle income countries. Modern producer-related services still account for a relatively small part of Turkey’s exports while travel and transport account for 85 percent of Turkey’s services exports. Nevertheless, exports in a few producer-related sub-sectors (e.g. insurance and computer and information-related services) have experienced double-digit annual growth during the period of 2000-2011.
Box 2.2: Trade in Services
-
200
400
600
800
1.000
0%
10%
20%
30%
40%
50%
60%
Turk
ey
Braz
il
Russ
ian
Fede
ratio
n
Indi
a
Chin
a
Sout
h Af
rica
Pola
nd
Rom
ania
US$
, 201
0
Shar
e of
goo
ds e
xpor
ts
Commercial services exports as share of goods exports
Per capita commercial services exports (US$, 2010), right axis
Figure 2.8: Turkey has more service exports than most peers
Source: World Bank’s Trade in Services Dataset (TSD)

Chapter 2: Trade: Benefiting from globalization
71
creased their market access, with significant levels of exports going to 137 countries by 2010.2 At a country level, too, the significant diversification of Turkish exports over the past decade is apparent. For example, Germany’s share of Turkey’s total ex-ports was reduced by almost half over the decade (from 20.7 percent to 10.5 percent). Within Middle East and North Africa (MENA), exports became less reliant on Israel (although it remains one of the main destinations in the region) and more depen-dent on Iraq, Islamic Republic of Iran, and the Unit-ed Arab Emirates. Other non-traditional trading partners that have become more important des-tinations for Turkish exports over the past decade are Russian Federation, Azerbaijan, and China. As shown in Table 2.1, thanks to successful diversifica-tion of markets, Turkey’s exports benefited from a strongly positive geographic pull effect over the pe-riod 2005-2010 despite being significantly exposed to the underperforming European market (World Bank, 2014b).
To a large extent, market diversification has fol-lowed a well-trodden path. As exports to the EU declined, exports to MENA increased, in a pattern reminiscent of the late 1970s (Figure 2.10). The EU has been a major trading partner for Turkey ever since the European Economic Community (EEC) was established in 1957 and especially since the CU went into force in 1996. It has generally been Turkey’s largest trading partner, with the MENA region taking second position. However, after the
2008 global financial crisis and the resulting slump in Europe in particular, there have also been con-certed efforts by Turkish companies to enter new markets, for instance in Africa, in the former Soviet Union and to a lesser extent in Asia and Latin Amer-ica. Government policy, especially since 2007, has contributed to these outcomes.
Market diversification has been significantly helped by government policy. In the aftermath of the ma-jor economic crisis in 2001, the contraction in do-mestic demand and devaluation of the TL formed the basis for the move towards export-orientation. New policies were introduced to expand exports to selected “target markets”, attract more FDI and develop a global “Made-in-Turkey” image. Among support programs were those for trade missions abroad and international trade fair participation. The “target markets/countries” approach contin-ued into the 2010s. In the context of the Market Access Committee established for new market pen-etration, studies have been carried out to identify target countries as well as a different set of “prior-ity countries”. For example, for the period of 2012-2013, 17 target countries and 27 priority countries were approved by the Market Access Committee. Exporters to the target countries can receive ad-ditional support according to two circulars issued by the Ministry of Economy.3 The selection of these countries was based not only on the size of the market and openness of the country, but also on a comprehensive macroeconomic analysis, the com-
Source: World Trade Indicators (WTI), World Bank
05
1015202530354045
Braz
il
Chin
a
Hung
ary
Indi
a
Kore
a,Re
publ
ic o
f
Pola
nd
Rom
ania
Russ
ian
Fede
ratio
n
Sout
h Af
rica
Turk
ey
Expo
rt M
arke
t Des
tinati
on
Conc
entr
ation
Inde
x
1995 2000 2008
Figure 2.9: Turkey has diversified its export markets more than other countries
2 Includes destinations with exports of more than US$10 million.
3 2009/5 and 2010/6.

Turkey’s Transitions
72
petitiveness analysis of Turkish exports within each market, the judicial and trade infrastructure, the state of services trade and strategic considerations such as energy links.4
Logistics and business networks have also helped. The impressive expansion of Turkish Airlines (from 66 international destinations in 1998 to 199 in 2013) facilitated the outreach of Turkey’s exports and exporters. Turkish Airlines now flies to over 240 destinations (including domestic flights) compared to 215 destinations for Lufthansa and about 200 for Air France. Turkey has also entered markets per-ceived as high risk by European suppliers, helped by the flexibility of Turkish exporters in business pro-cesses, receiving and delivering orders (frequently cited by exporters as a distinguishing feature), in-creasing business networks, as well as increased social and cultural ties. Turkey’s exports also ben-efited from the good quality reputation Turkish companies have acquired by successfully exporting to the EU market.5
The drivers of Turkey’s expansion into new markets have generally been firms with solid export experi-ence in the EU. Micro-level data analysis for Turkey shows that market expansion and diversification have been driven by a few leading exporters, i.e. those able to face the trade costs associated with
serving multiple destinations, such as establishing distribution networks, complying with standards, and dealing with cross-border trade finance is-sues and customs.6 This is not unusual and data for countries such as Chile, South Africa and France show that aggregate exports are largely driven by a few leading exporters that supply several foreign markets. This notwithstanding, market penetration by Turkish firms increased overall and the average number of exporters per destination almost dou-bled between 2002 and 2010 (World Bank, 2014b).
The diversification of exports away from the EU is thus, largely a story of existing exporters diversify-ing their customer base. Only four percent of the firms exporting to the EU in 2009, switched to other markets in 2010 (meaning they stopped exporting to the EU and started exporting to other markets). The share switching to the MENA region was one percent. By contrast, the share of exporters ex-panding to other markets in 2010 was 13 percent, of which 3 percent added MENA. A full 71 percent of the exporters that entered MENA for the first time in 2010 expanded there from the EU (World Bank, 2014b). This is consistent with the finding in Ulu (2014) that the search costs of entering new foreign markets fall with the number of countries a firm is already present in. Nonetheless, for some of the fast expanding enterprises in Turkey’s Anatolian
Source: DOTS, IMF.Note: All the group definitions are from DOTS’
0%
10%
20%
30%
40%
50%
60%
70%
1970
1972
1974
1976
1978
1980
1982
1984
1986
1988
1990
1992
1994
1996
1998
2000
2002
2004
2006
2008
2010
2012
Shar
e of
Tur
key`
s To
tal E
xpor
ts
Africa Developing Asia European Union
Middle East and North Africa Sub-Saharan Africa
Figure 2.10: Exports to MENA are the mirror image of exports to Europe
4 T.C. Başbakanlık Devlet Planlama Teşkilatı. 9. Kalkınma Planı 2007-2013, Özel Ihtisas Komisyonu Raporu: Dış Ticaret, Ankara, 2007 and Ministry of Economy website.
5 One Ambassador from an African country in Ankara told the authors why his country likes Turkish exporters: “They offer European quality at Turkish prices.”
6 Large exporters are measured as those with more than 200 employees. The breakdown of small, medium, large sized firms used on the source of this analysis (World Bank 2014b) differs slightly from the definition used by OECD, for example, which considers firms with less than 250 employees “SMEs”.

Chapter 2: Trade: Benefiting from globalization
73
provinces, the geographic proximity to the MENA market as well as the substantial investments in transport infrastructure has opened access to ex-port markets for the first time (Chapter 4).
One reason that EU exporters have been more suc-cessful in diversifying into other markets is that exporting to the EU is associated with higher pro-ductivity. Cebeci (2013) evaluates the role of export destinations on productivity, employment, and wages of Turkish firms by comparing the perfor-mance of firms that export to low-income destina-tions and those exporting to high-income destina-tions with those that do not export. Beginning to export to the EU market enhances firm productivity in Turkey: significantly increasing total factor pro-ductivity (TFP) by 7.4, 8.1 and 9.7 percent (com-pared to non-exporting firms) in the first, second and third year of exporting to the EU, respectively. In contrast, beginning to export to MENA does not bring significant benefits to firms’ TFP. For average wages, the impact of exporting to the EU is estimat-ed to be 1.3, 3.5 and 3.8 percent (relative to non-exporting firms) for each the first three years of ex-porting whereas the impact of exporting to MENA is not statistically significant.
Diversification of export markets improves firm sur-vival (Figure 2.11). It seems firms use the EU and European Free Trade Association (EFTA) market as a testing ground before aiming at more difficult markets. Figure 2.11 shows that only 22 percent of exporters to the EU and EFTA remained in business seven years after entry in the market. For exports to other regions, the 7-year survival rate was higher: 29 percent to MENA, 27 percent to the rest of Eu-rope and Central Asia, and 23 percent to the rest of the world. A higher degree of churning – or mortal-ity – in given destinations can be a symptom of low-er fixed costs to that destination and higher compe-tition in that market. Since the non-EU neighboring markets are relatively more uncertain and fraught with higher fixed costs, only more competitive ex-porters have the resources to test markets, face uncertainties and absorb fixed costs.7 Government support may thus play a particularly important role in encouraging firms to move to these more diffi-cult destinations. But ultimately, to enter the high growth markets of Asia, Turkey needs to move up the value chain. We now look at the progress the country has made in this regard over the past de-cade and the challenges still ahead.
Source: WB staff calculations based on data from TurkStatNote: Survival after 1 year is the average of survival rates between 2003 to 2010, survival after 2 years is the average of survival rates between 2004 to 2010, survival after 3 years is the average of survival rates between 2005 to 2010, survival after 4 years is the average of survival rates between 2006 to 2010, survival after 5 years is the average of survival rates between 2007 to 2010, survival after 6 years is the average of survival rates between 2008 to 2010, survival after 7 years is the survival rates for 2009.All the region definitions are TurkStat’s.
0%
10%
20%
30%
40%
50%
60%
1 year 2 years 3 years 4 years 5 years 6 years 7 years
Shar
e of
firm
s stil
l exp
ortin
g to
the
regi
on afte
r n
year
s
EU MENA Rest of Europe and Central Asia Rest of the World
Figure 2.11: Export survival of export relationships in different world regions
7 Both facts are supported by evidence that the average and median value of exports for entrants in the first year of exporting activity is lower for firms going to EU or EFTA countries than for those going to MENA countries. One caveat is that due to the more informal nature of trade – including suit-case trade – with non-traditional partners, export flows to MENA may not capture the most short-lived trading relationships and thus underestimate the degree of churning that actually takes place.

Turkey’s Transitions
74
Trading products:technology-content, sophistication, and quality
Increasing export quality, however measured
There has been a significant change in the sectoral composition of Turkey’s exports over the last de-cade. The share of the textile and apparel sector, which accounted for 40 percent of exports at the beginning of the decade, declined dramatically (Fig-ure 2.12). It was replaced, in particular, by the au-tomotive sector, which grew rapidly during this pe-riod, but also by the machinery and metals sectors. This decade-long pattern of structural transforma-tion slowed from 2007, however. Indeed, while the global financial crisis may have contributed to Tur-key’s export market diversification, it has also co-incided with a period of relative stagnation from a sector and product perspective. The vehicles sector was the most affected by the crisis and the slow-est to recover from it. Export growth after the crisis has been less dependent on vehicles and transport equipment and more dependent on metals, ma-chinery, and textiles, as well as food and beverag-es and chemicals (especially plastics), which have re-emerged as important export sectors. Indeed, Turkey over the past decade maintained a revealed comparative advantage (RCA) in a number of re-
source-based export sectors including those related to metals (e.g. iron and steel), agricultural products (sugar, tobacco, fruit and vegetables), as well as in textiles, and some chemicals, while simultaneously developing an RCA in new sectors such as road ve-hicles, dying, tanning and coloring of materials.
In parallel with the shift in sector composition, Tur-key’s export basket has become more diversified, much like its export destinations. Turkey’s export basket is extremely diversified both relative to the BRICS and regional peers (Hungary, Poland, Czech Republic, and Romania). Among this group, Turkey has the lowest level of export product concentra-tion, and along with Hungary is the only country to have diversified over the past decade. While the top 10 products in Turkey’s export basket account for about the same share of exports in 2010 as they did in 2000 (26.4 percent in 2010 and 27.5 per-cent in 2001), there has been an increase in both the range of products being exported and in the strength of some of the non-traditional products.8 Turkey exports 2.5 times as many products than it did a decade earlier; a faster expansion than all BRICS other than India (World Bank, 2014b).9
Turkey has significantly increased its medium-tech-nology exports. The share of medium technology exports in total exports increased by more than half over the last decade from 22 to 34-35 percent, although it recently declined to 30 percent in 2012 most likely linked to the decline in automotive ex-
Source: Comtrade (via World International Trade Statistics (WITS))
0%
5%
10%
15%
20%
25%
30%
35%
40%
2000 2001 2002 2003 2004 2005 2006 2007 2008 2009 2010 2011 2012
Shar
e of
Tot
al Ex
port
s
Other Vegetables Foodstuffs Textiles Metals Machinery Vehicles
Figure 2.12: Vehicles increase, textiles decline
8 This result applies at the 4-digit level of the Harmonized Classification (HS).
9 This result applies at HS 6-digit classification.
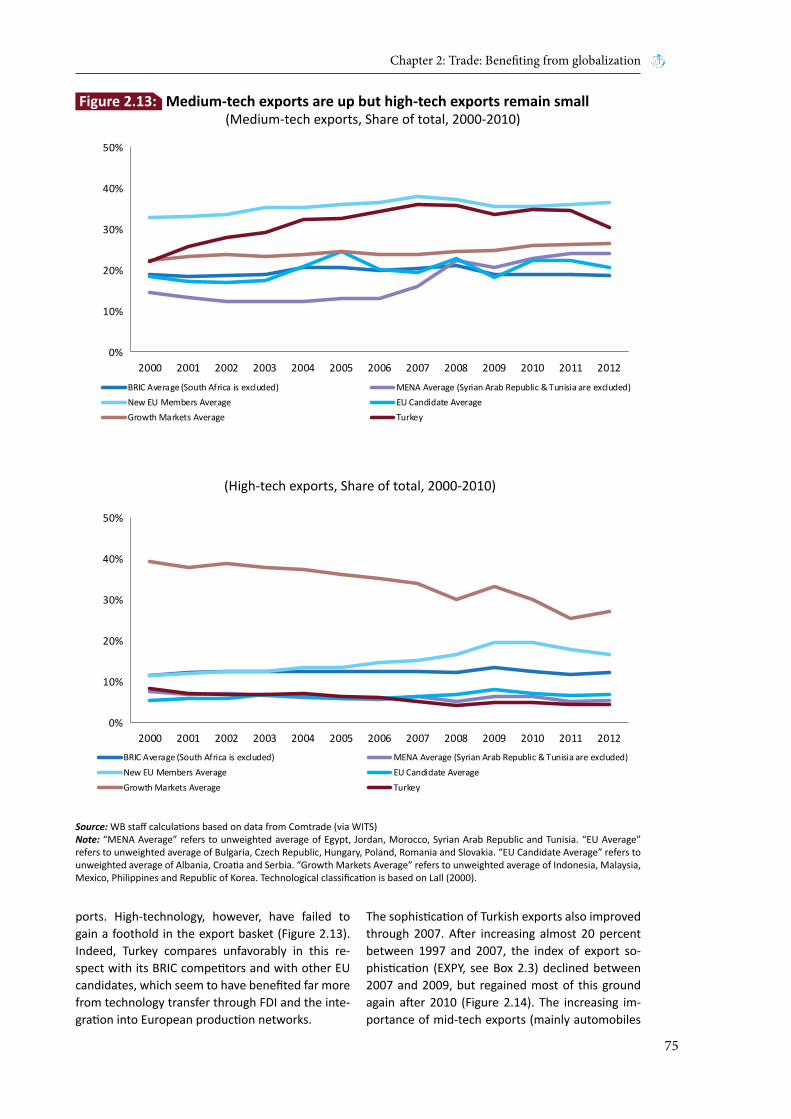
Chapter 2: Trade: Benefiting from globalization
75
ports. High-technology, however, have failed to gain a foothold in the export basket (Figure 2.13). Indeed, Turkey compares unfavorably in this re-spect with its BRIC competitors and with other EU candidates, which seem to have benefited far more from technology transfer through FDI and the inte-gration into European production networks.
The sophistication of Turkish exports also improved through 2007. After increasing almost 20 percent between 1997 and 2007, the index of export so-phistication (EXPY, see Box 2.3) declined between 2007 and 2009, but regained most of this ground again after 2010 (Figure 2.14). The increasing im-portance of mid-tech exports (mainly automobiles
Source: WB staff calculations based on data from Comtrade (via WITS) Note: “MENA Average” refers to unweighted average of Egypt, Jordan, Morocco, Syrian Arab Republic and Tunisia. “EU Average” refers to unweighted average of Bulgaria, Czech Republic, Hungary, Poland, Romania and Slovakia. “EU Candidate Average” refers to unweighted average of Albania, Croatia and Serbia. “Growth Markets Average” refers to unweighted average of Indonesia, Malaysia, Mexico, Philippines and Republic of Korea. Technological classification is based on Lall (2000).
0%
10%
20%
30%
40%
50%
2000 2001 2002 2003 2004 2005 2006 2007 2008 2009 2010 2011 2012
BRIC Average (South Africa is excluded) MENA Average (Syrian Arab Republic & Tunisia are excluded)New EU Members Average EU Candidate AverageGrowth Markets Average Turkey
0%
10%
20%
30%
40%
50%
2000 2001 2002 2003 2004 2005 2006 2007 2008 2009 2010 2011 2012
BRIC Average (South Africa is excluded) MENA Average (Syrian Arab Republic & Tunisia are excluded)New EU Members Average EU Candidate AverageGrowth Markets Average Turkey
Figure 2.13: Medium-tech exports are up but high-tech exports remain small (Medium-tech exports, Share of total, 2000-2010)
Figure 2.14: (High-tech exports, Share of total, 2000-2010)
Turkey’s Transitions
76
and auto parts) played an important role in the evolution of Turkey’s EXPY as they replaced less sophisticated products (garments and textiles) as the top export sectors and allowed the country to narrow the gap with countries such as Poland and Mexico until 2007. The complexity measure reveals a broadly similar pattern to EXPY. The decline in ex-port sophistication and complexity after 2007 can be at least partially attributed to the commodity price boom of 200812 and to the decline in automo-tive and other mid-tech exports to the EU.
Indicators of product quality, as reflected in unit prices, also confirm the substantial upgrading of Turkey’s export basket. Figure 2.15 shows that while in 2002 two-thirds of exports were concentrated in products which were sold at a unit price in the bot-tom third of the price distribution, i.e. compared to the price of all competitors selling to the same des-tination market, by 2010 the majority of products were sold at the middle or high end of the quality
range, including 28 percent in the top third of the destination-adjusted price distribution (double the level of 2002). Thus, in less than a decade, Turkey’s export quality distribution improved significantly.14
A more detailed analysis reveals that quality im-provements have not been uniform across prod-ucts and destination markets. For such an analysis, the concept of quality ladders is useful.15 To see where a country is positioned in a differentiated product space, one looks at all the exporters selling a particular product in the same destination mar-ket, and compares unit prices across this specific market. Low quality, and cheap products are at the bottom of the ladder, high quality, and expensive products at the top. Turkish exporters have gener-ally climbed up the quality ladders but the patterns differ across product categories and destination markets. Specifically, across the main product cat-egories, the following trends can be established:
In addition to indicators of technology content, economists recently have started to measure the sophistication of a country’s export basket. Hausmann, Hwang and Rodrik (2007) argue that exporting more sophisticated products leads to faster growth, due to the prospect of benefitting from higher spillovers of knowledge and technology embodied in these products. The sophistication of a particular export is measured by looking at which countries tend to specialize in its production. If a product, such as, an internal combustion engine, is largely produced by rich countries, that product would be revealed to be ‘rich’ and sophisticated. Similarly, coffee beans would be classified as having low sophistication, as low income countries dominate coffee bean production worldwide. The sophistication of a country’s export basket – denoted as ‘EXPY’ – derives from the sophistication of the basket of individual products (denoted as ‘PRODY’) it exports.13 More recently, Hausmann, Hidalgo et al. (2011) have improved on this measure by moving away from the reliance of PRODY and EXPY on the income levels of countries. Under the new approach – ‘The Product Complexity Index’ – complexity is a function not of income of countries but is calculated through an iterative process based on the network of relationships of countries and the products they export. Specifically, under this new approach, the complexity of a country’s export basked is a function of two concepts: i) The diversity of products it produces (i.e. the number of distinct products that it makes); and, ii) the ubiquity of those products (i.e. how many other countries make that product). Countries that have complex export baskets are more specialized and can fetch higher values for their exports.
Box 2.3: Measuring a country’s export sophistication
12 The commodity price boom affected Turkey’s EXPY by increasing the value (and share in total exports) of raw materials and commodity exports, because commodities are less sophisticated than other products (e.g. manufactures). The decline of world trade in 2009 affected Turkey’s EXPY by reducing disproportionally exports to developed countries (especially the EU-27, the main destination of more sophisticated goods).
13 Hausmann, Hwang and Rodrik (2007) show that countries with high EXPY tend to have higher growth rates in the future, supporting the idea that countries ‘become’ what they export by converging to the income level implied by their export baskets. Yet, this may only be part of the story because the same final product could be produced in different ways that embody more or less technology and because the production of one good may be separated into a variety of tasks, each requiring different levels of technology and knowledge. How you export may matter as much as what you export.
14 Unit price differences across products of the same category intuitively reflect differences in product quality. Thus a BMW is not the same as a Geely and does not cost the same, even though both are counted as a vehicle in standard product classifications, even at highly disaggregated level. A number of other factors may however account for unit price differences, and hence careful interpretation is in order. For references establishing an empirical link between product quality and unit values of exports, see Crozet et al. (2012), Manova and Zhang (2012).
15 Data on unit prices is used to develop analyses of quality ladders, measuring the relative quality of a country’s exports against all other countries that export a specific product (worldwide or to a specific market) and the evolution of Turkey’s exports over time. Quality ladders are a tool to benchmark an exporter’s position in a differentiated product space across products and destination markets.

Chapter 2: Trade: Benefiting from globalization
77
• Agri-food sector: Turkey has been in the lower part of the quality ladder during the entire pe-riod and for exports to both the EU and MENA. The quality ladder is significantly longer in the EU than in MENA, but the difference between the two was reduced by one third between 2000 and 2008.
• Auto and auto-parts: The ranking of Turkey went up in the EU between 2000 and 2008, but decreased somewhat in the MENA region due to the entry of many more competitors mainly from East Asia.
• Other Vehicles: The positioning of Turkey im-proved substantially from 2000 to 2008 both in the EU and MENA. In the latter, its positioning is at the top of the range along with France, Swe-den, Canada and Japan.
• Electrical and mechanical machinery: In both sectors, the ranking of Turkey improved dra-matically in the MENA market. Its ranking in the EU market, on the other hand, remained at the bottom of the range.
• Textiles and Clothing: The ranking remained un-changed in both regions.
Source: WB staff calculations based on data from Comtrade (via WITS)Note: “MENA Average” refers to unweighted average of Egypt, Jordan, Morocco, Syria and Tunisia. “EU Average” refers to unweighted average of Bulgaria, Czech Republic, Hungary, Poland, Romania and Slovakia. “EU Candidate Average” refers to unweighted average of Albania, Croatia and Serbia. “Growth Markets Average” refers to Indonesia, Malaysia, Mexico, Philippines and Republic of Korea.
Source: WB staff calculations based on data from Comtrade (via WITS)
14,000
15,000
16,000
17,000
18,000
19,000
20,000
21,000
2000 2001 2002 2003 2004 2005 2006 2007 2008 2009 2010 2011 2012
(SU
M) E
XPY
BRIC Average (South Africa is excluded)MENA Average (Syrian Arab Republic & Tunisia are excluded)New EU Members AverageEU Candidate Average (no data point is available for Serbia in 2003)Growth Markets AverageTurkey
0%
10%
20%
30%
40%
50%
60%
70%
low unit value mid unit value high unit value
Shar
e of
exp
ort b
y re
lativ
e uni
t val
ue, m
easu
red
at H
S6 le
vel
2000 2010
Figure 2.14: Turkey’s export sophistication has increased (EXPY) (2000-2010)
Figure 2.15: Export quality as reflected in unit prices has also gone up (2000 and 2010)
Turkey’s Transitions
78
Drivers of quality improvement:European integration and GVCs
The upgrading of Turkey’s export quality has been closely linked to the country’s European integration and the rising prominence of Turkish producers in GVCs. Those concerned with Turkey’s limited pres-ence in high tech goods exports have sometimes ar-gued for a targeted national policy to support high tech sectors and reduce dependence on imports, thereby boosting the value added generated in Tur-key’s export sector. However, an analysis of GVCs reveals that Turkey’s increased economic integra-tion and increased quality imports have been at the core of this export quality improvement.
Firm level analysis shows that companies exporting higher than average quality goods are larger, tend to have higher reliance on imported inputs and are more likely to be fully foreign owned. The CU with the EU has opened Turkey up to higher qual-ity imports as well as to European FDI. This has been an important driver of quality improvements. High unit values are also negatively associated with trade costs. Turkish companies seem to be selling the highest value products to the most accessible markets. In this sense, improvements in logistics
and reductions in trade costs are important contrib-utors to moving up the quality ladder (see below).
Import content and higher unit values contribute to firm survival. Figure 2.16 shows that the survival rate of firms exporting goods with higher relative unit values is much higher than for firms exporting lower value products. And once again, firms with higher import content16 have higher survival rates. Interestingly, the relationship between quality and imported inputs decays over time, suggesting that exporters may, over time, shift to domestic suppli-ers. It is also worth noting that investments in qual-ity pay off more quickly for larger firms than for smaller firms. The latter need a longer time before seeing the beneficial effects on export growth.
The benefits of European integration are also re-flected in the increase in intra-industry trade. Intra-industry trade is a measure of the extent to which domestic producers are integrated into production networks with trading partners. The CU has closely integrated Turkish companies into European pro-duction networks in sectors such as automobiles and clothing. Consequently, intra-industry trade between Turkey and the EU has increased from 30 percent in 1990 to over 50 percent in 2012. The reduction in trade costs associated with the CU in-
Source: World Bank (2014b), WB staff calculations based on Turkstat data
0%
10%
20%
30%
40%
50%
60%
Quality Import content
Surv
ival
rate
Low to medium Medium to high All firms
Figure 2.16: Firms exporting higher quality goods and having greater reliance on imported inputs are more likely to survive
16 Import content is defined as “value of intermediate goods import/total sales” per firm-year. Intermediate goods include the following categories based on Broad Economic Categories (BEC) classification: 111 - Primary food and beverages, mainly for industry, 121 - Processed food and bever-ages, mainly for industry, 21 - Primary industrial supplies not elsewhere specified, 22 - Processed industrial supplies not elsewhere specified, 32 - Processed fuels and lubricants, 42 - Parts and accessories of capital goods (except transport equipment), 53 - Parts and accessories of transport equipment.
Chapter 2: Trade: Benefiting from globalization
79
cluding the harmonization of standards is likely to have promoted growing intra-industry trade along GVCs, which are known to be particularly sensitive to trade costs (WEF, 2013). Duty-free access to the EU markets has helped to increase the sophistica-tion and quality of Turkey’s exports. Between 2001 and 2008, Turkey’s total intra-industry trade in manufacturing has increased significantly; only be-low the increase in Iceland, and considerably faster than in Hungary, Mexico and India (OECD, 2010, p.211).
Turkey’s participation in GVCs is comparable with that in larger high income countries. The partici-pation index17 measures the foreign value added embodied in gross exports and the domestic value added embodied in third countries gross exports.18 OECD (2012) finds that Turkey’s participation rate is just below 50 percent. The participation rate of Turkey is about the same as the one of India, Italy, the UK and Japan. It is higher than the participation of comparable mid-sized emerging countries such as Mexico, Brazil and Argentina, and also slightly higher than that of China, but lower than that of smaller high income and middle income countries.
Within GVCs, Turkey specializes in lower value seg-ments, such as final product assembly. Typically, the highest value segments are at the origination and design stage, or in marketing and consumer service. Assembly is labor intensive and, hence, tends to dominate in MICs. Other countries with strong presence in assembly are the Dominican Republic, Honduras and Mexico in the Americas; Germany, Hungary, Slovakia, Slovenia and Tunisia in the European and Mediterranean region; China, Cambodia, Thailand and Viet Nam in Asia (Gangnes et al., 2012). Taymaz et al. (2011), dividing the pro-duction process of traded goods into five different categories according to The United Nations (UN) Broad Economic Category (primary good; semi-fin-ished products, intermediate inputs, parts and ac-cessories, and consumption goods), also find that Turkey specializes in downstream labor intensive segments of the value chain. Turkey exports mostly consumption goods and semi-finished products as intermediate inputs and imports semi-finished products, capital goods and primary goods. It spe-cializes in sectors and production processes that are labor intensive. As Turkey moves up to high in-
come, it will need to move up GVCs and specialize in higher value segments.
One of Turkey’s advantages as a source country for production facilities is its good connectivity, partic-ularly with European markets, while trade costs for distant markets remain higher. Differences in size and endowments of national economies are not the only explanation for differences in the volume of trade and in its complexity, in terms of export participation and diversification of trade patterns. Distance and supply-side constraints and inefficien-cies play a large role. Bilateral trade costs between countries capture the price equivalent of the re-duction of international trade as compared with the potential implied by domestic production in the origin country and consumption in the destination markets (Anderson, 2002; Novy, 2010).19 Higher bi-lateral trade costs result in smaller bilateral trade flows.
Turkey has relatively low trade costs when com-pared to competitors in the region (Figure 2.18, first graph). Trade costs vis-à-vis EU markets – in partic-ular with France and Germany - are lower for Tur-key than for Romania, Bulgaria or Greece although Turkey is not an EU member. With respect to Italy, on the other hand, Greece, Bulgaria and Turkey have about the same level of bilateral trade costs. With distant markets, such as the United States, China, Brazil or Japan, Turkey does unequivocally better than Greece or other Black Sea countries but its trade costs are almost twice as high as those of the larger EU members (Figure 2.17, second graph). Turkey would need to narrow these differences to effectively compete with high income European suppliers in the fast growing markets of the Pacific region.
Low trade costs are also reflected in Turkey’s rela-tively good logistics performance. The performance of international supply chains is measured using the Logistics Performance Index (LPI). It is based on the assessment of logistics professionals located in the country’s major trading partners, and is a weight-ed average of six components that are critical for logistics performance. Turkey compares well with its neighbors and current competitors in logistics performance (Figure 2.18). It is 27th in global rank-ings, just below China and above Portugal, which
17 See Koopman et al. (2011) for a definition of the participation index.
18 The higher the foreign value added embodied in gross exports and the higher the value of inputs exported to third countries and used in their exports, the higher the participation of a given country in the value chain. The OECD (2012) has computed this indicator for OECD countries and se-lected non-OECD countries. Country size – in particular relative to regional peers – appears to matter. Both in advanced and emerging economies, smaller countries such as the Czech Republic, Singapore, Estonia, the Slovakia and Taiwan, Province of China post participation rates between 60 percent and 80 percent. By contrast larger countries have a lower participation index.
19 The recently published World Bank- United Nations Economic and Social Commission for Asia and The Pasific (UNESCAP) dataset (Arvis et al. 2013) proposes comprehensive measures of trade costs for 178 countries over the 1995-2010 period using the inverse gravity methodology due to Novy (2013).

Turkey’s Transitions
80
occupy the 26th and 28th position respectively. The comparison is even more favorable when the LPI is adjusted for the level of development as measured by the gross national income per capita; Turkey per-forms better than countries with similar per capita income (Figure 2.18 and Figure 2.19). Spotlight 2 reviews in more detail Turkey’s investments in in-frastructure and in particular the policies that have allowed the country to leverage significant private sector investments in improving connectivity. Tur-key’s integration with the European market has both provided an incentive and, in turn, been facili-tated by investments in connectivity and logistics.
Trading up to high income Policy reform measures starting in 1980, including a major liberalization of trade policies, have laid the basis for Turkey’s integration into the global econo-my and its solid export performance since 1980. A relatively favorable global economic environment, with healthy import growth demand, has helped Turkey increase its openness. Özal’s private-sector focused policies included a shift from import sub-stitution to export promotion and reduction in im-port quotas and tariffs. During this period, various export promotion policies were introduced, rang-
Source: Trade Costs Database, World Bank (data for Greece is 2008)
0%
20%
40%
60%
80%
100%
120%
Greece Bulgaria Romania Turkey
Ad va
lore
m e
quiv
alen
t
Germany France Italy
0%
50%
100%
150%
200%
250%
Greece Bulgaria Romania Turkey Germany France Italy
Ad va
lore
m e
quiv
alen
t
USA China Brazil Japan
Figure 2.17: Bilateral trade costs for Turkey and comparator countries
Vis-à-vis large non-EU countries
Vis-à-vis select EU markets

Chapter 2: Trade: Benefiting from globalization
81
ing from legislative changes for tax rebates and tax exemptions to credit and insurance mechanisms.
Turkey has become part of the European conver-gence machine. Closer economic integration with the EU, including through the CU that went into force in 1996, has helped Turkey integrate into both European and global markets. Trade and in-vestment linkages between the EU and Turkey have
deepened, and the CU has closely integrated Turk-ish companies into European and global produc-tion networks for automobiles and clothing. It has helped raise the quality and sophistication of Tur-key’s exports. Moreover, exporting to the sophis-ticated EU market has been an important spring-board for Turkey’s companies to facilitate their entry into MENA and other non-EU markets.
Source: LPI DatabaseNote: In the chart, a smaller number indicates better performance.
1 2 5 9 13 15 18 20 21 24 26 28 30 31 32 33 34 35 40 43 44 47 49 54 55 58 61 62 63 65
85 90
110116
0
20
40
60
80
100
120
140Ge
rman
yN
ethe
rland
sSi
ngap
ore
Uni
ted
Stat
esFr
ance
Hong
Kon
gSp
ain
Italy
Kore
a, R
ep.
Finl
and
Port
ugal
Chin
aTu
rkey
Pola
ndCz
ech
Repu
blic
Hung
ary
Sout
h Af
rica
Thai
land
Rom
ania
Slov
akia
Gree
ceBu
lgar
iaSa
udi A
rabi
aIn
dia
Croa
tiaCy
prus
Ukr
aine
Egyp
tSe
rbia
Braz
ilLe
bano
nRu
ssia
n Fe
d.Tu
nisia
Geor
gia
LPI C
ount
ry R
anki
ng, 2
014
Figure 2.18: Turkey ranks high in logistics performance compared to its neighbors…
Source: WDI, LPI DatabaseNote: In the chart, a higher number indicates better performance.
BRARUS
IND
CHNZAF
ROM POLHUNBGR
CZE
SVK
ALB
HRV
SRB
MAR
TUN
EGY
JOR
MEX
IDN
MYS
PHL
TUR
MDA
UKR
GEO
THA
AZE
KAZ
GRC
PRTESP ITA
CAN
DEU
2.0
2.5
3.0
3.5
4.0
4.5
0 5,000 10,000 15,000 20,000 25,000 30,000 35,000 40,000 45,000
LPI S
core
201
4
GDP per capita 2012, PPP (current international $)
Figure 2.19: …and performs better than countries with a similar per capita income

Turkey’s Transitions
82
Despite its remarkable integration, Turkey still re-mains less open than other upper middle income countries. Turkey`s openness ratio (at 58 percent) now compares favorably with the “BRICS”, yet it is well below that of many smaller MICs in East Asia or Eastern Europe (Figure 2.20). Moreover, exports of goods and services as a share of GDP have remained roughly constant throughout the past decade, whereas, for example, exports to GDP increased from 10 percent to 25 percent in India and from 21 percent to 41 percent in Poland. FDI inflows are also relatively lower than in comparator countries.
While Turkey has performed well, sustaining ex-port growth going forward cannot be taken for granted. The external environment is currently less favorable with suppressed global import demand growth. Moreover, Turkey’s current export basket is concentrated in relatively slow-growth and mid-tech sectors, with limited high-tech exports. And so far, export growth has been by-passing Turkey’s smaller and medium-sized companies, linked to the high fixed costs of engaging in trade.
As the advanced economies of Europe and North America finally recover from the 2008-2009 global economic and financial crisis, Turkey’s close links with the European economy may again turn to an advantage. In the wake of the crisis in the EU, a lot has been made of Turkey’s successful export mar-ket diversification as a key risk mitigation strategy.
But while exports to MENA have grown fast, the MENA market as a whole is likely to remain limited. MENA’s total imports amounted to US$830 billion in 2010. Germany imported US$1,100 billion from the world in the same year. The market in the EU as a whole is more than 6.5 times larger than that of MENA. This means that even with growth of as little as 1-2 percent a year, the additional market poten-tial generated in the EU will be greater than what is generated in MENA (World Bank, 2014b).
But most importantly, to continue to benefit from diversification of markets, Turkey should aim at the fast growing markets of Asia. Turkey is likely to face increasing competition in the EU market, not only from China, but also from countries with whom the EU has recently concluded free trade agreements or is in the process of negotiating free trade (includ-ing Mexico, Republic of Korea, South Africa, and, going forward, Canada, Japan, and USA). The ero-sion of Turkey’s preferential access to the EU and the slow-down in MENA import demand mean that increases in competitiveness to withstand com-petition in the EU and diversification into markets beyond MENA may be critical going forward. The Government’s support of efforts to increase trade with Africa and East Asia may be able to play a role in this regard.
Turkey’s move towards high-income will require greater trade and investment integration into the global economy as well as an upgrading of the
Source: WDI, World Bank.Note: “MENA Average” refers to unweighted average of Egypt, Jordan, Morocco, Syrian Arab Republic and Tunisia. “Growth Markets Average” refers to unweighted average of Indonesia, Malaysia, Mexico, Philippines and Republic of Korea. The “New EU Members” refers to Bulgaria, Czech Republic, Hungary, Poland, Romania and Slovakia.
1911
40 4128 31
68 7059
4957
7892
134
0
20
40
60
80
100
120
140
160
BRICS Average(Excludes Russia in1970, but includes
later)
Turkey MENA Average(Morocco & Tunisia
& Egypt)
Growth MarketsAverage
New EU MembersAverage
Perc
ent o
f GDP
Exports + Imports of goods and services
1970 1990 2011
Figure 2.20: Turkey’s trade openness remains lower than in high-growth markets
Chapter 2: Trade: Benefiting from globalization
83
export basket. Turkey should aim to significantly boost its share of global FDI, building on its exist-ing integration into European value chains. There is considerable scope for moving up these value chains, as well as benefiting from new opportuni-ties in the booming trade in global professional and medical services. Going forward, having more dynamic mid-sized firms with better access to ex-porting and a greater focus on not only quantity but also the quality of exports will be key.
There is clearly scope for creating an even more dynamic base of exporters in Turkey. International experience shows that dynamic firm and product entry is critical for overall export growth. World Bank (2014b) shows that Turkey’s exports have grown fastest when new firms enter into the export market and existing firms introduce new products. Indeed, econometric analysis of Turkish firm-level
data suggests that a one percent increase in firm or product entry leads to a 1.9 percent increase in export growth. By contrast, a one percent increase in market reach only leads to 0.25 percent export growth.
Growth will need to be increasingly driven by fron-tier innovation. While higher rates of product inno-vation come primarily from larger firms, with the capacity and range of skills necessary to invest in R&D, experience from other countries shows that the contribution of smaller firms is quite important. Moreover, although Turkey currently specializes mostly in activities in the middle of GVCs, focusing on standardized labor-intensive manufacturing ac-tivities, it specializes in sectors with relatively long value chains. This represents greater opportunities for upgrading along the value chain.
Turkey’s Transitions
84
ReferencesDokuzuncu Kalkınma Planı: Dış Ticaret. (2007). Özel Ihtisas Komisyonu Raporu. Ankara: T.C. Başbakanlık Devlet Planlama Teşkilatı.
Aldan, A., & Çulha, O. (2013). The Role of the Ex-tensive Margin in Export of Turkey: A Comparative Analysis. Working Paper No 13/32. Central Bank of Turkey.
Anderson, J. E. (2002, May). Trade Reform Diag-nostics with Many Households, Quotas, and Tariffs. Review of International Economics, 10(2), 215-36.
Atiyas, İ. (2012). Economic Institutions and Institu-tional Change in Turkey during the Neoliberal Era. New Perspectives on Turkey No: 14 pp. 45 - 69.
Bateman, D., & Arslan, İ. (1989). A Note on Turkey’s Trade Regime. Washington, D.C.: World Bank mim-eographed.
Cebeci, T., Lederman, D., & Rojas, D. (2013). The Structure of Exports across Destinations and Labor-Market Outcomes: An Empirical Case Study of Tur-key. The World Bank.
Crozet, M., Head, K., & Mayer, T. (2012). Quality Sorting and Trade: Firm-level Evidence for French Wine. Review of Economic Studies, 79(2), 609-644.
Foroohar, R. (2012, Feb. 09). Time. Retrieved 2013, from http://business.time.com/2012/02/09 t h re e - e co n o m i c - l e s s o n s - i m p o r te d - f ro m -turkey/#ixzz2pcbQotAv
Gangnes, B., Ma, A. C., & Assche, A. V. (2012, June). Global Value Chains and the Transmission of Busi-ness Cycle Shocks. Asian Development Bank Eco-nomics Working Paper Series No.29. Asian Devel-opment Bank.
Gill, I. S., & Raiser, M. (2012). Golden Growth: Re-storing the lustre of the European economic model. The World Bank.
Hausmann, R., Hwang, J., & Rodrik, D. (2007). What you export matters. Journal of Economic Growth, 12(1), 1-25.
Hidalgo, C., & Hausmann, R. (2011). The network structure of economic output. Journal of Economic Growth, 16(4), 309-342.
Koopman, R., Powers, W., Wang, Z., & Wei, S. (2011). Give Credit Where Credit is Due: Tracing Value Added in Global Production Chains. Working Papers 312011. Hong Kong Institute for Monetary Research.
Lall, S. (2000). The Technological Structure and Performance of Developing Country Manufactured Exports, 1985-98. 28 (3), 337-369. Oxford Develop-ment Studies.
Manova, K., & Zhang, Z. (2012). Export Prices Across Firms and Destinations. The Quarterly Journal of Economics, 127(1), 379-436.
Milanovic, B. (1986). Export Incentives and Turk-ish Manufactured Exports 1980-1984. World Bank Staff Working Papers 768. Washington, D.C.
Novy, D. (2010). Trade Costs and the Open Mac-roeconomy. Scandinavian Journal of Economics, 112(3), 514-545.
Novy, D. (2013). Gravity Redux: Measuring Inter-national Trade Costs with Panel Data. Economic In-quiry, 51(1), 101-121.
Reis, J. G., Arenas, G., Cebeci, T., Farole, T., Reyes, J. D., & Taglioni, D. (2013). Competitiveness Assess-ment of Turkey`s Goods Trade. Background Paper. World Bank.
Taymaz, E., Voyvoda, E., & Yılmaz, K. (2011). Uluslar-arasi Üretim Zincirlerinde Dönüşüm ve Türkiye`nin Konumu. Çalışma Raporları Serisi. TUSIAD-Koç Üni-versitesi Ekonomik Araştırma Forumu.
Ulu, M. (2014). Heterogeneity and Uncertainity in the Dynamics of Firm Selection into Foreing Mar-kets. Working Paper No 14/01. Central Bank of Tur-key.
WEF. (2013). World Economic Forum. World Com-petitiveness Report. Geneva.
World Bank. (2014a). Evaluation of the EU-Turkey Customs Union. World Bank.
World Bank. (2014b). Trading Up to High Income. World Bank.
Chapter 3: Finance : Banking sector restructuring and financial integration
85
Finance: Banking sectorrestructuring and financial integration
Chapter 3
Infrastucture
Turkey’s Transitions: Integration, Inclusion, Institutions
Labor
Welfare
FiscalSpace
Enterprise
Trade
Cities

Turkey’s Transitions
86

Chapter 3: Finance : Banking sector restructuring and financial integration
87
Finance: Banking sectorrestructuring and financialintegration
Bankers are often seen as the villains of the modern economy. The collapse of Lehman Brothers, an investment bank, stood at the
beginning of the global economic and financial crisis in 2007, banks fuelled the housing bubbles from Ireland to Spain (and some worry continue to do so in China), banks required large injections of public funding when these bubbles burst and in turn found themselves at the heart of the sovereign debt crisis in Europe. Bankers have been accused of greed and recklessness, and fined heftily for misin-forming their customers and manipulating the in-terbank market. In emerging markets, particularly in Central and Eastern Europe, banks lubricated the European convergence machine during the 2000s, by financing large external deficits and breaking the link between savings and investment that had held many developing countries back in the past. However, in the aftermath of the global economic and financial crisis, as parent banks struggled to re-build their capital buffers, capital has flown out of Europe’s periphery again and forced a painful ad-justment.
Among their much maligned international peers, Turkey’s banks today stand out as beacons of sta-bility. Turkey’s banking system was the only one in the The Organisation for Economic Co-operation and Development (OECD) that withstood the head-winds of the global economic and financial crisis without an injection of public funds. It still boasts enviably strong capital buffers –the risk-weighted average capital-asset ratio in the system stood at 16 percent at the end of 2012 – and while many banks have retreated from Central and Eastern Europe, the Turkish banking system experienced a continued increase in inflows after 2007. But de-spite relatively rapid, and to a considerable extent foreign-financed credit growth in recent years, the sector’s loan to deposit ratio is still a moderate 110 percent. Foreign investors and analysts alike point to Turkey’s banking system and strong, stability- oriented regulation, as an element of strength in Turkey’s macroeconomic outlook and international competitiveness.
It was not always so: much like in many financial crises before and after, Turkey’s banks were at the heart of the economic convulsion that seized Tur-key in 2000-2001. Turkey’s banking and foreign ex-change crisis at that time was the deepest and cost-liest of several crises the country has experienced. More than a quarter of all banks were intervened, merged or closed down, the overall costs amount-
ing to around a third of the country’s Gross Domes-tic Product (GDP). This chapter draws the lessons from Turkey’s banking sector restructuring experi-ence and asks whether the country is well placed to benefit from and manage the risks of today’s dy-namically changing global financial landscape. Spe-cifically, the chapter asks and answers three main questions:
• First, how did Turkey overcome the deep finan-cial and banking crisis of 2001 and what are the lessons for other countries dealing with the af-termath of a banking collapse? The answer is that far from being merely a technical exercise, the reason for the lasting success of the 2000-2001 reform was a root and branch change in the “way of doing banking”. Bank owners paid a high price for previous reckless behavior, regu-lators were given true independence and used it even at considerable political and sometimes personal risk, and macroeconomic, financial and fiscal policies were closely coordinated. But perhaps the most important lesson is that un-derlying governance weaknesses were squarely addressed.
• Second, how has Turkey managed the surge in capital inflows since the global economic and financial crisis, in the context of loose interna-tional liquidity? This question is of considerable interest in many emerging markets, initially af-fected by the dramatic expansion of the balance sheet of the world’s reserve banks and – since May 2013 – by the prospect of tapering of ex-traordinary monetary interventions. The chap-ter shows that Turkey has experimented with a range of monetary and macro-prudential tools, but the verdict on their effectiveness relative to more conventional instruments is still out.
• Third, as the benefits of excessive reliance on foreign savings are being reconsidered, how well is Turkey placed to mobilize domestic sav-ings and broaden its financial sector beyond the strong reliance on banks? Turkey’s experience with premature financial sector liberalization in the late 1980s, before strong independent regulation had been firmly established, has cau-tioned policy makers against opening up new segments of the financial sector too quickly. However, for the past three or four years, Tur-key has started to reform its capital market and taken active steps to encourage greater domes-tic savings and offer a wider range of domestic savings instruments. The fruits of these efforts are yet to be collected. As the chapter shows, Turkey’s non-bank financial sector and its capi-tal markets remain far less developed than those of many peers. But the dynamics point in a promising direction. In the meantime, Tur-key is well-served with policies that continue to
Turkey’s Transitions
88
monitor the build-up of leverage in the econ-omy carefully and that accept more balanced, moderate growth over the medium-term as the corollary of safeguarding Turkey’s hard-earned financial stability.
Lessons in bank restructuring –Turkey’s 2001 crisis
The years before the banking sectorcollapse1
The experience with economic liberalization in Tur-key is relatively short. Turkey’s post-war inward-looking economic policy strategy focused on heavy government intervention in economic activity and sheltering domestic markets from foreign competi-tion. This all changed in the early 1980s with the political ascendance of Turgut Özal, who came to power with the goal of liberalizing and modernizing a sclerotic economy plagued by high and chronic in-flation and tightening external constraints (Chapter 1). Özal’s reforms were initially successful in boost-ing economic growth, but from the mid-1980s, con-trol over fiscal policy weakened generating macro-economic stop-and-go cycles and rising inflation.
Following Özal’s move to the Presidency in 1989 and the loss of power of his Motherland Party (ANAP) in the 1991 general election, the political environ-ment became increasingly fractious. Turkey went through nine separate government changes in the 12 years prior to the 2002 elections, all of which re-sulted in either coalitions or minority governments. Populist economic policies resulted in chronic and increasingly higher budget deficits, financed to a large extent by monetization of government debt, leading in turn to stubbornly high levels of inflation, bringing the country into a vicious cycle of high real interest rates and higher budget deficits, eventually putting it on the brink of hyperinflation (see also Spotlight 3).
The environment of macroeconomic instability also brought about perverse incentives for the behavior of banks. With high (and climbing) real local cur-rency interest rates and an open external capital account, most banks sought to profit from borrow-ing short term internationally and investing in lon-ger term government securities and questionable related party lending. This strategy was facilitated by an existing foreign currency position regulatory limit that was looser than accepted best practice (50 percent as supposed 20 percent of equity). Moreover, banks could actually exceed even this loose position by placing a deposit at the Central
Bank (CBRT) equivalent to 8 percent of the excess over the required limit. Finally, the regulation ap-plied on a bank-solo basis, providing an additional incentive for banks to cover their spot short posi-tions with hedge contracts signed with subsidiaries or affiliates. By end-October 2000, the short foreign currency position in the banking system exceeded US$20 billion, or about 10 percent of GDP and twice the system’s total equity.
While the banking sector was considerably liber-alized, the quality of institutions did not improve commensurately. The number of banks increased from 40 in 1980 to 80 by the end of 1999. How-ever, with relatively lax licensing requirements, a large share of the new banks was owned and run by families with little or no sector qualifications, which set them up with the aim of financing their own companies. These banks were allowed to flaunt the rules in a fractured regulatory and supervisory environment. Whereas the CBRT had responsibility for offsite supervision, the Turkish Treasury had re-sponsibility for onsite evaluation and inspections. The combination of a monetary authority lacking functional independence and a fiscal authority concerned more with covering its financing needs proved to be a dismal recipe for the stability of the system. More than half of the new entrants (22) would eventually be taken over by the banking su-pervisor.
Corporate governance weaknesses in private banks were further compounded by the corrosive role played in the market by public sector banks. Three state-owned banks had traditionally operated out-side commercial rules, providing subsidized loans to key constituencies in the agricultural, Small and Medium Enterprises (SMEs) and housing sec-tors, and were effectively run by the main political parties in power. They also did not have to make proper provisions for bad loans and were in reality exempt from supervision or any compliance with regulations. The accumulated losses from subsi-dized lending, so called “duty losses”, were only partially covered by the Government and only after a long lag with government papers issued at below-market rates, which in a highly inflationary envi-ronment meant a quick deterioration of their bal-ance sheets and increasing funding problems. With duty losses reaching US$26 billion at end-2000 (3 percent of GDP), and with the state banks fund-ing their increasing liquidity needs in the overnight interbank market (US$21 billion at end-2000), the brewing of a perfect storm was at hand.
1 This sub-section is based on a background note written by Engin Akçakoca, former Chairman of the Banking Regulation and Supervision Agency (BRSA) and a consultant for the World Bank.
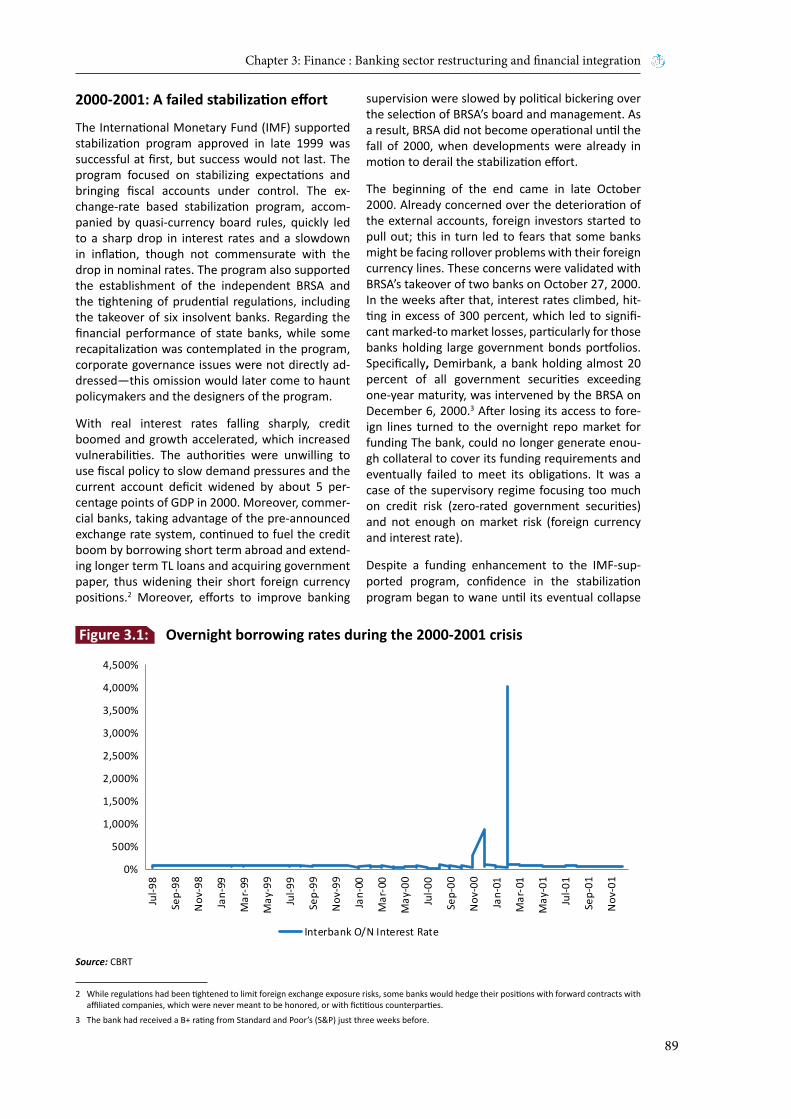
Chapter 3: Finance : Banking sector restructuring and financial integration
89
2000-2001: A failed stabilization effort
The International Monetary Fund (IMF) supported stabilization program approved in late 1999 was successful at first, but success would not last. The program focused on stabilizing expectations and bringing fiscal accounts under control. The ex-change-rate based stabilization program, accom-panied by quasi-currency board rules, quickly led to a sharp drop in interest rates and a slowdown in inflation, though not commensurate with the drop in nominal rates. The program also supported the establishment of the independent BRSA and the tightening of prudential regulations, including the takeover of six insolvent banks. Regarding the financial performance of state banks, while some recapitalization was contemplated in the program, corporate governance issues were not directly ad-dressed—this omission would later come to haunt policymakers and the designers of the program.
With real interest rates falling sharply, credit boomed and growth accelerated, which increased vulnerabilities. The authorities were unwilling to use fiscal policy to slow demand pressures and the current account deficit widened by about 5 per-centage points of GDP in 2000. Moreover, commer-cial banks, taking advantage of the pre-announced exchange rate system, continued to fuel the credit boom by borrowing short term abroad and extend-ing longer term TL loans and acquiring government paper, thus widening their short foreign currency positions.2 Moreover, efforts to improve banking
supervision were slowed by political bickering over the selection of BRSA’s board and management. As a result, BRSA did not become operational until the fall of 2000, when developments were already in motion to derail the stabilization effort.
The beginning of the end came in late October 2000. Already concerned over the deterioration of the external accounts, foreign investors started to pull out; this in turn led to fears that some banks might be facing rollover problems with their foreign currency lines. These concerns were validated with BRSA’s takeover of two banks on October 27, 2000. In the weeks after that, interest rates climbed, hit-ting in excess of 300 percent, which led to signifi-cant marked-to market losses, particularly for those banks holding large government bonds portfolios. Specifically, Demirbank, a bank holding almost 20 percent of all government securities exceeding one-year maturity, was intervened by the BRSA on December 6, 2000.3 After losing its access to fore-ign lines turned to the overnight repo market for funding The bank, could no longer generate enou-gh collateral to cover its funding requirements and eventually failed to meet its obligations. It was a case of the supervisory regime focusing too much on credit risk (zero-rated government securities) and not enough on market risk (foreign currency and interest rate).
Despite a funding enhancement to the IMF-sup-ported program, confidence in the stabilization program began to wane until its eventual collapse
Source: CBRT
0%
500%
1,000%
1,500%
2,000%
2,500%
3,000%
3,500%
4,000%
4,500%
Jul-9
8
Sep-
98
Nov
-98
Jan-
99
Mar
-99
May
-99
Jul-9
9
Sep-
99
Nov
-99
Jan-
00
Mar
-00
May
-00
Jul-0
0
Sep-
00
Nov
-00
Jan-
01
Mar
-01
May
-01
Jul-0
1
Sep-
01
Nov
-01
Interbank O/N Interest Rate
Figure 3.1: Overnight borrowing rates during the 2000-2001 crisis
2 While regulations had been tightened to limit foreign exchange exposure risks, some banks would hedge their positions with forward contracts with affiliated companies, which were never meant to be honored, or with fictitious counterparties.
3 The bank had received a B+ rating from Standard and Poor’s (S&P) just three weeks before.

Turkey’s Transitions
90
in February 2001. Liquidity shortages continued in early 2001, and economic policy uncertainty in-tensified when a constitutional crisis broke out on February 19, 2001, immediately increasing interest rates and heightening demand for foreign exchange in an attack on the peg (Figure 3.1). As CBRT tried to defend the TL, overnight interest rates surged to 4,000 percent on February 21, 2001. As a re-sult, after selling in vain close to US$5 billion to the markets, the CBRT opted to let the TL float, which would end up losing 40 percent of its value in just 10 days. Given the significant post-devaluation for-eign exchange losses from the banks’ short foreign exchange position (about US$15 billion as of Feb-ruary 19, 2001) and the massive overnight funding needs of state banks (about US$22 billion, or 100 percent of the monetary base), capital losses were substantial. The 2001 crisis came to be one of the ten most expensive ever in terms of fiscal costs (Fig-ure 3.2).
A rethinking of the whole stabilization strategy became necessary, including a renewed focus on restoring confidence in the banking system and in monetary institutions. The new program agreed with the IMF in May 2001 centered on the imple-mentation of measures to bestow the required functional and operational independence to the CBRT and the recently established BRSA—not an easy task considering the absolute lack of institu-tional credibility. Moreover, in order to reestablish confidence in the banking system, a comprehensive effort was put in place to restructure state banks, both financially and operationally. Finally, a scheme was designed to make the accounts of banks re-
maining in the system fully transparent, while en-couraging their owners to bring in fresh capital to strengthen their equity position.
Turkey post-2001 financial crisis:A change in incentives
Prior to 2001, political forces in Turkey, like in many other countries before, used and shaped financial sector policies and the operation of the financial system for political gain and influence, to the detri-ment of economic performance and welfare. More-over, early on in the implementation of the new re-form effort, and despite the significant costs of the crisis, some powerful segments of society were still betting on their failure. The implementation and success of the reforms, therefore, required not only their proper design but also steadfast determina-tion to see them through, which at times came at high political and personal costs.
The basic aim of the reforms was to develop a cred-ible policy framework that would provide the prop-er incentives for the financial system to thrive and benefit the population in general. The approach fol-lowed, based on greater transparency and account-ability in policymaking, increased sector competi-tion and strong regulatory and legal steps to limit moral hazard, appears to have worked in fostering a stable, more efficient, and trustworthy financial sector. Taken as a whole, all these reforms contrib-uted to a major change in the way of doing banking in Turkey.
Source: Laeven and Valencia (2012)
57 55
44 44 44 43 41
32 32 31
0%
10%
20%
30%
40%
50%
60%
70%
80%
90%
100%
1997 1980 2008 1996 1997 1981 2008 1993 2001 1997
Indonesia Argentina Iceland Jamaica Thailand Chile Ireland Macedonia,the Former
YugoslavRepublic of
Turkey Korea,Republic of
Fisc
al c
ost a
s a sh
are
of G
DP
Figure 3.2: The ten most costly banking crises
Chapter 3: Finance : Banking sector restructuring and financial integration
91
The reforms focused on four key areas:4
• The enhancement of the CBRT independence. With all other options essentially exhausted, the monetary policy framework was diametri-cally changed with a move to inflation targeting. Switching to an inflation targeting regime was never going to be easy, however. After all, the choice of an exchange rate-based stabilization strategy (with quasi-currency board rules) only 18 months earlier recognized the limits of mar-ket trust in the CBRT. Two aspects of the tran-sition helped strengthen the credibility of the regime switch. The first was the replacement of the CBRT Governor with a well-respected tech-nocrat. His own credibility was tested early on in the crisis, however, when, with the banking sys-tem facing severe liquidity pressures and even-tual runs by depositors, he opted to signal that the CBRT would be providing enough liquidity to maintain the payments system from failing. In his mind, it did not make sense to safeguard an inflation target when the cost would be the failure of the financial system. As it turns out, he was absolutely right. The second element came with supporting measures to eliminate (or at least mitigate) the temptations for monetiza-tion—most critically cleaning up the banking sector in a transparent way.⁵ This would entail steps to make state banks run on a more com-mercial basis (after significant recapitalization) and to save the core of the banking system in a transparent manner, not only by resolving failed banks but also by recapitalizing the remaining institutions in a credible way.
• The restructuring and (partial) privatization of state-owned banks. The restructuring of the state banks was a difficult task, both technically and politically. The single most important im-mediate step was to get the state banks out of the overnight interbank market. This required not only a significant recapitalization effort by the government to cover duty losses and other nonperforming assets (by issuing government bonds at market terms), but also monetary policy actions geared towards the liquidation of
state bank overnight liabilities while simultane-ously mopping up the liquidity generated.6 The corporate governance of the state banks was also completely revamped (Box 3.1).
• The establishment of an independent regulator (BRSA) and the prompt resolution of failed pri-vate banks. By the time the BRSA became op-erational in late 2000, a significant number of banks were in difficulties and might have been, to a large extent, already insolvent. BRSA’s ap-proach was based on the recognition that banks, whose owners were not willing to pro-vide additional capital, needed to be resolved quickly. The main concern was that a gradual approach to resolution created the wrong in-centives and actually magnified eventual losses. With that in mind, BRSA reduced the time gap between when banks were put under enhanced supervision and their eventual intervention to less than one year, from up to five years prior to its establishment. BRSA also moved to quickly resolve the banks taken over and recoup losses. After significant efforts to restructure them fi-nancially and operationally, 20 banks were sold to new owners or merged into existing institu-tions. Since most of the losses in these banks came about because of fraudulent transactions on the part of shareholders (close to US$14 bil-lion), the resolution agency (the Savings Deposit Insurance Fund (SDIF)) was given special pow-ers to enforce claims, including the ability to go after former shareholders’ private assets and holdings in other companies to compensate for their banks’ losses. This “no-bail-out-of-own-ers” policy was to be the most critical element of BRSA’s strategy to change the incentives in the system and bring market discipline to it. It would also be the most politically difficult to implement.
• The transparent recapitalization of the core of the banking system. The restructuring of the pri-vate sector banks presented an equally difficult, if different, challenge. While six additional insti-tutions were taken over by BRSA after February 2001, there was still little clarity in the market
4 The May 2001 economic reform program, of course, went beyond financial sector reforms, including, most importantly, measures to address fiscal sustainability concerns. On the latter see Spotlight 3.
5 There were, of course, legal changes that supported the move to a more independent CBRT, including central law amendments that called for the CBRT to focus exclusively on price and financial stability. Most crucially, though, these changes freed the CBRT from conducting off-site banking supervision, thereby removing it from a task that might have put pressure on it to abandon its monetary policy goals.
6 In retelling this story, most times little credit is given to the CBRT. Having been just granted functional independence, its management nonetheless agreed to act as a creditor to the state banks and mop up the liquidity generated using reverse repo operations, which could have resulted in signifi-cant losses should interest rates had failed to drop.

Turkey’s Transitions
92
about the full extent of the impact of the cri-sis on the remaining banks’ balance sheets. As a result, the government put in place a public support scheme that would, under very strin-gent conditions, make funds available to those banks unable to meet capital requirements on their own. Consistent with the no-bail-out-of-owners policy, the scheme called for discovered
losses to be reflected in a write down of their equity in the banks and for the government to take an equivalent participation (fully collateral-ized with owners’ assets). In order to enhance transparency, the first stage of the scheme con-sisted of a three-stage audit process. Indepen-dent auditing teams would look sequentially at the quality of loan portfolios and provide views
Restructuring of the state banks was conducted in two major steps: financial restructuring and operational restructuring. Financial restructuring was completed in 2001 immediately after the crisis. This was followed by operational restructuring with the ultimate target of privatizing the state banks.
Financial restructuring focused on clearing duty losses, decreasing short-term liabilities, recapitalizing the state banks, ensuring effective management of the loan portfolio, and normalizing deposit interest rates in line with market conditions.
Duty loss receivables exceeded 50 percent of the state banks’ assets by the end of 2000 (50 percent in the case of Ziraat Bank and 65 percent in Halk Bank), sapping the financial strength of these banks significantly. By the end of 2001, duty losses amounting to US$17.5 billion were liquidated and regulations allowing duty losses were abolished. New regulations were issued requiring proper allocation of resources for subsidies in the budget and transferring the funds to state banks before the actual disbursement to the beneficiaries.
The authorities introduced measures to improve state banks’ liquidity positions and strengthened their capital base. Until the end of 2001, capital support provided to the state banks totaled TL 3.6 billion, mostly in the form of government securities. In addition, state banks were provided liquidity through repo and direct sales transactions by the CBRT in return for special issue bonds they received from the Treasury. This improved the transmission channels for monetary policy as it made state banks sensitive to interbank market rates and reduced their dominance in the inter-bank market, thus pushing rates down.
Operational restructuring focused on organization, technology, products, human resources, financial management, risk management, strategic planning and service quality of the state banks to prepare them for commercial based operation in line with the requirements of modern banking and international competition.
As a first step, Ziraat Bank, Halk Bank and Emlak Bank were converted into corporations and were subject to operate on commercial basis by removing all the legal exceptions they had been enjoying. Second, management of Ziraat Bank and Halk Bank were transferred to a joint executive board, headed by a banking professional, which was authorized to prepare for restructuring and privatization. As the third step, Emlak Bank’s assets were transferred to Ziraat Bank and Halk Bank was merged with Pamuk Bank. There were significant reductions in the number of branches and in staff. The restructuring of Halk Bank and its merger with Pamuk Bank, a mid-sized private bank specialized in retail banking, gave Halk a commercial orientation and is considered an international success case of bank resolution and operational restructuring.
Following the first wave of reforms targeting financial and organizational restructuring, state banks continued to internalize these changes and to adopt a market based focus. As a result, they widened their client base, diversified their funding sources and two of them attracted private capital. Ziraat Bank, Halk Bank and Vakif Bank (a partially state-owned, partially employee owned bank, originally founded to hold the wealth of Ottoman foundations –waqfs) have enlarged and diversified their loan portfolios considerably towards more corporate, SME and retail clients. Starting with Vakif Bank and Halk Bank, towards the end of the last decade, state banks tapped international markets mainly through syndications and Eurobond issuances. More recently, the authorities accelerated privatization attempts: 25 percent of Vakif Bank shares and 50 percent of Halk Bank shares were quoted on the stock exchange, while Ziraat Bank is also being prepared for a public listing and eventual privatization. However, to date, the authorities have preferred to retain ultimate control – leaving the state banks exposed to accusations of political influence peddling.
The reform and privatization of Turkey’s state banks, thus, remains incomplete. Ultimately, the benefits of full privatization in terms of transparency and competition in the financial sector must be weighed against the potential benefits of state banks as providers of countercyclical financing during times of crisis and as risk takers to develop frontier markets. While Turkey’s state banks have been able to some extent to play a countercyclical role during the 2008-2009 crisis, the risk of a return to politically motivated lending remains and on balance would argue for a further reduction of government ownership in the sector.
Box 3.1: Restructuring the state banks

Chapter 3: Finance : Banking sector restructuring and financial integration
93
on potential losses and capital needs, which would be then certified by the BRSA. At the end of the process, most owners preferred to bring in fresh capital than to have to share ownership with the government. Only one bank asked for an injection of public funds (in the form of sub-ordinated debt) and the fourth largest bank was taken over when the audit process showed that it was insolvent due to nonperforming related party loans.
Following the first wave of reforms targeting fi-nancial and organizational restructuring, state banks continued to internalize these changes and to adopt a market based focus. As a result, they widened their client base, diversified their funding sources and two of them attracted private capi-tal. Ziraat Bank, Halk Bank and Vakif Bank (a par-tially state-owned, partially employee owned bank, originally founded to hold the wealth of Ottoman foundations –waqfs) have enlarged and diversified their loan portfolios considerably towards more corporate, SME and retail clients. Starting with Va-kif Bank and Halk Bank, towards the end of the last decade, state banks tapped international markets mainly through syndications and Eurobond issu-ances. More recently, the authorities accelerated privatization attempts: 25 percent of Vakif Bank shares and 50 percent of Halk Bank shares were quoted on the stock exchange, while Ziraat Bank is
also being prepared for a public listing and even-tual privatization. However, to date, the authorities have preferred to retain ultimate control – leaving the state banks exposed to accusations of political influence peddling.
The reform and privatization of Turkey’s state banks, thus remains, incomplete. Ultimately, the benefits of full privatization in terms of transpar-ency and competition in the financial sector must be weighed against the potential benefits of state banks as providers of countercyclical financing during times of crisis and as risk takers to develop frontier markets. While Turkey’s state banks have been able to some extent, to play a countercyclical role during the 2008-2009 crisis, the risk of a return to politically motivated lending remains. A further reduction of government ownership in the sector would thus seem warranted.
The response of the Turkish authorities to the crisis was not atypical in design to those implemented in other emerging economies (Figure 3.3), except for two key implementation aspects.7 The first one had to do with the legal changes to recover the costs of the crisis from the “culprits.” Rather than recapital-izing a going concern, intervention took place only after previous shareholders had been written down and losses fully reflected in bank balance sheets (no bail out).8 Most importantly, however, was the le-
Source: Laeven and Valencia (2012)
0
25
50
75
100Deposit Freeze
Guarantees on BankLiabilities
Liquidity Support
NationalizationsRecapitalizations
Expansionary MonetaryPolicy
Expansionary Fiscal Policy
Advanced Economies Emerging Economies Turkey Did Use Turkey Did Not Use
Figure 3.3: Policy responses to banking crises (Percent of countries using measure)
7 The Turkish authorities also put in place a blanket guarantee of bank liabilities. Given the lack of a counterfactual, there is still a debate whether it helped at all in restoring confidence, or that it just increased the eventual cost of the cleanup of the system.
8 Previously, before the transfer of the SDIF to the BRSA, banks under enhanced supervision had been allowed to receive liquidity support from it. Moreover, those owners, rather than placing additional capital into their banks, had been allowed to place deposits instead, in the expectation that losses would not be imposed on them.

Turkey’s Transitions
94
gal ability to recover losses from owners by going after their assets in other companies if those losses could be traced to fraudulent regulatory violations. This single step not only served to signal a change in incentives and, thus, a reduction in moral haz-ard, but also served to assuage taxpayers’ concerns over the bailout of politically connected wealthy individuals. The second had to do with the design and implementation of the recapitalization pro-gram. The BRSA had recognized that the conduct of stress tests on its own would not readily improve credibility in the system. The three-step auditing procedure, which required significant legal changes and the design of transparent and careful valuation rules, was put in place as a tool to certify the qual-ity of the loan portfolio. Once again, the principle followed all along in the strategy—that no share-holder would be bailed out—was key to providing the incentives for capital to be raised while remov-ing unfit and improper owners from the system.
The post-crisis strategy was immediately followed by steps to further strengthen the regulatory and supervisory framework. Most importantly, the BRSA put in place a phased-in reduction in related party lending from 70 to 25 percent of capital, and required capital from then on to be measured on a consolidated basis. In addition, accounting stan-dards were tightened (including through the cre-ation of the Turkish Accounting Board); new prin-ciples of independent auditing were issued; and the BRSA started relying more on risk-based supervi-sion procedures. To assist the process of debt work-
out, new out-of court settlement procedures were put in place, the so-called “Istanbul Approach” (Box 3.2). By late 2002, already the strategy had begun to bear fruit, with interest rates coming down, in-flation stabilizing, growth returning quickly, and foreign investment moving into the sector (Figure 3.4).9
The post-2008 global environment - Lessons in managing integrationAs Turkey became more integrated into internation-al capital markets post-2001, it reaped the benefits of its resolute bank restructuring process. Freed from the constraints of poor governance, weak reg-ulation and crowding out by profligate government borrowing, the banking system was ready to meet the demands for services from potential clients who for years had been affected by a high degree of financial repression. With improved risk manage-ment and underwriting systems, increased compe-tition due to the entry of international banks, and in the presence of a much stronger supervisory and regulatory framework, the expansion into “real” banking activities went hand in hand with healthy profits, low non-performing loans and the build-up of solid capital buffers.
When the global economic and financial crisis hit Turkey in 2008, the economy experienced a sharp fall in output, but its banking sector withstood the shock well and growth quickly recovered. Turkey was the only country in the OECD which did not
Source: World Bank, BRSA
42
44
46
48
50
52
54
56
0%
10%
20%
30%
40%
50%
60%
2002 2003 2004 2005 2006 2007 2008 2009 2010 2011 2012
Num
ber
of B
anks
Securities as a percent of total assets Credit in percent of total assets
Bank nonperforming loans in percent of total gross loans Number of Banks (right axis)
Figure 3.4: The results of the reforms are evident
9 Over the following five years, 13 foreign banks would acquire equity positions in Turkish banks, with seven of them becoming majority owners.

Chapter 3: Finance : Banking sector restructuring and financial integration
95
inject any public funds into its banks since 2008, and, on a range of indicators, its banking sector looks solid today compared to emerging market peers (Figure 3.5). Compared to the 2001 domestic crisis, short term market rates hardly budged dur-ing 2008-2009. Moreover, Turkey’s state-owned banks, once a major concern for macro-economic and financial stability, were able, to some extent, to provide counter-cyclical funding to the real sector during the years of the crisis, helped by significant provision of long-term loans from International Financial Institutions (Box 3.1). And while capital withdrew from the European periphery after 2008,
Turkey has experienced further inflows since (Fig-ure 3.6). Indeed, with relatively healthy corporate and financial sector balance sheets, Turkey seems well placed to continue to benefit from Europe’s “Convergence Machine”, as it begins to restart the engines after five years of retrenchment. However, the global economic environment has continued to pose new policy challenges in managing financial integration. The chapter now turns to examine the lessons from Turkey’s policy experiments to deal with the wall of global liquidity in the aftermath of the global crisis.
Among the elements of Turkey’s response to the banking crisis of 2001 were the adoption of Law 4743 to create asset management companies and establish the Istanbul Approach, and amendments to the Execution and Bankruptcy Act (EBA) in 2003 and 2004 designed to improve efficiency and promote corporate restructuring through formal court supervised proceedings.
Corporate financial distress reached epic proportions during the 2001 crisis, with nearly all sectors of the economy reflecting a steep decline in business activity, rapidly declining net profitability, and insufficient cash flow to meet interest expenses. Following the approach of workout models adopted in Asia, the Istanbul Approach relied on a framework agreement signed by 34 financial institutions that outlined terms and a process to encourage consensual multi-bank debt restructuring. The program resulted in the restructuring of debt in excess of US$6 billion for 322 companies. While most restructured debt carried long-term maturity dates of 15 years, commercial banks estimate that 55-60 percent of loans have been recovered or are performing. The Istanbul Approach lasted only for 3 years and has not been replaced by another corporate workout framework.
The EBA was amended in 2003-2004 to promote more efficient formal proceedings for liquidation or corporate restructurings. Reforms were designed to rectify shortcomings contributing to delays and abuses in the enforcement of rights, streamline administration and concordat proceedings for distressed enterprises, and introduce new procedures to accelerate reorganization of distressed enterprises. The 2003 reforms also made the creditor agreement (concordat) process more attractive for corporate restructuring by extending the scope of application to secured creditors. Other amendments to the liquidation process were intended to streamline procedures and improve efficiency and effectiveness.
However, notwithstanding many positive changes to the bankruptcy process, it continues to be little used due to strong cultural stigmas against bankruptcy, the restrictive application of the new rules, and in view of the excessive reliance on the post-2003 bankruptcy postponement option. Delays in bankruptcy proceedings continue to result from unenforced time limits by courts, which can trigger cross-defaults under agreements with other creditors.
Moreover, amendments to EBA Article 179 to introduce an extended bankruptcy postponement provision have created pernicious distortion in the rights of creditors and normal debtor-creditor relations. This device has been widely abused since first introduced and remains highly controversial. In practice, debtors routinely request (and courts have routinely granted) deferrals up to the maximum allowed period of five years. A whole range of alleged abuses have been attributed to the bankruptcy postponement, including forum shopping, undue influence by courts, corruption, and bad faith activities to defy repayment of debt. To deter abuse, the Supreme Court has elaborated the requisites for granting a bankruptcy postponement, in response to which debtors have turned to other forms of abuse, such as obtaining interim precautionary injunctions to block creditor enforcement actions.
Effective non-bankruptcy enforcement mechanisms play a vital role in promoting access to credit. Most bank loans in Turkey are done on a secured basis and are generally guaranteed by a major shareholder. Security in movable assets has proven somewhat challenging in Turkey, however, as there is no registration system for movable assets and the law requires possession to perfect the security interest. Although the 2003 EBA amendments attempted to close loopholes in the law contributing to delays in the execution against collateral, procedures continue to be protracted and cumbersome. Foreclosure proceedings in relation to real property are quicker than the process of obtaining a judgment to initiate bankruptcy proceedings. Given the problems in enforcement, lenders prefer individual debt collection over ineffective multi-creditor actions.
Box 3.2: Corporate debt restructuring: The Istanbul Approach and beyond

Turkey’s Transitions
96
Source: Global Financial Development DatabaseNote: The Chart uses a “best in class” normalization, where the highest (lowest for non-performing loans and loan/deposit ratios) is given the value of unity and all other regions are measured relative to this best in class level. The size of the resulting diamond reflects the strength of the banking system. As can easily be seen together with the Growth Markets, Turkey has the strongest banking sector among all the peers.The Chart uses 2011 data for all indicators, except Poland, Hungary, Bulgaria, Czech Republic and Syrian Arab Republic have 2008 as the latest available data for ̀ Bank credit to bank deposit` indicator. Morocco has 2008 as the latest available data for ̀ Bank regulatory capital to risk-weighted assets` indicator. Tunisia and Syrian Arab Republic do not have data for `Bank nonperforming loans to gross loans` and `Bank regulatory capital to risk-weighted assets` indicator`, therefore, excluded from the Middle East and North Africa (MENA) average for these indicators.The “European Union (EU) Members” refer to Bulgaria, Czech Republic, Hungary, Poland, Romania and Slovakia. “EU Candidate Average” refers to unweighted average of Albania, Croatia and Serbia. “MENA Average” refers to unweighted average of Egypt, Jordan, Morocco, Syrian Arab Republic and Tunisia. “Growth Markets Average” refers to unweighted average of Indonesia, Malaysia, Mexico, Philippines and Republic of Korea.
Source: Bank for International Settlements (BIS) DatabaseNote: The “EU Average” refers to Bulgaria, Croatia, Czech Republic, Greece, Hungary, Poland, Portugal, Romania and Spain. “MENA Average” refers to unweighted average of Egypt, Jordan, Morocco, Syrian Arab Republic and Tunisia. “Growth Markets Average” refers to unweighted average of Indonesia, Malaysia, Mexico, Philippines and Republic of Korea.
Bank credit to bank deposits(%)
Bank nonperforming loans togross loans (%)
Bank return on equity (%, aftertax)
Bank regulatory capital to risk-weighted assets (%)
Bank return on assets (%, aftertax)
BRICS Average New EU Members Average EU Candidate Average
MENA Average Growth Markets Average Turkey
0
100
200
300
400
500
600
700
800
Dec.02 Dec.03 Dec.04 Dec.05 Dec.06 Dec.07 Dec.08 Dec.09 Dec.10 Dec.11 Dec.12 Jun.13
In m
illio
n US
$
Selected EU Average BRICS Average MENA Average Growth Markets Average Turkey
Figure 3.5: Turkey’s banks are among the strongest in emerging markets
Figure 3.6: Post-crisis deleveraging in Europe - Continued inflows into Turkey External loans of reporting banks vis-à-vis all sectors

Chapter 3: Finance : Banking sector restructuring and financial integration
97
The global crisis and a policy conundrum
The monetary policy response in advanced coun-tries to the 2008 global crisis has presented new challenges for emerging markets.10 Historically low interest rates and quantitative easing policies in the US, Europe and Japan have stimulated significant short-term capital inflows into emerging markets. The attractiveness of the so-called “carry trade” has raised concerns that the host countries may pay the price with overheated economies, overvalued cur-rencies, and inflationary pressures. For countries dependent on foreign financing because of large current account deficits, and for countries with weak financial regulations, the volatility of global capital flows risked to amplify domestic credit cy-cles and exacerbate macroeconomic vulnerabilities should investor sentiment turn or monetary policy in the advanced economies be tightened.
In these circumstances, central banks which, for the most part, had been relying on a specific short-term policy rate to manage inflation, were faced with a conundrum: raising the policy rate to slow down domestic demand, mindful that this could attract further capital inflows, and, thus, put addi-tional upward pressure on the currency; or leaving interest rates unchanged to stem nominal currency appreciation at the cost of current and future in-flation. Moreover, monetary policymakers became increasingly concerned about the financial stabil-ity implications of these developments. The big question was: should central banks use monetary policy levers to avoid the potential buildup of vul-nerabilities in the financial sector, even if inflation was low? Central banks needed a new “compass” (Borio, 2011).
Turkey was not exempt from these policy chal-lenges. While the economy recovered fast from the global financial crisis with growth reaching almost 9 percent in 2010, a foreign financed credit boom en-sued (World Bank, 2013). Prior to 2008, the major-ity of capital inflows consisted of Foreign Direct In-vestment (FDI), but during the post-crisis recovery short term flows came to dominate (about 60 per-cent of inflows had maturities of one year or less), increasing rollover risks. These developments left the economy exposed to the risk of a sudden capi-tal flow reversal. With credit to the private sector booming, by far exceeding the growth of nominal GDP, and the current account deficit widening, the
CBRT made an adjustment to its monetary policy framework in late 2010 with the aim of reducing vulnerabilities and lessening risks to financial sta-bility.11
A new compass for the CBRT
The new “unorthodox” monetary policy strategy was announced in the fall of 2010. In the CBRT’s view, relying exclusively on a single instrument for monetary policy was sub-optimal. The CBRT ar-gued that increasing the policy rate to fight infla-tion would only provide further impetus to capital inflows and, thus, more pressures for currency ap-preciation and/or higher inflation. The CBRT added the goal of financial stability in addition to price stability to its mandate more explicitly.12 The inter-mediate goal of the new framework was to “deter excessive short-term capital inflows, while chang-ing their composition from short-term to long-term and from debt to equity and insulating domestic demand from excessive swings (CBRT, 2013)”.
One key element of the new policy framework was an interest rate corridor. While the use of an inter-est rate corridor—a symmetric and narrow band to keep interbank market rates around the pre-announced policy rate—had started in May 2010, the CBRT’s revamped variation centered on having a more proactive (and asymmetric) approach to changes in the floor and ceiling of the corridor—formed by the CBRT’s overnight borrowing and lending rates. The width of corridor would be ad-justed as warranted—and even asymmetrically— around the policy rate to fit the desired policy goals. The thinking was that, by generating some degree of uncertainty around interbank interest rates, the incentives for carry trades would diminish.
The new policy framework was accompanied by other supportive monetary policy instruments. These included:
• Repo operations through quantity and price auctions, with quantity auctions held on days deemed “ordinary,” and price auctions on days deemed “extraordinary.”13
• A special funding facility for primary dealer banks, in which liquidity is provided through a quantity auction, with the possibility of further injection of liquidity via price auctions on ex-traordinary days.
10 For excellent discussions on the “new” post-crisis role of central banks, see Goodhart (2010) and Borio (2011). See also Dell’Aricia et al. (2012) amd Osiňski, Seal and Hooguin (2013).
11 The following description of the new monetary policy strategy (and its implementation) by the CBRT is derived from several documents, including Başçı (2012); Kara (2012); IMF (2012 (a)); and several issues of the CBRT’s financial stability report.
12 This mandate was already embedded in the CBRT Law (Article 4, Part I).
13 For quantity auctions, maturity is 1-week, with the interest rate set by the CBRT (policy rate). Price auctions maturities are 1-week, 1-month and 3-month.
Turkey’s Transitions
98
• Since September 2011, the CBRT also allows for reserves required on domestic currency li-abilities to be met in foreign currency and gold, with varying reserve option coefficients (ROCs) further influencing liquidity conditions in the domestic money market.14
• No further remuneration of required reserves in domestic currency (October 2010), and differ-ential reserve requirements by maturity (Janu-ary 2011).
• Guiding market expectations by announcing certain limits on the flow and stock of liquidity that can be injected via the different facilities.
• Purchase (and later) sales of foreign exchange through auctions, sometimes accompanied by direct unannounced interventions in the market.
The policy-induced uncertainty in short-term mar-ket rates was the cornerstone of this strategy and the key signaling device. As the corridor would be widened, the volatility of market rates would be al-lowed to increase proportionally with it, even if on average they continued to remain close to the pol-icy rate. Thus, now it would be the floor of the cor-ridor that came to indicate a “guaranteed” rate of return. This, it was hoped, would deter short-term inflows and reverse appreciation pressures on the TL. The CBRT would also make more proactive use of reserve requirements (using levels, composition and remuneration) to temper credit growth.
November 2010-October 2011: Limited success in reigning in the credit boom
Towards the end of 2010, the imbalances in both domestic and external demand put financial stabil-ity at risk. Consequently, the CBRT lowered the bor-rowing rate (the low end of the corridor) from 6.5 percent in October to 1.75 in November, with the aim of limiting short-term capital flows by reducing risk-adjusted returns. The CBRT accompanied this move with unannounced changes in the volume of liquidity provided via the repo auctions, thus gener-ating volatility in the overnight market rate. In ad-dition, on the premise that credit was inelastic with respect to changes in interest rates, the CBRT raised reserve requirements (from April 2010 for Foreign Exchange (FX) denominated liabilities and October 2010 for TL), ceased to remunerate them (October 2010), and finally started to differentiate them by maturity (since January 2011 for TL and May 2011
for FX). By May 2011, the required reserves (RRs) on short-term TL liabilities had been increased to 16 percent, from 5.5 percent in October 2010.
Initially, the strategy did not have the desired ef-fect. Credit growth continued unabated, reaching 31 percent (adjusted for valuation changes) in 2011 barely below the 34 percent growth in 2010. More-over, there was an acceleration in inflation to 10.4 percent against the target of 5 percent and, while economic growth remained strong at 8.8 percent, the current account deficit widened significantly to around US$75 billion or 10 percent of GDP (Figure 3.7). Banks were able to continue to meet the con-tinued demand for credit by increasing their reli-ance on non-core funding sources, especially inter-bank foreign exchange loans (World Bank, 2013). In 2011, non-core liabilities of the sector increased by 48 percent in 2011. In addition, the increase in reserve requirements was met by net injections of the CBRT funding, thus nullifying the credit ra-tioning effect of those changes (IMF, 2012 ; CBRT, 2012).
Post-October 2011: A soft landing but no safety yet
In the second half of 2011, driven by external events, the monetary framework was adjusted. Re-flecting market turbulence related to the Euro crisis, capital inflows weakened from mid-2011 and the TL depreciated. In an effort to stem capital outflows, the CBRT raised the borrowing rate back to 5 per-cent (in August) and the lending rate from 9 to 12.5 percent (in October) (Figure 3.8). The CBRT also started foreign exchange selling auctions and low-ered reserve requirements (which have remained unchanged since January 2012). Moreover, on oc-casion, the CBRT delivered “additional monetary tightening in order to prevent undesired exchange rate movements from deteriorating the inflation outlook via pass-through and expectations”.15 On those occasions, funding supplied via quantity auc-tions at the policy rate was reduced or eliminated. Instead, the market was funded via market price based auctions, and hence, the overnight rate set-tled close to the upper bound of the interest rate corridor. Finally, in June 2012, the CBRT introduced the ROCs mentioned above, which contributed to an accumulation of gross foreign reserves and a lowering of net funding from the CBRT to banks (World Bank, 2013; IMF, 2012a).
14 Reserve option coefficients modulate the amount of mandatory reserves to be held in foreign currency and gold, creating incentives for foreign exchange accumulation if set below 1, and incentives to sell foreign exchange if set above 1. From November 2012, for foreign currency, the ROCs are 1.4 for 0-40 percent of deposits; 1.7, 2.0, 2.2, and 2.3 for increments of 5 percentage points until 60 percent. For gold, ROCs are 1 for 0-20 percent, 1.5 20-25 percent, and 2.0 for 25-30 percent of deposits.
15 Akçelik, Y., E. Ermişoğlu, and A. Oduncu (2013).

Chapter 3: Finance : Banking sector restructuring and financial integration
99
The changes in the monetary policy framework were complemented with macro-prudential mea-sures introduced by the banking regulator from late 2010.16 Specifically, the BRSA introduced (IMF 2012(a)):
• loan-to-value limits on real estate loans to con-sumers (at 75 percent) and for commercial de-velopments (at 50 percent) (December 2010);
• higher risk weights for new general purpose (consumer) loans (from 100 to 150 and 200 per-cent for loans of under or over 2 years of final maturity, respectively);
• higher general provisioning requirements (from 1 to 4 percent) and specific provisioning re-quirements (from 2 to 8 percent) for banks with high levels of consumer loans (exceeding 20
Source: CBRT
Source: CBRT
0%
5%
10%
15%
20%
25%
30%
35%
40%
45%
0
10,000
20,000
30,000
40,000
50,000
60,000
70,000
80,000
90,000
Jan.
09M
ar.0
9M
ay.0
9Ju
l.09
Sep.
09N
ov.0
9Ja
n.10
Mar
.10
May
.10
Jul.1
0Se
p.10
Nov
.10
Jan.
11M
ar.1
1M
ay.1
1Ju
l.11
Sep.
11N
ov.1
1Ja
n.12
Mar
.12
May
.12
Jul.1
2Se
p.12
Nov
.12
Perc
ent C
hang
e
In m
illio
n US
$
Current Account 12-month rolling sum (US$) Credit growth (right axis)
0%
2%
4%
6%
8%
10%
12%
14%
Jan-
10
Apr-1
0
Jul-1
0
Oct
-10
Jan-
11
Apr-1
1
Jul-1
1
Oct
-11
Jan-
12
Apr-1
2
Jul-1
2
Oct
-12
Jan-
13
Apr-1
3
Jul-1
3
Oct
-13
Jan-
14
Apr-1
4
Jul-1
4
(O/N) Borrowing (O/N) Lending
Policy Rate (1-Week Repo) Weighted Average Cost of CBRT Funding
Figure 3.7: A credit boom and rising external imbalances in 2010-2011
Figure 3.8: Policy rate adjustments and the corridor
16 Additionally, in June 2011, the authorities created a financial stability forum, which is headed by the Deputy Prime Minister and serves as a policy coordination body for macro-prudential issues. The forum comprises of the CBRT, the Turkish Treasury, BRSA, SDIF and the Capital Markets Board (CMB).

Turkey’s Transitions
100
percent of their portfolio) or high level of non-performing consumer loans (above 8 percent of outstanding consumer loans) (June 2011);
• regulatory changes forbidding cash advances and increases in credit limits until outstanding balances had been fully repaid (June 2011); these measures were supplemented by an in-crease in the required minimum monthly amor-tization payment in October 2013;
• capital surcharges for large exposures to inter-est rate risk and maturity mismatches, thus discouraging excessive duration gaps (August 2011); and,
• amendments to the capital adequacy regulation linking minimum capital requirements for banks with strategic foreign shareholders to mar-ket factors such as Credit Default Swaps (CDS) spreads of the parent and the country of origin (effective January 2012).17
The change in monetary policy strategy, the macro-prudential measures listed above, together with a nonbinding nominal credit growth target an-nounced by the government, contributed to the sharp slow-down in credit growth in late 2011 and all of 2012.18 Credit slowed to almost half of the previous year’s rate in 2012 (15.6 percent). The reduction in domestic, and to a lesser degree ex-ternal, demand dampened GDP growth from 8.8 percent in 2011 to 2.2 percent in 2012. Moreover, the current account deficit contracted sharply and end-year inflation dropped to its lowest levels in decades. Turkey had achieved the first successful “soft landing” of the post 2001 period.
However, the cycle of monetary expansion and sub-sequent, belated tightening repeated itself in 2013 and early 2014. With domestic demand sharply cur-tailed and global financial conditions easing in 2012 and the first quarter of 2013, the CBRT cut short-term interest rates and narrowed the interest rate corridor. In January and February 2013, overnight lending and borrowing rates were reduced by 25 basis points each. In March, the interest rate corri-dor was narrowed with a 100-basis-point cut in the overnight lending rate. In April, the policy rate and the overnight lending and borrowing rates were cut again by 50 basis points each. As a result, domes-tic credit growth accelerated again, exceeding by a substantial margin the government’s indicative 15 percent growth target for 2013.
Domestic demand responded positively to mon-etary stimulus, but with it the current account deficit also widened and inflation started creeping up again. When, in late May 2013, the Federal Re-serve (Fed) announced a gradual winding down of extraordinary monetary policies, Turkey on account of its large external imbalances, was among the most impacted emerging markets (Figure 3.9). The initial response of the CBRT to capital outflows was to increase the number of exceptional days and in-tervene in the foreign exchange market by selling around US$23 billion between May 2013 and Janu-ary 2014 reducing net reserves to just US$43 billion as of January 2014. Subsequent steps to tighten liquidity through further changes in the complex range of price and quantity instruments failed to stem TL depreciation, although efforts to curb con-sumer loans through a range of additional macro-prudential measures were effective.19 Nonetheless, with net reserves too low to mount an effective defense of the currency, and as domestic political uncertainty and a heavy electoral cycle added to the pressure, the CBRT belatedly changed course. On January 28, 2014, at an interim (unscheduled) Monetary Policy Committee (MPC) meeting, it in-creased key policy rates by 550 basis points imply-ing a rise in effective borrowing costs of 350 points (Figure 3.8). In essence, the CBRT had returned to monetary orthodoxy. As market conditions have stabilized in recent months, the CBRT has started to lower the policy rate again but with inflation run-ning at almost twice the 5 percent target, concerns are that higher inflationary expectations may be-come engrained.
Despite considerable policy experimentation, the CBRT does not seem to have found a silver bullet to insulate the domestic economy from changes in global financial conditions. While growth seems to be settling in a moderate 3-4 percent range, infla-tion has consistently exceeded the CBRT’s target and it could be argued that the CBRT has taken on too much responsibility for management of the economy, leaving fiscal policy largely off the hook. Ayşan, Fendoğlu and Kılınç (2014) summarize the CBRT’s policy framework and argue that it helped correct exchange rate overvaluation in 2011 and subsequently reduced exchange rate volatility compared to other emerging markets. The same authors (Ayşan, Fendoğlu and Kılınç, 2013) also suggest that following the introduction of the un-orthodox policy framework, the Turkish economy
17 Separately, in September 2011, the SDIF introduced a surcharge on deposit insurance premiums for large banks.18 In the spring of 2011, the government made a public announcement that they expected the growth rate in credit not to exceed 25 percent in an
exchange rate-adjusted basis in 2011.19 The measures, introduced in October 2013, comprise inter alia tighter verification requirements on the income of credit card holders, maximum
maturities for consumer loans, and length of instalment payments, greater risk weights on credit card receivables, and required minimum down-payments for automobile loans. Consumer credit has slowed significantly in 2014, contributing to a gradual external rebalancing.

Chapter 3: Finance : Banking sector restructuring and financial integration
101
Source: BloombergNotes: The period May-September 2013 was a period of concern among all emerging markets about the impact of “tapering”. These concerns subsided as it became clear that the Fed would taper very gradually and there was time to adjust. The period December 17-January 28 was characterized by heightened pressure on Turkish assets due to a combination of turning global investor sentiment and domestic political uncertainty.
60
70
80
90
100
110
120
130
140
15022
-May
-13
12-Ju
n-13
3-Ju
l-13
24-Ju
l-13
14-A
ug-1
3
4-Se
p-13
25-S
ep-1
3
16-O
ct-1
3
6-No
v-13
27-N
ov-1
3
18-D
ec-1
3
8-Ja
n-14
29-Ja
n-14
19-F
eb-1
4
12-M
ar-1
4
2-Ap
r-14
23-A
pr-1
4
14-M
ay-1
4
4-Ju
n-14
25-Ju
n-14
Stoc
k M
arke
t Ind
ex, 2
2 M
ay 2
013
= 10
0
Turkey Brazil Mexico South Africa India Poland Indonesia
80
85
90
95
100
105
110
115
120
125
130
22-M
ay-1
3
12-Ju
n-13
3-Ju
l-13
24-Ju
l-13
14-A
ug-1
3
4-Se
p-13
25-S
ep-1
3
16-O
ct-1
3
6-No
v-13
27-N
ov-1
3
18-D
ec-1
3
8-Ja
n-14
29-Ja
n-14
19-F
eb-1
4
12-M
ar-1
4
2-Ap
r-14
23-A
pr-1
4
14-M
ay-1
4
4-Ju
n-14
25-Ju
n-14
Exch
ange
Rat
e In
dex,
22
May
201
3 =
100
Turkey Brazil Mexico South Africa India Poland Indonesia
90
100
110
120
130
140
150
160
170
180
190
22-M
ay-1
3
12-Ju
n-13
3-Ju
l-13
24-Ju
l-13
14-A
ug-1
3
4-Se
p-13
25-S
ep-1
3
16-O
ct-1
3
6-No
v-13
27-N
ov-1
3
18-D
ec-1
3
8-Ja
n-14
29-Ja
n-14
19-F
eb-1
4
12-M
ar-1
4
2-Ap
r-14
23-A
pr-1
4
14-M
ay-1
4
4-Ju
n-14
25-Ju
n-14
10-Y
ear B
ond
Yiel
d In
dex,
22
May
201
3 =
100
Turkey Brazil Mexico South Africa India Poland Indonesia
Figure 3.9: Turkish financial markets came under severe pressure after the Fed’s tapering announcement
Turkey’s Transitions
102
became less susceptible to changes in global inves-tor sentiment, whereas before 2010, the Turkish economy had experienced greater sensitivity to the volatility of global capital flows than other emerg-ing markets. IMF (2013) research does not confirm this finding. Using an index of exchange rate pres-sures, they find Turkey consistently more sensitive to global sentiment than other emerging markets and little impact of the new policy framework. The IMF also found that the Reserve Option Coefficient acts asymmetrically during the cycle, with banks ac-cumulating foreign exchange as capital flows in, but hoarding it during an episode of capital outflows, forcing the CBRT to draw down net reserves to limit depreciation pressures. The most recent return to a more orthodox policy framework may be an accep-tance that, despite the willingness to experiment, much remains to be learned in emerging markets about ways to mitigate the impact of volatile global conditions on the domestic economy. We return to some basic policy lessons in the conclusion.
In the end, countries such as Turkey that rely in for-eign capital inflows may have to live with the risks these flows bring, for the benefit of supporting in-vestment and, thus, more rapid convergence. On balance, the ability of Turkey to attract foreign capi-tal is an asset that needs to be nurtured, while risk management is further strengthened. The strength of banking and public sector balance sheets pro-vides some insurance that even in the event of a change in investor sentiment, a full blown financial crisis is not – for now – on the cards. However, in parallel, Turkey could undertake efforts to diver-sify its funding away from short-term bank lending and develop a greater range of domestic financial instruments to attract savings from its own house-holds and enterprises. Indeed, it appears that countries that have a stronger domestic funding base are also those countries that have managed the risks of attracting global capital flows more ef-fectively.20 How to diversify sources of funding and promote domestic savings are issues to which the chapter now turns.
The search for sustainability –Lessons for Turkey’s financial deep-ening effortsThere is strong evidence of a link between financial depth and economic development and macroeco-nomic stability. There is an extensive literature, for example, on the financial development growth nex-us (Levine, 1997; Demirgüç-Kunt and Levine, 2008;
2009). A positive relationship is posited based on the financial system’s ability to: mobilize savings, al-locate resources to productive uses, facilitate trans-actions and risk management, and exert corporate control. A country providing an environment con-ducive to greater financial development is expected to have higher economic growth rates, with much of the effect coming through greater productivity rather than a higher overall rate of investment (IMF, 2011). At the same time, different types of finan-cial instruments may be needed at different stages of development, with equity and risk capital par-ticularly important as countries aim to shift from technology adaptation to innovation-based growth (Aghion, Howitt and Meyer-Foulkes, 2005).
Despite a strong record of economic performance over the last decade, Turkey’s financial sector re-mains relatively shallow. Specifically, while mon-etary and credit aggregates have increased to lev-els comparable with other middle income peers, capital markets remain thin in comparison (Figure 3.10). Turkey’s financial sector remains very much bank-centric and at the shorter end of the maturity spectrum, with significant implications for savings allocation and the financing of investment. Pro-moting financial sector development, especially encouraging bond market and specifically longer tenor financing, would help open up additional and more stable channels for funding supply.
More financial depth:International lessons
There are some common aspects (if not precon-ditions) associated with higher levels of financial depth (Luengnaruemitchai and Ong, 2005; Chami, Fullenkamp and Sharma, 2009; Goyal et al., 2011). While there is wide consensus that deepening is a gradual and largely organic process, and policy rec-ommendations need to account for country-specif-ic circumstances and institutions, some basic areas of emphasis emerge:
• Macro policy framework. A sound policy frame-work is essential for macroeconomic and finan-cial stability. It supports demand for domestic assets, and enhances the credibility of the gov-ernment as an issuer of debt securities, which typically serve as the low risk benchmark for the market. In this connection, a benchmark yield curve is a key requirement for market develop-ment and facilitates the reliable valuation of fi-nancial assets. This, in turn, necessitates sound public debt management policies. Conversely,
20 See Chapter 4 of IMF (2013) for a detailed analysis of factors behind the resilience shown by a group of countries to fluctuations in foreign capital inflows.

Chapter 3: Finance : Banking sector restructuring and financial integration
103
countries with unsustainable fiscal policies struggle to establish monetary policy credibility, as Turkey’s pre-2001 experience illustrates.
• Legal framework and market infrastructure. A strong and transparent legal framework is criti-cal for property and creditor rights to be pro-tected. The existence, and proper enforcement, of accounting and standards is sine qua non for confidence in the execution of financial transac-tions. There is also a need for a financial infra-structure such as exchanges and credit bureaus and a robust payments and settlements system, often with significant private sector involve-ment. Finally, a transparent and timely execu-tion regime will bring clarity to expected returns and costs of investment.
• Regulatory and supervisory regime. A sound regulatory and supervisory system needs to be established with the capacity to ensure finan-cial stability. Such a regulation needs to address disclosure and transparency among market par-ticipants, limit market dominance, and enforce risk management practices, without inhibiting innovation.
Promoting financial sector deepening thus entails a broad agenda of reforms. However, the sequencing of reforms is much less clear. A balance is needed whereby regulation fosters prudent market con-
duct without hindering development: too rapid deregulation risks engendering instability (Reinhart and Rogoff, 2008), but highly restrictive rules may hinder financial market development. Issues of regulatory capacity need to be considered, as well as the country’s own financial history and resulting risk preferences. Before aggressively seeking to de-velop new financial markets, it is important to un-derstand the demand for new types of investment such as equity, or even venture capital, as other-wise supply will chase a limited number of available deals, leading to low profits and potentially higher risks. Likewise, the demand for new financial instru-ments and the possible sources of funding for capi-tal markets need to be considered. All in all, this calls for nationally specific strategies to sequence capital market development, even if the overall aim for greater diversification and depth of financial markets is generally accepted.
Where does Turkey stand?
Turkey’s shallow financial sector is in part a reflec-tion of the continued aversion of private savers to enter into long term financial contracts, though structural and regulatory constraints may be factors as well. Risk aversion brought about by a history of crisis is reflected in a preference for shorter term deposits and financing instruments, with signifi-cant repercussions for financial innovation.21 Most
Source: Global Financial Development DatabaseNote: The chart follows the best in class methodology introduced earlier (see Figure 3.5). “Growth Markets Average” refers to unweighted average of Republic of Korea, Mexico, Malaysia and Philippines. “New EU Members Average” refers to unweighted average of Hungary, Poland, Slovakia and Czech Republic.
Liquid Liabilities to GDP
Life Insurance PremiumVolume to GDP
Non-life InsurancePremium Volume to GDP
Stock MarketCapitalization to GDP
Stock Market Total ValueTraded to GDP
Private Bond MarketCapitalization to GDP
Public Bond MarketCapitalization to GDP
BRICS Average Growth Markets Average New EU Members Average Turkey
Figure 3.10: Turkey: Financial market depth indicators
21 Countries like Brazil have been pointed out as “successful” in addressing this problem, allowing it to build its capital markets. However, the reality is that most financial contracts in local markets remain indexed to short-term (overnight) rates, inflation or the exchange rate (Park, 2012). Thus dura-tion, the relevant measure for risk diversification, remains largely unchanged. In a recent “Free Exchange” column, the Economist quotes research that suggests the personal experience of a financial crisis has long-lasting effects on individual risk aversion. See “Risk Off”, Economist.com/blogs/free exchange, January 25, 2014.
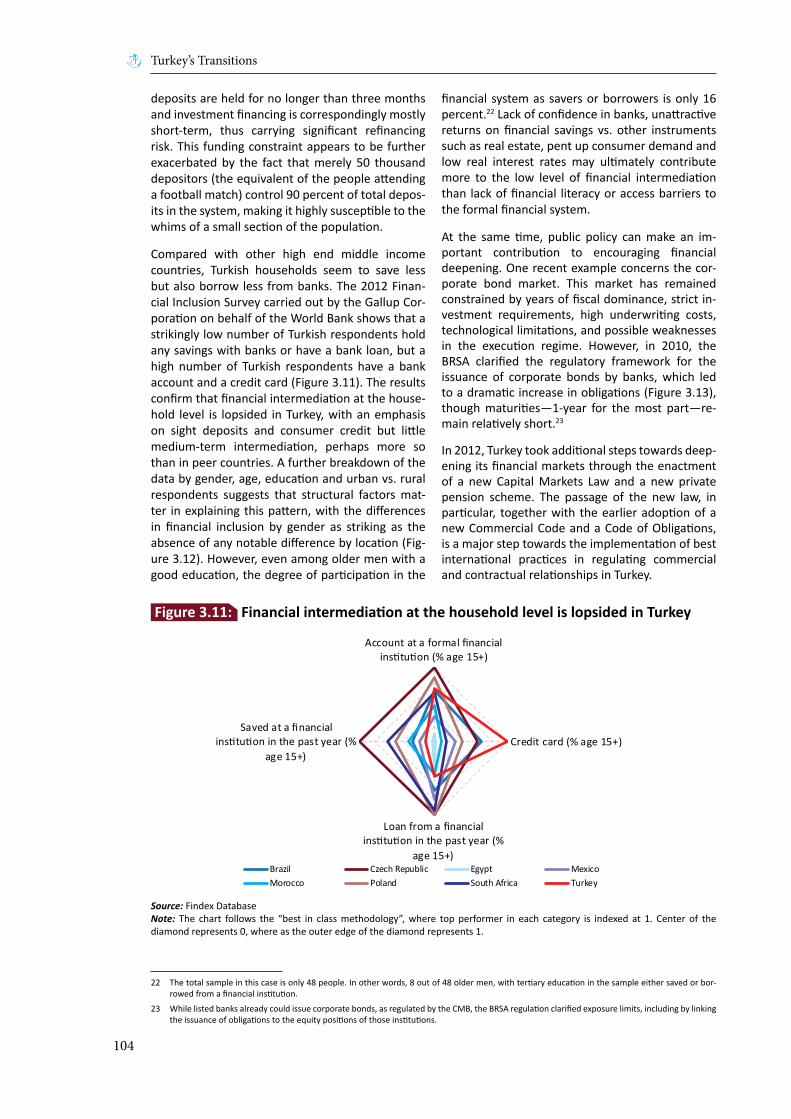
Turkey’s Transitions
104
deposits are held for no longer than three months and investment financing is correspondingly mostly short-term, thus carrying significant refinancing risk. This funding constraint appears to be further exacerbated by the fact that merely 50 thousand depositors (the equivalent of the people attending a football match) control 90 percent of total depos-its in the system, making it highly susceptible to the whims of a small section of the population.
Compared with other high end middle income countries, Turkish households seem to save less but also borrow less from banks. The 2012 Finan-cial Inclusion Survey carried out by the Gallup Cor-poration on behalf of the World Bank shows that a strikingly low number of Turkish respondents hold any savings with banks or have a bank loan, but a high number of Turkish respondents have a bank account and a credit card (Figure 3.11). The results confirm that financial intermediation at the house-hold level is lopsided in Turkey, with an emphasis on sight deposits and consumer credit but little medium-term intermediation, perhaps more so than in peer countries. A further breakdown of the data by gender, age, education and urban vs. rural respondents suggests that structural factors mat-ter in explaining this pattern, with the differences in financial inclusion by gender as striking as the absence of any notable difference by location (Fig-ure 3.12). However, even among older men with a good education, the degree of participation in the
financial system as savers or borrowers is only 16 percent.22 Lack of confidence in banks, unattractive returns on financial savings vs. other instruments such as real estate, pent up consumer demand and low real interest rates may ultimately contribute more to the low level of financial intermediation than lack of financial literacy or access barriers to the formal financial system.
At the same time, public policy can make an im-portant contribution to encouraging financial deepening. One recent example concerns the cor-porate bond market. This market has remained constrained by years of fiscal dominance, strict in-vestment requirements, high underwriting costs, technological limitations, and possible weaknesses in the execution regime. However, in 2010, the BRSA clarified the regulatory framework for the issuance of corporate bonds by banks, which led to a dramatic increase in obligations (Figure 3.13), though maturities—1-year for the most part—re-main relatively short.23
In 2012, Turkey took additional steps towards deep-ening its financial markets through the enactment of a new Capital Markets Law and a new private pension scheme. The passage of the new law, in particular, together with the earlier adoption of a new Commercial Code and a Code of Obligations, is a major step towards the implementation of best international practices in regulating commercial and contractual relationships in Turkey.
Source: Findex DatabaseNote: The chart follows the “best in class methodology”, where top performer in each category is indexed at 1. Center of the diamond represents 0, where as the outer edge of the diamond represents 1.
Account at a formal financialinstitution (% age 15+)
Credit card (% age 15+)
Loan from a financialinstitution in the past year (%
age 15+)
Saved at a financialinstitution in the past year (%
age 15+)
Brazil Czech Republic Egypt MexicoMorocco Poland South Africa Turkey
Figure 3.11: Financial intermediation at the household level is lopsided in Turkey
22 The total sample in this case is only 48 people. In other words, 8 out of 48 older men, with tertiary education in the sample either saved or bor-rowed from a financial institution.
23 While listed banks already could issue corporate bonds, as regulated by the CMB, the BRSA regulation clarified exposure limits, including by linking the issuance of obligations to the equity positions of those institutions.

Chapter 3: Finance : Banking sector restructuring and financial integration
105
Source: Findex Database
Account at aformalfinancial
institution
Credit card Loan from afinancial
institution inthe past year
Saved at afinancial
institution inthe past year
Male (% age 15+) Female (% age 15+)
0%
20%
40%
60%
80%
100%
Account at aformalfinancial
institution
Credit card Loan from afinancial
institution inthe past year
Saved at afinancial
institution inthe past year
Older adults (% age 25+) Young adults (% ages 15-24)
0%
20%
40%
60%
80%
100%
Account at aformalfinancial
institution
Credit card Loan from afinancial
institution inthe past year
Saved at afinancial
institution inthe past year
Rural (% age 15+) Urban (% age 15+)
0%
20%
40%
60%
80%
100%
0%
20%
40%
60%
80%
100%
Account at aformalfinancial
institution
Credit card Loan from afinancial
institution inthe past year
Saved at afinancial
institution inthe past year
Primary education or less (% age 15+)Secondary education or more (% age 15+)
Figure 3.12: Financial intermediation is higher among men, and among the older and better educated
(a) Financial intermediation by gender
(c) Financial intermediation by age groups
(b) Financial intermediation by rural vs. urban
(d) Financial intermediation by level of education
Source: BIS Database
0
2
4
6
8
10
12
14
16
Dec.09 Dec.10 Dec.11 Dec.12
In b
illio
n US
$
Financial Corporations Non-financial Corporations
Figure 3.13: Domestic debt securities issued by banks and non-financial corporations
Turkey’s Transitions
106
Moreover, the passage of the law is part of the government’s strategy and is consistent with its ul-timate goal of making Istanbul an international fi-nance center. Additional steps to promote financial market development and diversification include a new leasing and factor law, and the initial issuance of a sovereign sukuk, part of a general effort to de-velop Islamic finance.
The key changes brought about by the new Capital Markets Law include, among others:
• The creation of a new securities exchange (Borsa Istanbul) to replace the existing Istanbul Stock Exchange and merge it with the Gold Exchange and Turkish Derivatives Exchange (TURKDEX). This new joint-stock company is expected to become a publicly traded company, which will open it up to private and possibly foreign invest-ment, and, thus, to significant improvements in technology and infrastructure.
• A prospectus review process aligned with EU requirements. This process is expected not only to accelerate the issuance of securities but also serve to emphasize issuers’ responsibilities. Moreover, the law enables issuers to use a base prospectus which, once approved, will remain effective for 12 months instead of having to go through a full review process for each issuance. Issuers will also be permitted to incorporate by reference in the prospectus certain previously publicly filed information such as financial state-ments, audit reports and previously approved prospectuses, provided that the information contained in such documents is up to date.
• Enhancement of investor protection. The law ex-pands disclosure requirements for issuers, and significantly increases their liability for inaccu-rate or misleading information and omissions in their disclosed documents. In cases where damages cannot be collected from the issuer, the selling shareholders, the lead intermediary institution, any guarantors and members of the issuer’s board of directors will, to the extent of their culpability and as the circumstances war-rant, be liable for damages that can be linked to them. Further, independent auditors, credit rating agencies and others whose reports are included in the offering prospectus are respon-sible for any inaccurate or misleading informa-tion and omissions in such reports.
• Strict limits on related-party transactions. The law introduces definitions of insider trading and market manipulation that reflect the relevant
EU Directives. The law also includes extensive penalty provisions for violators of these prohi-bitions. In addition to monetary penalties and trading bans, insider traders and market ma-nipulators can face imprisonment of two to five years.
• Other important provisions relate to the cre-ation of an Investor Compensation Center, also modeled after EU examples, which replaces the old Investor Protection Fund, and the new ability to offer products that are not specifically regulated by the law, provided that certain addi-tional disclosures are made with respect to the description of the securities and the risks asso-ciated with them.
While the impact of these legal reforms is likely to take some time, the reform of the private pension system in late June 2012 has already started to bear fruit. The key element of the reform is a matching contribution by the government, effective January 1, 2013. Until the end of 2015, the new regulations also allow transfers from defined benefit (DB) to defined contribution (DC) plans without incurring tax, providing more favorable tax treatment of dis-tributions at retirement. These changes are being made as a way to encourage more savings among employees and create larger asset pools to be man-aged by the financial services industry, which the government hopes will promote Turkey as a region-al financial services center (Box 3.3 describes the pension reform in detail).
Early results are encouraging. As of July 4, 2014, 4.65 million participants were enrolled in the pri-vate pension scheme up from 3.1 million in January 2013. Assets under management by private pension funds have grown 45 percent over the same period. With pension funds accounting for almost half of all assets under management by mutual funds, this increase was instrumental in boosting mutual fund assets by TL 6.8 billion to TL 56.7 billion, despite challenging financial market conditions. However, given how prickly Turkish investors are about both liquidity and interest rate risks, some more time is needed to assess whether these changes are per-manent or not.24
24 Özel and Yalçın (2013) estimate that the impact of the reform, given its voluntary nature, is likely to be marginal (about 1.5 percent of GDP).

Chapter 3: Finance : Banking sector restructuring and financial integration
107
Conclusion: Lessons learned andremaining challengesTurkey’s financial sector reforms offer rich lessons to emerging as well as advanced economies. Indeed, Turkey’s approach to banking sector restructuring has inspired the design of reforms in countries such as Ukraine in 2008-2009. Turkey’s extensive use of macro-prudential measures to regulate credit growth continues to add to the growing experience among emerging markets with these new tools, even if the experiment with an unorthodox mon-etary policy framework has arguably proven less convincing. Turkey’s concerted attempt to boost domestic savings and widen the range of available financial instruments while at the same time avoid-ing the risks of excessively fast financial deregula-tion is likely to generate valuable experiences in the future. Here we offer some general conclusions on lessons learned and remaining challenges.
On banking restructuring:
The reforms of 2001 were an all-hands-on-deck response to a longstanding and complex policy
challenge. The reforms not only required a major re-thinking of how policies were conducted—rely-ing on operationally and functionally independent institutions for policy design and implementation—but also a major break in the political economy of the financial sector. The catalyst for reforms was not a sudden recognition by politicians that a major policy change was needed—a rare historical event anywhere, to be sure—but rather the emergence of a major economic dislocation that could only be addressed with “real” reforms. Sometimes there is nothing better than bad times for good policies to be implemented. With memories of the crisis fad-ing, its lessons should not be forgotten.
The cleanup of the system required powerful legal tools and the determination to use them—going after the culprits was key. The move to put state banks under more professional management and having them run on a commercial basis, including preparing them for privatization, signaled a major break from the past. The political patronage system sustained by these institutions had not only proven immensely costly to the Turkish state but had also led to distortions in the market that had hampered
The pension reforms introduced in Turkey contain a number of important tax incentives and other rules to encourage Turkish household to increase voluntary retirement savings. The most important measures include:
• Tax relief will be revised. Employers can claim a tax deduction on pension contributions up to 15 percent of employee income, with a cap on contributions that equates to the national minimum wage.
• Tax relief will be available on employee contributions through a direct matching contribution from the government. Employee contributions up to the national minimum wage will receive a 25 percent government match.
• Tax on distributions at retirement declines from a minimum tax rate of 3.75 percent of the total account value to 3.75 percent of the portion of the account that represents investment income. It is also applicable to early retirement distributions.
• Employees can save in an effective three-policy framework: the new government contributions, the employer-sponsored contributions and the employee contributions. This is in addition to the basic social security system, which is DB. Each policy component will be subject to separate vesting rules:
o The government matching contributions will be accessible at retirement. Prior to retirement, they are partially vested: 15 percent after 3 years of participation, 35 percent after 6 and 60 percent after 10.
o Employers will determine vesting of the employer-sponsored contributions, with vesting of up to seven years of participation. Under the previous regulations, vesting was up to five years.
o Employee contributions can vest immediately.
• Government matching contributions are available not only to employer-sponsored retirement plans but also to retirement plans established by individuals on their own.
• Transfer of funds from DB to DC plans can be made immediately (until the end of 2015) with no tax liability.
Box 3.3: Encouraging household savings by promoting voluntaryprivate pension accounts

Turkey’s Transitions
108
the development of the sector. Wresting control of these institutions from “the politicians” was central to the credibility of the effort. On the private sector side, the focus was on recovering the cost of the cleanup without bailing out owners. The key (inno-vative) element of the reforms was that failed bank owners were made responsible for all losses linked to fraudulent transactions, even if their value ex-ceeded their equity participations in the banks. The logic was that if owners used their banks to benefit their other businesses illegally, then those compa-nies were fair game for the state to seek compen-sation from. This element had a particular positive effect on mitigating moral hazard and strengthen-ing market discipline, with those banks remaining in the system showing a significant degree of risk aversion that served them well during the recent global financial crisis.
While there is no question that the 2001 reforms had the intended effects, the reform agenda is still unfinished to some degree. The operational inde-pendence of BRSA, while not questioned so far, remains at risk because its budget is still subject to parliamentary approval.25 Furthermore, the cen-terpiece of the cleanup effort—pushing out those owners that did not meet fit and proper criteria for a bank license and enforcing repayment of losses related to fraudulent transactions—came at a high economic and also personal cost. The lack of spe-cialized courts at times made the process a pro-tracted and costly one.26 Moreover, and perhaps more importantly, supervisors endured years of economic and personal duress by being subjected to largely frivolous lawsuits for their actions.27
On managing financial integration:
The CBRT was diving into unchartered waters when it introduced its unorthodox monetary policy strat-egy in late 2010. The policy conundrum triggered by the massive capital inflows clearly required a re-sponse—inaction was not an option. Nevertheless, while innovative, the early lack of success showed that perhaps the CBRT was trying to address too many goals—inflation, current account deficit, ex-change rate stability and capital inflows composi-tion—with too few instruments.28 It was not until more macro-prudential measures were introduced in mid-2011 that success was achieved to some de-
gree. In that regard, the degree of enhanced policy coordination brought about by the creation of the Financial Stability Committee (FSC) is clearly a key achievement. The success of the BRSA with the use of macro-prudential tools to slow down credit also provides valuable lessons to other emerging markets. The critical challenge ahead remains how to collectively address emerging vulnerabilities, particularly in a policy environment where institu-tions are operationally independent and may not individually have all the tools to deal with such fi-nancial stability concerns. In this regard, improving the operational procedures of the FSC (who does what, when, how decisions are reached, and how they are communicated to the public) remains an outstanding policy issue in Turkey.
The evidence regarding the impact of CBRT’s un-orthodox toolkit on macroeconomic volatility is mixed. Research by the CBRT suggests that the framework has contributed to relative exchange rate stability (compared to other emerging mar-ket economies’ currencies), a slowdown in credit growth, and a narrowing of the current account. The IMF (2013) presents evidence that suggests the policies may have had limited impact. Either way, it seems the unorthodox framework helped to abate the foreign financed credit boom only after it was accompanied with other macro-prudential measures. Their earlier introduction might have contributed to mitigate the extent of the boom in 2011 and facilitated a smoother adjustment.
More importantly, the ‘experiment’ may have come at the cost of a significant loss in the CBRT’s cred-ibility. The task of addressing financial stability concerns falls unto central banks not only because of legal requirements but rather because they are more adept in assessing risks and can react more quickly to emerging events. The policy instruments at their disposal can be activated rapidly since they usually do not require legislative approval or exter-nal consultation. The risk is that in taking on too many objectives, central banks may compromise the credibility of their core price stability mandate. Thus, the CBRT, while compelled to act by circum-stances, might have been better served by calling early on for tighter fiscal policy to help reign in the boom in domestic demand. The cost of the CBRT
25 In addition, rigidities in the salary structure may be putting BRSA at a disadvantage relative to private sector compensation packages.
26 At least in one case, a court reversed an intervention decision, years after the bank had been transferred to the SDIF and it had actually been sold to new owners.
27 While the law allows BRSA to pay for the legal fees incurred by their employees in addressing such legal actions, it does not explicitly protect them from liability for actions taken in the conduct of their duties.
28 It was not entirely clear either that policy actions were completely consistent, given that higher reserve requirements were matched by higher borrowings from the CBRT by commercial banks.
Chapter 3: Finance : Banking sector restructuring and financial integration
109
pro-activity has been a policy framework that is dif-ficult for market participants to understand, and by consistently failing to achieve the CBRT’s inflation target, may have damaged its credibility.29 Indeed, to some market participants, the whole episode has looked like a complex attempt to disguise the importance of interest rates as a tool for monetary policy in view of the intense domestic debate. Un-der stress, the unorthodox framework proved in-sufficient and interest rate policy returned center stage. Instead of finding the silver bullet, the CBRT may have “brought a knife to a gun fight”.
On deepening markets:
Turkey has made initial steps to enhance the depth and diversification of its financial sector. For years not much was done on this policy front in order to shield the government debt market from compe-tition for funds by the corporate sector. However, with public debt declining and with the recognition that reforms in this area would help address one of Turkey’s major remaining structural weaknesses—the lack of private sector savings—the government has rightly turned its focus to their enactment. Shallow markets not only increase the amplitude of the impact of external shocks (the corporate
sector has limited access to alternative sources of finance), but also lead to inefficient resource alloca-tion and lower rates of growth, as risks cannot be properly diversified.
The biggest stumbling block for quick progress in this area appears to be addressing the “credibility” gap. As in many other countries with a history of macroeconomic instability, Turkey’s savers remain wary of moving into longer tenor and more sophis-ticated financial instruments.30 There is, thus, an important link between the success of the mac-roeconomic policy framework in achieving price stability and the development of capital markets. Moreover, while experience in other countries has shown that reversing risk perceptions does take a long time, this should not preclude setting up the infrastructure for market development. From fur-ther improvements in the quality of supervision, to eliminating tax distortions that favor bank deposits over investments in capital market instruments, to rules aimed at boosting market liquidity to mobi-lize greater interest by institutional investors – the policy agenda is considerable. Patience and perse-verance will be needed – as Turkey’s own experi-ence with turning around the banking sector amply demonstrates.
29 As with any other policy strategy, communication is of the essence, particularly in the introduction of complex “innovative” instruments. The lesson here is that explaining “the why” is as important as to explaining “the how.”
30 Perhaps ironically, the market uncertainty created by the widening of the interest corridor appears to have generated the interest volatility that keeps net savers in the shorter end of the maturity spectrum.

Turkey’s Transitions
110
ReferencesAghion, P., Howitt, P., & Mayer-Foulkes, D. (2005). The Effect of Financial Development on Conver-gence: Theory And Evidence. Quarterly Journal of Economics120, 173-222.
Akçakoca, E. (2013). Policy Developments in Turkey 1990-2000. Background Paper.
Aysan, A., Fendoğlu, S., & Kılınç, M. (2014, Febru-ary). Managing Short-Term Capital Flows in New Central Banking:Unconventional Monetary Policy Framework in Turkey. Working Paper, 14/03.
Aysan, A., Fendoğlu, S., & Kılınç, M. (2013). Macro-prudential policies as buffer against volatile cross-border capital flows. Mimeographed. Central Bank of the Republic of Turkey.
Başçı, E. (2012). Monetary Policy of Central Bank of the Republic of Turkey after the Global Financial Crisis. Insight Turkey, 14(2), 23-26.
Borio, C. (2011). Central Banking Post-Crisis: What Compass for Unchartered Waters? BIS Working Pa-per No: 353.
CBRT. (2013, May). Financial Stability Report. Vol 16.
CBRT. (2012). Inflation Reports.
Chami, R., Fullenkamp, C., & Sharma, S. (2009). A Framework for Financial Market Development. Working Paper No: WP/09/156. IMF.
Dell’Ariccia, G., Igan, D., Laeven, L., Tong, H., Bakker, B., & Vandenbussche, J. (2012). Policies for Macro-financial Stability: How to Deal with Credit Booms. IMF Staff Discussion Note No: SDN/12/06. IMF.
Demirgüç-Kunt, A., & Levine, R. (2008). “Finance, Financial Sector Policies and Long-Run Growth”. World Bank Policy Research Paper 4469, January 2008. The World Bank: Washington, DC.
Demirgüç-Kunt, A., & Levine, R. (2009). Finance and Inequality: Theory and Evidence. Annual Review of Financial Economics, 1(1), 287-318.
Goodhart, C. (2010). The Changing Role of Central Banks . BIS Working Paper No: 326.
Goyal, R., Marsh, C., Raman, N., Wang, S., & Ahmed, S. (2011). Financial Deepening and Inter-national Monetary Stability. IMF Staff Discussion Note: SDN/11/16. IMF.
IMF. (2012). Turkey: Selected Issues. IMF Country Report No: 12/339. IMF.
IMF. (2013). Global Financial Stability Report: Tran-sition Challenges to Stability. IMF.
IMF. (2013). Turkey Article IV Selected Issues Paper. IMF Country Report No: 13/364.
Kara, A. (2012). Monetary Policy in Turkey after the Global Crisis. CBRT Working Paper No: 12/17.
Laeven, L., & Valencia, F. (2012). Systemic Banking Crises Database: An Update. IMF Working Paper No: WP/12/163. IMF.
Levine, R. (1997). Financial Development and Eco-nomic Growth: Views and Agenda. Journal of Eco-nomic Literature, 35(2), 688-726.
Luengnaruemitchai, P., & Ong, L. (2005). An Anat-omy of Corporate Bond Markets: Growing Pains and Knowledge Gains. IMF Working Paper No: WP/05/152. IMF.
Osiński, J., Seal, K., & Hoogduin, L. (2013). Macro-prudential and Microprudential Policies: Toward Cohabitation. IMF Staff Discussion Note: SDN 13/05. IMF.
Özel, Ö., & Yalçın, C. (2013). The Effect of Private Pension Reforms on Domestic Saving Rates in Developing Countries: Cross-Country Empirical Evidence. CBT Research Notes in Economics No: 2013-06.
Park, J. (2012). Brazil’s Capital Markets: Current Sta-tus and Issues for Further Development. IMF Work-ing Papers 12/224, September 2012.
Reinhart, C., & Rogoff, K. (2008). This Time Is Differ-ent. NBER Working Paper 16827. March 2008.
World Bank. (2013). Savings and Competitiveness Development Policy Loan. Program Document. World Bank.

Chapter 4: Enterprise: Harnessing structural change for integration and inclusion
111
Chapter
Enterprise: Harnessing structural changefor integration and inclusion
4
Infrastucture
Turkey’s Transitions: Integration, Inclusion, Institutions
Labor
Welfare
FiscalSpace
Trade
Finance
Cities

Turkey’s Transitions
112

Chapter 4: Enterprise: Harnessing structural change for integration and inclusion
113
Enterprise: Harnessing structural change for integration andinclusion
Hacı Boydak, an entrepreneur in his mid-50s from Kayseri in Central Anatolia presides over a multibillion-dollar conglomerate, whose vi-
sion is focused on continued innovation.1 This Turk-ish success story began in his father and uncle’s small carpentry workshop in the late 1950s. In the 1980s, the Boydaks, together with many other Ana-tolian entrepreneurs, used the space provided by economic liberalization to grow rapidly from infor-mal micro-firms to increasingly professional, export oriented enterprises. By integrating with, collabo-rating and learning from the rest of the world, he and other entrepreneurs in Turkey’s “Anatolian Tigers” have injected additional momentum into the economy. The opening of economic opportu-nities in these new centers of growth has also led to greater inclusion, as more productive jobs have been created for workers who beforehand had stagnant below-average income in the traditionally poorer Anatolian heartland.
This chapter examines the structural transforma-tion of Turkey’s economy over the past three de-cades. It takes three different perspectives to tell the story of Turkey’s enterprise sector and the leading role business has played in advancing their country to the doorstep of high income.
• First, the chapter asks to what extent increas-es in aggregate productivity in Turkey have been the result of between-industry structural change. The short answer provided in the first section of this chapter is that the shift of labor out of agriculture and into higher productivity manufacturing and service industries has ac-counted for around two thirds of the overall productivity growth in Turkey over the past two decades. In this sense, Turkey’s experience with structural change echoes the productivity push experienced by Asian countries over the same period. It is distinct from the experience of Latin America and Eastern Europe, where the process of structural change led to declines in both ag-ricultural and industrial employment, and the shift into services did not always result in higher productivity as a whole (McMillan and Rodrik, 2011; Raiser, Schaffer and Schuchhardt, 2000).
• Second, the chapter asks whether the positive impact of structural change at the aggregate level is mirrored at the enterprise and regional level in Turkey. In other words, have resources simply shifted from backward inland provinces to the advanced coastal regions, or has the structural transformation of Turkey’s economy opened up new opportunities for enterprises in Anatolia? The assessment of this chapter is that structural change in Turkey has been associated with regional convergence. Productivity growth in the more dynamic inland provinces – regions which we define as the “Anatolian Tigers”2 – has been higher than in the advanced western prov-inces. Moreover, in all provinces there is a shift in the within-industry structure of employment and production from less productive micro firms to more productive small and medium-sized en-terprises (SMEs). Turkey’s economy has become more integrated with global markets and more open to competition as a result of regulatory re-forms both in the 1980s and again after 2001; in this process micro-firms have grown into SMEs, and their growth has been an important factor driving the convergence in productivity across regions in Turkey. Targeted regional invest-ments in physical and social infrastructure have promoted regional convergence and connected the inland provinces to foreign trade. Structural change and market integration have made eco-nomic growth in Turkey more inclusive.
• Third, we ask whether the forces that drove pro-ductivity performance in the past are likely to propel the country all the way to high income. The short answer is that they will not suffice on their own. When productivity differences across sectors and firms have narrowed suffi-ciently to limit the benefits of further realloca-tion, the role of structural change as a driver of growth diminishes. As Eichengreen, Park and Shin (2013) show, at that point many middle in-come countries experience a marked slowdown in economic growth – a slowdown sometimes referred to as the “middle income trap” (Gill and Kharas 2007; see also Chapter 8). To escape this trap, countries must find ways to generate productivity improvements from within existing enterprises or through churning – the exit of lower productivity firms and the entry of higher productivity competitors. In other words, at higher levels of income, productivity growth must be driven by a process of Schumpeterian
1 See European Stability Initiative (2005) and www.boydak.com.
2 We should note that the literature has tended to associate the term “Anatolian Tigers” with fast growing secondary cities, rather than economic re-gions, as we do in this Chapter. We lack comparable data to repeat our analysis at the city level, although the story of Turkey’s urbanization presented in Chapter 5 is entirely consistent with the story of structural change and regional convergence, driven by private entrepreneurial activity, told in this Chapter.
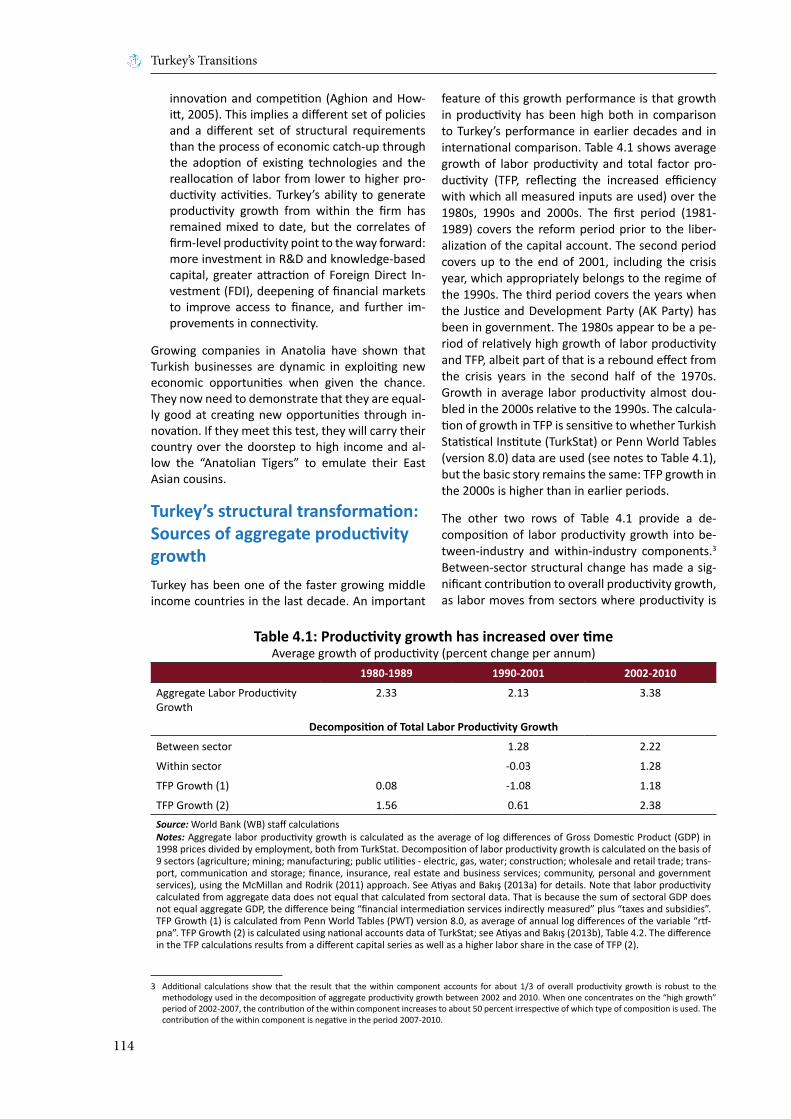
Turkey’s Transitions
114
innovation and competition (Aghion and How-itt, 2005). This implies a different set of policies and a different set of structural requirements than the process of economic catch-up through the adoption of existing technologies and the reallocation of labor from lower to higher pro-ductivity activities. Turkey’s ability to generate productivity growth from within the firm has remained mixed to date, but the correlates of firm-level productivity point to the way forward: more investment in R&D and knowledge-based capital, greater attraction of Foreign Direct In-vestment (FDI), deepening of financial markets to improve access to finance, and further im-provements in connectivity.
Growing companies in Anatolia have shown that Turkish businesses are dynamic in exploiting new economic opportunities when given the chance. They now need to demonstrate that they are equal-ly good at creating new opportunities through in-novation. If they meet this test, they will carry their country over the doorstep to high income and al-low the “Anatolian Tigers” to emulate their East Asian cousins.
Turkey’s structural transformation: Sources of aggregate productivity growthTurkey has been one of the faster growing middle income countries in the last decade. An important
feature of this growth performance is that growth in productivity has been high both in comparison to Turkey’s performance in earlier decades and in international comparison. Table 4.1 shows average growth of labor productivity and total factor pro-ductivity (TFP, reflecting the increased efficiency with which all measured inputs are used) over the 1980s, 1990s and 2000s. The first period (1981- 1989) covers the reform period prior to the liber-alization of the capital account. The second period covers up to the end of 2001, including the crisis year, which appropriately belongs to the regime of the 1990s. The third period covers the years when the Justice and Development Party (AK Party) has been in government. The 1980s appear to be a pe-riod of relatively high growth of labor productivity and TFP, albeit part of that is a rebound effect from the crisis years in the second half of the 1970s. Growth in average labor productivity almost dou-bled in the 2000s relative to the 1990s. The calcula-tion of growth in TFP is sensitive to whether Turkish Statistical Institute (TurkStat) or Penn World Tables (version 8.0) data are used (see notes to Table 4.1), but the basic story remains the same: TFP growth in the 2000s is higher than in earlier periods.
The other two rows of Table 4.1 provide a de-composition of labor productivity growth into be-tween-industry and within-industry components.3 Between-sector structural change has made a sig-nificant contribution to overall productivity growth, as labor moves from sectors where productivity is
Table 4.1: Productivity growth has increased over timeAverage growth of productivity (percent change per annum)
1980-1989 1990-2001 2002-2010
Aggregate Labor Productivity Growth
2.33 2.13 3.38
Decomposition of Total Labor Productivity Growth
Between sector 1.28 2.22
Within sector -0.03 1.28
TFP Growth (1) 0.08 -1.08 1.18
TFP Growth (2) 1.56 0.61 2.38Source: World Bank (WB) staff calculationsNotes: Aggregate labor productivity growth is calculated as the average of log differences of Gross Domestic Product (GDP) in 1998 prices divided by employment, both from TurkStat. Decomposition of labor productivity growth is calculated on the basis of 9 sectors (agriculture; mining; manufacturing; public utilities - electric, gas, water; construction; wholesale and retail trade; trans-port, communication and storage; finance, insurance, real estate and business services; community, personal and government services), using the McMillan and Rodrik (2011) approach. See Atiyas and Bakış (2013a) for details. Note that labor productivity calculated from aggregate data does not equal that calculated from sectoral data. That is because the sum of sectoral GDP does not equal aggregate GDP, the difference being “financial intermediation services indirectly measured” plus “taxes and subsidies”. TFP Growth (1) is calculated from Penn World Tables (PWT) version 8.0, as average of annual log differences of the variable “rtf-pna”. TFP Growth (2) is calculated using national accounts data of TurkStat; see Atiyas and Bakış (2013b), Table 4.2. The difference in the TFP calculations results from a different capital series as well as a higher labor share in the case of TFP (2).
3 Additional calculations show that the result that the within component accounts for about 1/3 of overall productivity growth is robust to the methodology used in the decomposition of aggregate productivity growth between 2002 and 2010. When one concentrates on the “high growth” period of 2002-2007, the contribution of the within component increases to about 50 percent irrespective of which type of composition is used. The contribution of the within component is negative in the period 2007-2010.

Chapter 4: Enterprise: Harnessing structural change for integration and inclusion
115
low (especially agriculture) to those where produc-tivity is relatively higher (especially manufacturing and “finance, real estate, insurance and business services”). For the 1990s, almost all productivity growth is due to between-sector structural change. In the 2000s, between-sector structural change still accounts for close to two thirds of overall produc-tivity change. Turkey resembles Asian countries, where the between-sector structural change com-ponent is often positive, rather than Latin American countries, where this structural change component is typically negative. The implication is that this is a worthy achievement and not an automatic devel-opment.4
Overall productivity growth in the 2000s has been high relative to other countries. The first graph of Figure 4.1 shows that Turkey in the 2000s had one of the highest annual labor productivity growth rates among middle-income countries. Turkey was only surpassed by Romania, India and China. How-ever, Turkey’s productivity performance tapered off towards the end of the decade. Our calculations based on Atiyas and Bakış (2013b) show that TFP aggregate growth for the period 2007-2011 is zero or negative, depending on the methodology used. This is also the period when the steady decline in
the share of agriculture in total employment is re-versed.
The lackluster overall productivity performance since the global economic and financial crisis in Tur-key emphasizes the importance of the shift towards greater within-sector productivity increases to sus-tain the gains of the past decade. The second graph of Figure 4.1 shows the low contribution in Turkey of the within-sector structural change component to labor productivity growth over the years 1988-2005. Relative to all other comparator countries with positive labor productivity growth over this period, Turkey had the lowest share of within-sec-tor productivity growth, suggesting the potential for unexhausted gains in the future with appropri-ate policy support.
The key to productive resource reallocations was the shift of labor from agriculture to the manufac-turing and service sectors. Figure 4.2 highlights the strong growth of the manufacturing employment share over the same period during which the ag-ricultural share fell drastically, with Turkey’s overall manufacturing employment in 2012 significantly higher than indicated by a global trend line. Fig-ure 4.3 further shows the major shift of labor into
Source: Penn World Tables version 8.0Note: Labor productivity calculated as “Real Gross Domestic Product series (RGDPo)” divided by “employment”. Growth calculated as log differences.
Source: WB staff calculations using U. Groningen 10-sector database and TurkStat dataNote: Countries are sorted ascending on within-component percent of total.
-2%
-1%
0%
1%
2%
3%
4%
5%
ISR
ITA
FIN
FRA
BRA
SWE
MEX EG
YHU
NUS
APR
TPO
LTW
NTH
ACH
LBG
RIR
N IRL
KOR
ARG
IDN
PER
TUR
ROM
IND
CHN
Grow
th in
Lab
or P
rodu
ctivi
ty (i
n pe
rcen
t)
1990-1999 2000-2011
-50%
-30%
-10%
10%
30%
50%
70%
90%
110%
130%
COL
TUR
THA
HKG CR
IIN
DM
EXM
YSTW
NPH
LSG
PCH
LPE
RKO
RAR
GVE
NBR
A
Gro
wth
in L
abor
Pro
ducti
vity
, 198
8-20
05
Between Within Total real productivity growth
Figure 4.1: Turkey had fast productivity growth over the past decade thanks to structural change
4 Raiser, Schaffer and Schuchhardt (2004) review structural change in the transition economies of Eastern Europe. Inherited over-industrialization has meant that structural change in many transition economies was initially associated with a decline in aggregate productivity. Since then, however, Eastern Europe has benefited from substantial growth in TFP thanks to the elimination of inefficiencies in the enterprise sector – a process that seems now to be coming to an end (EBRD, 2013).

Turkey’s Transitions
116
Source: World Development Indicators (WDI)Notes: The solid lines describe a fitted global trend line relating sectoral employment shares to GDP per capita
Figure 4.2: Labor in Turkey has moved from agriculture to industry and services since the 1980s

Chapter 4: Enterprise: Harnessing structural change for integration and inclusion
117
services from less than 40 to roughly 55 percent of total employment. Turkey, thereby, converges to the international trend line from below, suggesting the process of structural change may slow down going forward but is not quite over yet. Figure 4.3 provides a sense of the productivity implications of these shifts of labor across sectors. It shows that the significant shifts of labor to manufacturing were to higher-than-average productivity activities. It also shows that some labor went into lower than average productivity service activities over the pe-riod. A significant increase in employment was also recorded in construction, which has around aver-age productivity. While these activities are clearly of higher productivity than agriculture, it does raise questions about the extent to which future labor reallocations from agriculture (and possible manu-facturing if Turkey follows high income trends) into services will be able to sustain productivity growth. In other words, Turkey will need to find the sources of productivity gains within sectors once it reaches high income.
Several key changes in the policy and institutional environment played a critical role in the accelera-tion of productivity growth in the last decade. One important factor was macroeconomic stabilization. Fiscal prudence and sustained declines in inflation and real interest rates led to a major restructuring in the balance sheets of the banking system and increased credit to the private sector (Chapter 3). Turkey’s perceived country risk also declined sig-nificantly so that Turkey could benefit from the in-crease in global capital inflows that were in abun-
dance during the 2000s. This liquidity provided the financial resources for private sector growth. Together macroeconomic stabilization at home and the “Great Moderation” in the world economy en-hanced access to finance and lowered barriers for new firm entry and expansion.
At the same time, Turkey benefited from the grad-ual emergence of “European Union (EU)-anchored” competition-based regulations and institutions. Over a period of two decades of learning and in-stitution-building, Turkey’s governments began to accept constrains on political and administrative discretion in favor of relying more on productivity-enhancing rules. The traumatic impact of the 2001 crisis catalyzed a decisive shift towards rule-based economic governance, even though this shift is in-complete in many ways and rule-based regulation remains contested (Atiyas, 2012). The process of EU accession also played a significant role in the adop-tion of these institutions, particularly in the pe-riod between the establishment of the EU-Turkey Customs Union (CU) in late 1995 and the opening of accession negotiations in 2005. Since then, the momentum has been gradually lost and the pace of regulatory and business environment reforms has slowed. But the adoption of generally pro-market trade, financial and regulatory policies – together with infrastructure and urbanization policies that supported domestic market integration (as docu-mented in Spotlight 2 and Chapter 5) – have creat-ed the basis for productive labor reallocations over the past three decades.
Source: WB staff calculations based on national accounts data.Note: Size of circle represents employment share in 2001. AGR=Agriculture, CONS=Construction, CSPSGS=Community, Social, Personal and Government Services, FIRE=Finance, Insurance, and Real Estate, MAN=Manufacturing, MIN=Mining, PU= Public Utilities, TSC=Transport and Communication, WRT=Wholesale and Retail Trade.
AGR
CONSCSPSGS
FIRE
MAN
MIN
PU
TSC
WRT
-2
-1
0
1
2
-0.15 -0.10 -0.05 0.00 0.05
Natu
ral l
og o
f sec
tora
l pro
ducti
vity
/ to
tal
prod
uctiv
ty
Change in employment share (2001-2011)
Figure 4.3: Structural change has contributed to productivity growth

Turkey’s Transitions
118
Specific policies promoting market integration in-cluded: trade liberalization in the 1980s, the 1995 EU-Turkey CU, the competition law that was ad-opted in 1994 and finally became operational in 1997, a new privatization law in the mid-1990s, as well as regulatory reforms in telecommunications, power, and transport. The root and branch reform of financial market regulation also played a critical role, initiated by the banking law enacted in 1985 and solidified by the Banking Regulation and Su-pervision Agency (BRSA) bank recapitalization and capital strengthening program of January-August 2002 (Chapter 3). These were supplemented by the independence of the Central Bank and reform of institutions of public financial management in the early 2000s (Spotlight 3). Finally, one should also mention extensive privatization that took place in the last decade. Privatization was especially wide-spread in infrastructure industries, such as telecom-munications, energy and ports. Privatization both increased efficiency in the provision of public ser-vices and reduced the burden on the public purse of new investments in these areas (Spotlight 2).
As a result of these multifaceted regulatory re-forms, Turkey progressively reduced the gap to the frontier in the World Bank’s Doing Business indica-tors (Figure 4.4). Select indicators show significant improvements during the 2000s. Turkey is now
close to the best performers in the world in terms of starting a business and registering property. Red tape related to trading across borders has also de-clined significantly likely as a direct result of imple-mentation of the CU with the EU. Nevertheless, improvements in the areas of enforcing contracts, protecting investors and resolving insolvency cases are needed. Indeed, improvements in these specific areas must go hand in hand with the Government’s ambitions to improve flows of FDI going forward (see also Chapter 8).
While macroeconomic stability created an environ-ment which encouraged private sector develop-ment, institutional changes made it more likely that these gains would be sustained and shared more or less equally by private sector actors. In particular, they ensured that competition would take place on a level playing field and helped install the percep-tion that productivity would be more important than political connections for entrepreneurial suc-cess.5 Successful structural change based primarily on resource reallocation from agriculture to higher productivity sectors underlines Turkey’s success at integration with the rest of the world and, in par-ticular, the EU. We now turn to an analysis of how structural change has transformed the economies of the less advanced Anatolian Regions and, as a result, made economic growth in Turkey inclusive.
Source: Doing Business 2014 Note: Starting year for Registering Property is 2005. For Protecting Investors and Trading Across Borders the starting year is 2006.From the 2015 release onwards, a change has been introduced in the methodology and “distance to the frontier” measures for 2015 are not comparable across time.
64
78
53 54
63
12
88
76
6370
65
24
0
10
20
30
40
50
60
70
80
90
100
Starting aBusiness
RegisteringProperty
ProtectingInvestor
Trading AcrossBorders
EnforcingContracts
ResolvingInsolvency
Dist
ance
to F
ronti
er (b
est =
100)
2004 2014
Figure 4.4: Regulatory improvements to support global integration Distance to the frontier (best = 100)
5 There were exceptions to these trends. For instance, the exclusion of substantial public spending from the scope of the public procurement law has arguably increased the level of discretion and reduced transparency in this important area. The allocation of construction permits and land zoning changes have also suffered from a lack of transparency and allegations of political rent-seeking.

Chapter 4: Enterprise: Harnessing structural change for integration and inclusion
119
Inclusive growth and the rise of the Anatolian TigersThe structural changes in Turkey described in the previous section have been associated with im-portant shifts in economic and political power. It is often argued that the economic opening under Tur-gut Özal led to opportunities for the emergence of a new, socially conservative class of businessmen, which drew its strength from the growing integra-tion of Turkey’s inland provinces into Turkey’s do-mestic market and rising international trade (ESI, 2005; Yavuz, 2009). The rise of this new business elite created a strong constituency for pro-market reforms, which found its reflection in the specific brand of socially conservative and economically lib-eral politics championed by the Justice and Devel-opment Party (AK Party). Since then, the argument goes, Turkey’s growth model has become more inclusive. In the words of Acemoğlu and Robinson (2013): “One hypothesis – which of course needs to be investigated more systematically—is that the beginning of the AKP government saw an opening of economic opportunities to ‘Anatolian Tigers’…”.
There is no question that politically the program of socially conservative but economically liberal poli-cies has been a winning combination – earning the AK Party three successive general election victories with rising margins of popular support. In this sec-tion, we examine the economic basis for the change in Turkey’s political economy.
The benefits of Turkey’s greater integration with the rest of the world were spread throughout the coun-try. The relatively high productivity growth of the last decade partly reflects a story of catch-up and inclusion. Indeed, Turkey experienced a substantial amount of convergence in regional productivity over the last decade. Figure 4.5 shows that those (NUTS2) sub-regions that had low average manu-facturing (log) TFP in 2005 experienced higher TFP growth between 2005 and 2009.6 This convergence is most critically reflected in the emergence of new growth centers in the traditionally poorer and less industrialized Anatolian Regions, often dubbed “Anatolian Tigers”, which have started to play an increasing role in both the domestic economy and exports.
Yet, like other mythical creatures, the “Anatolian Ti-ger” has been difficult to study in its natural habitat because of lack of data. We try to overcome this informational gap by first going to the available data to clearly define what we mean by “Anatolian Tigers” and then using this objectively defined set to investigate their characteristics. The data dictate that our analysis is at the regional level, rather than the city level. This means that our analysis broad-ens the concept of the “Anatolian Tigers” from the city to the regional level – thus we will refer from now on to “Anatolian Tiger Regions”. We divide the regions of the country at the NUTS2 level into sub-regions. We identify as Tigers those sub-regions
Source: TurkStat Annual Industry and Service Statistics (AISS)Note: Manufacturing TFP at the NUTS2 level calculated as value added weighted average of firm-level TFP estimated from TurkStat’s AISS. For details on the calculation of firm-level TFP, see the Data Appendix.
R² = 0,3193
-1.5%
-1.0%
-0.5%
0.0%
0.5%
1.0%
6.5 7.0 7.5 8.0 8.5 9.0 9.5 10.0 10.5 11.0
Aver
age
grow
th in
Ln (T
FP) 2
005-
2009
Ln (TFP), 2005
Figure 4.5: Productivity levels have converged across regions in Turkey
6 Regional manufacturing TFP is calculated as the value added weighted average of firm-level TFP estimated from TurkStat’s Annual Industry and Ser-vice Statistics (AISS). Firm-level data from the Annual Industry and Service Statistics are available only for the 2003-2010 period. We start with 2005 because data issues with 2003 and 2004 render comparisons to other years invalid. In 2009, TurkStat switched to NACE Rev. 2 from NACE Rev.1.1. Since we compute TFP using factor shares estimated at 2 digit industries, we cannot use 2010 along with the 2005-2009 period.

Turkey’s Transitions
120
that had relatively low value added per capita in 2004 and which have experienced high job growth between 2004 and 2012.7 As shown in Figure 4.6, these sub-regions selected purely on economic criteria actually map quite closely with the geo-graphic Central Anatolian Region of the country indicated in blue and including the cities of Gazian-
tep, Kastamonu, Kayseri, Malatya and Van, among others. Sub-regions that had high value added in 2004 are identified as belonging to the “West” re-gion, representing provinces that have traditionally acted as industrial growth centers. The rest of the sub-regions are identified as the “Other” region.
Source: WB staff calculations using per-capita value added and employment data at the NUTS2 level obtained from the TurkStat websiteNotes: Each label in the figure on the right refers to a NUTS2 region as defined by TurkStat. Regions are defined as: ADA=Adana, Mersin; AGR=Ağrı, Kars, Iğdır, Ardahan; ANK=Ankara; ANT=Antalya, Isparta, Burdur; AYD=Aydın, Denizli, Muğla; BAL=Balıkesir, Çanakkale; BUR=Bursa, Eskişehir, Bilecik; ERZ=Erzurum, Erzincan, Bayburt; GAZ=Gaziantep, Adıyaman, Kilis; HAT=Hatay, Kahramanmaraş, Osmaniye; IST=İstanbul; IZM=İzmir; KAS=Kastamonu, Çankırı, Sinop; KAY=Kayseri, Sivas, Yozgat; KIR=Kırıkkale, Aksaray, Niğde, Nevşehir, Kırşehir; KOC=Kocaeli, Sakarya, Düzce, Bolu, Yalova; KON=Konya, Karaman; MAL=Malatya, Elazığ, Bingöl, Tunceli; MAN=Manisa, Afyon, Kütahya, Uşak; MAR=Mardin, Batman, Şırnak, Siirt; SAM=Samsun, Tokat, Çorum, Amasya; SAN=Şanlıurfa, Diyarbakır; TEK=Tekirdağ, Edirne, Kırklareli; TRA=Trabzon, Ordu, Giresun, Rize, Artvin, Gümüşhane; VAN=Van, Muş, Bitlis, Hakkari; ZON=Zonguldak, Karabük, Bartın. The x-axis represents per-capita value added in 2004 relative to the per-capita value added in Istanbul in 2004. The y-axis represents NUTS2 level employment growth between 2004 and 2012.
Figure 4.6: Identifying the Tigers (in blue): Fast growth from a low base
7 The classification methodology is inspired by Gönenç et. al. (2012).
0.4
Employment growth (2004 - 2012) vs initial Value Added (VA) per capita (2004)
KASHAT
MALVAN
SAN
MARTRASAM
ERZ
KIR
MAN
GAZ
BAL
AYD
ZONANT
TEKIZM ANK
KOC
ISTBURAGR
KAYADA
KON
0.2
0.0
-0.2
40 60 80 100
West, Anatolian Tigers, Others

Chapter 4: Enterprise: Harnessing structural change for integration and inclusion
121
Defined in this way, the contribution of the Tiger regions to overall economic activity in Turkey has increased over time. This can be seen by looking at firm-level data from the AISS. The AISS data set cov-ers all firms with 20 or more employees and rep-resentative samples of firms with less than 20 em-ployees in non-agriculture, non-financial sectors.9 As shown in Table 4.2, which is based on all firms in the dataset, the Tiger Regions share in sales and value added in non-agriculture and non-financial economic activities had an increasing trend be-tween 2005 and 2010, while its share in employ-ment has remained at around 22 percent, suggest-ing an increase in relative productivity in the Tiger Regions. These developments provide a deeper ex-planation for the economy-wide productivity gains experienced over the last decade. In the Tiger Re-gions, the reallocation of resources out of agricul-ture and into manufactures and services has been accompanied by an increase in the productivity of the non-agricultural sector relative to the nation-al average. In other words, there has been within sector productivity growth and – at the national level – within sector productivity convergence. This is an important qualification of the finding in the previous section of a relatively small contribution of within sector productivity growth to overall pro-ductivity growth in Turkey as a whole.
As of 2010, the composition of (non-agricultural and non-financial) economic activity in the West and Tiger Regions were quite similar, as shown in Table 4.3. In both regions, the bulk of employment
is located in manufacturing, retail and wholesale trade, transport, storage and communications and real estate, renting and business activities. The shares of these sectors in employment are quite similar across the two regions, except for real es-tate which has a higher share in the West relative to the Tiger Regions. The share of manufacturing in value added is also similar across the West and the Tigers. Looking at the evolution of employment and value added shares between 2005 and 2010 (Table 4.4), we find a sharp decline in the share of wholesale and retail trade and an increase in the share of construction as well as real estate services. Manufacturing increased its share in value added in both regions, but saw a significant decline in its share in employment in the West. Generally, Table 4.4 confirms anecdotal evidence of a construction and real estate boom in Turkey. This may not con-tinue, requiring Turkey to look for new sources of structural change going forward.
We now return to the question of productivity con-vergence and within industry productivity growth using firm-level data. Table 4.5 shows that the Ana-tolian Tigers have exhibited labor productivity con-vergence over time with the West Regions. Average labor productivity growth in manufacturing indus-tries has been faster in the Tiger Regions (7.4 per-cent per annum relative to 5.1 percent in the West Regions) and virtually the same in non-manufac-turing industries (a drop of 3.0 percent per annum relative to a drop of 2.8 percent per annum in the West Regions) over the period 2006 to 2010. Pro-
Table 4.2: Productivity convergence between the West and the TigersRegional distribution of employment, value added and sales (percent)
Account Region 2005 2010 Change
Employment West 71 70 -1
Tiger 21 22 1
Other 8 8 0
Value added West 83 77 -6
Tiger 14 18 4
Other 4 4 0
Sales West 82 78 -4
Tiger 13 17 4
Other 5 5 0Source: WB staff calculations using AISSNotes: Calculations are based on all firms (including firms with less than 20 employees which are weighted with the appropriate sampling). Firms assigned to regions according to the location of plant with the highest share of employment. Once a firm is as-signed to a region, all employment and value added of the firm is treated as belonging to that region. However, calculating regional shares on the basis of plants does not change the results. See the Data Appendix for details.
9 The AISS dataset includes all industries except agriculture, fishing and forestry, financial intermediation and a number of other service industries. Hence, the dataset provides information about a large part of the non-agricultural and non-financial industries. The dataset also provides informa-tion on location at the NUTS2 level, which is used to assign firms to the three regions in this study. See the Data Appendix for a detailed description.
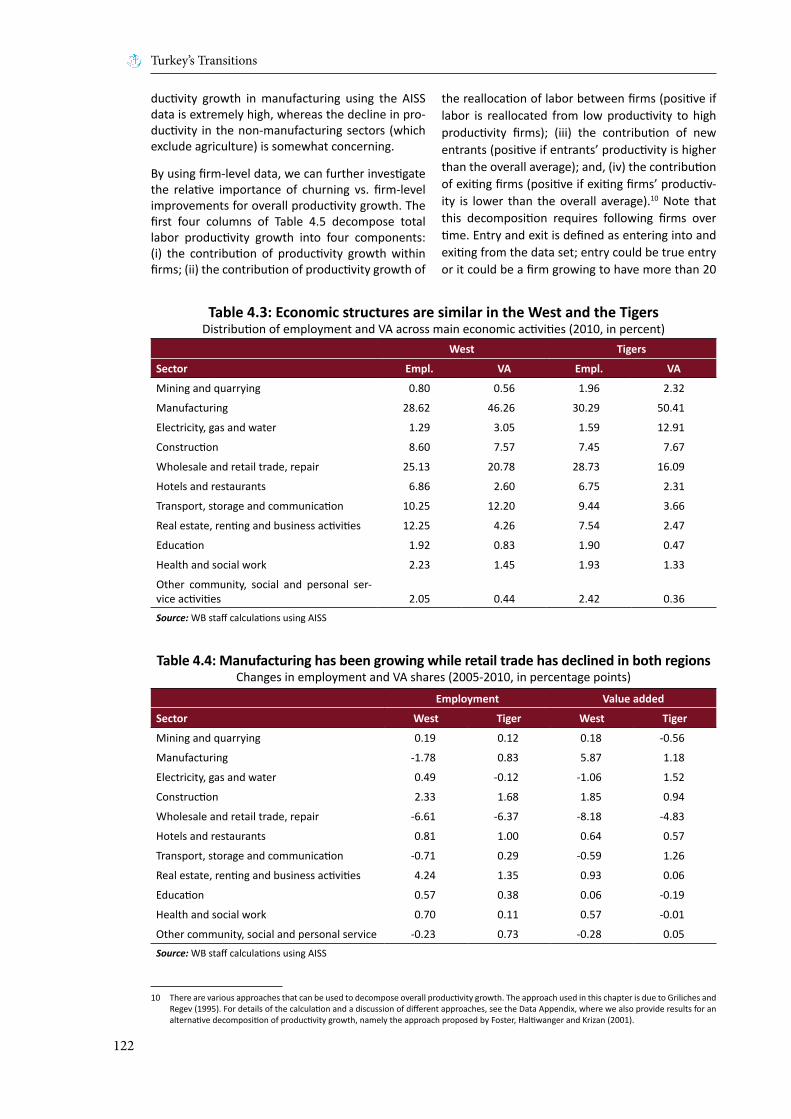
Turkey’s Transitions
122
ductivity growth in manufacturing using the AISS data is extremely high, whereas the decline in pro-ductivity in the non-manufacturing sectors (which exclude agriculture) is somewhat concerning.
By using firm-level data, we can further investigate the relative importance of churning vs. firm-level improvements for overall productivity growth. The first four columns of Table 4.5 decompose total labor productivity growth into four components: (i) the contribution of productivity growth within firms; (ii) the contribution of productivity growth of
the reallocation of labor between firms (positive if labor is reallocated from low productivity to high productivity firms); (iii) the contribution of new entrants (positive if entrants’ productivity is higher than the overall average); and, (iv) the contribution of exiting firms (positive if exiting firms’ productiv-ity is lower than the overall average).10 Note that this decomposition requires following firms over time. Entry and exit is defined as entering into and exiting from the data set; entry could be true entry or it could be a firm growing to have more than 20
Table 4.4: Manufacturing has been growing while retail trade has declined in both regionsChanges in employment and VA shares (2005-2010, in percentage points)
Employment Value added
Sector West Tiger West Tiger
Mining and quarrying 0.19 0.12 0.18 -0.56
Manufacturing -1.78 0.83 5.87 1.18
Electricity, gas and water 0.49 -0.12 -1.06 1.52
Construction 2.33 1.68 1.85 0.94
Wholesale and retail trade, repair -6.61 -6.37 -8.18 -4.83
Hotels and restaurants 0.81 1.00 0.64 0.57
Transport, storage and communication -0.71 0.29 -0.59 1.26
Real estate, renting and business activities 4.24 1.35 0.93 0.06
Education 0.57 0.38 0.06 -0.19
Health and social work 0.70 0.11 0.57 -0.01
Other community, social and personal service -0.23 0.73 -0.28 0.05Source: WB staff calculations using AISS
10 There are various approaches that can be used to decompose overall productivity growth. The approach used in this chapter is due to Griliches and Regev (1995). For details of the calculation and a discussion of different approaches, see the Data Appendix, where we also provide results for an alternative decomposition of productivity growth, namely the approach proposed by Foster, Haltiwanger and Krizan (2001).
Table 4.3: Economic structures are similar in the West and the TigersDistribution of employment and VA across main economic activities (2010, in percent)
West Tigers
Sector Empl. VA Empl. VA
Mining and quarrying 0.80 0.56 1.96 2.32
Manufacturing 28.62 46.26 30.29 50.41
Electricity, gas and water 1.29 3.05 1.59 12.91
Construction 8.60 7.57 7.45 7.67
Wholesale and retail trade, repair 25.13 20.78 28.73 16.09
Hotels and restaurants 6.86 2.60 6.75 2.31
Transport, storage and communication 10.25 12.20 9.44 3.66
Real estate, renting and business activities 12.25 4.26 7.54 2.47
Education 1.92 0.83 1.90 0.47
Health and social work 2.23 1.45 1.93 1.33
Other community, social and personal ser-vice activities 2.05 0.44 2.42 0.36Source: WB staff calculations using AISS
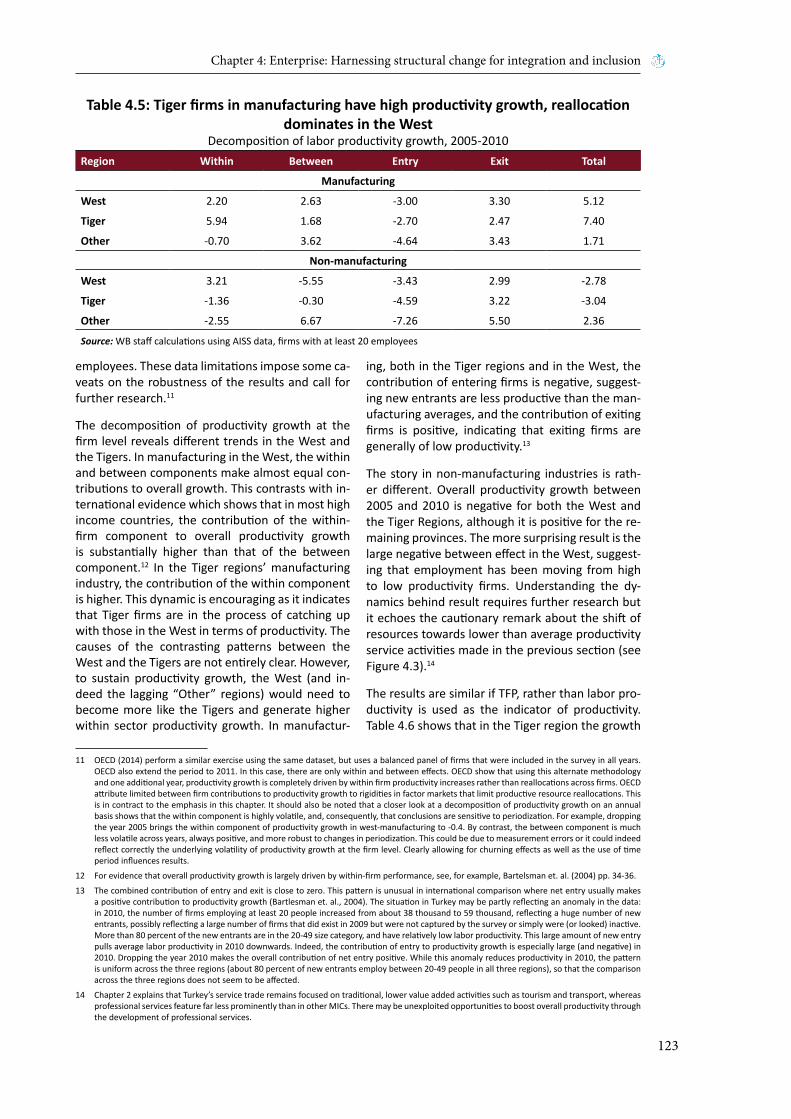
Chapter 4: Enterprise: Harnessing structural change for integration and inclusion
123
employees. These data limitations impose some ca-veats on the robustness of the results and call for further research.11
The decomposition of productivity growth at the firm level reveals different trends in the West and the Tigers. In manufacturing in the West, the within and between components make almost equal con-tributions to overall growth. This contrasts with in-ternational evidence which shows that in most high income countries, the contribution of the within-firm component to overall productivity growth is substantially higher than that of the between component.12 In the Tiger regions’ manufacturing industry, the contribution of the within component is higher. This dynamic is encouraging as it indicates that Tiger firms are in the process of catching up with those in the West in terms of productivity. The causes of the contrasting patterns between the West and the Tigers are not entirely clear. However, to sustain productivity growth, the West (and in-deed the lagging “Other” regions) would need to become more like the Tigers and generate higher within sector productivity growth. In manufactur-
ing, both in the Tiger regions and in the West, the contribution of entering firms is negative, suggest-ing new entrants are less productive than the man-ufacturing averages, and the contribution of exiting firms is positive, indicating that exiting firms are generally of low productivity.13
The story in non-manufacturing industries is rath-er different. Overall productivity growth between 2005 and 2010 is negative for both the West and the Tiger Regions, although it is positive for the re-maining provinces. The more surprising result is the large negative between effect in the West, suggest-ing that employment has been moving from high to low productivity firms. Understanding the dy-namics behind result requires further research but it echoes the cautionary remark about the shift of resources towards lower than average productivity service activities made in the previous section (see Figure 4.3).14
The results are similar if TFP, rather than labor pro-ductivity is used as the indicator of productivity. Table 4.6 shows that in the Tiger region the growth
Table 4.5: Tiger firms in manufacturing have high productivity growth, reallocation dominates in the West
Decomposition of labor productivity growth, 2005-2010Region Within Between Entry Exit Total
Manufacturing
West 2.20 2.63 -3.00 3.30 5.12
Tiger 5.94 1.68 -2.70 2.47 7.40
Other -0.70 3.62 -4.64 3.43 1.71
Non-manufacturing
West 3.21 -5.55 -3.43 2.99 -2.78
Tiger -1.36 -0.30 -4.59 3.22 -3.04
Other -2.55 6.67 -7.26 5.50 2.36
Source: WB staff calculations using AISS data, firms with at least 20 employees
11 OECD (2014) perform a similar exercise using the same dataset, but uses a balanced panel of firms that were included in the survey in all years. OECD also extend the period to 2011. In this case, there are only within and between effects. OECD show that using this alternate methodology and one additional year, productivity growth is completely driven by within firm productivity increases rather than reallocations across firms. OECD attribute limited between firm contributions to productivity growth to rigidities in factor markets that limit productive resource reallocations. This is in contract to the emphasis in this chapter. It should also be noted that a closer look at a decomposition of productivity growth on an annual basis shows that the within component is highly volatile, and, consequently, that conclusions are sensitive to periodization. For example, dropping the year 2005 brings the within component of productivity growth in west-manufacturing to -0.4. By contrast, the between component is much less volatile across years, always positive, and more robust to changes in periodization. This could be due to measurement errors or it could indeed reflect correctly the underlying volatility of productivity growth at the firm level. Clearly allowing for churning effects as well as the use of time period influences results.
12 For evidence that overall productivity growth is largely driven by within-firm performance, see, for example, Bartelsman et. al. (2004) pp. 34-36.
13 The combined contribution of entry and exit is close to zero. This pattern is unusual in international comparison where net entry usually makes a positive contribution to productivity growth (Bartlesman et. al., 2004). The situation in Turkey may be partly reflecting an anomaly in the data: in 2010, the number of firms employing at least 20 people increased from about 38 thousand to 59 thousand, reflecting a huge number of new entrants, possibly reflecting a large number of firms that did exist in 2009 but were not captured by the survey or simply were (or looked) inactive. More than 80 percent of the new entrants are in the 20-49 size category, and have relatively low labor productivity. This large amount of new entry pulls average labor productivity in 2010 downwards. Indeed, the contribution of entry to productivity growth is especially large (and negative) in 2010. Dropping the year 2010 makes the overall contribution of net entry positive. While this anomaly reduces productivity in 2010, the pattern is uniform across the three regions (about 80 percent of new entrants employ between 20-49 people in all three regions), so that the comparison across the three regions does not seem to be affected.
14 Chapter 2 explains that Turkey’s service trade remains focused on traditional, lower value added activities such as tourism and transport, whereas professional services feature far less prominently than in other MICs. There may be unexploited opportunities to boost overall productivity through the development of professional services.
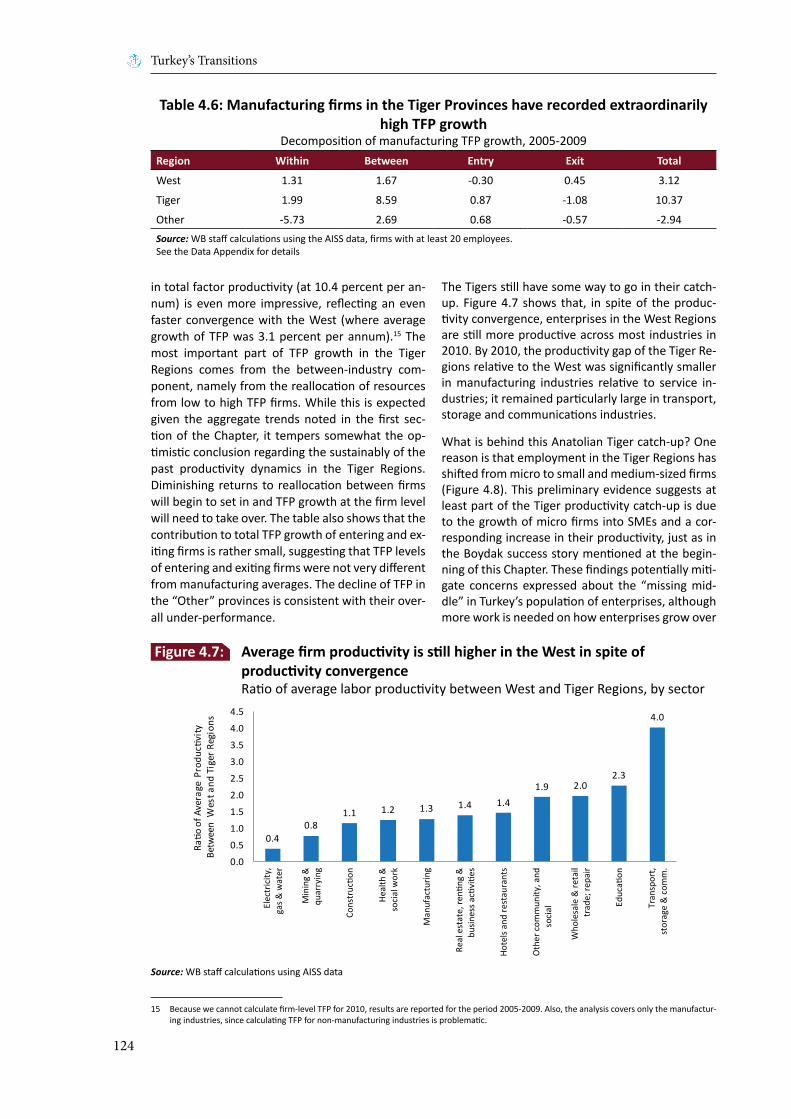
Turkey’s Transitions
124
in total factor productivity (at 10.4 percent per an-num) is even more impressive, reflecting an even faster convergence with the West (where average growth of TFP was 3.1 percent per annum).15 The most important part of TFP growth in the Tiger Regions comes from the between-industry com-ponent, namely from the reallocation of resources from low to high TFP firms. While this is expected given the aggregate trends noted in the first sec-tion of the Chapter, it tempers somewhat the op-timistic conclusion regarding the sustainably of the past productivity dynamics in the Tiger Regions. Diminishing returns to reallocation between firms will begin to set in and TFP growth at the firm level will need to take over. The table also shows that the contribution to total TFP growth of entering and ex-iting firms is rather small, suggesting that TFP levels of entering and exiting firms were not very different from manufacturing averages. The decline of TFP in the “Other” provinces is consistent with their over-all under-performance.
The Tigers still have some way to go in their catch-up. Figure 4.7 shows that, in spite of the produc-tivity convergence, enterprises in the West Regions are still more productive across most industries in 2010. By 2010, the productivity gap of the Tiger Re-gions relative to the West was significantly smaller in manufacturing industries relative to service in-dustries; it remained particularly large in transport, storage and communications industries.
What is behind this Anatolian Tiger catch-up? One reason is that employment in the Tiger Regions has shifted from micro to small and medium-sized firms (Figure 4.8). This preliminary evidence suggests at least part of the Tiger productivity catch-up is due to the growth of micro firms into SMEs and a cor-responding increase in their productivity, just as in the Boydak success story mentioned at the begin-ning of this Chapter. These findings potentially miti-gate concerns expressed about the “missing mid-dle” in Turkey’s population of enterprises, although more work is needed on how enterprises grow over
Table 4.6: Manufacturing firms in the Tiger Provinces have recorded extraordinarily high TFP growth
Decomposition of manufacturing TFP growth, 2005-2009Region Within Between Entry Exit Total
West 1.31 1.67 -0.30 0.45 3.12
Tiger 1.99 8.59 0.87 -1.08 10.37
Other -5.73 2.69 0.68 -0.57 -2.94Source: WB staff calculations using the AISS data, firms with at least 20 employees.See the Data Appendix for details
Source: WB staff calculations using AISS data
0.40.8
1.1 1.2 1.3 1.4 1.41.9 2.0
2.3
4.0
0.0
0.5
1.0
1.5
2.0
2.5
3.0
3.5
4.0
4.5
Elec
tric
ity,
gas &
wat
er
Min
ing
&qu
arry
ing
Cons
truc
tion
Heal
th &
soci
al w
ork
Man
ufac
turin
g
Real
est
ate,
renti
ng &
busin
ess a
ctivi
ties
Hote
ls an
d re
stau
rant
s
Oth
er c
omm
unity
, and
soci
al
Who
lesa
le &
reta
iltr
ade;
repa
ir
Educ
ation
Tran
spor
t,st
orag
e &
com
m.
Ratio
of A
vera
ge P
rodu
ctivi
ty
Betw
een
Wes
t and
Tig
er R
egio
ns
Figure 4.7: Average firm productivity is still higher in the West in spite of productivity convergence Ratio of average labor productivity between West and Tiger Regions, by sector
15 Because we cannot calculate firm-level TFP for 2010, results are reported for the period 2005-2009. Also, the analysis covers only the manufactur-ing industries, since calculating TFP for non-manufacturing industries is problematic.

Chapter 4: Enterprise: Harnessing structural change for integration and inclusion
125
Source: WB staff calculations using AISS data
0%
10%
20%
30%
40%
50%
60%
70%
s1-19 s20-49 s50-99 s100-249 s250-500 s500+
Empl
oym
ent
Shar
e by
Fir
m Si
ze C
lass
es (2
010)
West Tiger Other
-20%
-15%
-10%
-5%
0%
5%
10%
s1-19 s20-49 s50-99 s100-249 s250-500 s500+
Chan
ges
in Em
ploy
men
t Sh
ares
(200
5-20
10)
(in p
erce
ntag
e po
ints
)
West Tiger Other
0
10,000
20,000
30,000
40,000
50,000
60,000
s1-19 s20-49 s50-99 s100-249 s250-500 s500+
Labo
r Pro
ducti
vity
by S
ize
Cate
gory
(201
0, in
cons
tant
199
8 TL
)
West Tiger Other
Figure 4.8: Explaining Tiger catch-up – Faster expansion by more productive mid-size firms

Turkey’s Transitions
126
Figure 4.9: Explaining Tiger catch-up – Increase in Tiger exports, with exporters larger and more productive
Source: WB staff calculations based on TurkStat dataNotes: Export shares in the first figure are calculated form TurkStat export data broken down by provinces, obtained from the TurkStat website. Data for the rest of the figures are calculated by the WB staff by merging the AISS data set with the firm level Foreign Trade Statistics also compiled by TurkStat. Calculations are based on manufacturing firms with 20 or more employees and averaged over 2006-2009.
0.89
0.09
0.02
0.82
0.16
0.02
0.0
0.1
0.2
0.3
0.4
0.5
0.6
0.7
0.8
0.9
1.0
West Tiger Other
Regi
onal
Sha
res
in T
otal
Exp
orts
2002 2012
9.6
9.8
9.59.6
9.4
9.4
9.1
9.2
9.3
9.4
9.5
9.6
9.7
9.8
9.9
non-exp exporter non-exp exporter non-exp exporter
West Tiger Other
ln (l
abor
pro
ducti
vity
)
81
134
101
181
92
177
0
20
40
60
80
100
120
140
160
180
200
non-exp exporter non-exp exporter non-exp exporter
West Tiger Other
Mea
n Em
ploy
men
t per
firm
(per
sons
)
9.2
9.3
9.09.1
8.9
9.0
8.6
8.7
8.8
8.9
9.0
9.1
9.2
9.3
9.4
non-exp exporter non-exp exporter non-exp exporter
West Tiger Other
ln (T
FP)

Chapter 4: Enterprise: Harnessing structural change for integration and inclusion
127
time to substantiate this result.16 Nevertheless, it is worth highlighting that the employment share of the least-productive, smallest firms in the Tiger regions is still much higher than that in the West, implying much more of a shift in this direction is needed.
Another possible explanation of the Tiger produc-tivity catch-up is that Tiger firms are exporting more. The reverse may also be true: increases in productivity may have enabled Tiger firms to in-crease their exports. In any case, more productive firms in most countries tend to be more closely integrated into global markets. This is the case in Turkey also (see Chapter 2). Figure 4.9 shows that the share of the Tiger Regions in total exports has increased from about 9 percent in 2002 to 16 per-cent in 2010. It also shows that in all three regions exporters are larger (in terms of employment) and more productive than non-exporters. Interestingly, the average employment of exporters in the Tiger and Other Regions is larger than those in the West,
perhaps reflecting higher entry costs for exporters from those two regions.
Given the importance of exports not only to the Tiger story, but to the overall growth story of the country, it is worthwhile to look a little closer into the exports of the Tiger regions. We focus on the quality and technological content of exports. A measure that is often used to compare different qualities of the same product is unit values.17 While there are some differences, the results in Figure 4.10 show a high degree of similarity in the relative unit values between the West and Tiger regions. This is a good indication that recent trends of catch-up in the Tigers are sustainable. However, the Ti-gers still have much lower shares of employment and value added in medium and high technology sectors than the West. The process of convergence is not complete and, even in the West, the share of sectors with high technology content is still very small.
Source: WB staff calculations using the TurkStat AISS and Foreign Trade Statistics data setsNotes: Unit Calculations based on manufacturing firms with more than 20 employees. Unit values calculated at the HS6 level. The West composition of exports at the Statistical Classification of Economic Activities in the European Community (NACE) two digit level assumed to be equal to that of the Tigers.
0.00.10.20.30.40.50.60.7
Oth
er m
anuf
actu
ring
Furn
iture
Oth
er tr
ansp
ort e
quip
men
t
Mot
or v
ehic
les
Mac
hine
ry a
nd e
quip
men
t, ne
c.
Elec
tric
al e
quip
men
t
Com
pute
r ele
ctro
nic,
opti
cal
Fabr
icat
ed m
etal
pro
duct
s
Basic
met
als
Oth
er n
on-m
etal
lic m
iner
al
Rubb
er a
nd p
lasti
c
Phar
mac
eutic
als
Chem
ical
s and
che
mic
al p
rodu
cts
Coke
and
refin
ed p
etro
leum
Prin
ting
and
repr
.reco
rd. m
edia
Pape
r and
pap
er p
rodu
cts
Woo
d ex
cept
furn
iture
Leat
her
Wea
ring
appa
rel
Texti
les
Toba
cco
Beve
rage
s
Food
Unit
Valu
es fo
r Mai
n Ex
port
Cat
egor
ies
West Tiger
Figure 4.10: Firms in the Tiger regions export products of similar quality to firms in the West
16 For a discussion on the ‘missing middle’ evidence, see World Bank (2010) Chapter 3. Using data from the 2008 Enterprise Survey, the report shows that employment growth in smallest firms (1-10 employees) and largest firms (more than 250 employees) was higher than that in middle-sized firms between 2007 and 2010. While we cannot follow firms with less than 20 employees over time (and, therefore, cannot calculate their growth rates) our findings suggest that changes in the distribution of employment were favorable towards middle sized firms.
17 Following Reis and Farole (2012) for each HS6 export product, we calculate the unit value of that product relative to the 90th percentile of the unit value distribution of the same product across all countries exporting that product. This exercise is carried out for firms in the manufacturing indus-tries for 2010. We then aggregate relative unit values to the region-2 digit manufacturing sector level using the share of each firm-HS6 product in total exports of the region-manufacturing industry. In order to make the comparison meaningful, we assume that at the two digit level, the West has a similar composition of 6 digit HS products to that in the Tiger Regions.
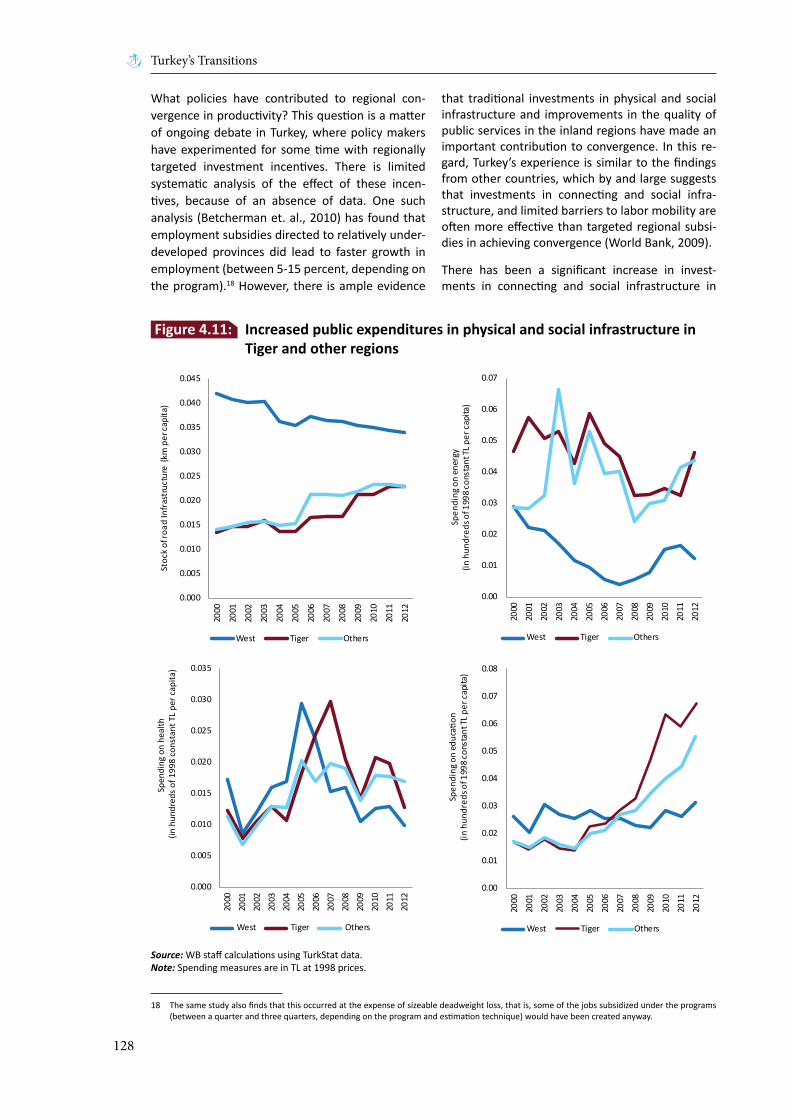
Turkey’s Transitions
128
What policies have contributed to regional con-vergence in productivity? This question is a matter of ongoing debate in Turkey, where policy makers have experimented for some time with regionally targeted investment incentives. There is limited systematic analysis of the effect of these incen-tives, because of an absence of data. One such analysis (Betcherman et. al., 2010) has found that employment subsidies directed to relatively under-developed provinces did lead to faster growth in employment (between 5-15 percent, depending on the program).18 However, there is ample evidence
that traditional investments in physical and social infrastructure and improvements in the quality of public services in the inland regions have made an important contribution to convergence. In this re-gard, Turkey’s experience is similar to the findings from other countries, which by and large suggests that investments in connecting and social infra-structure, and limited barriers to labor mobility are often more effective than targeted regional subsi-dies in achieving convergence (World Bank, 2009).
There has been a significant increase in invest-ments in connecting and social infrastructure in
Figure 4.11: Increased public expenditures in physical and social infrastructure in Tiger and other regions
Source: WB staff calculations using TurkStat data. Note: Spending measures are in TL at 1998 prices.
0.000
0.005
0.010
0.015
0.020
0.025
0.030
0.035
0.040
0.045
2000
2001
2002
2003
2004
2005
2006
2007
2008
2009
2010
2011
2012
Stoc
k of
road
Infr
astr
uctu
re (
km p
er c
apita
)
West Tiger Others
0.000
0.005
0.010
0.015
0.020
0.025
0.030
0.035
2000
2001
2002
2003
2004
2005
2006
2007
2008
2009
2010
2011
2012
Spen
ding
on
heal
th(in
hun
dred
s of 1
998
cons
tant
TL
per c
apita
)
West Tiger Others
0.00
0.01
0.02
0.03
0.04
0.05
0.06
0.07
2000
2001
2002
2003
2004
2005
2006
2007
2008
2009
2010
2011
2012
Spen
ding
on
ener
gy
(in h
undr
eds o
f 199
8 co
nsta
nt T
L pe
r cap
ita)
West Tiger Others
0.00
0.01
0.02
0.03
0.04
0.05
0.06
0.07
0.08
2000
2001
2002
2003
2004
2005
2006
2007
2008
2009
2010
2011
2012
Spen
ding
on
educ
ation
(in h
undr
eds o
f 199
8 co
nsta
nt T
L pe
r cap
ita)
West Tiger Others
18 The same study also finds that this occurred at the expense of sizeable deadweight loss, that is, some of the jobs subsidized under the programs (between a quarter and three quarters, depending on the program and estimation technique) would have been created anyway.

Chapter 4: Enterprise: Harnessing structural change for integration and inclusion
129
Anatolia over the past decade. As shown in Figure 4.11, spending in Tiger Regions relative to the West Regions was higher in both physical and social in-frastructure. This higher spending on both physical and social infrastructure in Central Anatolian urban areas no doubt also increased the appeal of these cities for enterprises, attracting entrepreneurs from the West to settle and start new enterprises or shift production to these now better-integrated and bet-ter-serviced locations (see Chapter 5).
Looking ahead – How to boost firm-level productivity growth Turkey’s productivity performance over the past decade has been relatively robust thanks to a struc-tural as well as spatial transformation of Turkey’s economy. Nonetheless, the relatively modest con-tribution of within firm productivity growth to over-all productivity growth raises the question whether the recent progress can be sustained once the ben-efits of structural change are exhausted (Eichen-green, Park and Shin, 2013).
In this final section, we cast a look ahead and iden-tify the likely main drivers of future within-firm pro-ductivity growth. Specifically, we analyze the main correlates of firm-level TFP in the 2005-2009 pe-riod and postulate that these are the likely drivers of future productivity growth as well. The results
are summarized in Table 4.7 and point to the way forward for Turkey (see Annex 1 for details of the regression results). The following lessons can be drawn:
First, in line with numerous studies for other coun-tries exports, firm age, size and FDI are the most im-portant correlates of firm level productivity. Export intensity is a significant source of learning about better global practices and changes in foreign de-mand, and is associated with higher TFP across all specifications. The positive contribution of age also reflects learning effects, with those firms that de-fend or extend their market position able to learn over time not only about what products the firm’s capabilities are best suited for but how to improve those capabilities. In our preferred specification (model (3)), firm size is also positively associated with higher TFP.19 In that specification, foreign own-ership also is positively associated with higher TFP. In addition, a number of regional variables influ-ence firm-level productivity, including the stock of capital in infrastructure and social services and the ease of access to finance. The policy implications point to the importance of further international integration in terms of greater exports as well as more efforts to attract FDI and further domestic in-tegration to spread the story of the Tigers to those provinces where productivity convergence has yet to take hold.
Table 4.7: Correlates of firm level productivity growthDependent variable: log total factor productivity Model 1 Model 2 Model 3
Export Intensity + + +
Log KBC per Worker + + +
Log R&D per worker + + +
Foreign Ownership +
Age +
Log Employment - - +
Log per capita transport utilities +
Log per capita health expenditures + +
Share of investment financed externally +
Constant + + +
Firm fixed effects Y Y N
Year effects Y Y N
Industry fixed effects N N YSource: Summary based on Table 4.9.Note: “+” reflects positive and significant coefficient; whereas, “-” reflects negative and significant coefficient. For detailed regression results, see Annex 1, Regression Results.
19 Although larger firms seem to have lower TFP when all firm level unobservable effects are controlled for in models (1) and (2), firm size (proxied by employment) is positively associated with TFP in the smaller sample where data are available on whether firm investment is financed externally.

Turkey’s Transitions
130
Second, there is a close association between invest-ments by firms in innovation capabilities and pro-ductivity upgrading and TFP levels. The coefficients of two variables that capture research and develop-ment (R&D) and broader knowledge based capital (KBC) intensity are highly significant in all examined specifications.20
Firms in the West are ahead of those in the other regions in terms of their innovation investments. Table 4.8 summarizes enterprise-level expen-ditures on R&D and KBC in the regions of Turkey over time.21 The KBC variable covers the following expenditures on intangible assets by individual en-terprises: computer software, rights (concessions, patents, trademarks, licenses, etc.) and other intan-gible investments (goodwill, organizational expen-ditures, R&D, etc.).22 The table shows substantial in-creases in both types of expenditures in all regions, though large gaps still exist between the West on the one hand, and the Tiger and Other regions on the other.23
International comparisons underscore the need for Turkish firms to improve their innovation capa-bilities. According to the Global Innovation Index 2013, Turkey still lags considerably behind leading innovators across a number of areas such as the business environment, human capital and Informa-tion and Communication Technologies (ICT) access,
knowledge absorption and collaboration assets, and investment in a few specific types of intangible assets (Figure 4.12). A summary of the peer group comparison suggests that:
• Turkey’s business environment as it relates to in-novation can be significantly improved. Turkey’s high costs of redundancy are an impediment to the reallocation of resources across firms, as are weaknesses in the insolvency framework (see also Chapter 3). Turkey also lags behind all comparators in terms of ease of access to mi-crofinance, which is presumed to play a critical role in facilitating innovation among new SMEs. Despite these weaknesses, however, we note that given the significant evidence of churning in Turkey, these weaknesses may be less of an impediment than the peer comparison would suggest.
• Regarding ICT, Turkey ranks better than Indone-sia and Mexico in terms of access to infrastruc-ture such as fixed and mobile phones as well as computers and the internet, but ranks worse than all comparators in e-participation, which measures the use of the internet in the provi-sion of government information to citizens.24 Turkey lags behind its peers in the extent of investment in human capital, captured here by the level of expenditure per student. Despite
Table 4.8: Firm investments in innovation capabilities – R&D and KBC
R&Dexpenditures per worker
Share of R&D personnel
expenditures in total personnel expenditures
Ratio of R&D expenditures
to sales
Share of KBC investments
in totalinvestment
expenditures
Ratio KBC expenditures
to sales
KBCinvestments per worker
2005
West 133.14 0.61 0.11 4.96 0.23 290.84
Tiger 49.11 0.26 0.07 1.38 0.07 51.49
Other 2.07 0.02 0.00 0.96 0.06 37.07
2010
West 311.21 1.52 0.24 14.23 0.91 1,183.71
Tiger 77.65 0.56 0.09 8.12 0.45 393.69
Other 8.05 0.07 0.01 11.42 0.58 417.96Source: WB staff calculations using AISS and R&D Activities Survey. See the Data Appendix for details.
20 KBC captures investments in the “soft” or intangible technologies of software and databases (digital capital), R&D, designs, and Intellectual Prop-erty Rights (IPRs) (intellectual capital), worker skills and management upgrading (managerial capital), branding and advertising (marketing capital), organizational change and new business models (organizational capital), as well as networking and peer-to-peer learning from value chains, consult-ants and other transmitters of global knowledge (collaboration capital). For an overview of the relevance of KBC for development, see Dutz (2013).
21 Data on R&D expenditures are taken from the Research and Development Activities Survey (RDAS) dataset, which has been merged with the AISS through firm codes.
22 Note that R&D expenditures are reported both in the AISS (as part of KBC) and RDAS data sets. According to TurkStat officials, R&D data in the RDAS data set are more reliable. In principle, it would have been desirable to subtract R&D expenditures from the definition of KBC. Unfortunately this is not possible as R&D expenditures are reported not separately but as part of “other intangible investments”.
23 An important element of KBC investments is investment in enterprise skills, such as expenditures on worker and management training. Unfortu-nately, there is no information on such expenditures in the TurkStat data sets. Availability of data on this dimension of KBC would provide a valu-able input for improved policy making.
24 Industry sources also point out that despite significant spending on hardware, there is little investment and little demand among Turkey’s firms in ICT services and software applications. This may be linked to relatively poor management quality in Turkey’s still predominantly family-owned businesses as the preliminary results of a management survey commissioned by the World Bank suggest.
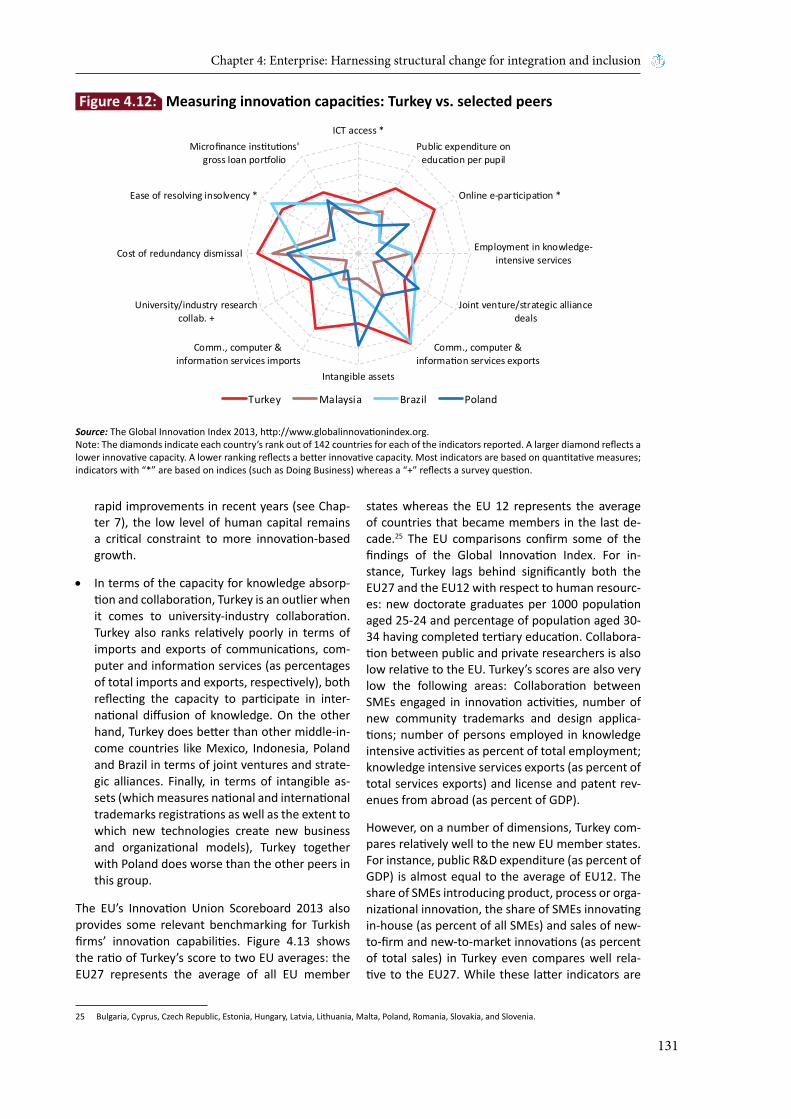
Chapter 4: Enterprise: Harnessing structural change for integration and inclusion
131
rapid improvements in recent years (see Chap-ter 7), the low level of human capital remains a critical constraint to more innovation-based growth.
• In terms of the capacity for knowledge absorp-tion and collaboration, Turkey is an outlier when it comes to university-industry collaboration. Turkey also ranks relatively poorly in terms of imports and exports of communications, com-puter and information services (as percentages of total imports and exports, respectively), both reflecting the capacity to participate in inter-national diffusion of knowledge. On the other hand, Turkey does better than other middle-in-come countries like Mexico, Indonesia, Poland and Brazil in terms of joint ventures and strate-gic alliances. Finally, in terms of intangible as-sets (which measures national and international trademarks registrations as well as the extent to which new technologies create new business and organizational models), Turkey together with Poland does worse than the other peers in this group.
The EU’s Innovation Union Scoreboard 2013 also provides some relevant benchmarking for Turkish firms’ innovation capabilities. Figure 4.13 shows the ratio of Turkey’s score to two EU averages: the EU27 represents the average of all EU member
states whereas the EU 12 represents the average of countries that became members in the last de-cade.25 The EU comparisons confirm some of the findings of the Global Innovation Index. For in-stance, Turkey lags behind significantly both the EU27 and the EU12 with respect to human resourc-es: new doctorate graduates per 1000 population aged 25-24 and percentage of population aged 30-34 having completed tertiary education. Collabora-tion between public and private researchers is also low relative to the EU. Turkey’s scores are also very low the following areas: Collaboration between SMEs engaged in innovation activities, number of new community trademarks and design applica-tions; number of persons employed in knowledge intensive activities as percent of total employment; knowledge intensive services exports (as percent of total services exports) and license and patent rev-enues from abroad (as percent of GDP).
However, on a number of dimensions, Turkey com-pares relatively well to the new EU member states. For instance, public R&D expenditure (as percent of GDP) is almost equal to the average of EU12. The share of SMEs introducing product, process or orga-nizational innovation, the share of SMEs innovating in-house (as percent of all SMEs) and sales of new-to-firm and new-to-market innovations (as percent of total sales) in Turkey even compares well rela-tive to the EU27. While these latter indicators are
Source: The Global Innovation Index 2013, http://www.globalinnovationindex.org. Note: The diamonds indicate each country’s rank out of 142 countries for each of the indicators reported. A larger diamond reflects a lower innovative capacity. A lower ranking reflects a better innovative capacity. Most indicators are based on quantitative measures; indicators with “*” are based on indices (such as Doing Business) whereas a “+” reflects a survey question.
ICT access *Public expenditure on
education per pupil
Online e-participation *
Employment in knowledge-intensive services
Joint venture/strategic alliancedeals
Comm., computer &information services exports
Intangible assets
Comm., computer &information services imports
University/industry researchcollab. +
Cost of redundancy dismissal
Ease of resolving insolvency *
Microfinance institutions'gross loan portfolio
Turkey Malaysia Brazil Poland
Figure 4.12: Measuring innovation capacities: Turkey vs. selected peers
25 Bulgaria, Cyprus, Czech Republic, Estonia, Hungary, Latvia, Lithuania, Malta, Poland, Romania, Slovakia, and Slovenia.

Turkey’s Transitions
132
Source: WB staff calculations based on IUS2013 database of the Innovation Union Scoreboard 2013 available at http://ec.europa.eu/enterprise/policies/innovation/files/ius-2013-database_en.xls. Note: For each indicator, TR/EU27 represents Turkey’s score for that indicator divided by the EU average, while TR/EU12 represents Turkey’s score divided by the average of countries that became members in the last decade (i.e. Bulgaria, Cyprus, Czech Republic, Estonia, Hungary, Latvia, Lithuania, Malta, Poland, Romania, Slovakia, and Slovenia).
0.0 0.2 0.4 0.6 0.8 1.0 1.2 1.4 1.6 1.8 2.0
Human Resources
New doctorate graduates
Population completed tertiary education
Finance and Support
Public R&D expenditure
Firm Investments
Business R&D expenditure
Non-R&D innovation expenditure
Linkages & Entrepreneurship
SMEs innovating in-house
Innovative SMEs collaborating with others
Public-private co-publications
Intellectual Assets
Community trademarks
Community designs
Innovators
SMEs introducing product or process innovations
SMEs introducing marketing/organisational innovations
Economic Effects
Employment in knowledge-intensive activities
Knowledge-intensive services exports
Sales of new to market and new to firm innovations
Licence and patent revenues from abroad
Ratio
TR/EU27 TR/EU12
Figure 4.13: Innovation scoreboard: Turkey and the European Union
perception, based they reveal an SME sector that reports relatively high levels of product and process innovation despite poor scores on measures of the quality of the national innovation system. It is ulti-mately the interaction between the supply of and demand for innovation that determines the returns to R&D. The authorities have increased public fund-
ing of R&D in recent years, encouraged venture capital financing through favorable tax treatment, and are working on a new patent legislation. More research is needed to understand whether these measures to improve the capacity of the national innovation system on the supply side will find ready demand among Turkish companies.

Chapter 4: Enterprise: Harnessing structural change for integration and inclusion
133
ConclusionTurkey has achieved fast productivity growth thanks to structural change and regional integra-tion. Horizontal, pro-market policies, starting with trade liberalization in the 1980s, improvements in macroeconomic and financial stability after 2001, and the establishment of largely rule-based regu-lation have created an environment conducive to enterprise growth and regional convergence. Tar-geted regional investments in physical and social infrastructure have also helped. Overall, Turkey’s enterprises have delivered productivity growth and rising exports, and created jobs, and this not only in Turkey’s already advanced coastal provinces, but critically also in the Anatolian heartland. This has made Turkey’s growth model more inclusive and has created a strong constituency for continued pro-market policies (Ülgen, 2013).
The main challenge that Turkey faces looking into the future is to increase within-industry and, espe-cially, within-firm productivity growth. As empha-sized in the literature, avoiding the middle income trap entails moving up the technology ladder (see, among others, Canuto et al. 2010). Slowdowns are
less likely in countries where the population has a relatively high level of secondary and tertiary education and where high-technology products account for a relatively large share of exports. Sus-tained growth into high income is also more likely in countries that have more open economies, at-tract greater amounts of FDI, and have stable mac-roeconomic conditions (see Chapter 8 for a detailed discussion of the literature on growth slowdowns in middle income countries).
The analysis in this Chapter confirms the cross-country findings on how to sustain growth in mid-dle income countries. Turkey’s most productive en-terprises are those that have grown over time from small, domestic market oriented workshops to me-dium or even large-scale companies, linked to the global economy. These companies invest more in R&D, they require more information technologies, they hire more skilled workers and are better man-aged. Like the Boydak group, they are enterprises that are ready to compete with the best and have shifted to a model of innovation-based growth. Tur-key needs more of them if the productivity gains of the past decades are to be sustained and if the country is to cross the threshold to high income.
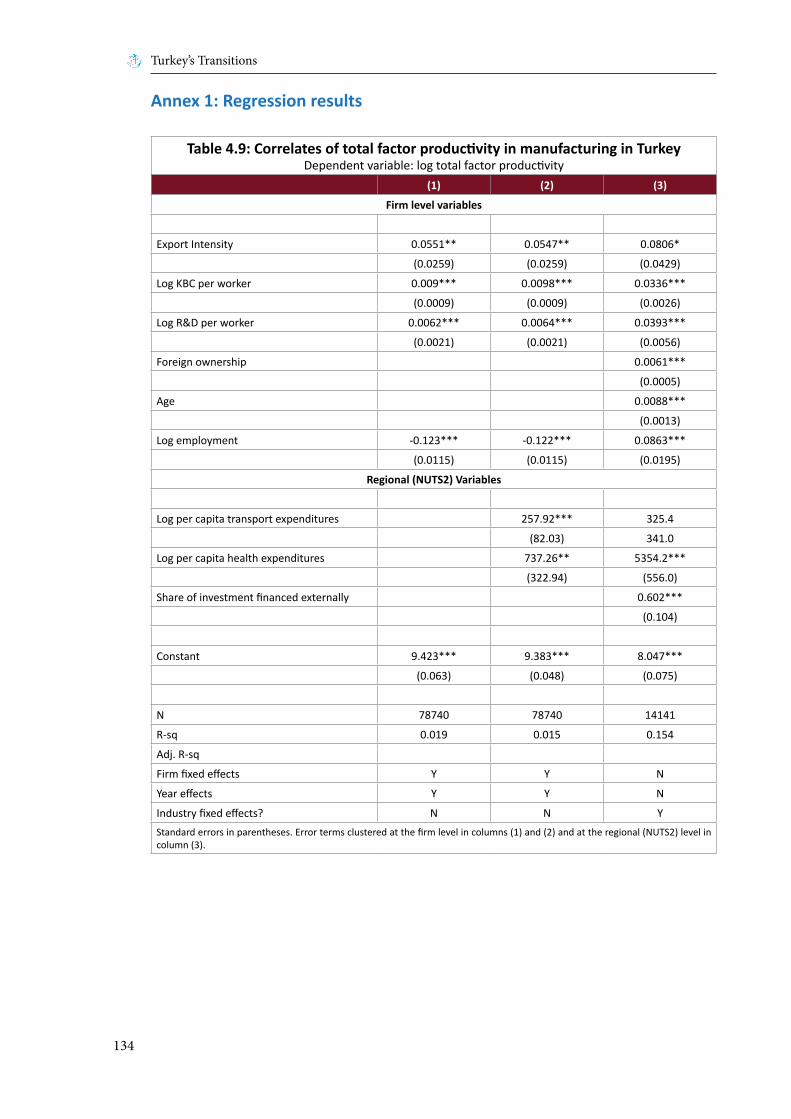
Turkey’s Transitions
134
Annex 1: Regression results
Table 4.9: Correlates of total factor productivity in manufacturing in TurkeyDependent variable: log total factor productivity
(1) (2) (3)
Firm level variables
Export Intensity 0.0551** 0.0547** 0.0806*
(0.0259) (0.0259) (0.0429)
Log KBC per worker 0.009*** 0.0098*** 0.0336***
(0.0009) (0.0009) (0.0026)
Log R&D per worker 0.0062*** 0.0064*** 0.0393***
(0.0021) (0.0021) (0.0056)
Foreign ownership 0.0061***
(0.0005)
Age 0.0088***
(0.0013)
Log employment -0.123*** -0.122*** 0.0863***
(0.0115) (0.0115) (0.0195)
Regional (NUTS2) Variables
Log per capita transport expenditures 257.92*** 325.4
(82.03) 341.0
Log per capita health expenditures 737.26** 5354.2***
(322.94) (556.0)
Share of investment financed externally 0.602***
(0.104)
Constant 9.423*** 9.383*** 8.047***
(0.063) (0.048) (0.075)
N 78740 78740 14141
R-sq 0.019 0.015 0.154
Adj. R-sq
Firm fixed effects Y Y N
Year effects Y Y N
Industry fixed effects? N N YStandard errors in parentheses. Error terms clustered at the firm level in columns (1) and (2) and at the regional (NUTS2) level in column (3).

Chapter 4: Enterprise: Harnessing structural change for integration and inclusion
135
ReferencesAcemoğlu, D., & Robinson, J. (2013). The Political Economy of Turkey. Retrieved from http://whyna-tionsfail.com/blog/2013/2/27/the-political-econo-my-of-turkey.html
Atiyas, İ., & Bakış, O. (2013a). Aggregate and Sec-toral TFP Growth in Turkey: A Growth Accounting Exercise. REF Working Paper No: 2013-1. Istanbul.
Atiyas, İ., & Bakış, O. (2013b). Structural Change and Industrial Policy in Turkey. REF Working Paper, 2013-3.
Bartelsman, E., Haltiwanger, J., & Scarpetta, S. (2004). Microeconomic Evidence of Creative De-struction in Industrial and Developing Countries. WPS 3464.
Betcherman, G., Daysal, N., & Pages, C. (2010). Do Employment Subsidies Work? Evidence From Re-gionally Targeted Subsidies in Turkey. Labor Eco-nomics 17 710-722.
Canuto, O., Dutz, M., & Reis, J. (2010). Technologi-cal Learning and Innovation: Climbing a Tall Ladder. Chapter 2 in The Day After Tomorrow: A Handbook on the Future of Economic Policy in the Developing World. (O. Canuto, & M. Giugale, Eds.) Washington, D.C.: The World Bank.
Dutz, M. A. (2013). Investments in Productivity: Knowledge Capital as a Driverof Structural Change and Growth - Growth FAQ: 10 Frequently Asked Questions on KBC. PRMED. Washington, D.C.: The World Bank.
Eichengreen, B., Park, D., & Shin, K. (2013). Growth Slowdowns Redux: New Evidence on the Middle-In-come Trap. NBER Working Paper 18673. Cambridge MA.
ESI (European Stability Initiative). (2005, September 19). Islamic Calvinists: Change and Conservatism in Central Anatolia. Berlin and Istanbul. Retrieved from http://www.esiweb.org
Foster, L., Haltiwanger, J., & Krizan, C. (2001). Ag-gregate Productivity Growth: Lessons from Micro-economic Evidence. New Developments in Produc-tivity Analysis. (E. Dean, M. Harper, & C. Hulten, Eds.) Chicago: University of Chicago Press.
Gönenç, R., Röhn, O., Koen, V., & Saygili, S. (2012). Structural Reforms to Boost Turkey’s Long-Term Growth. OECD Economics Department Working Pa-pers, 987. Paris: OECD Publishing.
Griliches, Z., & Regev, H. (1995). Firm Productivity in Israeli Industry: 1979-1988. Journal of Econo-metrics, 65(1), 175-203.
Mcmillan, M., & Rodrik, D. (2011). Globalization, Structural Change and Productivity Growth. NBER Working Paper 17143, June 2011.
OECD. (2014, July). Turkey Country Survey. Chapter 3.
Raiser, M., Schaffer, M., & Schuchhardt, J. (2004). Benchmarking Structural Change in Transition Countries. Structural Change and Economic Dy-namics, 15 (1), 47-81.
Reis, J., & Farole, T. (2012). Trade Competitiveness Diagnostics Toolkit. Washington, D.C.: The World Bank.
Ülgen, S. (2013, February). The Political Economy of Reform in Turkey and Its Relevance for the Arab World. World Bank Mimeo. Washington, D.C.: The World Bank.
World Bank. (2009). Reshaping Economic Geogra-phy. World Development Report 2009. Washington, D.C.: The World Bank.
World Bank. (2010). Turkey Investment Climate As-sessment.
World Bank. (2011). Running a Business in Turkey. Enterprise Surveys Country Note Series, Country Note 1. Washington D.C.: The World Bank.

Turkey’s Transitions
136
Data Appendix
Annual Industry and Service Statistics (AISS, 2003-2010)
The AISS data provides detailed information on rev-enue, costs, employment, investment, sector of ac-tivity (at 4 digit detail, NACE Rev. 1.1 for 2003-2009 and NACE Rev.2 for 2009-2010) and the region of location (NUTS2 level). NACE Rev. 1.1 sections from letter C to I, and letters K, M, N and O are covered. The AISS does not cover the following sectors:
A - Agriculture, hunting and forestry
B - Fishing
J – Financial Intermediation
L - Public administration and defense; compulsory social security
O - Other community, social and personal service activities
P - Activities of households
Q - Extra-territorial organizations and bodies
The AISS dataset covers all firms with 20 or more employees, and a representative sample of small firms with 1-19 employees. However, all firms with more than one plant (regardless of number of em-ployees) are covered if they are in one of the sec-tors C (mining and quarrying), E (electricity, gas and water supply) or I (transport, storage and commu-nications).
For NACE Rev. 2 (years 2009 and 2010) sectoral cov-erage is similar to the NACE Rev. 1.1. Here, the sec-tors that are not covered are:
A - Agriculture, forestry and fishing
K - Financial and insurance activities
O - Public administration and defense; compulsory social security
T - Activities of households as employers; undiffer-entiated goods- and services-producing activities of households for own use
U - Activities of extraterritorial organizations and bodies
A division of J - “Programming and broadcasting ac-tivities” in Information and Communication activi-ties is not covered.
Two classes of L - “Buying and selling of own real es-tate” and “Renting and operating of own or leased real estate” in the Real Estate Activities (section L) are not covered.
A division of S - “Activities of membership organiza-tions” in Other service activities (section S) is not covered.
Unfortunately, the change in the classification from NACE Rev. 1.1 to NACE Rev.2 creates a discontinuity in the data set and makes it impossible to under-take analysis that involves data at the sub-sectoral (say 2 digit) level. Hence in the text, any such analy-sis is carried out either for the period 2005-2009, or for the year 2010.
To deal with outliers, we trim the data as follows: first, we compute labor productivity (LP) for each firm (real value added divided by number of em-ployees). Then we trim firms with an average LP (over years the firm appears in the data) 2 stan-dard deviations above or below the mean LP. Using 3 standard deviations or trimming 1 percent from top and bottom yield similar results. For calculating real variables, we used 2-digit producer price index (published by TurkStat) for manufacturing and sec-toral GDP deflator (letters A to Q according to NACE Rev. 1.1 classification) for other sectors.
It was stated above that firms with less than 20 employees are covered on a sampling basis. AISS also reports sampling weights. For some analysis in the text, it makes sense to use the whole data set (i.e. including firms with less than 20 employ-ees) along with the appropriate sampling weights. For example, the analysis of employment shares of firms in different size classes uses the whole data set. Other questions, for example decomposition of productivity growth, require to focus only on firms with at least 20 employees (“20+ firms”). Whether the whole data set or only 20+ firms are used is in-dicated in the text.
The AISS data set does not contain information on physical capital stocks. We use depreciation allow-ances to impute capital stocks at the firm level. Un-fortunately, for almost half of the firms reported depreciation is zero. We find that implausible, as-suming that the depreciation rate is some nonnega-tive number. Thus, we impute depreciation allow-ances for such firms using sector (4 digit NACE Rev. 1.1), year dummies along with value added, num-ber of employees, electricity and oil expenditures. We assume that depreciation rate is 10 percent in the baseline specification. In the baseline specifica-tion, we estimate a Cobb-Douglas production func-tion with constant returns to scale at 2 digit NACE Rev. 1.1. Then, for each firm TFP is computes as a residual, using value added, capital and employ-ment at the firm level. TFP is computed only for firms in the manufacturing industry for the years 2003-2009.

Chapter 4: Enterprise: Harnessing structural change for integration and inclusion
137
The data set contains information on geographic lo-cation at the NUTS 2 level, which we use to assign firms to the regions West, Tiger and Other. Some firms have multiple plants (units) in different NUTS 2 regions. At the plant level, only information on the share of the plant in total employment and sales of the firm are available. To assign a geograph-ic location for such firms, we use the employment shares. Specifically, we assign each multi-plant firm in every year to the region where the plant with the highest employment share is located in that year. Because plants do not have unique ID codes that are constant over time and because not all informa-tion is available at the plant level, we cannot carry out the whole analysis on the basis of plant level information. However, we have calculated regional shares of employment and sales using plant level information as well, and the shares turn out to be very close to those calculated on the basis of firms assigned to regions in the way described above.
“Technological content” is defined for the manu-facturing industry. We follow the classification published by Eurostat. High technology (HT) indus-tries include sectors such as “basic pharmaceuti-cal products”; medium-high technology (MHT) industries include sectors such as “chemicals and chemical product”; medium-low technology (MLT) industries produce products like “coke and refined petroleum”; finally low technology (LT) industries include sectors like “food, beverages, tobacco, tex-tiles, wearing apparel etc.”26
The Foreign Trade Statistics (FT) The FT data set covers all exports and imports transactions by all firms in Turkey since 2002 on a monthly basis. The data are collected by the Turk-ish Customs Authority and processed by TurkStat. Thanks to the unique firm ID, one can follow indi-vidual firms through time. For any firm, we know each transaction’s (export and import) value, its quantity and destination at product level. In Turkey, product codes are 12 digit- the first 8 of which cor-respond to the Combined Nomenclature classifica-tion, and the last 4 digits are national. Hence, for international comparisons, one has access to 6 digit Harmonized System classification. Thanks to the firm ID, we can merge the FT data set with the AISS data set. This gives detailed information on sales, VA, costs, location, employment alongside exports and imports at firm level. The match between the two data sets is not perfect, because while the FT data set covers all firms that have export and im-port transactions, the AISS covers only a sample of firms with less than 20 employees. However, the match is quite reliable: total exports in the matched data amounts to 83 percent of total exports in the FT data set in 2010.
The Research and Development Activities Survey (RDAS)
The RDAS data set contains information on R&D expenditures and R&D personnel. The following enterprises are covered according to the survey frame: Enterprises funded by government agencies that provide R&D support, the top 500 enterprises in industry and services sectors by turnover and VA, enterprises in Technology Development Zones and Technoparks, enterprises benefiting from the insurance Premium support (article 3/3) stated in the Law on Supporting Research and Development, No.5746 and enterprises which are known as R&D performers from the AISS survey, public and private universities. Again, we can link this data set to the AISS data set via unique firm ID. The RDAS data set contains about 15 thousand observations over the period 2003-2010. The merging operation results in about 9000 matches. We note that the AISS data set also reports R&D expenditures at the firm level, and these numbers do not match those reported in the RDAS data set. According to TurkStat officials, R&D data in the RDAS data set is more reliable. Be-cause of this reason, for firms in the AISS that do not get matched to the RDAS data set, we assume that their R&D expenditures are zero.
Calculation of Relative Unit Valuesof Exports
Since there is no directly observable quality mea-sure in FT data, the literature uses unit values as a proxy for “quality” of similar products. Follow-ing Reis and Farole (2012), for each export product (classified according to 6 digit Harmonized System), we calculate the relative unit value of that product as follows: We divide its unit value to the 90th per-centile of the unit value distribution of the same product across all countries exporting that product. When we report regional aggregates such as West or Tigers, we calculate such aggregates as weighted averages where weights are export shares of these products (at 6 digit Harmonized System level). When doing sectoral comparisons, say 2 digit in-dustries, across regions this may yield biased re-sults because of “composition effects”: the compo-sition of exports at the two digit level are not likely to be the same in the West and the Tiger Regions. As a result, what is being compared is not the qual-ity of the same basket of products, but the aver-age quality level of exports at the two digit level. In order to obtain comparable indicators, we need to control for such composition effects. This is done by using the same basket across regions. For this, we
26 For the full list, see http://epp.eurostat.ec.europa.eu/cache/ITY_SDDS/Annexes/htec_esms_an3.pdf
Turkey’s Transitions
138
compute regional relative unit values using export shares of the Tigers (at 2 digit industry level) for all regions. This way, regional differences, if any, can be interpreted as quality differences of the same basket of products across regions.
Decomposition of Productivity Growth
There are various approaches that can be used to calculate the contribution of continuing, entering and exiting firms to overall productivity growth.27 The approach used in this paper follows Griliches and Regev (1995; “GR” for short). This approach decomposes change in aggregate productivity P between periods t and t - t in the following way:
Here sit and p
it are the employment share and pro-
ductivity for firm i at period t and C, E and X stand for the set of continuing, entering and exiting firms, respectively. Bars over a variable indicate averages of the variable over base and end years. Hence the terms s
l and p
l stand for averages over periods t
and t - tand P is the mean of productivity for the industry or the economy over periods t - t. Hence productivity growth is decomposed into four terms. The first term, called the “within-firm” effect, is the sum of productivity growth in each firm weighted by the mean share in employment. The second term is the “between-firm” effect expressed as the sum of changes in the employment share of the firm multi-plied by the difference between average firm-level productivity and average industry-level productiv-ity, averages being taken across beginning and end of period. The third term captures the contribution of entry and is positive if the productivity of new entrants is higher than the industry average. Finally, the last term is minus the contribution of exitors and increases aggregate productivity growth if the productivity of the exitors is less than the industry average. Entry and exit are defined relative to the whole data set.
Since decomposition of productivity growth re-quires to follow individual firms over time, calcula-tions are carried out on firms with at least 20 em-ployees. Entry and exit are defined as entering into and exiting from the data set. Hence, an entry could represent true entry into the market, or it could re-flect the employment growth in a firm such that a firm with less than 20 employees becomes a firm
with 20 and more employees and, therefore, enters the data set. The same is true with exit.
An alternative approach is that developed by Fos-ter, Haltiwanger and Krizan (2001, the FHK ap-proach, for short), differs in the weights used. Instead of using weights that are averages of the beginning and end of the period, the FHK approach uses beginning of the period weights. This changes formulas for the “within” and “between” compo-nents. In addition, the contribution of continuing firms gains a third term (in addition to the “within” and “between” components), which is the “cross term” (sum, across continuing firms, of the product of changes in productivity and changes in employ-ment shares).
Bartelsman et. al (2004) show a preference for the FHK approach. Even then, they argue that the GR approach would likely produce more robust results when the data is likely to suffer from measurement errors.
In this paper we use the GR approach, both because we believe the AISS data likely contains substantial measurement errors and because the “cross effect” in the FHK approach is very difficult to interpret. By contrast, the GR terms are more intuitive and easier to interpret. We further think that averaging shares across time makes sense and gives a more intuitive description of productivity dynamics.
We have, nevertheless, calculated productivity de-composition for the three regions using the FHK ap-proach as well. The results are as follows:
Comparison with Table 4.5 in the text will show that the qualitative results are very similar. One impor-tant point revealed by the FHK decomposition is that for non-manufacturing what appeared as large negative between effects under the GR composi-tion appears as relatively small positive between effects and very large negative cross effects under the FHK decomposition.
We have also undertaken decompositions of overall TFP growth for the manufacturing industry. These decompositions use VA rather than employment shares. The GR decompositions of TFP growth are reported in the text (Table 4.5).
∆𝑃𝑃𝑡𝑡,𝑡𝑡−𝜏𝜏 = �𝑠𝑠𝚤𝚤��𝑝𝑝𝑖𝑖𝑡𝑡 − 𝑝𝑝𝑖𝑖,𝑡𝑡−𝜏𝜏� 𝑖𝑖∈𝐶𝐶
+ ��𝑠𝑠𝑖𝑖𝑡𝑡 − 𝑠𝑠𝑖𝑖,𝑡𝑡−𝜏𝜏�(𝑝𝑝𝚤𝚤� − 𝑃𝑃�)𝑖𝑖∈𝐶𝐶
+ �𝑠𝑠𝑖𝑖𝑡𝑡(𝑝𝑝𝑖𝑖𝑡𝑡 − 𝑃𝑃�)𝑖𝑖∈𝐸𝐸
−�𝑠𝑠𝑖𝑖,𝑡𝑡−𝜏𝜏(𝑝𝑝𝑖𝑖,𝑡𝑡−𝜏𝜏 − 𝑃𝑃�)𝑖𝑖∈𝑋𝑋
27 See Bartelsman et. al. (2004) for a discussion of various approaches.

Spotlight 2: Infrastructure to connect and fuel the economy
139
Infrastructure to connectand fuel the economy
Spotlight 2
Turkey’s Transitions: Integration, Inclusion, Institutions
Labor
Welfare
FiscalSpace
Enterprise
Trade
Finance
Cities
Infrastucture

Turkey’s Transitions
140
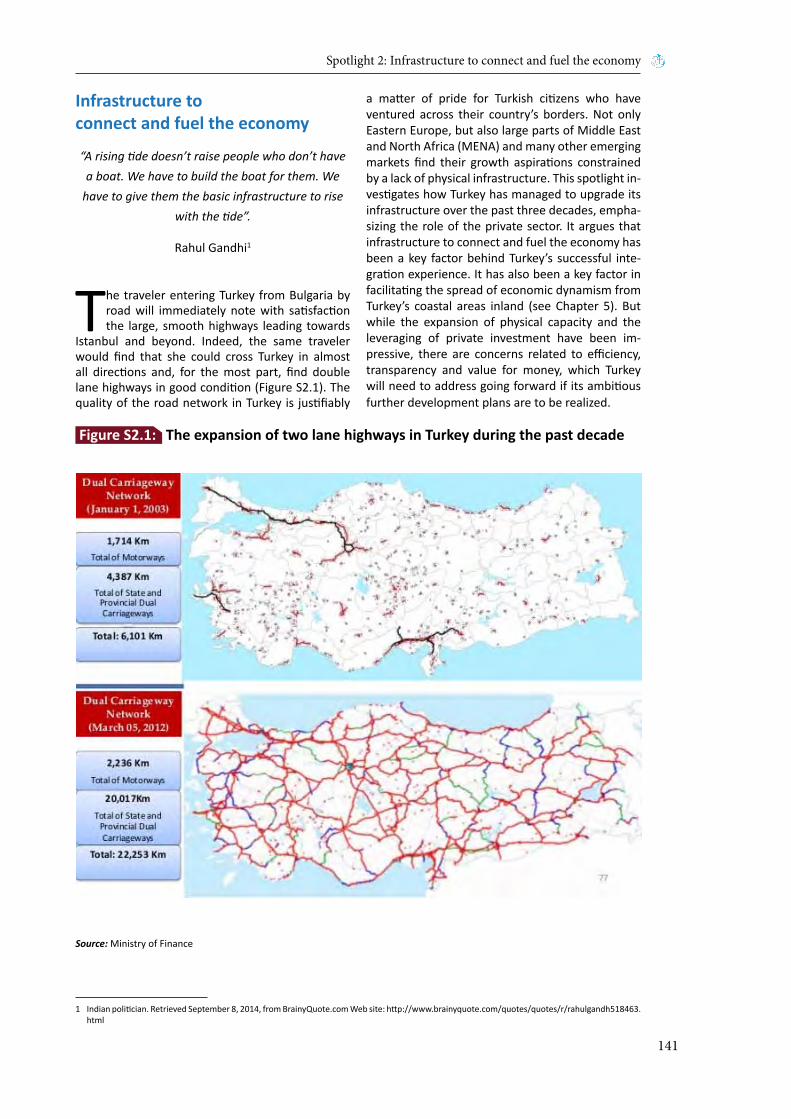
Spotlight 2: Infrastructure to connect and fuel the economy
141
Infrastructure toconnect and fuel the economy
“A rising tide doesn’t raise people who don’t have a boat. We have to build the boat for them. We
have to give them the basic infrastructure to rise with the tide”.
Rahul Gandhi1
The traveler entering Turkey from Bulgaria by road will immediately note with satisfaction the large, smooth highways leading towards
Istanbul and beyond. Indeed, the same traveler would find that she could cross Turkey in almost all directions and, for the most part, find double lane highways in good condition (Figure S2.1). The quality of the road network in Turkey is justifiably
a matter of pride for Turkish citizens who have ventured across their country’s borders. Not only Eastern Europe, but also large parts of Middle East and North Africa (MENA) and many other emerging markets find their growth aspirations constrained by a lack of physical infrastructure. This spotlight in-vestigates how Turkey has managed to upgrade its infrastructure over the past three decades, empha-sizing the role of the private sector. It argues that infrastructure to connect and fuel the economy has been a key factor behind Turkey’s successful inte-gration experience. It has also been a key factor in facilitating the spread of economic dynamism from Turkey’s coastal areas inland (see Chapter 5). But while the expansion of physical capacity and the leveraging of private investment have been im-pressive, there are concerns related to efficiency, transparency and value for money, which Turkey will need to address going forward if its ambitious further development plans are to be realized.
Source: Ministry of Finance
Figure S2.1: The expansion of two lane highways in Turkey during the past decade
1 Indian politician. Retrieved September 8, 2014, from BrainyQuote.com Web site: http://www.brainyquote.com/quotes/quotes/r/rahulgandh518463.html

Turkey’s Transitions
142
Infrastructure can be a powerful tool to connect and fuel the economy. Over the last two decades, empirical work has found evidence of the contribu-tion of infrastructure to growth and productivity (see Aschauer, 1989; Canning 1999; Demetriades and Mamuneas, 2000; Calderón and Servén 2004; 2010a, Vu, 2004 among others) and poverty and inequality (e.g., Estache, Foster and Wodon, 2002; Calderon and Chong 2004). While the debate on the size of the impacts is still very much alive, there is consensus that infrastructure development has
the potential to promote growth, increase equity, and, hence, reduce poverty (Calderon and Serven, 2010b).
In Turkey, too, infrastructure is likely to have con-tributed to rapid productivity growth. Focusing on investments in road, communications and energy infrastructure, Fedderke and Kaya (2013) find a positive and significant relationship between infra-structure and productivity between 1987 and 2006. Their findings suggest that a 1 percent increase in the road network led to around 0.5 percentage
Source: World Development Indicators (WDI) 2002-2012
Source: TEİAŞ (Turkish Electricity Transmission Company; www.teias.gov.tr)
35.6
28.9
0.03
88.5
26.0
6.8
90.8 18.6 10.5 millions
ICT INFRASTRUCTURE INDICATORSTurkeymobile telephone
subscriptions per 100 pop.
fixed telephone lines per 100 pop.
broadband Internet
subscribers/100 pop.
broadband Internet
subscribers/100 pop.
67.7 mobile telephone subscriptions in 2012
mobile telephone subscriptions per
100 pop.
fixed telephone lines per 100 pop.
broadband Internet
subscribers/100 pop.
fixed broadband
Internet subscribers in 2012 7.9 millions
mobile telephone subscriptions per
100 pop.
fixed telephone lines per 100 pop.
2002
2007
2012
0
10,000
20,000
30,000
40,000
50,000
60,000
1913
1925
1928
1931
1934
1937
1940
1943
1946
1949
1952
1955
1958
1961
1964
1967
1970
1973
1976
1979
1982
1985
1988
1991
1994
1997
2000
2003
2006
2009
2012
MW
Total Generation Capacity (MW)
Figure S2.2: Turkey experienced considerable improvements in mobile and broad-band coverage in the last decade
Figure S2.3: Totalelectricitygenerationcapacityincreasedrapidlyafter1978
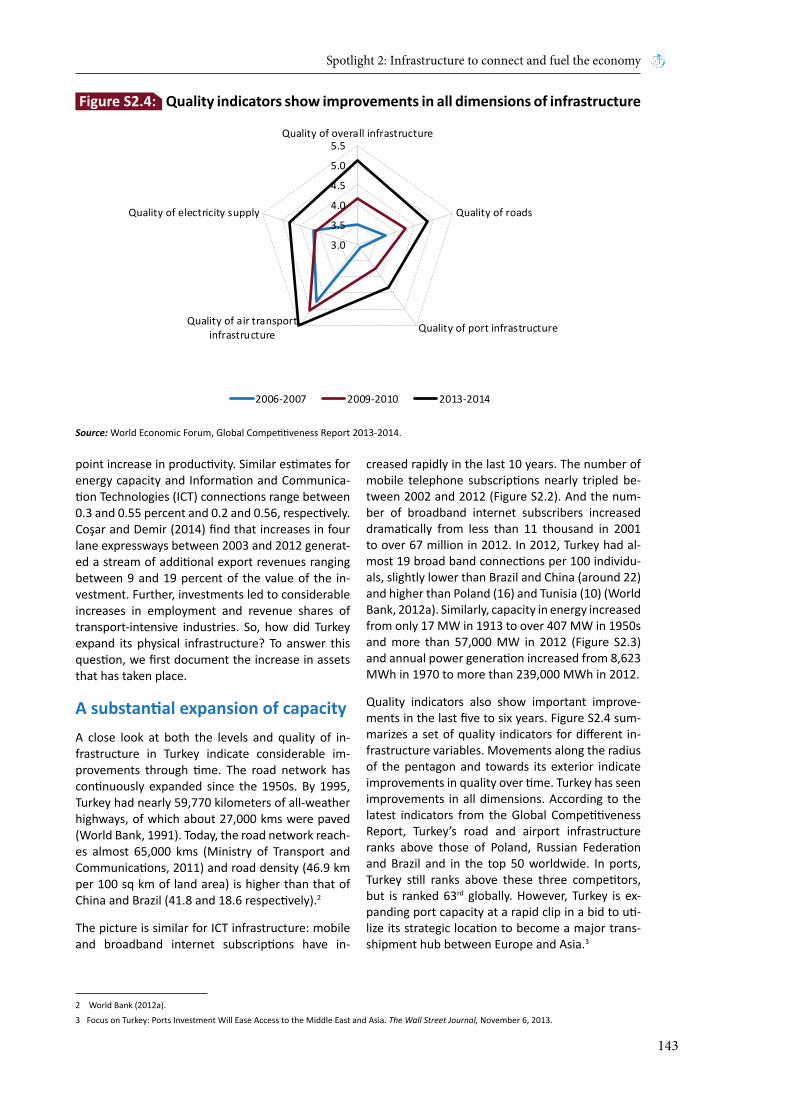
Spotlight 2: Infrastructure to connect and fuel the economy
143
point increase in productivity. Similar estimates for energy capacity and Information and Communica-tion Technologies (ICT) connections range between 0.3 and 0.55 percent and 0.2 and 0.56, respectively. Coşar and Demir (2014) find that increases in four lane expressways between 2003 and 2012 generat-ed a stream of additional export revenues ranging between 9 and 19 percent of the value of the in-vestment. Further, investments led to considerable increases in employment and revenue shares of transport-intensive industries. So, how did Turkey expand its physical infrastructure? To answer this question, we first document the increase in assets that has taken place.
AsubstantialexpansionofcapacityA close look at both the levels and quality of in-frastructure in Turkey indicate considerable im-provements through time. The road network has continuously expanded since the 1950s. By 1995, Turkey had nearly 59,770 kilometers of all-weather highways, of which about 27,000 kms were paved (World Bank, 1991). Today, the road network reach-es almost 65,000 kms (Ministry of Transport and Communications, 2011) and road density (46.9 km per 100 sq km of land area) is higher than that of China and Brazil (41.8 and 18.6 respectively).2
The picture is similar for ICT infrastructure: mobile and broadband internet subscriptions have in-
creased rapidly in the last 10 years. The number of mobile telephone subscriptions nearly tripled be-tween 2002 and 2012 (Figure S2.2). And the num-ber of broadband internet subscribers increased dramatically from less than 11 thousand in 2001 to over 67 million in 2012. In 2012, Turkey had al-most 19 broad band connections per 100 individu-als, slightly lower than Brazil and China (around 22) and higher than Poland (16) and Tunisia (10) (World Bank, 2012a). Similarly, capacity in energy increased from only 17 MW in 1913 to over 407 MW in 1950s and more than 57,000 MW in 2012 (Figure S2.3) and annual power generation increased from 8,623 MWh in 1970 to more than 239,000 MWh in 2012.
Quality indicators also show important improve-ments in the last five to six years. Figure S2.4 sum-marizes a set of quality indicators for different in-frastructure variables. Movements along the radius of the pentagon and towards its exterior indicate improvements in quality over time. Turkey has seen improvements in all dimensions. According to the latest indicators from the Global Competitiveness Report, Turkey’s road and airport infrastructure ranks above those of Poland, Russian Federation and Brazil and in the top 50 worldwide. In ports, Turkey still ranks above these three competitors, but is ranked 63rd globally. However, Turkey is ex-panding port capacity at a rapid clip in a bid to uti-lize its strategic location to become a major trans-shipment hub between Europe and Asia.3
Source: World Economic Forum, Global Competitiveness Report 2013-2014.
3.0
3.5
4.0
4.5
5.0
5.5Quality of overall infrastructure
Quality of roads
Quality of port infrastructureQuality of air transportinfrastructure
Quality of electricity supply
2006-2007 2009-2010 2013-2014
Figure S2.4: Quality indicators show improvements in all dimensions of infrastructure
2 World Bank (2012a).
3 Focus on Turkey: Ports Investment Will Ease Access to the Middle East and Asia. The Wall Street Journal, November 6, 2013.

Turkey’s Transitions
144
AlegacyofcontinuousinvestmentNo expansion of infrastructure capacity and qual-ity can happen without investment. Total invest-ment in transport, communications and energy accounted for about 18 percent of investments in the 1960s, increasing to about 25 percent on av-erage in the 1980s, over 30 percent in the 1990s, and above 25 percent over the last decade.4 Turkey is also among the top ten spenders in infrastruc-ture among emerging economies, with estimated
spending on infrastructure of about US$252 billion between 1991 and 2010.5
Yet, public investment in infrastructure as a per-centage of Gross Domestic Product (GDP) appears low compared to international benchmarks. Pub-lic investment in infrastructure remained around 3 percent of GDP in the 1970s and 1990s. In the 1980s, ambitious infrastructure plans brought pub-lic investment up to an annual average above 4 per-cent of GDP. In China, Thailand and Vietnam, total
Source: World Development Indicators (WDI) 2002-2012.
Transportandcommunications
Energy
0.0%
0.5%
1.0%
1.5%
2.0%
2.5%
3.0%
1963
1965
1967
1969
1971
1973
1975
1977
1979
1981
1983
1985
1987
1989
1991
1993
1995
1997
1999
2001
2003
2005
Private Public Total
0.0%
1.0%
2.0%
3.0%
4.0%
5.0%
6.0%
7.0%
8.0%
1963
1965
1967
1969
1971
1973
1975
1977
1979
1981
1983
1985
1987
1989
1991
1993
1995
1997
1999
2001
2003
2005
Private Public Total
Figure S2.5: Public vs. private investments as percentage of GDP
4 Ministry of Development and TurkStat.
5 Royal Bank of Scotland (2011). The Roots of Growth. Projecting Emerging Markets Infrastructure Demand to 2030.
Spotlight 2: Infrastructure to connect and fuel the economy
145
infrastructure investments exceed 7 percent of GDP and history seems to suggest that this is the appro-priate level of investments for fast growing econo-mies (Growth Commission, 2008). Turkey falls short of this level, but thanks to increasing private invest-ment, the gap is not very large.
Private infrastructure investment has played an increasingly important role, particularly after the 1980s. As shown in Figure S2.5, public investment in transport and communications hovered around the 2 percent of GDP mark from the early 1970s through the early 1990s, before declining to around 1.5 percent. However, private investment made up more than the slack, peaking at over 4 percent of GDP in 1997 and staying above 2 percent of GDP thereafter except the crisis years in the early 2000s. In the energy sector, the public sector has remained more dominant, but here, too, there is a shift towards greater private investment after the mid-1990s. Transport, communication and energy are typically at the forefront of attracting private investment in infrastructure. But in recent years, other sectors such as health care, are also attract-ing increasing private sector interest.
However, the real answer to Turkey’s successful expansion of infrastructure is linked to efforts that go beyond investments. While investments are key, international experience indicates that investments are more successful when: (i) regulations are in place to support competitive markets; (ii) coordina-tion across sectors and administrative units exists, and (iii) efforts are made to leverage private sector participation in infrastructure. In what follows, this spotlights provides insights on how Turkey has tak-en steps along these three directions, and through these, ensured that spending was in fact reflected in the creation of new infrastructure, maintenance of existing assets, and overall improvement of qual-ity. Figure S2.6 at the end of this Spotlight provides a timeline and overview over the critical reforms taken over the three and half decades since 1980 grouped by these three interlinked policy areas.
Layingthefoundation–regulationandinstitutionsInfrastructure investments can be wasted if invest-ments are not coordinated with policy and regula-tory efforts. Turkey has understood the importance of coordinating infrastructure investments with ap-propriate regulatory policies. One example where Turkey has made parallel efforts in investments and regulation is in its connective infrastructure.
Large investments in road infrastructure responded to increased demand in the 1980s. Truck transport became the dominant mode for freight transport,
changing from merely 25 percent in the 1950s to over 75 percent by the mid-1980s. In the early eighties, with World Bank assistance, the govern-ment focused on the rehabilitation of the Trans-Turkey Highway, to respond to the increased traffic between Europe and the Middle East. Important investments were made also to build roads to con-nect coastal areas with the still very much rural inland. In 1985, the Government started a large motorways program that included improvements along 1200 km of the most heavy transport corri-dors in Turkey. These included the segment from the Bulgarian border through Istanbul (including the Second Bosphorus bridge) to Ankara; the sec-tion between Mersin and Iskenderun through Ad-ana; and around Izmir (World Bank, 1991).
Importantly, investments were accompanied with critical institutional reforms and capacity building programs. There was a strong emphasis on train-ing of the General Directorate of Highways (KGM) personal and modernization and rationalization of road maintenance through the acquisition of new equipment and parts, as well as the development of an equipment management program and adop-tion of methodologies for investment analysis. In parallel, KGM started a process of modernization and reorganization with the assistance of the U.S. Federal Highway Administration and worked close-ly with the Ministry of Education and the police to improve road safety.
Regulatory reform also accompanied road invest-ments in more recent years. Large transport invest-ments continued through the first decade of the 2000s as public expenditures in the sector almost doubled as a share of GDP, reaching 1.92 percent of GDP in 2010 (World Bank, 2012b). In parallel, the Road Transport Law introduced in July 2003 and the subsequent Road Transport Regulation en-acted in 2004 regulated access to the market and the profession with the objective of bringing opera-tors to international standards. Operators had to obtain a license, based on criteria consistent with the European Union (EU) regulations: (i) profes-sional competence, to ensure safety; (ii) financial sustainability to ensure viability of the business; and (iii) good repute to ensure that those that do not respect rules and regulations are weeded out of the system. Managerial and professional com-petence were also highlighted in this new law as requirements for licensing, designating institutions for training and accreditation of operators, with the main objective of improving overall quality of op-erators and enhancing road safety.
While the road sector has made advances in build-ing a regulatory framework and creating key institu-tions, other infrastructure sectors such as ports and

Turkey’s Transitions
146
railways lag behind. Currently, ports are not sub-ject to any technical or economic regulation that can help improve efficiency and quality of services while promoting a more competitive environment. Because competition in some of Turkish ports is very limited, a strong and independent regulator may be required. Similar changes to railway legisla-tion will be required to bring the sector to EU stan-dards towards a competitive cost structure (World Bank, 2012c).
Today, Turkey is in the process of overhauling its railways sector to improve efficiency by promot-ing competition and private sector participation. Turkey’s railways sector lags well behind its road in-frastructure in terms of efficiency of operation and quality of service (World Bank, 2012b). Indeed, re-cent research suggests that poor railways services may actually be a drag on productivity (Fedderke and Kaya, 2013). The Law on Liberalization of Rail-way Transportation, which became effective May 1, 2013, sets out to significantly change performance of the sector by authorizing private train operators to compete using access to the national railway infrastructure. Over a five year transition period, the Government of Turkey will be putting in place the regulations necessary to implement the law and Turkish State Railways (TCDD) will complete its transformation into an infrastructure and train operating company. By the end of the transition pe-riod, TCDD Trains will compete with private opera-tors for freight service, and passenger services will be provided under public service obligation (PSO) contracts.
Turkey has also applied the principle of accompa-nying large investments with changes in regulation and market structure in the ICT sector. In the early 1980s, network infrastructure buildup was iden-tified as a priority and public investments led to access lines growing by 14 percent on average be-tween 1980 and 1985, and by 20 percent on average per year between 1985 and 1994. Significant infra-structure investments were made by Turk Telekom (which, at the time, was a wholly publicly owned company) as early as the 1980s with Turk Telekom investments increasing from 0.3 of Gross National Product (GNP) in 1980 to 1 percent by 1987 (Yılmaz, 2000). Investments, then, declined again to 0.3 per-cent of GNP in the second half of the 1990s given the financial constraints the government was facing and the fact that Turk Telekom’s profits were used to contribute to the general government budget (World Bank, 2005).
Important steps toward liberalization of mobile phone (Global System for Mobile, (GSM)) services and building the sector’s regulatory capacity were taken in the early 1990s (Öniş, 2006). In 1994, Turk
Telecom’s monopoly was first broken, when two private firms received the rights to offer GSM ser-vices through revenue sharing agreements with Turk Telekom. By 1998, the government had sold two operator licenses through a concession agree-ment for their GSM 900 networks for 25 years for US$500 million each.
An important reform process followed in the early 2000s, taking steps towards enhancing competi-tion and building institutional capacity. In 2000, a new telecommunications law (No. 4502) opened the door for moving toward opening fixed lines for competition and established the Telecommunica-tions Authority, laying the foundation for the sepa-ration of policymaking, regulation, and operation. In May of the same year, the first licenses were is-sued for the provision of voice telephony services by alternative operators (World Bank, 2005). Price cap regulation was introduced in 2001 to ensure that prices were below a maximum set by the government. For GSM tariffs, a maximum yearly increase of 3 percent was set as part of the opera-tors’ concessions agreements. For Turk Telekom, the maximum increase was fixed at 7.5 percent for 2002 and 2003 and then reduced to 4 percent in 2004 (World Bank, 2005). More recently, the Elec-tronic Communications Act came into force in 2008 to streamline the legal framework, foster further competition in the sector, lessen the uncertainties for operators, and increase allocation of resources to research and development. The move towards increased competition in the broadband market has been slower and benefits could still arise from similar efforts to foster competition through effec-tive design and enforcement of regulation (World Bank, 2011).
In the energy sector, reforms started in the early 1990s. In 1994, the state electric utility, Turkey National Power Company (TEK), was restructured leading to the separation of distribution from trans-mission and generation. Initially, generation invest-ments were attracted with the help of generous take or pay contracts often tendered in less than fully transparent ways, saddling the government with large contingent liabilities. But in the 2000s, the approach changed to emphasize competition and arms’ length regulation (Atiyas, 2012). In 2001, a new law for the electricity market (No. 4628) and related secondary legislation (including the Elec-tricity Market Licensing Regulation of 2002) created an independent Energy Market Regulatory Author-ity (EMRA) and provided a new legal framework for the sector. The new EMRA was created to oversee the sector, including licensing; preparing, publish-ing and applying new legislation and codes; per-forming tenders for city gas distribution networks; regulating tariffs for transmission and distribution;
Spotlight 2: Infrastructure to connect and fuel the economy
147
protecting customer rights; following the perfor-mance of all actors in the market and sanctioning parties that violate the rules (World Bank, 2005; 2013a).
The new legislation enacted in 2002 promoted changes both on the demand and supply sides of the energy sector. On the demand side, it allowed open access to the transmission and distribution grids by eligible consumers. Eligible consumers were initially defined as those exceeding a con-sumption threshold of more than 9 GWhs per year. These thresholds were then reduced gradually. On the supply side, it provided entry opportunities into the generation, wholesale trade, distribution, retail trade, import, and export of electricity. The new legislation also opened the door for the creation of joint ventures between distribution and generation companies and promoted unbundling of genera-tion, wholesale and transmission into three inde-pendent legal entities (World Bank, 2013a).
The Energy Market Law of 2008 also brought sever-al improvements to the electricity market, including important changes to the pricing structure. In 2008, a cost-based pricing mechanism was implemented, allowing electricity tariffs to reflect costs. Efforts to improve collection led to considerable improve-ments in 2009, finally achieving 100 percent collec-tion in 2010. This change in the pricing mechanism led to state-owned utilities achieving profitability and being able to pay their arrears to private sec-tor generators (World Bank, 2013a; 2013b). Market pricing also paved the way for the entry of the pri-vate sector into power generation, including impor-tant renewable energy investments.
The regulatory and institutional frameworks to pro-mote energy efficiency have recently been set up (World Bank, 2012c). Secondary legislation final-ized in 2011 opened the door for the supply of ex-cess energy to the distribution grid. The launch of the electricity trading mechanisms between 2009 and 2012 also marks a turning point in the electric-ity market. Today, about 75 percent of the electric-ity in Turkey is traded through bilateral contracts between generators and distributors, the remain-ing being traded in the day-ahead and balancing markets (World Bank 2013a). The New Electricity Market Law was introduced to further support the liberalization process in the sector in March, 2013. Among other changes, this Law combines whole-sale and retail companies under a single supply li-cense, allowing firms to perform wholesale and/or retail sale activities without restrictions (Ergun and Gökmen, 2013).
Workingbeyondsilos–coordinatingeffortsformoreefficientinvestmentsCoordination across sectors was also apparent in early efforts to extend and improve quality of infra-structure. To a great extent, Turkey’s policymakers appear to have acknowledged that working in silos limits the impact of both investments and regula-tory changes.
In the transport sector, investments in road connec-tivity in Turkey went hand in hand with efforts on safety and monitoring that required collaboration across sectors and institutions. In 1989, KGM was given the authority to introduce technical inspection of road vehicles including emission control. Later, this function came under the Ministry of Transport which has since put in place more than 200 fixed and 70 mobile stations to control the weight and dimensions of commercial vehicles. Road accidents due to overloading or non-compliance with techni-cal standards are estimated to have decreased by about 30 percent since 2004 when the Road Trans-port Regulation was introduced (Ministry of Trans-port and Communications, 2011).
Also, as early as 1989, KGM worked closely with the Ministry of Education and the police to improve road safety. Road safety has been a concern for some time since the number of accidents has been growing at a rate equal to the growth of traffic. While fatalities have decreased, injuries continue to grow at a rate of 1.3 percent annually. Further, the current rate of fatalities (eight per 10 thousand vehicles) is four times higher than the EU average. Conscious that this is a problem that has to be tackled from different angles, the government has promoted the collaboration of different ministries with a single objective: improving road safety. In that regard, the General Directorate of Security of the Ministry of Interior is responsible for regulating road safety, the Ministry of Transport is responsible for regulating and monitoring transport of danger-ous goods, the Ministry of Education for training drivers, and the Ministry of Health for guaranteeing driver health conditions (Togan, 2010).
Today, Turkey is also leveraging the impact of its investments in connective infrastructure by rede-signing and modernizing its customs. Customs re-forms started after the Customs Union (CU) agree-ment with the EU entered into force in 1995 and included efforts to improve the efficiency of Turkish Customs, reduce waiting times, and improve the capacity of personnel. Efforts were focused along three lines (i) modify customs legislations accord-ing to EU and international standards; (ii) develop and implement computer systems; and (ii) organize the administration to balance efforts to control cus-

Turkey’s Transitions
148
toms with those to facilitate trade. As part of the trade facilitation efforts, the Turkish Customs built in a specialized selectivity module into the new customs management software that checked each declaration against pre-selected risk assessment criteria. Such assessments assign the shipments to green, yellow, red or blue channels where red shipments required full inspection and companies cleared for the blue channel do not have to attach paper documents to their declaration. Coordinated efforts were required to modify legislation to allow for paperless trade and e-signature of official docu-ments (Togan, 2012).
Additional efforts include cooperation with inter-national platforms, signature and ratification of bilateral and international transport agreements. Today, beyond the CU with the EU, Turkey has free trade agreements with 22 countries and has a re-laxed legal framework enabling investors to export to different markets without customs duty. These efforts are also reinforced through treaties to pre-vent double taxation with 80 countries and bilateral agreements with 75 countries to promote and pro-tect investments (Gürsu, 2013). Further, efforts to build 19 logistic centers are underway. These are expected to become intermodal terminals where road, rail, and port services will be linked and sup-plemented with warehousing and light manufac-turing (Ministry of Transport and Communications, 2011).
Another example of cross-sectoral coordination is the recent effort to consider energy efficiency, en-ergy security and environment as part of an inte-grated energy program. Improvements in energy efficiency have been accompanied by important changes in regulation and coordination in envi-ronmental management. With the support of the World Bank, the government is currently making efforts to bring these three areas together under a single framework. An inter-ministerial Climate Change Coordination Board and a Climate Change Department at the Ministry of Environment and Urbanization (MoEU) were established in the first half of 2011 and are working on coordinating and ensuring complementarity between sector specific climate actions (World Bank, 2013a). Implementa-tion of these coordination arrangements has how-ever, been slow.
Leveragingtheprivatesectorforfi-nancingandefficiencyWhen financial sources are limited, thinking about ways of attracting private participation is essen-tial. Opening the door to private participation in infrastructure can serve several purposes. First, it can help bridge the gap between available public
resources and investment needs and balance com-peting demands for resources (opportunity cost of investment); second, it can increase the efficiency of service provision by strengthening market forc-es; third, it can contribute to transferring some commercial risk to the private sector.
Turkey was a pioneer in aiming to leverage private investment in infrastructure as early as the 1980s. The first law to allow private sector involvement was enacted in 1984 targeting the electricity sec-tor (Law No. 3096 of 1984). This law introduced the build-operate-transfer (BOT) concept, allowing con-cessions to private companies that would build new facilities and then operate them for up to 99 years (later reduced to 49). The law also introduced the possibility to transfer operating rights for existing generation and distribution assets to private com-panies under a lease-type agreement. Through this regulatory reform, Turkey also opened the door to allow private companies to produce their own elec-tricity. Regulatory efforts continued through the 1990s, with laws introducing the possibility of the Undersecretariat of Treasury to grant guarantees and provide tax exemptions to render BOT projects more attractive for the private sector. However, no framework was put in place to promote competi-tive tendering of projects, limiting the early ben-efits of private participation (World Bank, 2005).
Starting in the late 1980s, steps were taken to-wards private participation in the road sector. In 1988, Law 3465 removed the monopoly of the KGM on undertaking road projects. In 1994, a new law provided the framework for BOT schemes in the transport sector. Today, Turkish law also provides guidelines for the implementation of agreements, including dispute resolution mechanism provided either through arbitration or the courts (Rodrigues, Inal and Cankorel, 2013).
These early efforts toward regulatory reform in the 1980s and 1990s laid the foundations for the suc-cessful move towards privatization in the 2000s. Privatization revenues between 2005 and 2009 rose dramatically to around US$30 billion, after less than a third of this amount was raised in the twen-ty years before. Legal and institutional weaknesses and macroeconomic instability posed challenges to privatization in the early years. Further, at that time, the government tried to implement privati-zation narrowly through the issuance of Cabinet decrees. While the objective was to bypass oppo-sition, weaknesses in the nascent legal framework were used by opponents to slow down privatiza-tion. The Privatization Law of 1994 and the creation of the Competition Board were important steps to-ward transparency and accountability in privatiza-tion deals and, ultimately, aided the move to more competitive markets. Legislative efforts continued
Spotlight 2: Infrastructure to connect and fuel the economy
149
in the 2000s with the Foreign Investment Law of 2003, which removed many of the bureaucratic restrictions on foreign direct investments (Palmer, 2010). From the 1990s onwards, Turkey favored a model of introducing independent regulators as part of a strategy to separate policy development, ownership, and day to day regulatory oversight, and to ensure that regulation was isolated from political influence. However, political wrangling over the appointment of board members to these agencies highlighted that the concept of regulatory independence remained contested (OECD, 2002). This changed after 2001, with regulatory indepen-dence more strongly enshrined in legislation.
The energy sector is perhaps the most striking ex-ample of successful reforms to leverage private in-vestment. The restructuring and unbundling of the sector have led to an increase of nearly 60 percent in both electricity transmission and peak capacity between 2002 and 2010. These steps towards a more competitive market represented an impor-tant move away from the contracts awarded in the 1990s, which, in some cases entailed monopoly rights and government take or pay guarantees and were later cancelled by the Turkish Court of Ac-counts. Today, 43 percent of the electricity genera-tion comes from the state-owned Turkey National Energy Distribution Company (EUAŞ), 14.8 percent from BOT agreements, 1.5 percent from compa-nies operating under Transfer of Operational Rights agreement, 35 percent from independent produc-ers and the remaining 5.6 percent from auto pro-ducers (Ergun and Gökmen, 2013). The distribution sector is divided into 21 regions of which 13 were transferred to the private sector in 2012 and the re-maining eight in 2013. The state distribution com-pany Turkey National Energy Transmission Compa-ny (TEDAŞ) remains the owner of the assets but no longer operates any distribution company. The dis-tribution privatization program alone has attracted US$12.7 billion from the private sector.
More recently, in 2012, the Government adopted an Energy Efficiency Strategy, targeting a 20 percent reduction in energy intensity by 2023. Energy-effi-ciency credit lines have been put in place with Gov-ernment and international financial institutions (IFI) support to help realize these targets. Incentives have also been provided to foster increased participation of the private sector in the production of electricity from renewable sources. Over a span of eight year, electricity produced from privately owned renew-able generation facilities increased more than nine times, from 1,490 gigawatt hours (GWh) in 2002 to 13,773 GWh in 2010 (World Bank, 2012c).
In the ICT, sector the number of operators has in-creased continuously after liberalization. As of 2012, there were 422 operators holding 668 autho-rizations to provide a full complement of services in Turkey. The share of alternative fixed telephony service operators in total outgoing call volumes reached 17.9 percent in 2012, and 39.9 percent for outgoing calls abroad, indicating vibrant competi-tion in the sector. Today, the market share (in terms of subscribers) of mobile operators, Turkcell, Voda-fone and Avea are respectively 51.9 percent, 28.2 percent and 19.9 percent. Strengthening of mar-ket forces has triggered a wave of investments by the four companies under concession agreements (incumbent fixed operator Turk Telekom and three mobile operators Turkcell, Vodafone and Avea6) amounting to TL29.479 billion between 2004 and 2012. Demand for convergent voice and internet services led to an increase in the average revenue per user (ARPU) from 15.70 TL in 2005 to 21.99 in 2012 providing a sound foundation for further de-velopment of the ICT sector.
To promote private participation in infrastructure the government has offered a variety of demand and debt assumption guarantees (World Bank 2012b). Debt assumption and traffic guarantees have been used as a central feature of early PPPs for the larger road and bridge PPPs, while availabil-ity payments are part of the proposed health PPPs. Debt assumption guarantees have been offered by Treasury, traffic guarantees by the highways agency (KGM), and revenue guarantees for the new air-port by the General Directorate of State Airports (DHMİ). These guarantees enhance the ability of major deals to reach financial closure. However, go-ing forward, it would be necessary for the Govern-ment to invest more time and effort into adequate-ly evaluating and managing the risks given that the portfolio of guarantees is likely to grow rapidly as private participation increases.
Beyondexpansion–ensuringefficiencyandvalueformoneyWith the acquired experience and success Turkey has achieved over the last three decades, the coun-try is well placed to continue to meet rising infra-structure demands. Turkey’s aspirations are high, and to achieve them, additional investments in infrastructure will be required. However, Turkey’s ambitious PPP pipeline has so far failed to attract large-scale international and domestic term fund-ing is likely to be insufficient. Moreover, concerns have been voiced over the lack of a unified frame-work across sectors, the strength of feasibility stud-
6 Following privatization the incumbent fixed operator was obliged to provide mobile services via an arms’ length subsidiary called AVEA. The same applies to broadband internet services via arms’ length subsidiary called TTNET.

Turkey’s Transitions
150
ies, project selection, and management of the ten-dering process. The 2011 decree law resubmitting independent regulatory agencies to inspection by the relevant line ministry has also raised concerns that the political commitment to strong arms’ length regulation may be wavering (Atiyas, 2012). Altogether, these concerns represent potential risks for Turkey’s ambitious infrastructure goals.
Turkey should address remaining regulatory and in-stitutional weaknesses to ensure value for money in its upcoming infrastructure pipeline. Efforts to strengthen the regulatory framework and foster competition in ports, railways, ICT and energy will
be essential. Increased coordination across sec-tors will be necessary to achieve goals of climate change mitigation and to ensure Turkey’s economy is on a path of sustainability. And finally, promoting the cohesion in private participation government-wide will require the harmonization of all legisla-tion across sectors; improving the quality of bid-ding documents, contracts and feasibility studies to move toward international standards; and bet-ter management of risk and coordination with the portfolio of contingent liabilities. With the acquired experience of previous years, Turkey can do even better.
2013
2012
2011
2010
2009
2008
2004
2003
2002
2001
2000
1998
1994
1989
1988
1984Opening up participationin electricity sector Law 3096
New Electricity Market Law
Foreign Investment Law
Energy Market Law
Electricity Market Licencing Regulation
Turk Telecom monopoly broken:Turk Telecom maximum increase fixed (7.5%)
Energy Efficient Strategy
Movement to Increase Opportunitiesand Technology (FAITH)
Road Transport Regulation
Telecommunications Law No. 4502
Price Cap Regulation
First Licences issued for the provisionof voice telephony services
Electronic Communictions Act
Turk Telecom maximum increasefixed (4%)
Inter-ministerial Climate ChangeCoordination Board
Climate Change Department at the Minitsty of Environment and Urbanization
Energy Efficiency Secondary Legislation finalized
Law on Liberalization ofRailway Transportation
Creation of the independent EnergyMarket Regulatory Authority
Electricity Market Law No. 4628
Telecom Concession Agreement
TEK Restructuring
Turk Telecom monopoly broken
Privatization Law and creation ofCompetition Board
KGM and Ministry of Educationpartnership for Road Safety
General Directory of Highwaysmonopoly broken
Telecommunications (ICT)
Transport
Directorate of Roads given the authorityto introduce technical inspection
Energy and Electricity
Laying the Foundations
Coordinating Across Sectors
Leveraging Private SectorCapacity Building
Figure S2.6: Improvinginfrastructure–atimelineofreforms
Source: World Bank staff

Spotlight 2: Infrastructure to connect and fuel the economy
151
ReferencesAschauer, D. (1989). Is Public Expenditure Produc-tive? Journal of Monetary Economics 23, 177-200.
Atiyas, I. (2012). Economic Institutions and Institu-tional Change in Turkey during the Neoliberal Era. New Perspectives on Turkey, No. 14, 45-69.
Calderon, C., & Chong, A. (2004). Volume and Qual-ity of Infrastructure and the Distribution of Income: An Empirical Investigation. Review of Income and Wealth 50, 87-105.
Calderon, C., & Serven, L. (2004). The Effects of In-frastructure Development on Growth and Income Distribution. World Bank Policy Research Working Paper Number 3401. World Bank.
Calderon, C., & Serven, L. (2010). Infrastructure and Economic Development in Sub-Saharan Africa. Journal of African Economies.
Calderon, C., & Serven, L. (2010.b). Infrastructure in Latin America. Policy Research Working Paper 5317. World Bank.
Canning, D. (1999). The Contribution of Infrastruc-ture to Aggregate Output. World Bank Policy Re-search Working Paper 2246. World Bank.
Coşar, A., & Demır, B. (2014). Domestic Road Infra-structure and International Trade: Evidence from Turkey. Mimeographed. Chicago: Booth School of Business. Retrieved from http://faculty.chi-cagobooth.edu/kerem.cosar/research/cd_road-sandtrade_2014.pdf
Demetriades, P., & Mamuneas, T. (2000). Intertem-poral Output and Employment Effects of Public In-frastructure Capital: Evidence from 12 OECD Econo-mies. Economic Journal 110, 687-712.
Ergun, Ç. E., & Gökmen, N. (2013). Electricity reg-ulation in Turkey: Overview. Multi-jurisdictional guide 2013. Energy and Natural Resources.
Estache, A., Foster, V., & Wodon, Q. (2002, Febru-ary). Accounting for Poverty in Infrastructure Re-form: Learning from Latin America’s Experience. World Bank.
Fedderke, J., & Kaya, T. (2013, March). The Pro-ductivity Impact of Infrastructure in Turkey, 1987 – 2006. ERSA working paper 333. Economic Research Southern Africa.
Growth Commission. (2008). The Growth Report: Strategies for Sustained Growth and Inclusive De-velopment. Commission on Growth and Develop-ment. Washington, D.C.: World Bank.
OECD. (2002). Turkey: Crucial Support for Econom-ic Recovery. OECD Reviews of Regulatory Reform. OECD.
Öniş, Z. (2006). Power, Interests and Coalitions: The Political Economy of Mass Privatization in Tur-key. Retrieved 2014, from http://home.ku.edu.tr/~zonis/ONIS_Power_Interests_Coalitions.pdf
Palmer, M. C. (2010). The Turkish Privatization Expe-rience, 1984 to 2009. Turkey: Bridging Two Worlds.
Republic of Turkey Ministry of Transport and Com-munications. (2011). Transportation in Turkey. Country Report. Republic of Turkey Ministry of Transport and Communications.
Rodrigues, M., Inal, E., & Cankorel, T. (2013, Febru-ary 21). Road PPPs in Turkey. Infrastructure Journal.
Togan, S. (2010). Economic Liberalization and Tur-key. Routledge.
Togan, S. (2012, March). The EU-Turkey Customs Union: A Model for Future Euro-Med Integration. MEDPRO Technical Report No. 9.
Turkish Electricity Transmission Company (TEIAS). (n.d.). Retrieved from www.teias.gov.tr.
Vu, K. (2004). Measuring the Impact of ICT Invest-ments on Economic Growth. Unpublished. http://www.hks.harvard.edu/m-rcbg/ptep/khuongvu/Key%20paper.pdf .
World Bank. (1991). Memorandum and Recom-mendation of the President of IBRD to the Excecu-tive Directors on a Proposed Loan. LN-3324-TU. Re-port No: P-5484-TU. Washington D.C.: World Bank.
World Bank. (2005). Turkey: Economic Reform and Accession to the European Union. (S. Togan, & B. Hoekman, Eds.) Washington, D.C.: World Bank.
World Bank. (2008). The Growth Report: Strategies for Sustained Growth and Inclusive Development. Commission on Growth and Development. Wash-ington D.C.: World Bank.
World Bank. (2011). Broadband in Turkey: Com-pared to What? Washington D.C.: World Bank.
World Bank. (2012, October 21). Turkey Transport Expenditure Review. Washington D.C.: World Bank.
World Bank. (2012.b). Achieving Prosperity for All. Country Partnership Strategy. World Bank Group Country Parnership Strategy.

Turkey’s Transitions
152
World Bank. (2013). Implementation Completion and Results Report -ICR2926. Washington D.C.: World Bank.
World Bank. (2013). International Experience with Open Access to Power Grids. Washington D.C.: World Bank.
World Bank Development Indicators. (2012). Wash-ington D.C.: World Bank.
World Economic Forum. (2013). Global Competi-tiveness Report 2013-2014. Geneva.
Yılmaz, K. (2000). Türk Telekomünikasyon Sek-töründe Reform: Özelleştirme, Düzenleme ve Serbestleşme. Devletin Düzenleyici Rolü. (İ. Atiyas, Ed.) İstanbul: TESEV.

Chapter 5: Cities: Managing rapid urbanization
153
Cities: Managing rapid urbanization
Chapter 5
Turkey’s Transitions: Integration, Inclusion, Institutions
Labor
Welfare
FiscalSpace
Enterprise
Infrastructure
Trade
Finance

Turkey’s Transitions
154
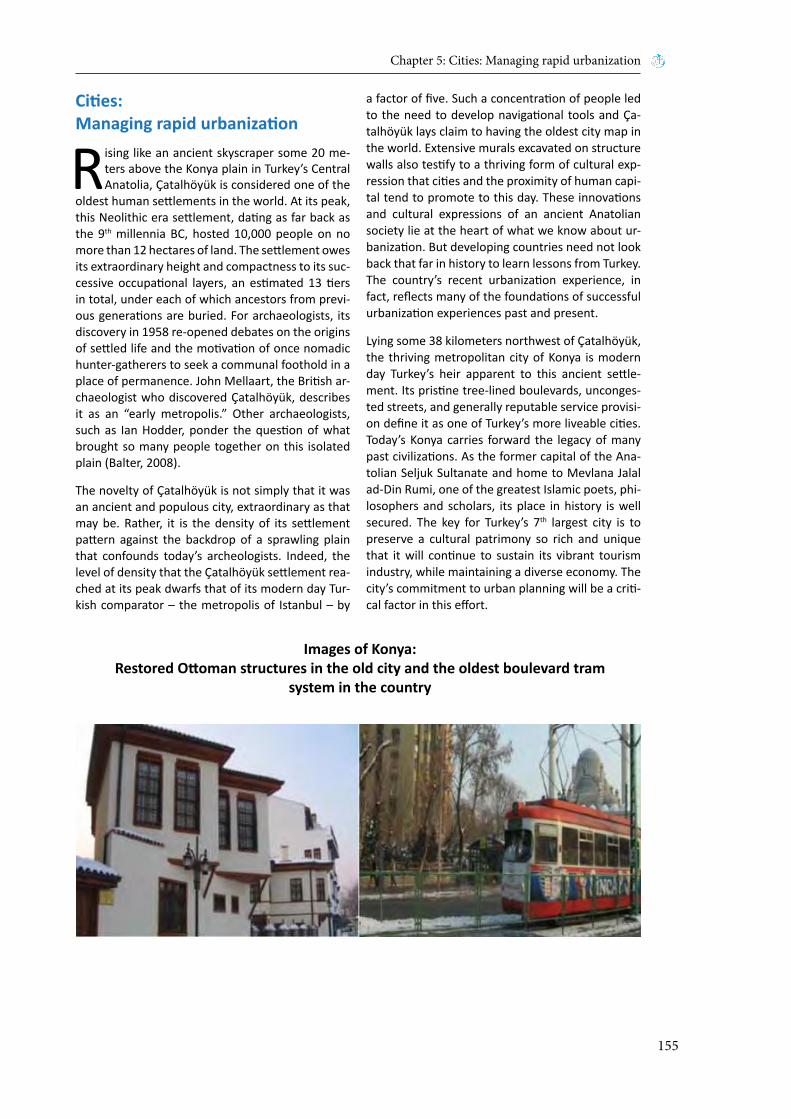
Chapter 5: Cities: Managing rapid urbanization
155
Cities:Managing rapid urbanization
Rising like an ancient skyscraper some 20 me-ters above the Konya plain in Turkey’s Central Anatolia, Çatalhöyük is considered one of the
oldest human settlements in the world. At its peak, this Neolithic era settlement, dating as far back as the 9th millennia BC, hosted 10,000 people on no more than 12 hectares of land. The settlement owes its extraordinary height and compactness to its suc-cessive occupational layers, an estimated 13 tiers in total, under each of which ancestors from previ-ous generations are buried. For archaeologists, its discovery in 1958 re-opened debates on the origins of settled life and the motivation of once nomadic hunter-gatherers to seek a communal foothold in a place of permanence. John Mellaart, the British ar-chaeologist who discovered Çatalhöyük, describes it as an “early metropolis.” Other archaeologists, such as Ian Hodder, ponder the question of what brought so many people together on this isolated plain (Balter, 2008).
The novelty of Çatalhöyük is not simply that it was an ancient and populous city, extraordinary as that may be. Rather, it is the density of its settlement pattern against the backdrop of a sprawling plain that confounds today’s archeologists. Indeed, the level of density that the Çatalhöyük settlement rea-ched at its peak dwarfs that of its modern day Tur-kish comparator – the metropolis of Istanbul – by
a factor of five. Such a concentration of people led to the need to develop navigational tools and Ça-talhöyük lays claim to having the oldest city map in the world. Extensive murals excavated on structure walls also testify to a thriving form of cultural exp-ression that cities and the proximity of human capi-tal tend to promote to this day. These innovations and cultural expressions of an ancient Anatolian society lie at the heart of what we know about ur-banization. But developing countries need not look back that far in history to learn lessons from Turkey. The country’s recent urbanization experience, in fact, reflects many of the foundations of successful urbanization experiences past and present.
Lying some 38 kilometers northwest of Çatalhöyük, the thriving metropolitan city of Konya is modern day Turkey’s heir apparent to this ancient settle-ment. Its pristine tree-lined boulevards, unconges-ted streets, and generally reputable service provisi-on define it as one of Turkey’s more liveable cities. Today’s Konya carries forward the legacy of many past civilizations. As the former capital of the Ana-tolian Seljuk Sultanate and home to Mevlana Jalal ad-Din Rumi, one of the greatest Islamic poets, phi-losophers and scholars, its place in history is well secured. The key for Turkey’s 7th largest city is to preserve a cultural patrimony so rich and unique that it will continue to sustain its vibrant tourism industry, while maintaining a diverse economy. The city’s commitment to urban planning will be a criti-cal factor in this effort.
Images of Konya: Restored Ottoman structures in the old city and the oldest boulevard tram
system in the country
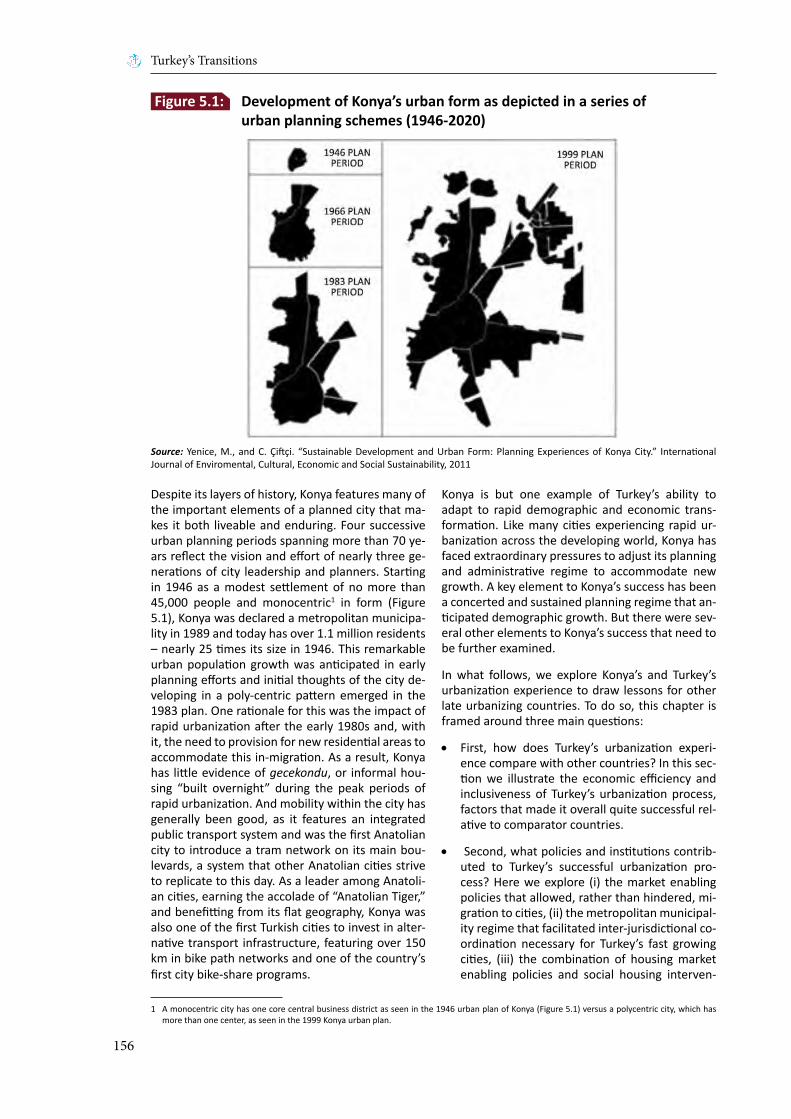
Turkey’s Transitions
156
Despite its layers of history, Konya features many of the important elements of a planned city that ma-kes it both liveable and enduring. Four successive urban planning periods spanning more than 70 ye-ars reflect the vision and effort of nearly three ge-nerations of city leadership and planners. Starting in 1946 as a modest settlement of no more than 45,000 people and monocentric1 in form (Figure 5.1), Konya was declared a metropolitan municipa-lity in 1989 and today has over 1.1 million residents – nearly 25 times its size in 1946. This remarkable urban population growth was anticipated in early planning efforts and initial thoughts of the city de-veloping in a poly-centric pattern emerged in the 1983 plan. One rationale for this was the impact of rapid urbanization after the early 1980s and, with it, the need to provision for new residential areas to accommodate this in-migration. As a result, Konya has little evidence of gecekondu, or informal hou-sing “built overnight” during the peak periods of rapid urbanization. And mobility within the city has generally been good, as it features an integrated public transport system and was the first Anatolian city to introduce a tram network on its main bou-levards, a system that other Anatolian cities strive to replicate to this day. As a leader among Anatoli-an cities, earning the accolade of “Anatolian Tiger,” and benefitting from its flat geography, Konya was also one of the first Turkish cities to invest in alter-native transport infrastructure, featuring over 150 km in bike path networks and one of the country’s first city bike-share programs.
Konya is but one example of Turkey’s ability to adapt to rapid demographic and economic trans-formation. Like many cities experiencing rapid ur-banization across the developing world, Konya has faced extraordinary pressures to adjust its planning and administrative regime to accommodate new growth. A key element to Konya’s success has been a concerted and sustained planning regime that an-ticipated demographic growth. But there were sev-eral other elements to Konya’s success that need to be further examined.
In what follows, we explore Konya’s and Turkey’s urbanization experience to draw lessons for other late urbanizing countries. To do so, this chapter is framed around three main questions:
• First, how does Turkey’s urbanization experi-ence compare with other countries? In this sec-tion we illustrate the economic efficiency and inclusiveness of Turkey’s urbanization process, factors that made it overall quite successful rel-ative to comparator countries.
• Second, what policies and institutions contrib-uted to Turkey’s successful urbanization pro-cess? Here we explore (i) the market enabling policies that allowed, rather than hindered, mi-gration to cities, (ii) the metropolitan municipal-ity regime that facilitated inter-jurisdictional co-ordination necessary for Turkey’s fast growing cities, (iii) the combination of housing market enabling policies and social housing interven-
Source: Yenice, M., and C. Çiftçi. “Sustainable Development and Urban Form: Planning Experiences of Konya City.” International Journal of Enviromental, Cultural, Economic and Social Sustainability, 2011
Figure 5.1: Development of Konya’s urban form as depicted in a series of urban planning schemes (1946-2020)
1 A monocentric city has one core central business district as seen in the 1946 urban plan of Konya (Figure 5.1) versus a polycentric city, which has more than one center, as seen in the 1999 Konya urban plan.
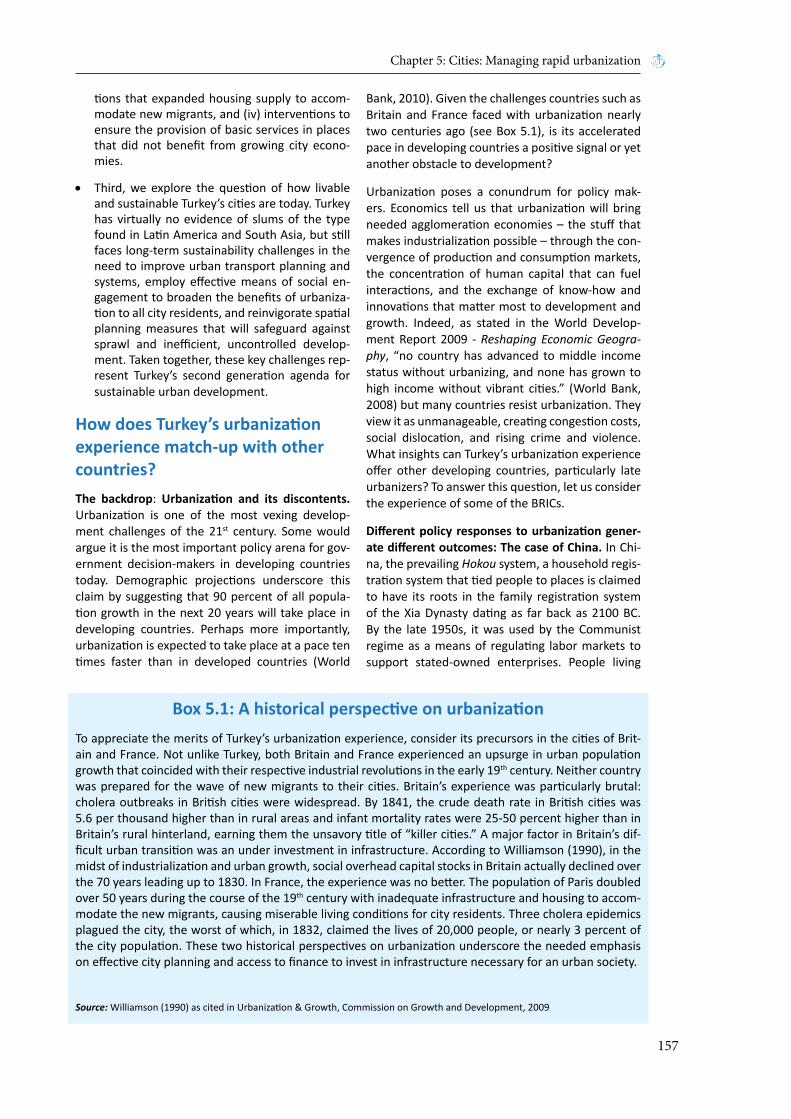
Chapter 5: Cities: Managing rapid urbanization
157
tions that expanded housing supply to accom-modate new migrants, and (iv) interventions to ensure the provision of basic services in places that did not benefit from growing city econo-mies.
• Third, we explore the question of how livable and sustainable Turkey’s cities are today. Turkey has virtually no evidence of slums of the type found in Latin America and South Asia, but still faces long-term sustainability challenges in the need to improve urban transport planning and systems, employ effective means of social en-gagement to broaden the benefits of urbaniza-tion to all city residents, and reinvigorate spatial planning measures that will safeguard against sprawl and inefficient, uncontrolled develop-ment. Taken together, these key challenges rep-resent Turkey’s second generation agenda for sustainable urban development.
How does Turkey’s urbanization experience match-up with other countries?The backdrop: Urbanization and its discontents. Urbanization is one of the most vexing develop-ment challenges of the 21st century. Some would argue it is the most important policy arena for gov-ernment decision-makers in developing countries today. Demographic projections underscore this claim by suggesting that 90 percent of all popula-tion growth in the next 20 years will take place in developing countries. Perhaps more importantly, urbanization is expected to take place at a pace ten times faster than in developed countries (World
Bank, 2010). Given the challenges countries such as Britain and France faced with urbanization nearly two centuries ago (see Box 5.1), is its accelerated pace in developing countries a positive signal or yet another obstacle to development?
Urbanization poses a conundrum for policy mak-ers. Economics tell us that urbanization will bring needed agglomeration economies – the stuff that makes industrialization possible – through the con-vergence of production and consumption markets, the concentration of human capital that can fuel interactions, and the exchange of know-how and innovations that matter most to development and growth. Indeed, as stated in the World Develop-ment Report 2009 - Reshaping Economic Geogra-phy, “no country has advanced to middle income status without urbanizing, and none has grown to high income without vibrant cities.” (World Bank, 2008) but many countries resist urbanization. They view it as unmanageable, creating congestion costs, social dislocation, and rising crime and violence. What insights can Turkey’s urbanization experience offer other developing countries, particularly late urbanizers? To answer this question, let us consider the experience of some of the BRICs.
Different policy responses to urbanization gener-ate different outcomes: The case of China. In Chi-na, the prevailing Hokou system, a household regis-tration system that tied people to places is claimed to have its roots in the family registration system of the Xia Dynasty dating as far back as 2100 BC. By the late 1950s, it was used by the Communist regime as a means of regulating labor markets to support stated-owned enterprises. People living
To appreciate the merits of Turkey’s urbanization experience, consider its precursors in the cities of Brit-ain and France. Not unlike Turkey, both Britain and France experienced an upsurge in urban population growth that coincided with their respective industrial revolutions in the early 19th century. Neither country was prepared for the wave of new migrants to their cities. Britain’s experience was particularly brutal: cholera outbreaks in British cities were widespread. By 1841, the crude death rate in British cities was 5.6 per thousand higher than in rural areas and infant mortality rates were 25-50 percent higher than in Britain’s rural hinterland, earning them the unsavory title of “killer cities.” A major factor in Britain’s dif-ficult urban transition was an under investment in infrastructure. According to Williamson (1990), in the midst of industrialization and urban growth, social overhead capital stocks in Britain actually declined over the 70 years leading up to 1830. In France, the experience was no better. The population of Paris doubled over 50 years during the course of the 19th century with inadequate infrastructure and housing to accom-modate the new migrants, causing miserable living conditions for city residents. Three cholera epidemics plagued the city, the worst of which, in 1832, claimed the lives of 20,000 people, or nearly 3 percent of the city population. These two historical perspectives on urbanization underscore the needed emphasis on effective city planning and access to finance to invest in infrastructure necessary for an urban society.
Source: Williamson (1990) as cited in Urbanization & Growth, Commission on Growth and Development, 2009
Box 5.1: A historical perspective on urbanization
Turkey’s Transitions
158
outside of their Hokou area of registration were not entitled to grain rations, education and health ben-efits, and employer-provided housing, which cer-tainly would have an influence on people staying in place. In short, access to state-delivered or spon-sored benefits was restricted to a person’s place of registration. Through a series of reforms and legal acts coinciding with economic liberalization in the 1990s and in recognition of villager movements to Chinese cities even with these restrictions, China began to relax, though never fully abandoned, its Hokou system prescriptions. This unleashed an un-precedented surge in urbanization beginning in the 1990s (Figure 5.2), fueling China’s rise in produc-tivity and competitiveness witnessed over the last twenty-five years.
Urbanization as misguided regional planning: The case of Russia. During the period of the communist regime in Russia, urbanization was recognized as an essential ingredient for industrialization and, much like in China, labor markets were strongly shaped by the state to support state-owned enterprises. However, in Russia’s case, urban settlements and urbanization were viewed as essential to the state’s policy of promoting industrialization, and were planned across the country around state-initiated industries that once formed the backbone of its command economy. Access to natural resources and military considerations led to planned urban settlements in far flung corners of Russia’s vast ter-ritory, with little regard for economic or social vi-ability. With the liberalization of Russia’s economy
in the 1990s, state-owned industries were rapidly abandoned and their urban hosts – known by their sobriquet of “mono-cities” or single industry cities – have become “shrinking cities”, i.e. cities whose economic function has contracted to the point that they are shedding their population base.
Urbanization is resisted in some countries as a force that uproots traditional values: The Case of India. Was it that Gandhi had it so wrong or that future generations interpreted his meaning wrong-ly when he asserted that “the future of India lies in its villages?”. Whatever one’s take on Gandhi’s views, despite substantial human capital, India re-mains dramatically behind other BRICs and emerg-ing market economies in its rate of urbanization (Figure 5.2). Other forces, possibly shaped by this supposition, have been at work as well. Mumbai, for instance, deliberately lowered its Floor Area Ra-tio (FAR)2 which resulted in the very flat, sprawled out city it is today. The FAR was first introduced at 4.5 in 1960, but, in 1991, Mumbai lowered its FAR to 1.33 in the central city and 1 in the suburban ar-eas. By comparison, cities such as New York, Tokyo, Hong Kong and Shanghai have FAR limits that range between 10 and 15. This had the effect of distorting the city’s land market and driving up housing costs to staggering levels. Real estate prices in Mumbai today rival those of Manhattan, and the city is host to one of the largest slums in the world – Dharavi. Traveling across two areas of the city can take well over two hours during rush hour, causing conges-tion that surely makes the average Mumbai resident question the merits of urbanization. (Bertaud, 2010)
Source: World Development Indicators (WDI), World Bank (WB) staff calculations
5%
15%
25%
35%
45%
55%
65%
75%
85%
1950 1955 1960 1965 1970 1975 1980 1985 1990 1995 2000 2005 2010 2015
Shar
e of
Urb
an P
opul
ation
Brazil Republic of Korea Turkey South Africa China India
Figure 5.2: Growth in share of urban population in Turkey and comparator countries (1950-2015)
2 FAR or FSI (Floor Space Index), the term used in India, is an urban planning regulation governing building heights and is the ratio of a building’s total floor area to the size of the parcel of land on which it is built.

Chapter 5: Cities: Managing rapid urbanization
159
Historically, urbanization is highly correlated with reductions in poverty and inequality and improve-ments in access to services.3 Turkey provides a poignant illustration of this global phenomenon in practice. Over the past six decades, Turkey has transformed itself from a predominantly agrarian economy with 75 percent of its population in ru-ral areas in the 1950s to the globally competitive industrial economy it is today with over 75 percent of its population residing in urban areas. Some 92 percent of Turkey’s gross value added is produced in cities today. And Turkey’s concomitant rise across most human development indicators has been equally remarkable. Among comparator countries, only the Republic of Korea managed a faster rate of urban growth over the same period, while India still lags far behind, and China, with a major push by its policy makers in the 1990s, is now dramati-cally surging forward (Figure 5.2). The question is how rapid urbanization fueled agglomeration economies across Turkey’s system of cities and how negative externalities were mitigated, if not fully avoided.
Turkey’s urbanization experience offers important lessons for policy makers across the developing world. Recognizing the importance of urbanization to the country’s ambitions of becoming a modern, industrialized economy as far back as the early days of the Republic, Turkey has encouraged rural-to-urban migration flows that fueled agglomeration
economies. During the country’s most rapid period of urbanization, from 1960-2013, Turkey’s industrial and services shares of the economy increased from 17.6 percent and 26.4 percent to 27 percent and nearly 64 percent respectively. From 1980-2012 Gross Domestic Product (GDP) per capita more than doubled.4 Early and substantial investments in transport infrastructure (see Spotlight 2) helped connect Turkey’s large land-mass country, enabling a “system of cities” to take root over the course of the second half of the last century. Today, new firms are increasingly moving toward dynamic secondary cities, capturing economic spillovers from Turkey’s large primary cities, while taking advantage of low-er land-rent values and labor costs. Turkey’s lead-ing cities, meanwhile, are diversifying and innovat-ing to remain competitive. Indeed, Turkey features a system of cities today that remarkably matches the rank-size distribution prediction of a country’s cities. Turkey’s cities largely perform above average in achieving density, suggesting efficient land use and higher productivity; and informality in housing is well below what would be expected for a country that went through such a rapid demographic trans-formation.
Turkey presents a classic example of a country ben-efiting from agglomeration economies. In principle, urbanization and economic growth should move in tandem (Spence, Annez and Buckley, 2009) and Tur-key’s development experience illustrates this point
Source: WDI, WB staff calculationsNotes: GDP data in Purchasing Power Parity (PPP) US$ has recently been updated to 2011. However the series has been backdated only to 1990 in the WDI database. Hence for this chart, the previous 2005 based PPP estimates are used.
ALB
AUS
AUTBELBLZ
BTN
BWA
BGR
CHL
CYP FINFRA
GABGMB
DEU
GRC HUN
IDN
ITA
JPN
JOR
MYS
MARNLD
NORPAK
PRYPRT
SAU
ESP
LCA
SWZ
CHETUN
USA
BRA
CHNTUR
ROM
KOR
BGD
NGA
-20%
-10%
0%
10%
20%
30%
40%
50%
-10,000 -5,000 0 5,000 10,000 15,000 20,000 25,000Chan
ge in
shar
e of
Urb
an P
opul
ation
(per
cent
of t
otal
) (in
per
cent
age
poin
ts)
Absolute Change in GDP per capita 1980 - 2012, (constant 2005 PPP $)
HHLH
LL HL
Figure 5.3: Urbanization and growth around the world - a mixed picture (1980-2012)
3 See Ravallion, et al. (2007) and Spence (2009)
4 From 1980 to 2012, per capita GDP rose from US$5,986 to US$13,737 (PPP based GDP per capita in constant 2005 international dollars as provided by World Development Indicators). In nominal GDP per capita terms using current US$, the figure rose from US$1,567 in 1980 to US$10,666 in 2012.
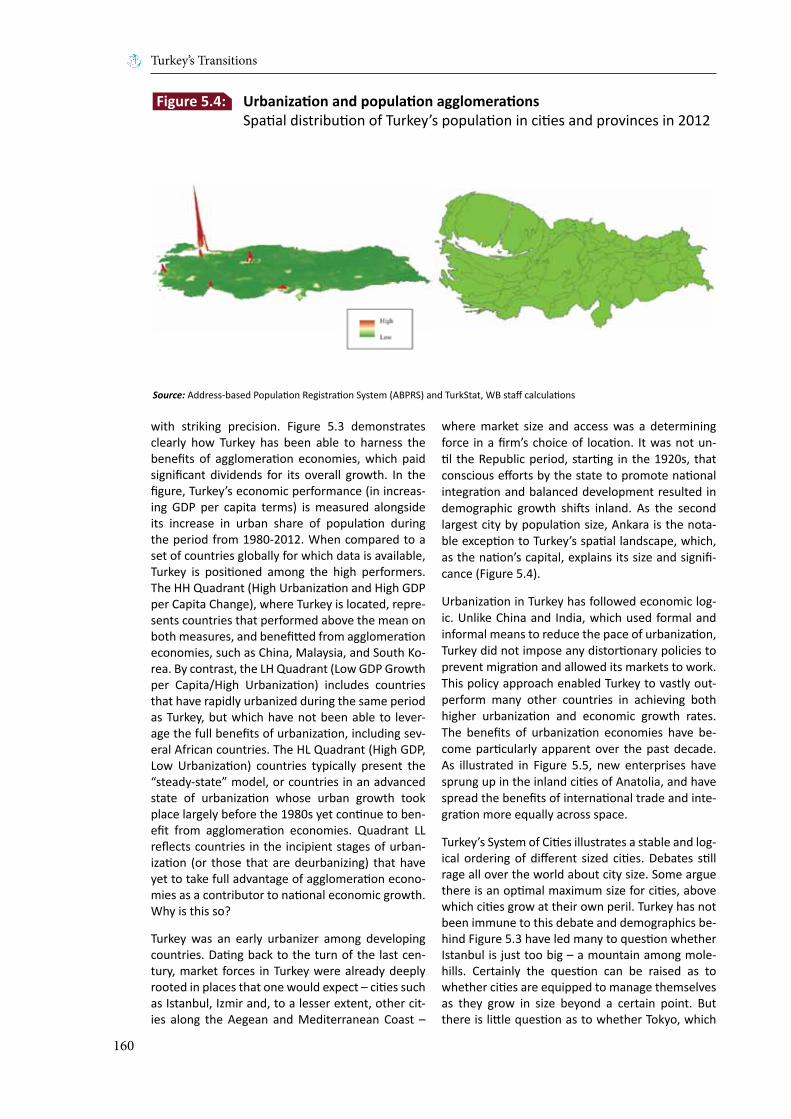
Turkey’s Transitions
160
with striking precision. Figure 5.3 demonstrates clearly how Turkey has been able to harness the benefits of agglomeration economies, which paid significant dividends for its overall growth. In the figure, Turkey’s economic performance (in increas-ing GDP per capita terms) is measured alongside its increase in urban share of population during the period from 1980-2012. When compared to a set of countries globally for which data is available, Turkey is positioned among the high performers. The HH Quadrant (High Urbanization and High GDP per Capita Change), where Turkey is located, repre-sents countries that performed above the mean on both measures, and benefitted from agglomeration economies, such as China, Malaysia, and South Ko-rea. By contrast, the LH Quadrant (Low GDP Growth per Capita/High Urbanization) includes countries that have rapidly urbanized during the same period as Turkey, but which have not been able to lever-age the full benefits of urbanization, including sev-eral African countries. The HL Quadrant (High GDP, Low Urbanization) countries typically present the “steady-state” model, or countries in an advanced state of urbanization whose urban growth took place largely before the 1980s yet continue to ben-efit from agglomeration economies. Quadrant LL reflects countries in the incipient stages of urban-ization (or those that are deurbanizing) that have yet to take full advantage of agglomeration econo-mies as a contributor to national economic growth. Why is this so?
Turkey was an early urbanizer among developing countries. Dating back to the turn of the last cen-tury, market forces in Turkey were already deeply rooted in places that one would expect – cities such as Istanbul, Izmir and, to a lesser extent, other cit-ies along the Aegean and Mediterranean Coast –
where market size and access was a determining force in a firm’s choice of location. It was not un-til the Republic period, starting in the 1920s, that conscious efforts by the state to promote national integration and balanced development resulted in demographic growth shifts inland. As the second largest city by population size, Ankara is the nota-ble exception to Turkey’s spatial landscape, which, as the nation’s capital, explains its size and signifi-cance (Figure 5.4).
Urbanization in Turkey has followed economic log-ic. Unlike China and India, which used formal and informal means to reduce the pace of urbanization, Turkey did not impose any distortionary policies to prevent migration and allowed its markets to work. This policy approach enabled Turkey to vastly out-perform many other countries in achieving both higher urbanization and economic growth rates. The benefits of urbanization economies have be-come particularly apparent over the past decade. As illustrated in Figure 5.5, new enterprises have sprung up in the inland cities of Anatolia, and have spread the benefits of international trade and inte-gration more equally across space.
Turkey’s System of Cities illustrates a stable and log-ical ordering of different sized cities. Debates still rage all over the world about city size. Some argue there is an optimal maximum size for cities, above which cities grow at their own peril. Turkey has not been immune to this debate and demographics be-hind Figure 5.3 have led many to question whether Istanbul is just too big – a mountain among mole-hills. Certainly the question can be raised as to whether cities are equipped to manage themselves as they grow in size beyond a certain point. But there is little question as to whether Tokyo, which
Source: Address-based Population Registration System (ABPRS) and TurkStat, WB staff calculations
Figure 5.4: Urbanization and population agglomerations Spatial distribution of Turkey’s population in cities and provinces in 2012
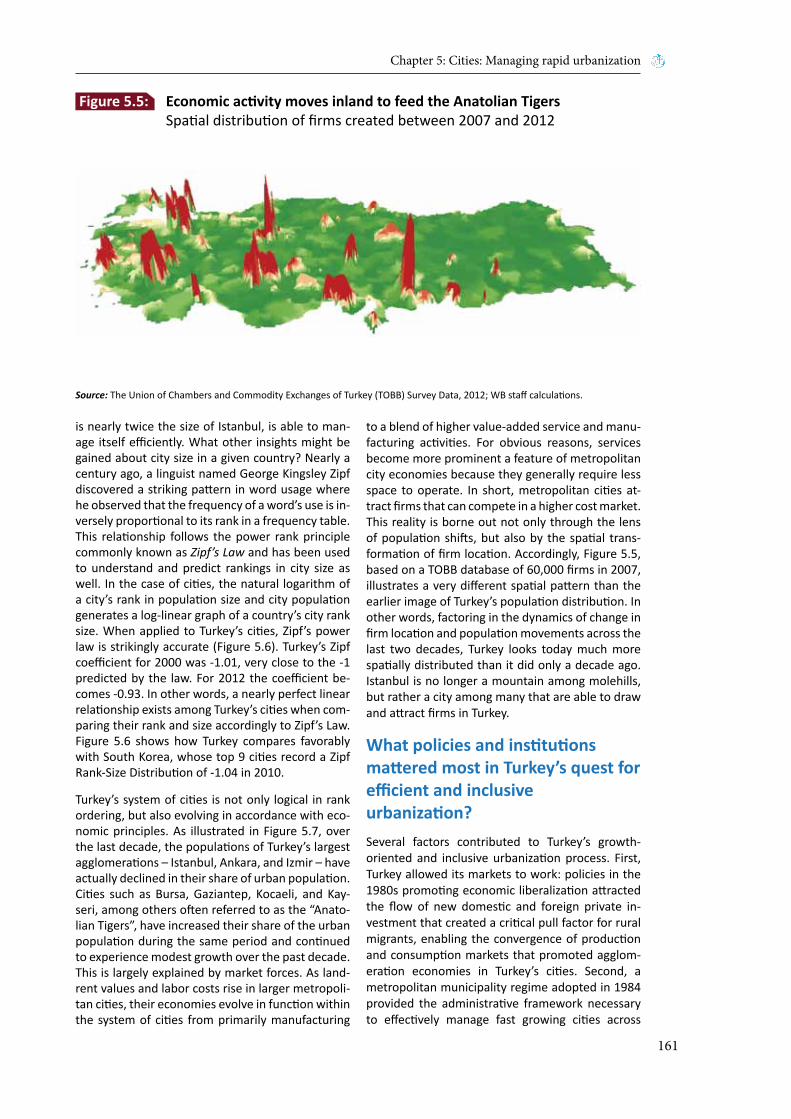
Chapter 5: Cities: Managing rapid urbanization
161
is nearly twice the size of Istanbul, is able to man-age itself efficiently. What other insights might be gained about city size in a given country? Nearly a century ago, a linguist named George Kingsley Zipf discovered a striking pattern in word usage where he observed that the frequency of a word’s use is in-versely proportional to its rank in a frequency table. This relationship follows the power rank principle commonly known as Zipf’s Law and has been used to understand and predict rankings in city size as well. In the case of cities, the natural logarithm of a city’s rank in population size and city population generates a log-linear graph of a country’s city rank size. When applied to Turkey’s cities, Zipf’s power law is strikingly accurate (Figure 5.6). Turkey’s Zipf coefficient for 2000 was -1.01, very close to the -1 predicted by the law. For 2012 the coefficient be-comes -0.93. In other words, a nearly perfect linear relationship exists among Turkey’s cities when com-paring their rank and size accordingly to Zipf’s Law. Figure 5.6 shows how Turkey compares favorably with South Korea, whose top 9 cities record a Zipf Rank-Size Distribution of -1.04 in 2010.
Turkey’s system of cities is not only logical in rank ordering, but also evolving in accordance with eco-nomic principles. As illustrated in Figure 5.7, over the last decade, the populations of Turkey’s largest agglomerations – Istanbul, Ankara, and Izmir – have actually declined in their share of urban population. Cities such as Bursa, Gaziantep, Kocaeli, and Kay-seri, among others often referred to as the “Anato-lian Tigers”, have increased their share of the urban population during the same period and continued to experience modest growth over the past decade. This is largely explained by market forces. As land-rent values and labor costs rise in larger metropoli-tan cities, their economies evolve in function within the system of cities from primarily manufacturing
to a blend of higher value-added service and manu-facturing activities. For obvious reasons, services become more prominent a feature of metropolitan city economies because they generally require less space to operate. In short, metropolitan cities at-tract firms that can compete in a higher cost market. This reality is borne out not only through the lens of population shifts, but also by the spatial trans-formation of firm location. Accordingly, Figure 5.5, based on a TOBB database of 60,000 firms in 2007, illustrates a very different spatial pattern than the earlier image of Turkey’s population distribution. In other words, factoring in the dynamics of change in firm location and population movements across the last two decades, Turkey looks today much more spatially distributed than it did only a decade ago. Istanbul is no longer a mountain among molehills, but rather a city among many that are able to draw and attract firms in Turkey.
What policies and institutionsmattered most in Turkey’s quest for efficient and inclusiveurbanization? Several factors contributed to Turkey’s growth-oriented and inclusive urbanization process. First, Turkey allowed its markets to work: policies in the 1980s promoting economic liberalization attracted the flow of new domestic and foreign private in-vestment that created a critical pull factor for rural migrants, enabling the convergence of production and consumption markets that promoted agglom-eration economies in Turkey’s cities. Second, a metropolitan municipality regime adopted in 1984 provided the administrative framework necessary to effectively manage fast growing cities across
Source: The Union of Chambers and Commodity Exchanges of Turkey (TOBB) Survey Data, 2012; WB staff calculations.
Figure 5.5: Economic activity moves inland to feed the Anatolian Tigers Spatial distribution of firms created between 2007 and 2012
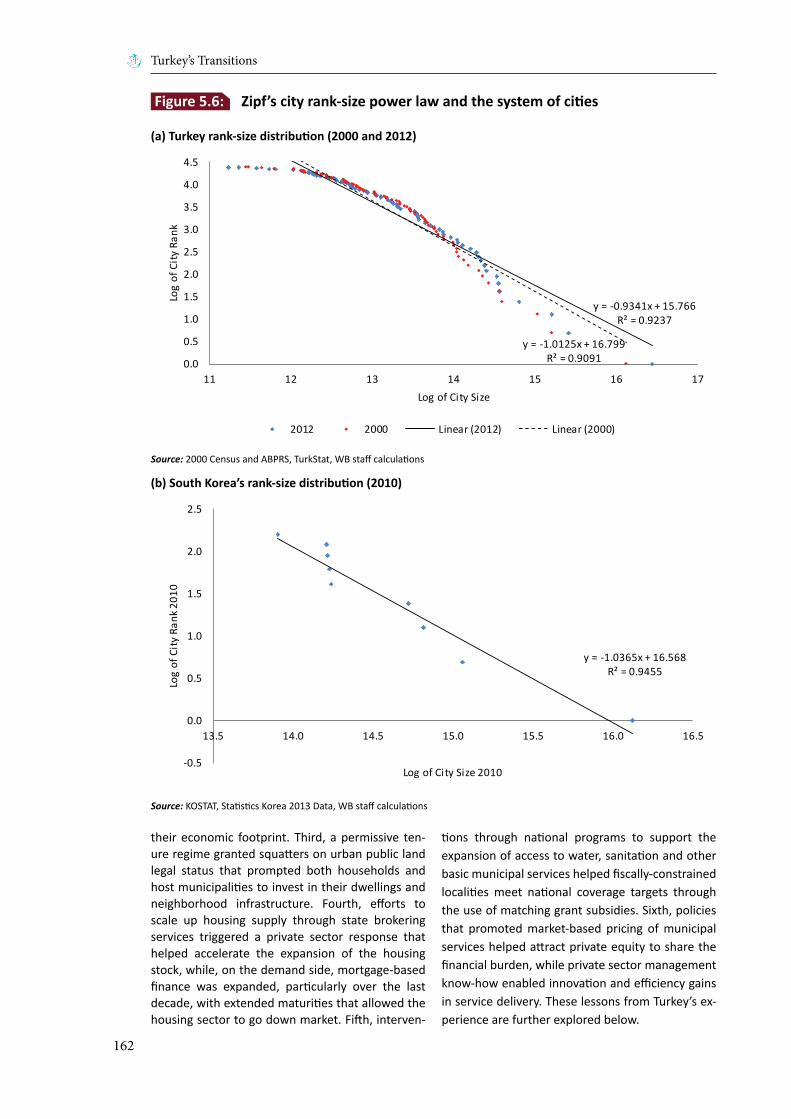
Turkey’s Transitions
162
their economic footprint. Third, a permissive ten-ure regime granted squatters on urban public land legal status that prompted both households and host municipalities to invest in their dwellings and neighborhood infrastructure. Fourth, efforts to scale up housing supply through state brokering services triggered a private sector response that helped accelerate the expansion of the housing stock, while, on the demand side, mortgage-based finance was expanded, particularly over the last decade, with extended maturities that allowed the housing sector to go down market. Fifth, interven-
tions through national programs to support the expansion of access to water, sanitation and other basic municipal services helped fiscally-constrained localities meet national coverage targets through the use of matching grant subsidies. Sixth, policies that promoted market-based pricing of municipal services helped attract private equity to share the financial burden, while private sector management know-how enabled innovation and efficiency gains in service delivery. These lessons from Turkey’s ex-perience are further explored below.
Source: KOSTAT, Statistics Korea 2013 Data, WB staff calculations
y = -0.9341x + 15.766R² = 0.9237
y = -1.0125x + 16.799R² = 0.90910.0
0.5
1.0
1.5
2.0
2.5
3.0
3.5
4.0
4.5
11 12 13 14 15 16 17
Log
of C
ity R
ank
Log of City Size
2012 2000 Linear (2012) Linear (2000)
Figure 5.6: Zipf’s city rank-size power law and the system of cities
y = -1.0365x + 16.568R² = 0.9455
-0.5
0.0
0.5
1.0
1.5
2.0
2.5
13.5 14.0 14.5 15.0 15.5 16.0 16.5
Log
of C
ity R
ank 2
010
Log of City Size 2010
Source: 2000 Census and ABPRS, TurkStat, WB staff calculations
(a) Turkey rank-size distribution (2000 and 2012)
(b) South Korea’s rank-size distribution (2010)
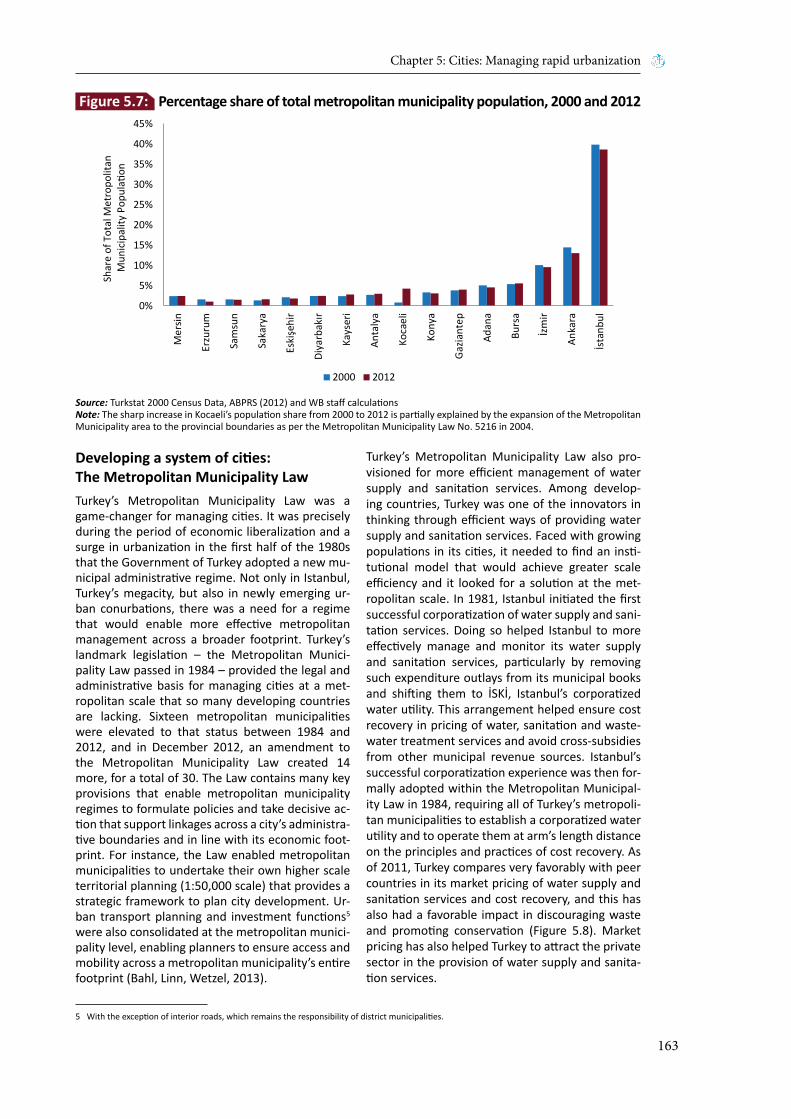
Chapter 5: Cities: Managing rapid urbanization
163
Developing a system of cities:The Metropolitan Municipality LawTurkey’s Metropolitan Municipality Law was a game-changer for managing cities. It was precisely during the period of economic liberalization and a surge in urbanization in the first half of the 1980s that the Government of Turkey adopted a new mu-nicipal administrative regime. Not only in Istanbul, Turkey’s megacity, but also in newly emerging ur-ban conurbations, there was a need for a regime that would enable more effective metropolitan management across a broader footprint. Turkey’s landmark legislation – the Metropolitan Munici-pality Law passed in 1984 – provided the legal and administrative basis for managing cities at a met-ropolitan scale that so many developing countries are lacking. Sixteen metropolitan municipalities were elevated to that status between 1984 and 2012, and in December 2012, an amendment to the Metropolitan Municipality Law created 14 more, for a total of 30. The Law contains many key provisions that enable metropolitan municipality regimes to formulate policies and take decisive ac-tion that support linkages across a city’s administra-tive boundaries and in line with its economic foot-print. For instance, the Law enabled metropolitan municipalities to undertake their own higher scale territorial planning (1:50,000 scale) that provides a strategic framework to plan city development. Ur-ban transport planning and investment functions5 were also consolidated at the metropolitan munici-pality level, enabling planners to ensure access and mobility across a metropolitan municipality’s entire footprint (Bahl, Linn, Wetzel, 2013).
Turkey’s Metropolitan Municipality Law also pro-visioned for more efficient management of water supply and sanitation services. Among develop-ing countries, Turkey was one of the innovators in thinking through efficient ways of providing water supply and sanitation services. Faced with growing populations in its cities, it needed to find an insti-tutional model that would achieve greater scale efficiency and it looked for a solution at the met-ropolitan scale. In 1981, Istanbul initiated the first successful corporatization of water supply and sani-tation services. Doing so helped Istanbul to more effectively manage and monitor its water supply and sanitation services, particularly by removing such expenditure outlays from its municipal books and shifting them to İSKİ, Istanbul’s corporatized water utility. This arrangement helped ensure cost recovery in pricing of water, sanitation and waste-water treatment services and avoid cross-subsidies from other municipal revenue sources. Istanbul’s successful corporatization experience was then for-mally adopted within the Metropolitan Municipal-ity Law in 1984, requiring all of Turkey’s metropoli-tan municipalities to establish a corporatized water utility and to operate them at arm’s length distance on the principles and practices of cost recovery. As of 2011, Turkey compares very favorably with peer countries in its market pricing of water supply and sanitation services and cost recovery, and this has also had a favorable impact in discouraging waste and promoting conservation (Figure 5.8). Market pricing has also helped Turkey to attract the private sector in the provision of water supply and sanita-tion services.
Source: Turkstat 2000 Census Data, ABPRS (2012) and WB staff calculationsNote: The sharp increase in Kocaeli’s population share from 2000 to 2012 is partially explained by the expansion of the Metropolitan Municipality area to the provincial boundaries as per the Metropolitan Municipality Law No. 5216 in 2004.
0%
5%
10%
15%
20%
25%
30%
35%
40%
45%
Mer
sin
Erzu
rum
Sam
sun
Saka
rya
Eskişe
hir
Diya
rbakır
Kays
eri
Anta
lya
Koca
eli
Kony
a
Gaz
iant
ep
Adan
a
Burs
a
İzm
ir
Anka
ra
İsta
nbul
Shar
e of
Tot
al M
etro
polit
an
Mun
icip
ality
Pop
ulati
on
2000 2012
Figure 5.7: Percentage share of total metropolitan municipality population, 2000 and 2012
5 With the exception of interior roads, which remains the responsibility of district municipalities.
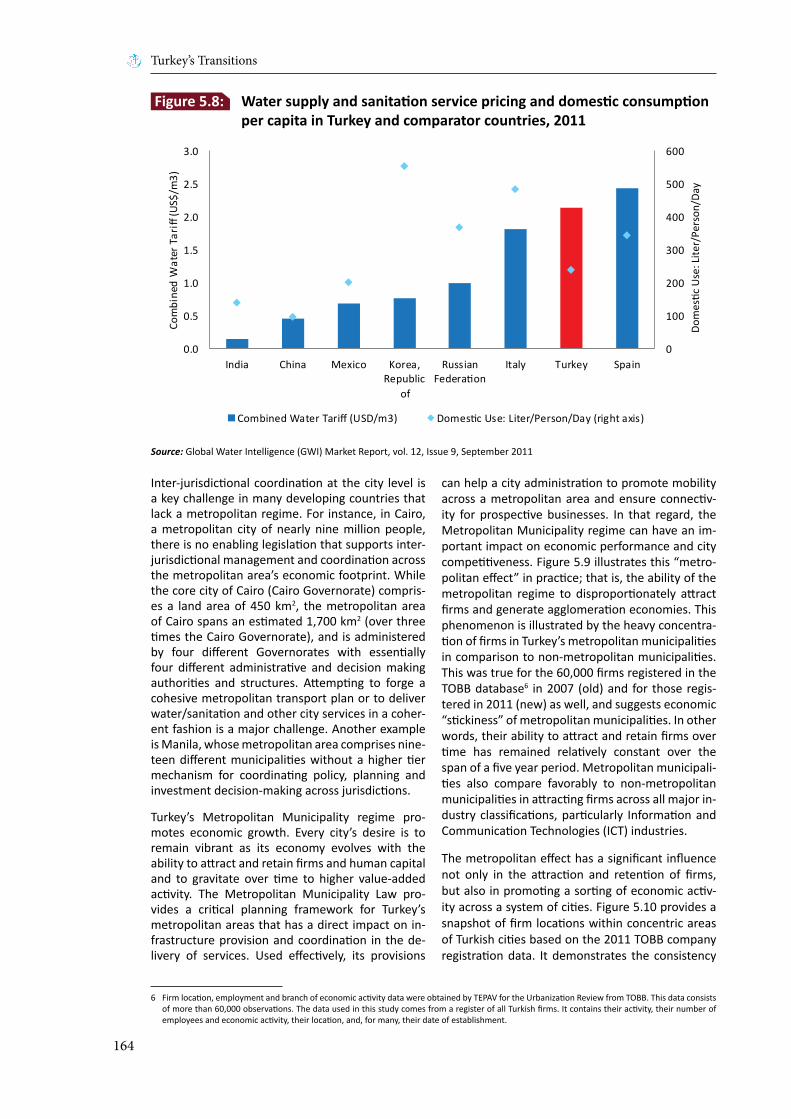
Turkey’s Transitions
164
Inter-jurisdictional coordination at the city level is a key challenge in many developing countries that lack a metropolitan regime. For instance, in Cairo, a metropolitan city of nearly nine million people, there is no enabling legislation that supports inter-jurisdictional management and coordination across the metropolitan area’s economic footprint. While the core city of Cairo (Cairo Governorate) compris-es a land area of 450 km2, the metropolitan area of Cairo spans an estimated 1,700 km2 (over three times the Cairo Governorate), and is administered by four different Governorates with essentially four different administrative and decision making authorities and structures. Attempting to forge a cohesive metropolitan transport plan or to deliver water/sanitation and other city services in a coher-ent fashion is a major challenge. Another example is Manila, whose metropolitan area comprises nine-teen different municipalities without a higher tier mechanism for coordinating policy, planning and investment decision-making across jurisdictions.
Turkey’s Metropolitan Municipality regime pro-motes economic growth. Every city’s desire is to remain vibrant as its economy evolves with the ability to attract and retain firms and human capital and to gravitate over time to higher value-added activity. The Metropolitan Municipality Law pro-vides a critical planning framework for Turkey’s metropolitan areas that has a direct impact on in-frastructure provision and coordination in the de-livery of services. Used effectively, its provisions
can help a city administration to promote mobility across a metropolitan area and ensure connectiv-ity for prospective businesses. In that regard, the Metropolitan Municipality regime can have an im-portant impact on economic performance and city competitiveness. Figure 5.9 illustrates this “metro-politan effect” in practice; that is, the ability of the metropolitan regime to disproportionately attract firms and generate agglomeration economies. This phenomenon is illustrated by the heavy concentra-tion of firms in Turkey’s metropolitan municipalities in comparison to non-metropolitan municipalities. This was true for the 60,000 firms registered in the TOBB database6 in 2007 (old) and for those regis-tered in 2011 (new) as well, and suggests economic “stickiness” of metropolitan municipalities. In other words, their ability to attract and retain firms over time has remained relatively constant over the span of a five year period. Metropolitan municipali-ties also compare favorably to non-metropolitan municipalities in attracting firms across all major in-dustry classifications, particularly Information and Communication Technologies (ICT) industries.
The metropolitan effect has a significant influence not only in the attraction and retention of firms, but also in promoting a sorting of economic activ-ity across a system of cities. Figure 5.10 provides a snapshot of firm locations within concentric areas of Turkish cities based on the 2011 TOBB company registration data. It demonstrates the consistency
Source: Global Water Intelligence (GWI) Market Report, vol. 12, Issue 9, September 2011
0
100
200
300
400
500
600
0.0
0.5
1.0
1.5
2.0
2.5
3.0
India China Mexico Korea,Republic
of
RussianFederation
Italy Turkey Spain
Dom
estic
Use
: Lite
r/Pe
rson
/Day
Com
bine
d W
ater
Tar
iff (U
S$/m
3)
Combined Water Tariff (USD/m3) Domestic Use: Liter/Person/Day (right axis)
Figure 5.8: Water supply and sanitation service pricing and domestic consumption per capita in Turkey and comparator countries, 2011
6 Firm location, employment and branch of economic activity data were obtained by TEPAV for the Urbanization Review from TOBB. This data consists of more than 60,000 observations. The data used in this study comes from a register of all Turkish firms. It contains their activity, their number of employees and economic activity, their location, and, for many, their date of establishment.
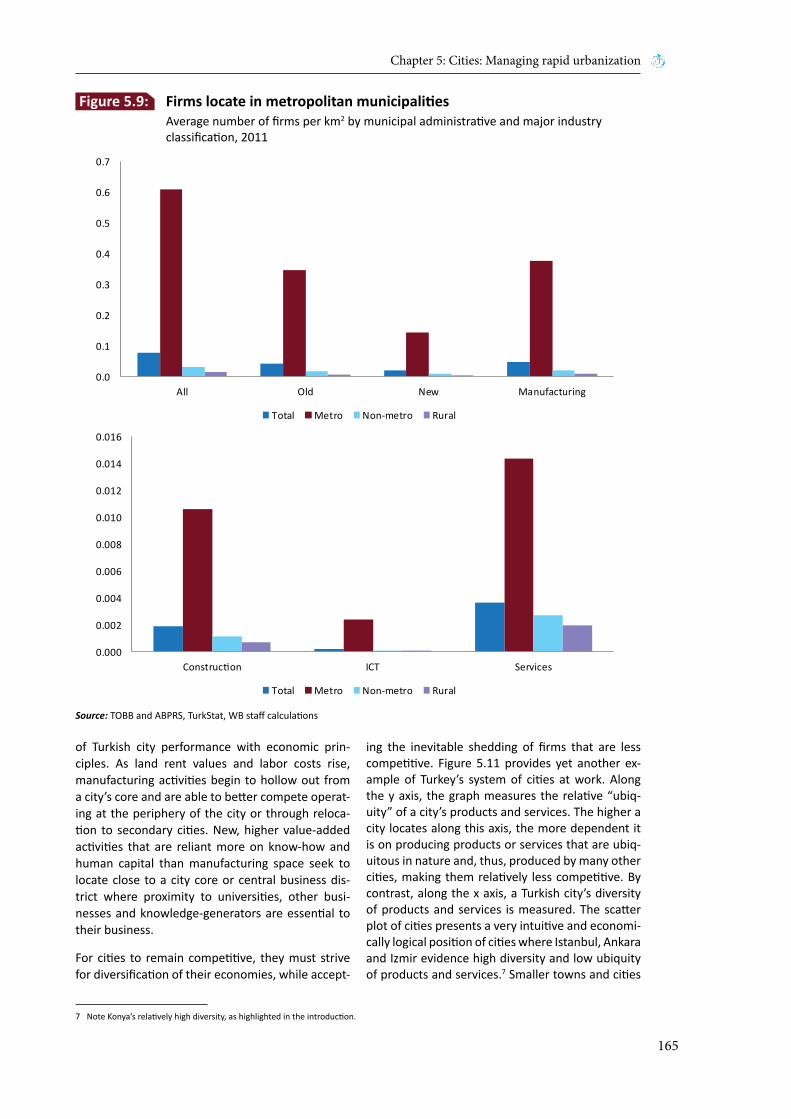
Chapter 5: Cities: Managing rapid urbanization
165
of Turkish city performance with economic prin-ciples. As land rent values and labor costs rise, manufacturing activities begin to hollow out from a city’s core and are able to better compete operat-ing at the periphery of the city or through reloca-tion to secondary cities. New, higher value-added activities that are reliant more on know-how and human capital than manufacturing space seek to locate close to a city core or central business dis-trict where proximity to universities, other busi-nesses and knowledge-generators are essential to their business.
For cities to remain competitive, they must strive for diversification of their economies, while accept-
ing the inevitable shedding of firms that are less competitive. Figure 5.11 provides yet another ex-ample of Turkey’s system of cities at work. Along the y axis, the graph measures the relative “ubiq-uity” of a city’s products and services. The higher a city locates along this axis, the more dependent it is on producing products or services that are ubiq-uitous in nature and, thus, produced by many other cities, making them relatively less competitive. By contrast, along the x axis, a Turkish city’s diversity of products and services is measured. The scatter plot of cities presents a very intuitive and economi-cally logical position of cities where Istanbul, Ankara and Izmir evidence high diversity and low ubiquity of products and services.7 Smaller towns and cities
Source: TOBB and ABPRS, TurkStat, WB staff calculations
0.0
0.1
0.2
0.3
0.4
0.5
0.6
0.7
All Old New Manufacturing
Total Metro Non-metro Rural
0.000
0.002
0.004
0.006
0.008
0.010
0.012
0.014
0.016
Construction ICT Services
Total Metro Non-metro Rural
Figure 5.9: Firms locate in metropolitan municipalities Average number of firms per km2 by municipal administrative and major industry classification, 2011
7 Note Konya’s relatively high diversity, as highlighted in the introduction.
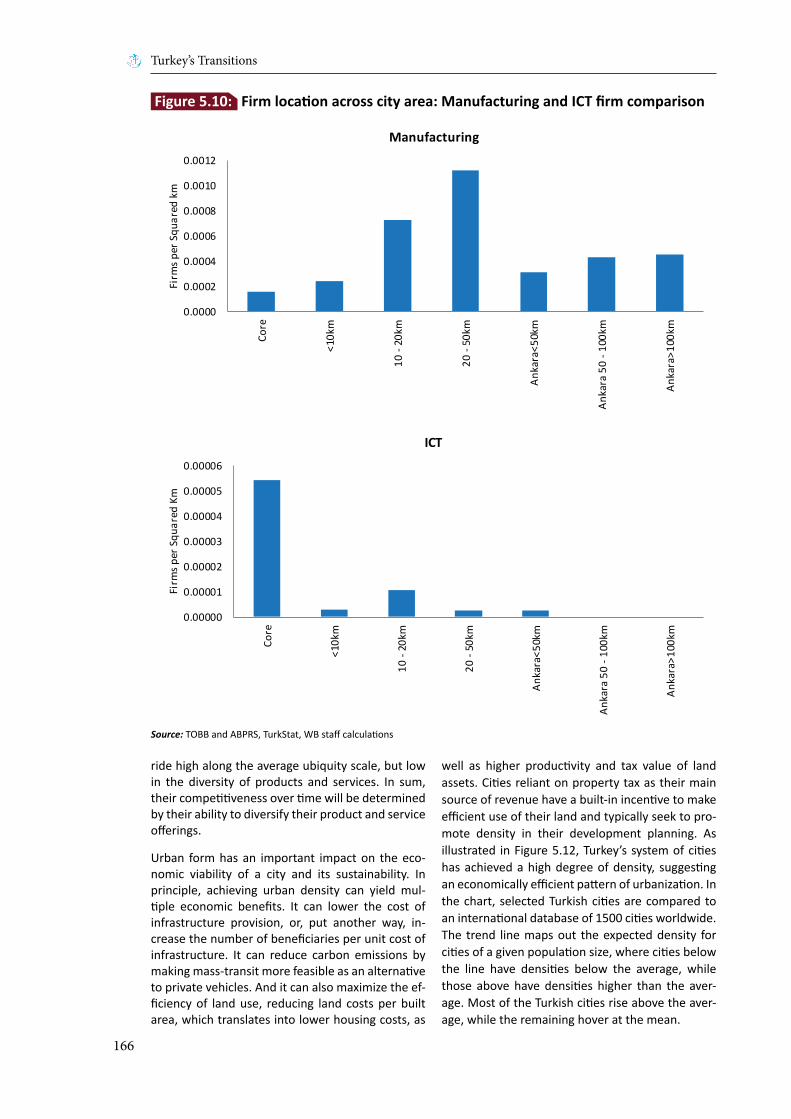
Turkey’s Transitions
166
ride high along the average ubiquity scale, but low in the diversity of products and services. In sum, their competitiveness over time will be determined by their ability to diversify their product and service offerings.
Urban form has an important impact on the eco-nomic viability of a city and its sustainability. In principle, achieving urban density can yield mul-tiple economic benefits. It can lower the cost of infrastructure provision, or, put another way, in-crease the number of beneficiaries per unit cost of infrastructure. It can reduce carbon emissions by making mass-transit more feasible as an alternative to private vehicles. And it can also maximize the ef-ficiency of land use, reducing land costs per built area, which translates into lower housing costs, as
well as higher productivity and tax value of land assets. Cities reliant on property tax as their main source of revenue have a built-in incentive to make efficient use of their land and typically seek to pro-mote density in their development planning. As illustrated in Figure 5.12, Turkey’s system of cities has achieved a high degree of density, suggesting an economically efficient pattern of urbanization. In the chart, selected Turkish cities are compared to an international database of 1500 cities worldwide. The trend line maps out the expected density for cities of a given population size, where cities below the line have densities below the average, while those above have densities higher than the aver-age. Most of the Turkish cities rise above the aver-age, while the remaining hover at the mean.
Source: TOBB and ABPRS, TurkStat, WB staff calculations
0.0000
0.0002
0.0004
0.0006
0.0008
0.0010
0.0012
Core
<10k
m
10 -
20km
20 -
50km
Anka
ra<5
0km
Anka
ra 5
0 - 1
00km
Anka
ra>1
00km
Firm
s per
Squ
ared
km
Manufacturing
0.00000
0.00001
0.00002
0.00003
0.00004
0.00005
0.00006
Core
<10k
m
10 -
20km
20 -
50km
Anka
ra<5
0km
Anka
ra 5
0 - 1
00km
Anka
ra>1
00km
Firm
s per
Squ
ared
Km
ICT
Figure 5.10: Firm location across city area: Manufacturing and ICT firm comparison
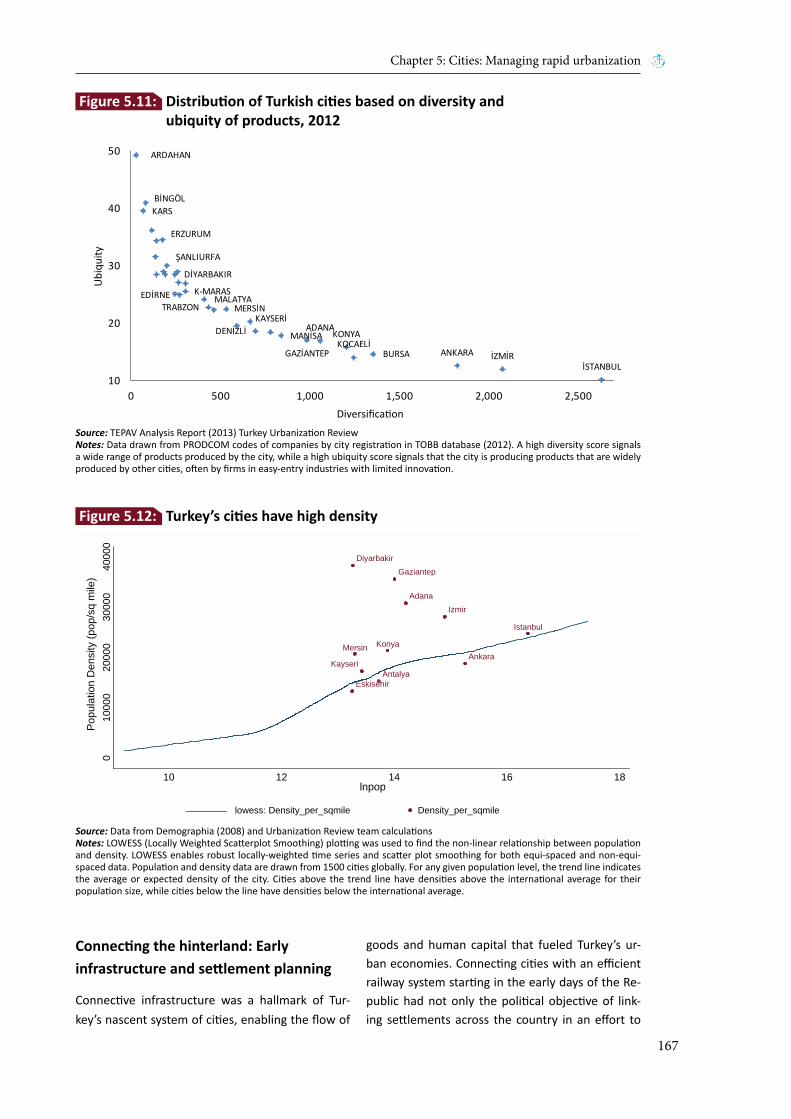
Chapter 5: Cities: Managing rapid urbanization
167
Connecting the hinterland: Earlyinfrastructure and settlement planning
Connective infrastructure was a hallmark of Tur-key’s nascent system of cities, enabling the flow of
goods and human capital that fueled Turkey’s ur-ban economies. Connecting cities with an efficient railway system starting in the early days of the Re-public had not only the political objective of link-ing settlements across the country in an effort to
Source: TEPAV Analysis Report (2013) Turkey Urbanization ReviewNotes: Data drawn from PRODCOM codes of companies by city registration in TOBB database (2012). A high diversity score signals a wide range of products produced by the city, while a high ubiquity score signals that the city is producing products that are widely produced by other cities, often by firms in easy-entry industries with limited innovation.
Source: Data from Demographia (2008) and Urbanization Review team calculationsNotes: LOWESS (Locally Weighted Scatterplot Smoothing) plotting was used to find the non-linear relationship between population and density. LOWESS enables robust locally-weighted time series and scatter plot smoothing for both equi-spaced and non-equi-spaced data. Population and density data are drawn from 1500 cities globally. For any given population level, the trend line indicates the average or expected density of the city. Cities above the trend line have densities above the international average for their population size, while cities below the line have densities below the international average.
İSTANBULİZMİRANKARA
KOCAELİBURSA
KONYAADANA
GAZİANTEP
MANİSA
KAYSERİDENİZLİ
MERSİNTRABZONMALATYAEDİRNE K-MARAS
DİYARBAKIR
ŞANLIURFA
ERZURUM
KARSBİNGÖL
ARDAHAN
10
20
30
40
50
0 500 1,000 1,500 2,000 2,500
Ubi
quity
Diversification
Eskisehir
Diyarbakir
Mersin
KayseriAntalya
Konya
Gaziantep
AdanaIzmir
Ankara
Istanbul
010
000
2000
030
000
4000
0P
opul
atio
n D
ensi
ty (p
op/s
q m
ile)
10 12 14 16 18lnpop
lowess: Density_per_sqmile Density_per_sqmile
Figure 5.11: Distribution of Turkish cities based on diversity and ubiquity of products, 2012
Figure 5.12: Turkey’s cities have high density

Turkey’s Transitions
168
promote national cohesion, but also the motive of improving accessibility and connectivity that pro-vided a strong economic foundation for Turkey’s cities. Turkey’s railway network and, eventually, its highly developed road network provided the eco-nomic backbone that support vibrant local econo-mies, even within the interior of the country. As Figure 5.13 illustrates, Turkey has used transport in-frastructure to connect population concentrations across the country.
Turkey’s early investment in settlement planning, dating back to the founding of the Republic, set an important foundation for the future of Turkey’s cit-ies. It was during the Republic Period (1923-1950) that a nation-wide industrialization and urbaniza-tion process firmly took root beyond Istanbul. To re-alize this vision, policy makers recognized the need to actively promote the planning and development of settlement areas. Given its geographical location in the interior of the country without the typical en-dowments that would attract people and firms, Tur-key’s capital city of Ankara is a prime example of a planned city. A metropolis of 4.5 million people to-day, Ankara owes its modern day existence to such planning efforts. Across Anatolia, planners in the early days of the Republic selected small Anatolian cities for the development of industrial enterprise at a time when the State was a majority owner of commercial activity. State manufacturing invest-ments, public enterprises and transport invest-ments were designed and executed to expand de-velopment eastward. The Marmara Region actually experienced a population decline during this period in favor of the Anatolian hinterland. This spatial transformation was spearheaded by state interven-
tion. Twenty-three settlements were planned over a decade starting in 1923 (Tekeli, 2009).
Turkey’s planning system evolved during the transi-tion years of the 1960s and 1970s. It was during the two decades of the 1960s-1970s that full-fledged urban planning took hold. In 1966 an Istanbul Mas-ter Plan Office was established and the city’s Mas-terplan completed, followed shortly thereafter by Izmir and Ankara in 1968 and 1969 respectively. Large public works projects of a monumental scale were undertaken across numerous cities. However, during the late 70s, the State’s role as a technocrat-ic agent of development shifted. During this period, the state began to recede from its active interven-tionist mode to more of an enabler of the private sector. Between 1968 and 1972, the private sector had already become the primary investor in manu-facturing (Tekeli, 2009).
A further key action of the Turkish Government was to ensure its cities were adequately financed. As many developing countries have experienced, it is one thing to plan a city and devolve functions to local governments; It is quite another to ensure they have adequate financing to fulfill those func-tions and build the needed infrastructure. Turkish policy makers were keenly aware of this need and with private banks not able or willing to provide long term finance for infrastructure, Iller Bank, or the Bank of Provinces/Municipalities, was founded in 1933. Iller Bank’s mandate was to provide the long-term financing necessary for newly prepared municipal development plans and infrastructure service needs. Iller Bank remains to this day a criti-cal institution in the financing, planning and devel-opment of cities.
Source: Ministry of Transportation, Maritime Affairs and Communications
Figure 5.13: Development of railways and population concentrations in Turkey in 2000
District Population of Turkey in 2000
Railways in 2000
Districts
100.000 to 1.000.000
50.000 to 100.00020.000 to 50.00010.000 to 20.000
0 to 10.000

Chapter 5: Cities: Managing rapid urbanization
169
Managing rural-urban migration:A permissive policy stance on informal settlements
While urbanization was steadily increasing during the 1950s-1970s, it was during the 1980s that Tur-key experienced a major surge of rural migrants to cities, causing rapid expansion of informal areas in urban settlements. Many cities were unable to accommodate this growth, and the influx of mi-grants took place so quickly that these informal settlements became known as gecekondu, literally “houses erected overnight”. Estimates of informal housing in major cities during that period ranged between 30-60 percent of all urban housing stock. Most in-migration during this phase was concen-trated in large cities along the coast (Istanbul and Izmir) and Ankara.
Turkey adopted a permissive policy toward rural migration and this policy stance likely encouraged migrants to flock to cities. Over the period from 1949-1990, eight amnesties were issued by the Government of Turkey legalizing informal and un-registered residences (Buğra, 1998). The prevailing attitude of the Turkish Government at the time, and tacitly accepted by the general public, was the no-tion that all citizens have a right to some form of ba-sic housing. The amnesties gave residents the right of usufruct and removed the fear of eviction. With security of tenure, as witnessed in other develop-ing countries, residents of informal areas began to invest in their housing, in some cases adding rooms that were subsequently rented to new migrants.8 Turkey was also in a fortunate position to take such decisions as the vast majority of land on which the informal settlements took shape was public land. These circumstances, perhaps, helped circumvent property rights criticisms from private land owners.
By the 1980s, as rural in-migration was peaking, ur-ban planning responsibilities were devolved to local authorities and planning regulations were relaxed to accommodate rapid urbanization and changes in land use patterns. With the emergence of the pri-vate sector during this period of economic liberal-ization, development plans lost their dominant role and were not directly led by the central govern-ment. This was a period of enormous significance for urbanization, as the largest shift in population from rural to urban settlements took place during this time. The Development Law (No. 3194), which was enacted in 1985, delegated increasing func-
tions to local governments in planning processes, while the state turned its hand to regional plan-ning, focused on economic zones and leveraging of economic endowments of a trans-jurisdictional nature. It was at this time, particularly in the early 1980s, that metropolitan cities turned to an “incre-mental planning” approach (Tekeli, 2009)9.
Meeting housing needs: Social housing and evolution of the TOKI model
The mid to late 1980s were also an important period in which other key institutions were established to more effectively manage rapid urbanization, which at this point, had reached its peak. A key measure was the passage of the Housing Development and Public Participation Law (No. 2985) in 1986. This law helped to shape formal state interventions into the housing policy arena. The law recognized the urgency of responding to rapid urbanization, which was peaking, provisioning for financing of low in-come housing at nominal rates with long-term pay-back periods. The Law also called for the establish-ment of a Housing Agency, which came to pass in 1990 when the Housing Development Administra-tion, otherwise known as TOKİ, was established.
From 1984-2002 over 940,000 housing units were delivered under the Government housing program. Initially, this was supported through a Mass Housing Fund (1984-1990) and subsequently by TOKİ (1990-2002). Figure 5.14 illustrates the housing permit (supply) to need ratio movements from 1958-2010, showing an overall upward trend. The Inadequacy of housing permits during Turkey’s peak period of urbanization from 1980- 1984 (reflected in the downward trend during this period) was reversed by Government intervention, raising the housing permit to need ratio to 35 percent by 1986 and over 50 percent by 1996. With the exception of the late 1990s, when Turkey’s economy was volatile, a likely factor impacting new housing starts, Turkey’s housing permit to need ratio remained relatively high, reaching over 60 percent in 2006 and nearly 70 percent by 2010.
The entry of TOKİ to the housing supply market was significant. TOKİ, founded in 1990, created a “wholesaling” mechanism for the large scale sup-ply of housing for both low and middle income market segments during Turkey’s most pressing period of urbanization. Its purpose and orientation was never to replace Turkey’s predominant pri-vate housing model with public provision. Rather,
8 Turkey’s attempt to address supply-side housing challenges was similar to what Mexico attempted to do. Both countries recognized what Spence argues, namely that “only a greater supply of serviced land and housing can lower costs, because it helps to solve the problem at its root as well as contain the fiscal burden of subsidies”. According to Spence, Mexico offered an upfront subsidy combined with efforts to provide better infrastruc-ture and security of tenure, allowing households to make investments in their home on their own.
9 For many analysts, this planning juncture marked the beginning of the decline of Turkish cities. They argue that the flexibility granted to cities and large-scale private developers ultimately undermined effective city planning, contributing to urban sprawl and unplanned development.

Turkey’s Transitions
170
its role was to create the enabling environment to promote the entry of large scale housing supply by the private sector. This was largely accomplished through TOKİ’s brokering role, which helped to cut red-tape, streamline administrative procedures into an effective “one-stop-shop”, facilitate the as-sembly of public land at a scale sufficient for large scale housing development, and mobilize housing finance. This, in turn, created investment opportu-nities for large contractors and real estate develop-ers, and the scaling up from the traditional coop-erative housing model that could not keep pace with increasing housing demand. This could only be achieved because Turkey’s approach to low income housing was not to supply it directly by the public sector but to use market mechanisms to encourage real estate developers and building contractors to go down market. To do so, TOKİ relied on the lever-aging of public land which factored in as a subsidy to make housing affordable to low income groups. Provisioning for low income housing was based on limited space housing models (often around 50-100 m2 units) that developers would not have devel-oped without the State’s intervention.
TOKİ’s approach to housing evolved over time and benefitted from lessons learned. While early proj-
ects were criticized for poor quality and location choices, as well as the absence of amenities and surrounding infrastructure, TOKİ factored these considerations into later models. Many later devel-opments also considered mixed income facilities. The mixed income feature of many TOKİ housing projects was made possible through cross-subsidies derived from the auction of development rights for the benefit of low income groups. The feature of mixed income housing has also enabled Turkey to avoid clustering the poor in low income housing projects that can lead to vertical slums.
The entry of TOKİ into the housing market went beyond the provision of low and middle-income housing. TOKİ’s housing model enabled Turkey’s housing supply market to scale up by mobilizing the land developing and financing, and a private sec-tor delivery mechanism that promoted the emer-gence of larger-scale real estate developers and construction companies. This was critically needed during Turkey’s period of rapid urbanization, as the prevailing cooperative housing model which facili-tated pooling of savings among individuals and in-vestor groups and an incremental housing supply approach was no longer adequate to keep up with demand.11 Figure 5.15 illustrates how the housing
Source: WB staff calculations using TurkStat Annual Building Construction Statistics (for permits); Population Division of the Department of Economic and Social Affairs of the United Nations Secretariat, World Population Prospects: The 2010 Revision and World Urbanization Prospects: The 2011 Revision, August, 2012 (for housing need)
0%
10%
20%
30%
40%
50%
60%
70%
1958
1960
1962
1964
1966
1968
1970
1972
1974
1976
1978
1980
1982
1984
1986
1988
1990
1992
1994
1996
1998
2000
2002
2004
2006
2008
2010
Ratio
of H
ousi
ng P
erm
its to
Hou
sing
Nee
dsPassage of Housing
Development and PublicParticipation Law No.2985 (1985)
Decree 412 creating TOKİ -Housing DevelopmentAdministration (1990)
Figure 5.14: Turkey housing starts to need ratio (1958-2010) and landmark housing legal and institutional initiatives 10
10 Housing supply to need ratio is calculated using housing permit data and population growth. Need is calculated based on an average household size of 4.5.
11 Ministry of Development indicates that TOKİ initially supported the market through a loan mechanism from its inception to 2002. Prior to this, 940,000 housing units were financed by a Mass Housing Fund between 1984-1990. TOKİ reports to have delivered 88,593 units under its “shanty transformation program” between 2003 and March 2014 and reports that 392,327 units were built for low and middle income groups overall. TOKİ ceased providing mass housing loans after 2007.

Chapter 5: Cities: Managing rapid urbanization
171
construction market evolved following the estab-lishment of TOKİ. As the chart shows, following a gestation period in which TOKİ experimented with different business models, the separation in market share of cooperatives and large scale private con-tractors began to be felt in earnest in the first half of the last decade. Substantial market share gains/losses were experienced by the private sector and cooperatives respectively by 2010.
Despite these positive contributions, TOKİ’s estab-lishment law provides it with extraordinary powers, including the ability to develop land without adher-ing to the city’s masterplan, and, in several instanc-es, its developments in scale and design are clearly at odds with the urban character of the surround-ing area. Community consultations have been fault-ed by critics for being perfunctory and without full
participation of all stakeholders. In addition, there have been demands for greater public scrunity of TOKİ’s financial accounts and the financials of specific transactions. In short, while the concept of combining functions into a single agency made good sense and delivered over 500,000 housing units in the span of less than seven years, greater transparency and accountability would strengthen the sustainability of the TOKİ model.
Developing of housing finance and rental markets to improve Access
Development of Turkey’s Mortgage Market was also a critical policy measure over the last decade in making housing more affordable. Turkey’s mort-gage finance market today is still in its early stag-es. However, the problem of accessing long-term
Source: TurkStat, Construction License data, WB staff calculations.
0
50
100
150
200
250
300
350
2001 2002 2003 2004 2005 2006 2007 2008 2009 2010
Dist
ribu
tion
of co
nstr
uctio
n pe
rmits
am
ong
prod
ucer
s (`0
00)
Private Cooperative Societies
0
10
20
30
40
50
60
70
80
90
2001 2002 2003 2004 2005 2006 2007 2008 2009 2010
Dist
ribu
tion
of b
uild
ing o
ccup
ancy
per
mits
am
ong
prod
ucer
s (pe
rcen
t)
Private Cooperative Societies
Figure 5.15: Distribution of housing construction and occupancy licenses by ownership form

Turkey’s Transitions
172
mortgage finance had been a persistent problem over the first half of the last decade. In the absence of long-term financing, many new housing devel-opments were also beyond the reach of middle income households. This has meant that accessing long-term financing for housing has been a real con-straint on demand, and possibly a factor in holding back the housing supply market overall. Figure 5.16 illustrates how this trend is changing over the past five years with shorter term maturities (less than 3
years and 3-5 years loans) being replaced by longer term (5-10 years and 15-20 years).
Housing options beyond ownership have proven to be critical for many rapidly urbanizing countries. Because of demand pressures, land and property values rise quickly during intense periods of urban-ization. Accordingly, developing countries often need to consider other housing options to address affordability problems for the lower income seg-
Source: Central Bank of the Republic of Turkey and WB staff calculations
Source: Cited in Özdemir (2011): MGI, 2003:298. Fribourg, 2006:24
0%
10%
20%
30%
40%
50%
60%
Oct
-07
Jan-
08
Apr-0
8
Jul-0
8
Oct
-08
Jan-
09
Apr-0
9
Jul-0
9
Oct
-09
Jan-
10
Apr-1
0
Jul-1
0
Oct
-10
Jan-
11
Apr-1
1
Jul-1
1
Oct
-11
Jan-
12
Apr-1
2
Jul-1
2
Perc
enta
ge S
hare
of T
otal
Mor
tgag
e Lo
ans
Less than 3 years 3 to 5 years 5 to 10 years 10 to 15 years 15 to 20 years
0%
10%
20%
30%
40%
50%
60%
Germ
any
Turk
ey
Denm
ark
Luxe
mbo
urg
Belg
ium
Swed
en
Fran
ce
Gree
ce
Latv
ia
Mal
ta
Aust
ria
Cypr
us
Port
ugal
Czec
h Re
p.
Italy
Finl
and
Pola
nd
Irela
nd
Net
herla
nds
Spai
n
Uni
ted
King
dom
Esto
nia
Slov
enia
Hung
ary
Lith
uani
a
Slov
akia
Rent
al S
hare
of H
ousi
ng M
arke
t
Figure 5.16: Weekly trends in mortgage financing
Figure 5.17: Rental share of housing market in Turkey and selected European countries (1994)

Chapter 5: Cities: Managing rapid urbanization
173
ments of the market. In that regard, dating back to provisions in a 1965 Condominium Law, Turkey was able to promote a “build and sell” model that of-fered middle income households a way of storing wealth during periods of high inflation and curren-cy volatility. This led to households investing and building in multiple residences and rental property. By 1994, Turkey was second only to Germany in the percentage of rental housing (28 percent) to home ownership (72 percent) in comparison to 25 Euro-pean Union countries (Figure 5.17). Importantly, Turkey’s highly developed rental market provided additional housing options for Turkish city residents and likely improved housing affordability, particu-larly in earlier periods when long-term mortgage finance was not available in the market.
Addressing regional inequities: Targeted provision of municipal services in small rural towns and engaging with theprivate sector in advanced cities
Interventions at the national government level in cases of market failure have been a hallmark of Turkey’s approach to support its system of cities. Beyond the Government’s foray into Housing Policy in the 1990s, efforts were also made to shore up the provision of basic urban services. Municipalities from their own resources and those supplied by the central government, began over time to regu-larize informal settlements, including the provision of road infrastructure, as well as network water, sanitation, and wastewater treatment to the point
that most have become permanent features of the urban landscape in many cities. As a result, many of Turkey’s informal settlements look and are much more habitable, sanitary and livable than the slums that persist in parts of Latin America and South Asia. In addition, Iller Bank provided financing to larger cities for infrastructure network expansion as they grew, enabling many to keep pace with rapid urbanization. But there were also acknowledged gaps in service coverage, particularly among small towns and villages, that generally had a very low economic base and insufficient revenue streams to service debt. In response to this market failure, spe-cial programs were initiated by the Government to ensure that water, sanitation and solid waste servic-es were provided in these fiscally dependent areas.
For small towns and villages, development pro-grams initiated by the Ministry of Development, such as KÖYDES and SUKAP, were designed to fill a critical gap. KÖYDES, or the small villages water and sanitation project, spanned in its first phase a period of eight years (2005-2012). The main aim of this program was to ensure broad-based ac-cess to water and sanitation services across all of Turkey’s settlements, particularly small villages in remote rural areas. A companion program, SUKAP, was established in 2011 and through Iller Bank has reached millions of beneficiaries in a span of only three years. Its target has been small municipalities and involves a 50 percent subsidy to municipalities to encourage them to borrow from Iller Bank and
Source: TurkStat Public Expenditure Data, WB staff calculations
0.7
0.3
0.9
3.2
0.9
2.5
0.0
0.5
1.0
1.5
2.0
2.5
3.0
3.5
Water Wastewater Waste
In b
illio
n TL
2003 2008
Figure 5.18: Turkey substantially expanded public expenditures on water, wastewater and solid waste infrastructure between 2003 and 2008

Turkey’s Transitions
174
invest in critical infrastructure service needs. As reflected in Figure 5.18, investment in water, sani-tation and solid waste infrastructure rose dramati-cally from 2003 to 2008, due in part to programs like SUKAP.
Programs supporting fiscally-constrained munici-palities with matching grant subsidies helped dra-matically expand water supply and sanitation ser-vice coverage, particularly over the past decade. These programs, taken together with a national system that provides financing for municipalities through Iller Bank and commercial banks, have con-tributed to raising Turkey’s access to water supply to nearly universal coverage by 2011, and sanita-tion services coverage to 91 percent (Figure 5.19).
Turkish cities have also benefitted from an innova-tive and enabling national policy environment that facilitates private participation in the provision of municipal services. Conventional approaches to solid waste disposal followed by many cities involve the development of sanitary landfills through the city’s own resources and the operation and main-tenance of such facilities by municipal staff over time. Indeed, that is the approach that the City of Ankara took in the 1980s when it developed its first landfill in a peripheral district called Mamak. However, some 20 years later, in 2002, Ankara Met-ropolitan Municipality decided to test the market for a private sector solution. Its main aim was to shift the commercial risk to the private sector for developing and operating the landfill, attract pri-
Source: WDI and WB staff calculations
86
99
83 8681
98100 10094 93 94 97
0%10%20%30%40%50%60%70%80%90%
100%
Turkey EU MembersAverage (excl.
Romania &Poland)
Growth MarketsAverage
MENA Average BRICS Average EU CandidateAverage
Perc
ent o
f pop
ulati
on w
ith a
cces
s
Improved water source 1991 Improved water source 2011
84
100
6977
50
9291100
8390
65
96
0%
10%
20%
30%
40%
50%
60%
70%
80%
90%
100%
Turkey EU MembersAverage (excl.
Romania &Poland)
Growth MarketsAverage
MENA Average BRICS Average EU CandidateAverage
Perc
ent o
f pop
ulati
on w
ith a
cces
s
Improved sanitation facilities 1991 Improved sanitation facilities 2011
Figure 5.19: Turkey’s water and sanitation service coverage (1991-2011)
Water
Sanitation
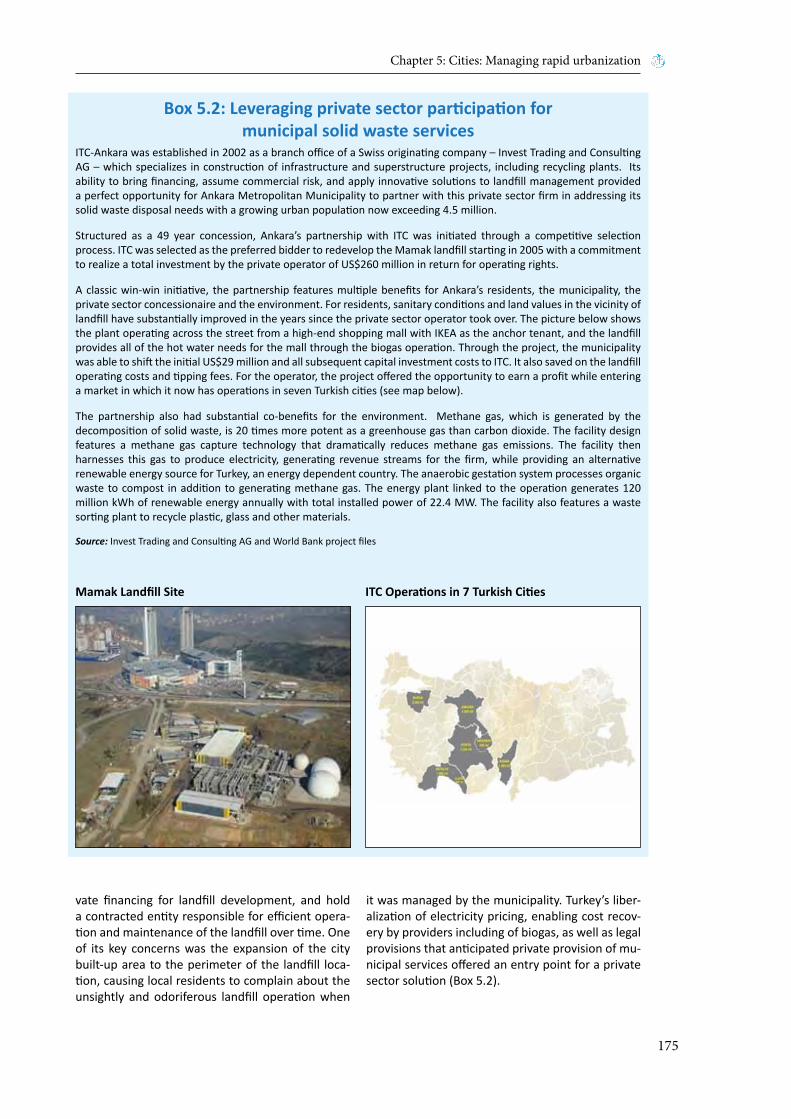
Chapter 5: Cities: Managing rapid urbanization
175
vate financing for landfill development, and hold a contracted entity responsible for efficient opera-tion and maintenance of the landfill over time. One of its key concerns was the expansion of the city built-up area to the perimeter of the landfill loca-tion, causing local residents to complain about the unsightly and odoriferous landfill operation when
it was managed by the municipality. Turkey’s liber-alization of electricity pricing, enabling cost recov-ery by providers including of biogas, as well as legal provisions that anticipated private provision of mu-nicipal services offered an entry point for a private sector solution (Box 5.2).
ITC-Ankara was established in 2002 as a branch office of a Swiss originating company – Invest Trading and Consulting AG – which specializes in construction of infrastructure and superstructure projects, including recycling plants. Its ability to bring financing, assume commercial risk, and apply innovative solutions to landfill management provided a perfect opportunity for Ankara Metropolitan Municipality to partner with this private sector firm in addressing its solid waste disposal needs with a growing urban population now exceeding 4.5 million.
Structured as a 49 year concession, Ankara’s partnership with ITC was initiated through a competitive selection process. ITC was selected as the preferred bidder to redevelop the Mamak landfill starting in 2005 with a commitment to realize a total investment by the private operator of US$260 million in return for operating rights.
A classic win-win initiative, the partnership features multiple benefits for Ankara’s residents, the municipality, the private sector concessionaire and the environment. For residents, sanitary conditions and land values in the vicinity of landfill have substantially improved in the years since the private sector operator took over. The picture below shows the plant operating across the street from a high-end shopping mall with IKEA as the anchor tenant, and the landfill provides all of the hot water needs for the mall through the biogas operation. Through the project, the municipality was able to shift the initial US$29 million and all subsequent capital investment costs to ITC. It also saved on the landfill operating costs and tipping fees. For the operator, the project offered the opportunity to earn a profit while entering a market in which it now has operations in seven Turkish cities (see map below).
The partnership also had substantial co-benefits for the environment. Methane gas, which is generated by the decomposition of solid waste, is 20 times more potent as a greenhouse gas than carbon dioxide. The facility design features a methane gas capture technology that dramatically reduces methane gas emissions. The facility then harnesses this gas to produce electricity, generating revenue streams for the firm, while providing an alternative renewable energy source for Turkey, an energy dependent country. The anaerobic gestation system processes organic waste to compost in addition to generating methane gas. The energy plant linked to the operation generates 120 million kWh of renewable energy annually with total installed power of 22.4 MW. The facility also features a waste sorting plant to recycle plastic, glass and other materials.
Source: Invest Trading and Consulting AG and World Bank project files
Mamak Landfill Site ITC Operations in 7 Turkish Cities
Box 5.2: Leveraging private sector participation formunicipal solid waste services

Turkey’s Transitions
176
How livable and sustainable are Turkey’s cities today?Turkish cities today offer a range of attractive fea-tures that make many of them both livable and a pleasure to visit. They have a wide range of cultural heritage endowments and many have modern, award-winning museums. They generally feature clean and well-maintained streets; solid waste col-lection is carried out daily in many of the larger cit-ies; taxi and public buses are frequently available and affordable; and there is virtually no evidence of slums of the type found in Latin America and South Asia. However, they still face a host of long-term sustainability challenges, such as the need to improve urban transport planning and systems, effective means of social engagement to broaden the benefits of urbanization to all city residents, and the spatial planning measures that will safe-guard against sprawl and inefficient, uncontrolled development. Taken together, these key challenges represent Turkey’s second generation agenda for sustainable urban development.
With a few exceptions, Turkish cities have effectively developed without plans over the last two decades. Turkish planning legislation allows for maximum planning flexibility by provisioning for amendment plans – a feature that is very rare in planning legisla-tion of developed countries. Many of the concerted planning efforts before the 1980s have diminished in substance and application. The impetus to be flexible is understandable during a period of rapid urbanization. However, a 2008 Council of Europe report indicates that in a single city as many as 250 amendment plans may be approved in a single year. What this means is that there is maximum uncer-tainty about the planned expansion of a city, how to link transport and other strategically important infrastructure to new residential and commercial needs and locations, which contributes in some instances to a mismatch of infrastructure services with development patterns – a very costly and in-efficient, not to mention unsustainable, future for cities.
The recently amended Metropolitan Municipality Law expands the number and geographical area of Turkey’s metropolitan municipalities, and this will present a critical challenge for Turkey’s cities. While the Metropolitan Municipality Law overall has had a positive impact on Turkey’s develop-ment, as noted earlier, the Law was amended again in 2012 (Law No. 6360) to add 14 new metropolitan municipalities. This measure may very well enable these cities to enjoy the “metropolitan effect” that their predecessors currently enjoy and the agglom-eration economies that come with it. However, the
Law also provides for all metropolitan municipali-ties to have their boundaries expanded to the limits of the province. In short, this would create a plan-ning area that in many cases well exceeds the met-ropolitan footprint. This will pose a major planning challenge as it implies that the same infrastructure service standards would need to be applied uni-versally across the entire provincial area, includ-ing both urban and rural settlement areas, which is not economically feasible. A second critical chal-lenge will be in managing urban land expansion and sprawl, as it would appear that conversion of rural to urban land would be less constrained under a single regime. These circumstances make effective strategic land use planning of metropolitan munici-palities a paramount policy priority.
Turkish cities have underinvested in public transit systems and personal vehicle use is on the rise. During early stages of urbanization, most cities have the financial means only to address basic ser-vice needs of their growing populations, and that has generally been true in Turkey as well. Devel-oping mass transit systems and other larger scale infrastructure needed by larger cities requires significant planning, a robust tax base and larger scale investments linked to well integrated land use planning. In past decades, many Turkish cities have relied on Turkey’s entrepreneurial private sector, including taxis and dolmus mini-buses, which are no longer adequate for larger scale cities. Conse-quently, many are only now beginning to address their growing urban transport needs in terms of planning and investing in public transit systems. Going forward, several fast growing cities will need to take steps to avoid congestion costs and other negative externalities. This reality is underscored by the relatively low capacity of Turkey’s mass transit systems, as reflected in Figure 5.20.
Without proactive policy and planning measures, the positive externalities of agglomeration econo-mies that Turkey has benefitted from over the years may turn into negative externalities of congestion and sprawl, depriving cities of the vitality that their city cores once knew. Rising land rent values and labor costs of Turkey’s cities have pushed out the boundaries of development as manufacturing firms seek lower cost locations to remain competitive. Improving policy coordination between institu-tions, strengthening the medium-term planning horizon of city governments and their accountabil-ity to citizens are critical priorities. This will become of even greater significance now that 14 municipali-ties have been granted metropolitan status, which took effect at the end of March 2014, following local elections. Effective planning measures will need to be put in place fairly rapidly to integrate planning across the entire provincial area. In that

Chapter 5: Cities: Managing rapid urbanization
177
regard, Turkey could benefit from lessons of other countries and policies that were adopted to man-age urban land expansion and prevent deteriora-tion of city central business districts or those that were required to promote urban renewal.
Turkey’s development planning and implementa-tion programs also do not sufficiently emphasize public consultation. Turkey’s rapid urbanization was, metaphorically, the tide that lifted all boats in economic terms, improving the lives of urban resi-dents as well as new rural migrants to cities across the board. But urbanization in Turkey, as in most other countries, also brought key challenges of so-cial dislocation and the often “un-neat” juxtaposi-tion of urban and rural cultures in a city setting that have yet to fully meld together into a civic culture and discourse. This phenomenon is inevitable and, managed well, can benefit all city residents through the diversity and co-mingling of different cultures and mindsets that spark creative energies, innova-tive ideas, and effective solutions. But this takes hard work and a dedicated commitment to public consultations in order to avoid the increasing criti-cisms of top-down interventions for which TOKİ is sometimes criticized. Engagement of community groups and development of a new social contract
represents the next development frontier for Tur-key’s cities.
The next development frontier for Turkey’s cities is well-captured in Turkey’s recently issued Tenth National Development Plan. Many of the critical development challenges for Turkey’s cities noted above are addressed in the Tenth Development Plan, including a critical emphasis on creating “Liv-able Spaces and Sustainable Environment.” The Plan places appropriate emphasis on policies aimed to promote (i) structural and functional improve-ments to the development planning system, includ-ing spatial planning and urban design; (ii) improving value capture from the conversion of rural to urban land in development planning (and using associ-ated revenue streams to develop social infrastruc-ture, including the expansion of public and green areas); (iii) using urban transformation to enhance city competitiveness and improving the efficiency of urban land management; and (iv) promoting social harmony, urban integrity, aesthetics and cul-ture in Turkish cities. All of these policy measures will need effective planning and monitoring of city performance and establishing the monitoring sys-tems necessary to promote livable and sustainable cities in Turkey.
Source: Tool for Rapid Assessment of City Energy (TRACE) Gaziantep Report and selected city data from TRACE database
197178
152
92.5 83.562.6 59.6
35.3 33.5 26.316.1 15.3 13.7 10.8 10.1 5.5
0
50
100
150
200
250
Buda
pest
War
saw
Paris
New
Yor
k
Buch
ares
t
Belg
rade
Sara
jevo
Rio
De
Jane
iro
Sam
sun
Eski
sehi
r
Amm
an
Baku
Gazia
ntep
Yere
van
Ista
nbul
Anka
ra
Met
ers
of H
igh
Tran
sit C
apac
ity P
er C
apita
Figure 5.20: Meters of high transit capacity per capita for selected cities
Turkey’s Transitions
178
ReferencesBahl, R., Linn, J., & Wetzel, D. (2013). Financing Met-ropolitan Governments in Developing Countries. Cambridge, MA: Lincoln Institute of Land Policy.
Balter, M. (1998, November). The First Cities – Why Settle Down? The Mystery of Communities. Science Magazine, Vol: 282 No:5393, 1442.
Bertaud, A. (2010, May). Land Markets, Govern-ment Interventions, and Housing Affordability. Working Paper 18. Washington, D.C.: Wolfensohn Center for Development at Brookings.
Bugra, A. (1998). The Immoral Economy of Hous-ing in Turkey. Insternational Journal of Urban and Regional Research, 22(2), 303-317.
Global Water Intelligence. (2011, September). GWI Market Report. Vol. 12, Issue 9.
Ozdemir, D. (2011). The Role of the Public Sector in the Provision of Housing Supply in Turkey, 1950-2009. International Journal of Urban and Regional Research, 35(6).
Ravallion, M., Chen, S., & Sangraula, P. (2007, April). New Evidence on the Urbanization of Global Pov-erty. World Bank Policy Research Working Paper 4199. World Bank.
Spence, M., Annez, P., & Buckley, R. (2009). Urban-ization and Growth. Commission on Growth and Development. The World Bank.
Tekeli, I. (2009). Cities in Modern Turkey. London School of Economics and Political Science.
TEPAV (Turkish Economic Policy Research Institute). (2013). Working Papers submitted for Turkey Ur-banization Review.
TOBB. (2007 and 2011). Enterprise Survey Data-base.
World Bank. (2008). Reshaping Economic Geogra-phy. World Development Report 2009. Washington, D.C.: The World Bank.
World Bank. (2010). Systems of Cities: Harnessing Urbanization Growth and Poverty Allevation. World Bank Urban Strategy. Washington, D.C.: World Bank.
World Bank. (Forthcoming 2014). Turkey Urbaniza-tion Review: Rise of the Anatolian Tigers. World Bank.
Yenice, M., & Ciftci, C. (2011). Sustainable Devel-opment and Urban Form: Planning Experiences of Konya City. International Journal of Enviromental, Cultural, Economic and Social Sustainability.

Chapter 6: Labor: Creating jobs for women and youth
179
Labor: Creating jobs forwomen and youth
Chapter 6
Turkey’s Transitions: Integration, Inclusion, Institutions
Welfare
FiscalSpace
Enterprise
Trade
Infrastucture
Finance
Cities

Turkey’s Transitions
180
Chapter 6: Labor: Creating jobs for women and youth
181
Labor:Creating jobs for women and youth
Nejla was a housewife until recently, but now her life and that of her family have changed. She works as an assistant nurse in the local
medical center in Nevşehir, a mid-sized Anatolian town. Her income is not very high but high enough to set some money aside to buy presents for her grandchildren. This is the biggest change in her life and makes her immensely proud, even though the work is physically demanding. Nejla’s husband at first, did not want to let her work outside the house. Nejla had heard that the medical center needed nurse assistants and that they would provide basic training. She wanted to try but her husband said no. In fact, he worried about her leaving the house even to go shopping. Eventually, however, Nejla’s son in law convinced her husband to let her go and work. Today Nejla is proud to share her story and most importantly, how she can now help her grand-children with her own income.1
The story of Nejla illustrates the close linkages be-tween socio-economic change and the labor market in Turkey. It shows how urbanization changes the working lives of women and initially keeps them tied to household chores, while men remain en-gaged in paid work (see Chapter 5). Over time, how-ever, as the labor market tightens, more and more women get drawn back into the labor force.2 This, in turn, encourages their neighbors to do the same. The story also shows how family roles are shifting across generations and there is greater acceptance of women working among the younger generation. This and the increase in educational attainment of girls have helped reverse the trend of declining fe-male labor force participation (LFP) in Turkey.
The labor market is also at the center of changes in people’s living standards over the past decade. As Chapter 1 illustrates, significant declines in pov-erty and increases in the income of the bottom 40 percent in Turkey (a phenomenon the World Bank Group calls “shared prosperity”) have been associated with rising labor earnings as well as an increase in LFP rates among household members. Work and welfare have been closely linked in Tur-key. It is, therefore, critical to understand the func-tioning of the labor market to account for Turkey’s inclusive growth story and assess its sustainability.
Against this background this chapter asks and an-swers three questions.
• First, how does Turkey’s recent labor market performance compare with historical trends and other emerging markets? The short answer
is that Turkey’s labor market performance since 2009 has been remarkable. The country cre-ated some 4.2 million jobs between 2009-2013 while, during the same period employment in the European Union (EU) declined by 2 million. Employment growth during this period was 4.9 percent per annum, compared with less than 2.5 percent in the growth markets, less than 2 percent in Middle East and North Africa (MENA), just 1.1 percent in the BRICs, and a de-cline of 1 percent in the new EU member states. These trends are also remarkable compared to Turkey’s pre-crisis performance. Throughout the 1990s and 2000s, Turkey’s unemployment rate was stubbornly high and employment re-sponded only moderately to economic growth. Whether Turkey going forward, will continue to create jobs at the pace it did in 2009-2013 or whether it will fall back to earlier, slower job growth trends will be a key determinant of the country’s pace of transition to high income.
• Second, what factors contributed to Turkey’s rapid employment creation after 2009? The chapter provides only a tentative answer to this question, as the evidence is not yet conclusive. A key factor seems to have been the continued process of structural change, which has promot-ed the creation of service sector jobs in Turkey’s growing cities, including in the less advanced regions (Chapter 4). The booming construction sector has also added to job creation, while ag-riculture has experienced a temporary halt in worker outflows. Government policy has helped through targeted reductions in social security contributions, while employment restrictions that appear onerous on paper have presented less of a binding constraint than might have been expected thanks to weak enforcement in the still large informal economy.
• Third, is Turkey’s young and growing population a challenge or an opportunity? The answer is a bit of both. It is an opportunity because Turkey is going through the most productive part of the demographic transition, where birth rates have already tailed off and dependency rates are fall-ing. It is also an opportunity because, as Chap-ter 7 elaborates, the young are far better edu-cated than their parents and this should further boost Turkey’s productive potential. It is a chal-lenge because the need to create jobs for new labor force entrants is compounded by the need to find employment for the growing number of women entering the labor force. The chapter summarizes policy options that could turn these challenges into a double demographic dividend.
1 Nejla was one of the participants at an Adım Adım Anadolu Event organized by the Ministry of Family and Social Policy, TUSIAD and the World Bank. Her story is printed here with her permission.
2 Tony Judt (2005) describes a similar phenomenon in his account of post-war Southern Europe.

Turkey’s Transitions
182
Turkey’s job-rich growthafter the crisisTurkey’s labor market historically exhibited many of the features of dual labor markets in other middle income countries. The shift from agriculture to manufacturing and services was combined with the growth of an informal urban sector, employing re-cent arrivals to the city in low skilled jobs. Female LFP declined as women left active employment in the rural economy to look after the household and the children in a less accommodating urban setting. As a result LFP rates were low and unemployment
– both official and hidden – relatively high (Figure 6.1). Heavy labor market regulation led to signifi-cant segmentation between the formal and infor-mal sectors (World Bank, 2010). It was, thus, not clear whether Turkey’s labor market offered posi-tive lessons for others to study.
Yet, Turkey’s recent ability to create jobs at a re-markable pace warrants a reappraisal. Turkey was among the hardest-hit countries by the global economic and financial crisis but its labor market weathered the storm extremely well and Turkey stands out as an exemplary case of employment creation in the past few years. Despite a temporary
Source: World Development Indicators (WDI)Note: Comparisons are drawn with The Organisation for Economic Co-operation and Development (OECD) averages in this chapter in addition to the peer groups used throughout the report. Categories are overlapping to some extent.
0%
10%
20%
30%
40%
50%
60%
70%
MENA EU Candidates Turkey New EUMembers
OECDMembers
BRICS GrowthMarkets
Labo
r For
ce P
artic
ipati
on R
ate
1990`s average 2000`s average 2010-2012 average
0%
2%
4%
6%
8%
10%
12%
14%
16%
18%
20%
GrowthMarkets
OECDMembers
BRICS New EUMembers
Turkey MENA EU Candidates
Unem
ploy
men
t Ra
te
1990`s average 2000`s average 2010-2012 average
Figure 6.1: Labor force participation in Turkey is lower and unemployment higher than in most peers

Chapter 6: Labor: Creating jobs for women and youth
183
spike to 15 percent during the crisis, unemployment declined to below pre-crisis levels and Turkey’s em-ployment in 2013 was 25 percent higher than it had been in 2007 (Figure 6.2). Increasing employment importantly has benefited both youth and women, two groups that have traditionally had lower than average employment rates. Youth unemployment, which hovered around 20 percent before the crisis,
declined to around 18 percent after the crisis, and female LFP began to climb, albeit from low levels.
Employment creation remained strong even as growth decelerated in 2012 and 2013. Monthly growth rates in employment remained above 3 per-cent in the first half of 2013, even though growth momentum slowed down in 2012 and 2013. This pace of job creation is significantly above pre-crises
Source: TurkStat
80
90
100
110
120
130
140
150
2004 2005 2006 2007 2008 2009 2010 2011 2012 2013
Inde
x 20
04=1
00
GDP Employment
Figure 6.2: Turkey’s remarkable post-crisis employment performance
Table 6.1: Most jobs go to the better educated
Share in WAPEmployment
Rate InformalityEmployment
Growth (thsnd)Contribution
(percent)
2004 2012 2004 2012 2004 2012 (2004-2012) (2004-2012)
Tota
l
Total 41.3 45.4 50.1 39.0 5189
Less than secondary 61.5 51.6 37.9 39.3 66.4 58.2 18 0.3
Secondary 31.7 36.9 42.0 45.7 36.0 31.8 2893 55.8
Higher 6.7 11.5 69.2 71.1 9.3 6.4 2278 43.9
Mal
e
Total 62.7 65.0 44.3 32.7 2926
Less than secondary 52.5 43.2 64.6 63.3 57.1 45.9 -518 -17.7
Secondary 39 43.3 57.3 62.3 34.7 29.4 2066 70.6
Higher 8.5 13.6 76.0 78.9 10.3 7.4 1378 47.1
Fem
ale
Total 25.2 26.3 67.1 54.2 2263
Less than secondary 85.1 59.7 18.8 22.5 89.3 82.5 536 23.7
Secondary 8.8 30.7 64.3 23.1 42.3 40.8 827 36.5
Higher 6.1 9.6 58.3 60.4 7.0 4.7 900 39.8
Source: TurkStat

Turkey’s Transitions
184
rates. Indeed, the growth elasticity of employment increased to 0.76 during 2009-2013, up from 0.26 during 2004-2007, and this increase was observed across all sectors3. We look at the types of jobs cre-ated in Turkey next, which suggest a large propor-tion of job creation is due to structural factors, al-though more temporary factors such as an increase in construction employment and some reverse job flows into agriculture also contributed.
Good jobs are created …
The formal service sector for highly educated workers has been the main driver of employment growth. Of the new net employment generated between 2005 and 2011, 76 percent was in non-agricultural sectors and close to half (49.1 percent) came from an increase in the services sector. Out-side agriculture, net new job creation benefited
Source: Labor Force Survey (LFS), TurkStat
Source: WDI
0.0%
0.5%
1.0%
1.5%
2.0%
2.5%
3.0%
3.5%
4.0%
4.5%
0.0
0.5
1.0
1.5
2.0
2.5
3.0
3.5
4.0
4.5
5.0
2005 2006 2007 2008 2009 2010 2011
In m
illio
n
Husbands are unemployed
Husbands are employed or out of labor force
Percent of married women who work and whose husbands are unemployed (right axis)
35%
40%
45%
50%
55%
60%
65%
2007 2008 2009 2010 2011 2012
Empl
oym
ent
of p
opul
ation
15+
BRICS EU Members EU CandidateMENA Growth Markets OECD MembersGreece Spain Turkey
Figure 6.3: The added worker effect
Figure 6.4: Employment rates are up but still low Employment rate (percent of total population 15+), 2007-2012
3 Population statistics were updated starting from 2004. According to TurkStat, statistics before and after 2004 should not be merged. Therefore, we use 2004-2007 as a proxy for the pre-crisis period.

Chapter 6: Labor: Creating jobs for women and youth
185
higher education graduates (half of all new jobs).4 Overall, almost 44 percent of employment growth came from university graduates who have a lower informality rate compared to other education lev-els (Table 6.1). On the other hand, since most of the employment growth in agriculture was due to women, less educated women also contributed sig-nificantly to female employment growth.
Crisis-related increases in labor supply do not ex-plain the increases in Turkey’s employment rate since 2007. An increase in the labor supply of mar-ried women (the “added worker effect”) can often be observed when their husbands become unem-ployed. Married women are often secondary work-ers with a less permanent attachment to the labor market than their partners. Karaoğlan and Ökten (2012) find a significant added worker effect on married women’s LFP in the period of 2000-2010 in Turkey. Başkaya and Şengül (2012) analyse the relation between business cycles and LFP of wom-en and men and find that women’s LFP increases in economic downturns in contrast to men’s. An upper bound estimate of the added worker effect would be the increase in the number of married women who are working and whose husbands are unemployed5. There is a 21 percent (or 38,000 in numbers) increase in such women in 2009 (Figure
6.3). This is a small proportion of the total increase in female employment in 2009, which was up by 276,000, of which 156,000 in the informal sector.
..if not yet for everyone
The success of Turkey in job creation after 2009 not-withstanding, Turkey’s employment rate remains below that of most peers. The employment rate for the working age population (WAP) (15+) is around 45 percent, significantly lower than the OECD aver-age of around 55 percent (Figure 6.4). Interestingly, the gap between Turkey and Southern European countries hard hit by the economic crisis, such as Greece and Spain, has shrunk in recent years as the employment rate in Turkey has increased at the same time as it declined in Southern Europe.6 In in-ternational comparison, Turkey’s employment rate is above that in MENA countries but lower than in other peers.
The low level of female LFP lies behind Turkey’s po-sition with respect to its peers (Figure 6.5). Male LFP was recorded as 76 percent in 2012, only 3 per-centage points lower than the OECD average. On the other hand, female LFP is only 30 percent, less than half of the average of OECD countries at 62
Source: OECD
0%
10%
20%
30%
40%
50%
60%
70%
80%
90%
Male Female Total
Shar
e of
tota
l pop
ulati
on, a
ge 1
5-64
, 201
1
Turkey OECD
Figure 6.5: The gender gap explains why employment rates are low Labor force participation in Turkey and OECD by gender
4 World Bank (2013 d, chapter 2).
5 If husbands of women that are already working anyway become unemployed during the crisis, the women would be counted in the analysis as well. In the absence of panel data that follows the same woman over time, this upper bound estimate is the best alternative.
6 Figure 6.4 is based on employment rates for the population aged 15 +. Since Turkey has a relatively large share of elderly (above 64) in agriculture who are still employed, this accounts for the fact that its employment rate in 2012 exceeded that of Spain and Greece, where much fewer in the 64+ age group still work. If we had limited comparison to the 15+-64 age group, both Greece and Spain would have higher employment rates than Turkey, although the gap would still be declining rapidly over the past four years.

Turkey’s Transitions
186
percent, and 17 percentage points lower than the second to lowest OECD member (Mexico, with 47 percent). The comparison to non-OECD peers is not much different (see also Chapter 1).
However, a generational shift may be under way. Women from younger birth cohorts participate more often in the labor market than their coun-terparts from older birth cohorts. Figure 6.6 shows
that the LFP rate of women that were born 1963-67 equaled 20 percent when they reached age 30-34. This rate almost doubles to about 38 percent for the same age group in the younger generation born between 1978 and 1982. The four youngest birth cohorts (females born between 1968 and 1987) ex-perienced a tremendous increase in LFP in the past five years. From 2007 to 2012, female LFP for these
Source: TurkStat LFS (1992, 1997, 2002, 2007, 2012). Data labels represent year of birth
Source: TurkStat
1983-871978-82 1973-77 1968-72
1963-67
1958-62
1953-57
0%
5%
10%
15%
20%
25%
30%
35%
40%
45%
15-19 20-24 25-29 30-34 35-39 40-44 45-49 50-54 55-59 60-64
Labo
r For
ce P
artic
ipati
on R
ate o
f Urb
an W
omen
Age
0%
20%
40%
60%
80%
100%
120%
15-19 20-24 25-29 30-34 35-39 40-44 45-49 50-54 55-59 60-64 65+
Labo
r For
ce P
artic
ipati
on R
ate
Age
Male 2000 Male 2012 Female 2000 Female 2012
Figure 6.6: Younger women are more likely to be active Labor force participation by age and birth cohort7
Figure 6.7: The gender gap is declining
7 The findings presented in this Chart were first notified to the team by Dr. İnsan Tunalı.

Chapter 6: Labor: Creating jobs for women and youth
187
four birth cohorts increased by about 10 percent-age points.
The changing demographic profile of working wom-en may herald a change in trend towards sustained increases in female LFP. The composition of the fe-male labor force changed significantly compared to the male labor force in the 2000s (Figure 6.7). For both males and females, LFP declined for the youngest (15-19) and oldest (55+) age groups. In the prime age group (20-54), male LFP did not al-ter much. On the other hand, there is a significant rise in female LFP for the 20-44 year age groups. The increase in female LFP in the prime age group is consistent with the improvements in educational outcomes as well as demographic changes such as delayed marriage and fertility (Dayıoğlu and Kırdar, 2010). As the retirement age also gradually in-creased, the share of the high-participation group can be expected to increase in the upcoming years.
Turkey seems, thus, to be following the U-shape pattern for female LFP typical of past development paths in many emerging markets (Goldin, 1994; Mammen and Paxson, 2000). Agricultural shedding and urbanization were the main drivers of decreas-ing female LFP rates through the middle of the 2000s. Female workers, who were mostly unpaid family workers in agriculture, could not participate in the urban labor force after migration to cities, contrary to their husbands (World Bank, 2009.a), primarily due to low levels of education. In addi-tion, the lack of child care in cities as opposed to the availability of family members in rural areas was another constraint that rural migrants faced.
Since then, the pace of job creation among better educated females has begun to exceed the decline in female employment as less skilled women move from rural areas to the city and employment rates are increasing. However, Turkey is still at a relatively shallow end of the ascendant part of the U (Figure 6.8). Policies to further increase female LFP are dis-cussed further below.
Because of low attachment to the labor market, the contribution of women’s earnings to the reduction of poverty and shared prosperity in Turkey has been low to date. As shown in Chapter 1, work and wel-fare have been closely linked. Since many women do not work, their contribution to household wel-fare has been marginal (Figure 6.9). In fact, because women from richer households are more likely to have joined the labor force over the past decade, this has contributed marginally to higher inequal-ity. However, if the trend towards rising female LFP is sustained and women from lower income brack-ets join the labor force, this will, over time, make a significant contribution to poverty reduction and to reduced inequality – as the experience of some Latin American countries over the past decade sug-gests. Work and welfare will, thus, continue to be linked, with women playing a key role in the future.
Some jobs could still be better
Overall formality has improved measurably but informality is still high. Job informality (defined as jobs without social security benefits) has come down remarkably from 48 percent in 2005 but it still affects 37 percent of workers in 2013 (Figure
Source: International Labor Organisation (ILO), WDI
1980 1985
1988 1989 1990 1991 1992
1993
1994 1995
1996 1997 1998
1999
2000 2001 2002
2003
2004 2005 2006 2007 2008
2009 2010
15
20
25
30
35
40
45
50
0 2,000 4,000 6,000 8,000 10,000 12,000
Fem
ale
Labo
r For
ce P
artic
ipati
on
(in p
erce
nt, 1
5+)
GDP/capita (current US$)
GOAL: - High Female LFP - High GDP/capita - Enough jobs for
high-and low skilled workers
Change 2007 - 2010: Increased female LFP and GDP/capita
Figure 6.8: The U-curve of female LFP in Turkey GDP and female labor supply in Turkey (1989-2010)
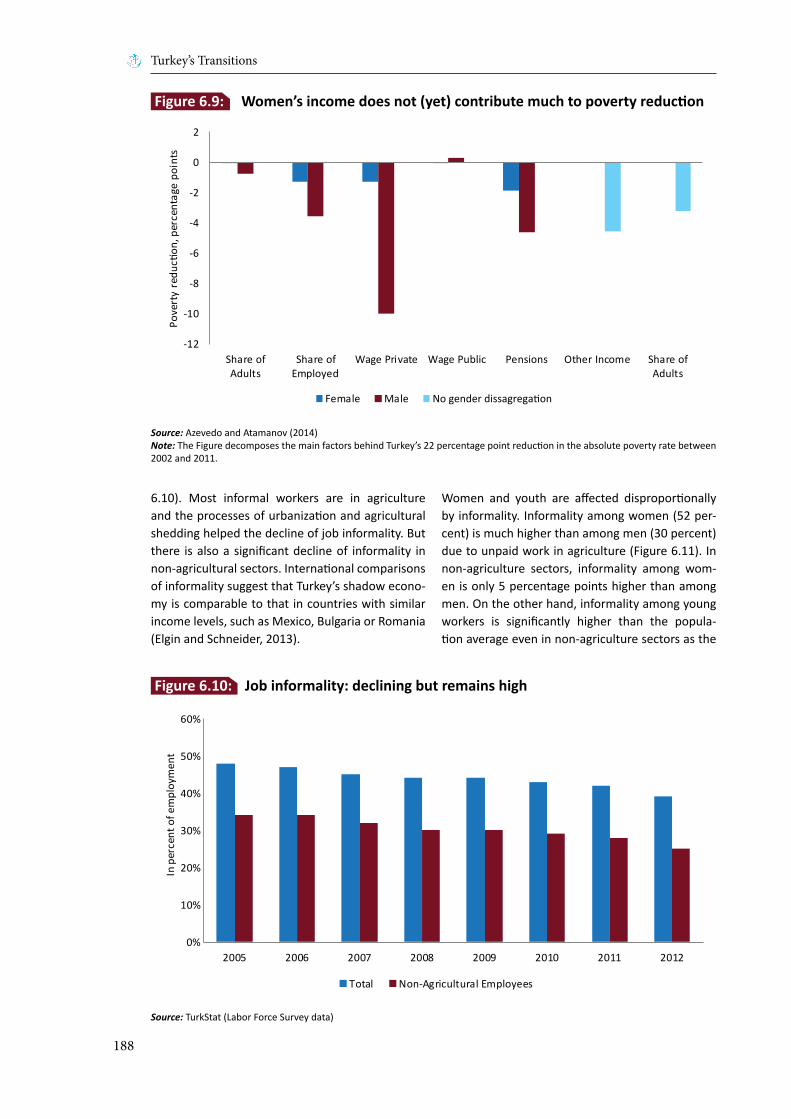
Turkey’s Transitions
188
6.10). Most informal workers are in agriculture and the processes of urbanization and agricultural shedding helped the decline of job informality. But there is also a significant decline of informality in non-agricultural sectors. International comparisons of informality suggest that Turkey’s shadow econo-my is comparable to that in countries with similar income levels, such as Mexico, Bulgaria or Romania (Elgin and Schneider, 2013).
Women and youth are affected disproportionally by informality. Informality among women (52 per-cent) is much higher than among men (30 percent) due to unpaid work in agriculture (Figure 6.11). In non-agriculture sectors, informality among wom-en is only 5 percentage points higher than among men. On the other hand, informality among young workers is significantly higher than the popula-tion average even in non-agriculture sectors as the
Source: TurkStat (Labor Force Survey data)
0%
10%
20%
30%
40%
50%
60%
2005 2006 2007 2008 2009 2010 2011 2012
In p
erce
nt o
f em
ploy
men
t
Total Non-Agricultural Employees
Figure 6.10: Job informality: declining but remains high
Source: Azevedo and Atamanov (2014)Note: The Figure decomposes the main factors behind Turkey’s 22 percentage point reduction in the absolute poverty rate between 2002 and 2011.
-12
-10
-8
-6
-4
-2
0
2
Share ofAdults
Share ofEmployed
Wage Private Wage Public Pensions Other Income Share ofAdults
Pove
rty
redu
ction
, per
cent
age
poin
ts
Female Male No gender dissagregation
Figure 6.9: Women’s income does not (yet) contribute much to poverty reduction

Chapter 6: Labor: Creating jobs for women and youth
189
young often experience entry barriers to formal employment (Tansel and Kan, 2011). Informality may cause an earnings gap between workers with similar observable characteristics and the gap ap-pears to be higher among women and young work-ers compared to prime age males (Başkaya and Hu-lagu, 2011).
Turkey’s rigid employment legislation could be one factor behind informality. Turkey has the strictest employment legislation among OECD countries according to the employment protection index created by the OECD (Figure 6.12). Cross country evidence suggests that a heavier regulatory burden
might induce informality (Loayza et al., 2005). Firms may choose to hire workers informally in order to escape the cost of hiring or firing due to rigid regu-lations. Moreover, the minimum wage, as a ratio of the median wage, in Turkey is highest among the OECD countries, which might increase informality among low skilled workers.
Another factor behind informality in the Turkish labor market might be the low retirement age. Despite the pension reforms that will gradually in-crease the retirement age to 65 for both men and women, workers today can still retire before the age of 50. Retirees do not pay taxes on their pen-
Source: TurkStatNote: Informality is defined as the ratio of workers without social security registration to total employment.
0%
10%
20%
30%
40%
50%
60%
Total Non-Agriculture
Perc
ent o
f Tot
al Em
ploy
men
t
Male Female
0%
10%
20%
30%
40%
50%
60%
Total Non-Agriculture
Perc
ent o
f Tot
al Em
ploy
men
t
Total 15-24
Figure 6.11: Informality is higher among women and youth
Source: OECD, World Bank (WB) staff calculationsNote: The index is calculated as a simple average of 3 indices created by OECD; strictness of employment protection legislation for collective dismissals, regular employment and temporary employment.
0.0
0.5
1.0
1.5
2.0
2.5
3.0
3.5
4.0
Turk
eyLu
xem
bour
gFr
ance
Belg
ium
Italy
Mex
ico
Slov
enia
Gre
ece
Spai
nN
orw
ayLa
tvia
Ger
man
yEs
toni
aSl
ovak
iaAu
stria
Pola
ndPo
rtug
alN
ethe
rland
sCz
ech
Repu
blic
Hung
ary
OEC
DIc
elan
dDe
nmar
kKo
rea,
Rep
.Sw
itzer
land
Irela
ndSw
eden
Japa
nFi
nlan
dIs
rael
Aust
ralia
Chile
Uni
ted
King
dom
Cana
daU
nite
d St
ates
New
Zea
land
Empl
oym
ent
Prot
ectio
n Le
gisl
ation
Inde
x
Figure 6.12: Turkey’s labor markets are segmented because of high costs of formality

Turkey’s Transitions
190
sions and have access to full health insurance with-out having to pay contributions, inducing workers who retire early and work informally. Tansel and Kan (2011) find that being in the age group 45 to 64 significantly increases the probability of working informally. World Bank (2010) estimates that 2 mil-lion pensioners worked informally as of 2008.
While informality is a symptom of restrictive formal employment regulations, it is also a factor mitigat-ing the impact of these regulations. This may ex-plain why despite of restrictive labor market poli-cies, employment creation has been so rapid. Over a longer period, Taşkın (2013) finds little difference in employment adjustment patterns in the US and Turkey during 1955-2012, although the two coun-tries sit at opposite extremes of OECD’s Employ-ment Protection Legislation Index. In a similar vein, OECD (2014) argues that because of strict regula-tions but lax enforcement, firms satisfy growing demand by taking on additional workers informally. At the same time, however, government policy has tried to lower barriers to formal employment with some effect. This is to what we now turn.
What did the Turkish government do right? – Policies that supported employment creationTurkey showed a sensible policy response to the crisis
The government implemented several measures as a response to the global financial crises in 2008.8 In January 2008, a minimum living allowance for per-sonal income tax was introduced which reduced the tax wedge by between 2.5 and 6 percentage points depending on the family status and income level of the worker. Furthermore, social security contribu-tions for employers were reduced by 5 percentage points in October 2008, which reduced the average tax wedge by another 2.5-3 percent (World Bank, 2010).9 As a result, Turkey’s ranking among OECD countries improved considerably (Figure 6.13).
In addition to across the board reductions in the labor tax wedge, several incentives were imple-mented to induce employment in targeted groups. Social security contributions were paid by the un-employment insurance fund up to the level due for the minimum wage for young workers (18-29 years old) and all women above 18 that were not formal-ly employed in the last 6 months and constituted net hires for firms in the period between July 2008
and June 2010. These employment subsidies were found to be effective. World Bank (2013) simulates that the reductions in social security contributions caused 0.65 and 0.46 percent increases in female and youth employment (aged 15-29), respectively, whereas the effect of similar reductions across the board on total employment would have been just 0.21 percent. Balkan, Başkaya and Tümen (2014) find that the targeted incentives increased the probability of employment among women in the prime age group by 2-2.5 percent, with the effect strongest among women above age 30. In 2011, the reductions were extended till 2015 and new target groups were added. More specifically, firms which hire new workers, who either attended train-ing courses of Turkish Labor Agency (İŞKUR) or who have vocational training certificates or were reg-istered as unemployed in İŞKUR, can also benefit from the reductions.
Reductions in labor costs for targeted groups were found to be more cost effective compared to across-the-board reductions. This is because workers from categories in high demand in the labor market may bargain away payroll tax reductions resulting in higher wages, and, thus, muting the intended ef-fect on lower labor costs and higher employment. Simulations suggest that less than 50 percent of reductions in social security contributions are translated into reduced labor cost in an across-the-board scheme, compared to a 75 percent reduc-tion in case of social security contribution subsidies targeted to minimum wage earners (World Bank 2009.b). In a similar fashion, World Bank (2013.b) estimates that the cost per employee of across-the-board reductions is more than three times the cost for targeted groups.
The government expanded a short-time work scheme in order to prevent job losses and intro-duced public works in order to create jobs for the unemployed. A short-term work scheme, which was introduced in 2005, was expanded from 3 months to 6 months in order to partially compen-sate workers in firms with reduced working hours. The income loss of workers who worked fewer than the usual hours due to the crisis was compensated by the unemployment insurance fund, allowing firms to retain workers and avoid the costs of re-dundancies and, later, the cost of rehiring. Around half a million workers benefited from the scheme in the crisis year 2009. Another measure was a public works scheme where unemployed workers registered at İŞKUR could work for 6 months (9 months since 2012) in public works and be paid the
8 For the full set of government response to crisis in the labor market, see World Bank 2013.a.
9 The reductions in social security contributions were implemented in the form of incentives to firms which paid their social security contributions fully.
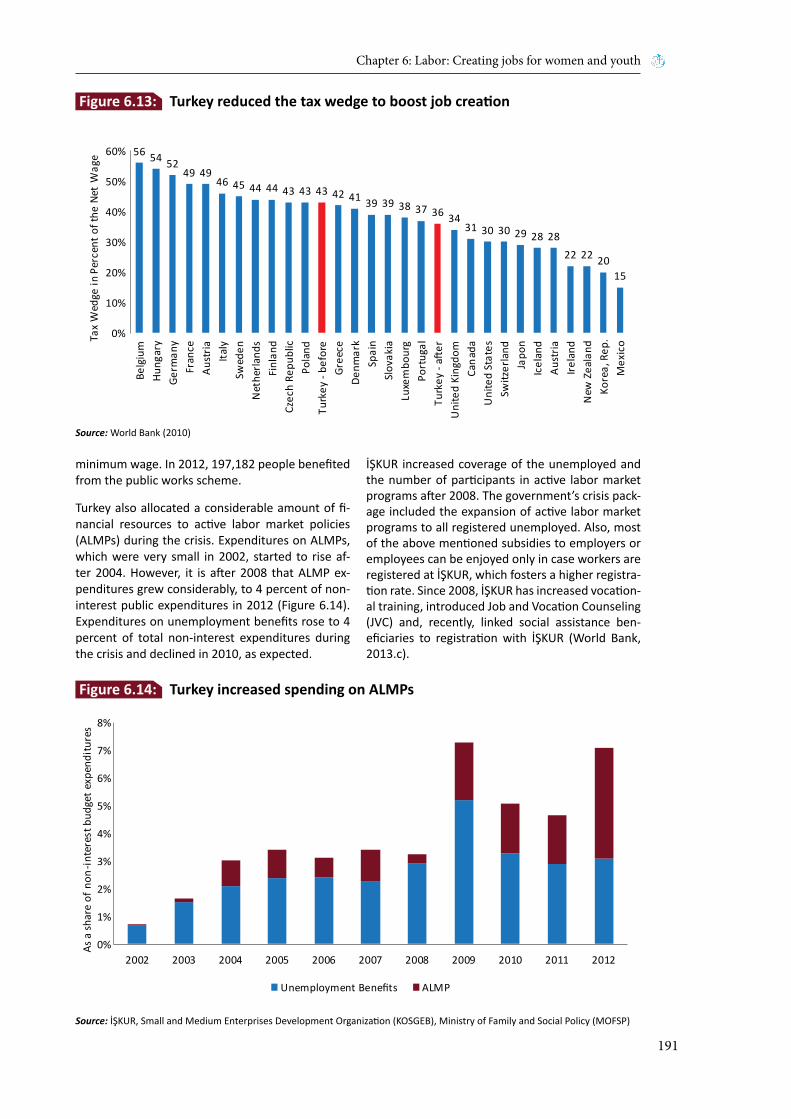
Chapter 6: Labor: Creating jobs for women and youth
191
minimum wage. In 2012, 197,182 people benefited from the public works scheme.
Turkey also allocated a considerable amount of fi-nancial resources to active labor market policies (ALMPs) during the crisis. Expenditures on ALMPs, which were very small in 2002, started to rise af-ter 2004. However, it is after 2008 that ALMP ex-penditures grew considerably, to 4 percent of non-interest public expenditures in 2012 (Figure 6.14). Expenditures on unemployment benefits rose to 4 percent of total non-interest expenditures during the crisis and declined in 2010, as expected.
İŞKUR increased coverage of the unemployed and the number of participants in active labor market programs after 2008. The government’s crisis pack-age included the expansion of active labor market programs to all registered unemployed. Also, most of the above mentioned subsidies to employers or employees can be enjoyed only in case workers are registered at İŞKUR, which fosters a higher registra-tion rate. Since 2008, İŞKUR has increased vocation-al training, introduced Job and Vocation Counseling (JVC) and, recently, linked social assistance ben-eficiaries to registration with İŞKUR (World Bank, 2013.c).
Source: World Bank (2010)
Source: İŞKUR, Small and Medium Enterprises Development Organization (KOSGEB), Ministry of Family and Social Policy (MOFSP)
56 54 5249 49
46 45 44 44 43 43 43 42 41 39 39 38 37 36 3431 30 30 29 28 28
22 22 2015
0%
10%
20%
30%
40%
50%
60%Be
lgiu
mHu
ngar
yGe
rman
yFr
ance
Aust
riaIta
lySw
eden
Net
herla
nds
Finl
and
Czec
h Re
publ
icPo
land
Turk
ey -
befo
reGr
eece
Denm
ark
Spai
nSl
ovak
iaLu
xem
bour
gPo
rtug
alTu
rkey
- aft
erU
nite
d Ki
ngdo
mCa
nada
Uni
ted
Stat
esSw
itzer
land
Japo
nIc
elan
dAu
stria
Irela
ndN
ew Z
eala
ndKo
rea,
Rep
.M
exic
oTax
Wed
ge in
Per
cent
of t
he N
et W
age
0%
1%
2%
3%
4%
5%
6%
7%
8%
2002 2003 2004 2005 2006 2007 2008 2009 2010 2011 2012
As a
shar
e of
non
-inte
rest
bud
get e
xpen
ditu
res
Unemployment Benefits ALMP
Figure 6.13: Turkey reduced the tax wedge to boost job creation
Figure 6.14: Turkey increased spending on ALMPs

Turkey’s Transitions
192
Consequently, the share of the total workforce and unemployed registered with İŞKUR increased strongly after the crisis. The share of the unem-ployed registered with İŞKUR increased from 34 percent to 94 percent between 2004 and 2012 (Figure 6.15). During the same period, the share of all unemployed registered with İŞKUR that was matched with a new job also increased from 4 per-cent to 23.5 percent. At the same time, the number of vacancies registered in İŞKUR increased nine fold from around 110,000 to 992,000. As a next step, İŞKUR should focus on improving placement rates as the ratio of placements over vacancies has actu-ally moderately declined.
Government policies have also contributed to the decline in informality. In 2009, the Government launched an action plan against informality, which includes measures such as strengthening the ca-pacity of tax and social security audits, sharing da-tabases among agencies, and moving towards a risk based inspection system. These measures, togeth-er with a lowering of corporate income taxation, as well as the targeted reductions in payroll taxes, may have contributed to the decline in informality. Interestingly, business statistics show a spike in the number of firms with more than 20 employees af-ter 2010, which may be one indication of the suc-cess in enticing firms over the threshold of infor-mality (World Bank, 2013.d).
Targeted government support is one factor to ex-plain how Turkey’s growth became job-rich after the crisis. Simulations suggest that 15 percent of employment growth can be attributed to declining social security contributions in 2008 (World Bank, 2013.b). In addition, public employment, which did not contribute to the employment growth in the years before the crisis, started to increase after the crisis (Ceritoğlu et al., 2012). Around 10 percent of new jobs came from the public sector between 2009 and 2011 (World Bank, 2013.d). The targeted policy measures to combat informality have further shifted relative incentives towards employment creation in the formal sector. Public policy, thus, made important contributions to Turkey’s employ-ment creation story after the crisis.
However, government policies alone cannot explain the strength of the labor market. Arguably, a key reason for rapid employment growth has been the strength in domestic demand for relatively labor intensive activities such as services and construc-tion, at the same time as labor supply has become more skilled. As is discussed in Chapter 4 in detail, this has driven reallocations of labor across sectors in a way that has been productivity enhancing at least until quite recently.10 Not only has structural change led to regional convergence and the rise of a new class of increasingly competitive enterprises, it has also supported the creation of “good jobs”. In addition, Chapter 5 shows how the process of
Source: İŞKUR, TurkStat
0%
10%
20%
30%
40%
50%
60%
70%
80%
90%
100%
2004 2005 2006 2007 2008 2009 2010 2011 2012
Share of registered unemployed in total unemployed
Placement over registered unemployed
Placement over vacancy
Figure 6.15: İŞKUR’s coverage and placement are increasing fast
10 With growth slowing in 2012 and 2013 and employment creation continuing apace, productivity has been flat over the past two years. This effect may be cyclical or, in part, reflect the predominance of lower than average productivity construction jobs in recent employment growth. These recent patterns require continued analysis to see if they indicate a new trend.
Chapter 6: Labor: Creating jobs for women and youth
193
structural change went hand in hand with a fast rate of urbanization, which is creating the demand for jobs in services. One area of concern, however, is the increasing role of construction and real estate in urban job creation. Relatedly, since 2012, rapid job creation has gone hand in hand with stagnant productivity. The sustainability of recent patterns thus, remains an issue.
Opportunities (and challenges) for the futureTurkey’s population is young, and the country is rel-atively rich given its youth. Turkey compares very favorably to other nations in terms of per capita Gross Domestic Product (GDP) considering its me-dian age (Figure 6.16). If Turkey manages to sustain the recent pace of job creation whilst ensuring that this goes hand in hand with higher productivity, the country could experience a virtuous cycle resulting in a large demographic dividend over the coming decades.
Turkey will have a rapidly growing WAP over the next decade. According to Government estimates, the WAP which is around 52 million today, will rise by 6 million in the next 10 years, and increase to around 68 percent of the total population in 202311 (Figure 6.17). Starting around 2005, Turkey has en-
tered a demographic window of opportunity where more than two thirds of its population is of work-ing age (between 15 and 65). Only after 2050 will this window close as the share of the elderly in the population increases (see also Hoşgör and Tansel, 2012).
Parallel to the rise in the WAP, labor supply in Tur-key will significantly increase. Even with no increas-es in LFP rates, Turkey’s labor force is expected to increase by 20 percent over the next 50 years. In addition, LFP (especially among women) will in-crease as younger cohorts participate more actively in the labor market. Allowing for increases in the overall LFP to the levels seen in the Nordic coun-tries, assuming female LFP converges to the cur-rent LFP of men, and assuming the working life is extended by 10 years (as foreseen by the pension reforms) increase the projected growth in labor supply to about 120 percent in the combined best case (Figure 6.18). Of course, the flipside of this de-mographic boon is the need to ensure that all these new entrants into the labor force find productive jobs. The next section looks at policies that would help Turkey maximize its demographic dividend. We focus on policies that determine the quality of labor supply. Labor demand, and, in particular, policies to increase demand for productive jobs are discussed in Chapter 4.
Source: WDI, United Nations (UN)
R² = 0,6247
4
5
6
7
8
9
10
11
12
15 20 25 30 35 40 45
Loga
rith
m o
f GDP
per
cap
ita (i
n 20
05 U
S$)
Median Age
TURKEY
VIETNAM
KUWAIT
AZERBAIJAN
Figure 6.16: Turkey is young and already relatively rich
11 Turkstat provides two sets of demographic scenarios. The base case assumes no future increase in fertility and is the one reported in this Chap-ter. The alternative scenario assumes fertility rebounds to above 2 children per female as a result of targeted family support measures.

Turkey’s Transitions
194
Policies to sustain the pace of job creationImproving the employment rate
Recent increases in the retirement age will gradu-ally increase employment rates among older age groups. The 2008 reforms in the pension system will increase the average retirement age by about 2 months per year (World Bank, 2013.b; Chapter 7). While this pace is slow by international standards, it will over time, nonetheless, provide some impor-tant benefits. First, to the extent that an increase in the average age of retirement reduces budget transfers to the social security institution for pen-sion payments, the funds saved could be allocated to ALMPs or to investments to improve the skills of the labor force. Second, an increase in the retire-ment age will retain experienced workers in the labor force for longer and reduce informal employ-ment post-retirement, thus, leveling the playing field for younger workers. Accelerating the transi-tion to a higher retirement age would bring higher benefits.
Linking the social support system to employment will help inactive people find their way back into the labor market. An action plan adopted in 2010 establishes a link between the social assistance (SA) system and İŞKUR’s employment programs with the objective of accelerating the economic activa-tion of SA beneficiaries. Since 2012, information on
SA beneficiaries is sent to İŞKUR by the Ministry of Family and Social Policies (MoFSP). Almost 30 per-cent of the 6.4 million SA beneficiaries are men of working age, for whom a direct link between the receipt of SA and registration at İŞKUR may pro-vide significant incentives to return to job activity (World Bank, 2013.c). This could help boost place-ment rates above the current level of around one fifth of all unemployed registered with İŞKUR.
Improving formality
An adjustment of the minimum wage might induce formal employment, especially among low skilled and young workers. The minimum wage in Turkey is 71 percent of the median wage, the highest ra-tio in the OECD. Earlier studies find that the mini-mum wage is binding for formal sectors, whereas almost half of workers in the informal sector earn less than the minimum wage (OECD, 2008; World Bank, 2013.b). There are several options to make the minimum wage less binding, such as not taxing it, allowing regional variation or providing regional employment subsidies. Turkey’s investment incen-tives already recognize the case for regional varia-tion by providing differentiated payroll tax deduc-tions, which are more generous for less advanced regions. Whether these incentives are sufficient to induce greater formality remains to be seen as the system is relatively new.
Further shifting the tax burden away from payroll to other taxes might also induce formal employment.
Source: TurkStatNotes: A cohort-components method was utilized for these projections. A slight decrease in fertility and a declining infant mortality rate are assumed. This assumes Turkey follows the typical demographic transition path of other older countries.
24,5 21,2 15,7
67,8 68,6
63,4
7,7 10,220,8
0%
10%
20%
30%
40%
50%
60%
70%
80%
90%
100%
2013 2023 2050
Popu
latio
n by
age
gro
ups (
in p
erce
nt o
f the
tota
l pop
ulati
on)
0-14 15-64 65+
Figure 6.17: Turkey’s demographic window of opportunity
Chapter 6: Labor: Creating jobs for women and youth
195
A World Bank report (2009.a) finds that employ-ment in Turkey is responsive to labor cost with an elasticity of 0.4 to 0.6 percent and, hence, declin-ing labor taxes might increase employment12 Tur-key has made good experiences with targeted pay-roll tax reductions for women, youth and workers registered with İŞKUR. These schemes have been repeatedly extended, which, on the evidence pre-sented, seems well justified.
Increasing the coverage and generosity of unem-ployment benefits might increase worker protec-tion and support efficiency-enhancing turnover as well as, encourage workers to join the formal sector. Turkey has the second lowest unemploy-ment replacement rate among OECD countries af-ter the Republic of Korea. Besides, the percentage of unemployed receiving unemployment benefits is much less compared to the OECD average; Tur-key’s coverage rate is around 11 percent compared to the OECD average of close to 50 percent (OECD, 2011.b). Because formal workers hardly benefit from greater unemployment protection than infor-mal workers, there are few incentives for workers to ask for formal jobs. At the same time, the high costs of current severance pay arrangements cre-ate disincentives for firms to hire formal workers. A reform of Turkey’s unemployment and severance pay arrangements could, thus, yield benefits for em-ployment creation as well as reduced informality.
Investing in Human Capital
Improving the skills of the labor force is crucial to increase employment together with productivity. The majority of the Turkish labor force has only up to 8 years of education. Younger cohorts have sig-nificantly higher levels of schooling, and Turkey is, thus, likely to gradually converge to levels reached in other OECD countries (Figure 6.19). The so-called “4+4+4” education reforms, which increase com-pulsory education to 12 years, and recent invest-ments in tertiary education will contribute to this convergence.13 However, countries like the Repub-lic of Korea have managed to dramatically increase educational attainment from around 40 percent of the cohort aged 55-64 to almost 100 percent a gen-eration later. Compared to this performance, Tur-key’s improvement historically looks modest (Fig-ure 6.20). In other words, more progress is needed.
Beyond increasing years of schooling, the quality and relevance of education will be crucial to en-sure diplomas translate into job relevant skills. The nature of the skills required in jobs in Turkey has changed over the last decade (World Bank, 2013.c). The need for routine cognitive skills is on the rise while jobs that require non-routine manual skills are on the decline. At the same time, Turkish em-ployers experience difficulty in filling jobs due to the unavailability of the right skills. According to the Talent Shortage Survey 2013 implemented by
Source: WB staff calculations based on UN, ILO and Eurostat DataNote: See World Bank (2012.a) for detailed discussion of the scenarios and methodology.
17
87
67
28
121
-13
7
-2
0
26
-16
1
-8
0
20
-40%
-20%
0%
20%
40%
60%
80%
100%
120%
140%
Constant participationrates
Convergence tobenchmark countries
Female to maleconvergence
Increase in work life by10 years
Combined maximumscenario
Chan
ge in
Lab
or S
uppl
y 20
10-2
060,
Per
cent
Turkey Greece Spain
Figure 6.18: Turkey is expected to have a lot more workers
12 Üngör (2013), similarly, finds that time varying taxes on consumption and labor play important roles in explaining the aggregate hours worked in Turkey.
13 See Chapter 7 for more details.

Turkey’s Transitions
196
Manpower Group, 58 percent of Turkish employers experience difficulty filling jobs, compared to 35 percent at the global average. Similarly, 56 percent of Turkish employers with vacancies mention that one reason for not filling them is the lack of skills, which is the highest share in a list of comparator countries (McKinsey, 2012). In a recent survey by the Ministry of Science, Industry and Technology, one third of Turkish employers in manufacturing report unfilled vacancies. In a qualitative assess-ment, these employers point to issues in the edu-cation system such as lack of internships, as well
as skills mismatch as reasons for not being able to hire. Thus, expanding programs that help the WAP increase the relevance of its skills, while adjusting overall education goals so they prepare for a rapidly changing economic structure, will help the growing workforce find good jobs.
The economic benefits of investments in skills could be very large. World Bank (2013.b) simulates that a 25 percent rise in the share of high skilled labor could increase the growth rate of real GDP by 2.5 percentage points (Table 6.2). Increasing skills in the workforce is also associated with declining
Source: World Bank (2013.c)
Source: OECD (2012)
78
58 59 6270 76 78 78 83 87
22
28 22 2317
13 13 13 9 6
014 19 16 13 11 8 9 8 7
0%
10%
20%
30%
40%
50%
60%
70%
80%
90%
100%
15-19 20-24 25-29 30-34 35-39 40-44 45-49 50-54 55-59 60-64
At most 8 years
Scho
olin
g Di
strib
ution
of W
AP
High school Tertiary
0%10%20%30%40%50%60%70%80%90%
100%
Kore
a, R
ep.
Czec
h Re
publ
icSl
ovak
iaPo
land
Slov
enia
Cana
daSw
eden
Russ
ian
Fed.
Finl
and
Switz
erla
ndU
nite
d St
ates
Isra
elAu
stria
Irela
ndCh
ileG
erm
any
Esto
nia
Hung
ary
Aust
ralia
Luxe
mbo
urg
Fran
ceN
orw
ayU
nite
d Ki
ngdo
mN
ethe
rland
sBe
lgiu
mDe
nmar
kN
ew Z
eala
ndG
reec
eIc
elan
dIta
lySp
ain
Braz
ilPo
rtug
alM
exic
oTu
rkey
Chin
a
Shar
e of
labo
r for
ce w
ho h
ave
attai
ned
at
leas
t sec
onda
ry ed
ucati
on
25-34 years-old 55-64 years-old
Figure 6.19: Educational attainment in Turkey is increasing
Figure 6.20: Experience in peers shows that educational attainment can improve fast

Chapter 6: Labor: Creating jobs for women and youth
197
informality, especially for women. Beyond educa-tion, what other measures could help Turkey boost female LFP? This is the final issue investigated in this Chapter.
How can Turkey get more women into work faster?Female LFP constraints are multi-faceted. They re-fer to markets, laws and institutions, and social norms (World Bank, 2012.b). Fostering female LFP requires lifting more than one barrier at the time. For example, women may have fewer opportunities for formal work because of deep seated gender dif-ferences in time use and allocation (reflecting social norms about who does house and care work), in the workings of markets (reflecting employers’ prefer-ences for certain skills and workers), and in the for-mal institutions of the state (such as labor codes).
Turkey has made progress in increasing women’s skills, and education of females has eased their way into the labor market. Since the nature of employ-ment has transformed itself from agricultural – of-ten non-paid – to white collar jobs, females need higher skill levels to succeed in the labor market. However, Figure 6.21 shows that, to date, only higher education has a notable effect on female employment rates. Short of sending all girls to uni-versity, other policies will be needed for Turkey to be able to close the gap in female LFP.
Turkey’s legal and regulatory framework, in prin-ciple, promotes gender equality. Turkish law has been adapted to prevent discrimination on the basis of gender, and facilitate access to the labor market for women. In 2003, a new labor law was enacted that forbids discrimination on the basis of gender (Gökşen et al., 2013). Five years later, the Committee on Equality of Opportunity for Women and Men was founded to ensure equal treatment in pay, hiring, promotion and termination of job contracts. Since 2004, an addendum to the Turkish constitution defines gender equality as an explicit responsibility of the state. In addition, the govern-ment has implemented policies such as covering social security contributions for women entering the labor market.
But more can be done in particular to make it easier for women to reconcile work and family. Labor force participation among urban women drops off signifi-cantly after each additional child that is born, par-ticularly among lower skilled women. For instance, in 2003, according to the Demographic and Health survey, labor force participation among low-skilled urban women declined from 32 to 15 percent af-ter the birth of their first child (Uraz et al; 2010). While participation rates have increased since, life events still have an impact on women’s participa-tion. In the same Demographic and Health Survey for 2008, two thirds of women cited childcare and household duties as the main reasons for not work-ing, and the 2006 Time Use Survey shows that em-ployed women devote twice the amount of time to home-related task than men do. Increasing the availability of childcare, by expanding the supply of services, is likely to have a doubly beneficial effect: on the one hand, it will release women’s time and open opportunities for new labor market entrants, and on the other, it might allow for women who are already working to work more hours or move into better jobs (for example out of informality)
International experience shows that availability of affordable child care and female LFP are positively correlated. Countries with extensive female LFP, such as France or Sweden, also have an extensive child care system. Further, countries where large in-vestments in early childhood education (ECE) have been newly undertaken have seen changes in their levels of female LFP.14
Enrollment in ECE in Turkey has been increasing rapidly in recent years but is still low by interna-tional standards (Figure 6.22). Government plans envisage several steps to increase ECE. For exam-ple, in the new tax law draft submitted to Parlia-ment, it is stated that, establishment and construc-tion costs are fully exempt from income tax for establishments that will exclusively operate as a kindergarten or creche and for firms that establish kindergarten/creche classes for their employees. Furthermore, private investments in ECE are given priority in the new investment incentive system of the government.15
Table 6.2: More skills would increase growth and reduce informality
Scenario∆ Growth
Rate
∆ Employment ∆ Informality
High Skilled Low Skilled Total Female
25 percent rise in high-skilled labor 2.5 17 -12 -10.4 -12.7
Source: World Bank (2013.b)
14 Such as Argentina (Berlinski and Galiani 2007), Mexico (3iE 2012 and Calderon 2012), and Brazil (Barros et al 2011)
15 For details of new investment incentive system: see http://www.ekonomi.gov.tr/upload/0B146D5C-F9DF-DB01-B7F8DD3B1391DCD5/web%20sayfas%C4%B1_ing.pdf

Turkey’s Transitions
198
Flexible work arrangements (FWAs) can also have a positive effect on female LFP. FWAs refer to flex-ibility in terms of work time and workplace e.g. part-time work, flexible start- and finishing times, annualized hours, telecommuting etc. (Farré, 2013). Career flexibility and support during career breaks are also key. Policies such as maternity leave protection can prevent negative impacts of child rearing on women’s career paths and facilitate re-entry into the labor force. Part-time employment and maternity protection and return policies are the most common FWA in the EU since 1980s. Es-
pecially in countries where the supply of full-time child care is restricted, working part-time can help balance work and family responsibilities. However, part-time workers are less likely to be unionized and concentrate often in less valued occupations with low wages and social security benefits. Hence, part-time jobs might affect female labor supply negatively. Del Boca et al. (2009) use data from seven European countries and show that only part-time jobs that provide a reasonable level of job pro-tection, social benefits and earnings have a positive effect on female employment.
Source: TurkStat
Source: United Nations Educational, Scientific and Cultural Organization (UNESCO), Institute for Statistics (www.uis.unesco.org)
0%
10%
20%
30%
40%
50%
60%
70%
80%
90%
Overall Men Women
Empl
oym
ent
rate
by
gend
er a
nd e
duca
tion,
201
2
Illiterate Less than Secondary Secondary Vocational Secondary Higher Education
0%
10%
20%
30%
40%
50%
60%
1998 1999 2000 2001 2002 2003 2004 2005 2006 2007 2008 2009 2010
Gros
s enr
ollm
ent r
ate
Turkey World
Figure 6.21: The gender gap declines as educational attainment goes up
Figure 6.22: Enrollment in ECE is increasing

Chapter 6: Labor: Creating jobs for women and youth
199
There is room for Turkey to increase female em-ployment via FWAs. The share of part-time em-ployment among women (8 percent) is quite low compared to the OECD average (24 percent) (Figure 6.23). On the other hand, half of part-time work-ers are female. Although this ratio is low compared to OECD countries, it is higher than the share of females in total employment, which is around 30 percent. Hence, part time jobs attract women rela-tively more than men. Consequently, increasing part-time jobs may increase female employment if remuneration levels, social benefits and job secu-rity are considered.
Changing informal institutions and social norms
Gender norms and female employment are strongly interrelated. Culture and norms have a strong effect in determining households’ investments in skills, tasks distribution, but also on the way markets and even the state will perceive women. Often gov-ernments follow societal norms when drawing up policies and implementing them. Less frequently, governments take a “transformative” approach and seek to foster change. For example, maternity leave policies can increase women’s prospects of partici-pating in economic activity, but they risk reinforcing the norm that women are the primary household care providers. Parental leave that guarantees both
maternity and paternity leave has “transformative” potential by giving men incentives to take on more care duties, and also changes employers’ views.
Social norms and views about women’s work in Turkey could be evolving to facilitate greater fe-male employment. Fernandez (2007) and Fogli and Veldkamp (2008) show how beliefs can change by observation of local peers; first locally and then regionally. For example, observing the effects of maternal employment on children via nearby em-ployed women, other mothers start participating in the labor force, first locally; and as localities be-come homogenous within themselves but differ-ent from each other, convergence starts happen-ing across regions. Güner and Uysal (2013) make a similar analysis for Turkey, and show that moth-ers adapt to peers locally, and practices observed in the mother get transmitted to the daughter, as measured by labor force engagement.16 Qualitative data for Turkey also shows that compliance with traditional gender roles is negatively correlated with non-agricultural employment among women (Gündüz-Hoşgör and Smits, 2008). Comparative data over time from the World Values Survey show an inconsistent picture, however. Attitudes towards gender equality in the household and in the labor market were improving through 2007, but in the 2012 wave, a moderate reversal can be observed. The same can be observed in the Family Structure
Source: OECD
10
6 5 68
24 2423
24 24
0%
10%
20%
30%
40%
50%
60%
70%
80%
0%
5%
10%
15%
20%
25%
30%
1990 1995 2000 2005 2012
Fem
ale
part
-tim
e em
ploy
men
t / t
otal
par
t-tim
e em
ploy
men
t
Fem
ale
part
-tim
e em
ploy
men
t / f
emal
e to
tal e
mpl
oym
ent
TUR OECD TUR (right axis) OECD (right axis)
Figure 6.23: Few women work part-time, more may want to do so
16 Güner and Uysal find that, women who were born in regions with low female employment rate at their time of birth (a proxy for their mothers’ employment) have low female LFP even if they migrate to regions with high female employment. Assuming that employment rates of mothers’ and daughters’ who live in different regions are correlated only due to transmission of cultural norms, they argue that culture plays a significant role in female employment.

Turkey’s Transitions
200
Research: between the 2006 and 2011 round of the survey, a slight increase in the percentage of peo-ple that thought it was inappropriate for women to engage in paid work could be observed, mostly due to an increase in this opinion among male respond-ents (MOFSP, 2013). The issue of social norms and how they could be changed to facilitate greater female employment and gender equality deserves additional research.
ConclusionTurkey’s rapid employment creation post-crisis is a remarkable achievement. Government policies, such as targeted payroll tax reductions, an increase in ALMPs, and measures to combat informality, have all combined to encourage formal job cre-ation. At the same time, Turkey has benefited from a structural transformation of its labor market, with demand for skills increasing at the same time as new cohorts of better educated young workers, including women, entered the labor force. The key lesson is that government policies were effective because they supported and enhanced the process of structural transformation. Labor market policies on their own cannot account for the pace of job creation after 2009 – combined with the dynam-ics of Turkey’s enterprise sector and the economic strength of its cities, however, they proved a potent combination for job rich growth.
Against this background, Turkey seems well poised to benefit from its large demographic window. The labor force will continue to grow by around 2.5 percent each year over the coming decade, as-suming the recent trend in increasing female LFP
is sustained. If the additional labor force entrants can continue to be matched with good jobs, Turkey will reap a significant demographic dividend start-ing from an unusually high level of income. Most other countries with similar demographic profiles are considerably poorer than Turkey, and most oth-er higher middle income countries are aging con-siderably faster.
However, sustained employment creation and a maximum demographic dividend are not foregone conclusions. Government policy will need to pro-vide support as recognized in the National Employ-ment Strategy that was recently approved. But the key will be to move from strategy to implementa-tion in a number of critical areas, such as allowing greater flexibility in labor market contractual ar-rangements, including part-time work, expanding childcare facilities and introducing parental leave regulations that provide equal incentives for men and women. Greater differentiation of minimum wages by region (or targeted regional wage sub-sidies) as well as more aggressive increases in the retirement age could support current policies to combat informality, which focuses on beefing up labor and tax inspections. An improvement in the business climate will be needed to sustain the cre-ation of higher productivity jobs once the current forces of structural change and the shift of jobs from agriculture to services runs out of steam. Fi-nally, and perhaps most importantly, Turkey will need to continue to invest in upgrading the skills of its workforce to ensure it meets the standards of high income. This is a topic to which we turn in the next Chapter.
Chapter 6: Labor: Creating jobs for women and youth
201
References3iE: Gustavo Angeles, P. G. (2012). The Impact of Day Care on Maternal Labor Supply and Child De-velopment in Mexico. 3iE Series Report.
Azevedo, J., & Atamanov, A. (2014). Pathways to the Middle Class. Washington, D.C.: The World Bank.
Balkan, B., Başkaya, Y., & Tümen, S. (n.d.). Evaluat-ing the Impact of the Post-2008 Employment Sub-sidy Program in Turkey. Working Paper, 14/4.
Başkaya, Y. S., & Hulagu, T. (2011, August ). Infor-mal-Formal Worker Wage Gap in Turkey: Evidence From A Semi-Parametric Approach. Working Paper No: 11/15. Central Bank of the Republic of Turkey.
Başkaya, Y. S., & Şengül, G. (2012). Analysis of Cy-clical Behavior of Turkish Labor Market Based on Gender (in Turkish, Türkiye’de Emek Piyasasının Çevrimsel Hareketinin Cinsiyet Bazında Analizi). Policy Notes No: 1209. Central Bank of the Republic of Turkey.
Berlinski, S., & Galiani, S. (2007). The effect of a large expansion of pre-primary school facilities on preschool attendance and maternal employment. Labour Economics, 14(3), 665-680.
Boca, D. D., Pasqua, S., & Pronzato, C. (2009). Moth-erhood and Market Work Decisions in Institutional Context: A European Perspective. Oxford Economic Papers, 61(Supplement 1), i147-i171.
Calderon, G. (2012). What is Good for the Goose is Good for the Ganter. The Effects of Childcare Provi-sions in Mexico. Mimeographed. Stanford Univer-sity.
Ceritoğlu, E., Gürcihan, H. B., & Taşkın, T. (2012). Unemployment Developments after 2001 and 2008 Crisis (in Turkish, 2001 ve 2008 Sonrasi İşsizlik Oranı Gelişmeleri). Policy Notes No: 1223. Central Bank of the Republic of Turkey.
Dayıoğlu, M., & Kırdar, M. G. (2010). Determinants of and Trends in Labor Force Participation of Wom-en in Turkey. Welfare and Social Policy Analytical Work Program Working Paper Number:5. State Planning Organization of the Republic of Turkey and World Bank.
de Barros, R., Olinto, P., Lunde, T., & Carvalho, M. (2011). The Impact of Access to Free Childcare on Women’s Labor Market Outcomes: Evidence from a Randomized Trial in Low-Income Neighborhoods of Rio de Janerio. World Bank Economists’ Forum.
Elgin, C., & Schneider, F. G. (2013). Shadow Econo-mies in OECD Countries: DGE vs. MIMIC Approach-es. Working Papers No: 2013/13. Bogazici Univer-sity Department of Economics.
Farré, L. (2013). Critical literature review on part-time labor policies and other policy packages and the impact on female labor force participation. Un-published Manuscript.
Fernandez, R. (2007). Culture as Learning: The Evo-lution of Female Labor Force Participation over a Century. NBER Working Papers, 13373.
Fogli, A., & Veldkamp, L. (2008). Nature or Nurture? Learning and the Geography of Female Labor Force Participation. NBER Working Papers, 14097.
Göksen, F., Alnıaçık, O. A., & Deniz, C. (2013). Analy-sis of Public Programs Relevant to Women’s Entre-preneurship and Access to Labor Markets. Istanbul: Koc University.
Goldin, C. (1994, April). The U-Shaped Female La-bor Force Function in Economic Development and Economic History. Working Paper No: 4707. Nation-al Bureau of Economic Research.
Gündüz-Hoşgör, A., & Smits, J. (2008). Variation in labor market participation of married women in Turkey. Women’s Studies International Forum, 2, 104-117.
Güner, D., & Uysal, G. (n.d.). Culture and Female La-bor Supply in Turkey. Unpublished Manuscript.
Hoşgör, S., & Tansel, A. (2011). Demography and Management Towards 2050: Repercussions on Ed-ucation, Labor, Health and Social Security Systems. Publication No: TÜSİAD-T/2011/12/523. TUSIAD.
Judt, A. (2005). Postwar: A History of Europe since 1945. London: Penguin Books.
Karaoğlan, D., & Ökten, C. (2012, June). Labor Force Participation of Married Women in Turkey: Is There an Added or a Discouraged Worker Effect? Discus-sion Paper Series IZA DP No: 6616. Forschungsin-stitut zur Zukunft der Arbeit Institute for the Study of Labor.
Loayza, N., Oviedo, A., & Serven, L. (2005). The Impact of Regulation on Growth and Informality: Cross Country Evidence. Policy Research Working Papers, WPS 3623.
Mammen, K., & Paxson, C. (2000). Women’s Work and Economic Development. Journal of Economic Perspectives, 14(4), 141-164.

Turkey’s Transitions
202
Manpower Group. (2013). 2013 Talent Shortage Survey Research Results. Manpower Group.
McKinsey. (2012). Education to Employment: De-signing a System that Works. McKinsey Center for Government.
Ministry of Science Industry and Technology. (2013). Assessing Turkey’s Human Resources (in Turkish: Türkiye’nin İnsan Kaynağının Belirlenmesi).
OECD. (2007). Babies and Bosses - Reconciling Work and Family Life. OECD.
OECD. (2008). Declaring Work or Staying Under-ground Informal Employment in Seven OECD Coun-tries. Employment Outlook. OECD.
OECD. (2011.a). Pensions at a Glance 2011: Retire-ment-income Systems in OECD and G20 Countries. OECD.
OECD. (2011.b). OECD Employment Outlook 2011. OECD.
OECD. (2012). Education at a Glance 2012: OECD Indicators. OECD.
Tansel, A., & Kan, E. O. (2011, January). Labor mo-bility across the formal/informal divide in Turkey: evidence from individual level data. MPRA Paper No. 35672. Munich Personal RePEc Archive.
Taşkın, T. (2013, October). Intensive Margin and Ex-tensive Margin Adjustments of Labor Market: Tur-key versus United States. Working Paper, 13/39.
Üngör, M. (2013, March). Some Thought Experiments on the Changes in Labor Supply in Turkey. Working Paper No: 13/14. Central Bank of the Republic of Turkey.
United Nations. (2004). World Population to 2300. United Nations Department of Economic and Social Affairs Population Division.
Uraz, A., Aran, M., Hüsamoğlu, M., Sanalmış, D. O., & Çapar, S. (2010, March). Recent Trends in Female Labor Force Participation in Turkey. Welfare and So-cial Policy Analytical Work Program Working Paper Number 2. State Planning Organization of the Re-public of Turkey and World Bank.
World Bank. (1993). Turkey: Women in Develop-ment. WB Country Study. World Bank.
World Bank. (2009.a). Female Labor Force Partici-pation in Turkey: Trends, Determinants and Policy Framework. Report No: 48508-TR. World Bank.
World Bank. (2009.b). Estimating the Impact of La-bor Taxes on Employment and the Balances of the Social Insurance Funds in Turkey. Report No: 44056-TR. World Bank.
World Bank. (2010). Turkey Country Economic Memorandum Informality: Causes, Consequences, Policies. Report No: 48523-TR. World Bank.
World Bank. (2012.a). Golden Growth: Restoring the Lustre of the European Economic Model. World Bank.
World Bank. (2012.b). World Development Report: Gender Equality and Development. World Bank.
World Bank. (2013.a). Good Jobs in Turkey. Forth-coming. World Bank.
World Bank. (2013.b). Turkey: Managing Labor Markets Through the Economic Cycle. Report No: 70130-TR. World Bank.
World Bank. (2013.c). Turkey Public Finance Re-view. Forthcoming. World Bank.
World Bank. (2013.d). Activating Vulnerable People into Good Jobs in Turkey. Forthcoming. World Bank.

Chapter 7: Welfare: Achieving better health and education outcomes
203
Welfare: Achieving betterhealth and education outcomes
Chapter 7
Turkey’s Transitions: Integration, Inclusion, Institutions
Labor
FiscalSpace
Enterprise
Infrastructure
Trade
Finance
Cities

Turkey’s Transitions
204

Chapter 7: Welfare: Achieving better health and education outcomes
205
Welfare: Achieving better health and education outcomes
İnci and her family migrated to Ankara from Ispar-ta in 2000. Her husband, with only five years of primary education, couldn’t find a formal sector
job and worked in the informal sector while İnci, a high school graduate, stayed at home to look af-ter the kids. In 2004, at the age of 40, İnci had a stroke. Her husband did not want to take care of his wife and two children, Akın and Şirin, and left them without support. Fortunately, İnci’s sister was able to move in to take care of her sister and the kids. İnci and her kids were able to get access to health services through the Green Card Program, ensuring that İnci got the drugs she needed, and İnci’s sister was eligible to receive social assistance as she was taking care of her incapacitated sister full-time. In 2006, the family became eligible for the Condition-al Cash Transfer (CCT) program and received cash benefits for Akın and Şirin’s attendance at school. İnci registered with the Ministry of Health (MoH)’s homecare system and now receives family doctor and physiotherapist visits once a week and is vis-ited by a neurologist and psychiatrist every month. She was also provided a wheelchair. Both of İnci’s children passed the university entrance exam and were eligible for a Prime Ministry scholarship. Akın recently graduated from the Middle East Technical University and enrolled for a Master’s degree. Şirin is still studying at the Ankara University, Faculty of Law.
The experience of İnci and her family is not unique. Over the last decade or so, the improvements in ac-cess to and the quality of basic services in Turkey have been impressive. Between 1985 and today, the life expectancy of girls has increased by 13 years, maternal mortality rates have fallen eight times, compulsory basic education has been increased from 5 to 12 years, and tertiary education has been dramatically expanded. The improvements in edu-cation and health outcomes experienced by İnci’s family are likely to continue into the next genera-tion. But a new problem will be facing the children of Şirin and Akın: they will live in a country with a lot more elderly people. This will require adjust-ments to Turkey’s welfare system as challenging and far-reaching as those that have brought better public services and improved economic opportuni-ties to İnci and her family.
This chapter chronicles the changes in Turkey’s ba-sic public services over the past 20 years. It shows how Turkey has progressively narrowed the gap in health and education outcomes with the advanced Organisation for Economic Co-operation and Devel-opment (OECD) countries and built a social service
system that has significantly raised the welfare of the population today, with the promise of hand-some economic rewards in the future. A couple of figures illustrate the magnitude of these improve-ments. Figure 7.1 shows the gap between Turkey’s health outcomes and those of the average in the OECD. These gaps have been falling rapidly. At the same time, the equity of outcomes has also im-proved. In 1998, infant mortality in the poorest quintile of the population was 47 per thousand live births higher than the rate in the richest quintile. By 2008, this difference had declined to 12.2 per thousand. Turkey has also made impressive gains in improving access to quality education. Turkey has recorded among the largest improvements in edu-cation outcomes among participants in the OECD Programme for International Student Assessment (PISA) study (Figure 7.2). This average improvement has gone hand in hand with significant reductions in the inequality of educational achievement, with the lowest quintiles of the socio-economic index registering much faster improvements than the better-off.
The improvement in health and education out-comes have been supported by many dynamics already explored in this book. Economic transfor-mation and structural changes have significantly improved household income for all segments of society, rapid urbanization has facilitated the more efficient and effective delivery of public services and macro-economic stabilization has created fis-cal space for increasing public financing in these sectors. But there have also been several waves of policy reform that have sought to improve health and education systems. These reforms have been going on for many decades, but accelerated from the 1980s onwards. Increasingly the quality and eq-uity of the provision of public services has become a primary objective of reforms, as progress has been made in closing access gaps. In this Chapter, we review these reform processes and their impact on the welfare outcomes of the Turkish population. While many reforms in health and education date back several decades, the Chapter emphasizes im-provements in the equality of access as a particular characteristic of the past decade or so. As a result, it argues, Turkey’s economic model since the turn of the millennium has become more inclusive. But the Chapter also cautions that new challenges are on the horizon for Turkey’s welfare system, related with Turkey’s demographic transition and the fu-ture prospects of an aging population.
In the rest of this Chapter, we examine both the context and substance of Turkey’s social service re-forms and seek to answer three broad questions.

Turkey’s Transitions
206
• First, how has Turkey achieved the improve-ments in overall welfare outcomes? The short answer is that reforms in public service delivery as well as significant increases in budget allo-cations have contributed equally. In the health sector, the Health Transformation Program, launched in 2003, initiated a decade of root and branch reform of the health system. Prob-lems of access were comprehensively tackled through supply-side initiatives (to improve the quantity and quality of health infrastructure and human resources) and demand-side ini-tiatives (the creation of universal health insur-ance). This was supported by an increased focus on improving primary, preventive care and on
incentives to ensure that the quality of service provision improved throughout the system and across the country. In the education sector, the Basic Education Law increased from 5 to 8 years the mandatory years of schooling in 1997, recently further extended to 12 years by the 4+4+4 reform. The subsequent Basic Education and Secondary Education Programs supported the construction and refurbishment of a large number of schools and classrooms, the provi-sion of equipment and materials, and lunches for poor students. There was also a rapid in-crease in salaries, recruitment and training of additional teachers. As part of the reform, there were a number of initiatives to address regional
Source: World Development Indicators (WDI) and Atun el al. (2013)
0
5
10
15
20
25
30
35
40
45
Mortality rate, infant (per 1,000 live births) Mortality rate, neonatal (per 1,000 livebirths)
Life expectancy at birth, total (years)
Gap
with
OEC
D
1990 2000 2010
0
5
10
15
20
25
30
35
40
45
50
Gap Between Rural and Urban Gap Between East and West Gap Betweeen Poorest andRichest Quintile
Mor
talit
y Rat
e, P
er 1
000
Live
Bir
ths
1998 2008
Figure 7.1: Health: The gap between Turkey and the OECD is shrinking with improved equity

Chapter 7: Welfare: Achieving better health and education outcomes
207
and gender inequalities in access to education. Related curriculum reforms and changes to vo-cational training further supported improved education outcomes. The reforms in both the health and education sectors have led to rapid improvements in health and education out-comes for Turkey’s citizens.
• Second, is Turkey taking advantage of its “de-mographic dividend”? The short answer is that Turkey has increased investments in education just in time to ensure future cohorts entering the workforce benefit from increased school-ing. A number of recent initiatives, such as the 4+4+4, the Early Childhood Education (ECE)
Strategy and the expansion in the supply of tertiary education will mean that the average years of schooling for those entering the work force will continue to increase (from relatively low levels) for some time to come. But Turkey’s education investments are still relatively low compared with other middle income countries and the quality gap to the advanced economies is still large, despite fast improvements. Build-ing on the gains over the past decade, further initiatives will be needed to increase the quality of education at all ages so that those entering the workforce have the skills necessary for a modern knowledge-based economy. This would include a focus on life-learning to ensure that
Source: World Bank (WB) staff calculations based on OECD PISA dataset
0
10
20
30
40
50
60
70
80
Reading Math Science Average
Gap
betw
een
Turk
ey &
OEC
D PI
SA s
core
s
2003 2009 2012
0
100
200
300
400
500
600
1 2 3 4 5
Aver
age
Scor
e (a
ll di
scip
lines
)
Quintile of Socio-Economic Index
2003 2009 2012
Figure 7.2: Education: Remarkable improvement in learning, particularly among low performers
Turkey’s Transitions
208
people are able to continue to build their skills and adapt to changing circumstances once they enter the workforce.
• Third, how is Turkey preparing for an ageing population? Turkey is part of a cohort of young countries that will see a tripling of the percent-age of elderly in their population over the com-ing 40 years. Improvements in health services with a focus on prevention and public health have helped rapidly improve life expectancy as well as the quality of life in old age. The Gov-ernment has begun to shift its focus to address-ing Non-Communicable Diseases (NCDs), which now represent the bulk of the disease burden in Turkey. In terms of income security in old-age, pension reform through the 2006 Social Secu-rity Institution Law helped rebalance the pen-sion system and improved both equity within the system and long-term sustainability. Yet, looking forward, challenges remain. Demo-graphic and epidemiological changes, as well as increased demand for new technologies, will exert strong upward cost pressure on the health sector, threatening sustainability. At the same time, although pension reform helped stabilize deficits in the pension system, these deficits will remain long into the future. There is also a need to address old age support for a large number of people currently not covered by the pension system, mostly those who work in Turkey’s large informal sector.
Health and Social Security:The context in the early 2000s
Turkey has undergone successive waves of health sector reform over many decades. Starting in the 1960s, universal health care became an objective in all five-year state plans. The Law on the Socializa-tion of Health adopted in 1961, promoted the es-tablishment of an integrated health service scheme with a three-tiered health system. The 1982 Con-stitution went further by providing a state guar-antee for citizens’ rights to health insurance and health services – aimed at accelerating initiatives to achieve universal health care. This was followed in 1987 with the Basic Law on Health to operational-ize these rights. It was, however, never fully imple-mented. By the 1990s, as successive governments grappled with political instability, economic shocks, rising unemployment and social discord, reform of the health sector had faded as a policy priority (Atun et al., 2013).
By the time the Government launched compre-hensive health sector reform in 2003, Turkey found itself confronted with a health landscape whose
poor performance on key indicators in absolute terms was compounded by regional and socioeco-nomic inequity. Turkey noticeably lagged behind the OECD and other middle-income countries. In 2002, life expectancy at 71.9 years was signifi-cantly lower than the OECD country average of 78.6 years and the infant mortality and maternal mor-tality rates were some of the highest among mid-dle-income countries (Menon, Mollahaliloğlu, and Postolovska, 2013). Health outcomes were mark-edly different between the east and the west of the country, among the richer and poorer segments of the population, and across rural and urban areas. For example, in 1998, under-5 mortality rates were 63.3 per 1000 live births in the east and 33.1 in the west of Turkey (Atun et al., 2013).
In 1992, the Government established the Green Card Program for the Poor. The goal was to provide health benefits to the poor who were not covered through formal means of insurance and who were unable to pay for health services. The initial phases of implementation of the program are illustrative of the state of public health care provision before reform: by 2003, after ten years of implementation, only 2.5 million people were registered under the program, far lower than the potential number of eligible beneficiaries. Moreover, the program was not effective at reaching the poorest—only 12 per-cent of the lowest income decile was covered. As a result, only 66.3 percent of the population was covered by health insurance (Atun et al., 2013).
Service provision was highly fragmented, with five different health insurance schemes including the Sosyal Sigortalar Kurumu (SSK) (covering ac-tive and retired workers from the formal sector), Emekli Sandığı (ES) (covering retired civil servants), Bağ-Kur (BK) (covering the self-employed), the Ac-tive Civil Servants Insurance Fund (covering civil servants in work and their dependents), and the Green Card scheme (for poor households). Each of these schemes had different benefit packages and disparate contractual arrangements with provider organizations, and there was little coordination between the MoH and the Ministry of Labor and Social Security (MoLSS), which were both providers and financiers of the health system (Menon, Mol-lahaliloglu, and Postolovska, 2013).
Even for those who were insured, adequate access to quality health services was a major challenge. Turkey suffered from an absolute shortage and in-equitable distribution of physical infrastructure and health human resources, which created inequali-ties in health service delivery and access. In 1990, there were 0.9 physicians per 1000 population. By 2000, this had increased to 1.3 per 1000 popula-tion, but the gap with the OECD actually increased
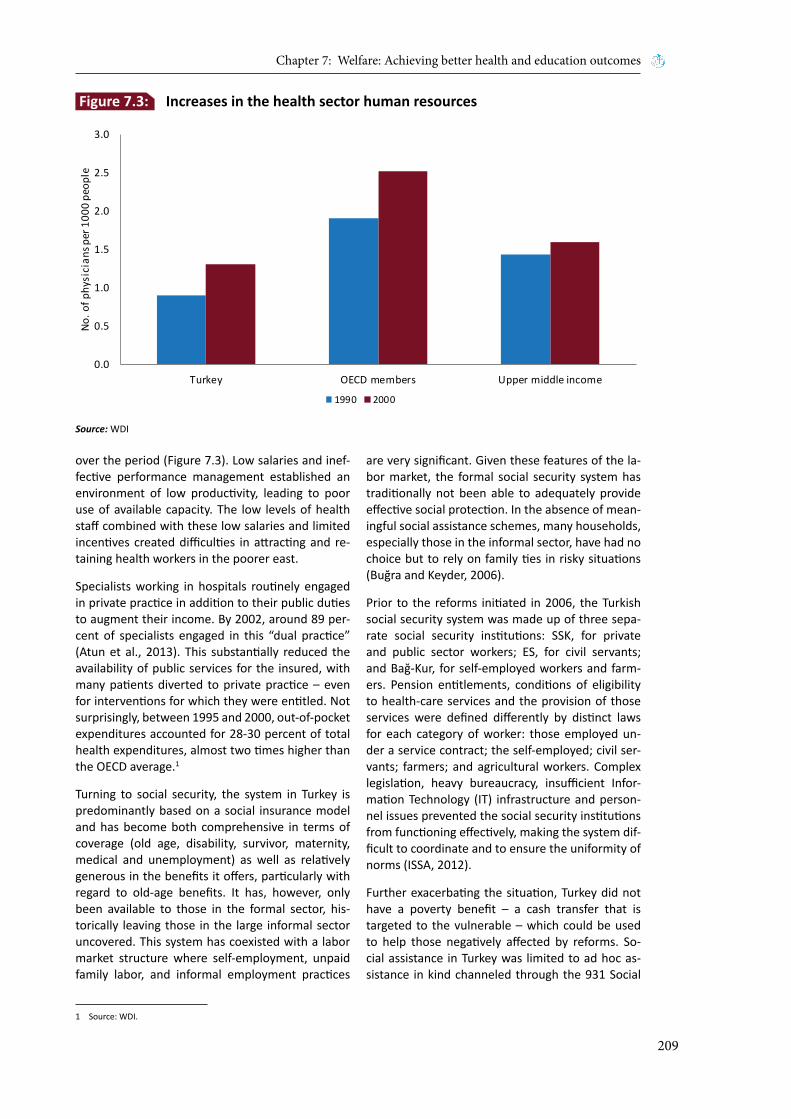
Chapter 7: Welfare: Achieving better health and education outcomes
209
over the period (Figure 7.3). Low salaries and inef-fective performance management established an environment of low productivity, leading to poor use of available capacity. The low levels of health staff combined with these low salaries and limited incentives created difficulties in attracting and re-taining health workers in the poorer east.
Specialists working in hospitals routinely engaged in private practice in addition to their public duties to augment their income. By 2002, around 89 per-cent of specialists engaged in this “dual practice” (Atun et al., 2013). This substantially reduced the availability of public services for the insured, with many patients diverted to private practice – even for interventions for which they were entitled. Not surprisingly, between 1995 and 2000, out-of-pocket expenditures accounted for 28-30 percent of total health expenditures, almost two times higher than the OECD average.1
Turning to social security, the system in Turkey is predominantly based on a social insurance model and has become both comprehensive in terms of coverage (old age, disability, survivor, maternity, medical and unemployment) as well as relatively generous in the benefits it offers, particularly with regard to old-age benefits. It has, however, only been available to those in the formal sector, his-torically leaving those in the large informal sector uncovered. This system has coexisted with a labor market structure where self-employment, unpaid family labor, and informal employment practices
are very significant. Given these features of the la-bor market, the formal social security system has traditionally not been able to adequately provide effective social protection. In the absence of mean-ingful social assistance schemes, many households, especially those in the informal sector, have had no choice but to rely on family ties in risky situations (Buğra and Keyder, 2006).
Prior to the reforms initiated in 2006, the Turkish social security system was made up of three sepa-rate social security institutions: SSK, for private and public sector workers; ES, for civil servants; and Bağ-Kur, for self-employed workers and farm-ers. Pension entitlements, conditions of eligibility to health-care services and the provision of those services were defined differently by distinct laws for each category of worker: those employed un-der a service contract; the self-employed; civil ser-vants; farmers; and agricultural workers. Complex legislation, heavy bureaucracy, insufficient Infor-mation Technology (IT) infrastructure and person-nel issues prevented the social security institutions from functioning effectively, making the system dif-ficult to coordinate and to ensure the uniformity of norms (ISSA, 2012).
Further exacerbating the situation, Turkey did not have a poverty benefit – a cash transfer that is targeted to the vulnerable – which could be used to help those negatively affected by reforms. So-cial assistance in Turkey was limited to ad hoc as-sistance in kind channeled through the 931 Social
0.0
0.5
1.0
1.5
2.0
2.5
3.0
Turkey OECD members Upper middle income
No. o
f phy
sici
ans p
er 1
000
peop
le
1990 2000
Figure 7.3: Increases in the health sector human resources
Source: WDI
1 Source: WDI.

Turkey’s Transitions
210
Assistance and Solidarity Foundations (SYDVs), and limited programs for the elderly and disabled under Law 2022, as well as institutional care for children and the elderly. Turkey had no other cash transfers that could help the vulnerable, unlike many neigh-boring countries of Western and Eastern Europe, which had universal child allowances (World Bank, 2001).
The social security system was plagued by finan-cial difficulties. Revenue was constrained by the high level of informal employment in the country, the under-declaration of earnings used to calculate contributions, and the low level of contribution collections. Expenditure rose primarily because of a trend towards early retirement, longer duration of pension payments due to increased life expec-tancy, and a loose link between the level of con-tributions made and actual pensions paid (ISSA, 2012). The pension system had been running defi-cits for more than a decade before the Government implemented its most significant reforms in 2006. It is estimated that the cumulative value of the defi-cits from 1994-2004, plus their debt servicing cost, amounted to roughly 110 percent of Gross Domes-tic Product (GDP) or 1.5 times total public debt (Verbeken, 2007). The burden of these transfers on an already fragile fiscal balance and the looming demographic transition were instrumental in rais-ing the importance of social security reform on the Government’s agenda (Buğra and Keyder, 2006).
The Health Transformation Program
Recent efforts at reform of the health system in Turkey emanate from the “Urgent Action Plan,” is-sued by the Government in 2002. As a result, the Government developed the Health Transforma-tion Program (HTP) as a comprehensive strategy for achieving universal health coverage. Adopt-ing a rights-based philosophy, the HTP set out to change key health system functions in the areas of governance, financing, resource allocation and ser-vice delivery in order to develop a patient-centered health system. The HTP sought to address two ma-jor shortcomings in particular. The first was the low level of health expenditures, and the second was the inequality and fragmentation of the health in-surance system, which had resulted in the poorest populations having low levels of coverage and high out-of-pocket expenditures (Menon, Mollahaliloğlu and Postolovska, 2013).
From the beginning, the HTP enjoyed strong com-mitment from the Prime Minister, the Cabinet and the Minister of Health, which proved critical for the implementation and success of the reform process. The political leadership sought to system-
atically identify problems along each health system function and with each health outcome and de-velop solutions to address them. As a result, HTP involved comprehensive and carefully sequenced changes following a two-pronged implementation approach. The first prong emphasized incremen-tal and tactical changes aimed at rapid and visible health sector improvements; the second prong fo-cused on strategic activities to achieve structural reforms that required major legislative changes. These changes were implemented systematically over a ten-year period, with a flexible approach de-termined by regular feedback on the receptivity of the health system to the changes being introduced. The design of HTP was informed by emerging evi-dence and global experience from countries such as Belgium, Cuba, Denmark, Estonia, Finland, Mexi-co, Thailand and the UK (Atun et al., 2013).
As one of its first measures, the HTP focused on expanding access to services for the poor and un-derserved as well as ensuring a significant increase in their financial protection. To achieve this, the HTP rapidly increased coverage of the Green Card scheme among the poorest deciles and expanded the benefit package. In order to address inequities and fragmentation, the HTP gradually harmonized benefits across the five different health insurance schemes with the aim of moving toward unified general health insurance (Atun et al., 2013). Ad-ditional targeted support to the poor was also provided. In 2001, the government initiated a CCT program, providing direct cash assistance condi-tional on the use of education and health services targeted to the poorest 6 percent of the popula-tion. By 2007, around a million children benefited from the CCT health program and a similar number of children continue to benefit from the CCT today (MoFSP, 2014).
At the same time, the government worked on sev-eral fronts to improve supply; that is, the overall availability and quality of health infrastructure. A critical element of this was the introduction of the Family Medicine Program. Focusing on the need to significantly expand and restructure the prima-ry care system, the Program was piloted in Düzce in 2005 after which it was rolled out nationwide. Family medicine providers now deliver “integrat-ed health services” covering a wide range of pri-mary care services, with an increasing emphasis on prevention of chronic diseases. They have also assumed the responsibility for conducting vaccina-tions, prenatal care, and infant follow-up, activities that were previously conducted primarily by mid-wives. This Program was coupled with other signifi-cant investments to increase the quality and avail-

Chapter 7: Welfare: Achieving better health and education outcomes
211
ability of tertiary care infrastructure.
Increases in physical capital and human capital also helped. The number of physicians and hospital beds increased by 33 and 25 percent respectively between 2003 and 2011. As a result, the number of doctors and beds per capita improved (Figure 7.4).2 A number of policies supported this process at the same time as addressing the inequitable distribu-tion of health staff. First, the HTP sought to greatly increase the capacity of universities to train medical personnel. The annual intake of medical students increased from 4,803 in the 2002/2003 to 10,009 in 2012/2013.3 New graduates were required to per-form compulsory service in different regions of Tur-key, in areas of greatest need, particularly the rural East and South-East. Second, the HTP introduced higher salaries and performance-related incentives for primary care providers that overall offered the opportunity to greatly increase take-home pay. Thirdly, the HTP introduced new personnel con-tracts for health staff and allowed outsourcing of health services with the aim of expanding staff availability in regions where recruitment and reten-tion was a challenge. Again, these new contracts of-fered higher salaries and performance related pay. Finally, in 2010, the government introduced a law that required doctors employed in the public sector to work full time and not to engage in private prac-tice. Through these measures, the HTP effectively addressed both supply constraints and incentive
problems (Atun et al., 2013).
The reforms under the HTP also sought to improve the experience for patients. The Directive on Pa-tients Rights – introduced in 2003 and enacted in 2005 –introduced new accountability measures to enable service users and citizens to directly express their views on the quality, responsiveness and avail-ability of health services, including the challenges encountered, their satisfaction levels and their expectations. These new mechanisms included di-rect communication of complaints and suggestions to the MoH Communications Centre (SABİM), the Prime Ministry Communication Centre (BİMER), to Patient Rights Units in public hospitals, and Patient Rights Communication Units at primary care level. As Atun et al. note these new mechanisms helped enhance the accountability of healthcare providers to citizens – accountability that was all but absent prior to HTP.
The institutional components of the reform, per-haps the most complex and contentious, centered on the Social Security Institution Law and Social Security and General Health Insurance Law, which were initiated in 2006 and finally approved in 2008. The legislation achieved three important objec-tives: (i) it merged the fragmented health insur-ance programs into one universal health insurance program providing a standard and comprehensive benefits package with reimbursement for a range
0.0
0.5
1.0
1.5
2.0
2.5
3.0
2003 2004 2005 2006 2007 2008 2009 2010 2011
No. o
f phy
sici
ans a
nd h
ospi
tal b
edds
pe
r 100
0 pe
ople
Physicians per 1000 people Hospital Beds per 1000 people
Figure 7.4: Investments in medical personnel and infrastructure have led to better coverage
Source: TurkStat
2 The significant increase in health infrastructure is not fully reflected in the per capita figures shown in Figure 7.4 as the population increased by 11 percent over the same reference period.
3 Source: Student Selection and Placement Center (ÖSYM).

Turkey’s Transitions
212
of preventive, diagnostic, and curative services; (ii) it created the Social Security Institution (SSI) which separated the roles of purchaser and pro-vider in the health system, with SSI established as the purchaser of health services from providers in the public and private spheres. Which also served the purpose of creating a unified risk pool to more effectively share across all income groups the risks associated with health-care costs and catastrophic payments; and (iii) it introduced important para-metric reforms to the pension system. These are discussed in more detail in the section below.
Many of the reforms described above necessitated additional public financing and, as a result, health spending increased rapidly. Per capita health spend-ing increased from US$464 in 2002 to US$1,160 in 2011 in constant (2005) Purchasing Power Parity (PPP) terms. This translates into a rate of increase of 10.7 percent annually – one of the fastest growth rates among OECD countries (Figure 7.5). The share of out-of-pocket expenditures as a ratio of GDP stayed constant, at around 1 percent, much lower than the OECD average of 1.7 percent.4 But public health expenditures as a percentage of GDP rose sharply from 3.8 percent to 5 percent. The share of health expenditures in total government expendi-ture rose from 9.1 percent to 12.8 percent.
While spending increased significantly, there were also a number of initiatives to contain costs and in-crease efficiency in the system. Reference pricing
for pharmaceuticals replaced the cost-plus model in 2004, reducing the price of drugs significantly (Memiş, 2013). Global budgeting for MoH facilities began to be implemented in 2006 in order to con-trol expenditures (Akyürek, 2012). A co-payment scheme for outpatient care in hospitals was initiat-ed in 2009 and various incentives were introduced to avoid unnecessary visits to specialist tertiary care. As a result of improved incentives, internal efficiency also improved. For example, the num-ber of outpatient visits per doctor in primary care increased from 16 in 2002 to 27.4 in 2010 (WHO, 2012).
Social security reform
Since 1990s, a primary objective of social security reforms has been to widen coverage and unify pro-vision under one national scheme for both pensions and social assistance. At the same time, the need to make parametric changes to the pension system in order to address fundamental sustainability issues came to the fore. A reform passed in 1999 created a two-pillar system in which current social security institutions (the first pillar) were maintained after overhauls to their structures, along with private pension schemes (the second pillar) to provide voluntary additional support.5 The 1999 reform in-creased the minimum retirement age in addition to the length of service and length of membership requirements. A gradual rise in minimum retire-ment age and contribution days was planned (SPO,
AUS
AUT
BEL CAN
CHLCZE
DNK
EST
FIN
FRA
DEUGRC
ISL
IRL
ISRITA
JPN
KOR
LUX
NLD
NZLNOR
POL
PRT
SVK
SVN
ESP
SWE
CHE
GBR
USA
TUR
MEXHUN
R² = 0,4221
0
2
4
6
8
10
12
14
0 1,000 2,000 3,000 4,000 5,000 6,000
Annu
al A
vera
ge C
ompo
und
Grow
th R
ate
of
Heal
th E
xpen
ditu
re P
er C
apita
200
2-20
11
Health Expenditure Per Capita 2002, PPP (constant 2005 international $)
Figure 7.5: Additional public financing for health was key for the reforms
Source: WDI
4 Source: WDI
5 The law on private pension schemes was approved in 2001 by the Parliament.
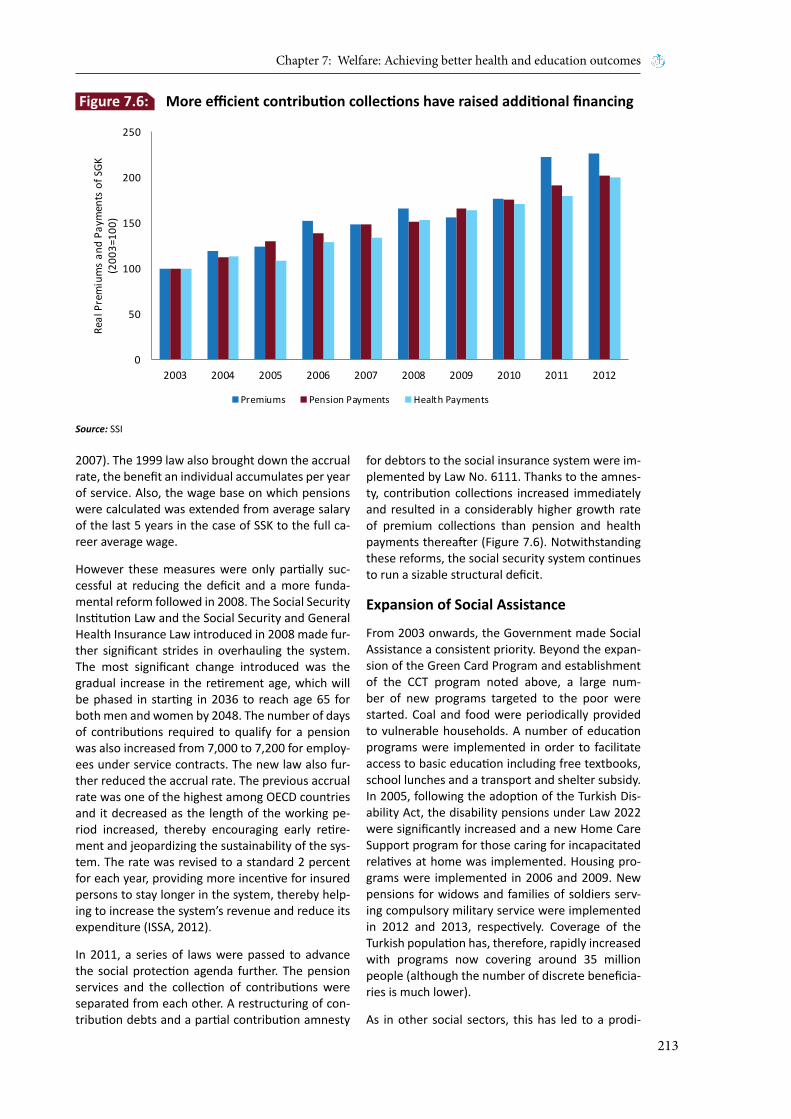
Chapter 7: Welfare: Achieving better health and education outcomes
213
2007). The 1999 law also brought down the accrual rate, the benefit an individual accumulates per year of service. Also, the wage base on which pensions were calculated was extended from average salary of the last 5 years in the case of SSK to the full ca-reer average wage.
However these measures were only partially suc-cessful at reducing the deficit and a more funda-mental reform followed in 2008. The Social Security Institution Law and the Social Security and General Health Insurance Law introduced in 2008 made fur-ther significant strides in overhauling the system. The most significant change introduced was the gradual increase in the retirement age, which will be phased in starting in 2036 to reach age 65 for both men and women by 2048. The number of days of contributions required to qualify for a pension was also increased from 7,000 to 7,200 for employ-ees under service contracts. The new law also fur-ther reduced the accrual rate. The previous accrual rate was one of the highest among OECD countries and it decreased as the length of the working pe-riod increased, thereby encouraging early retire-ment and jeopardizing the sustainability of the sys-tem. The rate was revised to a standard 2 percent for each year, providing more incentive for insured persons to stay longer in the system, thereby help-ing to increase the system’s revenue and reduce its expenditure (ISSA, 2012).
In 2011, a series of laws were passed to advance the social protection agenda further. The pension services and the collection of contributions were separated from each other. A restructuring of con-tribution debts and a partial contribution amnesty
for debtors to the social insurance system were im-plemented by Law No. 6111. Thanks to the amnes-ty, contribution collections increased immediately and resulted in a considerably higher growth rate of premium collections than pension and health payments thereafter (Figure 7.6). Notwithstanding these reforms, the social security system continues to run a sizable structural deficit.
Expansion of Social Assistance
From 2003 onwards, the Government made Social Assistance a consistent priority. Beyond the expan-sion of the Green Card Program and establishment of the CCT program noted above, a large num-ber of new programs targeted to the poor were started. Coal and food were periodically provided to vulnerable households. A number of education programs were implemented in order to facilitate access to basic education including free textbooks, school lunches and a transport and shelter subsidy. In 2005, following the adoption of the Turkish Dis-ability Act, the disability pensions under Law 2022 were significantly increased and a new Home Care Support program for those caring for incapacitated relatives at home was implemented. Housing pro-grams were implemented in 2006 and 2009. New pensions for widows and families of soldiers serv-ing compulsory military service were implemented in 2012 and 2013, respectively. Coverage of the Turkish population has, therefore, rapidly increased with programs now covering around 35 million people (although the number of discrete beneficia-ries is much lower).
As in other social sectors, this has led to a prodi-
0
50
100
150
200
250
2003 2004 2005 2006 2007 2008 2009 2010 2011 2012
Real
Pre
miu
ms
and
Paym
ents
of S
GK(2
003=
100)
Premiums Pension Payments Health Payments
Figure 7.6: More efficient contribution collections have raised additional financing
Source: SSI

Turkey’s Transitions
214
gious increase in spending for social assistance. Spending has more than tripled in real terms since 2003, albeit from very low levels. Spending as a percentage of GDP has grown from around 0.37 percent in 2003 to 1.26 percent in 2013. Programs for the disabled have grown particularly rapidly and now account for 30 percent of all social assistance spending, up from negligible levels before 2003. Notwithstanding the significant increases in spend-ing and coverage, the value of benefits provided to households remains relatively low by international standards.
Health and social securityoutcomes
Improving the equity of access for a healthier Turkey
In 2003, 2.5 million people were covered under the Green Card Program for the Poor. By 2011, the num-ber of beneficiaries had risen to 9.1 million people. As a result, health insurance coverage for the poor-est decile increased from 24 percent in 2003 to 85 percent in 2011 (Figure 7.7). The Green Card pro-gram and the increasing coverage of contributory insurance pushed the share of the total population covered by any kind of insurance from 64 percent in 2003 to 90 percent in 2011. Benefits were expand-ed to cover both outpatient and inpatient services at MoH and university hospitals and outpatient prescription drugs were included in the benefits package. Identification of the poor to be covered by the state budget was now based on a national system called the “Integrated Social Aid Services
System,” managed by a newly established MoFSP. The system is also used to determine the beneficia-ries of scholarships, homecare for the elderly, CCT, and disabled benefits (Menon, Mollahaliloğlu, and Postolovska, 2013). As a result of the expansion of health insurance, the percentage of households in-curring catastrophic health expenditures declined from 1.1 percent in 2003 to 0.6 percent in 2011. Along with the expansion of coverage, the Green Card Program also improved its targeting. In 2003, 55 percent of Green Card beneficiaries were in the poorest quintile. By 2011, this had risen to 65 per-cent (Aran and Chakraborty, 2013).
The improvement of supply in health infrastruc-ture, the family medicine program and the CCT rapidly improved vaccination outcomes. The CCT program alone was found to increase the full im-munization rate for pre-school children in the pro-gram by 13.6 percent (IFPRI, 2007). As of 2012, Turkey reached almost full coverage of immuniza-tion against diphtheria-pertussis-tetanus (DPT) and measles, catching up and even surpassing the OECD average (Figure 7.8).
One of the main objectives of the organizational reform was to strengthen local access and bring health services closer geographically to clients. Primary care and preventive care services are now delivered through family health centers with family medicine practice doctors and family heath person-nel (mainly nurses and midwives) and community health centers. The results have been impressive. In 1993, only 69 percent of births in Turkey were attended by skilled staff; by 2008, this figure had
0%
10%
20%
30%
40%
50%
60%
70%
80%
90%
100%
2003 2004 2005 2006 2007 2008 2009 2010 2011
Shar
e of
poo
rest
dec
ile co
vere
d by
insu
ranc
e
Green Card Obligatory Insurance
Figure 7.7: Reforms led to significant gains in coverage for the most vulnerable
Source: Aran and Chakraborty (2013)

Chapter 7: Welfare: Achieving better health and education outcomes
215
increased to 88 percent. The most significant in-creases in birth attendance by skilled staff were for the poorest quintile and in rural/Eeastern regions. For the poorest quintile, the probability of a birth being attended by trained staff increased from 43.1 percent in 1993 to 70.4 percent in 2008, with much of the progress achieved between 2003 and 2008 (Atun et al., 2013).
With improvements in access and quality, not sur-prisingly, people started using health services con-siderably more. The number of primary health care visits increased more than threefold from around 75 million in 2002 to 244 million in 2011, and pa-tients’ experience of the system also improved. Atun et al. note that, between 2003 and 2011, user satisfaction with health services increased signifi-cantly from 39.5 percent of the population to 75.9 percent. In 2003, the population was least satisfied
with the health services compared to any other public service (including social insurance, educa-tion, legal and judiciary, and public security). By 2011, satisfaction increased more than in any other sector and the health sector was ranked second, close behind public security.
As a result of over a decade of reforms and target-ed interventions, Turkey’s citizens and families are now far healthier and less vulnerable to catastroph-ic health events and resulting impoverishment than they were in the 1990s. A joint assessment con-ducted by the World Health Organisation (WHO), the World Bank, and the Turkish MoH confirmed the significant improvements, not only in the scope, but also in the depth of coverage – especially for poor households. Countries seeking to expand uni-versal coverage through a health insurance system can draw important lessons from the Turkish expe-
0
10
20
30
40
50
60
70
80
90
100
2003 2004 2005 2006 2007 2008 2009 2010 2011 2012
Imm
uniza
tion
Rate
(DPT
12
-23
mon
ths,
Per
cent
)
Gap Turkey OECD
0
10
20
30
40
50
60
70
80
90
100
2003 2004 2005 2006 2007 2008 2009 2010 2011 2012Imm
uniza
tion
Rate
(Mea
sles 1
2-2
3 m
onth
s, P
erce
nt)
Gap Turkey OECD
Figure 7.8: Turkey performs impressively in immunizing its youngest citizens
Source: WDI
Turkey’s Transitions
216
rience (WHO, 2012). The future challenge will be to continue to address the fiscal vulnerabilities of the social security system, and to ensure Turkey’s sustained progress towards a healthier and more secure citizenry.
Education
The context in the late 1990s
Turkey entered the new millennium with an under-powered labor force in terms of educational attain-ment. In 1997, almost 75 percent of the total labor force had less than secondary education, as com-pared with 29 percent on average in OECD coun-tries. The average years of schooling for the pop-ulation over 15 was estimated as 6 years in 2000, much lower than the OECD average of 10 years.6 Around 15 percent of the population of 15 and over did not have any schooling. Moreover, there was a considerable gender gap in educational attainment; the average years of schooling for women was 5.1 years and around 25 percent of women did not have any formal education at all.
Moreover, enrollment rates did not support signifi-cant increases in educational attainment. Although, by 1997, almost full enrollment for mandatory edu-cation had been accomplished, education was only mandatory for 5 years. The gross enrollment rate dropped to 65 percent in the second stage of pri-mary education (from grade 6-8) and declined fur-ther to around 53 percent in secondary education (from grade 9-11 at the time). Moreover, a signifi-cant gender gap still remained in enrollment, even in primary education.
Due to macroeconomic instability and high interest payments, Turkey did not have the fiscal space to allocate sufficient public resources to education. In 1999, public financing to education was 3 per-cent of GDP; low compared to the OECD average of 4.8 percent.7 This fed into a lack of educational inputs. For example, in 1997, the average number of students per teacher in secondary schools in Tur-key was 22 compared to an average of 14 in OECD countries.
Exacerbating the situation further were the re-gional disparities in educational resources. The av-erage number of students per teacher across both primary and secondary education in 1997 was 26.8 However, this varied widely across the country. In the least developed provinces, mostly in Eastern
Turkey, the number of students per teacher was more than 40. In addition, migration to large cit-ies and especially to Istanbul caused the number of students in these cities to increase rapidly, put-ting significant pressure on educational infrastruc-ture. The student/teacher ratio in Istanbul reached 36 in the mid-1990s. However, in general, it was the poorer East of the country that suffered more from a lack of educational infrastructure. In particu-lar, rural schools had problems with high turnover of teachers, availability of educational materials, school attendance, and educational performance (World Bank, 2008).
The government reform program
Since 1997, Turkey has pursued an education re-form agenda focused on two objectives: improving the quality of education and equalizing the popula-tion’s access to it. The Government has passed a series of laws to support the improvement of edu-cation outcomes, to make the educational system more efficient, and to increase the participation of girls. These reforms have been accompanied by the construction of new schools; the renovation or expansion of existing schools; a massive provision of computers, educational equipment, and edu-cational materials; and recurrent spending on the remuneration of teachers and other educational staff, as well as new recruitment and additional staff training (World Bank, 2005). The expansion of primary and secondary schooling has also been ac-companied by the development of new curricula, especially since 2004.
The first major contemporary education reform was the Basic Education Law, passed in August 1997, which extended the period of compulsory basic education from five years to eight years, and raised new tax revenues to finance a significant ex-pansion of the education infrastructure to accom-modate the expected increase in basic education enrollments. Enactment of this law was followed by the launch of the Government’s Basic Education Program to support the objectives and provisions stipulated by the law.
To meet growing education needs, Turkey’s teacher workforce increased by 70 percent between 1997 and 2012. The Government achieved this by in-creasing salaries, and offering incentives to improve teachers’ professional and career development. As a result, teachers’ salaries in Turkey doubled in real terms in the 2000s, one of the highest increases
6 Estimates by Barro R.J. and Lee J.W. (www.barrolee.com)
7 Source: WDI
8 In the preceding paragraph, we use data on student teacher ratios from WDI in order to draw comparisons with the OECD. Figures for Turkey at primary level are not available in the WDI. In this paragraph, we use data from TurkStat to allow regional comparisons within Turkey. However, data from TurkStat and WDI are not comparable.

Chapter 7: Welfare: Achieving better health and education outcomes
217
seen among OECD countries (OECD, 2013a). These interventions rendered the teaching profession more attractive, encouraging a better pool of ap-plicants to apply for teaching positions. Together with the shift to teacher recruitment based on the results of a central examination in 2002, this should have resulted in an overall increase in teacher qual-ity, even though data gaps make it difficult to evalu-ate the impact of teacher quality or performance on overall education outcomes.
Efforts were also made to improve the supply of schools and classrooms. Through a combination of Government resources and private contributions, Ministry of National Education (MoNE) constructed 103,983 new basic education classrooms during 1997-2001, bringing the total stock to 264,776.
This created additional capacity for more than 3 million basic education students. The Govern-ment launched a massive increase in new boarding schools for children in rural areas, renovated hun-dreds of rural and central village schools, and reha-bilitated and extended schools in low-income areas around large cities, known as gecekondus (World Bank, 2002). As a result, significant improvements were observed in the number of students per teacher and average class size (Figure 7.9).
Complementing these efforts, the Government launched targeted interventions to further level the educational playing field for students. The Basic Ed-ucation Program was providing free textbooks and school meals, and daily bussing for 600,000 stu-dents from villages without a school to larger popu-
80
100
120
140
160
180
20097
/98
98/9
9
99/0
0
00/0
1
01/0
2
02/0
3
03/0
4
04/0
5
05/0
6
06/0
7
07/0
8
08/0
9
09/1
0
10/1
1
11/1
2
12/1
3
13/1
4
Academic Year
Number of Teachers Number of Classes
Inde
x 19
98=1
00
15
17
19
21
23
25
27
29
31
33
97/9
8
98/9
9
99/0
0
00/0
1
01/0
2
02/0
3
03/0
4
04/0
5
05/0
6
06/0
7
07/0
8
08/0
9
09/1
0
10/1
1
11/1
2
12/1
3
13/1
4
Num
ber
of S
tude
nts
Academic Year
Number of students per teacher Number of students per class
Figure 7.9: Turkey’s education workforce and infrastructure kept pace with growing education needs
Source: TurkStat and MoNE Note: Data covers both primary and secondary levels combined.

Turkey’s Transitions
218
lation centers offering grades 6 to 8 (World Bank, 2002). The shift in the equity of public spending that these initiatives produced was quite marked. Table 7.1 shows that the share of public spend-ing on education going to the poorest quintile in-creased by 42 percent between 1994 and 2001 and that this happened entirely at the expense of the richest quintile.
As already noted, in 2001, the government launched the CCT program which helped increase enrollment, particularly for girls. By 2011, around 1.9 million chil-dren were enrolled in the program (MoFSP, 2012). Econometric results suggest that, after controlling for family background, the net primary school atten-dance rate increased by 1.3 percentage points for girls as compared with a control group. Notably, the CCT increased net secondary school attendance for girls by 10.7 percentage points (World Bank, 2008). A number of other programs to increase girls’ enrol-ment were also implemented.
To strengthen secondary education, in 2000, under the auspices of the Eighth Five-Year Development Plan and MONE’s Secondary Education Develop-ment Project, the Government set new targets for secondary education: (a) increasing compulsory ed-ucation from 8 to 12 years (a longer-term goal); (b) enrolling 95 percent of basic education graduates in secondary education (which was to start in the 2001 academic year); and (c) increasing secondary education from 3 to 4 years. MONE also initiated several related technical reforms, including: (a) making grade nine a common core general educa-tion program for all secondary education students to ensure all graduates have good basic skills; (b) delaying vocational specialization until grade 10; and (c) reducing the number of vocational subjects from 130 specialty programs to 30 broad vocational programs.
In 2004, the Government began the process of re-forming the educational curriculum to change the focus and content of the whole national curriculum in three phases. After piloting, the first phase was implemented nation-wide from September 2005. The second phase was to develop a new curricu-lum for grades 6–8. The third phase was to design a new curriculum for the new 4-year high school, the ninth grade of which is a common year for general and vocational high school students (Aksit, 2007). The new curricula not only changed the content of school education, but also encouraged innovative teaching methods with an emphasis on student-centered-learning. This provided a more active role for students instead of simply memorizing in-formation, which had historically been the primary learning method and remains prevalent in practice (OECD, 2013.b).
To strengthen completion rates and develop skills suitable for the labor market, Turkey has focused on improving vocational education and training (VET). Through various projects and programs, the Government has sought to tighten the link between students’ skills and the demands of the job market, and improve teacher quality and the curriculum. In 2001, the Government passed a law establishing the Board of Vocational Education at the central level with representatives from government, em-ployees, employers and other social partners, while a Provincial Board of Vocational Education was also established within each province. In 2002, the Gov-ernment initiated The Project on Strengthening the Vocational Education and Training System (SVET), a five year project with support from the European Union (EU), to design new national vocational stan-dards developed in co-operation with the indus-trial sector and other social partners. The creation of institutional development programs to provide high quality education for school administrators and teachers and a new certification system to en-
Table 7.1: Targeted spending contributed to leveling the playing field for more students Incidence of public spending on education: Improvements between 1994 and 2001
Household income quintiles
(Percent) 1 (poorest) 2 3 4 5 (richest)
1994
Basic Education Spending (8 years) 15.8 21.1 22.2 20.6 20.3
Secondary Education Spending 8.7 16.2 22.3 25.4 27.5
Total Education Spending 13.5 19.5 22.2 22.2 22.7
2001
Basic Education Spending (8 years) 21.7 21.4 21.0 22.0 13.9
Secondary Education Spending 13.0 14.6 25.4 22.8 24.2
Total Education Spending 19.2 19.4 22.3 22.2 16.9 Source: World Bank (2005)
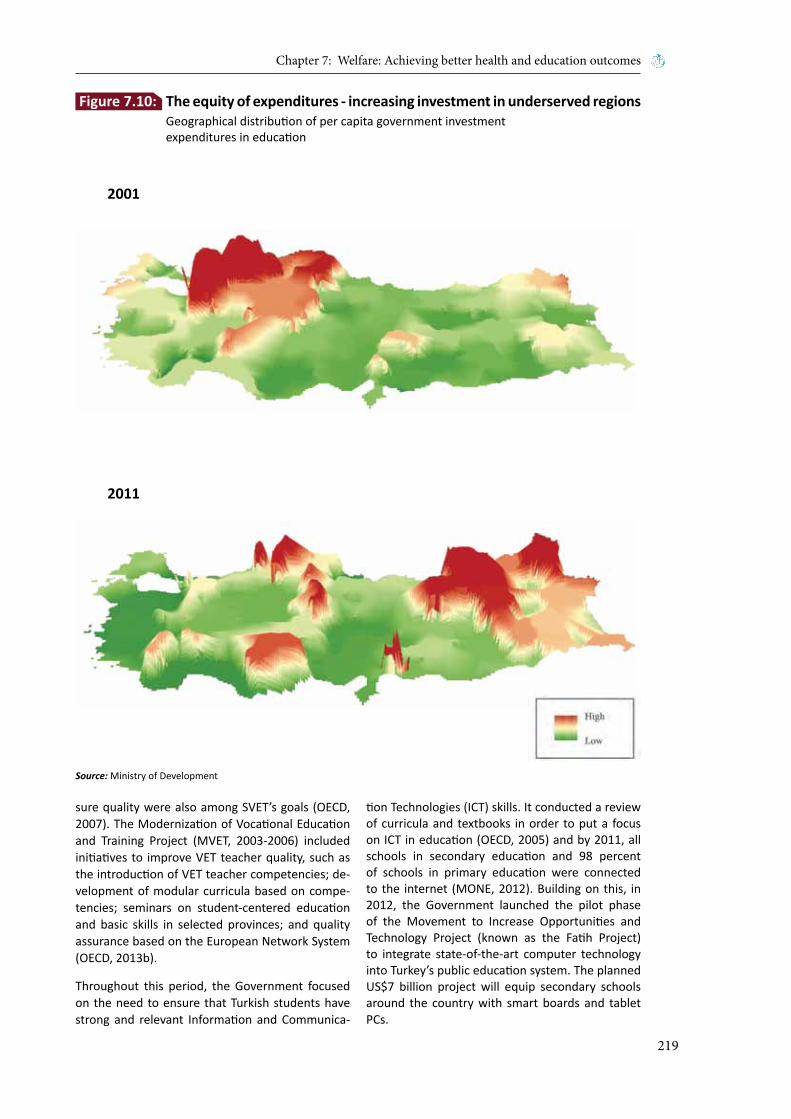
Chapter 7: Welfare: Achieving better health and education outcomes
219
sure quality were also among SVET’s goals (OECD, 2007). The Modernization of Vocational Education and Training Project (MVET, 2003-2006) included initiatives to improve VET teacher quality, such as the introduction of VET teacher competencies; de-velopment of modular curricula based on compe-tencies; seminars on student-centered education and basic skills in selected provinces; and quality assurance based on the European Network System (OECD, 2013b).
Throughout this period, the Government focused on the need to ensure that Turkish students have strong and relevant Information and Communica-
tion Technologies (ICT) skills. It conducted a review of curricula and textbooks in order to put a focus on ICT in education (OECD, 2005) and by 2011, all schools in secondary education and 98 percent of schools in primary education were connected to the internet (MONE, 2012). Building on this, in 2012, the Government launched the pilot phase of the Movement to Increase Opportunities and Technology Project (known as the Fatih Project) to integrate state-of-the-art computer technology into Turkey’s public education system. The planned US$7 billion project will equip secondary schools around the country with smart boards and tablet PCs.
Figure 7.10: The equity of expenditures - increasing investment in underserved regions Geographical distribution of per capita government investment expenditures in education
Source: Ministry of Development
Turkey’s Transitions
220
In 2006, the Government announced its aim to develop a lifelong education strategy to meet the requirements of a changing and developing econo-my and labor market. This led to the Higher Educa-tion Strategy for Turkey (2007), developed by the Higher Education Council (HEC). The strategy iden-tified increased expectations for higher education in a global, knowledge economy. The national High School Entrance Examination (OKS), taken by thou-sands of eighth graders competing for places in the country’s top high schools, was replaced by three Level Determination Exams (SBS), which were tak-en at the end of sixth, seventh and eighth grades. Recently, SBS was replaced by separate central ex-aminations in the eighth grade in 6 courses.
The extension of mandatory education to 8 years required a substantial increase in the education budget. As a result, the ratio of the MONE budget to the overall government budget increased from 9 percent in 1997 to 10.9 percent in 1998 and re-mained high in subsequent years. More striking was the increase in the share of education capital investments as the expanding education system re-quired additional physical infrastructure. The share of education in total public capital investments jumped from 15 percent in 1997 to 37 percent in 1998 and remained above 20 percent through 2002 (World Bank 2004).
Public expenditure on education continued to grow through the decade. According to Ministry of Finance data, public per capita expenditure on education increased in real terms by 7.4 percent
annually between 2004 and 2012. As a result, by 2012, Turkey spent almost 80 percent more on edu-cation per capita in real terms compared to 2004. The ratio of public education expenditure to GDP continues to follow an upward trend rising from 3 percent in 2006 (before which comparable data is not available) to 4 percent in 2012.9 It is also impor-tant to note that there was an important equity di-mension to public spending. As Figure 7.10 shows, per capita public capital investment in education shifted markedly from developed Western Regions to underdeveloped Eastern Regions between 2001 and 2011.
Education outcomes Turkey’s investments in education yielded a sig-nificant increase in educational coverage. After the enactment of the Basic Education Program, the net enrollment rate in primary education jumped sharply from 85 percent to 95 percent within three years and almost universal coverage was achieved in the education year 2011-2012. More strikingly, the gender gap, which was as high as 11 percent in 1998 disappeared as of 2012. Turkey was even more successful in expanding secondary education, supported by the success in achieving universal enrollment in primary education. The net second-ary enrollment rate jumped from 38 percent in the 1997-1998 education year to 77 percent in the 2013-2014 education year (Figure 7.11). Parallel to the gains made in primary education, the gender gap fell significantly, although a small gap of 1.2
0%
10%
20%
30%
40%
50%
60%
70%
80%
1998
1999
2000
2001
2002
2003
2004
2005
2006
2007
2008
2009
2010
2011
2012
2013
Net
Enro
llmen
t Rat
e (S
econ
dary
Educ
ation
)
Gap Total Males Females
Figure 7.11: Turkey’s investments in education rapidly increased enrollment rates
Source: TurkStat
9 These figures include expenditures of the central government only.

Chapter 7: Welfare: Achieving better health and education outcomes
221
percent remains as of 2012. Given that secondary education became mandatory in 2012, further ex-pansion in enrollment can be expected in the com-ing years.
In addition to rapidly expanding education access, Turkey also improved the quality of education sub-stantially. OECD evaluates education systems world-wide by testing the skills and knowledge of 15-year-old students using the PISA. Turkey’s results still lag the OECD average but, between 2003 and 2012, the gap narrowed significantly, especially in read-ing (Figure 7.2 in the introduction of this chapter). Turkey’s initially low level of PISA scores was one factor behind the decline in the gap with the OECD average as countries with poorer PISA results have more scope to improve. However, a comparison of the correlation between initial average PISA scores in 2003 and growth rates reveals that Turkey did much better than one would expect based on its initial results. In fact, Turkey has the highest annual change in average PISA scores between 2003 and 2012 among any participating country and it did better than countries that had poorer results than Turkey in 2003, such as Brazil, Mexico or Indonesia (Figure 7.12).
While achieving substantial improvement in aver-age PISA scores, Turkey also managed to reduce the effect of socioeconomic background on students’
success. The variance in mathematics results that can be explained by the parental socioeconomic background of students fell significantly between 2003 and 2012, and it did so at a faster rate than for almost any other country in the PISA sample (OECD, 2013.c). Related to this, PISA scores of students from poorer families continued to improve faster than the scores of students from richer families. All of these results highlight the returns that Turkey has reaped from its investments in improving the equity of the education system.
Turkey also invested significantly in higher educa-tion in the last decade. The number of universi-ties increased from 69 in 1997 to 176 in 2014. As a result, the net enrollment rate in tertiary educa-tion increased from 10 percent to 35 percent in 15 years. Supporting the increase in supply, demand for tertiary education also increased. Due to in-creasing enrollment at secondary education level, graduation rates from secondary school increased from 37 percent in 2000 to 56 percent in 2011. And with the expansion in the number of universities the capacity to accommodate this increasing num-ber of secondary school graduates has also been created. The number of new admissions in tertiary education has more than doubled, increasing from 176,000 to 380,000.10 Graduation has followed. Graduation from tertiary-type A education institu-tions11 reached 23 percent in 2011. The gap with
AUS
AUT
BEL
CAN
CZE
DNK
FIN
FRA
DEU
GRCHUN
ISL
IRLITA
JPN
KOR
LUX
MEX
NLD
NZL
NOR
POLPRT
SVK
ESP
SWE
CHE
TUR
USA
BRA
HKG
IDN LVA
LIE
MAC
RUS
SRB
THA
TUN
URY
-3
-2
-1
0
1
2
3
4
350 400 450 500 550 600
Annu
alis
ed Sc
ore
Chan
ge (2
003-
2012
)
Average PISA Score in 2003
Figure 7.12: Turkey has improved its PISA scores faster than any other participating country
Source: WB staff calculations based on OECD PISA dataset
10 Two year vocational programs after high school are not included in the number of admissions to tertiary programs.
11 According to the OECD, tertiary-type A programs (ISCED 5A) are largely theory-based and are designed to provide sufficient qualifications for entry to advanced research programs and professions with high skill requirements, such as medicine, dentistry or architecture. The graduation rate is calculated as the ratio of number of graduates to the total population in the theoretical age group.

Turkey’s Transitions
222
the OECD has narrowed, yet remains significant (Figure 7.13). But we would expect it to decline further in the coming years as a result of increased demand via the extension of mandatory education to 12 years and through increased supply via newly formed universities. Little is known about the qual-ity of university education and complaints by the private sector regarding the relevance of skills of new entrants into the labor force have persisted. Nonetheless, returns to education in Turkey remain high by regional comparison (World Bank, 2013.a).
Sustaining momentum – obstacles and opportunities
Optimizing health spending and ensuring sustainability
Turkey still has space for further improvement in health outcomes. The provision of high quality health care is still constrained by a number of fac-tors including a deficit of health care personnel. Turkey lags behind the OECD average in the num-ber of doctors per capita. In addition, only about a fifth of the doctors working in Turkey specialize in primary/generalist family care and this distribu-tion almost certainly limits community-wide access to medically prescribed treatments for NCDs linked risk management and care (Carter et al., 2012). The government has recognized this and, as stated in the 10th National Development Plan, it intends to increase the number of health personnel and con-tinue to equalize the distribution of health care professionals throughout the country. While it ex-pands the supply capacity of the system, however,
Turkey will need to pay even more attention to cost-effectiveness, as health care demand will increase.
Several external factors will affect future demand for health services and, thus, health expenditures in the medium- to long-term. While still relatively young, the Turkish population will age faster than many of its OECD counterparts. The demographic and epidemiological changes implied by this, along-side increased demand for new technologies that will arise from a more economically empowered population, will exert upward cost pressure on the health sector, and, in turn, on public expenditures, which will necessitate efficiency gains and/or alter-native sources of financing to sustain the system (World Bank, 2011).
As significant progress has been achieved in ad-dressing communicable diseases, NCDs have emerged as the primary public health issue (WHO, 2012). It is estimated that around 6.5 million dis-ability-adjusted life year (DALYs) a year (disability adjusted life years) are currently lost in Turkey due to NCDs, which are the cause of mortality in around 70 percent of all cases. Attributing a DALY value of US$10,000 (the approximate Turkish per capita GDP) implies a current gross total value of life and ability foregone of US$65 billion. This represents a lost welfare value comparable to 8-10 per cent of current GDP (Carter et al., 2012).
Although there has been a slight improvement, air pollution is still a severe problem and a major risk factor for NCDs. Chronic exposure to particulate matter contributes to the risk of developing cardio-vascular and respiratory diseases, as well as lung
37
76
9
28
56
83
23
39
0%
10%
20%
30%
40%
50%
60%
70%
80%
90%
Turkey OECD Turkey OECD
Upper Secondary Tertiary-A
Grad
uatio
n Ra
tes
2000 2011
Figure 7.13: Graduating more students into the global economy
Source: OECD (2013.c)

Chapter 7: Welfare: Achieving better health and education outcomes
223
cancer. In 2012, air pollution in Ankara and İstanbul exceeded the maximum acceptable limit set by the WHO and air pollution in Turkey is about twice as high as the European average. Shifting to clean en-ergy sources as well as improved mass transit and urban planning, as discussed in the Urbanization Chapter, will help reduce current levels of air pol-lution.
Data on another main cause of NCDs, namely obe-sity, are not promising either. Obesity among adults in Turkey has increased sharply from one in five in 1998 to one in three in 2010, parallel to develop-ments in European countries. The rate of obesity among women, at 40 percent, is particularly alarm-ing (WHO, 2012). There is evidence from other Mediterranean countries that obesity and related disease burdens in women impact particularly heavily on less economically and socially advan-taged groups and individuals. Problems such as il-literacy are known to be concentrated in the poorer Turkish female community, who may have special difficulties in access to health related advice and care in both rural and peri-urban settings. The Turk-ish government’s obesity prevention and control program (MoH, 2010) includes objectives such as increasing public awareness of the health conse-quences of obesity and encouraging healthier life-styles through media campaigns, school and work-place initiatives (Carter et al., 2012).
Another major risk factor for NCDs is smoking. In the 1980s, 47 percent of the Turkish adult popu-lation was smoking. As a result, the incidence of smoking related trachea, bronchus and lung can-
cer increased rapidly from 5 per 100,000 people in the 1980s to 20 per 100,000 today (Carter et al., 2012). There has since been a marked decline in smoking prevalence in Turkey. Government policies to cut smoking have included cigarette advertising restrictions, prohibiting smoking in public places, and increased tax on tobacco. Since 2009, the Law on Tobacco and Tobacco Products has prohibited smoking in all public indoor places and, as a result, exposure to second-hand tobacco smoke has since decreased substantially (Carter et al., 2012). Nev-ertheless, in 2010, 25.4 percent of the population was daily smokers, one of the highest rates in the OECD (WHO, 2012).
In order to reduce the effect of NCDs, more efforts are needed to understand the risk factors behind NCDs in the Turkish context, to monitor trends, in-crease public awareness and expand early diagno-sis and access to treatment.
Preparing social security for thedemographic transition
Over the last decade or so, Turkey implemented two important pension reforms in an attempt to stem the rise of pension spending and reduce in-equalities inherent in the old pension system. The reforms brought retirement ages, contribution pe-riods, accrual rates and indexation rules closer to international norms and were estimated to achieve significant savings over the long term. While re-forms slowed the growth, they did not stabilize pension spending in the short run partly due to the slow pace of reform implementation, which will
-4.0%
-3.5%
-3.0%
-2.5%
-2.0%
-1.5%
-1.0%
-0.5%
0.0%
2010
2015
2020
2025
2030
2035
2040
2045
2050
2055
2060
2065
2070
2075
ES, reformed BK, reformed SSK, reformed
Figure 7.14: The case for continued reforms–the pension system is projected to run deficits long into the future
Source: WB staff Pension Reform Option Simulation Toolkit (PROST) calculations, 2011
Turkey’s Transitions
224
only fully play out by 2075. Total pension spend-ing has still grown from 4.1 percent of GDP in 2002 to 7.1 percent of GDP in 2010, more than half of which is financed from the state budget. Moreover, as Figure 7.14 shows the system is projected to run a deficit of around 3 percent of GDP even into the long run.
Pension system parameters remain more generous in Turkey than in other countries even after taking the 1999 and 2006-2008 reforms into account. The differences can be seen in pensionable ages (the age where people can first draw full benefits), con-tribution period requirements, accrual rates and the generosity of the minimum pension guarantee. Figure 7.15 shows the average pensionable age in Turkey was the lowest among all OECD countries. In addition, the replacement rate (the ratio of the pension to the wage prior to retirement) for a me-dian earner in Turkey is well above the OECD aver-age (OECD, 2011).
Despite favorable demographic conditions, Turk-ish pension system continues to be burdened by a very high beneficiary to contributor ratio. The past reforms temporarily arrested the growth of this ra-tio, but could not reduce or prevent it from grow-ing in the long run. Importantly, thanks to widen-ing coverage that was also part of the reforms, the proportion of the elderly population with access to pension benefits will double. While undoubtedly positive from the perspective of income protection in old age, this development will apply new fiscal
pressures on the pension system counterbalancing the savings achieved by past reforms.
Despite falling dependency rates overall, Turkey is already seeing an increasing share of elderly in its population.12 The population aged over 65 is projected to triple by 2050. This raises two relat-ed concerns. First, despite recent increases in the coverage of pensions, a large and growing number of elderly people (all else being equal) will remain outside of the system, particularly those who have been employed in the informal sector. This raises in the future both equity concerns, as many may fall into poverty in old age, as well as fiscal concerns, if non-contributory social assistance programs need to expand to provide additional support to the el-derly uninsured. Second, according to the OECD, despite its comparatively young population, Turkey already spends 6.8 percent of GDP on public pen-sions. This expenditure exceeds that of Denmark, the Netherlands, the UK and the United States, de-spite the fact that these countries have 2-3 times as many citizens over the age of 65 relative to their population as Turkey (OECD, 2013.d). When one considers that pension spending per elderly per-son in Turkey already exceeds 100 percent of GDP per capita, the fiscal implications for Turkey’s de-mographics present a compelling case for reform (World Bank, 2013.b).
Options for further increasing contributions in Tur-key in order to reduce the fiscal pressure are lim-ited given its already high tax wedge. Thus, other
30
40
50
60
70
Icel
and
Nor
way
Uni
ted
Stat
esAu
stra
liaAu
stria
Cana
daDe
nmar
kFi
nlan
dG
erm
any
Irela
ndM
exic
oN
ethe
rland
sN
ew Z
eala
ndPo
land
Port
ugal
Spai
nSw
eden
Switz
erla
ndU
nite
d Ki
ngdo
mJa
pan
Slov
akia
Czec
h Re
publ
icFr
ance
Belg
ium
Hung
ary
Kore
a, R
ep.
Luxe
mbo
urg
Italy
Gre
ece
Turk
ey
Pens
iona
ble a
ge in
OEC
D co
untr
ies,
201
0
Men Women
Figure 7.15: Turkey has the lowest pensionable age in the OECD
Source: OECD (2011)
12 See Chapter 6 for more details.

Chapter 7: Welfare: Achieving better health and education outcomes
225
parametric reforms will need to be considered. These could include a faster increase in the statu-tory retirement age, a change in the application of the minimum contribution period, diversion of the minimum and average pension values and imposi-tion of actuarially fair reduction of benefits in the case of early retirement.
Improving educational outcomes
Although public education spending has increased by over one third as a share of GDP since 2006, it is still low by OECD standards and will need to rise further. The recent 4+4+4 legislation is expected to increase the number of students in the secondary education system. The OECD estimates that this
will lead to a rise in the average schooling of the adult population by ona year as of 2030 (OECD, 2012). The government is in a favorable position in the sense that there is strong domestic support in Turkey for increasing investments in education. According to a joint European Bank for Reconstruc-tion and Development (EBRD)-World Bank survey conducted in 2010, more than 40 percent of Turk-ish citizens would prefer extra government expen-diture on education, compared to a Western Euro-pean average closer to 25 percent (EBRD, 2011). This could present an opportunity, and mandate, for the Government to continue to prioritize public spending in this area. What should be the priorities for increased spending?
0%10%20%30%40%50%60%70%80%90%
100%Is
tanb
ul
Wes
t Mar
mar
a
Enro
llmen
t rat
es
Aege
an
East
Mar
mar
a
Wes
t Ana
tolia
Med
iterr
anne
an
Cent
ral A
nato
lia
Wes
t Bla
ck S
ea
East
Bla
ck S
ea
Nor
th E
ast A
nato
lia
Cent
ral E
ast A
nato
lia
Sout
h Ea
st A
nato
lia
2007 2013
-4%-2%0%2%4%6%8%
10%12%14%16%
Ista
nbul
Wes
t Mar
mar
a
Aege
an
East
Mar
mar
a
Wes
t Ana
tolia
Med
iterr
anne
an
Cent
ral A
nato
lia
Wes
t Bla
ck S
ea
East
Bla
ck S
ea
Nor
th E
ast A
nato
lia
Cent
ral E
ast A
nato
lia
Sout
h Ea
st A
nato
lia
2007 2013
Gend
er g
ap in
enr
ollm
ent r
ates
Figure 7.16: Turkey has been closing regional and gender gaps in terms of enrollment in secondary education
Source: TurkStat

Turkey’s Transitions
226
Although universal enrollment in primary education has been achieved, enrollment in secondary educa-tion only stands at around 70 percent. As a result of initiatives described in this Chapter, the gap be-tween regions in terms of enrollment in secondary education has fallen. However, enrollment remains notably low in some, mostly Eastern Regions (Fig-ure 7.16). Moreover, despite achievements in re-cent years, girls are particularly disadvantaged in enrollment in these same regions. Going forward, further efforts are needed to improve enrollment in the Eastern Regions not only by increasing the supply of education services, but also by promoting the attendance of girls.
Beyond access there is a need to further improve the quality of education. Teacher characteris-tics play a vital role in student success. In Turkey, teachers’ job satisfaction is low compared with in-ternational benchmarks, which can translate into negative behaviors that affect student learning. Results of the latest TIMSS (Trends in International Mathematics and Science Study) in 2011 confirm that teacher characteristics play an important role in learning outcomes; achievements are higher for students whose teachers apply more effective teaching strategies and are more satisfied with their job. Moreover, the effect of teacher satisfac-tion is more important for poorer students (World
0%
10%
20%
30%
40%
50%
60%
70%
80%
90%
1998 2000 2002 2004 2006 2008 2010
Gros
s Enr
ollm
emt i
n EC
E (P
erce
nt)
Turkey OECD
0
10
20
30
40
50
60
70
0
100
200
300
400
500
600
700
800
1 2 3 4 5 6 7 8 9 10Ho
useh
olds
(in
thou
sand
s)
Child
ren
in d
ecile
(in
thou
sand
s)
Per capita expenditure deciles
Number of children in decile (Ages 4-6)Number of households where at least one child attends kindergarten or preschool
Figure 7.17: More access to early childhood education is still needed
Source: WB (2011.b) based on HBS (2003) data
Source: United Nations Educational, Scientific and Cultural Organization (UNESCO)
Chapter 7: Welfare: Achieving better health and education outcomes
227
Bank, 2014). As a result, increasing the quality and motivation of the teacher workforce is crucial to further improve education outcomes.
Expanding ECE should be a top priority in the com-ing years. The literature on the economics of edu-cation highlights that ECE has the highest rate of return among all levels of education (Carnerio and Heckman, 2003). According to PISA data in 2012, at-tending preschool education increases PISA scores by 15 points in OECD countries and 25 points in Tur-key after controlling for family socioeconomic sta-tus effects (OECD, 2013.d). Despite improvements in recent years, enrollment in preschool education is still very low by international standards (Figure 7.17). Importantly, and perhaps not surprisingly, children from richer families currently benefit far more from ECE meaning that policies that promote widespread access to ECE will not only improve education outcomes in general but will also help to further improve equity.
Finally, given the long time horizon needed for edu-cation reforms to pay benefits, the need for a stra-tegic vision for the sector and a steady course re-main paramount. Several of the education reforms launched over the past 15 years need to be sus-tained to realize their full impact. Education reform has been a topic of hot debate in Turkey over many decades and this has led to frequent course correc-tions. But these are not costless. Some of the re-cent measures, such as an extension of the manda-tory period of schooling, were a natural extension of the system and perhaps long overdue. Others, such as the reintroduction of early streaming and frequent changes to the secondary school exami-nation system appear to do little to either reduce the still high level of socio-economic segregation in the education system or address fundamental is-sues of education quality. Instead, the reform focus of the early 2000s should be sustained, with atten-tion to a modern curriculum and interactive class-room teaching practices, teacher training and ca-reer management, quality assurance mechanisms and reforms of school financing and management practices to strengthen accountability. Indeed, the improvements recorded to date in student learning outcomes argue for consistency and continuity in the direction of education reforms.
ConclusionTurkey’s reforms in the health and education sec-tors over the last decades have led to an impressive overall improvement in the welfare of its popula-tion, underpinned by increased spending, but un-doubtedly accompanied by important policy ini-tiatives. In many cases, improvements have been rapid and are happening at a pace faster than in many of Turkey’s peers. There is much that other countries could learn from Turkey. In the health sector, Turkey’s long-term and carefully sequenced HTP offers important lessons in achieving universal health coverage. Turkey’s experience with address-ing inequalities in service delivery by using financ-ing and incentives is also particularly relevant.
The agenda going forward is framed by Turkey’s demographic transition. The demographic changes that took 100 years in developed countries will take place in Turkey in only 30 (Apakan, 2012).13 Accord-ing to current demographic trends, Turkey’s elderly population will double by 2032 and triple by 2045. This ageing population presents a challenge for Tur-key in terms of both health and social protection. The ageing population and the shift in the burden of disease to NCDs will put rapidly increasing pres-sure on the health system. At the same time, this ageing population necessitates further thinking of how to support the income of the elderly without pension coverage, as the evolving family structure in Turkey, shaped by urbanization and employment trends will mean that the extended family can no longer be relied upon to be the sole provider of support.
The demographic transition also has implications for Turkey’s youth. Turkey has the youngest popula-tion in Europe (by median age). By 2020, Turkey’s population is projected to overtake Germany’s to become the largest population in Western Europe. This presents an opportunity for Turkey’s young labor force, but one that they will only be able to seize if they are well educated and equipped with the skills that the labor markets need. Turkey’s lon-ger term prosperity necessitates investments in im-proving the quality and access of the educational system from early childhood education all the way to life-long learning in order to ensure that a large workforce is also a productive one.
13 www.cfr.org/content/publications/Apakan-Intro-and-Comments.pdf

Turkey’s Transitions
228
ReferencesAksit, N. (2007). Educational Reform in Turkey. in-ternational Journal of Educational Development, 27(2), 129-137.
Akyürek, C. (2012). Sağlıkta bir geri ödeme yöntemi olarak Global Bütçe ve Türkiye (Global Budget as a reimbursement method in health and Turkey). So-syal Güvenlik Dergisi (Journal of Social Security), 2012/2.
Aran M. and Chakraborty S. (2013). What Can we Say about Health Insurance, Coverage, Targeting and Financial Risk Protection in Turkey: Findings from Household Budget Survey (2003-2011).
Atun R., Aydin S., Aran M., Sumer S., Gurol I., Na-zligolu S., Ozgulcu S., Aydogan U., Ayar B., Dilmen U. and Akdag R. (2013). Universal Health Cover-age in Turkey: Enhancement of Equity. The Lancet, 382(9886), 65-99.
Buğra, A., & Keyder, C. (2006). The Turkish Welfare Regime in Transformation. Journal of European So-cial policy, 16(3), 211-228.
Carnerio P. and Heckman J. (2003). Human Capital Policy. NBER Working Paper No 9495.
Carter S., Taylor D., kanavos P., Grimacia F., Tordrup D. and Tattar M. (2012). Transforming Health in Turkey: 21st Century Opportunities. UCL School of Pharamacy.
DPT. (2007). Dokuzuncu Kalkınma Planı Sosyal Güvenlik Özel İhtisas Komisyonu Raporu (Ninth De-velopment Plan, Specialized Commission Report on Social Security. State Planning Organization, Repub-lic of Turkey.
EBRD. (2011). Life In Transition: After the Crisis. Eu-ropean Bank for Reconstruction and Development.
IFPRI. (2007). Impact Evaluation of the Conditional Cash Transfer Program in Turkey: Final Report. In-ternational Food Policy Research Institute.
ISSA. (2012). Modernizing the Social Security Sys-tem in Turkey. International Social Security Associa-tion.
Memiş, S. (2013). Fiyat ve Geri Ödeme Politikalarının İlaç Sanayi Üzerine Etkisi (The Effect of Price and Re-imbursement Policies on Pharmaceutical Industry). TEPAV Policy Note 2013/01.
Menon R., Mollahaliloğlu S. and Postolovska I. (2013). Toward Universal Coverage: Turkey’s Green Card Program for the Poor. Unversal Health Cover-age Series No 18. World Bank.
MOFSP. (2012). Sosyal Yardimlar Genel Mudurlugu Faaliyet Raporu (Annual Report if DG of Social As-sistance). Ministry of Family and Social Assistance.
MONE. (n.d.). 2011 Yili Faaliyet Raporu (Annual Re-port, 2011). Ministry of National Education.
OECD. (2005). Basic Education in Turkey: Back-ground Report. In Reviews of National Policies for Education. Organization for Economic Cooperation and Development.
OECD. (2007). Secondary Education: General, Voca-tional and Technical Education and Apprenticeship. In Review of National Policies for Education: Basic Education in Turkey. Organization of Economic Co-operation and Development.
OECD. (2008). OECD Reviews of Health Systems:Turkey. Organization for Economic Coop-eration and Development.
OECD. (2011). Pensions at a Glance 2011: Retire-ment-Income Systems in OECD and G20 Countries. Organization for Economic Cooperation and Devel-opment.
OECD. (2012). Economic Surveys: Turkey 2012. Or-ganization for Economic Cooperation and Develop-ment.
OECD. (2013a). Country Note: Education at a Glance 2013. Organization for Economic Cooperation and Development.
OECD. (2013b). Education Policy Outlook: Turkey. Organization for Economic Cooperation and Devel-opment.
OECD. (2013c). Education at a Glance 2013: Indica-tors. Organization for Economic Cooperation and Development.
OECD. (2013c). PISA 2012 Results: Excellence Through Equity: Giving Every Student the Chance to Succeed (Volume II). Organization for Economic Cooperation and Development.
OECD. (2013d). Pensions at a Glance 2013: Retire-ment-Income Systems in OECD and G20 Countries. Organization for Economic Cooperation and Devel-opment.
Verbeken, D. (2007). The pension Reform Challenge in Turkey. ECFIN Country Focus, Issur Brief No:3 Vol.4. European Commision-DG for Economic and Financial Affairs.

Chapter 7: Welfare: Achieving better health and education outcomes
229
WHO. (2012). Turkey Health System Performance Assesment 2011. World Health Organization, World Bank and Ministry of Health, Republic of Turkey.
World Bank. (2013b). The Inverted Pyramid: Pen-sion Systems in Europe and Central Asia Facing De-mographic Challenges. World Bank.
World Bank. (2001). Turkey Social Risk Mitigation Project/Loan: Project Appraisal Document. World Bank.
World Bank. (2002). Turkey Second Basic Education Project. World Bank.
World Bank. (2004). Turkey: Rapid Convergence for Compulsory Education-The 1997 Basic Education Program. World Bank.
World Bank. (2005). Sustainable Pathways to an Ef-fective, Equitable, and Efficient Education System for Pre-school through Secondary School Educa-tion. World Bank.
World Bank. (2008). Turkey Second Basic Education Project: Implementation and Completion Results Report. World Bank.
World Bank. (2011). Ensuring Fiscal Sustainability of the Turkish Health Sector. World Bank.
World Bank. (2013a). Back to Work: Growing with Jobs in Europe and Central Asia. World Bank.
World Bank. (2014). Turkey TIMSS 2011. World Bank.

Turkey’s Transitions
230

Spotlight 3: Fiscal stabilization and the move to rule based public finance management
231
Fiscal stabilization and themove to rule based
public finance management
Spotlight 3
Turkey’s Transitions: Integration, Inclusion, Institutions
Labor
Welfare
FiscalSpace
Enterprise
Trade
Finance
Cities
Infrastucture

Turkey’s Transitions
232

Spotlight 3: Fiscal stabilization and the move to rule based public finance management
233
Fiscal Stabilization and The Move to Rule Based Public FinanceManagement
“Fiscal discipline was the cornerstone of our economic program. … Political stability, structural
reforms, coupled with the prudent fiscal and monetary policy have paved the way for
uninterrupted growth periods of 27 quarters up to the last quarter of 2008.”1
Ali Babacan
Currency crises typically come in two variet-ies. “First generation” types – so-named be-cause they tended to prevail until the end
of the 20th century – are driven by an underlying public sector imbalance, which is funded by print-ing money, leading to the build-up of inflationary pressures and, ultimately, the collapse of money demand and the currency. “Second generation” crises follow a sudden shift in private sector port-folio allocations out of domestic assets. This may be triggered by political events, concerns over gov-ernance or changes in international risk appetite. The Asian financial crisis in the late 1990s is a good example of the second type, as private rather than public imbalances were at the root of the sharp cur-rency depreciations.
Turkey’s financial history abounds with first genera-tion type crises, most prominently the cataclysm of 2001. Driven by the politics of patronage and rent-seeking, governments struggled to keep pub-lic spending under control and Turkey repeatedly went through the cycle of government stimulus, rising inflation, pressures on money demand and the currency and, ultimately, the need to introduce a stabilization package to reassure Turkey’s foreign creditors and stop the fall of the currency. After 2001, this cycle stopped. As the above quote from Deputy Prime Minister Ali Babacan makes clear, a policy shift occurred as a result of the deep eco-nomic, financial and political crisis at the turn of the millennium and the risk of a first generation type crisis has been effectively banished in Turkey today.
This Spotlight reviews Turkey’s experience with fis-cal stabilization and the transition to rule-based public finance management after 2001. First, we chronicle the fiscal origins of the 2001 crisis and the authorities’ response. Second, we show how the fiscal space resulting from successful stabilization was used to expand welfare spending, particularly in health but also in education and, thus, forms
the backbone of growing access as documented in Chapter 7. Third, we argue that reforms of Turkey’s public financial management institutions were criti-cal in supporting fiscal stabilization and making it sustainable. Finally, we look at some of the unre-solved challenges in public financial management. The authorities’ proclivity to create greater room for government discretion to handle possible po-litical opposition echoes some of the tendencies of the 1980s. Turkey’s own experience, thus, arguably holds lessons for Turkey’s policy makers today. The consolidation of institutional changes is a long-term process and requires continued effort and commit-ment. This is a lesson for Turkey, as well as many other middle income countries.
The public sector origins of the 2001 crisisPoor public finance management was at the heart of growing imbalances in the 1990s. Created in the 1980s to give the government greater discretion in the pursuit of its export oriented policies, the prolif-eration of extra-budgetary funds and the financing of their deficits through state-owned banks led to the progressive loss of fiscal control (Figure S3.1). Interest rate subsidies to Small and Medium Enter-prises (SMEs) and agricultural enterprises led to the accumulation of so-called “duty losses”, annually compounded and reflected nominally in the bal-ance sheet as perpetual claims on the government. This recourse to quasi-fiscal financing directly un-dermined financial sector stability. When interest rates shot up in the late 1990s, the value of govern-ment bonds held by the state banks to compensate for these duty-losses plummeted and the necessary recapitalization of the banking sector contributed to the doubling of Turkey’s public debt stock to 95 percent of Gross Domestic Product (GDP) by 2001 (Figure S3.2; see also Chapter 3).
Little progress was made in addressing the structur-al causes of public sector deficits in banking, ener-gy, agriculture, and pension system. In the banking sector, commercial banks, both state and privately owned, borrowed abroad to purchase government securities and on-lend funds locally, often to relat-ed parties. Large open foreign exchange positions were allowed to build, while the authorities turned a blind eye to connected lending practices. In the power sector, lucrative build-operate-transfer con-tracts were awarded without open bidding. Long-term take-or-pay contracts committed state-owned distribution companies to purchase power at high tariffs from private generation facilities, while do-mestic final user tariffs often failed to cover the
1 Speech at the London School of Economics, August 27, 2009. Available at: www.lse.ac.uk/publicEvents/events/2009/20090827t1705z001.aspx

Turkey’s Transitions
234
costs. Large subsidies were also channeled through the state banks to agricultural SOEs. In the area of social security, a generous pension reform intro-duced in 1993 which lowered the effective retire-ment age in Turkey to less than 50 and left a large hole in the system. These structural deficiencies are discussed in greater detail elsewhere (Chapter 1, Chapter 3, Chapter 7).
The public expenditure management system was failing in three key areas. First, aggregate fiscal management was compromised by the significant growth of off-budget activities, particularly quasi-fiscal operations, as explained above. There was a major discrepancy between the official and actual fiscal stance and lack of budget comprehensive-ness and transparency meant that the framework
Source: Undersecretariat of Treasury, World Bank (WB) staff calculationsNote: The red bars refer to currency crises years
Source: WB Turkey Country Economic Memorandum, 2000 and 2003Note: Net public debt includes Government securities issued to recapitalize the Savings Deposit Insurance Fund (SDIF) and state Banks. The new GDP series of TurkStat does not extend back to 1994. Hence, the old Gross National Product (GNP) series is used as the denominator.
0%
5%
10%
15%
20%
25%
30%
1990 1991 1992 1993 1994 1995 1996 1997 1998 1999 2000 2001
Per
cent
of G
DP
PSBR Total Interest Payments (percent of GDP)
Increased PSBR
Stabilization Package
Hidden Fiscal Cost of State Banks
44.741.3
46.542.9 43.7
61.0 58.3
93.9
0%
10%
20%
30%
40%
50%
60%
70%
80%
90%
100%
1994 1995 1996 1997 1998 1999 2000 2001
Net
pub
lic d
ebt,
Perc
ent o
f GNP
Figure S3.1: The unravelling of fiscal discipline between 1990-2001 Consolidated public sector borrowing requirement (PSBR) in percent of GDP
Figure S3.2: The consequence of fiscal profligacy: rising public debt

Spotlight 3: Fiscal stabilization and the move to rule based public finance management
235
was effectively failing to exercise fiscal discipline. Second, strategic decision making was neglected and policies and plans were not linked to budgets. This was a legacy of the tendency in the 1980s to circumvent parliamentary control through the cre-ation of discretionary off-budget spending vehicles to finance priority projects, but these increasingly developed their own dynamics undermining stra-tegic relevance and coordination (Atiyas, 2012). Third, in spite of stringent controls over budget execution, the government failed to prevent waste and inefficiencies. Extremely rigid and compliance based financial controls, ex-ante approval functions of the central government with no delegation of authority to the line agencies, non-transparent pro-curement systems, and lack of an effective account-ability framework meant that effort was directed at circumventing ineffective rules and exploiting the rents from their inconsistent implementation.
Starting in the late 1990s, the authorities progres-sively addressed the structural origins of the public sector imbalances. Initial efforts (with International Monetary Fund (IMF) support) had limited success, in part because of inconsistent exchange rate and financial policies, but after 2001, a series of mac-ro-economic and structural adjustment programs finally achieved lasting fiscal stabilization. Address-ing citizen demand for better service delivery was at the core of these programs designed around fiscal adjustment, financial stabilization, disinfla-tion, and structural and institutional public sector reforms. A series of IMF Stand-By Arrangements,
World Bank adjustment policy loans as well as the government’s strong commitment to reaching the European Union (EU) standards anchored reform efforts.
At the core of the fiscal adjustment was a commit-ment to persistent primary fiscal surpluses. The public sector primary surplus targets defined in the IMF Stand-by Arrangements played a critical role as a kind of proxy for a fiscal rule. As reflected in Fig-ure S3.3, the cumulative fiscal adjustment was over 30 percent of GDP with an average primary surplus of 4.4 percent of GDP between 2001-2007. Primary surpluses were much lower after 2008 in part not only because of the impact of the 2009 global fi-nancial crisis and the sharp decline in GDP Turkey experienced in its wake, but also because of grow-ing rigidities in Turkey’s spending commitments to which we come back below. Still, with a public debt to GDP ratio comfortably below 40 percent, Tur-key’s current fiscal stance presents no risk to hard-earned fiscal stability.
Turkey’s fiscal stabilization, thus, has had lasting positive effects and can serve as an inspiration for other countries facing the difficult task to reign in after years of weak discipline. In reviewing 32 case studies of positive reform experiences to guide Europe as it works to restore the luster of its eco-nomic model, Gill and Raiser (2012) select Turkey as a case study in fiscal stabilization. Figure S3.4 con-firms that Turkey sustained one of the strongest fis-cal performances among any of its peers through-out the crisis years and subsequent recovery.
Source: Ministry of Development
1.9
4.3
3.4
5.2 5.4
4.5 4.8
3.1
1.6
-1.1
0.8
1.9
0.8 0.9
-2%
-1%
0%
1%
2%
3%
4%
5%
6%
2000 2001 2002 2003 2004 2005 2006 2007 2008 2009 2010 2011 2012 2013
Perc
ent o
f GDP
Figure S3.3: The fiscal stabilization effort Public sector primary balance (program definition), percent of GDP

Turkey’s Transitions
236
Fiscal stabilization, fiscal space and improved public servicesPrimary surpluses combined with falling interest rates and the impact of economic recovery cut Turkey’s public sector debt in half between 2002 and 2007 (Table S3.1). Interest payments declined from 11.3 percent of GDP in 2002 to 2.1 percent in 2007 and 0.1 percent in 2012. This progressively diminished the need for large primary surpluses to generate debt reduction and created fiscal space to fund new government priorities.
In addition to the reduction in interest payments, increased revenues from a growing tax base con-tributed to fiscal adjustment. Total government rev-enues increased by around 6.7 percentage points of GDP between 2002 and 2012, with a rise in con-tributions to social funds accounting for around four fifths of this increase. The creation of 6.3 mil-lion formal sector jobs during the 2002-2012 period drove the increase in social security contributions, while a shift in the structure of taxation towards in-direct taxes (in particular an increase in excise du-ties on fuel, alcohol and tobacco, as well as some luxury import good items) boosted tax revenues by
Source: IMF, World Economic Outlook Database
ARG
BRA
CANCHNCZE
FRADEU
GRC
INDIDN
ITAJPN
KOR MEXPOL
PRTROM
RUSZAF
ESP
TUR
GBRUSA
-30
-20
-10
0
10
20
30
40
50
-2 0 2 4 6 8 10 12 14
Chan
ge in
gen
eral
gov
ernm
ent g
ross
deb
t (2
007
-201
0), P
erce
ntag
e po
ints
Change in general government budget deficit (2007 - 2010), Percentage points
ARGBRA
CAN
CHNCZE
FRADEU
GRC
IND
IDN
ITA
JPN
KOR
MEX
POL
PRT
ROM
RUSZAF
ESP
TUR
GBRUSA
0
50
100
150
200
250
-4 -2 0 2 4 6 8 10 12
Gene
ral g
over
nmen
t gro
ss d
ebt 2
012,
Per
cent
of
GDP
General government budget deficit 2012, Percent of GDP
Figure S3.4: Turkey maintained fiscal discipline during the 2008-2009 crisis and beyond

Spotlight 3: Fiscal stabilization and the move to rule based public finance management
237
around 2.4 percentage points of GDP over the same period.2
The resulting fiscal space made room for a rap-id increase in non-interest central government spending. The bulk of this increase has gone to social spending, enabling the expansion of health care and social security coverage (Figure S3.5). In addition, there has also been significant growth in spending on personnel, driven in part by the growth in the number of teachers, but also the ex-pansion of administrative personnel in central gov-
ernment agencies. The use of fiscal space to fund the expansion of welfare and the improvement in public services is at the heart of Turkey’s progress in social inclusion documented in Chapter 7. Howev-er, it is also creating some spending rigidities which will need to be carefully managed should revenue growth slow with a shift towards more moderate growth in the economy overall. Investment spend-ing has increased but only modestly with private sector investment in infrastructure accounting for a substantial share of improvements in transport, telecoms, and power services (Spotlight 2).
Table S3.1: Decomposition of change in debt stock(Percent of GDP) 2002 2003 2004 2005 2006 2007 2008 2009 2010 2011 2012
General GovernmentDebt Stock (EU Definition) 74.0 67.7 59.6 52.7 46.5 39.9 40.0 46.1 42.3 39.1 36.1
Change in debt stock(percentage points) -3.9 -6.3 -8.1 -6.9 -6.2 -6.6 0.1 6.1 -3.7 -3.2 -3.1
Interest payments 11.3 6.1 6.1 2.4 2.6 2.1 2.3 1.4 0.5 0.3 0.1
Growth Effect -4.5 -3.7 -5.8 -4.6 -3.4 -2.1 -0.3 2.0 -3.9 -3.4 -0.9
Primary Balance (Excluding privatization revenues)
-4.4 -5.3 -6.0 -6.5 -5.9 -4.3 -2.9 0.2 -1.2 -2.7 -2.1
Privatization revenues -0.1 -0.1 -0.3 -0.6 -1.6 -1.4 -0.9 -0.5 -0.4 -0.3 -0.5
Revaluation effect -1.1 -0.1 -0.1 -0.1 0.1 -0.2 -0.1 -0.7 -0.1 0.1 0.3
Other -5.2 -3.2 -2.1 2.5 2.0 -0.8 1.9 3.6 1.3 2.8 0.0Source: Ministry of DevelopmentNote: (-) sign represents reduction in debt stock
Source: Ministry of Finance
Personnel24%
Interest44%
Social13%
Invest.6%
Other13%
2000
Personnel28%
Interest12%
Social26%
Invest.13%
Other21%
2013
Figure S3.5: The use of fiscal space in Turkey
2 The large informal economy and the cost of collecting direct taxes have influenced the shift of tax revenues towards indirect taxes as pointed out by M. Üngör (2014).
Turkey’s Transitions
238
Improved public financialmanagement institutions and the sustainability of fiscal stabilizationFiscal stabilization was sustained because the post-2001 policy framework included measures that went to the heart of public sector governance. Previous stabilization attempts were characterized by a sequence of initial fiscal retrenchment, fol-lowed by renewed expansion often in the context of pre-election hand-outs. The post-2001 approach instead introduced rule-based governance. Fiscal gains resulted from reforms in five areas in particu-lar.
• First, in 2003 and again in 2008, the authori-ties moved to contain the deficit of the Social Security Institution through institutional and parametric reform of the social security system. While the deficit has not been eliminated, bal-looning contingent liabilities have been avoided.
• Second, the state withdrew from direct involve-ment in productive activities by re-launching the restructuring and privatization of SOEs. While this process had started in the 1980s, it had initially proceeded in a haphazard way. The Privatization Law of 1994 introduced a unified framework and allowed the government to re-double privatization efforts, including the par-tial sale of flagship assets such as Turk Telekom, Turkish Airlines and Halk Bankasi. At the same time, employment in existing SOEs was sharp-ly reduced from 420,000 in 2001 to around 130,000 in 2013.3 The total SOE payroll declined from around 2.5 percent of GDP to less than 1 percent over the same period.
• Third, agricultural support policies and subsi-dies to SMEs were overhauled to eliminate one source of fiscal risk. Under the Agricultural Re-form Implementation Project (2001-2008), the government moved to a more market oriented agricultural policy. This included the abolition of administered output prices and the elimination of most input subsidies, including subsidized credit; the restructuring of agricultural SOEs and the Agricultural Sales Cooperatives Unions; and the introduction of direct income support decoupled from production levels. This signifi-cantly reduced the burden of agricultural sup-
port policies to the budget, although as a result of high external tariff barriers and some remain-ing government support schemes, Turkey’s ag-gregate support level is still among the highest in the Organisation for Economic Co-operation and Development (OECD) (around 2.1 percent of GDP).4
• Fourth, contingent liabilities resulting from a variety of public private partnership (PPP) contracts, particularly in the energy sector, were reduced through deregulation and tariff reform and future fiscal commitments better controlled through the issuance of transparent guidelines for financial and project guarantees under the new Public Debt Management Law. While the legacy of poorly designed privatiza-tion contracts in the energy sector took well over a decade to overcome, Turkey, during the 2000s achieved a significant increase in genera-tion capacity including from renewable sources, thanks largely to private investment in a more transparent regulatory environment. In the con-clusion we return to the lessons from this expe-rience for the new generation of PPP contracts and the importance of adhering to sound regu-latory frameworks.
• Fifth, measures to contain spending commit-ments were supported on the revenue side through tax policy changes and a substantial strengthening of revenue administration. A medium-term tax reform strategy was put in place to improve the stability, transparency and equity of the tax system. The taxation of corpo-rate income and income from financial invest-ments was simplified and the corporate income tax rate reduced from 30 to 20 percent. While Turkey has continued to use income tax credit extensively as part of various investment in-centive schemes, the system has become more transparent and rule based. On the tax admin-istration side, the Revenue Administration was made semi-autonomous in 2005 and has since made efforts to ease compliance costs. In the global paying taxes index produced by Price-waterhouseCoopers (PwC) for the World Bank Group, Turkey ranked 71 in 2014, and improved its distance to frontier to 23 percentage points in 2014 from 32 points in 2006.5
3 According to the Undersecretariat of Treasury Public Enterprises General Directorate statistics available at www.hazine.gov.tr
4 OECD estimates of total support in 2012 were 0.5 percent of GDP in Brazil, 0.8 percent in Russian Federation, and 0.9 percent on average for all OECD members. Only China and Indonesia have higher support levels than Turkey among the sample covered.
5 Turkey is ranked 5th in the comparator group used throughout this study, after South Africa and the Republic of Korea (with a distance to the frontier of 14 percentage points), and Malaysia and Croatia (with a distance of 18 percentage points). Turkey ranks above almost all new EU Member States and all BRICs.
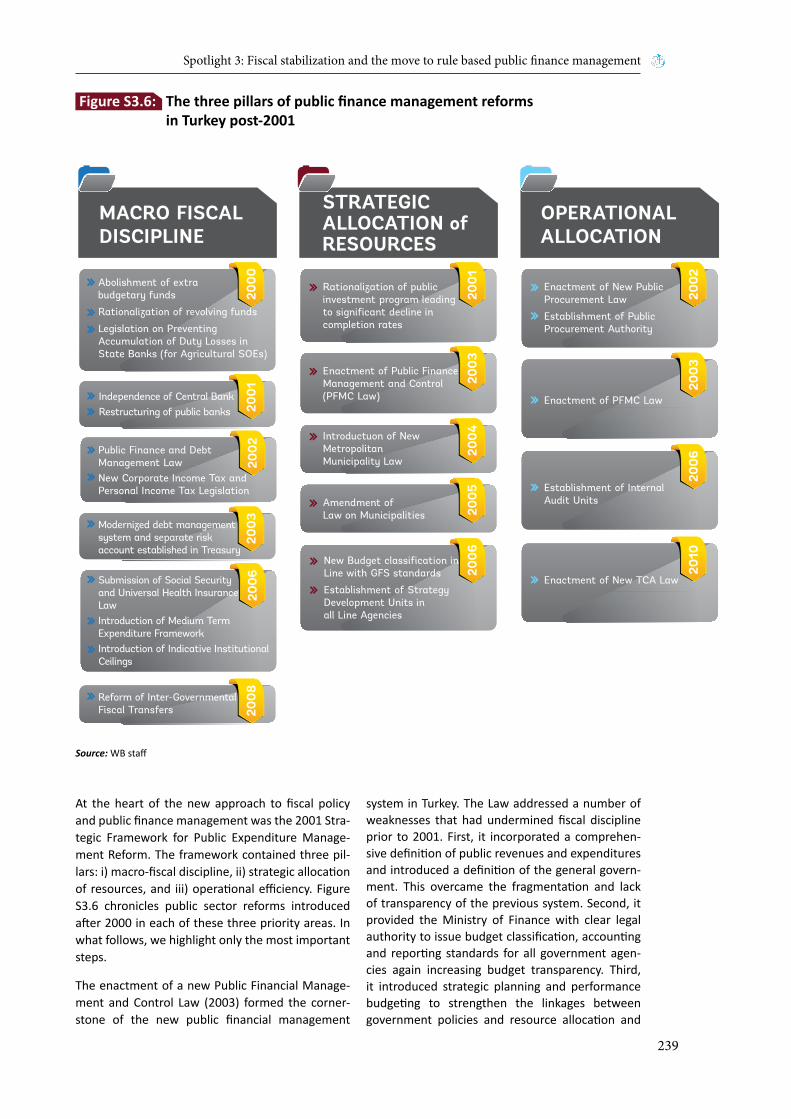
Spotlight 3: Fiscal stabilization and the move to rule based public finance management
239
At the heart of the new approach to fiscal policy and public finance management was the 2001 Stra-tegic Framework for Public Expenditure Manage-ment Reform. The framework contained three pil-lars: i) macro-fiscal discipline, ii) strategic allocation of resources, and iii) operational efficiency. Figure S3.6 chronicles public sector reforms introduced after 2000 in each of these three priority areas. In what follows, we highlight only the most important steps.
The enactment of a new Public Financial Manage-ment and Control Law (2003) formed the corner-stone of the new public financial management
system in Turkey. The Law addressed a number of weaknesses that had undermined fiscal discipline prior to 2001. First, it incorporated a comprehen-sive definition of public revenues and expenditures and introduced a definition of the general govern-ment. This overcame the fragmentation and lack of transparency of the previous system. Second, it provided the Ministry of Finance with clear legal authority to issue budget classification, accounting and reporting standards for all government agen-cies again increasing budget transparency. Third, it introduced strategic planning and performance budgeting to strengthen the linkages between government policies and resource allocation and
Source: WB staff
Figure S3.6: The three pillars of public finance management reforms in Turkey post-2001
MACRO FISCALDISCIPLINE
OPERATIONALALLOCATION
STRATEGICALLOCATION ofRESOURCES
2006
2002
2006
2001
Enactment of New PublicProcurement Law
Establishment of PublicProcurement Authority
2006
2001Rationalization of public
investment program leadingto significant decline incompletion rates
2006
2003Enactment of Public Finance
Management and Control(PFMC Law)
2006
2004Introductuon of New
MetropolitanMunicipality Law
2006
2005Amendment of
Law on Municipalities
2006
2000
2006
2003
2006
2008
2006
2003
Enactment of PFMC Law
2006
200620
0620
0220
0620
06
Establishment of InternalAudit Units
2006
2010
Enactment of New TCA Law
Abolishment of extrabudgetary funds
Rationalization of revolving funds
Legislation on PreventingAccumulation of Duty Losses inState Banks (for Agricultural SOEs)
Independence of Central BankRestructuring of public banks
Public Finance and DebtManagement LawNew Corporate Income Tax andPersonal Income Tax Legislation
Modernized debt managementsystem and separate riskaccount established in Treasury
Submission of Social Securityand Universal Health InsuranceLawIntroduction of Medium TermExpenditure FrameworkIntroduction of Indicative InstitutionalCeilings
2006
2006New Budget classification in
Line with GFS standards
Establishment of StrategyDevelopment Units inall Line Agencies
Reform of Inter-GovernmentalFiscal Transfers
Turkey’s Transitions
240
increase the efficiency of public spending, and mandated the government to prepare three-year rolling budgets to drive strategic resource alloca-tion. Fourth, the Law provided a clear definition of the accountability of ministers and heads of public administrations. Fifth, it delegated financial control and internal audit responsibilities to public agen-cies, thereby overcoming the problems associated with excessive and centralized compliance based controls, which, in turn, had motivated the pro-liferation of off-budget vehicles as a means to get anything done. Sixth, it strengthened government accountability by extending the scope and mandate of external audit to cover all government agencies as well as SOEs.
The consolidation of fiscal reporting and the ra-tionalization of medium-term fiscal planning were critical in asserting the government’s overall fiscal control. The authorities proceeded in several steps. Most extra-budgetary funds were abolished to-gether with the system of earmarked revenues and revolving funds, which had allowed line agencies to retain, own revenues for discretionary spend-ing (such as bonus payments to employees).6 Ad-ditionally, as early as 2001, a comprehensive public investment review was undertaken by the State Planning Organization to rationalize the public in-vestment portfolio. As a result, the average comple-tion period of the public investment program was reduced from over 10 years in 1999 to 4.6 years in 2010. Subsequently, in 2006, a functional bud-get classification consistent with the IMF’s Manual on Government Financial Statistics was introduced together with medium-term fiscal planning based on a three year rolling macroeconomic framework. This established institutional expenditure ceilings for government line agencies upstream in the bud-get preparation process and constituted a first step in a transition towards performance based bud-geting and greater spending autonomy at the line agency level.
The new institutional framework in the public sec-tor also involved changes in the system of account-ability. The Public Finance Management and Con-trol (PFMC) Law of 2003 involved a fundamental shift from ex-ante controls to ex-post monitoring. This shift built on three interrelated reform efforts. First, the government had to tighten the regulatory framework for discretionary public spending, in-cluding revamping the public procurement system. Prior to 2003, public procurement was discrimina-tory, non-transparent and riddled with exclusions and varying qualification requirements. The enact-ment of the Public Procurement Law which was in
2002 modelled after EU standards and subsequent steps to align the framework with the EU Acquis helped to address earlier shortcomings. Second, in 2007, internal control and internal audit func-tions were introduced and the public accounting framework modified to an accrual based chart of accounts. This strengthened the basis for ex post monitoring of line agency spending and commit-ments, although there remain significant needs to improve line agency capacity to effectively dis-charge their internal audit responsibilities. Third, as a further step to strengthen accountability a new TCA Law was enacted in 2010. The new TCA Law in-troduces performance and financial audit require-ments in addition to the traditional compliance based external audit system. Transition to the new external audit requirements has been challenging, however, because of the need to build capacity for financial and performance audits in the TCA, to introduce necessary accounting systems in cen-tral government agencies, and to create the space in Parliament for a substantial discussion of audit findings in the budget and finance committee.
Turkey’s public debt and liability management to-day is recognized among best practice examples among emerging markets. The Law on Regulating Public Finance and Debt Management enacted in 2002 created sound foundations for more efficient asset and liability management. With this legisla-tion, the scope and objectives of public debt man-agement were defined and the Undersecretariat of Treasury became the single borrowing authority for the central government. In addition, an efficient framework was set up for decision making on and monitoring of Treasury guarantees and receivables, borrowing and cash management.
The improvement in the Undersecretariat of Trea-sury’s risk management capacity is particularly noteworthy. A “Debt and Risk Management Com-mittee” was established within the Undersecretar-iat of Treasury, as a new high-level body to formu-late debt management strategy and policies. As a result of these efforts, the exposure of the central government debt stock to exchange rate, interest rate and liquidity risks was significantly reduced. A middle office was also created, and new risk mea-surement techniques were introduced, including for the assessment and management of contingent liabilities. Thus, annual limits on Treasury guaran-tees were introduced within the Annual Budget Law. Undersecretariat of Treasury charges a fee up to 1 percent of the total guaranteed amount depending on the underlying credit risk. A partial guarantee mechanism was also introduced to limit
6 Social Solidarity Fund, Promotion and Publicity Fund, Saving Deposit Insurance Fund, Defense Fund and Privatization Fund were excluded from the legislation abolishing all other EBFs passed in 2000 and 2001.
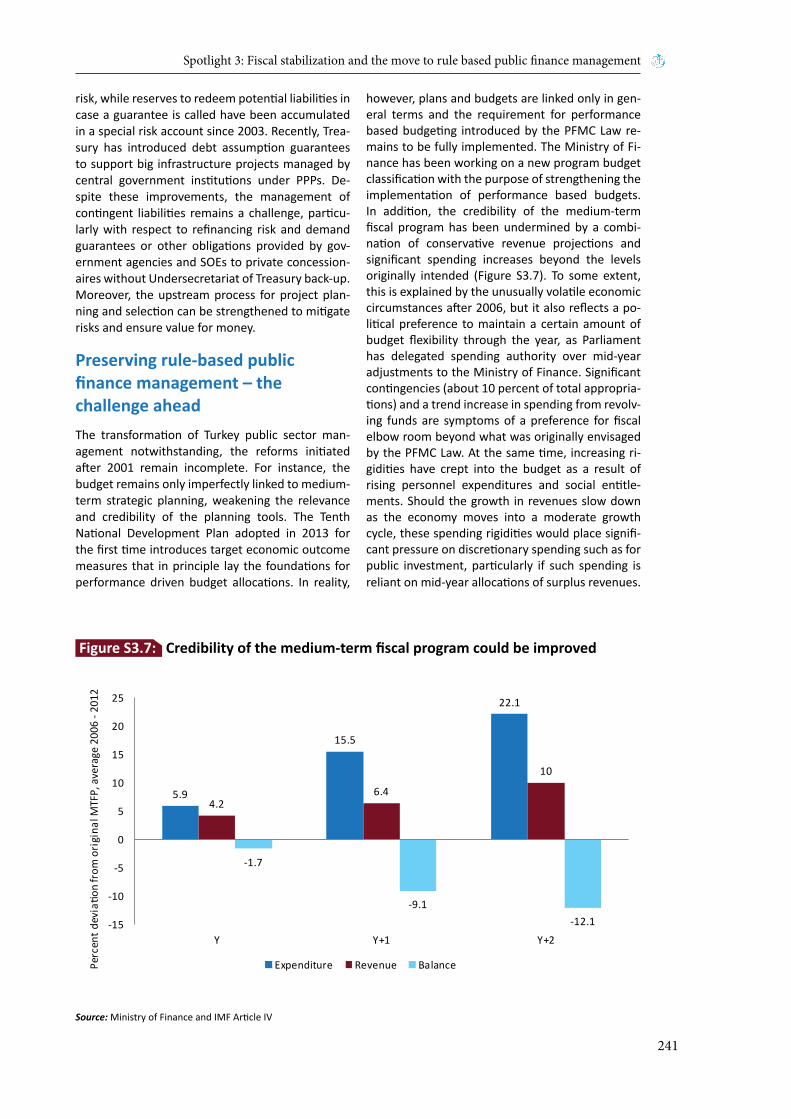
Spotlight 3: Fiscal stabilization and the move to rule based public finance management
241
risk, while reserves to redeem potential liabilities in case a guarantee is called have been accumulated in a special risk account since 2003. Recently, Trea-sury has introduced debt assumption guarantees to support big infrastructure projects managed by central government institutions under PPPs. De-spite these improvements, the management of contingent liabilities remains a challenge, particu-larly with respect to refinancing risk and demand guarantees or other obligations provided by gov-ernment agencies and SOEs to private concession-aires without Undersecretariat of Treasury back-up. Moreover, the upstream process for project plan-ning and selection can be strengthened to mitigate risks and ensure value for money.
Preserving rule-based publicfinance management – thechallenge aheadThe transformation of Turkey public sector man-agement notwithstanding, the reforms initiated after 2001 remain incomplete. For instance, the budget remains only imperfectly linked to medium-term strategic planning, weakening the relevance and credibility of the planning tools. The Tenth National Development Plan adopted in 2013 for the first time introduces target economic outcome measures that in principle lay the foundations for performance driven budget allocations. In reality,
however, plans and budgets are linked only in gen-eral terms and the requirement for performance based budgeting introduced by the PFMC Law re-mains to be fully implemented. The Ministry of Fi-nance has been working on a new program budget classification with the purpose of strengthening the implementation of performance based budgets. In addition, the credibility of the medium-term fiscal program has been undermined by a combi-nation of conservative revenue projections and significant spending increases beyond the levels originally intended (Figure S3.7). To some extent, this is explained by the unusually volatile economic circumstances after 2006, but it also reflects a po-litical preference to maintain a certain amount of budget flexibility through the year, as Parliament has delegated spending authority over mid-year adjustments to the Ministry of Finance. Significant contingencies (about 10 percent of total appropria-tions) and a trend increase in spending from revolv-ing funds are symptoms of a preference for fiscal elbow room beyond what was originally envisaged by the PFMC Law. At the same time, increasing ri-gidities have crept into the budget as a result of rising personnel expenditures and social entitle-ments. Should the growth in revenues slow down as the economy moves into a moderate growth cycle, these spending rigidities would place signifi-cant pressure on discretionary spending such as for public investment, particularly if such spending is reliant on mid-year allocations of surplus revenues.
Source: Ministry of Finance and IMF Article IV
5.9
15.5
22.1
4.26.4
10
-1.7
-9.1-12.1-15
-10
-5
0
5
10
15
20
25
Y Y+1 Y+2
Perc
ent d
eviatio
n fr
om o
rigi
nal M
TFP,
ave
rage
200
6 - 2
012
Expenditure Revenue Balance
Figure S3.7: Credibility of the medium-term fiscal program could be improved

Turkey’s Transitions
242
Public sector reforms also remain incomplete in the area of accountability and external scrutiny. In the area of public procurement, the exclusion of PPPs, revenue sharing arrangements under the public housing agency TOKİ, and defense spending greatly reduce the scope of the public procurement law (PPL).7 In addition, public utilities and SOEs have been exempted from the law for tenders be-low certain thresholds and for specific operations through ad hoc amendments instead of complet-ing the legislative framework with the adoption of specific utilities procurement legislation in line with EU Directives. Domestic price preferences and high thresholds for competitive bidding further limit the scope of the PPL. Completion of procurement re-forms could, thus, unlock significant value for tax payers and potentially help attract much needed Foreign Direct Investment (FDI). In the area of in-ternal and external audit, significant additional in-vestment in capacity building at all levels is needed to ensure line agencies adopt appropriate internal controls and the TCA produces performance and financial audits that provide a basis for holding all public entities to account. This should include an assessment of value for money in the increas-ing portfolio of PPP and revenue sharing arrange-ments in transport, housing and health sector. At the same time, the move from ex-ante control and
mostly compliance-based audits to a system of ex post monitoring oriented at value for money and improved performance takes time and the transi-tion is, thus, likely to take several more years to be complete. During this transition period, shortcuts should be avoided and, instead, political capital should be invested in ensuring all parties work co-operatively.
While the role of SOEs in the economy has been greatly reduced, further improvements could also be made in their governance to improve perfor-mance and limit fiscal risks. Many SOEs are ham-pered in their operation by limited autonomy and burdensome rules and regulations. At the same time, they often lack professional management and governance, including through management boards. Many SOEs are, thus, performing below their potential and the government is compelled to make budget transfers or, in some cases, intervene in markets to protect SOEs from potential private competition. Transfers now make up almost 100 percent of SOE capital spending up from 75 percent in 2007, and more than half of SOEs’ total payroll is covered by government subsidies. The completion of SOE reforms could unlock significant efficiency gains and, at the same time, lay the foundation for an alignment of state aid provisions with those of the EU Acquis.
Source: PEFA Secretariat and WB staff calculations
Budget Credibility
Comprehensiveness andTransparency
Policy Based Budgets
Predictability and Control inExecution
Accounting and Reporting
External Scrutiny
EU Accession Candidates Turkey Selected UMIC
Figure S3.8: Turkey’s performance in the public expenditure and financial accountability assessment
7 Benchmarking total public procurement spending reported by the Public Procurement Authority (PPA) to OECD averages suggests the exclusions mentioned above may account for up to 5.5 percent of GDP in value falling outside the scope of the PPL.

Spotlight 3: Fiscal stabilization and the move to rule based public finance management
243
In 2009, the authorities carried out a Public Ex-penditure and Financial Accountability (PEFA) as-sessment to benchmark the quality of their pub-lic financial management system against peers among middle income countries. As Figure S3.8 demonstrates, Turkey’s performance at that time was above the average for the Europe and Central Asia Region and other upper middle income coun-tries. Turkey’s greatest weakness relative to these comparators was in the area of external scrutiny, where the new TCA Law, once fully implemented, should allow Turkey to make significant headway. In absolute terms, Turkey’s PEFA ratings were also low (below 3) in the areas of budget credibility, pre-dictability and control. These comparative ratings – while dating back several years – chime with the analysis of this Spotlight. Reforms in public finan-cial management have slowed in recent years and acceleration is required to close the gap to interna-tional best practice benchmarks.
Over the past decade, Turkey has turned a major fis-cal crisis into an impulse for comprehensive public
sector reforms. Turkey’s achievements in this area have allowed the country to sustain strong fiscal management during the 2008-2009 global financial crisis and greatly reduce the burden on the budget of quasi-fiscal activities, SOEs and subsidies to vari-ous sectors of the economy. Over this period, the state has retreated comprehensively from direct intervention in the economy to become a regulator of private sector investment. However, the transi-tion to rule based governance in the public sector remains incomplete. The temptation for politicians to maximize the room for discretion and to limit the extent of public scrutiny over their decisions will be there as long as politics exist. Turkey has demon-strated the benefits of constraining such discretion, whilst at the same time decentralizing decision making to levels much closer to the ultimate ben-eficiaries of public policies. From housing policies to the management of municipal enterprises and from the development of large scale infrastructure to the allocation of state support to SMEs, these lessons should not be forgotten.

Turkey’s Transitions
244
ReferencesAtiyas, İ. (2012). Economic Institutions and Institu-tional Change in Turkey during the Neoliberal Era.
Gill, I., & Raiser, M. (2012). Golden Growth: Restor-ing the Lustre of the European Economic Model. World Bank.
Ungor, M. (2014). Average Effective Tax Rates on Consumption for Turkey: New Data and a Compara-tive Analysis. CBT Research Notes in Economics, 2014-02.

Chapter 8: Crossing the threshold to high income
245
Crossing the thresholdto high income
Chapter 8
Turkey’s Transitions: Integration, Inclusion, Institutions
Labor
Welfare
FiscalSpace
Enterprise
Trade
Finance
Cities
Infrastucture

Turkey’s Transitions
246
Photo Credit : G20 Taskforce, Department of the Prime Minister and Cabinet.
Chapter 8: Crossing the threshold to high income
247
Crossing the threshold to highincome
The dominance of the economies of Europe and North America over the rest is coming to an end. For almost five centuries, since the
mid-1500s, the “West” pulled ahead of the “rest” (Ferguson, 2011). However, in recent decades, countries from Asia to Latin America seem to have learned from earlier mistakes and introduced eco-nomic policies conducive to catch-up. They have become economies of interest for global investors and the policy lessons from their “turnaround” are being studied by economists in poor and rich coun-tries alike (Henry, 2013).
The story of Turkey is in many ways representative of the economic ascent experienced by emerging markets over the past three decades. Turkey’s re-emergence as a global economic player begins with the economic opening in the early 1980s under Turgut Özal. Since then, as this book has argued, Turkey’s economy has been transformed in many ways. It has stepped up to become an important re-gional economic hub and a global exporter of some significance. It has overcome a series of domestic financial crises to stand as the only Organisation for Economic Co-operation and Development (OECD) country that did not have to recapitalize its bank-ing system using public funds. It has emulated the Asian economies in productively reallocating agri-cultural labor to industry and services and making structural change a key engine of economic growth. It has invested in connecting infrastructure to open up its inland economy to competitive markets at home and abroad, and harnessed the economic benefits of urbanization to pull up the more under-developed regions. The move from rural, infor-mal jobs to urban employment in manufacturing and services has brought rising income to poorer households and led to the growth of middle class. Having long suffered from inflexible and segment-ed labor markets, Turkey has, nonetheless, found a way to accelerate job creation in recent years and its economy has added more jobs since the global crisis than many much larger competitors. Turkey’s fiscal consolidation after 2001 offers lessons for highly indebted countries today; and Turkey’s use of fiscal space to boost health and education out-comes has begun to close the large gap that sepa-rated Turkey from OECD standards in the access to and the quality of public services. Together, these many transitions have contributed to lift Turkey to the threshold to high income.
Other countries wishing to study Turkey’s achieve-ments will find many policy lessons in the preced-ing pages. But they may also ask: will Turkey’s rise
continue? Indeed, just as the advanced economies are emerging from the economic doldrums of the past five years, many emerging markets are strug-gling to sustain high rates of growth (Åslund, 2013). Will Turkey share their fate and see its convergence to high income interrupted? This concluding chap-ter offers some thoughts on how Turkey can con-tinue to progress. The discussion proceeds in two steps. First, we ask what can be learned from the experience of other middle income countries, both those that seem to have gotten stuck in a “middle income trap” and those that have successfully “es-caped”. Second, we ask what challenges can be derived from an analysis of Turkey’s own achieve-ments over the past three decade as chronicled in previous chapters of this book.
It turns out that the two steps lead to the same conclusion: to propel its economy forward and progress to high income, Turkey will need to ad-dress three inter-related challenges.
• First, Turkey will need to find a way to sustain productivity growth once the positive contribu-tion of the shift of labor out of agriculture slows down. Addressing this challenge involves poli-cies to boost innovation, attract more foreign direct investment (FDI), and deepen financial markets.
• Second, Turkey’s demographic transition will deliver greater prosperity only if Turkey contin-ues to create jobs at a pace sufficient to accom-modate the rising inflows of women and youth into the labor market. Policies to do so encom-pass making labor markets more flexible, invest-ing in upgrading the skills of the workforce and measures to support women (and men) as they seek to combine work and family life.
• Third, Turkey needs to deepen institutional re-forms to firmly establish the rule of law and arms’ length regulation of the market. Turkey’s most recent growth spurt came after a wave of fundamental institutional reforms. As in many other emerging markets, the reform momen-tum slowed in the wake of the global economic and financial crisis. Sustained progress towards high income will require closing the gap in the quality of economic institutions.
These structural challenges are compounded by the need to address macroeconomic vulnerabilities resulting from Turkey’s reliance on foreign capital inflows to finance investment. In the short run, a period of moderate growth may be unavoidable to rebalance the economy and reassure savers and in-vestors of Turkey’s commitment to macroeconomic stability. In the medium run, sustained economic growth and macro stability will require renewed

Turkey’s Transitions
248
emphasis on strengthening Turkey’s growth po-tential. To do so, Turkey could do worse than learn some lessons from the experience of other Euro-pean economies. Over half of the world’s success-ful “escapees” from middle income are in Europe. But unlike their East Asian peers, these escapees did not grow to high income by boosting domes-tic savings and adopting ferocious export oriented policies. Rather, they grew thanks to the benefits of trade and financial integration, which attracted direct investment and brought modern technolo-gies. By reinvigorating the momentum behind Eu-ropean integration, Turkey could equally benefit from Europe’s “Convergence Machine” just as the European economies are showing renewed signs of life. The excesses and subsequent deep adjust-ment crises of the Southern European economies also offer a warning: even in Europe, convergence is neither automatic nor irreversible. To maintain convergence, European economies need to remain disciplined.
The “middle income trap”Relative income levels around the world are highly persistent. As Figure 8.1 demonstrates, countries that were low income in 1960 –– were still pre-dominantly low income in 2011.1 Similarly, middle income countries – defined as countries with per capita incomes between 10 and 50 percent of the US level – have by and large remained middle in-come. The club of the high income countries has admitted only a handful of new members, and has lost even fewer. Turkey is solidly in the middle in-come camp, although it has improved its standing relative to the US from 27 percent of per capita in-come in 1960 to 34 percent in 2011.2
The transition to high income is difficult even when measured in absolute terms. Figure 8.2 takes a closer look at Turkey’s progression towards high income using the US$12,746 per capita threshold beyond which the World Bank classifies countries as high income (which is also the metric used by Gill and Kharas, 2007 and Felipe, Abdon and Kumar,
1 The figure follows (Bulman, Eden and Nguyen, 2012) in defining thresholds to middle and high income as 10 percent and 50 percent of US income levels respectively.
2 GDP per capita at chained PPPs (2005 US$) (PWT 8.0)
3 Global Economic Prospect Reports Developing Country Growth Rates as follows: 2003-2007 7.7 percent; 2007-2010 5.5 percent. See http://www.worldbank.org/en/publication/global-economic-prospects
Source: WB staff calculations based on data from World Development Indicators, Doing Business, Worldwide Governance Indicators (WGI), Transparency International, Open Budget Initiative, Fraser Institute and TurkStat.Note: Macro risks = inflation rate, net international investment position (percent of Gross Domestic Product (GDP)), general government debt (percent of GDP); Openness = export + imports (percent of GDP), FDI inflows (percent of GDP), Logistics Performance Index; Demographic potential = old age dependency, labor force participation rate; Innovation potential = average years of schooling of the workforce, R&D investment (percent of GDP); Inclusion = Gini coefficient of consumption; Business regulation = Doing Business distance to frontier, Fraser Institute index of light regulation; Governance = Fraser Institute index of legal structure, Transparency International Corruption Perceptions Index, Open Budget Index WGI on rule of law, government effectiveness, voice and accountability; structural potential = employment in agriculture (percent of total employment).
Macro Risks
Openness
Demographic Potential
Innovation
Inclusion
Business Regulation
Governance
Structural Potential
BRICS Average New EU Members Average EU Candidate Average
MENA Average Growth Markets Average Turkey
Figure 8.1: BenchmarkingTurkey’shighincomepotential

Chapter 8: Crossing the threshold to high income
249
2012). In the course of the 2000s, Brazil, Malaysia, Mexico, Poland, Russian Federation and Turkey all converged rapidly towards this threshold. But af-ter 2008, the process of convergence slowed and, among these peers only Poland and Russian Fed-eration made it across to high income. One reason for the interruption of convergence is the impact of the crisis on emerging market exchange rates, accentuated by concerns over the winding down of extraordinary monetary policy in the advanced economies during the course of 2013. Another rea-son is that growth rates slumped during 2008-2009, although they recovered rapidly afterwards. But if we abstract from the crisis period, and compare projected average growth in 2013-2016 to the pre-crisis average between 2003-2007, we still get a notable slow-down in average growth in emerging markets from 7.7 percent to 5.1 percent.3 For Tur-key, growth rates in 2013-2016 are forecast to aver-age 3.7 percent, compared to 6.9 percent in 2003-2007.4 Eventually, of course, Turkey as well as its peers will cross the threshold to high income, but the rate of progress may not be fast enough to sig-nificantly close the gap to the advanced countries. In a similar vein, EBRD (2013) argues that after two decades of rapid economic catch-up, many Eastern European countries are “stuck in transition” and are unlikely to see continued rapid economic con-vergence without deep structural reform.
The persistence of relative income levels and the
apparent slowdown of economic momentum in a number of prominent emerging market economies have motivated a growing literature on the possible existence of a “middle income trap”. Eichengreen, Park and Shin (2011; 2013) demonstrate that most developing countries tend to experience marked slowdowns in their growth rates once per capita in-comes exceed US$10,000 in Public Private Partner-ship (PPP) terms.5 Aiyar et al. (2013) similarly show that middle income countries have a higher prob-ability of experiencing a growth slowdown than ei-ther low or high income countries. Bulman, Eden and Nguyen (2012), by contrast, argue that growth slowdowns are not at all inevitable. Rather, they show countries that have successfully escaped from middle income have grown fast both before and after crossing the threshold, while countries that have remained stuck in middle income have per-formed consistently worse. Felipe, Abdon and Ku-mar (2012) focus on countries that have remained “stuck” in middle income for several decades and confirm that their policies and structural charac-teristics differ from those countries that showed sustained high growth. Berg, Ostry and Zettelmey-er (2008) study the length of growth spells, while Hausmann, Rodriguez and Wagner (2006) inves-tigate growth collapses. Again, both studies show that similar policies and structural factors matter in ensuring that growth spells last and growth col-lapses are avoided. The Growth Commission (Com-mission on Growth and Development, 2008) also
Source: World Development Indicators (WDI), TurkStat
500
2,500
4,500
6,500
8,500
10,500
12,500
14,500
2000 2001 2002 2003 2004 2005 2006 2007 2008 2009 2010 2011 2012
GNI p
er c
apita
, Atla
s met
hod
(cur
rent
US$
)
Mexico BrazilThailand MalaysiaRussian Federation TurkeyPoland High Income Threshold (WB Definition)
Figure 8.2: Turkey’s convergence to high income has slowed since 2007
4 See http://www.worldbank.org/content/dam/Worldbank/document/eca/turkey/tr-tren-jun-2014-eng.pdf
5 Eichengreen, Park and Shin’s first results suggested a single point beyond which growth is likely to slow at US$17,000 PPP. In revised estimates, the same authors find a stepwise deceleration of growth at levels of US$10,000 and again beyond US$15,000. Turkey’s per capita income is between these two levels at US$14,000 in 2011.
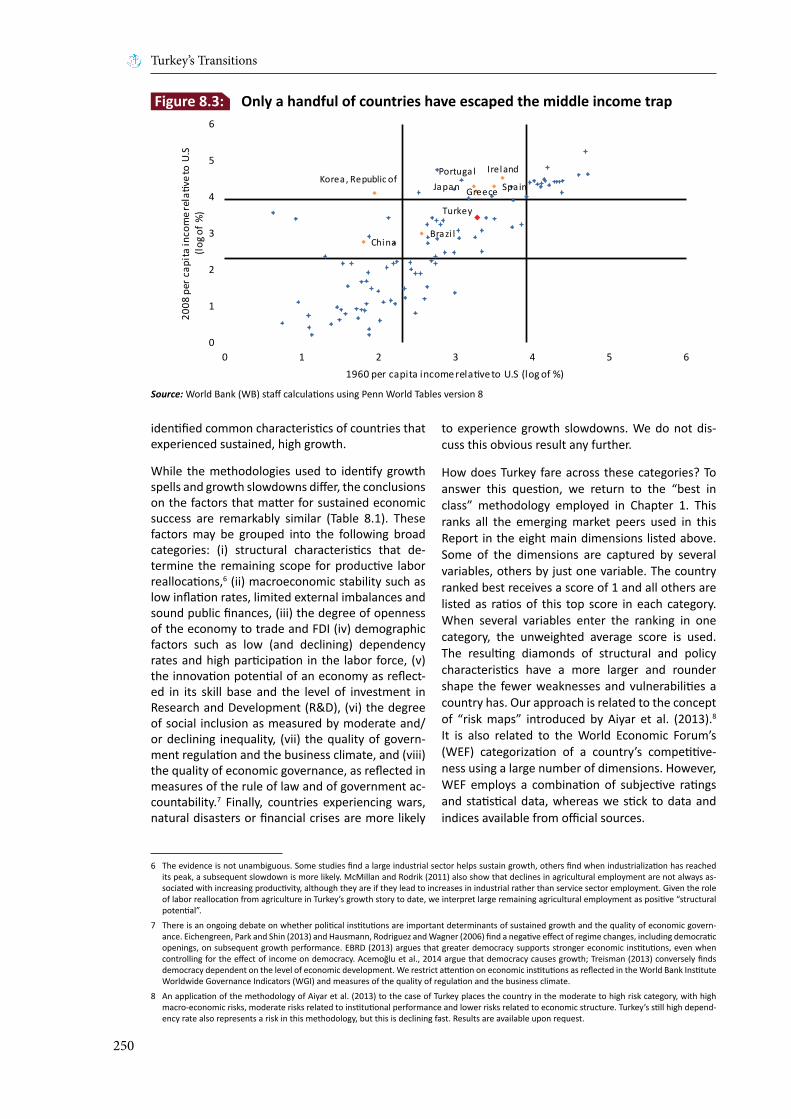
Turkey’s Transitions
250
identified common characteristics of countries that experienced sustained, high growth.
While the methodologies used to identify growth spells and growth slowdowns differ, the conclusions on the factors that matter for sustained economic success are remarkably similar (Table 8.1). These factors may be grouped into the following broad categories: (i) structural characteristics that de-termine the remaining scope for productive labor reallocations,6 (ii) macroeconomic stability such as low inflation rates, limited external imbalances and sound public finances, (iii) the degree of openness of the economy to trade and FDI (iv) demographic factors such as low (and declining) dependency rates and high participation in the labor force, (v) the innovation potential of an economy as reflect-ed in its skill base and the level of investment in Research and Development (R&D), (vi) the degree of social inclusion as measured by moderate and/or declining inequality, (vii) the quality of govern-ment regulation and the business climate, and (viii) the quality of economic governance, as reflected in measures of the rule of law and of government ac-countability.7 Finally, countries experiencing wars, natural disasters or financial crises are more likely
to experience growth slowdowns. We do not dis-cuss this obvious result any further.
How does Turkey fare across these categories? To answer this question, we return to the “best in class” methodology employed in Chapter 1. This ranks all the emerging market peers used in this Report in the eight main dimensions listed above. Some of the dimensions are captured by several variables, others by just one variable. The country ranked best receives a score of 1 and all others are listed as ratios of this top score in each category. When several variables enter the ranking in one category, the unweighted average score is used. The resulting diamonds of structural and policy characteristics have a more larger and rounder shape the fewer weaknesses and vulnerabilities a country has. Our approach is related to the concept of “risk maps” introduced by Aiyar et al. (2013).8 It is also related to the World Economic Forum’s (WEF) categorization of a country’s competitive-ness using a large number of dimensions. However, WEF employs a combination of subjective ratings and statistical data, whereas we stick to data and indices available from official sources.
6 The evidence is not unambiguous. Some studies find a large industrial sector helps sustain growth, others find when industrialization has reached its peak, a subsequent slowdown is more likely. McMillan and Rodrik (2011) also show that declines in agricultural employment are not always as-sociated with increasing productivity, although they are if they lead to increases in industrial rather than service sector employment. Given the role of labor reallocation from agriculture in Turkey’s growth story to date, we interpret large remaining agricultural employment as positive “structural potential”.
7 There is an ongoing debate on whether political institutions are important determinants of sustained growth and the quality of economic govern-ance. Eichengreen, Park and Shin (2013) and Hausmann, Rodriguez and Wagner (2006) find a negative effect of regime changes, including democratic openings, on subsequent growth performance. EBRD (2013) argues that greater democracy supports stronger economic institutions, even when controlling for the effect of income on democracy. Acemoğlu et al., 2014 argue that democracy causes growth; Treisman (2013) conversely finds democracy dependent on the level of economic development. We restrict attention on economic institutions as reflected in the World Bank Institute Worldwide Governance Indicators (WGI) and measures of the quality of regulation and the business climate.
8 An application of the methodology of Aiyar et al. (2013) to the case of Turkey places the country in the moderate to high risk category, with high macro-economic risks, moderate risks related to institutional performance and lower risks related to economic structure. Turkey’s still high depend-ency rate also represents a risk in this methodology, but this is declining fast. Results are available upon request.
Source: World Bank (WB) staff calculations using Penn World Tables version 8
ChinaBrazi l
Korea, Republic of
Turkey
Japan
Ireland
Greece SpainPortugal
0
1
2
3
4
5
6
0 1 2 3 4 5 6
2008
per
cap
ita in
com
e rel
ative
to U
.S(lo
g of %
)
1960 per capita income relative to U.S (log of %)
Figure 8.3: Only a handful of countries have escaped the middle income trap

Chapter 8: Crossing the threshold to high income
251
Table 8.1: Growth spells, growth slowdowns: Determinants of sustained growth in middleincomecountries,selectedfindingsfromtheliterature
Source Methodology Key Findings
Hausmann, Rodriguez and Wagner (2006)
Probability of growth collapses (growth falls below zero; dura-tion, peak to trough change in GDP, cumulative lost output)
Growth collapses are associated with negative ex-port shocks; sudden stops of capital flows; higher rates of inflation; weaker rule of law; lower human capital stock (education and health); lower levels of urbanization; poorer connectivity; less diverse prod-uct space; periods of political transition; natural di-sasters; and wars.
Berg, Ostry andZettelmeyer (2008)
Length of growth spell above 2 percent per annum; probability that growth spell lasts
Growth spells are associated with openness to trade and trade liberalization in previous period; higher levels of FDI inflows; lower current account defi-cits; lower exchange rate overvaluation and lower inflation; recent positive change in manufacturing exports and more diversified product space; better rule of law and investor protection; less inequality; recent reforms towards more democracy.
Growth Commission (2008)
Growth above 7 percent for at least 25 years – 13 cases9
Sustained growth is associated with greater open-ness; modest inflation and sustainable public financ-es; high investment and savings rates; limited regula-tory and price distortions; high government capacity, good governance and commitment to inclusion.
Bulman, Eden andNguyen (2012)
Countries that “escaped” to high income vs. countries that remained middle income during past five decades
Escapees have higher Total Factor Productivity (TFP) growth; are more open; have a higher stock of educa-tion; greater innovation potential measured by num-ber of patents; positive changes in share of industry and negative changes in share of agriculture in GDP; no increases in inequality; and declines in depen-dency ratios. Lower inflation and less overvaluation also contribute to sustaining rates of convergence in middle income countries. Political variables do not differ significantly between escapees and others.
Felipe, Abdon and Kumar (2012)
Time needed to cross income thresholds (more than 28 years for low middle to high middle in-come, more than 14 years from high middle to high income)
Countries that crossed income thresholds in less than the given timeframe had more diversified and sophisticated exports; experienced more rapid struc-tural transformation from agriculture to industry. Turkey took more than 28 years to get to high middle income, but is likely to cross from high middle in-come to high income in less than 14 years.
Aiyar et al. (2013) Large downside deviations of growth from predicted condi-tional convergence path in any one 5-year period
Middle income countries are more likely to experi-ence growth slowdowns (12-14 percent vs. 9-10 per-cent in low income and 6-8 percent in high income countries).
Slowdowns less likely in countries with increases in openness; less exposure to foreign capital inflows; smaller increases in investment rates; increases in public debt;10 larger shares of agriculture and ser-vices in GDP or recent increases in these shares; more diversified exports, greater proximity to large markets and greater regional integration; lower de-pendency ratios and more equal sex ratios (male/female); better rule of law and recent improvements in business regulations; improved connectivity in-frastructure. Slowdowns are more likely in coun-tries with sharp increases in the size of government spending; in countries in the tropics and in countries suffering from war.
9 The cases are: Botswana (1906-2005); Brazil (1950-1980); China (1961-2005); Hong Kong (1960-1997); Indonesia (1966-1997); Japan (1953-1983); Republic of Korea (1960-2001); Malaysia (1967-1997); Malta (1963-1994); Oman (1960-1999); Singapore (1967-2002); Taiwan, Province of China (1965-2002); Thailand (1960-1997).
10 Result is driven by HIPC countries, where debt relief happened dur-ing periods of growth slowdowns.

Turkey’s Transitions
252
Turkey’s strengths lie in its structural characteris-tics as a young country which has not yet fully ex-hausted the benefits of structural change (Figure 8.3). Compared to emerging market peers, particu-larly in Europe, Turkey still has quite a large share of employment in agriculture and its population is young. This provides for significant structural and demographic potential, although the realization of the latter is dependent on continued fast job cre-ation and rising participation rates. Turkey also has relative strengths in the area of business regula-tion where it scores better than Brazil, Russia, In-dia, China and South Africa (BRICS), the European Union (EU) Accession Candidates and Middle East
and North Africa (MENA), albeit below the Growth Markets and the New EU Member States. Turkey’s rank in the area of social inclusion is relatively poor compared with other European countries, but rela-tive to emerging market peers in Latin America and Asia, Turkey does better. As discussed throughout this Report, Turkey’s growth over the past decade has been inclusive. These gains should be sustained and extended.
Turkey’s weaknesses are in the low degree of open-ness, relatively greater macroeconomic vulnerabil-ity and weaker innovation potential.11 The ratio of Turkey’s exports and imports to GDP and the in-flow of FDI as a share of GDP are below most other
EBRD (2013) Estimates of future potential TFP growth in model where FDI, Sav-ings, TFP and Investment Rates are jointly determined
TFP growth is positively related to increased FDI; greater human capital stock; less distance to ad-vanced markets; and greater constraints on ex-ecutive power. FDI is positively related to greater openness; better rule of law; higher share of manu-facturing and services in GDP.
Eichengreen, Park and Shin (2013)
Slowdown in growth from above 3.5 percent by at least 2 percent-age points in any 7 year period
Probability of slowdown increases significantly be-yond US$11,000 and US$15,000 PPP.
Probability of slowdown is high in countries with higher rates of investment to GDP; greater degree of previous exchange rate undervaluation; lower rates of openness; lower levels of tertiary education achievement; fewer high tech exports; higher old age dependency ratios; recent financial crises; re-cent political regime changes (a change from autoc-racy to democracy increases the risk of a slowdown)
Source: WB staff based on sources quoted in the table.
Source: WDI, WGI
Uruguay
Turkey
R² = 0.3104
R² = 0.513
0
10,000
20,000
30,000
40,000
50,000
60,000
70,000
80,000
90,000
100,000
-2.0 -1.5 -1.0 -0.5 0.0 0.5 1.0 1.5 2.0
GDP
per c
apita
, PPP
(cur
rent
inte
rnati
onal
$)
Average WGI Score
Figure 8.4: Thecorrelationbetweenthequalityofeconomicinstitutionsand per capita income increases as countries get richer
11 This is consistent with Turkey’s WEF Competitiveness Index rankings, which identify Turkey’s macro environment, labor market efficiency and in-novation as areas of relatively weaker performance. Turkey does well relative to emerging market peers in the following areas according to WEF: institutions, infrastructure, goods market efficiency, financial market development, health and primary education, and business sophistication.

Chapter 8: Crossing the threshold to high income
253
emerging market peers analyzed in this Report and this is despite the significant improvements re-corded in both dimensions over the past decade. Turkey’s inflation rate is still relatively high (in our sample, only India, Serbia, Egypt and Syrian Arab Republic had higher inflation in 2013) and its reli-ance on external financing is a key vulnerability. While Turkey’s public finances are solid, the poor performance in the other two dimensions drags its ranking down. The rebalancing of Turkey’s economy over the past two years is necessary and needs to continue to permanently reduce risks to sustained growth stemming from Turkey’s macroeconomic vulnerabilities. Turkey’s innovation potential is be-low that of many emerging market peers on ac-count of the legacy of low investment in education. This is changing, as we document in Chapter 7, but the low stock of human capital may, nonetheless, affect the incentives for and returns to greater in-vestment in innovation (Goni and Maloney, 2014). Turkey’s public sector investment in R&D is rela-tively high, comparable with the new EU Member States, and the fast increase in tertiary enrolment is encouraging. Yet, private sector R&D remains low
at around 0.5 percent of GDP and corporate gover-nance and management quality need to improve to make Turkish firms fit for global competition.12
The quality of Turkey’s economic institutions is not out of line with the performance of other emerging market peers. The New EU Member States score highest in the dimension of governance, the Growth Markets are on top in the quality of the business climate. Turkey does better than the BRICs, the Ac-cession Candidates and MENA in both dimensions. Yet, on closer inspections, this result is less comfort-ing than it may appear. While institutional arrange-ments in middle income countries tend to vary considerably, all advanced, high income countries have similar economic institutions; notably strong and independent regulation, effective government, the rule of law, and established mechanisms for government accountability. Moreover, while at low and middle income levels the correlation between the quality of economic institutions and per capita income is relatively flat, at higher middle income and high income levels, it is both stronger and steeper (Figure 8.4).13
Source: World Bank, World Economic Forum (WEF), Fraser Institute, Heritage Foundation, Transparency International, International Budget Project.
98
148 152
177 177189
4256
112
6953 55
020406080
100120140160180200
Open BudgetIndex
WEF -Institutions
Fraser - LightRegulation
HeritageFoundation -
Index ofEconomicFreedom
CorruptionPerceptions
Index
WB - Ease ofDoing Business
Turk
ey`s
Ran
k ou
t of
Tota
l Num
ber o
f Cou
ntrie
s
Total Number of Countries Turkey`s Rank
Figure 8.5: Turkeyremainsmid-fieldonmostcomparativeindicesof institutionalperformance
12 Preliminary results of a recent management quality survey for Turkey, following the methodology of Bloom et al. (2012), show that Turkey has a fat “left tail” of poorly managed companies. Its average management quality is comparable to other middle income countries in Latin America and to Greece, Spain and Portugal in Southern Europe.
13 This finding is related to the argument of Aghion and Howitt (2005) among others that appropriate growth policies differ in middle and high income countries. Relating GDP per capita to the average WGI score linearly and testing for a structural break, we find this occurs at a WGI score of 0.7, corresponding to Uruguay with a PPP income of $23,340. Beyond this level, the slope of a linear relationship is significantly steeper. Turkey’s per capita income is significantly higher than predicted by the quality of its institutions ($18,551 compared with predicted $10,211). This makes it more likely that further improvements in institutional performance are necessary for Turkey to continue to increase its income level (see also Chapter 1).

Turkey’s Transitions
254
It seems that to get to high income, emerging mar-kets need to create the necessary institutional pre-requisites. Measured against the standards of high income countries, Turkey does not fare particularly well (Figure 8.5). Turkey’s performance is solidly middle income whatever indicator of the quality of institutions is used. Turkey’s rank is relatively the strongest in the WEF’s index of institutional qual-ity (56 out of 148) and Transparency International’s Corruption Perception Index (53 out of 177). But it does not make it into the top 40 on any indicator of institutional quality.
Institutional reforms are complex and often interde-pendent. Nonetheless, a closer look at the various dimensions of institutional performance can help identify priorities. To do so, we take a closer look at the large WGI dataset. These indicators draw on a total of 31 sources, some reporting expert rat-ings, some based on surveys and aggregated into 6 broad themes using principle component analysis (Kaufmann, Kraay and Mastruzzi, 2010).¹⁴ In Figure 8.6, Turkey is benchmarked against the OECD av-erage, the Republic of Korea (the most advanced among all the peers used in this book), and the oth-er peer group averages. The gap between Turkey and the high income countries can clearly be seen. Turkey’s scores are comparable to those of the new
EU Member States on Government Effectiveness and Control of Corruption, but considerably worse on Voice and Accountability and the Rule of Law (where Turkey’s score remains well below the mid-point of the global distribution). In Voice and Ac-countability, it is even below the score of the other EU Accession Candidates and barely better than the BRICS. This composite indicator covers issues such as political rights and civil liberties, freedom of the media, access to information, and the degree of parliamentary oversight over the executive. Strong checks and balances become more important as the complexity of policy decisions increases in high income countries.
There is nothing inevitable about being trapped in middle income. Japan and the East Asian Tigers and more recently, several new EU Member States have demonstrated persistently high growth rates that have taken them quickly through middle income to advanced economy status. Benchmarked against these examples and other middle income peers, Turkey’s prospects are mixed. They would brighten considerably as a result of a new boost of struc-tural and institutional reforms. The analysis in the preceding Chapters lays out a well-defined reform agenda to which we now turn.
Source: WGINote: The “EU Members” refers to Bulgaria, Czech Republic, Hungary, Poland, Romania and Slovakia. “EU Candidate Average” refers to unweighted average of Albania, Croatia and Serbia. “MENA Average” refers to unweighted average of Egypt, Jordan, Morocco, Syrian Arab Republic and Tunisia. “Growth Markets Average” refers to unweighted average of Indonesia, Malaysia, Mexico and Philippines. “OECD Average” refers to unweighted average of 34 OECD countries.
-1.0
-0.5
0.0
0.5
1.0
1.5Control of Corruption
GovernmentEffectiveness
Regulatory QualityRule of Law
Voice and Accountability
BRICS Average New EU Members AverageEU Candidate Average MENA AverageGrowth Markets Average (excluding Korea, Republic of) Korea, Rep.Turkey OECD Average
Figure 8.6: Worldwide Governance Indicators (WGI), 2013
14 The index of political stability and violence is not reported, as it is less directly related to issues of economic policy which are the focus of this Report. Turkey scores poorly on this indicator, largely because of the legacy of the long conflict in the country’s Southeast.
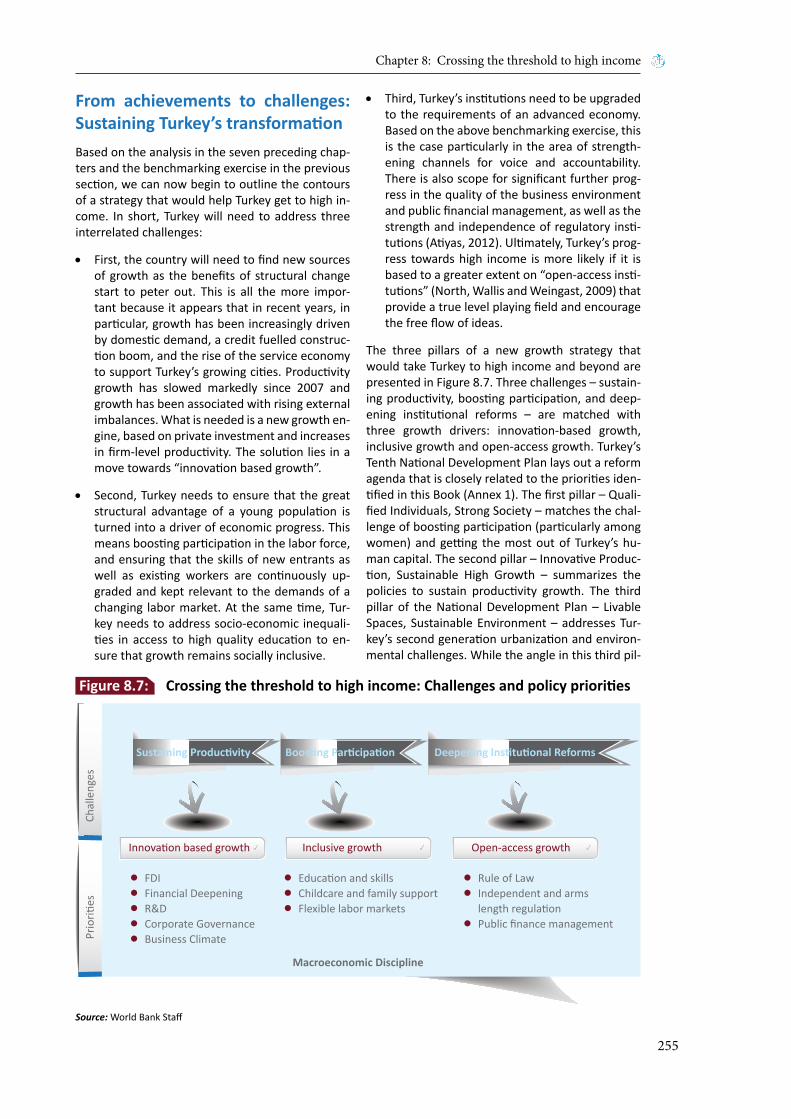
Chapter 8: Crossing the threshold to high income
255
From achievements to challenges: SustainingTurkey’stransformationBased on the analysis in the seven preceding chap-ters and the benchmarking exercise in the previous section, we can now begin to outline the contours of a strategy that would help Turkey get to high in-come. In short, Turkey will need to address three interrelated challenges:
• First, the country will need to find new sources of growth as the benefits of structural change start to peter out. This is all the more impor-tant because it appears that in recent years, in particular, growth has been increasingly driven by domestic demand, a credit fuelled construc-tion boom, and the rise of the service economy to support Turkey’s growing cities. Productivity growth has slowed markedly since 2007 and growth has been associated with rising external imbalances. What is needed is a new growth en-gine, based on private investment and increases in firm-level productivity. The solution lies in a move towards “innovation based growth”.
• Second, Turkey needs to ensure that the great structural advantage of a young population is turned into a driver of economic progress. This means boosting participation in the labor force, and ensuring that the skills of new entrants as well as existing workers are continuously up-graded and kept relevant to the demands of a changing labor market. At the same time, Tur-key needs to address socio-economic inequali-ties in access to high quality education to en-sure that growth remains socially inclusive.
• Third, Turkey’s institutions need to be upgraded to the requirements of an advanced economy. Based on the above benchmarking exercise, this is the case particularly in the area of strength-ening channels for voice and accountability. There is also scope for significant further prog-ress in the quality of the business environment and public financial management, as well as the strength and independence of regulatory insti-tutions (Atiyas, 2012). Ultimately, Turkey’s prog-ress towards high income is more likely if it is based to a greater extent on “open-access insti-tutions” (North, Wallis and Weingast, 2009) that provide a true level playing field and encourage the free flow of ideas.
The three pillars of a new growth strategy that would take Turkey to high income and beyond are presented in Figure 8.7. Three challenges – sustain-ing productivity, boosting participation, and deep-ening institutional reforms – are matched with three growth drivers: innovation-based growth, inclusive growth and open-access growth. Turkey’s Tenth National Development Plan lays out a reform agenda that is closely related to the priorities iden-tified in this Book (Annex 1). The first pillar – Quali-fied Individuals, Strong Society – matches the chal-lenge of boosting participation (particularly among women) and getting the most out of Turkey’s hu-man capital. The second pillar – Innovative Produc-tion, Sustainable High Growth – summarizes the policies to sustain productivity growth. The third pillar of the National Development Plan – Livable Spaces, Sustainable Environment – addresses Tur-key’s second generation urbanization and environ-mental challenges. While the angle in this third pil-
Source: World Bank Staff
Macroeconomic Discipline
Sustaining Productivity Boosting Participation Deepening Institutional Reforms
FDIFinancial DeepeningR&DCorporate GovernanceBusiness Climate
Education and skillsChildcare and family supportFlexible labor markets
Rule of LawIndependent and armslength regulationPublic finance management
Innovation based growth Inclusive growth Open-access growth
Prio
rities
Chal
leng
es
Figure 8.7: Crossingthethresholdtohighincome:Challengesandpolicypriorities

Turkey’s Transitions
256
lar is different than that chosen in this concluding chapter, the policy agenda is overlapping: Turkey needs stronger rules, reliable arms’ length regula-tion and improved mechanisms for government ac-countability to its citizens. This will help to maintain Turkey’s attraction for private investors to develop its cities and infrastructure in ways compatible with long-term financial, environmental and social sus-tainability.
To get fit for high income, Turkey can build on its many achievements as documented in this Report. The analysis in the preceding seven Chapters identi-fies both the mechanisms that have allowed Turkey to progress to this point, and the remaining short-comings that, if addressed, would allow it to move further (Table 8.2). Crossing the threshold to high income will involve three important transitions:
• Fromstructuralchangetoinnovation:Chapters 2, 3 and 4 documented the mechanisms that have allowed Turkey to create a private sector driven growth model, harnessing the benefits of structural change. International and Euro-pean integration, including Turkey’s integration into global value chains with the help of increas-ing FDI, have boosted Turkey’s competitiveness. A sound banking system and vastly improved connective infrastructure have reduced the cost of trade and doing business, and regulatory re-forms in the early 2000s have helped, too. But the momentum created by this combination has weakened. Going forward, Turkey’s firms need to shift their strategy from providing hous-ing and consumption goods to a rapidly growing urban population to producing more sophisti-cated products for the global market and the domestic middle class. For this, they need ac-cess to better technologies (including through attracting more FDI), to better skilled labor, and to a national eco-system that encourages inno-vation. Turkey’s financiers need to move into equity and other forms of risk capital. Turkey’s managers need to accept modern corporate governance and modern management prac-tices. Turkey’s scientists need to connect better with commercial reality. Government policy can do much to facilitate this shift through deregu-lation of professional services, the reforms of capital markets, setting the framework for the protection of intellectual property rights, and better targeted (not necessarily larger) govern-ment support. A widened trade agreement with the EU, possibly in the context of Turkey joining the Trans-Atlantic Trade and Investment Part-nership (TTIP) could provide an important boost to many of these reforms.
• Fromimprovedaccesstoservicestoequaleco-nomicopportunities:Chapters 5, 6 and 7 illus-trated how urbanization, the rise of the service economy, and increased public spending on social and municipal services have vastly im-proved the livelihoods particularly of the poorer segments of Turkey’s population. Job creation has kept pace with population growth and rising female labor force participation in recent years, ensuring that prosperity has been shared. But sustaining this positive momentum will be challenging, particularly if economic growth slows. Remaining socio-economic inequalities are significant, both regionally and across in-come quintiles. To achieve sustained, inclusive growth, government policies may need to be-come even better targeted. Labor markets need to become more flexible, while offering better income security to those negatively affected by structural shifts in the demand for skills. Wom-en need more childcare opportunities and fami-lies need improved parental leave to encourage more women to continue to work beyond mar-riage. Education policies need to evolve from providing access to ensuring quality and reduc-ing inequality in education outcomes by socio-economic groups. Social security arrangements need to be mindful of the fiscal risk of growing entitlements and adjust before such costs mul-tiply with an aging population. Turkey’s young population is a huge asset as the country looks at the road towards high income. Policies that boost participation and ensure equal economic opportunities will have high returns for many years to come.
• Fromregulatoryreformstoopen-access insti-tutions:Chapter 1 reviewed the origins of Tur-key’s rise and emphasized the importance of the shift of the model of economic governance from state-led to private sector led growth, par-ticularly in the context of the regulatory reforms of the late 1990s and early 2000s. In essence, the difference after 2001 was that Turkish policy makers understood that the benefits of market oriented reforms accrue sustainably only to countries that make parallel efforts to improve the rule of law, introduce arms’ length regula-tion and rely on independent institutions to ex-ercise control and accountability. Yet, the analy-sis also showed to what extent these reforms have remained incomplete and contested, from the regulation of financial markets and public private partnerships in infrastructure to the in-stitutions of corporate governance and public fi-nance management. Turkey needs to complete the shift towards economic institutions that are

Chapter 8: Crossing the threshold to high income
257
politically blind and treat every enterprise and every citizen equally. The transition to open-ac-cess institutions is a key complement to innova-tion-based growth and central to ensuring that growth remains inclusive.
Two more general conclusions can be drawn from a review of Turkey’s economic and social progress over the past three decades.
Persistence pays: In the majority of areas covered by this Report, addressing Turkey’s challenges will require persistence in reforms already under way. For instance, Chapter 2 and Spotlight 2 argue that Turkey’s investment in upgrading its logistics ca-pacity is an asset that should facilitate the deeper integration with global value chains. As Chapter 3 illustrates, Turkey has already adopted a series of measures to develop its capital markets and de-velop the financial market infrastructure needed to support technical upgrading and innovation by Turkish companies. Turkey has recently created an institutional framework to provide further autono-my to municipal governments to help them man-age the next stage of urban development (Chap-ter 5). This new framework now needs to be filled with life (and temptations for centrally directed initiatives resisted) and the capacity of municipal governments needs to be strengthened to make good use of their increased responsibilities. Tur-key’s impressive labor market performance after 2009, chronicled in Chapter 6, underlines the im-portance of continuing targeted employment sup-
port for women and youth, complemented with new measures to increase labor market flexibility. Finally, Turkey’s achievements in improving health and education outcomes ought to caution against calls for a radical rethinking of health and educa-tion policies. Persistence is the theme here as well. Policy reversals, on the other hand, could be costly.
New reform momentum is needed: In some ar-eas, Turkey’s reform efforts have slowed down in the past five years or even been partially reversed in ways that now pose risks to future growth. One area is the business climate where Turkey moved fast towards the best practice frontier between the late 1990s and the mid-2000s, but has seen other countries catch-up as its own pace of reform has slowed. A second area, as illustrated in Spotlight 3, is the reform of public financial management insti-tutions, where multiple exemptions, for instance, have weakened the integrity of the public procure-ment framework and where implementation diffi-culties have overshadowed positive achievements in the reform of external and internal audit. Figure 8.8 shows that across three indicators of institu-tional reforms tracked over time – the Global Gov-ernance Indicators of the World Bank Institute, the Doing Business ratings of the World Bank Group, and the OECD’s Product Market Regulation indica-tors – progress essentially stopped after 2007. Just as Turkey’s progress towards high income slowed with the global economic and financial crisis and as the anchor of EU Accession negotiations weakened, institutional reforms also went into slow motion.
Source: WGI, Doing Business, OECDNote: Pre-crisis refers to 2001-2007 for WGI, 2004-2007 for Doing Business, and 2003-2008 for Product Market Regulation (PMR); post crisis refers to 2008-2012 for WGI and Doing Business, and 2008-2013 for PMR.Doing Business indicators are calculated based on the 2014 release. From the 2015 release onwards, a change has been introduced in the methodology and “distance to the frontier” measures for 2015 are not comparable across time.
-10
-5
0
5
10
15
20
Cont
rol
of C
orru
ption
Gove
rnm
ent
Effe
ctive
ness
Regu
lato
ry Q
ualit
y
Rule
of L
aw
Voice
and
Acc
ount
abili
ty
Doin
g Bu
sines
s D
istan
ce to
Fro
ntier
OEC
D P
MR
Impr
ovem
ents
in In
dica
tors
Pre-Crisis Post-Crisis
Figure 8.8: Institutionalreformshaveslowedsincethemid-2000s
Turkey’s Transitions
258
This is not to deny progress in other areas, includ-ing a series of important judicial reform packages, but economic institutions have not been given suf-ficient attention. This will need to change if Turkey is to fulfill its aspirations.
Outlook:Europeanintegration,thedemographic dividend and Turkey’s convergence to high incomeIn reviewing the pattern of economic convergence in Europe, Gill and Raiser (2012) concluded: “Of the countries that have grown quickly from middle in-come to high income, half—Croatia, Cyprus, Czech Republic, Estonia, Greece, Hungary, Latvia, Malta, Poland, Portugal, Slovakia, and Slovenia—are in Eu-rope. If you can be a part of the formidable Euro-pean Convergence Machine, you do not need to be extraordinarily fortunate [like the Gulf States that grew rich after discovering vast oil reserves] to be-come prosperous nor—like the East Asian Tigers—do you have to be ferocious. You just have to be disciplined.”
Turkey’s growth story over the past three decades is intricately linked with the story of European in-tegration and convergence. The Customs Union between Turkey and the EU, which entered into force in 1996, has been a catalyst of technologi-cal upgrading as well as improvements in product regulations and quality control in Turkish manu-facturing. This has helped Turkey expand both its regional and global presence. The prospect and, after 2005, the start of accession negotiations with the EU has deeply influenced the focus of structural and institutional reforms, from regulatory changes in the transport and energy markets, the tighten-ing of environmental safeguards, and the develop-ment of a new capital markets infrastructure, to the reform of public finance management in areas such as external audit or public procurement. Even Turkey’s labor market institutions and the aspira-tions of its population for a relatively extensive wel-fare state point towards an economic model more similar to Europe’s social market economy than Asia’s developmental capitalism. In short, Turkey’s achievements are part of a pattern of economic convergence and institutional harmonization that is unique to Europe, and quite possibly the Region’s biggest asset.
Yet, many Turks have lost faith in the ability of Eu-rope to help them catch-up. The strength of Eu-rope’s Convergence Machine has faltered not just as a result of the global economic and financial cri-sis. Long before, Europe had stopped catching up with the US in productivity and was facing increas-ing competition from Asia. Remaining market bar-
riers, particularly in services and in labor markets, had become increasingly binding obstacles to fur-ther gains from economic integration. And Europe’s welfare model, whilst continuing to deliver strong social protection and higher levels of equality than in any other region in the world, had become unfit to serve an aging population.
Writing Europe off would be a big mistake, how-ever, both because so many aspects of Europe’s economic and social model remain strong, and because Europe has started to reform the weaker aspects in the past five years. Reforms to labor mar-kets and improvements in the business environ-ment are leading to gains in the competitiveness of Europe’s periphery and the economic imbal-ances inside the Eurozone are gradually reducing. Europe as a whole still lags the US on innovation, but Europe’s leading innovators, in Scandinavia, in Switzerland, or in Germany are showing the way to others on how to catch-up. And five years of tough fiscal measures have reduced the burden of over-bloated public sectors in many European countries, although the structural reforms needed to confront the challenges of aging are still largely outstanding. Europe’s economic recovery is no longer a fantasy as the Region is expected to turn the corner to posi-tive growth in 2014.
Turkey’s exporters have been among the first to no-tice. Exports to the EU, which experienced negative growth between December 2011 and September 2012, have recently started to pick up again (Fig-ure 8.9). The accession negotiations received a (at least temporary) fillip when the European Council agreed to open a new Chapter (22) on regional pol-icy. Leading Turkish politicians have declared 2014 to be the “year of Europe”. If history and the experi-ence of Turkey’s Eastern European neighbors is any guide, this orientation is well advised. Turkey has shown in the aftermath of the 2001 crisis that it is disciplined. Turkey’s location allows it to partake in the benefits of Europe’s Convergence Machine. As the Machine starts turning again, Turkey once more could benefit.
Besides its location and integration with the Euro-pean Convergence Machine, Turkey’s second big-gest asset is its young and dynamic people. As em-phasized in this Report, Turkey can look forward to a double demographic dividend as its dependency ratio is falling and as more women enter the labor force. In a downbeat assessment of US growth prospects, the American economist Robert Gordon (2012) predicts US growth will slow down signifi-cantly in part because of a decline in the contribu-tion of human capital. This is intimately linked with America’s own demographic transformation, as the convergence of female with male employment

Chapter 8: Crossing the threshold to high income
259
rates has been largely completed and the benefits of earlier extensions in access to education have become exhausted with the first cohort of baby boomers starting to exit the labor market. What appears as a drag on American growth prospects could be a boon for Turkey: if female employment rates continue to grow and as the investments in increased schooling over the past decade work their way into the labor market, Turkey’s growth prospects would brighten. They would brighten even more if the efforts to make Turkey’s develop-ment model more socially inclusive that have been chronicled in this Report translate into genuinely higher rates of social mobility.
Turkey’s path to high income, thus, lies visibly ahead. Progress will not be automatic, but as this Report has shown, Turkey has much strength on which to build. At a time when many observers have raised doubts over the future of Turkey’s eco-nomic and social development model, it is useful to remember these strengths, examine Turkey’s policy lessons and refocus attention on the tasks remain-ing ahead. These tasks will require diligent reform efforts over a number of years. But if Turkey is able to meet this challenge, as it celebrates the cente-nary in 2023 of the founding of the modern Turkish Republic, it will do so as a more competitive, inclu-sive and, ultimately, prosperous country.
Source: TurkStatNote: EU market includes Croatia, an EU member since July 2013.
-50%
-40%
-30%
-20%
-10%
0%
10%
20%
30%
40%
50%
Jan.
09
Apr.0
9
Jul.0
9
Oct
.09
Jan.
10
Apr.1
0
Jul.1
0
Oct
.10
Jan.
11
Apr.1
1
Jul.1
1
Oct
.11
Jan.
12
Apr.1
2
Jul.1
2
Oct
.12
Jan.
13
Apr.1
3
Jul.1
3
Oct
.13
Jan.
14
Apr.1
4
Perc
ent C
hang
e
Figure 8.9: TheConvergenceMachinestartingupagain? Change in exports to EU
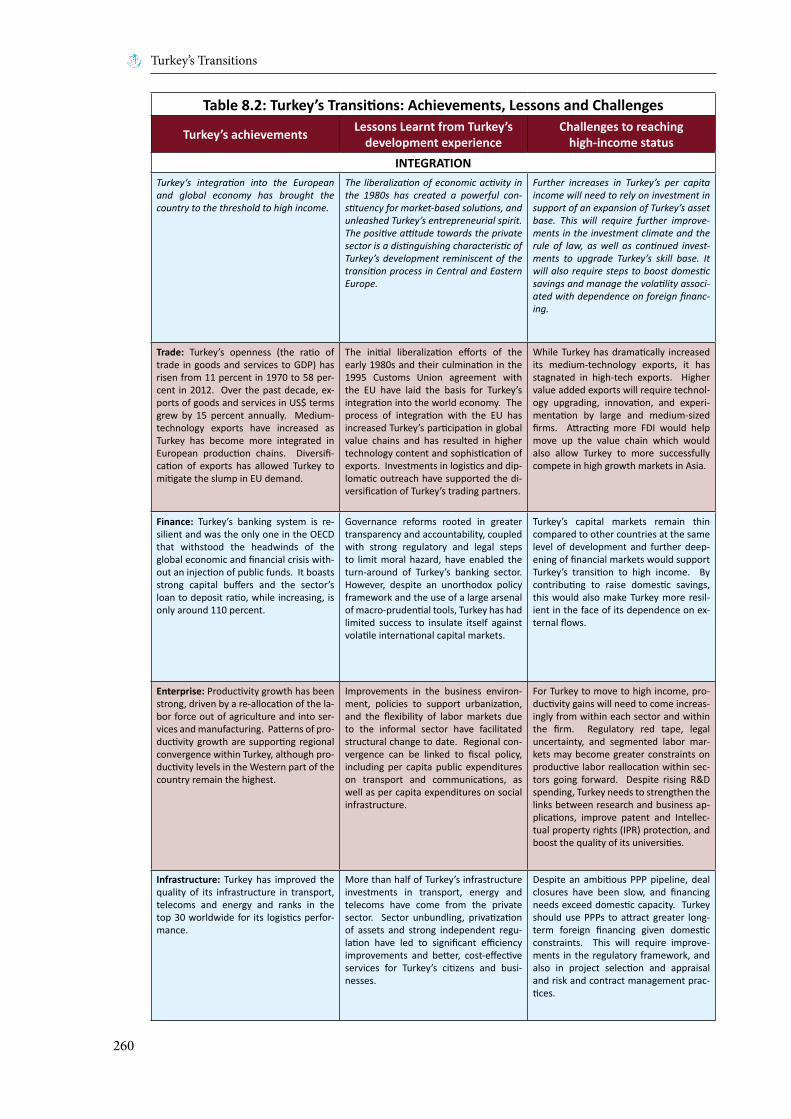
Turkey’s Transitions
260
Table8.2:Turkey’sTransitions:Achievements,LessonsandChallenges
Turkey’s achievements LessonsLearntfromTurkey’sdevelopment experience
Challenges to reachinghigh-income status
INTEGRATIONTurkey‘s integration into the European and global economy has brought the country to the threshold to high income.
The liberalization of economic activity in the 1980s has created a powerful con-stituency for market-based solutions, and unleashed Turkey’s entrepreneurial spirit. The positive attitude towards the private sector is a distinguishing characteristic of Turkey’s development reminiscent of the transition process in Central and Eastern Europe.
Further increases in Turkey’s per capita income will need to rely on investment in support of an expansion of Turkey’s asset base. This will require further improve-ments in the investment climate and the rule of law, as well as continued invest-ments to upgrade Turkey’s skill base. It will also require steps to boost domestic savings and manage the volatility associ-ated with dependence on foreign financ-ing.
Trade: Turkey’s openness (the ratio of trade in goods and services to GDP) has risen from 11 percent in 1970 to 58 per-cent in 2012. Over the past decade, ex-ports of goods and services in US$ terms grew by 15 percent annually. Medium-technology exports have increased as Turkey has become more integrated in European production chains. Diversifi-cation of exports has allowed Turkey to mitigate the slump in EU demand.
The initial liberalization efforts of the early 1980s and their culmination in the 1995 Customs Union agreement with the EU have laid the basis for Turkey’s integration into the world economy. The process of integration with the EU has increased Turkey’s participation in global value chains and has resulted in higher technology content and sophistication of exports. Investments in logistics and dip-lomatic outreach have supported the di-versification of Turkey’s trading partners.
While Turkey has dramatically increased its medium-technology exports, it has stagnated in high-tech exports. Higher value added exports will require technol-ogy upgrading, innovation, and experi-mentation by large and medium-sized firms. Attracting more FDI would help move up the value chain which would also allow Turkey to more successfully compete in high growth markets in Asia.
Finance: Turkey’s banking system is re-silient and was the only one in the OECD that withstood the headwinds of the global economic and financial crisis with-out an injection of public funds. It boasts strong capital buffers and the sector’s loan to deposit ratio, while increasing, is only around 110 percent.
Governance reforms rooted in greater transparency and accountability, coupled with strong regulatory and legal steps to limit moral hazard, have enabled the turn-around of Turkey’s banking sector. However, despite an unorthodox policy framework and the use of a large arsenal of macro-prudential tools, Turkey has had limited success to insulate itself against volatile international capital markets.
Turkey’s capital markets remain thin compared to other countries at the same level of development and further deep-ening of financial markets would support Turkey’s transition to high income. By contributing to raise domestic savings, this would also make Turkey more resil-ient in the face of its dependence on ex-ternal flows.
Enterprise: Productivity growth has been strong, driven by a re-allocation of the la-bor force out of agriculture and into ser-vices and manufacturing. Patterns of pro-ductivity growth are supporting regional convergence within Turkey, although pro-ductivity levels in the Western part of the country remain the highest.
Improvements in the business environ-ment, policies to support urbanization, and the flexibility of labor markets due to the informal sector have facilitated structural change to date. Regional con-vergence can be linked to fiscal policy, including per capita public expenditures on transport and communications, as well as per capita expenditures on social infrastructure.
For Turkey to move to high income, pro-ductivity gains will need to come increas-ingly from within each sector and within the firm. Regulatory red tape, legal uncertainty, and segmented labor mar-kets may become greater constraints on productive labor reallocation within sec-tors going forward. Despite rising R&D spending, Turkey needs to strengthen the links between research and business ap-plications, improve patent and Intellec-tual property rights (IPR) protection, and boost the quality of its universities.
Infrastructure: Turkey has improved the quality of its infrastructure in transport, telecoms and energy and ranks in the top 30 worldwide for its logistics perfor-mance.
More than half of Turkey’s infrastructure investments in transport, energy and telecoms have come from the private sector. Sector unbundling, privatization of assets and strong independent regu-lation have led to significant efficiency improvements and better, cost-effective services for Turkey’s citizens and busi-nesses.
Despite an ambitious PPP pipeline, deal closures have been slow, and financing needs exceed domestic capacity. Turkey should use PPPs to attract greater long-term foreign financing given domestic constraints. This will require improve-ments in the regulatory framework, and also in project selection and appraisal and risk and contract management prac-tices.

Chapter 8: Crossing the threshold to high income
261
Turkey’s achievements LessonsLearntfromTurkey’sdevelopment experience
Challenges to reachinghigh-income status
INCLUSIONTurkey’s development model in the 2000s has become socially inclusive, as reflected in a sharp decline in poverty, significant improvements in the welfare of the bot-tom of the income distribution, and large reductions in the inequality of access to basic social services.
Turkey’s poverty reduction and social inclusion story have primarily resulted from sustained economic growth and job creation. Turkey’s sustained fiscal con-solidation after 2001 has opened space for spending increases in health, educa-tion and municipal services which have supported improved access and greater economic opportunities for rural-urban migrants.
Sustaining improvements in social in-clusion will require continued rapid job creation (including for women), further reduction of the gap in access to and quality of basic services, and a widening of targeted policies to assist the most vul-nerable. Over the medium-term, Turkey should prepare for an aging society even if the demographic window will remain open for some time.
Urbanization: Turkey is one of the world’s fastest urbanizers and has created a sys-tem of cities that is economically efficient, whilst widening access to municipal ser-vices to the whole population.
Rural-urban migration was not restricted but facilitated by public policy, with great economic benefits. City planning was consolidated at the municipal level early on in the 1980s. Turkey’s privately-pro-vided social housing model avoided the creation of urban slums.
In fast growing secondary cities, lack of planning capacity risks growing urban sprawl. Turkey’s advanced cities are ef-ficient but could become more livable if second generation issues of public trans-port, green and recreational areas, and greater public consultation in city plan-ning are addressed.
Labormarkets: Employment growth since the 1980s has roughly kept pace with in-creases in the labor force. Most of the new jobs created have been of higher produc-tivity, boosting overall growth and social progress. The pace of job creation has accelerated after 2008, when Turkey cre-ated more than 4 million new jobs, many of which at higher skill levels.
In addition to the strong cyclical upswing, reductions in the tax wedge on labor and an expansion of active labor market pro-grams contributed to Turkey’s labor mar-ket performance post-2008. Structural change, improvements in education, and the pace of urbanization have ensured that the majority of new jobs created have been productive ones.
Sustaining job creation at least at histori-cal rates is critical to ensure that Turkey fully utilizes its demographic window of opportunity. With growth likely to moderate in the medium term, this may require targeted measures to boost em-ployment, particularly among women, whose labor force participation remains far below the other higher middle in-come countries. Creating high produc-tivity jobs going forward also requires steps to reduce the segmentation of labor markets between the formal and informal sectors, whilst increasing over-all labor market flexibility.
Welfare: Health and education outcomes have improved significantly addressing eq-uity as well as access, benefitting also the less well-off.
Rising spending as well as sector specific reforms have boosted social outcomes. Extension of the mandatory school age and changes in the curriculum in the late 1990s and early 2000s has helped Tur-key catch up on education. In the health sector, a large scale reform effort has created performance linked incentives, supported a shift towards prevention and primary care, and vastly improved access for the poorer parts of the population.
Turkey will not enjoy the fiscal divi-dend of debt consolidation forever and needs to prioritize spending. In looking for spending efficiencies, Turkey should revisit its social security model, which is generous particularly thanks to a low age of retirement. Sustaining progress in education will require more spend-ing, and also reforms to boost quality in the classroom and at the school level. In health care, dealing with rising entitle-ments and technology driven cost in-creases present challenges for efficiency.
Publicfinance: Comprehensive structural reforms in the public sector have support-ed a sharp and continuing decline in Tur-key’s public debt to GDP ratio and created fiscal space for improved public services.
Conservative budget policies and com-mitments to primary surpluses were combined with a wholesale reform of public financial management to escape from the fiscal politics of patronage and create a rule-based system for spending allocations, as well as expanding the rev-enue base.
Continued fiscal prudence would sup-port Turkey’s transition to high-income. Reforms on both the revenue and expen-diture side of the budget remain incom-plete, with a highly cyclical revenue base, growing social entitlements, and pockets of spending (particularly in infrastruc-ture) outside the scope of rule based fiscal governance representing the main challenges.
INSTITUTIONSTurkey has recorded significant improve-ments in institutional performance and public sector governance, particularly af-ter the 2001 crisis and anchored by the EU Accession negotiations process.
The pace of institutional reforms has slowed since 2007, with only marginal improvements in overall governance, and some concerns over reversals in selected areas such as voice and accountability or independent regulators in finance and in-frastructure.
Turkey has yet to establish the institu-tional foundations for the transition to high income. Improvements across the board are needed, including in the busi-ness climate, the rule of law, regulatory policies, the guarantee of civil and po-litical rights, public sector accountability, and decentralized decision making.
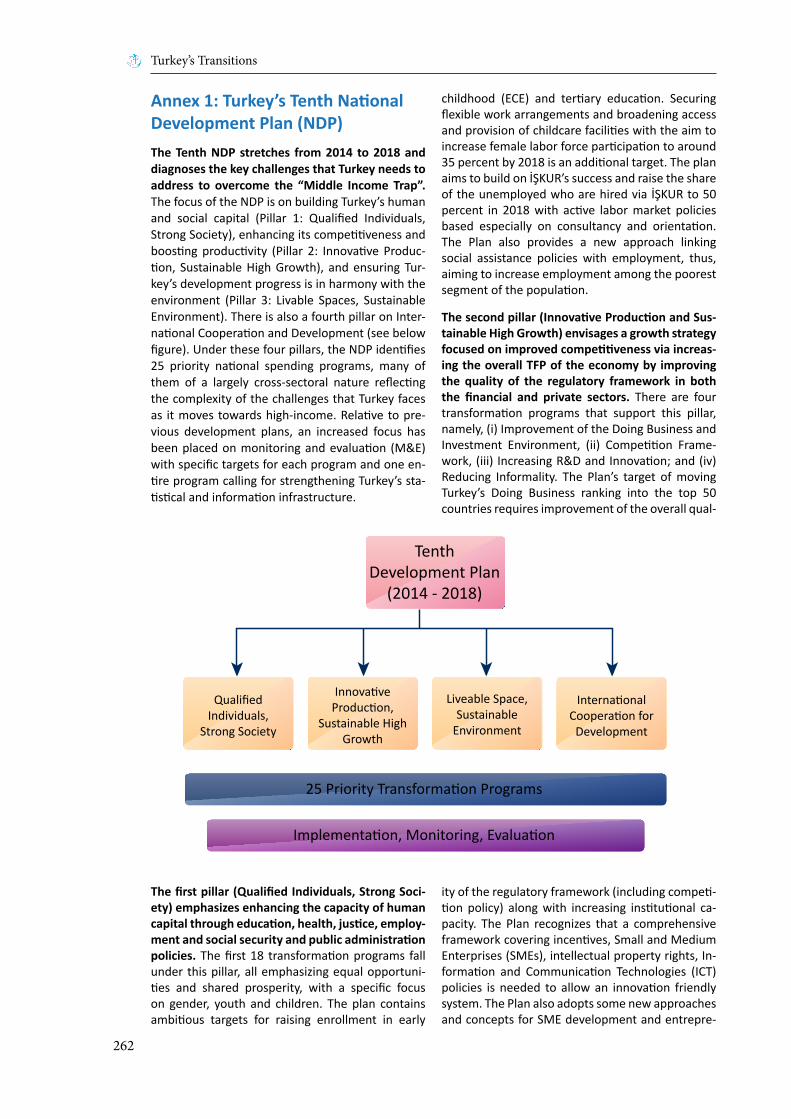
Turkey’s Transitions
262
Annex1:Turkey’sTenthNationalDevelopment Plan (NDP)The Tenth NDP stretches from 2014 to 2018 and diagnoses the key challenges that Turkey needs to address to overcome the “Middle Income Trap”. The focus of the NDP is on building Turkey’s human and social capital (Pillar 1: Qualified Individuals, Strong Society), enhancing its competitiveness and boosting productivity (Pillar 2: Innovative Produc-tion, Sustainable High Growth), and ensuring Tur-key’s development progress is in harmony with the environment (Pillar 3: Livable Spaces, Sustainable Environment). There is also a fourth pillar on Inter-national Cooperation and Development (see below figure). Under these four pillars, the NDP identifies 25 priority national spending programs, many of them of a largely cross-sectoral nature reflecting the complexity of the challenges that Turkey faces as it moves towards high-income. Relative to pre-vious development plans, an increased focus has been placed on monitoring and evaluation (M&E) with specific targets for each program and one en-tire program calling for strengthening Turkey’s sta-tistical and information infrastructure.
Thefirstpillar(QualifiedIndividuals,StrongSoci-ety)emphasizesenhancingthecapacityofhumancapitalthrougheducation,health,justice,employ-mentandsocialsecurityandpublicadministrationpolicies. The first 18 transformation programs fall under this pillar, all emphasizing equal opportuni-ties and shared prosperity, with a specific focus on gender, youth and children. The plan contains ambitious targets for raising enrollment in early
childhood (ECE) and tertiary education. Securing flexible work arrangements and broadening access and provision of childcare facilities with the aim to increase female labor force participation to around 35 percent by 2018 is an additional target. The plan aims to build on İŞKUR’s success and raise the share of the unemployed who are hired via İŞKUR to 50 percent in 2018 with active labor market policies based especially on consultancy and orientation. The Plan also provides a new approach linking social assistance policies with employment, thus, aiming to increase employment among the poorest segment of the population.
Thesecondpillar(InnovativeProductionandSus-tainable High Growth) envisages a growth strategy focusedonimprovedcompetitivenessviaincreas-ing the overall TFP of the economy by improving the quality of the regulatory framework in boththe financial and private sectors. There are four transformation programs that support this pillar, namely, (i) Improvement of the Doing Business and Investment Environment, (ii) Competition Frame-work, (iii) Increasing R&D and Innovation; and (iv) Reducing Informality. The Plan’s target of moving Turkey’s Doing Business ranking into the top 50 countries requires improvement of the overall qual-
ity of the regulatory framework (including competi-tion policy) along with increasing institutional ca-pacity. The Plan recognizes that a comprehensive framework covering incentives, Small and Medium Enterprises (SMEs), intellectual property rights, In-formation and Communication Technologies (ICT) policies is needed to allow an innovation friendly system. The Plan also adopts some new approaches and concepts for SME development and entrepre-
TenthDevelopment Plan
(2014 - 2018)
QualifiedIndividuals,
Strong Society
25 Priority Transformation Programs
Implementation, Monitoring, Evaluation
Liveable Space,Sustainable
Environment
InnovativeProduction,
Sustainable HighGrowth
InternationalCooperation for
Development

Chapter 8: Crossing the threshold to high income
263
neurship policies. Female and young entrepreneurs are targeted in enterprise support policies.
Aspartofthesecondpillar,thePlanacknowledgestheachievementsinthefinancialsector-especial-ly the performance of the banking sector - during the last decade and highlights some priority areas for future growth. Priority areas for the develop-ment of financial sector envisaged in the Plan can be summarized under three headings; (i) deepen-ing and diversification of the financial sector, (ii) im-proving financial inclusion; and (iii) strengthening legal and physical infrastructure.
Thethirdpillar(LivableSpaces,SustainableEnvi-ronment) introduces the concept of sustainabil-ity into urbanization and infrastructure policies.It also emphasizes minimizing regional disparities and improving the social and economic benefits of environmental measures. Additionally, this pillar analytically links sustainable urbanization with the
second pillar of improving competitiveness. Com-petitive cities are emphasized as centers for the knowledge based economy, financial and special-ized services, qualified labor force and R&D. Simi-larly, regional development is addressed from the perspective of national competitiveness.
Turkey’s newly emerging donor role forms the core of the fourth pillar. Turkey aims to assume an active role in international collaboration and development assistance as an upper middle in-come country. The pillar emphasizes this new role through providing financial support to Least De-veloping Countries (LDC), taking an active role in international structures/organization such as G20, COMCEC, UN, and ECO. The Plan not only makes reference to the EU Accession process and values its role as an anchor, but also emphasizes the con-tribution of Turkey to solving the EU’s economic challenges particularly by providing a large pool of young and dynamic workers.

Turkey’s Transitions
264
ReferencesAcemoğlu, D., & Robinson, J. (2012). Why Nations Fail: The Origins of Power, Prosperity and Poverty. New York: Crown Business.
Acemoğlu, D., Naidu, S., & Restrepo, J. R. (2014, March). Democracy Does Cause Growth. NBER Working Paper, 20004.
Aghion, P., & Howitt, P. (2005, August 25). Appro-priate Growth Policy: A Unifying Framework. 2005 Annual Schumpeter Lecture. Amsterdam.
Aiyar, S., Duval, R., Puy, D., Wu, Y., & Zhang, L. (2013, March). Growth Slowdowns and the Middle Income Trap. IMF Working Paper, 13/71.
Åslund, A. (2013). The BRICS Party is Over. VOX EU.
Atiyas, İ. (2012). Economic Institutions and Institu-tional Change in Turkey during the Neoliberal Era. New Perspectives on Turkey No: 14 pp. 45 - 69.
Berg, A., Ostry, J., & Zettelmeyer, J. (2006). What Makes Growth Sustained? IMF Working Paper, March 2008, 8/59.
Bloom, N., Genakos, C., Sadun, R., & Van Reenen, J. (2012, February). Management Practices Across Firms and Countries. NBER Working Paper No: 17850.
Bulman, D., Eden, M., & Nguyen, H. (2012). Tran-sitioning from Low-Income Growth to High-Income Growth: Is there a Middle Income Trap? World Bank Mimeographed. The World Bank.
EBRD. (2013). Stuck in Transition? London: EBRD.
Eichengreen, B., Park, D., & Shin, K. (2011). When Fast Growing Economies Slow Down: International Evidence and Implications for China. Working Paper 16919. National Bureau of Economic Research.
Eichengreen, B., Park, D., & Shin, K. (2013, Janu-ary). Growth Slowdowns Redux: New Evidence on the Middle-Income Trap. Working Paper 18673. Na-tional Bureau of Economic Research.
Felipe, J., Abdon, A., & Kumar, U. (2012). Tracking the Middle-income Trap: What Is It, Who Is in It, and Why? 715. Levy Institute of Economics. Bard College.
Ferguson, N. (2011). Civilization: The West and the Rest. The Penguin Press HC.
Gill, I. S., & Raiser, M. (2012). Golden Growth: Re-storing the Lustre of the European Economic Mod-el. The World Bank.
Gill, I., & Kharas, H. (2007). An East Asian Renais-sance: Ideas for Economic Growth. The World Bank.
Goni, E., & Maloney, W. (2014). Why Don’t Poor Countries Do R&D? World Bank Economic Policy Research Working Paper 6811.
Gordon, R. J. (2012, August). Is U.S. Economic Growth Over? Faltering Innovation Confronts The Six Headwinds. Working Paper 18315. Cambridge: National Bureau of Economic Research.
Hausmann, R., Rodriguez, F., & Wagner, R. (2006, October). Growth Collapses. Center for Interna-tional Development Working Papers, 136. Harvard University.
Henry, P. (2013). Turnaround: Third World lessons for First World Growth. Basic Books. New York.
Kaufmann, D., Kraay, A., & Mastruzzi, M. (2010). The Worldwide Governance Indicators. World Bank Policy Research Working Paper 5430.
McKinsey. (2013). Education to Employment: De-signing a System that Works. McKinsey Center for Government.
Mcmillan, M., & Rodrik, D. (2011). Globalization, Structural Change and Productivity Growth. NBER Working Paper 17143, June 2011.
North, D., Wallis, J., & Weingast, B. (2009). Violence and Social Orders. New York: Cambridge University Press.
Treisman, D. (2013). Democratization over time. Mimeographed. University of California at Los An-geles.
World Bank. (2012). Skills, Not Just Diplomas. Washington, D.C.: The World Bank.

Annex Tables
265
Annex Tables
Turkey’s Transitions: Integration, Inclusion, Institutions
Labour
Welfare
FiscalSpace
Enterprise
Trade
Infrastucture
Finance
Cities
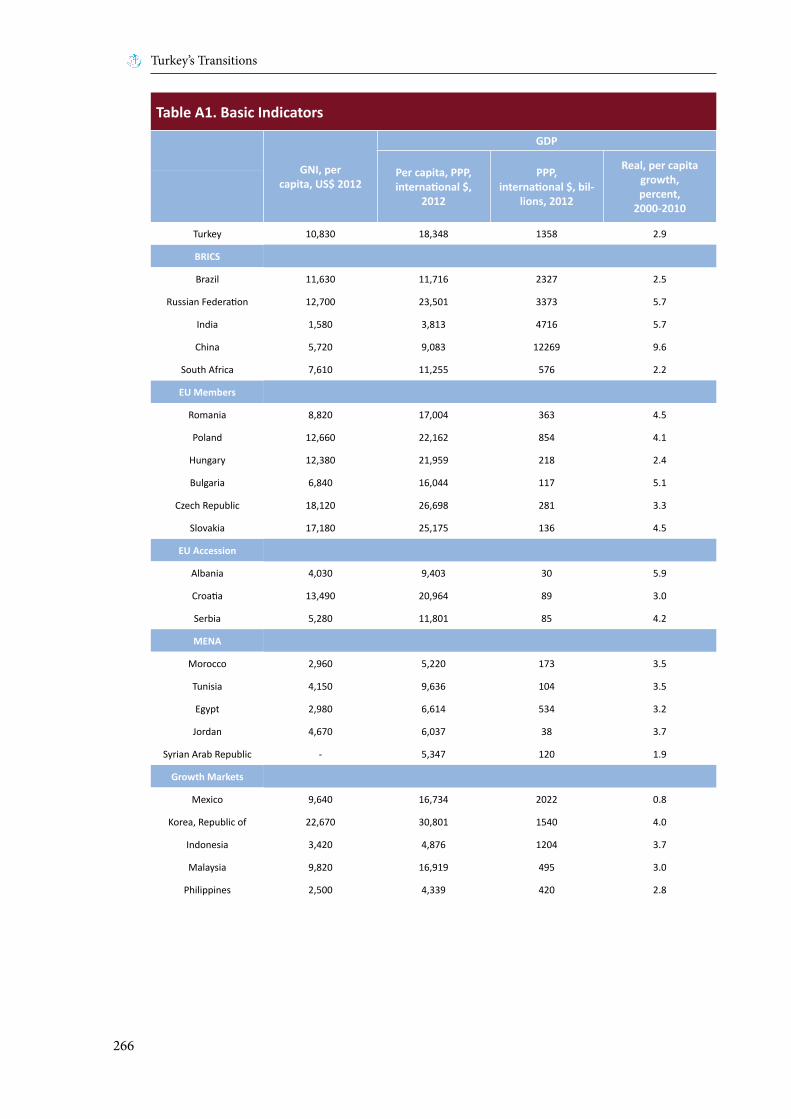
Turkey’s Transitions
266
Table A1. Basic Indicators
GNI, per capita, US$ 2012
GDP Population
TFP level at current PPPs
Per capita, PPP,international $,
2012
PPP,international $, bil-
lions, 2012
Real, per capita growth,percent,
2000-2010
Total,thousands, 2012
Working age, percent, 2012
Old age,percent,
2012
Total,thousands,
2050
Working age, percent 2050
Old age,percent,
2050
Turkey 10,830 18,348 1358 2.9 73,997 66.7 7.3 100,955 63.9 19.3 1.01
BRICS
Brazil 11,630 11,716 2327 2.5 198,656 68.1 7.3 232,304 63.1 21.1 0.43
Russian Federation 12,700 23,501 3373 5.7 143,533 71.6 13.0 129,908 60 25.7 0.63
India 1,580 3,813 4716 5.7 1,236,687 65.4 5.2 1,656,554 65.5 14.7 0.46
China 5,720 9,083 12269 9.6 1,350,695 73.3 8.7 1,303,723 59.5 26.8 0.37
South Africa 7,610 11,255 576 2.2 51,189 65.0 5.4 49,401 66.8 11.4 0.58
EU Members
Romania 8,820 17,004 363 4.5 21,327 70.0 15.0 18,060 56.1 31.3 0.55
Poland 12,660 22,162 854 4.1 38,543 71.0 14.0 32,085 55.4 31.7 0.80
Hungary 12,380 21,959 218 2.4 9,944 68.3 17.0 8,490 56.7 29.9 0.56
Bulgaria 6,840 16,044 117 5.1 7,305 67.5 18.9 4,651 53.9 33.8 0.56
Czech Republic 18,120 26,698 281 3.3 10,515 69.2 16.2 10,210 57.1 29 0.59
Slovakia 17,180 25,175 136 4.5 5,410 72.3 12.7 4,944 56.7 30 0.73
EU Accession
Albania 4,030 9,403 30 5.9 3,162 68.1 10.6 2,824 62.8 24 -
Croatia 13,490 20,964 89 3.0 4,267 67.0 18.0 3,864 57 29.6 0.71
Serbia 5,280 11,801 85 4.2 7,224 69.5 14.0 5,869 58 29 0.51
MENA
Morocco 2,960 5,220 173 3.5 32,521 67.2 5.0 42,026 62.3 18.6 0.38
Tunisia 4,150 9,636 104 3.5 10,778 69.7 7.1 12,180 59.3 24.3 0.45
Egypt 2,980 6,614 534 3.2 80,722 63.1 5.6 137,873 64.3 13.1 0.64
Jordan 4,670 6,037 38 3.7 6,318 62.4 3.5 11,243 61.8 12.5 0.36
Syrian Arab Republic - 5,347 120 1.9 22,399 60.7 3.9 33,658 65.9 13.9 -
Growth Markets
Mexico 9,640 16,734 2022 0.8 120,847 64.7 6.3 150,568 63.9 18 0.72
Korea, Republic of 22,670 30,801 1540 4.0 50,004 72.9 11.8 43,369 53.9 35.9 0.68
Indonesia 3,420 4,876 1204 3.7 246,864 65.6 5.1 300,183 63.8 19 0.38
Malaysia 9,820 16,919 495 3.0 29,240 68.2 5.2 42,929 63.3 16 0.50
Philippines 2,500 4,339 420 2.8 96,707 61.6 3.8 171,964 64.8 11.7 0.33

Annex Tables
267
Table A1. Basic Indicators
GNI, per capita, US$ 2012
GDP Population
TFP level at current PPPs
Per capita, PPP,international $,
2012
PPP,international $, bil-
lions, 2012
Real, per capita growth,percent,
2000-2010
Total,thousands, 2012
Working age, percent, 2012
Old age,percent,
2012
Total,thousands,
2050
Working age, percent 2050
Old age,percent,
2050
Turkey 10,830 18,348 1358 2.9 73,997 66.7 7.3 100,955 63.9 19.3 1.01
BRICS
Brazil 11,630 11,716 2327 2.5 198,656 68.1 7.3 232,304 63.1 21.1 0.43
Russian Federation 12,700 23,501 3373 5.7 143,533 71.6 13.0 129,908 60 25.7 0.63
India 1,580 3,813 4716 5.7 1,236,687 65.4 5.2 1,656,554 65.5 14.7 0.46
China 5,720 9,083 12269 9.6 1,350,695 73.3 8.7 1,303,723 59.5 26.8 0.37
South Africa 7,610 11,255 576 2.2 51,189 65.0 5.4 49,401 66.8 11.4 0.58
EU Members
Romania 8,820 17,004 363 4.5 21,327 70.0 15.0 18,060 56.1 31.3 0.55
Poland 12,660 22,162 854 4.1 38,543 71.0 14.0 32,085 55.4 31.7 0.80
Hungary 12,380 21,959 218 2.4 9,944 68.3 17.0 8,490 56.7 29.9 0.56
Bulgaria 6,840 16,044 117 5.1 7,305 67.5 18.9 4,651 53.9 33.8 0.56
Czech Republic 18,120 26,698 281 3.3 10,515 69.2 16.2 10,210 57.1 29 0.59
Slovakia 17,180 25,175 136 4.5 5,410 72.3 12.7 4,944 56.7 30 0.73
EU Accession
Albania 4,030 9,403 30 5.9 3,162 68.1 10.6 2,824 62.8 24 -
Croatia 13,490 20,964 89 3.0 4,267 67.0 18.0 3,864 57 29.6 0.71
Serbia 5,280 11,801 85 4.2 7,224 69.5 14.0 5,869 58 29 0.51
MENA
Morocco 2,960 5,220 173 3.5 32,521 67.2 5.0 42,026 62.3 18.6 0.38
Tunisia 4,150 9,636 104 3.5 10,778 69.7 7.1 12,180 59.3 24.3 0.45
Egypt 2,980 6,614 534 3.2 80,722 63.1 5.6 137,873 64.3 13.1 0.64
Jordan 4,670 6,037 38 3.7 6,318 62.4 3.5 11,243 61.8 12.5 0.36
Syrian Arab Republic - 5,347 120 1.9 22,399 60.7 3.9 33,658 65.9 13.9 -
Growth Markets
Mexico 9,640 16,734 2022 0.8 120,847 64.7 6.3 150,568 63.9 18 0.72
Korea, Republic of 22,670 30,801 1540 4.0 50,004 72.9 11.8 43,369 53.9 35.9 0.68
Indonesia 3,420 4,876 1204 3.7 246,864 65.6 5.1 300,183 63.8 19 0.38
Malaysia 9,820 16,919 495 3.0 29,240 68.2 5.2 42,929 63.3 16 0.50
Philippines 2,500 4,339 420 2.8 96,707 61.6 3.8 171,964 64.8 11.7 0.33

Turkey’s Transitions
268
Table A2. Trade
Exports of goods and services Imports of goods and services Exports, US$ Exports, US$Imports of goods and
services
HighTechnology Exports Global Export Market Share Export Market
Destination Export
Product
(% of GDP) (% of GDP) Goods(in billions)
Services(in billions)
(in billions, current US$)
% of Manufactured Exports % of World Trade Concentration
Index Concentration
Index
1980 2011 - 2012a 1980 2011 - 2012a 2012 2012 2012 2011 1970 1990 2012 2008 -2009 a 2006 - 2009 a
Turkey 5.2 26.4 11.9 31.6 163 44 249 1.8 0.21% 0.40% 0.85% 12.3 9.8
BRICS
Brazil 9.1 12.6 11.3 14.0 243 40 304 9.7 0.97% 0.93% 1.36% 17.6 10.7
Russian Federation - 29.4 - 22.1 528 62 445 8.0 - - - 15.1 36.3
India 6.0 23.8 9.1 31.5 298 146 580 6.9 0.72% 0.53% 1.67% 16.2 14.2
China 10.6 27.3 11.0 24.5 1,971 196 1935 25.8 0.91% 4.35% 13.97% 20.7 9.6
South Africa 35.4 28.3 27.3 31.3 93 15 120 5.1 - - - 17.1 15.4
EU Members
Romania - 34.2 - 41.4 51 12 72 10.2 0.66% 0.17% 0.32% 21.4 9.7
Poland - 46.2 - 45.8 191 38 229 5.9 1.26% 0.40% 1.01% 24.3 7.9
Hungary 39.1 94.0 41.3 86.5 90 22 103 22.7 0.61% 0.28% 0.56% 25.4 13.9
Bulgaria 35.7 66.6 30.7 70.3 27 7 36 7.5 - - - 16.6 13.2
Czech Republic - 78.0 - 72.4 125 23 139 16.0 - - - 30.0 9.6
Slovakia - 89.2 - 86.6 81 7 83 7.1 - - - 23.7 18.0
EU Accession
Albania 23.1 31.3 22.7 49.1 1 2 6 0.5 - 0.01% 0.01% 55.8 26.7
Croatia - 43.4 - 42.7 12 12 24 7.6 - - 0.07% 24.1 12.1
Serbia - 38.2 - 54.2 11 4 22 - - - 0.06% - 10.6
MENA
Morocco 17.4 36.2 26.7 50.4 17 15 47 - 0.17% 0.14% 0.11% 23.0 15.9
Tunisia 40.2 48.0 45.6 58.6 17 5 26 5.6 0.07% 0.11% 0.09% 31.7 17.3
Egypt 30.5 17.4 42.9 25.8 27 22 69 0.7 0.27% 0.08% 0.16% 13.6 21.5
Jordan 40.4 43.9 85.3 74.3 8 6 23 2.5 0.01% 0.03% 0.04% 20.1 24.6
Syrian Arab Republic 18.6 - 36.1 - - - - - 0.07% 0.12% 0.06% 30.0 34.0
Growth Markets
Mexico 10.7 32.9 13.0 34.5 371 16 402 16.5 0.47% 0.80% 2.07% 71.4 16.4
Korea, Republic of 32.1 56.5 40.0 53.4 553 111 622 25.7 0.30% 2.01% 3.07% 24.7 15.7
Indonesia 34.2 24.3 20.2 25.8 187 24 213 8.3 0.39% 0.76% 1.06% 23.0 12.9
Malaysia 56.7 87.1 54.3 75.3 228 38 229 43.4 0.60% 0.87% 1.27% 22.4 18.6
Philippines 23.6 30.8 28.5 34.0 46 19 76 46.4 0.37% 0.24% 0.29% 29.3 34.6
a. Data for the most recent available year

Annex Tables
269
Table A2. Trade
Exports of goods and services Imports of goods and services Exports, US$ Exports, US$Imports of goods and
services
HighTechnology Exports Global Export Market Share Export Market
Destination Export
Product
(% of GDP) (% of GDP) Goods(in billions)
Services(in billions)
(in billions, current US$)
% of Manufactured Exports % of World Trade Concentration
Index Concentration
Index
1980 2011 - 2012a 1980 2011 - 2012a 2012 2012 2012 2011 1970 1990 2012 2008 -2009 a 2006 - 2009 a
Turkey 5.2 26.4 11.9 31.6 163 44 249 1.8 0.21% 0.40% 0.85% 12.3 9.8
BRICS
Brazil 9.1 12.6 11.3 14.0 243 40 304 9.7 0.97% 0.93% 1.36% 17.6 10.7
Russian Federation - 29.4 - 22.1 528 62 445 8.0 - - - 15.1 36.3
India 6.0 23.8 9.1 31.5 298 146 580 6.9 0.72% 0.53% 1.67% 16.2 14.2
China 10.6 27.3 11.0 24.5 1,971 196 1935 25.8 0.91% 4.35% 13.97% 20.7 9.6
South Africa 35.4 28.3 27.3 31.3 93 15 120 5.1 - - - 17.1 15.4
EU Members
Romania - 34.2 - 41.4 51 12 72 10.2 0.66% 0.17% 0.32% 21.4 9.7
Poland - 46.2 - 45.8 191 38 229 5.9 1.26% 0.40% 1.01% 24.3 7.9
Hungary 39.1 94.0 41.3 86.5 90 22 103 22.7 0.61% 0.28% 0.56% 25.4 13.9
Bulgaria 35.7 66.6 30.7 70.3 27 7 36 7.5 - - - 16.6 13.2
Czech Republic - 78.0 - 72.4 125 23 139 16.0 - - - 30.0 9.6
Slovakia - 89.2 - 86.6 81 7 83 7.1 - - - 23.7 18.0
EU Accession
Albania 23.1 31.3 22.7 49.1 1 2 6 0.5 - 0.01% 0.01% 55.8 26.7
Croatia - 43.4 - 42.7 12 12 24 7.6 - - 0.07% 24.1 12.1
Serbia - 38.2 - 54.2 11 4 22 - - - 0.06% - 10.6
MENA
Morocco 17.4 36.2 26.7 50.4 17 15 47 - 0.17% 0.14% 0.11% 23.0 15.9
Tunisia 40.2 48.0 45.6 58.6 17 5 26 5.6 0.07% 0.11% 0.09% 31.7 17.3
Egypt 30.5 17.4 42.9 25.8 27 22 69 0.7 0.27% 0.08% 0.16% 13.6 21.5
Jordan 40.4 43.9 85.3 74.3 8 6 23 2.5 0.01% 0.03% 0.04% 20.1 24.6
Syrian Arab Republic 18.6 - 36.1 - - - - - 0.07% 0.12% 0.06% 30.0 34.0
Growth Markets
Mexico 10.7 32.9 13.0 34.5 371 16 402 16.5 0.47% 0.80% 2.07% 71.4 16.4
Korea, Republic of 32.1 56.5 40.0 53.4 553 111 622 25.7 0.30% 2.01% 3.07% 24.7 15.7
Indonesia 34.2 24.3 20.2 25.8 187 24 213 8.3 0.39% 0.76% 1.06% 23.0 12.9
Malaysia 56.7 87.1 54.3 75.3 228 38 229 43.4 0.60% 0.87% 1.27% 22.4 18.6
Philippines 23.6 30.8 28.5 34.0 46 19 76 46.4 0.37% 0.24% 0.29% 29.3 34.6
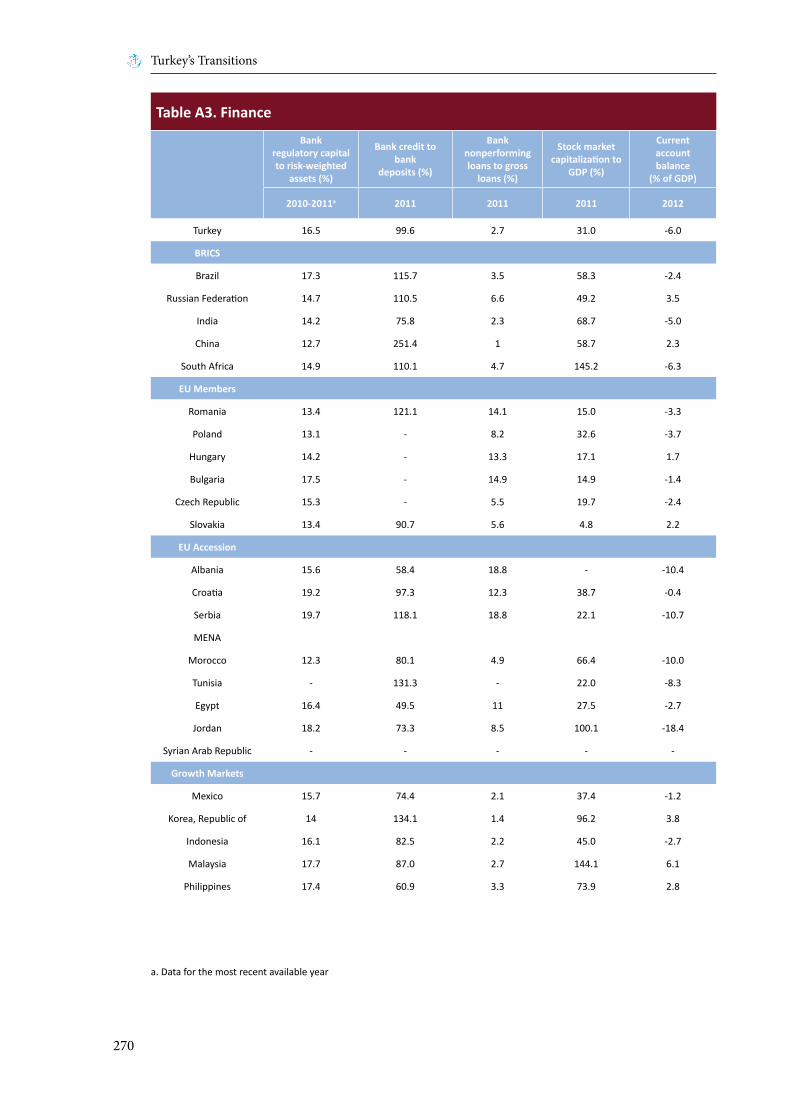
Turkey’s Transitions
270
Table A3. Finance
Bankregulatory capital to risk-weighted
assets (%)
Bank credit to bank
deposits (%)
Banknonperforming loans to gross
loans (%)
Stock market capitalization to
GDP (%)
Currentaccountbalance
(% of GDP)
Domesticcredit provided by
banking sector(% of GDP)
Stock market total value traded to
GDP (%)
Foreigndirect
investment
Cross-border banking flows
External debt stocks Short-term debt
2010-2011a 2011 2011 2011 2012 2012 2011 net inflows, 2012(% of GDP)
2012,(% of GDP)
2012(% of GNI)
2012 (% of totalexternal debt)
Turkey 16.5 99.6 2.7 31.0 -6.0 71.9 50.9 1.6 17.5% 43.1 29.9
BRICS
Brazil 17.3 115.7 3.5 58.3 -2.4 110.5 38.8 3.4 8.1% 19.9 7.4
Russian Federation 14.7 110.5 6.6 49.2 3.5 41.5 52.4 2.5 6.5% - -
India 14.2 75.8 2.3 68.7 -5.0 76.6 46.9 1.3 9.6% 20.8 24.6
China 12.7 251.4 1 58.7 2.3 155.1 112.4 3.1 4.8% 9.2 67.6
South Africa 14.9 110.1 4.7 145.2 -6.3 187.2 89.0 1.2 7.5% 36.6 20.3
EU Members
Romania 13.4 121.1 14.1 15.0 -3.3 54.3 1.3 1.1 21.5% 78.9 20.5
Poland 13.1 - 8.2 32.6 -3.7 63.8 17.1 1.4 13.9% - -
Hungary 14.2 - 13.3 17.1 1.7 68.7 16.9 7.5 27.2% 173.4 11.2
Bulgaria 17.5 - 14.9 14.9 -1.4 71.0 0.7 4.1 24.2% 102.9 27.1
Czech Republic 15.3 - 5.5 19.7 -2.4 68.4 7.1 5.4 12.5% - -
Slovakia 13.4 90.7 5.6 4.8 2.2 - 0.2 1.7 20.0% - -
EU Accession
Albania 15.6 58.4 18.8 - -10.4 66.5 - 10.0 5.6% 53.1 21.3
Croatia 19.2 97.3 12.3 38.7 -0.4 96.3 1.7 2.4 46.9% - -
Serbia 19.7 118.1 18.8 22.1 -10.7 62.4 0.7 0.9 17.9% 94.8 3.0
MENA
Morocco 12.3 80.1 4.9 66.4 -10.0 115.4 8.8 3.0 9.6% 36.0 12.3
Tunisia - 131.3 - 22.0 -8.3 82.3 3.1 3.4 6.4% 58.4 24.5
Egypt 16.4 49.5 11 27.5 -2.7 77.7 12.4 1.1 3.5% 15.7 16.6
Jordan 18.2 73.3 8.5 100.1 -18.4 114.2 23.4 4.8 15.1% 59.8 56.9
Syrian Arab Republic - - - - - - - - 0.5% 6.7 7.6
Growth Markets
Mexico 15.7 74.4 2.1 37.4 -1.2 47.0 9.5 1.3 7.1% 30.7 20.4
Korea, Republic of 14 134.1 1.4 96.2 3.8 168.7 168.0 0.4 10.2% - -
Indonesia 16.1 82.5 2.2 45.0 -2.7 42.6 16.2 2.2 6.8% 29.9 17.6
Malaysia 17.7 87.0 2.7 144.1 6.1 134.0 38.9 3.2 11.8% 35.5 45.2
Philippines 17.4 60.9 3.3 73.9 2.8 50.9 13.6 1.1 9.2% 24.6 13.8
a. Data for the most recent available year
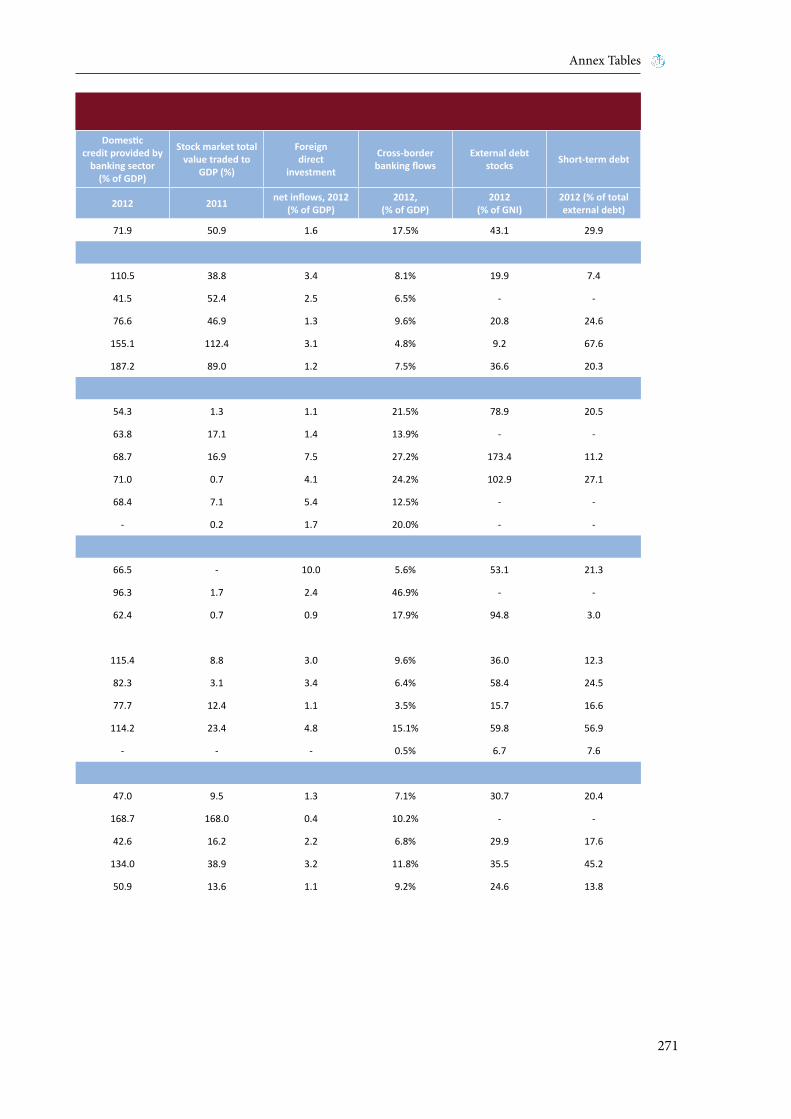
Annex Tables
271
Table A3. Finance
Bankregulatory capital to risk-weighted
assets (%)
Bank credit to bank
deposits (%)
Banknonperforming loans to gross
loans (%)
Stock market capitalization to
GDP (%)
Currentaccountbalance
(% of GDP)
Domesticcredit provided by
banking sector(% of GDP)
Stock market total value traded to
GDP (%)
Foreigndirect
investment
Cross-border banking flows
External debt stocks Short-term debt
2010-2011a 2011 2011 2011 2012 2012 2011 net inflows, 2012(% of GDP)
2012,(% of GDP)
2012(% of GNI)
2012 (% of totalexternal debt)
Turkey 16.5 99.6 2.7 31.0 -6.0 71.9 50.9 1.6 17.5% 43.1 29.9
BRICS
Brazil 17.3 115.7 3.5 58.3 -2.4 110.5 38.8 3.4 8.1% 19.9 7.4
Russian Federation 14.7 110.5 6.6 49.2 3.5 41.5 52.4 2.5 6.5% - -
India 14.2 75.8 2.3 68.7 -5.0 76.6 46.9 1.3 9.6% 20.8 24.6
China 12.7 251.4 1 58.7 2.3 155.1 112.4 3.1 4.8% 9.2 67.6
South Africa 14.9 110.1 4.7 145.2 -6.3 187.2 89.0 1.2 7.5% 36.6 20.3
EU Members
Romania 13.4 121.1 14.1 15.0 -3.3 54.3 1.3 1.1 21.5% 78.9 20.5
Poland 13.1 - 8.2 32.6 -3.7 63.8 17.1 1.4 13.9% - -
Hungary 14.2 - 13.3 17.1 1.7 68.7 16.9 7.5 27.2% 173.4 11.2
Bulgaria 17.5 - 14.9 14.9 -1.4 71.0 0.7 4.1 24.2% 102.9 27.1
Czech Republic 15.3 - 5.5 19.7 -2.4 68.4 7.1 5.4 12.5% - -
Slovakia 13.4 90.7 5.6 4.8 2.2 - 0.2 1.7 20.0% - -
EU Accession
Albania 15.6 58.4 18.8 - -10.4 66.5 - 10.0 5.6% 53.1 21.3
Croatia 19.2 97.3 12.3 38.7 -0.4 96.3 1.7 2.4 46.9% - -
Serbia 19.7 118.1 18.8 22.1 -10.7 62.4 0.7 0.9 17.9% 94.8 3.0
MENA
Morocco 12.3 80.1 4.9 66.4 -10.0 115.4 8.8 3.0 9.6% 36.0 12.3
Tunisia - 131.3 - 22.0 -8.3 82.3 3.1 3.4 6.4% 58.4 24.5
Egypt 16.4 49.5 11 27.5 -2.7 77.7 12.4 1.1 3.5% 15.7 16.6
Jordan 18.2 73.3 8.5 100.1 -18.4 114.2 23.4 4.8 15.1% 59.8 56.9
Syrian Arab Republic - - - - - - - - 0.5% 6.7 7.6
Growth Markets
Mexico 15.7 74.4 2.1 37.4 -1.2 47.0 9.5 1.3 7.1% 30.7 20.4
Korea, Republic of 14 134.1 1.4 96.2 3.8 168.7 168.0 0.4 10.2% - -
Indonesia 16.1 82.5 2.2 45.0 -2.7 42.6 16.2 2.2 6.8% 29.9 17.6
Malaysia 17.7 87.0 2.7 144.1 6.1 134.0 38.9 3.2 11.8% 35.5 45.2
Philippines 17.4 60.9 3.3 73.9 2.8 50.9 13.6 1.1 9.2% 24.6 13.8
Turkey’s Transitions
272
Table A4. Enterprise
GDPPer Worker
GDP PerWorker Growth
GDP PerWorker Growth
GDP PerWorker Growth
Employment Employment Employment Employment Employment Employment Research and development
Output-side real GDP at chained
PPPs in 2005US$
Annual Average Compound
Growth Rate
Annual Average Compound
Growth Rate
Annual Average Compound
Growth Rate
AverageTFP Growth
AverageTFP Growth Agriculture Agriculture Industry Industry Services Services Expenditure
(% of GDP)
2011 1980-1989 1990-1999 2000-2009 1991-2000 2001-2010 1990, % of Total Employment
2010 - 2012a, % of Total Employ-
ment
1990, % of Total Employment
2010 - 2012a, % of Total Employ-
ment
1990, % of Total Employment
2010 - 2012a, % of Total Employ-
ment2010 - 2011 a
Turkey 47,729 3.4% 0.3% 3.8% -0.8% 0.5% 46.9 23.6 20.7 26.0 32.4 50.4 0.8
BRICS
Brazil 16,805 0.3% 4.9% -0.2% -0.3% 0.5% 22.8 15.3 22.7 21.9 54.5 62.7 1.2
Russian Federation 35,283 - -9.0% 6.7% -4.0% 4.1% 13.9 - 40.2 - 45.6 - 1.1
India 9,404 0.3% 4.2% 5.6% 1.5% 1.4% - 47.2 - 24.7 - 28.1 -
China 13,826 3.2% 5.3% 7.7% 4.2% 3.1% 60.1 34.8 21.4 29.5 18.5 35.7 1.8
South Africa 21,050 -1.2% -2.4% 1.3% -1.9% 0.1% - 4.6 - 24.3 - 62.7 -
EU Members
Romania 30,968 1.0% 3.0% 8.5% -0.6% 2.9% 29.1 29.0 43.5 28.6 27.4 42.4 0.5
Poland 42,279 5.1% 7.2% 2.2% 3.3% 1.8% 25.2 12.6 37.0 30.4 35.8 57.0 0.8
Hungary 39,424 2.4% 3.2% 2.6% 0.0% 1.1% 18.2 5.2 36.8 29.8 45.0 64.9 1.2
Bulgaria 25,695 4.3% 0.9% 2.2% -2.1% 0.5% 18.5 6.4 44.2 31.3 37.3 62.2 0.6
Czech Republic 42,265 - -0.8% 1.6% -1.6% 1.5% - 3.1 - 38.1 - 58.8 1.8
Slovakia 47,644 - 0.5% 3.7% -0.3% 3.0% - 3.2 - 37.5 - 59.2 0.7
EU Accession
Albania 26,036 -0.6% 1.2% 7.0% - - - 41.5 - 20.8 - 37.7 -
Croatia 48,180 - -1.1% 3.0% -1.9% 1.2% - 13.7 - 27.4 - 58.7 0.7
Serbia 29,204 - -0.1% 4.1% -5.0% 3.9% - 21.0 - 26.5 - 52.6 0.7
MENA
Morocco 10,047 3.5% -1.1% 0.0% -0.9% 0.8% 3.9 39.2 36.4 21.4 59.5 39.3 0.7
Tunisia 16,757 2.0% 1.8% -1.2% 1.3% 0.7% - 16.2 - 33.5 - 49.6 -
Egypt 15,145 5.1% 8.3% 0.8% -0.6% -1.5% 39.0 29.2 20.7 23.5 40.1 47.1 0.4
Jordan 18,775 0.0% -5.3% 5.6% -1.2% 3.0% - 2.0 - 17.5 - 80.5 -
Syrian Arab Republic 15,152 -6.7% -2.0% 12.9% - - - 14.3 - 32.7 - 53.0 -
Growth Markets
Mexico 30,473 -3.0% -0.2% 0.5% -0.2% -1.3% 22.6 13.4 27.8 24.1 46.1 61.9 0.5
Korea, Republic of 58,865 6.9% 5.0% 2.5% 0.7% 0.5% 17.9 6.6 35.4 17.0 46.7 76.4 3.7
Indonesia 9,329 1.2% 1.1% 2.5% -1.0% 0.9% 55.9 35.9 13.7 20.6 30.2 43.5 -
Malaysia 25,142 -0.2% 1.3% 1.3% 0.0% 0.7% 26.0 12.6 27.5 28.4 46.5 59.0 1.1
Philippines 9,549 0.2% -0.5% -0.7% -0.7% 1.0% 45.2 32.2 15.0 15.4 39.7 52.5 -
a. Data for the most recent available year
Annex Tables
273
Table A4. Enterprise
GDPPer Worker
GDP PerWorker Growth
GDP PerWorker Growth
GDP PerWorker Growth
Employment Employment Employment Employment Employment Employment Research and development
Output-side real GDP at chained
PPPs in 2005US$
Annual Average Compound
Growth Rate
Annual Average Compound
Growth Rate
Annual Average Compound
Growth Rate
AverageTFP Growth
AverageTFP Growth Agriculture Agriculture Industry Industry Services Services Expenditure
(% of GDP)
2011 1980-1989 1990-1999 2000-2009 1991-2000 2001-2010 1990, % of Total Employment
2010 - 2012a, % of Total Employ-
ment
1990, % of Total Employment
2010 - 2012a, % of Total Employ-
ment
1990, % of Total Employment
2010 - 2012a, % of Total Employ-
ment2010 - 2011 a
Turkey 47,729 3.4% 0.3% 3.8% -0.8% 0.5% 46.9 23.6 20.7 26.0 32.4 50.4 0.8
BRICS
Brazil 16,805 0.3% 4.9% -0.2% -0.3% 0.5% 22.8 15.3 22.7 21.9 54.5 62.7 1.2
Russian Federation 35,283 - -9.0% 6.7% -4.0% 4.1% 13.9 - 40.2 - 45.6 - 1.1
India 9,404 0.3% 4.2% 5.6% 1.5% 1.4% - 47.2 - 24.7 - 28.1 -
China 13,826 3.2% 5.3% 7.7% 4.2% 3.1% 60.1 34.8 21.4 29.5 18.5 35.7 1.8
South Africa 21,050 -1.2% -2.4% 1.3% -1.9% 0.1% - 4.6 - 24.3 - 62.7 -
EU Members
Romania 30,968 1.0% 3.0% 8.5% -0.6% 2.9% 29.1 29.0 43.5 28.6 27.4 42.4 0.5
Poland 42,279 5.1% 7.2% 2.2% 3.3% 1.8% 25.2 12.6 37.0 30.4 35.8 57.0 0.8
Hungary 39,424 2.4% 3.2% 2.6% 0.0% 1.1% 18.2 5.2 36.8 29.8 45.0 64.9 1.2
Bulgaria 25,695 4.3% 0.9% 2.2% -2.1% 0.5% 18.5 6.4 44.2 31.3 37.3 62.2 0.6
Czech Republic 42,265 - -0.8% 1.6% -1.6% 1.5% - 3.1 - 38.1 - 58.8 1.8
Slovakia 47,644 - 0.5% 3.7% -0.3% 3.0% - 3.2 - 37.5 - 59.2 0.7
EU Accession
Albania 26,036 -0.6% 1.2% 7.0% - - - 41.5 - 20.8 - 37.7 -
Croatia 48,180 - -1.1% 3.0% -1.9% 1.2% - 13.7 - 27.4 - 58.7 0.7
Serbia 29,204 - -0.1% 4.1% -5.0% 3.9% - 21.0 - 26.5 - 52.6 0.7
MENA
Morocco 10,047 3.5% -1.1% 0.0% -0.9% 0.8% 3.9 39.2 36.4 21.4 59.5 39.3 0.7
Tunisia 16,757 2.0% 1.8% -1.2% 1.3% 0.7% - 16.2 - 33.5 - 49.6 -
Egypt 15,145 5.1% 8.3% 0.8% -0.6% -1.5% 39.0 29.2 20.7 23.5 40.1 47.1 0.4
Jordan 18,775 0.0% -5.3% 5.6% -1.2% 3.0% - 2.0 - 17.5 - 80.5 -
Syrian Arab Republic 15,152 -6.7% -2.0% 12.9% - - - 14.3 - 32.7 - 53.0 -
Growth Markets
Mexico 30,473 -3.0% -0.2% 0.5% -0.2% -1.3% 22.6 13.4 27.8 24.1 46.1 61.9 0.5
Korea, Republic of 58,865 6.9% 5.0% 2.5% 0.7% 0.5% 17.9 6.6 35.4 17.0 46.7 76.4 3.7
Indonesia 9,329 1.2% 1.1% 2.5% -1.0% 0.9% 55.9 35.9 13.7 20.6 30.2 43.5 -
Malaysia 25,142 -0.2% 1.3% 1.3% 0.0% 0.7% 26.0 12.6 27.5 28.4 46.5 59.0 1.1
Philippines 9,549 0.2% -0.5% -0.7% -0.7% 1.0% 45.2 32.2 15.0 15.4 39.7 52.5 -

Turkey’s Transitions
274
Table A5. Urbanization
Urban population Urban population growth
Improved sanitationfacilities
Improved sanitationfacilities Improved water source Improved water source CO2 emissions Combustible
renewables and waste
2012, (% of total)Average of Annual
Growth Rates1960 - 2012
rural, 2011 (% of rural population with ac-
cess)
urban 2011 (% of urban population with
access)
rural 2011 (% of rural population with access)
urban 2011(% of urban population with access)
metric tons per capita, 2010 % of total energy, 2011
Turkey 72.3 3.5 75.5 97.2 99.1 100 4.1 3.3
BRICS
Brazil 84.9 3.1 48.4 86.7 84.5 99.5 2.2 28.9
Russian Federation 74.0 1.0 59.3 74.4 92.2 98.7 12.2 1.0
India 31.7 3.0 23.9 59.7 89.5 96.3 1.7 24.7
China 51.8 3.6 55.8 74.1 84.9 98.4 6.2 7.9
South Africa 62.4 2.7 57.1 84.3 79.3 99 9.2 10.3
EU Members
Romania 52.8 1.2 - - - 98.5 3.7 10.3
Poland 60.8 1.0 - 95.5 - 100 8.3 8.1
Hungary 69.9 0.4 100 100 100 100 5.1 7.2
Bulgaria 73.6 1.2 100 100 99 99.7 5.9 5.1
Czech Republic 73.4 0.6 100 100 99.6 99.9 10.6 6.5
Slovakia 54.7 1.5 99.6 99.9 100 100 6.6 5.5
EU Accession
Albania 54.4 2.4 93 94.7 93.7 95.5 1.4 9.6
Croatia 58.1 1.4 97.6 98.6 96.8 99.8 4.7 5.6
Serbia 56.7 - 95.6 98.5 98.9 99.5 6.3 6.4
MENA
Morocco 57.4 3.2 52 83.1 60.8 98.2 1.6 2.8
Tunisia 66.5 2.9 75 97.3 89.2 100 2.5 14.6
Egypt 43.7 2.4 93.5 96.9 98.8 100 2.6 2.1
Jordan 83.0 4.9 98 98.1 90.5 97.3 3.4 0.1
Syrian Arab Republic 56.5 3.9 94 96.1 86.5 92.6 2.9 0.0
Growth Markets
Mexico 78.4 3.1 77.4 86.7 89.3 95.9 3.8 4.4
Korea, Republic of 83.5 3.5 100 100 87.9 99.7 11.5 1.5
Indonesia 51.4 4.4 43.5 73.4 75.5 92.8 1.8 25.4
Malaysia 73.4 4.4 94.6 96.1 98.5 100 7.7 4.6
Philippines 49.1 3.5 69.3 79.2 92.1 92.7 0.9 17.1
Annex Tables
275
Table A5. Urbanization
Urban population Urban population growth
Improved sanitationfacilities
Improved sanitationfacilities Improved water source Improved water source CO2 emissions Combustible
renewables and waste
2012, (% of total)Average of Annual
Growth Rates1960 - 2012
rural, 2011 (% of rural population with ac-
cess)
urban 2011 (% of urban population with
access)
rural 2011 (% of rural population with access)
urban 2011(% of urban population with access)
metric tons per capita, 2010 % of total energy, 2011
Turkey 72.3 3.5 75.5 97.2 99.1 100 4.1 3.3
BRICS
Brazil 84.9 3.1 48.4 86.7 84.5 99.5 2.2 28.9
Russian Federation 74.0 1.0 59.3 74.4 92.2 98.7 12.2 1.0
India 31.7 3.0 23.9 59.7 89.5 96.3 1.7 24.7
China 51.8 3.6 55.8 74.1 84.9 98.4 6.2 7.9
South Africa 62.4 2.7 57.1 84.3 79.3 99 9.2 10.3
EU Members
Romania 52.8 1.2 - - - 98.5 3.7 10.3
Poland 60.8 1.0 - 95.5 - 100 8.3 8.1
Hungary 69.9 0.4 100 100 100 100 5.1 7.2
Bulgaria 73.6 1.2 100 100 99 99.7 5.9 5.1
Czech Republic 73.4 0.6 100 100 99.6 99.9 10.6 6.5
Slovakia 54.7 1.5 99.6 99.9 100 100 6.6 5.5
EU Accession
Albania 54.4 2.4 93 94.7 93.7 95.5 1.4 9.6
Croatia 58.1 1.4 97.6 98.6 96.8 99.8 4.7 5.6
Serbia 56.7 - 95.6 98.5 98.9 99.5 6.3 6.4
MENA
Morocco 57.4 3.2 52 83.1 60.8 98.2 1.6 2.8
Tunisia 66.5 2.9 75 97.3 89.2 100 2.5 14.6
Egypt 43.7 2.4 93.5 96.9 98.8 100 2.6 2.1
Jordan 83.0 4.9 98 98.1 90.5 97.3 3.4 0.1
Syrian Arab Republic 56.5 3.9 94 96.1 86.5 92.6 2.9 0.0
Growth Markets
Mexico 78.4 3.1 77.4 86.7 89.3 95.9 3.8 4.4
Korea, Republic of 83.5 3.5 100 100 87.9 99.7 11.5 1.5
Indonesia 51.4 4.4 43.5 73.4 75.5 92.8 1.8 25.4
Malaysia 73.4 4.4 94.6 96.1 98.5 100 7.7 4.6
Philippines 49.1 3.5 69.3 79.2 92.1 92.7 0.9 17.1

Turkey’s Transitions
276
Table A6. Labor
Labor ForceParticipation
Labor ForceParticipation
Unemployment Rate
Employment Creation
Employment Rate Employment Rate Female Part Time
Employment
Labor force with less than secondary
education
Notice period forredundancy
dismissal
Severance pay for redundancy
dismissal
Total, % , 2012 Female, %, 2012 Total, %, 2010-12 a
2009 - 2012, Annual Average
Compound Growth Rate
Total, %, 2012 Young (15-24), %, 2012
% of TotalPart Time
Employment,2009-12a
% of total,2010 - 2012 a
2014, average for workers with 1, 5 and 10 years of tenure, in
salary weeks
2014, average for workers with 1, 5 and 10 years of tenure, in
salary weeks
Turkey 53.5 32.2 9.2 4.9% 44.9 32.8 60.0 61.4 6.7 23.1
BRICS
Brazil 74.9 64.8 6.7 2.0% 65.0 53.3 67.5 46.4 6.6 8.9
Russian Federation 73.1 68.4 5.5 1.3% 60.0 33.4 64.5 - 8.7 8.7
India 57.9 30.3 3.6 1.5% 53.7 34.0 - 54.7 4.3 11.4
China 77.0 70.0 - 0.6% 68.0 50.8 - - 4.3 23.1
South Africa 55.7 48.5 25.0 0.0% 38.8 12.5 65.4 52.5 4 5.3
EU Members
Romania 64.5 56.6 7.0 0.0% 52.3 23.9 48.6 22.8 4 0
Poland 66.7 60.0 10.1 0.5% 50.8 24.9 67.6 7.5 10.1 8.7
Hungary 64.2 58.3 10.9 0.7% 46.2 18.7 64.6 12.8 6.2 7.2
Bulgaria 67.2 63.3 12.3 -4.1% 46.6 21.6 53.2 13.3 4.3 3.2
Czech Republic 71.4 63.3 7.0 -0.1% 54.7 25.2 69.7 5.6 8.7 11.6
Slovakia 69.6 61.9 13.9 -0.3% 51.2 20.3 59.4 5.8 11.6 7.2
EU Accession
Albania 62.8 51.7 14.2 0.7% 47.0 26.3 - - 10.1 10.7
Croatia 63.8 58.2 15.8 -4.5% 43.2 16.3 54.3 14.9 7.9 7.2
Serbia - - 23.9 -1.9% 42.0 15.5 - 20.3 0 7.7
MENA
Morocco 58.9 52.0 9.0 1.5% 45.8 29.9 - 79.2 7.2 13.5
Tunisia 51.0 27.2 18.3 1.9% 41.4 22.2 - 42.7 4.3 7.8
Egypt 52.4 25.6 12.7 1.4% 43.2 21.9 - 43.6 10.1 26.7
Jordan 43.3 16.2 12.2 1.9% 36.2 16.9 - 49.3 4.3 0
Syrian Arab Republic 45.6 14.2 8.4 2.6% 39.9 24.4 27.4 - 8.7 0
Growth Markets
Mexico 64.9 48.1 4.9 2.9% 58.6 43.3 56.7 31.7 0 22
Korea, Republic of 65.7 55.1 3.2 1.6% 58.8 24.9 61.0 - 4.3 23.1
Indonesia 70.0 53.4 6.6 2.0% 63.3 39.6 - - 0 57.8
Malaysia 62.2 46.8 3.0 2.6% 57.5 35.7 - 19.8 6.7 17.2
Philippines 67.0 52.6 7.0 3.1% 60.7 40.7 - - 4.3 23.1

Annex Tables
277
Table A6. Labor
Labor ForceParticipation
Labor ForceParticipation
Unemployment Rate
Employment Creation
Employment Rate Employment Rate Female Part Time
Employment
Labor force with less than secondary
education
Notice period forredundancy
dismissal
Severance pay for redundancy
dismissal
Total, % , 2012 Female, %, 2012 Total, %, 2010-12 a
2009 - 2012, Annual Average
Compound Growth Rate
Total, %, 2012 Young (15-24), %, 2012
% of TotalPart Time
Employment,2009-12a
% of total,2010 - 2012 a
2014, average for workers with 1, 5 and 10 years of tenure, in
salary weeks
2014, average for workers with 1, 5 and 10 years of tenure, in
salary weeks
Turkey 53.5 32.2 9.2 4.9% 44.9 32.8 60.0 61.4 6.7 23.1
BRICS
Brazil 74.9 64.8 6.7 2.0% 65.0 53.3 67.5 46.4 6.6 8.9
Russian Federation 73.1 68.4 5.5 1.3% 60.0 33.4 64.5 - 8.7 8.7
India 57.9 30.3 3.6 1.5% 53.7 34.0 - 54.7 4.3 11.4
China 77.0 70.0 - 0.6% 68.0 50.8 - - 4.3 23.1
South Africa 55.7 48.5 25.0 0.0% 38.8 12.5 65.4 52.5 4 5.3
EU Members
Romania 64.5 56.6 7.0 0.0% 52.3 23.9 48.6 22.8 4 0
Poland 66.7 60.0 10.1 0.5% 50.8 24.9 67.6 7.5 10.1 8.7
Hungary 64.2 58.3 10.9 0.7% 46.2 18.7 64.6 12.8 6.2 7.2
Bulgaria 67.2 63.3 12.3 -4.1% 46.6 21.6 53.2 13.3 4.3 3.2
Czech Republic 71.4 63.3 7.0 -0.1% 54.7 25.2 69.7 5.6 8.7 11.6
Slovakia 69.6 61.9 13.9 -0.3% 51.2 20.3 59.4 5.8 11.6 7.2
EU Accession
Albania 62.8 51.7 14.2 0.7% 47.0 26.3 - - 10.1 10.7
Croatia 63.8 58.2 15.8 -4.5% 43.2 16.3 54.3 14.9 7.9 7.2
Serbia - - 23.9 -1.9% 42.0 15.5 - 20.3 0 7.7
MENA
Morocco 58.9 52.0 9.0 1.5% 45.8 29.9 - 79.2 7.2 13.5
Tunisia 51.0 27.2 18.3 1.9% 41.4 22.2 - 42.7 4.3 7.8
Egypt 52.4 25.6 12.7 1.4% 43.2 21.9 - 43.6 10.1 26.7
Jordan 43.3 16.2 12.2 1.9% 36.2 16.9 - 49.3 4.3 0
Syrian Arab Republic 45.6 14.2 8.4 2.6% 39.9 24.4 27.4 - 8.7 0
Growth Markets
Mexico 64.9 48.1 4.9 2.9% 58.6 43.3 56.7 31.7 0 22
Korea, Republic of 65.7 55.1 3.2 1.6% 58.8 24.9 61.0 - 4.3 23.1
Indonesia 70.0 53.4 6.6 2.0% 63.3 39.6 - - 0 57.8
Malaysia 62.2 46.8 3.0 2.6% 57.5 35.7 - 19.8 6.7 17.2
Philippines 67.0 52.6 7.0 3.1% 60.7 40.7 - - 4.3 23.1

Turkey’s Transitions
278
Table A7. Welfare
InfantMortality
Rate
Lifeexpectancy
at birth
HealthExpenditures
HealthExpenditures
TotalDependency
Ratio
GrossEnrollment
Rate
GrossEnrollment Rate
GrossEnrollment Rate
GrossEnrollment Rate
Number of Physi-cians PISA Score PISA Score PISA Score
per 1000 live births, 2012 years, 2011 Total, % of
GDP, 2011Public, % of GDP, 2011
0-14 and 65+, 2012
Pre-Primary (36-72
months), 2010 - 2012 a
Secondary, 2010 - 2012 a
Secondary, Female,
2010 - 2012 a
Tertiary,2010 - 2012 a
per 1000 people, 2010 - 2011 a
MathAverage, 2012
ReadingAverage, 2012
ScienceAverage, 2012
Turkey 12.2 74.5 6.7 5.0 0.50 29.2 88.9 85.0 60.7 1.7 448 475 463
BRICS
Brazil 12.9 73.3 8.9 4.1 0.47 - - - - 1.8 391 410 405
Russian Federation 8.9 69.0 6.2 3.7 0.40 - - - - 4.3 482 475 486
India 43.8 66.0 3.9 1.2 0.53 58.1 68.5 66.3 23.3 0.6 - - -
China 12.1 75.0 5.2 2.9 0.36 62.0 86.6 87.3 24.3 1.8 613 b 570 b 580 b
South Africa 33.3 55.3 8.5 4.1 0.54 76.5 101.9 103.5 - 0.8 - - -
EU Members
Romania 10.7 74.5 5.8 4.7 0.43 77.9 96.0 95.1 51.6 2.4 445 438 439
Poland 4.3 76.7 6.7 4.8 0.41 73.7 97.4 96.7 73.5 2.1 518 518 526
Hungary 5.3 74.9 7.7 5.0 0.46 86.9 100.8 99.7 59.5 3.4 477 488 494
Bulgaria 10.5 74.2 7.3 4.0 0.48 85.1 93.2 90.8 59.6 3.8 439 436 446
Czech Republic 3.1 77.9 7.4 6.2 0.44 103.3 96.0 96.1 64.6 3.7 499 493 508
Slovakia 6.3 76.0 8.7 5.5 0.38 90.1 93.5 93.8 55.1 3.0 482 463 471
EU Accession
Albania 15 77.2 6.3 2.8 0.47 68.8 - - 54.9 1.1 394 394 397
Croatia 4 76.9 7.8 6.6 0.49 64.1 98.0 99.9 58.8 2.7 471 485 491
Serbia 5.7 74.6 10.4 6.5 0.44 55.8 91.7 92.6 52.4 2.1 449 446 445
MENA
Morocco 26.8 70.4 6.0 2.1 0.49 59.2 68.9 63.4 16.2 0.6 - - -
Tunisia 13.8 74.8 6.2 3.4 0.43 - 91.1 93.3 35.2 1.2 388 404 398
Egypt 17.9 70.7 4.9 2.0 0.58 27.4 75.9 74.4 28.8 2.8 - - -
Jordan 16.4 73.6 8.4 5.7 0.60 33.8 89.1 90.6 39.9 2.6 386 399 409
Syrian Arab Republic 12.3 74.8 3.7 1.8 0.65 10.6 74.4 74.6 25.6 1.5 - - -
Growth Markets
Mexico 13.9 76.9 6.2 3.0 0.54 99.4 84.1 87.2 27.7 2.0 413 424 415
Korea, Republic of 3.3 80.9 7.2 4.1 0.37 117.7 96.7 96.0 100.8 2.0 554 536 538
Indonesia 25.8 70.4 2.7 0.9 0.52 41.5 81.2 81.6 27.2 0.3 375 396 382
Malaysia 7.3 74.7 3.6 1.6 0.47 77.7 66.9 65.9 37.1 1.2 421 398 420
Philippines 23.5 68.4 4.1 1.4 0.62 - - - -
a. Data for the most recent available year b. Shanghai - China

Annex Tables
279
Table A7. Welfare
InfantMortality
Rate
Lifeexpectancy
at birth
HealthExpenditures
HealthExpenditures
TotalDependency
Ratio
GrossEnrollment
Rate
GrossEnrollment Rate
GrossEnrollment Rate
GrossEnrollment Rate
Number of Physi-cians PISA Score PISA Score PISA Score
per 1000 live births, 2012 years, 2011 Total, % of
GDP, 2011Public, % of GDP, 2011
0-14 and 65+, 2012
Pre-Primary (36-72
months), 2010 - 2012 a
Secondary, 2010 - 2012 a
Secondary, Female,
2010 - 2012 a
Tertiary,2010 - 2012 a
per 1000 people, 2010 - 2011 a
MathAverage, 2012
ReadingAverage, 2012
ScienceAverage, 2012
Turkey 12.2 74.5 6.7 5.0 0.50 29.2 88.9 85.0 60.7 1.7 448 475 463
BRICS
Brazil 12.9 73.3 8.9 4.1 0.47 - - - - 1.8 391 410 405
Russian Federation 8.9 69.0 6.2 3.7 0.40 - - - - 4.3 482 475 486
India 43.8 66.0 3.9 1.2 0.53 58.1 68.5 66.3 23.3 0.6 - - -
China 12.1 75.0 5.2 2.9 0.36 62.0 86.6 87.3 24.3 1.8 613 b 570 b 580 b
South Africa 33.3 55.3 8.5 4.1 0.54 76.5 101.9 103.5 - 0.8 - - -
EU Members
Romania 10.7 74.5 5.8 4.7 0.43 77.9 96.0 95.1 51.6 2.4 445 438 439
Poland 4.3 76.7 6.7 4.8 0.41 73.7 97.4 96.7 73.5 2.1 518 518 526
Hungary 5.3 74.9 7.7 5.0 0.46 86.9 100.8 99.7 59.5 3.4 477 488 494
Bulgaria 10.5 74.2 7.3 4.0 0.48 85.1 93.2 90.8 59.6 3.8 439 436 446
Czech Republic 3.1 77.9 7.4 6.2 0.44 103.3 96.0 96.1 64.6 3.7 499 493 508
Slovakia 6.3 76.0 8.7 5.5 0.38 90.1 93.5 93.8 55.1 3.0 482 463 471
EU Accession
Albania 15 77.2 6.3 2.8 0.47 68.8 - - 54.9 1.1 394 394 397
Croatia 4 76.9 7.8 6.6 0.49 64.1 98.0 99.9 58.8 2.7 471 485 491
Serbia 5.7 74.6 10.4 6.5 0.44 55.8 91.7 92.6 52.4 2.1 449 446 445
MENA
Morocco 26.8 70.4 6.0 2.1 0.49 59.2 68.9 63.4 16.2 0.6 - - -
Tunisia 13.8 74.8 6.2 3.4 0.43 - 91.1 93.3 35.2 1.2 388 404 398
Egypt 17.9 70.7 4.9 2.0 0.58 27.4 75.9 74.4 28.8 2.8 - - -
Jordan 16.4 73.6 8.4 5.7 0.60 33.8 89.1 90.6 39.9 2.6 386 399 409
Syrian Arab Republic 12.3 74.8 3.7 1.8 0.65 10.6 74.4 74.6 25.6 1.5 - - -
Growth Markets
Mexico 13.9 76.9 6.2 3.0 0.54 99.4 84.1 87.2 27.7 2.0 413 424 415
Korea, Republic of 3.3 80.9 7.2 4.1 0.37 117.7 96.7 96.0 100.8 2.0 554 536 538
Indonesia 25.8 70.4 2.7 0.9 0.52 41.5 81.2 81.6 27.2 0.3 375 396 382
Malaysia 7.3 74.7 3.6 1.6 0.47 77.7 66.9 65.9 37.1 1.2 421 398 420
Philippines 23.5 68.4 4.1 1.4 0.62 - - - -

Turkey’s Transitions
280
Table A8. Fiscal
Generalgovernment gross debt
General governmentprimary net lending
borrowing
Generalgovernment total
expenditure
Generalgovernment revenue Tax revenue WGI Control of
CorruptionWGI Government Ef-
fectivenessWGI Voice andAccountability Open Budget Index
Percent of GDP, 2012 Percent of GDP,2009 - 2011 Avr.
Percent of GDP,2009 - 2011 Avr.
Percent of GDP,2009 - 2011 Avr.
Percent of GDP,2009 - 2011 Avr. Percentile Rank 2013 Percentile Rank 2013 Percentile Rank 2013 Country Rank, 2012
Turkey 36.2 0.4 36.7 33.5 19.9 62 66 41 42
BRICS
Brazil 68.0 2.6 39.0 36.3 15.1 55 51 59 12
Russian Federation 12.5 -2.4 38.4 35.7 13.7 17 43 19 10
India 66.7 -4.5 27.6 18.7 10.0 36 47 61 14
China 26.1 - 23.3 21.4 10.5 47 54 5 86
South Africa 42.3 -2.5 32.5 27.6 25.8 55 67 65 2
EU Members
Romania 38.2 -4.7 38.0 32.0 16.8 53 53 57 49
Poland 55.6 -4.1 44.5 37.7 16.7 71 71 78 25
Hungary 79.2 2.3 50.3 48.7 22.8 65 70 70 -
Bulgaria 17.6 -2.0 35.8 33.5 19.7 50 59 58 17
Czech Republic 45.9 -3.5 43.9 39.3 13.4 63 75 77 9
Slovakia 52.1 -5.7 40.0 33.0 12.5 60 73 76 15
EU Accession
Albania 61.4 -1.8 30.9 25.9 - 26 44 51 52
Croatia 53.7 -2.9 43.0 38.1 19.1 61 71 63 22
Serbia 61.8 - 45.8 41.8 22.3 51 50 57 61
MENA
Morocco 60.5 -2.0 32.5 28.2 23.7 46 52 28 64
Tunisia 44.0 0.0 32.1 30.3 20.3 54 55 45 85
Egypt 80.6 -4.1 33.3 25.0 14.6 33 20 18 82
Jordan 79.6 -5.0 33.0 25.9 16.0 61 50 25 30
Syrian Arab Republic - - - 22.4 - 8 8 4 -
Growth Markets
Mexico 43.5 - 26.8 22.6 - 39 63 54 23
Korea, Republic of 35.0 0.4 21.8 23.0 15.4 70 82 68 8
Indonesia 24.5 - 18.3 17.1 11.4 32 45 49 20
Malaysia 55.5 -3.4 29.5 24.7 14.6 68 82 37 62
Philippines 41.9 1.1 19.1 17.2 12.3 44 57 48 47
Annex Tables
281
Table A8. Fiscal
Generalgovernment gross debt
General governmentprimary net lending
borrowing
Generalgovernment total
expenditure
Generalgovernment revenue Tax revenue WGI Control of
CorruptionWGI Government Ef-
fectivenessWGI Voice andAccountability Open Budget Index
Percent of GDP, 2012 Percent of GDP,2009 - 2011 Avr.
Percent of GDP,2009 - 2011 Avr.
Percent of GDP,2009 - 2011 Avr.
Percent of GDP,2009 - 2011 Avr. Percentile Rank 2013 Percentile Rank 2013 Percentile Rank 2013 Country Rank, 2012
Turkey 36.2 0.4 36.7 33.5 19.9 62 66 41 42
BRICS
Brazil 68.0 2.6 39.0 36.3 15.1 55 51 59 12
Russian Federation 12.5 -2.4 38.4 35.7 13.7 17 43 19 10
India 66.7 -4.5 27.6 18.7 10.0 36 47 61 14
China 26.1 - 23.3 21.4 10.5 47 54 5 86
South Africa 42.3 -2.5 32.5 27.6 25.8 55 67 65 2
EU Members
Romania 38.2 -4.7 38.0 32.0 16.8 53 53 57 49
Poland 55.6 -4.1 44.5 37.7 16.7 71 71 78 25
Hungary 79.2 2.3 50.3 48.7 22.8 65 70 70 -
Bulgaria 17.6 -2.0 35.8 33.5 19.7 50 59 58 17
Czech Republic 45.9 -3.5 43.9 39.3 13.4 63 75 77 9
Slovakia 52.1 -5.7 40.0 33.0 12.5 60 73 76 15
EU Accession
Albania 61.4 -1.8 30.9 25.9 - 26 44 51 52
Croatia 53.7 -2.9 43.0 38.1 19.1 61 71 63 22
Serbia 61.8 - 45.8 41.8 22.3 51 50 57 61
MENA
Morocco 60.5 -2.0 32.5 28.2 23.7 46 52 28 64
Tunisia 44.0 0.0 32.1 30.3 20.3 54 55 45 85
Egypt 80.6 -4.1 33.3 25.0 14.6 33 20 18 82
Jordan 79.6 -5.0 33.0 25.9 16.0 61 50 25 30
Syrian Arab Republic - - - 22.4 - 8 8 4 -
Growth Markets
Mexico 43.5 - 26.8 22.6 - 39 63 54 23
Korea, Republic of 35.0 0.4 21.8 23.0 15.4 70 82 68 8
Indonesia 24.5 - 18.3 17.1 11.4 32 45 49 20
Malaysia 55.5 -3.4 29.5 24.7 14.6 68 82 37 62
Philippines 41.9 1.1 19.1 17.2 12.3 44 57 48 47

Turkey’s Transitions
282
Table A9. Infrastructure
Logisticsperformance index Road density
Fixed broadbandInternet
subscribers
Mobile cellularsubscriptions Telephone lines Cost to get
electricity
Proceduresrequired to connect
to electricity
Quality of Transport
Infrastructure
Quality ofElectricity and
TelephonyInfrastructure
Infrastructure
Overall (1=low to 5=high), 2012
2009 - 2010a (km of road per 100 sq. km of
land area)(per 100 people), 2012 (per 100 people), 2012 (per 100 people),
2012 (% of income per
capita), 2012 (number), 2012 Country Rank,2013 - 2014
Country Rank,2013 - 2014
Country Rank,2013 - 2014
Turkey 3.5 46.9 10.5 90.8 18.6 517.9 5 27 87 49
BRICS
Brazil 3.1 18.6 9.2 125.2 22.3 116.7 6 75 64 71
Russian Federation 2.6 6.0 14.5 183.5 30.1 1573.7 10 48 44 45
India 3.1 - 1.1 68.7 2.5 247.3 7 34 120 85
China 3.5 41.8 13.0 81.3 20.6 547.0 5 26 79 48
South Africa 3.7 - 2.2 134.8 7.9 1505.8 5 38 94 66
EU Members
Romania 3.0 34.3 15.9 106.1 21.9 584.2 7 122 82 100
Poland 3.4 129.9 16.6 132.7 16.0 208.3 6 92 60 74
Hungary 3.2 214.5 22.9 116.4 29.8 116.9 5 71 43 51
Bulgaria 3.2 17.5 17.6 145.7 30.4 340.7 6 97 62 75
Czech Republic 3.1 165.7 16.6 122.8 19.9 180.0 6 49 40 39
Slovakia 3.0 89.6 14.6 111.2 17.8 249.1 5 83 51 67
EU Accession
Albania 2.8 - 5.0 108.4 9.7 573.7 6 108 93 99
Croatia 3.2 51.8 20.3 113.3 37.4 318.7 5 60 37 42
Serbia 2.8 50.1 10.2 92.8 30.2 502.6 4 126 67 90
MENA
Morocco 3.0 13.1 2.1 119.7 10.1 2515.2 5 45 71 57
Tunisia 3.2 11.9 4.8 120.0 10.3 878.5 4 74 73 77
Egypt 3.0 13.7 2.7 115.3 10.2 396.0 7 79 101 98
Jordan 2.6 7.9 3.0 139.1 6.7 292.3 5 61 59 54
Syrian Arab Republic 2.6 37.7 1.8 61.2 20.9 902.9 5 - - -
Growth Markets
Mexico 3.1 18.9 10.9 86.8 17.4 382.8 7 39 92 64
Korea, Republic of 3.7 105.0 37.6 110.4 61.9 33.3 4 9 21 11
Indonesia 2.9 25.0 1.2 115.2 15.5 1243.8 6 40 90 61
Malaysia 3.5 43.7 8.4 140.9 15.7 53.9 5 15 48 29
Philippines 3.0 - 2.2 106.8 4.1 833.3 5 84 98 96
a. Data for the most recent available year

Annex Tables
283
Table A9. Infrastructure
Logisticsperformance index Road density
Fixed broadbandInternet
subscribers
Mobile cellularsubscriptions Telephone lines Cost to get
electricity
Proceduresrequired to connect
to electricity
Quality of Transport
Infrastructure
Quality ofElectricity and
TelephonyInfrastructure
Infrastructure
Overall (1=low to 5=high), 2012
2009 - 2010a (km of road per 100 sq. km of
land area)(per 100 people), 2012 (per 100 people), 2012 (per 100 people),
2012 (% of income per
capita), 2012 (number), 2012 Country Rank,2013 - 2014
Country Rank,2013 - 2014
Country Rank,2013 - 2014
Turkey 3.5 46.9 10.5 90.8 18.6 517.9 5 27 87 49
BRICS
Brazil 3.1 18.6 9.2 125.2 22.3 116.7 6 75 64 71
Russian Federation 2.6 6.0 14.5 183.5 30.1 1573.7 10 48 44 45
India 3.1 - 1.1 68.7 2.5 247.3 7 34 120 85
China 3.5 41.8 13.0 81.3 20.6 547.0 5 26 79 48
South Africa 3.7 - 2.2 134.8 7.9 1505.8 5 38 94 66
EU Members
Romania 3.0 34.3 15.9 106.1 21.9 584.2 7 122 82 100
Poland 3.4 129.9 16.6 132.7 16.0 208.3 6 92 60 74
Hungary 3.2 214.5 22.9 116.4 29.8 116.9 5 71 43 51
Bulgaria 3.2 17.5 17.6 145.7 30.4 340.7 6 97 62 75
Czech Republic 3.1 165.7 16.6 122.8 19.9 180.0 6 49 40 39
Slovakia 3.0 89.6 14.6 111.2 17.8 249.1 5 83 51 67
EU Accession
Albania 2.8 - 5.0 108.4 9.7 573.7 6 108 93 99
Croatia 3.2 51.8 20.3 113.3 37.4 318.7 5 60 37 42
Serbia 2.8 50.1 10.2 92.8 30.2 502.6 4 126 67 90
MENA
Morocco 3.0 13.1 2.1 119.7 10.1 2515.2 5 45 71 57
Tunisia 3.2 11.9 4.8 120.0 10.3 878.5 4 74 73 77
Egypt 3.0 13.7 2.7 115.3 10.2 396.0 7 79 101 98
Jordan 2.6 7.9 3.0 139.1 6.7 292.3 5 61 59 54
Syrian Arab Republic 2.6 37.7 1.8 61.2 20.9 902.9 5 - - -
Growth Markets
Mexico 3.1 18.9 10.9 86.8 17.4 382.8 7 39 92 64
Korea, Republic of 3.7 105.0 37.6 110.4 61.9 33.3 4 9 21 11
Indonesia 2.9 25.0 1.2 115.2 15.5 1243.8 6 40 90 61
Malaysia 3.5 43.7 8.4 140.9 15.7 53.9 5 15 48 29
Philippines 3.0 - 2.2 106.8 4.1 833.3 5 84 98 96

Turkey’s Transitions
284
Sources and Definitions
285
Sources and Definitions
Turkey’s Transitions: Integration, Inclusion, Institutions
Labour
Welfare
FiscalSpace
Enterprise
Trade
Infrastucture
Finance
Cities

Turkey’s Transitions
286
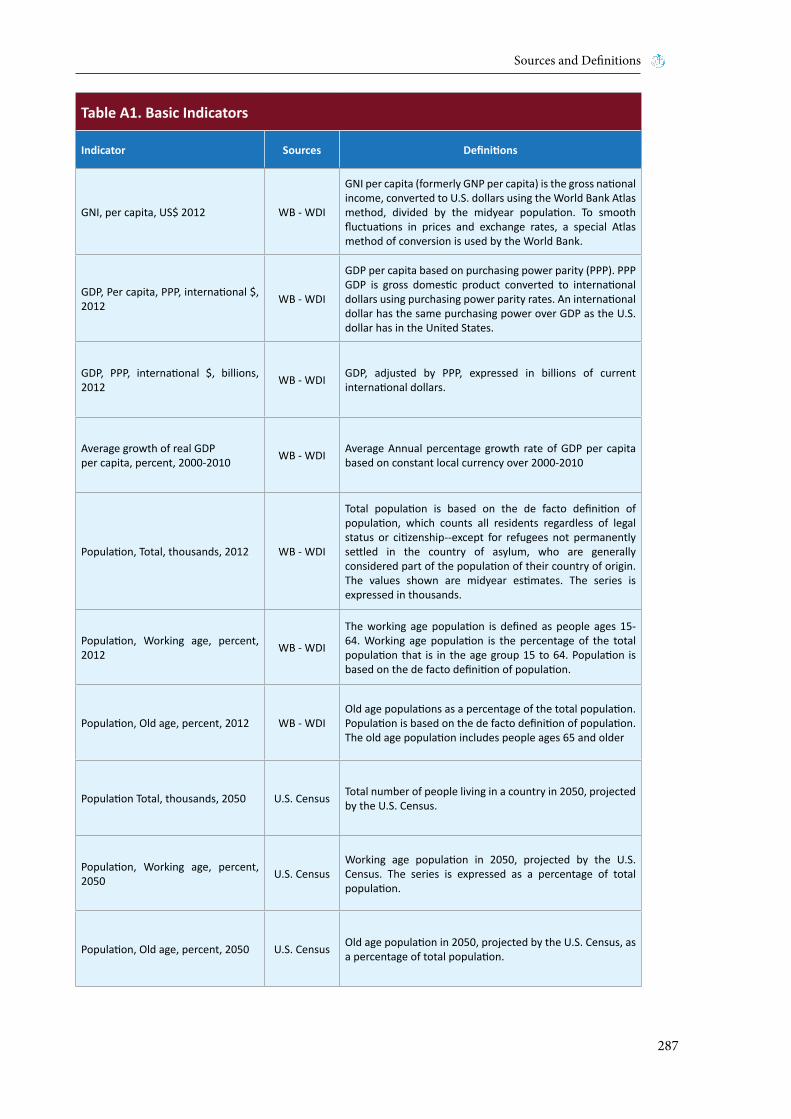
Sources and Definitions
287
Table A1. Basic Indicators
Indicator Sources Definitions
GNI, per capita, US$ 2012 WB - WDI
GNI per capita (formerly GNP per capita) is the gross national income, converted to U.S. dollars using the World Bank Atlas method, divided by the midyear population. To smooth fluctuations in prices and exchange rates, a special Atlas method of conversion is used by the World Bank.
GDP, Per capita, PPP, international $, 2012 WB - WDI
GDP per capita based on purchasing power parity (PPP). PPP GDP is gross domestic product converted to international dollars using purchasing power parity rates. An international dollar has the same purchasing power over GDP as the U.S. dollar has in the United States.
GDP, PPP, international $, billions, 2012 WB - WDI GDP, adjusted by PPP, expressed in billions of current
international dollars.
Average growth of real GDPper capita, percent, 2000-2010 WB - WDI Average Annual percentage growth rate of GDP per capita
based on constant local currency over 2000-2010
Population, Total, thousands, 2012 WB - WDI
Total population is based on the de facto definition of population, which counts all residents regardless of legal status or citizenship--except for refugees not permanently settled in the country of asylum, who are generally considered part of the population of their country of origin. The values shown are midyear estimates. The series is expressed in thousands.
Population, Working age, percent, 2012 WB - WDI
The working age population is defined as people ages 15-64. Working age population is the percentage of the total population that is in the age group 15 to 64. Population is based on the de facto definition of population.
Population, Old age, percent, 2012 WB - WDIOld age populations as a percentage of the total population. Population is based on the de facto definition of population. The old age population includes people ages 65 and older
Population Total, thousands, 2050 U.S. Census Total number of people living in a country in 2050, projected by the U.S. Census.
Population, Working age, percent, 2050 U.S. Census
Working age population in 2050, projected by the U.S. Census. The series is expressed as a percentage of total population.
Population, Old age, percent, 2050 U.S. Census Old age population in 2050, projected by the U.S. Census, as a percentage of total population.

Turkey’s Transitions
288
Table A2. Trade
Indicator Sources Definitions
Exports of goods and services(percent of GDP) WB - WDI
Exports of goods and services represent the value of all goods and other market services provided to the rest of the world. They include the value of merchandise, freight, insurance, transport, travel, royalties, license fees, and other services, such as communication, construction, financial, information, business, personal, and government services. They exclude compensation of employees and investment income (formerly called factor services) and transfer payments
Imports of goods and services(percent of GDP) WB - WDI
Imports of goods and services represent the value of all goods and other market services received from the rest of the world. They include the value of merchandise, freight, insurance, transport, travel, royalties, license fees, and other services, such as communication, construction, financial, information, business, personal, and government services. They exclude compensation of employees and investment income (formerly called factor services) and transfer payments
Exports of Goods (in billions US$) WB - WDI
Goods exports refer to all movable goods (including nonmonetary gold and net exports of goods under merchanting) involved in a change of ownership from residents to nonresidents. Data are in current U.S. dollars
Exports of Services (in billions US$) WB - WDIServices refer to economic output of intangible commodities that may be produced, transferred, and consumed at the same time. Data are in current U.S. dollars.
Imports of goods and services(in billions current US$) WB - WDI
Imports of goods and services comprise all transactions between residents of a country and the rest of the world involving a change of ownership from nonresidents to residents of general merchandise, nonmonetary gold, and services. Data are in current U.S. dollars.
High Technology Exports as a percent of Manufactured Exports WB - WDI
High-technology exports are products with high R&D intensity, such as in aerospace, computers, pharmaceuticals, scientific instruments, and electrical machinery.
Global export market share percent of World Trade IMF - DOTS Share of exports of a specific country in total world trade.
Export Market DestinationConcentration Index WB - WTI
Export market destination concentration index - This indicator reflects the Herfindahl-Hirschmann index measure of the degree of export market concentration of a country.
Export Product Concentration Index WB - WTIExport product concentration index - this indicator reflects the Herfindahl-Hirschmann index measure of the degree of export product concentration of a country.

Sources and Definitions
289
Table A3. Finance
Indicator Sources Definitions
Bank regulatory capital torisk-weighted assets (%)
WB- GFD Database
The capital adequacy of deposit takers. It is a ratio of total regulatory capital to its assets held, weighted according to risk of those assets.
Bank credit to bank deposits (%) WB- GFD Database
The financial resources provided to the private sector by domestic money banks as a share of total deposits. Domestic money banks comprise commercial banks and other financial institutions that accept transferable deposits, such as demand deposits. Total deposits include demand, time and saving deposits in deposit money banks.
Bank nonperforming loans to gross loans (%)
WB- GFD Database
Ratio of defaulting loans (payments of interest and principal past due by 90 days or more) to total gross loans (total value of loan portfolio). The loan amount recorded as nonperforming includes the gross value of the loan as recorded on the balance sheet, not just the amount that is overdue
Stock market capitalizationto GDP (%)
WB- GFD Database
Total value of all listed shares in a stock market as a percentage of GDP.
Current account balance (% of GDP) WB - WDI Current account balance is the sum of net exports of goods and services, net primary income, and net secondary income
Domestic credit provided by banking sector (% of GDP) WB - WDI
Domestic credit provided by the banking sector includes all credit to various sectors on a gross basis, with the exception of credit to the central government, which is net. The banking sector includes monetary authorities and deposit money banks, as well as other banking institutions where data are available (including institutions that do not accept transferable deposits but do incur such liabilities as time and savings deposits). Examples of other banking institutions are savings and mortgage loan institutions and building and loan associations.
Stock market total value tradedto GDP (%)
WB- GFD Database
Total value of all traded shares in a stock market exchange as a percentage of GDP.
Foreign direct investment WB - WDI
Foreign direct investment are the net inflows of investment to acquire a lasting management interest (10 percent or more of voting stock) in an enterprise operating in an economy other than that of the investor. It is the sum of equity capital, reinvestment of earnings, other long-term capital, and short-term capital as shown in the balance of payments.
Cross-border banking flows(% of GDP)
Bank for International Settlements
(BIS)
External loans and deposits of reporting banks vis-à-vis all sectors. Vis-à-vis individual countries.
External debt stocks (%of GNI) WB - WDI
Total external debt stocks to gross national income. Total external debt is debt owed to nonresidents repayable in currency, goods, or services. Total external debt is the sum of public, publicly guaranteed, and private nonguaranteed long-term debt, use of IMF credit, and short-term debt. Short-term debt includes all debt having an original maturity of one year or less and interest in arrears on long-term debt. GNI (formerly GNP) is the sum of value added by all resident producers plus any product taxes (less subsidies) not included in the valuation of output plus net receipts of primary income (compensation of employees and property income) from abroad
Short-term debt (% of total external debt) WB - WDI
Short-term debt includes all debt having an original maturity of one year or less and interest in arrears on long-term debt. Total external debt is debt owed to nonresidents repayable in currency, goods, or services. Total external debt is the sum of public, publicly guaranteed, and private nonguaranteed long-term debt, use of IMF credit, and short-term debt

Turkey’s Transitions
290
Table A4. Enterprise
Indicator Sources Definitions
GDP per WorkerPenn World
Table Version 8.0
Ratio of Output-side real GDP at chained PPPs in 2005US$ to number of persons engaged
GDP per Worker GrowthPenn World
Table Version 8.0
Average annual compound growth rate of GDP per Worker
Average TFP GrowthPenn World
Table Version 8.0
Average annual growth rate of TFP at constant national prices (2005=1)
Employment in Agriculture(% of Total Employment) WB - WDI
Employees are people who work for a public or private employer and receive remuneration in wages, salary, commission, tips, piece rates, or pay in kind. Agriculture corresponds to division 1 (ISIC revision 2) or tabulation categories A and B (ISIC revision 3) and includes hunting, forestry, and fishing.
Employment in Industry(% of Total Employment) WB - WDI
Employees are people who work for a public or private employer and receive remuneration in wages, salary, commission, tips, piece rates, or pay in kind. Industry corresponds to divisions 2-5 (ISIC revision 2) or tabulation categories C-F (ISIC revision 3) and includes mining and quarrying (including oil production), manufacturing, construction, and public utilities (electricity, gas, and water).
Employment in Services(% of Total Employment) WB - WDI
Employees are people who work for a public or private employer and receive remuneration in wages, salary, commission, tips, piece rates, or pay in kind. Services correspond to divisions 6-9 (ISIC revision 2) or tabulation categories G-P (ISIC revision 3) and include wholesale and retail trade and restaurants and hotels; transport, storage, and communications; financing, insurance, real estate, and business services; and community, social, and personal services
Research and DevelopmentExpenditure (%of GDP) WB - WDI
Expenditures for research and development are current and capital expenditures (both public and private) on creative work undertaken systematically to increase knowledge, including knowledge of humanity, culture, and society, and the use of knowledge for new applications. R&D covers basic research, applied research, and experimental development

Sources and Definitions
291
Table A5. Urbanization
Indicator Sources Definitions
Urban Population (% of Total) WB - WDI
Urban population refers to people living in urban areas as defined by national statistical offices. It is calculated using World Bank population estimates and urban ratios from the United Nations World Urbanization Prospects
Urban Population Growth WB - WDI Average of annual growth rate in urban population
Improved Sanitation Facilities WB - WDI
Access to improved sanitation facilities refers to the percentage of the population using improved sanitation facilities. The improved sanitation facilities include flush/pour flush (to piped sewer system, septic tank, pit latrine), ventilated improved pit (VIP) latrine, pit latrine with slab, and composting toilet.
Improved Water Source WB - WDI
Access to an improved water source refers to the percentage of the population using an improved drinking water source. The improved drinking water source includes piped water on premises (piped household water connection located inside the user’s dwelling, plot or yard), and other improved drinking water sources (public taps or standpipes, tube wells or boreholes, protected dug wells, protected springs, and rainwater collection).
CO2 emissions, metrics tons per capita WB - WDI
Carbon dioxide emissions are those stemming from the burning of fossil fuels and the manufacture of cement. They include carbon dioxide produced during consumption of solid, liquid, and gas fuels and gas flaring
Combustible renewables and waste (% of total energy) WB - WDI
Combustible renewables and waste comprise solid biomass, liquid biomass, biogas, industrial waste, and municipal waste, measured as a percentage of total energy use
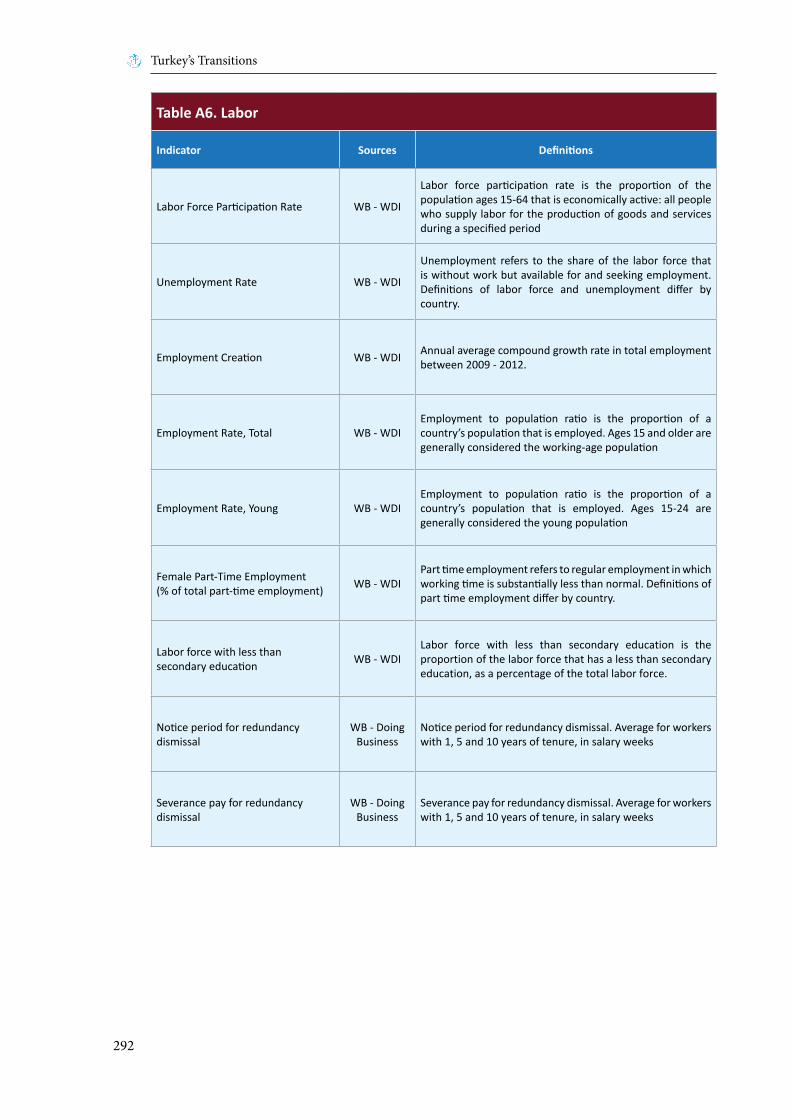
Turkey’s Transitions
292
Table A6. Labor
Indicator Sources Definitions
Labor Force Participation Rate WB - WDI
Labor force participation rate is the proportion of the population ages 15-64 that is economically active: all people who supply labor for the production of goods and services during a specified period
Unemployment Rate WB - WDI
Unemployment refers to the share of the labor force that is without work but available for and seeking employment. Definitions of labor force and unemployment differ by country.
Employment Creation WB - WDI Annual average compound growth rate in total employment between 2009 - 2012.
Employment Rate, Total WB - WDIEmployment to population ratio is the proportion of a country’s population that is employed. Ages 15 and older are generally considered the working-age population
Employment Rate, Young WB - WDIEmployment to population ratio is the proportion of a country’s population that is employed. Ages 15-24 are generally considered the young population
Female Part-Time Employment(% of total part-time employment) WB - WDI
Part time employment refers to regular employment in which working time is substantially less than normal. Definitions of part time employment differ by country.
Labor force with less thansecondary education WB - WDI
Labor force with less than secondary education is the proportion of the labor force that has a less than secondary education, as a percentage of the total labor force.
Notice period for redundancydismissal
WB - Doing Business
Notice period for redundancy dismissal. Average for workers with 1, 5 and 10 years of tenure, in salary weeks
Severance pay for redundancydismissal
WB - Doing Business
Severance pay for redundancy dismissal. Average for workers with 1, 5 and 10 years of tenure, in salary weeks

Sources and Definitions
293
Table A7. Welfare
Indicator Sources Definitions
Infant mortality rate, per1000 live births WB - WDI Infant mortality rate is the number of infants dying before
reaching one year of age, per 1,000 live births in a given year.
Life expectancy at birth WB - WDI
Life expectancy at birth indicates the number of years a newborn infant would live if prevailing patterns of mortality at the time of its birth were to stay the same throughout its life.
Total Health Expenditures % of GDP WB - WDI
Total health expenditure is the sum of public and private health expenditure. It covers the provision of health services (preventive and curative), family planning activities, nutrition activities, and emergency aid designated for health but does not include provision of water and sanitation.
Public Health Expenditures % of GDP WB - WDI
Public health expenditure consists of recurrent and capital spending from government (central and local) budgets, external borrowings and grants (including donations from international agencies and nongovernmental organizations), and social (or compulsory) health insurance funds.
Total Dependency Ratio WB - WDIDependency ratio is the ratio of dependents--people younger than 15 or older than 64--to the working-age population--those ages 15-64.
Gross Enrollment Rate, Pre-Primary WB - WDI
Gross enrollment ratio is the ratio of total enrollment, regardless of age, to the population of the age group that officially corresponds to the level of education shown. Preprimary education refers to the initial stage of organized instruction, designed primarily to introduce very young children to a school-type environment
Gross Enrollment Rate, Secondary WB - WDI
Gross enrollment ratio is the ratio of total enrollment, regardless of age, to the population of the age group that officially corresponds to the level of education shown. Secondary education completes the provision of basic education that began at the primary level, and aims at laying the foundations for lifelong learning and human development, by offering more subject- or skill-oriented instruction using more specialized teachers
Gross Enrollment Rate, Tertiary WB - WDI
Gross enrollment ratio is the ratio of total enrollment, regardless of age, to the population of the age group that officially corresponds to the level of education shown. Tertiary education, whether or not to an advanced research qualification, normally requires, as a minimum condition of admission, the successful completion of education at the secondary level.
Number of Physicians WB - WDI Physicians include generalist and specialist medical practitioners
PISA Scores OECD
The Programme for International Student Assessment (PISA) is a triennial international survey which aims to evaluate education systems worldwide by testing the skills and knowledge of 15-year-old students. Fifteen-year-old students from randomly selected schools worldwide take tests in the key subjects: reading, mathematics and science, with a focus on one subject in each year of assessment.

Turkey’s Transitions
294
Table A8. Fiscal
Indicator Sources Definitions
General governmentgross debt
IMF - World Economic Outlook
Gross debt consists of all liabilities that require payment or payments of interest and/or principal by the debtor to the creditor at a date or dates in the future. This includes debt liabilities in the form of SDRs, currency and deposits, debt securities, loans, insurance, pensions and standardized guarantee schemes, and other accounts payable. Thus, all liabilities in the GFSM 2001 system are debt, except for equity and investment fund shares and financial derivatives and employee stock options. Debt can be valued at current market, nominal, or face values (GFSM 2001, paragraph 7.110).
General government primarynet lending/borrowing
IMF - World Economic Outlook
Primary net lending/borrowing is net lending (+)/borrowing (–) plus net interest payable/paid (interest expense minus interest revenue).
General government totalexpenditure
IMF - World Economic Outlook
Total expenditure consists of total expense and the net acquisition of nonfinancial assets. Note: Apart from being on an accrual basis, total expenditure differs from the GFSM 1986 definition of total expenditure in the sense that it also takes the disposals of nonfinancial assets into account
General governmentrevenue
IMF - World Economic Outlook
Revenue consists of taxes, social contributions, grants receivable, and other revenue. Revenue increases government’s net worth, which is the difference between its assets and liabilities (GFSM 2001, paragraph 4.20). Note: Transactions that merely change the composition of the balance sheet do not change the net worth position, for example, proceeds from sales of nonfinancial and financial assets or incurrence of liabilities.
Tax Revenue % of GDP WB-WGI
Tax revenue refers to compulsory transfers to the central government for public purposes. Certain compulsory transfers such as fines, penalties, and most social security contributions are excluded. Refunds and corrections of erroneously collected tax revenue are treated as negative revenue.
WGI Control of Corruption WB-WGI
Control of Corruption captures perceptions of the extent to which public power is exercised for private gain, including both petty and grand forms of corruption, as well as “capture” of the state by elites and private interests. Percentile rank indicates the country’s rank among all countries covered by the aggregate indicator, with 0 corresponding to lowest rank, and 100 to highest rank. Percentile ranks have been adjusted to correct for changes over time in the composition of the countries covered by the WGI.
WGI GovernmentEffectiveness WB-WGI
Government Effectiveness captures perceptions of the quality of public services, the quality of the civil service and the degree of its independence from political pressures, the quality of policy formulation and implementation, and the credibility of the government’s commitment to such policies. Percentile rank indicates the country’s rank among all countries covered by the aggregate indicator, with 0 corresponding to lowest rank, and 100 to highest rank. Percentile ranks have been adjusted to correct for changes over time in the composition of the countries covered by the WGI.
WGI Voice andAccountability WB-WGI
Voice and Accountability captures perceptions of the extent to which a country’s citizens are able to participate in selecting their government, as well as freedom of expression, freedom of association, and a free media. Percentile rank indicates the country’s rank among all countries covered by the aggregate indicator, with 0 corresponding to lowest rank, and 100 to highest rank. Percentile ranks have been adjusted to correct for changes over time in the composition of the countries covered by the WGI.
Open Budget IndexInternational
BudgetPartnership
The Open Budget Survey countries from around the world, measuring three aspects of how governments are managing public finances: Budget transparency, budget participation, budget oversight.
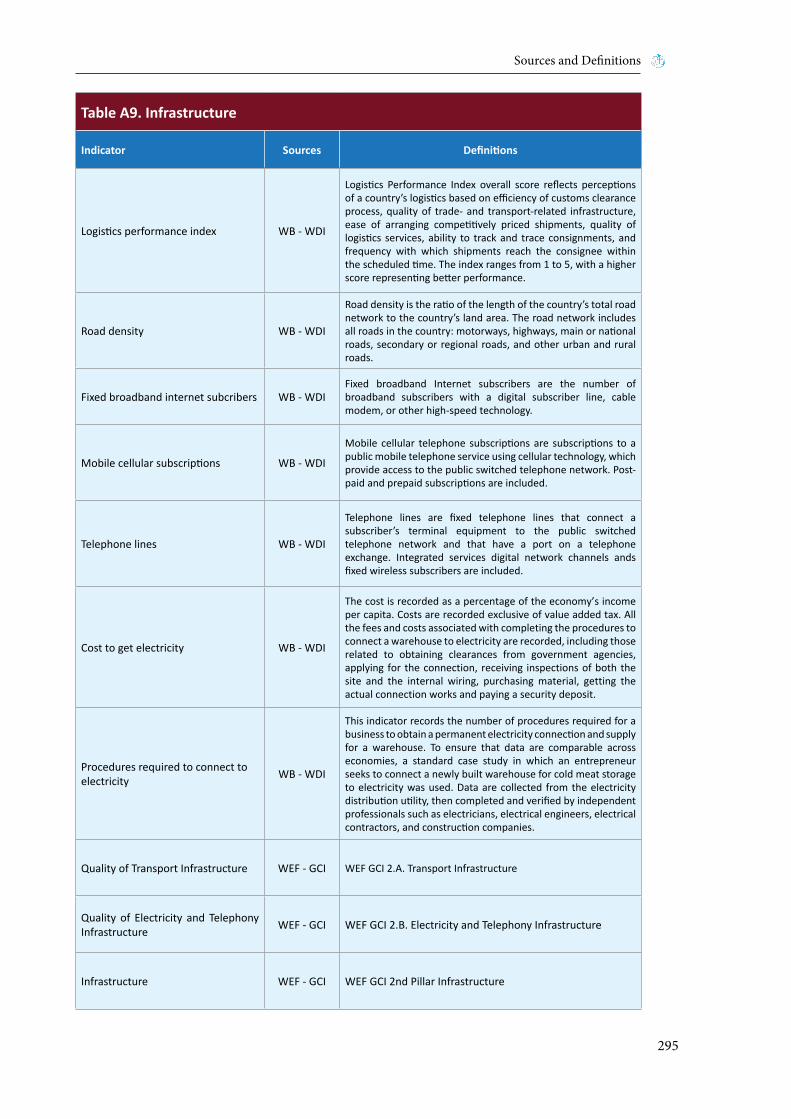
Sources and Definitions
295
Table A9. Infrastructure
Indicator Sources Definitions
Logistics performance index WB - WDI
Logistics Performance Index overall score reflects perceptions of a country’s logistics based on efficiency of customs clearance process, quality of trade- and transport-related infrastructure, ease of arranging competitively priced shipments, quality of logistics services, ability to track and trace consignments, and frequency with which shipments reach the consignee within the scheduled time. The index ranges from 1 to 5, with a higher score representing better performance.
Road density WB - WDI
Road density is the ratio of the length of the country’s total road network to the country’s land area. The road network includes all roads in the country: motorways, highways, main or national roads, secondary or regional roads, and other urban and rural roads.
Fixed broadband internet subcribers WB - WDIFixed broadband Internet subscribers are the number of broadband subscribers with a digital subscriber line, cable modem, or other high-speed technology.
Mobile cellular subscriptions WB - WDI
Mobile cellular telephone subscriptions are subscriptions to a public mobile telephone service using cellular technology, which provide access to the public switched telephone network. Post-paid and prepaid subscriptions are included.
Telephone lines WB - WDI
Telephone lines are fixed telephone lines that connect a subscriber’s terminal equipment to the public switched telephone network and that have a port on a telephone exchange. Integrated services digital network channels ands fixed wireless subscribers are included.
Cost to get electricity WB - WDI
The cost is recorded as a percentage of the economy’s income per capita. Costs are recorded exclusive of value added tax. All the fees and costs associated with completing the procedures to connect a warehouse to electricity are recorded, including those related to obtaining clearances from government agencies, applying for the connection, receiving inspections of both the site and the internal wiring, purchasing material, getting the actual connection works and paying a security deposit.
Procedures required to connect toelectricity WB - WDI
This indicator records the number of procedures required for a business to obtain a permanent electricity connection and supply for a warehouse. To ensure that data are comparable across economies, a standard case study in which an entrepreneur seeks to connect a newly built warehouse for cold meat storage to electricity was used. Data are collected from the electricity distribution utility, then completed and verified by independent professionals such as electricians, electrical engineers, electrical contractors, and construction companies.
Quality of Transport Infrastructure WEF - GCI WEF GCI 2.A. Transport Infrastructure
Quality of Electricity and Telephony Infrastructure WEF - GCI WEF GCI 2.B. Electricity and Telephony Infrastructure
Infrastructure WEF - GCI WEF GCI 2nd Pillar Infrastructure

Turkey’s Transitions
296

Integration, Inclusion, Institutions
297
Code NameALB AlbaniaARG ArgentinaAUS AustraliaAUT AustriaAZE AzerbaijanBEL BelgiumBGR BulgariaBRA BrazilCAN CanadaCHE SwitzerlandCHL ChileCHN ChinaCOL ColombiaCRI Costa RicaCZE Czech RepublicDEU GermanyDNK DenmarkECU EcuadorEGY EgyptESP SpainEST EstoniaFIN FinlandFRA FranceGBR United KingdomGEO GeorgiaGRC GreeceHKG Hong KongHRV CroatiaHUN HungaryIDN IndonesiaIND IndiaIRL IrelandIRN Iran, Islamic Republic ofISL IcelandISR IsraelITA ItalyJOR JordanJPN Japan
Code NameKAZ KazakhstanKOR Korea, Republic ofLIE LiechtensteinLUX LuxembourgLVA LatviaMAC MacaoMAR MoroccoMDA Moldova, Rebuplic ofMEX MexicoMKD Macedonia, the former Yugoslav Republic ofMYS MalaysiaNLD NetherlandsNOR NorwayNZL New ZealandPAK PakistanPAN PanamaPER PeruPHL PhilippinesPOL PolandPRT PortugalPRY ParaguayROM RomaniaRUS RussianFederationSGP SingaporeSRB SerbiaSVK SlovakiaSVN SloveniaSWE SwedenSYR Syrian Arab RepublicTHA ThailandTUN TunisiaTUR TurkeyTWN Taiwan, Province of ChinaUKR UkraineURY UruguayUSA United StatesVEN Venezuela, Bolivarian Republic ofZAF South Africa
Country codes and names
The3-lettercountrycodesusedinthisreportaretakenfromtheinternationalOrganizationforStandardization(ISO)3166-1alpha-3codes,exceptforafewcountries,asdescribedbytheWorldBank(data.worldbank.org/node/18).
The use of the word countries to refer to economies implies no judgement by the authors and contributorsaboutthelegalorotherstatusofaterritory.
The following are the codes and corresponding country names which can be found in the report:

Turkey’s Transitions
298
Related Documents