econstor www.econstor.eu Der Open-Access-Publikationsserver der ZBW – Leibniz-Informationszentrum Wirtschaft The Open Access Publication Server of the ZBW – Leibniz Information Centre for Economics Nutzungsbedingungen: Die ZBW räumt Ihnen als Nutzerin/Nutzer das unentgeltliche, räumlich unbeschränkte und zeitlich auf die Dauer des Schutzrechts beschränkte einfache Recht ein, das ausgewählte Werk im Rahmen der unter → http://www.econstor.eu/dspace/Nutzungsbedingungen nachzulesenden vollständigen Nutzungsbedingungen zu vervielfältigen, mit denen die Nutzerin/der Nutzer sich durch die erste Nutzung einverstanden erklärt. Terms of use: The ZBW grants you, the user, the non-exclusive right to use the selected work free of charge, territorially unrestricted and within the time limit of the term of the property rights according to the terms specified at → http://www.econstor.eu/dspace/Nutzungsbedingungen By the first use of the selected work the user agrees and declares to comply with these terms of use. zbw Leibniz-Informationszentrum Wirtschaft Leibniz Information Centre for Economics Baptista, Rui; Karaöz, Murat Working Paper Turbulence in high growth and declining industries Jena economic research papers, No. 2007,043 Provided in Cooperation with: Max Planck Institute of Economics Suggested Citation: Baptista, Rui; Karaöz, Murat (2007) : Turbulence in high growth and declining industries, Jena economic research papers, No. 2007,043 This Version is available at: http://hdl.handle.net/10419/25612

Welcome message from author
This document is posted to help you gain knowledge. Please leave a comment to let me know what you think about it! Share it to your friends and learn new things together.
Transcript
econstor www.econstor.eu
Der Open-Access-Publikationsserver der ZBW – Leibniz-Informationszentrum WirtschaftThe Open Access Publication Server of the ZBW – Leibniz Information Centre for Economics
Nutzungsbedingungen:Die ZBW räumt Ihnen als Nutzerin/Nutzer das unentgeltliche,räumlich unbeschränkte und zeitlich auf die Dauer des Schutzrechtsbeschränkte einfache Recht ein, das ausgewählte Werk im Rahmender unter→ http://www.econstor.eu/dspace/Nutzungsbedingungennachzulesenden vollständigen Nutzungsbedingungen zuvervielfältigen, mit denen die Nutzerin/der Nutzer sich durch dieerste Nutzung einverstanden erklärt.
Terms of use:The ZBW grants you, the user, the non-exclusive right to usethe selected work free of charge, territorially unrestricted andwithin the time limit of the term of the property rights accordingto the terms specified at→ http://www.econstor.eu/dspace/NutzungsbedingungenBy the first use of the selected work the user agrees anddeclares to comply with these terms of use.
zbw Leibniz-Informationszentrum WirtschaftLeibniz Information Centre for Economics
Baptista, Rui; Karaöz, Murat
Working Paper
Turbulence in high growth and declining industries
Jena economic research papers, No. 2007,043
Provided in Cooperation with:Max Planck Institute of Economics
Suggested Citation: Baptista, Rui; Karaöz, Murat (2007) : Turbulence in high growth anddeclining industries, Jena economic research papers, No. 2007,043
This Version is available at:http://hdl.handle.net/10419/25612
JENA ECONOMIC RESEARCH PAPERS
# 2007 – 043
Turbulence in High Growth and Declining Industries
by
Rui Baptista Murat Karaöz
www.jenecon.de
ISSN 1864-7057 The JENA ECONOMIC RESEARCH PAPERS is a joint publication of the Friedrich-Schiller-University and the Max Planck Institute of Economics, Jena, Germany. For editorial correspondence please contact [email protected]. Impressum: Friedrich-Schiller-University Jena Max-Planck-Institute of Economics Carl-Zeiß-Str. 3 Kahlaische Str. 10 D-07743 Jena D-07745 Jena www.uni-jena.de www.econ.mpg.de © by the author.
TURBULENCE IN HIGH GROWTH AND DECLINING INDUSTRIES
July 2007
Rui Baptista
IN+, Instituto Superior Técnico, Technical University of Lisbon and Max Planck Institute of Economics
Murat Karaöz
IN+, Instituto Superior Técnico, Technical University of Lisbon and IIBF, Department of Economics, Süleyman Demirel University, Isparta, Turkey
Abstract
We examine turbulence over the product life cycle using the lowest possible level of industry aggregation, allowing for the use of panel data to study the evolution of single product markets. We find that replacement of exiting firms by subsequent entry plays a primary role in generating turbulence in high growth markets, while displacement of incumbents by recent entrants is the main selection force in declining markets. As product life cycles progress, trial-and-error entry subsides, and turbulence decreases. JEL-classification: L11 Keywords: Entry; Exit; Selection; Product life cycle; Replacement;
Displacement
Acknowledgement: We thank Marco Vivarelli for useful comments and discussion on an earlier version of this work. We also thank participants in: the Max Planck Institute of Economics Workshop on Exit and Serial Entrepreneurship in Jena, January 2006; seminars held at CESPRI, Bocconi University, Milan and the Catholic Universities of Milan and Piacenza in March 2006; the Academy of Management Annual Meeting in Atlanta, August 2006; and the 2006 EARIE Conference in Amsterdam, August, 2006. Financial support from the Portuguese Foundation for Science and Technology (FCT) at various levels is gratefully acknowledged.
Contact: Rui Baptista, IN+ Centre for Innovation, Technology and Policy Research, Instituto Superior Técnico, Av. Rovisco Pais, 1049-001 Lisbon, Portugal. Ph: +351.218.417.379. Fax: +351.218.496.156. E-mail: [email protected]
1
Jena Economics Research Papers 2007-043
1. Introduction
Entry and exit are at the centre of a continual process of market selection, as products,
firms and industries emerge, grow, mature and ultimately disappear. Conventional
wisdom suggests that there should be an inverse relationship between entry and exit,
since profitable industries should draw more entrants and record lower rates of failing
firms. However, empirical studies across industries and countries have found quite the
opposite: entry and exit are significantly and positively correlated, as reported in
authoritative surveys by Siegfried and Evans (1994), and Caves (1998). While there are
significant differences across industries and over time, several key determinants affect
entry and exit the same way (a phenomenon termed ‘symmetry’ by Shapiro and
Khemani, 1987).
The literature addressing the dynamics of entry and exit is considerable, using a variety
of terms to refer to this phenomenon, including ‘turbulence’, as well as ‘churning’,
‘turnover’, and ‘market selection intensity’. To help understand the phenomenon, two
explanations have come to be commonly understood. Marshall (1920) suggested that
industry evolution was like a forest in that new trees eventually grow up and replace the
old trees. Schumpeter (1942) introduced the term ‘creative destruction’ to describe how
in capitalist economies the old ways of doing business are driven out, or endogenously
destroyed, by new.
Beesley and Hamilton’s (1984) seminal work highlighted the role played by turbulence
and new firms as ‘seedbeds’ for new industries, or the renewal of existing ones. Nickell
(1996) suggested that competition forces efficiency on firms through market selection.1
1 “...by letting many flowers bloom and ensuring only the best survive...” (Nickell, 1996, p. 741).
2
Jena Economics Research Papers 2007-043
Recent studies found evidence of turbulence’s positive effects. For example, Disney,
Haskel and Heden (2003a) find evidence that industry restructuring – entry, exit and
market share changes – contribute positively to productivity growth, while Aghion et al.
(2004) find that more entry leads to faster productivity growth of incumbents.
The present study adds to the literature by examining turbulence and market selection
from the viewpoint of the product life cycle. We propose and test hypotheses
concerning how the relationships between entry and exit of firms vary over time, and
the way these changes influence turbulence.
Some of the most influential studies that have addressed market selection dynamics
from a variety of perspectives – such as those by Caves and Porter (1976); Jovanovic
(1982); Gort and Klepper (1982); Beesley and Hamilton (1984); Shapiro and Khemani
(1987); Dunne, Roberts and Samuelson (1988); Geroski (1991, 1995a); Audretsch
(1995); Klepper (1996); and Baldwin (1998) – indicate that, while symmetry is indeed
significant,2 correlation patterns between entry and exit rates also emerge over time.
Indeed, entry and exit coexist in a manner such that, while entry compels subsequent
exit, exit makes room for more entry (Geroski, 1995b; Fotopoulos and Spence, 1998).
Turbulence would then be an instrument of an evolutionary process through which the
market selects successful firms by two means:
i. processes in which new firms enter the market and, by being successful, force
the subsequent exit of weak incumbents through ‘displacement’;
ii. processes in which new firms seek to fill the ‘vacuum’ created by the exit of
incumbents, or what could be called ‘replacement’.
Displacement occurs when new entrants create competitive pressure, forcing the exit of
2 For instance, barriers to entry, such as commitment to industry-specific investments, are found to act also as barriers to exit (Caves and Porter, 1976).
3
Jena Economics Research Papers 2007-043
the less efficient incumbents. Replacement occurs because the exit of incumbents is
perceived as an opportunity by potential entrants. The present paper proposes that, as
industries progress through their life cycles, the correlation between turbulence and
displacement should become greater, while the correlation between turbulence and
replacement should become smaller.
The incidence of displacement and replacement in the market does not tell the whole
story about market selection. Beesley and Hamilton (1984) indicate that industry
evolution involves large amounts of ‘trial-and-error entry’ (i.e. entry by firms that do
not survive in the market for long). Mata and Portugal (1994) found that in industries
registering large amounts of entry and exit, most of the exits are of recent entrants.
Audretsch (1995) uses a ‘revolving door’ to illustrate this phenomenon. It therefore
seems reasonable to suggest that there may be two distinct drivers of replacement:
i. young, trial-and-error exiters;
ii. exiting old incumbents whose competences have become obsolete.
We argue that, as industries move from early growth towards decline, the impact of the
exit of young firms on turbulence should become smaller.
The present study examines the determinants of turbulence across markets in a context
that differentiates industries between high growth, declining and low growth/mature.
The analysis is conducted at the lowest possible level of aggregation: the six-digit
standard industry classification available before 1994-95. Six-digit sectors virtually
correspond to individual product markets.
The rest of the paper is organized as follows. Section 2 develops hypotheses with regard
to the role played by displacement and replacement in generating turbulence over the
life cycle. Section 3 addresses the construction of the variables required to test those
4
Jena Economics Research Papers 2007-043
hypotheses, and discusses control variables concerning industry-level and
environmental determinants of turbulence. Section 4 presents the data and addresses
methodological issues. Results are presented in section 5, while section 6 concludes.
2. Turbulence and Market Selection in High Growth and Declining Industries
Theoretical analyses of industry dynamics over the product life cycle propose that
different stages of the cycle generate different entry and exit rates (Jovanovic and
MacDonald, 1994; Klepper, 1996; Jovanovic and Tse, 2006). Noteworthy empirical
studies – including, among others: Klepper and Graddy (1990); Baldwin and Gorecki
(1991); Klepper and Miller (1995); Agarwal and Gort (1996); Agarwal and Audretsch
(2001); and Disney, Haskel and Heden (2003b) – have indicated that entry rates are
higher than exit rates in the earlier stages of the product life cycle. As industries age and
set standards or dominant designs for their products, the focus of innovative activity
switches from product to process, opportunities for scale economies emerge in areas
such as production and distribution, price competition becomes more intense and a
‘shakeout’ occurs (Klepper, 1996).
An important conclusion emerges from these studies and is particularly emphasized by
both Baldwin and Gorecki (1991) as well as Agarwal and Gort (1996): the levels of
turbulence are higher in earlier stages of the industry/product life cycle, decreasing as
industries mature and exit rates surpass entry rates. Beesley and Hamilton (1984)
observe that emerging sectors are the ones that register greater levels of turbulence.
5
Jena Economics Research Papers 2007-043
Klepper and Graddy (1990) report that the change in the mean number of firms goes
from positive to negative as industries pass from early to late stages of their life cycles.
If, in addition to symmetry, the evolution of entry, exit and market selection features
both replacement and displacement, it is important to examine how these two effects
may vary over the life cycle, and how such variation will affect turbulence.
2.1. Displacement and replacement over the product life cycle
Displacement occurs when new entrants create more competitive pressure thus causing
overpopulation and forcing the exit of the less efficient incumbents, regardless of age.
In the early stages of the product life cycle, while the market is growing and dominant
designs have not yet emerged, competitive pressure should be less intense. New firms
are more likely to find customers that are new to the marketplace, while higher levels of
product differentiation mean that there is less price competition. As the life cycle
progresses and dominant designs emerge, products become homogeneous and new
entrants can only achieve success by taking customers away from incumbents. Price
competition should become more intense, with the less efficient firms being driven out
of the market (Harrigan, 1980, 1982). It seems therefore reasonable to claim that the
effect of displacement on turbulence and market selection should become larger as
industries age and their growth rates decline.
Replacement occurs because the exit of incumbents creates the perception among
potential entrants that there is room in the market to replace the exiting firms. Exit may
signal vacant or unmatched customer demand, helping trigger the next wave of entry,
exit and turbulence. As industries age and market growth rates decline, potential
entrants may no longer perceive incumbent exit as creating a vacuum in the market. As
6
Jena Economics Research Papers 2007-043
products become more homogeneous price competition becomes more intense, and
successful entry should require a larger scale of production and, thus, greater
investment, further increasing the disadvantages of new firms. Fewer new firms will
enter the market in response to incumbent exit. It is then reasonable to claim that the
effect of replacement on turbulence and market selection should become smaller
industries progress towards their decline.
The preceding logic suggests that in early stages of the product life cycle, replacement
should be a greater market selection force than displacement; in late stages of that cycle,
the importance of displacement as a market selection mechanism should become greater
than that of replacement. One can therefore formulate the first hypothesis to be tested in
the present study:
H1: In high growth industries, replacement effects increasing turbulence and
should be greater than displacement effects; in declining industries, the inverse
should be true.
2.2. Trial-and-error entry and the effect of replacement on turbulence
As previously noted, both theoretical and empirical work has pointed out that industry
evolution involves large amounts of trial-and-error entry by firms that do not survive
very long. We argue that it is the replacement of these young exiters with new trial-and-
error entrants that generates the sort of ‘revolving door’ process of entry and exit
described by Audretsch (1995). While the door revolves faster at the bottom end of the
firm size and age distributions than at the top, replacement effects are also associated
with exit of older and larger firms (i.e. established incumbents). High levels of
turbulence may not pose much of a threat to large industry leaders in the short run but,
7
Jena Economics Research Papers 2007-043
even in growing industries, as successful entrants expand and establish themselves in
the market, older incumbents may exit the industry, creating vacuum that may be filled
by potential entrants. Replacement effects on turbulence and market selection may then
be associated with either exit by young firms (trial-and-error), or by older ones.
The share represented by trial-an-error entry on replacement effects is likely to change
over the course of the product life cycle. High growth industries are usually populated
by many firms with competing product designs and moderate price competition. These
industries attract large waves of new entrants, some bringing innovative and competitive
products to the market. These waves of entry lead to large waves of exits of those
competitors whose abilities are at the fringe. Most of these exiters are likely to be recent
entrants (Audretsch, 2995; Geroski, 1995b; Caves, 1998). The opportunities offered by
high growth markets may lead potential entrants to feel overconfident about their
chances to be successful. High growth signals an abundance of profit opportunities and
many small sized entrants with insufficient market knowledge and no visible
competitive advantage will enter and exit rapidly (Vivarelli and Audretsch, 1998;
Vivarelli, 2004). According to Camerer and Lovallo (1999), under these circumstances
entry may be viewed as an expensive lottery ticket with positively skewed returns:
although most entrants expect to lose money and fail, entry still maximizes expected
profits because the payoffs for success are very large.
Sunk costs may also contribute to greater replacement effects in growing industries.
When investment in industry-specific assets is considerable, entry and exit is usually
deterred. However, in growing markets the possibility to liquidate equipment and
machinery in a spot market is higher than in declining markets. Exiters should be better
able to recover at least part of the invested funds, while future entrants may acquire
8
Jena Economics Research Papers 2007-043
existing production capacity at a lower cost than they would face by investing in new
facilities. In a review of the rise of the tire industry, French (1986) reported that
persistent failure rates encouraged new entrants by creating a stock of second hand
plants and equipment as the industry continued to grow.
In declining industries, incumbents are usually few and relatively large, with fierce price
competition (Harrigan, 1980; 1982; Lieberman, 1990), so the argument can be made
that firms entering these markets are more likely to be sure they own a significant cost
or differentiation advantage and, therefore, less likely to be trial-and-error entrants. As
industries progress over their life cycles, growth rates decline, and trial-and-error entry
should fade away. A second hypothesis can then be formulated:
H2: Replacement effects associated with ‘trial-and-error’ entrants (i.e. exit by
young firms) increasing turbulence and market selection should be greater in high
growth industries than in declining industries.
3. Variable Definition and Construction
Following Beesley and Hamilton (1984), we define the turbulence rate in industry i at
time t (TURBULENCEit) as the sum of the entry and exit rates in that industry at that
time (ENTRYit and EXITit). Entry rates are calculated as the ratio between the number
of entrants in industry i at time t and the stock of firms in industry i at time t-1. Exit
rates are calculated as the ratio between the number of exits in industry i at time t and
the stock of firms in industry i at time t-1. We have then:
TURBULENCEit = ENTRYit + EXITit (1)
9
Jena Economics Research Papers 2007-043
We define that turbulence rates (our dependent variable) are determined by explanatory
variables measuring the impact of displacement and replacement effects plus a vector of
control variables, which include industry growth and its volatility. The following sub-
sections discuss the rationale behind the choice of control variables, as well as the
construction of those variables.
3.1. Displacement
Displacement occurs when new entrants’ competitive pressure drives firms out of the
market. The effect of the intensity of entry on subsequent turbulence is expected to be
positive and significant for all industries. The lagged entry rate (ENTRYit-1) is used to
capture this effect. We assume a one period (i.e. one year) lag as reference for the
construction of variables associated with displacement and replacement. While
decisions to enter or exit markets motivated by previous incumbent exit or entry may
take longer to happen, we expect that turbulence rates corresponding to the number of
entries and exits recorded during a twelve month period should pick up most of the
displacement and replacement caused by entries and exits which occurred in the
previous twelve month period.3 Furthermore, assuming lags greater than one year would
reduce the number of observations significantly.
3.2. Replacement and exit by young firms and established incumbents
Entry due to replacement is assumed to occur as a response to last period’s exits. The
lagged exit rate (EXITit-1) is used to capture the overall replacement effect. The number
of exits (and, therefore, the exit rate) can be grouped according to the age (k) of the
3 Data are recorded annually, with steady twelve month periods in-between observations.
10
Jena Economics Research Papers 2007-043
exiting firms. Considering K years as the threshold separating young firms from
established incumbents, the exit rate can be written as:
EXITit = (EXITit)k≤K + (EXITit)k>K (2)
where: (EXITit)k≤K = ∑(EXITit)k (k=1, 2, …K) (3)
and: (EXITit)k>K = 1 – (EXITit-1)k≤K (4)
where (EXIT)k is the ratio between the number of exits of firms aged k years and the
stock of firms in the industry in the previous period.
The entrepreneurship literature often regards the first three years after start-up as critical
for the survival and success of new firms (Littunen et al., 1998). The Global
Entrepreneurship Monitor (GEM) survey of entrepreneurial activity defines young
businesses as firms that have been active for three and a half years or less.4 Mata and
Portugal (1994) find that more than 40% of new entrants in the Portuguese industry
have exited by the fourth year, which seems to indicate that firms remaining in the
market four years after entry may be deemed ‘established’ incumbents. We therefore
adopt the three year threshold (K = 3) to differentiate exits of trial-and-error entrants
(i.e. exits by young firms) from exits by established incumbents. Hence, we define two
distinct components accounting for the replacement effect on subsequent turbulence:
i. exit by young firms (i.e. trial-and-error entrants), measured by the exit rate of
firms that were three years or younger, lagged one period: EXIT3 = (EXITit-1)3
ii. exit by established incumbents, measured by the exit rate of firms that were four
years or older, lagged one period: EXIT4 = 1 – (EXITit-1)3
While acknowledging that this is a rough and somewhat arbitrary classification, we feel
it fulfils the present study’s objective of clarifying the mechanics of industry dynamics 4 According to the GEM definition, an enterprise is classified as a young business if it has paid salaries and wages for more than three months but for less than 42 months, and as an established business if it has paid salaries and wages for more than 42 months (Acs et al., 2005).
11
Jena Economics Research Papers 2007-043
by allowing us to identify which type of exit plays a bigger role in generating turbulence
through replacement at different stages of the product life cycle.
3.3. Control Variables: industry growth and its volatility
High market growth rates are taken as a signal of significant profit opportunities by
potential entrants (Geroski, 1995b; Caves, 1998; Camerer and Lovallo, 1999). However,
growth rates in expanding markets usually fluctuate significantly. Studies of markets
conducted by a variety of disciplines, including industrial organization and
organizational ecology, have shown that demand growth volatility is a significant source
of uncertainty (Hannan and Freeman, 1989; Geroski, 1991).
Gort (1963) argued that rapid growth generates instability in two ways. First, given
imperfect foresight, some firms adjust their scale of production faster than others and
this leads to shifts in market share. Second, assuming there are recurrent lags in the
adjustment of supply to rapid changes in demand, earnings will rise above a normal rate
of return. This last effect will attract more entrants into the industry, thus generating
turbulence.
Like incumbents, potential entrants in industries with high, volatile growth rates will
face uncertainty with their scale of entry. On one hand, uncertainty with regard to
market growth may cause overconfidence, leading potential entrants to invest too much,
thus affecting their chances to be profitable (Camerer and Lovallo, 1999). On the other
hand, uncertainty could also conceivably cause potential entrants to delay their
investment decisions, resulting in less entry and, therefore, lower levels of turbulence
(Dixit, 1989; 1992).
12
Jena Economics Research Papers 2007-043
The present study uses annual industry employment growth rates (GROWTH)5 to
account for industry growth and its effect on turbulence rates.6 Growth rates are usually
positively correlated with volatility. It is then necessary to distinguish the effects of
industry growth on industrial turbulence from those caused by its volatility.
Volatility in growth rates has been measured in a variety of ways (see Camerun et al.,
1987 for a brief review). The present study adopts a procedure similar to that proposed
by Schwartz and Altman (1973), regressing industrial employment growth rates against
time and taking the absolute value of the residuals. In order to mitigate the relatively
high level of correlation between the volatility measure and the employment growth
variable, we use the natural logarithm of volatility (VOLATILITY) in our estimations;
this reduces the problem of correlation between growth and its volatility considerably,
so both variables can be used simultaneously in estimation.
3.4. Control variables: determinants of turbulence across industries
Since the influential work of Orr (1974), a broad range of empirical studies have found
that entry and exit respond to a variety of incentives and barriers (recent examples
include: Carree and Dejardin, 2006; and Arauzo et al., 2007). These factors impact both
entry and exit (symmetry) and influence the intensity of competition.
5 We drop industry and time indices for the rest of our discussion of explanatory variables. Values for the variables change both across industries and over time, except for the variable accounting for the business cycle, which is the same for all industries. 6 An important drawback of our growth and volatility measure is that we use employment data instead of sales, due to the unreliability of sales data at our disposal. However, estimations using growth rates and volatility indexes based on corrected sales data, which are not reported here but are available from the authors upon request, yielded very similar results to the ones reported in the present paper.
13
Jena Economics Research Papers 2007-043
Scale economies
Studies such as those by Caves and Porter (1976), Harrigan (1981), and Shapiro and
Khemani (1987), established that technological and structural factors affect entry and
exit. Such factors include sunk costs and scale economies in production, R&D,
marketing and distribution. Also, strategic barriers to entry may arise if large firms in a
highly concentrated market act collusively (Schmalensee, 1988; Bunch and Smiley,
1992). The larger the industry’s minimum efficient scale (MES), the costlier it will be
for new firms to enter the market and achieve efficiency in operations, so the size of the
MES should have an impact on turbulence. Following Pashigan (1969), and Fotopoulos
and Spence (1998), we define the MES for industry i in year t as:
MES = (5) )/()/(1
AAnA jN
j jj∑ =
where A represents total employment in the industry; Aj denotes total employment in the
jth firm size class, nj denotes the number of firms in the jth firm size class, and N is the
total number of size classes in the industry. Hence, the MES is computed as the average
firm size in the jth firm size class, weighted by the share of industry employment
accounted for by firms in that class.
The extent to which the MES represents an effective barrier to entry is dependent on the
cost disadvantage faced by firms entering at scales lower than the MES (Caves et al.,
1975). This disadvantage has been measured using the cost disadvantage ratio (CDR) –
see, for instance, Caves et al. (1975); and Schmalensee (1988). We approach the CDR
by taking the ratio between average firm size and the MES. The lower the CDR, the less
effective a barrier to entry the MES is likely to be, and so the greater should be
turbulence.
14
Jena Economics Research Papers 2007-043
Concentration
In theory, an inverse relationship between industry concentration and both entry and
exit should be expected. High levels of concentration allow incumbents to collude in
order to control entry and exit, while stabilizing market shares (Schmalensee, 1988).
However, even in markets where the MES is relatively large and concentration levels
are high, small firms can coexist with much larger ones. This may happen either
because these firms are small enough not to be perceived as a threat by the larger ones,
or because the degree of product differentiation is significant (Gelman and Salop, 1983;
Lieberman, 1990; Bunch and Smiley, 1992). We examine the relationship between
concentration and turbulence using both the four firm concentration ratio
(CONCENTRATION) and the share of micro-firms (5 employees or less) in the
industry (MICROSHARE),7 both measured in terms of employment figures.
Industry concentration is expected to have varying impacts on turbulence depending on
industry growth and the extent of barriers to entry. High concentration might be a
temporary phenomenon, especially in emerging and growing industries where barriers
to entry are low. Concentration levels change over the product life cycle, so there is in
fact a degree of feedback and endogeneity between turbulence and concentration over
time (Jovanovic and MacDonald, 1994; Klepper, 1996; Jovanovic and Tse, 2006).
While concentration may be high in the very early stages of an industry’s evolution,
high levels of turbulence (mostly due to entry) will follow, leading to less concentration.
As the industry matures with its resulting shakeout, turbulence (now mostly due to exit)
remains significant and concentration increases. In the later stages of the life cycle,
7 In this way we are able to appraise the influence on turbulence of the evolution of the share represented by both the largest and the smallest firms in the market. The greater the combined market share of the largest firms, the lower should be the turbulence rate; the greater the combined market share of very small firms, the higher should be the turbulence rate.
15
Jena Economics Research Papers 2007-043
concentration should be high with low turbulence. Levy (1985) suggests that the rate of
change in concentration influences entry. For example, sharp increases in market
concentration indicate increasing levels of industry barriers causes less turbulence.
Therefore, we also test whether turbulence levels respond negatively to changes in
concentration using the annual variation in the Herfindahl index (VARHERF) as an
explanatory variable.
The extent of multi-plant operations
In a study of the determinants of entry, Duetsch (1984) found that the extent of multi-
plant operations significantly limits entry. Multi-plant operations may signal that
incumbents have expanded across geographic markets to save in transport costs, and/or
have segmented their product lines and are taking advantage of scale economies in plant
specialization. While the extent of multi-plant operations may act as a barrier to entry in
growing markets, it also acts as a barrier to firm exit in declining markets, since having
a large number of plants allows a firm to discontinue operations gradually (Ghemawat
and Nalebuff, 1985, 1990; Lieberman, 1990).The extent of multi-plant operations is
then expected to be negatively correlated with industry turbulence. The logarithm of the
average number of establishments per firm (PLANTS) is used to capture the effect of
multi-plant operations on turbulence.
Industry size and the business cycle
Studies of entry and exit suggest that larger industries have more entry and exit
activities (Orr, 1974; Khemani and Shapiro, 1986), hence we include the share of
industry employment in total employment in the economy (INDUSTRY SIZE) as an
16
Jena Economics Research Papers 2007-043
explanatory variable. In order to capture effects associated with macroeconomic cycles,
a dichotomous business cycle dummy (YEARDM) variable has been added to capture
the effects of business cycles (expansion=1 vs. recession=0) on turbulence levels.
4. Data and Methodlolgy
4.1. The data
In order to test the hypotheses in our study we explore the Quadros de Pessoal database,
a longitudinal matched employer-employee data set built from mandatory information
submitted annually by all firms with at least one employee to the Portuguese Ministry of
Employment and Social Security. Each year there is at least 145,000 firms with 170,000
establishments, and 2,000,000 employees and owners which are fully traceable with
unique identification numbers, thus allowing for the identification of both new entrants
and exiting firms, as well as the opening and closing of subsidiaries.
While the Portuguese economy is characterized by a small average firm size (which is
consistent with Portugal being a small open economy), we believe this does not impede
the validity of our results in comparison with other developed economies, as much of
the Portuguese data is consistent with data from other countries. In particular, Cabral
and Mata (2003) provide compelling evidence that the Portuguese economy displays
similar patterns to those of larger and more developed countries with regard to the firm
size distribution across industries.
Our panel covers a time span of eight years, from 1986 to 1993. Each firm is classified
by the six-digit sector of industry aggregation. This provides unprecedented detail,
17
Jena Economics Research Papers 2007-043
allowing for the recognition of turbulence patterns and identification of emerging and
declining product markets within more widely defined industries. However, the use of
such detailed, market-level data has a cost: firms competing in more than one industry
are allocated to the sector where it does the majority of its business. While this means
that some information is lost, a large percentage of firms – indeed most new entrants –
is small and in fact competes in only one market, or six-digit sector. We believe that the
insight gained from examining turbulence at the product market level outweighs the loss
of information due to the process of allocating firms to product markets. Our study then
focuses on 319 six-digit industrial sectors which covered about 95% of total industry
employment in 1993. Each sector had at least 100 employees in 1993. Table 1 presents
definitions and summary statistics for all the variables used in the present study, based
on the observations for the 319 sectors over eight years.
These sectors were ranked by average employment growth rates over the 1986-1993
period. The highest growth sectors comprising up to 10 percent of total employment in
1993 were classified as ‘high growth’ industries (yielding a total of 64 sectors). The
lowest growth sectors comprising up to 10 percent of total employment were classified
as ‘declining’ industries (yielding a total of 50 sectors).8
We have therefore divided our sample of 319 six-digit industrial sectors into three
groups: high growth (64 sectors); declining (50 sectors); and the remaining (205)
sectors, which we term ‘low growth’ or ‘mature’ industries in order to facilitate further
discussion.9
8 This procedure is similar to the one used by Birch (1987). 9 We realize that the 205 sectors included in this group are too different in terms of structure and growth stage to be classified under only one heading. The purpose of this ‘midway’ is solely to act as a control for the high growth and declining industry groups.
18
Jena Economics Research Papers 2007-043
Table 2 presents a comparative overview of the mean values of entry, exit, turbulence,
growth and volatility in growth rates over the 1986-1993 period for all six-digit
industrial sectors, as well as for high growth, declining and low growth/mature sectors
indicated individually. Mean values for exit of younger (trial-and-error) and established
incumbents are also presented.
In order to determine whether the high growth and declining industry groups are
significantly different from the whole sample, Levene’s (1960) F test of equality of
variances and Welch’s (1947) t test of equality of means were used. Levene’s test
rejected the variance equality hypothesis for all the variables. Welch’s test confirmed
that mean values for all variables in high growth and declining industries differ
significantly from the those for the whole sample, except for the exit rate of established
incumbents in high growth industries.10
Evidence in Table 2 shows that both turbulence and net entry rates are considerably
higher than the mean in high growth industries, which registers higher rates of entry and
exit than declining industries, while, as expected, the values for the low growth/mature
group are between the high-growth and declining groups. These statistics suggest that,
as an industry progresses through its life cycle, entry rates decline further than exit rates,
thus average net entry rates become negative. These results are consistent with Agarwal
and Gort (1996) for the US; Baldwin and Gorecki (1991) for Canada; and Disney et al.
(2003b) for the UK.
Exit rates of young firms are significantly higher than average in high growth sectors,
and significantly lower than average for declining ones, while the low growth/mature
10 The same tests were conducted for all remaining explanatory variables used in the present study. Results are available from the authors upon request. Equality of means and variances between the high growth and declining industry groups, and the whole sample was rejected at the 5% significance level or lower for all variables, except for the mean value of the four firm concentration ratio in high growth sectors.
19
Jena Economics Research Papers 2007-043

group registers values between the other two. However, differences between mean exit
rates for established incumbents across groups are weakly significant , suggesting that
replacement effects associated with the exit of established incumbents likely play an
important role in market selection regardless of the point in the product life cycle.
4.2. Empirical methodology
Table 3 displays the correlation coefficients between the variables used in this study.
The minimum efficient scale (MES) variable displays a high correlation coefficient with
the logarithm of the average number of establishments per firm (PLANTS), which is
probably a result of our measure for the MES having been calculated using firms and
not individual plants as a reference.11 Since this correlation would result in collinearity
problems, we excluded the MES variable from our analysis, as we believe that our
proxy for the cost disadvantage ratio (CDR) – the ratio between the average number of
firms in the industry and the MES – provides a strong enough indicator of the
significance of scale economies (increases in the CDR would strengthen barriers to
entry and exit, and thus lower turbulence).
Using TURBULENCE as the dependent variable, we run models for the whole sample
of 319 six-digit industrial sectors and for each industry group – high growth, declining
and low growth/mature – separately. For each industry group, we run a reduced model
including the full lagged exit (EXIT = EXIT3 + EXIT4) and a complete model, in
which the lagged exit rate is divided into exit by young businesses (EXIT3) and exit by
older incumbents (EXIT4). The complete model equation is then:
11 In defining the MES with reference to firms and not plants we attempted to capture scale economies that are not restricted to production technologies, but include company-level cost components such as advertising, distribution, sales, and R&D.
20
Jena Economics Research Papers 2007-043
titit
itit
ititit
ititititit
YEARDMSIZEINDUSTRYVARHERFMICROSHAREIONCONCENTRAT
PLANTSCDRVOLATILITYGROWTHEXITEXITENTRYTURBULENCE
.....
....4.3..
121110
98
765
43210
βββββ
ββββββββ
++++++
+++++++++=
(6)
Panel data estimators are used to examine the effect of changes in the explanatory
variables over time on turbulence levels across industries. Considering the variety of
explanatory variables being used and the reduced level of sector aggregation in the data,
the presence of heteroskedasticity is a potentially serious problem.12 The Cook-
Weisberg test for heteroskedasticity found that this problem is significant at the 1%
level when performing estimations using all 319 sectors (χ2=1348.5), and persists when
estimations are conducted for high growth and declining industry groups separately
(χ2=270.2; and χ2=133.9, respectively).
It is also reasonable to assume that errors are correlated over time and across industrial
sectors. We test for serial correlation using the Breusch-Pagan Lagrange multiplier
(LM) test for first-order (AR1) serial correlation (Baltagi and Li, 1995). Results found
serial correlation at the 1% significance level (χ2=15.2) for all 319 sectors. While the
declining industries group does not display significant signs of serial correlation
(χ2=0.28), this problem is significant at the 1% level for high growth industries (χ2=8.4).
Since errors are correlated over time, ordinary least squares (OLS) will not produce
unbiased estimates. We therefore use the feasible generalised least squares (FGLS)
estimator (Parks, 1967; Beck and Katz, 1995), which corrects for AR(1) serial
correlation specific to each panel and is also appropriate to deal with heteroskedasticity,
as it handles cross-sectional correlation as well.
12 The number of firms in each of the 319 six-digit industrial sectors being examined varies from one to 13014, with a mean of 409.5 and a standard deviation of 1017.7, so we expect significant variance in the values of explanatory variables.
21
Jena Economics Research Papers 2007-043
The models are also estimated using the Prais-Winsten OLS estimator with panel-
corrected standard errors, which also allows for estimation of panel models with
heteroskedastic and unbalanced panels and with AR(1) serial correlation. While the
FGLS work better with larger samples (Beck and Katz, 1995), the Prais-Winsten OLS
estimator provides a benchmark for checking the robustness of the results.
One final empirical issue concerns the endogeneity of the dependent variable
(TURBULENCE) and the explanatory variables measuring lagged entry and exit rates.
The sum of three of the explanatory variables – lagged entry (ENTRY), lagged exit of
young firms (EXIT3), and lagged exit of established incumbents (EXIT4) – corresponds
to the lagged value of the dependent variable. The possibility of endogeneity may
require a different approach to model estimation, such as the use of generalised methods
of moments (GMM) estimators, which entails the use of instrumental variables
correlated with the explanatory variable but not with the dependent variable.13 It should
be pointed out, however, that correlation coefficients between the dependent variable
and these three lagged explanatory variables are not especially high.14 We therefore do
not believe that endogeneity is significant enough to seriously affect results and do not
pursue the GMM approach.
13 Uncovering an observable variable that is correlated with, for instance, lagged entry, but not with turbulence is not an easy task. 14 According to Table 3, correlation coefficients with the explanatory variable (TURBULENCE) are: 0.18 for EXIT4; 0.29 for EXITT3; and 0.41 for ENTRY.
22
Jena Economics Research Papers 2007-043
5. Results
Estimation results of the complete model with all 319 six-digit industrial sectors are
presented in Table 4. Tables 5-7 present the results of the complete and reduced models
for high growth, declining and low growth/mature industries. The results do not display
significant incongruities between estimations for the full sample and for each industry
group. Coefficients of the FGLS estimations are consistent with those of the Prais-
Winsten estimations (in particular, the signs and significance levels are typically the
same), indicating that results are sufficiently robust, so FGLS results are used as the
reference for our discussion.
5.1. Displacement and replacement effects on turbulence
In order to test the Hypothesis H1 we use the reduced model (including full entry and
exit rates, lagged one period) for each group of industrial sectors. Both lagged entry
(ENTRY) and lagged exit (EXIT) have positive and significant effects on turbulence in
estimations for all industry groups. Results therefore indicate that both displacement and
replacement have significant effects on turbulence regardless of the stage of the product
life cycle.
Figure 1 plots the estimated (FGLS) coefficients of the displacement and replacement
variables for individual industry groups, in order to display their evolution throughout
the product life cycle. Displacement effects increase in magnitude as an industry
evolves from high to low growth/maturity, and then levels off: an increase of one
percentage point in entry rates increases the turbulence rate in the following period by
roughly 0.38 for both declining and low growth industries, but only by about 0.31 for
23
Jena Economics Research Papers 2007-043
high growth industries. Replacement effects decrease later in the product life cycle, as
predicted: an increase of one percent in the exit rate increases turbulence rates in the
subsequent period by about 0.465 in high growth markets. The effect’s magnitude is
still relatively high (0.43) for the midway group, but decreases to only 0.28 in declining
industries.
These results provide support for H1: the magnitude of the replacement effect is indeed
greater than that of the displacement effect in high growth industries, while the opposite
holds true for declining industries. Replacement effects remain greater than
displacement effects in the midway group but, given its size, it is hard to pinpoint at
which stage the magnitude of displacement effects on turbulence rates overtakes that of
replacement in the product life cycle.
5.2. Replacement effects and the exit of young firms and established incumbents
In order to test Hypothesis H2, we examine the replacement effects associated with exit
by young firms (trial-and-error entrants) and established incumbents separately using
the complete models, including the exit rates of young firms and established incumbents
(EXIT3 and EXIT4) instead of the full lagged exit rate (EXIT). The replacement effect
associated with exit of young firms is positive and significant for high growth
industries, as well as for the low growth/mature industry group. However it is not
significant for declining industries, suggesting that once industries reach decline, trial-
and-error entry is no longer important – an assessment which we can show in Table 2,
where the average exit rate of young firms in declining industries over the 1986-1993
period is only 2.4%, less than half the same rates for low growth/mature and high
growth sectors.
24
Jena Economics Research Papers 2007-043
Figure 2 plots the evolution of the magnitude of displacement and replacement (of
young firms and established incumbents) effects on turbulence, taking into account the
non-significance of the coefficient of EXIT3 for declining industries. The displacement
effect displays a similar pattern to that exhibited in the reduced model, increasing as
industries evolve from high growth to maturity and stabilizing afterwards. Even though
its magnitude decreases substantially, levelling off as industries approach decline,
replacement of exiting established incumbents remains the main market selection force
underlying turbulence over the whole product life cycle. Replacement of young exiters
declines steadily as industries progress from high growth towards maturity, later
becoming insignificant for declining industries, as pointed out above.
We consider that Hypothesis H2 is confirmed, because the replacement of young firms
(trial-and-error entrants) plays a less important role in generating turbulence as markets
evolve eventually becoming insignificant for declining markets. This fact is likely to be
the reason why the magnitude of displacement effects surpasses that of replacement
effects for declining industries in the reduced model estimations.
5.3. Control variables
In the model estimated for all sectors together, an increase of one percentage point in
the industry growth rate (GROWTH) increases the turbulence rate by about 0.065. The
coefficient for the industry growth rate is, however, quite different when models for
high growth, declining and other industries are estimated separately. Firstly, the
magnitude of the positive coefficient of industry growth rates on turbulence is greater
for low growth/mature industries than for high growth ones: an increase of one
percentage point in the industry growth rate yields an increase of about 0.05 in the
25
Jena Economics Research Papers 2007-043
turbulence rate for high growth industries, but the same change yields almost double
that value (about 0.09) for low growth industries. Secondly, the coefficient for the
growth rate in declining industries is negative. The fact that growth rate volatility is
included amongst the explanatory variables may play a part in generating these results.
Volatility is higher when growth rates are higher, so if volatility generates turbulence
through uncertainty, it may be suggested that a significant part of the effect of industry
growth on turbulence is associated with uncertainty generated by fluctuations in growth
rates.
Most of the other control variables are significant and have the expected effects.
Turbulence increases with a large share of employment held by microfirms in the
industry (MICROSHARE), and decreases the significance of scale economies (CDR)
increases. The extent of entry barriers has the expected effects on turbulence rates.
Larger industries are more turbulent and turbulence is significantly higher when the
business cycle is positive.15 The number of establishments per firm (PLANTS) has the
expected negative effect on turbulence, but this is only significant in the FGLS
estimation.
The results obtained from separate estimation of the models for high growth, declining
and low growth/mature industries are similar to the model including all sectors together,
both in terms of direction and size of the effects, suggesting that these control variables
affect turbulence the same way regardless of the stage in the product life cycle. The
main exception is the variable measuring the industry’s share in total employment
(INDUSTRY SIZE). The relative size of the industry in the economy has insignificant
effects on turbulence for both high growth and declining industries, but it affects 15 The fact that the Portuguese economy went through significant deregulation changes in the period 1986-1989 (immediately after entering the EU) very likely also plays a role in the significantly positive coefficient for YEARDM.
26
Jena Economics Research Papers 2007-043
turbulence positively in midway industries. The explanation for these results is
straightforward. On the one hand, industries in the early stages of their life cycle register
higher levels of turbulence due to higher levels of uncertainty, as well as both
replacement and displacement, even though their overall size and share of the economy
might still be small. On the other hand, declining industries decrease in size and
significance in the economy as firms exit; turbulence levels reflect such exit and
therefore are less likely to be affected by the corresponding decrease in share of the
industry in the economy.
The effects of concentration on turbulence are more ambiguous, thus reinforcing the
suggestion that concentration and turbulence are endogenous to a certain degree. The
coefficient for the four firm concentration ratio (CONCENTRATION) only has a
significant (negative) effect on turbulence in the FGLS estimation and, even then, the
magnitude of the coefficient is relatively small – an increase of one percentage point in
the combined market share of the four largest firms would result in a decrease of only
0.017 in the turbulence rate. The dynamic role played by decreases in concentration in
generating turbulence (as proposed by Levy, 1985), measured by the effect of the
change in the Herfindhal index, although significant, is also relatively small.
While the share of microfirms firms keeps its positive and significant effect on
turbulence regardless of the level of industry growth, the same is not true for the other
market structure variables. CONCENTRATION has significant negative effects on
turbulence for high growth and declining industries, but is insignificant for the large
midway group. An annual increase in concentration (as measured by VARHERF) has a
positive effect on turbulence in declining industries, but a negative impact for all other
industries. The positive relationship between concentration and turbulence observed in
27
Jena Economics Research Papers 2007-043
declining sectors may result from the exit of incumbents, which would increase
turbulence while also increasing concentration of market shares in the remaining firms.
6. Concluding Remarks
This study uses the concept of turbulence (entry and exit) in seeking to uncover the
underlying dynamics of industry selection and evolution over the product life cycle. The
data set allowed for an unusual observation of the evolution over time of six-digit
industrial sectors, which virtually correspond to product markets. While previous
studies showed the significance of symmetry in the effects of the determinants of both
entry and exit across several industries, the evolution of the dynamic relationship
between entry and exit over the product life cycle has received less attention from multi-
industry empirical studies. Indeed, while having been the focus of noteworthy
theoretical and industry-level empirical studies (such as those by Jovanovic, 1982; Gort
and Klepper, 1982; Klepper and Graddy, 1990; Jovanovic and MacDonald, 1994; and
Klepper, 1996), the evolution of market dynamics over the product life cycle has not, as
far as we know, been previously examined for a large sample of industries at such a low
level of aggregation.
This study departed from the idea that there are two mechanisms simultaneously at
work influencing the intertemporal relationships between entry and exit and, therefore,
affecting market selection and industry evolution:
i. displacement, in which new firms enter the market and, by being successful,
force the exit of less efficient incumbents; and
28
Jena Economics Research Papers 2007-043
ii. replacement, in which new firms are attracted into the market by the existence
(or the perception of existence) of a vacuum left by exiting incumbents.
The present study contributes to the literature by investigating how the dynamics of
displacement and replacement evolve over the course of the product life cycle,
uncovering which mechanisms play a major role in generating turbulence and market
selection as industries grow and decline, a question that goes back to metaphors of
industry evolution introduced by Marshall (1920) and Schumpeter (1942).
Our results indicate that displacement and replacement both play a role as market
selection mechanisms, having significant impacts on turbulence at all stages of the
product life cycle. As predicted during development of the hypotheses tested in this
study, displacement effects increase in magnitude as industries evolve from high growth
to mature stages (even though levelling off as they approach decline), while
replacement effects decrease in magnitude during the course of industry evolution. In
high growth industries, as well as in industries closer to maturity, selection occurs
primarily through the replacement of exiting firms by subsequent entry; while in
declining industries, selection occurs primarily via the displacement of incumbents by
recent entrants.
Overall, replacement appears to play the biggest role in market selection throughout
most of the product life cycle, as the vacuum created by exiting firms is filled with new
entrants. It is only when industry growth rates become persistently negative that the
displacement effect surpasses replacement effects as a market selection force. By
highlighting the dual nature of replacement effects, and separating them into those
generated by the exit of trial-and-error entrants (i.e. those firms that exit markets soon
after entry) and by established incumbents, the dynamic relationship between
29
Jena Economics Research Papers 2007-043
replacement and displacement changes over the product life cycle is exposed. While the
exit of established incumbents plays a significant role in generating turbulence
throughout the life cycle, the effect of the exit of young businesses on turbulence
declines steadily, eventually becoming insignificant as industries reach decline.
Exit of young, trial-and-error entrants (who are quickly replaced by new firms) is higher
than that of established incumbents for about 85% of the six-digit sectors examined
(high growth and mature product markets). However, the revolving door slows down as
markets progress from high growth towards maturity and decline, as the vacuum created
by the exit of young firms becomes smaller or, at least, less attractive to potential
entrants. We suggest that the decrease in the size of the replacement effect of young
exiters plays a significant role in changing the dynamics between replacement and
displacement as industries reach decline.
Furthermore, although the magnitude of replacement effects associated with the exit of
established incumbents decreases as industries progress from high growth to maturity, it
remains greater than the replacement effects associated with young firm exits,
suggesting that the exit of an established incumbent creates a stronger impression of
vacuum in the market than that of a trial-and-error entrant.
Our results confirm that for most industries the observation advanced by previous work
(such as, for instance, Beesley and Hamilton, 1984; and Agarwal and Gort, 1996) that
turbulence decreases as the product life cycle progresses and market growth rates
decline. However, by examining the effect of growth rates at different stages of the
product life cycle, the present study provides new insights into this relationship. Firstly,
we find that the positive effect of market growth on turbulence is actually higher in low
growth/mature industries than in high growth ones. This may be due to two sorts of
30
Jena Economics Research Papers 2007-043
reasons: one the one hand, since growth rates fluctuate more in high growth industries,
potential entrants may decide to “wait and see” if the increase in growth is sustained; on
the other hand, growth increases in mature industries may be interpreted as changes in
the current trend towards decline, thus attracting new entrants to take advantage of this
perceived revival. Perhaps more remarkably, the effect of growth rates on turbulence is
actually negative in declining markets. In these markets, an increase in the growth rate
may be interpreted as a sign that decline is slowing down, inducing incumbents to delay
exit.
It is possible that our findings with respect to the effect of market growth on turbulence
are linked to the inclusion in our models of the variable measuring volatility in growth
rates. Volatility is greater when growth rates are higher, so if volatility generates
turbulence through uncertainty, it may be possible that part of the turbulence usually
associated with high market growth rates is in fact a result of uncertainty in the
decisions of recent entrants and older incumbents, in the course of learning and strategic
interaction processes occurring in markets. Theories of learning and selection in markets
spawned by the seminal work of Jovanovic (1982) highlight the role played by the
uncertainty of young entrants with regard to their efficiency and to demand conditions.
We find that turbulence is positively influenced by volatility in growth rates for all but
declining industries.
In general, our study finds that the mechanisms propelling industry evolution are
different for different stages of the product life cycle. These differences are not simply
the result of changes in market growth rates, but are frequently associated with changes
in competitive dynamics and in uncertainty with regard to market growth. Future
avenues for research into the role played by displacement and replacement mechanisms
31
Jena Economics Research Papers 2007-043
in selection and industry evolution should include the examination of industry-level and
environmental determinants of these processes and their components, in order to shed
more light on variations in replacement and displacement across industries.
References
• Acs, Z.J., Arenius, P., Hay, M., and M. Minniti (2005), Global Entrepreneurship Monitor–2004 Summary Report. Babson College & London Business School.
• Agarwal, R. and D.B. Audretsch, (2001), “Does entry size matter? The impact of life cycle and technology on firm survival”, The Journal of Industrial Economics, 49, 21-43.
• Agarwal, R. and M. Gort, (1996), “The evolution of markets and entry, exit and survival of firms”, The Review of Economics and Statistics, 78(3), 489-498.
• Aghion, P., Blundell, R., Griffith, R., Howitt, P. and S. Prantl (2004), “Entry and productivity growth: evidence from microlevel panel data”, Journal of the European Economic Association, 2(2-3), 265-276.
• Arauzo, J.M., Manjón, M., Martín, M. and A. Segarra (2007), “Regional and sector-specific determinants of industry dynamics and the displacement–replacement effects”, Empirica, forthcoming (published online on March 2, 2007).
• Audretsch, D.B., (1995), Innovation and Industry Evolution, MIT Press, Cambridge.
• Baldwin, J.R., (1998), “The dynamics of industrial competition: a North American perspective”, Cambridge University Press.
• Baldwin J.R. and P.K. Gorecki, (1991), “Firm entry and exit in the Canadian manufacturing sector”, The Canadian Journal of Economics, 26(2), 1970-1982.
• Baltagi, B.H. and Q. Li, (1995), “Testing AR(1), and MA(1), disturbances in and error component model with autocorrelated disturbances”, Journal of Econometrics, 68, 133-151.
• Beck, N. and J.N. Katz, (1995), “What to do (and not to do), with time-series cross-section data”, American Political Science Review, 89(3), 634-647.
• Beesley M.E. and R.T. Hamilton, (1984), “Small firms’ seedbed role and the concept of turbulence”, Journal of Industrial Economics, 33(2), 217-231.
• Birch, D.L., (1987), “Job generation in America”, New York: the Free Press.
• Bunch, D. and R. Smiley, (1992), “Who Deters Entry? Evidence on the Use of Strategic Entry Deterrents”, Review of Economics and Statistic, 74, 509–521.
• Cabral, L.M.B. and J. Mata (2003), “On the evolution of the firm size distribution: facts and theory”, American Economic Review, 93(4), 1075-1090.
• Camerer, C. and D. Lovallo (1999), “Overconfidence and excess entry”, American
32
Jena Economics Research Papers 2007-043
Economic Review, 89(1), 306-18.
• Camerun, K.S., M.U. Kim and D.A. Whetten, (1987), “Organizational effects of decline and turbulence”, Administrative Science Quarterly, 32(2), 222-240.
• Carree, M.A. and M. Dejardin (2006), “Entry thresholds and actual entry and exit in local markets”, Small Business Economics, forthcoming (published online on November 23, 2006).
• Caves, R.E., (1998), “Industrial organization and new findings on the turnover and mobility of firms”, Journal of Economic Literature, 36, 1947-1982.
• Caves, R.E., Khalilzadeh-Shirazi, J. and M.E. Porter, (1975), “Scale Economies in Statistical Analyses, of Market Power”, Review of Economics and Statistics, 57 (2), 133-140.
• Caves, R. and M. Porter, (1976), “Barriers to Exit”, in Essays in Industrial Organization in Honor of Joe Bain, Eds. R. Masson and P. Qualss, Ballinger, Cambridge MA, 39-70.
• Caves, R.E., and M.E. Porter, (1978), “Market structure, oligopoly and the stability of market shares”, Journal of Industrial Economics, 289-313.
• Disney, R., Haskel, J. and Y. Heden (2003a), “Restructuring and productivity growth in UK manufacturing”, Economic Journal, 113, 666-694.
• Disney, R., Haskel, J. and Y. Heden (2003b), “Entry, exit and establishment survival in UK manufacturing”, Journal of Industrial Economics, 51(1), 91-112.
• Dixit, A. (1989), “Entry and exit decisions under uncertainty”, Journal of Political Economy, 97(3), 620-638.
• Dixit, A. (1992), “Investment and hysteresis”, Journal of Economic Perspectives, 6(1), 107-132.
• Duetsch, L.L., (1984), “Entry and the Extent of Multi-plant Operations”, Journal of Industrial Economics, 32 (4), 477-487.
• Dunne, T., M.J. Roberts and L. Samuelson, (1988), “Patterns of entry and exit in us manufacturing industries”, Rand Journal of Economics, 19, 495-515.
• Fotopoulos, G. and N. Spence, (1998), “Entry and exit from manufacturing industries: symmetry, turbulence and simultaneity – some empirical evidence from Greek manufacturing industries, 1982-1988”, Applied Economics, 30, 245-262.
• French, M., (1986), “Structural change and competition in the united states tire industry, 1920-1937”, Business History Review, 60 (1), 28-54.
• Gelman J. and S. Salop (1983), “Judo economics: capacity limitation and coupon competition”, Bell Journal of Economics 14, 315–325.
• Geroski, P.A., (1991), “Market dynamics and entry”, In: P.A. Geroski and J. Schwalbach, eds., Entry and Market Contestability: an International Comparison, Oxford: Blackwell.
• Geroski, P.A., (1995a), “Market Dynamics and Entry”, Oxford: Blackwell.
• Geroski, P.A., (1995b), “What do we know about entry?” International Journal of
33
Jena Economics Research Papers 2007-043
Industrial Organization, 13, 421- 440.
• Ghemawat, P. and B. Nalebuff, (1985), “Exit”, Rand Journal of Economics, 16(2), 184-194.
• Ghemawat, P. and B. Nalebuff, (1990), “The devolution of declining industries”, Quarterly Journal of Economics 105(1), 167-186.
• Gort, M., (1963), “Analysis of Stability and Change in Market Shares”, Journal of Political Economy, 71, 51-63.
• Gort, M. and S. Klepper, (1982), “Time paths in the diffusion of product innovations”, Economic Journal, 92, 630-653.
• Hannan, J.T. and J. Freeman, (1989), “Organizational ecology”, Cambridge: Harvard University Press.
• Harrigan, K.R., (1980), “Strategy formulation in declining industries”, The Academy of Management Review, 5(4), 599-604.
• Harrigan, K.R., (1981), “Deterrents to Divestiture”, Academy of Management Journal, 24 (2), 306-323.
• Harrigan, K.R., (1982), “Exit decisions in mature industries”, The Academy of Management Journal, 25(4), 707-732.
• Jovanovic, B., (1982), “Selection and the Evolution of Industry”, Econometrica, 50, 649-670.
• Jovanovic, B. and G.M. MacDonald, (1994), “The Life cycle of a Competitive Industry”, Journal of Political Economy, 102, 322-347.
• Jovanovic, B, and C. Tse (2006), “Creative destruction in industries”, National Bureau of Economic Research (NBER) Working Paper No. 12520.
• Khemani, R.S. and D.M. Shapiro, (1986), “The determinants of new plant entry in Canada”, Applied Economics, 18, 1243-1257.
• Klepper, S., (1996), “Entry, exit, growth and innovation over the product life cycle”, American Economic Review, 86, 562-583.
• Klepper, S. and E. Graddy, (1990), “The evolution of the new industries and the determinants of market structure”, The Rand Journal of Economics, 21(1), 27-44.
• Klepper, S. and J.H. Miller, (1995), “Entry, exit and shakeouts in the United States in new manufacturing products”, International Journal of Industrial Organization, 13(4), 567-591.
• Levene, H., (1960), “Contributions to Probability and Statistics”, 278–292, Stanford University Press, CA.
• Levy, D., (1985), “Specifying the Dynamics of Industry Concentration”, Journal of Industrial Economics, 34 (1), 55-68.
• Lieberman, M.B., (1990), “Exit from declining Industries, ‘Shakeout’ or ‘Stakeout’?” Rand Journal of Economics, 21(4), 538-553.
• Littunen, H., Streamer, E. and T. Nenonen (1998), “Survival of firms over the critical first three years and the local environment”, Entrepreneurship & Regional
34
Jena Economics Research Papers 2007-043
Development, 10, 189-202.
• Marshall, A. (1920), Principals of Economics, Macmillan, London.
• Mata, J., & Portugal, P. 1994. “Life Duration of New Firms”, Journal of Industrial Economics, 42: 227–246.
• Nickell, S. (1996), “Competition and corporate performance”, Journal of Political Economy”, 104, 724-746.
• Orr, D., (1974), “The determinants of entry: a study of the Canadian manufacturing industries”, Review of Economics and Statistics, 56, 58-66.
• Parks, R., (1967), “Efficient estimation of a system of regression equations when disturbances are both serially and contemporaneously correlated”, Journal of American Statistical Association, 62(318), 500-509.
• Pashigan, P. (1969), “The effect of market size on concentration”, International Economic Review, 10 (3), 291-314.
• Schmalensee, R., (1988), Industrial Economics: An Overview, Economic Journal, 98, 643-681.
• Shapiro, D. and R.S. Khemani, (1987), “The determinants of entry and exit reconsidered”, International Journal of Industrial Organization, 5, 15-26.
• Schumpeter J.A., (1942), Capitalism, Socialism and Democracy. New York, Harper & Row.
• Schwartz, R.A. and E.I. Altman, (1973), “Volatility behavior of industrial stock price indices”, The Journal of Finance, 28(4), 957-971.
• Siegfried, J.J. and L.B. Evans, (1994), “Empirical studies of entry and exit: a survey of the evidence”, Review of Industrial Organization, 9, 121-155.
• Sutton, J., (1997), “Gibrat’s Legacy”, Journal of Economic Literature, 35 (1), 40-59.
• Vivarelli M., (2004), “Are all the potential entrepreneurs so good?” Small Business Economics, 23(1), 41-49.
• Vivarelli, M. and D. Audretsch, (1998), “The Link between the Entry Decision and Post-entry Performance: Evidence from Italy”, Industrial and Corporate Change, 7 (3), 485-500.
• Welch, B.L. (1947), “The generalization of ‘Student's’ problem when several different population variances are involved”, Biometrika, 34, 28-35.
35
Jena Economics Research Papers 2007-043
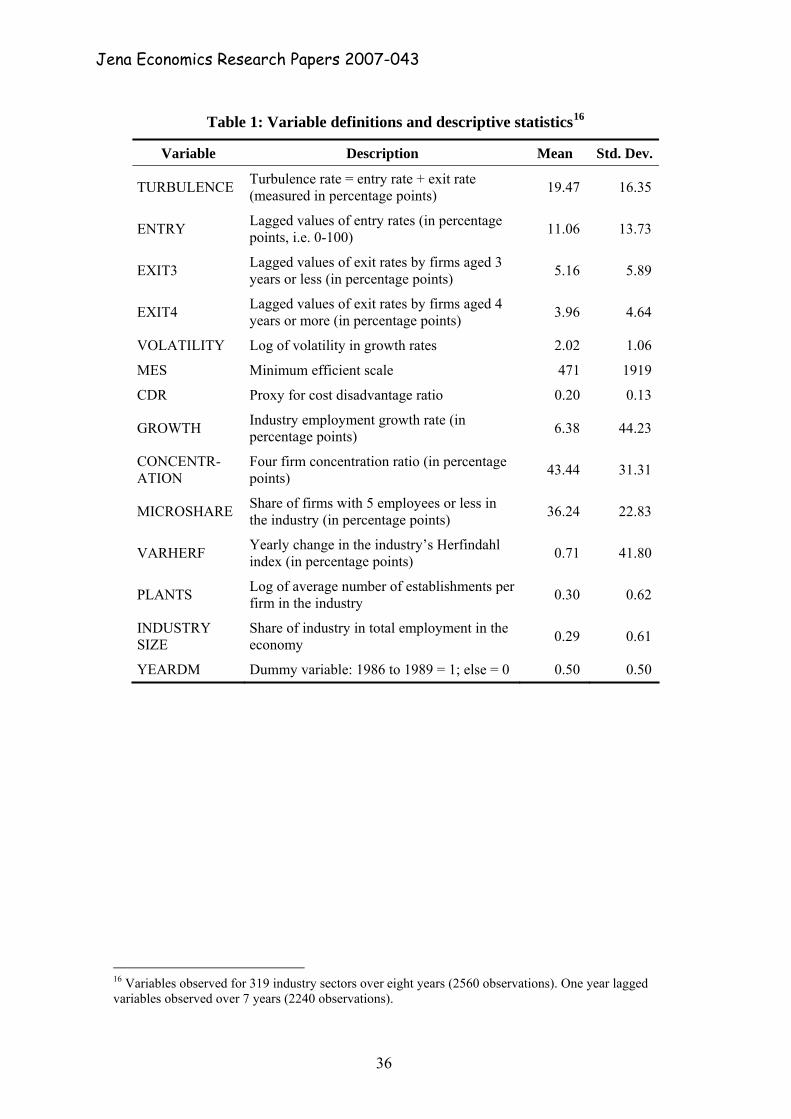
Table 1: Variable definitions and descriptive statistics16
Variable Description Mean Std. Dev.
TURBULENCE Turbulence rate = entry rate + exit rate (measured in percentage points) 19.47 16.35
ENTRY Lagged values of entry rates (in percentage points, i.e. 0-100) 11.06 13.73
EXIT3 Lagged values of exit rates by firms aged 3 years or less (in percentage points) 5.16 5.89
EXIT4 Lagged values of exit rates by firms aged 4 years or more (in percentage points) 3.96 4.64
VOLATILITY Log of volatility in growth rates 2.02 1.06
MES Minimum efficient scale 471 1919
CDR Proxy for cost disadvantage ratio 0.20 0.13
GROWTH Industry employment growth rate (in percentage points) 6.38 44.23
CONCENTR-ATION
Four firm concentration ratio (in percentage points) 43.44 31.31
MICROSHARE Share of firms with 5 employees or less in the industry (in percentage points) 36.24 22.83
VARHERF Yearly change in the industry’s Herfindahl index (in percentage points) 0.71 41.80
PLANTS Log of average number of establishments per firm in the industry 0.30 0.62
INDUSTRY SIZE
Share of industry in total employment in the economy 0.29 0.61
YEARDM Dummy variable: 1986 to 1989 = 1; else = 0 0.50 0.50
16 Variables observed for 319 industry sectors over eight years (2560 observations). One year lagged variables observed over 7 years (2240 observations).
36
Jena Economics Research Papers 2007-043

Table 2: Mean values of key variables
Variable High
Growth Industries
Declining Industries
Other (Low Growth / Mature)
Industries
All Industries
ENTRY 15.8 (*) (§) 5.5 (*) (§) 10.48 (*) 10.77
EXIT 10.1 (*) (§) 7.1 (*) (§) 8.62 (*) 8.70
TURBULENCE 25.9 (*) (§) 12.6 (**) (§) 19.10 (*) 19.47
GROWTH 27.88 (*) (§) -8.41 (*) (§§) 4.53 (*) 7.77
VOLATILITY 2.70 (*) (§) 1.89 (*) (§) 1.84 (*) (§) 2.02
EXIT3 6.3 (*) (§) 2.4 (*) (§) 5.24 (*) 5.16
EXIT4 3.8 (*) 4.6 (*) (§§§) 3.90 (*) 3.96
Equality of variances with the full sample (all industries) rejected with the rest of the population at 1% (*), 5% (**) or 10% (***) significance level. Equality of variances with the full sample (all industries) rejected with the rest of the population at 1% (§), 5% (§§) or 10% (§§§) significance level.
37
Jena Economics Research Papers 2007-043
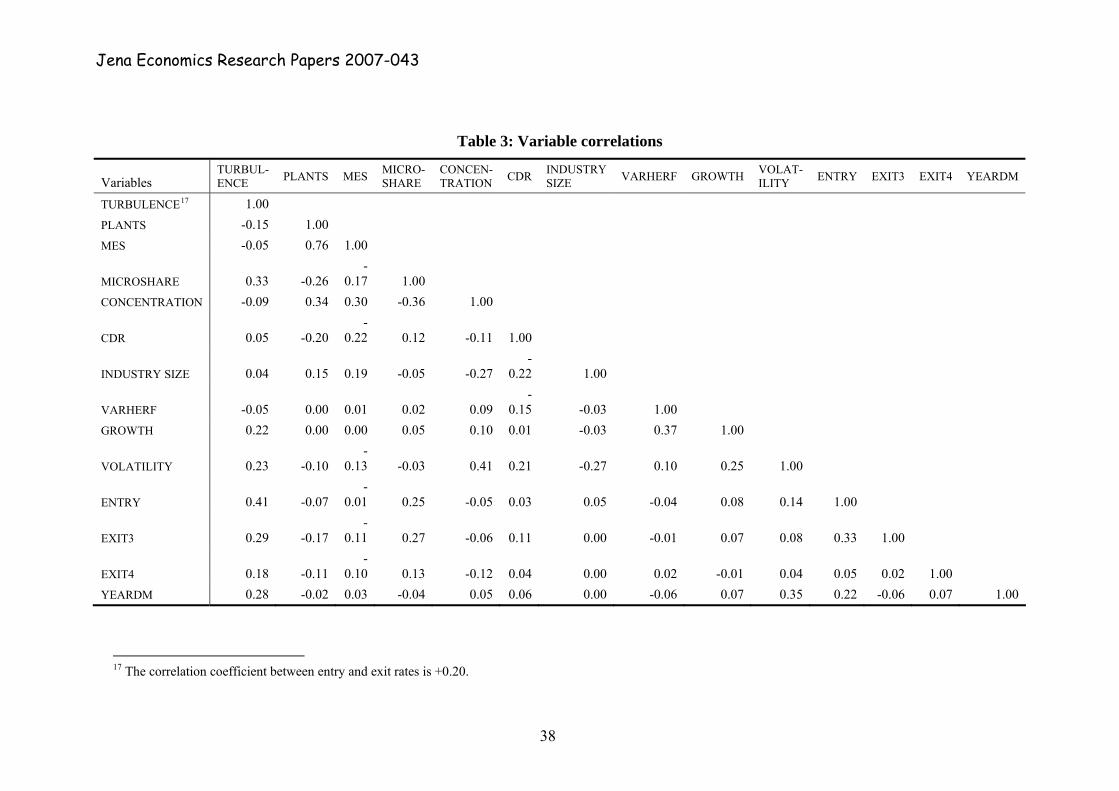
Table 3: Variable correlations
Variables TURBUL-ENCE PLANTS MES MICRO-
SHARE CONCEN-TRATION CDR INDUSTRY
SIZE VARHERF GROWTH VOLAT-ILITY ENTRY EXIT3 EXIT4 YEARDM
TURBULENCE17 1.00 PLANTS -0.15 1.00 MES -0.05 0.76 1.00
MICROSHARE 0.33 -0.26 -
0.17 1.00
CONCENTRATION -0.09 0.34 0.30 -0.36 1.00
CDR 0.05 -0.20 -
0.22 0.12 -0.11 1.00
INDUSTRY SIZE 0.04 0.15 0.19 -0.05 -0.27 -
0.22 1.00
VARHERF -0.05 0.00 0.01 0.02 0.09 -
0.15 -0.03 1.00 GROWTH 0.22 0.00 0.00 0.05 0.10 0.01 -0.03 0.37 1.00
VOLATILITY 0.23 -0.10 -
0.13 -0.03 0.41 0.21 -0.27 0.10 0.25 1.00
ENTRY 0.41 -0.07 -
0.01 0.25 -0.05 0.03 0.05 -0.04 0.08 0.14 1.00
EXIT3 0.29 -0.17 -
0.11 0.27 -0.06 0.11 0.00 -0.01 0.07 0.08 0.33 1.00
EXIT4 0.18 -0.11 -
0.10 0.13 -0.12 0.04 0.00 0.02 -0.01 0.04 0.05 0.02 1.00 YEARDM 0.28 -0.02 0.03 -0.04 0.05 0.06 0.00 -0.06 0.07 0.35 0.22 -0.06 0.07 1.00
17 The correlation coefficient between entry and exit rates is +0.20.
38
Jena Economics Research Papers 2007-043
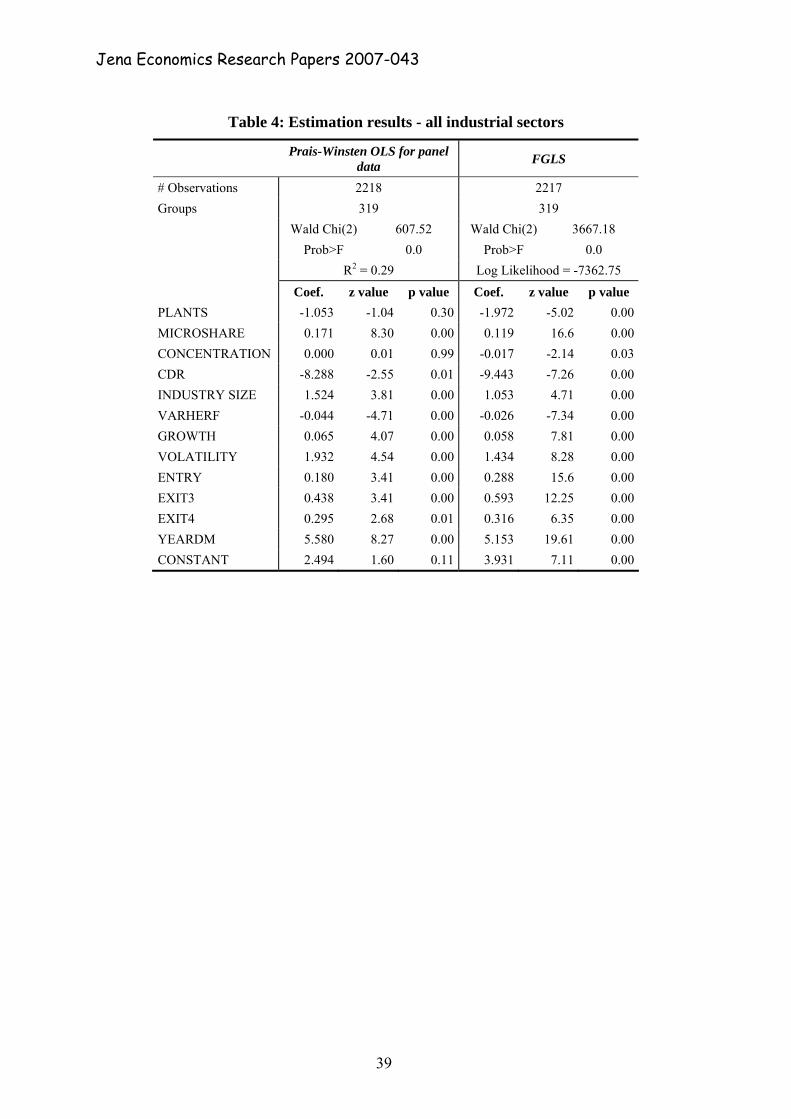
Table 4: Estimation results - all industrial sectors
Prais-Winsten OLS for panel data FGLS
# Observations 2218 2217 Groups 319 319 Wald Chi(2) 607.52 Wald Chi(2) 3667.18 Prob>F 0.0 Prob>F 0.0 R2 = 0.29 Log Likelihood = -7362.75 Coef. z value p value Coef. z value p value PLANTS -1.053 -1.04 0.30 -1.972 -5.02 0.00 MICROSHARE 0.171 8.30 0.00 0.119 16.6 0.00 CONCENTRATION 0.000 0.01 0.99 -0.017 -2.14 0.03 CDR -8.288 -2.55 0.01 -9.443 -7.26 0.00 INDUSTRY SIZE 1.524 3.81 0.00 1.053 4.71 0.00 VARHERF -0.044 -4.71 0.00 -0.026 -7.34 0.00 GROWTH 0.065 4.07 0.00 0.058 7.81 0.00 VOLATILITY 1.932 4.54 0.00 1.434 8.28 0.00 ENTRY 0.180 3.41 0.00 0.288 15.6 0.00 EXIT3 0.438 3.41 0.00 0.593 12.25 0.00 EXIT4 0.295 2.68 0.01 0.316 6.35 0.00 YEARDM 5.580 8.27 0.00 5.153 19.61 0.00 CONSTANT 2.494 1.60 0.11 3.931 7.11 0.00
39
Jena Economics Research Papers 2007-043
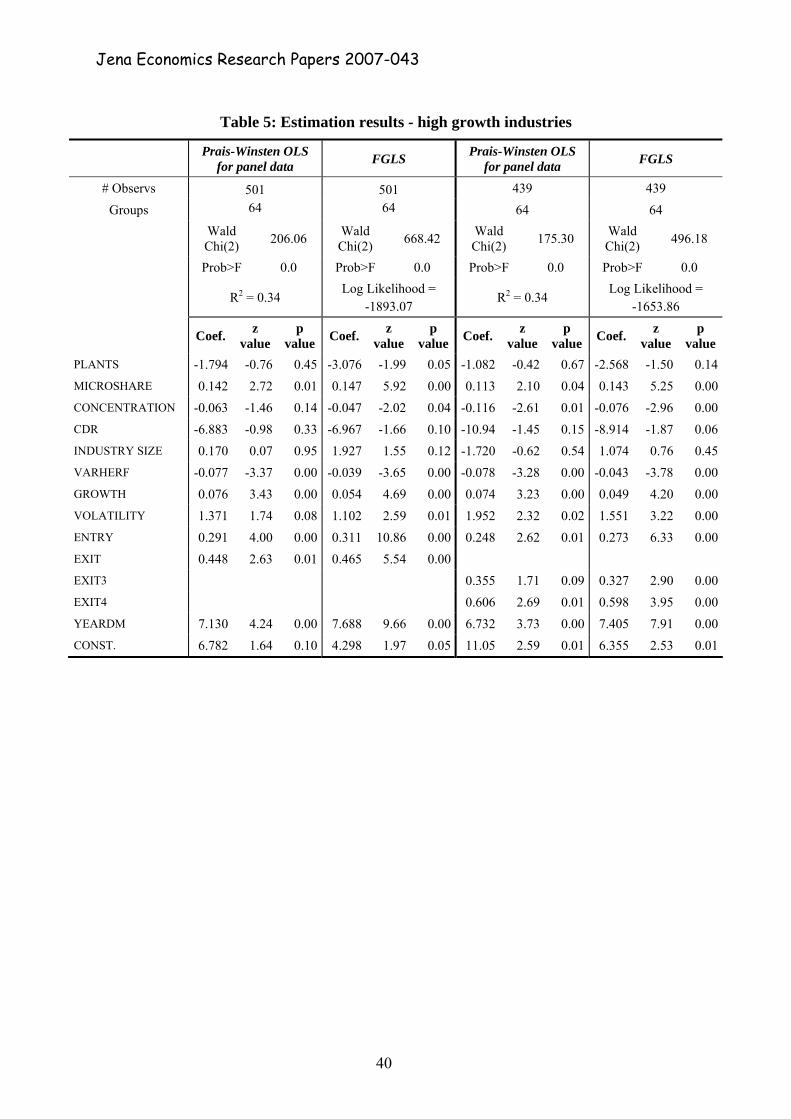
Table 5: Estimation results - high growth industries
Prais-Winsten OLS for panel data FGLS Prais-Winsten OLS
for panel data FGLS
# Observs 439 439 Groups
501 64
501 64 64 64
Wald Chi(2) 206.06 Wald
Chi(2) 668.42 Wald Chi(2) 175.30 Wald
Chi(2) 496.18
Prob>F 0.0 Prob>F 0.0 Prob>F 0.0 Prob>F 0.0
R2 = 0.34 Log Likelihood =
-1893.07 R2 = 0.34
Log Likelihood = -1653.86
Coef. z value
p value Coef. z
value p
value Coef. z value
p value Coef. z
value p
value PLANTS -1.794 -0.76 0.45 -3.076 -1.99 0.05 -1.082 -0.42 0.67 -2.568 -1.50 0.14MICROSHARE 0.142 2.72 0.01 0.147 5.92 0.00 0.113 2.10 0.04 0.143 5.25 0.00CONCENTRATION -0.063 -1.46 0.14 -0.047 -2.02 0.04 -0.116 -2.61 0.01 -0.076 -2.96 0.00CDR -6.883 -0.98 0.33 -6.967 -1.66 0.10 -10.94 -1.45 0.15 -8.914 -1.87 0.06INDUSTRY SIZE 0.170 0.07 0.95 1.927 1.55 0.12 -1.720 -0.62 0.54 1.074 0.76 0.45VARHERF -0.077 -3.37 0.00 -0.039 -3.65 0.00 -0.078 -3.28 0.00 -0.043 -3.78 0.00GROWTH 0.076 3.43 0.00 0.054 4.69 0.00 0.074 3.23 0.00 0.049 4.20 0.00VOLATILITY 1.371 1.74 0.08 1.102 2.59 0.01 1.952 2.32 0.02 1.551 3.22 0.00ENTRY 0.291 4.00 0.00 0.311 10.86 0.00 0.248 2.62 0.01 0.273 6.33 0.00EXIT 0.448 2.63 0.01 0.465 5.54 0.00 EXIT3 0.355 1.71 0.09 0.327 2.90 0.00EXIT4 0.606 2.69 0.01 0.598 3.95 0.00YEARDM 7.130 4.24 0.00 7.688 9.66 0.00 6.732 3.73 0.00 7.405 7.91 0.00CONST. 6.782 1.64 0.10 4.298 1.97 0.05 11.05 2.59 0.01 6.355 2.53 0.01
40
Jena Economics Research Papers 2007-043
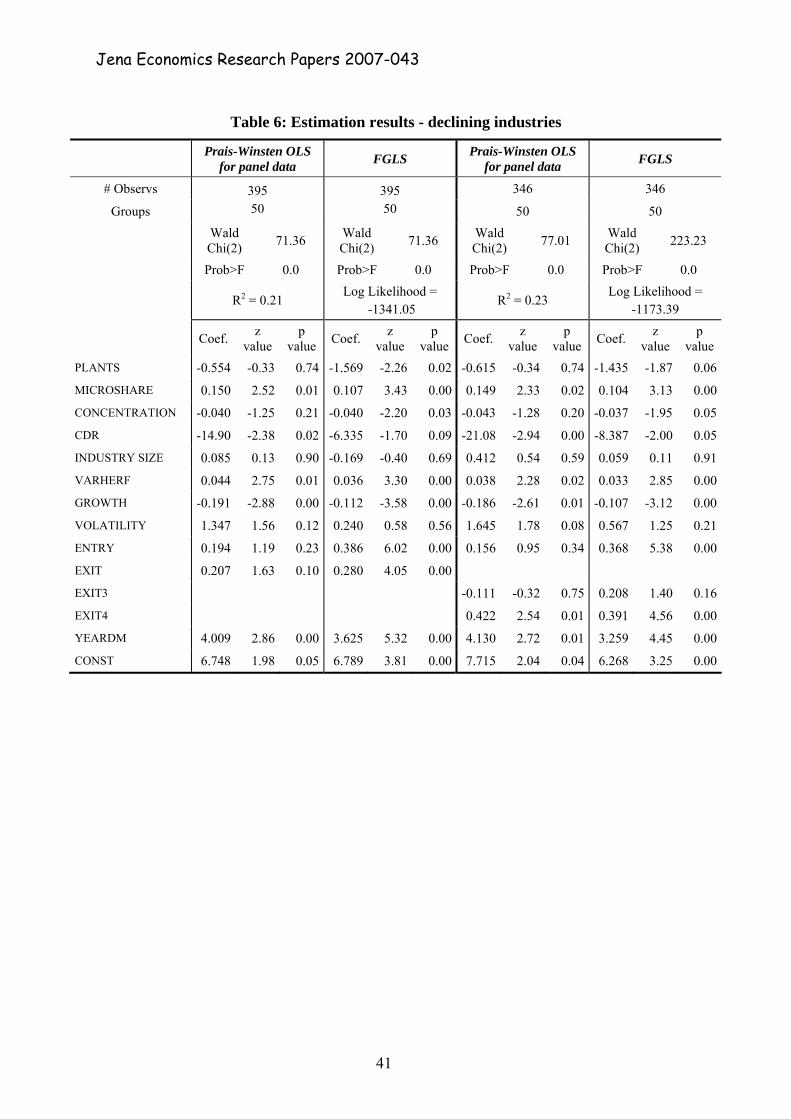
Table 6: Estimation results - declining industries
Prais-Winsten OLS for panel data FGLS Prais-Winsten OLS
for panel data FGLS
# Observs 346 346
Groups 395 50
395 50 50 50
Wald Chi(2) 71.36 Wald
Chi(2) 71.36 Wald Chi(2) 77.01 Wald
Chi(2) 223.23
Prob>F 0.0 Prob>F 0.0 Prob>F 0.0 Prob>F 0.0
R2 = 0.21 Log Likelihood =
-1341.05 R2 = 0.23
Log Likelihood = -1173.39
Coef. z value
p value Coef. z
value p
value Coef. z value
p value Coef. z
value p
value PLANTS -0.554 -0.33 0.74 -1.569 -2.26 0.02 -0.615 -0.34 0.74 -1.435 -1.87 0.06
MICROSHARE 0.150 2.52 0.01 0.107 3.43 0.00 0.149 2.33 0.02 0.104 3.13 0.00
CONCENTRATION -0.040 -1.25 0.21 -0.040 -2.20 0.03 -0.043 -1.28 0.20 -0.037 -1.95 0.05
CDR -14.90 -2.38 0.02 -6.335 -1.70 0.09 -21.08 -2.94 0.00 -8.387 -2.00 0.05
INDUSTRY SIZE 0.085 0.13 0.90 -0.169 -0.40 0.69 0.412 0.54 0.59 0.059 0.11 0.91
VARHERF 0.044 2.75 0.01 0.036 3.30 0.00 0.038 2.28 0.02 0.033 2.85 0.00
GROWTH -0.191 -2.88 0.00 -0.112 -3.58 0.00 -0.186 -2.61 0.01 -0.107 -3.12 0.00
VOLATILITY 1.347 1.56 0.12 0.240 0.58 0.56 1.645 1.78 0.08 0.567 1.25 0.21
ENTRY 0.194 1.19 0.23 0.386 6.02 0.00 0.156 0.95 0.34 0.368 5.38 0.00
EXIT 0.207 1.63 0.10 0.280 4.05 0.00
EXIT3 -0.111 -0.32 0.75 0.208 1.40 0.16
EXIT4 0.422 2.54 0.01 0.391 4.56 0.00
YEARDM 4.009 2.86 0.00 3.625 5.32 0.00 4.130 2.72 0.01 3.259 4.45 0.00
CONST 6.748 1.98 0.05 6.789 3.81 0.00 7.715 2.04 0.04 6.268 3.25 0.00
41
Jena Economics Research Papers 2007-043

Table 7: Estimation results – other (low growth/mature) industries
Prais-Winsten OLS
for panel data FGLS Prais-Winsten OLS
for panel data FGLS # Observs 1637 1637 1433 1433
Groups 205 205 205 205
Wald Chi(2) 403.92
Wald Chi(2) 3541.17
Wald Chi(2) 557.06
Wald Chi(2) 3633.71
Prob>F 0 Prob>F 0 Prob>F 0 Prob>F 0 Log Likelihood = Log Likelihood =
R2 = 0.25
-5165.92 R2 = 0.37
-4442.2
Coef. z
value p
value Coef. z
value p
value Coef. z
value p
value Coef. z
value p
value PLANTS -1.90 -1.92 0.06 -2.06 -5.0 0.00 -0.65 -0.7 0.486 -1.62 -3.78 0.00 MICROSHARE 0.17 7.6 0.00 0.10 15.8 0.00 0.13 6.75 0.00 0.09 12.98 0.00 CONCENTRATION 0.06 2.57 0.01 0.02 2.03 0.04 0.03 1.34 0.2 0.00 0.31 0.8 CDR -9.53 -2.34 0.02 -8.36 -7.04 0.00 -9.27 -2.73 0.006 -8.81 -7.27 0.00 INDUSTRY SIZE 2.44 5.33 0.00 1.55 6.66 0.00 1.53 4.03 0.00 1.07 4.89 0.00 VARHERF -0.04 -4.19 0.00 -0.02 -6.00 0.00 -0.04 -3.82 0.00 -0.02 -6.24 0.00 GROWTH 0.08 2.61 0.01 0.07 6.31 0.00 0.12 3.72 0.00 0.09 8.17 0.00 VOLATILITY 0.77 1.42 0.16 0.73 4.06 0.00 0.77 1.57 0.116 0.89 5.02 0.00 ENTRY 0.11 1.65 0.10 0.38 18.29 0.00 0.25 3.96 0.00 0.36 17.1 0.00 EXIT 0.36 2.98 0.00 0.43 13.71 0.00 EXIT3 0.29 3.99 0.00 0.27 4.44 0.00 EXIT4 0.33 2.08 0.038 0.41 6.87 0.00 YEARDM 6.33 8.33 0.00 5.20 20.43 0.00 6.17 8.43 0.00 5.22 19.25 0.00 CONST. 2.36 1.13 0.26 2.44 4.54 0.00 2.18 1.22 0.221 2.87 5.19 0.00
42
Jena Economics Research Papers 2007-043
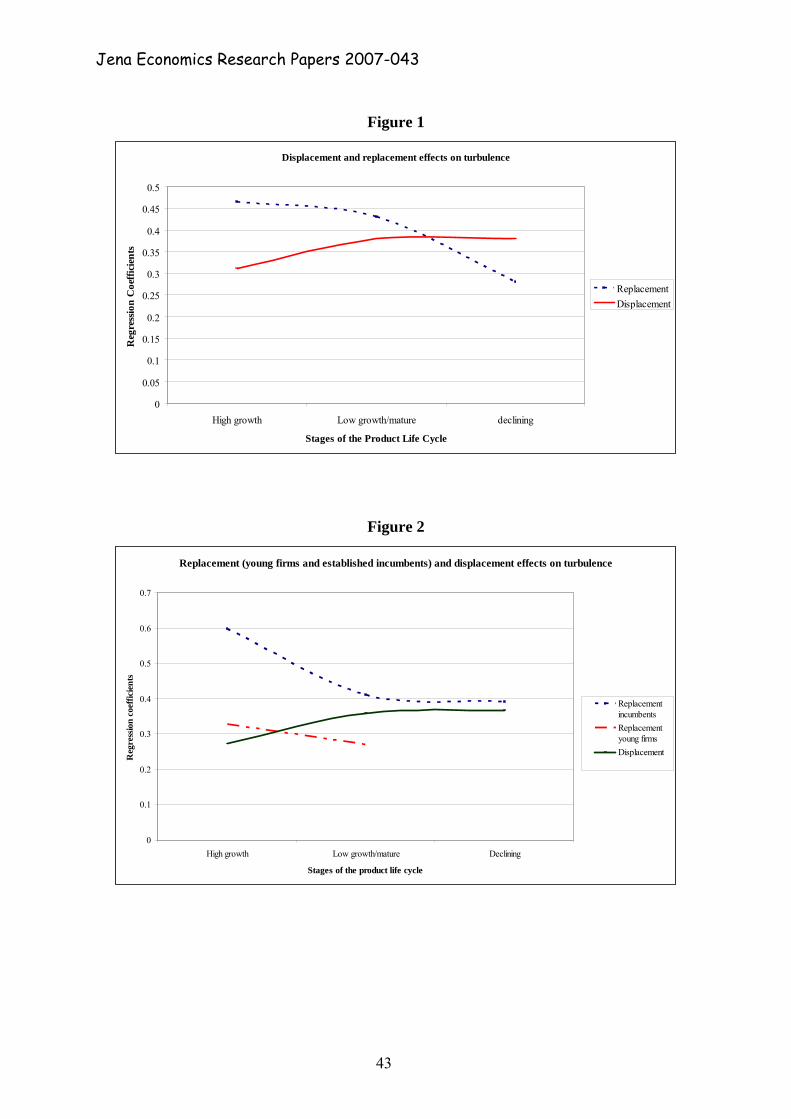
Figure 1
Displacement and replacement effects on turbulence
0
0.05
0.1
0.15
0.2
0.25
0.3
0.35
0.4
0.45
0.5
High growth Low growth/mature declining
Stages of the Product Life Cycle
Reg
ress
ion
Coe
ffici
ents
ReplacementDisplacement
Figure 2
Replacement (young firms and established incumbents) and displacement effects on turbulence
0
0.1
0.2
0.3
0.4
0.5
0.6
0.7
High growth Low growth/mature Declining
Stages of the product life cycle
Reg
ress
ion
coef
ficie
nts
ReplacementincumbentsReplacementyoung firmsDisplacement
43
Jena Economics Research Papers 2007-043
Related Documents