This article appeared in a journal published by Elsevier. The attached copy is furnished to the author for internal non-commercial research and education use, including for instruction at the authors institution and sharing with colleagues. Other uses, including reproduction and distribution, or selling or licensing copies, or posting to personal, institutional or third party websites are prohibited. In most cases authors are permitted to post their version of the article (e.g. in Word or Tex form) to their personal website or institutional repository. Authors requiring further information regarding Elsevier’s archiving and manuscript policies are encouraged to visit: http://www.elsevier.com/copyright

Welcome message from author
This document is posted to help you gain knowledge. Please leave a comment to let me know what you think about it! Share it to your friends and learn new things together.
Transcript

This article appeared in a journal published by Elsevier. The attachedcopy is furnished to the author for internal non-commercial researchand education use, including for instruction at the authors institution
and sharing with colleagues.
Other uses, including reproduction and distribution, or selling orlicensing copies, or posting to personal, institutional or third party
websites are prohibited.
In most cases authors are permitted to post their version of thearticle (e.g. in Word or Tex form) to their personal website orinstitutional repository. Authors requiring further information
regarding Elsevier’s archiving and manuscript policies areencouraged to visit:
http://www.elsevier.com/copyright
Author's personal copy
Turbine adapted maps for turbocharger engine matching
M. Tancrez a, J. Galindo b,⇑, C. Guardiola b, P. Fajardo b, O. Varnier b
a PSA – Peugeot Citroën, 18 rue des fauvelles, La Garenne-Colombes, Franceb CMT – Motores Térmicos, Universidad Politécnica de Valencia, Spain
a r t i c l e i n f o
Article history:Received 9 January 2010Received in revised form 18 June 2010Accepted 6 July 2010
Keywords:TurbochargerTurbine characteristicMatchingAdapted power
a b s t r a c t
This paper presents a new representation of the turbine performance maps oriented for turbochargercharacterization. The aim of this plot is to provide a more compact and suited form to implement inengine simulation models and to interpolate data from turbocharger test bench.
The new map is based on the use of conservative parameters as turbocharger power and turbine massflow to describe the turbine performance in all VGT positions. The curves obtained are accurately fittedwith quadratic polynomials and simple interpolation techniques give reliable results.
Two turbochargers characterized in an steady flow rig were used for illustrating the representation.After being implemented in a turbocharger submodel, the results obtained with the model have beencompared with success against turbine performance evaluated in engine tests cells. A practical applica-tion in turbocharger matching is also provided to show how this new map can be directly employed inengine design.
� 2010 Elsevier Inc. All rights reserved.
1. Background
Downsizing is a trend in engine development that allows betterefficiency and lower emissions based on the increase of power out-put in reduced displacement engines. In order to achieve this highoutput it is necessary to increase boosting pressure. In the last dec-ade, variable geometry turbocharger (VGT) technologies havespread to all engine displacements and all segments of the market,and nowadays, new turbocharging technologies are been evaluatedsuch as variable geometry compressors, sequentially turbochargedengines [1,2] or two-stage compressed engines [3].
The right design and coupling of the turbocharging system tothe internal combustion engine have capital importance for thecorrect behavior of the whole engine. More specifically, it is funda-mental in the gas exchange process and during the engine tran-sient evolution, and it will influence in an important way theengine specific consumption and pollutant emissions.
The matching of the compressor and turbine to an internal com-bustion engine is a complicated balance of many design consider-ations [4,5]. Appropriate turbocharger components must becarefully selected to match a given engine size and to fulfill as opti-mum as possible the performance required for a wide range of dif-ferent operating conditions.
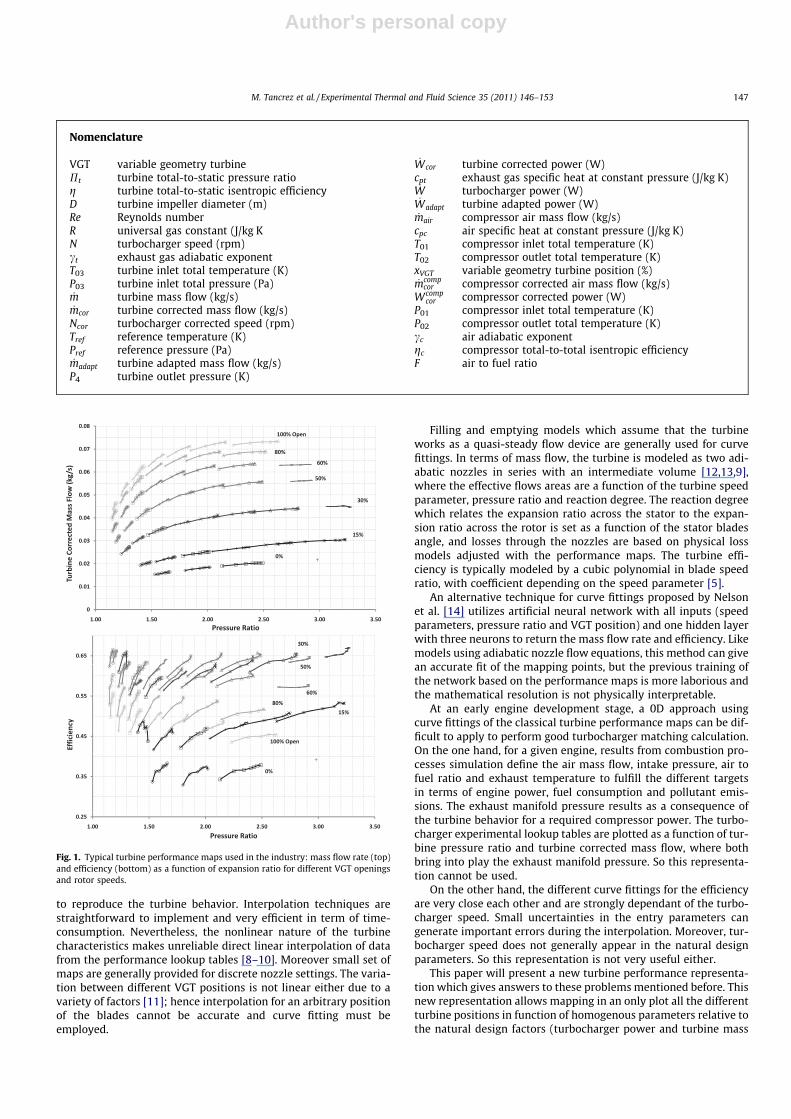
Any study of engine matching or system analysis requires cer-tain data of the turbocharger performance. Most turbochargermanufacturers provide compressor and turbine performance mapsin the form of lookup tables experimentally obtained in turbo-charger test benches. The representation of these data shown inFig. 1 give the interrelationships between efficiency and pressureratio, and between mass flow rate and pressure ratio. Rotor speedand VGT turbine position are additional inputs to characterize theturbine in a larger operating range.
From these maps, different approaches can be used to modelthe performance of the complete system and predict the compres-sor and turbine behavior: applying a one-dimensional model (1D)derived from basic principles and calibrated with the experimentaldata, or applying a zero-dimensional (0D) model relying only onexperimental data.
The first way is to use a 1D approach which takes into accountthe fluid and thermodynamic behavior of the exhaust gas in orderto compute more in detail the energy conversion. These 1D waveaction models are mainly based on the machine geometry interre-lating blade tip speed, turbine normalized mass flow, pressure ra-tio and slip factor (ratio between the tangential velocity of the airleaving the impeller and the impeller tip velocity) [6,7]. They relyon physical principles but include some constants, such as viscousdrag or clearance losses, that must be obtained and are not gener-ally available. Furthermore, they are quite time-consuming. Thisapproach is generally avoided in practice to carry out an effectiveturbocharger matching calculation.
The second way is to use a 0D approach with conventional mapinterpolation techniques or with ‘filling and emptying’ models able
0894-1777/$ - see front matter � 2010 Elsevier Inc. All rights reserved.doi:10.1016/j.expthermflusci.2010.07.018
⇑ Corresponding author. Address: CMT – Motores Térmicos, Universidad Polité-cnica de Valencia, Camino de Vera s/n, E-46022 Valencia, Spain. Tel.: +34963879656; fax: +34 963877659.
E-mail address: [email protected] (J. Galindo).
Experimental Thermal and Fluid Science 35 (2011) 146–153
Contents lists available at ScienceDirect
Experimental Thermal and Fluid Science
journal homepage: www.elsevier .com/locate /et fs
Author's personal copy
to reproduce the turbine behavior. Interpolation techniques arestraightforward to implement and very efficient in term of time-consumption. Nevertheless, the nonlinear nature of the turbinecharacteristics makes unreliable direct linear interpolation of datafrom the performance lookup tables [8–10]. Moreover small set ofmaps are generally provided for discrete nozzle settings. The varia-tion between different VGT positions is not linear either due to avariety of factors [11]; hence interpolation for an arbitrary positionof the blades cannot be accurate and curve fitting must beemployed.
Filling and emptying models which assume that the turbineworks as a quasi-steady flow device are generally used for curvefittings. In terms of mass flow, the turbine is modeled as two adi-abatic nozzles in series with an intermediate volume [12,13,9],where the effective flows areas are a function of the turbine speedparameter, pressure ratio and reaction degree. The reaction degreewhich relates the expansion ratio across the stator to the expan-sion ratio across the rotor is set as a function of the stator bladesangle, and losses through the nozzles are based on physical lossmodels adjusted with the performance maps. The turbine effi-ciency is typically modeled by a cubic polynomial in blade speedratio, with coefficient depending on the speed parameter [5].
An alternative technique for curve fittings proposed by Nelsonet al. [14] utilizes artificial neural network with all inputs (speedparameters, pressure ratio and VGT position) and one hidden layerwith three neurons to return the mass flow rate and efficiency. Likemodels using adiabatic nozzle flow equations, this method can givean accurate fit of the mapping points, but the previous training ofthe network based on the performance maps is more laborious andthe mathematical resolution is not physically interpretable.
At an early engine development stage, a 0D approach usingcurve fittings of the classical turbine performance maps can be dif-ficult to apply to perform good turbocharger matching calculation.On the one hand, for a given engine, results from combustion pro-cesses simulation define the air mass flow, intake pressure, air tofuel ratio and exhaust temperature to fulfill the different targetsin terms of engine power, fuel consumption and pollutant emis-sions. The exhaust manifold pressure results as a consequence ofthe turbine behavior for a required compressor power. The turbo-charger experimental lookup tables are plotted as a function of tur-bine pressure ratio and turbine corrected mass flow, where bothbring into play the exhaust manifold pressure. So this representa-tion cannot be used.
On the other hand, the different curve fittings for the efficiencyare very close each other and are strongly dependant of the turbo-charger speed. Small uncertainties in the entry parameters cangenerate important errors during the interpolation. Moreover, tur-bocharger speed does not generally appear in the natural designparameters. So this representation is not very useful either.
This paper will present a new turbine performance representa-tion which gives answers to these problems mentioned before. Thisnew representation allows mapping in an only plot all the differentturbine positions in function of homogenous parameters relative tothe natural design factors (turbocharger power and turbine mass
Nomenclature
VGT variable geometry turbinePt turbine total-to-static pressure ratiog turbine total-to-static isentropic efficiencyD turbine impeller diameter (m)Re Reynolds numberR universal gas constant (J/kg KN turbocharger speed (rpm)ct exhaust gas adiabatic exponentT03 turbine inlet total temperature (K)P03 turbine inlet total pressure (Pa)_m turbine mass flow (kg/s)_mcor turbine corrected mass flow (kg/s)
Ncor turbocharger corrected speed (rpm)Tref reference temperature (K)Pref reference pressure (Pa)_madapt turbine adapted mass flow (kg/s)
P4 turbine outlet pressure (K)
_Wcor turbine corrected power (W)cpt exhaust gas specific heat at constant pressure (J/kg K)_W turbocharger power (W)_Wadapt turbine adapted power (W)_mair compressor air mass flow (kg/s)
cpc air specific heat at constant pressure (J/kg K)T01 compressor inlet total temperature (K)T02 compressor outlet total temperature (K)xVGT variable geometry turbine position (%)_mcomp
cor compressor corrected air mass flow (kg/s)Wcomp
cor compressor corrected power (W)P01 compressor inlet total temperature (K)P02 compressor outlet total temperature (K)cc air adiabatic exponentgc compressor total-to-total isentropic efficiencyF air to fuel ratio
Fig. 1. Typical turbine performance maps used in the industry: mass flow rate (top)and efficiency (bottom) as a function of expansion ratio for different VGT openingsand rotor speeds.
M. Tancrez et al. / Experimental Thermal and Fluid Science 35 (2011) 146–153 147
Author's personal copy
flow). Furthermore, fitting methods and interpolations applied tothis representation are more compact to implement in a turbo-charger submodel and more reliable in most operating conditions.
The paper is structured as follow: Section 2 defines the new tur-bine performance representation with the different parametersused, while experimental facilities and on-engine testing data arepresented in Section 3. Finally, Section 4 presents its practicalapplication in turbocharger matching process.
2. Turbine adapted characteristics maps
Turbocharger performance characteristics are specified in termsof mass flow rate and isentropic efficiency for varying turbinespeed and pressure ratio on a steady flow rig. The information ob-tained is provided in table form and Fig. 1 shows a typical plot ofthis data. In case of variable geometry turbine, the inlet blade posi-tion is an additional input.
The use of these parameters is defined from the application ofdimensional analysis to compressible fluids through a turboma-chine [15]. The different non-dimensional groups can be expressedas:
Pt ;g ¼ f_mffiffiffiffiffiffiffiffiffiffiRT03p
D2P03;
NDffiffiffiffiffiffiffiffiffiffiRT03p ;Re; ct
� �ð1Þ
where Pt stands for the pressure ratio across the turbine, g the tur-bine total-to-static isentropic efficiency, D the impeller diameter, Rethe Reynolds number, R the Universal gas constant, N the turbo-charger speed and ct the exhaust gas adiabatic exponent.
For a machine of a specific size, handling a single gas and oper-ating at high Reynolds number, it has become customary to deleteD, R, ct and Re from Eq. (1). In addition, to avoid the dependence ofthe maps on the temperature and pressure upstream of the tur-bine, corrected mass flow rate _mcor and corrected speed Ncor areused. Under these conditions Eq. (1) becomes:
Pt ;g ¼ ff _mcor;Ncorg ð2Þ
with
_mcor ¼_m
ffiffiffiffiffiffiT03Tref
qP03Pref
ð3Þ
and
Ncor ¼Nffiffiffiffiffiffi
T03Tref
q ð4Þ
where Tref and Pref represent the reference temperature and pressurechosen respectively as 298 K and 101.3 kPa, T03 and P03 the turbineinlet total temperature and total pressure, and _m the exhaust massflow rate.
As mentioned before in the introduction, the drawback of thecorrected mass flow rate for turbocharger matching is its turbineinlet pressure dependence. This pressure results of the turbinebehavior and appears as an unknown in the engine design. Never-theless, the pressure downstream of the turbine, corresponding tothe pressure losses of the entire exhaust line, is generally known atearly development stage. So the use of this pressure is more appro-priate in the matching process and the adapted gas turbine flowcan be introduced as:
_madapt ¼ _mcorPt ¼_m
ffiffiffiffiffiffiT03Tref
qP4
Pref
ð5Þ
Where P4 is the turbine outlet pressure. This parameter has the par-ticularity of taking into account design parameters (exhaust mani-
fold temperature and exhaust back pressure) remaininghomogeneous to the turbine behavior.
A natural design factor in turbocharger calculation is the turbo-charger power. The manufacturer performance maps do not usenormally this parameter. Keeping the same philosophy followedwith the mass flow, the turbine corrected power can be expressedas:
_Wcor ¼ _mcorcptg 1�P1=ct�1t
� �¼
_WffiffiffiffiffiffiffiffiffiffiffiffiffiffiffiT03Tref
p P03Pref
ð6Þ
where cpt is the exhaust gas specific heat at constant pressure and_W the turbocharger power. The adapted power is defined as:
_Wadapt ¼ _WcorPt ¼_Wffiffiffiffiffiffiffiffiffiffiffiffiffiffiffi
T03Tref
p P4Pref
ð7Þ
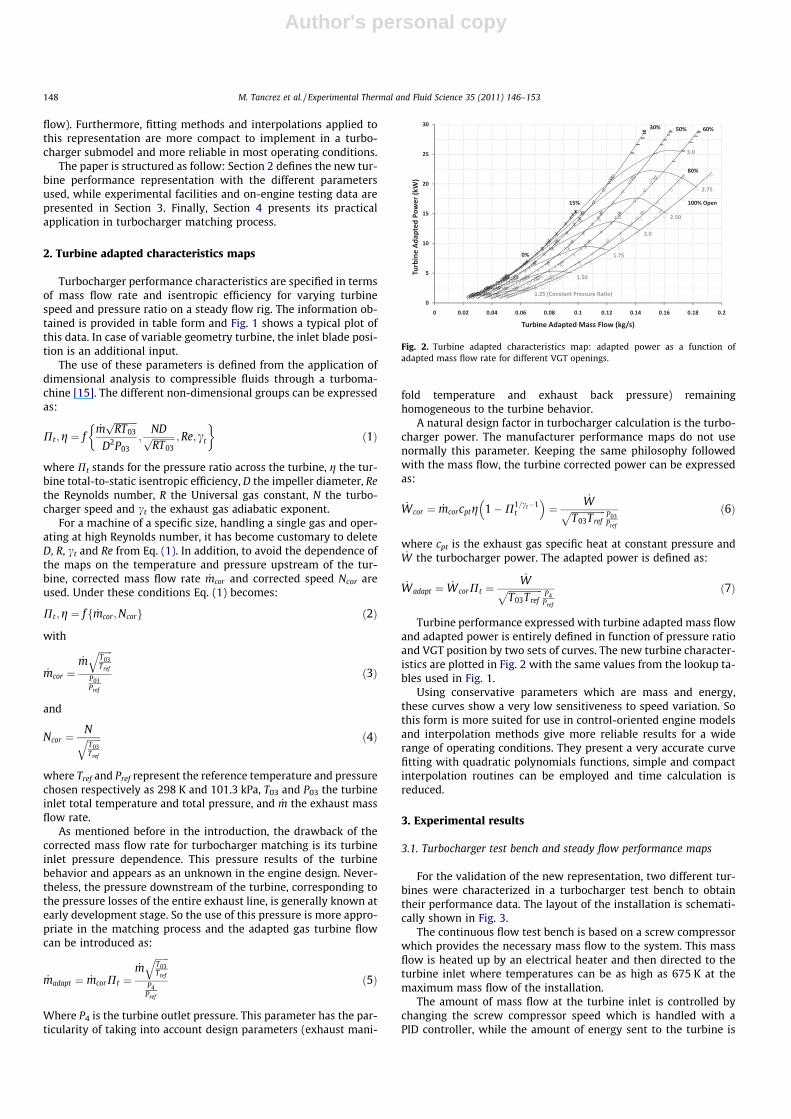
Turbine performance expressed with turbine adapted mass flowand adapted power is entirely defined in function of pressure ratioand VGT position by two sets of curves. The new turbine character-istics are plotted in Fig. 2 with the same values from the lookup ta-bles used in Fig. 1.
Using conservative parameters which are mass and energy,these curves show a very low sensitiveness to speed variation. Sothis form is more suited for use in control-oriented engine modelsand interpolation methods give more reliable results for a widerange of operating conditions. They present a very accurate curvefitting with quadratic polynomials functions, simple and compactinterpolation routines can be employed and time calculation isreduced.
3. Experimental results
3.1. Turbocharger test bench and steady flow performance maps
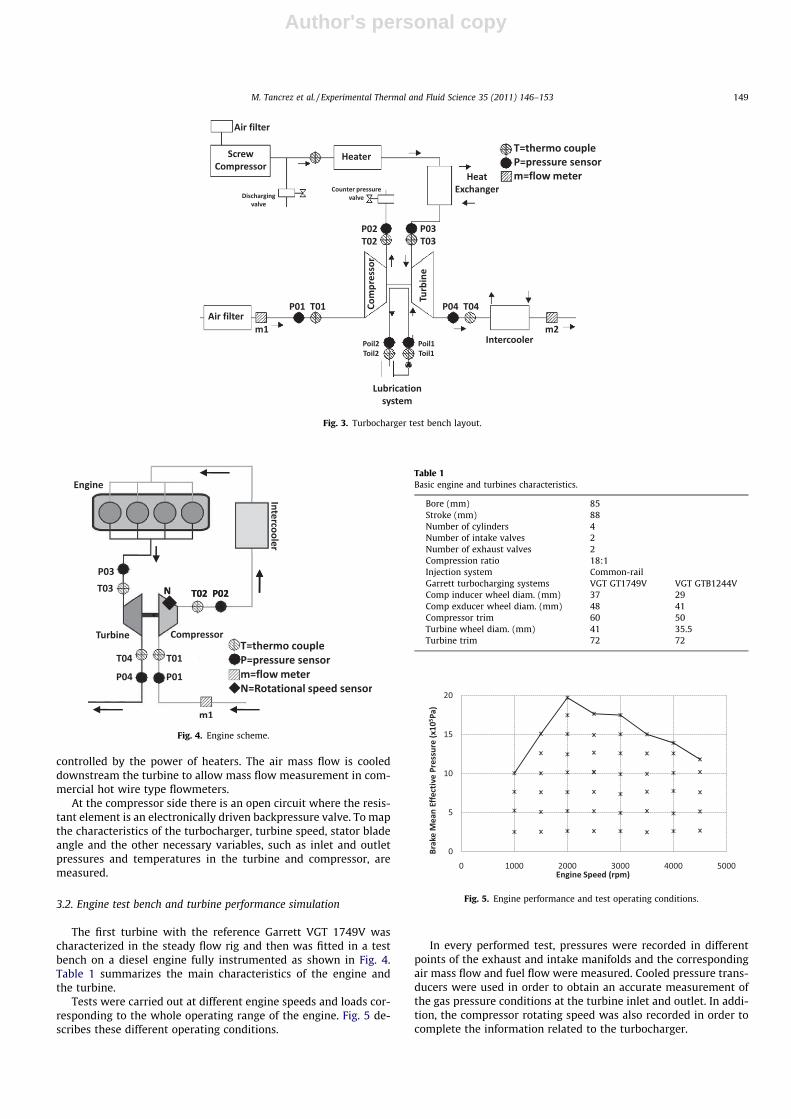
For the validation of the new representation, two different tur-bines were characterized in a turbocharger test bench to obtaintheir performance data. The layout of the installation is schemati-cally shown in Fig. 3.
The continuous flow test bench is based on a screw compressorwhich provides the necessary mass flow to the system. This massflow is heated up by an electrical heater and then directed to theturbine inlet where temperatures can be as high as 675 K at themaximum mass flow of the installation.
The amount of mass flow at the turbine inlet is controlled bychanging the screw compressor speed which is handled with aPID controller, while the amount of energy sent to the turbine is
Fig. 2. Turbine adapted characteristics map: adapted power as a function ofadapted mass flow rate for different VGT openings.
148 M. Tancrez et al. / Experimental Thermal and Fluid Science 35 (2011) 146–153
Author's personal copy
controlled by the power of heaters. The air mass flow is cooleddownstream the turbine to allow mass flow measurement in com-mercial hot wire type flowmeters.
At the compressor side there is an open circuit where the resis-tant element is an electronically driven backpressure valve. To mapthe characteristics of the turbocharger, turbine speed, stator bladeangle and the other necessary variables, such as inlet and outletpressures and temperatures in the turbine and compressor, aremeasured.
3.2. Engine test bench and turbine performance simulation
The first turbine with the reference Garrett VGT 1749V wascharacterized in the steady flow rig and then was fitted in a testbench on a diesel engine fully instrumented as shown in Fig. 4.Table 1 summarizes the main characteristics of the engine andthe turbine.
Tests were carried out at different engine speeds and loads cor-responding to the whole operating range of the engine. Fig. 5 de-scribes these different operating conditions.
In every performed test, pressures were recorded in differentpoints of the exhaust and intake manifolds and the correspondingair mass flow and fuel flow were measured. Cooled pressure trans-ducers were used in order to obtain an accurate measurement ofthe gas pressure conditions at the turbine inlet and outlet. In addi-tion, the compressor rotating speed was also recorded in order tocomplete the information related to the turbocharger.
Fig. 3. Turbocharger test bench layout.
Fig. 4. Engine scheme.
Table 1Basic engine and turbines characteristics.
Bore (mm) 85Stroke (mm) 88Number of cylinders 4Number of intake valves 2Number of exhaust valves 2Compression ratio 18:1Injection system Common-railGarrett turbocharging systems VGT GT1749V VGT GTB1244VComp inducer wheel diam. (mm) 37 29Comp exducer wheel diam. (mm) 48 41Compressor trim 60 50Turbine wheel diam. (mm) 41 35.5Turbine trim 72 72
Fig. 5. Engine performance and test operating conditions.
M. Tancrez et al. / Experimental Thermal and Fluid Science 35 (2011) 146–153 149
Author's personal copy
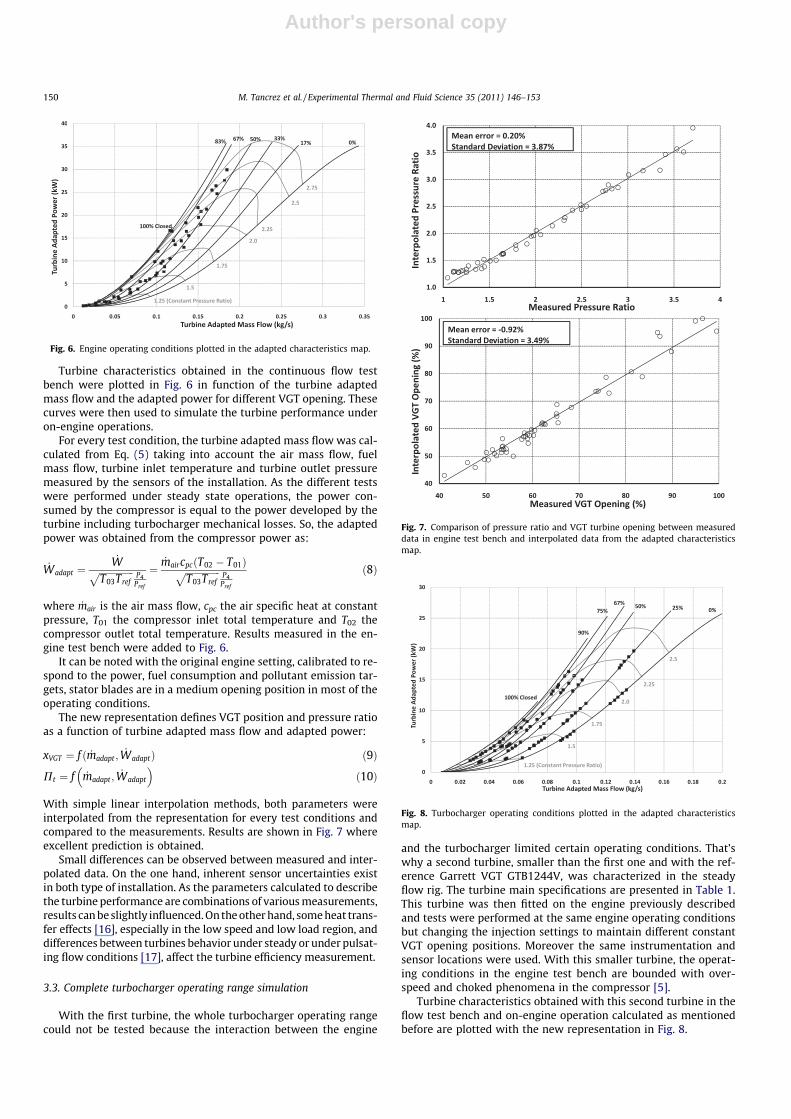
Turbine characteristics obtained in the continuous flow testbench were plotted in Fig. 6 in function of the turbine adaptedmass flow and the adapted power for different VGT opening. Thesecurves were then used to simulate the turbine performance underon-engine operations.
For every test condition, the turbine adapted mass flow was cal-culated from Eq. (5) taking into account the air mass flow, fuelmass flow, turbine inlet temperature and turbine outlet pressuremeasured by the sensors of the installation. As the different testswere performed under steady state operations, the power con-sumed by the compressor is equal to the power developed by theturbine including turbocharger mechanical losses. So, the adaptedpower was obtained from the compressor power as:
_Wadapt ¼_Wffiffiffiffiffiffiffiffiffiffiffiffiffiffiffi
T03Tref
p P4Pref
¼_maircpc T02 � T01ð Þffiffiffiffiffiffiffiffiffiffiffiffiffiffiffi
T03Tref
p P4Pref
ð8Þ
where _mair is the air mass flow, cpc the air specific heat at constantpressure, T01 the compressor inlet total temperature and T02 thecompressor outlet total temperature. Results measured in the en-gine test bench were added to Fig. 6.
It can be noted with the original engine setting, calibrated to re-spond to the power, fuel consumption and pollutant emission tar-gets, stator blades are in a medium opening position in most of theoperating conditions.
The new representation defines VGT position and pressure ratioas a function of turbine adapted mass flow and adapted power:
xVGT ¼ f ð _madapt; _WadaptÞ ð9Þ
Pt ¼ f _madapt; _Wadapt
� �ð10Þ
With simple linear interpolation methods, both parameters wereinterpolated from the representation for every test conditions andcompared to the measurements. Results are shown in Fig. 7 whereexcellent prediction is obtained.
Small differences can be observed between measured and inter-polated data. On the one hand, inherent sensor uncertainties existin both type of installation. As the parameters calculated to describethe turbine performance are combinations of various measurements,results can be slightly influenced. On the other hand, some heat trans-fer effects [16], especially in the low speed and low load region, anddifferences between turbines behavior under steady or under pulsat-ing flow conditions [17], affect the turbine efficiency measurement.
3.3. Complete turbocharger operating range simulation
With the first turbine, the whole turbocharger operating rangecould not be tested because the interaction between the engine
and the turbocharger limited certain operating conditions. That’swhy a second turbine, smaller than the first one and with the ref-erence Garrett VGT GTB1244V, was characterized in the steadyflow rig. The turbine main specifications are presented in Table 1.This turbine was then fitted on the engine previously describedand tests were performed at the same engine operating conditionsbut changing the injection settings to maintain different constantVGT opening positions. Moreover the same instrumentation andsensor locations were used. With this smaller turbine, the operat-ing conditions in the engine test bench are bounded with over-speed and choked phenomena in the compressor [5].
Turbine characteristics obtained with this second turbine in theflow test bench and on-engine operation calculated as mentionedbefore are plotted with the new representation in Fig. 8.
Fig. 6. Engine operating conditions plotted in the adapted characteristics map.
Fig. 7. Comparison of pressure ratio and VGT turbine opening between measureddata in engine test bench and interpolated data from the adapted characteristicsmap.
Fig. 8. Turbocharger operating conditions plotted in the adapted characteristicsmap.
150 M. Tancrez et al. / Experimental Thermal and Fluid Science 35 (2011) 146–153
Author's personal copy
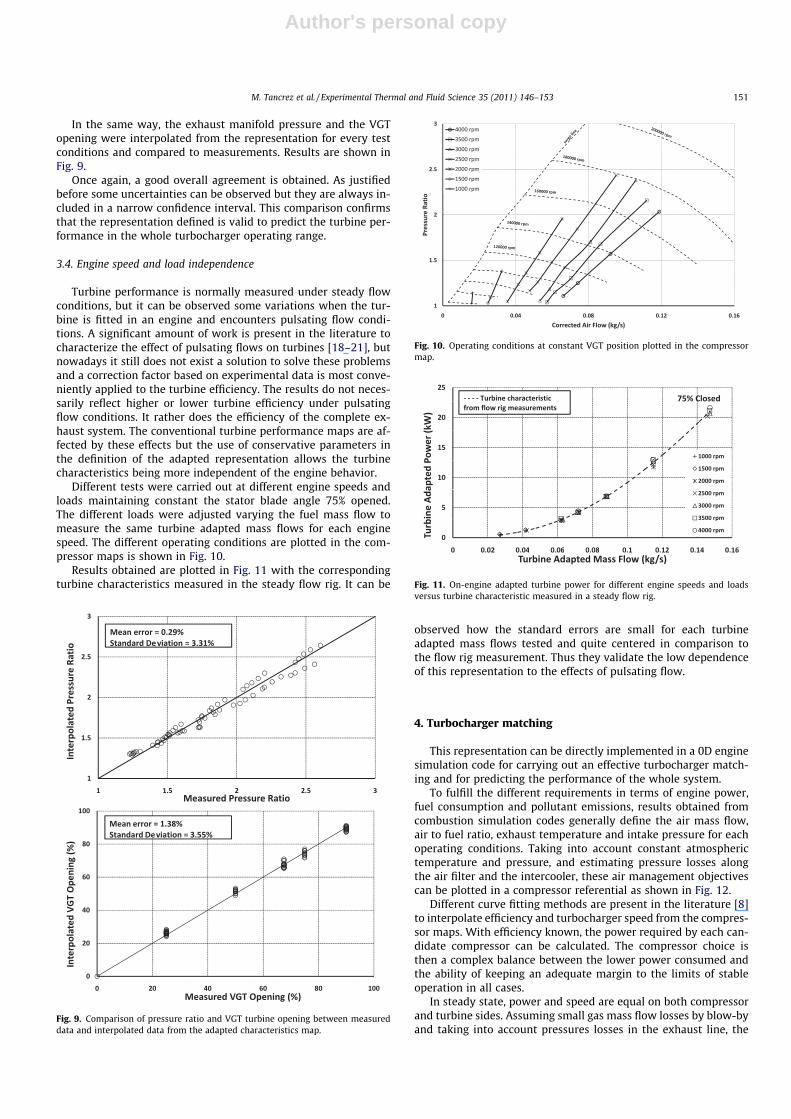
In the same way, the exhaust manifold pressure and the VGTopening were interpolated from the representation for every testconditions and compared to measurements. Results are shown inFig. 9.
Once again, a good overall agreement is obtained. As justifiedbefore some uncertainties can be observed but they are always in-cluded in a narrow confidence interval. This comparison confirmsthat the representation defined is valid to predict the turbine per-formance in the whole turbocharger operating range.
3.4. Engine speed and load independence
Turbine performance is normally measured under steady flowconditions, but it can be observed some variations when the tur-bine is fitted in an engine and encounters pulsating flow condi-tions. A significant amount of work is present in the literature tocharacterize the effect of pulsating flows on turbines [18–21], butnowadays it still does not exist a solution to solve these problemsand a correction factor based on experimental data is most conve-niently applied to the turbine efficiency. The results do not neces-sarily reflect higher or lower turbine efficiency under pulsatingflow conditions. It rather does the efficiency of the complete ex-haust system. The conventional turbine performance maps are af-fected by these effects but the use of conservative parameters inthe definition of the adapted representation allows the turbinecharacteristics being more independent of the engine behavior.
Different tests were carried out at different engine speeds andloads maintaining constant the stator blade angle 75% opened.The different loads were adjusted varying the fuel mass flow tomeasure the same turbine adapted mass flows for each enginespeed. The different operating conditions are plotted in the com-pressor maps is shown in Fig. 10.
Results obtained are plotted in Fig. 11 with the correspondingturbine characteristics measured in the steady flow rig. It can be
observed how the standard errors are small for each turbineadapted mass flows tested and quite centered in comparison tothe flow rig measurement. Thus they validate the low dependenceof this representation to the effects of pulsating flow.
4. Turbocharger matching
This representation can be directly implemented in a 0D enginesimulation code for carrying out an effective turbocharger match-ing and for predicting the performance of the whole system.
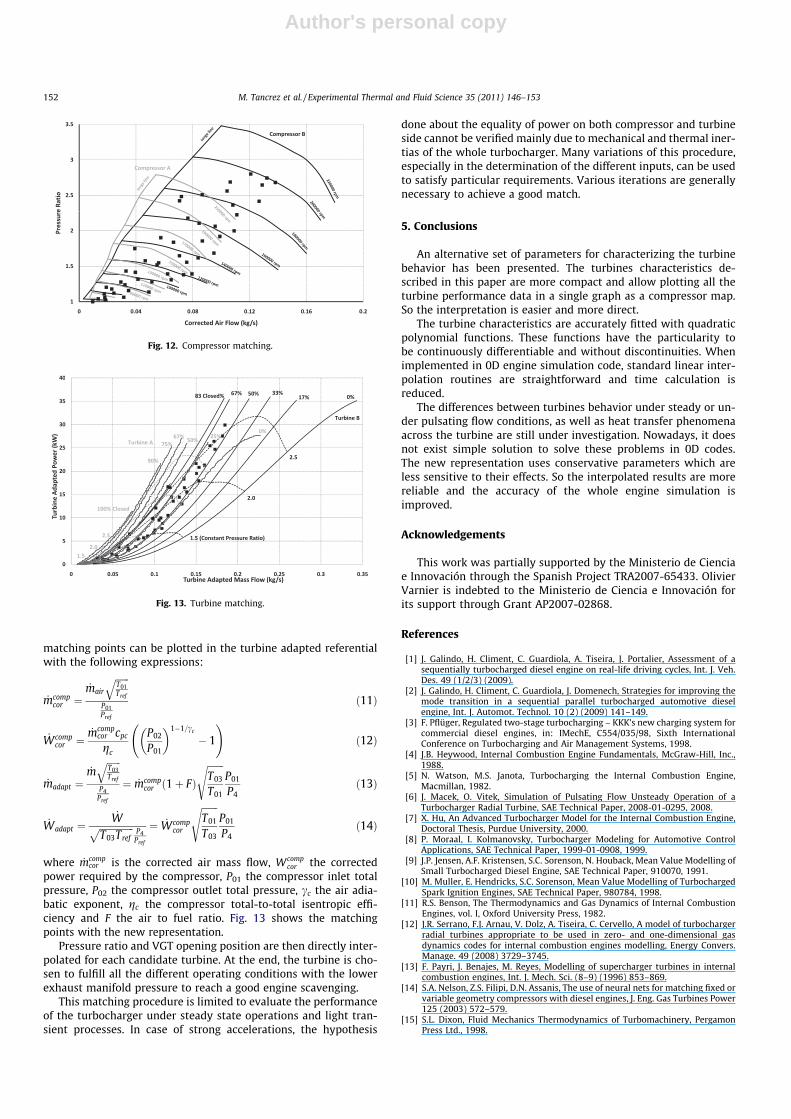
To fulfill the different requirements in terms of engine power,fuel consumption and pollutant emissions, results obtained fromcombustion simulation codes generally define the air mass flow,air to fuel ratio, exhaust temperature and intake pressure for eachoperating conditions. Taking into account constant atmospherictemperature and pressure, and estimating pressure losses alongthe air filter and the intercooler, these air management objectivescan be plotted in a compressor referential as shown in Fig. 12.
Different curve fitting methods are present in the literature [8]to interpolate efficiency and turbocharger speed from the compres-sor maps. With efficiency known, the power required by each can-didate compressor can be calculated. The compressor choice isthen a complex balance between the lower power consumed andthe ability of keeping an adequate margin to the limits of stableoperation in all cases.
In steady state, power and speed are equal on both compressorand turbine sides. Assuming small gas mass flow losses by blow-byand taking into account pressures losses in the exhaust line, the
Fig. 9. Comparison of pressure ratio and VGT turbine opening between measureddata and interpolated data from the adapted characteristics map.
Fig. 10. Operating conditions at constant VGT position plotted in the compressormap.
Fig. 11. On-engine adapted turbine power for different engine speeds and loadsversus turbine characteristic measured in a steady flow rig.
M. Tancrez et al. / Experimental Thermal and Fluid Science 35 (2011) 146–153 151
Author's personal copy
matching points can be plotted in the turbine adapted referentialwith the following expressions:
_mcompcor ¼
_mair
ffiffiffiffiffiffiT01Tref
qP01Pref
ð11Þ
_Wcompcor ¼
_mcompcor cpc
gc
P02
P01
� �1�1=cc
� 1
!ð12Þ
_madapt ¼_m
ffiffiffiffiffiffiT03Tref
qP4
Pref
¼ _mcompcor ð1þ FÞ
ffiffiffiffiffiffiffiT03
T01
sP01
P4ð13Þ
_Wadapt ¼_Wffiffiffiffiffiffiffiffiffiffiffiffiffiffiffi
T03Tref
p P4Pref
¼ _Wcompcor
ffiffiffiffiffiffiffiT01
T03
sP01
P4ð14Þ
where _mcompcor is the corrected air mass flow, Wcomp
cor the correctedpower required by the compressor, P01 the compressor inlet totalpressure, P02 the compressor outlet total pressure, cc the air adia-batic exponent, gc the compressor total-to-total isentropic effi-ciency and F the air to fuel ratio. Fig. 13 shows the matchingpoints with the new representation.
Pressure ratio and VGT opening position are then directly inter-polated for each candidate turbine. At the end, the turbine is cho-sen to fulfill all the different operating conditions with the lowerexhaust manifold pressure to reach a good engine scavenging.
This matching procedure is limited to evaluate the performanceof the turbocharger under steady state operations and light tran-sient processes. In case of strong accelerations, the hypothesis
done about the equality of power on both compressor and turbineside cannot be verified mainly due to mechanical and thermal iner-tias of the whole turbocharger. Many variations of this procedure,especially in the determination of the different inputs, can be usedto satisfy particular requirements. Various iterations are generallynecessary to achieve a good match.
5. Conclusions
An alternative set of parameters for characterizing the turbinebehavior has been presented. The turbines characteristics de-scribed in this paper are more compact and allow plotting all theturbine performance data in a single graph as a compressor map.So the interpretation is easier and more direct.
The turbine characteristics are accurately fitted with quadraticpolynomial functions. These functions have the particularity tobe continuously differentiable and without discontinuities. Whenimplemented in 0D engine simulation code, standard linear inter-polation routines are straightforward and time calculation isreduced.
The differences between turbines behavior under steady or un-der pulsating flow conditions, as well as heat transfer phenomenaacross the turbine are still under investigation. Nowadays, it doesnot exist simple solution to solve these problems in 0D codes.The new representation uses conservative parameters which areless sensitive to their effects. So the interpolated results are morereliable and the accuracy of the whole engine simulation isimproved.
Acknowledgements
This work was partially supported by the Ministerio de Cienciae Innovación through the Spanish Project TRA2007-65433. OlivierVarnier is indebted to the Ministerio de Ciencia e Innovación forits support through Grant AP2007-02868.
References
[1] J. Galindo, H. Climent, C. Guardiola, A. Tiseira, J. Portalier, Assessment of asequentially turbocharged diesel engine on real-life driving cycles, Int. J. Veh.Des. 49 (1/2/3) (2009).
[2] J. Galindo, H. Climent, C. Guardiola, J. Domenech, Strategies for improving themode transition in a sequential parallel turbocharged automotive dieselengine, Int. J. Automot. Technol. 10 (2) (2009) 141–149.
[3] F. Pflüger, Regulated two-stage turbocharging – KKK’s new charging system forcommercial diesel engines, in: IMechE, C554/035/98, Sixth InternationalConference on Turbocharging and Air Management Systems, 1998.
[4] J.B. Heywood, Internal Combustion Engine Fundamentals, McGraw-Hill, Inc.,1988.
[5] N. Watson, M.S. Janota, Turbocharging the Internal Combustion Engine,Macmillan, 1982.
[6] J. Macek, O. Vitek, Simulation of Pulsating Flow Unsteady Operation of aTurbocharger Radial Turbine, SAE Technical Paper, 2008-01-0295, 2008.
[7] X. Hu, An Advanced Turbocharger Model for the Internal Combustion Engine,Doctoral Thesis, Purdue University, 2000.
[8] P. Moraal, I. Kolmanovsky, Turbocharger Modeling for Automotive ControlApplications, SAE Technical Paper, 1999-01-0908, 1999.
[9] J.P. Jensen, A.F. Kristensen, S.C. Sorenson, N. Houback, Mean Value Modelling ofSmall Turbocharged Diesel Engine, SAE Technical Paper, 910070, 1991.
[10] M. Muller, E. Hendricks, S.C. Sorenson, Mean Value Modelling of TurbochargedSpark Ignition Engines, SAE Technical Paper, 980784, 1998.
[11] R.S. Benson, The Thermodynamics and Gas Dynamics of Internal CombustionEngines, vol. I, Oxford University Press, 1982.
[12] J.R. Serrano, F.J. Arnau, V. Dolz, A. Tiseira, C. Cervello, A model of turbochargerradial turbines appropriate to be used in zero- and one-dimensional gasdynamics codes for internal combustion engines modelling, Energy Convers.Manage. 49 (2008) 3729–3745.
[13] F. Payri, J. Benajes, M. Reyes, Modelling of supercharger turbines in internalcombustion engines, Int. J. Mech. Sci. (8–9) (1996) 853–869.
[14] S.A. Nelson, Z.S. Filipi, D.N. Assanis, The use of neural nets for matching fixed orvariable geometry compressors with diesel engines, J. Eng. Gas Turbines Power125 (2003) 572–579.
[15] S.L. Dixon, Fluid Mechanics Thermodynamics of Turbomachinery, PergamonPress Ltd., 1998.
Fig. 12. Compressor matching.
Fig. 13. Turbine matching.
152 M. Tancrez et al. / Experimental Thermal and Fluid Science 35 (2011) 146–153

Author's personal copy
[16] S. Shaaban, J. Seume, Analysis of turbocharger non-adiabatic performance, in:C647/027, Proceedings of 8th International Conference on Turbochargers andTurbocharging, London, 2006.
[17] H. Chen, I. Hakeem, R. Martinez-Botas, Modelling of a turbocharger turbineunder pulsating inlet conditions, Proc. Inst. Mech. Eng., Part A: J. Power Energy210 (1996) 397–408.
[18] F.J. Wallace, G.P. Blair, The Pulsating Flow Performance of Inward Radial FlowTurbines, ASME, Paper 65-GTP-21, 1965.
[19] M. Capobianco, A. Gambarotta, G. Cipolla, Influence of the pulsating flowoperation on the turbine characteristics of a small internal combustion engine
turbocharger, in: Turbocharging and Turbochargers, Inst. Mech. Eng., 1989, pp.63–69.
[20] K. Konishi, H. Yoshiki, S. Tashiro, Performances of radial inflow turbines forexhaust gas turbochargers under nonsteady flow conditions, in: Proc. 1991Yokohama Int. Gas Turbines Congress, 1991, pp. 157–64
[21] D.E. Winterbone, R.J. Pearson. Turbocharger turbine performance underunsteady flow – a review of experimental results and proposed models, in:Proc. IMechE 6th International Conference on Turbocharging and AirManagement Systems, Paper C554/031/98, 1998, pp. 193–206.
M. Tancrez et al. / Experimental Thermal and Fluid Science 35 (2011) 146–153 153
Related Documents