Welcome message from author
This document is posted to help you gain knowledge. Please leave a comment to let me know what you think about it! Share it to your friends and learn new things together.
Transcript
Halaman 1 dari 11
Kontak:
Equity & Index Valuation Division
Phone: (6221) 7884 0200 [email protected]
“Pernyataan disclaimer pada halaman akhir merupakan
bagian yang tidak terpisahkan dari dokumen ini” www.pefindo-consulting.co.id
Tunas Baru Lampung, Tbk Laporan Kedua
Equity Valuation
1 Juni 2015
Target Harga
Terendah Tertinggi 1.065 1.250
Agribisnis
Kinerja Saham
Sumber: Bloomberg, PEFINDO Riset & Konsultasi - Divisi
Valuasi Saham & Indexing
Informasi Saham Rp
Kode saham TBLA
Harga saham 28 Mei 2015 560
Harga Tertinggi 52 minggu terakhir 815
Harga Terendah 52 minggu terakhir 470
Kapitalisasi Pasar Tertinggi 52 minggu
(miliar) 4.354
Kapitalisasi Pasar Terendah 52 minggu (miliar)
2.511
Penilaian Saham Sebelumnya Saat Ini
Terendah 990 1.250
Terendah 845 1.065
Market Value Added & Market Risk
Sumber: Bloomberg, PEFINDO Riset & Konsultasi - Divisi
Valuasi Saham & Indexing
Pemegang Saham (%)
PT Budi Delta Swakarya 27,80
PT Sungai Budi 26,49
Widarto 0,04
Santoso Winata 0,04
Publik (dibawah 5% kepemilikan) 45,63
Tahun yang Manis
PT Tunas Baru Lampung Tbk (TBLA) mengukir sejarahnya sejak tahun 1973, saat pertama kali didirikan. TBLA aktif dalam industri agribisnis, terutama perkebunan kelapa sawit dan produk turunannya, tebu dan produksi gula rafinasi, termasuk perkebunan nanas. TBLA merupakan
bagian dari grup Sungai Budi, salah satu perusahaan pelopor agribisnis.
Saat ini, TBLA memiliki 78.826 hektar (“ha”) area perkebunan berlokasi di Lampung, Sumatera Selatan dan Kalimantan Barat. TBLA mendistribusikan produknya ke luar dan dalam negeri. Salah satu produknya yang terkenal di dalam negeri adalah minyak goreng “Rose Brand”. Untuk mempertahankan pertumbuhannya di masa datang, TBLA telah menambah jumlah area tertanamnya (menjadi 6.000 ha, per September 2014) di Kalimantan Barat, membangun pabrik
pengolahan gula di Terbanggi – Lampung, pabrik pengolahan kelapa sawit di Surabaya dan Lampung, membangun pabrik biodiesel baru di Lampung, dan memperluas area tebu di Lampung.

“Pernyataan disclaimer pada
halaman akhir merupakan bagian
yang tidak terpisahkan dari
dokumen ini”
www.pefindo-consulting.co.id
Tunas Baru Lampung, Tbk
01 Juni 2015 Halaman 2 dari 11
Penyesuaian Target Harga
Kami membuat beberapa penyesuaian untuk proyeksi kami sebelumnya, dan menyesuaikan target harga kami menjadi Rp1.065 – Rp1.250 per saham, berdasarkan pertimbangan sebagai berikut:
Permintaan CPO global dan domestik masih ada. Meskipun harga jual rata-rata CPO global menurun, kami melihat bahwa permintaan global untuk CPO Indonesia masih ada. Persediaan yang menipis di Tiongkok selama 1Q2015, akan menyebabkan permintaan yang signifikan dari CPO Indonesia di kuartal berikutnya. Sementara India terus menunjukkan tren peningkatan permintaan CPO Indonesia. Di dalam negeri, peraturan baru untuk meningkatkan kandungan minyak nabati pada biodiesel, secara signifikan mempengaruhi
produksi. Dari 0,4 juta kilo liter ("KL") biodiesel di tahun 2011, meningkat menjadi 2,9 juta KL per September 2014, yang diterjemahkan menjadi sekitar 10 miliar KL produksi CPO, naik dari sekitar 6,5 miliar KL pada tahun 2011.
Merasakan efek dari pabrik gula baru. Setelah pabrik penyulingan gula baru selesai dibangun pada akhir tahun 2013, pendapatan TBLA dari bisnis pengolahan gula melonjak secara signifikan. Volume penjualan gula rafinasi
pada tahun 2014 adalah 115.134 ton, jauh lebih tinggi dari tahun 2013 (hanya 7.445 ton). Ke depan, kami melihat bahwa bisnis dari pengolahan gula akan memberikan kontribusi yang lebih tinggi untuk pendapatan TBLA, karena mereka baru tahun pertama memproduksi dari pabrik gula baru.
Kinerja yang luar biasa. Kami melihat bahwa kinerja TBLA sangat mengagumkan di 2014. Pendapatan melonjak 71% yoy atau mencapai Rp3,7 triliun, didukung pertumbuhan yang kuat dari bisnis pengolahan gula.
Penurunan rugi bersih transaksi mata uang asing menciptakan peningkatan laba sebelum pajak sebesar 373% yoy, atau sebesar Rp562 miliar. Di masa depan, kami melihat bahwa TBLA akan terus membukukan peningkatan pendapatan, terutama dari bisnis pengolahan gula, seiring dioperasikannya pabrik penyulingan gula baru secara bertahap hingga mencapai pemanfaatan yang optimal.
Perubahan asumsi risk-free rate, equity premium, dan beta menjadi 8,19%,
2,22%, dan 0,60x. Prospek Usaha Kami melihat bahwa permintaan global untuk CPO Indonesia masih ada, karena CPO merupakan komoditas yang tetap dibutuhkan oleh masyarakat. Peningkatan populasi dan masyarakat kelas menengah juga menciptakan permintaan yang
stabil akan CPO Indonesia. Di dalam negeri, berlakunya peraturan peningkatan kandungan minyak nabati dalam bahan bakar biodiesel, membuat permintaan CPO stabil. Sementara di bisnis gula, kesenjangan yang lebar antara permintaan dan penawaran gula rafinasi, seperti ditunjukkan dengan seberapa cepat kuota impor gula mentah terpenuhi pada tahun 2014, membuat prospek bisnis ini masih cerah. Mengingat ini, kami melihat bahwa prospek TBLA, sebagai perusahaan yang aktif dalam bisnis ini tetap optimis. Sebagai hasilnya, kami
memperkirakan bahwa pendapatan TBLA akan tumbuh minimal 11,5% CAGR selama periode tahun 2014-2019. Tabel 1: Ringkasan Kinerja
2012 2013 2014 2015P 2016P
Pendapatan [Rp miliar] 3.806 3.705 6.338 6.691 7.439
Laba Sebelum Pajak [Rp miliar] 311 119 562 780 930
Laba Bersih [Rp miliar] 242 84 433 580 691
EPS [Rp] 45 16 81 109 129
Pertumbuhan EPS [%] (42) (65) 414 34 19
P/E [x] 10,8 29,8 9,3 5,2* 4,3*
PBV [x] 1,5 1,4 1,6 1,0* 0,8*
Sumber: PT Tunas Baru Lampung Tbk, Estimasi PEFINDO Divisi Valuasi Saham & Indexing
Catatan: *) Berdasarkan harga saham tanggal 29 Mei 2015 – Rp560/saham
PARAMETER INVESTASI
“Pernyataan disclaimer pada
halaman akhir merupakan bagian
yang tidak terpisahkan dari
dokumen ini”
www.pefindo-consulting.co.id
Tunas Baru Lampung, Tbk
01 Juni 2015 Halaman 3 dari 11
Overview Ekonomi Indonesia Tahun 2015: Diekspektasikan Tumbuh Lebih
Kencang Pada tahun 2015, kami mengekspektasikan tingkat pertumbuhan ekonomi untuk berada di kisaran 5,3% -5,7%, ditopang oleh konsumsi swasta meningkat, inflasi yang terkendali dan tingkat suku bunga yang stabil. Sejauh ini, tekanan inflasi yang relatif rendah selama 1Q2015 telah membuat daya beli masyarakat stabil, digambarkan oleh Indeks Keyakinan Konsumen yang relatif stabil selama Februari 2015. Belanja Pemerintah yang cukup besar, dengan ekspansi APBN-nya juga
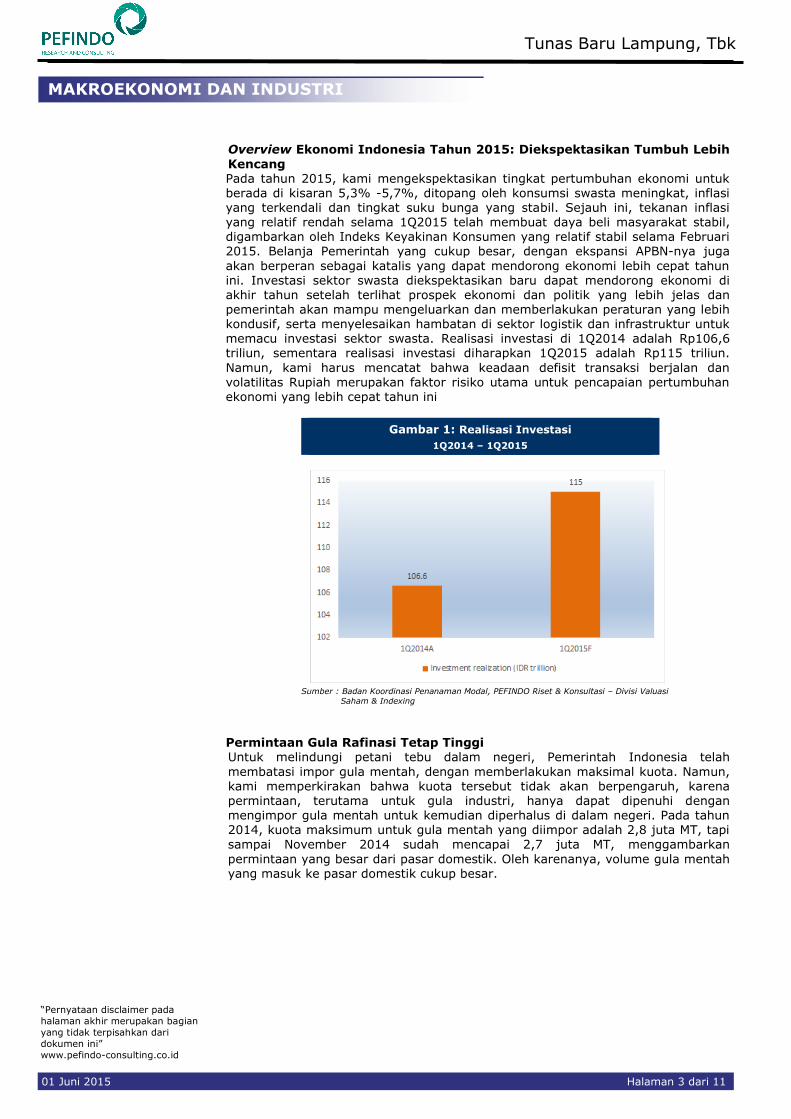
akan berperan sebagai katalis yang dapat mendorong ekonomi lebih cepat tahun ini. Investasi sektor swasta diekspektasikan baru dapat mendorong ekonomi di akhir tahun setelah terlihat prospek ekonomi dan politik yang lebih jelas dan pemerintah akan mampu mengeluarkan dan memberlakukan peraturan yang lebih kondusif, serta menyelesaikan hambatan di sektor logistik dan infrastruktur untuk memacu investasi sektor swasta. Realisasi investasi di 1Q2014 adalah Rp106,6 triliun, sementara realisasi investasi diharapkan 1Q2015 adalah Rp115 triliun.
Namun, kami harus mencatat bahwa keadaan defisit transaksi berjalan dan volatilitas Rupiah merupakan faktor risiko utama untuk pencapaian pertumbuhan ekonomi yang lebih cepat tahun ini
Gambar 1: Realisasi Investasi
1Q2014 – 1Q2015
Sumber : Badan Koordinasi Penanaman Modal, PEFINDO Riset & Konsultasi – Divisi Valuasi
Saham & Indexing
Permintaan Gula Rafinasi Tetap Tinggi Untuk melindungi petani tebu dalam negeri, Pemerintah Indonesia telah
membatasi impor gula mentah, dengan memberlakukan maksimal kuota. Namun, kami memperkirakan bahwa kuota tersebut tidak akan berpengaruh, karena permintaan, terutama untuk gula industri, hanya dapat dipenuhi dengan mengimpor gula mentah untuk kemudian diperhalus di dalam negeri. Pada tahun 2014, kuota maksimum untuk gula mentah yang diimpor adalah 2,8 juta MT, tapi
sampai November 2014 sudah mencapai 2,7 juta MT, menggambarkan
permintaan yang besar dari pasar domestik. Oleh karenanya, volume gula mentah yang masuk ke pasar domestik cukup besar.
MAKROEKONOMI DAN INDUSTRI
“Pernyataan disclaimer pada
halaman akhir merupakan bagian
yang tidak terpisahkan dari
dokumen ini”
www.pefindo-consulting.co.id
Tunas Baru Lampung, Tbk
01 Juni 2015 Halaman 4 dari 11
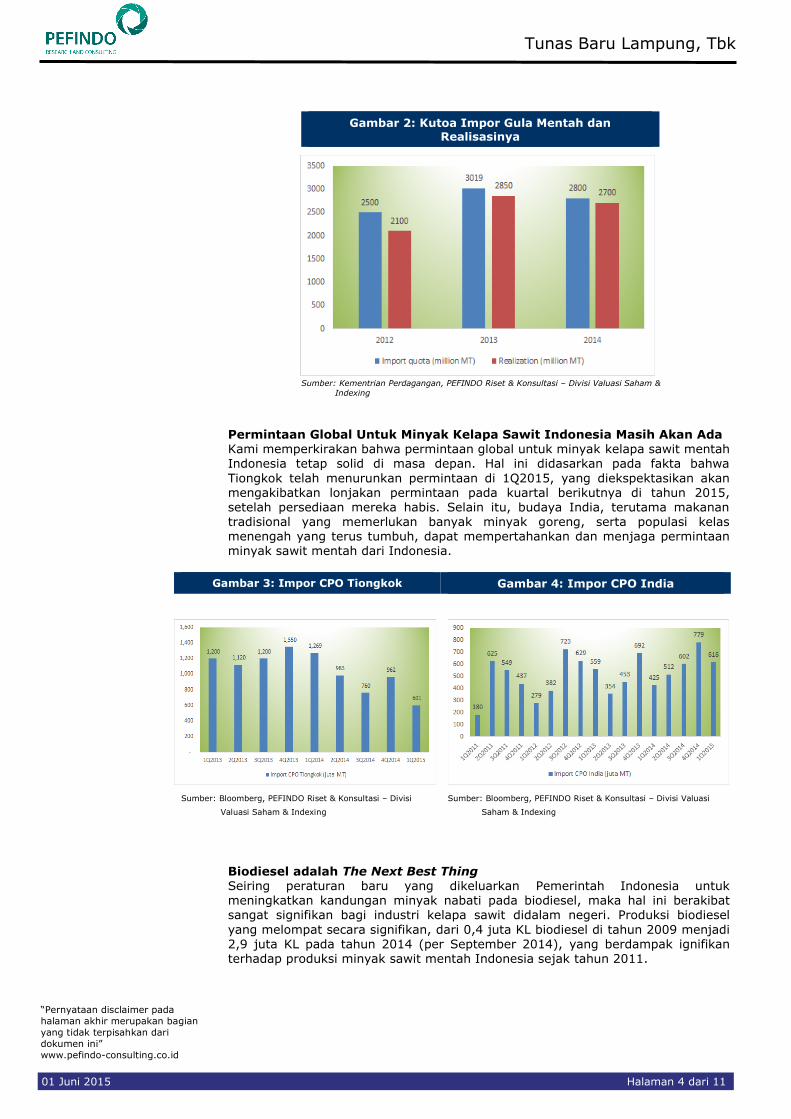
Gambar 2: Kutoa Impor Gula Mentah dan Realisasinya
Sumber: Kementrian Perdagangan, PEFINDO Riset & Konsultasi – Divisi Valuasi Saham &
Indexing
Permintaan Global Untuk Minyak Kelapa Sawit Indonesia Masih Akan Ada Kami memperkirakan bahwa permintaan global untuk minyak kelapa sawit mentah Indonesia tetap solid di masa depan. Hal ini didasarkan pada fakta bahwa
Tiongkok telah menurunkan permintaan di 1Q2015, yang diekspektasikan akan mengakibatkan lonjakan permintaan pada kuartal berikutnya di tahun 2015, setelah persediaan mereka habis. Selain itu, budaya India, terutama makanan tradisional yang memerlukan banyak minyak goreng, serta populasi kelas menengah yang terus tumbuh, dapat mempertahankan dan menjaga permintaan minyak sawit mentah dari Indonesia.
Gambar 3: Impor CPO Tiongkok Gambar 4: Impor CPO India
Sumber: Bloomberg, PEFINDO Riset & Konsultasi – Divisi
Valuasi Saham & Indexing
Sumber: Bloomberg, PEFINDO Riset & Konsultasi – Divisi Valuasi
Saham & Indexing
Biodiesel adalah The Next Best Thing Seiring peraturan baru yang dikeluarkan Pemerintah Indonesia untuk meningkatkan kandungan minyak nabati pada biodiesel, maka hal ini berakibat sangat signifikan bagi industri kelapa sawit didalam negeri. Produksi biodiesel
yang melompat secara signifikan, dari 0,4 juta KL biodiesel di tahun 2009 menjadi 2,9 juta KL pada tahun 2014 (per September 2014), yang berdampak ignifikan terhadap produksi minyak sawit mentah Indonesia sejak tahun 2011.
“Pernyataan disclaimer pada
halaman akhir merupakan bagian
yang tidak terpisahkan dari
dokumen ini”
www.pefindo-consulting.co.id
Tunas Baru Lampung, Tbk
01 Juni 2015 Halaman 5 dari 11
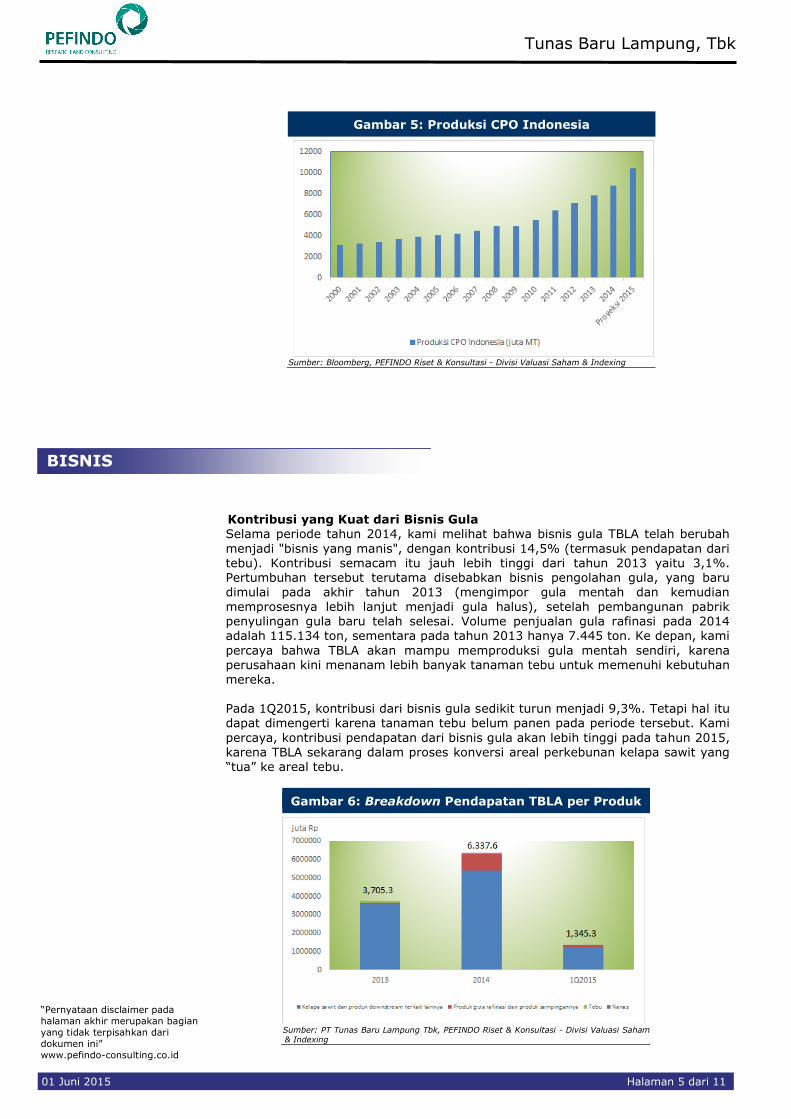
Gambar 5: Produksi CPO Indonesia
Sumber: Bloomberg, PEFINDO Riset & Konsultasi - Divisi Valuasi Saham & Indexing
Kontribusi yang Kuat dari Bisnis Gula Selama periode tahun 2014, kami melihat bahwa bisnis gula TBLA telah berubah
menjadi "bisnis yang manis", dengan kontribusi 14,5% (termasuk pendapatan dari tebu). Kontribusi semacam itu jauh lebih tinggi dari tahun 2013 yaitu 3,1%. Pertumbuhan tersebut terutama disebabkan bisnis pengolahan gula, yang baru dimulai pada akhir tahun 2013 (mengimpor gula mentah dan kemudian
memprosesnya lebih lanjut menjadi gula halus), setelah pembangunan pabrik penyulingan gula baru telah selesai. Volume penjualan gula rafinasi pada 2014 adalah 115.134 ton, sementara pada tahun 2013 hanya 7.445 ton. Ke depan, kami
percaya bahwa TBLA akan mampu memproduksi gula mentah sendiri, karena perusahaan kini menanam lebih banyak tanaman tebu untuk memenuhi kebutuhan mereka. Pada 1Q2015, kontribusi dari bisnis gula sedikit turun menjadi 9,3%. Tetapi hal itu dapat dimengerti karena tanaman tebu belum panen pada periode tersebut. Kami
percaya, kontribusi pendapatan dari bisnis gula akan lebih tinggi pada tahun 2015, karena TBLA sekarang dalam proses konversi areal perkebunan kelapa sawit yang “tua” ke areal tebu.
Gambar 6: Breakdown Pendapatan TBLA per Produk
Sumber: PT Tunas Baru Lampung Tbk, PEFINDO Riset & Konsultasi - Divisi Valuasi Saham & Indexing
BISNIS
“Pernyataan disclaimer pada
halaman akhir merupakan bagian
yang tidak terpisahkan dari
dokumen ini”
www.pefindo-consulting.co.id
Tunas Baru Lampung, Tbk
01 Juni 2015 Halaman 6 dari 11
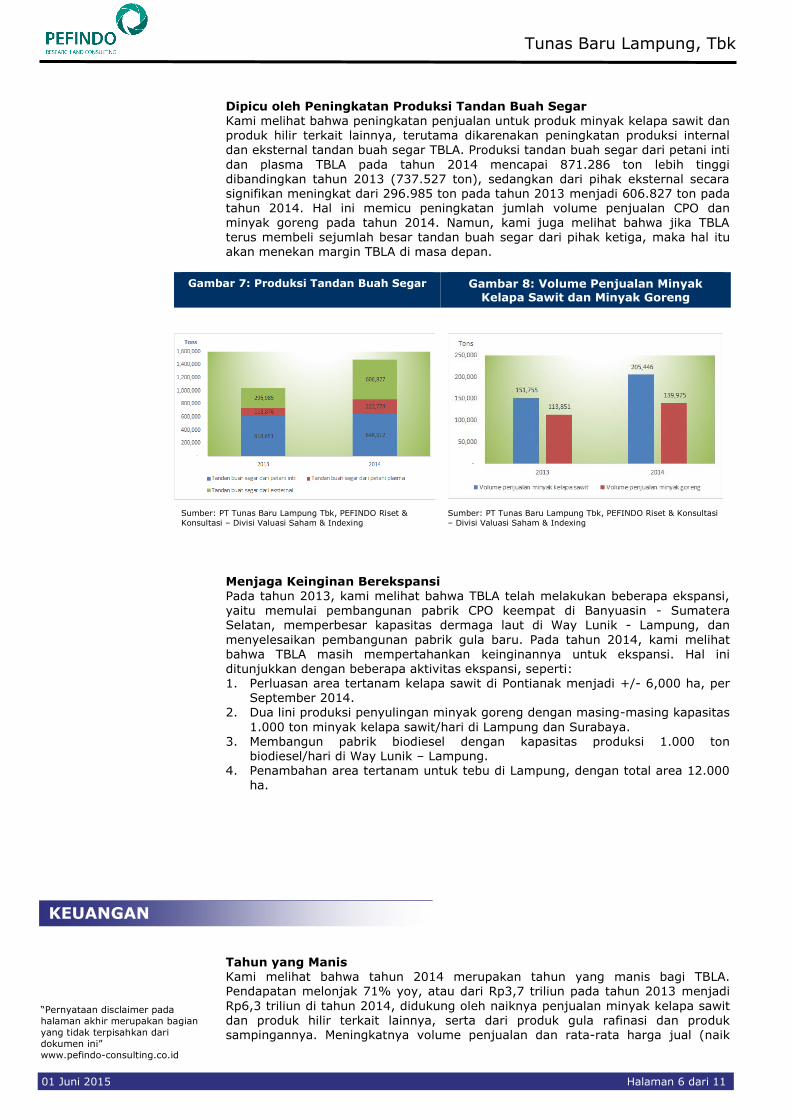
Dipicu oleh Peningkatan Produksi Tandan Buah Segar
Kami melihat bahwa peningkatan penjualan untuk produk minyak kelapa sawit dan produk hilir terkait lainnya, terutama dikarenakan peningkatan produksi internal dan eksternal tandan buah segar TBLA. Produksi tandan buah segar dari petani inti
dan plasma TBLA pada tahun 2014 mencapai 871.286 ton lebih tinggi dibandingkan tahun 2013 (737.527 ton), sedangkan dari pihak eksternal secara signifikan meningkat dari 296.985 ton pada tahun 2013 menjadi 606.827 ton pada tahun 2014. Hal ini memicu peningkatan jumlah volume penjualan CPO dan minyak goreng pada tahun 2014. Namun, kami juga melihat bahwa jika TBLA terus membeli sejumlah besar tandan buah segar dari pihak ketiga, maka hal itu akan menekan margin TBLA di masa depan.
Gambar 7: Produksi Tandan Buah Segar Gambar 8: Volume Penjualan Minyak Kelapa Sawit dan Minyak Goreng
Sumber: PT Tunas Baru Lampung Tbk, PEFINDO Riset &
Konsultasi – Divisi Valuasi Saham & Indexing
Sumber: PT Tunas Baru Lampung Tbk, PEFINDO Riset & Konsultasi
– Divisi Valuasi Saham & Indexing
Menjaga Keinginan Berekspansi Pada tahun 2013, kami melihat bahwa TBLA telah melakukan beberapa ekspansi,
yaitu memulai pembangunan pabrik CPO keempat di Banyuasin - Sumatera Selatan, memperbesar kapasitas dermaga laut di Way Lunik - Lampung, dan
menyelesaikan pembangunan pabrik gula baru. Pada tahun 2014, kami melihat bahwa TBLA masih mempertahankan keinginannya untuk ekspansi. Hal ini ditunjukkan dengan beberapa aktivitas ekspansi, seperti: 1. Perluasan area tertanam kelapa sawit di Pontianak menjadi +/- 6,000 ha, per
September 2014. 2. Dua lini produksi penyulingan minyak goreng dengan masing-masing kapasitas
1.000 ton minyak kelapa sawit/hari di Lampung dan Surabaya. 3. Membangun pabrik biodiesel dengan kapasitas produksi 1.000 ton
biodiesel/hari di Way Lunik – Lampung. 4. Penambahan area tertanam untuk tebu di Lampung, dengan total area 12.000
ha.
Tahun yang Manis
Kami melihat bahwa tahun 2014 merupakan tahun yang manis bagi TBLA. Pendapatan melonjak 71% yoy, atau dari Rp3,7 triliun pada tahun 2013 menjadi
Rp6,3 triliun di tahun 2014, didukung oleh naiknya penjualan minyak kelapa sawit dan produk hilir terkait lainnya, serta dari produk gula rafinasi dan produk sampingannya. Meningkatnya volume penjualan dan rata-rata harga jual (naik
KEUANGAN
“Pernyataan disclaimer pada
halaman akhir merupakan bagian
yang tidak terpisahkan dari
dokumen ini”
www.pefindo-consulting.co.id
Tunas Baru Lampung, Tbk
01 Juni 2015 Halaman 7 dari 11
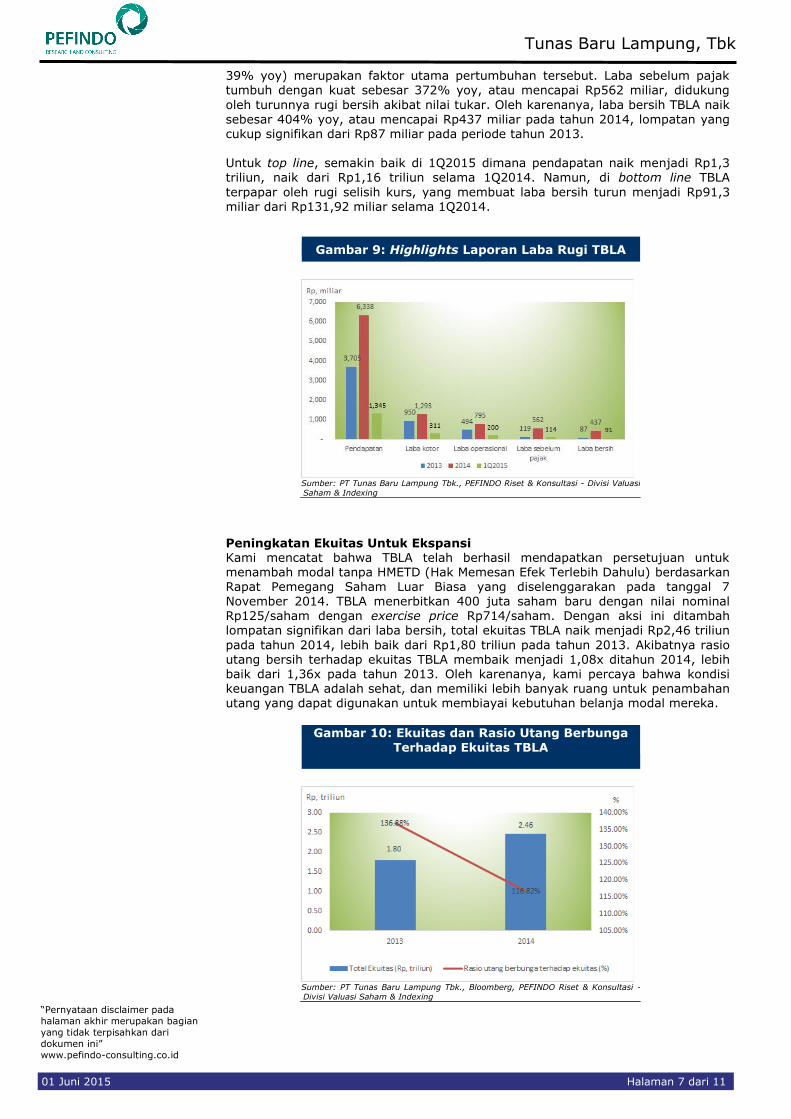
39% yoy) merupakan faktor utama pertumbuhan tersebut. Laba sebelum pajak tumbuh dengan kuat sebesar 372% yoy, atau mencapai Rp562 miliar, didukung
oleh turunnya rugi bersih akibat nilai tukar. Oleh karenanya, laba bersih TBLA naik
sebesar 404% yoy, atau mencapai Rp437 miliar pada tahun 2014, lompatan yang cukup signifikan dari Rp87 miliar pada periode tahun 2013. Untuk top line, semakin baik di 1Q2015 dimana pendapatan naik menjadi Rp1,3 triliun, naik dari Rp1,16 triliun selama 1Q2014. Namun, di bottom line TBLA
terpapar oleh rugi selisih kurs, yang membuat laba bersih turun menjadi Rp91,3 miliar dari Rp131,92 miliar selama 1Q2014.
Gambar 9: Highlights Laporan Laba Rugi TBLA
Sumber: PT Tunas Baru Lampung Tbk., PEFINDO Riset & Konsultasi - Divisi Valuasi Saham & Indexing
Peningkatan Ekuitas Untuk Ekspansi Kami mencatat bahwa TBLA telah berhasil mendapatkan persetujuan untuk menambah modal tanpa HMETD (Hak Memesan Efek Terlebih Dahulu) berdasarkan Rapat Pemegang Saham Luar Biasa yang diselenggarakan pada tanggal 7
November 2014. TBLA menerbitkan 400 juta saham baru dengan nilai nominal Rp125/saham dengan exercise price Rp714/saham. Dengan aksi ini ditambah lompatan signifikan dari laba bersih, total ekuitas TBLA naik menjadi Rp2,46 triliun
pada tahun 2014, lebih baik dari Rp1,80 triliun pada tahun 2013. Akibatnya rasio utang bersih terhadap ekuitas TBLA membaik menjadi 1,08x ditahun 2014, lebih baik dari 1,36x pada tahun 2013. Oleh karenanya, kami percaya bahwa kondisi keuangan TBLA adalah sehat, dan memiliki lebih banyak ruang untuk penambahan utang yang dapat digunakan untuk membiayai kebutuhan belanja modal mereka.
Gambar 10: Ekuitas dan Rasio Utang Berbunga Terhadap Ekuitas TBLA
Sumber: PT Tunas Baru Lampung Tbk., Bloomberg, PEFINDO Riset & Konsultasi - Divisi Valuasi Saham & Indexing
“Pernyataan disclaimer pada
halaman akhir merupakan bagian
yang tidak terpisahkan dari
dokumen ini”
www.pefindo-consulting.co.id
Tunas Baru Lampung, Tbk
01 Juni 2015 Halaman 8 dari 11
PENILAIAN
Metodologi Penilaian Kami mengaplikasikan metode Discounted Cash Flow (DCF) sebagai metode penilaian utama dengan pertimbangan bahwa pertumbuhan pendapatan adalah merupakan faktor yang sangat mempengaruhi nilai (value driver) jika
dibandingkan dengan pertumbuhan aset Selanjutnya, kami juga mengaplikasikan metode Guideline Company Method (GCM) sebagai metode pembanding lainnya. Penilaian ini didasarkan pada Nilai 100% saham per tanggal 29 Mei 2015,
menggunakan laporan keuangan TBLA per tanggal 31 Maret 2015 sebagai dasar dilakukannya analisa fundamental.
Estimasi Nilai
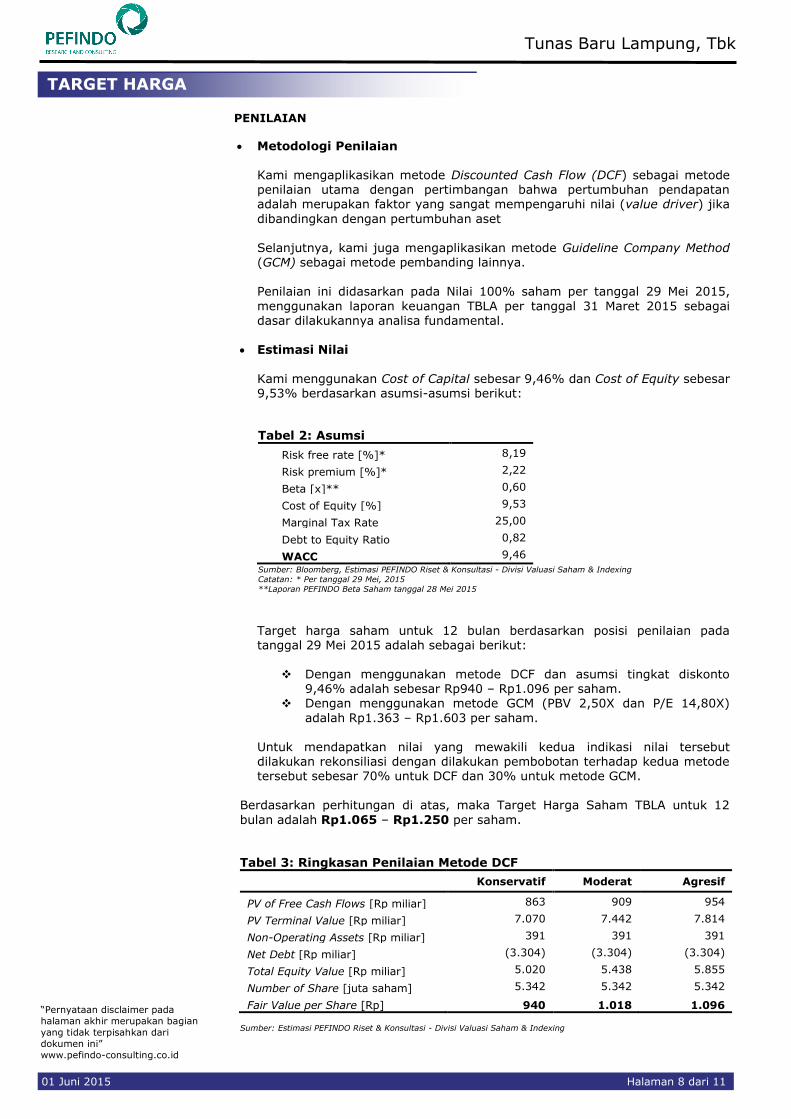
Kami menggunakan Cost of Capital sebesar 9,46% dan Cost of Equity sebesar 9,53% berdasarkan asumsi-asumsi berikut:
Tabel 2: Asumsi
Risk free rate [%]* 8,19
Risk premium [%]* 2,22
Beta [x]** 0,60
Cost of Equity [%] 9,53
Marginal Tax Rate 25,00
Debt to Equity Ratio 0,82
WACC 9,46
Sumber: Bloomberg, Estimasi PEFINDO Riset & Konsultasi - Divisi Valuasi Saham & Indexing
Catatan: * Per tanggal 29 Mei, 2015
**Laporan PEFINDO Beta Saham tanggal 28 Mei 2015
Target harga saham untuk 12 bulan berdasarkan posisi penilaian pada tanggal 29 Mei 2015 adalah sebagai berikut:
Dengan menggunakan metode DCF dan asumsi tingkat diskonto
9,46% adalah sebesar Rp940 – Rp1.096 per saham. Dengan menggunakan metode GCM (PBV 2,50X dan P/E 14,80X)
adalah Rp1.363 – Rp1.603 per saham.
Untuk mendapatkan nilai yang mewakili kedua indikasi nilai tersebut dilakukan rekonsiliasi dengan dilakukan pembobotan terhadap kedua metode tersebut sebesar 70% untuk DCF dan 30% untuk metode GCM.
Berdasarkan perhitungan di atas, maka Target Harga Saham TBLA untuk 12
bulan adalah Rp1.065 – Rp1.250 per saham.
Tabel 3: Ringkasan Penilaian Metode DCF
Konservatif Moderat Agresif
PV of Free Cash Flows [Rp miliar] 863 909 954
PV Terminal Value [Rp miliar] 7.070 7.442 7.814
Non-Operating Assets [Rp miliar] 391 391 391
Net Debt [Rp miliar] (3.304) (3.304) (3.304)
Total Equity Value [Rp miliar] 5.020 5.438 5.855
Number of Share [juta saham] 5.342 5.342 5.342
Fair Value per Share [Rp] 940 1.018 1.096
Sumber: Estimasi PEFINDO Riset & Konsultasi - Divisi Valuasi Saham & Indexing
TARGET HARGA

“Pernyataan disclaimer pada
halaman akhir merupakan bagian
yang tidak terpisahkan dari
dokumen ini”
www.pefindo-consulting.co.id
Tunas Baru Lampung, Tbk
01 Juni 2015 Halaman 9 dari 11
Tabel 4: Perbandingan GCM
TBLA SMAR AALI Rata-rata
Penilaian, 29 Mei 2015
P/E [x] 7,20 15,80 21,30 14,80
P/BV [x] 1,20 2,90 3,40 2,50
Sumber: Bloomberg, Estimasi PEFINDO Riset & Konsultasi - Divisi Valuasi Saham & Indexing
Tabel 5: Ringkasan Penilaian Metode GCM
Multiples
(x)
Est. EPS
(IDR)
Est. BV/Share
(IDR)
Value
(IDR)
P/BV 2,50 - 539 1.363
P/E 14,80 109 - 1.603 Sumber: Bloomberg, Estimasi PEFINDO Riset & Konsultasi - Divisi Valuasi Saham & Indexing
Tabel 6: Rekonsiliasi Nilai Wajar Nilai Wajar per Saham [Rp]
DCF GCM Rata-rata
Batas atas 1.096 1.603 1.250
Batas bawah 940 1.363 1.065
Bobot 70% 30%
Sumber: Estimasi PEFINDO Riset & Konsultasi - Divisi Valuasi Saham & Indexing
“Pernyataan disclaimer pada
halaman akhir merupakan bagian
yang tidak terpisahkan dari
dokumen ini”
www.pefindo-consulting.co.id
Tunas Baru Lampung, Tbk
01 Juni 2015 Halaman 10 dari 11
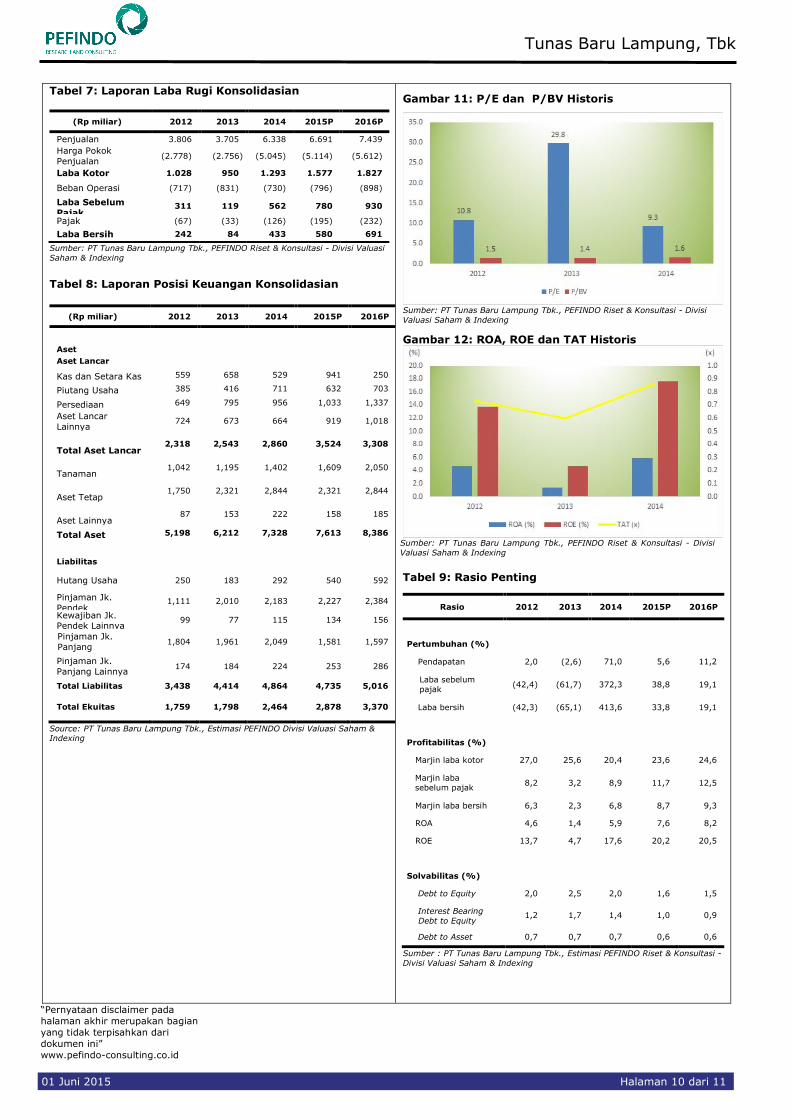
Tabel 7: Laporan Laba Rugi Konsolidasian
(Rp miliar) 2012 2013 2014 2015P 2016P
Penjualan 3.806 3.705 6.338 6.691 7.439
Harga Pokok
Penjualan (2.778) (2.756) (5.045) (5.114) (5.612)
Laba Kotor 1.028 950 1.293 1.577 1.827
Beban Operasi (717) (831) (730) (796) (898)
Laba Sebelum
Pajak 311 119 562 780 930
Pajak (67) (33) (126) (195) (232)
Laba Bersih 242 84 433 580 691
Sumber: PT Tunas Baru Lampung Tbk., PEFINDO Riset & Konsultasi - Divisi Valuasi
Saham & Indexing Tabel 8: Laporan Posisi Keuangan Konsolidasian
(Rp miliar) 2012 2013 2014 2015P 2016P
Aset
Aset Lancar
Kas dan Setara Kas 559 658 529 941 250
Piutang Usaha 385 416 711 632 703
Persediaan 649 795 956 1,033 1,337
Aset Lancar
Lainnya 724 673 664 919 1,018
Total Aset Lancar 2,318 2,543 2,860 3,524 3,308
Tanaman 1,042 1,195 1,402 1,609 2,050
Aset Tetap 1,750 2,321 2,844 2,321 2,844
Aset Lainnya 87 153 222 158 185
Total Aset 5,198 6,212 7,328 7,613 8,386
Liabilitas
Hutang Usaha 250 183 292 540 592
Pinjaman Jk.
Pendek 1,111 2,010 2,183 2,227 2,384
Kewajiban Jk. Pendek Lainnya
99 77 115 134 156
Pinjaman Jk.
Panjang 1,804 1,961 2,049 1,581 1,597
Pinjaman Jk.
Panjang Lainnya 174 184 224 253 286
Total Liabilitas 3,438 4,414 4,864 4,735 5,016
Total Ekuitas 1,759 1,798 2,464 2,878 3,370
Source: PT Tunas Baru Lampung Tbk., Estimasi PEFINDO Divisi Valuasi Saham & Indexing
Gambar 11: P/E dan P/BV Historis
Sumber: PT Tunas Baru Lampung Tbk., PEFINDO Riset & Konsultasi - Divisi
Valuasi Saham & Indexing
Gambar 12: ROA, ROE dan TAT Historis
Sumber: PT Tunas Baru Lampung Tbk., PEFINDO Riset & Konsultasi - Divisi
Valuasi Saham & Indexing
Tabel 9: Rasio Penting
Rasio 2012 2013 2014 2015P 2016P
Pertumbuhan (%)
Pendapatan 2,0 (2,6) 71,0 5,6 11,2
Laba sebelum
pajak (42,4) (61,7) 372,3 38,8 19,1
Laba bersih (42,3) (65,1) 413,6 33,8 19,1
Profitabilitas (%)
Marjin laba kotor 27,0 25,6 20,4 23,6 24,6
Marjin laba
sebelum pajak 8,2 3,2 8,9 11,7 12,5
Marjin laba bersih 6,3 2,3 6,8 8,7 9,3
ROA 4,6 1,4 5,9 7,6 8,2
ROE 13,7 4,7 17,6 20,2 20,5
Solvabilitas (%)
Debt to Equity 2,0 2,5 2,0 1,6 1,5
Interest Bearing
Debt to Equity 1,2 1,7 1,4 1,0 0,9
Debt to Asset 0,7 0,7 0,7 0,6 0,6
Sumber : PT Tunas Baru Lampung Tbk., Estimasi PEFINDO Riset & Konsultasi -
Divisi Valuasi Saham & Indexing
“Pernyataan disclaimer pada
halaman akhir merupakan bagian
yang tidak terpisahkan dari
dokumen ini”
www.pefindo-consulting.co.id
Tunas Baru Lampung, Tbk
01 Juni 2015 Halaman 11 dari 11
DISCLAIMER
Laporan ini dibuat berdasarkan sumber-sumber yang kami anggap terpercaya dan dapat diandalkan. Namun kami tidak menjamin kelengkapan, keakuratan atau kecukupannya. Dengan demikian kami tidak bertanggung jawab atas segala keputusan investasi yang diambil berdasarkan laporan ini. Adapun asumsi, opini, dan perkiraan merupakan hasil dari pertimbangan internal kami per tanggal penilaian (cut off date),
dan kami dapat mengubah pertimbangan diatas sewaktu-waktu tanpa pemberitahuan terlebih dahulu. Kami tidak bertanggung jawab atas kekeliruan atau kelalaian yang terjadi akibat penggunaan laporan ini. Kinerja dimasa lalu tidak selalu dapat dijadikan acuan hasil masa depan. Laporan ini bukan merupakan rekomendasi penawaran, pembelian atau menahan suatu saham tertentu. Laporan ini mungkin tidak sesuai untuk beberapa investor. Seluruh opini dalam laporan ini telah disampaikan dengan itikad baik, namun sewaktu-waktu dapat berubah tanpa pemberitahuan terlebih dahulu, dan disajikan dengan benar
per tanggal diterbitkan laporan ini. Harga, nilai, atau pendapatan dari setiap saham Perseroan yang disajikan dalam laporan ini kemungkinan dapat lebih rendah dari harapan pemodal, dan pemodal juga mungkin mendapatkan pengembalian yang lebih rendah dari nilai investasi yang ditanamkan. Investasi didefinisikan sebagai pendapatan yang kemungkinan besar diterima dimasa depan, namun nilai dari pendapatan yang akan diterima tersebut kemungkinan besar juga akan berfluktuasi. Untuk saham Perseroan yang penyajian laporan keuangannya didenominasi dalam mata uang selain Rupiah, perubahan
nilai tukar mata uang tersebut kemungkinan dapat menurunkan nilai, harga, atau pendapatan investasi pemodal. Informasi dalam laporan ini bukan merupakan pertimbangan pajak dalam mengambil suatu keputusan investasi. Target harga saham dalam Laporan ini merupakan nilai fundamental, bukan merupakan Nilai Pasar Wajar, dan bukan merupakan harga acuan transaksi yang diwajibkan oleh peraturan perundang-undangan yang berlaku.
Laporan target harga saham yang diterbitkan oleh PT Pefindo Riset Konsultasi (PRK) atau PEFINDO Research and Consulting bukan merupakan rekomendasi untuk membeli, menjual, atau menahan suatu saham tertentu, dan tidak dapat dianggap sebagai nasehat investasi oleh PRK yang berhubungan dengan cakupan Jasa kepada, atau kaitannya kepada, beberapa pihak, termasuk emiten, penasehat keuangan, pialang saham, investment banks, institusi keuangan dan perantara keuangan, dalam kaitannya menerima imbalan atau keuntungan lainnya dari pihak tersebut.
Laporan ini tidak ditujukan untuk pemodal tertentu dan tidak dapat dijadikan bagian dari tujuan investasi
terhadap suatu saham dan juga bukan merupakan rekomendasi investasi terhadap suatu saham tertentu atau suatu strategi investasi. Sebelum melakukan tindakan dari hasil laporan ini, pemodal disarankan untuk mempertimbangkan terlebih dahulu kesesuaian situasi dan kondisi dan, jika dibutuhkan, mintalah bantuan penasehat keuangan.
PEFINDO memisahkan kegiatan Valuasi Saham dengan kegiatan Pemeringkatan untuk menjaga independensi dan objektivitas dari proses dan produk kegiatan analitis. PEFINDO telah menetapkan kebijakan dan prosedur untuk menjaga kerahasiaan informasi non-publik tertentu yang diterima sehubungan dengan proses analitis. Keseluruhan proses, metodologi dan database yang digunakan dalam penyusunan Laporan Target Harga Referensi Saham ini secara keseluruhan adalah berbeda dengan proses, metodologi dan database yang digunakan PEFINDO dalam melakukan pemeringkatan.
Laporan ini dibuat dan disiapkan PRK dengan tujuan untuk meningkatkan transparansi harga saham yang tercatat di Bursa Efek Indonesia. Laporan ini juga bebas dari pengaruh tekanan atau paksaan dari Bursa maupun Perseroan yang dinilai. PRK akan menerima imbalan dari Perseroan dan Bursa Efek Indonesia untuk 2 (dua) kali pelaporan per tahun. Untuk keterangan lebih lanjut, dapat mengunjungi website kami di http://www.pefindo-consulting.co.id
Laporan ini dibuat dan disiapkan oleh PT PEFINDO Riset Konsultasi - Divisi Valuasi Saham dan Indexing. Di Indonesia Laporan ini dipublikasikan pada website kami dan juga pada website Bursa Efek Indonesia.
Page 1 of 11
Contact:
Equity & Index Valuation Division
Phone: (6221) 7884 0200 [email protected]
“Disclaimer statement in the last page is an integral part
of this report” www.pefindo-consulting.co.id
Tunas Baru Lampung, Tbk Secondary Report
Equity Valuation
June 1, 2015
Target Price
Low High 1,065 1,250
Agribusiness Industry
Stock Performance Chart
Source : Bloomberg, PEFINDO Research & Consulting -
Equity & Index Valuation Division
Stock Information IDR
Ticker code TBLA
Market price as of April 28, 2015 560
Market price – 52 week high 815
Market price – 52 week low 470
Market cap – 52 week high (bn) 4,354
Market cap – 52 week low (bn) 2,511
Stock Valuation Last Current
High 990 1,250
Low 845 1,065
Market Value Added & Market Risk
Source : Bloomberg, PEFINDO Research & Consulting -
Equity & Index Valuation Division
Shareholders (%)
PT Budi Delta Swakarya 27.80
PT Sungai Budi 26.49
Widarto 0.04
Santoso Winata 0.04
Public (each below 5% of ownerships) 45.63
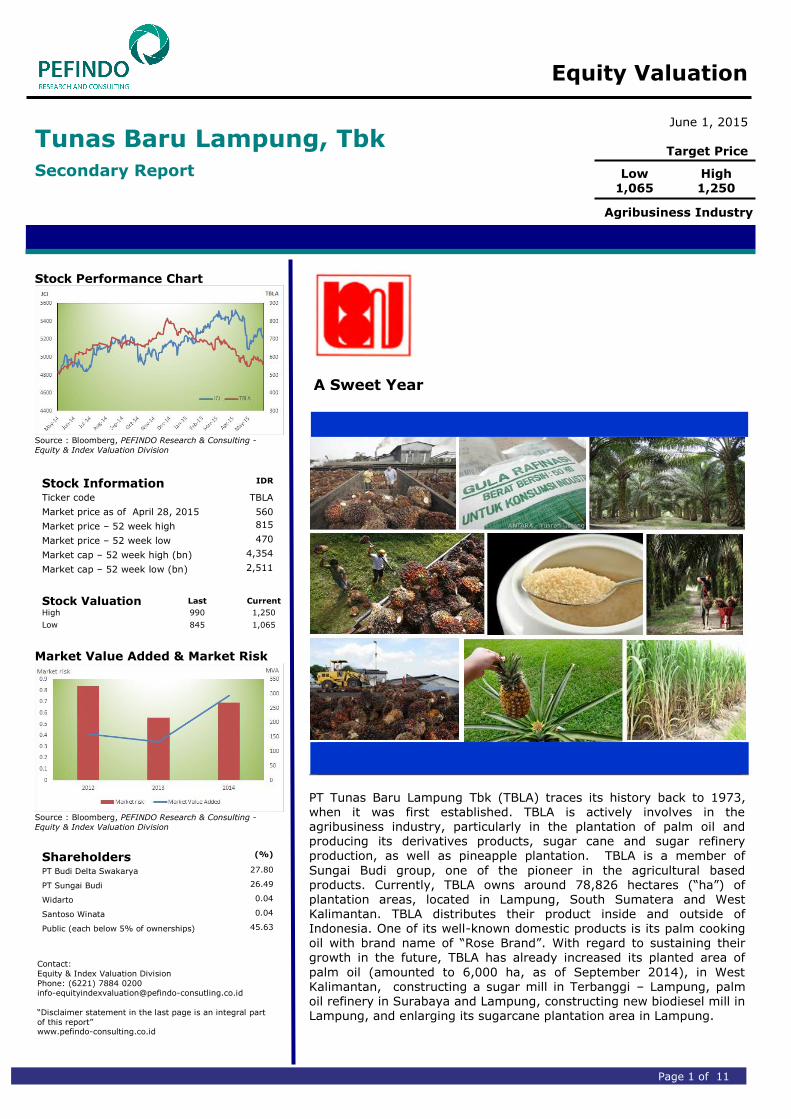
A Sweet Year
PT Tunas Baru Lampung Tbk (TBLA) traces its history back to 1973, when it was first established. TBLA is actively involves in the agribusiness industry, particularly in the plantation of palm oil and producing its derivatives products, sugar cane and sugar refinery
production, as well as pineapple plantation. TBLA is a member of
Sungai Budi group, one of the pioneer in the agricultural based products. Currently, TBLA owns around 78,826 hectares (“ha”) of plantation areas, located in Lampung, South Sumatera and West Kalimantan. TBLA distributes their product inside and outside of Indonesia. One of its well-known domestic products is its palm cooking oil with brand name of “Rose Brand”. With regard to sustaining their growth in the future, TBLA has already increased its planted area of
palm oil (amounted to 6,000 ha, as of September 2014), in West Kalimantan, constructing a sugar mill in Terbanggi – Lampung, palm oil refinery in Surabaya and Lampung, constructing new biodiesel mill in Lampung, and enlarging its sugarcane plantation area in Lampung.
“Disclaimer statement in the last
page is an integral part of this
report” www.pefindo-consulting.co.id
Tunas Baru Lampung, Tbk
June 01, 2015 Page 2 of 11
Target Price Adjustment We made several adjustments to our previous projections, and adjust our target price to a range of IDR1,065 – IDR1,250 per share, based on the following considerations:
Global and domestic demand of CPO is still there. Despite the dropping average
sales price of global CPO, we view that global demand for Indonesia’s CPO is still there. Depleted inventories in China during 1Q2015, will cause significant demand of Indonesia’s CPO in the next quarters. While India continues to show growing demand of Indonesia’s CPO. In domestic, the new regulation to increase the content of vegetable oil in the biodiesel, significantly affect the
production. From 0.4 million kilo liters (“KL”) of biodiesel in 2011, it rose to 2.9 million Kl as of September 2014, which translates into around a production of total 10,000 million KL of CPO, up from around 6,500 million KL in 2011.
Feel the effect of the new sugar refinery mill. After the new sugar refinery mill has been completed in the late 2013, TBLA’s revenue from sugar refinery business was soaring-up significantly. Sales volume of refined sugar in 2014
was 115,134 tons, much higher than in 2013 (only 7,445 tons). Going forward, we view that the sugar refinery business will provide higher contribution to TBLA’s revenue, since it was only their first year of production from the new sugar refinery mill.
Superb performance. We view that TBLA has accomplished such astonishing performance in 2014. Its revenue soared by 71% yoy or reach IDR3.7 trillion, on the back of strong growth from sugar refinery business. Decreasing net loss
of foreign exchange creates a rose of earning before tax by 373% yoy, or amounted to IDR562 billion. In the future, we see that TBLA will continue to book an increasing revenue, especially from sugar refinery business, as the new sugar refinery mill will gradually operates at optimum utilization.
Change of Risk-free rate, equity premium, and beta assumption to 8.19%, 2.22%, and 0.60x respectively.
Business Prospects We view that global demand for Indonesian CPO is still there, since CPO is constitutes as a commodity that continuously needed by people. Increasing population and middle-class society also create a stable demand for Indonesia’s CPO. In domestic, the enactment regulation of increasing vegetable oil content in biodiesel fuel, keeps the demand for CPO stable. While in sugar business, a deep
gap between demand and supply for refinery sugar, as showed by how quick the import quota was being filled in 2014, makes the prospect of this business remains bright. Given this, we view that TBLA’s prospect, as a company that actively participates in these business remains in the upbeat condition. As a result, we estimate that TBLA’s revenue will grow by at least 11.5% CAGR during 2014 – 2019 periods.
Table 1: Performance Summary
2012 2013 2014 2015P 2016P
Net sales (IDR bn) 3,806 3,705 6,338 6,691 7,439
Pre-tax profit (IDR bn) 311 119 562 780 930
Net profit (IDR bn) 242 84 433 580 691
EPS (IDR) 45 16 81 109 129
EPS Growth (%) (42) (65) 414 34 19
P/E (x) 10.8 29.8 9.3 5.2* 4.3*
PBV (x) 1.5 1.4 1.6 1.0* 0.8*
Source: PT Tunas Baru Lampung Tbk, PEFINDO Research & Consulting - Equity & Index Valuation Division Estimates
Notes: *) Based on Share Price as of May 29, 2015 – IDR560/share
INVESTMENT PARAMETERS
“Disclaimer statement in the last
page is an integral part of this
report” www.pefindo-consulting.co.id
Tunas Baru Lampung, Tbk
June 01, 2015 Page 3 of 11
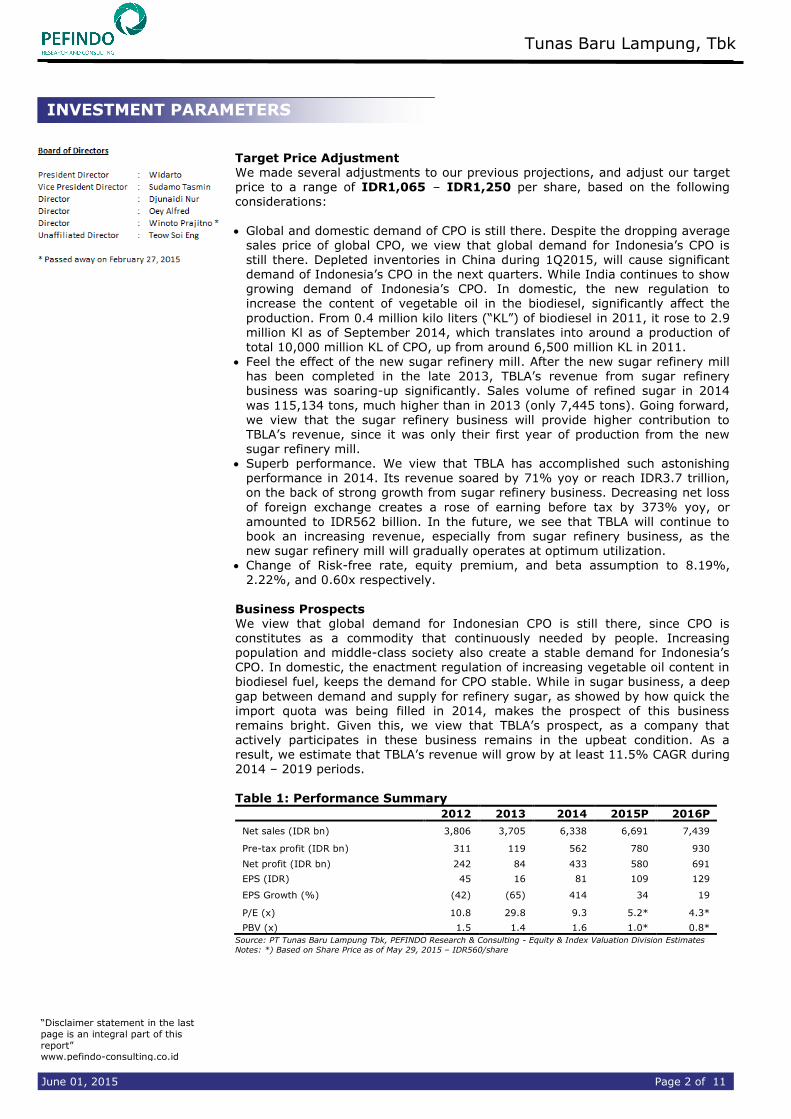
Indonesia Economy Overview in 2015: Expected to Grow Faster
In 2015, we expect the economic growth rate to yield in the region of 5.3%-5.7%, sustained by an increasing private consumption, controlled inflation and stable interest rate environment. So far, the relatively low inflationary pressure during 1Q2015 has kept people purchasing power stable, depicted by Confident Consumer Index that is relatively stable during February 2015. Government spending with its expansive 2015 state budget will also play as the catalyst that can propel the faster economic growth this year. Private sector investment can only be expected
to give more weight to the economic growth later in the year until after the businesses can see brighter economic and political outlook more clearly and the government will have been able to issue and implement more conducive regulations and de-bottleneck logistic and infrastructure strains to spur private sector investment. Investment realization in 1Q2014 was IDR106.6 trillion, while expected investment realization in 1Q2015 was IDR115 trillion. However, we should note that the state of current account deficit and Rupiah volatility are major
risk factors to the achievement of faster economic growth this year.
Figure 1: Investment Realization
1Q2014 – 1Q2015
Source: Investment Coordination Board, PEFINDO Research & Consulting - Equity & Index
Valuation Division
Demand for Refined Sugar Remains Large To protect domestic sugarcane farmers, the Indonesian Government is limiting the import of raw sugar, by enacting a maximum quota. However, we foresee that such quota will not be affected, since the demand, especially industry sugar, can
only be fulfilled by importing raw sugar and refined it domestically. In 2014, the maximum quota for imported raw sugar was 2.8 million MT, but until November 2014 it already reached 2.7 million MT, picturing a massive demand from domestic market. Given this, large volume of sugar has entered domestic market illegally.
MACROECONOMY AND INDUSTRY

“Disclaimer statement in the last
page is an integral part of this
report” www.pefindo-consulting.co.id
Tunas Baru Lampung, Tbk
June 01, 2015 Page 4 of 11
Figure 2: Raw Sugar Import Quota and Realization
Source: Ministry of Trade, PEFINDO Research & Consulting - Equity & Index Valuation
Division
Global Demand for Indonesia’s Crude Palm Oil Will Still There We estimate that the global demand for Indonesia’s crude palm oil remains solid in the future. It is based on the fact that China has lowered its demand in 1Q2015, which indicate a surge demand for the next quarters in 2015, after their inventories was depleted. Beside that, India’s culture, especially its traditional food
that requires lots of palm cooking oil, as well as its growing middle class population, sustain and keep dragging-up the demand for Indonesia’s crude palm oil.
Figure 3: China’s Import of CPO Figure 4: India’s Import of CPO
1,200 1,120
1,200
1,350 1,269
983
760
962
601
-
200
400
600
800
1,000
1,200
1,400
1,600
1Q2013 2Q2013 3Q2013 4Q2013 1Q2014 2Q2014 3Q2014 4Q2014 1Q2015
China's import of CPO (million MT)
180
625
549
437
279
382
723
629559
354
453
692
425
512
602
779
616
0
100
200
300
400
500
600
700
800
900
India's imported CPO (million MT)
Source: Bloomberg, PEFINDO Research & Consulting – Equity
& Index Valuation Division
Source: Bloomberg, PEFINDO Research & Consulting – Equity
& Index Valuation Division
Biodiesel is The Next Best Thing
As the Indonesian Government issued a new regulation to increase the content of
vegetable oil in the biodiesel, the effect for the domestic palm oil industry is just massive. With significant jump of production, or from 0.4 KLof biodiesel in 2009 to 2.9 million KL in 2014 (as of September 2014), it dragged a significant impact to the production of Indonesia crude palm oil since 2011.
“Disclaimer statement in the last
page is an integral part of this
report” www.pefindo-consulting.co.id
Tunas Baru Lampung, Tbk
June 01, 2015 Page 5 of 11
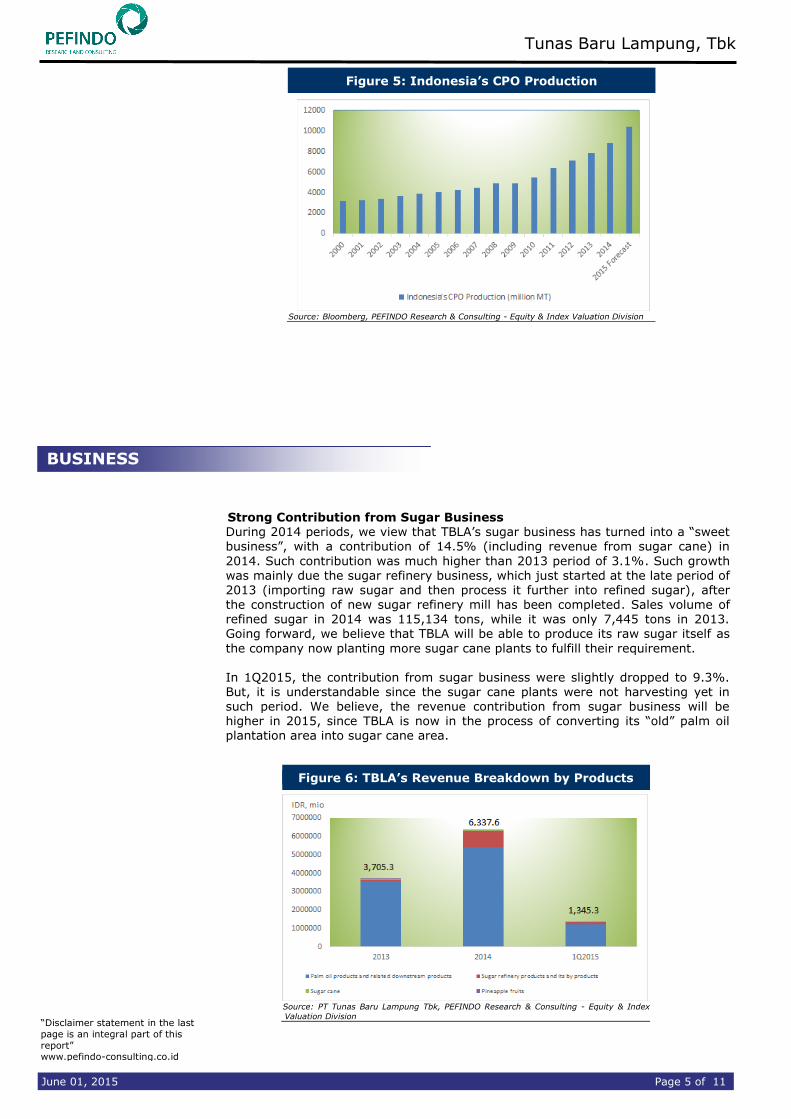
Figure 5: Indonesia’s CPO Production
Source: Bloomberg, PEFINDO Research & Consulting - Equity & Index Valuation Division
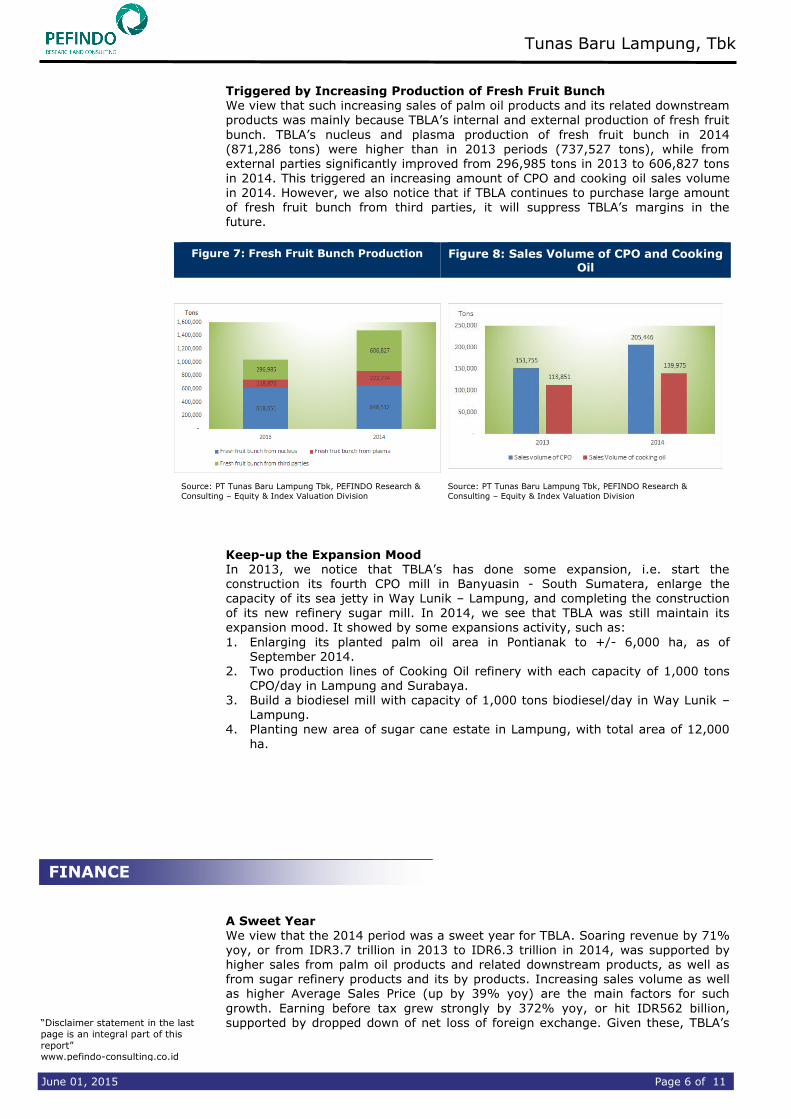
Strong Contribution from Sugar Business During 2014 periods, we view that TBLA’s sugar business has turned into a “sweet business”, with a contribution of 14.5% (including revenue from sugar cane) in
2014. Such contribution was much higher than 2013 period of 3.1%. Such growth was mainly due the sugar refinery business, which just started at the late period of 2013 (importing raw sugar and then process it further into refined sugar), after
the construction of new sugar refinery mill has been completed. Sales volume of refined sugar in 2014 was 115,134 tons, while it was only 7,445 tons in 2013. Going forward, we believe that TBLA will be able to produce its raw sugar itself as
the company now planting more sugar cane plants to fulfill their requirement. In 1Q2015, the contribution from sugar business were slightly dropped to 9.3%. But, it is understandable since the sugar cane plants were not harvesting yet in such period. We believe, the revenue contribution from sugar business will be higher in 2015, since TBLA is now in the process of converting its “old” palm oil plantation area into sugar cane area.
Figure 6: TBLA’s Revenue Breakdown by Products
Source: PT Tunas Baru Lampung Tbk, PEFINDO Research & Consulting - Equity & Index
Valuation Division
BUSINESS
“Disclaimer statement in the last
page is an integral part of this
report” www.pefindo-consulting.co.id
Tunas Baru Lampung, Tbk
June 01, 2015 Page 6 of 11
Triggered by Increasing Production of Fresh Fruit Bunch We view that such increasing sales of palm oil products and its related downstream
products was mainly because TBLA’s internal and external production of fresh fruit
bunch. TBLA’s nucleus and plasma production of fresh fruit bunch in 2014 (871,286 tons) were higher than in 2013 periods (737,527 tons), while from external parties significantly improved from 296,985 tons in 2013 to 606,827 tons in 2014. This triggered an increasing amount of CPO and cooking oil sales volume in 2014. However, we also notice that if TBLA continues to purchase large amount of fresh fruit bunch from third parties, it will suppress TBLA’s margins in the future.
Figure 7: Fresh Fruit Bunch Production Figure 8: Sales Volume of CPO and Cooking Oil
Source: PT Tunas Baru Lampung Tbk, PEFINDO Research &
Consulting – Equity & Index Valuation Division
Source: PT Tunas Baru Lampung Tbk, PEFINDO Research &
Consulting – Equity & Index Valuation Division
Keep-up the Expansion Mood In 2013, we notice that TBLA’s has done some expansion, i.e. start the construction its fourth CPO mill in Banyuasin - South Sumatera, enlarge the capacity of its sea jetty in Way Lunik – Lampung, and completing the construction
of its new refinery sugar mill. In 2014, we see that TBLA was still maintain its expansion mood. It showed by some expansions activity, such as:
1. Enlarging its planted palm oil area in Pontianak to +/- 6,000 ha, as of September 2014.
2. Two production lines of Cooking Oil refinery with each capacity of 1,000 tons CPO/day in Lampung and Surabaya.
3. Build a biodiesel mill with capacity of 1,000 tons biodiesel/day in Way Lunik – Lampung.
4. Planting new area of sugar cane estate in Lampung, with total area of 12,000
ha.
A Sweet Year We view that the 2014 period was a sweet year for TBLA. Soaring revenue by 71% yoy, or from IDR3.7 trillion in 2013 to IDR6.3 trillion in 2014, was supported by higher sales from palm oil products and related downstream products, as well as from sugar refinery products and its by products. Increasing sales volume as well as higher Average Sales Price (up by 39% yoy) are the main factors for such
growth. Earning before tax grew strongly by 372% yoy, or hit IDR562 billion, supported by dropped down of net loss of foreign exchange. Given these, TBLA’s
FINANCE

“Disclaimer statement in the last
page is an integral part of this
report” www.pefindo-consulting.co.id
Tunas Baru Lampung, Tbk
June 01, 2015 Page 7 of 11
net income rose by 404% yoy, or reached IDR437 billion in 2014, a giant leap from IDR87 billion in 2013 period.
For top line, it gets better in 1Q2015 as its revenue rose to IDR1.3 trillion, up from IDR1.16 trillion during 1Q2014. However, at the bottom line TBLA was suffered by the loss on foreign exchange, which made its net profit dropped to IDR91.3 billion from IDR131.92 billion during 1Q2014.
Figure 9: TBLA’s Highlights of Income Statement
Source: PT Tunas Baru Lampung Tbk., PEFINDO Research & Consulting - Equity &
Index Valuation Division
Increasing Equity for Expansion We note that TBLA has successfully get an approval to increase its capital without Rights Issue (pre-emptive rights) based on the Extraordinary Stockholders’
Meeting held on November 7, 2014. TBLA issued 400 million new shares with nominal amount of IDR125/share with exercise price of IDR714/share. With such action plus a significant leap of net income, TBLA’s total equity improved to IDR2.46 trillion in 2014, better than IDR1.80 trillion in 2013. As a result TBLA’s net
debt to equity ratio improved to 1.08x in 2014, better than 1.36x in 2013. Given this, we believe that TBLA’s financial condition is healthier, and has more room for debt to finance their capex requirement.
Figure 10: TBLA’s Equities and Net Debt to Equity Ratio,
Source: PT Tunas Baru Lampung Tbk., Bloomberg, PEFINDO Research & Consulting
- Equity & Index Valuation Division
“Disclaimer statement in the last
page is an integral part of this
report” www.pefindo-consulting.co.id
Tunas Baru Lampung, Tbk
June 01, 2015 Page 8 of 11
VALUATION
Methodology We apply Discounted Cash Flow (DCF) method as the main valuation approach considering the income growth is a value driver in TBLA instead of asset growth.
Furthermore, we also apply Guideline Company Method (GCM) as comparison method. This valuation is based on 100% of TBLA’s shares price as of May 29, 2015, using TBLA’s financial report as of March 31, 2015 for our fundamental
analysis.
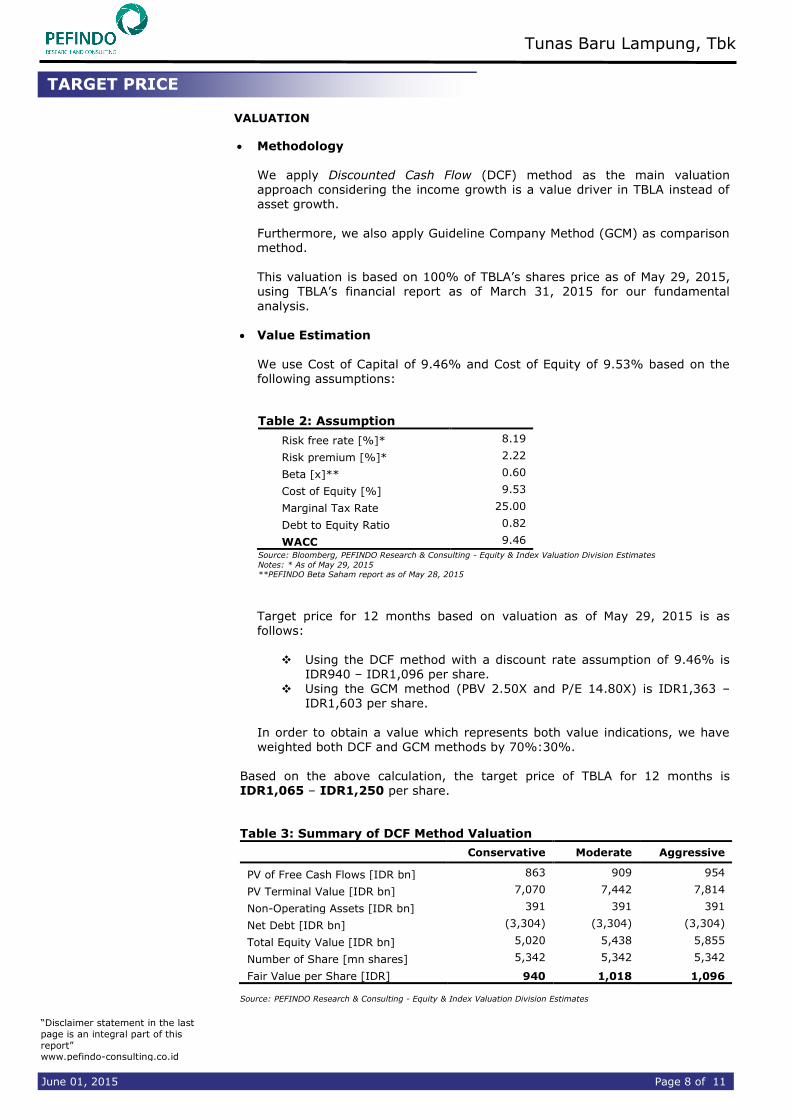
Value Estimation
We use Cost of Capital of 9.46% and Cost of Equity of 9.53% based on the following assumptions:
Table 2: Assumption
Risk free rate [%]* 8.19
Risk premium [%]* 2.22
Beta [x]** 0.60
Cost of Equity [%] 9.53
Marginal Tax Rate 25.00
Debt to Equity Ratio 0.82
WACC 9.46
Source: Bloomberg, PEFINDO Research & Consulting - Equity & Index Valuation Division Estimates
Notes: * As of May 29, 2015 **PEFINDO Beta Saham report as of May 28, 2015
Target price for 12 months based on valuation as of May 29, 2015 is as follows:
Using the DCF method with a discount rate assumption of 9.46% is IDR940 – IDR1,096 per share.
Using the GCM method (PBV 2.50X and P/E 14.80X) is IDR1,363 – IDR1,603 per share.
In order to obtain a value which represents both value indications, we have weighted both DCF and GCM methods by 70%:30%.
Based on the above calculation, the target price of TBLA for 12 months is IDR1,065 – IDR1,250 per share.
Table 3: Summary of DCF Method Valuation
Conservative Moderate Aggressive
PV of Free Cash Flows [IDR bn] 863 909 954
PV Terminal Value [IDR bn] 7,070 7,442 7,814
Non-Operating Assets [IDR bn] 391 391 391
Net Debt [IDR bn] (3,304) (3,304) (3,304)
Total Equity Value [IDR bn] 5,020 5,438 5,855
Number of Share [mn shares] 5,342 5,342 5,342
Fair Value per Share [IDR] 940 1,018 1,096 Source: PEFINDO Research & Consulting - Equity & Index Valuation Division Estimates
TARGET PRICE
“Disclaimer statement in the last
page is an integral part of this
report” www.pefindo-consulting.co.id
Tunas Baru Lampung, Tbk
June 01, 2015 Page 9 of 11
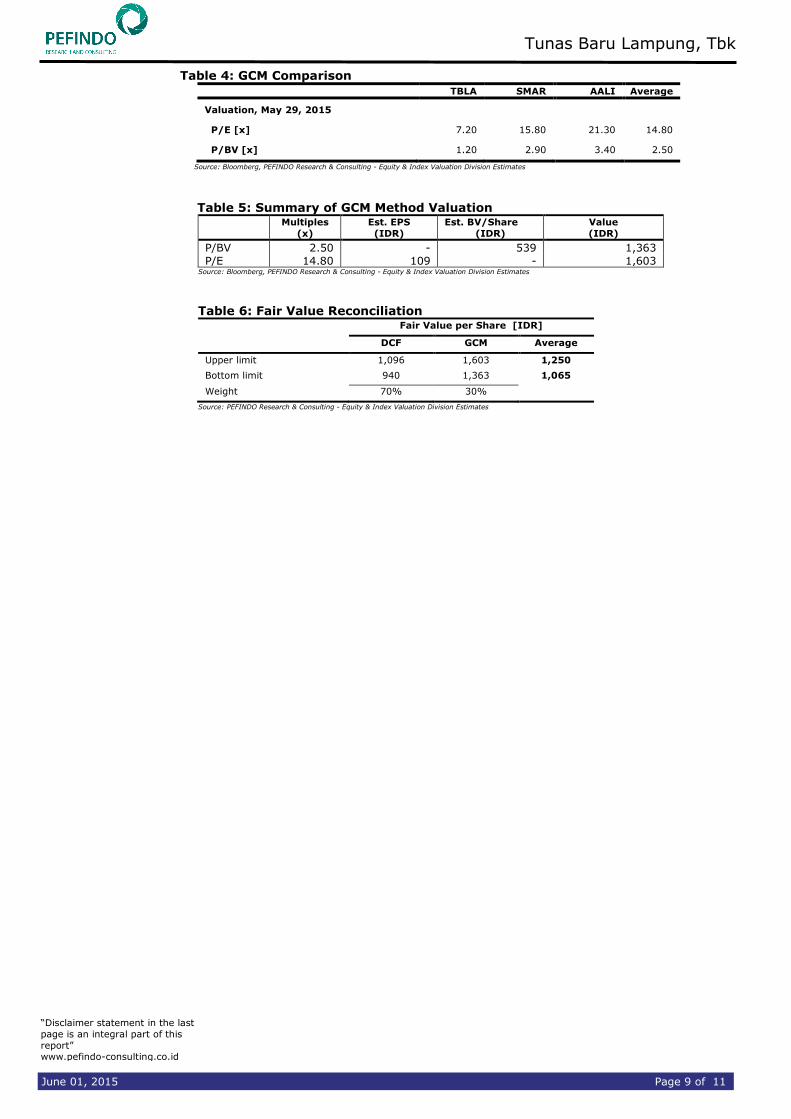
Table 4: GCM Comparison
TBLA SMAR AALI Average
Valuation, May 29, 2015
P/E [x] 7.20 15.80 21.30 14.80
P/BV [x] 1.20 2.90 3.40 2.50
Source: Bloomberg, PEFINDO Research & Consulting - Equity & Index Valuation Division Estimates
Table 5: Summary of GCM Method Valuation
Multiples
(x)
Est. EPS
(IDR)
Est. BV/Share
(IDR)
Value
(IDR)
P/BV 2.50 - 539 1,363
P/E 14.80 109 - 1,603 Source: Bloomberg, PEFINDO Research & Consulting - Equity & Index Valuation Division Estimates
Table 6: Fair Value Reconciliation Fair Value per Share [IDR]
DCF GCM Average
Upper limit 1,096 1,603 1,250
Bottom limit 940 1,363 1,065
Weight 70% 30%
Source: PEFINDO Research & Consulting - Equity & Index Valuation Division Estimates
“Disclaimer statement in the last
page is an integral part of this
report” www.pefindo-consulting.co.id
Tunas Baru Lampung, Tbk
June 01, 2015 Page 10 of 11
Table 7: Consolidated Statements of Comprehensive Income
(IDR billion) 2012 2013 2014 2015P 2016P
Net Sales 3,806 3,705 6,338 6,691 7,439
COGS (2,778) (2,756) (5,045) (5,114) (5,612)
Gross Profit 1,028 950 1,293 1,577 1,827
Operating Expense (717) (831) (730) (796) (898)
Pre-tax Profit 311 119 562 780 930
Tax (67) (33) (126) (195) (232)
Net Profit 242 84 433 580 691
Source: PT Tunas Baru Lampung Tbk., PEFINDO Research & Consulting - Equity &
Index Valuation Division Estimates
Table 8: Consolidated Statements of Financial Position
(IDR billion) 2012 2013 2014 2015P 2016P
Assets
Current Assets
Cash and cash
equivalents 559 658 529 941 250
Receivables 385 416 711 632 703
Inventory 649 795 956 1,033 1,337
Other Assets 724 673 664 919 1,018
Total Current Assets
2,318 2,543 2,860 3,524 3,308
Plantation 1,042 1,195 1,402 1,609 2,050
Fixed Assets 1,750 2,321 2,844 2,321 2,844
Other Assets 87 153 222 158 185
Total Assets 5,198 6,212 7,328 7,613 8,386
Liabilities
Trade payables 250 183 292 540 592
Short-term loan 1,111 2,010 2,183 2,227 2,384
Other Short-term
payables 99 77 115 134 156
Long term loan 1,804 1,961 2,049 1,581 1,597
Other long-term
payables 174 184 224 253 286
Total Liabilities 3,438 4,414 4,864 4,735 5,016
Total Equity 1,759 1,798 2,464 2,878 3,370
Source: PT Tunas Baru Lampung Tbk., PEFINDO Research & Consulting - Equity &
Index Valuation Division Estimates
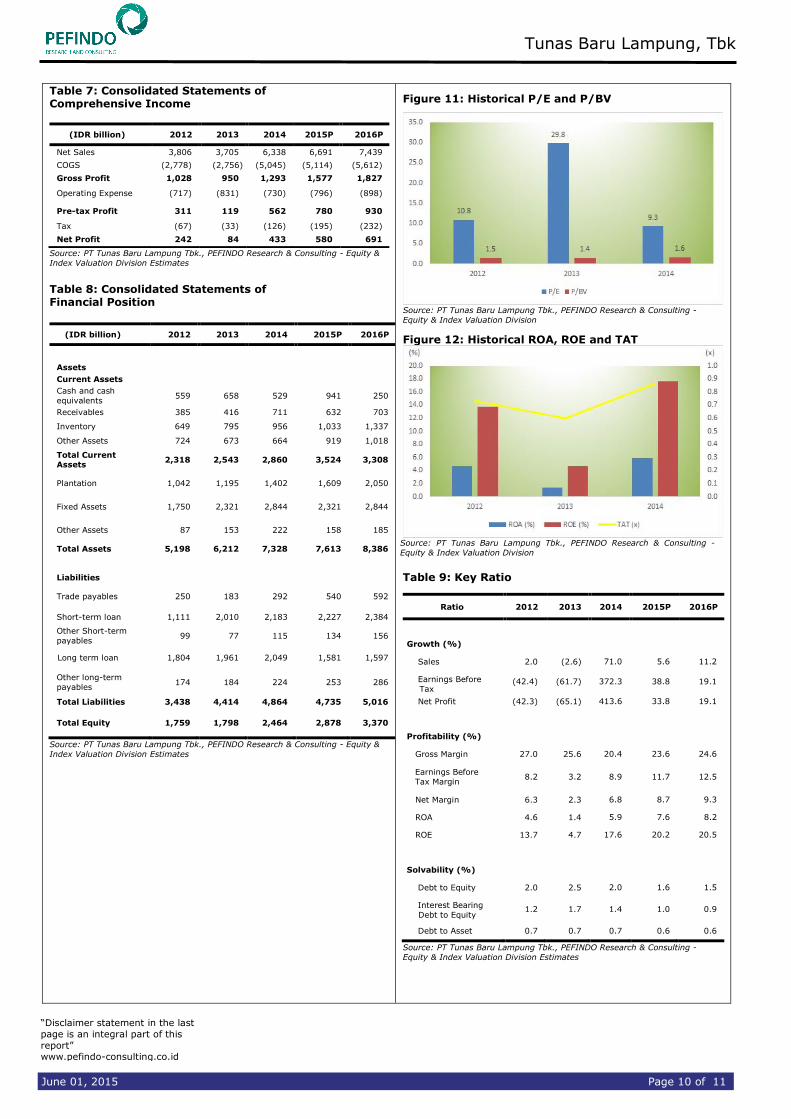
Figure 11: Historical P/E and P/BV
Source: PT Tunas Baru Lampung Tbk., PEFINDO Research & Consulting -
Equity & Index Valuation Division
Figure 12: Historical ROA, ROE and TAT
Source: PT Tunas Baru Lampung Tbk., PEFINDO Research & Consulting -
Equity & Index Valuation Division
Table 9: Key Ratio
Ratio 2012 2013 2014 2015P 2016P
Growth (%)
Sales 2.0 (2.6) 71.0 5.6 11.2
Earnings Before
Tax (42.4) (61.7) 372.3 38.8 19.1
Net Profit (42.3) (65.1) 413.6 33.8 19.1
Profitability (%)
Gross Margin 27.0 25.6 20.4 23.6 24.6
Earnings Before
Tax Margin 8.2 3.2 8.9 11.7 12.5
Net Margin 6.3 2.3 6.8 8.7 9.3
ROA 4.6 1.4 5.9 7.6 8.2
ROE 13.7 4.7 17.6 20.2 20.5
Solvability (%)
Debt to Equity 2.0 2.5 2.0 1.6 1.5
Interest Bearing
Debt to Equity 1.2 1.7 1.4 1.0 0.9
Debt to Asset 0.7 0.7 0.7 0.6 0.6
Source: PT Tunas Baru Lampung Tbk., PEFINDO Research & Consulting -
Equity & Index Valuation Division Estimates
“Disclaimer statement in the last
page is an integral part of this
report” www.pefindo-consulting.co.id
Tunas Baru Lampung, Tbk
June 01, 2015 Page 11 of 11
DISCLAIMER
This report was prepared based on trusted and reliable sources. Nevertheless, we do not
guarantee its completeness, accuracy and adequacy. Therefore, we are not responsible for any investment decisions made based on this report. All assumptions, opinions and predictions were
solely our internal judgments as of the reporting date, and those judgments are subject to
change without further notice.
We are not responsible for any mistakes or negligence that occurs by using this report. Recent
performance cannot always be used as a reference for future outcome. This report does not offer a recommendation to purchase or hold particular shares. This report might not be suitable
for some investors. All opinions in this report have been presented fairly as of the issuing date
with good intentions; however, they could change at any time without further notice. The price, value or income of each share of the Company stated in this report might be lower than
investor expectations, and investors may obtain returns lower than the invested amount.
Investment is defined as the probable income that will be received in the future; nonetheless such returns may fluctuate. As for companies whose shares are denominated in a currency
other than Rupiah, foreign exchange fluctuation may reduce their share value, price or the
returns for investors. This report does not contain any information for tax considerations in
investment decision-making.
The share price target in this report is a fundamental value, not a fair market value or a transaction price reference required by regulations.
The share price target report issued by the PT PEFINDO Riset Konsultasi (“PRK”) or “PEFINDO Research and Consulting” is not a recommendation to buy, sell or hold particular shares. It
should not be considered as investment advice from the PRK and its scope of service to some
parties, including listed companies, financial advisors, brokers, investment banks, financial institutions and intermediaries, does not correlate with receiving rewards or any other benefits
from such parties.
This report is not intended for any particular investor and cannot be used as part of an
objective investment analysis of particular shares, an investment recommendation, or an
investment strategy. We strongly recommend investors to consider the suitability of the situation and conditions before making a decision in relation with the figures in this report. If
necessary, consult with your financial advisor.
PEFINDO keeps the activities of the Equity Valuation Division separate from its Ratings Division
to preserve the independence and objectivity of its analytical processes and products. PEFINDO
has established policies and procedures to maintain the confidentiality of non-public information received in connection with each analytical process. The entire process, methodology and the
database used in the preparation of the Reference Share Price Target Report as a whole are
different from the processes, methodologies and databases used by PEFINDO in issuing ratings.
This report was prepared and composed by PRK with the objective of enhancing the
transparency of share prices of listed companies in the Indonesia Stock Exchange (IDX). This report is also free of influence from any other party, including pressure or force either from IDX
or the listed company reviewed. PRK earns reward from IDX and the reviewed company for
issuing this report twice a year. For further information, please visit our website at http://www.pefindo-consulting.co.id
This report was prepared and composed by the PEFINDO Research & Consulting - Equity &
Index Valuation Division. In Indonesia, this report is published in our website and in the IDX website.
Related Documents