Tullow Oil plc, Company Intelligence Report 1 © GlobalData. This report is a licensed product and is not to be copied, reproduced, shared or resold in any form. REFERENCE CODE GDGE0671V | PUBLICATION DATE AUGUST 2014 TULLOW OIL PLC COMPANY INTELLIGENCE REPORT

Welcome message from author
This document is posted to help you gain knowledge. Please leave a comment to let me know what you think about it! Share it to your friends and learn new things together.
Transcript

Tullow Oil plc, Company Intelligence Report
1
© GlobalData. This report is a licensed product and is not to be copied, reproduced, shared or resold in any form.
REFERENCE CODE GDGE0671V | PUBLICATION DATE AUGUST 2014
TULLOW OIL PLC COMPANY INTELLIGENCE REPORT
Tullow Oil plc, Company Intelligence Report
2
© GlobalData. This report is a licensed product and is not to be copied, reproduced, shared or resold in any form.
TULLOW OIL PLC, COMPANY INTELLIGENCE REPORT
Executive Summary
Tullow Oil plc, Key Valuation Metrics, 2014 Stock exchange XX
Stock symbol TLW
Current price (£ per share/US$ per share)as of August 7, 2014
XX/XX
Target price (£ per share/US$ per share) XX/XX
2013 revenue (US$ bil) XX
Market capitalization (£ bil/US$ bil) as of August 7, 2014
6.6/11.2
Estimated enterprise value (US$ bil) XX
52-week high/low (£ per share) 10.8/7.3
52-week high/low (US$ per share) 17.2/10.4
Source: GlobalData; Google Finance, 2014a
Exploration-led Growth Strategy to Facilitate Tullow’s Long-Term Growth
Exploration, Appraisal and Development in Africa and Atlantic Margins to Underpin Tullow’s Growth Trajectory
Tullow Oil plc (Tullow) has a balanced asset portfolio consisting of XX licenses across XX countries. The company’s operations are mainly focused on high-impact exploration, development and production activities that fuel the company’s exploration-led growth strategy. Tullow currently operates in Africa, Europe, South America and Asia.
Tullow’s assets in the West and North Africa (WNA) region are the major contributors to the company’s production base. The production contribution from these assets enables the company to generate significant cash flows, which is utilized to fund Tullow’s Exploration and Development (E&D) activities around the globe. The Jubilee field located in Ghana is the company’s flagship asset. In 2013, the field constituted XX% of Tullow’s overall annual production, with production averaging XX barrels per day (bd) (gross). Furthermore, Tullow witnessed an increase of XX% in production volumes from this field in 2013 compared to 2012. Tullow also has a major development program in progress in its Tweneboa-Enyenra-Ntomme (TEN) fields. The company made material progress with the approval given by the government of Ghana to its Plan of Development (PoD) for Jubilee on May 29, 2013. First production from this project is expected in mid-2016. In 2013, a high-impact exploration program was initiated in Mauritania. The Fregate-1 well, which was the first well in the Block 7 license, encountered XX feet (ft) (XX meters (m)) of net oil and gas pay in February 2014.
Tullow Oil plc vs. Peer Group, Operational Performance, 2013 Parameters Tullow Peer average*
Proved and Probable reserves (mmboe) XX XX
Oil/gas (%) in total reserves XX XX
Total production (mmboe) XX XX
Lifting cost (US$ per boe), three-year XX XX
Net-back (US$ per boe), three-year XX XX
Recycle ratio, three-year XX XX
Oil and gas F&D cost per boe, three-year XX XX
Reserve replacement cost (US$ per boe), annual
XX XX
Reserve life index XX XX
Development costs (US$ mil) XX XX
Acquisition costs (US$ mil) XX XX
Total net developed and undeveloped acreage (mil)
XX XX
Source: GlobalData, Oil and Gas eTrack, Advanced Company Operational and Financial Benchmarking [Accessed on July 01, 2014] F&D: Finding and Development; mmboe: million barrels of oil equivalent *Peers include Enquest, JKX Oil & Gas, Premier Oil, Salamander Energy, SOCO International
Tullow Oil plc, Company Intelligence Report
3
© GlobalData. This report is a licensed product and is not to be copied, reproduced, shared or resold in any form.
TULLOW OIL PLC, COMPANY INTELLIGENCE REPORT
Executive Summary
Tullow’s asset base in South and East Africa (SEA) has good potential to support the company’s future cash flows. The company’s focus in this region is its operations in Kenya and Uganda. Tullow has made seven successive discoveries in the past two years in the South Lokichar Basin, Kenya, and is actively considering several development options for the discoveries in Kenya as well as in Uganda. Additionally, in 2013 Tullow was able to make three oil discoveries at the Agete-1, Ekales-1, and Etuko-1 wells in Kenya. These discoveries highlighted the potential of Tullow’s rift basin acreage in terms of exploration and production. In June 2014, Tullow made a discovery of about XX m (XX ft) and XX m (XX ft) of net oil and net gas pay zone respectively with its Ngamia-2 appraisal well. Following the successful discovery, Tullow shall continue to drill additional appraisal wells in the Ngamia prospect in order to further test its prospectivity and is conducting a three-dimensional (3D) seismic program that shall enable Tullow to achieve a thorough mapping of the fault trends.
In Uganda, the company’s development plans progressed following the awarding of an initial production license to Tullow and its partners supporting the development of the Kingfisher license. A Memorandum of Understanding (MoU) was also signed between the government of Uganda and Tullow’s partners in relation to the Lake Albert Rift Basin program.
Tullow’s Europe, South America and Asia (ESAA) asset base consists of some of the company’s mature producing assets, coupled with frontier exploration areas. Subsequent to its acquisition of Spring Energy, Tullow initiated a high-impact Norway exploration program. Tullow’s Wisting Central well was able to make a play opening consisting of a light oil discovery located in the Hoop-Maud Basin (Barents Sea). In Asia, however, Tullow sold its mature gas business in Bangladesh
in order to focus its attention towards exploring for light oil.
2014 Update
In 2014, Tullow expects its total oil and gas production (on a working interest basis) to be about XX thousand barrels of oil equivalent per day (mboed). This is a decline of approximately XX% compared to the production volumes in 2013. From the capital expenditure (capex) perspective, Tullow intends to spend about US$XX billion in 2014. Of the total capex, XX% will be spent on exploration activities, XX% on appraisal and the remaining XX% on development activities.
Tullow Oil plc, Company Intelligence Report
4
© GlobalData. This report is a licensed product and is not to be copied, reproduced, shared or resold in any form.
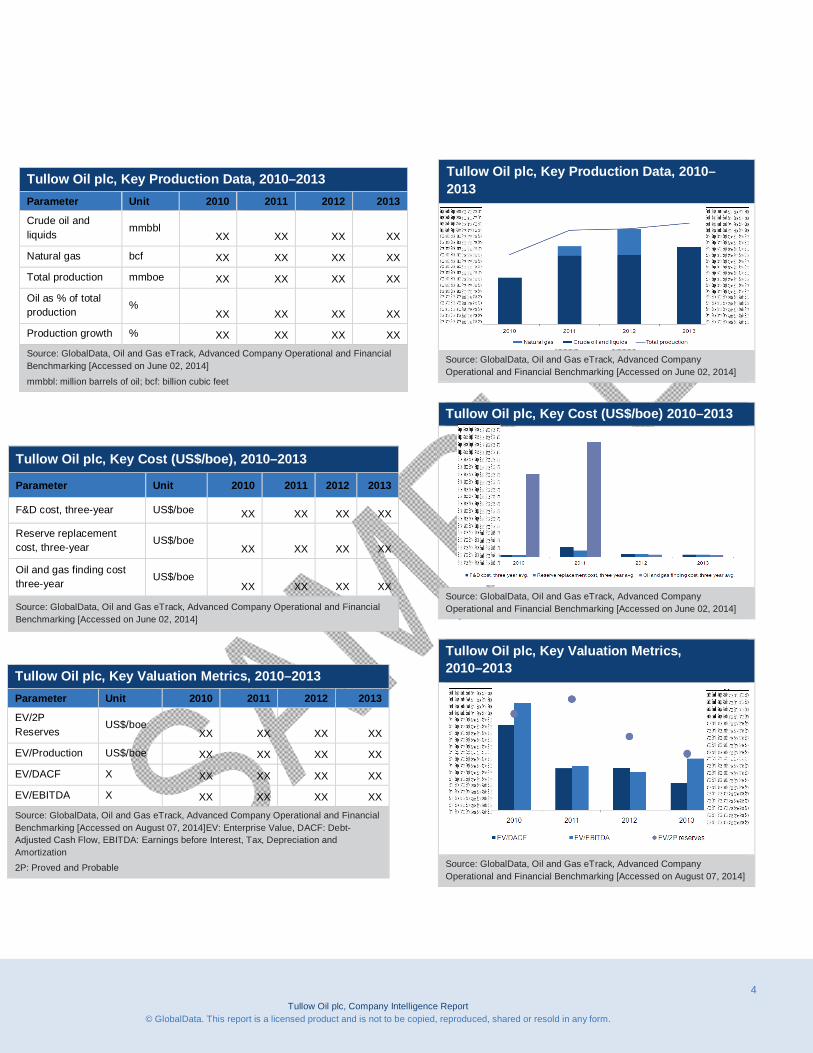
Tullow Oil plc, Key Valuation Metrics, 2010–2013 Parameter Unit 2010 2011 2012 2013
EV/2P Reserves
US$/boe XX XX XX XX
EV/Production US$/boe XX XX XX XX
EV/DACF X XX XX XX XX
EV/EBITDA X XX XX XX XX
Source: GlobalData, Oil and Gas eTrack, Advanced Company Operational and Financial Benchmarking [Accessed on August 07, 2014]EV: Enterprise Value, DACF: Debt-Adjusted Cash Flow, EBITDA: Earnings before Interest, Tax, Depreciation and Amortization 2P: Proved and Probable
Tullow Oil plc, Key Cost (US$/boe) 2010–2013
Source: GlobalData, Oil and Gas eTrack, Advanced Company Operational and Financial Benchmarking [Accessed on June 02, 2014]
Tullow Oil plc, Key Valuation Metrics, 2010–2013
Source: GlobalData, Oil and Gas eTrack, Advanced Company Operational and Financial Benchmarking [Accessed on August 07, 2014]
Tullow Oil plc, Key Production Data, 2010–2013 Parameter Unit 2010 2011 2012 2013
Crude oil and liquids
mmbbl XX XX XX XX
Natural gas bcf XX XX XX XX
Total production mmboe XX XX XX XX
Oil as % of total production
% XX XX XX XX
Production growth % XX XX XX XX
Source: GlobalData, Oil and Gas eTrack, Advanced Company Operational and Financial Benchmarking [Accessed on June 02, 2014]
mmbbl: million barrels of oil; bcf: billion cubic feet
Tullow Oil plc, Key Cost (US$/boe), 2010–2013
Parameter Unit 2010 2011 2012 2013
F&D cost, three-year US$/boe XX XX XX XX
Reserve replacement cost, three-year
US$/boe XX XX XX XX
Oil and gas finding cost three-year
US$/boe XX XX XX XX
Source: GlobalData, Oil and Gas eTrack, Advanced Company Operational and Financial Benchmarking [Accessed on June 02, 2014]
Tullow Oil plc, Key Production Data, 2010–2013
Source: GlobalData, Oil and Gas eTrack, Advanced Company Operational and Financial Benchmarking [Accessed on June 02, 2014]

Tullow Oil plc, Company Intelligence Report
5
© GlobalData. This report is a licensed product and is not to be copied, reproduced, shared or resold in any form.
TULLOW OIL PLC, COMPANY INTELLIGENCE REPORT
Table of Contents
Tullow Oil plc, Key Reserves and Reserves Metrics, 2010–2013 Parameter Unit 2010 2011 2012 2013
Commercial crude oil reserves
mmbbl XX XX XX XX
Commercial natural gas reserves
bcf XX XX XX XX
Commercial total oil and gas reserves
mmboe XX XX XX XX
Oil as % of total reserves
% XX XX XX XX
Source: GlobalData, Oil and Gas eTrack, Advanced Company Operational and Financial Benchmarking [Accessed on June 02, 2014]
Tullow Oil plc, Result of Oil and Gas Operations per boe, 2010–2013
Parameter Unit 2010 2011 2012 2013
Oil and gas revenue per boe
US$/boe XX XX XX XX
Lifting cost per boe, three-year
US$/boe XX XX XX XX
Net-back per boe, three-year
US$/boe XX XX XX XX
Recycle ratio, three-year
% XX XX XX XX
Source: GlobalData, Oil and Gas eTrack, Advanced Company Operational and Financial Benchmarking [Accessed on June 02, 2014]
Tullow Oil plc, Result of Oil and Gas Operations per boe, 2010–2013
Source: GlobalData, Oil and Gas eTrack, Advanced Company Operational and Financial Benchmarking [Accessed on June 02, 2014]
Tullow Oil plc, Key Reserves and Reserves Metrics, 2010–2013
Source: GlobalData, Oil and Gas eTrack, Advanced Company Operational and Financial Benchmarking [Accessed on June 02, 2014]
bcf: billion cubic feet
Tullow Oil plc, Company Intelligence Report
6
© GlobalData. This report is a licensed product and is not to be copied, reproduced, shared or resold in any form.
TULLOW OIL PLC, COMPANY INTELLIGENCE REPORT
Table of Contents
Table of Contents Table of Contents ............................................................................................................................... 6
1.1 List of Tables ...................................................................................................................... 10
1.2 List of Figures ..................................................................................................................... 15
2 Tullow Oil plc, Company Overview .......................................................................................... 22
3 Tullow Oil plc, Key Highlights .................................................................................................. 30
3.1 Exploration and Development Opportunities to Support Tullow’s Growth Trajectory ........... 30
3.1.1 WNA ............................................................................................................................... 32
3.1.2 SEA ................................................................................................................................ 37
3.1.3 ESAA .............................................................................................................................. 41
3.2 Ghana, Uganda, Ethiopia and Kenya to Underpin Tullow’s Exploration-led Growth Strategy 45
3.2.1 Ghana............................................................................................................................. 47
3.2.2 Uganda ........................................................................................................................... 57
3.2.3 Kenya and Ethiopia ......................................................................................................... 60
4 Tullow Oil plc, SWOT Analysis ................................................................................................ 64
4.1 Strengths ............................................................................................................................ 64
4.1.1 Wide Geographical Presence ......................................................................................... 64
4.1.2 Steady Growth in Revenues ........................................................................................... 66
4.1.3 Growth in Reserves through Organic Reserve Additions ................................................ 67
4.2 Weaknesses ....................................................................................................................... 68
4.2.1 Incremental Costs Negatively Affecting Margins ............................................................. 68
4.3 Opportunities ...................................................................................................................... 69
4.3.1 Substantial Exploration and Development Programs: An Opportunity to Increase Reserves and Production................................................................................................ 69
4.4 Threats................................................................................................................................ 70
4.4.1 Timely Approvals and Management of Above-ground Risk Factors ................................ 70
Tullow Oil plc, Company Intelligence Report
7
© GlobalData. This report is a licensed product and is not to be copied, reproduced, shared or resold in any form.
TULLOW OIL PLC, COMPANY INTELLIGENCE REPORT
Table of Contents
4.4.2 Volatility in Commodity Prices Could Adversely Affect Tullow’s Future Growth Plans ..... 71
4.4.3 Intense Competition from Other Industry Participants ..................................................... 71
5 Tullow Oil plc, Goals and Strategies ........................................................................................ 72
5.1 Extensive Exploration Strategy and Delineation and Development of Existing Inventory ..... 73
5.2 Strategic Divesture of Assets .............................................................................................. 74
6 Tullow Oil plc, Acreage ............................................................................................................ 75
7 Tullow Oil plc, Exploration and Development Overview ........................................................... 78
7.1 West and North Africa ......................................................................................................... 93
7.1.1 Congo (Brazzaville) ........................................................................................................ 94
7.1.2 Côte d’lvoire.................................................................................................................... 96
7.1.3 Equatorial Guinea ........................................................................................................... 98
7.1.4 Gabon........................................................................................................................... 100
7.1.5 Ghana........................................................................................................................... 104
7.1.6 Guinea .......................................................................................................................... 114
7.1.7 Liberia........................................................................................................................... 116
7.1.8 Mauritania ..................................................................................................................... 118
7.1.9 Sierra Leone ................................................................................................................. 121
7.2 South and East Africa ....................................................................................................... 122
7.2.1 Ethiopia ........................................................................................................................ 124
7.2.2 Kenya ........................................................................................................................... 127
7.2.3 Madagascar .................................................................................................................. 136
7.2.4 Mozambique ................................................................................................................. 138
7.2.5 Namibia ........................................................................................................................ 140
7.2.6 Uganda ......................................................................................................................... 142
7.3 Europe, South America and Asia ...................................................................................... 146
7.3.1 Norway ......................................................................................................................... 147
Tullow Oil plc, Company Intelligence Report
8
© GlobalData. This report is a licensed product and is not to be copied, reproduced, shared or resold in any form.
TULLOW OIL PLC, COMPANY INTELLIGENCE REPORT
Table of Contents
7.3.2 Greenland ..................................................................................................................... 155
7.3.3 Netherlands .................................................................................................................. 157
7.3.4 UK ................................................................................................................................ 160
7.3.5 French Guiana .............................................................................................................. 165
7.3.6 Guyana ......................................................................................................................... 167
7.3.7 Suriname ...................................................................................................................... 169
7.3.8 Uruguay ........................................................................................................................ 171
7.3.9 Pakistan ........................................................................................................................ 173
8 Tullow Oil plc, Capital Expenditure ........................................................................................ 176
8.1 Costs Incurred................................................................................................................... 180
9 Tullow Oil plc, Production Overview ...................................................................................... 183
9.1 Production Profile .............................................................................................................. 183
9.2 Assets Portfolio ................................................................................................................. 188
9.2.1 West and North Africa ................................................................................................... 189
9.2.2 Europe, South America and Asia .................................................................................. 195
10 Tullow Oil plc Forecast Production and Financial Statements................................................ 197
10.1 Income Statement (2011–2018) ........................................................................................ 198
10.2 Balance Sheet (2011–2018).............................................................................................. 199
10.3 Cash Flow Statement (2011–2018) ................................................................................... 201
11 Tullow Oil plc, Valuation ........................................................................................................ 203
11.1 Net Asset Value ................................................................................................................ 203
12 Tullow Oil plc, Peer Comparison ........................................................................................... 205
12.1 Share Price Performance .................................................................................................. 205
12.2 Operational and Financial Performance ............................................................................ 206
12.3 Key Financial and Operational Ratio ................................................................................. 212
13 Tullow Oil plc, Production and Reserves Trends ................................................................... 215
Tullow Oil plc, Company Intelligence Report
9
© GlobalData. This report is a licensed product and is not to be copied, reproduced, shared or resold in any form.
TULLOW OIL PLC, COMPANY INTELLIGENCE REPORT
Table of Contents
13.1 Total Oil and Gas, Reserves and Production .................................................................... 215
13.1.1 Total Crude Oil and Natural Gas Production and Reserves Trend, 2009-2013 ............. 215
13.1.2 Total Crude Oil & Natural Gas Production and Reserves By Country/Region, 2009-2013 ..................................................................................................................................... 217
13.1.3 Total Crude Oil and Natural Gas Reserve Changes, 2009-2013 ................................... 220
13.2 Crude Oil/Liquids Production and Reserve ........................................................................ 222
13.2.1 Crude Oil/Liquids Production and Reserve Trend, 2009-2013 ...................................... 222
13.2.2 Crude Oil Production and Reserves By Country/Region, 2009-2013 ............................ 223
13.2.3 Crude Oil/Liquids Reserve Changes, 2009-2013 .......................................................... 226
13.3 Natural Gas Production and Reserve ................................................................................ 228
13.3.1 Natural Gas Production and Reserve Trend, 2009-2013............................................... 228
13.3.2 Natural Gas Production and Reserves, By Country/Region, 2009-2013 ....................... 229
13.3.3 Natural Gas Reserve Changes, 2009-2013 .................................................................. 232
13.4 Total Crude Oil and Natural Gas Reserves Life Index ....................................................... 234
13.4.1 Total Crude Oil and Natural Gas Reserves Life Index, 2009-2013 ................................ 234
13.4.2 Total Crude Oil and Natural Gas Reserves Life Index, By Country/Region, 2009-2013 235
Tullow Oil plc, E&P Costs Trends................................................................................................... 239
13.5 Allocation of the Upstream Capital Expenditure ................................................................ 239
13.5.1 Upstream Capital Expenditure, 2009-2013 ................................................................... 239
13.5.2 Acquisition Costs By Country/Region, 2009-2013 ......................................................... 241
13.5.3 Exploration and Development Costs, By Country/Region, 2009-2013........................... 244
13.6 Oil and Gas Cost Per boe, US$/boe .................................................................................. 246
13.6.1 Oil and Gas Cost Per boe, US$/boe, 2009-2013 .......................................................... 246
13.6.2 Oil and Gas Cost Per boe, US$/boe, By Country/Region, 2009-2013 ........................... 248
Tullow Oil plc, Reserve Replacement Ratio ................................................................................... 250
13.7 Oil and Gas Production Replacement Ratio ...................................................................... 250
13.7.1 Oil and Gas Production Replacement Ratio, 2009-2013 ............................................... 250
Tullow Oil plc, Company Intelligence Report
10
© GlobalData. This report is a licensed product and is not to be copied, reproduced, shared or resold in any form.
TULLOW OIL PLC, COMPANY INTELLIGENCE REPORT
Table of Contents
13.7.2 Oil and Gas Production Replacement Ratio, By Country/Region, 2009-2013 ............... 253
Tullow Oil plc, Results of Oil & Gas Operations Trend ................................................................... 261
13.8 Oil and Gas Revenue and Expenses ................................................................................ 261
13.8.1 Oil and Gas Revenue and Expenses, 2009-2013 ......................................................... 261
13.8.2 Oil and Gas Revenue and Expenses, By Country/Region, 2009-2013 .......................... 263
13.9 Oil and Gas Revenue and Expenses, Per boe .................................................................. 264
13.9.1 Oil and Gas Revenue and Expenses, By boe, 2009-2013 ............................................ 264
13.9.2 Oil and Gas Revenue and Expenses Per boe, By Country/Region, 2009-2013 ............ 266
13.10 Oil and Gas Performance Metrics ..................................................................................... 267
14 Tullow Oil plc, Well data ........................................................................................................ 268
14.1 Well statistics .................................................................................................................... 268
14.1.1 Exploration and Development Wells Drilled, 2009-2013................................................ 268
14.1.2 Exploration and Development Wells Drilled, By Country/Region, 2009-2013 ................ 270
15 Appendix ............................................................................................................................... 274
15.1 Abbreviations .................................................................................................................... 274
15.2 Sources............................................................................................................................. 277
15.3 Research Methodology ..................................................................................................... 281
15.3.1 Coverage ...................................................................................................................... 281
15.3.2 Secondary Research .................................................................................................... 282
15.3.3 Primary Research ......................................................................................................... 282
15.4 Disclaimer ......................................................................................................................... 283
1.1 List of Tables Table 1: Tullow Oil plc, Total Acreage (Acres), 2013 ...................................................................................... 24
Tullow Oil plc, Company Intelligence Report
11
© GlobalData. This report is a licensed product and is not to be copied, reproduced, shared or resold in any form.
TULLOW OIL PLC, COMPANY INTELLIGENCE REPORT
Table of Contents
Table 2: Tullow Oil plc, Total Commercial Reserves (mmboe), 2013 .............................................................. 24
Table 3: Tullow Oil plc, Total Commercial Reserves (mmboe), As of June 30, 2014 ....................................... 25
Table 4: Tullow Oil plc, Total Oil and Gas Production (mmboe), 2013 ............................................................ 25
Table 5: Tullow Oil plc, Total Oil and Gas Production (mboed), H1 2014 ........................................................ 26
Table 6: Tullow Oil plc, WNA Exploration and Appraisal Program, 2014–2015 ............................................... 35
Table 7: Tullow Oil plc, WNA Development Opportunities, 2014 ..................................................................... 36
Table 8: Tullow Oil plc, SEA Exploration and Appraisal Program, 2014–2015 ................................................ 39
Table 9: Tullow Oil plc, SEA Development Opportunities, 2014 ...................................................................... 40
Table 10: Tullow Oil plc, ESAA Exploration and Appraisal Program, 2014–2015 ............................................ 43
Table 11: Tullow Oil plc, Development Opportunities, 2014 ............................................................................ 44
Table 12: Tullow Oil plc, Ghana Timeline, 2006–2013 .................................................................................... 48
Table 13: Tullow Oil plc, Uganda Timeline, 2004–2014 .................................................................................. 59
Table 14: Tullow Oil plc, Kenya and Ethiopia Timeline, 2010–2013 ................................................................ 63
Table 15: Tullow Oil plc, Total Acreage (Million Acres), 2011–2013 ................................................................ 75
Table 16: Tullow Oil plc, Well Discoveries, 2010–2013................................................................................... 84
Table 17: Tullow Oil plc, Dry Wells, 2010–2013 ............................................................................................. 85
Table 18: Tullow Oil plc, Well Success Rate (%), 2010–2013 ......................................................................... 86
Table 19: Tullow Oil plc, Exploration and Appraisal Program, 2014–2015 ...................................................... 87
Table 20: Tullow Oil plc, Development Opportunities, 2014 ............................................................................ 89
Table 21: Tullow Oil plc, Congo, Exploration, Development and Production License, 2013 ............................. 96
Table 22: Tullow Oil plc, Congo, Development Plan, 2014 ............................................................................. 96
Table 23: Tullow Oil plc, Côte d’Ivoire, Exploration and Appraisal Wells, 2013 ............................................... 97
Table 24: Tullow Oil, Côte d’lvoire, Exploration, Development and Production License, 2013 ......................... 98
Tullow Oil plc, Company Intelligence Report
12
© GlobalData. This report is a licensed product and is not to be copied, reproduced, shared or resold in any form.
TULLOW OIL PLC, COMPANY INTELLIGENCE REPORT
Table of Contents
Table 25: Tullow Oil plc, Côte d’Ivoire, Development Plan, 2014 .................................................................... 98
Table 26: Tullow Oil plc, Equatorial Guinea, Exploration, Development and Production License, 2013 ......... 100
Table 27: Tullow Oil plc, Gabon, Exploration and Appraisal Wells, 2013 ...................................................... 100
Table 28: Tullow Oil plc, Gabon, Exploration and Appraisal Activity, 2014 .................................................... 103
Table 29: Tullow Oil plc, Gabon, Exploration, Development and Production Licenses, 2013 ......................... 103
Table 30: Tullow Oil plc, Ghana, Exploration and Appraisal Wells, 2013 ...................................................... 104
Table 31: Tullow Oil plc, Ghana, Exploration and Appraisal Activity, 2015 .................................................... 107
Table 32: Tullow Oil plc, Ghana, Development Plan, 2014 ........................................................................... 108
Table 33: Tullow Oil plc, Ghana, Exploration, Development and Production License, 2013........................... 108
Table 34: Tullow Oil plc, Guinea, Exploration and Appraisal Activity, 2015 ................................................... 115
Table 35: Tullow Oil, Guinea, Exploration, Development and Production License, 2013 ............................... 116
Table 36: Tullow Oil, Mauritania, Exploration, Development and Production License, 2013 .......................... 120
Table 37: Tullow Oil plc, Mauritania, Exploration and Appraisal Activity, 2015 .............................................. 120
Table 38: Tullow Oil plc, Mauritania, Development Plan, 2014 ..................................................................... 120
Table 39: Tullow Oil, Sierra Leone, Exploration, Development and Production License, 2013 ...................... 122
Table 40: Tullow Oil, Ethiopia, Exploration, Development and Production License, 2013 .............................. 126
Table 41: Tullow Oil, Kenya, Exploration, Development and Production License, 2013................................. 135
Table 42: Tullow Oil plc, Kenya, Exploration and Appraisal Activity, 2014–2015 ........................................... 135
Table 43: Tullow Oil plc, Kenya, Development Plan, 2014 ............................................................................ 136
Table 44: Tullow Oil, Madagascar, Exploration, Development and Production License, 2013 ....................... 138
Table 45: Tullow Oil plc, Madagascar, Exploration and Appraisal Activity, 2015 ........................................... 138
Table 46: Tullow Oil, Madagascar, Exploration, Development and Production License, 2013 ....................... 140
Table 47: Tullow Oil, Namibia, Exploration, Development and Production Licenses, 2013 ............................ 142

Tullow Oil plc, Company Intelligence Report
13
© GlobalData. This report is a licensed product and is not to be copied, reproduced, shared or resold in any form.
TULLOW OIL PLC, COMPANY INTELLIGENCE REPORT
Table of Contents
Table 48: Tullow Oil plc, Namibia, Development Plan, 2014 ......................................................................... 142
Table 49: Tullow Oil, Uganda, Exploration, Development and Production License, 2013 .............................. 145
Table 50: Tullow Oil plc, Uganda, Development Plan, 2014 ......................................................................... 145
Table 51: Tullow Oil, Norway, Exploration, Development and Production License, 2013 ............................... 152
Table 52: Tullow Oil plc, Norway, Exploration and Appraisal Activity, 2014–2015 ......................................... 154
Table 53: Tullow Oil plc, Norway, Development Plan, 2014 .......................................................................... 154
Table 54: Tullow Oil, Greenland, Exploration, Development and Production License, 2013 .......................... 157
Table 55: Tullow Oil, Netherlands, Exploration, Development and Production License, 2013 ........................ 159
Table 56: Tullow Oil plc, Netherlands, Development Plan, 2014 ................................................................... 160
Table 57: Tullow Oil, UK, Exploration, Development and Production License, 2013...................................... 163
Table 58: Tullow Oil plc, UK-CMS Area, Development Plan, 2014 ................................................................ 165
Table 59: Tullow Oil, Suriname, Exploration, Development and Production License, 2013 ........................... 171
Table 60: Tullow Oil plc, Suriname, Exploration and Appraisal Activity, 2015................................................ 171
Table 61: Tullow Oil, Uruguay, Exploration, Development and Production License, 2013 ............................. 173
Table 62: Tullow Oil, Pakistan, Exploration, Development and Production License, 2013 ............................. 175
Table 63: Tullow Oil plc, Costs Incurred (US$ mil), 2009–2013 .................................................................... 181
Table 64: Tullow Oil plc, Reserve Replacement Ratio and Finding and Development Costs Incurred (US$ per boe), 2010–2013 ................................................................................................................. 182
Table 65: Tullow Oil plc, Oil and Gas Production by Country (mmboe), 2010–2013 ...................................... 185
Table 66: Tullow Oil plc, Total Oil and Gas Production, 2011–2018 .............................................................. 187
Table 67: Tullow Oil plc, WNA, Oil and Gas Production by Country (mboed), 2011–2014 ............................. 189
Table 68: Tullow Oil plc, ESAA, Oil and Gas Production by Country (mboed), 2011–2014............................ 195
Table 69: Tullow Oil plc, Total Oil and Gas Production, 2011–2018 .............................................................. 197
Table 70: GlobalData, Price Forecasts, 2014–2018 ..................................................................................... 197
Tullow Oil plc, Company Intelligence Report
14
© GlobalData. This report is a licensed product and is not to be copied, reproduced, shared or resold in any form.
TULLOW OIL PLC, COMPANY INTELLIGENCE REPORT
Table of Contents
Table 71: Tullow Oil plc, Income Statement (US$ mil), 2011–2018............................................................... 198
Table 72: Tullow Oil plc, Balance Sheet (US$ mil), 2011–2018 .................................................................... 199
Table 73: Tullow Oil plc, Cash Flow Statement (US$ mil), 2011–2018 .......................................................... 201
Table 74: Tullow Oil plc, Net Asset Value, 2013 ........................................................................................... 203
Table 75: Tullow Oil plc, Peer Group Comparison, Operational and Financial Performance, 2013 ................ 206
Table 76: Tullow Oil plc, Peer Group Comparison, Total Reserves and Production (mmboe), 2013 .............. 210
Table 77: Tullow Oil plc, Peer Group Comparison, Financial and Operational Ratios, 2013 .......................... 212
Table 78: Tullow Oil plc, Total Crude Oil and Natural Gas, Production and Reserves, mmboe, 2009-2013 ... 215
Table 79: Tullow Oil plc, Total Crude Oil & Natural Gas Production and Reserves, By Country/Region, mmboe, 2009-2013 ................................................................................................................... 218
Table 80: Tullow Oil plc, Total Crude Oil and Natural Gas Reserve Changes, mmboe, 2009-2013 ............... 220
Table 81: Tullow Oil plc, Crude Oil Production and Reserves Metrics, mmbbl, 2009-2013 ............................ 222
Table 82: Tullow Oil plc, Crude Oil Production and Reserves, By Country/Region, mmbbl, 2009-2013 ......... 224
Table 83: Tullow Oil plc, Crude Oil Reserve Changes, mmbbl, 2009-2013 .................................................. 226
Table 84: Tullow Oil plc, Natural Gas Production and Reserves Metrics, bcf, 2009-2013 .............................. 228
Table 85: Tullow Oil plc, Natural Gas Production and Reserves, By Country/Region, bcf, 2009-2013 ........... 230
Table 86: Tullow Oil plc, Natural Gas Reserve Changes, bcf, 2009-2013 ..................................................... 232
Table 87: Tullow Oil plc, Oil and Gas Reserves Life Index, Years, 2009-2013 .............................................. 234
Table 88: Tullow Oil plc, Oil and Gas Reserves Life Index, By Country/Region, Years, 2009-2013 ............... 237
Table 89: Tullow Oil plc, Upstream Capital Expenditure, US$ mil, 2009-2013 ............................................... 239
Table 90: Tullow Oil plc, Proved and Unproved Acquisition Costs, By Country/Region, US$ mil, 2009-2013 242
Table 91: Tullow Oil plc, Exploration and Development Costs, By Country/Region, US$ mil, 2009-2013 ...... 244
Table 92: Tullow Oil plc, Reserves Replacement, Finding and Development Costs, Finding Cost and Proved Acquisition Costs Per boe, US$/boe, 2009-2013 .......................................................... 246
Tullow Oil plc, Company Intelligence Report
15
© GlobalData. This report is a licensed product and is not to be copied, reproduced, shared or resold in any form.
TULLOW OIL PLC, COMPANY INTELLIGENCE REPORT
Table of Contents
Table 93: Tullow Oil plc, Reserves Replacement, Finding and Development Costs, Finding Cost and Proved Acquisition Costs Per boe, US$/boe, By Country/Region, 2009-2013 ........................... 248
Table 94: Tullow Oil plc, Oil and Gas Production Replacement Ratio, %, 2009-2013 .................................... 250
Table 95: Tullow Oil plc, 3-Year Wt.Avg. Oil and Gas Production Replacement Ratio, By Country/Region, %, 2009-2013 ........................................................................................................................... 258
Table 96: Tullow Oil plc, Revenue and Expenses, US$ mil, 2009-2013 ........................................................ 261
Table 97: Tullow Oil plc, Revenue and Expenses, By Country/Region, US$ mil, 2009-2013 ......................... 263
Table 98: Tullow Oil plc, Oil and Gas Revenue and Expenses, US$/boe, 2009-2013 ................................... 264
Table 99: Tullow Oil plc, Oil and Gas Revenue and Expenses, US$/boe, By Country/Region, 2009-2013 .... 266
Table 100: Tullow Oil plc, Oil and Gas Performance Metrics, 2009-2013 ...................................................... 267
Table 101: Tullow Oil plc, Exploratory and Developed Wells, 2009-2013 ...................................................... 268
Table 102: Tullow Oil plc, Exploratory and Developed Wells, By Country/Region, 2009-2013 ....................... 270
1.2 List of Figures Figure 1: Tullow Oil plc, Operational Map, 2014 ............................................................................................. 23
Figure 2: Tullow Oil plc, Financial and Operational Overview, 2010–2013 ...................................................... 27
Figure 3: Tullow Oil plc, Share Performance, August 2013 – July 2014 .......................................................... 29
Figure 4: Tullow Oil plc, Asset Overview, 2014............................................................................................... 31
Figure 5: Tullow Oil plc, West and North Africa, Operational Map, 2014 ......................................................... 32
Figure 6: Tullow Oil plc, South and East Africa, Operational Map, 2014 ......................................................... 37
Figure 7: Tullow Oil plc, Europe, South America and Asia, Operational Map, 2014 ......................................... 41
Figure 8: Tullow Oil plc, Major Projects, Operational Map, 2014 ..................................................................... 46
Figure 9: Tullow Oil plc, Ghana, Overview, 2014 ............................................................................................ 48
Figure 10: Tullow Oil plc, Jubilee Field Overview 2014 ................................................................................... 51
Figure 11: Tullow Oil plc, TEN Overview 2014 ............................................................................................... 53

Tullow Oil plc, Company Intelligence Report
16
© GlobalData. This report is a licensed product and is not to be copied, reproduced, shared or resold in any form.
TULLOW OIL PLC, COMPANY INTELLIGENCE REPORT
Table of Contents
Figure 12: Tullow Oil plc, TEN Development Overview 2014 .......................................................................... 54
Figure 13: Tullow Oil plc, TEN Development Capex (US$ bil), 2013–2018 ..................................................... 55
Figure 14: Tullow Oil plc, TEN Development Timeline, 2013–2016................................................................. 56
Figure 15: Tullow Oil plc, Uganda, Operational Map, 2014 ............................................................................. 58
Figure 16: Tullow Oil plc, Kenya and Ethiopia, Overview, 2014 ...................................................................... 62
Figure 17: Tullow Oil plc, Asset Overview, 2014 ............................................................................................. 65
Figure 18: Tullow Oil plc, Total Revenue (US$ bil), 2010–2013 ...................................................................... 67
Figure 19: Tullow Oil plc, Exploration Costs Written Off (US$ mil), 2009–2013 ............................................... 68
Figure 20: Tullow Oil plc, Strategy Overview, 2014 ........................................................................................ 72
Figure 21: Tullow Oil plc, Total Acreage (Million Acres), 2011–2013............................................................... 76
Figure 22: Tullow Oil plc, Exploration Acreage (km2), 2014............................................................................ 77
Figure 23: Tullow Oil plc, Operational Map, 2014 ........................................................................................... 78
Figure 24: Tullow Oil plc, Oil Exploration Strategy, Africa and Atlantic Margin, 2014 ....................................... 79
Figure 25: Tullow Oil plc, Exploration, Appraisal and Development and Operations Capex (US$ bil), 2010–2013 ........................................................................................................................................... 80
Figure 26: Tullow Oil plc, Contingent Resources Additions and Revisions (mmboe), 2009–2013 .................... 81
Figure 27: Tullow Oil plc, Contingent Resources Additions (mmboe) and Key Wells Data, 2007–2013 ........... 82
Figure 28: Tullow Oil plc, E&A Activities 2014 ................................................................................................ 83
Figure 29: Tullow Oil plc, Key Exploration Wells, 2014–2015 ......................................................................... 91
Figure 30: Tullow Oil plc, Exploratory Targets, 2014 ...................................................................................... 92
Figure 31: Tullow Oil plc, West and North Africa, Operational Map, 2014 ....................................................... 94
Figure 32: Tullow Oil plc, Congo, Operational Map, 2014 ............................................................................... 95
Figure 33: Tullow Oil plc, Côte d’Ivoire, Operational Map, 2014 ...................................................................... 97
Figure 34: Tullow Oil plc, Equatorial Guinea, Operational Map, 2014 ............................................................. 99

Tullow Oil plc, Company Intelligence Report
17
© GlobalData. This report is a licensed product and is not to be copied, reproduced, shared or resold in any form.
TULLOW OIL PLC, COMPANY INTELLIGENCE REPORT
Table of Contents
Figure 35: Tullow Oil plc, Gabon, Operational Map, 2014 ............................................................................. 102
Figure 36: Tullow Oil plc, Ghana, Operational Map, 2014 ............................................................................. 105
Figure 37: Tullow Oil plc, Ghana, 2014 ........................................................................................................ 106
Figure 38: Tullow Oil plc, Jubilee Oil Resource Potential (mmbbl), 2014....................................................... 109
Figure 39: Tullow Oil plc, TEN Resource Potential (mmbbl), 2014 ................................................................ 110
Figure 40: Tullow Oil plc, TEN Development Overview 2014 ........................................................................ 111
Figure 41: Tullow Oil plc, TEN Development Capex (US$ bil), 2013–2018 ................................................... 113
Figure 42: Tullow Oil plc, TEN Development Timeline, 2013–2016............................................................... 114
Figure 43: Tullow Oil plc, Guinea, Fatala and Sylli Prospects, 2014 ............................................................. 115
Figure 44: Tullow Oil plc, Guinea, Operational Map, 2014 ............................................................................ 115
Figure 45: Tullow Oil plc, Liberia, Operational Map, 2014 ............................................................................. 117
Figure 46: Tullow Oil plc, Mauritania, Operational Map, 2014 ....................................................................... 118
Figure 47: Tullow Oil plc, Sierra Leone, Operational Map, 2014 ................................................................... 121
Figure 48: Tullow Oil plc, South and East Africa, Operational Map, 2014 ...................................................... 123
Figure 49: Tullow Oil plc, Ethiopia, Operational Map, 2014 ........................................................................... 124
Figure 50: Tullow Oil plc, Ethiopia, Discovery and Future Drilling Locations, 2014 ........................................ 125
Figure 51: Tullow Oil plc, Kenya, Operational Map, 2014 ............................................................................. 127
Figure 52: Tullow Oil plc, Kenya, Onshore Rift Basins, 2014 ........................................................................ 130
Figure 53: Tullow Oil plc, Kenya, Well Costs (US$ mil), 2014 ....................................................................... 131
Figure 54: Tullow Oil plc, Kenya, Discovery and Future Drilling Locations, 2014........................................... 132
Figure 55: Tullow Oil plc, Kenya, Appraisal Timeline, 2014 .......................................................................... 133
Figure 56: Tullow Oil plc, Kenya, Proposed Pipeline, 2014 ........................................................................... 134
Figure 57: Tullow Oil plc, Madagascar, Operational Map, 2014 .................................................................... 137
Tullow Oil plc, Company Intelligence Report
18
© GlobalData. This report is a licensed product and is not to be copied, reproduced, shared or resold in any form.
TULLOW OIL PLC, COMPANY INTELLIGENCE REPORT
Table of Contents
Figure 58: Tullow Oil plc, Mozambique, Operational Map, 2014 ................................................................... 139
Figure 59: Tullow Oil plc, Namibia, Operational Map, 2014 .......................................................................... 141
Figure 60: Tullow Oil plc, Uganda, Operational Map, 2014 ........................................................................... 143
Figure 61: Tullow Oil plc, Uganda, Appraisal Timeline, 2014 ........................................................................ 145
Figure 62: Tullow Oil plc, Europe, South America and Asia, Operational Map, 2014 ..................................... 146
Figure 63: Tullow Oil plc, Norway, Operational Map, 2014 ........................................................................... 147
Figure 64: Tullow Oil plc, Norway – North Sea/Norwegian Sea, Operational Map, 2014 ............................... 150
Figure 65: Tullow Oil plc, Norway – Barents Sea, Operational Map, 2014 .................................................... 151
Figure 66: Tullow Oil plc, Greenland, Operational Map, 2014 ....................................................................... 156
Figure 67: Tullow Oil plc, Netherlands, Operational Map, 2014 .................................................................... 158
Figure 68: Tullow Oil plc, UK, Operational Map, 2014 .................................................................................. 161
Figure 69: Tullow Oil plc, UK – Northern North Sea and CMS Area, Operational Map, 2014......................... 162
Figure 70: Tullow Oil plc, UK – Thames Area, Operational Map, 2014 .......................................................... 163
Figure 71: Tullow Oil plc, French Guiana, Operational Map, 2014 ................................................................ 166
Figure 72: Tullow Oil plc, Guyana, Operational Map, 2014 ........................................................................... 168
Figure 73: Tullow Oil plc, Suriname, Operational Map, 2014 ........................................................................ 170
Figure 74: Tullow Oil plc, Uruguay, Operational Map, 2014 .......................................................................... 172
Figure 75: Tullow Oil plc, Pakistan, Operational Map, 2014 .......................................................................... 174
Figure 76: Tullow Oil plc, Capex by Activity (US$ bil), 2014 .......................................................................... 177
Figure 77: Tullow Oil plc, Capex by Activity (US$ bil), 2010–2014 ................................................................ 178
Figure 78: Tullow Oil plc, Capex by Activity (US$ bil), 2011–2014 ................................................................ 179
Figure 79: Tullow Oil plc, Costs Incurred (US$ mil), 2009–2013 ................................................................... 180
Figure 80: Tullow Oil plc, Reserve Replacement Ratio and Finding and Development Costs Incurred (US$ per boe), 2010–2013 ................................................................................................................. 182
Tullow Oil plc, Company Intelligence Report
19
© GlobalData. This report is a licensed product and is not to be copied, reproduced, shared or resold in any form.
TULLOW OIL PLC, COMPANY INTELLIGENCE REPORT
Table of Contents
Figure 81: Tullow Oil plc, Oil and Gas Production (mmboe), 2010–2013 ...................................................... 184
Figure 82: Tullow Oil plc, Total Oil and Gas Production (mmboe), 2011–2018 .............................................. 186
Figure 83: Tullow Oil plc, Production Mix (%), 2011–2018 ............................................................................ 187
Figure 84: Tullow Oil plc, Production Mix by Commodity and Region, mboed, 2013 ..................................... 188
Figure 85: Tullow Oil plc, Gabon Net Production Profile (boed), 2006–2025 ................................................. 192
Figure 86: Tullow Oil plc, Ghana, Gross Production Profile (mboed), 2010–2036 ......................................... 194
Figure 87: Tullow Oil plc and Peers, Relative Share Price Performance Index (%), August 2013–July 2014 . 205
Figure 88: Tullow Oil plc and Peer Group, Financial and Operational Parameters (US$/boe), 2013 .............. 207
Figure 89: Tullow Oil plc and Peer Group, F&D Cost and Reserve Replacement Comparison, 2013 ............ 208
Figure 90: Tullow Oil plc, Peer Group Comparison, Total Reserves and Production (mmboe), 2013 ............. 209
Figure 91: Tullow Oil plc and Peer Group, Reserve Life Index (Years), 2013 ................................................ 211
Figure 92: Tullow Oil plc, Peer Group Comparison, Valuation Ratios, 2013 .................................................. 214
Figure 93: Tullow Oil plc, Total Crude Oil and Natural Gas, Production and Reserves, mmboe, 2009-2013 .. 215
Figure 94: Tullow Oil plc, Total Oil & Gas Reserves, End of Period, By Country/Region, mmboe, 2009-2013217
Figure 95: Tullow Oil plc, Total Oil & Gas Production, By Country/Region, mmboe, 2009-2013 .................... 218
Figure 96: Tullow Oil plc, Total Crude Oil and Natural Gas Reserve Changes, mmboe, 2013 ....................... 220
Figure 97: Tullow Oil plc, Crude Oil Production and Reserves Metrics, mmbbl, 2009-2013 ........................... 222
Figure 98: Tullow Oil plc, Oil Reserves, End of Period, By Country/Region, mmbbl, 2009-2013 .................... 223
Figure 99: Tullow Oil plc, Oil Production, By Country/Region, mmbbl, 2009-2013 ......................................... 224
Figure 100: Tullow Oil plc, Crude Oil Reserve Changes, mmbbl, 2013 ........................................................ 226
Figure 101: Tullow Oil plc, Natural Gas Production and Reserves Metrics, bcf, 2009-2013 ........................... 228
Figure 102: Tullow Oil plc, Gas Reserves, End of Period, By Country/Region, bcf, 2009-2013 ..................... 229
Figure 103: Tullow Oil plc, Gas Production, By Country/Region, bcf, 2009-2013 .......................................... 230
Tullow Oil plc, Company Intelligence Report
20
© GlobalData. This report is a licensed product and is not to be copied, reproduced, shared or resold in any form.
TULLOW OIL PLC, COMPANY INTELLIGENCE REPORT
Table of Contents
Figure 104: Tullow Oil plc, Natural Gas Reserve Changes, bcf, 2013 ........................................................... 232
Figure 105: Tullow Oil plc, Oil and Gas Reserves Life Index, Years, 2009-2013 ........................................... 234
Figure 106: Tullow Oil plc, Gas Reserve Life Index, By Country/Region, Years, 2009-2013.......................... 235
Figure 107: Tullow Oil plc, Oil & Gas Reserve Life Index, By Country/Region, Years, 2009-2013 ................. 236
Figure 108: Tullow Oil plc, Oil Reserve Life Index, By Country/Region, Years, 2009-2013 ............................ 237
Figure 109: Tullow Oil plc, Upstream Capital Expenditure, US$ mil, 2009-2013............................................ 239
Figure 110: Tullow Oil plc, Proved Acquisition Costs, By Country/Region, US$ mil, 2009-2013 .................... 241
Figure 111: Tullow Oil plc, Unproved Acquisition Costs, By Country/Region, US$ mil, 2009-2013 ................ 242
Figure 112: Tullow Oil plc, Exploration Costs, By Country/Region, US$ mil, 2009-2013................................ 244
Figure 113: Tullow Oil plc, 3-Year Wt.Avg., Reserves Replacement, Finding and Development Costs, Finding Cost and Proved Acquisition Costs Per boe, US$/boe, 2009-2013 ............................... 246
Figure 114: Tullow Oil plc, Oil & Gas Finding Cost per boe, 3-Year Average, By Country/Region, US$/boe, 2009-2013 ................................................................................................................................ 248
Figure 115: Tullow Oil plc, 3-Year Wt.Avg., Oil and Gas Production Replacement Ratio, %, 2009-2013 ....... 250
Figure 116: Tullow Oil plc, 3-Year Wt. Avg. Gas F&D Production Replacement, By Country/Region, %, 2009-2013 ................................................................................................................................ 253
Figure 117: Tullow Oil plc, 3-Year Wt. Avg. Gas RRC Production Replacement, By Country/Region, %, 2009-2013 ................................................................................................................................ 254
Figure 118: Tullow Oil plc, 3-Year Wt. Avg. Oil & Gas F&D Production Replacement, By Country/Region, %, 2009-2013 ........................................................................................................................... 255
Figure 119: Tullow Oil plc, 3-Year Wt. Avg. Oil & Gas RRC Production Replacement, By Country/Region, %, 2009-2013 ........................................................................................................................... 256
Figure 120: Tullow Oil plc, 3-Year Wt. Avg. Oil F&D Production Replacement, By Country/Region, %, 2009-2013 ......................................................................................................................................... 257
Figure 121: Tullow Oil plc, 3-Year Wt. Avg. Oil RRC Production Replacement, By Country/Region, %, 2009-2013 ......................................................................................................................................... 258
Figure 122: Tullow Oil plc, Revenue and Expenses, US$ mil, 2009-2013 ..................................................... 261
Tullow Oil plc, Company Intelligence Report
21
© GlobalData. This report is a licensed product and is not to be copied, reproduced, shared or resold in any form.
TULLOW OIL PLC, COMPANY INTELLIGENCE REPORT
Table of Contents
Figure 123: Tullow Oil plc, Oil and Gas Revenue and Expenses, US$/boe, 2009-2013 ................................ 264
Figure 124: Tullow Oil plc, Oil and Gas Performance Metrics, 2009-2013 ..................................................... 267
Tullow Oil plc, Company Intelligence Report
22
© GlobalData. This report is a licensed product and is not to be copied, reproduced, shared or resold in any form.
TULLOW OIL PLC, COMPANY INTELLIGENCE REPORT
Tullow Oil plc, Company Overview
2 Tullow Oil plc, Company Overview Tullow is an independent energy company, which was founded in 1985. The company is engaged in exploration, appraisal, development and production activities, primarily in Africa and the Atlantic Margins. The company’s operations are segregated into three regional geographies, namely West and North Africa (WNA); South and East Africa (SEA); and Europe, South America and Asia (ESAA). Tullow currently has XX licenses in XX countries, with a total acreage of XX square miles (mi2) (XX square kilometers (km2)).
In the WNA region, Tullow has around XX licenses spread across nine countries, with a total acreage holding of XX mi2 (XX km2). The company has interests in XX producing fields in this region. Tullow’s operations in the nine countries constitute of activities in Congo (Brazzaville), Cote d’Ivoire, Equatorial Guinea, Gabon, Ghana, Guinea, Liberia, Mauritania, and Sierra Leone. Of these nine countries, Ghana is one of the major areas of operations for Tullow.
In the SEA region, Tullow has Exploration and Development (E&D) activities in XX licenses in six countries – Ethiopia, Kenya, Madagascar, Mozambique, Namibia and Uganda – with a total acreage holding of XX mi2 (XX km2).
In the ESAA region, Tullow’s exploration, development and production activities span nine countries, with XX licenses. Tullow has a total acreage holding of XX mi2 (XX km2) and around XX producing fields in this region. In this region, the company has interests in Greenland, Netherlands, Norway, UK, French Guiana, Guyana, Suriname, Uruguay and Pakistan. The company also had interests Bangladesh, but divested these in December 2013 to Kris Energy.
Tullow is headquartered in London, UK and has corporate offices in Cape Town, South Africa; Dublin, Ireland; and The Hague, the Netherlands. Tullow’s shares are listed on the London Stock Exchange (LSE) under the ticker TLW, on the Irish Stock Exchange under the ticker TQW, and on and Ghana Stock Exchange (GSE) under the ticker TLW.
The following figure illustrates Tullow’s global operations.
Tullow Oil plc, Company Intelligence Report
30
© GlobalData. This report is a licensed product and is not to be copied, reproduced, shared or resold in any form.
TULLOW OIL PLC, COMPANY INTELLIGENCE REPORT
Tullow Oil plc, Key Highlights
3 Tullow Oil plc, Key Highlights 3.1 Exploration and Development Opportunities to Support Tullow’s
Growth Trajectory Tullow’s operations primarily consist of finding oil in the African continent as well as the Atlantic Margins area.
In the African continent, Tullow’s operations consist of exploration, development and production activities in the several countries worldwide. In the WNA region, Tullow has XX licenses spanning nine countries, with an area covering XX square miles (mi2) (XX square kilometers (km2)). In the SEA region, the company has interest in 15 licenses spanning six countries, with a coverage area of XXmi2 (XX km2). In ESAA, Tullow has interest in about XX licenses that span across nine countries, with an area that covers about XX mi2 (XX km2) of land.
The following figure illustrates Tullow’s key operational areas across the globe.

Tullow Oil plc, Company Intelligence Report
72
© GlobalData. This report is a licensed product and is not to be copied, reproduced, shared or resold in any form.
TULLOW OIL PLC, COMPANY INTELLIGENCE REPORT
Tullow Oil plc, Goals and Strategies
5 Tullow Oil plc, Goals and Strategies Tullow’s long-term goal is to increase its shareholder returns by becoming the foremost independent E&P Company in the world. The company believes it can achieve this through a significant E&D program coupled with high-value substantial production.
The following figure illustrates Tullow’s strategy
Figure 20: Tullow Oil plc, Strategy Overview, 2014
Source: Tullow, 2014ap
Tullow Oil plc, Company Intelligence Report
197
© GlobalData. This report is a licensed product and is not to be copied, reproduced, shared or resold in any form.
TULLOW OIL PLC, COMPANY INTELLIGENCE REPORT
Tullow Oil plc, Forecast Production and Financial Statements
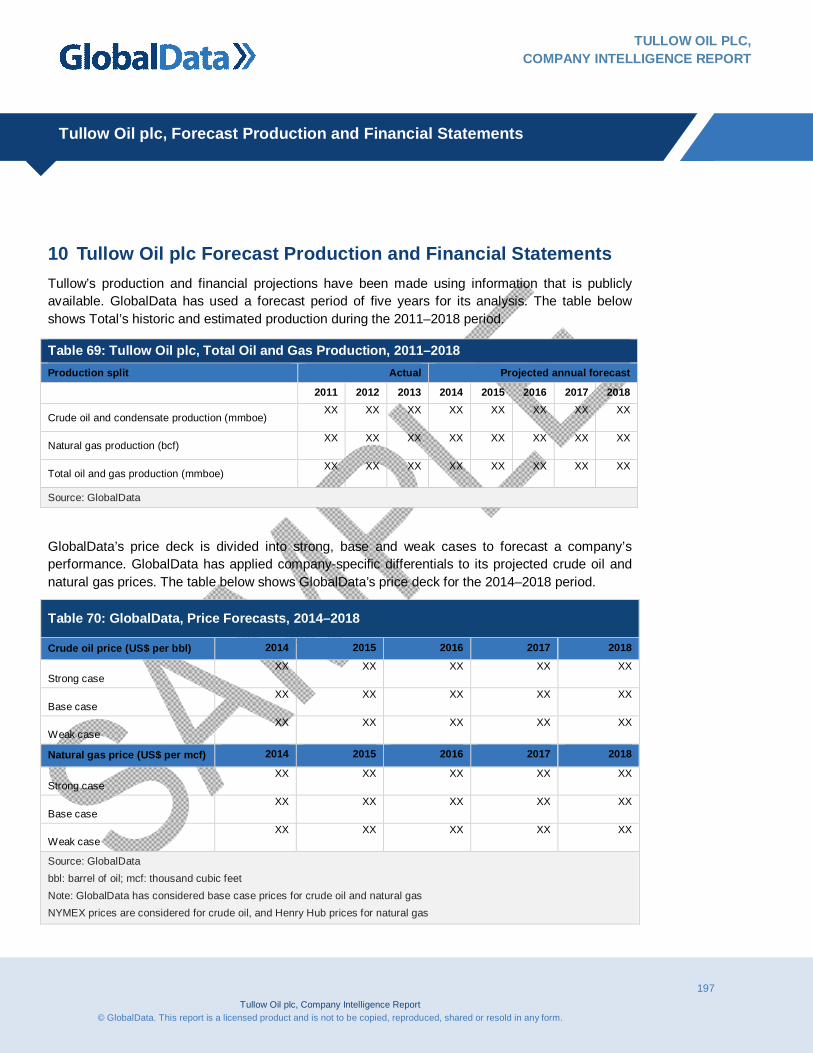
10 Tullow Oil plc Forecast Production and Financial Statements Tullow’s production and financial projections have been made using information that is publicly available. GlobalData has used a forecast period of five years for its analysis. The table below shows Total’s historic and estimated production during the 2011–2018 period.
GlobalData’s price deck is divided into strong, base and weak cases to forecast a company’s performance. GlobalData has applied company-specific differentials to its projected crude oil and natural gas prices. The table below shows GlobalData’s price deck for the 2014–2018 period.
Table 70: GlobalData, Price Forecasts, 2014–2018
Crude oil price (US$ per bbl) 2014 2015 2016 2017 2018
Strong case XX XX XX XX XX
Base case XX XX XX XX XX
Weak case XX XX XX XX XX
Natural gas price (US$ per mcf) 2014 2015 2016 2017 2018
Strong case XX XX XX XX XX
Base case XX XX XX XX XX
Weak case XX XX XX XX XX
Source: GlobalData bbl: barrel of oil; mcf: thousand cubic feet Note: GlobalData has considered base case prices for crude oil and natural gas NYMEX prices are considered for crude oil, and Henry Hub prices for natural gas
Table 69: Tullow Oil plc, Total Oil and Gas Production, 2011–2018 Production split Actual Projected annual forecast
2011 2012 2013 2014 2015 2016 2017 2018
Crude oil and condensate production (mmboe) XX XX XX XX XX XX XX XX
Natural gas production (bcf) XX XX XX XX XX XX XX XX
Total oil and gas production (mmboe) XX XX XX XX XX XX XX XX
Source: GlobalData

Tullow Oil plc, Company Intelligence Report
198
© GlobalData. This report is a licensed product and is not to be copied, reproduced, shared or resold in any form.
TULLOW OIL PLC, COMPANY INTELLIGENCE REPORT
Tullow Oil plc, Forecast Production and Financial Statements
10.1 Income Statement (2011–2018) Tullow’s income statement is provided in the following table. The company’s total Exploration and Production (E&P) revenue is expected to increase from US$XX billion in 2013 to US$XX billion in 2014. In addition, GlobalData expects the company’s E&P revenue to increase at an Average Annual Growth Rate (AAGR) of XX% between 2014 and 2018. Tullow’s total production costs are expected to account for an average of XX% of its total E&P revenue between 2014 and 2018. The company’s Earnings before Interest and Taxes (EBIT) in 2014 are expected to amount to US$0.8 billion, equivalent to XX% of its total revenue. The EBIT is expected to increase at an average rate of around XX% between 2014 and 2018. Similarly, the company’s Earnings Before Interest, Taxes, Depreciation and Amortization (EBITDA) in 2014 is expected to amount to around US$XX billion, equivalent to around XX% of its total revenue. This value is expected to increase at an AAGR of around XX% between 2014 and 2018. Tullow is expected to generate a net income of US$XX million in 2014, which translates into basic Earnings per Share (EPS) of US$XX
Table 71: Tullow Oil plc, Income Statement (US$ mil), 2011–2018
2011 2012 2013 2014 2015 2016 2017 2018
E&P revenue XX XX XX XX XX XX XX XX
Other revenue XX XX XX XX XX XX XX XX
Total revenue XX XX XX XX XX XX XX XX
Production costs XX XX XX XX XX XX XX XX
General and administrative expense
XX XX XX XX XX XX XX XX
EBITDAX XX XX XX XX XX XX XX XX
(Gain) loss on divestitures XX XX XX XX XX XX XX XX
Other Operating Expenses XX XX XX XX XX XX XX XX
Exploration Expense/Dry Hole
XX XX XX XX XX XX XX XX
EBITDA XX XX XX XX XX XX XX XX
DD&A expenses XX XX XX XX XX XX XX XX
Operating income (EBIT) XX XX XX XX XX XX XX XX
Other non-operating incomes (+)/ expenses (-)
XX XX XX XX XX XX XX XX
Net interest expenses XX XX XX XX XX XX XX XX
Tullow Oil plc, Company Intelligence Report
199
© GlobalData. This report is a licensed product and is not to be copied, reproduced, shared or resold in any form.
TULLOW OIL PLC, COMPANY INTELLIGENCE REPORT
Tullow Oil plc, Forecast Production and Financial Statements
Earnings before tax XX XX XX XX XX XX XX XX
Total income tax XX XX XX XX XX XX XX XX
Profit after tax XX XX XX XX XX XX XX XX
Minority Interest XX XX XX XX XX XX XX XX
Net income to common shareholders
XX XX XX XX XX XX XX XX
Basic shares outstanding XX XX XX XX XX XX XX XX
Diluted shares outstanding XX XX XX XX XX XX XX XX
Basic EPS XX XX XX XX XX XX XX XX
Dilutive EPS XX XX XX XX XX XX XX XX
Source: GlobalData; Tullow, 2011; Tullow, 2012; Tullow, 2013a DD&A: Depreciation, Depletion and Amortization EBITDAX: Earnings before Interest, Taxes, Depreciation, Depletion, Amortization and Exploration
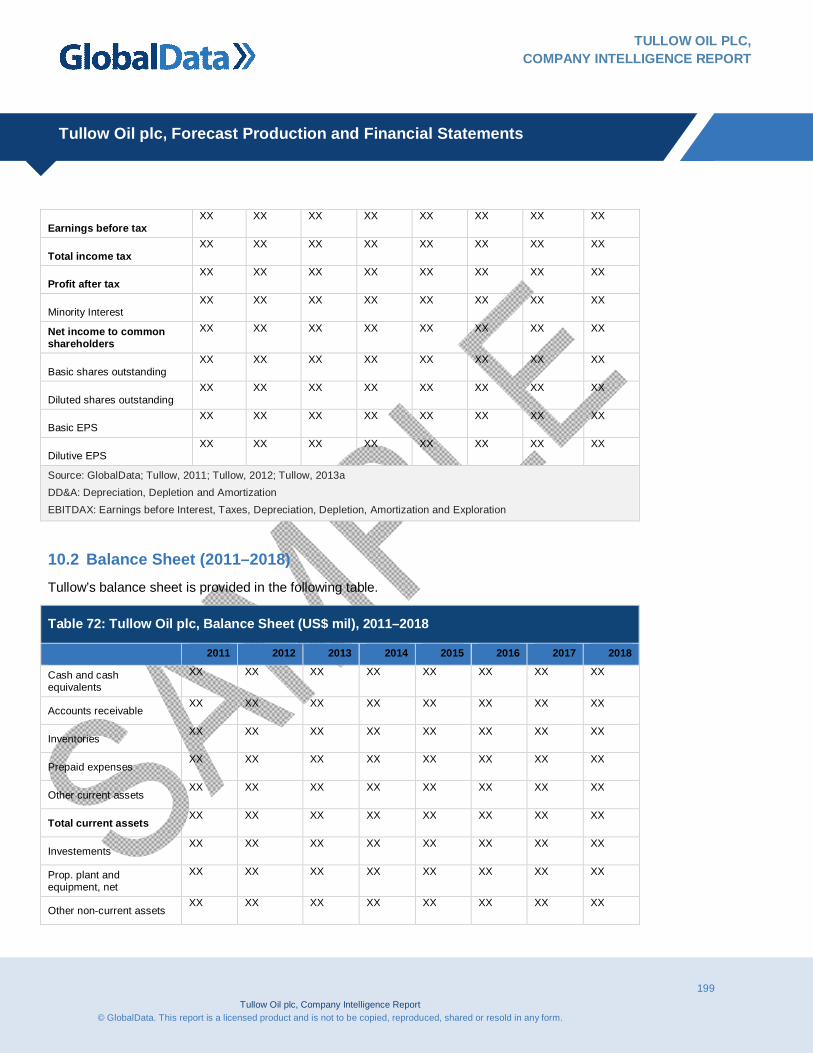
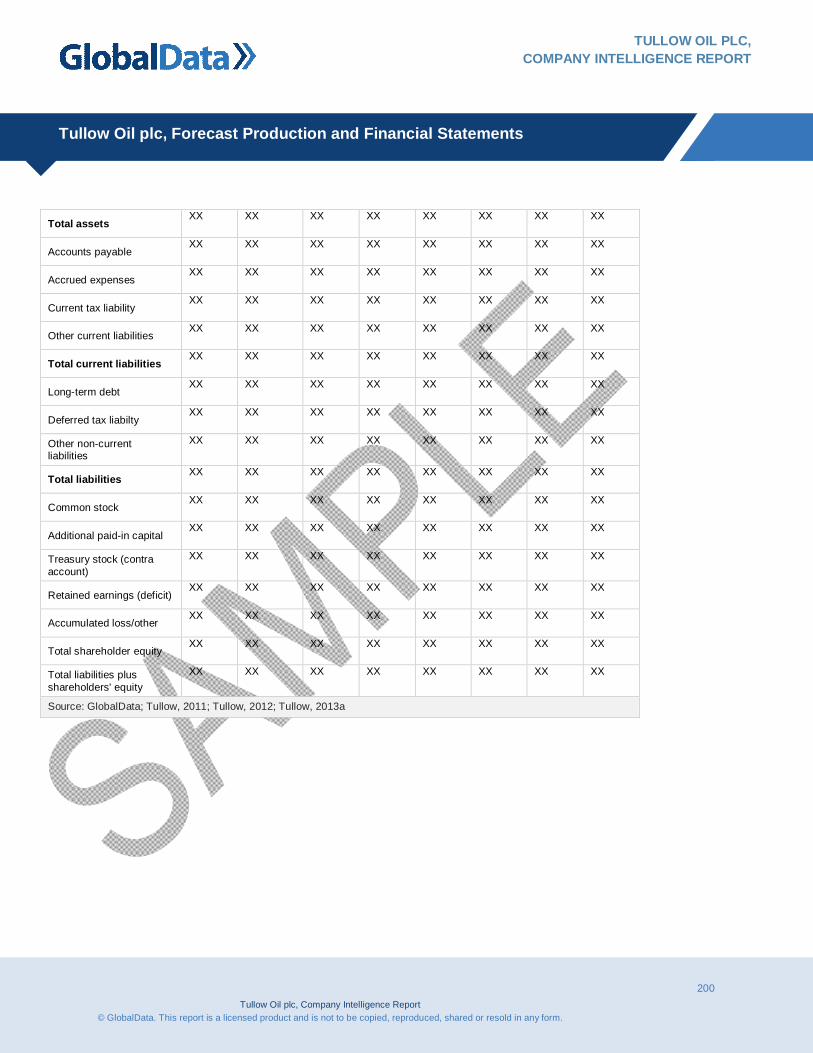
10.2 Balance Sheet (2011–2018) Tullow’s balance sheet is provided in the following table.
Table 72: Tullow Oil plc, Balance Sheet (US$ mil), 2011–2018
2011 2012 2013 2014 2015 2016 2017 2018
Cash and cash equivalents
XX XX XX XX XX XX XX XX
Accounts receivable XX XX XX XX XX XX XX XX
Inventories XX XX XX XX XX XX XX XX
Prepaid expenses XX XX XX XX XX XX XX XX
Other current assets XX XX XX XX XX XX XX XX
Total current assets XX XX XX XX XX XX XX XX
Investements XX XX XX XX XX XX XX XX
Prop. plant and equipment, net
XX XX XX XX XX XX XX XX
Other non-current assets XX XX XX XX XX XX XX XX
Tullow Oil plc, Company Intelligence Report
200
© GlobalData. This report is a licensed product and is not to be copied, reproduced, shared or resold in any form.
TULLOW OIL PLC, COMPANY INTELLIGENCE REPORT
Tullow Oil plc, Forecast Production and Financial Statements
Total assets XX XX XX XX XX XX XX XX
Accounts payable XX XX XX XX XX XX XX XX
Accrued expenses XX XX XX XX XX XX XX XX
Current tax liability XX XX XX XX XX XX XX XX
Other current liabilities XX XX XX XX XX XX XX XX
Total current liabilities XX XX XX XX XX XX XX XX
Long-term debt XX XX XX XX XX XX XX XX
Deferred tax liabilty XX XX XX XX XX XX XX XX
Other non-current liabilities
XX XX XX XX XX XX XX XX
Total liabilities XX XX XX XX XX XX XX XX
Common stock XX XX XX XX XX XX XX XX
Additional paid-in capital XX XX XX XX XX XX XX XX
Treasury stock (contra account)
XX XX XX XX XX XX XX XX
Retained earnings (deficit) XX XX XX XX XX XX XX XX
Accumulated loss/other XX XX XX XX XX XX XX XX
Total shareholder equity XX XX XX XX XX XX XX XX
Total liabilities plus shareholders' equity
XX XX XX XX XX XX XX XX
Source: GlobalData; Tullow, 2011; Tullow, 2012; Tullow, 2013a

Tullow Oil plc, Company Intelligence Report
201
© GlobalData. This report is a licensed product and is not to be copied, reproduced, shared or resold in any form.
TULLOW OIL PLC, COMPANY INTELLIGENCE REPORT
Tullow Oil plc, Forecast Production and Financial Statements
10.3 Cash Flow Statement (2011–2018) The following table provides Tullow’s cash-flow statement for the 2011–2018 period. The company’s CFO increased from about US$XX billion in 2012 to US$XX billion in 2013. It will be able to fund most of its capex plans by internally generated operational cash flow between 2014 and 2018, although it will also require a certain level of debt. The company’s operational cash flows will steadily increase at an annual average rate of 8% between 2014 and 2018.
Table 73: Tullow Oil plc, Cash Flow Statement (US$ mil), 2011–2018
2011 2012 2013 2014 2015 2016 2017 2018
Profit before taxation XX XX XX XX XX XX XX XX
DD&A XX XX XX XX XX XX XX XX
Income tax paid XX XX XX XX XX XX XX XX
Dry hole and impairment expense
XX XX XX XX XX XX XX XX
Change in working capital XX XX XX XX XX XX XX XX
Other operating XX XX XX XX XX XX XX XX
Operating cash flows XX XX XX XX XX XX XX XX
Capex XX XX XX XX XX XX XX XX
Asset acquisitions XX XX XX XX XX XX XX XX
Asset sales XX XX XX XX XX XX XX XX
Other investing XX XX XX XX XX XX XX XX
Investing cash flows XX XX XX XX XX XX XX XX
Additions to (reductions in) long-term debt
XX XX XX XX XX XX XX XX
Additions to (reductions in) Short-term debt
XX XX XX XX XX XX XX XX
Dividends paid XX XX XX XX XX XX XX XX
Distribution to non-controlling interest
XX XX XX XX XX XX XX XX
Other XX XX XX XX XX XX XX XX
Financing cash flows XX XX XX XX XX XX XX XX

Tullow Oil plc, Company Intelligence Report
202
© GlobalData. This report is a licensed product and is not to be copied, reproduced, shared or resold in any form.
TULLOW OIL PLC, COMPANY INTELLIGENCE REPORT
Tullow Oil plc, Forecast Production and Financial Statements
Total increase/decrease of cash
XX XX XX XX XX XX XX XX
Source: GlobalData; Tullow, 2011; Tullow, 2012; Tullow, 2013a
Tullow Oil plc, Company Intelligence Report
274
© GlobalData. This report is a licensed product and is not to be copied, reproduced, shared or resold in any form.
TULLOW OIL PLC, COMPANY INTELLIGENCE REPORT
Appendix
15 Appendix 15.1 Abbreviations 2P: Proven reserves
AAGR: Average Annual Growth Rate
API: American Petroleum Institute
bbl: barrels of oil
bcf: billion cubic feet
bcfe: billion cubic feet equivalent
bd: barrels of oil per day
boed: barrels of oil equivalent per day
CAGR: Compound Annual Growth Rate
capex: capital expenditure
CFO: Cash Flow from Operations
CMS:
CWC: Completed Well Costs
DACF: Debt-Adjusted Cash Flow
DD&A: Depreciation, Depletion and Amortization
DST: Drill Stem Test
E&A: Exploration and Appraisal
E&D: Exploration and Development
E&P: Exploration and Production
EA: Exploration Areas
EBIT: Earnings Before Interest and Taxes
EBITDA: Earnings before Interest, Tax, Depreciation, Depletion and Amortization
EBITDAX: Earnings before Interest, Taxes, Depreciation, Depletion, and Amortization and Exploration Expenses
EPS: Earnings per Share
ESAA: Europe, South America and Asia
Tullow Oil plc, Company Intelligence Report
275
© GlobalData. This report is a licensed product and is not to be copied, reproduced, shared or resold in any form.
TULLOW OIL PLC, COMPANY INTELLIGENCE REPORT
Appendix
EV: Enterprise Value
F&D: Finding and Development
FEED: Front-End Engineering and Design
FID: Final Investment Decision
FPSO: Floating production Storage and Offloading
ft: feet
GNPC: Ghana National Petroleum Corporation
JDA: Joint Development Agreement
km2: square kilometers
m: meters
mbd: thousand barrels of oil per day
mcf: thousand cubic feet
mcfed: thousand cubic feet equivalent
mi2: square miles
mil: million
mmbbl: million barrels of oil
mmboe: million barrels of oil equivalent
mmcf: million cubic feet
mmcfd: million cubic feet per day
mmcfed: million cubic feet equivalent per day
MoU: Memorandum of Understanding
NAV: Net Asset Value
NGL: Natural Gas Liquids
NYSE: New York Stock Exchange
PoD: Plan of Development
PSC: Production Sharing Contract
PV: Present Value
SEA: South and East Africa
Tullow Oil plc, Company Intelligence Report
276
© GlobalData. This report is a licensed product and is not to be copied, reproduced, shared or resold in any form.
TULLOW OIL PLC, COMPANY INTELLIGENCE REPORT
Appendix
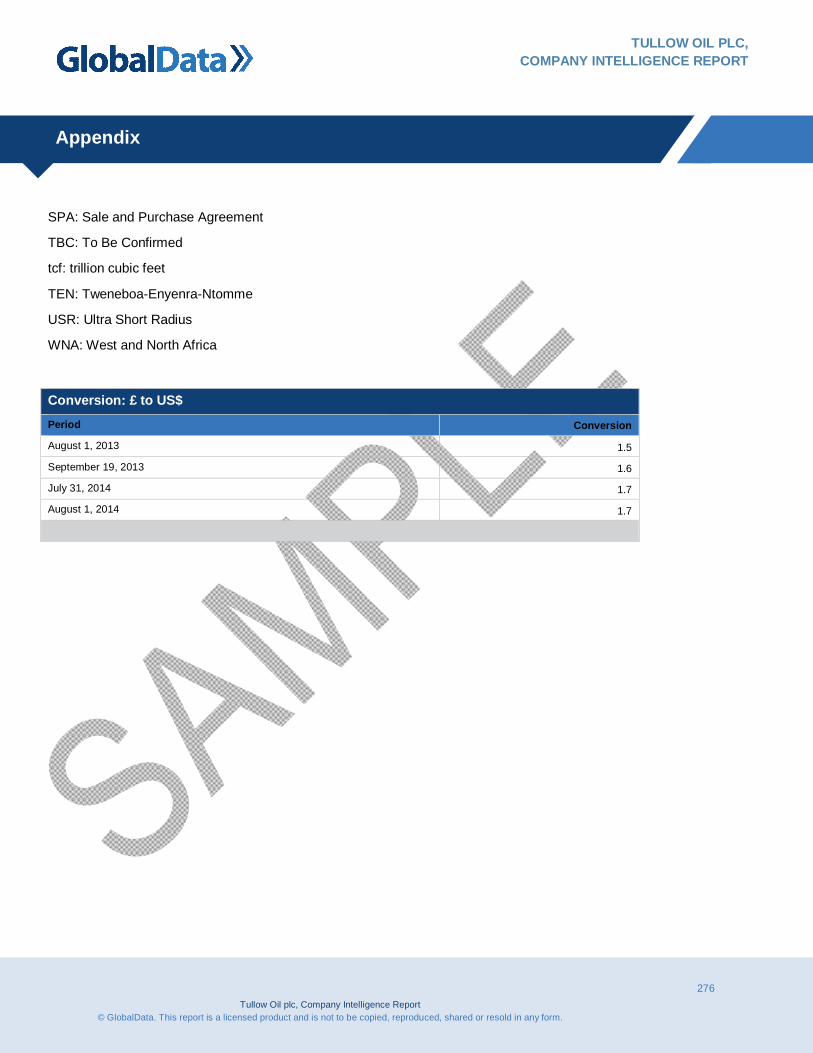
SPA: Sale and Purchase Agreement
TBC: To Be Confirmed
tcf: trillion cubic feet
TEN: Tweneboa-Enyenra-Ntomme
USR: Ultra Short Radius
WNA: West and North Africa
Conversion: £ to US$
Period Conversion
August 1, 2013 1.5
September 19, 2013 1.6
July 31, 2014 1.7
August 1, 2014 1.7

Tullow Oil plc, Company Intelligence Report
277
© GlobalData. This report is a licensed product and is not to be copied, reproduced, shared or resold in any form.
TULLOW OIL PLC, COMPANY INTELLIGENCE REPORT
Appendix
15.2 Sources
Google Finance (2014a). Summary. Google Finance. Available from: http://www.google.com/finance?q=LON%3ATLW&ei=9Ba2U_DIIcvPkAWBrYFA [Accessed on August 4, 2014]
Google Finance (2014b). Historical Prices. Google Finance. http://www.google.com/finance/historical?q=LON%3ATLW&ei=-Ra2U9CgJIq7kgWBoYCQAw [Accessed on August 4, 2014]
Tullow (2011). Factbook-2011. Tullow Oil. Available from: http://www.tullowoil.com/files/pdf/results/2011_full_year_factbook.pdf [Accessed on June 4, 2014]
Tullow (2012a). Factbook-2012. Tullow Oil. Available from: http://www.tullowoil.com/images/files/cms/2012_Full_year_results_factbook_final.pdf [Accessed on June 4, 2014]
Tullow (2012b). Annual General Meeting. Tullow Oil. Available from: http://www.tullowoil.com/files/pdf/agm_presentation_2012.pdf [Accessed on June 4, 2014]
Tullow (2013a). Annual report 2013. Tullow Oil. Available from: http://www.tullowoil.com/files/pdf/tullow_ar_report_2013.pdf [Accessed on June 4, 2014]
Tullow (2013b). Factbook-2013. Tullow Oil. Available from: http://www.tullowoil.com/images/files/cms/2013_FULL_YEAR_FACTBOOK__2_.pdf [Accessed on June 4, 2014]
Tullow (2013c). Ghana Investor Presentation-May2013. Tullow Oil. Available from: http://www.tullowoil.com/images/files/cms/Tullow_Oil_2013_Investor_Forum__FINAL2_.pdf[Accessed on June 4, 2014]
Tullow (2014c). Overview Presentation-May2014. Tullow Oil. Available from: http://files.the-group.net/library/tullow/files/pdf_366_t.pdf [Accessed on June 4, 2014]
Tullow (2014d). West and North America - Regional Business Unit Map. Tullow Oil. Available from: http://www.tullowoil.com/index.asp?pageid=246 [Accessed on June 3, 2014]
Tullow (2014e).Congo Operational Map. Tullow Oil. Available from: http://www.tullowoil.com/index.asp?pageid=252 [Accessed on June 5, 2014]
Tullow (2014f). 2014 Annual General Meeting. Tullow Oil. Available from: http://www.tullowoil.com/files/pdf/tullow_oil_2014_agm_presentation.pdf [Accessed on June 4, 2014]
Tullow Oil plc, Company Intelligence Report
278
© GlobalData. This report is a licensed product and is not to be copied, reproduced, shared or resold in any form.
TULLOW OIL PLC, COMPANY INTELLIGENCE REPORT
Appendix
Tullow (2014g). Exploration And Appraisal Activity. Tullow Oil. Available from: http://www.tullowoil.com/index.asp?pageid=48&topnav=reports&year=2003 [Accessed on June 4, 2014]
Tullow (2014h). Côte d’Ivoire Operational Map. Tullow Oil. Available from: http://www.tullowoil.com/index.asp?pageid=256 [Accessed on June 4, 2014]
Tullow (2014i). Côte d’Ivoire Operational Map. Tullow Oil. Available from: http://www.tullowoil.com/index.asp?pageid=259 [Accessed on June 5, 2014]
Tullow (2014j). Gabon Operational Map. Tullow Oil. Available from: http://www.tullowoil.com/index.asp?pageid=262 [Accessed on June 5, 2014]
Tullow (2014k). Ghana Operational Map. Tullow Oil. Available from: http://www.tullowoil.com/index.asp?pageid=264 [Accessed on June 5, 2014]
Tullow (2014l). Guinea Operational Map. Tullow Oil. Available from: http://www.tullowoil.com/index.asp?pageid=559 [Accessed on June 5, 2014]
Tullow (2014m). Liberia Operational Map. Tullow Oil. Available from: http://www.tullowoil.com/index.asp?pageid=267 [Accessed on June 6, 2014]
Tullow (2014n). Sierra Leone Operational Map. Tullow Oil. Available from: http://www.tullowoil.com/index.asp?pageid=279 [Accessed on June 7, 2014]
Tullow (2014o). South and East America - Regional Business Unit Map. Tullow Oil. Available from: http://www.tullowoil.com/index.asp?pageid=477 [Accessed on June 7, 2014]
Tullow (2014p). Ethiopia Operational Map. Tullow Oil. Available from: http://www.tullowoil.com/index.asp?pageid=430 [Accessed on June 7, 2014]
Tullow (2014q). Madagascar Operational Map. Tullow Oil. Available from: http://www.tullowoil.com/index.asp?pageid=269 [Accessed on June 9, 2014]
Tullow (2014r). Mozambique Operational Map. Tullow Oil. Available from: http://www.tullowoil.com/index.asp?pageid=528 [Accessed on June 9, 2014]
Tullow (2014s). Namibia Operational Map. Tullow Oil. Available from: http://www.tullowoil.com/index.asp?pageid=274 [Accessed on June 9, 2014]
Tullow (2014t). Uganda Operational Map. Tullow Oil. Available from: http://www.tullowoil.com/index.asp?pageid=282 [Accessed on June 9, 2014]
Tullow (2014u). Europe, South America and Asia Map. Tullow Oil. Available from: http://www.tullowoil.com/index.asp?pageid=296 [Accessed on June 9, 2014]

Tullow Oil plc, Company Intelligence Report
279
© GlobalData. This report is a licensed product and is not to be copied, reproduced, shared or resold in any form.
TULLOW OIL PLC, COMPANY INTELLIGENCE REPORT
Appendix
Tullow (2014v). Norway Operational Map. Tullow Oil. Available from: http://www.tullowoil.com/index.asp?pageid=553 [Accessed on June 10, 2014]
Tullow (2014w). Greenland Operational Map. Tullow Oil. Available from: http://www.tullowoil.com/index.asp?pageid=545 [Accessed on June 10, 2014]
Tullow (2014x). Netherland Operational Map. Tullow Oil. Available from: http://www.tullowoil.com/index.asp?pageid=289 [Accessed on June 11, 2014]
Tullow (2014y). United Kingdom Operational Map. Tullow Oil. Available from: http://www.tullowoil.com/index.asp?pageid=293 [Accessed on June 11, 2014]
Tullow (2014z). French Guiana Operational Map. Tullow Oil. Available from: http://www.tullowoil.com/index.asp?pageid=309 [Accessed on June 11, 2014]
Tullow (2014aa). Guyana Operational Map. Tullow Oil. Available from: http://www.tullowoil.com/index.asp?pageid=310 [Accessed on June 11, 2014]
Tullow (2014ab). Suriname Operational Map. Tullow Oil. Available from: http://www.tullowoil.com/index.asp?pageid=312 [Accessed on June 11, 2014]
Tullow (2014ac). Uruguay Operational Map. Tullow Oil. Available from: http://www.tullowoil.com/index.asp?pageid=535 [Accessed on June 11, 2014]
Tullow (2014ad). Uruguay Operational Map. Tullow Oil. Available from: http://www.tullowoil.com/index.asp?pageid=303 [Accessed on June 11, 2014]
Tullow (2014ae).Capital Markets Day Presentation – June 25, 2014. Tullow Oil. Available from: http://files.the-group.net/library/tullow/files/pdf_434_t.pdf [Accessed on June 26, 2014]
Tullow (2014af). Major Projects Map. Tullow Oil. Available from: http://library.the-group.net/tullow/client_upload/image/MPT_Africa_Ghana__Uganda__Kenya___Ethiopia_Location_Map_Oct_2013.jpg [Accessed on June 26, 2014]
Tullow (2014ag). Ghana Overview. Tullow Oil. Available from: http://library.the-group.net/tullow/client_upload/image/majorprojects/ghana/MP_Ghana_Overview_Oct_2013.jpg [Accessed on June 26, 2014]
Tullow (2014ah). Ghana Timeline. Tullow Oil. Available from: http://www.tullowoil.com/index.asp?pageid=51 [Accessed on June 27, 2014]
Tullow (2014ai).Uganda Overview. Tullow Oil. Available from: http://library.the-group.net/tullow/client_upload/image/majorprojects/uganda/MP_Uganda_Overview_Feb_2014.jpg [Accessed on June 27, 2014]
Tullow Oil plc, Company Intelligence Report
280
© GlobalData. This report is a licensed product and is not to be copied, reproduced, shared or resold in any form.
TULLOW OIL PLC, COMPANY INTELLIGENCE REPORT
Appendix
Tullow (2014aj).Uganda Timeline. Tullow Oil. Available from: http: http://www.tullowoil.com/index.asp?pageid=63 [Accessed on June 27, 2014]
Tullow (2014ak).Kenya and Ethiopia Overview. Tullow Oil. Available from: http: http://library.the-group.net/tullow/client_upload/image/majorprojects/MP_Kenya___Ethiopia_Overview_Jan_2014v2.jpg [Accessed on June 27, 2014]
Tullow (2014al).Kenya and Ethiopia Timeline. Tullow Oil. Available from: http: http://www.tullowoil.com/index.asp?pageid=591 [Accessed on June 27, 2014]
Tullow (2014am).Jubilee Field Overview. Tullow Oil. Available from: http: http://library.the-group.net/tullow/client_upload/image/majorprojects/ghana/MP_Ghana_Jubilee_Field___Dev_Area_June_2013.jpg [Accessed on June 30, 2014]
Tullow (2014an). TEN field Overview. Tullow Oil. Available from: http: http://library.the-group.net/tullow/client_upload/image/majorprojects/ghana/MP_Ghana_TEN_Oct_2013.jpg [Accessed on June 27, 2014]
Tullow (2014ao). Trading Statement and Operational Update July 2014. Tullow Oil. Available from: http://files.the-group.net/library/tullow/files/pdf_435.pdf [Accessed on July 8,2014]
Tullow (2014ap). 2014 Half Yearly Results Presentation. Tullow Oil. Available from: http://www.tullowoil.com/images/files/cms/Tullow_Oil_plc__2014_HY_Results_Presentation_PRINT.pdf [Accessed on July 30,2014]
Tullow (2014aq). 2014 Half Yearly Results Factbook. Tullow Oil. Available from: http://www.tullowoil.com/images/files/cms/2014_HY_FACTBOOK_FINAL.pdf [Accessed on July 30,2014]
Tullow (2014ar). 2014 Half Yearly Results. Tullow Oil. Available from: http://www.tullowoil.com/files/pdf/results/2014_half_yearly_results.pdf [Accessed on July 30,2014]
281 © GlobalData. This report is a licensed product and is not to be copied, reproduced, shared or resold in any form.
Appendix
15.3 Research Methodology GlobalData’s dedicated research and analysis teams consist of experienced professionals with advanced statistical expertise and marketing, market research and consulting backgrounds in the energy industry.
GlobalData adheres to the codes of practice of the Market Research Society (www.mrs.org.uk) and Strategic and Competitive Intelligence Professionals (www.scip.org).
All GlobalData databases are continuously updated and revised.
15.3.1 Coverage
The objective of updating GlobalData’s coverage is to ensure that it represents the most up-to-date vision of the industry possible.
Changes to the industry taxonomy are built on the basis of extensive research of company, association and competitor sources.
Company coverage is based on three key factors: market capitalization; revenues; and media attention and innovation and market potential.
An exhaustive search of 56 member exchanges is conducted and companies are prioritized on the basis of their market capitalization.
The estimated revenues of all major companies, including private and governmental, are gathered and used to prioritize coverage.
Companies that are making the news or that are of particular interest due to their innovative approach are prioritized.
GlobalData aims to cover all major news events and deals in the energy industry, updated on a daily basis.
282 © GlobalData. This report is a licensed product and is not to be copied, reproduced, shared or resold in any form.
Appendix
15.3.2 Secondary Research
The research process begins with extensive secondary research using internal and external sources to gather qualitative and quantitative information relating to each market.
The secondary research sources that are typically referred to include, but are not limited to:
Company websites, annual reports, financial reports, broker reports, investor presentations and Us Securities and Exchanges Commission (SEC) filings
Industry trade journals and other technical literature
Internal proprietary and external databases
National government documents, statistical databases and market reports
News articles, press releases and web-casts specific to the companies operating in the market
15.3.3 Primary Research
GlobalData conducts hundreds of primary interviews each year with industry participants and commentators in order to validate its data and analysis. A typical research interview fulfills the following functions:
Provides first-hand information on market size, market trends, growth trends, competitive landscape and future outlook.
Helps to validate and strengthen secondary research findings
Further develops the analysis team’s expertise and market understanding
283 © GlobalData. This report is a licensed product and is not to be copied, reproduced, shared or resold in any form.
Appendix
15.4 Disclaimer All Rights Reserved.
No part of this publication may be reproduced, stored in a retrieval system or transmitted in any form by any means; electronic, mechanical, photocopying, recording or otherwise, without the prior permission of the publisher, GlobalData.
Related Documents